canadian bioinformatics workshops - github pages
TRANSCRIPT
1Module 3: Network Visualization with Cytoscape bioinformatics.ca
Canadian Bioinformatics Workshopswww.bioinformatics.ca
bioinformaticsdotca.github.io
2Module 3: Network Visualization with Cytoscape bioinformatics.ca
3Module 3: Network Visualization with Cytoscape bioinformatics.ca
Module 3Network Visualization and
analysis with CytoscapeRuth Isserlin
Pathway and Network Analysis of –omics DataJuly 27-29, 2020
Workshop icon
4Module 3: Network Visualization with Cytoscape bioinformatics.ca
Learning Objectives
• By the end of this lecture, you will:• Understand the advantages of network visualization.• Understand how to choose and installCytoscape Apps• Be able to use basic Cytoscape features• Be able to create and optimize a network inCytoscape
5Module 3: Network Visualization with Cytoscape bioinformatics.ca
Network Visualization and Analysis Outline
• Introduction• Network Basics• Network Visualization• Network Analysis
• Demo: Cytoscape software tool for Network visualization and analysis
6Module 3: Network Visualization with Cytoscape bioinformatics.ca
Six Degrees of Separation
• Everyone in the world is connected by at most six links.
• Originally demonstrated by Stanely Milgram at Harvard in 1960s in an experiment to find how many random acquaintances it would take to connect two people…. sometimes defined as the the social distance between two people.
• Popularized in the 1990s with six degrees of Kevin Bacon.
• Demonstrated the interconnectivity of our social structures.
• Networks exists everywhere – power grids, cell tower networks, Fed ex delivery networks, supply chain networks ….
• Is this Biologically relevant?
7Module 3: Network Visualization with Cytoscape bioinformatics.ca
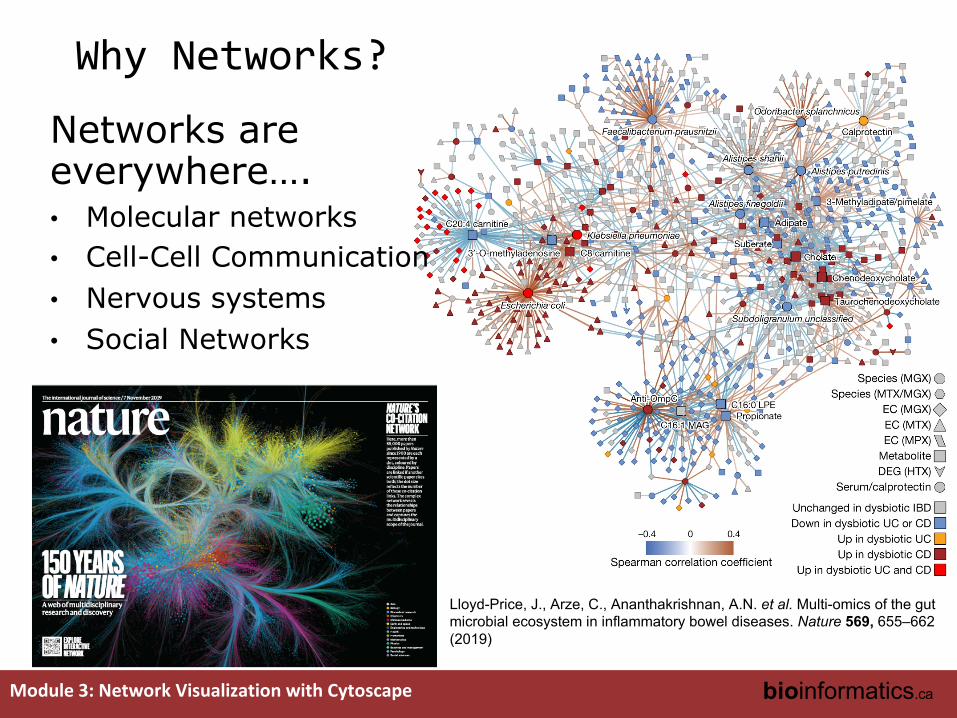
Why Networks?
Networks are everywhere….• Molecular networks• Cell-Cell Communication• Nervous systems• Social Networks
Lloyd-Price, J., Arze, C., Ananthakrishnan, A.N. et al. Multi-omics of the gut microbial ecosystem in inflammatory bowel diseases. Nature 569, 655–662 (2019)
8Module 3: Network Visualization with Cytoscape bioinformatics.ca
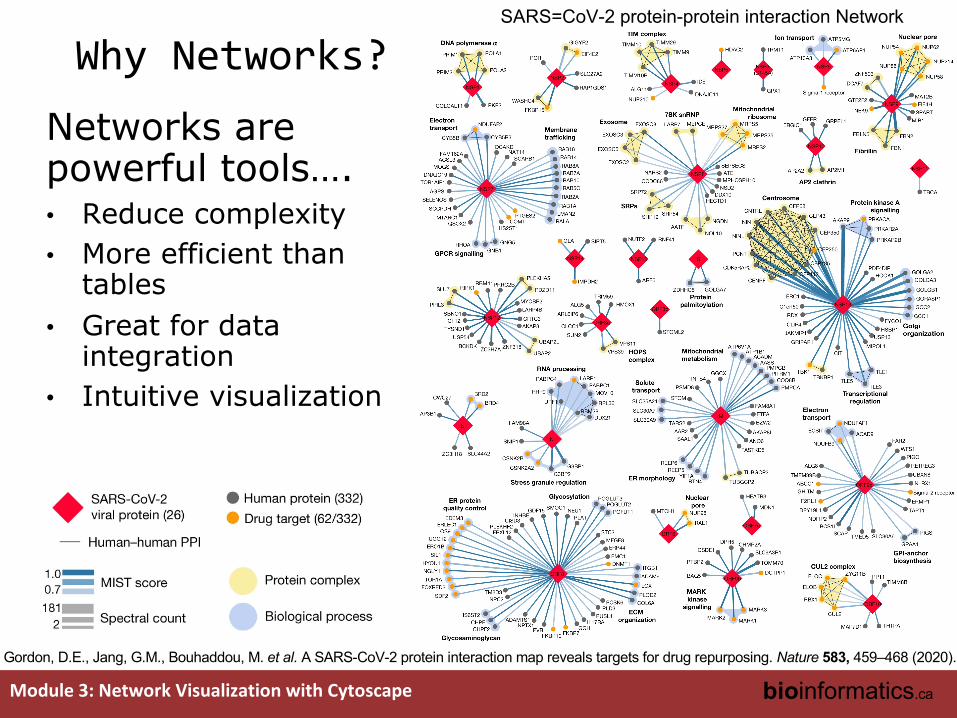
Why Networks?Networks are powerful tools….• Reduce complexity• More efficient than
tables• Great for data
integration• Intuitive visualization
SARS=CoV-2 protein-protein interaction Network
Gordon, D.E., Jang, G.M., Bouhaddou, M. et al. A SARS-CoV-2 protein interaction map reveals targets for drug repurposing. Nature 583, 459–468 (2020).
9Module 3: Network Visualization with Cytoscape bioinformatics.ca
Why Would We Use Network Visualization for Biological Data?
• Represent relationships of biological molecules– Physical, regulatory, genetic, functional interactions
• Useful for discovering relationships in large data sets– Better than tables in Excel
• Visualize multiple data types together– Discover interesting patterns
• Network analysis– Finding sub-networks with certain properties (densely
connected, co-expressed, frequently mutated, clinical characteristics)
– Finding paths between nodes (or other network “motifs”)– Finding central nodes in network topology (“hub” genes)
10Module 3: Network Visualization with Cytoscape bioinformatics.ca
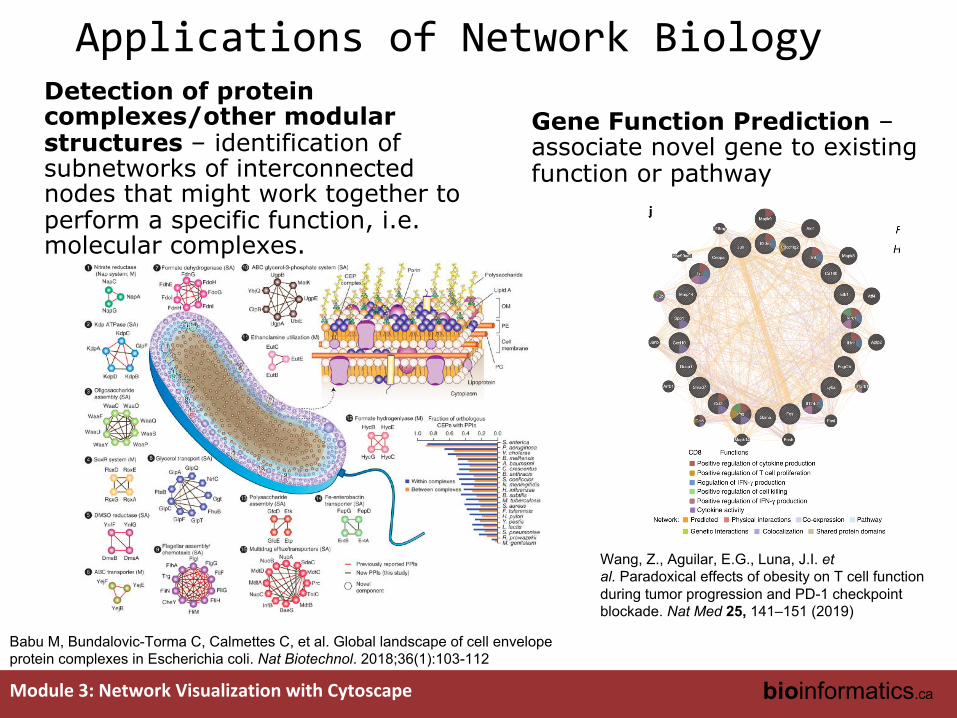
Applications of Network Biology
Gene Function Prediction –associate novel gene to existing function or pathway
Detection of protein complexes/other modular structures – identification of subnetworks of interconnected nodes that might work together to perform a specific function, i.e. molecular complexes.
Wang, Z., Aguilar, E.G., Luna, J.I. et al. Paradoxical effects of obesity on T cell function during tumor progression and PD-1 checkpoint blockade. Nat Med 25, 141–151 (2019)
Babu M, Bundalovic-Torma C, Calmettes C, et al. Global landscape of cell envelope protein complexes in Escherichia coli. Nat Biotechnol. 2018;36(1):103-112
11Module 3: Network Visualization with Cytoscape bioinformatics.ca
Network Alignment and comparison– analyze evolution of networks between different species to identify similarities and evolutionary relationships
Motif analysis– discover higher order organization such motifs, feedback loops (small network patterns that are over-represented when compared to a randomized version of the same network)
Applications of Network BiologySubnetwork based diagnosis –biomarker or biomarker panel. Identification of subnetworks activated in disease
Pathway based gene association – uncovering common pathways disturbed during disease.
12Module 3: Network Visualization with Cytoscape bioinformatics.ca
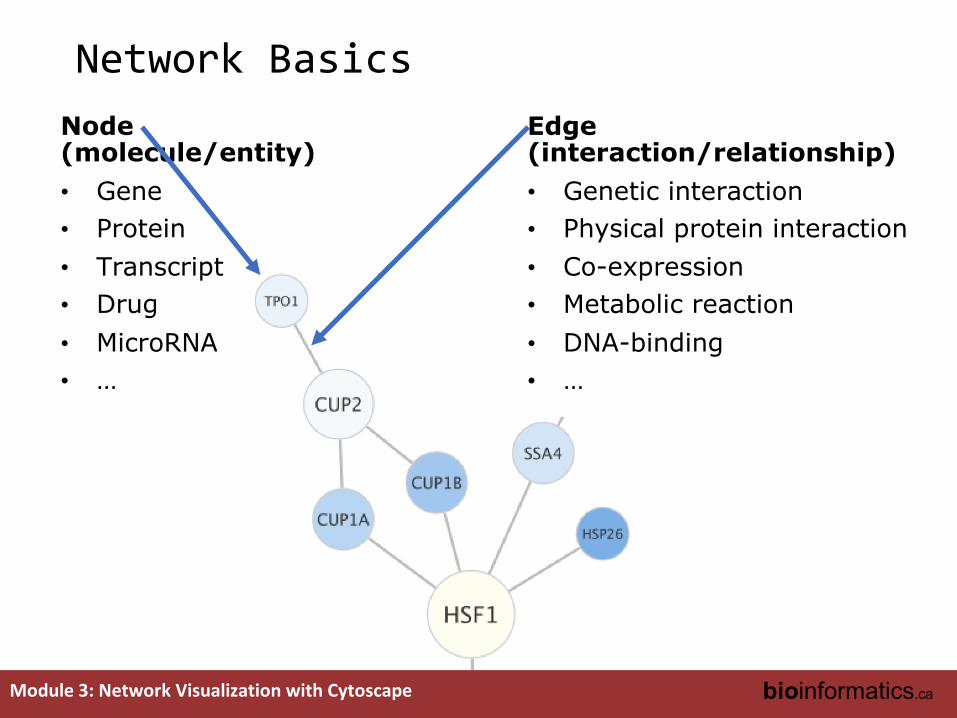
Network BasicsNode (molecule/entity)• Gene• Protein• Transcript• Drug• MicroRNA• …
Edge(interaction/relationship)• Genetic interaction• Physical protein interaction• Co-expression• Metabolic reaction• DNA-binding• …
13Module 3: Network Visualization with Cytoscape bioinformatics.ca
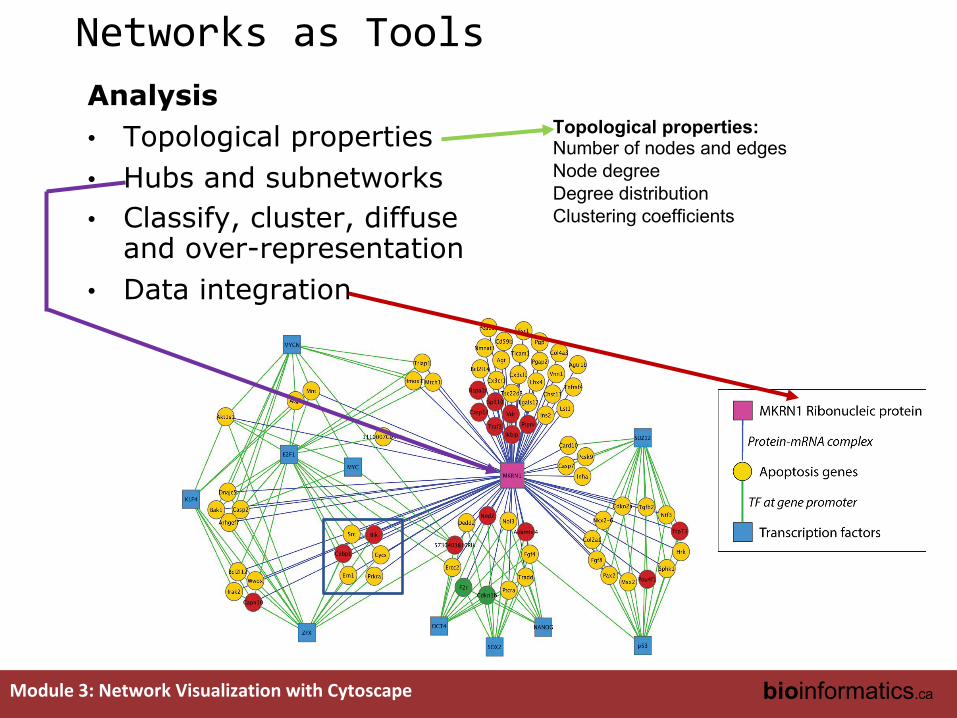
Networks as ToolsAnalysis• Topological properties • Hubs and subnetworks• Classify, cluster, diffuse
and over-representation• Data integration
Topological properties:Number of nodes and edgesNode degreeDegree distributionClustering coefficients
14Module 3: Network Visualization with Cytoscape bioinformatics.ca
Networks as Tools
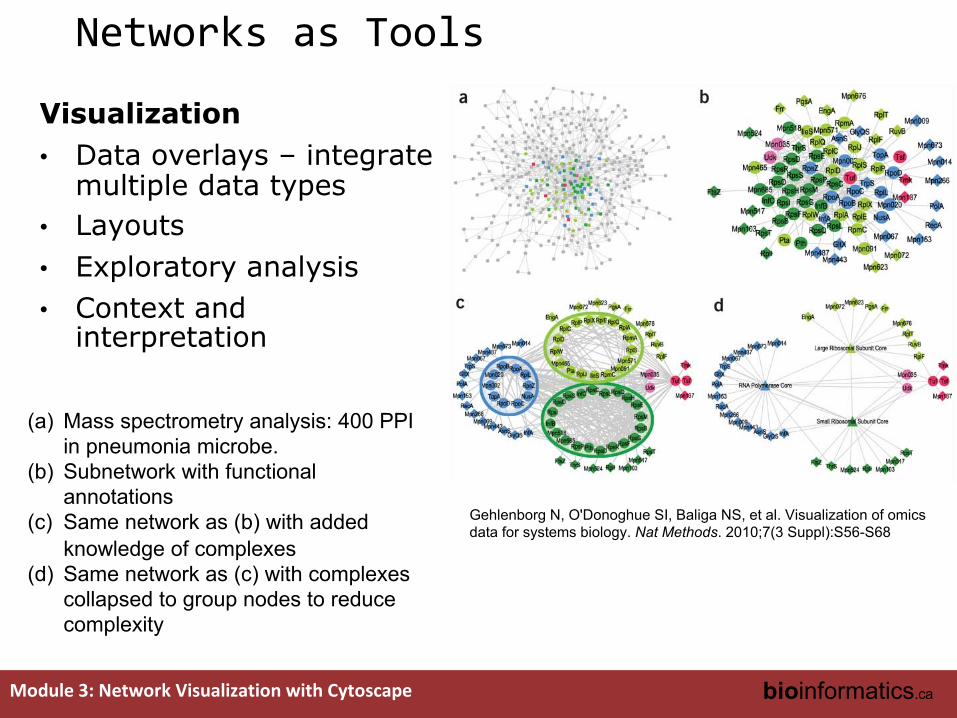
Visualization• Data overlays – integrate
multiple data types• Layouts• Exploratory analysis• Context and
interpretation
Gehlenborg N, O'Donoghue SI, Baliga NS, et al. Visualization of omics data for systems biology. Nat Methods. 2010;7(3 Suppl):S56-S68
(a) Mass spectrometry analysis: 400 PPI in pneumonia microbe.
(b) Subnetwork with functionalannotations
(c) Same network as (b) with added knowledge of complexes
(d) Same network as (c) with complexes collapsed to group nodes to reduce complexity
15Module 3: Network Visualization with Cytoscape bioinformatics.ca
What’s Missing?
• Dynamics• Pathways/networks represented as static processes
• Difficult to represent a calcium wave or a feedback loop• More detailed mathematical representations exist that
handle these e.g. Stoichiometric modeling, Kinetic modeling (VirtualCell, E-cell, …)• Need to accumulate or estimate comprehensive kinetic information
• Detail – atomic structures• Context – cell type, developmental stage
16Module 3: Network Visualization with Cytoscape bioinformatics.ca
What Have We Learned?
• Networks are useful for seeing relationships in large data sets
• Important to understand what the nodes and edges mean
• Important to define the biological question - know what you want to do with your gene list or network
• Many methods available for gene list and network analysis– Good to determine your question and search for a solution– Or get to know many methods and see how they can be
applied to your data
17Module 3: Network Visualization with Cytoscape bioinformatics.ca
Network Visualization and Analysis using Cytoscape
• Network visualization and analysis using Cytoscape software
• Cytoscape basics• Cytoscape network analysis examples
18Module 3: Network Visualization with Cytoscape bioinformatics.ca
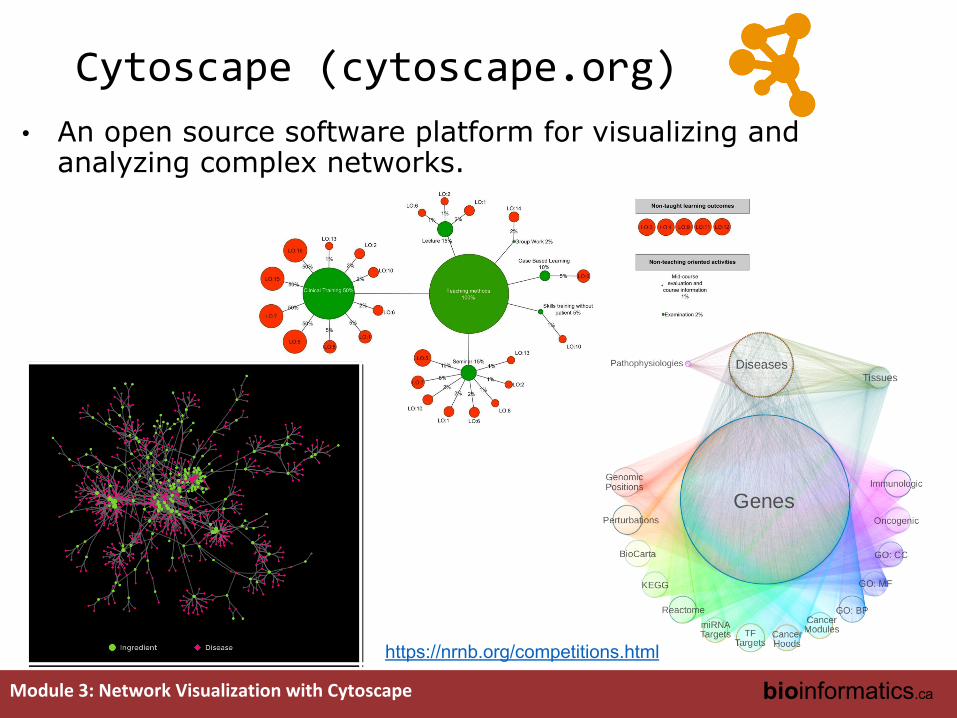
Cytoscape (cytoscape.org)• An open source software platform for visualizing and
analyzing complex networks.
https://nrnb.org/competitions.html
19Module 3: Network Visualization with Cytoscape bioinformatics.ca
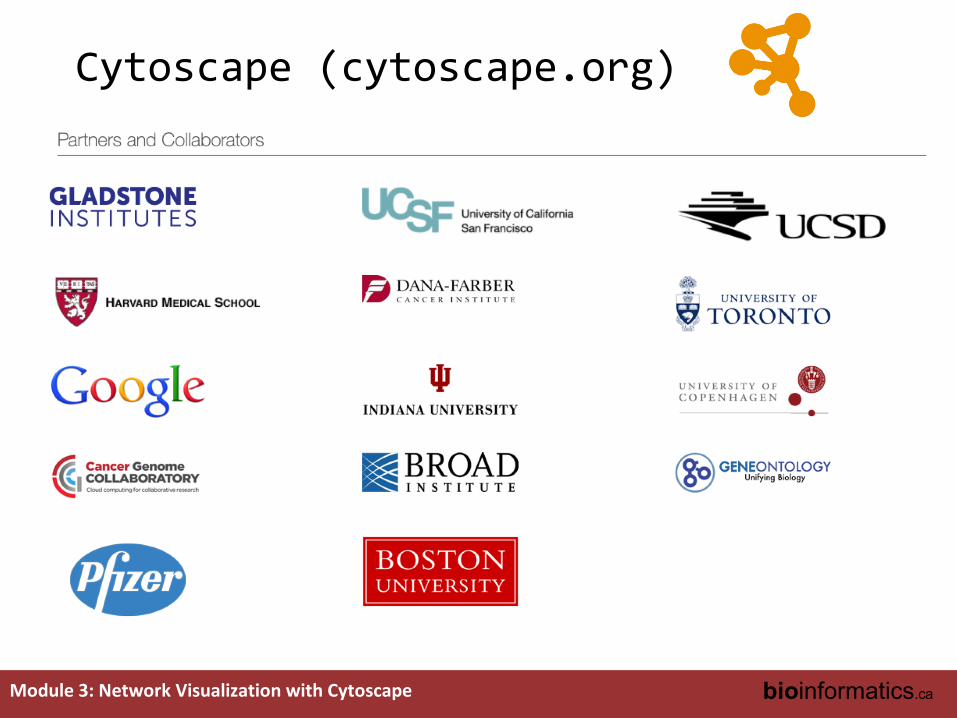
Cytoscape (cytoscape.org)• An open source software platform for visualizing and
analyzing complex networks.
20Module 3: Network Visualization with Cytoscape bioinformatics.ca
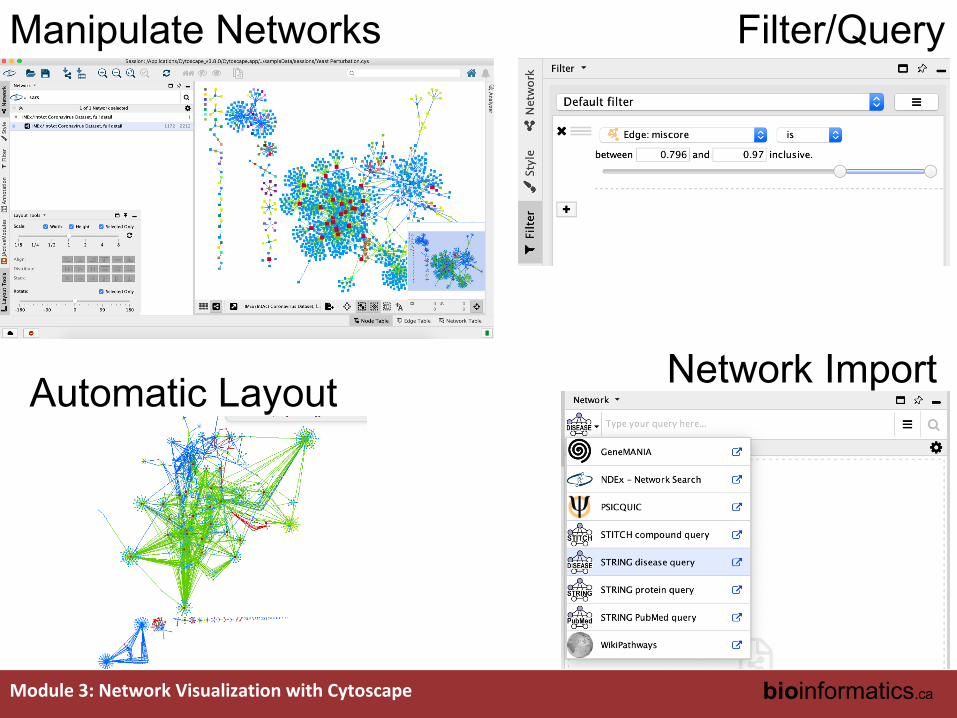
Manipulate Networks Filter/Query
Automatic Layout Network Import
21Module 3: Network Visualization with Cytoscape bioinformatics.ca
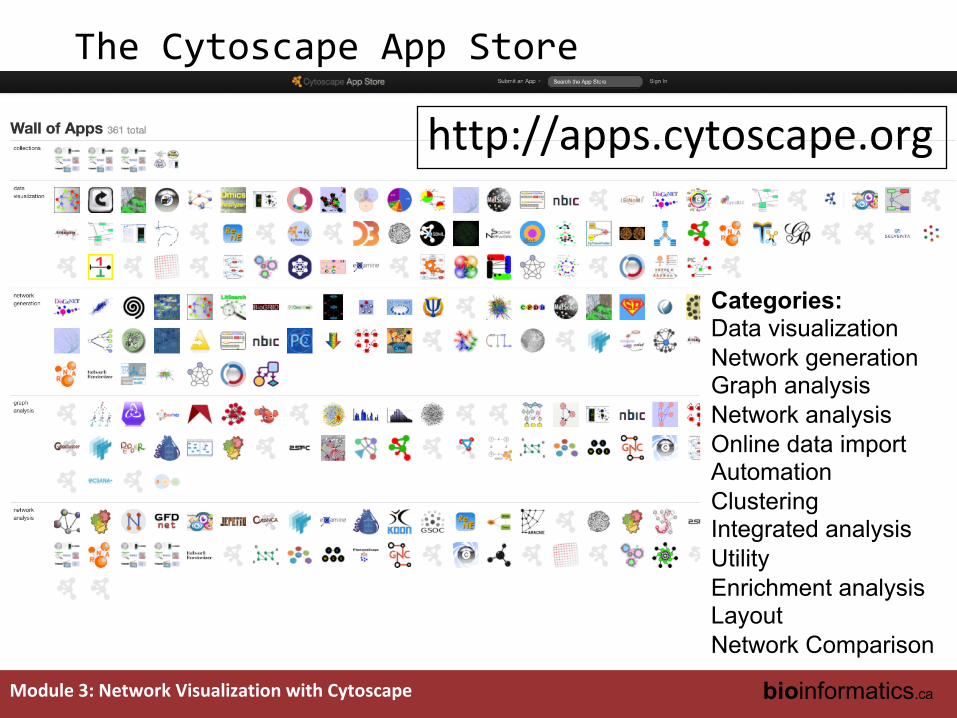
The Cytoscape App Store
http://apps.cytoscape.org
Categories:Data visualizationNetwork generationGraph analysisNetwork analysisOnline data importAutomationClusteringIntegrated analysisUtilityEnrichment analysisLayoutNetwork Comparison
22Module 3: Network Visualization with Cytoscape bioinformatics.ca
Active Community
• 10,000s users, >17,600 downloads/month (May 2018)• Help
• Documentation, data sets• Mailing lists• http://tutorials.cytoscape.org
• Automatable through R or python using cyrest• Cited 2121 (google scholar), 1,437 (ISI web of Science)• >361 Apps Extend Functionality (July 2020)
• Build your own, requires programming
http://www.cytoscape.org
Cline MS et al. Integration of biological networks and gene expression data using Cytoscape Nat Protoc. 2007;2(10):2366-82
23Module 3: Network Visualization with Cytoscape bioinformatics.ca
What Have We Learned?
• Cytoscape is a useful, free software tool for network visualization and analysis
• Provides basic network manipulation features• Apps are available to extend the functionality
24Module 3: Network Visualization with Cytoscape bioinformatics.ca
Cytoscape DemoVersion 3.8.0
www.cytoscape.org
25Module 3: Network Visualization with Cytoscape bioinformatics.ca
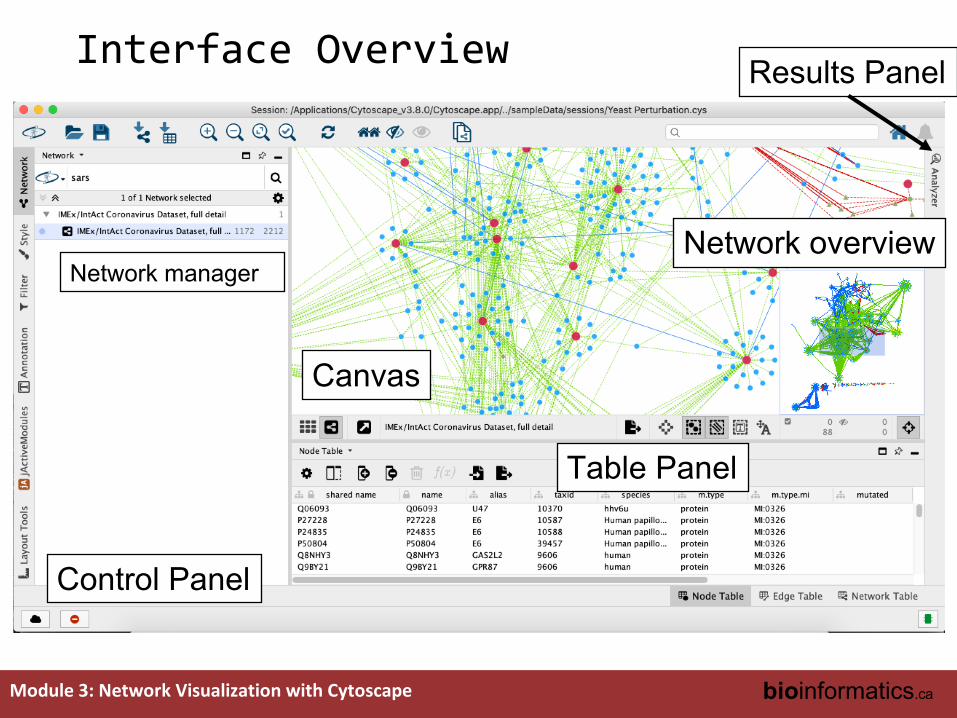
Canvas
Network overviewNetwork manager
Table Panel
Control Panel
Results PanelInterface Overview
26Module 3: Network Visualization with Cytoscape bioinformatics.ca
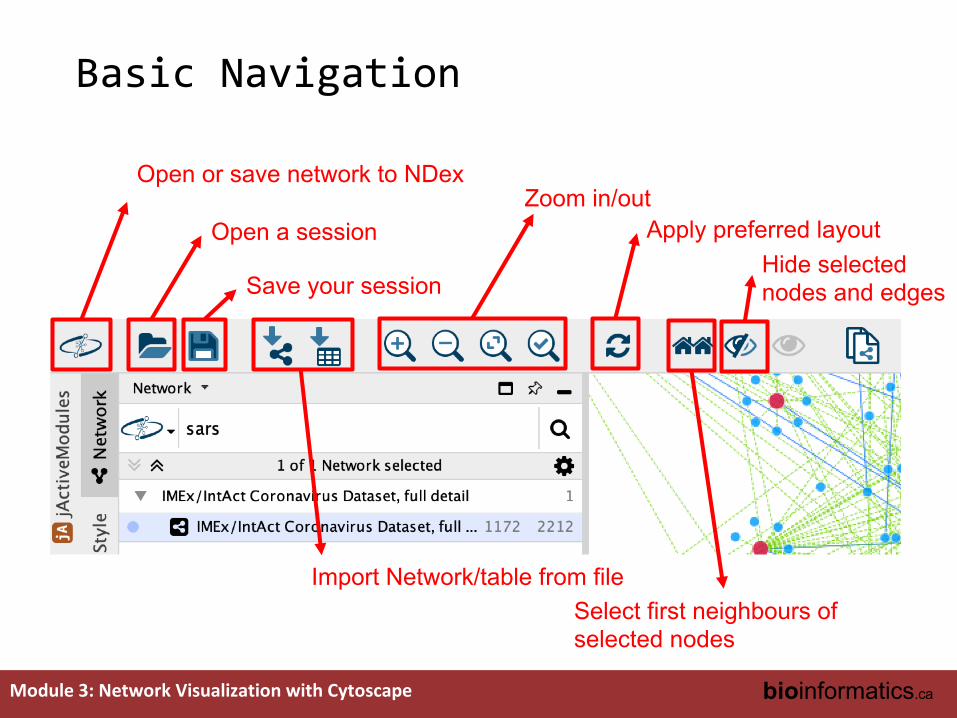
Open or save network to NDex
Open a session
Save your session
Zoom in/outApply preferred layout
Import Network/table from fileSelect first neighbours ofselected nodes
Hide selected nodes and edges
Basic Navigation
27Module 3: Network Visualization with Cytoscape bioinformatics.ca
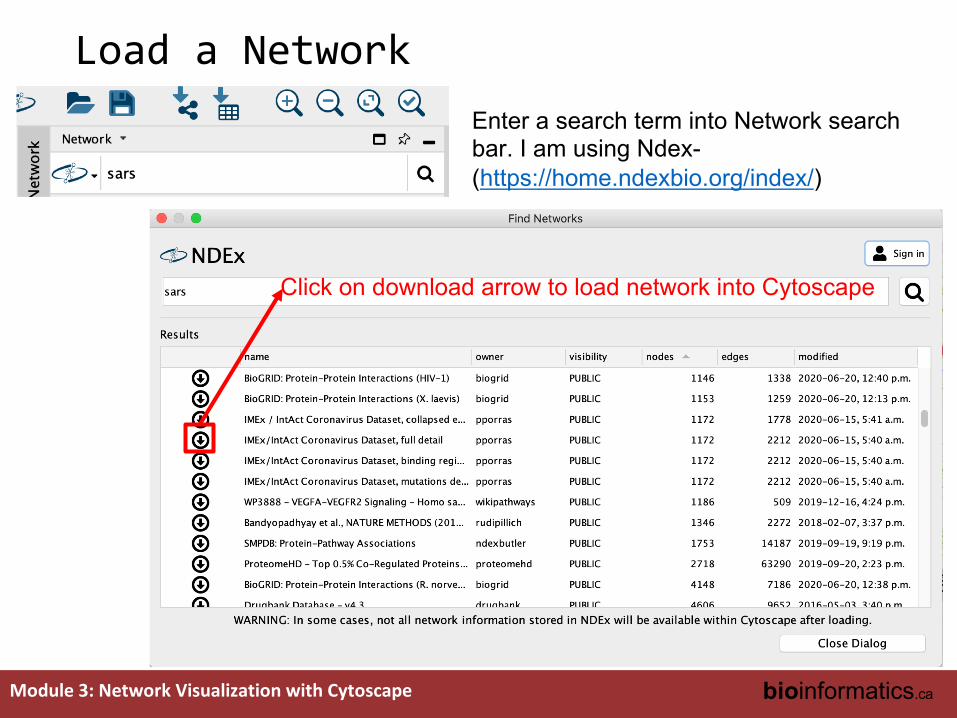
Load a NetworkEnter a search term into Network search bar. I am using Ndex-(https://home.ndexbio.org/index/)
Click on download arrow to load network into Cytoscape
28Module 3: Network Visualization with Cytoscape bioinformatics.ca
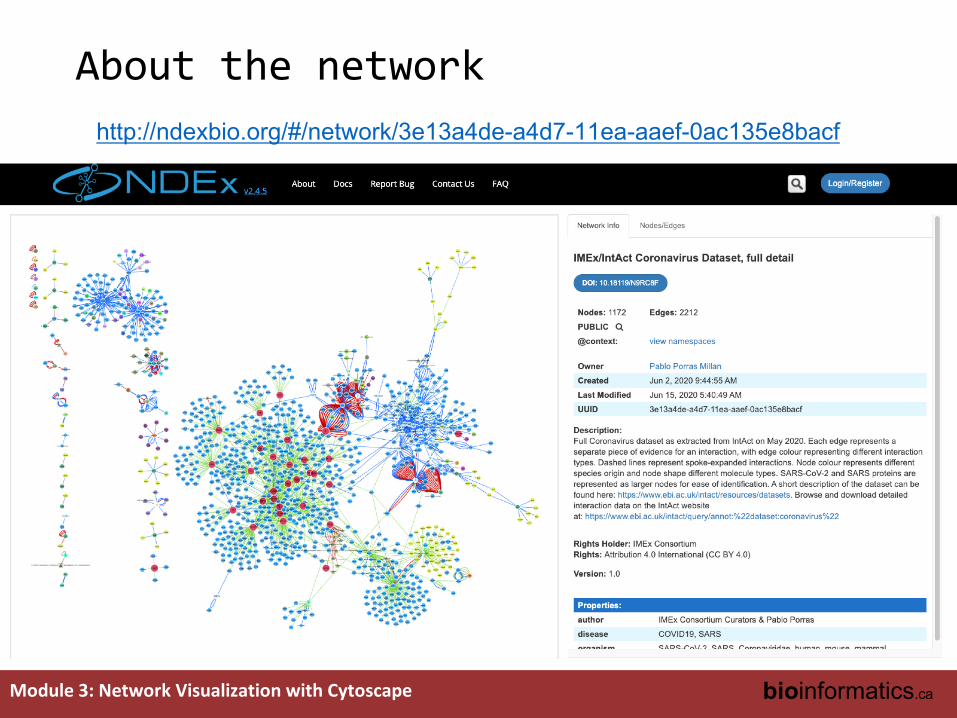
About the network http://ndexbio.org/#/network/3e13a4de-a4d7-11ea-aaef-0ac135e8bacf
29Module 3: Network Visualization with Cytoscape bioinformatics.ca
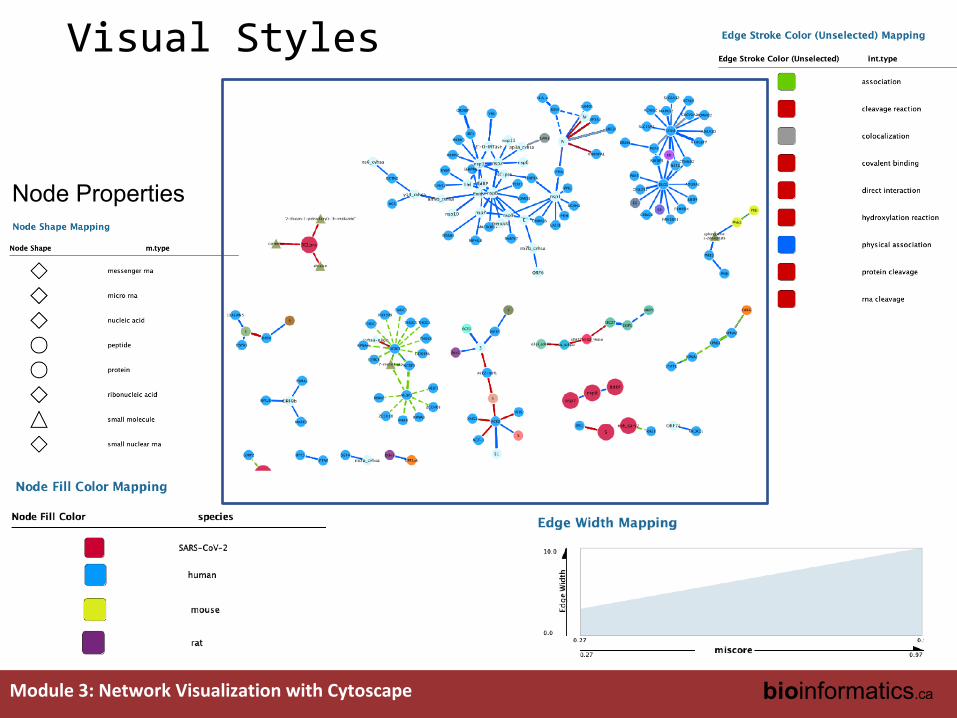
Visual Styles
Node Properties
30Module 3: Network Visualization with Cytoscape bioinformatics.ca
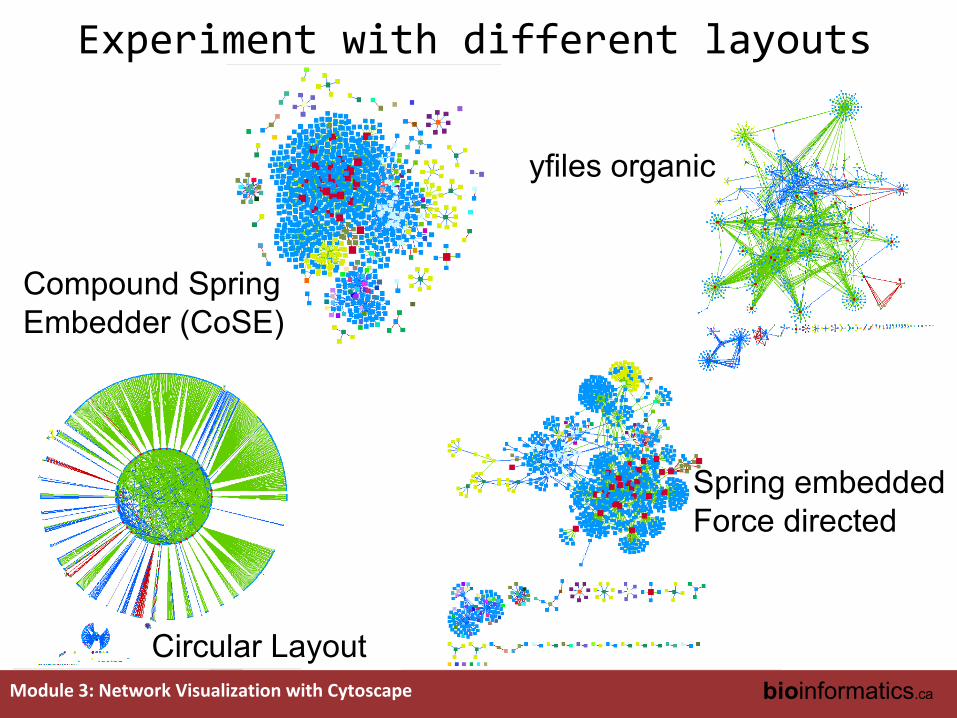
Experiment with different layouts
Compound Spring Embedder (CoSE)
Circular Layout
Spring embeddedForce directed
yfiles organic
31Module 3: Network Visualization with Cytoscape bioinformatics.ca
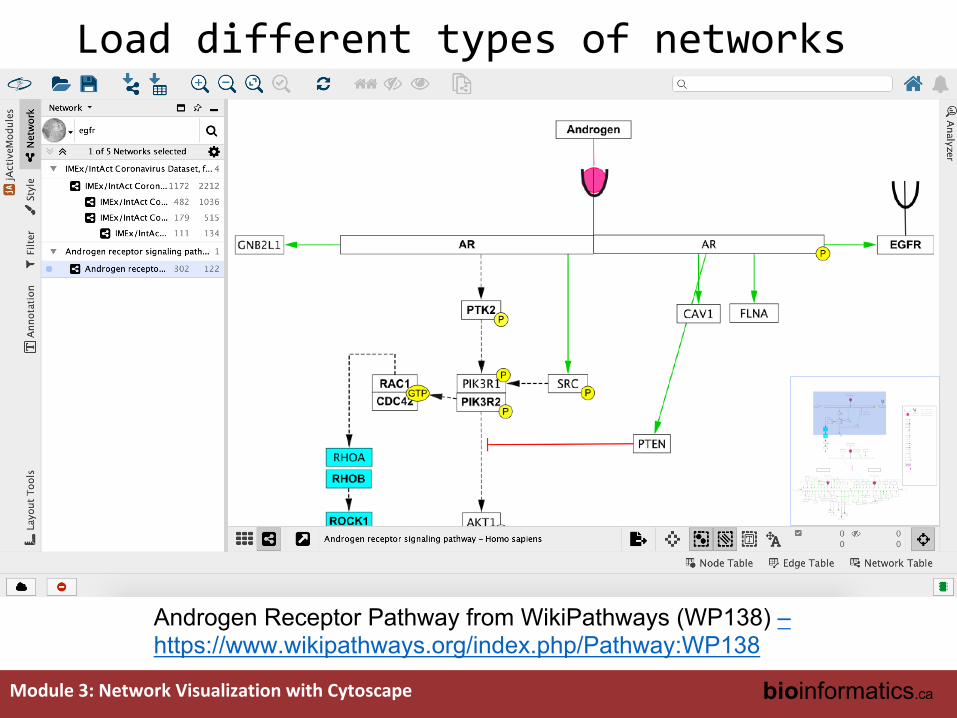
Load different types of networks
Androgen Receptor Pathway from WikiPathways (WP138) –https://www.wikipathways.org/index.php/Pathway:WP138
32Module 3: Network Visualization with Cytoscape bioinformatics.ca
We are on a Coffee Break & Networking Session
Workshop Sponsors: