burdyak, a. and novikov, v. (2014). housing finance in ukraine: a long way to go // housing finance...
TRANSCRIPT
To be cited as:
Burdyak, A. and Novikov, V. (2014). Housing finance in Ukraine: a long way to go //
Housing Finance International, Autumn 2014. International Union for Housing Finance, Brussels, Belgium. Pp. 17-25.
http://www.housingfinance.org/publications/housing-finance-international
Aleksandra Burdyak, Valery Novikov
Housing finance in Ukraine: a long way to go
1. Introduction
Besides current events attracting the world's attention to Ukraine, there are several reasons for
economists’ interest in the country. Ukraine is the second largest transition country having a land area of
603,700 sq. km, larger than Metropolitan France, with a population of 45.3 million 2013 average and a
GDP comparable to Norway (Word Bank Indicators, 2014). The transition process in Ukraine was
characterized by an extremely large initial shock and a fairly slow recovery. The country’s real GDP
declined by more than 60% in the 1990s and has not reached the pre-transition level since then, making
the transition process highly attractive for post-soviet countries researches as an experimental model.
Besides, there is a big gap in knowledge on housing and housing finance in Ukraine, and the aim of this
article is to shed some light on the subject. Recent changes in the overall economic situation in Ukraine
have deeply affected housing finance. In Spring 2014 a 40% depreciation of the national currency1
drastically reduced the chance for mortgage borrowers to make payments on dollar and euro mortgages
which accounted for 2/3 of mortgage debt before the exchange rate jump. Although mortgages are not
widespread in Ukraine, the repossession of property mortgaged to banks and the cost of housing
expressed in dollars could devastate the sector. Given the bleak outlook, there is an urgent need to rethink
the funding model and to identify new solutions.
At this point we should draw the attention to the two-fold role of housing finance, as it is
understood in transitional economies, contrary to that in developed ones (Stephens, 2005; 2014). In the
‘western’ sense the housing finance system functions to facilitate or hinder labour mobility by helping
people to get a dwelling; either buying or renting it. In Ukraine support for vulnerable groups to obtain
housing is mainly understood as a social security payment for rent and the cost of communal services
such as heating, water supply etc. Such support is provided via means testing regardless of the type of
tenancy – either homeowners or social housing renters can apply for it. Ukraine has a most generous well-
functioning housing allowance system: all costs in excess of 15% of household income are reimbursed,
and for households with children or pensioners the threshold is 10% (Ministry of Social Policy, 2014).
1 Exchange rate has grown from 7.99 UAH in January to 11.75 UAH per 1 USD in July 2014, The National Bank of
Ukraine, access 22 of August 2014.
There is also a privilege program for certain categories of people with disabilities, veterans, etc. – they are
provided communal services at a reduced price; this program is not targeted at the poor.
The disparity between having the highest average costs for supplying gas and the lowest
residential gas and heating tariffs in Europe, at 40% of those in Poland and 40% of those of the Baltic
countries, is leading to huge energy usage inefficiency; 10 times more intensive than OECD average. This
was underlined in 2013 World Bank research (World Bank, 2013). Estimating the direct budgetary and
quasi-fiscal subsidies on gas and heating as 7% GDP in 2012, the research provides the conclusion that a
gradual increase in energy tariffs coupled with better targeted social assistance is vital for Ukraine’s
budget and energy security. Detailed justification of a need for a tariff increase based on micro data was
provided 5 years ago (Fankhauser et al., 2008). Therefore tariff had not been changed for the past 10
years until it has increased dramatically in Spring 2014. Although housing allowances will support the
poorest households within the social norms of consumption, more expensive utilities for consumers
promise that the coming winter to be a challenging one. Describing the progress of housing affordability
and the housing finance transformation since 1990 we will offer an overview of the prospects for future
development.
There are two reasons for this unusual two-fold role of housing finance. First, governance and
management system is extremely inertial. In Soviet times housing was constructed and provided by
government, the cost of rent was symbolic for households, therefore housing costs predominantly
consisted of communal services payments. The housing sphere was run by the Ministry of Housing and
Communal Services and the role of government in ‘providing decent housing for reasonable cost’ was
understood as the provision of water, electricity, heating supply, including electrical networks and water
and sewer pipes maintenance, together with direct assistance to poor households over payments. Since
then the ownership structure in the housing utilities sector has changed, housing become mostly private.
However the Ukrainian Ministry for Regional Development, Construction, Housing and Communal
Services is functioning (Ministry for Regional…, 2014) and affordable housing beside its ‘western’
meaning has been still widely understood in Ukraine as affordable cost of ‘communal services’ for the
households. This socially sensitive area has always attracted attention before an election and the idea of
affordable communal services always appears in political debates.
While mortgage credit problems and direct need for housing concerns only a small proportion of
Ukrainians, the 2014 Spring increase of tariffs for housing and communal services has reduced the
affordability of comfortable housing for all the population. A partial answer from government was an
additional funding for housing allowances, targeted at poor households with income under subsistence
level. The program is expected to cover up to 4.5 million. Ukrainian families or 30% of total population,
while only 1.4 million households (almost 5 million people or 11% of population) had benefited from the
program before (UNIAN, 2014). But the consequences of old water pipes and wiring, obsolete units now
worn out, low energy efficiency of housing and poor management are still to affect affordable decent
housing in Ukraine as a basic need to be satisfied in as part of the progress of human development
(Stiglits et al., 2009; Human development, 2012).
Housing provision is one of the crucial socio-economic characteristics of a country. All
governments share the objective of achieving adequate and affordable housing for their citizens, including
in Ukraine. The ‘right to housing’ in the United Nations Declaration of Human Rights expresses the
general aim of housing policy. Therefore government does not necessarily take direct measures to achieve
it.
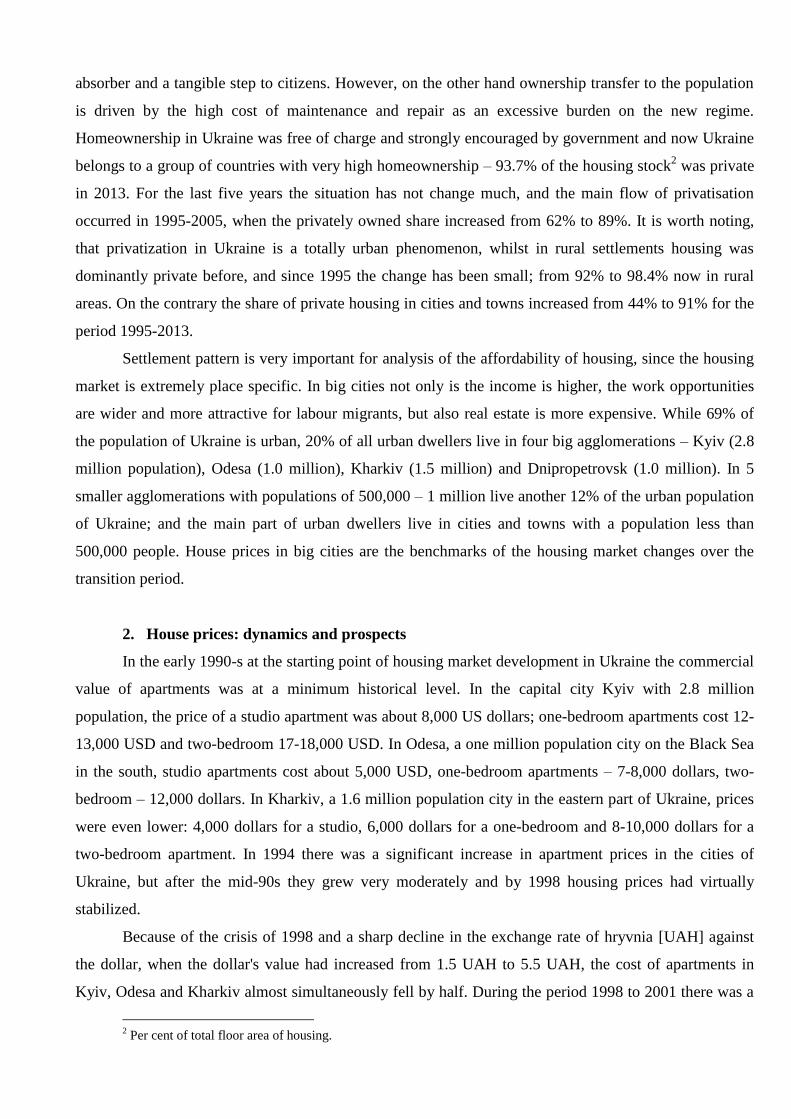
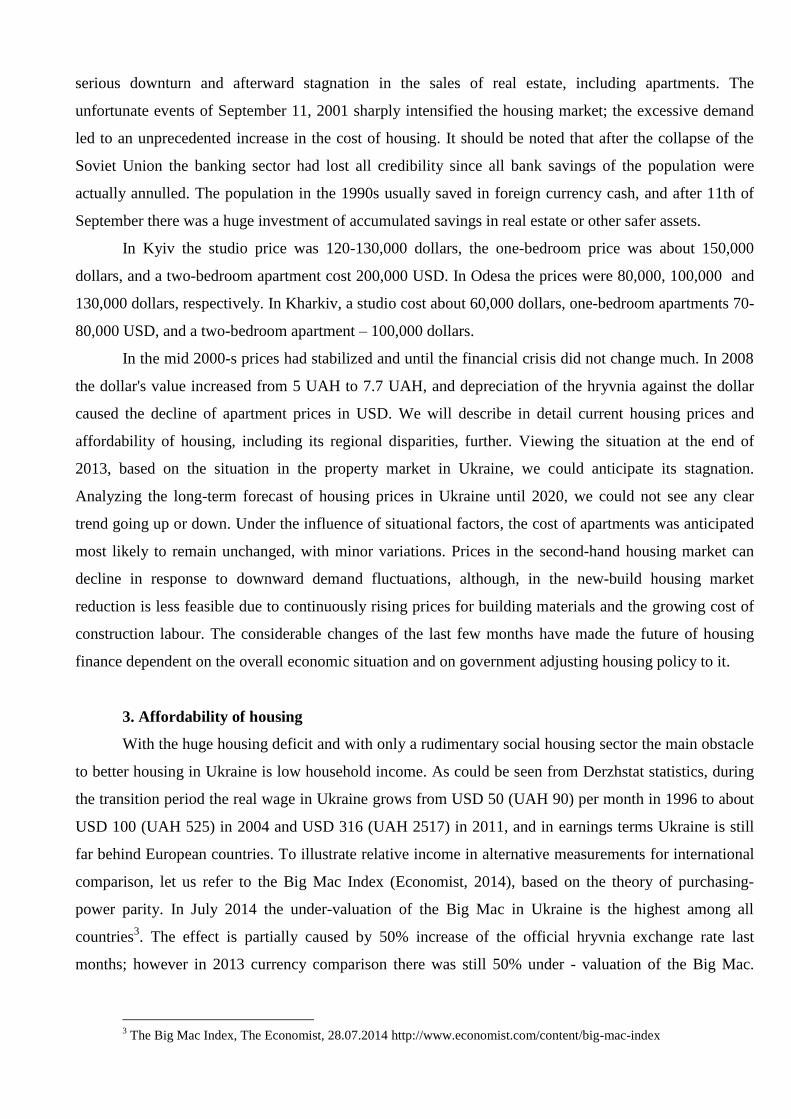
It should be underlined that in Ukraine despite the huge increase of housing per capita stock for
the post-soviet period from 17.8 sq.m to 23.7 sq.m per capita, the living conditions are still worse than
those in European countries (Eurofound, 2012; Derzhstat, 2014). To a great extent the growth has been
caused by population decrease from 51.8 million persons in 1990 to 45.6 million in 2013 – this
component accounts for 42% of housing per capita increase. Nevertheless, there is still about a 1 million
queue of households waiting for housing (Figure 1). Ukraine faces a problem of providing people with
decent and affordable housing.
Figure 1 Average living space area (LHS) and number of households in a waiting list for housing
(RHS).
Source: State Statistics Service (Derzhstat) data
Looking twenty - thirty years back one can conclude that housing has been constantly on the
agenda in Ukraine. In the Soviet Union housing was mainly constructed and provided free of charge by
the state. However in the mid 1990-s when the old system was broken and total economic downturn and
lack of funding led to a sharp reduction in housing construction, the main idea of housing policy was to
enable the market to work as in other former socialist countries. It is well known that privatisation in
Eastern and Central Europe is associated with political regime changes (Lowe, Tsenkova, 2003; Tosics,
Hegedüs, 2003; Buckley, Kalarical, 2005). On the one hand the process is interpreted as a political shock
2,6 2,7 2,7 2,6 2,6 2,4 2,3 2,2 2,0 1,8 1,6 1,5 1,5 1,4 1,3 1,3 1,3 1,2 1,2 1,1 1,1 1,0
18 18 18 19 1919
20 20 2021 21 21 22 22 22 22 23 23 23 23 24 24
0
0,5
1
1,5
2
2,5
3
0
5
10
15
20
25
Households in a
queue for housing,
mln. (RHS)
Floor area, sq m
per capita
absorber and a tangible step to citizens. However, on the other hand ownership transfer to the population
is driven by the high cost of maintenance and repair as an excessive burden on the new regime.
Homeownership in Ukraine was free of charge and strongly encouraged by government and now Ukraine
belongs to a group of countries with very high homeownership – 93.7% of the housing stock2 was private
in 2013. For the last five years the situation has not change much, and the main flow of privatisation
occurred in 1995-2005, when the privately owned share increased from 62% to 89%. It is worth noting,
that privatization in Ukraine is a totally urban phenomenon, whilst in rural settlements housing was
dominantly private before, and since 1995 the change has been small; from 92% to 98.4% now in rural
areas. On the contrary the share of private housing in cities and towns increased from 44% to 91% for the
period 1995-2013.
Settlement pattern is very important for analysis of the affordability of housing, since the housing
market is extremely place specific. In big cities not only is the income is higher, the work opportunities
are wider and more attractive for labour migrants, but also real estate is more expensive. While 69% of
the population of Ukraine is urban, 20% of all urban dwellers live in four big agglomerations – Kyiv (2.8
million population), Odesa (1.0 million), Kharkiv (1.5 million) and Dnipropetrovsk (1.0 million). In 5
smaller agglomerations with populations of 500,000 – 1 million live another 12% of the urban population
of Ukraine; and the main part of urban dwellers live in cities and towns with a population less than
500,000 people. House prices in big cities are the benchmarks of the housing market changes over the
transition period.
2. House prices: dynamics and prospects
In the early 1990-s at the starting point of housing market development in Ukraine the commercial
value of apartments was at a minimum historical level. In the capital city Kyiv with 2.8 million
population, the price of a studio apartment was about 8,000 US dollars; one-bedroom apartments cost 12-
13,000 USD and two-bedroom 17-18,000 USD. In Odesa, a one million population city on the Black Sea
in the south, studio apartments cost about 5,000 USD, one-bedroom apartments – 7-8,000 dollars, two-
bedroom – 12,000 dollars. In Kharkiv, a 1.6 million population city in the eastern part of Ukraine, prices
were even lower: 4,000 dollars for a studio, 6,000 dollars for a one-bedroom and 8-10,000 dollars for a
two-bedroom apartment. In 1994 there was a significant increase in apartment prices in the cities of
Ukraine, but after the mid-90s they grew very moderately and by 1998 housing prices had virtually
stabilized.
Because of the crisis of 1998 and a sharp decline in the exchange rate of hryvnia [UAH] against
the dollar, when the dollar's value had increased from 1.5 UAH to 5.5 UAH, the cost of apartments in
Kyiv, Odesa and Kharkiv almost simultaneously fell by half. During the period 1998 to 2001 there was a
2 Per cent of total floor area of housing.
serious downturn and afterward stagnation in the sales of real estate, including apartments. The
unfortunate events of September 11, 2001 sharply intensified the housing market; the excessive demand
led to an unprecedented increase in the cost of housing. It should be noted that after the collapse of the
Soviet Union the banking sector had lost all credibility since all bank savings of the population were
actually annulled. The population in the 1990s usually saved in foreign currency cash, and after 11th of
September there was a huge investment of accumulated savings in real estate or other safer assets.
In Kyiv the studio price was 120-130,000 dollars, the one-bedroom price was about 150,000
dollars, and a two-bedroom apartment cost 200,000 USD. In Odesa the prices were 80,000, 100,000 and
130,000 dollars, respectively. In Kharkiv, a studio cost about 60,000 dollars, one-bedroom apartments 70-
80,000 USD, and a two-bedroom apartment – 100,000 dollars.
In the mid 2000-s prices had stabilized and until the financial crisis did not change much. In 2008
the dollar's value increased from 5 UAH to 7.7 UAH, and depreciation of the hryvnia against the dollar
caused the decline of apartment prices in USD. We will describe in detail current housing prices and
affordability of housing, including its regional disparities, further. Viewing the situation at the end of
2013, based on the situation in the property market in Ukraine, we could anticipate its stagnation.
Analyzing the long-term forecast of housing prices in Ukraine until 2020, we could not see any clear
trend going up or down. Under the influence of situational factors, the cost of apartments was anticipated
most likely to remain unchanged, with minor variations. Prices in the second-hand housing market can
decline in response to downward demand fluctuations, although, in the new-build housing market
reduction is less feasible due to continuously rising prices for building materials and the growing cost of
construction labour. The considerable changes of the last few months have made the future of housing
finance dependent on the overall economic situation and on government adjusting housing policy to it.
3. Affordability of housing
With the huge housing deficit and with only a rudimentary social housing sector the main obstacle
to better housing in Ukraine is low household income. As could be seen from Derzhstat statistics, during
the transition period the real wage in Ukraine grows from USD 50 (UAH 90) per month in 1996 to about
USD 100 (UAH 525) in 2004 and USD 316 (UAH 2517) in 2011, and in earnings terms Ukraine is still
far behind European countries. To illustrate relative income in alternative measurements for international
comparison, let us refer to the Big Mac Index (Economist, 2014), based on the theory of purchasing-
power parity. In July 2014 the under-valuation of the Big Mac in Ukraine is the highest among all
countries3. The effect is partially caused by 50% increase of the official hryvnia exchange rate last
months; however in 2013 currency comparison there was still 50% under - valuation of the Big Mac.
3 The Big Mac Index, The Economist, 28.07.2014 http://www.economist.com/content/big-mac-index
Therefore we can conclude that Ukraine permanently belongs to a group of countries with relatively low
income.
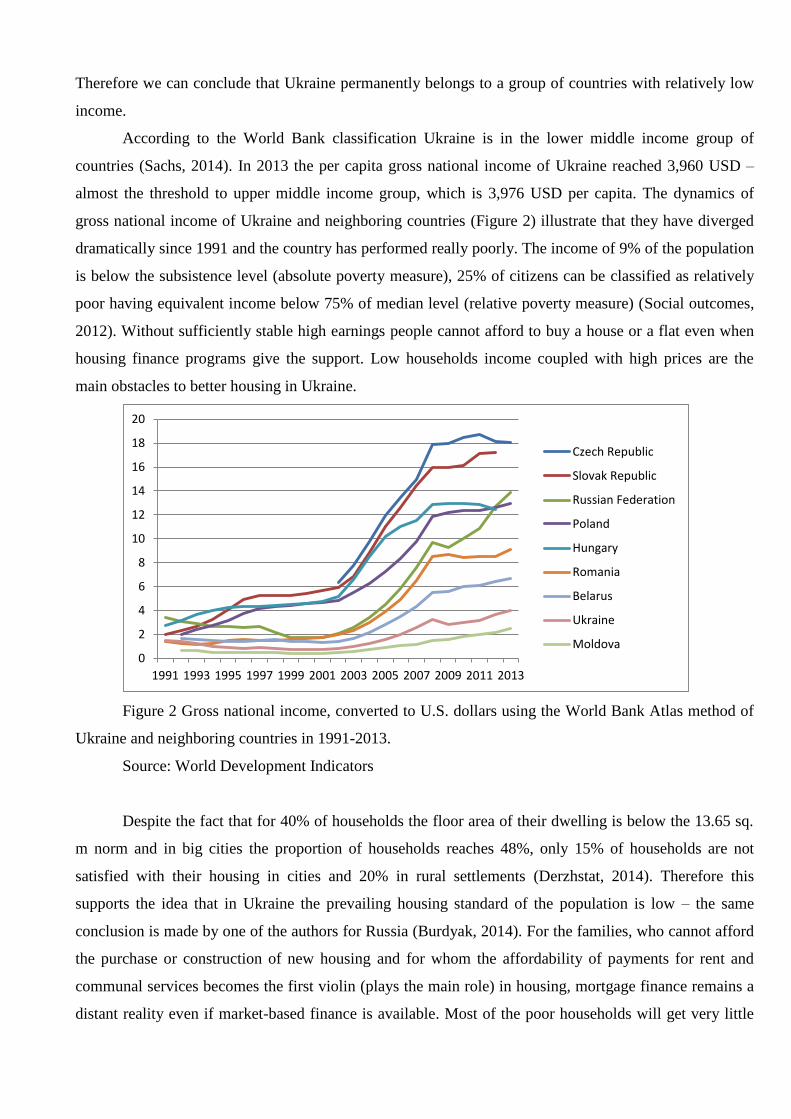
According to the World Bank classification Ukraine is in the lower middle income group of
countries (Sachs, 2014). In 2013 the per capita gross national income of Ukraine reached 3,960 USD –
almost the threshold to upper middle income group, which is 3,976 USD per capita. The dynamics of
gross national income of Ukraine and neighboring countries (Figure 2) illustrate that they have diverged
dramatically since 1991 and the country has performed really poorly. The income of 9% of the population
is below the subsistence level (absolute poverty measure), 25% of citizens can be classified as relatively
poor having equivalent income below 75% of median level (relative poverty measure) (Social outcomes,
2012). Without sufficiently stable high earnings people cannot afford to buy a house or a flat even when
housing finance programs give the support. Low households income coupled with high prices are the
main obstacles to better housing in Ukraine.
Figure 2 Gross national income, converted to U.S. dollars using the World Bank Atlas method of
Ukraine and neighboring countries in 1991-2013.
Source: World Development Indicators
Despite the fact that for 40% of households the floor area of their dwelling is below the 13.65 sq.
m norm and in big cities the proportion of households reaches 48%, only 15% of households are not
satisfied with their housing in cities and 20% in rural settlements (Derzhstat, 2014). Therefore this
supports the idea that in Ukraine the prevailing housing standard of the population is low – the same
conclusion is made by one of the authors for Russia (Burdyak, 2014). For the families, who cannot afford
the purchase or construction of new housing and for whom the affordability of payments for rent and
communal services becomes the first violin (plays the main role) in housing, mortgage finance remains a
distant reality even if market-based finance is available. Most of the poor households will get very little
0
2
4
6
8
10
12
14
16
18
20
1991 1993 1995 1997 1999 2001 2003 2005 2007 2009 2011 2013
Czech Republic
Slovak Republic
Russian Federation
Poland
Hungary
Romania
Belarus
Ukraine
Moldova
direct benefit from the development of housing finance; to meet their housing needs the idea of social
housing should be revitalized, revised and implemented.
Ukraine has a number of government housing programs (The Ministry for Regional Development,
2014). ‘Own House’ has operated since 1997 and supports individual housing construction and
connection to a piped gas supply in rural areas by preferential loans at 3% per year: it has 100 thousand
participants. In 2002 the ‘State housing program for Youth’ starts, it also provides cheap housing loans,
has covered 7 thousand young families and has been extended till 2017 with expected participation from
17 thousand young families. Since 2012 government financing of affordable housing for those from the
waiting list goes through two sources: the Affordable Housing Program 30/70, under which the state pays
30% of the cost of construction, and the citizen pays the remaining 70%; and mortgage loans at a reduced
interest rate of 16% per year, of which the citizen makes payments at 3% interest rate and the state
provides remaining interest payments every year. Government housing programs do support housing
construction, but they are not sufficient; they cannot help very poor families who are not able to afford to
participate in any co-financing of new housing. Currently the financing of affordable housing programs in
Ukraine has been suspended.
The problems created by the low official wage are in some degree weakened by shadow income
and informal employment – the phenomenon is quite common for other transition economies (Gimpelson,
Kapelyushnikov, 2014). While there are different views of the scale of the informal sector in Ukraine,
some of them suggest that in the early 2000-s it was up to 50% of GDP. The involvement in informal
work is estimated at about 25% of the work force, including 10-15% of employed people who work only
on informal jobs and others who are combining formal and informal work (Commander et al., 2013). But
when we take all the people involved in agricultural production, informal employment jumps to more
than 60% of the work force in Ukraine. Other authors revealed the share of non-standard employment to
be 27.5 percent in 2010 (Kupets, Vahitov, Babenko, 2012). People who have under-declared income from
informal employment are directly supporting their relatives. Labor migrants working abroad receive three
times more salary than their counterparts at home, and not only send money to their families in Ukraine,
but also buy or build housing for themselves or their children here. In most cases social support and
protection come from family and through intergenerational support, not from institutions. In reality in
Ukraine the older generation of parents is supporting their children and grandchildren in difficult
situations, especially in cases of unemployment or temporary or casual jobs. They help their children
much more often than children can support and help their retired parents. This is because pensions are
paid on time and in the full amount, pensioners’ monthly expenditures are usually much lower, and there
is no need for additional housing, as there often is for young families. De-shadowing the economy and
legalizing all labor income would make a contribution to the official level of income, to housing
affordability and the availability of mortgages.
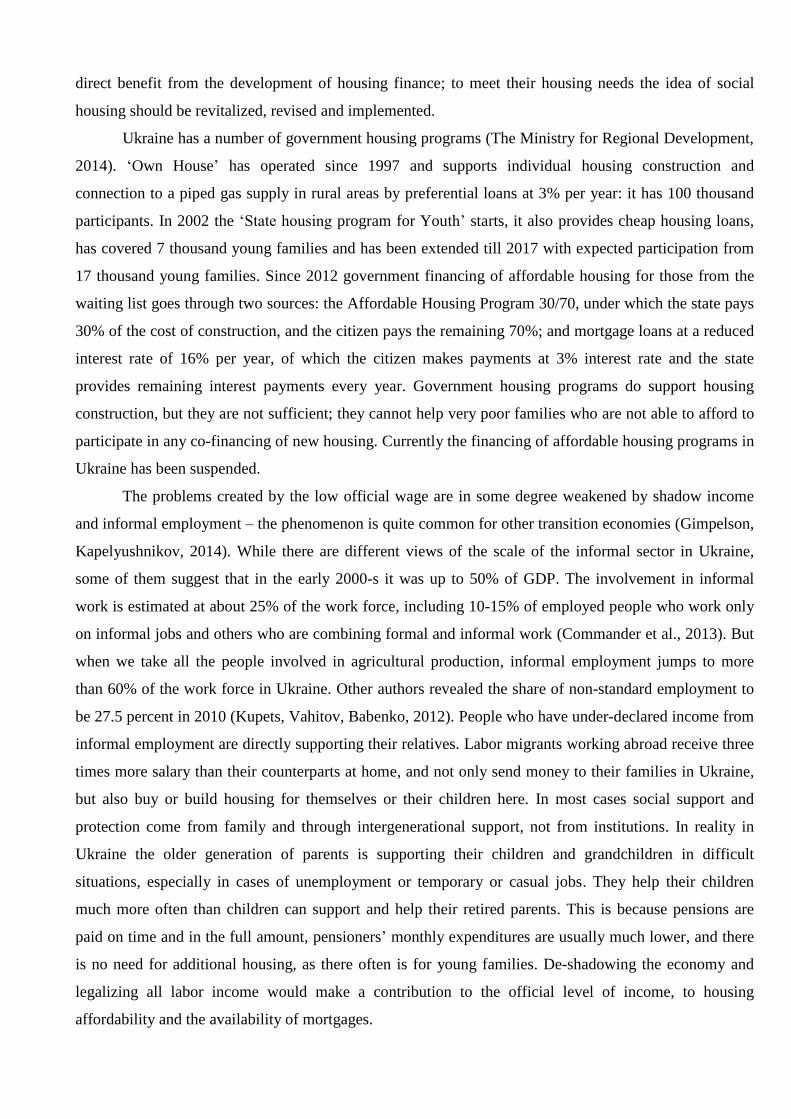
Mortgage finance has quite a long history in Ukraine. Ten years ago the State Mortgage Institution
[SMI] was created (Concept, 2004), therefore banks were already providing mortgage loans. In National
Bank of Ukraine Statistics mortgage loans have been reported since 2006, at that point they counted for
25% of all consumer loans and mortgage debt was 3.8% compared to GDP (National Bank, 2014). To
avoid ambiguity we should underline the difference between two notions presented in National Bank
statistics. If ownership of the housing, including that under construction, or any other real estate
ownership acts as loan collateral4, the loan is called a ‘mortgage’ regardless of the purpose of lending.
Conversely, in the statistics there is a reference to all loans for purchase, construction or renovation of
housing without any reference to loan collateral, and strictly speaking mortgage loans are at the
intersection of the two. In 2012 the definitions became very similar; nevertheless for 2006-2013 we
present both categories (Figure 3). Consumer debt on mortgages was at its maximum in 2008-2009,
however it did not exceed 15% of GDP; housing loans has reached not more than 11% of GDP. Further,
in regional analysis of mortgages, we refer to a ‘housing loans’ category following the Independent
Association of the Banks of Ukraine practice (Independent Association …, 2014).
Figure 3 The size of the debt on mortgages and housing loans in million $ and as % of GDP of
Ukraine.
Source: Author’s calculations based on State Statistics Service (Derzhstat) data
The role of State Mortgage Institution in overall provision of credit has been negligible, a
maximum 1-2% of loans were refinanced by SMI every year; a total of 8500 mortgages were SMI
supported from 2005 till the end of 2012. However the Institution well fulfilled its role as a development
4 In case of several collaterals real estate ownership should be the maximal component.
3,8
10,1
15,1 14,510,2
7,54,5 3,9
4 064
14 472
27 228
17 038
13 954
12 230
7 9037 043
0,0
10,0
20,0
30,0
40,0
50,0
60,0
70,0
80,0
90,0
100,0
0
5000
10000
15000
20000
25000
30000
2006 2007 2008 2009 2010 2011 2012 2013
mortgage, % of GDP (RHS)
loans for purchase, construction andrenovation of housing, mln $ (LHS)
mortgage, mln $ (LHS)
loans for purchase, construction andrenovation of housing, % of GDP (RHS)
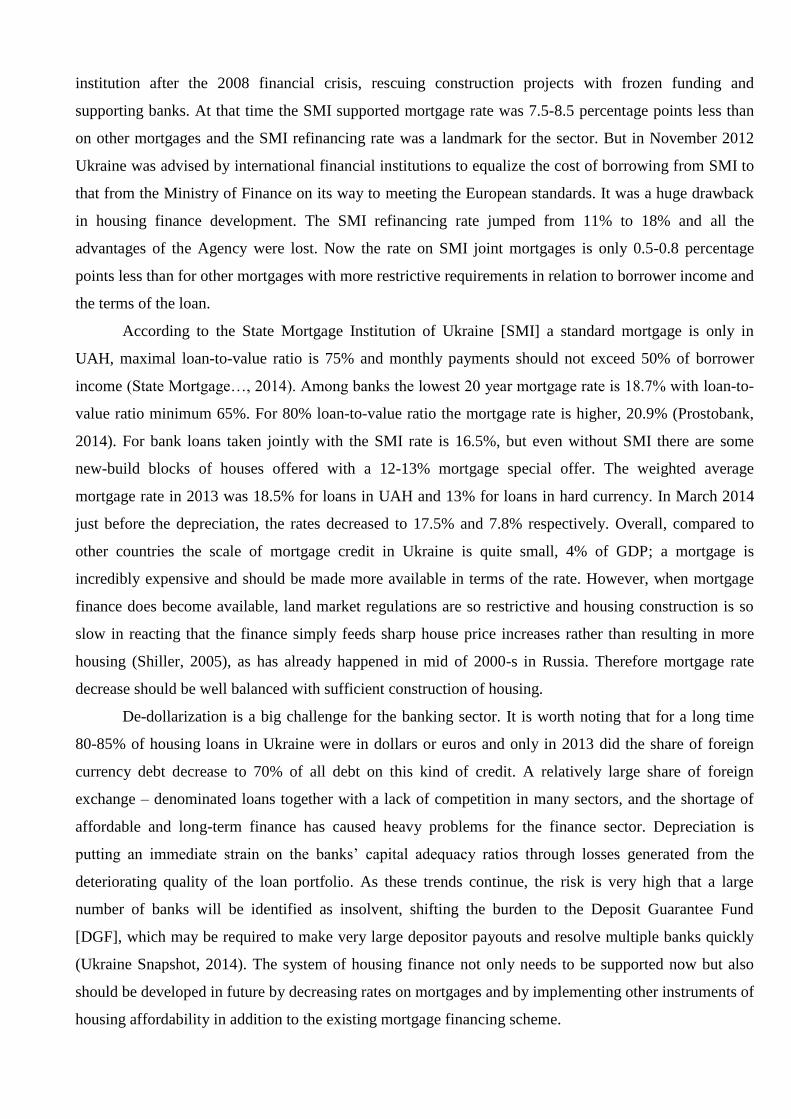
institution after the 2008 financial crisis, rescuing construction projects with frozen funding and
supporting banks. At that time the SMI supported mortgage rate was 7.5-8.5 percentage points less than
on other mortgages and the SMI refinancing rate was a landmark for the sector. But in November 2012
Ukraine was advised by international financial institutions to equalize the cost of borrowing from SMI to
that from the Ministry of Finance on its way to meeting the European standards. It was a huge drawback
in housing finance development. The SMI refinancing rate jumped from 11% to 18% and all the
advantages of the Agency were lost. Now the rate on SMI joint mortgages is only 0.5-0.8 percentage
points less than for other mortgages with more restrictive requirements in relation to borrower income and
the terms of the loan.
According to the State Mortgage Institution of Ukraine [SMI] a standard mortgage is only in
UAH, maximal loan-to-value ratio is 75% and monthly payments should not exceed 50% of borrower
income (State Mortgage…, 2014). Among banks the lowest 20 year mortgage rate is 18.7% with loan-to-
value ratio minimum 65%. For 80% loan-to-value ratio the mortgage rate is higher, 20.9% (Prostobank,
2014). For bank loans taken jointly with the SMI rate is 16.5%, but even without SMI there are some
new-build blocks of houses offered with a 12-13% mortgage special offer. The weighted average
mortgage rate in 2013 was 18.5% for loans in UAH and 13% for loans in hard currency. In March 2014
just before the depreciation, the rates decreased to 17.5% and 7.8% respectively. Overall, compared to
other countries the scale of mortgage credit in Ukraine is quite small, 4% of GDP; a mortgage is
incredibly expensive and should be made more available in terms of the rate. However, when mortgage
finance does become available, land market regulations are so restrictive and housing construction is so
slow in reacting that the finance simply feeds sharp house price increases rather than resulting in more
housing (Shiller, 2005), as has already happened in mid of 2000-s in Russia. Therefore mortgage rate
decrease should be well balanced with sufficient construction of housing.
De-dollarization is a big challenge for the banking sector. It is worth noting that for a long time
80-85% of housing loans in Ukraine were in dollars or euros and only in 2013 did the share of foreign
currency debt decrease to 70% of all debt on this kind of credit. A relatively large share of foreign
exchange – denominated loans together with a lack of competition in many sectors, and the shortage of
affordable and long-term finance has caused heavy problems for the finance sector. Depreciation is
putting an immediate strain on the banks’ capital adequacy ratios through losses generated from the
deteriorating quality of the loan portfolio. As these trends continue, the risk is very high that a large
number of banks will be identified as insolvent, shifting the burden to the Deposit Guarantee Fund
[DGF], which may be required to make very large depositor payouts and resolve multiple banks quickly
(Ukraine Snapshot, 2014). The system of housing finance not only needs to be supported now but also
should be developed in future by decreasing rates on mortgages and by implementing other instruments of
housing affordability in addition to the existing mortgage financing scheme.
For two years housing finance in Ukraine has experienced a time of turbulence. In 2013 alone,
some new articles of the Budget Code and of the Tax Code, 56 laws and more than 40 government acts
came into force that totally changed the real estate market (RBK, 2014). At the end 2012 the SMI
refinancing rate jumped. Since January 2013 certificates of title, contracts of sale, mortgages, other
encumbrances and other documents relating to the rights to housing and other real property, must be
registered with the State Registration Service in the relevant registers of rights.
On September 2013 the National Bank set the maximum amount of cash payments at the level of
150,000 UAH per day for individuals. All cash transactions carried out on housing market usually in
dollars without actually fixing the amount paid (except the mortgage) have become illegal. According to
the new rule while selling and buying an apartment, you need to open a bank account, transfer funds to
pay for the procedure and lose some money by exchanging dollars into hryvnia and back.
In August 2013 Ukraine implemented a new procedure for the assessment of property for tax
purposes and the calculation of other mandatory payments. It led to long queues for the procedure in spite
of additional costs of assessment.
In January 2014 new rules of real estate taxation came into force. Previously only one dwelling
was considered for tax purposes, usually the largest; the apartment area should not exceed 120 sq. m and
the area of a house was limited to 240 sq. m. Now the total living area of all dwellings belonging to the
taxpayer, including different types (apartments, houses or apartments and houses) is taken into account.
For owners of more than one dwelling the tax rate is 1% for the total area up to 740 sq. m and 2.7% above
this threshold. At the same time the list of vulnerable groups subject to tax exemption has been expanded.
Since March 2014 there has been imposed a limit 15,000 UAH5 on cash withdrawals or purchase
of foreign currency per person per day. Together with restrictions on cash payments and hard currency
deposit withdrawals they are binding for sellers and buyers of housing.
In short, the housing market has been really unstable due to overall economic and political
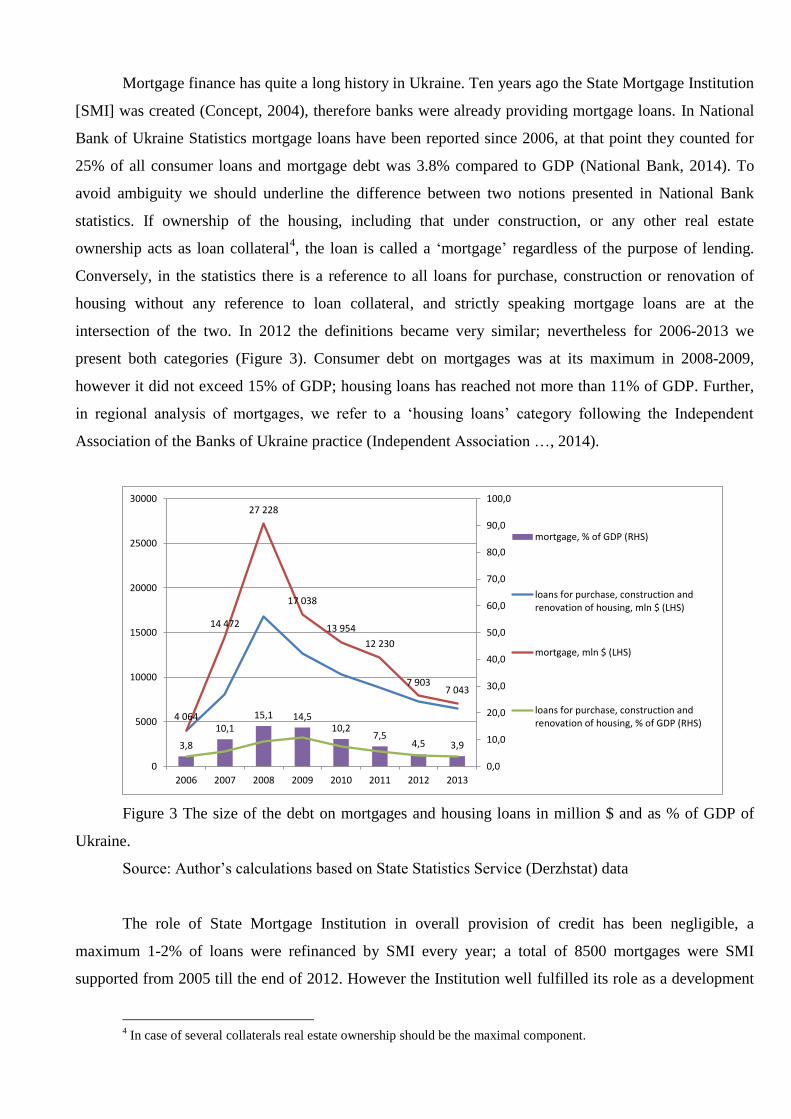
turbulence. Nevertheless, the regional disparities in housing affordability can be measured as a ratio of the
average wage to the price of 40 sq. m of accommodation (studio) in December 2013 and in April 2014, as
well as a ratio of the average wage minus subsistence level of a working-age adult to the price of the same
40 sq. m of accommodation (studio) in December 2013 (Table, Annex 3). The rationale behind this is that
the average working Ukrainian would have to save all her money for 6.6 years to buy a standard flat. If
she saves a half of her earnings, or there are two working adults consuming one salary and saving
another, the period will be twice long, 13.2 years. Supposing that the cost of living for adult person equals
the minimum subsistence level and all the rest of the wage is saved for housing, then the period of saving
will be 10.4 years. In April 2014 the period of saving all earnings for housing become 1.7 longer
compared to December 2013.
5 It is 1,277 USD in July 2014.
4. Regional disparities in housing affordability
Considerable regional diversity within Ukraine is striking for housing and for the overall
economic position of this large country (Lehmann et al, 2012). However all findings on housing have
limitations due to data constraints, because there are no official statistics on the housing market in
Ukraine. While we can estimate regional prices by looking at open-access adverts at Domik.ua, as the
Independent Association of the Banks of Ukraine does (Domik, 2014; Independent, 2014), we should
keep in mind that (a) they are seller-prices and do not necessarily coincide with the final price of a deal,
and (b) the number of deals in a specific region sometimes is small, therefore jumps in prices are
smoothed by the moving average technique. The volume of the housing market by regions continues to be
a puzzle for researchers. The database of the World Bank 2010 (Kupets, 2012) has the same limitations,
consisting of housing and rent prices only in main regional cities therefore representing regional housing
with a high degree of conditionality. Taking into account the low level of urbanization in some regions
together with concentration of economic activity and housing construction in regional centers we can
conclude that so-called ‘regional’ prices in the Domik database are predominantly the regional center
ones.
There are 27 administrative units6 in Ukraine and the division is consistent with the Nomenclature
of Territorial Units for Statistics standard (NUTS-2) in the old and new EU member states. Officially
adopted subdivision of Ukraine into macro regions do not exists. A useful grouping of regions is based on
human and economic development regional statistics (Kupets, 2009), however the ‘geographical’ one we
keep to is the most widely used and simple. We describe affordability of housing and mortgage
concentration by region in the context of their socio-economic characteristics (Table, Annex 3; Map,
Annex 1). A detailed report on the main specialization of regions and geographic concentration of
manufacturing industries can be found (Fankhauser et al., 2008; Kupets et al., 2012). We also refer to O.
Kupets research on housing and rental prices as factors in relation to internal labour mobility (Kupets,
2012) with the main finding that in 2010 differences in housing prices were much more pronounced than
persistent regional disparities in income and wages. Huge inequality in the affordability of housing still
exists in 2013.
• Kyiv City is characterized by exceptionally high levels of economic and human development,
high living standards and favorable employment opportunities, concentration of human capital,
investment, production, overall prosperity and attractiveness to internal migrants from the rest of the
country despite very high housing prices; $439 per month for one bedroom apartment rent7 in 2010. The
6 The administrative unit in Ukraine is called ‘oblast’. Usually the name of region is derived from the name of the
central city except for Crimean Autonomous Republic, Zakarpattia and Volyn. 7 Rental prices are cited from (Kupets, 2012)
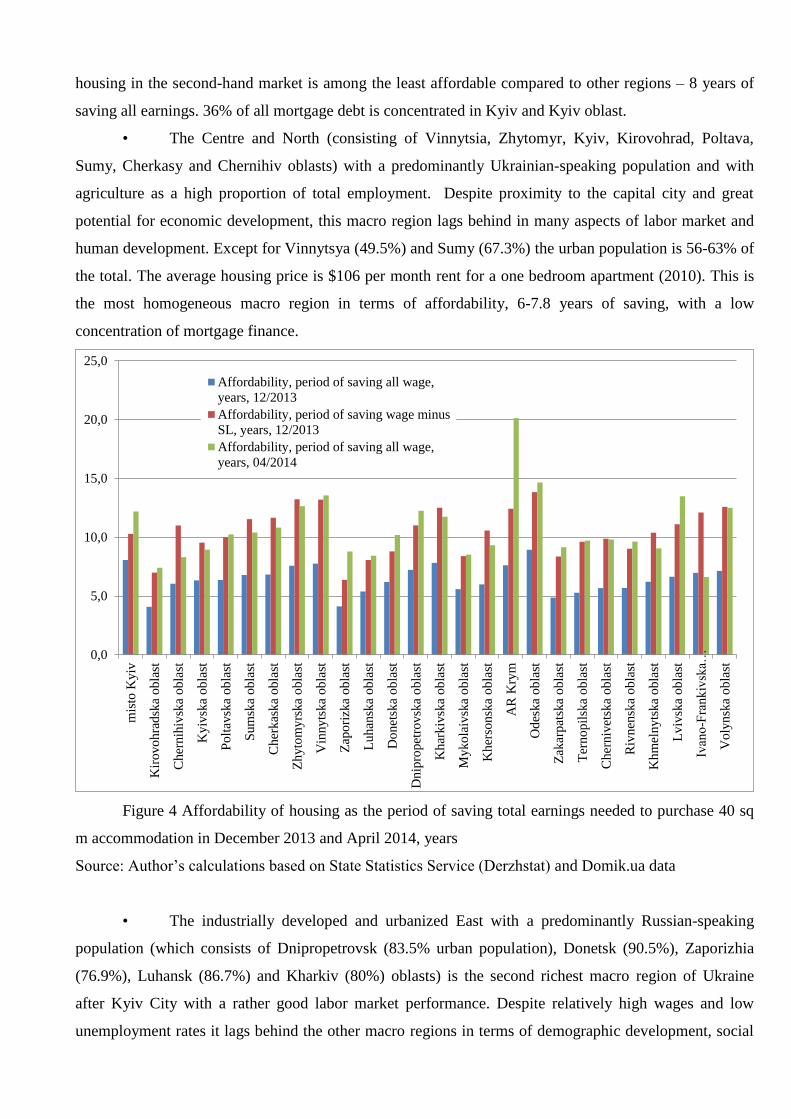
housing in the second-hand market is among the least affordable compared to other regions – 8 years of
saving all earnings. 36% of all mortgage debt is concentrated in Kyiv and Kyiv oblast.
• The Centre and North (consisting of Vinnytsia, Zhytomyr, Kyiv, Kirovohrad, Poltava,
Sumy, Cherkasy and Chernihiv oblasts) with a predominantly Ukrainian-speaking population and with
agriculture as a high proportion of total employment. Despite proximity to the capital city and great
potential for economic development, this macro region lags behind in many aspects of labor market and
human development. Except for Vinnytsya (49.5%) and Sumy (67.3%) the urban population is 56-63% of
the total. The average housing price is $106 per month rent for a one bedroom apartment (2010). This is
the most homogeneous macro region in terms of affordability, 6-7.8 years of saving, with a low
concentration of mortgage finance.
Figure 4 Affordability of housing as the period of saving total earnings needed to purchase 40 sq
m accommodation in December 2013 and April 2014, years
Source: Author’s calculations based on State Statistics Service (Derzhstat) and Domik.ua data
• The industrially developed and urbanized East with a predominantly Russian-speaking
population (which consists of Dnipropetrovsk (83.5% urban population), Donetsk (90.5%), Zaporizhia
(76.9%), Luhansk (86.7%) and Kharkiv (80%) oblasts) is the second richest macro region of Ukraine
after Kyiv City with a rather good labor market performance. Despite relatively high wages and low
unemployment rates it lags behind the other macro regions in terms of demographic development, social
0,0
5,0
10,0
15,0
20,0
25,0
mis
to K
yiv
Kir
ovo
hra
dsk
a obla
st
Cher
nih
ivsk
a o
bla
st
Ky
ivsk
a ob
last
Polt
avsk
a ob
last
Sum
ska
obla
st
Cher
kas
ka
obla
st
Zh
yto
my
rska
obla
st
Vin
ny
tska
obla
st
Zap
ori
zka
ob
last
Lu
han
ska
obla
st
Do
net
ska
ob
last
Dn
ipro
pet
rov
ska
obla
st
Kh
ark
ivsk
a ob
last
Myko
laiv
ska
obla
st
Kh
erso
nsk
a ob
last
AR
Kry
m
Od
eska
ob
last
Zak
arpat
ska
obla
st
Ter
no
pil
ska
obla
st
Cher
niv
etsk
a obla
st
Riv
nen
ska
obla
st
Kh
mel
nyts
ka
obla
st
Lv
ivsk
a ob
last
Ivan
o-F
rank
ivsk
a…
Voly
nsk
a obla
st
Affordability, period of saving all wage,
years, 12/2013
Affordability, period of saving wage minus
SL, years, 12/2013
Affordability, period of saving all wage,
years, 04/2014
situation and environment quality. The average housing price here in 2010 was $158 per month rent for a
one bedroom apartment. While in Zaporizska and Luhanska oblast housing is quite affordable, in
Dnipropetrovsk and Kharkiv it would take 7 years to save for a standard flat. The mortgage finance is
concentrated in Kharkiv.
• The South (which includes Crimean AR and Sevastopol, Mykolayiv, Odesa and Kherson
oblasts) with a predominantly Russian-speaking population and a rather diversified economy. The overall
human and labor market development in this macro region is more advanced than in the rest of the
country (leaving aside Kyiv city) but it is highly volatile because of the significant dependence on the
seasons, weather conditions, and the political situation (particularly in Crimean AR and Sevastopol). The
urban population is 61-68% of the total. The average housing price is $169 per month rent for a one
bedroom apartment (2010). Odessa not only has the highest unaffordable housing compared to other
regions, but also 14% of Ukraine mortgage finance is concentrated here. Odessa, Kyiv city and Kyiv
oblast are the biggest centers of mortgage finance.
• The agrarian and predominantly rural West with a Ukrainian-speaking population (which
includes the most rural Zakarpattia (37.2% urban population), Ivano-Frankivsk, Ternopil, and Chernivtsi
(all 42-44%), Rivne (47.8%), Volyn (51.7%) Khmelnitskyi (54.6%) and Lviv (60.7%) oblasts) exhibits
the worst performance measured by economic, labor market and human capital indicators but it performs
fairly well in terms of the demographic, social, and environmental situation. Weak labor market
development, poor living conditions and material well-being of the local population encourage
considerable out-migration of population, both within the boundaries of Ukraine and outside them.
Considerable inflow of money from labour migrants from abroad to their families keeps average housing
price quite high at $127 per month rent for a one bedroom apartment (2010). Lvivska and Zakarpatska
oblasts have 2-3% of Ukrainian mortgage finance, while others are not so much involved. In Lvivska,
Ivano-Frankivska and Volynska oblast the affordability of housing is quite moderate, 6.6-7 years, in other
western regions the period of saving is shorter.
In many respects, the basic conclusion on housing finance in Ukraine is striking but positive: there
is a long way to go, but a journey of a thousand miles begins with a single step.
References
Buckley R., Kalarical J. (2005). Housing policy in Developing Countries: Conjectures and
Refutations. Oxford University Press, IBRD / The World Bank, 2005.
Burdyak A. (2014). Second Generation of Home Owners: Challenge for Housing Policy in Russia.
The European Network for Housing Research Conference 'Beyond Globalisation. Remaking Housing
Policy in a Complex World', 1 - 4 July 2014, Edinburgh, Scotland, UK.
Concept (2004). The Concept of Creating a National Mortgage System, approved by the Cabinet
of Ministers of Ukraine 10.08.2004, №559-year.
Commander, S., Isachenkova, N. and Rodionova, Y. (2013). Informal employment dynamics in
Ukraine: An analytical model of informality in transition economies. International Labour Review, 152
(3-4), pp. 445-467.
Economist (2014). The Big Mac Index, The Economist, 28.07.2014.
http://www.economist.com/content/big-mac-index
Eurofound (2012). Third European Quality of Life Survey — Quality of life in Europe: Impacts of
the crisis, Publications Office of the European Union, Luxembourg.
Fankhauser S, Rodionova Y, Falcetti E (2008). Utility payments in Ukraine: affordability,
subsidies and arrears. Energy Policy. 36 (11), pp. 4168-4177.
Gimpelson V., Kapelyushnikov R. (2014). In the Shadow of Regulation: the Informality of the
Russian Labor market. Eds. V. Gimpelson, R. Kapelyushnikov. M.: HSE Publishing House, 2014. [in
Russian: V teni regulirovaniya: neformal'nost' na rossijskom rynke truda. Pod obshchej redakciej: V. E.
Gimpel'son, R. I. Kapelyushnikov. M.: Izdatel'skij dom NIU VSHEH, 2014].
Heywood, Andrew (2010). Rhetoric to Reality: a Report on Affordable Housing Prospects in an
Age of Austerity. The Smith Institute. September 2010.
Human development (2012). Human development in Ukraine: standard of living transformation
and regional disparities (collective monograph). Ptoukha Institute for Demography and Social Studies of
the NAS of Ukraine, 2012. [in Ukrainian: Ljuds'kij rozvitok v Ukraїnі: transformacіja rіvnja zhittja ta
regіonal'nі disproporcіi (kolektivna monografіja) / vіdpov. za vipusk L.M. Cheren'ko, O.V. Makarova, za
red. E.M. Lіbanovoi – K.: Іn-t demografіi ta socіal'nih doslіdzhen' іm. M.V. Ptuhi NAN Ukrainy, 2012].
Kupets O. (2009). Preliminary Analysis of the Regional Human Development Impacts of the
Crisis in Ukraine, background paper for the World Bank (Human Development Sector), June 2009.
Kupets, Olga. (2012). Characteristics and determinants of internal labor mobility in Ukraine.
Washington DC : World Bank.
Kupets, O., Vakhitov, V. and Babenko, S. (2012). Jobs Case Study Ukraine. Demographic
Change. Background paper for World Development Report 2013. Mimeo.
Lehmann et al. (2012). Lehmann H., Muravyev A., Zimmermann K. F. The Ukrainian
longitudinal monitoring survey: towards a better understanding of labor markets in transition. Lehmann et
al. IZA Journal of Labor & Development 2012, 1:9. http://www.izajold.com/content/1/1/9
Lowe S., Tsenkova S. (2003). Housing Change in East and Central Europe Integration or
Fragmentation? Stuart Lowe and Sasha Tsenkova (eds.). Ashgate, 2003.
Prostobank (2014). Average mortgage rate starts to decrease / Prostobank Consulting, 29.07.2014.
http://www.prostobank.ua/zhile_v_kredit/novosti/srednie_stavki_po_ipoteke_na_vtorichku_nachali_snizh
atsya
Quality of life (2013). Quality of life measurement in Ukraine. Analytic report. Lіbanova E.M.,
Gladun O.M., Lіsogor L.S. et al. Ptoukha Institute for Demography and Social Studies of the NAS of
Ukraine, UNDP, Ministry of Economic Development and Trade of Ukraine. Kyiv: 2013. [in Ukrainian:
Vimіrjuvannja jakostі zhittja v Ukrainі, Analіtichna dopovіd', Lіbanova E.M., Gladun O.M., Lіsogor L.S.
ta іn. – K.: 2013]
RBK (2014). Top 3 Key Legislative Innovations in the Real Estate Market in 2013, 20.12.2013
[in Russian: Top-3 kljuchevyh zakonodatel'nyh novacij na rynke nedvizhimosti v 2013 godu].
http://realt.rbc.ua/rus/top-3-klyuchevyh-zakonodatelnyh-novatsiy-na-rynke-nedvizhimosti-
20122013145800
Sachs, Jeffrey D. (2014). The Age of Sustainable Development / Coursera Online Course. The
Earth Institute, Columbia University, 2014.
Shiller, Robert J. 2005. Irrational Exuberance. Princeton: Princeton University Press.
Social outcomes (2012). Social outcomes of government programs: theoretical, methodological
and applied aspects of assessment: [monograph] / ed. E.M. Libanova; Ptoukha Institute for Demography
and Social Studies of the NAS of Ukraine. - Uman: Publisher "Sochi", 2012. [in Ukrainian: Socіal'nі
rezul'taty derzhavnyh program: teoretyko-metodolohіchnі ta prykladnі aspekty otcіnyuvannya :
[monografіya] / za red. E. M. Lіbanovoi; Іnstitut demografії ta socіal'nih doslіdzhen' іmenі M. V. Ptuhi
NAN Ukrainy. – Uman' : Vidavec' «Sochіns'kij», 2012].
Stephens M (2014). Issues in the Treatment of Housing Costs in Poverty Measures, The European
Network for Housing Research Conference 'Beyond Globalisation. Remaking Housing Policy in a
Complex World', 1 - 4 July 2014, Edinburgh, Scotland, UK.
Stephens M. (2005). The Role of Housing Finance in the Housing Policy of Transition Countries /
in: Housing Finance: New and Old Models in Central Europe, Russia, and Kazakhstan Edited by József
Hegedüs and Raymond J. Struyk. Pp. 43 – 62. Local Government and Public Service Reform Initiative
and Open Society Institute, Budapest. 2005.
Stiglitz, J.E., Sen, A.K. and Fitoussi, J.-P. (2009). Report by the Commission on the Measurement
of Economic Performance and Social Progress.
Synovate (2010). Survey of Labour Mobility in Russia, Ukraine, Bulgaria and Serbia.
http://www.synovate.com/russia/news/press/2010.10.20.01.shtml
Teslyuk E. et al. (2010). Better targeting of social assistance programs in Ukraine / The World
Bank; [E. Teslyuk D., F. Leith, C. Petrina and al.];. eds. E. Teslyuk. - K.: World Bank, 2010.
Tosics I. and Hegedüs J. (2003). Housing in South-Eastern Europe / In: Stuart Lowe and Sasha
Tsenkova (eds.): Housing Change in East and Central Europe Integration or Fragmentation? Chapter 2,
pp. 21-44. Ashgate, 2003.
UNIAN (2014). After the tariff increase thirds of Ukrainians are promised up to UAH 500
compensation / UNIAN News Agency, 03/27/2014 [Posle povyshenija tarifov treti ukraincev obeshhajut
po 500 grn subsidij / Informacionnoe agentstvo UNIAN, 27.03.2014],
http://economics.unian.net/soc/901154-posle-povyisheniya-tarifov-treti-ukraintsev-obeschayut-po-500-
grn-subsidiy.html
Ukraine Snapshot (2014). World Bank Group – Ukraine Partnership: Country Program Snapshot,
April 2014. http://www.worldbank.org/content/dam/Worldbank/document/Ukraine-Snapshot.pdf
World Bank (2013). Gas and District Heating Tariff Reform in Ukraine: Mitigating the Impact of
Tariff Increases through Targeted Cash Transfers and Energy Efficiency.
World Bank (2014). Indicators. http://data.worldbank.org/indicator, access 25.07.2014.
Derzhstat of Ukraine. http://www.ukrstat.gov.ua/
Domik. http://domik.ua/nedvizhimost/dinamika-cen.html
State Mortgage Institution of Ukraine. http://ipoteka.gov.ua
The Independent Association of the Banks of Ukraine. http://www.nabu.com.ua/eng/
The Map of Ukraine. United Nations, March 2014.
http://www.un.org/depts/Cartographic/map/profile/ukraine.pdf
The Ministry for Regional Development, Construction, Housing and Communal Services of
Ukraine. http://minregion.gov.ua/
The Ministry of Social Policy of Ukraine. http://www.mlsp.gov.ua
The National Bank of Ukraine. http://www.bank.gov.ua
The World Bank in Ukraine. http://www.worldbank.org/en/country/ukraine
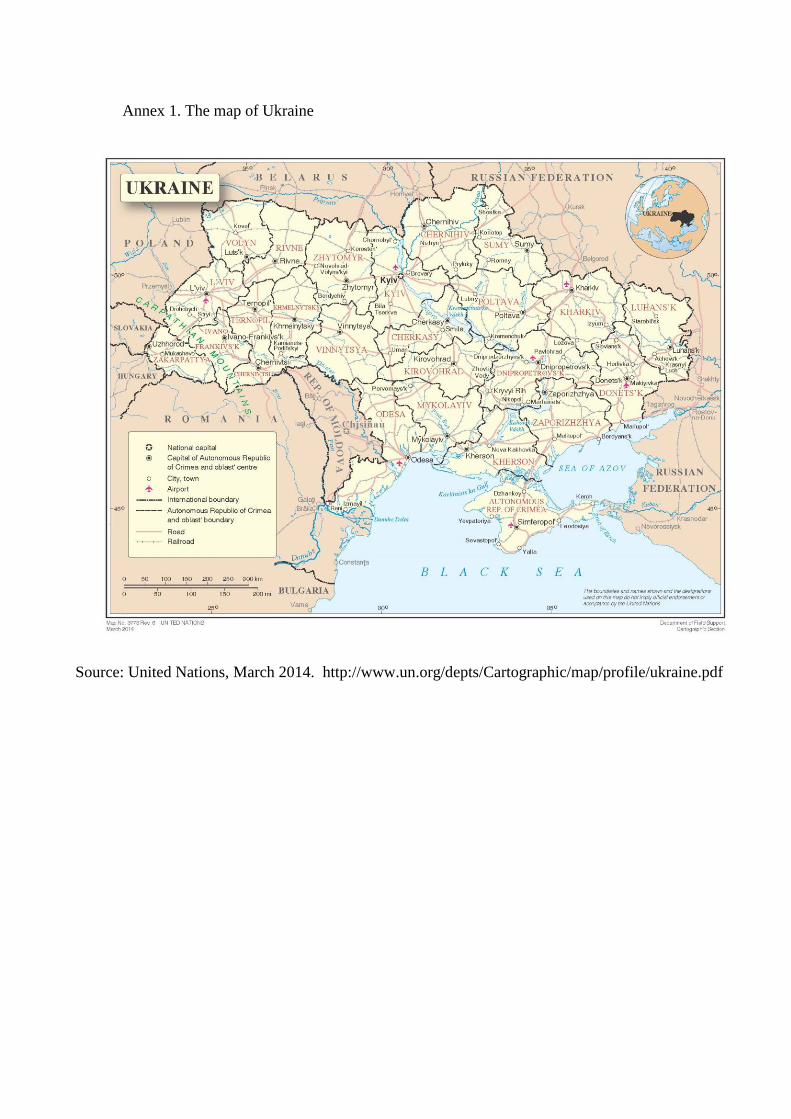
Annex 1. The map of Ukraine
Source: United Nations, March 2014. http://www.un.org/depts/Cartographic/map/profile/ukraine.pdf
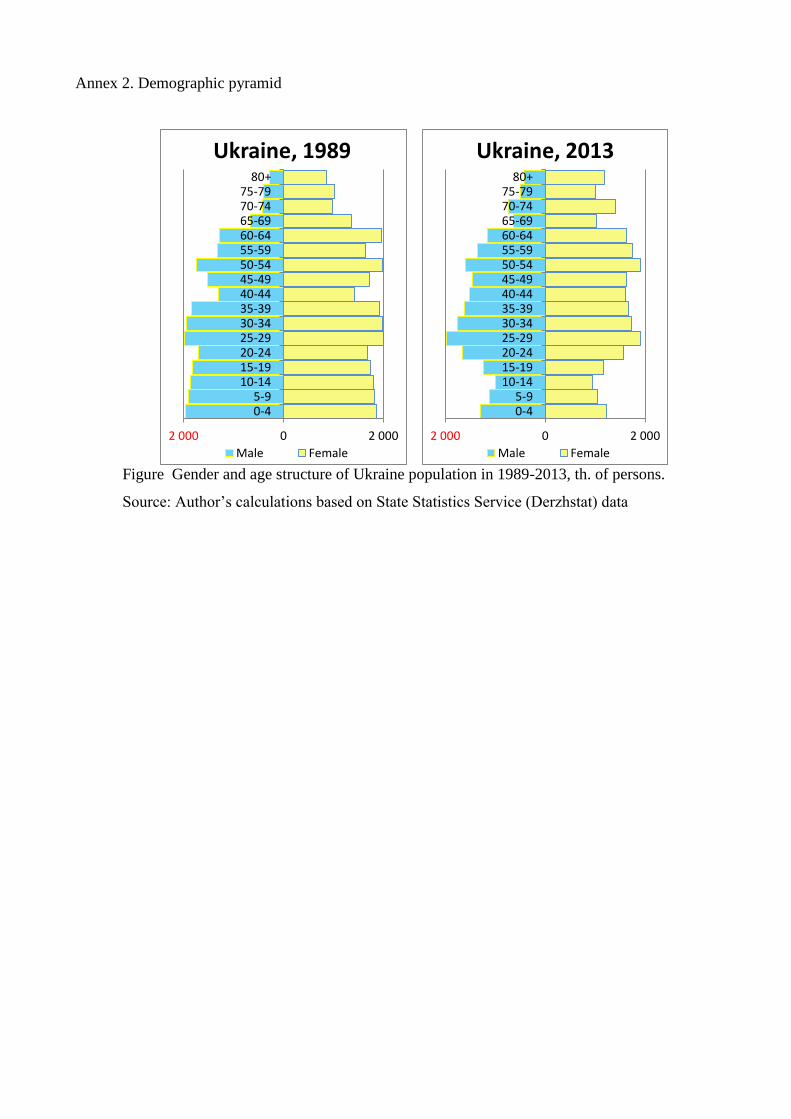
Annex 2. Demographic pyramid
Figure Gender and age structure of Ukraine population in 1989-2013, th. of persons.
Source: Author’s calculations based on State Statistics Service (Derzhstat) data
2 000 0 2 000
0-45-9
10-1415-1920-2425-2930-3435-3940-4445-4950-5455-5960-6465-6970-7475-79
80+
Ukraine, 1989
Male Female
2 000 0 2 000
0-45-9
10-1415-1920-2425-2930-3435-3940-4445-4950-5455-5960-6465-6970-7475-79
80+
Ukraine, 2013
Male Female
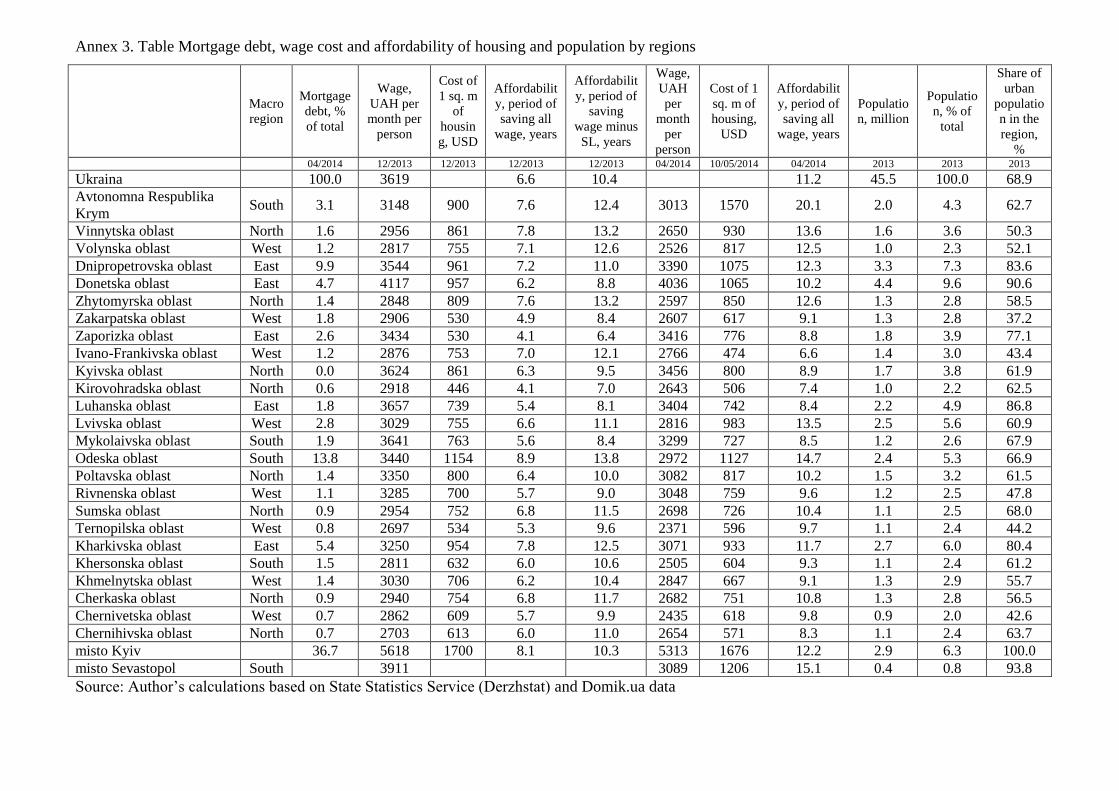
Annex 3. Table Mortgage debt, wage cost and affordability of housing and population by regions
Macro
region
Mortgage
debt, %
of total
Wage,
UAH per
month per
person
Cost of
1 sq. m
of
housin
g, USD
Affordabilit
y, period of
saving all
wage, years
Affordabilit
y, period of
saving
wage minus
SL, years
Wage,
UAH
per
month
per
person
Cost of 1
sq. m of
housing,
USD
Affordabilit
y, period of
saving all
wage, years
Populatio
n, million
Populatio
n, % of
total
Share of
urban
populatio
n in the
region,
% 04/2014 12/2013 12/2013 12/2013 12/2013 04/2014 10/05/2014 04/2014 2013 2013 2013
Ukraina 100.0 3619 6.6 10.4 11.2 45.5 100.0 68.9
Avtonomna Respublika
Krym South 3.1 3148 900 7.6 12.4 3013 1570 20.1 2.0 4.3 62.7
Vinnytska oblast North 1.6 2956 861 7.8 13.2 2650 930 13.6 1.6 3.6 50.3
Volynska oblast West 1.2 2817 755 7.1 12.6 2526 817 12.5 1.0 2.3 52.1
Dnipropetrovska oblast East 9.9 3544 961 7.2 11.0 3390 1075 12.3 3.3 7.3 83.6
Donetska oblast East 4.7 4117 957 6.2 8.8 4036 1065 10.2 4.4 9.6 90.6
Zhytomyrska oblast North 1.4 2848 809 7.6 13.2 2597 850 12.6 1.3 2.8 58.5
Zakarpatska oblast West 1.8 2906 530 4.9 8.4 2607 617 9.1 1.3 2.8 37.2
Zaporizka oblast East 2.6 3434 530 4.1 6.4 3416 776 8.8 1.8 3.9 77.1
Ivano-Frankivska oblast West 1.2 2876 753 7.0 12.1 2766 474 6.6 1.4 3.0 43.4
Kyivska oblast North 0.0 3624 861 6.3 9.5 3456 800 8.9 1.7 3.8 61.9
Kirovohradska oblast North 0.6 2918 446 4.1 7.0 2643 506 7.4 1.0 2.2 62.5
Luhanska oblast East 1.8 3657 739 5.4 8.1 3404 742 8.4 2.2 4.9 86.8
Lvivska oblast West 2.8 3029 755 6.6 11.1 2816 983 13.5 2.5 5.6 60.9
Mykolaivska oblast South 1.9 3641 763 5.6 8.4 3299 727 8.5 1.2 2.6 67.9
Odeska oblast South 13.8 3440 1154 8.9 13.8 2972 1127 14.7 2.4 5.3 66.9
Poltavska oblast North 1.4 3350 800 6.4 10.0 3082 817 10.2 1.5 3.2 61.5
Rivnenska oblast West 1.1 3285 700 5.7 9.0 3048 759 9.6 1.2 2.5 47.8
Sumska oblast North 0.9 2954 752 6.8 11.5 2698 726 10.4 1.1 2.5 68.0
Ternopilska oblast West 0.8 2697 534 5.3 9.6 2371 596 9.7 1.1 2.4 44.2
Kharkivska oblast East 5.4 3250 954 7.8 12.5 3071 933 11.7 2.7 6.0 80.4
Khersonska oblast South 1.5 2811 632 6.0 10.6 2505 604 9.3 1.1 2.4 61.2
Khmelnytska oblast West 1.4 3030 706 6.2 10.4 2847 667 9.1 1.3 2.9 55.7
Cherkaska oblast North 0.9 2940 754 6.8 11.7 2682 751 10.8 1.3 2.8 56.5
Chernivetska oblast West 0.7 2862 609 5.7 9.9 2435 618 9.8 0.9 2.0 42.6
Chernihivska oblast North 0.7 2703 613 6.0 11.0 2654 571 8.3 1.1 2.4 63.7
misto Kyiv
36.7 5618 1700 8.1 10.3 5313 1676 12.2 2.9 6.3 100.0
misto Sevastopol South
3911
3089 1206 15.1 0.4 0.8 93.8
Source: Author’s calculations based on State Statistics Service (Derzhstat) and Domik.ua data
Contributors’ biographies
Aleksandra Burdyak is a senior researcher at the Institute for Social Analysis and
Forecasting of the Russian Presidential Academy of National Economy and Public
Administration. She is an expert on mortgage lending, housing policy and welfare,
a leading researcher in social assistance and housing affordability programs; one of
the authors of Russian Federation NHDR (2009). Corresponding author, e-mail:
Valery M. Novikov is Doctor of Economics, Professor and head of
department of the Ptoukha Institute for Demography and Social Studies of the
National Academy of Sciences of Ukraine. He was scientific consultant for the
President of Ukraine (1994-2000) and an expert of the UNDP in Ukraine (2001-
2004). Research interests: social infrastructure and social policy. Email:
Aleksandra Burdyak Valery M. Novikov