the growth and performance of affordable housing finance
TRANSCRIPT
Policy Research Working Paper 10038
The Growth and Performance of Affordable Housing Finance Lenders in India
Nadeem M. KarmaliGuillermo J. Rodriguez Ruiz
Urban, Disaster Risk Management, Resilience and Land Global PracticeMay 2022
Pub
lic D
iscl
osur
e A
utho
rized
Pub
lic D
iscl
osur
e A
utho
rized
Pub
lic D
iscl
osur
e A
utho
rized
Pub
lic D
iscl
osur
e A
utho
rized
Produced by the Research Support Team
Abstract
The Policy Research Working Paper Series disseminates the findings of work in progress to encourage the exchange of ideas about development issues. An objective of the series is to get the findings out quickly, even if the presentations are less than fully polished. The papers carry the names of the authors and should be cited accordingly. The findings, interpretations, and conclusions expressed in this paper are entirely those of the authors. They do not necessarily represent the views of the International Bank for Reconstruction and Development/World Bank and its affiliated organizations, or those of the Executive Directors of the World Bank or the governments they represent.
Policy Research Working Paper 10038
Anecdotal studies have highlighted the recent rapid growth of so-called affordable housing finance companies across India. These new lenders are reported to be using a high-touch approach common to microfinance to provide mortgages to households that are newer to credit, have irreg-ular incomes, and live in smaller urban centers. As there is no specific license type for these lenders, this paper uses detailed credit bureau data to identify which lenders could be tagged as affordable housing finance companies. Using several classification techniques, the paper then assesses their growth and performance. The results vindicate the anecdotal studies and show that this nascent sector grew at an average annual compound growth rate of 27–32 per-cent between 2016 and 2020. Affordable housing finance
companies have been able to lend to more marginalized borrowers who are newer to credit and do so in a markedly different way than other lenders. Delinquencies at afford-able housing finance companies are higher only for smaller loans, while risk-adjusted lending spreads are higher for all affordable housing finance company loan sizes. This suggests that, thus far, the approach is profitable and sus-tainable. Looking forward, this lending model could be useful for other countries to explore given the incipient success in India, although there are crucial capital market and institutional features that are unique to India. The paper also discusses demand-side subsidies for mortgages in India and identifies opportunities to improve the targeting of the program.
This paper is a product of the Urban, Disaster Risk Management, Resilience and Land Global Practice. It is part of a larger effort by the World Bank to provide open access to its research and make a contribution to development policy discussions around the world. Policy Research Working Papers are also posted on the Web at http://www.worldbank.org/prwp. The authors may be contacted at [email protected].
The Growth and Performance of Affordable Housing Finance Lenders in India
Nadeem M. Karmali Guillermo J. Rodriguez Ruiz
JEL No. G21, G23, L85, R31, R32, N25, O18 Keywords: Affordable housing, mortgage product innovation, housing finance institutions.
This research was undertaken at the World Bank supported by funding from the Foreign, Commonwealth & Development Office through Externally Funded Output 1479. The two World Bank projects associated with this research are the First Tamil Nadu Housing Sector Strengthening Program Development Policy Loan (P172732), and the Tamil Nadu Housing and Habitat Development Project2022 (P168590), both from the South Asia Urban, Disaster Risk, Resilience, and Land Global Practice. The Task Team Leaders of these projects at inception were Yoonhee Kim (P172732), and Abhijit Sankar Ray, Angelica Nunez del Campo and Yoonhee Kim (P168590). The authors would like to thank Yan F. Zhang and other World Bank peer reviewers for comments The authors would also like to thank the team at the credit bureau for their insights into the housing finance sector in India.

2
1 Introduction
Microfinance emerged as a viable business lending technology that leveraged the principles
of traditional bank lending and adapted it for small-value loans in developing countries in the
1990s. Over the past decade, India has witnessed the growth of so-called ‘affordable housing
finance companies’ (AHFC) that purportedly offer mortgages to those on the fringes of the formal
housing finance market. There have been several anecdotal studies describing this new type of
housing finance lender in terms of understanding their credit underwriting processes, typical
borrower profiles, and the geographic footprint. However, there is less research on the quantitative
growth and performance—through a banking lens—of these lenders. This paper seeks to fill that
void by leveraging a unique credit reporting data set. This is undertaken in two steps. First, through
a classification exercise of tagging lenders and housing loans into several categories, including a
proposed AHFC lender and loan characteristic classification types. Second, using these derived
AHFC classification types, assessing the quantitative mortgage portfolio characteristics. This
assessment is both in terms of AHFC borrower profiles as well as the growth and performance of
AHFC mortgage portfolios.
The implications of this new type of lender are critical for housing finance policies in other
developing countries. Having a sound understanding of the actual growth and performance of
AHFC lenders in India can help design better housing finance policies to lend to those beyond the
reach of traditional housing finance institutions in developing countries, provided there is evidence
of incipient AHFC success. This is especially important given the large housing needs across the
developing world and the market imperfections in many housing finance markets in these countries
(Chiquier and Lea 2009, McKinsey Global Institute 2014).
The paper's main finding is that the anecdotal evidence of high and sustainable growth of
AHFC lenders is confirmed through the available data. These AHFC loans are: (a) smaller than
loans from private lenders in Tier 1 cities (or in megacities), (b) more concentrated in smaller
towns and rural areas, and (c) more likely than other mortgages to cater to those with irregular
income and those that are new to credit. Although AHFC interest rates are higher, the performance
of these loans has been better for larger AHFC loans and slightly worse for smaller AHFC loans
compared to the rest of the mortgage portfolio. Given these positive results, it is important to
appreciate the unique institutional and regulatory context in which AHFC have emerged in India—
3
the role of local capital market development, the National Housing Bank (NHB), and specialized
state-sponsored retail housing finance institutions. These latter institutions witnessed rapid
regulatory reform starting in the late 1980s, as the Indian economy increasingly embraced market
mechanisms. The paper’s annex provides a detailed history for those readers interested in
understanding the precise policy context in India where AHFC have emerged. The institutional
and political economy narrative in the annex allows one to evaluate whether other developing
countries could also benefit from similar reforms.
The paper also leverages the credit bureau data to undertake a light assessment of the
current mortgage interest rate subsidy program in India, to the extent that credit bureau data allows
an assessment of a recent large government housing program. The current mortgage interest rate
subsidy program is called the Pradhan Mantri Awas Yojana Credit Linked Subsidy Scheme
(PMAY-CLSS) and its main mortgage vertical is an up-front subsidy of the net present value of a
portion of the monthly mortgage payments, paid to accredited housing finance lenders for eligible
borrowers. The paper concludes that the targeting, risk management, and the rationing of public
funding can be strengthened for the PMAY-CLSS. It would be prudent to tighten the eligibility
requirements for the PMAY-CLSS and instill processes to ensure compliance is high with regard
to any eligibility requirements.
The structure of this paper is as follows: section 2 sketches a brief literature review of
housing and types of housing lenders in India, section 3 provides an overview of the data available,
section 4 describes loan and borrower characteristics from the credit bureau, section 5 presents the
approach to classifying AHFC, section 6 assesses AHFC performance, section 7 undertakes a light
assessment of PMAY-CLSS housing loans in the credit bureau data, and section 8 concludes. The
annex provides an overview of the history of housing policies in India with a focus on the
regulatory environment for housing finance.
2 Literature Review
Since independence, the history of housing policy (including housing finance) in India has
evolved through several paradigms with distinct policy stances. It is widely acknowledged that
there have been three distinct paradigms of housing policy in India, starting from the government
being a provider, to an enabler, and presently to a facilitator of housing (Ghosh 2018).
4
Although one can synthesize the history of housing policy in India into distinct paradigms,
housing in India encompasses several sectors and overlapping ministerial policies: starting from
land policy to the provision of water and sanitation, to government housing policy through housing
ministries, to financial sector regulation through financial institutions, and then the institutional
setup of housing finance lenders and finally taxation. Therefore, housing policy has not been
shaped by a single ministry or institution over time, but rather through a patchwork of programs
and policies. A detailed annex covers this history to provide a framework to understand the growth
of AHFC within the panorama of housing policies over time.
The overarching setup of housing finance in India is dual—scheduled commercial banks
(SCB) and Housing Finance Companies (HFC).1 The latter were seeded from the government’s
capitalization of a central housing bank—NHB—and HFC have contributed to the development
of local currency capital markets with securities that have long tenors. This is unusual for a country
with India’s GDP, as most local currency capital markets in developing countries have yield curves
that do not extend to long tenor securities. There is also extensive regulatory scaffolding for
housing finance in India, including direct lending requirements and other deposit mandates. The
annex provides further details on these parameters. Given the parallels between microfinance and
AHFC, it is apt to cover some of the literature on microfinance.
2.1 Microfinance and Micro-Mortgages
At the end of the last century, microfinance emerged as a viable new business model to
lend small sums of money to low- to middle-income individuals in developing countries
(Armendáriz and Morduch 2010, Morduch 1999). Although it has been found that credit
constraints are not the only binding constraint for such borrowers to significantly improve their
incomes, microfinance has now been established as a viable and profitable business model (or
lending technology) in environments where traditional credit information infrastructures are less
prevalent (Banerjee, Duflo, et al. 2015, Banerjee, Breza, et al. 2017). The success of microfinance
consumer and small business lending has also spurred interest in housing microfinance or micro-
mortgages.
1 AHFC are not an established type of lender yet. In the classification exercise in section 5 AHFC are part of the HFC grouping.

5
The canonical loan product offered by microfinance institutions is fairly standard around
the developing world—a loan averaging US$500 at an interest rate around 25 percent for a term
of 1 – 2 years (MIX Market 2021), where the higher interest rate is due to a high-touch underwriting
and monitoring to increase repayment probabilities.
Related to microfinance, the term ‘housing microfinance’ most commonly refers to loans
for incremental housing construction offered by these same microfinance lenders, with similar loan
characteristics to the canonical microfinance product. 2 The uptake of housing microfinance
products has been extensive around the world, but the portfolio percentages are still small
(Ferguson 2003, Ferguson 2004). This may be because microfinance lending is often fungible.
Further, as many potential microfinance borrowers do not either own land or have the property
rights to the land they use, microfinance lenders are not able to increase housing microfinance loan
amounts as outright mortgages are not feasible. Finally, as most microfinance institutions around
the world are non-deposit taking and obtain their funding wholesale in short-term markets in
foreign currency, they are not able to offer long term loans in local currency. See the annex on the
history of housing finance in India for a perspective on how HFC are funded and the role of the
government in these local currency capital markets in India.
On the other hand, reference to micro-mortgage has a longer history of use in the literature
and popular press, although its definition is more ambiguous. The use of the term micro-mortgage
likely originated in the US in reference to small dollar value mortgages to underserved populations
(Sarkar and McKee 2004, McCargo, et al. 2018). In the US, a micro-mortgage is often defined as
a mortgage of less than either US$70,000 or US$100,000. That is roughly a third of the value of
the average mortgage in the US. The term micro-mortgage has been used in the literature for
developing countries, for example in Uganda and in Myanmar, though it is not clear how this
differs from regular mortgages in these two geographies.3
2.2 Affordable Housing Finance and Affordable Housing Finance Companies
In India, what is increasingly referred to as ‘affordable housing finance’ is a slightly
different concept from either housing microfinance or micro-mortgages as defined above.
2 Examples of incremental housing construction for a dwelling are roof replacement or improving water and sanitation facilities. 3 See Mayer (2011) and Asian Development Bank (2019).
6
Although the exact provenance of the term is not clear, a recent study defines it as lending to
borrowers who: do not have reliable income documentation, are located in peri-urban areas, use
the loan for the construction of a dwelling on an owned parcel of land, and borrow an average of
INR 930,000 for construction (Das, Karamchandani and Thuard 2018). This loan size represents
two-thirds of the average new mortgage across the whole of India (INR 1,500,000) and two-fifths
of the average mortgage size in Tier 1 cities (INR 2,500,000). Das, Karamchandani, and Thuard
(2018) trace the beginning of this sector to a pilot study in Gujarat in 2006:
In 2006…the Monitor Group...began to build a new low-income housing industry that would enable thousands of low-income households to own homes in urban India. They were supported by the National Housing Bank, the World Bank Group, the Michael & Susan Dell Foundation, the Rockefeller Foundation, and the United Kingdom’s Department for International Development. The genesis of this effort lay in the fact that low-income households, who often lived in rented accommodation, could afford to buy small houses at market prices, but no one was building these houses or financing such customers. The team started with creating supply. Developers intrinsically knew this demand existed, and the inclusive markets team showed them the profitability of serving this market. A few banks and housing finance companies agreed to fund customers in pilot projects, but it was still difficult to convince developers to create supply. After reaching out to more than 600 developers in three cities, the team finally convinced a smaller developer in Ahmedabad. They helped him select a site, refine layouts and pricing, and even sign-up customers in local factories. The 450-unit project was sold out on the day of launch, with a waiting list of 9,000 customers. This led to other developers in Ahmedabad starting low-income projects. The Monitor Inclusive Markets team leveraged this success to get similar projects started in other markets and to get a broader range of players involved - from new participants like Jerry Rao, who founded VBHC, to established corporations like the Mahindra Group.4
Anecdotal evidence points to new lenders, AHFC, that have emerged to serve this new
market segment. A recent study discusses the lending technologies that AHFC have introduced
focusing on outreach, underwriting, and risk management (Bhanot, et al. 2020). Overall, these
studies claim that AHFC have been able to go further down-market by developing their own credit
profiles of borrowers through diary cash log methods, undertaking more frequent monitoring, and
assessing total household income (rather than just individual income).
4 Das, Karamchandani and Thuard (2018), p 2.

7
There have been some attempts to calibrate the size of these new lenders. Das,
Karamchandani, and Thuard (2018) estimate that AHFC “have grown from a combined loan book
of INR 10.9 billion in March 2013 to over INR 270 billion in December 2017, at an average loan
ticket size of INR 930,000 and have facilitated the ownership of more than 230,000 affordable
homes.”5 It is instructive to consider a few vignettes of these households to better understand the
context. Broadly, borrowers are more marginal loan candidates and mortgages are smaller than
what legacy lenders would normally underwrite in India. Table 1 shows two stylized AHFC
borrowers in urban areas. Although monthly debt service ratios are high for these stylized families
by international standards, this is often justified by the use of a lower bound estimate of a
household’s irregular monthly income and the preference for saving in real estate in India, where
savings in other assets is much less common (Badarinza, Balasubramaniam and Ramadorai 2016).
Table 1: AHFC Borrower Vignettes
Family I Family II • Nuclear family of four, the husband is a painting
contractor, and the wife is a homemaker. • Monthly household income: ~INR 24,000 • Constructing a 1,000 square foot ground+1 story
house on a 600 square foot plot − The plot is located on non-agricultural land, and
cost INR 540,000 (already owned by family) − Construction cost: INR 1,050,000
Loan product used: • INR 740,000 construction loan (70% LTV) • Tenor: 15 years • Interest rate: 13.95% • Monthly payment (EMI): INR 9,800 • Monthly debt service ratio: 41%
• Nuclear family of three, the husband is a vegetable vendor, and the wife runs a tailoring shop.
• Monthly household income: ~INR 49,000 • Constructing an 1,800 square foot ground+1 story
house on a 1,000 square foot plot − The plot is located on the outskirts of city, and
cost INR 1,000,000 (already owned by family) − Construction cost: INR 1,800,000
Loan product used: • INR 1,260,000 construction loan (70% LTV) • Tenor: 15 years • Interest rate: 13.5% • Monthly Payment (EMI): INR 16,400 • Monthly debt service ratio: 33%
Notes: LTV = loan to value. EMI = equated monthly installment. Source: Adapted from Das, Karamchandani and Thuard (2018).
Part of the challenge is defining which loans and lenders qualify in this ‘new’ affordable
category in India. A 2019 report by Deloitte uses a consultative approach to define ‘affordable
housing finance’ as: “housing finance to first-time house owners forming part of the LIG [lower
income group] and economically viable portion of EWS [economically weaker sections], i.e.,
5 Das, Karamchandani and Thuard (2018), p 7.
8
customers with an annual household income of approximately INR 200,000 to 600,000 and loan
ticket size ranging from approximately INR 500,000 to 1,800,000.”6
As outlined in Karmali and Weng (2022), the definitions for low-income group (LIG) and
economically weaker section (EWS) in India are housing specific and are not grounded in any
means testing framework. The LIG definition is so broad that it encompasses the top decile of
urban household incomes, despite the category name starting with the word ‘low.’ There are also
state and national criteria (either from financial sector regulations, building regulations, or housing
programs) that impose definitions of what is ‘affordable’ based on the carpet area, building heights,
household income, and the price of the unit. These definitions are sometimes in conflict with each
other, but are all focused on better targeting state and national support to lower-income segments.7
The first goal of this paper is to use data from a credit bureau to understand the segmentation
better and to analyze the growth and the performance of this affordable housing finance sector. The
second goal is to examine the characteristics of mortgage subsidies under the PMAY-CLSS, a
flagship mission of the Government of India. The next section introduces the data, followed by a
section that triangulates various sources to arrive at possible definitions for AHFC lenders and loans.
3 Overview of Credit Bureau Data
Housing policy, housing programs, and housing finance in India are spread across several
institutions and sectors. This is also the case for lending institutions. As such, there is limited
comprehensive financial information about housing finance in India given that SCB and HFC each
have a large share of the market. Credit bureaus and now the Reserve Bank of India (RBI), after
the recent regulatory change in oversight for HFC, are best positioned to analyze the entire housing
finance market. The World Bank collaborated with a credit bureau to obtain anonymized mortgage
data to better understand the growth and performance of this new category of affordable housing
finance.8 The goal is to verify the anecdotal evidence in the literature using data.
6 Deloitte (2019), p 36. 7 See for example Knight Frank and CREDAI (2020). 8 Housing loans were defined as all loans classified as ‘home loan,’ which in India is a personal loan against the pledging of collateral for the purpose of building or acquiring a dwelling. The data also capture ‘home loans’ underwritten by microfinance companies, given the recent regulation to include microfinance companies in the mandatory credit reporting regulations in India. One limitation of credit bureau data is that we are not able to see non-lending financial statement line items, which could have a material impact on lender performance such as capitalization and liquidity.
9
In doing so, significant attention was placed to understand the underlying credit reporting
regulations for mortgages in India and how best to structure the data for analysis. As such, the
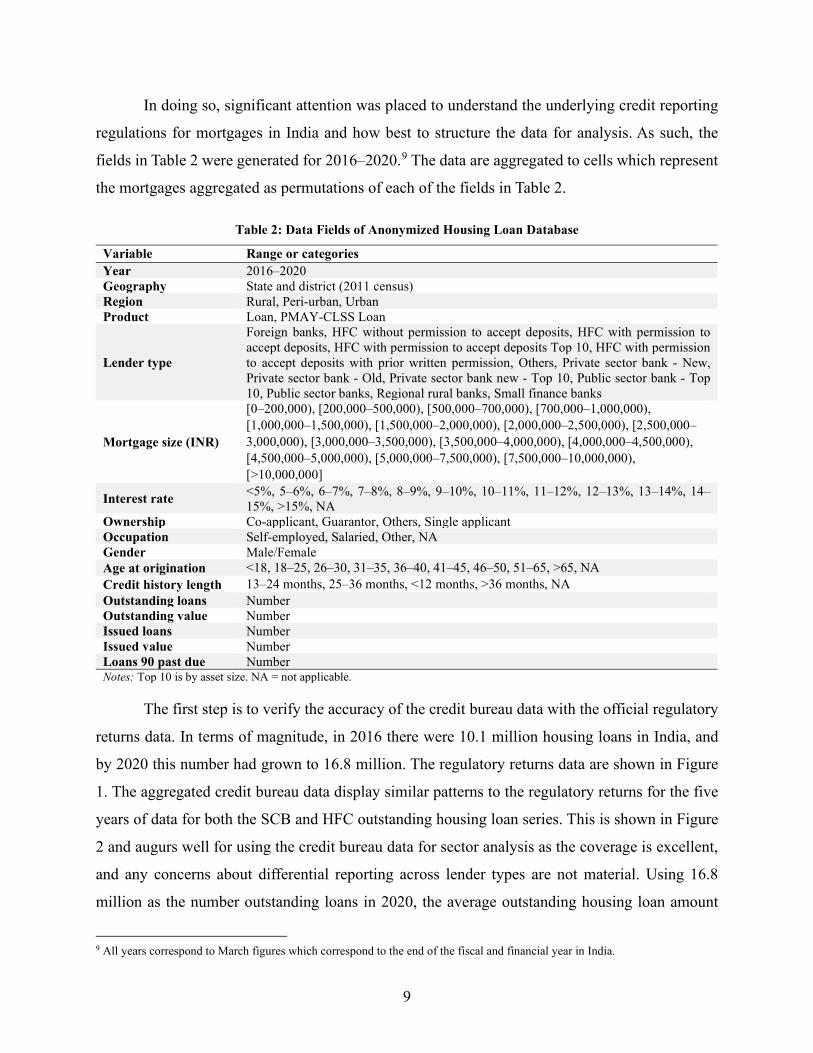
fields in Table 2 were generated for 2016–2020.9 The data are aggregated to cells which represent
the mortgages aggregated as permutations of each of the fields in Table 2.
Table 2: Data Fields of Anonymized Housing Loan Database
Variable Range or categories Year 2016–2020 Geography State and district (2011 census) Region Rural, Peri-urban, Urban Product Loan, PMAY-CLSS Loan
Lender type
Foreign banks, HFC without permission to accept deposits, HFC with permission to accept deposits, HFC with permission to accept deposits Top 10, HFC with permission to accept deposits with prior written permission, Others, Private sector bank - New, Private sector bank - Old, Private sector bank new - Top 10, Public sector bank - Top 10, Public sector banks, Regional rural banks, Small finance banks
Mortgage size (INR)
[0–200,000), [200,000–500,000), [500,000–700,000), [700,000–1,000,000), [1,000,000–1,500,000), [1,500,000–2,000,000), [2,000,000–2,500,000), [2,500,000–3,000,000), [3,000,000–3,500,000), [3,500,000–4,000,000), [4,000,000–4,500,000), [4,500,000–5,000,000), [5,000,000–7,500,000), [7,500,000–10,000,000), [>10,000,000]
Interest rate <5%, 5–6%, 6–7%, 7–8%, 8–9%, 9–10%, 10–11%, 11–12%, 12–13%, 13–14%, 14–15%, >15%, NA
Ownership Co-applicant, Guarantor, Others, Single applicant Occupation Self-employed, Salaried, Other, NA Gender Male/Female Age at origination <18, 18–25, 26–30, 31–35, 36–40, 41–45, 46–50, 51–65, >65, NA Credit history length 13–24 months, 25–36 months, <12 months, >36 months, NA Outstanding loans Number Outstanding value Number Issued loans Number Issued value Number Loans 90 past due Number Notes: Top 10 is by asset size. NA = not applicable.
The first step is to verify the accuracy of the credit bureau data with the official regulatory
returns data. In terms of magnitude, in 2016 there were 10.1 million housing loans in India, and
by 2020 this number had grown to 16.8 million. The regulatory returns data are shown in Figure
1. The aggregated credit bureau data display similar patterns to the regulatory returns for the five
years of data for both the SCB and HFC outstanding housing loan series. This is shown in Figure
2 and augurs well for using the credit bureau data for sector analysis as the coverage is excellent,
and any concerns about differential reporting across lender types are not material. Using 16.8
million as the number outstanding loans in 2020, the average outstanding housing loan amount
9 All years correspond to March figures which correspond to the end of the fiscal and financial year in India.
10
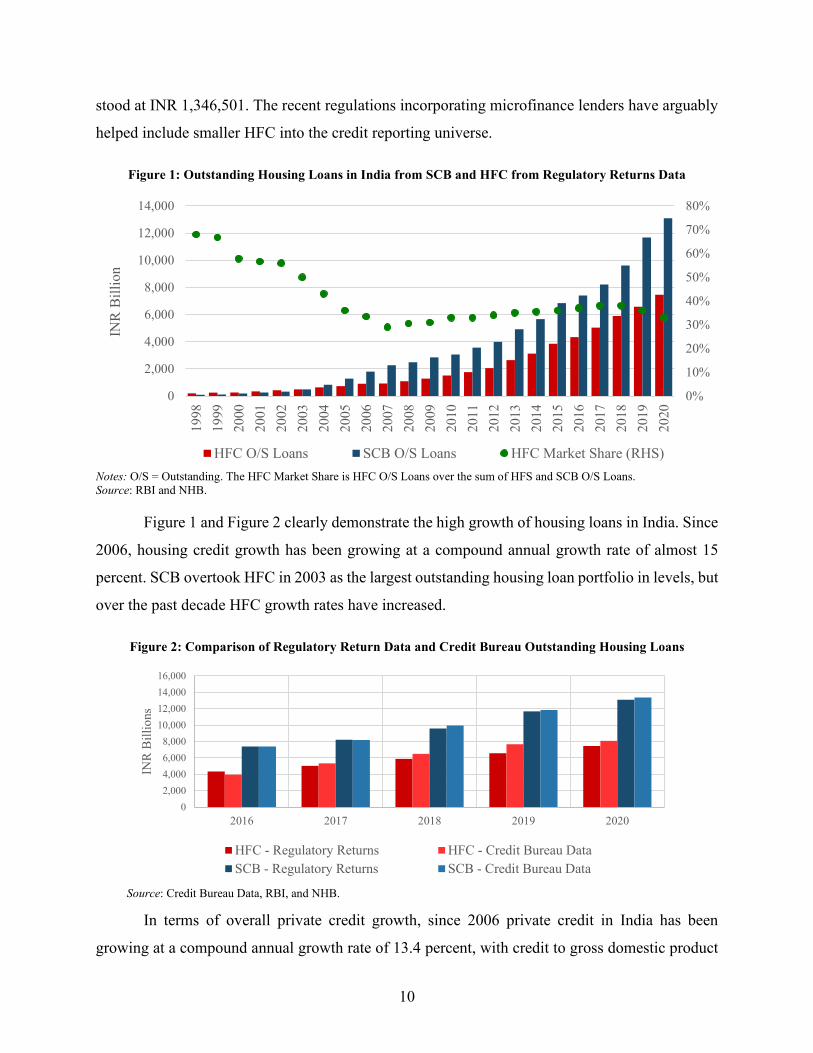
stood at INR 1,346,501. The recent regulations incorporating microfinance lenders have arguably
helped include smaller HFC into the credit reporting universe.
Figure 1: Outstanding Housing Loans in India from SCB and HFC from Regulatory Returns Data
Notes: O/S = Outstanding. The HFC Market Share is HFC O/S Loans over the sum of HFS and SCB O/S Loans. Source: RBI and NHB.
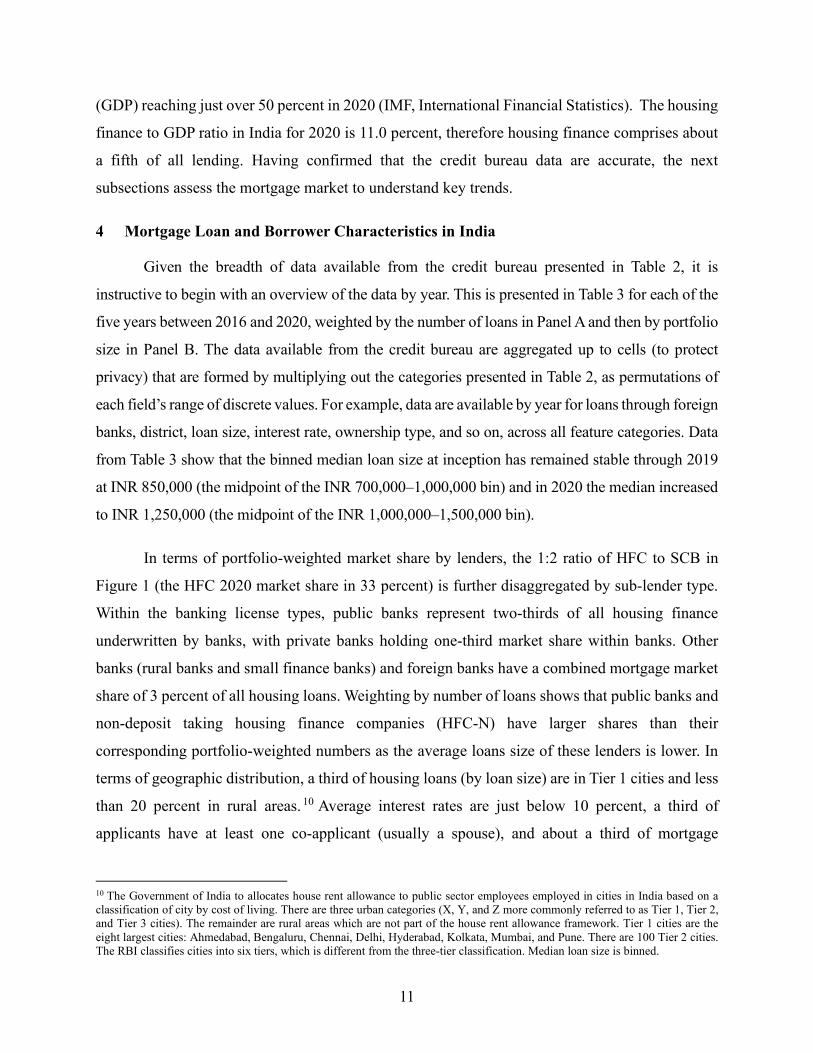
Figure 1 and Figure 2 clearly demonstrate the high growth of housing loans in India. Since
2006, housing credit growth has been growing at a compound annual growth rate of almost 15
percent. SCB overtook HFC in 2003 as the largest outstanding housing loan portfolio in levels, but
over the past decade HFC growth rates have increased.
Figure 2: Comparison of Regulatory Return Data and Credit Bureau Outstanding Housing Loans
Source: Credit Bureau Data, RBI, and NHB.
In terms of overall private credit growth, since 2006 private credit in India has been
growing at a compound annual growth rate of 13.4 percent, with credit to gross domestic product
0%
10%
20%
30%
40%
50%
60%
70%
80%
0
2,000
4,000
6,000
8,000
10,000
12,000
14,00019
9819
9920
0020
0120
0220
0320
0420
0520
0620
0720
0820
0920
1020
1120
1220
1320
1420
1520
1620
1720
1820
1920
20
INR
Bill
ion
HFC O/S Loans SCB O/S Loans HFC Market Share (RHS)
02,0004,0006,0008,000
10,00012,00014,00016,000
2016 2017 2018 2019 2020
INR
Bill
ions
HFC - Regulatory Returns HFC - Credit Bureau DataSCB - Regulatory Returns SCB - Credit Bureau Data
11
(GDP) reaching just over 50 percent in 2020 (IMF, International Financial Statistics). The housing
finance to GDP ratio in India for 2020 is 11.0 percent, therefore housing finance comprises about
a fifth of all lending. Having confirmed that the credit bureau data are accurate, the next
subsections assess the mortgage market to understand key trends.
4 Mortgage Loan and Borrower Characteristics in India
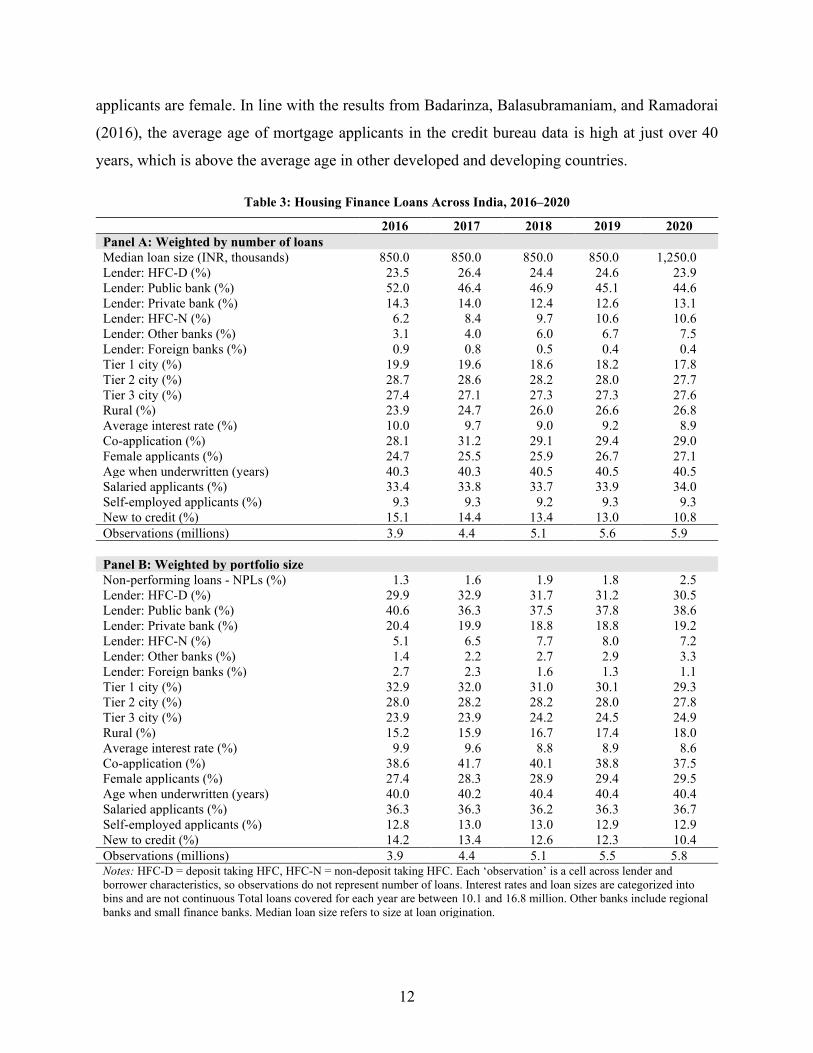
Given the breadth of data available from the credit bureau presented in Table 2, it is
instructive to begin with an overview of the data by year. This is presented in Table 3 for each of the
five years between 2016 and 2020, weighted by the number of loans in Panel A and then by portfolio
size in Panel B. The data available from the credit bureau are aggregated up to cells (to protect
privacy) that are formed by multiplying out the categories presented in Table 2, as permutations of
each field’s range of discrete values. For example, data are available by year for loans through foreign
banks, district, loan size, interest rate, ownership type, and so on, across all feature categories. Data
from Table 3 show that the binned median loan size at inception has remained stable through 2019
at INR 850,000 (the midpoint of the INR 700,000–1,000,000 bin) and in 2020 the median increased
to INR 1,250,000 (the midpoint of the INR 1,000,000–1,500,000 bin).
In terms of portfolio-weighted market share by lenders, the 1:2 ratio of HFC to SCB in
Figure 1 (the HFC 2020 market share in 33 percent) is further disaggregated by sub-lender type.
Within the banking license types, public banks represent two-thirds of all housing finance
underwritten by banks, with private banks holding one-third market share within banks. Other
banks (rural banks and small finance banks) and foreign banks have a combined mortgage market
share of 3 percent of all housing loans. Weighting by number of loans shows that public banks and
non-deposit taking housing finance companies (HFC-N) have larger shares than their
corresponding portfolio-weighted numbers as the average loans size of these lenders is lower. In
terms of geographic distribution, a third of housing loans (by loan size) are in Tier 1 cities and less
than 20 percent in rural areas. 10 Average interest rates are just below 10 percent, a third of
applicants have at least one co-applicant (usually a spouse), and about a third of mortgage
10 The Government of India to allocates house rent allowance to public sector employees employed in cities in India based on a classification of city by cost of living. There are three urban categories (X, Y, and Z more commonly referred to as Tier 1, Tier 2, and Tier 3 cities). The remainder are rural areas which are not part of the house rent allowance framework. Tier 1 cities are the eight largest cities: Ahmedabad, Bengaluru, Chennai, Delhi, Hyderabad, Kolkata, Mumbai, and Pune. There are 100 Tier 2 cities. The RBI classifies cities into six tiers, which is different from the three-tier classification. Median loan size is binned.
12
applicants are female. In line with the results from Badarinza, Balasubramaniam, and Ramadorai
(2016), the average age of mortgage applicants in the credit bureau data is high at just over 40
years, which is above the average age in other developed and developing countries.
Table 3: Housing Finance Loans Across India, 2016–2020
2016 2017 2018 2019 2020 Panel A: Weighted by number of loans Median loan size (INR, thousands) 850.0 850.0 850.0 850.0 1,250.0 Lender: HFC-D (%) 23.5 26.4 24.4 24.6 23.9 Lender: Public bank (%) 52.0 46.4 46.9 45.1 44.6 Lender: Private bank (%) 14.3 14.0 12.4 12.6 13.1 Lender: HFC-N (%) 6.2 8.4 9.7 10.6 10.6 Lender: Other banks (%) 3.1 4.0 6.0 6.7 7.5 Lender: Foreign banks (%) 0.9 0.8 0.5 0.4 0.4 Tier 1 city (%) 19.9 19.6 18.6 18.2 17.8 Tier 2 city (%) 28.7 28.6 28.2 28.0 27.7 Tier 3 city (%) 27.4 27.1 27.3 27.3 27.6 Rural (%) 23.9 24.7 26.0 26.6 26.8 Average interest rate (%) 10.0 9.7 9.0 9.2 8.9 Co-application (%) 28.1 31.2 29.1 29.4 29.0 Female applicants (%) 24.7 25.5 25.9 26.7 27.1 Age when underwritten (years) 40.3 40.3 40.5 40.5 40.5 Salaried applicants (%) 33.4 33.8 33.7 33.9 34.0 Self-employed applicants (%) 9.3 9.3 9.2 9.3 9.3 New to credit (%) 15.1 14.4 13.4 13.0 10.8 Observations (millions) 3.9 4.4 5.1 5.6 5.9 Panel B: Weighted by portfolio size Non-performing loans - NPLs (%) 1.3 1.6 1.9 1.8 2.5 Lender: HFC-D (%) 29.9 32.9 31.7 31.2 30.5 Lender: Public bank (%) 40.6 36.3 37.5 37.8 38.6 Lender: Private bank (%) 20.4 19.9 18.8 18.8 19.2 Lender: HFC-N (%) 5.1 6.5 7.7 8.0 7.2 Lender: Other banks (%) 1.4 2.2 2.7 2.9 3.3 Lender: Foreign banks (%) 2.7 2.3 1.6 1.3 1.1 Tier 1 city (%) 32.9 32.0 31.0 30.1 29.3 Tier 2 city (%) 28.0 28.2 28.2 28.0 27.8 Tier 3 city (%) 23.9 23.9 24.2 24.5 24.9 Rural (%) 15.2 15.9 16.7 17.4 18.0 Average interest rate (%) 9.9 9.6 8.8 8.9 8.6 Co-application (%) 38.6 41.7 40.1 38.8 37.5 Female applicants (%) 27.4 28.3 28.9 29.4 29.5 Age when underwritten (years) 40.0 40.2 40.4 40.4 40.4 Salaried applicants (%) 36.3 36.3 36.2 36.3 36.7 Self-employed applicants (%) 12.8 13.0 13.0 12.9 12.9 New to credit (%) 14.2 13.4 12.6 12.3 10.4 Observations (millions) 3.9 4.4 5.1 5.5 5.8 Notes: HFC-D = deposit taking HFC, HFC-N = non-deposit taking HFC. Each ‘observation’ is a cell across lender and borrower characteristics, so observations do not represent number of loans. Interest rates and loan sizes are categorized into bins and are not continuous Total loans covered for each year are between 10.1 and 16.8 million. Other banks include regional banks and small finance banks. Median loan size refers to size at loan origination.
13
It has been argued that the wealth and asset accumulation of Indian households is different
compared to other countries (particularly China) due to the limited range of savings options and
household asset preferences for real estate and gold.11 In terms of occupation, a third of applicants
are salaried and an eighth are reported to be self-employed. It is likely that the occupation field is
not well answered as there is a high share of ‘other occupation.’ Just over a tenth of housing finance
borrowers are new to credit—which is defined as having either no credit history or less than two
years of credit history. The mortgage NPL definition used in Table 3 is the 90 days or higher
delinquency portfolio over the gross portfolio value, and this is in line with the regulatory
definition. The level and trends of the credit bureau data match those reported by the RBI and
NHB. For example, in 2019, the gross non-performing assets (GNPA) ratio of housing loans was
1.8 percent for SCB and 1.3 percent for HFC. Combining these using the shares from Figure 1
yields a total delinquency rate of 1.6 percent, while the number reported in Table 3 is 1.8 percent.
The regulatory data also point to a recent increase in delinquency, but the levels remain low.12
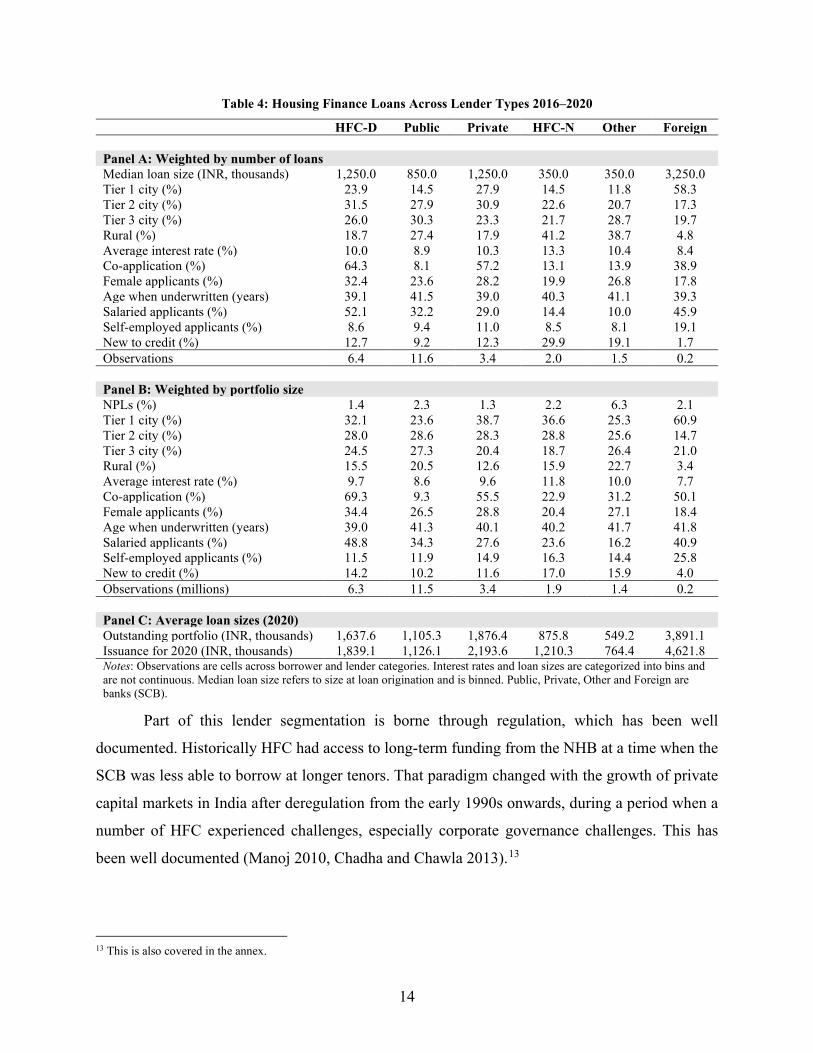
Table 4 displays the same rows as Table 3, but focuses across lenders within the five-year
time window, where each column represents the loans underwritten by a lender type for the five
years of data available. Across these lenders there is clear market segmentation. Comparing the
first three lenders (HFC-D, public banks, and private banks) that represent 80 percent of the market,
HFC-D have higher interest rates, higher loan sizes, higher exposure in Tier 1 cities, and lend more
to salaried borrowers. Public banks have lower loan sizes, the lowest interest rates, but also higher
delinquency rates, and have their highest share of loans (by portfolio size) in Tier 2 cities. Private
banks are the most concentrated in Tier 1 cities, have low delinquency rates, higher loan sizes, and
the smallest portfolio of the first three lender types in rural areas. HFC-N and Other banks are
more alike, with smaller loan sizes, higher interest rates and lending more to those who are newer
to credit. However, Other banks have much higher delinquency rates than HFC-N. Foreign banks
have much larger median loan size (with a median three times larger than the market median), are
skewed toward larger cities, have lower interest rates, and lend to the most seasoned borrowers in
terms of credit history.
11 See Badarinza, Balasubramaniam, and Tarun (2016) and Reserve Bank of India (2017). 12 As a result of COVID-19, the delinquency at HFC for 2021 has been estimated to have increased to 2.7 percent (ICRA 2021).
14
Table 4: Housing Finance Loans Across Lender Types 2016–2020
HFC-D Public Private HFC-N Other Foreign Panel A: Weighted by number of loans Median loan size (INR, thousands) 1,250.0 850.0 1,250.0 350.0 350.0 3,250.0 Tier 1 city (%) 23.9 14.5 27.9 14.5 11.8 58.3 Tier 2 city (%) 31.5 27.9 30.9 22.6 20.7 17.3 Tier 3 city (%) 26.0 30.3 23.3 21.7 28.7 19.7 Rural (%) 18.7 27.4 17.9 41.2 38.7 4.8 Average interest rate (%) 10.0 8.9 10.3 13.3 10.4 8.4 Co-application (%) 64.3 8.1 57.2 13.1 13.9 38.9 Female applicants (%) 32.4 23.6 28.2 19.9 26.8 17.8 Age when underwritten (years) 39.1 41.5 39.0 40.3 41.1 39.3 Salaried applicants (%) 52.1 32.2 29.0 14.4 10.0 45.9 Self-employed applicants (%) 8.6 9.4 11.0 8.5 8.1 19.1 New to credit (%) 12.7 9.2 12.3 29.9 19.1 1.7 Observations 6.4 11.6 3.4 2.0 1.5 0.2 Panel B: Weighted by portfolio size NPLs (%) 1.4 2.3 1.3 2.2 6.3 2.1 Tier 1 city (%) 32.1 23.6 38.7 36.6 25.3 60.9 Tier 2 city (%) 28.0 28.6 28.3 28.8 25.6 14.7 Tier 3 city (%) 24.5 27.3 20.4 18.7 26.4 21.0 Rural (%) 15.5 20.5 12.6 15.9 22.7 3.4 Average interest rate (%) 9.7 8.6 9.6 11.8 10.0 7.7 Co-application (%) 69.3 9.3 55.5 22.9 31.2 50.1 Female applicants (%) 34.4 26.5 28.8 20.4 27.1 18.4 Age when underwritten (years) 39.0 41.3 40.1 40.2 41.7 41.8 Salaried applicants (%) 48.8 34.3 27.6 23.6 16.2 40.9 Self-employed applicants (%) 11.5 11.9 14.9 16.3 14.4 25.8 New to credit (%) 14.2 10.2 11.6 17.0 15.9 4.0 Observations (millions) 6.3 11.5 3.4 1.9 1.4 0.2 Panel C: Average loan sizes (2020) Outstanding portfolio (INR, thousands) 1,637.6 1,105.3 1,876.4 875.8 549.2 3,891.1 Issuance for 2020 (INR, thousands) 1,839.1 1,126.1 2,193.6 1,210.3 764.4 4,621.8 Notes: Observations are cells across borrower and lender categories. Interest rates and loan sizes are categorized into bins and are not continuous. Median loan size refers to size at loan origination and is binned. Public, Private, Other and Foreign are banks (SCB).
Part of this lender segmentation is borne through regulation, which has been well
documented. Historically HFC had access to long-term funding from the NHB at a time when the
SCB was less able to borrow at longer tenors. That paradigm changed with the growth of private
capital markets in India after deregulation from the early 1990s onwards, during a period when a
number of HFC experienced challenges, especially corporate governance challenges. This has
been well documented (Manoj 2010, Chadha and Chawla 2013).13
13 This is also covered in the annex.
15
Between 2018–2019 two non-bank financial institutions with negligible housing finance
exposure experienced severe distress: one defaulted and the other was placed under receivership.
This led to the strengthening of non-bank regulation in India, including regulation for HFC. More
recently there have been discussions about the potential role of securitization to help reduce
duration risk in the banking sector, though there are important directed lending quotas (known as
‘priority sector lending’) that create misaligned incentives for banks to transfer their originated
mortgages to the capital markets.
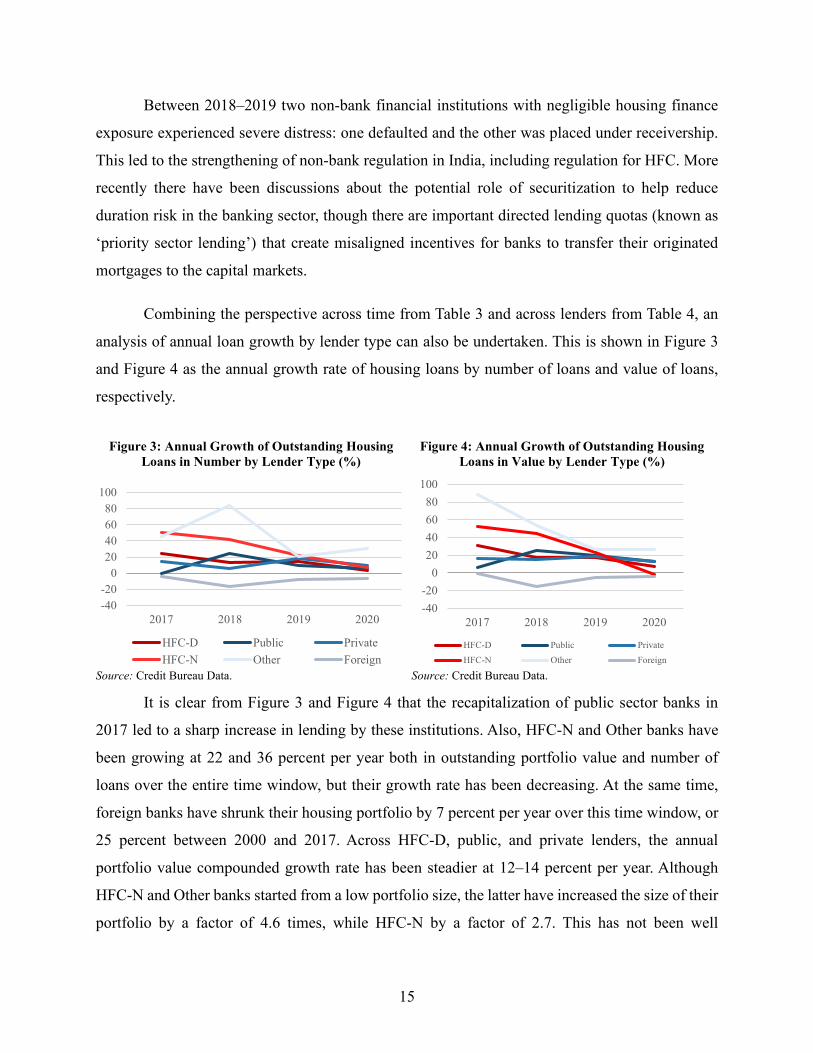
Combining the perspective across time from Table 3 and across lenders from Table 4, an
analysis of annual loan growth by lender type can also be undertaken. This is shown in Figure 3
and Figure 4 as the annual growth rate of housing loans by number of loans and value of loans,
respectively.
Figure 3: Annual Growth of Outstanding Housing Loans in Number by Lender Type (%)
Source: Credit Bureau Data.
Figure 4: Annual Growth of Outstanding Housing Loans in Value by Lender Type (%)
Source: Credit Bureau Data.
It is clear from Figure 3 and Figure 4 that the recapitalization of public sector banks in
2017 led to a sharp increase in lending by these institutions. Also, HFC-N and Other banks have
been growing at 22 and 36 percent per year both in outstanding portfolio value and number of
loans over the entire time window, but their growth rate has been decreasing. At the same time,
foreign banks have shrunk their housing portfolio by 7 percent per year over this time window, or
25 percent between 2000 and 2017. Across HFC-D, public, and private lenders, the annual
portfolio value compounded growth rate has been steadier at 12–14 percent per year. Although
HFC-N and Other banks started from a low portfolio size, the latter have increased the size of their
portfolio by a factor of 4.6 times, while HFC-N by a factor of 2.7. This has not been well
-40-20
020406080
100
2017 2018 2019 2020
HFC-D Public PrivateHFC-N Other Foreign
-40-20
020406080
100
2017 2018 2019 2020
HFC-D Public PrivateHFC-N Other Foreign
16
documented at the subsector level, but this high growth could be the reason for an increasing
number of anecdotal studies on the growth of smaller-sized housing finance institutions across
India.
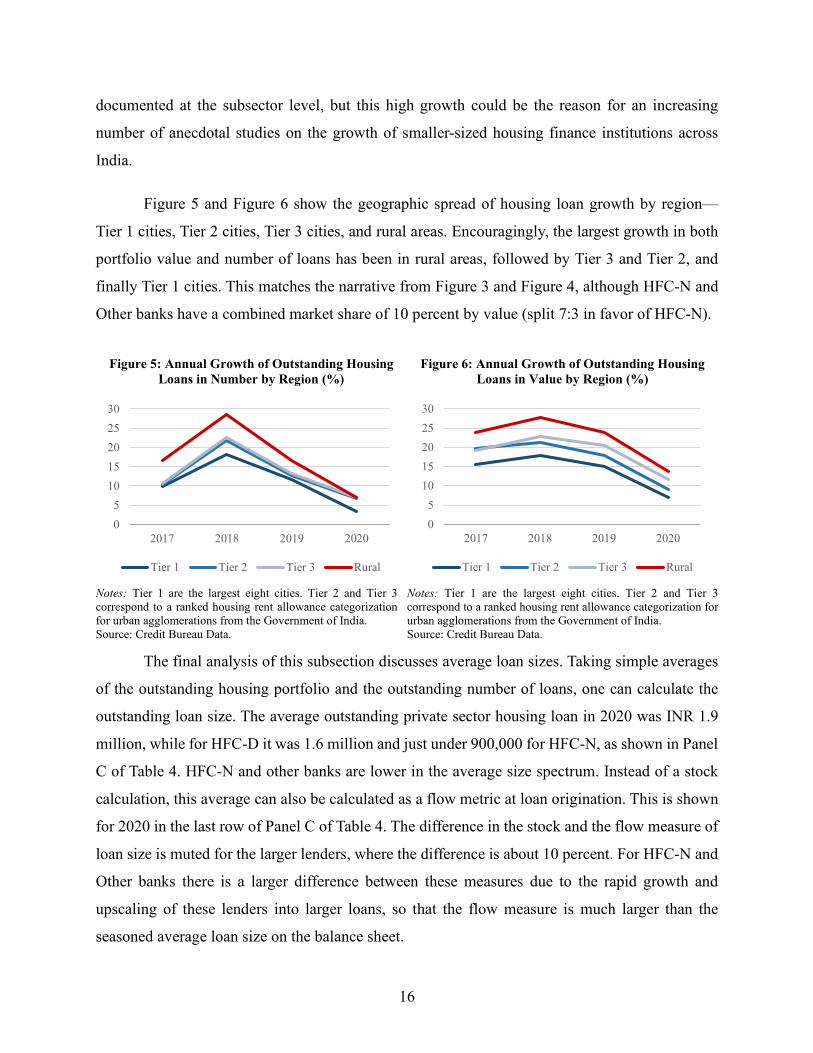
Figure 5 and Figure 6 show the geographic spread of housing loan growth by region—
Tier 1 cities, Tier 2 cities, Tier 3 cities, and rural areas. Encouragingly, the largest growth in both
portfolio value and number of loans has been in rural areas, followed by Tier 3 and Tier 2, and
finally Tier 1 cities. This matches the narrative from Figure 3 and Figure 4, although HFC-N and
Other banks have a combined market share of 10 percent by value (split 7:3 in favor of HFC-N).
Figure 5: Annual Growth of Outstanding Housing Loans in Number by Region (%)
Notes: Tier 1 are the largest eight cities. Tier 2 and Tier 3 correspond to a ranked housing rent allowance categorization for urban agglomerations from the Government of India. Source: Credit Bureau Data.
Figure 6: Annual Growth of Outstanding Housing Loans in Value by Region (%)
Notes: Tier 1 are the largest eight cities. Tier 2 and Tier 3 correspond to a ranked housing rent allowance categorization for urban agglomerations from the Government of India. Source: Credit Bureau Data.
The final analysis of this subsection discusses average loan sizes. Taking simple averages
of the outstanding housing portfolio and the outstanding number of loans, one can calculate the
outstanding loan size. The average outstanding private sector housing loan in 2020 was INR 1.9
million, while for HFC-D it was 1.6 million and just under 900,000 for HFC-N, as shown in Panel
C of Table 4. HFC-N and other banks are lower in the average size spectrum. Instead of a stock
calculation, this average can also be calculated as a flow metric at loan origination. This is shown
for 2020 in the last row of Panel C of Table 4. The difference in the stock and the flow measure of
loan size is muted for the larger lenders, where the difference is about 10 percent. For HFC-N and
Other banks there is a larger difference between these measures due to the rapid growth and
upscaling of these lenders into larger loans, so that the flow measure is much larger than the
seasoned average loan size on the balance sheet.
05
1015202530
2017 2018 2019 2020
Tier 1 Tier 2 Tier 3 Rural
05
1015202530
2017 2018 2019 2020
Tier 1 Tier 2 Tier 3 Rural
17
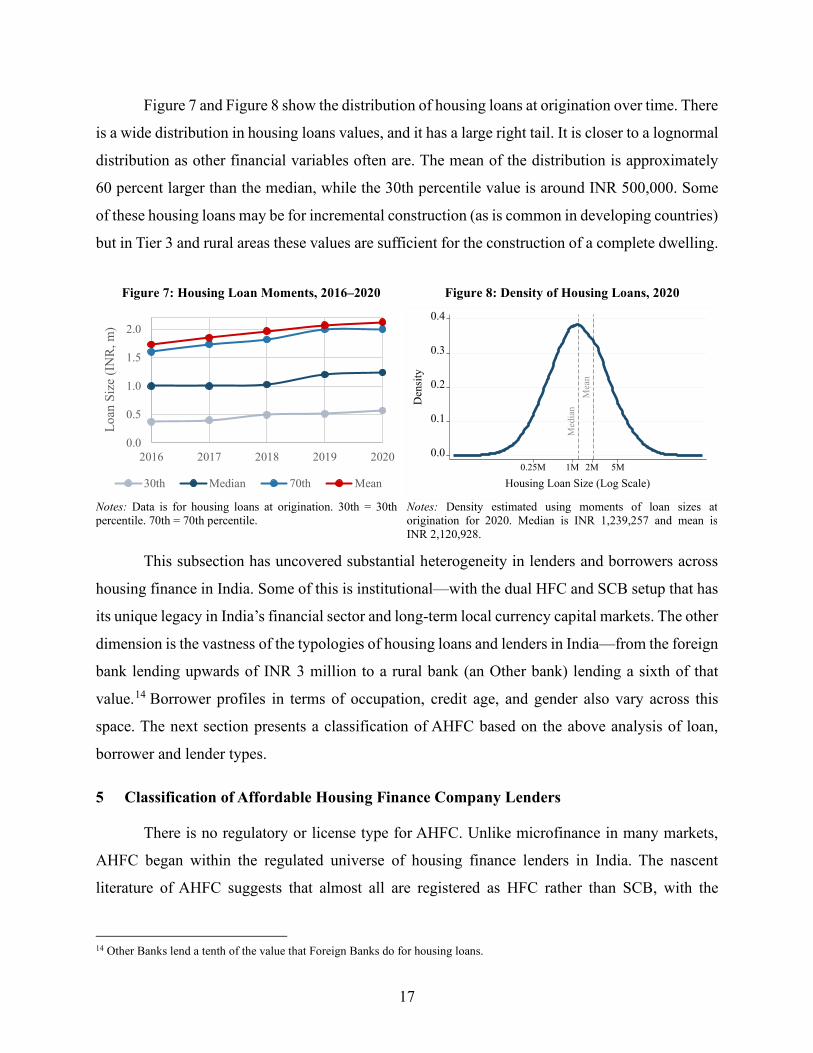
Figure 7 and Figure 8 show the distribution of housing loans at origination over time. There
is a wide distribution in housing loans values, and it has a large right tail. It is closer to a lognormal
distribution as other financial variables often are. The mean of the distribution is approximately
60 percent larger than the median, while the 30th percentile value is around INR 500,000. Some
of these housing loans may be for incremental construction (as is common in developing countries)
but in Tier 3 and rural areas these values are sufficient for the construction of a complete dwelling.
Figure 7: Housing Loan Moments, 2016–2020
Notes: Data is for housing loans at origination. 30th = 30th percentile. 70th = 70th percentile.
Figure 8: Density of Housing Loans, 2020
Notes: Density estimated using moments of loan sizes at origination for 2020. Median is INR 1,239,257 and mean is INR 2,120,928.
This subsection has uncovered substantial heterogeneity in lenders and borrowers across
housing finance in India. Some of this is institutional—with the dual HFC and SCB setup that has
its unique legacy in India’s financial sector and long-term local currency capital markets. The other
dimension is the vastness of the typologies of housing loans and lenders in India—from the foreign
bank lending upwards of INR 3 million to a rural bank (an Other bank) lending a sixth of that
value.14 Borrower profiles in terms of occupation, credit age, and gender also vary across this
space. The next section presents a classification of AHFC based on the above analysis of loan,
borrower and lender types.
5 Classification of Affordable Housing Finance Company Lenders
There is no regulatory or license type for AHFC. Unlike microfinance in many markets,
AHFC began within the regulated universe of housing finance lenders in India. The nascent
literature of AHFC suggests that almost all are registered as HFC rather than SCB, with the
14 Other Banks lend a tenth of the value that Foreign Banks do for housing loans.
0.0
0.5
1.0
1.5
2.0
2016 2017 2018 2019 2020
Loan
Siz
e (I
NR,
m)
30th Median 70th Mean
Mea
nM
edia
n
0.0
0.1
0.2
0.3
0.4
Den
sity
0.25M 1M 2M 5M
Housing Loan Size (Log Scale)
18
plurality holding the HFC-N license type (Das, Karamchandani and Thuard 2018, Deloitte 2019).
Though this is still an understudied area, the provenance of AHFC within the HFC-N license type
could be linked to the liability side of the balance sheet, where HFC-N borrow in long-term local
currency debt markets because they do not have deposits as a funding source. This does not imply
that banks are not engaged in similar lending as AHFC, but the literature and anecdotal evidence
suggests that banks are playing a smaller role in this new space.
As there is no license type for AHFC lenders, the classification exercise in this paper takes
a two-pronged classification approach. The detailed credit bureau data does not bifurcate lenders
apart from the thirteen lender groups available in the credit bureau data. These are grouped by ten
broad license and ownership types and then split into thirteen with a top ten carve out for three
types.
The first step of the two-pronged classification approach takes a lender view. To aide with
the classification exercise, the credit bureau also supplied a 2020 list of all lenders by total housing
loan portfolio size and average outstanding housing loan amount. This lender list in addition to
publicly available financial statements from self-identifying AHFC lenders is used to identify
possible AHFC lenders in the 2020 credit bureau lender list. The second step of the classification
approach transfers the lender and loan size guidelines from the first step to the detailed credit
bureau data, to classify possible AHFC loans.
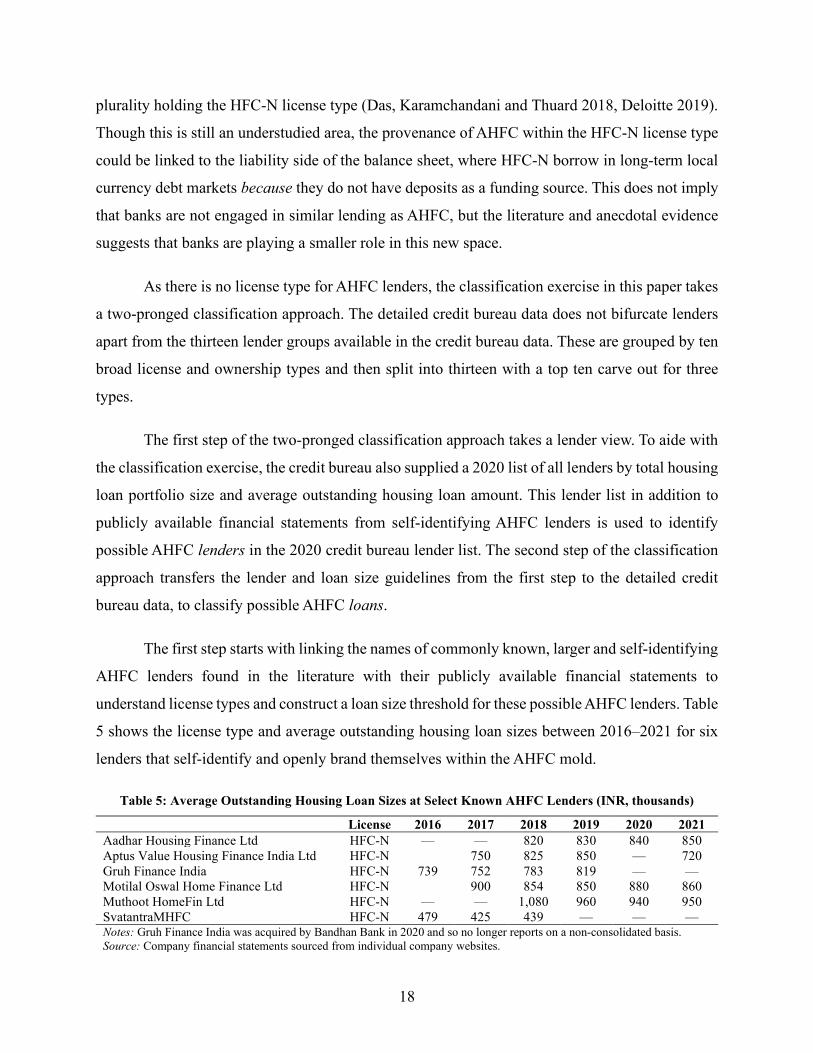
The first step starts with linking the names of commonly known, larger and self-identifying
AHFC lenders found in the literature with their publicly available financial statements to
understand license types and construct a loan size threshold for these possible AHFC lenders. Table
5 shows the license type and average outstanding housing loan sizes between 2016–2021 for six
lenders that self-identify and openly brand themselves within the AHFC mold.
Table 5: Average Outstanding Housing Loan Sizes at Select Known AHFC Lenders (INR, thousands)
License 2016 2017 2018 2019 2020 2021 Aadhar Housing Finance Ltd HFC-N — — 820 830 840 850 Aptus Value Housing Finance India Ltd HFC-N 750 825 850 — 720 Gruh Finance India HFC-N 739 752 783 819 — — Motilal Oswal Home Finance Ltd HFC-N 900 854 850 880 860 Muthoot HomeFin Ltd HFC-N — — 1,080 960 940 950 SvatantraMHFC HFC-N 479 425 439 — — — Notes: Gruh Finance India was acquired by Bandhan Bank in 2020 and so no longer reports on a non-consolidated basis. Source: Company financial statements sourced from individual company websites.
19
All the lenders in Table 5 are licensed as HFC-N. This is therefore the first filter to be
applied to the categorization and it fully conforms to all the anecdotal evidence in the literature
about AHFC. Further, most of the average outstanding housing loan values in Table 5 are below
INR 1,000,000 and the median of the average outstanding loan sizes from Table 5 is INR 830,000.
This is commensurate with the HFC-N average outstanding loan size in Panel C of Table 4. The
Table 5 figures are also in line with the average loan size of 26 AHFC balance sheets of
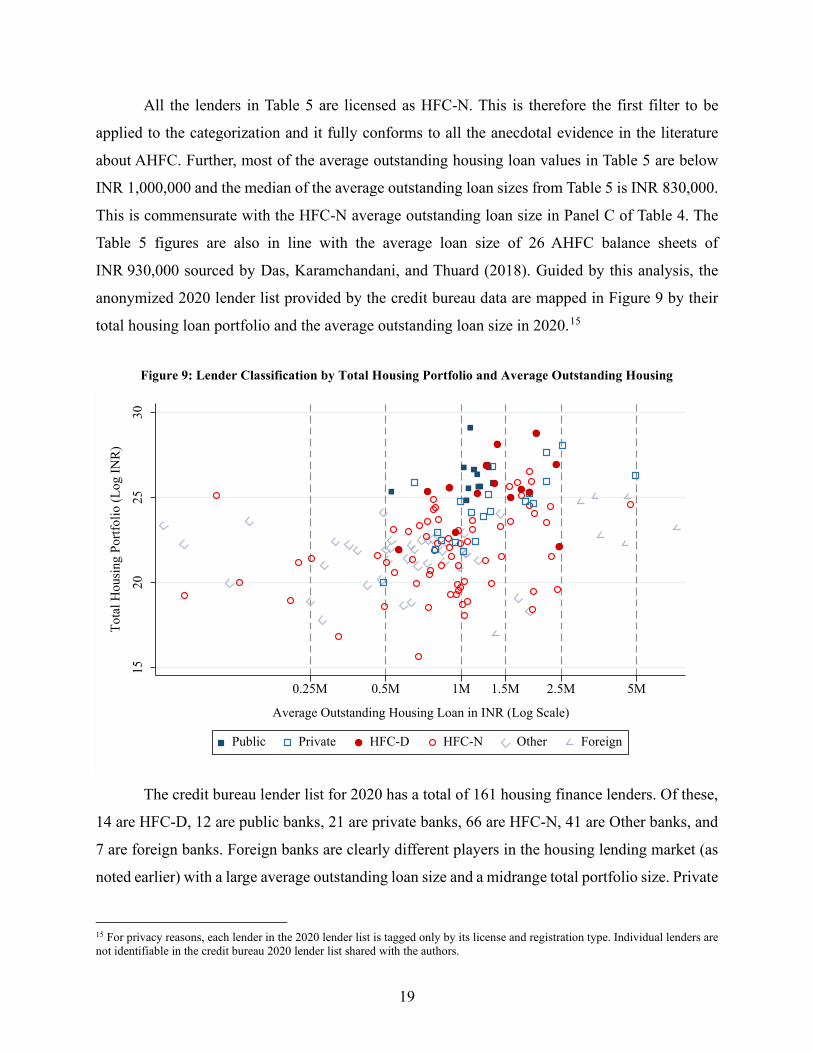
INR 930,000 sourced by Das, Karamchandani, and Thuard (2018). Guided by this analysis, the
anonymized 2020 lender list provided by the credit bureau data are mapped in Figure 9 by their
total housing loan portfolio and the average outstanding loan size in 2020.15
Figure 9: Lender Classification by Total Housing Portfolio and Average Outstanding Housing
The credit bureau lender list for 2020 has a total of 161 housing finance lenders. Of these,
14 are HFC-D, 12 are public banks, 21 are private banks, 66 are HFC-N, 41 are Other banks, and
7 are foreign banks. Foreign banks are clearly different players in the housing lending market (as
noted earlier) with a large average outstanding loan size and a midrange total portfolio size. Private
15 For privacy reasons, each lender in the 2020 lender list is tagged only by its license and registration type. Individual lenders are not identifiable in the credit bureau 2020 lender list shared with the authors.
1520
2530
Tota
l Hou
sing
Por
tfolio
(Log
INR
)
0.25M 0.5M 1M 1.5M 2.5M 5M
Average Outstanding Housing Loan in INR (Log Scale)
Public Private HFC-D HFC-N Other Foreign
20
banks are larger in size and have larger average outstanding loan sizes. HFC-N are arguably most
like private banks in the Figure 9 mapping of lenders in housing portfolio and average outstanding
housing loan size space. Public banks are all to the left of the INR 1,500,000 vertical line—which
may be an internal target or a strategy to meet priority sector lending targets. HFC-N are smaller
than the main players (HFC-D, private and public banks) though there is a significant variation
amongst them. Other banks are also below INR 1,000,000 average outstanding housing loan size
space but have smaller portfolios in general.
Based on this graphical lender segmentation analysis, the anecdotal evidence from the
literature, and the data in Table 5, the lender classification approach taken here is to classify AHFC
lenders as HFC-N lenders that have an outstanding average housing loan size less than
INR 1,000,000. There is an element of circularity to this classification approach, as it is well
documented that AHFC offer smaller loans than legacy lenders. Without a separate license type,
using portfolio moments is an expedient way to classify a nascent typology of lender. Other lenders
could compete in this space, as AHFC is more about borrowers and products rather than lender
license or registration types.
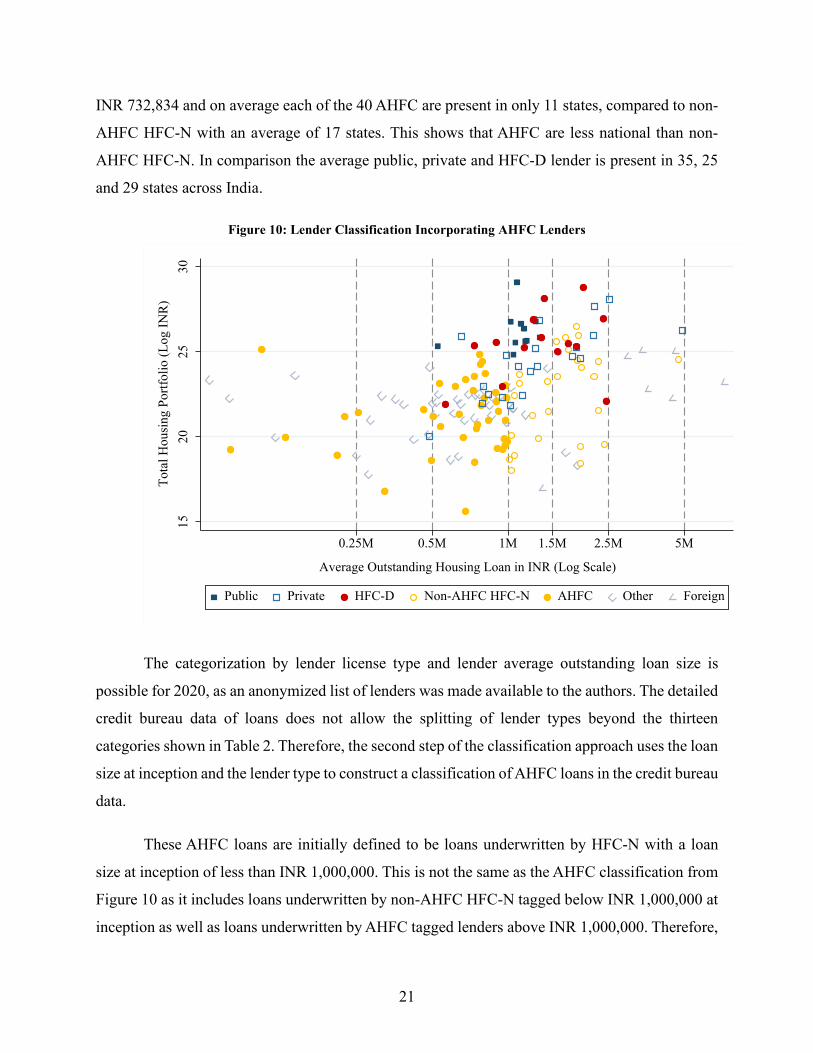
Armed with this new definition, Figure 10 shows the same segmentation as Figure 9, but
with an AHFC categorization based on license type and an average loan size of less than
INR 1,000,000. This includes HFC-N lenders with average outstanding loan sizes below INR
500,000 which is less than half of the value from Table 5. As the 2020 lender listing provided by
the credit bureau is anonymized, it is not possible to verify the identity of these AHFC tagged
lenders.
Using this first AHFC classification step definition, out of the 66 HFC-N lenders, 40 are
classified as AHFC based on this average outstanding loan size threshold. The total AHFC loan
portfolio size is INR 350.3 billion with 1.15 million outstanding active loans for the year 2020.
Therefore, the average outstanding loan amount is INR 304,897.16 This splits the HFC-N category
24:76 in portfolio value and 65:35 in number of loans, implying that AHFC have a 1.8 percent
market share of the entire housing finance market. Their median loan size at issuance is
16 This is smaller than the value in Table 5 as those are larger, urban, more prominent and self-identifying AHFC lenders and because Figure 10 includes a number of large AHFC lenders with small average outstanding loan sizes.
21
INR 732,834 and on average each of the 40 AHFC are present in only 11 states, compared to non-
AHFC HFC-N with an average of 17 states. This shows that AHFC are less national than non-
AHFC HFC-N. In comparison the average public, private and HFC-D lender is present in 35, 25
and 29 states across India.
Figure 10: Lender Classification Incorporating AHFC Lenders
The categorization by lender license type and lender average outstanding loan size is
possible for 2020, as an anonymized list of lenders was made available to the authors. The detailed
credit bureau data of loans does not allow the splitting of lender types beyond the thirteen
categories shown in Table 2. Therefore, the second step of the classification approach uses the loan
size at inception and the lender type to construct a classification of AHFC loans in the credit bureau
data.
These AHFC loans are initially defined to be loans underwritten by HFC-N with a loan
size at inception of less than INR 1,000,000. This is not the same as the AHFC classification from
Figure 10 as it includes loans underwritten by non-AHFC HFC-N tagged below INR 1,000,000 at
inception as well as loans underwritten by AHFC tagged lenders above INR 1,000,000. Therefore,
1520
2530
Tota
l Hou
sing
Por
tfolio
(Log
INR
)
0.25M 0.5M 1M 1.5M 2.5M 5M
Average Outstanding Housing Loan in INR (Log Scale)
Public Private HFC-D Non-AHFC HFC-N AHFC Other Foreign
22
the second step of the classification approach is a AHFC loan definition, in contrast to the first
AHFC lender approach. Both are bound by the HFC-N license type and capital market liability
model.
The AHFC lender and loan classification approaches yield different universes of loans. The
AHFC loan definition with an INR 1,000,00 ceiling yields a total 2020 AHFC portfolio size of
INR 306.0 billion with 1.23 million outstanding active loans. Therefore, the outstanding average
loan amount is INR 248,033. It splits the HFC-N category 20:80 in portfolio value and 69:31 by
number of loans and implies an AFHC market share of 1.4 percent of the entire housing finance
market for 2020. As a result, the AHFC loan definition has a higher number smaller HFC-N loans,
which in aggregate totals a slightly smaller universe in value. This AHFC loan definition approach
does allow for a time series construction: in the five years from 2016 to 2020, AHFC lenders tagged
as such have underwritten 4.5 million loans, totaling more than one trillion rupees. AHFC have
grown their portfolio by an average annual compound rate of 27 percent between 2016—2020, or
equivalently by a factor of 3.4 over these 5 years.
Given that this initial AHFC loan definition includes smaller loans (those below INR
500,000) which could be for incremental housing construction or housing microfinance in rural
areas, the AHFC loan definition approach can be adapted to focus solely on defining loans with a
loan size floor. Imposing a loan size floor of INR 500,000 so that the AHFC loan definition is
restricted to HFC-N underwritten loans between INR 500,000 and INR 1,000,000 then the
portfolio outstanding would be INR 188.5 billion, the market share for 2020 would be 0.9 percent
and the compound annual growth rate between 2016—2020 would be 32 percent. This suggest that
including the smaller loans does not change the narrative of a high growth rate from a small base.
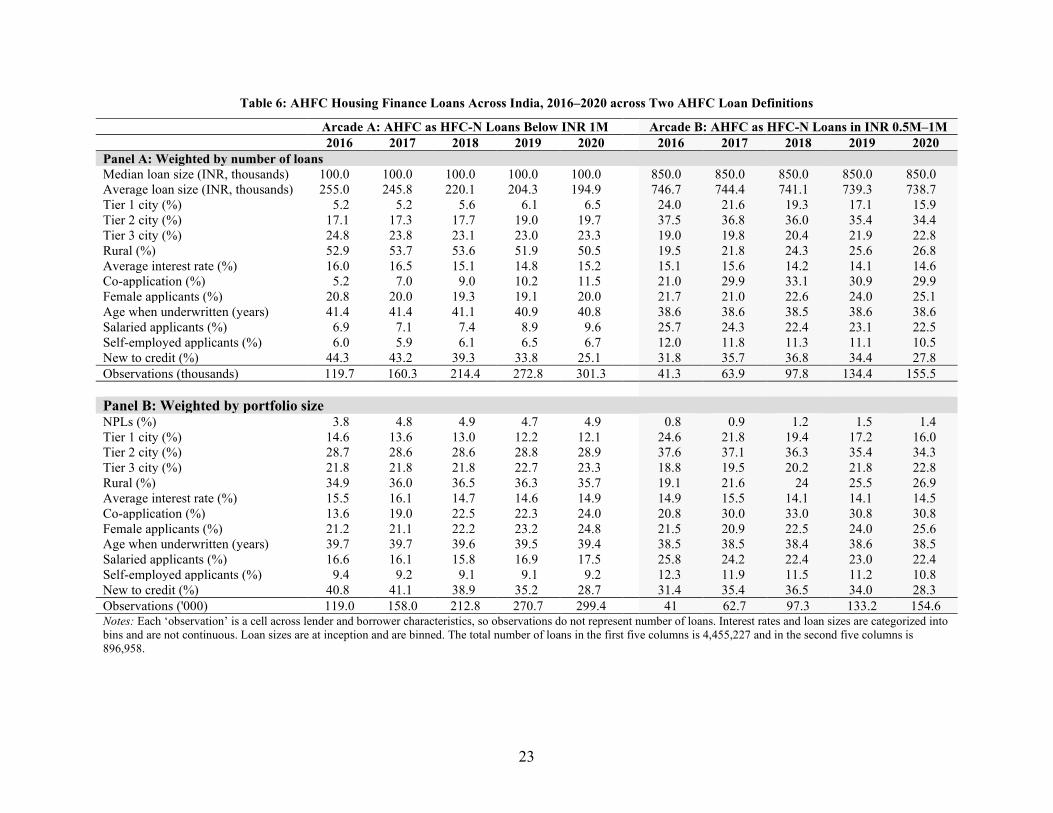
Table 6 uses the both these AHFC loan definitions—in the first five columns as Arcade A
for HFC-N loans below INR 1,000,000 and in the second five columns as Arcade B for HFC-N
loans between INR 500,000 and INR 1,000,000—to compute loan and borrower characteristics
for each of the five years using the credit bureau data. Starting with Panel A, which are loans
weighted by the number of loans: as expected, the main differences between the panels of Table 6
is the loan size. The average binned loan size at inception in Arcade A is INR 194,900 compared
to INR 738,700 in Arcade B for 2020. This is because Arcade B is truncated from below and
23
Table 6: AHFC Housing Finance Loans Across India, 2016–2020 across Two AHFC Loan Definitions
Arcade A: AHFC as HFC-N Loans Below INR 1M Arcade B: AHFC as HFC-N Loans in INR 0.5M–1M 2016 2017 2018 2019 2020 2016 2017 2018 2019 2020 Panel A: Weighted by number of loans Median loan size (INR, thousands) 100.0 100.0 100.0 100.0 100.0 850.0 850.0 850.0 850.0 850.0 Average loan size (INR, thousands) 255.0 245.8 220.1 204.3 194.9 746.7 744.4 741.1 739.3 738.7 Tier 1 city (%) 5.2 5.2 5.6 6.1 6.5 24.0 21.6 19.3 17.1 15.9 Tier 2 city (%) 17.1 17.3 17.7 19.0 19.7 37.5 36.8 36.0 35.4 34.4 Tier 3 city (%) 24.8 23.8 23.1 23.0 23.3 19.0 19.8 20.4 21.9 22.8 Rural (%) 52.9 53.7 53.6 51.9 50.5 19.5 21.8 24.3 25.6 26.8 Average interest rate (%) 16.0 16.5 15.1 14.8 15.2 15.1 15.6 14.2 14.1 14.6 Co-application (%) 5.2 7.0 9.0 10.2 11.5 21.0 29.9 33.1 30.9 29.9 Female applicants (%) 20.8 20.0 19.3 19.1 20.0 21.7 21.0 22.6 24.0 25.1 Age when underwritten (years) 41.4 41.4 41.1 40.9 40.8 38.6 38.6 38.5 38.6 38.6 Salaried applicants (%) 6.9 7.1 7.4 8.9 9.6 25.7 24.3 22.4 23.1 22.5 Self-employed applicants (%) 6.0 5.9 6.1 6.5 6.7 12.0 11.8 11.3 11.1 10.5 New to credit (%) 44.3 43.2 39.3 33.8 25.1 31.8 35.7 36.8 34.4 27.8 Observations (thousands) 119.7 160.3 214.4 272.8 301.3 41.3 63.9 97.8 134.4 155.5 Panel B: Weighted by portfolio size NPLs (%) 3.8 4.8 4.9 4.7 4.9 0.8 0.9 1.2 1.5 1.4 Tier 1 city (%) 14.6 13.6 13.0 12.2 12.1 24.6 21.8 19.4 17.2 16.0 Tier 2 city (%) 28.7 28.6 28.6 28.8 28.9 37.6 37.1 36.3 35.4 34.3 Tier 3 city (%) 21.8 21.8 21.8 22.7 23.3 18.8 19.5 20.2 21.8 22.8 Rural (%) 34.9 36.0 36.5 36.3 35.7 19.1 21.6 24 25.5 26.9 Average interest rate (%) 15.5 16.1 14.7 14.6 14.9 14.9 15.5 14.1 14.1 14.5 Co-application (%) 13.6 19.0 22.5 22.3 24.0 20.8 30.0 33.0 30.8 30.8 Female applicants (%) 21.2 21.1 22.2 23.2 24.8 21.5 20.9 22.5 24.0 25.6 Age when underwritten (years) 39.7 39.7 39.6 39.5 39.4 38.5 38.5 38.4 38.6 38.5 Salaried applicants (%) 16.6 16.1 15.8 16.9 17.5 25.8 24.2 22.4 23.0 22.4 Self-employed applicants (%) 9.4 9.2 9.1 9.1 9.2 12.3 11.9 11.5 11.2 10.8 New to credit (%) 40.8 41.1 38.9 35.2 28.7 31.4 35.4 36.5 34.0 28.3 Observations ('000) 119.0 158.0 212.8 270.7 299.4 41 62.7 97.3 133.2 154.6 Notes: Each ‘observation’ is a cell across lender and borrower characteristics, so observations do not represent number of loans. Interest rates and loan sizes are categorized into bins and are not continuous. Loan sizes are at inception and are binned. The total number of loans in the first five columns is 4,455,227 and in the second five columns is 896,958.
24
contains no ‘small’ loans. As a result, Arcade A has half of its loans in rural areas, compared to a
quarter in Arcade B, with the plurality of Arcade B loans in Tier 2 cities. Average interest rates
across both arcades are in the mid-teens, with Arcade B having slightly lower interest rates. These
interest rates are higher than the HFC-N interest rates from Table 4. In terms of the other
characteristics, larger loans are more often associated with co-applicant and more female
applicants. Across both arcades, a quarter are new to credit, and for Arcade A, this value started at
44.8 percent in 2016. Panel B shows loans weighted by portfolio size. The starkest difference is in
terms of loan delinquencies. Arcade B has an NPL rate of just 1.4 in 2020 compared to 4.9. With
almost equal interest rates, this suggests that Arcade B loans are more profitable, and the spreads
in Arcade B are the highest out of all other lender categories in Table 4. These descriptive statistics
match the anecdotal evidence of AHFC from the literature well, although the data in Arcade A does
have a rural bias given the AHFC loan definition for these columns does not have a floor.
With either AHFC loan definition, it is clear that the AHFC lenders identified are lending
through a different modality than the legacy lenders shown in the first three columns of Table 4. It
is also striking how the quantitative narrative from Table 6 is similar to the global narrative that
compares how microfinance institutions lend in comparison to banks. This analogy is further
extended with the observation that many self-identifying AHFC use a 30-day delinquency metric
for internal distress measurement which is exactly how the microfinance sector measures early
warnings towards potential NPLs. Having described the market segmentation and the market
positioning of AHFC lenders, the next section undertakes econometric tests of whether AHFC
lending is statistically different from other lenders.
6 Econometric Analysis of Lending by Affordable Housing Finance Companies
The previous section discussed the overarching market segmentation and defined AHFC
as a carve-out of HFC-N, either through a lender classification or a loan classification. It
highlighted the differences between different lender types, the large heterogeneity of the housing
finance landscape in India, and the differences in AHFC loans and borrowers compared to other
lender types.
This section takes advantage of the detailed micro data to undertake additional
segmentation analysis to uncover the loans and borrowers across different lender types. This
25
section poses the question of whether, controlling for as much as can be measured in the data,
AHFC are really operating through a different business model. From the data in Section 5, it could
be the case that these differences in means and medians can be explained by other factors—such
as geography or the occupation of borrowers. Table 6 shows that AHFC have smaller loans, lend
less in Tier 1 cities, have higher interest rates, and offer loans more often to non-salaried and those
with no or shorter credit histories. However, a subsequent line of inquiry is how do these AHFC
lenders perform in the same cell against other lenders. Whether AHFC are simply located
somewhere else or if their strategy is discernably different from other lenders is a key question. In
particular, the rural and smaller loans cannot be compared to larger urban loans, even though the
lender license type is the same. A regression framework is set up so to identify similar borrowers
and loan types and test whether AHFC outcomes differ. Put differently, how do other lenders
perform when they behave like AHFC, as other lenders are not excluded from serving these
borrowers or underwriting these types of loans. Theoretically, this section presents its results in a
framework that attempts to align loan-borrower pairs that only differ by lender type to measure if
AHFC are lending differently using an omitted category indicator variable approach. For example,
to assess if AHFC are more likely to lend to those who are new to credit, the exercise is to find all
the loan-borrower pairs that are identical in all dimensions except their credit vintage and assess
whether AHFC have an edge or proclivity to lend more to those who are newer to credit.
This is achieved through a regression framework to understand the trade-offs between these
variables. This can help uncover the performance of AHFC in more detail. Regressions are run
with various borrower and loan characteristics as the dependent variable against an indicator
variable of whether the loan cell is an AHFC lender together with additional control variables. The
form of these regressions is as follows:
𝑌𝑌𝑖𝑖𝑖𝑖 = 𝛼𝛼 + 𝛽𝛽 ∙ 𝐴𝐴𝐴𝐴𝐴𝐴𝐴𝐴𝑖𝑖𝑖𝑖 + 𝑋𝑋𝑖𝑖𝑖𝑖 + 𝜀𝜀𝑖𝑖𝑖𝑖 [1]
𝑌𝑌𝑖𝑖𝑖𝑖 = 𝛼𝛼 + 𝛽𝛽 ∙ 𝐴𝐴𝐴𝐴𝐴𝐴𝐴𝐴𝑖𝑖𝑖𝑖 + 𝛾𝛾 ∙ 𝐴𝐴𝐴𝐴𝐴𝐴𝐴𝐴𝑖𝑖𝑖𝑖 ∙ 𝑌𝑌𝑌𝑌𝑌𝑌𝑌𝑌𝑖𝑖 + 𝑋𝑋𝑖𝑖𝑖𝑖 + 𝜀𝜀𝑖𝑖𝑖𝑖 [2]
Equation [1] helps understand how different outcomes (Y) vary with AHFC status across
all time periods, while equation [2] assesses how this has changed over time. The control variables
are the vector X, and i and t correspond to a loan-borrower-lender-type cell, and time. The results
26
of the regressions are shown in Table 7 for HFC-N loans below INR 1,000,000 and those between
INR 500,000 and INR 1,000,000 as in Table 6.
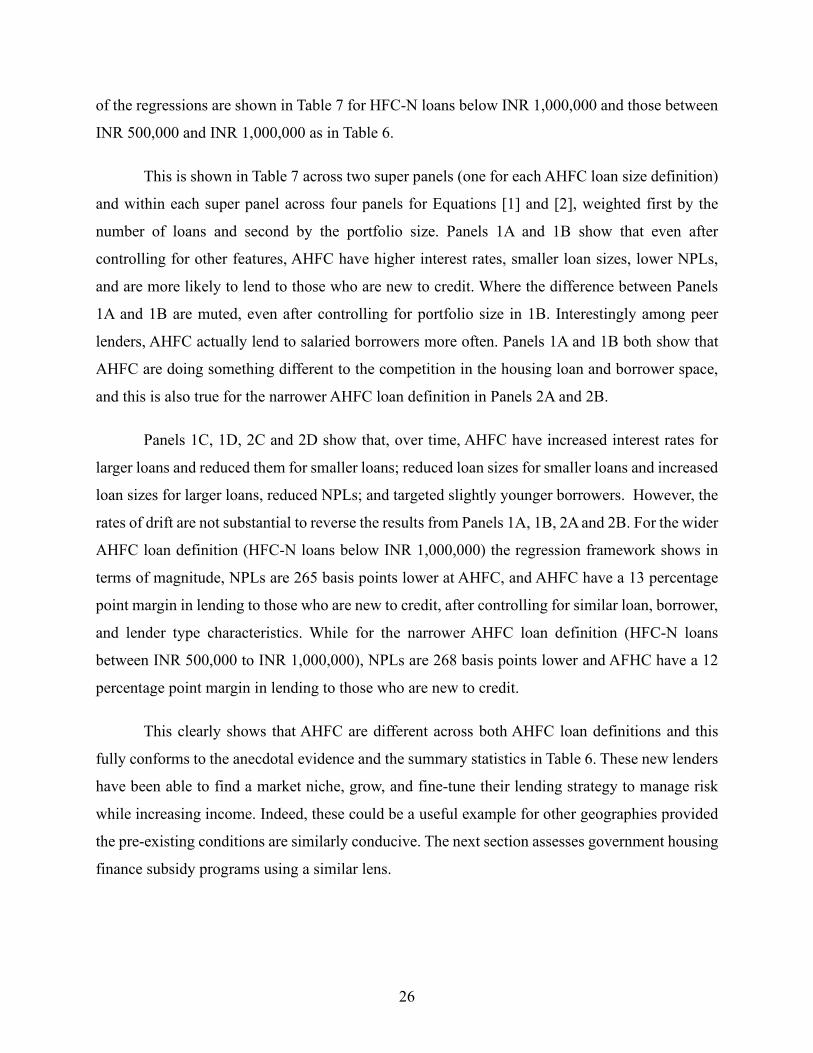
This is shown in Table 7 across two super panels (one for each AHFC loan size definition)
and within each super panel across four panels for Equations [1] and [2], weighted first by the
number of loans and second by the portfolio size. Panels 1A and 1B show that even after
controlling for other features, AHFC have higher interest rates, smaller loan sizes, lower NPLs,
and are more likely to lend to those who are new to credit. Where the difference between Panels
1A and 1B are muted, even after controlling for portfolio size in 1B. Interestingly among peer
lenders, AHFC actually lend to salaried borrowers more often. Panels 1A and 1B both show that
AHFC are doing something different to the competition in the housing loan and borrower space,
and this is also true for the narrower AHFC loan definition in Panels 2A and 2B.
Panels 1C, 1D, 2C and 2D show that, over time, AHFC have increased interest rates for
larger loans and reduced them for smaller loans; reduced loan sizes for smaller loans and increased
loan sizes for larger loans, reduced NPLs; and targeted slightly younger borrowers. However, the
rates of drift are not substantial to reverse the results from Panels 1A, 1B, 2A and 2B. For the wider
AHFC loan definition (HFC-N loans below INR 1,000,000) the regression framework shows in
terms of magnitude, NPLs are 265 basis points lower at AHFC, and AHFC have a 13 percentage
point margin in lending to those who are new to credit, after controlling for similar loan, borrower,
and lender type characteristics. While for the narrower AHFC loan definition (HFC-N loans
between INR 500,000 to INR 1,000,000), NPLs are 268 basis points lower and AFHC have a 12
percentage point margin in lending to those who are new to credit.
This clearly shows that AHFC are different across both AHFC loan definitions and this
fully conforms to the anecdotal evidence and the summary statistics in Table 6. These new lenders
have been able to find a market niche, grow, and fine-tune their lending strategy to manage risk
while increasing income. Indeed, these could be a useful example for other geographies provided
the pre-existing conditions are similarly conducive. The next section assesses government housing
finance subsidy programs using a similar lens.
27
Table 7: Regressions of Housing Loans and Borrower Outcomes for AHFC Versus Comparators across Two AHFC Loan Definitions
(1) (2) (3) (4) (5) (6) (7) (8) (9) Int Size NPL Tier 1 Co-App Female Salaried Age New
Supe
r Pa
nel 1
Panel 1A: Equation [1] Weighted by number of loans for loans less than INR 1M AHFC 4.52*** −5.20*** −3.03*** 0.00*** −0.01*** −0.09*** 0.08*** −1.12*** 0.09*** R2 0.40 0.30 0.80 0.95 0.52 0.32 0.30 0.17 0.28 Panel 1B: Equation [1] Weighted by portfolio size for loans less than INR 1M AHFC 4.43*** −14.58*** −2.65*** 0.00*** −0.06*** −0.03*** 0.09*** −1.96*** 0.13*** R2 0.42 0.43 0.73 0.95 0.51 0.34 0.29 0.21 0.28 Panel 1C: Equation [2] Weighted by number of loans for loans less than INR 1M AHFC × Year −0.100*** −0.395*** −1.054*** 0.000*** 0.016*** −0.007*** 0.010*** 0.015** −0.014*** R2 0.35 0.28 0.64 0.95 0.48 0.25 0.25 0.14 0.20 Panel 1D: Equation [2] Weighted by portfolio size for loans less than INR 1M AHFC × Year 0.003*** 1.043*** −0.608*** 0.001*** 0.047*** 0.004*** 0.015*** 0.020*** −0.028*** R2 0.36 0.40 0.52 0.95 0.46 0.27 0.23 0.16 0.19 Observations 23,245,203 34,360,277 24,684,949 34,360,277 34,360,277 34,360,277 34,360,277 32,813,692 34,293,278
Supe
r Pa
nel 2
Panel 2A: Equation [1] Weighted by number of loans for loans between INR 0.5M–1M AHFC 4.08*** -3.24*** -2.88*** 0.00*** 0.09*** -0.06*** 0.12*** -1.85*** 0.12*** R2 0.40 0.29 0.80 0.95 0.52 0.32 0.30 0.17 0.28 Panel 2B: Equation [1] Weighted by portfolio size for loans between INR 0.5M–1M AHFC 4.14*** -13.23*** -2.68*** 0.00*** -0.03*** -0.03*** 0.10*** -2.15*** 0.12*** R2 0.42 0.43 0.73 0.95 0.51 0.34 0.29 0.21 0.28 Panel 2C: Equation [2] Weighted by number of loans for loans between INR0.5M–1M AHFC × Year -0.058*** 0.109*** -1.289*** -0.001*** 0.021*** -0.006*** 0.007*** -0.086*** 0.011*** R2 0.35 0.27 0.64 0.95 0.48 0.25 0.25 0.14 0.20 Panel 2D: Equation [2] Weighted by portfolio size for loans between INR0.5M–1M AHFC × Year 0.036*** 1.570*** -0.776*** 0.000*** 0.047*** 0.003*** 0.014*** -0.022*** -0.014*** R2 0.36 0.39 0.52 0.95 0.46 0.27 0.23 0.16 0.19 Observations 23,245,203 34,360,277 24,684,949 34,360,277 34,360,277 34,360,277 34,360,277 32,813,692 34,293,278
Notes: Int = interest rate. NPL = non-performing loan, Co-App = if loan has a co-applicant, which is usually a spouse of the main applicant and New = new to credit which is defined as borrowers with less than two years of credit history. Regressions are weighted by portfolio outstanding and control for all other loan, borrower, and lender characteristics available for each column. For example, the regression on interest rates is controlled for other lenders, geography, borrower occupation, borrower gender, loan size, application type, borrower age, borrower credit history length, and borrower occupation. Coefficient of other control variables not shown. * p<0.05, ** p<0.01, *** p<0.001
28
7 PMAY-CLSS Loans and Recipients
In India there are a range of government-funded housing programs, and currently the
PMAY umbrella initiative is arguably the most important, especially for potential urban owner
occupiers.17 The PMAY umbrella initiative (which includes other programs aside from the PMAY-
CLSS) was launched in June 2015 and aims to provide affordable housing to the poor. Its original
stated objective was to provide housing for all by 2022, the year by which it aimed to build 50
million homes: 30 million in rural areas and 20 million in urban areas. The PMAY helps households
in the EWS, LIG, and middle-income groups I and II (MIG-I and MIG-II).18 The ‘Housing for All
by 2022’ program has been implemented under two broad categories: PMAY Urban and PMAY
Gramin (Rural). The PMAY suite of programs provides central assistance through state
government to urban local bodies and other implementing agencies across four pillars: (a) an in
situ rehabilitation of existing slum dwelling using land as a resource through private participation,
(b) a credit linked subsidy scheme (CLSS) administered through primary lending institutions,
(c) a lump-sum subsidy for the purchase or construction of a dwelling called the affordable housing
in partnership (AHP), and (d) a subsidy for beneficiary-led construction or enhancements to
dwellings.
The housing finance linked subsidy program—CLSS—provides an up-front subsidy for
eligible borrowers who obtain a housing loan from a participating lender. For EWS and LIG
borrowers, the CLSS provides an up-front subsidy of up to INR 267,280 on the first INR 600,000
of a housing loan, calculated as the net present value of the interest of a fixed mortgage payment
of up to 20 years at an interest rate of 6.5 percent. EWS and LIG borrowers must have a woman
as a co-owner of the mortgage, or a woman must be the borrower herself. For MIG-I and MIG-II
the subsidy is for the first INR 900,000 and INR 1,200,000 of a housing loan and is the net present
value of the interest of this value (or lower) at an interest rate of 4 and 3 percent over 20 years.
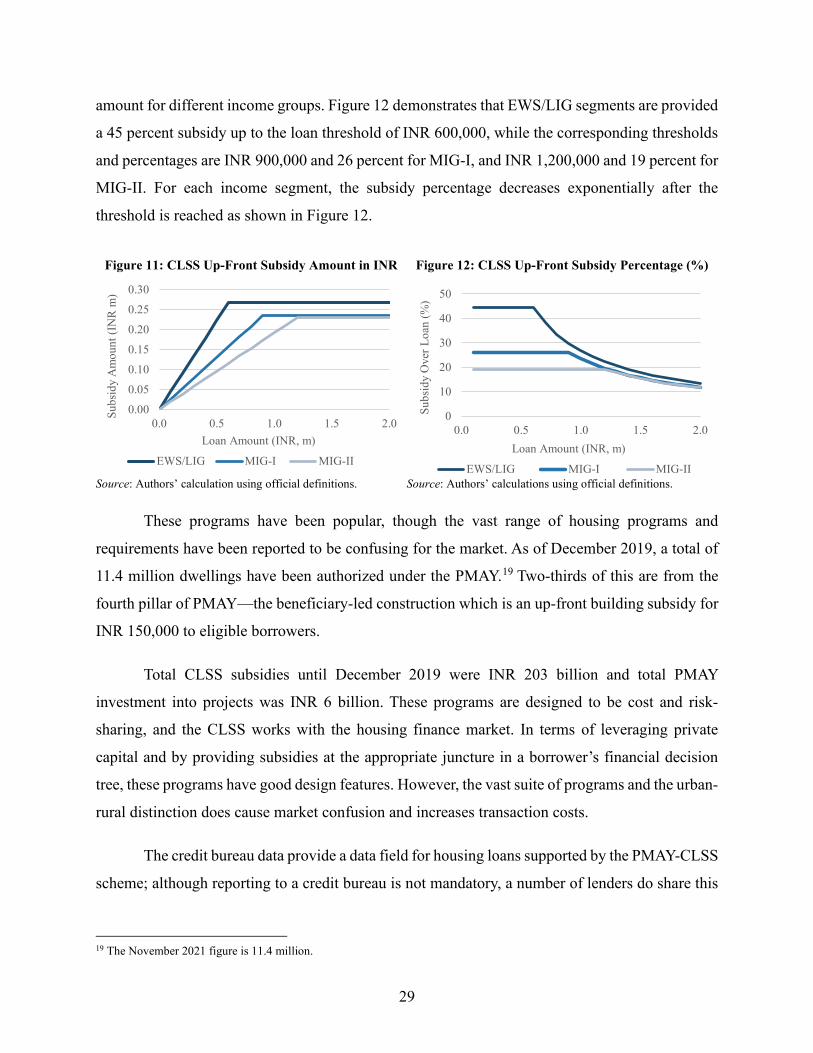
Figure 11 shows the rupee value of the PMAY-CLSS subsidy for different income groups as the
loan amount varies, and Figure 12 shows how the subsidy percentage of the loan varies by the loan
17 See the annex for a complete history of housing and housing finance programs. 18 These are definitions that are housing specific in India and are not means tested. They also combine area and the square footage of the dwelling in an unusual way, especially for single- or two-person households. The current thresholds are: EWS households are those with annual income below INR 300,000 and a carpet area of less than 30 m2; LIG between INR 300,000 and INR 600,000 and a carpet area of less than 60 m2; MIG-I between INR 600,000 and INR 1,200,000 and a carpet area of 160 m2; and MIG-II between INR 1,200,000 and INR 1,800,000 and a carpet area of less than 200 m2.
29
amount for different income groups. Figure 12 demonstrates that EWS/LIG segments are provided
a 45 percent subsidy up to the loan threshold of INR 600,000, while the corresponding thresholds
and percentages are INR 900,000 and 26 percent for MIG-I, and INR 1,200,000 and 19 percent for
MIG-II. For each income segment, the subsidy percentage decreases exponentially after the
threshold is reached as shown in Figure 12.
Figure 11: CLSS Up-Front Subsidy Amount in INR
Source: Authors’ calculation using official definitions.
Figure 12: CLSS Up-Front Subsidy Percentage (%)
Source: Authors’ calculations using official definitions.
These programs have been popular, though the vast range of housing programs and
requirements have been reported to be confusing for the market. As of December 2019, a total of
11.4 million dwellings have been authorized under the PMAY.19 Two-thirds of this are from the
fourth pillar of PMAY—the beneficiary-led construction which is an up-front building subsidy for
INR 150,000 to eligible borrowers.
Total CLSS subsidies until December 2019 were INR 203 billion and total PMAY
investment into projects was INR 6 billion. These programs are designed to be cost and risk-
sharing, and the CLSS works with the housing finance market. In terms of leveraging private
capital and by providing subsidies at the appropriate juncture in a borrower’s financial decision
tree, these programs have good design features. However, the vast suite of programs and the urban-
rural distinction does cause market confusion and increases transaction costs.
The credit bureau data provide a data field for housing loans supported by the PMAY-CLSS
scheme; although reporting to a credit bureau is not mandatory, a number of lenders do share this
19 The November 2021 figure is 11.4 million.
0.00
0.05
0.10
0.15
0.20
0.25
0.30
0.0 0.5 1.0 1.5 2.0
Subs
idy
Am
ount
(IN
R m
)
Loan Amount (INR, m)
EWS/LIG MIG-I MIG-II
0
10
20
30
40
50
0.0 0.5 1.0 1.5 2.0Su
bsid
y O
ver L
oan
(%)
Loan Amount (INR, m)
EWS/LIG MIG-I MIG-II
30
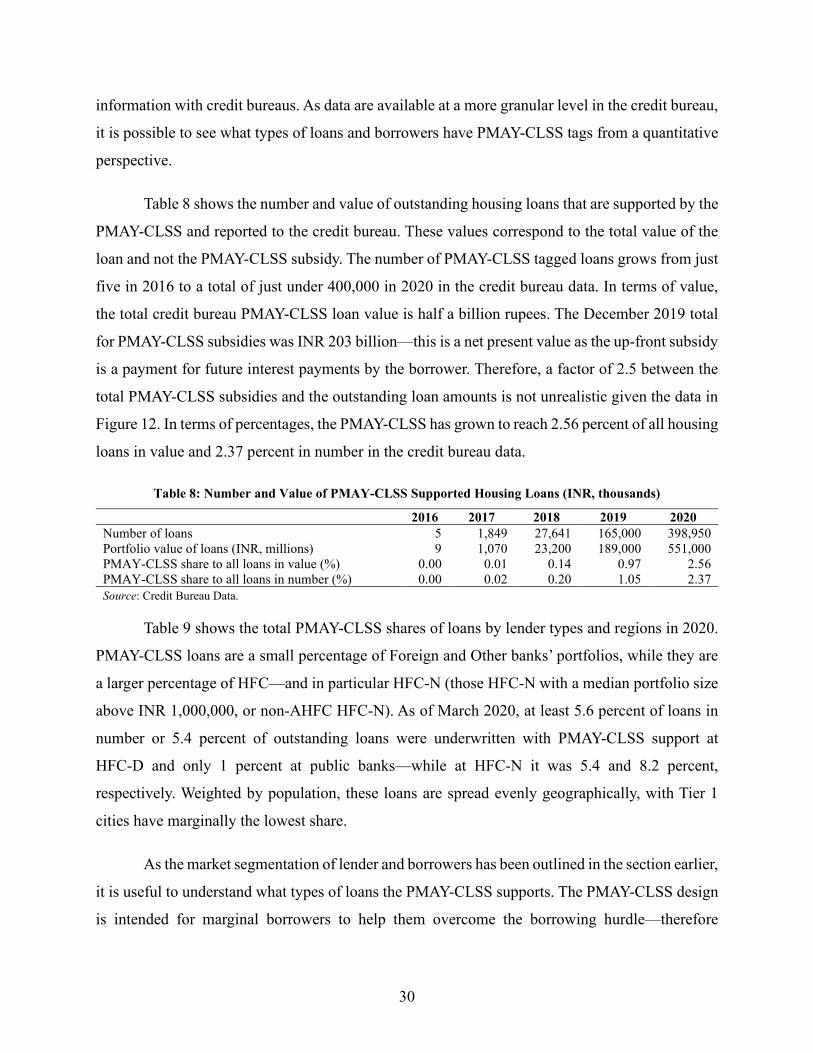
information with credit bureaus. As data are available at a more granular level in the credit bureau,
it is possible to see what types of loans and borrowers have PMAY-CLSS tags from a quantitative
perspective.
Table 8 shows the number and value of outstanding housing loans that are supported by the
PMAY-CLSS and reported to the credit bureau. These values correspond to the total value of the
loan and not the PMAY-CLSS subsidy. The number of PMAY-CLSS tagged loans grows from just
five in 2016 to a total of just under 400,000 in 2020 in the credit bureau data. In terms of value,
the total credit bureau PMAY-CLSS loan value is half a billion rupees. The December 2019 total
for PMAY-CLSS subsidies was INR 203 billion—this is a net present value as the up-front subsidy
is a payment for future interest payments by the borrower. Therefore, a factor of 2.5 between the
total PMAY-CLSS subsidies and the outstanding loan amounts is not unrealistic given the data in
Figure 12. In terms of percentages, the PMAY-CLSS has grown to reach 2.56 percent of all housing
loans in value and 2.37 percent in number in the credit bureau data.
Table 8: Number and Value of PMAY-CLSS Supported Housing Loans (INR, thousands)
2016 2017 2018 2019 2020 Number of loans 5 1,849 27,641 165,000 398,950 Portfolio value of loans (INR, millions) 9 1,070 23,200 189,000 551,000 PMAY-CLSS share to all loans in value (%) 0.00 0.01 0.14 0.97 2.56 PMAY-CLSS share to all loans in number (%) 0.00 0.02 0.20 1.05 2.37 Source: Credit Bureau Data.
Table 9 shows the total PMAY-CLSS shares of loans by lender types and regions in 2020.
PMAY-CLSS loans are a small percentage of Foreign and Other banks’ portfolios, while they are
a larger percentage of HFC—and in particular HFC-N (those HFC-N with a median portfolio size
above INR 1,000,000, or non-AHFC HFC-N). As of March 2020, at least 5.6 percent of loans in
number or 5.4 percent of outstanding loans were underwritten with PMAY-CLSS support at
HFC- D and only 1 percent at public banks—while at HFC-N it was 5.4 and 8.2 percent,
respectively. Weighted by population, these loans are spread evenly geographically, with Tier 1
cities have marginally the lowest share.
As the market segmentation of lender and borrowers has been outlined in the section earlier,
it is useful to understand what types of loans the PMAY-CLSS supports. The PMAY-CLSS design
is intended for marginal borrowers to help them overcome the borrowing hurdle—therefore
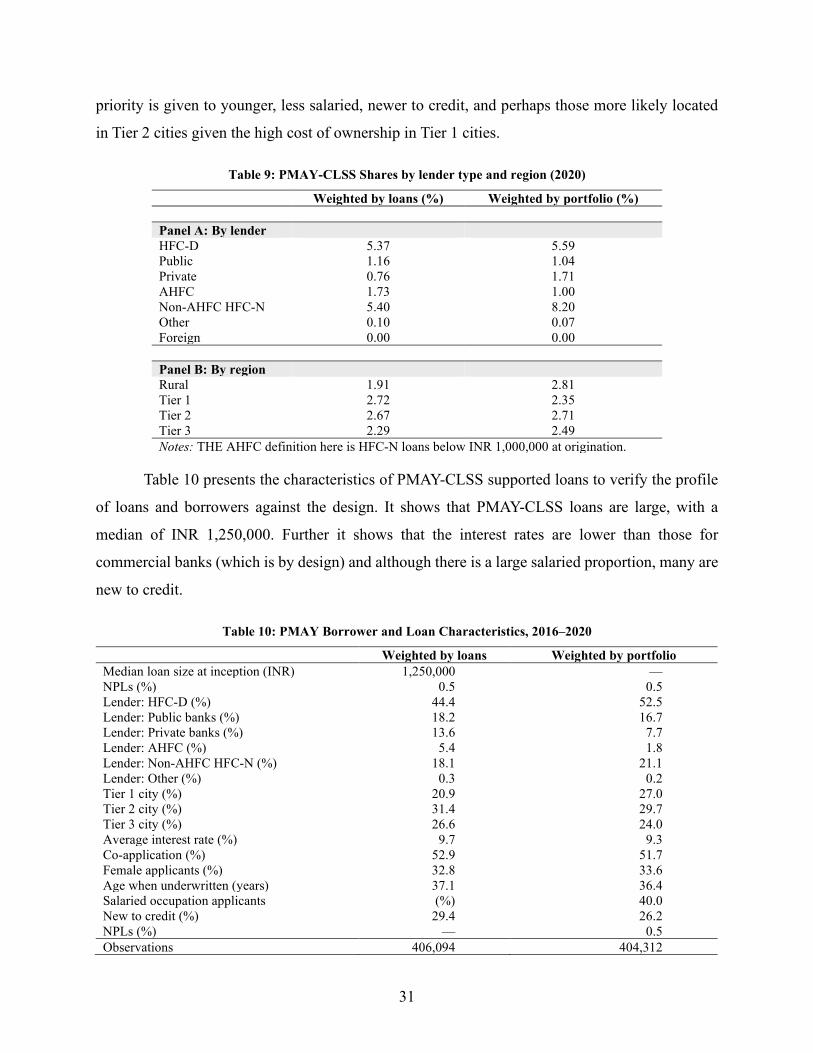
31
priority is given to younger, less salaried, newer to credit, and perhaps those more likely located
in Tier 2 cities given the high cost of ownership in Tier 1 cities.
Table 9: PMAY-CLSS Shares by lender type and region (2020)
Weighted by loans (%) Weighted by portfolio (%) Panel A: By lender HFC-D 5.37 5.59 Public 1.16 1.04 Private 0.76 1.71 AHFC 1.73 1.00 Non-AHFC HFC-N 5.40 8.20 Other 0.10 0.07 Foreign 0.00 0.00 Panel B: By region Rural 1.91 2.81 Tier 1 2.72 2.35 Tier 2 2.67 2.71 Tier 3 2.29 2.49 Notes: THE AHFC definition here is HFC-N loans below INR 1,000,000 at origination.
Table 10 presents the characteristics of PMAY-CLSS supported loans to verify the profile
of loans and borrowers against the design. It shows that PMAY-CLSS loans are large, with a
median of INR 1,250,000. Further it shows that the interest rates are lower than those for
commercial banks (which is by design) and although there is a large salaried proportion, many are
new to credit.
Table 10: PMAY Borrower and Loan Characteristics, 2016–2020
Weighted by loans Weighted by portfolio Median loan size at inception (INR) 1,250,000 — NPLs (%) 0.5 0.5 Lender: HFC-D (%) 44.4 52.5 Lender: Public banks (%) 18.2 16.7 Lender: Private banks (%) 13.6 7.7 Lender: AHFC (%) 5.4 1.8 Lender: Non-AHFC HFC-N (%) 18.1 21.1 Lender: Other (%) 0.3 0.2 Tier 1 city (%) 20.9 27.0 Tier 2 city (%) 31.4 29.7 Tier 3 city (%) 26.6 24.0 Average interest rate (%) 9.7 9.3 Co-application (%) 52.9 51.7 Female applicants (%) 32.8 33.6 Age when underwritten (years) 37.1 36.4 Salaried occupation applicants (%) 40.0 New to credit (%) 29.4 26.2 NPLs (%) — 0.5 Observations 406,094 404,312
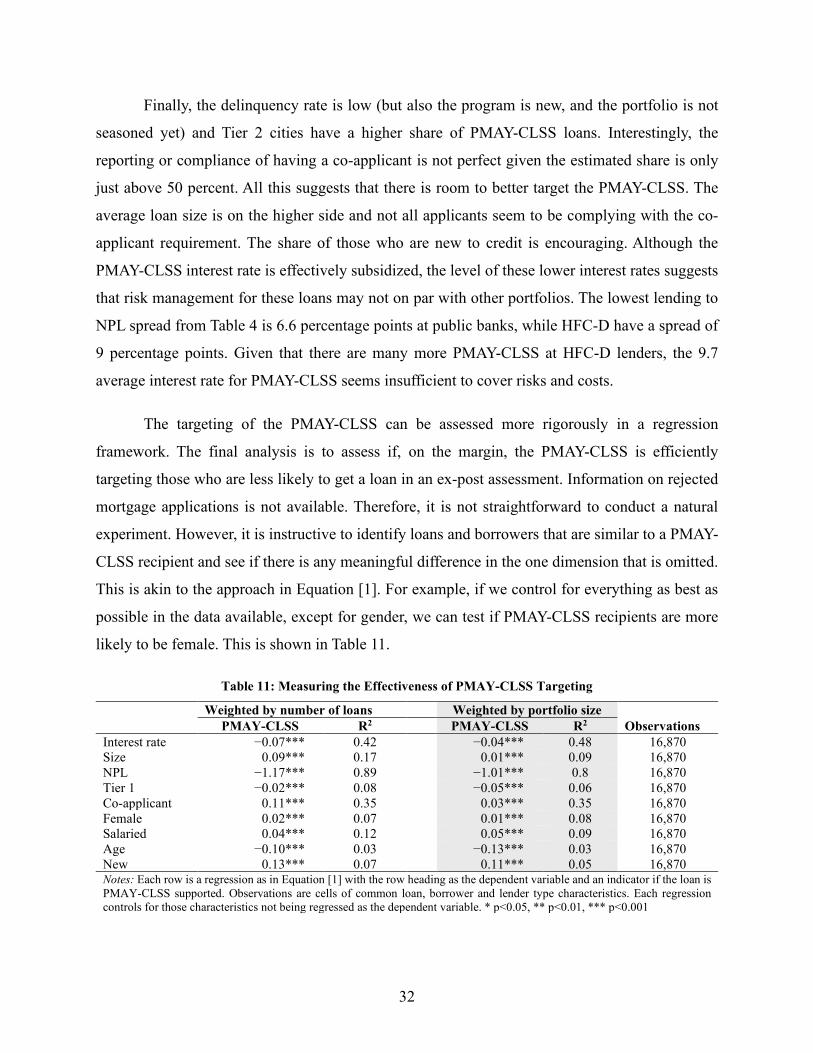
32
Finally, the delinquency rate is low (but also the program is new, and the portfolio is not
seasoned yet) and Tier 2 cities have a higher share of PMAY-CLSS loans. Interestingly, the
reporting or compliance of having a co-applicant is not perfect given the estimated share is only
just above 50 percent. All this suggests that there is room to better target the PMAY-CLSS. The
average loan size is on the higher side and not all applicants seem to be complying with the co-
applicant requirement. The share of those who are new to credit is encouraging. Although the
PMAY-CLSS interest rate is effectively subsidized, the level of these lower interest rates suggests
that risk management for these loans may not on par with other portfolios. The lowest lending to
NPL spread from Table 4 is 6.6 percentage points at public banks, while HFC-D have a spread of
9 percentage points. Given that there are many more PMAY-CLSS at HFC-D lenders, the 9.7
average interest rate for PMAY-CLSS seems insufficient to cover risks and costs.
The targeting of the PMAY-CLSS can be assessed more rigorously in a regression
framework. The final analysis is to assess if, on the margin, the PMAY-CLSS is efficiently
targeting those who are less likely to get a loan in an ex-post assessment. Information on rejected
mortgage applications is not available. Therefore, it is not straightforward to conduct a natural
experiment. However, it is instructive to identify loans and borrowers that are similar to a PMAY-
CLSS recipient and see if there is any meaningful difference in the one dimension that is omitted.
This is akin to the approach in Equation [1]. For example, if we control for everything as best as
possible in the data available, except for gender, we can test if PMAY-CLSS recipients are more
likely to be female. This is shown in Table 11.
Table 11: Measuring the Effectiveness of PMAY-CLSS Targeting
Weighted by number of loans Weighted by portfolio size PMAY-CLSS R2 PMAY-CLSS R2 Observations Interest rate −0.07*** 0.42 −0.04*** 0.48 16,870 Size 0.09*** 0.17 0.01*** 0.09 16,870 NPL −1.17*** 0.89 −1.01*** 0.8 16,870 Tier 1 −0.02*** 0.08 −0.05*** 0.06 16,870 Co-applicant 0.11*** 0.35 0.03*** 0.35 16,870 Female 0.02*** 0.07 0.01*** 0.08 16,870 Salaried 0.04*** 0.12 0.05*** 0.09 16,870 Age −0.10*** 0.03 −0.13*** 0.03 16,870 New 0.13*** 0.07 0.11*** 0.05 16,870 Notes: Each row is a regression as in Equation [1] with the row heading as the dependent variable and an indicator if the loan is PMAY-CLSS supported. Observations are cells of common loan, borrower and lender type characteristics. Each regression controls for those characteristics not being regressed as the dependent variable. * p<0.05, ** p<0.01, *** p<0.001

33
Each row in Table 11 is a regression as in Equation [1], but this time with a PMAY-CLSS
indicator instead of an AHFC indicator variable. The results show that indeed the PMAY-CLSS
has loan and borrower elements that are both progressive and regressive in terms of targeting:
interest rates are lower (4 percentage points than would otherwise be estimated); the loan size is
higher; NPLs are lower; borrowers are more likely to be outside Tier 1 cities; borrowers are more
likely to be female, younger, and are new to credit. However, they are also mostly salaried.
This suggests that—if indeed the demand side is where the housing constraints are most
binding—the PMAY-CLSS is helping on the margin push toward less well-covered market
segments. If the challenge is on the supply side, as suggested by Karmali and Weng (2022), then
these PMAY-CLSS subsidies can be better targeted. The interest rate of the PMAY-CLSS seems
too low and the loan size too large. It is of concern that the average PMAY-CLSS loan size is high
at INR 1,250,000—suggesting that the targeting can be strengthened through tools such as means
testing or other socioeconomic and qualitative approaches to the allocation of subsidies.
8 Conclusion
This paper takes a quantitative view of a new class of lender (AHFC) in the Indian
mortgage market by leveraging detailed credit bureau data. The anecdotal evidence in the literature
shows that these lenders are using a high-touch approach common to microfinance to lend to those
who are newer to credit, with higher interest rates, while managing the risk of these borrowers.
Through a lender market segmentation exercise, the credit bureau data are used to construct
a number of definitions for these lenders as there is no unique financial institution license type for
AHFC. The results from the data vindicate this qualitative narrative and show that AHFC have
grown, especially in terms of the number of loans in Tier 2 and 3 cities and in rural areas (if the
AHFC definition is extended below INR 500,000 at housing loan inception). Their average loan
sizes are between 2.5 to 1.7 times smaller than in Tier 1 cities and they charge higher interest rates.
The econometric analysis shows that in market segments where they compete with other lenders,
AHFC are doing something different. They are lending more often to those who are new to credit
and are not salaried. Their delinquency rates to date are below the additional lending spread that
they charge compared to other lenders, and so far, this seems a sustainable business. This is
particularly true for the AHFC loan definition that imposes a floor for loans at INR 500,000. The
34
detailed analysis herein dispels the worry that this is a high-risk business from inception. The loan
amounts are manageable, and it seems AHFC know their customers well given the high-touch
microfinance strategies that they appear to be using. However, the exercise to tag lenders and loans
in the available data is not perfect, and the analysis here contains smaller HFC-N loans as well that
may not be underwritten by AHFC lenders as the detailed credit bureau data do not allow a
separation of lender types.
The policy implications are to allow these AHFC to continue to lend to those neglected by
legacy lenders provided that these new lenders have good prudential and corporate governance
standards. Their novel approach to housing finance should not attract excessive regulation,
especially within the arc of ‘government as a facilitator’ of housing. The detailed annex shows the
special institutional context in which AHFC emerged in India. This context is central to the
narrative. The unique dual housing finance setup in India has allowed for local currency capital
markets to grow and these AHFC have likely found a niche between borrowing long term in local
currency and lending—often with the support of government programs—to those deemed
unworthy borrowers by other institutions. Their growth and low delinquency rates are impressive.
In terms of the size of the housing finance market in India, the injection of capital in public sector
banks in 2017 increased the number of loans from these lenders, especially in non-Tier 1 markets.
Although AHFC have grown rapidly from a low base—especially in the number of loans—they
only represent between 1.4 to 2.4 percent of the mortgage market.
The implications for other countries trying to replicate this model would be to assess a
candidate market’s local currency capital market and whether alternative credit screening
techniques used by AHFC, such as the diary cash log method, can be borrowed from this successful
India example. The annex allows for a more detailed peer country institutional comparison. The
experience of microfinance has shown the risk of mission drift, where once microfinance
institutions are allowed to accept deposits, they find lower risk corporate borrowers and start to
compete with banks. Although not conclusive in this study, it seems that by not allowing deposits,
the HFC-N license type has spurred a new type of mortgage lending that a deposit-led liability
business model would never allow.
35
The paper also discusses the PMAY-CLSS loans and borrowers. This subsidy program has
grown since 2016 and there are now just below 400,000 housing loans supported by this program.
There are elements of the PMAY-CLSS targeting that are both regressive and progressive. PMAY-
CLSS beneficiaries are more likely to live in Tier 2 cities and be new to credit; however, the loan
size is large compared to other loans and the interest rate seems to be too low. This raises concerns
about appropriate targeting, risk management, and the rationing of public funding. It would be
prudent to tighten the eligibility requirements for the PMAY-CLSS, ensure compliance is high (for
example, for co-applicants), and review beneficiary profiles to ensure that the most deserving are
obtaining this public support.

36
Bibliography
Armendáriz, Beatriz, and Jonathan Morduch. 2010. The Microfinance Promise. MIT Press.
Asian Development Bank. 2019. Financing Affordable Housing in Yangon. Philippines: Asian
Development Bank.
Badarinza, Cristian, Vimal Balasubramaniam, and Tarun Ramadorai. 2016. "The Indian Household
Finance Landscape." SSRN 2797680.
Banerjee, Abhijit, Emily Breza, Ester Duflo, and Cynthia Kinnan. 2017. "Do Credit Constraints
Limit Entrepreneurship? Heterogeneity in the Returns to Microfinance." Global Poverty
Research Lab Working Paper, 17-104.
Banerjee, Abhijit, Esther Duflo, Rachel Glennerster, and Cynthia Kinnan. 2015. "The Miracle of
Microfinance? Evidence from a Randomized Evaluation." American Economic Journal:
Applied Economics 7 (1): 22-5.
Bhalla, A. K., P. S Gill , and P. Arora. 2008. "Housing Finance in India: Development, Growth and
Policy implications." PCMA Journal of Business 1 (1): 51-63.
Bhanot, Disha, Manav Khaire, Arti Kalro, and Shishir K. Jha. 2020. "Affordable Housing Finance
Companies in India: How Do They ‘Differently’Serve the Underserved?" Housing Studies
35 (3): 1–29.
Campbell, John Y., Tarun Ramadorai, and Benjamin Ranish. 2015. "The Impact of Regulation on
Mortgage Risk: Evidence from India." American Economic Journal: Economic Policy 7
(4): 71-102.
Chadha, Pankaj, and Vanitha Chawla. 2013. "Comparative Analysis of Indian Housing Finance
Companies Based on Corporate Governance Disclosures." International Journal of
Management and Science 3 (2): 11-19.
Chiquier, Loic, and Michael J. Lea. 2009. Housing Finance Policy in Emerging Markets. World
Bank Publications.
Das, C., A., Karamchandani, and J. Thuard. 2018. "State of the Low-income Housing Finance
Market."
Datt, G., M. Ravallion, and R. Murgai. 2016a. "Growth, Urbanization and Poverty Reduction in
India." NBER Working Paper 21983.
Datt, G., M. Ravallion, and R. Murgai. 2016b. Poverty Reduction in India: Revisiting Past Debates
with 60 Years of Data. CEPR.
37
Deloitte. 2019. Defining “Affordable”. Deloitte Touche Tohmatsu India LLP.
Ferguson, Bruce. 2003. "Housing Microfinance–A Key to Improving Habitat and the
Sustainability of Microfinance Institution." Enterprise Development and Microfinance 14:
21-31.
Ferguson, Bruce. 2004. "Scaling Up Housing Microfinance: A Guide to Practice." Housing
Finance International 19 (1): 3–13.
Ghosh, Ratna. 2018. "Approach to Housing Policy: The Indian Perspective." 6th Annual
International Conference on Architecture and Civil Engineering.
Government of India. 1951. "First Five Year Plan."
Government of India. 1969. "Fourth Five-Year Plan."
Government of India. 1956. "Second Five Year Plan."
Government of India. 1980. "Sixth Five-Year Plan."
Hingorani, P. 2011. Revisiting Low Income Housing: A Review of Policies and Perspectives. Indian
Institute for Human Settlements.
ICRA. 2019. "Indian Mortgage Finance Market Update."
ICRA. 2021. "Press Release: Steady Disbursements’ Growth in Last Two Quarters Indicates Better
Prospects for HFCs in FY2022; Asset Quality Remains Monitorable: ICRA."
IMF. 2019. "India Article IV Consultation-Press Release." Washington, DC.
India Ratings & Research. 2019. "Market Wire: Housing Finance Sector Continues to Face
Multiple Headwinds."
Karmali, Nadeem M., and Xinyu Weng. 2022. Housing Demand and Affordability in India :
Implications for Housing Policy. Policy Research Working Paper no. WPS 1003,
Washington, D.C.: World Bank Group.
Knight Frank and CREDAI. 2020. "Affordable Housing in Tamil Nadu: Assessing the Potential."
Manoj, P. K. 2010. "Benchmarking Housing Finance Companies in India: Strategies for Enhanced
Operational Efficiency and Competitiveness." European Journal of Economics, Finance
and Administrative Sciences 21: 21-34.
Marjit, Sugata, and Vivekananda Mukherjee. 2015. "Market Liberalization and Rent Seeking in
India." In Companion to the Political Economy of Rent Seeking, edited by Roger D.
Congleton and Arye L. Hillman, 410–420. Edward Elgar Publishing.
38
Mathur, O. P. 2009. Slum Free Cities: A New Deal for the Urban Poor. National Institute of Public
Finance and Policy.
Mayer, Richard Campbell. 2011. Low-income Housing in Kampala, Uganda: A Strategy Package
to Overcome Barriers for Delivering Housing Opportunities Affordable to the Urban Poor.
PhD diss, Massachusetts Institute of Technology.
McCargo, Alanna, Bing Bai, Taz George, and Sarah Strochak. 2018. Small-dollar Mortgages for
Single-family Residential Properties. The Urban Institute.
McKinsey Global Institute. 2014. A Blueprint for Addressing the Global Affordable Housing
Challenge.
MIX Market. 2021. "MIX Market data." https://datacatalog.worldbank.org/dataset/mix-market.
Morduch, Jonathan. 1999. "The Microfinance Promise." Journal of Economic Literature 37 (4):
1569-1614.
National Housing Bank. 2019-20. "Annual Report."
National Housing Bank. 2018-2019. "Report on Trend and Progress of Banking in India."
National Housing Bank. 1987. "The National Housing Bank Act."
Ravallion, M., and G. Datt. 1996. "How Important to India's Poor is the Sectoral Composition of
Economic Growth?" World Bank Economic Review 10: 1-26.
Ravallion, Martin. 2009. A Comparative Perspective on Poverty Reduction in Brazil, China. Policy
Research Working Paper 5080, World Bank.
Ravallion, Martin. 2000. "Should Poverty Measures be Anchored to the National Accounts?"
Economic and Political Weekly 34 (35&36): 3245-3252.
Reserve Bank of India. 2021. "Discussion Paper on Revised Regulatory Framework for NBFCs -
A Scale-Based Approach."
Reserve Bank of India. 2017. "Report of the Housing Finance Committee - Indian Household
Finance."
Sahu, G., Y. Zachariah, and S. Baski. 2009. National Level Background Document on Urban Issues
and Concerns: Laying Foundation for Urban India Reforms Facility (UIRF) with Focus
on Small and Medium Towns in India. Mumbai: Urban India Reforms Facility, School of
Habitat Studies, Tata Institute of Social Sciences.
39
Sarkar, Sohini, and Katharine McKee. 2004. "The Future of Housing Microfinance in the United
States." In Housing Microfinance: A Guide to Practice, edited by Sohini Sarkar and
Katharine McKee.
Singh, Arun K. 2013. Slums and Urban Environment Challenges in India: An Appraisal of
Planning and Policy Issues. YS Books International.
Sivaramakrishnan, K. C. 1969. "Urban Housing: Challenge and Response." Economic and
Political Weekly 4 (36): 1443-1445.
Swain, Rabindra, Muna Sahoo, and Prava Mishra. 2017. "Non-performing Assets of Scheduled
Commercial Banks in India: Its Regulatory Framework." Parikalpana: KIIT Journal of
Management 13 (2): 154-162.
Tiwari, P., and J. Rao. 2016. Housing Markets and Housing Policies in India. ADBI Working Paper
Series.
Tiwari, P., and P. Debata. 2008. Mortgage Market in India. London: Wiley Blackwell.
Tiwari, Piyush, R Nair, P Ankinapalli, J. Rao, M Gulati, and P Hingorani. 2015. India's Reluctant
Urbanization: Thinking Beyond. London: Palgrave.
UN Department of Social Affairs, Population Dynamics. 2018. "World Urbanization Prospects."
https://population.un.org/wup/Country-Profiles/.
Wadhwa, Kiran. 2009. "Affordable Housing for Urban Poor." National Resource Centre.
Wadhwa, Kiran. 1988. "Housing Programmes for Urban Poor: Shifting Priorities." Economic and
Political Weekly 23 (34): 1762-1767.
40
9 Annex on the History of Housing Finance and Housing Policy in India
9.1 Introduction
To understand the growth of AHFC, it is critical to place these relatively new institutions
in the arc of the history of housing finance and housing policy in India. Given the early success of
these institutions in India, shown in this paper, a critical question is how other markets and
countries can borrow from this example to support housing finance for those on the margins of
more traditional housing finance around the developing world. This annex provides a detailed
history of housing finance and housing policy in India to draw attention to the complexity of the
housing ecosystem in India and to allow policy makers to draw parallels or otherwise to the
conditions in other markets to gauge if similar institutions such as AHFC could flourish in other
countries. Following Ghosh (2018), this annex begins with a three-paradigm presentation of the
history of housing finance and housing policy. After which, the annex explores contemporary
housing finance and housing policies in greater detail.
Although the 1946 Constitution of India is silent with respect to a public role in the
provision of housing, the Government of India assumed a responsibility to provide housing in its
First Five-Year Plan in 1951. Over the course of history, the role of the public sector in housing in
India has changed significantly. This can be traced across three paradigms from the 1950s to today:
(a) starting from a provider perspective, where housing provision was squarely in public hands as
part of a larger welfare system with direct subsidies to household in the 1950s and 1960s; (b) to
the role of an enabler of housing using cross-subsidies and more flexible financing instruments
during the 1970s and 1980s; (c) to being a facilitator with the introduction of market-based
instruments and demand-side interventions since 1990.
In the early years after independence, the institutional setup for public housing was
developed through the establishment of housing boards, housing cooperatives, and public
agencies, together with the enactment of urban development regulations in major cities in the form
of master plans and building bylaws. This institutional development occurred within a context of
rapid urbanization because of the country’s incipient industrialization that began during World War
II. This was marked by steady and continuous migration from rural areas to urban areas and cities.
This migratory pressure into urban areas, which was coupled with high population growth
41
(averaging 2 percent growth per year from 1950 to 1990), placed a strain on the need for housing
in urban areas. Despite the national government’s commitment to address this housing challenge,
the economic dynamism of cities, increasing unemployment or underemployment in agriculture,
and the added draw of people from rural areas mainly from the poorer segments of society resulted
in the creation of urban slums with substandard dwellings that lacked basic amenities such as water
and electricity, and were largely unsanitary dwellings that were built from non-permanent
construction materials (Government of India 1951).
The post-independence housing challenge was not limited to urban areas. There were also
rural housing challenges, but their nature was different. While in the cities the main challenges
were high land costs and overcrowding, in rural areas the main issues were the lack of water,
communication, transportation, and sanitation services.
Successive Five-Year Plans developed and monitored by the national government’s
Planning Commission are evaluated throughout this analysis from a housing sector lens, starting
from the First Five-Year Plan in 1951 through to the Seventh Plan in 1985, when the development
of the housing finance sector was presented, and finally the last Five-Year Plan—the Twelfth Plan
in 2012.
Sivaramakrishnan (1969) has noted that public housing policy has been developed based
on two dichotomies: under the assumption that the housing market was part of the welfare policy
(a public good) or the presumption that it is a productive sector capable of fostering economic
growth (a private good). These dichotomies match the literature’s classification of India’s housing
programs intro three broad paradigms for housing policy mentioned above: (a) government as a
provider of housing, (b) government as an enabler of housing, and (c) government as a facilitator
of housing. These three paradigms can be mapped to the individual government programs in
housing that were included in each Five-Year Plan of the country. Although the relationship
between programs and the overarching paradigms is not perfect, there are clear trends in the types
of programs designed and the contemporaneous policy direction. It was not until the early 1990s
that the role of the financial sector in housing finance was incorporated into government policy.
These paradigms, plan numbers, and corresponding government programs are summarized in
Table 12. The subsequent subsections discuss each of these three paradigms separately.
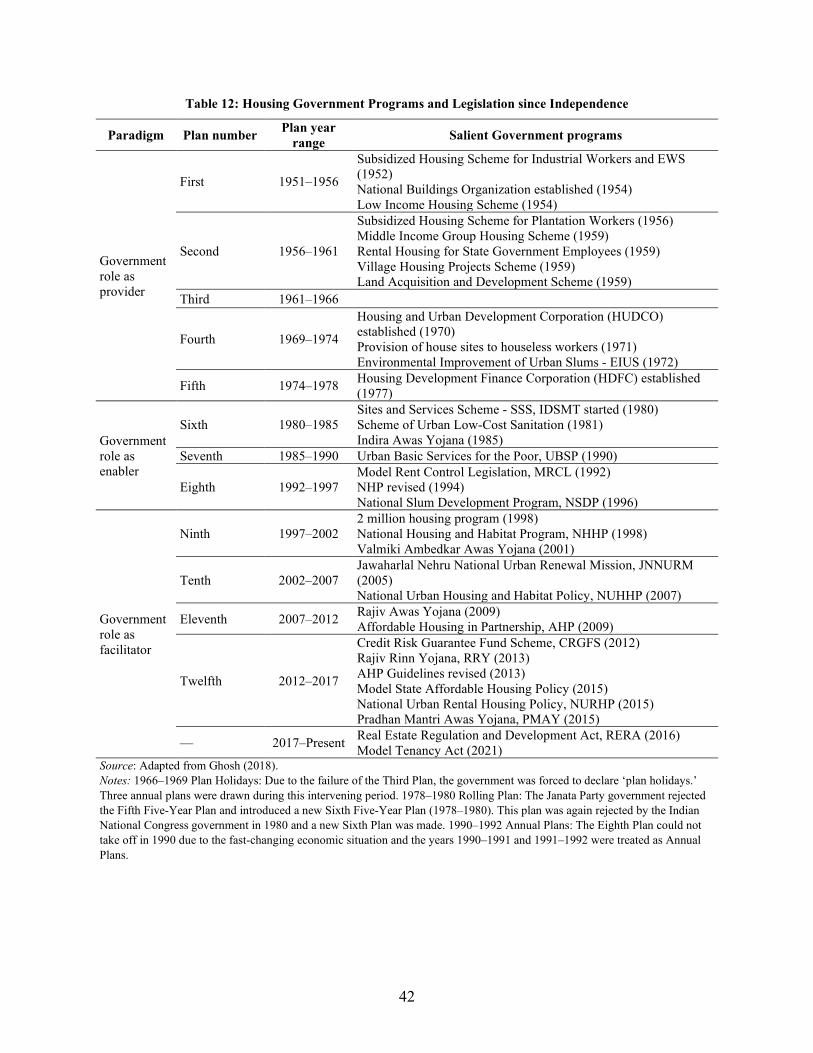
42
Table 12: Housing Government Programs and Legislation since Independence
Paradigm Plan number Plan year range Salient Government programs
Government role as provider
First 1951–1956
Subsidized Housing Scheme for Industrial Workers and EWS (1952) National Buildings Organization established (1954) Low Income Housing Scheme (1954)
Second 1956–1961
Subsidized Housing Scheme for Plantation Workers (1956) Middle Income Group Housing Scheme (1959) Rental Housing for State Government Employees (1959) Village Housing Projects Scheme (1959) Land Acquisition and Development Scheme (1959)
Third 1961–1966
Fourth 1969–1974
Housing and Urban Development Corporation (HUDCO) established (1970) Provision of house sites to houseless workers (1971) Environmental Improvement of Urban Slums - EIUS (1972)
Fifth 1974–1978 Housing Development Finance Corporation (HDFC) established (1977)
Government role as enabler
Sixth 1980–1985 Sites and Services Scheme - SSS, IDSMT started (1980) Scheme of Urban Low-Cost Sanitation (1981) Indira Awas Yojana (1985)
Seventh 1985–1990 Urban Basic Services for the Poor, UBSP (1990)
Eighth 1992–1997 Model Rent Control Legislation, MRCL (1992) NHP revised (1994) National Slum Development Program, NSDP (1996)
Government role as facilitator
Ninth 1997–2002 2 million housing program (1998) National Housing and Habitat Program, NHHP (1998) Valmiki Ambedkar Awas Yojana (2001)
Tenth 2002–2007 Jawaharlal Nehru National Urban Renewal Mission, JNNURM (2005) National Urban Housing and Habitat Policy, NUHHP (2007)
Eleventh 2007–2012 Rajiv Awas Yojana (2009) Affordable Housing in Partnership, AHP (2009)
Twelfth 2012–2017
Credit Risk Guarantee Fund Scheme, CRGFS (2012) Rajiv Rinn Yojana, RRY (2013) AHP Guidelines revised (2013) Model State Affordable Housing Policy (2015) National Urban Rental Housing Policy, NURHP (2015) Pradhan Mantri Awas Yojana, PMAY (2015)
— 2017–Present Real Estate Regulation and Development Act, RERA (2016) Model Tenancy Act (2021)
Source: Adapted from Ghosh (2018). Notes: 1966–1969 Plan Holidays: Due to the failure of the Third Plan, the government was forced to declare ‘plan holidays.’ Three annual plans were drawn during this intervening period. 1978–1980 Rolling Plan: The Janata Party government rejected the Fifth Five-Year Plan and introduced a new Sixth Five-Year Plan (1978–1980). This plan was again rejected by the Indian National Congress government in 1980 and a new Sixth Plan was made. 1990–1992 Annual Plans: The Eighth Plan could not take off in 1990 due to the fast-changing economic situation and the years 1990–1991 and 1991–1992 were treated as Annual Plans.
43
9.2 A Provider of Housing: 1951–1964
India’s post-independence policy makers conceived an urban-centered industrial country
that would anchor rural labor absorption and lead to long-term sustained economic growth.
Theoretically, the process would bring longer-term gains to poor people, including through much
sought-after rural labor absorption.
The first thorough evaluation of the country’s housing situation was conducted in the
Second Five-Year Plan in 1956. This revealed a significant ‘shortage’ of housing mainly in urban
areas. The supply shortage metric that was used, and is still used today, is to consider the stock of
housing that is ‘inadequate.’20 This has been commonly defined as whether a dwelling is pucca—
or if its walls and roof are built of permanent building materials. In the case of roofing, permanent
materials would include wood, stone, cement, reinforced concrete, iron sheets, or asbestos.21 In
general, this approach is a problematic characterization of any housing assessment as it is not
grounded in economic choice or relative quality improvements in the built environment (Karmali
and Weng 2022). This adequacy of the housing framework also subsumes that transforming a
current household from an ‘inadequate’ dwelling to an ‘adequate’ dwelling would be welfare
enhancing, without any regard for other housing amenities that hedonic pricing regressions would
classify as valuable—such as distance to work. Despite these methodological shortcomings that
admittedly only came to the international housing literature later in the 1970s, most of the early
Five-Year Plans characterized housing through this ‘shortage’ approach.
In 1951, 2.5 million dwellings were deemed to be ‘needed’ in addition to the 10 million
existing stock of dwellings in urban areas.22 In rural areas, the contemporaneous 1951 analysis
showed that housing quality was worse, especially for access to clean water and good sanitation
(Government of India 1956). To address this situation, different policies were implemented from
1951 to 1964, including programs targeting housing demand through a subsidized approach that
offered loans and subsidies to cover up to 80 percent (up to a maximum per income grouping) of
the construction cost and land acquisition cost. These programs were administered through state
governments, charities, and hospitals directly to beneficiary households. One such program
20 The second plan does mention that: “housing statistics are also extremely deficient and incomplete and data are not available showing either the progress of new construction or the extent of shortage.” 21 Asbestos is not banned in India, despite a 1986 moratorium on licensing any new asbestos mining. 22 Assuming that an estimated 62 million people resided in urban areas in 1951.
44
launched in 1956 was called Low Income Group Housing Scheme that addressed housing demand
through long-term home building loans to individuals and cooperatives. The eligibility criteria was
for individuals and cooperative members with income less that INR 6,000 per year, and loans had
a 3 percent interest rate repayable in three years. By the end of the Second Plan all housing program
loans amounted to INR 2.15 billion and 40,000 benefited from the different housing schemes,
including the Low Income Group Housing Scheme.
Additionally, all Five-Year Plans incorporated ‘slum clearance’ policies, as a mechanism
to directly address these ‘new’ dwelling environments in large urban centers. Overall, these
‘clearance’ policies met with limited success mainly due to the lack of viable housing options to
accommodate the existing slum residents. During the first three Five-Year Plans, there was a net
reduction of urban housing stock due to these slum clearance policies and a limited private supply
of new housing (Hingorani 2011).
All housing programs conceived through the successive Five-Year Plans paid special
attention to rural housing policies, which aimed to improve the construction quality as well as
water and sanitation systems. This is because after India’s independence, almost 85 percent of the
population still lived in rural areas. However, the availability of public funding for rural housing
was limited, and only pilot housing programs were launched in rural areas. For example, the Rural
Community Program where communities assumed a larger responsibility in improving village
housing conditions, or the establishment of brick kilns in rural areas starting from 1950 to improve
rural dwelling construction. Indeed, this was an early warning that the provider of housing
paradigm would not be able to address all housing challenges, due to the real budget constraint
that was more binding in rural areas.
One program from this period was implemented by the national government to provide
housing to industrial workers: the Subsidized Industrial Housing Scheme. The scheme provided a
combination of loans (with tenors up to 15 years) and grants to cooperatives of industrial workers,
state governments, and public authorities. The purpose of these funds was to cover the cost of
construction up to a prescribed maximum cost, and funding differed depending on the number of
rooms in the proposed dwelling. These grants would cover between 25 and 50 percent of the cost
(Government of India 1951). On the legislative side, the government enacted regulations to ensure
45
the correct use of the land, and regulations to enforce building bylaws. However, compliance was
limited. This contributed to pockets of unorganized urbanization, unauthorized squatter
settlements, poor construction techniques, basic infrastructure deserts without water supply or
sanitation.
Given the provider paradigm at the time, the increasing cost of building materials was often
cited as a major barrier for growing the supply of housing. It was also a period where a free market
and unregulated prices were not the prevailing policy priority. As a result, the National Buildings
Organisation (NBO) was established. It was tasked to develop low-cost housing designs and
explore ways to reduce costs through appropriate choice of building materials and an efficient
utilization of labor (Hingorani 2011). The organization was also mandated to carry out technology
transfer, experimentation, development, and dissemination of housing statistics.
Overall, several commentators have noted that many of these housing programs in this first
provider paradigm were not able to meet their ambitious targets. Hingorani (2011) notes that the
intended results of these programs were not met, as the ‘shortage’ of dwellings remained high.
Further the target low- and middle-income beneficiaries were frequently not able to access housing
programs, due to poor design and nonexistent means testing. Another challenge that is couched
within the parameters of the provider paradigm, in addition to the aforementioned high cost of
building materials, was the increasing cost of land in urban areas which posed a major challenge.
Other measures such as rent control policies or land requisition proved to be a major obstacle for
private investment along with bureaucratic and procedural hurdles (Hingorani 2011). Another
review of this period concludes that the top-down provider paradigm to housing, with substantial
involvement by the central government in all aspects from land acquisition to construction and
allocation, resulted in limited success, in particular low impact for the target groups (Tiwari and
Rao 2016). Sahu, Zachariah, and Baski (2009) note that due to the limited success of these
programs and the lack of a substitute private sector to supply housing there was a limited supply.
The new housing supply fell behind the demand because of failure to implement programs, lack
of funds, and rising construction costs (Sahu, Zachariah and Baski 2009).
46
9.3 An Enabler of Housing: 1965–1990
Starting in 1965, national policy makers began to question the viability of the provider
paradigm. All the successive Five-Year Plans from 1965 to 1990 conceded the limited past success
of the public sector in providing adequate housing. Further, there was a recognition to engage with
the private sector, sometimes simply to cope with the rapid population growth and high
urbanization. For the first time, the private construction and real estate sectors were seen as
important pillars of economic development and dynamism during the enabler paradigm period
(Tiwari, et al. 2015).
From 1950 to 1980, public investments in housing through the successive Five-Year Plans
represented nearly 7 percent of total public investment, other investments by public sector
enterprises, departmental undertakings, and grants-in-aid institutions accounted for 11.3 percent,
while private sector investment during the corresponding period was around 81 percent of total
investment in housing in India (Government of India 1980).
Nevertheless, despite this growing recognition of the limited success of policies designed
during the provider paradigm period, the national government continued implementing existing
loan and subsidy programs and policies with minor adjustments. There was no abrupt change
across paradigms, but the evolution was more gradual. Even though the rate of urbanization
increased, a large majority of the population continued to live in rural areas: with only 23 percent
of the population living in cities in 1980. However, this number as a percentage does not express
the magnitude of the challenge of housing provision in urban areas for almost 160 million people
(Tiwari and Rao 2016). The Fourth Five-Year Plan (1969–1974) reoriented housing policy toward
a new strategy, especially in relation to ‘slum clearance.’ In this plan, the national government
admitted the inefficiencies of the previous instruments that led in some cases to the actual creation
of new slums and the deterioration of existing ones (Government of India 1969).
The provider paradigm period was characterized by the direct delivery of housing programs
to beneficiary households, where the government played a leading role for the provision of
housing. In contrast, during the enabler paradigm period of 1965–1990, two major initiatives were
launched that paved the way for a new public approach toward housing: the Environmental
Improvement of Urban Slums Scheme (EIUS) in 1972 and the Sites and Services Scheme (SSS)
47
in 1980. The EIUS aimed to improve basic infrastructure in slums (both notified and not notified)
of major cities. The program started in 11 cities and later expanded to 9 more cities. Its goals were
ambitious and included the provision of tap water, community toilets and baths, drainage, street
lighting, and the widening and paving of roads (Singh 2013). This program continued well into the
1990s where its scope was widened under the Eighth Five-Year Plan to incorporate other poverty
alleviation programs (Mathur 2009). This recognition that the in-situ built environment can be
improved through service provision was a marked departure from the relocation policies for slum
residents during the provider paradigm period.
Similarly, in 1980 the government launched the SSS, which provide basic infrastructure or
land for a fee to dwelling builders and contractors (Wadhwa 1988). Like the EIUS, the SSS was
designed to be attuned to housing demand and its parameters allocated fiscal resources to sites
which private parties deemed suitable. As a result, both the EIUS and the SSS have been
characterized as a success for urban areas in the literature.
However, in rural areas, the challenges of low-quality construction and the lack of water
and sanitation facilities remained. Although the urban government housing policy paradigm had
shifted between 1965 and 1990, there was less change in the approach to rural housing. The rural-
focused plans continued to program for the provision of building sites (or land) to all the remaining
landless rural families, which was a legacy of the provider paradigm. Urban policy was faster to
abandon such extreme goals, as fiscal resource constraints become more binding, especially for
housing (Government of India 1980).
Given the growing fiscal constraints, an unsustainable level of subsidies promised under
previous programs, and the limited success of many housing programs there was a realization in
the 1970s that a strategy grounded in public provision of housing to all would not succeed to solve
the ‘slum problem’ or the housing shortage (Mathur 2009). In response, an incremental approach
to provide infrastructure to access transport and services and secure tenure was gaining
consideration in the design of new programs (Wadhwa 1988).
In 1970, the national government embarked on establishing a publicly owned financial
corporation to promote housing and urban development infrastructure. With this vision, the
government created a national institution called the Housing and Urban Development Corporation
48
(HUDCO). The use of the legal structure ‘corporation’ cannot be overemphasized and is the
hallmark of the enabler paradigm period. HUDCO’s mandate was to assist and promote housing
and urban development programs with government agencies, which is fulfilled by providing
finance for building sites and services, and other dwelling construction programs of housing
boards. HUDCO’s social obligation required it to provide at least 55 percent of the credit to EWS
and LIG households (Tiwari and Rao 2016).
In parallel, seven years later in 1977, the Housing Development Finance Corporation
(HDFC) was established as a private sector financial institution. HDFC became the first
specialized mortgage company in India and focused on retail lending based on market principles
and targeted mainly middle- and high-income households. The success of HDFC led to the
emergence of several other HFC, either as private sector or joint ventures with the co-ownership
of the government, other banks, or insurance companies (Hingorani 2011). These were financial
institutions with a special license to engage almost exclusively in housing finance.
On the regulatory side, in 1988 the government took major steps to address two of the most
significant housing challenges in India: the regulatory framework and housing finance. The first
one was the formulation of the National Housing Policy which established the foundation of
housing policy in India. The National Housing Policy was amended on two occasions, in 1994 and
1998, to respond to the problems identified since its creation and to incorporate the National
Habitat and Housing Policy (Ghosh 2018). These two initiatives laid the foundation, from the
housing perspective, for the wave of liberalization that started in India in the 1990s.
The second major step was the creation of the NHB, established from the need to deepen
the access to local currency long-term finance by individual households at a large scale, through a
wholesale model. This was based on the experience in the US with the success of Freddie Mac and
Fannie Mae. The preamble of the National Housing Bank Act of 1987 cements the NHB’s objective
as: “…to operate as a principal agency to promote housing finance institutions both at local and
regional levels and to provide financial and other support to such institutions and for matters
connected therewith or incidental thereto…”23
23 The Housing Finance Bank Act (1987).
49
Wadhwa (2009) claims that the biggest contribution of the enabler paradigm period was in
the housing finance sector: as housing credit expanded this had positive social and financial
benefits, especially for MIG and high-income group (HIG) households. These incipient market-
based programs laid the foundation for the third and final paradigm: the facilitator approach.
9.4 A Facilitator for Housing: 1990–Present
The wave of economic liberalization in India starting in the 1990s affected all sectors and
branches of the economy, including housing. The housing policies and programs with direct
subsidies to households were largely abandoned in favor of market-driven policies, as was also the
case in other sectors. The Seventh Five-Year Plan (1985–1990) set the tone for a facilitator and
promotional role of the public sector in the area of housing provision. The cornerstone of this was
the further development of the housing finance market.
The first ideological shift was a recognition that urban areas were international centers for
economic activity and identifying urban-specific needs required designated policies and measures
that differed from those of the rural areas. This recognition was the realization that markets (mainly
capital markets and housing markets) functioned in urban areas, but they were less or
underdeveloped in rural areas.
A second marker was an explicit change in the role of the government that was redefined
as a facilitator instead of a provider or an enabler. The Eighth and Ninth Five-Year Plans reiterated
that the public sector was meant to create the facilitating legislation to boost private sector
participation, whereas subsidy-based policies were reserved for vulnerable and underprivileged
populations. For example, the Seventh Five-Year Plan states that “…the government’s role will
have to be restricted to the improvement of slums, direct provision of housing to the weaker
sections of the society and encouragement and support of housing finance institutions.” This went
as far as demoting the responsibilities of slum improvement and EWS housing to lower geographic
governmental tiers (Tiwari and Rao 2016).
Additionally, a major change in the institutional setup was a push for decentralization that
took place through the 74th Constitutional Amendment in 1992. This made local authorities
responsible for providing a service that has hitherto not been included in the constitution: housing.
This sea change triggered the creation of various and diverse local housing policies, mainly
50
targeting LIG and EWS segments. With this housing devolution formalized in the constitution,
local authorities emerged as the leading entities of housing. At the same time the provenance of
the funding for these programs was still from the national government and are still referred to as
centrally sponsored schemes (Mathur 2009). Therefore, the design is for implementation to be
local, but part of the funding is from the national government. The difference with the previous
schemes before 1992, was that the programs did not include local government co-funding.
However, after partial devolution in housing programming, local authorities were required to
match the funds coming from the central government.
On the financial side, this period was the most important for developing financial
institutions to cover the needs for housing financial instruments. The Seventh Plan admitted that
“[t]he most crucial need for housing development… [is to establish] a proper and diversified
institutional structure for housing finance.” During the sunset years of the enabler paradigm period
(1965–1990), the NHB was created to serve this purpose. Furthermore, other commercial banks
and housing finance institutions were instructed by the government to participate on a larger scale
in housing finance activities (Tiwari and Rao 2016).
This paradigm shift was a boon for private real estate developers who were able to benefit
from lower interest rates, market-friendly legislation, and less government interference for
approvals. The national government extended the expansion of capital market funding to
government agencies and local authorities to meet their own financial obligations (Hingorani
2011). The increasing competition among players also brought its own losers. The public entities,
agencies, housing boards, and other institutions that were traditionally mandated to provide
financial support for the LIG and EWS population were not able to compete with the private
operators without the support of the government which led to a reduction in their operations.
On the housing regulatory side, the liberalization process continued, and the housing
legislation enacted from the provider paradigm period after independence to control prices or to
limit building opportunities was progressively repealed. As a result, the Urban Land Ceiling and
Regulation Act and Rent Control Acts were repealed in many cities. Even the Development
Control Rules were changed and experimented with in many cities. It even allowed builders to
construct high density buildings (with high floor space indexes) in areas without the needed
supporting transportation of services infrastructure (Hingorani 2011).
51
However, other problems remained unsolved such as land acquisition. Early in the
facilitator paradigm period, the government was not able to enact legislation to reduce the
unorganized use of land and unauthorized construction is still a problem mainly in cities, which
has contributed to the growth of some slums.
The overall evaluation of this period is positive considering the significant progress made
in deepening housing finance, although this was often regressive rather than progressive. The
primary beneficiaries have been increases in homeownership for MIG and HIG segments. The next
subsections discuss housing finance and programs in more detail in this current facilitator
paradigm.
9.4.1 Contemporary Housing Finance in India
This subsection discusses particular housing finance institutional details and regulations,
and how these have evolved over time. It covers lenders, priority sector lending, and prudential
supervision and regulation.
9.4.1.1 Lenders
HFC and SCB are the two main providers of housing finance in India. Other mortgage
providers include cooperative banks and cooperative housing financial societies. Emerging
housing finance institutions that serve more informal borrowers include small finance banks,
microfinance institutions and AHFC. With the rapid growth of urbanization and growing incomes,
the government recognized the critical importance of housing finance and the need for the
development of a multi-institutional-type network to meet the growing investment needs of the
housing sector. The history of this dual SCB and HFC setup on the supply side of housing finance
originated in the 1990s, when SCB entered the housing market.
Commercial banks, or SCB, are defined as those banks that are licensed according to the
second schedule of the RBI Act (1934) and that perform standard banking operations such as taking
deposits and providing loans. SCB are categorized into three main groups according to their
ownership and the nature of their operation: public sector banks, private sector banks, and foreign
52
banks.24 Nationwide, as of March 2019, there are 87 SCB: 20 public sector banks with a total of
87,860 branches; 22 private sector banks with 32,375 branches; and 45 foreign banks with 300
branches. SCB are regulated and supervised by the RBI. Housing loans are an important part of
SCB lending and are categorized as personal loans. As of March 2018, housing loans represented
12.7 percent of outstanding loans and 22.6 percent of loans to households.
The NHB has historically licensed and regulated HFC. The NHB defines HFC as “a
company registered under the Companies Act, 1956 (1 of 1956) which primarily transacts or has
as one of its principal objects, the transacting of the business of providing finance for housing,
whether directly or indirectly.” As of January 2020 there were 101 HFC with a total of 5,100
branches across India, of which 18 have permission to accept public deposits.25 As of August 2019,
HFC are now regulated by the RBI. Before August 2019, HFC were regulated by the NHB under
the provisions of the National Housing Bank Act of 1987. 26 The rationale for the change in
regulator is based on NHB’s widening mandate as it has increasingly assumed the role of refinancer
and lender to the housing finance sector, and this has created a conflict of interest.27
The HFC sector is highly concentrated with the top 2 HFC accounting for 58.5 percent of
the total HFC loan portfolio and the top 5 HFC representing over 82 percent.28 The first HFC was
founded in October 1977. It was founded and capitalized as a ‘development finance institution’ by
the Industrial Credit and Investment Corporation of India Limited and included equity from the
International Finance Corporation (IFC).
In the early stages of regulated housing finance, HFC played a larger role than SCB,
because the sole purpose of HFC was related to housing finance. However, the limited number of
HFC branches inhibited the growth across the market in the early years.29 The participation of SCB
in the housing market increased in the early 1990s, as the RBI required SCB to allocate annually
24 Public banks include the State Bank of India and its associates and nationalized banks. 25 Out of the 18 HFC with permission to accept public deposits, 6 of them are required to obtain prior written permission from the NHB before accepting any public deposits 26 The NHB, wholly owned by the RBI, is a multi-functional development finance institution for the housing sector. Its functions include regulation and supervision of HFC, financing, and promotion and development of housing finance in India. The NHB aims to promote a sound, healthy, viable, and cost-effective housing finance system to cater to all segments of the population and to integrate the housing finance system with the overall financial system. 27 Report on Trend and Progress of Banking in India 2018–19. 28 ICRA - Indian Mortgage Finance Market Update for June 2019. 29 For example, in 2000 there were only 524 HFC branches compared to 5,100 in 2018.
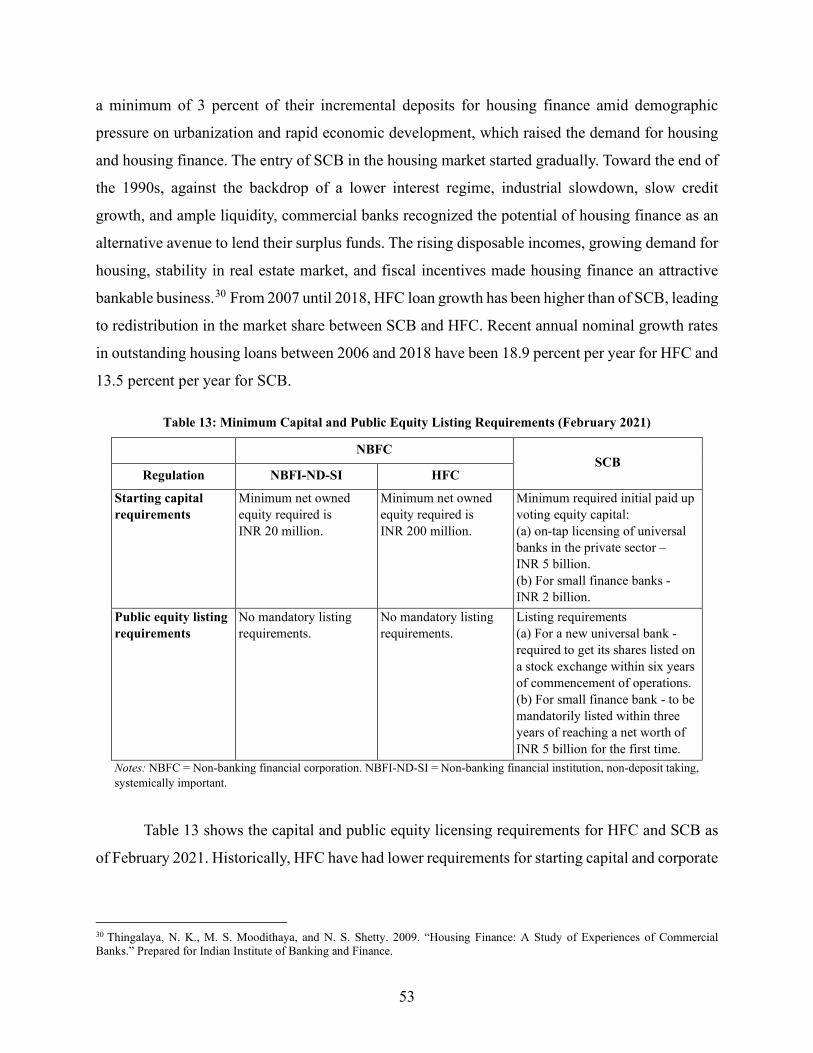
53
a minimum of 3 percent of their incremental deposits for housing finance amid demographic
pressure on urbanization and rapid economic development, which raised the demand for housing
and housing finance. The entry of SCB in the housing market started gradually. Toward the end of
the 1990s, against the backdrop of a lower interest regime, industrial slowdown, slow credit
growth, and ample liquidity, commercial banks recognized the potential of housing finance as an
alternative avenue to lend their surplus funds. The rising disposable incomes, growing demand for
housing, stability in real estate market, and fiscal incentives made housing finance an attractive
bankable business.30 From 2007 until 2018, HFC loan growth has been higher than of SCB, leading
to redistribution in the market share between SCB and HFC. Recent annual nominal growth rates
in outstanding housing loans between 2006 and 2018 have been 18.9 percent per year for HFC and
13.5 percent per year for SCB.
Table 13: Minimum Capital and Public Equity Listing Requirements (February 2021)
NBFC SCB
Regulation NBFI-ND-SI HFC
Starting capital requirements
Minimum net owned equity required is INR 20 million.
Minimum net owned equity required is INR 200 million.
Minimum required initial paid up voting equity capital: (a) on-tap licensing of universal banks in the private sector – INR 5 billion. (b) For small finance banks - INR 2 billion.
Public equity listing requirements
No mandatory listing requirements.
No mandatory listing requirements.
Listing requirements (a) For a new universal bank - required to get its shares listed on a stock exchange within six years of commencement of operations. (b) For small finance bank - to be mandatorily listed within three years of reaching a net worth of INR 5 billion for the first time.
Notes: NBFC = Non-banking financial corporation. NBFI-ND-SI = Non-banking financial institution, non-deposit taking, systemically important.
Table 13 shows the capital and public equity licensing requirements for HFC and SCB as
of February 2021. Historically, HFC have had lower requirements for starting capital and corporate
30 Thingalaya, N. K., M. S. Moodithaya, and N. S. Shetty. 2009. “Housing Finance: A Study of Experiences of Commercial Banks.” Prepared for Indian Institute of Banking and Finance.
54
governance. This gap has closed over the years as HFC licensing and corporate governance
requirements have become stricter, though there remains a regulatory arbitrage gap.
9.4.1.2 Priority Sectors and RBI Regulations
All SCB institutions are required to extend a material portion of their loans to state-
determined priority sectors. These priority sectors are: (a) agriculture; (b) micro, small, and
medium enterprises; (c) export credit; (d) education; (e) housing; (f) social infrastructure; (g)
renewable energy, and (h) others. As per the Master Circular on Priority Sector Lending, 40 percent
of net bank credit must be in these sectors.31 In June 2018 and then in April 2019, RBI increased
the threshold for the size of housing loans that can be counted toward this priority target. The latest
limits are INR 3,500,000 per unit in urban centers (with population above 1 million) and INR
2,500,000 in other urban centers. There are also many affordable housing schemes, both at the
national and state levels, which promote the construction of affordable housing for the poor—see
Section 9.4.2. Further, in 1998 RBI mandated SCB to allocate 3 percent of net new deposits of
public sector banks to housing.
9.4.1.3 Prudential Supervision and Regulation
The fundamental premise underlying the non-banking financial company (NBFC),
including HFC, regulatory framework is for ‘lighter’ regulation than banks. Arguably, it enables
NBFC to have operational flexibility and develop sectoral and geographical expertise, resulting in
a variety of financial services and ease of access. The regulatory arbitrage in favor of NBFC is a
deliberate policy choice and is sometimes framed as a trade-off with cheap deposit funding that
banks have access to. Arbitrage induced by ‘lighter’ regulation is built on the premise that any
NBFC scale of operations is expected to be significantly low compared to banks and it may,
therefore, not pose any significant systemic risk (Reserve Bank of India 2021).
The RBI assumed powers to regulate HFC from the NHB in 2019. HFC are a specialized
NBFC type. In February 2021, the RBI established a new definition of HFC. To qualify as HFC, a
NBFC must have 50 percent assets as housing loans, 75 percent of which should be for individual
31 RBI, Priority Sector Lending - Targets and Classification.
55
homebuyers (RBI Directives to HFC, February 2021). In particular, the updated definitions are as
follows:
(a) “Housing finance company” shall mean a company incorporated under the Companies
Act, 2013 that fulfils the following conditions: It is an NBFC whose financial assets, in the
business of providing finance for housing, constitute at least 60% of its total assets (netted
off by intangible assets). Housing finance for this purpose shall mean providing finance as
stated at clauses (a) to (k) of : “[o]ut of the total assets (netted off by intangible assets), not
less than 50% should be by way of housing financing for individuals as stated at clauses
(a) to (e) of: “Housing Finance” shall mean financing, for purchase/ construction/
reconstruction/ renovation/ repairs of residential dwelling units.
Campbell, Ramadori, and Ranish (2015) studied the changing regulation across housing
finance in India to understand how these impact mortgage outcomes at banks. They find that
priority sector limits incentivize smaller and risker loans, and this is particularly salient around the
priority lending sector threshold. This suggests that banks are willing to accept a higher
delinquency rate to meet these priority lending sector targets. They also find that banks are willing
to accept a higher delinquency rate for mortgages when mortgages qualify for a more favorable
capital risk weight. Another finding of their paper is that a change in the definition for delinquent
mortgage loans (from 180 days to 90 days) led to improvements in loan monitoring and lower
delinquency rates overall.
9.4.1.4 Summary of the Contemporary Housing Finance Landscape
Given the above landscape of housing finance, the dual role of SCB and HFC is clearly
unique to India. This had led to the development of local currency capital markets, especially long-
term local currency debt. However, this has come at the cost of some inefficiency. Under this
institutional structure are several regulations—either as priority sector lending thresholds or
mandatory deposit requirements—that shape the housing finance sector and incentives. Without
these, many of the current features of housing finance in India would not have existed. This is also
part of the explanation for why the AHFC type has emerged in India. The next section discusses
housing programs and housing regulations that have also shaped the market.
56
9.4.2 Contemporary Housing Programs and Housing Regulations in India
Although the financial sector regulatory environment is often distinct from government
fiscal programming and policies, these are closely linked for housing in India, as housing programs
and policies have direct mortgage implications (either as liquidity or as directed lending).
9.4.2.1 Recent Housing Regulations and Legislation
There are several new programs and regulations that have been launched or enacted since
1990. These include repealing the Rent Control Act in four states to loosen restrictions on the rental
market, especially the hereditary rights to a rental contract. The new Model Tenancy Act tries to
firstly set forth the establishment of conditions for tenancy, eviction, and management of the
property. Second, in regulating tenancy, it proposes mechanisms to balance and protect the rights
of landlords and tenants. Last, it proposes a three-tier adjudicatory mechanism consisting of rent
authorities, rent courts, and rent tribunals for swift adjudication of tenancy-related disputes.
In terms of repossession, the 2002 Securitisation and Reconstruction of Financial Assets
and Enforcement of Securities Interest (SARFAESI) Act made asset seizure and repossession due
to nonpayment of debt easier in India. The SARFAESI Act essentially empowered banks and other
financial institutions to directly auction residential or commercial properties that have been
pledged to them in order to recover loans from borrowers. Before this act took effect, financial
institutions had to take recourse to civil suits in the courts to recover their dues, which was more
time-consuming process. Other methods of asset repossession include Debt Recovery Tribunals
(DRTs) and Lok Adalat. Evidence shows that the SARFAESI Act recovered the highest amount of
non-performing assets during a period of study between 2008–2016, so it is arguably the most
favorable recovery channel of non-performing assets (Swain, Sahoo and Mishra 2017).
The newest legislation is the Real Estate Regulatory Authority (RERA) Act, 2016. It is an
act passed by Indian Parliament that seeks to protect the interests of potential homebuyers and
increase investments in the real estate sector. According to the act, state governments are required
to enact their own rules under based on the model rules framed under the central act. The main
objectives of the central act are to increase transparency and accountability in the real estate sector
and to create a new real estate regulator in each state.
57
9.4.2.2 Ongoing Housing Programs
In terms of ongoing programs, the PMAY is the most important program for affordable
housing. The umbrella PMAY initiative was launched in June 2015 with the goal to provide
affordable housing to the poor. See section 7 for details on the current programs. For the PMAY
Urban, the progress as of March 2021 (FY2020–2021) is a total of 11.2 million houses authorized
(out of which 4.83 million have been completed), and of these 1.6 million are CLSS beneficiaries.
Therefore, the Beneficiary-Led Construction and the Affordable Housing in Partnership are much
larger than the CLSS. The PMAY Rural aims at providing a pucca house, with basic amenities, to
all houseless households and those households living in kutcha or dilapidated houses, by 2022.
9.5 Implications for the Development of the AHFC Lender Type in Other Countries
Combining the unique financial landscape in India with the program and regulations in
housing, especially new regulations on real estate companies and the aspiration to create a judicial
layer for rental markets, shows that housing in India needs to be understood within a particular
institutional context. AHFC cannot simply be extracted from India without this connective tissue.
In fact, it is very likely that the combination of a dual SCB-HFC setup, priority sector lending
requirements, deep local currency capital markets, a cost of labor where high-touch underwriting
is feasible, and housing demand-side subsidies have all contributed to the creation of the AHFC
type. These features need to be appreciated as much as the incipient success of AHFC themselves.