housing market - idlc finance limited
TRANSCRIPT
a of 30
Volume 17 | Issue 12 | December 2021
HOUSINGMARKET
RISINGCONSTRUCTION
MATERIAL PRICES& ITS IMPACT

03Economy at a Glance
04Month in Brief
05For the Record
06World Economic Indicator
07Banking Data Corner
08Spotlight on Startup • Lilac
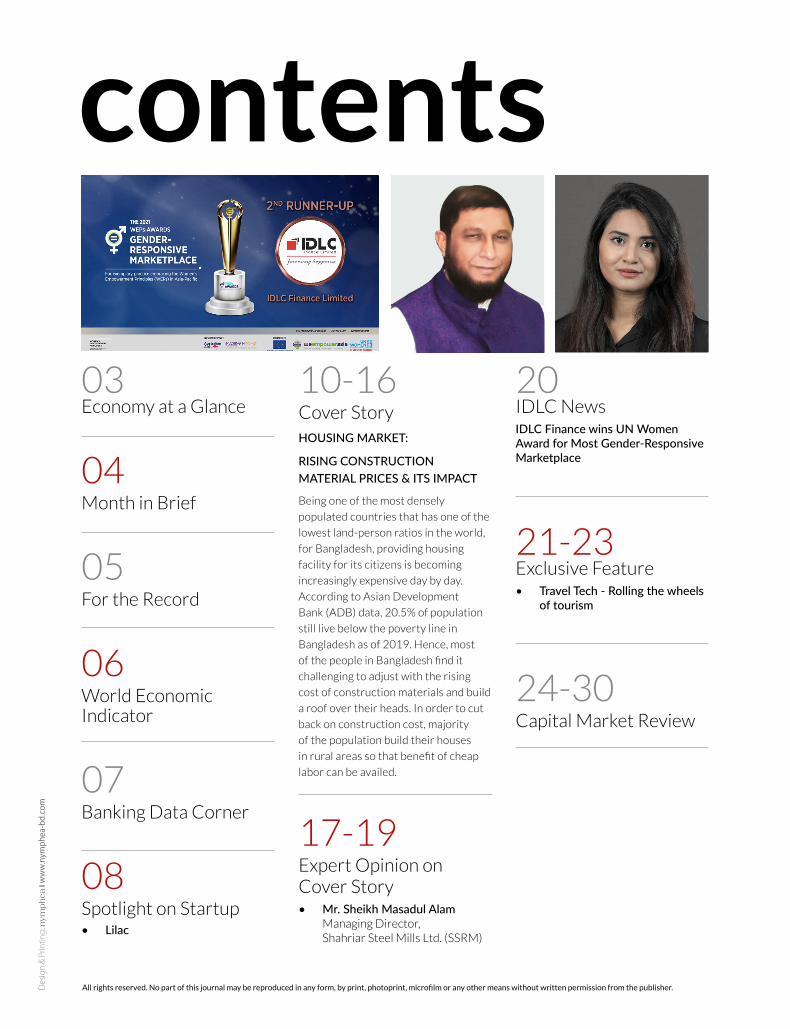
10-16Cover StoryHOUSING MARKET:
RISING CONSTRUCTION MATERIAL PRICES & ITS IMPACT
Being one of the most densely
populated countries that has one of the
lowest land-person ratios in the world,
for Bangladesh, providing housing
facility for its citizens is becoming
increasingly expensive day by day.
According to Asian Development
Bank (ADB) data, 20.5% of population
still live below the poverty line in
Bangladesh as of 2019. Hence, most
of the people in Bangladesh find it
challenging to adjust with the rising
cost of construction materials and build
a roof over their heads. In order to cut
back on construction cost, majority
of the population build their houses
in rural areas so that benefit of cheap
labor can be availed.
17-19Expert Opinion on Cover Story• Mr. Sheikh Masadul Alam
Managing Director, Shahriar Steel Mills Ltd. (SSRM)
20 IDLC NewsIDLC Finance wins UN Women Award for Most Gender-Responsive Marketplace
21-23 Exclusive Feature • Travel Tech - Rolling the wheels
of tourism
24-30Capital Market Review
contents
All rights reserved. No part of this journal may be reproduced in any form, by print, photoprint, microfilm or any other means without written permission from the publisher. Des
ign
& Pr
intin
g: n
ym
phea
l www.nymphea-bd.com
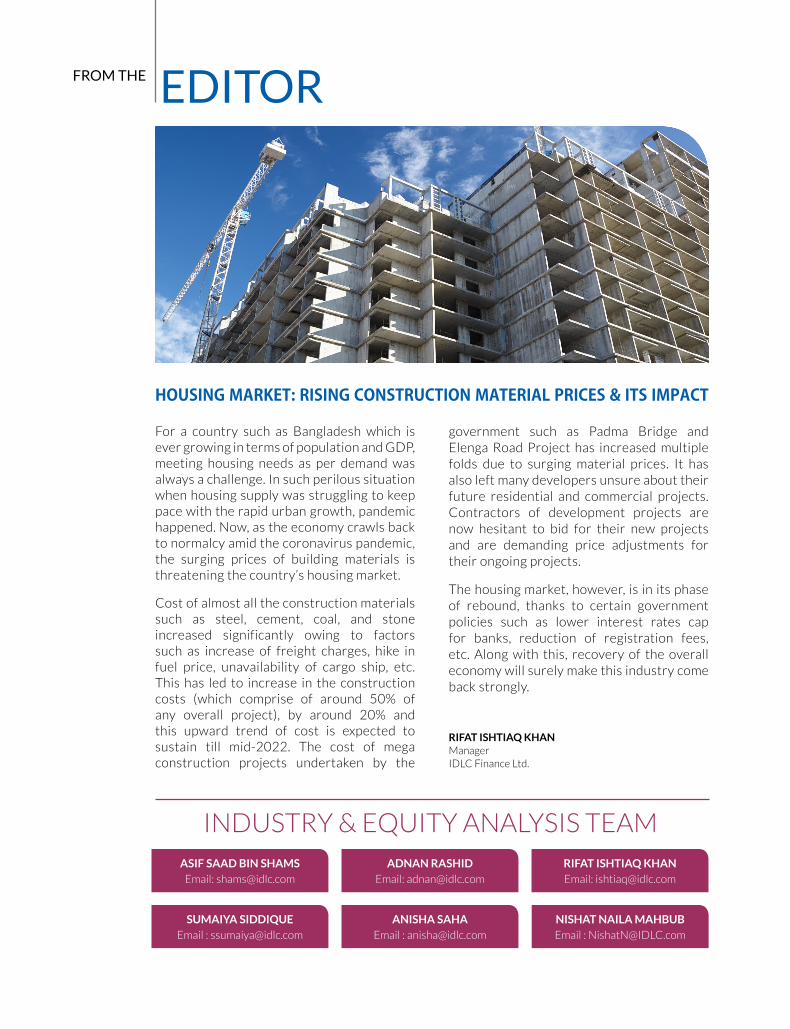
HOUSING MARKET: RISING CONSTRUCTION MATERIAL PRICES & ITS IMPACT
FROM THE EDITOR
For a country such as Bangladesh which is ever growing in terms of population and GDP, meeting housing needs as per demand was always a challenge. In such perilous situation when housing supply was struggling to keep pace with the rapid urban growth, pandemic happened. Now, as the economy crawls back to normalcy amid the coronavirus pandemic, the surging prices of building materials is threatening the country’s housing market.
Cost of almost all the construction materials such as steel, cement, coal, and stone increased significantly owing to factors such as increase of freight charges, hike in fuel price, unavailability of cargo ship, etc. This has led to increase in the construction costs (which comprise of around 50% of any overall project), by around 20% and this upward trend of cost is expected to sustain till mid-2022. The cost of mega construction projects undertaken by the
government such as Padma Bridge and Elenga Road Project has increased multiple folds due to surging material prices. It has also left many developers unsure about their future residential and commercial projects. Contractors of development projects are now hesitant to bid for their new projects and are demanding price adjustments for their ongoing projects.
The housing market, however, is in its phase of rebound, thanks to certain government policies such as lower interest rates cap for banks, reduction of registration fees, etc. Along with this, recovery of the overall economy will surely make this industry come back strongly.
RIFAT ISHTIAQ KHAN Manager IDLC Finance Ltd.
INDUSTRY & EQUITY ANALYSIS TEAM
ANISHA SAHAEmail : [email protected]
NISHAT NAILA MAHBUBEmail : [email protected]
SUMAIYA SIDDIQUEEmail : [email protected]
ASIF SAAD BIN SHAMSEmail: [email protected]
ADNAN RASHIDEmail: [email protected]
RIFAT ISHTIAQ KHANEmail: [email protected]
3 of 30
REMITTANCE
PRIVATE SECTOR CREDIT GROWTH
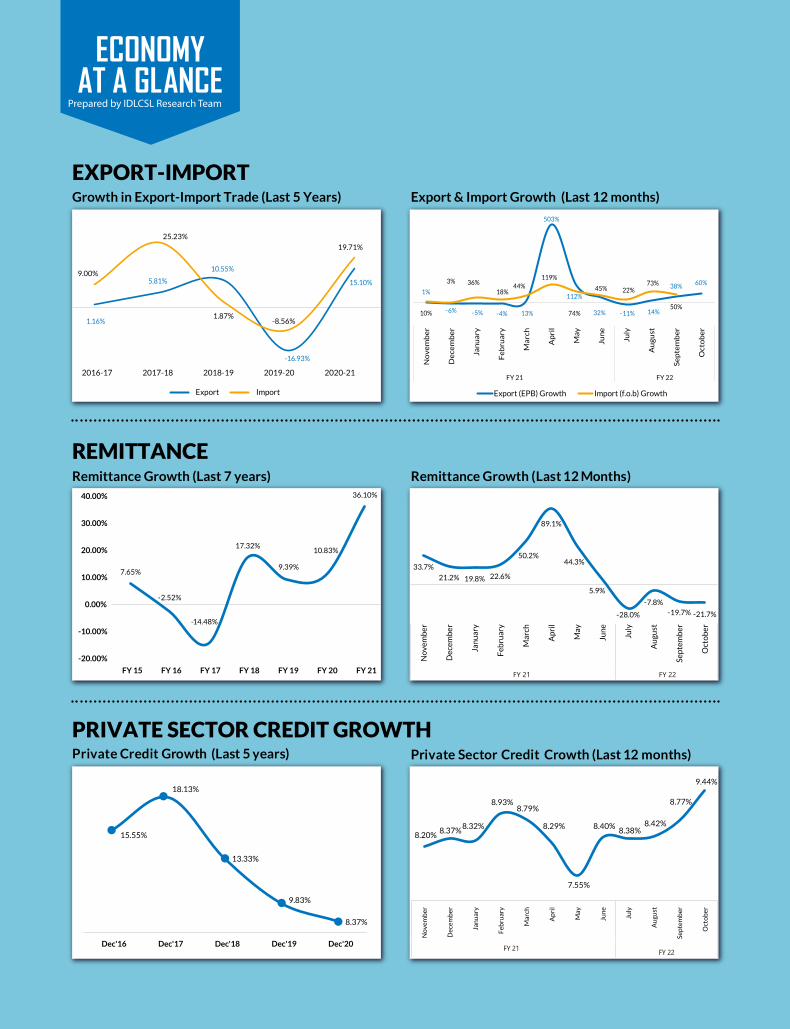
ECONOMYAT A GLANCE
EXPORT-IMPORT Growth in Export-Import Trade (Last 5 Years) Export & Import Growth (Last 12 months)
Remittance Growth (Last 12 Months)Remittance Growth (Last 7 years)
Private Credit Growth (Last 5 years) Private Sector Credit Crowth (Last 12 months)
Prepared by IDLCSL Research Team
Export Import
2016-17 2017-18 2018-19 2019-20 2020-21
1.16%
5.81%
10.55%
-16.93%
15.10%9.00%
25.23%
1.87%-8.56%
19.71%
7.65%
-2.52%
-14.48%
17.32%
9.39%
10.83%
36.10%
-20.00%
-10.00%
0.00%
10.00%
20.00%
30.00%
40.00%
FY 15 FY 16 FY 17 FY 18 FY 19 FY 20 FY 21
Export (EPB) Growth Import (f.o.b) Growth
1%
-6% -5% -4% 13%
503%
112%
32% -11% 14%
38% 60%
10%
3% 36%
18%44%
119%
74%
45% 22%73%
50%
No
vem
be
r
De
cem
be
r
Jan
uar
y
Feb
ruar
y
Mar
ch
Ap
ril
May
Jun
e
July
Au
gust
Se
pte
mb
er
Oct
ob
er
FY 21 FY 22
15.55%
18.13%
13.33%
9.83%
8.37%
Dec'16 Dec'17 Dec'18 Dec'19 Dec'20
33.7%
21.2% 19.8% 22.6%
50.2%
89.1%
44.3%
5.9%
-28.0%
-7.8%-19.7% -21.7%
No
vem
ber
Dec
emb
er
Janu
ary
Feb
ruar
y
Mar
ch
Apr
il
May
June
July
Au
gust
Sep
tem
ber
Oct
ob
er
FY 22FY 21
FY 21
8.20%8.37%
8.32%
8.93%8.79%
8.29%
7.55%
8.40%8.38%
8.42%
8.77%
9.44%
No
vem
ber
Dec
emb
er
Janu
ary
Feb
ruar
y
Mar
ch
Apr
il
May
June
July
Au
gust
Sep
tem
ber
Oct
ob
er
FY 22
4 of 30
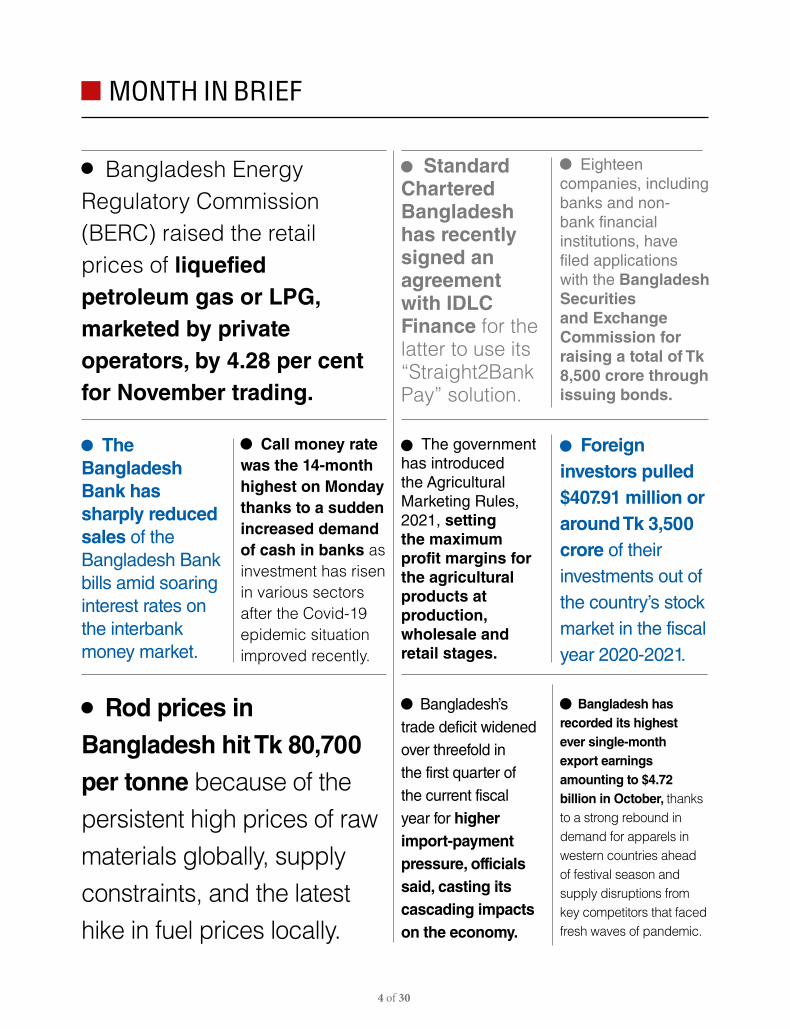
Eighteen companies, including banks and non-bank financial institutions, have filed applications with the Bangladesh Securities and Exchange Commission for raising a total of Tk 8,500 crore through issuing bonds.
MONTH IN BRIEF
The government has introduced the Agricultural Marketing Rules, 2021, setting the maximum profit margins for the agricultural products at production, wholesale and retail stages.
The Bangladesh Bank has sharply reduced sales of the Bangladesh Bank bills amid soaring interest rates on the interbank money market.
Bangladesh Energy Regulatory Commission (BERC) raised the retail prices of liquefied petroleum gas or LPG, marketed by private operators, by 4.28 per cent for November trading.
Standard Chartered Bangladesh has recently signed an agreement with IDLC Finance for the latter to use its “Straight2Bank Pay” solution.
Call money rate was the 14-month highest on Monday thanks to a sudden increased demand of cash in banks as investment has risen in various sectors after the Covid-19 epidemic situation improved recently.
Foreign investors pulled $407.91 million or around Tk 3,500 crore of their investments out of the country’s stock market in the fiscal year 2020-2021.
Rod prices in Bangladesh hit Tk 80,700 per tonne because of the persistent high prices of raw materials globally, supply constraints, and the latest hike in fuel prices locally.
Bangladesh has recorded its highest ever single-month export earnings amounting to $4.72 billion in October, thanks to a strong rebound in demand for apparels in western countries ahead of festival season and supply disruptions from key competitors that faced fresh waves of pandemic.
Bangladesh’s trade deficit widened over threefold in the first quarter of the current fiscal year for higher import-payment pressure, officials said, casting its cascading impacts on the economy.
5 of 30
For the Record
PRIVATE SECTOR WILL BE ABLE TO SELL LPG THROUGH
DIFFERENT SIZES OF CYLINDERS TO CONSUMERS AT PROPORTIONATE HIGHER
PRICES IN NOVEMBER
This latest investment round validates our dedication and relentless efforts over the last 10 years and places its trust on the potential of a well-regulated fintech space
The companies sat with us and we have asked them to offload shares slowly. The companies will be offered with an extended time-frame to offload more shares
Md Abdul Jalil, BERC chairman on BERC raises LPG price.
Kamal Quadir, founder and chief executive officer of bKash on Japan’s SoftBank to aquire 20% stake in bKash
Prof. Shibli Rubayat Ul Islam, BSEC chairman on BSEC to extend time-frame.
Shah Md. Ahsan Habib, professor and director at the Bangladesh Institute of Bank Management (BIBM), on BDT slides amid high demand for USD.
Mohammad Shams-ul-Islam, Managing Director of Agrani Bank on Call money rate 14-month highest.
Dr. Shaikh Shamsuddin Ahmed, a BSEC commissioner on CSE conducts mock trading of treasury bond
Bangladesh Bank should
continue with its foreign
currency liquidity
support to the banks to ease
the demand for the greenback in the market
The increase in call money rate reflects that the country’s
economy is recovering. The rate is increasing as investment
in various sectors has grown following the improved situation
of the epidemic
The objective of commencing the trading of treasury bond is to ensure participations of general people in transactions of such bond
6 of 30
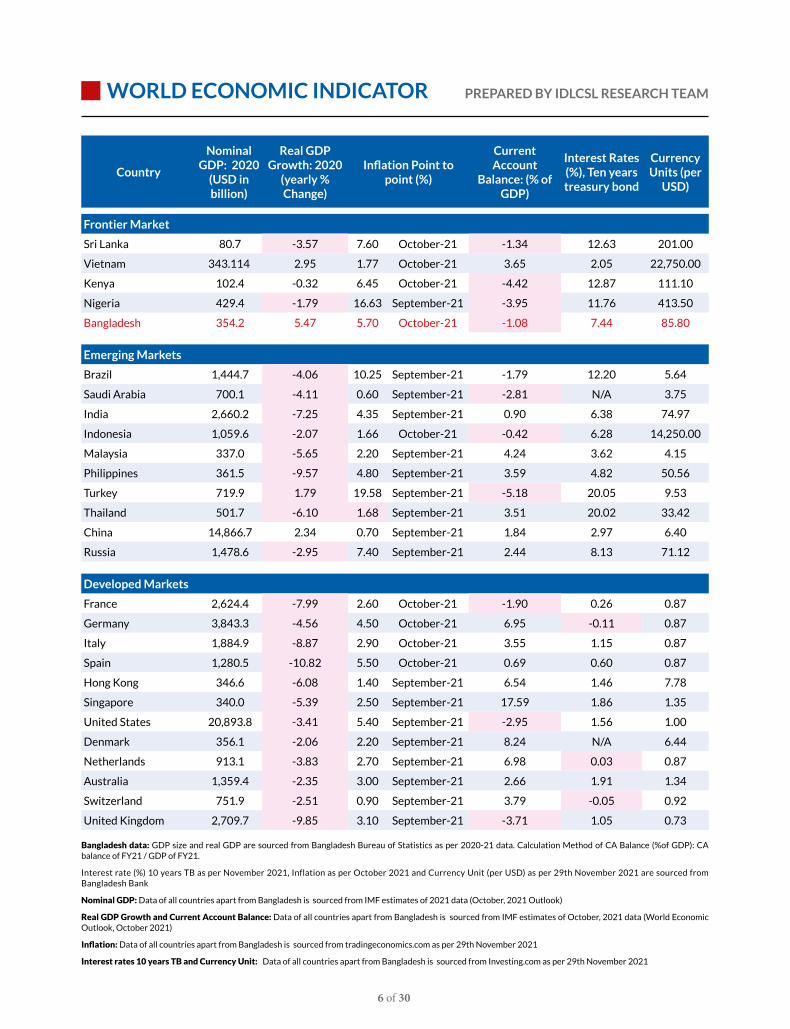
WORLD ECONOMIC INDICATOR
Country
Nominal GDP: 2020
(USD in billion)
Real GDP Growth: 2020
(yearly % Change)
Inflation Point to point (%)
Current Account
Balance: (% of GDP)
Interest Rates (%), Ten years treasury bond
Currency Units (per
USD)
Frontier Market
Sri Lanka 80.7 -3.57 7.60 October-21 -1.34 12.63 201.00
Vietnam 343.114 2.95 1.77 October-21 3.65 2.05 22,750.00
Kenya 102.4 -0.32 6.45 October-21 -4.42 12.87 111.10
Nigeria 429.4 -1.79 16.63 September-21 -3.95 11.76 413.50
Bangladesh 354.2 5.47 5.70 October-21 -1.08 7.44 85.80
Emerging Markets
Brazil 1,444.7 -4.06 10.25 September-21 -1.79 12.20 5.64
Saudi Arabia 700.1 -4.11 0.60 September-21 -2.81 N/A 3.75
India 2,660.2 -7.25 4.35 September-21 0.90 6.38 74.97
Indonesia 1,059.6 -2.07 1.66 October-21 -0.42 6.28 14,250.00
Malaysia 337.0 -5.65 2.20 September-21 4.24 3.62 4.15
Philippines 361.5 -9.57 4.80 September-21 3.59 4.82 50.56
Turkey 719.9 1.79 19.58 September-21 -5.18 20.05 9.53
Thailand 501.7 -6.10 1.68 September-21 3.51 20.02 33.42
China 14,866.7 2.34 0.70 September-21 1.84 2.97 6.40
Russia 1,478.6 -2.95 7.40 September-21 2.44 8.13 71.12
Developed Markets
France 2,624.4 -7.99 2.60 October-21 -1.90 0.26 0.87
Germany 3,843.3 -4.56 4.50 October-21 6.95 -0.11 0.87
Italy 1,884.9 -8.87 2.90 October-21 3.55 1.15 0.87
Spain 1,280.5 -10.82 5.50 October-21 0.69 0.60 0.87
Hong Kong 346.6 -6.08 1.40 September-21 6.54 1.46 7.78
Singapore 340.0 -5.39 2.50 September-21 17.59 1.86 1.35
United States 20,893.8 -3.41 5.40 September-21 -2.95 1.56 1.00
Denmark 356.1 -2.06 2.20 September-21 8.24 N/A 6.44
Netherlands 913.1 -3.83 2.70 September-21 6.98 0.03 0.87
Australia 1,359.4 -2.35 3.00 September-21 2.66 1.91 1.34
Switzerland 751.9 -2.51 0.90 September-21 3.79 -0.05 0.92
United Kingdom 2,709.7 -9.85 3.10 September-21 -3.71 1.05 0.73
Bangladesh data: GDP size and real GDP are sourced from Bangladesh Bureau of Statistics as per 2020-21 data. Calculation Method of CA Balance (%of GDP): CA balance of FY21 / GDP of FY21.
Interest rate (%) 10 years TB as per November 2021, Inflation as per October 2021 and Currency Unit (per USD) as per 29th November 2021 are sourced from Bangladesh Bank
Nominal GDP: Data of all countries apart from Bangladesh is sourced from IMF estimates of 2021 data (October, 2021 Outlook)
Real GDP Growth and Current Account Balance: Data of all countries apart from Bangladesh is sourced from IMF estimates of October, 2021 data (World Economic Outlook, October 2021)
Inflation: Data of all countries apart from Bangladesh is sourced from tradingeconomics.com as per 29th November 2021
Interest rates 10 years TB and Currency Unit: Data of all countries apart from Bangladesh is sourced from Investing.com as per 29th November 2021
PREPARED BY IDLCSL RESEARCH TEAM
7 of 30
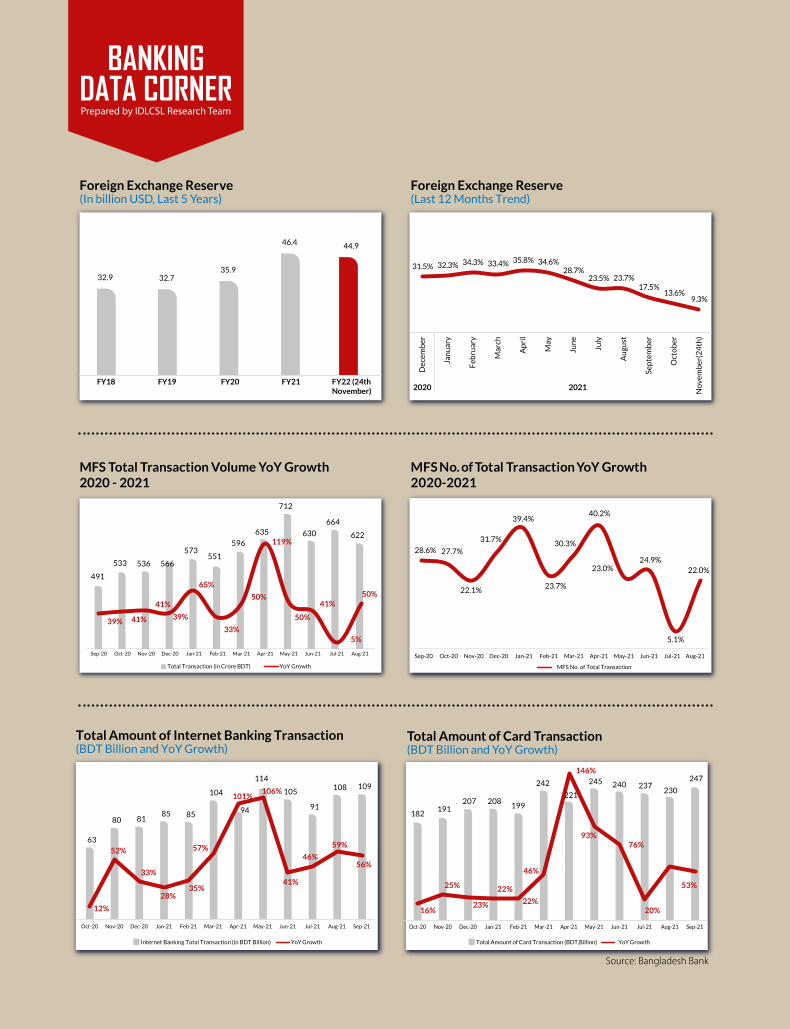
BANKINGDATA CORNER
Foreign Exchange Reserve(In billion USD, Last 5 Years)
MFS Total Transaction Volume YoY Growth 2020 - 2021
Foreign Exchange Reserve (Last 12 Months Trend)
MFS No. of Total Transaction YoY Growth2020-2021
Prepared by IDLCSL Research Team
FY18 FY19 FY20 FY21 FY22 (24thNovember)
32.9 32.7 35.9
46.4 44.9
Total Amount of Internet Banking Transaction (BDT Billion and YoY Growth)
Total Amount of Card Transaction (BDT Billion and YoY Growth)
Total Transaction (in Crore BDT) YoY Growth
Sep-20 Oct-20 Nov-20 Dec-20 Jan-21 Feb-21 Mar-21 Apr-21 May-21 Jun-21 Jul-21 Aug-21
491
533 536 566
573551
596
635
712
630
664
622
39% 41%
41%
39%
65%
33%
50%
119%
50%
41%
5%
50%
Jun-21 Aug-21Sep-20 Oct-20 Nov-20 Dec-20 Jan-21 Feb-21 Mar-21 Apr-21 May-21
MFS No. of Total Transaction
Jul-21
28.6% 27.7%
22.1%
31.7%
39.4%
23.7%
30.3%
40.2%
23.0%24.9%
5.1%
22.0%
Internet Banking Total Transaction (in BDT Billion) YoY Growth
63
80 81 85 85
104
94
114
105
91
108 109
12%
52%
33%
28%35%
57%
101%106%
41%
46%
59%
56%
Oct-20 Nov-20 Dec-20 Jan-21 Feb-21 Mar-21 Apr-21 May-21 Jun-21 Jul-21 Aug-21 Sep-21
Total Amount of Card Transaction (BDT,Billion) YoY Growth
182 191
207 208 199
242
221
245 240 237 230
247
16%
25%
23%
22%
22%
46%
146%
93%76%
20%
53%
Oct-20 Nov-20 Dec-20 Jan-21 Feb-21 Mar-21 Apr-21 May-21 Jun-21 Jul-21 Aug-21 Sep-21
31.5% 32.3% 34.3% 33.4% 35.8% 34.6%28.7%
23.5% 23.7%17.5%
13.6%9.3%
Dec
emb
er
Janu
ary
Feb
ruar
y
Mar
ch
Apr
il
May
June
July
Au
gust
Sep
tem
ber
Oct
ob
er
No
vem
ber
(24
th)
2020 2021
Source: Bangladesh Bank
8 of 30
LILAC
MBR: Lilac is Bangladesh’s upcoming femtech focusing on feminine hygiene & health. Will you please share with us the story behind this innovative idea of Lilac?
Ronika Karmaker: About 90% women in our country struggle with their health and I am one of them. As a woman, I always wondered why there are no holistic platforms focused on women’s health as it was a struggle for me and many women around me. Women in Bangladesh have little or no access to services related to their health and wellness, be it regarding their menstrual hygiene, pre-natal, post-natal care, interfertility and so on.
As a woman, I always wanted to build a platform/organization which would cater to women’s health since it’s an unexplored area. I wondered why there are no digital platforms focused on making periods easier for women and create a community where women can discuss their struggles, stories, and experiences. Then I went on to share this idea with our Kamran Anand Haq (VP- Sales & Operations), and we initiated the monthly menstruation subscription package model to bring women in metropolitan cities the convenience and quality of products for their total hygiene care. Sadman (VP-Tech) came in the scene with his expertise in building the active web platform to help us to bring the monthly period bundles and the E-shop for hygiene and essential items.
SPOTLIGHT ON STARTUP
Ronika Karmaker CEO & Co-Founder Lilac
Interviewed By Anisha Saha, Team MBR
MBR: As Lilac is one of the first to dive into the feminine hygiene and health sector in Bangladesh what are the factors that motivated you to create the platform?
Ronika Karmaker: The idea of building a holistic platform didn’t come to us in one day. As mentioned, we had initially decided to bring forth a subscription-based period care, just like renowned femtech – Lola. However, as we carried on our research and surveys, we realized that only a niche of the market can be reached through this service. As a team, we decided that we want to impact more lives than just a niche segment through our services. We realized there is no holistic platforms for women’s health and wellness but there is a great opportunity to bring modern and convenient solutions in this sector. That’s when we decided to build
Bangladesh’s first-ever holistic digital wellness platform for women, with the aim to impact all women’s lives with our services.
Few of the rising healthtechs of Bangladesh has paved the way to show
that the mass is gradually leaning towards online based platforms for their convenience. Even though femtech is a new concept to the people here, we are clearly witnessing the vital role women play in creating and sustaining healthy families. The FemTech market is expected to grow to USD 60 bln by 2027 but the industry here remains under-developed and underinvested so there is a huge potential for growth.
9 of 30
Women are now increasingly pushing for equality in all aspects of life, including the workplace and healthcare. So they have slowly started to pay attention to every aspect of their health, including general healthcare, emotional wellbeing, pregnancy, fertility, and a lot more. We believe Lilac can become 360-degree solution in their daily life, by taking care of all the health aspects under one roof.
MBR: Lilac aims to create a community and safe space for women to share their experiences without hesitation. Would you like to share a glimpse of your offered services?
Ronika Karmaker: Since we are building this platform to be the holistic digital wellness platform for women, Lilac aims to cater to women’s health by providing them support through various services ranging from Wellness Packages (Monthly Menstrual Bundles, Pre-Natal & Post-Natal Care launching soon), Ovulation Tracking, E-Shop, Blog and Medical Expert Consultation (soon to be launched). Lilac will be the one stop solution platform for women’s health concerns whether it be for tracking their monthly ovulation cycle, consulting a medical expert or gaining awareness on a hygiene item through our content.
MBR: Lilac symbolizes confidence, as your aim is to empower women and educate them about their body what are the prospects & the long-term goals of Lilac?
Ronika Karmaker: Lilac aims to create a one-stop solution for the overall women’s health & hygiene
to make health care more accessible to the women of our country. In future, we envision this platform becoming a digital clinic which caters to women’s health and this platform can help creating an impact in other countries of South-East Asia where women are deprived of awareness, expert’s guidance, and products for their health. Lilac’s vision will always be to support and empower the women of Bangladesh through its services.
MBR: In Bangladesh, there is still a lot of stigma surrounding the topic of women’s health and hygiene. Can you please share with us some of the challenges that you had to face to make Lilac a reality from just an idea?
Ronika Karmaker: As you are aware, reproductive health has huge social stigma surrounding it especially in the countries of South Asia like Bangladesh, and there is severe lack of knowledge regarding proper hygiene maintenance even amongst the educated women of Bangladesh. One of the biggest challenges we faced as a team first getting into the market was that the society is heavily entangled in the taboo over women’s health and hygiene. Even in metropolitan cities, educated women de-prioritize their health and hygiene and still do not possess enough knowledge about their body or different hygiene products. Even though we can see a gradual increase in spending power of working women here, they still do not readily invest in their health and hygiene. Hence part of our challenge lies in making women aware about their health and how Lilac can be a one-stop solution to their health concerns.
10 of 30
Written ByAlawol Ahamed
Assistant Manager Consumer Division
IDLC Finance Limited
HOUSING MARKET:RISING CONSTRUCTION MATERIAL
PRICES & ITS IMPACT
11 of 30
COVER STORY
PRELUDE
Being one of the most densely populated countries that has one of the lowest land-person ratios in the world, for Bangladesh, providing housing facility for its citizens is becoming increasingly expensive day by day. According to Asian Development Bank (ADB) data, 20.5% of population still live below the poverty line in Bangladesh as of 2019. Hence, most of the people in Bangladesh find it challenging to adjust with the rising cost of construction materials and build a roof over their heads. In order to cut back on construction cost, majority of the population build their houses in rural areas so that benefit of cheap labor can be availed.
However, Bangladesh is emerging as one of the fastest-growing nations in the world. According to a report published by the Boston Consulting Group (BCG) titled, “Bangladesh, The Surging Consumer Market Nobody Saw Coming”, every year around 2 mln Bangladeshis join the ranks of the middle and affluent class (MAC).The report also predicts that, if Bangladesh maintains this pace, the MAC population of the country will grow by 65% over the next five years. Housing needs for this large population is one of the biggest challenges for the government of Bangladesh today.
In recent months, construction materials have experienced significant price increase not only in Bangladesh but all over the world and this surge in the price of construction materials is most likely to continue and it will eventually result in the rise of development costs of megaprojects, commercial and residential projects. These high prices are not only creating a significant impact on the real estate developers but also affecting the construction industry and contractors. This massive rise of construction material prices is affecting real estate developers so badly that the developers and the constructors have to consider whether or not to initiate any new residential or commercial projects. Further, contractors of the development projects are not only hesitant to bid for new projects but also demanding price adjustment for ongoing projects.
OVERVIEW OF THE HOUSING MARKET OF BANGLADESH
Housing Market at a Glance
Bangladesh has been experiencing rapid urbanization over the last few decades. Although the majority of our population lives in rural areas, the importance of this sector has been declining over the years. The contribution of the agricultural sector in GDP has come down from about 50% in 1972 to only 16% in 2015 (BBS, 2015). The rural population reached a peak of 107.8 mln in 2011 and is projected to decline further to 89.5 mln by 2050. Conversely, the urban population, which was 43 mln in 2011 is projected to reach 112 mln by 2050 and would still be growing according to IFC.
Bangladesh is one of the most densely populated countries in the world. The pressure of the rapidly growing urban population has significantly contributed to the scarcity and cost of urban land for housing and other purposes. Land prices are high and permanent housing is rare. Bangladesh will need to construct approximately 8.5 mln new houses in the next five years to overcome the existing shortage in urban areas and meet the future demand for housing. Most of the need is concentrated in the lower and lower-middle income groups.
In the urban areas, the housing deficit grew from 1.13 mln units in 2001 to 4.6 mln units in 2010. This deficit is projected to reach 8.5 mln units by the end of 2021:
Table -01: Urban Housing Deficit (Formal Housing)
Year Housing Deficit in Urban Areas (Mln)
Total Urban Population (Mln)
1991 0.95 mln units 20.87
2001 1.13 mln units 28.81
2011 4.6 mln units 43.43
2021 8.5 mln deficit (projected) 60.00
* Source: HIES, 2010; BBS, 2001; National Housing Authority, 2005, Planning Commission
12 of 30
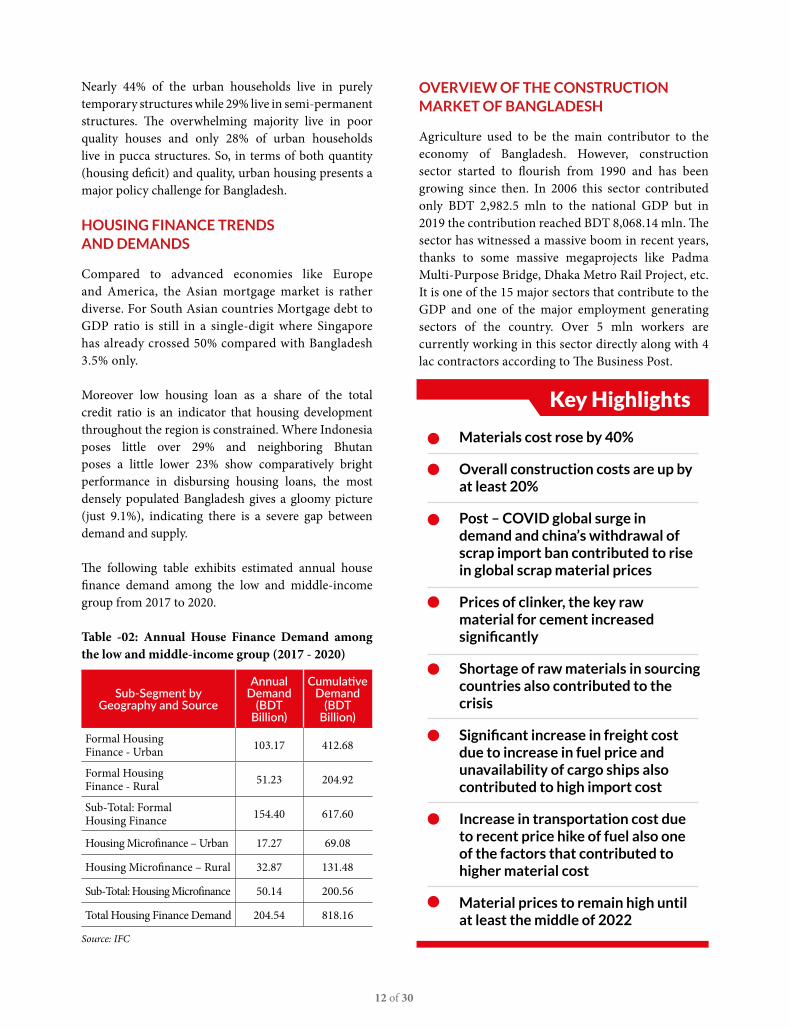
Nearly 44% of the urban households live in purely temporary structures while 29% live in semi-permanent structures. The overwhelming majority live in poor quality houses and only 28% of urban households live in pucca structures. So, in terms of both quantity (housing deficit) and quality, urban housing presents a major policy challenge for Bangladesh.
HOUSING FINANCE TRENDS AND DEMANDS
Compared to advanced economies like Europe and America, the Asian mortgage market is rather diverse. For South Asian countries Mortgage debt to GDP ratio is still in a single-digit where Singapore has already crossed 50% compared with Bangladesh 3.5% only.
Moreover low housing loan as a share of the total credit ratio is an indicator that housing development throughout the region is constrained. Where Indonesia poses little over 29% and neighboring Bhutan poses a little lower 23% show comparatively bright performance in disbursing housing loans, the most densely populated Bangladesh gives a gloomy picture (just 9.1%), indicating there is a severe gap between demand and supply.
The following table exhibits estimated annual house finance demand among the low and middle-income group from 2017 to 2020.
Table -02: Annual House Finance Demand among the low and middle-income group (2017 - 2020)
Sub-Segment by Geography and Source
Annual Demand
(BDT Billion)
Cumulative Demand
(BDT Billion)
Formal Housing Finance - Urban 103.17 412.68
Formal Housing Finance - Rural 51.23 204.92
Sub-Total: Formal Housing Finance 154.40 617.60
Housing Microfinance – Urban 17.27 69.08
Housing Microfinance – Rural 32.87 131.48
Sub-Total: Housing Microfinance 50.14 200.56
Total Housing Finance Demand 204.54 818.16
Source: IFC
OVERVIEW OF THE CONSTRUCTION MARKET OF BANGLADESH
Agriculture used to be the main contributor to the economy of Bangladesh. However, construction sector started to flourish from 1990 and has been growing since then. In 2006 this sector contributed only BDT 2,982.5 mln to the national GDP but in 2019 the contribution reached BDT 8,068.14 mln. The sector has witnessed a massive boom in recent years, thanks to some massive megaprojects like Padma Multi-Purpose Bridge, Dhaka Metro Rail Project, etc. It is one of the 15 major sectors that contribute to the GDP and one of the major employment generating sectors of the country. Over 5 mln workers are currently working in this sector directly along with 4 lac contractors according to The Business Post.
• Materials cost rose by 40%
Overall construction costs are up by at least 20%
Post – COVID global surge in demand and china’s withdrawal of scrap import ban contributed to rise in global scrap material prices
Prices of clinker, the key raw material for cement increased significantly
Shortage of raw materials in sourcing countries also contributed to the crisis
Significant increase in freight cost due to increase in fuel price and unavailability of cargo ships also contributed to high import cost
Increase in transportation cost due to recent price hike of fuel also one of the factors that contributed to higher material cost
Material prices to remain high until at least the middle of 2022
Key Highlights
13 of 30
The construction industry of Bangladesh is expected to recover by 8% in 2021, after shrinking by an estimated 1.2% in 2020 being heavily impacted by pandemic. In the upcoming year, the industry is expected to continue to recover, with output increasing by 7.2% and then expanding by 7.1% per year over the next few years. From 2022 - 2025, the industry’s output is expected to be supported by the government’s focus on the development of infrastructure, as well as through investment in energy and utilities construction projects.
CONSTRUCTION MATERIAL PRICES ARE ON THE RISE: REASONS and ITS IMPACT
The construction sector impacts socio-economic expansion development in developing countries like Bangladesh by contributing substantially to their gross domestic product (GDP). Building materials cost can comprise half (50%) of the total cost of all projects executed by the construction industry. Furthermore, the cost of building materials is influenced by supply and demand, as well as quality, quantity, time, place, buyer, and seller during the construction process. Currency exchange, material specifications, inflation pressure, and the availability of new materials in the country are some other additional factors.
Construction materials play a pivotal role in building as a substantial input in project development. The constant rise in the price of building materials poses a significant challenge to the construction industry’s ability to deliver projects of high quality and on time. The fluctuating market value for construction materials tends to cause high project risk to all stakeholders like suppliers, contractors, and clients involved in the construction production. The demand for housing of all types, combined with inflation and constrained monetary supply, has posed a significant challenge to the construction industry’s cost of building materials. Therefore, the cost of construction materials is essential to improve and deliver sustainable projects within budgeted time, cost, and it is also essential to maintain quality and meet the expectation of the customers.
Over the last few months, overall construction costs in Bangladesh have gone up by over 20% because of the surge in the price of raw materials. Prices of iron rod, cement, bitumen, and stone chips have increased in the last year due to the rising demand for raw materials
globally after economies reopened following the ease of the coronavirus pandemic. From steel to bitumen to imported stone to cement to brick, all have become very costly.
IMPACT OF INCREASED RAW MATERIAL COST ON THE SUPPLIERS
The construction cost has gone up by 20% because the price of materials has increased. The cost of raw materials is experiencing increasing trend in the international market which is paving the way for the rise in construction material prices.
For the manufacturers of construction materials (especially steel and cement) nothing seems to be working in their favor due to unfavorable tax measures to escalating raw materials price, intensified competition, price war, weakening domestic currency and slow demand. Demand is expected to rise shortly and further appreciation of raw materials price would worsen the situation.
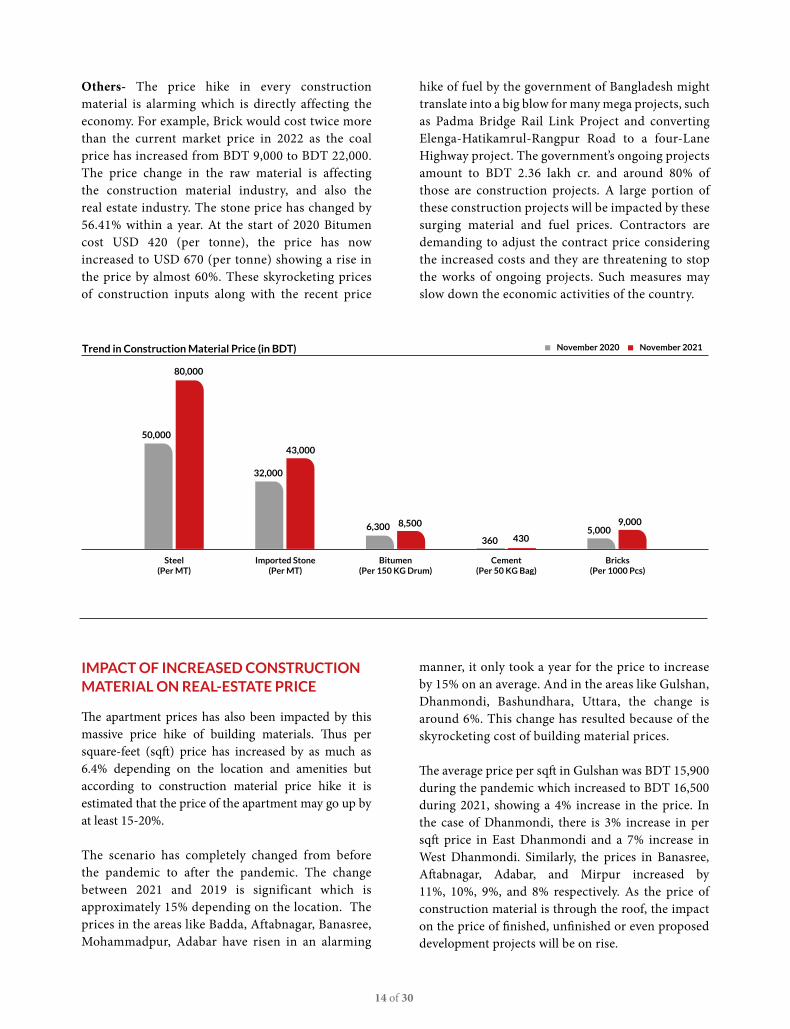
Steel- The continuous upward direction in price trend is alarming for the real estate industry. The reason behind it is the price of raw material has increased in the global market and as we have to import the raw material, the price is rising in the local market as well. The main raw material for steel is the imported scrap which is worth about USD 550-USD 590 per ton now and just a year ago it was USD 300-USD 350 per ton. The change is almost 57% which has also affected the local market. At the very beginning of 2020 the price of steel (per tonne) was BDT 53,000 and it just took a year for the price increased by almost 51%. And now it will cost BDT 80,000 to get 65 grade MS Steel (per tonne). The analysts of the industry can predict that the increase in steel price would raise the construction price by 10%-15%.
Cement-The rise in the price of Clinker, the main raw material for cement in the international market has impacted the price of cement in the local market. The production of cement fully depends on the import of raw materials and as a result, the price of raw materials rising in the global market is forcing local manufacturers to increase cement prices. On the verge of the pandemic cement price (per 50kg) was BDT 360 and now it has risen to BDT 430 which is almost 20% increase in the price.
14 of 30
Others- The price hike in every construction material is alarming which is directly affecting the economy. For example, Brick would cost twice more than the current market price in 2022 as the coal price has increased from BDT 9,000 to BDT 22,000. The price change in the raw material is affecting the construction material industry, and also the real estate industry. The stone price has changed by 56.41% within a year. At the start of 2020 Bitumen cost USD 420 (per tonne), the price has now increased to USD 670 (per tonne) showing a rise in the price by almost 60%. These skyrocketing prices of construction inputs along with the recent price
hike of fuel by the government of Bangladesh might translate into a big blow for many mega projects, such as Padma Bridge Rail Link Project and converting Elenga-Hatikamrul-Rangpur Road to a four-Lane Highway project. The government’s ongoing projects amount to BDT 2.36 lakh cr. and around 80% of those are construction projects. A large portion of these construction projects will be impacted by these surging material and fuel prices. Contractors are demanding to adjust the contract price considering the increased costs and they are threatening to stop the works of ongoing projects. Such measures may slow down the economic activities of the country.
50,000
80,000
32,000
43,000
6,300 8,500
360 4305,000
9,000
Steel(Per MT)
Imported Stone(Per MT)
Bitumen(Per 150 KG Drum)
Cement(Per 50 KG Bag)
November 2020
Bricks(Per 1000 Pcs)
Trend in Construction Material Price (in BDT) November 2021
IMPACT OF INCREASED CONSTRUCTION MATERIAL ON REAL-ESTATE PRICE
The apartment prices has also been impacted by this massive price hike of building materials. Thus per square-feet (sqft) price has increased by as much as 6.4% depending on the location and amenities but according to construction material price hike it is estimated that the price of the apartment may go up by at least 15-20%.
The scenario has completely changed from before the pandemic to after the pandemic. The change between 2021 and 2019 is significant which is approximately 15% depending on the location. The prices in the areas like Badda, Aftabnagar, Banasree, Mohammadpur, Adabar have risen in an alarming
manner, it only took a year for the price to increase by 15% on an average. And in the areas like Gulshan, Dhanmondi, Bashundhara, Uttara, the change is around 6%. This change has resulted because of the skyrocketing cost of building material prices.
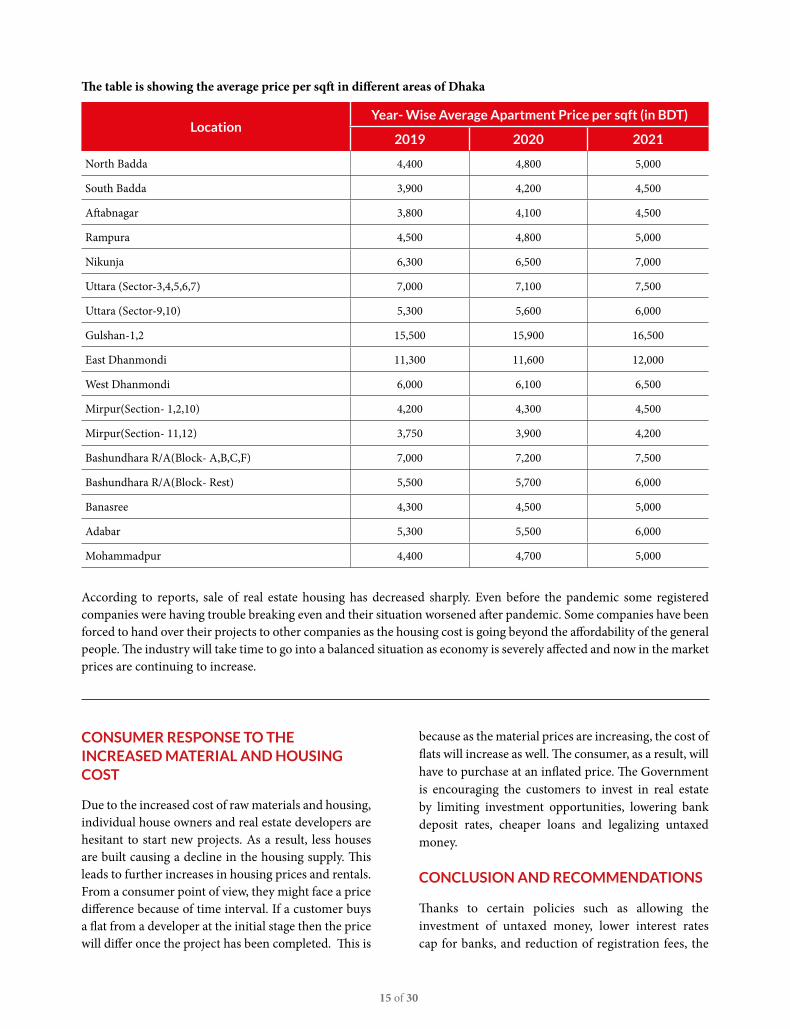
The average price per sqft in Gulshan was BDT 15,900 during the pandemic which increased to BDT 16,500 during 2021, showing a 4% increase in the price. In the case of Dhanmondi, there is 3% increase in per sqft price in East Dhanmondi and a 7% increase in West Dhanmondi. Similarly, the prices in Banasree, Aftabnagar, Adabar, and Mirpur increased by 11%, 10%, 9%, and 8% respectively. As the price of construction material is through the roof, the impact on the price of finished, unfinished or even proposed development projects will be on rise.
15 of 30
The table is showing the average price per sqft in different areas of Dhaka
LocationYear- Wise Average Apartment Price per sqft (in BDT)
2019 2020 2021
North Badda 4,400 4,800 5,000
South Badda 3,900 4,200 4,500
Aftabnagar 3,800 4,100 4,500
Rampura 4,500 4,800 5,000
Nikunja 6,300 6,500 7,000
Uttara (Sector-3,4,5,6,7) 7,000 7,100 7,500
Uttara (Sector-9,10) 5,300 5,600 6,000
Gulshan-1,2 15,500 15,900 16,500
East Dhanmondi 11,300 11,600 12,000
West Dhanmondi 6,000 6,100 6,500
Mirpur(Section- 1,2,10) 4,200 4,300 4,500
Mirpur(Section- 11,12) 3,750 3,900 4,200
Bashundhara R/A(Block- A,B,C,F) 7,000 7,200 7,500
Bashundhara R/A(Block- Rest) 5,500 5,700 6,000
Banasree 4,300 4,500 5,000
Adabar 5,300 5,500 6,000
Mohammadpur 4,400 4,700 5,000
According to reports, sale of real estate housing has decreased sharply. Even before the pandemic some registered companies were having trouble breaking even and their situation worsened after pandemic. Some companies have been forced to hand over their projects to other companies as the housing cost is going beyond the affordability of the general people. The industry will take time to go into a balanced situation as economy is severely affected and now in the market prices are continuing to increase.
CONSUMER RESPONSE TO THE INCREASED MATERIAL AND HOUSING COST
Due to the increased cost of raw materials and housing, individual house owners and real estate developers are hesitant to start new projects. As a result, less houses are built causing a decline in the housing supply. This leads to further increases in housing prices and rentals. From a consumer point of view, they might face a price difference because of time interval. If a customer buys a flat from a developer at the initial stage then the price will differ once the project has been completed. This is
because as the material prices are increasing, the cost of flats will increase as well. The consumer, as a result, will have to purchase at an inflated price. The Government is encouraging the customers to invest in real estate by limiting investment opportunities, lowering bank deposit rates, cheaper loans and legalizing untaxed money.
CONCLUSION AND RECOMMENDATIONS
Thanks to certain policies such as allowing the investment of untaxed money, lower interest rates cap for banks, and reduction of registration fees, the
16 of 30
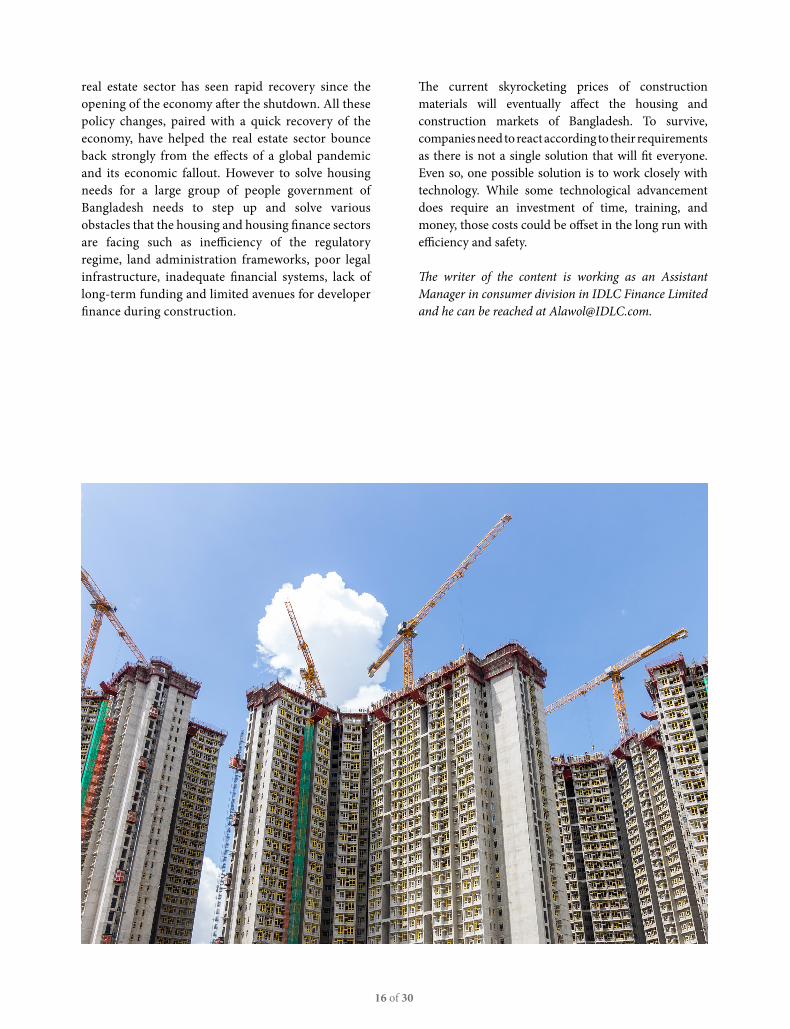
real estate sector has seen rapid recovery since the opening of the economy after the shutdown. All these policy changes, paired with a quick recovery of the economy, have helped the real estate sector bounce back strongly from the effects of a global pandemic and its economic fallout. However to solve housing needs for a large group of people government of Bangladesh needs to step up and solve various obstacles that the housing and housing finance sectors are facing such as inefficiency of the regulatory regime, land administration frameworks, poor legal infrastructure, inadequate financial systems, lack of long-term funding and limited avenues for developer finance during construction.
The current skyrocketing prices of construction materials will eventually affect the housing and construction markets of Bangladesh. To survive, companies need to react according to their requirements as there is not a single solution that will fit everyone. Even so, one possible solution is to work closely with technology. While some technological advancement does require an investment of time, training, and money, those costs could be offset in the long run with efficiency and safety.
The writer of the content is working as an Assistant Manager in consumer division in IDLC Finance Limited and he can be reached at [email protected].
17 of 30
EXPERT OPINION ON COVER STORY
MBR: The steel industry is an established and growing industry in Bangladesh and it has experienced significant growth in the past few years. Please tell us about the current situation of steel market of Bangladesh.
Mr. Sheikh Masadul Alam: There is no country in today’s globalized world that has not been impacted by the Corona virus pandemic. Almost all commercial, economic and social activities have been suffering from the pandemic since last year. Similarly, the construction and engineering industries are no different; they have also been suffering from this crisis. To revive the economy after the ease of Covid – 19 situations, every country has expatiated the construction activities as such the use of steels as well as other construction materials have increased significantly across the globe. Bangladesh is no different. Construction activities of the country have been increasing thanks to the immense support from the Government of Bangladesh despite having lot of limitations and challenges. Because of these increased activities in the construction sector demand as well as the prices for steel and other construction materials have increased. Bangladeshi steel industry has almost recovered from the stagnant situation that we observed during general lockdown imposed to curve the pandemic. Moreover all the linkage industries have revived because of this. Although, due to skyrocketing prices of construction materials some people thought that the demand will go
down and the manufacturers won’t be able to sell their products however this actually did not happen. We are now in the construction season and the demand will be up further so do the prices of these materials.
MBR: How do you foresee the local market for construction material will evolve in the upcoming days?
Mr. Sheikh Masadul Alam: Reinforced demand in post pandemic are owning to rising infrastructural activities and this will continue at least in the short term as we have just entered the construction season and in this sector we call it peak time. During construction season or peak time demand for construction materials go up by 40 - 50% compared to off season especially
rainy season. Moreover, government will continue to invest in different mega projects which will
contribute to higher demand for building materials in the years to come. However, there will be further crisis when it comes to raw
materials of different construction items such as scraps, Iron Ore etc. due to various reasons. Holiday
season is starting after 15th December in raw material exporting countries which will impact the supply chain. Moreover, China, the world’s biggest sourcing hub will enjoy a month long holiday from February which will have a profound impact on the supply chain. Moreover, supply chain could be further impacted by extreme winter season of some of the exporting countries. These factors may further volatile the market. However, since we have
Mr. Sheikh Masadul AlamManaging Director,Shahriar Steel Mills Ltd. (SSRM)
Interviewed By Alawol Ahamed,Assistant Manager, Consumer Division, IDLC Finance Limited
18 of 30
enough demand locally the use of materials will go up even if the price increased further.
MBR: Do we need to increase production capacity to cater the growing development projects initiated by the government?
Mr. Sheikh Masadul Alam: Most of the manufacturers have already increased or have invested to increase their capacity as such we have adequate capacity to cater the growing demand. Like other manufacturers SSRM also recently increased its production capacity. Almost all big players have excess capacity as the demand is not adequate enough to utilize their full capacity. Although few companies export steel on limited scale, the industry is still fully reliant on local market and any additional demand can be served from existing capacity.
MBR: Prices of steel, cement, stone chips and other construction materials have risen in the last year following the ease of the pandemic. Can you please tell us what factors are responsible for this surge in the price globally as well as in Bangladesh?
Mr. Sheikh Masadul Alam: There are several factors contributed to this skyrocketing raw material prices. The prime raw-material for production of steel is Iron Ore while scrap is the prime raw materials for recycled steel manufacturers. Raw-material prices increased due global crisis caused by COVID-19 pandemic. All the mines from where Iron Ore is sourced were closed for almost two years due to pandemic. Moreover all activities in scrap exporting countries were put on hold in most of the sourcing countries. As the situation improves, demand for these products increased substantially and this largely contributed to this price movement.
Moreover, locally sourced scraps from damaged/expired ships, cargo containers and other materials were in short supply. Additionally, transportation costs especially cargo rents increased substantially due to increase in fuel price along with increased demand. Different kinds of restrictions such as quarantine for cargo workers have increased the costs by four times.
As the industry is heavily dependent on imported raw materials and any devaluation of local currency increases the import costs. Taka is losing its value over US dollars over the last few months and this may continue further. This will have a great impact on the overall costs. Recent price hike of fuel will also increase the transportation cost which will not only impact the steel industry but also affect the whole economy negatively.
MBR: The rise of fuel prices could lead to major changes in all the industries, on a broader perspective on the country’s economy. Can you please tell us what impact will the recent fuel price hike have in the construction material market?
Mr. Sheikh Masadul Alam: Fuel prices feed into the prices of other goods and services and any price hike will impact all industries not just construction industry. Increased fuel price in the international and local market contributed to high costs for deep sea cargoes. Moreover local transportation costs to move raw materials and finished goods also increased substantially.
MBR: The housing market of Bangladesh was badly hit by the pandemic and has slowly started to show improvement during this year. How do you think the rise in the price of construction materials will affect the implementation of ongoing and upcoming development projects and the economy as a whole?
Mr. Sheikh Masadul Alam: I think the government is ready and has enough tools to deal with this increased building material costs. I, along with other related persons have been raising our concerns regarding possible price hike of raw material costs through different talk shows and meetings. We proposed to lower the government’s VAT & Taxes by BDT 4,000 – 5,000 and believed that the government has the capacity to do so. Although our proposal regarding withdrawal or lowering down the import duties and other charges has not been accepted by the government. I am sure government and its agencies are aware of the situation and will be able to manage the crisis. So far construction
19 of 30
works of development projects are progressing and have not seen any slowdown. Mega projects won’t be impacted greatly as government can move around the contract prices as the terms and conditions of these projects always have provisions. However contractors of smaller projects with shorter duration may be impacted and some may need to incur losses.
MBR: In order for economic growth to be sustainable, industries have to be conscious of how they operate. What initiatives can be taken by the manufacturers to ensure sustainable practices and make the industry more environments friendly?
Mr. Sheikh Masadul Alam: We have already started to work to make our process environment friendly according to our capacity. We have installed ETP through this dusts are collected, filtered and sold with considerable higher prices. SSRM has already installed such capacity which is probably the first of its kind in Dhaka and we are getting the benefits now. Others are also trying to install such technology. Currently
SSRM collects and sell around 100 MT of dusts every month that are previously been thrown away in the environment. I am sure this will give us competitive advantages as well as save the environment. Steel industry recycles scraps or waste metals to produce billet that help to keep our environment clean and safe. Apart from the smoke that it produces, there is nothing it dumps in the environment. Since we are recycling and cleaning the environment, government should start proving incentives so that people involved in this industry are encouraged and invest in environment friendly process. Instead government is trying to impose VAT & taxes on different by products that are being sold or exported. I think this industry will do well with some government support and friendly tax policy because everything here can be used or recycled. A lot has been invested by the promoters of this industry and we are willing to invest further in environment friendly process that will keep us, our workers as well as our environment safe. With the encouragement and help of the regulators, we believe we will be able to create a safe and environment friendly industry that will keep us all safe and healthy.
20 of 30
IDLC NEWS
IDLC Finance wins UN Women Award for Most Gender-Responsive Marketplace
IDLC Finance has been selected as the 2nd Runner Up in the Gender-Responsive Marketplace category at the virtual ceremony of the 2021 Regional Asia-Pacific Women’s Empowerment Principles (WEPs) Awards on November 18th in a virtual ceremony.
In this regard, M. Jamal Uddin, MD & CEO of IDLC Finance said “At IDLC we always try to eliminate gender biases in all our actions and decisions. This award will inspire us to keep working towards a gender bias-free environment, and also inspire others in our industry to bring in these practices in their own line of work. We are very happy to receive the prestigious award and be recognized for our work in creating a gender-responsive marketplace.
This second edition of the Asia-Pacific WEPs Awards was presented by UN Women through the WeEmpowerAsia project, which is funded by and in partnership with the European Union. The 2021 Awards were also supported by Investing in Women (IW), an initiative of the Australian Government supporting gender equality and women’s economic empowerment in Southeast Asia. The awards
recognized actions in the private sector that promote gender equality in six categories: Leadership Commitment, Youth Leadership, Gender-inclusive Workplace, Gender-responsive Marketplace, Community Engagement and Partnerships, and Transparency and Reporting. This year, the awards also celebrated SME Champions.
The Gender-responsive Marketplace category recognized corporations for embracing gender-lens throughout their value-chains from sourcing to disposal. This includes championing supplier diversity, gender-inclusive distribution and selling, and gender-responsive marketing and advertising. It also includes supporting women entrepreneurs through capacity development or market access opportunities, implementing progressive programs and/or policies to incentivize procurement from women-owned businesses or other gender-responsive companies. The category also recognizes companies with actions or programs that promote gender equality and women’s empowerment in advertisements and other sales and marketing activities.
21 of 30
EXCLUSIVE FEATURE
TRAVEL TECH - ROLLING THE WHEELS OF TOURISM
Overview of the Tourism Industry
Tourism is a dynamic industry and one of the most profitable sectors of the world economy. It plays an important role in the economy in the context of both developing and developed countries. Tourism in Bangladesh contributes both directly and indirectly towards the GDP growth of the country by creating new employment opportunities, alleviating poverty, earning foreign currency from the foreign tourists, improving economic standards for the locals and making people economically and socially stable. The tourism industry is one of the most profitable sectors in Bangladesh and the country has seen a positive trend in the comings and earnings from this industry.
Travel Tech Redefining Tourism
Technology has put its mark and become a blessing for every industry. The tourism industry in Bangladesh is no exception. With a growing interest in travel, the dynamics of the industry has changed fundamentally. Once the industry was predominantly ruled by traditional travel agencies, but nowadays, we are seeing rapid rise of Online Travel Agencies (OTAs) over the past few years. The change has affected consumer choice and behavior. A growing number of urban travelers now are using online travel services to avail various travel-related services from booking flights to hotels to finding relevant information. According to market insiders, the market share of the OTAs has grown to 5%-20% from almost non-existent just a few years ago. The leading OTAs such as Flight Expert, ShareTrip, Go Zayaan and Amarroom share a significant market share among themselves.
In the global economy, we have seen the growth of the travel-tech industry in the last 3 decades. Unlike most countries, the travel industry in Bangladesh has always been offline. Traditionally, someone has to rely on a travel agent to book tickets and search hotels to find a relevant match. Even though the overall industry
was growing, the use of technology in the local travel industry was not growing as fast as it should have. Around 2017, Online Travel Agencies, OTAs, started popping up in the country. The shift in the industry slowly started to gain momentum as people slowly but enthusiastically started to move to online from offline. When the pandemic hit, the industry came to a standstill as all non-essential travel stopped. As restrictions were lifted and people grew impatient, domestic travel picked up again from September and domestic travel grew approximately four times from October 2020 to January 2021. With the resurrection of the industry, the shift to online has become more apparent as people avoided physical visits to the agent offices, stations and so on. Slowly, the convenience of online booking was paying off and the appeal is continuing to grow.
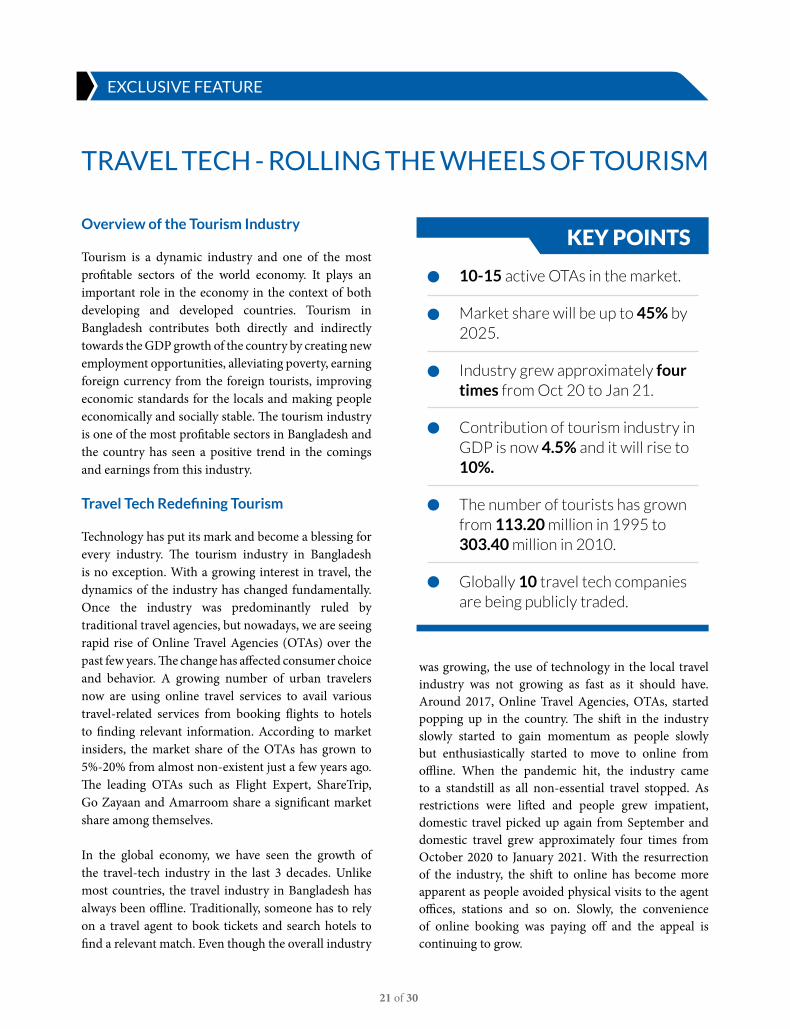
• 10-15 active OTAs in the market.
• Market share will be up to 45% by 2025.
• Industry grew approximately four times from Oct 20 to Jan 21.
• Contribution of tourism industry in GDP is now 4.5% and it will rise to 10%.
• The number of tourists has grown from 113.20 million in 1995 to 303.40 million in 2010.
• Globally 10 travel tech companies are being publicly traded.
KEY POINTS
22 of 30
ShareTrip: ShareTrip is the country’s first and leading online travel platform that
provides end to end travel solution and experience. Initially started with the name Travel Booking BD, they had a dream to make travel easier for people. Customers can avail their travel services by using their app or through their website. They do not want to limit their services only to the direct customers and have already built their own B2B portal. Through the portal, they are aiming to cater to the travel business entities.
Amarroom: Amarroom is a Dhaka-based domestic market focused OTA. The company
started its operation in 2016 and quickly managed to get attention from the market. Amarroom has created an in-house inventory management software for the local hotels which it offers for free to hotels. Hotels can use the inventory to manage their off-line inventory as well as online sales through Amarroom. Amarroom’s plan was to build a technology-powered ecosystem where all domestic hotels, resorts, airlines, buses and relevant service providers will be integrated and offer cost-efficient and flexible tourism services to the people with the aim to fulfill an important gap in the market.
Go Zayaan: GoZayaan is a travel tech company which focuses on the emerging
market of Bangladesh. The company provides one-stop online travel solution for booking local and international flights and also reserving hotel rooms for holidays, thereby providing the travelers the ease to book tickets by being the first-ever platform in Bangladesh that accepts payment from both local currency cards as well as mobile financial services. Recently, to expand its service offerings and to invest in its in-house developed technology platform, GoZayaan has received a foreign investment of 22 crores.
Flight Expert: Flight Expert, one of the very first online based travel agency, was
founded in 2016 aiming to unlock all the facilities of Online Travel Agency (OTA) so that people can easily book local and international flights or reserve hotels online, all at once. Flight Expert holds close to 35% market share in the OTA booking segment in Bangladesh. The company operates booking services throughout the world and has listings of about 250,000 hotels and over 600 airlines. Aiming to provide quality services to people, Flight Expert successfully reached out to people over internet and smartphones. Now, it is regarded as one of the best OTAs in Bangladesh.
Major Players in the Industry
23 of 30
The Future of Travel Tech
Tourism industry has experienced major impact due to the increased popularity of internet over the years. In the beginning, travel suppliers went online to provide information. Now, major online travel sites are much more likely to offer booking options to tech-savvy consumers who can go beyond simple transactions such as point-to point air and hotel reservations. In fact, travel packages are accounting for an increased share of online business in the tourism industry. The tourism online business is growing fast and the competition is fierce. The online travel agencies are expected to flourish exponentially in the future years. Online advertising is essential in this particular industry for companies to gain customers and therefore to make profit. Tourism-related businesses need to understand
the full potential of this marketing tool in order to succeed against the major players. Keeping up with the pace of technological development and global trends, Bangladesh’s travel market is expected to experience exponential growth in the coming years.
COVID-19 and its ramifications on the industry has acted as a wake-up call for tourism players globally, forcing them to become creative while embracing digital technology. The post-pandemic world will see travelers become more dependent on digital channels. Therefore, it is crucial for tourism players to embrace digital technology to accommodate these travelers or risk losing customers to competitors. While traditional travel agencies may find it difficult when OTAs make aggressive moves, the reality of travel services in Bangladesh moving predominantly online is inevitable.
24 of 30
CAPITAL MARKET REVIEW
Performance of Equity Markets of Bangladesh and Peer Countries
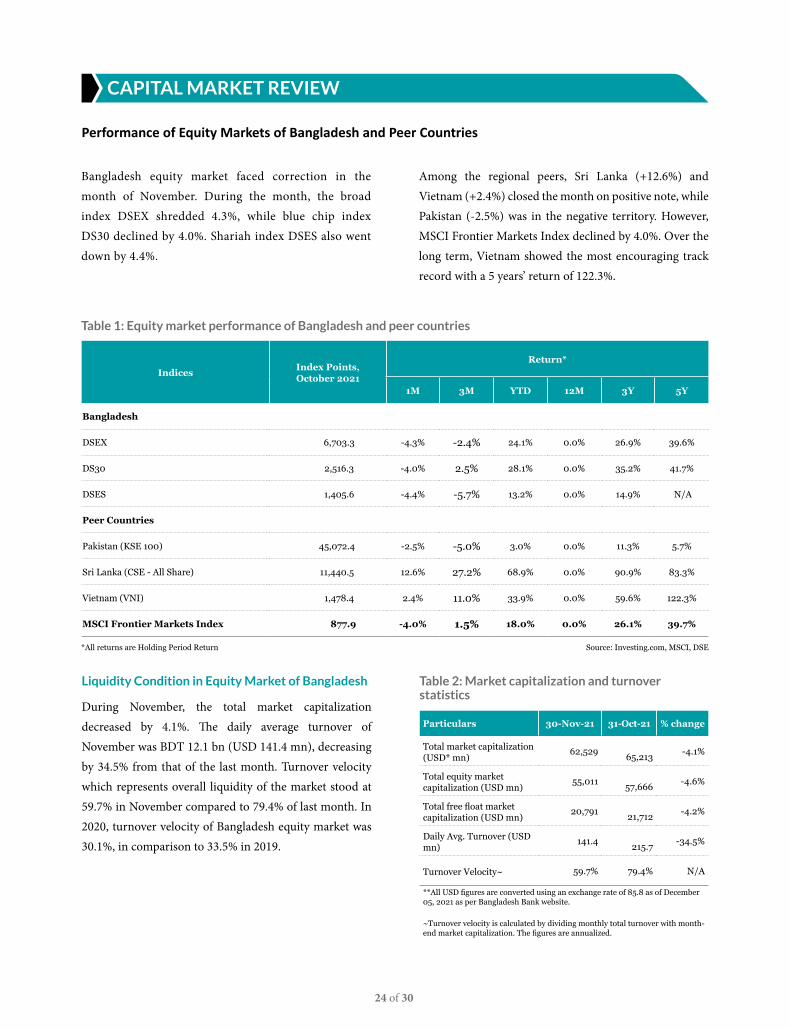
Bangladesh equity market faced correction in the month of November. During the month, the broad index DSEX shredded 4.3%, while blue chip index DS30 declined by 4.0%. Shariah index DSES also went down by 4.4%.
Among the regional peers, Sri Lanka (+12.6%) and Vietnam (+2.4%) closed the month on positive note, while Pakistan (-2.5%) was in the negative territory. However, MSCI Frontier Markets Index declined by 4.0%. Over the long term, Vietnam showed the most encouraging track record with a 5 years’ return of 122.3%.
Liquidity Condition in Equity Market of Bangladesh
During November, the total market capitalization decreased by 4.1%. The daily average turnover of November was BDT 12.1 bn (USD 141.4 mn), decreasing by 34.5% from that of the last month. Turnover velocity which represents overall liquidity of the market stood at 59.7% in November compared to 79.4% of last month. In 2020, turnover velocity of Bangladesh equity market was 30.1%, in comparison to 33.5% in 2019.
Table 2: Market capitalization and turnover statistics
Particulars 30-Nov-21 31-Oct-21 % change
Total market capitalization (USD* mn)
62,529 65,213 -4.1%
Total equity market capitalization (USD mn)
55,011 57,666 -4.6%
Total free float market capitalization (USD mn)
20,791 21,712 -4.2%
Daily Avg. Turnover (USD mn)
141.4 215.7 -34.5%
Turnover Velocity~ 59.7% 79.4% N/A
**All USD figures are converted using an exchange rate of 85.8 as of December 05, 2021 as per Bangladesh Bank website.
~Turnover velocity is calculated by dividing monthly total turnover with month-end market capitalization. The figures are annualized.
Table 1: Equity market performance of Bangladesh and peer countries
Indices Index Points, October 2021
Return*
1M 3M YTD 12M 3Y 5Y
Bangladesh
DSEX 6,703.3 -4.3% -2.4% 24.1% 0.0% 26.9% 39.6%
DS30 2,516.3 -4.0% 2.5% 28.1% 0.0% 35.2% 41.7%
DSES 1,405.6 -4.4% -5.7% 13.2% 0.0% 14.9% N/A
Peer Countries
Pakistan (KSE 100) 45,072.4 -2.5% -5.0% 3.0% 0.0% 11.3% 5.7%
Sri Lanka (CSE - All Share) 11,440.5 12.6% 27.2% 68.9% 0.0% 90.9% 83.3%
Vietnam (VNI) 1,478.4 2.4% 11.0% 33.9% 0.0% 59.6% 122.3%
MSCI Frontier Markets Index 877.9 -4.0% 1.5% 18.0% 0.0% 26.1% 39.7%
*All returns are Holding Period Return Source: Investing.com, MSCI, DSE
25 of 30
Figure 2: Historical market P/E* and it’s median
*Price Earnings (P/E) Ratio is calculated by dividing total market capitalization of all profit making listed companies with their total audited annual earnings.
Source: CEIC, DSES
Month End P/E Ratio Median P/E
Current Market P/E* in Context of History
4.00x
9.00x
14.00x
19.00x
24.00x
29.00xMonth End P/E Ratio, 18.41x
Median P/E, 15.12x
Jan
-01
Jun
-01
No
v-0
1A
pr-
02
Au
g-0
2Ja
n-0
3Ju
n-0
3O
ct-0
3M
ar-
04
Au
g-0
4D
ec-
04
Ma
y-0
5O
ct-0
5M
ar-
06
Jul-
06
De
c-0
6M
ay
-07
Se
p-0
7F
eb
-08
Jul-
08
No
v-0
8A
pr-
09
Se
p-0
9F
eb
-10
Jun
-10
No
v-1
0A
pr-
11
Au
g-1
1Ja
n-1
2Ju
n-1
2O
ct-1
2M
ar-
13
Au
g-1
3Ja
n-1
4M
ay
-14
Oct
-14
Ma
r-1
5Ju
l-1
5D
ec-
15
Ma
y-1
6S
ep
-16
Fe
b-1
7Ju
l-1
7D
ec-
17
Ap
r-1
8S
ep
-18
Fe
b-1
9Ju
n-1
9N
ov
-19
Ap
r-2
0A
ug
-20
Jan
-21
Jun
-21
No
v-2
1
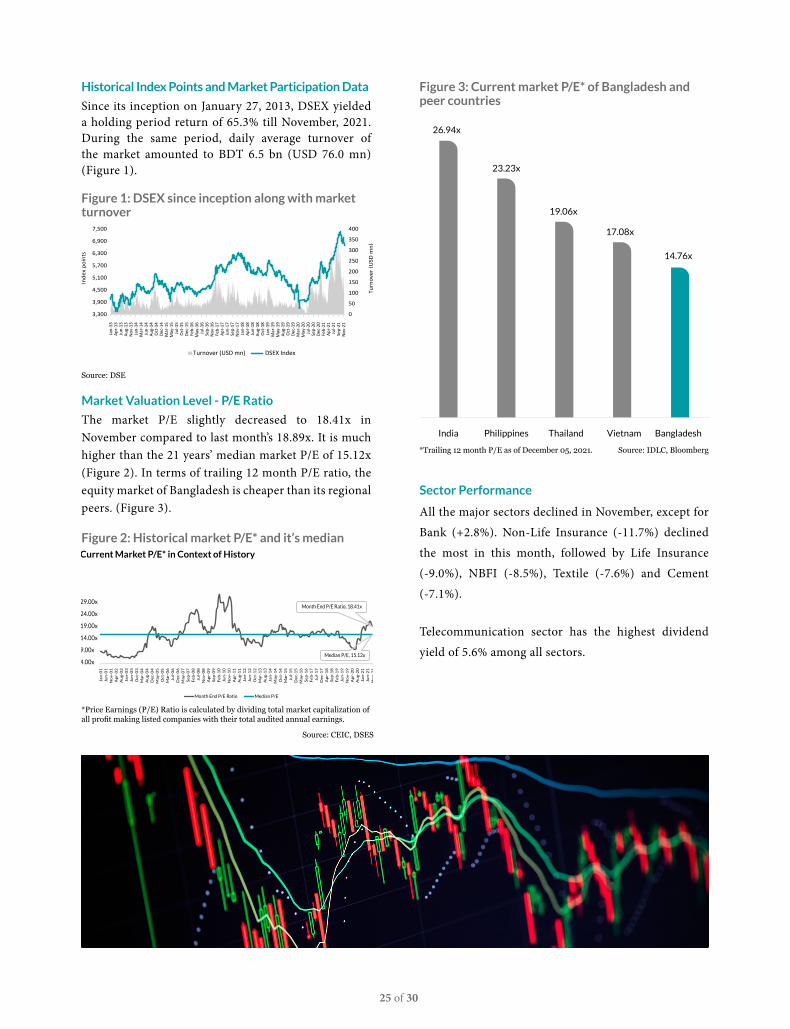
Historical Index Points and Market Participation Data
Sector Performance
Figure 3: Current market P/E* of Bangladesh and peer countriesSince its inception on January 27, 2013, DSEX yielded
a holding period return of 65.3% till November, 2021. During the same period, daily average turnover of the market amounted to BDT 6.5 bn (USD 76.0 mn) (Figure 1).
Market Valuation Level - P/E Ratio
The market P/E slightly decreased to 18.41x in November compared to last month’s 18.89x. It is much higher than the 21 years’ median market P/E of 15.12x (Figure 2). In terms of trailing 12 month P/E ratio, the equity market of Bangladesh is cheaper than its regional peers. (Figure 3).
26.94x
23.23x
19.06x
17.08x
14.76x
India Philippines Thailand Vietnam Bangladesh
*Trailing 12 month P/E as of December 05, 2021. Source: IDLC, Bloomberg
Source: DSE
Turnover (USD mn) DSEX Index
Turn
over
(USD
mn)
Inde
x po
ints
0
50
100
150
200
250
300
350
400
3,300
3,900
4,500
5,100
5,700
6,300
6,900
7,500
Jan-
13Ap
r-13
Jun-
13Au
g-13
Nov
-13
Jan-
14M
ar-1
4Ju
n-14
Aug-
14O
ct-1
4De
c-14
Mar
-15
May
-15
Jul-1
5O
ct-1
5De
c-15
Feb-
16M
ay-1
6Ju
l-16
Sep-
16N
ov-1
6Fe
b-17
Apr-
17Ju
n-17
Sep-
17N
ov-1
7Ja
n-18
Apr-
18Ju
n-18
Aug-
18O
ct-1
8Ja
n-19
Mar
-19
May
-19
Aug-
19O
ct-1
9De
c-19
Mar
-20
May
-20
Jul-2
0Se
p-20
Dec-
20Fe
b-21
Apr-
21Ju
l-21
Sep-
21N
ov-2
1
Figure 1: DSEX since inception along with market turnover
All the major sectors declined in November, except for Bank (+2.8%). Non-Life Insurance (-11.7%) declined the most in this month, followed by Life Insurance (-9.0%), NBFI (-8.5%), Textile (-7.6%) and Cement (-7.1%).
Telecommunication sector has the highest dividend yield of 5.6% among all sectors.
26 of 30
Table 3: Sector performance snapshot
SectorMarket Capitalization
(USD mn) Return*P/E (x)** P/BV (x)^ Dividend
Yield~Total Free Float 1M 3M YTD 12M 3Y 5Y
Telecommunication 8,145 870 -3.5% -5.1% 7.4% 29.7% 31.4% 79.9% 17.9 7.3 5.6%Pharmaceuticals & Chemicals 8,177 4,462 -1.5% 0.2% 17.2% 32.4% 46.5% 74.4% 16.2 3.1 2.0%
Bank 8,614 4,698 2.8% 3.8% 27.0% 29.8% 38.8% 77.5% 8.0 0.8 3.2%
Engineering 6,269 1,270 -6.2% -16.8% 6.4% 46.1% 47.7% 57.9% 19.0 2.6 2.1%
Fuel & Power 5,210 1,506 -5.4% -8.4% 6.5% 10.8% 9.7% 33.6% 11.3 1.4 5.6%
Food & Allied 5,024 1,519 -2.9% 4.5% 46.7% 67.3% 80.6% 122.5% 23.7 9.9 2.9%
NBFI 2,531 823 -8.5% -10.4% 16.8% 37.7% 24.6% 58.4% 21.3 2.3 2.1%
Miscellaneous 2,868 1,303 -3.2% 16.3% 74.3% 131.3% 135.2% 166.0% 13.1 2.7 2.2%
Textile 1,834 1,038 -7.6% -10.4% 34.4% 41.2% -9.3% 29.2% 4.4 1.0 2.3%
Cement 1,511 593 -7.1% -14.1% 49.1% 79.1% 32.2% -7.4% 19.5 3.4 1.4%
Non Life Insurance 1,362 765 -11.7% -19.0% 15.5% 14.9% 224.6% 256.3% 19.0 2.4 1.8%
Life Insurance 855 501 -9.0% -4.8% 22.6% 19.2% 33.6% 61.9% 39.9 7.7 1.6%
Travel & Leisure 292 154 -0.1% 20.3% 9.3% 10.7% 10.0% 40.2% 25.6 0.9 1.7%
Ceramics 354 135 -9.2% -11.0% 35.2% 45.2% 18.2% 26.8% 31.6 2.0 1.7%
IT 454 285 1.6% -6.6% 18.3% 25.0% 12.7% 17.2% 26.2 3.1 1.3%
Services & Real Estate 321 174 -7.7% 5.3% 29.2% 48.7% 42.1% 17.6% 21.0 1.6 1.8%
Tannery 372 202 -7.4% 21.0% 58.4% 68.4% 11.2% 15.9% 22.2 2.9 0.9%
Paper & Printing 236 74 -6.9% -20.1% -12.6% -5.7% -47.3% -47.5% 24.4 1.4 1.1%
Jute 22 13 -7.9% -21.7% -35.4% -8.3% -49.4% 87.2% 370.5 5.5 0.2%
Market 55,011 20,791 -4.3% -2.4% 24.1% 0.0% 26.9% 39.6% 13.5 1.9 3.2%
*All returns are Holding Period Return.
**Price Earnings (P/E) Ratio is calculated by dividing total market capitalization of all profit making listed companies with their annualized earnings.
^P/BV is calculated by dividing total market capitalization of listed companies with their respective total book values, excluding companies with negative book values.
~Dividend yield is calculated by dividing last year’s declared cash dividend with market capitalization.
Table 4: Performance of different market cap classes
Cap Class
Definition based on market
capitalization (USD mn)
% of total equity Mcap
Return*P/E (x) P/BV (x) Dividend
Yield1M 3M YTD 12M 3Y 5Y
Large ≥118 78.2% -2.8% -0.3% 20.3% 31.7% 72.3% 122.3% 19.6 2.0 3.8%
Mid 36-117 11.4% -3.0% -4.8% 32.9% 41.2% -31.0% -25.6% 29.4 1.4 2.2%
Small 12-35 8.1% -9.7% -15.4% 21.2% 28.4% 52.6% 81.8% 78.7 1.2 2.0%
Micro <12 2.3% -5.2% -20.0% 36.3% 41.2% -86.7% -84.3% 166.5 0.8 0.6%
Market - - -4.3% -2.4% 24.1% 0.0% 26.9% 39.6% 13.5 1.9 3.2%
*All returns are Holding Period Return
Cap Class Performance
During the month of November, all the Cap classes closed in negative territory. Small Cap Class (-14.1%) declined the most. Large Cap was the highest dividend yielding (3.8%) class.
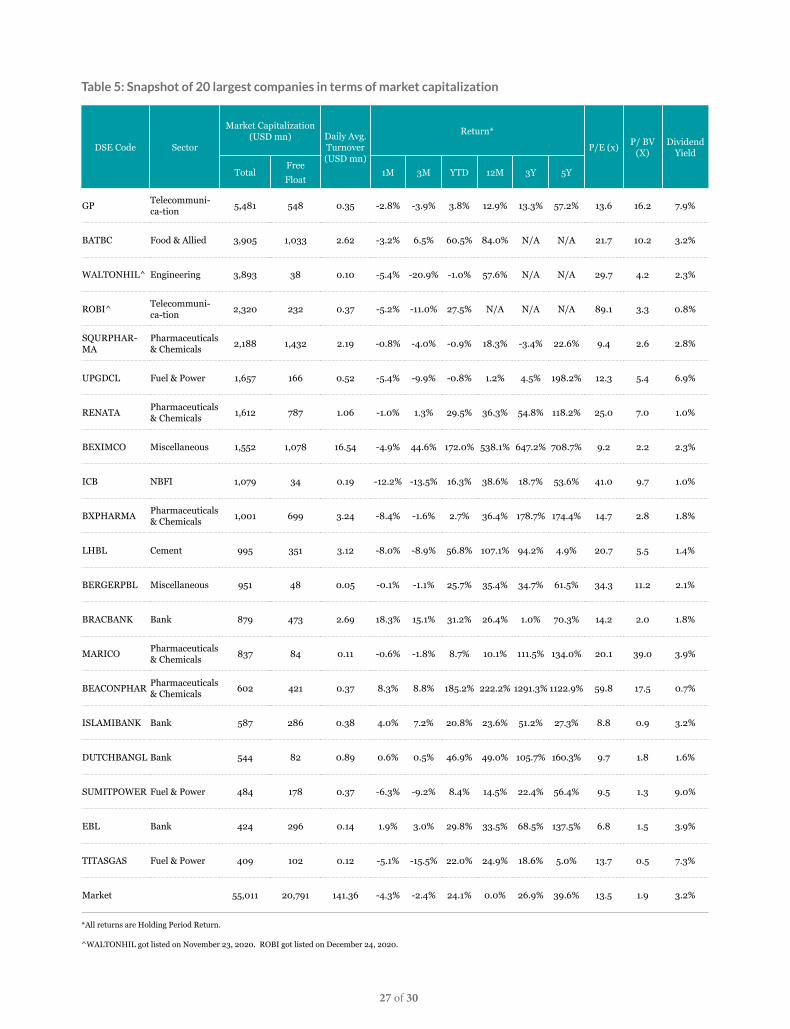
Performance of 20 Largest Listed Companies in Bangladesh
Among the 20 largest listed companies in terms of market capitalization, BRACBANK posted astounding return of 18.3% in November. BEACONPHAR (+8.3%), ISLAMIBANK (+4.0%), EBL (+1.9%) and DUTCHBANGL (+0.6%) also closed the month in positive territory. ICB (-12.2%) decline the most followed by BXPHARMA (-8.4%), LHBL (-8.0%), SUMITPOWER (-6.3%), UPGDCL (-5.4%) and WALTOHIL (-5.4%). Majority of these companies yielded outstanding return over longer time horizon (5 years) such as BEACONPHARMA (+1,122.9%), BEXIMCO (+708.7%), UPGDCL (+198.2%), BXPHARMA (+174.4%) and DUTCHBANGL (+160.3%).
Among the scrips, SUMITPOWER, GP, TITASGAS, UPGDCL, and MARICO recorded higher dividend yield compared to that of market.
27 of 30
Table 5: Snapshot of 20 largest companies in terms of market capitalization
DSE Code Sector
Market Capitalization (USD mn) Daily Avg.
Turnover (USD mn)
Return*
P/E (x) P/ BV (X)
Dividend Yield
TotalFreeFloat
1M 3M YTD 12M 3Y 5Y
GP Telecommuni-ca-tion 5,481 548 0.35 -2.8% -3.9% 3.8% 12.9% 13.3% 57.2% 13.6 16.2 7.9%
BATBC Food & Allied 3,905 1,033 2.62 -3.2% 6.5% 60.5% 84.0% N/A N/A 21.7 10.2 3.2%
WALTONHIL^ Engineering 3,893 38 0.10 -5.4% -20.9% -1.0% 57.6% N/A N/A 29.7 4.2 2.3%
ROBI^ Telecommuni-ca-tion 2,320 232 0.37 -5.2% -11.0% 27.5% N/A N/A N/A 89.1 3.3 0.8%
SQURPHAR-MA
Pharmaceuticals & Chemicals 2,188 1,432 2.19 -0.8% -4.0% -0.9% 18.3% -3.4% 22.6% 9.4 2.6 2.8%
UPGDCL Fuel & Power 1,657 166 0.52 -5.4% -9.9% -0.8% 1.2% 4.5% 198.2% 12.3 5.4 6.9%
RENATA Pharmaceuticals & Chemicals 1,612 787 1.06 -1.0% 1.3% 29.5% 36.3% 54.8% 118.2% 25.0 7.0 1.0%
BEXIMCO Miscellaneous 1,552 1,078 16.54 -4.9% 44.6% 172.0% 538.1% 647.2% 708.7% 9.2 2.2 2.3%
ICB NBFI 1,079 34 0.19 -12.2% -13.5% 16.3% 38.6% 18.7% 53.6% 41.0 9.7 1.0%
BXPHARMA Pharmaceuticals & Chemicals 1,001 699 3.24 -8.4% -1.6% 2.7% 36.4% 178.7% 174.4% 14.7 2.8 1.8%
LHBL Cement 995 351 3.12 -8.0% -8.9% 56.8% 107.1% 94.2% 4.9% 20.7 5.5 1.4%
BERGERPBL Miscellaneous 951 48 0.05 -0.1% -1.1% 25.7% 35.4% 34.7% 61.5% 34.3 11.2 2.1%
BRACBANK Bank 879 473 2.69 18.3% 15.1% 31.2% 26.4% 1.0% 70.3% 14.2 2.0 1.8%
MARICO Pharmaceuticals & Chemicals 837 84 0.11 -0.6% -1.8% 8.7% 10.1% 111.5% 134.0% 20.1 39.0 3.9%
BEACONPHAR Pharmaceuticals & Chemicals 602 421 0.37 8.3% 8.8% 185.2% 222.2% 1291.3% 1122.9% 59.8 17.5 0.7%
ISLAMIBANK Bank 587 286 0.38 4.0% 7.2% 20.8% 23.6% 51.2% 27.3% 8.8 0.9 3.2%
DUTCHBANGL Bank 544 82 0.89 0.6% 0.5% 46.9% 49.0% 105.7% 160.3% 9.7 1.8 1.6%
SUMITPOWER Fuel & Power 484 178 0.37 -6.3% -9.2% 8.4% 14.5% 22.4% 56.4% 9.5 1.3 9.0%
EBL Bank 424 296 0.14 1.9% 3.0% 29.8% 33.5% 68.5% 137.5% 6.8 1.5 3.9%
TITASGAS Fuel & Power 409 102 0.12 -5.1% -15.5% 22.0% 24.9% 18.6% 5.0% 13.7 0.5 7.3%
Market 55,011 20,791 141.36 -4.3% -2.4% 24.1% 0.0% 26.9% 39.6% 13.5 1.9 3.2%
*All returns are Holding Period Return.
^WALTONHIL got listed on November 23, 2020. ROBI got listed on December 24, 2020.
28 of 30
Table 6: Top ten open end funds based on 4Y return (CAGR) performance
Name Asset Management Company
Fund Size (USD mn)
NAV Return
2021 YTD* 2020 2017-2020
CAPM Unit Fund CAPM 1.9 27.0% 30.6% 11.4%
UFS-Pragati Life Unit Fund UFS 1.4 26.5% 35.5% 9.1%
LankaBangla 1st Balanced Unit Fund LankaBangla 6.3 20.9% 29.2% 8.7%
Peninsula AMCL BDBL Unit Fund One Peninsula 3.2 26.4% 35.3% 8.5%
IDLC Balanced Fund IDLC 6.3 19.0% 29.4% 8.3%
Seventh ICB Unit Fund ICB 5.7 22.9% 20.4% 7.7%
VIPB Accelerated Income Unit Fund VIPB 8.5 16.4% 13.0% 7.2%
ICB AMCL Pension Holders' Unit Fund ICB 4.5 27.6% 36.5% 6.9%
ATC Shariah Unit Fund ATCP 1.8 12.1% 17.6% 6.6%
Third ICB Unit Fund ICB 4.5 16.6% 23.9% 6.4%
Market (Broad Index) Return (%) 26.8% 22.3% 1.8%
*Based on published NAV and DSEX point of November 25, 2021
Table 7: Top ten close end funds based on 5Y return (CAGR) performance
DSE Code FundManager
Fund Size (USD mn)
Price1
(BDT)NAV1
(BDT)Price/NAV
DividendYield2 (%)
NAV Return3
Redemption Year 4
2021 YTD 2020 2018-2020 2016-20
NLI1STMF VIPB 8.4 13.5 14.3 94.5% 13.0% 16.8% 13.4% -0.1% 9.5% 2022
GRAMEENS2 AIMS 43.4 16.4 20.4 80.3% 7.9% 16.2% 18.5% 2.7% 9.2% 2023
RELIANCE1 AIMS 10.0 11.0 14.2 77.2% 9.5% 17.6% 15.5% 2.2% 8.7% 2021
1STPRIMFMF ICB AMCL 3.6 20.8 15.3 136.3% 3.8% 40.0% 35.7% 3.1% 8.5% 2029
PRIME1ICBA ICB AMCL 12.3 7.1 10.5 67.4% 10.6% 37.4% 33.0% 2.8% 8.1% 2030
ICBSONALI1 ICB 12.5 8.0 10.7 74.6% 8.8% 29.4% 28.3% 2.4% 7.8% 2023
ICBEPMF1S1 ICB 8.6 7.1 9.8 72.3% 8.5% 40.1% 40.0% 1.4% 6.9% 2030
ICBAMCL2ND ICB 6.4 10.4 10.9 95.4% 7.7% 38.1% 35.1% 0.3% 6.9% 2029
LRGLOBMF1 LR GLOB-AL 41.8 7.0 11.5 60.7% 21.6% -0.6% 24.9% 2.0% 6.7% 2031
ICB3RDNRB ICB AMCL 11.4 6.8 9.7 69.8% 10.3% 38.5% 37.2% 1.4% 6.6% 2030
Market 26.8% 22.3% -4.7% 3.1%
1 Price as of November 28, 2021, and NAV published on November 25, 2021.
2 On last cash dividend declared.
3 CAGR computed for respected periods, except for 2020 and 2021 YTD, adjusted for dividend. YTD returns of funds debuting within the year represent return generated since debut, hence is not directly comparable with return of funds that operated throughout the year.
4 In reference to BSEC Press Release weGmBem/gyLcvÎ (3q LÛ)/2011/25 published on November 16, 2018, tenure of existing listed closed end mutual funds can be extended by another tenure equal to maximum 10 years, provided that the full tenure of the subject fund does not exceed 20 years in total. However, the mutual funds those are not willing to extend their tenure will still have the option to convert or wind up as per rules and regulations.
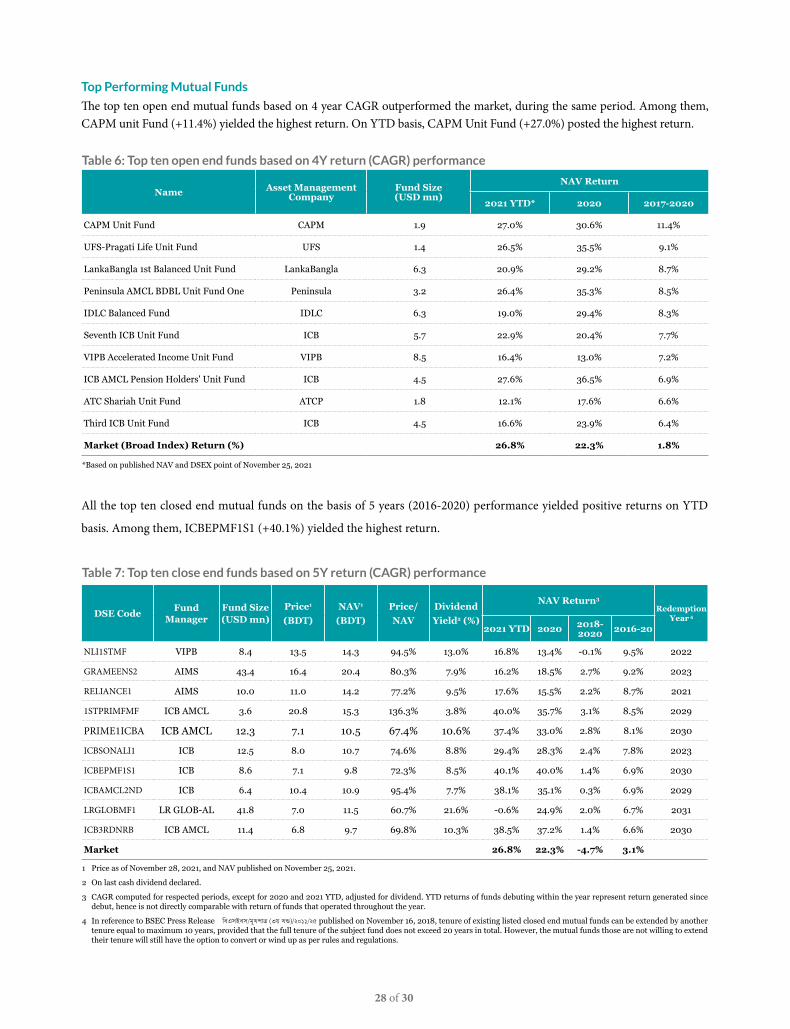
Top Performing Mutual Funds
The top ten open end mutual funds based on 4 year CAGR outperformed the market, during the same period. Among them, CAPM unit Fund (+11.4%) yielded the highest return. On YTD basis, CAPM Unit Fund (+27.0%) posted the highest return.
All the top ten closed end mutual funds on the basis of 5 years (2016-2020) performance yielded positive returns on YTD
basis. Among them, ICBEPMF1S1 (+40.1%) yielded the highest return.
29 of 30
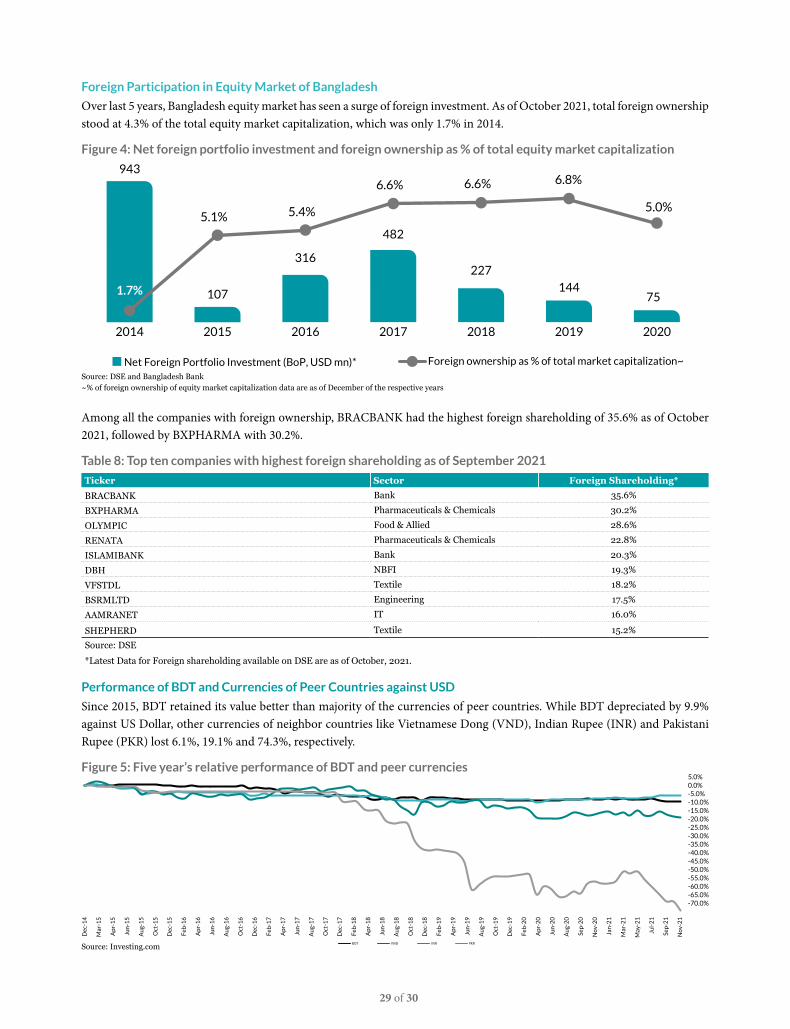
Foreign Participation in Equity Market of Bangladesh
Over last 5 years, Bangladesh equity market has seen a surge of foreign investment. As of October 2021, total foreign ownership stood at 4.3% of the total equity market capitalization, which was only 1.7% in 2014.
Performance of BDT and Currencies of Peer Countries against USD
Since 2015, BDT retained its value better than majority of the currencies of peer countries. While BDT depreciated by 9.9% against US Dollar, other currencies of neighbor countries like Vietnamese Dong (VND), Indian Rupee (INR) and Pakistani Rupee (PKR) lost 6.1%, 19.1% and 74.3%, respectively.
Among all the companies with foreign ownership, BRACBANK had the highest foreign shareholding of 35.6% as of October 2021, followed by BXPHARMA with 30.2%.
Source: DSE and Bangladesh Bank~% of foreign ownership of equity market capitalization data are as of December of the respective years
Figure 4: Net foreign portfolio investment and foreign ownership as % of total equity market capitalization
943
107
316
482
227
144
2014 2015 2016 2017 2018 2019
Net Foreign Portfolio Investment (BoP, USD mn)* Foreign ownership as % of total market capitalization~
5.1% 5.4%
6.6% 6.6% 6.8%
5.0%
1.7% 75
2020
Table 8: Top ten companies with highest foreign shareholding as of September 2021
Ticker Sector Foreign Shareholding*
BRACBANK Bank 35.6%
BXPHARMA Pharmaceuticals & Chemicals 30.2%
OLYMPIC Food & Allied 28.6%
RENATA Pharmaceuticals & Chemicals 22.8%
ISLAMIBANK Bank 20.3%
DBH NBFI 19.3%
VFSTDL Textile 18.2%
BSRMLTD Engineering 17.5%
AAMRANET IT 16.0%
SHEPHERD Textile 15.2%
Source: DSE
*Latest Data for Foreign shareholding available on DSE are as of October, 2021.
Figure 5: Five year’s relative performance of BDT and peer currencies
BDT VND INR PKR
-70.0%-65.0%-60.0%-55.0%-50.0%-45.0%-40.0%-35.0%-30.0%-25.0%-20.0%-15.0%-10.0%-5.0%0.0%5.0%
Dec
-14
Mar
-15
Apr
-15
Jun-
15
Aug
-15
Oct
-15
Dec
-15
Feb-
16
Apr
-16
Jun-
16
Aug
-16
Oct
-16
Dec
-16
Feb-
17
Apr
-17
Jun-
17
Aug
-17
Oct
-17
Dec
-17
Feb-
18
Apr
-18
Jun-
18
Aug
-18
Oct
-18
Dec
-18
Feb-
19
Apr
-19
Jun-
19
Aug
-19
Oct
-19
Dec
-19
Feb-
20
Apr
-20
Jun-
20
Aug
-20
Sep-
20
Nov
-20
Jan-
21
Mar
-21
May
-21
Jul-
21
Sep-
21
Nov
-21
Source: Investing.com
30 of 30