a of 30 volume 17 l issue 1 l january 2021 - idlc
TRANSCRIPT

a of 30
Volume 17 l Issue 1 l January 2021

03Economy at a Glance
04Month In Brief
05For the Record
06World Economic Indicator
07Banking Data Corner
08-9Research in Focus • Global Banking Annual Review
2020: A Test of Resilience
11-14Cover Story• Impact of Covid-19 Pandemic on
the Coastal Shipping Industry of Bangladesh
With a disruption in global trade due the pandemic, the impact has been large on the coastal shipping industry. 80% of our imports relies on this industry which is eventually affecting the overall economy. In 2021 per vessel trips could come down to 6 or less trips which is normally 12-18 trips. But as there is raising demand is the industry, when the economic situation will ease up; the industry will get back to speed as international supply chain is slowly becoming normal.
16-19Exclusive Feature• Cement Industry Current Market Update The cement industry has been making a significant comeback after the COVID-19 situation. The industry has suffered from over capacity which is around 45 million tonnes more than the current demand. The annual per capita cement consumption has grown from 45kg to 200kg in the last two decades because more companies are continuing to invest like Bashundhara Group. As few government projects were halted because of the situation, some companies started facing negative growth but it’s bouncing back to normal quite fast
20 -21Spotlight on Startup • KLUDIO
22-24Career Insight • BecominganACCAqualified
25-30Capital Market Review
contents
Allrightsreserved.Nopartofthisjournalmaybereproducedinanyform,byprint,photoprint,microfilmoranyothermeanswithoutwrittenpermissionfromthepublisher.Des
ign
& Pr
intin
g: n
ym
phea
l w
ww
.nym
phea
-bd.
com

The Costal Shipping and Cement Industry of Bangladesh: Recovering from the Pandemic Wave
FROM THE EDITOR
The cement industry of Bangladesh has been recognized as one of the fastest growing cement markets worldwide, with a double digit growth rate over the last decade, and an annual demand of around 33 million tonnes. This is owing to the construction of mega projects undertaken, and the constant infrastructural development on way to further develop the nation. Yet Bangladesh remains as one of the least cement consuming nations in the world topped by China, India, Myanmar etc. The deadly wave of the Coronavirus, followed by lockdowns has had an adverse impact on an industry that employs over 10,60,000 people directly and indirectly. Disrupted supply chains, halted projects, and fluctuating exchange rates have made it challenging for cement manufacturers and exporters to maintain a smooth business flow as companies incurred losses and capacity remained underutilized. However, investors remain hopeful of the future as they approve fund to enhance the cement production capacity of Bangladesh.
As we speak of exports and imports, a crucial industry comes into focus – the Coastal Shipping industry of Bangladesh, which not only assists trade but plays a vital role in the inland waterway transport system. Lightering vessels, in particular, have played an important role in assuring safe offloading process from Mother Ships as ports in Bangladesh are not deep enough for many international ships to navigate through. Necessary lockdowns, to contain the virus, have forced trade levels down, allowing only drugs and other essential commodities to be traded. This put lightering vessel companies in a state of despair as they struggled to cover their overheads with minimal business activity. However, as lockdowns slowly recede and several mega projects start construction, the industry is showing promising growth prospects.
Sushmita Saha Assistant Manager IDLC Finance Limited
INDUSTRY & EQUITY ANALYSIS TEAMASIF SAAD BIN SHAMS
Email: [email protected]
ADNAN RASHIDEmail: [email protected]
BONNISHIKHA CHOWDHURYEmail: [email protected]
SUSHMITA SAHAEmail: [email protected]
3 of 30
REMITTANCE
PRIVATE SECTOR CREDIT GROWTH
ECONOMYAT A GLANCE
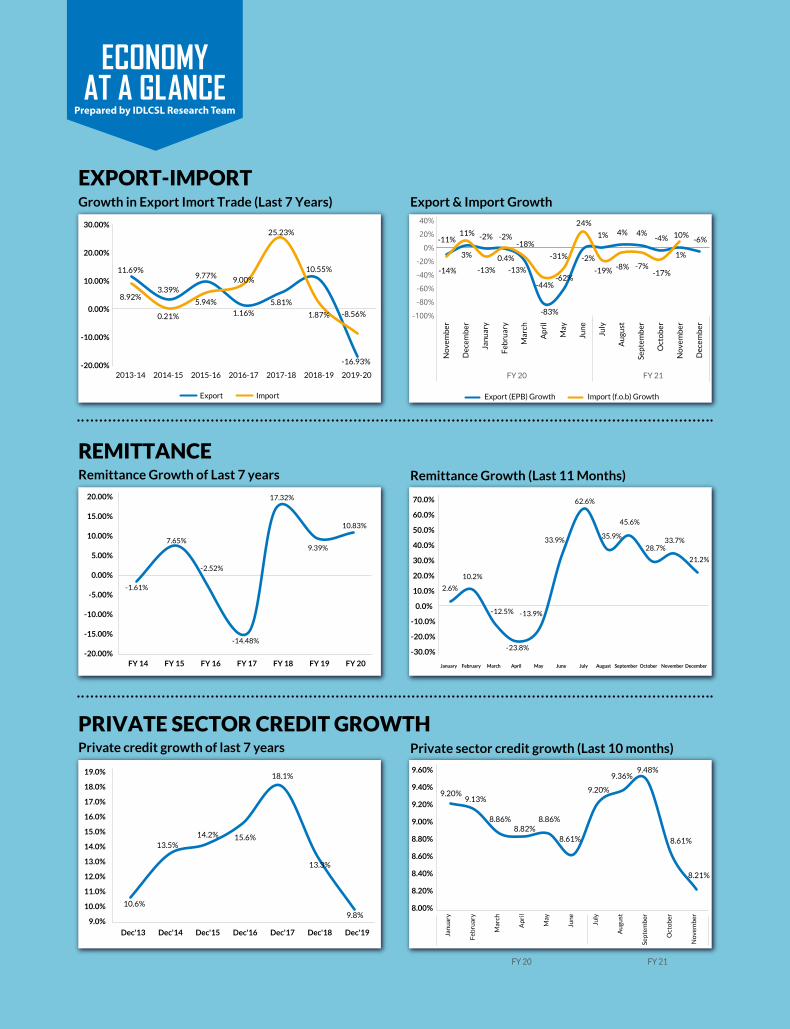
EXPORT-IMPORT Growth in Export Imort Trade (Last 7 Years)
Remittance Growth of Last 7 years
Export & Import Growth
Remittance Growth (Last 11 Months)
Private credit growth of last 7 years Private sector credit growth (Last 10 months)
Export Import Export (EPB) Growth Import (f.o.b) Growth
10.6%
13.5%14.2% 15.6%
18.1%
13.3%
9.8%9.0%
10.0%
11.0%
12.0%
13.0%
14.0%
15.0%
16.0%
17.0%
18.0%
19.0%
Dec'13 Dec'14 Dec'15 Dec'16 Dec'17 Dec'18 Dec'19
-1.61%
7.65%
-2.52%
-14.48%
17.32%
9.39%
10.83%
-20.00%
-15.00%
-10.00%
-5.00%
0.00%
5.00%
10.00%
15.00%
20.00%
FY 14 FY 15 FY 16 FY 17 FY 18 FY 19 FY 20
Prepared by IDLCSL Research Team
11.69%
3.39%
9.77%
1.16%
5.81%
10.55%
-16.93%
8.92%
0.21%
5.94%
9.00%
25.23%
1.87% -8.56%
-20.00%
-10.00%
0.00%
10.00%
20.00%
30.00%
2013-14 2014-15 2015-16 2016-17 2017-18 2018-19 2019-20
-11%
3%
-2% -2%-18%
-83%
-62%
-2%
1% 4% 4%-4%
1%
-6%
-14%
11%
-13%
0.4%
-13%
-44%
-31%
24%
-19% -8% -7%-17%
10%
-100%-80%-60%-40%-20%
0%20%40%
No
vem
ber
Dec
emb
er
Janu
ary
Feb
ruar
y
Mar
ch
Apr
il
May
June
July
Au
gust
Sep
tem
ber
Oct
ob
er
No
vem
ber
Dec
emb
er
FY 20 FY 21
-30.0%
-20.0%
-10.0%
0.0%
10.0%
20.0%
30.0%
40.0%
50.0%
60.0%
70.0%
January February March April May June July August September October November December
2.6%
10.2%
-12.5%
-23.8%
-13.9%
33.9%
62.6%
35.9%
45.6%
28.7%33.7%
21.2%
Janu
ary
Feb
ruar
y
Mar
ch
Apr
il
May
June
July
Au
gust
Sep
tem
ber
Oct
ob
er
Nov
emb
er
FY 20 FY 21
9.20%9.13%
8.86%8.82%
8.86%
8.61%
9.20%
9.36%9.48%
8.61%
8.21%
8.00%
8.20%
8.40%
8.60%
8.80%
9.00%
9.20%
9.40%
9.60%

4 of 30
The Executive Committee of the National Economic Council (Ecnec) cleared four development projects, including BDT 6.93 billion one to install the third submarine cable.
MONTH IN BRIEF
The Bangladesh Securities and Exchange Commission has moved to scrap the lottery system introduced for general investors in initial public offering and to allow every applicant to get shares on pro rata basis.
11 banks have failed to meet the minimum capital requirement despite the central bank’s deferral facility on keeping their provisioning against defaulted loans.
The Ministry of Industries has proposed big tax cuts and other incentives to automobile assemblers and parts manufacturers to boost local manufacturing.
The volume of non-performing loans (NPLs) fell by nearly 2% or BDT 16.76 billion to BDT 944.40 billion as on September 30 from BDT 961.17 billion as on June 30 this year.
28 listed companies have failed to comply with rules related to at least 30% joint shareholding by directors by the stipulated time.
The amount of foreign debt per capita rose by 6.8% in the fiscal 2019-20 compared to the previous financial year, 2018-19.
Savings in banking sector rising amid pandemic
Banks will have to set aside an additional amount of around BDT 10,000 crore in provisioning to absorb shocks arising from the ongoing economic hardship caused by the coronavirus pandemic.
The government has lowered the maximum investment limit in national savings bonds for non-resident Bangladeshis (NRBs).MAR APR MAY JUN JUL AUG SEP
10
.22
9.8
5
9.8
8
9.9
7
-4.5
2
3.3
7
4.4
1
14
.41
6.9
1
11
.94
7.1
2
21
.49
8.6
6
20
.75
2019 2020
DEMAND DEPOSIT GROWTH (Figures in percent)

5 of 30
For the Record
THE AMOUNT OF NPLS MAY FALL FURTHER IN THE FINAL
QUARTER OF THE YEAR AS BANKS WILL EXPEDITE THEIR
RECOVERY DRIVES
The present trend of foreign trade might continue in the coming months. But this trend is not showing any good signal
This is a positive start to the towerco regime in Bangladesh; it was much needed towards meeting the demand of quality customer service
Syed Mahbubur Rahman, Former Chairman of the Association of Bankers Bangladesh & CEO of Mutual Trust Bank Limited on NPL drop.
Professor Mustafizur Rahman, distinguished fellow at the CPD on Trade deficit drops.
Jahurul Haque, Chairman of
BTRC on Grameenphone’s
deal signing with edotco to
set up 500 towers.
Abu Farah Md. Naser, Executive Director of the Bangladesh Bank on provide loans to IT freelancers.
Kazi Sayedur Rahman, Deputy Governor of the Bangladesh Bank on remittance inflow
Md Arfan Ali, Managing Director of Bank Asia on Pandemic savings.
WE’VE ADVISED THE BANKS TO EXTEND THEIR
FINANCIAL SUPPORT TO VIRTUAL ID CARDHOLDER
FREELANCERS TO HELP THEM EXPLORE
THE POTENTIAL FREELANCING
SECTOR OF BANGLADESH
The government’s incentive and app-based services,
offered by most of the banks, have encouraged non-resident
Bangladeshis (NRBs) to send their hard-earned money through formal channels instead of informal ones
THE EXCESS SAVINGS ARE A RESULT OF CONSUMERS’ BEING SHY IN SPENDING AMID RESTRICTIONS ON MOVEMENT DURING THIS CRISIS PERIOD

6 of 30
WORLD ECONOMIC INDICATOR
Country
Nominal GDP:
October, 2020 (USD in billion)
Real GDP Growth:
October 2020 (yearly % Change)
Inflation Point to point (%)
Current Account Balance:
(% of GDP)
Interest Rates (%), Ten years treasury bond
Currency Units
(per USD)
Frontier Market
Sri Lanka 81.1 -4.55 4.20 Dec,2020 -3.63 7.80 185.39
Vietnam 340.6 1.60 0.19 Dec,2020 1.61 2.38 23,080.00
Kenya 101.0 1.05 5.62 Dec,2020 -4.90 11.98 109.29
Nigeria 443.0 -4.28 14.89 Nov,2020 -3.65 7.26 395.05
Bangladesh 330.1 5.24 5.29 Dec,2020 -0.02 5.81 84.80
Emerging Markets
Brazil 1,363.8 -5.80 4.31 Nov,2020 0.27 6.90 5.20
Saudi Arabia 680.9 -5.44 5.80 Nov,2020 -2.51 n/a 3.75
India 2,935.6 -10.29 6.93 Nov,2020 0.33 5.86 73.00
Indonesia 1,088.8 -1.50 1.68 Dec,2020 -1.30 6.00 13,884.00
Malaysia 336.3 -6.00 -1.70 Nov,2020 0.94 2.60 4.01
Philippines 367.4 -8.26 3.30 Nov,2020 1.61 3.02 47.97
Turkey 649.4 -4.99 14.60 Dec,2020 -3.66 12.95 7.35
Thailand 509.2 -7.15 -0.41 Nov,2020 4.17 1.11 29.86
China 14,860.8 1.85 -0.50 Nov,2020 1.30 3.24 6.46
Russia 1,464.1 -4.12 4.90 Dec,2020 1.17 5.88 74.41
Developed Markets
France 2,551.5 -9.76 0.20 Nov,2020 -1.92 -0.38 0.81
Germany 3,780.6 -5.98 -0.30 Nov,2020 5.75 -0.61 0.81
Italy 1,848.2 -10.65 -0.02 Nov,2020 3.23 0.50 0.81
Spain 1,247.5 -12.83 -0.50 Dec,2020 0.54 0.02 0.81
Hong Kong 341.3 -7.47 -0.20 Nov,2020 4.35 0.70 7.75
Singapore 337.5 -6.00 -0.10 Nov,2020 14.98 0.87 1.32
United States 20,807.3 -4.27 1.20 Nov,2020 -2.12 0.93 1.00
Denmark 339.6 -4.50 0.50 Nov,2020 6.37 n/a 6.05
Netherlands 886.3 -5.40 0.80 Nov,2020 7.56 -0.53 0.81
Australia 1,334.7 -4.16 -0.70 Nov,2020 1.85 0.97 1.29
Switzerland 707.9 -5.30 -0.70 Nov,2020 8.48 -0.55 0.88
Britain 2,638.3 -9.76 0.30 Nov,2020 -2.05 0.17 0.73
Bangladesh data: GDP size and real GDP are sourced from Bangladesh Bureau of Statistics as per 2019-20 data. Calculation Method of CA Balance (%of GDP): CA balance of FY19-20 / GDP of FY19-20.
Interest rate (%) 10 yearsTB as perDecember, 2020, Inflation as perDecember,2020 andCurrencyUnit (perUSD) as per 3rdDecember,2020 are sourced fromBangladesh Bank.
Nominal GDP: Data of all countries apart from Bangladesh is sourced from IMF estimates of 2020 data (October, 2020 Outlook)
Real GDP Growth and Current Account Balance: Data of all countries apart from Bangladesh is sourced from tradingeconomics.com as per 5th December, 2020
Inflation: Data of all countries apart from Bangladesh is sourced from tradingeconomics.com as per 5th December, 2020.
Interest rates 10 years TB and Currency Unit: Data of all countries apart from Bangladesh is sourced from Investing.com as per 5th December,2020
PREPARED BY IDLCSL RESEARCH TEAM
7 of 30
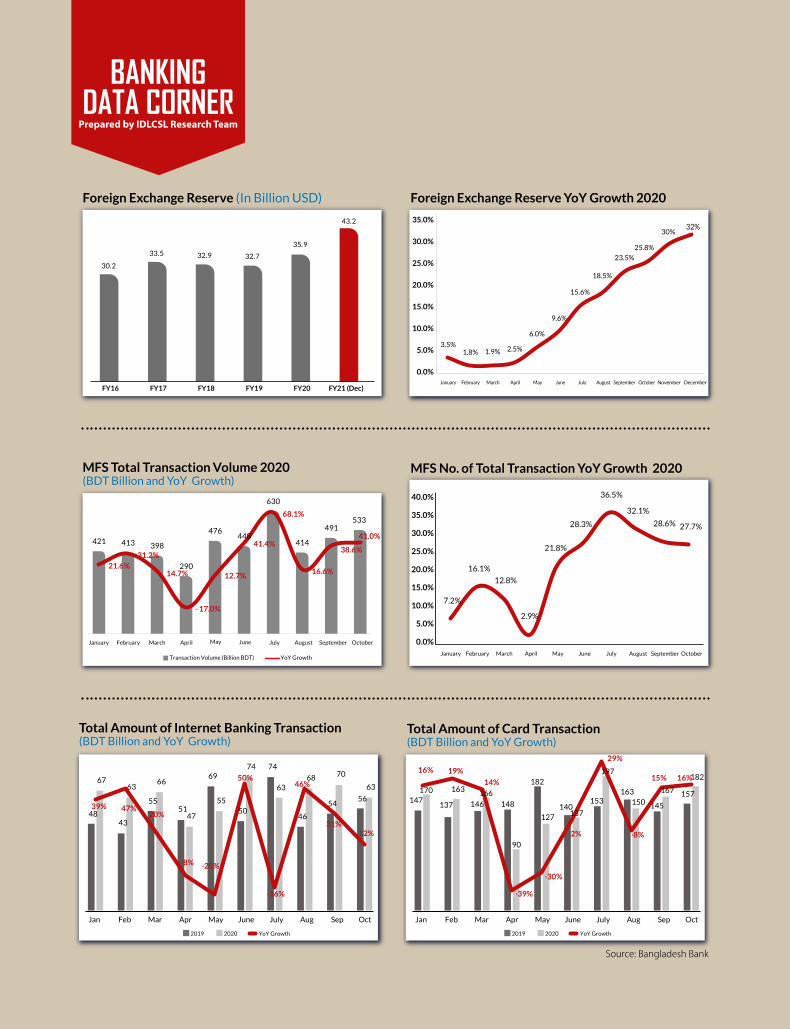
BANKINGDATA CORNER
Foreign Exchange Reserve (In Billion USD)
MFS Total Transaction Volume 2020 (BDT Billion and YoY Growth)
Foreign Exchange Reserve YoY Growth 2020
MFS No. of Total Transaction YoY Growth 2020
Prepared by IDLCSL Research Team
30.2
33.5 32.9 32.7
35.9
43.2
FY16 FY17 FY18 FY19 FY20 FY21 (Dec)
January February March April May June July August September October
Transaction Volume (Billion BDT) YoY Growth
0.0%
5.0%
10.0%
15.0%
20.0%
25.0%
30.0%
35.0%
40.0%
January February March April May June July August September October
3.5%1.8% 1.9% 2.5%
6.0%
9.6%
15.6%
18.5%
23.5%
25.8%
30%
0.0%
5.0%
10.0%
15.0%
20.0%
25.0%
30.0%
35.0%
January February March April May June July August September October DecemberNovember
32%
Total Amount of Internet Banking Transaction(BDT Billion and YoY Growth)
Total Amount of Card Transaction(BDT Billion and YoY Growth)
2019 2020 YoY Growth 2019 2020 YoY Growth
Jan Feb Mar Apr May June July Aug Sep Oct
48 43
55 51
69
50
74
46
54 56
67 63
66
47
55
74
63 68 70
63
39% 47%20%
-8% -20%
50%
-16%
46%
31%12%
Jan Feb Mar Apr May June July Aug Sep Oct
147 137 146 148
182
140 153
163
145
157 170 163 166
90
127 137
197
150
167
182 16% 19%
14%
-30%
-39%
-2%
29%
-8%
15% 16%
421 413 398
290
476 448
630
414
491 533
21.6%31.2%
14.7%
- 17.0%
12.7%
41.4%
68.1%
16.6%
38.6%
41.0%
7.2%
16.1%
12.8%
2.9%
21.8%
28.3%
36.5%
32.1%
28.6% 27.7%
Source: Bangladesh Bank

8 of 30
GLOBAL BANKING ANNUAL REVIEW 2020: A TEST OF RESILIENCE
RESEARCH IN FOCUS
BANKING INDUSTRY ON THE EDGE
It has been almost a year since the novel coronavirus has deeply shaken economies all over the globe. Industries of all types have been widely affected. The banking industry being one of them has had to endure through challenging times as well. Banks are expected to have severe credit losses, likely through late 2021, almost all banks and banking systems are expected to survive. Then, amid a muted global recovery, banks are likely to face profound challenges regarding ongoing operations. These challenges are expected to persist beyond 2024. According to McKinsey Global banking annual review, global banking seems to be more in a stable situation than it had been during the recession 12 years ago. If the institutions are efficient enough in terms of capital management, then return on equity can be gained back within five years.
DEALING WITH THE VIRUS
Initially when the crisis began, banks took protective measures for both employees and their customers while their financial system kept operating smoothly. Moving on to few months later, with the number of cases as well as deaths rising, productivity of the banks had eventually declined. Even before the crisis, leading banks in developed markets had achieved 25 percent less branch use per customer than their peers by migrating payments, transfers, and cash transactions to self-service and digital channels. In addition to those who were already digital-only customers previously, another 10 to 15 percent of customers will be unlikely to use a branch after the crisis, further increasing the need to act.
MCKINSEY CATEGORIZED THE PANDEMIC INTO TWO PHASES
Phase one: The very first one being the increase in loan loss provisions. As soon as the third quarter of 2020 was reached, provision of loan losses went up to $1.15
trillion. With the economy crashing down at a steady rate, millions have lost their job, shelter and subsequently shutting down their businesses. This ultimately drove most banks to a very high liquidity level which disrupted their initial goal- securing liquidity and funding according to McKinsey. Businesses play the most important role as a customer to the banks. The pandemic declined their sales which eventually increased their obligation towards their banks. Banks were seen to have
KEY FINDINGS
ROE to decline from 8.9% in 2019 to 1.5% in 2021
Low interest rates will lead to losing $3.7 trillion of revenue
$2.7 trillion of provision expenses due to loan losses by 2024
$3.7 trillion of revenue will be lost over five years which is equivalent of more than a half year of industry revenues that will never come back
From 63% in 2019 to 77% banks in 2020,cost of capital has not been returned
Common equity tier 1 (CET1) ratios would decrease from 12.5% in 2019 to 12.1% in 2024, with a low of 10.9% expected in 2021.
Estimated 7% of banks, representing only 2.7% of industry capital, have a 50% greater chance of needing more capital to stay above regulatory minimum
ABOUT THE RESEARCHGlobal Banking Annual Review 2020: A test of resilience is a McKinsey & Co. report. It is summarized for MBR by Syed Mehnaaz Haque, Intern, IDLC Finance Ltd.

9 of 30
dramatic drop in provision due to the support provided by the government. A new standard referred to as International Financial Reporting Standard 9 (IFRS 9), which calls for banks to take provisions sooner than previously. This new implementation can give a rise in loan amounts which is enough problematic already.
Phase two: the coming years, from provision of loan losses, the spotlight will be shifted on revenues- entering phase two of the pandemic. According to McKinsey, revenues may be recover for two to four years. Revenues are most likely to drop by 14% considering their precrisis situation by the
end of 2024. Sparking globally, from 2020-2024 the industry could encounter losing $1.5 trillion to $4.7 trillion revenue. As many name it, the revenues generated by shadow banking grew twice as fast as the balance-sheet companies of banks between 2017 and 2019. Observing revenues from business lines, we see that retail and corporate banking were by far the main contributors to the top line in 2019, which are both vulnerable to a zero-rate setting and elevated risk. Fee-based companies are a smaller component of wealth and asset management, market infrastructure, investment banking, and payments.
INVESTMENTS GREW IN DIGITAL CHANNELS
Even during a global pandemic, banks have continued investing in different platforms. The McKinsey Global banking annual review explained two prospects of investments during this crisis.
Wealth Management: It plays a crucial role in times of crisis. Looking into the next four years, market performance will be leading the revenue growth globally. Business owners will try to capitalize their business through lowest interest rates possible. While the pandemic has had an adverse effect but an increase in digitalization has led services to be more accessible for clients locally and internationally as well. Nonetheless, wealth management will continue to be an attractive business due to its capital efficiency and growth profile relative to other opportunities, and its increasingly central role in financial advisory as other advisory services such as insurance consolidate.
Capital markets, investment banking, and market infrastructure: During the
early stages of the pandemic, market based
businesses at some banks were running at
the same pace as they had previously, but
with time their progress and productivity
declined. Since the growth of the businesses
have slowed down their sales and services
will eventually adjust at a lower level. The
crisis will motivate businesses to engage into
M&A activities but buyers and sellers are
likely to be less enthusiastic compared to how
they used to be.
As per the report issued by McKinsey, the above
points do not represent the full impact the crisis
has on revenues and balance sheet of the business.
Businesses are most likely to fall behind in terms
of their profitability. The bank’s management has
to make intricate moves to make way through the
difficult path that lies ahead them.
Total crisis impact, revenues and loan-loss provisions, $ trillion
Stage 1 Stage 2
Forgonerevenue
Loan provisions Forgone revenue Loan-lossprovisions
1 1.9 2.9 2.7 0.8 3.5

10 of 30
IMPACT OF COVID-19 PANDEMIC ON
THE COASTAL SHIPPING INDUSTRY
OF BANGLADESH
Nuruzzaman Rashed Assistant Manager, Corporate
Tarek Musanna Assistant Manager, Corporate

11 of 30
IMPACT OF COVID-19 PANDEMIC ON THE COASTAL SHIPPING INDUSTRY OF BANGLADESH
Huge mother vessels carry goods from around the world to sea ports. Much of the imported goods are bulk in nature. Then the goods are unloaded to smaller vessels that transport them from sea ports to river ports. These smaller vessels are called coastal ships or lighter vessels. It is a type of flat-bottomed barge used to transfer goods to and from moored ships as the mother vessels cannot directly enter the port jetties to unload large volumes of cargo due to the low draft at the outer anchorage area. Besides that these vessels are used in transporting cargos from coast to inland and from inland to inland. The average capacity of which is usually 1200-1600 metric tons. These vessels are also called coastal ships as they can’t venture out in the open sea, but operate internally or close to the coasts.
Industry Overview
There are three major types of coastal and inland vessels:
Bangladesh Inland Water Transport Authority (BIWTA), The Cargo Vessel Owner’s’ Association, and Water Transport Cell negotiate to fix prices and mechanisms to operate. For India going vessels, the concern has to take permission from DG Shipping to move along the coastal areas and without this permission, no vessel is allowed on this route. Usually vessels with capacity of 1500-1600 MT go
to India and vessel with higher capacity, as in more than 1500-1600 MT run the Chottogram route. The cost of shipping varies between routes and goods. Per metric ton could cost between BDT 400 to BDT 1000 depending on the route and goods transported. Even though majority of the imports are transported using these vessels, the medium is hardly used for export oriented goods. Hence, these
Lighterage vessels that transfers cargo from the port/mothership to domestic locations
Oil tankers that transport oil to power plants and other destinations
Passenger vessels
The focus of this report is on lighterage vessels and its industry, which transports 80% of the imports coming in the country through waterways.
As of late 2018, around 2500 lighterage vessels were operating on different routes
Around 1000 under Water Transport Cell, the
authority that allocates trips to vessels
Around 500 under private initiatives
Around 100 chartered by private companies
Threatof New Entry:High
Buyer Power:Low
Competitive Rivalry:Moderate - High
Threat of Substitution:
Very Low
Porter’s 5 Forces Analysis
SupplierPower:
High

12 of 30
Pre Covid-19 Scenario
Since the ports in Bangladesh are bottlenecked and not deep enough for many of the international ships to be able to navigate, there’s a massive demand for small, lighterage ships to offload cargo from those mother ships. There was a massive mismatch between demand and capacity to offload back in 2017, where the demand was 10x the capacity. Since then BIWTA has allowed permits for around 500 ships to be built. The situation has improved a little. There is still demand for ships as imports are rising every year.
Covid-19 and Lockdown
As Covid-19 forced shutdowns on economies, the supply chain of the world has been massively disrupted. Lockdowns were enforced in late March in Bangladesh, but businesses started to feel the wrath of the virus pretty early on. Businesses opened Letters of Credit worth $1.6 billion in April, a 268 percent drop from the same month last year and 263 percent from March, according to Bangladesh Bank data stated in a bdnews24 article. “The entire world was on lockdown in April due to the COVID-19
Carrying Cost
There are three major types of task for a lighter vessel.
It can transport goods from the mother vessel from Chottogram Outer Anchorage or Chottogram Jetty to different river ports in the country.
The cost varies as per the locations of the ports:
It can ‘lighter’ or offload from the Chottogram outer anchorage to the Chottogram port or Kalurghat bridge.
The above mentioned rate chart is applicable for Clinker, Cement and Limestone. However BDT 55 to BDT 160 per Metric Ton can be added with the above mentioned rate considering the nature of the products.
It can transport goods and materials from India.
The above mentioned rate chart is applicable for Fly Ash, however the vessel owners charge additional $2 to $2.50 considering the nature of the products and destination.
The major cargo transported are:
Clinker Fly ash Cement
Steel Ceramic Sugar
Fertilizer Food grains, etc.
RATE CHART PER METRIC TON IN BANGLADESH
DestinationFrom Chottogram Outer Anchorage
(BDT in TK)
From Chottogram Jetti (BDT in TK)
Dhaka/Narayanganj 548 508
Barisal 574 541
Chandpur 524 491
Khulna/Noapara 807 753
Mongla 753 709
Baghabari 889 819
Ashuganj/Ghorasal/
Daudkandi646 646
Bhola/Barguna 624 587
Chatak/Sunamganj 1002 1002
Aricha 831 777
Manikganj/Jafarganj 865 809
LIGHTERING RATE CHART PER METRIC TON (BDT IN TK)
From Chottogram outer anchorage to port 326
From Chottogram outer anchorage to Kalurghat Bridge 416
RATE CHART PER METRIC TON FROM INDIA
Destination Rate Per Metric Ton (In USD)
Dhaka/Narayanganj 13.5
Ghorashal 14
Mongla 11.5
Barisal 12.5
vessels usually stay empty going back to the ports. The cost of shipping has been on the rise in the last few years as ship building has become costlier due to the increase in the major raw material, steel plate price. A lighterage ship can cost from a few crore to around 10-20 crores depending on the size, quality of materials and intended cargo weight.

13 of 30
Source: Bangladesh Bank
MonthCustom based import (c&f)R
2018-19 2017-18
FY59914.70
(+1.78)58865.30 (+25.23)
Month 2019-20R 2018-19
July 5247.10 5079.10
August 4072.70 4458.90
September 5004.20 5160.20
October 5279.30 5546.70
November 4392.40 5081.60
December 5254.20 4744.20
January 5334.10 6120.80
February 4723.70 4703.90
March 4277.20 4893.60
April 2858.50 5120.10
May 3533.40 5124.40
June 4807.90 3881.20
July-June 54784.70 (-8.56)
59914.70 (+1.78)
Month 2020-21p 2019-20R
July 4228.00 5247.10
August 3806.00 4072.70
September 4652.50 5004.20
July-September 12686.50 (-11.43)
14324.00 (-2.55)
Currently the total number of ships on the India route is around 350-450 even though the requirement is only around 300.
Usually, a single ship can make 18 trips in the Chottogram route and 12 trips in the India route in a year.
Strategy during Covid-19
For the time being, the main focus of the businesses is retention of existing staff and workers, and thereby they are trying to pay staff salary & bonus on time. As the economic situation eases up, the industry will get back to speed as international supply chain is slowly becoming normal.
Business Scope
A ship can operate for 15-20 years with regular maintenance
After the end of the lifetime, ships are overhauled to be operational again
In January 2020, the custom based import in the country was around $5.3 billion. It took a downturn from February and took a massive hit in April. Many internal ports were closed due to the lockdown. Ships were completely at a standstill. From May, the situation was starting to improve slightly, but as Covid-19 persisted, it could never go back to normal numbers. On top of that, imports declined again in August. With the suspected second wave coming, and the infected numbers going back to initial, high numbers in some of the western countries, the situation might not recover immediately.
Back in July-August, due to lack of trips on the Chottogram port route, which handles 90% of all the incoming goods into the country, many businesses are compelled to deploy their vessels to the India route. But with the downturn of logistics and transportation, the competition in the route is fierce. Around 90% of India going vessels carry raw materials for cement industry which faced significant de-growth in this year. As a result, total number of trips per vessel could come down to 6 trips or less this year.
KEY POINTS
Lighterage vessels contributes to transporting 80% of the imports coming in the country through waterways.
Demand of ships keep growing on account of mega projects such as Payra Deep Sea Port, expansion of Chittagong Port, Rampal coal fired power plant, Ruppur Nuclear Power Plant draw to conclusions.
On account of Covid-19 shutdown, businesses opened Letters of Credit worth $1.6 billion in April, a 268% drop from the same month last year and 263% from March, according to Bangladesh Bank data. No one opened LCs other than importers of drugs and some essential commodities ahead of the Ramadan.
In January 2020, the custom based import in the country was around $5.3 billion. It took a downturn from February as many internal ports were closed due to the lockdown. Ships were completely at a standstill.
If the current situation persists, businesses with high leverage will find it difficult to survive and will end up selling their vessels. But, the businesses with low leverage, will be able to survive and thrive afterwards.
pandemic. No one opened LCs other than importers of drugs and some essential commodities ahead of the Ramadan,” BB’s Executive Director Kazi Saidur Rahman said, terming the situation “distressing”. The situation slightly improved on the later months.

14 of 30
Approximate Operational Cost Breakdown for a 1500 Metric Ton Vessel on Chottogram Route:
A 1500 MT vessel on usually needs around 2400 liter of diesel for each trip.
The vessel is manned by a crew of 13, personnel cost is fixed by BIWTA.
The approximate cost of crew per month is around BDT 150,000 per month.
A vessel needs to be maintained properly and is usually docked every 1-2 years for repair and maintenance. Including this period, a 1500 MT vessel can transport do 18 trips and 12 trips respectively on the Chottogram and India Route.
Prospects
Demand of lighter and coastal ships keep on growing as Bangladesh is developing more and more. As mega projects are being carried out, more and more construction materials are required. Most of these materials or the raw materials required, such as limestone, sandstone, granite, crushed stones, fly ash, clinker are transported using these vessels via waterways.
As the Government is planning on building the capacity of the ports, specially with deep sea
COMPONENTS IN BDT
Plates and other hardware 31,000,000
Docking and labor expense 15,000,000
Painting 2,500,000
Engine 5,000,000
Fan and Wings 2,500,000
Anchor and chain 1,000,000
Navigational equipments 900,000
Plan, Survery, etc. 4,000,000
Others 9,100,000
Total Cost 71,000,000
CHITTAGONG ROUTE
INDIA ROUTE
Revenue per trip 975,000 1,575,000 Costs (Fuel, Staff, Commission, Line Charge)
390,000 630,000
Profit per trip 585,000 945,000 Annual Profit 10,530,000 11,340,000 Return on investment 14.8% 16.0%
Source: Clients
Approximate Construction Cost Breakdown for a 1500 Metric Ton vessel
Approximate Revenue Breakdown for a 1500 Metric Ton vessel
ports, such as Payra deep sea port, the inflow of mother vessels as well as efficiency of offloading goods will increase multifold. The demand for lighter ships are projected to be double then compared to now.
Transportation of coal to and fly ash from Rampal coal fired power plants will depend on these vessels, will likely increase the demand.
As the demand of daily commodity and food grains increase with the increase of par capita income of the population, the imports of these goods will increase as well.
Challenges
Even though insurance for ocean going ships are mandatory, the same mandate doesn’t apply for inland vessels. The risk or accident proneness is relatively low within the coasts, on the other hand insurance premium is high. Hence ships are insured only when there’s a major need for it, like getting financing. But there are few occurrences of ships capsizing every year, and the ships are very expensive to recover.
Another challenge is the transparency in getting trips/queues by the Water Transport Cell. When the trips are scarce, it’s imperative that there are no irregularities and proper regulations are maintained by the authority. On top of that, large factory owners are investing in procuring vessels which do not operate under Water Transport Cell, which is turn results in decreased trips.
Suggestion
Much of the sector is still very informal. There hasn’t been much support from the government in the past. But recently the sector is receiving some attention from the Government. The administrative bodies for oil tanker vessels are discussing with the finance ministry for a possible refinancing scheme at a lower-than-market rate for constructing vessels. We suggest the government extends this support for lighter vessels as well.
Conclusion
Given the regulation and the rising demand of the industry, coastal and inland shipping is generally a very stable and profitable business for those who have experience in this industry and an established fleet of ships. As the Covid-19 situation eases up and imports get back to normal, this industry is expected to bounce back quickly. If the situation persists, businesses with high leverage will find it difficult to survive and will end up selling their vessels. But the businesses with low leverage, will be able to survive and thrive afterwards.

15 of 30
CEMENT INDUSTRY
CURRENT MARKET UPDATE
Bonnishikha Chowdhury ExecutiveOfficer,CreditSME
Saraf Rahman Khan Intern, IDLC Finance Ltd.

16 of 30
Export
The cement industry earned export revenue of
$8.06 million in the first nine months of FY 19-
20. However, there were no export earnings from
this sector in April due to the nationwide general
holidays. At the end of ten months of the fiscal
year, cement exports remained stuck in the place
where it had been a month earlier. However, the
government’s export target for the sector, in the
current fiscal year, is $10.54 million.
Bangladesh exports 90% of its cement to India. As
the rupee depreciated against the dollar, cement
exports to India fell by 20% year-on-year.
Demand and Supply Scenario
Currently, the annual demand for cement is 33 million tonnes, while the industry’s installed capacity is 78 million tonnes with another 11 million tonnes to be added in the next three years, according to Bangladesh Cement Manufacturers Association (BCMA). Over the last seven years, the CAGR of the cement industry had been approximately 11.5%.
Per Capita Consumption
The annual per capita cement consumption has grown from 45kg to 200kg in the last two decades in line with the economic development of Bangladesh. However, Bangladesh is still one of the lowest consuming countries of cement products in the world.
CONSUMPTION OF CEMENT (KGS)1700
CH
INA
SOU
TH K
OR
EA
MA
LAYS
IA
THA
ILA
ND
IND
IA
MYA
NM
AR
BA
NG
LAD
ESH
WO
RLD
AVER
AG
E
1250
800
500312 270
187
563
Source: EBL Securities
Employment
Directly employed in the cement industry
60,000
Indirectly employed in the cement industry
1,000,000
CEMENT INDUSTRY: CURRENT MARKET UPDATE
EXCLUSIVE FEATURE
Investment Status:
DATA CHART
Export revenue in the firstnine months of FY 19-20
$8.06 million
Government’s exporttarget in FY 20-21
90% cementexported to India
$10.54 million
Crore invested in the cement industry30,000 crore from Bank loans
BDT 42,000
Some BDT 42, 000 crore has been invested in this sector. Of that, around BDT 30,000 crore is from bank loans.
Companies are pouring heavy investment into the sector to increase capacity. Bashundhara Group is investing BDT 1,000 crore for the installation of a third cement

17 of 30
Impact of pandemic
Manufacturers could utilize only 10% of their
capacity during lock down which caused them a
loss of BDT 3,000 crore.
Government projects were halted during the
Covid-19 shutdown. As a result, sales of big
companies declined up to 90%.
Loss of income due to business shutdown meant
many urban dwellers were unable to pay rent or
forfeited flat purchases – the source of income for
real estate developers. Moreover, ongoing projects
were forced to a halt for two months. The real estate
downturn translated to less demand for associated
sectors including the cement industry.
Raw material price in the international market
is already 10-15% down after the novel
coronavirus outbreak.
Exports have seen a fall in FY 2019-20 as ports
were closed down during the general holidays,
barring trade. Although this decline may be
seen as a one-time event, there are other
reasons to believe that exports will fall in the
long run. Competition from Indian companies
due to the granting of transit facilities will
threaten the future potential of cement exports
to the northeastern states of India. Moreover,
Bangladeshi cement exporters also incur high
transportation costs which disincentivize
exports.
RAW MATERIAL PRICES (BEFORE AND AFTER LOCK DOWN CURRENT SCENARIO)
Details Units Before Pandemic(BDT) After Pandemic(BDT)
Clinker Metric Ton 4,858 4,979
Gypsum Metric Ton 2,714 2,571
Fly Ash Metric Ton 2,465 2,411
Slag Metric Ton 2,742 2,575
Lime Stone Metric Ton 2,309 2,304
FINISHED GOODS PRICES (BEFORE AND AFTER LOCKDOWN CURRENT SCENARIO)
Details(Premier Cement) Units Before Pandemic(BDT) After Pandemic(BDT)
Cement OPC Bag 420 395
Cement PCC Bag 405 380
production unit. Moreover, back in July, Bangladesh Chemical Industries Corp (BCIC) and Saudi-Arabia based Engineering Dimension International Investment (EDII) agreed to build a cement plant under the name of Saudi Bangla Integrated Cement Co Ltd. These investments and the swift recovery – all point to the fact that cement manufacturers have faith in continued growth in the construction and infrastructure development of the country in the coming days.
Key market players
Around 81% of the cement market is controlled
by 10 leading companies. However, in this ongoing
pandemic situation smaller companies did better
than the larger ones owing to the activity of the rural
economy. From June, the sales of the big companies
started to increase again.

18 of 30
Before and after lockdown Financial Implications and growth status
Before the shutdown, the industry’s daily revenue was over BDT 100 crore whereas
now, the daily revenue has fallen below BDT
25 crore. The industry’s biggest concern now is
receivables of about BDT 10,000 - 12,000 crore
because of dependence on credit sales.
Jan Feb Mar Apr May Jun Jul Aug Sep Oct Nov Dec
Despite the decline in sales, 70%
cement manufacturers
enter the growth trajectory
The sector faced an 11% growth compared to the
same time last year
The sector experienced an overall negative growth of 6.98%
The sector experienced a 9%
growth slowed down by flooding
across the country in July
Sales increased slightly as mid-income people and
expatriates begin purchases. However, government’s
purchase volume is yet to reach expected levels.
Cement manufacturers face a 52% decline sales
Sectoral growth rises to 6.60%
Cement consumption is likely to come down to
7% from 12%-15%
Tax Burden
Almost 100% raw materials for cement factories are
imported and the main item clinker is subject to BDT
500 import duty against the import of per tonne.
Based on the import price of $42 for a tonne of clinker,
effective import duty goes as high as 14%, which
is highest among cement manufacturing countries
which depend on imported raw materials.
A nearly 45% overcapacity, coupled with a rapid
increase in utility bills and of course volatility in
prices of imported raw materials prevent cement
manufacturers from increasing prices regardless
of the cost scenario. Thus, The BCMA demands the
import duty at 5% or BDT 300 per tonne. They also
requested that the government withdraw 3% AIT on
cement supply from the factories.
Amirul Haque, managing director of Premier Cement,
said, “No sector has more than five percent duty on
intermediate raw materials. But in the cement sector,
it is more than 15%. A huge amount of money from
businesses get stuck because of the 3% advance tax.”
Industry Plea
The industry needs sufficient working capital in the
coming days so that it can withstand the reduced
cash flows – both because of low revenue and slow
collection of receivables.
BCMA sought incentives from the government to
weather the Covid-19 storm. It also sought a six
month’s relief from paying utility bills and taxes.
Challenges and Way Forward
Currently, there are 35 cement factories in the
country with a production capacity of eight crore
tonnes of cement. The country has a demand for 3.5
crore tonnes which would add 1.1 crore tonnes more
in the next three years. Around 81% of the cement
market is controlled by 10 leading companies.
Hope still remains that the government will
accelerate its infrastructure spending to offset the
impact of a potential slack in private sector activities.
There will also remain challenges as the government

19 of 30
is likely to be overburdened through providing fiscal
incentives to prop up the economy
According to the Bangladesh Cement Manufacturers
Association among 36 companies operational right
now, only seven were in negative growth in August.
The overall growth in the cement sector this month
was more than 9%
Impact of COVID-19 on a few prominent companies in the industry
Shah Cement
Shah Cement – a prominent name in the cement industry of Bangladesh – has faced adversities no less than others. During the second quarter of 2020, the company recorded drastic declines in sales volume. In April and May, the sales of Shah Cement dropped by 37% and 27% compared to the same months of the earlier year. In June too they recorded negative growth. However, in August, the company achieved 14.30% growth compared with the same
period last year. Overall, Shah Cement recorded
negative growth of 8.07% in the first three quarters
of the year.
operational right now36 Companies
7 Companies in negative growth
9% Growth in the cement sector this month
Market Share before lockdown
13.32%
Market Share after lockdown
13.17%
On condition of anonymity, an official of Abul Khair Group, the mother company of Shah Cement, said that their sales decreased in January as the construction of the Padma Bridge project had been halted as Chinese engineers were stuck in their country. However, supply has increased since July and it is expected that there wouldn’t be negative growth next year – according to the same official.
Bashundhara Cement
Bashundhara Cement, a supplier of the Padma bridge project, faced sales decline from 45% to 40% during the first 2 months of shutdown. The company returned to growth in June-August period.
Unique Cement
Unique cement is known to be the second leading company of the market and they have recorded a 46% negative growth from April through to May. In June-August, the company got, on average, more than 30% growth, and their market share increased to 8.39% in 2020.
Source : The Business Standerd
20 of 30
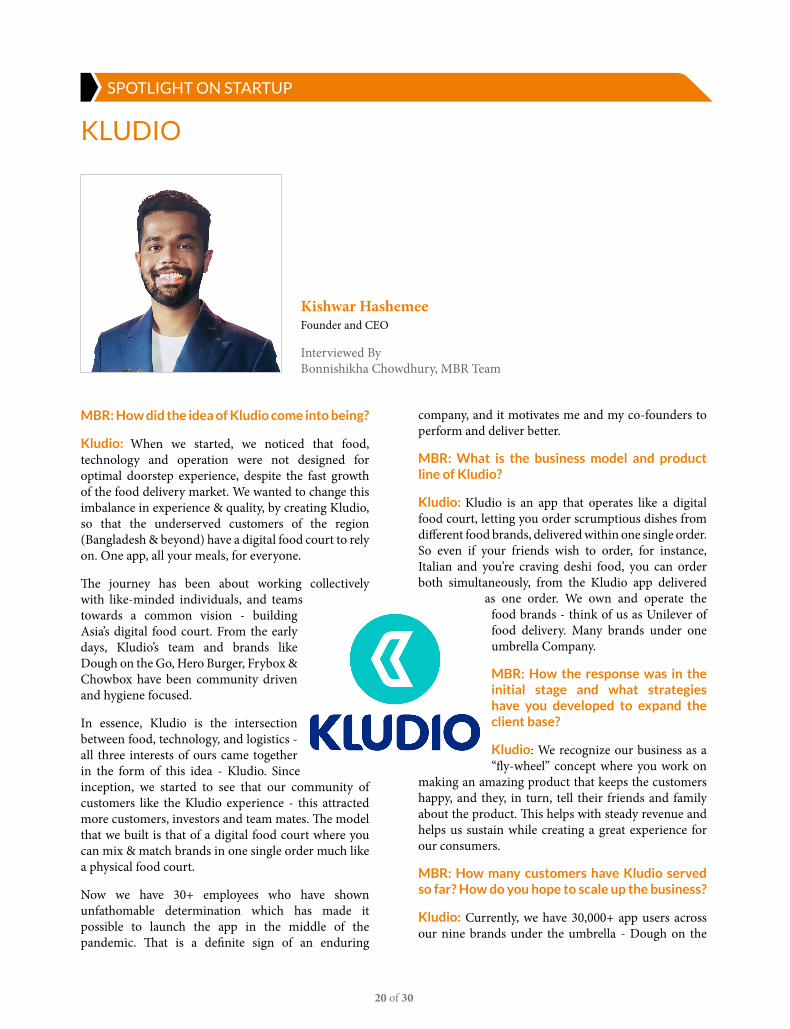
SPOTLIGHT ON STARTUP
KLUDIO
MBR: How did the idea of Kludio come into being?
Kludio: When we started, we noticed that food, technology and operation were not designed for optimal doorstep experience, despite the fast growth of the food delivery market. We wanted to change this imbalance in experience & quality, by creating Kludio, so that the underserved customers of the region (Bangladesh & beyond) have a digital food court to rely on. One app, all your meals, for everyone.
The journey has been about working collectively with like-minded individuals, and teams towards a common vision - building Asia’s digital food court. From the early days, Kludio’s team and brands like Dough on the Go, Hero Burger, Frybox & Chowbox have been community driven and hygiene focused.
In essence, Kludio is the intersection between food, technology, and logistics - all three interests of ours came together in the form of this idea - Kludio. Since inception, we started to see that our community of customers like the Kludio experience - this attracted more customers, investors and team mates. The model that we built is that of a digital food court where you can mix & match brands in one single order much like a physical food court.
Now we have 30+ employees who have shown unfathomable determination which has made it possible to launch the app in the middle of the pandemic. That is a definite sign of an enduring
company, and it motivates me and my co-founders to perform and deliver better.
MBR: What is the business model and product line of Kludio?
Kludio: Kludio is an app that operates like a digital food court, letting you order scrumptious dishes from different food brands, delivered within one single order. So even if your friends wish to order, for instance, Italian and you’re craving deshi food, you can order both simultaneously, from the Kludio app delivered
as one order. We own and operate the food brands - think of us as Unilever of food delivery. Many brands under one umbrella Company.
MBR: How the response was in the initial stage and what strategies have you developed to expand the client base?
Kludio: We recognize our business as a “fly-wheel” concept where you work on
making an amazing product that keeps the customers happy, and they, in turn, tell their friends and family about the product. This helps with steady revenue and helps us sustain while creating a great experience for our consumers.
MBR: How many customers have Kludio served so far? How do you hope to scale up the business?
Kludio: Currently, we have 30,000+ app users across our nine brands under the umbrella - Dough on the
Kishwar HashemeeFounder and CEO
Interviewed By Bonnishikha Chowdhury, MBR Team
21 of 30
Go, Hero Burger, Frybox, Chowbox to name the champions.
Right now, we deliver within the Banani, Mohakhali, Gulshan, Bashundhara, DOHS areas and its periphery. We will be covering all of Dhaka by 2022, and eventually, we plan to expand throughout the country and other emerging countries in Asia and Middle East.
MBR: What challenges does Kludio face in general?
Kludio: Challenges keep changing every quarter, every month – even, every day. When we started, they revolved around brand creation and kitchen operations. Now, these are built-in capabilities of the team: Kludio can create cuisines and brands in weeks.
We recently launched our consumer-facing app to create a direct customer relationship, which has solved issues around market access and overdependence on aggregators.
Logistics used to be a challenge, but we have since built an elastic fleet that enables us to deliver hot and fresh food quickly.
Every challenge that we overcome becomes a capability, ultimately allowing the team to move toward our vision.
MBR: Considering the COVID-19 situation, what are the difficulties you have been facing and how do you intend to recover or mitigate those?
Kludio: While the Covid-19 landscape has become a part of the day-to-day operations, the entire Kludio team managed to show resilience by participating in the
change management process smoothly. The team has developed a special bonding after navigating through the crisis together.
The COVID-19 pandemic has helped us rethink and improvise the way we provide services. We launched a consumer-facing app in August this year, which has been highly successful.
There have been challenges in supply chain, and raw material pricing, which has led to creation and adaptation of new processes and systems within the company. “Scarcity builds creativity.” - quote Kishwar
The entire team has put in special efforts in upholding global standards of hygiene, ultimately giving our customers a sense of comfort and assurance at a difficult time like this.
MBR: What are the future plans for Kludio?
Kludio: The food delivery market in Bangladesh has exhibited a compound annual growth rate (CAGR) of more than 80% since 2016 – it’s on track to be a billion-dollar market by 2025.
In the mid-term, we’re focused on scaling our full stack model as it has been successfully proven. The model works and the market is large, so the focus is on opening new kitchens to unlock the pent-up demand in a city of 20 million people - Dhaka. Imagine 30 kitchens with 15 proprietary brands in each – that’s a total of 450 digital restaurants.
Our long term goal is to scale up into other countries of Asia, and the Middle East while also adding new business models within Kludio.

22 of 30
Prawma Tapashi Khan ACCAEducation Manager-Bangladesh ACCA
Interviewed By Bonnishikha Chowdhury, MBR Team
BECOMING AN ACCA QUALIFIED
CAREER INSIGHT
MBR: Please kindly share what motivated you to
pursue ACCA and your journey of becoming the
Education Manager of ACCA Bangladesh with us.
Prawma Tapashi Khan ACCA: I started my corporate career back in 2008 and I knew practically nothing about any professional qualification. When I entered the treasury department of one of the largest conglomerates in Bangladesh, I understood that I must future proof my career with a professional qualification to survive and rise in this sector. The more research I did, the more I contemplated the possibilities of going global. Further to that, I was already in a job, so switching to CA firms (which is mandatory for a CA) was not really an option, so ACCA seemed to be the most promising professional qualification. I registered for it. To finish it quickly, I went to the UK and studied at Kaplan Financials which gave me different perspectives of my life, philosophy and career choice. So, when I came back after being qualified, I chose to be an educator and started training ACCA in Bangladesh along with managing a training institute of 30+ employees including faculty members. And then the opportunity came to apply for a position at ACCA; the largest professional accountancy body in the world and I couldn’t miss it. So, here I am!
MBR: What are the prospects of getting the ACCA Qualification in Bangladesh and globally?
Prawma Tapashi Khan ACCA: One can easily kick-start the ACCA qualification and sit for exams from any country. Moreover, in Bangladesh, one can start their ACCA qualification with an entry-route called the Certified Accounting Technician (CAT). CAT is also an individual global qualification. Be it Dhaka or central London, you will be a part of the global community of ACCA. And with ACCA, you can earn other qualifications with zero to very few exams. For example, an ACCA member can achieve CPA Canada by attending only one exam from Bangladesh or two exams in Malaysia to become a Malaysian CA or ANZ CA qualification and AAA in the Middle East without any exam. And, there are many more collaborations globally, that will truly make you a global citizen of the financial world.
MBR: What does ACCA offer differently than other accounting certifications like – CPA/CMA?
Prawma Tapashi Khan ACCA: Firstly, every qualification has its unique proposition and beauty, I would say. Keeping that in mind, I am very proud to say that ACCA is the largest global body for professional accountants. When someone joins ACCA, the person becomes part of our diverse body of more than 227,000 fully qualified members and 544,000 future members in 179 countries. Employers across the globe seek out ACCA-trained

23 of 30
professionals – because they know they have the strategic thinking, technical skills and professional values to drive their organizations forward. We currently work with more than 7571 approved employers and 98 global accountancy partnerships – and connect our members with thousands of vacancies through the ACCA career portal. Another important aspect is when you study with ACCA, you can take your career in any direction you prefer. ACCA opens doors to the best and most interesting accounting and finance roles all over the world. And you become one of the sought-after finance professionals our fast-changing world needs. ACCA is the only professional body that gives you the option to choose advanced papers based on your strength and aspiration. In addition to that, we hold exam sessions each quarter and some of our exams can be taken on-demand as well, giving you the flexibility to progress through our qualifications at your own pace. Our flexible exams also give you the opportunity to specialize in a chosen area and in a number of countries you can even take exams based on your national tax and law. Additionally, you can even gain additional qualifications on your way to the prestigious ACCA membership, including BSc in Applied Accounting from Oxford Brookes University and MSc in Professional Accountancy from the University of London.
MBR: What are the challenges of getting ACCA and how to mitigate those?
Prawma Tapashi Khan ACCA: The basic challenge I find is the proper mindset that consists of insincerity and lack of a plan. There is a saying, if you fail to plan, you plan to fail. Students get into ACCA and become overwhelmed in the first place and they hardly understand where to start or how to start. Especially, someone who wants to study by themselves. So when I started, I went through the full syllabus of ACCA, connected papers and planned when I would sit for which exam and how the papers would complement each other. I hardly see that now in our students. Another challenge is for corporate people. With an extensive workload, it becomes difficult for them to study regularly. First of all, I would recommend that you choose to study with one of our approved
learning partners since they have qualified members with vast teaching experience. Also, the environment will encourage you to keep your spirit on. Now the classes are online but soon they will be blended to bring the human touch. And most importantly, plan your way out and plan to pass!
MBR: Are people from non-numerical backgrounds encouraged to peruse ACCA? If yes, why do you think so?
Prawma Tapashi Khan ACCA: Yes, of course. ACCA is not rocket science. It is more about understanding what business needs and how strategically one can think. If you know the basics of equations, you are good to go. What I feel and know is, to pass ACCA, you need different skills than numerical. In fact, it is completely the opposite now. Exams are hardly calculative, they are more focused on ‘why?’ and ‘how’?’ The skills you need are analytical, professional skepticism, commercial acumen, digital, technical, time management, etc. The exams are online and students need to compose their thoughts into writing via software. So, if you have those skills, the spreadsheet will do the rest!
MBR: Is ACCA only for accountants? Will it add any value if the candidate is pursuing a finance-related career?
Prawma Tapashi Khan ACCA: ‘Accountant’ is a term which is too defined for ACCA and soon it is going to be a designation of the past! ACCA is the most forward-thinking professional accountancy body in the world. In fact, our motto is ‘Think Ahead’. You can call us business partners for accounting and finance. As I said before, the skills you need are different than the stereotyped ones. The numerical work is going to be done by AI and robotics. And ACCA prepares you to adopt new changes to ensure sustainability. ACCAs are strategic professionals that would provide value to the business. So yes, of course, ACCA will definitely add value to people working in finance and accounting roles. The world is getting smaller by the virtue of globalization. You need to be Jack of many trades and also master of some. And through ACCA, you can be more than that.
24 of 30
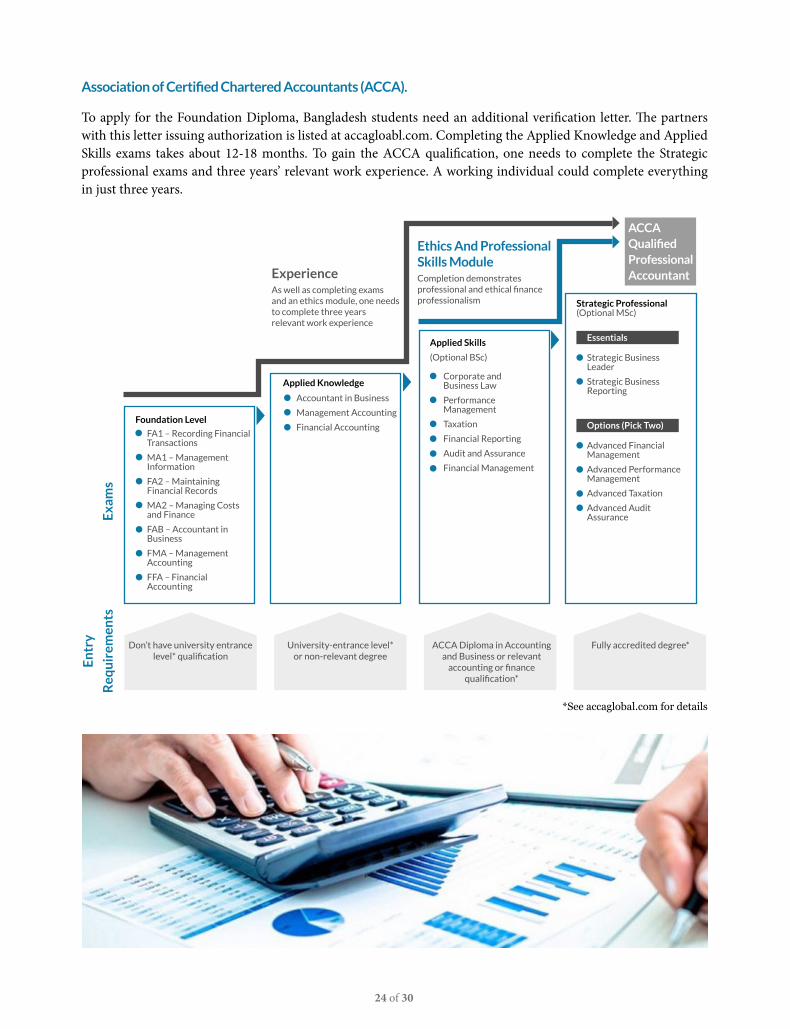
Association of Certified Chartered Accountants (ACCA).
To apply for the Foundation Diploma, Bangladesh students need an additional verification letter. The partners with this letter issuing authorization is listed at accagloabl.com. Completing the Applied Knowledge and Applied Skills exams takes about 12-18 months. To gain the ACCA qualification, one needs to complete the Strategic professional exams and three years’ relevant work experience. A working individual could complete everything in just three years.
Exa
ms
En
try
Req
uir
emen
ts
Don’t have university entrance level* qualification
FA1 – Recording Financial Transactions
MA1 – Management Information
FA2 – Maintaining Financial Records
MA2 – Managing Costs and Finance
FAB – Accountant in Business
FMA – Management Accounting
FFA – Financial Accounting
Accountant in Business
Management Accounting
Financial Accounting
University-entrance level* or non-relevant degree
Corporate and Business Law
Performance Management
Taxation
Financial Reporting
Audit and Assurance
Financial Management
ACCA Diploma in Accounting and Business or relevant
accounting or finance qualification*
Fully accredited degree*
ExperienceAs well as completing exams and an ethics module, one needs to complete three years relevant work experience
Ethics And Professional Skills ModuleCompletion demonstrates professional and ethical finance professionalism Strategic Professional
(Optional MSc)
Essentials
Strategic Business Leader
Strategic Business Reporting
Options (Pick Two)
Advanced Financial Management
Advanced Performance Management
Advanced Taxation
Advanced Audit Assurance
Applied Knowledge
Applied Skills
(Optional BSc)
Foundation Level
ACCAQualifiedProfessionalAccountant
*See accaglobal.com for details

25 of 30
CAPITAL MARKET REVIEW
Performance of Equity Markets of Bangladesh and Peer Countries
Bangladesh equity market ended the month of
December in positive territory. During the month,
the broad index DSEX gained 11.0%, while blue chip
index DS30 increased by 16.4%. On the other hand,
Shariah index DSES increased by 11.5%, respectively.
Among the regional peers, Vietnam advanced (+10.0%) the most during the month, followed by Sri Lanka (+8.5%). MSCI Frontier Markets Index increased by 4.8%. Over the long term, Vietnam showed the most encouraging track record with a 5 years’ return of 90.6%.
Liquidity Condition in Equity Market of Bangladesh
During December, the total market capitalization
increased by 14.9%. The daily average turnover
of December 2020 was BDT 10.3 bn (USD 121.2
mn), increasing by 29.9% from that of last month.
Turnover velocity which represents overall liquidity
of the market stood at 57.8% in December compared
to 53.6% of last month. In 2019, turnover velocity of
Bangladesh equity market was 33.5%, in comparison
to 34.4% in 2018.
Table 2: Market capitalization and turnover statistics
Particulars 31-Dec-20 30-Nov-20 % change
Total market capitalization (USD* mn)
52,857 45,988 14.9%
Total equity market capitalization (USD mn)
45,839 38,957 17.7%
Total free float market capitalization (USD mn)
16,548 15,103 9.6%
Daily Avg. Turnover (USD mn)
121.2 93.3 29.9%
Turnover Velocity~ 57.8% 53.6% N/A
*All USD figures are converted using an exchange rate of 84.80 as of December 30, 2020 as per Bangladesh Bank website.
~Turnover velocity is calculated by dividing monthly total turnover with month-end market capitalization. The figures are annualized.
Table 1: Equity market performance in Bangladesh and peer countries
Indices Index Points, December 2020
Return*
1M 3M 12M 3Y 5Y
Bangladesh
DSEX 5,402.1 11.0% 8.8% 21.3% -13.5% 16.7%
DS30 1,964.0 16.4% 15.8% 29.8% -14.0% 12.2%
DSES 1,242.1 11.5% 10.9% 24.2% -10.7% N/A
Peer Countries
Pakistan (KSE 100) 43,755.4 6.5% 7.8% 7.4% 8.1% 33.3%
Sri Lanka (CSE - All Share) 6,774.2 8.5% 13.2% 10.5% 6.4% -1.7%
Vietnam (VNI) 1,103.9 10.0% 21.9% 14.9% 12.2% 90.6%
MSCI Frontier Markets Index 744.2 4.8% 9.6% -3.0% -9.2% 20.0%
*All returns are Holding Period Return Source: Investing.com, MSCI, DSE

26 of 30
Figure 2: Historical market P/E* and it’s median
*Price Earnings (P/E) Ratio is calculated by dividing total market capitalization of all profit making listed companies with their total audited annual earnings. Source: CEIC, DSE
Current Market P/E* in Context of History
Month End P/E Ratio Median P/E
Month End P/E Ratio, 16.50x
Median P/E, 15.00x
4.00x
9.00x
14.00x
19.00x
24.00x
29.00x
Jan
-01
Dec
-01
Oct
-02
Sep-
03
Jul-
04
May
-05
Ap
r-0
6
Feb
-07
Dec
-07
No
v-0
8
Sep-
09
Jul-
10
Jun
-11
Ap
r-1
2
Feb
-13
Jan
-14
No
v-1
4
Sep-
15
Au
g-1
6
Jun
-17
May
-18
Mar
-19
Jan
-20
Dec
-20
Historical Index Points and Market Participation Data
Sector Performance
Figure 3: Current market P/E* of Bangladesh and peer countriesSince its inception on January 27, 2013, DSEX
yielded a holding period return of 33.2% till December, 2020. During the same period, daily average turnover of the market amounted to BDT 5.4 bn (USD 64.9 mn) (Figure 1).
Market Valuation Level - P/E Ratio
The market P/E increased to 16.5x in December compared to last month’s 13.03x. It is slightly higher than the 20 years’ median market P/E of 15.0x (Figure 2). In terms of trailing 12 month P/E ratio, the equity market of Bangladesh is cheaper than most of its regional peers. (Figure 3).
34.08x
30.59x
25.98x
19.71x
16.29x 15.47x
India Philippines Thailand Vietnam Bangladesh Pakistan
*Trailing 12 month P/E as of December 31, 2020.
Source: IDLC, Bloomberg
Source: DSETurnover (USD mn) DSEX Index
0
50
100
150
200
250
300
350
3,300
3,900
4,500
5,100
5,700
6,300
Jan-
13M
ar-1
3M
ay-1
3Ju
l-13
Sep-
13N
ov-1
3Ja
n-14
Mar
-14
May
-14
Jul-1
4Se
p-14
Nov
-14
Jan-
15M
ar-1
5M
ay-1
5Ju
l-15
Sep-
15N
ov-1
5Ja
n-16
Mar
-16
May
-16
Jul-1
6Se
p-16
Nov
-16
Jan-
17M
ar-1
7M
ay-1
7Ju
l-17
Sep-
17N
ov-1
7Ja
n-18
Mar
-18
May
-18
Jun-
18Au
g-18
Oct
-18
Dec-
18Fe
b-19
Apr-
19Ju
n-19
Aug-
19O
ct-1
9De
c-19
Feb-
20Ap
r-20
Jun-
20Au
g-20
Oct
-20
Dec-
20
Tu
rno
ver
(USD
mn
)
Ind
ex p
oin
ts
Figure 1: DSEX since inception along with market turnover
During December, Engineering sector (+37.3%) advanced the most, followed by Telecommunication (+20.8%), Cement (+19.8%), Pharmaceutical & Chemicals (+12.5%). On the other hand, only Life Insurance (-2.8%) and Fuel & Power (-0.1%) ended the month in negative territory.
Bank, the largest free-float market capitalization sector, is relatively undervalued in terms of P/E ratio. On the other hand, Fuel & Power sector has the highest dividend yield of 5.3% among all sectors.

27 of 30
Table 3: Sector performance snapshot
SectorMarket Capitalization
(USD mn) Return*P/E (x)** P/BV (x)^ Dividend
Yield~Total Free Float 1M 3M 12M 3Y 5Y
Pharmaceuticals & Chemicals 7,119 3,843 12.5% 7.8% 22.8% 12.8% 39.1% 17.3 2.7 1.5%
Bank 6,704 3,749 2.2% 3.0% 11.0% -16.7% 66.9% 8.2 0.6 4.1%
Telecommunication 7,691 821 20.8% 17.0% 44.5% -0.6% 97.6% 16.9 6.8 2.7%
Fuel & Power 4,960 1,319 -0.1% -6.0% 7.4% 11.5% 34.1% 10.9 1.4 5.3%
Engineering 5,905 1,017 37.3% 27.2% 88.3% 28.3% 47.6% 18.8 2.4 1.8%
Food & Allied 3,543 1,095 14.0% 9.5% 41.9% 17.6% 40.8% 20.0 7.1 3.0%
NBFI 2,204 698 17.9% 2.8% 29.8% -20.8% 36.7% 25.8 2.0 2.0%
Textile 1,309 751 4.8% -6.1% -0.2% -22.1% 1.8% 17.6 0.8 1.7%
Miscellaneous 1,675 615 32.1% 29.1% 46.1% 54.6% 80.4% 46.0 1.6 1.5%
Cement 1,048 427 19.8% 10.3% 27.5% -34.8% -36.0% 23.0 2.3 1.7%
Non Life Insurance 1,165 665 -0.5% 24.7% 95.4% 147.1% 277.9% 22.1 2.0 1.9%
Life Insurance 674 375 -2.8% -2.7% -6.3% 16.3% 21.7% 26.4 7.0 1.9%
Travel & Leisure 303 158 1.2% 3.0% 13.8% 0.5% 25.9% 191.3 0.8 0.5%
IT 300 188 5.6% -1.0% 9.2% 2.6% 23.4% 23.3 2.3 1.5%
Ceramics 287 123 7.4% 4.7% 4.3% -17.6% -9.1% 90.0 1.6 2.8%
Tannery 226 113 5.6% 3.2% -2.7% -29.2% -34.1% 21.9 1.7 1.1%
Services & Real Estate 222 112 15.0% 14.3% 39.2% -11.9% -20.4% 18.0 1.1 2.6%
Paper & Printing 125 45 7.8% -1.6% 7.3% -51.8% -46.5% 44.1 1.2 0.0%
Jute 34 20 42.0% 24.3% 10.8% 43.8% 231.5% 1,099.5 8.5 0.1%
Market 46,035 16,548 11.0% 8.8% 21.3% -13.5% 16.7% 15.0 1.6 2.7%
*All returns are Holding Period Return.
**Price Earnings (P/E) Ratio is calculated by dividing total market capitalization of all profit making listed companies with their annualized earnings.
^P/BV is calculated by dividing total market capitalization of listed companies with their respective total book values, excluding companies with negative book values.
~Dividend yield is calculated by dividing last year’s declared cash dividend with market capitalization.
Table 4: Performance of different market cap classes
Cap Class
Market Capitalization of Constituent
Companies (USD mn)
% of Total Equity Market Capitalization
Return*P/E (x) P/BV (x) Dividend
Yield1M 3M 12M 3Y 5Y
Large ≥119 79.8% 8.4% 3.6% 21.7% -2.0% 50.4% 13.8 1.7 3.2%
Mid 36-118 10.7% 9.0% 9.1% 20.4% -1.7% 40.4% 16.9 1.0 1.9%
Small 12-35 7.7% 7.0% -2.5% 11.2% -13.8% 26.4% 22.7 1.0 2.0%
Micro <12 1.8% 5.8% 5.2% 29.3% 5.5% 47.3% 32.1 0.5 0.9%
Market - - 11.0% 8.8% 21.3% -13.5% 16.7% 15.0 1.6 2.7%
*All returns are Holding Period Return.
Cap Class Performance
During the month of December, all the Cap classes were advanced with Mid Caps (+9.0%) increasing the most. Large cap was the highest dividend yielding (3.2%) class.
Performance of 20 Largest Listed Companies in Bangladesh
Among the 20 largest listed companies in terms of market capitalization, ROBI (294.0%) increased the most. The second largest mobile network company of the country got listed on the bourse on 24th Dec, 2020. Moreover, BEXIMCO (+134.0%), WALTONHIL (+59.2%), BXPHARMA (+32.9%), SQURPHARMA (+19.4%) yielded attractive return.
Majority of these companies yielded outstanding return over longer time horizon (5 years) such as UPGDCL (+189.1%), BEXIMCO (+181.5%) and BXPHARMA (+152.3%).
Among the scrips, TITASGAS, SUMITPOWER, DUTCHBANGL, UPGDCL, ISLAMIBANK, GP and BATBC recorded higher dividend yield compared to that of market.

28 of 30
Table 5: Snapshot of 20 largest companies in terms of market capitalization
DSE Code Sector
Market capitalization
(USD mn) Daily Avg. Turnover (USD mn)
Return*
P/E (x) P/ BV (X)
Dividend Yield
TotalFreeFloat
1M 3M 12M 3Y 5Y
GP Telecommuni-cation 5,527 553 1.08 8.8% 5.2% 29.6% -11.4% 79.1% 13.1 16.1 3.7%
WALTONHIL^ Engineering 3,979 39 1.00 59.2% 47.1% N/A N/A N/A 21.0 4.3 1.8%
BATBC Food & Allied 2,506 663 1.53 14.7% 8.3% 30.7% 14.9% 35.7% 18.3 6.4 3.4%
SQURPHARMA Pharmaceuticals & Chemicals 2,295 1,501 2.13 19.4% 7.6% 15.5% -14.1% 24.0% 12.4 2.7 2.0%
ROBI^ Telecommunication 1,841 184 - 294.0% N/A N/A N/A N/A 100.9 2.6 0.0%
UPGDCL Fuel & Power 1,801 180 1.32 -11.8% -11.6% 7.4% 106.3% 189.1% 13.1 5.8 5.0%
RENATA Pharmaceuticals & Chemicals 1,272 621 0.44 5.2% -3.1% 2.2% 28.0% 57.0% 21.8 5.5 1.1%
BXPHARMA Pharmaceuticals & Chemicals 1,002 700 6.86 32.8% 61.7% 173.1% 89.0% 152.3% 19.8 2.8 0.7%
ICB NBFI 939 30 0.16 19.2% -0.9% 28.6% -26.9% 20.4% 64.8 8.3 0.5%
MARICO Pharmaceuticals & Chemicals 794 79 0.75 1.3% -0.3% 33.9% 122.3% 85.5% 18.9 36.6 0.9%
BERGERPBL Miscellaneous 782 39 0.14 7.7% 3.3% 5.9% 45.2% 61.7% 43.1 9.1 2.1%
BRACBANK Bank 693 378 0.88 -3.7% 8.8% -14.8% -35.5% 84.0% 16.5 1.5 1.6%
LHBL Cement 655 231 2.27 32.0% 18.0% 46.2% -27.5% -30.5% 27.8 3.6 2.1%
BEXIMCO Miscellaneous 589 409 11.05 134.6% 134.6% 313.0% 133.9% 181.5% 101.8 0.8 0.9%
ISLAMIBANK Bank 509 248 0.15 2.3% -0.4% 48.0% -16.2% 23.6% 8.7 0.8 3.7%
SUMITPOWER Fuel & Power 490 180 0.27 5.7% -8.0% 11.1% 32.2% 40.9% 7.5 1.3 5.1%
OLYMPIC Food & Allied 451 273 0.21 8.8% 9.9% 15.8% -30.3% -14.8% 16.8 5.3 2.7%
UNILEVERCL Food & Allied 399 38 0.56 18.6% 27.1% 64.3% 100.4% 83.9% 55.4 30.0 1.9%
DUTCHBANGL Bank 383 50 0.11 1.4% -0.5% 2.7% 22.6% 87.2% 7.8 1.2 4.6%
TITASGAS Fuel & Power 359 90 0.13 2.3% -8.6% -0.3% -20.1% -18.4% 11.5 0.4 8.4%
Market 46,035 16,548 121.23 11.0% 8.8% 21.3% -13.5% 16.7% 15.0 1.6 2.7%
*All returns are Holding Period Return.
^WALTONHIL got listed on September 23, 2020. ROBI got listed on December 24, 2020.

29 of 30
Table 6: Top ten open end funds based on 3Y return (CAGR) performance
Name Asset Management Company
Fund Size (USD mn)
NAV Return
2020 YTD* 2019 2017-2019
CAPM Unit Fund CAPM 1.9 30.6% -7.3% 5.7%
VIPB Accelerated Income Unit Fund VIPB 8.3 13.0% -4.6% 5.4%
Seventh ICB Unit Fund^ ICB 5.0 N/A -7.8% 3.8%
ATC Shariah Unit Fund ATCP AML 1.5 17.6% -10.8% 3.2%
LankaBangla 1st Balanced Unit Fund LankaBangla 5.1 29.2% -8.0% 2.6%
Sixth ICB Unit Fund^ ICB 3.2 N/A -8.4% 2.4%
MTB Unit Fund Alliance 10.1 11.6% -0.9% 1.7%
UFS-Popular Life Unit Fund^ UFS 8.7 N/A -9.0% 1.6%
Third ICB Unit Fund^ ICB 3.8 N/A -8.2% 1.1%
Peninsula AMCL BDBL Unit Fund One Peninsula 2.3 35.3% -7.7% 0.9%
Market (Broad Index) Return (%) 22.3% -18.0% -4.3%
*Based on published NAV and DSEX point of December 30, 2020^NAV of Dec 30 was not disclosed due to year closing.
Table 7: Top ten close end funds based on 5Y return (CAGR) performance
DSE Code FundManager
Fund Size (USD mn)
Price1
(BDT)NAV1
(BDT)Price/NAV
DividendYield2 (%)
NAV Return3
Redemption Year 4
2020 YTD 2019 2017-19 2015-19
NLI1STMF VIPB 8.1 13.2 13.7 96.1% 3.8% 13.4% -4.5% 5.0% 9.7% 2022
SEBL1STMF VIPB 15.2 12.1 12.9 93.6% 2.5% 12.8% -4.4% 4.7% 8.7% 2021
ATCSLGF ATC AML 8.2 11.0 11.3 97.2% 0.0% 4.9% -8.1% 4.1% 7.5% 2025
EBL1STMF RACE 18.2 7.0 10.7 65.5% 0.0% 7.4% -5.0% 4.4% 6.8% 2029
PHPMF1 RACE 35.7 6.1 10.7 56.8% 0.0% 7.9% -3.5% 4.7% 6.2% 2030
RELIANCE1 AIMS 9.3 13.7 13.0 105.4% 0.0% 15.5% -6.6% 3.8% 6.2% 2021
GRAMEENS2 AIMS 40.2 17.5 18.7 93.6% 4.0% 18.5% -7.1% 4.5% 6.0% 2023
1JANATAMF RACE 36.7 6.4 10.7 59.7% 0.0% 6.5% -4.0% 3.5% 5.8% 2030
POPULAR1MF RACE 37.9 5.8 10.8 54.0% 0.0% 6.9% -4.6% 3.8% 5.8% 2030
AIBL1STIMF RACE 13.5 9.9 11.5 86.2% 8.1% 21.7% -6.4% 2.1% 5.3% 2031
Market 2.7% 22.3% -18.0% -4.3% -1.9%
1 Price as of January 04, 2020, and NAV published on December 30, 2020.2 On last cash dividend declared.3 CAGR computed for respected periods, except for 2019 and 2020 YTD, adjusted for dividend. YTD returns of funds debuting within the year represent return generated since debut, hence is not directly comparable with return of funds that operated throughout the year.
4In reference to BSEC Press Release weGmBem/gyLcvÎ (3q LÛ)/2011/25published on March 16, 2018, tenure of existing listed closed end mutual funds can be extended by another tenure equal to maximum 10 years, provided that the full tenure of the subject fund does not exceed 20 years in total. However, the mutual funds those are not willing to extend their tenure will still have the option to convert or wind up as per rules and regulations.
Top Performing Mutual Funds:
The top ten open end mutual funds based on 3 year CAGR outperformed the market, during the same period. Among
them CAPM unit Fund (+5.7%) yielded the highest return. On YTD basis, Peninsula AMCL BDBL Unit Fund One
(+35.3%), CAPM Unit Fund (+30.6%) and LankaBangla 1st Balanced Unit Fund (29.2%) outperformed the market.
All the top ten closed end mutual funds on the basis of 5 years (2015-2019) performance yielded positive returns
on YTD bas. Among them, AIBL1STIMF (+21.7%) yielded the highest return.

30 of 30
Foreign Participation in Equity Market of Bangladesh
Over last 5 years, Bangladesh equity market has seen a surge of foreign investment. As of November, 2020 total foreign ownership stood at 5.1% of the total equity market capitalization, which was only 1.7% in 2014.
Performance of BDT and Currencies of Peer Countries against USD
Since 2015, BDT retained its value better than majority of the currencies of peer countries. While BDT depreciated by 8.4% against US Dollar, other currencies of neighbor countries like Vietnamese Dong (VND), Indian Rupee (INR) and Pakistani Rupee (PKR) lost 8.0%, 16.0% and 58.7%, respectively.
Among all the companies with foreign ownership, BRACBANK had the highest foreign shareholding of 39.4% as of November 2020, followed by BXPHARMA with 29.1%.
Source: DSE and Bangladesh Bank*Net portfolio investment data are as of December of the respective years, except 2020. ~% of foreign ownership of equity market capitalization data are as of December of the respective years, except 2020 (as of November).
Figure 4: Net foreign portfolio investment and foreign ownership as % of total equity market capitalization
943
107
316
482
227
144
2014 2015 2016 2017 2018 2019
Net Foreign Portfolio Investment (BoP, USD mn)* Foreign ownership as % of total market capitalization~
5.1% 5.4%
6.6% 6.6% 6.8%
5.1%
1.7%
78
2020(upto November)
Table 8: Top ten companies with highest foreign shareholding as of November 2020
Ticker Sector Foreign Shareholding*
BRACBANK Bank 39.4%
BXPHARMA Pharmaceuticals & Chemicals 29.1%
OLYMPIC Food & Allied 28.4%
RENATA Pharmaceuticals & Chemicals 22.7%
DBH NBFI 21.9%
MLDYEING Textile 21.9%
ISLAMIBANK Bank 20.6%
SHEPHERD Textile 18.4%
VFSTDL Textile 18.3%
BSRMLTD Engineering 17.1%
Source: DSE
*Latest Data for Foreign shareholding available on DSE are as of November 2020.
Figure 5: Five year’s relative performance of BDT and peer currencies
BDT VND INR PKR
-70.0%
-65.0%
-60.0%
-55.0%
-50.0%
-45.0%
-40.0%
-35.0%
-30.0%
-25.0%
-20.0%
-15.0%
-10.0%
-5.0%
0.0%
5.0%
Dec
-14
Feb-
15
Mar
-15
Apr
-15
Jun-
15
Jul-
15
Aug
-15
Oct
-15
Nov
-15
Dec
-15
Feb-
16
Mar
-16
Apr
-16
Jun-
16
Jul-
16
Aug
-16
Oct
-16
Nov
-16
Dec
-16
Jan-
17
Mar
-17
Apr
-17
May
-17
Jul-
17
Aug
-17
Sep-
17
Nov
-17
Dec
-17
Jan-
18
Mar
-18
Apr
-18
May
-18
Jul-
18
Aug
-18
Sep-
18
Oct
-18
Dec
-18
Jan-
19
Feb-
19
Apr
-19
May
-19
Jun-
19
Aug
-19
Sep-
19
Oct
-19
Dec
-19
Jan-
20
Feb-
20
Apr
-20
May
-20
Jun-
20
Aug
-20
Sep-
20
Oct
-20
Nov
-20
Dec
-20
Source: Investing.com

31 of 30