blue economy report
TRANSCRIPT

T H E E U BLUE ECONOMYREPORT 20
T H E E U BLUE ECONOMYREPORT 2 22


T H E E U BLUE ECONOMYREPORT 20
T H E E U BLUE ECONOMYREPORT 2 22

© European Union, 2022The reuse policy of European Commission documents is regulated by Decision 2011/833/EU (OJ L 330, 14.12.2011, p. 39).Project number: 2022.2588Title: The EU Blue Economy Report 2022.
Print ISBN 978-92-76-52443-4 ISSN 2599-6576 doi:10.2771/923170 KL-AR-22-001-EN-C
PDF ISBN 978-92-76-52444-1 ISSN 2599-6584 doi:10.2771/793264 KL-AR-22-001-EN-N
Disclaimer:This document was prepared by the Directorate-General Maritime Affairs and Fisheries jointly with the Joint Research Centre. Views expressed in unofficial documents do not necessarily represent the views of the European Commission and the European Commission cannot be held responsible for any use of the information contained herein. The 2022 EU Blue Economy Report supersedes all prior editions of the report.

I
2022
The EU Blue Economy Report 2022
This Report was drafted by the European Commission Directorate General for Maritime Affairs and Fisheries, and the Joint Research Centre. It was prepared by unit MARE A4: Economic Analysis, Markets and Impact Assessment and units JRC C7: Knowledge for the Energy Union and JRC D2: Water and Marine Resources in collaboration with other Commission services.
Comments can be sent to:
Directorate-General for Maritime Affairs and FisheriesUnit A4: Economic Analysis, Markets and Impact AssessmentEuropean Commission1049 Bruxelles/BrusselBelgique/Belgiëor by email to: [email protected]
Project Coordination (in alphabetical order): Jann Martinsohn and Frangiscos Nikolian
Main authors (in alphabetical order): Anna M. Addamo, Angel Calvo Santos, Jordi Guillén, Sarah Neehus, Ana Peralta Baptista, Giacomo Petrucco, Simone Quatrini, Thomas Telsnig
Secondary authors (in alphabetical order):Rita Araujo, AspBan (beta-i), Ricardo Barranco, Filipe Batista, Faycal Bouraoui, Wouter van de Bund, Natacha Carvalho (EEA), Maud Casier, Franca Contini, Department for Research and Innovation – Royal Norwegian Ministry of Trade, Industry and Fisheries. Norway, Directorate General for Maritime Affairs and Sustainable Fisheries (Subdireccio General de Pesca i Aqüicultura) – Government of Catalonia, Directorate Strategy, Knowledge and Innovation – Ministry of Agriculture, Nature and Food quality. The Netherlands, Directorate General for Maritime Policy (DGPM) – Ministry of Sea. Portugal, EMODnet, European Bank for Reconstruction and Development (EBRD), European Investment Bank (EIB), Maurizio Gibin, Bernd Gawlik, Ales Gnamus, Georg Hanke, Ifremer, Andrej Krzan (PlanetCare Ltd), Carlo Lavalle, Simon Letout, Diego Macias Moy, Manuel Alonso Pleguezuelo, Hidde Politiek, Anabela Marques Santos, Ignazio Mongelli, Alberto Pistocchi, Paola Proietti, Puerto de Vigo (Autoridad Portuaria de Vigo), Emanuele Quaranta, Service for Entrepreneurship. The Netherlands, Joana Simoes (EarthPulse), Evodia Tapoglou, Victoria Tornero, Michalis I. Vousdoukas
How to cite this report: European Commission (2022). The EU Blue Economy Report. 2022. Publications Office of the European Union. Luxembourg.

This edition of the Blue Economy Report is delivered to you in the context of particularly difficult circumstances affecting Europe and the world. In addition to the incommensurable human tragedies of those directly affected, the unjustified invasion of Ukraine by Russia unavoidably affects the economy, including the blue economy sectors, due to the vast disruptions of supply chains and the record-high energy prices. Those disruptions come on top of the already substantial impacts of Brexit and the COVID-19 pandemic, and more broadly the increasingly
observable impacts of climate change, environmental degradation and the resulting loss of biodiversity.
Such extraordinary circumstances show that we need to accelerate the green transition and improve the resilience and sustainability of the European economy, for which healthy, thriving natural systems are imperative. This is particularly true for the blue economy sectors, which are embedded in, and dependent on, the natural environment. And while this makes them vulnerable to the problems of climate change and environmental decline, it also means they have enormous potential to transform our economy. Indeed, the ocean and its marine ecosystems provide essential building blocks for the economy of the future, such as renewable energy, healthy food, green transportation and innovative nature-based solutions.
The blue economy will therefore continue to play an important role in achieving the ambitions of the European Green Deal1. This fact is once again emphasized by the Sustainable Blue Economy communication2, published by the Commission in May 2021, and some of the initiatives from the ‘Fit for 55’ package3. This fifth edition of the Blue Economy Report therefore pays special attention to the initiatives of the Sustainable Blue Economy communication, as well as developments and policy initiatives of the European Green Deal, its Farm-to-Fork strategy4, the trends in the Strategic Foresight5, and more.
In this year’s edition, you will find a comprehensive overview of the latest trends in the EU’s blue economy sectors, providing sector-specific, socio-economic knowledge to support informed decisions by policy-makers and blue economy operators and stakeholders.
Moreover, the report remains the cornerstone of the blue economy activities in the EU by showing a picture of the challenges and opportunities faced by all sectors, as well as the main drivers to attain its potential, based on the most recent available data.
This fifth edition of the report addresses the impacts on the established and emerging sectors of the most recent shocks to the EU blue economy: Brexit, the COVID-19 pandemic and mitigation measures put in place, the energy price-hike trend, and climate impacts, such as the effects of increasing sea levels.
Further, I am particularly enthusiastic about the launch of the EU Blue Economy Observatory, which is an important step towards an EU-wide platform that brings together the most accurate and up-to-date socio-economic data on the blue economy. The Observatory will become the backbone of the blue economy’s science base to support its sustainable transformation.
I firmly believe that, even in the face of the current challenges, the blue economy can continue to be an accelerator of the transition towards sustainability, and that the Commission, the industry, NGOs, policymakers and citizens can join forces to make the ambitious targets of the European Green Deal a reality. I trust that this report can serve you as a guide and inspiration in this journey.
Enjoy this new edition!
VIRGINIJUS SINKEVIČIUS, EU Commissioner for Environment, Oceans and Fisheries
1 https://ec.europa.eu/info/strategy/priorities-2019-2024/european-green-deal_en 2 https://ec.europa.eu/oceans-and-fisheries/ocean/blue-economy/sustainable-blue-economy_en 3 https://ec.europa.eu/clima/eu-action/european-green-deal/delivering-european-green-deal_en 4 Farm to Fork Strategy (europa.eu)5 Strategic foresight | European Commission (europa.eu)
FO R E WO R DII
THE
EU B
LUE
ECO
NO
MY
REPO
RT

FO R E WO R D
Dear readers,
In these difficult times marked by worsening manifestations of global warming, a still undefeated COVID-19 pandemic, and growing uncertainty about peace, stability and security at the borders of the European Union due to the Russian invasion of Ukraine, the 27 EU Member States have resolutely enacted unprecedented responses that are commensurate with the multiple challenges affecting directly or indirectly our society, environment, economy and well-being.
Oceans play a key role in enabling the transition to a sustainable economy, also supporting us in our effort to respond efficiently to disruptive events and crises. They provide us with vital resources and ecosystem services, such as oxygen, food, water, energy, connectivity, temperature regulation or biodiversity. At the same time, marine ecosystems are complex and fragile. Economic sectors and regions that depend heavily on marine and coastal resources are thus particularly vulnerable to external shocks.
Caring for the health and productivity of our seas and oceans is a herculean task, demanding concerted efforts and consistent action on all levels. Insofar as research is concerned, we are (i) promoting ocean literacy, (ii) investing in marine-related innovation and digitalization, and (iii) enhancing our Blue Economy monitoring and analytical capacity.
In the education domain we created the EU4Ocean coalition connecting diverse organisations, projects and people for the sustainable management of the ocean. We are also supporting the development of sustainability skills. Being 2022 the European Year of the Youth, we are empowering young people to take action to protect our planet and build a sustainable future.
As President von der Leyen put it: ‘every problem is an opportunity for innovation’. That is why within Horizon Europe we have embedded a special mission to Restore our Ocean and Waters. As part of the mission, four lighthouse programs will support the delivery of break-through innovation in major European rivers and sea basins. With a total endowment of 500 million euro, solutions will be tested over the next three years to offload the pressure on our ocean and water ecosystems.
We are also harnessing the power of the digital revolution. By connecting our assets – from Copernicus satellites to marine buoys and underwater drones – we will produce real-time ocean knowledge available to citizens, scientists and policymakers. This digital twin of the ocean, a unique source of ocean information and platform for global cooperation, is set to be operational by 2024.
Last but not least, since 2018 we monitor the socio-economic performance of the EU Blue Economy, its dependencies from coastal and marine ecosystems, and the drivers affecting their health and productivity. I am proud to introduce the 5th annual edition of the EU Blue Economy report, which for the first time includes sectoral analyses up to the year preceding its preparation, i.e. 2020 in this case, including COVID-19 impacts. Trust you will find a wealth of information in this report.
To further enhance evidence-based decision-making and offer the most up-to-date knowledge, we are also setting up the EU Blue Economy Observatory that will significantly expand our analytical responsiveness and stakeholder outreach. As for the Blue Economy report, the Observatory will be the product of a close collaboration between the JRC and DG MARE, with the active involvement of several other Commission’s DGs and many specialised Agencies of the European Union.
Together, this digital twin and the lighthouses will switch on the lights in the ocean. Allow me to wish to all of you good winds in the months ahead.
MARIYA GABRIEL, EU Commissioner for Innovation and Youth, responsible for the European Commission’s in-house science and knowledge service, the Joint Research Centre
III
2022

IV
THE
EU B
LUE
ECO
NO
MY
REPO
RT CON T E N T S
FOREWORD II
EXECUTIVE SUMMARY VI
CHAPTER 1: INTRODUCTION 1
CHAPTER 2: GENERAL CONTEXT AND EU OVERVIEW 5
2.1 ECONOMIC CONTEXT 62.2 POST COVID-19 RECOVERY: MAIN ECONOMIC IMPACTS 72.3. FINANCING 82.4. MARITIME SPATIAL PLANNING (MSP) 162.5 INDIRECT EMPLOYMENT AND ACTIVITY 182.7. OVERVIEW OF EU ESTABLISHED SECTORS 23
CHAPTER 3: THE EUROPEAN GREEN DEAL AND THE PATH TO SUSTAINABLE BLUE ECONOMY 33
3.1 EUROPEAN GREEN DEAL: CONTEXT AND RELEVANCE 343.2 THE CIRCULAR ECONOMY 503.3 STRONGER EUROPE IN THE WORLD 52
CHAPTER 4: ESTABLISHED SECTORS 55
4.1 MARINE LIVING RESOURCES 574.2 MARINE NON-LIVING RESOURCES 644.3 MARINE RENEWABLE ENERGY (OFFSHORE WIND) 704.4 PORT ACTIVITIES 784.5 SHIPBUILDING AND REPAIR 864.6 MARITIME TRANSPORT 934.7 COASTAL TOURISM 101
CHAPTER 5: EMERGING SECTORS 111
5.1 OCEAN ENERGY 1135.2 BLUE BIOTECHNOLOGY 1245.3 DESALINATION 1295.4 MARITIME DEFENCE, SECURITY AND SURVEILLANCE 1355.6 RESEARCH AND INNOVATION 1425.7 INFRASTRUCTURE 144

CHAPTER 6: ENVIRONMENT AND ECOSYSTEM SERVICES IN A SUSTAINABLE BLUE ECONOMY 147
6.1 HUMAN INTERACTIONS WITH BLUE NATURAL CAPITAL 1536.2 MARINE ECOSYSTEM ACCOUNTING AND NATURE-BASED SOLUTIONS 1566.3 MARINE POLLUTION 1586.4 WASTE-WATER TREATMENT 1686.5 DECARBONISATION TRENDS IN THE EU BLUE ECONOMY 1706.6 IMPACTS OF COASTAL INUNDATIONS IN EU ECONOMIC GROWTH 175
CHAPTER 7: REGIONAL AND INTERNATIONAL ANALYSES 179
7.1 THE BLUE ECONOMY IN THE EU SEA BASINS 1807.2 BLUE ECONOMY: THE INTERNATIONAL DIMENSION 193
CHAPTER 8: CASE STUDIES 201
8.1 COMMUNITY OF PRACTICE NORTH SEA: KEY TO SUCCESS? 2028.2 THE PORTUGUESE OBSERVATORY FOR THE BLUE ECONOMY
AND THE OCEAN SATELLITE ACCOUNT 2058.3 ‘ATLANTIC SMART PORTS BLUE ACCELERATION NETWORK’ PROJECT (ASPBAN) 2078.4 ASSESSMENT OF MARINE ECOSYSTEMS AND ECOSYSTEM SERVICES IN FRANCE 210
ANNEXES
ANNEX 1: MEMBER STATE PROFILES 3ANNEX 2: SUMMARY TABLES 33ANNEX 3: METHODOLOGICAL FRAMEWORK 67ACRONYMS 82GLOSSARY 85
V
2022

VI
THE
EU B
LUE
ECO
NO
MY
REPO
RT
In its fifth edition, the EU Blue Economy Report continues to ana-lyse the scope and size of the Blue Economy in the European Union. It aims at providing support to policymakers and stakehold-ers in the quest for a sustainable development of oceans, coastal resources and, most notably, to the development and implemen-tation of polices and initiatives under the European Green Deal in line with the new approach for a sustainable Blue Economy. Through its economic evidence, the Report also seeks to serve as a source of inspiration to investors.
For the purposes of the Report, the Blue Economy includes all those activities that are marine-based or marine-related. Therefore, the Report examines not only established sectors (i.e. those that traditionally contribute to the Blue Economy) but also emerging and innovative sectors (i.e. less mature industries linked to the marine environment), which bring new opportunities for investment and hold large potential for the future development of coastal communities. This latter sectoral cluster also includes industries for which data is not fully available in the public domain, such as maritime defence. Analyses are provided for the EU-27 as a whole and by sector and industry for each Member State (MS).
The European Green Deal and the European Strategy for data will require reliable, accurate and centralised data for their initiatives. This Report intends to serve as a useful input to assessing the evolving contribution of oceans and coasts to the European econ-omy. It is also intended to support the development of policies that pursue the EU strategic vision for a sustainable Blue Economy at all levels of governance.
The fifth edition of the Report continues to provide a perspective on the impacts that several factors have on the Blue Economy, including global environmental challenges like climate change, ongoing geo-political changes and their implications on mari-time security and surveillance, increasing energy and commodity prices, evolving governance frameworks such as Maritime Spatial Planning or those originating from the ‘Fit for 55’ package, and innovative technological solutions that emerge from research & development. This edition also analyses the post COVID-19 impacts on the various sectors, as well as the effects of the mit-igation measures put in place, such as the EU Recovery fund. It includes as well some initial reflections on the potential impacts of Russia’s invasion of Ukraine on some of the Blue Economy sectors. This years’ report also comprises an assessment of the impact of rising sea levels on MSs’ Gross Domestic Product (GDP).
The Blue Economy established sectors include Marine living resources, Marine non-living resources, Marine Renewable energy, Port activities, Shipbuilding and repair, Maritime transport and Coastal tourism. The analysis of these sectors is based on data collected by the European Commission from EU Member States and the European Statistical System. Fisheries and aquaculture
6 This year’s edition of the Blue Economy Report supersedes the 2020 Blue Economy Report; in this edition, the 2018 data are final while in the previous edition, they were still provisional and estimated data. At time of publication, 2019 SBS data were unavailable. Additionally, last year’s edition included the UK, and this current edition is for the EU-27 only.
7 COM(2020) 301 final, July 2020, https://ec.europa.eu/energy/sites/ener/files/hydrogen_strategy.pdf8 https://ec.europa.eu/energy/sites/ener/files/offshore_renewable_energy_strategy.pdf
data were collected under the EU Data Collection Framework (DCF). Analyses for all other established sectors are based on Eurostat data from Structural Business Statistics (SBS), PRODCOM, National Accounts and tourism statistics6.
According to the most recent figures, the established sectors of the EU Blue Economy directly employed close to 4.45 million peo-ple and generated around €667.2 billion in turnover and €183.9 billion in gross value added (Table 0.1).
Table 0.1 EU Blue Economy established sectors, main indicators, 2019
Indicator EU Blue Economy 2019
Turnover €667.2 billion
Gross value added €183.9 billion
Gross profit €72.9 billion
Employment 4.45 million
Net investment in tangible goods €6.1 billion
Net investment ratio 3.3 %
Average annual salary €24 739
Notes: Turnover is calculated as the sum of the turnover in each sector; it may lead to double counting along the value chain. Nominal values. Direct impact only. Net investment excludes maritime transport and coastal tourism. Net investment ratio is defined as net investment to GVA.
Source: Eurostat (SBS), DCF and Commission Services.
For the established sectors, two sectors are particularly note-worthy: (1) the living resources sector, with gross profits valued at €7.2 billion in 2019, saw a 41 % rise on 2009 (€5.1 billion). €121.1 billion, 29 % more than in 2009. And (2) the marine renewable energy sector (mainly offshore wind), which has also experienced growing trends, with employment increasing by 17 % in 2019 (compared to 2018). Since 2009, the two sec-tors that have seen the largest growing trends in terms of EU Blue Economy’s Gross Value Added (GVA) were Living resources (+31 %) and Shipbuilding and repair (+39 %).
The Blue Economy emerging and innovative sectors include marine renewable energy (i.e. Ocean energy, floating solar energy and offshore hydrogen generation), Blue bioeconomy and biotech-nology, Desalination, Maritime defence, security and surveillance, Research and Infrastructure (submarine cables, robotics). These sectors offer significant potential for economic growth, sustaina-bility transition, as well as employment creation.
Emerging Marine Renewable Energy will be key if the EU is to meet its EGD, offshore the EU Hydrogen Strategy7 and the ‘Offshore Renewable Energy Strategy’8 goals. It will also be a cor-nerstone for the RePowerEU Communication recently published by the European Commission.to attain more affordable, secure and
E X EC U T IV E S U M M A RY
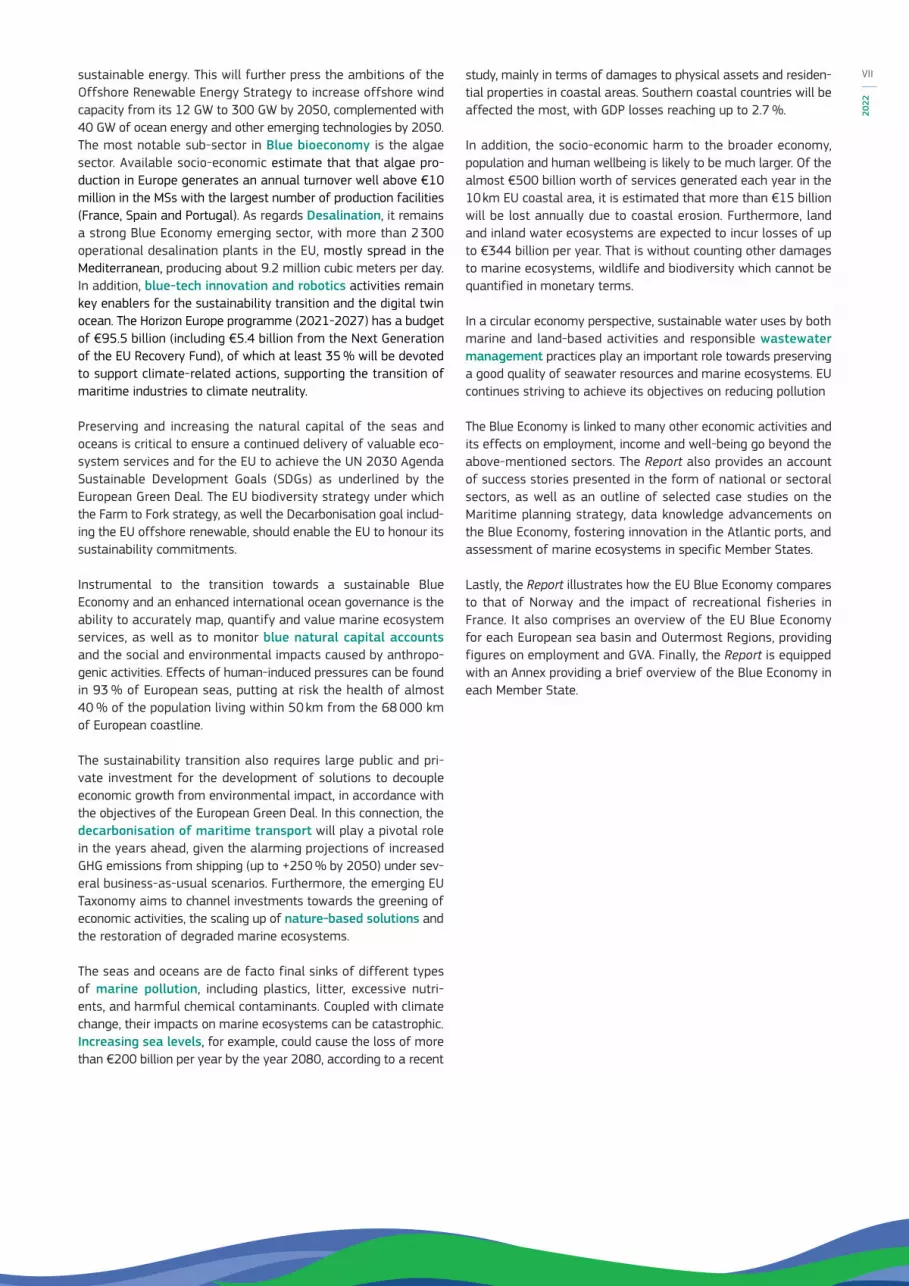
sustainable energy. This will further press the ambitions of the Offshore Renewable Energy Strategy to increase offshore wind capacity from its 12 GW to 300 GW by 2050, complemented with 40 GW of ocean energy and other emerging technologies by 2050. The most notable sub-sector in Blue bioeconomy is the algae sector. Available socio-economic estimate that that algae pro-duction in Europe generates an annual turnover well above €10 million in the MSs with the largest number of production facilities (France, Spain and Portugal). As regards Desalination, it remains a strong Blue Economy emerging sector, with more than 2 300 operational desalination plants in the EU, mostly spread in the Mediterranean, producing about 9.2 million cubic meters per day. In addition, blue-tech innovation and robotics activities remain key enablers for the sustainability transition and the digital twin ocean. The Horizon Europe programme (2021-2027) has a budget of €95.5 billion (including €5.4 billion from the Next Generation of the EU Recovery Fund), of which at least 35 % will be devoted to support climate-related actions, supporting the transition of maritime industries to climate neutrality.
Preserving and increasing the natural capital of the seas and oceans is critical to ensure a continued delivery of valuable eco-system services and for the EU to achieve the UN 2030 Agenda Sustainable Development Goals (SDGs) as underlined by the European Green Deal. The EU biodiversity strategy under which the Farm to Fork strategy, as well the Decarbonisation goal includ-ing the EU offshore renewable, should enable the EU to honour its sustainability commitments.
Instrumental to the transition towards a sustainable Blue Economy and an enhanced international ocean governance is the ability to accurately map, quantify and value marine ecosystem services, as well as to monitor blue natural capital accounts and the social and environmental impacts caused by anthropo-genic activities. Effects of human-induced pressures can be found in 93 % of European seas, putting at risk the health of almost 40 % of the population living within 50 km from the 68 000 km of European coastline.
The sustainability transition also requires large public and pri-vate investment for the development of solutions to decouple economic growth from environmental impact, in accordance with the objectives of the European Green Deal. In this connection, the decarbonisation of maritime transport will play a pivotal role in the years ahead, given the alarming projections of increased GHG emissions from shipping (up to +250 % by 2050) under sev-eral business-as-usual scenarios. Furthermore, the emerging EU Taxonomy aims to channel investments towards the greening of economic activities, the scaling up of nature-based solutions and the restoration of degraded marine ecosystems.
The seas and oceans are de facto final sinks of different types of marine pollution, including plastics, litter, excessive nutri-ents, and harmful chemical contaminants. Coupled with climate change, their impacts on marine ecosystems can be catastrophic. Increasing sea levels, for example, could cause the loss of more than €200 billion per year by the year 2080, according to a recent
study, mainly in terms of damages to physical assets and residen-tial properties in coastal areas. Southern coastal countries will be affected the most, with GDP losses reaching up to 2.7 %.
In addition, the socio-economic harm to the broader economy, population and human wellbeing is likely to be much larger. Of the almost €500 billion worth of services generated each year in the 10 km EU coastal area, it is estimated that more than €15 billion will be lost annually due to coastal erosion. Furthermore, land and inland water ecosystems are expected to incur losses of up to €344 billion per year. That is without counting other damages to marine ecosystems, wildlife and biodiversity which cannot be quantified in monetary terms.
In a circular economy perspective, sustainable water uses by both marine and land-based activities and responsible wastewater management practices play an important role towards preserving a good quality of seawater resources and marine ecosystems. EU continues striving to achieve its objectives on reducing pollution
The Blue Economy is linked to many other economic activities and its effects on employment, income and well-being go beyond the above-mentioned sectors. The Report also provides an account of success stories presented in the form of national or sectoral sectors, as well as an outline of selected case studies on the Maritime planning strategy, data knowledge advancements on the Blue Economy, fostering innovation in the Atlantic ports, and assessment of marine ecosystems in specific Member States.
Lastly, the Report illustrates how the EU Blue Economy compares to that of Norway and the impact of recreational fisheries in France. It also comprises an overview of the EU Blue Economy for each European sea basin and Outermost Regions, providing figures on employment and GVA. Finally, the Report is equipped with an Annex providing a brief overview of the Blue Economy in each Member State.
VII
2022


C h A p T E R 1I N T R O D U C T I O N

Aim of the report
The ocean is at the foundation of life in the planet and plays a vital role in safeguarding that some of our most basic needs are met. The Blue Economy comprises all activities that are linked to the water, the sea and the oceans. It relies not only on more tra-ditional forms of utilisation (e.g. fishing and aquaculture), but also combines a broader vision of activities that can offer important sources of sustainable economic development for Member States and coastal communities in particular.
The Blue Economy can contribute to a large extent to Europe’s green ambitions. A sustainable Blue Economy enables society to obtain value from the oceans and coastal regions, whilst respect-ing their long-term ability to regenerate and endure such activities through the implementation of sustainable practices. This implies that human activities must be managed in a way that guaran-tees the health of the oceans and safeguards long-term economic productivity, so that the potential they offer can be realised and sustained over time.
The annual EU Blue Economy Report aims to continuously improve the measuring and monitoring of the socio-economic performance of the Blue Economy (for the 2009-2019 period in the current edition), while taking its environmental impacts into account. The EU is determined to deliver on European Green Deal9, with the adoption of the ‘Fit for 55 package’, implemen-tation of the Zero Pollution Action Plan10, and with other initia-tives being prepared, at the same time as it ensures a transition based on sustainable economic growth and employment. Besides, the insight of the Sustainable Blue Economy Communication11, can help achieve this sustainable growth objective while protect-ing and restoring nature, fighting pollution, and tackling climate change.
The Report provides a socio-economic assessment of Blue Economy activities, as well as robust evidence in support of rele-vant new initiatives and policies in this domain. It also makes an important contribution to the achievements of the European Green Deal (EGD), which aims at implementing the United Nation’s 2030 Agenda by putting ‘sustainability and the well-being of citizens at the centre of economic policy and the sustainable development at the heart of the EU’s policymaking and action’12. In line with this, it plays an instrumental role in the transition of the EU’s Blue Economy towards a sustainable future, as outlined in the above-mentioned Sustainable Blue Economy Communication. At the UN climate change COP26 in Glasgow, the European Commission supported the consensus reached by over 190 countries on the completion of the Paris Agreement rulebook and the Paris targets to limit global warming to 1.5 degrees Celsius13. The Report also serves as a tool to monitor the implementation of such agree-ments across the Blue Economy sectors.
9 Commission Communication on ‘The European Green Deal’ COM (2019) 640 final.10 COMMUNICATION FROM THE COMMISSION TO THE EUROPEAN PARLIAMENT, THE COUNCIL, THE EUROPEAN ECONOMIC AND SOCIAL COMMITTEE AND THE COMMITTEE OF
THE REGIONS Pathway to a Healthy Planet for All EU Action Plan: ‘Towards Zero Pollution for Air, Water and Soil’ COM/2021/400 final.11 COM/2021/240 final.12 COM (2019) 640 final, p. 3.13 https://ec.europa.eu/info/strategy/priorities-2019-2024/european-green-deal/climate-action-and-green-deal/
eu-cop26-climate-change-conference_en?msclkid=b19768d8a92311ecb6d8815e24c5b000 14 The Blue Economy Indicators tool can be accessed through the online dashboard available at: https://blueindicators.ec.europa.eu/15 COM (2020) 66 Final p. 13.16 Commission Communication on ‘A European Strategy for Data’ COM (2020) 66 Final.
Building on previous editions, the fifth edition of the EU Blue Economy Report aims to continue to provide accurate and reli-able data and trends for the maritime and ocean related sec-tors and activities, as good data is essential in order to develop and implement policies. It also provides a solid evidence-based ground on which to make policy decisions that support the tran-sition into more carbon efficient and less polluting technologies and activities.
The Report is accompanied by the Blue Economy Indicators (BEI). An IT tool that stores and disseminates the data underlying the analyses contained in the Report, as well as additional data-sets for transparency purposes14. The BEI ensures that the data reported are available to all in a way that is easily accessible, so that it can be verified and re-used in line with the European strategy aiming to make ‘more high-quality public sector data available for re-use […]’15. The data made available through the BEI are based on the methodology detailed in Annex 3.
In addition to the European Green Deal, the report and particularly the Blue Economy Indicators strive for more and better data in line with the European Commission’s European Data Strategy16 to ensure that the EU is a front-runner in an ever more-digital world. The goal of the strategy is to create a policy environment to make the EU a leader in a data-driven society. Creating a sin-gle market for data will allow it to flow freely within the EU and across sectors for the benefit of businesses, researchers, and pub-lic administrations. Only with high quality data can policy makers and citizens make adequate and informed decisions.
What does the Blue Economy include?
For the purpose of this Report, the EU’s Blue Economy encom-passes all sectoral and cross-sectoral economic activities based on or related to the oceans, seas and coasts:
• Marine-based activities: include the activities undertaken in the ocean, sea and coastal areas, such as Marine living resources (capture fisheries and aquaculture), Marine non-living resources, Marine renewable energy, Desalination, Maritime transport and Coastal tourism.
• Marine-related activities: activities which use products and/or produce products and services from the ocean or marine-based activities like seafood processing, biotechnol-ogy, Shipbuilding and repair, Port activities, technology and equipment, digital services, etc.
2
THE
EU B
LUE
ECO
NO
MY
REPO
RT
In terms of geographical scope, the Report focuses on the EU territory, including wherever possible, EU Outermost Regions17 and landlocked Member States. For the purpose of broadening the context and facilitating comparative analysis, it also includes special assessments of particular geographical areas outside of the EU remit that have a significant role in terms of the global Blue Economy18.
The Report focuses on the direct socio-economic performance of the economic activities included in the identified Blue Economy sectors. However, it should be noted that the Blue Economy gen-erates significant indirect economic effects (e.g. across the sup-ply chain) and induced economic effects (i.e. general consump-tion and expenditure stemming from the household disposable income generated by Blue Economy activities). Wherever possi-ble, an account of these effects is provided in the sector-specific chapters. In the absence of granular data that would allow for an accurate attribution of indirect and induced effects to the Blue Economy, an overview of methodologies used to estimate the Blue Economy multiplier is provided in Chapter 2, providing an illustrative example.
Contents and structure
Following the present Introduction, Chapter 2 provides an over-view of several broad issues, such as the general economic and political context, providing a background to the Blue Economy and an overview of the sources of financing available for Blue Economy activities and projects. The chapter further includes a summary of the main features of the established sectors. It also comprises a general assessment of the impacts and responses to the COVID-19 crisis. In addition, it includes a brief section on indirect Blue Economy effects on employment and Gross Value Added (GVA). This year this chapter also includes for the first time a section dedicated to Strategic Foresight on the European level, delineating megatrends that have a direct impact on the Blue Economy.
With a focus on the European Green Deal, Chapter 3 highlights the main elements of the EGD, of relevance to the Blue Economy, including a revision of the ‘Fit for 55’ package adopted by the Commission. This year’s edition also includes a section on main initiatives stemming from the Communication on a Sustainable Blue Economy. Further details are also provided on policies and/or initiatives that fall under the realm of the EGD, such as the Farm to Fork strategy (F2F) and the circular economy and the opportu-nities it offers to the Blue Economy sectors, especially at an EU level. Finally, this chapter briefly discusses the role of the EU in the world as regards its maritime policies.
Chapter 4 then reviews a series of traditional Blue Economy industries, i.e. the ‘established sectors’, looking at the main eco-nomic indicators as well as the trends, drivers and interactions with other sectors or activities, including their environmental impacts. This chapter provides an analysis at the EU level, but also emphasises the contribution made by individual MSs to different sectors. The established sectors include:
17 https://ec.europa.eu/regional_policy/en/policy/themes/outermost-regions/#:~:text=The %20European %20Union %20(EU) %20counts,the %20Canary %20Islands %20(Spain)18 In this year’s edition, the international analysis showcases the Norwegian
Blue Economy.
• Marine living resources• Marine non-living resources• Marine renewable energy• Ports activities• Shipbuilding and repair• Maritime transport• Coastal tourism.
Chapter 5 provides an analysis of the emerging sectors, i.e. sec-tors that are either not mature, new (i.e. based on innovative tech-nologies), or which have activities falling outside of the spectrum of national statistics (e.g. data limitations due to strict disclosure policies or confidentiality issues). The chapter highlights the esti-mated impact that these sectors have based on available data and their potential for further growth and expansion. The following sectors are included in this section:
• Ocean energy• Blue bioeconomy and biotechnology• Desalination• Maritime Defence, security and surveillance• Research and Education• Infrastructure (submarine cables, robotics, etc.).
Following this section, Chapter 6 provides an overview of some of the main dependencies, liabilities, and impacts of the Blue Economy on blue natural capital and ecosystems services, as well as opportunities arising from the transition to a more sustainable Blue Economy. It covers, among others, the issue of marine pol-lution in European seas, the importance of wastewater manage-ment, the latest decarbonisation trends, as well as an assessment of the impacts of sea level rise on the broader economy in the EU. On the other hand, the chapter also provides an overview of the most promising techniques to minimize human impact on the blue natural capital, such as via the adoption of marine ecosystem accounting and the deployment of nature-based solutions.
Chapter 7 covers the regional and international dimensions and is split into two main sections. The first section provides a disag-gregated analysis of the relative share of the Blue Economy in the EU sea basins. This section presents results for employment and GVA for all seven Blue Economy established sectors. The second section puts the EU Blue Economy results into perspective vis-à-vis other major world actors. This year, the comparison is with the Blue Economy in Norway.
Finally, Chapter 8 compiles a number of case studies that explore in more detail some niche sections of the Blue Economy. They specifically focus on the strategy of some Member States imple-menting their MSP strategy (Netherlands), setting up a Blue Economy Observatory to ensure accurate data knowledge on the Blue Economy sectors (Portugal), and attempting to measure the value of ecosystems services (France). A final case study provides the perspective of a Blue Economy ports accelerator in the Atlantic Sea basin, looking at the all the process and actors, and the objec-tives to ensure a transition to green and innovative hubs.
3
2022
A series of Annexes complete the Report offering an overview of the Blue Economy for each of the EU Member States (Annex 1). The Annexes also contain a series of additional tables with comple-mentary data on the established sectors (Annex 2), and a detailed explanation of the methodological approaches used across the Report (Annex 3).
Note on the Russian invasion of Ukraine
As the recent Russia’s invasion of Ukraine will likely have signifi-cant economic impact on the European economy, it will inevitably also impact the Blue Economy sectors as well. Considering that the situation is evolving, and necessary datasets are not yet read-ily available due to the actuality of recent events, the economic impact of the Russian invasion of Ukraine can yet only be approx-imated. Where possible, implications on the Blue Economy sectors are explored in the respective chapters.
Note on the COVID-19 outbreak
The data used for the production of this Report mostly covers the period from 2009 to 2019. Wherever possible, more recent data has also been used. However, at the time of writing this Report, 2020 data published in Eurostat’s Structural Business Statistics (SBS) were available only for few indicators (e.g. turnover) and Blue Economy activities, at a high level of sectoral aggregation (NACE level 2). Therefore, the analysis of COVID-19 impacts on the Blue Economy sectors could not be conducted with the same degree of accuracy for all the indicators presented in this Report. The estimates provided should be taken with caution. In addition to providing a brief description of COVID-19 effects on specific Blue Economy sectors or activities (Chapter 4), this report com-prises a section (2.2) on post COVID-19 recovery impacts across the whole Blue Economy.
Note on the treatment of the United Kingdom
As the UK is no longer a member of the European Union (since February 2020), it has not been included in the report and the analyses herein. All data refer to the 27 EU Member States (EU-27), unless otherwise specified, and as such cannot be compared to prior reports, which included UK data.
4
THE
EU B
LUE
ECO
NO
MY
REPO
RT

C h A p T E R 2G E N E R A L C O N T E X T A N D E U O V E R V I E W

This chapter provides the general context for the report as well as relevant background information for the subsequent chapters. Firstly, it presents the general economic context. Then, the impli-cations of the COVID-19 pandemic are delineated, specifically looking at Blue Economy sectors across the European Union. This is followed by an overview of blue funding exploring financing opportunities for the industry as well as investment trends. The following section focuses on Sustainable Blue Economy devel-opments in view of Marine Spatial Planning. Lastly, this chapter provides examples of indirect effects of the Blue Economy on employment and Gross Value Added (GVA) as well as casting an overview of the established sectors.
19 The national GDP and employment data have been extracted from Eurostat.20 https://www.oecd-ilibrary.org/sites/4181d61b-en/index.html?itemId=/content/publication/4181d61b-en#chapter-d1e21
2.1 ECONOMIC CONTEXTThe Gross Domestic Product (GDP) of the EU-27 was estimated at €14 015 billion and employment at 193.6 million people in 201919. The contribution of the Blue Economy established sectors to the EU-27 economy in 2019 was 1.5 % in terms of GVA and 2.3 % in terms of employment (Figure 2.1).
The relative size of the EU Blue Economy in terms of GVA and employment with respect to the EU overall economy has decreased from 2009. However, it can be seen that the relative size of the EU Blue Economy both in terms of GVA and employ-ment decreased with the 2008 economic crisis. The crisis went through 2012 and since then the relative size of the EU Blue Economy has increased, in particular in terms of employment.
This shows that the EU Blue Economy grows and shrinks faster than the EU overall economy. This could be partly due to the importance of coastal tourism – with 44 % of the GVA and 63 % of the employment of the EU Blue Economy – that grows faster in periods of economic growth, but also shrinks faster during crisis. It should be noted that national production and business statistics do not always allow for a detailed disaggregation of economic variables by destination, such as maritime use. Shipbuilding, for instance, is an industry with multiple indirect and induced effects (see Section 2.5 for more details). Only few of them are captured by our Blue Economy statistics, which therefore should be consid-ered as an underestimation of the total.
The outbreak of the COVID-19 pandemic in February 2020 rep-resented a major shock for the global and EU economies, with severe socio-economic consequences in 2020 and 2021. It is therefore expected that the EU Blue Economy will be more affected by the crisis than the overall EU economy. Estimates based on preliminary Eurostat data show that the turnover of coastal tourism declined almost by half in 2020, being one of the economic activities hit harder in the whole economy.
Since March 2022, the Russia’s invasion of Ukraine is affecting Europe’s and global security and stability, with highly likely nega-tive impacts on economic growth, financial markets and commod-ity prices. Russia and Ukraine are large producers and exporters of key food items, minerals and energy. Russia and Ukraine account together for about 30 % of global exports of wheat, 20 % for corn, mineral fertilisers and natural gas, and 11 % for oil20. This crisis has already resulted in a considerable economic and financial shock, predominantly affecting the commodity markets, with the prices of oil, gas and wheat increasing.
This crisis has also affected the EU Blue Economy sectors in dif-ferent ways, ranging from increases in oil prices, to trade restric-tions, and supply chain bottlenecks. The impact on the different sectors will depend on the extent and duration of the conflict and retaliation measures.
Nevertheless, the EU Blue Economy also grows faster when the economy recovers, offering important investment opportunities.
Figure 2.1 Contribution of the Blue Economy to the overall EU economy
Source: Own elaboration from Eurostat (SBS) and DCF data.
6
THE
EU B
LUE
ECO
NO
MY
REPO
RT

In 2020, the EU recorded a real decrease in GDP of 6.1 % as the initial impact of the COVID-19 crisis was felt. This was consid-erably larger than the decrease in activity in 2009 during the global financial and economic crisis. In 202O, the Gross Domestic Product (GDP) of the EU-27 was estimated at €13 400 billion21, down from €14 000 billion in 2019. Employment was estimated at 187 000 million people.
21 Gross domestic product at market prices and employment extracted from Eurostat.22 https://ec.europa.eu/info/publications/european-economic-forecast-winter-2022_en 23 https://ec.europa.eu/info/sites/default/files/flash_consumer_2022_01_en.pdf24 https://www.eesc.europa.eu/cs/news-media/news/eesc-suggests-key-additions-ecs-recommendations-economic-policy-euro-area-2022 25 https://ec.europa.eu/info/business-economy-euro/recovery-coronavirus/recovery-and-resilience-facility_en_
2.2 POST COVID-19 RECOVERY: MAIN ECONOMIC IMPACTSThe Economic Forecast of the European Commission projected a weaker estimation of the EU economy, for the first quarter of 2022, as the GDP is not increasing at the same pace as previously expected.
The growth rate is estimated to be at 3.1 % in 2022. Following an expansion of 5.3 % in 2021, real GDP is forecasted to rise by 4.0 % in 2022 and 2.8 % in 2023 respectively, which is mostly rooted in domestic demand. Reasons for the slower pace regard-ing GDP growth are mainly due to tighter macroeconomic policies, recurrent COVID-19 outbreaks, re-imposed restrictions and ele-vated energy prices, which are set to weigh on consumption and investment decisions in the first half of 202222. EU GDP pre-pan-demic levels were reached in the third quarter of 2021, while projections show that Member States will pass this milestone by the end of 2022.
Growth is estimated to have slowed down, after a robust rebound in spring and autumn of 2021. In the last quarter of 2021, surge in COVID-19 infections, high energy prices and continued sup-ply-side disruptions have added weight on economic slowdown. Many Member States economies’ growth is still under pressure due to the pandemic. A continuous decrease in the number of infections will support recovery as supply conditions are normal-ising and inflationary pressures become more moderate. The implementation of the Recovery and Resilience Facility in Member States, aiming at improving labour market conditions, impacting household’s savings, and good financing conditions are expected to be supporting economic growth. However, growth in employ-ment did not increase enough to outpace surging labour demand. A reduction of internal demand can be noticed in light of the slight decrease in the estimation of the EU consumer confidence indica-tor (0.4 points down) compared to December 202123.
Moreover, one of the main challenges of the EU economy is expected to be the question as to how to deal with the accumula-tion of public debt, the high level of inflation and how to further foster the transformation towards a green and digital economy, while also focusing on social stability24.
Following the economic expansion, the labour market is expected to complete its recovery in 2022. The unemploy-ment rate decreased below pre-pandemic rates to 6,4 %. An estimated 3.4 million jobs will be created between 2022 and 2023, translating into a decreased unemployment rate of 6.5 % in 2023. These positive forecasts are rooted in the continued policy support of Member States and the EU, with instruments like NextGenerationEU and the associated Recovery Resilience Facility25 which supports reforms to strengthen economic and social resilience and the cohesion of the Single Market, while
7
2022

promoting green and digital transitions in Member States. With the help of the RRF and associated structural reforms, productiv-ity will grow back to a strong pace of 2.9 % in 2022 and 1.6 % in 202326.
After reaching a record rate of 5.0 % in December 2021 and 5.1 % in January 2022, inflation in the euro zone is expected to remain above 3 % until the third quarter. Inflation is then expected to decline to 2.1 % in the last quarter of the year, before moving below 2 % throughout 2023. The lowest annual rates were regis-tered in France (3.3 %), Portugal (3.4 %) and Sweden (3.9 %). The highest annual rates were recorded in Lithuania (12.3 %), Estonia (11.0 %) and Czechia (8.8 %)27.
COVID-19 impacts are also analysed under the different sections of this report.
26 https://ec.europa.eu/info/publications/european-economic-forecast-autumn-2021_en 27 https://ec.europa.eu/eurostat/documents/2995521/14245727/2-23022022-AP-EN.pdf/1bd1f78c-b615-7052-7379-3129551900eb 28 Sumaila, U.R., Walsh, M., Hoareau, K. et al. Financing a sustainable ocean economy. Nat Commun 12, 3259 (2021). https://doi.org/10.1038/s41467-021-23168-y 29 See ‘Ocean Solutions That Benefit People, Nature and the Economy’. High level panel for a sustainable Ocean Economy, Ocean Solutions Report | High Level Panel
for a Sustainable Ocean Economy (oceanpanel.org)
2.3. FINANCINGBlue Economy investment outlook
Investing in the Blue Economy calls for an interaction and coop-eration of local, national, and international level financial instru-ments, that are provided by different types of stakeholders: individuals, public and private companies, governments, non-gov-ernmental and inter-governmental institutions. Some of these financial instruments, include traditional loans and grants, but also venture capital, private and public equity, pension and investment funds. The use of the different instruments and the participation of the different stakeholders depends on the expected returns on investment from the Blue Economy projects. This depends on the risks associated to these projects. Several barriers contribute to the associated investment risks28:
1. the need for a more efficient regulatory and policy frame-work, with more transparency on sustainability activities, more availability of data, and clearer guidelines and taxon-omy for sustainable investments;
2. the development of a broader range of financial instruments and partnerships, with appropriate risk sharing, due to long or uncertain returns of investments for some of the projects;
3. the development of insurance and other risk mitigation measures for the high risk profile associated projects linked to the Blue Economy.
Following a report by the high-level panel for a sustainable Ocean Economy29, Investments in a sustainable ocean economy could represent positive returns. Investing €2.54 trillion ($2.8 trillion) today in just four ocean-based solutions – offshore wind production, sustainable ocean-based food production, decarbonisation of international shipping, and conservation and restoration of mangroves – would yield a net benefit of €14.11 trillion ($15.5 trillion) by 2050, a benefit-cost ratio of more than 5:18.
8
THE
EU B
LUE
ECO
NO
MY
REPO
RT

Source: Adapted from Report on ‘Ocean Solutions that Benefit People, Nature and the Economy’, December 202030.
The European Commission has been supporting and advocating a shift to sustainable investment. It has been supporting several ini-tiatives, such as the Sustainable Blue Economy Finance initiative, now hosted by the UN, or the publication of the EU taxonomy, to help investors understand whether an economic activity is envi-ronmentally sustainable and that encourages them to redirect capital flows toward sustainable activities.
Since 2018 the European Commission has been developing a policy agenda on sustainable finance and how to make sustain-ability considerations an integral part of its financial policy. The action plan on financing sustainable growth called for the creation of a common classification system, i.e. an ‘EU taxonomy’ for envi-ronmentally sustainable activities. This will provide for a common language and a clear definition of ‘sustainable’ finance for inves-tors, business and policy makers. The EU Taxonomy Regulation31 established six environmental objectives: climate change mitiga-tion, climate change adaptation, sustainable use and protection of water and marine resources, transition to a circular economy, pollution prevention and control, and protection and restoration of biodiversity and ecosystems. The Commission has also pub-lished its new ‘strategy for financing the transition to a sustaina-ble economy’ on 6 July 202132. This strategy aims to support the European green deal by channelling private investment towards the transition to a climate-neutral economy33. The new measures include updating financial disclosure and sustainability reporting rules, as well as actions for enhancing sustainability advisory ser-vices and capacity-building for companies, including SMEs.
30 https://oceanpanel.org/ocean-action/files/full-report-ocean-solutions-eng.pdf31 Regulation (EU) 2020/852 of the European Parliament and of the Council of 18 June 2020 on the establishment of a framework to facilitate sustainable investment,
and amending Regulation (EU) 2019/2088.32 Strategy for financing the transition to a sustainable economy | European Commission (europa.eu)33 Sustainable finance | European Commission (europa.eu)34 Platform on Sustainable Finance | European Commission (europa.eu)35 Sustainable finance package | European Commission (europa.eu)36 Sustainable finance package | European Commission (europa.eu)37 EU taxonomy: Commission presents Complementary Climate Delegated Act to accelerate decarbonisation | European Commission (europa.eu)
In October 2020, the Commission established the ‘Platform on Sustainable Finance’34, an advisory body composed of experts from the private and public sector, providing advice on the EU Taxonomy. This platform will be preparing advisory work for the Commission in the next years, on different sustainability areas. Mandatory reporting under the Taxonomy Regulation will apply from January 2022, for the climate change mitigation and adap-tation objectives, and from January 2023, for the other four objectives. A first delegated act on sustainable activities for climate change adaptation and mitigation objectives35 was for-mally adopted on 4 June 2021 for scrutiny by the co-legislators. Accompanying this delegated act, and building on the transition finance report adopted by the Platform on Sustainable Finance in March 2021, the Commission adopted a Communication on ‘EU taxonomy, corporate sustainability reporting, sustainability preferences and fiduciary duties: Directing finance towards the European green deal’36. This Communication aimed at delivering key messages on how the sustainable finance toolbox facilitates access to finance for the transition. Work on the remaining objec-tives will be published from 2022 to 2024.
The Commission continues working and updating the EU tax-onomy, and approved, on 2 February 2022, in principle a Complementary Climate Delegated Act37 which includes in the list of economic activities covered by the EU taxonomy, spe-cific nuclear and gas energy activities under strict conditions. In addition, it introduces requirements for large listed non-finan-cial and financial companies to disclose the proportion of their activities linked to natural gas and nuclear energy. This should
Figure 2.2 Benefit-Cost Ratios and Net Benefits by 2050 for four Sustainable Ocean-Based Interventions
0
2
4
6
8
10
12
14
16
Benefit-Costratio (average)
Net Benefit TOT (in trillion EUR) (in trillion EUR)
12:01
3,19
10:01
6,1
4:01
4,64
3:010,18
14,11
Benefit/Cost (ratio) Total benefits (€ trillion)
Offshore windenergy production
Ocean-basedfood production
Decarbonisation ofinternational shipping
Conservation and restorationof mangroves
9
2022

help investors to distinguish between the different activities they are investing in. This Complementary Delegated Act will be for-mally adopted, once scrutinized by co-legislators. The Platform on Sustainable Finance is also working on an advice on the criteria for the EU taxonomy on water, biodiversity, pollution prevention and circular economy.
As a transparency tool, the Taxonomy Delegated Acts will intro-duce mandatory disclosure obligations on large companies and investors (i.e. to disclose Taxonomy aligned activities). This will allow for more transparency in investment portfolios and will likely drive more financial entities to increase investment in sus-tainability, including in Blue Economy projects, as from 2022.
The Recovery and Resilience Facility (RFF) provides €723.8 billion of loans and grants to support reforms and investments focusing on the Country Specific Recommendations (European Semester) as well as the green and digital transitions. The largest share of the money is invested in short-term and shovel-ready pro-jects in 2021, 2022 and 2023 to guarantee an immediate effect on the economy. Although, the Blue Economy/maritime sector is not directly mentioned in RRF legal base, many Recovery and Resilience Plans (RRP) of coastal states include substantial invest-ments into sustainable Blue Economy, amounting to ca. €10.5 bil-lion (ca. 1.5 %) of the total RRF budget. In particular, the RRPs of Belgium, Cyprus, Greece, France, Italy, Poland, Portugal and Spain include sizable Blue Economy investments. Some of the marine/Maritime-related investments proposed in these plans include greening and innovating the fisheries and aquaculture sectors, monitoring marine and coastal biodiversity, restoration of river systems, waste water treatment, flood protection, offshore energy parks, upgrading of port infrastructure, coastal tourism, greening and digitalisation of ports and shipyards, investments in green shipping and blue skills support.
Overview of current EU financing for the Blue Economy
The ‘BlueInvest’ investment platform was launched by the European Commission in April 2019, with the goal to foster invest-ment, innovation and sustainable growth in the Blue Economy. It provides support to innovative SMEs and start-ups active in the Blue Economy sectors, through its online community, invest-ment readiness assistance, matchmaking, investor outreach and engagement, its academy, projects pipeline and a BlueInvest Fund.
BlueInvest follows a two-pronged approach with, on the one hand, customised support, investment-readiness advice and visibility to innovative SMEs and start-ups in the Blue Economy and, on the other hand, providing access to investors and contributing to the creation of a dedicated financial ecosystem for Blue Tech SMEs.
The BlueInvest Community brings together more than 1 000 Blue Economy entrepreneurs, investors, corporates and innovation stakeholders interested in the Blue Economy.
• The BlueInvest Academy offers capacity-building courses, training events and exclusive webinars to accelerate busi-nesses for investment, market access and international expansion.
• Investment readiness assistance: It provides an exclusive coaching programme for high potential start-ups and SMEs with innovative and sustainable products and solutions for the Blue Economy. Businesses and projects selected for Investment Readiness Assistance will receive coaching pack-ages tailored specifically to their readiness levels and busi-ness objectives. Over 170 SMEs and start-ups from coastal regions across the EU have benefited until now from cus-tomised and needs-based coaching in all relevant areas of
Figure 2.3 Blue Invest Key Figures
Source: European Commission.
10
THE
EU B
LUE
ECO
NO
MY
REPO
RT
business success (target is 200 by the end of the current contract in Q1 2022). The satisfaction rate of SMEs coached was 97 %. (www.blue-invest.eu).
• Outreach to investors: Over 300 companies looking for finance to either bring their product or service to market or increase their market share are featured in the Blue Invest project pipeline. Between 2019 and 2021, the programme has promoted these companies through individual contacts and more than 40 matchmaking and pitching events.
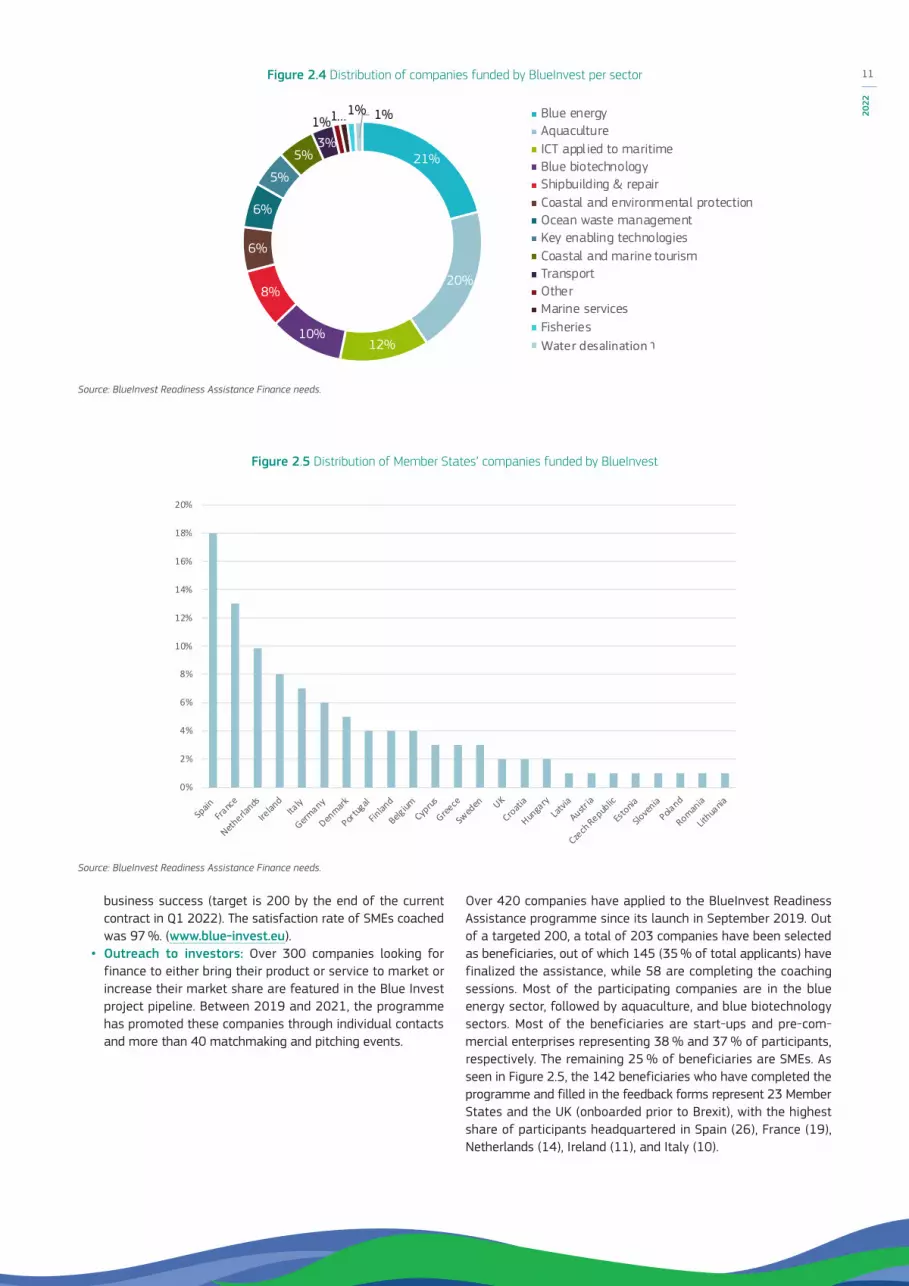
Over 420 companies have applied to the BlueInvest Readiness Assistance programme since its launch in September 2019. Out of a targeted 200, a total of 203 companies have been selected as beneficiaries, out of which 145 (35 % of total applicants) have finalized the assistance, while 58 are completing the coaching sessions. Most of the participating companies are in the blue energy sector, followed by aquaculture, and blue biotechnology sectors. Most of the beneficiaries are start-ups and pre-com-mercial enterprises representing 38 % and 37 % of participants, respectively. The remaining 25 % of beneficiaries are SMEs. As seen in Figure 2.5, the 142 beneficiaries who have completed the programme and filled in the feedback forms represent 23 Member States and the UK (onboarded prior to Brexit), with the highest share of participants headquartered in Spain (26), France (19), Netherlands (14), Ireland (11), and Italy (10).
Figure 2.4 Distribution of companies funded by BlueInvest per sector
Source: BlueInvest Readiness Assistance Finance needs.
Figure 2.5 Distribution of Member States’ companies funded by BlueInvest
Source: BlueInvest Readiness Assistance Finance needs.
0%
2%
4%
6%
8%
10%
12%
14%
16%
18%
20%
Spain
France
Netherla
nds
Irelan
dIta
ly
Germany
Denmark
Portug
al
Finlan
d
Belgium
Cyprus
Greece
Swed
en UK
Croatia
Hunga
ryLat
via
Austria
Czech Repub
lic
Estonia
Sloven
ia
Poland
Romania
Lithua
nia
21%
20%
12%10%
8%
6%
6%
5%
5%3%
1%1…1% 1% Blue energyAquacultureICT appl ied to maritimeBlue biotechnologyShipbuilding & repairCoastal and environmental protectionOcean waste managementKey enabling technologiesCoastal and marine tourismTransportOtherMarine servicesFisheriesWater deasalination
21%
20%
12%10%
8%
6%
6%
5%
5%3% 1%1%1%1% Blue energy
Aquaculture
ICT applied to maritime
Blue biotechnology
Shipbuilding & repair
Coastal and environmental protection
Ocean waste management
Key enabling technologies
Coastal and marine tourism
Transport
Other
Marine services
Fisheries
Water desalination
11
2022

BlueInvest Financing Instruments
The European Maritime and Fisheries Fund (EMFF) of the European Commission aims to improve access to finance and investment readiness for start-ups, early-stage businesses and SMEs. Between 2016 and 2021 EMFF awarded over €65 million to SMEs developing projects with innovative products, technol-ogies and services for the Blue Economy. Close to 60 projects were funded, including many projects that support biodiversity and ecosystem regeneration through innovation. Starting with a pilot call for proposals in 2016 (Blue Tech call), which was subse-quently scaled up as ‘Blue Economy Window’ and later branded as ‘BlueInvest Call’. In 2019 and 2020 the selection process was tightened to put more emphasis on market readiness. In particular the Blue Economy Window/ BlueInvest grants calls have been very efficient to identify and support early-stage promising technolo-gies and SMEs.
In 2020, the European Commission partnered with the European Investment Fund (EIF) to launch the BlueInvest Fund for providing financing to underlying equity funds that strategically target and support innovative Blue Economy companies. BlueInvest Fund was structured under the European Fund for Strategic Investment (EFSI) Equity Product with an EFSI guarantee of €75 million. Investment is made in ‘intermediary’ funds, not directly into companies. To date, the EIF successfully deployed financing for the Blue Economy ulti-mately surpassing the initial target of €75 million. Based on a call to fund managers, four deals were approved amounting to €85 million (including EIF Own Resources) as well as a fifth deal of €15 million under InnovFin Equity38. This brought the total of fund commitments approved or signed to €100 million and the total expected amount of capital mobilized (with private investment) to €300 million. Based on the BlueInvest model, Portugal Blue, a €50 million national funding instrument was launched with European Investment Fund (EIF) support. With the signature of these five deals, the EIF expects to conclude the rollout of this initiative and pave the way for a scale up programme in the next Multi Financial Framework.
In March 2022, a new dedicated equity initiative, InvestEU Blue Economy, has been announced mobilising an additional €500 mil-lion of EU funds for financial intermediaries investing in this sec-tor. It has also been announced that the platform activities will continue beyond 2022 until 2026. The scaled-up equity initiative builds on the BlueInvest Fund pilot under EFSI, brings together the European Maritime, Fisheries and Aquaculture Fund, the EIB Group and InvestEU finance39, thereby mobilising an additional €500 million of EU funds for financial intermediaries investing in this sector. This will result in €1,5 billion of risk-financing available to innovative and sustainable Blue Economy SMEs and start-ups, via financial intermediaries. The call for expression of interest will be soon published by the EIF40. As a novelty the BlueInvest plat-form as well as the EIF and EIB will provide capacity building and advisory support for financial intermediaries and impact investors targeting investments in the Blue Economy.
38 InnovFin Equity programme is a financial product launched by the EC and the EIF in the framework of Horizon 2020. It provides equity investments and co-investments to or alongside investment funds, focusing on companies in their early stages of development, operating in innovative sectors covered by Horizon 2020 (InnovFin Equity (europa.eu).
39 European Commission and EIB Group sign InvestEU agreements unlocking billions for investment across the European Union.40 The EIF and InvestEU.41 NORDIC SEAFARM AB.
BOX 2.1. ULVA FARM41 – Large scale sea cultivation of green seaweed, Sweden
The rising population demands radical solutions towards food security, which cannot be solely met through land-based agri-culture. Seaweed (macroalgae) aquaculture has the potential to supplement food supplies, enhance the maritime economy, and enable ecosystem services. Ulva (green seaweed) stands out due to its high protein content (up to 30 %), presence of vitamins (e.g., A, B, C, E), trace minerals (e.g., Fe, Ca,Mg) and dietary fibres. Despite the advantages, Europe produces only 0.6 % of the total global seaweed (2016) production of 33 million tonnes (wet weight) and consumes close to 10 %. Asia dominates the production (>90 %). Ulva is highly suitable for large-scale cultivation, as it grows fast (19.7 g/m2/day) with a short cultivation cycle. But scaling up its production – using existing land and sea-based approaches – is prone to tech-no-economic challenges.
The ULVA FARM project will tackle these challenges and demon-strate large-scale Ulva cultivation in 2 ha of sea on the Swedish west coast (municipality of Tanum). It will demonstrate a high throughput production of seeding material (germlings), usage of a specific rope mesh substrate and testing 2 cul-tivation cycles which could potentially result up to 20 ton/ha/year of Ulva yield. This would validate the scalability of the Ulva production at a large scale, with 0 % use of land, fertilizers and 90 % reduced production costs compared with tank-based systems. Ulva Farm will result in 25 tonnes of cost-efficient EU-organic certified Ulva, absorb 945 kg of nutrients to prevent eutrophication, sequester 5.7 tonne CO2 eq. of carbon and create 7 FTE jobs. It will also enable Nordic Seafarm to raise €4-5 million in equity by 2024. By 2030, an Ulva farm of 50ha will sequester 227 tonnes eq. of CO2, produce 1000 tons/y, absorb 37.8 tonnes of nutrients from the sea, while employing 40 FTEs (direct and indirect); and thereby reducing the dependence on Asian import. The project stated on 01/10/2021 and will end on 31/12/2023. Total EU Contribution under Blue Economy window: €846 689.
Governmental funding, venture capital and private equity can play a critical role in the coming years in supporting the development of sustainable technologies and innovation that will contribute to the conservation of oceans, coastlines, marine life and the Blue Economy in general.
12
THE
EU B
LUE
ECO
NO
MY
REPO
RT

BOX 2.2. REEFY42 – Reef Enhancing Breakwater design, Netherlands Reefy restores coral and oysters reefs, in tropical and tem-plate environments. The company develops the REB: Reef Enhancing Breakwater (patent-pending) consisting of mod-ular, lego-like blocks that can be interlocked to create an underwater artificial reef structure. This modular approach allows us to design reefs based on blocks of different sizes and complexities, fulfilling different site requirements. As a result, the structure creates new flourishing reef ecosystems while protecting the shoreline from incoming waves. The elongated and hydrodynamically designed geometry of the modular units, allows have a very stable solution. The ecolog-ical design of Reefy can attenuate wave energy by working together with nature, reducing wave energy up to 90 % and maintenance up to 30 % if reef-building species are included compared to standard breakwaters. It is a BlueInvest pipeline project. (up to €0.5 m funding).
Furthermore, in support of the Commission’s Blue Growth long term strategy, as part of the sustainable bioeconomy research, dedicated Blue Growth calls43 were launched within Horizon 2020 with a total funding of €448 million. Overall, 66 projects were funded aimed at unlocking the potential of the resources from seas, oceans and inland waters for different uses and across the range of marine and maritime industries, while protecting biodi-versity and enhancing climate resilience. They supported sustain-able growth in the marine and maritime sectors through a respon-sible management of marine resources for healthy, productive, safe, secure and resilient seas and oceans, which are essential for thriving ecosystems, climate regulation, global food security, human health, livelihoods and economies.
2.3.1 THE EUROPEAN INVESTMENT BANK: SUPPORTING SUSTAINABLE BLUE ECONOMY ACTIVITIES44
In the context of its climate action ambition, the European Investment Bank Group (EIBG) has been investing in a sustainable Blue Economy and supporting initiatives that reduce pollution and preserve the ocean and its marine biodiversity and ecosystem.
Some of the economic sectors supported by the EIB include: sustainable seafood production, marine transport, shipbuilding, coastal management and resilience, coastal tourism, biotechnol-ogy, stormwater management, wastewater treatment, solid waste management, research and innovation in ocean industries, off-shore renewable energy production.
42 Reefy B.V. | Maritime Forum (europa.eu)43 Blue growth: unlocking the potential of the oceans (H2020-BG-2014-2015), Blue Growth: demonstrating an ocean of opportunities (H2020-BG-2016-2017), Blue Growth:
sustainably harvest the potential of aquatic and marine resources, while protecting biodiversity and enhancing climate resilience (H2020-BG-2018-2020). 44 All figures are unaudited and provisional.
Climate action and sustainability financial support: The EIB Clean and Sustainable Ocean Programme
Under the Clean and Sustainable Ocean Programme, the Bank has been stepping up its lending and advisory activities in sup-port of the oceans. This is the overarching programme for the EIB’s current and future ocean-based initiatives and activities, which currently includes two main components the Clean Oceans Initiative (COI) and the Blue Sustainable Ocean Strategy (Blue SOS). The EIB’s Clean and Sustainable Ocean Programme also involves strengthening the Bank’s technical assistance and advi-sory services to make clean and sustainable ocean projects more attractive and scalable for economic development.
The COI – a joint initiative of the EIB, the German and French development banks, KfW Group and Agence Française de Développement – initially aimed to finance €2 billion in private and public sector projects that reduce the discharge of plastics into the oceans by 2023. So far, more than 80 % of the target and 37 Clean Ocean Initiative projects have been signed by the partners. At the One Ocean Summit in Brest in February 2022, where the European Bank for Reconstruction and Development (EBRD) became the sixth COI member (along with the Italian ‘Cassa Depositi e Prestiti’ and the Spanish ‘Instituto de Credito Oficial’, who joined the Initiative in 2020), it was announced that the initiative would raise its financing target to €4 billion by the end of 2025.
EIB’s Blue SOS purpose is to improve the health of the oceans, build stronger coastal environments and boost blue sustaina-ble economic activities. With this aim, the EIB has committed to more than doubling its lending to sustainable ocean projects to an amount of €2.5 billion, over the 2019-2023 period. The target is to mobilise at least €5 billion of investments for a global sus-tainable Blue Economy.
In support of the four key sectors of this initiative, the EIB has deployed a total of around €764 million since December 2021, corresponding to 30 % of the target. Approximately €488 million of the overall amount have supported projects in green shipping, €251 million in sustainable coastal protection investments, €19 million in the sustainable production of seafood and €6 million in research and development. Furthermore, the EIB’s investment efforts under the BlueSOS have mobilised over €1.6 billion of financing into the sustainable Blue Economy.
Sustainable Seafood Production
Over the last five years, the EIB provided financing close to €236 million for sustainable seafood production in the EU including for fisheries, aquaculture and seafood processing and preserving, mainly in cooperation with local banks and other institutions that offer financing for SMEs.
13
2022

The EIB is also working on a pipeline of innovative aquaculture (land-based recirculating aquaculture systems) projects under the thematic window for circular bioeconomy as part of an initia-tive launched by the EIBGroup in cooperation with the European Commission under Horizon 2020 and the EU Research and Innovation programme for the budgetary period 2014-2020.
Sustainable Blue Economy Finance Principles
The EIB Group has been supporting activities and initiatives that focus on a wide range of sustainable Blue Economy projects. The activities in this area include financing projects, through loans, grants, equity investments as well as working together with other institutions to foster transparency initiatives that contribute to more sustainable finance within the Blue Economy. Jointly with the European Commission, the EIB has developed the Sustainable Blue Economy Finance Principles, along with WWF for Nature and the World Resources Institute, to guide investors through a global investment framework towards the sustainable use of the ocean’s resources. The United Nations Environment Programme (UNEP) as endorsed these principles45, as a basis for a new Sustainable Blue Economy Finance Initiative under the UNEP Finance Initiative. The Sustainable Blue Economy Finance Initiative was created in 2019, based on the Principles, and under the umbrella of UN Environment. In 2021, the initiative published practical guidance46 for financial institutions covering five key ocean sectors (seafood, shipping, ports, offshore renewables and coastal tourism). Two additional sectors will be added in 2022: solid waste management and coastal infrastructures.
Marine renewable energy projects
The Bank has been at the heart of financing the growth in off-shore wind energy industry and has the ambition to further accel-erate clean energy innovation, energy efficiency and renewables. In Europe, the Bank has co-financed around 40 % of all offshore wind production and has also committed to finance the next major innovation in the sector, ‘floating offshore wind’. Since 2003, the EIB has financed 33 offshore wind projects in Belgium, Denmark, Germany, France, the Netherlands, Portugal and the U.K. for a total signed loan amount of more than €10 billion. In addition, the Bank is also committed to financing floating offshore wind and intends to continuously support the commercial demonstration of innovative wave and tidal technologies.
45 The Principles – United Nations Environment – Finance Initiative (unepfi.org) 46 ‘Turning the tide: How to Finance a Sustainable Ocean Recovery’ https://www.unepfi.org/publications/turning-the-tide/
BOX 2.3 Offshore wind farm in Normandy, FranceThe EIB is supporting the construction and operation of an offshore wind farm in the French region of Normandy – off the coast of Courseulles-sur-Mer, Calvados – with a loan of €350 million. This is the second offshore wind farm the Bank is financing in France, after the Fécamp offshore wind farm project, France’s largest to date, for which the EIB granted a €450 million loan in 2020. Both projects belong to the first group of projects constructed in France. The windfarm at Courseulles comprises 64 wind turbines with an installed capacity of 7 MW, each with a total capacity of 450 MW – the equivalent of the electricity consumption of 630 000 people or 90 % of the population of Calvados.
The project dates back to 2007 and will create up to 1 000 jobs in the region. This new project marks an acceleration in offshore wind investment in France: in Normandy alone, four projects should see the light of day in the coming years. By 2050, France wants to achieve an offshore wind capacity of 40 GW. This is not only to be reached through offshore wind farms using foundations directly fixed to the bottom of the sea. Floating offshore wind is expected to play a major role. Floating offshore platforms can be built and installed in most marine environments, even if not suited for fixed-bottom technology due to deep waters. The EIB is also supporting four demonstration projects off the French coast utilizing floating offshore wind technology and supported by the French Agence de l’Environnement et de la Maîtrise de l’Énergie (ADEME). These projects are still at an earlier stage.
The Blue Digital Agenda
Evidence shows that regions, which can monitor ocean essential variables, are better equipped to take advantage of their blue assets. To foster the market uptake of new developments in ocean monitoring and protection technologies and services, thereby pro-moting the so-called Blue-Digital Agenda, the EIB is collaborating with the European Commission services from DG MARE, EUSPA, Copernicus Marine Service and other partners. In October 2021, the Bank organised together with DG MARE a webinar to pres-ent new developments in Ocean monitoring and protection tech-nologies and services – innovations ranging from ocean energy solutions, to Underwater Internet of Things (IoT), rescue services operations, plastic collection technologies and drones to moni-tor coastal areas – stimulating stakeholders’ engagement on the Digital Blue Agenda.
The EIB is committed to tackling the financing gap at public and private level and co-ordinate the financing challenges of ocean monitoring services and technologies, notably to accelerate down-stream commercial applications and to scale up investments in ocean monitoring and protection technologies. The Bank is build-ing up a pipeline of projects, focusing also on new space-based solutions to monitor our seas.
14
THE
EU B
LUE
ECO
NO
MY
REPO
RT

2.3.2. THE EUROPEAN BANK FOR RECONSTRUCTION AND DEVELOPMENTAs a signatory to the Sustainable Blue Economy Finance Principles, the EBRD continues its mission to promote a sustainable blue future for the marine natural capital and to complement the ongoing work on sustainable use and protection of water and marine resources. This engagement combines direct investments, capacity-building activities, policy dialogue and the development of partnerships.
EBRD direct investments to date in Blue Economy sectors amount to €7.37 billion (€20.9 billion total project value). These corre-spond mostly to water and sewage systems (ca. €3.85 billion); shipbuilding and water transportation (ca. €1.87 billion); ports and harbour operations (ca. €870 million); solid waste management (ca. €470 million); and property and tourism coastal investments (ca. €330 million).
The EBRD holds some valuable experience in promoting systemic environmental remediation in the Baltic and Barents Seas through the Northern Dimension Environmental Partnership (NDEP), estab-lished in 2002 and having supported47 wastewater treatment facilities for a total value of €1.3 billion, treating over 2 million m³ of water (about 1 000 Olympic swimming pools) per day. The Helsinki Convention has recognised the significant impact of NDEP in the reduction of phosphorus and nitrogen levels in the Gulf of Finland (61 % and 18 % respectively). The positive results achieved through NDEP have driven the proposal for mirroring such partnership in the Mediterranean, in cooperation with the EIB and the Union for the Mediterranean.
In terms of technology transfer, the Bank is supporting the introduction of environmental technologies for cleaner coasts and water systems in the Mediterranean region through its Environmental Technology Transfer Programme (ENVITECC)48. This programme is implemented in partnership with the United Nations Environment Programme (UNEP) and co-financed by the Global Environment Facility. It combines investments with techni-cal assistance, policy dialogue and capacity-building activities49.
Recognising biodiversity challenges in the Black and Caspian seas, EBRD’s joint activities with International Maritime Organization (IMO) and GloBallast have led to technical and institutional capac-ity building in understanding the global spread of invasive species and pathogens in the ballast tanks of international cargo vessels. This has also contributed to setting mandatory requirements for the International Convention for the Control and Management of Ships’ Ballast Water and Sediments.
The partnership with IMO continues its engagement under the Financing Sustainable Maritime Transport (FINSMART) Initiative. This initiative provides a platform for regular dialogue between key maritime stakeholders on addressing the financial challenges to the transition of the shipping sector to a more sustainable
47 ESIF: Burgas Water Project (ebrd.com)48 Covering the following countries: Albania, Bosnia and Herzegovina, Egypt, Lebanon, Montenegro, Morocco, Tunisia and Turkey.49 ENVITECC | EBRD FINTECC50 WhatsNewNews (imo.org)51 Burgas, Iasi, Rousse, Smolyan, Split, Stara Zagora and Vratsa.52 ESIF: Burgas Water Project (ebrd.com)
and resilient future. In July 2021, a roundtable was organised that focused on investment needs with over 50 participants from partner countries and other relevant key stakeholders50.
Furthermore, the EBRD has a strong track record in investing in effective wastewater facilities, which is essential for improving water quality and safeguarding the Blue Economy. Over the past two years the Bank has contributed €70 million towards €938 mil-lion of investment in modern waste water treatment systems, mainly in partnership with EU financing instruments, in seven cit-ies51 in Bulgaria, Croatia and Romania. These investments will result in untreated wastewater discharge being reduced by 3.7 mil-lion m³ annually and in 380 000 people being connected to improved sanitation systems.
BOX 2.4 Burgas Water Project: Reducing environmental pressure on the Black Sea52
In July 2021, the EBRD signed a €17.3 million loan agree-ment with the Burgas Water Supply and Sanitation Company. The company is the sole provider of water supply and san-itation services for over 400 000 inhabitants of the Burgas Region located in south-eastern Bulgaria. The proceeds of the loan will be used to co-finance the first stage of a wider investment programme. This includes the rehabilitation of over 76 km of water supply pipelines, the construction of 42 km of wastewater collection infrastructure and associ-ated tanks and reservoirs. The EBRD loan is complemented by investments grants from the EU’s Operational Programme ‘Environment’.
The project will reduce environmental pressure on the Black Sea, in particular since the Company’s service area includes the Black Sea coast, which is a major summer tourist area. It will result an increase of the volume of treated wastewater before discharge by over 2.1 million cubic meters.
15
2022

2.4. MARITIME SPATIAL PLANNING (MSP)Maritime Spatial Planning (MSP) is a policy framework for medi-ating between human activities and managing their impact on the marine environment. It is considered a key pillar of the Sustainable Blue Economy53.
It embodies the integrated development of activities at sea and is an essential instrument for effective ocean governance. As a planning tool, MSP is the result of policies, permits and other administrative conclusions that are adopted to define the spatial and temporal distribution of existing and future activities within those determined waters54. By ensuring coherence and exposing synergies and trade-offs amongst ocean uses, MSP embeds stra-tegic foresight into decisions about the use of Europe’s maritime space. The key feature of MSP are a combination of various sec-tors’ interests, societal needs, values and objectives. It can be considered a modern, holistic and cohesive approach to manage several sea areas in a sustainable way55. As such, MSP acts as facilitator for achieving the objectives of the EU’s Green Deal in the maritime realm.
To understand how a marine area is organised, it’s important to see step by step what the main variables and the challenges are to overcome that are considered when developing a MSP56. It is often difficult to promote a fair distribution of the bene-fits derived from marine resources, to define them and conse-quently to organise the area based on the stakeholders’ interests. Amongst the main stakeholders for MSP are: fisheries communi-ties, industrial sectors, NGOs, researchers and academia, neigh-bouring countries, and international organisations (regional and global). Because stakeholders come from a different range of cat-egories, the process can prove sometimes difficult. Nevertheless, important progress has been made.
MSP in the EU
The EU MSP Directive57 is the legal framework that provides the grounds for development of MSPs within the EU, in particular through the establishment of maritime spatial plans in the marine waters by Member States under their jurisdiction. The adoption and implementation of the Directive has resulted in the EU being the most advanced grouping of countries in the development of MSP and are an international reference in this field. Member States’ plans must consider a holistic approach with the involve-ment of stakeholders, cross-border cooperation, and application of ecosystem-based approach, promoting the co-existence of activities, land-sea interaction and reviewing plans every 10 years.
Member States are required to establish their plans58 and sub-mit them to the Commission and to any other Member State concerned.
53 P. Ramirez-Monsalve, J Van Tatenhove ‘Mechanisms of power in maritime spatial planning processes in Denmark, Ocean & Coastal Management’ (2020).54 https://eur-lex.europa.eu/legal-content/EN/TXT/PDF/?uri=CELEX:52020DC0741&from=EN 55 COM(2020) 741 final.56 https://seaplanspace.eu/msp/ 57 Directive 2014/89/EU.58 By 31/03/2021, Article 15.3 of Directive 2014/89/EU.59 https://maritime-spatial-planning.ec.europa.eu/msp-eu/introduction-msp#1 60 https://maritime-spatial-planning.ec.europa.eu/ 61 https://ec.europa.eu/oceans-and-fisheries/news/31-march-2021-d-day-maritime-spatial-planning-europe-2021-03-31_en
The main goals that Member States are pursuing when establish-ing a MSP can be resumed as:
• incentivise synergies between different sectors and reduce conflicts;
• encourage investment, by transparency, clear rules and fea-sible objectives;
• increase border cooperation, often these areas might have energy grids, shipping lanes, pipelines, submarine cables and other activities, but also to develop coherent networks of pro-tected areas;
• protect the environment and promote sustainability, through identification of impact and opportunities for multiple use of sea space.
Despite some legal obligations stemming from the EU MSP Directive, Member States are free to design and determine the format and content of their maritime spatial plans, including the institutional arrangements and the allocation of maritime activities59.
Several projects have been set up within the EU to spread the knowledge amongst Member States on how to design and develop MSPs. The majority of those projects are financed via EU fund-ing programs, following the MSP Directive. The goal is to achieve experience exchange and knowledge transfer as well as to foster consistency among the various MSPs within a sea-basin.
One of the funding sources for MSP cooperation projects in EU sea basins is the European Maritime Fisheries and Aquaculture Fund (EMFAF, previously EMFF). By 2021, the EMFF had funded 15 projects in all EU sea basins for a total amount of €25 mil-lion – these projects facilitated cross-border stakeholder contacts and consultations. MSP has been identified as an area for closer regional cooperation, also with non-EU countries. In 2021, two additional projects have been launched: one joint project (North Sea and the Baltic) and one in the Outermost Regions.
One of the main initiatives to spread reliable information between MSPs is the European MSP platform60. This tool provides admin-istrative and technical support to Member States implementing the MSP legislation. The main challenge lies in the coordination of needs between sectors. By providing material on MSP processes, technical studies and featuring information on existing MSPs, it becomes easier to cope with the different sectors’ requirements61.
16
THE
EU B
LUE
ECO
NO
MY
REPO
RT

Contributing to the Green deal agenda by Implementing MS
The Commission has prepared the first report on progress made in view of implementation of the MSP Directive on behalf of respec-tive Member States, assessing their development.
All Member States that have adopted maritime spatial plans so far have referred to an ecosystem-based approach and have taken into account to a varied degree environmental, economic, social and safety aspects in their plans.
Use of Data and securing the participation of all relevant stake-holders are central elements to the implementation of maritime spatial plans. So are land-sea interactions and the identification of the spatial and temporal distribution of activities and uses. Interactions between activities and users must be considered, also in terms of multi-use and location.
Another essential pillar for long-term sustainable management of the maritime space is cross-border cooperation considering that space management often affects more than one country. In that case, transboundary impacts and developments must be taken into account in the plans. Cooperation with third countries is also part of maritime spatial planning through informal bilateral coop-eration, cooperation in the context of Regional Seas Conventions and cooperation through EU-funded projects.
62 Commission Communication ‘An EU Strategy to harness the potential of offshore renewable energy for a climate neutral future’, COM/2020/741 final of 19.11.2020.
MSP can contribute to decarbonisation of the energy system, which is essential for achieving the EU’s climate objectives by 2030. In its strategy on offshore renewable energy62 the EU iden-tifies MSP as an essential tool to facilitate and deploy offshore renewable energy in a sustainable way. For that, allocation of maritime space for increasing marine renewable energy produc-tion and intensified regional co-operation between Member States are key. Several Member States have included in their plans: areas for future offshore wind parks, identified multi-use of maritime space for different objectives (e.g. renewable energy and aqua-culture), engagement with stakeholders for co-existence of Blue Economy activities and consideration for the protection of marine environment (see example in Chapter 8.1).
Figure 2.6 EU Maritime spatial planning projects (2021)
Source: The European Atlas of the Seas (www.european-atlas-of-the-seas.eu).
17
2022

2.5 INDIRECT EMPLOYMENT AND ACTIVITY The number of employees hired to produce a final good or service can be defined as direct employment. In an open economy that is not operating at full production capacity, changes in demand for the final goods and services of an industry tend to generate corresponding changes in the supply or output of that industry, and consequently, of its workforce. To sustain an increased pro-duction, for example, producers employ more workers. Conversely, decreasing demand may lead to reductions in output and labour. Changes in demand and output also determine changes in the use of raw materials and intermediate inputs along the industry’s supply chain. Producers of intermediate goods and services will hire more or less workers in response to changes in demand from economic activities downstream. The number of employees hired by the producers of intermediate inputs in an industry’s supply chain can be defined as indirect employment. Direct and indirect employment generates household income throughout the econ-omy. A proportion of this income will be spent on other goods and services in the broader economy. In turn, these expenditures and consumption tend to create other jobs. This is defined as induced employment.
Direct, indirect, and induced employment also apply to the Blue Economy. According to some estimates, six marine sectors account for approx. 99 % of direct employment in the Blue Economy63. These are:
• living resources (e.g. fishing, aquaculture, processing, markets),
• non-living resources (e.g. oil and gas, sand and gravel, salt), • transport (e.g. passenger and freight shipping), • shipbuilding (including offshore floating structures and
marine equipment), • coastal tourism, • renewable energy.
The Blue Economy creates additional employment opportunities both in coastal regions and in the EU as a whole. Sectors such as coastal tourism, shipbuilding or marine living resources create jobs that are not directly attributed by national statistics to the established or emerging Blue Economy sectors.
While direct employment for established Blue Economy sectors in the EU can be determined on the basis of Eurostat’s struc-tural business statistics (SBS)64, which describe the structure and performance of EU businesses, the ability to accurately measure indirect and induced effects is hampered by the lack of granular value chain-level data. In the absence of comprehensive data,
63 Eunomia (2017). Green Jobs in the Blue Economy – A Bottom-up Approach. Final Report to DG Environment of the European Commission.64 Eurostat: https://ec.europa.eu/eurostat/web/structural-business-statistics 65 COGEA (2017). Study on the establishment of a framework for processing and analysing maritime economic data in Europe. Final report. June 2017. P. 48.66 Scholaert F. (2020). The blue economy: Overview and EU policy framework. European Parliamentary Research Service (EPRS), p. 22.67 FAO (2016). The State of World Fisheries and Aquaculture 2016. Contributing to food security and nutrition for all. Rome. 200 pp.68 UNCTAD (2019). Advancing Sustainable Development Goal 14: Sustainable fish, seafood value chains, trade and climate.69 Union for the Mediterranean. Towards a Sustainable Blue Economy in the Mediterranean region. 2021 Edition, p. 8. It should be noted that the Union for the Mediterranean
has 42 member countries, therefore the study also covers non-EU Member States in the Mediterranean sea-basin.70 Quote from SEA Europe and IndustriAll Europe. Commitment made under the EU Pact for Skills. Upskilling shipbuilding and maritime technology workers in Europe. https://
ec.europa.eu/social/BlobServlet?docId=24825&langId=en71 Sustainable energy jobs platform (https://sejplatform.org/). 72 Adapted from ‘Study on Measuring Employment Effects – Final Report and Guidelines’. Centre for Strategy and Evaluation Services, 2006.
indirect employment is estimated on basis of industry surveys or inferred from representative case studies. Estimating induced employment is more challenging because the causalities between demand, use, supply, and employment are less obvious and influ-enced by multiple factors.
A study conducted for the European Commission’s DG MARE found that in 2014, the Blue Economy created a total of about 5.7 mil-lion jobs, of which 3.2 million through direct employment in the established sectors and an additional 2.5 million generated via their respective supply chains65. The study showed that coastal tourism was by far the largest economic activity in terms of value added and jobs generated (55 %), given the wide range of activi-ties generated by tourism (e.g. accommodation, food and restau-rants, transport, etc.).
Other studies showed that, EU seaports alone create about 2.5 million jobs (direct and indirect), of which only about half a million are captured by sectoral statistics. This is because ports generate employment and economic benefits in other sectors, such as logis-tics, shipping maritime services, etc.66. As regards fisheries, it has been estimated that 59.5 million people were directly employed in the primary sector of capture fisheries (65 %) and aquacul-ture (35 %) in 2018 globally (including full-time, part-time and occasional workers)67, and another 200 million people employed along the value chain from harvesting to distribution68. A study from the Union for the Mediterranean, estimates that fisheries support approx. 200 000 direct and 500 000 indirect jobs69. This phenomenon can also be observed in other Blue Economy sec-tors such as Shipbuilding, which is reported to create approxi-mately ‘576 000 direct jobs and additional 500 000 ones’70. In the renewable energy industry, indirect employment is estimated in the literature to range from 50 % to 100 %71 of total employment.
This section aims to provide an overview of the main techniques that can be used to measure indirect employment, based on methodological approaches published in the scientific literature. As an example of application of these techniques, this section also presents the direct and indirect employment figures of the Italian Blue Economy, assessed by Italian authorities, on the basis of more granular data available.
Measuring indirect employment
Estimating the number of jobs indirectly attributable to Blue Economy activities implies assessing the broader economic impacts of Blue Economy sectors and can be partly based on direct employment data. One way of estimating such impacts is through multipliers that quantify the knock-on effects on employ-ment, income and gross value added (GVA) generated by increas-ing demand and output72 which is commonly referred to as the
18
THE
EU B
LUE
ECO
NO
MY
REPO
RT
multiplier effect. In other words, these multipliers estimate the economic impacts associated with additional purchases of inputs from suppliers along the value chain required to meet a given increase in the demand of a specific product73. The use of multi-pliers is based on the assumption that there is a causal correlation between two variables, so that changes in one variable (e.g. pro-duction units, GVA, etc.) produce changes in another variable (e.g. FTE – Full Time Equivalent jobs)74.
Type I multipliers only cover direct and indirect effects of changes in demand. While Type II multipliers also include induced effects. It is generally accepted that Type 1 multipliers may underesti-mate economic effects, while Type II multipliers may overesti-mate them75. A Type I employment multiplier, for example, shows the ratio of direct plus indirect employment changes to the direct employment change. A Type II employment multiplier also includes induced changes. Similarly, Type I and Type II multipliers can be used to estimate the effects generated on employment by changes in output76.
Multipliers can be derived from the analysis of Input-Output (I-O) models of the economy (e.g. national economies) showing inter-industry linkages (e.g. OECD Input-Output Tables – IOTs77). EUROSTAT gathers I-O data from Member States78. I-O data can be organized in the form of product-by-product or industry-by-in-dustry matrices depicting inter-industry or inter-product relation-ships within an economy. The I-O approach to derive employment multipliers is based on a number of strict assumptions, such as the following: (i) demand drives economic activity: because of excess capacity or price elasticity of supply, the economy can expand without creating upward pressure on wages and infla-tion; (ii) fixed prices: there will be no price adjustment or supply constraints; (iii) same supply chain profile: imports from the EU or outside the EU are assumed to have the same profile as domestic supplies79. Therefore, I-O multipliers are not well suited to esti-mate indirect employment and income effects if a sector is not structured in a similar way across Member States, or when the economy is experiencing significant or rapid changes from the reference year, as is the case with the COVID-19 pandemic.
Supply and use tables (SUTs) provide additional detail on the loca-tion of indirect employment. National SUTs are matrices by prod-uct and industry showing how domestic production and imports of goods and services in an economy are used by industries for inter-mediate consumption and final use. As such, SUTs can be used to identify the proportion of inputs from intra EU trade and extra-EU trade, and therefore distinguish between indirect employment that
73 COGEA (2017). Study on the establishment of a framework for processing and analysing maritime economic data in Europe. Contract no. EASME/EMFF/2014/1.3.1.13/SI2.718095. Draft final report. January 2017. P. 11.
74 Practitioners’ Notes on Monitoring and Results Measurement Based on the Advanced Training Workshop in Results Measurement for Private Sector Development. February 2018.75 Miller, R. E., & Blair, P. D. (2009). Input-output analysis: foundations and extensions. Cambridge university press.76 Supply, Use and Input-Output Tables. Scottish Government. November 2021.77 https://www.oecd.org/sti/ind/input-outputtables.htm 78 https://ec.europa.eu/eurostat/web/esa-supply-use-input-tables/data/database 79 COGEA (2017). Study on the establishment of a framework for processing and analysing maritime economic data in Europe.
Contract no. EASME/EMFF/2014/1.3.1.13/SI2.718095. Draft final report. January 2017. P. 16.80 Ashyrov, G., Paas, T., & Tverdostup, M. (2018). The Input-Output Analysis of Blue Industries: Comparative Study of Estonia and Finland. University of Tartu, Working Paper.81 See e.g. (i) Van Der Linden, J. A. (2001). The economic impact study of maritime policy issues: application to the German case. Maritime Policy & Management, 28(1),
33-54; (ii) Morrissey, K., & O’Donoghue, C. (2013). The role of the marine sector in the Irish national economy: An input–output analysis. Marine policy, 37, 230-238; (iii) Kwak, S. J., Yoo, S. H., & Chang, J. I. (2005). The role of the maritime industry in the Korean national economy: an input–output analysis. Marine Policy, 29(4), 371-383.
82 https://ec.europa.eu/eurostat/web/esa-supply-use-input-tables/figaro 83 https://www.informare.camcom.it/al-salone-nautico-di-genova-il-ix-rapporto-sulleconomia-del-mare/ 84 https://www.unioncamere.gov.it/osservatori-e-analisi-dei-sistemi-locali-centro-studi/economia-del-mare 85 ‘IX Rapporto Economia del Mare 2021’ by INFORMARE (Azienda Speciale della Camera di Commercio di Frosinone Latina) and Unioncamere – Centro Studi Guglielmo
Tagliacarne, July 2021. https://www.informare.camcom.it/ix-rapporto-sull-economia-del-mare-2021
can be attributed to within and outside the EU. The underlying assumption is that industries are interdependent. The magnitude of such economic interdependence can be expressed in terms of backward and forward linkages80. This approach has been applied on several analyses of maritime industries81.
The FIGARO (Full International and Global Accounts for Research in input-Output analysis) project provides experimental EU-inter country Supply, Use and Input-Output Tables, also referred to as the FIGARO tables. These tables are the result of a co-opera-tion project between Eurostat and the European Commission’s Joint Research Centre. FIGARO aims to facilitate the analysis of socio-economic impacts and environmental effects of globalisa-tion in the EU82.
Direct and indirect effects of the Italian Blue Economy
Given its location in the centre of the Mediterranean, approxi-mately 7 500 km of coastline, and over 600 municipalities with sea-shore jurisdiction, Italy is deeply linked to the sea. The Italian Blue Economy plays a central role in the economic performance of the country. Its direct value is one and a half times higher than that of agriculture. An important contribution comes from the South of Italy, which produces a third of the entire national Blue Economy value83.
Since 2012, the Italian Union of Chambers of Commerce, Industry, Handicraft and Agriculture (Unioncamere) is measuring the size and performance of the Italian Blue Economy84. According to its IX National Report on the Economy of the Sea85, in 2019 the GVA of the Italian Blue Economy amounted to €47.5 billion, corresponding to 3 % of total GVA of the Italian economy. It directly employed 893.6 thousand people, representing 3.5 % of the total Italian workforce.
When considering also the indirect effects – besides the direct ones – generated across the Blue Economy value chain, the GVA of the Italian Blue Economy increases to €136.9 billion, repre-senting 8.6 % of the added value produced by the entire national economy. This effect can be quantified with a coefficient, called multiplier and which indicates how much added value is activated, for every euro produced by a Blue Economy activity, in all the activities of the rest of the economy. In 2019, each euro produced in the Italian Blue Economy sectors generates another €1.9 in the rest of the national economy.
19
2022

Source: Adapted from Unioncamere – Centro Studi delle Camere di commercio Guglielmo Tagliacarne, 202186.
The sectoral breakdowns contained in the abovementioned report provide a more detailed picture of the capacity of individual Blue Economy sectors to generate direct and indirect effects. As illus-trated in Figure 2.8, Maritime transport appears to be the sector with the largest GVA multiplier (2.8), followed by Shipbuilding (2.4) and Sports and leisure activities (2.1). The lowest multipli-ers are to be found in the marine and coastal Extractive indus-tries (1.2) and in Environmental research, regulation and pro-tection activities (0.5).
The calculation of these multipliers is facilitated by the availability of more granular data in Italy for each economic activity. ATECO 2007 is the national version of Nace Rev. 2, the European eco-nomic activities nomenclature, which enables the monitoring of a large number of sectors and sub-sectors at a more disaggregated level, as well as to capture different forms of production and emerging or new activities, including for the Blue Economy87. Since 2008, the Italian National Institute of Statistics (Istat) publishes data at this level of detail and regularly updates the classification.
86 Ibid.87 https://www.istat.it/en/archivio/17959 88 Sistema Informativo Excelsior, Unioncamere (2020). ‘Economia del mare e Green Deal’. The Excelsior ‘Information System for Employment and Training’ by Unioncamere, in
collaboration with the Ministry of Labour, ANPAL, and the European Union, is one of the official surveys included in the National Statistical Program (PSN). https://excelsior.unioncamere.net/
89 Taylor S. et al. (2017). Eunomia. Green Jobs in the Blue Economy – A Bottom-up Approach. No 11.066100/2015/716324/SFRA/ENV.C2. Final Report to DG Environment of the European Commission.
The COVID-19 pandemic has hit the Italian Blue Economy supply chain hard. Italy has lost €10.7 billion in 2020, almost a quar-ter of the total national value, particularly in coastal and marine tourism sector. The shipbuilding supply chain also registered a large contraction, estimated at 11 % from 2019. Nonetheless, the Italian Blue Economy is playing a key role in the economic recovery of the country. While 45.1 % of Italian companies in the Blue Economy sectors have been forced to reduce the number of their employees, the sectoral figures range between 57 % in coastal tourism and 12.5 % in activities related to environmental research, regulation, and protection.
According to the Excelsior Information System by Unioncamere, a close relationship between the Blue Economy and the green transition is confirmed by the strong demand for skills related to energy saving and environmental sustainability, which are con-sidered necessary for 81.4 % of the Blue Economy professions88. This is in line with the findings of an earlier study of European Commission’s DG Environment, that established that green jobs (i.e. those linked to the reduction of environmental risk and dam-age to marine and terrestrial environments, sustainable exploita-tion of marine resources, as well as regulatory activities to miti-gate or correct environmental damage) will be created in all Blue Economy sectors in the years ahead89. Consequently, green jobs will represent a significant subset of Blue Economy’s employment, poised to substantially increase in terms of importance and mag-nitude, in line with the implementation of the European Green Deal (EGD), the Circular Economy Action Plan (CEAP), and the Sustainable Blue Economy Communication.
Figure 2.7 GVA of the Italian Blue Economy, 2019 data
Total GVA Blue Economy value chain:
€136.9 billion (8.6 %)
Multiplier: 1.9
Blue Economy €47.5 billion
(3.0 %)
GVA created in the rest of the Italian economy:
€89.4 billion (5.6 %)
20
THE
EU B
LUE
ECO
NO
MY
REPO
RT

Source: Unioncamere – Centro Studi delle Camere di commercio Guglielmo Tagliacarne, 202190
2.6. STRATEGIC FORESIGHT AND THE BLUE ECONOMYAs the wide-reaching implications of the COVID-19 crisis have shown, emergency preparedness and anticipation of future risks and opportunities have a crucial relevance in making EU policy-making future-proof. The political guidelines for the Commission in the period of 2019-2024 aim to achieve the transition towards a green, digital and fair Europe.91 This long-term direction is facil-itated by the application of strategic foresight.
Strategic foresight is the discipline of exploring, anticipating and shaping the future; it helps build and use collective intelligence in a structured and systematic way to anticipate developments and better prepare for change92 by:
• Anticipating trends, risks, emerging issues as well as their (potential) implications and opportunities
• Informing EU policymaking, specifically new Commission ini-tiatives as well as the reviewing of existing policies
90 Adapted from: ‘IX Rapporto Economia del Mare 2021’ by INFORMARE (Azienda Speciale della Camera di Commercio di Frosinone Latina) and Unioncamere - Centro Studi Guglielmo Tagliacarne, July 2021. https://www.informare.camcom.it/ix-rapporto-sull-economia-del-mare-2021.
91 A Union that strives for more. Political Guidelines for the next European Commission 2019-2024.92 European Commission (2017) Strategic Foresight Primer.93 COM/2021/219 final.94 Better Regulation Toolbox (2021). Chapter 3 – Identifying impacts in evaluations, fitness checks and impact assessments.
https://ec.europa.eu/info/sites/default/files/br_toolbox_-_nov_2021_-_chapter_3.pdf
As the COVID-19 pandemic as well as the recent Russia’s invasion of Ukraine a have shown, EU policy-making has to be swift and agile in responding to emerging issues. Strategic foresight plays an integral role in this regard which is manifested in the revised Better Regulation Communication93 and Better Regulation Toolbox which sets the frame of reference for EU policy-making:
When identifying impacts in evaluations, fitness checks and impact assessments, strategic foresight needs to be considered, notably with regards to creating a clearer understanding of meg-atrends and drivers or change that likely have an impact of the respective policy initiative, taking into account its key future chal-lenges as well as creating future-proof policy options that address these future challenges.
Here, key uncertainties are addressed by identifying viable alter-native future developments as well as affected stakeholders, identifying changes in overarching EU policy objectives in the medium to long term as well as assessing the performance of existing policies in view of an ever-changing environment94.
Strategic foresight aims to facilitate evidence-based policy mak-ing by fostering future-proof policy design aligning short-term initiatives with long-term objectives by applying the following techniques:
• Horizon scanning: systematic overview of emerging trends and events that may have implications in the future – in this process, new signals of change are identified
Figure 2.8. GVA of Italian Blue Economy sectors and related multipliers, 2019 data (€ billion, left scale)
14,7
8,3 7,5 8,33,4 2,7 2,6
28,6
23,6
18,0
3,9
6,4 5,83,1
1,9
2,8
2,4
0,5
1,9
2,1
1,2
0,0
0,5
1,0
1,5
2,0
2,5
3,0
0
5
10
15
20
25
30
35
40
45
50
Accommodationand catering
services
Maritimetransport
Shipbuilding Environmentalresearch,
regulation,protection
Fisheries Sport and leisureactivities
Extractiveindustries
Direct GVA (left scale) Indirect GVA (left scale) Mult iplier (right scale)
21
2022

• Megatrends analysis: analysis and discussion of shifts in patterns and interdependencies of trends which form basis of clear estimations of what the world could look like which translate into a plan of action
• Scenario planning: interactive process incorporating inter-views, further analysis and modelling based on the outcomes of horizon scanning and megatrends analysis process, esti-mating the likelihood of respective scenarios and their asso-ciated implications
• Visioning: defining the preferred direction, creating a shared understanding constituting a course of action which details a specific action plan to achieve progress towards the iden-tified vision95
Through this work, the following 10 challenges and opportuni-ties for the EU’s global leadership were identified in the 2021 Strategic Foresight Report96:
As identified in the European Commission’s first Strategic Foresight Report the Blue Economy plays an integral role in con-tributing to future resilience, most notably in view of the goals laid out in the European Green Deal. There are several key global megatrends that will have a detrimental effect on the EU and on the Blue Economy specifically in the future, namely:
95 https://ec.europa.eu/info/strategy/strategic-planning/strategic-foresight_en 96 COM(2021) 750 final.97 European Commission (2020). 2020 Strategic Foresight Report: Charting the course towards a more resilient Europe. https://ec.europa.eu/info/sites/default/files/strategic_
foresight_report_2020_1_0.pdf
Climate change and other environmental challenges:Biodiversity loss poses a key challenge that needs to be tackled in the future, same as the emission of greenhouse gases, unsustainable levels of con-sumption of raw materials, energy, water, food and land use can have detrimental adverse effects on
the livelihoods of European citizens. In line with this, the preser-vation of marine ecosystems is central in the endeavour to ensure the future of all Blue Economy sectors. Not only from the eco-nomic perspective, but also in terms of ecological considerations the Blue Economy needs to further grow in alignment with envi-ronmental targets, involving renewable energy, coastal protection against climate change as well as marine habitat preservation and carbon sequestration.97
Shifts in the global order and demography: Shifts in the global order may have a multitude of implications on the Blue Economy, specifically in terms of maritime defence and the competition for maritime space. Shifts in demography on the other hand may have implications in terms of ripple effects caused by an
ageing workforce which may require targeted initiatives to further strengthen the Blue Economy serving as an employer of millions of workers adapting to this long-term shift in make-up of the workforce in the long run.
To address these future challenges and opportunities, DG MARE set up its own Strategic Foresight hub in 2020, contributing to the general work of foresight across the European Commission but is currently also in the preparation stage for several projects that aim to incorporate strategic foresight in the maritime domain, such as the Fishers of the Future project.
Table 2.2 Strategic areas to strengthen the EU’s global leadership
10 strategic areas to strengthen the EU’s global leadership
1. Ensuring sustainable and resilient health and food systems
2. Securing decarbonized and affordable energy
3. Strengthening capacity in data management, artificial intelligence and cutting edge technologies
4. Securing and diversifying supply of critical raw materials
5. Ensuring first-mover global position in standard-setting
6. Building resilient and future-proof economic and financial systems
7. Developing and retaining skills and talent matching EU ambitions
8. Strengthening security and defence capacities and access to space
9. Working with global partners to promote peace, security and prosperity for all
10. Strengthening resilience of institutions
Source: EU Strategic Foresight Report 2021: The EU’s capacity and freedom to act.
22
THE
EU B
LUE
ECO
NO
MY
REPO
RT

BOX 2.5 Fishers of the futureThe sustainability of fisheries and the future of fishers and fishing communities are key policy challenges in the context of the Common Fisheries Policy (CFP)98. In line with this, DG MARE will launch its first strategic foresight project on Fishers of the Future. The aim of the project is to explore long-term trends that affect the job and the role of fishers.
Many factors influence the long-term sustainability and prof-itability of the fishing sector as well as the livelihoods of fishing communities. While the relevance of different trends is evident, most of them have been considered only recently by policy-makers and have hence only been explored to a lesser extent. Therefore, the project will set out to analyse relevant cumulative effects and their socio-economic, techno-logical, scientific and cultural consequences in the long-term perspective.
By putting individuals at the core, this project will explore the fishers’ and fishing communities’ hopes, fears, expectations and needs in order to be able to support them in the transi-tion of the sector.
Key trends will be identified (e.g. climate change, ageing workforce and market developments) and analysed vis-à-vis their implications on the affected fishers and fishing com-munities. By anticipating trends, developments and impli-cations, the project will offer insights that are valuable for evidence-based policy making in relation to the European Green Deal (e.g. marine biodiversity protection), resilience, food supply, the social dimension, innovation, the digital tran-sition, geopolitics and fisheries management.
It is important to note, that this project does not only aim to facilitate informed policy-making addressing long-term trends but also aims to inform fishers and fishing communi-ties on how to anticipate and respond to these trends in an adequate manner.
To summarise, the project aims to: (i) Explore the profiles of today’s fishers and the framework in which they operate, (ii) identify relevant drivers and bottlenecks for change and delineate their consequences for fishers in relation to the dif-ferent profiles and (iii) identify the possible profiles of fishers in 2050 in light of the drivers for change.
98 https://ec.europa.eu/oceans-and-fisheries/policy/common-fisheries-policy-cfp_en99 Capture fisheries and aquaculture.100 For details on the compilation of data for Coastal tourism see the methodological annex.
2.7. OVERVIEW OF EU ESTABLISHED SECTORSIntroduction
The established sectors continue to be a major contributor to the EU Blue Economy, and it is in these sectors where more complete, accurate and comparable data are available.
The seven established sectors considered in this report are Marine living resources, Marine non-living resources, Marine renewable energy, Port activities, Shipbuilding and repair, Maritime transport and Coastal tourism. Each sector is further divided into subsectors as summarised in Table 2.3. These subsectors are at the same time divided into activities. The details of what is included in each sector and subsector are explained in Annex II and III.
Table 2.3 The Established Blue Economy sectors and their subsectors
Sector Sub-sector
Marine living resources
Primary production
Processing of fish products
Distribution of fish products
Marine non-living resources
Oil and gas
Other minerals
Support activities
Marine renewable energy Offshore wind energy
Port activities Cargo and warehousing
Port and water projects
Shipbuilding and repair Shipbuilding
Equipment and machinery
Maritime transport
Passenger transport
Freight transport
Services for transport
Coastal tourism
Accommodation
Transport
Other expenditure
This section provides a summary of the main economic data as well as the trends and the drivers behind these for each of the established sectors, and how they interact with each other. DCF data are used for the primary sector99 activities in the Marine living resources sector while for the rest of sectors, Eurostat Structural Business Statistics (SBS) data are used. In addition, data from Tourism expenditure survey and from the EU Tourism Satellite Account were used for the Coastal tourism sector100.
The time series goes from 2009 to 2019. In this edition, the 2019 data is final while 2020 turnover data are estimations based on Eurostat’s preliminary data published for economic activities at
23
2022

higher sectoral aggregations (NACE level-2 statistics). Hence, the data presented in this report supersede data presented in previ-ous reports which may be different because of improvements in the methodology, revisions of the data or corrections of errors. Other differences may stem from updates and revisions in the methodology and/or data (see Methodology section in Annex III for more details).
This section provides an overview of the main economic indicators of the established sectors from an aggregated EU perspective. A detailed analysis for each of the sectors is presented in Chapter 4.
Although only the direct contribution of the Blue Economy sectors is considered here, all sectors have indirect and induced effects on the rest of the economy. For example, in Shipbuilding and repair, most of the value added is from upstream and downstream activities. This means that beyond its specific contribution, it has important multiplier effects on income and jobs in many sectors of the economy.
The EU Blue Economy
The seven established sectors of the EU Blue Economy generated a gross value added (GVA) of €183.9 billion in 2019; that is, a 20 % increase compared to 2009. Gross operating surplus (profit) at €72.9 billion was 22 % higher than in 2009 (Figure 2.9), while total turnover101 at €667.2 billion, increased by 15 % (€578 billion in 2009).
These established sectors, including the covered subsectors and their activities, directly employed almost 4.45 million people in 2019. Although this figure is just 0.5 % more than in 2009, it means that the number of jobs in the EU Blue Economy is now-adays higher than before the economic crisis. The increase is largely driven by Coastal tourism that employs 63 % of the total EU Blue Economy jobs. Marine renewable energy (production and transmission), which is still in a strong expansion phase given
101 Considering turnover can lead to double counting along the value chain since the outputs from one activity can be the inputs of another activity (i.e., intermediate consumption). This may particularly affect some sectors, such as Living resources and Shipbuilding and repair. For example, the value of a fish could be counted several times in the Marine living resources sector, when caught in the primary production sub-sector, then when processed in the Processing of fish product sub-sectors, and finally when sold in the Distribution of fish products sub-sector.
102 These figures exclude Maritime transport, Cargo and warehousing, Service activities incidental to water transportation and Coastal tourism due to the lack of data.
that it is a relatively young sector, saw the number of persons employed increase more than twenty-six times since 2009, from 384 persons to more than 10 500 persons in 2019.
Gross remuneration per employee for the EU Blue Economy established sectors has increased steadily since 2009, peaking in 2015 (at €24 925 per employee) and falling slightly afterwards. However, with an average of just over €24 737 per employee, employment remuneration in 2019 was 17 % higher than in 2009 (Figure 2.10).
The decrease in average employment remuneration can be largely attributed to significant drops in the employment in Non-living resources (-71 % compared to 2009), a well-remunerated sector that has been contracting for some years; while the employment in Coastal tourism has increased in recent years (43 % compared to 2015), which is a low-remunerated sector.
Gross investments in tangible goods in 2019 decreased by 14 % compared to 2009: from €29.8 billion to €25.9 billion. As detailed further down, the decline in gross investments was mainly driven by decreases in investments in the sectors of Maritime trans-port, Non-living resources, and Port activities into a minor extent. Maritime transport, the largest investor in 2019 (€11.9 billion) saw gross investments drop overall by almost 32 % compared to 2009.
Shipbuilding and repair reported a positive trend with overall gross investments increasing an 8.6 % compared to 2009; while gross investments in Living resources increased by 12.6 %. Yet, their contribution to the Blue Economy investments is still small com-pared to sectors with decreasing investments.
Net investments in tangible goods102, estimated at €6.1 billion in 2019, also decreased (-20 %) compared to €7.6 billion in 2009, and -40 % compared to 2015 (€10.1 billion invested) (Figure 2.11). Despite this decrease, net investments remained positive,
Figure 2.9 Size of the EU Blue Economy, € billion
Source: Own calculations based on Eurostat (SBS) and DCF data.
24
THE
EU B
LUE
ECO
NO
MY
REPO
RT

signalling a replacement and expansion of capital. The net invest-ment ratio (net investment to GVA) declined, ranging from 5 % in 2009 to 3.3 % in 2019, peaking in 2015 at 6.6 %.
Recent developments
The outbreak of the coronavirus pandemic in February 2020 rep-resented a major shock for the global and EU economies, with severe socio-economic consequences in 2020 and 2021.
Since March 2022, Russia’s invasion of Ukraine has affected the EU Blue Economy sectors in different ways, from increases in oil prices, to trade restrictions, among others. The impact in the dif-ferent sectors will depend on the extent and duration of the con-flict and retaliation measures.
Unfortunately, Eurostat only reported full data until 2019. However, there are preliminary turnover data from Eurostat, DCF data on the fisheries and fishing processing sector up to 2020, with 2021 estimations, as well as some specific sector reports. This is why the data analysed in this report ends in 2019, but, at least on a qualitative basis, it is tried to explain the situation of the Blue Economy sectors in 2020, 2021, 2022 and beyond when possible.
First estimates show that coastal tourism was the sector most impacted by the COVID-19 pandemic with a reduction of its turno-ver almost by half, being one of the economic activities hit harder in the whole economy. Given the importance of coastal tourism in the EU Blue Economy, since it represents the 44 % of the GVA and 63 % of the employment, it is expected that the EU Blue Economy will be more affected by the crisis than the overall EU economy.
Figure 2.10 Employment (thousand people), personal costs (€ million) and remuneration (€ thousand) in the EU Blue Economy
Source: Own calculations based on Eurostat (SBS) and DCF data.
Figure 2.11 Investment in tangible goods in the EU Blue Economy, € billion
Source: Own calculations based on Eurostat (SBS) and DCF data.
25
2022

On the other hand, high oil prices may significantly impact fuel-in-tensive sectors such as maritime transport and fisheries. But could be an incentive to other sectors such as oil and gas extraction in non-living resources and marine renewable energy.
Main features of the EU established sectors
The EU Shipbuilding and repair industry is an innovative, dynamic and competitive sector. With a market share of around 6 % of the global order book in terms of compensated gross tonnage and 19 % in terms of value; for marine equipment, the EU share rises to 50 %103, the EU is a major player in the global shipbuilding industry. The European Shipbuilding industry is currently com-posed of approximately 300 shipyards specialised in building and repairing the most complex and technologically advanced civilian and naval ships and platforms and other hardware for maritime applications. The industry generates a production value of about €42.9 billion yearly and directly employs approximately 300 000 people in Europe.
The EU specialises in segments of shipbuilding with high level of technology and added value, such as cruise ships, offshore sup-port vessels, fishing vessels, ferries, research vessels, dredgers, mega-yachts, tugs and other non-cargo carrying ships (ONCCV), etc. The EU is also a global leader in the production of high-tech, advanced maritime equipment and systems ranging from pro-pulsion systems, large diesel engines, environmental, and safety systems, to cargo handling and electronics. This specialisation and leadership position is a direct result of the sector’s continu-ous investments in research and innovation as well as in a highly skilled workforce.
The global economic and financial crisis of 2008 had a pro-found impact on the industry globally for several years, after which the business model changed, and part of the workforce shifted to external subcontractors and suppliers. EU shipbuilders have been reducing costs and restructuring capacity by adjusting their production programmes and optimising the supply chain. EU shipbuilding continues to face fierce international competi-tion from countries like China and South Korea, as they try to enter European niche markets of specialised high-tech ships gas a result of the crisis and the oversupply in cargo markets.
Maritime transport plays a key role in the EU economy and trade, estimated to represent between 75 % and 90 % (depending on the sources) of the EU’s external trade and one third of the intra-EU trade. EU passenger ships can carry up to 1.3 million passengers, representing 40 % of the world’s passenger transport capacity. In 2019, almost half of maritime traffic in the EU was from ships engaged exclusively in domestic routes, mainly due to the fre-quent crossings made by roll-on, roll-off passenger ships and ferries. Italy remained the largest maritime passenger transport country in Europe in 2020, followed by Greece. Maritime transport of passengers in EU ports was severely hit by the COVID-19 pan-demic in 2020, decreasing by 45 % compared to 2019. Belgium, Ireland, the Netherlands and France recorded the highest shares of extra-EU seaborne passenger transport (excluding cruise pas-sengers) in 2020, having ferry links with the United Kingdom. EU ports handled close to 4 billion tonnes of goods, accounting for
103 Balance (2017).104 EMSA/EEA (2021) European Maritime Transport Environmental Report. https://www.eea.europa.eu/publications/maritime-transport/
around half of all goods by weight traded between the EU-27 and the rest of the world. Maritime transport is thus an important pillar of the Blue Economy, and the whole EU economy in general.
On the other hand, maritime transport exerts pressures on the environment104. While shipping is the most carbon-efficient mode of transportation, the size and global nature of maritime shipping makes it necessary for the industry continues to reduce its envi-ronmental impact, in particular, in the context of the European Green Deal.
The main developments in Maritime transport in recent years are related to the continuous increase in ship sizes for all segments (e.g. tankers and container carriers, but also cruises), which have significantly affected Shipbuilding and repair and Port activities. The sector was particularly affected by the last global financial crisis, but has recovered to pre-crisis levels in terms of GVA and employment, since 2017.
Port activities play a key role in trade, economic development and job creation; without them, there would be no maritime trans-port. Moreover, seaports, as multi-activity transport and logistic nodes, play a crucial role in the development of maritime sec-tors. Many European ports are important clusters of energy and industry; in other words, ports facilitate the clustering of energy and industrial companies in their proximity. Many ports across the EU are reducing their environmental impact while also enabling green shipping fleets. These activities will have an important role in reaching the objectives of the European Green Deal (EGD). The trend towards larger ships lead, to lower average transport costs; however, they also require new ports infrastructure and impact competition between port authorities and port operators. For example, the number of containers arriving into European ports has risen by more than four times over the past 20 years.
The exploitation of Europe’s seas and oceans for Marine non- living resources has played a key role in terms of providing access to sources of energy and raw materials necessary for the European economy. Although some of its sub-sectors have now reached maturity and are in decline, it is expected that the sector will continue to play a crucial role in the transition to a sustaina-ble Blue Economy, both in terms of enhancing the availability of critical materials needed for the development of low-carbon tech-nologies, and by minimising its impacts on the marine environ-ment and climate change mitigation with the adoption of climate neutral, circular, responsible and resource efficient approaches.
Even if the offshore Oil and gas sector has been in decline for some years, more than 80 % of the current European oil and gas production takes place offshore, mainly in the North Sea and to a lesser extent in the Mediterranean and Black Seas. This is in great part due to the prioritisation of renewable energy developments and a move towards decarbonisation. In early 2020, oil prices collapsed due to market concerns and the fall in economic activity following the COVID-19 pandemic. Russia’s invasion of Ukraine has resulted in increased oil prices, which may lead to an increase in activity and investments in the oil and gas production.
26
THE
EU B
LUE
ECO
NO
MY
REPO
RT

Conversely, the demand for Other minerals such as sand and gravel, used for construction purposes and for producing concrete, is likely to increase. Moreover, as coastal communities attempt to adapt to new pressures posed by climate change, dredging, beach nourishment and sand reclamation may intensify. Trade-offs with environmental protection will have to be taken into account.
The Marine Renewable energy (production and transmission) sector represents an important source of green energy and can make a significant contribution to the EU’s 2050 energy strat-egy. The sector is growing exponentially, albeit still encountering challenges. For instance, land-based wind farms are developing faster than their maritime counterparts as they tend to have lower installation and maintenance costs. Wind energy production continues to be cheaper on land, making competition tough for developing offshore activities, particularly in view of low energy prices. The lack of electrical connections (cables/grids) is also a substantial barrier to the development of offshore wind farms, adding to investment costs. Maritime spatial planning is giving the sector the allocation and regulative framework to continue its growth. Europe has more than 90 % of the world’s total installed
offshore wind capacity and will continue to dominate the offshore wind market for years to come. Offshore wind in Europe is focused mainly on the North Sea, which has relatively shallow waters.
Europe continues to stand as the most-visited region, welcoming half of the world’s international tourist arrivals. Coastal tourism plays an important role in many EU Member State economies, with a wide-ranging impact on economic growth, employment and social development. Coastal tourism it is the largest Blue Economy sector, representing the 44 % of the GVA and 63 % of the employ-ment of the total EU Blue Economy. Over half of the EU’s tourist accommodation establishments were located in coastal areas. Visitors to coastal areas were generally higher in southern EU Member States. Coastal communities, mainly composed of SMEs and micro-enterprises, are particularly vulnerable to economic, financial and political changes.
While tourism was expected to continue to grow in 2020, the outbreak of the COVID-19 pandemic in Europe in February 2020 has put the tourism industry under unprecedented pressure. Due to travel restrictions imposed by MSs, there were few new
Table 2.4 Overview of the EU Blue Economy by sector
Source: Own calculations based on Eurostat (SBS) and DCF data.
Persons employed (thousand) 2009 2010 2011 2012 2013 2014 2015 2016 2017 2018 2019
Living resources 528,9 527,6 508,5 536,7 520,7 518,5 521,7 529,7 527,8 539,9 538,7
Non-living resources 34,4 31,6 29,8 30,4 27,7 28,1 27,5 17,9 12,5 11,1 10,1
Ocean energy 0,4 0,6 0,9 1,0 1,2 1,7 4,0 5,1 7,0 8,3 10,6
Port activities 381,6 372,5 359,5 367,4 363,6 403,9 414,0 418,1 414,9 385,1 382,6
Shipbuilding and repair 306,8 274,7 263,4 255,5 256,6 258,8 263,9 269,1 274,5 292,7 299,1
Maritime transport 357,5 354,5 363,1 356,3 356,4 375,9 383,1 367,5 384,5 398,1 403,0
Coastal tourism 2 818,2 2 597,0 2 286,7 1 940,5 2 036,6 2 032,4 1 965,5 2 192,3 2 371,6 2 845,8 2 804,6
Blue economy jobs 4 427,7 4 158,5 3 812,1 3 487,7 3 562,9 3 619,4 3 579,6 3 799,8 3 992,9 4 481,0 4 448,7
National employment 184 570 182 166 182 277 181 282 180 464 181 981 184 044 186 964 189 678 191 831 193 604
Blue economy (% of national jobs) 2,4% 2,3% 2,1% 1,9% 2,0% 2,0% 1,9% 2,0% 2,1% 2,3% 2,3%
GVA (€ million) 2009 2010 2011 2012 2013 2014 2015 2016 2017 2018 2019
Living resources 14 812 15 326 15 889 15 955 15 501 15 938 16 932 18 189 18 395 19 196 19 332
Non-living resources 11 190 11 325 11 935 11 237 9 684 8 215 8 422 4 688 3 911 4 257 4 671
Ocean energy 41 115 168 191 298 397 723 991 1 300 1 398 1 925
Port activities 23 184 23 364 26 858 23 944 24 233 25 413 26 406 27 174 27 407 26 542 27 937
Shipbuilding and repair 11 263 11 814 11 747 10 911 11 060 11 606 11 251 12 385 13 515 14 727 15 647
Maritime transport 26 930 30 020 27 123 27 435 29 065 28 748 32 486 27 094 31 184 30 109 34 309
Coastal tourism 66 393 64 720 58 887 50 925 54 714 54 174 56 032 60 352 68 750 79 979 80 109
Blue economy GVA 153 813 156 683 152 607 140 599 144 554 144 491 152 253 150 873 164 462 176 207 183 930
National GVA 9 532 263 9 848 639 10 145 776 10 205 623 10 320 481 10 555 602 10 936 678 11 231 243 11 664 797 12 046 015 12 476 809
Blue economy (% of national GVA)
1,6% 1,6% 1,5% 1,4% 1,4% 1,4% 1,4% 1,3% 1,4% 1,5% 1,5%
27
2022

bookings for tourism services while at the same time, the indus-try was flooded with claims for refunds on cancellations and the non-performance of services. Whilst the European Commission and national governments implemented measures to mitigate the effects, the business activity of coastal tourism almost halved.
The Marine living resources sector encompasses the harvest-ing of renewable biological resources (Primary sector), their Processing and their Distribution. Capture fisheries production has increased and may have the capacity to do so further, in part due to the improved status of fish stocks and increased fishing opportunities, together with higher average market prices and reduced operating costs. The economic performance is expected to continue to improve as fish stocks recover, and capacity contin-ues to adapt. However, these benefits have not yet been achieved in the Mediterranean Sea basin where most fisheries have not yet moved towards sustainable fishing conditions. 93.9 % of the
105 European Environment Agency (EEA), 2019. Marine messages II: Navigating the course towards clean, healthy and productive seas through implementation of an ecosystem-based approach. EEA Report no. 17/2019.
assessed fish and shellfish stocks commercially exploited in the Mediterranean Sea (2016 data) did not meet any of the two pri-mary criteria that define MSFD good environmental status (GES) objective, namely (i), a fishing mortality and (ii) a reproductive capacity compatible with having population biomass levels above those capable of producing maximum sustainable yield (MSY). The situation was only marginally better in the Black Sea (85.7 %), while the EU average stood at 44.8 %105.
EU Aquaculture production in weight has stagnated over the last decades even if its value has increased. The development of Maritime Spatial Plans at the Member State level as well as the revision of the Strategic Guidelines for the sustainable develop-ment of the EU aquaculture should give the opportunity to boost the EU aquaculture production.
Figure 2.12 Evolution of the EU Blue Economy by sector, Index: 2019 = 100
Source: Own calculations based on Eurostat (SBS) and DCF data.
-
20
40
60
80
100
120
2009 2010 2011 2012 2013 2014 2015 2016 2017 2018 2019
Employment
Coastal tourism Maritime transport Shipbuilding and repairLiving resources Non-living resources Ports activitiesBlue Economy jobs
-
25
50
75
100
125
150
2009 2010 2011 2012 2013 2014 2015 2016 2017 2018 2019
GVA
Coastal tourism Maritime transport Shipbuilding and repairLiving resources Non-living resources Ports activitiesBlue Economy GVA
28
THE
EU B
LUE
ECO
NO
MY
REPO
RT

EU production (from capture fisheries and aquaculture) covers about 30 % of the total raw material requirements for the EU Processing of fish products. The processing sector is therefore dependent on global fish markets. The Distribution of fish products is increasingly concentrated in the hands of a few players. Adding value can enable producers to recover part of the value of the product, which is usually generated further down the chain.
Russia’s invasion of Ukraine resulted in increased oil prices that put at risk the economic viability of the EU fishing fleet.
Evolution and comparison across EU established sectors
GVA data show an acceleration in the growth of all sectors from 2013 onwards except for Non-living resources (Table 2.4 and Figure 2.12). The GVA generated by Coastal tourism in 2019, the largest Blue Economy sector in the EU, increased by 21 % com-pared to 2009. Maritime transport and Port activities, increased by 27 % and 21 %, respectively. Other sectors that contributed to growth were Living resources (+31 %) and Shipbuilding and repair (+39 %). On the other hand, Non-living resources dropped by 68 %.
Employment is recovering since 2013. With respect to 2009, overall, 2019 figures are remarkably similar. The highest rela-tive expansion was observed, in Maritime transport (+13 %). In Shipbuilding and repair employment has grown with respect to the
minimum observed in 2013-2014, but it has not yet recovered to 2009 levels. In Non-living resources, a significant declining trend is seen.
The sectors are also vastly different in their capital intensity. This is the case, for instance, for Coastal tourism compared to the Non-living resources. Coastal tourism is labour-intensive, and often run by small or medium-sized local or family businesses; it is widespread along the entire EU coastline. This is reflected in the sector making the greatest contribution to the EU Blue Economy in terms of employment, gross value added and profit (Figure 2.13) and with its share increasing over time. However, the sec-tor’s contribution to GVA and profits are substantially lower than to employment.
Within Non-living resources, the Oil and gas subsector is a highly capitalised industry that requires few employees per unit of out-put and is concentrated in a few geographical areas. The indus-try is generally comprised of large companies, which might have fewer direct links to local coastal communities. Consequently, this sector accounts for only a tiny fraction of employment (under 1 % in 2019) but a substantial part of overall Blue Economy-related profits.
Figure 2.13 Employment and GVA evolution across Established sectors, 2009-2019
Source: Own calculations based on Eurostat (SBS) and DCF data.
0
0,25
0,5
0,75
1
2009 2010 2011 2012 2013 2014 2015 2016 2017 2018 2019
Employment proportion
Coastal tourism Maritime transport Shipbuilding and repairLiving resources Non-living resources Ocean energyPorts activities
0
0,25
0,5
0,75
1
2009 2010 2011 2012 2013 2014 2015 2016 2017 2018 2019
GVA proportion
Coastal tourism Maritime transport Shipbuilding and repairLiving resources Non-living resources Ocean energyPorts activities
29
2022

The Blue Economy established sectors across Member States
In 2019, the contribution of the established Blue Economy sectors to the overall EU economy was 2.3 % in terms of employment (down slightly from 2.4 % in 2009) and 1.5 % in terms of GVA (down from 1.6 % in 2009). The contribution varies widely across Member States. In terms of employment, shares range from 15 % in Greece to 0.1 % in Luxembourg and in GVA, from 8 % in Croatia to less than 0.1 % in Luxembourg (Figure 2.13).
In general, the Blue Economy exceeds 5 % of the national GVA or employment in the insular Member States or those with archipel-agos: Greece, Malta, Cyprus, Croatia and Portugal. Estonia is an exception with an employment share of 6 %. Other Member States with relatively large Blue Economy sectors (contribution between
3 % and 5 % of the national GVA or employment) include Spain, Denmark, Latvia, Ireland and Bulgaria. For self-evident reasons, the Blue Economy’s contribution to the national economy is very limited (below 0.4 %) in landlocked Member States (Luxembourg, Austria, Czechia, Slovakia and Hungary). Other Member States with a relatively modest Blue Economy (between 0.5 % and 1.0 % of the national economy) include Belgium, Slovenia, Poland and Romania. Two of the four largest EU economies (Germany and France) are below the EU average, Italy is slightly above the aver-age and only Spain is well above average (Figure 2.14).
Several Member States have seen the share of Blue jobs increase substantially compared to 2009. More evident cases include Greece, Malta, Portugal, Latvia and Denmark. On the other hand, decreases in Blue jobs are more noticeable in Bulgaria and Estonia.
0%
1%
2%
3%
4%
5%
6%
7%
8%
9%
HR MT CY DK EL EE PT ES LV BG LT NL IT SE FI BE FR DE IE SI PL RO HU CZ SK AT LU
2009 2019
Figure 2.14 Relative size of the Blue Economy, percentage
Share of Blue jobs in national employment
Share of Blue GVA in the national economy
Source: Own calculations based on Eurostat (SBS) and DCF data.
0%
2%
4%
6%
8%
10%
12%
14%
16%
EL MT CY HR EE PT ES DK LV IE BG SE IT FI LT NL FR DE PL SI RO BE SK HU CZ AT LU
2009 2019
30
THE
EU B
LUE
ECO
NO
MY
REPO
RT

In absolute terms, the four largest Member States (Spain, Germany, Italy and France) are the largest contributors to the EU Blue Economy for both employment (with a combined contribution of 52 %) and GVA (a combined contribution of 61 %). Only Greece manages to enter between these four countries by positioning second in the contribution to the EU Blue Economy in employ-ment terms. Other countries with significant contributions in terms of either employment or GVA include Greece as just mentioned, Portugal, the Netherlands and Denmark (Figure 2.15).
An increase in the GVA generated by the Blue Economy estab-lished sectors can be observed in most Member States between 2009 and 2019. The most significant expansion is recorded in Ireland, Portugal and Malta (with increase of over 50 % over the last decade). Similarly, an expansion of about 30 % or more is observed in Belgium, Poland and Sweden. On the other hand, in
2019 GVA in Bulgaria and Greece had not yet recovered to the levels observed in 2009. Employment has not recovered 2009 levels yet (e.g. Bulgaria, Croatia, Estonia, France, Italy, Romania and Sweden) (Figure 2.13 and Figure 2.14).
C h A p T E R 3
Figure 2.15 National contribution to the EU Blue Economy, percentage (EU-27 = 100 %)
In terms of employment
In terms of GVA
Source: Own calculations based on Eurostat (SBS) and DCF data.
0%
5%
10%
15%
20%
25%
ES EL IT DE FR PT NL HR PL DK SE BG IE RO FI EE CY LV BE MT LT HU CZ SK SI AT LU
2009 2019
0%
2%
4%
6%
8%
10%
12%
14%
16%
18%
20%
ES DE IT FR DK NL EL SE PT BE HR PL IE FI CY RO EE BG MT LT LV HU AT CZ SI SK LU
2009 2019
31
2022


T H E E U R O P E A N G R E E N D E A L A N D T H E P AT H
T O S U S TA I N A B L E B L U E E C O N O M Y

This chapter aims to provide a general overview of the European Green Deal (EGD)106 which aims to modernise the European Union’s economy in a resource-efficient and competitive way by ensur-ing net-zero emissions of greenhouse gases by 2050, economic growth decoupled from resource use while not leaving any per-son or place behind107. Beyond that, related policies, actions and initiatives are discussed, touching upon the EU Biodiversity Strategy for 2030, the zero pollution action plan, the sustainable Blue Economy Communication, ocean observation, Farm to Fork Strategy, decarbonisation and the circular economy.
This chapter provides a general overview of the European Green Deal (EGD) – the plan to make the EU’s economy sustainable, the financing programmes underpinning this strategy and the initiatives that have been proposed by the Commission to date, which are closely linked to the Blue Economy agenda. Sustainable use of oceans, aquatic and marine resources are a central part of the solution for the greatest environmental challenges that the EGD aims to address. The EGD is the roadmap of the Blue Economy Report. To support this roadmap, the EU designed a new approach towards a Sustainable Blue Economy, which will also be presented under this chapter, thus adding the blue in the green goals. As always, demonstrating that reliable, accurate and com-parable data are essential for the sustainable development of Blue Economy sectors and any initiatives and strategies in relation to them.
A section on the circular economy is also provided, explaining its main characteristics and how these are beneficial for the envi-ronment and for society. The chapter also sheds light on the role of the EU in the world as a frontrunner of a green recovery from the global environmental and health challenges and how the EGD can ensure the EU and becomes a champion for the sustainability transition in the world.
106 COM(2019) 640.107 https://ec.europa.eu/info/strategy/priorities-2019-2024/european-green-deal_en108 Forging a climate-resilient Europe - the new EU Strategy on Adaptation to Climate Change — Climate-ADAPT (europa.eu) 109 Economic impacts | EU Science Hub (europa.eu)110 COM(2019) 640.
3.1 EUROPEAN GREEN DEAL: CONTEXT AND RELEVANCEAs stated in the EU Communication ‘Forging a climate-resilient Europe – the new EU Strategy on Adaptation to Climate Change’108, the exposure of today’s EU economy to global warming of 3°C above pre-industrial levels would result, according to conservative estimations, in an annual loss of at least €170 billion (1.36 % of EU GDP109). Slow onset sea level rise is also an increasing worry for coastal areas, which produce approximately 40 % of the EU GDP and are home to ~40 % of its population.
The European Green Deal (EGD) agenda announced in 2019 by the European Commission set up a strategy to overcome climate change and environmental challenges and transforming the EU into a fair and prosperous society with a modern, resource-effi-cient and competitive economy where economic growth is decou-pled from resource use110. The EGD was also communicated to the United Nations Framework Convention on Climate Change (UNFFCCC) as the EU strategy to implement the United Nations’ 2030 Agenda and its seventeen sustainable development goals (SDGs). Under the EGD, the EU has been preparing several initi-atives to ensure that it is on path to reach its ambitious climate targets of reducing net emissions by at least 55 % by 2030 com-pared to 1990 and for being the first climate neutral continent by 2050.
The Commission is mobilising at least €1 trillion in sustainable investments over the next decade, to achieve the goals set by the European Green Deal. 30 % of the EU’s multiannual budget (2021-2028) and the EU’s unique NextGenerationEU (NGEU) instrument to recover from the COVID-19 pandemic, has been allocated for green investments. In addition, EU countries must devote at least 37 % of the financing they receive under the €672.5 billion Recovery and Resilience Facility to investments and reforms that support climate objectives. The Commission will also issue green bonds, on behalf of the EU, to raise 30 % of the funds under NGEU.
Furthermore, through the EU Cohesion Policy EU countries, regions, local governments and cities must devote at least 30 % of what they receive from the European Regional Development Fund to implement large investments that contribute to the European Green Deal. Also, 37 % of the Cohesion Fund will con-tribute specifically to achieving climate neutrality by 2050.
The Just Transition Mechanism, which focuses on ensuring a fair and just transition to a green economy, will mobilise significant investments over the period 2021-2027 to support citizens of the regions most impacted by the transition.
34
THE
EU B
LUE
ECO
NO
MY
REPO
RT

To mobilising public and private investments the InvestEU pro-gramme will target at least 30 % of investment contributing to cli-mate objectives. A dedicated Just Transition Scheme will generate additional investment to the benefit of Just Transition territories in complementarity with the Just Transition Fund and the public sector loan facility.
In addition, sustainable finance measures, including the Taxonomy Regulation for classifying green investments, will contribute to the European Green Deal by boosting private sector investment in green and sustainable projects.
In 2021, the European Union adopted the European climate law111 which aims to ensure that all sectors of the economy and soci-ety contribute to the target of net-zero emissions by 2050, and outlines a framework for the assessment of progress towards that goal. The Law also proposes a new EU net emission reduc-tion target for 2030 of at least 55 % compared to 1990 (the EU -55 % target).
In July 2021, the Commission presented ‘Fit for 55’, a compre-hensive package of legislative initiatives covering climate, energy, land use, transport and taxation with the aim of ensuring that EU policies are in line with the EU’s climate goals. Some of these initiatives are especially linked to the Blue Economy:
EU emission trading system112: The Commission has proposed a comprehensive set of changes to the existing EU’s emissions trading scheme (EU ETS) that should result in an overall emission reduction in sectors concerned of 61 % by 2030 compared with 2005. The increased ambition is to be achieved by strengthening the current provisions and extending the scope of the
111 (Regulation (EU) 2021/1119) – https://eur-lex.europa.eu/legal-content/EN/TXT/?uri=CELEX:32021R1119 112 https://ec.europa.eu/clima/eu-action/eu-emissions-trading-system-eu-ets_en 113 https://eur-lex.europa.eu/legal-content/EN/TXT/?uri=CELEX:52021PC0557 114 https://eur-lex.europa.eu/legal-content/EN/TXT/?uri=CELEX:52021PC0558 115 https://eur-lex.europa.eu/legal-content/en/TXT/?uri=CELEX:52021PC0556
scheme notably to include emissions from maritime transport in the EU ETS. In addition, the Commission proposes to create a new self-standing emissions trad-ing system for buildings and road transport to sup-port Member States in meeting their national targets under the effort sharing regulation in a cost-efficient way. With the proposal, emissions reductions of 43 % should be achieved for these sectors by 2030, com-pared to 2005.
Renewable Energy Directive113: With energy produc-tion and use accounting for 75 % of EU emissions, it is critical to accelerate the transition to a greener energy system. The directive will set an increased target to pro-duce 40 % of our energy from renewable sources (such as offshore and hydrogen) by 2030. All Member States will contribute to this goal, and specific targets are pro-posed for renewable energy use in transport, heating and cooling, buildings and industry.
The Energy Efficiency Directive114 will set an ambitious binding annual target for reducing energy use at EU level, cut emissions and tackle energy poverty, includ-ing the renovation of buildings.In order to tackle emis-sions in transport and complement emission trading, several measures are required: The Commission pro-posed a regulation for stronger CO2 emissions stand-ards for cars and vans115 to fast-track the transition to zero-emission mobility. It requires average emis-sions cuts of new cars (55 % from 2030 and 100 % from 2035 compared to 2021 levels) to zero-emis-sion by 2035. In line with the objective of zero-emis-sion car sales, the Commission also proposes a revised
Figure 3.1 The European Green Deal Investment Plan
Source: Commission Services, European Green Deal Communication.
35
2022

Alternative Fuels Infrastructure Regulation116 to install more alternative and frequent charging and fuelling points. It also applied to access of clean energies to in major ports and airports. Another initiative to stimulate the uptake of sustainable maritime fuels and zero-emis-sion technologies is the FuelEU Maritime Initiative117, which will set up a maximum limit on the greenhouse gas content of energy used by ships calling at European ports. Finally, the Commission is proposing a revision of the Energy Taxation Directive118 to align the taxation of energy products with EU energy and climate policies. These rules will help promoting clean technologies and removing outdated exemptions and reduced rates that currently encourage the use of fossil fuels.
The EGD calls for a transformation of the economic set-up and for it to happen, the Blue Economy sectors need to develop sus-tainably. Over the past 15 years, the Union has laid a solid foun-dation for an integrated and cohesive maritime policy in Europe that involves its Member States, regions and numerous local stakeholders. A focus on a more resilient and sustainable eco-nomic model is needed, one that not only creates lasting jobs in a healthier environment but that also counters the COVID-19 crisis119.
All EU actions and policies will have to contribute to the European Green Deal objectives. The challenges are complex and inter-linked120. Thanks to its diversity, dynamism and innovation potential, the Blue Economy can contribute significantly to the objectives of the European Green Deal. Operating in a uniquely important environmental space, it is well placed to show that tran-sitioning to sustainability is possible while still offering high-qual-ity jobs and prosperity for coastal communities.
3.1.1 BIODIVERSITY STRATEGY
Investing in nature
The EU Biodiversity Strategy for 2030121,122, is a long-term plan to protect nature and reverse the degradation of ecosystems, containing specific actions and commitments to put Europe’s bio-diversity on a path to recovery by 2030. The Commission is com-mitted to promoting nature-based solutions through an ecosys-tem-based management approach123 (see also Chapter 6). Marine biodiversity is the foundational principle for economic activities
116 https://eur-lex.europa.eu/legal-content/en/TXT/?uri=CELEX:52021PC0559 117 https://eur-lex.europa.eu/legal-content/EN/TXT/?uri=CELEX:52021PC0562 118 https://eur-lex.europa.eu/legal-content/en/TXT/?uri=CELEX:52021PC0563 119 COM/2021/240 final – https://eur-lex.europa.eu/legal-content/EN/TXT/?uri=COM:2021:240:FIN120 COM(2019) 640.121 COM(2020) 380 final – ‘EU Biodiversity Strategy for 2030’122 According to the strategy, by 2030 at least 30 % of the sea should be protected in the EU (i.e. an extra 19 % as compared to today) and 10 % should be strictly protected.
Today, less than 1 % of marine areas are strictly protected in the EU. In the future, at least one third of MPA should be strictly protected.123 In this regard, the full implementation of the Marine Strategy Framework Directive (2008/56/EC) and the Birds and Habitats Directives is essential. 124 Barbier et al. (2018), How to pay for saving biodiversity. 125 https://ec.europa.eu/social/main.jsp?catId=738&langId=en&pubId=8219 126 https://dopa.jrc.ec.europa.eu/kcbd/actions-tracker/ 127 https://dopa.jrc.ec.europa.eu/kcbd/actions-tracker/public/groups/in %20progress 128 COM/2021/240 final – https://eur-lex.europa.eu/legal-content/EN/TXT/?uri=COM:2021:240:FIN; pg 8
like fisheries, biotechnology and tourism; the conservation of marine ecosystems and the restoration of those degraded also provides an economic opportunity124.
Marine ecosystems
This Strategy stresses the need to manage human activities at sea through an ecosystem-based approach, strengthening the protection and restoration of marine ecosystems. This includes the expansion of Marine Protected Areas and the establishment of strictly protected areas for habitats and fish stocks recovery. It touches upon tackling the overexploitation of fishing stocks; the elimination or decrease of bycatch to protect certain species; and practices that damage the seabed. It also addresses the spread of invasive alien species, to be covered under a new initiative125.
Over 100 actions overall are being tracked through the EU Biodiversity Strategy Actions Tracker126. Until now, 22 of those have been completed, while 77 are in progress (7 of which directly related to marine ecosystems)127.
Responsible food production
The Farm to Fork and the Biodiversity strategy are mutually rein-forcing, bringing together nature, farmers, business and consum-ers for jointly working towards a competitively sustainable future. The Farm to Fork strategy offers the joined-up vision for a fair, healthy and environmentally friendly food system. It works along-side other Green Deal strategies and sets out initiatives on pivotal issues ranging from animal welfare to labelling (see 3.1.3).
European fisheries have made considerable efforts to bring fish stocks back to sustainable levels and to meet the Common Fisheries Policy’s (CFP) sustainability standard128. In addition, Aquaculture has an important role to play in helping to build a sustainable food system and has the potential as a source of low-impact food. Aquaculture in the EU, when compared to aqua-culture in other countries, is subject to some of the strictest regu-latory requirements for quality, health and the environment. This sector can still further improve its environmental performance and thereby contribute to the objectives of the EGD and related strategies.
Algae can also be an alternative source of protein, thereby con-tributing to the transition to a sustainable food system and global food security, as prioritised by the EGD agenda. It can also serve as a sustainable feed ingredient for aquaculture, as well. Algae production in the sea can contribute to removing excess carbon,
36
THE
EU B
LUE
ECO
NO
MY
REPO
RT

nitrogen and phosphorus from wastewater, thus combatting eutrophication129. It also contributes to fostering the circular econ-omy and ensuring availability of materials to produce bio-based products130.
The new sustainable Blue Economy approach131 intends to protect the environment, while providing a coherent approach across the Blue Economy sectors and facilitating their coexistence and syn-ergies in the maritime space.
BOX 3.1 Zero Pollution, Marine Strategy and sustainable Blue EconomyMaritime activities are dependent on the natural capital held in Europe’s seas. In parallel, human activities exert multiple pressures on the marine environment and its ecosystems, both on land (notably agriculture and urban/industrial settle-ments) and at seas, causing a range of widespread impacts across freshwater resources, seas and the ocean.
Marine pollution is one important pressure on marine eco-systems, threatening the health of the marine environment, with corresponding impacts on commercial and recreational activities.
The Blue Economy can contribute to improve the sustainable management of human activities at the sea by promoting sustainable fishing and tourism, sustainable production and making people aware of their sustainability choices. It can also support the production of renewable energy at sea, the de-carbonisation and de-pollution of maritime transport and the greening of ports.
A pollution free environment allows nature’s rich biodiver-sity to flourish. The Zero Pollution Action Plan for air, water and soil adopted on 12 May 2021132 presents a comprehen-sive ‘roadmap’ of what it will take to jointly move towards a pollution free environment. Among other main targets, this Action plan aims to prevent and reduce pollution in waters and oceans, and facilitate remediation.
The EU Marine Strategy Framework Directive133 is another ambitious legal framework that is essential to achieve clean, health and productive seas of ‘good environmental status’. The Directive has pushed for a better understanding of the pressures and impacts of human activities on the sea, and their implications for marine biodiversity, their habitats, and the ecosystems they sustain. It has created a cross-policy and cross-sectoral framework to look after Europe’s seas in a comprehensive way. The Commission has embarked on an ambitious review process of this Directive, to ensure that it continues to deliver for the next generation.
129 COM/2021/240 final – https://eur-lex.europa.eu/legal-content/EN/TXT/?uri=COM:2021:240:FIN130 COM/2021/240 final – https://eur-lex.europa.eu/legal-content/EN/TXT/?uri=COM:2021:240:FIN 131 COM/2021/240 final – https://eur-lex.europa.eu/legal-content/EN/TXT/?uri=COM:2021:240:FIN 132 COM/2021/400 final – https://eur-lex.europa.eu/legal-content/EN/TXT/?uri=CELEX %3A52021DC0400&qid=1623311742827 133 Directive 2008/56/EC – https://eur-lex.europa.eu/legal-content/EN/TXT/?uri=CELEX:32008L0056 134 https://ec.europa.eu/oceans-and-fisheries/ocean/blue-economy/sustainable-blue-economy_en
3.1.2 THE NEW SUSTAINABLE BLUE ECONOMY COMMUNICATION The health of seas and oceans is the key to the resilience and profitability of our blue sectors. Ensuring healthy and sustainable oceans and seas is not only crucial to keeping the economy of our coastal communities alive, but also the most important asset of the Blue Economy.
In this view, on 17 May 2021, the Commission adopted a Communication134 with a new approach for a sustainable Blue Economy in Europe for the industries and sectors related to oceans, seas and coasts.
This Communication sets out a detailed agenda for greening the Blue Economy, underpinned by international ocean governance. In particular, it strives for a holistic and cross-sectorial approach to oceans that tries to put the post-COVID-19 recovery on a sustain-able footing. In this Communication, the Commission asks every blue sector to adopt more sustainable business models, develop clean alternatives, and find new ways to work with others and to reduce the cumulative effects of our activities on the marine environment.
Several concrete, desirable transformations in the differ-ent sectors of the Blue Economy have been identified in the Communication which can guide public and private initiatives. The main objectives of these transformations are to:
• achieve the objectives of climate neutrality and zero pol-lution notably by developing offshore renewable energy, by decarbonising maritime transport and by greening ports. The use of ports as hubs and use of a sustainable ocean energy mix are also tools to achieve these objectives;
• switch to a circular economy and reduce pollution by adopting renewed standards for fishing gear design, ship recycling, and decommissioning of offshore platforms and action to reduce plastics and micro plastics pollution;
• preserve and restore biodiversity and ecosystems. which will increase fish stocks, contribute to climate mitigation and resilience, and minimised impacts of fishing on marine habitats;
• support climate adaptation and coastal resilience such as developing green infrastructure in coastal areas and protect-ing coastlines from the risk of erosion and flooding, to help preserve biodiversity and landscapes, while benefitting tour-ism and the coa stal economy;
• ensure sustainable food production through a sustainable food system and new marketing standards for seafood, use of algae and seagrass, stronger fisheries control as well as research and innovation in cell-based seafood to help to pre-serve Europe’s seas;
37
2022

• improve management of space at sea: in addition to mar-itime spatial planning strategy, the Commission is setting up a new Blue Forum for users of the sea to coordinate a dialogue between offshore operators, stakeholders and sci-entists engaged in fisheries, aquaculture, shipping, tourism, renewable energy and other activities. The objective will be to stimulate cooperative exchange for the sustainable use of marine environment.
Maritime Spatial Planning plays a key role in the Commission’s approach to the coexistence and synergies of economic activi-ties in the maritime space, without damaging the environment. Furthermore, the Communication proposes a series of actions to boost investment in research (e.g. Mission on Oceans, water and seas), skills and innovation, and mobilizes financing opportunities under the new European Maritime Fisheries and Aquaculture Fund, and other EU Programmes (e.g. Resilience and Recovery Facility).
The Communication calls on all maritime players: Member States, regions, stakeholders, large and small businesses, local groups, young people passionate about the health of our ocean and the general public to work in the same direction and to base their activities on the responsible use of natural resources, on decar-bonisation and on circular economy concepts.
Some initiatives and actions are already on the way to support the transition to a Sustainable Blue Economy, as announced by the Commission’s Communication.
Smart specialisation platform
The Commission has been reinforcing its support to the devel-opment of Blue Economy-related interregional partner-ships and value chains, also as an implementation tool of the Communication for Sustainable Blue Economy in the EU. In the 2014-2020 period, the smart specialisation approach has pro-gressively evolved from an ex-ante conditionality for using ERDF funds (European Regional Development Fund), into a sound bottom- up process that involves the quadruple helix of stakeholders – public authorities, business, academia and citizens – in the identification of regional and national sectors with a competitive advantage, in order to prioritise R&I investments accordingly.
More than 40 regions had selected Blue Economy sectors/sub-sectors as Smart specialisation strategy priorities in the 2014-2020 programming period of ERDF. In the 2021-2027 period the Commission intends to support as many regions as possible to include Blue Economy in their S3 strategies (Smart Specialisation strategy)135. This has interesting synergies with EMFAF (European Maritime Fisheries and Aquaculture Fund) and other Commission’s investment-related activities, e.g. BlueInvest, with sea basin and macro regional strategies, as well as with Horizon Europe, Mission Ocean, seas and waters and its lighthouse projects.
In order to streamline all efforts and progressively activate a permanent support to Blue Economy sectors’ interregional
135 https://www.interregeurope.eu/fileadmin/user_upload/plp_uploads/policy_briefs/Smart_Specialisation_Strategy__S3__-_Policy_Brief.pdf?msclkid=24aed2bfaa2811eca3b3325d07715a5a
136 https://ec.europa.eu/info/files/communication-commission-european-missions_en
partnerships, to facilitate Blue Economy direct, indirect and cross sector value chains, both at regional and interregional level, the Commission has identified the set-up of the smart specialisa-tion thematic platform for sustainable Blue Economy as the way forward, in cooperation with DG REGIO. This platform com-plements the 3 existing ones on energy, agro-food and industrial modernisation.
The platform will allow a structured permanent support to the stakeholders, with a set of services, including advise to Member States and regional authorities on how to design and implement their smart specialisation strategies through promotion of 4 helix approach for stakeholders’ involvement, facilitation of mutual learning, local and interregional networking, partnerships oppor-tunities, better funds alignment, etc. The set-up of the smart spe-cialisation thematic platform for sustainable Blue Economy will advance by steps.
The Commission (DG MARE) has formally announced the smart specialisation thematic platform for sustainable Blue Economy during the Steering Committee meeting of the smart specialisa-tion thematic platforms of end March 2022 In 2022 the work will focus on the development of its architecture while progressively starting some initial services. The setup of the platform should be finalised in 2023.
This will support interregional partnerships on Blue Economy sectors, tapping into the financial opportunities of the new Interregional Innovation Investments (I3) instrument of DG REGIO, aiming at strengthening interregional cooperation via bottom-up mechanisms and focusing on commercialisation and scale up investments, therefore unlocking the innovation potential high-lighted by S3 strategies.
Mission Restore our Ocean and Waters by 2030
EU Missions136, launched in September 2021 under Horizon Europe – the EU’s key research and innovation funding programme – offers a new collaborative approach to tackle some of the main challenges of our times in health, climate and the environment, based on sound evidence, through innovative solutions. These Missions provide a framework of action to achieve specific goals in a set timeframe. They will also reframe research and innova-tion, a key enabler of the European Green Deal (EGD) transitions, by combining it with new forms of governance and collaboration, as well as with a new way of engaging with citizens, especially youth, to create impact and deliver on the EGD. The Missions pro-pose ambitious systemic transformations to inspire public confi-dence in a future of Europe that is sustainable, resilient and fair.
The ocean and thus the Blue Economy, have a dedicated EU Mission. Based on a systemic approach, the main goal of the Mission ‘Restore our Ocean and Waters by 2030’ is to address the ocean and waters in a holistic way and play a key role in achieving climate neutrality and restoring aquatic nature. The Mission will contribute to the objectives of the EU Green Deal by:
38
THE
EU B
LUE
ECO
NO
MY
REPO
RT

protecting 30 % of the EU’s waters, restoring marine ecosystems and 25 000 km of free-flowing rivers, preventing and eliminating pollution – reducing plastic litter at sea, avoiding nutrient losses and minimising the use of chemical pesticides by 50 % – as well as making the Blue Economy climate-neutral and circular.
Four Mission Lighthouses137 will serve as spaces for transfor-mation, demonstration and innovation in major basins, namely in the Atlantic-Arctic coast, the Mediterranean Sea, the Baltic-North Sea, and the Danube River. They will provide answers as to how we can restore the ocean and waters, enhancing at the same time sustainability in the Blue Economy, through a change of paradigm (technological, societal, governance), allowing swift deployment and encouraging relevant investment.
Key enablers for this Mission are knowledge of the ocean/water system and public mobilisation. The main enabler of the knowl-edge system under the Mission Ocean and Waters is the European Digital Twin Ocean (DTO). Based on observations, models and the latest technological advances, such as artificial intelligence, the Digital Twin Ocean is a computing environment, which allows the assessment of different situational scenarios, providing knowl-edge-based input for informed decision-making. The Digital Twin Ocean will unlock the door to knowledge and its translation into actions: it is a digital co-creation place at the crossroad of dif-ferent disciplines and of different communities. The uses are unlimited.
To make this Mission reality, a dynamic investment system is needed. Horizon Europe and other EU programmes are provid-ing the initial financing. Financial products such under the ongo-ing BlueInvest pilot fund launched in 2020 with the European Investment Fund (€85 million EFSI plus €15 million from InnovFin
137 Lighthouses are a new concept under the Mission that will act as hubs and platforms for the development, demonstration and deployment of transformative innovations of all forms – technological, social, business, governance – in order to reach the three specific Mission objectives. They will integrate existing knowledge outputs and new knowledge, co-designed and co-implemented with citizens and stakeholders, ensuring local business participation and citizen engagement and outreach.
138 https://emodnet.eu/en 139 https://www.copernicus.eu/en
allocated to five Venture Capital Funds to mobilise up €300 mil-lion investments), and a dedicated thematic blending instrument under InvestEU (additional €485 million EU funds in the period 2021-2027, resulting in approx. 1,5 billion of risk-finance to be made available to the market) will also be available to finance SME-driven technologies and solutions developed under Mission Ocean and Waters, once these are market-ready and to attract investors. Other funding at national, regional, and local scale, pri-vate investments and donors will complement this investment system to lead this Mission to success.
Ocean knowledge
Gathering data and knowledge on the Ocean and its ecosystems is key to support the growth of Blue Economy sectors and the transition to sustainability. Stakeholders – such as public author-ities, business actors, investors, civil society – depend on reliable, high-quality and harmonised data to make informed decisions about the industry.
Several initiatives have been implemented by the EU with the pur-pose to share data on marine and ocean observation. EMODnet138 is an example of such an initiative, aggregating, harmonising and sharing openly in-situ marine data from 120 different institu-tions. The Copernicus marine environment service139 is another important source of information, providing satellite data and forecasting services in the EU sea basins and in the world. In addition, EUMOFA (the European Market Observatory for Fisheries and Aquaculture) is the Observatory responsible for collecting and sharing data on fisheries and aquaculture. However, new initia-tives on ocean knowledge are in progress.
Figure 3.2 Regions with SBE smart specialisations
Source: Eye@RIS – JRC/IPTS.
39
2022

BOX 3.2 EMODnet: MARINE ENVIRONMENT AND HUMAN ACTIVITIES DATA AT YOUR FINGERTIPSThe European Marine Observation and Data Network (EMODnet; emodnet.ec.europa.eu) is a flagship Marine Data and Knowledge initiative of the European Commission (EC) Directorate-General for Maritime Affairs and Fisheries (DG MARE), supported by the EU’s Integrated Maritime Policy. It is bringing together 120 key marine institutes and organisations across the EU and its neighbouring countries to provide unrestricted access to marine data in Europe.
Standardised, harmonised data and added value data products, open and free for all EMODnet offers a single gateway to open-source marine data collected in situ (in water) from the sea surface to the sea floor on hundreds of parameters of the marine environment. EMODnet also offers diverse data and information on European capacity for human activities at sea, spanning the Blue Economy sectors from marine/offshore renewable energy to aggregate extraction, submarine cables, aquaculture and fisheries, algae production, oil and gas platforms and shipping and vessel density, to cultural heritage and area management/designation. To make this possible, EMODnet brings together the European operators for ocean observation, marine monitoring and wider data collection and experts in data management, curation and data services to collec-tively deliver EMODnet’s public open access in situ marine data services, for all.
An operational service delivering marine data, information and knowledge for research, policy, Blue Economy and society. By collect-ing once, integrating and making pan-EU datasets available, EMODnet adds value and impact to marine data making it available for use many times for multiple purposes. This information offers opportunities to Blue Economy operators to increase efficiency and reduce costs in the baseline marine environmental surveying, micro-siting, operations at sea, enabling a more evidence-driven and green sustainable management of human activities at sea and enabling smarter climate adaptation and coastal resilience. Added value data products are generic for all sectors and stimulates further innovation in the market.
EMODnet as an EU focal point for Marine Spatial Planning. It offers integrated transboundary and pan-European marine environ-mental data as a tool to manage the use of our seas and oceans coherently and to ensure that human activities take place in an efficient, safe and sustainable way. In addition, since 2021, EMODnet is a gateway to access national Maritime Spatial Plans (see map layer extracted from EMODnet Human Activities). EMODnet Human Activities works in close co-operation with Regional Sea Conventions, the EC JRC, Technical Group (TG) on Data for MSP towards a technical solution for harmonizing EU MSP within EMODnet.
The user experience In 2021 EMODnet welcomed over 89 000 unique visitors and users to the Central Portal, with use cases and testimonials across research, policy, industry, civil society and from EU and beyond. Users can view, query, and download datasets that comply with EU INSPIRE geospatial data standards, and can also benefit from the many EMODnet data and web services to discover and access data, all with associated metadata, standardized to international ISO standards. From end 2022 all EMODnet services will be fully centralised making the user experience even more simplified with a central map viewer and back-end metadata catalogue.
Figure 3.3 Unique visitors to EMODnet services (2021)
Source: EMODnet.
Num
ber
of u
niqu
e vi
sito
rs in
202
1
40
THE
EU B
LUE
ECO
NO
MY
REPO
RT

Ocean Observation: Underpinning the Blue Economy
Ocean observation is composed of surveys, monitoring campaigns or sampling programmes for measuring the state and dynamics of oceans, seas and coastal areas and the marine organisms that inhabit them. This includes both measurements from instruments mounted on fixed or moving platforms as well as samples taken from the sea and analysed in laboratories.
Data from ocean observation are essential for efficient, effective and safe operations of nearly all economic activity at sea and for measuring its impact on the environment. Observation is con-sequently mostly undertaken or commissioned by public bodies responsible for activities such as research, fisheries management, environmental monitoring, safe navigation, coastal protection or licensing new offshore or coastal activities. A survey carried out by the EuroGOOS consortium in 2021140 showed that in each EU country, at least four ministries or departments had some respon-sibility for these observations. Figure 3.4 provides an estimate of the annual cost of these observations for EU countries. It is a safe assumption that the total public spending is over €2 billion a year.
However, this estimate is not a complete list. It does not, for instance, cover observations made for meteorological purposes or for geological surveys. In the case of research, it does not include the cost of the researchers themselves. Nor does it include observations made by private bodies for their own purposes, those undertaken for defence or those from sensors on earth-orbiting satellites. This would certainly more than double the total amount.
About 85 % of the running costs are for the use of the ships that carry the instruments, technicians and scientists although this fraction is expected to fall as new technology enters into operation. For instance, ocean gliders – autonomous, unmanned underwater vehicles – require little or no human assistance and are uniquely suited for collecting data in remote locations, safely and at relatively low cost. Some EU companies are making inroads into this growing business although the fragmented EU market makes it hard to compete with companies from outside the EU, primarily the United States.
140 https://eurogoos.eu/?msclkid=e453d163aa0611ec99942b25da0078e6 141 https://ec.europa.eu/info/law/better-regulation/have-your-say/initiatives/12539-Ocean-observation-sharing-responsibility/public-consultation_en142 https://op.europa.eu/en/publication-detail/-/publication/16c677b1-596f-11ec-91ac-01aa75ed71a1/language-en/format-PDF/source-243045580
A public consultation closed in 2021141 revealed a consensus amongst all stakeholders, public and private, that the efficiency of these operations would be considerably enhanced through a more coordinated approach between all the authorities concerned. The European Commission is therefore preparing to adopt a pro-posal in 2022 for a common EU approach for measuring once and using the data for many purposes based on joint planning of observation activities and a framework for collaboration on a national and EU scale.
EU Blue Economy Observatory
With timely data becoming fundamental for evidence-based policy and decision-making, socio-economic data on the Blue Economy sectors activities are increasingly relevant.
A feasibility study on the set up of the Blue Observatory142 pub-lished by the Commission confirms that the established sectors are already monitored quite extensively through several data sources. The emerging sectors, however, have limited data avail-ability in publicly available data sources with majority of data being dispersed over multiple sources. Several challenges persist such as lack of information available to calculate the share of the Blue Economy in the overall data. This often results in inac-curate reporting of indicators such as, the number of companies, turnover, GVA (Gross value added), and the number of employees. Incomplete reporting of company data by private and public data sources, or no data availability for some sectors are other chal-lenges faced when gathering data on the Blue Economy.
This study also assessed the feasibility of setting up an EU Blue Economy Observatory and the Sea Satellite Accounts Sea Satellite, where the observatory takes a central role in data collection and compilation and takes a coordination role in providing guidelines and assisting Member States. The activities and sectors covered, as well as the geography are key to define the deployment of the Observatory. The level of importance, growth and data availability will be some of the criteria to start the work of the Observatory.
Figure 3.4 Estimate of spending on ocean observation in the EU made as part of the preparation for the EU’s ocean observation initiative
Source: Commission services own calculation.
41
2022

The EU Blue Economy Observatory will be set up as a collab-orative knowledge dissemination platform aiming at reducing knowledge gaps in ocean socio-economic valuation, harmonise and enhance the accuracy of Blue Economy statistics, and enable near real-time monitoring of decarbonisation efforts across the Blue Economy sectors.
The Observatory, to be established by the Commission services of DG MARE and the JRC, will be responsible for collecting, analysing and disseminating, on a periodical basis, socio-economic data, studies and reports on established and emerging sectors of the EU Blue Economy. The objective will be to support with science-based evidence the sustainable transformation of the EU Blue Economy and to inform policy-makers in a more transparent and targeted manner about the status, developments and findings of the latest scientific and socio- economic evidence on the EU Sustainable Blue Economy.
It will follow on the work already done by some Members States, such as Ireland and Portugal in setting up a Blue Economy Observatory (see the case study about Portugal in Chapter 8.2).
Blue Skills and Jobs
The Commission has long been promoting blue skills and careers. The challenges created by the twin transition of the European economy, and thus the Blue Economy as well, could offer at the same time a unique opportunity for boosting skills in the Blue Economy. Digital skills especially become critical to support growth in the industry. Increasingly more qualified workers will be needed to work on innovative, and technology-based projects in many blue sectors, while at the same time these skills will be relevant to attract investment. Skill gaps will also need to be reduced in the future. For example, around 30 % of the companies in the offshore renewable energy sector claim that needed skills are unavailable or that they face shortages.
Thus, promoting the already established Blue Careers programme under EMFAF will remain key, while focusing on the promotion of gender balance in the maritime professions is another imperative. The EMFAF and other EU funds, such as the European Social Fund and the Technical Support Instrument, or funding available under the Erasmus+ programme can be harnessed to address training, reskilling and upskilling of workers in the Blue Economy. This falls within the context of the European Skills Agenda and is also in line with the action plan adopted by the Commission to implement the European Pillar of Social Rights across the EU.
The Commission will continue to actively promote cooperation and partnerships between stakeholders to facilitate the creation of training projects relevant for the Blue Economy.
143 https://bapsi.eu/
BOX 3.3 BAPSI143 – Blue Academy for Professionals of the Seafood IndustryWorldwide, the demand for seafood products increases con-stantly, making the case for a more efficient, responsible and sustainable exploitation of resources. It is therefore impera-tive for professionals working in the sector to upgrade their knowledge and practices so that companies remain compet-itive and capable of coping with the constant changes and challenges in the sector. Yet, sector representatives accuse a lock of adequate skills and competencies on the labour market due to, in part, a mismatch between available edu-cational programmes and industry needs. Consequently, the Blue Academy for Professionals of the Seafood Industry (BAPSI) aims to promote a fruitful dialogue between the fisheries industrial sector and education providers and to ensure graduates develop industry-vetted skill sets. BAPSI’s one-year academy offered: 12 short-blended courses, 2 days of seminars/conference, 5 practice learning days, hands-on experiences such as an apprenticeship ‘alongside the man-ager’ as well as ‘exchange visits’. The target groups bene-fited from access to highly-relevant training courses and, by mixing theoretical concepts with hands-on practice, BAPSI sought to improve the learning experience for optimal results. Ultimately, the overarching aim of the project is to promote a closer collaboration between industry and education to help bridge the skills gap in partner countries, namely Italy, Spain and Portugal.
BAPSI received EU funding amounting to €749 801 and was concluded in April 2022.
Ocean Literacy
Ocean literacy is a concept that captures the knowledge of, action for, and sustainable use of the finite resources of the ocean and seas. Understanding how we influence the ocean and how the ocean influences us is at the core of ocean literacy. This under-standing allows us to make responsible choices to better protect our ocean and to use the opportunities it offers in a sustainable manner.
Established in 2020 by the Directorate-General for Maritime Affairs and Fisheries of the European Commission, the European Coalition for ocean literacy (EU4Ocean) connects diverse organ-isations, projects and people that contribute to the ocean liter-acy movement and the sustainable management of the ocean. Supported by the European Commission, this bottom-up inclusive initiative aims at uniting the voices of Europeans to make the ocean a concern of everyone.
42
THE
EU B
LUE
ECO
NO
MY
REPO
RT

EU4Ocean coalition communities
The coalition is made up of three components:
• a Platform144 for organisations and individuals engaged in Ocean Literacy initiatives;
• an European Youth Forum for the Ocean145;• a Network of European Blue Schools146.
The EU4Ocean Platform
The EU4Ocean Platform147 is one of the three communities of the EU4Ocean Coalition. It brings together a wide range of stakehold-ers – NGOs, academia and research institutes, aquaria, networks, industry (SME) and public authorities – to connect, collaborate and mobilize efforts on Ocean Literacy. With 125 member entities across 21 European Union Member States and 6 wider nations at the beginning of 2022, the EU4Ocean Platform has grown dur-ing 2021 into a diverse community working across sectors and regions for the development of joint Ocean Literacy activities.
144 https://webgate.ec.europa.eu/maritimeforum/en/frontpage/1483 145 https://webgate.ec.europa.eu/maritimeforum/en/frontpage/1484 146 https://webgate.ec.europa.eu/maritimeforum/en/frontpage/1485 147 https://webgate.ec.europa.eu/maritimeforum/en/frontpage/1483 148 https://en.bahiadesantander-codigo.com/
The objectives of the EU4Ocean Platform are to:
• consolidate and build on existing initiatives on ocean literacy, spanning different stakeholder sectors;
• connect disparate and diverse stakeholders acting on ocean literacy to form an inclusive Ocean Literacy community net-work that stimulates an environment of concrete actions and commitments to create an ‘ocean-literate generation’;
• jointly identify in topic-oriented groups the best opportunities of Ocean Literacy activities that can be scaled up to larger campaigns to raise awareness in wider society;
• connect with and provide capacity building to youth in terms of ocean literacy; and
• build momentum for EU4Ocean to ensure growth and spread-ing of the initiative.
The EU4Ocean Platform members cooperate within three Working Groups respectively dedicated to Climate and Ocean, Food from the Ocean and Healthy and Clean Ocean. In addition to enhanced networking, cooperation between members has led to the co-de-velopment and extended impact of initiatives such as the Coastal Code148 for the Bay of Santander in Spain developed by Platform member Navigatio, which is based on three concepts: respect, pro-tect and enjoy. Based on the trust and goodwill of all users of the bay, this code serves as guide of conduct for everyone, as the sum of all individual actions have a greater impact.
Figure 3.5 Map of the EU4Ocean communities
Source: The European Atlas of the Seas (www.european-atlas-of-the-seas.eu).
43
2022

BOX 3.4 Bringing Ocean Literacy to local communitiesBringing ocean literacy to local communities and engaging people locally is a central pursuit for the EU4Ocean coali-tion. During the last 2 years, the mobilization of key actors, young people and schools developed in all sea-basins and was expressed in the organization of sea-basin events, which included ocean literacy festivals, bringing together experts, youth, artists, policy makers and citizen in the relevant European sea basins. These sea-basin events also included, dedicated teacher’s workshops, which provided training and gave inspiration for bringing the sea to the classrooms and for becoming a Blue School.
5 sea-basin events have been organized: starting with the event organized at the Atlantic Ocean and the North Sea in May 2021, sailing to the ‘Let’s Make the Baltic Sea Blue!’ in August 2021, followed by ‘Let’s Make the Mediterranean Sea Blue!’ in September, and the ‘Let’s Make the Black Sea Blue!’ in November, with last one the ‘Listen to the Arctic Ocean’ in April 2022.
In addition, EU4Ocean Platform meetings have brought together all Platform members to discuss achievements and upcoming activities. These meetings as well as other communication via diverse channels (EU4Ocean Coalition newsletter, e-mails, and social media) inform Platform members of opportunities to sup-port the activities of the two other EU4Ocean communities – the Youth4Ocean Forum and the Network of Blue Schools.
Finally, In May 2021 the EU4ocean coalition, and through the col-lection of ocean facts and scientific information gathered from the thematic work of the platform members, launched an advo-cacy campaign, the Make Europe Blue campaign, which calls on citizens, business, organisations, authorities, and celebrities to commit to an action that can benefit the ocean, while at the same time disseminates this information to make them ocean literate (See Figure 3.6).
Youth4Ocean Network
The Youth4Ocean Forum connects the younger generation of EU citizens from different backgrounds and sectors to spread ocean literacy and raise their voices for the Ocean. With more than 230 members representing 36 nationalities, the Forum allows the young generation to lead actions and projects in the field, carry out ocean advocacy to influence decision-making and legislation, and offers them the possibility to gain skills and find support.
In 2021, members of the Youth4Ocean Forum took part in 17 conferences and workshops in Europe, bringing forward the voices of youth for the ocean. A telling example, a representation of 12 members attended the UNFCCC COP26 in Glasgow and carried out a whole range of activities there.
Figure 3.7 Overview of the Youth4Ocean Forum in numbers
Source: EU4Ocean Platform.
The Youth4Ocean Forum is also a place to get recognition and visibility for young project holders. Successful applicants can get accredited by the European Commission as ‘Young Ocean Advocate’ through an open call for projects. Their projects address the issues of ocean protection and sustainable use of marine resources in many domains, from arts to sports, to practical activ-ities with children to Blue Economy solutions, innovative engi-neering propositions to polar research projects. The Youth4Ocean Forum members also participate in the three Working Groups of
Figure 3.6 Map of the MakeEUBlue pledges in different countries
Source: EU4Ocean Platform.
44
THE
EU B
LUE
ECO
NO
MY
REPO
RT

the EU4Ocean Platform: i) Climate and Ocean, ii) Food from the Ocean and Healthy and iii) Clean Ocean. They also cooperate with the Network of EU Blue Schools to carry out Ocean Literacy activi-ties with school children. Below are a few numbers illustrating the extent of Youth4Ocean’s activities149:
Figure 3.8 Number of Activities per sea basin (including YOA projects)
0 10 20 30 40 50 60 70 80 90
International
Black Sea
Mediterranean
Baltic
Atlantic
Artic
Number of activities Number of YOA projects
Source: EU4Ocean Platform.
Network of European Blue Schools
The Network of European Blue Schools was established in 2020 under the coalition to support teachers in their mis-sion to promote a European eco-citizenship of the ocean through education. The role of teachers is essential to the mission of the EU4Ocean Coalition. Formal education is one of the key agents in the promotion of ocean literacy, equip-ping younger generations of citizens with knowledge, skills, competencies and values, to secure a clean, vibrant and healthy ocean for us all.
The Network of European Blue Schools invites all teachers to share ocean literacy principles in the classroom and help their schools become a European Blue School, by taking up the Find the Blue challenge and bringing the ocean on a more long-term basis into the classrooms. In a European Blue School, teachers help students build their understand-ing of the ocean, the issues it is facing and the economic opportunities it offers. Through project-based learning, teachers actively engage with their pupils and students to bring marine topics into the classroom, making marine (sci-ence) education an essential part of school curricula and allowing students to explore new concepts such as ‘Ocean Health’, ‘Food from the Ocean’ and ‘Climate and Ocean’ in a meaningful way.
149 All numbers updated on 02/02/22.150 https://www.seaweedeurope.com/ 151 Home – International Polar Foundation 152 https://www.fee.global/ 153 http://www.blacksea-commission.org/Institutions/Permanent %20Secretariat/
The main goals of the European Blue School program are to:
• create a more ocean literate society where schools become agents for change and sustainability;
• build bridges between ocean professionals and schools; • set up a network where teachers can share experiences and
collaborate with other schools, at national and supranational level;
• foster students’ ownership, collaborations with other organi-zations and peoples’ involvement with the ocean and to cre-ate a community with the same passion for the key values of these projects.
The Network of European Blue Schools is open to all schools within the European Union and schools that collaborate with schools in the European Union. These schools can apply online to get a European Blue School certification and can take part in the online European Blue School Community.
Several partnerships have been established such as with Seaweed for Europe150, the Black Sea Universities Network, UNESCO and the Education for Climate Coalition. More are on the way, for example with the International Polar foundation151 on Arctic, Ecoschools, FEE152, Blue Generations (Spain, Poland, Bulgaria, Greece), the Commission on the Protection of Black Sea Against Pollution153 (Black Sea).
Figure 3.9 Network of European Blue Schools: Total schools per sea basin
18
10
14
14
17
Atlantic Ocean North Sea Baltic Sea Black Sea Mediterranean Sea
Source: EU4Ocean Platform.
International engagements on ocean literacy
The European Commission – DG MARE and IOC UNESCO have recently announced a collaboration on Ocean Literacy in support of the European EU4Ocean coalition on ocean literacy. This collab-oration will inscribe this EU-wide initiative and enlist its activities under the United Nations Decade of Ocean Science for Sustainable Development (2021-2030) that started on 1 January 2021. The ‘Ocean decade’ will support efforts to reverse the cycle of decline in ocean health and gather ocean stakeholders worldwide behind
45
2022

a common framework that will ensure that ocean science can fully support actors around the world in creating improved condi-tions for sustainable development of the Ocean.
3.1.3 FARM TO FORK STRATEGY
As one of the critical elements of the European Green Deal, the Farm to Fork Strategy (F2F)154 addresses the challenges of sustainable food systems, by recognising the inseparable links between healthy people, healthy societies, and a healthy planet. Several initiatives were developed under this strategy in the past year.
The 2021 Farm to Fork annual Conference organised by the Commission, focused on the progress made on the implemen-tation of the Farm to Fork strategy. The conference gathers European stakeholders across the food value chain who are inter-ested in helping to shape the EU’s path towards sustainable food systems. In this regard, the potential of the EU aquaculture to accelerate the shift to sustainable fish and seafood production was discussed in the 2021 conference, with a specially focus on the role of the new ‘Strategic guidelines for a more sustainable and competitive EU Aquaculture aquaculture for the period 2021 to 2030’ 155 as a game changer, and the challenges and benefits of the organic aquaculture.
One of the flagship initiatives announced in the F2F strategy that is of great importance for fisheries and aquaculture, is the development of a Legislative framework for sustainable food systems. The initiative aims at accelerating and facilitating the transition to sustainable food systems and will have as a core objective to promote policy coherence at EU and national level, mainstream sustainability in all food-related policies and strengthen the resilience of food systems. It will also consider elements related to sustainable food procurement and sustain-able labelling.
The work on this framework legislation started in 2021 and it is expected to conclude by the end of 2023. The inception impact assessment was published in September 2021156.
The Farm to Fork Strategy also planned an initiative to prepare the EU for potential food crises by means of the contingency plan for ensuring food supply and security157. Drawing on the lessons learnt from the COVID-19 pandemic, the contingency plan addresses any crisis that affects the food system and puts food security within the EU in danger. It establishes the creation of a European Food Security Crisis preparedness and response Mechanism (EFSCM). The aim is to ensure a sufficient and varied supply of safe, nutritious, affordable and sustainable food to cit-izens at all times.
154 https://ec.europa.eu/food/horizontal-topics/farm-fork-strategy_en 155 COM(2021)236 final.156 Sustainable EU food system –new initiative (europa.eu)157 EUR-Lex - 52021DC0689 - EN - EUR-Lex (europa.eu)158 f2f_sfpd_coc_final_en.pdf (europa.eu)159 Further information can be found under following link : Code of Conduct (europa.eu)
The goal of the EFSCM is to contribute to improve the level of preparedness of the EU food system and the cooperation between the public and private sectors. It relies on a set of rules and proce-dures and a dedicated group of experts from EU Member States, stakeholder organisations and certain non-EU countries with food supply chains that are highly integrated with the EU’s. The Commission will convene the group of experts periodically. Further, it will be triggered in case of exceptional, unpredictable, and large-scale events or risks that have the potential to threaten EU food supply or security. Russia’s invasion of Ukraine and its impact in food security has already triggered the mechanism.
The F2F Strategy also refers to the revision of the EU marketing standards for seafood products. This initiative aims at stream-lining and modernising the current standards, so that they better contribute to providing the market with sustainable products, as defined in the objectives of the Common Market Organisation (CMO) Regulation. For that purpose, the Commission considers introducing standardised product information on the basis of well-defined sustainability criteria and indicators. This would result in a grading of the product for these sustainability aspects. The Commission will ensure coherence between this initiative and other actions under the European Green Deal and F2F Strategy.
In July 2021, the Commission has launched the Code of Conduct for responsible business and marketing practices158, alongside industry stakeholders. The objective of the Code is to cover all major aspects of food sustainability (economic, social, and envi-ronmental) in the food supply chain and reflect the goals and ambitions of the F2F Strategy and Green Deal. The Code focuses on the middle of the supply chain actors, between the farm and the fork, but its aim is to cover the whole chain so it also includes objectives for action for primary producers. It is a non-legislative initiative led by stakeholders. Some fisheries and aquaculture associations already signed up to the Code159.
The F2F strategy also notes algae as a promising future source of protein and outlines the support necessary to the algae industry. As a bold follow-up action, Commission is working on a cross-cut-ting EU Algae Initiative aiming to unlock algae potential in Europe by increasing sustainable production, consumption and innovative use of algae and algae products in the EU, including feed, phar-maceuticals, bioplastics, fertilisers, biofuels etc. Once scaled up, the algae sector will deliver a variety of healthy food products, while the low-carbon algae industry will help to regenerate oceans by reducing excess nutrients and carbon in marine ecosystems.
Organic farming
Organic farming, including aquaculture, responds to the growing societal demand for quality food produced at high environmental and animal welfare standards. It can contribute to the protection of nature and help reverse the degradation of ecosystems, and plays an important role in the Green Deal ambition of transitioning to sustainable food production and consumption.
46
THE
EU B
LUE
ECO
NO
MY
REPO
RT

In March 2021, the European Commission published an action plan to accelerate the development of the organic sector160. The plan aims to boost the production and consumption of organic products, inter alia, by meeting the objective of the F2F Strategy for organic aquaculture to have a significant increase by 2030. Structured around three axes: 1) boosting consumption while maintaining consumer trust, 2) increasing production, and 3) improving further the sustainability of the sector, it identi-fies 23 actions to achieve the targets and enhance the role of organic farming.
In line with the new organic agriculture legislation, which entered into force on 1 January 2022, the European Commission also aims at fostering local and small-scale processing. This is crucial to ensure organised and efficient supply chains for organic prod-ucts, and to make sure that small producers can find an outlet for their production.
For aquaculture, there are several instruments that can contribute to boosting organic aquaculture such as the Common Fisheries Policy and the new strategic guidelines for a more sustainable and competitive aquaculture for the period 2021 to 2030161. Further, the Commission also encourages EU Member States to include organic aquaculture in the (ongoing) review of their national strategic plans on aquaculture and support this type of aquaculture production with part of the funds available under the European Maritime Fisheries and Aquaculture Fund (EMFAF 2021-2027). Horizon Europe will continue to support research an innovation for organic aquaculture. The Commission will also identify and address any specific obstacles to the growth of EU organic aquaculture.
The new Strategic guidelines for EU aquaculture
The strategic coordination on aquaculture policy in the EU is based on the Commission’s Strategic Guidelines for the sustain-able development of EU aquaculture (first adopted in 2013), and the Multi-annual National Strategic Plans (MNSPs) for aquaculture prepared by EU Member States considering those guidelines. The implementation of these MNSPs has been supported by the Open Method of Coordination (exchange of good practices among EU Member States facilitated by the Commission), as well as by fund-ing made available in the European Maritime and Fisheries Fund (EMFF) and other EU funds, such as Horizon 2020. In addition, the Aquaculture Advisory Council (AAC, representing stakeholders including industry and other interest groups such as NGOs) pro-vides advice to the Commission on issues related to aquaculture policy.
160 COM(2021)141 final.161 COM(2021)236 final162 COM(2021) 236 final163 https://ec.europa.eu/oceans-and-fisheries/events/blue-farming-european-green-deal-vision-sustainable-aquaculture-production-and-consumption_en164 Blue Farming in the European Green Deal165 https://www.eesc.europa.eu/en/our-work/opinions-information-reports/opinions/strategic-guidelines-sustainable-development-eu-aquaculture166 https://cor.europa.eu/en/news/Pages/eco-label-aquaculture.aspx
The new Strategic Guidelines for EU aquaculture162, adopted in May 2021 by the Commission, were developed in close con-sultation with EU Member States and the stakeholders, providing a common vision for further growth of aquaculture in the EU as a sector that is more competitive and resilient and becomes a global reference in terms of sustainability, thereby contributing to the objectives of the European Green Deal. The Guidelines set four inter-related objectives to achieve this vision: 1) building resilience and competitiveness, 2) participating in the green tran-sition, 3) ensuring social acceptance and consumer information, and 4) increasing knowledge and innovation.
The Guidelines provide concrete recommendations on a broad range of issues and propose specific actions by the Commission, EU Member States and the AAC. To support the implementa-tion of the Guidelines, the Commission will in 2022 set up an EU Aquaculture Assistance Mechanism. It will serve as a tool to help the Commission, EU Member States, the industry, and other stakeholders to develop further guidance and consolidate best practices on the areas covered in the Guidelines. The Assistance Mechanism will also help implement that guidance and best prac-tices. This mechanism will include a website with an accessible knowledge base for all stakeholders (for example, a guide on EU funding and a database of EU-funded aquaculture projects).
Taking into consideration the new Guidelines, EU Member States are currently reviewing their MNSPs. The European Maritime, Fisheries and Aquaculture Fund (EMFAF, 2021-2027) will continue to provide support to EU Member States to implement their strat-egy for the sector, as reflected in their respective MNSPs.
The Commission also organized a High-level stakeholder’s event in May 2021 to engage all the relevant stakeholders in the dis-cussion about the newly adopted Guidelines163 and the future of sustainable aquaculture164 in the EU.
The European Economic and Social Committee165 and the European Committee of the Regions166 have adopted their opinions in 2021 on the new guidelines, while the European Parliament is expected to adopt its own-initiative report in 2022.
47
2022

BOX 3.5 EASY FEED167 As fish stocks in the sea have been decreasing significantly over the last few years, catching wild fish to feed farm fish has become unsustainable. Finding substitutes to feed fish in farms is therefore critical.
EASY Feed is a project that contributes to the sustainable and profitable development of aquaculture in the EU, con-tributing to the EU blue growth strategy. The project brings to the fish farming sector a new and unique sustainable pro-duction model, to offer European consumers a healthy, high quality and affordable product It aims at producing organic aquaculture feed formula, made out of spirulina and quinoa. It completely excludes fishmeal and fish oil in its composi-tion, and is profitable, as its production costs are up to 40 % cheaper than classical feed. Tilapia is grown into the coordi-nator’s facilities and benefits from the EASYFEED formula, to be marketed, at a later stage, as sustainable fish production.
After the consortium confirmed the feasibility of its innova-tive fish feed on a small scale as a solution to decrease the dependence of the aquaculture sector on marine resources, they wanted to go a step further to validate its use on an industrial scale. This will bring on the market a unique final tilapia-based product obtained in a most sustainable way. Tilapia will also be marketed in new formats (fish sticks, hamburgers, frankfurter and tilapia with vegetables ready-to-eat dishes), which will open new doors for its commercial-isation on the EU market.
Easy Feed is active in the Mediterranean Sea basin. The pro-ject received EU funding amounting to €438 563.
3.1.4 DECARBONISATION
As laid out in the European Green Deal, the European Union strives to reduce greenhouse gas emissions by at least 55 % (compared to 1990 levels) and to become carbon neutral by 2050. Moreover, the EGD strives to reduce emissions across all forms of transport across the Member States by 90 %. The Blue Economy can con-tribute to these climate objectives by fostering decarbonisation particularly through marine renewable energy and zero-emission maritime transport.
Marine renewable energy
Marine renewable energy, comprising emerging technologies such as offshore wind energy, wave and tidal energy bear the poten-tial to power most of the EU in the future, considering research advancements in the field throughout the past years. As already explained in section 3.1, the renewable energy directive168 pro-vides the legal framework along with the Offshore Renewable
167 https://cinea.ec.europa.eu/featured-projects/easy-feed_en168 https://eur-lex.europa.eu/legal-content/EN/TXT/?uri=CELEX:52021PC0557 169 COM(2020) 741 final – ‘An EU Offshore Renewable Energy Strategy’.170 The strategy aims to have an installed capacity of at least 60GW of offshore wind and at least GW of ocean energy by 2030, with a view to reach by 2050 300GW and
40GW of installed capacity respectively.171 IMO, Fourth IMO GHG Study 2020, Final report, London, 2020b.172 EMSA (2021). European Maritime Transport Environmental Report.
Energy Strategy169 to empower the European Union to harness this opportunity to its full potential by multiplying the capacity for offshore renewable energy by 30 in the year 2050 170.
Maritime transport
Even though maritime transport contributes less to the green-house gas emissions compared to other modes of transport, it still accounted for roughly 2.8 % of man-made emissions in 2018171. Maritime transport also exerts other pressures on the environ-ment apart from emissions: taking the example of air pollution, it is important to acknowledge that this leads not only to adverse effects on the environment but can be also detrimental for human health. In order to improve environmental standards, the EU con-sistently tightened the rules for ships operating under Member States’ flags as well as others that trade in European waters since the late 1990s resulting in reduction of carbon dioxide and sul-phur oxide emissions as well as other sources of pollution (e.g. oil and chemicals). Moreover, onshore power supply cold ironing is deemed a promising solution for improving air quality across ports and coastal areas; if the electricity provided stems from renewa-ble sources, onshore power supply bears the potential to reduce emissions at berth to a minimum, also decreasing noise levels172.
There are multiple factors that render decarbonisation of the ship-ping sector challenging: Firstly, the inherent international nature of the sector which makes legislation beyond European jurisdiction difficult. Secondly, there is a lack of diversity in terms of infra-structure and associated facilities and thirdly, it is also important to acknowledge that the vessels that are in use and their age also play a major role.
Decarbonisation of waterborne transport
The European Commission specifically targeted decarbonisation of waterborne transport throughout the funding periods of 2007-2013 and 2014-2020 under the 7th Framework Programme (FP7) as well as Horizon 2020, investing €760 million whereas other beneficiary organisations contributed around €239 million. In total, this funding brought forward 133 waterborne projects dedicated to decarbonisation.
Research projects that focused on hull design primarily addressed lightweight composite materials for structural components, hydro-dynamic hull design, reduction of hull friction as well as repair methods and surface protection. Fostering these technological developments has potential for improving efficiency.
Regarding power and propulsion, research projects explored the potentials of wind-assisted propulsion to increase engine efficiency and associated reduction of fuel consumption. Apart from that, waste heat can be used to feed ships’ heating/cooling systems. Another way of fostering decarbonisation is the elec-trification of vessels and exploration of battery use in maritime
48
THE
EU B
LUE
ECO
NO
MY
REPO
RT
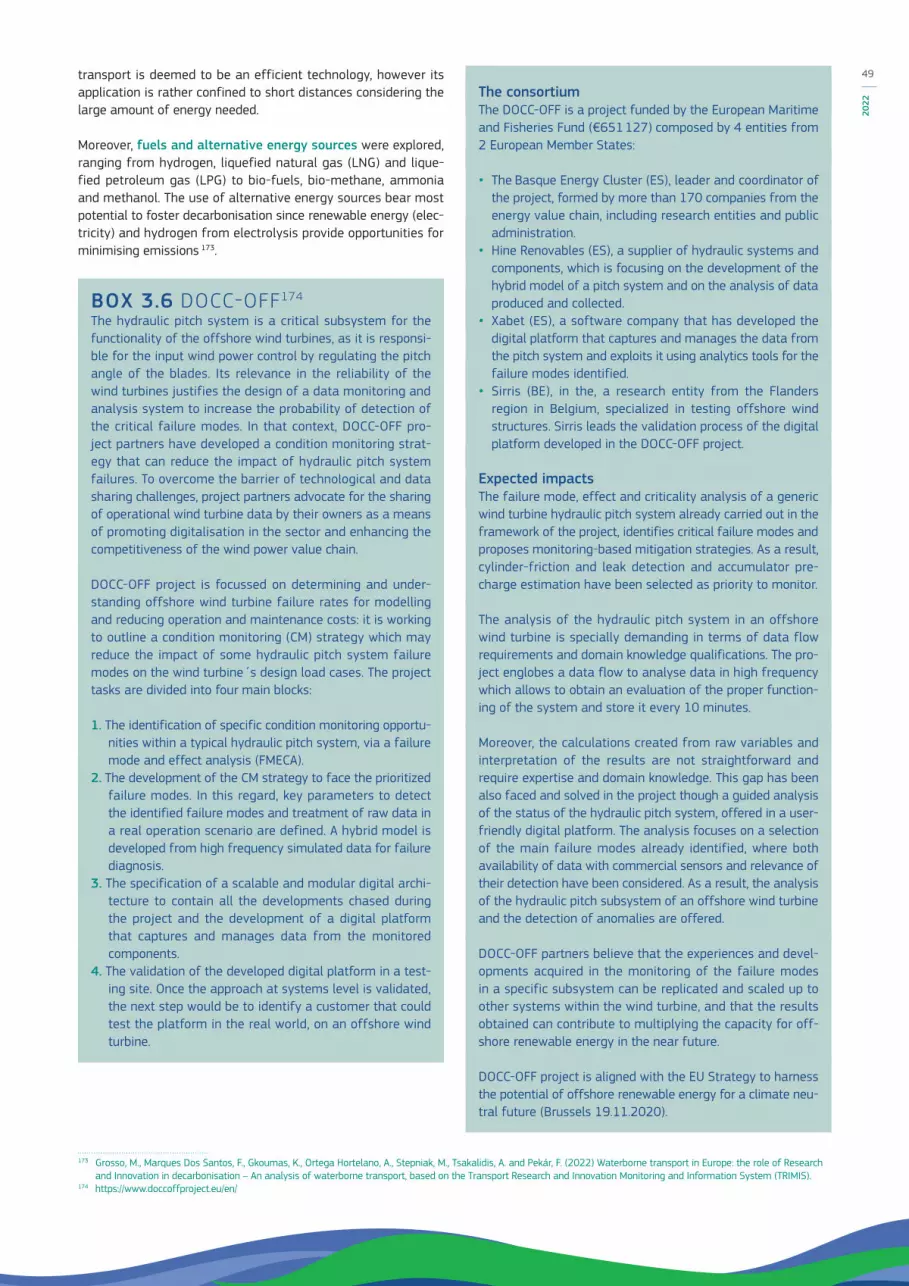
transport is deemed to be an efficient technology, however its application is rather confined to short distances considering the large amount of energy needed.
Moreover, fuels and alternative energy sources were explored, ranging from hydrogen, liquefied natural gas (LNG) and lique-fied petroleum gas (LPG) to bio-fuels, bio-methane, ammonia and methanol. The use of alternative energy sources bear most potential to foster decarbonisation since renewable energy (elec-tricity) and hydrogen from electrolysis provide opportunities for minimising emissions 173.
BOX 3.6 DOCC-OFF174 The hydraulic pitch system is a critical subsystem for the functionality of the offshore wind turbines, as it is responsi-ble for the input wind power control by regulating the pitch angle of the blades. Its relevance in the reliability of the wind turbines justifies the design of a data monitoring and analysis system to increase the probability of detection of the critical failure modes. In that context, DOCC-OFF pro-ject partners have developed a condition monitoring strat-egy that can reduce the impact of hydraulic pitch system failures. To overcome the barrier of technological and data sharing challenges, project partners advocate for the sharing of operational wind turbine data by their owners as a means of promoting digitalisation in the sector and enhancing the competitiveness of the wind power value chain.
DOCC-OFF project is focussed on determining and under-standing offshore wind turbine failure rates for modelling and reducing operation and maintenance costs: it is working to outline a condition monitoring (CM) strategy which may reduce the impact of some hydraulic pitch system failure modes on the wind turbine´s design load cases. The project tasks are divided into four main blocks:
1. The identification of specific condition monitoring opportu-nities within a typical hydraulic pitch system, via a failure mode and effect analysis (FMECA).
2. The development of the CM strategy to face the prioritized failure modes. In this regard, key parameters to detect the identified failure modes and treatment of raw data in a real operation scenario are defined. A hybrid model is developed from high frequency simulated data for failure diagnosis.
3. The specification of a scalable and modular digital archi-tecture to contain all the developments chased during the project and the development of a digital platform that captures and manages data from the monitored components.
4. The validation of the developed digital platform in a test-ing site. Once the approach at systems level is validated, the next step would be to identify a customer that could test the platform in the real world, on an offshore wind turbine.
173 Grosso, M., Marques Dos Santos, F., Gkoumas, K., Ortega Hortelano, A., Stepniak, M., Tsakalidis, A. and Pekár, F. (2022) Waterborne transport in Europe: the role of Research and Innovation in decarbonisation – An analysis of waterborne transport, based on the Transport Research and Innovation Monitoring and Information System (TRIMIS).
174 https://www.doccoffproject.eu/en/
The consortiumThe DOCC-OFF is a project funded by the European Maritime and Fisheries Fund (€651 127) composed by 4 entities from 2 European Member States:
• The Basque Energy Cluster (ES), leader and coordinator of the project, formed by more than 170 companies from the energy value chain, including research entities and public administration.
• Hine Renovables (ES), a supplier of hydraulic systems and components, which is focusing on the development of the hybrid model of a pitch system and on the analysis of data produced and collected.
• Xabet (ES), a software company that has developed the digital platform that captures and manages the data from the pitch system and exploits it using analytics tools for the failure modes identified.
• Sirris (BE), in the, a research entity from the Flanders region in Belgium, specialized in testing offshore wind structures. Sirris leads the validation process of the digital platform developed in the DOCC-OFF project.
Expected impactsThe failure mode, effect and criticality analysis of a generic wind turbine hydraulic pitch system already carried out in the framework of the project, identifies critical failure modes and proposes monitoring-based mitigation strategies. As a result, cylinder-friction and leak detection and accumulator pre-charge estimation have been selected as priority to monitor.
The analysis of the hydraulic pitch system in an offshore wind turbine is specially demanding in terms of data flow requirements and domain knowledge qualifications. The pro-ject englobes a data flow to analyse data in high frequency which allows to obtain an evaluation of the proper function-ing of the system and store it every 10 minutes.
Moreover, the calculations created from raw variables and interpretation of the results are not straightforward and require expertise and domain knowledge. This gap has been also faced and solved in the project though a guided analysis of the status of the hydraulic pitch system, offered in a user-friendly digital platform. The analysis focuses on a selection of the main failure modes already identified, where both availability of data with commercial sensors and relevance of their detection have been considered. As a result, the analysis of the hydraulic pitch subsystem of an offshore wind turbine and the detection of anomalies are offered.
DOCC-OFF partners believe that the experiences and devel-opments acquired in the monitoring of the failure modes in a specific subsystem can be replicated and scaled up to other systems within the wind turbine, and that the results obtained can contribute to multiplying the capacity for off-shore renewable energy in the near future.
DOCC-OFF project is aligned with the EU Strategy to harness the potential of offshore renewable energy for a climate neu-tral future (Brussels 19.11.2020).
49
2022

Synergies with other EU projects The EU R&D project ROMEO focuses also on the reduction of component failure in unplanned maintenance and increased reliability trough the development of a digital twin. While DOCC-OFF focuses on a specific part in the wind turbine (the hydraulic pitch system), ROMEO analyses different subsys-tems, namely main shaft, gearbox, generator, blade bearing, transformer and converter.
Because of the similarity and complementarity of the top-ics, both consortiums are aiming at setting-up a joint ‘Digital twin technologies for wind turbine O&M seminar’ along this year. The projects aim for the same type of audience, and in respect to this audience the insights from both projects are expected to be more valuable.
To overcome the barrier of technological and data sharing challenges, project partners advocate for the sharing of operational wind turbine data by their owners as a means of promoting digitalisation in the sector and enhancing the competitiveness of the wind power value chain.
The project runs from 11/2019 to 10/2021.
175 Trinh Thi Xuan My ‘Circular Business Model as an Environmental Solution To Decarbonization’ (2021).176 COM/2008/0699 final - https://ec.europa.eu/growth/sectors/raw-materials/policy-and-strategy-raw-materials_en 177 COM(2008) 699 final ‘Policy and strategy for raw materials’. 178 Girtan et al. ‘The Critical Raw Materials Issue between Scarcity, Supply Risk, and Unique Properties’. 179 Dataset downloaded from the Material Flow Data Portal, maintained by the Vienna University of Economics and Business (WU Vienna).
Available: http://materialflows.net/visualisation-centre.180 https://ec.europa.eu/eurostat/web/circular-economy
3.2 THE CIRCULAR ECONOMYThe Circular Economy (CE) is becoming more commonly accepted as a realistic solution to the issue of sustainable growth. The tran-sition to a circular economy can be deemed a technical evolution from the linear production–consumption model. The CE’s goal in fact, is to interconnect business cycles in order to maintain the value of products and services for as long as possible, while increasing the efficiency of resources as well as minimising waste and emissions.175
At the core of the CE is the consideration on how to address raw materials, their availability, extraction, use and distribution within the value chain. With the Raw Materials Initiative176, adopted in 2008, the EU began actions to secure global competitiveness of manufacturing industries and to accelerate the transition to a resource-efficient and sustainable society. The Raw Materials Initiative is one of the strategies adopted by the EU to shift towards a more resource-efficient economy and sustainable development177.
The COVID-19 pandemic, highlighted once again the importance of addressing material’s availability, their market and distribution. The pandemic impacted Europe’s value chains and demonstrated their shortcomings, highlighting Europe’s dependency on other regions in the world for raw materials. Furthermore, the OECD estimates that the global consumption of resources will grow by up to 40 % by 2040 and close to 90 % by 2060178.
Respectively, prior to the pandemic, a total of 8.1 Gt of material resources were used in 2018 in the EU-27 economy. Two thirds of these resources (5.4 Gt) were extracted from the EU, 21 % (1.7 Gt) were imported from outside the EU, and only 11.8 % (less than 1 Gt) were recycled or retrofitted. Given that half of total green-house gas emissions (GHG) and more than 90 % of biodiversity loss and water stress come from resource extraction and process-ing, the EU material footprint must be significantly reduced and economic growth decoupled from resource use in order to achieve the EU sustainability commitments and climate-neutrality targets by 2050179.
Against this backdrop, the European Union has engaged in an ambitious path towards a low-carbon and circular economy. A fully circular economy is one where waste is minimised and resources are kept in use in a perpetual flow by ensuring that unavoidable waste or residues are recycled or recovered. A circular economy aims to maintain the value of products, materials and resources for as long as possible by returning them into the product cycle at the end of their use, while minimising the generation of waste. The fewer products we discard, the less materials extracted, the better for the environment180.
50
THE
EU B
LUE
ECO
NO
MY
REPO
RT

Although many aspects and principles of the Circular Economy appeared as early as the 1970s, the concept was officially intro-duced in the EU in 2014. Focusing on the recent frameworks and regulations, the most significant one, adopted in March 2020 by the EU Commission is the new Circular Economy Action Plan (CEAP)181. Its main goal is to decouple economic growth from the use of resources, while ensuring that the European Union’s econ-omy remains competitive over the long term182.
With the CEAP the EU plans to reduce its consumption footprint and double the EU’s circular material use rate in the coming dec-ade, while generating savings of €600 billion for EU businesses (equivalent to 8 % of their annual turnover)183, increasing the EU’s GDP by an additional 0.5 % by 2030, and creating around 700 000 new jobs. On the environmental front, it estimates that circular economy initiatives could reduce EU carbon emission by 43 % by 2030 (i.e. 450 million tonnes)184 and 83 % by 2050185.
The Action Plan proposed 35 different measures covering the entire lifecycle of products, from design and manufacturing to consumption, repair, reuse, and recycling. It also proposed legisla-tive and non-legislative measures and targets areas where action at the EU level brings added value.
The aim of the CEAP is to reduce the EU’s consumption footprint and double the EU’s circular material use rate in the coming dec-ade, while generating savings of €600 billion for EU businesses (equivalent to 8 % of their annual turnover), increasing the EU’s GDP by an additional 0.5 % by 2030, and creating around 700 000 new jobs. Furthermore, it is estimated that circular economy ini-tiatives could reduce EU carbon emission by 43 % by 2030 (i.e. 450 million tonnes) and 83 % by 2050. By these means, economic considerations will be aligned with environmental considerations.
Some of the specific objectives of the CEAP include: i) making sustainable products the norm in the European Union; ii) focusing on the sectors that use the most resources and where the poten-tial for circular action is high (e.g. electronics and ICT, batteries and vehicles, packaging, plastics, textiles, construction and build-ings, food, water and nutrients); iii) ensuring less waste; and iv) empowering consumers and public buyers by introducing a ‘right to repair’ and to reliable information on issues such as the dura-bility of products to help them make environmentally sustainable choices.
Rapid environmental degradation, depletion of resources, unbal-anced consumption, and excessive waste generation has led to the development of policies for reducing the negative impacts of production and consumption on the environment186. First, there is an imperative need that the value of products, materials and
181 COM(2020) 98.182 European Investment Bank. The EIB Circular Economy Guide: Supporting the circular transition (2020), p. 7.183 European Commission Memo. Questions and answers on the Commission Communication ‘Towards a Circular Economy’ and the Waste Targets Review (2014), p. 2.184 https://ec.europa.eu/info/sites/info/files/circular-economy-factsheet-general_en.pdf 185 Ellen MacArthur Foundation, & McKinsey Center for Business and Environment. Growth within: a circular economy vision for a competitive Europe.
Ellen MacArthur Foundation (2015), p. 14.186 Almas Heshmati IZA DP No. 9611 ‘A Review of the Circular Economy and its Implementation’ (2015), p. 2.187 Mazur-Wierzbicka, Ewa. ‘Circular economy: advancement of European Union countries.’ Environmental Sciences Europe 33.1 (2021).188 https://ec.europa.eu/eurostat/web/circular-economy/indicators 189 COM/2021/240 final – https://ec.europa.eu/oceans-and-fisheries/ocean/blue-economy/sustainable-blue-economy_en190 Directive (EU) 2019/904.191 Directive (EU) 2019/883.192 https://ec.europa.eu/environment/topics/waste-and-recycling/waste-oil_de
resources is maintained in the economy for as long as possible, and that generation of waste is quickly minimised. A study ana-lysing the European monitoring framework for measuring CE187, taking into consideration production and consumption, waste management, secondary raw materials and competitiveness and innovation, revealed that leading countries regarding CE include Germany, Belgium, Spain, France Italy and the Netherlands. These countries were high-rated in terms of private investments, jobs and GVA related to CE sectors, projects and patents related to recycling and secondary raw materials, quantity of circular mate-rial used, as well as bio-waste recycling 188.
3.2.1 POLICIES TOWARDS CIRCULARITY IN THE BLUE ECONOMYThe concept of the circular economy underpins the decoupling of economic growth and sustainability: this is evidently also relevant for the Blue Economy sectors. Following EU-frameworks such as the Communication on Sustainable Blue Economy189, this shift becomes evident where a paradigm shift from ‘blue growth’ to a ‘sustainable Blue Economy’ was introduced.
For this shift to materialise, economic activities need to reduce their impact on the coastal area and the entire marine environ-ment. Value chains also need to contribute to the implementation of the European Green Deal, going towards climate neutrality, zero pollution, waste prevention and circular economy.
Several initiatives have been put forward by the EU to tackle maritime pollution and adopt circular Blue Economy strategies. The transposition of the Single-Use Plastics (SUP) Directive190 and the Port Reception Facilities (PRF) Directive191, will provide opportunities in the collection of marine litter and promote new investments in port facilities to receive waste, separate collection, storage, and treatment. Within the Circular Economy Action Plan, the Commission is also laying down several actions to minimise EU exports of waste and tackle illegal shipments. This is the case of the review of rules on proper treatment of waste oils to be reviewed by the European Commission by 2022192.
Litter and waste in coastal areas can generate risks and affect both human health and the environment. At the same time, those types of waste have potential economic value, as they can become sources of energy or material that can be recycled, there-fore contributing to circularity. In 2020, the EU exported around 33 million tonnes of waste to non-EU countries and imported around 16 million tonnes. Nearly 70 million tonnes of waste are shipped between EU countries each year. Administrative procedures and illegal trade hinder the circulation of waste and the potential
51
2022
of the circular economy within the EU. The Waste Shipment Regulation193 (WSR) lays down rules on ship’s waste manage-ment, against any negative effect on the environment and the human health. The main objectives of the revised regulation are to facilitate shipments of waste for reuse and recycling in the EU, to ensure that the EU does not export its waste challenges to third countries, and to tackle illegal waste shipments. The Regulation sets out rules for the import/export of waste between EU mem-bers and third countries and for shipments within the internal market. The goals of the revised proposal of the waste shipment regulation are to increase the level of protection of the environ-ment and public health from the impacts of unsound transbound-ary shipments of waste and to better contribute to the European Green Deal and the Circular Economy Action Plan.
• Revised regulation on persistent organic pollutants (2021) The ambition with this proposal is to eliminate or minimise Persistent Organic Pollutants’ (POPs) emissions from waste. Although POPs are generally no longer used in new prod-ucts, they can still be found in waste coming from water-proof textiles, furniture, plastics and electronic equipment. In order to reduce the environmental impact and sustain the European Green Deal as well as the CEAP, this proposal intends to put stricter limits on the use of these groups of substances in waste, perfluorooctanoic acid (PFOA) and its salts and related compounds (used in waterproof textiles and fire-fighting foams), dicofol (a pesticide, previously used in agriculture), and pentachlorophenol, its salts and esters (found in treated wood and textiles)194.
• The EU Action Plan for the Marine Environment aims to conserve fisheries resources and protect marine ecosystems by exploiting the synergies between fisheries and environ-mental policies and improving the implementation195. Plastic litter entering the ocean is increasing and, according to a report published in 2022 by WWF, 88 % of the marine species studied, were affected by contamination of plastic196.
• The EU Strategy for Plastics in a Circular Economy on the other hand focuses is on litter prevention from both land and sea-based sources. It is the first EU-wide policy framework adopting a material specific life-cycle approach integrating design, use, re-use and recycling197.
193 COM/2021/709 final – https://ec.europa.eu/environment/topics/waste-and-recycling/waste-shipments_en 194 COM(2021) 656.195 European Commission Action Plan for the Marine Environment (2021) – https://ec.europa.eu/oceans-and-fisheries/news/
action-plan-conserve-fisheries-resources-and-protect-marine-ecosystems-your-opinion-counts-take-part-2021-10-25_en196 https://wwfint.awsassets.panda.org/downloads/wwf_impacts_of_plastic_pollution_on_biodiversity.pdf 197 https://ec.europa.eu/info/research-and-innovation/research-area/environment/circular-economy/plastics-circular-economy_en 198 https://ec.europa.eu/info/business-economy-euro/banking-and-finance/sustainable-finance/overview-sustainable-finance/platform-sustainable-finance_en 199 https://ec.europa.eu/info/business-economy-euro/banking-and-finance/sustainable-finance/international-platform-sustainable-finance_en 200 COM(2019) 640.201 https://ec.europa.eu/environment/news/eu-launches-global-alliance-circular-economy-and-resource-efficiency-2021-02-22_en202 https://ec.europa.eu/maritimeaffairs/policy/ocean-governance_en 203 https://en.unesco.org/ocean-decade 204 https://www.decadeonrestoration.org/ 205 COM(2019) 640.
3.3 STRONGER EUROPE IN THE WORLDThe EU aims to continue to be a global frontrunner on climate and environmental measures, consumer protection, and workers’ rights. It aims to continue to promote an economy based on a sus-tainable activity, that leads by example and diplomacy, supported by effective trade, development, and external policies. Tackling climate change is a global challenge that can only be addressed at a global level. The EU acts therefore, to be a frontrunner while coordinating international efforts on finance, environmental and energy actions that can support sustainable transition in and out-side Europe.
To ensure that financial support is channelled to sustainable activ-ities, it established the EU Platform on Sustainable Finance198 (see Chapter 2), and participates in the International Platform on Sustainable Finance199. This effort is instrumental to put Europe firmly on a new path of sustainable and inclusive growth200.
On international level the EU continues to lead efforts and build strong alliances with partners. For example, together the United Nations Environment Programme (UNEP), and in coordination with the United Nations Industrial Development Organization (UNIDO), the EU launched the Global Alliance on Circular Economy and Resource Efficiency (GACERE) 201. Its overall objective is to spur innovation and make the transition more equitable by cre-ating green jobs and lowering environmental impacts. Besides the EU, the Alliance has already been joined by eleven countries (Canada, Chile, Colombia, Japan, Kenya, New Zealand, Nigeria, Norway, Peru, Rwanda and South Africa). The Alliance is expected to facilitate multilateral dialogue on the management of natural resources, potentially accelerating the advancement of the inter-national ocean governance agenda202.
It will also keep its efforts to foster and promote the opportuni-ties offered by the UN Decade of Ocean Science for Sustainable Development203, as well as to the UN Decade on Ecosystem Restoration204. This adds the other existing instances of interna-tional ocean governance through which EGD objectives will be pur-sued. It also recognises the need to maintain its security of supply and competitiveness even when and where others are unwilling or unable to act205.
The ambitious EU Biodiversity strategy also involves an important governance effort for the EU to lead in addressing the global bio-diversity crisis, and for collaboration action at international level. The EU realises the need to increase efforts to address the chal-lenges of biodiversity loss, deforestation, pollution and climate
52
THE
EU B
LUE
ECO
NO
MY
REPO
RT

change in an integrated way, and is pursuing several actions, as for example the endorsement of the Leaders’ Pledge for Nature206. Also, the Farm to Fork strategy globally supports the transition to sustainable food systems. The EU will pursue the development of Alliances on sustainable food systems with all its partners in bilat-eral, regional and multilateral fora. In this regard, it is worth men-tioning the creation of the blue food coalition at the occasion of the Food Systems Summit207 that took place in New York in 2021.
The EU will continue to foster international cooperation and to use its influence, expertise and financial resources to mobilise its neighbours and partners to join on the sustainability transition to tackle climate challenges and achieve EGD goals.
BOX 3.7 Enaleia – from the bottom of the sea to the circular economy208
Enaleia is a social, non-profit enterprise that uses circular and social economy solutions to tackle marine plastic pollu-tion and overfishing. It started in 2016 as the first school of professional fisheries in Greece, and has run several projects in different places of the world, from clean-up mega projects to research projects. Enaleia aims at solving two problems in collaboration with the fishing communities: the reduction of fish stocks & Marine plastic pollution.
Projects in the Mediterranean Through several projects, they have trained more than 1 500 fishers to collect plastic from the sea, having collected more than 250 000 kg of marine plastic and fishing nets so far. More than 65 % of the collected material is integrated into the circular economy and gets upcycled into new products. For example, more than 20 000 Kg of used fishing nets col-lected has been used to produce 260 000 pairs of socks. The Clean-Up Project is another example of where Enaleia has implemented a wide-scale marine plastic clean-up in the Mediterranean region, in collaboration with professional fishers. The aim is to mitigate and prevent marine plastic pollution by incentivizing fishers to collect marine plas-tic from the seabed and deliver their used fishing gear. In sequence, in collaboration with certified recycling and upcy-cling companies, Enaleia facilitates the integration of the collected marine plastic into the circular economy, turning them into pellets ad flakes that can be used in the form of new, sustainable products. Enaleia has also been involved in the training of professional fishers in sustainable fishing techniques, such as fisheries tourism, with the aim to miti-gate the overfishing problem. Over 300 were already trained in those techniques.
206 Home – Leaders Pledge for Nature 207 https://www.un.org/en/food-systems-summit?msclkid=bd2ded20b07611ec84ff149349e7096a 208 https://enaleia.com/209 http://oceanets.eu/
BOX 3.8 Oceanets209 – Technological approaches for circular economy solutions Around 640 000 tons of fishing equipment are lost or aban-doned in oceans annually, and they can remain in the oceans for up to 600 years. The loss or discarding of fishing gears can have particularly harmful impacts at sea, as they keep fishing and trapping marine life and smother its habitat. Abandoned fishing gears can also represent a risk for navi-gation. In addition to ghost fishing, (when fishing gear is lost or abandoned at the sea), abandoned or lost fishing gears are a source of pollution for the marine waters, and a waste of resources.
OCEANETS aims at preventing, recovering, and recycling of abandoned fishing gears, with the objective of demonstrat-ing the feasibility of a circular economy approach for these complex waste materials.
OCEANETS activities are two-fold. On one side, it aims at involving stakeholders, mainly skippers and captains of fishing fleets, in using the appropriate tools to prevent that fishing gears are lost, and to recover the ones that are aban-doned in the marine environment. On the other side, the pro-jects aim at recycling the recovered fishing gears to produce high quality textiles.
The objective of the OCEANETS project is to guarantee the viability of a circular economy model of certain fishing gear through the development of an ICT tool for preventing their loss and the optimization of the recycling technologies for its valorisation. This will be undertaken through the demon-stration and validation of technologies and high-added value products obtained in a technical, economic and environmental viable value chain in the Atlantic basin, being easily trans-ferable to other European marine areas as well as to other regions of the world.
The ICT tool can serve also to alert and signal the presence of lost or abandoned fishing gears in order to recover them. The ICT tool has been designed and tested with the support of skippers, captain and ship owners operating in the port of Vigo.
For the recovered fishing gears, OCEANETS has optimised a pilot plant to chemically recycle the plastics fishing gears to produce high quality yarn. At the moment, Oceanets has produced a pilot ‘pilot fabric’ made of polyamide to be tested for the production of sports gear.
The focus of the project is on the Atlantic basin. Oceanets received EU funding amounting to €426 090 and ran from 01/01/2019-31/12/2020.
53
2022


C h A p T E R 4E S TA B L I S H E D
S E C T O R S

The established sectors constitute the major contributors to the EU Blue Economy, despite the inevitable impacts caused by the COVID-19 pandemic since its outbreak in Europe in March 2020 and the effects produced by other endogenous factors (e.g. evolv-ing regulatory framework) and exogenous drivers (e.g. fuel prices).
The seven established sectors presented in this chapter are Marine living resources, Marine non-living resources, Marine renewable energy, Port activities, Shipbuilding and repair, Maritime trans-port and Coastal tourism. Each sector is further broken down into subsectors as summarised in Table 4.1. More details about which economic activities are included in each sector and subsector, and how their marine proportion or contribution to the EU Blue Economy is calculated, are provided in Annex 3.
Given that for each of these industries, authoritative, standardized and comparable data are available for the EU at multiple levels of spatial and sectoral aggregation, this chapter provides a detailed overview of their main socio-economic indicators, as well as the trends and drivers behind their recent performance and foresee-able outlook. To this end, DCF210 data are used for the analysis of primary sector211 activities in the Marine living resources section. For the other established sectors, Structural Business Statistics (SBS)212 data as collected and published by Eurostat are used, instead. Wherever available, data from Tourism expenditure sur-veys and from the EU Tourism Satellite Accounts are also used for the socio-economic analysis of Coastal tourism activities213.
For the purposes of this report, the Blue Economy is intended to include both established and emerging sectors. These latter sectors, that are defined either as innovative activities provid-ing a marginal, yet growing contribution to the EU Blue Economy (e.g. renewable ocean energy), or as more mature and promi-nent industries but with data disclosure limitations (e.g. maritime defence), are presented in Chapter 5. While all efforts are made to include in Chapters 4 and 5 the most comprehensive account of all activities related to the Blue Economy as possible, the quantifi-cation of each sectoral contribution may be incomplete due to the absence of Blue Economy qualifiers in the standard nomenclature of business activities employed in national statistics or by other official data sources used for the report.
The output of industries manufacturing intermediate goods and services (such as communication equipment and GIS tracking), for example, can be used as inputs by both terrestrial and mari-time sectors (e.g. transport). As a result, not all relevant economic activities taking place across the Blue Economy value chains can be adequately captured in the analysis and aggregation of SBS data. Nor the quantification of their maritime shares can be done in the absence of complementary (but often confidential) busi-ness-level data or robust proxies. For this reason, turnover, GVA
210 The Data Collection Framework (DCF) was established in 2000 (EU Regulation 2017/1004) to enable the JRC to collect fisheries data from EU Member States via data calls issued by DG MARE. DCF data is analysed, among others, by the experts of the Scientific, Technical and Economic Committee for Fisheries (STECF), which underpins the decision-making process of the Common Fisheries Policy (CFP). https://datacollection.jrc.ec.europa.eu/
211 Capture fisheries and aquaculture.212 https://ec.europa.eu/eurostat/web/structural-business-statistics213 For details on the compilation of data for Coastal tourism, see the methodological annex (Annex 3).214 Considering turnover can lead to double counting along the value chain since the outputs from one activity can be the inputs of another activity (i.e., intermediate
consumption). This may particularly affect some sectors, such as Living resources and Shipbuilding and repair. For example, the value of a fish could be counted several times in the Marine living resources sector, when caught in the primary production sub-sector, then when processed in the Processing of fish product sub-sectors, and finally when sold in the Distribution of fish products sub-sector.
and the other socio-economic indicators presented in this report are likely to underestimate the actual size and performance of each sector and of the entire EU Blue Economy as a whole.
Furthermore, the report only assesses the direct socio-economic contribution of each established sector to the Blue Economy. In other words, their indirect and induced effects on aggregated Blue Economy employment and income and on other sectors of the economy are not included.
The socio-economic indicators covered in this chapter include: per-sons employed, average remuneration per employee (gross salary, inclusive of employers’ mandatory contributions), turnover, GVA (value added at factor cost), gross profit (gross operating surplus) and net investments in tangible goods (purchases minus sales). Turnover is included mainly for analytical triangulation purposes and ease of reference in the interpretation of economic patterns and trends, particularly when other socio-economic variables have data gaps. Turnover values should be interpreted with caution due to potential duplications and overlaps when aggregating data from different economic activities across value chains (e.g. companies supplying raw materials, supporting services, interme-diate inputs, etc.)214. This double counting issue is not affecting value-added indicators, which therefore illustrate sectoral perfor-mance more accurately than turnover.
The time series presented in this report go from 2009 to 2020. For the first time, this edition also includes an analysis of turnover data from the year preceding the initial elaboration of the report (i.e. 2020). At the time of finalizing this report, only a limited set of 2020 data had been published by Eurostat. While 2019 data are final, 2020 data are estimations based on Eurostat’s prelimi-nary data for economic activities at higher sectoral aggregations (NACE level-2 statistics). Changes in sectoral turnover values from 2019 to 2020 have been used to extrapolate 2020 values for GVA and Gross profits, under the assumption that these indicators were highly correlated with turnover. All values are nominal, i.e., they have not been adjusted for inflation. Hence, changes in nom-inal value reflect at least in part the effect of inflation.
The data presented in this report supersede those presented in previous reports. Differences from data published in earlier edi-tions may be due to the availability of updated datasets and to corrections of previous errors. Other differences may originate from revisions or improvements of the methodology introduced as a result of advancements made in the analytical models and/or in the interpretation of the underlying data (see Methodological framework in Annex 3 for more details).
For each sector, a general background is provided, followed by the main socio-economic results for 2019 (or 2020, wherever possi-ble) and recent trends. This latter section includes a brief account of some of the main drivers behind the observed trends, and of
56
THE
EU B
LUE
ECO
NO
MY
REPO
RT

the sectoral linkages and interactions with other economic sectors and the environment. This basic analysis is usually complemented by a description of one or more important topics or specific issues characterizing the sector or its sub-sectors in the reporting period.
Where possible, context is provided regarding the impacts of Russia’s invasion of Ukraine. At the moment that this report is being drafted, the EU had adopted a fifth package of restrictive measures against Russia, notably affecting the following Blue Economy-related domains215,216:
• entry ban on Russian-flagged vessels to EU ports (exemp-tions: medical, food, energy and humanitarian purposes e.g.);
• import bans including a variety of goods, notably high-end seafood (caviar, caviar substitutes and crustaceans);
• restrictions on Russian export of maritime navigation and radio communication technology as well as a prior informa-tion sharing provision for exports of maritime safety equip-ment. The European Union has also added Russian Maritime Register of Shipping to the list of state-owned enterprises subject to financing limitations;
• prohibiting the sale, supply transfer or export to Russia of specific goods and technologies in oil refining.
It is important to note that the Commission and the European External Action Service are working on additional proposals that might be adopted after the publication of this report.
Table 4.1 The established Blue Economy sectors and sub-sectors
Sector Sub-sector
Marine living resourcesPrimary productionProcessing of fish productsDistribution of fish products
Marine non-living resourcesOil and gasOther mineralsSupport activities
Marine renewable energy Offshore wind energy
Port activitiesCargo and warehousingPort and water projects
Shipbuilding and repairShipbuildingEquipment and machinery
Maritime transportPassenger transportFreight transportServices for transport
Coastal tourismAccommodationTransportOther expenditure
Source: Own elaboration
215 https://ec.europa.eu/commission/presscorner/detail/en/ip_22_1649216 https://ec.europa.eu/commission/presscorner/detail/en/IP_22_2332217 FAO. 2020. Fishery and Aquaculture Statistics. Food balance sheets of fish and fishery products 1961-2017 (FishstatJ). In: FAO Fisheries Division [online]. Rome. Updated
2020. www.fao.org/fishery/statistics/software/fishstatj/en
4.1 MARINE LIVING RESOURCES
4.1.1 BACKGROUND
The Marine living resources sector encompasses the harvesting of renewable biological resources (primary sector), their conversion into food, feed, bio‐based products and bioenergy (processing) and their distribution along the supply chain.
The EU is the sixth largest producer of fishery and aquaculture products (behind China, Indonesia, India, Vietnam and Peru), cov-ering around 3 % of global production. However, overall production has been rather stable in the last decades. The EU has about 57 000 active vessels landing about 4 million tonnes of seafood worth €6.3 billion; while the aquaculture sector reached a produc-tion of about 1.2 million tonnes worth €4 billion in 2019.
The processing and distribution of seafood products are heavily dependent on the supply of raw materials from the primary sec-tor. High consumption and increased demand for seafood prod-ucts and stagnation in the primary sector make these activities increasingly dependent on imports from third countries. In fact, the EU is the largest importer of seafood in the world. Its self-suf-ficiency in meeting a growing demand for seafood products from its own waters is around 30 %; i.e., EU citizens consumed more than three times as much as they produced. EU citizens on aver-age consume around 24 kg of seafood and spend around €100 on seafood per year217. The main products consumed are tuna (mostly canned), cod, salmon, Alaska pollock, shrimps, mussel and herring.
Despite this general stagnation on the production side, the eco-nomic performance of the sector has been increasing overtime. Partly thanks to the overall improvement on the stocks in the North-East Atlantic and low fuel prices for the primary sector; together with the consumers’ high demand and willingness to pay for high-quality seafood products for the processing and distribu-tion sectors.
However, the COVID-19 outbreak with the restrictive measures adopted in March and April 2020 in the EU has had significant economic impacts on the people employed in the marine living-re-sources sector. Economic results in 2020 and 2021 are signifi-cantly driven by the combined effects of a decline in demand and a supply chain disruption resulting from the COVID-19 health cri-sis. In addition to COVID-19, the economic results for 2021 – and beyond – of the EU marine living resources sector are going to be significantly affected by Brexit. In particular for capture fisheries that catch a non-negligible part of their landings in UK waters.
Since March 2022, oil prices have increased sharply as a result of Russia’s invasion of Ukraine, seriously impacting the performance of the whole sector, but in particular risking the sustainability of the EU fishing fleet.
57
2022

For the purpose of this report, Marine living resources comprises three subsectors that are further broken-down into the following activities:
• primary sector: Capture fisheries (small-scale coastal, large-scale and industrial fleets) and Aquaculture (marine, fresh-water and shellfish);
218 The retail sale in non-specialised stores (e.g. supermarkets and hypermarkets) is not included as it is currently not possible to identify the volume of seafood with respect the rest of products sold in those stores. See the methodological annex for additional information.
• processing of fish products: Processing and preservation of fish, crustaceans and molluscs; Prepared meals and dishes, Manufacture of oils and fats and other food products;
• distribution of fish products: Retail sale of fish, crustaceans and molluscs in specialised stores218 and Wholesale of other food, including fish, crustaceans and molluscs.
Figure 4.1 Size of the EU Marine living resource sector, € million
Note: Turnover should be interpreted with caution due to the problem of double counting throughout the value chain. Turnover in 2020 is an estimation based on Eurostat’s preliminary data, GVA and Gross operating surplus are estimated assuming that follow the same trend as turnover.
Source: Eurostat (SBS), DCF and own calculations.
Figure 4.2 Persons employed (thousand), personnel costs (€ million) and average wage (€ thousand) in the EU Marine living resource sector
Source: Eurostat (SBS) and own calculations
0
5 000
10 000
15 000
20 000
25 000
200 9 201 0 201 1 201 2 201 3 201 4 201 5 201 6 201 7 201 8 201 9 202 0
GVA
0
1 000
2 000
3 000
4 000
5 000
6 000
7 000
8 000
2009
2010
2011
2012
2013
2014
2015
2016
2017
2018
2019
2020
Gross operating surplus
0
20 000
40 000
60 000
80 000
100 000
120 000
140 0002009
2010
2011
2012
2013
2014
2015
2016
2017
2018
2019
2020
Turnover
0
500
1 000
1 500
2 000
2 500
3 000
3 500
2009
2010
2011
2012
2013
2014
2015
2016
2017
2018
2019
Net investment
0
5 000
10 000
15 000
20 000
25 000
200 9 201 0 201 1 201 2 201 3 201 4 201 5 201 6 201 7 201 8 201 9 202 0
GVA
0
1 000
2 000
3 000
4 000
5 000
6 000
7 000
8 000
2009
2010
2011
2012
2013
2014
2015
2016
2017
2018
2019
2020
Gross operating surplus
0
20 000
40 000
60 000
80 000
100 000
120 000
140 000
2009
2010
2011
2012
2013
2014
2015
2016
2017
2018
2019
2020
Turnover
0
500
1 000
1 500
2 000
2 500
3 000
3 500
2009
2010
2011
2012
2013
2014
2015
2016
2017
2018
2019
Net investment
0
2
4
6
8
10
12
14
0
100
200
300
400
500
600
2009
2010
2011
2012
2013
2014
2015
2016
2017
2018
2019
Persons employed (left-axis) Personnel costs (right-axis)
0
5
10
15
20
25
2009
2010
2011
2012
2013
2014
2015
2016
2017
2018
2019
Average remuneration per employee
0
2
4
6
8
10
12
14
0
100
200
300
400
500
600
2009
2010
2011
2012
2013
2014
2015
2016
2017
2018
2019
Persons employed (left-axis) Personnel costs (right-axis)
0
5
10
15
20
25
2009
2010
2011
2012
2013
2014
2015
2016
2017
2018
2019
Average remuneration per employee
58
THE
EU B
LUE
ECO
NO
MY
REPO
RT

In broader terms, these activities form an integral part of the EU Blue bioeconomy, which includes any economic activity associ-ated with the use of renewable aquatic biological biomass, e.g. food additives, animal feeds, pharmaceuticals, cosmetics, energy, etc. Due to limited data availability and its inception nature, the biotechnology and bioenergy industries are discussed in Emerging sectors (Section 5.2).
Overall, the contribution of Marine living resources to the EU Blue Economy in 2019 was 12 % of the jobs, 11 % of the GVA and 10 % of the profits. Overall, the economic performance of the sector has improved from 2009 and seems that the sector was not significantly hit by the COVID-19 pandemic.
4.1.2 MAIN RESULTS
Size of the EU Marine living resources in 2019 and recent trends
Overall, the performance of the Marine living resources sector has steadily increased over the period analysed in terms of production and profit while stagnating in terms of employment.
Marine living resources generated a gross value added (GVA) of about €19.3 billion in 2019, a 31 % increase compared to 2009 (Figure 4.1). In 2019, the sector contributed to 10.5 % of the EU Blue Economy GVA (established sectors), up from 9.6 % in 2009.
Gross profit, valued at €7.2 billion in 2019, saw a 41 % rise on 2009 (€5.1 billion). Turnover reached almost €121.1 billion, 29 % more than in 2009. The sector invested (net) €2.5 billion in tan-gible goods, a figure that has fluctuated between €1.8 billion in 2011 and €3.0 billion in 2009 Figure 4.1).
Preliminary data from Eurostat suggest that turnover decreased by just about 1.4 % in 2020. It is expected that GVA and gross profits have suffered similar effects.
The activities included in the sector directly employed over 538 700 persons in 2019, representing 12 % of the EU blue jobs (established sectors). With the number of jobs decreasing and
annual personnel costs increasing, amounting to €11.9 billion in 2019, the average annual gross wage was almost €22 100; a 26 % increase on the 2009 average of €17 560 (Figure 4.2).
Spain leads the Marine living resources sector with 22 % of the jobs and 19 % of the GVA. Moreover, Spain generates the most jobs in all three sub-sectors apart from distribu-tion, where Germany takes the lead.
Results by subsector and Member State
Employment: The Primary sector contributed to 37 % of the jobs and the Distribution sector contributed to 39 % of the jobs, while Processing contributed with 24 %. Employment fell from 2009 to 2014, and has been recovering since then; overall, it has decreased by 2 %: Processing and Distribution saw increases of 9 % and 6 % respectively, while the Primary sector decreased by 6 %. The top employers, in descending order, include Spain, Italy, France, and Germany.
Gross value added: Distribution contributed with 46 % of the sector’s GVA of €19.3 billion, followed by the Processing (28 %) and Primary (26 %) sectors. GVA of the sub-sectors increased by 31 % compared to 2009: +22 % for the Primary sector, +33 % for Processing and +34 % for Distribution. The top contributors, in descending order, include Spain, Germany, France and Italy.
Gross profit: reaching almost €7.2 billion in 2019, gross profit increased by 41 % compared to 2009: +131 % for the Primary sec-tor, +26 % for Processing and +34 % for Distribution. Distribution contributed to 50 % of the sector’s total profit, followed by the Processing sector (26 %) and the Primary sectors (24 %).
Net investment in tangible goods: Contrary to profit, net investment saw an overall cut of 18 % compared to 2009. This decrease is mainly driven by the 38 % reduction in the Primary sector and 6 % in Distribution. Net investments increased in the Processing subsector by 22 %. Still, most (40 %) of the invest-ments take place in the Primary production subsector.
Turnover: Distribution contributed with 64 % of the sector’s total turnover of €121 billion, followed by Processing (28 %) and then the Primary sector (9 %). Turnover of the three sub-sectors increased by 29 % compared to 2009: +51 % for Processing, +25 % for Distribution and +10 % for the Primary sector.
Figure 4.3 Share of employment in the EU Marine living resources sector, 2019
Source: Eurostat (SBS) and own calculations.
22%
14%
11%10%
8%
35%
Employment by country
Spain
Italy
France
Germany
Poland
Others
37%
24%
39%
Employment by sub-sector
Primary production
Processing of fishproducts
Distribution of fishproducts
59
2022

4.1.3 TRENDS AND DRIVERS
Within the primary sector, capture fisheries represent about the 80 % of the domestic production. In 2019, the EU fishing fleet had 57 236 active vessels. The fleet landed 4.03 million tonnes of seafood with a value of €6.3 billion. Direct employment gener-ated by the sector amounted to 129 540 fishers, corresponding to 92 298 FTEs. The amount of gross value added (GVA) and gross profit generated by the EU fishing fleet was €3.4 billion and €1.25 billion, respectively219.
Wild capture production has increased in recent years and may have the capacity to do so further, particularly in the Mediterranean Sea where stocks are not recovering yet. Profits have risen over the last few years, in part due to better status of fish stocks and increased fishing opportunities, in particular in the North-East Atlantic and nearby waters, together with higher average market prices and reduced operating costs, such as fuel. The economic performance was expected to continue to improve as fish stocks recover and capacity continued to adapt.
However, the COVID-19 pandemic and subsequent public health interventions had a significant effect on some EU fishing fleets, mainly seen in a reduction in landings and fishing effort, espe-cially in the first months after the outbreak. Nonetheless, the prof-itability of the EU fishing fleet was overall not severely affected by the COVID-19 pandemic and as a whole continues to be prof-itable despite the decrease in landings. This is mainly due to a corresponding reduction in fishing costs from a decreased fish-ing activity and low fuel prices. Economic performance also likely benefited from the early response of fisheries administrations to support the sector220.
In this context of the COVID-19 pandemic, the change in economic performance of the EU’s fishing fleet in 2020 is driven by factors
219 A detailed analysis of the economic performance of the EU fishing fleet activity is produced annually by the STECF and can be consulted at https://stecf.jrc.ec.europa.eu/reports/economic See for instance: STECF (2021). The 2021 Annual Economic Report on the EU Fishing Fleet (STECF 21-08). EUR 28359 EN, Publications Office of the European Union, Luxembourg.
220 STECF (2021). The 2021 Annual Economic Report on the EU Fishing Fleet (STECF 21-08). EUR 28359 EN, Publications Office of the European Union, Luxembourg.221 Carpenter, Carvalho, Guillen, et al. 2022. The economic performance of the EU fishing fleet during the COVID-19 pandemic. Aquatic Living Resources.222 Carvalho, & Guillen (2021). Economic Impact of Eliminating the Fuel Tax Exemption in the EU Fishing Fleet. Sustainability, 13(5), 2719.
including, inter alia: i) lower demand for product (reduced purchas-ing power and closure of HORECA channels), ii) weaker first sale price of many fresh fish and shellfish, iii) price variance followed by price stabilization, for example by supporting cold storage, since fishers, retailers and processors are also confronted with limited stocking capacity (e.g. freezing products); iv) reduced fish-ing effort, due to lower demand and COVID-19 restrictions (i.e., social distancing of crew members at sea); and v) lower fuel costs due to reduced fuel prices and reduced fishing effort221.
Since March 2022, oil prices have increased sharply as a result of Russia’s invasion of Ukraine. Consequently, the EU fisheries sector was paying around €1.1-1.2 per litre of fuel in mid-March 2022. Early estimates show that if fuel prices will continue at this level, the EU-27 fishing fleet would have losses of 0.3 billion in the operating profit222, risking the sustainability of the fleet. However, the impact of the fuel price increases vary significantly across the different EU fishing fleets. About 40 % of the small-scale fleet, 66 % of the large-scale fleet and 87 % of the distant-water fleet would obtain losses if fuel prices continue at this level.
In addition to COVID-19 and high fuel prices, the living resources sector is going to be significantly affected by Brexit. In particular, under a post-Brexit trade deal that entered into force in 2021, the EU fishing fleet will have its fishing rights in UK waters reduced by 25 % over a period of five years, with the main reduction imple-mented in 2021 (-15 %), followed by a 2.5 % reduction in each subsequent year until 2026.
Within the context of Brexit, the Trade and Cooperation Agreement (TCA) between the European Union and the United Kingdom of Great Britain and Northern Ireland establishes the Parties’ shares of the TACs for 124 stocks and includes the changes in these shares applicable to the EU and the United Kingdom in each of the 5 years 2021 to 2025.
Figure 4.4 Share of the GVA generated by the EU Marine living resources sector, 2019
Source: Eurostat (SBS) and own calculations.
19%
16%
15%14%
6%
30%
Value added by country
Spain
Germany
France
Italy
Netherlands
Others
26%
28%
46%
Value added by sub-sector
Primary production
Processing of fishproducts
Distribution of fishproducts
60
THE
EU B
LUE
ECO
NO
MY
REPO
RT

The total impact of the TCA may not be fully enumerated until factors in addition to the changes to the sharing arrangements are known (for example, trade volumes, fish prices, indirect effects arising from, so called, flag-vessels, etc.). Nonetheless, the direct – quota-share impact – of the TCA can be determined by comparing the Member States quotas in 2020 with the equivalent quotas that would result if the new sharing arrangements, set out in the TCA, are applied to the 2020 (pre-UK EU leave) shares.
The approach used by STECF experts223 provides an estimate of the relative impact of the TCA the precise final amount, either by volume (tonnes) or value (euro), will depend on a number of other factors in particular the TAC for each of these stocks, their expected utilisation, and the average price per tonne in each of the years 2021-2025.
In terms of the economic Impact, losses due to the TCA are observed in all major seafood groups (pelagic, demersal and shellfish) and in all major fishing areas. Pelagic fisheries account for 57 836 tonnes (78.5 %) of the total, demersal 14 933 tonnes (20.3 %) and shellfish 928 tonnes (1.3 %). The distribution by area is concentrated in the North Sea, 29 044 tonnes (39.4 %) and in international waters, 27 723 tonnes (37.6 %) with the balance, 23 %, distributed across all other fishing areas.
By 2025, losses due to the TCA is simulated to be increased to their final value. Similarly, to the analysis for 2021, pelagic fish-eries is simulated to account for the bulk of losses amounting to some 94 365 tonnes (78.5 %) of the total, the demersal fisheries to some 26 981 tonnes (20.3 %) and shellfish to 1 547 tonnes (1.3 %)224. The distribution by area is remains concentrated in the North Sea, 52 042 tonnes (39.4 %) and in international waters 46 205 tonnes (37.6 %) with the balance, 23 %, distributed across all other fishing areas. By Member State, Denmark, with losses of 32 686 tonnes (26.6 % of the total), Ireland, 26 875 tonnes (21.9 %), the Netherlands, 20 830 tonnes (16.9 %) and France, 19 342 tonnes (15.8 %) together, share 81 % of the impact of Brexit.
In total, Member States fleet expect to catch some 38 880 tonnes less fish in 2021 as a direct result of Brexit with a loss of income of €42.97 million. By 2025, when the full Brexit changes (as set out in the TCA) come into force these figures are simulated to rise to 67 000 tonnes and approximately €71.5 million.
The nowcast225 results for 2021 summarising the estimates on the performance of the EU-27 fleet in 2021, are based on pre-liminary data. Preliminary results for 2021 compared to 2020 indicate a potential decrease of 4 % in landed value, a decrease of 1.6 % in FTE as well as a 2.4 % decrease in revenue. The EU
223 Scientific, Technical and Economic Committee for Fisheries (STECF) – The 2021 Annual Economic Report on the EU Fishing Fleet (STECF 21-08), EUR 28359 EN, Publications Office of the European Union, Luxembourg, 2021, ISBN 978-92-76-40959-5, doi:10.2760/60996, JRC126139.
224 The final loss/change in quotas will depend on the status of the stocks; i.e., if stocks recover, and the ICES scientific advice.225 This nowcast includes several factor changes (e.g. on fish prices, fuel prices, in the number of vessels, quotas changes because of Brexit, COVID-19 impacts etc)
Therefore this performance simulation can’t be only attributed to BREXIT impacts.226 A detailed analysis of the economic performance of the EU aquaculture sector produced by the STECF can be consulted at https://stecf.jrc.ec.europa.eu/reports/economic
See for instance: STECF (Scientific, Technical and Economic Committee for Fisheries). The EU Aquaculture Sector – Economic report 2020 (STECF-20-12). Publications Office of the European Union: Luxembourg, 2021. The 2022 STECF report on the EU aquaculture sector is going to be published later in 2022.
227 European Commission, 2021. COMMUNICATION FROM THE COMMISSION TO THE EUROPEAN PARLIAMENT, THE COUNCIL, THE EUROPEAN ECONOMIC AND SOCIAL COMMITTEE AND THE COMMITTEE OF THE REGIONS Strategic guidelines for a more sustainable and competitive EU aquaculture for the period 2021 to 2030. COM/2021/236 final. https://eur-lex.europa.eu/legal-content/EN/TXT/?uri=COM:2021:236:FIN
fleet as a whole is expected to reduce the profitability in gross (-7 %) and net terms (-9.4 %), although with still positive margins in both.
Nevertheless, EU aquaculture production (in volume) has stag-nated over the last decades even if its value has increased. According to the latest Scientific Technical and Economic Committee for Fisheries (STEFC) report on the EU aquaculture sector226, overall, the performance of the aquaculture sector is improving. The EU aquaculture sector reached 1.2 million tonnes in sales weight and €4.1 billion in turnover in 2018, about a 5 % increase compared to 2017. The production of mussels, which is the main species produced in the EU aquaculture in weight has decreased in recent years due to environmental factors (harmful algae blooms, lack of seed, diseases). The production of other important species (such as seabream and seabass), where the producers have higher degree of control on the production factors, has increased.
EU aquaculture production is mainly concentrated in four coun-tries: Spain (27 %), France (18 %), Italy (12 %), and Greece (11 %), making up 69 % of the sales weight. These four countries are furthermore covering 62 % of the turnover in the EU-27. The total number of enterprises in the EU is estimated to be around 15 000. More than 80 % of the enterprises in the aquaculture sector are micro-enterprises, employing less than 10 employees. The sector employs around 69 thousand people (39 thousand full time equiv-alent – FTE), in 2018.
Profitability for the EU aquaculture sector was positive in 2018. However, the overall EU aquaculture sector has experienced a slight decrease in all economic performance indicators in 2018 compared to 2017. The negative economic development is driven by the marine fishes segment, whereas the segments freshwater fishes and shellfish, experienced a slight increase.
Considering the increasing demand of seafood products and the opportunity to establish new farms partly due to Maritime Spatial Planning, it seems realistic to expect a growth of the EU aquaculture products, in particular of those with a high degree of control (e.g. in closed systems), at least in the mid-term. The Commission’s strategic guidelines for a more sustainable and competitive EU aquaculture highlight the future relevance of low trophic level aquaculture to sustainably produce marine food for a growing global demand227.
While production is largely carried out by a large number of oper-ators, distribution is increasingly concentrated in the hands of a few players. The EU is the largest importer of seafood in the world. Imports of fish and seafood products from around the globe help satisfy the needs of the processing and distribution sectors to have a steady supply of fish products for EU consumers
61
2022

throughout the year. The supply of fisheries and seafood products to the EU market is ensured by the EU’s own production and by imports.
In 2019, the overall number of enterprises carrying out fish pro-cessing as a main activity was equal to around 3 ,200 firms. The sector has produced a turnover of about €28.5 billion and employed more than 110 thousand people (corresponding to around 100 thousand FTE)228.
The great bulk of enterprises (98 %) of the sector are SMEs (less than 250 employees), 85 % are small-sized (less than 50 employ-ees) and more than a half are micro-enterprises. The distribu-tion of enterprise by size-classes confirms that there are large differences across Member States. The highest shares of large industries (above 250 employees) are located in Eastern Europe (e.g. Poland, Lithuania and Romania). Over the analysed period (2009-2019) a progressive concentration of production is observ-able testified by a decrease of the total number of enterprises, in particular the smaller ones and a parallel increase of bigger enterprises, of turnover and of the level of employment.
The purchase of fish and raw material is the dominant cost item for the sector, accounting for more than 70 % of the total pro-duction costs, share increasing over the observed time. EU pro-duction (from capture fisheries and aquaculture) covers about 30 % of the total raw material requirements for the EU fish pro-cessing sector. The processing sector is therefore very depend-ent on global fish markets. Whether the dependency on imports will be reduced as more stocks in European waters are fished at Maximum Sustainable Yield (MSY) level remains to be seen. Raw material prices have not decreased over the last years, despite an increase in the supply, due partly to an increase in demand. The high percentage costs of raw material is expected to further increase and are not expected to be offset by improvements in efficiency (e.g. via innovations). Thus, the rising costs in raw mate-rials and energy, is one of the main causes of the sector’s low, although slightly improved, profit margins.
The impacts of the COVID-19 pandemic on the EU fish process-ing industry have been changing as the pandemic waves evolved. Since the first European outbreak in March 2020, the processing industry moved from a boost in demand, caused by consumer’s fear, to a less optimistic scenario of disrupted supply, increasing costs and contraction in demand. Overall, the EU fish processors seem to have managed the impacts of the pandemic disruptions quite well. Despite the initial shocks in labour productivity and the disruptions in the supply of raw materials, sales and prices of processed fish products recovered since the end of 2020 and returns may have increase in many segments. The initial shocks on labour productivity and the supply chains started mitigating by the end of 2020, heading for recovery in the levels of activity and economic performance in 2021229.
An outlook of the sector shows that the sharp rise in energy costs, as the MS economies recover from the effects of COVID-19, and the expected rise as a consequence of the Russia’s invasion of
228 STECF. 2022. Economic Report on the fish processing industry. Publications Office of the European Union, Luxembourg.229 Ibid.230 https://www.cbi.eu/market-information/fish-seafood/organic-seafood/231 It can be therefore considered a threat for pure organic fish and seafood. https://www.cbi.eu/market-information/fish-seafood/organic-seafood
Ukraine will undoubtedly have an impact on the fish processing industry across the EU. The ability of the processing industry to pass on cost increases, whether for raw materials, labour, energy or other costs, depends on the relative price elasticities of demand and supply faced by the individual enterprises concerned. In the context of a relative unconcentrated sector (although there is a small evidence of progressive concentration) a greater part of the burden of cost increases could normally be expected to fall on fish processors, meaning that they are not simply able to pass the whole of cost increases on to purchasers. The latter also impact the use of sustainability certifications or other eco-labelling, as customers, in special wholesale and retail actors, have the final influence on making certified raw materials profitable or not for processors.
Different studies point to important differences in the COVID-19 impact between regions and firms; while being a challenging period, some firms managed to improve their profitability. Diverse commercial structures, sales systems and species caught, including the closure of restaurants, reduction of tourism (see section 4.7), and the importance of the small-scale fleets, in addition to the extent and duration of lockdown restrictions can be some of the main reasons explaining these differences.
One market strategy pursued by parts of the EU fleet, mainly the small-scale fleets, was to distribute and sell their products directly to consumers (e.g. through web shops, direct sales and home delivery) with the help of digital technologies (e.g. social networks) and sometimes through Fisheries Local Action Groups (FLAGs).
Production and consumption of organic fish and seafood still rep-resent a niche and new market in the EU despite growing demand in the recent years230. From a global perspective, Europe continues to be the largest market for organic seafood and although the consumption of organic seafood products is still relatively small, it is expected to grow strongly in the near future mainly because consumers are becoming more environmentally and socially aware. Several large retailers across Europe have declared their strong commitment for selling more sustainable seafood but this mostly includes the Aquaculture Stewardship Council (ASC) and the Marine Stewardship Council (MSC) certified products. Seafood labelled as sustainable does not need to be organic231.
62
THE
EU B
LUE
ECO
NO
MY
REPO
RT

BOX 4.1 EASY FEED232 As fish stock in the sea has been decreasing significantly over the last few years, catching wild fish to feed farm fish has become unsustainable. Finding substitutes to feed fish in farms is therefore critical.
EASYfeed is project that that contributes for sustainable and profitable development of aquaculture in the EU, contribut-ing to the EU blue growth strategy. The project brings to the fish farming sector a new and unique sustainable production model, to offer European consumers a healthy, high quality and affordable product It aims at producing organic aquacul-ture feed formula, made out of spirulina and quinoa. It com-pletely excludes fishmeal and fish oil in its composition, and is profitable, as its production costs are up to 40 % cheaper than classical feed. Tilapia is grown into the coordinator’s facilities and benefits from the EASYFEED formula, to be marketed, at a later stage, as sustainable fish production.
After the consortium confirmed the feasibility of its innova-tive fish feed on a small scale as a solution to decrease the dependence of the aquaculture sector on marine resources, they wanted to go a step further to validate its use on an industrial scale. This will bring on the market a unique final tilapia-based product obtained in a most sustainable way. Tilapia will also be marketed in new formats (fish sticks, hamburgers, frankfurter and tilapia with vegetables ready-to-eat dishes), which will open new doors for its commercial-isation on the EU market.
EasyFEED is active in the Mediterranean sea basin. The pro-ject received EU funding amounting to €438 563.
4.1.4 INTERACTIONS WITH OTHER SECTORS AND THE ENVIRONMENTCommercial fishing competes with other maritime activities in terms of access to resources and space. This is particularly the case with respect to Maritime transport, Marine non-living resources and Ocean energy (offshore windfarms). On the other hand, capture fisheries may benefit from Port activities. Positive spill over effects may be generated by the Marine Protected Areas (MPAs) where fisheries resources are protected effec-tively, but these MPAs may reduce the current fishing grounds. For instance, Coastal tourism activities may compete for space with fishing but tourists are also an important source of demand for fish products, especially from small-scale coastal fleets233.
Aquaculture may compete for access to space with Coastal tourism, Port activities, Maritime transport, Non-living resources (offshore oil and gas, marine mining) and fishing. Synergies may exist with offshore windfarms (e.g. multi-use platforms) and mix interactions with Coastal tourism.
232 https://easyfeed-project.eu/en/home/ 233 Note that various requirements, conditions and licencing may be required for providing such services. 234 Based on an assessment of commercial fish/shellfish stocks in the area for which reference points are available.235 Scientific, Technical and Economic Committee for Fisheries (STECF). Monitoring of the performance of the Common Fisheries Policy (STECF-Adhoc-22-01). Publications
Office of the European Union, Luxembourg, 2021, EUR 28359 EN.236 https://www.ices.dk/sites/pub/Publication %20Reports/Advice/2021/Special_Requests/eu.2021.08.pdf237 Directive 2008/56/EC.
Since the early 2000s, better management of fish and shellfish stocks has contributed to a decrease in fishing pressure in the North-east Atlantic Ocean and the Baltic Sea, and there are signs of recovery in the reproductive capacity of several fish and shell-fish stocks. Currently, 28 % of the assessed fish and shellfish stocks in those two regions are within safe biological limits234, meaning that the number of stocks within safe biological limits has experienced a 3.5-fold increase, from 8 in 2003 to 28 in 2020235. Fishing mortality in these regions is on average near the levels producing maximum sustainable yield, but further improve-ment is needed for all stocks to reach maximum sustainable yield fishing mortality levels, in accordance with the common fisheries policy objectives.
In contrast, in the Mediterranean Sea and the Black Sea, the situa-tion remains critical, with 87 % of the assessed stocks overfished and a significant lack of knowledge about fishing pressure and reproductive capacity. Upon the EU’s initiative, the MedFish4Ever and Sofia ministerial Declarations were adopted in 2017 and 2018 respectively. They launched a new political momentum to redress the governance of fisheries in the two sea basins. Also within the EU, good progress was achieved under the CFP in the past two years, notably with the adoption and implementation of the first ever Multi-Annual Plan (MAP) in the Mediterranean, the EU MAP for demersals in the Western Mediterranean, and the adoption of the send-alone Fishing opportunities regulation for the Mediterranean and the Black Sea.
Further urgent action is needed, and success will depend on the availability and quality of marine information, the commitment to implement scientific advice and an adequate uptake of manage-ment measures. Many stocks remain overfished and/or outside safe biological limits. It is clear that efforts by all actors will need to be intensified to ensure that stocks are managed sustainably.
Additional action is needed to reduce the environmental impacts of fishing activities, particularly to better protect and conserve seabed habitats and to reduce incidental by-catch. For example, by-catch is a key pressure for sharks, rays and skates in Europe seas, where 32-53 % of all species are threatened. Seabed habi-tats are under significant pressure across European seas from the cumulative impacts of bottom fishing, offshore industries, coastal developments, and pollution by contaminants, nutrient enrichment and litter, particularly from land-based sources. Recent analyses by the International Council for the Exploration of the Sea236 shows that 85 % of the seabed in the depth zone 0-800m in EU Atlantic and southern Baltic Sea waters is physically disturbed by bottom fishing, with a similar proportion in the Mediterranean Sea (0-1 000m depth zone). Below these depths bottom fishing has already been prohibited to protect the seabed and sensitive species. During the first Marine Strategy Framework Directive (MSFD)237 implementation cycle, fisheries was identified as the main human activity causing physical damage to the seabed. It is likely that the poor status of benthic habitats will influence species depending directly or indirectly on them, including the abundance of commercially exploited species.
63
2022
4.2 MARINE NON-LIVING RESOURCESThe marine non-living resources is an important Blue Economy sector. For many years, the sector has played a key role in terms of providing access to sources of energy and raw materials neces-sary for the European economy. Although some of its sub-sectors have now reached maturity and are in decline, it is expected that the sector will continue to play a crucial role in the transition to a sustainable Blue Economy, both in terms of enhancing the availability of critical materials needed for the development of low-carbon technologies, and by minimising its impacts on the marine environment and climate change mitigation with the adop-tion of climate neutral, circular, responsible and resource efficient approaches238.
4.2.1 BACKGROUND
The exploitation of Europe’s seas and oceans for non-living marine resources has increased over the last decade and is projected to continue growing. However, the mature offshore gas and oil sector has been in decline for some years.
For the purpose of this report, the Marine non-living resources sector comprises three main subsectors, further broken-down into activities:
1. Oil and gas: Extraction of crude petroleum, Extraction of nat-ural gas;
2. Other minerals: Operation of gravel and sand pits; mining of clays and kaolin; it also includes extraction of salt.
3. Support activities for petroleum and natural gas extraction, other mining and quarrying.
More than 80 % of the current European oil and gas production takes place offshore, mainly in the North Sea and to a lesser extent in the Mediterranean and Black Seas. Offshore produc-tion in the North Sea is carried out by Denmark, the Netherlands, Germany and Ireland. Offshore production occurs in the Baltic mainly along the Polish coast and in the Mediterranean on the continental shelf in Greece, Spain and Croatia. Romania and Bulgaria are hydrocarbon (oil and gas) producers in the Black Sea. Increasing exploration plans are foreseen for the Mediterranean region (in the Cypriot, Greek and Maltese continental shelves), the Black Sea (Bulgarian and Romanian continental shelves) as well as for the Atlantic East coast (Portuguese continental shelf)239. Italy established a moratorium on offshore oil and gas exploration permits, as well as a sharp increase in fees payable on upstream concessions, with the aim to prioritise renewable energy develop-ments and move towards decarbonisation.
238 EU Technical Expert Group (TEG) on Sustainable Finance. Financing a sustainable European economy. Taxonomy technical report. June 2019. 239 Joint Research Centre (JRC) (2015). EU Offshore Authorities Group – Web Portal: Offshore Oil and Gas Production. https://euoag.jrc.ec.europa.eu/node/63240 Report of the European Commission (2021). Study on Decommissioning of offshore oil and gas installations: a technical, legal and political analysis.241 Report of the European MSP Platform for the European Commission (2018). Technical Study: MSP as a tool to support Blue Growth. Sector Fiche: Marine Aggregates
and Marine Mining, Based on EMODnet datahase.
The mature offshore gas and oil sector has been mostly in decline over the past few years due to decreasing production and rising production costs, as well as a push towards clean energy in line with the EGD. Until 2022, low oil prices and the trend towards alternative sources of energy with a lower carbon footprint have undermined the economic viability of offshore facilities. In the EU, UK and Norway, a growing number of offshore oil and gas installations are reaching the end of their economically produc-tive life and are entering the process of decommissioning. The main reasons for decommissioning an oil or gas field are either that its production is decreasing, making operating costs too high to sustain further operation or, that technical conditions require shut-down and it is considered uneconomic to upgrade the infra-structure to continue production of the remaining resources. Decommissioning is also expected to accelerate due to the shift from fossil fuels to renewable and low-carbon energy sources. Although decommissioning in the EU will not be completed until at least 2050, the costs are high now and it is estimated that €4 8 billion will be spent in the EU-27 on decommissioning of oil and gas infrastructure in 2020-2030. Given this high level of activ-ity and its impacts, the Commission has prioritised this study to investigate the adequacy of EU legislation. 240
Since March 2022, oil prices have increased sharply as a result of Russia’s invasion of Ukraine. Consequently, the resolve of the EU and the United States to rapidly decrease their dependency on Russian oil and gas is expected to lead to an uplift of offshore oil and gas exploration in European seas and beyond.
The Other minerals sub-sector, for its part, continues to be on the rise. Mining the seabed is identified in Europe’s Blue Growth strategy as an important component of the future maritime econ-omy, especially to meet the requirements of high-tech industries. Activity within Europe is predominantly focussed on marine aggre-gate extraction rather than mining activities. More than 50 million m3 of marine aggregates, mainly sand and gravel, are extracted from the European marine seabed, mostly for the construction industry, beach nourishment and sea defence construction (i.e., to safeguard dunes, beaches, coastal areas and islands). The biggest EU aggregate extractor countries in 2018 were the Netherlands, Denmark, France and Belgium241.
The demand for resources such as sand and gravel, used for con-struction purposes and creating concrete, is also likely to increase. Increasing demands for drinking water mean that desalination is also expected to grow. Likewise, as coastal communities attempt to adapt to new pressures posed by climate change, dredging, beach nourishment and sand reclamation may intensify.
Overall, the contribution of Marine non-living resources to the EU Blue Economy in 2019 was 0.2 % to jobs, 2.5 % to GVA and 5 % to profits. Until 2022, the sector has been in decline due mainly by the decreasing production in the offshore oil sub-sector.
64
THE
EU B
LUE
ECO
NO
MY
REPO
RT

4.2.2 MAIN RESULTS
Size of the EU Marine non-living resources sector in 2019-2020
In 2019, the GVA generated by the sector amounted to almost €4.7 billion, a 58 % decrease compared to 2009. Gross profits, at €3.7 billion, shrunk by 61 % on 2009 (€9.7 billion). Reported turnover was €13.1 billion, an 80 % decrease on the €67 billion turnover in 2009 (Figure 4.5).
Net investments in tangible goods shrank to about €0.3 billion in 2019, almost 86 % less than in 2009. The ratio of net investment to GVA was estimated at 7 % in 2019, down from 21.4 % in 2009. New investments have been declining due to the downsizing of the oil extraction section, the remaining investments are being channelled into innovation, exploration and production units fur-ther offshore and in deeper waters.
Preliminary data from Eurostat suggest that turnover fur-ther decreased by about 13 % in 2020 compared to 2019. It is expected that GVA and gross profits have suffered similar decreases.
In 2019, the sector directly employed more than 10 060 persons, 71 % less than in 2009. Personnel costs totalled €0.9 billion, 40 % less than in 2009. As personnel costs decreased less than persons employed, annual average gross wage, estimated at almost €90 700, more than doubled compared to 2009 (€44 570) (Figure 4.6).
Denmark leads in Marine non-living resources with 27 % of the jobs and 39 % of the GVA, followed by Italy with 22 % and 14 %, respectively. The sector has been in decline, in most part due to the contractions in the oil and gas sub-sector.
Results by sub-sectors and Member States
Employment: Oil and gas extraction accounted for about 3 870 persons employed in 2019, which represents 38 % of Marine non-living resources employment; Other minerals employed 14 % of the sectoral workforce, while Mining support activities employed its largest share (48 %). Overall, employment in the sector decreased by 71 % compared to 2009. An 85 % decrease was registered for oil and gas, a 38 % decrease in support activi-ties and a 17 % decrease for other minerals. Member States that employed more personnel, in descending order, include Denmark, Italy, the Netherlands, and Romania.
Turnover: Oil and gas accounts for almost €10.5 billion, which represents 80 % of the whole Marine non-living resources sector’s turnover; other minerals produced about €450 million and support activities the remaining €2.2 billion. Overall turnover in the sector decreased by 80 %, driven by a similar decrease for the oil and gas sub-sector (84 % decrease).
Gross value added: Oil and gas accounts for almost €4.7 billion of GVA, which corresponds to 66 % of the total for the whole sec-tor; other minerals produced about €160 million of GVA (3 %), and support activities the remaining €1.4 billion (31 %). Overall GVA
Figure 4.5 Size of the EU Marine non-living resource sector, € million
Note: Turnover should be interpreted with caution due to the problem of double counting throughout the value chain. Turnover in 2020 is an estimation based on Eurostat’s preliminary data, GVA and Gross operating surplus are estimated assuming that follow the same trend as turnover.
Source: Eurostat (SBS) and own calculations.
0
2 000
4 000
6 000
8 000
10 000
12 000
2009
2010
2011
2012
2013
2014
2015
2016
2017
2018
2019
2020
Gross operating surplus
0
1 000
2 000
3 000
4 000
5 000
6 000
2009
2010
2011
2012
2013
2014
2015
2016
2017
2018
2019
Net investment
0
10 000
20 000
30 000
40 000
50 000
60 000
70 000
80 000
200 9 201 0 201 1 201 2 201 3 201 4 201 5 201 6 201 7 201 8 201 9 202 0
Turnover
0
5 000
10 000
15 000
20 000
25 000
200 9 201 0 201 1 201 2 201 3 201 4 201 5 201 6 201 7 201 8 201 9 202 0
GVA
0
1 000
2 000
3 000
4 000
5 000
6 000
7 000
8 000
2009
2010
2011
2012
2013
2014
2015
2016
2017
2018
2019
2020
Gross operating surplus
0
20 000
40 000
60 000
80 000
100 000
120 000
140 000
2009
2010
2011
2012
2013
2014
2015
2016
2017
2018
2019
2020
Turnover
0
500
1 000
1 500
2 000
2 500
3 000
3 500
2009
2010
2011
2012
2013
2014
2015
2016
2017
2018
2019
Net investment
0
5 000
10 000
15 000
20 000
25 000
200 9 201 0 201 1 201 2 201 3 201 4 201 5 201 6 201 7 201 8 201 9 202 0
GVA
0
1 000
2 000
3 000
4 000
5 000
6 000
7 000
8 000
2009
2010
2011
2012
2013
2014
2015
2016
2017
2018
2019
2020
Gross operating surplus
0
20 000
40 000
60 000
80 000
100 000
120 000
140 000
2009
2010
2011
2012
2013
2014
2015
2016
2017
2018
2019
2020
Turnover
0
500
1 000
1 500
2 000
2 500
3 000
3 500
2009
2010
2011
2012
2013
2014
2015
2016
2017
2018
2019
Net investment
0
2 000
4 000
6 000
8 000
10 000
12 000
14 000
200 9 201 0 201 1 201 2 201 3 201 4 201 5 201 6 201 7 201 8 201 9 202 0
GVA
0
5 000
10 000
15 000
20 000
25 000
200 9 201 0 201 1 201 2 201 3 201 4 201 5 201 6 201 7 201 8 201 9 202 0
GVA
0
1 000
2 000
3 000
4 000
5 000
6 000
7 000
8 000
2009
2010
2011
2012
2013
2014
2015
2016
2017
2018
2019
2020
Gross operating surplus
0
20 000
40 000
60 000
80 000
100 000
120 000
140 000
2009
2010
2011
2012
2013
2014
2015
2016
2017
2018
2019
2020
Turnover
0
500
1 000
1 500
2 000
2 500
3 000
3 500
2009
2010
2011
2012
2013
2014
2015
2016
2017
2018
2019
Net investment
0
5 000
10 000
15 000
20 000
25 000
200 9 201 0 201 1 201 2 201 3 201 4 201 5 201 6 201 7 201 8 201 9 202 0
GVA
0
1 000
2 000
3 000
4 000
5 000
6 000
7 000
8 000
2009
2010
2011
2012
2013
2014
2015
2016
2017
2018
2019
2020
Gross operating surplus
0
20 000
40 000
60 000
80 000
100 000
120 000
140 000
2009
2010
2011
2012
2013
2014
2015
2016
2017
2018
2019
2020
Turnover
0
500
1 000
1 500
2 000
2 500
3 000
3 500
2009
2010
2011
2012
2013
2014
2015
2016
2017
2018
2019
Net investment
65
2022

Figure 4.6 Persons employed (thousand), personnel costs (€ million) and average wage (€ thousand) in the EU Marine non-living resource sector
Source: Eurostat (SBS) and own calculations.
0
20
40
60
80
100
2009 2010 2011 2012 2013 2014 2015 2016 2017 2018 2019
Average remuneration per employee
Figure 4.7 Share of employment in the EU Marine non-living resources sector, 2019
Source: Eurostat (SBS) and own calculations
27%
22%20%
16%
15%
Employment by country
Denmark
Italy
Netherlands
Romania
Others
38%
14%
48%
Employment by sub-sector
Extraction of oil and gas
Other mining andquarrying
Mining support activit ies
Figure 4.8 Share of the GVA generated by the EU Marine non-living resources sector, 2019
Source: Eurostat (SBS) and own calculations
66%3%
31%
Value added by sub-sector
Extraction of oil andgasOther mining andquarryingMining supportactivities
66%3%
31%
Value added by sub-sector
Extraction of oil andgasOther mining andquarryingMining supportactivities
66%3%
31%
Value added by sub-sector
Extraction of oil andgasOther mining andquarryingMining supportactivities
49%
31%
16%4%
Value added by country
Denmark
Netherlands
Italy
Others
49%
31%
16%4%
Value added by country
Denmark
Netherlands
Italy
Others49%
31%
16%4%
Value added by country
Denmark
Netherlands
Italy
Others
0
0,2
0,4
0,6
0,8
1
1,2
1,4
1,6
1,8
0
5
10
15
20
25
30
35
40
2009
2010
2011
2012
2013
2014
2015
2016
2017
2018
2019
Persons employed (left-axis)Personnel costs (right-axis) 1.8
1.6
1.4
1.2
1
0.8
0.6
0.4
0.2
0
38%
14%
48%
Employment by sub-sector
Extraction of oil and gas
Other mining andquarrying
Mining support activit ies
66
THE
EU B
LUE
ECO
NO
MY
REPO
RT

in the sector decreased by 58 %, driven by the decrease in the oil and gas sub-sector (70 %). The top contributors, in descending order, include Denmark (with 49 %), the Netherlands (31 %), and Italy (16 %). It is estimated that the sectoral GVA in 2020 suffered a similar decrease as turnover.
Gross profit: The bulk of profits are generated by oil and gas (€2.7 billion), which suffered a 71 % decline from 2009. Other minerals gained about €80 million of gross profits, and support activities the remaining €1.0 billion (27 % of the total). In total, gross profits suffered a significant fall in 2019 compared to 2009 (61 %) reflecting the decrease in the activity of the sector. It is estimated that gross operating margins were further eroded in 2020, as a consequence of the COVID-19 outbreak.
Net investment in tangible goods: The overall 81 % fall in invest-ments from 2019 to 2009 was driven by the oil and gas and sup-port activities sub-sectors; while other minerals suffered a rela-tive lower decrease (10 % decrease). The impacts of COVID-19 on economic activity and market confidence led to a further decline in offshore exploitation of oil and gas in 2020-21. It is likely that investments will pick up again in 2022 as a result of the shifts in demand and international trade of oil and gas resources.
4.2.3 TRENDS AND DRIVERS
The EU aims to be climate neutral by 2050. To achieve these reduction targets, significant investments need to be made in new low-carbon technologies, renewable energies, energy effi-ciency, and grid infrastructure. Natural gas should play a key role
242 Eurostat. Oil and petroleum products - a statistical overview. Available at: https://ec.europa.eu/eurostat/statistics-explained/index.php?title=Oil_and_petroleum_products_-_a_statistical_overview&oldid=315177#Imports_of_crude_oil
in achieving this reduction even with current technologies until supply of renewable energies becomes the main source. As invest-ments are made for time horizons of 20 to 60 years, policies that promote a stable business framework, which encourages low-car-bon investments, need to be in place well beforehand.
None of the EU Member States are self-sufficient in relation to their energy needs (as far as fossil fuels are concerned), with some smaller Member States, such as Malta, Cyprus and Luxembourg, almost completely reliant on external supplies. At the other end of the range, Estonia and Denmark are much less reliant on imports to meet their energy needs (Figure 4.9).
Despite decreasing crude oil production and consumption in the EU in recent years, crude oil and its derived products still remain the largest contributors to energy consumption242. The EU imports more than half of the fossil fuel energy it consumes each year, with a particularly high levels of dependency for crude oil and natural gas.
In the EU in 2019, the dependency rate was equal to 61 %, which means that more than half of the EU’s energy needs were met by net imports. The main imported energy product was petro-leum products (including crude oil, which is the main component), accounting for almost two thirds of energy imports into the EU, followed by gas (27 %) and solid fossil fuels (6 %). In 2020, imports of crude oil from non-EU countries dropped by 13.3 % from 2019. As illustrated in Figure 4.10, more than one fourth of the extra-EU’s crude oil imports in 2020 came from Russia (25.8 %), followed by Norway (8.7 %), Kazakhstan (8.5 %), United States (8.1 %), Saudi Arabia and Nigeria (both slightly below 8 %).
Figure 4.9 Energy dependency rate, 2000, 2019
Source: Eurostat
67
2022

Despite a year-on-year 12.5 % reduction in total EU imports of natural gas from non-EU countries, the EU dependence on the two largest exporters into the EU, namely Russia and Norway, increased by 2 % and 5 %, respectively. As illustrated in Figure 4.11, more than 43 % of the EU’s imports of natural gas in 2020 came from Russia, despite a contraction of about 13.6 million cubic metres of EU imports, followed by Norway (21.1 %), Algeria (8.2 %), Qatar (4.6 %), United States (4.4 %) and the UK (4.3 %)243.
Crude oil and gas prices have been relatively low until recently. Fluctuations due to endogenous and exogenous shocks, make future fossil fuel prices uncertain. The reduction in EU demand for crude oil partly thanks to the push towards clean energy by the EGD, together with the potential reduction in Chinese demand and increases in world production of crude oil led to a decrease in oil prices. On the other hand, demand for gas is expected to continue increasing and, in consequence, so will its price.
Following the measures taken to confront the COVID-19 pandemic in early 2020, oil prices collapsed due to market concerns and the fall in economic activity, as well as the related Saudi Arabia-Russia oil price war that began in March 2020. Therefore, it is expected that the economic performance of offshore exploitation of oil and gas may have continued to decline in 2020 and 2021. The low prices together with a decreasing trend in production and increasing costs to exploit more remote reserves point to the con-tinued deterioration of the economic performance of the sector.
However, oil price increases in 2022, in great part due to Russia’s invasion of Ukraine and potential changes in the supply may lead to increases in the oil and gas activity in the EU, as well as in the economic performance of the sector.
In light of these events, the EU announced on the 8 of March an outline of a plan to make Europe independent from Russian fossil fuels before 2030, starting with gas244. REPowerEU will address the uncertainty scenario of the recent months with the rise in energy prices and seek to diversify Europe’s sources of gas sup-ply, speed up the roll-out of renewable gases and replace gas in heating and power generation. It also presents MSs with additional guidance on possible measures, such as the possibility to regu-late prices in exceptional circumstances, how Member States can redistribute revenue from high energy sector profits and emis-sions trading to consumers, and provision of short-term support to affected companies via EU State Aid rules. It will also present a legislative proposal requiring underground gas storage across the EU to be filled up to at least 90 % of its capacity by 1 October each year. The plan, will complement the ‘Fit for 55 initiatives’ and will increase the resilience of the EU-wide energy system based on two main pillars: (i) Diversifying gas supplies (e.g. higher Liquefied Natural Gas (LNG) and pipeline imports from non-Rus-sian suppliers, and larger volumes of biomethane and renewable hydrogen production); (ii) and, reducing faster the use of fossil fuels by boosting energy efficiency, increasing renewables and electrification, and addressing infrastructure bottlenecks.
243 Eurostat. Energy statistics. https://ec.europa.eu/eurostat/cache/infographs/energy/244 COM(2022) 108 final - resource.html (europa.eu)245 European Commission. Study on Decommissioning of offshore oil and gas installations: a technical, legal and political analysis: Final report. Luxembourg: Publications
Office of the European Union, 2022.
4.2.4 INTERACTIONS WITH OTHER SECTORS AND THE ENVIRONMENT Activities related to Marine non-living resources may compete for access to space with activities in Coastal tourism, the Marine living resources’ primary sector (capture fisheries and aqua-culture) and Maritime transport. In particular, gravel extraction may conflict with capture fisheries because gravel beds are the principal spawning grounds for several commercially important species. On the other hand, synergies exist with Port activities and Shipbuilding and repair and mixed interactions with Marine renewable energy (offshore wind farms).
The majority of oil and gas production in Europe takes place off-shore. Following the departure of the United Kingdom from the EU, which operates 363 offshore installations, there are currently around 193 installations in European waters. Given the EU’s high energy demand, these operations help ensure a secure supply of energy.
The sector has developed technologies, infrastructure and oper-ational skills of significant value to the Blue Economy. With the depletion of many exploited oil and gas fields and the start of decommissioning, these strengths could prove very useful for the development of new offshore activities, such as floating offshore windfarms or geothermal power and structures such as multi-use platforms.
Against a backdrop of increased renewable energy production, offshore oil and, in particular, natural gas projects are expected to continue to be a major source of hydrocarbon resources in the coming decade. These activities will further develop Port activi-ties, where a significant share of traffic involve offshore support vessels (OSV), such as, offshore construction vessels (OCV), dive support vessels, stand-by vessels, inspection, maintenance and repair vessels (IMR), ROV support vessels, etc. As well as offering further cargo and Engineering, Procurement, Construction (EPC) opportunities, offshore oil & gas also increases Port activities via decommissioning. This involves moving components away from hydrocarbons fields that are coming to the end of their working lives or have already reached this point.
Decommissioning is expected to accelerate in the coming years due to the shift from fossil fuels to renewable and low-carbon energy sources. Although decommissioning in the EU will not be completed until at least 2050, the costs are high now and it is estimated that €4.8 bn will be spent in the EU-27 on decommis-sioning of oil and gas infrastructure in 2020-2030. To decom-mission an offshore oil or gas field, a process known as ‘plug and abandonment’ (P&A) isolates the reservoir from the marine environment through the placement of two or more cement bar-riers in the well bore. This can provide isolation in the short to medium term. However, the long-term integrity of well P&A bar-riers is not proven245.
68
THE
EU B
LUE
ECO
NO
MY
REPO
RT

Figure 4.10 Crude oil: EU imports from non-EU countries, 2020 (based on thousand tonnes)
Source: Eurostat and own elaboration.
Figure 4.11 Natural gas: EU imports from non-EU countries, 2020 (based on million cubic metres)
Source: Eurostat and own elaboration.
69
2022

Accidents such as the 2010 Deepwater Horizon disaster in the Gulf of Mexico, illustrate the need for comprehensive safety measures. While safety is the primary responsibility of opera-tors and individual countries, EU rules are important because an accident in one country can cause environmental and economic damage to its neighbours as well. Under the Directive on Safety of Offshore Oil and Gas Operations246, the EU has put in place a set of rules to help prevent accidents, as well as respond promptly and efficiently should one occur.
Since 2016, the Commission publishes an annual report on the safety of EU offshore oil and gas operations. According to the latest report, Member States reported 156 reportable events in 2019, up from 120 in 2018. Most of the incidents (43 %) belong to the category of unintended releases of gas and/or oil, while 3.75 % concerned the loss of well control (blowout/diverter acti-vation and well-barrier failures), and 2.5 % concerned failures of safety and environmental critical elements (SECE). A further 0.94 % were vessel-collision incidents, while 0.63 % concerned the loss of structural integrity of the installation, and 0.31 % con-cerned helicopter accidents (1 event). Two incidents required the evacuation of personnel and, for the first time since reporting, 1 incident resulted in the loss of life247.
Projects for extraction of petroleum and gas have to undergo either an environmental impact assessment (EIA) or a screening procedure in accordance with the EIA Directive248. According to the abovementioned safety directive, companies are fully liable for environmental damages caused to protected marine species and natural habitats. The pressures and impacts of such human activities on the marine environment also need to be considered by Member States in their marine strategies under the MSFD. Physical loss or disturbance to the seabed, changes of hydro-graphical conditions, levels of contaminant inputs of energy (e.g. underwater noise during the construction phase) generated by such activities should be given particular attention. At regional level, this process should be carried out in close cooperation with regional seas conventions.
Aggregate extraction and dredging are activities thought to poten-tially cause significant environmental impact. In particular, they can create permanent hydrographical changes, including from seawater movement, salinity and sea temperature changes. During the first MSFD implementation cycle, dredging was identi-fied as the main human activity causing physical damage on the seafloor in the Black Sea. The Water Framework Directive (WFD) reporting shows that about 28 % of EU’s coastline is affected by permanent hydrographical changes, including seawater move-ment, salinity or temperature. In Europe, dredging activities and the disposal of these materials are well established and regulated by national authorities, which in turn are normally based on inter-national guidelines (e.g. OSPAR guidelines)249.
246 Directive 2013/30/EU of the European Parliament and of the Council, 12 June 2013.247 European Commission (2021). Annual Report on the Safety of Offshore Oil and Gas Operations in the European Union for the Year 2019. COM(2021) 585 final.248 Directive 2011/92/EU as amended by 2014/52/EU. 249 OSPAR Guidelines for the Management of Dredged Material at Sea, Agreement 2014-06. Available at: www.ospar.org/documents?d=34060250 COM(2020) 741 final.251 The first offshore wind farm (Vindeby) was installed in Denmark in 1991 and decommissioned in 2017, after 25 years of useful life. 252 JRC analysis based on GWEC (2021) Global Offshore Wind Report 2021 and 4C OFFSHORE (2022) WIND FARMS DATABASE.
4.3 MARINE RENEWABLE ENERGY (OFFSHORE WIND)
4.3.1 BACKGROUND
Marine Renewable Energy (MRE) includes both offshore wind energy and ocean energy. MRE represent an important source of green energy and can make a significant contribution to the EU’s 2050 energy strategy. The EU Offshore Renewable Energy Strategy aims for an installed capacity of at least 60 GW of off-shore wind and at least 1 GW of ocean energy by 2030. By 2050, installed capacity should further surge to 300 GW of offshore wind and 40 GW of ocean energy, respectively250.
Moreover, the MRE sector presents a great potential to sustainably generate economic growth and jobs, enhance the security of its energy supply and boost competitiveness through technological innovation.
Ocean energy technologies are currently being developed and tested to exploit the vast source of clean, renewable energy that seas and oceans offer. Although still at the research and develop-ment stage and not yet commercially available, promising ocean technologies include: wave energy, tidal energy, salinity gradient energy and ocean thermal energy conversion (OTEC). Wave and tidal energy are currently the more mature of these innovative technologies.
Offshore wind energy is currently the only commercial deploy-ment of a marine renewable energy with wide-scale adoption. At the end of 2021, European sea basins are leading in terms of installed offshore wind energy, with over 65 % of the world’s total installed capacity. Starting with only a small number of demonstration plants251 in the early 2000s, the EU now has a total installed offshore wind capacity of 16.3 GW across 10 countries252. In late 2021, 1.8 GW of new capacity were added to the grid. The main EU producers of offshore wind energy are Germany, the Netherlands, Belgium and Denmark. The UK is cur-rently the country with largest offshore wind fleet installed in European waters (about 10.3 GW)
Given the significant growth of the offshore wind sector, both in terms of construction of the wind parks but also in generat-ing green electricity, this edition of the EU Blue Economy Report includes the production and transmission of electricity generated by offshore wind farms as an additional established sector.
For the purpose of this report, and due to data availability, the Marine renewable energy sector currently comprises only Offshore wind. Results are complemented by analyses of the sector in terms of capacity and construction of new plants
70
THE
EU B
LUE
ECO
NO
MY
REPO
RT

(Section 4.3.3) while other ocean energy technologies (i.e. floating wind energy, wave and tidal energy, etc.) are presented under Emerging Sectors (Section 5.1).
Overall, Offshore wind energy (production and transmission) contributed 0.2 % of the jobs, 1 % of the GVA and 1.7 % of the profits to the total EU Blue Economy in 2019. The sector is still relatively small but is in expansion.
4.3.2 MAIN RESULTS
Size of the EU Offshore wind energy (production and transmission) in 2019-2020
In 2019, the GVA generated by the production and transmission of Offshore wind energy253 was more than €1.9 billion, 46 times more than in 2009 (€41 million). Gross profits, at €1.27 billion, 55 times more than in 2009 (€23 million) (Figure 4.12). Reported turnover was above €13.1 billion, 69 times higher than the €188 million in 2009.
Net investments in tangible goods reached €938 million in 2019, more than 10 times more than in 2009. The ratio of net invest-ment to GVA was estimated at 67 %, higher than in previous years. New investments are being channelled into innovation, development, exploration and production units further offshore and in deeper waters.
253 Information on this still emerging sector is limited and the results presented are undervalued. Data on GVA and profits are available for Belgium, Denmark and Germany. Data on employment and investments are available for Belgium, Denmark, Germany and the Netherlands.
Preliminary data from Eurostat suggest that turnover decreased about 13 % on average in the electricity supply sector in 2020, while it is expected that GVA and gross profits have suffered sim-ilar decreases.
The sector directly employed 10 563 persons, up from 384 per-sons in 2009. Personnel costs totalled €495 million, 2 652 % more than in 2009. The annual average wage, estimated at €46 832, almost the same compared to 2009 (€46 848) (Figure 4.13).
Germany currently leads in Offshore wind energy with 80 % of the jobs and 64 % of the GVA, followed by Denmark with 30 % of the GVA. The sector is in large expansion. Estimates suggest that COVID-19 impact led to a 7 % decrease in the turnover.
Results by Member States
Employment: The top contributors, in descending order, include Germany with 80 % (8 462 persons), followed by Denmark (1,047 persons), the Netherlands (559 persons) and Belgium (495 per-sons) in 2019.
Gross value added: The top contributors, in descending order, include Germany with 64 % (€1.22 billion), Denmark (€585 mil-lion) and Belgium (€118 million).
Figure 4.12 Size of the EU Offshore wind energy (production and transmission), € million
Note: Turnover should be interpreted with caution due to the problem of double counting throughout the value chain. Turnover in 2020 is an estimation based on Eurostat’s preliminary data, GVA and Gross operating surplus are estimated assuming that follow the same trend as turnover.Source: Eurostat (SBS) and own calculations.
0
2 000
4 000
6 000
8 000
10 000
12 000
14 000
200 9 201 0 201 1 201 2 201 3 201 4 201 5 201 6 201 7 201 8 201 9 202 0
Turnover
0
500
1 000
1 500
2 000
2 500
2009
2010
2011
2012
2013
2014
2015
2016
2017
2018
2019
2020
GVA
0
300
600
900
1 200
1 500
2009
2010
2011
2012
2013
2014
2015
2016
2017
2018
2019
2020
Gross operating surplus
0
100
200
300
400
500
600
700
800
900
1 000
2009
2010
2011
2012
2013
2014
2015
2016
2017
2018
2019
Net investment
71
2022

Gross profit: Germany produced 55 % of the profits (€697 mil-lion), followed by Denmark with 40 % (€507 million), and then Belgium with the remaining 5 % (€67 million).
Net investment in tangible goods: Germany invested 38 % (€358 million) of the total reported, followed by Denmark with 29 % (€274 million), Belgium with 21 % (€198 million) and then the Netherlands with the remaining 12 % (€109 million).
Turnover: Germany accounted for 84 % (€11 billion) of the turn-over produced, followed by Demark with 11 % (€1.4 billion) and then Belgium with the remaining 5 % (€679 million).
4.3.3 TRENDS AND DRIVERS
During the last decade, the wind energy sector saw a strong increase in offshore wind technologies due to higher capacity factors achievable, much larger sites availability and a remark-able cost reduction, supported by important technological advances, such as in wind turbine reliability. Also, offshore could build on some lessons learned in the onshore wind sector and competitive tendering. Offshore wind is expected to play a sig-nificant role in reaching Europe’s carbon-neutrality targets. The European Commission Offshore Renewable Energy Strategy254
254 COM(2020) 741.255 Wind Europe (2021): Offshore Wind in Europe. Key trends and statistics 2020.256 JRC (2021). Technology Development Report LCEO: Wind Energy. JRC123138 (data update 02/2022).
was published in November 2020 as part of the EGD roadmap. The Strategy outlines the ambitions to deploy 300 GW of offshore wind energy by 2050, supplying about 30 % of the EU future elec-tricity, with an intermediate target of 60 GW by 2030. Starting as a first mover in the offshore sector, with the first offshore wind farm installed in Denmark in 1991, the EU currently is a global leader in offshore wind manufacturing.
The EU offshore wind energy sector has grown to a capacity of 16.3 GW by the end of 2021 (Figure 4.15)255, with an increase of 1.8 GW in the last year. It represents a growth of 7 % from 2020 total installed capacity of offshore wind.
Most of the EU installed capacity is located in the North (84 %) and Baltic Seas (15 %). Germany is the Member State with the largest installed capacity of offshore wind energy (47 %) followed by the Netherlands (23 %), Denmark (14 %), Belgium (14 %). A nascent industry is present in Finland, Sweden, France, Spain, Ireland and Portugal. EU’s offshore wind industry keeps on lead-ing the sector driven by a strong home market representing about 46 % of the worldwide capacity deployed256.
Figure 4.13 Persons employed (thousand), personnel costs (€ million) and average wage (€ thousand) in EU Offshore wind energy (production and transmission)
Source: Eurostat (SBS) and own calculations.
Figure 4.14 Share of employment and GVA generated by the EU Offshore wind energy (production and transmission), 2019
Source: Eurostat (SBS) and own calculations.
0
0,1
0,2
0,3
0,4
0,5
0,6
0
2
4
6
8
10
12
2009
2010
2011
2012
2013
2014
2015
2016
2017
2018
2019
Persons employed (left-axis)Personnel costs (right-axis)
0
10
20
30
40
50
60
70
2009
2010
2011
2012
2013
2014
2015
2016
2017
2018
2019
Average remuneration per employee
80%
10%
5%5%
Employment by Member State
Germany
Denmark
Netherlands
Belgium
38%
29%
12%
21%
Value added by Member State
GermanyDenmark
NetherlandsBelgium
72
THE
EU B
LUE
ECO
NO
MY
REPO
RT

The total investment needed to deploy the 14.6 GW capacity installed between 2010 and 2020 is estimated to have amounted to €52 billion, with an average capital expenditure of around €3.6 million per MW.
In 2021, 2.2 GW of new EU offshore wind capacity was financed, reaching final investment decision (FID) for €7.6 billion worth of investment (Figure 4.16), representing a decrease in new off-shore wind commitments compared to 2020 (3.6GW; 10.4 billion). 1.4 GW of the 2.2 GW of new offshore wind projects have been awarded in Germany (Arcadis Ost 1, Gode Wind 3 and Borkum Riffgrund 3 Projects); with the remaining in France (0.45 GW) and in Denmark (0.34 GW). The average capital expenditure (CAPEX) of new EU projects is of €3.47 million per MW257. It shall be noted, that while the trend of the average CAPEX is declining for offshore wind projects, there is still significant difference in capital costs across projects. Factors such as rated turbine capacity, depth of the site (and the foundation technology pursued) and the size of a project affect the overall costs. Additionally delays in adminis-trative procedures could push the cost of a project up.
In the run up to 2050, decrease in estimated CAPEX for offshore wind is expected to range between €2.05 and €2.7 million per MW for an average offshore wind project258. This CAPEX reduction is mainly driven by the increase in average turbine sizes (e.g. from about 4 MW in 2016 and 8 MW in 2022 to about 12-15 MW in 2025) and the increase in offshore wind project size resulting in scaling effects259.
Offshore wind energy is gaining importance in relation to onshore wind energy: new offshore wind capacity installed, increased from 13.4 % in 2017 to 24 % in 2020. However, this was followed by a
257 WindEurope, Offshore wind energy 2021 statistics, March 2022.258 Excluding offshore wind floating technology.259 JRC, Low Carbon Energy Observatory, Wind Energy Technology Development Report 2020, European Commission, 2020, JRC120709.260 SWD(2021) 307 final, PART 2/5.261 JRC Technology Market Report – Wind Energy (2019).262 EU & UK.263 An even stronger market concentration can be expected following the insolvency of Senvion and the closure of its Bremerhaven turbine manufacturing plant at the end of
2019.264 SWD(2021) 307 final, PART 2/5.
drop in 2021 to about 10 %. In cumulative terms, offshore wind represents about 8 % of the total installed wind energy capacity in the EU in 2021, growing from 5 % in 2016. It represents over 45 % of the wind energy capacity installed in Belgium and 37 % in the Netherlands (Figure 4.17).
The current number of jobs in the European offshore wind sector is 77 000 (38 000 direct jobs and 39 000 indirect jobs). Estimates towards 2030 expect up to 201 000 jobs in the European off-shore wind sector260. Due to the globalisation of the wind energy sector (both onshore and offshore), the number of mergers and acquisitions increased over the last years. These transactions have consolidated the market, with wind players increasing their market share and economies of scale.
In terms of market share within Europe, EU companies are ahead of their competitors in providing offshore generators of all power ranges, reflecting a well-established European offshore market and the increasing size of newly installed turbines261. Currently, about 93 % of the total offshore capacity installed in Europe262 in 2019 is produced locally by European manufacturers (SiemensGamesa Renewable Energy, Vestas and Senvion263). On a global level, an increased deployment activity in China (more than 3GW/year) led to a strong increase in the market share of Chinese OEMs (47 %) leading ahead of the European manufac-turers (39 %) when assessing their cumulative market share. This is mainly due to a set of new policies in China targeting renewa-ble energy integration and a shift from Feed-in-Tariffs towards a tender-based support scheme. Offshore wind projects approved before 2018 and grid connected by end of 2021 still receive a Feed-in-Tariff whereas auctions in the following two years will implement a price cap264. The growing offshore wind market offers
Figure 4.15 EU offshore wind energy capacity additions (left) and installed capacity (right), GW
Note: (*) = Preliminary data at the end of 2021.Source: JRC based on, GWEC, WindEurope, 4COffshore.
0
2
4
6
8
10
12
14
16
18
2010
2011
2012
2013
2014
2015
2016
2017
2018
2019
2020
2021*Cum
ulat
ive
inst
alle
d ca
paci
ty [
GW
]
Belgium Denmark Finland
France Germany Ireland
Netherlands Portugal Spain
SwedenJRC (2022)
0
1
2
3
2010
2011
2012
2013
2014
2015
2016
2017
2018
2019
2020
2021*
Ann
ual c
apac
ity a
dditi
ons
[GW
]
Belgium Denmark Finland
France Germany Ireland
Netherlands Portugal Spain
SwedenJRC (2022)
73
2022

Figure 4.16 Announced financing and capacity to be installed, EU offshore wind energy
Notes: Data based on the finance deals closed each year. Capacity might be added in the respective year or in the following years. For years 2016-2019 UK based projects are also included.
Source: WindEurope (2019, 2020,2021,2022), EurObserver’ER (2019, 2020).
Figure 4.17 Onshore vs. offshore wind energy in the EU-27: Historic ratio of offshore over total wind energy, percentage (left) and Ratio of new installed capacity (right)
Source: EurObserver’ER (2020) WindEurope (2021), JRC analysis.
0
1200
2400
3600
4800
6000
0
5000
10000
15000
20000
25000
2016 2017 2018 2019 2020 2021
Cap
acity
fina
nced
(M
W)
Ass
et F
inan
ce m
EUR
Finance Capacity Financed
0
1
2
3
4
5
0
1000
2000
3000
4000
5000
6000
2016 2017 2018 2019 2020 2021
Cap
acity
fina
nced
(m
EUR
MW
)
Ass
et F
inan
ce m
EUR
Capacity Financed mEur/MW
0%
10%
20%
30%
40%
50%
Germany Denmark Belgium Netherlands EU27
2016 2017 2018 2019 2020 2021
0%
20%
40%
60%
80%
100%
2017 2018 2019 2020
Annu
al in
stal
led
capa
city
(GW
)
Offshore Onshore
Figure 4.18 Offshore renewable energy: examples of projects and production sites in the EU
Source: European Commission.
New offshore wind investments Average capital expenditure per MW
74
THE
EU B
LUE
ECO
NO
MY
REPO
RT

the opportunity for European manufacturers to expand their mar-ket and production capabilities and allows to lift synergies from the onshore wind market.
Across all EU-27, the United Kingdom and Norway a cumulative offshore wind capacity of about 20.6 GW has been allocated through competitive tendering procedures, which are expected to be commissioned until 2025. With about 12.6 GW of off-shore capacity, the Top 5 developers (Ørsted, Vattenfall, RWE Renewables (innogy SE), SSE Renewables, Equinor) account for more than 60 % of the ownership of the allocated capacity265. In March 2021, about 66 % of the total competitive tendered offshore capacity was owned by developers from EU-27 coun-tries, keeping their share almost stable (losing only 2 %) since the announcement of their successful bid. Developers from the United Kingdom and Norway follow with 16 % and 8 %, respectively. The share of non-European companies in European competitive ten-dered offshore projects is at about 8 % with Japan (3.8 %) and China (1.8 %) being the strongest non-European shareholders, investing mostly in projects in the United Kingdom (CfD Allocation Round 2 projects) and the Netherlands (Borssele 1&2).
265 JRC Technology Market Report – Wind Energy (2019), March 2021 Update.266 https://energy.ec.europa.eu/topics/renewable-energy/eu-strategy-offshore-renewable-energy_en
Notably, the latest competitive tender schemes in the Netherlands (Hollandse Kust Noord) saw also a strong presence of the European Oil & Gas major companies (Equinor, Shell, Eni, Total) stepping into the field of offshore wind development.
The Offshore Renewable Energy Strategy published by the European Commission in November 2020 proposes to increase Europe’s offshore wind capacity from its current level of 12 GW to at least 60 GW by 2030 and to 300 GW by 2050, contributing to the EU’s ambitious energy and climate targets of the EU Green Deal., while ensuring protection of the EU environment (e.g. do not harm principle, environmental protection). The investment needed to do so is estimated at up to €800 billion. Several European developers are working on floating offshore wind turbines, with the first pilot projects on track and deployment expected to accel-erate towards the end of this decade. The Strategy addresses the definition of the factors of energy production, as well as broader issues, such as: access to sea-space, industrial and employment dimensions, regional and international cooperation, the tech-nological transfer of research projects from the laboratory into practice266.
BOX 4.2 WindFloat Atlantic – first floating wind farm in continental EuropeThe WindFloat Atlantic (WFA) project represents a significant step towards the commercial maturity of floating offshore wind technology, materializing the EU Green Deal objectives, demonstrating the commercial viability and risk acceptance of financial institutions building on previous achievements of the WindFloat 1 prototype.
The project led by Ocean Winds (a Joint-Venture between EDP Renewables and ENGIE), REPSOL and Principle Power (PPI) is a pre-commercial floating offshore wind farm formed by 3 wind turbines of 8.4MW rated power each. Located 18 kilometers off the coast of Viana do Castelo in the northern region of Portugal, it sits in 100 meters water depths and uses the semi-submersi-ble floating technology developed by PPI (WindFloat®) moored to the seabed by anchoring systems. With an installed capacity of 25MW it delivers the equivalent electricity of 50 000 inhabitants’ consumption in a yearly basis, avoiding the emission of 33 000 tons of CO² peryear.
Innovative technology to supply clean energyKey technology requirements were developed, implemented, and demonstrated, including an extended design lifetime of 25-years, building on the knowledge of oil and gas permanent units and fixed-bottom offshore wind. The use of large commercial turbines required a quay-side assembly process, with turbines installed with the foundations a float or temporally grounded. By using an onshore crane, the project avoided the use of large offshore heavy-lift vessels, also allowing for certain work to be completed onshore. The offshore activities were simplified, allowing a tow-to-port maintenance strategy for large component replacement. Following a multi-contract strategy, the project fostered the development of an European value chain.
20 direct contracts and hundreds of workers and teams of professionals were involved in the various stages of the WFA project, with a positive socio-economic impact across several European regions where the project was developed. In fact, offshore wind is forecasted to be the fastest growing source of renewable energy in the next 30 years, showing great potential to develop an entire value chain that goes from engineering know-how, to equipment manufacturing, construction/installation logistics and the operational phase of the projects. This renewable energy source is set to become a global industry, underpinning countries to meet their energy transition targets, while delivering value added to economies, through creating highly qualified jobs, while coexisting and fostering other industries such as fishing and open-sea aquaculture.
The WFA project was the first offshore floating project to have proved bankability in October 2018, when the European Investment Bank provided the project with €60 000 000, financed by the InnovFin Energy Demo Projects joint financial instrument which aims to help the technology demonstration of pioneering energy projects. The project has also benefited from a €29 900 000 grant from the European Union’s NER300 program and €6 000 000 from the Portuguese Government, through the Portuguese Carbon Fund.
75
2022

BOX 4.3 SAFEWAVE project – for offshore wind energyThe aim of the SafeWAVE project267 consists of overcoming some of the non-technological barriers that could hinder the future development of Ocean Energy, one of the main pil-lars of the EU Blue Growth strategy: (i) environmental risk and uncertainty about the potential environmental impacts of wave energy developments; (ii) the need for a Maritime Spatial Planning (MSP) approach to overcome the potential competition and conflicts between wave energy and other marine users; (iii) complex and long consenting processes and (iv) opposition among host communities of future wave energy deployments.
Ocean energy can provide clean, predictable, indigenous and reliable energy and contribute to the EU’s objective of reach-ing a share of renewables of at least 32 % of the EU’s gross final consumption by 2030.
SafeWind builds on the results of the WESE project funded by the EMFF in 2018. Some of the specific objectives of SafeWind are:
• Develop an Environmental Research Demonstration Strategy based on the collection, processing, modelling, analysis and sharing of environmental data collected in wave energy sites from different European countries (Mutriku power plant and BIMEP in Spain, Aguçadoura in Portugal and SEMREV in France). It will focus on under-standing the effects of wave energy projects and increase the knowledge on priority research areas.
• Develop a Planning and Consenting Strategy through pro-viding guidance to ocean energy developers and to public authorities tasked with consenting and licensing of wave energy projects for most of the EU countries in the Atlantic Arc (France, Ireland Spain and Portugal).
• Develop a Public Education and Engagement Strategy to assist in working collaboratively with coastal communi-ties in France, Ireland, Portugal and Spain, co-developing and demonstrating a framework for education and public engagement, and promoting ocean literacy.
The technology for floating offshore wind in deep waters and harsh environments is progressing steadily towards commer-cial viability268. Floating applications seem to become a viable option for EU countries and regions lacking shallower waters (floating offshore wind for depths between 50-1000 metres) and could open up new markets such as the Atlantic Ocean, the Mediterranean Sea and potentially the Black Sea. Therefore, float-ing offshore wind is one of the EU’s R&I priorities; increased R&I could foster EU competitiveness.
In total about 16.5 GW of floating offshore wind energy is expected to be produced until 2030, with significant capacities
267 Home – SAFEWAVE PROJECT (safewave-project.eu)268 UNEP & BloombergNEF, Global trends in renewable energy investment, 2019.269 GWEC, Global Offshore Wind Report 2021, 2021.270 https://ec.europa.eu/commission/presscorner/detail/en/speech_22_1632
in selected Asian countries (South Korea and Japan) besides the European markets (France, Norway, Italy, Greece, Spain). Due to good wind resources in shallow waters, only limited floating off-shore capacity is expected in China in the mid-term269.
In order to make renewable energy at sea and the ocean success-ful however, other aspects are also essential. Infrastructure to bring offshore energy onshore is key for the development of off-shore wind energy since the renewable energy generated needs to be delivered to the consumers on land. Optimisation of wind turbine design (turbine size and generators) is another important factor to address because more and more powerful generators with a reduced size and weight will be demanded. Circularity of production, operation and removal of offshore wind farms must also be addressed.
The Offshore Renewable Energy Strategy addresses long-term offshore grid planning taking into account aspects related to mar-itime spatial planning and potential Hydrogen and/or Power-to-X (H2/P2X) energy transformation facilities and smart sector inte-gration. This could ensure vital co-existence with maritime trans-port routes, traffic separation schemes, anchorage areas, and port development and synergies, supporting the decarbonisation of the maritime transport and logistic industry.
The initiatives in the ‘Fit for 55 package’ (see chapter 3.1), adopted by the European Commission in July 2021and RePowerEU plan270 (see chapter 4.2), announced in March 2022, will also play a crit-ical role for the clean transition in the EU. The RePowerEU plan, includes amongst other, an objective to speed up permitting pro-cedures to grow Europe’s on- and offshore wind capacity and the need for diversification of energy sources.
4.3.4 INTERACTIONS WITH OTHER SECTORS AND THE ENVIRONMENT The Marine renewable energy may compete for the access to space with the Marine living resources (primary sector), Coastal tourism and Maritime transport sectors.
Growth of marine energy, in particular offshore wind creates potential synergies with the offshore oil and gas sector, with competencies required to construct, maintain and decommis-sion offshore projects and to operate in harsh marine environ-ments. Integration could bring benefits in terms of reduced costs, improved environmental performance and utilization of infrastruc-ture. The possibility to provide electricity to offshore oil and gas operations where there are wind farms nearby, or via floating turbines, reducing the need to run diesel or gas-fired generators on the platform and reducing emissions of carbon dioxide (CO2) and air pollutants. New uses for existing offshore infrastructure once it reaches the end of its operational life, in ways that might aid energy transitions: for example, platforms could provide off-shore bases for maintenance of wind farms, house facilities to convert power to hydrogen or ammonia, or be used to inject CO2 into depleted fields. In fact, some crossover between the sectors
76
THE
EU B
LUE
ECO
NO
MY
REPO
RT

is already evident, in particular in the North Sea – a mature oil and gas basin with a thriving renewable energy industry – with some large oil and gas companies being also major players in offshore wind. For example, the former oil and gas company, Ørsted in Denmark, has moved entirely to wind and other renewables.
The potential synergies extend well beyond the energy sector to encompass shipping, port infrastructure, other maritime indus-tries. Port activities and Shipbuilding and repair (shipyards) ben-efit from the economic potential of offshore wind energy. Ports are home to the manufacturers of offshore wind turbines and their large components, as well as project developers and logis-tics companies. In particular, ports in the North and Baltic seas are adapting rapidly to offshore wind energy with, for example, expansion areas for plant and component manufacturers and heavy-duty terminals and berths for special ships in the sector. While coastal regions benefit in particular from this development, inland suppliers also benefit, e.g. from the metal and mechanical engineering industries, technical service providers, insurance or financing companies, certifiers and consulting firms.
Ports could play an essential role in manufacturing and assembly of foundations, production of large components (e.g. blades, tow-ers), and electrical infrastructures such as the substations, instal-lation, operation and maintenance of wind farms. Accommodating floating offshore wind development will however require signif-icant investments in upgrading port infrastructure (e.g. quays, dry-docks). Moreover, ports can also serve as hubs where sec-tor coupling of wind energy and power-to-x takes (P2X) place to decarbonise ‘hard-to-abate’ sectors, efficiently converting and storing excess energy. According to WindEurope at least fourteen European ports have dedicated wind activities and are located mainly in the North Sea, Atlantic and Baltic Sea. Greening of ports and related operations are considered a priority, alongside with opportunities arising from floating offshore wind, storage and hydrogen production271. Moreover, the latest winning bid from Crosswinds B.V. (a Shell-Eneco consortium) in the subsidy-free Hollandse Kust Noord tender included the production of renewable hydrogen in the Port of Rotterdam with an electrolyser capacity of around 200 MW272.
Shipping is also a key enabler of the development of, efficient and sustainable solutions; offshore wind is considered one of them. It could encourage the use of energy-efficient and environmentally friendly vessel serving functions across the full offshore project lifecycle, rewarding the use of vessels with limited to no GHG emissions. However, the transportation in the future of larger, heavier blades will probably be more costly, depending on the type of the vessels, and will require more planning at the design phase.
Wind farms for EU energy generation in offshore sites have only been commercially viable for 30 years and the scale of the farms and the size of turbines have dramatically increased in the last 15 to 20 years. Because the lifetime of the first generation of wind farms is coming to an end, there are now two options: repower or decommission. One of the issues with decommissioning is that
271 WindEurope, Offshore Wind Ports Platform, https://windeurope.org/policy/topics/offshore-wind-ports/, 2020.272 WPM 2020, https://www.windpowermonthly.com/article/1690675/shell-eneco-win-hollandse-kust-noord-auction273 Benjamin Pakenham, Anna Ermakova and Ali Mehmanparast ‘A Review of Life Extension Strategies for Offshore Wind Farms Using Techno-Economic Assessments’, (2021).274 https://cinea.ec.europa.eu/news/circular-future-offshore-wind-energy-2021-06-24_en. 275 https://energy.ec.europa.eu/topics/infrastructure/high-level-groups/north-seas-energy cooperation_en?msclkid=ce3ea97aa8a911ecabbd6205675e86a8 276 https://www.bwo-offshorewind.de/
when the first-generation offshore wind farms were installed, decommissioning costs were inaccurately estimated due to lim-ited data available. The other important point is that environmen-tal requirements have changed and have largely become more demanding273.
Between now and 2030 policies will address how and if to repower or decommission over 1 800 wind turbines. There is also a need to optimise the use of resources in the offshore wind sec-tor, to avoid huge volumes of waste when turbines are at the end of their life cycle. Applying a circular approach, increasing resource efficiency and using resilient and recyclable materials will be the key strategies to put in place, to be in line with the EU Circular Economy Action Plan274.
Increasing the number of offshore wind turbines means also defining other technical aspects. Another field that policies will cover in fact, is the energy infrastructure, define MSPs and improve the internal market for electricity.
Following the post COVID-19 impact, it is important to front load investment in offshore renewable energy where possible, as this is likely to boost enduring jobs and economic activity and thereby contribute to the green recovery and long-term sustainable, inclu-sive growth. According to WindEurope, the industry should focus on recovery capacity, scalable recycling technologies and new, easier to recycle blade materials. They have further called for a European ban on landfilling decommissioned wind turbine blades by 2025.
Across the EU, offshore wind projects are being deployed within the MSP of MSs, taking into account other Blue Economy activi-ties and the objective of achieving good environmental status of the EU marine environment. Furthermore, MSs are getting into regional cooperation to tap on synergies across sea basins. This is for example the case of North Seas Energy Cooperation275 coun-tries, who are joining on the possibilities for concrete cooperation projects, such as joint offshore wind projects that would be con-nected to and supported by several Member States. This cooper-ation work also includes possible ‘hybrid’ solutions that could use cross-border solutions for connecting offshore wind farms to the grid and seek synergies with interconnection capacity between countries, and on the corresponding market arrangements.
Thus, the expansion of offshore wind energy offers growth impulses throughout the EU Blue Economy as well as other sec-tors. It creates additional jobs in many businesses across its value chain (development, construction, operation). This means that off-shore wind power creates value in several economic sectors. For example, according to the German Federal Association of Offshore Wind Farm Operators (BWO),276 the development of offshore wind energy in Germany has so far created about 27 000 jobs. These are not only located near the coast, but also in the southern and western Germany, where important components such as bearings, gearboxes and generators are manufactured, due to the industrial
77
2022

value chain. The expansion of offshore wind energy has great eco-nomic potential: total sales along the entire value chain amounted to around €9 billion in 2018.
Nevertheless, environmental considerations are also important to address in the development of offshore wind energy. Habitats dis-turbance and degradation, increased underwater noise, disruption of seabed integrity, decreased water quality and collision of wind turbines with sea birds and bats are just a few examples of the negative impacts of offshore renewable energy on the marine environment.277, including an increased understanding of the eco-logical impacts of large-scale offshore wind. Maritime Spatial Planning (MSP) can be considered as instrumental to278 balance sea uses and sustainably manage the marine ecosystems279 by applying an ecosystem-based approach which in turn aligns with the marine strategy framework directive280.
An independent assessment (ETC/ICM, 2019b) shows that wind-farms and oil and gas installations are the most frequent human-made structures liable to cause hydrographical pressure in the EU’s offshore waters. Offshore energy installations are present in almost 800 (10 km×10 km) grid cells, representing less than 0.5 % of a total assessed offshore area (234 692 cells). The high-est concentration is in the North-east Atlantic region with pres-ence in 700 cells, representing 0.7 % of assessed offshore area (101 943 cells)281. However, there is no region-wide assessment available to estimate the adverse effects of these installations on benthic and/or water column habitats.
277 COM(2020) 7730 final.278 North Seas Energy Cooperation – Work Programme 2020-2023, 2019.279 North Seas Energy Cooperation – Work Programme 2020-2023, 2019.280 Directive 2008/56/EC of the European Parliament and of the Council of 17 June 2008 establishing a framework for community action in the field of marine environmental
policy (Marine Strategy Framework Directive).281 SWD(2020) 62 final.282 https://www.espo.be283 Deloitte. Europe’s ports at the crossroads of transitions A study commissioned by the European Sea Ports Organisation (ESPO), June 2021.284 Eurostat. Maritime transport of goods – quarterly data. https://ec.europa.eu/eurostat/web/products-eurostat-news/-/ddn-20211209-1285 European Maritime Safety Agency (EMSA) and European Environment Agency (EEA). European Maritime Transport Environmental Report 2021.
4.4 PORT ACTIVITIES The port sector is crucial to the European economy. Ports are essential infrastructures of huge commercial and strategic importance, and port activities are instrumental in supporting the free movement of goods and persons in Europe. Ports are impor-tant to a number of other sectors including Maritime transport, Shipbuilding and Maritime defence, among others. They act as facilitators of economic and trade development. Many European ports are important clusters of energy and industry; in other words, ports facilitate the clustering of energy and industrial companies in their proximity. Close cooperation between ports, shipping lines and other actors in the logistics chain is necessary to ensure efficient and smooth cargo flows282.
The impacts of the COVID-19 pandemic, combined with the green and digital transitions are bringing about a profound transforma-tion of Europe’s economy and society. These developments create challenges and opportunities for the port industry. Ports in Europe are very diverse. Yet, they are confronted with similar constraints, choices, targets, and objectives. On the one hand, the negative environmental externalities generated by port activities must be increasingly addressed and mitigated, in line with the EGD. On the other hand, the ecological transition offers new development opportunities. Ports in Europe are exploring new areas of activities and need to develop new capabilities, such as providing the space, equipment and handling technology required by the growing off-shore energy industry, develop as sustainable energy hubs, and many other emerging Blue Economy sectors. While maintaining their core business as crucial supply chains hubs, ports have never proven more essential than during the health crisis to connect maritime and hinterland transport283.
4.4.1 BACKGROUND
Port activities play a key role in trade, economic development and job creation in Europe. It is a mature and growing Blue Economy sector. Ports, as multi-activity transport and logistic nodes, also play a crucial role in the development of established and emerg-ing maritime sectors.
In 2019, EU ports handled 3.6 billion tonnes of goods (gross weight). In 2020, this figure decreased to 3.3 billion tonnes due to the COVID-19 pandemic, which determined a drop in the number of ships calling at EU ports comprised between 14.4 % and 29 %, compared with the previous year284. Despite this decline, EU ports enable maritime transport to handle 77 % of the EU’s external trade and 35 % of all intra-EU trade285.
78
THE
EU B
LUE
ECO
NO
MY
REPO
RT

Figure 4.19.A Top 20 EU ports by volume of containers handled, 2019-2020 (TEUs).
Source: Own elaboration from Eurostat data.
Figure 4.19.B COVID-19 impacts on the volume of containers handled in EU Member States, 2019-2020 (TEUs).
Source: Own elaboration from Eurostat data.
Figure 4.19.C Top 20 EU ports by number of passengers embarking and disembarking, 2019-2020 (thousand).
Source: Own elaboration from Eurostat data.
79
2022

The number of containers heading into European ports has risen by more than four times over the past 20 years286. The top 15 EU ports in terms of cargo capacity (2021 data) are, in this order: Rotterdam (NL), Antwerp (BE), Hamburg (DE), Valencia (ES), Piraeus (EL), Bremerhaven (DE), Algeciras (ES), Barcelona (ES), Gioia Tauro (IT), Le Havre/Rouen (FR), Marsaxlokk (MT), Genoa (IT), Gdansk (PL), Zeebrugge (BE), Sines (PT). In 2021, they han-dled 78 million TEU287, up 5 % from 2020. The port of Antwerp was the only large gateway port in Europe registering a positive growth in 2020 (+1.4 %). Rotterdam, on the other hand, lost 1.5 % of activity in 2020 in terms of volume of containers handled (Figure 4.19.A). However, in 2021 it experienced a strong rebound (+7.8 %), with a volume of loaded containers of 12 million TEU288. The EU-27 as a whole registered a reduction of 2,276 TEUs in 2020 mainly due to COVID-19 impacts, representing a 2.4 % drop compared to 2019. While the EU countries in the Baltic Sea (Estonia, Lithuania, Finland) were hit the hardest in relative values, the most affected Member States in terms of container volume handled were Germany, where there was a reduction of about one million TEUs, Spain (-723 thousand TEUs), France (-436 thousand TEUs), and Greece (-377 thousand TEUs). On the other hand, Italy and Belgium registered volume increases of approx. 400 thousand TEUs each (Figure 4.19.B).
The number of passengers embarking and disembarking in EU ports in 2019-2020 has followed a similar trajectory as for freight. However, the drop caused by COVID-19 travel restrictions has been much more severe, both for the EU passenger gateway ports (Figure 4.19.C) and for each EU Member State as a seaborne travel destination (Figure 4.19.D). The largest EU passenger ports experienced drops bigger than 50 %, with the port of Helsinki reg-istering a reduction of more than 6 million passengers, followed by the ports of Tallinn, Calais, and Piraeus losing approximately 5 million passengers each.
More and more ports across the EU, aim to reduce their environ-mental and climate impact while also enabling green shipping
286 World Shipping Council.287 Unit of cargo capacity: twenty-foot equivalent unit.288 Notteboom, T. (2022). PortEconomics.eu
fleets or acting as clean energy hubs. These activities will have an important role in reaching the objectives of the European Green Deal (EGD).
For the purpose of this report, the Port activities sector comprises two main sub-sectors, further broken-down into the following activities:
1. cargo and warehousing: Cargo handling and Warehousing and storage;
2. port and water projects: Construction of water projects and Service activities incidental to water transportation.
Port activities accounted for 9 % of the jobs, 15 % of the GVA and 16 % of the profits in the EU Blue Economy in 2019. The sector has grown since 2009 in terms of jobs and GVA.
4.4.2. MAIN RESULTS
Size of the Port activities sector in 2019-2020
The value added generated by Port activities grew by 21 % from 2009 to 2019, reaching €27.9 billion. Gross profit, at €11.8 bil-lion, was 20 % higher than in 2009. Turnover amounted to €68.5 billion, a 24 % rise on 2009 (Figure 4.20).
Preliminary data from Eurostat suggest a decrease in about 6 % on the average in turnover in 2020. It is expected that GVA and gross profits have suffered similar decreases from 2019.
The sector directly employed 382 625 persons in 2019, than in 2009 (381 570 persons). Personnel costs increased by 21 %, from €13.3 billion in 2009 to €165.1 billion in 2019. This led to a simi-lar 21 % increase in average wages compared to 2009. The aver-age annual wage was estimated at about €42 100 (Figure 4.21).
Figure 4.19.D COVID-19 impacts on the number of seaborne passengers travelling to EU Member States, 2019-2020.
Source: Own elaboration from Eurostat data.
80
THE
EU B
LUE
ECO
NO
MY
REPO
RT

Figure 4.20 Size of the EU Port activities sector, € million
Note: Turnover should be interpreted with caution due to the problem of double counting throughout the value chain. Turnover in 2020 is an estimation based on Eurostat’s preliminary data, GVA and Gross operating surplus are estimated assuming that follow the same trend as turnover.
Source: Eurostat (SBS) and own calculations.
0
10 000
20 000
30 000
40 000
50 000
60 000
70 000
80 000
2009
2010
2011
2012
2013
2014
2015
2016
2017
2018
2019
2020
Turnover
0
5 000
10 000
15 000
20 000
25 000
30 000
2009
2010
2011
2012
2013
2014
2015
2016
2017
2018
2019
2020
GVA
0
2 000
4 000
6 000
8 000
10 000
12 000
14 000
16 000
2009
2010
2011
2012
2013
2014
2015
2016
2017
2018
2019
2020
Gross operating surplus
0
200
400
600
800
1 000
1 200
2009
2010
2011
2012
2013
2014
2015
2016
2017
2018
2019
Net investment
Figure 4.21 Persons employed (thousand), personnel costs (€ million) and average wage (€ thousand) in the EU Port activities sector
Source: Eurostat (SBS) and own calculations.
024681012141618
050
100150200250300350400450
2009
2010
2011
2012
2013
2014
2015
2016
2017
2018
2019
Persons employed (left-axis) Personnel costs (right-axis)
0
10
20
30
40
50
2009
2010
2011
2012
2013
2014
2015
2016
2017
2018
2019
Average remuneration per employee
024681012141618
050
100150200250300350400450
2009
2010
2011
2012
2013
2014
2015
2016
2017
2018
2019
Persons employed (left-axis) Personnel costs (right-axis)
81
2022

Figure 4.22 Share of employment in the EU Port activities sector, 2019
Source: Eurostat (SBS) and own calculations.
Germany leads Port activities by contributing 23 % of the GVA and generating 23 % of the jobs; followed by the Netherlands (17 % and 9 % in terms of jobs and GVA), Spain (13 % and 11 %) and France (12 % and 9 %).
Results by sub-sectors and Member States
Employment: The majority of the sector’s workforce (54 %) is employed in Cargo and warehousing, with 204 760 direct jobs; while Ports and water projects employed 177 860 persons (46 %). Compared to 2009, the number of jobs in Cargo and warehousing increased by 5 % while decreasing by 6 % in Ports and water pro-jects. Member States that employed more workers, in descending order were Germany (23 %), Spain (11 %), France and Italy (10 % each), and the Netherlands (9 %).
Gross value added: The value added generated by the sector in 2019 was almost evenly distributed between Cargo and ware-housing (44 %) and Ports and water projects (56 %). The top con-tributors, in descending order, include Germany (23 %), followed by the Netherlands (17 %), Spain (13 %) and France (12 %).
Gross profit: Total gross profit gained by the sector amounted to €11.8 billion in 2019: of which €4.7 billion (40 % of the sector total) in Cargo and warehousing, and €7.1 billion (60 %) in Ports and water projects. Cargo and warehousing increased by 32 %
289 Net investments in tangible good are unavailable for most of the activities, but Construction of water projects.
compared to 2009, while Ports and water projects registered a 13 % increase. It is estimated that gross operating margins decreased in 2020, as a consequence of the decrease in economic activity and transport restrictions imposed by COVID-19 outbreak.
Gross investments in tangible goods289: Most of the new invest-ments in 2019 went to Ports and water projects (66 %), which saw a 6 % decrease from 2009 figures. While investments in Cargo and warehousing decreased by 4 %, resulting in an overall decrease of 6 %.
Turnover: In 2019, total turnover amounted to €68.5 billion: €32.3 billion (47 % of the sector total) in Cargo and warehousing and €36.2 billion (53 %) in Ports and water projects. Cargo and ware-housing increased by 24 % compared to 2009, similarly, Ports and water projects increased by 23 %; leading to an overall increase of 24 % for the sector.
4.4.3 TRENDS AND DRIVERS
The European market for port activities has evolved considerably over the past few years, and is still evolving as a result of a num-ber of key drivers, namely: (i) environmental (e.g. climate change impacts, resource and energy footprint, etc.), (ii) technological (e.g. digitalisation, logistic tech, automation, etc.), (iii) geopolitical
Figure 4.23 Share of the GVA generated the EU Port activities sector, 2019
Source: Eurostat (SBS) and own calculations.
23%
11%
10%9%
9%
38%
Employment by country
Germany
Spain
France
Italy
Netherlands
Others
54%46%
Employment by sub-sector
Cargo and warehousing
Port and water projects
23%
17%
13%12%
8%
27%
Value added by country
Germany
Netherlands
Spain
France
Italy
Others
44%
56%
Value added by sub-sector
Cargo andwarehousing
Port and waterprojects
44%
56%
Value added by sub-sector
Cargo andwarehousing
Port and waterprojects
82
THE
EU B
LUE
ECO
NO
MY
REPO
RT
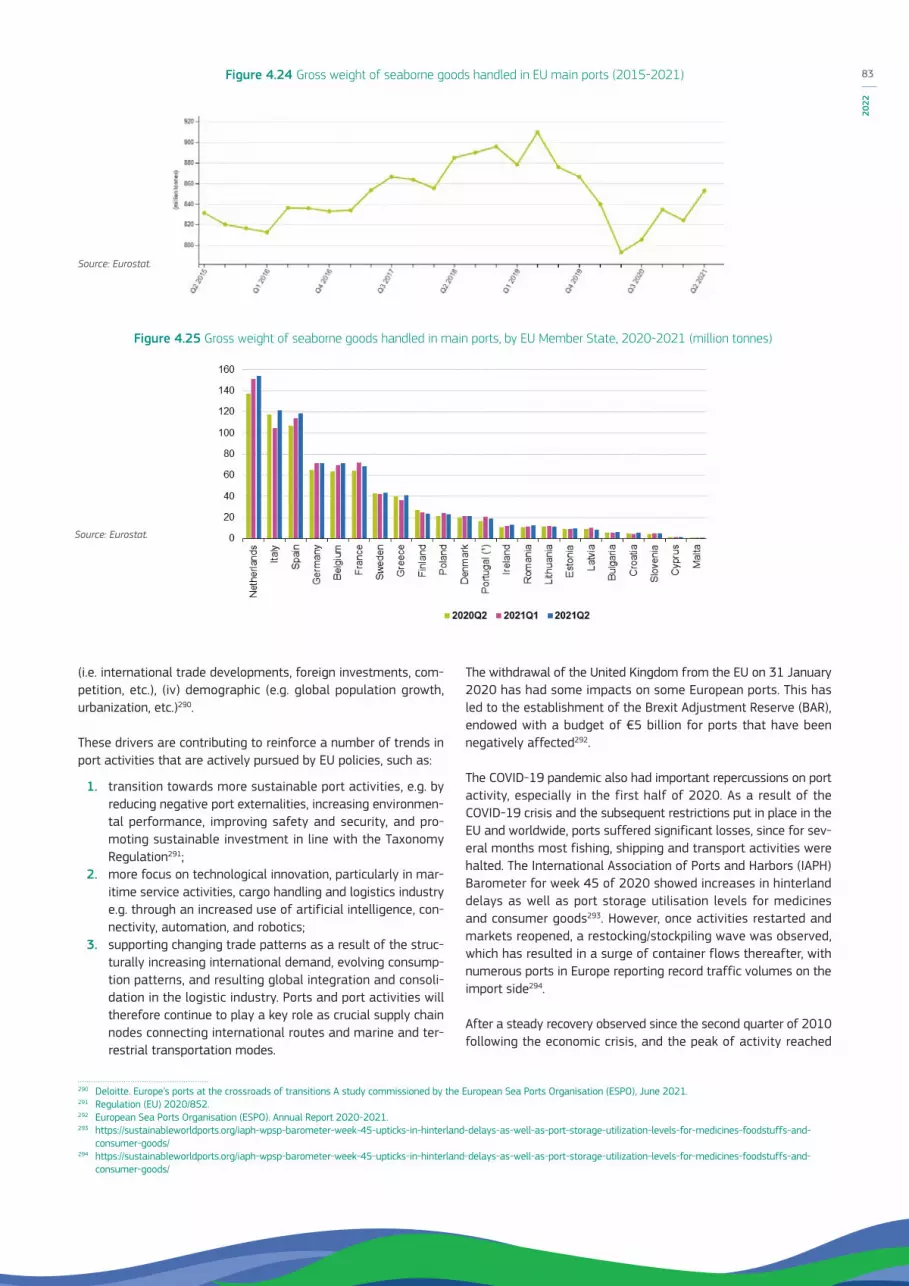
(i.e. international trade developments, foreign investments, com-petition, etc.), (iv) demographic (e.g. global population growth, urbanization, etc.)290.
These drivers are contributing to reinforce a number of trends in port activities that are actively pursued by EU policies, such as:
1. transition towards more sustainable port activities, e.g. by reducing negative port externalities, increasing environmen-tal performance, improving safety and security, and pro-moting sustainable investment in line with the Taxonomy Regulation291;
2. more focus on technological innovation, particularly in mar-itime service activities, cargo handling and logistics industry e.g. through an increased use of artificial intelligence, con-nectivity, automation, and robotics;
3. supporting changing trade patterns as a result of the struc-turally increasing international demand, evolving consump-tion patterns, and resulting global integration and consoli-dation in the logistic industry. Ports and port activities will therefore continue to play a key role as crucial supply chain nodes connecting international routes and marine and ter-restrial transportation modes.
290 Deloitte. Europe’s ports at the crossroads of transitions A study commissioned by the European Sea Ports Organisation (ESPO), June 2021.291 Regulation (EU) 2020/852.292 European Sea Ports Organisation (ESPO). Annual Report 2020-2021.293 https://sustainableworldports.org/iaph-wpsp-barometer-week-45-upticks-in-hinterland-delays-as-well-as-port-storage-utilization-levels-for-medicines-foodstuffs-and-
consumer-goods/294 https://sustainableworldports.org/iaph-wpsp-barometer-week-45-upticks-in-hinterland-delays-as-well-as-port-storage-utilization-levels-for-medicines-foodstuffs-and-
consumer-goods/
The withdrawal of the United Kingdom from the EU on 31 January 2020 has had some impacts on some European ports. This has led to the establishment of the Brexit Adjustment Reserve (BAR), endowed with a budget of €5 billion for ports that have been negatively affected292.
The COVID-19 pandemic also had important repercussions on port activity, especially in the first half of 2020. As a result of the COVID-19 crisis and the subsequent restrictions put in place in the EU and worldwide, ports suffered significant losses, since for sev-eral months most fishing, shipping and transport activities were halted. The International Association of Ports and Harbors (IAPH) Barometer for week 45 of 2020 showed increases in hinterland delays as well as port storage utilisation levels for medicines and consumer goods293. However, once activities restarted and markets reopened, a restocking/stockpiling wave was observed, which has resulted in a surge of container flows thereafter, with numerous ports in Europe reporting record traffic volumes on the import side294.
After a steady recovery observed since the second quarter of 2010 following the economic crisis, and the peak of activity reached
Figure 4.24 Gross weight of seaborne goods handled in EU main ports (2015-2021)
Source: Eurostat.
Figure 4.25 Gross weight of seaborne goods handled in main ports, by EU Member State, 2020-2021 (million tonnes)
Source: Eurostat.
83
2022

in the second quarter of 2019, maritime transport observed a downwards trend until the second quarter of 2020. Almost half (48 %) of 75 ports surveyed globally in June 2020 had registered a decline in container vessel calls compared to pre-COVID-19 times295. Port throughput was down across the board in Europe in 2020. Traffic bounced back towards the end of 2020 (Figure 4.24), as ports were used as strategic hubs to offset congested supply chains296.
In the second quarter of 2021, the Netherlands, Spain and Italy were the EU countries with the largest amount of maritime freight handled in their main ports, handling more than 100 million tonnes of goods (Figure 4.25). Only four of the maritime EU Member States reported a decrease in the tonnes of goods handled in their main ports compared to the same quarter of 2020. In relative terms, the largest decrease was observed for Finland (-13.9 %), followed by Latvia (-9.8 %), Cyprus (-1.3 %) and Lithuania (-0.4 %). On the other hand, Malta reported the highest increase in main port activity in this period (+51.4 %). Several countries, among which Ireland (+19.4 %) and Romania (+19.0 %), recorded noticeable growths in this period. Portugal, Slovenia, the Netherlands, Belgium and Spain recorded increases of more than 10 %.
The EU Recovery and Resilience Facility is expected to facilitate the inclusion of new investments in ports infrastructure in the National Recovery and Resilience Plans, which will further boost port activities. Other measures put in place by the EU and the Member States should provide additional support for the sector.
4.4.4 INTERACTIONS WITH OTHER SECTORS AND THE ENVIRONMENT Port activities provide the basic infrastructure and services for many other Blue Economy sectors including Marine living resources, Maritime transport, Marine non-living resources, Marine renewable energy, Coastal tourism and Maritime defence and security. Ports are at the heart of the maritime shipping industry, they are the departure, entry and transfer points for all goods, services, and persons travelling by ship. Beyond making use of these key services, ships also dock, refuel, and offload their waste at ports.
In this context, ports may act as facilitators of economic and trade development for their hinterland. On the other hand, ports may compete for space, for instance, with aquaculture and Coastal tourism.
295 https://sustainableworldports.org/wp-content/uploads/2020-06-22-COVID19-Barometer-Report.pdf296 Deloitte. Europe’s ports at the crossroads of transitions A study commissioned by the European Sea Ports Organisation (ESPO), June 2021.297 https://www.espo.be298 EEA-EMSA European maritime transport environmental report 2021, Publications Office, 2021, https://data.europa.eu/doi/10.2800/650762299 https://ec.europa.eu/info/sites/default/files/fueleu_maritime_-_green_european_maritime_space.pdf 300 https://eur-lex.europa.eu/legal-content/EN/TXT/?uri=CELEX:52021DC0550 301 COM/2021/559 final – https://eur-lex.europa.eu/legal-content/en/TXT/?uri=CELEX:52021PC0559 302 https://transport.ec.europa.eu/transport-themes/infrastructure-and-investment/trans-european-transport-network-ten-t_
en?msclkid=48b296dba87411ecb30cdc5a6d06e891
Many European ports are important clusters of energy and indus-try. This role is taken either as provider of clean energy to vessels (for navigation and use while at berth), as import points for clean energy to be used upstream (LNG, hydrogen) or through energy production within their area. In the case of the provision of elec-tricity to vessels, the connections with the energy grid is quite important. Industrial activities can take place also within or close to port areas due to proximity to ease of access to resources or as staging points (for example, the assembly and/ or production of offshore wind equipment297.
Port activities come with challenges, as they can cause local and global environmental impacts such as air pollution, greenhouse gases emissions, waste and garbage generation, noise, ship waste, local community impacts, sediment impacts, dust, water pollution, and use of land due to port development298.
The EU international trade with internal and international market highly depends on seaports. 75 % of imported and exported goods and 31 % of exchanges within the EU market, are transiting via seaports299.
The European Commission has been addressing these challenges through the revision of legislation, including under the ‘Fit for 55 package’ (see Chapter 3.1). With the goal of reducing emissions of net 55 % by 2030, compared to 1990 levels, several initiatives have been adopted to improve the initial 40 % emissions target300.
Among the initiatives submitted, the proposal for the Alternative Fuels Infrastructure Regulation301 is of particular importance to the ports sector, as it is a set of requirements for the provision of energy to maritime vessels, aiming to reduce their environmental impact.
The proposal does not change the requirements of the previous Alternative Fuels Infrastructure Directive in terms of provision of Liquefied Natural Gas (LNG), considering this as a transition fuel. However, the main element is the requirement for ports to make available sufficient capacity of electricity at berth (provide onshore power supply – OPS) to three of the most polluting cate-gories of vessels (container ships, ferries, and cruise vessels). This provision is in parallel to the requirement of the Fuel EU Maritime proposal, requesting vessels to use OPS when available at ports for their energy requirements at berth, thus minimising the risk of stranded assets.
The Trans-European Transport Network (TEN-T)302 ports with a minimum volume of traffic will be required to cover at least 90 % of the port calls with OPS, thus not only reducing CO2 emissions, but also the pollution for port cities and coastal areas.
84
THE
EU B
LUE
ECO
NO
MY
REPO
RT

BOX 4.4 Green Growth Strategy from a Blue Port ‘Blue Growth Vigo’
As a major player in the economic activity in the surroundings of the Ria of Vigo, the Port of Vigo is running since 2016, the appli-cation of the Blue Economy approach in the region through the Blue Growth Vigo Plan (bluegrowthvigo.eu).
The successful implementation of the Blue Growth Plan of the Port of Vigo 2016-2020 has, led to more than 300 participants involved, and to an extension to the period 2021-2027. Some of the highlights among others, include the training of 2 152 users of the Port of Vigo, the reduction of emissions by 28 %, the regeneration of 66 800 m2 of marine soil, a 17 % increase in merchandise traffic, or the creation and preservation of jobs, with 14 062 direct jobs and 50 000 direct and indirect jobs.
All this has been achieved in a concrete way with the collaborative design of 51 projects and the start-up of 33 of them303.
Several projects are being developed under each objective, and can be highlighted:
• Green Port objective – the “Living Port” (H2020) project which aims to promote the conservation and recovery of biodiversity in degraded areas.
• Innovative Port: reference is made to the relevance of being an energy self-sufficient port in the project ‘0 emissions target in 2030’. • Inclusive port, we work to reinforce the professionalisation of workers in the different sectors of the Blue Economy, ‘Marenet’
project (EASME). • Connected Port, leads us to work on projects such as CoLogistics (POCTEC), focused on digitising processes in favour of trans-
parency and process quality control.
Within the Blue Growth Plan, work with the different interest groups is done on specific projects and actions from a comprehensive perspective of competitiveness, connectivity and being green through Zero Emissions. The Green Bay project is an example, focused on promoting electrification and introducing hydrogen in the mobility of the Ria of Vigo.
To endure in this work, great investment and research challenges are faced and must be adapted to each sector, requiring the collaboration of different actors.
Work is reinforced through of the 6 thematic work commissions (fishing, history and training, merchandise and maritime trans-port, biotechnology and blue energy, cruise ship traffic and shipbuilding) that meet to deal with the challenges of sustainability and promote projects and concrete actions. Representatives of these commissions include the business sectors, the Academy the administration and the civil society.
Collaboration between actors throughout the Plan has proven to be highly effective, not only in generating impactful projects for the community, but also in attracting funds: the initiatives included in the plan attracted approximately 67 million euros in pub-lic-private investment and 197 public-private partnerships.
Finally, one of the fundamental keys of the Vigo Blue Growth Plan is the capitalisation of experience and results through trans-fer and commitment to collaboration with other national and international entities and working in a network. This approach has earned the Port numerous awards and recognitions in the last 4 years, namely on sustainability from IAPH, ESPO, the European Commission. The Port has been also participated in international collaboration with: the FAO and the European Commission, on promoting joint work between ports globally; the IOC UNESCO to strengthen Marine Space Planning processes, and the World Bank, the European Parliament and the Committee of the Regions on the impact of the sustainable Blue Economy.
This work and commitment will be reinforced in the 2021–2027 Vigo Blue Growth Plan.
303 www.bluegrowthvigo.eu/impacto
Figure 4.26 Blue Growth Monitoring System
Source: Port of Vigo.
85
2022

As announced in the ‘Commission’s sustainable and smart mobil-ity strategy’304 the European Commission has in 2021 started a major review of existing legislation on flag state responsibilities, port state control and accident investigation. The overall objective is to enable a safe and cost-efficient maritime transport frame-work for businesses and administrations. Maritime safety and smart and sustainable shipping in EU waters continued to rely on the contribution of the European Maritime Safety Agency, the mandate of which will be soon updated and possibly extended to additional areas305.
On the 24th of January 2022, the EU Commission has also adopted four implementing acts supplementing the Directive on port reception facilities306. The Directive, adopted in 2019, pre-vents illegal discharges of waste, generated on ships and pas-sively fished waste, into the sea. The implementing acts will ensure the rules to define if there is sufficient storage capacity for delivery exemptions; the criteria for determining when a ship is entitled to a reduced fee for reduction of port fees for sustainable waste management, criteria for collecting and reporting report on the amount and characteristics of passively fished waste deliv-ered to their ports, and mechanism for the selection of ships for inspection.
Climate change impacts are felt across all Blue Economy sectors. In addition to Maritime transport, the port industry, port infrastruc-ture and port activities are severely affected. To protect from sea levels and extreme weather events, ports need to invest in new resilience and mitigation port infrastructure. At the same time, ports are expected to play an active role in climate change mit-igation, for instance through the greening of the maritime and logistics sector. First, by shifting from conventional fossil fuels to renewable sources of energy and green fuels. Secondly, by making circular economy efforts to reduce and recycle waste alongside sustainable waste management approaches307. Several ports are adopting new strategies to face the new environmental chal-lenges and become greener.
304 COM(2020)789final – https://eur-lex.europa.eu/resource.html?uri=cellar:5e601657-3b06-11eb-b27b-01aa75ed71a1.0001.02/DOC_1&format=PDF 305 European Commission presents landmark Sustainable and Smart Mobility Strategy | CIVITAS 306 https://transport.ec.europa.eu/news/commission-adopts-rules-delivery-waste-ships-eu-ports-2022-01-24_en 307 Deloitte. Europe’s ports at the crossroads of transitions A study commissioned by the European Sea Ports Organisation (ESPO), June 2021.308 Source: Sea Europe.309 Balance (2017).310 Quote from SEA Europe and IndustriAll Europe. Commitment made under the EU Pact for Skills. Upskilling shipbuilding and maritime technology
workers in Europe. https://ec.europa.eu/social/BlobServlet?docId=24825&langId=en
4.5 SHIPBUILDING AND REPAIRThe shipbuilding industry deals with the production of larger (mainly seagoing) vessels intended for the merchant fleet (cargo or passenger transport), the offshore energy industry or military purposes. It also includes products and services supplied for the building, conversion, and maintenance of these ships.
The European shipbuilding industry is important from both an economic and social perspective. It is also linked to other sec-tors including transport, security, energy, research, and the envi-ronment. Shipbuilding is an important and strategic industry in a number of EU countries. Shipyards contribute significantly to regional industrial infrastructure and national security interests.
4.5.1 BACKGROUND
The EU shipbuilding industry is a dynamic and competitive sector. With a market share of around 6 % of the global order book in terms of compensated gross tonnage308 and 19 % in terms of value; for marine equipment, the EU share rises to 50 %309, the EU is a major player in the global shipbuilding industry.
The European Shipbuilding industry is currently composed of approximately 300 shipyards specialised in building and repairing the most complex and technologically advanced civilian and naval ships and platforms and other hardware for maritime applications. The industry is reported to comprise approx. 22 000 equipment suppliers and service companies. According to the partnerships under the EU Pact for Skills, the annual production value of the entire supply chain of the European shipbuilding industry is reported to have reached €125 billion in total, creating 576 000 direct jobs and an additional half a million indirect jobs310
The EU specialises in segments of shipbuilding with high level of technology and added value, such as cruise ships, offshore sup-port vessels, fishing vessels, ferries, research vessels, dredgers, mega-yachts, tugs and other non-cargo carrying ships (ONCCV), etc. The EU is also a global leader in the production of high-tech, advanced maritime equipment and systems ranging from pro-pulsion systems, large diesel engines, environmental, and safety systems, to cargo handling and electronics. This specialisation and leadership position is a direct result of the sector’s continu-ous investments in research and innovation as well as in a highly skilled workforce.
The global economic and financial crisis of 2008 had a profound impact on the industry globally for several years, after which the business model changed and part of the workforce shifted to external subcontractors and suppliers. EU shipbuilders have been reducing costs and restructuring capacity by adjusting
86
THE
EU B
LUE
ECO
NO
MY
REPO
RT

their production programmes and optimising the supply chain. Figures show a significant drop in shipbuilding employment since 2009; however, the sector had been recovering since 2013 also employment-wise.
The pandemic has hit European shipyards extremely hard in 2020, with new orders in Europe declining around 90 % in terms of Compensated Gross Tonnes (CGT), due mainly to the sharp drop in cruise ship orders. Yet, the economic impact of the COVID-19 pan-demic was less pronounced in Asia (-16 % ordering in China and -18 % in South Korea), where shipbuilding is less concentrated on specific market segments. In addition, governments have put in place enormous stimulus packages, complementing, and rein-forcing the effect of existing local content policies and financing tools targeted to their domestic shipbuilders. This has reinforced an already existing trend in reduction of EU shipbuilding activity, which has resulted in decreasing EU market share, currently less than 5 %311.
For the purpose of this report, the Shipbuilding and repair sector includes the following sub-sectors and activities:
1. Shipbuilding: building of ships and floating structures; build-ing of pleasure and sporting boats; repair and maintenance of ships and boats.
2. Equipment and machinery: manufacture of cordage, rope, twine and netting; manufacture of textiles other than apparel; manufacture of sport goods; manufacture of engines and turbines (except aircraft), and manufacture of instruments for measuring, testing and navigation.
While shipyards can be clearly identified as working 100 % in the domain of the Blue Economy, companies producing equip-ment and machinery can work for both maritime and non-mari-time industries. In other words, the outputs of these activities can have multiple uses. For example, safety equipment, communica-tion systems, navigation equipment, other electrical components and machinery that are used in the construction of vessels might also be used as intermediary inputs for non-maritime industries. Therefore, our Blue Economy statistics for this sub-sector result from the estimation of their maritime proportion on the basis of available Eurostat’s statistics on the production of manufactured goods (PRODCOM) (see methodology in Annex, for more details).
Depending on the extent of vertical integration and specialisation of industries, a different share of manufacturing and industrial activities can be distributed across their supply chain. National production and business statistics do not always allow for a detailed disaggregation of economic variables by destination, such as maritime use. Shipbuilding, for instance, is an industry with multiple indirect and induced effects (see Section 2.5 for more details). Only few of them are captured by our Blue Economy statistics, which therefore should be considered as an underesti-mation of the total.
311 European Commission. Scenarios towards co-creation of transition pathway for tourism for a more resilient, innovative and sustainable ecosystem. Staff Working Document SWD(2021) 164 final. More information on COVID-19 effects on shipbuilding can be found in ‘Impact of COVID-19 on the Maritime Sector in the EU’, EMSA: http://www.emsa.europa.eu/publications/item/4436-impact.html
Overall, Shipbuilding and repair accounted for 7 % of the jobs, 9 % of the GVA and 5 % of the profits in the total EU Blue Economy in 2019. The sector has recovered from the drop experienced in 2012-3 and 2015.
4.5.2 MAIN RESULTS
Size of the EU Shipbuilding and repair sector in 2019-2020
In 2019, the GVA in the sector was valued at almost €15.6 bil-lion, up 39 % compared to 2009. Gross profit, at €3.3 billion, was 89 % higher than the 2009 figure (€1.8 billion) (Figure 4.27). Reported turnover was €57.9 billion, a 23 % rise in 2009.
Preliminary data from Eurostat suggest turnover decreased by about 5 % in 2020. It is expected that GVA and gross profits have suffered a similar reduction.
Almost 300 000 persons were directly employed in the sector (down less than 2.5 % since 2009). On the other hand, personnel costs increased by 27 % in 2019 compared to 2009 (Figure 4.28). With a total of €12.0 billion in personnel costs, the average gross wage was more than €40 300, up 30 % from almost €31 000 in 2009.
Germany leads Shipbuilding and repair with 17 % of the jobs and 25 % of the GVA, followed closely by France and Italy with 14 % of the jobs each and 21 % and 19 % of the GVA, respectively.
Results by sub-sectors and Member States
Employment: Of the almost 300 000 persons directly employed in the sector, about 255 630 persons (85 %) work in Shipbuilding and more than 43 450 persons (15 %) work in the Equipment and machinery sub-sector. The 3 % fall in employment over the period was due to the 4 % decrease in Shipbuilding, while employ-ment increased 7 % in the Equipment and machinery sub-sector. The Member States that employ more workers in this sector are Germany (17 %), followed closely by Italy and France (14 % each).
Gross value added: Most of the value added is generated in Shipbuilding (83 %). GVA in both sub-sectors increased in 2019 compared to 2009: Shipbuilding by 43 % and Equipment and machinery by 21 %. The top Member States producers are Germany (25 %), followed by France (21 %) and Italy (19 %).
Gross profit: The bulk (87 %) of profits in 2019 were generated by Shipbuilding (€2.9 billion), while Equipment and machinery generated the remaining 13 % (€0.4 billion). Profits rose by 89 % compared to 2009, due to increases in Shipbuilding (+121 %), while profits from Equipment and machinery slightly decreased (-6 %). It is expected that gross operating margins were further eroded in 2020, as a consequence of the COVID-19 crisis.
87
2022

Net investment in tangible goods: Net investments reached more than €1.2 billion in 2019. Overall, investments decreased by 18 % compared to 2009 figures. This decrease is due to investments in Shipbuilding falling by 25 %, while investments in Equipment and machinery increased by 24 %. The impact of the COVID-19 pandemic has further reduced ship-owners’ interest in investing in new ships.
Turnover: Reported turnover for 2019 amounted to €49.0 billion for Shipbuilding and €8.9 billion for Equipment and machinery, indicating an increase of 26 % and 9 % respectively compared to 2009.
Figure 4.28 Persons employed (thousand), personnel costs (€ million) and average wage (€ thousand) in the EU Shipbuilding and repair sector
Source: Eurostat (SBS) and own calculations.
Figure 4.27 Size of the EU Shipbuilding and repair sector, € million
Note: Turnover should be interpreted with caution due to the problem of double counting throughout the value chain. Turnover in 2020 is an estimation based on Eurostat’s preliminary data, GVA and Gross operating surplus are estimated assuming that follow the same trend as turnover.
Source: Eurostat (SBS) and own calculations.
0
500
1 000
1 500
2 000
2 500
3 000
3 500
4 000
2009
2010
2011
2012
2013
2014
2015
2016
2017
2018
2019
2020
Gross operating surplus
0
10 000
20 000
30 000
40 000
50 000
60 000
70 000200 9 201 0 201 1 201 2 201 3 201 4 201 5 201 6 201 7 201 8 201 9 202 0
Turnover
0
500
1 000
1 500
2 000
2 500
3 000
3 500
4 000
2009
2010
2011
2012
2013
2014
2015
2016
2017
2018
2019
2020
Gross operating surplus
0
5 000
10 000
15 000
20 000
200 9 201 0 201 1 201 2 201 3 201 4 201 5 201 6 201 7 201 8 201 9 202 0
GVA
0
500
1 000
1 500
2 000
2 500
3 000
3 500
4 000
2009
2010
2011
2012
2013
2014
2015
2016
2017
2018
2019
2020
Gross operating surplus
0
200
400
600
800
1 000
1 200
1 400
1 600
1 800
2009
2010
2011
2012
2013
2014
2015
2016
2017
2018
2019
Net investment
0
5
10
15
20
25
30
35
40
45
2009
2010
2011
2012
2013
2014
2015
2016
2017
2018
2019
Average remuneration per employee
0
2
4
6
8
10
12
14
0
50
100
150
200
250
300
350
2009
2010
2011
2012
2013
2014
2015
2016
2017
2018
2019
Persons employed (left-axis) Personnel costs (right-axis)
0
2
4
6
8
10
12
14
0
50
100
150
200
250
300
350
2009
2010
2011
2012
2013
2014
2015
2016
2017
2018
2019
Persons employed (left-axis) Personnel costs (right-axis)
88
THE
EU B
LUE
ECO
NO
MY
REPO
RT

83%
17%
Value added by sub-sector
Shipbuilding
Equipment andmachinery
4.5.3 TRENDS AND DRIVERS
Before COVID-19, Europe’s shipbuilding industry was faring bet-ter than its competitors. After having lost cargo market share to the Asian shipbuilding industry in the previous decades, European shipyards had successfully repositioned to higher-end niche seg-ments like cruise ships, ferries and specialised non-cargo carrying vessels. COVID-19 has severely hit European shipyards both on the demand and production side. In the first half of 2020, orders registered a 64 % decline in terms of compensated gross tonnage (CGT), or a 72 % plunge in value from 2019, representing the strongest drop globally. The “ordering freeze” caused by COVID-19 affected particularly the cruise sector, which accounts for more than 80 % of the European orderbook312.
The resulting reduction in shipyards’ output (i.e. -27 % from 2019) also led to significant contractions across the supply chain, affecting Europe’s maritime equipment manufacturing segment.
312 USWE (2020). Report on Forecasting Trends and Challenges for a 4.0 Shipbuilding Workforce in Europe.313 SEA Europe. Annual Report 2020.314 SEA Europe. Market Developments & Covid-19 Impact. Social Dialogue Committee. November 2020.315 Sea Europe (2020). SEA MM Report No 50.316 Deadweight tonnage.317 Clarkson Research.318 SMM Digital live press conference, February 2021.
Because of the lockdowns, several production facilities were closed temporarily in March-April 2020. The situation improved in the second half of the year, as production gradually resumed313. This recovery nonetheless suffered from construction delays, especially for cruise ships, partly because of the financial strains imposed on customers by the health crisis.
The effects of the COVID-19 pandemic continue to affect the ship-building and maritime equipment industry worldwide and espe-cially, in Europe. Reportedly, production remains at lower levels than usual in many shipyards314. The crisis will likely have lasting repercussions and uncertainties on potential demand recovery prospects, investments and production over the next years315.
In 2021 the world shipyards delivered about 80 million DWT316 of ships, while orders for 2022 are down to 55 million DWT317. Investments are therefore postponed until the return of better market conditions and confidence, particularly in Europe318.
Figure 4.29 Share of employment in the EU Shipbuilding and repair sector, 2019
Source: Eurostat (SBS) and own calculations.
Figure 4.30 Share of the GVA generated in the EU Shipbuilding and repair sector, 2019
Source: Eurostat (SBS) and own calculations.
17%
14%
14%
9%8%
38%
Employment by Member State
Germany
Italy
France
Poland
Spain
Others85%
15%
Employment by sub-sector
Shipbuilding
Equipment andmachinery
85%
15%
Employment by sub-sector
Shipbuilding
Equipment andmachinery
85%
15%
Employment by sub-sector
Shipbuilding
Equipment andmachinery
25%
21%
19%
7%
5%
23%
Value added by country
Germany
France
Italy
Spain
Netherlands
Others
89
2022

According to a survey undertaken by the European Community Ship Owners Association (ECSA) in June 2020, at least 70 % of the companies expected a decrease in turnover in 2nd half of 2020 compared to of the same period in 2019319. The hardest hit seg-ments were RoPax Ferries, Passenger Ferries, RoRo, General Cargo, Car carriers, Offshore service vessels (especially oil & gas) and Cruises. In the 2nd half of 2020 (compared to the 2nd half of 2019) seafarer employment was expected to fall by up to 20 % in a third of companies. Additionally, one out of ten companies expected a fall in seafarer jobs of 40 %. Prospects for 2021 based on the survey showed similar patterns320. In cruise, offshore, car carriers and ferries, some companies expected cuts of over 60 % of employment. Tanker and dry bulk companies anticipated the smallest employment changes.
The pandemic has only worsened the situation for the European shipbuilding output, which had already decreased by almost 50 % in the 2010-2019 period, when compared to 2000-2010. Ordering at European yards was extremely limited in 2020, with only 58 units of 0.6m CGT reported ordered, down by 63 % from last year in CGT321. Comparing the first halves of both 2019 and 2020, new orders in European shipyards decreased by 62 % (from 1 591 to 599), completion of constructions fell by close to 48 % (1 254 to 646) and order books fell from 12 067 to 11 332 (i.e. 6 %).
Compared with the rest of the world, the European Shipbuilding sector seems to have suffered significantly, with orderbooks being the only exception (in both cases at 6 %).
319 https://www.ecsa.eu/sites/default/files/publications/Survey %20June %202020 %20Final %20Conclusions.docx.pdf320 https://www.ecsa.eu/sites/default/files/publications/Survey %20June %202020 %20Final %20Conclusions.docx.pdf321 Note that this data is applicable until June 2020.
Figure 4.32 Comparison in Shipbuilding output in Europe between 2019 and 2020
100
2 100
4 100
6 100
8 100
10 100
12 100
Completions New orders Orderbook
1st half 2019 1st half 2020
Source: HIS Fairplay in Sea Europe.
Table 4.2 Decrease in Shipbuilding output between the first half of 2019 and first half of 2020 in Europe and the World
Europe World
Completions 48 % 17 %
New orders 62 % 40 %
Orderbook 6 % 6 %
Source: HIS Fairplay and Sea Europe, own elaboration
Figure 4.31 Evolution of European Order book’s Product Portfolio by Ship Types (in ‘000 CGT).
Source: SEA Europe (Annual Report 2020) based on IHS data.
90
THE
EU B
LUE
ECO
NO
MY
REPO
RT

The lack of a levelled playing field in international trade penalises the European shipbuilding industry. Despite the strong interna-tional competition, mainly from China and South Korea, the out-look looks promising. Demand for new ships, equipment and tech-nologies for all Blue Economy sectors is expected to increase in the next decade. It is anticipated that new ships, equipment, and technologies will increase in complexity, requiring specific exper-tise, highly skilled personnel and know-how, in which European shipyards currently excel322.
In order to deliver more cost-effective, safer, competitive, and eco-friendly vessels and offshore structures, the shipbuilding industry is expected to employ a wide range of technological innovations, for instance in the field of lightweight materials, dig-itisation, automation, advanced design and production technology. Therefore, Europe has the opportunity to maintain and strengthen its leadership in the design, engineering, construction and mainte-nance of highly integrated complex systems in high value ships, equipment and machinery323.
BOX 4.5 ECOPRODUGI – Cleaner Shipping for the Baltic SeaECOPRODIGI is a project that aims to increase eco-efficiency efficient operations and processes in the shipping industry, at all stages of the vessel lifecycle: from design and building to the use, maintenance, stowage as well as conversion pro-cesses. The project takes place in the Baltic, one of the busi-est seas. ECOPRODIGI provides information on key eco-inef-ficiencies of the industry, and also develops and pilots digital solutions to measure, visualise and optimise the industry pro-cesses. The project also develops trainings for the industry actors, workshops and policy recommendations.
ECOPRODIGI is funded by the Interreg Baltic Sea Region Programme. Total budget: €4 243 492.11 (of which European Regional Development Fund co-financing: €2 996 231.57; Norwegian funding: €141 125.00).
Duration of the project: 10/2017–12/2020
4.5.4 INTERACTIONS WITH OTHER SECTORS AND THE ENVIRONMENTThe shipbuilding industry impacts on various policy areas, in par-ticular research and innovation, intellectual property, maritime clusters, safety, and the environment. In particular, Shipbuilding provides the assets, capabilities, technologies and knowhow for several Blue Economy activities such as the Primary sector (capture fisheries and offshore aquaculture), Maritime transport, Non-living resources, Marine renewable energy, Coastal tourism (transport) and Maritime defence and security. Shipbuilding and repair are also highly linked to Port activities. The EU Shipbuilding and equipment sectors have new opportunities, especially work-ing alongside growing and emerging sectors, such as assistance
322 USWE (2020). Report on Forecasting Trends and Challenges for a 4.0 Shipbuilding Workforce in Europe. 323 Ibid.324 USWE (2020). Report on Forecasting Trends and Challenges for a 4.0 Shipbuilding Workforce in Europe.325 Ship-technology.com. GG5G Class Ro-Ro Vessels. 9 December 2020.
vessels and structures for offshore wind farms, as well as other ocean technologies and the exploration and exploitation of the deep-sea.
The management of hazardous wastes, wastewater, stormwater, and air emissions generated by vessel construction, maintenance, repair and dismantling activities (EBDR) in Ship building and recy-cling activities are responsible for environmental pressures.
Given that shipyards are inevitably near and on water, the poten-tial impact of emissions from shipbuilding operations on their immediate environment can be very significant. This increases the likelihood of propagation of some of those emissions, notably due to the hazardous materials (such as asbestos, lead or mercury) it contains in either its structure or equipment. In addition, after its construction, ships will continue to have impacts throughout their operational lives, and until their final dismantling. Regulation (EU) No 1257/2013 on ship recycling aims to prevent, reduce and minimise accidents, injuries and other negative effects on human health and the environment when ships are recycled and the haz-ardous waste they contain is removed. It also forbids the use of certain hazardous materials. It lays down requirements for ships and recycling facilities, to ensure that an environmentally safe recycling process; restricts the installation and use of hazardous materials on ships (e.g. asbestos or ozone-depleting substances); and establishes a European list of ship recycling facilities.
The legislation applies to all ships flying the flag of an EU country and to vessels with non-EU flags that call at an EU port or anchor-age. The only exceptions are warships, other vessels on non-com-mercial government service and ships below 500 gross tonnes. Recycling may only take place at facilities listed on the EU List of facilities, which was launched by Commission Implementing Decision (EU) 2016/2323. The facilities may be located in the EU or in non-EU countries. They must comply with a series of require-ments related to workers’ safety and environmental protection. As of December 2020, all existing EU flagged ships and non-EU ships calling at an EU port or anchorage must have a mandatory inventory of Hazardous Materials. An evaluation of the Evaluation of Ship Recycling Regulation is due by December 2023.
Increasingly stringent environmental regulations driven by soci-etal and policy expectations on shipping to reduce its environ-mental footprint will continue to be key drivers for fleet replace-ment investments324. As part of the decarbonisation process, the European shipping industry is gradually developing and deploying vessels that minimize emissions. An example is the ferry ‘Ellen’: With support from the EU Horizon 2020 programme, this electric ferry was completed in 2019 to connect the islands of Ærø and Fynshav in Denmark. The ferry is equipped with the largest battery ever installed on a ship, having a capacity of 4.3 MWh, allowing to save 2 000 tons of CO2 per year (Figure 4.33). Another example is Grimaldi’s Green 5th Generation-class (GG5G-class) vessels, which employ a hybrid roll-on/roll-off (Ro-Ro) technology for short-sea shipping. They are powered by lithium batteries to guarantee zero emissions inside ports. Since May 2020, twelve of such ro-ro freighters, with the capacity for 3 500 passengers, 271 cars and 210 heavy vehicles, operate in the Mediterranean325.
91
2022

Although shipping is already the most environmentally friendly mode of transport (see section 6.3), further reductions to emis-sions are needed. The global shipbuilding market is expected to grow in the future due to increasing seaborne trade and economic growth, rising energy consumption, demand of eco-friendly ships, LNG fuelled engines and shipping services. Many new projects are being developed across the EU.
Figure 4.33 E-ferry Ellen
Source: European Community Shipowners’ Associations (ECSA).
326 Aspiring Wingsails
BOX 4.6 Aspiring wingsails326: reducing fuel use and pollutant emmissions in vesselsAspiring wings is a consortium formed by two SMEs from two European countries: Spain and Norway. Bound4blue (Spain) is in charge of the aspiring wingsail technology development and overall turn-key solution management. B4b is a private SME based in Cantabria (Spain), whose mission is to deliver automated wind-assisted propulsion systems harnessing renewable energy as a turn-key solution to all shipowners and operators looking to decrease their fuel-related costs and pollutant emissions. The first product of the company is a rigid wingsail system designed to be installed onto mer-chant vessels as complementary propulsion system, taking profit of wind power to reduce their fuel consumption and pollutant emissions.
Kyma a.s (Norway) is in charge of performance monitoring of the vessel, comparing its performance pre- and post-wingsail installation. They are specialists in the field of manufactur-ing and development of products for marine performance monitoring. The Kyma products are installed on more than 6 000 vessels worldwide and supplied to numerous reputable shipowners and management companies. The Kyma system displays instant values on board, in assistance to the best possible operation of the vessel.
The consortium will demonstrate for the first time ever, the use of B4B´s new aspiring wingsail (patent pending) in a fishing vessel provided by one of their customers in Galicia (Spain). Demo journeys will be carried out in order to evaluate performance. The Norwegian partner, Kyma, will measure the fuel saving efficiency of B4B´s new wingsail.
The outcome of the project is to prove and validate the effi-ciency of bound4blue´s aspiring wingsail and kyma’s perfor-mance monitoring system adapted to sail-assisted fishing vessel owned by OR.PA.GU, in order to reduce fuel use and pollutant emissions.
Expectations are that fuel use and associated emissions are reduced by up to 40 % in the fishing sector. The outcome of the project is proving the efficiency of B4B´s aspiring wing-sail (patent to be filed during project development) in reduc-ing fuel use in a fishing vessel. This will increase the compet-itiveness of the European fishing industry (and the European maritime transport industry as well, since the solution is also suitable for merchant and passenger vessels). This will result in job creation, both at B4B and in the shipbuilding and repair sector, and their auxiliary companies.
The project received EU funding amounting to €647 138 and runs from 01/01/2019 to 01/06/2022.
92
THE
EU B
LUE
ECO
NO
MY
REPO
RT

4.6 MARITIME TRANSPORTMaritime transport is an essential element of global trade and the economy and is therefore highly globalised. In the EU, it car-ries 77 % of external trade and 35 % of intra-EU trade. In 2019, ships registered under the flag of an EU Member State repre-sented 17.6 % of the total world fleet measured in dead weight tonnage (DWT). EU passenger ships can carry up to 1.3 million passengers, representing 40 % of the world’s passenger transport capacity. In 2019, almost half of maritime traffic in the EU was from ships engaged exclusively in domestic routes, mainly due to the frequent crossings made by roll-on, roll-off passenger ships and ferries. EU ports handled close to 4 billion tonnes of goods, accounting for around half of all goods by weight traded between the EU-27 and the UK, and the rest of the world. Maritime trans-port is thus an important pillar of the Blue Economy. On the other hand, it exerts pressures on the environment. Greenhouse gas emissions as well as air pollution, in particular nitrogen and sul-phur oxides, and particulate matter, from shipping and port activ-ities contribute to global warming, leading, among others to an increase in extreme weather events and sea level rise327. To a marginal extent, these pressures have been partly mitigated dur-ing the COVID-19 pandemic.
4.6.1 BACKGROUND
Maritime transport plays a key role in the world’s economy and holds a crucial contribution to decarbonisation. Shipping is the most carbon-efficient mode of transportation, with the lowest carbon dioxide (CO2) emissions per distance and weight carried. International maritime shipping accounts for less than 3 % of annual global CO2
328 and produces less exhaust gas emissions – including nitrogen oxides, hydrocarbons, carbon monoxide and sulphur dioxide – for each tonne transported per kilometre than air or road transport329. However, given the importance of maritime transport and the prospects of increased maritime transport, it is indispensable that the industry continues to reduce its environ-mental impact.
Due to the expected growth of the world economy and associated transport demand from world trade, greenhouse gas emissions from shipping could grow from 50 % to 250 % by 2050 if meas-ures are not taken330, making it paramount for the industry to continue to improve energy efficiency of ships and to shift to alternative fuels.
The majority of goods transported into and out of the EU are shipped using maritime transport (Figure 4.34). Maritime transport plays a key role in the EU economy and trade, estimated to rep-resent around 80 % of worldwide goods transportation and one third of the intra-EU trade. Moreover, almost 420 million passen-gers aboard cruises and ferries embark and disembark at EU ports in 2019, a 1.8 % increase from the previous year331.
327 European Environmental Agency (EEA). European Maritime Transport Environmental Report 2021. Publications Office of the European Union, 2021.328 International Maritime Organization (IMO) expert working group http://www.imo.org329 Swedish Network for Transport and the Environment.330 http://www.imo.org/en/OurWork/Environment/PollutionPrevention/AirPollution/Pages/Greenhouse-Gas-Studies-2014.aspx331 Eurostat’s Passengers embarked and disembarked in all ports by direction – annual data.332 Inland transport is considered part of the Blue Economy because it includes transport of passengers and freight via rivers, canals, lakes and other inland waterways,
including within harbours and ports.
Figure 4.34 Mode of transport ( %) used by goods traded to and from the EU in 2019.
Source: adapted from EEA (2021). European Maritime Transport Environmental Report 2021.
In 2019, the total weight of goods transported to/from main ports in the EU-27 by short sea shipping (excludes the movement of cargo across oceans, deep sea shipping) was 1.8 billion tonnes.
For the purpose of this report, Maritime transport includes the following sub-sectors:
1. passenger transport: sea and coastal passenger water transport and inland332 passenger water transport;
2. freight transport: sea and coastal freight water transport and inland freight water transport;
3. services for transport: renting and leasing of water transport equipment.
Overall, Maritime transport accounted for 9 % of the jobs, 19 % of the GVA and 25 % of the profits in the EU Blue Economy in 2019. The sector seems to have recovered from the drop in 2016.
4.6.2 MAIN RESULTS
Size of the EU Maritime transport sector in 2019-20
The sector generated a GVA of €34.3 billion in 2019, which is 27 % higher compared to 2009. Gross profit, at €18.2 billion, increased by 30 % on 2009. The profit margin was estimated at 11 %, the same as in 2009. The investment ratio (gross invest-ment in tangible goods / GVA) was estimated at 34 %, still well below the figure for 2009 (65 %). The turnover reported for 2019 was €163.4 billion, a 34 % increase on 2009.
93
2022

Figure 4.35 Size of the EU Maritime transport sector, € million
Note: Turnover should be interpreted with caution due to the problem of double counting throughout the value chain. Turnover in 2020 is an estimation based on Eurostat’s preliminary data, GVA and Gross operating surplus are estimated assuming that follow the same trend as turnover.
Source: Eurostat (SBS) and own calculations.
Preliminary data from Eurostat suggest that in 2020 turno-ver decreased by about 11 % from 2019, primarily due to the reduction in passenger transport imposed by the COVID-19 lock-downs333. It is expected that GVA and gross profits have suffered similar decreases.
In 2019, more than 403 000 persons were directly employed in the sector (13 % more than in 2009). Total wages and salaries amounted to €15.9 billion and the annual average wage was esti-mated at almost €39 000, up 9 % compared to 2009.
333 UNCTAD (2021). COVID-19 and Maritime Transport: Impact and Responses. Transport and Trade Facilitation Series No 15. UNCTAD/DTL/TLB/2021/1. Geneva and New York.
Germany leads Maritime transport, contributing with 34 % of the jobs and 36 % of the GVA, followed by Italy with 18 % of the jobs and 14 % of the GVA; while Denmark has only the 7 % of the jobs, but 18 % of the GVA.
Results by sub-sectors and Member States
Employment: Services for transport account for 46 % of the jobs (185 400 persons), while Passenger transport covered 30 % (120 300 persons) and Freight transport the remaining 24 % (97 280 persons). Overall employment increased 13 % in 2019
0
50 000
100 000
150 000
200 0002009
2010
2011
2012
2013
2014
2015
2016
2017
2018
2019
2020
Turnover
0
2 0004 0006 0008 000
10 00012 00014 00016 00018 00020 000
2009
2010
2011
2012
2013
2014
2015
2016
2017
2018
2019
2020
Gross operating surplus
0
2
4
6
8
10
12
14
16
18
20
2009
2010
2011
2012
2013
2014
2015
2016
2017
2018
2019
Gross investment
Figure 4.36 Persons employed (thousand), personnel costs (€ million) and average wage (€ thousand) in the EU Maritime transport sector
Source: Eurostat (SBS) and own calculations.
0
10 000
20 000
30 000
40 000
20 09 20 10 20 11 20 12 20 13 20 14 20 15 20 16 20 17 20 18 20 19 20 20
GVA
0
50 000
100 000
150 000
200 000
2009
2010
2011
2012
2013
2014
2015
2016
2017
2018
2019
2020
Turnover
024681012141618
050
100150200250300350400450
2009
2010
2011
2012
2013
2014
2015
2016
2017
2018
2019
Persons employed (left-axis) Personnel costs (right-axis)
024681012141618
050
100150200250300350400450
2009
2010
2011
2012
2013
2014
2015
2016
2017
2018
2019
Persons employed (left-axis) Personnel costs (right-axis)
0
10
20
30
40
50
2009 2010 2011 2012 2013 2014 2015 2016 2017 2018 2019
Average remuneration per employee
024681012141618
050
100150200250300350400450
2009
2010
2011
2012
2013
2014
2015
2016
2017
2018
2019
Persons employed (left-axis) Personnel costs (right-axis)
94
THE
EU B
LUE
ECO
NO
MY
REPO
RT

compared to 2009; the 20 % decrease in Freight transport was compensated by the 25 % increase in Services and +37 % in Passenger transport. The top Member States contributors are Germany (34 %), followed by Italy (18 %), France (8 %), and the Netherlands and Denmark (7 % each).
Gross value added: In 2019, freight transport covered 43 % of the sector’s GVA, amounting to €14.8 billion followed by Services with 32 % (€11.1 billion) and then Passenger transport with 25 % (€8.4 billion). Overall GVA increased 27 % compared to 2009: +62 % in Passenger transport, +27 % in Services while Freight transport increased by 14 %. Top Member States contributors are Germany at €12.2 billion (36 %), followed by Denmark (€6.3 bil-lion), Italy (€4.9 billion), and the Netherlands (€2.0 billion).
Gross profit: In 2019, profit is mainly generated in Freight trans-port, €9.8 billion (54 %), followed by Passenger transport with €4.5 billion (25 %) and then Services €3.9 billion (21 %). Overall profit increased 30 % compared to 2009, with Passenger trans-port increasing 102 %, while Services for transport increasing just 1 %, and Freight transport increasing by 24 %.
334 Net investment in tangible goods unavailable for the sector.
Gross investment in tangible goods334. In 2019, gross investment amounted to €11.9 billion, a 32 % plunge compared to 2009. Services received 13 % of the sector investment, Passenger trans-port received 38 % and Freight transport received 49 %. Services and Freight transport saw investments fall by 44 % and 51 % compared to 2009, respectively, while investments in Passenger transport increased 20 %.
Turnover: Again, turnover is mainly generated in Freight transport, accounting for 59 % of the total sector turnover (€96.6 billion), followed by Services at 27 % (€43.9 billion) and then Passenger transport with 14 % (€22.9 billion). Overall sector’s turnover in 2019 increased 34 % compared to 2009: +45 % in Passenger transport, +32 % in Services and +31 % in Freight transport. However, 2020 turnover suffered a 12 % decrease from 2019 due to the disruptions in maritime transportation networks and reduced demand in destination markets resulting from the COVID-19 pandemic. This reduced the overall growth from 2009 to 16 %.
Figure 4.37 Share of employment in EU Maritime transport sector, 2019
Source: Eurostat (SBS) and own calculations
Figure 4.38 Share of the GVA generated in the EU Maritime transport sector, 2019
Source: Eurostat (SBS) and own calculations.
30%
24%
46%
Employment by sub-sector
Passenger transport
Freight transport
Services for transport
34%
18%8%
7%
7%
26%
Employment by Member State
Germany
Italy
France
Netherlands
Denmark
Others
34%
18%8%
7%
7%
26%
Employment by Member State
Germany
Italy
France
Netherlands
Denmark
Others
25%
43%
32%
Value added by sub-sector
Passenger transport
Freight transport
Services for transport
36%
18%14%
6%
4%
22%
Value added by Member State
Germany
Denmark
Italy
Netherlands
France
Others
36%
18%14%
6%
4%
22%
Value added by Member State
Germany
Denmark
Italy
Netherlands
France
Others
95
2022
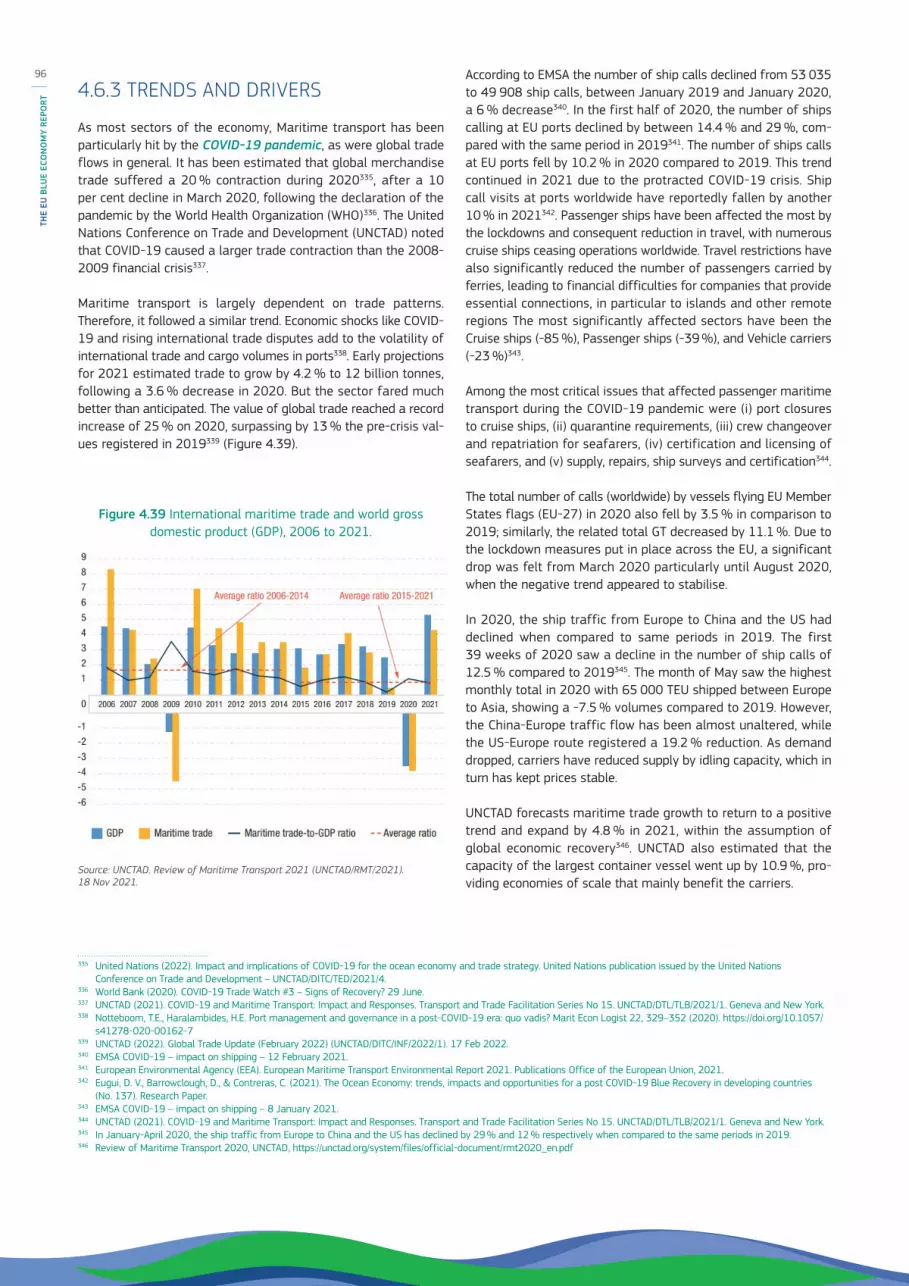
4.6.3 TRENDS AND DRIVERS
As most sectors of the economy, Maritime transport has been particularly hit by the COVID-19 pandemic, as were global trade flows in general. It has been estimated that global merchandise trade suffered a 20 % contraction during 2020335, after a 10 per cent decline in March 2020, following the declaration of the pandemic by the World Health Organization (WHO)336. The United Nations Conference on Trade and Development (UNCTAD) noted that COVID-19 caused a larger trade contraction than the 2008-2009 financial crisis337.
Maritime transport is largely dependent on trade patterns. Therefore, it followed a similar trend. Economic shocks like COVID-19 and rising international trade disputes add to the volatility of international trade and cargo volumes in ports338. Early projections for 2021 estimated trade to grow by 4.2 % to 12 billion tonnes, following a 3.6 % decrease in 2020. But the sector fared much better than anticipated. The value of global trade reached a record increase of 25 % on 2020, surpassing by 13 % the pre-crisis val-ues registered in 2019339 (Figure 4.39).
Figure 4.39 International maritime trade and world gross domestic product (GDP), 2006 to 2021.
Source: UNCTAD. Review of Maritime Transport 2021 (UNCTAD/RMT/2021). 18 Nov 2021.
335 United Nations (2022). Impact and implications of COVID-19 for the ocean economy and trade strategy. United Nations publication issued by the United Nations Conference on Trade and Development – UNCTAD/DITC/TED/2021/4.
336 World Bank (2020). COVID-19 Trade Watch #3 – Signs of Recovery? 29 June.337 UNCTAD (2021). COVID-19 and Maritime Transport: Impact and Responses. Transport and Trade Facilitation Series No 15. UNCTAD/DTL/TLB/2021/1. Geneva and New York.338 Notteboom, T.E., Haralambides, H.E. Port management and governance in a post-COVID-19 era: quo vadis? Marit Econ Logist 22, 329–352 (2020). https://doi.org/10.1057/
s41278-020-00162-7339 UNCTAD (2022). Global Trade Update (February 2022) (UNCTAD/DITC/INF/2022/1). 17 Feb 2022.340 EMSA COVID-19 – impact on shipping – 12 February 2021.341 European Environmental Agency (EEA). European Maritime Transport Environmental Report 2021. Publications Office of the European Union, 2021.342 Eugui, D. V., Barrowclough, D., & Contreras, C. (2021). The Ocean Economy: trends, impacts and opportunities for a post COVID-19 Blue Recovery in developing countries
(No. 137). Research Paper.343 EMSA COVID-19 – impact on shipping – 8 January 2021.344 UNCTAD (2021). COVID-19 and Maritime Transport: Impact and Responses. Transport and Trade Facilitation Series No 15. UNCTAD/DTL/TLB/2021/1. Geneva and New York.345 In January-April 2020, the ship traffic from Europe to China and the US has declined by 29 % and 12 % respectively when compared to the same periods in 2019.346 Review of Maritime Transport 2020, UNCTAD, https://unctad.org/system/files/official-document/rmt2020_en.pdf
According to EMSA the number of ship calls declined from 53 035 to 49 908 ship calls, between January 2019 and January 2020, a 6 % decrease340. In the first half of 2020, the number of ships calling at EU ports declined by between 14.4 % and 29 %, com-pared with the same period in 2019341. The number of ships calls at EU ports fell by 10.2 % in 2020 compared to 2019. This trend continued in 2021 due to the protracted COVID-19 crisis. Ship call visits at ports worldwide have reportedly fallen by another 10 % in 2021342. Passenger ships have been affected the most by the lockdowns and consequent reduction in travel, with numerous cruise ships ceasing operations worldwide. Travel restrictions have also significantly reduced the number of passengers carried by ferries, leading to financial difficulties for companies that provide essential connections, in particular to islands and other remote regions The most significantly affected sectors have been the Cruise ships (-85 %), Passenger ships (-39 %), and Vehicle carriers (-23 %)343.
Among the most critical issues that affected passenger maritime transport during the COVID-19 pandemic were (i) port closures to cruise ships, (ii) quarantine requirements, (iii) crew changeover and repatriation for seafarers, (iv) certification and licensing of seafarers, and (v) supply, repairs, ship surveys and certification344.
The total number of calls (worldwide) by vessels flying EU Member States flags (EU-27) in 2020 also fell by 3.5 % in comparison to 2019; similarly, the related total GT decreased by 11.1 %. Due to the lockdown measures put in place across the EU, a significant drop was felt from March 2020 particularly until August 2020, when the negative trend appeared to stabilise.
In 2020, the ship traffic from Europe to China and the US had declined when compared to same periods in 2019. The first 39 weeks of 2020 saw a decline in the number of ship calls of 12.5 % compared to 2019345. The month of May saw the highest monthly total in 2020 with 65 000 TEU shipped between Europe to Asia, showing a -7.5 % volumes compared to 2019. However, the China-Europe traffic flow has been almost unaltered, while the US-Europe route registered a 19.2 % reduction. As demand dropped, carriers have reduced supply by idling capacity, which in turn has kept prices stable.
UNCTAD forecasts maritime trade growth to return to a positive trend and expand by 4.8 % in 2021, within the assumption of global economic recovery346. UNCTAD also estimated that the capacity of the largest container vessel went up by 10.9 %, pro-viding economies of scale that mainly benefit the carriers.
96
THE
EU B
LUE
ECO
NO
MY
REPO
RT

Figure 4.40 Ship calls reported to SSN in 2019 and 2020 per month
Source: EMSA347.
According to Container Trades Statistics348 demand data, the worldwide decline in demand growth, reaches almost 17 % per year on a yearly basis (until April). During the first quarter of 2020, the global demand declined by 8.1 %, resulting in a total loss of 4.4 million TEU (twenty-foot equivalent unit) of 2020 cargo compared to 2019. Containership capacity growth is set to slow to a moderate 2.3 % in full year 2020. Container shipping markets have seen clear improvements, and though major risks remain, the outlook is more promising than previously. Global container volumes were up 6.9 % in September 2020 compared to 2019, and the trend is set to continue rising through a capacity curb349. The period starting from November 2020 saw a dramatic increase in the price of shipping containers in Asia to Europe routes, from about €2 111 ($2 500) in November to €6 744 ($8 159) in February350. In 2021 congested ports and delays in supply have caused global disruption in supply chains and routes. During this period shipping costs have soared, backlogs in the supply chain have accumulated, with containers spread across the world in the wrong ports. The price of transporting a 40-foot container from China to California increased from $1 500 in 2019 to nearly $21 000 in September 2021351. As volumes continue to be high and capacity in ports is still experimenting bottlenecks, freight rates are expected to remain high352.
International shipping is expected to grow during the next few decades. An increase in transport volumes for all ship categories until the year 2050 has been projected, except for oil transport where tonne-miles will be reduced by more than 30 %. The largest relative trade increases are expected for natural gas carriers and container ships (Figure 4.41).
347 European Maritime Safety Agency (EMSA). COVID-19 impact on shipping, 12 February 2021.348 https://www.containerstatistics.com/ 349 Drewry Maritime Financial Insight – January 2021.350 Freightos Baltic Index https://fbx.freightos.com/. Exchange rates used as per ECB in November 2020 and February 2021.351 https://www.reuters.com/breakingviews/shipping-news-makes-grim-reading-central-banks-2022-02-09/ 352 https://www.reuters.com/business/maersk-expects-supply-chain-chaos-continue-2022-2022-02-09/353 DNV. Energy transition outlook 2020: A global and regional forecast to 2050.354 http://www.ilo.org/global/about-the-ilo/newsroom/news/WCMS_755390/lang--en/index.htm355 Review of Maritime Transport 2020, UNCTAD, https://unctad.org/system/files/official-document/rmt2020_en.pdf356 https://ec.europa.eu/transport/sites/transport/files/guidelines_for_safe_mass.pdf 357 COM(2020) 789 final.
Figure 4.41 World seaborne trade and projected trade in tonne-miles by vessel type.
Notes: Adapted from EEA (2021). European Maritime Transport Environmental Report 2021.
Source: DNV (2020)353..
The pandemic negatively affected employment in the sector with around 300 000 seafarers still stranded on vessels354 by mid-Sep-tember 2020. Negative effects were also felt on the recreational boating sector, which includes boat and equipment manufacturers, marinas, as well as boat rental and service providers (see Box 4.4).
UNACT355 reported that, despite the growth in total fleet tonnage, in recent years the increase in vessel size, combined with multiple efficiency gains and the recycling of less efficient vessels, have contributed to a limited growth in carbon dioxide emissions by the sector. As new ship designs, more ecological friendly replace older and less efficient models, more gains can be expected. However, these marginal improvements will not be sufficient to meaning-fully decrease overall carbon-dioxide emissions, and more engine and fuel technology changes will be required.
The EGD aims at a 90 % reduction in greenhouse emissions by 2050. More alternative and cleaner transport alternatives are needed. The use of information technologies, digitalisation and automation will provide opportunities and challenges to the sec-tor, and will contribute for a more sustainable maritime trans-port. The European Commission has been encouraging the use of Autonomous and Sustainable Ships and Shipping, and recently published the EU Operational Guidelines on trials of Maritime Autonomous Surface Ships356.
The Commission also adopted an ambitious strategy (SSMS) for European transport under the umbrella of the Green Deal357. Sustainability, based on multimodal transport system (for both passengers and freight) and enhanced recharging and refuelling infrastructure for zero emission vehicles, (including ships, boats, ferries) and digitalisation and use of new technologies provide the base for this new strategy.
-35%-30%-25%-20%-15%-10%-5%0%5%10%15%
-10 000 20 000
30 000 40 000 50 000
60 000 70 000 80 000
90 000
Jan Fev Mar Apr May Jun Jul Aug Sep Oct Nov Dez
2019 2020 Trend 2019 to 2020
97
2022

4.6.4 INTERACTIONS WITH OTHER SECTORS AND THE ENVIRONMENTMaritime transport requires Ports and their infrastructure to operate. Transport companies have an interest in optimising their routes, which may compete in space with other activities such fishing, offshore energy, aquaculture and marine protected areas.
From an environmental point of view, maritime transport exerts pressures on the marine environment. Greenhouse gas emissions (GHG) emissions from shipping and ports contribute to global warming. Air pollution from ships, especially nitrogen and sulphur oxide as well as particulate matter, damages the marine environ-ment and human health, affecting almost 40 % of Europeans liv-ing within 50 km of the sea358. Overall, these different emissions alter temperature, increase CO2 levels, acidify waters and soils and change nutrient and oxygen levels. They contribute as well to extreme weather events and sea level rise.
When released into the environment, contaminants such as waste and pollution, negatively affect marine fauna and flora. It can pro-duce changes in distribution of species, population size and migra-tion. Pollution events, such as oil spills, can also have dramatic effects on the economy of the affected areas. Other discharges, such as marine litter, can impact marine fauna, entangle animals, lead to injuries or kill organisms. They can pose dangers to mar-itime safety. Communities may also need to rehabilitate their shorelines. In addition, ships create underwater noise. This noise can produce loss of hearing on marine species, reduction in com-munication between the species individuals, a potential increase in stress levels and various behavioural changes. Maritime trans-port also accounts for the largest proportion of Non-Indigenous Species (NIS) introductions in seas around the EU. NIS and aquatic pathogens can create a threat to local biodiversity, human health and severely damage local economies if they adapt to their new environment.
Despite the contraction in maritime transport due to the COVID-19 pandemic, shipping emissions have decreased by a modest 1 % in 2020 (Figure 4.42), indicating that air and road transportation may have been impacted more severely359, while on the other hand releasing more pressure on terrestrial ecosystems than mar-itime transport on marine ecosystems.
Marine habitats for which the greatest number of maritime trans-port related pressures have been reported are estuaries, large shallow inlets and bays, and sandbanks slightly covered by sea water. These areas are identified as good locations for ports, since they are sheltered from waves and wind.
358 EMSA & EEA, European Maritime Transport Environmental Report 2021. https://www.eea.europa.eu/publications/maritime-transport/359 Eugui, D. V., Barrowclough, D., & Contreras, C. (2021). The Ocean Economy: trends, impacts and opportunities for a post COVID-19 Blue Recovery in developing countries
(No. 137). Research Paper.360 COM(2021)550final – https://eur-lex.europa.eu/legal-content/EN/TXT/?uri=CELEX:52021DC0550 361 COM/2021/562 final – https://eur-lex.europa.eu/legal-content/EN/TXT/?uri=CELEX:52021PC0562 362 Marine Benchmark. International Shipping Emissions, December 2021.
In synergy with the deployment of alternative marine fuels, efforts are made under the zero-pollution action plan to drastically reduce further emissions to air, water, and the broader environ-mental footprint from the maritime transport sector. Delivering on the establishment of wide ranging ‘Emission Control Areas’ (ECA) in all EU waters with zero pollution to air and water from shipping for the benefits of sea basins, coastal areas and ports should be a priority. In particular, the Commission has spearheaded efforts to replicate the success of existing ECAs in the Mediterranean Sea requiring urgent protection. Such designation could, by 2030, cut emissions of SO2 and NOx from international shipping by 80 % and 20 %, respectively, compared to the current regulations. Moreover, the Commission would aim to start similar work in the Black Sea area where progress is also needed.
The revisions and initiatives linked to the European Green Deal climate have been presented under the ‘Fit for 55’ package360, adopted by the European Commission in July 2021 (See Section 3.1 and Section 4.4). The FuelEU Maritime proposal361 aiming to increase the demand for alternative fuels and reduce the greenhouse gas intensity of the energy used on-board by ships, places a requirement for these types of vessels to use OPS in ports where this is available as of 2030 or alternative zero-emis-sion technologies such as fuel cells or battery packs. The FuelEU Maritime will increase the use of sustainable alternative fuels in shipping and at European ports. The proposal accommodates all renewable and low-carbon fuels in maritime transport: liquid bio-fuels, e-liquids, decarbonised gas (including bio-LNG and e-gas), decarbonised hydrogen and decarbonised hydrogen-derived fuels (including methanol, and ammonia), as well as electricity.
For onshore power supply, in particular, the FuelEU Maritime is expected to provide, on the one hand, a guaranteed demand for the development of the infrastructure, and on the other hand, unlock the benefits of the use of shore-power for local air quality on top of climate mitigation.
Figure 4.42 – Monthly international shipping emissions
Source: Marine Benchmark, December 2021362.
98
THE
EU B
LUE
ECO
NO
MY
REPO
RT

The FuelEU Maritime regulation is one of these proposals and, to guide the EU maritime sector towards decarbonisation. These two proposals complement each-other by ensuring the provision of sufficient demand and capacity and avoiding the risk of stranded assets.363
The Commission has also adopted a proposal for extension of the EU Emission Trading System (ETS)364 to the maritime sector to cover CO2 emissions from large ships (above 5 000 gross ton-nage). This will ensure that emission from shipping will also fall under the general cap and will thus create a price signal to drive decarbonisation.
Moreover, the revision of the revision of the Energy Taxation Directive365 will also support decarbonisation and promote the use of clean technologies and energies, by putting forward minimum rates of taxation on the relevant fuels used for intra-EU ferry, fishing and freight vessels.
The implementation of the initiatives laid down in the Sustainable and smart mobility strategy366, published in December 2020, will also continue to promote sustainability of the maritime transport sector. In this strategy there were 82 initiatives in 10 key areas for action (‘flagships’), each with concrete measures, with mile-stones for 2030 and 2050. It includes concrete actions for fur-ther shifting towards more sustainable transport modes, including a shift from road freight into inland water transport and short sea shipping (and rail), further develop intermodal transport and the TEN-T support for the Motorways of the Sea. It also means aiming for zero-emission airports and ports. Ports should become multimodal mobility and transport hubs, new clean energy hubs for integrated electricity systems, hydrogen and other low-carbon fuels, and testbeds for waste reuse and the circular economy.
4.6.5 DECARBONIZING MARITIME TRANSPORT367
For the world to decarbonize, shipping must decarbonize368. This requires that zero-emission ships become the dominant choice by 2030 and to bridge the competitiveness gap between traditional fuels and sustainable alternatives.
363 COM(2021) 559 final 364 https://ec.europa.eu/clima/eu-action/eu-emissions-trading-system-eu-ets/revision-phase-4-2021-2030_en365 COM/2021/563 final – https://eur-lex.europa.eu/legal-content/en/TXT/?uri=CELEX:52021PC0563 366 COM(2020) 789 final.367 Getting to Zero Coalition (2020), The First Wave: A blueprint for commercial-scale zero-emission shipping pilots and Capgemini Invent (2020), Fit for net-zero: 55 Tech
Quests to accelerate Europe’s recovery and pave the way to climate neutrality.368 https://www.weforum.org/agenda/2021/05/decarbonising-shipping-the-time-to-act-is-now/369 https://www.imo.org/en/MediaCentre/MeetingSummaries/Pages/MEPC77.aspx370 Innovation Needs for Decarbonization of Shipping, Mission Innovation, Danish Maritime Authority, 2021, http://mission-innovation.net/missions/shipping/371 Maritime Forecast to 2050, Energy Transition Outlook 2021, DNV, 2021, https://eto.dnv.com/2021/maritime-forecast-2050/about372 Mapping of Zero Emission Pilots and Demonstration Projects – Second Edition, Getting to Zero Coalition, Global Maritime Forum, March 2021, https://www.
globalmaritimeforum.org/content/2021/03/Mapping-of-Zero-Emission-Pilots-and-Demonstration-Projects-Second-edition.pdf373 https://www.maersk.com/news/articles/2021/02/17/maersk-first-carbon-neutral-liner-vessel-by-2023374 https://www.maersk.com/news/articles/2021/08/18/maersk-secures-green-e-methanol375 https://www.yara.com/news-and-media/news/archive/2021/ammonia-bunkering-technology-company-azane-fuel-solutions-and-project-partners-receives-public-funding-
for-worlds-first-green-ammonia-bunkering-terminal/376 Industry Transition Strategy, Maersk Mc-Kinnely Moller Center for Zero Carbon Shipping, 2021, https://cms.zerocarbonshipping.com/media/uploads/documents/MMMCZCS_
Industry-Transition-Strategy_Oct_2021.pdf
Following a global agreement at the latest COP 26 to speed up action to reduce emissions, the International Maritime Organization (IMO) has agreed to revise its initial greenhouse gas (GHG) Strategy by 2023369 but has failed to adopt the target of a full decarbonisation of international shipping by 2050. As part of fit-for-55 package, the European Commission has put for-ward three key measures supporting such a target: the inclusion of shipping into the EU Emissions Trading System, the FuelEU Maritime Regulation and the revision of the Renewable Energy Directive. This regulatory triangle aims at providing a consistent framework to incentivize the right behaviour, push the use of the right fuels and support their production.
Technologies to produce zero-emission fuels and vessels are to a large extent available but in most instances not market ready370. While the number of new build vessels with alternative fuel systems has doubled since 2019, it remains dominated by Liquefied Natural Gas (LNG) projects371 while methanol, hydro-gen and ammonia projects only account for a small part of the new builds. Innovation remains key to reduce costs and improve the safety, efficiency and scalability of alternative fuel technol-ogies. Since 2020, the Getting to Zero coalition has observed an increased uptake in new projects for the production and use of methanol and ammonia on large vessels372.
Methanol dual fuel and ammonia dual fuel are the two main foreseen fuel pathways towards the deep decarbonisation of shipping from the outset. Methanol on-board solutions are more mature (already in-use) than ammonia technologies (on track for a demonstration of on-board use by 2025). In 2021, notable announcements include the foreseen operation of the world’s first container vessel fuelled by green e-methanol by 2023373,374 but also the support of the Norwegian government to the develop-ment of the world’s first green ammonia terminal375.
The early years of the transition across the industry is however challenged by the several alternative fuels options and their wide cost gap with the fossil fuels used today376. E-ammonia is foreseen to have the lowest costs per energy unit by 2050, benefiting from reduced costs of electricity. Bio-fuels – while cost competitive by a large margin by 2030 – face scaling constraints that will affect availability and price. Similarly, the availability of biogenic carbon sources will challenge the competitiveness of e-methanol. The cost of blue fuels is driven by the costs for nat-ural gas as a feedstock, carbon capture and permanent storage.
99
2022

LNG dual fuel – with more mature technologies and supply options but limited GHG reduction potential – also constitutes a fuel pathway. There are however concerns regarding the poten-tial of LNG377 to play a transitional role (via bio and e-LNG) or a temporary one (if vessels are prepared for a later switch to ammonia) beyond niche applications. Investing in LNG infrastruc-tures exposes to the risk of technology lock-ins and stranded assets. The use of natural gas indeed include residual carbon emissions and methane leakage (on ships but also along the sup-ply chain), and is expected to be less competitive over time given the falling prices of renewable electricity.
The debate is now moving on to global transition strategies and identification of first movers that can push the industry to reach a tipping point378. Zero-carbon fuel solutions are not yet seen as a prospective commercial opportunity across the value chain and a critical challenge to overcome is to ensure that all parties act simultaneously and engage in enabling investments. The necessary innovative technologies, business models and financing solutions will not be developed unless actors in ships, fuel infrastructures in ports and maritime fuel production commit and collaborate. Several examples are being developed across the industry.
Beyond incentives, foreseen solution to overcome the first mover challenges rely on collective action and/or the sharing of risks. Mission Innovation’s initiative379 aims to foster innova-tion and international collaborations between states, international organisations, research institutions and corporations. The creation of industrial alliances380 across the value chain can allow for the scale-up of solutions for a large market and de-risk investments. The development of green corridors381 can also help cut through the complexity of coordinating fuel infrastructures and vessels in the value chain and across countries. Enabling measures along trade routes between major port hubs where zero-emission solu-tions are supported and demonstrated can support the industry in taking its first steps and the scaling up of pilots and demonstra-tions into industry-wide solutions.
Industry leadership however cannot drive the transition alone and the activation of other critical levers is essential to ensure a global level playing field and unlock project finance. Safety and environmental standards are necessary to provide a clearer framework for new technologies and solutions. There is a need for common metrics for carbon accounting with clarification of emis-sions from the various links in the cycle of extraction, production and use of fuels. A global carbon pricing can be designed to both support developing countries and early adopters if revenue is rein-vested into the industry through subsidising R&D or infrastructure projects. The development of green financing mechanisms can also help the industry support the required capital expenditures.
377 The Role of LNG in the Transition Toward Low- and Zero-Carbon Shipping, World bank, 2021, https://openknowledge.worldbank.org/handle/10986/35437378 A Strategy for the Transition to Zero-Emission Shipping – An Analysis of Transition Pathways, Scenarios, and Levers for Change, Getting to Zero Coalition, UMAS, 2021,
https://www.globalmaritimeforum.org/content/2021/10/A-Strategy-for-the-Transition-to-Zero-Emission-Shipping.pdf379 http://mission-innovation.net/missions/shipping/380 See the European Commission’s consultation on the establishment of a new industrial alliance focused on boosting the supply and affordability of renewable and
low-carbon gaseous and liquid fuels. https://transport.ec.europa.eu/news/european-commission-seeks-views-renewable-and-low-carbon-fuels-value-chain-industrial-alliance-2021-11-09_en
381 The Next Wave – Green Corridors, Getting to Zero Coalition, Mission Possible Partnership, 2021, https://www.globalmaritimeforum.org/content/2021/11/The-Next-Wave-Green-Corridors.pdf
382 https://bound4blue.com/en/
BOX 4.7 GREENing the BLUE: bound4blue wingsail demonstration project382
Maritime transport sectors are facing a double challenge. On a one hand, new regulations are forcing reductions in pol-lutant and greenhouse gas emissions, already entering into force, and becoming stronger from 2020. On the other, the increase in fuel costs (which represents about 50-60 % of their operation costs).
This is if particular relevance when new less pollutant fuels have to be used, such as Marine Gasoil (MGO), which doubles the cost compared to the currently used Heavy Fueloil (HFO), causing a dramatic impact in fuel-related OPEX. Therefore, there is a market demand for solutions that contribute to reduce fuel use in this sector with a convenient return on investment (ROI).
GREENing the BLUE is a project that looks at propulsion options for maritime transport. It presents a full-scale demonstration of a tilting patented wingsail solution based in an aeronautical design which can reduce fuel use and related pollutant emissions from maritime transport by an average of 30 %. This is critical for an industry looking for more effi-cient propulsion systems and emissions reduction. The project aims to increase energy efficiency and decrease fuel use and emissions from the shipping sector, which supports the EU goal to become climate neutral by 2050. It has the ambition to increase the competitiveness of the European maritime transport sector, resulting in direct and indirect job creation.
The project received EU funding amounting to €810 151 and runs from 01/01/2019 to 31/12/2021. The project received a seal of excellence under the EU SME Instrument before applying for EMFF funding. The EMFF project, which supported the demonstration of the wingsail solution, helped to secure blended finance from the EIC Accelerator.
100
THE
EU B
LUE
ECO
NO
MY
REPO
RT

4.7 COASTAL TOURISMEurostat defines tourism as ‘the activity of visitors taking a trip to a main destination outside the usual environment, for less than a year, for any main purpose, including business, leisure or other personal purpose, other than to be employed by a resident entity in the place visited’383. The beauty, cultural wealth and diversity of the EU’s coastal areas have made them a preferred destination for many holidaymakers in Europe and abroad, making coastal and maritime tourism an important tourism sector. More than 50 % of bed capacity in hotels across Europe is concentrated in regions with a sea border384.
Tourism is thus a major economic activity in the European Union, constituting its third-largest economic sector with a wide-ranging impact on economic growth, employment, and social development. Europe’s main strengths include its infrastructure, its cultural diversity in a comparatively small area, and its borderless travel area within the Schengen zone385. Tourism can be a powerful tool in fighting economic decline and unemployment. Nevertheless, as is the case for the tourism sector as a whole, coastal tourism faces a series of challenges, ranging from greening its activities, reducing impacts on the marine environment, and vulnerability to exogenous shocks, including inflationary pressures on commodi-ties and fuel prices and major health crises such as the one cre-ated by the COVID-19 pandemic.
4.7.1. BACKGROUND
Coastal tourism is the biggest mature and growing sector across the Blue Economy in terms of GVA and employment386. As described in the EU’s Blue Growth strategy, coastal and maritime tourism bears large potential to promote a smart, sustainable and inclusive Europe387. This section aims to provide an overview regarding the overall size and socio-economic performance of the sector in 2019-2020, outlining the consequences of the COVID-19 pandemic and illustrating innovative and promising approaches towards sustainable maritime and coastal tourism and related leisure activities.
Europe is the most-visited continent worldwide, welcoming half of the world’s international tourist arrivals. The EU alone accounts for almost 40 % of the world’s international arrivals. Coastal areas and islands tend to be major tourism hotspots. These areas have always been sought for their unique characteristics making them ideal places for leisure and tourism activities to take roll. In recent years, the increasing number of tourists have led to concerns around the environmental impacts of tourism on marine ecosys-tems and the sustainable development of coastal areas, espe-cially those characterised by high-density building and expanding environmental footprints. Over half of the EU’s tourist accommo-dation establishments are located in coastal areas388.
383 Eurostat. ‘Methodological manual for tourism statistics’, p. 16.384 European Commission. Coastal and maritime tourism. https://ec.europa.eu/growth/sectors/tourism/offer/maritime-coastal_en 385 European Parliamentary Research Service (EPRS). Tourism and the European Union - Recent trends and policy developments, Sept. 2015.386 https://ec.europa.eu/maritimeaffairs/policy/coastal_tourism_en387 COM(2012) 494 final of 13.9.2012 ‘Blue Growth: opportunities for marine and maritime sustainable growth’.388 European Commission. 2018. European Union Tourism Trends (https://ec.europa.eu/growth/tools-databases/vto/content/2018-eu-tourism-trends-report).389 https://ec.europa.eu/info/sites/default/files/communication-industrial-strategy-update-2020_en.pdf390 European Commission (2022). Transition pathway for tourism. https://op.europa.eu/en/publication-detail/-/publication/404a8144-8892-11ec-8c40-01aa75ed71a1
BOX 4.8 Transition pathway for tourismFollowing the COVID-19 crisis, the European Commission published the Transition pathway for tourism in the begin-ning of 2022, being the first pathway that was delivered fol-lowing the updated Industrial Strategy (2021)389 which calls for the acceleration of green and digital transformation with the aim of increasing the resilience of the European economy.
Through a co-creation process involving all tourism stake-holders, the transition pathway for tourism identifies in total 27 areas of initiatives for the green and digital transition and for improving the resilience of EU tourism industry. The actions relate to several overarching themes, notably:
Regulation and public governance which encompasses measures for short-term rentals, regulatory support for multimodal travelling, improving statistics and indicators for tourism, comprehensive tourism strategies development/update and collaborative governance of tourism destinations;
Green and digital transition encompassing, among others, sustainable mobility, circularity of tourism services, green transition of tourism companies and SMEs, data-driven tourism services, improvement of the availability of online information on the tourism offer, easily accessible best prac-tices, peer learning and networking for SMEs, research and innovation projects and pilots on circular and climate-friendly tourism, support for digitalisation of tourism SMEs and destinations;
Resilience which refers to, among others, seamless cross- border traveling, coordinated management and updated information on traveling, awareness-raising on skills needs for the twin transition, awareness-raising on changes in tour-ism demand, developing and renewing tourism education, fostering skills in tourism, promoting fairness and equality in tourism jobs as well as accessibility;
Moreover, the transition pathway for tourism advocates for supporting the visibility of funding opportunites for tourism actors390.
101
2022

Visitors to coastal areas are typically more numerous in southern EU Member States, which are generally more conducive to beach holidays due to their latitude and climatic conditions. In 2019, for instance, coastal areas accounted for more than three quarters of the total nights spent in tourist accommodation across Malta (100 %), Cyprus (97 %), Greece (96 %), Spain (96 %), Croatia (93 %), Denmark (91 %), Portugal (84 %), Latvia (83 %) and Estonia (78 %). But also, in Sweden (63 %), Ireland (62 %) and Italy (53 %), coastal areas outperformed non-coastal areas, well above the EU-27 average of 47.4 %. The two most popular tourist destinations in the EU in 2019 were the Canary Islands in Spain, followed by the Adriatic coastal region of Jadranska Hrvatska in Croatia391.
However, the sector suffered greatly from the travel restric-tions and lockdowns introduced across the EU from March 2020 onwards to contain the spreading of COVID-19 infections and the consequent health crisis. The accommodation and food service subsectors were hit particularly hard by both the containment measures and contracting demand. Since the beginning of the pandemic, virtually all Member States have implemented restric-tions on non-essential travel. Some closed their borders and rein-stated internal border controls within the Schengen area, often accompanied by quarantine requirements for cross-border travel-lers. This meant that millions of European citizens were suddenly unable to travel392.
The resulting effects on turnover and other socio-economic indi-cators of the sector have lasted much longer than for many other sectors of the economy. It is only from the first quarter of 2021 that accommodation and food services rebounded, marking a 28.4 % increase in 2Q2021, while total turnover of all services stood at about 94 % of the pre-crisis quarter’s levels (Figure 4.43).
Tourism occupies an important place in the economy of many EU Member States, with wide-ranging impact on economic growth, employment and social development. Tourism is particularly important for countries in Southern Europe, like Spain, Portugal, Italy, Malta and Greece, but also in other coastal countries namely Croatia, Bulgaria, Romania and the Netherlands393. For many of the countries that offer ‘sun, sea and sand’ (3S) tourism, beach tourism accounts for a significant amount of their total national revenue394. Therefore, the economies of these countries have been the most affected by the health crisis.
391 Eurostat. Top 20 EU tourism destinations (NUTS 2 regions) in terms of nights spent in tourist accommodation establishments, 2019.392 Eurostat. Statistics explained. Tourism in the EU – what a normal summer season looks like – before Covid-19.393 Batista e Silva, F., Herrera, M. A. M., Rosina, K., Barranco, R. R., Freire, S., & Schiavina, M. (2018). Analysing spatiotemporal patterns of tourism in Europe at high-resolution
with conventional and big data sources. Tourism Management, 68, 101-115.394 Mestanza-Ramón, C.; Pranzini, E.; Anfuso, G.; Botero, C.M.; Chica-Ruiz, J.A.; Mooser, A. (2020). An attempt to characterize the ‘3S’ (Sea, Sun, and Sand) parameters:
Application to the Galapagos Islands and continental Ecuadorian beaches, Sustainability 12, 3468.395 Eurostat. Tourism Satellite Accounts in Europe 2019 edition. November 2019.396 https://ec.europa.eu/info/live-work-travel-eu/coronavirus-response/travel-during-coronavirus-pandemic/eu-helps-reboot-europes-tourism_en#documents397 European MSP Platform. Technical Study: MSP as a tool to support Blue Growth. Sector Fiche: Coastal and Maritime Tourism, 16.02.2018.
The annual tourism gross value added in the EU was estimated at €787 billion before COVID-19395. The tourism industry represents 10 % of the EU’s GDP, encompassing 2.4 million businesses (of which over 90 % are SMEs). 40 % of all international arrivals take place in the EU, making it the global leader. 85 % of Europeans spend their summer holidays in the EU whereas for every €1 gen-erated in the tourism sector €0.56 added value is created. The industry encompasses 23 million direct and indirect jobs account-ing for 12 % of EU employment whereas 37 % of tourism workers are under 35 years old.
Table 4.3 Member States most dependent on Tourism as percentage of GDP
Member States % of GDP
HR 25 %
CY 22 %
EL 21 %
PT 19 %
ES 15 %
EE 15 %
AT 15 %
IT 13 %
SI 12 %
BG 12 %
MT 11 %
FR 10 %
DE 9 %
Source: European Commission396.
Strictly speaking, coastal tourism covers beach-based tourism and recreational activities, e.g. swimming, sunbathing, and other activities for which the proximity of the sea is an advantage, such as coastal walks and wildlife watching. Maritime tourism covers water-based activities and nautical sports in the maritime area, such as sailing, scuba diving and cruising. Cruising can be also considered part of maritime tourism. In most cases, mari-time tourism activities take place along the coastline as well as between the shore and on-water tourism activity areas, while for instance diving, snorkelling and underwater cultural heritage are place-based activities. The distance to shore is typically between zero and few km. Water depth depends on sub-sector needs and might be a crucial element for certain activities (e.g. water-based activities such as boating, yachting, nautical sports)397.
102
THE
EU B
LUE
ECO
NO
MY
REPO
RT

Source: Eurostat398.
All the manufacturing activities producing supplies (e.g. water-sport equipment) and services for coastal and maritime tourism (e.g. travel agencies) should also be considered as contributing directly or indirectly to the socio-economic performance of the sector. However, some of these activities are not included in the analysis presented in this section due to the data limitations out-lined above.
For the purpose of this report, Coastal tourism is intended to also cover maritime tourism and is broken down into three main sub-sectors:
1. Accommodation 2. Transport 3. Other expenditures
Overall, Coastal tourism accounted for 63 % of the jobs, 44 % of the GVA and 38 % of the profits in the EU Blue Economy in 2019.
398 Eurostat data from September 2021. https://ec.europa.eu/eurostat/statistics-explained/index.php?title=Impact_of_Covid-19_crisis_on_services399 In 2017, a few countries (e.g. Denmark and Sweden) changed the methodology for the collection of tourism statistics and therefore, there is a break in the series. Growth
rates have been estimated by adjusting for the change of methodology.
4.7.2 MAIN RESULTS
Size of the EU Coastal tourism sector in 2019-2020
GVA generated by the sector in 2019 amounted to slightly more than €80 billion, a 21 % rise compared to 2009399. Gross operat-ing surplus was valued at €27.4 billion (+42 % compared to 2009) (Figure 4.44). Turnover amounted to almost €230 billion, 20 % more than in 2009.
Preliminary data from Eurostat suggest that turnover decreased by about 46 % in 2020 due almost entirely to the COVID-19 out-break. It is expected that GVA and gross profits have suffered similar decreases.
More than 2.8 million people were directly employed in the sector in 2019 (almost the same as in 2009, but up by 45 % compared to 2015) and personnel costs reached €52.7 billion, up from €46.9 billion in 2009 (Figure 4.44), amounting to an average gross wage of almost €18 800 in 2019, a 13 % increase from €16 640 in 2009. Personnel costs have followed a similar trend.
The sector was impacted by the global economic and financial crisis of 2008-09, which saw a gradual decrease in all economic indicators, including employment over the period 2009 to 2015. However, in the period 2016 to 2019 a strong recovery took place. The impacts of COVID-19 on the socio-economic performance of the coastal tourism sector seems to have been worse than those of the former crisis.
Figure 4.43 EU development of services turnover, Q1 2020-Q2 2021 103
2022

Spain leads Coastal tourism with 25 % of the jobs and 30 % of the GVA, followed by Greece, Italy and France. The sector was recovering and growing until it was hit by the COVID-19 restrictions introduced since Q2 of 2020.
Results by sub-sectors and Member States
Employment: Subsector Other expenditures generated over 1.3 million jobs in 2019, corresponding to 46 % of the Coastal tourism direct employment. Accommodation employed 1.1 million persons (39 %) and transport a further 427 750 jobs (15 %). Compared to 2009, all sub-sectors, apart from other expenditure that
increased by 19 %, saw a decrease in persons employed: -15 % in Accommodation and -4 % in Transport. The Member States that employed more people were Spain, employing 25 % of the EU sec-toral workforce (704 900 persons), followed by Greece with 17 % (487 000 persons) and then Italy with 11 % (304 100 persons).
Gross value added: Most of the value added in 2019 was generated by the Accommodation sub-sector: €37.0 million (46 % of the total), followed by Other expenditure €25.0 mil-lion (31 %) and Transport almost €18.2 million. Compared to 2009, all sub-sectors saw substantial increases in GVA: +10 % in Accommodation, +35 % in Other expenditure and +28 % in
Figure 4.45 Size of the EU Coastal tourism sector, € million
Note: Turnover should be interpreted with caution due to the problem of double counting throughout the value chain. Gross investment is not available for Coastal Tourism. Turnover in 2020 is an estimation based on Eurostat’s preliminary data, GVA and Gross operating surplus are estimated assuming that follow the same trend as turnover.
Source: Eurostat (SBS) and own calculations.
Figure 4.45 Persons employed (thousand), personnel costs (€ million) and average wage (€ thousand) in the EU Coastal tourism sector
Source: Eurostat (SBS) and own calculations.
0
20 000
40 000
60 000
80 000
100 0002009
2010
2011
2012
2013
2014
2015
2016
2017
2018
2019
2020
GVA
0
50 000
100 000
150 000
200 000
250 0002009
2010
2011
2012
2013
2014
2015
2016
2017
2018
2019
2020
Turnover
0
10
20
30
40
50
60
0
500
1 000
1 500
2 000
2 500
3 000
2009
2010
2011
2012
2013
2014
2015
2016
2017
2018
2019
Persons employed (left-axis)Personnel costs (right-axis)
0
5
10
15
20
2009
2010
2011
2012
2013
2014
2015
2016
2017
2018
2019
Average remuneration per employee
0
5 000
10 000
15 000
20 000
25 000
30 000
200 9 201 0 201 1 201 2 201 3 201 4 201 5 201 6 201 7 201 8 201 9 202 0
Gross operating surplus
0
20 000
40 000
60 000
80 000
100 000
2009
2010
2011
2012
2013
2014
2015
2016
2017
2018
2019
2020
GVA
104
THE
EU B
LUE
ECO
NO
MY
REPO
RT

23%
31%
46%
Value added by sub-sector
Transport
Other expenditure
Accommodation
Transport. As a consequence of the drastic decrease in intra-EU and international tourism imposed by the COVID-19 pandemic, it is likely that GVA suffered as sharp a decline in 2020 as was the case for turnover, as illustrated in Figure 4.44.
Gross profit: The bulk of profits in 2019 were generated in the Accommodation sub-sector (€145.6 billion, 53 %), followed by Other expenditure (25 %) and Transport (21 %). Compared to 2009, gross operating surplus increased significantly for all sub-sectors: +40 % in Accommodation, +18 % in Other expenditure and +92 % in Transport. Again, it is expected that gross operating margins declined in 2020, possibly below the lowest levels recorded in 2012 when interna-tional travelling to the Schengen area decreased significantly due to major difficulties in visa applications arising from new short-stay visa rules400.
Turnover: In 2019, subsector Other expenditure generated €86.5 billion in turnover, followed by the Accommodation sub-sector with €77.6 billion and then Transport (€66.0 billion). Compared to 2009, all sub-sectors saw a turnover increase: +12 % Accommodation, +26 %
400 European Commission. ‘Study on the economic impact of short stay visa facilitation on the tourism industry’, European Commission, 2013. 401 https://ec.europa.eu/growth/sectors/tourism/offer/maritime-coastal_en
Other expenditure and +21 % Transport. As indicated above, turnover of the sector nearly halved in 2020, while rebounding in 2021 to almost reach its pre-COVID-19 levels in Q2 of 2021.
4.7.3. TRENDS AND DRIVERS
The growth rate in the tourism sector has accelerated since the reces-sion that followed the 2008 financial crisis positively impacting on the EU economy. Sustained growth has been instrumental in supporting the economic recovery of many EU Member States, largely contribut-ing to job creation, GDP and the balance of payments.
EU policy aims to maintain Europe’s standing as a leading tourist destination while maximising the industry’s contribution to growth and employment. As part of the EU’s Blue Growth strategy, the coastal and maritime tourism sector has been identified as an area with special potential to foster a smart, sustainable and inclusive Europe401.
Figure 4.46 Share of employment in the EU Coastal tourism sector, 2019
Source: Eurostat (SBS) and own calculations
Figure 4.47 Share of the GVA generation in the EU Coastal tourism sector, 2019
Source: Eurostat (SBS) and own calculations.
36%
18%14%
6%
4%
22%
Value added by Member State
Germany
Denmark
Italy
Netherlands
France
Others
15%
46%
39%
Employment by sub-sector
Transport
Other expenditure
Accommodation
25%
17%
11%8%
7%
32%
Employment by country
Spain
Greece
Italy
Portugal
France
Others
30%
14%
13%7%
7%
29%
Value added by country
Spain
France
Italy
Greece
Germany
Others
105
2022
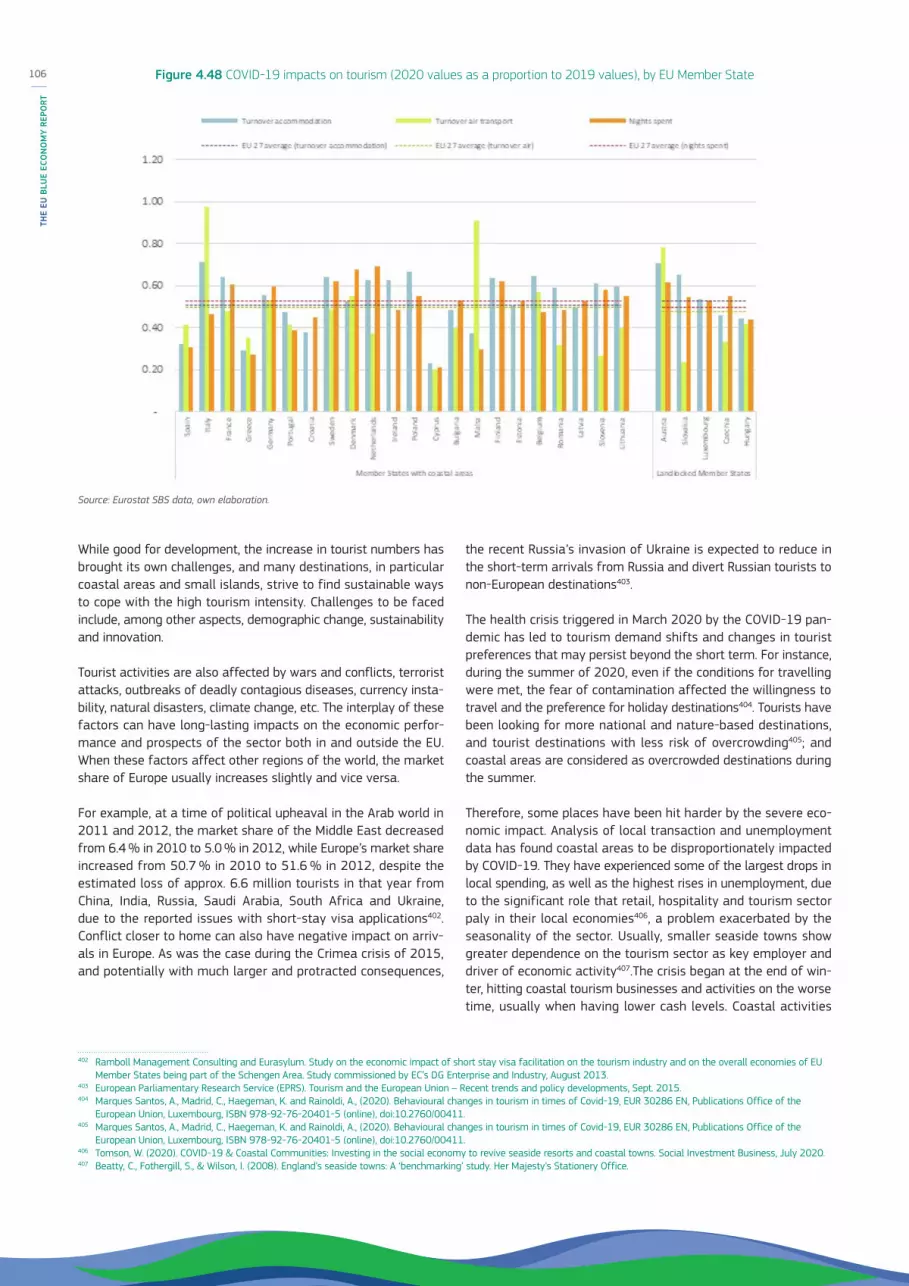
While good for development, the increase in tourist numbers has brought its own challenges, and many destinations, in particular coastal areas and small islands, strive to find sustainable ways to cope with the high tourism intensity. Challenges to be faced include, among other aspects, demographic change, sustainability and innovation.
Tourist activities are also affected by wars and conflicts, terrorist attacks, outbreaks of deadly contagious diseases, currency insta-bility, natural disasters, climate change, etc. The interplay of these factors can have long-lasting impacts on the economic perfor-mance and prospects of the sector both in and outside the EU. When these factors affect other regions of the world, the market share of Europe usually increases slightly and vice versa.
For example, at a time of political upheaval in the Arab world in 2011 and 2012, the market share of the Middle East decreased from 6.4 % in 2010 to 5.0 % in 2012, while Europe’s market share increased from 50.7 % in 2010 to 51.6 % in 2012, despite the estimated loss of approx. 6.6 million tourists in that year from China, India, Russia, Saudi Arabia, South Africa and Ukraine, due to the reported issues with short-stay visa applications402. Conflict closer to home can also have negative impact on arriv-als in Europe. As was the case during the Crimea crisis of 2015, and potentially with much larger and protracted consequences,
402 Ramboll Management Consulting and Eurasylum. Study on the economic impact of short stay visa facilitation on the tourism industry and on the overall economies of EU Member States being part of the Schengen Area. Study commissioned by EC’s DG Enterprise and Industry, August 2013.
403 European Parliamentary Research Service (EPRS). Tourism and the European Union – Recent trends and policy developments, Sept. 2015. 404 Marques Santos, A., Madrid, C., Haegeman, K. and Rainoldi, A., (2020). Behavioural changes in tourism in times of Covid-19, EUR 30286 EN, Publications Office of the
European Union, Luxembourg, ISBN 978-92-76-20401-5 (online), doi:10.2760/00411.405 Marques Santos, A., Madrid, C., Haegeman, K. and Rainoldi, A., (2020). Behavioural changes in tourism in times of Covid-19, EUR 30286 EN, Publications Office of the
European Union, Luxembourg, ISBN 978-92-76-20401-5 (online), doi:10.2760/00411.406 Tomson, W. (2020). COVID-19 & Coastal Communities: Investing in the social economy to revive seaside resorts and coastal towns. Social Investment Business, July 2020.407 Beatty, C., Fothergill, S., & Wilson, I. (2008). England’s seaside towns: A ‘benchmarking’ study. Her Majesty’s Stationery Office.
the recent Russia’s invasion of Ukraine is expected to reduce in the short-term arrivals from Russia and divert Russian tourists to non-European destinations403.
The health crisis triggered in March 2020 by the COVID-19 pan-demic has led to tourism demand shifts and changes in tourist preferences that may persist beyond the short term. For instance, during the summer of 2020, even if the conditions for travelling were met, the fear of contamination affected the willingness to travel and the preference for holiday destinations404. Tourists have been looking for more national and nature-based destinations, and tourist destinations with less risk of overcrowding405; and coastal areas are considered as overcrowded destinations during the summer.
Therefore, some places have been hit harder by the severe eco-nomic impact. Analysis of local transaction and unemployment data has found coastal areas to be disproportionately impacted by COVID-19. They have experienced some of the largest drops in local spending, as well as the highest rises in unemployment, due to the significant role that retail, hospitality and tourism sector paly in their local economies406, a problem exacerbated by the seasonality of the sector. Usually, smaller seaside towns show greater dependence on the tourism sector as key employer and driver of economic activity407.The crisis began at the end of win-ter, hitting coastal tourism businesses and activities on the worse time, usually when having lower cash levels. Coastal activities
Figure 4.48 COVID-19 impacts on tourism (2020 values as a proportion to 2019 values), by EU Member State
Source: Eurostat SBS data, own elaboration.
106
THE
EU B
LUE
ECO
NO
MY
REPO
RT

usually rely on Easter as necessary income boost for stabilising finances and repay debts from the winter408. With the 2020 wide-spread lockdowns, this essential recovery period was missed for many regions.
The impacts of COVID-19 on coastal regions has affected the overall performance of the whole tourism sector in all EU Member States. Countries with coastal areas experienced larger impacts in most socio-economic performance indicators, such as air trans-port turnover and number of nights spent, than landlocked coun-tries (Figure 4.47). In relative terms, the countries whose coastal tourism sector has been worst affected by COVID-19 are, in this order: Cyprus (-77.0 %), Greece (-70.8 %), Spain (-67.9 %), Malta (-62.4 %), Croatia (-61.9 %), Portugal (-52.5 %), Bulgaria (-51.4 %), Latvia (-50.3 %), Estonia (-49.3 %), and Denmark (-47.5 %). These countries registered deeper drops in accommo-dation turnover than the EU-27 average (-46.5 %).
A slow and long-term recovery process is expected with many activities not being able to surpass the crisis. As leisure spend-ing deteriorates for many households, a fast recovery of tourism demand will be hindered by the economic slow-down409.
Still uncertain is the impact of Brexit on coastal tourism. Almost 60 million tourists from the United Kingdom used to visit the EU every year before COVID-19410, with the most popular destinations being Spain, Italy, France and Ireland. It is yet to be seen if after COVID-19, British tourists will continue to visit the EU in such numbers.
On the other hand, a change in government and private sec-tor approach to tourism could push forward an optimistic sce-nario411. Studies show that tourists are willing to pay more for safer vacations412. The COVID-19 recovery could thus contribute to the on-going global transformation of the current economic system towards a carbon neutral one413, together with other mar-ket trends. Indeed, it is expected that tourists will look for more eco-friendly solutions for holidays in the future, as a result of the COVID-19 health crisis414. For many industry experts, this is a transformative opportunity leading to a greater and faster adap-tion of more sustainable environmental solutions and a greater social appreciation of coastal natural and cultural values415. The European Green Deal and the new EU growth strategy can help in such green transitions, thanks to policy reforms, specific financial mechanism, as well as innovation, digitalisation, education and training416.
408 Zielinski, S., & Botero, C. M. (2020). Beach tourism in times of COVID-19 pandemic: critical issues, knowledge gaps and research opportunities. International Journal of Environmental Research and Public Health, 17(19), 7288.
409 Grech, V., Grech, P., & Fabri, S. (2020). A risk balancing act–tourism competition using health leverage in the COVID-19 era. International Journal of Risk & Safety in Medicine, (Preprint), 1-5.
410 https://www.etias.us/will-brexit-affect-tourism/411 Renaud, L. (2020). Reconsidering global mobility–distancing from mass cruise tourism in the aftermath of COVID-19. Tourism Geographies, 22(3), 679-689.412 Couto, G., Castanho, R. A., Pimentel, P., Carvalho, C., Sousa, Á., & Santos, C. (2020). The impacts of COVID-19 crisis over the tourism expectations of the Azores archipelago
residents. Sustainability, 12(18), 7612.413 Prideaux, B., Thompson, M., & Pabel, A. (2020). Lessons from COVID-19 can prepare global tourism for the economic transformation needed to combat climate change.
Tourism Geographies, 22(3), 667-678.414 Marques Santos, A., Madrid, C., Haegeman, K. and Rainoldi, A., (2020). Behavioural changes in tourism in times of Covid-19, EUR 30286 EN, Publications Office of the
European Union, Luxembourg, ISBN 978-92-76-20401-5 (online), doi:10.2760/00411.415 Hall, C. M., Scott, D., & Gössling, S. (2020). Pandemics, transformations and tourism: be careful what you wish for. Tourism Geographies, 22(3), 577-598.
Marques Santos, A., Edwards, J. and Laranja, M., From Digital Innovation to “Smart Tourism Destination”: Stakeholders’ reflections in times of a pandemic, European Commission, 2021, JRC123390.
416 https://ec.europa.eu/info/strategy/priorities-2019-2024/european-green-deal_en417 European MSP Platform. Technical Study: MSP as a tool to support Blue Growth. Sector Fiche: Coastal and Maritime Tourism, 16.02.2018.418 Batista e Silva, F., Barranco, R., Proietti, P., Pigaiani, C., & Lavalle, C. (2020). A new European regional tourism typology based on hotel location patterns and geographical
criteria. Annals of Tourism Research, 103077.
Despite the uncertainties caused by a still unresolved COVID-19 crisis, the ongoing Russia’s invasion of Ukraine, its potential esca-lations in the region, high energy and fuel prices, looming infla-tion, etc., it can be expected that coastal tourism will continue to expand, both in terms of nights spent in coastal regions but also in number of tourists. This will have implications on onshore spatial planning mainly through the construction of new infrastructure and port facilities. While it is not likely that new marinas will be developed, as the marina density is already high (approx. 1 marina per 14 km of coastline), it is expected that hotels or other touristic accommodation will be developed along the coastline417.
4.7.4 TOURISM CAPACITY IN COASTAL AREASThe estimated accommodation capacity allows understanding the coastal tourism importance per NUTS3 region (Figure 4.49). Most regions have high shares of rooms located within the 10 km range, an indication how coasts are the main tourism driver and visitors’ attraction.
Figure 4.49 Share of accommodation capacity (number of rooms) in coastal areas per NUTS3.
Source: Batista e Silva and others (2020)418.
107
2022

Source: Batista e Silva and others (2020)419.
When looking at absolute values, Italy is the European coun-try with most accommodation capacity in coastal areas with 916 thousand rooms, followed by Spain (670 thousand), Greece (585 thousand), France (495 thousand) and Croatia (345 thou-sand). From the coastal countries, the ones with the least sum are Estonia (13.2 thousand), Lithuania (9.9 thousand), Finland (9.4 thousand), Slovenia (9.1 thousand) and finally Latvia with 8.5 thousand rooms (Figure 4.50).
Cyprus presents the highest average number of coastal rooms per NUTS3 (76 000 coastal rooms per NUTS3). This may due the entire island being considered one unique region. Together with Bulgaria (almost 53 000), Croatia (49 000) and Romania (46 000) are the countries with highest averages. The lower averages are found in Estonia (4 100), Netherlands (4 000) and Finland (1 500 coastal rooms per NUTS3). According to the definition of coastal tourism applied in this section to differentiate between typolo-gies420, rooms located in coastal cities are classified as urban. This might partially explain the lower Dutch and Finnish values (Figure 4.50).
EU-27 NUTS3 regions have on average 15 000 rooms, with Mallorca in Spain reaching the maximum value of 173 000, fol-lowed by Rhodes in Greece with 117 000, Burgas province in Bulgaria with 109 000, Algarve in Portugal with 105 000 and Istria in Croatia with 101 000 room completing the top 5.
At EU level, the majority of tourism expenditure is generated in the summer months and takes place in coastal regions (Figure 4.51). Such regions are predominantly oriented to beach tourism and thus highly affected by seasonality. In 2018, the total nights spent was over 95 million with the exceptional summer peak generating over €73 billion and representing 41 % of the annual tourism expenditure in these regions. Moreover, the majority of the nights spent on islands and coasts originated from foreign
419 Batista e Silva, F., Barranco, R., Proietti, P., Pigaiani, C., & Lavalle, C. (2020). A new European regional tourism typology based on hotel location patterns and geographical criteria. Annals of Tourism Research, 103077.
420 Coastal zones are delineated by applying a 10 km-straight line buffer to the coastline (Eurogeographics, EuroBoundaryMap, https://eurogeographics.org/maps-for-europe/ebm/. Copernicus EU-DEM, https://land.copernicus.eu/imagery-in-situ/eu-dem/eu-dem-v1.1. If an area is both a city and a coastal zone (e.g. Barcelona, Copenhagen), then we assume the city is the main driver of visitors. Similarly, if an area is both part of a coastal area and a mountain (not common, but may occur in, for example, Crete, Liguria and Sardinia), then we assume the coastal traits have higher prevalence in driving visitors to the area. The resulting layer was then overlaid with a 100m2 ‘hotel grid layer’ with the number of rooms in tourism accommodation, obtaining the coastal tourism capacity within each NUTS3. Regions where most accommodation capacity is located within the 10 km buffer were classified has coastal. It was additionally decided to consider all islands within this class. See for further details: Batista e Silva, F., Barranco, R., Proietti, P., Pigaiani, C., & Lavalle, C. (2020). A new European regional tourism typology based on hotel location patterns and geographical criteria. Annals of Tourism Research, 103077.
421 Barranco, R., Batista e Silva, F., Jacobs-Crisioni, C., Proietti. P., Pigaiani. C., Kavalov. B., Kucas, A., Kompil., M., Vandecasteele, I., Lavalle. C., Rainoldi. A., Characterisation of tourism expenditure in EU regions, JRC, European Commission 2020.
422 Batista e Silva, F., Herrera, M. A. M., Rosina, K., Barranco, R. R., Freire, S., & Schiavina, M. (2018). Analysing spatiotemporal patterns of tourism in Europe at high-resolution with conventional and big data sources. Tourism Management, 68, 101-115.
423 Marques Santos et al. (2020). Behavioural changes in tourism in times of COVID-19, EUR 30286 EN, Publications Office of the European Union, Luxembourg,
tourists resulting in €113 billion421. In general, these regions have also higher tourism intensity levels, with an average 12.3 nights spent per local inhabitant, turning them among some of the most vulnerable to shocks in the tourism sector (e.g. Mediterranean, Atlantic, Baltic and in the Black Sea).
Vulnerability in coastal regions
The tourism vulnerability index is calculated by taking into account two indicators: tourism intensity and seasonality. Tourism inten-sity is computed as the ratio of regional tourists per resident. Seasonality is the degree to which touristic activity is concentrated in one season. Regions with more tourists per inhabitant (higher intensity) and where touristic activity is concentrated in shorter periods (higher seasonality) are considered more vulnerable. EU NUTS3 regions were classified in four categories according to the relative vulnerability of their tourism sectors, ranging from Low, to Medium, High and Very High422. Regions with a higher tourism vulnerability index are also those where employment generated by tourism activities is most important (Table 4.5).
Table 4.4 Contribution of tourism sector (net overall effect) to regional employment, by category of the regional
vulnerability to tourism index, EU-27, 2018
Regional vulnerability to tourism index
Contribution of tourism sector to total employment ( % Total)
Low 6.3 %
Medium 11.1 %
High 13.0 %
Very High 18.1 %
Source: Marques Santos and others (2020)423.
Figure 4.50 Tourism accommodation capacity in coastal areas per NUTS3 (sum and average rooms)108
THE
EU B
LUE
ECO
NO
MY
REPO
RT

Source: Barranco and others (2020)424.
Both nights spent and accommodation in coastal areas are mainly located in very high vulnerable regions (74 % and 77 %, respectively). These values show how much coasts and islands are vulnerable to impacts in the tourism sector like the COVID-19 pandemic (Figure 4.52), especially when considering that tour-ism-related activities in coastal areas contribute to about 40 % of total employment425.
4.7.5 CRUISE TOURISM
Cruise tourism constitutes an integral segment within Coastal tourism contributing to the global economy. To illustrate the segment’s relevance, it is important to note that based on 2018 data, more than half of all EU port calls were made by roll-on and roll-off passengers and cruise ships. The number one port for cruise liners in the European Union is Barcelona (ES), followed by Civitaveechia (IT), Dubrovnik (HR) Piraeus (GR) and Palma (ES)426.
Europe is the largest cruise ship builder and the second most pop-ular cruise destination in the world. Beyond that, Europe also rep-resents a large source market: From 2018-2020, Western Europe represented the second largest market following North America with a share of 21 % in global cruising 427.
Evidently, the COVID-19 crisis had a tremendous impact on the sector due to travel restrictions put in place after the outbreak and its aftermath. It has to be noted that the suspension of the sector had not only an impact on tour operators and the ship-building sector but also respective tourism destinations includ-ing ports as well as local service providers, travel agents and other associated small and medium-sized enterprises. In order to ensure a safe and gradual recovery of the industry in the EU, the European Maritime Safety Agency published a guidance document in cooperation with the European Centre for Disease Prevention
doi:10.2760/00411.424 Barranco, R., Batista e Silva, F., Jacobs-Crisioni, C., Proietti. P., Pigaiani. C., Kavalov. B., Kucas, A., Kompil., M., Vandecasteele, I., Lavalle. C., Rainoldi. A., Characterisation of
tourism expenditure in EU regions, JRC, European Commission 2020.425 Estimation based on the estimated total employment generated by the tourism sector from Marques Santos et al. (2020) and Eurostat data about the proportion of nights
in coastal areas.426 EMSA, 2021, European Maritime Transport Environmental Report. (https://www.eea.europa.eu/publications/maritime-transport)427 CLIA 2022. State of the Cruise Industry Outlook. (https://cruising.org/en-gb/news-and-research/research/2022/january/state-of-the-cruise-industry-outlook-2022) 428 https://www.ecdc.europa.eu/sites/default/files/documents/COVID-19-cruise-guidance-27-07-2020.pdf429 CLIA 2022. State of the Cruise Industry Outlook. (https://cruising.org/en-gb/news-and-research/research/2022/january/state-of-the-cruise-industry-outlook-2022) 430 CLIA 2021. Europe Passenger Report 2020. https://cruising.org/en-gb/news-and-research/research/2021/june/clia-europe-passenger-report-2020
and Control428. Moreover, the industry fosters responsible Cruise tourism by maintaining solid public health protocols: testing, vac-cination, contactless technology, advanced ventilation, cleaning & sanitation, mask-wearing, physical distancing, having response plans and medical personnel in place429.
Globally, passenger embarkations dropped from 20.7 million in 2019 to only 5.8 million in 2020 which represents an 81 % decrease. Employment decreased by 51 % only accounting for 576 000 jobs in 2020 compared to 1.17 million jobs in 2019. The total economic contribution of the sector dropped by 59 % to merely 56 billion Euros in 2020, compared to 2019 levels. Overall, the passenger volume across Europe dropped by 82.5 % in 2020 compared to 2018430.
In 2020, most cruise tourists hailed from Germany, representing 531 000 passengers whereas 259 000 came from the UK and Ireland, 151 000 from Italy and 146 000 from France. Significant drops in passenger volume between 2019 and 2020 were particularly
Figure 4.51 Left: Tourism total annual expenditure by typology and season for 2018. Right: Tourism total annual expenditure by typology and tourism origin in 2018. € million
Figure 4.52 Share of coastal nights spent and accommodation rooms per tourism vulnerability class
4 7 15
74
3 9 12
77
020406080
100
Low Medium High Very high
Nights spent Rooms
Source: Own elaboration from Marques Santos and others (2020) and Eurostat data.
109
2022

observed by Spain (91,9 %), UK & Ireland (87 %), the Netherlands (85,6 %) and Belgium (84,9 %). Overall, the passenger volume across Europe dropped by 82,5 % in 2020 compared to 2019.
Cruise ships accounted for 6 % of black carbon emissions despite only accounting for less than 1 % of the global fleet431. Over the timeframe from 2008 to 2019, the weighted average speed of cruise ships that are calling in to EU ports reduced by 24 % – this speed reduction is associated with minimizing fuel consumption as well as other associated costs which in turn contribute to the reduction of environmental pressures.432 In line with the goals that are laid out in the European Green Deal, the cruise industry also aims for net carbon neutral cruising by 2050 433 .
4.7.6 INTERACTIONS WITH OTHER SECTORS AND THE ENVIRONMENT Coastal and maritime tourism depend highly on good environ-mental conditions and in particular on good water quality. Any maritime or land-based activity deteriorating the environmental can negatively affect tourism. Besides competition for space when resources are shared between tourism and other sectors, impacts might arise due to land-sea nexus of interactions. An example of this are oil spills from ships434, as well as agricultural runoff, urban wastewater, and industrial discharges. All these activities can have direct and indirect effects on both marine and terrestrial ecosys-tems (See Chapter 6.X) and on the economic activities depending on them435. The Zero pollution action plan of the European Green Deal is key in that regard and aims to reduce pollution to levels no longer considered harmful to health and natural ecosystems that respect the boundaries with which our planet can cope, thereby creating a toxic-free environment.
431 Comer, B., et al., 2017, Black carbon emissions and fuel use in global shipping, 2015, International Council on Clean Transportation (https://theicct.org/publications/black-carbon-emissions-global-shipping-2015).
432 EMSA, 2021. European Maritime Transport Environmental Report. (https://www.eea.europa.eu/publications/maritime-transport)433 CLIA 2021. Environmental commitment, innovation and results of the cruise industry. (https://cruising.org/en-gb/news-and-research/research/2021/november/
environmental-commitment-innovation-and-results-of-the-cruise-industry).434 Ecorys (2016). Study on specific challenges for a sustainable development of coastal and maritime tourism in Europe.435 European MSP Platform. Technical Study: MSP as a tool to support Blue Growth. Sector Fiche: Coastal and Maritime Tourism, 16.02.2018.
Coastal areas may also be directly or indirectly affected by a number of climate change related impacts, such as, flooding, erosion, saltwater intrusion, increase in air and seawater temper-atures and droughts.
Ports are crucial for the economic growth of coastal and inland areas. Passenger and cruise transport are important means for maritime and coastal tourism development while freight trans-port can be seen as a competing activity in terms of space. An example of this fragile balance appears in cruise tourism. The EU Commission promotes a pan-European dialogue between cruise operators, ports and coastal tourism stakeholders to enhance syn-ergies in the sector, targeting best practice sharing in innovation, competitiveness and sustainability strategies.
Co-existence with other Blue Economy sectors, such as extraction of Marine living and non-living resources may depend on direct spatial conflicts, while synergies may also exist. For example, Marine renewable energies such as offshore wind farms may help to mitigate environmental impacts by reducing carbon and other greenhouse gas emissions but may imply a trade-off with aesthetic benefits.
The natural resources and beauty of coastal areas have made them popular destinations for visitors. A healthy natural envi-ronment is a huge asset, but tourism generates many pressures on local environment and ecosystems, such as higher water use, increased waste generation and accumulated emissions from air, road and sea transport in peak seasons. In addition, coastal areas are especially prone to a number of climate change related impacts, such as flooding, erosion, saltwater intrusion, increase in temperatures and periods of drought. These can have severe direct and indirect effects on coastal and maritime tourism. Coastal defence is of prime importance to counter coastal ero-sion and flooding and maintain tourism facilities and activities.
Table 4.5: Passenger volume (in thousands) for European Countries
Country 2018 2019 2020 % decrease between 2019-2020
Germany 2.233 2.587 531 79,5 %
UK & Ireland 2.009 1.992 259 87,0 %
Italy 831 950 151 84,1 %
France 521 545 146 73,2 %
Spain 530 553 46 91,9 %
Austria 136 136 25 81,9 %
Netherlands 113 123 18 85,6 %
Sweden 63 59 16 72,8 %
Denmark 45 45 14 68,6 %
Belgium 70 66 10 84,9 %
Portugal 28 28 5 81,9 %
Note: United Kingdom & Ireland present a combined figure, however the United Kingdom is no longer part of the EU.
Source: CLIA. 2022. Europe Passenger Report 2020.
110
THE
EU B
LUE
ECO
NO
MY
REPO
RT

C h A p T E R 5E M E R G I N G S E C T O R S

As in the previous editions of the Report, this chapter provides an account of emerging and innovative sectors of the Blue Economy, i.e. those economic sectors and activities linked to the marine environment that are either not mature (e.g. ocean energy other than oil, gas and offshore wind) or for which data is not available in the public domain (e.g. maritime defence, safety and security).
Given that data gaps persist for most of these emerging sectors, a similar in-depth analysis as the one conducted for the estab-lished Blue Economy sectors is still not entirely possible. Nor we can provide an accurate evaluation of their socio-economic perfor-mance or impacts, due to current limitations in national and inter-national statistics for these sectors. In the absence of granular data on some of the main economic indicators (e.g. GVA, profits, etc.), this chapter uses alternative proxy indicators wherever pos-sible, such as output, production capacity or number of licences, among others.
This chapter provides an analysis of the Blue bioeconomy, fol-lowed by an overview of Ocean energy industries other than oil, gas and offshore wind (i.e. floating offshore wind436, wave and tidal energy, gloating solar energy and offshore hydrogen), a section about Marine observation, another section cover-ing Maritime defence, security and surveillance, a section enti-tled Research and innovation and a final section on marine Infrastructure (sub-marine cables and robotics).
This chapter also includes a section on Desalination, which remains a strong emerging sector of the Blue Economy. In the EU and UK, 60.5 million people and €1 158 billion of economic activity are exposed to water scarcity. This is 8.6 million people and €163 billion more than in the period 1980-2010437. The first desalination plant in Europe was built in Spain nearly a half cen-tury ago. Since then, facilities have sprung up in water-stressed regions throughout Europe. With more than 2 300 seawater desal-ination plants operational in the EU (out of more than 18 000 plants worldwide438,439) mostly spread in the Mediterranean440, the EU is producing about 9.2 million cubic meters of desalinated water per day (i.e. approx. 10 % of global capacity).
The Blue bio-technology and non-traditional living resources is a growing Blue Economy sector in Europe. Bio-based alternatives to conventional fossil technologies offer potential solutions for decarbonising chemical activities, in addition to safeguarding other environmental benefits441. The Circular Economy Action Plan (CEAP)442 underlines the potential of renewable bio-based materials, e.g. in the context of bio-based plastics. Within the sector, algae production in Europe remains a prominent industry,
436 Note that the fixed offshore wind has now transitioned into an established sector (Marine renewable energy, Section 4.3).437 Climate change and Europe’s water resources, Bisselink B. et al, 2020. EUR 29951 EN, doi:10.2760/15553 – JRC Technical Report: Climate change
and Europe’s water resources.438 https://knowledge4policy.ec.europa.eu/foresight/topic/aggravating-resource-scarcity/renewable-water_en 439 World Bank. 2019. ‘The Role of Desalination in an Increasingly Water-Scarce World.’ World Bank, Washington, DC.440 European Environment Agency (EEA), 2021. Water resources across Europe – confronting water stress: an updated assessment. EEA Report No 12/2021.441 Spekreijse, J., Vikla, K., Vis, M., Boysen-Urban, K., Philippidis, G. and M’barek, R., Bio-based value chains for chemicals, plastics and pharmaceuticals, EUR 30653 EN,
Publications Office of the European Union, Luxembourg, 2021, ISBN 978-92-76-32459-1, doi:10.2760/712499, JRC124141.442 COM/2020/98 final.443 Araújo, R., Vázquez Calderón, F., Sánchez López, J., Azevedo, I. C., Bruhn, A., Fluch, S., ... & Ullmann, J. (2021). Current status of the algae production industry in Europe:
an emerging sector of the Blue Bioeconomy. Frontiers in Marine Science, 7, 1247.444 COM(2020) 301 final, July 2020, https://ec.europa.eu/energy/sites/ener/files/hydrogen_strategy.pdf445 COM(2020) 741 final, November 2020, https://ec.europa.eu/energy/sites/ener/files/offshore_renewable_energy_strategy.pdf446 Initial figures provided in USD: $2 473 million and forecasted to reach $4 914 million.447 Charisi, V., Compañó, R., Duch Brown, N., Gomez, E., Klenert, D., Lutz, M., Marschinski, R., Torrecilla-Salinas, C., What future for European robotics? A science for policy
perspective, JRC virtual conference, 27-29 January 2021, Publications Office of the European Union, Luxembourg, 2021, ISBN 978-92-76-37412-1, doi:10.2760/988825.
with algae and spirulina production units in 23 Member States443, generating an annual turnover well above 10 million euros in the countries with the largest number of production facilities (France, Spain and Portugal).
Emerging Marine Renewable Energy includes various types of renewable energy: Floating offshore wind, Wave and Tidal energy, floating Solar Photovoltaic energy (FPV) and Offshore hydrogen generation all of which may help the EU meet its goals under the EGD. Moreover, offshore renewables will pave the way to achieving the objectives of the EU Hydrogen Strategy444 and the ‘Offshore Renewable Energy Strategy’445, which proposes to increase offshore wind capacity from its current level (12 GW) to at least 60 GW by 2030 and to 300 GW by 2050. Offshore wind deployment is to be complemented with 40 GW of ocean energy and other emerging technologies (e.g. FPV) by 2050.
The Maritime defence, security and surveillance sector although not an emerging activity as such, is included in this chapter because extensive, comparable data are not publicly available. This edition also provides an overview of the maritime security and surveillance sectors, as in the previous edition.
Research, blue-tech innovation and robotics activities are key enablers for the sustainability transition and the digital twin ocean. The Horizon Europe programme (2021-2027) has a budget of €95.5 billion (including €5.4 billion from the Next Generation of the EU Recovery Fund), of which at least 35 % will be devoted to climate-related actions, supporting the transition of maritime industries to climate neutrality. As regards the maritime Robotics sub-sector (including underwater and marmite airborne drones), in 2019, the global underwater robotics market was valued at €2 209 million and forecasted to reach €4 390 million by 2025446. Europe is a world-leader in robotics, producing almost one third of all robots worldwide. Together with Artificial Intelligence (AI), robotics technologies are central to the digital transformation of our societies and economies, with the potential to create new jobs and increase productivity447.
112
THE
EU B
LUE
ECO
NO
MY
REPO
RT

5.1 OCEAN ENERGYThe marine renewable energy sector comprises different tech-nologies for the production of renewable energy: Offshore wind (with bottom-fixed foundation to the seabed or anchored float-ing devices), ocean energy (tidal and wave power, Ocean Thermal Energy Conversion, salinity gradient), floating solar photovoltaic (FPV), and renewable hydrogen production offshore. Offshore wind (bottom fixed) represents the most advanced sector and therefore has been included in Chapter 4 as an established Blue Economy sector (see Section 4.3). The other technologies are at an earlier stage of development, therefore an analysis of their state of play is presented in this Chapter instead.
Large commercial-scale projects are currently operating in European waters for bottom-fixed wind turbines but other tech-nologies are starting to catch up. Large commercial floating wind energy projects are being announced in some Member States and ocean energy is reaching a level of maturity that makes them attractive to future applications.
In November 2020, the European Commission published the Offshore Renewable Energy Strategy448 which outlines the expected contribution of the marine renewable energy sector to the EU ambitions to net zero emission by 2050. The Strategy proposes to increase Europe’s offshore wind capacity from its current level of 12 GW to at least 60 GW by 2030 and to 300 GW by 2050. Offshore wind deployment is complemented with 40 GW of ocean energy and other emerging technologies such as floating wind and solar by 2050. In addition, offshore renewable are expected to contribute significantly to another EU strategy: the EU Hydrogen Strategy449. The objective is to have 40GW of renewables linked electrolysis capacity in the EU by 2030. The linkage between offshore renewables and hydrogen production has been further emphasised in the EU acquis as the revision of
448 https://ec.europa.eu/energy/sites/ener/files/offshore_renewable_energy_strategy.pdf449 COM(2020) 301 final, July 2020, https://ec.europa.eu/energy/sites/ener/files/hydrogen_strategy.pdf450 EC (2021), European Green Deal: Commission proposes transformation of EU economy and society to meet climate ambitions, Press release, 14 July 2021, Brussels,
https://ec.europa.eu/commission/presscorner/detail/en/ip_21_3541451 4 out of 15 floating turbines worldwide are produced and located in the European Union.452 With 13,5 MW of the global 34 MW ocean energy capacity installed in EU-27 waters in 2019, ref. European Commission (2020) Clean Energy Transition –
Technologies and Innovations Report (Annex to {SWD (2020) 953}).453 JRC, 2019) JRC: ENSPRESO – WIND – ONSHORE and OFFSHORE. European Commission, Joint Research Centre (JRC) [Dataset] PID:
http://data.europa.eu/89h/6d0774ec-4fe5-4ca3-8564-626f4927744e
the Renewable Energy Directive in July 2021 introduced specific sub-targets on hydrogen in order to decarbonise hard-to abate sectors with Green Hydrogen (e.g. 50 % renewable share in hydro-gen consumption in the industry)450.
This ambitious growth is based on two key factors: the vast energy potential across all of Europe’s sea basins and on the global lead-ership position of EU companies in the sector. This leadership posi-tion ranges from floating offshore wind451, to ocean energy tech-nologies such as wave or tidal452, or from floating photovoltaic installations, to the use of algae to produce biofuels.
Floating wind technology opens up the possibility to harvest the most resourceful wind energy sites in Europe. Nearly 80 % of the wind in Europe blows in waters that are at least 60 meters deep, where it is too expensive to fix structures to the bottom of the sea. JRC453 estimates the technical potential for floating offshore wind in Europe with about 4 540 GW, of which 3 000 GW would be located in deep sea (water depth between 100 m and 1000 m). Furthermore, every sea basin in is different, and has different potential due to its specific geological condition and the specific stage of offshore renewable energy development. Hence, different technologies suit different sea basins.
Ocean energy is a largely untapped renewable energy source, although it has significant potential to unlock further decarboni-sation of the EU energy system. Tidal and wave energy technolo-gies are the most advanced among the ocean energy technologies, with significant potential located in different Member States and regions. For tidal energy, there is significant potential in France, Ireland and Spain, and localised potential in other Member States. For wave energy, high potential is to be found in the Atlantic, local-ised potential in North Sea, Baltic, Mediterranean, and Black Sea.
A new emerging trend in the offshore renewable energy sector is the development of floating photovoltaic (FPV). While the current
Figure 5.1 State of play of offshore renewable energy projects in the EU
Source: JRC.
113
2022

installed capacity is limited, the Offshore Renewable Energy Strategy recognises the potential of these technologies, and the potential for fast technology progression based on the results of ongoing demonstration projects. One of the technological chal-lenges to overcome is the interaction with waves, which has larger impacts than FPV installed on hydropower reservoirs.
Nevertheless, meeting the ambitions set in the Offshore Renewable Energy Strategy (the Strategy) requires significant scale up, commitment and a greater involvement of the EU and Member State governments, as under current policies, the present and projected installation pace would lead to only approximately 90 GW by 2050. According to the Strategy, continued support will be needed for emerging offshore renewable technologies to move from pilot and demonstration phases to a utility scale, focusing on identifying technological solutions that best reconcile the EU’s economic and environmental goals.
EU instruments, such as InvestEU, the Connecting Europe Facility (CEF) or the Innovation Fund, could help mobilise the funds needed to support such endeavour. The CEF provides incentives for cross-border cooperation in the field of renewable energy, and could be used to, for example, fund the joint development of a floating wind farm to support European technology leadership. The Innovation Fund can support the demonstration of innovative clean technologies at commercial scale, such as ocean energy, new floating offshore wind technologies or projects to couple off-shore wind parks with battery storage or hydrogen production.
5.1.1 FLOATING OFFSHORE WIND
Floating offshore wind is a growing sector that is strengthen-ing Europe’s leadership in renewable energy. The technology for floating offshore wind in deep waters and harsh environments is progressing steadily towards commercial viability454. Floating applications seem to become a viable option for EU countries and regions with deep waters (depths between 50-1 000 metres) and could open up new markets such as the Atlantic Ocean, the Mediterranean Sea and potentially the Black Sea. Hence, floating offshore wind is one of the EU’s R&I priorities; increased R&I could foster EU competitiveness455.
454 UNEP & BloombergNEF, Global trends in renewable energy investment, 2019.455 Telsnig T. (2020). Wind Energy Technology Development Report 2020. European Commission.456 Principle Power, KOWL: World’s largest floating windfarm fully operational, 2021, Accessed: 02/02/2022.
URL: https://www.principlepower.com/news/kowl-worlds-largest-floating-windfarm-fully-operational457 Stiesdal, The world’s first industrialized offshore foundation, 2021, Accessed: 02/02/2022.
URL: https://www.stiesdal.com/offshore-technologies/the-tetraspar-full-scale-demonstration-project/458 EC, CORDIS – H2020 project FLAGSHIP (FLoAtinG offSHore wInd oPtimization for commercialization), 2022, Accessed: 02/02/2022.
URL: https://cordis.europa.eu/project/id/952979459 JRC, Low Carbon Energy Observatory, Wind Energy Technology Development Report 2020, European Commission, 2020, JRC120709 (data update 01/2022).460 Communication from the Commission, A Clean Planet for all - A European strategic long-term vision for a prosperous, modern, competitive and climate neutral economy.
COM (2018) 773 final.461 Levelized Cost of Energy.462 ETIPWind. 2020. Floating Offshore Wind. Delivering climate neutrality. 463 JRC analysis based on 4COffshore Offshore Wind Database.464 GWEC, Global Offshore Wind Report 2020, 2020.
The first multi-turbine floating project was Hywind Scotland with a capacity of 30 MW, commissioned in 2017 by Equinor, followed by the Floatgen project in France and the WindFloat Atlantic in Portugal. In 2021 the Kincardine project was fully commissioned in Scotland (UK) after being delayed due to supply chain issues caused by the COVID-19 pandemic. With 48MW the project is cur-rently the world’s largest floating offshore wind farm456. Moreover, the commissioning of the 3.6 MW TetraSpar demonstrator was completed at the METCentre test site in Norway at the end of 2021. The concept uses a tetrahedral structure assembled from tubular steel components aiming for an industrialised and lean production of offshore foundations457. At the same location (MET Centre) the H2020-funded FLAGSHIP (FLoAtinG offSHore wInd oPtimization for commercialization) project aims to install by the end of 2022 a cost-effective 10 MW floating offshore wind turbine by using a floating semi-submersible concrete substruc-ture458. There is a pipeline of projects that will lead to the installa-tion of 530 MW of floating capacity in European waters by 2025 (of which 247 MW are deployed in EU MSs), which would need to accelerate afterwards459,460. A higher level of ambition and clarity is needed to reach a market size sufficient to yield cost reduc-tions: there is potential to reach an LCOE461 of less than €100/MWh in 2030 if large capacity is deployed. Moreover, the EU wind industry targets 150 GW of floating offshore by 2050 in order to become climate-neutral462.
The global market for floating offshore wind represents a consid-erable market opportunity for EU companies. Latest announce-ments of national floating offshore wind targets (particularly in Europe and Asia) suggest a substantial increase in the deployed capacity in the mid-term. In total about 12.2 GW to 16.5 GW of floating offshore wind energy is expected by 2030, with signifi-cant capacities in some Asian countries (South Korea and Japan) besides the European markets (France, Norway, Italy, Greece, Spain, the United Kingdom) (see Figure 5.2). The current lead-ership of European countries in deployment of floating offshore wind is expected to change in the second half of the decade with South Korea, Japan joining the established European markets (Norway, the United Kingdom and France). Thus, the market share of European countries (including the United Kingdom and Norway) in floating offshore wind is expected to decrease from 71 % in the period 2021-2025 to about 44 % in the period 2026-2030. By then by Asia (37 %) and North America (19 %) are expected to hold significant shares of the market. Due to good wind resources in shallow waters, no significant floating offshore capacity is expected in China in the mid-term463,464.
114
THE
EU B
LUE
ECO
NO
MY
REPO
RT

Source: JRC465.
465 Telsnig, T, Wind Energy Technology Development Report 2020, European Commission, 2020, JRC120709, (data update 02/2022).
Project Country First Power Capacity [MW]
# of turbines Floating concept
SeaTwirl S1 Sweden 2015 (operational) 0.03 1 Spar-buoy
Floatgen Project 1 France 2018 (operational) 2 1 Barge
WindFloat Atlantic (WFA) 2 Portugal 2020 (operational) 25 3 Semi-Submersible
PivotBuoy – PLOCAN Spain 2022 0.225 1 Semi-Submersible
DemoSATH – BIMEP1 Spain 2022 2 1 Barge
MULTIPLAT2 Spain 2022 10 2 Semi-Submersible
Floating Power Plant - PLOCAN Spain 2023 5 1 Semi-Submersible
EOLINK 5 MW Demonstrator France 2023 30 3 Barge
EolMed 4 France 2023 25.2 3 Tension-leg platform
Provence Grand Large2 France 2023 30 3 Semi-Submersible
Golfe du Lion France 2023 28.5 3 Semi-Submersible
Groix & Belle-Île France 2023 25 5 Spar-buoy
SeaWind Demonstrator Not decided 2024 6.2 1 Semi-Submersible
FLOCAN 52 Spain 2024 50 4 Semi-Submersible
GOFIO Spain 2025 8 1 Semi-Submersible
UNITECH Zefyros by Hywind Technology Norway 2009 (operational) 2.3 1 Spar-buoy
Hywind Scotland Pilot Park** United Kingdom 2017 (operational) 30 5 Spar-buoy
Kincardine - phase 1** United Kingdom 2018 (operational) 2 1 Semi-Submersible
Kincardine - phase 2** United Kingdom 2021 (operational) 48 5 Semi-Submersible
TetraSpar Demonstrator - Metcentre Norway 2021 (operational) 3.6 1 Spar-buoy
Hywind Tampen Norway 2022 88 11 Spar-buoy
FLAGSHIP - Metcentre 1 Norway 2022 10 1 Semi-Submersible
SeaTwirl S23 (VAWT) Norway 2024 1 1 Spar-buoy
Blyth Offshore Demonstrator - phase 2** United Kingdom 2025 58.4 5 Semi-Submersible
TwinHub** United Kingdom 2025 40 4 Semi-Submersible
Erebus** United Kingdom 2027 96 10 Semi-Submersible
Dolphyn Project - pre-commercial** United Kingdom 2027 10 1 Semi-Submersible
Notes: R&D projects taking place outside of the EU are listed in the bottom half of the table.1 Funded by the EC’s FP7 or H2020 programme.2 Funded by the EC’s NER300 programme.3 Received a €2.48 million grant from the European Innovation Council’s SME instrument.4 Co-financed by the European Investment Bank.5 Combined wind-wave generator. Project will be further developed to 47MW.
** UK projects are listed because of the role in R&D of floating wind technology.
Table 5.1 EU and other European floating offshore wind farms and demonstrators and the respective floating substructure concept used (announced and operational
115
2022

The main distinctive criterion in multiple floating designs is the substructure used to provide the buoyancy and thus the stability to the plant, such as Spar-buoy, Semi-Submersible, Tension-leg platform (TLP), Barge or Multi-Platforms substructures. So far, no concept has prevailed over the others; however, Equinor’s spar-buoy concept has already been deployed in a pre-commercial pro-ject (see Table 5.1). Given the variety of concepts estimates are that the TRL of offshore floating wind concepts range between 4 and 9466. Spar-buoy and semi-submersible concepts have already reached TRL 8-9 as they are being built and tested at large scale. Based on estimates on the current global project pipeline until 2030 semi-submersible floaters will hold the highest share in floating offshore wind projects with about 64 % followed by spar-buoy (13 %), barge (10 %), TLP (7 %) and semi-spar (4 %)467. With a 2 MW floating prototype in France (Floatgen Project, generating 6 GWh in 2019468) Ideol aims to demonstrate the capabilities of a concrete barge-type substructure (‘Damping Pool’ floating foun-dation) in a deep-water setting. To date TLP designs have not yet reached this level of maturity469.
With 88 MW (11 8 MW SGRE-turbines), the next significant up-scaled project (Hywind Tampen) will be deployed close to the Gullfaks and Snorre fields to meet approximately 35 % of the annual power requirement of five oil and gas platforms. This would also mean an increase in the design of the spar-buoy platforms (weight, draught and catenary length) as compared to the initial Hywind Scotland design as the project will be located 140 km from shore at a water depth of about 260-300 meters470.
In February 2022, Netherlands-based Seawind Ocean Technology signed a Memorandum of Understanding (MOU) with Petrofac, a leading international service provider to the energy indus-try. Petrofac will support design verification as well as project
466 Moro A, Antunes dos reis V and Watson S: JRC Workshop on identification of future emerging technologies in the wind power sector.467 GWEC. (2021). Global Offshore Wind Report 2021, 468 Ideol pilot doubles power yield and is ‘ready for deployment.’ Accessed: 02/18/2020.
URL: https://www.windpowermonthly.com/article/1671567/ideol-pilot-doubles-power-yield-ready-deployment469 Watson et al. Future emerging technologies in the wind power sector: A European perspective. Renewable and Sustainable Energy Reviews 113 (109270). DOI:10.1016/j.
rser.2019.109270.470 Telsnig T. (2020). Wind Energy Technology Development Report 2020. European Commission.471 Seawind (2022), Press Release – 21 February 2022 SEAWIND OCEAN TECHNOLOGY SIGNS MOU WITH PETROFAC, https://seawindtechnology.com/
wp-content/uploads/2022/02/Seawind-Ocean-Technology-signs-MOU-with-Petrofac-21.02.22_final.pdf (accessed 07/03/2022).
management and EPC service to the SeaWind concept. The com-pany claims that this will enable the deployment of a first 6.2 MW demonstrator in European waters by 2024471.
Floating hybrid energy platforms are still at a lower TRL (1-5), though the announced Katanes Floating Energy Park – Pilot (based on the P80 wind-wave energy platform) comprising a 3.4 MW wave converter and an 8 MW wind turbine could lift this system to TRL 6-7 by 2022.
Floating offshore wind is one of the EU’s R&I priorities. The EC has boosted the development of floating offshore wind concepts and solutions. The FP7 programme funded seven research pro-jects on floating offshore wind. Some projects such as FLOATGEN (see Table 5.1) and DEMOWFLOAT demonstrated different float-ing concepts at pre-commercial scale in operational environment. H2020 has already allocated funding to 21 research projects on floating offshore wind since 2014. In total, the EC has granted more than €106m to R&D projects on floating offshore wind solu-tions via FP7 and H2020 funding programmes since 2009, making floating offshore wind was the second most funded wind energy topic in the EU’s Framework Programmes (Figure 5.3). Floating offshore wind R&I received significant boost in 2019 when 8 pro-jects spread across the EU were awarded funds through H2020. The selected projects were: COREWIND (Coordinator: ES), FLOTANT (ES), PivotBuoy (ES), SeaTwirl (SE), SATH (ES), EDOWE (NL), ASSO (FR), FLOAWER (FR). In 2020 another 3 projects on floating off-shore wind were funded through H2020: STEP4WIND (NL), FLAGSHIP (ES) and SEAFLOWER (IT). Although the number of pro-jects decreased in 2020 funding increased by 26 % as compared to 2019 indicating a stronger focus on demonstration projects and innovations at a high TRL.
Figure 5.2 Global capacity outlook until 2030 on floating offshore wind
Source: JRC.
27 86 27
0
1000
2000
3000
4000
5000
6000
7000
Today 2025 2030 Today 2025 2030 Today 2025 2030
EU 27 Other EU Rest of World
Capa
city
[MW
]
JRC 2020
116
THE
EU B
LUE
ECO
NO
MY
REPO
RT

5.1.2. TIDAL AND WAVE ENERGY
Tidal and wave energy technologies are the most advanced among the ocean energy technologies, with significant potential located in different Member States and regions. Tidal technol-ogies can be considered at pre-commercial stage, benefitting from design convergence, significant electricity generation (over 60 GWh since 2016472) and a number of projects and prototypes deployed across Europe and worldwide. Instead, most of the wave energy technological approaches are at R&D stage. Many positive results on wave energy are stemming from ongoing European and national projects. Over the past 5 years significant technology progress has been achieved thanks to the successful deployment of demonstration and first-of-a-kind farms; with the sector show-ing particular resilience in overcoming the setbacks473 that have hindered the industry in 2014/15474.
The variety in ocean resource and location requires different tech-nological concepts and solutions. Therefore, several methods exist to turn ocean energy into electricity:
• Wave energy converters derive energy from the movement of waves. Most advanced technology can be considered at TRL 8-9, with Manufacturing Readiness Level of 1. Most of technology are at TRL 6-7. A convergence towards a common conceptual design to extract the energy from the waves and transform it into electricity, would help the industrialisation of the sector. The fact that the industry is not there yet means that a higher R&D effort is still necessary.
• Tidal stream turbines harness the flow of the currents to pro-duce electricity. About 10 different converters designs are at an advantaged TRL stage [TRL 8-9], and are feeding elec-tricity into the grid in real operational environments – both individually and as arrays.
• Tidal range uses the difference in sea level between high and low tides to create power. Because this sub-sector employs a
472 Ocean Energy Europe (2021) Ocean Energy Key trends and statistics 2020.473 European Commission (2017) Study on Lessons for Ocean Energy Development EUR 27984.474 Magagna & Uihllein (2015) 2014 JRC Ocean Energy Status Report
(https://publications.jrc.ec.europa.eu/repository/bitstream/JRC93521/jrc %20ocean %20energy %20report_v2.pdf).475 JRC (2014) – Ocean Energy Status Report.
similar technology as the one used for the hydropower sector, tidal range is the more established ocean energy technology, with several projects generating power around the world, especially in France and in Korea. Such systems let the tide fill a natural or artificial basin, then blocking the ‘opening.’ Environmental considerations, limited amount of appropri-ate sites and high upfront capital required have slowed the development of new projects in Europe.
• OTEC exploits the temperature difference between deep cold ocean water and warm surface waters to produce electricity via heat-exchanger. OTEC is suited to oceans where high tem-perature differences will yield the most electricity. A number of demonstration plants are planned to be developed in EU overseas territories opening up export opportunities.
• Salinity gradient power generation utilises the difference in salt content between freshwater and saltwater, found in areas such as deltas or fjords, to provide a steady flow of electricity via Reverse Electro Dialysis (RED) or osmosis.
Given the resources available in the EU, and the advancement of the technologies, it is expected that in the short-to-medium term (up to 2030), ocean energy development in the EU will be largely dependent on the deployment of tidal and wave energy convert-ers. In the EU, the highest resource potential for ocean energy exists along the Atlantic coast, with further localised exploitable potential in the Baltic and Mediterranean seas and in overseas regions (e.g. Reunion, Curacao). The theoretical potential of wave energy in Europe is about 2800 TWh annually, whilst the potential for tidal current was estimated to be about 50 TWh per year. OTEC offers potential only for the EU overseas islands since its deploy-ment is basically only possible in tropical seas475.
The total installed capacity of ocean energy worldwide amounts for 574 MW, including 494 MW of tidal range projects (240 MW in France and 254 MW in the republic of Korea). Excluding tidal range, the total cumulative installed capacity of ocean energy
Figure 5.3 EC funding on wind energy R&I priorities in the period 2009 -2020 under FP7 and H2020
Source: JRC.
117
2022

Figure 5.4 Global installed capacity (excluding tidal range)
Source: JRC (2021) Facts and Figures.
worldwide476 reached 46MW by the end of 2021. However, the active contributing to the network capacity is smaller, with some of the devices having being decommissioned following the suc-cessful completion of testing programmes. About 75 % of the global capacity is installed in European waters, equally split between deployments in EU-27 and in the UK (15.6 and 15.9 MW respectively), as shown in Figure 5.4477.
Wave. At the start of 2021, the global cumulative installed capac-ity of wave energy was of 23.3 MW, with 12MW (51 %) installed in Europe. In 2020, 200 kW of new wave energy capacity was deployed in the EU478. Notable wave energy converters deployed in 2021 include the Penguin 2, a device by Wello, which was deployed in Spain.
Tidal. At the start of 2021, the global installed capacity of tidal energy was of 36.3 MW, 77 % of the installed capacity is deployed in Europe, of which 24 % in EU waters. In the UK there are 18 MW of operational tidal energy capacity. EU developers have largely benefitted from successful collaboration and interlinkage between EU support and the availability of ad-hoc infrastructure especially in Scotland and in Northern Ireland. As a matter of fact, 65 % of the global tidal energy installed capacity comes from EU devel-opers. Notable deployment for tidal energy in 2021 include the O2 device by Orbital, which is the first with a capacity of 2 MW and became operational in Orkney, Scotland.
476 Ocean Energy Europe (2021) Ocean Energy Key trends and statistics 2020.477 JRC 2020, Facts and figures on Offshore Renewable Energy Sources in Europe, JRC121366.478 Ocean Energy Europe (2021) Ocean energy key trends and statistics 2020.479 European Commission (2020) Offshore Renewable Energy Strategy.480 Ocean Energy Europe (2021) Ocean Energy Key trends and statistics 2020.481 JRC 2020, Facts and figures on Offshore Renewable Energy Sources in Europe, JRC121366.482 European Commission (2018) Market study on Ocean Energy.483 IEA (2019) World Energy Outlook 2019.484 Current policy initiative without specific support for emerging RES such as ocean.
The ambition for the sector, as outlined by the Offshore Renewable Energy Strategy is to reach 100 MW of installed capacity by 2025 and 1 GW by 2030479. Ireland, Portugal and Spain have set targets of ocean energy deployment in the National Energy and Climate Plans for a total of 230 MW to become operational by 2035480.
Based on announced projects, the EU ocean energy project pipe-line consists of about 2.4 GW until for the next 7 years. This pipeline comprises projects currently under development, and of industrial ambitions stated by some technology developers481. This pipeline is in line with the market projections released by DG MARE482 and with the IEA483 modelling scenario in the most optimistic development scenarios for ocean energy. It shall be noted that in the pessimistic484 scenario DG MARE and IEA expect between 0.25 GW and 0.6 GW of installed capacity by 2025 and around 1GW by 2030.
The development of ocean energy technologies is still primarily at the R&D stage, nevertheless some technology have already pro-gress towards first-of-a-kind demonstration and pre-commercial projects. Tidal energy technology has made the most significant stride forwards with over 60 GWh of electricity generated from the demo projects.
118
THE
EU B
LUE
ECO
NO
MY
REPO
RT

Source: Source JRC, European Commission485 – European Commission (2020)
Clean Energy Transition – technologies and Innovations reports.
The landscape of the ocean energy supply chain is rapidly chang-ing thanks to the technology validation projects currently ongoing in European test centres. The necessity of reducing the cost of ocean energy technology, also through economies of scale, implies that the presence of Original Equipment Manufacturers (OEMs) with access to large manufacturing facilities could be seen as an indicator of the consolidation of the supply chain.
In the period between 2012 and 2015 many OEMs have reduced their involvement in the sector, an inversion of tendency has been seen in the past years: new industrial players such as Enel Green Power, ENI, Fincantieri, Saipem, SBM Offshore, Total and Warstila have entered the market; bringing with them experience from the oil and gas and shipping sectors.
The increased presence of OEMs that adds on from the ones already presented in the sector such as AndritzHydro Hammerfest, Lockheed Martin, Engie, Schottel can be seen as a sign of the pro-gress and confidence in the sector moving forward. Furthermore, the sector can also rely on the experience of key intermediate components and sub-components companies, such as Bosch Rexroth, AVV, SKF, Schaeffler and Siemens to mention a few that are actively supporting R&D and demonstration projects. These companies are currently engaged on at ad-hoc base, but their involvement in the sector could grow once the market and supply chain consolidated.
485 European Commission (2020). Clean Energy Transition – Technologies and Innovations Report (Annex to {SWD (2020) 953}.486 FTI-Consulting. (2016). Global Wind Supply Chain Update 2016.487 Magagna, D., Monfardini, R., & Uihlein, A. (2016). JRC Ocean Energy Status Report 2016.488 EMEC. (2021). Marine Energy. http://www.emec.org.uk/marine-energy/ 489 TRL6 is used as cut-off point for developers receiving sufficient fuds to develop a small scale prototype of the device to be tested at sea. 490 JRC (2020). Facts and figures on Offshore Renewable Energy Sources in Europe, JRC121366.
It is important to notice, that as witnessed in the wind energy sector, a strong project pipeline ensures that there is sufficient demand for OEMs, and as a result ensures demand for the man-ufacturing of components and subcomponents and for the supply of raw materials486487. The landscape for ocean energy is rapidly changing thanks to the technology validation projects currently ongoing in European and international test centres.
The development of ocean energy has seen already almost 300 different concepts being proposed488. About half of them have progressed to higher TRL and even fewer tested in operational environment. 49.4 % of the ocean energy developers in the EU-27, when considering technology at TRL6 or higher489. 13.6 % of ocean energy developers at TRL6 or more are located in the UK, with the remaining 37 % located in the rest of the world.
In terms of tidal energy 41 % of the tidal energy technology developers are based in the EU-27, and 18 % in the UK (Figure 5.5). The Members State with the highest number of developers are Netherlands and France. Major non-EU players are Canada, the US, the UK and Norway490.
For wave energy, 52 % of active wave energy developers at TRL6 or higher are located in the EU (Figure 5.5). The UK (14 %) has the highest number of developers, followed by the US, Denmark, Italy and Sweden. Other key players in the sector are Australia, and Norway. A number of developers of technology at low TRL are not included in this analysis.
Figure 5.5 Distribution of tidal and wave energy developers
Tidal Wave
119
2022

Note: (*) = preliminary data.
Source: JRC491.
Whilst the highest concentration of wave and tidal energy devel-opers occurs within the EU and Europe many developers are looking to deploy their technologies outside of Europe thanks availability of market instruments available elsewhere, such has the high feed-in-tariffs in Canada. Developing a strong internal market will be fundamental for the EU in order to build on and maintain its current leadership position in the market. As seen for other renewable energy sources first-mover advantage and strong internal markets are key to maintain a competitive position.
European leadership spans across the whole ocean energy supply chain492 and innovation system493. The European cluster formed by specialised research institutes, developers and the availability of research infrastructures has allowed Europe to develop and maintain its current competitive position.
The EU maintains global leadership despite the UK’s withdrawal from the EU and changes in the market for wave and tidal energy technologies. 63 % of the global ocean energy capacity has been developed by EU-27 based companies494.
The ocean energy market is slowly forming. The next decade will be fundamental for EU developers to maintain their competitive-ness with the global ocean energy capacity of 3.5 expected to reach 2.5 GW by 2025 and to 10 GW by 2030495. With signifi-cant investments in ocean energy outside of Europe (Canada, US, Japan), dedicated support for is needed to ensure that a strong EU market can take off, allowing for the consolidation of the EU supply chain.
491 Magagna, D., Ocean Energy Technology Development Report2020, EUR 30509 EN, Publications Office of the European Union, Luxembourg, 2020, ISBN 978-92-76-27282-3, doi:10.2760/81693, JRC123159
492 JRC (2017) Supply chain of renewable energy technologies in Europe.493 JRC (2014) Overview of European innovation activities in marine energy technology.494 JRC (2020) Facts and figures on Offshore Renewable Energy Sources in Europe, JRC121366.495 EURActive (2020) https://www.euractiv.com/section/energy/interview/irena-chief-europe-is-the-frontrunner-on-tidal-and-wave-energy/ 496 Start of the SET plan initiative.497 Private investments are estimated from the patent data available through Patstat. Sources: Fiorini, A., Georgakaki, A., Pasimeni, F. and Tzimas, E., (2017) Monitoring R&I in
Low-Carbon Energy Technologies, JRC105642, EUR 28446 EN and Pasimeni, F., Fiorini, A., and Georgakaki, A. (2019). Assessing private R&D spending in Europe for climate change mitigation technologies via patent data. World Patent Information, 59, 101927.
498 EU funds awarded up to 2020 included UK recipients.499 Magagna, D., Ocean Energy Technology Development Report2020, EUR 30509 EN, Publications Office of the European Union, Luxembourg, 2020, ISBN
Between 2007496 and 2019 2021, total EU R&D expenditure on wave and tidal energy amounted to €3.84 billion with the majority of it (€2.74 billion) coming from private sources (Figure 5.6)497. In the same period, national R&D programmes have contributed EUR463 million to the development of wave and tidal energy. EU funds, including the European Regional Development Fund (ERDF) and Interreg projects, amounting to €493 million. A further €148 million had been made available through the NER300 Programme. On average, for the reporting period EUR1 of public funding (EU498+National) has leveraged EUR2.9 of private investments.
In the period 2017-2021 European, ERDF and National pro-grammes have contributed to fund ocean energy projects for €1.828 billion for a total worth of the projects equal to €2.342 billion. A breakdown of the funds and project cost is provided in Table 5.2.
Table 5.2 Breakdown of funds for ocean energy through European, ERDF and national programmes 2017-2021
Funding Contribution (€) Total Project Costs (€)
ERDF 257 608 557 363 165 296
EU 469 716 690 791 526 683
Ocean-ERANET
13 469 842 18 629 654
National 508 709 787 521 170 701
Regional 578 814 003 648 114 003
Total 1 828 318 879 2 342 606 337
Source: JRC499.
€ -€ 50
€ 100 € 150 € 200 € 250 € 300 € 350 € 400 € 450
2007
2008
2009
2010
2011
2012
2013
2014
2015
2016
2017*
2018*
2019*
Private R&D National R&D EU NER300
Figure 5.6 EU R&D expenditure on ocean energy, € million 120
THE
EU B
LUE
ECO
NO
MY
REPO
RT

Given the current status of the sector, where very limited number of projects operates thanks to commercial revenues and to Power Purchase Agreements (PPAs) with utilities. Furthermore, with many companies still being SMEs and focussing on R&I it is not possible to estimate the turnover of the sector. The challenge facing the ocean energy sector is identifying ways to support the deploy-ment of wave and tidal energy farms through innovative support schemes, until revenues are available most of the companies are going forwards thanks to a mix of grant, public funds, private equity and VC. An increasing number of developers are exploring the use of crowdfunding either for the fabrication of their new device, to support R&D activities, or to reach the required capital for deployment. Such efforts have mobilised over €20.5 million (or about USD 23 million) over the past three years. Characteristic example is Sabella’s crowdfunding for tidal power research that reached €1.5 million at the end of 2021. The impact of crowd-funding is comparable with public funding for projects, and it is likely to have limited impact, especially in terms of deployment of projects500. Nevertheless, it is telling of the difficulties being encountered by technology developers.
R&D activity in ocean energy involves over 838 EU companies and research institutions in 26 Member States501. In the EU-28, 51 % of the ocean energy inventions patented are for wave energy technology, 43 % for tidal energy, 2.7 % on Oscillating Water Column (OWC, this represents a subset of wave energy technol-ogy), and 3 % for Ocean Thermal Energy Conversion (OTEC). The EU-28 is a leader in the filing of patents in international markets, seeking protection in all key markets such as the United States, South Korea, and China as well as Canada and Australia (included in ROW). Nevertheless, the EU receives only a small number of
978-92-76-27282-3, doi:10.2760/81693, JRC123159.500 Hume (2018) The Rise of Crowdfunding for Marine Energy https://www.maritime-executive.com/features/the-rise-of-crowdfunding-for-marine-energy 501 JRC (2020) Technology Development Report Ocean Energy 2020 Update.502 Lee, N., Grunwald, U., Rosenlieb, E., Mirletz, H., Aznar, A., Spencer, R., & Cox, S. (2020). Hybrid floating solar photovoltaics-hydropower systems: benefits and global
assessment of technical potential. Renewable Energy, 162, 1415-1427.503 Quaranta, E., Aggidis, G., Boes, R. M., Comoglio, C., De Michele, C., Patro, E. R., ... & Pistocchi, A. (2021). Assessing the energy potential of modernizing the European
hydropower fleet. Energy Conversion and Management, 246, 114655.
incoming patents applications from outside, primarily from the United States (Figure 5.7). The patent filings indicate that the EU is a net exporter of Ocean energy technology and innovation, and that European Ocean energy developers are well positioned to exploit the growth of the sector globally.
5.1.3 FLOATING SOLAR PHOTOVOLTAIC ENERGYFloating solar photovoltaic (FPV) installations open up new oppor-tunities for employing conventional photovoltaic installations whilst reducing the impact on land. Structurally FPV consists of a floating structure on which traditional solar panels are installed. To date, most FPV structures have been installed on lakes and hydro-power reservoirs. Global installed capacity has increased from less than 1 MW in 2007 to 1 314 MW in 2018 and is pro-jected to reach approximately 13 000 MW by 2022502. While most of existing capacity and projected growth is expected in Asia, it has been estimated that FPV installations on hydropower reser-voirs in Europe could generate up to 729 GW, in addition to energy gains in terms of evaporation reduction503.
Deploying floating PVs at sea requires overcoming a number of challenges related to the survivability of the structure at sea, as well understanding the influence of the marine environment such as of algae growth, pollution, and salt deposits on the conversion system.
While at the state of the art of FPV offshore at sea is at predom-inantly R&D and demonstration phase, the sector has witnessed
273.2273.2ROWROWEUEU245.3245.3
ROWROW150.6150.6124.1124.1USUS
USUS103.7103.7 83.383.3CNCN
73.773.7EUEU
JPJP44.544.5
KRKR39.339.3
38.538.5KRKRCNCN24.124.1
14.714.7JPJP
Figure 5.7 Global patents flow, number of patents (for the years 2007-2016). The left side present the information of where invention have been generated, whilst the right side indicates where companies are seeking protection
Notes: Intra-market patents are not included. 2016 is the latest full and validated year on Patstat.
Source: JRC.
121
2022

a surge of interested in the last 5 years. In the EU, in addition to projects developed in the Netherlands (Oceans of Energy, TNO) and in France (HelioRec), new players have entered the Floating PV Market, including many O&G companies that are diversifying their portfolio.
Saipem (IT) that has entered in a partnership with Equinor to develop floating PV for harsh environments, developing a mod-ular PV system that can be also used for hybrid offshore pro-jects504. Shell (NL) has announced that floating PV modules will be installed from 2025 as part of their 759 MW offshore wind project Hollands Kust Noord developed in partnership with Eneco. Like Saipem, Shell is moving towards the development of hybrid projects mixing multiple renewable energy sources offshore, with storage and hydrogen generation505. Fred Olsen and Ocean Sun have launched a new project, support by EU Horizon 2020 to deploy 250 kW of floating PV at sea in the Canary Island506. Similarly, ocean energy developer SINN Power is now investigat-ing the development of a floating hybrid platform that combines wave energy, wind energy and floating PV507.
Recognising the potential of floating PV (both at sea and on inland waters), the Dutch government has published a roadmap for the development of the technology. In particular, concerning offshore photovoltaics the Dutch government is looking to develop pilot projects in the North Sea in the period 2021-2026 to monitor efficiency and environmental impact of such installation. The expectation, according to the roadmap is that in the next 10-20 the technology will be able to be one of the sources of renewable electricity in the country508.
The Netherlands already boosts some of the most advanced pilot projects for floating PV operational, such as the one developed by Oceans of Energy, which has already withstood different storms, with waves above 10m high509. Recently the expansion of the project from 50 kW to 1 MW was supported by the Netherlands Enterprise Agency.
A number of challenges remain to be addressed in order to facil-itate deployment of FPV at commercial scale such as long-term reliability, and costs, and integration in the gird system, the devel-opment of substations. The technical viability in this harsh and remote environment and the potential for FPV production costs still needs to be demonstrated. Furthermore, a key step required for the commercialisation of FPV at sea is the assessment of its potential contribution to the EU Green Deal, and the interaction with other maritime uses to identify ideal sites for deployment.
FPV installations are expected to provide additional value to dif-ferent sectors of the Blue Economy such as aquaculture and to help remote coastal communities offset diesel generators, by providing direct access to electricity offsite. According to the World Bank, floating PV are of particular value for small island
504 Saipem (2020) – New frontiers renewables floating solar.505 Green Tech Media (2021) - Super-Hybrid: Dutch Offshore Wind Farm to Include Floating Solar, Batteries and Hydrogen.506 Bringing Offshore Ocean Sun to the global market https://cordis.europa.eu/project/id/965671507 https://www.sinnpower.com/platform508 Ministerie van Economische Zaken en Klimat (2021) Routekaart Zon Op Water.509 https://oceansofenergy.blue510 http://documents.worldbank.org/curated/en/579941540407455831/pdf/Floating-Solar-Market-Report-Executive-Summary.pdf511 Green hydrogen or renewable hydrogen is hydrogen produced through the electrolysis of water (in an electrolyser, powered by electricity), and with the electricity stemming
from renewable sources.512 A hydrogen strategy for a climate-neutral Europe https://eur-lex.europa.eu/legal-content/EN/TXT/?qid=1594897267722&uri=CELEX:52020DC0301 513 A hydrogen strategy for a climate-neutral Europe https://eur-lex.europa.eu/legal-content/EN/TXT/?qid=1594897267722&uri=CELEX:52020DC0301
community, to decarbonise energy demand and whilst overcoming the limitations due to the limited availability of land suitable for ground-mounted PV installations510.
In 2021 considerable steps have been taken to combine FPV with other ocean renewables sources of energy or other ocean activities. Multiple projects are being developed in that direction and are currently in lower TRLs stages. H2020 – funded project EU-SCORES (European Scalable Offshore Renewable Energy Source) aims at exploring the capabilities of combining different types of marine renewables. Moreover, use of FPV for aquaculture activities (HelioRec), water desalination (Ocean Sun) and to power unmanned survey vessels (Van Oord) is also examined.
5.1.4 HYDROGEN GENERATION OFFSHOREThe production of offshore electricity is confronted with a num-ber of challenges related to the grid stability, and variability due to the temporal mismatch between the supply (e.g. when wind turbines are generating electricity) and the demand (when the electricity is required). The production of renewable hydrogen by electrolysis can help overcome several of those challenges and provide alternative for storing excess electricity generated at sea that is not immediately delivered to the grid. Once produced hydrogen could be employed for energy carrier (in fuel cells) or as fuel heavy transport by water, road and eventually by air.
In 2020, the European Commission published the Hydrogen Strategy released in 2020, stating the ambition to build by 2030 40 GW of green hydrogen511 electrolysers. It is estimated that 80 to 120 GW of renewable energy sources are needed to power the green hydrogen electrolysers512. Together, the Hydrogen Strategy and the Offshore Renewable Energy Strategy have created the framework for the development of offshore hydrogen generation coupled with offshore wind parks, or even in hybrid renewable energy projects combining offshore wind, ocean energy and float-ing PV.
The generation of hydrogen offshore as a number of advantages, both hydrogen transportation and storage can be done at large scale and relatively low cost. Furthermore, offshore oil and gas platforms could be re-purposed for renewable hydrogen produc-tion. This offers the advantage for upstream oil company to trans-form their operation and to exploit the know-how of operating in harsh marine environments.
Overall, the Hydrogen Strategy estimates that from now to 2030, investments in electrolysers could range between €24 and €42 billion. In addition, over the same period, €220-340 billion would be required to scale up and directly connect 80-120 GW of solar and wind energy production capacity to the electrolysers to pro-vide the necessary electricity513. Offshore hydrogen generation
122
THE
EU B
LUE
ECO
NO
MY
REPO
RT

could play a substantial role, offering new business cases to O&G companies to the manufacturing of electrolysers in addition to contributing to the meeting the goals of the European Green Deal; and boosting the EU Blue Economy.
It is essential however that the ongoing pilots and announced pro-jects prove the economic viability of generating green hydrogen offshore. The expectation is that renewable hydrogen technologies will reach maturity by 2030, and that they will be deployed at scale between 2030 to 2050514.
The foremost technical challenge for producing renewable hydro-gen offshore is the development of an electrolyser module, which is compatible with the ocean environment, able to operate effec-tively when coupled with intermittent renewable power and is sufficiently compact to achieve very high rates of hydrogen pro-duction per platform or per device. The technical viability in this harsh and remote environment and the potential for competitive hydrogen production costs still needs to be demonstrated.
A number of projects are already exploring the possibility of specific options for the coupling of offshore energy and green hydrogen production: coupling wind energy, ocean energy and floating PV with electrolisers. Many pilot projects have already been launched in the past year. The potential reuse of existing gas infrastructure in a hydrogen supply chain has been investigated by the ‘Pre-Pilot Power to Gas Offshore’ (3P2GO)515 project, which has been followed by the pilot project PosHydon516, led by TNO. The goal is the realisation of the world’s first offshore power-to-gas pilot to produce hydrogen offshore and a test centre for other innovative power-to-gas technologies. The plan foresees a scale-up process for this type of system, starting at 1-10 MW, then 20-250 MW and ultimately >250 MW systems. The location chosen is an old oil and gas platform, located off the coast of The Hague. This platform is fully electrified, and in a first phase of the project, the megawatt electrolyser will be fed by main land power. The final goal is however to generate green hydrogen from solar farms and the offshore wind farms located nearby. This project shall put the basis for a technology expected to grow synchronically to the planned future wind power in the North Sea. A more visionary project is the Norwegian project Deep Purple517 that envisages not only offshore hydrogen production from wind farm, but also its subsea storage. The electrolyser – fuel cell mod-ules – are planned to be part of the windmill structure.
514 A hydrogen strategy for a climate-neutral Europe https://eur-lex.europa.eu/legal-content/EN/TXT/?qid=1594897267722&uri=CELEX:52020DC0301515 Topsector energie (2020) https://projecten.topsectorenergie.nl/projecten/pre-pilot-power-to-gas-offshore-00031694 and
https://projecten.topsectorenergie.nl/storage/app/uploads/public/5e5/f65/63d/5e5f6563d9095865360210.pdf (in Dutch)516 TNO (2020) https://www.tno.nl/en/focus-areas/energy-transition/roadmaps/towards-co2-neutral-fuels-and-feedstock/hydrogen-for-a-sustainable-energy-supply/
world-first-an-offshore-pilot-plant-for-green-hydrogen/ 517 Energy Valley (2019) – https://energyvalley.no/wp-content/uploads/2019/04/Deep-Purple-.pdf518 For further information about ITEG project see: https://www.nweurope.eu/projects/project-search/iteg-integrating-tidal-energy-into-the-european-grid/519 Sabella (2020) – Phares Project – https://www.sabella.bzh/en/projects/phares 520 Recharhe (2020) Shell unveils world's largest offshore wind plan to power green hydrogen –
https://www.rechargenews.com/wind/shell-unveils-worlds-largest-offshore-wind-plan-to-power-green-hydrogen/2-1-763610521 Green Tech Media (2021) – Super-Hybrid: Dutch Offshore Wind Farm to Include Floating Solar, Batteries and Hydrogen 522 Rijksoverheid (2020) https://www.government.nl/documents/publications/2020/04/06/government-strategy-on-hydrogen 523 Miteco (2020) Hoja de Ruta del Hidrógeno: una apuesta por el hidrógeno renovable – https://www.miteco.gob.es/es/prensa/201006nphojaderutah2_tcm30-513813.pdf 524 BMWI (2020) Die Nationale Wasserstoffstrategie – https://www.bmwi.de/Redaktion/EN/Publikationen/Energie/the-national-hydrogen-strategy.
pdf?__blob=publicationFile&v=6 525 BMWI (2020) Die Nationale Wasserstoffstrategie – https://www.bmwi.de/Redaktion/EN/Publikationen/Energie/the-national-hydrogen-strategy.
pdf?__blob=publicationFile&v=6526 RWE (2020) Aquaventus – https://www.group.rwe/en/our-portfolio/innovation-and-technology/hydrogen/aquaventus 527 RWE (2020) Rostock – https://www.group.rwe/en/our-portfolio/innovation-and-technology/hydrogen/rostock
The ITEG project518 (funded under the Interreg program) combines the Orbital Marine O2 2 MW tidal turbine with a custom-built hydrogen electrolyser (500 kW, developed by AREVA) and an onshore energy management system to be deployed as an energy storage solution. The Phares519 project comprises two Sabella tidal turbines rate 500 kW, one 0.9 MW wind turbine, a 500 kW photo-voltaic installation and a hydrogen-based energy storage systems to be deployed on island of Ushant. Both ITEG and Phares projects aim to demonstrate the viability of tidal energy for decarbonisa-tion and its potential to provide grid stability, especially in islands ecosystems
Integrated systems also started developing in 2021. Siemens Gamesa is adapting its largest 14 MW offshore wind turbine, to accommodate an integrated electrolysis system, while Sabella partnered with H2X-Ecosystems for the development of green hydrogen production system powered by tidal energy2020 saw an increased interest of O&G companies to invest in green off-shore hydrogen. Shell announced the NorthH2 project, aiming by 2027 to couple 3-4 GW offshore wind generation with hydrogen production near Groningen. The expectation is that by 2040 the project could grow to 10 GW of offshore wind capacity producing 800 000 tonnes of green hydrogen520. Norwegian Oil Company Equinor and German utility RWE have also joined the NorthH2 project. Shell has also plan to integrate hydrogen electrolysers in their 759 MW offshore wind project Hollandse Kust Noord, which also foresee the installation of floating PV module from 2025 onwards521.
These projects are framed in the ongoing ambition of the Dutch government to support the development of hydrogen as stated in the ‛Government Strategy on Hydrogen’522. Similar strategies have been unveiled in Spain523 and in Germany524.
The German Roadmap foresees that by 2030 5GW of offshore wind energy will be coupled with hydrogen electrolysers, with the expectation that a further 5 GW will be added between 2035 and 2030525. Project announces already match the government ambition. RWE is leading the development of a 10 GW offshore wind – green hydrogen project to be developed in the North Sea with the Island of Heligoland serving as a hub. The project is expected to be operative by 2035 developing 1 million tons of green hydrogen526. RWE is also exploring the potential to gener-ate green hydrogen in port facilities (onshore electrolysers) with electricity coming from wind farms located in the Baltic Sea527.
123
2022

In Denmark, Orsted has reached final investment decision for the H2RES project. The project will have a capacity of 2MW and will be able to generate 1 ton of green hydrogen daily, which will be used for road transportation in the Greater Copenhagen areas. The project is expected to become operational in later 2021528. Denmark has also announced the development of energy islands in the North Sea (3GW to 10 GW) and in the Baltic Sea (2 GW). The projects are expected to deliver electricity to Denmark and neighbouring countries. Storage and Hydrogen generation (and refuelling for shipping) are currently being evaluated and their integration will depend on their maturity529.
Offshore green energy development is not taking place only in the North Sea and in the Baltic. In Italy, Saipem and Alboran have signed a Memorandum of Understanding for the development of 5 green hydrogen projects in the Mediterranean basin (3 located in Italy, 1 in Albania and 1 in Morocco)530. In Spain, Naturgy and Energas have announced plan for green hydrogen project off the coast of Asturias. The two-phase project will see the deployment of a pilot consisting of a 5 MW electrolyser connected to 50 MW of offshore wind. In the second stage the offshore wind capacity will be extended to 250 MW. The project is complemented with 100 MW of onshore wind coupled with a 10 MW electrolyser531.
528 Orsted (2021) Ørsted takes final investment decision on first renewable hydrogen project – https://orsted.com/en/media/newsroom/news/2021/01/672305561121775 529 Danish Energy Agency (2021) Denmark's Energy Islands – https://ens.dk/en/our-responsibilities/wind-power/energy-islands/denmarks-energy-islands 530 Saipem (2021) – https://www.saipem.com/en/media/press-releases/2021-03-04/saipem-and-alboran-hydrogen-together-green-hydrogen-production531 Naturgy (2021) Naturgy and Enagás are studying the production of green hydrogen from 350 MW of wind power in Asturias
https://www.naturgy.com/en/naturgy_and_enagas_are_studying_the_production_of_green_hydrogen_from_350_mw_of_wind_power_in_asturias532 Carroll, A.R.; Copp, B.R.; Davis, R.A.; Keyzers, R.A.; Prinsep, M.R. (2019). Marine natural products. Natural Product Reports, 36, 122-173.533 EUMOFA. 2020. Blue Bioeconomy Report. Luxembourg: Publications Office of the European Union.534 European Commission, 2021. COMMUNICATION FROM THE COMMISSION TO THE EUROPEAN PARLIAMENT, THE COUNCIL, THE EUROPEAN ECONOMIC AND SOCIAL
COMMITTEE AND THE COMMITTEE OF THE REGIONS Strategic guidelines for a more sustainable and competitive EU aquaculture for the period 2021 to 2030. COM/2021/236 final. – https://eur-lex.europa.eu/legal-content/EN/TXT/?uri=COM:2021:236:FIN
5.2 BLUE BIOTECHNOLOGYThe exploitation of marine biotic resources is analysed in this report in the Marine living resources (section 4.1) and the blue biotechnology (this section 5.2) sectors.
The Marine living resources sector encompasses the harvesting of renewable biological resources (primary sector), their transforma-tion into food and feed products (processing) and their distribution along the supply chain. These traditional activities are analysed in the established sectors chapter.
While the Blue biotechnology sectors consider the non-tradition-ally commercially exploited groups of marine organisms and their biomass applications. Thus, they encompass any economic activity associated with the use of renewable aquatic biological biomass, e.g. food additives, animal feeds, pharmaceuticals, cosmetics, energy, etc.
Algae (macro- and micro-), bacteria, fungi and invertebrates are among the important marine resources included in the Blue Bioeconomy. This biomass is used for a variety of commercial applications including food and food supplements, feed, cosmet-ics, fertilisers and plant biostimulants, and innovative commercial uses as biomaterials, bioremediation or biofuels. These groups of organisms and derived compounds are important resources in relation to a number of EU priorities such as carbon neutrality, innovative, healthy and sustainable food systems and sustainable and circular bioeconomy. Hundreds of new compounds from the marine realm are being discovered every year demonstrating the innovative nature and potential of the sector532 , while new tech-nologies are being researched to increase the quality and reliabil-ity of these compounds533.
The strategic guidelines for a more sustainable and competitive EU aquaculture534 emphasize the potential of aquaculture as a major contributor to building a sustainable and responsible food system, in particular as a low-carbon footprint source of protein. As such, these guidelines aim to boost low environmental impact aquaculture, which is identified as the production of low trophic species (micro and macro-algae, non-fed such as filter feeders like molluscs, organic aquaculture and integrated multi-trophic aquaculture (IMTA).
124
THE
EU B
LUE
ECO
NO
MY
REPO
RT

5.2.1 CURRENT STATUS OF THE ALGAE SECTORAlgae production
There is a lot of uncertainty on the amount of algae produced in the EU. According to FAO data535, the EU aquaculture pro-duced in 2019 more than 260 tonnes of macroalgae valued about €4 million mostly in France, Spain, Ireland and Portugal; 5 tonnes of microalgae valued more than €25 thousand in France and Bulgaria; and almost 350 tonnes of spirulina valued about €8.5 million mainly in France and Greece. While more than 86 000 tonnes of macroalgae were obtained from the harvest of wild stocks mainly in France, Ireland and Spain.
535 FAO (2022). FishStatJ – Software for Fishery and Aquaculture Statistical Time Series Rome: Food and Agricultural Organization of the United Nations.536 Araújo R, Vásquez Calderón F, Sanchez Lopez J, Azevedo I, Bruhn A, Flunch S, Garcia-Tasende M, Ghaderiardakani F, Ilmjärv T, Laurans M, MacMonagail M, Mangini S,
Peteiro C, Rebours C, Stefánsson T, Ullmann J (2021). Emerging sectors of the Blue Bioeconomy in Europe: status of the algae production industry. Frontiers in Marine Sciences doi: 10.3389/fmars.2020.626389.
537 Araújo R, Vásquez Calderón F, Sanchez Lopez J, Azevedo I, Bruhn A, Flunch S, Garcia-Tasende M, Ghaderiardakani F, Ilmjärv T, Laurans M, MacMonagail M, Mangini S, Peteiro C, Rebours C, Stefánsson T, Ullmann J (2021). Emerging sectors of the Blue Bioeconomy in Europe: status of the algae production industry. Frontiers in Marine Sciences doi: 10.3389/fmars.2020.626389.
A recent study536 showed that the number of companies producing algae in Europe has increased significantly (150 %) in the last decade (Figure 5.8).
According Araujo and others537 the European algae sector counts on 225 algae production companies (with a share of 67 % of macroalgae and 33 % of microalgae producers) and 222 Spirulina producers.
Macroalgae production is being developed in 13 countries (Figure 5.9). Spain, France, Ireland and Norway are the countries in Europe with the largest number of macroalgae companies. The activities connected to the macroalgae industry represent an important cul-tural heritage and constitute an essential source of income for some coastal and rural communities.
Figure 5.8 Number of algae producing companies currently operating in Europe (starting activity since 1926)
Note: The values shown represent the number (left axis) and the accumulated (right axis) number of companies per year from the companies currently active. Source: Araujo et al. 2021.
Figure 5.9 Number and relative distribution between macro- and microalgae (a) and Spirulina (b) production companies by country
Source: Araujo et al. 2021
125
2022

Figure 5.10 Numbers of macro- and microalgae producing companies in Europe broken down by production technology and country
Note: Production volumes (tonnes) by country are detailed, when available, according to the FAO data (2020).Source: modified from Araujo et al. 2021
Harvesting from wild stocks is the primary production method for macroalgae in Europe, being used by 68 % of the macroalgae production units and covering 11 European countries (Figure 5.10). Among these, 85 % of the producers harvest the biomass by hand, while only 15 % with mechanical means. Mechanical harvesting is usually carried out by companies running a fleet of vessels, thus corresponding to higher biomass removal potential compared to manual harvesting. Spain, France and Ireland are the countries with the highest number of macroalgae harvesting companies.
Aquaculture production of macroalgae, presently ongoing in 13 European countries, is at an early stage of development in Europe in terms of production volumes and number of production units. According to the official statistics, seaweed aquaculture production contributes to less than 1 % of total European sea-weed biomass production538 although accounting for 32 % of the mapped macroalgae production units. Most of the production units are located at sea (offshore or in coastal waters) with only 24 % of the companies conducting land-based activities.
Germany, France and Spain host the largest number of microalgae producers in Europe while France dominates the Spirulina pro-duction landscape with 65 % of the mapped production units in Europe. Sixteen European countries have microalgae and 15 have Spirulina production plants (Figure 5.9).
Microalgae are cultivated by different production methods. Some production plants combine different production systems, e.g. pho-tobioreactors (PBR) with fermenters or open ponds. Overall, PBR are the most common system used for microalgae production (71 %), while for Spirulina the primary production method used is open ponds (83 % of the companies) (Figure 5.10).
538 FAO (2022). FishStatJ – Software for Fishery and Aquaculture Statistical Time Series Rome: Food and Agricultural Organization of the United Nations.539 Scientific, Technical and Economic Committee for Fisheries (STECF) – The EU Aquaculture Sector – Economic report 2020 (STECF-20-12). Publications Office
of the European Union, Luxembourg, 2021, EUR 28359 EN.
Uses of the algae production
Most of the seaweed companies in Europe direct their biomass production at food (36 %), food- related uses (15 %) i.e. food supplements, nutraceuticals and hydrocolloid production and, to feed (10 %), accounting for 61 % of the total uses. Cosmetics and well-being products also contribute to a significant share of the biomass uses (17 %) while each of the other applications (e.g. fertilisers and biostimulants) individually contribute with less than 11 % to the total share. These values refer to the number of companies directing the produced biomass at each of the uses, which might not reflect the volumes allocated to each application (Figure 5.11).
Food supplements and nutraceuticals (24 %), cosmetics (24 %) and feed (19 %) are the main applications of microalgae biomass, contributing together to 63 % of the total uses (Figure 5.11). Spirulina production is mainly directed at food and food supple-ments and nutraceuticals, contributing to 75 % of the reported uses.
Socio-economic assessment of the algae sector
The available STECF data on the turnover, cost structure and employment on the algae sector refer to the aquaculture indus-try539. These data cover only France (macro-, microalgae and Spirulina), Spain (macro-, microalgae and Spirulina) and Portugal (macroalgae), which are the main producing countries. The total production value in these countries was reported to be €10.7 mil-lion in 2018. This value is in line with the €12.5 million reported by FAO for the whole EU.
12 t
19000 t
41258 t29540 t
169584 t
3463 t
1883 t
126
THE
EU B
LUE
ECO
NO
MY
REPO
RT

The analysis of the STECF data shows that France, Spain and Portugal reported a total number of 156 algae aquaculture com-panies, 87 % of them are micro-enterprises with fewer than five employees. The EU aquaculture (considering these countries) employs 509 persons, 399 in full time equivalent (FTE).
For the period 2015-2018, the STECF data shows that the algae aquaculture sector was profitable in 2015, with a GVA margin and an EBIT margin of 54 % and 23 %, respectively; but the economic performance deteriorated to reach a GVA margin and an EBIT margin of 32 % and -0.03 % in 2018.Unfortunately, FAO does not report the value of wild harvest production; therefore, there is no clear estimates of the value of the 86 000 tonnes of macroalgae harvested.
The most notable sector of the EU Blue Bioeconomy is the algae sector. It is considered an innovative sector of the EU Blue Economy that is evolving and growing, offering new opportuni-ties, new sustainable products and creating jobs while contributing to ocean regeneration. In this regard, the new approach for a sustainable Blue Economy in the EU540 adopted in May 2021, among others, emphasizes a major opportunity for developing new algae-based food and feed products in the EU market to alle-viate environmental pressures exerted by agriculture, aquaculture, and fisheries. Although pollution should primarily be reduced at source, this new approach also stresses that algae production at sea will help mitigate excess carbon, nitrogen and phosphorus from water. Moreover, the European Commission will explore the potential of cell-based seafood as an innovative and sustainable alternative.
However, despite many innovative start-ups driving sustainable production in Europe, the EU (including EEA countries) still pro-duces less than 1 % of the global algae production541.
540 https://ec.europa.eu/oceans-and-fisheries/ocean/blue-economy/sustainable-blue-economy_en 541 https://op.europa.eu/en/publication-detail/-/publication/037825ae-22d7-11ea-af81-01aa75ed71a1/language-en 542 COM(2021) 800 final
The European algae sector remains modest in size today, but the conditions are favourable to grow it into a strong sustainable and regenerative sector within the EU Blue Bioeconomy. Not only is the innovation community burgeoning, but demand is also soar-ing, and political momentum is building, with algae seen as a way to support the European Green Deal objectives of building a resource-efficient, resilient, competitive and sustainable econ-omy, where by 2050 biodiversity is conserved, restored and used sustainably.
The European Green Deal recognizes the potential of algae for a sustainable food system in Europe and global food security. Most importantly, various initiatives such as the Farm to Fork Strategy (for further information see Chapter 3), the Bioeconomy Strategy, the Blue Bioeconomy Forum and the Renewable Energy Directive call for EU action to better utilize the potential of algae in Europe. As laid out in the Farm to fork strategy, the European Commission will ‘set out well-targeted support for the algae industry, as algae should become an important source of alternative protein for sustainable food system and global food security’.
In May 2021, the European Commission published its new strat-egy for a more sustainable and competitive aquaculture in Europe. The strategy envisages the development of the EU Algae Initiative – to address the challenges and opportunities of algae farming and propose concrete actions. The strategy also promotes other aquaculture systems with lower environmental impact, such as integrated multi trophic aquaculture (IMTA) and lower trophic species e.g. algae and shellfish. Furthermore, in December 2021, the Commission Communication on sustainable carbon cycles542 acknowledges the role of algae in carbon sequestration.
Figure 5.1 Share of commercial biomass applications by macroalgae and microalgae production company
Note: These results are based on the share in the number of companies (not by volume).
Source: Araujo et al. 2021.
127
2022

Consequently, the European Commission intends to adopt a cross-cutting EU Algae Initiative – European Commission Communication accompanied by an Action Plan by end of 2022. The initiative will pave the way for a strong, sustainable and regenerative EU algae sector. With the overall objective to unlock algae potential in Europe, the initiative will focus on how to increase the sustainable production, ensure safe consumption and boost innovative use of algae and algae-based products in Europe.
The initiative will deliver specific actions on improving the gov-ernance framework (e.g. guidelines, European standards), on sup-porting functioning of the market (e.g. supporting the authoriza-tion of algae as novel foods), on increasing consumer awareness and acceptance of algae products as well as on closing gaps in knowledge, research, development and innovation in Europe. Most importantly, it will also advance the shift from wild harvesting practices to algae farming to better contribute to food security, economic circularity, ensuring greater availability of bio based products and halting biodiversity loss.
However, the EU Blue Bioeconomy is not only about algae. More and more marine creatures are expanding northwards and thriv-ing due to warming waters caused by climate change and due to changes in the food web. While this poses environmental threats, this may also create market opportunities. For example, jelly-fish are thriving due to increased food (plankton) availability and decreased fish numbers to compete with for food. Obstruction of power plants functioning was observed in recent years due to jellyfish blooms543.
BOX 5.1 GoJelly Project – jellyfish for biofiltersThe GoJelly project544 identifies various potential market applications from jellyfish biomass like producing food and feed, biofertilizers or collection of microplastics. Researchers have discovered that mucus of jellyfish can bind microplastic which might be a game changer in wastewater treatment. The project tested whether biofilters can be produced from jellyfish. These biofilters could then be used in sewage treat-ment plants or in factories where microplastic is produced.
More data and research is needed to discover the future economic and ecologic importance of other thriving (often invasive) species in the European seas like sea urchins, sea stars, Chinese crabs among others.
543 https://www.theguardian.com/environment/2016/oct/13/power-stations-to-get-early-warning-against-jellyfish-invasions544 https://gojelly.eu/about/545 Zhang, X., and Thomsen, M. (2019). Biomolecular composition and revenue explained by interactions between extrinsic factors and endogenous rhythms of Saccharina
latissima. Mar. Drugs 17:107. doi: 10.3390/md17020107.546 Bak, U. G., Mols-Mortensen, A., and Gregersen, O. (2018). Production method and cost of commercial-scale offshore cultivation of kelp in the Faroe Islands using multiple
partial harvesting. Algal. Res. 33, 36-47. doi: 10.1016/j.algal.2018.05001.547 van den Burg, S. W. K., Rockmann, C., Banach, J. L., and van Hoof, L. (2020). Governing risks of multi-use: seaweed aquaculture at offshore wind farms. Front. Mar. Sci. 7:60.
doi: 10.3389/fmars.2020.00060.548 Buck, B. H., Troell, M. F., Krause, G., Angel, D. L., Grote, B., and Chopin,T. (2018). State of the art and challenges for offshore integrated multitrophic aquaculture (IMTA). Front.
Mar. Sci. 5:165. doi: 10.3389/fmars.2018.00165.
5.2.2. OTHER ACTIVITIES IN BLUE BIOECONOMY AND BIOTECHNOLOGYBiorefineries
The algae biorefinery (or algae biofactory) is currently explored as an approach to increase the environmental sustainability (by optimising resources and minimising waste) and economic fea-sibility (by maximising profits) of existing conventional industrial processes. Different conversion pathways are being researched for the use, extraction and valorisation of algae biomass value-added products545. All potential impacts of such technologies need to be addressed in a holistic way to ensure that they are sustainable.
Several European scale projects have been researching ways to optimise processes and upscale production with the aim to facil-itate the widespread implementation of an algae biorefinery in Europe and boost the algae sector.
Offshore aquaculture
The production of macroalgae biomass by offshore aquacul-ture still corresponds to a minority of the aquaculture farms in Europe. The upscaling of this production method relies on over-coming technological constraints and knowledge limitations in order to reduce infrastructural and logistics costs and increase biomass yields. This cultivation method offers advantages in terms of management of maritime space and increase of the production capacity. At present, projects seek technological solu-tions to increase the profitability of offshore aquaculture546 and to combine multipurpose activities as for example wind farms with seaweed aquaculture facilities547.
Integrated Multi-Trophic Aquaculture (IMTA)
Integrated Multi-Trophic Aquaculture (IMTA) systems are regarded as a way to increase the environmental and economic sustain-ability of the production of all the involved cultures. The IMTA approach is based on the co-cultivation of species from different trophic levels (2 or more) with mitigation potential by reducing the nutrients and organic matter inputs from finfish aquaculture548.
Cultivation of less exploited species
The cultivation and harvesting of less exploited groups of organ-isms (e.g. sea urchins or sea stars) is being researched as a means to reduce the pressure on natural resources in specific areas, and to increase the diversification of aquaculture to low trophic levels. However, these activities are still at a very early stage of devel-opment in Europe.
128
THE
EU B
LUE
ECO
NO
MY
REPO
RT

Use of fish by-products
The use of biomass from fish rest raw material for commercial applications not directly related to human consumption is being studied based on the example of some successful case studies549.
Cellular mariculture and cell-based seafood
The emerging technology of cellular mariculture, defined as the production of marine products from cell cultures rather than from whole plants or animals, is attracting growing interest due to its potential to address public health, environmental and animal wel-fare challenges. For seafood from fish cell and tissue-cultures, it represents an emerging approach to address similar challenges with industrial aquaculture and marine capture systems550.
BOX 5.2 The Biomass Study & the Knowledge Centre for BioeconomyThe JRC’s Biomass Study551
Understanding biomass supply, demand, costs and their associated Impacts is of high relevance to a number of EU policy areas. In 2015, the JRC launched its biomass study, which responds to a mandate given by twelve European Commission services, to provide data, models and analy-ses on EU and global biomass supply and demand and its environmental, social and economic sustainability. The study covers all sources of biomass, including from fisheries and algae and all uses.
The European Commission’s Knowledge Centre for Bioeconomy552
The growing complexity of the policy issues at stake and the increasing abundance of data and information availa-ble require an ability to map, review, analyse and condense the best available knowledge in support of EU policies. The European Commission’s Knowledge Centre for Bioeconomy was launched in 2017 by the JRC to pull together the knowl-edge and expertise needed, from within the JRC but also from other sources, to assess the status, progress and impact of the bioeconomy.
549 EUMOFA. 2020. Blue Bioeconomy Report. Luxembourg: Publications Office of the European Union.550 EUMOFA. 2020. Blue Bioeconomy Report. Luxembourg: Publications Office of the European Union.551 https://knowledge4policy.ec.europa.eu/projects-activities/jrc-biomass-mandate 552 https://knowledge4policy.ec.europa.eu/bioeconomy 553 World Resources Institute (WRI). https://www.wri.org/water554 Falkenmark Water Stress indicator (European Environment Agency. Indicator Fact Sheet, (WQ1) Water exploitation index).555 Eurostat water statistics. https://ec.europa.eu/eurostat/statistics-explained/index.php?title=Water_statistics 556 United Nations, The United Nations World Water Development Report 2021: Valuing Water. UNESCO, Paris.557 Magagna D., Hidalgo González I., Bidoglio G., Peteves S., Adamovic M., Bisselink B., De Felice M., De Roo A., Dorati C., Ganora D., Medarac H., Pistocchi A., Van De Bund W. and
Vanham D. Water – Energy Nexus in Europe, Publications Office of the European Union, Luxembourg, 2019, ISBN 978-92-76-03385-1, doi: 10.2760/968197, JRC115853..558 Bisselink et al. (2018) Impact of a changing climate, land use, and water usage on Europe’s water resources: A model simulation study. JRC Technical reports. Available at:
https://ec.europa.eu/jrc/en/publication/impact-changing-climate-land-use-and-water-usage-europe-s-water-resources-model-simulation-study 559 JRC (2019) Water – Energy Nexus in Europe. JRC Science for Policy report. Available at: https://ec.europa.eu/jrc/en/publication/water-energy-nexus-europe
5.3 DESALINATIONWater is essential for life. It is an indispensable resource for the economy, and also plays a fundamental role in the climate regula-tion cycle. Yet, one fourth of the world population lives in countries experiencing severe water stress. Demand for water is projected to grow by up to 30 % by 2050. Global water deficit is projected to reach 40 % by 2030, and as many as 3.5 billion people risk water scarcity by 2025 already553. Seawater desalination allows to increase the supply of freshwater for household, industrial, and agricultural uses.
Water stress can be caused by natural phenomena (e.g. droughts) and by human activities (e.g. over-abstraction). Based on aver-age water abstractions for household use and for agricultural and industrial uses, a developed country is considered to experience ‘water stress’ when its annual freshwater resources per capita per year are below 1 700 m³. Less than 1 000 m³ of water availability per capita/year causes a limitation to economic development and human health and well-being, and below 500 m³ is considered as a main constraint to life554. Among the EU Member States, this is the case in Poland, Czechia, Cyprus and Malta, where the lowest volume of water resources was recorded, at 164 m³ per inhabit-ant555. This situation is aggravated by global challenges such as COVID-19 and climate change556. Southern European countries are projected to face decreasing water availability, particularly Spain, Portugal, Greece, Cyprus, Malta, and Italy557. Many regions in the EU will face severe water scarcity by 2050558, including the coastal Mediterranean regions (as well as other regions in France, Germany, Hungary, Italy, Romania and Bulgaria)559.
The level of abstraction per inhabitant is not only determined by the dominance of sectors requiring large amounts of water, such as agriculture and electricity generation, but also by unsustainable water management practices. There are considerable differences in the amounts of freshwater abstracted within each of the EU Member States, in part reflecting the size of each country and the resources available, but also abstraction practices, climate and the industrial and agricultural structure of each country. Between 1990 and 2019 there has been a marked decrease in freshwater abstraction in many EU Member States a result of various factors, including the reduction of water losses and increasing water use efficiency (Figure 5.8).
129
2022

Sweden, the Netherlands and France have registered the highest volumes of water abstracted from non-freshwater sources (e.g. seawater, brackish water, etc.). In Malta, the volume of non-fresh water abstracted is almost 5 times higher than the volume of fresh water abstracted (2019 data, estimated). Much of this is seawater used for the production of freshwater by desalination.
Desalination is the alternative water supply that can alleviate a growing pressure on freshwater resources. Currently, desalina-tion technology is used to overcome water shortages in areas where freshwater resources are limited, such as big coastal cities, islands and offshore industrial plants where seawater cannot be used due to high salinity. In the long term, a demand for desalina-tion and other water management solutions such as water re-use is expected to reduce the impact of climate change on freshwater availability. This chapter provides an overview of the current state of play of the desalination sector in Europe.
5.3.1 CURRENT DESALINATION CAPACITY
Europe’s desalination capacity has been recently estimated at 8.7 million m3/day, which is around 9 % of the global installed capacity560. Desalination capacity in Europe has grown signif-icantly over the first decade of the century, with 4.58 million m3/day of new capacity between 2000 and 2009 with a total investment of €4 billion in Engineering, Procurement and Construction (EPC). Between 2010 and 2019 the new commis-sioned capacity was only 0.84 million m3/day with an estimated investment of €630 million. Since 2010 most of the new capac-ity installed was in the form of small and medium size plants. Most of the large and extra-large plants commissioned between 2000 and 2010 were built to serve large coastal cities such as Barcelona and Alicante in Spain.
560 Post J., de Jong P., Mallory M., Doussineau M., Gnamus A. (2021), Smart Specialisation in the Context of Blue Economy – Analysis of Desalination Sector, EUR 30768 EN, Publications Office of the European Union, Luxembourg, 2021, ISBN 978-92-76-40319-7, doi:10.2760/058360.
561 Maltese official data shows that current Reverse Osmosis annual production in Malta is 20 million m3/annum, whereas full capacity production would render 28 million m3/annum. Malta’s targeted capacity by the end of 2023 is 41 million m3/annum equating to 1.2 % of the current total EU capacity by the end of 2023.
In January 2021, there were 2 309 operational desalination plants in the European Union, producing about 9.2 million cubic meters per day (m3/day, 3 352 million m3/year) of fresh water, mainly from seawater and brackish water. This represents around 9 % of the global installed capacity. Desalination capacity in Europe has grown significantly over the first decade of the century, with 4.58 million m3/day of new capacity between 2000 and 2009 with a total investment of €4 billion in Engineering, Procurement and Construction (EPC). Between 2010 and 2019 the new commis-sioned capacity was only 0.84 million m3/day with an estimated investment of €630 million. Since 2010 most of the new capacity installed was in the form of small and medium size plants.
About 65 % of the operational plants in the EU are located in coastal areas or offshore. The offshore plants support offshore activities, mostly oil and gas fields. The inland plants are used for the production of drinking water and industrial water; often through a process of purification of saline/brackish water present in local aquifers.
According to DesalData, Spain holds 65 % of the desalination capacity in the EU, and an estimated 5.7 % of the global desal-ination capacity (Figure 5.13), with the remaining being located mainly in: Italy (7.5 %), France (3.5 %), Cyprus (3.4 %), Malta561 (2.9 %) and Greece (2.8 %). Desalination plants located in Northern European countries such as Germany (4 %), the Netherlands (3.8 %), Belgium (1.9 %) and Ireland (1.1 %) are mainly connected to the production of drinking water and industrial water. Most of the large and extra-large plants commissioned between 2000 and 2010 were built to serve large coastal cities such as Barcelona and Alicante in Spain.
Figure 5.12 Total abstraction of fresh water per inhabitant, 1990-2019 (m³ per year)
Source: Eurostat.
130
THE
EU B
LUE
ECO
NO
MY
REPO
RT

Source: European Environment Agency562. Reference data: ©ESRI.
The bulk of desalination capacity (63 %, 5.7 million m3/day) is directed primarily at the production of water for public water sup-ply managed by the municipalities. Only 3 % of the desalination capacity is employed in the production of drinking water to serve tourist facilities. The remaining desalination capacity is for indus-trial application (23 %) and irrigation purposes (12 %).
There are 33 very large capacity (over 50 000 m3/day) desalina-tion plants that supply 34.2 % of the total desalination volume (3.1 million m3/day), while 166 large capacity (10 000-50 000 m3/day) plants supply 34.6 % of the total desalination volume. The 7 822 medium size (capacity of 1 000-10 000 m3/day) supply 25.7 % and 1 312 small (capacity below 1 000 m3/day) plants supply the remaining 5.5 %.
562 European Environment Agency (EEA), 2021. Water resources across Europe - confronting water stress: an updated assessment. EEA Report No 12/2021.
5.3.2 DESALINATION TECHNOLOGIES
The technology used in desalination is rather common and com-prises different technological solutions:
• Reverse osmosis (RO) systems remove salt from seawater exploiting the osmosis principle by transferring water through a series of semi-permeable membranes.
• Electrodialysis (ED) systems are also common in the EU, employing ionised membranes (with electrodes) to remove salt from feedwater.
• Nanofiltration (NF) is another type of membrane technology normally employed to purify water with little saline content.
• Multi effect evaporation desalination (MED) and multi-stage flash desalination (MSF) are thermal desalination technologies, employing heat to evaporate and condense water in order to purify it.
-
0,5
1,0
1,5
2,0
2,5
3,0
3,5
XL L M S
Industry
Irrigation
Municipalities
Touristfacilities
Figure 5.13 EU desalination capacity in coastal areas by use and size (left) and by Member State (right), million m3/day
Source: Desaldata.
-
1,0
2,0
3,0
4,0
5,0
6,0
7,0
ES IT DE NL FR CY MT EL BE IE PL AT
Figure 5.14 Desalination capacity and technologies in the EU
131
2022

Desalination plants are typically concentrated in the proximity of the coastline. Coastal desalination plants also tend to be larger than inland desalination plants563. As illustrated in Figure 5.14, more than ¾ of the desalination capacity in Europe is located in the Mediterranean Sea basin, with a combination of different desalination technologies supplying more than 5 million m3/day of freshwater.
Thanks to decreasing costs over recent decades, desalination is becoming a more affordable and reliable option than other solu-tions for water supply564. The costs have decreased significantly, and for reverse osmosis of seawater in the Mediterranean they could be around €0.65/m3565. This has made of Reverse osmo-sis (RO) the most widely used desalination technology in Europe (83.5 % of total capacity, followed by Electrodialysis Reversal with 4.5 % and Electrodialysis 4.2 %, while multi-effect distillation and nanofiltration had 3 % each.
Desalination is an energy intensive process. Desalination facil-ities for industries and irrigation provide 0.82 billion m3/year of desalinated water (30 % of the total EU desalination capacity) and require some 17 TWh a year of electricity to operate. The energy needs of agricultural and industrial desalination facilities, are close to those of the public water supply566.
Membrane desalination technologies have lower energy require-ments than thermal technologies. MSF systems require roughly 83-84 kWh/m3 of energy, while largescale RO systems require 3-5 kWh/ m3 for seawater (Olsson, 2012)567. Given the lower oper-ational costs, membrane systems are more widely employed in the EU. Thermal processes are widely employed in the Middle East due to low-cost fuels and co-location with large power plants.
Reverse osmosis membranes have an estimated mean lifetime of 5-7 years. This means that the membranes have to be replaced 4 to 5 times in the operational lifetime of a desalination plant. As a result, it has become a very competitive commodity market with low margins and, hence, little room for innovation. After 2010, the market almost completely turned into a replacement market (Figure 5.15). The size of the membrane market for 2020-2025 is in the same order of magnitude as the contracted construction of new desalination plants in that same period.
563 Jones, E., Qadir, M., van Vliet, M. T., Smakhtin, V., & Kang, S. M. (2019). The state of desalination and brine production: A global outlook. Science of the Total Environment, 657, 1343-1356.
564 Hidalgo González, I., Medarac, H., & Magagna, D. (2020). Projected freshwater needs of the energy sector in the European Union and the UK.565 World Bank. (2019). The role of desalination in an increasingly water-scarce world. World Bank.566 Magagna D., Hidalgo González I., Bidoglio G., Peteves S., Adamovic M., Bisselink B., De Felice M., De Roo A., Dorati C., Ganora D., Medarac H., Pistocchi A., Van De Bund W.
and Vanham D. Water – Energy Nexus in Europe, Publications Office of the European Union, Luxembourg, 2019, ISBN 978-92-76-03385-1, doi: 10.2760/968197.567 Olsson, G. (2012) – Water and Energy: Threats and Opportunities.568 Post J., de Jong P., Mallory M., Doussineau M., Gnamus A. (2021), Smart Specialisation in the Context of Blue Economy – Analysis of Desalination Sector, EUR 30768 EN,
Publications Office of the European Union, Luxembourg, 2021, ISBN 978-92-76-40319-7, doi:10.2760/058360.569 European Commission (2020) Clean energy for EU islands. Available at:
https://energy.ec.europa.eu/topics/markets-and-consumers/clean-energy-eu-islands_en 570 https://cordis.europa.eu/article/id/241187-wave-power-for-clean-drinking-water 571 https://webgate.ec.europa.eu/life/publicWebsite/project/details/4776
Figure 5.15 Global Membrane market estimates for new desalination capacity and 5-yearly replacement (€ million)
0
150
300
450
<2000
2000
-2005
2005
-2010
2010
-2015
2015
-2020
2020
-2025
new membranesreplacement
Source: JRC Technical report568.
Coastal desalination processes require about 18 TWh of energy each year. About 38 % of the energy demand for desalination processes comes from European islands. Their path to carbon neutrality, as laid out in the EU ‘Clean energy for EU islands initia-tive’569, will require the development of sustainable technological solutions to power desalination with renewable energy sources.
Conventional desalination systems require connection to the elec-tricity grid, which might be problematic for isolated sites. As part of the ‘Blue Growth Strategy’, the EU-funded H2020 W2O project has demonstrated the economic viability of the world’s first wave-driven desalination system, Wave2O. This operates completely ‘off-grid’ to supply large quantities of affordable fresh water570.
The LIFE-supported DESEACROP project (2017-2020) has tested the viability and sustainability of using desalinated seawater for the irrigation of crops and the treatment of drainages and their reutilization in hydroponic systems in the Mediterranean region. Trials showed a 46 % increase in tomato production and an 11 % reduction in the use of irrigation water. The project thus demon-strated that irrigation with desalinated seawater increases crop productivity compared to irrigation with well water or soil irriga-tion. It also assessed the feasibility of scaling up the technology in terms of energy and water consumption, carbon footprint, crop costs and profitability571.
132
THE
EU B
LUE
ECO
NO
MY
REPO
RT

Source: JRC572.
Increasing the supply of desalinated water to meet the growing demand for all uses requires a significant R&D effort aimed at developing viable energy-efficient technologies and deployable solutions at scale. The EU supports public-private partnerships that deliver innovation in the desalination sector. Under the Horizon 2020 programme, €23.3 million were allocated to inno-vation actions for the period 2014-2019 (Figure 5.16).
Several European engineering firms have been involved in the design, construction and development of most European desali-nation plants. Reverse Osmosis membranes are among the most critical components of desalination plants and one of key focus on R&D in the sector. Between 2003 and 2016, RO technology was the subject of 51 % of R&D innovation in the field of desalination, based on patenting activity. However, the EU contribution to global R&D on reverse osmosis is rather modest, filing for only 3 % of the inventions (Figure 5.17).
Figure 5.17 Share of patents applications addressing Reverse Osmosis innovation between 2000 and 2016 based on country
of origin of the applicant
Source: JRC calculations based on the European Patent Office.
572 Post J., de Jong P., Mallory M., Doussineau M., Gnamus A.(2021), Smart Specialisation in the Context of Blue Economy – Analysis of Desalination Sector, EUR 30768 EN, Publications Office of the European Union, Luxembourg, 2021, ISBN 978-92-76-40319-7, doi:10.2760/058360, JRC125905.
573 https://cordis.europa.eu/project/id/685793 574 Global Desalination Market Report 2021. Renub research.
To overcome thermodynamical limitations of RO, which point to 1.09 kwh/m3 for seawater at 50 % recovery, Microbial Desalination Cells (MDC) concurrently treat wastewater and generate energy to achieve desalination. MDCs can produce around 1.8 kWh of bio-electricity from the handling of 1 m3 of wastewater. Such energy can be used to remove the salt content in seawater without exter-nal energy input or reduce the salinity to decrease the amount of energy required for a subsequent desalination treatment. With financial support from the Horizon 2020 programme, between 2016 and 2020 the MIDES project has developed two prototypes (now in operation in Spain) to produce drinking water using inno-vative solutions to overcome the limitations of the disruptive MDC technology573.
Thus, the desalination sector is experiencing a high-pace of inno-vation. A recent review of the largest vendors shows that EU companies represent a significant share of technology providers however, high disparities may be observed among technology cat-egories and sub-categories. European companies rank among the top patenting companies when it comes to the R&D related to desalination powered by renewable energy sources. The develop-ment of desalination powered by wave energy or offshore wind technology can support several offshore Blue Economy activities.
5.3.3 TRENDS AND OUTLOOK
The global population increase and the rise in demand for con-sumable water have driven the growth of the desalination sec-tor in the past two decades. The global desalination market has been valued at €17.4 billion in 2021 and was projected to reach €29 billion by 2027574. However, the COVID-19 pandemic is ham-pering the sector’s growth. In 2020, manufacturing delays have determined temporary interruptions in a number of construc-tion sites. While production activity has partly resumed in 2021, it can be expected that the industry will continue to experience a sluggish growth in the near future.
Figure 5.16 Breakdowns of H2020 funding for desalination, 2014-2019 133
2022

Sources Own elaboration from: IDA575, World Bank576.
With desalination plants’ lifetimes of 20 to 25 years, it can be expected that in the coming years, increasing investments will be necessary to modernize or replace outdated facilities. The OECD estimates that the annual investment needed to address water supply and sanitation needs globally is USD 0.9 trillion. This corresponds to a cumulative amount of USD 13.6 trillion over the period 2016-2030577. However, the limited capacity commis-sioned in Europe over the last decade (2010-2019) shows that this sector of the EU Blue Economy has grown comparatively less in the EU than outside. In other regions, the installed capacity has almost doubled in recent years. The Middle East and North Africa, East Asia and Pacific, and North America have reached nearly 78 % of global desalination capacity, collectively578.
The market for newly developed desalination plants is not growing as expected in Europe 579. For example, a year ago, a total capacity of 200 000 m3/day of new desalination projects were planned for the 2021 to 2024 period. However, by January 2021, only a total capacity of 79 400 m3/day of new desalination projects had been planned for the 2021-2025 period. Reverse osmosis is the predominant technology that these newly planned desalination plants are expected to employ.
575 International Desalination Association (IDA). (2011). Desalination at a glance.576 World Bank. (2019). The role of desalination in an increasingly water-scarce world. World Bank.577 OECD (2017). Technical note on estimates of infrastructure investment needs. Background note to the report Investing in Climate, Investing in Growth, July 2017.578 Jones, E., Qadir, M., van Vliet, M. T., Smakhtin, V., & Kang, S. M. (2019). The state of desalination and brine production: A global outlook. Science of the Total Environment,
657, 1343-1356.579 Post J., de Jong P., Mallory M., Doussineau M., Gnamus A. (2021), Smart Specialisation in the Context of Blue Economy – Analysis of Desalination Sector, EUR 30768 EN,
Publications Office of the European Union, Luxembourg, 2021, ISBN 978-92-76-40319-7, doi:10.2760/058360, JRC125905.580 Pistocchi, A., et al. (2020a). Can seawater desalination be a win-win fix to our water cycle? Water research, 115906. https://doi.org/10.1016/j.watres.2020.115906581 Post J., de Jong P., Mallory M., Doussineau M., Gnamus A. (2021), Smart Specialisation in the Context of Blue Economy – Analysis of Desalination Sector, EUR 30768 EN,
Publications Office of the European Union, Luxembourg, 2021, ISBN 978-92-76-40319-7, doi:10.2760/058360, JRC125905.582 European Environment Agency (EEA), 2021. Water resources across Europe - confronting water stress: an updated assessment. EEA Report No 12/2021.583 Pistocchi, A., et al. (2020). Can seawater desalination be a win-win fix to our water cycle? Water research, 115906. https://doi.org/10.1016/j.watres.2020.115906
Pistocchi, A., Bleninger, T., & Dorati, C. (2020). Screening the hurdles to sea disposal of desalination brine around the Mediterranean. Desalination, 491, 114570.584 COM/2020/380 final.585 COM/2021/400 final.
Going forward, the sector is called not only to catch up with other regions in terms of installed capacity, but also to sub-stantially contribute to the sustainability and energy transitions. Desalination has been proposed as a “win-win solution” to restore the water cycle and is expected to become commonly used as societies progressively understand its broader benefits. Coupling desalination with water reuse maximises the socio-economic and ecological return on investments580. The desalination industry has the potential for creating prosperity and employment in Europe through a combination of innovation-based sustainable water, energy and chemical technologies581.
In this process, the environmental impacts of desalination must be assessed carefully, because desalination is associated with signif-icant environmental problems such as brine disposal, energy use and CO2 emissions582. Energy is required not only in the separation step itself, but also in water pumping, pre- and post-treatment, brine disposal pumping, etc. In addition to total energy consump-tion, the various desalination processes should be compared on the basis of their respective investment and production costs (Table 5.3).
Capital and operational costs associated with desalination plants depend on a number of factors, from the dimension of the plant, to the type of desalination technology employed and the salinity of the water to be treated. The least efficient and most energy-in-tensive desalination technologies may face important constraints in the current context of increasing energy prices. In addition to increasing its energy efficiency, the desalination industry must decarbonize its sources of energy in order to become more sus-tainable. Moreover, desalination leads to discharges of concen-trated brine streams. While impacts associated with brine dis-posal are typically local and limited in extent, the impacts must be appropriately mitigated583 in accordance with the provisions of the EU Biodiversity Strategy584 and the EU Zero Pollution Action Plan585.
Table 5.3 Comparison between alternative seawater desalination technologies
Notes: Costs are based on 2016 values and EUR-USD exchange rate of 1.11082; MLD = million litres per day.
Desalination technology Gain Output Ratio
(GOR)
Energy requirements
(kWhr/m3)
Capital costs CAPEX
(€ million/MLD)
Costs of water production
(€/m3)
Multi-stage Flash Evaporation (MSF) 8 – 10 2.5 – 3 1.5 – 2.8 0.92 – 1.57
Seawater Reverse Osmosis (SWRO) in the Mediterranean Sea
n.a. 2.5 – 3 0.7 – 2.0 0.58 – 1.46
Multi-Effect Distillation / Thermal Vapor Compression (MED/TVC)
8 – 10 1.0 – 2 1.1 – 2.1 1.01 – 1.35
134
THE
EU B
LUE
ECO
NO
MY
REPO
RT

A promising solution is to design an outfall providing sufficient initial dilution. This usually implies a sufficient outfall velocity compatible with hydraulic and structural limitations (i.e. not above 7 m/s). When a reasonable velocity per se does not ensure suffi-cient dilution, outfalls require more complex and expensive design, and brine disposal may become a major issue. Concentrating the brine beyond typical recovery would reduce the distance of dis-posal from the coast, and hence disposal costs. Further brine con-centration should be appraised in relationship with the costs of increasing recovery.
A seawater reverse osmosis plant may be designed in order to be fed by photovoltaic (PV) or other renewable energy sources, at costs that are already, or may soon become, competitive with plants running on conventional fuels. The concept of a 100 % PV-based desalination plant with a modular scheduling of water production following the monthly variability of radiation, battery and water storage has been proposed to increase autonomy from the grid in the extended Mediterranean region586. A saltwater reservoir at a certain elevation, followed by a booster pump, enables splitting the fixed energy demand of membrane operation from the flexible demand for pumping to the reservoir, which may use PV power.
Using an engineering costing model, it has been estimated that a large share of the population in the Mediterranean region could be serviced by PV-fueled desalination at a cost below €1/m3, which is comparable to the average cost of producing one cubic meter of desalted water using RO technology, of €0.86 (2019 data)587. A stand-alone plant producing desalinated water with PV produc-tion on site has high capital costs. Nonetheless, these costs would be lower than certain conventional solutions, such as diesel-pow-ered local power grids.
586 Ganora, D., Dorati, C., Huld, T. A., Udias, A., & Pistocchi, A. (2019). An assessment of energy storage options for large-scale PV-RO desalination in the extended Mediterranean region. Scientific Reports, 9(1), 16234. https://doi.org/10.1038/s41598-019-52582-y
587 Pistocchi, A., et al. (2020a). Can seawater desalination be a win-win fix to our water cycle? Water research, 115906. https://doi.org/10.1016/j.watres.2020.115906588 All EU Member States except Denmark due to its opt-out.589 ASD 2020 Facts and Figures.590 In January 2020, Fincantieri and Naval Group created the 50/50 joint venture Naviris JV.
5.4 MARITIME DEFENCE, SECURITY AND SURVEILLANCESame as in last year’s edition, this chapter covers the Maritime defence, and the Maritime security and surveillance sector. Although often closely interconnected, an attempt is made to distinguish between Defence and Maritime security and surveil-lance. These sectors are gaining relevance and are at the same time rapidly expanding with a growing number of technological innovations and applications for both military and civilian uses. As publicly available data is still somewhat scarce, this section is included in the emerging sectors chapter.
5.4.1 MARITIME DEFENCE
This section covers the Maritime defence sector, navies in particu-lar. It provides an overview of the current state of play and the latest data available for the sector.
The European Defence Agency (EDA) has been collecting defence data on an annual basis, since 2006, in line with the Agency’s Ministerial Steering Board Decision of November 2005. According to the last publication, 2020 saw defence expenditure by the 26 European Defence Agency588 Member States rise for the sixth consecutive year. Overall Member States allocated €198 billion to defence. Compared to 2019, defence expenditure increased by 5 % despite the ongoing economic crisis caused by the COVID-19 pan-demic. In 2020, defence Research and Technology (R&T) spending amounted to €2.5 billion, up by 46 % compared to 2019 spending levels. This is the highest amount registered by EDA since the Agency started collecting data in 2005 and the first time since 2008, that defence R&T spending reached above €2 billion.
The European increase in spending is mainly directed at defence investments in research, development and procurement of new equipment.
The Naval sector
The European naval industry sector is responsible for the design and production of military vessels, aircraft carriers and nuclear submarines. In 2020, the turnover of European naval shipbuild-ing sector amounted to €29.2 billion, accounting for 24.5 % of the total European defence revenues589. Being a highly compet-itive industry across the whole range of naval ships and almost the totality of its core systems and components, the main play-ers in this industry are large ‘tier-1’ companies. These include Damen (NL), Fincantieri (IT), Naval Group (FR)590, Navantia (ES) and ThyssenKrupp (DE), but also a wide network of highly specialised sub-contractors and suppliers of different sizes. Moreover, 18.7 % of the total number of SMEs doing business in defence (estimated at between 2000 and 2500), operate in the naval domain.
135
2022

In 2020, the naval sector employed 289 000 highly skilled work-ers (together with the land sector), which represent nearly 63 % of the total 462 800 jobs attributable to the whole European defence industry591.
Data seems to suggest that despite the COVID-19 pandemic, the defence sector, including the naval segment, was able to show economic resilience592. With reference to the broader shipbuilding market, though, Europe continues to suffer from the impact of COVID-19. For instance, while 2021 was marked by a surge in global ordering volumes in comparison to 2020, data suggest that European shipyards and equipment manufacturers are suffering more than in Asia593. In the first half of 2021, contracting levels at European yards were extremely low, with a decrease of 53 % in Compensated Gross Tons (CGT) in comparison to 2020594. By contrast, main Asian players experienced considerable increases in their order volumes.595 It is clear that the civil sector has been the most impacted by the consequences of the COVID-19 pan-demic. Nonetheless, this pressure on the civilian side may end up impacting the overall R&D investment levels, considering that revenues of the major EU defence and naval players depend also on the civilian market.
France and the UK account for 40 % of the total Defence R&D spending in Europe, with Germany, Italy, Spain and Sweden fol-lowing. However, the amounts spent are a low percentage of the overall defence budget596.
According to some forecasts597, the full impact of the pandemic in Europe’s maritime technology sector will mostly be felt in 2021/2022, when the lack of new orders will decrease workload. The impact of the pandemic in terms of military budget cuts may delay acquisition and modernisation programs of EU Navies, with negative repercussions on the naval industry. This situation, as predicted, is expected to last until at least 2023/2024 598.
The European Defence Agency activities
The European Defence Agency (EDA) activities in the maritime domain support as well the implementation of the EU Maritime Security Strategy (EUMSS), its corresponding Action Plan and the implementation of the two maritime Capability Development Priorities: naval manoeuvrability and underwater control contrib-uting to resilience at sea. The EU Capability Development priority Naval Manoeuvrability focuses notably on Maritime Situational Awareness (MSA) which, as the very basis for all naval operations, will be advanced to the highest level of interoperability. MSA is the effective understanding of activities, associated with and occur-ring in the maritime domain that could impact on the security, safety and environment of the European Union and its Member States. The Maritime Surveillance project (MARSUR), implemented within the EDA’s remit, aims to create a network using existing
591 ASD 2020 Facts and Figures.592 ASD 2020 Facts and Figures.593 SEA_Europe_Annual_Report_2020.pdf (seaeurope.eu), p. 19.594 SEA Europe, Shipbuilding Market Monitoring Report No 52 (1H 2021).595 For example, Korea won 46 % of global new orders in 1H 2021, followed by China (40 %) and Japan (8.1 %).
SEA Europe Shipbuilding Market Monitoring Report No 52 (1H 2021).596 ASD 20210 Facts and Figures.597 ‘Coronavirus, Climate Change and Smart Shipping: 3 maritime scenarios, 2020-2050’, Dr Martin Stopford, April 2020,
A White paper published by Seatrade maritime, part of Informa Markets.598 Sea Europe, ‘The Covid-19 impact on Europe’s maritime technology sector’.599 https://ec.europa.eu/defence-industry-space/eu-defence-industry/european-defence-fund-edf_en
naval and maritime information exchange systems. In 2021, MARSUR was operationally used for the first time as maritime surveillance information sharing network for the Coordinated Maritime Presences (CMP) pilot case in the Gulf of Guinea. The network facilitates the exchange of operational information, such as ship positions, tracks, and amplifying information. To this end, EDA and the European External Action Service (EEAS) signed a bilateral arrangement on the provision of access to MARSUR Network, Technology and related services to the EEAS and the EU Military Staff. EDA is also supporting MARSUR Member States in interconnecting the MARSUR Network with the EU Common Information Sharing Environment (CISE). The technical connectivity is already established and tested.
Additional work is done by the EDA on Anti-submarine Warfare, Maritime Naval Mine Warfare capabilities, and harbour and criti-cal infrastructure protection within the dedicated Project Teams. Unmanned Maritime Systems is a key theme across all modules.
The European Defence Fund (EDF)
The EDF aims to strengthen the EU defence sector contributing to the technological sovereignty of the Union, while fostering competitiveness, efficiency and innovation capacity in defence. The EDF is expected to reduce the Union’s reliance on foreign military technology and expand its geopolitical influence in the world. It seeks to open the cross-border supply chain to new entrants. SMEs’ cross-border participation will be a key indication of success.
The implementation of the EDF under the multiannual financial framework of the Union (2021-2027) will financially support consortia of companies from different MSs undertaking coopera-tive defence research and development of defence products and technologies.
The EDF is composed of a budget of close to €8 billion for 2021-2027 dedicated to European defence. About one-third (€2.7 billion) is set to fund collaborative defence research, while the remaining two-thirds (€5.3 billion) are booked to fund collaborative capabil-ity development projects complementing national contributions599. The EDF budget represents a significant increase €90 million biennium budget of the Preparatory Action on Defence Research (PADR) launched in 2017, and the €500 million budget of the European Defence Industrial Development Programme (EDIDP) for 2019 and 2020.
136
THE
EU B
LUE
ECO
NO
MY
REPO
RT

The Fund whichplacess the EU among the top 4 defence research and technology investors in Europe, acts as a catalyst for an inno-vative and competitive industrial and scientific base. Its main fea-tures are:
• financing projects that help make the EU more secure and resilient, and correspond to priorities agreed by MSs in par-ticular, within the framework of the Common Secuirty and Defence Policy (CSDP);
• only collaborative projects involving at least 3 participants from 3 Member States are eligible;
• The EU will only co-fund the development of common proto-types where MSs commit to buying the final product;
• cross-border participation of SMEs and mid-caps is strongly incentivised by providing higher financing rates and favouring projects by consortia which include SMEs and mid-caps;
• targeting breakthrough innovation, with up to 8 % of the funds dedicated to disruptive technology and innovative equipment allowing the EU to boost its long-term techno-logical leadership.
Sustainability in defence
In terms of sustainability, EDA also contributes to the green agenda of the European Union, leading activities that are relevant for the maritime sector. These include, amongst other activities, the Incubation Forum for Circular Economy in European Defence (IF CEED), ran by EDA since October 2021. The Forum aims to apply the EU Green Deal’s Circular Economy approach to European defence, by incubating collaborative and transnational circularity projects and/or roadmaps, through the engagement of a coopera-tive community (e.g. EU Ministries of Defence, industry, institutes, research centres, financial institutions, academia, and pertinent public bodies at national and international level). EDA is also involved in supporting Ministries of Defence in addressing energy, environmental and climate change related challenges.
600 Regulation (EC) No 1406/2002, establishing EMSA, as amended by Regulation (EU) No 2016/1625 of 14 September 2016601 European Union Naval Force Operation Atalanta: https://eunavfor.eu/mission/602 https://www.operationirini.eu
5.4.2 MARITIME SECURITY AND SURVEILLANCEThe surveillance of EU waters requires strong cooperation and coordination between Member States. This work is supported by the European Commission and the agencies in the framework of the European Union Maritime Security Strategy (EUMSS) and the development of Common Information Sharing Environment (CISE), as one of the achievements of the EU MSS. Extensive resources and investment are also needed to develop technological and innovation surveillance systems and tools in order to protect EU waters and therefore EU citizens.
The EU Agencies work beyond EU waters
European Maritime Security Agency (EMSA)
Set up in 2002600, the European Maritime Security Agency (EMSA) aims to ensure a high, uniform and effective level of maritime safety, security, as well as the prevention and response to pollution caused by ships, and oil and gas installations. The agency also contributes to the overall efficiency of maritime traf-fic and maritime transport and facilitated the establishment of a European Maritime Transport Space without Barriers. The Budget for 2021 was €105 million.
Significant investments in terms of funding, personnel and mil-itary and civilian assets are essential to support EU mission, patrolling, and protect important trade routes with the EU. Threats to EU shipping are common through pirate activity in High-Risk Areas, such as the Indian Ocean and off the coast of Somalia.
In the context of the EU’s Common Security and Defence Policy., EMSA is supporting EU Naval Force operations – ATALANTA and IRINI. This is following the signature of two cooperation agreements with EUNAVFOR-Somalia (operation ATALANTA601) on the one hand and EUNAVFOR-Mediterranean (operation IRINI602) on the other.
BOX 5.3 Offshore Renewable Energy for Defence: SYMBIOSIS
Together with the European Commission (Directorate-General for Energy – DG ENER), EDA is currently developing SYMBIOSIS, a project that aims at identifying and presenting the conditions that could foster the co-existence between offshore renewable energy developments and defence activities and systems. The SYMBIOSIS project will strive to offer solutions by mapping the maritime spaces reserved or used for present and future military activities and purposes, assessing their suitability for deploying offshore renewable projects and analysing the hurdles and risks constraining their development and exploitation. In this respect, the Agency will bring together the defence community and key stakeholders from the civilian community (governmental institutions, public and private sectors) to ensure sustainable and durable symbiosis. Through research, simulation-modelling, and evalua-tion-testing in the European maritime spaces, the project will develop different regulatory, technological and operational solutions and alternatives to address concerns and requirements.
The project’s outcome will contribute significantly to the EU’s efforts to achieve climate neutrality by 2050 while enhancing defence energy resilience and autonomy. The project will build on the outcome of the extensive work carried out within the Consultation Forum for Sustainable Energy in the Defence and Security Sector (CF SEDSS) – a European Commission initiative managed by EDA and funded by the EU’s horizon 2020 research and innovation programme since 2015. The SYMBIOSIS project is estimated to start in May 2022 with a grant under Horizon Europe, following the approval of its project proposal by the European Climate, Infrastructure and Environment Executive Agency (CINEA).
137
2022

Operation ATALANTA targets counter piracy and the protection of vulnerable vessels and humanitarian shipments off the coast of Somalia, while operation IRINI seeks to enforce the UN arms embargo on Libya and in doing so contribute to the country’s peace process. By cooperating with EMSA in the areas of mar-itime security and surveillance, multiple sources of ship specific information and positional data can be combined to enhance maritime awareness for the EU Naval Force in places of particu-larly high risk and sensitivity. The service is accessed through the SafeSeaNet Ecosystem Graphical User Interface (SEG) where a whole range of maritime information and analytical tools are available to approved users. Through the Copernicus Maritime Surveillance (CMS) service managed by EMSA, satellite imagery has been used to detect vessels in areas of particular interest.
EMSA is also managing the CMS in West Africa and the Gulf of Guinea, assisting the United Nations Office on Drugs and Crimes (UNODC). The Global Maritime Crime Programme (GMCP), run by UNODC, carries out activities in the areas of counter-piracy, mar-itime capacity building, and combating maritime crime including the trafficking of illicit substances by sea. CMS has provided satel-lite imagery and value-added products for a number of the African NEMO exercises (Navy’s Exercise for Maritime Operations, coordi-nated by the French Navy). NEMO is designed to bolster coastal states’ maritime security capabilities in the Gulf of Guinea603.
603 http://www.emsa.europa.eu/copernicus/cms-cases/item/3983-copernicus-infosheet-support-to-international-organisations-nemo-operations-in-the-gulf-of-guinea-west-africa.html
604 http://www.emsa.europa.eu/newsroom/infographics/item/3941-integrated-maritime-services-users-types.html 605 http://www.emsa.europa.eu/copernicus/cms-cases/item/3992-copernicus-infosheet-customs-activities-overview.html 606 http://www.emsa.europa.eu/copernicus/cms-cases/item/3991-copernicus-infosheet-customs-activities-use-case-apprehending-the-ali-primera.html607 http://www.emsa.europa.eu/newsroom/latest-news/item/3339-integrated-maritime-services-operational-awareness-across-sectors-and-seas.html608 https://www.copernicus.eu/en/use-cases/cmems-support-copernicus-maritime-surveillance-service609 COM(2021)240 final.
Technological developments and investments: helping coastguards
EMSA’s integrated maritime services (IMS), which uses a vast array of data and information (EMSA receives daily over 30 million vessel position messages and over 40 earth observation images), now serve more than 5 500 users604, including border control605, customs606, maritime security, defence and law enforcement607. Through one-single service, Member State authorities can rely on terrestrial and satellite vessel position data, satellite optical imagery, drones and met-ocean data, allowing for large areas of the sea to be monitored.
The Copernicus Maritime Surveillance system (CMS) is a European Programme that provides access to satellite surveillance information to all EU Member States’ bodies with tasks at sea608. Data is available from the system just 30 minutes after the sat-ellite overpass. CMS value-added products can be used for vessel detection, feature detection, activity detection, oil spill detection, monitoring incidents, tracking objects at sea, and wind and wave information, hence facilitating search and rescue missions or preventing accidents. It can also be used as ocean forecasting and other coastal services at European level. As announced in the Sustainable Blue Economy Communication609, the Commission will aim at expanding the Copernicus marine service.
Interoperability of maritime information – The Common Information Sharing environment (CISE)
CISE is an information sharing environment for the EU maritime domain that provides the interoperability between the existing Member State’s (MS) maritime systems from seven different mar-itime sectors (maritime safety and security, marine environment, fisheries control, customs, border control, law enforcement, and defence) and the EU sectorial frameworks. This system facilitates the exchange of additional classified and unclassified information in a timely and efficient manner, while avoiding duplication.
CISE is focussed on providing additional information sys-tem-to-system to top-up legacy systems) based on a standard (i.e. the CISE’s Data and Service model).
The CISE’s infrastructure has two main building blocks:
• a standard component that dispatches the information (so called CISE Node), and
• the systems that an organization wants to connect to CISE (also called Legacy System) with its Adaptor. The Adaptor plays the crucial role to connect the organization’s Legacy System to the node and at that level can decide which infor-mation should be consumed from and provided to the other participants connected to the network.
BOX 5.4. OCEAN2020 – marking European defence funded researchOCEAN2020, launched in 2018, was the largest project funded under the European Commission’s Preparatory Action on Defence Research, the closing of OCEAN2020. It was awarded a total budget of €35.4 million. A closing confer-ence presented the major achievements of this project over the last three years in October 2021 and included a sea trial bringing together 15 unmanned systems, 4 naval vessels, 5 tactical command and control systems, one earth obser-vation satellite system plus a prototype of an EU Maritime Operations Centre.
The project demonstrated the integration of new unmanned assets with existing military vessels to give a unique, well documented maritime situation for high level decision mak-ers and the demonstration of autonomous coordination of multiple unmanned systems for a specific task, like under-water search for mines. These achievements are opening the way for follow-on future research activities in the areas like swarming of unmanned systems, sufficient communication links between underwater assets and their mother ships for big data transfer or application of Artificial Intelligence to process big data coming from multiple sensors to generate clear maritime situational awareness.
138
THE
EU B
LUE
ECO
NO
MY
REPO
RT

Any stakeholder that intends to join the CISE shall develop the Adaptor, as the node is provided by the Commission free of charge (through the contribution of the European Maritime Safety Agency and Joint Research Centre).
In 2019, the Commission set up a preparatory action, which is a transitional Phase, to enable the full implementation of CISE and its transition into operations. This Transitional Phase will last until December 2023. It will cover amongst other activities, establish-ing a Cooperation Agreement for information sharing and defining an auditing scheme to foster capabilities sharing establishing an initial set of services to streamline the sharing of information in the operational phase; delivering a new version of the net-work and defining the implementation of CLASSIFIED information sharing.
Nineteen610 EU Member States and EEA/EFTA countries have appointed a member in the governance board of CISE, namely the CISE Stakeholder Group (CSG). In addition, several EU insti-tutions and agencies are CSG members, e.g. EDA, EFCA, Frontex, SatCen, Commission services (JRC, DG MARE, DG MOVE, EEAS), and MAOC(N) as an observer.
The CISE’s network is continuously increasing in terms of nodes and information shared. The current CISE network comprises already 28 stakeholders (Member States and EU bodies) and 12 nodes.
CISE Stakeholder Group (CSG) meetings have been taking place on a quarterly basis and several working groups have been estab-lished in order to support the tasks of the CSG members.
610 BE, BG, CY, EE, ES, FI, FR, DE, GR, HR, IT, LT, MT, NL, NO, PO, PT, RO and SL.
All the authorities participating in the transitional phase agreed on a legally binding Cooperation Agreement (CA) in February 2021. This CA will enhance trust and cooperation between the national authorities involved in the exchange of information.
To complement the activities of the transitional phase, the Commission launched a specific study on CISE security. The study defined the classification level required to allow stakeholders to safely exchange sensitive data through a trusted and secure channel. Furthermore, the study evaluated the level of integrity of the CISE software, ensuring a high level of trust in the network and between the stakeholders. While the current CISE network still shares only UNCLASSIFIED information, during the transitional phase the modalities will be defined and implemented in order to exchange also CLASSIFIED information up to EU restricted, which will only be established at the beginning of the operational phase, which will start at the very end of 2023.
Further to these activities, under the ‘direct management’ of the EMFAF, a first call for proposal ‘Action for a CISE incident alert-ing system’ was launched on 26 August 2021 by the European Climate, Infrastructure and Environment Executive Agency (CINEA). This call aims to co-finance one single project to enhance the cooperation between public maritime authorities by promoting the development of at least two services at pre-operational phase and to foster the uptake of CISE in view of its operationalisation.
Under the ‘shared management’, each Member State is invited to present its public investment plan covering the EMFAF pro-gramming period (2021-2027) and its planned actions to fulfil the objectives of the fund and meet the fund’s priorities. Under Priority 4, namely ‘strengthening international ocean governance
Figure 5.18 CISE information sharing environment
Source: EMSA.
139
2022

and enabling seas and oceans to be safe, secure, clean and sus-tainably managed’, which also fosters maritime surveillance under CISE, the fund can be used during the entire programming period to co-finance the expenses linked to:
• the technical setting up of CISE in terms of infrastructure and software, and
• staff costs which are fully within the scope of the CISE-related operations and essential to its implementation.
The implementation of CISE will be monitored by a newly estab-lished Council preparatory body named the ‘Working Party for Maritime Issues’.
In addition, the Commission Communication on a new approach for a sustainable Blue Economy611 highlights that a safe and secure maritime space is the prerequisite to preserving EU’s stra-tegic interests such as freedom of navigation, external border control or the supply of essential materials and for protecting economic activities and citizens, both at sea and on shore.
Cooperation on coastguard functions amongst three key EU agen-cies generate significant economies of scale, by reducing overlaps, developing multipurpose operations and sharing aircrafts and ves-sels for search and rescuing operations, oil pollution response etc. The Commission will propose rolling out the CISE’s operational phase in 2024, subject to the results of the transition phase, to create a fully-fledged information sharing system between mar-itime surveillance authorities in the EU.
611 COM/2021/240 final; https://ec.europa.eu/oceans-and-fisheries/ocean/blue-economy/sustainable-blue-economy_en
European Fisheries Control Agencies (EFCA)
Within the European Cooperation on Coast Guard Functions EFCA supports fisheries control operations at sea with earth observation provided by the Copernicus Maritime Surveillance service oper-ated by EMSA and through specifically tailored capacity building activities.
In the context of Maritime Security and Surveillance at interna-tional level, the European Fisheries Control Agency (EFCA) is also supporting the states in West Africa and in the Gulf of Guinea through the implementation of the five-year EU funded PESCAO project, which includes a component aiming to improve the fight against Illegal, Unregulated and Unreported (IUU) fishing activi-ties in that area. EFCA provides technical assistance to the Sub-Regional Fisheries Commission (SRFC), the Fisheries Committee for the Western Central Gulf of Guinea (FCWC) and their member countries, in a coordinated manner, using the experience gained in the EU context. In 2022, EFCA supported fisheries control oper-ations at sea with earth observation Copernicus Maritime Service, the chartering of flights for aerial surveillance and through spe-cifically tailored capacity building activities.
Figure 5.19 CISE stakeholder group member
Source: EMSA.
140
THE
EU B
LUE
ECO
NO
MY
REPO
RT

Sustainability: Control and enforcement of conservation measures for fisheries
One of the key elements of sustainable fisheries is the control and enforcement of conservation measures. Within the EU, the European Fisheries Control Agency (EFCA) is providing oper-ational coordination and support to Member States and the Commission, as regards fisheries control activities, through Joint Deployment Plans (JDP). In 2020, the cooperation and cooper-ative efforts led to 38 452 coordinated inspections, and 1787 suspected infringements detected for the six JDPs (NAFO/NEAFC, North Sea, Baltic Sea, Black Sea, Western Waters, Mediterranean & Eastern Atlantic) that were implemented, with some adjust-ments needed due to the COVID-19 pandemic. Also, EFCA’s char-tered Offshore Patrol Vessel (OPV) was in 2020 operational for 335 days and provided a robust platform for fisheries inspections in EU and international waters. The EFCA OPV contributed to the implementation of JDPs in the EU sea basins by adding capacity to fisheries control operations outside the territorial waters of MS and providing a platform to deploy multinational Member State inspection teams.
EFCA’s information systems enabled the collection of data from each Member State providing details of their fishing vessels, catches and other such information. Overall, in 2020 EFCA received Electronic Reporting System-logbook data from 4 185 vessels in 13 Member States and a volume of 36.2 million Vessel Monitoring System (VMS) data. In the area of technologies, the long-lasting cooperation between EMSA and EFCA in integrated maritime awareness resulted in the development of the Integrated Maritime Service (IMS) application dedicated to fisheries control. By the end of 2020, there were 1 053 credentials issued by EFCA to users in Member States and the European Commission.
Frontex
In terms of maritime domain awareness, the EUROSUR Fusion Services (EFS), established under the European Border and Coast Guard regulation612, supplied and coordinated by the European Border and Coast Guard Agency commonly referred to as Frontex, are based on the common application of surveillance tools and inter-agency cooperation at the EU level, including the provision of Copernicus security services. EFS provide the Member States, the Commission and the Agency with value-added information services related to the European integrated border management. These services provide information on the external borders and on the pre-frontier area on a regular, reliable, and cost-efficient basis and should be expanded to support border checks, air border surveillance and the monitoring of migration flows.
Regarding the maritime domain, EFS include automated ves-sel tracking and detection capabilities, software functionalities allowing complex calculations for detecting anomalies and pre-dicting vessel positions, as well as precise weather and oceano-graphic forecasts. In addition, EFS uses optical and radar satellite technology to locate vessels suspected to be engaged in people smuggling, weapons and drug trafficking, or any other criminal
612 Regulation (EU) 2019/1896 of 13 November 2019 on the European Border and Coast Guard.613 Coast guard functions are understood as those commonly referred to by the three agencies and outlined in the Commission Recommendation (EU) 2021/1222
of 20 July 2021 establishing a ‘Practical Handbook’ on European cooperation on coast guard functions.614 Coast guard functions are understood as those commonly referred to by the three agencies and outlined in the Commission Recommendation (EU) 2021/1222
of 20 July 2021 establishing a ‘Practical Handbook’ on European cooperation on coast guard functions.
activity. Many of the services are delivered in cooperation with the European Maritime Safety Agency (EMSA) and the EU Satellite Centre (SatCen). As a result, in 2021 Frontex monitored over 230 vessels of interest.
In addition, Frontex is combining its expertise in border manage-ment with advanced maritime analytical tools and artificial intel-ligence under the remit of the Maritime Intelligence Community – Risk Analysis Network (MIC-RAN). MIC-RAN produces valuable intelligence to tackle maritime threats at EU level in cooperation with analysts from different maritime law enforcement entities.
In terms of maritime operational response activity-sea, in the course of 2021, four maritime joint operations (JOs) were imple-mented by Frontex at the external borders of the EU under the concept of Multipurpose Operational Activities at sea borders: JO Themis hosted by Italy, JO Poseidon hosted by Greece, JO Indalo, and JO Opal Coast hosted by France and Belgium. In addition, there were two operations with executive powers in non-EU countries – at the sea borders of Montenegro and Albania.
The aim of the maritime operations is to provide increased techni-cal and operational assistance to the host Member States in order to control illegal immigration flows, tackle cross-border crime and to enhance European cooperation on coast guard functions and law enforcement activities.
As part of the operations, Frontex provided the host countries with personnel and technical equipment such as planes and heli-copters, vessels and thermo-vision vehicles to strengthen border control at the external border and foster EU cooperation on coast guard functions.
In addition, as part of the European Cooperation on Coast Guard Functions, Frontex, EFCA and EMSA may support national author-ities performing coast guard functions613 at national, European and, where appropriate, international level with Multipurpose Maritime Operation (MMO) as an operational activity.
The aim is to increase operational response at sea relying on advanced cooperation between national authorities and EU agen-cies. The first such operation, MMO Black Sea 2021, was jointly implemented by Frontex, EFCA and EMSA between March to October 2021 to support Bulgaria and Romania in their respective Exclusive Economic Zones. The operation focused on several coast guard functions, including environmental protection. As a result, 27 incidents were reported, including illegal waste and timber shipments and potential marine pollution.
European Cooperation on Coast Guard Functions
Within the European Union, cooperation between authorities in the Member States responsible for the implementation of coast guard functions614 is critical to seek for synergies and avoid over-laps. At EU level, the European Border and Coast Guard Agency (Frontex), the European Fisheries Control Agencies (EFCA), and the European Maritime Safety Agency (EMSA) strengthened their
141
2022

cooperation, each within its mandate, to support each other and national authorities carrying out coast guard functions in areas consisting of information exchange, surveillance services, capacity building, risk assessment and capacity sharing as mentioned in their respective founding regulation.
Capacity sharing, development of Multipurpose Maritime Operations (MMO) and the development and launch of emerging technologies for information exchange and surveillance (such as the deployment of Remotely Piloted Aircraft Systems (RPAS)), are some of the main achievements of this cooperation
BOX 5.5 The European Peace Facility (EPF)The European Peace Facility (EPF) is an off-budget funding mechanism for EU actions under the Common Foreign and Security Policy (CFSP) and with military and defence implica-tions. It funds actions that aim to enhance the Union’s ability to prevent conflicts, build peace and strengthen international security. It has a total budget of €5.69 billion for the period 2021-2027.
The EPF consists of two pillars:
• A pillar for Military Operations which covers the common costs of military CSDP missions and operations, building on and replacing the Athena mechanism. It is implemented by an Administrator for Operations.
• A pillar for Assistance Measures which finances the mili-tary aspects of Peace Support Operations, including those previously supported by the African Peace Facility, and supports capacity building of partner countries and inter-national organisations in military and defence matters. It is implemented by an Administrator for Assistance Measures.
615 https://ec.europa.eu/info/horizon-europe_en616 Note: Cluster 6 of the Strategic Plan specifically targets the sustainable Blue Economy: ‘Research and innovation will support the transition to a climate neutral, sustainable
and productive Blue Economy, including thriving aquaculture, fisheries and emerging sectors such as marine biotechnology. Innovative nature-based solutions will unlock the potential of the sustainable bioeconomy and replace fossil-based, carbon-intensive and harmful materials with innovative, climate-neutral, bio-based, non-toxic materials and chemicals. Innovative solutions, a non-toxic and more circular use of resources and the mainstreaming of circular systems will contribute to achieving zero polluted land, soil, water and air, seas and oceans, including by taking a multi-stressors approach’.
5.6 RESEARCH AND INNOVATIONThis chapter takes a closer look at what research initiatives have been launched, which particular Blue Economy sectors have been researched as well as delineating which technological develop-ments have been enabled through Research and Innovation (R&I funding).
Research and Innovation (R&I) is deemed to be a central driver for fostering a sustainable Blue Economy as well as fulfilling the goals laid out in the European Green Deal (see chapter 3) as well as building back better after the COVID-19 crisis. R&I is ideally placed to set direction, address synergies as well as trade-offs and leverage the full range of EU instruments, consequently ena-bling the twin green and digital transitions. It drives, navigates and accelerates the transformative Green Deal agenda through transparent, comprehensive and balanced scientific evidence and innovative solutions.
R&I fosters science and evidence-based policy making which in turn leads to effective actions; a forward-looking, mission-oriented and impact-focused research and innovation agenda actively con-tributes to sustainable Blue Economy development. Beyond that, quality controlled and harmonised marine data and observation across a range of disciplines and human activities are fundamen-tal to the sustainable transformation of the Blue Economy, to advance understanding of marine ecosystems and (cumulative) impacts of human activities.
Horizon Europe: The Horizon Europe Framework Programme615, with its policy instruments beyond the traditional R&I topics, will actively foster green and digital transitions. The Programme has a budget of €94.4 billion over seven years (2021-2027)616, of which at least 35 % will be devoted to climate-related actions, support-ing the transition of maritime industries to climate neutrality. In addition, another envelope of around €15 billion is dedicated towards achieving climate neutrality in Europe by 2050, entail-ing the transition to greenhouse gas neutrality of the energy and mobility sectors while boosting their competitiveness, resilience and utility for citizens and society. Beyond that, around €9 billion will be invested to accelerate the ecological transition required by the Green Deal, supporting transformative change of the economy and society with the aim to reduce environmental degradation, to halt the decline of biodiversity and to better manage natural resources while concretely serving the EU’s climate objectives and ensuring food and water security.
European Partnership for a climate-neutral, sustainable and productive Blue Economy: The future co-funded European Partnership for a climate-neutral, sustainable and productive Blue Economy will (SBEP) enable a just and inclusive transition to a cli-mate-neutral, sustainable and productive Blue Economy, providing for a healthy ocean, the wellbeing of citizens, and a Blue Economy that is in harmony with nature and whose benefits are distributed
142
THE
EU B
LUE
ECO
NO
MY
REPO
RT

fairly. The SBEP targets the Green Deal and Digital Europe objec-tives and contributes to the Global Earth Observing System, by mobilising relevant stakeholders who will co-create and co-deliver knowledge-based solutions and innovative governance models by combining financial resources for joint transnational calls and resources for other activities. The integration of sea-basin initia-tives and strategies will ensure that impact is delivered at local, regional, national and international levels.617
Horizon 2020 (2013-2020): As the predecessor of the Horizon Europe programme, Horizon 2020 was the largest European funding programme which contributed greatly to sustainable Blue Economy development by investing in research and inno-vation, serving as a buffer to the impacts of global warming and to provide opportunities for new human activities. To the Blue Economy, this was particularly relevant in view of marine litter and marine pollutions, among others. €79 billion went to Research and Innovation. This funding contributed to effectively monitor, make sense, protect, preserve and harness the oceans. The last and biggest call of Horizon 2020, the European Green Deal call, worth €1 billion aims at accelerating a just and sustainable tran-sition to a climate-neural Europe. In view of the maritime dimen-sion, it fosters digital twinning of the ocean, restoring biodiversity and ecosystem services as well as testing and demonstrating sys-temic innovations in support of the Farm2Fork strategy. Resulting projects will spur Europe’s recovery from the COVID-19 crisis by turning green challenges into innovation opportunities.
Figure 5.20 Thematic funding under Horizon 2020 by sector (€ million)
Blue Growth
Blue bioeconomy &biotechnologyAquaculture
Ocean observation
Marine biodiversity
Marine pollution (excludingmarine litter)Marine l itter
Fisheries
Coastal tourism
Note: Some projects funded under the different portfolios and Blue Growth calls might overlap.
Source: DG RTD data, own elaboration.
The majority of Horizon 2020 funding dedicated to the Blue Economy was dedicated to Ocean observation, followed by Blue Growth and Blue bioeconomy and biotechnology. It is important to note that figures presented below exclusively correspond to EU funding.
617 European Commission DG RTD. (2020). Draft proposal for a European Partnership under Horizon Europe: A climate neutral, sustainable and productive Blue Economy. https://ec.europa.eu/info/sites/default/files/research_and_innovation/funding/documents/ec_rtd_he-partnership-climate-neutral-sustainable-productive-blue-economy.pdf
Table 5.4 Thematic funding Horizon 2020 (€ millions)
Sector EU Funding (€ millions)
Ocean Observation 677
Blue Growth 448
Blue bioeconomy and biotechnology 345
Aquaculture 204
Marine biodiversity 114
Marine pollution 101
Marine litter 93
Fisheries 80
Coastal tourism 53
Source: DG RTD data, own elaboration.
143
2022

5.7 INFRASTRUCTUREThis chapter builds on previous efforts to take into account sub-marine cables and robotics, when assessing the socio-economic impacts of the EU Blue Economy. In the previous edition, it focused solely on Submarine cables, but this edition also brings some updates to the digitalisation and robotics in the Blue Economy.
Future editions of this report and chapter may add other elements and sub-sectors if deemed relevant and fit under this category.
5.7.1 SUBMARINE CABLES
Submarine cable networks are a critical infrastructure ensuring that data, telecommunication, and power transmission connec-tions are possible within the EU and between the EU and third countries. The International Cable Protection Committee (ICPC) – that brings together Government administrations and private parties that have a stake in the Submarine cable sector, is the forum where these stakeholders exchange technical, environmen-tal and legal information, with an aim to enhance the security of submarine cables618.
According to estimations, there are more than 400 submarine cables around the world in 2021, covering around 1.3 kilometres around the world (Figure 5.21), with 45 more cables expected to be added by 2025619.
Compared to satellites, cables can carry far more data at far less cost. The economic importance of submarine cable networks (responsible for 99 % of international data transfer and commu-nication620) was further enhanced during the past year, with the world affected by the COVID-19 pandemics and relying more than ever before on data and telecommunication exchanges that are provided by such subsea cables. According to Submarine Cable Map 2020621, data traffic demand is driving content providers such as Amazon, Google, Facebook, and Microsoft to take part in submarine cables investment, driving projects and route prioriti-sation. These providers account for over 50 % of demand on the Atlantic, intra-Asia, and trans-Pacific submarine route. With the massive demand for internet traffic further increasing, construc-tion of new submarine cables might continue to be necessary to avoid service disruption, degradation, and slower speeds.
Some of the challenges for submarine cables relate to damages from ship anchors and fishing nets (accidents account for two-thirds of defaults in cables). Other challenges that are ever more present relate to international security and data protection in this critical infrastructure. Out of the 378 cables in service in 2019, 205 submarine cables were connected to EU Member States, including Outermost Regions (ORs) and Overseas Countries and Territories (OCTs). Of these cables, 105 cables were connected only among EU MS, ORs and OCTs, and 100 cables were connected
618 International Cable Protection Committee. ‘About the ICPC’ [www.iscpc.org/about-the-icpc/, accessed on 4 March 2021].619 Telegeography. ‘Submarine cable frequently asked questions’ [https://www2.telegeography.com/submarine-cable-faqs-frequently-asked-questions].620 International Cable Protection Committee (ICPC). 621 https://submarine-cable-map-2020.telegeography.com/ (accessed 4 March 2021).622 OECD, ‘A new era of digitalisation for ocean sustainability? Prospects, benefits, challenges’ –
https://www.oecd-ilibrary.org/docserver/a4734a65-en.pdf?expires=1647885462&id=id&accname=guest&checksum=7A165867F749D2281521B3B4CD2AC89E
to third countries across most corners of the globe. Particularly in the EU, where a large number of submarine cables connected to EU MSs (including ORs and OCTs) were laid in the early 2000s or before (more than 100 cables with a length above 275 000 Km), replacement and construction of new cables in the next few years might become needed.
These cables amount to approximately 564 000 Km length, of which approximately 518 000 Km were connected to third coun-tries. Denmark is connected to the largest number of cables in thousand km (32), followed by Italy (27), Sweden (23), and France (21). In terms of length, France is connected to the largest network of submarine cables (206 000 Km) followed by (179), Portugal (137), and Spain (77).
Telecommunications submarine cables also can offer a wide opportunity to integrate sensor technology to be used in ocean observation, for example.
5.7.2 MARITIME TECHNOLOGY AND ROBOTICS: THE DIGITALISATION OF THE BLUE ECONOMY
Digitalisation and technological innovation have been emerging and transforming the maritime sector in nearly every aspect of its operations, from underwater to air equipment. Several innovations in ocean-related projects are in the pipeline with the potential to make a significant impact in the coming years. Technological advancement is happening at a fast pace in four areas: (i) ocean sensing and imaging instruments (by using artificial intelligence and machine to machine communication); (ii) the expanding spa-tial coverage of float arrays and fixed observation platforms; (iii) the increasing autonomy in mobile platforms; and (iv) new com-plex systems integration schemes622.
Maritime robots are increasingly being used in Blue Economy activities. It is high-value/high-cost sector with considerable entry barriers related to R&D. Underwater robots can be used for differ-ent purposes in the maritime environment, such as surveys, scien-tific research, oil and gas exploration, border surveillance, infra-structure inspection, and farming. Underwater systems are one of the most valuable sectors within the robotics market. Underwater robots are increasingly being used for surveillance, including defence and military use, but also for industrial and commer-cial purposes, as they enable ocean or underwater exploration in challenging environmental situations. In addition, more coun-tries are using bots to navigate inside the water for surveillance and defence, monitoring naval movements in the water. This sort of usage for security purposes is increasing the demand. Risks of cyber threats and technological breach require more invest-ments in research and innovation. According to a recent report,
144
THE
EU B
LUE
ECO
NO
MY
REPO
RT

Underwater Robotics Market size was valued at $2,685 Billion in 2020 and is projected to reach $6, 719 billion in 2028 (+ CAGR 12.15 % from 2021 to 2028)623.
In terms of application the Global Underwater Robotics Market can be used for Commercial Exploration, Defense, and Scientific Purposes. Among the segments, the use is the highest in Commercial Exploration. This is because presently many countries are trying to find alternative resources of oil and gas that can suf-fice their need. This is causing them to explore the water bodies in their region. Thus, the need to explore is driving the market of underwater robotics.
Two of the main types of unmanned water vehicles are Remotely Operated Vehicles (ROV) and Autonomous Underwater Vehicles (AUV):
• A remotely operated vehicle (ROV) is an underwater vehicle, which is usually tied to a ship using a series of cables and is used along with a tether management system (TMS). These cables transmit commands and control signals between the operator and the ROV enabling remote navigation of the vehi-cle. The growth of the ROV segment is attributed to the rising offshore deep-sea oil and drilling industry due to its need to perform undersea operations, such as equipment assembling, drilling, underwater repair, and maintenance.
• An autonomous underwater vehicle (AUV) is an underwater vehicle that does not require input from an operator. It capa-ble of carrying out simple activities with little or no human supervision. AUVs are often used as survey platforms to map the seafloor or characterise physical, chemical, or biological properties of the water.
623 https://www.verifiedmarketresearch.com/product/underwater-robotics-market/
Other types of robotics used in the maritime environment are for example the Remotely Piloted Aircraft System (RPAS), very often used in surveillance operations. These are small and light craft with a wide range and the capacity to stay in the air for many hours, while being controlled effectively from the ground, and sending back detailed data and images. They are used for marine pollution monitoring and detection, multipurpose maritime surveillance, ships monitoring, amongst other activities.
Technological advancement in the field of sensors and in state-of-the-art robotic technology will contribute to the growth of the AUV market. Yet, despite their importance, the mass uptake of marine robotics has been limited due to high costs associated to R&D, complexity of underwater operations, such as commu-nication and navigation, as well as technological constraints. Having the right skills to design, create and operate these robots is also an important challenge that needs to be addressed in the future (see section 5.6. Research and Education – Skills for the Blue Economy). Legal challenges related to robots, autonomous and artificial intelligence (AI)-based systems are other important issues in this domain.
Several projects across the EU are already using these types of technology, some of which have been targeted by EU funds.
Figure 5.21 European submarine cables
Source: Submarine Cable Map, last updated 24 March 2022, https://www.submarinecablemap.com/
145
2022

BOX 5.6. SMART-HATCHERY – smart foods systems for hatcheries The production of high-quality fish and shrimp juveniles in aquaculture is still hindered by sub-optimal production conditions occurring during the larval stage of many farmed animals. One of the major farming bottlenecks occurring during these early-life stages is the lack of systems that maximize the feeding efficiency, which includes minimizing fish feed loss.
There are no solutions for automated live feed supplying and there are no adequate solutions for monitoring, controlling and optimizing dry feeding of small particle pellets during the larval and weaning stages, as opposed to later growth stages, for which fully automated feeding systems are commercially available.
In parallel, aquaculture currently faces another challenge regarding the feedstock: It needs a new kind of microdiets that improve not only the Feed Conversion Rate (FCR) and a superior juvenile quality of fish and shrimp, but also a strong reduction of production costs, allowing hatcheries to increase the number of production cycles per year.
Smart systemsSMART-HATCHERY intends to increase the profitability of fish farmer by reducing the costs of feeding processes in weaning stages while improving the quality of the feed and rearing water and offering a high-quality and safe seafood, with the best organoleptic and nutritional values. The project’s main goal is to innovate and make a change in the current feeding processes in aquaculture hatcheries of marine fish and shrimp species, by demonstrating the benefits of using:
1. smartFEEsh: A centralized smart feeders based in innovative digital technologies, such as Cloud technologies, Internet of Things (IoT) and Artificial Intelligence which radically increase the co-feeding efficiency, reduce the wastes while increasing the quality of the water, reduce the stress level and susceptibility to disease and thus improve the welfare of the species.
2. WINFEEDS: A new generation of dry microdiets resulting from nutritional knowledge (premium quality ingredients that fulfil lar-vae nutritional requirements) and cutting–edge technologies (cold-extrusion and encapsulation – using pharmaceutical expertise), while have low leaching and high-water stability, leading to maximal larval performance and welfare.
Main goalsSMAR-HATCHERY will enable a change in the current feeding practices in hatcheries in finfish aquaculture, using innovative process automation and ICTs (information and communication technologies) to increase feeding efficiency, improve animal welfare, ensure quality and safety of aquaculture products, and will consequently be a key contributor to the sustainability of commercial finfish aquaculture operations. It aims to:
1. increase production to reduce dependence on external markets624; 2. promote the diversification of production by incorporating new species and new processed and added value products; 3. contribute to the creation of improved sustainable aquaculture systems; 4. improve professional skills and competences; and5. improve social perception and acceptability of the European aquaculture products.
The project received EU funding amounting to €474 808.
BOX 5.7. DEMO-BLUESMARTFEED625 – smart technology for sustainable aquaculture Fish feed is the main production cost (40-50 %) for any fish farming company. Despite technological advances for the control of feed delivery, its efficiency is still far from optimal. Actual technology for monitoring feed supply is based on vision cameras and acoustic devices. These systems are expensive and often unattainable for producers and require a great effort for maintenance particularly in organically-enriched marine environments.
DEMO-BLUESMARTFEED (Demonstration project of a smart technology for monitoring the delivery of feed for a sustainable aqua-culture) is a Greek-Spanish consortium developing a system based on new technologies, programmed to better calibrate fish feed supply. It aims at validating the SICA technology (‘Smart System for Feeding Control’) in real operational conditions (offshore sea cages in Spain and Greece) in order to speed up its market uptake. The SICA technology aims at minimizing wasted non-eaten feed, resulting then into substantial savings for fish farmers, and a lighter environmental impact of aquaculture activities.
The project’s main objectives are: to verify the performance of the SICA (smart system for feeding control) technology in offshore environment; to improve the current SICA by designing a tailor product to fulfil customers’ needs; to validate SICA with relevant stakeholders (fish farmers) in Spain and Greece; to certify SICA under the CE marking; and to develop a Commercial Plan to support a successful commercial launch of the SICA technology.
The project received EU funding amounting to €740 615 and will be active in the Mediterranean Sea basin.
624 European Commission – https://ec.europa.eu/fisheries/sites/fisheries/files/docs/body/2015-aquaculture-facts_en.pdf625 http://bluesmartfeed.eu/
146
THE
EU B
LUE
ECO
NO
MY
REPO
RT

C h A p T E R 6E N V I R O N M E N T A N D
E C O S Y S T E M S E R V I C E S I N A S U S TA I N A B L E
B L U E E C O N O M Y

In its Communication on a new approach for a sustainable Blue Economy in the EU, entitled Transforming the EU’s Blue Economy for a Sustainable Future, the European Commission has commit-ted to ‘prepare guidance on an ecosystem-based approach to maritime spatial planning and promote the multi-use of marine space by combining different activities in the same location (for instance, mariculture and offshore renewable energy systems)’ 626.
The concept of multi-functionality of oceans is not new. Nevertheless, it has evolved significantly over the past decades. Advancements in marine knowledge and technology, combined with growing coastal populations, have led to a large increase in the abundance, diversity, and intensity of maritime uses627. As illustrated in the previous chapters, the prominent sectors of the Blue Economy create value, jobs and maintain high prospects of growth by virtue of the sustainability transition628.
In addition to established uses, such as fishing, shipbuilding, marine transport, or resource extraction, the emerging Blue Economy sectors are carving out sea space and introducing addi-tional competition for limited marine resources629. Besides human activities, oceans sustain marine biodiversity and many other life-supporting goods and services and goods upon which human-kind depends630. Cumulative anthropogenic uses and intensive exploitation activities can exert excessive pressures on the marine environment, causing potential conflicts among users, depletion of blue natural capital, and degradation of marine ecosystems631.
In this context, it is crucial for a sustainable Blue Economy to harness the most advanced knowledge of marine ecosystem structure, functions, services, benefits, and values (Figure 6.1); use accurate monitoring and assessment tools of blue natural capital and marine ecosystem biocapacity; employ best practices in sustainable resource exploitation and ocean governance; adopt ecosystem-based approaches in spatial planning; and introduce nature-based solutions in response to pressing socio-economic and environmental challenges.
626 COM(2021) 240 final, 17 May 2021.627 See e.g. Vermaat et al. (2005). Managing European Coasts – Past, Present and Future. Heidelberg: Springer.628 Remotti & Damveraki. (2015). Ocean Research in Horizon 2020: The Blue Growth potential. Brussels (BE): European Parliament-Directorate-General for Internal Policies of
the Union.629 Jackson et al. (2020). A sustainable food system for the European Union. Doctoral dissertation. Science Advice for Policy by European Academies.630 European Environment Agency. Biodiversity and marine resources. Speech by Professor Jacqueline McGlade, Executive Director, European Environment Agency at the Pre-
COP 9 meeting, Bonn, May 14 2008. Symposium II: Biodiversity: Functions and uses.631 Depellegrin et al. (2019). Exploring Multi-Use potentials in the Euro-Mediterranean sea space. Science of the Total Environment, 653, 612-629.632 Haines-Young & Potschin (2010). The links between biodiversity, ecosystem services and human well-being. In: Raffaelli DG, Frid CLJ, editors. Ecosystem Ecology: A New
Synthesis. Cambridge: BES Ecological Reviews Series, Cambridge University Press. 110–139.633 Burkhard, B., & Maes, J. (2017). Mapping ecosystem services. Advanced books, 1, e12837.634 Liquete et al. (2013). Current status and future prospects for the assessment of marine and coastal ecosystem services: a systematic review. PloS one, 8(7), e67737.635 See e.g. The Second World Ocean Assessment. United Nations (2021). See also Boillat, S., & Ifejika Speranza, C. (2019). IPBES Global Assessment Report on Biodiversity and
Ecosystem Services. Chapter 3. Assessing progress towards meeting major international objectives related to nature and nature’s contributions to people.636 Zhongming et al. (2021). NEGLECTED: Environmental Justice Impacts of Marine Litter and Plastic Pollution. United Nations Environment (UNEP).637 Jolliffe et al. (2021). Blueprint for improved measurement of the international ocean economy: An exploration of satellite accounting for ocean economic activity.
Figure 6.1 Illustration of the cascade model632
Source: Haines-Young and Potschin in Burkhard and Maes 2017633.
Blue natural capital and ecosystem services
Blue natural capital is the world’s stocks of natural ocean assets, including all abiotic (e.g. water, oxygen, dissolved nutrients, etc.) and biotic resources (i.e. living organisms). Marine ecosystem ser-vices can be defined as the flow of benefits to humans that orig-inate from blue natural capital.
Research on blue natural capital and on marine and coastal eco-system services has steadily advanced over the past few years634. Great progress has been made in terms of mapping, quantifi-cation, valuation, and impact assessment. However, significant knowledge and application gaps persist, testified by the alarming data about marine pollution and biodiversity loss in European seas and beyond635, as well as numerous cases of marine ecosystem mismanagement, environmental justice and liability636.
The Blue Economy should be seen as a complex system of inter-actions and interdependencies between anthropogenic economic activities, the marine ecosystems and biodiversity. Yet the meas-urement of benefits, dependencies and impacts of economic activities on the marine environment remains too isolated or partial, if not absent. The full value of ecosystem services that economic activities depend on, as well as the full cost of their environmental impacts and liabilities is often not assessed, or not systematically captured by national statistics. As a result, Blue Economy statistics tend to be incomplete and broadly incompa-rable with data on the rest of the economy637.
148
THE
EU B
LUE
ECO
NO
MY
REPO
RT

To address this issue, a number of countries are establishing sea satellite accounts (see for example section 8.2) and ocean ecosystem accounts, (see section 6.2) as experimental or inte-grated components of their systems of national accounts (SNA). To enhance the consideration of economic-environmental link-ages in sustainability assessments and enable cross-country and regional comparisons of Blue Economy statistics, the OECD has developed a blueprint framework for improved measurement of the international ocean economy638.
The mapping of terrestrial, freshwater, and marine ecosystems and their services in the EU has made considerable progress with the Mapping and Assessment of Ecosystems and their Services (MAES) initiative, implemented as part of the EU Biodiversity Strategy to 2020. The results of this first EU-wide assessment indicate that marine ecosystems are the most extended ecosys-tem type, covering 5.8 million km2 (compared to 4.4 million km2 on land). However, the condition of ecosystems that are under specific protection measures is unfavourable, with further acidifi-cation of marine ecosystems. While progress has been made since 2010 in maintaining fish stocks at sustainable levels, pressures from overfishing activities and marine pollution still high, leading to degradation and loss of marine biodiversity and habitats. Over 70 % of marine habitats is in unfavourable conservation status639.
By combining OECD’s classification of ocean economic activities with the ecosystem services framework640 it might be possible to comprehensively map all Blue Economy sectors together with the corresponding blue natural capital endowments and flows of ecosystem services. An initial attempt at such an integrated map-ping is illustrated in Table 6.1. This approach can be expanded to also show high environmental and social impact Blue Economy activities, Taxonomy-aligned activities641, as well as off-market services originating from blue natural capital.
Marine science is accustomed to system thinking, and has access to considerable data and modelling tools linking natural capital assets and ecosystem services642. Therefore, we have the capacity to understand the integration of traditional capital and natural capital, and use it for decision support643.
Crucial to support maritime spatial planning and decisions about sustainable use of marine resources is the assessment of marine ecosystem services. A recent example is the case study provided in Chapter 8 illustrating the results of the assessment of marine and coastal ecosystems and ecosystem services in France (see section 8.4). Despite a growing number of studies on marine eco-system services, the assessments are usually limited to relatively few ecosystem services, particularly those related to commercial exploitation or coastal protection644.
638 Jolliffe et al. (2021). Blueprint for improved measurement of the international ocean economy: An exploration of satellite accounting for ocean economic activity.639 Maes et al. (2020). Mapping and Assessment of Ecosystems and their Services: An EU ecosystem assessment, EUR 30161 EN, Publications Office of the European Union,
Ispra. ISBN 978-92-76-17833-0, doi:10.2760/757183.640 Leemans & De Groot (2003). Millennium Ecosystem Assessment: Ecosystems and human well-being: a framework for assessment.641 i.e. activities that are environmentally sustainable activities according to the technical screening criteria provided by the EU Taxonomy Regulation (EU 2020/852) on the
establishment of a framework to facilitate sustainable investment.642 Austen, M. (2021). Natural Capital: Can it be operationalised for the marine environment? Presentation.643 Neill, P. (2021). World Ocean Observatory: The Ocean as Natural Capital.644 Culhane et al. (2018). Linking marine ecosystems with the services they supply: what are the relevant service providing units? Ecological Applications, 28(7), 1740-1751.645 Mongruel et al. (2020). IFREMER. Conceptual proposal and methodology for the building of a marine ecosystem account, based on ecosystem services assessments
Reference: JRC/IPR/2019/VLVP/3665. Service contract 722444 for the European Commission, Joint Research Center, JRC.D.2 Water and Marine Resource Unit.646 Austen et al. (2019). Valuing Marine Ecosystems-Taking into account the value of ecosystem benefits in the Blue Economy.
To advance and harmonize assessment guidelines, the JRC has commissioned a study aimed at informing the development of an EU-supported conceptual framework and methodology for eco-system services assessments645 . The study offers insights into coherent approaches to the integration of socio-economic analysis of marine ecosystem services and marine natural capital, and provides a first set of practical recommendations towards the establishment of marine ecosystem accounts in the EU.
The study recommends inter-alia that marine ecosystem accounting:
• be based on the strong sustainability paradigm, which con-siders that ecosystem degradation may be irreversible and there might be no substitutes;
• focussed on information regarding critical thresholds and capacity in physical units;
• be used for assessments targeting key marine ecosystems services (e.g. 10 to 15), including the main abiotic marine services (e.g. carbon sequestration).
Recognizing that the direct and indirect benefits of marine eco-system services are still rarely used in support of decision making, the European Marine Board recommends including more system-atically ecosystem valuation in marine management decision models, and promote the harmonization of ecosystem service frameworks for increased comparability of results. Furthermore, natural capital accounting and wider dissemination of data and indicators about monetary and non-monetary marine ecosys-tem values, costs and trade-offs is expected to increase their usability646.
In this connection, the abovementioned IFREMER study rec-ommends valuation methods that are consistent with the SNA approach and coherent with general accounting principles. Instead of seeking to estimate the monetary value of natural capital, it is recommended to focus on data concerning production activi-ties, investment activities, and ecosystem maintenance activities. However, this approach clearly leads to a large underestimation of crucial non-marketed ecosystem services and their values to the Blue Economy.
149
2022
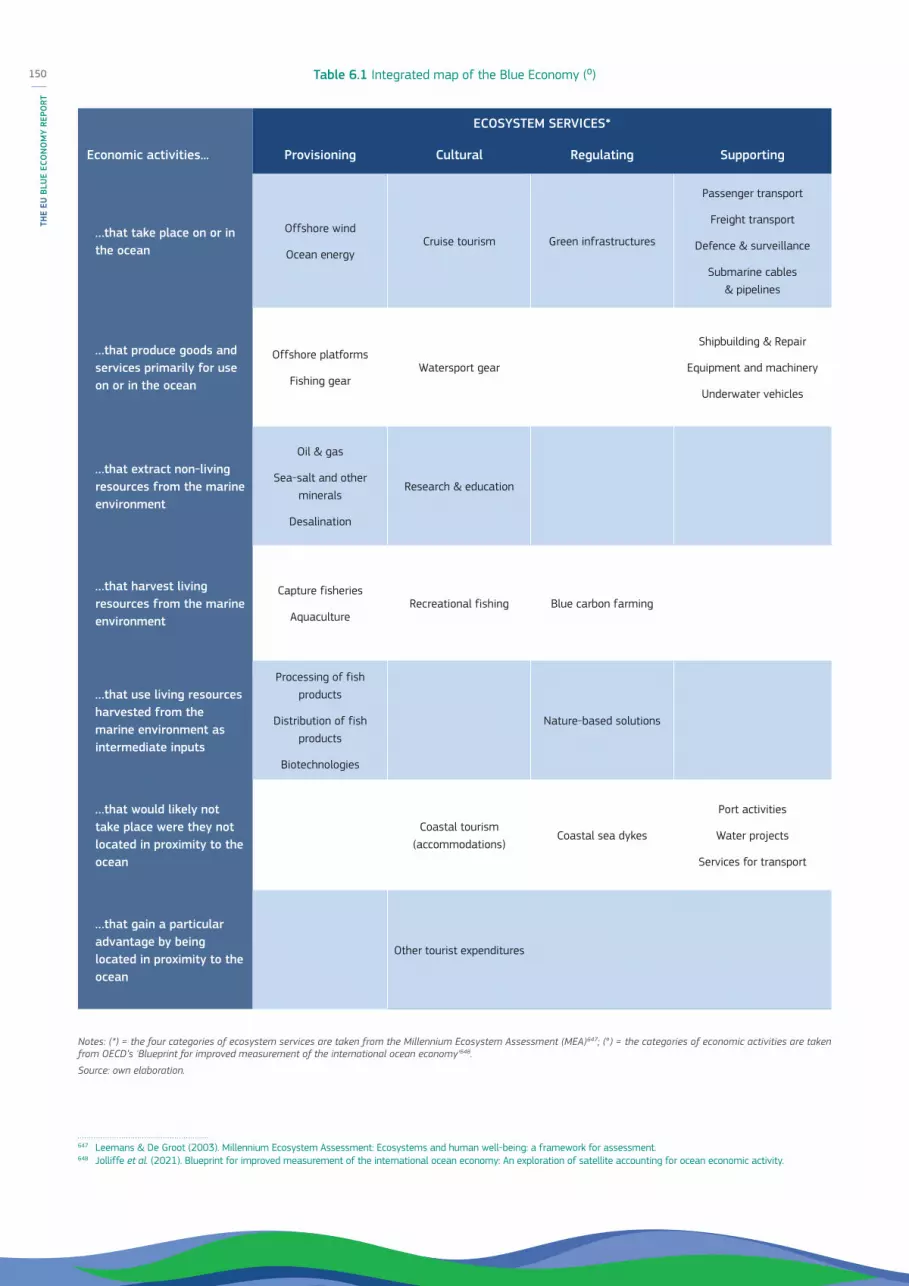
Table 6.1 Integrated map of the Blue Economy (⁰)
Notes: (*) = the four categories of ecosystem services are taken from the Millennium Ecosystem Assessment (MEA)647; (°) = the categories of economic activities are taken from OECD’s 'Blueprint for improved measurement of the international ocean economy'648.
Source: own elaboration.
647 Leemans & De Groot (2003). Millennium Ecosystem Assessment: Ecosystems and human well-being: a framework for assessment.648 Jolliffe et al. (2021). Blueprint for improved measurement of the international ocean economy: An exploration of satellite accounting for ocean economic activity.
ECOSYSTEM SERVICES*
Economic activities... Provisioning Cultural Regulating Supporting
…that take place on or in the ocean
Offshore wind
Ocean energyCruise tourism Green infrastructures
Passenger transport
Freight transport
Defence & surveillance
Submarine cables & pipelines
…that produce goods and services primarily for use on or in the ocean
Offshore platforms
Fishing gearWatersport gear
Shipbuilding & Repair
Equipment and machinery
Underwater vehicles
…that extract non-living resources from the marine environment
Oil & gas
Sea-salt and other minerals
Desalination
Research & education
…that harvest living resources from the marine environment
Capture fisheries
AquacultureRecreational fishing Blue carbon farming
…that use living resources harvested from the marine environment as intermediate inputs
Processing of fish products
Distribution of fish products
Biotechnologies
Nature-based solutions
…that would likely not take place were they not located in proximity to the ocean
Coastal tourism (accommodations)
Coastal sea dykes
Port activities
Water projects
Services for transport
…that gain a particular advantage by being located in proximity to the ocean
Other tourist expenditures
150
THE
EU B
LUE
ECO
NO
MY
REPO
RT

As an example, the recent economic valuation of goods and ser-vices provided by the deep seas in areas beyond national juris-diction649 has assessed a number of provisioning services (e.g. deep-water fish, precious corals, bio-molecules for pharmaceuti-cals, deep and ultra-deep oil, seabed minerals) as well as regulat-ing services (carbon sequestration in the deep seas) and cultural services (e.g. scientific research in the deep seas, and touristic deep sea explorations). The resulting total economic value (TEV) has been estimated at USD 267 billion per year, of which 97 % coming from provisioning services (abiotic and biotic resources), and only 3 % from regulating and cultural services (Figure 6.2).
Figure 6.2 Total economic value (TEV) of deep-sea ecosystem services: breakdown
Source: adapted from Ottaviani, 2020 (FAO)650.
A key challenge in the valuation of non-traded goods and services is the volatility and uncertainty of unit values. The abovemen-tioned study shows that the value of carbon sequestration can be assumed to represent between 1 % of deep sea TEV (with a unit price of USD 8.5/tonne of CO2 used in the EU ETS carbon market – Figure 6.2.A), and 38 % of TEV (with a unit price of USD 417/tonne of CO2 reflecting the social cost of carbon651 – Figure 6.2.C), with several alternatives that can be considered in between, under different assumptions (e.g. Figure 6.2.B).
Another challenge in the valuation of ecosystem services is the detection and accurate estimation of the magnitude of changes in case of major ecosystem disturbances or shocks affecting their supply or use, such as the COVID-19 pandemic. A recent report published by the UN Conference on Trade and Development (UNCTAD) illustrates some aggregated figures about COVID-related impacts on a number of Blue Economy sectors, coming from different sources:
• Global Blue Economy: 3.5 % contraction in 2020 (source: World Bank).
• Fishing effort: 9 % decrease in active fishing vessels in 2020 (source: Global Fishing Watch).
• Fish production: 50 % reduction in the Mediterranean (source: FAO).
649 Ottaviani, D. (2020). Economic value of ecosystem services from the deep seas and the areas beyond national jurisdiction. Food & Agriculture Organization of the United Nations (FAO).
650 Ibid.651 Ricke et al. (2018). Country-level social cost of carbon. Nature Climate Change, 8(10), 895-900.652 European Commission, Directorate-General for Environment, Nel, J., Elbersen, B., Bolt, J., et al., Managing healthy and resilient ecosystems in the bioeconomy : guidelines
report : final report, 2022, https://data.europa.eu/doi/10.2779/946677653 https://knowledge4policy.ec.europa.eu/bioeconomy_en 654 Campagne et al. (2021). What evidence exists on how changes in marine ecosystem structure and functioning affect ecosystem services delivery? A systematic map
protocol. Environmental Evidence, 10(1), 1-11.655 OECD. (2019). Rethinking innovation for a sustainable ocean economy. OECD Publications Centre.
• Coastal and marine tourism: tourist arrivals decreased by 60 % to 80 % in 2020 (source: UNWTO).
• Maritime transport: 20 % contraction of global maritime trade during 2020 (source: UNCTAD).
Managing marine resources sustainably
All ecosystems have thresholds and tipping points. Systems should be in place both at company level and jurisdictional level to de-risk overexploitation of resources and ensure that business models are in accordance with the production capacity of the ecosystem. The guidelines for managing healthy and resilient ecosystems that have recently been published by the Commission provide systemic principles, indicators, and approaches for identi-fying good practices652. The Knowledge Centre for Bioeconomy653 has also been set up to facilitate uptake. The transition to a more sustainable and circular Blue Economy demands the rigorous application of these principles and guidelines in the years ahead in order to meet the ambitious sustainability goals.
The overall negative picture emerging from multiple assessments of marine ecosystems and their services call for urgent action to introduce sustainable management practices. Habitat degradation, overexploitation of marine resources, pollution (chemical, waste, noise), introduction of alien species, and climate change not only directly affect the delivery of ecosystem services that are key to many Blue Economy sectors, but also generate cascading effects on human health and wellbeing that can destabilize the wider economy and society654.
Hence, the importance to decarbonize maritime transport, dras-tically reduce plastic and litter pollution, increase protection of vulnerable marine and coastal habitats, introduce nature-based solutions, and promote the uptake of alternative technologies both by marine sectors and terrestrial one in order to minimize impacts on the marine environment. All of these measures are described in the next sections of this chapter.
The sustainability transition also offers new economic opportuni-ties. Marine ecosystems can provide the solution to many global challenges, such as health, food security, clean energy, climate regulation to name just a few. To seize these opportunities, research, development and innovation in science and technology are key. In this connection, the OECD pinpoints three areas holding the greatest potential: (i) activities and applications that pursue win-win outcomes for Blue Economy sectors and the marine envi-ronment; (ii) the creation of Blue Economy innovation networks; and (iii) initiatives to improve measurement and monitoring of the Blue Economy655.
Indeed, monitoring, reporting and verification systems can be major enablers of the sustainability transition, as they can provide investment assurance and increase transparency and
151
2022

comparability of sustainability outcomes and impacts. Despite a considerable advancement over the past few years of corporate social responsibility practices, ESG656 reporting frameworks, vol-untary sustainability standards, and impact assessment models, sustainability assessment practice still shows significant gaps and flaws, which explain a widespread credibility deficit657.
Regulatory frameworks, on the other hand, have shown a lim-ited effectiveness in preventing intended or unintended environ-mental damage and multiple cases of environmental justice658. The EU Environmental Liability Directive (ELD) has established a framework based on the polluter pays principle (PPP) to prevent and remedy environmental damage659. Environmental damage is defined as damage to protected species and natural habitats, water, and soil. Operators carrying out dangerous activities fall under strict liability (i.e. no need to proof fault). While operators carrying out other occupational activities are liable for fault-based damage to protected species or natural habitats. The evaluation of its effectiveness, conducted in 2020, concluded that further efforts are needed for raising awareness and shaping positive social attitudes in connection with the ELD, as well as in encour-aging the participation of the concerned communities and the environmental NGOs660.
Application of the PPP itself is far from being satisfactory. A report released by the European Court of Auditors (ECA) in 2021, revealed that the PPP ‘is reflected and applied to varying degrees in the different EU environmental policies and its coverage and application was incomplete. With regards to environmental liabil-ity, the Commission’s actions to support Member States’ imple-mentation of the Environmental Liability Directive had not solved key weaknesses, such as unclear key concepts and definitions and the absence of financial security in cases of insolvency. The EU budget is sometimes used to fund clean-up actions that should under the Polluter Pays Principle have been borne by polluters’661.
On another front, the Commission is advancing the operation-alization of its Taxonomy Regulation662 via the development of Delegated Acts defining environmentally sustainable activities on the basis of a set of technical screening criteria. These latter are currently being developed for the four environmental objectives beyond climate change mitigation and adaptation, including ‘sus-tainable use and protection of water and marine resources’, with expert inputs from the EU Platform on Sustainable Finance663.
656 In sustainability assessment practice, ESG stands for Environmental, Social, and Governance assessment a criteria or indicators.657 Quatrini, S. (2021). Challenges and opportunities to scale up sustainable finance after the COVID-19 crisis: Lessons and promising innovations from science and practice.
Ecosystem Services, 48, 101240.658 BIO Intelligence Service (2014), ELD Effectiveness: Scope and Exceptions, Final Report prepared for European Commission – DG Environment.659 Directive 2004/35/CE of the European Parliament and of the Council of 21 April 2004 on environmental liability with regard to the prevention and remedying of
environmental damage.660 Lavrysen & Bouquelle (2021). Improving implementation and the evidence base for the ELD. Report prepared for the European Commission. Framework Contract No ENV
D.4/FRA/2016/0003.661 ECA (2021). Special Report The Polluter Pays Principle: Inconsistent application across EU environmental policies and actions. Special report No 12.662 Regulation (EU) 2020/852 of the European Parliament and of the Council of 18 June 2020 on the establishment of a framework to facilitate sustainable investment, and
amending Regulation (EU) 2019/2088.663 https://ec.europa.eu/info/business-economy-euro/banking-and-finance/sustainable-finance/overview-sustainable-finance/platform-sustainable-finance_en 664 https://ecoscopium.eu/ 665 Joint Communication to the European Parliament, the Council, the European Economic and Social Committee and the Committee of the Regions – International ocean
governance: an agenda for the future of our oceans (JOIN/2016/049 final).666 Dodgshun et al. (2021). Setting the course for a sustainable blue planet: Recommendations for enhancing EU action. International Ocean Governance Stakeholder Forum,
financed by the European Union.
Criteria address not only activities in the established Blue Economy sectors, such as fishing, maritime transport, and coastal tourism, but also emerging sectors and other activities across the Blue Economy value chain such as retrofitting and upgrade of vessels for operating on sea or coastal waters, nature-based solutions for flood and drought risk prevention, conservation of habitats, restoration marine ecosystems, remediation activities for pollution prevention and control, desalination and sewerage.
Of specific relevance to fisheries, is the Horizon-funded EcoScope project664, which aims at developing a robust decision-support tool to promote an efficient, ecosystem-based approach to the man-agement of fisheries in European seas. The tool will use a scoring system integrating spatial, climatic, environmental, biophysical, social, and economic indicators.
Last but not least, sustainable management of marine resources and ecosystems for the benefit of current and future generations is the remit of multilateral cooperation of the framework of the international ocean governance (IOG) agenda.
In 2016, the Commission and the EU’s High Representative set out a joint Communication on international ocean governance: an agenda for the future of our oceans665, which specifies 50 actions for safe, secure, clean and sustainably managed oceans in Europe and around the world under the following policy pil-lars: (i) strengthening the international framework governing the oceans, (ii) reducing pressure on oceans and seas and creating the conditions for a sustainable ‘blue’ economy, (iii) strengthening international ocean research and data. The joint Communication is an integral part of the EU’s response to the United Nations’ 2030 Agenda for Sustainable Development, in particular Sustainable Development Goal 14 ‘to conserve and sustainably use the oceans, seas and marine resources’ (SDG14) and contributes to the European Green Deal.
In 2020, the Commission and the European External Action Service (EEAS) launched the International Ocean Governance Forum (IOG Forum) – a platform for ocean stakeholders within and beyond Europe to share knowledge, experiences and good practices on ocean governance, and to support the further devel-opment of the IOG agenda. The report of the IOG Forum666 con-tains a set of recommendations and pathways to enhance the IOG agenda, to be implemented by the Commission and, where relevant, by its Member States. The recommendations are illus-trated in Figure 6.3.
152
THE
EU B
LUE
ECO
NO
MY
REPO
RT

Figure 6.3 EU pathways to leverage action in international ocean governance
Source: IOG Forum (2021)667.
Figure 6.4 Human activities and pressures affecting the state of the marine environment
Note: the size of the curves corresponds to the frequency of the linkage activity-pres-sure being reported, but does not differentiate between well-managed activities (e.g. the use of less noisy ships for maritime transport, the direct discharge of well-treated wastewater at sea, etc.) from non-adequately managed ones.
Source: DG ENV, Marine Strategy Framework reporting 2018 under Art 8.1c
667 Ibid.668 EEA (2015). Marine Messages. Our seas, our future – moving towards a new understanding. https://www.eea.europa.eu/publications/marine-messages669 EEA (2019). Marine messages II Navigating the course towards clean, healthy and productive seas through implementation of an ecosystembased approach. ISBN 978-92-
9480-197-5, doi:10.2800/71245.670 For example, EEA (2019). Global and European temperature (CSI 012/CLIM 001), https://www.eea.europa.eu/ds_resolveuid/IND-4-en; ETC/ICM Report 3/2019: Biodiversity in
Europe’s seas – Eionet Portal (europa.eu).671 European Environment Agency, European Maritime Safety Agency, European maritime transport environmental report 2021, Publications Office, 2021, https://data.europa.
eu/doi/10.2800/650762
6.1 HUMAN INTERACTIONS WITH BLUE NATURAL CAPITAL As Blue Economy activities depend on the natural capital held in Europe’s seas, it is vital that this capital is used sustainably so that marine ecosystems and their services, and hence, the human activities and well-being that rely on them, can be maintained over time.
According to the latest MSFD reporting, each of the main Blue Economy activities may exert multiple pressures on the marine environment and its ecosystems (Figure 6.4). In addition, many land-based activities (notably agriculture and urban/industrial set-tlements), exert a range of widespread pressures across freshwa-ter resources, oceans, and seas.
Pressures from human activities on habitats and species are found in 93 % of Europe’s marine area. More pressures are exerted on marine resources indirectly by human activities using abiotic nat-ural capital (e.g. non-living resources) than those activities using marine ecosystem services (e.g. living resources) directly668. This is a key concern as living resources depend on good environmen-tal and ecosystem conditions, while activities using non-living resources, as well as land-based activities (also see section 3.2), cause pressures on marine ecosystems but are mostly not reliant on their state (Table 6.2).
The persistent exposure to multiple and cumulative effects of cli-mate, economic and societal pressures is taking a toll on the over-all condition of marine ecosystems669. Signs of stress are evident at all scales – from changes in the composition of marine species and habitats to a shift in the seas’ overall physical and chemical characteristics, fundamentally altering the marine environment670.
Despite progress in recent years to better explore resources, com-mercial fisheries and maritime transport continue to exert some of the greatest pressures on the marine environment. Greenhouse gas emissions and air pollution, in particular nitrogen and sulphur oxides, from shipping, port activities and fishing contribute to global warming, leading to an increase in extreme weather events and sea level rise. Emissions from these but also to a greater extent from other sectors, including land-based, also contribute to ocean acidification, changes in salinity and nutrient availability, and local stressors, such as reduced oxygen and eutrophication. They can also be detrimental to human health, affecting almost 40 % of Europeans living within 50 km of the sea671.
153
2022

Pollution events, such as oil spills, can also have dramatic effects on the economy of the affected areas. Other discharges, such as marine litter, can impact marine fauna, entangle, injure, or kill animals and can pose dangers to maritime safety. The great-est sources of underwater noise are pile-driving and geological resource surveys, however additionally ships also create under-water noise, which can produce loss of hearing in marine spe-cies, a reduction in communication between individuals, a poten-tial increase in stress levels and various behavioural changes. Maritime transport also accounts for the largest proportion of introductions of non-indigenous species in seas around the EU. Non-indigenous species and aquatic pathogens can pose a threat to local biodiversity and human health and severely damage local economies if they adapt to their new environment672. The introduction of non-indigenous species can also be facilitated by climate change. In the Mediterranean, for example, following the warming of seawater temperature species from warmer seas (e.g. the thermophilic Lessepsian migrants) found a suitable environ-ment to thrive and develop a distinct advantage over native tem-perate species673.
Together, these and other factors exacerbate the decline in marine biodiversity and can lead to a global redistribution of marine spe-cies, impacting fisheries’ productivity and the provision of other ecosystem goods and services, including food, medicines, energy, and opportunities for leisure, as well as less tangible outputs, such as limiting coastal erosion or mitigating climate change674.
As such, ecosystems and biodiversity remain under threat in Europe’s seas. This implies, for example, that increasing levels of global warming might exacerbate biodiversity loss and fur-ther erode the resilience of ecosystems, while pressure on land resources is likely to accelerate climate change even further through aridification and loss of vegetated cover675.
672 EEA (2019). Marine messages II Navigating the course towards clean, healthy and productive seas through implementation of an ecosystem-based approach. ISBN 978-92-9480-197-5, doi:10.2800/71245.
673 See e.g. Hidalgo et al. (2018). Climate change impacts, vulnerabilities and adaptations: Mediterranean Sea and the Black Sea marine fisheries. Impacts of climate change on fisheries and aquaculture, 139.
674 European Environment Agency. Europe’s marine biodiversity remains under pressure. https://www.eea.europa.eu/publications/europes-marine-biodiversity-remains-under-pressure
675 EEA (2019). The European environment – state and outlook 2020: knowledge for transition to a sustainable Europe, European Environment Agency. https://www. eea.europa.eu/soer-2020
676 Stockholm Resilience Centre. Planetary boundaries. https://www.stockholmresilience.org/research/planetary-boundaries.html. 677 ETC/ICM Technical Report 4/2019 Multiple pressures and their combined effects in Europe’s seas, see
https://www.eionet.europa.eu/etcs/etc-icm/products/etc-icm-report-4-2019-multiple-pressures-and-their-combined-effects-in-europes-seas678 WWF (2020). WWF reaction to European Commission’s 2020 Blue Economy Report, World Wildlife Fund. https://www.wwf.eu/?364429/
WWF-reaction-to-European-Commissions-2020-Blue-Economy-Report679 EEA (2019). The European environment – state and outlook 2020: knowledge for transition to a sustainable Europe, European Environment Agency. https://www. eea.
europa.eu/soer-2020
According to the planetary boundary framework676, climate change and biodiversity loss are identified among the issues of most seri-ous concern for the Earth’s life support systems. While the situ-ation remains serious, there are signs that marine species and habitats are recovering in some EU marine regions. This is largely due to significant, often decades-long, efforts by individuals and governments to reduce impacts.
An integrated classification of the condition of biodiversity shows that some, mainly offshore, areas in the Northeast Atlantic Ocean are still in good condition677. However, coastal areas and semi-en-closed seas continue to face significant challenges regarding the recovery of the entire ecosystem. The most extensive combined effects in shelf areas occur in the North Sea, parts of the Baltic Sea, and the Adriatic Sea (Figure 6.5).
Blue growth and development rely on the maintenance and res-toration of marine ecosystems upon which we depend for these goods and services, especially in the face of a changing and erratic climate678. The continuation of the ‘Great Acceleration’ with rising consumption levels driven by a growing population raises the critical questions of whether and at what point human-in-duced pressures exceed environmental limits or tipping points679.
Table 6.2 Dependence and pressure of human activities on natural capital
Source: Own elaboration from European Environmental Agency (2019).
Blue Economy sector
Main dependence on: Main pressure on:
Marine abiotic natural capital
Marine biotic natural capital
Marine abiotic natural capital
Marine biotic natural capital
Marine living resources X X X
Marine non-living resources X X X
Marine renewable energy X X X
Port activities X X X
Shipbuilding and repair X
Maritime transport X X X
Coastal tourism X X X
154
THE
EU B
LUE
ECO
NO
MY
REPO
RT

A ‘business as usual’ model entails great risk to all ocean stake-holders680, and ultimately the very existence of humans and our societies that depend on healthy seas with thriving marine life for our well-being681. This goes against the 2030 Agenda for Sustainable Development and all seventeen SDGs, in particular, SDG 14 – life below water and goals focusing on hunger (SDG 2), poverty (SDG 1), work and economic growth (SDG 8), and climate action (SDG 13)682.
The way that we are currently utilising the natural capital held in certain areas of our seas is not sustainable683. Ambitions for sustainable blue growth needs to decouple from marine ecosys-tem degradation and depletion684. That being said, it is impor-tant to distinguish well-managed activities from inadequately managed or unsustainable activities. The EU Taxonomy regula-tion685 provides detailed guidelines for identifying environmen-tally sustainable economic activities (also see section 2.2). The first delegated act concerning the technical screening criteria for economic activities with significant contribution to climate change mitigation and adaptation (the ‘Climate Delegated Act’) was adopted in June 2021686. A second delegated act on the technical screening criteria for the remaining four environmental objectives (the ‘Environmental Delegated Act’), including the objective of
680 ETC/ICM Technical Report 4/2019 Multiple pressures and their combined effects in Europe’s seas, see https://www.eionet.europa.eu/etcs/etc-icm/products/etc-icm-report-4-2019-multiple-pressures-and-their-combined-effects-in-europes-seas
681 European Environment Agency. Europe’s marine biodiversity remains under pressure. https://www.eea.europa.eu/publications/europes-marine-biodiversity-remains-under-pressure
682 Nature Communications. 2021. Financing a sustainable ocean economy. https://doi.org/10.1038/s41467-021-23168-y683 EEA (2015). State of Europe’ seas, EEA report 2/2015. 684 Europe’s seas face uncertain future if urgent, coherent action not taken — European Environment Agency (europa.eu)685 Regulation (EU) 2020/852.686 Commission Delegated Regulation (EU) 2021/2139 of 4 June 2021 supplementing Regulation (EU) 2020/852.
‘sustainable use and protection of water and marine resources’, is set to be adopted later this year. Ultimately, the EU Taxonomy aims to improve the flow of money and investments towards sus-tainable technologies and business activities across the EU, which is key to making Europe climate neutral by 2050.
Restoring marine ecosystems and moving towards a ‘good con-dition’ for Europe’s seas as well as reaching good environmental status under the Marine Strategy Framework Directive is crucial and feasible with high political resolve, increasing coordination and acceptance among stakeholders, and effective policy inte-gration. Sustainable consumption and production patterns are also key to the transition to a circular economy, reducing the carbon footprint, increasing resource efficiency and greening the Blue Economy. A sustainable Blue Economy can only be achieved if there is interaction and alignment with other EU policies (e.g. Common Fisheries Policy) and actions including the Biodiversity and Farm-to-Fork Strategies, the Marine Strategy Framework Directive, the Habitat and Birds Directives, the Zero pollution action Plan and the REPowerEU action.
Figure 6.5 Integrated classification of biodiversity condition in Europe’s seas
Source: EEA, 2019 and ETC/ICM, 2019 – Based on BEAT+ classification of biodiversity in Europe’s seas.
155
2022

6.2 MARINE ECOSYSTEM ACCOUNTING AND NATURE-BASED SOLUTIONSMeasuring the environmental status of marine ecosystems and their use is decisive in understanding the progress towards a more sustainable future of the Blue Economy. This integrated and holis-tic approach is the basis of the marine accounting (also named ocean accounting). It is a statistical framework (the System of Environmental-Economic Accounting- Ecosystem Accounting, SEEA EA) that aims to provide multiple indicators for a relia-ble and comparable information of the triple bottom line (TBL, social, economic and environmental condition687) and to ensure an adequate evidence-based policy decision688. Nevertheless, the measurement of the ocean economy remains a novel exercise
687 Slaper, T.F, Hall, T.J. (2011). The Triple Bottom Line: What Is It and How Does It Work? Indiana Business Review, Spring 2011, 4-8.688 Global Ocean Accounts Partnership. Technical Guidance on Ocean Accounting for Sustainable Development (United Nations, 1st edition, 2019).
European Commission (2020). The EU Blue Economy Report. 2020. Publications Office of the European Union. Luxembourg. UNSD (2021). Developing a SEEA Ocean. Items for discussion and decision: environmental-economic accounting.
689 Jolliffe, J., Jolly, C., Stevens, B. (2021). ‘Blueprint for improved measurement of the international ocean economy: An exploration of satellite accounting for ocean economic activity’, OECD Science, Technology and Industry Working Papers, No. 2021/04, OECD Publishing, Paris, https://doi.org/10.1787/aff5375b-en
690 European Commission (2020). The EU Blue Economy Report. 2020. Publications Office of the European Union. Luxembourg.691 Tsakiridis, A., Aymelek, M., Norton, D., Burger, R., O’Leary, J., Corless, R., Hynes (2019). Ireland’s Ocean Economy. SEMRU. 84 pp.692 Fenichel, E.P., Addicott, E.T., Grimsrud, K.M. et al. (2020). Modifying national accounts for sustainable ocean development. Nat Sustain 3, 889–895. https://doi.org/10.1038/
s41893-020-0592-8
in most countries and is beset by technical challenges. Not least because ocean economic activities can be difficult to distinguish from their land-based alternatives through established industrial classification systems (see section 2.5). As a result, data for many ocean economic activities are unavailable at the level of compa-rability guaranteed by national accounting systems – the stand-ard bearer for the measurement of economic activity. At present, however, statistics on ocean economic activities are incomplete and incomparable with data on the rest of the economy and the work continues at international level to develop the methods required to achieve comparable marine environmental-economic accounts689. Despite some countries are pioneers in developing measurements of ocean economic activity at national level, e.g. Portuguese Satellite Ocean Account690, Irish Ocean Economy691, or Norwegian ocean economy692, their measurements still lack of the environmental statistical components.
Table 6.3 North-East Atlantic marine ecosystem services: physical and monetary use account estimates for 2008-2019
Source: own adaptation from Blazquez, 2021.
YEARS
2008 2009 2010 2011 2012 2013 2014 2015 2016 2017 2018 2019
ECOSYSTEM SERVICES CATEGORY
ECOSYSTEM SERVICES
FLOWACCOUNT UNIT
PROVISIONING
Fisheriesphysical Mill. t 8.54 8.46 8.72 8.07 8.11 8.46 8.66 9.15 8.33 9.34 9.32 8.14
monetary € Million 1 727.60 2 846.50 2 641.30 2 165.10
Aquaculturephysical Mill. t 1.73 1.88 2.07 1.96 2.12 2.16 2.1 2.15
monetary € Million 1 262.50 476.9 -149.2 1 416.60 1 391.70 1 248.20 4 215.10 3 684.30
REGULATION & MAINTENANCE
Carbon sequestration
physical Mill. t CO2 captured 4.013
monetary € Million 1 612.50
CULTURAL Outdoor recreation
physical No. Visits 200.78
monetary € Million 253.13
ABIOTIC
Generation of electricity from wind
power
physical MW 386.82 498.54 1 043.64 2 148.44 2 081.18 3 267.46 3 742.46 4 105.03 4 312.69 5 536.16 6 946.97 6 773.65
monetary € Million 25.5 49.9 46.6 62.1 124.5 168.3 227.8 475.2 359.6 388.1 763.3
Minerals extraction
physical Mill. t 135.53 139.35 146.05 140.72 150.89 144.45 148.55 145.54 135.41 136.19 121.42 135.53
monetary € Million 147.2
Oil and gas extraction
physical Mill. TOEQ 431.44 409.17 376.19 306.68 292.02 423.66 407.38 315.42 297.65 300.26 295.49
monetary € Million 137 610 63 898 76 379 87 934 82 429 80 795 -13 442 -294 129 17 527 41 374 24 845
156
THE
EU B
LUE
ECO
NO
MY
REPO
RT

Table 6.4 Storylines developed across European Seas under the EU-funded research projects FutureMARES
NbS
EFFECTIVE RESTORATION EFFECTIVE CONSERVATION SUSTAINABLE HARVESTING
RESTORING HABITAT-FORMING SPECIES THAT CAN ACT AS ‘CLIMATE RESCUERS’.
Habitats such as seagrasses, mangroves, and shellfish reefs form natural coastal protection. This helps to protect against increased storminess, sea level rise and flood risks resulting from climate change.
CONSERVATION STRATEGIES THAT CONSIDER HOW CLIMATE CHANGE WILL AFFECT HABITAT SUITABILITY.
Conservations strategies are at their most effective when they consider the impacts that climate change will have for flora & fauna habitats.
SUSTAINABLY HARVESTING SEAFOOD FROM FISHERIES AND AQUACULTURE.
Ecosystem management and a multispecies approach can help adapt to shifts in species' productivity, distribution and interactions. For example, growing and catching seafood lower in the food web will be more sustainable in the long term.
Baltic SeaNo. Showcases 1 1 1
Storyline Seaweeds, seagrasses, inverts, fish at the north-east Baltic Sea coast
Seaweeds, seagrasses, inverts, fish at the north-east Baltic Sea coast Basins. management & MPAs at the Baltic Sea
North-east Atlantic
No. Showcases 6 9 8
Storyline
Norwegian Coast, inter-relationships among kelp, sea urchins and cod
Norwegian Coast, inter-relationships among kelp, sea urchins and cod
Norwegian Coast, inter-relationships among kelp, sea urchins and cod
Eelgrass (Zostera) in the south-west Baltic Sea
Marine spatial planning at the north-east Atlantic and North Sea
Marine spatial planning at the north-east Atlantic and North Sea
Oyster & mussels at the Dutch coastSoft sediment infauna and epifauna (carbon cycling/burial) at the north-east Atlantic and North Sea
Seaweed, mussels, oyster at the north-east Atlantic and North Sea
Torridge saltmarsh habitats at the north-east Atlantic & North Sea Coasts: 40° latitude (N. Atlantic) Salmon at Hardangerfjord, Norway
Seagrass (Zostera noltei) at the Bay of Biscay and Iberian coast
Offshore European Seas: plankton (Blue Carbon) Mussel culture at the south-west Baltic Sea
Kelp forests & biodiversity in northern Portugal
Kelp forests & biodiversity in northern Portugal Bay of Biscay Artisinal & commercial fisheries
Riverine fish (marine opportunists) at the Atlantic and Scandinavian waters
Riverine fish (marine opportunists) at the Atlantic and Scandinavian waters
Riverine fish (diadromous) at the Atlantic Transitional & upstream
Riverine fish (diadromous) at the Atlantic Transitional & upstream
MPA in south-west Bay of Biscay
Mediterranean Sea
No. Showcases 2 7 3
Storyline
Basin-wide: coastal to offshore ecosystems, habitat-forming, spatial management measures at the Mediterranean Sea
Basin-wide: coastal to offshore ecosystems, habitat-forming, spatial management measures at the Mediterranean Sea
Basin-wide: coastal to offshore ecosystems, habitat-forming, spatial management measures at the Mediterranean Sea
North-west (Balearic Islands) seagrass (P. oceanica)
Reef & canopy-forming macroalgae and AIS in the south-east Mediterranean Sea
Reef & canopy-forming macroalgae and AIS in the south-east Mediterranean Sea
Habitat-forming macroalgae/corals in the western Mediterranean Sea
MPA network (P. oceanica) communities at the Western Mediterranean
Basin-wide sea turtle conservation in the Mediterranean Sea
MPAs for Aegean pelagic and demersal communities
Karpathos & Saria MPAs: seagrasses and meadows, soft/rocky bottom
Under the North-East Atlantic Environmental Strategy 2030, OSPAR has developed the first European attempt of marine eco-system accounting at regional level693. Following the guidelines delineated in the SEEA EA, the study explored and assessed the biophysical and economic value of natural capital and a few eco-system services in the marine ecosystems of North-East Atlantic. As result, the North-East Atlantic marine ecosystem assets
693 Blazquez, M.A. (2021). Natural capital accounting for the North-East Atlantic area. Preliminary results and first estimates. Rijkswaterstaat Water Verkeer en Leefomgeving, 122 pp.
694 Out of many regulating services (e.g. temperature, currents, seawater ice, etc.) only carbon sequestration has been assessed, confirming that the figures are largely underestimated.
estimated have an asset value of €125.75 billion, of which more than 40 % comes from carbon sequestration and outdoor recrea-tion (and these estimates are underestimated)694 (see Table 6.3).
The good environmental status of European Seas is the source of many ecosystem services that in turn generate significant ben-efits to the society and the economy, and any threats to their
157
2022

ecosystems directly affect human wellbeing. Nature based-solu-tions (NbS) are cost-effective strategies that can have an impact on the environmental status of the marine ecosystem and even-tually simultaneously provide environmental, social and economic benefits and resilience695. In fact, by restoring and conserving sea-grasses, seaweeds, kelp forests, plankton in offshore sea and by introducing many other NbS, such as eco-designed marine infra-structures696 and biomimicry applications697, habitats are enabled to improve their flora and fauna and in turn provide a remarkable number of ES: from the provision of raw material and fisheries, to carbon sequestration, to nature-based tourism. From this perspec-tive, NbS can be considered as linked to the long-term delivery of multiple ecosystem services, and ES accounts can facilitate monitoring how much NbS can increase the flow of each service from the marine ecosystem to a different set of users.
Despite their crucial importance in the TBL, the NbS are not either often implemented or assessed for their economic benefits. In this context, the EU-funded research projects FutureMARES698 examine the relations between climate change, marine biodiversity and ecosystem services, designed the project activities around three main NbS: effective restoration, effective conservation, and sus-tainable harvesting of marine resources. Throughout ten unique showcases (see Table 6.4.), FutureMARES aims to demonstrate the extent of the effects of climate change mitigation for differ-ent marine environments distributed across European Seas, and to develop strategies for working with and enhancing nature to support marine societies and businesses to service and thrive.
The growing awareness that NbS can help to protect from climate change impacts while slowing further warming, supporting bio-diversity and securing ecosystem services, is contrast with the lack of rigorous assessment of the potential of NbS to provide the intended benefits699. Such disparity has led to have some con-cerns over the NbS’ reliability and cost-effectiveness compared to engineered alternatives and their resilience to climate change700. Seddon and others701 highlighted that trade-offs can arise if cli-mate mitigation policy encourages NbS with low biodiversity value, such as afforestation with non-native monocultures, that can result in maladaptation, especially in a rapidly changing world where bio-diversity-based resilience and multi-functional landscapes are key. Therefore, the climate change policy must ensure that NbS can achieve their potential to tackle both the climate and biodiversity crisis while also contributing to sustainable development.
695 European Commission (2021). The EU Blue Economy Report. 2021. Publications Office of the European Union. Luxembourg.696 Pioch, S., Relini, G., Souche, J. C., Stive, M. J. F., De Monbrison, D., Nassif, S., ... & Kilfoyle, K. (2018). Enhancing eco-engineering of coastal infrastructure with eco-design:
Moving from mitigation to integration. Ecological Engineering, 120, 574-584. EFARO – European Fisheries and Aquaculture Research Organisations. Nature Based Solution with Eco-design: how to build with nature. Webinar. February 2022.
697 Hayek, M., Salgues, M., Habouzit, F., Bayle, S., Souche, J. C., De Weerdt, K., & Pioch, S. (2020). In vitro and in situ tests to evaluate the bacterial colonization of cementitious materials in the marine environment. Cement and Concrete Composites, 113, 103748.
698 FutureMARES – Climate Change and Future Marine Ecosystem Services and Biodiversity’ is funded by the European Union’s Horizon 2020 Research and Innovation Programme under grant agreement No. 869300. https://www.futuremares.eu/
699 Seddon N, Chausson A, Berry P, Girardin CAJ, Smith A, Turner B. (2020). Understanding the value and limits of nature-based solutions to climate change and other global challenges. Phil. Trans. R. Soc. B 375: 20190120. http://dx.doi.org/10.1098/rstb.2019.0120
700 Vousdoukas, M.I, Metnaschi, L., Voukouvalas, E., Bianchi, A., Dottori, F., Feyen, L. (2018). Climatic and socioeconomic controls of future coastal flood risk in Europe. Nature Climate Change, https://www.eea.europa.eu/soer-2020
701 Seddon N, Chausson A, Berry P, Girardin CAJ, Smith A, Turner B. (2020). Understanding the value and limits of nature-based solutions to climate change and other global challenges. Phil. Trans. R. Soc. B 375: 20190120. http://dx.doi.org/10.1098/rstb.2019.0120
702 Beaumont, N.J., Aanesen, M., Austen, M.C., Börger, T., Clark, J.R., Cole M., Hooper, T., Lindeque, P.K., Pascoe, C., Wylesd, K.J. 2019. Global ecological, social and economic impacts of marine plastic. Marine Pollution Bulletin 142:189-195.
703 Kershaw, P. J., Turra, A., & Galgani, F. (2019). Guidelines for the monitoring and assessment of plastic litter and microplastics in the ocean.704 Tornero V, Hanke G. 2016. Identification of marine chemical contaminants released from sea-based sources: A review focusing on regulatory aspects. EUR 28039.
Luxembourg (Luxembourg): Publications Office of the European Union. Veiga, J.M., Fleet, D., Kinsey, S., Nilsson, P., Vlachogianni, T., Werner, S., Galgani, F., Thompson, R.C., Dagevos, J., Gago, J., Sobral, P. and Cronin, R. 2016. Identifying Sources of Marine Litter. MSFD GES TG Marine Litter Thematic Report; JRC Technical Report; EUR 28309; doi:10.2788/018068.
6.3 MARINE POLLUTION Pollution of the marine environment by chemicals, plastics, nutri-ents, noise and other pressures continues to be a primary con-cern. While the MSFD is providing a complete policy framework to monitor, assess and mitigate the pressures through adequate measures.
Marine pollution threatens the health of the marine environment and the use of the seas for commercial and recreational activi-ties702. Indeed, pollution is also one of the main drivers for the loss of marine biodiversity. Marine pollution comprises different types of pollutant input to the seas, be it in the form of liquid sub-stances (such as chemical compounds, diluted nutrients, oil spills and other toxic substances), litter (i.e. persistent, manufactured or processed solid material703 such as plastics, metal, glass, rubber or wood, underwater noise and other inputs from energy.
Sources of marine pollution are both land-based activities (e.g. industrial emissions, agricultural runoffs, land-fills, untreated municipal sewerage, chemical/illegal discharges in rivers and floodwaters, littering of beaches and coastal areas) as well as sea-based activities (e.g. offshore mining and extractive activities, aquaculture, illegal oil spills from tank vessels or ships, accidental dumping from sea transport or tourism, abandoned fishing gear, etc.)704.
Pollution can occur as an intentional disposal of chemicals and waste, e.g. through waste water outlets, waste mismanagement, littering, or dumping. The introduction can be direct, from ships (e.g. oil and other chemical spills and sulphur pollution) or other activities at sea, as well as from coastal or inland sources, trans-ported by rivers to the sea.
Every year, significant amounts of litter end up in the ocean worldwide, in the order of millions of tonnes. For the most part, it consists of plastics originating from direct industrial discharge (e.g. granulated pellets), or indirectly via the disposal of household consumption items (e.g. single-use plastics, personal care prod-ucts), fragmentation and degradation of inputs used in agriculture, transportation, construction and manufacturing industries (e.g. coatings, paints, tyres, etc.), abandoned or discarded fish gear, and atmospheric deposition of microplastic particles (Figure 6.6).
158
THE
EU B
LUE
ECO
NO
MY
REPO
RT

Source: adapted from705.
Marine litter accumulates on shorelines, but can also be found on the ocean surface in convergent zones (ocean gyres), in the water column, on the sea floor706. The discarding of litter into the seas has been recognised as a threat to the environment and to the undertaking of human activities707. In addition, long-range air-borne introduction of contaminants, e.g. pesticides and microplas-tics, through deposition and atmospheric washout contribute to the pollution of the marine environment.
In addition to demonstrating the unsustainability and resource inefficiency of the linear economy, marine litter disrupts both terrestrial and marine ecosystems, affecting their regenerative capacity, degrading the blue natural capital and its ability to supply valuable ecosystem services. In turn, this damages the Blue Economy and has wide ranging socio-economic and health consequences.
705 UN Environment (2017). Marine Litter Socio Economic Study, United Nations Environment Programme, Nairobi. Kenya.706 United Nations (2021). The second World Ocean Assessment (WOA II). Volume 2.707 EU. 2018. Staff working document: SWD (2018)254: COMMISSION STAFF WORKING DOCUMENT IMPACT ASSESSMENT Parts 1-3.
Different pollution types have different sources, environmen-tal pathways and impacts. The introduction of persistent, toxic chemical substances, which can bioaccumulate, eventually leads to high contamination levels even if the emissions occur at low concentration levels, e.g. through atmospheric input or from diffuse sources. These include heavy metals, POPs (Persistent Organic Pollutants) and other chemical substances of concern. Eutrophication is mostly caused by human activities like farm-ing and other activities that can lead to fertilizer run off into aquatic systems due to an overabundance of nutrients. The seas and oceans are de facto final sinks of different types of marine pollution, where re-concentration and accumulation of pollutants, including litter and chemical contaminants can take place.
Different types of pollution can be interlinked, for example plastic material often contain additives (such as plasticisers, colorants, etc.) thereby constituting an additional pathway for these sub-stances to enter the marine environment. The relation between the economy and marine pollution is complex, as economic activ-ities may result in pollution, while pollution also hinders economic activities. The factors to be considered include costs for preven-tion, clean-up, reduction or cessation of pollution, costs causing socio-economic harm and the harm to wildlife and human wellbe-ing, which often cannot be expressed in monetary terms.
Figure 6.6 Flow of plastics between the economy and environment 159
2022

BOX 6.1 The Marine Litter Watch
The EEA developed the Marine Litter Watch (MLW708), a web/mobile app to strengthen Europe’s knowledge base and thus provide support to European policymaking. The initiative uses citizen science – scientific research conducted, at least partly, by members of the public – and smartphone technology to encourage and support citizen communities in providing structured data on marine litter and at the same time to clean up Europe’s beaches.
Assessment of these citizens’ data helps to strengthen Europe’s knowledge base on beach litter and thus provide support to relevant/interrelated European policies in tackling plastic pollution and marine litter, whilst accelerating the transition to a circular plastics economy, most notably the Marine Strategy Framework Directive (MSFD), the Single-Use Plastics Directive (SUPs), the Zero Pollution Action Plan (ZPAP), Green Deal and Circular Economy Action Plan (CEAP).
Citizens populate the EEA’s MLW database with an immense amount of data (over 2 million items), making it an important database for beach litter worldwide. Preliminary results show that (Figure 6.7):
• Plastics dominate the litter collected from European beaches, reaching more than an 80 % share of beach litter found in all seas except the Baltic Sea (67 %).
• Single-Use Plastics (SUPs), together with fishery-related items, make up the bulk of the top ten list of beach litter.
• Shares of packaging-related litter range between 18 % and 28 % in EU seas.
• The share of SUP is highest in the Black Sea (65 %) and the Mediterranean (53 %), while fishery and shipping-related litter constitute the highest share in the North Atlantic Ocean (15 %).
• The Mediterranean Sea and the Black Sea coasts are more polluted compared to the North Atlantic Ocean and Baltic Sea.
• When excluding the Black Sea, trends in litter abundance remained high until 2017 after which a downwards trend is observed, with the lowest values occurring in 2020; which is possibly due to the COVID lockdowns. The mean value estimated from the MLW database for the north-east Atlantic Ocean and Baltic Sea in 2020 was around 32 items/100 m; very close to the threshold set for EU beaches (20 items/100 m of beach).
708 Marine LitterWatch – European Environment Agency. https://www.eea.europa.eu/themes/water/europes-seas-and-coasts/assessments/marine-litterwatch/data-and-results/marine-litterwatch-data-viewer
709 Thevenon, F., Carroll C., Sousa J. (editors), 2014. Plastic Debris in the Ocean: The Characterization of Marine Plastics and their Environmental Impacts, Situation Analysis Report. Gland, Switzerland: IUCN.
710 Jambeck, J. R., Geyer, R., Wilcox, C., Siegler, T. R., Perryman, M., Andrady, A., ... & Law, K. L. 2015. Plastic waste inputs from land into the ocean. Science, 347(6223), 768-771.711 Pew Charitable Trusts & SYSTEMIQ. 2020. Breaking the plastic wave. A Comprehensive Assessment of Pathways Towards Stopping Ocean Plastic Pollution. 712 Alessi, E. & Di Carlo, G. 2018. ‘Out of the plastic trap: saving the Mediterranean from plastic pollution’. WWF Mediterranean Marine Initiative,Rome, Italy. 28 pp.713 González-Fernández, D., Cózar, A. Hanke, G., Viejo, J., Morales-Caselles, C., Bakiu, R., Barceló, D., Bessa, F., Bruge, A., Cabrera, M., Castro-Jiménez, J., Constant, M., Crosti, R.,
Galletti, Y., Kideys, A. E., Machitadze, N., Pereira de Brito, J., Pogojeva, M., Ratola, N., Rigueira, J., Rojo-Nieto, E., Savenko, O., Schöneich-Argent, R. I., Siedlewicz, G., Suaria, G., & Tourgeli, M. (2021). Floating macro-litter leaked from Europe to the ocean. Nature Sustainability, 4, 484-493.
714 Macias, D., Stips, A., Hanke, G. 2021. Model based estimate of transboundary litter pollution on Mediterranean coasts, Marine Pollution Bulletin, 113121,715 Canals, M., Pham, C. K., Bergmann, M., Gutow, L., Hanke, G., Van Sebille, E., ... & Giorgetti, A. (2021). The quest for seafloor macrolitter: a critical review of background
knowledge, current methods and future prospects. Environmental Research Letters, 16(2), 023001.716 Food and Agriculture Organization of the United Nations (FAO). 2020. Sea-based sources of marine litter – A review of current knowledge and assessment of data gaps.717 Vlachogianni, T., Fortibuoni, T., Ronchi, F., Zeri, C., Mazziotti, C., Tutman, P., ... & Scoullos, M. 2018. Marine litter on the beaches of the Adriatic and Ionian Seas: An assessment
of their abundance, composition and sources. Marine pollution bulletin, 131, 745-756.718 Ioakeimidis, C., Galgani, F., & Papatheodorou, G. (2017). Occurrence of marine litter in the marine environment: a world panorama of floating and seafloor plastics. In
Hazardous Chemicals Associated with Plastics in the Marine Environment (pp. 93-120). Springer, Cham.
6.3.1. PLASTIC POLLUTION
Plastic is not only the most common litter item but its environ-mental impacts are also the largest in coastal and marine eco-systems. At least 8 million tonnes of plastic end up in the ocean worldwide every year, making up 80 % of all marine litter from surface water to deep sea ecosystems709. It is estimated that more than 150 million tonnes of plastics have accumulated in the world’s oceans, while 4.6-12.7 million tonnes are added every year710. According to recent studies, the annual flow of plastic waste into the ocean could triple by 2040, reaching to 29 million metric tonnes per year, equivalent to 50 kg of plastic for every metre of coastline worldwide711. Europe is the second largest plastics producer in the world, after China. It is estimated that 150 000-500 000 tonnes of macroplastics and 70 000-130 000 tonnes of microplastics end up in the European seas every year712.
Recent studies, based on litter flux measurements through obser-vation, then used for modelling litter pathways in riverine system across Europe, showed that between 307 and 925 million litter items leak annually into the European seas. Smaller river systems play a significant role in this process713. The fate of litter at sea depends on the basin morphology. While floating litter in enclosed basins is likely to get into the vicinity of a coast714, a major part of litter will eventually sink to the seafloor715.
It is generally assumed that most of the plastic waste entering the world’s ocean comes from land-based sources – i.e. approxi-mately 80 % of marine litter, with regional fluctuations716. In the Adriatic Sea, for example, sea-based activities accounted for 6.3 % of marine litter, compared to 34.7 % attributed to land-based sources717. The Mediterranean Sea is one of the most affected in the world, with single-use plastics accounting for 60 % of all litter718.
160
THE
EU B
LUE
ECO
NO
MY
REPO
RT

Figure 6.8 Median number of beach litter per 100m by marine region and in each beach site
Source:EEA719.
Figure 6.9 Annual Emissions of Microplastics to Surface Water (Upper and Lower Ranges)720
Source: Eunomia Research & Consulting721.
719 Kideys, A., Šubelj, G., Aydın, M., 2021, Marine litter and European beaches: learning from citizen science, ETC/ICM Technical Report 1/2021: European Topic Centre on Inland, Coastal and Marine waters, 15 pp.
720 Eunomia Research & Consulting and Amec Foster Wheeler modelling. In Hann, S., Sherrington, C., Jamieson, O., Hickman, M., Kershaw, P., Bapasola, A., & Cole, G. 2018. Investigating options for reducing releases in the aquatic environment of microplastics emitted by (but not intentionally added in) products. Report for DG Environment of the European Commission, 335.
721 Adapted from Amec Foster Wheeler modelling. In Hann, S., Sherrington, C., Jamieson, O., Hickman, M., Kershaw, P., Bapasola, A., & Cole, G. (2018). Investigating options for reducing releases in the aquatic environment of microplastics emitted by (but not intentionally added in) products. Report for DG Environment of the European Commission, 335.
161
2022

BOX 6.2 Marine litter in Catalonia
Marine litter, the remains of all kinds of objects and materials dumped at sea, are currently one of the main causes of pollution, creating serious environmental and economic problems around the world.
The Mediterranean Sea, is especially vulnerable to the effects of marine litter1 and is currently considered one of the most pol-luted seas on the planet2. Collection and disposal of marine litter is very difficult because of the drift and the immensity of the tri-dimensional space through which objects and particles move. In addition, there are no efficient methods to clean the seabed. Thus, there is a need to take advantage of existing resources, such as fisheries, to help eliminate accidentally caught litter while disseminating both their work and the need to preserve the oceans3.
Monitoring marine litterThe Catalan Research Institute for the Governance of the Sea (ICATMAR) was created as a result of the collaboration between the Directorate General for Fisheries and Maritime Affairs of the Government of Catalonia and the Institute of Marine Sciences (ICM-CSIC). As an autonomous organization it responds to the need of generating scientific advice for management purposes in the Blue Economy field. Through the ICATMAR, the ICM-CSIC has developed, a monitoring program with the trawling fleet to characterize the catch, including marine litter, in the framework of the 2030 Maritime Strategy of Catalonia. Data collection begun in 2018 and will continue to offer the data needed to sustain fisheries and improve management plans. However, the data collected and analyzed below covers 2020-2021 for and overview of the debris fished in the Catalan coast and help develop best management practices.
Results On a global scaleMost of the fished marine litter corresponded (in weight) to clinker, which represented 36 % of the total litter (Figure 6.10) and a density greater than 33 kg per km2. Clinker can be considered as a tracer of trading routes from recent centuries and the high tradition of this activity in the Mediterranean translates in frequently findings of clinker on the seabed. The next most abundant category by weight was processed wood, which would mainly correspond to boxes or remains of ships and ports, being of 25 % of the marine litter which correspond to a density of 23.6 kg per km2. The third category most abundant category was glass (19 % and 17.7 kg per km2) and then, plastic (9 % and 8.8 kg per km2).
Marine litter is present in the Catalan seafloor being clinker, processed wood, glass and plastic the categories with the highest densities. However, benthic marine macro-litter is not evenly distributed with variability according to area, depth and season. In detail, when analysing the data by zones, marine litter ranges between 31 % and 35 % but plastics are most abundant in the central area. At depth, the shelf contains most of the marine debris accumulating up to 50 % of the total being plastic and processed wood the main components of the catch. Seasonally, most marine litter was caught in autumn, being 41 % of the catch.
Within the plastic category, the results showed that wet wipes are the major component of the plastic fraction, accounting up to 57 % of the plastic. The distribution of wet wipes, however, was more than 10 times higher in the central area (8.1 kg per km2) representing 59.3 % of the plastic fraction, coinciding with the most urbanized coast of Catalonia.
The study of the macro-benthic marine litter of fishing grounds on the Catalan coast reveals the amount of waste that exists on its seabed, which vast majority is originated from land. Thus, it is recommended to take advantage of fisheries to study and extract accidentally fished marine litter and improve waste management actions on land, especially in the central area of Catalonia.
1 FAO, 2018. The State of Mediterranean and Black Sea Fisheries, p. 172.2 Galgani, F., Claro, F., Depledge, M., Fossi, C., 2014. Monitoring the impact of litter in large vertebrates in the Mediterranean Sea within the European Marine Strategy
Framework Directive (MSFD): Constraints, specificities and recommendations. Marine Environmental Research 100, 3-9.3 Galimany, E., Marco-Herrero, E., Soto, S., Recasens, L., Lombarte, A., Lleonart, J., ... & Ramón, M. (2019). Benthic marine litter in shallow fishing grounds in the NW
Mediterranean Sea. Waste Management, 95, 620-627.
Figure 6.10 Relative percentage by weight of each category of marine litter collected by the trawling fleet
Figure 6.11 Average density (kg per km2) of the plastic category (total column) detailed
with the number of wet wipes (in blue) by study area.
162
THE
EU B
LUE
ECO
NO
MY
REPO
RT

Microplastics (i.e. plastic items smaller than 5mm) are of par-ticular concern due to their potential toxicity, harm for animals, and other consequences, some of which are not fully known yet. Beyond a few estimations and comparisons722, precise data to assess the exact exposure of humans to micro- and nanoplastics through their diet cannot be produced until standardised methods and definitions are available723. Microplastics are used by different industries (e.g. as exfoliants or industrial abrasives), produced by fragmentation from larger pieces of plastic waste, or generated from wear (for example when washing clothes or from car tyre abrasion) or unintentional loss (e.g. marine paint). Microplastics are then carried by sewage and stormwater. While soils are by far the largest sinks of microplastics, a proportion of microplastic emissions end up reaching the aquatic and marine environment (see Figure 6.9).
Plastic marine litter generates harmful effects at multiple levels and scales, including economic impacts (e.g. damage to vessels, fishing equipment, and fisheries), social impacts (e.g. reduction of aesthetic value and public safety), and environmental impacts (e.g. ecosystem disruption, soil degradation, habitat destruction, animal mortality, etc.). Given that litter can be transported over large distances, these effects can be produced in areas that are far away from the point of origin, impacting populations and eco-nomic sectors that are not solely responsible for its generation.
6.3.2 NUTRIENT INPUTS
Excessive amounts of dissolved nitrogen (N) and phosphorus (P) in coastal ocean ecosystems generate an increase in phytoplank-ton net primary production. In turn, the increase of organic matter may activate eutrophication processes, which can pose serious threats to vital marine ecosystem services, such as production of oxygen, biodiversity habitat, fish biomass, and CO2 sequestration.
The global supply of biologically reactive N (such as nitrate, nitrite, ammonium, urea and free amino acids) and P (such as orthophos-phate, polyphosphate and organically bound phosphates) has dou-bled in the 21st century due to anthropogenic activities. The main sources of nitrogen are agriculture (through the use of synthetic fertilizers, monocultures of legumes, and manures from livestock production), combustion of fossil fuels (via the release of nitrogen oxides in the atmosphere and their subsequent deposition on land and seas), treated/untreated municipal sewage724, and erosion725.
722 Ragusa, A., Svelato, A., Santacroce, C., Catalano, P., Notarstefano V., Carnevali, O., Papa, F., Rongioletti, M.C.A., Baiocco, F., Draghi, S., D’Amore, E., Rinaldo, D., Matta, M. , & Giorgini, E. 2021. Plasticenta: First evidence of microplastics in human placenta. Environment International 146: 106274. https://doi.org/10.1016/j.envint.2020.106274
723 Toussaint, B., Raffael, B., Angers-Loustau, A., Gilliland, D., Kestens, V., Petrillo, M., Rio-Echevarria, I.M., & Guy Van den Eede. 2019. Review of micro- and nanoplastic contamination in the food chain, Food Additives & Contaminants: Part A, 36:5, 639-673, DOI: 10.1080/19440049.2019.1583381.
724 United Nations (2021). The second World Ocean Assessment (WOA II). Volume 2. Powley, H. R., Durr, H. H., Lima, A. T., Krom, M. D., & Van Cappellen, P. (2016). Direct discharges of domestic wastewater are a major source of phosphorus and nitrogen to the Mediterranean Sea. Environmental science & technology, 50(16), 8722-8730.
725 Malagó, A., Bouraoui, F., 2021. Global anthropogenic and natural nutrient fluxes: From local to planetary assessments. Environmental Research Letters, 2021, 16(5), 054074.
726 B. Grizzetti, O. Vigiak, A. Udias, A. Aloe, M. Zanni, F. Bouraoui, A. Pistocchi, C. Dorati, R. Friedland, A. De Roo, C. Benitez Sanz, A. Leip, M. Bielza, 2021, How EU policies could reduce nutrient pollution in European inland and coastal waters, Global Environmental Change, 69: 102281.
727 Breitburg, D., Levin, L. A., Oschlies, A., Grégoire, M., Chavez, F. P., Conley, D. J., ... & Zhang, J. (2018). Declining oxygen in the global ocean and coastal waters. Science, 359(6371), eaam7240.
728 Glibert, P. M., Al-Azri, A., Icarus Allen, J., Bouwman, A. F., Beusen, A. H., Burford, M. A., ... & Zhou, M. (2018). Key questions and recent research advances on harmful algal blooms in relation to nutrients and eutrophication. Global ecology and oceanography of harmful algal blooms, 229-259.
729 Fourqurean, J. W., Duarte, C. M., Kennedy, H., Marbà, N., Holmer, M., Mateo, M. A., ... & Serrano, O. (2012). Seagrass ecosystems as a globally significant carbon stock. Nature geoscience, 5(7), 505-509.
730 OSPAR’s Intermediate Assessment 2017. https://oap.ospar.org/en/ospar-assessments/intermediate-assessment-2017731 Murray, C. J., Müller-Karulis, B., Carstensen, J., Conley, D. J., Gustafsson, B. G., & Andersen, J. H. (2019). Past, present and future eutrophication status of the Baltic Sea.
Frontiers in Marine Science, 6, 2.
Grizzetti et al. (2022) estimated the discharge in 2012 of inland nitrogen in European coastal areas around 4TgN with agriculture the largest contributor (49 %) while human and industrial waste-waters contributed 23 %. The emission of phosphorus in coastal areas in 2012 was around 0.29 TgP with wastewater and agricul-ture contributing 48 % and 22 %, respectively726.
The impacts of excessive loads of N and P can be catastrophic for marine ecosystems given the cascading effects they produce on the marine environment and its life supporting, provisioning and regulating functions. Combined with global warming and aggra-vated by concurrent human-induced pressures such as ocean acidification, they produce long lasting consequences both at local and planetary scales.
Accumulation of organic matter triggered by anthropogenic nutri-ent inputs causes the loss of oxygenated habitats for aerobic organisms, as well as production of CO2 as a by-product of aer-obic respiration. The number of marine ecosystems experiencing hypoxia, especially in continental shelf areas, has shown a 10-fold increase since 1950727. In combination with increasing water temperatures and ocean acidification, hypoxia causes increased fish and shellfish mortality, which not only affects fisheries but also produces harmful toxic substances. The reported increase in toxic algal events in recent years can therefore be attributed to excess nutrient loads as a primary cause728. Furthermore, coastal eutrophication has been found to negatively affect seagrass beds, of which the extent is shrinking at an estimated rate of 1.5 % per year729.
In Europe, the shallow coastal waters of the North Sea have reg-istered steep increases of anthropogenic N and P loads between 1950 and 1990, 75 % of which were carried by the Rhine and Elbe rivers. Since then, the situation has started to improve following the introduction of nutrient abatement measures. However, these measures resulted in an increase N:P ratio with a negative impact on the ecological health of marine ecosystems. Phosphorus input from island sources has been reduced steadily in the Bay of Biscay and Iberian Coast while no trend could be detected for nitrogen concentration730. In the Baltic Sea, on the other hand, the area suffering from eutrophication is still increasing beyond 16 % of its total area, despite the growing efforts made to reduce new N and P inputs from the late 1990s731. In the Black Sea, time series of phosphorus concentrations showed significant decreases in the northwest shelf area, while nitrogen concentrations showed
163
2022

a more variable pattern. The Mediterranean Sea is probably the regional seas with fewest eutrophication problem areas. This is partly related to the fact that the offshore parts of the Mediterranean Sea are characterized by very low nutrient concen-trations (Figures 6.12 and 6.13)732.
Figure 6.12 Winter dissolved inorganic nitrogen concentration observed in European seas, 2013-2017
Source: EEA733.
Figure 6.13 Winter mean orthophosphate concentrations in European seas, 2013-2017
Source: EEA734.
732 Malagó, A., Bouraoui, F., Grizzetti, B., & De Roo, A. (2019). Modelling nutrient fluxes into the Mediterranean Sea. Journal of Hydrology: Regional Studies, 22, 100592.European Environment Agency.
733 European Environment Agency (EEA). https://www.eea.europa.eu/data-and-maps/figures/winter-dissolved-inorganic-nitrogen-ammonium734 European Environment Agency (EEA). https://www.eea.europa.eu/data-and-maps/figures/winter-dissolved-inorganic-nitrogen-ammonium735 Directive 2008/56/EC of the European Parliament and of the Council, 17 June 2008.736 COM/2018/028.737 Tornero, V., Boschetti, S., Hanke, G., Marine Strategy Framework Directive, Review and analysis of Member States’ 2018 reports –
Descriptor 8: Contaminants in the environment – Descriptor 9: Contaminants in seafood, EUR 30659 EN, Publications Office of the European Union, Luxembourg, 2021, ISBN 978-92-76-34085-0, doi:10.2760/621757.
738 European Environment Agency, 2019. Contaminants in Europe’s seas. Moving towards a clean, non-toxic marine environment. EEA Report No 25/2018. Luxembourg: Publications Office of the European Union, 2019, ISBN 978-92-9480-058-9, https://www.eea.europa.eu/publications/contaminants-in-europes-seas
739 COM(2020) 259 ‘Report from the Commission and the European Parliament and the Council on the implementation of the Marine Strategy Framework Directive (Directive 2008/56/EC)’, p. 20.
6.3.3 THE EU RESPONSE
The EU has put significant importance to actions that should limit marine litter and microplastics. The Marine Strategy Framework Directive (MSFD), adopted in 2008, defines marine pollution as the direct or indirect introduction into the marine environment, as a result of human activity, of substances or energy, including human-induced marine underwater noise, which results or is likely to result in deleterious effects such as harm to living resources and marine ecosystems, including loss of biodiversity, hazards to human health, the hindering of marine activities, including fish-ing, tourism and recreation and other legitimate uses of the sea, impairment of the quality for use of sea water and reduction of amenities or, in general, impairment of the sustainable use of marine goods and services735.
The MSFD required EU Member States to ensure that properties and quantities of marine litter do not cause harm to the coastal and marine environment. Tackling pollution and littering of the seas by curbing plastics and microplastics is also one of the major areas of the Commission’s Plastics Strategy736, together with the promotion of plastics recycling, the creation of an enabling envi-ronment for innovation and investment towards circular solutions (see section 3.2), and the support for global action towards ade-quate plastic waste prevention, collection and recycling systems.
In their 2018 MSFD reporting on Assessments, Good Environmental Status and Targets for MSFD Descriptor 8, Chemical Contaminants, the majority of the MS reported GES as ‘expected to be achieved later than 2020’ or as ‘Unknown – Not assessed’. Only in few cases, GES was reported as achieved737. In 2018, the Status of the European Seas regarding chemical contaminants was evaluated, confirming that chemical pollution continues to be a large scale challenge, though progress has been observed as some contami-nant concentrations appear to be declining, though not all of these meet the agreed threshold values738.
As of June 2020, the quality status of Europe’s seas portrayed a mixed picture. While EU rules regulating chemicals have led to a reduction in some contaminant levels, there has been an increased accumulation of plastics and plastic chemical residues in most of the marine species including fish and shellfish products739. Some species show signs of recovery (e.g. white-tailed eagles in the Baltic Sea), while others show steep deterioration (40 % of elasmo-branchs in the Mediterranean). While fishing effort has decreased in the North-east Atlantic, about 79 % of Europe’s coastal seabed and 43 % of the shelf/slope area is physically disturbed, mainly caused by bottom trawling. 46 % of Europe’s coastal waters are still subject to intense eutrophication (see Figure 6.14).
164
THE
EU B
LUE
ECO
NO
MY
REPO
RT

Source: European Commission740.
The Directive has nevertheless pushed for a better understanding of the pressures and impacts of human activities on the sea, and their implications for marine biodiversity, their habitats, and the ecosystems they sustain. The EU has surpassed the Aichi target for Marine Protected Areas (MPAs), although management meas-ures must be put in place741. Furthermore, the knowledge gained from MSFD implementation has been a driving force leading to the adoption of the Single use Plastics Directive742, which intro-duced a set of ambitious measures:
• a ban on selected single-use products743 made of plastic for which alternatives exist on the market;
• measures to reduce consumption of food containers and bev-erage cups made of plastic and specific marking and labelling of certain products;
• extended Producer Responsibility schemes covering the cost to clean-up litter, applied to products such as tobacco filters and fishing gear;
• a 90 % separate collection target for plastic bottles by 2029 (77 % by 2025) and the introduction of design requirements to connect caps to bottles, as well as target to incorporate 25 % of recycled plastic in PET bottles as from 2025 and 30 % in all plastic bottles as from 2030.
740 https://ec.europa.eu/environment/marine/eu-coast-and-marine-policy/marine-strategy-framework-directive/index_en.htm741 European Environment Agency (2019). EU reaches the Aichi target of protecting ten percent of Europe’s seas. Publications Office of the European Union.742 Directive (EU) 2019/904 of the European Parliament and of the Council of 5 June 2019 on the reduction of the impact of certain plastic products on the environment.743 https://ec.europa.eu/environment/topics/plastics/single-use-plastics_en
A major development from the extensive studies of marine lit-ter and microplastics occurrence, sources, sinks and movement reported in the literature is the realization that plastic pollution enters all environments. When plastic pollution first became a concern it was considered limited only to oceans where gyres were slowly discovered. Now it is well documented that plastic pollution is an issue in the marine and aquatic environment, but also in the terrestrial compartment as well as the atmosphere and in organisms. The growing and omnipresent nature of plastic pol-lution is still greatly overwhelming our ability to limit it on a sys-temic and global level. It is now well understood that microplastics are transported over long distances through the atmosphere and that city dust contains microplastics. Coatings and paintings are now recognized as an important source of microplastics. Tire wear rubber particles (TWRP) from vehicles are recognized as the larg-est source of microplastics although most monitoring studies do not report on them due to a severe lack of reliable and practical analytical methods for their identification and characterization. Based on the evidence measures are discussed however very few have been implemented due to the use and importance of plas-tics in virtually all spheres of human activity. We are thus still in a period of discovery and have not yet entered into a period of pollution reduction or remediation. All our current attempts at reducing plastic pollution are experimental, limited in reach and not significant in relation to the problem at hand. The complexity of interrelated sources, movement and polluted compartments is symbolically shown in Figure 6.15.
Figure 6.14 MSFD status of implementation (infographic) 165
2022
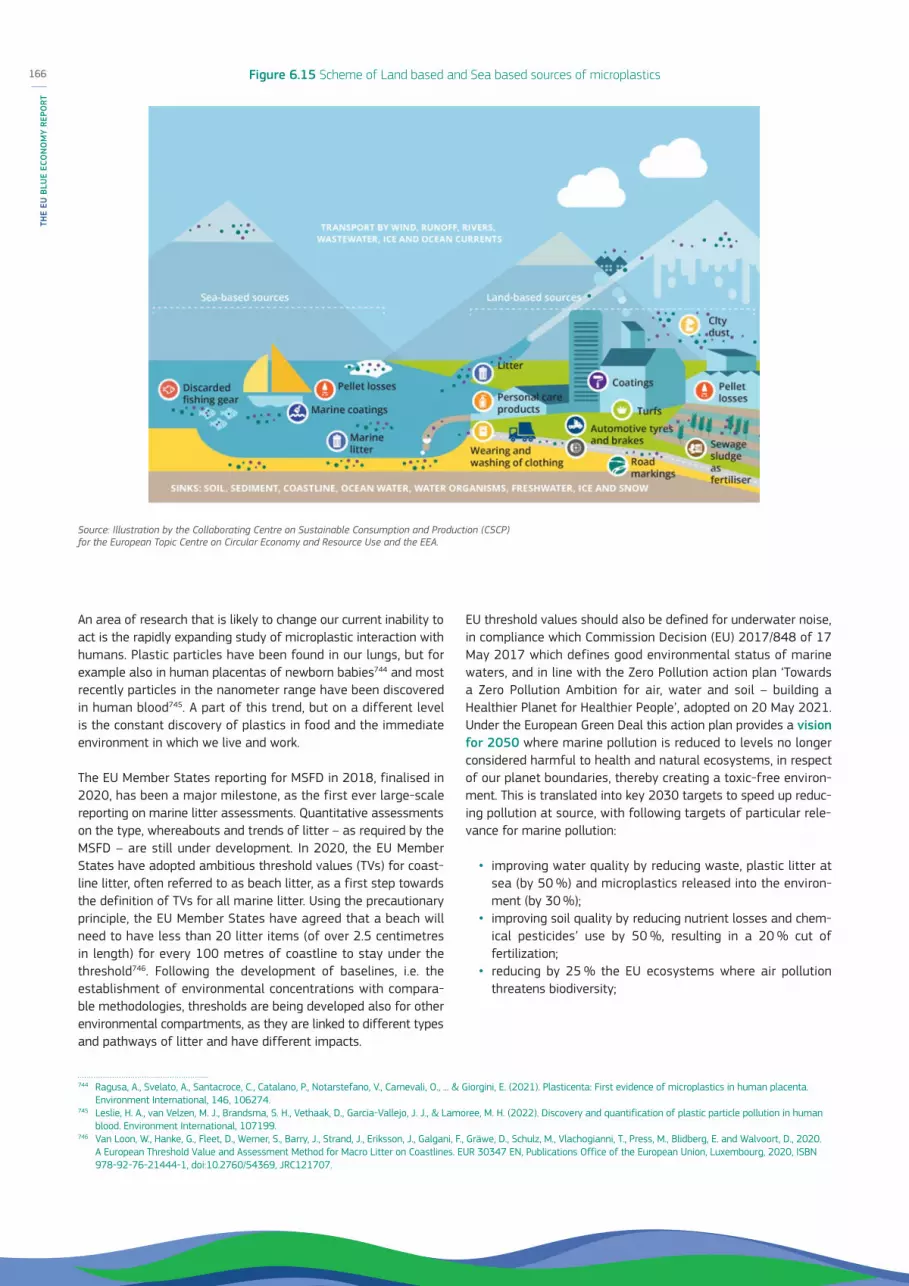
An area of research that is likely to change our current inability to act is the rapidly expanding study of microplastic interaction with humans. Plastic particles have been found in our lungs, but for example also in human placentas of newborn babies744 and most recently particles in the nanometer range have been discovered in human blood745. A part of this trend, but on a different level is the constant discovery of plastics in food and the immediate environment in which we live and work.
The EU Member States reporting for MSFD in 2018, finalised in 2020, has been a major milestone, as the first ever large-scale reporting on marine litter assessments. Quantitative assessments on the type, whereabouts and trends of litter – as required by the MSFD – are still under development. In 2020, the EU Member States have adopted ambitious threshold values (TVs) for coast-line litter, often referred to as beach litter, as a first step towards the definition of TVs for all marine litter. Using the precautionary principle, the EU Member States have agreed that a beach will need to have less than 20 litter items (of over 2.5 centimetres in length) for every 100 metres of coastline to stay under the threshold746. Following the development of baselines, i.e. the establishment of environmental concentrations with compara-ble methodologies, thresholds are being developed also for other environmental compartments, as they are linked to different types and pathways of litter and have different impacts.
744 Ragusa, A., Svelato, A., Santacroce, C., Catalano, P., Notarstefano, V., Carnevali, O., ... & Giorgini, E. (2021). Plasticenta: First evidence of microplastics in human placenta. Environment International, 146, 106274.
745 Leslie, H. A., van Velzen, M. J., Brandsma, S. H., Vethaak, D., Garcia-Vallejo, J. J., & Lamoree, M. H. (2022). Discovery and quantification of plastic particle pollution in human blood. Environment International, 107199.
746 Van Loon, W., Hanke, G., Fleet, D., Werner, S., Barry, J., Strand, J., Eriksson, J., Galgani, F., Gräwe, D., Schulz, M., Vlachogianni, T., Press, M., Blidberg, E. and Walvoort, D., 2020. A European Threshold Value and Assessment Method for Macro Litter on Coastlines. EUR 30347 EN, Publications Office of the European Union, Luxembourg, 2020, ISBN 978-92-76-21444-1, doi:10.2760/54369, JRC121707.
EU threshold values should also be defined for underwater noise, in compliance which Commission Decision (EU) 2017/848 of 17 May 2017 which defines good environmental status of marine waters, and in line with the Zero Pollution action plan ‘Towards a Zero Pollution Ambition for air, water and soil – building a Healthier Planet for Healthier People’, adopted on 20 May 2021. Under the European Green Deal this action plan provides a vision for 2050 where marine pollution is reduced to levels no longer considered harmful to health and natural ecosystems, in respect of our planet boundaries, thereby creating a toxic-free environ-ment. This is translated into key 2030 targets to speed up reduc-ing pollution at source, with following targets of particular rele-vance for marine pollution:
• improving water quality by reducing waste, plastic litter at sea (by 50 %) and microplastics released into the environ-ment (by 30 %);
• improving soil quality by reducing nutrient losses and chem-ical pesticides’ use by 50 %, resulting in a 20 % cut of fertilization;
• reducing by 25 % the EU ecosystems where air pollution threatens biodiversity;
Figure 6.15 Scheme of Land based and Sea based sources of microplastics
Source: Illustration by the Collaborating Centre on Sustainable Consumption and Production (CSCP) for the European Topic Centre on Circular Economy and Resource Use and the EEA.
166
THE
EU B
LUE
ECO
NO
MY
REPO
RT

In that regard, the MSFD, with its ecosystem-based approach, is an essential tool to achieve these ambitious objectives. Its ongo-ing review, building on the MSFD implementation report adopted in June 2020, aims to identify if elements of the current framework could be improved to protect the marine environment more effec-tively and efficiently, while benefiting from our seas and ocean sustainably.
An important driver of activities reducing the marine litter and microplastic pollution are research and development efforts through the ‘Mission’ approach of the European Commission – a novelty of the Horizon Europe research and innovation programme for the years 2021-2027. The EU Missions are designed to sup-port Europe’s transformation into a greener, healthier, more inclu-sive and resilient continent. Most relevant for the Blue Economy is the ‘Restore our ocean and waters Mission’747. The first round of calls for proposals is scheduled for April 2022.
Research on microplastics and nanoplastics (MNPs) is already conducted with a number of ongoing Horizon 2020 projects748. Currently most research as well as scientific publications remain focused on obtaining better understanding of microplastic pollution:
• reports of microplastics occurrence in various geographic locations and environmental compartments. There is a grow-ing interest in terrestrial and soil pollution with microplastics;
• improvements in identification, separation and characteriza-tion methods for microplastics;
• study of the fate and changing properties of microplastics;• evaluations of the effects of microplastics on various
organisms;• the effect of microplastics on human health. CUSP749 – the
European research cluster of five large-scale projects focused on understanding the health impacts of the MNPs.
This focus is continued with Horizon Europe (2021-2027) for example within the Mediterranean sea basin lighthouse – actions to prevent, minimise and remediate litter and plastic pollution with the first call for proposals closing in April 2022.
Microplastics are the subject of a number of projects funded through Cohesion policy initiatives. Conceived within the reformed Cohesion policy of the EU, a place-based innovation endeavours, characterised by the identification of strategic areas for interven-tion based on the analysis of the strengths and potential of the economy and on an Entrepreneurial Discovery Process (EDP) with wide stakeholder involvement, the Smart Specialization Strategies of the EU Member States and regions were an important impetus also for the environmental protection, although often not defining marine litter, plastic pollution or microplastics as distinct research and innovation priorities750. Nevertheless, a comprehensive
747 https://ec.europa.eu/info/research-and-innovation/funding/funding-opportunities/funding-programmes-and-open-calls/horizon-europe/eu-missions-horizon-europe/healthy-oceans-seas-coastal-and-inland-waters_en
748 https://cordis.europa.eu749 https://cusp-research.eu750 Krzan, A., Gnamus. A. 2022. Smart Specialisation in the Context of Blue Economy – Marine Environmental Protection and Micro-plastics Threat in the European Seas, JRC
Science for Policy Report (in press). 751 https://kohesio.ec.europa.eu752 https://ec.europa.eu/info/law/better-regulation/have-your-say/initiatives/12823-Microplastics-pollution-measures-to-reduce-its-impact-on-the-environment/
public-consultation_en753 https://microplastics.biois.eu754 Ahmed, R., Hamid, A. K., Krebsbach, S. A., He, J., & Wang, D. (2022). Critical review of microplastics removal from the environment. Chemosphere, 133557.755 https://eic.ec.europa.eu756 https://cordis.europa.eu/project/id/101010566757 https://cordis.europa.eu/project/id/101010214758 https://www.eea.europa.eu/publications/microplastics-from-textiles-towards-a/microplastics-from-textiles-towards-a
overview of the new Kohesio database751 showed in total 71 pro-jects dealing with the microplastics with focuses similar to those carried out within the Horizon projects, though these latter also include vocational/training activities etc. and involve partners from Finland (8), Spain (7), Portugal (6), Germany (5), Lithuania (3), Greece (2), Croatia (1), Netherlands (1) and France (1). Some activities topping out on the marine litter and microplastics issues were addressed also by the European Maritime and Fisheries Fund (EMFF) with the recipients within the fishery and aquaculture sec-tors undertaking revenue-generating projects.
In line with the European Green Deal and related targets for reducing marine pollution there is a push at the EU as well as at the Member States level to draft measures that will allow reach-ing these challenging targets. An EU wide consultation process is ongoing (Feb-May 2022) on Microplastics pollution – measures to reduce its impact on the environment752. An EC-sponsored study on unintentionally released microplastics is ongoing focused on three primary areas: pellets, tire particles and textile fibres to which paints, laundry and dishwasher capsules and geotextiles have been added as sources753. Reducing microplastic pollution will undoubtedly require the development of new technological solutions. For example a critical review of microplastics removal from the environment discussing options, advances and gaps was recently published754.
A view of European entrepreneurial activity looking at marine lit-ter and microplastics may be offered by looking at the European Innovation Council funded actions755. Within the Horizon program the EIC supports market-creating innovation in small companies with significant growth potential and global ambitions. Since its start in 2018 it has funded more than 430 such projects. There are at least two projects that are looking into solutions for the prevention of pollution with the textile fibres conducted in Slovenia756 and Sweden757.
Activities to limit pollution with textile fibres seem to be advanc-ing faster than other microplastics types. France has already passed specific legislation that will have results in 2025 and other countries appear to be heading in the same direction. The European Environmental Agency has recently published a report: Microplastics from textiles: Towards a circular economy for textiles in Europe758. The developments on textile fibres indicate that this might be the first source (type) of microplastic pollution that will be subject to intervention.
167
2022

6.4 WASTE-WATER TREATMENTAmong the pressures that threaten the status, health and func-tionalities of the ocean and marine biodiversity, and of the goods and services that ocean ecosystems deliver, many originate from land-based sectors such as industry, agriculture, urbanisation, often located far from the ocean. Releasing excessive nutrients in agricultural runoff, improperly discharging chemical pollutants and plastics, disposing of unused pharmaceuticals into the sewage system generate harmful and long-lasting impacts on the water cycle, ultimately affecting the marine environment and impairing its capacity to produce vital ecosystem functions and services.
Addressing ocean pollution and other pressures on the marine environment in a cost-effective way requires integrated solutions that adequately take into account the nexus between land and sea and a “source-to-sea” resource management paradigm759. From a circular economy perspective, sustainable water uses and respon-sible wastewater management practices on land play an impor-tant role towards preserving a good quality of seawater resources and marine ecosystems. Such an approach will build on closer links and integration between the land and sea communities.
While a comprehensive assessment of efforts made to mitigate or reduce the impact of land-based activities on the marine environ-ment is beyond the purposes of this Report, this section presents an overview of relevant waste-water treatment and waste-man-agement activities in the EU.
Waste-water management activities of relevance to the Blue Economy can be found in the following sub-sectors, as defined in the Statistical classification of economic activities (NACE)760:
• water supply, which concerns the collection, purification, desalinisation and distribution of sea or ground water761;
• sewerage activities, which concern the operation of sewer systems or sewage treatment facilities that collect, treat, and dispose of sewage762;
• the treatment and disposal of waste, whether solid or non-solid waste, including the dumping of refuse on land or in water, the operation of ocean floor landfills, the disposal and storage of radioactive nuclear waste763;
• remediation and decontamination activities, including the cleaning up of oil spills and other pollutions in ocean, seas, and coastal areas764.
759 Strosser et al. EU International Ocean Governance Forum. Discussion paper for Thematic Working Group 2 ‘Reducing pressure on the ocean and seas and creating the conditions for a sustainable blue economy’. ACTeon. April 2020.
760 NACE Rev. 2. https://ec.europa.eu/eurostat/statistics-explained/index.php?title=NACE_background761 NACE code E36.00.762 NACE code E37.00.763 NACE division E38.764 NACE code E39.00.765 The United Nations World Water Development Report 2022. Groundwater - Making the invisible visible. UN Water & UNESCO. 766 The Second World Ocean Assessment (WOA II). United Nations, 2021.767 NACE codes E36.00 and E37.00768 UN World Water Development Report 2022.769 The Second World Ocean Assessment (WOA II). United Nations, 2021.
In the absence of granular data by location, destination or pur-pose enabling the measurement of disaggregated socio-economic indicators, e.g. by typology of waste (e.g. solid or liquid), level of toxicity, or spatial distribution of treatment plants, it is not pos-sible to isolate the activities related to waste-water treatment per se. Nor it is possible to isolate the marine proportion or dis-tinguish between waste-water management activities having a direct impact on the ocean and those that only have an indirect impact (see section 2.5), e.g. via its effects across the freshwater cycle. The vast majority of discharges from urban waste-water treatment agglomerations, for instance, are to freshwater, than directly to the marine environment. Hence, these activities go beyond waste-water treatment, and they also consider drinking water and waste treatment in general.
While the values presented here should not be considered as fully belonging to the Blue Economy, they certainly make a significant contribution to it, particularly in terms of preserving the health and productivity of the ocean and its capacity to provide eco-system services that are central to many Blue Economy sectors, as well as the broader economy. In addition, the socio-economic performance of the sector provides an illustration of the effort made at preventing or mitigating damages at the source (e.g. on land and upstream in the hydrological cycle)765, in order to avoid higher and potentially irreversible damages caused by pollution downstream (i.e. on coastal and marine ecosystems)766.
6.4.1 CHALLENGES AND OUTLOOK
In the EU-27, there were more than 76 thousand enterprises clas-sified within the EU’s water supply, sewerage, waste management and remediation activities sector in 2019; together they employed 1.5 million persons (1.3 million FTEs). In FTE terms, water, col-lection, treatment, supply and sewerage activities combined767 was the second largest waste management subsector in the EU, occupying approximately one third (33 %) of its workforce.
While these numbers cannot be considered of exclusive relevance to the Blue Economy for the reasons mentioned above, they illus-trate the magnitude of the effort required along the water cycle to preserve the health and productivity of freshwater and seawater ecosystems. They also suggest that current efforts are probably insufficient, given the alarming levels of groundwater storage depletion768, water pollution and the resulting adverse impacts on marine biosphere, human health and well-being769. Lastly, they highlight the fact that tackling marine pollution requires a sys-tematic, cross-sectoral waste management approach, as debris and pollutants originating from both land-based and marine
168
THE
EU B
LUE
ECO
NO
MY
REPO
RT

activities can be transported long distance across the water cycle and their negative impacts clearly go beyond sectoral boundaries or national borders.
Although the level of access to improved sanitation across the European region is relatively high (i.e. 95 % compared to an aver-age of approx. 60 % globally) and wastewater treatment levels have improved during the last 15-20 years, significant volumes of wastewater are reportedly discharged without treatment, par-ticularly in Eastern Europe770.
Direct discharges of treated and untreated wastewater may cause large inflows of nutrients, contaminants and pathogens into the seas and coastal marine ecosystems, which may determine adverse impacts including harmful algal blooms and hypoxia, potentially fuelling or accelerating eutrophication processes. The Mediterranean Sea is particularly affected by large deposits of nitrogen (N) and phosphorus (P), mainly originating from agricul-tural runoff771. Specifically, recent studies show that the main con-tributor to total nitrogen and nitrate loads in the Mediterranean is agriculture followed by natural phenomena, while the dominant source of orthophosphate are wastewater and scattered dwell-ings772. Indirect discharges are very significant, and increasing. It has been estimated that by 2050 total riverine P discharge to the Mediterranean Sea could be 18−42 % greater than in year 2000773.
Of concern are also pharmaceuticals and personal care prod-ucts (PPCPs), i.e. chemical compounds contained in products used for personal care or medical purposes, including veterinary uses, which are creating increasing pressure on coastal and marine eco-systems. PPCPs enter the marine environment mainly via waste-water from households (e.g. pharmaceuticals, cosmetics and food additives) and agricultural activities (e.g. antibiotics), or via recre-ational activities (e.g. ultraviolet filters contained in sunscreens). Processes to remove PPCPs from wastewater are not efficient and therefore remain in the environment for a long time, often degrading into substances that are more toxic774. While data are still scarce, a number of studies show that PPCP-related pollut-ants can be found in all ocean environments, not only in coastal areas with higher anthropogenic activities but also in remote regions, including the Arctic775.
As regards plastics, it is estimated that between 8 million and 13 million tonnes of plastics (micro-plastics, macro-plastics and nanoplastics) enter the ocean each year776, most of it (up to 80 %) from land-based sources. Studies suggest that the annual eco-nomic damage plastics impart on the marine ecosystem is at least $13 billion per year. With plastic production expected to double
770 UNESCO. The United Nations World Water Development Report 2017 Wastewater. United Nations World Water Assessment Programme (WWAP).771 Powley, H. R., Durr, H. H., Lima, A. T., Krom, M. D., & Van Cappellen, P. (2016). Direct discharges of domestic wastewater are a major source of phosphorus and nitrogen to
the Mediterranean Sea. Environmental science & technology, 50(16), 8722-8730.772 Malagó, A., Bouraoui, F., Grizzetti, B., & De Roo, A. (2019). Modelling nutrient fluxes into the Mediterranean Sea. Journal of Hydrology: Regional Studies, 22, 100592.773 Ludwig, W., Bouwman, A. F., Dumont, E., & Lespinas, F. (2010). Water and nutrient fluxes from major Mediterranean and Black Sea rivers: Past and future trends and their
implications for the basin-scale budgets. Global biogeochemical cycles, 24(4).774 Kallenborn, R. et al. (2018). Pharmaceuticals and personal care products (PPCPs) in Arctic environments: indicator contaminants for assessing local and remote
anthropogenic sources in a pristine ecosystem in change. Environmental Science and Pollution Research, vol. 25, No. 33, pp. 33001-33013.775 The Second World Ocean Assessment (WOA II). United Nations, 2021.776 Howlett, M., Ramesh, M., & Perl, A. (2009). Studying public policy: Policy cycles and policy subsystems (Vol. 3). Oxford: Oxford university press; Worm, B., Lotze, H. K.,
Jubinville, I., Wilcox, C., & Jambeck, J. (2017). Plastic as a persistent marine pollutant. Annual Review of Environment and Resources, 42, 1-26.777 Strosser et al. EU International Ocean Governance Forum. Discussion paper for Thematic Working Group 2 ‘Reducing pressure on the ocean and seas and creating the
conditions for a sustainable blue economy’. ACTeon. April 2020.778 UNESCO. The United Nations World Water Development Report 2017 Wastewater. United Nations World Water Assessment Programme (WWAP).779 Eurostat Statistics Explained. Water supply, sewerage, waste management and remediation statistics. Feb 2022.
over the next 20 years, it is estimated that current production and waste management trends will lead to 12 billion tonnes of plastic waste in landfills or in the natural environment by 2050.
While waste management (including recycling, reuse and disposal) is governed by national policies, and significant progress has been made in the EU as a whole, it is clear that any action under-taken without multilateral cooperation or focused solely on waste management is unlikely to bring the required positive change on a global scale. Recognizing that the impacts from marine plas-tics and litter originate from both land and sea-based sources, an interplay of transnational initiatives and legal instruments is required to tackle this problem of international dimension with severe global and local repercussions777.
Tackling waste-water effectively, requires a circular approach to controlling and regulating various wastewater flows, which embraces a combination of complementary strategies, includ-ing: (i) prevention or reduction of pollution at the source (e.g. by prohibiting the use of certain contaminants) and monitoring pol-lutant discharges in order to support pollution control measures, (ii) waste-water collection and treatment, e.g. to save freshwa-ter (iii) using reclaimed wastewater as an alternative source of freshwater in order to meet an increasing demand, and (iv) using waste-water as a source of resources, such as energy (e.g. in the form of biogas) and nutrients (e.g. nitrogen and phosphorus)778.
6.4.2 ACTIONS PROMOTED UNDER THE EU POLICY FRAMEWORKEU policy aims to move waste management up the waste hierar-chy taking into account environmental impacts over the entire life cycle. Waste prevention can be achieved through cleaner technol-ogies, better design, or more efficient production and consumption patterns; as well as reducing waste these preventative actions may lead to reductions in resource consumption throughout pro-duction and distribution chains. EU legislation sets binding targets for Member States on the recovery and recycling/re-use of munic-ipal waste, batteries, electrical and electronic waste, construction and demolition waste, end-of-life vehicles and packaging779.
The European water acquis lays down water protection objectives fully reflected in the European Green Deal initiative, particularly relevant to the Zero Pollution Action Plan and the Chemicals Strategy, the Farm-to-fork strategy, Circular Economy Action Plan and the Biodiversity Strategy. The recent fitness check of the Water Framework Directive (WFD) and related legislation con-cluded that these policies are fit for purpose and have provided
169
2022

a governance framework for integrated water management in the EU, but their objectives were not fully achieved also due to gaps in the effective design and implementation of river basin management plans.
The REFIT evaluation of the Urban Wastewater Treatment Directive (UWWTD) has acknowledged the important role of this piece of EU legislation in protecting our waters, and has iden-tified areas where policy could be strengthened, including in chemical pollution, urban runoff management, and resource effi-ciency. Nutrients and pesticides, although the subject of specific Directives, still represent a threat to water ecosystems in many EU regions, and a significant issue to address more effectively also in the context of the Common Agricultural Policy. Pollutants of emerging concern, including pharmaceuticals and microplastics, and pathogens represent an additional challenge, prompting for effective and adaptive policy responses.
Within the context of the 2030 Agenda for Sustainable Development and its dedicated goal on water ‘Ensure availabil-ity and sustainable management of water and sanitation for all’ (SDG6), environment ministers from around the world have iden-tified water quality challenge as a priority. Tackling existing, but also emerging water quality challenges and looking into scenarios of change and avenues for solutions requires an unprecedented collaboration and affordable and accessible technology, innova-tion and knowledge management to address the issue on local, regional and global scales.
Last but not least, waste-water can be used to address human health challenges, as illustrated for example by the Health Emergency Preparedness and Response Authority (HERA) incuba-tor to monitor SARS-CoV-2 and its variants780.
780 https://ec.europa.eu/environment/news/coronavirus-response-monitoring-wastewater-contributes-tracking-coronavirus-and-variants-across-all-2022-03-17_en 781 The European Commission’s Communication on the 2030 Climate Target Plan (COM/2020/562). 17 September 2020.782 COM(2019) 640.783 https://ec.europa.eu/clima/policies/eu-climate-action_en 784 https://ec.europa.eu/clima/policies/transport/shipping_en 785 International Maritime Organization (IMO). Fourth IMO greenhouse gas study (2020).786 European Maritime Safety Agency (EMSA) and European Environment Agency (EEA). European Maritime Transport Environmental Report 2021. Publications Office of the
European Union, 2021.
6.5 DECARBONISATION TRENDS IN THE EU BLUE ECONOMY
6.5.1 BACKGROUND
The EGD calls for a transition towards a modern, resource-ef-ficient and competitive economy where net GHG emissions are gradually phased out and the EU’s natural capital is protected. In the trajectory towards EU climate neutrality by 2050, the Commission aims to reduce net GHG by at least 55 % by 2030781. This long-term strategy, endorsed by the European Parliament and Council in 2019, is at the heart of the European Green Deal (EGD)782 (see section 3.1), which sets out a comprehensive pack-age of measures ranging from ambitious GHG emission reduc-tions, to cutting-edge research and innovation for the develop-ment of low carbon technologies, to the preservation of Europe’s natural environment783.
In this context, a sustainable Blue Economy offers many solutions to achieve the EGD objectives, but some of the current activities, technologies and processes need to reduce their carbon footprint, while new, carbon-neutral activities and technologies need to take centre stage in the EU Blue Economy.
The EGD calls for a 90 % reduction in GHG from all modes of transport, which are responsible for almost a quarter of Europe’s GHG, and this includes a number of important sectors of the EU Blue Economy, such as Maritime transport. However, compara-tively less than transport by road or air on a per tonne-kilometre basis, shipping contributes to carbon emissions because of the great volumes involved, representing around 13 % of the overall EU GHG from the transport sector784. In 2020, the International Maritime Organization (IMO) projected the sector’s GHG emis-sions to increase from about 90 % of 2008 emissions in 2018 to 90-130 % of 2008 emissions by 2050785.
In addition to GHG emissions, maritime transport is a major emit-ter of other air pollutants, such as sulphur oxides (SOx), which are responsible for triggering or aggravating acidification and eutrophication processes in the marine environment. Sulphur oxides and particulate matter from shipping and port activities contribute to global warming, leading among others to an increase in extreme weather events and sea level rise. In addition to con-tributing to water acidification and changes in oxygen levels, they can also be detrimental to human health, affecting almost 40 % of Europeans living within 50 km of the sea. For these reasons, the IMO designated the Baltic and North Seas as emission control areas for sulphur oxides and nitrogen oxides (NOx). Thanks to this type of measures, including the Sulhpur Directive (Directive 2012/33/EU), SOx and particulate matter emissions from shipping are expected to drop substantially by 2050786.
170
THE
EU B
LUE
ECO
NO
MY
REPO
RT

Maritime transport faces huge decarbonisation challenges in the next decades, due to current lack of market- ready zero-emis-sion technologies, long development timeframes and life cycles of vessels. The 2020 Communication on a Sustainable and Smart Mobility Strategy787 aims to bring the first zero emission vessels to market by 2030. It incentivises the deployment of renewa-ble and low-carbon fuels (using hydrogen, for example) and the feeding of onshore power supply with renewable energy. EU ship-yards could seize the opportunities arising from the fast-growing markets of installation and maintenance of offshore wind parks and manufacturing of digitalized and energy-efficient service ves-sels. European ship designers are already developing innovative wind-powered ships, which will significantly reduce fuel consump-tion and CO2 emissions in the near future.
Decarbonisation also includes the necessary energy transition in the EU fishing fleets. Despite some progress on reducing emis-sions from shipping and fishing vessels, this reduction may not be considered enough in relation to the goals of the Paris Agreement. The contribution of the shipping sector to emission reductions consistent with the temperature goals of the Paris Agreement remains an important issue in the EU. Therefore, the European Parliament included GHG emissions from ships over 5 000 gross tonnes in the emissions trading system (EU ETS) by 1 January 2022. In parallel, the European Commission has launched an initiative to extend the EU Emission Trading System788 to mari-time transport and to end fossil-fuel subsidies when revising the Energy Taxation Directive789, which would affect the current tax exemption for shipping and fishing fleets. It is also considering incorporating new propulsion systems in the current review of the Recreational Craft Directive790, and revising the ship source pollution Directive791.
6.5.2 ENERGY TRANSITION IN THE EU FISHING FLEETS: RECENT TRENDS IN FUEL EFFICIENCY AND FUEL INTENSITY
The EU fishing fleet consumed 2 010 million litres of fuel to land 4.05 million tonnes of fish valued 6.3 billion at the first sale in 2019. This fuel consumption leads to the emission of roughly 5.2 million tonnes of CO2. Between 2009 and 2019, the fuel con-sumption and therefore CO2 emissions decreased by 12 %, while fish landings in weight decreased by 1 % but increased in value by 12 %.
Fuel (energy) costs amounted to €1 003 million, with an average fuel price of €0.50 per litre. The fleet directly generated €3.4 billion of GVA and 1.2 billion of gross profits. Between 2009 and 2019, fuel costs decreased by 24 %.
787 COM(2020) 789.788 Directive (EU) 2018/410 of the European Parliament and of the Council of 14 March 2018.789 https://ec.europa.eu/info/law/better-regulation/have-your-say/initiatives/12227-Revision-of-the-Energy-Tax-Directive 790 Directive 2013/53/EU of the European Parliament and of the Council of 20 November 2013.791 Directive 2009/123/EC of the European Parliament and of the Council of 21 October 2009 amending Directive 2005/35/EC on ship-source pollution and on the introduction
of penalties for infringements.792 STECF (Scientific, Technical and Economic Committee for Fisheries). The 2020 Annual Economic Report on the EU Fishing Fleet; Publications Office of the European Union:
Luxembourg, 2020. Cheilari, A., Guillen, J., Damalas, D., & Barbas, T. (2013). Effects of the fuel price crisis on the energy efficiency and the economic performance of the European Union fishing fleets. Marine Policy, 40, 18-24. Tyedmers P.H. Fisheries and energy use. Encyclopedia Energy 2004; 2: 683-693. Muir. J.F. 2015. Fuel and energy use in the fisheries sector – approaches, inventories and strategic implications. FAO Fisheries and Aquaculture Circular No. 1080. Rome, Italy.
The quantity of fuel used by the EU fishing fleet is influenced by several factors, in particular the type of fishing operation, fishing gear and fuel price. Fuel use and efficiency are often measured for the fisheries sector with several indicators792:
• Fuel intensity is defined as the quantity of fuel consumed per quantity of fish landed, expressed as litres per kg;
• Fuel efficiency is defined as the ratio between fuel costs and income from landings, expressed as a percentage. The lower the percentage the more fuel efficient the vessel (i.e., less income is used to cover fuel costs);
• Fuel use per income generated is defined as the ratio between the quantity of fuel consumed and the value of landings, expressed as litres per euro.
The EU fleet has become more fuel efficient over the years, yet has shown less efficiency in more recent years. This is largely a result of higher fuel prices after 2016 that lead into higher fuel costs, as this indicator is very dependent on the fuel price. Fuel costs as a proportion of income were estimated at 16 % in 2019, up 4 percentage points compared to 2016, but still almost 8 per-centage points below 2008.
Fuel intensity – the amount of fuel consumed per landed tonne – has declined, stabilising since 2014 at around 0.45 litres per landed kg.
This analysis can be repeated at more detailed levels, e.g. at sea basin (Mediterranean and Black Seas, North East Atlantic Ocean, and Other Fishing Regions), at activity level (small-scale, large scale and distant water fleets) or even at fishing gear level (purse seiners, trawlers, long-liners, etc.). Due to the heterogeneity of the EU fishing fleets and the species they target, results are expected to differ significantly. Figure 6.17 shows the evolution of fuel intensity (i.e., energy consumption per landed tonne) disaggre-gated per fishing gear and vessel length.
Of course, instead of fuel consumed, in most cases it can be reported the CO2 emissions, resulting in indicators that are pro-portional – i.e., showing the same trends but in a slightly different scale. However, CO2 emissions rather than fuel consumed might make comparisons across sectors easier.
171
2022

0,0
0,1
0,2
0,3
0,4
0,5
0,6
0,7
0,8
2008 2009 2010 2011 2012 2013 2014 2015 2016 2017 2018 2019
Fuel use per income Fuel efficiency Fuel price Fuel intensity
Figure 6.16 A Evolution of Fuel intensity (l/kg), Fuel efficiency ( %), Fuel use per income (l/€) and Fuel price
1 STECF (Scientific, Technical and Economic Committee for Fisheries). The 2021 Annual Economic Report on the EU Fishing Fleet; Publications Office of the European Union: Luxembourg, 2021.
Source: Own elaboration from STECF data1
Figure 6.17 Evolution of fuel intensity in litres per tonne in 2019,
per fishing gear and vessel length
Source: STECF’ Annual Economic Report of the EU fishing fleet (2021).
DFN 892
VL0006 844
VL0010 547
VL0612 1248
VL1012 664
FPO 486
VL0006 764
VL0010 517
VL0612 733
VL1012 395
HOK 1309
VL0006 1929
VL0010 1306
VL0612 2939
VL1012 447
MGO 446
VL0006 919
VL0010 289
VL0612 1256
VL1012 108
MGP 93
VL0010 68
VL1012 96
PG 144
VL0006 515
VL0010 162
VL0612 387
VL1012 75
PGO 910
VL0006 1364
VL0010 741
VL0612 876
PGP 836
VL0006 779
VL0010 457
VL0612 1275
VL1012 527
PMP 739
VL0006 434
VL0010 813
VL0612 959
VL1012 367
DFN 699
VL1218 820
VL1824 672
VL2440 577
FPO 1047
VL1218 1234
VL1824 551
VL2440 6768
HOK 808
VL1218 916
VL1824 770
VL2440 724
MGO 533
VL1824 533
MGP 429
VL1218 430
VL1824 405
PGP 892
VL1218 898
VL1824 775
VL2440 895
PMP 464
VL1218 458
VL1824 498
VL2440 145
DRB 499
VL0010 256
VL0612 2358
VL1012 336
VL1218 228
VL2440 13000
DTS 940
VL0010 716
VL0612 1916
VL1012 915
VL1218 1785
VL1824 1796
VL2440 871
VL40XX 419
PS 364
VL0006 1159
VL0010 225
VL0612 416
VL1012 130
VL1218 181
VL1824 210
VL2440 229
VL40XX 515
TBB 1685
VL0010 361
VL1012 419
VL1218 572
VL1824 1317
VL2440 1978
VL40XX 2484
TM 160
VL1012 3928
VL1218 160
VL1824 237
VL2440 80
VL40XX 190
Total EU 535
Static 772 Towed 508
Demersal 737 Pelagic 160
LSF 529SSCF 623
Static 623
172
THE
EU B
LUE
ECO
NO
MY
REPO
RT

6.5.3 TRENDS IN FUEL EFFICIENCY AND FUEL INTENSITY IN THE EU AQUACULTURE SECTOR
In 2018, the EU aquaculture sector produced 1.2 million tonnes of fish with a value of €4.1 billion in the first-sale. This represents slightly more than 20 % of the EU domestic production (consider-ing fisheries and aquaculture) of fish products in terms of weight and about 38 % in terms of value. EU finfish aquaculture produc-tion amounted to 0.47 million tonnes valued €2.6 in 2018; while shellfish aquaculture produced 0.47 million tonnes valued €1.3 billion, for the same period.
It is only available information of the energy costs for the EU aquaculture sector, but it is missing on energy consumption793. Hence, only CO2 emissions efficiency and CO2 emissions efficiency of production could be estimated. However, at the time of the production of this report no new data is available, since data is expected to become available in the second half of 2022.
The analysis reported in the previous edition of this report shows that the energy costs as a proportion of the production value (expressed as a percentage) for wild-capture fisheries oscillates between 12 % and 23 % for the period 2009-2018. The higher the fuel price, the less efficient the sector is, as it spends more on energy to produce the same amount. While for shellfish and finfish aquaculture, energy costs represent between 3 % and 7 %.
While the CO2 emissions efficiency of production, i.e., the energy costs necessary to produce a kg of fish, shows that the energy costs have increased more than aquaculture production, which has been rather stable during this period. During the same period, the value of aquaculture production has increased significantly, but at a similar rate than the energy costs
For the shellfish aquaculture, the indicator is much lower than for finfish, showing that less CO2 emissions are required to produce a kg of shellfish than producing of finfish, highlighting the impor-tance of the shellfish and low trophic level production to reduce the carbon footprint of the food system. Whereas the CO2 emissions efficiency for both shellfish and finfish aquaculture is very similar due to the higher prices of finfish compared to shellfish ones.
793 Scientific, Technical and Economic Committee for Fisheries (STECF) – The EU Aquaculture Sector – Economic report 2020 (STECF-20-12). Publications Office of the European Union, Luxembourg, 2021, EUR 28359 EN.
794 Swedish Network for Transport and the Environment.795 EMSA/EEA (2021). European Maritime Transport Environmental Report 2021.796 European Commission. (2021). 2020 Annual Report on CO2 Emissions from Maritime Transport. {SWD(2021) 228 final}.797 https://ec.europa.eu/clima/policies/transport/shipping_en798 Sims R., et al., 2014: Transport. In: Climate Change 2014: Mitigation of Climate Change. Contribution of Working Group III to the Fifth Assessment Report of the
Intergovernmental Panel on Climate Change [Edenhofer, O., et al. (eds.)]. Cambridge University Press, Cambridge, United Kingdom and New York, NY, USA.
6.5.4 ENERGY TRANSITION IN THE EU MARITIME TRANSPORTMaritime transport (shipping) is the most carbon-efficient mode of transportation, with the lowest carbon dioxide (CO2) emissions per distance and weight carried. Indeed, it produces less exhaust gas emissions – including nitrogen oxides, hydrocarbons, carbon monoxide and sulphur dioxide – for each tonne transported per kilometre than air or road transport794.
Maritime transport carried out 77 % of the goods traded to and from the EU in 2019795. Ships registered under the flag of an EU Member State represent 17.6 % of the total world fleet measured in dead weight tonnage (DWT). EU passenger ships can carry up to 1.3 million passengers, representing 40 % of the world’s pas-senger transport capacity.
Maritime transport produced about 3-4 % of total EU CO2 emis-sions in 2019796. From the 1st of January 2018, large ships over 5 000 gross tonnage loading or unloading cargo or passengers at ports in the European Economic Area (EEA) are to monitor and report their related CO2 emissions and other relevant informa-tion797. This covers around 90 % of all CO2 emissions, whilst only including around 55 % of all ships calling into EEA ports.
The share of maritime transport compared to other transport modes continues to increase, as well as the total volume trans-ported. Hence, the maritime transport sector is not decreasing its emissions at the desired pace. However, given the importance of maritime transport and the prospects of increased maritime transport, it is indispensable that the industry continues to reduce its environmental impact.
Table 6.5 CO2 emissions range per tonne-kilometre for freight. In g CO2/km
Transport mode Transport mean CO2 emission range
Maritime transport container ship coastal, container ship ocean
bulk carrier oceanbulk tanker ocean
20-455-251-52-7
Road heavy-duty vehicles (big truck) 70-90
Railway diesel freight trainelectric freight train
25-605-25
Civil aviationshort haul cargo aircraft 1 200-2 900
long haul cargo aircraft 350-950
Source: Intergovernmental Panel on Climate Change, 2014798.
173
2022

As can be seen from Figure 6.18, GHG emissions from the EU maritime transport sector (blue line) declined until 2014, and since then had an increasing trend. While the GHG emissions divided by turnover, as a proxy of business activity, went up a bit and remained relatively stable. This shows that the GHG emissions of the EU Maritime transport sector increased proportional to the turnover (i.e., business activity).
Figure 6.18 GHG emissions by the EU maritime transport sector, 2009-2020. Emissions in million tonnes (left axis) and emissions per turnover in tonnes per million euro (right axis)
-
200
400
600
800
1 000
1 200
0
20
40
60
80
100
120
140
160
2009
2010
2011
2012
2013
2014
2015
2016
2017
2018
2019
2020
Emissions
Emissions per turnover
Note: 2020 turnover data estimated, based on trends observed from 2019. Therefore, the value of emissions per turnover for 2020 should be considered with caution.
Source: Own elaboration from Eurostat data.
Due to the expected growth of the world economy and associated transport demand from world trade, greenhouse gas emissions from shipping could grow from 50 % to 250 % by 2050 if meas-ures are not taken799, making it paramount for the industry to continue to improve energy efficiency of ships and to shift to alternative fuels.
799 http://www.imo.org/en/OurWork/Environment/PollutionPrevention/AirPollution/Pages/Greenhouse-Gas-Studies-2014.aspx800 Innovation Needs for Decarbonization of Shipping, Mission Innovation, Danish Maritime Authority, 2021,
http://mission-innovation.net/missions/shipping/801 Industry Transition Strategy, Maersk Mc-Kinnely Moller Center for Zero Carbon Shipping, 2021,
https://cms.zerocarbonshipping.com/media/uploads/documents/MMMCZCS_Industry-Transition-Strategy_Oct_2021.pdf802 European Commission. (2021). 2020 Annual Report on CO2 Emissions from Maritime Transport. {SWD(2021) 228 final}.803 COMMISSION STAFF WORKING DOCUMENT (2020). Full-length report. Accompanying the document Report from the Commission 2019 Annual Report
on CO2 Emissions from Maritime Transport. {C(2020) 3184 final}.
To reduce emissions, the maritime transport needs the deploy-ment of mature energy efficiency technologies and operational practices. In the medium- and long-term, the shipping sector will have to shift from fossil-based marine fuels to alternative fuels, renewable energy sources, and hybrid technologies that are both environmentally sustainable and economically viable. Technologies to produce zero-emission fuels and vessels are to a large extent available but in most instances not market ready800. The early years of this transition are challenged by the existence of several alternative fuels options and their wide cost gap with the fossil fuels used today801. Hence, the smooth deployment of these energy efficient technologies will depend into a large extent on several factors, such as costs, availability, maturity, reliability and level of environmental sustainability802.
However, for the successful reduction of emissions from the Maritime transport sector, it is not only required appropriate regulatory and non-regulatory incentives, R&I and an invest-ment-friendly environment for the sector; but it also goes well beyond, as it should consider how ships are fuelled, designed and built, as well as how they interact with ports803, while keeping the EU Maritime transport sector competitive.
174
THE
EU B
LUE
ECO
NO
MY
REPO
RT

6.6 IMPACTS OF COASTAL INUNDATIONS IN EU ECONOMIC GROWTH
6.6.1. INTRODUCTION
The 68 000 km of coastline, where around 40 % of the overall population lives, makes of the EU-27 a highly exposed region to storm surges and coastal inundations804. On the 1st of February 1953, a combination of high tides and storms pushed the North Sea water to rise up to five meters above the average level and the consequent inundations of the coasts of the Netherlands, Belgium, Germany and the UK caused the death of 2 100 people and huge economic losses. While mortality of coastal inundations has been decreasing in the last decades805, a similar trend has not been observed for monetary losses. On November 2019, a flood estimated to be a 1-in-50 year event hit Venice, in Italy, and caused losses and damages for around a billion of euro. River floods are still more frequent in Europe and have larger socio-economic consequences, but a recent study indicates that by mid-century the scenario could be completely different, with coastal inundation events causing heavy disruption occurring at increasingly shorter recurrence intervals806.
The direct consequences of severe and more frequent inundations, like for example damages to physical assets, will likely generate economic impacts, in the long term, which are well beyond the initial loss. In fact, at the foundation of the economic growth is, in addition to technological development, the availability of certain amount of physical assets per worker and the dynamic process of accumulation of those assets, which relies on the financial resources available for investments. Therefore, along with the market value of the lost or damaged assets, a complete assess-ment of the economic losses of inundations should also include the value of the production lost due to a lower availability of capi-tal per worker and how this interferes with the long-term dynamic process of economic growth.
With this in mind, this section shows how and to what extent the direct consequences of future coastal inundations will interact with EU countries’ economic growth. The findings presented here originate from a thorough coastal flood risk analysis based on the model LISCOAST (Large-scale Integrated Sea-level and Coastal Assessment Tool), combined with a set of depth damage functions that assess weather-related impacts under present and future climates for a high emissions scenario (RCP8.5). State-of-the-art large-scale modelling tools and datasets are used to quantify hazard, exposure and vulnerability and quantify consequent risks in monetary terms. The large uncertainty that underlies the extent, frequency and timing of the sea level rise related inundations is taken into account with the combination of a GCM ensemble, probabilistic distribution of extreme wind, atmospheric pressure and maximum tidal level in a Copula – Monte Carlo framework807.
804 It has been estimated that almost half of EU GDP is generated in those regions and that in these areas is where around 40 % of the overall population lives, as shown in: Kulp, S.A., Strauss, B.H. (2019). New elevation data triple estimates of global vulnerability to sea-level rise and coastal flooding. Nature Communications 10, 4844.
805 Bouwer, L. M. and Jonkman, S. N. (2017) Global mortality from storm surges is decreasing. Environmental Research Letters, 13 014008.806 Vousdoukas, M. I., Mentaschi, L., Voukouvalas, E., Bianchi, A., Dottori, F., & Feyen, L. (2018). Climatic and socioeconomic controls of future coastal flood risk in Europe.
Nature Climate Change, 8(9), 776-780. Vousdoukas, M. I., Mentaschi, L., Voukouvalas, E., Verlaan, M., & Feyen L. Extreme sea levels on the rise along Europe’s coasts. Earth’s Future, 5, 304–323 (2017).
807 Vousdoukas, M. I., Mentaschi, L., Voukouvalas, E., Bianchi, A., Dottori, F., & Feyen, L. (2018). Climatic and socioeconomic controls of future coastal flood risk in Europe. Nature Climate Change, 8(9), 776-780.
808 DG ECFIN (2018). The 2018 Ageing Report: Underlying Assumptions and Projection Methodologies. Institutional Paper 065. November 2017. Brussels.
This probabilistic set of direct economic damages data projected for Europe are analysed with a Solow-type growth model aligned to the official demographic and economic projections available for the EU Member States until 2100808. The economic model quantify the associated long-term losses under different scenarios, includ-ing the households’ consumption vs. savings decision, frictions in the reconstruction process and boost of the economy’s produc-tivity when the destroyed assets are replaced with ones that are more productive.
6.6.2 FORESIGHT ANALYSIS: RESULTS
The economic consequences of future sea-level-rise inunda-tions are presented in terms of annuitized estimates of GDP and Welfare losses for three times windows with 30 years averages around 2020’s, 2050’s and 2080’s. Impacts on GDP and Welfare are expressed as percentage with regards to baseline, in the six analysed scenarios. Due to the underlying assumptions about how households face the repairing costs, the scenarios generate quite different results both for mean impacts and their distribution. The impacts in the two Prudent scenarios are much smaller, because households are assumed to absorb the property damages with a consumption reallocation. Therefore, the damage to residential properties, which is the biggest among the three considered direct physical impacts, do not affect the capital stock of the economy, the state variable of the model that makes that any initial shock to compound over time.
According to these projections, by the end of this century (2080’s) the overall GDP losses could vary within a wide range comprised between a minimum of 0.03 % and 0.62 % of baseline GDP for the scenarios Prudent+productivity and Myopic, respectively. Expressed in absolute terms these GDP losses correspond to €8 billion and to €180 billion in 2080’s, for the two scenarios respec-tively. As for GDP, the two Prudent scenarios are those with the smallest losses, in short, medium and long-term. The differences with the Myopic scenarios becomes significant, especially in the long-term, both for the average impacts and the distribution. A closer look at the distribution of the GDP impacts reveals that, in our worst-case scenario, in 2080’s, the mean annuitized GDP impacts for Europe in 2080’s have a 10 % chance of exceed-ing €194 billion and a 1 % chance of exceeding €258 billion. By assuming that the new installed capital assets embody a more productive technology generate significantly smaller losses. Especially in the Prudent scenario GDP losses are half as much. However, as mentioned in the previous section, this scenario, i.e. Prudent+productivity, is extremely optimistic, almost unrealistic. If we assume that, more realistically, that the duration of the recovery process depends on the resources available for recon-struction and the institutional efficiency, those improvements are totally lost.
175
2022

In terms of welfare, the losses range from a minimum of 0.52 % to a maximum of 0.66 % of consumption in 2080’s. In the two Prudent scenarios, the households suffer an immediate, short-term effect on welfare because households spend for the repair-ing and give up other spending, which decreases their level of welfare. Around 2020’s, welfare losses are larger for the Prudent scenarios. However, in the long-term the compounding of the shocks in the Myopic scenario generates larger losses of GDP and a faster decline of household income, consumption, along with their living standards.
At regional level, most affected regions are in the South, which comprises Bulgaria, Greece, Italy, Malta, Portugal and Spain, and Ireland with GDP losses amounting to 0.02 % – 1.22 % and 0.18 % – 1.43 % of GDP respectively, i.e. €1.7 billion – €90 billion and €1.8 billion – €15 billion respectively, in 2080’s. In Centre-south (France, Romania and Slovenia) and North (Denmark, Estonia, Finland, Latvia, Lithuania and Sweden) regions the impacts are around half as much, in the range 0.01 % to 0.45 % and 0.07 % to 0.73 % of GDP, or from €0.8 billion to €24 billion and from €2 billion to 22 billion in 2080’s, but with a larger uncertainty. In the North, impacts have 1 % chance of being more than 50 % larger than mean impacts, while in Centre-south the same increase is around 20 %. In the Centre-north (Belgium, Germany, Nederland and Poland) the estimated impacts are the smallest of the five analysed regions in 2080’s, on average less than half of the impacts estimated for Europe in the range from 0.01 % to 0.21 % of GDP, from €1.3 billion to €24 billion in 2080’s. However, the results for Centre-north region have the largest uncertainty. In 1 % of the analysed cases, impacts result close to €150 billion.
Figure 6.19 shows the impacts on GDP at country level for the six scenarios. Most affected countries are Greece, Cyprus and Croatia with losses of 0.91 % –17 %, 0-4.4 % and -1.15 % – 2.74 % of GDP in 2080’s.
In some of the countries, i.e. Bulgaria, Estonia, Spain, Croatia, Lithuania, Latvia. Malta, Poland, Romania and Slovenia, the model projects gains in GDP in the long term, only for the Prudent sce-narios. These countries are those with largest productivity gaps and therefore a reconstruction with edge technology would yield largest comparative advantages. However, as already discussed previously, these predictions correspond to a very optimistic scenario.
Figure 6.20 shows the welfare loss by country. As for the GDP losses, the welfare losses reveal a similar geographical pattern, with Southern countries, i.e. Cyprus, Greece, Italy, Malta, Portugal and Spain, plus Ireland having the largest average losses, while Centre-north, i.e. Belgium, Germany and Poland, the smallest. While for aggregate Europe, the Prudent scenarios present higher welfare losses in the short-term compared to Myopic, this is not entirely true for results at country level. In fact, both in North and Centre-south, the largest welfare losses of the Prudent scenarios persist also in 2050 and 2080. For some North or Southern-centre countries, i.e. Belgium, Romania and Sweden among others, both the frequency and intensity of the inundations are expected to increase in farer future compared to other countries, where this happens more gradually throughout all the century, and therefore the economic damages do not have enough time in our projec-tions, which stops in 2100, to compound.
6.6.3 CONCLUSIONS
The majority of the impacts come from damages to residential properties, as they affect the consumption vs. saving household decision. The two sets of analysed scenarios Prudent and Myopic give very different results. For the impacts on GDP, Myopic scenar-ios always have larger impacts in all regions. However, for welfare impacts this is not observed for North and Centre-south regions, which reveals a trade-off between GDP and Welfare impacts. This trade-off is observed also for the other regions, but only in the short/medium term.
The analysed scenarios represent two extreme cases, as house-holds most probably will make a decision that lies somewhere in between using up their savings to smooth consumption over their lifetime or temporary giving up their welfare in order to preserve their assets. However, these results are indicative of how signifi-cant is this particular issue with respect to sea-level rise impacts and how large is the scope for policies that aim at macro financial stability and at improving both firms and households economic resilience through savings and insurance.
The physical impact of climate change has not only a direct con-sequence on economic growth via a lower productivity of the damaged assets, but also affects other relevant macroeconomic variables, such as credit availability for instance. The results of this study suggest that the link between macro-financial varia-bles and climate impacts are probably stronger than previously thought and should deserve more attention, e.g. within the frame-work of relevant monetary policies.
With regard to a scenario where the destructive event could have a positive economic effect via the higher productivity of the new installed assets with respect to those that are replaced, the pre-dictions tend to suggest a large scope for policies that promote a prudent behaviour, i.e. insurance against disaster, and particularly the technology transfer among countries. This calls for coopera-tion between coastal regions and islands sharing common needs in the same sea basin to develop adaptation strategies and joint approaches to maritime spatial planning.
The results from this study also suggests that GDP and wel-fare losses reveal a similar geographical pattern, with Southern European countries experiencing larger losses, while countries in Centre-north of Europe, i.e. Belgium, Germany and Poland, the smallest. As most of EU-27 global wealth and population is con-centrated on its coastline, an increasing flood hazard will neces-sarily require the adoption of risk mitigation policy and precise economic and social adaptation measures. Furthermore, Member States may address these challenges with long-term planning to phase in investments, with support from EU funds. These invest-ments should consider nature-based solutions and measures to adapt the economies of the coastal areas taking advantage of the opportunities offered by the Sustainable Blue Economy.
176
THE
EU B
LUE
ECO
NO
MY
REPO
RT

Figure 6.19 Distribution of impacts on GDP the 6 analysed scenarios ( % of GDP annuitized)
Note: Losses of GDP (bars) are compared to the baseline scenario that does not account for coastal flood losses. Whiskers report the standard deviation of the overall sample.
Source: JRC.
Figure 6.20 Distribution of impacts on Welfare in the 6 analysed scenarios ( % of consumption; annuitized)
Note: Losses of welfare (bars) are compared to the baseline scenario that does not account for coastal flood losses. Whiskers report the standard deviation of the overall sample.
Source: JRC.
177
2022

C h A p T E R 7R E G I O N A L
A N D I N T E R N AT I O N A L A N A LY S E S

This chapter is split into two main sections. The first section pro-vides an overview of the impact of the Blue Economy in the EU at sea basin level. The section presents results for employment and GVA at sea basin level resulting from the seven Blue Economy established sectors. Consequently, an overview of recent policy developments in the Mediterranean Sea basin is presented. In this year’s edition, the Blue Economy Report touches up on the Outermost Regions for the first time, which constitutes the fol-lowing section. As a result of Russia’s invasion of Ukraine, the economic performance of Blue Economy sectors is expected to be affected. This aggression and the evolving security situation in the Black Sea has resulted in disruption of fishing activities. A fishing ban was introduced in some areas of the Black Sea, i.e. Romanian waters bordering Ukraine in Danube Delta, and both Member States as well as other riparian countries (Turkey) issued security warnings. However, at the moment of drafting this report, there is no specific analysis for the moment as the situation is rapidly evolving. Lastly, on the international front, this chapter also explores the Blue Economy of Norway.
Table 7.1 Member States participating in the different sea basins and strategies809
809 Some of the Sea basins may include third states, which are not indicated in the table (e.g. Western Balkans and Northern African countries).
7.1 THE BLUE ECONOMY IN THE EU SEA BASINSSea basins
It is also important to know the extent of Blue Economy activi-ties by sea basin to be able to determine the effects of the Blue Economy at a regional level. The various European sea basins are distinct from one another, based on geography, prevailing biodiversity and governance. These distinct features offer differ-ent opportunities and potentials for further Blue Economy devel-opments but may also present certain threats and weaknesses. Hence, it is relevant to analyse the socio-economic specificities of the Blue Economy in each sea basin as well as the strategies and common approaches taken by Member States.
Sea basin strategies:
• Atlantic: Atlantic Strategy• Western Mediterranean: Initiative for the sustainable
development of the Blue Economy in the Western Mediterranean – WestMED
• Black Sea: Common Maritime Agenda for the Black Sea
Macro-regional strategies:
• Adriatic and Ionian Seas: EU Strategy for the Adriatic and Ionian Region – EUSAIR
• Baltic Sea: EU Strategy for the Baltic Sea Region – EUSBSR
Context
The term ‘sea basin strategy’ refers to an integrated framework to address common marine and maritime challenges faced by Member States in a sea basin or in one or more sub-sea basins. Sea basin strategies also promote cooperation and coordination in order to achieve economic, social and territorial cohesion. The Commission develops these strategies in cooperation with the Member States concerned, their regions and other stakeholders as appropriate (e.g. third countries). The strategies encompass existing inter-governmental and interregional initiatives and are implemented by Regional Seas Conventions, other regional bodies and multi-level governance structures as they move from political declarations to integrated projects and investments.
Northern Waters MediterraneanBlack Sea
Atlantic North Sea Baltic Sea Mediterranean West MED East MED Adriatic-Ionian
Strategy Sea basin Strategy Sea basin Strategy Sea (sub)-basin Strategy Sea basin
ES BE DE CY ES CY EL BG
FR DE DK EL FR EL HR RO
IE NL EE ES IT IT
PT DK FI FR MT SI
SE LT HR PT
FR LV IT
PL MT
SE SI
Source: Own elaboration.
180
THE
EU B
LUE
ECO
NO
MY
REPO
RT

As regards the abovementioned Macro-regional strategies, they are intended to cover a broader thematic scope for territorial cooperation, which can include a maritime component. Specifically, EUSAIR involves 9 countries, including four EU Member States (Croatia, Greece, Italy and Slovenia) and five Accession Countries (Albania, Bosnia and Herzegovina, Montenegro, North Macedonia Serbia). Its main objectives revolve around marine and maritime growth; connecting the region; environmental quality; and sustain-able tourism. As regards EUSBSR, it involves 8 EU Member States (Estonia, Denmark, Finland, Germany Latvia, Lithuania, Poland and Sweden) and promotes cooperation with non-EU neighbour-ing countries. Its statutory objectives are to save the sea from hazardous substances and excess nutrients, develop energy and transport connectivity, and increase prosperity in the region.
It is important to note that Member States may participate in multiple strategies: some strategies may cover more than one sea basin and/or may overlap with other strategies/sea basins.
Beyond that, this report features basins that are not incorporated into any regional strategy, to provide grounds for comparison of socio-economic performance indicators across different spatial levels and their evolution over time. Hence, in addition to the Adriatic-Ionian Sea, the Atlantic, the Baltic Sea, the Black Sea, and the Western Mediterranean Sea, the North Sea, the Mediterranean (as a whole) and the Eastern Mediterranean are also presented in this section.
Size
To assess the size of the Blue Economy by sea basin and strat-egy, this section presents estimations of employment and GVA for the countries participating in the different sea basins and EU strategies.
Hence, it can be seen that in the Mediterranean Sea basin there are 8 MS with a blue economy that employed 2.6 million per-sons and generated €93.9 billion of GVA. The EU countries with the largest blue economy in the Mediterranean Sea are Spain (906 thousand persons employed and €32.8 billion of GVA), Italy (532 thousand persons and €24.4 billion), and France (374 thou-sand persons and €22.4 billion). However, it should be noted that not all the employment and GVA in Spain and France is solely generated in the Mediterranean Sea basin. Section 7.1.4 further explores the EU Outermost Regions.
The Mediterranean Sea basin is followed in terms of employment by the West-Med with 5 MS employing 2.1 million persons and a GVA of €86.3 billion generated; and the Atlantic strategy with 4 MS employing 1.6 million persons and €63.9 billion.
7.1.1 DISTRIBUTION OF THE BLUE ECONOMY SECTORS BY SEA BASINTo assess the specific size of the Blue Economy taking place in each sea basin is necessary to know how the different blue econ-omy sectors are distributed.
It is important not only important to analyse the Blue Economy at the national level, but also to analyse it at different geographical levels such as coastal community, NUTS2, NUTS3 and sea basin. Each geographical level provides different information to help pol-icy-makers. Due to the need of very detailed data and analyses, as well as to the extension of this report, specific analysis at coastal community, and island-level (NUTS2 and NUTS3) are out of the scope of this publication. Nevertheless, collecting and dis-aggregating data at those levels ensure a more precise analysis at sea basin level.
However, collecting and disaggregating data as well as linking them to sea basins is not always a straightforward exercise due to the nature of some Blue Economy activities. Let us not forget that we consider Blue Economy all sectoral and cross-sectoral economic activities based on or related to the oceans, seas and coasts. As such, Blue Economy activities can be classified as:
Figure 7.1 Persons employed (in thousands) by Member States participating in the different sea basins and strategies in 2019
Source: Own elaboration from Eurostat and DCF data.
Figure 7.2 Gross value added (in € billion) by Member States participating in the different sea basins and strategies in 2019
Source: Own elaboration from Eurostat and DCF data.
181
2022

• Marine-based activities: include the activities undertaken in the ocean, sea, insular and coastal areas, such as capture fisheries and aquaculture in Marine living resources, extrac-tion of oil and gas and of other minerals in Marine miner-als, production of electricity in Marine renewable energy, Desalination, Maritime transport and Coastal tourism.
• Marine-related activities: activities which use products and/or produce products and services from the ocean or marine-based activities like seafood processing and distribution as well as biotechnology in Marine living resources, Shipbuilding and repair, Port activities, technology and equipment, digital services, etc.
Thus, while marine-based activities take place in the sea or by the sea, that is not the case for marine-related activities, which can be undertaken hundreds or even thousands of kilometres from where the marine products originated (e.g. seafood processing and distribution) or from where they are going to be used (e.g. building an engine for a vessel).
This implies that often marine-based activities are easier to allo-cate to precise marine or coastal locations and therefore sea basins, while this can prove more difficult for some marine-re-lated activities. For example, it is challenging to allocate to a cer-tain sea basin the seafood consumption taking place in inland areas, such as Paris or Madrid.
For most marine-based activities and some marine-related activ-ities – such as aquaculture, offshore wind energy, desalination, shipbuilding and Coastal tourism – it should be possible to map where the activity takes place and so which coastal areas bene-fit from it. For some other activities such as Maritime transport and capture fisheries we can link the economic activity to the inbound and outbound ports, and from the port to the NUTS2 and NUTS3. Unfortunately, this is still an on-going analysis an only preliminary outcomes can be provided at this stage. Moreover, we only have complete data for the established sectors, i.e. Coastal tourism, Marine living resources, Marine non-living resources, Marine renewable energy, Maritime transport, Port activities, and Shipbuilding and repair.
Coastal tourism
Coastal tourism is generally higher in southern EU Member States, which are generally more conducive to beach holidays due to cli-matic conditions. In 2019, for instance, coastal areas accounted for more than three quarters of the total nights spent in tour-ist accommodation across Malta (100 %), Cyprus (97 %), Greece (96 %), Spain (96 %), Croatia (93 %), Denmark (91 %), Portugal (84 %), Latvia (83 %) and Estonia (78 %).
Coastal tourism is the main Blue Economy sector in the EU. It accounted for 63 % of the jobs and 44 % of the GVA in the over-all EU Blue Economy in 2019. Spain leads Coastal tourism with 25 % of the jobs and 30 % of the GVA, followed by Greece, Italy and France.
810 Fosse, J. & Le Tellier, J. (2017). Sustainable Tourism in the Mediterranean: State of Play and Strategic Directions. Plan Bleu. Valbonne. (Plan Bleu Paper, 17).
811 STECF (2021). The 2021 Annual Economic Report on the EU Fishing Fleet (STECF 21-08). EUR 28359 EN, Publications Office of the European Union, Luxembourg.
The Spanish Blue Economy is dominated by Coastal tourism, which contributed 78 % to Blue Economy jobs and 72 % to GVA in 2019. Similarly, the Blue Economy in France is dominated by Coastal tourism, which contributed with 54 % of the Blue Economy jobs and 51 % of the GVA in 2019. Hence, the importance to obtain adequate estimates to split the coastal tourism sector between Atlantic and Mediterranean for Spain and France.
Preliminary estimates suggest that 70-75 % of the total coastal tourism in Spain took place in the Mediterranean, while 25-30 % took place in the Atlantic Sea basin, which includes the Canary Islands with about 20 % of the total coastal tour-ism. The development of coastal tourism has often been detri-mental to environmental integrity and social equity, particularly in the Mediterranean. Hence, the establishment of sustainability frameworks such as the Mediterranean Strategy for Sustainable Development 2016-2025 and the Regional Action Plan on Sustainable Consumption and Production for the Mediterranean (SCP AP), aiming to promote an inclusive socio-economic develop-ment in the region while taking into account the carrying capacity of healthy natural ecosystems810.
Marine living resources
Fishing fleet
The main fishing grounds for the EU fishing fleet are located FAO fishing areas 27 (Northeast Atlantic, Baltic and North seas) and FAO 37 (Mediterranean and Black seas). Part of the EU fleet also operates in fishing areas much further afield. These areas, includ-ing EU Outermost Regions, are collectively termed ‘Other Fishing Regions’. According to STECF811:
The North Sea & Eastern Arctic region (NSEA), is comprises ICES areas 27.1, 27.2, 27.3a, 27.4, 27.5, and 27.7d. The revenue gen-erated by the NSEA fleet in 2019 was estimated at about €1.5 billion, with a GVA produced estimated at about €817 million. The Danish fleet was the most important in terms of both landed weight (498 thousand tonnes) and landed value (€350 million). Furthermore, the Dutch fleet is also an important contributor. The share of the French, German, Swedish and Belgian fleets is con-siderably lower, but except for the French fleet, the region itself is of major importance for these national fleets. Based on the value of landings, the North Sea & Eastern Arctic region is a very important fishing region for Denmark (86 % of total landings), the Netherlands (78 %), Germany (65 %), Sweden (43 %) and Belgium (38 %).
The Baltic Sea covers ICES areas 27.3b, c and d, and is bounded by the Swedish part of the Scandinavian Peninsula, mainland Europe and the Danish islands. The revenue generated by the EU Baltic Sea fleet in 2019 was estimated at almost €224 million, with a GVA over €122 million. Eight Member States were involved in Baltic Sea fisheries in 2019: Denmark, Estonia, Finland, Germany, Latvia, Lithuania, Poland and Sweden. Most of the Member States bordering the Baltic Sea are highly dependent on the region, where the main species targeted include herring, sprat and cod.
182
THE
EU B
LUE
ECO
NO
MY
REPO
RT

The North Western Waters (NWW) cover the Atlantic ICES areas 5, 6 and 7. The revenue (income from landings and other income) generated in the NWW was estimated at €1.06 billion, with a GVA oft €542 million. The Member States fishing in the NWW are Belgium, Denmark, France, Germany, Ireland, Lithuania, the Netherlands, Sweden, Portugal and Spain. The main fleets oper-ating in 2019 were from France and Ireland. The Netherlands, Spain, Belgium and Denmark also conduct part of their fishing activity in the NWW.
The Southern Western Waters (SWW) covers the Atlantic zone run-ning from the tip of Brittany in the North, to the Strait of Gibraltar in the south and including the Outermost Regions of Madeira, the Azores and the Canary Islands (ICES areas 8, 9 and 10, and the COPACE divisions 34.1.1., 34.1.2, 34.2.0). In 2019, the EU fleet operating in the SWW generated over €1.2 billion in revenue and €708 million in GVA. The main fleets operating in the region were the Spanish, French, and Portuguese. Besides those, four more EU fleets operated in the region in 2019: Ireland, Belgium, Denmark and the Netherlands, yet having limited fishing activity in the region.
The Mediterranean region covers FAO fishing areas 37.1, 37.2, and 37.3, and nine Member States: Croatia, Cyprus, France, Greece, Italy, Malta, Portugal, Slovenia, and Spain. The Mediterranean fleet accounted for 58 % of all EU vessels and 46 % of the EU employment (FTE) in 2019. The Mediterranean fleet also contrib-uted to 10 % of the EU landings in weight and 30 % in value. For Spain and France, the percentage of landings in weight originated from Mediterranean waters was less than 10 %, and marginal for Portugal. The revenue was estimated at €1.82 billion and GVA to €1.12 billion in 2019.
The Black Sea region covers FAO fishing area 37.4. Bulgaria and Romania are involved in the Black Sea fisheries. All landings by the Bulgarian and Romanian fishing fleets originate only from the Black Sea. Revenue was estimated at €10.5 million and GVA at €7.4 million in 2019.
Overall, around 17 % of the EU fleet’s activity in terms of land-ings in weight and 15 % in value came from fishing operations in Other Fishing Regions (OFR) in 2019. While for the majority of the Member States’ fleets fishing activity in OFR is low or null for oth-ers, the share of landings from activity in OFR can be substantial. Spain (58 % of landings in weight), France (24 %) and Portugal (14 %) are relatively dependent on these fishing areas for their fishing activity, while Italy, Germany and the Netherlands are less dependent, with around 3 % of their landings in weight coming from the OFR in 2019.
Thus, according to these STECF data812, the value of landings from the Mediterranean Sea represented about 10 % of the total French landings, 74 % from the North Atlantic Ocean, and 16 % from the other Fishing regions; in terms of employment, they represented 15 %, 58 % and 27 %, respectively. For Spain, the Mediterranean Sea represented about 16 % of the total Spanish
812 STECF (2021). The 2021 Annual Economic Report on the EU Fishing Fleet (STECF 21-08). EUR 28359 EN, Publications Office of the European Union, Luxembourg.813 STECF (Scientific, Technical and Economic Committee for Fisheries). The EU Aquaculture Sector – Economic report 2020 (STECF-20-12). Publications Office of the European
Union: Luxembourg, 2021.814 FAO (2022). FishStatJ – Software for Fishery and Aquaculture Statistical Time Series Rome: Food and Agricultural Organization of the United Nations.815 Joint Research Centre (JRC) (2015). EU Offshore Authorities Group – Web Portal: Offshore Oil and Gas Production. https://euoag.jrc.ec.europa.eu/node/63
landings in value, 43 % for the North Atlantic Ocean, and 41 % for the other Fishing regions; in terms of employment, they repre-sented 22 %, 61 % and 17 %, respectively.
Aquaculture
The EU aquaculture sector reached 1.2 million tonnes in sales weight and €4.1 billion in turnover in 2018. EU aquaculture pro-duction is mainly concentrated in four countries: Spain (27 %), France (18 %), Italy (12 %), and Greece (11 %), making up 69 % of the sales weight and 62 % of the turnover in the EU-27813.
According to FAO data814, the value of the French aquaculture production from the Mediterranean Sea represented about 10 % of the total French aquaculture production, 69 % the Northeast Atlantic Ocean production, and 21 % for the freshwater aquacul-ture. While for Spain, the Mediterranean Sea represented about 46 % of the total Spanish aquaculture production in value, 44 % the Atlantic Ocean production (including 8 % from the Canary Islands), and 9 % for the freshwater aquaculture.
Processing and distribution
The EU self-sufficiency in seafood products is around 30 %. In other words, EU countries consume more than three times more than they produced. Thus, the processing and distribution sectors are very dependent on global fish markets.
Compared to the production from the fishing fleets and the aqua-culture sectors, which are marine-based activities, it is rather chal-lenging to allocate these marine-related activities to a sea basin given where the activity takes place and the origin of the product (e.g. inland and imports, respectively).
Marine non-living resources
More than 80 % of the current European oil and gas production takes place offshore, mainly in the North Sea and to a lesser extent in the Mediterranean and Black Seas. Offshore produc-tion in the North Sea is carried out by Denmark, the Netherlands, Germany and Ireland. Offshore production occurs in the Baltic mainly along the Polish coast and in the Mediterranean on the continental shelf in Greece, Spain and Croatia. Romania and Bulgaria are hydrocarbon (oil and gas) producers in the Black Sea. Increasing exploration plans are foreseen for the Mediterranean region (in the Cypriot, Greek and Maltese continental shelves), the Black Sea (Bulgarian and Romanian continental shelves) as well as for the Atlantic East coast (Portuguese continental shelf)815.
Italy established a moratorium on offshore oil and gas exploration permits, as well as a sharp increase in fees payable on upstream concessions, with the aim to prioritise renewable energy develop-ments and move towards decarbonisation.
183
2022

Figure 7.3 A) Total goods inbound and outbound by NUTS3. B) Total passengers inbound and outbound by NUTS3
Source: Own elaboration from Eurostat data.
In the EU in 2019, the dependency rate was equal to 61 %, which means that more than half of the EU’s energy needs were met by net imports. The main imported energy product was petro-leum products (including crude oil, which is the main component), accounting for almost two thirds of energy imports into the EU, followed by gas (27 %) and solid fossil fuels (6 %). The main exporter to the EU is Russia, followed by Norway (see introduction of Chapter 4 on the ‛EU sanctions against Russia following the invasion of Ukraine’816).
Maritime transport and Port activities
For Port activities, it is possible to allocate the activity that takes place in the EU ports by looking at the inbound and outbound cargo and passengers by port817. Likewise, the inbound and out-bound cargo and passengers by port can provide an approximation of where the maritime transport takes place.
The top 15 EU ports in terms of cargo capacity (2021 data) are, in this order: Rotterdam (NL), Antwerp (BE), Hamburg (DE), Valencia (ES), Piraeus (EL), Bremerhaven (DE), Algeciras (ES), Barcelona (ES), Gioia Tauro (IT), Le Havre/Rouen (FR), Marsaxlokk (MT), Genoa (IT), Gdansk (PL), Zeebrugge (BE), Sines (PT).
The three Spanish ports that appear in this list are all Mediterranean. In Figure 4.19.A, we can find two other Spanish ports (Las Palmas and Bilbao) in position 16 and 20, which are in the Atlantic basin. Thus, the majority of the cargo enters Spain through its Mediterranean ports.
816 https://ec.europa.eu/info/strategy/priorities-2019-2024/stronger-europe-world/eu-solidarity-ukraine/eu-sanctions-against-russia-following-invasion-ukraine_en 817 European Environment Agency, European Maritime Safety Agency, European maritime transport environmental report 2021, Publications Office, 2021,
https://data.europa.eu/doi/10.2800/650762818 We are aware that it is not always straight forward to link where the activity takes place, the port of origin and arrival and where the company or vessel
are registered. Holmes, S., Natale, F., Gibin, M., Guillen, J., Alessandrini, A., Vespe, M., & Osio, G. C. (2020). Where did the vessels go? An analysis of the EU fishing fleet gravitation between home ports, fishing grounds, landing ports and markets. Plos one, 15(5), e0230494.
While when looking at the Top 20 EU ports by number of pas-sengers (Figure 4.19.c), appears the port of Palma de Mallorca (Mediterranean), followed by the Santa Cruz de Tenerife (Atlantic). Here, it can also be expected a majority of passengers in Mediterranean ports considering other important passenger des-tinations in the Mediterranean such as Barcelona and Valencia.
The cargo and passengers by port can also be allocated the NUTS2 and NUTS3 regions where the ports are (see Figure 7.3)818.
Shipbuilding and repair
The European Shipbuilding industry is currently composed of approximately 300 shipyards specialised in building and repairing the most complex and technologically advanced civilian and naval ships and platforms and other hardware for maritime applica-tions. The industry generates a production value of about €42.9 billion yearly and directly employs approximately 300 000 people in Europe.
It should be feasible to geo-locate where are the main EU shipping yards, which would help to provide a more accurate distribution of where the activity takes place.
184
THE
EU B
LUE
ECO
NO
MY
REPO
RT

Source: European Environment Agency819. Reference data: ©ESRI.
Marine renewable energy
Offshore wind energy is currently the only commercial deploy-ment of a marine renewable energy with wide-scale adoption. The EU currently has a total installed offshore wind capacity of 16.3 GW across 10 countries820. The main EU producers of off-shore wind energy are Germany, the Netherlands, Belgium and Denmark.
It should be feasible to geo-locate where are the main offshore wind farms, which would help to provide a more accurate distri-bution of where the activity takes place.
Desalination
Desalination plants are typically concentrated in the proximity of the coastline. About 65 % of the operational plants in the EU are located in coastal areas or offshore. Coastal desalination plants also tend to be larger than inland desalination plants. The off-shore plants support offshore activities, mostly oil and gas fields. The inland plants are used for the production of drinking water and industrial water; often through a process of purification of saline/brackish water present in local aquifers.
More than ¾ of the desalination capacity in Europe is located in the Mediterranean Sea basin, as illustrated in Figure 7.4. According to DesalData, Spain holds 65 % of the desalination capacity in the EU, with the remaining being located mainly in: Italy (7.5 %), France (3.5 %), Cyprus (3.4 %), Malta (2.9 %) and Greece (2.8 %). Desalination plants located in Northern European countries such as Germany (4 %), the Netherlands (3.8 %), Belgium (1.9 %) and Ireland (1.1 %) are mainly connected to the production of drink-ing water and industrial water. Most of the large and extra-large plants commissioned between 2000 and 2010 were built to serve large coastal cities such as Barcelona and Alicante in the Spanish Mediterranean.
819 European Environment Agency (EEA), 2021. Water resources across Europe – confronting water stress: an updated assessment. EEA Report No 12/2021.820 JRC analysis based on GWEC (2021) Global Offshore Wind Report 2021 and 4C OFFSHORE (2022) WIND FARMS DATABASE.
For Spain, more than 90 % of the coastal desalination takes place in the Mediterranean. For the Atlantic Sea basin, the activity in the Canary Islands is very relevant. While in France, the desalina-tion activity in both the Atlantic and the Mediterranean is rather similar.
7.1.2 THE BLUE ECONOMY IN THE SEA BASINS: FACTS AND FIGURESIn this section, estimates on the size and distribution of the estab-lished sectors in terms of GVA and employment across sea basins based on the importance of each sector in each sea basin are provided.
The goal is to give an indication of the relative size of each sea basin and its specialisation in terms of activities. Figures should thus not be taken as precise values but as an indication of their magnitude.
The national values of the Blue Economy and their sectors have been assigned to the corresponding sea basin and subsequently aggregated. For Member States with access to more than one sea basin, the distribution of each blue economy sector per sea basin, as shown in previous section, has been used. For those cases where the distributions were not available, the proportion of the GDP and employment of their coastal NUTS 3 regions belonging to a given sea basin were used to estimate the size of the national Blue Economy corresponding to that sea basin. Further details on the methodology are explained in Annex 3.2.
Figure 7.4 Desalination capacity and technologies in the EU 185
2022

Total Blue Economy 2009 2010 2011 2012 2013 2014 2015 2016 2017 2018 2019
European Union 154 157 153 141 145 144 152 151 164 176 184
Nor
ther
n w
ater
s
Atlantic Ocean 17.2 % 17.6 % 19.2 % 18.5 % 19.0 % 19.2 % 18.6 % 19.2 % 19.2 % 19.7 % 18.9 %
North Sea 24.9 % 25.2 % 25.7 % 27.9 % 27.5 % 27.2 % 27.5 % 26.0 % 26.2 % 25.1 % 25.9 %
Baltic Sea 19.2 % 20.9 % 21.9 % 22.7 % 22.9 % 22.6 % 22.7 % 20.6 % 20.8 % 19.7 % 21.2 %
Med
iter
rane
an Mediterranean 40.6 % 38.9 % 36.4 % 34.0 % 33.7 % 34.2 % 34.4 % 36.5 % 36.2 % 37.4 % 36.4 %
West Mediterranean 15.2 % 14.8 % 15.5 % 14.9 % 15.0 % 14.9 % 14.9 % 15.5 % 15.3 % 16.1 % 15.4 %
Adriatic-Ionian Sea 17.9 % 16.5 % 13.8 % 12.1 % 12.1 % 12.6 % 12.6 % 13.5 % 13.8 % 13.8 % 13.7 %
East Mediterranean 9.2 % 7.1 % 5.5 % 4.1 % 4.4 % 4.8 % 4.4 % 4.9 % 5.3 % 5.2 % 5.1 %
Black Sea 1.6 % 1.3 % 1.4 % 1.0 % 1.0 % 0.9 % 1.0 % 1.2 % 1.0 % 1.2 % 1.1 %
Table 7.2. The EU Blue Economy by sea basin, GVA, € billion
Source: Own elaboration from Eurostat (SBS) and DCF data.
Table 7.3 The EU Blue Economy by sea basin, employment, person thousand
Source: Own elaboration from Eurostat (SBS) and DCF data.
Figure 7.5 The EU Blue Economy by sea basin, 2019
Source: Own elaboration from Eurostat (SBS) and DCF data.
Employment, person thousand GVA, € billion
0
500
1 000
1 500
2 000
2 500
Atla
ntic
Nor
th S
ea
Bal
tic
ME
D
Wes
tMED
Adr
iatic
- Io
nian
Eas
t MED
Bla
ck S
ea
Nothern waters Mediterranean
01020304050607080
Atla
ntic
Nor
th S
ea
Bal
tic
ME
D
Wes
tMED
Adr
iatic
- Io
nian
Eas
t MED
Bla
ck S
ea
Nothern waters Mediterranean
Total Blue Economy 2009 2010 2011 2012 2013 2014 2015 2016 2017 2018 2019
European Union 4428 4158 3812 3488 3563 3619 3580 3800 3993 4481 4449
Nor
ther
n w
ater
s
Atlantic Ocean 18 % 18 % 19 % 20 % 21 % 20 % 20 % 20 % 20 % 20 % 20 %
North Sea 13 % 14 % 15 % 16 % 16 % 16 % 17 % 16 % 16 % 16 % 16 %
Baltic Sea 15 % 16 % 17 % 18 % 18 % 18 % 19 % 18 % 18 % 16 % 16 %
Med
iter
rane
an
Mediterranean 47 % 46 % 43 % 43 % 42 % 43 % 42 % 43 % 44 % 46 % 46 %
West Mediterranean 16 % 15 % 16 % 16 % 16 % 16 % 16 % 16 % 16 % 16 % 16 %
Adriatic-Ionian Sea 24 % 24 % 20 % 19 % 19 % 21 % 19 % 20 % 21 % 23 % 23 %
East Mediterranean 13 % 12 % 10 % 8 % 9 % 11 % 10 % 11 % 12 % 14 % 14 %
Black Sea 8 % 7 % 7 % 4 % 4 % 4 % 4 % 4 % 3 % 4 % 4 %
186
THE
EU B
LUE
ECO
NO
MY
REPO
RT

In 2019, the largest sea basin in terms of GVA was the Mediterranean (€67 billion or 36 % of the EU Blue Economy GVA), followed by the North Sea (€47.7 billion, 26 %). Similarly in terms of employment: 46 % of the Blue Economy employment is located in the Mediterranean (2.05 million employees) and 23 % in the Adriatic-Ionian Sea (1.02 million employees).
The size of the Blue Economy in the Eastern Mediterranean and the Black Sea is much smaller relative to the overall EU Blue Economy (Table 7.2 and Table 7.3).
In terms of evolution, the economy (for both GVA and employ-ment) in the Mediterranean Sea basins is driven by the evolu-tion of Coastal tourism. On the other hand, the expansion in the Northern waters seems rather contained, particularly in terms of GVA; mainly due to the contraction of the Marine Non-living resources (see Section 4.2).
Northern waters
Given the size of the ports of Rotterdam, Antwerp and Hamburg and the importance of the extraction of crude oil by Denmark and the Netherlands, there is a certain degree of concentration in these sectors, in particular in terms of GVA, although Coastal tour-ism remains the main sector. Having said this, some particularities are observed in each sea basin of the Northern waters.
The Blue Economy in the Atlantic Ocean generated €34.9 bil-lion of GVA and employed 0.89 million people in 2019. The GVA is generated mainly by Coastal tourism (€20.4 billion), followed by Living resources (€6.5 billion) and Port activities (€3.5 bil-lion). In terms of employment, Coastal tourism (0.6 million peo-ple) employs more than all the other sectors combined. Living resources (0.18 million people), Shipbuilding and repair (0.04 million people) and Port activities (0.04 million people) are also sectors offering significant employment opportunities (Figure 7.3).
In the North Sea, the importance of large ports makes Maritime transport and Port activities the main sectors in terms of GVA (€14 billion and €12 billion, respectively) and the second and third ones in terms of employment (0.14 and 0.12 million people, respectively) behind Coastal tourism (0.28 million people). Coastal tourism is also relatively important in terms of GVA (€10 billion).
In the Baltic Sea, while Coastal tourism is (€11 billion GVA and 0.35 million jobs) also the main Blue Economy sector in terms of employment, a somewhat even distribution of activities can be observed. In terms of GVA, Maritime transport is the most impor-tant sector (€13 billion) in 2019.
Figure 7.6 The Atlantic Ocean Strategy Blue Economy by sector, 2019
Source: Own elaboration from Eurostat (SBS) and DCF data.
Employment, person thousand GVA, € billion
0100200300400500600700
Coas
tal t
ouris
m
Mar
ine
livin
gre
sour
ces
Mar
ine
non-
livin
gre
sour
ces
Mar
ine
rene
wab
leen
ergy
Mar
itim
e tr
ansp
ort
Port
act
iviti
es
Ship
build
ing
and
repa
ir
0
5
10
15
20
25
Coas
tal t
ouris
m
Mar
ine
livin
gre
sour
ces
Mar
ine
non-
livin
gre
sour
ces
Mar
ine
rene
wab
leen
ergy
Mar
itim
e tr
ansp
ort
Port
act
iviti
es
Ship
build
ing
and
repa
ir
Figure 7.7 The North Sea basin Blue Economy by sector, 2019
Source: Own elaboration from Eurostat (SBS) and DCF data.
Employment, person thousand GVA, € billion
0
50
100
150
200
250
300
Coas
tal t
ouris
m
Mar
ine
livin
gre
sour
ces
Mar
ine
non-
livin
gre
sour
ces
Mar
ine
rene
wab
leen
ergy
Mar
itim
e tr
ansp
ort
Port
act
iviti
es
Ship
build
ing
and
repa
ir
02468
10121416
Coas
tal t
ouris
m
Mar
ine
livin
gre
sour
ces
Mar
ine
non-
livin
gre
sour
ces
Mar
ine
rene
wab
leen
ergy
Mar
itim
e tr
ansp
ort
Port
act
iviti
es
Ship
build
ing
and
repa
ir
187
2022

Figure 7.8 The Baltic Sea Strategy Blue Economy by sector, 2019
Source: Own elaboration from Eurostat (SBS) and DCF data.
Employment, person thousand GVA, € billion
050
100150200250300350400
Coas
tal t
ouris
m
Mar
ine
livin
gre
sour
ces
Mar
ine
non-
livin
gre
sour
ces
Mar
ine
rene
wab
leen
ergy
Mar
itim
e tr
ansp
ort
Port
act
iviti
es
Ship
build
ing
and
repa
ir
02468
101214
Coas
tal t
ouris
m
Mar
ine
livin
gre
sour
ces
Mar
ine
non-
livin
gre
sour
ces
Mar
ine
rene
wab
leen
ergy
Mar
itim
e tr
ansp
ort
Port
act
iviti
es
Ship
build
ing
and
repa
ir
Figure 7.9 The Mediterranean Sea basin Blue Economy by sector, 2019
Source: Own elaboration from Eurostat (SBS) and DCF data.
Employment, person thousand GVA, € billion
0200400600800
1 0001 2001 4001 6001 800
Coas
tal t
ouris
m
Mar
ine
livin
gre
sour
ces
Mar
ine
non-
livin
gre
sour
ces
Mar
ine
rene
wab
leen
ergy
Mar
itim
e tr
ansp
ort
Port
act
iviti
es
Ship
build
ing
and
repa
ir
05
1015202530354045
Coas
tal t
ouris
m
Mar
ine
livin
gre
sour
ces
Mar
ine
non-
livin
gre
sour
ces
Mar
ine
rene
wab
leen
ergy
Mar
itim
e tr
ansp
ort
Port
act
iviti
es
Ship
build
ing
and
repa
ir
Mediterranean waters
In the Mediterranean, the Blue Economy generated €67 bil-lion GVA in 2019 and 2.05 million jobs. The key sector is clearly Coastal tourism (€41billion GVA and 1.55 million jobs) followed by Maritime transport (€8 billion GVA) and Port activities (with €7.5 billion of GVA). With small variations, this general structure is also observed across the different sub-basins.
In the West Mediterranean, the Blue Economy generated €28 billion GVA in 2019 and 0.7 million jobs, most of which in the Coastal tourism sector (0.57 million jobs).
In the Adriatic and Ionian Region, the Blue Economy gener-ated €25 billion GVA in 2019 and 1.02 million jobs, mainly in the Coastal tourism sector, followed by Maritime transport, Port activities and Living resources.
In the East Mediterranean basin, the Blue Economy generated €9 billion GVA in 2019 and 0.61 million jobs, mainly in the Coastal tourism sector (0.52 million jobs and €6.4 billion GVA), followed by Maritime transport, Port activities and Living resources.
821 https://www.westmed-initiative.eu/ – Strategy to be reviewed in 2022822 https://www.adriatic-ionian.eu/
In the Black Sea basin, the Blue Economy generated €2 billion GVA in 2019 and 0.16 million jobs, mainly in the Coastal tour-ism sector (0.09 million jobs and €1 billion GVA), followed by Shipbuilding and repair and Port activities.
7.1.3. SEA BASIN INSIGHTS: THE MEDITERRANEAN AND THE EU STRATEGY FOR BALTIC SEA
In this edition of the Blue Economy Report, the emphasis is put on the Mediterranean Sea basin and the Strategy for the Baltic Sea (EUSBSR). Next to EU initiatives such as WestMED821 Sea Basin Strategy, and the EU Macro Regional Strategy for the Adriatic and the Ionian Region (EUSAIR)822, the Union for the Mediterranean (UfM) plays an integral role in interregional cooperation across the Mediterranean. Further, the report also provides a focus on the revised action plan of the EUSBSR.
188
THE
EU B
LUE
ECO
NO
MY
REPO
RT

Figure 7.10 The West Mediterranean Strategy Blue Economy by sector, 2019
Source: Own elaboration from Eurostat (SBS) and DCF data.
Employment, person thousand GVA, € billion
0
100
200
300
400
500
600Co
asta
l tou
rism
Mar
ine
livin
gre
sour
ces
Mar
ine
non-
livin
gre
sour
ces
Mar
ine
rene
wab
leen
ergy
Mar
itim
e tr
ansp
ort
Port
act
iviti
es
Ship
build
ing
and
repa
ir
0
5
10
15
20
25
Coas
tal t
ouris
m
Mar
ine
livin
gre
sour
ces
Mar
ine
non-
livin
gre
sour
ces
Mar
ine
rene
wab
leen
ergy
Mar
itim
e tr
ansp
ort
Port
act
iviti
es
Ship
build
ing
and
repa
ir
Figure 7.11 The Adriatic-Ionian Sea Strategy Blue Economy by sector, 20199
Source: Own elaboration from Eurostat (SBS) and DCF data.
Employment, person thousand GVA, € billion
0100200300400500600700800900
Coas
tal t
ouris
m
Mar
ine
livin
gre
sour
ces
Mar
ine
non-
livin
gre
sour
ces
Mar
ine
rene
wab
leen
ergy
Mar
itim
e tr
ansp
ort
Port
act
iviti
es
Ship
build
ing
and
repa
ir
02468
10121416
Coas
tal t
ouris
m
Mar
ine
livin
gre
sour
ces
Mar
ine
non-
livin
gre
sour
ces
Mar
ine
rene
wab
leen
ergy
Mar
itim
e tr
ansp
ort
Port
act
iviti
es
Ship
build
ing
and
repa
ir
The Union for the Mediterranean
The UfM is an intergovernmental Euro-Mediterranean organisation that fosters cooperation between EU Member States and other Southern and Eastern Mediterranean countries823.
The UfM does not exclusively address the Blue Economy sectors per se, but rather aims to promote stability, human development and integration across the region.
In support for the post COVID-19 recovery, the UfM launched a cross-sector initiative Med4Jobs that specifically target women and youth employability across the programming region824.
Beyond that, the UfM launched a Grant Scheme for Employment Promotion in support of non-profit organisations across the Mediterranean with the aim of strengthening economic resilience, covering the following priority areas825:
823 Albania, Algeria, Bosnia and Herzegovina, Egypt, Israel, Jordan, Lebanon, Mauritania, Monaco, Montenegro, Morocco, Palestine, Syria (suspended its membership in 2011), Tunisia and Turkey.
824 https://ufmsecretariat.org/project/mediterranean-initiative-for-jobs-med4jobs/825 UfM (2021). Vision and Actions to Promote Employment in the Southern Mediterranean: Role and Contribution of the Union for the Mediterranean.826 COM(2021) 240 final.827 UfM (2021). Ministerial Declaration on Sustainable Blue Economy. https://ufmsecretariat.org/wp-content/uploads/2021/02/Declaration-UfM-Blue-Economy-EN-1.pdf
• Improve economic resilience of citizens, particularly vul-nerable groups through employment-related capacity development
• Promote training and skills development, fostering employa-bility and economic activity
• Support entrepreneurial activity and capacity building of micro, small and medium enterprises
Nevertheless, the UfM also has greater relevance in terms of the Blue Economy for the Mediterranean, which is manifested in the second Ministerial declaration on Sustainable Blue Economy which was signed in 2021. The declaration is strongly aligned with the European Commission’s Sustainable Blue Economy Communication826 and reaffirms commitments of participating countries to cooperate closely and to address challenges and opportunities for the sustainability of the Mediterranean Sea and Blue Economy sectors, notably827:
189
2022

• Governance and future of sea basin strategies • Marine research and innovation• Skills, careers and employment • Sustainable food from the sea • Fisheries and aquaculture• Sustainable, climate-neutral and zero-pollution maritime
transport and ports• Interactions between marine litter and the Blue Economy• Coastal and maritime tourism• Maritime spatial planning and integrated coastal zone
management• Marine renewable energies• Maritime safety and security • Sustainable investment in the Blue Economy
828 https://medblueconomyplatform.org/vkc/news/10th-meeting-of-the-ufm-working-group-on-blue-economy-23-march-2022-0b12f5e285/829 UfM (2021) Ministerial Declaration on Energy. https://ufmsecretariat.org/wp-content/uploads/2021/06/3rd-UfM-Ministerial-Declaration-on-Energy-14-June-2021-1.pdf830 UfM (2021). Ministerial Declaration on Environment and Climate Action.831 https://ufmsecretariat.org/first-ufm-ad-hoc-senior-official-meeting-on-research-and-innovation-convenes-for-advancing-a-ministerial-meeting/832 https://ufmsecretariat.org/ufm-meeting-platform-transport-2022/
To guide the implementation of the above-mentioned priorities, a roadmap is currently being drafted828.
Moreover, the UfM agreed on other ministerial declarations in 2021, namely on energy829, on Environment and Climate Action830 and is currently in the process for agreeing on ministe-rial declarations on both Research and Innovation831 as well as Sustainable Transport832.
A new Agenda for the Mediterranean
In terms of regional cooperation in the Mediterranean it is also worth mentioning that in 2021, a new Agenda for the Mediterranean has been defined in the frame of the renewed partnership with the Southern Neighbourhood, fostering a green, digital, resilient and just recovery aligned with UN Sustainable
Figure 7.12 The East Mediterranean Sea basin Blue Economy by sector, 2019
Source: Own elaboration from Eurostat (SBS) and DCF data.
Employment, person thousand GVA, € billion
0
100
200
300
400
500
600Co
asta
l tou
rism
Mar
ine
livin
gre
sour
ces
Mar
ine
non-
livin
gre
sour
ces
Mar
ine
rene
wab
leen
ergy
Mar
itim
e tr
ansp
ort
Port
act
iviti
es
Ship
build
ing
and
repa
ir
-101234567
Coas
tal t
ouris
m
Mar
ine
livin
gre
sour
ces
Mar
ine
non-
livin
gre
sour
ces
Mar
ine
rene
wab
leen
ergy
Mar
itim
e tr
ansp
ort
Port
act
iviti
es
Ship
build
ing
and
repa
ir
Figure 7.13 The Black Sea basin Blue Economy by sector, 2019
Source: Own elaboration from Eurostat (SBS) and DCF data.
Employment, person thousand GVA, € billion
190
THE
EU B
LUE
ECO
NO
MY
REPO
RT

Development Goals833, the Paris Agreement834 and the European Green Deal. The proposed actions of the new Agenda for the Mediterranean cover the following key policy areas835 :
• Human development, good governance and the rule of law• Strengthen resilience, build prosperity and seize the digital
transition• Peace and security• Migration and mobility• Green transition: climate resilience, energy and environment
The EU Strategy for Baltic Sea: Revised action plan836
The EU Baltic Strategy for Baltic Sea region (EUSBSR)837 was the first to be adopted of the four main EU macro-regional sea basins strategies. It is based on a long tradition of cooperation in the region, and it provides an unique platform of coordination between eight EU Member States (Denmark, Estonia, Finland, Germany, Latvia, Lithuania, Poland and Sweden); It also includes collabora-tion with the neighbouring non-EU countries in the region where relevant and appropriate (Belarus, Iceland, Norway and Russia)838.
The revised Action plan, that accompanies the EUSBSR, addresses updated challenges, such as the emerging and increasingly press-ing global challenges (i.e. climate change, pandemics, demographic changes and migration), the EU´s new strategic and governance frameworks and the EU budget. It also assesses the contribution of its policy areas in the strategy to the UN Sustainable Development Goals and into EU policies and funding programmes. The EUSBSR is focus on the engagement of the region’s stakeholder, empowering them to continue to network, cooperate and contribute to policy shaping and development in the region.
Main objectives
The 3 main Objectives of the strategy (Save the Sea, Connect the Region and Increase Prosperity), remain the same, as well as the multilevel and cross-sectoral cooperation model. The main 9 sub-objectives are: Clear water in the sea; Rich and healthy wildlife; Clean and safe shipping; Reliable energy markets; Good transport conditions; Connecting people in the region; Better coop-eration in fighting cross-border crime; Improved global compet-itiveness of the Baltic Sea Region; Climate change adaptation, risk prevention and management. They relate to more than one objective and are interlinked.
Policy areas
The EURSBR comprises 14 policy areas (instead of the previous 13 policy areas and 4 horizontal actions), while the total number of actions is streamlined to 44 (from previously 73). Most of the actions are cross-sectoral and cross-cutting, referring to more than one objective or sub-objective. The actions are implemented through different activities that can relate to policy recommenda-tion, new approach, increased coordination or network initiative.
833 https://sdgs.un.org/2030agenda834 https://unfccc.int/process-and-meetings/the-paris-agreement/the-paris-agreement835 JOIN(2021) 2 final.836 SWD(2021) 24 final.837 Four EU macro-regional strategies have been adopted so far: EU Strategy for the Baltic Sea Region (EUSBSR; 2009), EU Strategy for the Danube Region (EUSDR; 2010), EU
Strategy for the Adriatic and Ionian Region (EUSAIR; 2014), EU Strategy for the Alpine Region (EUSALP; 2015).838 SWD(2021) 24 final.839 C326/47.
In the period 2021-2027, the funding for the actions under the Strategy is coming from existing financial instruments, such as Interreg Baltic Sea region transnational programme, European Regional Development Fund, European Agricultural Fund for Rural Development, European Social Fund+, European Maritime and Fisheries Fund, Horizon Europe, TEN-T, Erasmus+, LIFE and the Connecting Europe Facility. National, regional and private sources as well as funds from the EIB are also used to fund the actions.
The Governance of the strategy is assured through different actors such as: The European Commission, (advisory body), high level group (EU level body), steering groups (cooperation body at policy area body), national coordinators group (core decision mak-ing body), policy area group (key operational stakeholder at policy area level), Baltic Sea strategy point (Support structure guided by the national coordinator’s group).
7.1.4 THE BLUE ECONOMY IN THE OUTERMOST REGIONS The EU has nine Outermost Regions, which are located in three different sea basins and which are part of three Member States:
• Guadeloupe, Martinique and Saint-Martin are located in the Caribbean, French Guiana in South America and Mayotte and Réunion in the Indian Ocean (France);
• Azores and Madeira (Portugal) and the Canary Islands (Spain) are located in the Atlantic, conforming the Macaronesia area.
Located thousands of kilometers away from continental Europe, Outermost Regions are an integral part of the EU. While these regions are different from one another, they all lack diversification of their economies and suffer from particularly high unemploy-ment and low gross domestic product, significantly worse than EU and respective national averages. They face particular constraints due to their remoteness, insularity, and vulnerability to climate change and natural disasters, which hamper their potential growth and development.
In this context, the Treaty on the Functioning of the European Union839 (Article 349) provides for specific measures to support these regions, including tailored conditions for the application of EU law and to access EU programmes.
At the same time, the Outermost Regions have a special Blue Economy potential due to their unique assets: rich biodiversity, strategic location for space and astrophysics activities, extensive maritime economic zones, and proximity to other continents.
To overcome the challenges and take advantage of the opportuni-ties, the EU is committed to supporting sustainable development in the Outermost Regions with specific measures.
191
2022

Encouraging Outermost Regions to adopt Blue Economy Strategies
The EU’s policy for Europe’s Outermost Regions focuses on improving accessibility, increasing competitiveness and strength-ening regional integration, putting an emphasis on the develop-ment of the Blue Economy.
To foster this development and in light of the possibilities pre-sented by the European Green Deal and the upcoming program-ming period, the European Commission provides dedicated support in the preparation, adoption, implementation, and evaluation of Blue Economy strategies in the Outermost Regions. A step-by-step methodological guidance was developed in 2020840. Beyond that, regular dialogues are organised to take stock of the state of play.
840 Methodological assistance for the outermost regions to support their efforts to develop blue economy strategies - Publications Office of the EU (europa.eu)841 COM(2021) 240 final.
The methodological guidance describes the landscape of the Blue Economy in each of the basins, identifies the few dominant and well-developed activities such as coastal tourism, the shipping sector and the exploitation of living resources and highlights the potential for further expansion of the Blue Economy, especially in view of activities related to ocean energy and blue biotechnology.
It is worth noting that the Outermost Regions benefit from specific measures under the Common Fisheries Policy, including support from the European Maritime, Fisheries and Aquaculture Fund (EMFAF).
The Outermost Regions’ specific treatment is also explicitly addressed in the new approach for a Sustainable Blue Economy.841
Policy areas Actions
PA Nutri
Action 1: Reduce nutrient emissions from agriculture and other diffuse sources Action 2: Reduce nutrient emissions from urban areas and other point sources Action 3: Develop and promote safe and sustainable nutrient recyclingAction 4: Address nutrients already accumulated in the Baltic Sea Action 4: Address nutrients already accumulated in the Baltic Sea
PA HazardsAction 1: Prevent pollution and reduce the use of hazardous substances Action 2: Mitigate and remediate contamination
PA Bio-economy
Action 1: Strengthen the role and importance of the bio-economy for achieving increased sustainability, productivity and adaption to climate change as well as resilience, including climate resilience in ecosystems Action 2: Improving agricultural practices for sustainability and adaptation (e.g. to climate change) in a sustainable and resilient growing bioeconomy Action 3: Strengthen multiple use of resources through cross-cutting and cross sectorial approaches to release potential and accelerate the development of a sustainable circular bioeconomy
PA Safe
Action 1: Providing reliable navigational conditions to the Baltic Sea Action 2: Developing winter navigation to meet future challenges Action 3: To be a forerunner in digitalisation and automation Action 4: Ensure accurate preparedness and response for maritime accidents and security issues
PA ShipAction 1: Support measures reducing emissions from shipping including digitalization. Action 2: Support research on emerging thematic challenges related to clean shipping and its impact on the environment and wildlife in the Baltic Sea Action 3: Support development of shore-side facilities to enhance clean shipping measures including infrastructure for alternative fuels
PA TransportAction 1: Improve connectivity of the regions and cooperation with third countries Action 2: Development of measures towards climate-neutral and zero pollution transport Action 3: Facilitate innovative technologies & solutions in the Baltic Sea region
PA Energy
Action 1: Streamlining efforts on energy efficiency in the region by deepening regional cooperation Action 2: Further regional gas and electricity market integration including climate proof infrastructure development Action 3: Baltic synchronization Action 4: Increasing the share of renewable energy including marine renewable energy
PA Spatial planning
Action 1: Strengthening territorial cohesion in the Baltic Sea region through land based spatial planning Action 2: Ensuring coherent maritime spatial plans throughout the Baltic Sea
PA SecureAction 1: Build capacities for prevention, preparedness, response and recovery in emergency and crisis management. Action 2: Strengthening mechanisms for joint strategic and operational actions protecting human beings and societies from criminal threats. Action 3: A common societal security culture in the Baltic Sea region
PA Tourism Action 1: Transnational tourism development in remote and rural areas Action 2: Investing in people, skills and technology in the tourism industry Action 3: Protection and sustainable utilization of cultural heritage and natural resources in tourism destinations
PA CultureAction 1: Promoting the Baltic Sea region cultural and creative industries, encouraging creative entrepreneurship Action 2: Promoting Baltic Sea regionculture and European values, using culture for sustainable development Action 3: Preserving the BSR’s cultural heritage, strengthening regional identity
PA Innovation Action 1: Challenge-driven innovation Action 2: Digital innovation and transformation Action 3: Co-creative innovation
PA HealthAction 1: Promoting active and healthy ageing to address the challenges of demographic change Action 2: Promoting a Health in all policies approach with focus on the impact of environmental factors, and especially climate change on human health Action 3: Increasing stakeholder and institutional capacity to tackle regional health challenges.
PA Education Action 1: Preventing early school leaving and improving transition from school to work Action 2: International excellence and wider participation in science and research Action 3: A labour market for all, using resources of longer livesAction 4: Recognising potential – easing the way for migrants
Table 7.4 Policy Areas and Actions EURSBR
Source: EURSBR, Action Plan, own elaboration.
192
THE
EU B
LUE
ECO
NO
MY
REPO
RT

The new Communication on the renewed partnership with EU Outermost Regions
Since 2004, the European Commission has adopted every 4-5 years a Communication setting out the priorities for a strategic approach to and partnership with the EU Outermost Regions. While the objectives of the 2017 Communication remain valid, the Commission has now implemented most of its actions and has enshrined the Outermost Regions’ specificities in over 20 EU funds and programmes for the programming period 2021-2027.
The new EU Strategy for the Outermost Regions is included in Commission Work Programme 2022 as an initiative that presents the engagement of the Commission towards these regions in line with their special status under the Treaty.
The Communication will present the priorities and focus of EU actions with and for them, to support a sustainable and inclusive growth and recovery in the years ahead, commits to undertak-ing action to continue supporting them, and recommends actions for the Member States and the regions themselves. It takes into account the strong impact of the COVID-19 crisis, which has ampli-fied these regions’ constraints and slowed down their recovery.
The strategy considers Blue economy as a priority, linking actions and commitments to the wider policy context of the EU Green Deal. It encourages Outermost Regions to participate in the projects and activities of the Mission ‘Restore our Ocean and Waters’ at basin-level, such as, but not limited to, those imple-mented in the Atlantic and Arctic lighthouse. Equally, to build on their Smart Specialisation Strategies (S3) for developing sus-tainable Blue Economy value chains (e.g. coastal tourism, marine renewable energy, sustainable fisheries and aquaculture, pollution prevention, disaster risk management, climate change adaptation and mitigation).
Other studies
The Outermost Regions also face specific challenges due to their distant location and their biodiversity hotspots on the one hand, and limited access to regional coordination and knowledge sharing platforms on the other hand. The need for more and better data collection on their fisheries and marine ecosystems persists, despite efforts made. A dedicated study842 has been published in March 2022, providing an overview of the state of data collection and scientific advice in the European Outermost Regions, formulating recommendations and presenting a case study of French Guyana.
Equally, the Blue Economy is specifically addressed in the recent study on the specific impact of COVID 19 pandemic on the Outermost Regions843 (January 2022). This report provides an overview of the health, economic, and social impacts of the pan-demic in the Outermost Regions. It assesses the factors that shape these impacts, and puts forward recommendations for recovery and resilience-building measures. The Blue Economy is presented as a key element to address the overarching challenges of the Green Transition, the diversification of the economy and the development of new competences and skills.
842 Overview of the state of data collection and scientific advice in the EU ORs, with case study on a roadmap towards regular stock assessment in French Guiana – Publications Office of the EU (europa.eu)
843 Study on the impact of the COVID-19 pandemic on the outermost regions (OR) – Publications Office of the EU (europa.eu)844 Co-chaired by Norway and Palau, the Ocean Panel represents nations of highly diverse oceanic, economic and political perspectives. Members include Australia, Canada,
Chile, Fiji, France, Ghana, Indonesia, Jamaica, Japan, Kenya, Mexico, Namibia, Norway, Palau, Portugal and the United States of America. It is supported by the UN Secretary-General’s Special Envoy for the Ocean. They are nations large and small, across all ocean basins, at every stage of economic development, at every extreme of the ocean environment from the tropics to the Arctic. These nations account for at least 45 % of the world’s coastlines and nearly 35 % of the world’s exclusive economic zones (EEZs), ~25 % of the world’s fisheries and ~20 % of the world’s shipping fleet.
7.2 BLUE ECONOMY: THE INTERNATIONAL DIMENSIONIn previous editions of the Blue Economy Report, we provided a comparative analysis of the US Blue Economy as well as the Chinese Blue Economy. Although the goal of the EU Blue Economy Report is to provide information on the state of the EU Blue Economy, assessing what is happening at the international level is useful to comprehend the bigger picture. In line with this, this year’s report explores the Blue Economy of Norway.
7.2.1 THE BLUE ECONOMY IN NORWAY
Norway is one of the leading ocean economies worldwide and is striving to achieve high levels of value creation as well as employ-ment from oceans within sustainable limits. Building a strong and sustainable ocean economy based on preserving clean and healthy oceans with well-functioning ecosystems and enabling value creation through sustainable use is deemed a central prior-ity of the Norwegian Government.
Norway in the international context
Norway has a long tradition of knowledge-based ocean management putting emphasis on strong sector man-agement and institutional involvement paired with inte-grated ocean management plans. Norway acknowledges the importance of the regional fisheries management organisations (RFMOs) and regional cooperation forums for the environment and resource management such as OSPAR e.g. Norway is one of the largest contributors to the United Nations Decade of Ocean Science for Sustainable Development. Norwegian participation is based on relevant national research programs and established international cooperation, including through the EU. Norway has estab-lished and continues to co-chair the High-level Panel for a Sustainable Ocean Economy involving 16 Heads of State and Government844. Panel country members have put for-ward a new ocean action agenda underpinned by the aim to sustainably manage 100 % of the ocean area under national jurisdiction. All other island and coastal states are encouraged to follow suit by 2030.
Beyond that, integrated ocean management plans are a tool both for ensuring value creation and food security and for maintaining the environmental value of Norway’s sea and ocean areas. These plans clarify an overall framework and encourage closer coordination and clear priorities for the management of Norway’s marine areas. The purpose is to provide greater predictability and facilitate coexistence between industries that are based on the use of the sea and ocean areas and the sustainable use of their resources.
193
2022

Norway is continuing its long-standing efforts in various interna-tional cooperation mechanisms that contribute to global ocean management including further develop the Law of the Sea as a tool for protecting the oceans through conservation and sustain-able use of marine resources. Norway has been an active mem-ber of IMO since 1958 and is committed to working towards the achievement of the IMO’s goals and objectives. Moreover, it has been a member of the IMO Council.
Norwegian development cooperation relating to the ocean amounted to €75.4 million in 2019. Development co-operation is operated through the programmes ‘Fish for Development’ and ‘Oceans for development’. In 2018, Norway was a key player in the establishment of the Problue multi-donor fund, which is the World Bank’s blue economy programme.
Norway-EU relations
The Agreement on the European Economic Area (EEA) is the cornerstone of relations between Norway and the EU. The ocean dimension is important for Norwegian cooperation with the EU, especially in light of the implementation of the European Green Deal. Norway is a full participant in the Horizon Europe pro-gramme, and participates in ocean observation infrastructures such as EMODnet, Jericho-RI and the Copernicus Marine Service. Norway is actively supporting the European intergovernmental ocean co-operation through industry participation, financial and/or in-kind contributions via JPI Oceans845 and the Horizon Europe partnerships that are currently under development, including the Sustainable Blue Economy partnership as well as the zero-emis-sion waterborne transport partnership.
Cooperation with the EU in the area of fisheries is longstanding and of vital importance for Norway, even though management of
845 https://jpi-oceans.eu/jpi-oceans
fisheries resources is not included in the EEA Agreement. Fisheries cooperation between the EU and Norway is based on bilateral agreements, while trade in fish and fish products is regulated by a protocol in the EEA Agreement as well as several bilateral agree-ments. Norway and the EU, together with the United Kingdom, share the responsibility for the management of joint fish stocks in the North Sea.
The EEA and Norway Grants are funded by Iceland, Liechtenstein and Norway. The Grants have two goals – to contribute to a more equal Europe, both socially and economically – and to strengthen the relations between Iceland, Liechtenstein and Norway, and the 15 Beneficiary States across Europe. During the 2014-2021 fund-ing period, the EEA and Norway Grants amount to €2.8 billion. Norway participates in InvestEU and has been co-operating with the European Investment Bank since 1974. Moreover, Norway is a founding member of the European Bank for Reconstruction and Development.
Size and composition of the Norwegian Ocean Industries
The Norwegian maritime industries include the shipping industry, the shipbuilding industry, and service and equipment suppliers for all types of ships and vessels. They also include vessels and mar-itime technology used in other ocean industries, including aqua-culture, fisheries, offshore oil and gas production, offshore renew-able energy, as well as knowledge-building in research groups on topics in technology and social sciences that are significant to the Norwegian maritime industry.
The value added from the maritime industries in 2019, as reported from the Statistics Bureau of Norway, was close to €9.5 billion, where ship-owning companies amounted to €5.4 billion, suppliers
Figure 7.14 Value creation in ocean industries 2011-2020 distributed on main sectors
Source: Menon Economics.
194
THE
EU B
LUE
ECO
NO
MY
REPO
RT

of equipment and services amounted to €3.3 billion and ship-yards to €0.7 billion. The industry exported worth €17.6 billion in 2019846.
According to calculations by Menon Economics, 225 000 employ-ees work in the three major ocean industries of oil and gas, mar-itime and seafood847. These industries are productive, and their total value creation was €70.5 billion in 2019. This means that almost 30 % of value creation in the Norwegian business sector is created by the ocean industries. The oil and gas industry, including large parts of the specialised section of the supply industry, is Norway’s largest ocean industry with a value creation of €551 bil-lion in 2019. The industry employed just over 146 000 individuals nationwide in 2019848. The maritime industry is the second largest with a value creation of almost €15.8 billion and 88 000 people employed in that same year, while the seafood industry had a value creation of €8.6 billion and employed almost 51 000 people. Supply industries serve multiple ocean industries. The ocean econ-omy also includes other businesses such as parts of the tourism industry that are focused on experienced-based activities linked to the ocean. There are also new and emerging ocean industries, such as offshore wind and carbon capture and storage (CCS).
Oil and gas
The petroleum industry is Norway’s largest and most important industry when measured in terms of value creation, government revenues, investments and export value. It contributes to eco-nomic activity across the country, while also stimulating commer-cial, technological and social development. Knowledge and tech-nology developed in the oil and gas industry will not only be able to be broadly applied in other ocean industries, but also in other sectors such as medicine and onshore infrastructure projects.
Total oil and gas production in 2025 is expected to be almost at the same level as at the start of the 2000s, before produc-tion is expected to gradually decline. Investments until 2030 are expected to be slightly below the level seen in recent years. The Norwegian petroleum industry will continue to play an important role in the Norwegian economy over the next few years, however the industry is no longer expected to be an equally strong engine for growth up to and beyond 2030.
The Maritime Industry
The Norwegian maritime industries are among the world lead-ing maritime industries, and includes the shipping industry, the shipbuilding industry, and service and equipment suppliers for all types of ships and vessels. They also include vessels and mari-time technology used in other ocean industries, including aqua-culture, fisheries, offshore oil and gas production, offshore renew-able energy, as well as knowledge-building in research groups on corresponding topics in technology and social sciences. The Norwegian maritime industry is Norway’s second largest export industry, after the oil and gas sector, generating more than a third of the Norwegian export. Shipping companies represent the largest segment of Norway’s maritime industry.
846 Please note that these figures may overlap to a certain degree with other ocean industries.847 Menon Economics (2019 figures).848 These figures do not include the slightly less specialised supply companies and other suppliers.849 Please note that these figures may overlap to a certain degree with other ocean industries.850 Norwegian Seafood Council.
Norway is the world’s 6th largest shipping nation measured by value, and the 6th in terms of the size of the fleet controlled by Norwegian shipping companies and ranks as the 8th largest in terms of tonnage in the world.
The value added from the maritime industries in 2019, as reported from the Statistics Bureau of Norway, was close to €9.5 billion, where ship-owning companies amounted to €5.4 billion, suppliers of equipment and services amounted to €3.3 billion and shipyards to €0.7 billion. The industry exported worth €17.6 billion in 2019.849
Offshore carbon capture and storage (CSS)
Carbon Capture and Storage (CCS) may contribute significantly to cutting emissions, especially in hard-to-abate sectors with limited or no other alternatives. The Norwegian full-scale carbon cap-ture and storage project Longship will be the first CCS project to integrate a complete chain of individual CO2 providers, a flexible cross-border transport solution and an open-access storage infra-structure which offers companies across Europe the opportunity to store their CO² safely and permanently underground. Longship includes the capture of CO2 from two industrial sources (cement and waste-to energy) and the transport of liquid CO2 from these industrial capture sites to an onshore terminal on the Norwegian west coast. From there, the liquefied CO2 will be transported by pipeline to an offshore storage location under the seabed in the North Sea, meant for permanent storage. The first phase of the project will most likely be completed mid-2024, with a storage capacity of up to 1.5 million tonnes of CO2 per year. The transport and storage operator, Northern Lights, have signalled their ambi-tions for a second phase, with a minimum storage capacity of 5 million tonnes of CO2 per year. Through Norway’s Longship it will be demonstrated that CCS is safe and feasible. It will facilitate learning and reduce costs in subsequent projects. The Norwegian Petroleum Directorate has estimated a theoretical storage poten-tial of 80 billion tonnes of CO2 in geological structures on the Norwegian Continental Shelf. Norway will pursue an active indus-trial policy and facilitate socio-economically profitable carbon capture and geological storage on the continental shelf.
Norwegian Seafood Sector – key figures and policy priorities
Norway is the world’s second largest exporter of seafood for as much as €11.9 billion in 2021850. The industry includes aquacul-ture, harvesting, fish processing, and trade of seafood. The indus-try employed a total of 66 000 man-years directly and indirectly in the same year, of which 36 000 are indirectly among suppli-ers and in affiliated value chains. The seafood industry directly accounted for a tax contribution and investments of €2 and 1.5 billion respectively, in 2019.
Fishing and aquaculture directly generated value creation of approximately €4.8 billion, employed 18 400 people, and contrib-uted to €1.5 billion in taxes. Fish processing typically concerns the production and processing of fish and fish-related products, and
195
2022

the value creation from this was less than half as great as fishing, catching and aquaculture in 2019. The fish processing accounted for a direct value creation of €2 billion the same year, and this subgroup further employed 10 400 man-years, and contributed €0.4 billion back to society in the form of taxes.
Wholesale of seafood amounted to a total value creation of €0.2 billion, while the person employed and contributed with taxes of 1 400 man-years and €0.1 billion respectively. In 2020, approx-imately 1.5 million tons of Norwegian farmed fish were pro-duced and sold, with a total first-hand value of approximately €6.4 billion. Despite lower growth in recent years, export value has increased as a result of increased demand and favorable exchange rate. About 95 % of Norwegian seafood production is exported. The structure of the Norwegian aquaculture industry is varied. Nearly 75 % of the 120 major companies are fami-ly-owned. In order to support municipalities that make areas available to the industry, the Government has established an aquaculture fund.
Norway aims for sustainable growth in aquaculture. Its frame-work condition and policy actions are consequently designed to promote an aquaculture industry which:
• safeguards fish health and welfare;• produces sustainable seafood with a low climate and envi-
ronmental footprint;• produces healthy and safe seafood that meets nutritional
needs and food preferences;• has good market access, complying with international
requirements for food safety, sustainable production as well as fish health and welfare;
• contributes to adequate and profitable jobs, indirectly con-tributing to positive local ripple effects along the entire coast.
0,0
1000,0
2000,0
3000,0
4000,0
5000,0
6000,0
7000,0
8000,0
0100 000200 000300 000400 000500 000600 000700 000800 000900 0001 000 0001 100 0001 200 0001 300 0001 400 0001 500 0001 600 0001 700 0001 800 000
1993 1995 1997 1999 2001 2003 2005 2007 2009 2011 2013 2015 2017 2019 2021* € million(average exchange
rate 2021)
Tonnes
Tonnes Value* Preliminary
Figure 7.15 Total quantity sold and first-hand value of fish in the aquaculture industry 1992-2020
Source: Norwegian Directorate of Fisheries.
0
200
400
600
800
1 000
1 200
1 400
Health
and c
are
Ener
gy
Envir
onmen
t
Climate
Aquac
ultur
e
Marine
Maritim
e
Educ
ation
Agricu
lture
Welf
are
Publi
c sec
tor
Fishe
ries
Develo
pmen
t
Tour
ism
€ m
illio
n
Industrial sector Institute sector Higher education sector
Figure 7.16 Expenditure on R&D by thematic area and performing sector (million €) Value creation in ocean industries 2011-2020 distributed on main sectors
Source: Statistics Norway and NIFU, R&D Statistics
196
THE
EU B
LUE
ECO
NO
MY
REPO
RT

7.2.2 OCEAN-RELATED RESEARCH IN NORWAYResearch and innovation are key to future value creation in the ocean industries, and for ensuring sustainable growth. Therefore, a significant proportion of the grants from the Research Council of Norway and Innovation Norway go towards various ocean indus-tries. The ocean industries are represented in the most important Norwegian industry clusters, including in the three GCE-clusters851.
In addition to the allocation to the funding agencies, institutes and universities receive direct funding, surpassing 50 % of total Research and Development (R&D) expenditure852. Several of the largest institutes are engaged in marine and maritime research, including SINTEF AS, the Institute of Marine Research, the Norwegian Food Research Institute NOFIMA and the NORCE Norwegian Research Centre. Some institutes, especially the Institute of Marine Research, the Norwegian Institute for Nature Research and the Norwegian Institute for Bioeconomy Research (NIBIO), have a significant scope of international research collab-oration (66–72 %). Ocean industries are prominently featured in the Norwegian R&D tax incentive scheme853.
Given the high importance of the ocean industries in the econ-omy, the ocean research priorities are varied. Green shipping, digitalisation and autonomy are particularly important areas for maritime research. Within oil and gas, more and more companies are investing in digital and environmentally friendly solutions. The focus within energy and the environment is on offshore wind and hydrogen infrastructure, as well as fuel cells for maritime solu-tions. The supply industry from the oil and gas industries plays an important role in this transition. Seafood industry necessitates continuous improvement of monitoring techniques as well as adapting to new issues such as microplastics, new types of pollut-ants and new marine species aimed for human consumption. It is a priority to increase knowledge about healthy and safe seafood, specifically considering the entire food chain.
The seabed in Norwegian waters is mapped by the Mareano Programme, which provides knowledge about depth and seabed topography, geology, sediment, habitats and pollution. The Marine Base maps Pilot Programme from 2020 to 2022 demonstrates new methods of collaborating on the collection and dissemina-tion of data relating to seabed conditions along the coast. The governmental institutions’ research vessels, research stations and laboratories constitute a significant part of the marine research infrastructure that is under state ownership.
Space and Ocean Observation
Norway makes extensive use of both satellite navigation and earth observation, partly as a result of large sea areas, rugged terrain and its maritime-oriented economy. In addition to Norway’s own surveillance satellites, program participation in Galileo, EGNOS and Copernicus constitutes an important part of Norway’s space-based ocean observation. Norway also has many com-petitive companies in downstream space activities. This applies to various maritime applications of space technology, such as
851 Global Centres of Expertise (GCE Node in Kristiansand, GCE Ocean Technology in Bergen and GCE Blue Maritime in Ålesund).852 Science & Technology Indicators for Norway 2021.853 The SkatteFUNN R&D tax incentive scheme is a government program designed to stimulate research and development (R&D) in Norwegian trade and industry. The
incentive is a tax credit and comes in the form of a possible deduction from a company’s payable corporate tax. All branches of industry and all types of companies can apply. To be eligible the company must seek to develop a new or improved product, service or production process through a dedicated R&D project.
854 The service is based on contributions from 10 Norwegian ministries and 29 administrative agencies and research institutes.
maritime communication, maritime surveillance and advanced navigation services. Norwegian companies have so far obtained contracts for more than €200 million in EU space programs.
Figure 7.17 The AISSat-1 satellite keeps its eye on shipping traffic in Norwegian and international waters
Source: Norwegian Space Centre
In view of the collection, development and information sharing efforts regarding Norwegian and Arctic coastal and marine areas, the initiative BarentsWatch consists of an open information sys-tem with services for end users. By collecting and sharing existing data, including from satellites, BarentsWatch contains services such as the nationwide wave forecast. In addition, a shielded mon-itoring system contributes to the efficiency of operational efforts such as combatting illegal, unreported and unregulated fishing.
Figure 7.18 Coverage area of the BarentsWatch information service
Source: BarentsWatch854.
197
2022

Ocean Space laboratories – next generation Ocean technology development
In December 2021 The EFTA Surveillance Authority approved full state funding for the construction of the Ocean Space Center in Trondheim. The Ocean Space Center marks the renewal of the marine technology laboratories at the Norwegian University of Science and Technology, and will be a facility for marine and mar-itime research and education. It will contain wet and dry labo-ratories with sea basins, construction and machine laboratories, teaching rooms and teaching laboratories. The facility also includes a fiord laboratory with environmental monitoring equipment. The total estimated cost is estimated to amount to €0.8 billion.
Ensuring adequate and relevant competence
Increasingly more advanced technology in the established ocean industries and the emergence of new ocean industries will require further development of education and skills. Digitalisation and automation require a workforce with competence and knowledge that can further the competitiveness of the Norwegian ocean industries. The close cooperation between companies, knowledge institutions, workers and government authorities has played an important role in the historical development of Norway as an ocean economy. In line with this, seafarers are vital to upholding safety and security standards on-board of ships Norway is com-mitted to strengthening marine education and the development of maritime knowledge with the aim to ensure future industry needs to be met The Norwegian Agency for International Cooperation and Quality Enhancement in Higher Education has from 2022 been given a particular task to strengthen maritime expertise. However, broader skills development for ocean industries is not only fostered by means of the Norwegian government but is com-plemented in various other ways as demonstrated in the country’s full participation in the Erasmus+ programme.
BOX 7.1 Bridges – (Blue Region initiatives for developing growth, employability and skills in farming of finfish)
In 2020, the Trøndelag County Municipality was awarded a contract as coordinator of a Centre of Excellence in Vocational Education and Training. The project is called BRIDGES (Blue Region Initiatives for Developing Growth, Employability and Skills in the farming of finfish). In addi-tion to partners in Sweden, Finland and Iceland, local high school Guri Kunna, SalMar, Blue competence centre and Easy Learning Solutions AS participates in the project. The aim is to develop world class aquaculture education.
855 https://www.tu.no/artikler/signerte-hydrogenfergekontrakt-legger-til-rette-for-hydrogenproduksjon-i-relativt-stor-skala/516774?key=lZfUxEZy856 https://www.tu.no/artikler/verdens-forste-hydrogenbulkskip-kan-bli-bygget-i-norge/517729?key=5EUrXwcp
7.2.3 GREENER AND SMARTER SHIPPING FOR LOWER EMISSIONSNorway has strengthened its commitment to green shipping. Norway is committed to the ambition of halving emissions from domestic shipping and fisheries by 2030 compared to 2005. There are presently more than 80 ferries in operation with fully or par-tially electric propulsion systems which is close to one third of all ferries in Norway. Low and zero-emission criteria are introduced in new tenders for ferries and high-speed vessels when feasible. Efforts are being made to develop policies that contribute to the green transformation for service vessels in the aquaculture and offshore industries, and climate requirements will be assessed for public procurements of maritime transport services. Norway aims to increase the number of hydrogen pilot and demonstration projects in shipping. The industry has promoted and developed several autonomous shipping projects based on new technology and digitised solutions for approval by the Norwegian Maritime Authority.
Hydrogen electric and ammonia vessels
MF Hydra, the first hydrogen-electric ferry, will be put into service in 2022, and by the end of 2025, a four-hour weather-beaten ferry route between Bodø and Moskenes in the northern Norway will be partly powered by hydrogen855. The first ammonia vessel is expected to be ready for operations in the offshore sector in 2024. In 2020, the Research Council of Norway allocated more than €15.3 million to develop hydrogen-based shipping technol-ogy. Enova has allocated €22.4 million to the development of two hydrogen-powered cargo ships under the project name Topeka.
The Green shipping programme, launched in 2015, is a public private partnership that counts over 100 industrial members, like ship owners, yards, cargo owners, energy providers and financial actors, organizations, and observers from different public author-ities. The vision of the programme is to strengthen Norway’s lead-ing position on environmentally friendly shipping. The Programme has launched over 40 pilot projects, of which 13 pilots have reached or are near fruition.
One of these is a project that aims to move cargo from road to sea by a long-term charter, i.e. grains in one direction and stone and gravel on the return voyage. The charter enables the ship owner to invest in a zero-emission cargo ship. The ship owning company Egil Ulvan Rederi AS won the contract in 2021 in compe-tition with over 30 companies. The ship is designed by Norwegian Ship Design (TNSDC) and will be a 5 500 dwt bulk carrier, 68 m long, and fuelled by hydrogen and wind. The design reached Approval in Principle for hydrogen from Lloyd’s early 2022 and is ready for tenders at shipyards. The goal is to launch ship opera-tions in 2024856.
198
THE
EU B
LUE
ECO
NO
MY
REPO
RT

Source: Lloyd’s Register857.
Autonomous electric vessels already shift cargo from road to sea
Getting retail goods onto the shelves of Europe’s supermarkets requires complex logistical operation and is also a major source of carbon emissions. A pioneering project involving Kongsberg Maritime brings a radical new approach to this issue, by removing the trucks from the value chain. In a world first, Norway’s largest grocery distributor, ASKO, will be using two newly built autonomous electric vessels to cross the Oslo fjord in order to deliver groceries. The zero emission vessels, both battery driven, will have the capac-ity to carry 16 trailers of cargo, each with a maximum capacity of 29 tons. They will reduce road travel by two million kilometres and cut carbon emissions by 5000 tons annually. The route will be established in summer 2022, initially with a reduced crew. Approval for fully unmanned operations is expected during 2024.
Figure 7.20 ASKO and Norgesgruppen’s autonomous and electric sea drone that will operate between Moss-Horten
Source: ASKO and Naval Dynamics.
857 Lloyd’s Register (LR) has awarded approval in principle to Norwegian ship owner Egil Ulvan Rederi AS for its zero-emission self-discharging hydrogen-fueled bulk carrier, With Orca. The vessel is planned to enter into a long-term transport contract with cargo owners Felleskjøpet Agri and Heidelberg Cement.
Offshore wind
Norway has opened two areas for offshore wind: Utsira Nord with a capcity of 1.5 GW floating wind and Sørlige Nordsjø II with a capacity of 3 GW bottom-fixed wind. One of the objectives of Norwegian offshore wind policy is to support the ability of Norwegian exporters to compete in a growing global market, as well as facilitate sustainable resource management in the long-term. Hywind Tampen, which will be the world’s largest floating offshore wind farm, is under development. Hywind Tampen has received a grant of €0.23 billion from Enova. The next step in the commitment to offshore wind will be to realise offshore wind on an industrial scale in order to achieve economies of scale.
7.2.4 SMART GREEN PORTS
Ports in Norway are either owned by private companies or by municipalities. The new Norwegian Harbour Act allows municipal-ities and ports to differentiate their prices and fees according to environmental performance. Many Norwegian municipalities and ports now differentiate prices and fees according to an environ-mental index.
As much as 90 % of Norway’s import and export volumes are transported by sea. In general, the external costs per unit (tonne-kilometre) of maritime transport are significantly lower than the external costs per unit of road transport. It is clear that green shipping demands green solutions also onshore.
In 2019, the Government introduced an aid scheme for invest-ments in port infrastructure in order to promote efficient and
Figure 7.19 Zero-emission self-discharging hydrogen-fueled bulk carrier 199
2022

environmentally friendly ports and logistics chains. Funding has been awarded to more than ten projects in different ports, includ-ing investments in smart gate systems. The benefits in terms of time savings for trucks and ships are expected to be signifi-cant. When the ports invest in onshore power, they may receive support from Enova, a state enterprise owned by the Ministry of Climate and Environment. Since 2015, Enova has awarded a total of €81.7 million to more than 100 onshore power projects in var-ious Norwegian ports. The goal is to create a functioning market for onshore power.
7.2.5 OTHER INITIATIVES
Norwegian Institutes at the centre of EU projects pointing towards sustainable multitrophic aquaculture in the Atlantic
Norwegian research institute NOFIMA leads an All-Atlantic Consortium of 35 partners from 15 countries the ongoing Horizon 2020-project AquaVitae that aims to increase sustaina-ble, low-trophic aquaculture production in and around the Atlantic Ocean, by developing new species, processes and products. The Norwegian Research Centre (NORCE) leads ASTRAL (2020-2024) which works with integrated multi-trophic aquaculture (IMTA). Both projects promote sustainable aquaculture production across the Atlantic area and are collaborating closely with the European Aquaculture Technology & Innovation Platform (EATIP).
The Sea lice challenge
One major challenge for a possible growth in Norwegian aqua-culture production is the sea lice. The sea lice problem is both a threat for wild salmon and is, to say the least, a welfare problem for the farmed salmon. Several research and innovation projects are currently ongoing or were concluded which are both nation-ally and EU-funded, looking at the problem from different angles. The company Scale AQ with funding from The Research Council of Norway (€0.4 million), use artificial intelligence to control the sea lice through visual monitoring. Number of sea lice must be counted regularly and reported to the authorities. Sea lice used to be counted manually but this company has developed an under-water camera-based lice counter system for counting the lice on salmon while it swims in the cage. This gives a better estimate of number of lice than the manual method and is much more gentle on the salmon The system has now been implemented in the industry.
200
THE
EU B
LUE
ECO
NO
MY
REPO
RT

C h A p T E R 8C A S E S T U D I E S

As with prior editions, this report includes number of case studies that explore and help illustrate additional elements of the Blue Economy as a whole. The case studies generally focus on concrete or niche areas, on Member States best practices and/or initiatives and on efforts undertaken by the sectors to invest and develop a more sustainable Blue Economy. The case studies in this specific edition of the report focus mainly on the sustainability, innovation and the green transition. They depict various technological devel-opments, initiatives and projects undertaken by Member States and stakeholders in an effort to achieve the goals set out in the European Green Deal.
The first case study illustrates the work undertaken by the Netherlands in building a Community of Practice within its Maritime Spatial Plans by fostering a network and culture of collaboration towards the objective of developing a Sustainable Blue Economy. A second case study looks at the set-up of a Blue Observatory in Portugal, exploring the benefits of structuring and gathering extensive data on the Blue Economy. A third case study presents the various initiatives undertaken by France, in attempt-ing to measure the ecosystem services at national level and the challenges associated to it. Finally, the last case study presenting how ports are at the crossroads of innovation and sustainability, and how they are set to support the growth of the Blue Economy in the Atlantic sea basin.
8.1 COMMUNITY OF PRACTICE NORTH SEA: KEY TO SUCCESS?Setting up a Committee of Practice in the North Sea
The Community of Practice North Sea (CoP) was originally cre-ated as a forum for policy makers, entrepreneurs, researchers and NGO’s to discuss how to bring multiple-use pilots/initiatives into practice and scaling-up in order to realise the MSP themes fishery/food-, nature- and energy on the North Sea. It was set up by the Dutch Ministry of Agriculture, Nature and Food as a multi-level stakeholder engagement forum aiming at enhancing involvement of different sectors.
To set up the CoP, all relevant parties were identified and brought together in a close network. The experience gathered in coopera-tion on land, in which government, research institutes and industry work closely together, was used for the North Sea project, as well.
The initial focus of this CoP North Sea was initially restricted to the multiple use of the North Sea. However, it soon became clear that the scope should be enlarged to facilitate Sustainable Blue Economy development.
The transition to a Sustainable Blue Economy is in line with the UN’s Sustainable Development Goals (SDGs) which were created to provide (global) direction to the pursuit of sustainable use of the planet’s resources. For the North Sea, this translates into a focus on the topics of sustainable and sufficient food, sustainable energy and a balance of these activities with nature.
The North Sea plays an important role for the Netherlands, in achieving sustainable food and energy production that does not conflict with. Food and energy are linked to SDGs 2 and 7, while SDG14 represents the balance with the natural environment, and SDG17 affects the importance of going through this transition and realizing it with all relevant stakeholders.
At sea, this way of working together is still relatively new and various NGOs are considered important partners and stakeholders in the North Sea. While exploring on how to shape a successful transition towards a Sustainable Blue Economy, the involved min-istries came across the concept of Community of Practice (CoP). One of the benefits of a CoP is that it is an informal network where bottom-up work is encouraged with concrete innovations and ideas from practice, in which policy and research can be directly involved. This also means that policy and research can focus on the developments and innovations of tomorrow, which in turn opens the door for adaptive future-proof policy. As CoPs are informal, self-organizing and based on trust, by creating an environment in a non-political setting, the CoP fosters a culture of collaboration.
That is why the Dutch government has set up the North Sea CoP. With this approach, the Netherlands aims at accelerating the real-isation of the three transitions in the North Sea: food, energy and nature. These three transitions form the basis of the Sustainable Blue Economy in the Netherlands.
202
THE
EU B
LUE
ECO
NO
MY
REPO
RT

Another particular point of concern that also plays an important role in the North Sea, is the lack of space. This means that, in addition to the task of environmentally sustainable integration of economic activities, an answer must also be found for sustaina-ble and robust use of maritime space. This brings the challenge of dealing with different levels of ambitions and interests that potentially conflict one another. In the North Sea CoP, the focus has been on looking for synergies and win-win outcomes.
In an environment where competition for space at sea takes place, shared use is a potential solution. An example is the shared use of wind farms by aquaculture or floating solar panels. This is a promising solution, however this does not necessarily come with-out challenges. Some of these are related to (existing) legisla-tion and regulations or, for example, technical or socio-economic implications. For research, this could also mean that there are still many unanswered questions that form the basis for new and appropriate legislations as well as regulations.
Maritime Spatial Planning (MSP) also plays an important role in this endeavour. In this context, shared use is included in the North Sea 2020-2027 Programme, the policy framework in which all North Sea policy comes together.
Figure 8.1 Learning through joint activities in communities of Practice
Source: Steins, Veraart, Klostermann & Poelman (2021)858.
The link to sustainability, decarbonisation and innovation
The Sustainable Blue Economy
The Sustainable Blue Economy is part of the Dutch Government-wide North Sea Program 2022-2027 and aims at making the existing Blue Economy activities more sustainable and to
858 Steins, Nathalie & Veraart, J.A. & Klostermann, Judith & Poelman, Marnix. (2021). Combining offshore wind farms, nature conservation and seafood: Lessons from a Dutch community of practice. Marine Policy. 126. 104371. 10.1016/j.marpol.2020.104371.
incorporate emerging sectors of the Blue Economy in the North Sea in a sustainable way. This requires an integrated package for a Sustainable Blue Economy, which is feasible and cost-effective.
In the Netherlands, the Sustainable Blue Economy, of which shared use forms part, focuses on the triangle:
• food – making traditional fisheries more sustainable and innovations on fisheries/aquaculture;
• energy – such as Wind at Sea and innovations for other forms of renewable energy and making shipping and tourism more sustainable; and
• nature – nature-inclusive construction and nature development.
Outlook
Realizing the Sustainable Blue Economy entails working on a future perspective, ‘The outlook’ is another important dimension of the Program. As the CoP is the learning network with which innovations can be initiated by and with the CoP members, ‘The outlook’ is the roadmap that determines where the Sustainable Blue Economy development is heading, what is needed to achieve its associated goals and who will subsequently set the bar.
The Outlook for the Sustainable Blue Economy determines the direction in which it will develop until 2040 and which main topics will lead to 2030. This is done on the basis of scenario studies and a Theory of Change in which a future picture is determined. However, practice – both nationally and internationally – does not stand still, which means that the future picture and the leading themes are periodically examined and adjusted. The themes to be identified largely determine the resulting research questions that must be answered in order to shape the path towards a Sustainable Blue Economy.
The CoP members are given the opportunity to contribute their ideas, reflect on the results and also indicate which course should be followed. The government ultimately determines the actual course, based on the network’s input.
It is therefore important to gather the right knowledge and form contacts in a network as much as possible in order to realize the movement towards a Sustainable Blue Economy together. An important part of this knowledge and forming contacts also lays outside the Netherlands. That is why, as a network, the Netherlands is affiliated with various European trajectories and projects. Given the importance of MSP for, among other things, the use of space at sea, the government of the Netherlands par-ticipates in cooperation at the level of two sea basins: namely the North Sea and the Baltic Sea.
From the national scope to the regional approach and its objectives: eMSP NSBSR
At the end of 2020, together with 15 partners from both seas’ basins, the group submitted the cooperation proposal to the European Commission for the eMSP (North Baltic Sea Regions)
203
2022

NBSR project on Emerging ecosystem-based Maritime Spatial Planning topics in North and Baltic Sea Regions. This project was launched in September 2021.
The aim of the eMSP NBSR project is to enable Maritime Spatial Planners of Managing Authorities and policy makers from the North Sea and Baltic Sea regions to reflect on current MSP prac-tices, learn effectively from each other and jointly identify prob-lems and solutions. This will provide national governments and the European Commission with new knowledge and information on implementation, development and research actions as well as management approaches that can or should be followed to address future challenges and opportunities of the sea in a coher-ent manner. Industry involvement, academia and non-governmen-tal organizations’ involvement is encouraged.
With all countries having defined MSPs in 2021, MSP in Europe is entering a new phase. The period that follows is a unique opportunity to take stock on what has been achieved so far in the respective countries and sea basins and what needs to be done to ensure that MSP lives up to its full potential. It is also a unique opportunity to share lessons learnt, expand and align the available information and knowledge base, and use the newly acquired knowledge and experience to tackle the challenges ahead together. However, preparing for this is not a one-time event, but rather a process that requires continuous learning and exchange between MSP authorities/planners, stakeholders and scientists. A suitable platform that brings people, information and insights together in a flexible and above all reflexive way is cur-rently lacking.
The NBSR project is built around the Community of Practice (CoP) model. The outcomes of this work, such as policy briefs help stakeholders to improve the design, implementation and monitor-ing of maritime spatial plans and to make use of the best availa-ble knowledge from science and innovation. The group focuses on:
• Ocean governance• Ecosystem-based approach• Sustainable Blue Economy• Monitoring and evaluation• Data exchange, information and communication technology
at the service of MSP.
Sustainable Blue Economy in practice
The CoP aims to make hands-on sustainable innovation possible. There are currently various CoP themes that focus on sustainabil-ity and decarbonisation. Box 8.1 highlights of on these, focusing on the development of a nature-inclusive business park.
BOX 8.1 Nature-inclusive food production inside and outside the wind farms
Like other EU countries, the Netherlands faces major chal-lenges in relation to climate change and efforts to minimize it. As a result, the Netherlands is focusing on the production of sustainable energy, largely by building wind turbines at sea. As a result, the space for traditional fisheries will have to shrink, resulting in a further decline in both employment and the supply of sustainable food from the North Sea.
In order to guarantee and possibly increase both food pro-duction and employment, the Dutch Government is focusing on new innovative forms of food (production) inside and out-side wind farms, shared use of space in the North Sea and new associated nature-inclusive revenue models. To this end, large-scale experimental rooms will be set up where scale-up experiments can take place under controlled and manageable conditions with good monitoring of the effects and validation of models that visualize the impact of food production on the North Sea. These large-scale experiments should lead to new forms of food production (passive fishing and aquaculture) and entrepreneurship in the North Sea that mitigate the pre-viously described effects on land use and climate change. This contributes to making the economy more sustainable, climate-resilient and the earning capacity of the Netherlands. In the development of passive fisheries and aquaculture, the aim is to achieve synergy with nature development, which can create robust ecosystems and promote ecological capac-ity. Aquaculture offers refuges, breeding grounds and source material for the development of robust nature. These inno-vations also contribute to new revenue models such as ‘bio-based’ building materials.
The experimental areas (Nature Including Mariparks) will be set up and managed in such a way that economic activ-ity makes a positive contribution to making the North Sea nature more robust. Finally, efforts are being made to make the associated logistics and the required energy supply more sustainable.
The way forward
With this strategy, the Netherlands has a clear goal to attain a Sustainable Blue Economy that is in line with the SDGs and European and National objectives. Working with a national net-work, the Netherlands is also working on a blue network at European level and is developing a roadmap to achieve this goal.
Knowledge sharing and the bonding of existing networks is key to achieve the goals of a sustainable Blue Economy. Government and research, but certainly also NGOs and companies and entre-preneurs are being called to participate in this strategy. It includes as well people with knowledge and experience of the sea, such as fishing, to people with a wild idea with which they think they can make a good contribution to the balance between energy, food and nature at sea.
204
THE
EU B
LUE
ECO
NO
MY
REPO
RT

8.2 THE PORTUGUESE OBSERVATORY FOR THE BLUE ECONOMY AND THE OCEAN SATELLITE ACCOUNTBlue Economy assessment plays an important role in supporting public policy monitoring and evaluation to support decision-mak-ing, including policy instruments dedicated to managing marine environment such as the Marine Strategy Framework Directive. Despite this, besides reports like the Blue Economy report (build-ing on Eurostat NACE codes), until now no statistical methodo-logical procedure was defined and implemented at international level to have recurrent, reliable, and transparent indicators on all levels of the Blue Economy, across countries for this purpose, and considering the Blue Economy as a whole.
The first National Ocean Strategy in Portugal, published in 2006 (NOS 2006-2016), established the importance of creating a Portuguese Observatory for the Blue Economy, defining a set of activities to be monitored, the methodology and frequency of monitoring, and the criteria for data collection.
This Observatory859 is a monitoring platform that compiles up-to-date data, and makes available reliable information for the main economic, social, and environmental indicators of the ocean econ-omy, marine natural capital and related ecosystem services. It was developed under the responsibility of the Directorate General of Maritime Policy (DGPM), of the Portuguese Ministry of the Sea, in the context of the National Ocean Strategy (NOS). The Portuguese Observatory for the Blue Economy will be the main source of monitoring and evaluation of the new National Ocean Strategy. Despite the fact that monitoring reports to support NOS have been published since 2012, the set-up of the Observatory as it stands today, took place 3 years ago.
859 https://www.dgpm.mm.gov.pt/observatorio 860 This project is funded by the EMFF.
Setting up the pilot
Following an integrated and inter-sectorial approach, the tech-nical work behind the Portuguese Observatory is supported by SEAMInd – Economic, Social and Environmental Indicators and Ocean Satellite Account.
The objective of the SEAMInd is to identify a limited but rele-vant set of indicators to measure the results and impacts of the marine and maritime policy, considering a sustainable develop-ment approach, and make them observable and available in an integrated, friendly, and recurrent platform. In total, 576 perfor-mance indicators have been identified across 10 focus areas. This task involved consulting all public entities with ocean-related responsibilities, considered as the supply side of indicators. The needs identified were measured as the demand side of those indicators. An overarching additional consultation of public and private entities was also launched to better understand what indicators were more relevant to be available for stakeholders. From the demand side, the need to support the transversal public policy ocean related contexts (Figure 8.2 was considered, bearing in mind an Integrated Maritime Policy perspective.
More recently, and fully aligned with the ambitions of the European Commission to set up the Blue Economy Observatory and the Ocean Observatory Initiative, Portugal has been investing in the implementation of the SEAMInd Platform860. This intends to be an interoperable platform for indicators, supporting National Ocean Strategy monitoring as well as National accounting efforts for the ocean related economy.
By 2023, SEAMInd data is expected to become accessible to the public through thie SEAMInd digital platform. At an operational level, the Portuguese Observatory for the Blue Economy techno-logical platform will be connected to the EU Common Information Sharing Environment (CISE), using the Portuguese node (NIPIM@R).
Figure. 8.2 SEAMInd integrated and inter-sectorial approach
Source: DGPM, Portugal.
205
2022

At a second stage, an upgraded version of this platform, SEAMInd Platform 5.0, is foreseen, using big data and artificial intelligence for forecasting and foresight purposes861.
The Portuguese Ocean Satellite Account
The Ocean Satellite Account is a statistical instrument developed by Statistics Portugal (INE) with the support of DGPM. Its first edition reports to 2010-2013 and was released in 2016. A second edition concerning the period 2016-2018 was published by INE in 2020 and the account should be compiled on a regular basis every three years862). The produced indicators are also available through the SEAMInd Platform. The Portuguese Ocean Satellite Account was a pioneer project based on the conceptual frame-work of the Portuguese National Accounts, and their indicators are used to monitor the economic dimension of the National Ocean Strategy, as well as to estimate the relative macroeconomic importance of Ocean Economy in the Portuguese Economy.
The data provided by the Portuguese Ocean Satellite Account bears great relevance as it:
• supports decision and policy making related to the sea;• supports the monitoring of the National Ocean Strategy in its
macroeconomic component;• supports the Inter-Ministerial Commission for Maritime
Affairs (ICMA);• provides information in the context of the Integrated Maritime
Policy (IMP); • provides information on the socioeconomic context of
Marine Strategy Framework Directive (MSFD), as well as the Portuguese contribution for the economic and social analysis in the core of OSPAR Convention for the Protection of the Marine Environment of the Northeast Atlantic;
• supports National Ocean Strategy updates;• also supports other processes where data for the Sea
Economy are decisive, including for private decisionmaking or public awareness.
The Portuguese Ocean Satellite Account reinforces the institu-tional cooperation in compiling this accounting instrument con-sidered as a core tool for supporting public policies in the field of Ocean Economy.
Portugal is the only European country with an Ocean Satellite Account.
Since the beginning of the pilot project, in 2013, more countries have been using national accounts to evaluate their ocean econ-omy. In 2021, the United States of America published its first Marine Economy Satellite Account, that includes the nation’s oceans and Great Lakes related economies. The OECD continues working with pilot experiences in some countries to improve ocean economy measurement, namely to develop internationally com-parable statistics on ocean economy. Furthermore, the European Commission announced it will be launching a European Blue Economy Observatory that will carry out these estimates at EU level, besides the work done in the yearly EU Blue Economy report.
861 It is expected that this project will be funded under EMFAF.862 Established by Council Resolution of Ministers No. 99/2017, of July 10th.863 https://www.ine.pt/xportal/xmain?xpid=INE&xpgid=ine_destaques&DESTAQUESdest_boui=261968449&DESTAQUESmodo=2&xlang=en;
https://www.ine.pt/xportal/xmain?xpid=INE&xpgid=ine_destaques&DESTAQUESdest_boui=459803212&DESTAQUEStema=55505&DESTAQUESmodo=2&xlang=en
Portugal’s experience with the implementation of its Ocean Satellite Account may be taken as a reference in the development of a methodological framework.
Measuring total impacts of the Portuguese Blue Economy with the Ocean Satellite Account
The Portuguese Blue Economy reveals a positive evolution, according to results from the Ocean Satellite Account863. In 2018, the direct and indirect impact of the Blue Economy was estimated to have a contribution of 5.1 % to GDP and 5.4 % to GVA (Figure 8.3). The direct GVA produced in 2018 by the Portuguese Blue Economy roughly corresponds to 4 % of the whole economy. In other words, 1 % of the expenditure in Blue Economy products has an impact of 0.05 % of total GDP (direct and indirect impacts).
Figure 8.3 Ocean Satellite Account: Evolution of the weight (%) of direct GVA, total GVA and total GDP, in Portugal
Source: Statistics Portugal, Sea Satellite Account 2016-2018 (Press Release).
Gross Fixed Capital Formation (GFCF) in ocean economy products represented 1.4 % of total GFCF in the national economy, in 2016 and 2017. Figure 8.4 shows the average share of each ocean economy products, considering the ocean economy.
Figure 8.4 Ocean Satellite Account: Gross Fixed Capital Formation (GFCF) on ocean economy products
(average 2016-2017) in Portugal
Other transport equipment
20.2%
Scientific R&D services
23.8%
Constructions and construction works for civil engineering
22.8%
Real estate services
7.2%Other products
16.9%
Repair and installation services of machinery and equip.
9.2%
Source: DGPM, Portugal.
206
THE
EU B
LUE
ECO
NO
MY
REPO
RT

Exports of ocean economy products represented approximately 5 % of total exports, having grown 21.8 %, 2.9 percentage points higher than national exports. The external balance of goods and services was positive, having increased by 30.9 % in 2017 and 17.2 % in 2018. Figure 8.5 shows the structure of imports and exports of the ocean economy.
Fig. 8.5 Ocean Satellite Account: Structure of ocean economy imports (Top)
and exports (Bottom) (average 2016-2018Po) in Portugal
Source: Statistics Portugal, Sea Satellite Account 2016-2018 (Press Release).
The Portuguese experience to setup the Observatory for the Blue Economy, at National level, shows how improved methodologies can contribute to better public and private policies and deci-sions, more transparency, and more involvement of the public in ocean related debates. It also shows how innovation in Public Administration can foster an innovative and open society, where decisions and processes are more data driven and backed by sci-ence validated outputs, in what concerns ocean related issues
864 https://aspban.eu865 https://ec.europa.eu/info/news/atlantic-action-plan-20-2020-jul-27_en?msclkid=fe55e6a9a5d911ec83b0f1cfa58cfb48 866 http://www.atlanticstrategy.eu/en?msclkid=0e2e0bf7a5d711ecbedccb53ba25e118 867 Beta-i Collaborative Innovation (PT, Lead Partner), Forúm Oceano (PT), Magellan (PT), Irish Maritime Development Office (IE), KALEIDO Ideas & Logistics (SP), Eurotran (FR),
NOAH ReGen (FR), Cluster Maritimo de Canarias (SP), CPMR – Conference of Peripheral Maritime Regions of Europe (FR), GCE Ocean Technology (NO), Port XL (NL), World Ocean Council (USA), and Global Accelerator Network (USA).
8.3 ‘ATLANTIC SMART PORTS BLUE ACCELERATION NETWORK’ PROJECT (ASPBAN)Context and Objectives
The ‘Atlantic Smart Ports Blue Acceleration Network’ (AspBAN864) is a 2-year project (ending in April 2023) which is co-financed by the European Commission’s European Maritime and Fisheries Fund (EMFF) that responds to the objectives of the Atlantic Action Plan 2.0 (AAP 2.0)865 of the Atlantic Strategy Committee (ASC)866.
The EU Atlantic Ports need to diversify the focus and revenue sources of their business models, by acting in a more sustaina-ble and smart way. This entails an evolution of port governance mechanisms, including the role of port operators. Hence, ports must cooperate with each other to mobilise financing for special-ised smart infrastructures that will increase sea-basin trade and the growth of new blue businesses (aquaculture, marine renew-ables, etc.) adjacent to ports activities. As noted, ports are one of the main interfaces with the ocean and will play a strategic role as launchpads for a new generation of blue companies. Thus, beyond their logistics role, ports have all the conditions to operate as ecosystems for the Blue Economy innovation, by integrating in the same physical space: research centres, mature companies, start-ups and scale-ups, and in most of the blue sectors, both conventional and emerging.
AspBAN launches the building blocks that will found a dynamic acceleration services platform for EU Atlantic ports to work as Blue Economy hubs. This is done through the establishment of a network/partnership between EU Atlantic ports in two differ-ent EU Member States and the development of a blue accelerator scheme for Atlantic ports to stimulate innovative sustainable busi-nesses in an innovation ecosystem.
AspBAN Consortium & Strategic Partners Network
ASPBAN’s consortium was based on the overall concept of the project, to deploy a representative and diverse open innovation, acceleration and investment ecosystem around the EU Atlantic Ports, thus providing them with solutions to overcome challenges and meet innovation needs. The AspBAN consortium counts with the participation of several entities867 from Portugal, Spain, France, Ireland, Netherlands, Norway and USA. The involvement of several entities from different geographies is key to both broaden the scope and to increase the capitalisation potential of ASPBAN.
The Strategic Partners Network (SPN) is one of AspBAN biggest assets and consists of a large and representative pool of 142 partners, and a total universe of 391 ports, committed to partic-ipate and engage in the project activities. Also, the SPN keeps on growing, being composed of different stakeholder groups that are crucial for the transformation of ports as hubs for the sustainable Blue Economy: 41 ports and 5 ports associations, 20 investment
Food products
58.8%
Food products
16.2%
Food and beverage services
12.3%
Water transport services
7.9%
Fish and other products
5.1%
3.5%
Food and beverage services
3.1%
Other products
7.0%
Other products
3.7%
Accomm. services
16.3%
Accommodation services
51.3%
Fish and other fishing and aquaculture products
14.9%
Warehouse and support services for transp.
207
2022

funds and finance entities, 33 companies, 18 blue accelerators & clusters, 8 business associations, 11 policy entities, Municipalities, Research Institutes, Universities, etc.
Roadmap
AspBAN has a very complete and inclusive governance model, based on a collaborative approach, with different governance bodies and taskforces, relying on the involvement and exper-tise of the Advisory Board and the Strategic Partners Network. Communication, dissemination and transferability of results, will ensure the visibility and sustainability of the project, demonstrate the transferability to other sea -basins of Europe in support of the development of smart blue ecosystems and a sustainable Blue Economy.
Operationally, AspBAN can be divided into two main areas: the community building around the ports and its wider ecosystem, in order to identify and engage with the relevant stakeholders that will collaborate in the transformation of the ports into Blue Economy hubs (Networks or Databases); and the collaborative innovation programs (Acceleration Services and Open Innovation) that will generate start-ups pools, and also feed the pipelines of investment fund opportunities by mobilising financing for smart ports that operate as Blue Economy hubs.
Besides the SPN, there are four complementary networks/databases being created and developed with community build-ing purposes: a Blue Economy acceleration and a blue invest-ment networks, an international mentor network and the creation of a finance platform for Atlantic smart ports Blue Economy acceleration.
Moreover, two collaborative innovation programs are being devel-oped, both with different objectives, and advantages, for startups, and also other stakeholders involved in the programs:
• The acceleration services programme is a fully tailor-made program adapted to the needs of the startups, with the objective of connecting them to other startups, scale-ups, SMEs, ports, and investors, in a deep and immersive dive into the European blue innovation ecosystem. This program is based on both the acceleration of the business and the collaborations within the Blue Economy. The selected startups will be invited to pitch their solution/product to investors and the Ports community.
• The open innovation programme is a tailor-made accelera-tion scheme with the main objective of establishing concrete pilot projects between startups and ports/corporates, thus increasing the chances of developing innovative products/solutions that effectively respond to the challenges of the ports. This will lead to the development of a Blue Economy ecosystem around the ports-centric blue innovation hubs, allowing a deeper collaboration between the different stake-holders and a more fluid ecosystem of specialists, inves-tors, startups, ports, clusters, etc. The program ends with a demonstration day where the case studies of successful pilots will be presented and linked to potential sources of funding and investment to enable further pilot development and/or replication.
Finally, research will be conducted to determine the best busi-ness models that will guarantee the future sustainability and commercial use of AspBAN and reach a recommendation of the most appropriate, in light of the policies of the EU Green Deal. This will entail the identification of two business models, that will operate in an integrated way: a smart ports Blue Economy business model that will enable ports to diversify their revenue sources by cooperating with each other in Blue Economy sectors, thus increasing sea-basin maritime blue growth in the Atlantic; and a blue accelerator scheme business model that will enable the smart ports blue network by feeding a high-quality pipeline of startups and scale-ups that will diversify ports revenue sources and client’s profiles.
BOX 8.2 AspBAN Top Objectives and DeliverablesAspBAN top 5 Objectives:
1. identify 10 common Blue Economy challenges in the Ports community;
2. attract 450 start-ups for both innovation programs; 3. achieve a final pool of 30 innovative start-up solutions that
will develop 50 pilots in 30 Atlantic ports; 4. attract €6 million in direct private investment for the final
pool of start-ups; 5. mobilize €5 billion of potential private investment, and 6. achieve a reduction of at least 100 000 tons of CO2 in the
operations of the 30 ports. At present, there is no organised innovation ecosystem in the EU Atlantic space for achieving this kind of impact, nor in another maritime basin. As such, AspBAN is pioneering this approach in EU’s maritime policy, generating an investment-friendly context for a sustainable ocean economy, piloting the application of the most recent EU policies.
AspBAN top 5 deliverables are to create and grow in the Atlantic Ports:
1. an organized innovation ecosystem for developing sustain-able Blue Economy business opportunities, that accounts for the different of stakeholders groups;
2. a physical and digital platform of acceleration and inno-vation services;
3. an investment opportunities roadmap for developing sus-tainable Blue Economy business opportunities in the, with a model that can be replicated in other geographies;
4. an investment community specialized in developing sus-tainable Blue Economy business opportunities in ports;
5. an identification of smart and green infrastructures nec-essary for developing sustainable Blue Economy business opportunities.
208
THE
EU B
LUE
ECO
NO
MY
REPO
RT

Figure 8.6 Results of the surveys and consultations on the focus of port development
Source: AspBAN.
Results thus far…
The desk research revealed that there is a significant resonance among ports in light of the Blue Economy and that ports are eager to cooperate with each other to become Blue Economy Hubs. Results highlight that many Blue Economy accelerators are rel-atively new and still develop capacity, and that the accelerators’ link to sufficient numbers of companies may hamper develop-ment. Ports are focused on meeting current economic demands and planning infrastructure developments to provide capac-ity required to meet future needs through long-term planning. Additionally, Blue Economy emerging sectors are being considered; and large ports have the resources to engage in a wide range of innovation activities, while small ports have limited capacity for activities that do not produce immediate returns on investment. Thus, it limits their ability to fully engage with all stakeholders within the innovation ecosystem.
Considering the development of ports within the next 5 years, results indicate that almost 80 % of ports’ primary goal is to become hubs for the Blue Economy in emerging sectors, and more than 70 % want to improve their current business model processes (Figure 8.6). When looking into the next 5 years and beyond the percentage of ports wanting to facilitate development of the BE emerging sector increases to 90 %, with 10 % of ports looking into core areas so the other 90 % can focus on new blue businesses (Figure 8.6).
Simultaneously, AspBAN organised a series of workshops for Atlantic Ports, to give them a short overview of the call objec-tives and expected results. Ports have also received the Guidelines
with practical input to help Atlantic Ports becoming an innova-tion-friendly space. Finally, a survey targeting ports regarding the main challenges faced, Identified 147 challenge. These were divided into six Blue Economy categories established by the European Commission and taken as a framework in the paper (Figure 8.7).
The results of the open call of the acceleration services were above expectations with 188 start-ups and SMEs applying, with a high number of applications from the target countries of AspBAN (Figure 8.8 – left). After a thorough evaluation using a well-estab-lished and effective methodology, 80 startups were selected to participate in the program and accelerate their business, having the opportunity to pitch their solution/product to the AspBAN port and investors community (Figure 8.8).
The experts and mentors’ network was created and mapped the competence needs in the industry, Results show that the greatest competencies needed for companies are in raising capital and scaling up, followed by working with corporates, knowledge of markets and sectors, and product and technology development.
Next steps
As next steps AspBAN is kick-starting the acceleration services that will allow the ‘Top 80’ start-ups to deep dive into the blue tech ecosystem, connecting them to investors, like-minded peo-ple and mentors to accelerate their business. Simultaneously, the open innovation program is also kicking-off with the definition of the 10 main innovation challenges of the ports, and the open call and scouting aimed at attracting 300 start-ups globally that can
0% 10% 20% 30% 40% 50% 60% 70% 80% 90% 100%
Continue to offer current cargo handlingservices
Facilitate the development of emergingsectors
Move to new Cargo type
Other
0%
20%
40%
60%
80%
100%
Improve currentbusiness model
processes
Invest to facilitateemerging sectors -Offshore Wind etc
Move to newcargo type
HinterlandDevelopment
Other
Focus of Port Development for next 5 Years
Focus of Port Development in 5 years and beyond
209
2022

answer those challenges in a more sustainable way, in line with the APP 2.0. and the European Green Deal goals. The organization and execution of both programs will run intensively during this second year.
Currently, the investors’ network is being developed, as well as the planning of blue investment events and the development of a service package for investors. In alignment is the platform that we are developing, that is connecting all the different networks and stakeholders to each other and to the start-ups and SMEs, creating a dynamic and collaborative community building allowing the ecosystem around the ports to grow.
This will enable startups to test solutions and perform pilot pro-jects in ports, whilst facilitating access to finance
To conclude, events that ensure knowledge transfer and expe-rience from the project to other sea basins of Europe and demonstrate the transferability of the model being developed by AspBAN will continue. Based on the experience of the project Recommendations to the European Institutions will be developed in particular as related to the blue ecosystem potential of ports as Blue Economy hubs. The outcome of this innovative project will be shared by AspBAN’s in a conference to be organised at the end of the project.
868 https://ec.europa.eu/environment/nature/info/pubs/docs/brochures/2020 %20Biod %20brochure %20final %20lowres.pdf869 The key messages from the Marine WG report can be dowloaded from the folder ‘Key messages for decision makers’ on the EFESE website: https://www.ecologie.gouv.fr/
levaluation-francaise-des-ecosystemes-et-des-services-ecosystemiques
8.4 ASSESSMENT OF MARINE ECOSYSTEMS AND ECOSYSTEM SERVICES IN FRANCEThe French Assessment of Ecosystems and Ecosystem Services (EFESE) is a program initiated in 2012 by the French Ministry of Ecology in the context of the European Biodiversity Strategy to 2020868, one of the objectives of which was to improve knowledge of ecosystems and their services in the EU (target 2, action 5). The first phase of the EFESE program produced assessments by major types of ecosystems: forest ecosystems; agricultural ecosystems; urban ecosystems; continental wetlands and freshwater ecosys-tems; marine and coastal ecosystems; rocky and high mountain areas. Each thematic assessment delivered an expert report and key messages for decision-makers. A national stakeholder com-mittee was established in order to define the general orientation of the program and to discuss and approve key messages869. The assessment of marine and coastal ecosystems and ecosystem services was carried out between 2015 and 2018 by a work-ing group (Marine WG) led by Ifremer and the University of Brest (UBO) with the support of the French Agency for Biodiversity (AFB).
Methodological issues and organisation of the assessment
The ecosystem services approach became popularised and widely disseminated through the Millennium Ecosystem Assessment (MEA), which was conducted from 2001 to 2005 under the aus-pices of the United Nations in order to provide a state-of-the-art for the scientific appraisal of the world’s ecosystems and the
Figure 8.7 Treemap chart representing the number ( %) of challenges received for each of the 6 Blue Economy categories
Source: AspBAN.
Climate neutrality and zero pollution
49%Improve management of space at sea
30%
Switching to a circular economy an reduce pollution
3%
Climate adaptation and coastal resilience 2%
Ensure sustainable food production
3%
Preservation of biodiversity and invest in nature
13%
210
THE
EU B
LUE
ECO
NO
MY
REPO
RT

services they provide870. However, various visions of the ecosys-tem services concept have been proposed before and after the MEA. In this sense, the assessment of ecosystem services raises the following unsolved methodological issues871:
• Should the assessment consider the potential, actual, or sus-tainable use of ecosystem services?
• Should abiotic ecosystem services be taken into account or only the biotic ecosystem services?
• Are ecosystem services the result of man-made investment in the use of natural capital and does the service flow depend on planning and management rules?
• What are the underlying values of ecosystem services in terms of contribution to security, basic materials for a good life (food, drinking water, etc.), health, good social relations, and freedom of choice?
The main methodological choices of the EFESE program were to focus on the actual uses and benefits in relation to the state of the ecosystems and to make explicit the links between ecosystem services and the pressures exerted on ecosystems on the one hand, and management policies on the other hand. The EFESE Marine WG decided to clearly adopt the paradigm of the strong sustainability, by virtue of which manufactured capital and natu-ral capital are not substitutable but complementary, which makes the conservation of ‘critical natural capital’ an imperative for sustainability872. Regarding the economic assessments of ecosys-tem services, particularly those expressed in monetary units, the EFESE Marine WG considers thus that they are not intended to
870 https://www.millenniumassessment.org/en/index.html871 Heink, U., Hauck, J., Jax, K., & Sukopp, U. (2016). Requirements for the selection of ecosystem service indicators – The case of MAES indicators. Ecological Indicators, 61,
18-26.872 The strong sustainability paradigm is based on the recognition of the global planetary boundaries and therefore imposes the conservation of a critical natural capital,
for which there is no substitute and whose degradation or depletion could be irreversible. It is opposed to the weak sustainability paradigm, which considers that natural capital is not a particular form of capital and that it can therefore be valued monetarily and be subject to the same trade-offs as all other forms of assets via cost-benefit analyses, before any decision is made to conserve or destroy it.
873 Mongruel R., Kermagoret C., Carlier A., Scemama P., Le Mao P., Levain A., Ballé-Béganton J., Vaschalde D. & Bailly D., 2019. Milieux marins et littoraux : évaluation des écosystèmes et des services rendus. Rapport de l’étude réalisée pour le compte du programme EFESE, IFREMER – UBO – AFB, 354 pages + Annexes. A condensed version of the report is available in English here: https://archimer.ifremer.fr/doc/00760/87162/
be presented in an aggregated form or integrated in cost-benefit analyses. Indeed, aggregating the benefits rendered by ecosys-tem services would imply that these services are considered as substitutable with each other, an assumption incompatible with the paradigm of strong sustainability. Also, employing monetary assessments to carry out ‘global’ cost-benefit analyses would entail an even more serious violation of this paradigm: indeed, comparing the benefits and costs of nature conservation policies would amount to accepting the idea that the components of the ecosystems and ecological processes targeted are not irreplace-able and thus do not form a ‘critical natural capital’. Economic assessments of the benefits delivered by marine ecosystems – when they can be carried out – are above all, useful to know: the type of advantages (individual or collective) perceived by society, their relative importance, the groups of actors involved, the cost for society of the associated management systems, and possi-bly, the way in which these advantages vary as a function of the evolution of the state of ecosystems and the modes of their utilisation.
The EFESE study on marine and coastal ecosystems873 uses only economic assessments based on observable data, since they alone ensure a genuine comparison between types of ecosystem and types of service in the framework of an assessment per-formed at such a large scale. Thus, the monetary data comprises market prices when such markets exist, which is the case in par-ticular for a certain number of goods produced by ecosystems, and cost data: costs of access, maintenance and replacement. The data of the costs incurred include public expenditure for the
Figure 8.8 Frequency map of the start-ups that applied to the Acceleration services program (left) and the percentage of start-ups and SMEs applications per Blue Economy sector /industry (right)
Source: AspBAN.
211
2022

protection of certain ecosystems and services, household expendi-ture to benefit from certain services and, lastly, replacement costs imputable to the restoration of a service or the impacts caused by its lost. Data on the number of beneficiaries are displayed when they exist. The entire approach has consisted in defining as pre-cisely as possible the service being assessed and the population that benefits from it. A monetary indicator is always related to a physical indicator (level of production, type of investment needed to benefit from the ES). Beneficiaries include professionals using ecosystems, consumers, recreational users or the general public.
Besides the members of the Marine WG, the EFESE study on marine and coastal ecosystems involved a large number of sci-entific experts who were called on to participate in workshops, and certain of them contributed directly to the preparation of the final report. In particular, consultation with these experts external to the Marine WG permitted validating the typologies of the eco-systems used and ensuring that the best knowledge available was employed. In addition, the stakeholders interested in the marine subjects were invited to set out their expectations regarding the study and express their perception of the ecosystems at risk and key ecosystem services. The involvement of the stakeholders took the form of meetings and an electronic consultation, which were used to identify the key ecosystems and issues related to their services from a social perspective874.
Typology of marine ecosystem services
Regarding the typology of ecosystem services, the conceptual framework of the EFESE Program is an adaptation of version 4.3 of the Common International Classification of Ecosystem Services (CICES). The main contributions of the EFESE program assessment framework consists in the following: a differentiated treatment of ecological functions, a focus on goods resulting from ecosystems rather than provisioning services and a distribution of cultural ser-vices between, on the one hand, that which belongs to the herit-age building on nature, and on the other hand, that which belongs to recreational activities, education and knowledge and landscape amenities. The typology of services adopted by the EFESE Marine WG conforms to these conventions. Nonetheless, certain goods and regulation services must be further specified to take into account the particularities of marine and coastal ecosystems.
The last attempt to introduce consistency to the major typologies of ecosystem services, while specifying definitions to adapt them to marine and coastal ecosystems, was carried out in the frame-work of the project ‘Mapping and Assessment of Ecosystems and their Services’ (MAES), at a time when CICES was only at version 3, in 2011875. Then, an assessment was carried out on the evalu-ations available in 2012 for each service by major type of marine and coastal ecosystem. In addition to their identification as ser-vices potentially delivered by marine and coastal ecosystems, certain services were perceived as having been scarcely studied, especially among the regulation services: water supply and stor-age, biological regulation, air quality and regulation, weather reg-ulation. Among these services, only biological regulation had been evaluated in the framework of EFESE Marine WG, which included
874 Scemama, P., Mongruel, R., Kermagoret, C., Bailly, D., Carlier, A., & Le Mao, P. (2022). Guidance for stakeholder consultation to support national ecosystem services assessment: A case study from French marine assessment. Ecosystem Services, 54, 101408.
875 https://biodiversity.europa.eu/ecosystems/mapping-and-assessment-of-ecosystems-and-their-services-maes-1/common-international-classification-of-ecosystem-services-cices
876 CICES, 2018. Common International Classification of Ecosystem Services (CICES) V5.1, 18/03/2018.
the service of ‘pathogen regulation’ due to its potential contribu-tion to human activities such as shellfish farming and recreational activities.
Four groups of cultural services were defined in line with the new criteria adopted for categorizing these services in the last 2018 version of CICES876:
1. Recreational services, which involve a physical interaction on site with the ecosystems and are based on specific activities intended to provide in particular, relaxation and pleasure in contact with nature.
2. Contemplating landscapes, which implies presence on site but as an intellectual experience based on the beauty of nature and the inspiration it provides.
3. Production of information and knowledge, which belongs to an intellectual and cognitive approach.
4. Heritage building, which involve relationships with eco-systems with spiritual and artistic dimensions as well as those related to identity. Heritage processes can be divided between institutionalized heritage (e.g. protected areas) and other forms of heritage.
Lastly, in line with the conventions adopted in the conceptual framework of the EFESE and the results of the consultation with the stakeholders:
• life cycle maintenance and ocean nourishment services (a service which can be likened to that of soil formation for terrestrial ecosystems) were evaluated as ecological func-tions via the ‘reproduction and nursery’ and the ‘food web’ functions, as explained above;
• the water purification service was analysed only from the angle of nutrient regulation since the other dimensions of this service (sequestration of chemical contaminant resi-dues, ecosystem regeneration following accidental pollution of black tide type, etc.) are difficult to evaluate;
• as regards goods produced by marine and coastal ecosys-tems, the study included the products of professional fishing, goods resulting from shellfish farming activities (especially important in certain coastal regions of France), products resulting from macro-algae and the production of molecules;
• goods resulting from marine ecosystems intended for energy production have been omitted from the scope of the study.
212
THE
EU B
LUE
ECO
NO
MY
REPO
RT

The notion of dis-service, that is to say constraints and disadvan-tages that the functioning of marine ecosystems inflict on human societies is not dealt with in this evaluation. Finally, 15 ecological functions and services have been evaluated on the basis of avail-able scientific knowledge as listed in the Table 8.1 below.
Table 8.1 List of functions and services evaluated on the basis of available scientific knowledge
Functions & services evaluated
Ecological functionsFood web maintenance
Reproduction and nursery
Goods produced by ecosystems
Production of goods from fishing
Production of goods from shellfish farming
Exploitation of macroalgae
Exploitation of molecules
Regulation and maintenance services
Nutrient regulation
Coastal protection
Climate regulation
Pathogen regulation
Cultural services
Recreational services
Landscape amenities
Knowledge production
Institutionalised heritage
Other forms of heritage
Source: Ifremer.
Levels of services by ecosystem types
The synthesis of available knowledge allows for a qualitative assessment of the contribution of marine and coastal ecosystems to the provision of ecological functions and ecosystem services by major types of ecosystems at the scale of the French maritime domain. Table 8.2 summarises this contribution according to four modalities: high, medium, low or non-existent. Because of their qualification as a constituent element of human well-being, eco-system services (unlike ecological functions) are evaluated via the benefits that society derives from them, regardless of the specific features of the ecosystem that provides them, its size and even its state. From this perspective, it is necessary to take into account the total demand for services in order to estimate the contribution of major ecosystem types to the provision of services. This implicitly incorporates the effects of the size and distribution of ecosystems on their ability to satisfy a demand that is itself more or less extensive.
Ecosystems with the most diverse bundle of services are the soft and rocky bottoms of the intertidal zone, special habitats such as seagrass beds, mangroves and coral reefs, and finally estu-aries, lagoons and water bodies under estuarine influence. Some
877 UNEP, 2009. Report from the workshop on Ecosystem Service Indicators: Developing and mainstreaming ecosystem service indicators for human wellbeing: Gaps, opportunities and next steps. UNEP World Conservation Monitoring Centre, Cambridge (UK), 33 p.
services are provided (i.e. with at least a moderate contribution) only by a limited number of ecosystems, which therefore play a key role with respect to these services. This is the case, in particu-lar, for the production of goods, especially from shellfish farming, macro-algae fields and molecules. It stands also for the service of climate regulation, concentrated on particular habitats such as seagrass beds and mangroves and on the pelagic compart-ment where phytoplankton is. The service of coastal protection concentrates on coral reefs, mangroves and sea grass beds and to a lesser extent in beaches and dune chains, salt marshes and lagoons. Food production services (through fisheries and shell-fish farming) are generally associated with a high contribution in terms of food webs and, breeding and feeding service. A very wide variety of ecosystems provide a significant level of recrea-tional services, with the exception of offshore ecosystems, where the contribution is low, and deep-sea ecosystems, where these services can be considered absent.
With respect to heritage building processes, two findings emerge from the assessment. Firstly, so-called ‘special’ habitats are glob-ally more subject to become heritage, whether through institu-tional action or through forms of attachment and value originat-ing from civil society. Second, heritage-building processes involve coastal and nearshore ecosystems to a greater extent than off-shore ones, in part because ownership and management depend on physical access to nature and its components.
Available indicators and knowledge gaps
The categories used to organize the assessment of the available indicators are adapted from the conclusions of a working group of the United Nations Environment Programme (UNEP)877 that con-siders five categories. Three categories are unchanged: (1) indi-cators of the state of the ecosystem of interest for the function or service under consideration, (2) indicators of the capacity of the ecosystem to provide the service and (3) indicators of the actual use of the service (service ‘flow’). The two others are mod-ified. The UNEP report distinguishes between benefits – defined as ‘what directly benefits human well-being’ – and impacts on physical, economic, social and spiritual well-being. As these dis-tinctions seemed insufficiently clear, the EFESE Marine WG opted for a distinction betweenn benefits – defined as ‘what directly benefits human well-being’ – and impacts on physical, economic, social and spiritual well-being. As these distinctions seemed insufficiently clear, the EFESE Marine WG opted for a distinction between:
i. indicators reflecting an individual benefit, i.e. the increase in the well-being of an individual through his or her own direct interaction with the ecosystem, and
ii. indicators reflecting a collective benefit, which benefits social groups as a whole, including their moral and even spiritual aspirations. Collective benefits thus broadly refer to what the IPBES conceptual framework considers as benefits other than ‘economic needs’, i.e. health, the quality of the environment, the quality of life and the quality of the environment.
This distinction between individual and collective benefits also echoes the convention adopted by the UK’s National Ecosystem
213
2022

Assessment (NEA) in order to distinguish between ‘individual’ and ‘shared’ values878. The indicators themselves are derived from a review of the literature and from proposals made by the EFESE Marine WG for some services. Not all the indicators presented as available on a large scale or on an ad hoc basis in the assessment (see Table 8.3) were systematically included in the study, but the review of available knowledge at least made it possible to decide on the availability of the indicator.
The assessment shows that there is still a considerable lack of knowledge to provide information on all types of indicators in a comprehensive manner for most services. For some services, there are no reliable indicators for a quantitative estimate of the benefit. This is the case for the service of producing goods from marine bio-molecules. An explanation may be the fact that this service essentially exists in a potential form, as many molecules of interest for pharmaceuticals or nutraceuticals have still to be discovered. Even if not quantified, this service must be considered because it makes it possible to express the option value of certain ecosystems still little known and used, such as deep-sea ecosys-tems, and therefore the need to conserve them and respect the integrity of their functioning.
Indicators of the individual and collective benefits derived from marine ecosystem services for which estimates exist are gathered in Table 8.4 (this table shows the results for metropolitan France only). The indicators do not attempt to distinguish within the cat-egory of collective benefits. The results of this economic assess-ment highlight the significant deficits in the quantitative indicators available to assess the benefits provided by the following services: production of molecules, nutrient regulation, coastal protection in mainland France, climate regulation, pathogen regulation, recrea-tional activities and knowledge production in overseas territories, and finally forms of heritage other than institutional. It should be noted that indicators of collective benefits, for which the EFESE Marine WG proposes to use estimators in terms of the number of beneficiaries or expenditure for maintaining the capacity of eco-systems to provide services, are therefore less often missing than indicators of individual benefits, particularly as regards regulatory services or heritage.
Conclusions and recommendations
An assessment of marine ecosystems and ecosystem services at a national or regional scale is a complex process which requires a multidisciplinary and precautious science-based approach. In particular, such assessments should be carried out according to the following prospects:
• describe the state of marine ecosystems, taking into account the gaps existing in current knowledge and the priorities expressed by the stakeholders and/or reflected in existing management systems;
• the diversity of marine ecosystems and stakeholders means that a large number of ES should be accounted for, and as a consequence narrow valuation focusing on ‘ready or easy to value’ ecosystem services (fisheries, climate regulation, tourism) while neglecting the others should be avoided;
878 Turner, K., Schaafsma, M., Elliott, M., Burdon, D., Atkins, J., Jickells, T., Tett, P., Mee, L., van Leeuwen, S., Barnard, S., Luisetti, T., Paltriguera, L., Palmieri, G., & Andrews, J. (2014). UK National Ecosystem Assessment Follow-on. Work Package Report 4: Coastal and marine ecosystem services: principles and practice. UNEP-WCMC, LWEC, UK.
• estimate the advantages gained from each service sepa-rately, according to an approach by range of services, as not all services can be assessed with the same precision and thoroughness;
• some indicators are not accurate for ecosystem services val-uation: for instance coastal tourism does not always mean ‘blue tourism’ dependent on ecosystems and their services;
• economic indicators should be extended to cost indicators, which are useful for estimating regulating ecosystem ser-vices and some cultural services;
• collective benefits have to be accounted for, and open the way for linking economic values to other dimensions of eco-system services value.
214
THE
EU B
LUE
ECO
NO
MY
REPO
RT

Table 8.5: Relative contribution of ecosystems in the French maritime domain to the total flow of functions and services
Food
web
s
Repr
oduc
tion
and
nur
sery
Goo
ds f
rom
fis
heri
es
Goo
ds f
rom
mar
icul
ture
m
aric
ultu
rear
ines
Goo
ds f
rom
mac
ro-a
lgae
Mol
ecul
es
Regu
lati
on o
f nu
trie
nts
Coas
tal p
rote
ctio
n
Regu
lati
on o
f cl
imat
e
Regu
lati
on o
f pa
thog
ens
Supp
ort
for
recr
eati
on
Prov
isio
n of
land
scap
e pl
aisa
nts
Prod
ucti
on o
f kn
owle
dge
Inst
itut
iona
lised
her
itag
e
Oth
er f
orm
s of
her
itag
e
H – Coastal and Marine HabitatsH1 – Coastal dunes and sandy shores
H2 – Coastal pebbles
H3 – Cliffs, ledges and rocky shores
H4 – Rock and other hard intertidal substrates
H5 – Intertidal sediment
H6 – Rock and other hard subtidal substrates
H7 – Rock and other circalittoral hard substrates
H8 – Subtidal sediment
H9 – Deep habitats F
HP – Special HabitatsSH1 – Salt Marshes
SH2 – Seagrass beds
SH3 – Coral Reefs
SH4 – Mangroves
SH5 – Macro-algae fields
SH6 – Coralligenous
WB – Water BodiesWB1 – Mediterranean lagoons
WB2 – Lagoons
WB3 – Estuarine Transition Waters
WB4 – Coastal waters under estuarine influence
WB5 – Other waters over continental shelves
F F
WB6 – Epipelagic zone of ocean waters
F F
WB7 – Meso and bathy-pelagic ocean bathypelagics
F F
■ High contribution ■ Medium contribution ■ Low contribution ■ No contribution F: function rather than service
Source: Ifremer.
215
2022

Table 8.6: Assessment of availability of indicators for the evaluation of ecosystem functions and services in the French maritime domain
Ecosystem services Conditions/state Capacity Flow of service/use Individual benefits Collective benefits
Food webs [Function]
Food web compartments balance
Primary production Contribution to all services
Not relevant Protective measures (Potential)
Secondary production
Reproduction and nursery [Function]
Location and biodiversity of suitable habitats
Area of suitable habitats
Contribution to all services
Not relevant Protective measures Restoration measures
Fisheries goods Status of fishing stocks
Maximum sustainable yield
Quantities of fish landed
Consumption (volume & value)Induced employment
Health, food security (number of beneficiaries, nutritional value)
Mariculture goods Number of sites suitable for shellfish farming
Carrying capacity of shellfish farming areas
Quantities of shellfish produced
Consumption (volume & value)Induced employment
Health, food safety (idem fishery goods)
Macro-algae goods Status of exploitable stocks
Maximum sustainable yield
Quantities of macro-algae landed
Consumption (volume & value), Induced employment
Health, food safety (idem fishery goods))
Molecules Number of species of nutraceutical or pharmaceutical interest
NA Quantities of species of interest extracted
Consumption of derivatives Induced employment
Health, food security (number of beneficiaries, nutritional and therapeutic value)
Nutrient regulation Level of primary production
Nutrient assimilation rate
Nutrient flux emitted
Avoided costs of individual remediation
Group treatment costs
Coastal protection Existence of ecosystems with protective species
Area and density of protective vegetation in vulnerable areas
Erosion intensity and frequency of extreme events in vulnerable areas
Damage avoided (economic activities)
Damage avoided (personal safety and living conditions)
Regulation of the global climate
Carbon Stock (vegetation, soil, water bodies)
Net Carbon Storage and Sequestration
NA Damage avoided (economic activities)
Mitigation of climate change Damage avoided
Pathogen regulation
Pathogen population density
Density of anti-pathogen species
Quantity of pathogens emitted
Avoided costs for the exploitation of sensitive species
Wildlife habitat enhancement
Collective treatment costs
Support for recreational activities
Quality of on sitefishing sites Quality of bathing water Status of wild populations for nature watching
Capacity of a sustainable use
Number of users Individual spending on recreational activities
Expenditure by user associations
Health, well-being (number of beneficiaries)
Production of pleasant landscapes
NA NA Number of users Difference in prices linked to the seascape
Well-being, Quality of living environment (no. of beneficiaries)
Production of knowledge
Not relevant Not relevant Number of publications Number of trainees or training sessions
Number of scientists Number of marine science students
Research and education expenditures
Public awareness of nature
Institutionalized heritage
Number of species of heritage interest Number and extent of sites of heritage interest
Not relevant Number of protected species Number of marine sites classified or protected
Individual expenditures to access sites of heritage interest
Expenditures for the protection of species and sites of heritage interest
Number of visitors in classified or protected sites
Attachment to the preservation of natural heritage
Well-beingQuality of living conditions (no. of beneficiaries)
Other forms of heritage
Traditional or artistic practices related to marine ecosystems
Not relevant
Number of events Number of artistic worksNumber of users
Attachment to maritime cultureSense of belonging
Well-beingSocial relationsQuality of living conditions (no. of beneficiaries)
■ Indicator available almost universally for the ecosystems of the French maritime domain ■ Indicator available on an ad hoc basis only ■ Indicator not available; NA: no indicator mentioned in the literature]Source: Ifremer.
216
THE
EU B
LUE
ECO
NO
MY
REPO
RT

Table 8.7: Individual and collective benefits derived from the functions and services provided by the ecosystems of the French maritime domain of metropolitan France
Individual benefits Collective benefits
Indicators Estimates Indicators Estimate
Food webs [Function]
Not relevant Conservation measures NA
Reproduction and nursery [Function]
Not relevant Functional protected fisheries zones
Areas still under designation (2018)
Costs of marine biodiversity conservation measuresIncluding restoration and compensation
€28 062 000 (2009)€28 610 678 (2016)€12 272 000 (2009)€3 761 000 (2016)
Fisheries goods Volume of salesValue of sales
240 000 tons (2014)€680 million (2014)
No. of consumers Annual consumption
80 to 96% of the population24 kg/inhabitant/year
Direct employment 9 681 FTE (2014) Management costs €133 700 000 (2008)€85 822 811 (2016)
Mariculture goods Volume of salesValue of sales Direct employment
154 500 tons (2013)€535 million (2013)8 500 FTE (2012)
No. of consumers Annual consumption
20 to 33% of the population 10 kg/inhabitant/year
Management costs €38 970 000 (2008)€25 000 000 (2016)
Macro-algae goods Volume of sales 40 à 70 000 tons No. of consumers 58% of the population
Value of salesDirect employment
NDND
Annual consumption ND
Molecules Consumption of derivated productsInduced employment
ND Number of consumers Annual consumption
ND
Nutrient regulation Avoided individual depollution costs
ND [-] Eutrophication treatment costs
€52 714 600 (2009)€273 829 300 € (2016)
Coastal protection Avoided losses (economic activities)
ND Damage avoided (safety and living conditions)
ND
Regulation of the global climate
Avoided losses (economic activities)
ND Mitigation of climate change
Carbon sequestration : 1.66 à 7.01 TgC/an
Damage avoided ND
Pathogen regulation
[-] Individual depollution costs
ND [-] Social costs induced by the contamination
ND
Wastewater treatment costs
1 247 056 000 € (2009)1 394 042 000 € (2016)
Support for recreational activities
Expenditures by recreation fishersDiving business turnover
€1 250 000 000 (2006)€20 925 000 (2016)
Number of recreational fishers
France :2 450 000 (2009)
Number of divers Mediterranean : 50 000 (2012)
Production of pleasant landscapes
Share of landscape in the consumption of recreation services (Normand Breton gulf)
Normand-Breton gulf :46% marine landscape4% underwater landscape
Shoreline appeal- number of inhabitants- tourist nights
7 786 264 (12%)123 900 000 (31%)
Production of knowledge
Employment in marine research
4 084 Public research expenditure
€335 000 000 (2016)
Number of students in marine sciences
3 000 Education expenses ND
Institutionalized heritage
Number of visit of protected sites per year
ND Number of marine species protected Number and area of marine protected sites
Expenditures on Marine Protected Areas
National et local : 332Classified (2015): 720 sites164 000 haMPA (2017) : 327 sites90 331 km²(23,99% of French EEZ)€75 169 000 (2009)€69 356 390 (2016)
Other forms of heritage
Number of participants in sea-related cultural events
ND Number of sea-related cultural events
ND
■ Broad estimate; ■ Point estimate ■ Proxy, probably highly overestimated value Italic = potential benefit ■ No estimate available; [-] losses due to ecosystem overloading].Source: Ifremer.
217
2022

T HE FOL LOWING A NNE XES
A RE AVA IL A BL E IN A SEPA R AT E F IL E :
ANNEX 1 M EM B ER STATE PROFILES
ANNEX 2 SUM MARY TABLES
ANNEX 3 M ETHODOLOGIC AL FR AM EWORK
ACRONYMS
GLOSSARY
218
THE
EU B
LUE
ECO
NO
MY
REPO
RT


978-92-76-52444-1doi:10.2771/793264
KL-AR-22-001-EN-N