2020 blue ribbon report - minnesota legislature
TRANSCRIPT
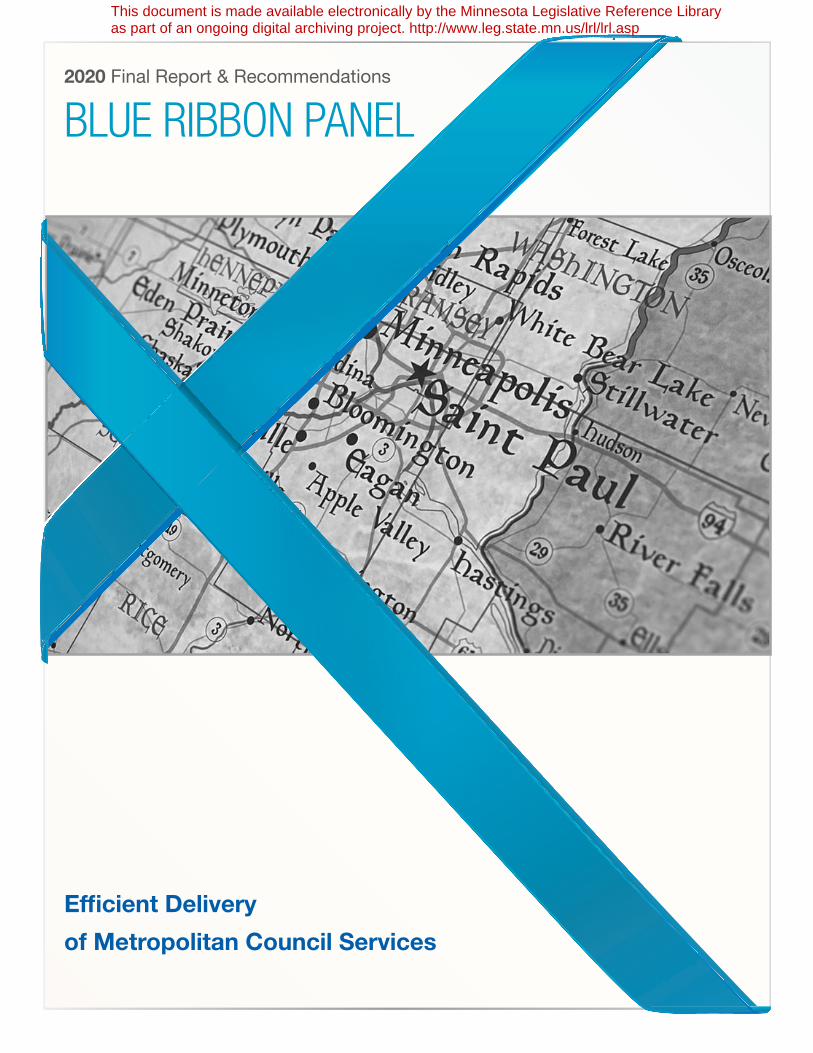
2020 Final Report & Recommendations
BLUE RIBBON PANEL
Efficient Delivery
of Metropolitan Council Services
This document is made available electronically by the Minnesota Legislative Reference Library as part of an ongoing digital archiving project. http://www.leg.state.mn.us/lrl/lrl.asp
2020 Final Report & Recommendations
BLUE RIBBON PANEL
*This report of the Metropolitan Council Blue Ribbon Panel was completed at the request of Minnesota Governor Tim Walz.
Copies may be obtained by contacting:Communications Director, Terri [email protected]
Efficient Delivery of Metropolitan Council Services
Submission Letter to Governor 2-3
Executive Summary 4
Governer’s Executive Order 5-7
Blue Ribbon Panel Members 8-9
Findings & Recommendations 10-19
Blue Ribbon Process – Meeting Notes & Summary 20-41
Presentations & Supporting Materials 42-148
Blue Ribbon Panel Correspondence 149-320
Acknowledgements 321
TABLE OF CONTENTS
1
2BLUE RIBBON COMMITTEE REPORT | December 2020
Metropolitan Council Blue Ribbon Panel
St. Paul, MN
December 21 , 2020
Office of Governor Tim Walz & Lt. Governor Peggy Flanagan
130 State Capitol
75 Rev Dr. Martin Luther King Jr. Blvd.
St. Paul, MN 55155
Dear Governor Tim Walz:
The members of the Metropolitan Council Blue Ribbon Panel are pleased to submit herewith
our final report entitled Efficient Delivery of Metropolitan Council Services.
We examined the role of elected versus appointed Metropolitan Council members. We also
addressed the Metropolitan Council's role as a Metropolitan Planning Organization ("MPO")
and identified and evaluated the ways this federal designation may complement and conflict
with the Council's responsibilities under Minnesota law. Finally, the Blue Ribbon Committee
reviewed the effectiveness of the delivery of regional transit service.
To learn the perspectives of the communities the Metropolitan Council serves, the Committee
met over a three-month period, collecting input through open (virtual) meetings. The input
we received from the Council, legislative staff, agency representatives, local government
representatives, and interested advocacy groups validates and highlights the breadth of
contexts across the organization. This work also reinforces that these are issues about which
many members of our communities are passionate. Other resources informed the panel's work
including legal guidance pertaining to Council and MPO responsibilities, existing policies, and
confirming that the Council is fulfilling its responsibilities under Minnesota law.
3BLUE RIBBON COMMITTEE REPORT | December 2020
Our recommendations recognize the existing work and statutory responsibilities of the
Metropolitan Council. However, we include specific observations and recommendations for
consideration that reflect critical questions from the Committee. The broad majority of the
panel endorses these conclusions. Dissenting views are included in this report.
We are proud of the work generated by the Blue Ribbon Committee and appreciate the
consideration of these recommendations.
Respectfully submitted,
!~~ Peter Bell Patrick Born John (Jay) Cowles
James Hovland Elizabeth Kautz Douglas Loon
Mary Jo McGuire Khani Sahebjam George Schember
Alene Tchourumoff Thomas Weaver Janet Williams
Pahoua Yang Hoffman Zhirong (Jerry) Zhao
4BLUE RIBBON COMMITTEE REPORT | December 2020
Executive Summary
On August 28, 2020, Governor Tim Walz issued Executive Order 20-88, establishing the Blue Ribbon Committee on the Metropolitan Council’s Structure and Services (Committee) to review three identified issues: the role of elected versus appointed Metropolitan Council Members, the Metropolitan Council’s role as a Metropolitan Planning Organization (MPO), and the effectiveness of the delivery of regional transit service. The Committee included a panel of civic, business, and academic leaders to provide for a broad range of input and expertise.
The Committee met over a three-month period, collecting a broad range of input through open (virtual) meetings. Information and testimony were received from state legislative staff, state agency representatives, Metropolitan Council staff, local government officials, and interested advocacy groups and civic organizations.
This report reflects the Committee’s findings and consensus recommendations regarding the three issues that the Committee was directed to review in Executive Order 20-88.
• The role of elected versus appointed Metropolitan Council members
The Committee recommends that Metropolitan Council Members should be appointed by the governor and should not be directly elected to the Council. Metropolitan Council Members should not be sitting local elected officials. The Committee recommends a change in current law to establish four-year staggered terms for Council Members, and an expansion of the nominating committee to include a majority of local elected officials.
• The Metropolitan Council’s role as a Metropolitan Planning Organization (“MPO”) and identify and evaluate the ways this federal designation may complement and conflict with the Council’s responsibilities under Minnesota law
The Committee finds that the U.S. Department of Transportation has determined that the Metropolitan Council is the properly designated MPO for the Twin Cities metropolitan area under federal law. Federal agencies have recognized the legal status of the Council as the region’s MPO directly, through certification of the planning process and plan approval, and award of federal transportation funds.
• The effectiveness of the delivery of regional transit service
The Committee finds that the current regional transit model allows for conflicting priorities for investment, but also provides value in opportunities for local input. The Committee recognizes that stable and long-term funding have been a challenge for the regional transit system, and that there is a great deal of uncertainty moving forward as budget deficits loom and ridership trends were severely disrupted by the COVID-19 pandemic.
5BLUE RIBBON COMMITTEE REPORT | December 2020
1
Executive Order 20-88
Establishing the Governor’s Blue Ribbon Committee on the Metropolitan Council’s Structure and Services
I, Tim Walz, Governor of the State of Minnesota, by the authority vested in me by the Constitution and applicable statutes, issue the following Executive Order:
The Metropolitan Council is the regional policy-making body, planning agency, and service provider for the Twin Cities metropolitan area, with a mission to foster efficient and economic growth for a prosperous metropolitan region. The Council is tasked with providing critical services in the Twin Cities metropolitan area and bringing communities together to develop a shared vision for the region.
The Metropolitan Council has been serving the Twin Cities metropolitan region for over 50 yearsand has evolved over time to proactively take on challenges that transcend city and county boundaries in an area that is home to 56% of Minnesota’s population. The Metropolitan Council provides essential services and infrastructure, including Metro Transit’s bus and rail system, Metro Mobility, Transit Link, wastewater collection and treatment, regional parks and trails,affordable housing, and regional planning. The Metropolitan Council’s operations and investments support communities and businesses in the metropolitan region and ensure a high quality of life for its residents.
For the benefit of the Twin Cities area and the entire state, the Metropolitan Council must have the proper tools and appropriate organizational structures to fulfill its statutory obligations and meet the needs of the communities in the region. To ensure that residents and businesses in the Twin Cities region continue to receive the Metropolitan Council’s services in the most efficient and equitable manner, I am establishing a Blue Ribbon Committee to evaluate the structure ofthe Metropolitan Council and the delivery of its statutory responsibilities. The Blue Ribbon Committee will include civic, business, and academic leaders to provide for a broad range of input and expertise.
For these reasons, I order that:
1. The Governor’s Blue Ribbon Committee on the Metropolitan Council’s Structure andServices (“Committee”) is established.
Page 1 of 3
6BLUE RIBBON COMMITTEE REPORT | December 2020
Our region is a great place to live, work, and do business.
2
2. The purpose of the Committee is to review:
a. The role of elected versus appointed Metropolitan Council members
b. The Metropolitan Council’s role as a Metropolitan Planning Organization(“MPO”) and identify and evaluate the ways this federal designation maycomplement and conflict with the Council’s responsibilities under Minnesotalaw
c. The effectiveness of the delivery of regional transit service
3. The members of the Committee are:
a. Mary Liz Holberg, Dakota County Commissioner, District 6, who will serveas Chair of the Committee
b. Peter Bell, Director, Schafer Richardson Realty Trust
c. Patrick Born, Chair, Board of Directors of the Citizens League
d. John (Jay) Cowles, Managing Director, Lawrence Creek, LLC
e. James Hovland, Mayor, City of Edina
f. Elizabeth Kautz, Mayor, City of Burnsville
g. Douglas Loon, President, Minnesota Chamber of Commerce
h. Mary Jo McGuire, Ramsey County Commissioner, District 2
i. Khani Sahebjam, Chief Strategy Officer, SRF Consulting
j. George Schember, Vice President, Cargill Transportation & Logistics
k. Alene Tchourumoff, Senior Vice President for Community Development andthe Center for Indian Country Development, Federal Reserve Bank ofMinneapolis
l. Thomas Weaver, CEO, Achieve Services
m. Janet Williams, Mayor of Savage
n. Pahoua Yang Hoffman, Senior Vice President, Community Impact, Saint Pauland Minnesota Foundation
o. Zhirong (Jerry) Zhao, Professor and Director of the Master of Public PolicyProgram, University of Minnesota Humphrey School of Public Affairs
Page 2 of 3
7BLUE RIBBON COMMITTEE REPORT | December 2020
3
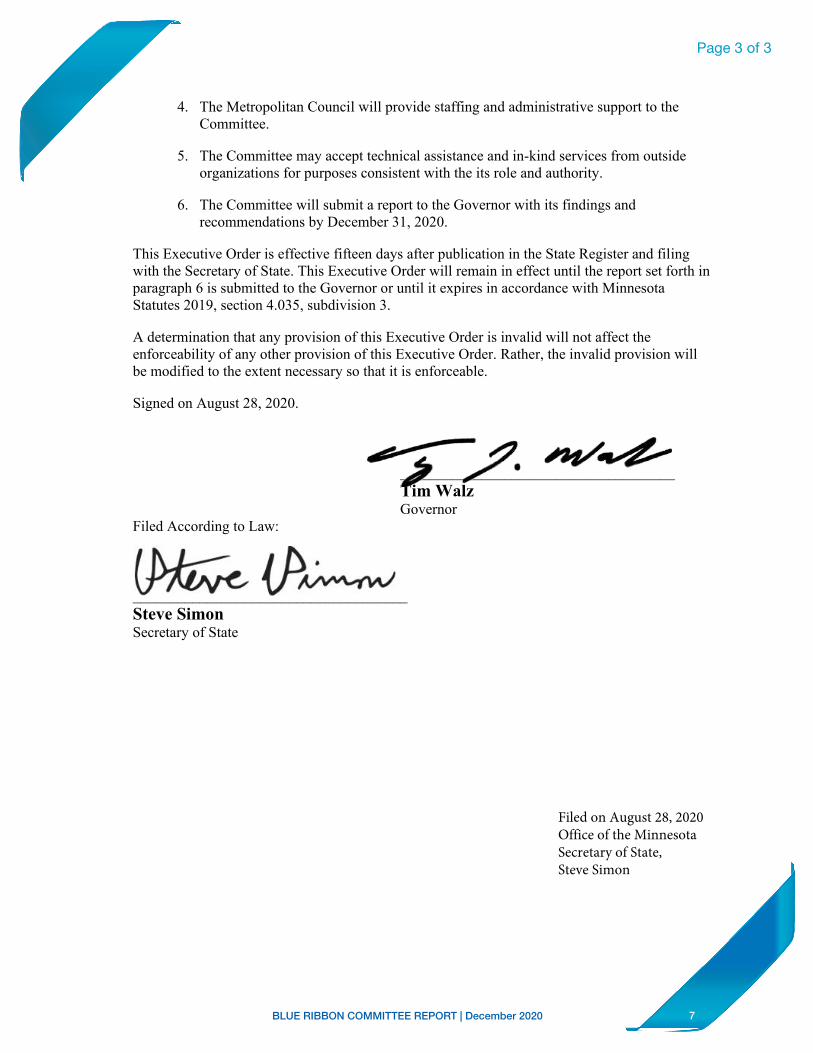
4. The Metropolitan Council will provide staffing and administrative support to theCommittee.
5. The Committee may accept technical assistance and in-kind services from outsideorganizations for purposes consistent with the its role and authority.
6. The Committee will submit a report to the Governor with its findings andrecommendations by December 31, 2020.
This Executive Order is effective fifteen days after publication in the State Register and filingwith the Secretary of State. This Executive Order will remain in effect until the report set forth in paragraph 6 is submitted to the Governor or until it expires in accordance with Minnesota Statutes 2019, section 4.035, subdivision 3.
A determination that any provision of this Executive Order is invalid will not affect the enforceability of any other provision of this Executive Order. Rather, the invalid provision will be modified to the extent necessary so that it is enforceable.
Signed on August 28, 2020.
_____________________________________Tim WalzGovernor
Filed According to Law:
_____________________________________Steve SimonSecretary of State
Filed on August 28, 2020Office of the MinnesotaSecretary of State,Steve Simon
Page 3 of 3
3
4. The Metropolitan Council will provide staffing and administrative support to theCommittee.
5. The Committee may accept technical assistance and in-kind services from outsideorganizations for purposes consistent with the its role and authority.
6. The Committee will submit a report to the Governor with its findings andrecommendations by December 31, 2020.
This Executive Order is effective fifteen days after publication in the State Register and filingwith the Secretary of State. This Executive Order will remain in effect until the report set forth in paragraph 6 is submitted to the Governor or until it expires in accordance with Minnesota Statutes 2019, section 4.035, subdivision 3.
A determination that any provision of this Executive Order is invalid will not affect theenforceability of any other provision of this Executive Order. Rather, the invalid provision willbe modified to the extent necessary so that it is enforceable.
Signed on August 28, 2020.
_____________________________________Tim WalzGovernor
Filed According to Law:
_____________________________________Steve SimonSecretary of State
Filed on August 28, 2020Office of the MinnesotaSecretary of State,Steve Simon
--;;-/. Al/~
~<P~
8BLUE RIBBON COMMITTEE REPORT | December 2020
Metropolitan Council
BLUE RIBBON Panel Biographies
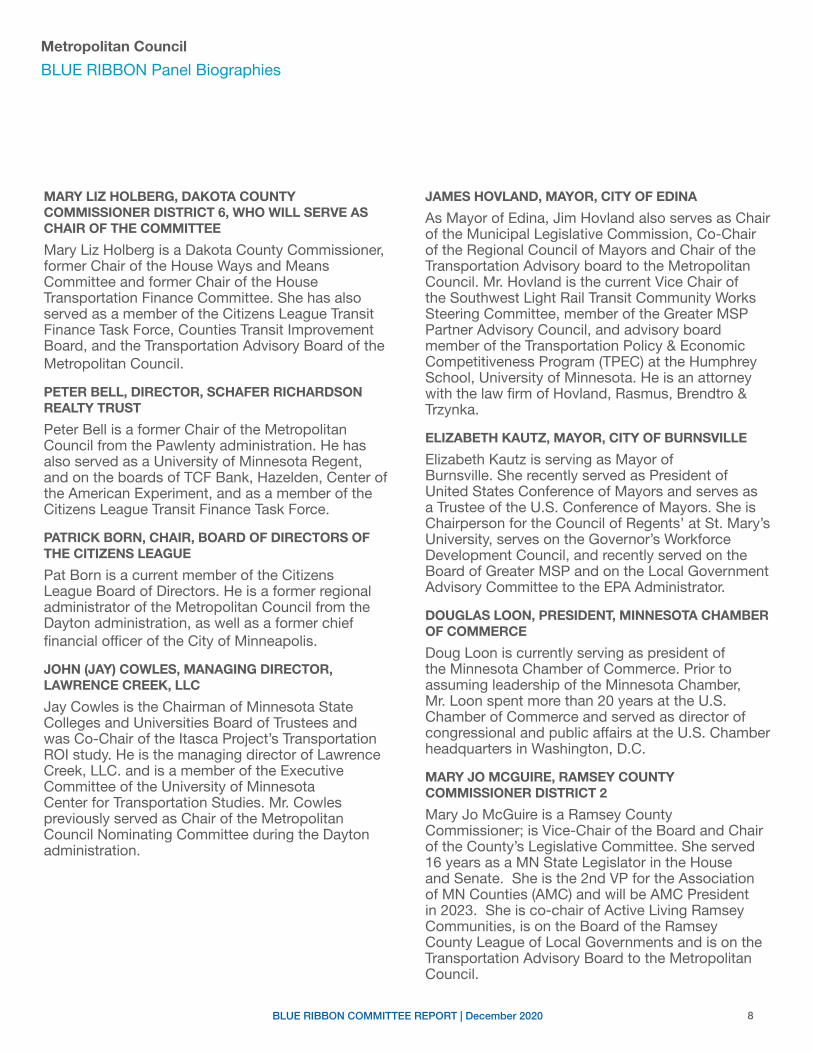
JAMES HOVLAND, MAYOR, CITY OF EDINA
As Mayor of Edina, Jim Hovland also serves as Chair of the Municipal Legislative Commission, Co-Chair of the Regional Council of Mayors and Chair of the Transportation Advisory board to the Metropolitan Council. Mr. Hovland is the current Vice Chair of the Southwest Light Rail Transit Community Works Steering Committee, member of the Greater MSP Partner Advisory Council, and advisory board member of the Transportation Policy & Economic Competitiveness Program (TPEC) at the Humphrey School, University of Minnesota. He is an attorney with the law firm of Hovland, Rasmus, Brendtro & Trzynka.
ELIZABETH KAUTZ, MAYOR, CITY OF BURNSVILLE
Elizabeth Kautz is serving as Mayor of Burnsville. She recently served as President of United States Conference of Mayors and serves as a Trustee of the U.S. Conference of Mayors. She is Chairperson for the Council of Regents’ at St. Mary’s University, serves on the Governor’s Workforce Development Council, and recently served on the Board of Greater MSP and on the Local Government Advisory Committee to the EPA Administrator.
DOUGLAS LOON, PRESIDENT, MINNESOTA CHAMBER OF COMMERCE
Doug Loon is currently serving as president of the Minnesota Chamber of Commerce. Prior to assuming leadership of the Minnesota Chamber, Mr. Loon spent more than 20 years at the U.S. Chamber of Commerce and served as director of congressional and public affairs at the U.S. Chamber headquarters in Washington, D.C.
MARY JO MCGUIRE, RAMSEY COUNTY COMMISSIONER DISTRICT 2
Mary Jo McGuire is a Ramsey County Commissioner; is Vice-Chair of the Board and Chair of the County’s Legislative Committee. She served 16 years as a MN State Legislator in the House and Senate. She is the 2nd VP for the Association of MN Counties (AMC) and will be AMC President in 2023. She is co-chair of Active Living Ramsey Communities, is on the Board of the Ramsey County League of Local Governments and is on the Transportation Advisory Board to the Metropolitan Council.
MARY LIZ HOLBERG, DAKOTA COUNTY COMMISSIONER DISTRICT 6, WHO WILL SERVE AS CHAIR OF THE COMMITTEE
Mary Liz Holberg is a Dakota County Commissioner, former Chair of the House Ways and Means Committee and former Chair of the House Transportation Finance Committee. She has also served as a member of the Citizens League Transit Finance Task Force, Counties Transit Improvement Board, and the Transportation Advisory Board of the Metropolitan Council.
PETER BELL, DIRECTOR, SCHAFER RICHARDSON REALTY TRUST
Peter Bell is a former Chair of the Metropolitan Council from the Pawlenty administration. He has also served as a University of Minnesota Regent, and on the boards of TCF Bank, Hazelden, Center of the American Experiment, and as a member of the Citizens League Transit Finance Task Force.
PATRICK BORN, CHAIR, BOARD OF DIRECTORS OF THE CITIZENS LEAGUE
Pat Born is a current member of the Citizens League Board of Directors. He is a former regional administrator of the Metropolitan Council from the Dayton administration, as well as a former chief financial officer of the City of Minneapolis.
JOHN (JAY) COWLES, MANAGING DIRECTOR, LAWRENCE CREEK, LLC
Jay Cowles is the Chairman of Minnesota State Colleges and Universities Board of Trustees and was Co-Chair of the Itasca Project’s Transportation ROI study. He is the managing director of Lawrence Creek, LLC. and is a member of the Executive Committee of the University of Minnesota Center for Transportation Studies. Mr. Cowles previously served as Chair of the Metropolitan Council Nominating Committee during the Dayton administration.
9BLUE RIBBON COMMITTEE REPORT | December 2020
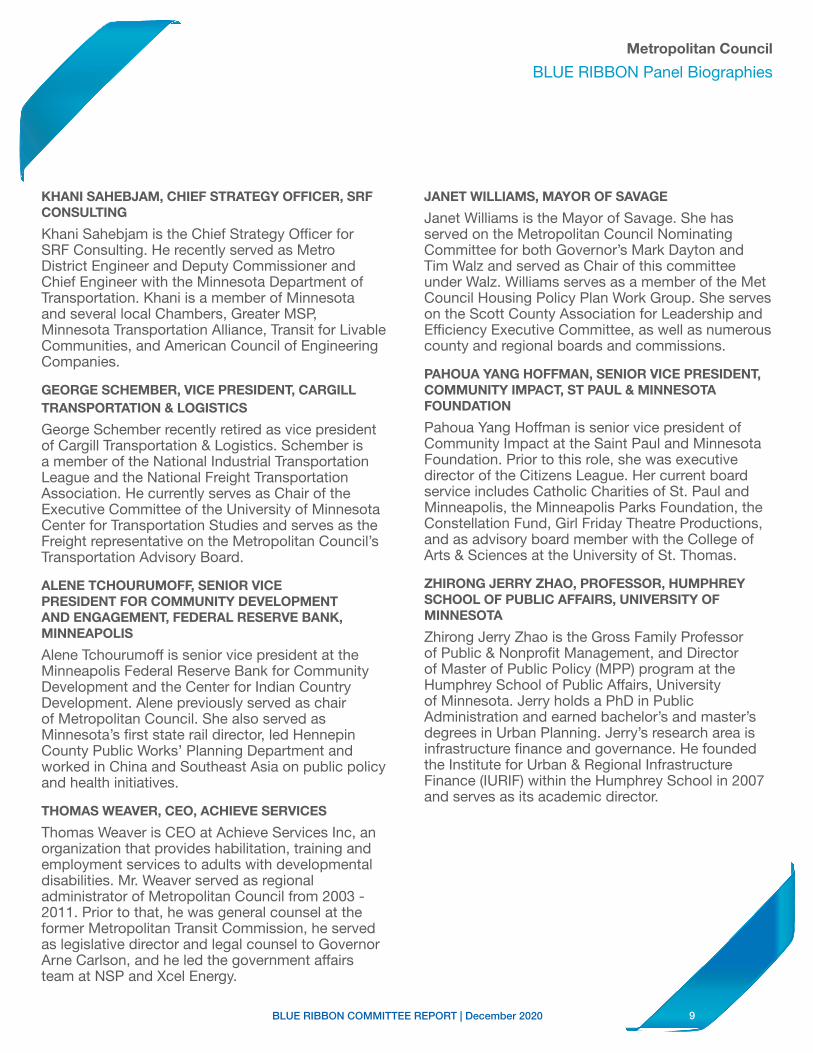
KHANI SAHEBJAM, CHIEF STRATEGY OFFICER, SRFCONSULTING
Khani Sahebjam is the Chief Strategy Officer for SRF Consulting. He recently served as Metro District Engineer and Deputy Commissioner and Chief Engineer with the Minnesota Department of Transportation. Khani is a member of Minnesota and several local Chambers, Greater MSP, Minnesota Transportation Alliance, Transit for Livable Communities, and American Council of Engineering Companies.
GEORGE SCHEMBER, VICE PRESIDENT, CARGILL TRANSPORTATION & LOGISTICS
George Schember recently retired as vice president of Cargill Transportation & Logistics. Schember is a member of the National Industrial Transportation League and the National Freight Transportation Association. He currently serves as Chair of the Executive Committee of the University of Minnesota Center for Transportation Studies and serves as the Freight representative on the Metropolitan Council’s Transportation Advisory Board.
ALENE TCHOURUMOFF, SENIOR VICE PRESIDENT FOR COMMUNITY DEVELOPMENT AND ENGAGEMENT, FEDERAL RESERVE BANK, MINNEAPOLIS
Alene Tchourumoff is senior vice president at the Minneapolis Federal Reserve Bank for Community Development and the Center for Indian Country Development. Alene previously served as chair of Metropolitan Council. She also served as Minnesota’s first state rail director, led Hennepin County Public Works’ Planning Department and worked in China and Southeast Asia on public policy and health initiatives.
THOMAS WEAVER, CEO, ACHIEVE SERVICES
Thomas Weaver is CEO at Achieve Services Inc, an organization that provides habilitation, training and employment services to adults with developmental disabilities. Mr. Weaver served as regional administrator of Metropolitan Council from 2003 - 2011. Prior to that, he was general counsel at the former Metropolitan Transit Commission, he served as legislative director and legal counsel to Governor Arne Carlson, and he led the government affairs team at NSP and Xcel Energy.
JANET WILLIAMS, MAYOR OF SAVAGE
Janet Williams is the Mayor of Savage. She has served on the Metropolitan Council Nominating Committee for both Governor’s Mark Dayton and Tim Walz and served as Chair of this committee under Walz. Williams serves as a member of the Met Council Housing Policy Plan Work Group. She serves on the Scott County Association for Leadership and Efficiency Executive Committee, as well as numerous county and regional boards and commissions.
PAHOUA YANG HOFFMAN, SENIOR VICE PRESIDENT, COMMUNITY IMPACT, ST PAUL & MINNESOTA FOUNDATION
Pahoua Yang Hoffman is senior vice president of Community Impact at the Saint Paul and Minnesota Foundation. Prior to this role, she was executive director of the Citizens League. Her current board service includes Catholic Charities of St. Paul and Minneapolis, the Minneapolis Parks Foundation, the Constellation Fund, Girl Friday Theatre Productions, and as advisory board member with the College of Arts & Sciences at the University of St. Thomas.
ZHIRONG JERRY ZHAO, PROFESSOR, HUMPHREY SCHOOL OF PUBLIC AFFAIRS, UNIVERSITY OF MINNESOTA
Zhirong Jerry Zhao is the Gross Family Professor of Public & Nonprofit Management, and Director of Master of Public Policy (MPP) program at the Humphrey School of Public Affairs, University of Minnesota. Jerry holds a PhD in Public Administration and earned bachelor’s and master’s degrees in Urban Planning. Jerry’s research area is infrastructure finance and governance. He founded the Institute for Urban & Regional Infrastructure Finance (IURIF) within the Humphrey School in 2007 and serves as its academic director.
Metropolitan Council
BLUE RIBBON Panel Biographies
10BLUE RIBBON COMMITTEE REPORT | December 2020
Page 1 of 10
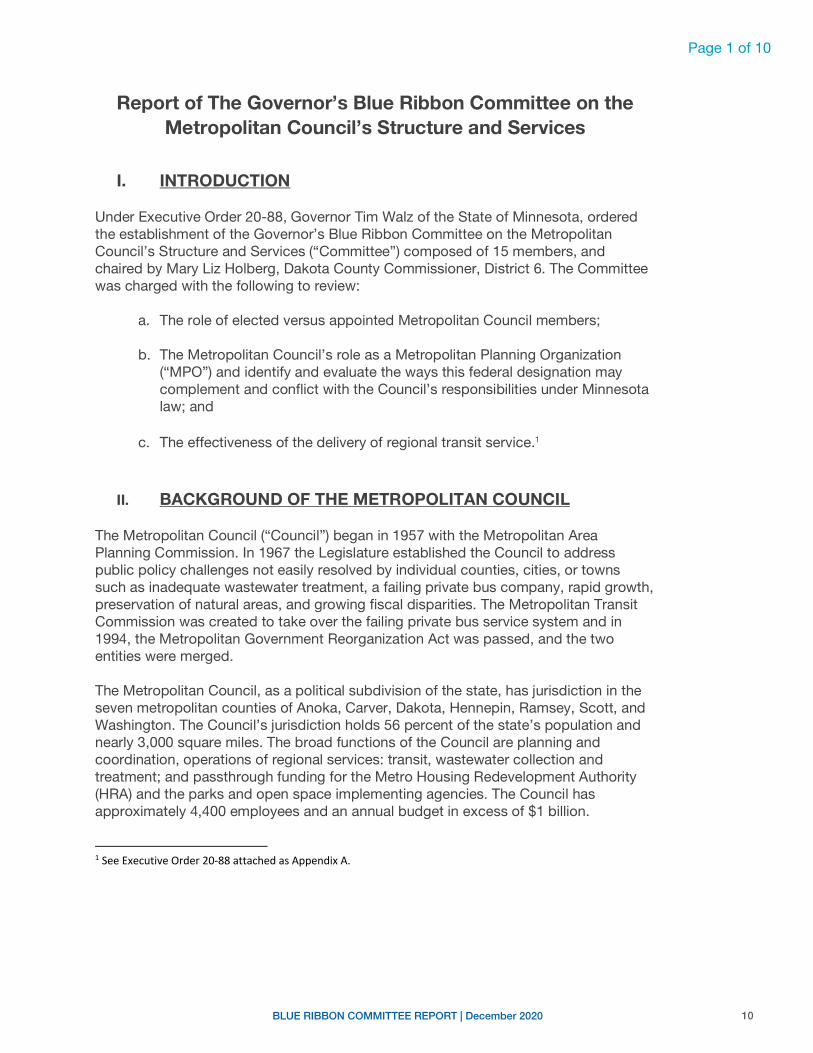
Report of The Governor’s Blue Ribbon Committee on the Metropolitan Council’s Structure and Services
I. INTRODUCTION
Under Executive Order 20-88, Governor Tim Walz of the State of Minnesota, ordered the establishment of the Governor’s Blue Ribbon Committee on the Metropolitan Council’s Structure and Services (“Committee”) composed of 15 members, and chaired by Mary Liz Holberg, Dakota County Commissioner, District 6. The Committee was charged with the following to review:
a. The role of elected versus appointed Metropolitan Council members;
b. The Metropolitan Council’s role as a Metropolitan Planning Organization (“MPO”) and identify and evaluate the ways this federal designation may complement and conflict with the Council’s responsibilities under Minnesota law; and
c. The effectiveness of the delivery of regional transit service.1
II. BACKGROUND OF THE METROPOLITAN COUNCIL
The Metropolitan Council (“Council”) began in 1957 with the Metropolitan Area Planning Commission. In 1967 the Legislature established the Council to address public policy challenges not easily resolved by individual counties, cities, or towns such as inadequate wastewater treatment, a failing private bus company, rapid growth, preservation of natural areas, and growing fiscal disparities. The Metropolitan Transit Commission was created to take over the failing private bus service system and in 1994, the Metropolitan Government Reorganization Act was passed, and the two entities were merged. The Metropolitan Council, as a political subdivision of the state, has jurisdiction in the seven metropolitan counties of Anoka, Carver, Dakota, Hennepin, Ramsey, Scott, and Washington. The Council’s jurisdiction holds 56 percent of the state’s population and nearly 3,000 square miles. The broad functions of the Council are planning and coordination, operations of regional services: transit, wastewater collection and treatment; and passthrough funding for the Metro Housing Redevelopment Authority (HRA) and the parks and open space implementing agencies. The Council has approximately 4,400 employees and an annual budget in excess of $1 billion.
1 See Executive Order 20-88 attached as Appendix A.
11BLUE RIBBON COMMITTEE REPORT | December 2020
Page 2 of 10
The Metropolitan Council has 16 members who each represent a geographic district and a chair who serves at large. They are all appointed by and serve at the pleasure of the governor with the advice and consent of the Minnesota Senate. Additionally, Minn. Stat. § 473.123 provides:
• Members of the Council must be appointed to reflect fairly the various demographic, political, and other interests in the metropolitan area and the districts.
• Members of the Council must be persons knowledgeable about urban and metropolitan affairs.
The Council delivers its statutory responsibilities in the following manner: a. Community Development The purpose of the Community Development division of the Metropolitan Council is to oversee the regional planning process and the 10-year regional planning cycle. Community development is also responsible for planning and funding the regional parks in coordination with local park implementing agencies. Community Development oversees Metropolitan Livable Communities Act programs, which are designed to create compact and connected development patterns, to help change long-term market incentives that adversely impact the creation and preservation of living wage jobs, to create incentives for developing communities to include a full range of housing opportunities, and to create incentives to preserve and rehabilitate affordable housing. Community Development operates the Metro Housing and Redevelopment Authority (HRA), which was created by the Minnesota Legislature in 1974. The Metro HRA is the largest administrator of tenant-based rental assistance in the state. Finally, Community Development provides research on regional issues and long-term regional forecasts for population, households, and jobs. b. Metropolitan Transportation Services Metropolitan Transportation Services is responsible for transportation planning and contracted transit operations. Metropolitan Transportation Services supports the Council in its role as the region’s federally required Metropolitan Planning Organization (MPO) and performs long-range transportation system planning for all modes. Metropolitan Transportation Services is also responsible for contracted transit operations, providing coordination for metropolitan transit operations across all providers; providing financial assistance to transit providers; and administering transportation grants to local agencies and transit operators. The division’s family of transit services includes contracted regular route services, Metro Mobility ADA service, Transit Link dial-a-ride, and Metro Vanpool. Metropolitan Transportation Services also provides regional services across transit providers including fleet management,
12BLUE RIBBON COMMITTEE REPORT | December 2020
Page 3 of 10
technology implementation, grants management, and regional provider performance reporting. c. Metro Transit Metro Transit provided more than 84 percent of the nearly 92 million transit rides regionwide in 2019. The Metro Transit service area covers 907 square miles and 90 cities. Metro Transit services include local and express bus, METRO Blue and Green Line light rail, Northstar commuter rail and the METRO A and C bus rapid transit lines. Metro Transit also provides travel demand management support for the communities it serves, assistance on transit-oriented development, regional support for scheduling and customer service, and the Metro Transit Police Department. Metro Transit is also the lead agency for several transitways under development, including the following planned lines in the METRO system: Green Line Extension, Blue Line Extension, Orange Line, Gold Line, and D, B, and E Lines.
d. Environmental Services The key role of Environmental Services is to operate the regional wastewater treatment system. Environmental Services also carries out the water supply planning activities required under Minnesota state statute. Environmental Services serves approximately 50 percent of Minnesota’s population. The majority of the funding comes from municipal wastewater charges, with smaller funding coming from the Sewer Availability Charge and Industrial Waste Charges. As the water supply planning authority, Environmental Services develops guidance and plans for the orderly and economical development of water supply services and protects public health and water quality. Environmental Services also manages the Metro Area Water Supply Advisory Committee, which guides Council water supply planning and approves the Master Water Supply Plan.
III. WORK OF THE BLUE RIBBON COMMITTEE
The Committee met seven times between Sept. 14, 2020 and Dec. 7, 2020. It was provided with an extensive amount of written material for review and heard testimony from the Council and legislative staff, agency representatives, local government representatives, and interested advocacy groups, as documented in the appendices to this report. Based upon the written materials and testimony provided, and discussions among Committee members, the Committee addressed the issues that Gov. Walz requested be explored and herewith makes the following conclusions and findings and provides recommended actions to the governor and the Minnesota Legislature as articulated in the following section.
13BLUE RIBBON COMMITTEE REPORT | December 2020
Page 4 of 10
IV. ISSUES THE GOVERNOR REQUESTED BE ADDRESSED
1. Role of Elected Versus Appointed Metropolitan Council Members
Executive Order 20-88 directed the Committee to explore the role of potentially having elected versus appointed Metropolitan Council members.
Committee Conclusions and Findings: The current process of appointment is robust and transparent. Council vacancies are announced and posted through the Secretary of State’s open appointments process, which allows all interested and eligible persons to apply for a Council position. A nominating committee, established in Minn. Stat. § 473.123(c), is selected by the governor and is statutorily composed of seven members of which three must be local elected officials. The nominating committee goes through an extensive evaluation process of potential Council members that includes a review of application materials and candidate interviews. Candidate interviews have been open to the public to maximize transparency. At the conclusion of the review and interview process, the nominating committee forwards its recommendations for each Council district to the governor for consideration.
Per statute, the governor must notify the Minnesota Senate of the intention to appoint five days prior to the deadline, at which time the appointment becomes official, pending confirmation by the Senate.
The Blue Ribbon Committee finds the following:
• Council Members should be appointed by the governor and not be directly elected to the Council. The Council needs to focus on the best interests of the entire region and not be beholden to the specific area a Council Member represents. A directly elected Council also raises concerns about creating a“mini-legislature” for the metropolitan area that would be implementing laws enacted by the state.
• Council Members should not be sitting local elected officials.o A Metropolitan Council made up of elected local officials would raise
serious concerns about parochialism and real or perceived conflicts of interest inherent with one person holding dual offices. At times, specific local interests may not align with needs and goals of regional systems and long-range plans.
o Serving on the Metropolitan Council requires a significant commitment of time. Local elected officials often have other employment and obligations in addition to their elected office that would limit their ability to take on another role. This would create a limited and self-selected pool of local
14BLUE RIBBON COMMITTEE REPORT | December 2020
Page 5 of 10
elected officials who would have the ability to dedicate the time necessary to also serve as a Metropolitan Council member.
o Local officials would serve and vote in two political subdivisions generally considered to be incompatible functions.
o Local elected officials would serve as the both regulator in their role on the Council and the regulated party in their role as a local elected official. These are incompatible roles.
• There is a lack of consensus and support among the region’s local governments for a large structural reorganization or fundamental change to the Council. However, there appears to be broader agreement and support for making adjustments to the current nominating and appointment process.
Recommended Actions:
• Provide in statute for staggered four-year Council Member terms. This action would provide continuity of knowledge and experience when an administration turns over. With all members serving the same term of service, it is possible to lose the entirety of institutional memory on the Council gained over four years. Staggered terms would provide staff with greater consistency and stability in implementing the policy decisions of the Council. With staggered terms, sitting Council Members can assist with the onboarding process by acting as mentors to new appointees. The governor would maintain accountability by appointing the majority of the members including the chair along with half the Council Members in the first two years of his/her term.
• Require in statute that the nominating committee be expanded and comprised of a majority of local elected officials. The Committee believes there is a distinct benefit to the selection process by more fully involving local officials in the process, including having the nominating committee contain a majority of local elected officials.
• Require in statute that the nominating committee recommend up to three finalists for each Council seat and that the names of finalists and their qualifications be publicly announced at least 14 days prior to final selection by the governor. An open appointment process, including appropriately publishing vacancies and publishing the names of finalists allows for increased transparency and influence by the public, local government officials, and legislators.
Committee Minority Counterpoint: Gubernatorial appointments provide for an effective Council, but at times only represent the agenda of the administration making the appointment. Requiring Council Members to also be elected local officials could add a layer of accountability and reduce the possibility of major swings in regional planning philosophy or abrupt changes in policy.
15BLUE RIBBON COMMITTEE REPORT | December 2020
Page 6 of 10
2. The Metropolitan Council’s Role as a Metropolitan Planning Organization (MPO)
Executive Order 20-88 directed the Blue Ribbon Committee to explore the Metropolitan Council’s role as a Metropolitan Planning Organization (“MPO”) and identify and evaluate the ways this federal designation may complement and conflict with the Council’s responsibilities under Minnesota law.
Committee Conclusions and Findings: The Council has served as the designated Metropolitan Planning Organization (MPO) for the region since 1973 when it was designated as such by then Gov. Wendell Anderson, and in 1975 this designation was codified in state law. Federal law requires that Metropolitan Planning Organizations be designated in regions with more than 50,000 in population. Metropolitan Planning Organizations are responsible for multimodal transportation planning, providing an ongoing, cooperative regional planning process, and approving federal transportation funds for expenditure within the region. Large MPOs in regions with populations of more than 200,000, such as the Council, also are responsible for directly allocating federal transportation funds provided to the region.
Over time, federal law has changed to require that Metropolitan Planning Organization board membership include representation of local elected officials, state transportation agencies, and transit providers among its members. However, federal law also grandfathered in MPOs that had existed and been designated prior to Dec. 18, 1991. These grandfathered MPOs continue to legally exist, provided the membership and voting structure of the board does not significantly change, which could require a re-designation. In the recent past, there have been assertions that the Council is either not a legal Metropolitan Planning Organization or that changes in the Council structure since 1991 have caused the grandfathering law to no longer apply. High-level officials from the U.S. Department of Transportation have addressed these issues on at least four occasions over the past decade and have consistently found that the Council does serve as a legally designated Metropolitan Planning Organization under the grandfather clause and that no actions have significantly changed the membership or voting structure of the Council in such a way as to require a re-designation.
Therefore, the Blue Ribbon Committee finds that consistent with federal law (23 U.S. Code section 134) and opinions from the U.S. Department of Transportation that found the Council to be a legitimate Metropolitan Planning Organization in compliance with federal law:
16BLUE RIBBON COMMITTEE REPORT | December 2020
Page 7 of 10
• The Council is the legitimate regional Metropolitan Planning Organization (MPO), is covered under the federal law grandfather provision, and the U.S. Department of Transportation has confirmed that it continues to apply.
• The federal agencies are fully aware of, and in approval of the Council’s status as the legal MPO; have provided numerous certifications of the region’s planning processes; and have recognized the legal status of the Council as the recipient of regional federal transportation funds, and approver of the region’s long-range transportation plan and annual Transportation Improvement Program.
• Re-designating the regional MPO would be a complex process that under federal law must include the approval of the governor and agreement of local units of government representing at least 75 percent of the region’s population, including the region’s largest city, Minneapolis. Due to the current urbanized area extending into Houlton, Wisconsin (near Stillwater), re-designation may also potentially require approval of the governor of Wisconsin.
• The region has developed an effective, collaborative, working process whereby the Transportation Advisory Board, which includes a majority of local elected officials as required under Minn. Stat. § 473.146, subd. 4(b), plays a major role in the regional planning process and is responsible for allocating the region’s federal transportation funds.
• The Transportation Advisory Board is integral to the regional planning processes under long-standing protocol. The existing planning process requires that the Transportation Advisory Board provide recommendations on all of the region’s federally required documents including the long-range Transportation Policy Plan, Transportation Improvement Program, transportation public participation plan, and annual Unified Planning Work Program. In addition, for the allocation of federal funds, the Council and the Transportation Advisory Board have adopted a process whereby the Council can only concur with the board’s recommended program of projects for federal funding or send it back to the board for revision. This process allows for the Transportation Advisory Board and Council to work out any differences. On only one occasion in 30 years has the Council returned an item to Transportation Advisory Board.
Recommended Actions:
• The Metropolitan Council and Transportation Advisory Board should require a super majority 3/5ths vote (60 percent) on federally required actions and recommendations from the TAB to the Council to include the recommendations on the Regional Solicitation project selection, Transportation Policy Plan, Transportation Improvement Program, public participation plan, and Unified Planning Work Program.
• The Metropolitan Council and Transportation Advisory Board should consider eliminating the term “Advisory” in the board’s name to be replaced with another term or simply dropped (e.g. Transportation Board or Transportation Planning Board).
Committee Minority Counterpoint: While the regional planning process is working, some state and local elected officials have voiced dissatisfaction with the structure of the Metropolitan Planning Organization and assert that absent the grandfather provision, the current MPO structure does not adhere to federal law. A few committee members expressed casual support seeking a re-designation, but also recognize it would be a complex and contentious process, with simultaneously no clear regional agreement on what issues or problems need to be solved through a re-designation. However, to bring this issue to a resolution, it has been suggested that the state’s congressional delegation work to put this issue to rest with clear and straightforward statutory language at the federal level to clarify any real or perceived ambiguity.
3. Effectiveness of Delivery of Regional Transit Services
Executive Order 20-88 directed the Blue Ribbon Committee to explore the present effectiveness of delivery of regional transit services.
Committee Conclusions and Findings The Committee reviewed the various transit services provided within the region including Metro Transit and Suburban Transit Provider regular route bus services, light rail transit, bus rapid transit, commuter rail, Transit Link dial-a-ride, and Metro Mobility mandated ADA services. The various purposes, structure of the services, ridership levels and general operating measures, such as cost and subsidy, were presented. The role of the counties and Council in developing and funding transitways was discussed and the Minnesota Department of Transportation provided information on transit services in Greater Minnesota.
The Committee found that the region’s transit governance structure is complex, but that services are generally efficient and cost effective when compared to similar services provided in peer regions. Adequate funding for regional transit, particularly for service expansion and transitway development, has been a recurring issue and in the past has led to measures that further complicate the governance structure (i.e. creation of suburban providers, regional transit board, and Counties Transit Improvement Board). In addition, the ridership and costs of Metro Mobility, which is a federal and state mandated service for people with disabilities, have been growing well beyond the rate of inflation with little ability for the Council to reduce or control its cost.
17BLUE RIBBON COMMITTEE REPORT | December 2020
Page 8 of 10
Committee Minority Counterpoint:
• While the regional planning process is working, some state and local elected officials have voiced dissatisfaction with the structure of the Metropolitan Planning Organization and assert that absent the grandfather provision, the current MPO structure does not adhere to federal law. A few committee members expressed casual support seeking a re-designation, but also recognize it would be a complex and contentious process, with simultaneously no clear regional agreement on what issues or problems need to be solved through a re-designation. However, to bring this issue to a resolution, it has been suggested that the state’s congressional delegation work to put this issue to rest with clear and straightforward statutory language at the federal level to clarify any real or perceived ambiguity.
• In order to counter-balance the appointed Met Council, the voting strength of elected officials on the Transportation Advisory Board should be increased. Minn. Stat. 473.146, which sets out membership for the Transportation Advisory Board, could be amended to reduce the number of non-elected members with voting rights. The current structure of eighteen local elected officials and sixteen non-elected members could be adjusted so that some of the non-elected are eliminated as voting members. For example, the members representing Department of Transportation, the Pollution Control Agency, Metropolitan Airports Commission and the Metropolitan Council could be non-voting to increase the ratio of local elected officials to non-elected officials.
• The Metropolitan Council and Transportation Advisory Board should consider eliminating the term “Advisory” in the board’s name to be replaced with another term or simply dropped (e.g. Transportation Board or Transportation Planning Board).
Committee Minority Counterpoint: While the regional planning process is working, some state and local elected officials have voiced dissatisfaction with the structure of the Metropolitan Planning Organization and assert that absent the grandfather provision, the current MPO structure does not adhere to federal law. A few committee members expressed casual support seeking a re-designation, but also recognize it would be a complex and contentious process, with simultaneously no clear regional agreement on what issues or problems need to be solved through a re-designation. However, to bring this issue to a resolution, it has been suggested that the state’s congressional delegation work to put this issue to rest with clear and straightforward statutory language at the federal level to clarify any real or perceived ambiguity.
3. Effectiveness of Delivery of Regional Transit Services
Executive Order 20-88 directed the Blue Ribbon Committee to explore the present effectiveness of delivery of regional transit services.
Committee Conclusions and Findings The Committee reviewed the various transit services provided within the region including Metro Transit and Suburban Transit Provider regular route bus services, light rail transit, bus rapid transit, commuter rail, Transit Link dial-a-ride, and Metro Mobility mandated ADA services. The various purposes, structure of the services, ridership levels and general operating measures, such as cost and subsidy, were presented. The role of the counties and Council in developing and funding transitways was discussed and the Minnesota Department of Transportation provided information on transit services in Greater Minnesota.
The Committee found that the region’s transit governance structure is complex, but that services are generally efficient and cost effective when compared to similar services provided in peer regions. Adequate funding for regional transit, particularly for service expansion and transitway development, has been a recurring issue and in the past has led to measures that further complicate the governance structure (i.e. creation of suburban providers, regional transit board, and Counties Transit Improvement Board). In addition, the ridership and costs of Metro Mobility, which is a federal and state mandated service for people with disabilities, have been growing well beyond the rate of inflation with little ability for the Council to reduce or control its cost.
18BLUE RIBBON COMMITTEE REPORT | December 2020
Page 9 of 10
The Committee recognizes that the COVID-19 pandemic has had significant impact on the state’s overall financial situation and on the region’s transit system both in terms of reduced ridership and revenue. The long-term, ongoing impacts of the pandemic on residents’ travel needs and choices, and to the region’s transit system will not be fully understood for many months and potentially years into the future. It is very likely that in the coming years, changes to the transit system design and mix of services will need to be made in response to this changing travel demand. Federal Coronavirus Aid, Relief, and Economic Security (CARES) Act funding provided in response to the pandemic has helped financially support the system in the short term; however, transit funding shortfalls are expected in the next biennium and beyond.
Based upon the testimony and evidence provided, the Blue Ribbon Committee finds the following:
• The Committee recognizes the value of local input that is part of the suburban transit provider model and that dedicated funding allows suburban providers to try innovative ideas. However, the committee also recognizes that this model can lead to inefficiencies due to small size, inefficient service designs that end at or skip over service area boundaries, and duplication of administrative functions. The committee concludes there should not be a creation of new suburban transit providers and the regional transit system structure should continue to be evaluated for efficiencies.
• The Committee recognizes that transit funding shortfalls have been an ongoing issue for decades and that past legislative actions have provided short-term solutions that at times have further complicated the region’s transit governance and funding structures without necessarily providing funding to maintain and grow the system.
• The necessary level of state and federally mandated Metro Mobility ADA service is substantially more expensive to provide than regular transit service. The service has a growing financial need that competes for funding with general public transit service provided by the Council and the suburban transit providers.
• The Blue Ribbon Committee recognizes that the state will face substantial funding shortfalls during the 2021 Legislative Session due to pandemic-related economic conditions. These shortfalls will present serious challenges to the state’s and local governments’ ability to assist in maintaining the region’s transit services.
Recommended Actions:
19BLUE RIBBON COMMITTEE REPORT | December 2020
Page 10 of 10
• The Committee urges the governor and legislature to provide continued financial support to the regional transit system. High efficiency, low subsidy and high ridership services should be a priority for funding. Consideration of the regional and racial equity impacts of any significant reductions in transit service should be determined before making final funding decisions.
• The governor and legislature should statutorily shift the Metro Mobility budget from a base general fund appropriation to a forecasted budget program based upon demand. Metro Mobility/ADA program funding should be forecast and separated from funding provided for general public transit. Appropriations for forecasted programs are based upon forecasted usage (ridership) and will increase as ridership grows. This action would help ensure that the growing demand for mandated Metro Mobility service is addressed but does not lead to budget shortfalls for general transit services.
• The Council and its regional partners, Transportation Advisory Board, local governments, and transit providers should continue to cooperatively:
o Seek long-term funding solutions that allow for system growth and do not further complicate the region’s transit system structure.
o Evaluate transit governance options that support transit service efficiencies and allow for strong local input into decisions about investment and operations.
o Develop, adopt, and articulate agreed-upon regional transit service outcomes and measures that at a minimum consider ridership demand, efficiency and subsidy. These measures should be used regionwide to help prioritize transit service investment.
• The Council should contract for an efficiency and geographic equity study every five years to evaluate the regional transit system, including an analysis of light rail, passenger rail, regular route bus, bus rapid transit, Metro Mobility, and suburban transit providers. In addition, the study could examine where transit services exist and are most efficient, where services are less efficient, and where services are not available within the metropolitan area. This study could inform the decision-making process for transit investments and operational plans. [For consideration at the December 7 meeting]
• An independent entity should be contracted to conduct an efficiency and geographic balance study, with updates every five years to evaluate the regional transit system, including an analysis of light rail, passenger rail, regular route bus, bus rapid transit, Metro Mobility, and suburban transit providers. In addition, the study could examine where transit services exist and are most efficient, where services are less efficient, and where services are not available within the metropolitan area. This study could inform the decision-making process for transit investments and operational plans.
20BLUE RIBBON COMMITTEE REPORT | December 2020
BLUE RIBBON PROCESS Meeting Notes & Summaries
21BLUE RIBBON COMMITTEE REPORT | December 2020
Page - 1
Minutes of the GOVERNOR’S BLUE RIBBON COMMITTEE Monday, September 14, 2020 | 2:00 p.m.
Committee Members Present: Mary Liz Holberg, Peter Bell, Patrick Born, John (Jay) Cowles, James Hovland, Elizabeth Kautz, Douglas Loon, Mary Jo McGuire, Khani Sahebjam, George Schember, Alene Tchourumoff, Thomas Weaver, Janet Williams, Zhirong (Jerry) Zhao
Committee Members Absent: Pahoua Yang Hoffman
CALL TO ORDER Committee Chair Mary Liz Holberg called the meeting of the Governor’s Blue Ribbon Committee to order at 2:00 p.m. on Monday, September 14, 2020.
INFORMATION 1. Historical background of the Metropolitan Council; State and Federal Statutory Responsibilities
(Deb Dyson, Legislative Analyst, House Research)
Deb Dyson, Legislative Analyst, House Research, shared background information about the Metropolitan Council, including governance issues and proposals, as a way of giving historical context to the committee’s work. The Governor’s executive order establishing the Blue Ribbon Committee states that the committee is to review: 1. The role elected versus appointed Metropolitan Council members; 2. The Metropolitan Council’s role as a Metropolitan Planning Organization (MPO) and identify and evaluate the ways the federal designation map complement and conflict with the Council responsibilities under Minnesota law; and 3. The effectiveness of the delivery of regional transit services.
The Metropolitan Council is a political subdivision of the state, with jurisdiction in seven metropolitan counties with 56 percent of the state’s population. The functions of the Council are planning and coordination, operations of regional services: transit, wastewater collection and treatment; and passthrough funding for: Metro Housing Redevelopment Authority (HRA), parks and open space, and MLCA. While transportation is a significant and important function for the Council, it is not the only Council function to take into consideration when looking at the Council’s governance structure. The Metropolitan Council began in 1957 with the Metropolitan Area Planning Commission. In 1967 the issues emerged of wastewater, transportation and federal requirements for the region. In 1967 the Legislature established the Council as an appointed body and in the same year established the Metropolitan Transit Commission to take over failing private bus service. In 1994 the Metropolitan Government Reorganization acted was passed and the two were merged. Since 1995, many years see bills introduced to study governance, abolish the Council, make the Council a state agency, make the Council an elected body or a Council of Government (COG), change who makes appointments, or split off a function.
Committee members had questions about the Legislature’s role in overseeing the Council and Council budgets, including the local and federal shares of the Metropolitan Council budget. Committee members also had a question about if there has been a governor who has ever championed changes to the Met Council, including moving to elected officials. While there have been governors with an interest in making changes to the Council structure, there has not been a governor with an interest in moving to an elected Council. Committee members also asked about the process of appointing Council members and if
Page 1 of 3
22BLUE RIBBON COMMITTEE REPORT | December 2020
Page - 2 | METROPOLITAN COUNCIL
there have been changes made to the appointment process. Some changes have been made in the past to the appointment process.
2. How does the Council deliver its statutory responsibilities? a. Community Development (Lisa Barajas, Director, Community Development)
The purpose of the Community Development division is to oversee the regional planning process and the 10-year regional planning cycle. Community development is also responsible for planning and funding the regional parks planning process, in coordination with local park agencies. Community Development also oversees the Metropolitan Livable Communities Act programs, to create compact and connected development patterns, help to change long-term market incentives that adversely impact the creation and preservation of living wage jobs, create incentives for developing communities to include a full range of housing opportunities, and to create incentives to preserve and rehabilitate affordable housing. This program is fully funded by the local tax levy. Community Development operates the Metro Housing and Redevelopment Authority (Metro HRA), which was created by the Minnesota Legislature in 1974 to administer rent subsidy. The Metro HRA is the largest administrator of tenant-based rental assistance in the state. Finally, Community Development provides research on regional issues.
b. Metropolitan Transportation Services (Nick Thompson, Director, Metropolitan Transportation Services)
Metropolitan Transportation Services (MTS) is responsible for planning, transit operations and grants. MTS serves as the region’s federally required Metropolitan Planning Organization (MPO) and performs long-range transportation system planning for all modes. The Council’s designation as the MPO will be revisited in greater depth at a later meeting. MTS is responsible for transit operations, providing contracting and coordination for metropolitan transit operations. MTS also provides financial assistance to local transit providers. MTS also administers transportation grants to local agencies and transit operators. MTS is the designated planning agency per both state and federal law. The MTS family of transit services includes fixed route, Metro Mobility ADA service, Metro Mobility non-ADA service, Transit Link and Metro Vanpool. MTS also provides regional services including fleet for regional services, technology, grants management, regional policy, regional provider performance reporting, and support of suburban transit providers.
c. Metro Transit (Wes Kooistra, General Manager, Metro Transit)
Metro Transit provided over 84 percent of the nearly 92 million transit rides regionwide in 2019. The Metro Transit service area covers 907 square miles and 90 cities. In 2019 125 routes were used to provide transit service. The last travel inventory showed that approximately 60 percent of trips are for work or school. Bus is about two-thirds of all rides. 2020 ridership has been very different from 2019 ridership levels, over 50 percent down overall. Kooistra also shared information about the funding structure for both operations and capital development. Committee members had a question about opt-outs, which are cities that have opted out of Metro Transit services.
d. Environmental Services (Leisa Thompson, General Manager, Environmental Services)
The key role of Environmental Services is to operate the regional wastewater treatment system. Environmental Services also carries out the water supply planning activities required under Minnesota Statute. Environmental Services serves approximately 50 percent of Minnesota’s population. The majority of the funding comes from municipal wastewater charges, with smaller funding coming from the Sewer Availability Charge and Industrial Waste Charges. As the water supply planning authority, Environmental Services develops the guide for the orderly, economical development of the metropolitan
Page 2 of 3
23BLUE RIBBON COMMITTEE REPORT | December 2020
Page - 3 | METROPOLITAN COUNCIL
area, and protects public health and water quality. Environmental Services also operates the Metro Area Water Supply Advisory Committee (MAWSAC). MAWSAC assists and guides Council water supply planning and approves the Master Water Supply Plan. A committee member had a question about pricing for industrial waste charges and asked if the Council makes a profit. Thompson stated that this is based on the estimated cost for the service and program.
3. Regional Governance Models (Lisa Barajas, Director, Community Development)
Lisa Barajas shared an overview of different models of regional governance. Councils of government (COGs) are the most common form of regional government. A COG is a voluntary member organization of local governments that plays a coordination role and/and or addresses regional issues. Other common models are MPOs, regional development authorities (RDA), and regional planning agencies (RPA). Many organizations are a combination of more than one form of regional government and are located somewhere on the spectrum from voluntary to a state or federally delegated authority.
4. Committee Discussion
Committee members had no further discussion.
ADJOURNMENT Business completed; the meeting adjourned at 3:30 p.m.
Bridget Toskey Recording Secretary
Page 3 of 3
24BLUE RIBBON COMMITTEE REPORT | December 2020
Page - 1
Minutes of the GOVERNOR’S BLUE RIBBON COMMITTEE Monday, September 28, 2020 | 2:00 p.m.
Committee Members Present: Mary Liz Holberg, Peter Bell, Patrick Born, John (Jay) Cowles, Pahoua Yang Hoffman, James Hovland, Elizabeth Kautz, Douglas Loon, Mary Jo McGuire, Khani Sahebjam, George Schember, Alene Tchourumoff, Thomas Weaver, Janet Williams, Zhirong (Jerry) Zhao
Committee Members Absent: None
CALL TO ORDER Committee Chair Mary Liz Holberg called the meeting of the Governor’s Blue Ribbon Committee to order at 2:00 p.m. on Monday, September 28, 2020.
INFORMATION 1. Metropolitan Council Role as Metropolitan Planning Organization (Nick Thompson, Director,
Metropolitan Transportation Services; Amy Vennewitz, Deputy Director, Metropolitan Transportation Services)
Nick Thompson and Amy Vennewitz gave a presentation on the Council’s status as the Metropolitan Planning Organization (MPO) for the region. The Metropolitan Council is the designated planning agency for any long-range comprehensive transportation planning required by section 134 of the Federal Highway Act of 1962, Section 4 of Urban Mass Transportation Act of 1964 and Section 112 of Federal Aid Highway Act of 1973 and other federal transportation laws. MPOs must exist within all urbanized areas with a population greater than 50,000. There are approximately 400 MPOs across the country and there are eight in Minnesota. Urbanized areas with a population greater than 200,000 serve as Transportation Management Areas (TMA). TMAs allocate federal transportation funds and approve all spending of federal funds in the MPO area. The Council is the only TMA in Minnesota and is the 17th largest MPO by population nationally. After each census, the federal government defines urbanized areas (UZA) based upon population density and contiguous density and contiguous development. After the 2010 census, portions of Wright and Sherburne counties as well as Houlton, WI were defined as urbanized and required to be added to the MPO.
The backbone of federal law is the requirement for a 3C Planning Process. The 3C planning process means that it is cooperative, comprehensive and continuing. The core responsibilities of an MPO are to: establish a setting for effective decision-making; identify and evaluate transportation improvement options; prepare and maintain a Metropolitan Transportation Plan (MTP); develop a Transportation Improvement Program (TIP); identify performance measurement targets and monitor whether implemented projects are achieving targets; involve the public; demonstrate air quality conformity for MPOs on air quality non-attainment and maintenance areas; and implement a Congestion Management Process for large MPOs.
The Transportation Advisory Board (TAB) is an advisory body established by state law, comprised of 34 members: 18 elected officials (seven county, ten city, one Suburban Transit Provider); four agency representatives (MnDOT, MAC, MPCA, Council); eight citizens appointed by the Council; and four modal representatives (one freight, two transit, one bicycle/pedestrian). Local elected officials participate in selecting and approving
Page 1 of 3
25BLUE RIBBON COMMITTEE REPORT | December 2020
Page - 2 | METROPOLITAN COUNCIL
federally funded projects through Regional Solicitation and TIP. TAB recommends the program of projects for federal funding and the Council then concurs or denies the program. They also provide comments and review of planning products. The Technical Advisory Committee (TAC) advises the TAB and provides technical support, recommendations and review.
The Metropolitan Council was designated as the MPO in 1973 by Governor Wendell Andersen. In 1991 the federal ISTEA Act which included MPO membership requirements “grand-fathered in” non-conforming MPOs. The Council’s status as the MPO has been reaffirmed by the USDOT on four occasions: January 2011, August 2015, February 2016, and August 2018. A metropolitan planning organization may be redesignated by agreement between the Governor and units of general purpose local government that together represent at least 75 percent of the existing planning area population (including the largest incorporated city (based on population) as determined by the Bureau of the Census) as appropriate to carry out this section.
Janet Williams commented that there seems to be an emphasis on transportation rather than bicycle or pedestrian. Thompson replied that the next regional planning document takes a deeper look at all regional modes of transportation. Williams also asked why Sherburne and Wright counties would be considered part of the Council MPO rather than the MPO in St. Cloud. Thompson clarified that per the federal designation of contiguous land use, Sherburne and Wright would be considered a part of the Twin Cities MPO.
Jerry Zhao asked for an explanation of the differences of the Council as an MPO, and why the Council needed to be “grandfathered in.” The key difference is that an MPO should have elected officials, but the Council has appointed officials. Janet Williams commented that the Council Members are appointed by the Governor, though it is not always mentioned that the appointment process includes elected officials on the nominating committees. George Shember asked if the MPO is just for transit. Wastewater treatment and other Council operations are not a part of the MPO.
Tom Weaver asked Nick Thompson to comment on the efficiency of the current MPO status. Thompson responded that the Council has strong regional planning processes and TAB works well as an advisory board. Committee members also had questions about TAB and transit, and the transit process if it were not operated by an MPO. Thompson responded that often they have another transit governing board. Pat Born and Khani Sahebjam asked how an MPO would function if it was moved away from the Council. Amy Vennewitz mentioned that the MPO is prohibited from being a part of the state Department of Transportation. Elizabeth Kautz asked what problem would be solved by the MPO, and what would happen to the opt-outs if the MPO were moved. Chair Mary Liz Holberg commented that she does not yet know what the outcome will be from this committee, and what direction the committee will take.
2. Greater Minnesota MPO Overview (Tim Henkel, Assistant Commissioner, Modal Planning & Planning Management)
Tim Henkel, Minnesota Department of Transportation, gave a presentation on the MPOs in Greater Minnesota. There are seven greater Minnesota MPOs that lead planning in urbanized areas of more than 50,000 people. These MPOs are responsible for policymaking in these areas, based on the 3C Planning Process. Metropolitan Council is currently the only Transportation Management Area (TMA) in Minnesota; the Fargo-Moorhead Council of Governments is expected to be designated as a TMA after the 2020 census. Four of the Greater MN MPOs are interstate agencies. All of the seven Greater MN MPOs are made up of some, if not all, elected officials. Greater MN MPOs play a coordinating role in selecting projects. They do not receive direct appropriation like the Council.
Page 2 of 3
26BLUE RIBBON COMMITTEE REPORT | December 2020
Page - 3 | METROPOLITAN COUNCIL
Alene Tchourumoff asked if the governor of Wisconsin would need to approve changes to the MPO designation. She also asked if the Greater MN MPOs have additional functions and responsibilities other than transportation planning. Henkel responded that only the COGs have responsibilities that go farther than transportation planning; the MPOs function just as planning agencies. Khani Sahebjam asked about MPO designation and if there is any forecasted redesignation for Sherburne and Wright counties. Committee members had other questions and comments about greater Minnesota MPOs and funding, as well as federal transit funding.
3. Committee Discussion
Chair Mary Liz Holberg gave a brief preview of upcoming meetings. Mary Jo McGuire asked if future meetings would discuss the economic role of the Council or housing, or if the committee would focus on transportation. Chair Holberg replied that it will be decided by the group. Khani Sahebjam asked for a summary of historic positions that have been taken on the Council’s status as MPO. Judd Schetnan replied that several letters were provided and will be posted on the website. Veto letters provided also include broader Council governance, including bills passed related to staggered terms and an elected Council. He does not have a library of the letters but can look into finding more information.
ADJOURNMENT Business completed; the meeting adjourned at 3:25 p.m.
Bridget Toskey Recording Secretary
Page 3 of 3
27BLUE RIBBON COMMITTEE REPORT | December 2020
Page - 1
Minutes of the GOVERNOR’S BLUE RIBBON COMMITTEE Monday, October 12, 2020 | 2:00 p.m.
Committee Members Present: Mary Liz Holberg, Peter Bell, Patrick Born, John (Jay) Cowles, Pahoua Yang Hoffman, James Hovland, Elizabeth Kautz, Douglas Loon, Mary Jo McGuire, Khani Sahebjam, George Schember, Alene Tchourumoff, Thomas Weaver, Janet Williams, Zhirong (Jerry) Zhao
Committee Members Absent: None
CALL TO ORDER Committee Chair Mary Liz Holberg called the meeting of the Governor’s Blue Ribbon Committee to order at 2:00 p.m. on Monday, October 12, 2020.
APPROVAL OF MINUTES It was moved by Loon, seconded by Kautz to approve the minutes of the September 14, 2020 and September 28, 2020 meetings of the Governor’s Blue Ribbon Committee. Motion carried on the following roll call:
Aye: 15 Holberg, Bell, Born, Hoffman, Hovland, Kautz, Loon, McGuire, Sahebjam, Schember, Weaver, Williams, Zhao
Nay: 0 Absent: 0
Not Recorded:2 Cowles, Tchourumoff
INFORMATION 1. Overview of Regional Transit Service and Providers (Matt Burress, Legislative Analyst, House
Research) Matt Burress, Legislative Analyst with the Minnesota House Research Department, gave an overview of regional transit service and providers. Transit service in the region includes regular route bus, express/commuter bus, bus rapid transit (BRT), rail, demand response (dial-a-ride), route deviation, paratransit. Also proposed and/or in development are dedicated BRT and streetcar service. There are several entities involved in transportation in the region: the Metropolitan Council, MnDOT, the State legislature, counties and regional railroad authorities, cities, transit providers, private contractors and operators, residents, other state and regional agencies and the U.S. Department of Transportation. USDOT includes the Federal Transit Administration (FTA), Federal Highway Administration (FHWA), and the Federal Railroad Administration (FRA).
The Twin Cities metro area has several types of funding: federal, state (motor vehicle sales tax [MVST], general fund appropriations, General Obligation [G.O.] bond proceeds), regional/local, and generated revenue (farebox, advertising). MVST is the 6.5% sales tax on the sale of new and used vehicles; MVST funds for transit are statutorily appropriated. State bonding is debt financing for capital projects and has various constitutional requirements and limitations. State bonding is authorized in legislation. Key types
Page 1 of 3
28BLUE RIBBON COMMITTEE REPORT | December 2020
Page - 2 | METROPOLITAN COUNCIL
of state bonding are trunk highway bonds and other G.O. bonds. The regional transit capital (RTC) levy is the Met Council property taxes imposed by the Council under state statute and are separate from other Metropolitan Council levies. RTC tax revenue goes to debt service on bonds. County regional railroad authorities (RRA) are tied to each county and preserve and improve rail service and rail right-of-way.
The Metropolitan Council has several transit-related entities: Metro Transit, Metropolitan Transportation Services, the Transportation Advisory Board (TAB), and Regional Administration. Metro Transit operates regular route bus service and other core transit services in the Twin Cities metro area, including light rail transit (LRT), bus rapid transit (BRT), and commuter rail. Metro Mobility is the ADA bus service and offers shared rides for the eligible general public, which are reserved in advance. These trips are limited to riders who are unable to use regular route bus service. Metro Mobility is operated through a contracted service agreement. Transit Link is the dial-a-ride bus service which offers shared rides for the general public, in areas where regular route transit is limited or not offered. Eligibility for Transit Link is based on origin/destination distance from regular route transit. Transit Link is also operated as a contracted service. Vanpool is a service that offers organized shared rides. The driver of the Vanpool is among the commuters and offers subsidized vehicle leases. The remaining costs are split by the riders.
Four transit providers operate transit service in several suburban communities instead of Met Council regular route bus service. The types of service include local circulators, express/commuter bus and some dial-a-ride service. These suburban transit providers serve individual cities or multiple cities under joint powers agreements and are governed by elected officials or a mix of citizens and elected officials. The University of Minnesota Twin Cities also operates fixed route bus service, including a local circulator and Campus Connector as well as paratransit service. The Twin Cities campuses are also served by Metro Transit, Metro Mobility and suburban transit providers.
Committee members had questions about funding and bonding mechanisms, transit systems in Greater Minnesota, and ADA services and the role of an MPO in transit services. Jim Hovland asked that the Transportation Advisory Board be included in the list of Council functions. Doug Loon asked about farebox recovery per operating mode. Judd Schetnan will share farebox per person subsidy information with the committee.
2. Overview of the 2011 Legislative Auditor Report (Judy Randall, Deputy Legislative Auditor, Program Evaluation Division)
Judy Randall, Deputy Legislative Auditor with the Office of the Legislative Auditor gave an overview of the 2011 Legislative Auditor Report on Governance of Transit in the Twin Cities Region. In 2011 the Office of the Legislative Auditor completed an audit of transit governance in the Twin Cities. The key legislative recommendations were: the Legislature should restructure the Metropolitan Council; and the Legislature should clarify the goals and priorities of transit in the Twin Cities region. The report compared the Council to 11 peers, including Denver, Phoenix, Portland and Seattle. The Council performed well on efficiency measures, including operating cost per passenger, fare-recovery percentage, subsidy per passenger, subsidy per passenger mile. The Council also performed well on service-use and access measures. The report also highlights challenges due to the transit governance structure, including fragmentation and complexity, distrust among some of the transit organizations, time-consuming coordination, and no agreed-upon set of priorities.
The report asserts that the composition of the Metropolitan Council contributes to some of the challenges. The Council is appointed by the Governor, has limited accountability to the public, limited credibility with stakeholders and other transit organizations in the region, limited stability, and contributes to the large number of transit organizations in the region. The recommendations were that
Page 2 of 3
29BLUE RIBBON COMMITTEE REPORT | December 2020
Page - 3 | METROPOLITAN COUNCIL
the Legislature should restructure the Metropolitan Council to be a mix of appointed and elected members who serve staggered terms. This could potentially lead to more streamlined governance.
Khani Sahebjam asked how the efficiency of the Council was measured, if it was a dollar-to-dollar ratio or if it was efficiency of services. Judy Randall stated that it was based on economic measures compared to peers. Committee members had questions and comments about the composition of elected official and appointed official recommendations, as well as about the recommendation of staggered terms. Alene Tchourumoff asked if Ms. Randall would be able to share any concerns that other entities had about conflicts of interest due to elected officials serving a regulatory role over Council operations. Ms. Randall replied that Metro Cities would be a better group to answer that question, and Judd Schetnan shared that staff from Metro Cities will be speaking at the next meeting.
3. Committee Discussion Committee members had no further questions or comments.
ADJOURNMENT Business completed; the meeting adjourned at 2:37 p.m.
Bridget Toskey Recording Secretary
Page 3 of 3
30BLUE RIBBON COMMITTEE REPORT | December 2020
Page - 1
Minutes of the GOVERNOR’S BLUE RIBBON COMMITTEE Monday, October 26, 2020 | 2:00 p.m.
Committee Members Present: Mary Liz Holberg, Peter Bell, Patrick Born, John (Jay) Cowles, Pahoua Yang Hoffman, James Hovland, Elizabeth Kautz, Douglas Loon, Mary Jo McGuire, Khani Sahebjam, George Schember, Alene Tchourumoff, Thomas Weaver, Janet Williams, Zhirong (Jerry) Zhao
Committee Members Absent: None
CALL TO ORDER Committee Chair Mary Liz Holberg called the meeting of the Governor’s Blue Ribbon Committee to order at 2:00 p.m. on Monday, October 26, 2020.
APPROVAL OF MINUTES It was moved by Kautz, seconded by Zhao to approve the minutes of the September 14, 2020 and September 28, 2020 meetings of the Governor’s Blue Ribbon Committee. Motion carried on the following roll call:
Aye: 13 Holberg, Born, Cowles, Hoffman, Hovland, Kautz, Loon, McGuire, Sahebjam, Schember, Tchourumoff, Williams, Zhao
Nay: 0 Absent: 0
Not Recorded:2 Bell, Weaver
INFORMATION 1. Metro Cities (Patricia Nauman, Executive Director)
Patricia Nauman gave an overview of Metro Cities and their relationship with the Metropolitan Council. Metro Cities provides lobbying for cities and is considered by many to be a watchdog for the Council. Cities are responsible for the implementation of many regional policies and programs and are a primary constituency of the Metropolitan Council. Metro Cities has statutory appointing authority for municipal officials on the Transportation Advisory Board (TAB) and Technical Advisory Committee (TAC), and a statutory consulting role for municipal members appointed to the Metropolitan Area Water Supply Advisory Committee (MAWSAC). Metro Cities also appoints municipal officials to the regional Geographic Information Systems (GIS) Board. Jim Hovland asked about the position of Metro Cities to favor local elective officials, and the distinction of having both a TAB made up of local elected officials and a Council made up of elected officials. Nauman responded that while TAB is a very important body, it is an advisory body which is a distinction Metro Cities makes as a different level of work.
2. Citizens League (Pat Born, Board Chair; Pahoua Hoffman, former Executive Director) Pat Born and Pahoua Hoffman shared an overview of the 2015 Citizens League Task Force. The key findings of the task force were: the Council continues to be an important regional advocate; the current governance structure inhibits the Met Council’s ability to effectively plan for the long-term and act as an independent advocate for the regions; and challenges in the region have expanded and will continue to evolve
Page 1 of 3
31BLUE RIBBON COMMITTEE REPORT | December 2020
Page - 2 | METROPOLITAN COUNCIL
due to changing demographics and the growth in poverty in the region. There are also concerns related to transportation governance including accountability and transparency, efficiency and effectiveness, and equity. The Citizens League recommendations were: four-year staggered terms for Council members, all appointed by the governor; to strengthen the member selection process; and to fully exercise the Council’s current authority in statute to reduce concentrations of poverty and foster increased connections to social and economic opportunities. In 2019 Governor Walz did adopt the majority of these recommendations, though not staggered terms. Jerry Zhao asked about staggered terms, and why they were not adopted. Born responded that there were several issues that would be affected by this change, and Chair Holberg added that it would be unusual for a governor to take on a reform change mid-term.
3. Suburban Transit Association (Luther Wynder, MVTA CEO) Luther Wynder shared the position of the Suburban Transit Association (STA) with regard to the Metropolitan Council. Suburban communities sought legislation in 1982 to create transit agencies to serve fast-growing suburban areas. Before the suburban transit agencies formed, several suburban communities were paying into the transit system and receiving limited to no transit service. Minnesota Valley Transit Authority, Maple Grove Transit, Plymouth Metro Link and Southwest Transit formed. While suburban ridership has grown from one million passengers per year to more than five million passengers per year since the creation of the suburban transit agencies, funding equity has remained an ongoing concern. STA believes that suburban providers should receive an equitable, proportional share of transit funding for the region and would support any Met Council governance alterations that would support this goal. STA favors governance that is more accountable to the region and is structured to ensure suburban communities are directly represented. The innovation, success and service of the Suburban Transit Association can be enhanced by a more collaborative decision-making structure that recognizes member organizations as a full partner with a "seat at the table" when it comes to building a public transportation network for the future. Committee members had questions and comments about revenues and MVST funds allocated to suburban communities. Chair Holberg added that there is a formula for MVST returns to Metro Transit and suburban transit providers. There was also discussion of net contributions and net returns.
4. Council of Metropolitan Area Leagues of Women Voters (Karen Schaffer, Chair) Karen Schaffer gave an overview of the Council of Metropolitan Area Leagues of Women Voters (CMAL) and their study of Metropolitan Council governance. CMAL is an inter-league membership organization that is political but non-partisan. CMAL focusses on government issues of the metropolitan area. CMAL conducted a study of the Met Council from August to December of 2018, through a public forum, literature review, coordinated interview teams and interviews of relevant stakeholders. Their positions are: Metropolitan Council members should be appointed by the governor, with fixed, staggered terms and removed only for cause; members should have a regional perspective, knowledge of regional issues, demographic diversity and the ability to meet the time requirements of service; members should not be local elected officials; members should not be directly elected to the Metropolitan Council; and a nominating committee should recommend a slate of candidates for the Metropolitan Council to the governor. Khani Sahebjam asked for a clarification of the composition of the membership of CMAL.
5. Minnesota Inter-County Association (Mike Beard, Scott County Commissioner; Matt Massman, Executive Director)
Commissioner Mike Beard gave an overview of the Metropolitan Governance Reform principles and statement of objectives. The Twin Cities’ Local Government Coalition is a coalition of local government through the area that have joined together to develop a position statement and set of principles for improving metropolitan governance in the Twin Cities. The Coalition supports the need for regional planning, collaboration and coordination, but seeks to expand local government representation on the Metropolitan Council. Their statement of belief is: the Metropolitan Council, due to its taxing and policy
Page 2 of 3
32BLUE RIBBON COMMITTEE REPORT | December 2020
Page - 3 | METROPOLITAN COUNCIL
authority, should be accountable to a regional constituency of those impacted by its decisions. It should not operate as a state agency as it does in its current form, answerable to only one person, the governor. Their principles for reforms are: a majority of members of the Metropolitan Council shall be elected officials, appointed from cities and counties within the region; cities shall directly control the appointment process for city representatives; counties shall appoint their own representatives; staggered terms of office not coterminous with the governor; membership on the Council shall include representation from every metropolitan county government; the Council shall represent the entire region, therefore voting shall be structured based on population and incorporate a system of checks and balances. Mary Jo McGuire asked for a comment on the time commitment required for being on the Council, and how would that would work for elected officials. Commissioner Beard responded that this has been discussed and the person selected would need to be someone who would be able to devote the time. Committee members also had questions and comments about the selection of municipal elected officials, as well as the question of land use and city comprehensive plans submitted to the Council.
6. Metro Governance Transparency Initiative (Ann Goering) Ann Goering shared main points of concern regarding the interpretation of the applicable federal statute with regard to Metropolitan Council governance. The 2012 Revision unambiguously requires the Metropolitan Council to comply with statutory membership requirements. Prior to the 2012 amendments to the applicable federal law, the statutory requirement that mandated the inclusion of elected officials on the MPO applied only to organizations that were newly designated as an MPO or who has undergone a redesignation. The 2012 amendment eliminated the phrase “when designated or redesignated” and replaced it as well as added a provision stating, “A metropolitan planning organization may be restructured to meet the requirements of paragraph (2) without undertaking redesignation.” In addition, the “Limitation on Statutory Construction” provision does not grandfather the membership of a non-compliant MPO. While the Council was in existence prior to December 18, 1991, nothing in the statutory provision cited above relieves the Met Council or other entities from complying with the statute. It is not a general grandfathering provision. According to Goering, bringing the Council into compliance with the membership requirements of an MPO as required by federal law is legally mandated. Tom Weaver asked about the FTA’s decision that disagreed with Goering’s letter in 2016, and if anything has changed since that time. Goering responded that the FTA can always change their mind on this decision on compliance. Jim Hovland asked if there has been any litigation, and the response what that there was no lawsuit. Committee members also had questions and comments about the lack of response from the local FTA and if they went to the USDOT, as well as the legality of the structure of the Council. Pat Born suggested that the group should also hear from an attorney from the Council on their interpretation of the law.
7. Committee Discussion Chair Holberg gave a preview of upcoming meetings. Pat Born suggested that time be provided at the next meeting for a round-robin of committee members to share their positions. This idea was met with approval from the committee members. Khani Sahebjam asked if future conversations could be split between transit and governance.
ADJOURNMENT Business completed; the meeting adjourned at 3:28 p.m.
Bridget Toskey Recording Secretary
Page 3 of 3
33BLUE RIBBON COMMITTEE REPORT | December 2020
Page - 1
Minutes of the GOVERNOR’S BLUE RIBBON COMMITTEE Monday, November 9, 2020 | 2:00 p.m.
Committee Members Present: Mary Liz Holberg, Peter Bell, Patrick Born, John (Jay) Cowles, Pahoua Yang Hoffman, James Hovland, Elizabeth Kautz, Douglas Loon, Mary Jo McGuire, Khani Sahebjam, George Schember, Alene Tchourumoff, Thomas Weaver, Janet Williams, Zhirong (Jerry) Zhao
Committee Members Absent: None
CALL TO ORDER Committee Chair Mary Liz Holberg called the meeting of the Governor’s Blue Ribbon Committee to order at 2:00 p.m. on Monday, November 9, 2020.
APPROVAL OF MINUTES It was moved by Kautz, seconded by Zhao to approve the minutes of the October 26, 2020 meeting of the Governor’s Blue Ribbon Committee. Motion carried on the following roll call:
Aye: 11 Holberg, Born, Hoffman, Hovland, Kautz, Loon, McGuire, Sahebjam, Schember, Williams, Zhao
Nay: 0 Absent: 0
Not Recorded:4 Bell, Cowles, Tchourumoff, Weaver
INFORMATION 1. Metropolitan Council Metropolitan MPO Compliance (Dave Theisen, Deputy General Counsel,
Metropolitan Council)
Dave Theisen shared the Council’s standing with regard to Metropolitan Council MPO compliance. The Council has had multimodal planning responsibilities since 1975, and the responsibilities have been uninterrupted since that time. The abolishment of three regional agencies in 1994 created the Metropolitan Council as it is today. This action also ended staggered terms, changing to terms coterminous with the governor. 2012 federal legislation required MPOs to consist of local officials, officials of public transportation agencies, and state officials within two years after MAP-21 enactment, but statute also states: Nothing in this subsection shall be construed to interfere with the authority, under any State law in effect on December 18, 1991, of a public agency with multimodal transportation responsibilities. FHA and FTA have frequently reviewed Council multimodal transportation planning work and have not raised questions about the Council’s MPO status. The Council governing body does not include local officials, public transportation agency officials, or state officials, but a “grandfather” provision allows the Council to continue operating under the state law as it was first enacted in 1975. FHWA and FTA have confirmed that the Council is covered under the grandfather provision and are fully aware of the Council’s status. In addition, more than half of TAB members are elected local and county officials; 88% represent counties, cities, and transit/transportation interests. TAB is more than an advisory committee; it is integral to transportation planning processes under long-existing protocol.
Page 1 of 4
34BLUE RIBBON COMMITTEE REPORT | December 2020
Page - 2 | METROPOLITAN COUNCIL
Committee members had questions about TAB, and their approval abilities as a body consisting of some elected officials. Doug Loon asked if a change to the Council such as moving to staggered terms could put the Council’s grandfathered status in jeopardy. Theisen replied that a change in terms would not be a substantial enough change, but a change to elected officials would be a change that may require redesignation. It would also be dependent upon the language in the legislation.
2. Metropolitan Area and Greater Minnesota Paratransit Service Delivery and Funding Discussion (Nick Thompson, Director, Metropolitan Transportation Services)
Nick Thompson gave an overview of ADA paratransit in Minnesota. There are two systems of paratransit in Minnesota, Metro Mobility and Greater Minnesota ADA. Metro Mobility is required by the State of Minnesota to serve the Transit Taxing District in place in 2006 as well as new cities as directed by the Legislature. Metro Mobility serves customers with a certified disability. There is no limit on distance but must stay within the Metro Mobility geographic boundaries. This is a door-through-door service. Greater Minnesota ADA serves customers within ¾ of a mile of fixed route service. This service is available in several large greater Minnesota cities, and serves the elderly and those with disabilities. The maximum trip lengths are within city limits of the respective city. This is a door-to-door service. In greater MN there are trips provided through the transit providers via contract. These contracts are funded through a care provider via DHS.
3. Committee Discussion on Executive Order Direction: • The role of elected versus appointed Metropolitan Council members • The Metropolitan Council’s role as a Metropolitan Planning Organization, and identify and
evaluate the ways this federal designation may complement and/or conflict with the Met Council’s responsibilities under Minnesota law
• The effectiveness of the delivery of regional transit service
Each committee member shared his or her thoughts on the above topics. Mayor Kautz said that she has not heard anything compelling about having elected officials on the Council. She also compared a Council of elected officials to the now disbanded Counties Transit Improvement Board.
Mayor Hovland shared that he has been happy with the current model of the Council, and he has no question about the legality of the Council. He believes that a benefit of the current model is TAB making biennial decisions about federal money that comes in. He has found that the process works well and is a model of good governance. He also believes that there would be time constraints and conflicts of interest to have elected officials on the Council. He is in favor of staggered terms. Mayor Hovland is also in favor of the nominating committee, and the governor selecting from the slate of candidates presented by the nominating committee. With respect to transit service as it currently exists, he is in favor of keeping the same model of transit service delivery.
Mayor Williams feels that the Council as it operates with the TAB traditionally has done a good job. The majority of the studies done do not recommend changing the make-up of the Council. She pointed out that the nominating committee is made up of elected officials. With Governor Walz this was expanded so that there were seven elected officials, including an elected official representing each county. She is not in favor of elected officials on the Met Council. With regard to suburban transit, this transit service began because those in the suburbs did not believe they were getting the transit service for the money they paid. Now over 40% of those using suburban transit are from outside the taxing district, which is something that should be explored further.
Jerry Zhao shared that it seems that current system is working well, and that if a new system is designed it will need to be set up in a way that meets current legislature. Zhao is also in favor of staggered terms for Council Members.
Page 2 of 4
35BLUE RIBBON COMMITTEE REPORT | December 2020
Page - 3 | METROPOLITAN COUNCIL
Khani Sahebjam shared that it appears that the Council and TAB are working well together, but this governance issue is not going to go away. He also said that it is clear that there are some transit trust issues and some inefficiencies that will need to be addressed.
Peter Bell shared that he is an opponent of an elected Council, but he differs from other committee members as he has serious concerns about the continued existence of suburban transit providers. They do not represent all suburban communities and there is some duplication in administrative costs. He also believes that TAB works well as-is.
Tom Weaver doesn’t believe the governance structure is broken but does believe there are things worth looking at. He is not in favor of elected officials on the council but believes the group should be mindful of local governments’ view on this and whether they think they are adequately represented. He believes there are some things that could be done to give local elected officials more influence in the appointment process. With respect to the delivery of transit, it is clear that the current structure is legally sufficient from a federal perspective and that the TAB works.
Pat Born said that he is in favor of appointed Council Members with staggered terms, which would lead to additional trust within local officials of the Metropolitan Council. Born has not heard anything compelling toward an MPO redesignation. With regard to the suburban transit providers, he believes there is an argument that they are not as efficient, simply because they are smaller, not because they are not good managers. If they were to do away with suburban transit providers, there would need to be something in place to address the attention to service that they provide.
Commissioner McGuire agrees that there should not be an elected Council and would be happy to look at staggered terms. She doesn’t think it is a broken system, and that it works as-is. Commissioner McGuire also believes that TAB works well as a body that advises the Council. She also agrees that the Council should continue to be the MPO for the region.
Alene Tchourumoff shared that she also agrees with others and hopes that the outcome of this is that it is clear that the Council is in compliance with federal law. She believes that there would be several issues with having elected officials on the Council, and that the appointment process works well. She also is in favor of staggered terms for continuity. In terms of the effectiveness of regional transit providers, Tchourumoff has concerns about the efficiency of the system overall. She thinks there are opportunities to enhance the overall efficiency and effectiveness of our transit system.
George Schember doesn’t believe there should be changes to the MPO status, and that it would be a solution in search of a problem. He is not in favor of a Council of elected officials nor expansion of the opt-out service.
Doug Loon stated that the Chamber has long aligned itself with the 2011 report from the Office of the Legislative Auditor that the legislature should restructure the Met Council along the lines of a mix of appointed and elected members. He believes that elected officials would be a great way to address the question of validity of the Council. That being said, he does not believe the Met Council is broken, and that the Council has been executed well over time. He questions the long-term validity of the Council without governance reforms. He is in favor of staggered terms to increase legitimacy of the Council. He agrees that if this is not addressed now the issue will linger. He also asks that if having elected officials at the TAB works, why wouldn’t it work for the full Council. He believes the suburban transit provider system works well.
Jay Cowles shared that the MPO legal case appears to be well-answered by the Council, and that moving to a different form of MPO would be very complicated and difficult to achieve. The Met Council has done a good job and made a number of accommodations in past years to address concerns.
Page 3 of 4
36BLUE RIBBON COMMITTEE REPORT | December 2020
Page - 4 | METROPOLITAN COUNCIL
Cowles doesn’t believe that the committee has received enough information about the opt-outs for him to have an opinion.
Pahoua Hoffman shared that cities were not supportive of elected officials. Hoffman and the Citizens League both support staggered terms. There is so much work building the knowledge and understanding of roles for Council Members; staggered terms would allow for continuity. She also believes that there is room for improvement in the appointment process.
Mary Liz Holberg shared a few issues that have not yet been addressed. Representing a community that for decades has not felt a part or represented by TAB, when people talk about TAB working well she doesn’t know that if that is a shared opinion across the region. With regard to the appointment process, she suggested raising the appointment recommendation threshold, and that perhaps the recommendations would have to be a super majority; in other words having elected officials having weighted recommendations might make sure that a fair share of the composition of the groups’ desires would be reflected. She is not in favor of an entirely elected Council but is in favor of staggered terms in some form. The MPO issue is a very small issue in the grand scheme of things, as it is a very small share of transportation money in the state. She believes there does need to be a discussion about some of the inherent conflicts with the Council being an operator and a funder. She also believes that all of Metro Transit should be funded as a forecasted program because it appears that Metro Mobility with its rapidly increasing cost is taking funding from regular route bus and rail operations. She believes that there should also be leadership continuity as transit projects take decades to complete.
Peter Bell shared that he does not believe the Council is as effective as it could be. However, he is in favor of smaller changes rather than wholescale changes. Mayor Williams believes that some of the struggle comes from some of the animosity between cities and counties. There was also some committee discussion about the Counties Transit Improvement Board.
Judd Schetnan shared that he will be drawing from today’s committee discussion to begin working on recommendations for the committee before the final meeting. He said that the group does not seem to be interested in pursuing a Council of elected officials, but that the group seems to be in favor of staggered terms as well as elected officials on the appointing committee. He said that the group also seems to be in favor of the Council remaining as the region’s MPO. He also said that it does not seem that the group is coalescing around the idea of making any changes to the suburban transit providers. He said the group has talked somewhat around Metro Mobility, and that it is important as a state and federally mandated program. He asked that committee members let him know if he is missing anything. Peter Bell asked to learn more about Metro Mobility, and how far beyond the federally mandated services Metro Mobility is and if there is a cost for those services. Schetnan will get this information out to committee members before the next meeting. Chair Holberg asked that he also send the financials from opt-out providers to committee members before the next meeting as well.
ADJOURNMENT Business completed; the meeting adjourned at 3:46 p.m.
Bridget Toskey Recording Secretary
Page 4 of 4
37BLUE RIBBON COMMITTEE REPORT | December 2020
Page - 1
Minutes of the GOVERNOR’S BLUE RIBBON COMMITTEE Monday, November 23, 2020 | 2:00 p.m.
Committee Members Present: Mary Liz Holberg, Peter Bell, Patrick Born, John (Jay) Cowles, Pahoua Yang Hoffman, James Hovland, Elizabeth Kautz, Douglas Loon, Mary Jo McGuire, Khani Sahebjam, George Schember, Alene Tchourumoff, Thomas Weaver, Janet Williams, Zhirong (Jerry) Zhao
Committee Members Absent: None
CALL TO ORDER Committee Chair Mary Liz Holberg called the meeting of the Governor’s Blue Ribbon Committee to order at 2:00 p.m. on Monday, November 23, 2020.
APPROVAL OF MINUTES It was moved by Kautz, seconded by Zhao to approve the minutes of the November 9, 2020 meeting of the Governor’s Blue Ribbon Committee. Motion carried on the following roll call:
Aye: 14 Holberg, Bell, Born, Cowles, Hoffman, Hovland, Loon, McGuire, Sahebjam, Schember, Tchourumoff, Weaver, Williams, Zhao
Nay: 0 Absent: 0
Not Recorded: 1 Kautz
INFORMATION 1. Committee Discussion on the Draft Blue Ribbon Report
Committee members shared their comments on the draft report distributed to the committee. Pat Born like the draft and thought that it was well-organized and reflected the discussion from the committee. Chair Holberg asked committee members to share if they had any concerns on the layout of the draft. There were no comments from committee members. Chair Holberg then asked for comments on the first section of the draft, regarding the “Role of Elected Versus Appointed Metropolitan Council Members.” Tom Weaver asked for a clarification on the purpose of the potential action for consideration “that the governor to provide an explanation in writing if he or she appoints a Council Member that was not included in the slate of candidates recommended by the nominating committee.” Pahoua Hoffman shared that Citizens League asked that the candidates and appointees be posted publicly, but that a written explanation from the governor would not seem necessary. Committee members then had comments and discussion on the “potential actions for consideration.” Tom Weaver suggested a change to bullet four under Committee Conclusions and Findings either to make it clearer, or to remove it all together, as it seems contrary to what the group is trying to accomplish. Committee members then had a discussion on the meaning of making changes to the Met Council. Mary Jo McGuire questioned the recommendation that the nominating committee be comprised of a majority of local elected officials. Committee members then had a discussion about the wording and structure of the recommendations. Pahoua Hoffman asked that a piece of public announcement is missing from the potential actions for consideration. The group
Page 1 of 3
38BLUE RIBBON COMMITTEE REPORT | December 2020
Page - 2 | METROPOLITAN COUNCIL
agreed with this recommendation. Alene Tchourumoff questioned from an equity standpoint if the names being made public would discourage people from applying. Chair Holberg reminded the group that all applications are public information. Committee members then had a discussion about how the information would be made public.
Chair Holberg asked for comments on the second section of the draft, “The Metropolitan Council’s Role as a Metropolitan Planning Organization (MPO).” Mayor Hovland will mark up the draft with technical comments and return to Judd Schetnan and Chair Holberg. Jerry Zhao asked if the first section could be expanded to give more background before conclusions and findings. Commissioner McGuire clarified that potential actions would be recommendations in the final report. George Schember asked about bullet one, and if it is weakened by the following bullet points by offering an opportunity to change positions. Alene Tchourumoff asked for clarification about the scope and action of projects that are voted on by TAB, and if it is more than the regional solicitation, and if this would be affected by a required 60% approval. Chair Holberg replied that currently just barely half of the TAB is elected versus appointed members. Mayor Hovland shared that there are other actions that TAB is involved in as well, and recommended actions are then moved up in the TIP. Chair Holberg pointed out that the requirement of elected officials is served by the TAB, but at a weaker level. Khani Sahebjam commented on the “committee minority counterpoint” and the sentence stating that local elected officials are dissatisfied with the current process. He asked if they are doing enough with TAB to address that issue. Tom Weaver said that hopefully this report will provide some solutions and will move the Council in the right direction. Peter Bell said that this report and recommendations are evolutionary, not revolutionary. Chair Holberg asked if the group is comfortable with a 50/50 split of elected and appointed TAB officials. Committee members had a discussion about the split of officials on the TAB, and how they are appointed. Alene Tchourumoff asked for a deeper look at the TAB for a final item at the next meeting. Janet Williams asked for an addition of the word “some” under Committee Minority Counterpoint, to say that “some elected officials have voiced dissatisfaction with the current process.”
Chair Holberg asked for comments about the third section of the draft report, “Effectiveness of Delivery of Regional Transit Services.” Alene Tchourumoff recommended a change to the second bullet, strengthening the language as this would be a benefit to the agency. Khani Sahebjam had a comment on the phrase “continuous evaluation,” asking both what that would look like, and asking about the efficiency of evaluation. Peter Bell shared a concern about the recommendation regarding the financial condition of the State of Minnesota. He asked if the group is missing an opportunity to have input on how the transit system may be restructured given the State’s financial situation. He believes that the group may be able to have an impact on something that may already be coming to the transit system. Pat Born stated that another big unknown is how quickly people will return to using transit, if they do at all. Peter Bell asked that at a minimum to set some priority areas if there will be restructuring, to encourage the governor and Met Council to look at these three or four priority areas. He hopes that these things will happen with their input rather than without their input. Mayor Hovland asked about the bullet point regarding that suburban transit provider service should not be expanded. Hovland pointed out that some of the fastest growing areas of the region are the outer ring suburbs. Chair Holberg and Judd Schetnan pointed out that some of the fastest-growing suburbs, Lakeville and Woodbury, are a part of Metro Transit. Doug Loon shared his prospective that growth meant additional providers, not expansion of service areas. Tom Weaver shared that efficiency will be important given the financial position the state is in. He also believes that the public subsidy for Northstar is high and should be examined closely. Mayor Kautz shared that she is a proponent for the opt-outs providing efficient service. She believes that changes to these services should not be made in a haphazard way. Peter Bell suggested that they add a statement that they realize the dire financial situation that the state is in, not necessarily mentioning Northstar. He also asked they state they realize ridership may be affected, and that they recommend recognizing or cutting services. Alene Tchourumoff asked for a timeline and procedure for edits to the report. Judd Schetnan asked that specific committee members who will be
Page 2 of 3
39BLUE RIBBON COMMITTEE REPORT | December 2020
Page - 3 | METROPOLITAN COUNCIL
rewriting sections share that with staff in the next few days so a draft can be turned around to the committee for review and input. The goal will be to finalize a draft next week to be adopted on December 7. Mayor Hovland asked that more background information and summary of the group’s work be added to the report, and that all of the information discussed be made public. Judd Schetnan replied that the supporting information will all be shared with the report. Jerry Zhao shared that he likes the idea of more regional service, but that nothing is done in a rush, due to COVID and financial condition changes.
ADJOURNMENT Business completed; the meeting adjourned at 3:40 p.m.
Bridget Toskey Recording Secretary
Page 3 of 3
40BLUE RIBBON COMMITTEE REPORT | December 2020
Page - 1
Minutes of the GOVERNOR’S BLUE RIBBON COMMITTEE Monday, December 7, 2020 | 2:00 p.m.
Committee Members Present: Mary Liz Holberg, Peter Bell, Patrick Born, John (Jay) Cowles, Pahoua Yang Hoffman, James Hovland, Elizabeth Kautz, Douglas Loon, Mary Jo McGuire, Khani Sahebjam, George Schember, Alene Tchourumoff, Thomas Weaver, Janet Williams, Zhirong (Jerry) Zhao
Committee Members Absent: None
CALL TO ORDER Committee Chair Mary Liz Holberg called the meeting of the Governor’s Blue Ribbon Committee to order at 2:00 p.m. on Monday, December 7, 2020.
APPROVAL OF MINUTES It was moved by Kautz, seconded by Hovland to approve the minutes of the November 23, 2020 meeting of the Governor’s Blue Ribbon Committee. Motion carried on the following roll call:
Aye: 13 Holberg, Bell, Born, Cowles, Hoffman, Hovland, Kautz, McGuire, Sahebjam, Schember, Tchourumoff, Weaver, Zhao
Nay: 0 Absent: 0
Not Recorded: 2 Loon, Williams
INFORMATION 1. Committee Discussion
Chair Holberg asked for the committee’s approval to allow staff to make small changes, such as correcting typos, without full committee approval. Chair Holberg asked committee members to submit edits to bios to be submitted by noon on December 8.
Chair Holberg asked for comments on the first section of the draft report. Commissioner McGuire asked for a change to the report where it says “local officials have jobs” to read “local elected officials have other jobs and obligations.” Mayor Hovland suggested replacing the word “jobs” with “employment and obligations.”
Chair Holberg then asked for comments on the second section of the report. Khani Sahebjam asked about a comment from Doug Loon regarding the state’s congressional delegation, now located under “committee minority counterpoint.” Sahebjam asked if this should be a recommended action or just a mention. Mayor Hovland asked that it be left where it is, as it is a minority point. The committee agreed with this action. Khani Sahebjam also asked about the majority of elected officials on TAB, and if it is a goal to have more elected officials on TAB. Mayor Hovland cited the statute defining TAB membership and shared that there are already few citizen members on TAB. Peter Bell suggests that this be a part of the minority report, to suggest to the governor that this has been considered and has some support from the committee. The
Page 1 of 2
41BLUE RIBBON COMMITTEE REPORT | December 2020
Page - 2 | METROPOLITAN COUNCIL
committee agreed to have Chair Holberg and Sahebjam to work on language adding the discussion of a stronger local elected presence on TAB to the minority report. Peter Bell shared that he believes the TAB is working well and he hesitates to make changes that may have unintended effects. However, he is sensitive to the belief of some that there is not enough elected official presence on the Council. Commissioner McGuire agreed with Bell and asked that a minority report suggestion be very general. Chair Holberg pointed out that not all people and not all counties believe that TAB is working well. Chair Holberg circled back to Doug Loon, and asked for his comments regarding adding the congressional delegation portion to the minority report. Loon said that it would provide clarity to the issue but that he can agree to the majority opinion. Alene Tchourumoff shared that the Executive branch agency responsible for interpreting and enacting the will of Congress has weighed in several times over the last 29 years and their response is clear. Mayor Williams and Pahoua Hoffman added that additional review has been completed after the Citizens League report.
Chair Holberg asked for comments on the third section of the report. Peter Bell shared his additional comment that was added to the draft report, highlighted in green. He raised this issue based upon his concern that if the committee didn’t address the potential budgetary situation faced by the State of Minnesota, they would be seen as not fulfilling their responsibility. He also suggested that they consider recommending a periodic report on the efficiency of various subcomponents of the transit system. The suggested report would be not necessarily the centerpiece of but a part of either scaling back or expanding the transit system. Commissioner McGuire does not have a problem with the study but questioned how it would be funded. Chair Holberg understood this to be an independent study, possibly through the Center for Transportation Studies at the University of Minnesota. Committee Members then had a discussion about the feasibility and the structure of the proposed study. They also addressed adding governance to this study. Pahoua Hoffman offered an amendment to the language for the study and linking it to the ten-year planning cycle. Commissioner McGuire asked for a clarification on the word equity, and what types of equity would be studied. Peter Bell stated that he was referring to geographic equity in this instance, to keep the scope narrower. The committee agreed to adopt Peter Bell’s language with amendments. Jim Hovland asked to clear up ambiguous language under “findings.” Pat Born suggested to remove the sentence in question under the first bullet point, as it contradicts the paragraph above. Mayor Hovland said that the first sentence under the last bullet point in the executive summary will need to be addressed based upon the fact that the bullet point was removed in the previous section.
Chair Holberg explained the next steps for the report. The draft will be completed by staff and a final report will circulated to the committee. The report will include all supporting materials and bios of all committee members. Chair Holberg asked the group to decide how the report should be signed: either to use electronic signature or to use a list of names under her signature. The group agreed that Chair Holberg will sign her name for the group.
ADJOURNMENT Business completed; the meeting adjourned at 3:15 p.m.
Bridget Toskey Recording Secretary
Page 2 of 2
42BLUE RIBBON COMMITTEE REPORT | December 2020
BLUE RIBBON PANELPresentations & Supporting Materials
43BLUE RIBBON COMMITTEE REPORT | December 2020Minnesota House Research Department
www.house.mn/hrd | 651-296-6753 | 600 State Office Building | St. Paul, MN 55155
Memorandum September 14, 2020
To Governor’s Blue Ribbon Committee on the Metropolitan Council’s Structure and Services
From Deborah A. Dyson, Legislative Analyst
Subject Brief History of Metropolitan Council Governance Issues and Proposals
I was invited to make a presentation to the Blue Ribbon Committee to provide some historical context for the committee’s work. Below is an outline of what I hope to cover.
The Governor’s executive order establishing the Blue Ribbon Committee states that the committee is to review:
a. The role of elected versus appointed Metropolitan Council members
b. The Metropolitan Council’s role as a Metropolitan Planning Organization (“MPO”) and identify and evaluate the ways this federal designation may complement and conflict with the Council’s responsibilities under Minnesota law
c. The effectiveness of the delivery of regional transit service
Current Status of the Metropolitan Council
Political subdivision of the state, jurisdiction in seven metropolitan counties with 56 percent of state’s population
Functions:
-Planning and coordination: Metropolitan Development Guide (Thrive MSP 2040), with long term policy and system plans, review and approval of local comprehensive plans
-Operations: owns and operates regional services: transit, wastewater collection and treatment
-Pass-through funding: Metro HRA, parks and open space, MLCA
While transportation is a significant and important function for the council, it is not the only council function to take into consideration when looking at the council’s governance structure.
Page 1 of 3
~MN HOUSE ~ RESEARCH
44BLUE RIBBON COMMITTEE REPORT | December 2020
Memorandum
Minnesota House Research Department Page 2
History
1957 – Metropolitan Area Planning Commission
1967 – Issues?
wastewater
transportation
federal requirements
1967 – Question was not whether to establish a new regional governance structure but what regional structure: elected or appointed.
Elected: planning and operations
Appointed: planning and coordinating
The 1967 Legislature established the Council as an appointed body and in the same year established the Metropolitan Transit Commission to take over failing private bus service.
1967 – 1990
1969 –the Metropolitan Waste Control Commission
1974 – the Metro HRA
1974 –the Metropolitan Parks and Open Space Commission
1975 – Recodification
1976 – the Metropolitan Land Planning Act
1977 – the Metropolitan Sports Facilities Commission
1984 – Regional Transit Board, governance studies
1989 – Dual-track airport planning
1990-1993 – 5 major bills to reorganize metropolitan government. 3 – elected; 2 – appointed
1993 – State Advisory Council on Metropolitan Governance
1994 – Metropolitan Government Reorganization Act
Page 2 of 3
45BLUE RIBBON COMMITTEE REPORT | December 2020
Memorandum
Minnesota House Research Department Page 3
1995 – Metropolitan Livable Communities Act, changes to the Metropolitan Land Planning Act, decision in the dual track airport planning process
1997 – elected Metropolitan Council bill passed, vetoed by the Governor
Since 1995, many years see bills introduced to study governance, abolish the Council, make the Council a state agency, make the Council an elected body or a COG, change who makes appointments, split off a function.
More recently bills to re-established staggered terms for Council members. Those passed have been vetoed by governors of both major parties.
2018 – a bill passed to change membership of the council to consist of 29 members of which 24 would be elected city and county officials. Vetoed.
Page 3 of 3
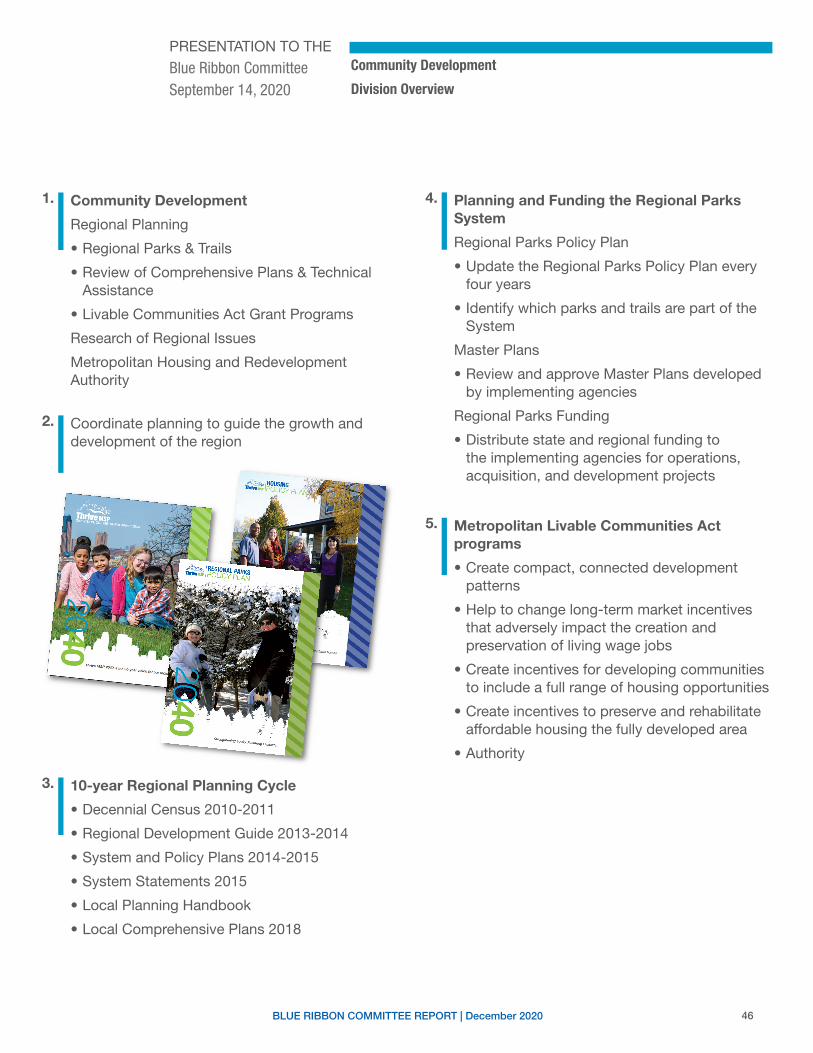
46BLUE RIBBON COMMITTEE REPORT | December 2020
PRESENTATION TO THE
Blue Ribbon CommitteeSeptember 14, 2020
Community Development
Division Overview
1. Community Development
Regional Planning
• Regional Parks & Trails
• Review of Comprehensive Plans & Technical Assistance
• Livable Communities Act Grant Programs
Research of Regional Issues
Metropolitan Housing and Redevelopment Authority
2. Coordinate planning to guide the growth and development of the region
3. 10-year Regional Planning Cycle
• Decennial Census 2010-2011
• Regional Development Guide 2013-2014
• System and Policy Plans 2014-2015
• System Statements 2015
• Local Planning Handbook
• Local Comprehensive Plans 2018
4. Planning and Funding the Regional Parks System
Regional Parks Policy Plan
• Update the Regional Parks Policy Plan every four years
• Identify which parks and trails are part of the System
Master Plans
• Review and approve Master Plans developed by implementing agencies
Regional Parks Funding
• Distribute state and regional funding to the implementing agencies for operations, acquisition, and development projects
5. Metropolitan Livable Communities Act programs
• Create compact, connected development patterns
• Help to change long-term market incentives that adversely impact the creation and preservation of living wage jobs
• Create incentives for developing communities to include a full range of housing opportunities
• Create incentives to preserve and rehabilitate affordable housing the fully developed area
• Authority
I I
I
I
47BLUE RIBBON COMMITTEE REPORT | December 2020
PRESENTATION TO THE
Blue Ribbon CommitteeSeptember 14, 2020
Community Development
Division Overview
6. Metro Housing and Redevelopment Authority
• Created by Minnesota Legislature in 1974 to administer rent subsidy programs for low income families
• Largest administrator of tenant-based rental assistance (including federal Housing Choice Vouchers) in the state:
- 7,200 program households
- Roughly $65 million annually in rent payments
- 2,000 active landlords
7. Research on Regional Issues
• Answering questions, finding meaning, informing policy and decision-making, adding value and interpreting data
I
I
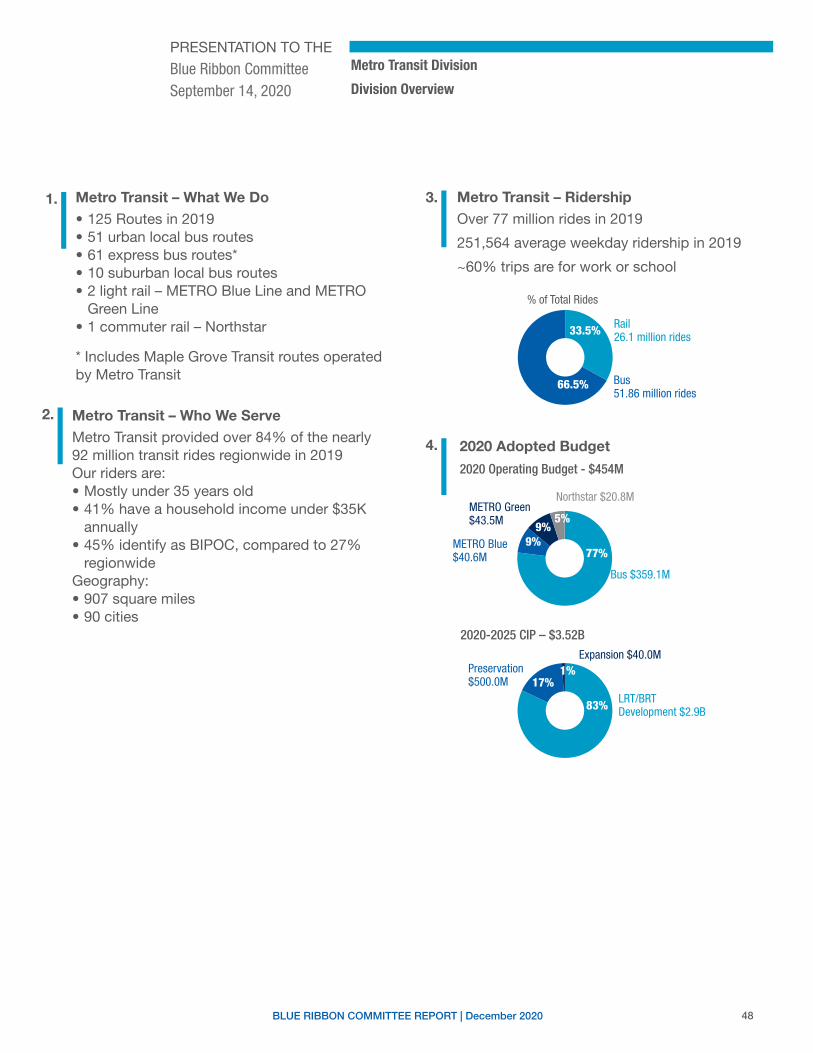
48BLUE RIBBON COMMITTEE REPORT | December 2020
1. • 125 Routes in 2019• 51 urban local bus routes • 61 express bus routes* • 10 suburban local bus routes• 2 light rail – METRO Blue Line and METRO
Green Line • 1 commuter rail – Northstar
* Includes Maple Grove Transit routes operated by Metro Transit
Metro Transit – What We Do
2.
Metro Transit provided over 84% of the nearly 92 million transit rides regionwide in 2019Our riders are:• Mostly under 35 years old• 41% have a household income under $35K
annually• 45% identify as BIPOC, compared to 27%
regionwideGeography:• 907 square miles• 90 cities
Metro Transit – Who We Serve
3. Over 77 million rides in 2019
251,564 average weekday ridership in 2019
~60% trips are for work or school
Metro Transit – Ridership
4.
2020 Operating Budget - $454M
2020 Adopted Budget
Metro Transit Division
Division Overview
2020-2025 CIP – $3.52B
77+9+9+5+tBus $359.1M
77%
5%
9%
METRO Green $43.5M
METRO Blue $40.6M
Northstar $20.8M
9%
82+17+1+tLRT/BRT Development $2.9B83%
1%17%
Expansion $40.0MPreservation $500.0M
33+67+tRail 26.1 million rides33.5%
66.5% Bus 51.86 million rides
% of Total Rides
PRESENTATION TO THE
Blue Ribbon CommitteeSeptember 14, 2020
I I
I I
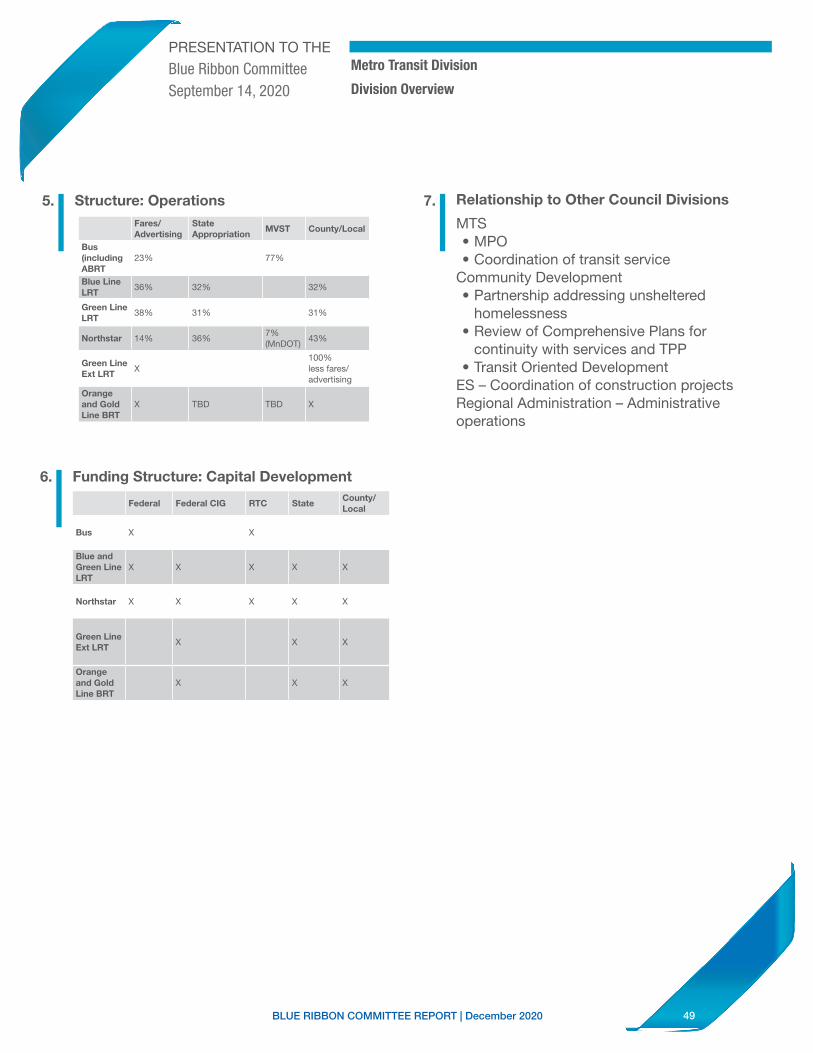
49BLUE RIBBON COMMITTEE REPORT | December 2020
PRESENTATION TO THE
Blue Ribbon CommitteeSeptember 14, 2020
Metro Transit Division
Division Overview
5. Structure: Operations
6. Funding Structure: Capital Development
Relationship to Other Council Divisions
MTS• MPO• Coordination of transit service
Community Development • Partnership addressing unsheltered
homelessness• Review of Comprehensive Plans for
continuity with services and TPP• Transit Oriented Development
ES – Coordination of construction projectsRegional Administration – Administrative operations
Fares/Advertising
State Appropriation
MVST County/Local
Bus (including ABRT
23% 77%
Blue Line LRT
36% 32% 32%
Green Line LRT
38% 31% 31%
Northstar 14% 36%7% (MnDOT)
43%
Green Line Ext LRT
X100% less fares/advertising
Orange and Gold Line BRT
X TBD TBD X
Federal Federal CIG RTC StateCounty/Local
Bus X X
Blue and Green Line LRT
X X X X X
Northstar X X X X X
Green Line Ext LRT
X X X
Orange and Gold Line BRT
X X X
7.
I I ----------
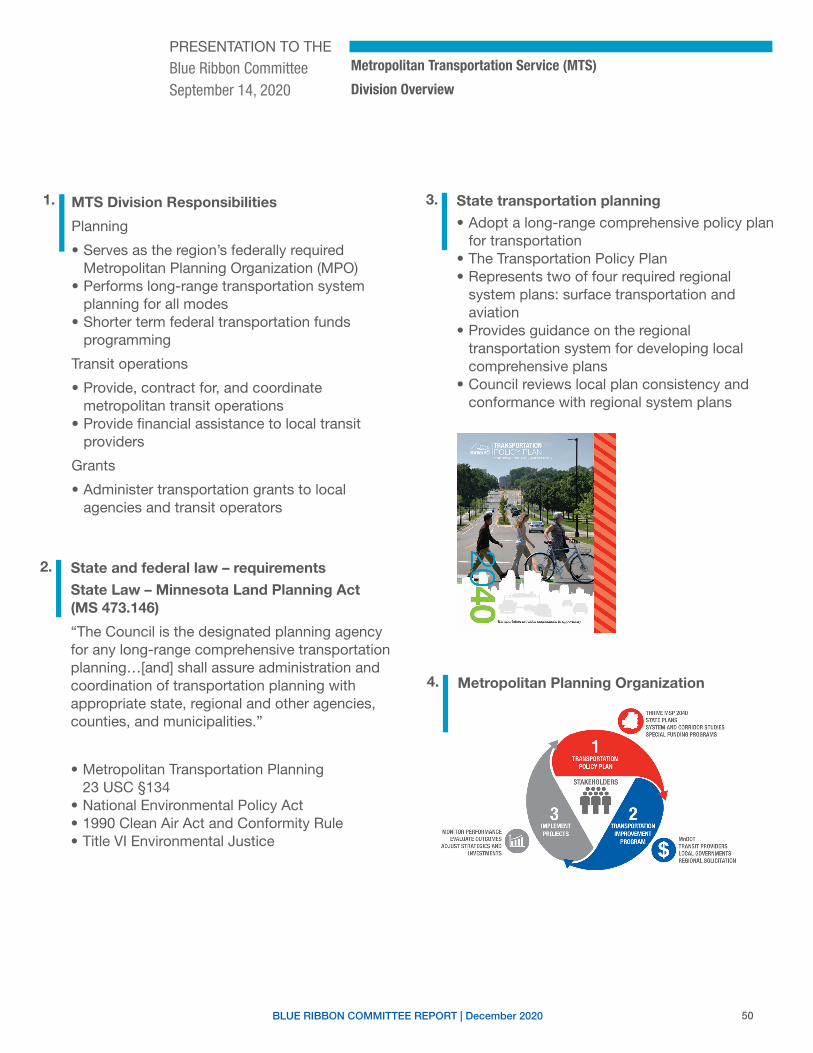
50BLUE RIBBON COMMITTEE REPORT | December 2020
PRESENTATION TO THE
Blue Ribbon CommitteeSeptember 14, 2020
Metropolitan Transportation Service (MTS)
Division Overview
1. MTS Division Responsibilities
Planning
• Serves as the region’s federally required Metropolitan Planning Organization (MPO)
• Performs long-range transportation system planning for all modes
• Shorter term federal transportation funds programming
Transit operations
• Provide, contract for, and coordinate metropolitan transit operations
• Provide financial assistance to local transit providers
Grants
• Administer transportation grants to local agencies and transit operators
2.
State Law – Minnesota Land Planning Act (MS 473.146)
“The Council is the designated planning agency for any long-range comprehensive transportation planning…[and] shall assure administration and coordination of transportation planning with appropriate state, regional and other agencies, counties, and municipalities.”
• Metropolitan Transportation Planning 23 USC §134
• National Environmental Policy Act• 1990 Clean Air Act and Conformity Rule• Title VI Environmental Justice
State and federal law – requirements
3.
• Adopt a long-range comprehensive policy plan for transportation
• The Transportation Policy Plan • Represents two of four required regional
system plans: surface transportation and aviation
• Provides guidance on the regional transportation system for developing local comprehensive plans
• Council reviews local plan consistency and conformance with regional system plans
State transportation planning
4. Metropolitan Planning Organization
I I
I
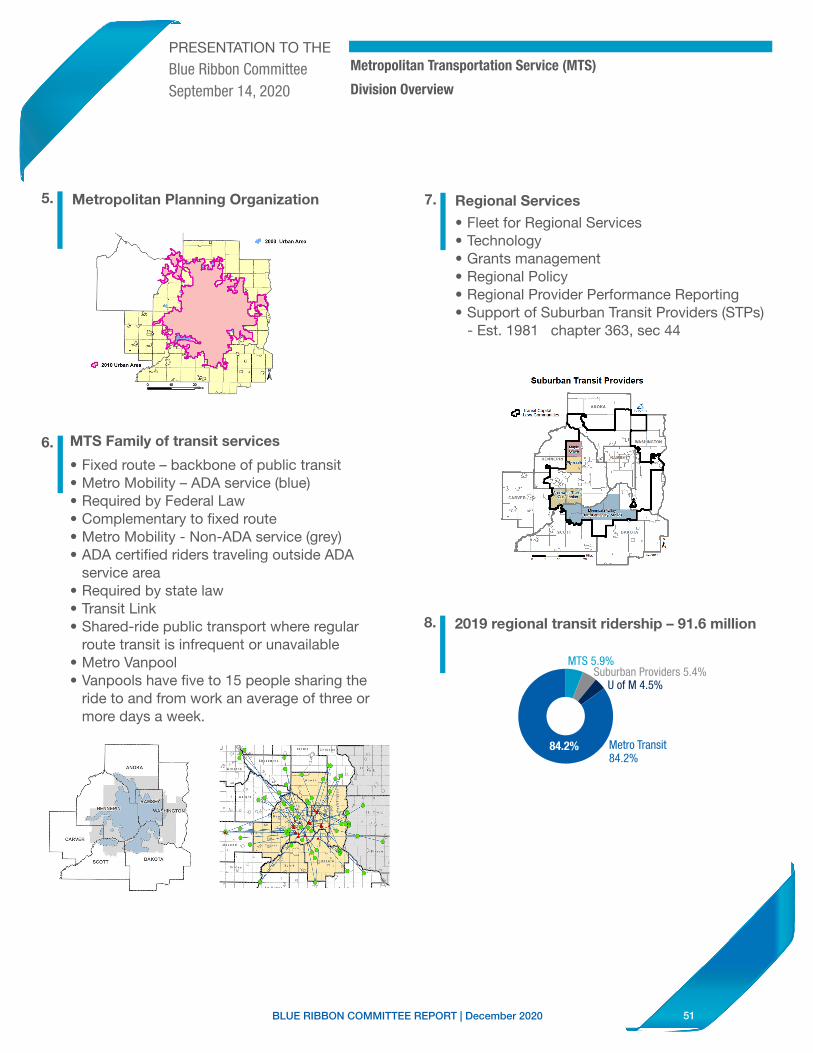
51BLUE RIBBON COMMITTEE REPORT | December 2020
Metropolitan Transportation Service (MTS)
Division Overview
6. MTS Family of transit services
• Fixed route – backbone of public transit• Metro Mobility – ADA service (blue)• Required by Federal Law• Complementary to fixed route• Metro Mobility - Non-ADA service (grey)• ADA certified riders traveling outside ADA
service area• Required by state law• Transit Link• Shared-ride public transport where regular
route transit is infrequent or unavailable• Metro Vanpool• Vanpools have five to 15 people sharing the
ride to and from work an average of three or more days a week.
5. Metropolitan Planning Organization 7.
• Fleet for Regional Services• Technology• Grants management• Regional Policy• Regional Provider Performance Reporting• Support of Suburban Transit Providers (STPs) - Est. 1981 chapter 363, sec 44
Regional Services
8. 2019 regional transit ridership – 91.6 million
U of M 4.5%
MTS 5.9%
Metro Transit 84.2%
Suburban Providers 5.4%
6+5+4+85+t84.2%
PRESENTATION TO THE
Blue Ribbon CommitteeSeptember 14, 2020
I
Suburb~u't Transit Providers
I
I
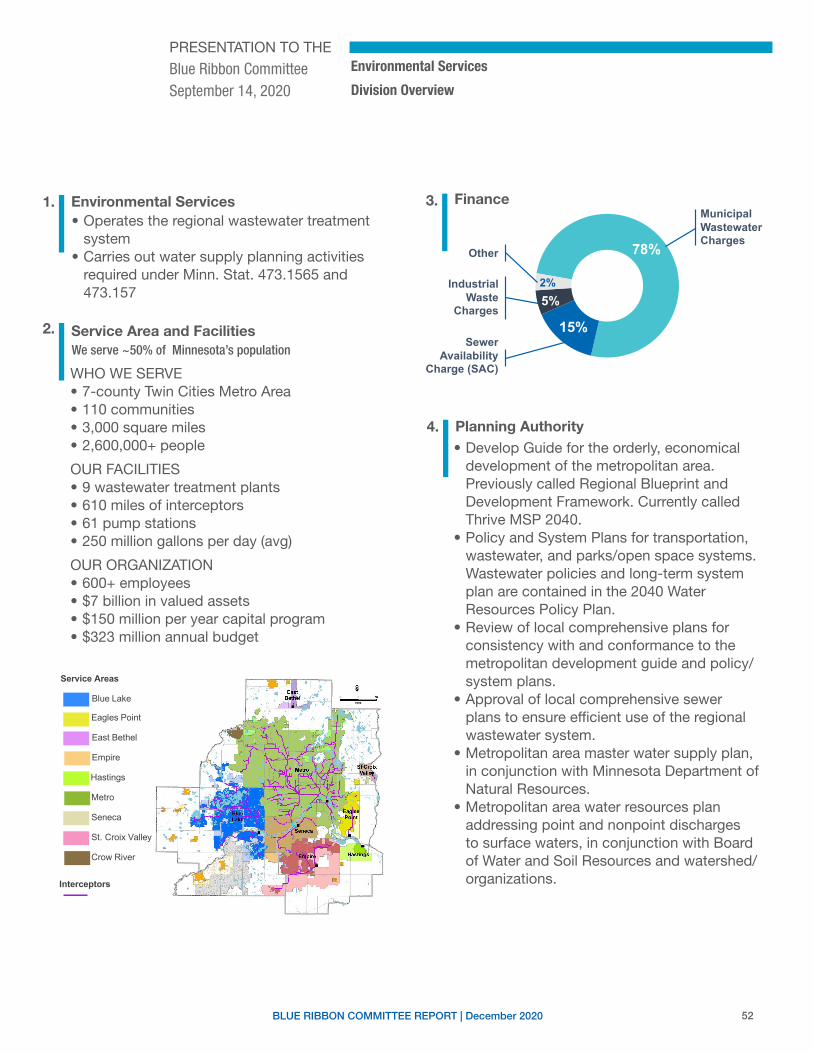
52BLUE RIBBON COMMITTEE REPORT | December 2020
Environmental Services
Division Overview
1. Environmental Services
2. Service Area and Facilities
3. Finance• Operates the regional wastewater treatment
system• Carries out water supply planning activities
required under Minn. Stat. 473.1565 and 473.157
We serve ~50% of Minnesota’s population
WHO WE SERVE• 7-county Twin Cities Metro Area• 110 communities• 3,000 square miles• 2,600,000+ people
OUR FACILITIES• 9 wastewater treatment plants• 610 miles of interceptors• 61 pump stations• 250 million gallons per day (avg)
OUR ORGANIZATION• 600+ employees• $7 billion in valued assets• $150 million per year capital program• $323 million annual budget
78%
Municipal Wastewater Charges
Sewer Availability
Charge (SAC)
15%
5%2%Industrial
Waste Charges
Other
Crow River
St. Croix Valley
Seneca
Metro
Hastings
Empire
East Bethel
Eagles Point
Service Areas
Blue Lake
Interceptors
4. Planning Authority• Develop Guide for the orderly, economical
development of the metropolitan area. Previously called Regional Blueprint and Development Framework. Currently called Thrive MSP 2040.
• Policy and System Plans for transportation, wastewater, and parks/open space systems. Wastewater policies and long-term system plan are contained in the 2040 Water Resources Policy Plan.
• Review of local comprehensive plans for consistency with and conformance to the metropolitan development guide and policy/system plans.
• Approval of local comprehensive sewer plans to ensure efficient use of the regional wastewater system.
• Metropolitan area master water supply plan, in conjunction with Minnesota Department of Natural Resources.
• Metropolitan area water resources plan addressing point and nonpoint discharges to surface waters, in conjunction with Board of Water and Soil Resources and watershed/organizations.
PRESENTATION TO THE
Blue Ribbon CommitteeSeptember 14, 2020
I I
I I
---------
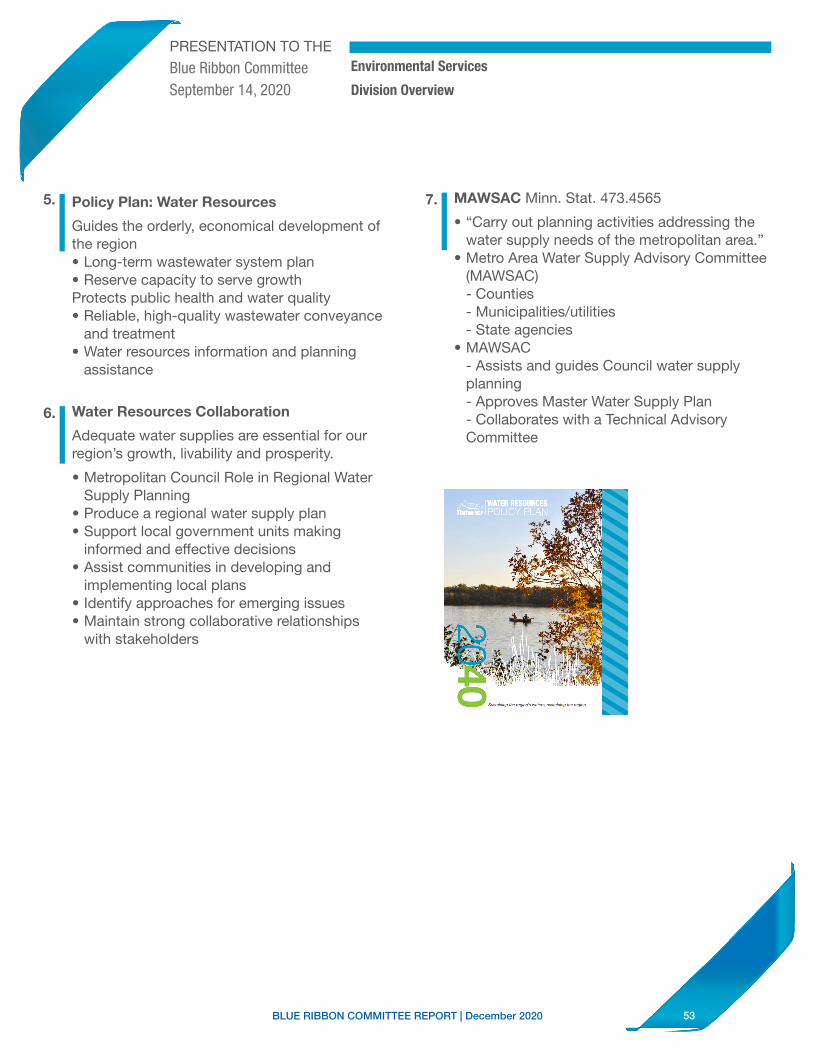
53BLUE RIBBON COMMITTEE REPORT | December 2020
PRESENTATION TO THE
Blue Ribbon CommitteeSeptember 14, 2020
Environmental Services
Division Overview
5. Policy Plan: Water Resources
Guides the orderly, economical development of the region• Long-term wastewater system plan• Reserve capacity to serve growthProtects public health and water quality• Reliable, high-quality wastewater conveyance
and treatment• Water resources information and planning
assistance
6. Water Resources Collaboration
Adequate water supplies are essential for our region’s growth, livability and prosperity.
• Metropolitan Council Role in Regional Water Supply Planning
• Produce a regional water supply plan• Support local government units making
informed and effective decisions• Assist communities in developing and
implementing local plans• Identify approaches for emerging issues• Maintain strong collaborative relationships
with stakeholders
7. MAWSAC Minn. Stat. 473.4565
• “Carry out planning activities addressing the water supply needs of the metropolitan area.”
• Metro Area Water Supply Advisory Committee (MAWSAC)- Counties- Municipalities/utilities- State agencies
• MAWSAC- Assists and guides Council water supply planning- Approves Master Water Supply Plan - Collaborates with a Technical Advisory Committee
I I
I
' 0 $,--~• •' Jl •~•"\J\>!)<-M)<>' .. -,.;,1 .. 11,\,"'"'
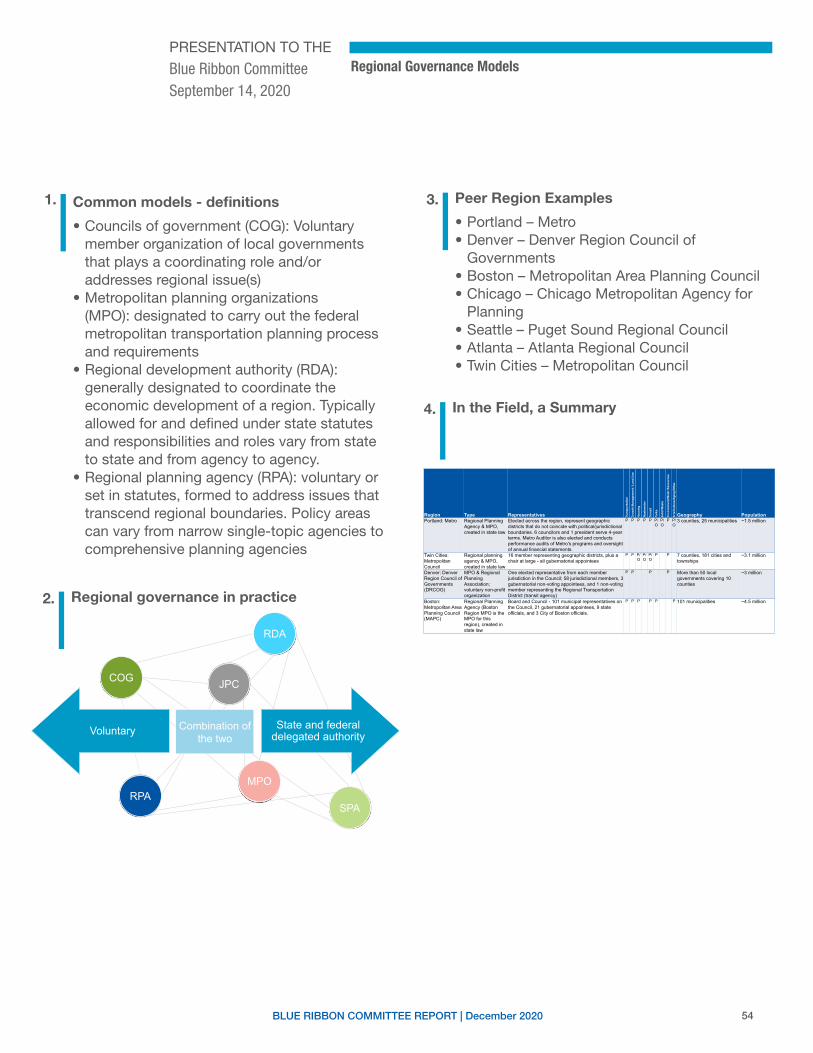
54BLUE RIBBON COMMITTEE REPORT | December 2020
PRESENTATION TO THE
Blue Ribbon CommitteeSeptember 14, 2020
Regional Governance Models
1. Common models - definitions
• Councils of government (COG): Voluntary member organization of local governments that plays a coordinating role and/or addresses regional issue(s)
• Metropolitan planning organizations (MPO): designated to carry out the federal metropolitan transportation planning process and requirements
• Regional development authority (RDA): generally designated to coordinate the economic development of a region. Typically allowed for and defined under state statutes and responsibilities and roles vary from state to state and from agency to agency.
• Regional planning agency (RPA): voluntary or set in statutes, formed to address issues that transcend regional boundaries. Policy areas can vary from narrow single-topic agencies to comprehensive planning agencies
2. Regional governance in practice
3. Peer Region Examples
• Portland – Metro• Denver – Denver Region Council of
Governments• Boston – Metropolitan Area Planning Council• Chicago – Chicago Metropolitan Agency for
Planning• Seattle – Puget Sound Regional Council• Atlanta – Atlanta Regional Council• Twin Cities – Metropolitan Council
Voluntary State and federal delegated authority
Combination of the two
COG
MPO
RDA
RPA
JPC
SPA
4. In the Field, a Summary
Region Type Representatives Tran
spor
tatio
n
Gro
wth
Man
agem
ent /
Lan
d U
se
Hou
sing
Was
tew
ater
Tran
sit
Park
s
Solid
Was
te
Envi
ronm
ent/W
ater
Res
ourc
es
Art
s/C
ultu
re/A
ging
/Oth
er
Geography PopulationPortland: Metro Regional Planning
Agency & MPO, created in state law
Elected across the region, represent geographic districts that do not coincide with political/jurisdictional boundaries. 6 councilors and 1 president serve 4-year terms. Metro Auditor is also elected and conducts performance audits of Metro's programs and oversight of annual financial statements.
P P P P P P/OP/O
P P/O
3 counties, 25 municipalities ~1.5 million
Twin Cities: Metropolitan Council
Regional planning agency & MPO, created in state law
16 member representing geographic districts, plus a chair at large - all gubernatorial appointees
P P P/OP/OP/O
P P 7 counties, 181 cities and townships
~3.1 million
Denver: Denver Region Council of Governments (DRCOG)
MPO & Regional Planning Association; voluntary non-profit organization
One elected representative from each member jurisdiction in the Council; 58 jurisdictional members, 3 gubernatorial non-voting appointees, and 1 non-voting member representing the Regional Transportation District (transit agency)
P P P P More than 50 local governments covering 10 counties
~3 million
Boston: Metropolitan Area Planning Council (MAPC)
Regional Planning Agency (Boston Region MPO is the MPO for this region), created in state law
Board and Council - 101 municipal representatives on the Council, 21 gubernatorial appointees, 9 state officials, and 3 City of Boston officials.
P P P P P P 101 municipalities ~4.5 million
I I
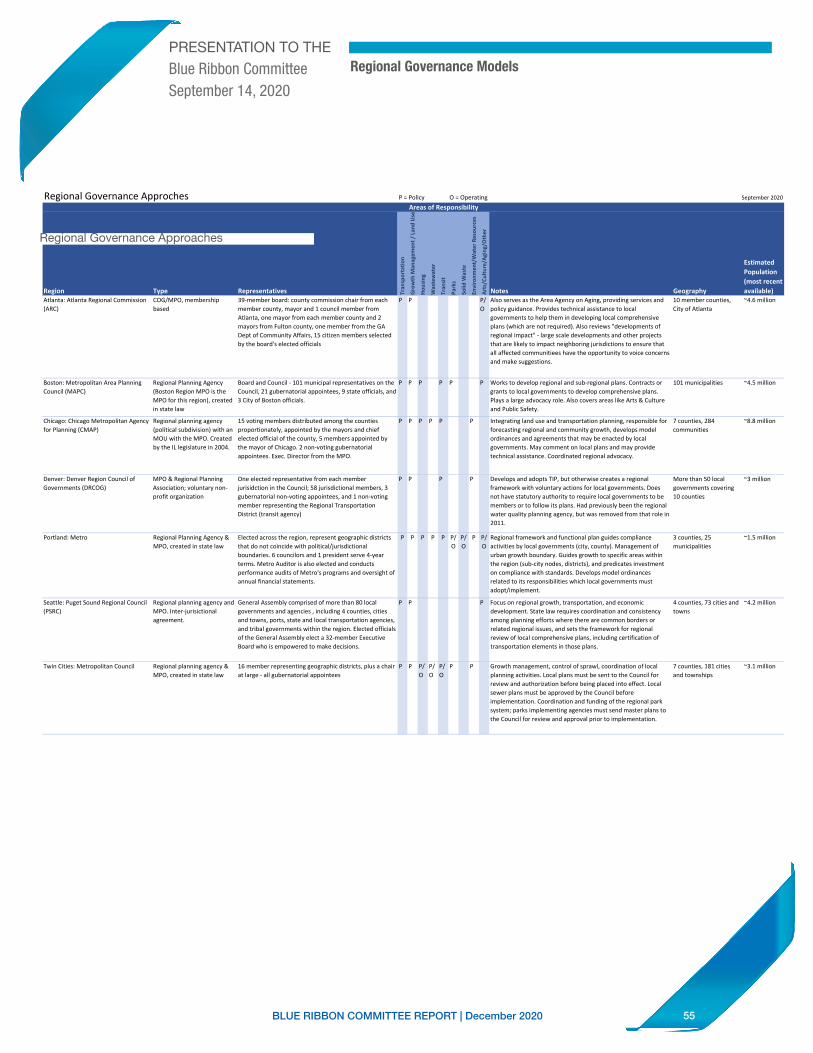
55BLUE RIBBON COMMITTEE REPORT | December 2020
P = Policy O = Operating September 2020
Region Type Representatives Tran
sportatio
n
Growth M
anagem
ent /
Lan
d Use
Hou
sing
Wastewater
Tran
sit
Parks
Solid
Waste
Environm
ent/Water Resou
rces
Arts/Culture/A
ging/O
ther
Notes Geography
Estimated Population (most recent available)
Atlanta: Atlanta Regional Commission (ARC)
COG/MPO, membership based
39‐member board: county commission chair from each member county, mayor and 1 council member from Atlanta, one mayor from each member county and 2 mayors from Fulton county, one member from the GA Dept of Community Affairs, 15 citizen members selected by the board's elected officials
P P P/O
Also serves as the Area Agency on Aging, providing services and policy guidance. Provides technical assistance to local governments to help them in developing local comprehensive plans (which are not required). Also reviews "developments of regional impact" ‐ large scale developments and other projects that are likely to impact neighboring jurisdictions to ensure that all affected communitiees have the opportunity to voice concerns and make suggestions.
10 member counties, City of Atlanta
~4.6 million
Boston: Metropolitan Area Planning Council (MAPC)
Regional Planning Agency (Boston Region MPO is the MPO for this region), created in state law
Board and Council ‐ 101 municipal representatives on the Council, 21 gubernatorial appointees, 9 state officials, and 3 City of Boston officials.
P P P P P P Works to develop regional and sub‐regional plans. Contracts or grants to local governments to develop comprehensive plans. Plays a large advocacy role. Also covers areas like Arts & Culture and Public Safety.
101 municipalities ~4.5 million
Chicago: Chicago Metropolitan Agency for Planning (CMAP)
Regional planning agency (political subdivision) with an MOU with the MPO. Created by the IL legislature in 2004.
15 voting members distributed among the counties proportionately, appointed by the mayors and chief elected official of the county, 5 members appointed by the mayor of Chicago. 2 non‐voting gubernatorial appointees. Exec. Director from the MPO.
P P P P P P Integrating land use and transportation planning, responsible for forecasting regional and community growth, develops model ordinances and agreements that may be enacted by local governments. May comment on local plans and may provide technical assistance. Coordinated regional advocacy.
7 counties, 284 communities
~8.8 million
Denver: Denver Region Council of Governments (DRCOG)
MPO & Regional Planning Association; voluntary non‐profit organization
One elected representative from each member jurisidction in the Council; 58 jurisdictional members, 3 gubernatorial non‐voting appointees, and 1 non‐voting member representing the Regional Transportation District (transit agency)
P P P P Develops and adopts TIP, but otherwise creates a regional framework with voluntary actions for local governments. Does not have statutory authority to require local governments to be members or to follow its plans. Had previously been the regional water quality planning agency, but was removed from that role in 2011.
More than 50 local governments covering 10 counties
~3 million
Portland: Metro Regional Planning Agency & MPO, created in state law
Elected across the region, represent geographic districts that do not coincide with political/jurisdictional boundaries. 6 councilors and 1 president serve 4‐year terms. Metro Auditor is also elected and conducts performance audits of Metro's programs and oversight of annual financial statements.
P P P P P P/O
P/O
P P/O
Regional framework and functional plan guides compliance activities by local governments (city, county). Management of urban growth boundary. Guides growth to specific areas within the region (sub‐city nodes, districts), and predicates investment on compliance with standards. Develops model ordinances related to its responsibilities which local governments must adopt/implement.
3 counties, 25 municipalities
~1.5 million
Seattle: Puget Sound Regional Council (PSRC)
Regional planning agency and MPO. Inter‐jurisictional agreement.
General Assembly comprised of more than 80 local governments and agencies , including 4 counties, cities and towns, ports, state and local transportation agencies, and tribal governments within the region. Elected officials of the General Assembly elect a 32‐member Executive Board who is empowered to make decisions.
P P P Focus on regional growth, transportation, and economic development. State law requires coordination and consistency among planning efforts where there are common borders or related regional issues, and sets the framework for regional review of local comprehensive plans, including certification of transportation elements in those plans.
4 counties, 73 cities and towns
~4.2 million
Twin Cities: Metropolitan Council Regional planning agency & MPO, created in state law
16 member representing geographic districts, plus a chair at large ‐ all gubernatorial appointees
P P P/O
P/O
P/O
P P Growth management, control of sprawl, coordination of local planning activities. Local plans must be sent to the Council for review and authorization before being placed into effect. Local sewer plans must be approved by the Council before implementation. Coordination and funding of the regional park system; parks implementing agencies must send master plans to the Council for review and approval prior to implementation.
7 counties, 181 cities and townships
~3.1 million
Areas of ResponsibilityRegional Governance Approches
PRESENTATION TO THE
Blue Ribbon CommitteeSeptember 14, 2020
Regional Governance Models
Regional Governance Approaches
---1 ---1 ---1 ---1
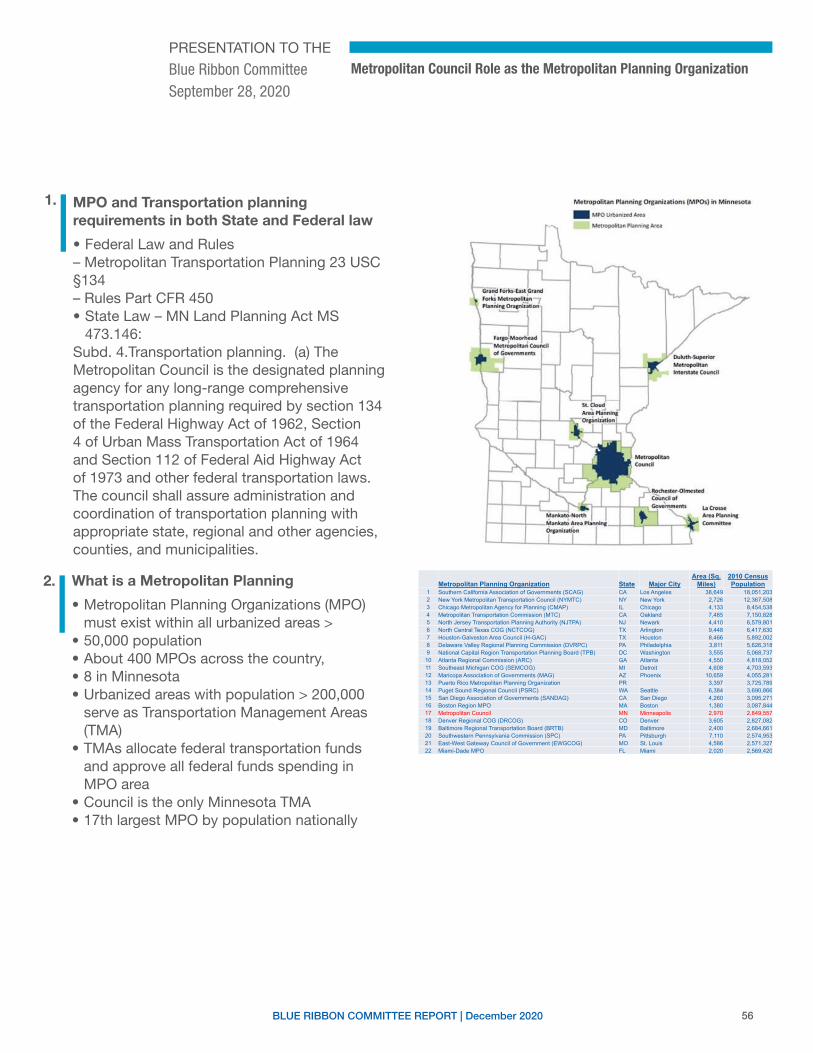
56BLUE RIBBON COMMITTEE REPORT | December 2020
Metropolitan Council Role as the Metropolitan Planning Organization
1. MPO and Transportation planning requirements in both State and Federal law
• Federal Law and Rules– Metropolitan Transportation Planning 23 USC §134– Rules Part CFR 450• State Law – MN Land Planning Act MS
473.146:Subd. 4.Transportation planning. (a) The Metropolitan Council is the designated planning agency for any long-range comprehensive transportation planning required by section 134 of the Federal Highway Act of 1962, Section 4 of Urban Mass Transportation Act of 1964 and Section 112 of Federal Aid Highway Act of 1973 and other federal transportation laws. The council shall assure administration and coordination of transportation planning with appropriate state, regional and other agencies, counties, and municipalities.
2. What is a Metropolitan Planning
• Metropolitan Planning Organizations (MPO) must exist within all urbanized areas >
• 50,000 population• About 400 MPOs across the country,• 8 in Minnesota• Urbanized areas with population > 200,000
serve as Transportation Management Areas (TMA)
• TMAs allocate federal transportation funds and approve all federal funds spending in MPO area
• Council is the only Minnesota TMA• 17th largest MPO by population nationally
5
Metropolitan Planning Organization State Major CityArea (Sq.
Miles)2010 Census Population
1 Southern California Association of Governments (SCAG) CA Los Angeles 38,649 18,051,2032 New York Metropolitan Transportation Council (NYMTC) NY New York 2,726 12,367,5083 Chicago Metropolitan Agency for Planning (CMAP) IL Chicago 4,133 8,454,5384 Metropolitan Transportation Commission (MTC) CA Oakland 7,485 7,150,8285 North Jersey Transportation Planning Authority (NJTPA) NJ Newark 4,410 6,579,8016 North Central Texas COG (NCTCOG) TX Arlington 9,448 6,417,6307 Houston-Galveston Area Council (H-GAC) TX Houston 8,466 5,892,0028 Delaware Valley Regional Planning Commission (DVRPC) PA Philadelphia 3,811 5,626,3189 National Capital Region Transportation Planning Board (TPB) DC Washington 3,555 5,068,737
10 Atlanta Regional Commission (ARC) GA Atlanta 4,550 4,818,05211 Southeast Michigan COG (SEMCOG) MI Detroit 4,608 4,703,59312 Maricopa Association of Governments (MAG) AZ Phoenix 10,659 4,055,28113 Puerto Rico Metropolitan Planning Organization PR 3,397 3,725,78914 Puget Sound Regional Council (PSRC) WA Seattle 6,384 3,690,86615 San Diego Association of Governments (SANDAG) CA San Diego 4,260 3,095,27116 Boston Region MPO MA Boston 1,380 3,087,84417 Metropolitan Council MN Minneapolis 2,970 2,849,55718 Denver Regional COG (DRCOG) CO Denver 3,605 2,827,08219 Baltimore Regional Transportation Board (BRTB) MD Baltimore 2,400 2,684,66120 Southwestern Pennsylvania Commission (SPC) PA Pittsburgh 7,110 2,574,95321 East-West Gateway Council of Government (EWGCOG) MO St. Louis 4,586 2,571,32722 Miami-Dade MPO FL Miami 2,020 2,569,420
PRESENTATION TO THE
Blue Ribbon CommitteeSeptember 28, 2020
I
I
Metropolitan Pbnnin1 Orsanltatlons (MPOsJ in Minn6QLJ
- MPOU<bo .........
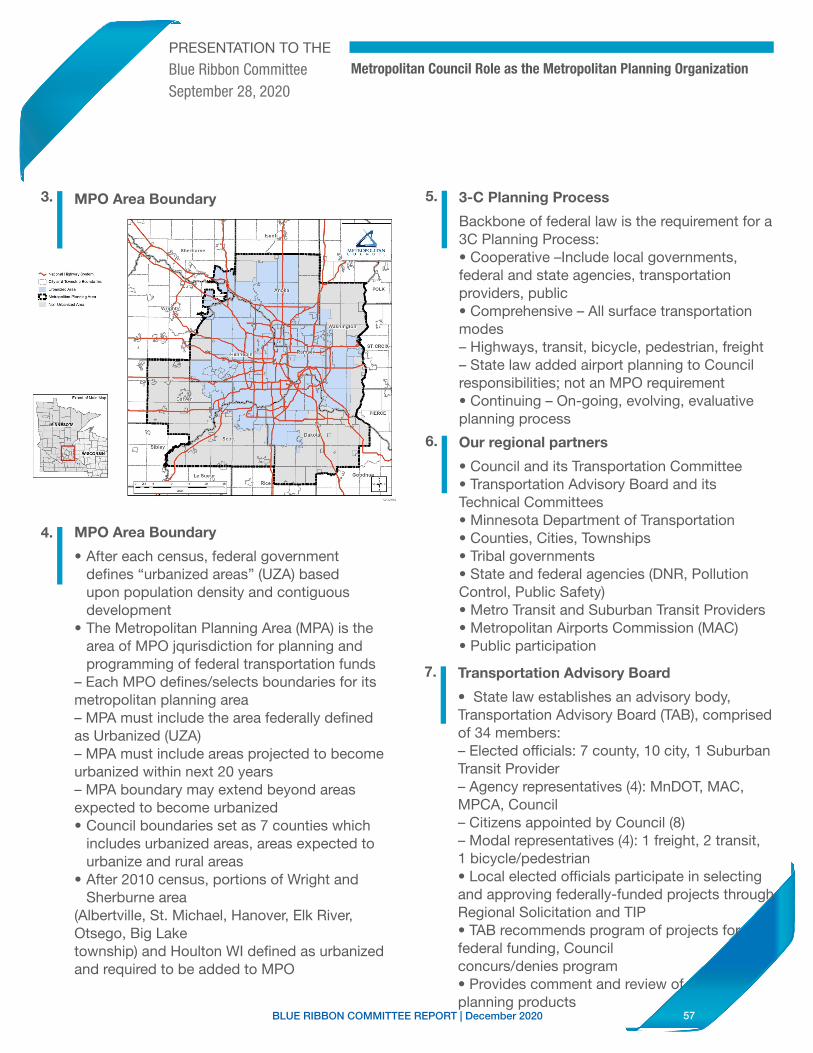
57BLUE RIBBON COMMITTEE REPORT | December 2020
Metropolitan Council Role as the Metropolitan Planning Organization
MPO Area Boundary3.
MPO Area Boundary
• After each census, federal government defines “urbanized areas” (UZA) based upon population density and contiguous development
• The Metropolitan Planning Area (MPA) is the area of MPO jqurisdiction for planning and programming of federal transportation funds
– Each MPO defines/selects boundaries for its metropolitan planning area– MPA must include the area federally defined as Urbanized (UZA)– MPA must include areas projected to become urbanized within next 20 years– MPA boundary may extend beyond areas expected to become urbanized• Council boundaries set as 7 counties which
includes urbanized areas, areas expected to urbanize and rural areas
• After 2010 census, portions of Wright and Sherburne area
(Albertville, St. Michael, Hanover, Elk River, Otsego, Big Laketownship) and Houlton WI defined as urbanized and required to be added to MPO
4.
3-C Planning Process
Backbone of federal law is the requirement for a 3C Planning Process:• Cooperative –Include local governments, federal and state agencies, transportation providers, public• Comprehensive – All surface transportation modes– Highways, transit, bicycle, pedestrian, freight– State law added airport planning to Council responsibilities; not an MPO requirement• Continuing – On-going, evolving, evaluative planning process
5.
Our regional partners
• Council and its Transportation Committee• Transportation Advisory Board and its Technical Committees• Minnesota Department of Transportation• Counties, Cities, Townships• Tribal governments• State and federal agencies (DNR, Pollution Control, Public Safety)• Metro Transit and Suburban Transit Providers• Metropolitan Airports Commission (MAC)• Public participation
6.
Transportation Advisory Board
• State law establishes an advisory body, Transportation Advisory Board (TAB), comprised of 34 members:– Elected officials: 7 county, 10 city, 1 Suburban Transit Provider– Agency representatives (4): MnDOT, MAC, MPCA, Council– Citizens appointed by Council (8)– Modal representatives (4): 1 freight, 2 transit, 1 bicycle/pedestrian• Local elected officials participate in selecting and approving federally-funded projects through Regional Solicitation and TIP• TAB recommends program of projects for federal funding, Councilconcurs/denies program• Provides comment and review of planning products
7.
PRESENTATION TO THE
Blue Ribbon CommitteeSeptember 28, 2020
I ,.,,_, t-t11N •~ ~ •~ ,1Jr ,
( J C1t•>(l -_,..,it , 6:>1•io•o ;::i ........ , _ !::,~.-.,..,,,,•c••"'' ........... _,.,,.
I
I
I
I
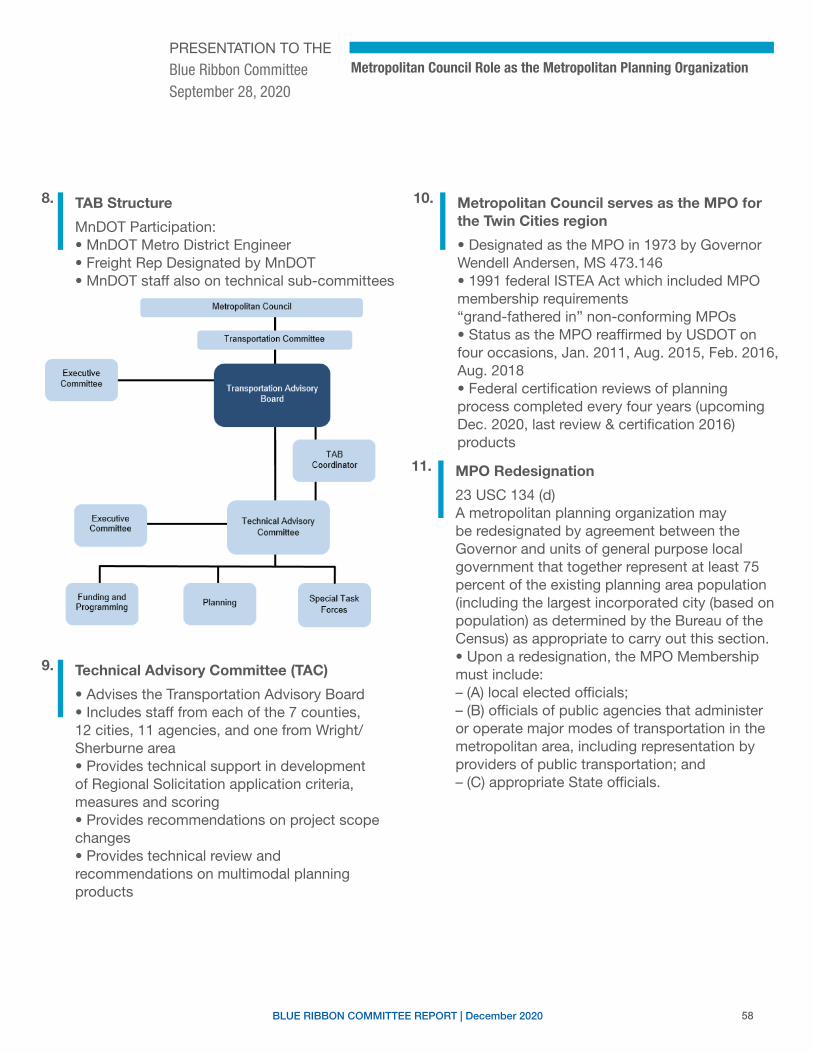
58BLUE RIBBON COMMITTEE REPORT | December 2020
Metropolitan Council Role as the Metropolitan Planning Organization
TAB Structure
MnDOT Participation:• MnDOT Metro District Engineer• Freight Rep Designated by MnDOT• MnDOT staff also on technical sub-committees
8.
Technical Advisory Committee (TAC)
• Advises the Transportation Advisory Board• Includes staff from each of the 7 counties, 12 cities, 11 agencies, and one from Wright/Sherburne area• Provides technical support in development of Regional Solicitation application criteria, measures and scoring• Provides recommendations on project scope changes• Provides technical review and recommendations on multimodal planning products
9.
Metropolitan Council serves as the MPO for the Twin Cities region
• Designated as the MPO in 1973 by Governor Wendell Andersen, MS 473.146• 1991 federal ISTEA Act which included MPO membership requirements“grand-fathered in” non-conforming MPOs• Status as the MPO reaffirmed by USDOT on four occasions, Jan. 2011, Aug. 2015, Feb. 2016, Aug. 2018• Federal certification reviews of planning process completed every four years (upcoming Dec. 2020, last review & certification 2016)products
10.
MPO Redesignation
23 USC 134 (d)A metropolitan planning organization may be redesignated by agreement between the Governor and units of general purpose local government that together represent at least 75 percent of the existing planning area population (including the largest incorporated city (based on population) as determined by the Bureau of the Census) as appropriate to carry out this section.• Upon a redesignation, the MPO Membership must include:– (A) local elected officials;– (B) officials of public agencies that administer or operate major modes of transportation in the metropolitan area, including representation by providers of public transportation; and– (C) appropriate State officials.
11.
PRESENTATION TO THE
Blue Ribbon CommitteeSeptember 28, 2020
I
Executive Committee
I
Executive Committee
Funding and Programming
Metropolitan Council
Transportation Committee
Planning
TAB Coordinator
Technical Advisory Committee
Special Task Forces
I
I
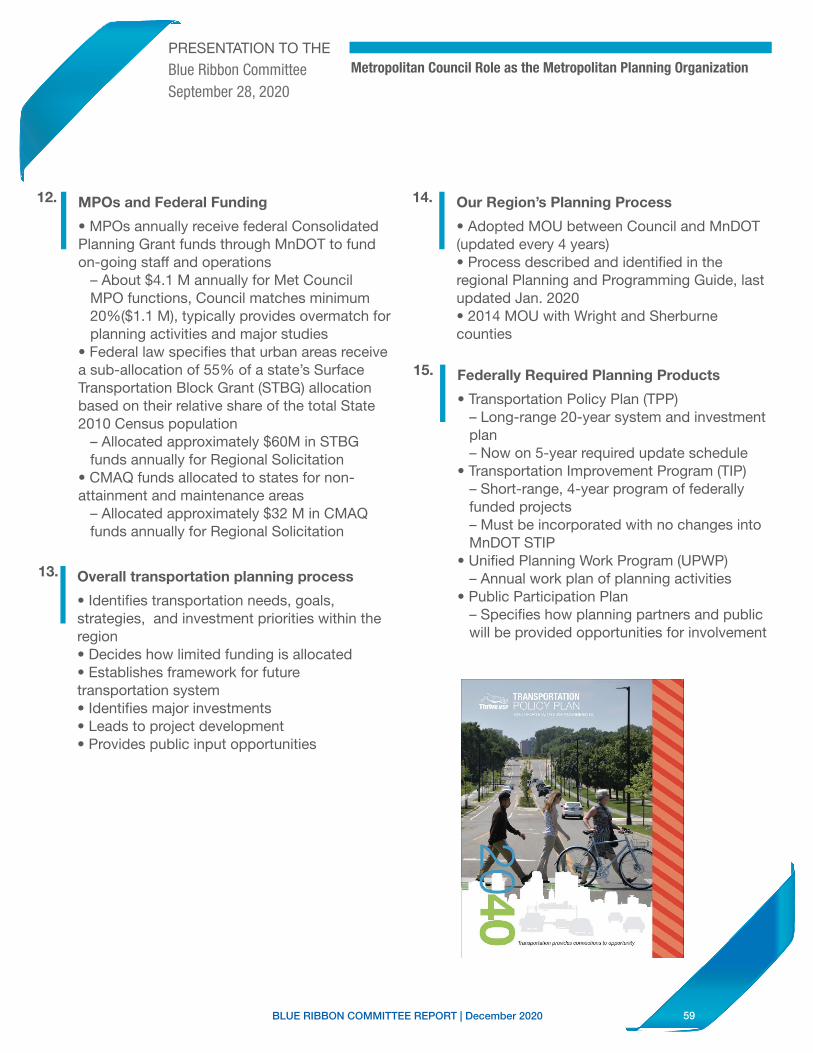
59BLUE RIBBON COMMITTEE REPORT | December 2020
Metropolitan Council Role as the Metropolitan Planning Organization
MPOs and Federal Funding
• MPOs annually receive federal Consolidated Planning Grant funds through MnDOT to fund on-going staff and operations
– About $4.1 M annually for Met Council MPO functions, Council matches minimum 20%($1.1 M), typically provides overmatch for planning activities and major studies
• Federal law specifies that urban areas receive a sub-allocation of 55% of a state’s Surface Transportation Block Grant (STBG) allocation based on their relative share of the total State 2010 Census population
– Allocated approximately $60M in STBG funds annually for Regional Solicitation
• CMAQ funds allocated to states for non-attainment and maintenance areas
– Allocated approximately $32 M in CMAQ funds annually for Regional Solicitation
12.
Overall transportation planning process
• Identifies transportation needs, goals, strategies, and investment priorities within the region• Decides how limited funding is allocated• Establishes framework for future transportation system• Identifies major investments• Leads to project development• Provides public input opportunities
13.
Our Region’s Planning Process
• Adopted MOU between Council and MnDOT (updated every 4 years)• Process described and identified in the regional Planning and Programming Guide, last updated Jan. 2020• 2014 MOU with Wright and Sherburne counties
14.
Federally Required Planning Products
• Transportation Policy Plan (TPP)– Long-range 20-year system and investment plan– Now on 5-year required update schedule
• Transportation Improvement Program (TIP)– Short-range, 4-year program of federally funded projects– Must be incorporated with no changes into MnDOT STIP
• Unified Planning Work Program (UPWP)– Annual work plan of planning activities
• Public Participation Plan– Specifies how planning partners and public will be provided opportunities for involvement
15.
PRESENTATION TO THE
Blue Ribbon CommitteeSeptember 28, 2020
I I
I
I
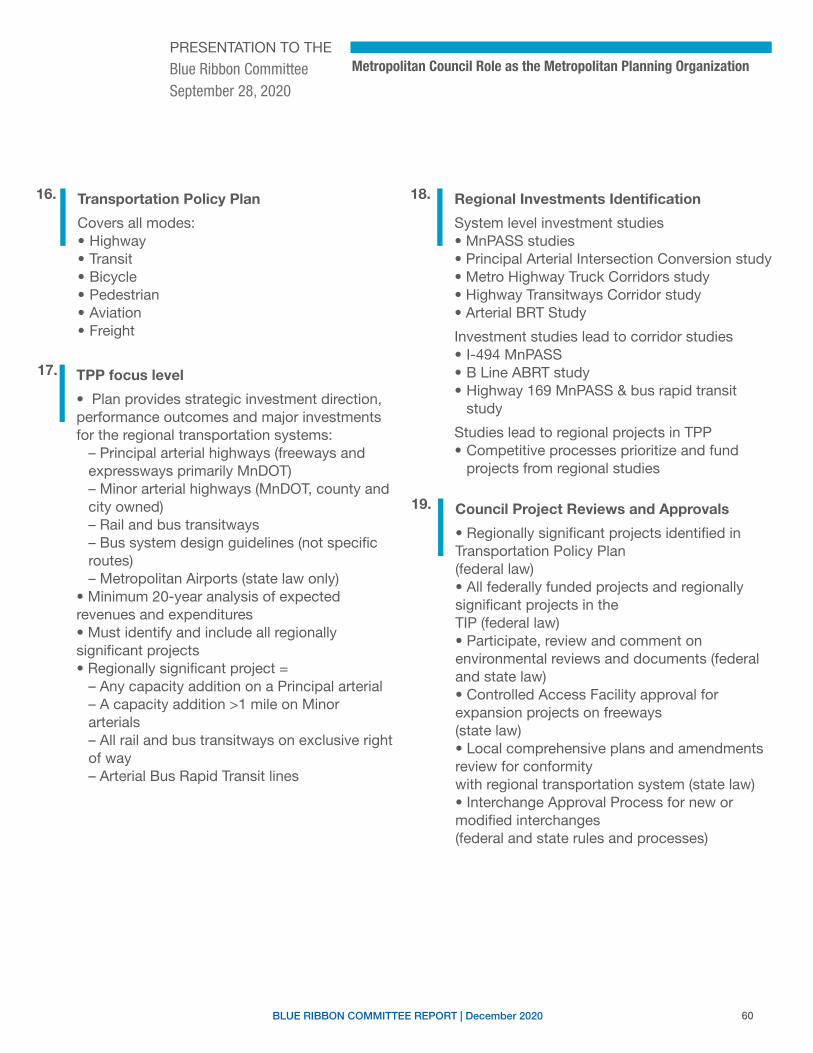
60BLUE RIBBON COMMITTEE REPORT | December 2020
Metropolitan Council Role as the Metropolitan Planning Organization
Transportation Policy Plan
Covers all modes:• Highway• Transit• Bicycle• Pedestrian• Aviation• Freight
16.
TPP focus level
• Plan provides strategic investment direction, performance outcomes and major investments for the regional transportation systems:
– Principal arterial highways (freeways and expressways primarily MnDOT)– Minor arterial highways (MnDOT, county and city owned)– Rail and bus transitways– Bus system design guidelines (not specific routes)– Metropolitan Airports (state law only)
• Minimum 20-year analysis of expected revenues and expenditures• Must identify and include all regionally significant projects• Regionally significant project =
– Any capacity addition on a Principal arterial– A capacity addition >1 mile on Minor arterials– All rail and bus transitways on exclusive right of way– Arterial Bus Rapid Transit lines
17.
Regional Investments Identification
System level investment studies• MnPASS studies• Principal Arterial Intersection Conversion study• Metro Highway Truck Corridors study• Highway Transitways Corridor study• Arterial BRT Study
Investment studies lead to corridor studies• I-494 MnPASS• B Line ABRT study • Highway 169 MnPASS & bus rapid transit
study
Studies lead to regional projects in TPP• Competitive processes prioritize and fund
projects from regional studies
18.
Council Project Reviews and Approvals
• Regionally significant projects identified in Transportation Policy Plan(federal law)• All federally funded projects and regionally significant projects in theTIP (federal law)• Participate, review and comment on environmental reviews and documents (federal and state law)• Controlled Access Facility approval for expansion projects on freeways(state law)• Local comprehensive plans and amendments review for conformitywith regional transportation system (state law)• Interchange Approval Process for new or modified interchanges(federal and state rules and processes)
19.
PRESENTATION TO THE
Blue Ribbon CommitteeSeptember 28, 2020
I I
I
I
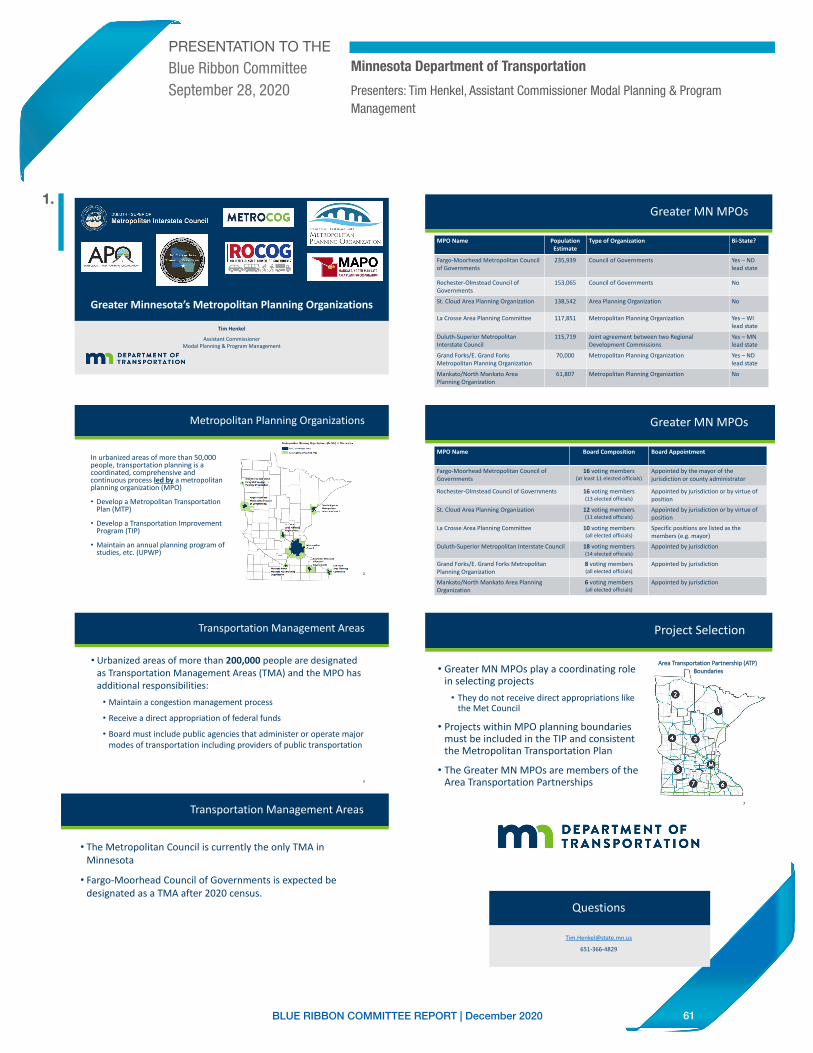
61BLUE RIBBON COMMITTEE REPORT | December 2020
PRESENTATION TO THE
Blue Ribbon CommitteeSeptember 28, 2020
Minnesota Department of Transportation
Presenters: Tim Henkel, Assistant Commissioner Modal Planning & Program Management
1.
Greater Minnesota’s Metropolitan Planning Organizations
Tim Henkel
Assistant CommissionerModal Planning & Program Management
Metropolitan Planning Organizations
In urbanized areas of more than 50,000 people, transportation planning is a coordinated, comprehensive and continuous process led by a metropolitan planning organization (MPO)
• Develop a Metropolitan Transportation Plan (MTP)
• Develop a Transportation Improvement Program (TIP)
• Maintain an annual planning program of studies, etc. (UPWP)
2
Transportation Management Areas
• Urbanized areas of more than 200,000 people are designated as Transportation Management Areas (TMA) and the MPO has additional responsibilities:
• Maintain a congestion management process
• Receive a direct appropriation of federal funds
• Board must include public agencies that administer or operate major modes of transportation including providers of public transportation
3
Transportation Management Areas
• The Metropolitan Council is currently the only TMA in Minnesota
• Fargo-Moorhead Council of Governments is expected be designated as a TMA after 2020 census.
4
Greater MN MPOs
5
MPO Name Population Estimate
Type of Organization Bi-State?
Fargo-Moorhead Metropolitan Council of Governments
235,939 Council of Governments Yes – ND lead state
Rochester-Olmstead Council of Governments
153,065 Council of Governments No
St. Cloud Area Planning Organization 138,542 Area Planning Organization No
La Crosse Area Planning Committee 117,851 Metropolitan Planning Organization Yes – WI lead state
Duluth-Superior Metropolitan Interstate Council
115,719 Joint agreement between two Regional Development Commissions
Yes – MN lead state
Grand Forks/E. Grand Forks Metropolitan Planning Organization
70,000 Metropolitan Planning Organization Yes – ND lead state
Mankato/North Mankato Area Planning Organization
61,807 Metropolitan Planning Organization No
Greater MN MPOs
6
MPO Name Board Composition Board Appointment
Fargo-Moorhead Metropolitan Council of Governments
16 voting members (at least 11 elected officials)
Appointed by the mayor of the jurisdiction or county administrator
Rochester-Olmstead Council of Governments 16 voting members (13 elected officials)
Appointed by jurisdiction or by virtue of position
St. Cloud Area Planning Organization 12 voting members (11 elected officials)
Appointed by jurisdiction or by virtue of position
La Crosse Area Planning Committee 10 voting members (all elected officials)
Specific positions are listed as the members (e.g. mayor)
Duluth-Superior Metropolitan Interstate Council 18 voting members(14 elected officials)
Appointed by jurisdiction
Grand Forks/E. Grand Forks MetropolitanPlanning Organization
8 voting members(all elected officials)
Appointed by jurisdiction
Mankato/North Mankato Area Planning Organization
6 voting members(all elected officials)
Appointed by jurisdiction
Project Selection
• Greater MN MPOs play a coordinating role in selecting projects
• They do not receive direct appropriations like the Met Council
• Projects within MPO planning boundaries must be included in the TIP and consistent the Metropolitan Transportation Plan
• The Greater MN MPOs are members of the Area Transportation Partnerships
7
AArreeaa TTrraannssppoorrttaattiioonn PPaarrttnneerrsshhiipp ((AATTPP)) BBoouunnddaarriieess
Questions
651-366-48298
I
m il DEPARTMENT OF TRANS PORT A Tl ON
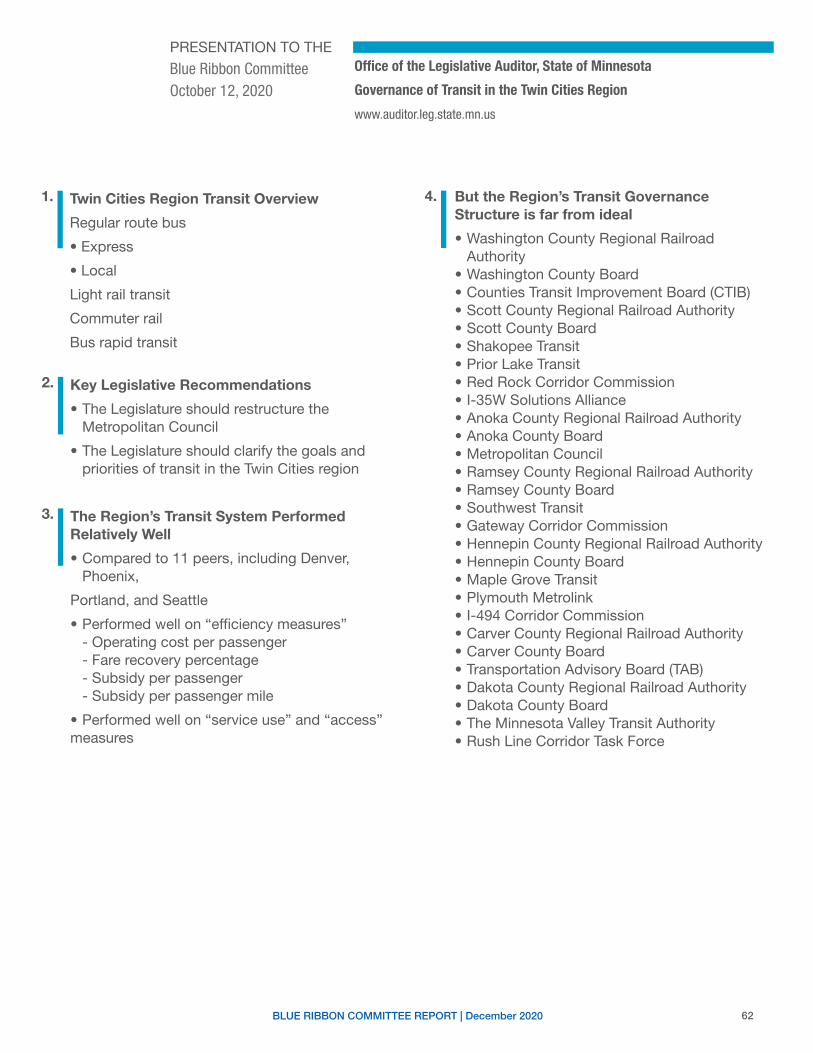
62BLUE RIBBON COMMITTEE REPORT | December 2020
PRESENTATION TO THE
Blue Ribbon CommitteeOctober 12, 2020
Office of the Legislative Auditor, State of Minnesota
Governance of Transit in the Twin Cities Region
www.auditor.leg.state.mn.us
1. Twin Cities Region Transit Overview
Regular route bus
• Express
• Local
Light rail transit
Commuter rail
Bus rapid transit
2. Key Legislative Recommendations
• The Legislature should restructure the Metropolitan Council
• The Legislature should clarify the goals and priorities of transit in the Twin Cities region
3. The Region’s Transit System Performed Relatively Well
• Compared to 11 peers, including Denver, Phoenix,
Portland, and Seattle
• Performed well on “efficiency measures”- Operating cost per passenger- Fare recovery percentage- Subsidy per passenger- Subsidy per passenger mile
• Performed well on “service use” and “access”measures
4. But the Region’s Transit Governance Structure is far from ideal
• Washington County Regional Railroad Authority
• Washington County Board• Counties Transit Improvement Board (CTIB)• Scott County Regional Railroad Authority• Scott County Board• Shakopee Transit• Prior Lake Transit• Red Rock Corridor Commission• I-35W Solutions Alliance• Anoka County Regional Railroad Authority• Anoka County Board• Metropolitan Council• Ramsey County Regional Railroad Authority• Ramsey County Board• Southwest Transit• Gateway Corridor Commission• Hennepin County Regional Railroad Authority• Hennepin County Board• Maple Grove Transit• Plymouth Metrolink• I-494 Corridor Commission• Carver County Regional Railroad Authority• Carver County Board• Transportation Advisory Board (TAB)• Dakota County Regional Railroad Authority• Dakota County Board• The Minnesota Valley Transit Authority• Rush Line Corridor Task Force
I I
I
I
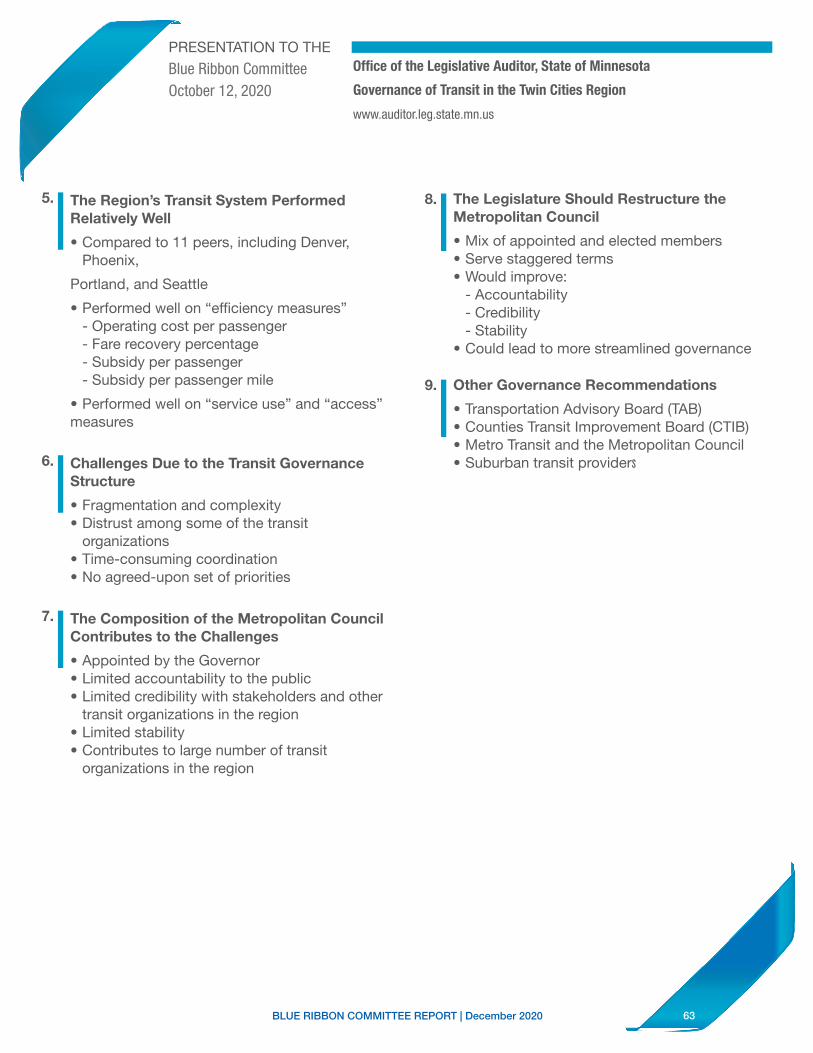
63BLUE RIBBON COMMITTEE REPORT | December 2020
5. The Region’s Transit System Performed Relatively Well
• Compared to 11 peers, including Denver, Phoenix,
Portland, and Seattle
• Performed well on “efficiency measures”- Operating cost per passenger- Fare recovery percentage- Subsidy per passenger- Subsidy per passenger mile
• Performed well on “service use” and “access”measures
6. Challenges Due to the Transit Governance Structure
• Fragmentation and complexity• Distrust among some of the transit
organizations• Time-consuming coordination• No agreed-upon set of priorities
7. The Composition of the Metropolitan Council Contributes to the Challenges
• Appointed by the Governor• Limited accountability to the public• Limited credibility with stakeholders and other
transit organizations in the region• Limited stability• Contributes to large number of transit
organizations in the region
8. The Legislature Should Restructure the Metropolitan Council
• Mix of appointed and elected members• Serve staggered terms• Would improve:
- Accountability- Credibility- Stability
• Could lead to more streamlined governance
9. Other Governance Recommendations
• Transportation Advisory Board (TAB)• Counties Transit Improvement Board (CTIB)• Metro Transit and the Metropolitan Council• Suburban transit providers
PRESENTATION TO THE
Blue Ribbon CommitteeOctober 12, 2020
Office of the Legislative Auditor, State of Minnesota
Governance of Transit in the Twin Cities Region
www.auditor.leg.state.mn.us
I I
I I
I
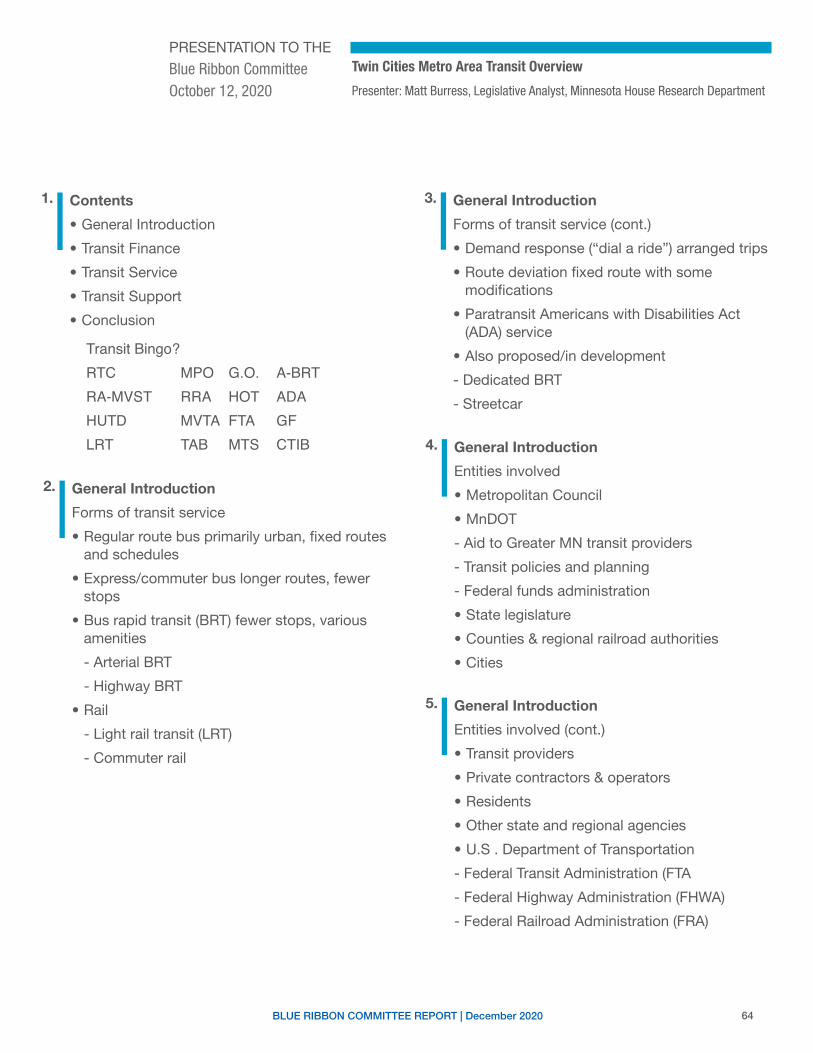
64BLUE RIBBON COMMITTEE REPORT | December 2020
PRESENTATION TO THE
Blue Ribbon CommitteeOctober 12, 2020
Twin Cities Metro Area Transit Overview
Presenter: Matt Burress, Legislative Analyst, Minnesota House Research Department
1. Contents
• General Introduction
• Transit Finance
• Transit Service
• Transit Support
• Conclusion
2. General Introduction
Forms of transit service
• Regular route bus primarily urban, fixed routes and schedules
• Express/commuter bus longer routes, fewer stops
• Bus rapid transit (BRT) fewer stops, various amenities
- Arterial BRT
- Highway BRT
• Rail
- Light rail transit (LRT)
- Commuter rail
3. General Introduction
Forms of transit service (cont.)
• Demand response (“dial a ride”) arranged trips
• Route deviation fixed route with some modifications
• Paratransit Americans with Disabilities Act (ADA) service
• Also proposed/in development
- Dedicated BRT
- Streetcar
Transit Bingo?RTC MPO G.O. A-BRTRA-MVST RRA HOT ADAHUTD MVTA FTA GFLRT TAB MTS CTIB 4. General Introduction
Entities involved
• Metropolitan Council
• MnDOT
- Aid to Greater MN transit providers
- Transit policies and planning
- Federal funds administration
• State legislature
• Counties & regional railroad authorities
• Cities
5. General Introduction
Entities involved (cont.)
• Transit providers
• Private contractors & operators
• Residents
• Other state and regional agencies
• U.S . Department of Transportation
- Federal Transit Administration (FTA
- Federal Highway Administration (FHWA)
- Federal Railroad Administration (FRA)
I
I
I
I
I
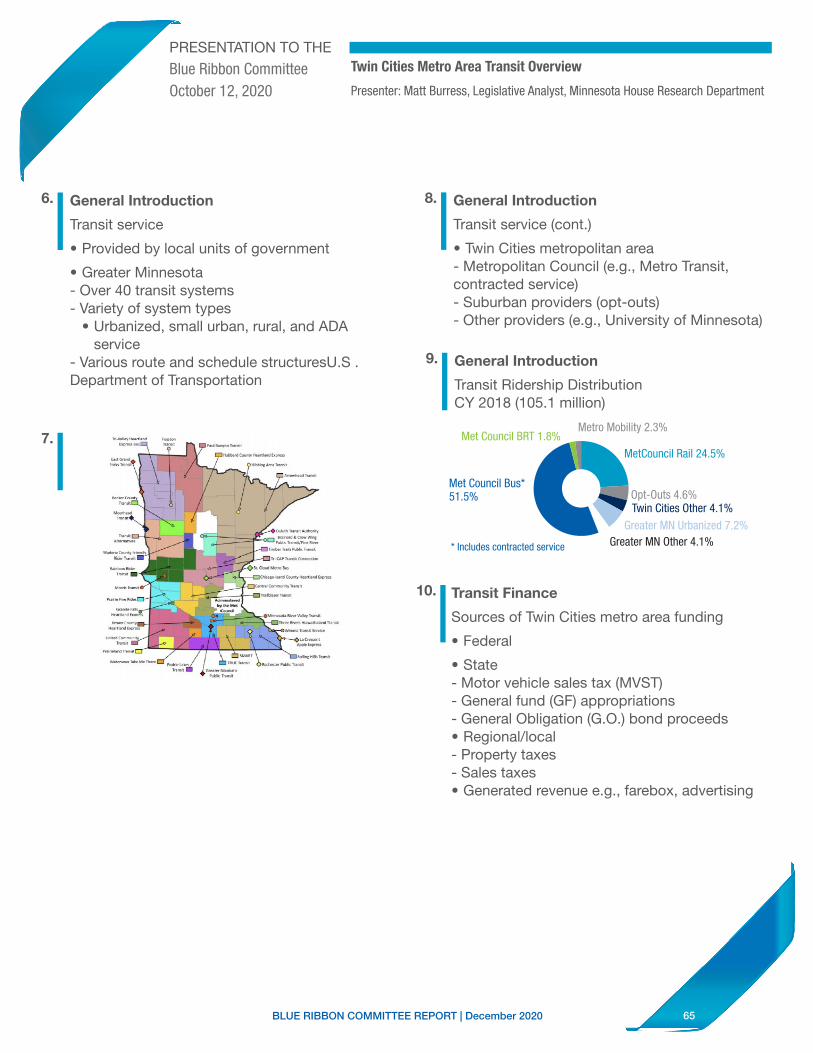
65BLUE RIBBON COMMITTEE REPORT | December 2020
PRESENTATION TO THE
Blue Ribbon CommitteeOctober 12, 2020
Twin Cities Metro Area Transit Overview
Presenter: Matt Burress, Legislative Analyst, Minnesota House Research Department
6. General Introduction
Transit service
• Provided by local units of government
• Greater Minnesota- Over 40 transit systems- Variety of system types
• Urbanized, small urban, rural, and ADA service
- Various route and schedule structuresU.S . Department of Transportation
7.
8. General Introduction
Transit service (cont.)
• Twin Cities metropolitan area- Metropolitan Council (e.g., Metro Transit, contracted service)- Suburban providers (opt-outs)- Other providers (e.g., University of Minnesota)
9. General Introduction
Transit Ridership Distribution CY 2018 (105.1 million)
10. Transit Finance
Sources of Twin Cities metro area funding
• Federal
• State- Motor vehicle sales tax (MVST)- General fund (GF) appropriations- General Obligation (G.O.) bond proceeds• Regional/local- Property taxes- Sales taxes• Generated revenue e.g., farebox, advertising
Twin Cities Other 4.1%
MetCouncil Rail 24.5%
Met Council Bus* 51.5% Opt-Outs 4.6%24+5+4+7+4+52+2+2tGreater MN Urbanized 7.2%
Greater MN Other 4.1%
Metro Mobility 2.3%Met Council BRT 1.8%
* Includes contracted service
I
I 111•-.-..... ·-·••• I
I
I
I
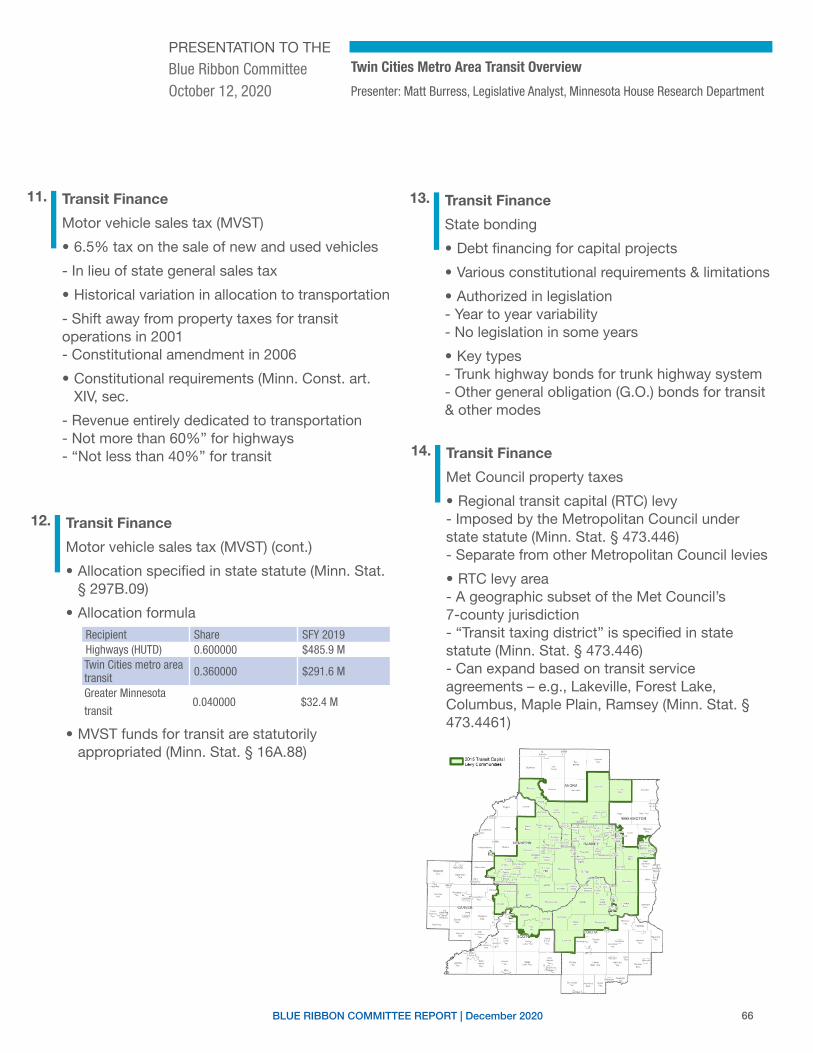
66BLUE RIBBON COMMITTEE REPORT | December 2020
11. Transit Finance
Motor vehicle sales tax (MVST)
• 6.5% tax on the sale of new and used vehicles
- In lieu of state general sales tax
• Historical variation in allocation to transportation
- Shift away from property taxes for transit operations in 2001- Constitutional amendment in 2006
• Constitutional requirements (Minn. Const. art. XIV, sec.
- Revenue entirely dedicated to transportation- Not more than 60%” for highways- “Not less than 40%” for transit
12. Transit Finance
Motor vehicle sales tax (MVST) (cont.)
• Allocation specified in state statute (Minn. Stat. § 297B.09)
• Allocation formulaRecipient Share SFY 2019Highways (HUTD) 0.600000 $485.9 MTwin Cities metro area transit 0.360000 $291.6 M
Greater Minnesota
transit0.040000 $32.4 M
• MVST funds for transit are statutorily appropriated (Minn. Stat. § 16A.88)
13. Transit Finance
State bonding
• Debt financing for capital projects
• Various constitutional requirements & limitations
• Authorized in legislation- Year to year variability- No legislation in some years
• Key types- Trunk highway bonds for trunk highway system- Other general obligation (G.O.) bonds for transit & other modes
14. Transit Finance
Met Council property taxes
• Regional transit capital (RTC) levy- Imposed by the Metropolitan Council under state statute (Minn. Stat. § 473.446)- Separate from other Metropolitan Council levies
• RTC levy area- A geographic subset of the Met Council’s 7-county jurisdiction- “Transit taxing district” is specified in state statute (Minn. Stat. § 473.446)- Can expand based on transit service agreements – e.g., Lakeville, Forest Lake, Columbus, Maple Plain, Ramsey (Minn. Stat. § 473.4461)
PRESENTATION TO THE
Blue Ribbon CommitteeOctober 12, 2020
Twin Cities Metro Area Transit Overview
Presenter: Matt Burress, Legislative Analyst, Minnesota House Research Department
I
I -
I
I
CJ 2015l, anoatC•1"lall u.v,eomm11n11K
67BLUE RIBBON COMMITTEE REPORT | December 2020
15. Transit Finance
Met Council property taxes (cont.)
• RTC tax revenue goes to debt service on bonds• RTC bonding- Bonds issued by the Metropolitan Council under legislative authorization
- Typically annual or biennial authorizations in state statute (Minn. Stat. § 473.39)
- Proceeds primarily used for transit fleet maintenance and replacement, and some facilities- Proceeds also used as a match for federal aid
16. Transit Finance
Counties Transit Improvement Board (CTIB), 2008-17
• Former joint powers board from five counties- Anoka, Dakota, Hennepin, Ramsey, and Washington• 0.25% sales and use tax, and $20 vehicle
excise tax• Dissolved by the counties in 2017
17. Transit Finance
Counties Transit Improvement Board (CTIB), 2008-17 (cont.)
• Various legislative requirements and CTIB policies
• Main use of revenue- Transitway (LRT, commuter rail, highway BRT) capital
- Limited for arterial BRT- 50% of net transitway operating costs
- Not for bus operations- Some transitway planning
18. Transit Finance
County local option sales and use taxes
• Statewide authority (Minn. Stat. § 297A.993)• Imposed by numerous counties, including
former CTIB counties• Rate of up to 0.5% and $20 vehicle sales excise
tax• Use of revenue- Can be used for specified transit and road spending- Historically used for transitway capital and a share of transit operating costs
PRESENTATION TO THE
Blue Ribbon CommitteeOctober 12, 2020
Twin Cities Metro Area Transit Overview
Presenter: Matt Burress, Legislative Analyst, Minnesota House Research Department
19. Transit Finance
County regional railroad authorities (RRA)
• Tied to each county- Separate political subdivision- Board typically composed of the county commissioners• Purpose: preserve and improve rail service and
rail right-of-way• Property tax levy- Historically used for transitway capital costs and some project development• LRT and commuter rail funding limitations (Minn.
Stat. § 398A.10)- Up to 10% of capital costs of new projects- No operating costs
20. Transit Finance
Major sources recap
Entity / Source Revenue Type GeographyFederal Various (e.g., federal gas tax) NationalState – MVST Sales tax StatewideState – GF Various (e.g. state income tax) StatewideState – bond proceeds Debt / state taxes StatewideMet Council – RTC
bonds & levy” Debt / property tax Regional (RTC levy district)
Met Council – farebox User fee RegionalCounty Sales taxes CountyCounty RRA Property taxes County
I
I
I
I
I
I -
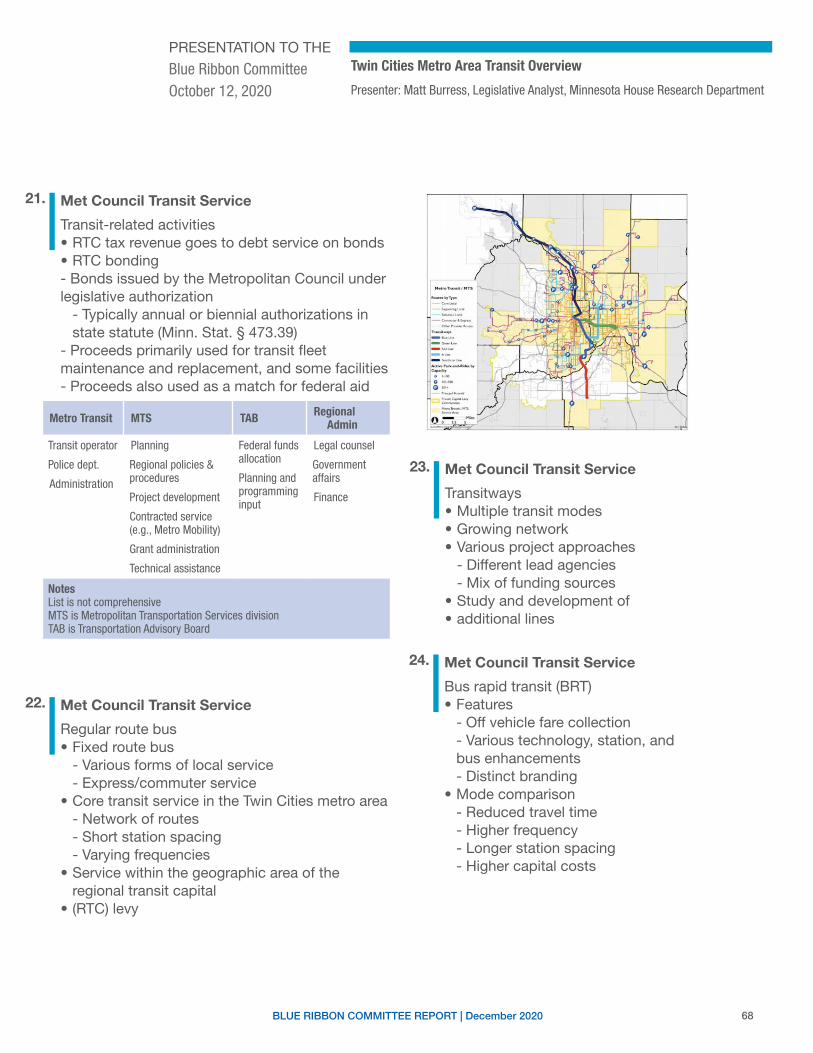
68BLUE RIBBON COMMITTEE REPORT | December 2020
21. Met Council Transit Service
Transit-related activities• RTC tax revenue goes to debt service on bonds• RTC bonding- Bonds issued by the Metropolitan Council under legislative authorization
- Typically annual or biennial authorizations in state statute (Minn. Stat. § 473.39)
- Proceeds primarily used for transit fleet maintenance and replacement, and some facilities- Proceeds also used as a match for federal aid
Metro Transit MTS TAB Regional Admin
Transit operator
Police dept.
Administration
Planning
Regional policies & procedures
Project development
Contracted service (e.g., Metro Mobility)
Grant administration
Technical assistance
Federal funds allocation
Planning and programming input
Legal counsel
Government affairs
Finance
NotesList is not comprehensiveMTS is Metropolitan Transportation Services divisionTAB is Transportation Advisory Board
22. Met Council Transit Service
Regular route bus• Fixed route bus
- Various forms of local service- Express/commuter service
• Core transit service in the Twin Cities metro area- Network of routes- Short station spacing- Varying frequencies
• Service within the geographic area of the regional transit capital
• (RTC) levy
23. Met Council Transit Service
Transitways• Multiple transit modes• Growing network• Various project approaches
- Different lead agencies- Mix of funding sources
• Study and development of• additional lines
24. Met Council Transit Service
Bus rapid transit (BRT)• Features
- Off vehicle fare collection- Various technology, station, andbus enhancements- Distinct branding
• Mode comparison- Reduced travel time- Higher frequency- Longer station spacing- Higher capital costs
Twin Cities Metro Area Transit Overview
Presenter: Matt Burress, Legislative Analyst, Minnesota House Research Department
PRESENTATION TO THE
Blue Ribbon CommitteeOctober 12, 2020
I
I
I I
69BLUE RIBBON COMMITTEE REPORT | December 2020
PRESENTATION TO THE
Blue Ribbon CommitteeOctober 12, 2020
Twin Cities Metro Area Transit Overview
Presenter: Matt Burress, Legislative Analyst, Minnesota House Research Department
25. Met Council Transit Service
Bus rapid transit (cont.)
• Arterial BRT (A-BRT)- Primarily operated on urban minor arterial roads in mixed traffic- A Line in 2016, C Line in 2019- Additional lines in planning/project development
• Highway BRT- Primarily operated on highways and principal arterial roads- In mixed traffic with some dedicated shoulders and managed lanes- Larger scale, some indoor station designs- Red Line in 2013, Orange Line in progress
26. Met Council Transit Service
Light rail transit (LRT)
• Features- Operation on rails in dedicated right-of-way
- Off-vehicle fare collection- Larger open stations- Platform loading
• Mode comparison- Longer station spacing- Large-scale capital costs
27. Met Council Transit Service
Light rail transit (LRT)
• Lines- Hiawatha LRT (Blue Line) in 2004- Central Corridor LRT (Green Line) in 2014- Southwest LRT (Green Line Extension) under construction- Bottineau LRT (Blue Line Extension) in development
28. Met Council Transit Service
Commuter rail
• Lines- Hiawatha LRT (Blue Line) in 2004- Central Corridor LRT (Green Line) in 2014- Southwest LRT (Green Line Extension) under construction- Bottineau LRT (Blue Line Extension) in development
29. Met Council Transit Service
Commuter rail
• Features- Operation on railway in dedicated right-of-way- Off-vehicle fare collection- Larger open stations- Platform loading
• Mode comparison- Commuter-oriented service- Long-distance- Longest station spacing
30. Met Council Transit Service
Metro Mobility• ADA bus service
- Shared rides for eligible general public- Reserved in advance- Specified time window/constraints
• Limited to riders who are unable to use regular route bus service- Eligibility is based on disability or health condition- Certification process used
• Contracted service• Separate GF appropriation starting in FY
2020-21
I I
I
I
I
I
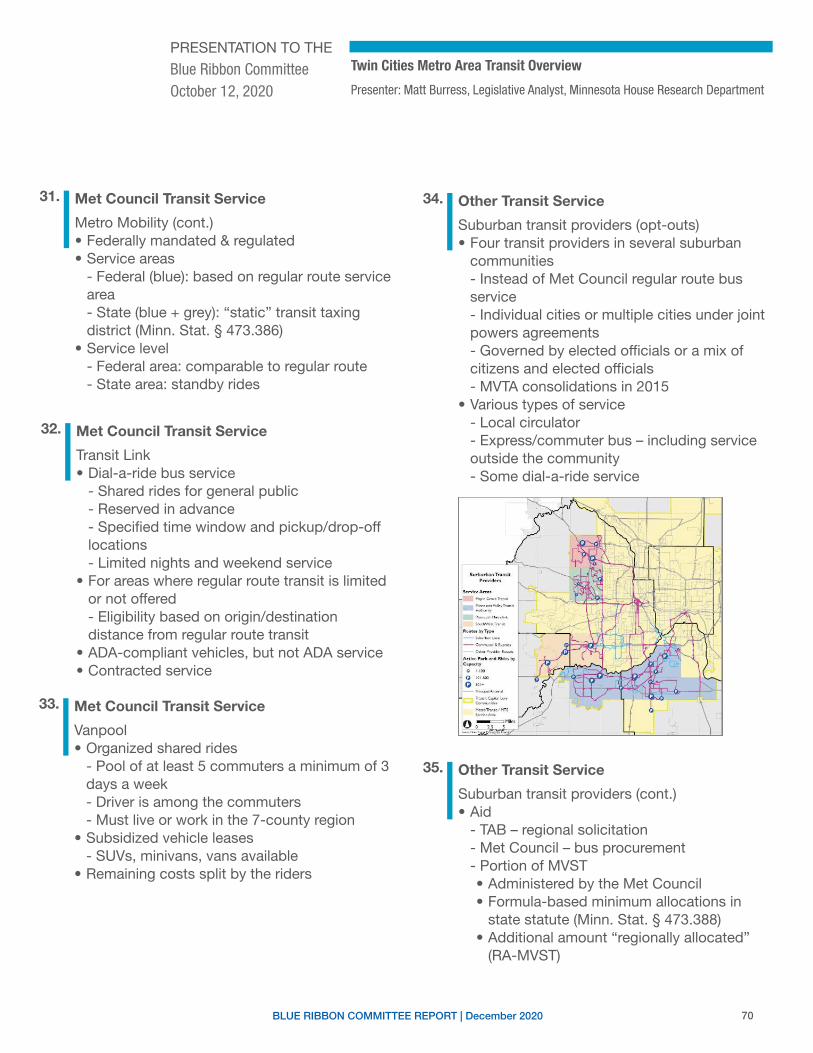
70BLUE RIBBON COMMITTEE REPORT | December 2020
PRESENTATION TO THE
Blue Ribbon CommitteeOctober 12, 2020
Twin Cities Metro Area Transit Overview
Presenter: Matt Burress, Legislative Analyst, Minnesota House Research Department
31. Met Council Transit Service
Metro Mobility (cont.)• Federally mandated & regulated• Service areas
- Federal (blue): based on regular route service area- State (blue + grey): “static” transit taxing district (Minn. Stat. § 473.386)
• Service level- Federal area: comparable to regular route- State area: standby rides
32. Met Council Transit Service
Transit Link• Dial-a-ride bus service
- Shared rides for general public- Reserved in advance- Specified time window and pickup/drop-off locations- Limited nights and weekend service
• For areas where regular route transit is limited or not offered- Eligibility based on origin/destination distance from regular route transit
• ADA-compliant vehicles, but not ADA service• Contracted service
33. Met Council Transit Service
Vanpool• Organized shared rides
- Pool of at least 5 commuters a minimum of 3 days a week- Driver is among the commuters- Must live or work in the 7-county region
• Subsidized vehicle leases- SUVs, minivans, vans available
• Remaining costs split by the riders
34. Other Transit Service
Suburban transit providers (opt-outs)• Four transit providers in several suburban
communities- Instead of Met Council regular route bus service- Individual cities or multiple cities under joint powers agreements- Governed by elected officials or a mix of citizens and elected officials- MVTA consolidations in 2015
• Various types of service- Local circulator- Express/commuter bus – including service outside the community- Some dial-a-ride service
35. Other Transit Service
Suburban transit providers (cont.)• Aid
- TAB – regional solicitation- Met Council – bus procurement- Portion of MVST• Administered by the Met Council• Formula-based minimum allocations in
state statute (Minn. Stat. § 473.388)• Additional amount “regionally allocated”
(RA-MVST)
I I
I
I I
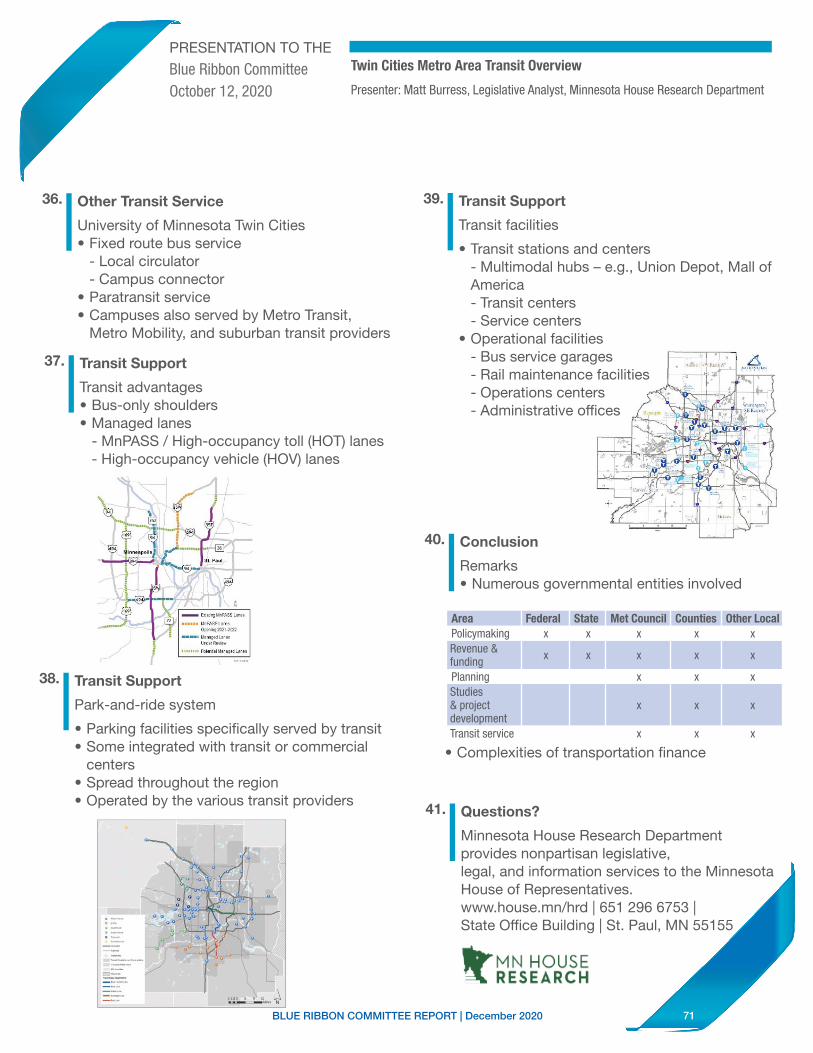
71BLUE RIBBON COMMITTEE REPORT | December 2020
PRESENTATION TO THE
Blue Ribbon CommitteeOctober 12, 2020
Twin Cities Metro Area Transit Overview
Presenter: Matt Burress, Legislative Analyst, Minnesota House Research Department
36. Other Transit Service
University of Minnesota Twin Cities• Fixed route bus service
- Local circulator- Campus connector
• Paratransit service• Campuses also served by Metro Transit,
Metro Mobility, and suburban transit providers
37. Transit Support
Transit advantages• Bus-only shoulders• Managed lanes
- MnPASS / High-occupancy toll (HOT) lanes- High-occupancy vehicle (HOV) lanes
38. Transit Support
Park-and-ride system
• Parking facilities specifically served by transit• Some integrated with transit or commercial
centers• Spread throughout the region• Operated by the various transit providers
39. Transit Support
Transit facilities
• Transit stations and centers- Multimodal hubs – e.g., Union Depot, Mall of America- Transit centers- Service centers
• Operational facilities- Bus service garages- Rail maintenance facilities- Operations centers- Administrative offices
40. Conclusion
Remarks• Numerous governmental entities involved
Area Federal State Met Council Counties Other LocalPolicymaking x x x x xRevenue & funding x x x x x
Planning x x xStudies & project development
x x x
Transit service x x x
• Complexities of transportation finance
41. Questions?
Minnesota House Research Department provides nonpartisan legislative,legal, and information services to the Minnesota House of Representatives.www.house.mn/hrd | 651 296 6753 | State Office Building | St. Paul, MN 55155
I
I
I
I
I ------
I ..,.MN HOUSE ~ RESEARCH
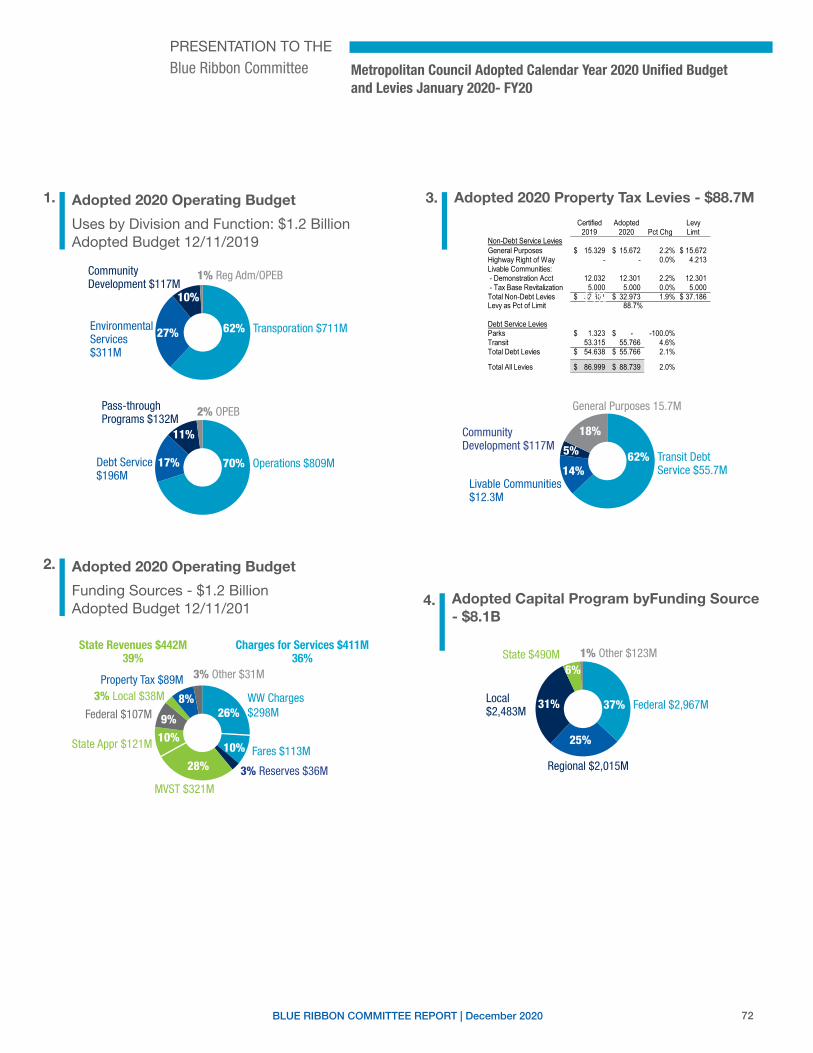
72BLUE RIBBON COMMITTEE REPORT | December 2020
1. Adopted 2020 Operating Budget
Uses by Division and Function: $1.2 BillionAdopted Budget 12/11/2019
4. Adopted Capital Program byFunding Source - $8.1B
2. Adopted 2020 Operating Budget
Funding Sources - $1.2 BillionAdopted Budget 12/11/201
3. Adopted 2020 Property Tax Levies - $88.7M
62+27+10+1+tTransporation $711M62%27%
Community Development $117M
Environmental Services $311M
1% Reg Adm/OPEB
10%
70+17+11+2+tOperations $809M70%17%
Pass-throughPrograms $132M
Debt Service $196M
2% OPEB
11%
26+1010+3+28+1010+9+3+8+3tMVST $321M
8%26%
Fares $113M
WW Charges $298M
3% Reserves $36M
10%10%
9%
3% Local $38M
28%
3% Other $31M
State Appr $121M
Federal $107M
Property Tax $89M
Charges for Services $411M36%
State Revenues $442M39%
Certified Adopted Levy2019 2020 Pct Chg Limt
Non-Debt Service LeviesGeneral Purposes 15.329$ 15.672$ 2.2% 15.672$ Highway Right of Way - - 0.0% 4.213 Livable Communities: - Demonstration Acct 12.032 12.301 2.2% 12.301 - Tax Base Revitalization 5.000 5.000 0.0% 5.000 Total Non-Debt Levies 32.361$ 32.973$ 1.9% 37.186$ Levy as Pct of Limit 88.7%
Debt Service LeviesParks 1.323$ -$ -100.0%Transit 53.315 55.766 4.6%Total Debt Levies 54.638$ 55.766$ 2.1%
Total All Levies 86.999$ 88.739$ 2.0%
37+25+31+6+1tFederal $2,967M37%
25%
State $490M
Local $2,483M
1% Other $123M
31%
6%
Regional $2,015M
14%
63+14+5+18+tTransit Debt Service $55.7M
62%14%
Community Development $117M
Livable Communities $12.3M
General Purposes 15.7M
5%
18%
PRESENTATION TO THE
Blue Ribbon Committee Metropolitan Council Adopted Calendar Year 2020 Unified Budget and Levies January 2020- FY20
I I _ --
I I
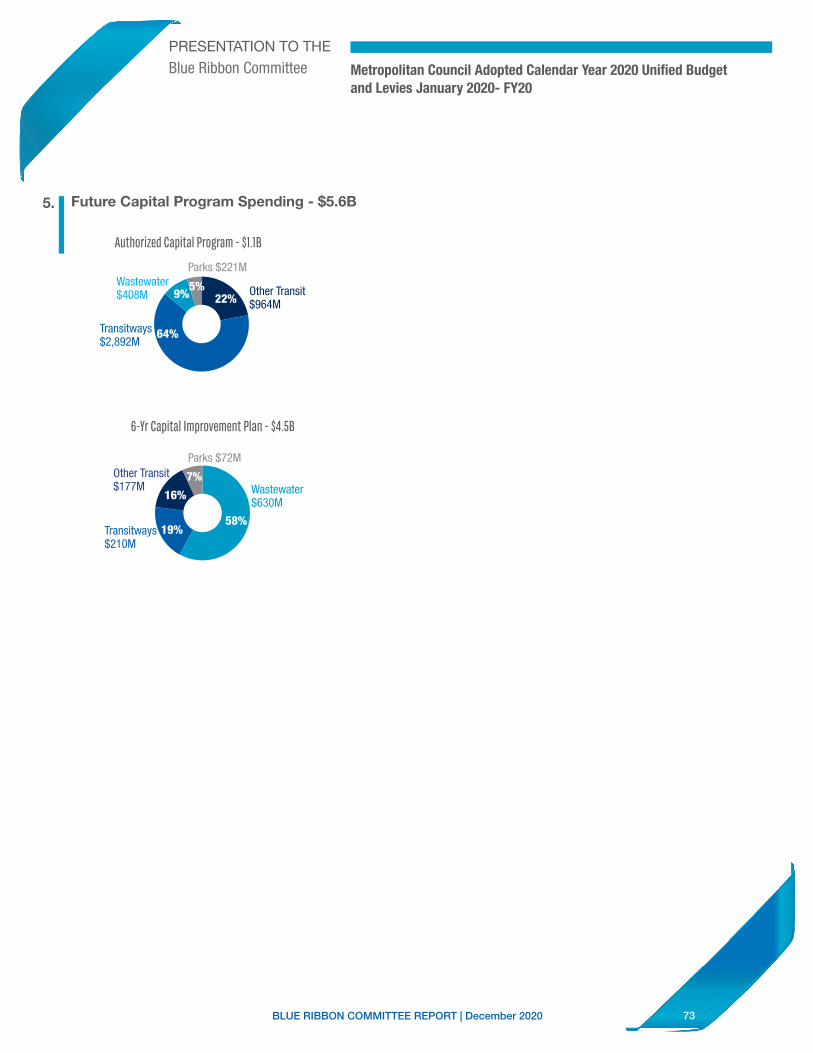
73BLUE RIBBON COMMITTEE REPORT | December 2020
PRESENTATION TO THE
Blue Ribbon Committee Metropolitan Council Adopted Calendar Year 2020 Unified Budget and Levies January 2020- FY20
5. Future Capital Program Spending - $5.6B
6-Yr Capital Improvement Plan - $4.5B
Authorized Capital Program - $1.1B
22+64+9+5+tOther Transit$964M22%
64%
Wastewater $408M
Transitways $2,892M
Parks $221M
9%5%
Wastewater$630M
22%
64%
Other Transit $177M
Transitways $210M
Parks $72M9%
58+19+16+7+t58%19%
16%
7%
I
74BLUE RIBBON COMMITTEE REPORT | December 2020
Metro Cities (Association of Metropolitan Municipalities)
Organizational Structure and Background Information
Prepared for Governor’s Blue-Ribbon Committee on the Metropolitan Council
October 2020
• Metro Cities (Association of Metropolitan Municipalities) was established in 1974 to represent the shared interests of cities in the metropolitan area at the Legislature, Executive Branch and Metropolitan Council. Membership in Metro Cities is open to cities in the seven-county metropolitan region.
• Metro Cities is governed by a 19-member Board of Directors. The Board sets the organization’s strategic plan, budget and legislative priorities. The Board is made up of elected and appointed city officials and is balanced for geographic location and city size.
• Metro Cities operates with a four person staff, including its Executive Director, two Government Relations Specialist, and an Office Manager.
• Legislative policies are adopted by the membership and cover issues of significance to metropolitan cities including taxes, aids, fiscal disparities, transportation, housing, economic development, local authority, and state and regional programs, among others.
• The association’s policies are comprehensive with respect to the activity of the Metropolitan Council, and include established policies on regional governance, livable communities’ programs, transit, housing policy and requirements, comprehensive planning requirements and processes, density, inflow and infiltration, water supply and regional fee structures.
• Metro Cities plays a unique role among local government organizations in its representation of the shared interests of cities at the Metropolitan Council. Cities are responsible for the implementation of many regional policies and programs and are a primary constituency of the Metropolitan Council.
• Metro Cities is often called the ‘watchdog’ of the Metropolitan Council and works to ensure that city needs are accounted for across all aspects of regional decision making. Metro Cities staff closely monitors Metropolitan Council policy and funding decisions and responds to its actions in a manner consistent with the association’s policies.
• Metro Cities has statutory appointing authority for municipal officials on the Transportation Advisory Board (TAB) and Technical Advisory Committee (TAC), and a statutory consulting role for municipal members appointed to the Metropolitan Area Water Supply Advisory Committee (MAWSAC). Metro Cities also appoints municipal officials to the regional Geographic Information Systems (GIS) Board.
75BLUE RIBBON COMMITTEE REPORT | December 2020
Metro Cities’ 2021 Legislative Policies (DRAFT) Regional Governance, Transportation Advisory Board, and Regional Transit Systems (policies will receive final adoption on 11-19-20)
Goals and Principles for Regional Governance
The Twin Cities metropolitan region is home to a majority of the state’s population and businesses and is poised for significant growth in the next two decades. At the same time, the region faces significant challenges and opportunities. The responses to these opportunities and challenges will determine the future success of the region and its competitiveness in the state, national and world economies.
The Metropolitan Council was created to manage the growth of the metropolitan region, and cities are responsible for adhering to regional plans as they plan for local growth and service delivery.
The region’s cities are the Metropolitan Council’s primary constituency, with regional and local growth being primarily managed through city comprehensive planning and implementation, and the delivery of a wide range of public services. To function successfully, the Metropolitan Council must be accountable to and work in collaboration with city governments.
The role of the Metropolitan Council is to set broad regional goals and to provide cities with technical assistance and incentives to achieve those goals. City governments are responsible and best suited to provide local zoning, land use planning, development and service delivery. Any additional roles or responsibilities for the Metropolitan Council should be limited to specific statutory assignments or grants or authorization and should not usurp or conflict with local roles or processes, unless such changes have the consent of the region’s cities.
Metro Cities supports an economically strong and vibrant region, and the effective, efficient and equitable provision of regional infrastructure, services and planning throughout the metropolitan area. Metro Cities supports the provision of approved regional systems and planning that can be provided more effectively, efficiently or equitably on a regional level than at the local level by individual local units of government.
The Metropolitan Council must involve cities in the delivery of regional services and planning and be responsive to local perspectives on regional issues and be required to provide opportunities for city participation on Council advisory committees and task forces.
The Metropolitan Council must involve cities at all steps of planning, review and implementation around the regional development guide, policy plans, systems statements, and local comprehensive plan requirements to ensure transparency, balance and Council adherence to its core mission and functions. These processes should allow for stakeholder input before policies and plans are released for comment and finalized. Any additional functions for the Council should not be undertaken unless authorized specifically by state law.
Regional Governance Structure
Metro Cities supports the appointment of Metropolitan Council members by the Governor with four-year, staggered terms for members to stabilize ideological shifts and provide for continuity of knowledge on the Council, which is appropriate for a long-range planning body. The appointment of the Metropolitan Council Chair should coincide with the term of the Governor.
Page 1 of 3
76BLUE RIBBON COMMITTEE REPORT | December 2020
Metro Cities supports a nominating committee process that maximizes participation and input by local officials. Metro Cities supports expanding the nominating committee from seven to 13 members, with a majority of a 13-member committee being local elected officials. Of the local officials appointed to a nominating committee, two thirds should be elected city officials, appointed by Metro Cities.
Consideration should be given to the creation of four separate nominating committees, with committee representation from each quadrant of the region.
Metro Cities supports having the names of recommended nominees or other individuals under consideration for appointment to the Council by the Governor to be made public at least 21 days prior to final selection by the Governor, and a formal public comment period before members are appointed to the Council.
Metro Cities supports the appointment of Metropolitan Council members who have demonstrated the ability to work with cities in a collaborative manner, commit to meet with local government officials regularly and who are responsive to the circumstances and concerns of cities in the district that they represent on the Council. Council members should understand the diversity and the commonalities of the region, and the long-term implications of regional decision-making. A detailed position description outlining the required skills, time commitment and understanding of regional and local issues and concerns should be clearly articulated and posted in advance of the call for nominees. Metro Cities supports opportunities for local officials to provide input during the decennial legislative redistricting process for the Metropolitan Council and supports transparency in the redistricting process.
Transportation Planning Process: Elected Officials’ Role
The Transportation Advisory Board (TAB) was developed to meet federal requirements, designating the Metropolitan Council as the organization that is responsible for a continuous, comprehensive and cooperative (3C) transportation planning process to allocate federal funds among metropolitan area projects. Input by local officials into the planning and prioritization of transportation investments in the region is a vital component of these processes.
Metro Cities supports continuation of the TAB with a majority of locally elected municipal officials as members and participating in the process.
Regional Transit System
The Twin Cities Metropolitan Area needs a multi-modal regional transit system as part of a comprehensive transportation strategy that serves all users, including commuters and the transit dependent. The transit system should be composed of a mix of high occupancy vehicle (HOV) lanes, high occupancy toll (HOT) lanes, a network of bike and pedestrian trails, bus rapid transit, express and regular route bus service, exclusive transit ways, light rail transit, streetcars, and commuter rail corridors designed to connect residential, employment, retail and entertainment centers. The system should be regularly monitored and adjusted to ensure that routes of service correspond to the region’s changing travel patterns. Current congestion levels and forecasted population growth require a stable, reliable and growing source of revenue for transit construction and operations so that our metropolitan region can meet its
Page 2 of 3
77BLUE RIBBON COMMITTEE REPORT | December 2020
transportation needs to remain economically competitive. Metro Cities supports an effective, efficient and comprehensive regional transit system as an invaluable component in meeting the multimodal transportation needs of the metropolitan region and to the region’s economic vibrancy and quality of life. Metro Cities recognizes that transit service connects residents to jobs, schools, healthcare and activity centers. Transit access and service frequency levels should recognize the role of public transit in addressing equity, including but not limited to racial and economic disparities, people with disabilities and the elderly. Metro Cities supports strategic expansion of the regional transit system. Metro Cities supports a regional governance structure that can ensure a measurably reliable and efficient system that recognizes the diverse transit needs of our region and addresses the funding needs for all components of the system. These regional governance structures must work with and be responsive to the needs of the communities they serve. Metro Cities recognizes the need for flexibility in transit systems for cities that border the edges of the seven-county metropolitan area to ensure users can get to destinations outside of the seven-county area. Metro Cities encourages the Metropolitan Council to coordinate with collar counties so that riders can get to and from destinations beyond the boundaries of the region. Metro Cities opposes statutory changes restricting the use of local funds for planning or construction of transit projects. Restricting local planning and funding limits the ability of cities to participate in transit corridor planning and development. State and regional policymakers must coordinate with local units of government as decisions are made at the state level on transit projects that also involve municipal planning, funding and policy decisions. Metro Cities is opposed to legislative or Metropolitan Council directives that constrain the ability of metropolitan transit providers to provide a full range of transit services, including reverse commute routes, suburb-to-suburb routes, transit hub feeder services or new, experimental services that may show a low rate of operating cost recovery from the fare box. In the interest of including all potential options in the pursuit of a regionally balanced transit system, Metro Cities supports the repeal of the gag order on the Dan Patch Commuter Rail Line and opposes the imposition of legislative moratoriums on the study, planning, design, or construction of specific transit projects. In the interest of safety and traffic management, Metro Cities supports further study of rail safety issues relating to water quality protections, public safety concerns relating to derailments, traffic implications from longer and more frequent trains and the sensitive balance between rail commerce and the quality of life impacts on the communities through which they pass. The COVID-19 crisis has had dramatic effects on public transit service, including changing business practices that are likely to substantially reduce transit demand for the foreseeable future. Adverse economic effects threaten revenues available to fund transit operations. Suburban transit providers are concerned that funding challenges may be used to attempt to justify a repeal of their authorizing legislation and to consolidate transit services into a single regional entity. This would result in reverting to conditions existing nearly 40 years ago when inadequate service caused twelve suburbs to elect not to be part of the traditional transit system. Metro Cities strongly supports the autonomy of suburban transit providers to conduct operations to meet demonstrated and unique needs in their designated service areas independent from the operations of other regional transit providers.
Page 3 of 3
-
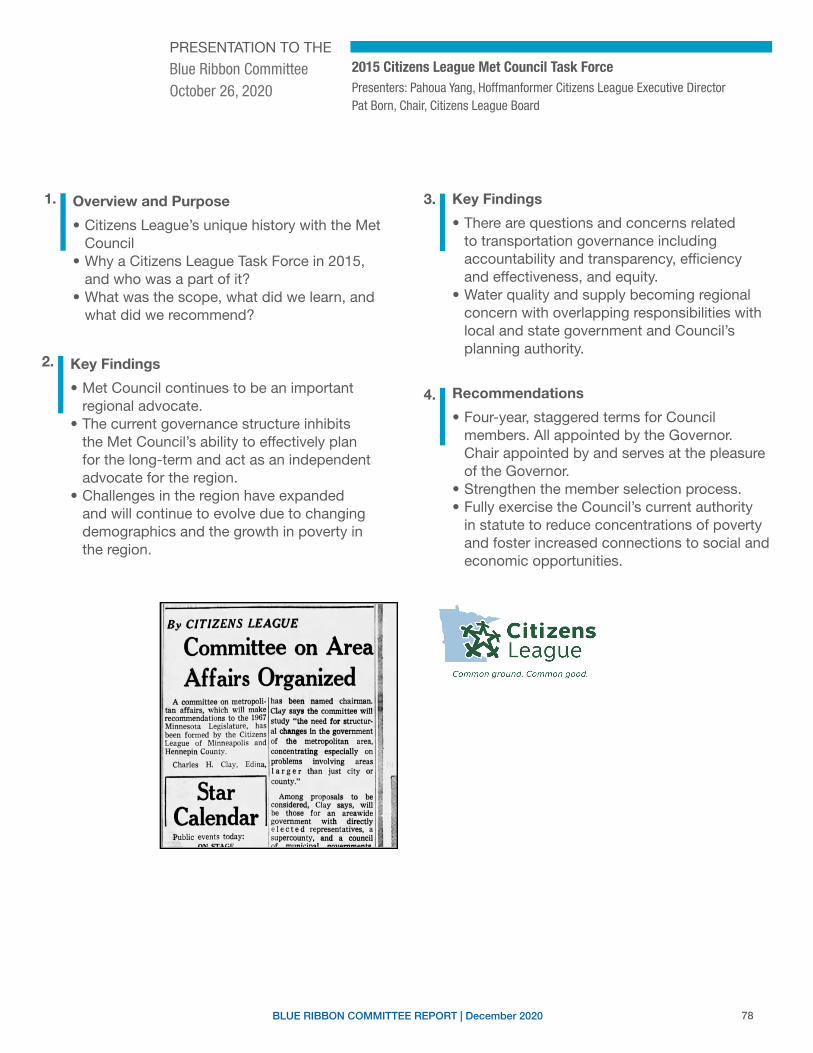
78BLUE RIBBON COMMITTEE REPORT | December 2020
2015 Citizens League Met Council Task Force
1. Overview and Purpose
• Citizens League’s unique history with the Met Council
• Why a Citizens League Task Force in 2015, and who was a part of it?
• What was the scope, what did we learn, and what did we recommend?
4. Recommendations
• Four-year, staggered terms for Council members. All appointed by the Governor. Chair appointed by and serves at the pleasure of the Governor.
• Strengthen the member selection process.• Fully exercise the Council’s current authority
in statute to reduce concentrations of poverty and foster increased connections to social and economic opportunities.
Presenters: Pahoua Yang, Hoffmanformer Citizens League Executive DirectorPat Born, Chair, Citizens League Board
2. Key Findings
• Met Council continues to be an important regional advocate.
• The current governance structure inhibits the Met Council’s ability to effectively plan for the long-term and act as an independent advocate for the region.
• Challenges in the region have expanded and will continue to evolve due to changing demographics and the growth in poverty in the region.
3. Key Findings
• There are questions and concerns related to transportation governance including accountability and transparency, efficiency and effectiveness, and equity.
• Water quality and supply becoming regional concern with overlapping responsibilities with local and state government and Council’s planning authority.
PRESENTATION TO THE
Blue Ribbon CommitteeOctober 26, 2020
I
I
By CITIZENS LEAGUE
Committee on Area Affairs Organized
A committee on metropoll- ha, been named chainnan. tan affairs, which will make Clay aa11 the committee will recommendations to the 1967 study "the need for structurMinneso,a Legislature, has 1 "~--- In th t been formed by the Citizens 8 .........,.. e govemmen League of Minneapolis and of the metropolitan area, Hennepin County. concentrating especially on
Charles H. Clay, Edina, problems lnvol_ving . areas I a r g e r than Just city or county."
Among proposals to be considered, Clay says, will be those for an areawide government with directiy e I e c t e d represeotativts, a supercounty, and a council 1_, .
I
I
Citizens League
Common ground. Common good.
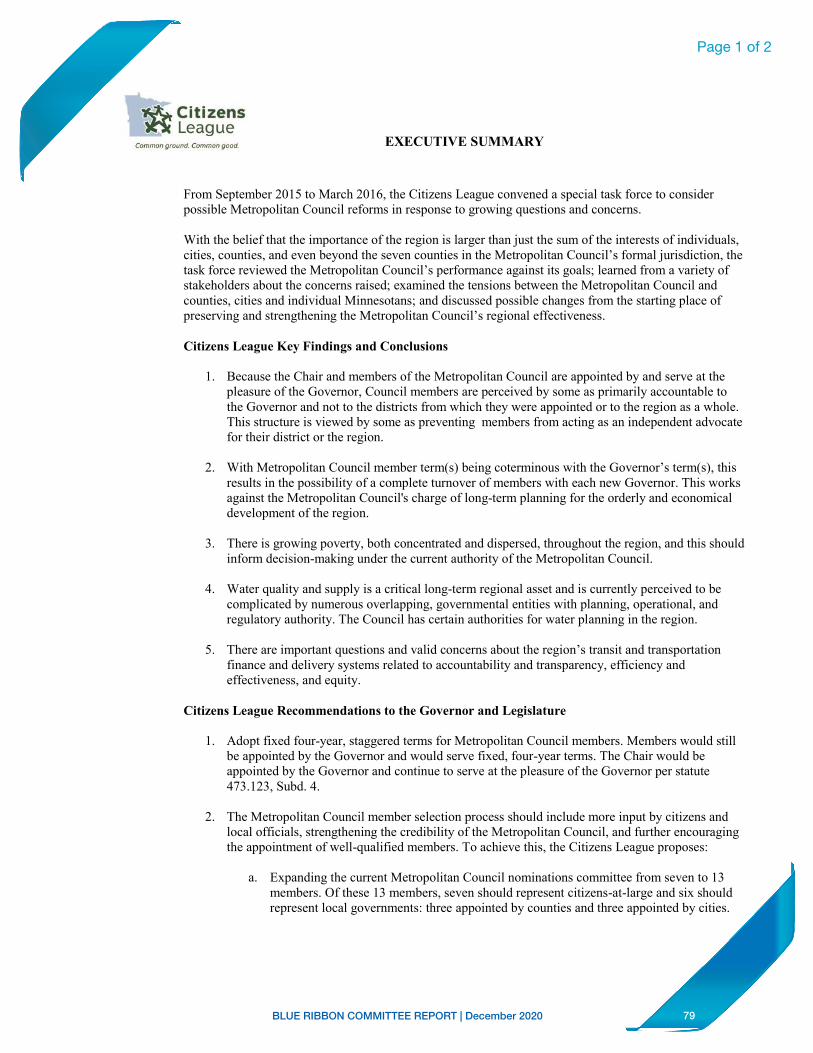
79BLUE RIBBON COMMITTEE REPORT | December 2020
Exe Summary Only. Final 04.04.2016
EXECUTIVE SUMMARY
From September 2015 to March 2016, the Citizens League convened a special task force to consider possible Metropolitan Council reforms in response to growing questions and concerns. With the belief that the importance of the region is larger than just the sum of the interests of individuals, cities, counties, and even beyond the seven counties in the Metropolitan Council’s formal jurisdiction, the task force reviewed the Metropolitan Council’s performance against its goals; learned from a variety of stakeholders about the concerns raised; examined the tensions between the Metropolitan Council and counties, cities and individual Minnesotans; and discussed possible changes from the starting place of preserving and strengthening the Metropolitan Council’s regional effectiveness. Citizens League Key Findings and Conclusions
1. Because the Chair and members of the Metropolitan Council are appointed by and serve at the
pleasure of the Governor, Council members are perceived by some as primarily accountable to the Governor and not to the districts from which they were appointed or to the region as a whole. This structure is viewed by some as preventing members from acting as an independent advocate for their district or the region.
2. With Metropolitan Council member term(s) being coterminous with the Governor’s term(s), this results in the possibility of a complete turnover of members with each new Governor. This works against the Metropolitan Council's charge of long-term planning for the orderly and economical development of the region.
3. There is growing poverty, both concentrated and dispersed, throughout the region, and this should
inform decision-making under the current authority of the Metropolitan Council.
4. Water quality and supply is a critical long-term regional asset and is currently perceived to be complicated by numerous overlapping, governmental entities with planning, operational, and regulatory authority. The Council has certain authorities for water planning in the region.
5. There are important questions and valid concerns about the region’s transit and transportation finance and delivery systems related to accountability and transparency, efficiency and effectiveness, and equity.
Citizens League Recommendations to the Governor and Legislature
1. Adopt fixed four-year, staggered terms for Metropolitan Council members. Members would still be appointed by the Governor and would serve fixed, four-year terms. The Chair would be appointed by the Governor and continue to serve at the pleasure of the Governor per statute 473.123, Subd. 4.
2. The Metropolitan Council member selection process should include more input by citizens and local officials, strengthening the credibility of the Metropolitan Council, and further encouraging the appointment of well-qualified members. To achieve this, the Citizens League proposes:
a. Expanding the current Metropolitan Council nominations committee from seven to 13 members. Of these 13 members, seven should represent citizens-at-large and six should represent local governments: three appointed by counties and three appointed by cities.
Page 1 of 2
80BLUE RIBBON COMMITTEE REPORT | December 2020
Exe Summary Only. Final 04.04.2016
b. Adding additional public announcements to the current selection process: i. Detailed position description with required skills, time commitment, and
connection to district to be clearly articulated and posted in advance of the call for nominees.
ii. Requiring that the nominations committee recommend three finalists for each Metropolitan Council seat. The names of these finalists and their qualifications should be made public at least 14 days prior to final selection by the Governor.
c. Adding to the current Metropolitan Council member qualifications: i. Experience in local government and/or experience in such areas including but not
limited to transportation, housing, environment, and regional development. ii. The need/ability to represent both the demographic diversity of each district and
the region as a whole. iii. Ability to meet the time commitment required to attend Council and community
meetings, as specified in the position description.
Citizens League Recommendations to the Metropolitan Council
3. Fully deploy the Met Council’s current authority to reduce concentrations of poverty in the region and foster increased connections to social and economic opportunities. Full utilization of Met Council authority includes but is not limited to:
a. The creation of an equity policy plan to reduce concentrations of poverty in the region; b. The evaluation of existing transit routes to ensure the best means to more directly connect
areas of concentrated poverty with job centers and high-growth industry clusters; and c. Using its research and convening authority to align regional stakeholders in pursuing
strategies that will reduce poverty and its concentration, increase economic and social opportunity to advance future economic growth and mitigate the impact of demographic changes in the region related to aging.
Recommendations for Further Study by the Citizens League Water Supply
4. The Citizens League task force acknowledges the importance of water supply in the region, as well as the many government agencies involved in its management. However, the task force did not study this issue in sufficient detail to provide a recommendation on such an important, regional issue. As such, the task force recommends that this issue be further studied by the Citizens League to ensure that water supply remains adequate and sustainable across the region, including all entities involved in its management and regulation.
Transportation Planning and Governance 5. Experts who met with the Citizens League task force maintained that the region’s system of
transit governance, planning, funding and operation works well despite its seemingly fragmented but definitely complex nature. Still, there are important questions related to accountability and transparency, efficiency and effectiveness, and equity. Given the limited time the task force had to review these issues, it recommends that the Citizens League undertake a study of the region’s system of governance, planning, funding and operation of all forms of transportation.
Page 2 of 2
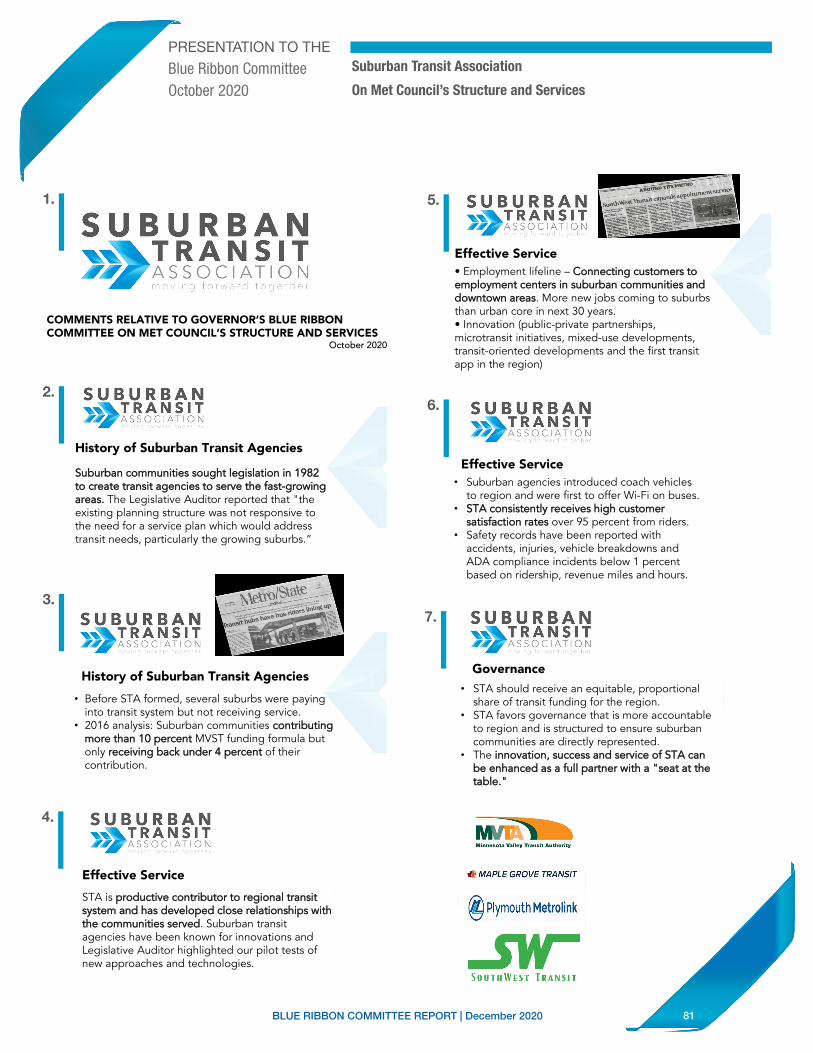
81BLUE RIBBON COMMITTEE REPORT | December 2020
• Suburban agencies introduced coach vehicles to region and were first to offer Wi-Fi on buses.
• SSTTAA ccoonnssiisstteennttllyy rreecceeiivveess hhiigghh ccuussttoommeerr ssaattiissffaaccttiioonn rraatteess over 95 percent from riders.
• Safety records have been reported with accidents, injuries, vehicle breakdowns and ADA compliance incidents below 1 percent based on ridership, revenue miles and hours.
Effective Service
• STA should receive an equitable, proportional share of transit funding for the region.
• STA favors governance that is more accountable to region and is structured to ensure suburban communities are directly represented.
• The iinnnnoovvaattiioonn,, ssuucccceessss aanndd sseerrvviiccee ooff SSTTAA ccaann bbee eennhhaanncceedd aass aa ffuullll ppaarrttnneerr wwiitthh aa ""sseeaatt aatt tthhee ttaabbllee..""
Governance
• Employment lifeline – CCoonnnneeccttiinngg ccuussttoommeerrss ttoo eemmppllooyymmeenntt cceenntteerrss iinn ssuubbuurrbbaann ccoommmmuunniittiieess aanndd ddoowwnnttoowwnn aarreeaass. More new jobs coming to suburbs than urban core in next 30 years.• Innovation (public-private partnerships, microtransit initiatives, mixed-use developments, transit-oriented developments and the first transit app in the region)
Effective Service
• Before STA formed, several suburbs were paying into transit system but not receiving service.
• 2016 analysis: Suburban communities ccoonnttrriibbuuttiinngg mmoorree tthhaann 1100 ppeerrcceenntt MVST funding formula but only rreecceeiivviinngg bbaacckk uunnddeerr 44 ppeerrcceenntt of their contribution.
History of Suburban Transit Agencies
COMMENTS RELATIVE TO GOVERNOR’S BLUE RIBBON COMMITTEE ON MET COUNCIL’S STRUCTURE AND SERVICES
October 2020
SSuubbuurrbbaann ccoommmmuunniittiieess ssoouugghhtt lleeggiissllaattiioonn iinn 11998822 ttoo ccrreeaattee ttrraannssiitt aaggeenncciieess ttoo sseerrvvee tthhee ffaasstt--ggrroowwiinngg aarreeaass.. The Legislative Auditor reported that "the existing planning structure was not responsive to the need for a service plan which would address transit needs, particularly the growing suburbs.”
History of Suburban Transit Agencies
PRESENTATION TO THE
Blue Ribbon CommitteeOctober 2020
Suburban Transit Association
On Met Council’s Structure and Services
1.
2.
3.
STA is pprroodduuccttiivvee ccoonnttrriibbuuttoorr ttoo rreeggiioonnaall ttrraannssiitt ssyysstteemm aanndd hhaass ddeevveellooppeedd cclloossee rreellaattiioonnsshhiippss wwiitthh tthhee ccoommmmuunniittiieess sseerrvveedd. Suburban transit agencies have been known for innovations and Legislative Auditor highlighted our pilot tests of new approaches and technologies.
Effective Service
5.
6.
7.
4.
• STA should receive an equitable, proportional share of transit funding for the region.
• STA favors governance that is more accountable to region and is structured to ensure suburban communities are directly represented.
• The iinnnnoovvaattiioonn,, ssuucccceessss aanndd sseerrvviiccee ooff SSTTAA ccaann bbee eennhhaanncceedd aass aa ffuullll ppaarrttnneerr wwiitthh aa ""sseeaatt aatt tthhee ttaabbllee..""
GovernanceI
I SUBURBAN ,"-.TRAN SIT .1q ASS,O~I ATI ON
I
I
SUBURBAN ,,A..T RAN S IT .1qA.sso Cl/\ Tl o, \I
SUBURBAN >~Is~<~:~.~iL!
,t, MAPLE GROVE TRANSIT
@Plymouth Metrolink
SOUTHWEST TRANSIT
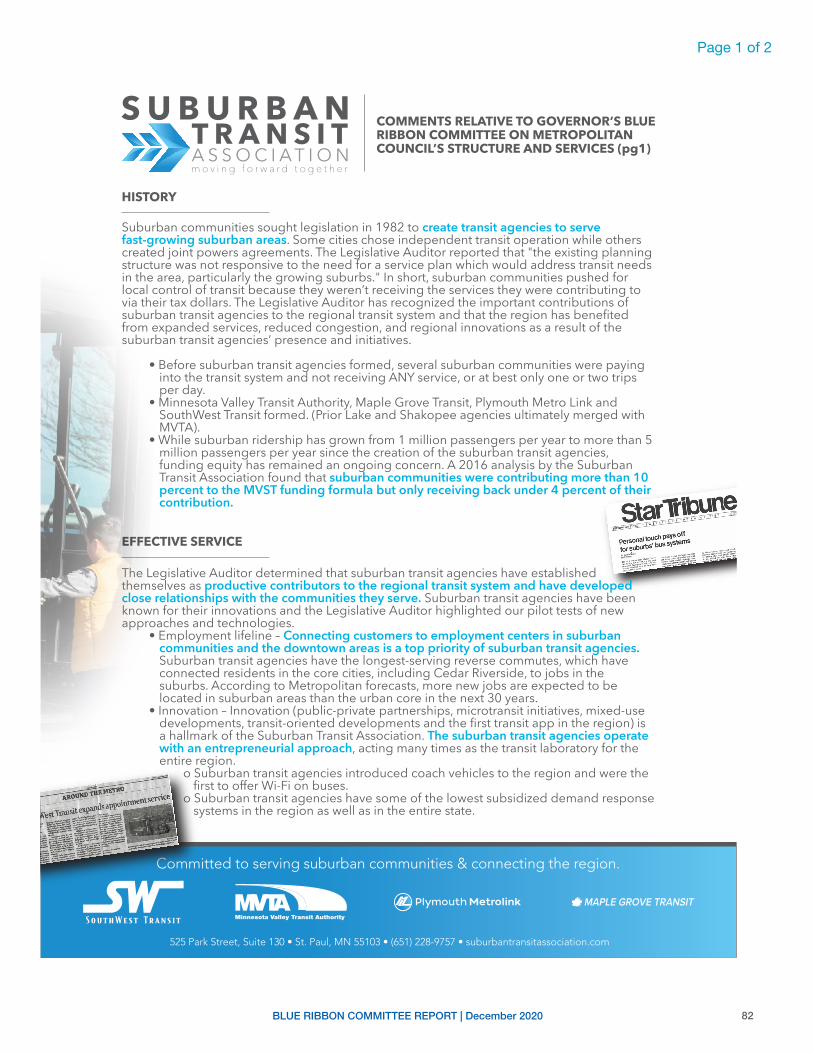
82BLUE RIBBON COMMITTEE REPORT | December 2020
525 Park Street, Suite 130 • St. Paul, MN 55103 • (651) 228-9757 • suburbantransitassociation.com
Committed to serving suburban communities & connecting the region.
HISTORY
Suburban communities sought legislation in 1982 to create transit agencies to serve fast-growing suburban areas. Some cities chose independent transit operation while others created joint powers agreements. The Legislative Auditor reported that "the existing planning structure was not responsive to the need for a service plan which would address transit needs in the area, particularly the growing suburbs." In short, suburban communities pushed for local control of transit because they weren’t receiving the services they were contributing to via their tax dollars. The Legislative Auditor has recognized the important contributions of suburban transit agencies to the regional transit system and that the region has benefited from expanded services, reduced congestion, and regional innovations as a result of the suburban transit agencies’ presence and initiatives.
• Before suburban transit agencies formed, several suburban communities were paying into the transit system and not receiving ANY service, or at best only one or two trips per day.
• Minnesota Valley Transit Authority, Maple Grove Transit, Plymouth Metro Link and SouthWest Transit formed. (Prior Lake and Shakopee agencies ultimately merged with MVTA).
• While suburban ridership has grown from 1 million passengers per year to more than 5 million passengers per year since the creation of the suburban transit agencies, funding equity has remained an ongoing concern. A 2016 analysis by the Suburban Transit Association found that suburban communities were contributing more than 10 percent to the MVST funding formula but only receiving back under 4 percent of their contribution.
EFFECTIVE SERVICE
The Legislative Auditor determined that suburban transit agencies have established themselves as productive contributors to the regional transit system and have developed close relationships with the communities they serve. Suburban transit agencies have been known for their innovations and the Legislative Auditor highlighted our pilot tests of new approaches and technologies.
• Employment lifeline – Connecting customers to employment centers in suburban communities and the downtown areas is a top priority of suburban transit agencies. Suburban transit agencies have the longest-serving reverse commutes, which have connected residents in the core cities, including Cedar Riverside, to jobs in the suburbs. According to Metropolitan forecasts, more new jobs are expected to be located in suburban areas than the urban core in the next 30 years.
• Innovation – Innovation (public-private partnerships, microtransit initiatives, mixed-use developments, transit-oriented developments and the first transit app in the region) is a hallmark of the Suburban Transit Association. The suburban transit agencies operate with an entrepreneurial approach, acting many times as the transit laboratory for the entire region.
o Suburban transit agencies introduced coach vehicles to the region and were the first to offer Wi-Fi on buses.
o Suburban transit agencies have some of the lowest subsidized demand response systems in the region as well as in the entire state.
COMMENTS RELATIVE TO GOVERNOR’S BLUE RIBBON COMMITTEE ON METROPOLITAN COUNCIL’S STRUCTURE AND SERVICES (pg1)
Page 1 of 2
SUBURBAN TRANSIT ASSOCIATION moving f orwa r d t ogether
SOUTHWEST TRANSIT Minnesota Valler Transit Authority
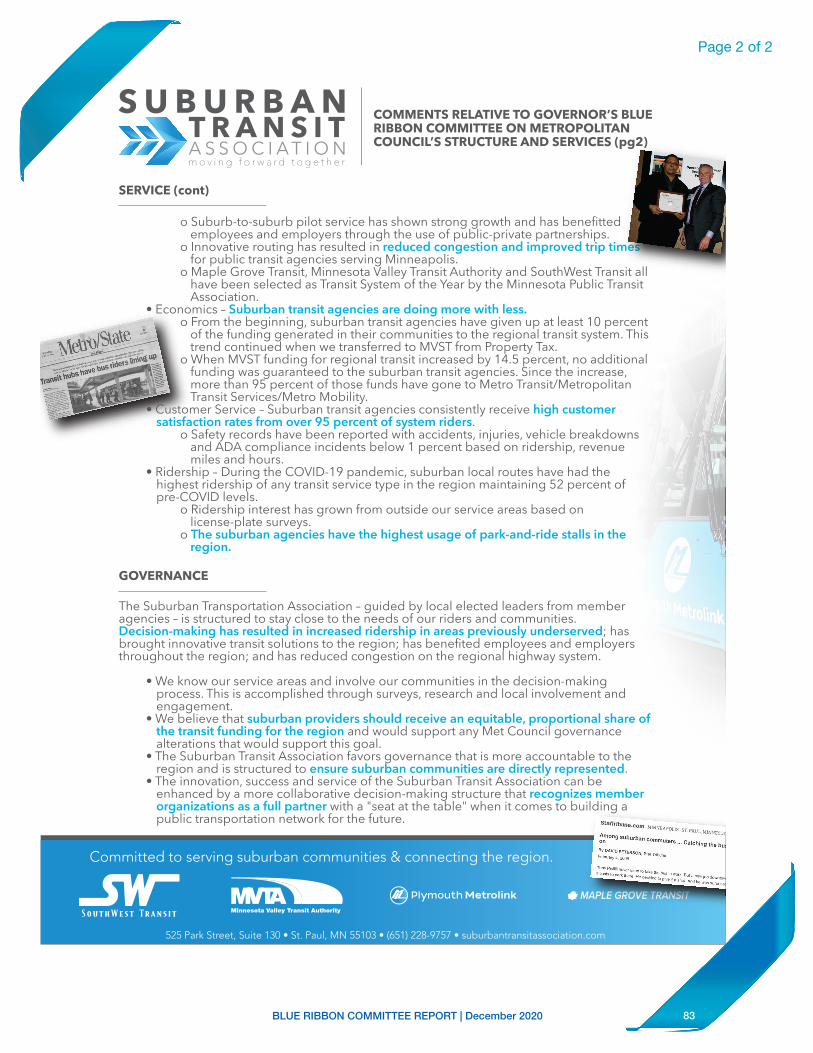
83BLUE RIBBON COMMITTEE REPORT | December 2020
525 Park Street, Suite 130 • St. Paul, MN 55103 • (651) 228-9757 • suburbantransitassociation.com
Committed to serving suburban communities & connecting the region.
SERVICE (cont)
o Suburb-to-suburb pilot service has shown strong growth and has benefitted employees and employers through the use of public-private partnerships.
o Innovative routing has resulted in reduced congestion and improved trip times for public transit agencies serving Minneapolis.
o Maple Grove Transit, Minnesota Valley Transit Authority and SouthWest Transit all have been selected as Transit System of the Year by the Minnesota Public Transit Association.
• Economics – Suburban transit agencies are doing more with less. o From the beginning, suburban transit agencies have given up at least 10 percent
of the funding generated in their communities to the regional transit system. This trend continued when we transferred to MVST from Property Tax.
o When MVST funding for regional transit increased by 14.5 percent, no additional funding was guaranteed to the suburban transit agencies. Since the increase, more than 95 percent of those funds have gone to Metro Transit/Metropolitan Transit Services/Metro Mobility.
• Customer Service – Suburban transit agencies consistently receive high customer satisfaction rates from over 95 percent of system riders.
o Safety records have been reported with accidents, injuries, vehicle breakdowns and ADA compliance incidents below 1 percent based on ridership, revenue miles and hours.
• Ridership – During the COVID-19 pandemic, suburban local routes have had the highest ridership of any transit service type in the region maintaining 52 percent of pre-COVID levels.
o Ridership interest has grown from outside our service areas based on license-plate surveys.
o The suburban agencies have the highest usage of park-and-ride stalls in the region.
GOVERNANCE
COMMENTS RELATIVE TO GOVERNOR’S BLUE RIBBON COMMITTEE ON METROPOLITAN COUNCIL’S STRUCTURE AND SERVICES (pg2)
The Suburban Transportation Association – guided by local elected leaders from member agencies – is structured to stay close to the needs of our riders and communities. Decision-making has resulted in increased ridership in areas previously underserved; has brought innovative transit solutions to the region; has benefited employees and employers throughout the region; and has reduced congestion on the regional highway system.
• We know our service areas and involve our communities in the decision-making process. This is accomplished through surveys, research and local involvement and engagement.
• We believe that suburban providers should receive an equitable, proportional share of the transit funding for the region and would support any Met Council governance alterations that would support this goal.
• The Suburban Transit Association favors governance that is more accountable to the region and is structured to ensure suburban communities are directly represented.
• The innovation, success and service of the Suburban Transit Association can be enhanced by a more collaborative decision-making structure that recognizes member organizations as a full partner with a "seat at the table" when it comes to building a public transportation network for the future.
Page 2 of 2
84BLUE RIBBON COMMITTEE REPORT | December 2020
Response to Questions Raised by the Governor’s Blue-Ribbon Committee on the Metropolitan Council’s Services and Structure
What are some of the innovations first developed or introduced to our region by the Suburban transit providers?
▪ Suburban providers have implemented the region’s first micro transit services.
▪ Suburban providers have introduced Coach Vehicles to the region which have proven to be the most cost-effective vehicle for long haul commutes. Compared to an articulated bus (the only other option to provide high capacity seating) the coach has a useful life of 14 years versus 12 for the artic; the coach costs $250,000 less than an artic; the maintenance costs on a coach is less than on an artic; the coach handles better in the snow and ice than an artic; and a coach only has 5 fewer seats than an artic. The Coach bus has become the standard vehicle for express routes and is now used by every public provider in the metro area.
▪ Suburban providers have introduced public-private partnerships to the region with large employers (Amazon, Mystic Lake) and local jurisdictions to provide limited stop service on the suburb-to-suburb Route 495 express route, MVTA’s fastest growing route.
▪ Suburban providers were the first in our region to offer Wi-Fi on buses and at stations.
▪ Suburban providers have a strong commitment to Reverse Commute services, providing access to thousands of jobs that had not been served prior to its inception.
▪ Suburban providers have been recognized for Preparedness Plans rolled out shortly after the 9-11 terrorist attacks and have been recognized by the Transportation Security Administration and Homeland Security, the Canadian Urban Transit Association, and multiple times by the American Public Transit Association.
▪ Suburban providers developed the region’s first real-time transit app. ▪ Suburban providers have developed Transit-Oriented Developments; for
example, SouthWest Station is not only home to SouthWest’s largest park and ride with 1,000 dedicated transit parking stalls, but includes over 500 apartment units, 100,000 s.f. of commercial real estate, and will include the SW LRT Green Line operation in 2023.
Page 1 of 4
85BLUE RIBBON COMMITTEE REPORT | December 2020
▪ Suburban providers have installed plexiglass row separators and ion air purification systems on buses to reduce the transmission of COVID-19, and instill greater rider confidence in the safety of public transit.
Why do suburban providers (or opt outs as phrased in the question) ‘beg’ the Metropolitan Council for money? The reality is that the suburban transit providers do not “beg” the Metropolitan Council for money. We are simply asking for our share of the funding spelled out in State Statute, and a portion of the additional funding for metropolitan area transit that has been allocated since 2008. Prior to 2001, suburban transit, like all of transit in the Twin Cities metropolitan area, was funded by the property tax. During this period, fast growing suburban areas like those represented by members of the Suburban Transit Association generated enough funding to keep up with the expansion in households as well as businesses in their areas. From the beginning, the Suburban Transit Providers have given up at least 10% of the funding generated in their communities to the regional transit system (Metro Transit and Metro Mobility). This trend continued when we transferred to MVST from Property Tax. When the regional transit system transferred off the property tax and on to MVST, the suburban transit providers received 3.74% of the statewide MVST allocation, while the Metropolitan Council/Metro Transit received 17.76% (total of both equaled 21.5%). In 2008 the total amount of MVST funding for metropolitan area transit increased from 21.5% to 36%. Since then, the funding for suburban transit has remained relatively flat, while Metro Transit/Metropolitan Council’s transit services has seen an increase more than 14%. Suburban transit providers rely solely on MVST and passenger fares for their operations. The Metropolitan Council/Metro Transit receive not only MVST, but State General Funding and funding from Hennepin County for rail operations. Finally, the MVST funding generated from the suburban transit communities totals more than 10% of the statewide total. The suburban systems currently receive 4.3% of the amount collected in our communities for transit operations. The metropolitan area (minus the suburban transit communities) contributes 33% of the statewide MVST. Metro Transit and the Metropolitan Council receives 31.7% of the 33% their communities contribute. Why were Suburban Transit Systems, formally known as opt-out providers, created in the first place?
o Until 2002, metropolitan area transit was funded through property taxes. Many suburban communities were not receiving anywhere close to the amount of service to justify the amount of tax dollars being collected in their communities. In 1982, the Legislature recognized this inequity and provided a window of opportunity for communities meeting specific criteria to opt out of the Metropolitan Transit services and receive up to 90% of the funding collected in their communities to establish their own transit systems. Justification:
▪ Suburban communities had no control over the transit service they received.
Page 2 of 4
86BLUE RIBBON COMMITTEE REPORT | December 2020
▪ Several suburban communities were paying into the transit system and not receiving ANY service, or at best only one or two trips per day.
o Suburban Transit Providers are also closer to, and better understand the transit needs of their communities. Better than a large, centralized transit system ever could.
▪ Suburban providers have received customer satisfaction ratings above 95% for over ten years.
▪ Suburban providers have exceptional safety records.
Are suburban transit providers less efficient than Metro Transit? As pointed out by the Legislative Auditor, this is a complicated question to answer. First you have the fact that not everyone is allocating costs in the same manner. As an example, one could examine the services contracted by Metro Transit. Labor costs are averaged/estimated and may not accurately reflect what it costs to operate the service. Expenses such as vehicle maintenance may be offset with federal funding. Other expenses such as facility/vehicle storage, deadhead, administrative support, testing and training, all seem to be underestimated relative to the cost allocation of other regional providers as well as what is occurring in their own operation. To simplify, one only needs to look at things like wages (especially in the driver and mechanic ranks since this makes up the largest expense category), benefit packages and work rules, and things like employee-to-bus ratio (for mechanics), and the percentage of administrative costs to total budget. When doing this comparison, it would be difficult to concur that Metro Transit could operate the services provided by the suburban transit providers in a more cost effective/efficient manner. The Metropolitan Council as well as some members of the Blue-Ribbon Committee want to center in on the subsidy per passenger as the way to determine cost effectiveness. Looking simply at this statistic fails to provide the complete answer. You need to examine and factor in things such as the distance of the trip (which are generally longer in the suburban markets), the number of times a bus can recycle during the productive peak periods (again because of the distance traveled), and the fare charged which is under the control of the Metropolitan Council. Quantifying express transit service to/from suburban communities should also take into consideration the value suburban express service brings to air quality and traffic mitigation. Suburban transit systems have performed well in both as evidenced in the past awards of federal Congestion Mitigation and Air Quality funding. When looking at the express routes performed by Metro Transit and at their actual/fully allocated costs, they are not performing more efficiently than any suburban provider. Finally, one metric that is commonly used by the Federal Transit Administration (FTA) to measure system efficiency is the Cost of Service Per Passenger Mile, which is a statistic used to account for the physical distance of service provided, as well as the time needed to operate those services. In 2018, the following Cost Per Passenger Mile statistics were reported to FTA’s National Transit Database (NTD) for fixed route services:
• SouthWest Transit: $0.52 • Plymouth Metrolink: $0.65
Page 3 of 4
87BLUE RIBBON COMMITTEE REPORT | December 2020
• Minnesota Valley Transit Authority: $0.98 • Metro Transit: $1.20
The above statistics demonstrate that Suburban Transit Providers are indeed just as efficient, if not more efficient, than Metro Transit when one starts looking at the type of transit provided by the Suburban Transit Providers. Are the suburban communities receiving Metro Mobility services, and are they paying for those service? The communities represented by the suburban transit providers are receiving some level of Metro Mobility service. It should be noted however, Metro Mobility/ADA service is federally mandated, and triggered by having a system of local fixed transit service. Only a small number of the communities represented by the Suburban Transit Association fall under this federal mandate. The Metropolitan Council, who receives State General Funding as well as Health and Human Services to help off-set Metro Mobility expenses, has taken the position to provide the service beyond its federal requirement.
Page 4 of 4
88BLUE RIBBON COMMITTEE REPORT | December 2020
Council of Metropolitan Area Leagues of Women Voters
Testimony to the Governor’s Blue Ribbon Committee on the Metropolitan Council
October 26, 2020
The Council of Metropolitan Area Leagues of Women Voters (CMAL) is an Inter-League Organization established under the auspices of the League of Women Voters of the United States. CMAL was established in 1962 with the purpose of increasing the knowledge of its members and the public with respect to regional government issues.
CMAL is a membership organization comprised of 19 local League of Women Voters chapters in the seven-county metro area, with approximately 1200 members.
Like all League of Women Voters entities, CMAL is political but strictly non-partisan. We do not support or endorse any candidate or political party.
From August 2018 to January 2019, CMAL engaged in a study of Metropolitan Council governance. A committee of eight League members from five of the seven metro area counties led it.
The study committee (1) conducted interviews with stakeholders, including Pat Nauman (Metro Cities), Alene Tchourumoff (Metropolitan Council), Pahoua Yang Hoffman (Citizens League) and Kathleen Salzman (Metropolitan Governance Transparency Initiative) (see p28 of report for complete list) (2) hosted a public forum for League members and the general public, (panel members were Deb Dyson (House Research), Keith Carlson (Minnesota Inter-County Association), Charlie Vander Aarde (Metro Cities) , and C. Terrence Anderson (University of Minnesota Center for Urban and Regional Affairs)), (3) reviewed the available literature, including the 2016 report from the Citizens League , the 2011 Legislative Auditor Report, historical reports from the Metropolitan Council library, and articles in the press, and, (4) with the help of 30 other League members, carried out interviews of over 50 local elected and appointed officials (mayors, county commissioners, city managers, county administrators, city community development and planning directors) (pg. 28-30) to gather their opinions of and interactions with the Metropolitan Council, utilizing a standardized questionnaire (pg. 33-36).
Based upon all of the above, the committee issued its report, Metropolitan Council Governance, to members in January 2019. The report included the results of the interviews with local officials (pg. 19-25), as well as, information regarding the pros and cons regarding Metropolitan Council governance issues (pg. 14-19).
In the interview process, we learned that interviewees felt the Metropolitan Council is working effectively with respect to the sewer system, transit/transportation (transit, BRT, LRT), livable communities grants, environmental cleanup grants, research, forecasting and planning assistance. The Metropolitan Council was seen as less effective with respect to communication, interaction with cities, public perception, transit in some cities or within cities, Comprehensive Planning (an onerous process every 10 years) that is harder on smaller cities with small staffs, and “one-size-fits-all” with little flexibility (pg. 20-21). We also learned that elected officials have a different relationship with the Metropolitan Council than do their city or county staff, who stated their appreciation of the technical assistance from the Metropolitan Council staff. We urge you to review the report in its entirety.
In January and February 2019, the 19 LWV local chapters held meetings to discuss the governance issues and to vote on the consensus questions presented in the report. In March 2019 the CMAL Board tallied the votes taken at these meetings and adopted its position on Metropolitan Council governance. Each of the following positions had the support of more than 80% of those participating.
• The Governor should appoint members of the Metropolitan Council.
• Members of the Metropolitan Council should be appointed to fixed, staggered terms, and should be removable only for cause.
• Metropolitan Council members should be required to have a regional perspective, knowledge of regional issues, demographic diversity, and the ability to meet the time requirements for serving in the office.
• Metropolitan Council members should not be local elected officials or be directly elected to the office of Metropolitan council member.
• A nominating committee should recommend a slate of Metropolitan Council nominees to the Governor.
Respectfully Submitted,
Karen Schaffer
Chair, Council of Metropolitan Area Leagues of Women Voters (CMAL)
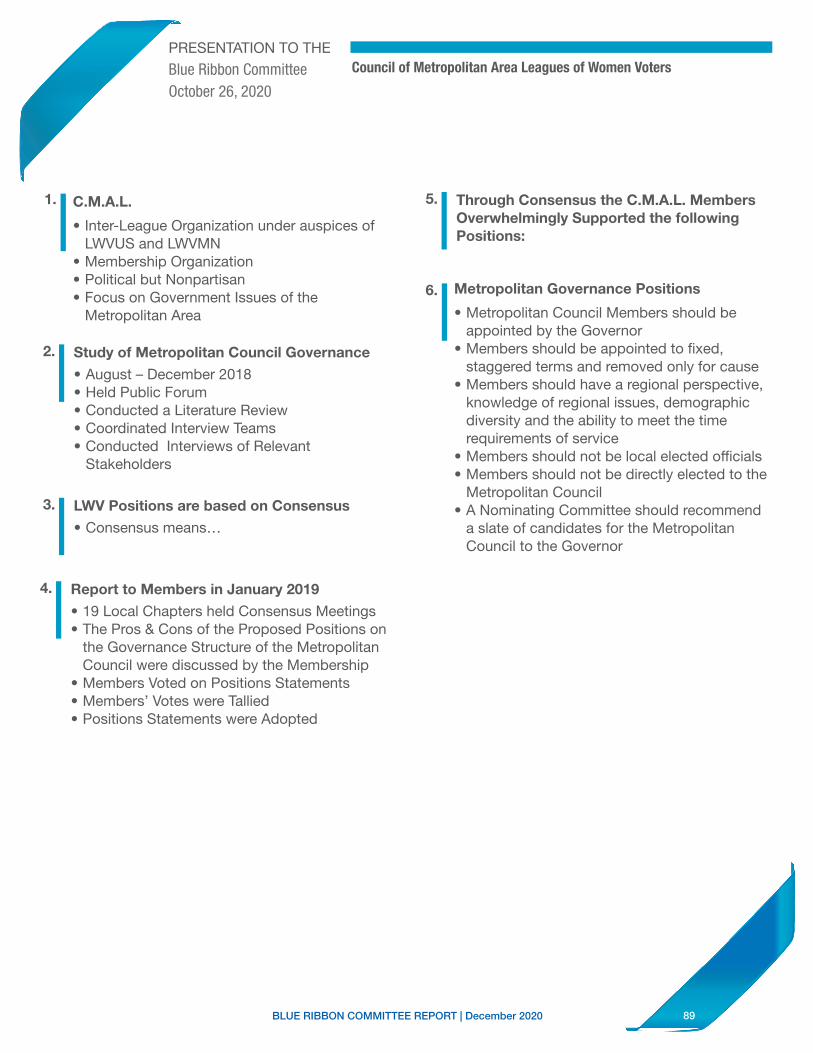
89BLUE RIBBON COMMITTEE REPORT | December 2020
Council of Metropolitan Area Leagues of Women Voters
1. C.M.A.L.
• Inter-League Organization under auspices of LWVUS and LWVMN
• Membership Organization• Political but Nonpartisan• Focus on Government Issues of the
Metropolitan Area
6. Metropolitan Governance Positions
• Metropolitan Council Members should be appointed by the Governor
• Members should be appointed to fixed, staggered terms and removed only for cause
• Members should have a regional perspective, knowledge of regional issues, demographic diversity and the ability to meet the time requirements of service
• Members should not be local elected officials• Members should not be directly elected to the
Metropolitan Council• A Nominating Committee should recommend
a slate of candidates for the Metropolitan Council to the Governor
2.
• August – December 2018• Held Public Forum• Conducted a Literature Review• Coordinated Interview Teams• Conducted Interviews of Relevant
Stakeholders
Study of Metropolitan Council Governance
3.
• Consensus means…
LWV Positions are based on Consensus
4.
• 19 Local Chapters held Consensus Meetings• The Pros & Cons of the Proposed Positions on
the Governance Structure of the Metropolitan Council were discussed by the Membership
• Members Voted on Positions Statements• Members’ Votes were Tallied• Positions Statements were Adopted
Report to Members in January 2019
5. Through Consensus the C.M.A.L. Members Overwhelmingly Supported the following Positions:
PRESENTATION TO THE
Blue Ribbon CommitteeOctober 26, 2020
I
I
I I
I I
90BLUE RIBBON COMMITTEE REPORT | December 2020
Press Release
The Council of Metropolitan Area Leagues of Women Voters (CMAL) announces its updated position on governance of the Metropolitan Council.
Based upon the report of its study committee, members of all local leagues across the metropolitan area overwhelmingly voted to support the following:
• Appointment of Metropolitan Council members and its Chair by the Governor,
• Fixed staggered terms for Metropolitan Council members with removal only for cause, and
• Metropolitan Council members should have a regional perspective, knowledge of regional issues, reflect demographic diversity and be able to meet the time requirements to serve effectively.
Members of all 19 chapters of the League of Women Voters in the 7-county metropolitan area participated in the voting process in January and February 2019.
In 2018, League members interviewed over 50 municipal and county elected officials and staff across the metropolitan area, asking a series of questions regarding their satisfaction with the Metropolitan Council. The respondents expressed high levels of satisfaction with the sewer system, transit and transportation, planning resources and technical expertise. The areas cited most often for improvement are its communication and interaction with cities and need to streamline the comprehensive planning process.
The CMAL committee launched its study after last spring’s legislative bill to replace the appointment of citizens by the governor with the appointment of local elected city and county officials to the regional agency. CMAL in its 50+ year history had not addressed the issue of whether local elected officials could or should be appointed to serve on the Metropolitan Council. There was little support among participants for the appointment of local elected city and county officials to the Metropolitan Council.
March 19, 2019
91BLUE RIBBON COMMITTEE REPORT | December 2020
METROPOLITAN
COUNCIL
GOVERNANCEReporttoMembersoftheCouncilofMetropolitanArea
LeaguesofWomenVoters,onastudyconductedtoupdateLeaguepositionontheMetropolitanCouncil.
January2019
M e t r o p o l i t a n C o u n c i l S t u d y J a n u a r y 2 0 1 9 1 | P a g e
Table of Contents PurposeofStudytoUpdateCMALPositiononMetropolitanCouncilGovernance.....................3
CurrentPositionRegardingGovernanceofMetropolitanCouncil......................................................4
ConsensusQuestionsforMetropolitanLeagueMembers.......................................................................5
WhatistheMetropolitanCouncil?....................................................................................................................7
MetropolitanCouncilManagement...................................................................................................................7
WhatDoestheMetropolitanCouncildo?.......................................................................................................8
MetropolitanCouncil2018Budget..............................................................................................................8
FunctionsoftheMetropolitanCouncil............................................................................................................9
Long-RangePlanning..........................................................................................................................................9
LandUsePlanning............................................................................................................................................10
Transportation...................................................................................................................................................10
TransportationPlanning...........................................................................................................................10
TransportationAdvisoryBoard......................................................................................................................11
OperationoftheRegionalTransitSystem.............................................................................................12
RegionalParksandTrails..............................................................................................................................12
Housing..................................................................................................................................................................12
HousingPlanning.........................................................................................................................................13
WastewaterandWater...................................................................................................................................13
QuestionsandOpposingViewpointsforCMALMembersToConsider.........................................14
MetropolitanCouncilGovernanceStructure........................................................................................14
ShouldCMALContinuetoSupportItsPositionofMetropolitanCouncilMembers
AppointedbytheGovernor?........................................................................................................................14
LocallyElectedOfficialsServingonMetropolitanCouncil.........................................................14
ShouldlocalelectedofficialsserveontheMetropolitanCouncil?...............................................15
ShouldCMALcontinuetosupportfixed,staggeredtermsforMetropolitanCouncil
members,whethertheyareappointed,electedlocalofficials,orelecteddirectly?............15
ShouldCMALcontinuetosupportitscurrentpositionof“anopenappointmentprocess,
includingpublicizedvacancies,withincreasedcitizen,localgovernmentandlegislative
influenceonappointments”?.......................................................................................................................16
MetropolitanCouncilMemberQualifications...........................................................................................17
ShouldCMALbemorespecificinthetypeofformalqualificationsthatarerequiredfor
appointmenttoMetropolitanCouncil?...................................................................................................17
Council of Metropolitan Area Leagues
Metropolitan Council Governance January 2019
Page 1 of 34
92BLUE RIBBON COMMITTEE REPORT | December 2020
M e t r o p o l i t a n C o u n c i l S t u d y J a n u a r y 2 0 1 9 2 | P a g e
ShouldCMALcontinuetosupportitsposition:“TheAppointedMetropolitanCouncilis
ResponsibletoourElectedStateLegislatureandwatchedoverbyourElectedLocal
Officials”?..............................................................................................................................................................17
ShouldtheNumberofMetropolitanCouncilDistrictsBeIncreased?........................................17
ShouldtheTransportationAdvisoryBoard(Tab)BeRetained?.................................................18
HowisregionalplanningaccomplishedinotherurbanareasoftheUnitedStates?..........19
ArelocalofficialssatisfiedwiththeMetropolitanCouncil?...........................................................19
Questionnaireoverview........................................................................................................................................20
InterviewResults...........................................................................................................................................20
MetropolitanCouncilEffectiveness.....................................................................................................20
MetropolitanCouncilImpactonCityorCounty.............................................................................20
MetropolitanCouncilMembership.......................................................................................................21
ChairoftheMetropolitanCouncil.........................................................................................................22
RemovalofMembers..................................................................................................................................22
MetropolitanCouncilMembershipQualifications.........................................................................22
MetropolitanCouncilMemberNominationandSelectionProcess........................................23
MetropolitanCouncilAccountability...................................................................................................24
MetropolitanCouncilandTransportationAdvisoryBoard.......................................................24
TransportationFunds................................................................................................................................24
Bibliography.............................................................................................................................................................26
Acknowledgements...............................................................................................................................................28
Appendix....................................................................................................................................................................31
MetropolitanCouncilOrganizationalChart(2017)...........................................................................31
MetropolitanCouncilDistricts....................................................................................................................32
QuestionnaireUsedtoCollectData...........................................................................................................33
Page 2 of 34
93BLUE RIBBON COMMITTEE REPORT | December 2020
M e t r o p o l i t a n C o u n c i l S t u d y J a n u a r y 2 0 1 9 3 | P a g e
PURPOSEOFSTUDYTOUPDATECMALPOSITIONONMETROPOLITANCOUNCILGOVERNANCE
Thepurposeofthisstudyistoupdatethe2001CouncilofMetropolitanAreaLeaguesof
WomenVoters(CMAL)positiononMetropolitanCouncilGovernance.
Inthe2018MinnesotaLegislativesession,abipartisanbillpassedboththeHouseand
SenatetoaddlocalelectedofficialstotheMetropolitanCouncil.
ThepreviousCMALpositionhadnotconsideredtheappointmentoflocalelectedofficials
totheMetropolitanCouncil.Thisreporthasbeenpreparedtoenableourmembersto
updatetheCMALconsensuspositiononMetropolitanCouncilgovernance.
Page 3 of 34
94BLUE RIBBON COMMITTEE REPORT | December 2020
M e t r o p o l i t a n C o u n c i l S t u d y J a n u a r y 2 0 1 9 4 | P a g e
CURRENTPOSITIONREGARDINGGOVERNANCEOFMETROPOLITANCOUNCIL
Perthe2001CMALStudyoftheMetropolitanCouncilGovernance,theCMALBoard
adoptedthefollowingPositionbasedupontheconsensusofCMALmembership.
TheCouncilofMetropolitanAreaLeagues(CMAL)supportsasthedecision-makingbody
formetropolitanneedsinaccordancewiththesecriteria:
Ø EfficiencyandEconomy
Ø EquitableFinancing
Ø Flexibility
Ø CitizenControl
Ø ResponsivenesstotheElectorate
CMALsupportsprovisionforcoordinatedmetropolitanservicesfocusedthroughthe
MetropolitanCouncil.
CMALsupportsretentionofanappointedMetropolitanCouncilwithgreateruseofits
existingpowers.(1969)(1976)(1993)(2001)
CMALsupports:
§ RetentionofanappointedMetropolitanCouncil
TheappointedMetropolitanCouncilisseenaslessparochial,lesssubjecttospecial
interests,andbetterabletoadoptandmaintainunpopularpositionsforthegoodof
theentirearea.
§ TheappointedMetropolitanCouncilisresponsibletoourelectedstateLegislature
andwatchedoverbyourelectedlocalofficials(1969)(1976)(1993)(2001).
§ Anopenappointmentprocessincluding:
• Publicizedvacancies
• Increasedcitizen,localgovernmentandlegislativeinfluenceon
appointments
• Formalqualificationsforoffice
• Returntofixed,staggeredterms
• Establishmentofaremovalprocedureformembersofthecounciland
districtapportionmentbasedonpopulation(1969)(1976)(1993)(2001)
IntheeventthatitappearsthattheCouncilmaybecomeanelectedbody,CMALsupports:
§ Nonpartisancandidateswiththeavailabilityofpublicfinancing
§ Selectionofthechairmadebythecouncilmembersfromamongtheirnumber
§ Maintainingofpopulationasthebasisfordistricts
§ ElectionofCouncilmembersatthesametimeaslocalofficials.
§ Continuationofapart-timeCouncilandtheperdiembasisforcompensation(1976)
(1993)
Page 4 of 34
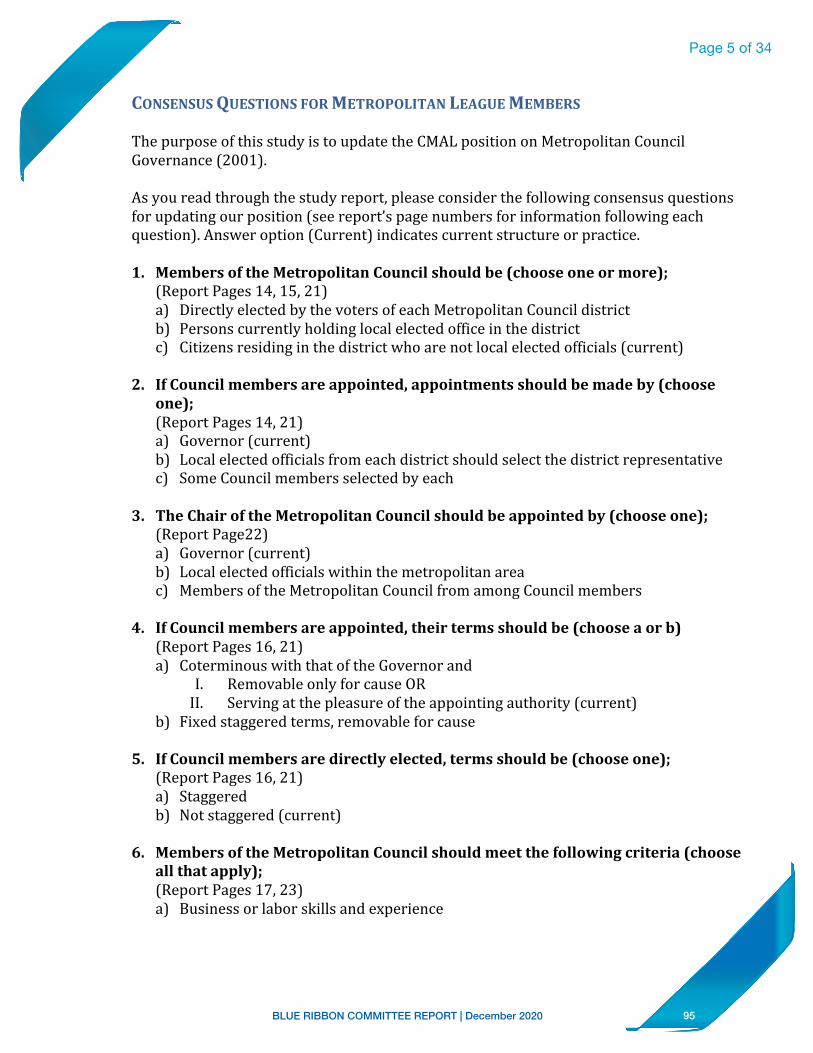
95BLUE RIBBON COMMITTEE REPORT | December 2020
M e t r o p o l i t a n C o u n c i l S t u d y J a n u a r y 2 0 1 9 5 | P a g e
CONSENSUSQUESTIONSFORMETROPOLITANLEAGUEMEMBERS
ThepurposeofthisstudyistoupdatetheCMALpositiononMetropolitanCouncil
Governance(2001).
Asyoureadthroughthestudyreport,pleaseconsiderthefollowingconsensusquestions
forupdatingourposition(seereport’spagenumbersforinformationfollowingeach
question).Answeroption(Current)indicatescurrentstructureorpractice.
1. MembersoftheMetropolitanCouncilshouldbe(chooseoneormore);(ReportPages14,15,21)
a) DirectlyelectedbythevotersofeachMetropolitanCouncildistrict
b) Personscurrentlyholdinglocalelectedofficeinthedistrict
c) Citizensresidinginthedistrictwhoarenotlocalelectedofficials(current)
2. IfCouncilmembersareappointed,appointmentsshouldbemadeby(chooseone);(ReportPages14,21)
a) Governor(current)
b) Localelectedofficialsfromeachdistrictshouldselectthedistrictrepresentative
c) SomeCouncilmembersselectedbyeach
3. TheChairoftheMetropolitanCouncilshouldbeappointedby(chooseone);(ReportPage22)a) Governor(current)
b) Localelectedofficialswithinthemetropolitanarea
c) MembersoftheMetropolitanCouncilfromamongCouncilmembers
4. IfCouncilmembersareappointed,theirtermsshouldbe(chooseaorb)(ReportPages16,21)
a) CoterminouswiththatoftheGovernorand
I. RemovableonlyforcauseOR
II. Servingatthepleasureoftheappointingauthority(current)
b) Fixedstaggeredterms,removableforcause
5. IfCouncilmembersaredirectlyelected,termsshouldbe(chooseone);(ReportPages16,21)a) Staggered
b) Notstaggered(current)
6. MembersoftheMetropolitanCouncilshouldmeetthefollowingcriteria(chooseallthatapply);(ReportPages17,23)
a) Businessorlaborskillsandexperience
Page 5 of 34
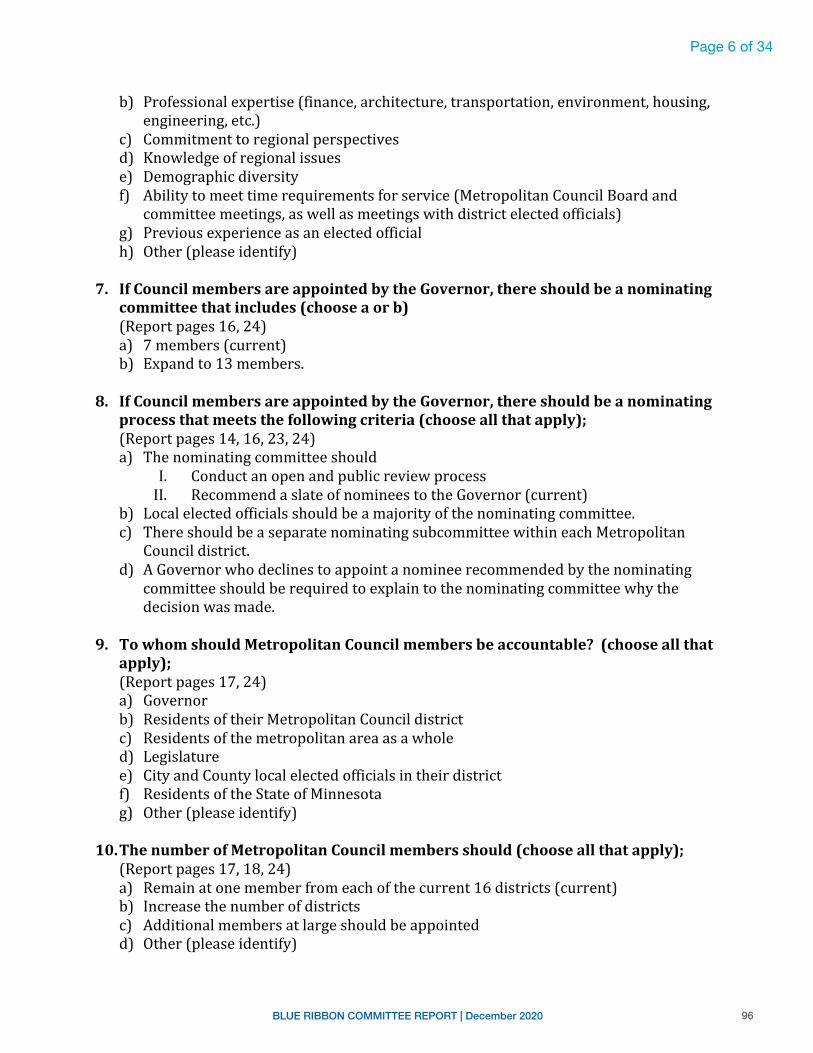
96BLUE RIBBON COMMITTEE REPORT | December 2020
M e t r o p o l i t a n C o u n c i l S t u d y J a n u a r y 2 0 1 9 6 | P a g e
b) Professionalexpertise(finance,architecture,transportation,environment,housing,
engineering,etc.)
c) Commitmenttoregionalperspectives
d) Knowledgeofregionalissues
e) Demographicdiversity
f) Abilitytomeettimerequirementsforservice(MetropolitanCouncilBoardand
committeemeetings,aswellasmeetingswithdistrictelectedofficials)
g) Previousexperienceasanelectedofficial
h) Other(pleaseidentify)
7. IfCouncilmembersareappointedbytheGovernor,thereshouldbeanominatingcommitteethatincludes(chooseaorb)(Reportpages16,24)
a) 7members(current)
b) Expandto13members.
8. IfCouncilmembersareappointedbytheGovernor,thereshouldbeanominatingprocessthatmeetsthefollowingcriteria(chooseallthatapply);(Reportpages14,16,23,24)
a) Thenominatingcommitteeshould
I. Conductanopenandpublicreviewprocess
II. RecommendaslateofnomineestotheGovernor(current)
b) Localelectedofficialsshouldbeamajorityofthenominatingcommittee.
c) ThereshouldbeaseparatenominatingsubcommitteewithineachMetropolitan
Councildistrict.
d) AGovernorwhodeclinestoappointanomineerecommendedbythenominating
committeeshouldberequiredtoexplaintothenominatingcommitteewhythe
decisionwasmade.
9. TowhomshouldMetropolitanCouncilmembersbeaccountable?(chooseallthatapply);(Reportpages17,24)
a) Governor
b) ResidentsoftheirMetropolitanCouncildistrict
c) Residentsofthemetropolitanareaasawhole
d) Legislature
e) CityandCountylocalelectedofficialsintheirdistrict
f) ResidentsoftheStateofMinnesota
g) Other(pleaseidentify)
10. ThenumberofMetropolitanCouncilmembersshould(chooseallthatapply);(Reportpages17,18,24)
a) Remainatonememberfromeachofthecurrent16districts(current)
b) Increasethenumberofdistricts
c) Additionalmembersatlargeshouldbeappointed
d) Other(pleaseidentify)
Page 6 of 34
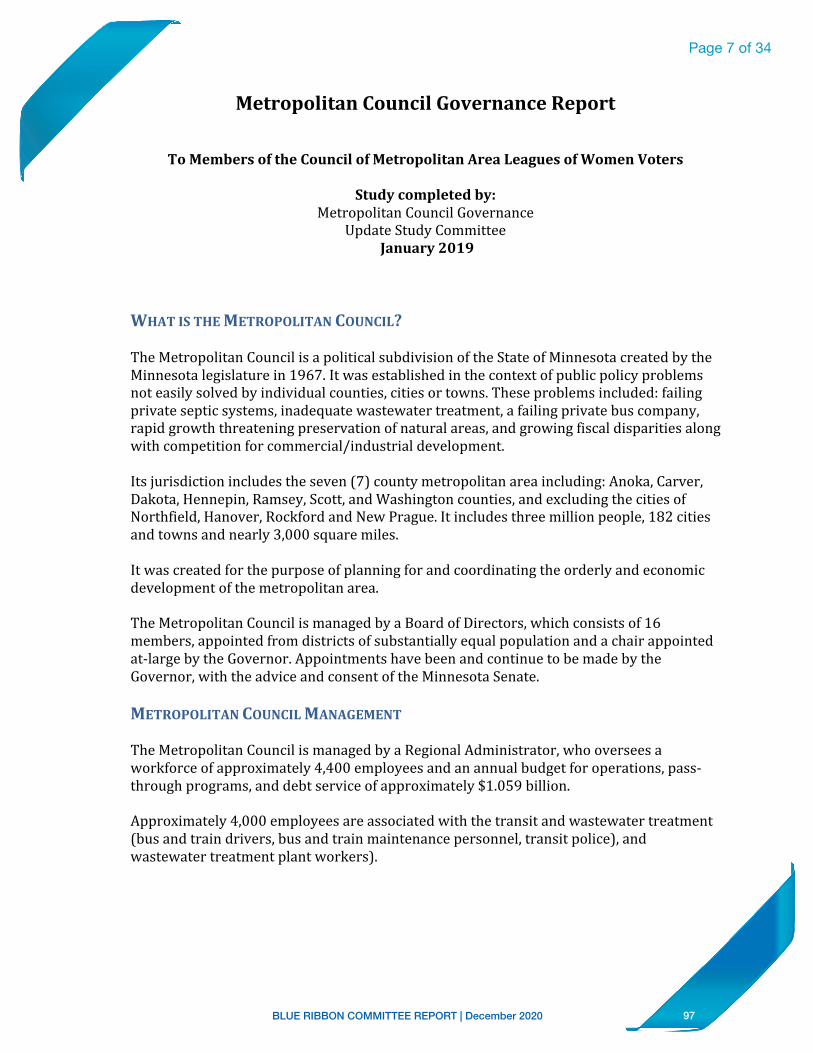
97BLUE RIBBON COMMITTEE REPORT | December 2020
M e t r o p o l i t a n C o u n c i l S t u d y J a n u a r y 2 0 1 9 7 | P a g e
MetropolitanCouncilGovernanceReport
ToMembersoftheCouncilofMetropolitanAreaLeaguesofWomenVoters
Studycompletedby:MetropolitanCouncilGovernance
UpdateStudyCommittee
January2019
WHATISTHEMETROPOLITANCOUNCIL?
TheMetropolitanCouncilisapoliticalsubdivisionoftheStateofMinnesotacreatedbythe
Minnesotalegislaturein1967.Itwasestablishedinthecontextofpublicpolicyproblems
noteasilysolvedbyindividualcounties,citiesortowns.Theseproblemsincluded:failing
privatesepticsystems,inadequatewastewatertreatment,afailingprivatebuscompany,
rapidgrowththreateningpreservationofnaturalareas,andgrowingfiscaldisparitiesalong
withcompetitionforcommercial/industrialdevelopment.
Itsjurisdictionincludestheseven(7)countymetropolitanareaincluding:Anoka,Carver,
Dakota,Hennepin,Ramsey,Scott,andWashingtoncounties,andexcludingthecitiesof
Northfield,Hanover,RockfordandNewPrague.Itincludesthreemillionpeople,182cities
andtownsandnearly3,000squaremiles.
Itwascreatedforthepurposeofplanningforandcoordinatingtheorderlyandeconomic
developmentofthemetropolitanarea.
TheMetropolitanCouncilismanagedbyaBoardofDirectors,whichconsistsof16
members,appointedfromdistrictsofsubstantiallyequalpopulationandachairappointed
at-largebytheGovernor.Appointmentshavebeenandcontinuetobemadebythe
Governor,withtheadviceandconsentoftheMinnesotaSenate.
METROPOLITANCOUNCILMANAGEMENT
TheMetropolitanCouncilismanagedbyaRegionalAdministrator,whooverseesa
workforceofapproximately4,400employeesandanannualbudgetforoperations,pass-
throughprograms,anddebtserviceofapproximately$1.059billion.
Approximately4,000employeesareassociatedwiththetransitandwastewatertreatment
(busandtraindrivers,busandtrainmaintenancepersonnel,transitpolice),and
wastewatertreatmentplantworkers).
Page 7 of 34
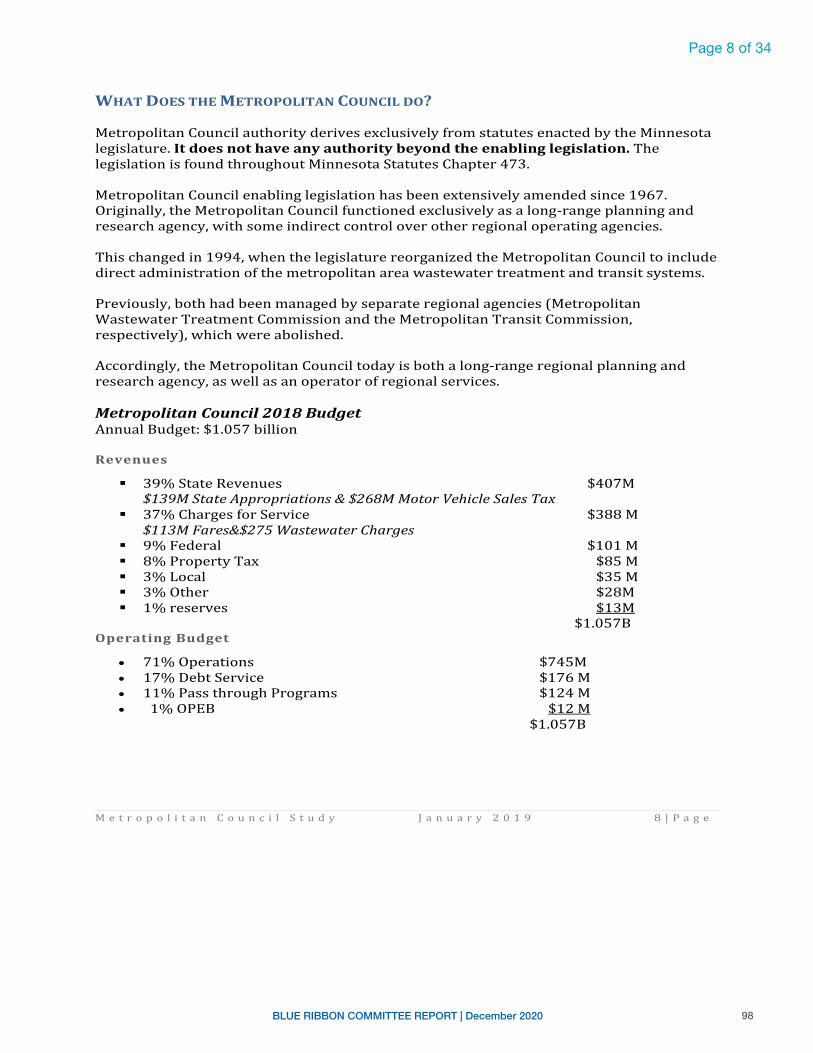
98BLUE RIBBON COMMITTEE REPORT | December 2020
M e t r o p o l i t a n C o u n c i l S t u d y J a n u a r y 2 0 1 9 8 | P a g e
WHATDOESTHEMETROPOLITANCOUNCILDO?
MetropolitanCouncilauthorityderivesexclusivelyfromstatutesenactedbytheMinnesota
legislature.Itdoesnothaveanyauthoritybeyondtheenablinglegislation.The
legislationisfoundthroughoutMinnesotaStatutesChapter473.
MetropolitanCouncilenablinglegislationhasbeenextensivelyamendedsince1967.
Originally,theMetropolitanCouncilfunctionedexclusivelyasalong-rangeplanningand
researchagency,withsomeindirectcontroloverotherregionaloperatingagencies.
Thischangedin1994,whenthelegislaturereorganizedtheMetropolitanCounciltoinclude
directadministrationofthemetropolitanareawastewatertreatmentandtransitsystems.
Previously,bothhadbeenmanagedbyseparateregionalagencies(Metropolitan
WastewaterTreatmentCommissionandtheMetropolitanTransitCommission,
respectively),whichwereabolished.
Accordingly,theMetropolitanCounciltodayisbothalong-rangeregionalplanningand
researchagency,aswellasanoperatorofregionalservices.
MetropolitanCouncil2018BudgetAnnualBudget:$1.057billion
Revenues
§ 39%StateRevenues $407M
$139MStateAppropriations&$268MMotorVehicleSalesTax
§ 37%ChargesforService $388M
$113MFares&$275WastewaterCharges
§ 9%Federal $101M
§ 8%PropertyTax $85M
§ 3%Local $35M
§ 3%Other $28M
§ 1%reserves $13M
$1.057B
OperatingBudget
• 71%Operations $745M
• 17%DebtService $176M
• 11%PassthroughPrograms $124M
• 1%OPEB $12M
$1.057B
Page 8 of 34
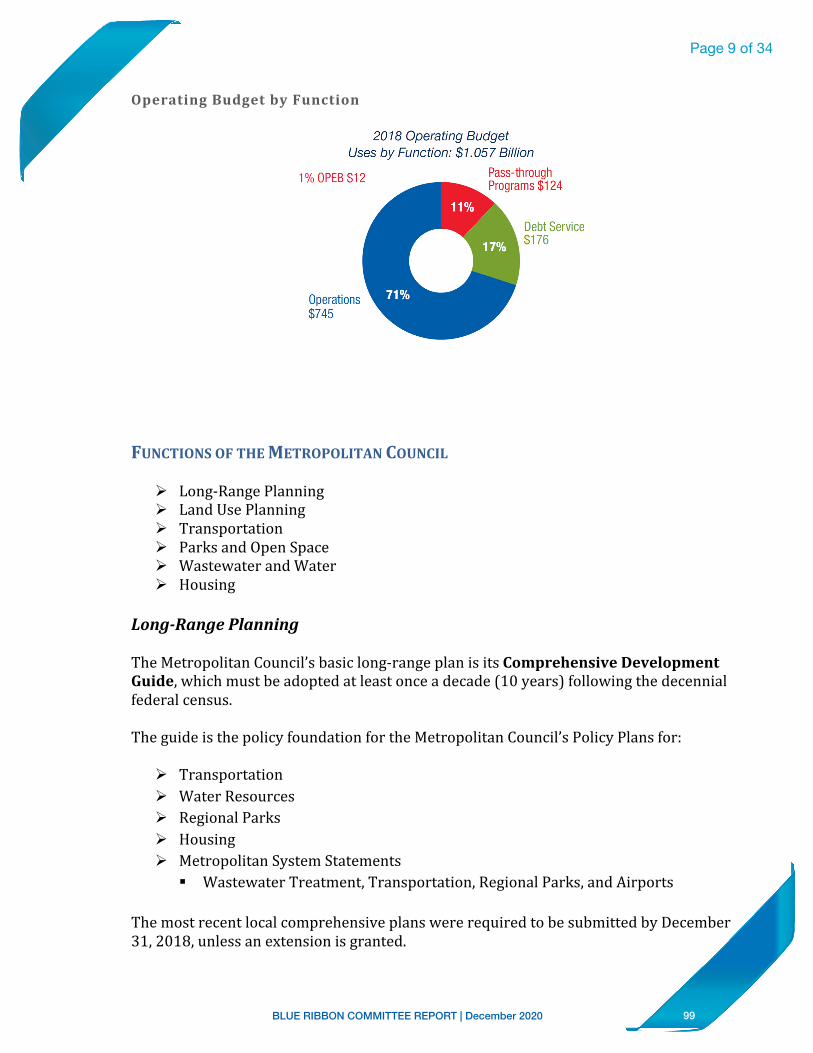
99BLUE RIBBON COMMITTEE REPORT | December 2020
M e t r o p o l i t a n C o u n c i l S t u d y J a n u a r y 2 0 1 9 9 | P a g e
OperatingBudgetbyFunction
FUNCTIONSOFTHEMETROPOLITANCOUNCIL
Ø Long-RangePlanning
Ø LandUsePlanning
Ø Transportation
Ø ParksandOpenSpace
Ø WastewaterandWater
Ø Housing
Long-RangePlanning
TheMetropolitanCouncil’sbasiclong-rangeplanisitsComprehensiveDevelopmentGuide,whichmustbeadoptedatleastonceadecade(10years)followingthedecennial
federalcensus.
TheguideisthepolicyfoundationfortheMetropolitanCouncil’sPolicyPlansfor:
Ø Transportation
Ø WaterResources
Ø RegionalParks
Ø Housing
Ø MetropolitanSystemStatements
§ WastewaterTreatment,Transportation,RegionalParks,andAirports
ThemostrecentlocalcomprehensiveplanswererequiredtobesubmittedbyDecember
31,2018,unlessanextensionisgranted.
Page 9 of 34
2018 Operating Budget Uses by Function: $1.057 Billion
1% OPEB $12
Operations $745
•
/ 17%
71%
Debt Service $176
100BLUE RIBBON COMMITTEE REPORT | December 2020
M e t r o p o l i t a n C o u n c i l S t u d y J a n u a r y 2 0 1 9 1 0 | P a g e
Implementationstrategiesaredevelopedovertheupcomingdecade,withthemostcurrent
ComprehensiveDevelopmentGuide,adoptedin2014,entitledThriveMSP2040.
LandUsePlanning
Althoughlanduseplanningandregulation(zoning,subdivisioncontrol,etc.)isprimarily
withintheauthorityoflocalgovernment,theMetropolitanLandPlanningActof1976
requireslocalgovernmentsto:
§ Developlocalcomprehensiveplansthatincludetheelementsidentifiedbythe
MetropolitanCouncil;
§ SubmittheplanstotheMetropolitanCouncilforreviewofconformitywith
MetropolitanCouncilplansandpolicies;
§ Refrainfromadoptingzoningthatconflictswiththeapprovedlocalcomprehensive
plan.
Transportation
TheMetropolitanCouncilhastwoprincipaltransportationfunctions:
§ Transportationplanning
§ Operationoftheregionaltransitsystem.
TransportationPlanning
TheMetropolitanCouncilisresponsiblefortheefficientandeffectiveregionalinter-modal
transportationplanning,allwithintheconstraintsoflikelyavailablefinancialresources,
including:
§ Aviation
§ Highway,
§ Transit,bicycle,andpedestrian.
Tothisend,theMetropolitanCouncilpreparesitsTransportationPolicyPlaneveryfour(4)
years,amongotherreports,plansandpolicies.
TheMetropolitanCouncilisthedesignatedMetropolitanPlanningOrganization(MPO)for
themetropolitanarea.
Metroarearequestsforfederaltransportationfundingforcertainhighway,bridgeand
transitprojectsarechanneledthroughtheMetropolitanCouncil,whichreviewsand
prioritizestheminconjunctionwiththeMetropolitanCouncil’sTransportationAdvisory
Board(TAB).
Page 10 of 34
101BLUE RIBBON COMMITTEE REPORT | December 2020
M e t r o p o l i t a n C o u n c i l S t u d y J a n u a r y 2 0 1 9 1 1 | P a g e
TRANSPORTATIONADVISORYBOARD
WhatistheTransportationAdvisoryBoard(TAB)andhowdoesitwork?
FederalRequirementsforMetropolitanPlanningOrganizations(MPOs)
• Federallawrequiresthaturbanizedareaswithpopulationoverthan50,000havea
MetropolitanPlanningOrganization(MPO)inplacetobeeligibleforfederalfunding
forcertainhighway,bridgeandtransitprojects.
• Amongotherresponsibilities,theMPOisrequiredtoprioritizerequestsforfederal
fundingoflocaltransportationprojects.
• ThepurposeofMPOreviewistoassurethefederalgovernmentthatfederally
fundedtransportationprojectshavebroadcommunitysupportandthereforeare
likelytobesuccessfullyimplemented.
• Thereareapproximately400federallydesignatedMPOsintheUnitedStates.
• UnderfederallawanMPOmustconsistoflocalelectedofficials,officialsofpublic
agenciesthatadministertransportationservices,andappropriatestateofficials.
• TheMinnesotaTransportationAdvisoryBoard(TAB)consistsofamajorityoflocal
electedofficials.ThelegislatureestablishedtheTABtoenabletheMetropolitan
CounciltobetheMPOforthemetropolitanarea,eventhoughnolocalelected
officialsserveontheMetropolitanCouncil.
• TheMinnesotalegislature,in1974,establishedtheTransportationAdvisoryBoard
(TAB)(MNStatute473.146)toadvisetheMetropolitanCouncilontheprioritization
ofmetropolitanareatransportationprojectsforpotentialfederalfunding.
Historically,theMetropolitanCouncilhasadoptedtheTABprioritiesforfederal
transportationfunding.
WhoServesontheTransportationAdvisoryBoard?
TheTransportationAdvisoryBoard(TAB)consistsof:
§ 17localelectedofficials
§ 16othermembers,includingpersonsrepresentingvarioustransitmodes,state
officials,and8MetropolitanCouncilappointees.
Page 11 of 34
102BLUE RIBBON COMMITTEE REPORT | December 2020
M e t r o p o l i t a n C o u n c i l S t u d y J a n u a r y 2 0 1 9 1 2 | P a g e
OperationoftheRegionalTransitSystem
TheMetropolitanCouncilistheprimaryproviderofregionaltransitservices.
Transitoperationsinclude:
§ Regularroutebusservice(expressandlocal)
§ Dial-a-ride(MetroMobilityandTransitLink)
§ LightRailTransit(LRT)
§ BusRapidTransit(highwayBRTandarterialBRT)
§ CommuterRail.
RegionalParksandTrails
ThroughitsregionalParksPolicyPlan,theMetropolitanCouncilplansfordevelopmentof
theregionalparksystem,whichincludes55regionalparksandregionalparkreserves,400
milesofinterconnectedregionaltrailsandeight(8)specialrecreationalfeatures.
Regionalparksandtrailfacilitiesareowned,developedandoperatedby10local
implementingagencies,notbytheMetropolitanCouncilitself.
TheimplementingagenciesareAnokaCounty,CarverCounty,DakotaCounty,Ramsey
County,ScottCounty,WashingtonCounty,ThreeRiversParkDistrict(chieflysuburban
HennepinCounty),CityofSt.Paul,CityofMinneapolisandCityofBloomington.
TheMetropolitanCouncilapprovestheimplementingagencies’regionalparksplansand
providesgrantstothemforacquisitionanddevelopmentofregionalparkandtrail
facilities.
FundingsourcesforthegrantsincludetheStateofMinnesotaCleanWater,Landand
LegacyAmendment,theEnvironmentalandNaturalResourcesTrustFund,andregional
parkbondsissuedbytheMetropolitanCouncil.
TheMetropolitanCouncilalsoallocatestotheimplementingagencieslegislatively
appropriatedfundsforparkoperationsandmaintenance,althoughmostoperatingcosts
forthesefacilitiesrestswiththeimplementingagencies.
Housing
TheMetropolitanCouncilhastwoprincipalhousingfunctions:housingplanningand
operationofthefederalSection8affordablehousingvoucherprogram.
Page 12 of 34
103BLUE RIBBON COMMITTEE REPORT | December 2020
M e t r o p o l i t a n C o u n c i l S t u d y J a n u a r y 2 0 1 9 1 3 | P a g e
HousingPlanning
1.TheMetropolitanCouncilhasdevelopeditsHousingPolicyPlan,baseduponthe
principlesofThriveMSP2040.
2.TheMetropolitanCouncilguidesandreviewsthehousingelementsoflocal
comprehensiveplans.Itidentifiesexistinghousingneedsandpromotestheallocationof
landfordevelopmentofaffordablehousing.
3.TheMetropolitanCouncilimplementstheLivableCommunitiesProgram,whichawards
grantstocitiesfortheclean-upofpollutedsites,expansionofaffordablehousing
opportunities,andthebuildingofpedestrian-friendlyandtransit-orienteddevelopment.
FundingforthegrantscomesfromtheMetropolitanCouncil’spropertytaxlevyforthis
purpose,inanamountnottoexceed$20millionperyear.
OperationofthefederalSection8affordablehousingvoucherprogram:
Ø MetropolitanCouncil,throughitsHousingandRedevelopmentAuthority(HRA),
administersthefederalSection8voucherprogramfor100suburbsandrural
communitiesinthemetroarea,mainlyinAnoka,Carver,HennepinandRamsey
Counties.
Ø MetropolitanCouncilalsoimplementstheFamilyAffordableHousingProgram,
whichconsistsof~150scatteredsitesinglefamilyhomesandtownhomes,forlow
andverylow-incomefamilies,whopayrentwithSection8vouchers.Thisprogram
wascreatedasaresultoffairhousinglitigationinthemetroarea.
WastewaterandWater
TheMetropolitanCouncilhastwoprincipalwastewaterandwaterfunctions:Wastewater
andwaterplanningandOperationofsewerinterceptorsandwastewatertreatmentplants.
TheMetropolitanCouncilbuilds,operatesandmaintainseightwastewatertreatment
plantsand600milesofsewerinterceptors.
ThroughitsWaterResourcesPolicyPlan,theMetropolitanCouncilundertakeslong-range
planningforthemanagementof:
§ Wastewater
§ Watersupply § Surfacewater.
Page 13 of 34
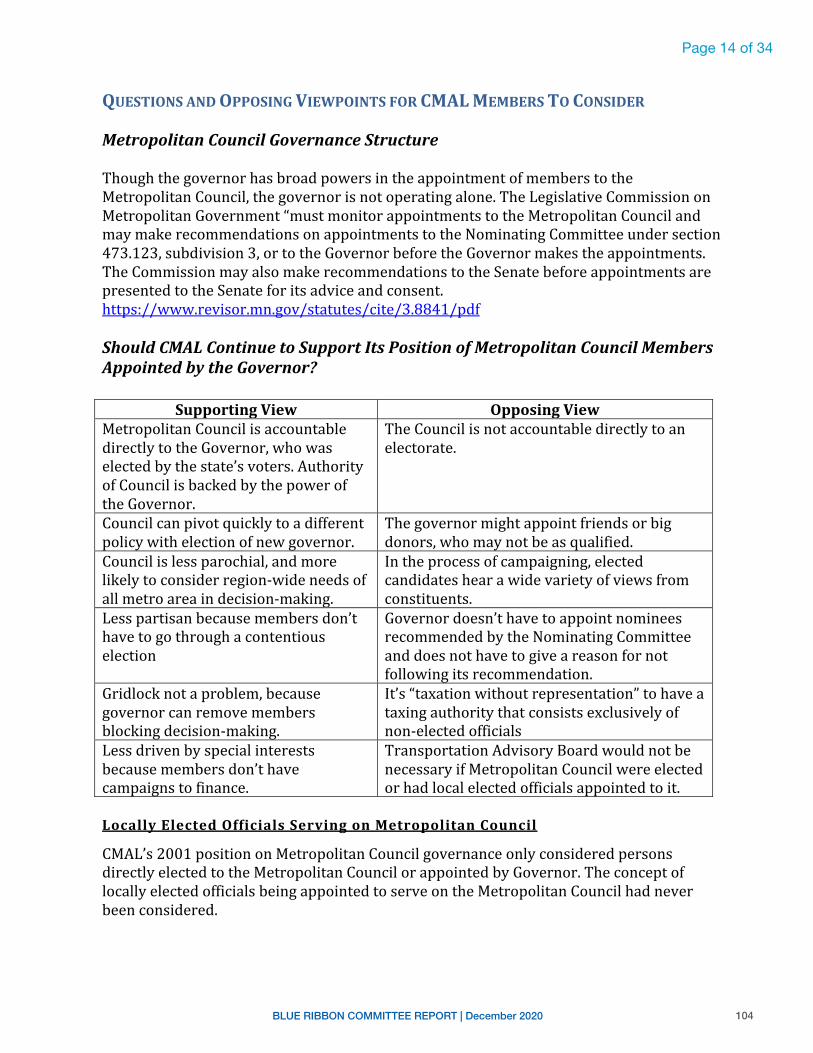
104BLUE RIBBON COMMITTEE REPORT | December 2020
M e t r o p o l i t a n C o u n c i l S t u d y J a n u a r y 2 0 1 9 1 4 | P a g e
QUESTIONSANDOPPOSINGVIEWPOINTSFORCMALMEMBERSTOCONSIDER
MetropolitanCouncilGovernanceStructureThoughthegovernorhasbroadpowersintheappointmentofmemberstothe
MetropolitanCouncil,thegovernorisnotoperatingalone.TheLegislativeCommissionon
MetropolitanGovernment“mustmonitorappointmentstotheMetropolitanCounciland
maymakerecommendationsonappointmentstotheNominatingCommitteeundersection
473.123,subdivision3,ortotheGovernorbeforetheGovernormakestheappointments.
TheCommissionmayalsomakerecommendationstotheSenatebeforeappointmentsare
presentedtotheSenateforitsadviceandconsent.
https://www.revisor.mn.gov/statutes/cite/3.8841/pdf
ShouldCMALContinuetoSupportItsPositionofMetropolitanCouncilMembersAppointedbytheGovernor?
SupportingView OpposingViewMetropolitanCouncilisaccountable
directlytotheGovernor,whowas
electedbythestate’svoters.Authority
ofCouncilisbackedbythepowerof
theGovernor.
TheCouncilisnotaccountabledirectlytoan
electorate.
Councilcanpivotquicklytoadifferent
policywithelectionofnewgovernor.
Thegovernormightappointfriendsorbig
donors,whomaynotbeasqualified.
Councilislessparochial,andmore
likelytoconsiderregion-wideneedsof
allmetroareaindecision-making.
Intheprocessofcampaigning,elected
candidateshearawidevarietyofviewsfrom
constituents.
Lesspartisanbecausemembersdon’t
havetogothroughacontentious
election
Governordoesn’thavetoappointnominees
recommendedbytheNominatingCommittee
anddoesnothavetogiveareasonfornot
followingitsrecommendation.
Gridlocknotaproblem,because
governorcanremovemembers
blockingdecision-making.
It’s“taxationwithoutrepresentation”tohavea
taxingauthoritythatconsistsexclusivelyof
non-electedofficials
Lessdrivenbyspecialinterests
becausemembersdon’thave
campaignstofinance.
TransportationAdvisoryBoardwouldnotbe
necessaryifMetropolitanCouncilwereelected
orhadlocalelectedofficialsappointedtoit.
LocallyElectedOfficialsServingonMetropolitanCouncil
CMAL’s2001positiononMetropolitanCouncilgovernanceonlyconsideredpersons
directlyelectedtotheMetropolitanCouncilorappointedbyGovernor.Theconceptof
locallyelectedofficialsbeingappointedtoserveontheMetropolitanCouncilhadnever
beenconsidered.
Page 14 of 34
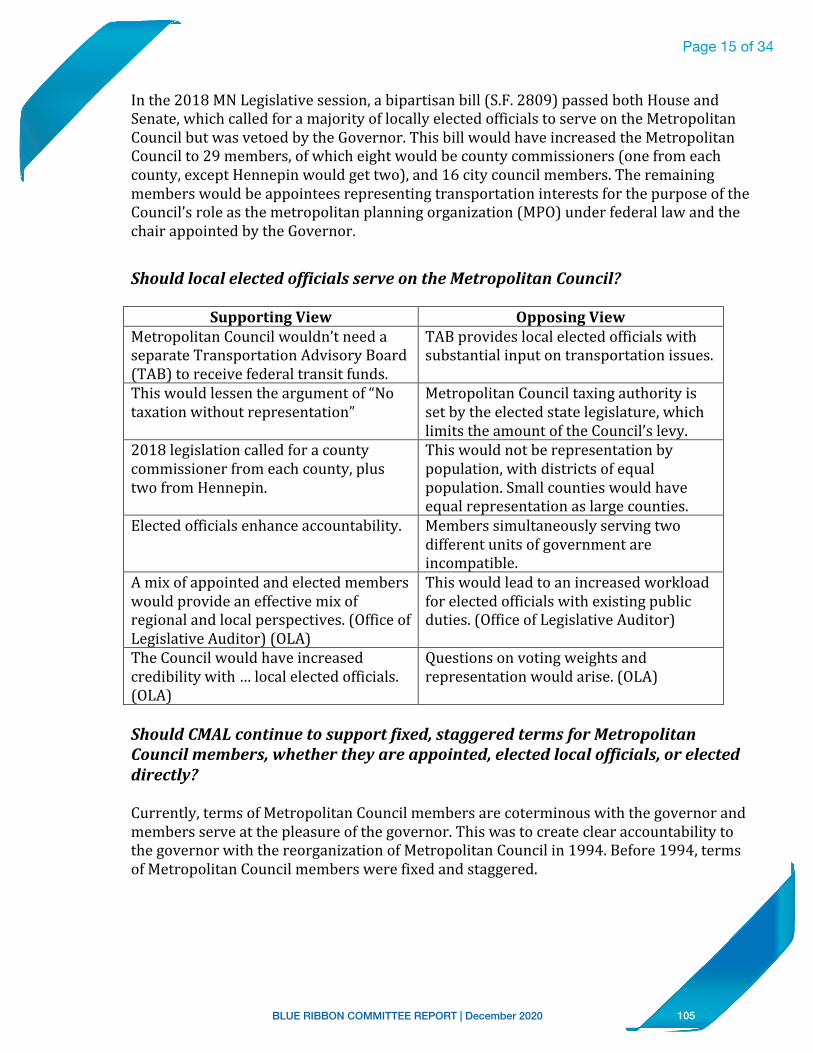
105BLUE RIBBON COMMITTEE REPORT | December 2020
M e t r o p o l i t a n C o u n c i l S t u d y J a n u a r y 2 0 1 9 1 5 | P a g e
Inthe2018MNLegislativesession,abipartisanbill(S.F.2809)passedbothHouseand
Senate,whichcalledforamajorityoflocallyelectedofficialstoserveontheMetropolitan
CouncilbutwasvetoedbytheGovernor.ThisbillwouldhaveincreasedtheMetropolitan
Councilto29members,ofwhicheightwouldbecountycommissioners(onefromeach
county,exceptHennepinwouldgettwo),and16citycouncilmembers.Theremaining
memberswouldbeappointeesrepresentingtransportationinterestsforthepurposeofthe
Council’sroleasthemetropolitanplanningorganization(MPO)underfederallawandthe
chairappointedbytheGovernor.
ShouldlocalelectedofficialsserveontheMetropolitanCouncil?
SupportingView OpposingViewMetropolitanCouncilwouldn’tneeda
separateTransportationAdvisoryBoard
(TAB)toreceivefederaltransitfunds.
TABprovideslocalelectedofficialswith
substantialinputontransportationissues.
Thiswouldlessentheargumentof“No
taxationwithoutrepresentation”
MetropolitanCounciltaxingauthorityis
setbytheelectedstatelegislature,which
limitstheamountoftheCouncil’slevy.
2018legislationcalledforacounty
commissionerfromeachcounty,plus
twofromHennepin.
Thiswouldnotberepresentationby
population,withdistrictsofequal
population.Smallcountieswouldhave
equalrepresentationaslargecounties.
Electedofficialsenhanceaccountability. Memberssimultaneouslyservingtwo
differentunitsofgovernmentare
incompatible.
Amixofappointedandelectedmembers
wouldprovideaneffectivemixof
regionalandlocalperspectives.(Officeof
LegislativeAuditor)(OLA)
Thiswouldleadtoanincreasedworkload
forelectedofficialswithexistingpublic
duties.(OfficeofLegislativeAuditor)
TheCouncilwouldhaveincreased
credibilitywith…localelectedofficials.
(OLA)
Questionsonvotingweightsand
representationwouldarise.(OLA)
ShouldCMALcontinuetosupportfixed,staggeredtermsforMetropolitanCouncilmembers,whethertheyareappointed,electedlocalofficials,orelecteddirectly?Currently,termsofMetropolitanCouncilmembersarecoterminouswiththegovernorand
membersserveatthepleasureofthegovernor.Thiswastocreateclearaccountabilityto
thegovernorwiththereorganizationofMetropolitanCouncilin1994.Before1994,terms
ofMetropolitanCouncilmemberswerefixedandstaggered.
Page 15 of 34
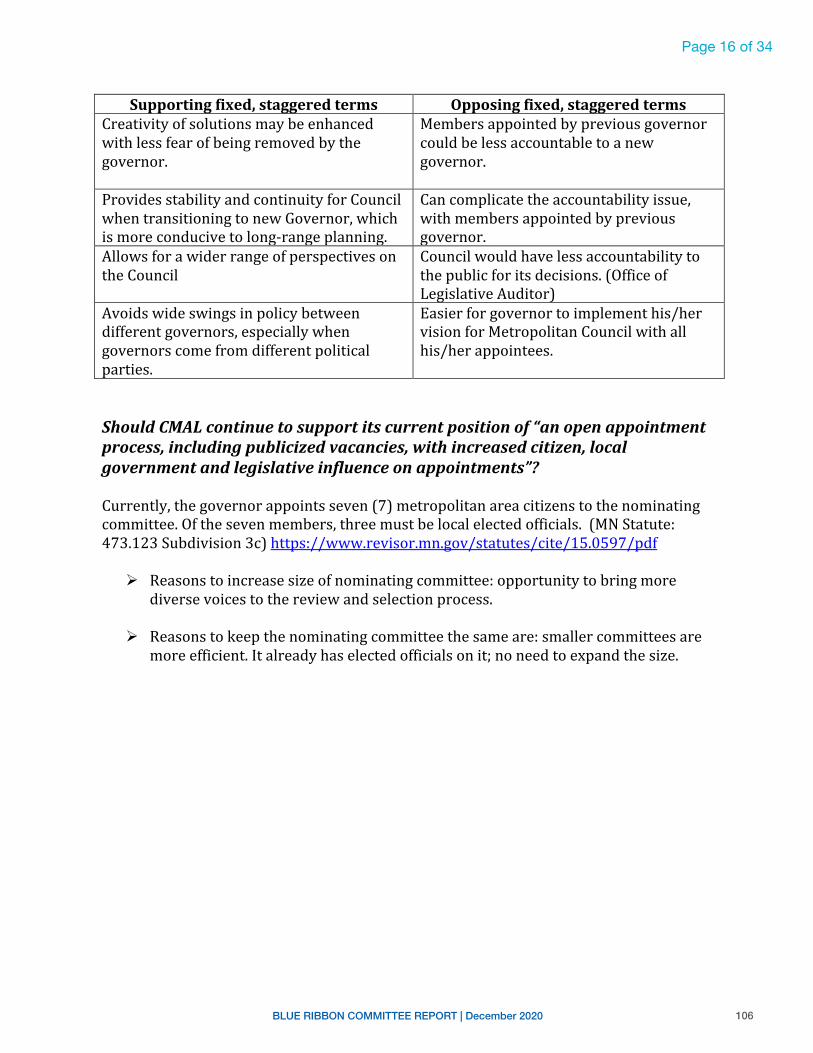
106BLUE RIBBON COMMITTEE REPORT | December 2020
M e t r o p o l i t a n C o u n c i l S t u d y J a n u a r y 2 0 1 9 1 6 | P a g e
Supportingfixed,staggeredterms Opposingfixed,staggeredtermsCreativityofsolutionsmaybeenhanced
withlessfearofbeingremovedbythe
governor.
Membersappointedbypreviousgovernor
couldbelessaccountabletoanew
governor.
ProvidesstabilityandcontinuityforCouncil
whentransitioningtonewGovernor,which
ismoreconducivetolong-rangeplanning.
Cancomplicatetheaccountabilityissue,
withmembersappointedbyprevious
governor.
Allowsforawiderrangeofperspectiveson
theCouncil
Councilwouldhavelessaccountabilityto
thepublicforitsdecisions.(Officeof
LegislativeAuditor)
Avoidswideswingsinpolicybetween
differentgovernors,especiallywhen
governorscomefromdifferentpolitical
parties.
Easierforgovernortoimplementhis/her
visionforMetropolitanCouncilwithall
his/herappointees.
ShouldCMALcontinuetosupportitscurrentpositionof“anopenappointmentprocess,includingpublicizedvacancies,withincreasedcitizen,localgovernmentandlegislativeinfluenceonappointments”?
Currently,thegovernorappointsseven(7)metropolitanareacitizenstothenominating
committee.Ofthesevenmembers,threemustbelocalelectedofficials.(MNStatute:
473.123Subdivision3c)https://www.revisor.mn.gov/statutes/cite/15.0597/pdf
Ø Reasonstoincreasesizeofnominatingcommittee:opportunitytobringmore
diversevoicestothereviewandselectionprocess.
Ø Reasonstokeepthenominatingcommitteethesameare:smallercommitteesare
moreefficient.Italreadyhaselectedofficialsonit;noneedtoexpandthesize.
Page 16 of 34
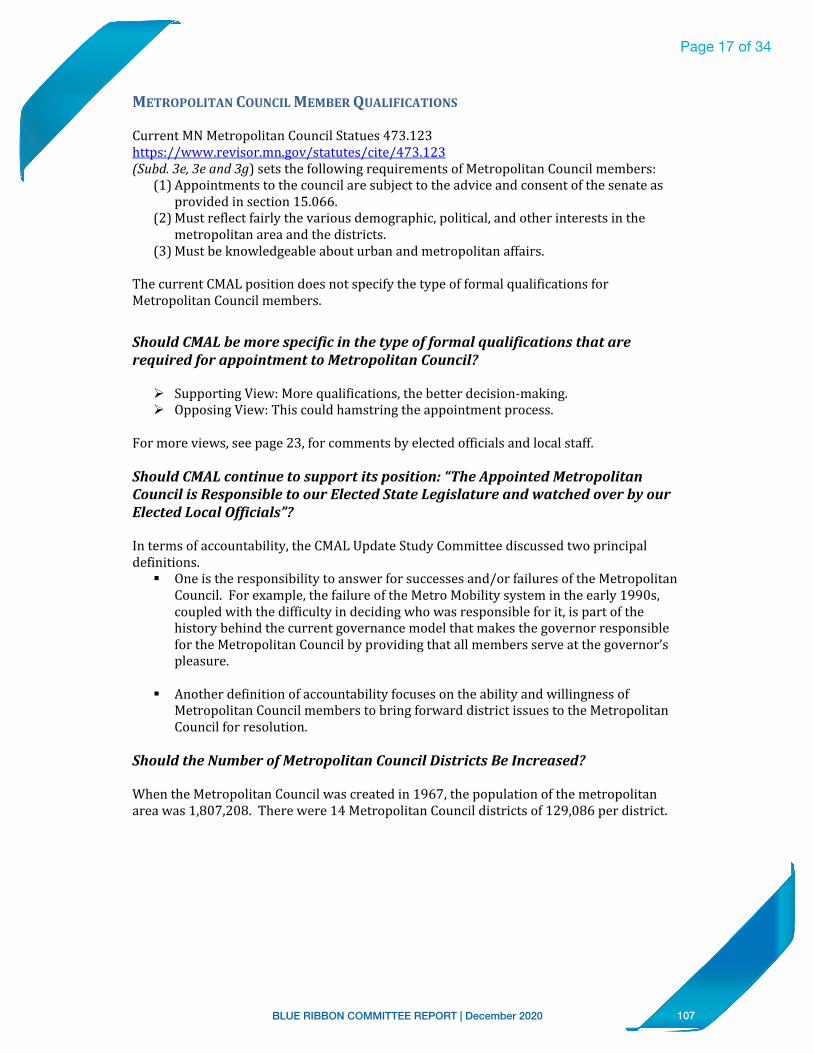
107BLUE RIBBON COMMITTEE REPORT | December 2020
M e t r o p o l i t a n C o u n c i l S t u d y J a n u a r y 2 0 1 9 1 7 | P a g e
METROPOLITANCOUNCILMEMBERQUALIFICATIONS
CurrentMNMetropolitanCouncilStatues473.123
https://www.revisor.mn.gov/statutes/cite/473.123
(Subd.3e,3eand3g)setsthefollowingrequirementsofMetropolitanCouncilmembers:(1) Appointmentstothecouncilaresubjecttotheadviceandconsentofthesenateas
providedinsection15.066.
(2) Mustreflectfairlythevariousdemographic,political,andotherinterestsinthe
metropolitanareaandthedistricts.
(3) Mustbeknowledgeableabouturbanandmetropolitanaffairs.
ThecurrentCMALpositiondoesnotspecifythetypeofformalqualificationsfor
MetropolitanCouncilmembers.
ShouldCMALbemorespecificinthetypeofformalqualificationsthatarerequiredforappointmenttoMetropolitanCouncil?
Ø SupportingView:Morequalifications,thebetterdecision-making.
Ø OpposingView:Thiscouldhamstringtheappointmentprocess.
Formoreviews,seepage23,forcommentsbyelectedofficialsandlocalstaff.
ShouldCMALcontinuetosupportitsposition:“TheAppointedMetropolitanCouncilisResponsibletoourElectedStateLegislatureandwatchedoverbyourElectedLocalOfficials”?Intermsofaccountability,theCMALUpdateStudyCommitteediscussedtwoprincipal
definitions.
§ Oneistheresponsibilitytoanswerforsuccessesand/orfailuresoftheMetropolitan
Council.Forexample,thefailureoftheMetroMobilitysystemintheearly1990s,
coupledwiththedifficultyindecidingwhowasresponsibleforit,ispartofthe
historybehindthecurrentgovernancemodelthatmakesthegovernorresponsible
fortheMetropolitanCouncilbyprovidingthatallmembersserveatthegovernor’s
pleasure.
§ Anotherdefinitionofaccountabilityfocusesontheabilityandwillingnessof
MetropolitanCouncilmemberstobringforwarddistrictissuestotheMetropolitan
Councilforresolution.
ShouldtheNumberofMetropolitanCouncilDistrictsBeIncreased?
WhentheMetropolitanCouncilwascreatedin1967,thepopulationofthemetropolitan
areawas1,807,208.Therewere14MetropolitanCouncildistrictsof129,086perdistrict.
Page 17 of 34
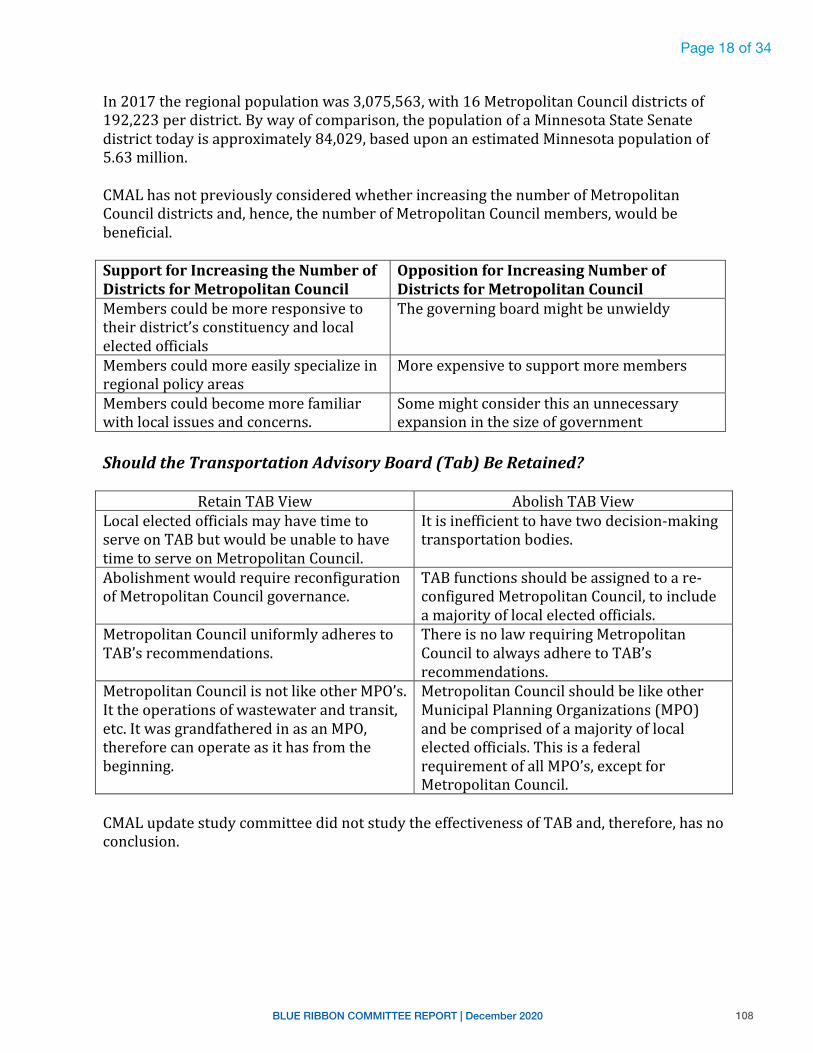
108BLUE RIBBON COMMITTEE REPORT | December 2020
M e t r o p o l i t a n C o u n c i l S t u d y J a n u a r y 2 0 1 9 1 8 | P a g e
In2017theregionalpopulationwas3,075,563,with16MetropolitanCouncildistrictsof
192,223perdistrict.Bywayofcomparison,thepopulationofaMinnesotaStateSenate
districttodayisapproximately84,029,baseduponanestimatedMinnesotapopulationof
5.63million.
CMALhasnotpreviouslyconsideredwhetherincreasingthenumberofMetropolitan
Councildistrictsand,hence,thenumberofMetropolitanCouncilmembers,wouldbe
beneficial.
SupportforIncreasingtheNumberofDistrictsforMetropolitanCouncil
OppositionforIncreasingNumberofDistrictsforMetropolitanCouncil
Memberscouldbemoreresponsiveto
theirdistrict’sconstituencyandlocal
electedofficials
Thegoverningboardmightbeunwieldy
Memberscouldmoreeasilyspecializein
regionalpolicyareas
Moreexpensivetosupportmoremembers
Memberscouldbecomemorefamiliar
withlocalissuesandconcerns.
Somemightconsiderthisanunnecessary
expansioninthesizeofgovernment
ShouldtheTransportationAdvisoryBoard(Tab)BeRetained?
RetainTABView AbolishTABView
Localelectedofficialsmayhavetimeto
serveonTABbutwouldbeunabletohave
timetoserveonMetropolitanCouncil.
Itisinefficienttohavetwodecision-making
transportationbodies.
Abolishmentwouldrequirereconfiguration
ofMetropolitanCouncilgovernance.
TABfunctionsshouldbeassignedtoare-
configuredMetropolitanCouncil,toinclude
amajorityoflocalelectedofficials.
MetropolitanCounciluniformlyadheresto
TAB’srecommendations.
ThereisnolawrequiringMetropolitan
CounciltoalwaysadheretoTAB’s
recommendations.
MetropolitanCouncilisnotlikeotherMPO’s.
Ittheoperationsofwastewaterandtransit,
etc.ItwasgrandfatheredinasanMPO,
thereforecanoperateasithasfromthe
beginning.
MetropolitanCouncilshouldbelikeother
MunicipalPlanningOrganizations(MPO)
andbecomprisedofamajorityoflocal
electedofficials.Thisisafederal
requirementofallMPO’s,exceptfor
MetropolitanCouncil.
CMALupdatestudycommitteedidnotstudytheeffectivenessofTABand,therefore,hasno
conclusion.
Page 18 of 34
109BLUE RIBBON COMMITTEE REPORT | December 2020
M e t r o p o l i t a n C o u n c i l S t u d y J a n u a r y 2 0 1 9 1 9 | P a g e
HowisregionalplanningaccomplishedinotherurbanareasoftheUnitedStates?
Asnotedabove,thereareapproximately400MetropolitanPlanningOrganizations
(MPOs)intheUnitedStates.CMALhadintendedtoundertakeareviewofatleastsomeof
these,inordertoofferacomparisonwithourmetropolitanarea.
ItwasnotrealisticforustoundertakeacomparativestudyofMPOsinthetimeframe
availablefortheupdatestudy,howeverthereisawidevarietyamongMPOsastotheir
areasofauthorityandresponsibility.
MostMPOshaveonlyplanningauthority;notmanyoperateregionalservicesdirectly,such
asinMinnesota.AllMPOsexcepttheMetropolitanCouncilincludelocalelectedofficialsor
directlyelectedofficialsontheirboards.
TherearealsoawidevarietyoflegalclimatesinwhichMPOsoperate.Someareashave
manylocalgovernmentalunits(suchasinMinnesota)andotherdonot.
Inessence,avalidcomparisonwithotherMPOswillhavetotakeintoconsiderationscope
aswellofgovernancestructure;anythingshortofthatwouldresultinanapples-to-oranges
comparison.
ArelocalofficialssatisfiedwiththeMetropolitanCouncil?
FromOctobertomid-December2018,36CMALmembersfrom16localleagues
interviewed50citymayors,councilmembers,countycommissioners,county
administrators,citymanagers,planningdirectors,andcommunitydevelopmentdirectors.
Thepurposeoftheinterviewswastogatheropinionsofthoseinlocalgovernmentwho
havethemostinteractionwithMetropolitanCounciltodeterminethepositiveandnegative
impactsofMetropolitanCounciloncitiesandcounties,andwhat,ifany,changestothe
governanceandselectionprocessforMetropolitanCouncilwouldbesupported.
Allthoseinterviewedwereassuredtheiranswerswereanonymousandwouldonlybe
knownintheaggregatecompilations.
Page 19 of 34
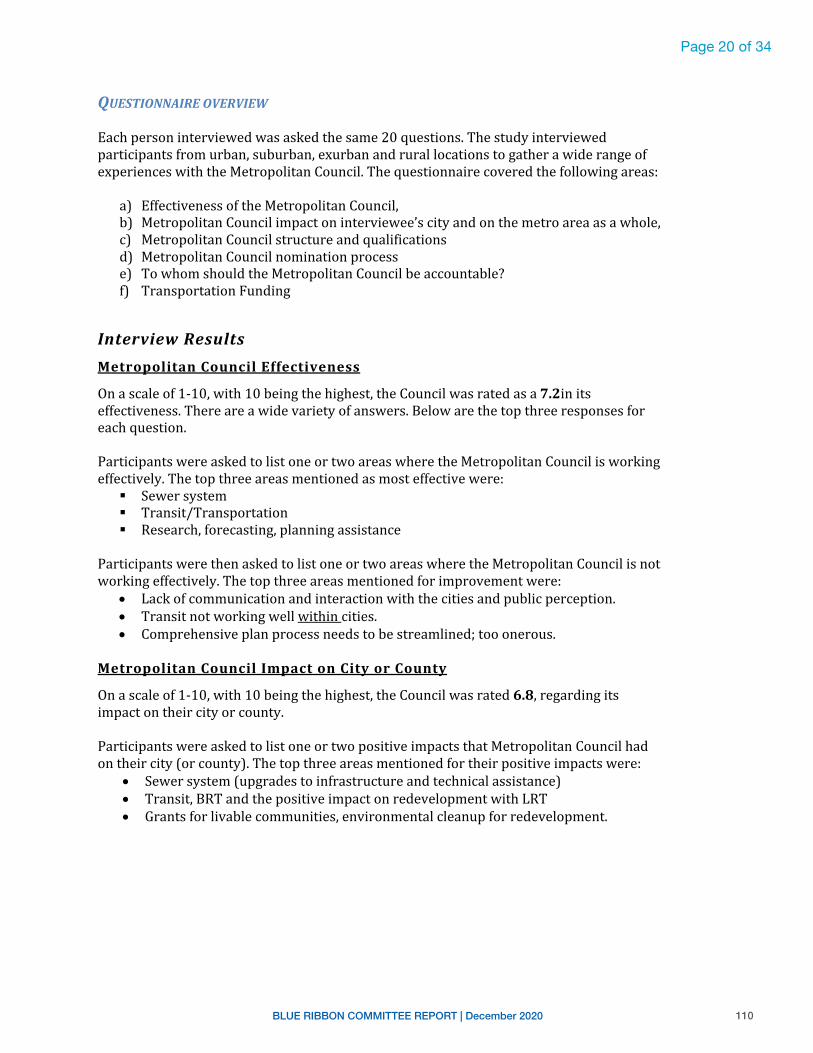
110BLUE RIBBON COMMITTEE REPORT | December 2020
M e t r o p o l i t a n C o u n c i l S t u d y J a n u a r y 2 0 1 9 2 0 | P a g e
QUESTIONNAIREOVERVIEW
Eachpersoninterviewedwasaskedthesame20questions.Thestudyinterviewed
participantsfromurban,suburban,exurbanandrurallocationstogatherawiderangeof
experienceswiththeMetropolitanCouncil.Thequestionnairecoveredthefollowingareas:
a) EffectivenessoftheMetropolitanCouncil,
b) MetropolitanCouncilimpactoninterviewee’scityandonthemetroareaasawhole,
c) MetropolitanCouncilstructureandqualifications
d) MetropolitanCouncilnominationprocess
e) TowhomshouldtheMetropolitanCouncilbeaccountable?
f) TransportationFunding
InterviewResults
MetropolitanCouncilEffectiveness
Onascaleof1-10,with10beingthehighest,theCouncilwasratedasa7.2inits
effectiveness.Thereareawidevarietyofanswers.Belowarethetopthreeresponsesfor
eachquestion.
ParticipantswereaskedtolistoneortwoareaswheretheMetropolitanCouncilisworking
effectively.Thetopthreeareasmentionedasmosteffectivewere:
§ Sewersystem
§ Transit/Transportation
§ Research,forecasting,planningassistance
ParticipantswerethenaskedtolistoneortwoareaswheretheMetropolitanCouncilisnot
workingeffectively.Thetopthreeareasmentionedforimprovementwere:
• Lackofcommunicationandinteractionwiththecitiesandpublicperception.
• Transitnotworkingwellwithincities.
• Comprehensiveplanprocessneedstobestreamlined;tooonerous.
MetropolitanCouncilImpactonCityorCounty
Onascaleof1-10,with10beingthehighest,theCouncilwasrated6.8,regardingits
impactontheircityorcounty.
ParticipantswereaskedtolistoneortwopositiveimpactsthatMetropolitanCouncilhad
ontheircity(orcounty).Thetopthreeareasmentionedfortheirpositiveimpactswere:
• Sewersystem(upgradestoinfrastructureandtechnicalassistance)
• Transit,BRTandthepositiveimpactonredevelopmentwithLRT
• Grantsforlivablecommunities,environmentalcleanupforredevelopment.
Page 20 of 34
111BLUE RIBBON COMMITTEE REPORT | December 2020
M e t r o p o l i t a n C o u n c i l S t u d y J a n u a r y 2 0 1 9 2 1 | P a g e
ParticipantswerethenaskedtolistoneortwoareaswheretheMetropolitanCouncilhada
negativeimpactontheircity(orcounty).Thetopthreeareasmentionedasnegative
impactsontheircitywere:
• ComprehensivePlan:hugeprocessevery10years,unclearcriteria,missioncreep,
densityrequirementsthatdon’tconsidernaturallyoccurringaffordablehousing
(NOAH);mandatestoputthingsintoplanbutcannotdoplanwithoutmoney;‘one-
size-fits-all’goalsandnotmuchflexibility.
• Bureaucracyandlackofresponsiveness.Longprocesstochangelanduse.
• Seweraccesschargesareaffectingbusinessgrowth(citedbyfourcities).
MetropolitanCouncilMembership
ThesurveywantedtounderstandifthecurrentMetropolitanCouncilmembershipis
workingoriftherewassupportforchangesinthestructure.
InthecurrentstructuretheGovernorappointsthemembership.
§ 51%supportthecurrentsystemofthegovernorappointingMetropolitanCouncil
members.
AllwereaskediftheywouldsupportanyofthefollowingchangesintheMetropolitan
Councilmembershipstructure:
§ 88%supportedswitchingtofixed,staggeredtermsforthebenefitoflong-range
planningandtomaintaininstitutionalknowledgewhenanewgovernoriselected,
especiallyiffromadifferentpoliticalparty.Thoseopposingstaggeredtermsliked
governorwithhis/herteam.Twoopposedanythingtodowithgovernorappointing.
§ 46%favoredcountiesandcitiesappointingmembers.Supporterswantedmore
localinputintotheprocess.Opposingviewswerethatitmightbetooparochial,too
political,toocomplicatedandsomewouldfeartherepresentedcounties.
§ 30%supportcountiesandcitieswithineachdistrictappointingmemberswhoare
localelectedofficials.Supportersfeltelectedofficialswerebetteratcommunicating
andwouldincreaseaccountability.Opposingviewswerethatelectedofficialswould
nothavethetime(citedmostoftenbytheelectedofficials)andincompatible
interestsassociatedwithservingtwodifferentconstituencies.
§ 21%supportedexpandingmembershiptoincludecitizens-at-large.Supportfor
moreinput,butmostopposedseeingnovalueinincreasingthesize.
§ 19%supportedthedirectelectionofMetropolitanCouncilmembers.Supporters
saidthiswouldgivemoreaccountabilityasataxingauthority,butmostopposed
thisasthedistrictwouldbetoolarge,itwouldbecomehyper-partisanandfeared
MetropolitanCouncilwouldlosesightofwhat’sbestfortheregion.
Page 21 of 34
112BLUE RIBBON COMMITTEE REPORT | December 2020
M e t r o p o l i t a n C o u n c i l S t u d y J a n u a r y 2 0 1 9 2 2 | P a g e
§ 14%supportedexpandingthemembershipbyincreasingthenumberofDistricts
withintheMetropolitanCouncil.MostopposedincreasingthesizeofCouncil.
Supporterslikedthatrepresentativeswouldhavemoretimetomeetwithcities.
ChairoftheMetropolitanCouncil
Currently,theGovernorappointstheChairoftheMetropolitanCouncil.
§ 72%supportedthegovernor’sappointingtheMetropolitanCouncilchair.
Thesurveyasksallparticipantsifthefollowingchangesintheappointmentof
MetropolitanCouncilmembersmightbeconsidered:
§ 46%wouldsupportmembershipelectingtheChairthroughaninternalprocess
betweenCouncilmembers.Supportercomment:Itwouldbe“self-governing”.
Commentsagainstthissaiditcouldcreatealotofpoliticsorfactions;andthatthe
newmemberswouldn’tknoweachother.
§ 17%supportedtheLegislaturedevelopingaprocesstoselectthechair.Supportfor
thiswasthattheruralviewpointsmightbebetterrepresented;opposition
questionedwhylegislatorsoutsidethemetroareashouldhaveasayandthatthis
wouldslowdowntheprocessofselectingachair.
RemovalofMembers
Currently,theGovernormayreplaceamemberforanyreason.
§ 61%supporttheprocessthatonlythegovernorcanreplaceamemberforany
reason,withthecaveatthatthegovernorcouldnotsimplyreplaceallprevious
administrationappointees.
Thesurveyaskedallparticipantsifthefollowingchangesinthereplacementof
MetropolitanCouncilmembersmightbeconsidered:
§ 49%supporttheCouncildevelopingaprocessforremovingmembers.
§ 36%supporttheLegislaturedevelopingaprocessforremovingmembers.
Mostcommentswerethatwhoeverappointsshouldbeabletoremovemembers.
Otherssaidthereshouldbesomeproceduralprocessorcodeofconductdevelopedin
casetherewasaproblem.
MetropolitanCouncilMembershipQualifications
Currently,thequalificationsformembershipontheMetropolitanCouncilinclude:
Ø Candidatemustliveinthedistrict
Ø Candidatemustbeknowledgeableabouturbanandmetropolitanissues
Page 22 of 34
113BLUE RIBBON COMMITTEE REPORT | December 2020
M e t r o p o l i t a n C o u n c i l S t u d y J a n u a r y 2 0 1 9 2 3 | P a g e
Ø Candidatemustfairlyrepresentthevariousdemographic,politicalandother
interestsoftheirdistrict.
§ 90%supportthecurrentMetropolitanCouncilmembershipqualifications.
Thesurveyalsoaskedabouttheimportanceofthefollowingqualificationsformembership
intheCouncil.
Onascaleof1-10with10beingthehighest:
§ AverageRankof9.2:Candidatescancommitthetimenecessarytoachievethe
Council’sobjectives.78%ratedthisasveryimportant(9or10).
§ AverageRankof7.2:Candidateshavesubjectmatterexpertise.26%ratedthisvery
important.
§ AverageRankof7.1:Candidateshaveexperienceinlocalgovernment.30%rated
thisveryimportant.
§ AverageRankof6.8:Candidatesrepresenttheirdistrict’sdemographics.24%rated
thisveryimportant.
Respondentsaddedotherqualifications:suchascollaborative,nonpartisan,market
knowledge,openminded,understandruralaffairs,visionarythinkers,notsingleissue,and
goodcommunicator.
MetropolitanCouncilMemberNominationandSelectionProcess
Currently,theGovernorhastheresponsibilityto:
Ø AppointaNominationCommitteeofseven(7)memberstoreviewapplicationsfor
Councilmembershipforall16Districts.
Ø Fromthoseapplications,theNominationCommitteeproposesaslateofcandidates
totheGovernor.
Ø Theslateofcandidatesisnotmadepublic,andtheGovernormaychoosefromthis
slateorselectfromoutsidetheslate.
Ø Theslateofproposedcandidatesisnotpublished,andtheGovernorcanoptto
choosetheslateornominateothercandidates.
50%supportedthecurrentmembershipnominationprocess.
Allparticipantswereaskedwhatchangestheywouldsupporttothenominationprocess.
§ 40%feltthattheNominationCommitteeshouldbeexpandedto13members.
Supporterssaiditwouldbringmorediversevoicestotheselectionprocess.Those
opposedcitedthatitwouldstillbethegovernorappointing.
Page 23 of 34
114BLUE RIBBON COMMITTEE REPORT | December 2020
M e t r o p o l i t a n C o u n c i l S t u d y J a n u a r y 2 0 1 9 2 4 | P a g e
§ 60%feltthatiswasimportanttoexpandthenominationcommitteetoinclude
electedcityandcountyofficials.Somesupporterswantedamajorityofelectedcity
andcountyofficialsonthecommittee,especiallyiftherearen’telectedofficialson
MetropolitanCouncil.Otherssaidtherealreadyareelectedofficialsonthis
committeeandwereconcernedaboutitbeingself-serving.Somesuggestedhaving
pastelectedofficialsoncommitteeinstead.
§ 40%feltitwasnecessarytoestablishdistrictcommitteestoreceivenominations
fortheirdistrictandmakerecommendationstotheNominatingCommittee.
Asupportingcomment:“Representationwouldbebetter.”Opposingcomment:“I’m
concernedtheprocesswouldbegettingtoocomplexandbureaucratic.”
§ 60%supportedtheproposedslateofcandidatesbepublishedpriortothegovernor
selectingthefinalcandidates.Somerespondedtoadd“21days”beforeappointment
fortransparency.Thoseopposedwereconcernedtherecouldbelobbyingpressure
andalsocoulddiscouragesomefromapplying.
• 50%felttheGovernorshouldexplainwhyhe/shedidnotappointfromthe
recommendedslateofcandidates.(Somesupportedbutsaidgovernorshould
explainwhyhischoice,insteadofwhynotfromtheslate.)
MetropolitanCouncilAccountability
ParticipantswereaskedtowhomshouldtheMetropolitanCouncilbeaccountable?
Theycouldselectanyorallofthechoicesbelow:
§ Governor(56%)
§ ResidentsofeachDistrict(56%)
§ MetropolitanRegionasawhole(52%)
§ Legislature(22%)
§ FederalrulesmandatingtheCouncil(20%)
§ Localelectedofficials(18%)
MetropolitanCouncilandTransportationAdvisoryBoard
Participantswereasked,“HowwelldotheMetropolitanCouncilandtheTransportation
AdvisoryBoardworktogether?
Onascaleof1-10,with10beingthehighest:
§ 28%ofparticipantsdidnothaveenoughexperiencetoanswerthequestion.
§ 72%respondedwiththeaveragerankingof7.9
TransportationFunds
Participantswereasked,“HowfairisthecurrentdistributionofMetropolitanCouncil
transportationfundstoyourcityorcounty”?
Page 24 of 34
115BLUE RIBBON COMMITTEE REPORT | December 2020
M e t r o p o l i t a n C o u n c i l S t u d y J a n u a r y 2 0 1 9 2 5 | P a g e
Onascaleof1-10,with10beingthehighest:
§ 20%ofparticipantsdidnothaveenoughexperiencetoanswerthequestion.
§ 80%respondedwithanaveragerankof6.7.
Commentsontransportationfundingrangedfrom“thescoringprocessisfair”to“unfair”.
Somesaideastmetrogetslessfundingthanwestmetro.Anothersaidsomeprojectsmay
bemoreexpensivethanothers,butoveradecade,theyachievegeographicbalancein
distributinglimitedfunds.
Someaskedforamoretransparentscoringprocess;otherssaidtherewasnobias.One
suburbancitysaidtheyneedmorecoordinationofinfrastructureforstreetsandroads
whenthesewerlinesareexpanded.Anothersaidnotallcitieshavethepersonnel“savvy”
ortimetowritetheapplicationsfortransportationfunds.
Thereweremanyinterestingandinformativecommentsfromlocalofficialsthatwillbe
publishedlaterinanaggregatedformatforanonymitytothoseofficialsinanappendixto
thisreport.
Page 25 of 34
116BLUE RIBBON COMMITTEE REPORT | December 2020
M e t r o p o l i t a n C o u n c i l S t u d y J a n u a r y 2 0 1 9 2 6 | P a g e
BIBLIOGRAPHY
Reports
CitizensLeague.TheMetropolitanCouncil:RecalibratingfortheFuture.April4,2016.
CitizensLeagueontheMetropolitanCouncil
Haigh,Susan.:TheMetropolitanCouncil.”WilliamMitchellL.Rev.1602013-2014.
MetroGovernanceTransparencyInitiative(MGTI)metrogovernance.com
MetropolitanCounciloftheTwinCities,metrocouncil.org
MetropolitanMaze2000.CouncilofMetropolitanAreaLeaguesofWomenVoters.
September2000.
Naftalin,Arthur.MakingOneCommunityoutofMany–PerspectivesontheMetropolitan
CounciloftheTwinCitiesArea.(MetropolitanCouncil,September1986).
OfficeoftheLegislativeAuditor.GovernanceofTransitintheTwinCitiesRegion.January
2011.
Press
Burkhardt,KevinandKing,Jason.“BringtheMetCouncilintothe21stCentury.”Star
Tribune,August18,2017.
Callaghan,Peter.“AbilltoreformtheMetCouncilwillprobablybevetoedThatdoesn’t
meanalotofpeoplestilldon’thaveproblemswiththeMetCouncil.MinnPost,May5,2018.
Crockett,KimandKing,Jason.“MetCouncilneedsmorethantweaks.”Startribune,April
28,2016.
Dornfeld,Steve.“MetCouncilActuallyServesMetroAreaQuiteWell.”Startribune,August
3,2017.
Editorialstaff.“Fedsshouldn’tinterferewithMetCouncil.”StarTribune,April30,2018.
Gamache,MikeandThompson,Annette.“It’stimetochangethemakeupoftheunelected
MetCouncil.”StarTribune,May13,2018.
Gaylord,KathleenandMaluchnik,Randy.“Here’sanewwaytoappointMetCouncil
members.”StarTribune,July13,2017.
Page 26 of 34
117BLUE RIBBON COMMITTEE REPORT | December 2020
M e t r o p o l i t a n C o u n c i l S t u d y J a n u a r y 2 0 1 9 2 7 | P a g e
Hovland,James,Kautz,ElizabethandWilliams,Janet.“Noneedtomesswiththe
MetropolitanCouncil.”StarTribune,May4,2018.
Lewis,Jason.“ApologistsforunelectedMetCouncilgetdesperate.”OpinionPage,Star
Tribune,May10,2018.
Look,Matt,Maluchnik,Randy,Schouweiler,Nancy,andUlrich,Jon.“TheMetropolitan
Council:It’slongpasttimetomakeitaccountabletothepublic.”StarTribune,October1,
2016.
Moore,Janet.“Rep.Lewis’movetoretoolMetCouncilfailsinD.C.”StarTribune,October
11,2018.
Nelson,Emma.“CoalitionpushesmajorMetcouncilbreakdown.”StarTribune,October23,
2016.
Roper,Eric.“U.S.HouseOKsMeasuretakingaimatMetCouncil.”StarTribune,April27,
2018.
Roper,Eric.“LegislaturesendsMetcouncilreformstoDayton.”StarTribune,May18,
2018.
Roper,Eric.“Rep.LewisseekstocurbMetCouncilrole.”StarTribune,May3,2018.
Runbeck,LindaandPeppin,Joyce.“Whythisunelectedgoverningbodyneedsreforms.”
StarTribune,November18,2017.
Sturdevant,Lori.“Oursuccessisaregionalstory–atriskofanunhappyending.”Star
Tribune,February4,2018.
Taylor,Zach.“TheMetropolitanCouncil:beforecuringitsmakeup,understanditshistory.”
StarTribune,May24,2018.
Page 27 of 34
118BLUE RIBBON COMMITTEE REPORT | December 2020
M e t r o p o l i t a n C o u n c i l S t u d y J a n u a r y 2 0 1 9 2 8 | P a g e
ACKNOWLEDGEMENTS
TheCouncilofMetropolitanAreaLeaguesofWomenVoters(CMAL)gratefully
acknowledgesthetimeandinputfromboththeinterviewersandthoseinterviewed.
TheircontributionshelpedCMALmembersunderstandtheimpactofMetropolitanCouncil
anditsgovernancestructureoncitiesandcounties.Themanyprofessionalsintheareaof
governancehelpedthestudycommitteeunderstandtheoverviewoftheissues.Thankyou
tothefollowing:
AleneTchourumoff,Chair,MetropolitanCouncil
CharlieVanderAarde,GovernmentRelationsSpecialist,MetroCities
C.TerrenceAnderson,UofMCenterforUrbanandRegionalAffairs
MaryAnderson,formerMetropolitanCouncilChairandformerMayorofGoldenValley
KeithCarlson,ExecutiveDirector,MinnesotaInter-CountyAssociation
DebDyson,LegislativeAnalyst,MinnesotaHouseofRepresentatives
PahouaYangHoffman,ExecutiveDirector,CitizensLeague
AngelaKlebsch,PolicyDirector,CitizenLeague
PatriciaNauman,ExecutiveDirector,MetroCities
KatieRodriguez,MetropolitanCouncilmember
KathleenSalzman,formerMinnesotaStateSenator,consultanttoMGTI
MayorsBobApplegren,Randolph
MyronBailey,CottageGrove
ToddCarlson,Excelsior
MollyCummings,Hopkins
GerryDeLaVega,TonkaBay
MaryHamann-Roland,AppleValley
ShepHarris,GoldenValley
KathiHemken,NewHope
JimHovland,Edina
ElizabethB,Kautz,Burnsville
DebKind,Greenwood
BillMars,Shakopee
JakeSpano,St.LouisPark
MarkSteffenson,MapleGrove
BradWiersum,Minnetonka
JanetWilliams,Savage
ScottZerby,Shorewood
EdwinaGarcia,CityofRichfield,CouncilMember
CityManagers,CommunityDevelopmentDirectorsandPlanningDirectorsJeffDahl,CityofWayzataCityManager
MarieDarling,CityofShorewoodPlanningDirector
DonnaDrummond,CityofSt.PaulPlanningDirector
Page 28 of 34
119BLUE RIBBON COMMITTEE REPORT | December 2020
M e t r o p o l i t a n C o u n c i l S t u d y J a n u a r y 2 0 1 9 2 9 | P a g e
JenniFaulkner,CityofBurnsvilleCommunityDevelopmentDirector
GrantFernelius,CityofCoonRapids,CommunityDevelopmentDirector
DustyFinke,CityofMedinaPlanningDirector
TimGladhill,CityofRamseyCommunityDevelopmentDirector
JohnHinzman,CityofHastings,CommunityDevelopmentDirector
EricHoversten,CityofMoundCityManager/Planner
JillHutmacherCityofEaganCommunityDevelopmentDirector
SteveJuetten,CityofPlymouthCommunityDevelopmentDirector
ThomasLawell,CityofAppleValley,CityAdministrator
JenniferLevitt,CityofCottageGroveInterimCityAdministrator
DeanLotter,CityofNewBrightonCityManager
MichaelMartin,CityofMaplewoodEconomicDevelopmentDirector
KirkMcDonald,CityofNewHopeCityManager
MegMcMonigal,CityofSt.LouisParkPrincipalPlanner
JustinMiller,CityofLakevilleCityAdministrator
HeidiNelson,CityofMapleGroveCityAdministrator
DaveOsberg,CityofEaganCityAdministrator
JohnSutter,CityofCrystalCommunityDevelopmentDirector
JeffThomson,CityofWayzata,PlanningandBuildingManager
JohnTingley,CityofTonkaBayAdministrator
PatTrudgeon,CityofRosevilleCityManager
BillTurnblad,CityofStillwaterCommunityDevelopmentDirector
JamieVerbrugge,CityofBloomingtonCityManager
SeanWalther,CityofSt.LouisParkPlanning/ZoningSupervisor
JasonZimmerman,CityofGoldenValleyPlanningDirector
EricZweber,CityofMapleGrove,InterimSeniorPlanner
CountyJanCallison,HennepinCountyCommissionerDistrict6
LindaHiggins,HennepinCountyCommissionerDistrict2
MattLook,AnokaCountyCommissionerDistrict1
MattSmith,DakotaCountyAdministrator
LeagueofWomenVotersVolunteerInterviewersSusanAnderson,LWVAnoka,BlaineandCoonRapids
PollyBergerson,LWVDakotaCounty
GinnyBjerke,LWVNewBrighton
DorothyBoen,LWVMinnetonka,EdenPrairie,andHopkins
PaulaSteinClark,LWVDakotaCounty
PegDuBord,LWVSouthTonka
ShannonEmil,LWVSouthTonka
KayErickson,LWVSouthTonka
ColleenFeige,LWVEdina
LindeGassman,LWVDakotaCounty
SherryHood,LWVRosevilleArea
HollyJenkins,LWVDakotaCounty
Page 29 of 34
120BLUE RIBBON COMMITTEE REPORT | December 2020
M e t r o p o l i t a n C o u n c i l S t u d y J a n u a r y 2 0 1 9 3 0 | P a g e
EleanorJohnson,LWVBrooklynPark,Osseo,MapleGrove
BonnieKoch,LWVRosevilleArea
LisaKopas-Lane,LWVSouthTonka
AnneKoutnik,LWVDakotaCounty
LindaKrefting,LWVBrooklynPark,OsseoandMapleGrove
PeggyKvam,LWVMinnetonka,EdenPrairieandHopkins
IdelleLongman,LWVEdina
MarthaMicks,LWVGoldenValley
TamaraMittelstadt,LWVWoodbury/CottageGroveArea
SharonMurphy-Garber,LWVSouthTonka
ArdythNorem,LWVWayzataPlymouthArea
PaulaOverby,LWVDakotaCounty
MaryRice,LWVBloomington
JeanRozinka,LWVWoodbury/CottageGrove
KarlaSand,LWVWoodburyandCottageArea
ElaineSavick,LWVSt.LouisPark
KarenSchaffer,LWVRosevilleArea
MaureenScaglia,LWVRichfield
JoAnnSchaub,LWVSouthTonka
MiriamSimmons,LWVWhiteBearLakeArea
CarolThiss,LWVSouthTonka
KayThompson,LWVSouthTonka
MarciaWattson,LWVBloomington
LoisWendt,LWVCrystal,NewHopeandEastPlymouth
TracyWhitney,LWVSouthTonka
KarenZais,LWVSouthTonka
CMALStudyCommitteeKarenSchaffer,CommitteeChair
SusanAnderson
PegDuBord
HollyJenkins
LynneMarkus
MarthaMicks
ArdythNorem
ElaineSavick
Page 30 of 34
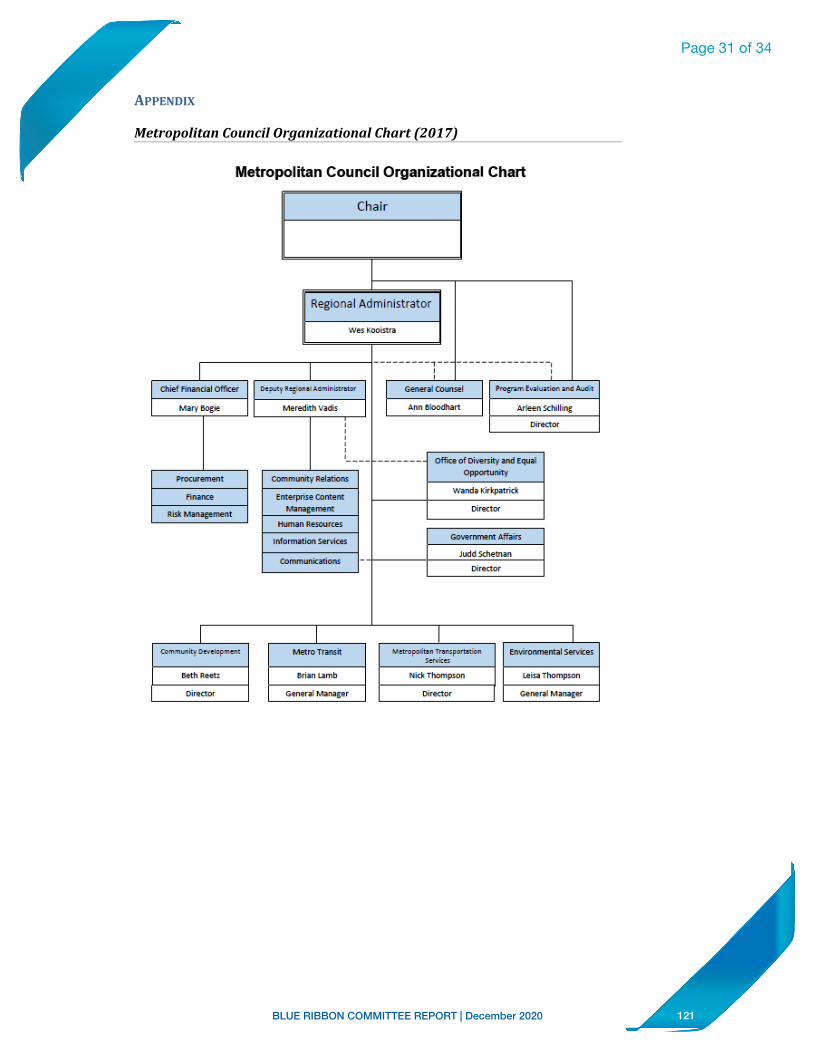
121BLUE RIBBON COMMITTEE REPORT | December 2020
M e t r o p o l i t a n C o u n c i l S t u d y J a n u a r y 2 0 1 9 3 1 | P a g e
APPENDIX
MetropolitanCouncilOrganizationalChart(2017)
Page 31 of 34
Metropolitan Council Organizational Chart
Chair
Regional Administrator
Wes Kooistra
---------1------------------. I I I '
Chief financial Officer I Douty R.e:s;onaJ AC-"l"li t1i:trnor I GtNral co.....i I Prova-m Evalua!ion and Auc:t
Mary IIOC:;. I M•r•dithvacis I Ann 8loo<llan I Arffll SChillinC
' Director I
' I I , ____ ~------- 4 Office of Oiver,~y and Equal
Procurement community RelatiDns Opportunity
Fin..ct Ente,prise <X>ntont Wanda Kirkpatrick
Rtslt Mlruigement Miflilgtmlnl Director
Humin R.esou.rce:s
lnfommion services Government Affairs
Judd SChttn.an convnunicn<>ns
oireaor
I COtlL'fll.mrty I>-rv-t.loptl'"fflt Metro Tr1ins1t Mttropolita.n rnr_.:port1t:0n
Servie:e~ EnW~I services
BethRH<l Brian Lamb Nick Thompson Leisa Thompson
Director Gene~ Manilger Oirec.tor Gener~ Milliger
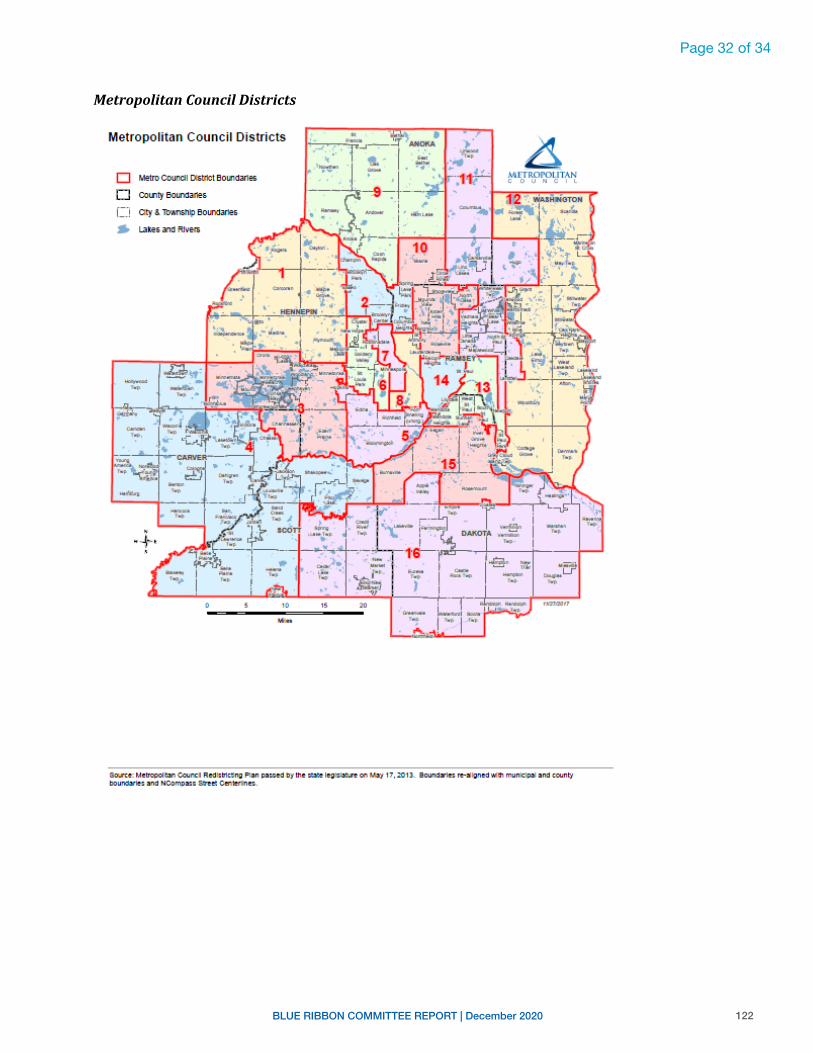
122BLUE RIBBON COMMITTEE REPORT | December 2020
M e t r o p o l i t a n C o u n c i l S t u d y J a n u a r y 2 0 1 9 3 2 | P a g e
MetropolitanCouncilDistricts
Page 32 of 34
Metropolitan Counoi l Districts
0 M:tro Court d i 0:Sll1ct IBOLlldar1E6
• COlllty 6ound _5
D aty & 11Y,nsri1p 1aoundanes
Lakle&anll
-
·-"i·-• \
0
...... ,.,
.....
.,..,_
sv..n:e: tAetrq;d~ C:oor .. ,d 1Rett b1ct:n:i I an p3z e~ rtJy ttte ,:, :.e- leJ bo~ l n~ INCD.mpz~ s ner. Cer. e!i
>'
~ MCTROroUTAN r. DU N C L
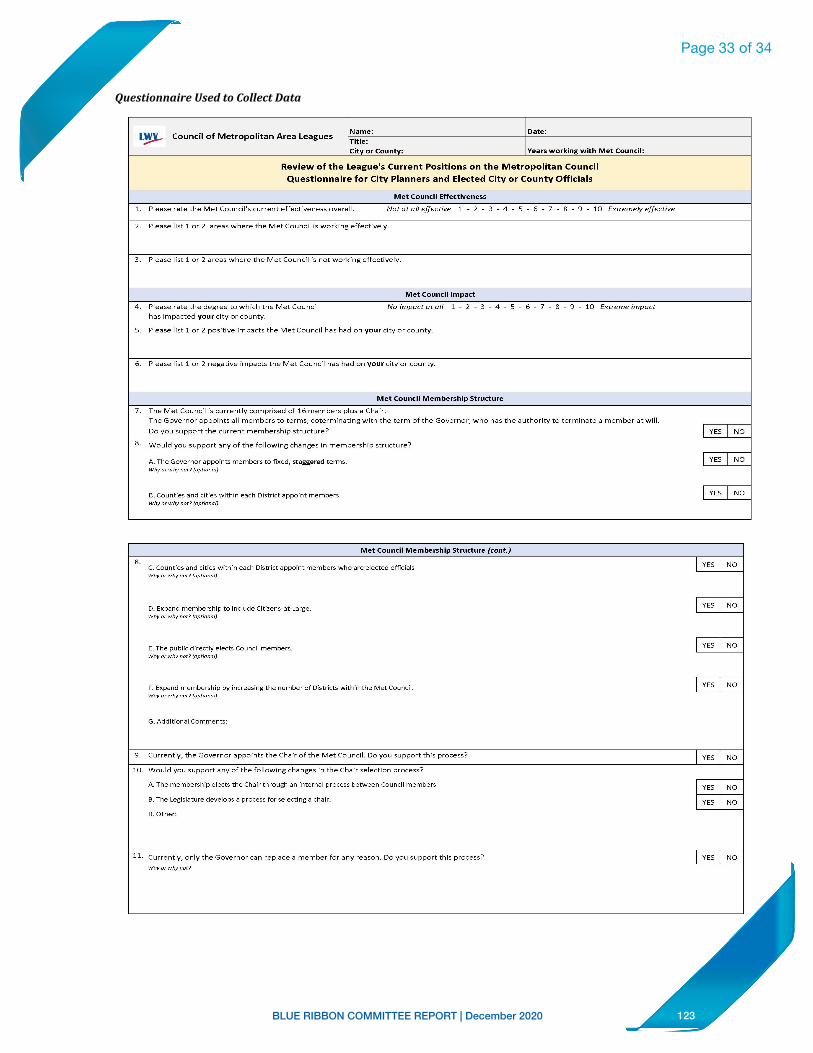
123BLUE RIBBON COMMITTEE REPORT | December 2020
QuestionnaireUsedtoCollectData
M e t r o p o l i t a n C o u n c i l S t u d y J a n u a r y 2 0 1 9 3 4 | P a g e
Page 33 of 34
L~ Council of Metropolitan Are.a Leagues N~me;
Tltle: cttv or Coutttv:
Date:
Yean. worldn2 with Met co,mcil;
Review of tho League's Current Positions. on the Metropolitan Council Questionnaire for City Planners and Elected City or County Offh;ials.
Met council effectiveness
1. Ple:1se r~te the r ... , et Coundl s.: .1·re"lt etfectivere-1s overall.
Met council Impact
4. Pl~~s~ r~t~ d,~ dc-F\r~c towh·ch :he Vlct ::ounc·1 h.J:-: irrp.J~c voorci:-.· or :ount\r.
No lm;,ocr en oll
5. Pl~11:-.~ li11 1 01 , push\,~ iwp11::l1 .h~ Vl~I :.,11111< i l111s •·11d uu your d .y 01 :xm11.-.•.
ti. i>le:ise 11;.t l .:>r l. n1?g:1t1w& lmp:1<:ts the M&: i.:::>L.ncll hes 'lad or vour city or .:.ount-1.
Met Councll Membership Structure
7. The- •A~t ::ourcl ls<.11n-rtlv<.:>rrprf1~d ot J6rn4?'llbe-r1 plu1 a Chair. I h& .::;;over nor eppol'lts ell m~-rl:>l?rs :o ce'1"'l!. cot~r'lll'la:l'lf wr:h che t&rrn of t'l~ (j.::,wrnor. who 'l:IS t'le aL.tl·orr:v to t~rrrlnetl? e rn1?1"'l:::~r a: wlll. 11u -.•011 :,1.pr,1:11 111<· 1:1.11c,,·111·1:111hmsh·ps.1u<:h.11c?
&. ','V~dd ynu !'.11:::::,rt ;.n~ t'1f1'h~ f:,ll~\\>ine r:h-1,1~:: ·n mt"m::~·!'i.hip o;t·.1(:t11m~
..
A 'le G,:w~rn:::• apD::: ·nts -n~-nben t::: ti,;ed, &teegered terms. h'o'l'JM ':/'11' 11r,t,' 1r.,>•M,:,~11
n. ;~::.mli~·- 11·11: d.i~~. wi.hiu "':1' ·1 O\,t ·kt :1ppoirl lllf"lr:l~l"I h'lf/'11 y;i.- 'le>-1:'(,;••iNt,~••)
Met COuncH Memb~rshlp st ru<ture (co11t.)
<..:. <..:~..1ntics .J'ld c·ticnvithin ooc, Jbtrict ,1~poh: rrc-nbor.; who ;,ro clc,;toc:t o~r;·~1s 1//'II•~• ,1.•l.'J ,.~•!( .''lvt/1.0,,;,'.'
o. ExP=~:i mcmb::!l'shlp to 1~:1ude cruz:ms-at-l.a'g~. ,.,,..,..,,,,.., . .,,.,,,,.,. . .,,.,;,,,, .... ,
E. Th~ publl< clrecuy :1~:t~ ,:ouncl r-:1r:i:ri. ,.,,..,..,,,,.., • .,,.,,,, .... ,,,.,:,,,, .. :J
i-. t.,e~onc ncrr~c·shir, t,v incr:-osi'lp, the- runbcrof Oi~t·ict; •1/t'li- the- Met COL.ncil. '!l'll'IJr A'•~'I ,:~~,' f-,o)t,'11.'IC.'.'
C.•:lthEr:
... , .... , ... :1.;,,.,,,.,
I YL!, I N'-l
I ye,, I N'-l
I YFS I N:-l
I 't'ES I \10
I YES I ,o
I rn I ,o
I YES I ,o
I YES I ,,:,
I YCS I ,o
I HS I ,o
I HS I ,o
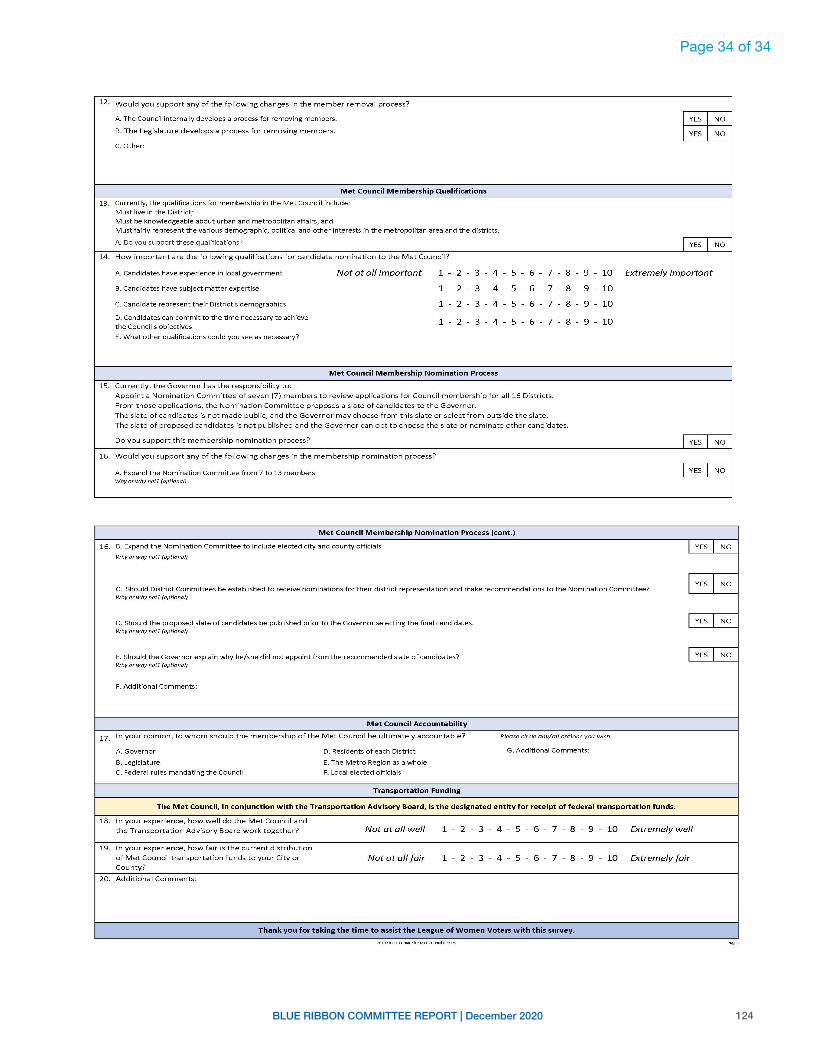
124BLUE RIBBON COMMITTEE REPORT | December 2020
M e t r o p o l i t a n C o u n c i l S t u d y J a n u a r y 2 0 1 9 3 5 | P a g e
M e t r o p o l i t a n C o u n c i l S t u d y J a n u a r y 2 0 1 9 3 6 | P a g e
Page 34 of 34
12. Would you support any of the following changes in the member removal process?
A. The Council internally develops a process for removing members. I YES I NO
B. The Legislature develops a process for removing members. I YES I NO
C. Other:
Met Council Membe rship Qual ificat ions
13. Currently, the qualifications for membership in the Met Council include: Must live in the District;
Must be knowledgeable about urban and metropolitan affa irs, and Must fairly represent the various demographic, political and other interests in the metropolitan area and the districts.
A. Do you support these qualifications? I YES I NO
14. How important are the following qualifications for cand idate nomination to the Met Council?
A. Candidates have experience in local government Not at all important 1 - 2 - 3 - 4 5 6 7 - 8 - 9 - 10 Extremely important
B. Candidates have subject matter expertise 1 - 2 - 3 - 4 5 6 - 7 - 8 - 9 - 10
C. Candidate represent their District's demographics 1 - 2 - 3 - 4 5 6 - 7 - 8 - 9 - 10
D. Cand idates can commit to the time necessary to achieve 1 - 2 - 3 - 4 5 6 - 7 - 8 - 9 - 10
the Cou ncil' s objectives
E. What other qualifications could you see as necessary?
Met Council M embership Nomination Process
lS. Currently, the Governor has the responsibility to:
Appoint a Nomination Committee of seven (7) members to review applications for Council membership for all 16 Districts.
From those appl ications, the Nomination Committee proposes a slate of candidates to the Governor.
The slate of candidates is not made publ ic, and the Governor may choose from this slate or select from outside the slate.
The slate of proposed candidates is not published and the Governor can opt to choose the slate or nominate other candidates.
Do you support this membership nomination process? I YES I NO
16. Would you support any of the following changes in the membership nomination process?
A. Expand the Nomination Committee from 7 to 13 members I YES I NO Why or why not? (opt ional)
Met Council Membership N omination Process (cont.)
16. B. Expand the Nomination Committee to include elected city and county officials I YES I NO Why or why not? (optional)
I YES I NO C. Should District Committees be established to rec eive nominations for their district representation and make recommendations to the Nomination Committee? Why or why not? (optional)
D. Should the proposed slate of candidates be published prior to the Governor selecting the final candidates. I YES I NO Why or why not ?(optionol)
E. Should the Governor explain why he/she did not appoint from the recommended slate of candidates? I YES I NO Why or why not? (optional)
F. Additional Comments:
Met Council Accountability
17. I n your opinion, to whom should the membership of the Met Council be ultimately accountable? Please circfe any/all options you wish.
A. Governor D. Residents of each District G. Additional Comments:
B. Legislature E. The Metro Region as a whole
C. Federal rules mandating the Council F. Local elected officials
Transportation Funding
The Met Cou ncil~ in conj unction with the Transportat ion Advisory Board~ is the designated entity for rece ipt of federal transportat ion funds.
18. I n your experience, how well do the Met Council and
the Transportation Advisory Board work together? Not at a ll well 1 - 2 - 3 4 - 5 6 - 7 - 8 - 9 - 10 Extremely well
19. In your experience, how fair is the current distribution
of Met Council transportation funds to your City o r Not at all fair 1 - 2 - 3 4 - 5 6 - 7 - 8 9 - 10 Extremely fair County?
20. Additiona l Comments:
Thank you f or taking the time to assist the League of W omen Voters w ith this survey.
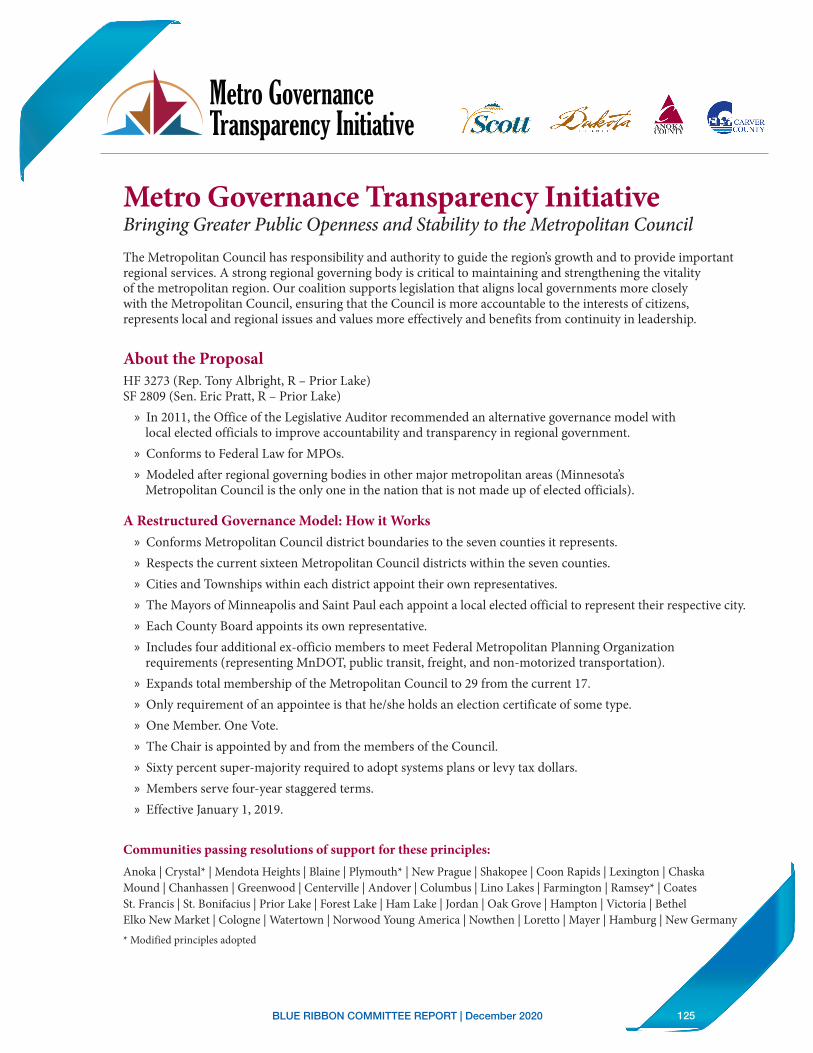
125BLUE RIBBON COMMITTEE REPORT | December 2020
For more information, visit www.metrogovernance.com
About the ProposalHF 3273 (Rep. Tony Albright, R – Prior Lake)SF 2809 (Sen. Eric Pratt, R – Prior Lake)
» In 2011, the Office of the Legislative Auditor recommended an alternative governance model with local elected officials to improve accountability and transparency in regional government.
» Conforms to Federal Law for MPOs. » Modeled after regional governing bodies in other major metropolitan areas (Minnesota’s Metropolitan Council is the only one in the nation that is not made up of elected officials).
A Restructured Governance Model: How it Works » Conforms Metropolitan Council district boundaries to the seven counties it represents. » Respects the current sixteen Metropolitan Council districts within the seven counties. » Cities and Townships within each district appoint their own representatives. » The Mayors of Minneapolis and Saint Paul each appoint a local elected official to represent their respective city. » Each County Board appoints its own representative. » Includes four additional ex-officio members to meet Federal Metropolitan Planning Organization requirements (representing MnDOT, public transit, freight, and non-motorized transportation).
» Expands total membership of the Metropolitan Council to 29 from the current 17. » Only requirement of an appointee is that he/she holds an election certificate of some type. » One Member. One Vote. » The Chair is appointed by and from the members of the Council. » Sixty percent super-majority required to adopt systems plans or levy tax dollars. » Members serve four-year staggered terms. » Effective January 1, 2019.
Communities passing resolutions of support for these principles:Anoka | Crystal* | Mendota Heights | Blaine | Plymouth* | New Prague | Shakopee | Coon Rapids | Lexington | Chaska Mound | Chanhassen | Greenwood | Centerville | Andover | Columbus | Lino Lakes | Farmington | Ramsey* | Coates St. Francis | St. Bonifacius | Prior Lake | Forest Lake | Ham Lake | Jordan | Oak Grove | Hampton | Victoria | Bethel Elko New Market | Cologne | Watertown | Norwood Young America | Nowthen | Loretto | Mayer | Hamburg | New Germany* Modified principles adopted
Metro Governance Transparency InitiativeBringing Greater Public Openness and Stability to the Metropolitan CouncilThe Metropolitan Council has responsibility and authority to guide the region’s growth and to provide important regional services. A strong regional governing body is critical to maintaining and strengthening the vitality of the metropolitan region. Our coalition supports legislation that aligns local governments more closely with the Metropolitan Council, ensuring that the Council is more accountable to the interests of citizens, represents local and regional issues and values more effectively and benefits from continuity in leadership.
Metro Governance Transparency Initiative
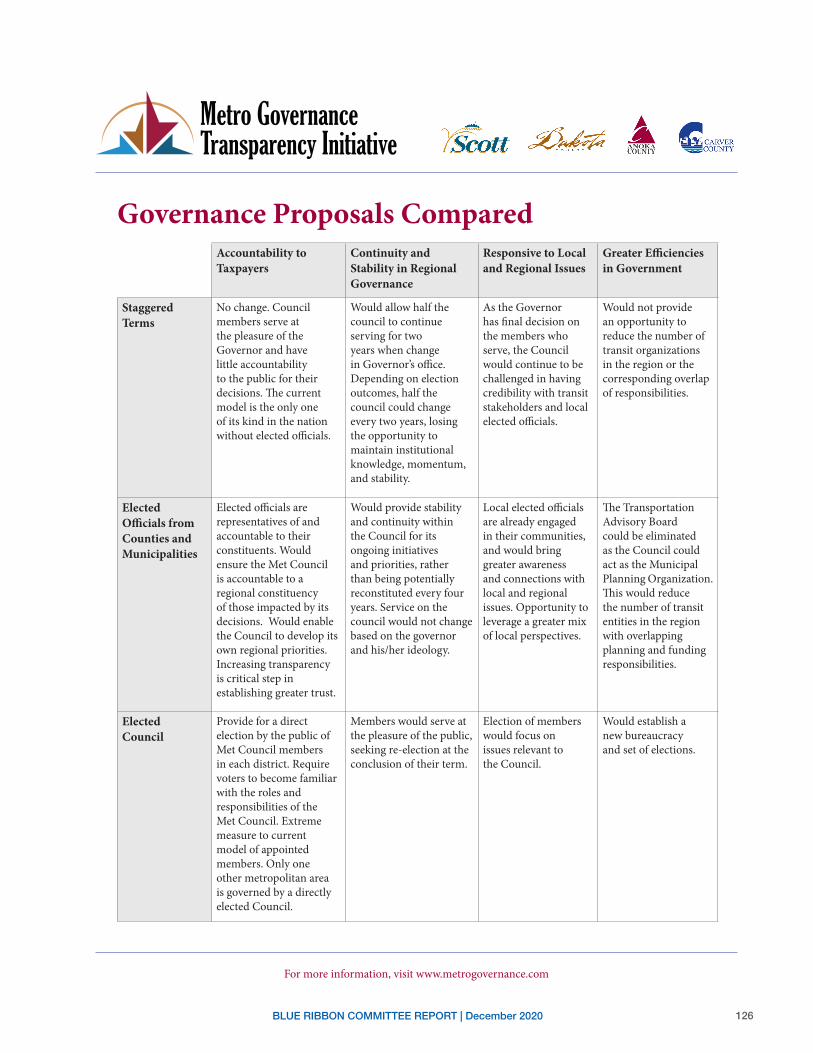
126BLUE RIBBON COMMITTEE REPORT | December 2020
For more information, visit www.metrogovernance.com
Accountability to Taxpayers
Continuity and Stability in Regional Governance
Responsive to Local and Regional Issues
Greater Efficiencies in Government
Staggered Terms
No change. Council members serve at the pleasure of the Governor and have little accountability to the public for their decisions. The current model is the only one of its kind in the nation without elected officials.
Would allow half the council to continue serving for two years when change in Governor’s office. Depending on election outcomes, half the council could change every two years, losing the opportunity to maintain institutional knowledge, momentum, and stability.
As the Governor has final decision on the members who serve, the Council would continue to be challenged in having credibility with transit stakeholders and local elected officials.
Would not provide an opportunity to reduce the number of transit organizations in the region or the corresponding overlap of responsibilities.
Elected Officials from Counties and Municipalities
Elected officials are representatives of and accountable to their constituents. Would ensure the Met Council is accountable to a regional constituency of those impacted by its decisions. Would enable the Council to develop its own regional priorities. Increasing transparency is critical step in establishing greater trust.
Would provide stability and continuity within the Council for its ongoing initiatives and priorities, rather than being potentially reconstituted every four years. Service on the council would not change based on the governor and his/her ideology.
Local elected officials are already engaged in their communities, and would bring greater awareness and connections with local and regional issues. Opportunity to leverage a greater mix of local perspectives.
The Transportation Advisory Board could be eliminated as the Council could act as the Municipal Planning Organization. This would reduce the number of transit entities in the region with overlapping planning and funding responsibilities.
Elected Council
Provide for a direct election by the public of Met Council members in each district. Require voters to become familiar with the roles and responsibilities of the Met Council. Extreme measure to current model of appointed members. Only one other metropolitan area is governed by a directly elected Council.
Members would serve at the pleasure of the public, seeking re-election at the conclusion of their term.
Election of members would focus on issues relevant to the Council.
Would establish a new bureaucracy and set of elections.
Governance Proposals Compared
Metro Governance Transparency Initiative ,:CARVER
~ COUNTY
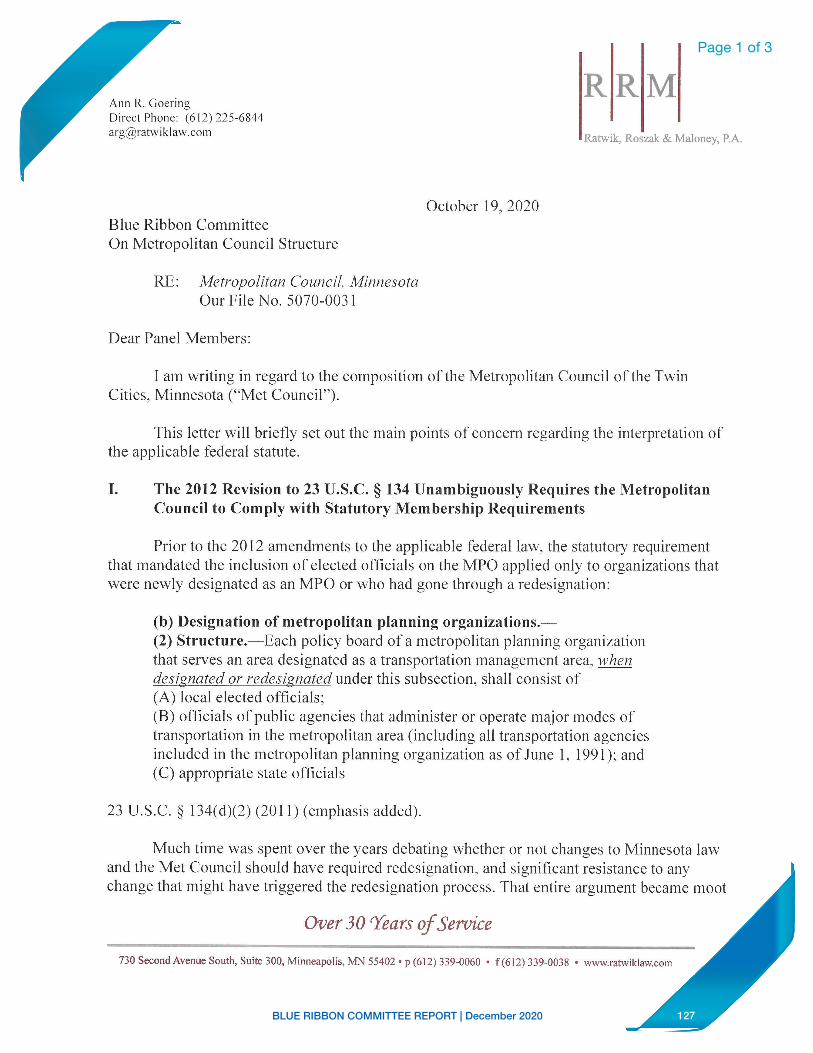
127BLUE RIBBON COMMITTEE REPORT | December 2020
Page 1 of 3
Ann R. Goering r)irecl Plione: (612) 225-6844 [email protected]
Blue Ribbon Committee On Metropolitan Council Structure
RF: ,\.1elropolitan Council, :tfinnesota Our File No. 5070-0031
Dear Panel \.fem hers:
RRM Ratwik, Roszak & Maloney, PA.
Ck.tobl!r 19, 2020
I an1 wrir.ing in regard to Lhe composition of the l\tkln.ipolil.an Council of Lhe Twin Cities, :V1innesota ("Met Council'}
This Jell.er will brieny seL out the main points oi\;oncern regarding the interpretation or the applicahle federal statute.
T. The 2012 Revision to 23 U.S.C. § 134 Unambiguously l{e11ufrcs the Metropolitan Council to Comply with Statutory Memhership Requirements
Prior to the 20 12 amendments to tJie applicable federal law, the slat utory requirement that mandated the inclusion of elected officials on the MPO applied only to organizations that were newly designated as an MPO or who had gone through a redesignation:
(b) Designation of metropolitan planning organizations.-(2) Sl.ruelure. · Lach policy board or a melropolitan planning organization that serves an area designated as a transportation management area, yvhen designated or redesigna1ed under this subsection, shall consist of-(A) local dcctcd ollfoials; (B) officials of public agencies that administer or operate major modes of transportation in the metropolitan area (including all trnnsportalion agencies included in the nu:tropolilan planning organization as of June l . 199 l ); and (C) appropriate state officials
23 U.S.C. § 114(d)(2) (201 l)(cmphasis added).
\tlnch tirne was spent over the years debating whether or not changes to Minnesota law and the Met Council should have required redesignation. and significant resistance to any change thal might have triggered the redesignation process. That entire argum;.;nl became moot
Over 30 rtears of Service
730 Second Avenue South, Suite 300, Minneapolis, M'l 55402 • p (6 12) 339-0060 • f (612) 339-0038 • www.ratwikfaw.com
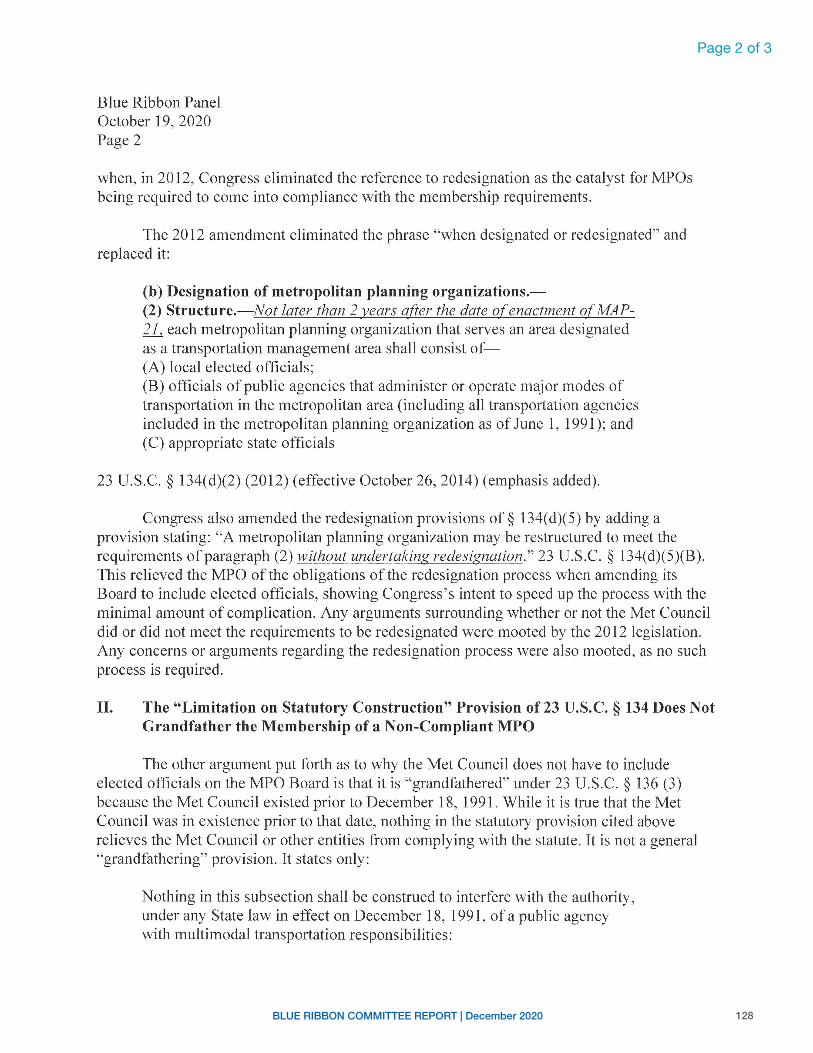
128BLUE RIBBON COMMITTEE REPORT | December 2020
Page 2 of 3
Blue Ribbon Panel October 19, 2020 Page 2
when, in 2012, Congress eliminated the reference to redesignation as the catalyst for MPOs being required to come into compliance with the membership requirements.
The 2012 amendment eliminated the phrase "when designated or redesignated" and replaced it:
(b) Designation of metropolitan planning organizations.-(2) Structure.- Not later than 2 years afier the date of enactment ofMAP-21, each metropolitan planning organization that serves an area designated as a transportation management area shall consist of-(A) local elected officials; (B) officials of public agencies that administer or operate major modes of transportation in the metropolitan area (including all transportation agencies included in the metropolitan planning organization as of June 1, 1991 ); and (C) appropriate state officials
23 U.S.C. § 134(d)(2) (2012) (effective October 26, 2014) (emphasis added).
Congress also amended the redesignation provisions of§ 134(d)(5) by adding a provision stating: "A metropolitan planning organization may be restructured to meet the requirements of paragraph (2) without undertaking redesignation." 23 U.S.C. § 134(d)(5)(B). This relieved the MPO of the obligations of the redesignation process when amending its Board to include elected officials, showing Congress's intent to speed up the process with the minimal amount of complication. Any arguments surrounding whether or not the Met Council did or did not meet the requirements to be redesignated were mooted by the 2012 legislation. Any concerns or arguments regarding the redesignation process were also mooted, as no such process is required.
II. The "Limitation on Statutory Construction" Provision of 23 U.S.C. § 134 Does Not Grandfather the Membership of a Non-Compliant MPO
The other argument put forth as to why the Met Council does not have to include elected officials on the MPO Board is that it is "grandfathered" under 23 U.S.C. § 136 (3) because the Met Council existed prior to December 18, 1991. While it is true that the Met Council was in existence prior to that date, nothing in the statutory provision cited above relieves the Met Council or other entities from complying with the statute. It is not a general "grandfathering" provision. It states only:
Nothing in this subsection shall be construed to interfere with the authority , under any State law in effect on December 18, 1991 , of a public agency with multimodal transportation responsibilities:
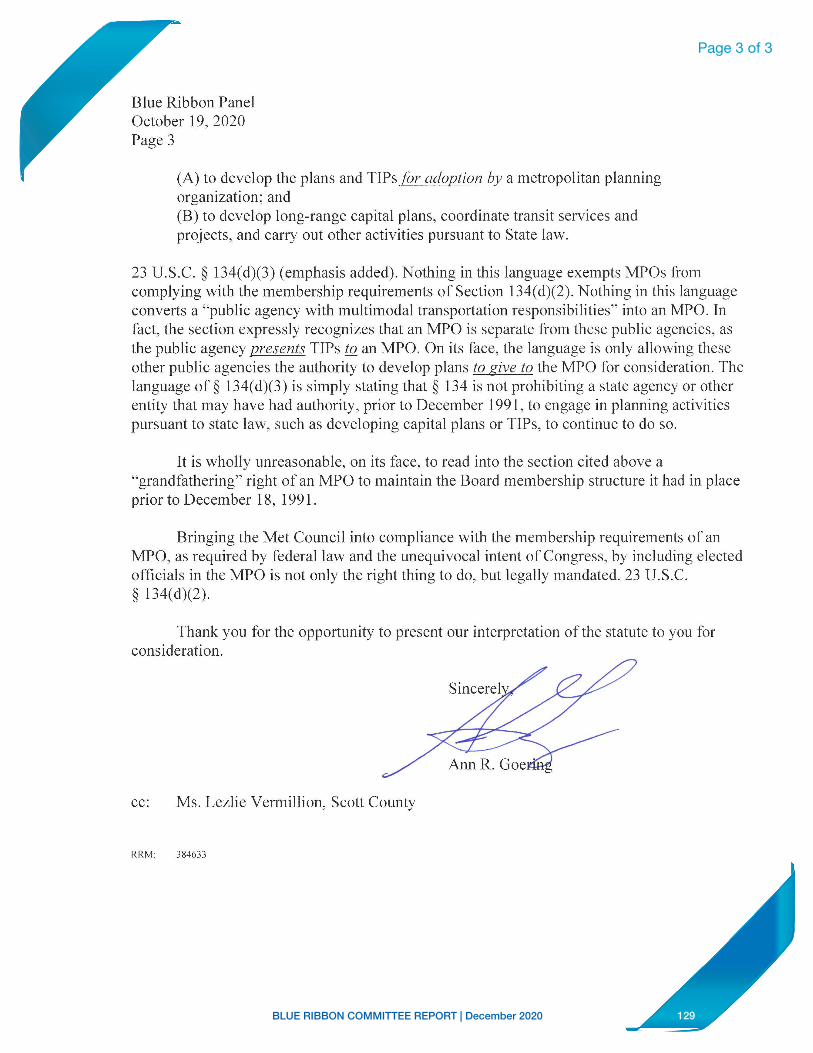
129BLUE RIBBON COMMITTEE REPORT | December 2020
Page 3 of 3
Blue Ribbon Pand October 19, 2020 Page 3
(A) to develop the plans and Tl Psjor odoprion hv a metropolitan planning organization; and (8) to devdop long-range capital plans, coordinate transit services and projects, and carry out other activities pursuam to State law.
23 U.S.C. § 134(d)(3) (emphasis added). Nothing in this language exempts MPOs from complying with the membership requirements of Section 134(d)(2). Nothing in this language converts a "public agency with multimodal transportation responsibilities'' into an MPO. ln fact , the section expressly recognizes that an MPO is separate from these public agencies, as the. public agency vresents TlPs to an MPO. On its face, the language is only allowing these other public agencies the authority to develop plans to give 10 the MPO for consideration. The language of§ 134( d)(3) is simply stating that § 134 is not prohibiting a state agency or other entity that may have had authority, prior to December 1991, to engage in planning activities pursuant to state law, such as developing capital plans or TlPs, to continue to do so.
It is wholly unreasonable, on its face, to read into the section cited above a "grandfathering" right of an .fv1PO to maintain the Board membership structure it had in place prior to December 18, 199 I,
Bringing the Met Council into compliance with the membership requirements of an MPO, as required by federal law and the unequivocal intent of Congress, by including elected officials in the MPO is not only the right thing to do, but legally mandated. 23 U .S.C. § l34(d)(2).
Thank you for the opportunity to present our interpretation of the statute to you for consideration.
cc: Ms. Lezlie Vermillion, Scott County
RRM: .;846.' 3
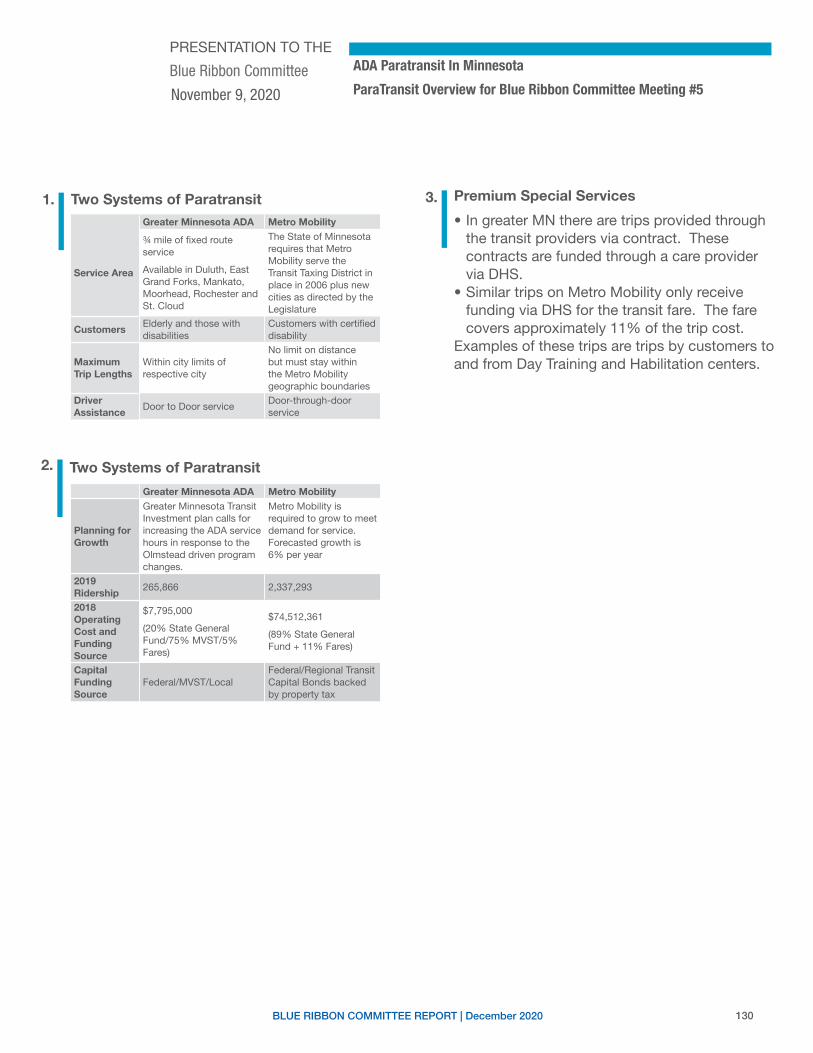
130BLUE RIBBON COMMITTEE REPORT | December 2020
1. Two Systems of Paratransit
2. Two Systems of Paratransit
3.
• In greater MN there are trips provided through the transit providers via contract. These contracts are funded through a care provider via DHS.
• Similar trips on Metro Mobility only receive funding via DHS for the transit fare. The fare covers approximately 11% of the trip cost.
Examples of these trips are trips by customers to and from Day Training and Habilitation centers.
Premium Special Services
ADA Paratransit In Minnesota
ParaTransit Overview for Blue Ribbon Committee Meeting #5
Greater Minnesota ADA Metro Mobility
Service Area
¾ mile of fixed route service
Available in Duluth, East Grand Forks, Mankato, Moorhead, Rochester and St. Cloud
The State of Minnesota requires that Metro Mobility serve the Transit Taxing District in place in 2006 plus new cities as directed by the Legislature
CustomersElderly and those with disabilities
Customers with certified disability
Maximum Trip Lengths
Within city limits of respective city
No limit on distance but must stay within the Metro Mobility geographic boundaries
Driver Assistance
Door to Door serviceDoor-through-door service
Greater Minnesota ADA Metro Mobility
Planning for Growth
Greater Minnesota Transit Investment plan calls for increasing the ADA service hours in response to the Olmstead driven program changes.
Metro Mobility is required to grow to meet demand for service. Forecasted growth is 6% per year
2019 Ridership
265,866 2,337,293
2018 Operating Cost and Funding Source
$7,795,000
(20% State General Fund/75% MVST/5% Fares)
$74,512,361
(89% State General Fund + 11% Fares)
Capital Funding Source
Federal/MVST/LocalFederal/Regional Transit Capital Bonds backed by property tax
PRESENTATION TO THE
Blue Ribbon Committee
November 9, 2020
I I
-
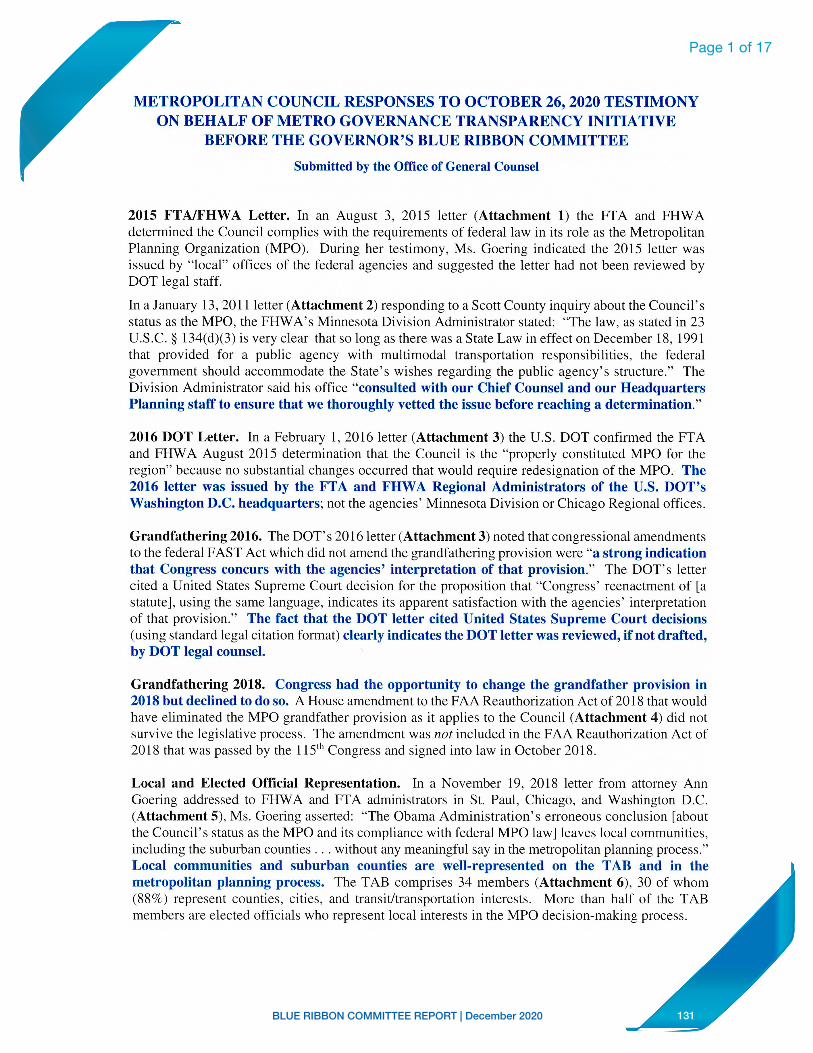
131BLUE RIBBON COMMITTEE REPORT | December 2020
ADA Paratransit In Minnesota
ParaTransit Overview for Blue Ribbon Committee Meeting #5
Page 1 of 17
METROPOLITAN COUNCIL RESPONSRS TO OCTOBER 26, 2020 TESTIMONY ON BEHALF OF METRO GOVERKANCE TRANSPARENCY INITIATIVE
BEFORE THE GOVERNOR'S BLUE RIBBON COMMITTEE
Submitted by the Otlice of General Counsel
2015 FTA/FIIWA Letter. In an August 3, 2015 letter (Attachment I) the FTA and FHWA determined the Council complies with the requirements of federal law in its role as the Metropolitan Planning Organization (MPO). During her testimony, Ms. Goering indicated the 2015 letter was issued by " local" offices of the federal agencies and suggest.ed the letter had not been reviewed by DOT legal staff.
In a January 13, 201 1 letter (Attachment 2) responding to a Scott County inquiry about the Counci I' s stan1s as the MPO, the FHWA's Minnesota Division Administrator stated: 'The law, as stated in 23 U.S.C. § l34(d)(3) ili vc:ry dear that so long as there was a State Law in effect on December 18, 1991 that provided for a public agency with mul ti modal transportation responsibili ties, the frdernl government should accommodate the State's wishes regarding the public agency's strncturc." The Division Administrator said his office "consulted with our Chief Counsel and our Headquarters Planning staff to ensure that we thoroughly vetted the issue before reaching a determination."
2016 DOT Letter. In a February I. 2016 letter (Attachment 3) the lJ.S. DOT confirmed the FT.A and FHWA August 2015 determination that the Council is Lhe "properly constituted MPO for the region'' beL:ause no substantial changes occurred that would require redesignation of the MPO. The 2016 letter was issued by the FTA and FHWA Regional Administrators of the U.S. DOT's Washington D.C. headquarters; not the agencies' Minnesota Division or Chicago Regional offices.
Grandfathering 2016. The DOT's 2016 kller (Attachment 3) noted that congressional amendments to the federal FAST Act which did not amend the grandfathering provision were "a strong indication that Congress concurs with the agencies' interpretation of that provision." The DOTs letter cited a United States Supreme Court decision for the proposition that "Congress' reenactment of [a statute], using the same language, indicates its apparent satisfaction with r.he agencies' interpretation of that provision." Tbc fact tbat the DOT letter cited United States Supreme Court decisions ( using standard legal citation fonnat) clearly indicates the DOT letter was reviewed, if not drafted, by DOT legal counsel.
Grandfathering 2018. Congress had the opportunity to change tl1e grandfather provision in 2018 but declined to do so. A House amendment to the FAA ReauLhori,.ation AL:t of 2018 that would have eliminated the MPO grandfather provision as it applies to the Council (Attachment. 4) did not survive: the kgislalivt: process. Tht: amendment was not included in the FAA Reauthorization Act of 2018 that was passed by the 115th Congress and signed into law in October 2018.
Local and Elected Official Representation. In a November 19, 2018 letter from attorney Ann Goering addressed to FHWA and Ff A administrators in St. Paul, Chicago, and Washington D.C. (Attachment 5), Ms. Goering assertc:d: "The: Obama Admini~tration's erroneous conclusion labout the Council's status as the MPO and its compliance with federal MPO law] leaves local communities, including the suhurhan counties ... without. any meaningful say in the metropoli1:an plannjng process." Local communities and suburban counties arc well-represented on the TAll and in the metropolitan planning process. The TAB comprises 34 members (Attachment 6), 30 of whom (88%) represent coumies, cit.ies, and transit/transportation int.crests. ~fore than half of the TAB members are elected officials who represent local interests in the MPO decision-making process.
132BLUE RIBBON COMMITTEE REPORT | December 2020
Page 2 of 17
US.Deportment dltansportation Federal Highway Administration
Federal Transit Administration
Ann R. Goering Ratwik, Roszak & Maloney Attorney 730 Second Avenue South Suite 300 Minneapolis, MN 55402
Dear Ms. Goering:
ATTACHMENT 1
August 3, 2015
FHWA, Minnesota Division 380 Jackson Street • Cray Plaza, Suite 500 St. Paul, MN 55101-4802
FTA, Region V 200 West Adams Street Suite 320 Chicago, IL 60606-5253
This letter is in response to your letter dated May 8, 2015, which claims there were significant inaccuracies in the 2012 Transportation Management Area (TMA) certification review report pertaining to the Metropolitan Planning Organization (MPO) designation of the Metropolitan Council (Council) for the Minneapolis-St Paul Metropolitan Area. You assert that the 2012 Report erroneously concluded that the Council's Advisory Board is part of the Twin Citi"!S MPO. Additionally, you assert that Council is not in compliance with 23 U.S.C. § 134, requiring that the MPO be redesignated.
The wording used in the last TMA certification review, describing the MPO as the Council and the Transportation Advisory Board (TAB), was inaccurate. ·Toe TMA certification review report section covering the MPO designation will be changed to more accurately describe the designation and responsibilities in the next certification review.
The Council is the designated MPO for the Twin Cities Region, and the Council officials are responsible for carrying out the metropolitan transportation planning p1"9cess [MN Statute 473.146 subd. 4(a)]. The TAB is an advisory body to the Cowicil [MN Statute 4 73 .146 subd. 4(b )]. The TAB is not designated as the MPO, and its membership is not consistent with 23 U.S.C. 134( d)(2).
That said, the Council is the properly designated MPO, in compliance with 23 U.S;C. §134. The limitation on statutory construction, known as the grandfathering exemption, continues to apply to the Council. Specifically, 23 U.S.C. §134 states in relevant part:
(3) Limitation on statutory constru.ction.-Nothing in this subsection shall be construed to interfere with the authority, under any State law in effect on December 18, 1991, of a public agency with multimodal transportation responsibilities-
(A) to develop the plans and TIPs for adoption by a metropolitan planning organization; and
(B) to develop long-range capital plans, coordinate transit services and projects, and carry out other activities pursuant to State law.
133BLUE RIBBON COMMITTEE REPORT | December 2020
Page 3 of 17
( 4) Continuing designation.-A designation of a metropolitan planning organization under this subsection or any other provision of law shall remain in effect witil 1he metropolitan planning organization is redesignated under paragraph (5).
See 23 U.S.C. 134(d)(3) & (4).
The Minnesota Stat-e Law, that provided the Council with multimodal transportation responsibilities, WWI
in effect on December 18, 1991. The exemption from the MPO structural requirements contained in 23 U.S.C. l34(d)(2) has been continued in law under 23 U.S.C. 134(d)(4) until such time as the MPO is redesignated.
White the Council has been altered by State Statute a few times over the years, the changes were not •substantial' so as to require a redesignation. 23 C.F .R. 450,3 lO(k) sets forth those instances when redesignation of a MPO would be required. It states:
Redesignation of an MPO (in accordance with the provisions of this section) is required whenever the existing MPO proposes to make:
(1) A substantial change in the proportion ofvotingmembers on the existing MPO representing the largest incorporated city, other units of general purpose local government served by the MPO, and the State(s); or
(2) A substantial change in the decision makiug authol'ity or responsibility of the MPO, or in decision making procedures established under MPO by-laws.
23 C.F.R. 450.3 J 0(1) sets forth those instances when redesignation of a MPO would oot be requirt:d. It states:
The following changes to an MPO do not require a redesignation (as long as they do not trigger a substantial change as described in paragraph (k) of the section):
( 1) The identification of a new urbanized area (as detennined by 1he Bureau of 1he Census) within an existing metropolitan planning area;
(2) Adding members to the M PO that represent new units of general purpose local government resulting from expansion of the metropolitan planning area;
(3) Adding members to satisfy the specific membership requirements for an MPO that serves a 1'MA; or
( 4) Periodic rotation of members representing units of general-purpose local government, as established under MPO by-laws.
While you claim the Council has changed over tne years, requiring redesignation, a review of those changes does not support your position. Specifically:
• The Council became a public corporation and political subdivision of the state. This change does not result in a substantial change to the proportion of voting members or decision-making authority (21 C.F.R. 450.310(k)].
134BLUE RIBBON COMMITTEE REPORT | December 2020
Page 4 of 17
• The appointment terms of the Council members was changed, but the propo1tion of voting members was sustained [23 C.F .R. 450.3 lO(k)(l)]. Changes related to the periodic rotation of the members does not require redesignation [23 C.F.R. 450.310(1)(4)].
• The Council became able to manage the grant funding without depositing the money into the State Treasury. This change does not result in a substantial change to the proportion of voting members or decision-making authority [23 C.F.R. 450.310(k)].
• The Council membership districts were altered to represent the population changes from the census. This change does not result in a substantial change to the proportion of voting members [23 C.F.R. 450.3 IO(k)(l)], and changes to the urbanized area within the metropolitan planning area do not require redesignation [23 C.F.R. 450.310(1)(1)].
• The Twin Cities urbanized area now extends into Wisconsin (St. Croix County) and two 2 MN counties (Wright and Sherburne) outside of the designated seven (7) counties. The Council can rebalance its representation because of the expansion of the urbanized area, and the rebalancing does not require redesignation [23 C.F.R. 450.310(1)(2)].
The Council may restructure, at any time, to meet the requirements of23 U.S.C. 134(d)(2) for the policy board to be comprised of local elected officials; officials of public agencies that administer or operate major modes of transportation in the metropolitan area, including representation by providers of public transportation; and appropriate State officials without redesignation [23 U.S.C. 134(d)(S)(B)]. While we would encourage the Council to move toward the structure described in 23 U.S.C. 134(d)(2) in order to make the MPO more directly accountable to its public, it remains their decision, because restructuring is not required until a substantial change necessitates redesignation.
FHW A and FTA have concluded the 1973 designation of the Council as the MPO for the Twin Cities by then Governor Anderson was in conformance with both the Federal law and regulations and that the existing structure remains compliant. lfyou have any questions or would like to discuss the matter further, please feel free to contact our offices.
Arlene K. Kocher, P.E. Division Administrator Federal Highway Administration
Cc: Adam Duininck, Metropolitan Council Charlie Zelle, MnDOT
Marisol R. Simon Regional Administrator Federal Transit Administration
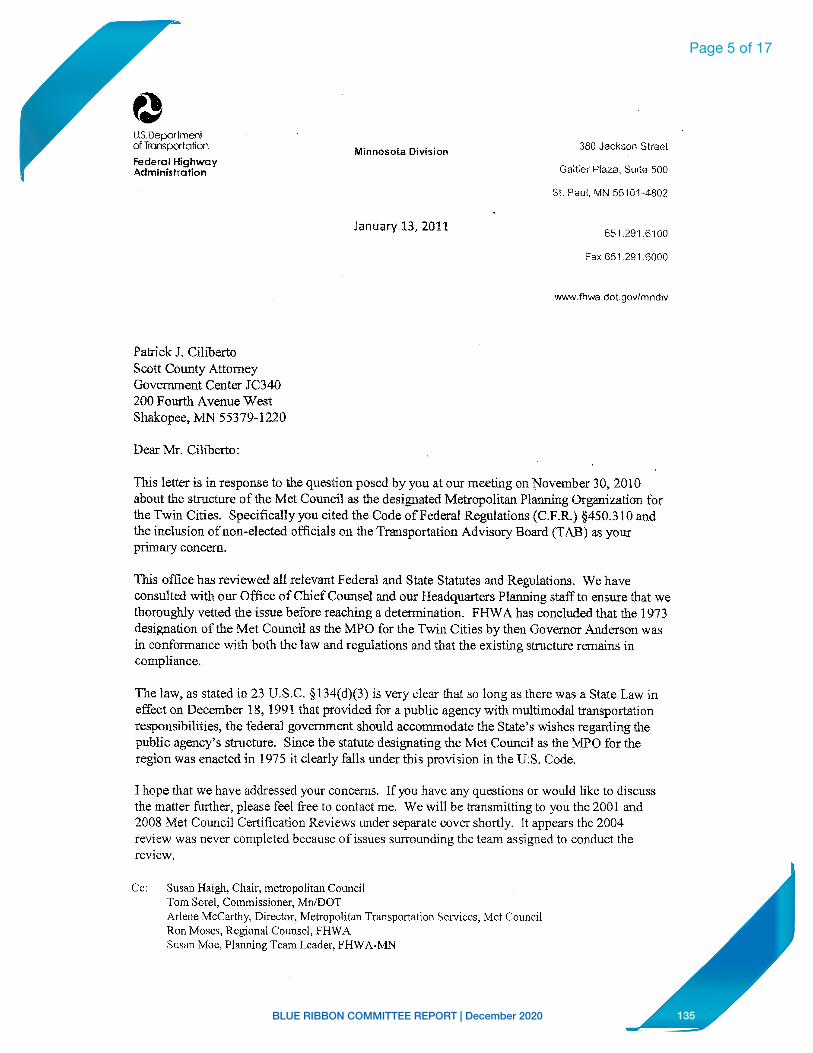
135BLUE RIBBON COMMITTEE REPORT | December 2020
Page 5 of 17
0 US. Deportrr•t:1)f cr tansi;:crtotion
Federal Highway Administration
Patrick J. Ciliberto Scott County Attorney Government Center JC34-0 200 .Fourth A venue West Shakopee, MN 55379-1220
Dear .Mr. Ciliberto:
Minnosota Division
January 13, 2011
.360 JaCl<.$0(1 Stre"'l
Gallier Plaza, Su,le 500
St. Paul, MN 55 'il1-4a02
Fax 651.29 · .. !~000
w·ww.fhwa.ctot.gov/mndiv
This letter is in response to the question posed by you at our meeting on November 30, 2010 about the structure of the Met Council as the designated Metropolitan Planning Oro,.,a.nization for the T1.vU1 Cities. Specifically you cited the Code of Federal Regulations ( C.F .R.) §450.310 and the inclu"lion ofnon-elccted officials on the Transportation Advisory Board (TAB) as your primary concern.
1bis office rui.<1 reviewed all relevant Federal and Stale S1atutes and Regulations. We have consulted with our Office of Chief Counsel and our Headquarters Planning 3taff to ensure that we thoroughly vetted the issue before reaching a detennination. FHW A has concludcrl that tht: 1973 designation of the :.\-let Cowicil as the MPO for the Tuin Cities by then Governor Anderson was in conformance with both the law and regulation~ and that the ex.i.sting :.tr.icture remains in compliance.
The law, as stated in 23 U.S.C. §134(d)(3) is very dear th.at ~o long a:. there was a State Law in effect on December 18, t 991 th.at provided for a public agency with multimodal transportation responsibilitie.~, the federal government 11hould accommodate the State's wishes regarding the public agency's structure. Since the statute designating the Met Council as the Y!PO for the region was enacted in 1975 it clearly falls under this provision in the U:S. Code.
l nope tha1 we nave addressed your concerns. If yuu have any questions or would like to discuss the matter further, please feel free to contact me. We will be transmitting to you the 2001 aud 2008 Met Council Certification Reviews under separate cover shortly. It appears the 2004 review was never completed because of i~sues surrounding the team a.~signed to conclucr the review,
Cc: Susan Haigh. Chair, metmpolitan Council Tom Sorel, Commissioner, MniT>OT A.rlene McCarthy, Direclor, Mclrovolitan T=s11ortation Services, Met Council Ron Moses, Regional Counsel, HIWA Susan Moc, Planniug Team Leader, I-HWA-MN
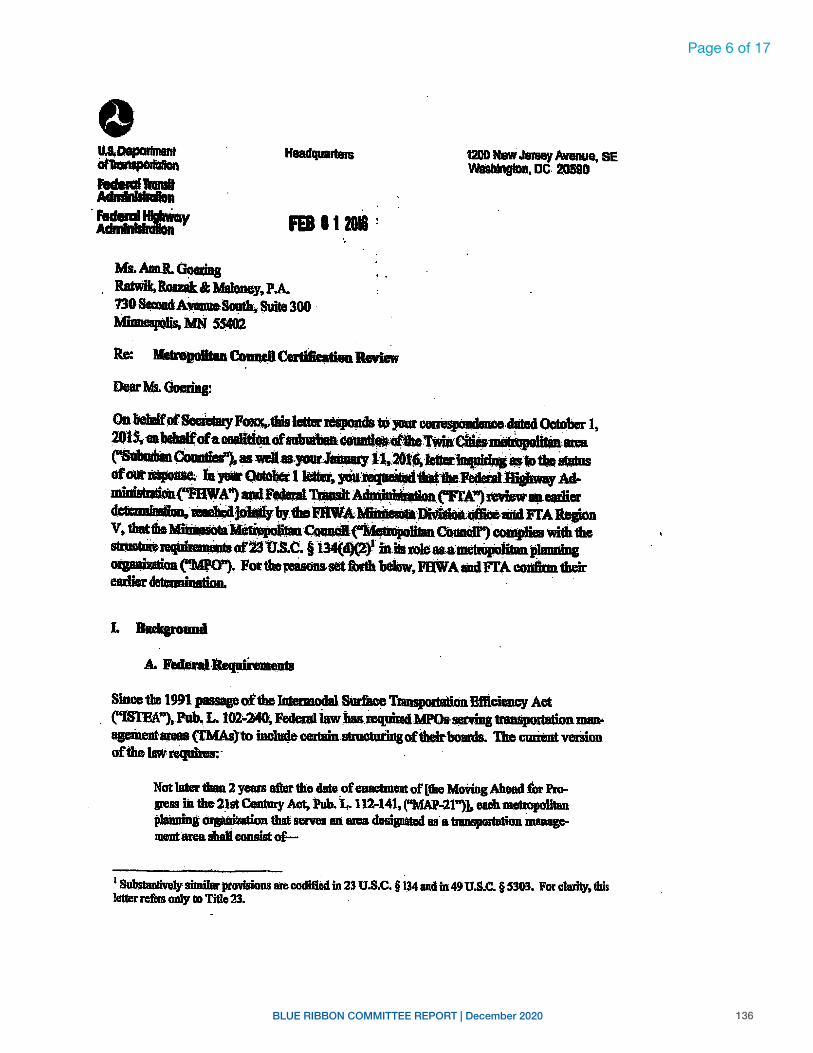
136BLUE RIBBON COMMITTEE REPORT | December 2020
Page 6 of 17
0 Headquartats
FEB01201!
Ms.ADILR.~ Ratwik,loak&;Maloney,P.A 73t-8-md;A;,..,.Somh, thlite 300 · MinmapQlis, MN SS4G2
R.e: Metro..,._ColllltllCerdlation Review
Dear Ms. Goering:
1200 New JeJBay Avenue, SE Wsah-stan,DC- 20590
On WfQf~ F this 18tferTPiinnrJ-to · ~-chitad n-.,mr 1 ---, OX¥,, &~ . yourcom,..,.__- . ,. ~ , 201S,-eabehalfofacoalifi•.ofsubilltiaa~(¢h:twia•~.~ .. ~C~aswt.a.your.,._,i:1.20tf,Jeitltr~•••--ota~ Jil·· · -·• octohct 1..-., ._.,.. · ' .-tilhB.FtdamlD"~-Ad-. JUUi' . . . 1-~ ...... ~-.,
miaistotloa-C'FH\VA")-1Fot. ,.._.AdanbJW#Lm.CffA'1Miew•eemer ....,,_ . ...._joWi.JbythaP.8\VA·.Mim•·l>msiGaolimaiOlFTAllqion V thatdP!~~ .. ~~~u.-~'"IH\ . · imwi1h1he , . ~!l'}'V.w,au. . . . . ·. \ -, ... v.....,__ 1 eoJDp stmamiiv~,ts •£29 'O.S.C. § 134(d)(2)~- iaiis :mleaaa•metropolitauplaoning oigaoiuticm ~o,. Forthereisam-set:&nth beiaw, FIIWA idd FfA-. cc,e1lum their earlier &,tonninatimi. .
I. hkgromul
.A. Federallleqairementl
Sae tJle 19'J passage of the Jatmmoda1 Surfao~ TlllllpOltation Fflieiency Aet ("ISTEAj1 Plib~ L 102-~ Federal iaw_itaamquindMPOasemng tnmsportationmanagement&l811S (l'MAs)to inc~cmtain.structaringoftheir-bolllds. The cm:iimt vemion of die law Rqllims:.
Not bar dnm. 2 years ath,r tho date. of euacbDent of [1ho Mo\'ing.Ahead for Progreu iil the 21st Century Act, Pub. Ii- 112-141, ("MAP"21")], eaeh mctropolit&n phmniag o--m that &llftS an ama desipitecl as a tranapmtDtion DUlllllpme:atanaahali consist GE-
1 Sub$tantively similar provisions are codified in 23 U.S.C. § 134 and in 49 U.S.C. § 5303. For cluitf, this letterreftrs omy to Title 23.
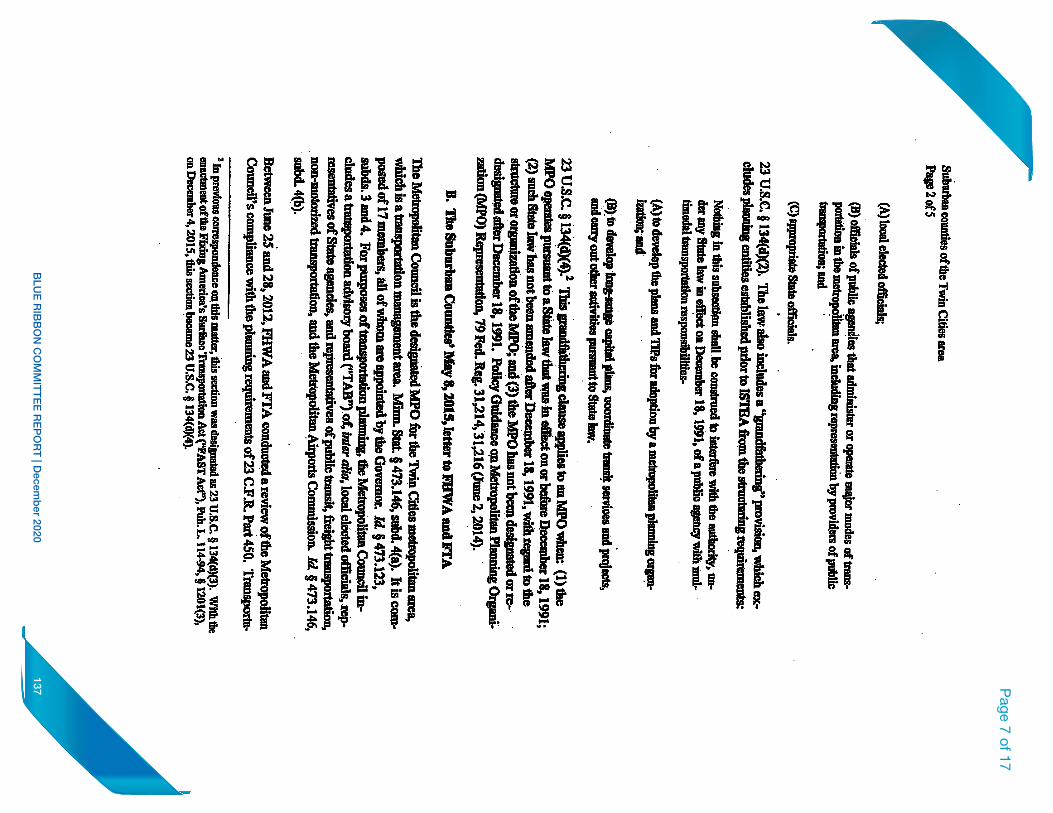
137B
LUE
RIB
BO
N C
OM
MIT
TE
E R
EP
OR
T | D
ecemb
er 2020
Page 7 of 17
Blil !i'f inn1u _ 11n1s is n 111 f i . t[i.t
1Hf l 1ir 1§1
1lHI fi 1! f1!f. ii t ! n I ~i rl ~-~ t , r: ... I: _ 0 1. If~ • i -a .. t I li' i i I Ii ,. 0.
ti!-1_ Ji Ui1~111·· s i='l'I· 1··1 --~-1:,i! If~ f !l ;· ~Ir - m I I~ ,- 4 , =,l.:.g r. . . 1- r ' 1· ~ ' • ~ ~ w~9•! ~J f ! I f 0 J ff '1•·t 'I . t ~-:1·. I l . ... ~iJ·JJ; I €. !· ,,. ' ! ?tt .f l ~ s( ~l fl,,f-;~ • ~
18 f ;.! ~, .I I 1-I , . . ..1 r: ~SID es· ~i - 11 I V -1'.l -h 1-I- ~~[f •/i 1 ! .f if~ · I· 1 I' J.1 Ii .-;. h Hila! ~ i ;_Jt l _. Lt .1 ' -
i; , ~ . JO. ,. s J {, r it .. ' j, ' SI' ~ ' • . w,
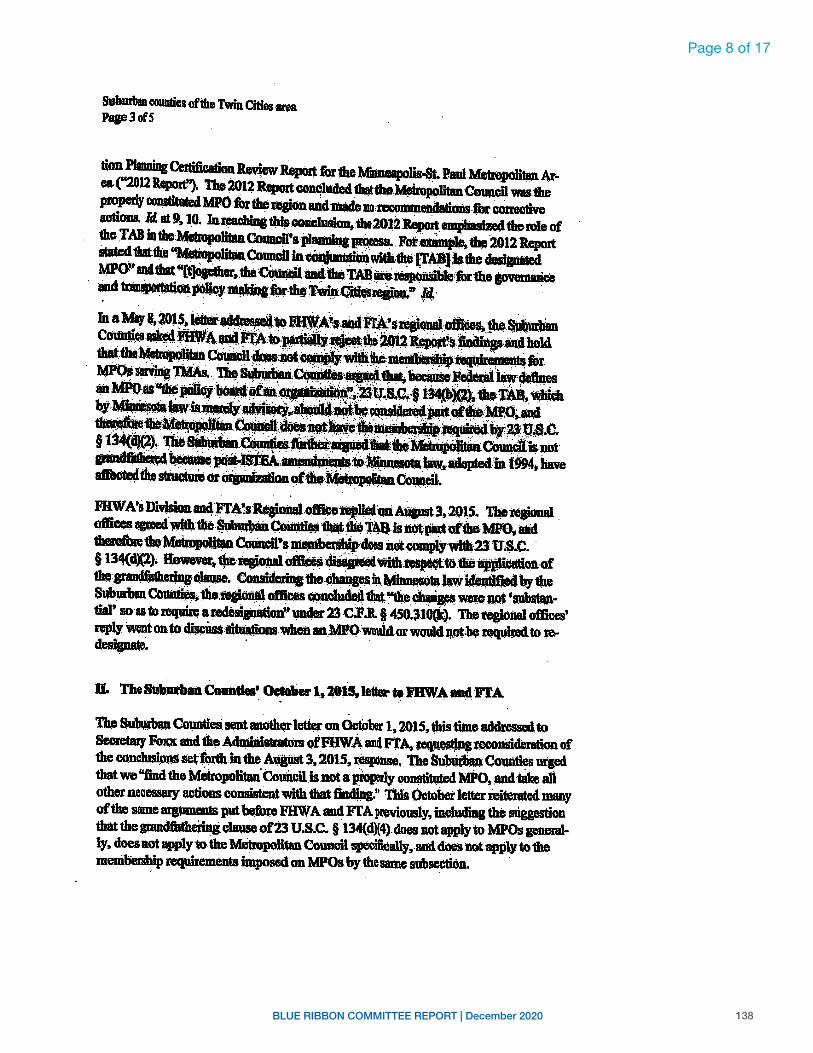
138BLUE RIBBON COMMITTEE REPORT | December 2020
Page 8 of 17
Subudlan eowdies ofthe Twin Cities-area PageJofS
Jaa u-o 20.• .. 1. S i.etlii:_ • ...• ....__..ii_ innl_i '7c :,•-A:f, • ..._,i.1lil,).,; __ 5·-~-.... 'i.·offl .... ·. +l,,..,,Li._,-1..: __ .. .,,~, •• • ··'-. ,' ~~111"~'.,P,,-:;.l't. ~~~~ .. - ... ~ . :,~ . .i-i;ataylU]Jllll ComdiCJasbdFilWA · .· F.TAil,: · _. •.. -- -· ·eat ·:' -· .. · ~stmdm !I-. :clhold
atrecteclU..StnK:tlmi or c,ipuMIAatd-.~lltanCo.,~ .. FHW A•s»msion 11itlFr.~,d~qj,onal.Qflb-n_pUe4'qnAuplll 3, 2015. ~~onal . oftlces.-wltb-~Q) .... ,_'.114'~il0tpu.tofth&MPO.iliid themftm;the~~•s~·-ilot-~IJ-23:U.$t;: .. § 134(d)ll). ~ tlm-~offt-.~wl11uo1p--to~:iqf.licatioa-of thtUJ1•\lfatbatjngqlaQ8e. C'Amsiforing1hc-¢bmp:•~tam.v~e4t,ytlw ~Gd>anCo~1he:~oftices~t1\!lt.~e~wer.e.llP.t'~tial' so·as to~•~• ..tcn-23 .C.F.lt § 450.JlO(k). The regional ofliees' reply wenton·to di$cus$mtQti.ODB \Vheftan,MPtlwouidor wouldnotbe.l'QqUiJed to '.fC-desi_... , .
IL The Silhurb1111CG11D.tiea1 ~lier l, 1015, leter t() MIW4 lliltl Fl'A
1b Sub\ublQl Cm;inties sent anoti.,letter OD Oc:tobir 1, 2015, this time addressed. to Seoretary Fox.x and t'h., A~..._<>ffHWA an4 Fl'A.-reciu~:fQCOnsicimd:ionof the' . I, • . . ,1,-ro· rt1a· .L .. -'-ri.miif- 4 2015• TiPillmri-- TheSu~Co'Qiitiesn-...1_ conc,US1pns .se~ _ .m - .n. • .- .,, , ._..,..r......,, . . 1~'"'~ . . . -e-tbat we "find the Meiropolitan Council_isnot a properlf 'l0-1tQtedMPO, ud·take a11 other necessary actions consistent with tbat ~-11 1ius Oetobet lei.er reiterated many of the 111ID.e argtJments put before FHW A an~ Ff A p~ously, including the suggestion thatthegrand61tb.erin&c~of23U.S.C. § 1,4{cl){4).does not applyto MPOs pnemlly, does not apply to-the~ Counoil spacltiaally,-and ~not apply to the mem~p requirements imposed on MPOs by the same sub~on. ·
139BLUE RIBBON COMMITTEE REPORT | December 2020
Page 9 of 17
Sulnlbaa counties of the 1\vin Cities area Pap4ofS
With respect to 1ie first. ugammot, aa '1QJ~acl in.~ joiat p01iq, guidanr.e, PHW A~ Fl'A1,awu,,n,,inedthat1bo~•mffidl~~protiaion.clooutillaj,plytoDJ'.MPOtliat (1) optafla PIDIIW to aS.Iawthat WIIS-in-drcctan or·IKilbia:Qecmnboi ll. 1991; (2) sudl.State law bas not Ileen _,._,-.tier ~bor IS. 1991. with~ 1Q tlia ~ « ... nntian oftbo MP(•. -ind@·t.MPOhu Id bcicn .• piimrl or-ro~atwr n.o.lJs 18; 199i. 79;Pod.,: Rag.U,.2l6 •••• ...._. that 1xdl'J4fdidlua hlajointNotbl of~"i~,o-nn,1-.){ANl misiom to?edrMI•~ ~rui1mg· ....... 79.·pe4.,Jlli.3l.784 (J-UDD2. 2014). ~. ~eaa&:lild tu.FAST Act. P,l.. n+M. w1Mh. mobJdi4·•...,~•23 U:AC.f 1M (PAST~. }201) l!l,!J"ltU.S.C.. § 5.3'3 (FAST Ac:t.§-3003). l1ii F'A$T Achilltifiicl·~ ·idttmgto imM;P's deal .:iatlart or selectimudloftidals or · .. " 1b-anl41iJlht eftum'Ain'; .. ~ . - _.: , ~ - . ... •, ·· 'I <lulitae,mlNPIM-aadpNl:c~liN'i1mt,;lliiUi;..,.a,.~•t1-1-c1oo-
.....;.L; ....:.,, ditI •aaieiilHbc · · · -111 .lliid ·~..1 C .. : · · ' .... -,_ rt:of tu DIR~.-~ · .. . . ,. . .·IJ"f'.§I ,i-7 . .... "lrn,P•:14&--~ .... .• !PL . , • statqtoryti!,mpswJiile'lmh,gt11¢p4&tM1tqpovuiimWJOtifla:stmnJincQmdoa 111,t ~commn with1a,..,Mm11~ ~-~"-· af,...;.--.w- s... • o Davis . . .;, . . . . . -~...,~ -......--v~~ '..,.....,. . Y. lJnildJttit,t .~ U;8. 472, 4&2·(1.990).~• ~-mtd Qffi, statute). 1lfiiD8 the samclulUIF. indlCU1Sita~•~wili tbeprr;valima bilc:q>rela1lun of 1'bc 111111t1.-,; Pi,,n ,,_ ~ 487 US. 552, 566-68 (1981). .
Seocmil.tbalubudHmCuuutiel~ with1lic.FRW~anclFTA repnal ~• cnnclu6m thit 111o·S1at1:-lawcbanpll...e~•~-' .,,.,..to~ a _._g..aimt1 mdso dW.mltqaima ~ ~ 1oemsiciiitowinpfiimce:wlth 23 u.s,c. § 134{d.)(2). 'k, llfde:UHd in tha PHWA/PTA ~ GofdlDM, aa MPO is no 1onpl a,i1-Qitliiim,l·fmmwnmtF~~sl•nrtarin&'ffJi(.-1 ·•t;. tf eldltwillc MPOreclMgrims a,: dumps m~·..-im,ct:111eslnlolaie or oqmizatimt'Jf11te MPO. B;adnimmin41his ~1JetwamtiteatatMld; btb pm«flitberingpro• visioiim4rcdmglfion. we cmrduu tlllltnebbcrof6or..,.. ~- mpJL +41ilre.
We reviewM 1IJ,!. ..,...,dmmts to 1he laws go~dio Ma.uopollbmCounciloitcd in yuor Odo"'1 1, 201S. latsr. 1n 9IIIDIDll!f, the _,.,.,,.if41•~ (1) cibnr-.Hho MPO iipm a S...admhristrativff agc.ncyto a pliblic coipondioullllCl ~ rrol,dk,ialonof1hD State3; (2) cbqe4 the t«m kugth ofMPO ~; (3).Uowcd the~ Council to "'--1...1 · a di or ...... funds wffllaut ........ .;+ieg 1Jac monay into 111c State uu-, \IR, . .IJIOSC . -, -1"'---i-Treumr; a.nd. (4) d.tiBP.Pi provisions Rgimting tbe Metropolitan Couml clistmts which have ohlnpd to·~ .thepopulalk>n dim11!,os from thoPed-.al deoemdal cemrus, ~though the numl,er of.districts remain• 1m same.6
1 Mimi, Stat. §473.12', auN. 1 (1994); Mum, Laa 1994 c. SJll-6,F. No. 2015. Sc. 4. 'Mimi. Siat. § 473.12S, nbd. 2L (1994). · . 'Mii1B. SIii&. § 473.129, ftbd.4 (19'4); Mhm. Laws 19M c. 628-S.F. No. 2015, See. 39. 5 l\.irm. Stat. § 473.129, subcl. 3 (1994).
140B
LUE
RIB
BO
N C
OM
MIT
TE
E R
EP
OR
T | D
ecemb
er 2020
Page 10 of 17
s1• 111·t';1••1···1·~1:·~ 1~1111agJ:11s ~~ I .Js ·_.··. --.1; -i·,;1·· i :._:1_.,,:_. :.:.: ::: ;·:1:.;_-·_'.J. ;:1;--.::=:i:_•·I;-,' ~~ Q. ·. -·. _I !f - :Ji I , . - a--~·-···· .=; - -~I,:-• j·jit"""$Oe> !It. g S' -~ ~ • · ~ : · , ~ ,,- _ · : ~ : ... · . :ID . · • ; . ,, . ·. :i;• ' • · .. ': · • 'N; ' J:i. 'i!. ...,, ~ • ;jjj '. . , . . ••.. ; . , , ... ; , - . . • ._ -: . .... : • - .s - . I e. C, ! s ~ f ~ ·a fl ' ., ., : ' : :8' -· :.it ., . ' . ·a II& . .. . . . !2· Si · ; Pl .. l?l. ·-·' --~; '.- .,·_·;$:/\ ;• .. '../ ::1. :=.,:_ _·}: ,e¢.\ :.: .. -.1 :-i ~; , Jill_ I: I :.I ~_ I_. 11:1---1• ·:1·. ;;.:1·•.:'.=:l:_l·~-irt I•-,;·· :1:..2_· · 1•_.j, :,1-_~ ;e f ~ fo ~- I .0 1" :. : · : ~---~ =!d .. t, ...• :'.iin : . : ·. i :~·~,-•· !- · i ··; ·,s. · ~ ~-}~· .- J"ll) ~ : ; . _· ; t.Ji. ;Olli.· .. --: .,·· .... ,,, ; . .. . ; . . . .•, ; . :(, i : · .. · . 1 iii . -~ .. G:lli. '.·_ .... · ')ir,;,1.-·' .. ·-. . '·· .. ~-. · .. ·i" . . .. . . i:i t , Ii . , •• ·1;,;,i I • • • • < . . f/,;11, ·•, •· • I!
~f J-lf ,1~,l 111. ,,~-,! i ~Iii I 11 i'l·;·l~i '.lll~t r~n!,~r::frt
- . _, , . - . ~- .. ,,-.. ; _'. • :-:-: : ._:.; ,.:, . . , i • :: 1·. t' - - . : .. ,.:-•• - :~,>-· -:Ii r =·. - -· - : __ • -1 · --. -· -· ' · ·._ · · · t- f' ·. '= · 'j ! -' ,, . · .on ·&· & ; • -, :· · .. ,. · -. ·· · (! JI ~ i I~ ;I ·1 : ·• is/f ::t ;f!_: .. ·:.-_,--- :. _:i ti, r I ,,"<:•1: . '.· rt, r _,_i _ _._-:r1_::I .. , .) ' ,_ ·.f h~ 1 .. > J, :11, '.-t; _ ~O:! i:)1~ .. ;:-1:·u,- · I' : ; .. :1~. ,,L r1· 1:-~ .I,!!! ii • l a:_. : 1·--. I· .. if: : • 'i'r· ~.:' ,- ·; :_- ,. , : __ ,·. . ~ ,_ : I' :. , . I· .... ~ -1-. .· . -. . -:¥'A ... . ' . ~- • . . . . . Q .• . ,/ . . I:) . ·~ td . ! .,.... • ,-·, .lijj)· · .• ,, . : ''i '. ·', . -~ ···9-· . . . . . titi ,. _;_ . . 211 . • : ': .. , -- -: ·:• \: . ; :: a '. ~ . : _· 'a· ; : ! \ . - .
.. ' . l --~ : 11 f' .. I : t " ·g J t .. . !. ~ ·. · · t#o S ;fB'.1·:· -,-- ___ :·.1 r ,,,,·-,- ;-·-: -. ', . :IJ~ :· ··: :· -- , ' It I s ·tJ£, . ,_; -:Ii:·;,:·· i::-, °'. ;_-:_-('''.a_--~ -. '_ .. ri s-- · • 1 : ,-., : '( · · : ·' ," · ~ • ·t &> :r ci Ii o l ;l , J ,,.,,t t'l it~ r i'''
l!
141BLUE RIBBON COMMITTEE REPORT | December 2020
Page 11 of 17
In a November 19, 2018 letter from attorney Ann Goering addressed to l-'H WA and FT A administrators in St. Paul, Chicago, and Washington D.C., Ms. Goering asserted that the FIA and FHW A erroneously concluded the Council was "grandfathered" in under federal I.aw governing transportation planning for urbanized areas and incom:clly concluded lhe Council qualifies as lhe MPO under federal law. Ms. Goering stated: "The Obama Administration ignored the expressed will of Congress, choosing lo rely on its own administrative prerogative instead."
Congress ha.~ at lca.~t twice expressed its "will" on this issue: first when it passed legislation in 19911
that "grandfathered" in MPOs as they existed at the time of the legislation; and a second time in 2018 when Congress had the opportunity to change the grandfather provision but declined to do so.
In April 2018 former Representative Ja:;on Lewis (Minn.) offered an amendment to the FAA Reauthorization Act of2018 that would have eliminated the "grandfather" provision of title 2317.S.C. section 134(d)(4) as it applies to the Coundl's sratus as the MPO.2 Representative Lewis' amendment did not survive the legislative process and was not included in the FAA Reauthorization Act of 2018 that was passed by the 115th Congress and enacted into law. 3
1 Inlermodal Surface Transportation Efficiency Act of 1991, Pub. L. No. l02-240 (Dec. 18, 1991 ).
2 Among other things section 134 governs MPO designation, structure, and representation. Represent11ti ve Lewis' amendment was incorporated as Section 599B under Title V of the House version of the bill (R.R. 4). The Lewis amendment would have made the following change to section 134(d)(4) of title 23, United States Code:
(4) Limitation on sbdutory coostruction. - :Nelhie~ Except with respect w a metropolitan planning organization whose structure consists of no local elected officials, nothing in this subsection shall be constrned to interfere wilh th'-= aulhority, under any S1a1.t: law in effect on December 18, 1991, of a public agency with rnultimodal transportation responsibilities -
The Council has been the designated MPO for the Minneapolis-Saim Paul metropolitan area under stale law sini.;e 1975. See 1975 Minn. Laws ch. 13, § 9 ("The IIJ.Clr.opolitan council shall be the designated planning agency for any long-r1:1Dge comprehensive transponation planning required under section 134 of the Federal Highway Act of 1962, Section 4 of the Urban Mass Transportation Act of 1964 and Section 112 of Federal .'\id Highway Act of 1973 and such other federal transpo1tation laws as may hereinafter be enacted.") (codified at Minn. Stat. § 473.146, subd. 4 (l 976)).
3 The Senate version of the bill (H.R. 302), which did not inchule Ille Lewis amendment, was signed by the President on October 5, 2018.
142BLUE RIBBON COMMITTEE REPORT | December 2020
Page 12 of 17
Ann R. Goering Direct Phone: (612) 225-6844 arg@ratw iklaw .com
K Jane Williams Acting Administrator Federal Transit Administration 1200 New Jersey Avenue, SE Washington, DC 20590
Brandye Hendrickson Acting Administrator Federal Highway Administration 1200 New Jersey Avenue, SE Washington, DC 20590
REC'D NOV 2 2 2018
MN· FHWA
November 19, 2018
Kelly Brookins
RRM Ratwilc, Roszak & Maloney. P.A.
Acting Regional Administrator Federal Transit Administration 200 West Adams Street Suite 320 Chicago, IL 60606-5253
Arlene Kocher Division Administrator Federal Highway Administration 380 Jackson Street Cray Plaza, Suite 500 St. Paul, MN 55101-4802
RE: Metropolitan Council Certification Review Our File No. 5070~003 l
Dear Ms. Williams, Ms. Brookins, Ms. Hendrickson, and Ms. Kocher:
We have been working with the Minnesota counties of Anoka, Carver, Dakota, and Scott for the past several years. We are writing to follow-up on Ms. Williams' August 23, 2018, letter to Congressman Jason Lewis regarding the Metropolitan Council. At the outset, we thank you for agreeing to undertake further review of the Metropolitan Council's compliance with federal requirements regarding the composition of a Metropolitan Planning Organization ("MPO"). As part of your review, we ask that you reverse the Obama Administration's 2016 erroneous determination that the Metropolitan Council is "grandfathered" from the unequivocal statutory requirements of 23 U.S.C. § 134(d)(2). That decision did not accurately consider the changes made to the Metropolitan Council since 1991 and is inconsistent with the express language of Section 134(d).
The Obama Administration's erroneous conclusion leaves local communities, including the suburban counties that originally approached the Obama Administration with this issue, without any meaningful say in the metropolitan planning process. Instead, as stated in Congressman Lewis's letter. all significant decision-making is controlled at the state level, by
p (612) 339-0060 • f (612) 339-0038 • www.ralwiklaw.cnm
143BLUE RIBBON COMMITTEE REPORT | December 2020
Page 13 of 17
November 19, 2011! Page 2
gubernatorial appointees. In effect, the Ohama Administration's erroneous decision protected the authority of a governor and his unelected appointees at the expense of the rights of the citiztms ofl:he Twin Cities Metropolitan Region t-0 have elected representation in the MPO decision-making proces::;.
I. The Obama Administration Erront!ously Determim:d that the Metropolifao Council is Exempt from the Federal Requirements Regarding MPO Structure.
In 2016, the Obama Administration admitted that the Transportation Adviso .. y Board ("TAB") "is not part of the MPO, and therefore the Metropolitan Council's Membership does not comply with 2::1 U.S.C. § l34(d)(2)." Nevertheh.'l!>S, then-FHWA Admini!'ltrator Gregory G. Nadeau and then-FIA Acting Administrator Therese McMillian concluded that the Metropolitan Council was "grandfathered" front compliance with. Section 134(d)(2). With all due respect to the Obama Administration, this application of Section l34(d)(4) was erroneous and an over-reach of administrntive authority.
The crux of(he Obama Administration's decision is that the Metropolitan Council is "grandfathered" from compliance with the requirements of Section J 34(d}(2) under Section 134(d)(4). As di~cusscd in our 2015 con·espondence with the Obama Administration ("2015 Letters"), as well as the separate correspondence from local suburban counties received by the Obama Administration in 2015, Sect.ion 134(d)(4) docs not apply to the membership requirements of Section 134(d)(2). Nor does Section 134(d)(4) bestow the powers ofan MPO on an entity Iha! is not a properly cunsiituled MPO. The Obama Administration ignored the cxpresi;ed will of Congress, choosing to rnly on its own administrative prerogative instead.
Nevertheless, even assuming that the Section 134(d)(4) applies to thi:: MPO membership requirements of Section 134(d}(2) in general, they do not protect the Metropolitan Council from compliance with those requirements. As stated in Congressman Lewis's letter nnd OUl'
2015 correspondence with the Obama Administration, thert: h1:1ve br:cn numerous changes to lhe statutes governing the Metropolitan Council. These changes huve htt.d a substantial effect on the orgwtization and structure of the Metropolitan Couucil. Therefore, even if the grandfathering analysis of Section 134( d)( 4) were applicable to the membership requirements of.Section 134(d)(2}, they would not apply to the Metropolitan Council.
Even according to the Obama Administration's June 2, 2014, Polic,y Guidal'lce, "an exemption from Lhe MPO structure requirements is only appropriate for an MPO where (I) the MPO operates pursuant io a State law that was in effect on or before Oecemher 18, 1991; (2) such State law has riot been amended a.ft.er December l 8, I 991, as regards to the structure or organization ofthe \1PO; and (3) ,he MPO has not been designaMI or re-designated after December 18, 1991." 79 F~d. Reg. at 3 l 2 l6 (emphasis added). The Mct.ropolitan Council doe:; not meet this standard.
144BLUE RIBBON COMMITTEE REPORT | December 2020
Page 14 of 17
November 19, 2018 Page 3
As discussed by Congressman Lewis's letter and described in the 2015 Letter, there have been several significant changes to the Minnesota statutes governing the Metropolitan Council's structure and organization since 1991. Perhaps most significantly, when the Metropolitan Council was first created, it was an administrative agency of the State of Minnesota. Minn. Stat.§ 473.122 (1990); see also Minn. Stat.§ 473.123 (1990). In 1994, the Minnesota legislature amended Section 473.123 to provide that the "metropolitan council. .. is established as a public corporation and a political subdivision of the state ... " Minn. Stat. § 473.123, subd. 1 (1994) (emphasis added).
The Obama Administration considered the creation of a separate, independent entity to be a "minor" change to the Metropolitan Council's structure a~d organization. Nevertheless, the fact remains that the body known as the Metropolitan Council simply did not exist as an independent entity prior to 1994. Creating a. separate, independent "political subdivision," akin to a county, is a fundamental change in the structure of the Metropolitan Council. This change alone should remove any doubt as to the application of Section 134( d)( 4) to the Metropolitan Council. The then-newly created entity should have been designated or re-designated as the MPO is 1994 and the fundamental shift in the nature of the Metropolitan Council, from an "administrative agency" of the State to a separate entity, is certainly a significant amendmenl regarding its structure.
Another noteworthy statutory change, in 1994, the Minnesota legislature amended the statutory provisions governing the terms of Metropolitan Council members to provide that Metropolitan Council members' terms ''end with the term of the governor" or the effective date of the net appointment. Minn. Stat. § 4 73 .123, subd. 2a (1994 ). Also, for the first time in 1994, the Minnesota legislature decreed that each Metropolitan Council member "serves at the pleasure of the governor.'' Minn. Stat.§ 123, subd. 2a(1994).
This statutory change deeply affected the Metropolitan Council's organization. In I 991, Metropolitan Council members were appointed to a fixed term that potentially spanned multiple gubernatorial administrations. Minn. Stat.§ 473.123, subd. 2a (1990). After 1994, Metropolitan Council members only serve as long as the governor who appointed them. In 199 l, there was no express statutory provision for removing Met Council members. After 1994, the statute clearly provides that members can be removed by the governor. Before 1994, there was some stability in the Metropolitan Council's membership. Now, as Congressman Lewis indicated in his letter, the governing law "creates a dynamic where the regional planning board for seven counties is completely controlled at the state level" dependent on the four-year election cycle and the whim of the current governor. This is another fundamental shift in the organization of the Metropolitan Council that takes it firmly out of the ambit of Section 134( d)( 4 ). 1
1 Our 2015 Letter and Congressman Lewis's letter describe multiple additional statutory changes that have had a significant impact on the Metropolitan Council's organization and structure since l 994.
145BLUE RIBBON COMMITTEE REPORT | December 2020
Page 15 of 17
Novemher 19, 20 '. 8 Page 4
The Obama Administratiun disregarded the signi!icanl statutory changes that have altered lhc Mt:tropolitan Council's structure and organization since l 99 l. The Obama Administration determined that these statutory changes did not "directly affect in any maleri:i.l way the structure or organi7,ation of the Council itself." Categorizing these statutory amendments, including an amendment that acwally created the independent political subdivision known as the Metropolitan Council, as "minor," the Obama Administration conclt1dcd that the "core of the Metropolitan Council's structure and organization remains the same as it was in 1991." The Obama Administration's apparently cursory review of the changes to the structure of the Metropolitan Council misses the mark entirely. All of these i:;w~eping changt:s a/Tectoo the organization and !structure of the Metropolitan Council and occurred after December l 8, 1991, Accordingly, even applying the test outlined in the June 2, 2014, Policy Guidance, the Metropolitan Council is nol exemJJt From the membership requirements expressly set forth in Section I 34(d).
II. The MctropoUtan Coun~II Still Represents that the TAB is Part of the MPO.
In her August 23, 2018, Ms. Williams stated that the FHW A and FT A previously "required th1: Met Council lo remove reference to lhe [TAB] as the MPO." The Metropolitan Cow1cil has completely ignoretl that directive. As of the writing of this letter, the Metropolitan Council's websile :;till reads:
The Transportation Advisory Roanl. (TAB) is a key participant in the region's transportation planning proce~s. TAB was created by the state legislature in L 974 to perfonn transportation planning and programming for the Twin Citiell metrop()litan area, as designated by state and federal law
"'** As the region's federally designated Metropolitan Planning Organization (MPO) the Council and the TAB are responsible for the continuing, cooperative, ond comprehensive lran~portalion planning in the Twin Cities Metropolitan Area. This qualities the region for teder.1.l transportation planning,, operating, and construction funds'-
The Metropolitan Council's "Transportation Advisory Boarci FAQ" goes even fu11her, admitting that the TAH was crcnted to comply with fcdc.:rnl law regarding i\.1PO membership. Specifically, the FAQ states that the Ylctropolita.n "Council, in conjunction with TAB, serves as the designated FMl•O and receives federal transportation funds.'' 1
1 h.11p_s:flme11·.Q.~Q\lJ)ril ... 12ref.J!:~Jl§P.1,1.r,10,1io11/l>.!n1.l!lin~-J.{.[)i111.svorla1i.9.n-Plan11ing-l'roc~~ri rnns11orln!io11•.A~l.:1i.8~!.l)'.::fu>:1r<!.asu; (emphasis added),
l!llt1:1.:/lrne1 tQcoun\:.i!,,1r1V-r 1,ui,~~1111~tiJJnlPublicali(1t1s:h11!!:.l!..t\ilJUl'<;eslf 1:u[l~P..Y.J:.l({J io11- Ill unning/M I ~CE LC~NEOUSDOCI i ME:--JTSff 1·~port!Jtio11-l\dyi~o;·y-Ao;1rd.: . .ll A B.J!]• 1·eyu1ml ly-/\ sJ,. .alijM ( ~mphasis <tdded).
146BLUE RIBBON COMMITTEE REPORT | December 2020
Page 16 of 17
The Metropolitan Council continues to make these assertions despite the previous determination by the FT A and FHW A that the "TAB is not part of the MPO, and therefore the Metropolitan Council's membership does not comply with 23 U.S.C. § 134(d)(2)." The gubernatorially-appointed members of the Metropolitan Council continue to mislead the public despite the previous direction to remove references to the TAB as part of the MPO. The Metropolitan Council continues to rely on the TAB to provide the appearance of local accountability, where, as indicated by Congressman Lewis, the metropolitan planning process for the Minneapolis-St. Paul region, is "completely controlled at the state level and certain counties often receive preference."
As evidenced by the Metropolitan Council's continuing misrepresentations, directing the Metropolitan Council to remove references to the TAB as part of the MPO and h.oping for voluntary compliance with Section 134(d)(2) is not sufficient to address these concerns. The only way to ensure that the Metropolitan Council consists of the required statutory members, and thereby give local communities a meaningful voice in the regional planning process, is to force the Metropolitan Council to actually comply with Section 134(d)(2).
III. Conclusion
As the Obama Administration correctly recognized, the TAB is not, and has never been, the designated MPO for the Twin Cities region. Nevertheless, and despite direction from the FT A and FHW A, the Metropolitan Council continues to represent that the TAB is part of the designated MPO. These assertions mislead local communities into thinking that their local elected officials have an actual voice in making long-term planning decisions that affect their daily lives. The reality is that the Governor's office still controls those decisions, despite the express language in Section l34(d)(2).
The Obama Administration overlooked these concerns and concluded that the Metropolitan Council was excluded from the requirements of Section 134(d)(2). That determination ignores express congressional intent and cemented the authority of the Governor at the expense of Twin Cities taxpayers' representative voices.
In light of the foregoing and Congressman Lewis's letter, we request that you find that the Metropolitan Council is not a properly constituted MPO. We request that you take action consistent with that finding, including refusal to approve any TIP adopted by the Metropolitan Council, and any other submissions that require MPO action until such time as its membership conforms to the express congressional mandate in Section 134(d)(2).
Please feel free to contact the undersigned with any questions. We look forward to yom· response.
cc: Congressman Jason Lewis Secretary of Transportation Elaine L. Chao Anoka County Administrator Jerry Soma Carver County Administrator Dave Hemze Dakota County Administrator Matt Smith Scott County Administrator Gary Shelton
Enclosures: 2015 Letters to FT A and FHA
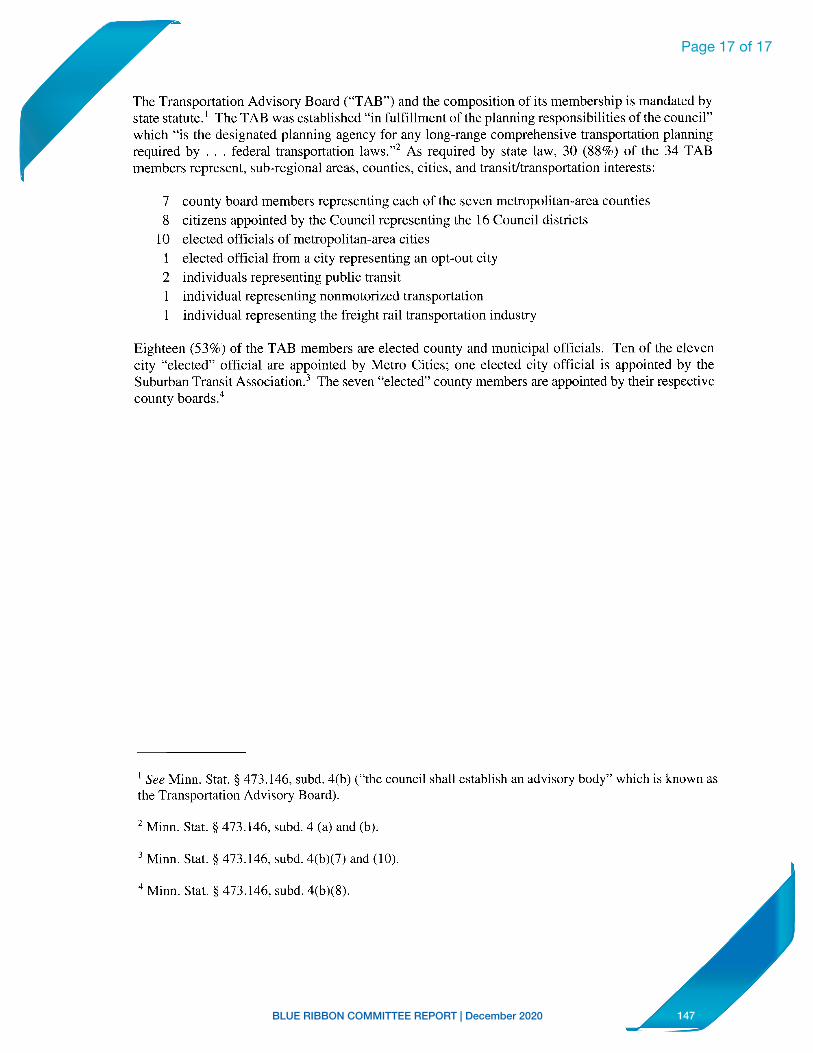
147BLUE RIBBON COMMITTEE REPORT | December 2020
Page 17 of 17
The Transportation Advisory Board ("TAB") and the composition of its membership is manda~d by state statute. 1 The TAB was eslablished "inf ulfillmenl of the planning responsibilities of the council" which "is rhe designated planning agency for any long-range comprehen~ive transportalion planning required by ... federal transp01tation laws."2 As required by state law, 30 (88%) of the 14 TAB members represent, sub-regional areas, counties, cities, and transit/transportation intcn:sts:
7 counly board members represenling each of the seven metropolitan-area counties
8 ciLizens appoinled by Lhe Council representing the 16 Council districts
IO elected officials of metropolitan-area cities
elected officiaJ from a city representing an opt-out cily
2 individuals representing public transit
I individual represent.ing nonmor.orized transprntation
individual representing the freight rail transportation industry
Eighteen (53%) of the TAR members are elected county and municipal officials. Ten of the eleven city "elected" official are appointed by Metro Cities; one ele<:u:d ciLy official is appointed by the Suburban Transit Association.1 The seven ''elected" county members are appointed by their respective county boards.'1
1 See Minn. Slal .. § 473.146, suhd. 4(b) ("the council shall establish an advismy body'' which is known iis the Transportation Advisory Board).
2 Minn. Stat.§ 473.146. subd. 4 (a) and (b).
3 Minn. SI.al.§ 473.146, subd. 4(b)(7) and (10).
4 Minn. Stat.§ 471.146, suhd. 4(hJ(8).
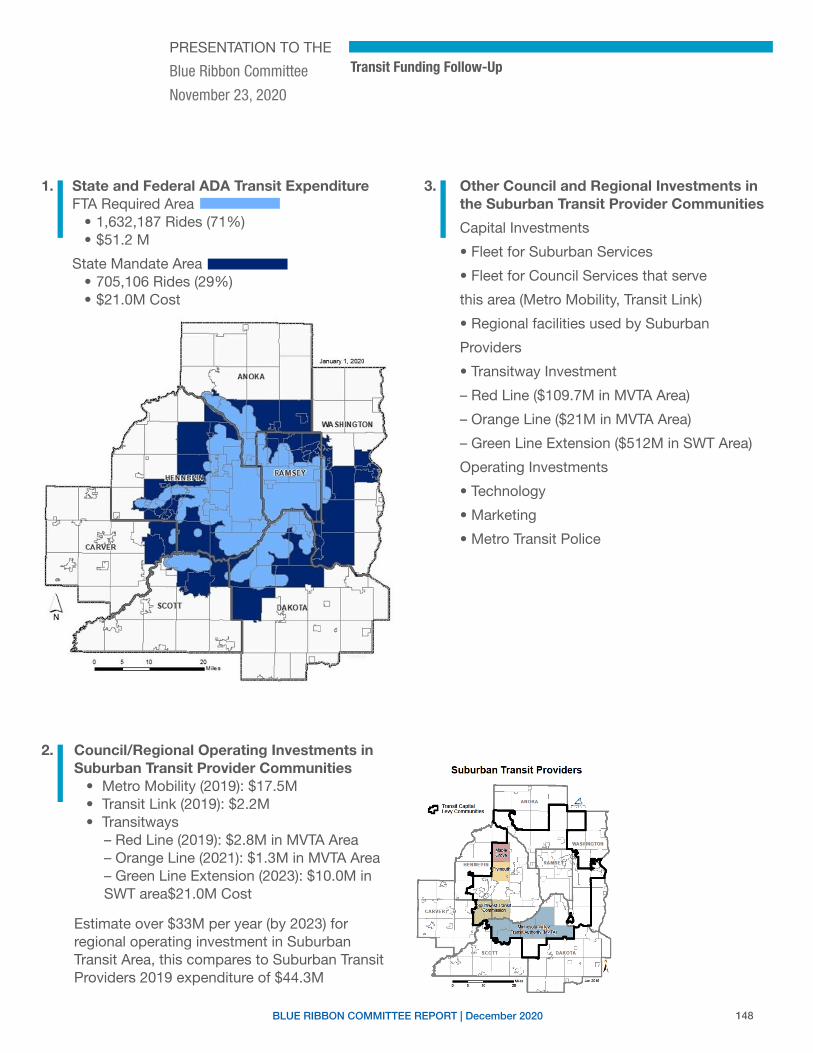
148BLUE RIBBON COMMITTEE REPORT | December 2020
PRESENTATION TO THE
Blue Ribbon Committee
November 23, 2020
Transit Funding Follow-Up
1.
2.
3.State and Federal ADA Transit ExpenditureFTA Required Area
• 1,632,187 Rides (71%)• $51.2 M
State Mandate Area• 705,106 Rides (29%)• $21.0M Cost
Council/Regional Operating Investments in Suburban Transit Provider Communities
• Metro Mobility (2019): $17.5M• Transit Link (2019): $2.2M• Transitways
– Red Line (2019): $2.8M in MVTA Area– Orange Line (2021): $1.3M in MVTA Area– Green Line Extension (2023): $10.0M in SWT area$21.0M Cost
Estimate over $33M per year (by 2023) for regional operating investment in Suburban Transit Area, this compares to Suburban Transit Providers 2019 expenditure of $44.3M
Other Council and Regional Investments inthe Suburban Transit Provider Communities
Capital Investments
• Fleet for Suburban Services
• Fleet for Council Services that serve
this area (Metro Mobility, Transit Link)
• Regional facilities used by Suburban
Providers
• Transitway Investment
– Red Line ($109.7M in MVTA Area)
– Orange Line ($21M in MVTA Area)
– Green Line Extension ($512M in SWT Area)
Operating Investments
• Technology
• Marketing
• Metro Transit Police
I I
I Suburban Transit Providers
149BLUE RIBBON COMMITTEE REPORT | December 2020
BLUE RIBBON PANEL Correspondence
150BLUE RIBBON COMMITTEE REPORT | December 2020
The Honorable Jason Lewis U.S. House of RepresentativesWashington, DC 20515
Dear Congressman Lewis:
Thank you for your letter requesting that the U.S. Department of Transportation review the compliance of the Minneapolis-St. Paul Metropolitan Planning Organization (MPO), known as the Metropolitan Council (Met Council), with Federal requirements for the composition of an MPO.
The Moving Ahead for Progress in the 21st Century Act (23 U.S.C. 134(d)(2)) mandates that an MPO serving a designated transportation management area shall consist of local elected officials; officials of public agencies that administer or operate major modes of transportation in the metropolitan area, including providers of public transportation; and appropriate State officials. These statutory requirements are also reflected in regulation at 23 CFR 450.310(d).
Your letter indicates that the Met Council is comprised entirely of unelected, Governor-appointed members and therefore does not satisfy the MPO composition required by Federal law. As you note, however, for MPOs that already existed as of December 18, 1991, another provision at 23 U.S.C. 134(d)(4) may in certain circumstances permit an exemption from the composition requirements that otherwise apply.
Your letter suggests that the Met Council does not qualify for the 23 U.S.C. 134(d)(4) exemption because the Met Council should be construed to have been redesignated since 1991, due to changes that took place in 1994 through Minnesota State statute regarding the structure and organization of the Met Council. These changes include separation of the MPO from State government; granting the Met Council independent authority to hold, use, and dispose of grants; changing the term lengths of Met Council members to coincide with the Governor’s term; and designating that the Members serve at the pleasure of the Governor.
As you are aware, the Federal Highway Administration (FHWA) and Federal TransitAdministration (FTA) previously reviewed the Met Council’s compliance with Federal requirements for the composition of an MPO, in response to requests by a coalition of suburban counties in the Met Council’s metropolitan planning area. At that time, FHWA and FTA determined that the Met Council was designated as an MPO before December 18, 1991, and has not been redesignated since, thereby allowing an exemption under 23 U.S.C. 134(d)(4) from the
1200 New Jersey Avenue, SEWashington, DC 20590
Administrator
August 23, 2018
Page 1 of 2
U.S. Department of Transportation
Federal Transit Administration
S10-180418-024
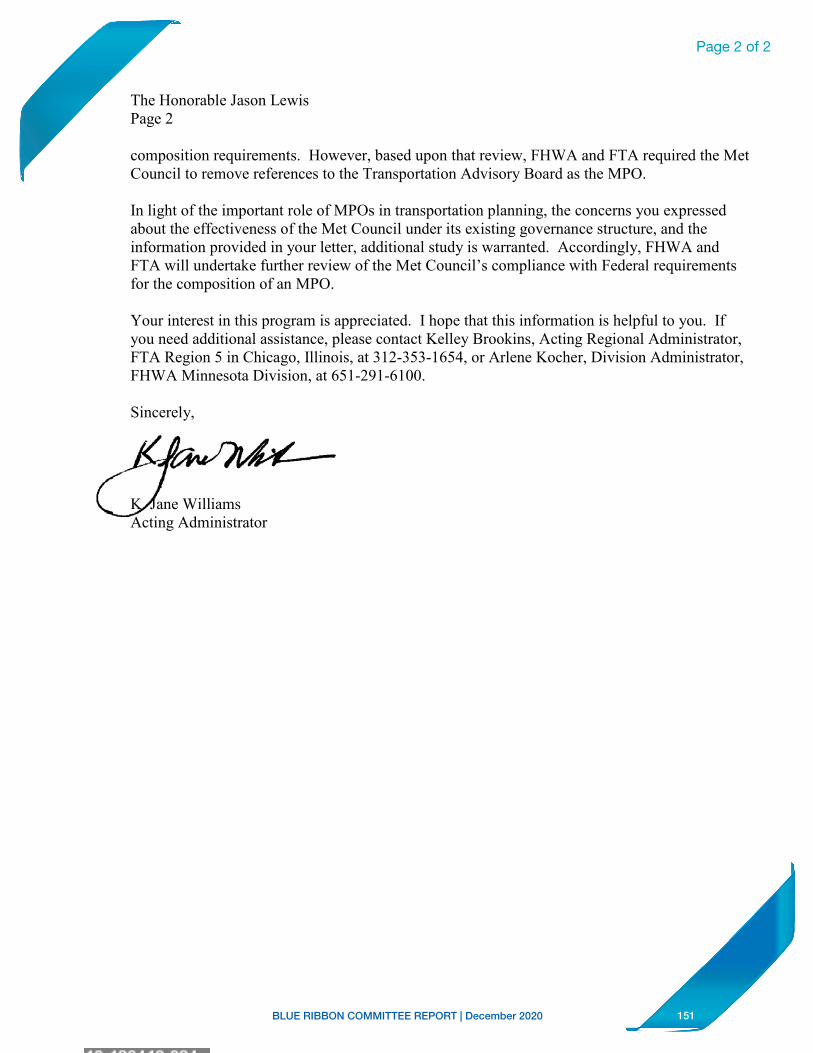
151BLUE RIBBON COMMITTEE REPORT | December 2020
The Honorable Jason LewisPage 2
composition requirements. However, based upon that review, FHWA and FTA required the Met Council to remove references to the Transportation Advisory Board as the MPO.
In light of the important role of MPOs in transportation planning, the concerns you expressed about the effectiveness of the Met Council under its existing governance structure, and the information provided in your letter, additional study is warranted. Accordingly, FHWA and FTA will undertake further review of the Met Council’s compliance with Federal requirements for the composition of an MPO.
Your interest in this program is appreciated. I hope that this information is helpful to you. If you need additional assistance, please contact Kelley Brookins, Acting Regional Administrator, FTA Region 5 in Chicago, Illinois, at 312-353-1654, or Arlene Kocher, Division Administrator,FHWA Minnesota Division, at 651-291-6100.
Sincerely,
K. Jane WilliamsActing Administrator
Page 2 of 2
:a;;=••-* euw_u •-•-
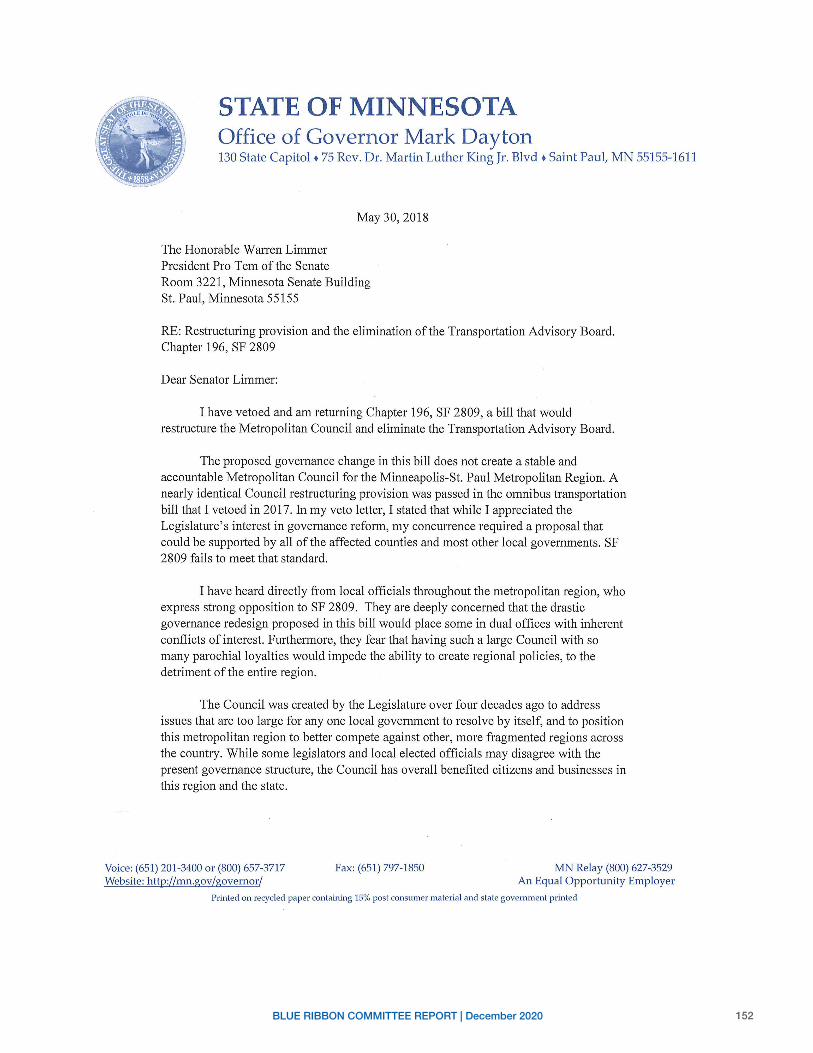
152BLUE RIBBON COMMITTEE REPORT | December 2020
STATE OF MINNESOTA Office of Governor Mark Dayton 130 State Capitol • 75 Rev. Dr. Martin Luther King Jr. Blvd • Saint Paul, MN 55155-1611
The Honorable Wanen Limmer President Pro Tern of the Senate
May 30, 2018
Room 3221, Minnesota Senate Building St. Paul, Minnesota 55155
RE: Restructuring provision and the elimination of the Transportation Advisory Board. Chapter 196, SF 2809
Dear Senator Limmer:
I have vetoed and am returning Chapter 196, SF 2809, a bill that would restructure the Metropolitan Council and eliminate the Transportation Advisory Board.
The proposed governance change in this bill does not create a stable and accountable Metropolitan Council for the Minneapolis-St. Paul Metropolitan Region. A nearly identical Council restructuring provision was passed in the omnibus transportation bill that I vetoed in 2017. In my veto letter, I stated that while I appreciated the Legislature's interest in governance refmm, my concunence required a proposal that could be supported by all of the affected counties and most other local governments. SF 2809 fails to meet that standard.
I have heard directly from local officials throughout the metropolitan region, who express strong opposition to SF 2809. They are deeply concerned that the drastic governance redesign proposed in this bill would place some in dual offices with inherent conflicts of interest. Furthermore, they fear that having such a large Council with so many parochial loyalties would impede the ability to create regional policies, to the detriment of the entire region.
The Council was created by the Legislature over four decades ago to address issues that are too large for any one local government to resolve by itself, and to position this metropolitan region to better compete against other, more fragmented regions across the country. While some legislators and local elected officials may disagree with the present governance structure, the Council has overall benefited citizens and businesses in this region and the state.
Voice: (651) 201-3400 or (800) 657-3717 Website: h ttp://rnn.gov/govemor/
Fax: (651) 797-1850 MN Relay (800) 627-3529 An Equal Opportunity Employer
Printed on recycled paper containing 15% post consumer material and state government printed
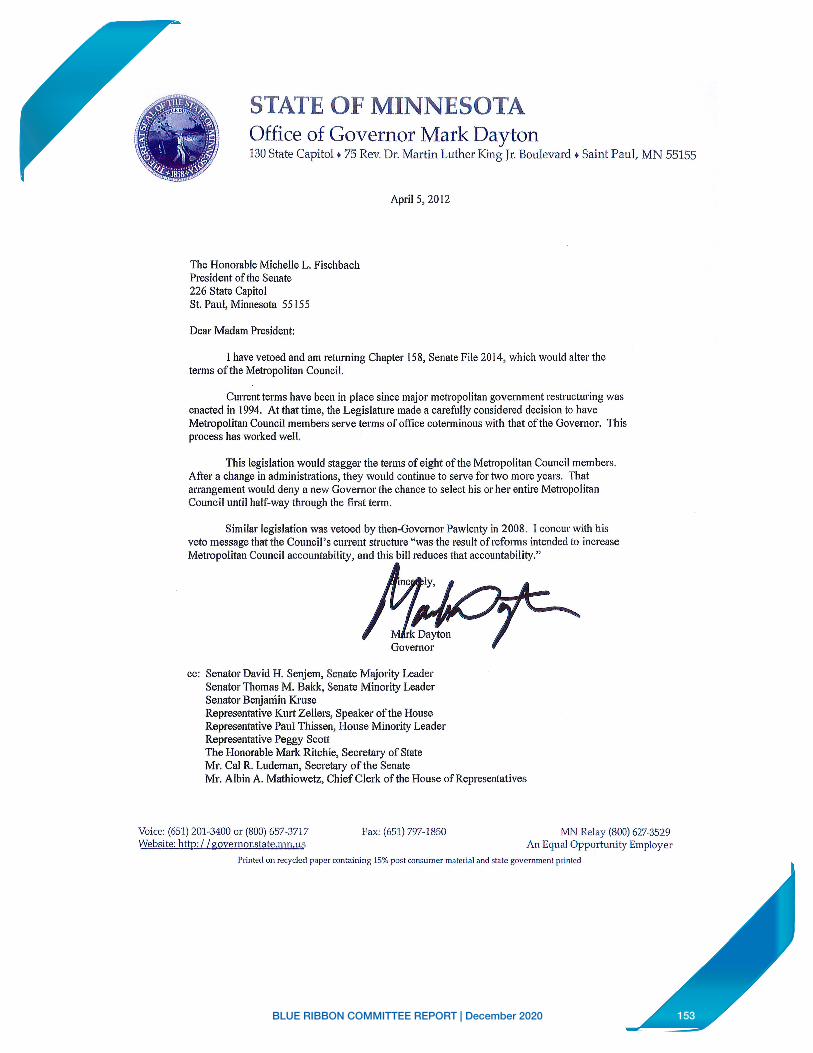
153BLUE RIBBON COMMITTEE REPORT | December 2020
STATE OF MINNESOTA Office of Governor Mark Dayton 130 State Capitol + 75 Rev. Dr. Martin. Luther King Jr. Boulevard + Saint Paul, MN 55155
The Honorable Michelle L. Fiscl1bach President of the Senate 226 State Capitol St. Paul, Mim1esota 55155
Dear Madam President:
April 5, 2012
I have vetoed and am returning Chapter 158, Senate File 2014, which would alter the terms of the Metropolitan Council.
Current te,-ms have been in place since major metropolitan government resh·ucturing was enacted in 1994. At that ti,ne, the Legislature made a carefully considered decision to have Metropolitan Council members serve terms of office coterminous with that of the Governor. This process has worked wel L
This legislation would stagger the terms of eight of the Metropolitan Council members. All-er a change in administrations, they would continue to serve for two more years. That arrangement would deny a new Governor the chance to select his or her entire Metropolitan Council until half-way through the first term.
cc: Senator David H. Senjem, Senate Majority Leader Senator Thomas M. Bakk, Senate Minority Leader Senator Benjamin Kruse Representative Kurt Zellers, Speaker of the House Representative Paul Thissen, House Minority Leader Representative Peggy Scott The Honorable Mark Ritchie, Secretary of State Mr. Cal R. Ludeman, Secretary of the Senate Mr. Albin A. Mathiowetz, Chief Clerk of the House of Representatives
Voice: (651) 201-3400 or (800) 657-371.7 Website: htt11: I /governor.state.mr,.us
Pax: (651) 797--1850 MN Relay (800) 627-3529 An Equal Opportunity Employer
Pl'i.nk:d on rer:ycll!d paper <·ontaininr. l 5% post consumer marcriaJ and stale government printed
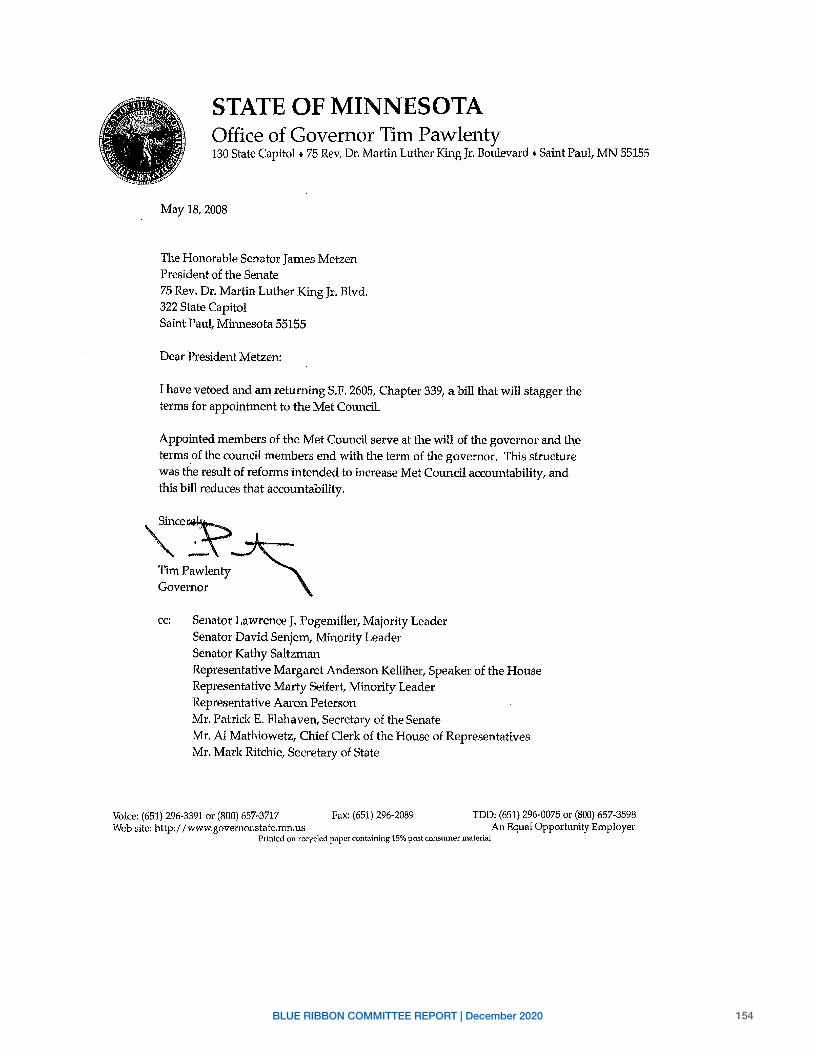
154BLUE RIBBON COMMITTEE REPORT | December 2020
STATE OF MINNESOTA Office of Governor Tim Pawlenty 130 State Capitol • 75 Rev. Dr. Martin Luther King Jr. Boulevard • Saint Paul, MN 55155
May 18, 2008
The Honorable Senator James Metzen President of the Senate 75 Rev. Dr. Martin Luther King Jr. Blvd. 322 State Capitol Saint Paul, Minnesota 55155
Dear President Metzen:
I have vetoed and am returning S.F. 2605, Chapter 339, a bill that will stagger the terms for appointment to the Met Council.
Appointed members of the Met Council serve at the will of the governor and the terms_of the council members end with the term of the governor. This structure was the result of reforms intended to increase Met Council accountability, and this bill reduces that accountability.
~x. ... '11m Pawlenty '..::f-:::: Governor . \
cc: Senator Lawrence J. Pogemiller, Majority Leader Senator David Senjem, Minority Leader Senator Kathy Saltzman Representative Margaret Anderson Kelliher, Speaker of the House Representative Marty Seifert, Minority Leader Representative Aaron Peterson Mr. Patrick E. Flahaven, Secretary of the Senate Mr. Al Mathiowetz, Chief derk of the House of Representatives Mr. Mark Ritchie, Secretary of State
Voice: (651) 296-3391 or (800) 657-3717 Fax: (651) 296-2089 TDD: (651) 296·0075 or (800) 657-3598 Web site: http:/ /www.governor.state.mn.us An Equal Opportunity Employer
Printed on recycled paper containing 15% post consumer material
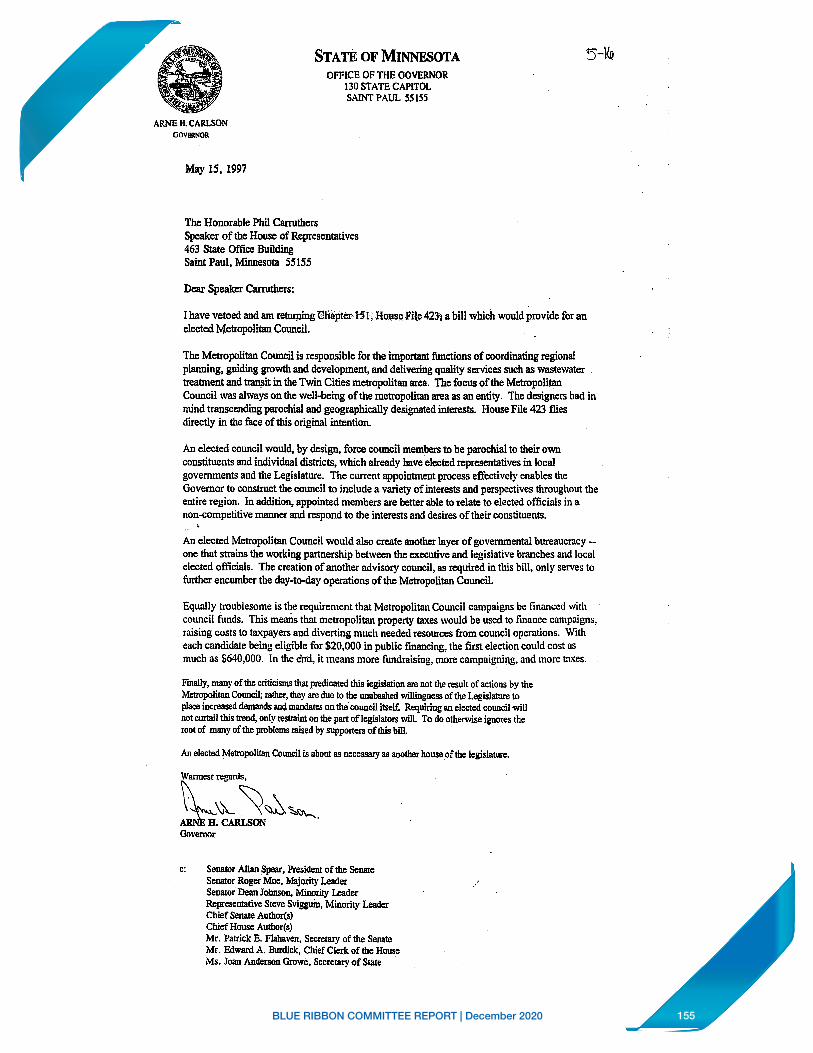
155BLUE RIBBON COMMITTEE REPORT | December 2020
May 15, 1997
STATE OF MINNESOTA OFFlCE OF THE OOVERNOR
130STATECAPITOL SAINT PAUL 55155
The Honorable Phil CBn'Ulhers Speaker oftbe House ofRepresemalivcs 463 Stall: Office Building Saint Paul, Minnesota SSISS
Dear Speaker Carruthers:
5-1((,
I have vetoed and am retuQling Chapter lS l; H~ FU~ 42Jl a bill which would provide for an elected Mettopolitan Council.
The Metropolitan Couilcil is tespOnsible for the important 1\mctions of coonlinating regional planning, guiding growth and development, and delivering quality services such as wastewatei- . treatmeDt and tr~t in 1he Twin Cities meuopolitan mea. The focus of the.Metropolitan Coancil was always on lbe well-being of the metropolitan mea as an entity. The designers had in mind transcending parochial and geographically designated imerests. House File 423 flies directly in the face oftbis original intention.
An elected cooncil would, by design, force couocil members-to be parochial to their own constituents and individual districts, which already have ·elcctDd representalives in local governments and tbe Legislature. The current appointment process effectively enables the Governor to construct the 00uncil to include a variety ofintaests mid perspectives throughout the entire region. In addition, appoi111ed members are better able to relate io elected officials in a non-competitive maimer and respond to the interests and desires of their constituents.
An elected Metropolitan Council would also create another layer of govemmeotal bureaucracy -one that strains the wotking partllCl'.ship between the executive and legislative branches and local elected officials. The creation of another advisory counci~ as required in this bill, only serves to further encumber the day-to-day operations of the Metropolitan Council.
Equally troublesome is the requirement that Metropolitan CoW1Cil campaigns be financed with · council funds. This meruis that metropolitnn property taxes would be used to fi11llnce campaigns, raising costs to taxpayers and diverting much needed resources from council operations. With each condidate being eligible for $20,000 in public fmancing, the first election could 00st as much ns $640,000. In tile e'nd, it means more fundraising, more compaigni"g. and more t3xcs.
F'mally, meny oftbe criticisms that ~caied mis legislelion are ®t the result of actions by t!tt M£uopQ!ilan Council; awr, they are due in the 1UJaba8hed wi~ of die LegislalUl'e to place .increased demands and mandat~ Qn lhe' council il!olf. Requiring 811 elected COllllCil will PO\ curtail this~ only wtraint on lhll part oflegis!atnrs will. To do otberwis• ignores the root af aumy of the pohlems raised by !UppOltm of this biU.
An el~ ~uopolitan Council is about ss ncc.,ssmy as anolher hou.90 .m the legislat.wc.
c: Senator Alliln_Spear, PrcsideDI oftbe Senate Semtor l¼ler Moe. Majorily Leader Scmmr Deanr~oa. Mbioricy- Leader. Repraenwive Steve Sviggum, Mioozily Leader Cbi£f Sc:nate .Aolbol(a) Chief House Allthot(s) Mr. Plurick E. Flallaven, Secreta,y of the Sem.te Mt. F.dward A. &nlick, Chief Cle.k of tbe &use Ms. loan Alldetsoll Growe, Seaeiary af Stale ·
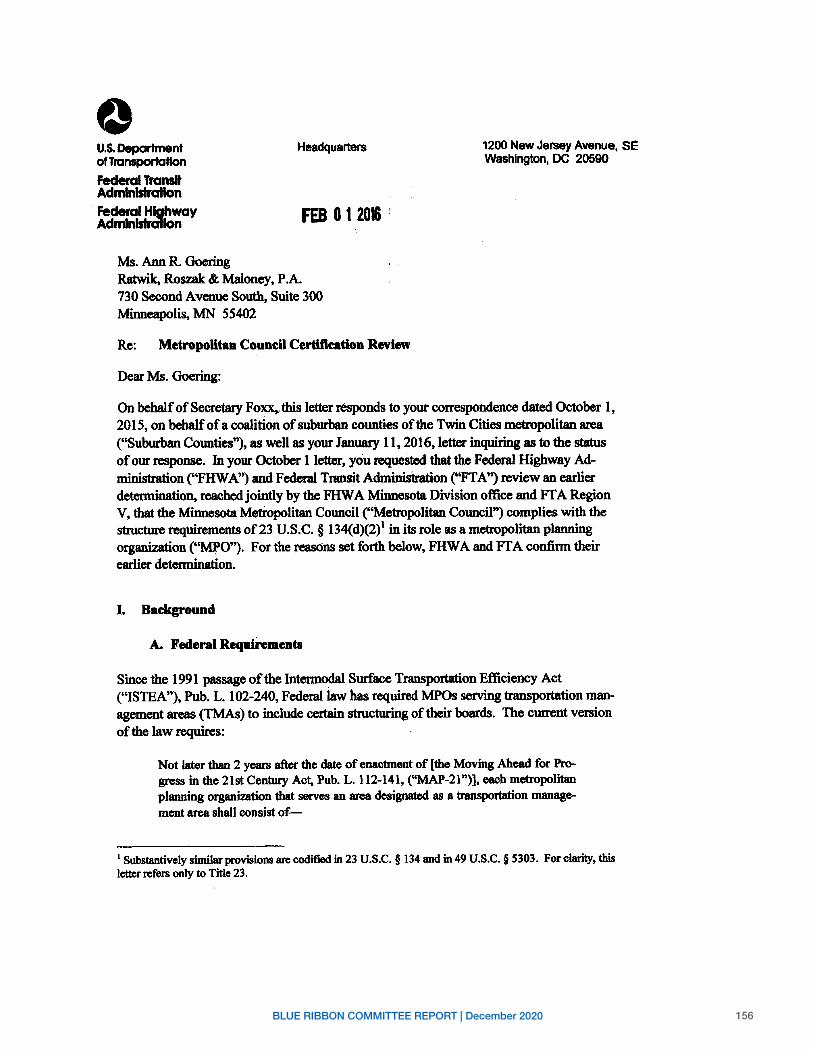
156BLUE RIBBON COMMITTEE REPORT | December 2020
0 U.S. Department of 'Dan8porlatlon
Federal Transit Admlnlslraflon
. Federal Hlahway Aclmlnlltrcillon
Ms. Ann R. Goering
Headquarters
FEB0120I!
Ratwik, RoS7.8k & Maloney, P.A. 730 Second Avenue South, Suite 300 Minneapolis, MN 5S402
Re: Metropolitu Coaacll Certifieatioa Review
Dear Ms. Goering:
1200 New Jersey Avenue, SE Washington, DC 20590
On behalf of Secretary Foxx,, this letter responds to your correspondence dated October 1, 2015, on behalf of a coalition of suburban counties of the Twin Cities metropolitan area (''Suburban Counties''), as well as your January 11, 2016, letter inquiring as to the status of our response. In your October I letter, you requested that the Federal Highway Administration ("FHW A") and Federal Transit Administration ("Ff A") review~ earlier determination, reached jointly by the FHW A Minnesota Division office and FT A Region V, that the Minnesota Metropolitan Council ("Metropolitan Council") complies with the structure requirements of23 U.S.C. § 134(dX2)1 in its role as a metropolitan pJanning orpnimtion ("MfO''). For the reasons set forth below, FHW A and FTA confirm their earlier determination.
A. F'eclenl Requirements
Since the 1991 passage of the Intermodal Surface Transportation Efficiency Act ("ISTEA"), Pub. L. 102-240, Federal law has required MPOs serving transportation management·areas (TMAs) to include certain structuring of their boards. The current version of the law requires:
Not later than 2 years after the date of enactment of [the Moving Ahead for Progress in the 21st Century Aot, Pub. L. 112-141, ("MAP-21")], each metropolitan planning organimion that serves an area designated as a transporlation management area shall consist of-
1 Substantively similar provisions are codified in 23 U.S.C. § 134 and in 49 U.S.C. § S303. For clarity, this letter refers only to Title 23.
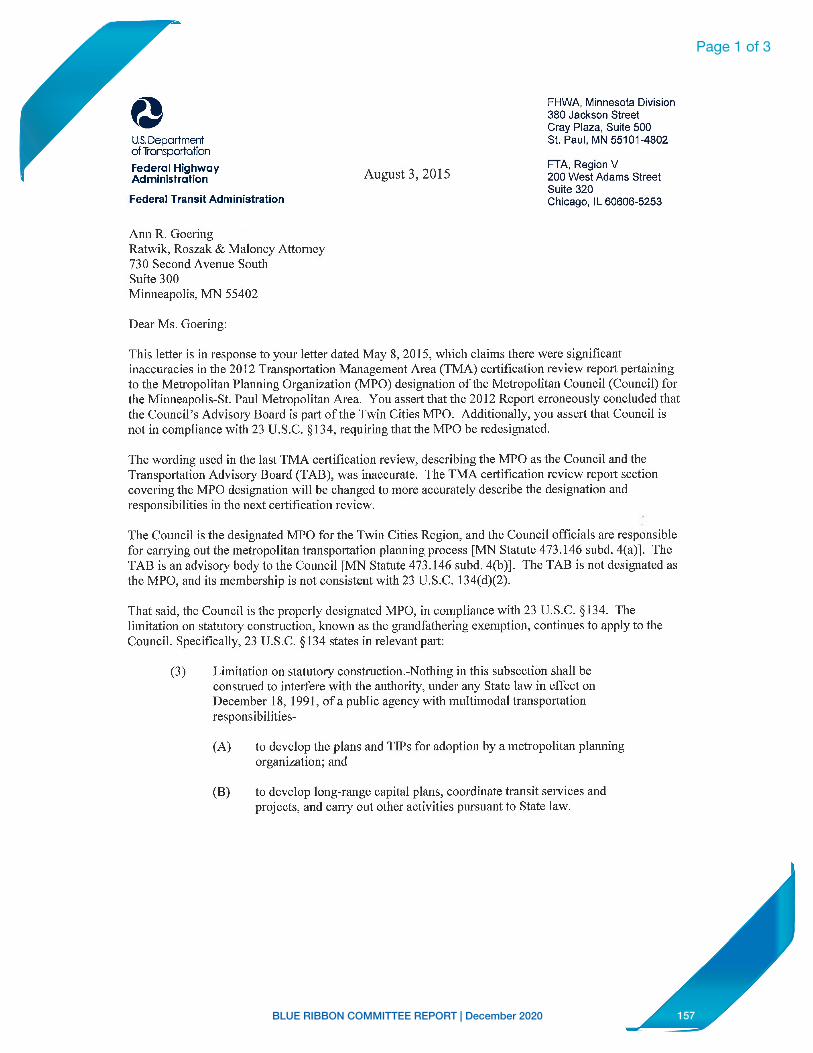
157BLUE RIBBON COMMITTEE REPORT | December 2020
Page 1 of 3
US. Deportment of Transportation Federal Highway AdministrQtion
Federal Transit Administration
Ann R. Goering Ratwik, Roszuk & Maloney Attorney 730 Second Avenue South Suite 300 Minneapolis, i\'JN 55402
Dear Ms. Goering:
August 3, 2015
FHWA. Minnesota Division 380 Jackson Street Cray Plaza. Suite 500 St. Paul. MN 55101-4802
FTA, Region V 200 West Adams Street Suite 320 Chicago, IL 60806-5253
Thi& letter is in response to your letter dated May 8, 2015, which claims there were significant inaccnmcics in the 2012 Transpo:1ation Manugcment A..rea.(TMA) cerl.ification rcviC\1.1· report pcrtai11i11g tot.he Metropolitan J>lanninC4 Organi,ation (MPO) designation of the Metropolitan Council (Couuci[) for the Minneapolis-St. Paul Mctropolitm1 Area. You asserl that the 2012 Rcpmt erroneously concluded that the Council's Advisory Board is part of the Twin Cities JvfPO. Ad<.litionally, you assert that Council is not in compfomce wilh 23 U.S.C. § I 34, reltuiring that lhe MPO he rcdcsignatcd.
The wording used in the last TMA ce1tificatio11 n:view, describing the MPO as the Council and the Transport.11ion Advisory Board (Tf\n), was inaccurate. The TMA cenification review report section covering the MPO de.,ignation will he changed to more accurately describe the designation an<.! responsibilities in the next certification review.
The Council is the de~ignaled i'rll'O for tJ1e Twin Cities Region, and the Council officials are responsible for canying out the metropolitan transportation planning process [MN Statute 473.146 subd. 4(a)J. The TAB i.s an advisory body to the Council [MN Statute 473.146 subd. 4(b)J. The TAB is not de;;igiwll:d as the :\1PO, and its membership is not consistent with 23 U.S.C. 134(d)(2).
That said, the Council i.~ the properly designated MPO, in compliance with 23 U.S.C. § 134. The limitation on statutory constructio11, known as the grandfathering exemption, co11ti11ues lo apply 10 lhe Council. SpcciticaJly, 23 U.S.C. § 134 states in relevant part:
(3) I ,imitation on statutory construction.-Kothing in this subsection shall be construed to inr.erfere with 1..he authority, 1.1nder .my State law in effed on December 18, 1991, ofa publit: i1ge1tcy with multimoclal transpoitation respon:;ibilities-
(A) to develop the plans and TIPs for adoption by a me!ropoli1a11 planning organi:i:ation; and
(B) to develop long-range capital plans, coordinate transit services and projects, and carry 0\lt other aclivities pursuant to State law.
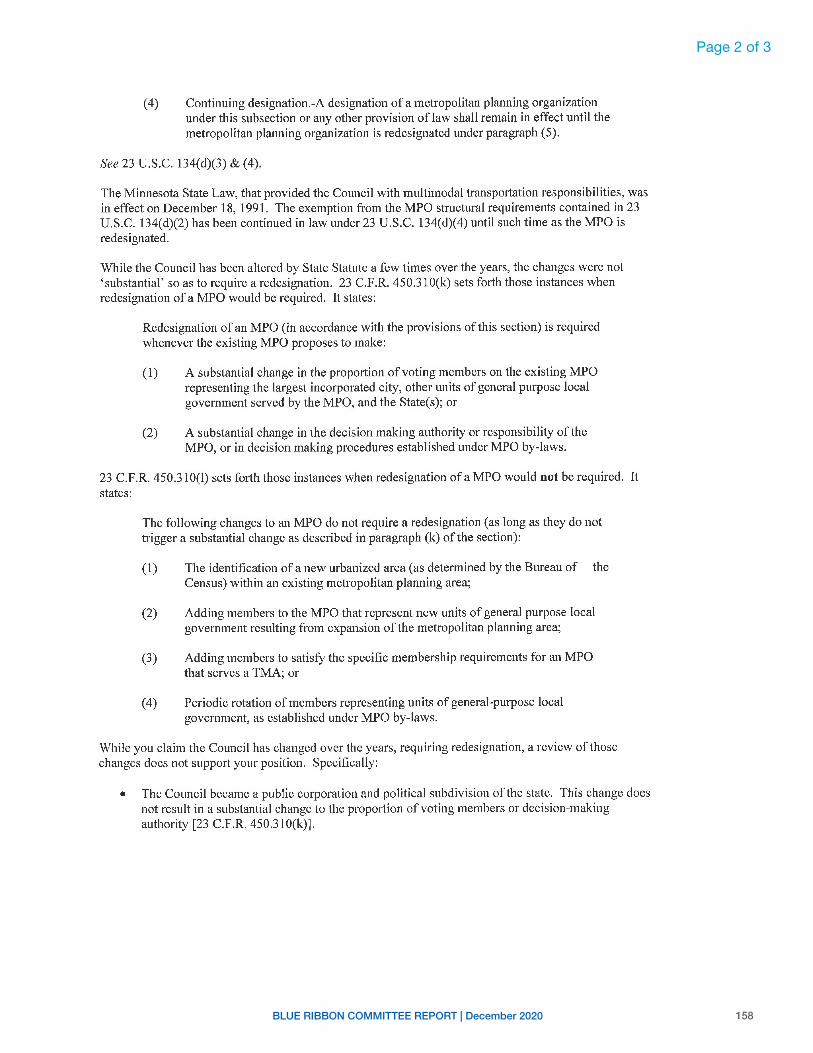
158BLUE RIBBON COMMITTEE REPORT | December 2020
Page 2 of 3
( 4) Continuing designation.-A designation of a metropolitan planning organization under this subsection or any other provision of law shall remain in effect until the metropolitan planning organization is redesignated under paragraph (5).
See 23 U.S.C. 134(d)(3) & (4).
The Minnesota State Law, that provided the Council with multimodal transportation responsibilities, was in effect on December 18, 1991. The exemption from the MPO structural requirements contained in 23 U.S.C. 134(d)(2) has been continued in law under 23 U.S.C. 134(d)(4) until such time as the MPO is redesignated.
While the Council has been altered by State Statute a few times over the years, the changes were not 'substantial' so as to require a redesignation. 23 C.F.R. 450.31 0(k) sets forth those instances when redesignation of a MPO would be required. It states:
Redesignation of an MPO (in accordance with the provisions of this section) is required whenever the existing MPO proposes to make:
(I) A substantial change in the proportion of voting members on the existing MPO representing the largest incorporated city, other units of general purpose local government served by the MPO, and the State(s); or
(2) A substantial change in the decision making authority or responsibility of the MPO, or in decision making procedures established under MPO by-laws.
23 C.F.R. 450.310(1) sets forth those instances when redesignation of a MPO would not be required. It states:
The following changes to an MPO do not require a redesignation (as long as they do not trigger a substantial change as described in paragraph (k) of the section):
( 1) The identification of a new urbanized area ( as determined by the Bureau of the Census) within an existing metropolitan planning area;
(2) Adding members to the MPO that represent new units of general purpose local government resulting from expansion of the metropolitan planning area;
(3) Adding members to satisfy the specific membership requirements for an MPO that serves a TMA; or
( 4) Periodic rotation of members representing units of general-purpose local government, as established under MPO by-laws.
While you claim the Council has changed over the years, requiring redesignation, a review of those changes does not support your position. Specifically:
• The Council became a public corporation and political subdivision of the state. This change does not result in a substantial change to the proportion of voting members or decision-making authority [23 C.F.R. 450.310(k)].
159BLUE RIBBON COMMITTEE REPORT | December 2020
Page 3 of 3
• The appoiulrm:nt IC;)fnts oflh;;: Council member.; was changed, hut the propmtion of voting members was suMaine<l [23 C.F.R. 450.3 I0(k)( I)). Changes relatt:d to the periodic rotation of the mi:mbers does not require mlesigmnion f23 C.F.R. 450.310(1)(4)).
• The Council bei.:1m1e able to manage the grant fonding without depositing the money into the State Trcasu1y. This change does not result in a substHntial change to the prornrtin11 ofvnting members ur <.h:cisio11-making authority (23 C.F.R. 450.31 O(k)).
• The Cou11cil membership districts were altered to re1,rescnt the populatiuu cha11ges from the census. This change does not result in a substanti:1] change to 1 he rmportinn of voting members (23 C.F.R. 450.1 l()(k)(l )), and changes to the urhani7.cd area within the metropolitan planuing area do not require redesigna.Lion [23 C.f.R. ,150.310(1)(1)).
• The Twin Cities urbani:,,ed area now extends into Wisconsin (St. Croix County) and two 2 MN counties (Wright and Sherburne) outside of the designated sc::ve11 (7) counties. The Council can rebalance it~ representation because of the expansion of the urbanized area, and the rebalancing does not require redesignation I 23 C.F.R. '150.310(1)(2)].
The Council may restructure, at any time, to meet the requirements of23 C.S.C. 134(d)(2) for the policy board to be comprised of local elected officials; officials of public agencies that admiuis!er or operate major modes oftransporl:ation in the mctmpolitan area, irn:lu<ling represe.ntation by providers of public transportation; and appropriate State officials without redesignation (23 U.S.C. 13-1(d)(5)(H)]. While we woul<l encourage the Council to move toward the slructure described in 21 {!.S.C. 134(d)(2) in order to make the MPO more directly accountable lo its public, it remains their decision, because restructuring is not required until a substantial change necessila1es rede.,ig11atio11.
fllWA ancl FTA have concluded the 1973 designation of the Co1111cil as the MPO for the Twin Cities by then Governor Anderson wa~ in conformance with both the Fcdcrnl law and regulations and that the existing structure remains compliant. If you have any questions or would like to discuss the matter further, please foci free to contact our otl\ecs.
Arlene I<. Kocher, P.E. Division Ad111i11istrator Fc<lernl [ lighway Administration
Cc: Adam Vuininck, Metropolitan Council Charlie Zelle, MnDOT
Murisol R.. Simon Regional J\dministrator Federal Transit Administration
160BLUE RIBBON COMMITTEE REPORT | December 2020
Metropolitan Council Members Appointment Process The Secretary of State issued the “Notice of Vacancy” for all 16 Metropolitan Council districts on Nov. 1, 2018. Any person interested in being a Met Council member could apply for consideration by the nominating committee selected by then Governor-elect Tim Walz.
The appointment process involved applicants going through a nomination process, including a public hearing before a nominating committee. That committee forwarded recommendations to the Governor for consideration. The Governor is statutorily required to appoint Council members by the first Monday in March, which was March 4, 2019.
Nominating committee The nominating committee has historically been comprised of seven members who are current or formerly elected local officials, plus the Council Chair as an ex officio member. To create more seats at the table for Minnesotans to help shape his administration, Governor-elect Walz expanded the committee to 12, including the Chair and four additional ex officio members from the metropolitan community.
The nominating committee, appointed by Governor Walz and Lt. Governor Flanagan, first identified five applicants from each of the 16 districts.
The finalists had an opportunity to provide public testimony at four public meetings, which were open to the public and streamed online. At each meeting, the nominating committee interviewed the candidates for four different Council districts. See interviews from all 16 Council districts.
The nominating committee then recommended three names from each district to Gov. Walz for consideration.
More than 200 people applied to serve as a Metropolitan Council Member. The nominating committee interviewed 79 finalists at four public meetings.
Nominating committee members • Janet Williams, Mayor of Savage, representing Scott County, Chair of the Nominating
Committee • Dave Bartholomay, Mayor of Circle Pines, representing Anoka County • Randy Maluchnik, County Commissioner, representing Carver County • George Tourville, Mayor of Inver Grove Heights, representing Dakota County • Andrea Jenkins, Minneapolis City Council Vice President, representing Hennepin County • John Choi, County Attorney, representing Ramsey County • Lisa Weik, County Commissioner, representing Washington County • Nora Slawik, Metropolitan Council Chair, ex officio member • Nikki Villavicencio, Disability Rights Advocate, ex officio member • Pahoua Hoffman, Executive Director of the Citizens League, ex officio member • Dr. Joe Hobot, President and CEO of American Indian OIC, ex officio member • Ruby Azurdia-Lee, President of Comunidades Latinas Unidas en Servicio (CLUES), ex
officio member
Appointments On Feb. 25, Governor Tim Walz notified the Minnesota State Senate of his intention to appoint 16 residents to serve on the Metropolitan Council. When seated, the nominees would represent the most diverse Council in its more than 50-year-history.
Per statute, the Governor must notify the Senate of his intention to appoint five days prior to the deadline of March 4, at which time the appointment becomes official, pending confirmation by the Senate.
The new Council Members were sworn in at a special Met Council Meeting on Wednesday, March 6.
Page 1 of 10
161BLUE RIBBON COMMITTEE REPORT | December 2020
Internal Memorandum
DATE: October 13, 2020
TO: Governor’s Blue Ribbon Committee on the Metropolitan Council’s Structure and Services
FROM: Judd Schetnan
SUBJECT: 2018 Regional Transit Statistics and Peer Region Comparisons
DefinitionsMetricsThe following are definitions of key metrics used in the subsequent tables and analysis.
• Farebox Recovery – The percent of total operating costs covered by farebox revenue. • Ridership – Number of people who board a transit vehicle. • In-Service Hours - Time when vehicle is traveling on the route and available for picking up
passengers. Calculated from first time point to last time point on each vehicle trip. Excludes layover/recovery and deadhead.
• Subsidy per Passenger – Net operating subsidy (i.e. operating cost minus fare revenue) divided by ridership.
• Passengers per Hour – Ridership divided by in-service hours.
Bus Route TypesThe following are definitions of non-transitway, fixed-route bus service types from the Transportation Policy Plan (TPP) that are used to evaluate routes against similar routes. Figure 1 is a map of Transit Market Areas from the TPP.
• Core Local – Core Local routes typically serve the denser urban areas of Transit Market Areas I and II, usually providing access to a downtown or major activity center along important commercial corridors. They form the base of the core bus network and are typically some of the most productive routes in the system.
• Supporting Local – Supporting local routes are typically designed to provide crosstownconnections within Transit Market Areas I and II. Typically, these routes do not serve a downtown but play an important role connecting to core local routes and ensuring transit access for those not traveling downtown.
• Suburban Local – Suburban local routes typically operate in Transit Market Areas II and III in a suburban context and are often less productive that core local routes. These routes serve an important role in providing a basic level of transit coverage throughout the region. Provider-specific variations on suburban local bus include community routes and feeder routes.
• Commuter and Express - Commuter and express bus routes primarily operate during peak periods to serve commuters to downtown or a major employment center. These routes typically operate non-stop on highways for portions of the route between picking up passengers in residential areas or at park-and-ride facilities and dropping them off at a major destination.
Page 2 of 10
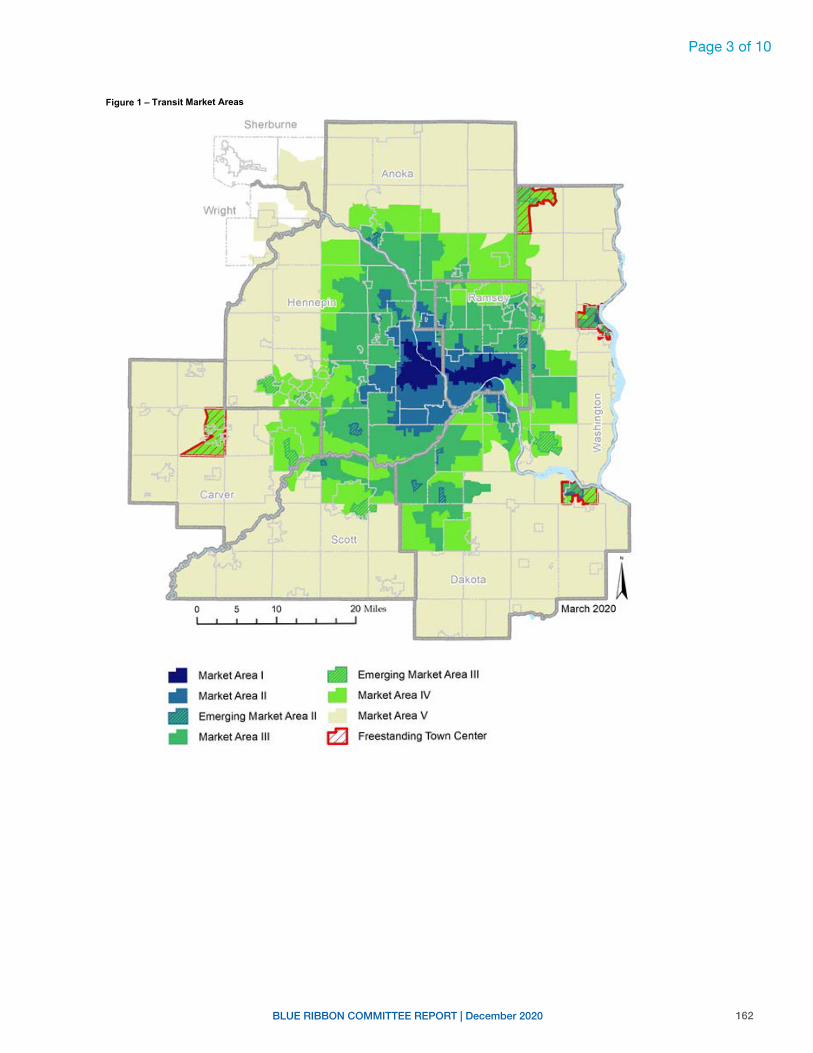
162BLUE RIBBON COMMITTEE REPORT | December 2020
Page - 2 | METROPOLITAN COUNCIL
Figure 1 – Transit Market Areas
Page 3 of 10
Sherburne
Anoka
~ r:.:·~ , ..
Carver
Scott . Dakota A
0 5 10 20 Miles
II Market Area I d Emerging Market Area Ill
1111 Mark.et Area II Market Area IV
di Emerging Market Area II Market Area V
II Market Area Ill [21 Freestanding Town. Center
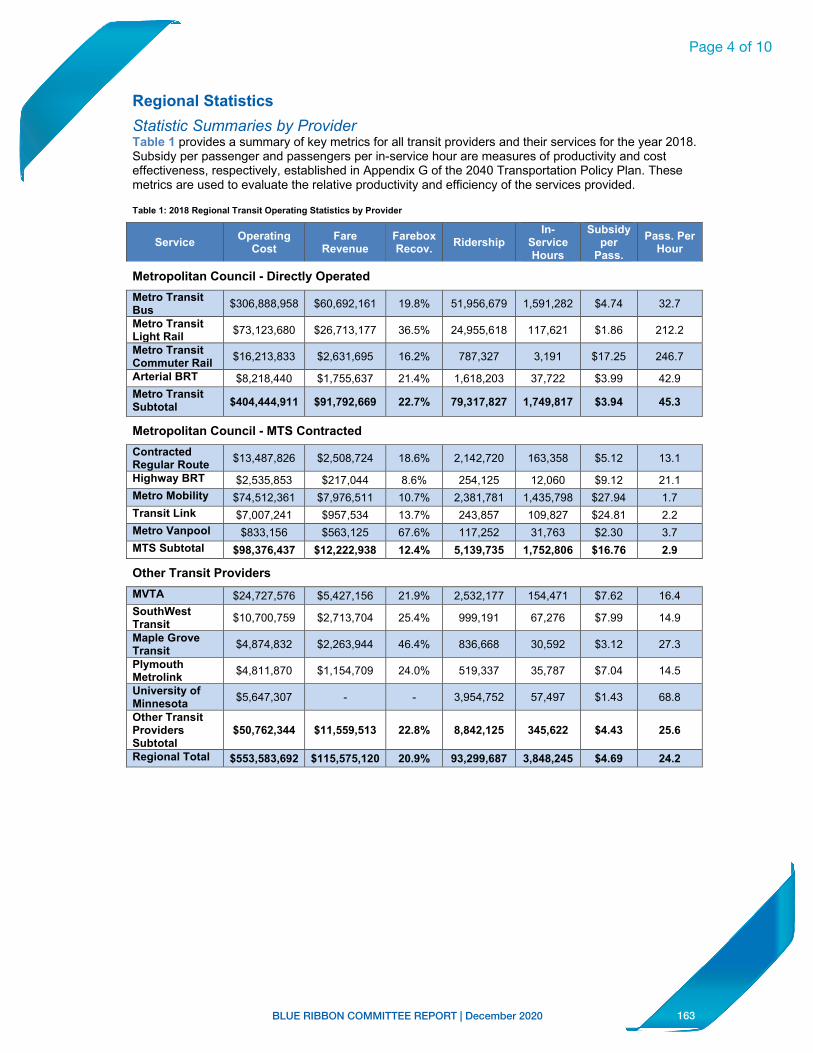
163BLUE RIBBON COMMITTEE REPORT | December 2020
Page - 3 | METROPOLITAN COUNCIL
Regional StatisticsStatistic Summaries by ProviderTable 1 provides a summary of key metrics for all transit providers and their services for the year 2018. Subsidy per passenger and passengers per in-service hour are measures of productivity and cost effectiveness, respectively, established in Appendix G of the 2040 Transportation Policy Plan. These metrics are used to evaluate the relative productivity and efficiency of the services provided.
Table 1: 2018 Regional Transit Operating Statistics by Provider
Service Operating Cost
Fare Revenue
Farebox Recov. Ridership
In-Service Hours
Subsidy per
Pass.Pass. Per
Hour
Metropolitan Council - Directly OperatedMetro Transit Bus $306,888,958 $60,692,161 19.8% 51,956,679 1,591,282 $4.74 32.7
Metro Transit Light Rail $73,123,680 $26,713,177 36.5% 24,955,618 117,621 $1.86 212.2
Metro Transit Commuter Rail $16,213,833 $2,631,695 16.2% 787,327 3,191 $17.25 246.7
Arterial BRT $8,218,440 $1,755,637 21.4% 1,618,203 37,722 $3.99 42.9Metro Transit Subtotal $404,444,911 $91,792,669 22.7% 79,317,827 1,749,817 $3.94 45.3
Metropolitan Council - MTS ContractedContracted Regular Route $13,487,826 $2,508,724 18.6% 2,142,720 163,358 $5.12 13.1
Highway BRT $2,535,853 $217,044 8.6% 254,125 12,060 $9.12 21.1Metro Mobility $74,512,361 $7,976,511 10.7% 2,381,781 1,435,798 $27.94 1.7Transit Link $7,007,241 $957,534 13.7% 243,857 109,827 $24.81 2.2Metro Vanpool $833,156 $563,125 67.6% 117,252 31,763 $2.30 3.7MTS Subtotal $98,376,437 $12,222,938 12.4% 5,139,735 1,752,806 $16.76 2.9
Other Transit ProvidersMVTA $24,727,576 $5,427,156 21.9% 2,532,177 154,471 $7.62 16.4SouthWest Transit $10,700,759 $2,713,704 25.4% 999,191 67,276 $7.99 14.9
Maple Grove Transit $4,874,832 $2,263,944 46.4% 836,668 30,592 $3.12 27.3
Plymouth Metrolink $4,811,870 $1,154,709 24.0% 519,337 35,787 $7.04 14.5
University of Minnesota $5,647,307 - - 3,954,752 57,497 $1.43 68.8
Other Transit Providers Subtotal
$50,762,344 $11,559,513 22.8% 8,842,125 345,622 $4.43 25.6
Regional Total $553,583,692 $115,575,120 20.9% 93,299,687 3,848,245 $4.69 24.2
Page 4 of 10
- - - - - - -
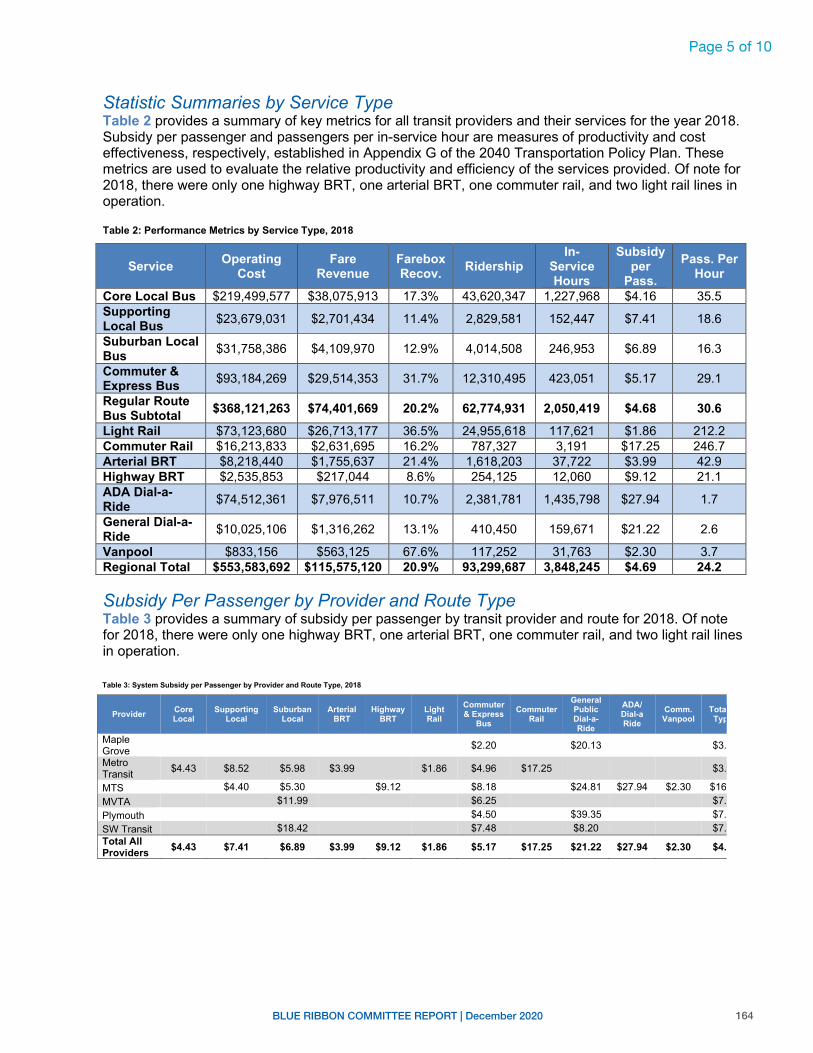
164BLUE RIBBON COMMITTEE REPORT | December 2020
Page - 4 | METROPOLITAN COUNCIL
Statistic Summaries by Service TypeTable 2 provides a summary of key metrics for all transit providers and their services for the year 2018. Subsidy per passenger and passengers per in-service hour are measures of productivity and cost effectiveness, respectively, established in Appendix G of the 2040 Transportation Policy Plan. These metrics are used to evaluate the relative productivity and efficiency of the services provided. Of note for 2018, there were only one highway BRT, one arterial BRT, one commuter rail, and two light rail lines in operation.
Table 2: Performance Metrics by Service Type, 2018
Service Operating Cost
Fare Revenue
Farebox Recov. Ridership
In-Service Hours
Subsidy per
Pass.
Pass. Per Hour
Core Local Bus $219,499,577 $38,075,913 17.3% 43,620,347 1,227,968 $4.16 35.5Supporting Local Bus $23,679,031 $2,701,434 11.4% 2,829,581 152,447 $7.41 18.6
Suburban Local Bus $31,758,386 $4,109,970 12.9% 4,014,508 246,953 $6.89 16.3
Commuter & Express Bus $93,184,269 $29,514,353 31.7% 12,310,495 423,051 $5.17 29.1
Regular Route Bus Subtotal $368,121,263 $74,401,669 20.2% 62,774,931 2,050,419 $4.68 30.6
Light Rail $73,123,680 $26,713,177 36.5% 24,955,618 117,621 $1.86 212.2Commuter Rail $16,213,833 $2,631,695 16.2% 787,327 3,191 $17.25 246.7Arterial BRT $8,218,440 $1,755,637 21.4% 1,618,203 37,722 $3.99 42.9Highway BRT $2,535,853 $217,044 8.6% 254,125 12,060 $9.12 21.1ADA Dial-a-Ride $74,512,361 $7,976,511 10.7% 2,381,781 1,435,798 $27.94 1.7
General Dial-a-Ride $10,025,106 $1,316,262 13.1% 410,450 159,671 $21.22 2.6
Vanpool $833,156 $563,125 67.6% 117,252 31,763 $2.30 3.7Regional Total $553,583,692 $115,575,120 20.9% 93,299,687 3,848,245 $4.69 24.2
Subsidy Per Passenger by Provider and Route TypeTable 3 provides a summary of subsidy per passenger by transit provider and route for 2018. Of note for 2018, there were only one highway BRT, one arterial BRT, one commuter rail, and two light rail lines in operation.
Page - 5 | METROPOLITAN COUNCIL
Table 3: System Subsidy per Passenger by Provider and Route Type, 2018
Provider Core Local
Supporting Local
Suburban Local
Arterial BRT
Highway BRT
Light Rail
Commuter & Express
BusCommuter
Rail
General Public Dial-a-Ride
ADA/Dial-aRide
Comm. Vanpool
Total All Types
Maple Grove $2.20 $20.13 $3.12
Metro Transit $4.43 $8.52 $5.98 $3.99 $1.86 $4.96 $17.25 $3.94
MTS $4.40 $5.30 $9.12 $8.18 $24.81 $27.94 $2.30 $16.76MVTA $11.99 $6.25 $7.62Plymouth $4.50 $39.35 $7.04SW Transit $18.42 $7.48 $8.20 $7.99Total All Providers $4.43 $7.41 $6.89 $3.99 $9.12 $1.86 $5.17 $17.25 $21.22 $27.94 $2.30 $4.89
Page 5 of 10
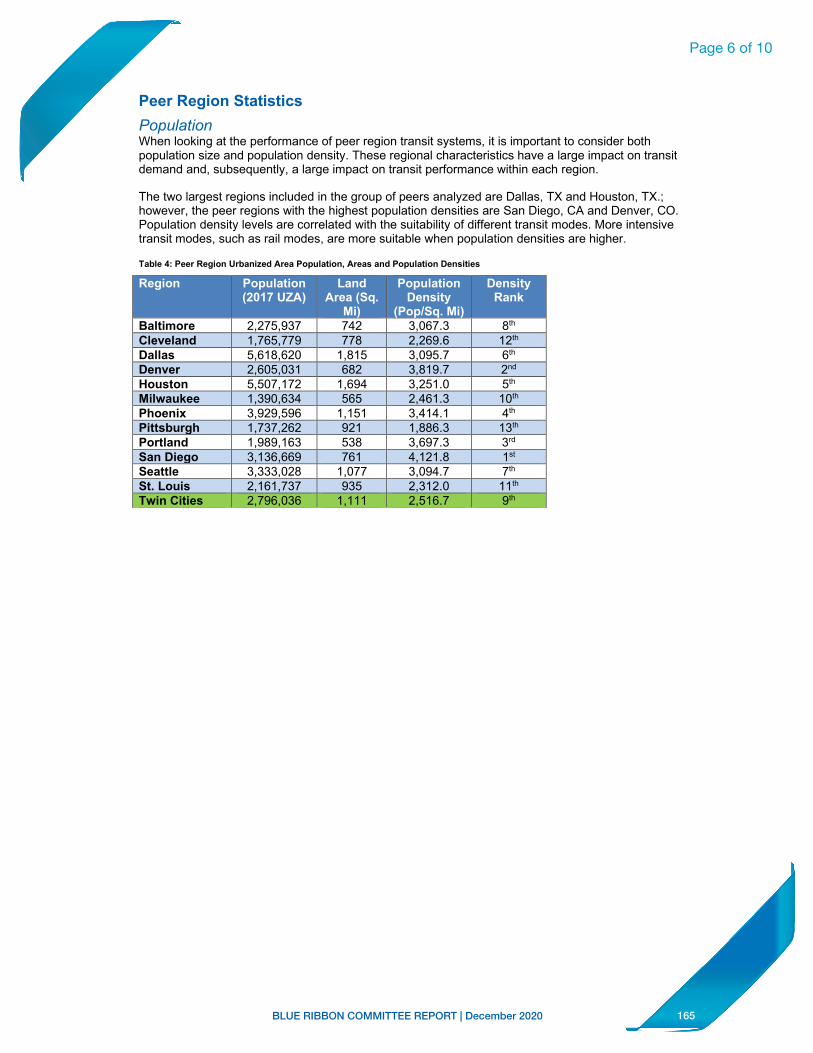
165BLUE RIBBON COMMITTEE REPORT | December 2020
Page - 6 | METROPOLITAN COUNCIL
Peer Region StatisticsPopulationWhen looking at the performance of peer region transit systems, it is important to consider both population size and population density. These regional characteristics have a large impact on transit demand and, subsequently, a large impact on transit performance within each region.
The two largest regions included in the group of peers analyzed are Dallas, TX and Houston, TX.;however, the peer regions with the highest population densities are San Diego, CA and Denver, CO. Population density levels are correlated with the suitability of different transit modes. More intensive transit modes, such as rail modes, are more suitable when population densities are higher.
Table 4: Peer Region Urbanized Area Population, Areas and Population Densities
Region Population (2017 UZA)
LandArea (Sq.
Mi)
Population Density
(Pop/Sq. Mi)
Density Rank
Baltimore 2,275,937 742 3,067.3 8th
Cleveland 1,765,779 778 2,269.6 12th
Dallas 5,618,620 1,815 3,095.7 6th
Denver 2,605,031 682 3,819.7 2nd
Houston 5,507,172 1,694 3,251.0 5th
Milwaukee 1,390,634 565 2,461.3 10th
Phoenix 3,929,596 1,151 3,414.1 4th
Pittsburgh 1,737,262 921 1,886.3 13th
Portland 1,989,163 538 3,697.3 3rd
San Diego 3,136,669 761 4,121.8 1st
Seattle 3,333,028 1,077 3,094.7 7th
St. Louis 2,161,737 935 2,312.0 11th
Twin Cities 2,796,036 1,111 2,516.7 9th
Page 6 of 10
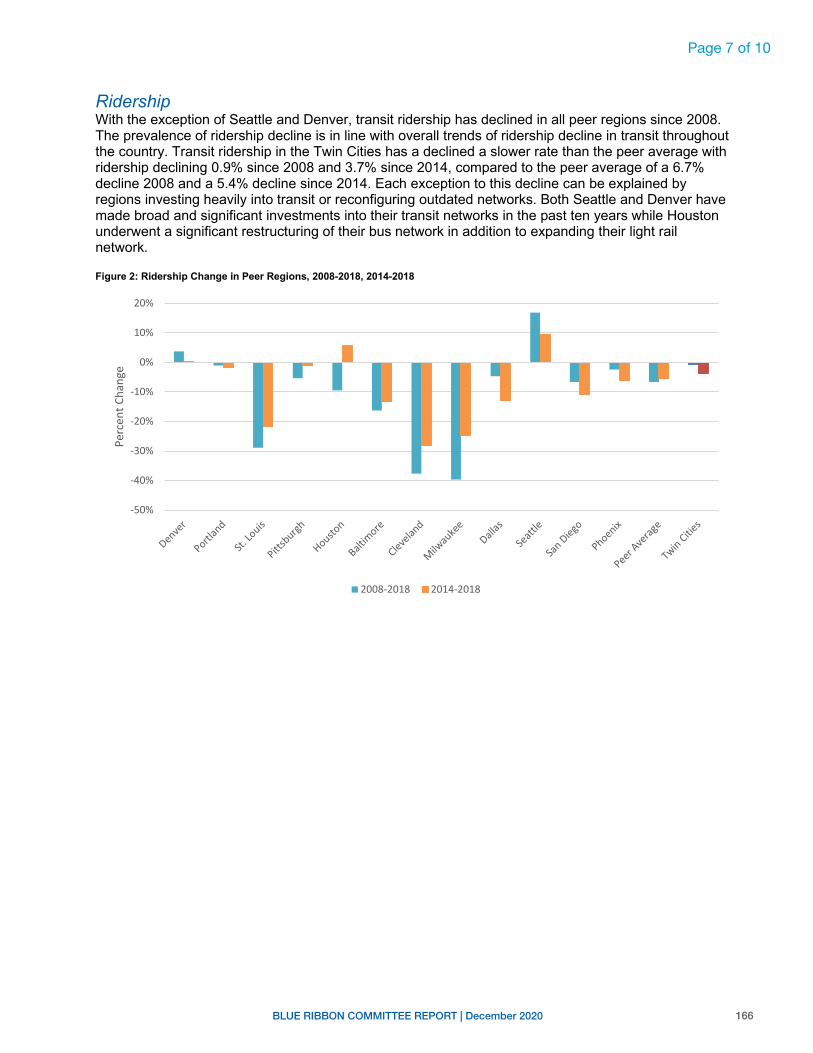
166BLUE RIBBON COMMITTEE REPORT | December 2020
Page - 7 | METROPOLITAN COUNCIL
RidershipWith the exception of Seattle and Denver, transit ridership has declined in all peer regions since 2008. The prevalence of ridership decline is in line with overall trends of ridership decline in transit throughout the country. Transit ridership in the Twin Cities has a declined a slower rate than the peer average with ridership declining 0.9% since 2008 and 3.7% since 2014, compared to the peer average of a 6.7% decline 2008 and a 5.4% decline since 2014. Each exception to this decline can be explained by regions investing heavily into transit or reconfiguring outdated networks. Both Seattle and Denver have made broad and significant investments into their transit networks in the past ten years while Houston underwent a significant restructuring of their bus network in addition to expanding their light rail network.
Figure 2: Ridership Change in Peer Regions, 2008-2018, 2014-2018
-50%
-40%
-30%
-20%
-10%
0%
10%
20%
Perc
ent C
hang
e
2008-2018 2014-2018
Page 7 of 10
IL I r I , , -.
• •
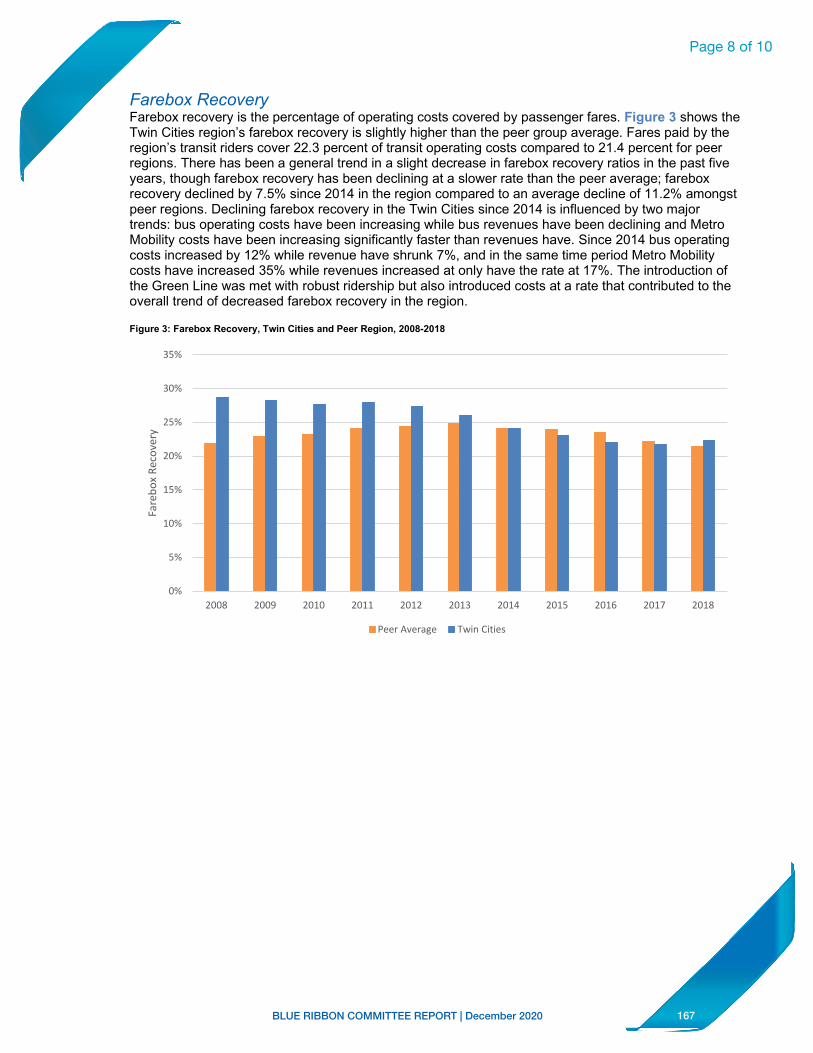
167BLUE RIBBON COMMITTEE REPORT | December 2020
Page - 8 | METROPOLITAN COUNCIL
Farebox RecoveryFarebox recovery is the percentage of operating costs covered by passenger fares. Figure 3 shows the Twin Cities region’s farebox recovery is slightly higher than the peer group average. Fares paid by the region’s transit riders cover 22.3 percent of transit operating costs compared to 21.4 percent for peer regions. There has been a general trend in a slight decrease in farebox recovery ratios in the past five years, though farebox recovery has been declining at a slower rate than the peer average; farebox recovery declined by 7.5% since 2014 in the region compared to an average decline of 11.2% amongst peer regions. Declining farebox recovery in the Twin Cities since 2014 is influenced by two major trends: bus operating costs have been increasing while bus revenues have been declining and Metro Mobility costs have been increasing significantly faster than revenues have. Since 2014 bus operating costs increased by 12% while revenue have shrunk 7%, and in the same time period Metro Mobility costs have increased 35% while revenues increased at only have the rate at 17%. The introduction of the Green Line was met with robust ridership but also introduced costs at a rate that contributed to the overall trend of decreased farebox recovery in the region.
Figure 3: Farebox Recovery, Twin Cities and Peer Region, 2008-2018
0%
5%
10%
15%
20%
25%
30%
35%
2008 2009 2010 2011 2012 2013 2014 2015 2016 2017 2018
Fare
box
Reco
very
Peer Average Twin Cities
Page 8 of 10
• •
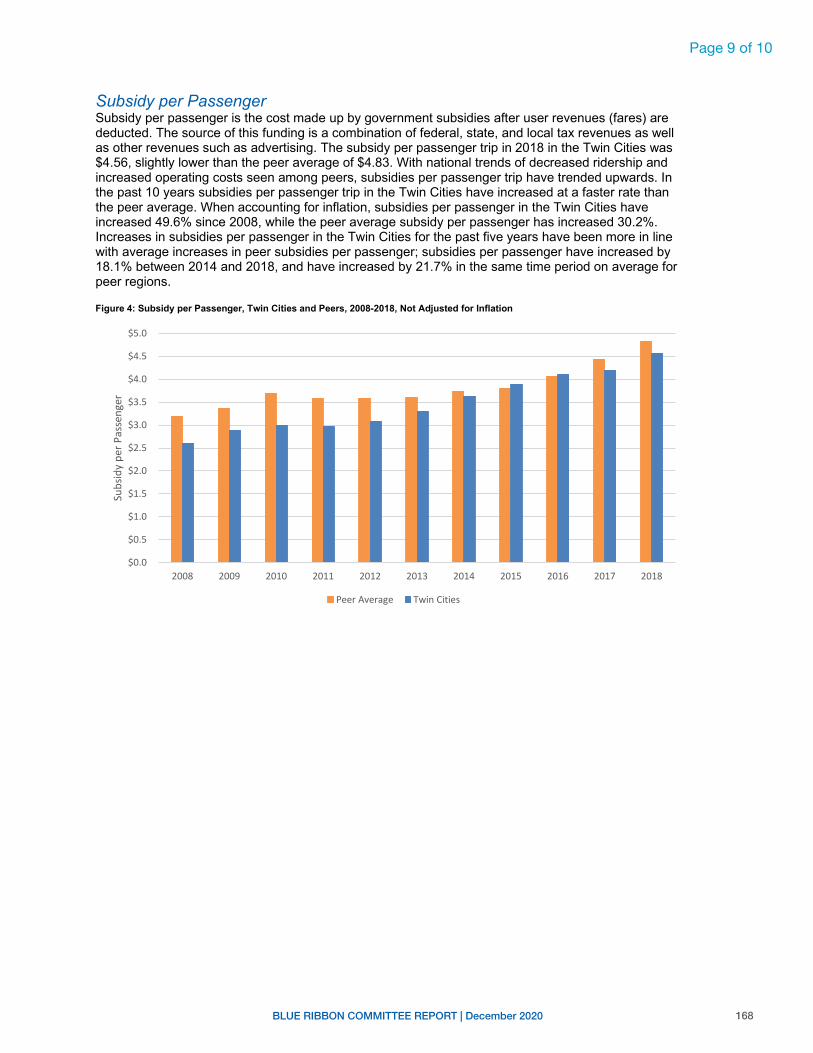
168BLUE RIBBON COMMITTEE REPORT | December 2020
Page - 9 | METROPOLITAN COUNCIL
Subsidy per PassengerSubsidy per passenger is the cost made up by government subsidies after user revenues (fares) are deducted. The source of this funding is a combination of federal, state, and local tax revenues as well as other revenues such as advertising. The subsidy per passenger trip in 2018 in the Twin Cities was $4.56, slightly lower than the peer average of $4.83. With national trends of decreased ridership and increased operating costs seen among peers, subsidies per passenger trip have trended upwards. In the past 10 years subsidies per passenger trip in the Twin Cities have increased at a faster rate than the peer average. When accounting for inflation, subsidies per passenger in the Twin Cities have increased 49.6% since 2008, while the peer average subsidy per passenger has increased 30.2%. Increases in subsidies per passenger in the Twin Cities for the past five years have been more in line with average increases in peer subsidies per passenger; subsidies per passenger have increased by 18.1% between 2014 and 2018, and have increased by 21.7% in the same time period on average for peer regions.
Figure 4: Subsidy per Passenger, Twin Cities and Peers, 2008-2018, Not Adjusted for Inflation
$0.0
$0.5
$1.0
$1.5
$2.0
$2.5
$3.0
$3.5
$4.0
$4.5
$5.0
2008 2009 2010 2011 2012 2013 2014 2015 2016 2017 2018
Subs
idy
per P
asse
nger
Peer Average Twin Cities
Page 9 of 10
• •
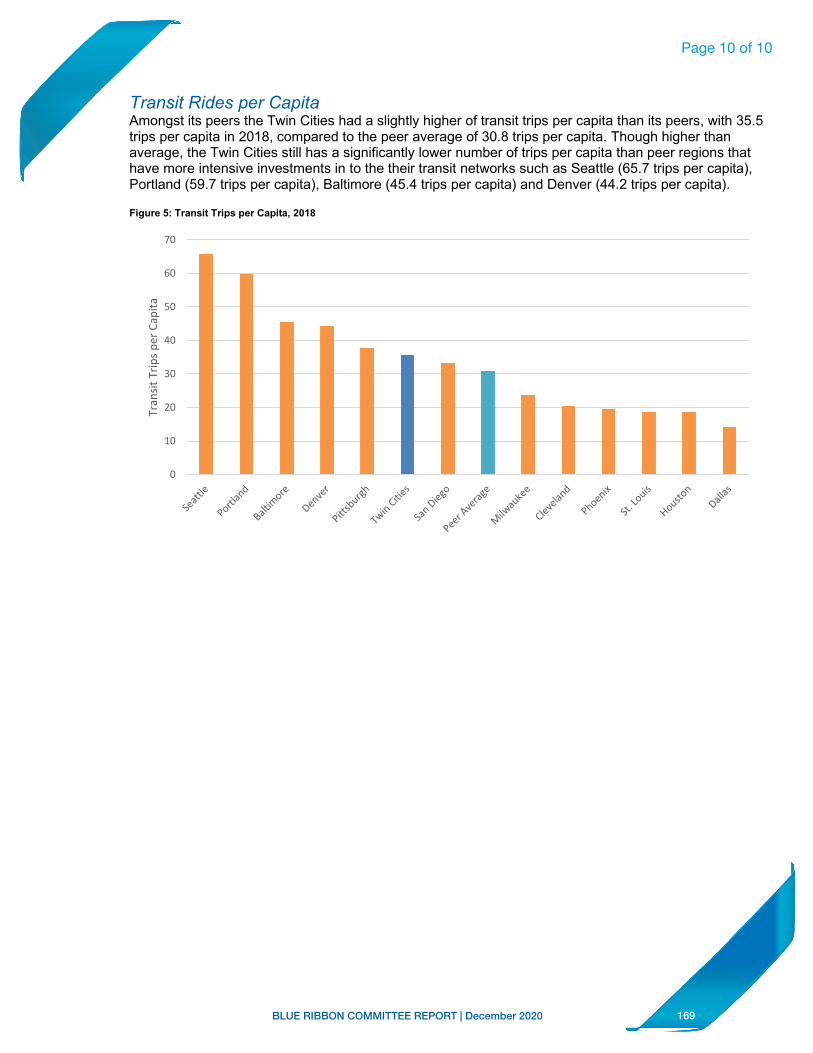
169BLUE RIBBON COMMITTEE REPORT | December 2020
Page - 10 | METROPOLITAN COUNCIL
Transit Rides per CapitaAmongst its peers the Twin Cities had a slightly higher of transit trips per capita than its peers, with 35.5 trips per capita in 2018, compared to the peer average of 30.8 trips per capita. Though higher than average, the Twin Cities still has a significantly lower number of trips per capita than peer regions that have more intensive investments in to the their transit networks such as Seattle (65.7 trips per capita), Portland (59.7 trips per capita), Baltimore (45.4 trips per capita) and Denver (44.2 trips per capita).
Figure 5: Transit Trips per Capita, 2018
0
10
20
30
40
50
60
70
Tran
sit T
rips p
er C
apita
Page 10 of 10
I I I I I I
170BLUE RIBBON COMMITTEE REPORT | December 2020
Supplemental Information on Transit Capital Projects
Minnesota Statutes 473.39 provides the Metropolitan Council with bonding authority for transit. Subdivision 4 of this section requires the Council to adopt a three-year transit capital improvement plan before the Council issues debt obligations authorized in Subdivision 1. Specifically, the statute states:
Subd. 4. Transit capital improvement program. The council may not issue obligations pursuant to this section until the council adopts a three-year transit capital improvement program. The program must include a capital investment component that sets forth a capital investment strategy and estimates the fiscal and other effects of the strategy. The component must specify, to the extent practicable, the capital improvements to be undertaken. For each improvement specified, the program must describe:
(1) need, function, objective, and relative priority;(2) alternatives, including alternatives not involving capital expenditures;(3) ownership and operating entity;(4) location and schedule of development;(5) environmental, social, and economic effects;(6) cost;(7) manner of finance and revenue sources, including federal and state
funds, private funds, taxes, and user charges; and(8) fiscal effects, including an estimate of annual operating costs and
sources of revenue to pay the costs.
The Council adopts a six-year capital improvement plan (CIP). The current CIP covers the period from 2021 to 2026. Additional information is provided below for all projects in the CIP to provide supplemental information meeting the statutory requirement.
(1) Need, function, objective and relative priority
The capital improvement plan responds to the various needs of providing transit service in the Twin Cities. The CIP summarizes transit capital projects into six categories:
Fleet: These projects purchase vehicles needed to provide transit service. This includes buses, light rail vehicles, and equipment specifically for vehicles such as security cameras. It also includes mid-life overhauls used to extend the useful life of vehicles.
Support Facilities: These projects are necessary to maintain and house the fleet and provide other ancillary facilities to support operations. This includes garages, office space, fueling stations, and other support facilities. These projects also include major maintenance and repairs to these facilities to extend their useful life.
Customer Facilities: These projects encourage transit use by providing hubs for buses so riders can transfer from one route to another, providing parking spaces for transit users, sheltering riders from the elements, and providing other amenities to encourage and facilitate transit use.
Page 1 of 5
171BLUE RIBBON COMMITTEE REPORT | December 2020
Technology Improvements: These projects include communication and computer equipment necessary to the operation of the transit system. It includes radios, dispatching systems, automatic vehicle locators, mobile data terminals, and other similar equipment.
Other Capital Equipment: These projects include equipment and other items necessary for the operation of the transit system but do not fit in the first four categories. It can include such things as tow trucks, supervisor vehicles, police vehicles, bus lifts, bus washes, fareboxes and other equipment.
Transitways: These projects include light rail, commuter rail and bus rapid transit projects making significant capital investment within specific transit corridors.
The Capital Program includes capital projects with secured funding and other capital projects with anticipated but not secured funding. Funded projects are broken into three tiers. The first tier is projects necessary to maintain the existing transit system. The second tier includes projects to expand the bus system and the third tier includes projects to expand the number of transitways in the region. Projects that maintain the existing transit system are of higher priority than expansion projects. Projects are not ranked further within the various tiers because the bus system is a network and projects are interconnected.
(2) Alternatives examined to include projects in the CIP
All alternatives are examined before a project is recommended for scarce transit resources. Alternatives examined include whether a project can be delayed or avoided, whether other funding sources would be more appropriate, whether other locations would better meet transit needs, and other considerations.
Major transitway projects seeking federal New Starts funding go through a formal alternatives analysis prescribed by the Federal Transit Administration.
(3) Ownership and operating entity;
Transit equipment and facilities are owned and operated by numerous transit providers in the region. The largest transit provider is the Council’s Metro Transit Division. Other transit providers include the opt out or replacement service providers and various cities, counties, and non-profit organizations. The Council operates under a regional fleet concept, with buses and other transit vehicles owned by the Council and operated by various providers. Information on ownership and operating entity for each transit asset included in the capital improvement plan is provided in the supplemental table.
(4) Location and schedule of development;
Information on the location and schedule of development is included in the supplemental table. In many instances, the specific location of capital asset cannot be determined.Fleet assets when acquired become part of the regional fleet and are assigned to particular providers or particular routes based on the overall transit service plan for the region.
Page 2 of 5
172BLUE RIBBON COMMITTEE REPORT | December 2020
Many capital assets are located in a specific location but benefit the entire transit system or sub areas within the region.
(5) Environmental, social, and economic effects;
The Metropolitan Council Transit CIP is integral to the operation of the Twin Cities transit system. The environmental, social, and economic effects of the transit system supported by transit CIP are as follows.
Takes people to and from work
– 60% of bus riders, 51% of LRT riders, 76% of Northstar riders, and 62% of BRT riders are going to or from work
Removes cars from the streets and highways during peak periods
– Buses carry the equivalent of up to one and a half lanes of traffic at highly congested points in the highway system
– Because transit removed cars from the roads, citizens avoided 10 million hours of being stuck in congestion
Provides mobility options beyond driving
– 65% of bus riders and 73% of rail riders chose to ride even though they had other transportation options
Allows people to live without a car
– 31% of bus riders do not have an automobile available for their use either by choice or because of economic reasons
Provides mobility for low-income persons
– 32% of bus riders and 37% of light rail riders earn less than $25,000
Provides access to areas with high concentrations of employment
– 40% of downtown Minneapolis, 20% of downtown St Paul, and 20% of University of Minnesota employees get to work via transit during peak periods
Provides mobility for persons whose physical abilities may be declining.
– 12% of rail users are age 55 or older.
Page 3 of 5
173BLUE RIBBON COMMITTEE REPORT | December 2020
(6) Cost;Total project costs and projected costs in the 2021-2026 period are provided in the supplemental table.
(7) Manner of finance and revenue sources,
The Transit Capital Improvement Plan assumes funds from the following sources:
Federal Grants
– 5307 Formula Funds: Federal gas taxes allocated on a formula basis – 5337 State of Good Repair: Allocations on a formula basis – 5339 Bus and Bus Facilities: Allocations on a formula basis – TEA-21 Title I CMAQ/STP: Allocated competitively through the TAB Process– TEA 21 Title III 5309 New Starts: Allocated by Congress for transitways
Regional Funds
– Regional Transit Capital bonds: These revenues are from property-tax supported bonds sold by the Metropolitan Council requiring legislative approval and provide local match for federal grants.
State Funds
– State bonding bill: Can be either general cash revenues or general revenue bond funds.
– Trunk highway bonds: Bonds sold and repaid with funds from the Trunk Highway Fund.
Local Funds
– Local funds from county regional rail authorities for transitways – Funds from the Counties Transit Improvement Board for transitways
(8) Fiscal effects, including an estimate of annual operating costs and sources of revenue to pay the costs.
Annual Operating Costs
Tier One Preservation Projects
This includes projects necessary to maintain the existing transit system, including replacement of buses, capital facilities and equipment that have reached the end of their useful life. Because they are replacing existing vehicles or facilities, they do not result in new operating costs. As such, they are already funded through existing operating funds.
Page 4 of 5
174BLUE RIBBON COMMITTEE REPORT | December 2020
Tier Two Expansion Projects
These projects expand the transit system. As such, they may require additional operating and maintenance funds. Buses acquired to provide additional service incur the costs of additional drivers and mechanics to operate and maintain the vehicles. Transit facilities including support and customer facilities, technology and other capital equipment have additional maintenance costs and may have additional operating costs.
Operating costs associated with this expansion will include the salaries and benefits for operators of expansion vehicles; fuel and service for the vehicles; salaries and benefits for mechanics that maintain the vehicles, snowplowing and other maintenance of park and ride facilities, and other typical costs of operating a multi-modal transit system.
Tier Three Transitway Projects
These transitway projects expand the transit system and will have additional operating and maintenance costs.
Three large transitway projects are included in the capital improvement plan. The Southwest Light Rail Transit project (METRO Green Line Extension) will have partial year 2024 operating costs of $19.57 million with full year operating costs in 2025 of $40.37 million. The Bottineau Light Rail Transit project (METRO Blue Line Extension) will have partial year 2026 operating costs of approximately $9.0 million with full year operating costs in 2027 of $35.87 million. The METRO Gold Line BRT Transit Project will have partial year 2024 operating costs of $4.83 million with full year operating costs in 2025 of $9.97 million.
Other transitway projects in the capital improvement plan include the D Line and B Line BRT, Rush Line BRT and other BRT projects with preliminary planning and design.
Sources of Revenues to Pay the Costs
The transit system relies on several funding sources to pay the operating and maintenance costs for capital equipment and facilities acquired through the capital improvement plan.Sources include:
Fare revenues, State general fund appropriations, Motor vehicle sales tax receipts distributed to the Metropolitan Transit Fund, Operating contributions from county regional rail authorities, Other revenues include advertising and investment income.
With passage of the constitutional amendment dedicating additional receipts from the motor vehicle sales tax to transit in the region, the Council has additional revenues to operate and maintain the existing system. The additional revenues from the motor vehicle sales tax were phased in starting in fiscal year 2008, with full implementation in fiscal year 2012.
Page 5 of 5
175BLUE RIBBON COMMITTEE REPORT | December 2020
O L A OFFICE OF THE LEGISLATIVE AUDITORSTATE OF MINNESOTA
EVALUATION REPORT
Governance of Transit in the Twin Cities Region
JANUARY 2011 PROGRAM EVALUATION DIVISION Centennial Building – Suite 140 658 Cedar Street – St. Paul, MN 55155 Telephone: 651-296-4708 ● Fax: 651-296-4712 E-mail: [email protected] ● Web Site: http://www.auditor.leg.state.mn.us Through Minnesota Relay: 1-800-627-3529 or 7-1-1
176BLUE RIBBON COMMITTEE REPORT | December 2020
Programm Evaluaation DivvisionThe Programm Evaluationn Division waas created within the OOffice of the LLegislative AAuditor (OLA)in 1975. Thhe division’s mission, as seet forth in laww,is to determmine the degreee to which sttate agencies and programms are accommplishing theirr goals and objectives aand utilizing rresources effiiciently.
Topics for eevaluations arre approved bby the Legislative Audit Commmission (LAC)), which has equal representation fromm the House aand Senate and the twoo major politiccal parties. HHowever,evaluationss by the officee are independdentlyresearched by the Legisllative Auditorr’s professionnalstaff, and reeports are issuued without pprior review bbythe commisssion or any oother legislatoors. Findings,,conclusionss, and recommmendations doo not necessarily reflect the viiews of the LAAC or any of its member s.
A list of reccent evaluatioons is on the llast page of this report. A more commplete list is avvailable at OLA's web site (www.auuditor.leg.statte.mn.us), as are copies oof evaluation reports.
The Office of the Legislative Auditorr also includessa Financial Audit Divisioon, which annnually conducts ann audit of the state’s financcial statementts,an audit of federal fundss administeredd by the state,,and approximately 40 auudits of indiviidual state agencies, booards, and coommissions. TThe division also investiigates allegatiions of impropper actions byystate officiaals and emplooyees.
Evaaluation SStaffJamess Nobles, Legiislative Audittor
Joel AAlterEmi BBennettValeriie Bombach Jody HHauerDavidd KirchnerCarriee Meyerhoff Judithh Randall Sarah RobertsKJ StaarrJulie TTrupke-BastiddasJo VosJohn YYunker
To obttain a copy off this documeent in an accessibleformat (electronic AASCII text, BBraille, large pprint, or audio)), please call 6651-296-47088. People witthhearinng or speech ddisabilities maay call us throough Minneesota Relay byy dialing 7-1--1 or 1-800-6 27-3529.
All OLLA reports arre available att our Web sitee:http://www.auditorr.leg.state.mn..us
If youu have commeents about ourr work, or youu want to sugggest an audit,, investigationn, or evaluatioon,pleasee contact us att 651-296-47008 or by e-maail [email protected]
Printed on RRecycled Papeer
177BLUE RIBBON COMMITTEE REPORT | December 2020
O L A OFFICE OF THE LEGISLATIVE AUDITOR STATE OF MINNESOTA • James Nobles, Legislative Auditor
January 2011
Members of the Legislative Audit Commission:
Transit in the Twin Cities region has grown significantly over the past decade and, by many measures, the region’s transit system has performed well. However, the governance structure for transit in the region is far from ideal.
More than 25 organizations are involved with transit planning, development, or operations in the Twin Cities region and, in some cases, their relationships are strained by overlapping responsibilities and distrust. Additionally, the lack of an agreed-upon vision and priorities for transit in the region has contributed to the transit governance challenges.
The current situation has resulted in large part from the Metropolitan Council’s lack of credibility among elected officials and other regional stakeholders. Therefore, the first step toward reform should be to address the composition of the Metropolitan Council. While several approaches are possible, we recommend a Council with a mix of gubernatorial appointees and elected officials from the region.
Our evaluation was conducted by Judy Randall (evaluation manager), Emi Bennett, and Julie Trupke-Bastidas. The Metropolitan Council, Counties Transit Improvement Board, Suburban Transit Association, and various other organizations cooperated fully with our evaluation.We thank them for their assistance.
Sincerely,
James Nobles Legislative Auditor
Room 140 Centennial Building, 658 Cedar Street, St. Paul, Minnesota 55155-1603 • Tel: 651-296-4708 • Fax: 651-296-4712 E-mail: [email protected] • Web Site: www.auditor.leg.state.mn.us • Through Minnesota Relay: 1-800-627-3529 or 7-1-1
178BLUE RIBBON COMMITTEE REPORT | December 2020
Table of Contents
Page
SUMMARY ix
INTRODUCTION 1
1. BACKGROUND 3 Transit Modes 3 Transit Organizations 5 Governance Responsibilities 13 History of Transit in the Twin Cities Region 14 Transit Expenditures and Revenues 18
2. TRANSIT GOVERNANCE CHALLENGES AND OPTIONS 29 Principles of Effective Governance 29 Transit Governance Challenges 31 Governance Options for the Metropolitan Council 40 Other Governance Recommendations 48
3. BUS TRANSIT 53 Bus Service Overview 53 Services and Providers 56 Coordination 61 Met Council's Oversight Role 62 Funding 64 Challenges 67 Recommendations 73
4. TRANSITWAYS 77 Transitways Overview 77 Funding for Transitway Development 80 Transitway Planning and Development 81 Transitway Challenges 85 Recommendations 91
5. TRANSIT PERFORMANCE 95 Goals for Transit 95 Transit Performance Measures 97 Peer Region Comparisons 100 Intra-Regional Comparisons 116 Recommendations 122
LIST OF RECOMMENDATIONS 125
AGENCY RESPONSE: Metropolitan Council 127
vi GOVERNANCE OF TRANSIT IN THE TWIN CITIES REGION
AGENCY RESPONSE: Counties Transit Improvement Board 129
AGENCY RESPONSE: Suburban Transit Association 135
RECENT PROGRAM EVALUATIONS 139
Table of Contents
179BLUE RIBBON COMMITTEE REPORT | December 2020
List of Tables and Figures
Page
TABLES
1.1 Transit Modes in the Twin Cities Region 4 1.2 Ridership by Transit Mode, 2009 5 1.3 Key Organizations with Responsibility for Transit in the Twin Cities
Region 7 1.4 Transportation Advisory Board Members 10 1.5 Transit Governance Responsibilities in the Twin Cities Region,
by Entity 14 1.6 Legislative Changes to Transit Governance in the Twin Cities Region,
1967-2008 17 1.7 Transit Operating Expenditures, 2005 to 2009 19 1.8 State General-Obligation Bonds for Transit, 2003-2009 26 1.9 Transit Passenger Fare Revenues, 2005 to 2009 27 2.1 Principles of Effective Transit Governance 30 2.2 Governance Structure—Status Quo 43 2.3 Governance Restructure Option 1—Staggered Terms and
Metropolitan Council Members Appointed by the Governor 44 2.4 Governance Restructure Option 2—Staggered Terms and a Mix of
Appointed and Elected Metropolitan Council Members 45 2.5 Governance Restructure Option 3—Staggered Terms and County
Commissioners as Metropolitan Council Members 47 2.6 Governance Restructure Option 4—Metropolitan Council Members
Directly Elected 48 2.7 Comparison of Metropolitan Council Governance Options 49 3.1 Suburban Transit Providers in the Twin Cities Region and Cities
Served 56 3.2 Select Bus Operating Statistics for the Twin Cities Region, 2009 57 3.3 Metropolitan Council Procedures for Regional Transit Providers, 2010 64 3.4 Projected Regional Bus Transit Provider Operating Reserve Balances,
Calendar Year 2011 72 4.1 Existing and Potential Transitways in the Twin Cities Region, 2010 78 4.2 Light Rail and Commuter Rail Operating Statistics, 2009 80 4.3 Transitway Capital Funding Sources 82 5.1 Transit-Related Goals in State Statutes 96 5.2 Selected Performance Measures of Transit 98 5.3 Factors Affecting the Comparability of Transit Performance
Outcomes 99 5.4 Characteristics of Peer Regions and Transit Modes, 2008 101 5.5 Ridership and Miles of Service, Twin Cities Region and Peer
Regions, 2008 103 5.6 Population and Access to Transit Services in the Twin Cities Region,
by County, 2010 110
180BLUE RIBBON COMMITTEE REPORT | December 2020
viii GOVERNANCE OF TRANSIT IN THE TWIN CITIES REGION
5.7 Transit-Dependent Households and Access to Transit Services in the Twin Cities Region, by County, 2010 112
5.8 Performance on Selected Measures by Transit Service Type and Provider, 2009 120
FIGURES
1.1 Jurisdictions of Various Transit Organizations in the Seven-County Twin Cities Region, 2010 8
1.2 Transit Operations Funding Sources, 2009 211.3 Budgeted Transit Capital Funding Sources, 2009 223.1 Service Areas of the Suburban Transit Providers, 2010 553.2 Communities in the Twin Cities Metropolitan Region Subject to
the Regional Transit Capital Levy, 2011 664.1 Transitways in the Twin Cities Region, 2010 794.2 Federal “New Starts” Planning Process 835.1 Percentage of Ridership by Transit Mode, Twin Cities Region and
Peer Regions, 2008 1055.2 Bus Services by Route Type in the Twin Cities Region, 2009 117 5.3 Route-Type Passengers Served by Provider in the Twin Cities
Region, 2009 118
181BLUE RIBBON COMMITTEE REPORT | December 2020
Summary
Major Findings: Key Recommendations: The Twin Cities region’s transit The Legislature should restructure
system has performed well on most the Metropolitan Council so that it measures of efficiency, has a mix of appointed and elected effectiveness, and impact in Council members, all serving comparison with 11 peer regions. staggered terms. (pp. 41-49)(pp. 100-115)
Given the current structure of the However, the governance of transit Metropolitan Council, we do not
in the Twin Cities region is recommend eliminating other complex and fraught with distrust, organizations involved with transit, and coordination among the many such as the Counties Transit transit organizations in the region Improvement Board or the The region has has been difficult. (pp. 31-34) Transportation Advisory Board. made significant (pp. 51-52)advances in The Metropolitan Council’s role as
transit in recent the regional transit planner has We do not recommend eliminating years, but the been hampered by how members the suburban transit providers, region’s transit are appointed; as a result of its although there are opportunities for
structure, the Council lacks some consolidation. (p. 52)governanceadequate credibility and structure is far accountability among stakeholders. The Metropolitan Council should from ideal. (pp. 34-35) coordinate with stakeholders to
prioritize potential transitways for Additionally, there is no agreed- future development based on the
upon set of priorities for transitway needs of the region. (pp. 91-92)development in the Twin Cities region, and existing Minnesota law The Legislature should amend prohibits consideration of all Minnesota law and allow potential transitways in the region. consideration of the Dan Patch (pp. 37-38, 86-88) corridor. (p. 93)
Scarce resources for transit are The Legislature should not commit likely to become scarcer as the capital funds to transitway state confronts a significant budget development projects without deficit. (p. 38) ensuring that operating revenues
for the first five to ten years have The Metropolitan Council and been identified. (p. 94)
suburban transit providers have disagreed over the allocation of The Legislature should explicitly “supplemental” Motor Vehicle give the Metropolitan Council Sales Tax revenue in the region, authority to allocate the increasing the distrust and tension “supplemental” revenue for transit between these groups. (pp. 70-72) in the region generated by the
Motor Vehicle Sales Tax. (p. 73)
182BLUE RIBBON COMMITTEE REPORT | December 2020
x GOVERNANCE OF TRANSIT IN THE TWIN CITIES REGION
The transit system in the Twin Cities region performed well relative to 11 peer regions around the country.
However, the region’sgovernancestructure has created challenges and conflicts.
Repor t Summary Transit in the Twin Cities region includes several transit types, or “modes.” Our evaluation included four modes of transit: regular-route bus service, light rail transit, commuter rail, and bus rapid transit.1The Twin Cities region has recently added two modes of transit, bus rapid transit and commuter rail, and is developing two new light rail lines. Nevertheless, in 2009, regular-route bus service provided close to 90 percent of the transit rides in the region. Metro Transit, a division within the Metropolitan Council, is the primary provider of transit in the region and operates bus, light rail, and commuter rail services. Suburban providers offer bus service to 12 communities in the Twin Cities metropolitan area.
Several organizations have transit responsibilities in the region, including the Metropolitan Council, the Transportation Advisory Board (TAB), the Counties Transit Improvement Board (CTIB), county regional railroad authorities, and suburban transit providers. Many of these organizations were created to address perceived local transit needs. The structure of transit governance in the region has changed several times since the Council was created in 1967 and has gone through periods of fragmentation and consolidation.
In 2009, providers spent almost $319 million on transit operations in the Twin Cities region. Since 2004, the region has spent more than $1.7 billion on transit capital expenditures.
1 Our evaluation does not address dial-a-ride service, such as Transit Link and Metro Mobility.
When compared with 11 peer regions around the country, transit in the Twin Cities region performed favorably.2 For example, in 2008, the Twin Cities region’s transit system performed better than most of its peers on efficiency measures, including subsidy per passenger and operating costs per passenger. The Twin Cities region also compared favorably when evaluating service-use measures, such as passengers per hour and passenger miles per mile of service.
Our evaluation focused on governance of transit in the region. We considered the governance of transit to include: (1) planning for and identifying potential corridors for new transit; (2) developing and building transitways, including conducting analyses to determine optimal routes and transit modes; (3) providing transit; (4) generating revenue for transit, typically through imposing a levy or tax or collecting passenger fares; (5) allocating revenue for transit; and (6) measuring the performance of transit.
Governance of transit in the Twin Cities region is complex and made more difficult by the uneasy relationships among the var ious organizations involved with transit in the region.
Each transit organization serves a distinct but somewhat overlapping role for transit in the region. Each organization can operate independently to some extent but also must coordinate with others in the region. The complexity of the system makes it difficult to know which
2 The 11 peer regions are: Baltimore, Cleveland, Dallas-Fort Worth, Denver, Phoenix, Pittsburgh, Portland, St. Louis, San Diego, Seattle, and Tampa.
183BLUE RIBBON COMMITTEE REPORT | December 2020
xiSUMMARY
Coordination among the many transitorganizationsinvolved in governance is difficult.
A central governance issue has been the MetropolitanCouncil’s lack of credibility with elected officials and other transit stakeholders.
organization is accountable for which transit responsibility.
There is significant distrust between the Met Council and the other transit organizations in the Twin Cities region. This distrust makes coordination among the organizations difficult. The strongest example is the relationship between the Met Council and the suburban transit providers. In interviews we had with suburban transit providers and Council staff, and during joint meetings with representatives from the two organizations, the conflict and distrust between these two groups were evident.
The relationship between the Met Council and the Counties Transit Improvement Board is also strained. For example, the two organizations disagree over the definition of “ transitway,” which has led to tension regarding CTIB’s funding priorities.
Coordination among transit organizations in the region is time consuming and inefficient.
The suburban transit providers and Metro Transit coordinate their services effectively. However, coordination between the Met Council and the suburban providers has required significant time and energy from both Council and suburban provider staff, even though the suburban providers represent only about 6 percent of all rides in the region. The suburban providers and the Council have had innumerable staff and committee meetings, required approvals, e-mails, and shared letters. Staff on both sides of this relationship think the coordination efforts are inefficient and time consuming, and the lack of trust between these two groups makes
it difficult to reach agreement on many transit-related issues.
Coordination between the Council and CTIB is also time consuming. Having both bodies make decisions about transit investments in the region leads to overlap and requires additional coordination.
The Metropolitan Council’s structure has created a lack of credibility among many stakeholders and transit organizations in the region.
The Met Council’s lack of credibility stems from the governance structure of the Council itself. Because Council members are appointed by the governor rather than elected, many stakeholders we interviewed did not think that Met Council members are sufficiently accountable for their decisions. Many stakeholders with whom we met believed that Council members represent the views of the governor and not the region as a whole or the district from which they were appointed. Because Met Council members are appointed, local elected officials often question the legitimacy of Council decisions.
Transit resources have been unpredictable.
Transit providers spent almost $319 million in 2009 on transit operations in the region. Motor Vehicle Sales Tax (MVST) revenues are the largest source of operating funds for transit in the Twin Cities region. However, these revenues have not grown as projected. The state’s May 2007 projections anticipated that more than $169 million of MVST revenues would be allocated to transit in the Twin Cities region in fiscal year
184BLUE RIBBON COMMITTEE REPORT | December 2020
xii GOVERNANCE OF TRANSIT IN THE TWIN CITIES REGION
With multiple entities involved in governance, the region has not achieved consensus on a set of pr ior ities for transit.
Changing the composition of the MetropolitanCouncil is the first step in improving the governance of transit in the region.
2010; instead, $140.7 million was allocated to transit in the region.
Minnesota statutes do not identify how “ supplemental” Motor Vehicle Sales Tax revenue should be allocated for transit in the region.
In 2006, Minnesota voters passed a constitutional amendment to allocate additional Motor Vehicle Sales Tax revenue to transit. However, the Legislature has not clarified how this funding, known as “supplemental” MVST revenue, should be allocated within the region. Staff from the suburban transit providers told us that they had expected to receive a formula-based portion of the new funds. Instead, the Met Council created a procedure to distribute the supplemental MVST funds based on regional priorities.
There is no agreed-upon set of pr ior ities for transit in the region, and state laws prohibit consideration of all potential transit cor r idors.
Because the process for developing transitways in the region relies on local initiatives and funding, there are multiple transit corridors being evaluated without a common understanding of the region’s transit priorities. Each community considers its transit project to be a priority, but the project may not be a priority for the region.
Additionally, at one time organizations in the region had conflicting maps regarding potential transitways in the region. In its 2030 Transportation Policy Plan, the Met Council developed a map identifying potential transitways in the region. But, the Counties Transit Improvement Board developed a different map that did not include all
potential transitways and indicated different modes for some potential corridors.
State statutes do not add clarity. The goals for transit identifed in law are vague and are not prioritized. Furthermore, state law prohibits the consideration or study of the Dan Patch corridor (a potential commuter rail corridor between Minneapolis and Northfield) for development as a commuter rail line.3 The prohibition regarding the Dan Patch corridor has implications when planning other transitways in the region.
The Legislature should restructure the governance of the Metropolitan Council to increase its credibility, accountability, and effectiveness as the regional transit planner .
Many problems with the governance of transit stem from having the governor appoint members to the Met Council. In particular, the current governance structure has led to: (1) diminished accountability and credibility for the Council, (2) difficulty in building consensus across organizations in the region, (3) reduced effectiveness due to an increased need for coordination, and (4) multiple competing visions for transit.
We conclude that the structure of the Met Council must be addressed before other aspects of transit governance can be corrected. We present four governance options for the Metropolitan Council for the Legislature to consider; we recommend having a mix of appointed and elected Council members, all serving staggered terms.
3 Laws of Minnesota 2002, chapter 393, sec. 85, subds. 2-4.
185BLUE RIBBON COMMITTEE REPORT | December 2020
Introduction
The organization chart for transit in the Twin Cities region is markedly complex, with numerous entities involved in planning, developing, and
providing various transit services. Recent funding changes and the creation of a new transit investment board have further added to the complexity of transit in the region.
This organizational complexity has raised questions regarding the governance structure of transit in the region and how well it is working. In response to these concerns, the Legislative Audit Commission directed the Office of the Legislative Auditor to evaluate the governance of transit in the Twin Cities region. Our evaluation addressed the following questions:
How is author ity for governance, planning, management, operations, and funding of transit systems in the Twin Cities region distr ibuted among state and local governments?
To what extent do the responsibilities of transit agencies in the region over lap, and is their work adequately coordinated?
To what extent are the region’s effor ts to provide bus service and develop transit cor r idors adequately coordinated? To what extent does funding for transit cor r idors adequately balance capital and operating funding needs?
How does transit in the Twin Cities region compare with other regions in the country, and how well do transit providers within the Twin Cities region per form?
There are many forms of transit in the Twin Cities region and our evaluation focuses only on certain types. Specifically, our evaluation includes express and local regular-route bus service, light rail transit (LRT), commuter rail, and bus rapid transit (BRT). Our evaluation did not include dial-a-ride service, such as Transit Link or Metro Mobility; vanpools; private bus service, such as that provided by Greyhound or Jefferson Bus Lines; inter-city passenger rail, such as that provided by Amtrak; air service; or the relationship between highways and transit. The analysis in this evaluation also excludes bus service provided by the University of Minnesota, the Northstar Corridor Development Authority, and the city of Ramsey, except where indicated.
To better understand the transit governance structure in the Twin Cities region, we reviewed Minnesota statutes, Metropolitan Council procedures and documents, relevant federal law, and regional and national literature. We also spoke with a wide variety of stakeholders in the region, including Metropolitan Council members and staff; commissioners from the seven Twin Cities metropolitan counties, several of whom served on the Counties Transit
186BLUE RIBBON COMMITTEE REPORT | December 2020
2 GOVERNANCE OF TRANSIT IN THE TWIN CITIES REGION
Improvement Board; board members from two suburban transit providers; members of the Transportation Advisory Board; staff from the six suburban transit providers; representatives of corridor commissions around the region; private bus operators; and representatives from a number of interest groups, including the Itasca Project, Metro Cities, Transit for Livable Communities, and the Minnesota Chamber of Commerce. We regularly attended meetings of the Counties Transit Improvement Board and the Metropolitan Council.
We also conducted site visits of the primary providers in the region, including Metro Transit and the six suburban transit providers (Maple Grove Transit, the Minnesota Valley Transit Authority, Plymouth Metrolink, Prior Lake Transit, Shakopee Transit, and SouthWest Transit). We met with the lead staff for each of these providers and, in several cases, toured garages and maintenance facilities. We also visited park-and-ride facilities for each of these providers.
To evaluate transit funding in the region, we analyzed data provided by the regional transit providers, reviewed state and federal law, and examined project funding documents. We also discussed funding-related issues with many of the stakeholders listed above.
To assess the performance of transit in the region as compared with peers in other parts of the country, we reviewed state and federal law and the national literature to better understand peer regions and to identify appropriate performance measures to use when evaluating the region’s transit system. We then analyzed data reported to the National Transit Database as well as data provided by the Metropolitan Council, Metro Transit, and the six suburban providers to evaluate the performance of the providers within the region and compared with other regions across the country.
To address many of the evaluation questions posed in this report, we conducted two surveys: one of all county commissioners in the seven-county region and one of all elected city officials and city managers in the region. In the end, however, the response rates for both of these surveys were too low for us to generalize the responses and form conclusions. To the extent possible, we used information we gathered through the surveys to further illustrate conclusions we arrived at using other data.
Chapter 1 provides an overview of the region’s transit system and introduces the concept of governance as it relates to transit in the Twin Cities region. We address concerns about governance of the transit system in Chapter 2. In this chapter, we introduce nine principles for effective governance and then use these principles to evaluate the Twin Cities region’s transit governance structure. Chapter 2 culminates in recommendations for improving the governance of transit in the Twin Cities region. Chapters 3 and 4 evaluate in more depth the region’s regular-route bus and transitway systems, respectively. In Chapter 5, we present our analysis of the performance of the region’s transit system as compared with regional peers and among providers within the region. We present additional analysis in an online appendix, which is available at http://www.auditor.leg.state.mn.us/ped/2011/transit-app.pdf.
187BLUE RIBBON COMMITTEE REPORT | December 2020
Background 1
This evaluation focused on regular-route bus service, light rail transit, commuter rail, and bus rapid transit.
In this chapter, we provide an overview of transit in the Twin Cities region, including a description of the transit types, or “modes,” currently operated and
the organizations involved in various aspects of transit in the region. Next, we discuss the governance of transit—the responsibilities involved with governance and how they apply to transit in the region. We then provide a brief history of the evolution of transit in the Twin Cities region. The chapter concludes with a review of transit expenditures and revenues.
TRANSIT MODES Minnesota law defines “ transit” as “general or specific transportation service provided to the public on a regular and continuing basis.” 1 Table 1.1 outlines the different modes of transit currently offered in the Twin Cities region.2 As shown in the table, transit includes a range of services; our evaluation focused on regular-route bus service, light rail transit, commuter rail, and bus rapid transit.3
Regular-route bus service follows a fixed schedule along a specific route. Regular-route bus service has three categories: urban-local, suburban-local, and express. In the Twin Cities region, regular-route bus service is provided or contracted for by Metro Transit, suburban transit providers, and Metropolitan Transportation Services.4 Metropolitan Transportation Services also administers most dial-a-ride service in the Twin Cities region.
Light rail transit (LRT) is provided by electrically powered trains along a dedicated route. The Hiawatha light rail line, which operates from downtown Minneapolis to the Mall of America in Bloomington, is the only LRT currently operating in the Twin Cities region. A second LRT, the Central Corridor, which will provide service between downtown Minneapolis and downtown St. Paul, is currently under construction. Commuter rail typically travels longer distances than light rail and operates on existing or abandoned freight rail lines. The
1 Minnesota Statutes 2010, 174.22, subd. 7. 2 For the purposes of this evaluation, we defined the “Twin Cities region” as the seven-county Twin Cities metropolitan area, which includes Anoka, Carver, Dakota, Hennepin, Ramsey, Scott, and Washington counties. This is also the area in which the Metropolitan Council has jurisdiction, with some small exceptions, as defined in law. See Minnesota Statutes 2010, 473.121, subd. 2. 3 Our evaluation did not include dial-a-ride services, such as Transit Link and Metro Mobility, or vanpool.4 For the purposes of our evaluation, we excluded regular-route bus services provided by the University of Minnesota, the city of Ramsey, and the Northstar Corridor Development Authority.
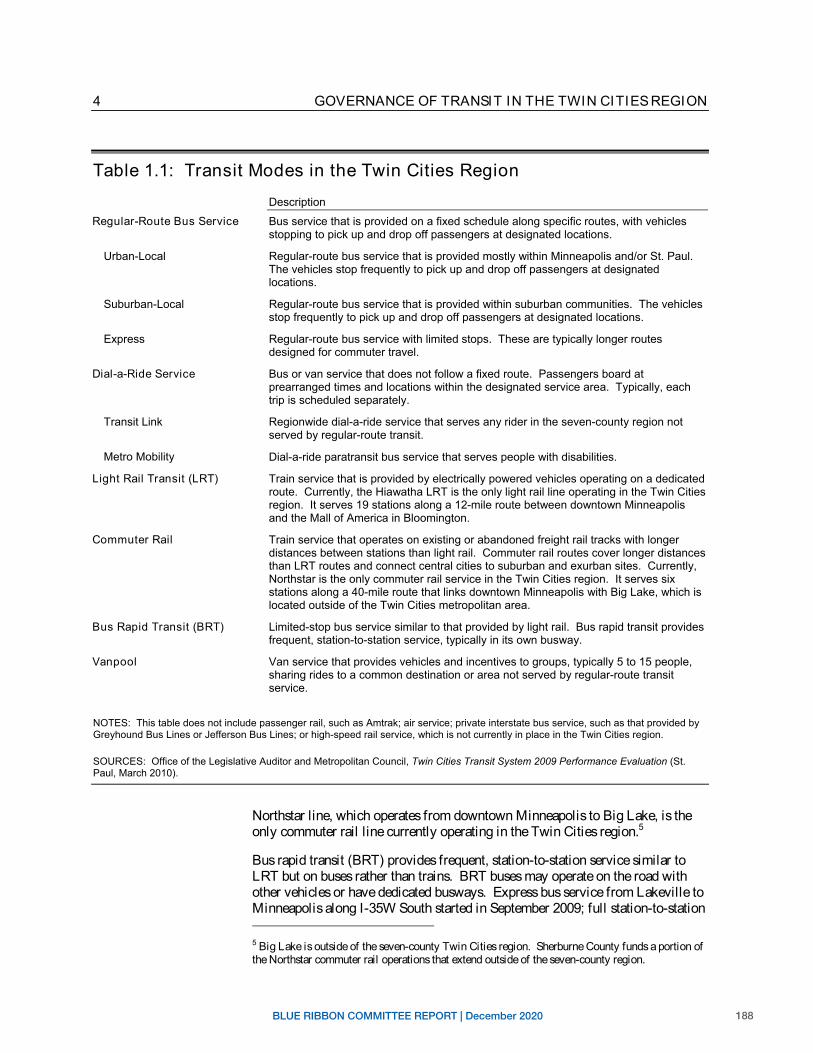
188BLUE RIBBON COMMITTEE REPORT | December 2020
4 GOVERNANCE OF TRANSIT IN THE TWIN CITIES REGION
Table 1.1: Transit Modes in the Twin Cities Region
Description
Regular-Route Bus Service Bus service that is provided on a fixed schedule along specific routes, with vehicles stopping to pick up and drop off passengers at designated locations.
Urban-Local Regular-route bus service that is provided mostly within Minneapolis and/or St. Paul. The vehicles stop frequently to pick up and drop off passengers at designated locations.
Suburban-Local Regular-route bus service that is provided within suburban communities. The vehicles stop frequently to pick up and drop off passengers at designated locations.
Express Regular-route bus service with limited stops. These are typically longer routes designed for commuter travel.
Dial-a-Ride Service Bus or van service that does not follow a fixed route. Passengers board at prearranged times and locations within the designated service area. Typically, each trip is scheduled separately.
Transit Link Regionwide dial-a-ride service that serves any rider in the seven-county region not served by regular-route transit.
Metro Mobility Dial-a-ride paratransit bus service that serves people with disabilities.
Light Rail Transit (LRT) Train service that is provided by electrically powered vehicles operating on a dedicated route. Currently, the Hiawatha LRT is the only light rail line operating in the Twin Cities region. It serves 19 stations along a 12-mile route between downtown Minneapolis and the Mall of America in Bloomington.
Commuter Rail Train service that operates on existing or abandoned freight rail tracks with longer distances between stations than light rail. Commuter rail routes cover longer distances than LRT routes and connect central cities to suburban and exurban sites. Currently, Northstar is the only commuter rail service in the Twin Cities region. It serves six stations along a 40-mile route that links downtown Minneapolis with Big Lake, which is located outside of the Twin Cities metropolitan area.
Bus Rapid Transit (BRT) Limited-stop bus service similar to that provided by light rail. Bus rapid transit provides frequent, station-to-station service, typically in its own busway.
Vanpool Van service that provides vehicles and incentives to groups, typically 5 to 15 people, sharing rides to a common destination or area not served by regular-route transit service.
NOTES: This table does not include passenger rail, such as Amtrak; air service; private interstate bus service, such as that provided by Greyhound Bus Lines or Jefferson Bus Lines; or high-speed rail service, which is not currently in place in the Twin Cities region.
SOURCES: Office of the Legislative Auditor and Metropolitan Council, Twin Cities Transit System 2009 Performance Evaluation (St. Paul, March 2010).
Northstar line, which operates from downtown Minneapolis to Big Lake, is the only commuter rail line currently operating in the Twin Cities region.5
Bus rapid transit (BRT) provides frequent, station-to-station service similar to LRT but on buses rather than trains. BRT buses may operate on the road with other vehicles or have dedicated busways. Express bus service from Lakeville to Minneapolis along I-35W South started in September 2009; full station-to-station
5 Big Lake is outside of the seven-county Twin Cities region. Sherburne County funds a portion of the Northstar commuter rail operations that extend outside of the seven-county region.
189BLUE RIBBON COMMITTEE REPORT | December 2020
5BACKGROUND
BRT service in this corridor is scheduled to begin in 2012.6 BRT service from Lakeville to the Mall of America along Cedar Avenue is scheduled to also begin in 2012.
When we reviewed the transit services provided in the region, we found that:
Although the Twin Cities region is served by several modes of transit, buses provided close to 90 percent of the transit r ides in the region in 2009.
Table 1.2 shows 2009 ridership on the different modes of transit provided in the Twin Cities region. As the table shows, almost 88 percent of the rides in 2009 were on buses.7 Metro Transit bus service provided almost 80 percent of all rides in the region (and 90 percent of all bus rides in the region) in 2009.
Table 1.2: Ridership by Transit Mode, 2009
Percentage of Ridership Total Ridership
Regular-Route Bus Service Buses provided 88 Metro Transit 64,141,700 79.0%percent of the Suburban Transit Providers 4,639,713 5.7 transit r ides in the Metropolitan Transportation Services 2,435,872 3.0
Twin Cities Total Ridership all Bus Service 71,217,285 87.7% Rail Service region in 2009.
Hiawatha Light Rail Transit 9,863,042 12.2 Northstar Commuter Raila 82,282 0.1
Total Ridership all Train Service 9,945,324 12.3% Total Ridership all Transit Modes 81,162,609 100.0%
NOTES: Ridership represents the number of passenger trips (boardings) on transit services. Bus ridership data do not include special services, such as shuttles to the Minnesota State Fair, or transit provided by the University of Minnesota, the Northstar Corridor Development Authority, or the city of Ramsey. a Northstar commuter rail started passenger service in November 2009.
SOURCE: Office of the Legislative Auditor, analysis of data reported to the National Transit Database, 2009, and data supplied by Metro Transit and Metropolitan Transportation Services.
TRANSIT ORGANIZATIONS When we reviewed the organizations that have responsibility for transit in the Twin Cities region, we found that:
There are many organizations involved in transit in the Twin Cities region, and each serves a somewhat distinct but over lapping role.
6 The I-35W South BRT service currently operates as an express bus route only. 7 Northstar commuter rail service started in November 2009. As a result, Table 1.2 does not include a full year’s worth of ridership data for Northstar service.
190BLUE RIBBON COMMITTEE REPORT | December 2020
6 GOVERNANCE OF TRANSIT IN THE TWIN CITIES REGION
The Metropolitan Council is an importantregional governmentagency in the seven-county Twin Cities metropolitanarea.
Table 1.3 lists the key organizations in the Twin Cities region with responsibility for some aspect of transit in the region and outlines each organization’s transit-related responsibility.8 Figure 1.1 illustrates the overlapping jurisdictions of several of these entities. Some of these entities, including the Metropolitan Council, the Transportation Advisory Board (TAB), county-based organizations, and the suburban transit providers, are discussed below in more detail.
Metropolitan Council The Metropolitan Council (also referred to in this report as the Met Council and the Council) is a regional government agency created by the Legislature in 1967.9By law, the Met Council’s jurisdiction is the seven-county Twin Cities metropolitan area, which includes Anoka, Carver, Dakota, Hennepin, Ramsey, Scott, and Washington counties.10 As outlined in its 2009 annual report, the Council has five areas of focus: transit, wastewater and water supply, affordable housing, planning, and the efficiency of regional services.
The Met Council is governed by a board of 16 members and a chair, all of whom are appointed by the governor. State law divides the seven-county region into 16 Metropolitan Council districts with substantially equal populations.11 Each Council district must be represented by one member.12 Each Met Council member serves at the pleasure of the governor, and the terms of the Council members end with the term of the governor.13
Minnesota statutes designate the Metropolitan Council as the region’s Metropolitan Planning Organization.14 According to federal law, each urbanized area with a population of more than 50,000 must have a designated Metropolitan Planning Organization, which consists of local elected officials, officials of transportation-related public agencies, and appropriate state officials.15 Because federal law requires local elected officials to serve on the Metropolitan Planning Organization, state law directs the Metropolitan Council to establish an advisory committee with citizens and local representatives to fulfill the planning
8 The table does not include the Minnesota Department of Transportation (MnDOT) or the Legislature, both of which have some transit-related responsibilities. For example, MnDOT oversees passenger rail in the state, and the Legislature funds transit operations and capital investments.9 Laws of Minnesota 1967, chapter 896. 10 Minnesota Statutes 2010, 473.121, subd. 2. As stated in law, the cities of Northfield, Hanover, Rockford, and New Prague are excluded from the Met Council’s jurisdiction. 11 Minnesota Statutes 2010, 473.123, subd. 3a. The Met Council districts are redrawn after each decennial census. 12 Minnesota Statutes 2010, 473.123, subds. 3 and 3d. 13 Minnesota Statutes 2010, 473.123, subd. 2a. 14 Minnesota Statutes 2010, 473.146, subd. 4(a). 15 23 U.S. Code, sec. 134(d)(1) and (2).
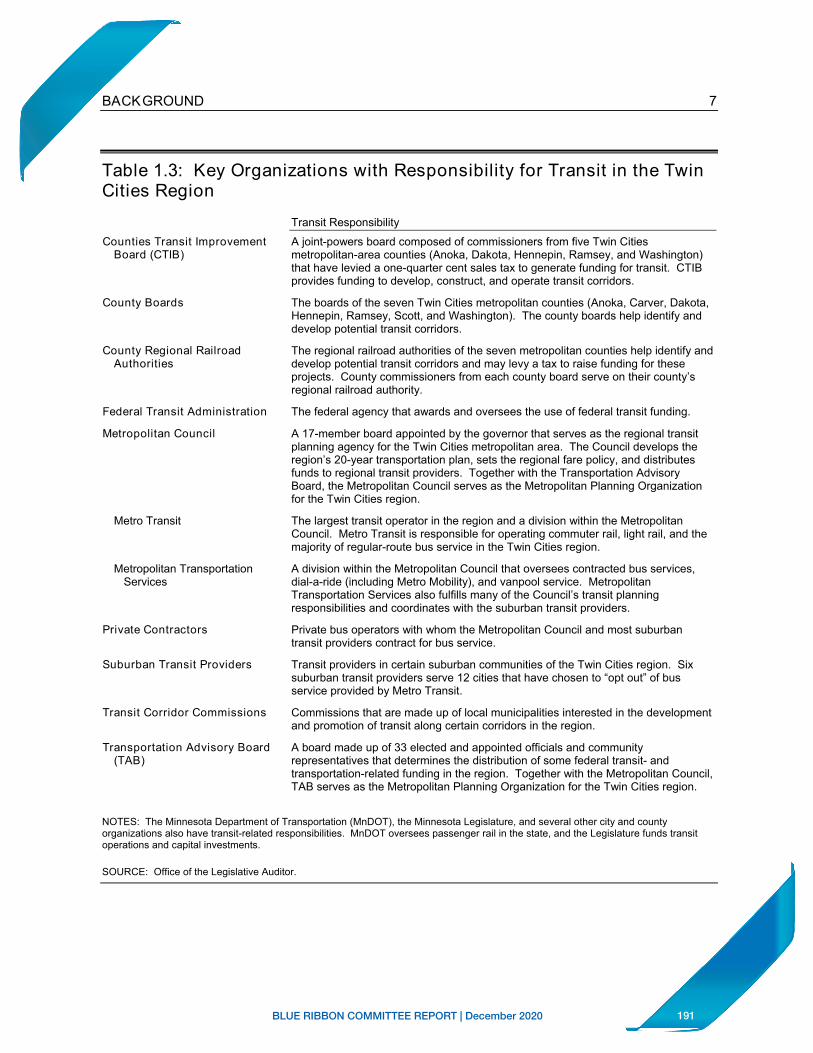
191BLUE RIBBON COMMITTEE REPORT | December 2020
7BACKGROUND
Table 1.3: Key Organizations with Responsibility for Transit in the Twin Cities Region
Transit Responsibility
Counties Transit Improvement A joint-powers board composed of commissioners from five Twin Cities Board (CTIB) metropolitan-area counties (Anoka, Dakota, Hennepin, Ramsey, and Washington)
that have levied a one-quarter cent sales tax to generate funding for transit. CTIB provides funding to develop, construct, and operate transit corridors.
County Boards The boards of the seven Twin Cities metropolitan counties (Anoka, Carver, Dakota, Hennepin, Ramsey, Scott, and Washington). The county boards help identify and develop potential transit corridors.
County Regional Railroad The regional railroad authorities of the seven metropolitan counties help identify and Authorities develop potential transit corridors and may levy a tax to raise funding for these
projects. County commissioners from each county board serve on their county’s regional railroad authority.
Federal Transit Administration The federal agency that awards and oversees the use of federal transit funding.
Metropolitan Council A 17-member board appointed by the governor that serves as the regional transit planning agency for the Twin Cities metropolitan area. The Council develops the region’s 20-year transportation plan, sets the regional fare policy, and distributes funds to regional transit providers. Together with the Transportation Advisory Board, the Metropolitan Council serves as the Metropolitan Planning Organization for the Twin Cities region.
Metro Transit The largest transit operator in the region and a division within the Metropolitan Council. Metro Transit is responsible for operating commuter rail, light rail, and the majority of regular-route bus service in the Twin Cities region.
Metropolitan Transportation A division within the Metropolitan Council that oversees contracted bus services, Services dial-a-ride (including Metro Mobility), and vanpool service. Metropolitan
Transportation Services also fulfills many of the Council’s transit planning responsibilities and coordinates with the suburban transit providers.
Private Contractors Private bus operators with whom the Metropolitan Council and most suburban transit providers contract for bus service.
Suburban Transit Providers Transit providers in certain suburban communities of the Twin Cities region. Six suburban transit providers serve 12 cities that have chosen to “opt out” of bus service provided by Metro Transit.
Transit Corridor Commissions Commissions that are made up of local municipalities interested in the development and promotion of transit along certain corridors in the region.
Transportation Advisory Board A board made up of 33 elected and appointed officials and community (TAB) representatives that determines the distribution of some federal transit- and
transportation-related funding in the region. Together with the Metropolitan Council, TAB serves as the Metropolitan Planning Organization for the Twin Cities region.
NOTES: The Minnesota Department of Transportation (MnDOT), the Minnesota Legislature, and several other city and county organizations also have transit-related responsibilities. MnDOT oversees passenger rail in the state, and the Legislature funds transit operations and capital investments.
SOURCE: Office of the Legislative Auditor.
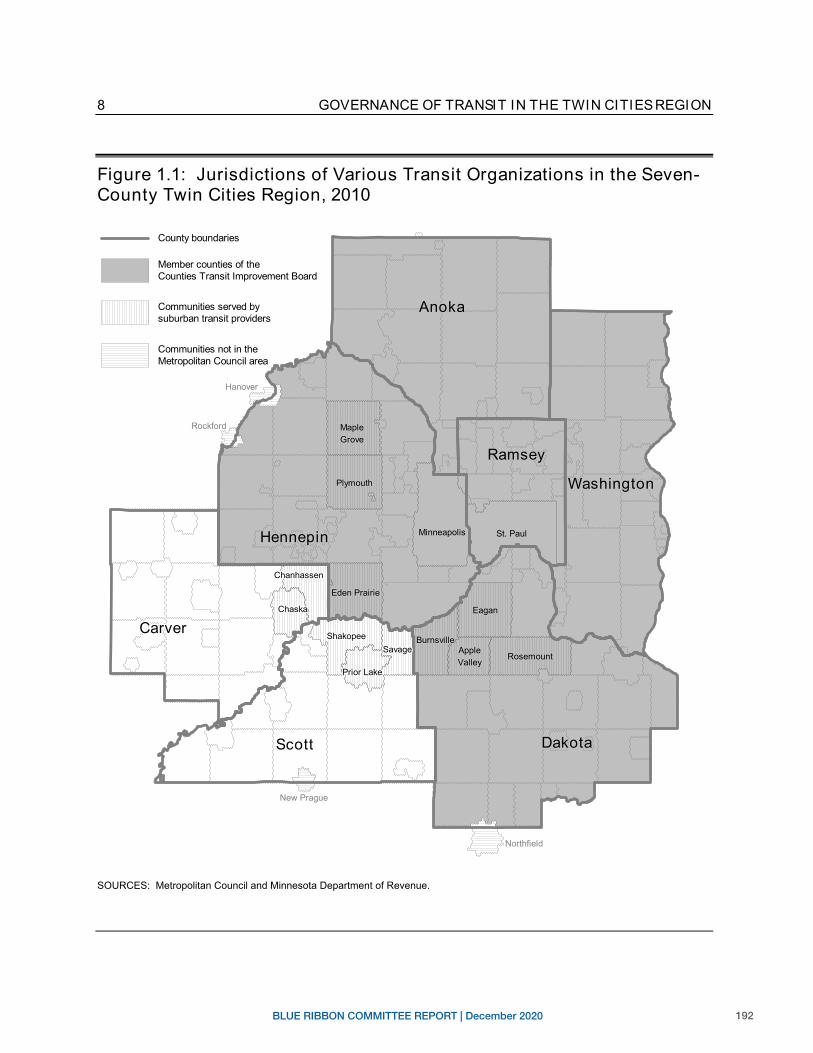
192BLUE RIBBON COMMITTEE REPORT | December 2020
8 GOVERNANCE OF TRANSIT IN THE TWIN CITIES REGION
Figure 1.1: Jurisdictions of Various Transit Organizations in the Seven- County Twin Cities Region, 2010
Hanover
Rockford
New Prague
Northfield
HennepinHennepinHennepinHennepinHennepinHennepinHennepinHennepinHennepin
CarverCarverCarverCarverCarverCarverCarverCarverCarver
RamseyRamseyRamseyRamseyRamseyRamseyRamseyRamseyRamsey
ScottScottScottScottScottScottScottScottScott
AnokaAnokaAnokaAnokaAnokaAnokaAnokaAnokaAnoka
DakotaDakotaDakotaDakotaDakotaDakotaDakotaDakotaDakota
ChaskaChaskaChaskaChaskaChaskaChaskaChaskaChaskaChaska
ChanhassenChanhassenChanhassenChanhassenChanhassenChanhassenChanhassenChanhassenChanhassen
Prior LakePrior LakePrior LakePrior LakePrior LakePrior LakePrior LakePrior LakePrior Lake
SavageSavageSavageSavageSavageSavageSavageSavageSavage ShakopeeShakopeeShakopeeShakopeeShakopeeShakopeeShakopeeShakopeeShakopee
MapleMapleMapleMapleMapleMapleMapleMapleMaple GroveGroveGroveGroveGroveGroveGroveGroveGrove
AppleAppleAppleAppleAppleAppleAppleAppleApple ValleyValleyValleyValleyValleyValleyValleyValleyValley
Minneapolis
WashingtonWashingtonWashingtonWashingtonWashingtonWashingtonWashingtonWashingtonWashington
BurnsvilleBurnsvilleBurnsvilleBurnsvilleBurnsvilleBurnsvilleBurnsvilleBurnsvilleBurnsville
EaganEaganEaganEaganEaganEaganEaganEaganEagan
RosemountRosemountRosemountRosemountRosemountRosemountRosemountRosemountRosemount
Eden PrairieEden PrairieEden PrairieEden PrairieEden PrairieEden PrairieEden PrairieEden PrairieEden Prairie
PlymouthPlymouthPlymouthPlymouthPlymouthPlymouthPlymouthPlymouthPlymouth
St. Paul
Communities not in the Metropolitan Council area
Communities served by suburban transit providers
Member counties of the Counties Transit Improvement Board
County boundaries
SOURCES: Metropolitan Council and Minnesota Department of Revenue.
-Ill
=
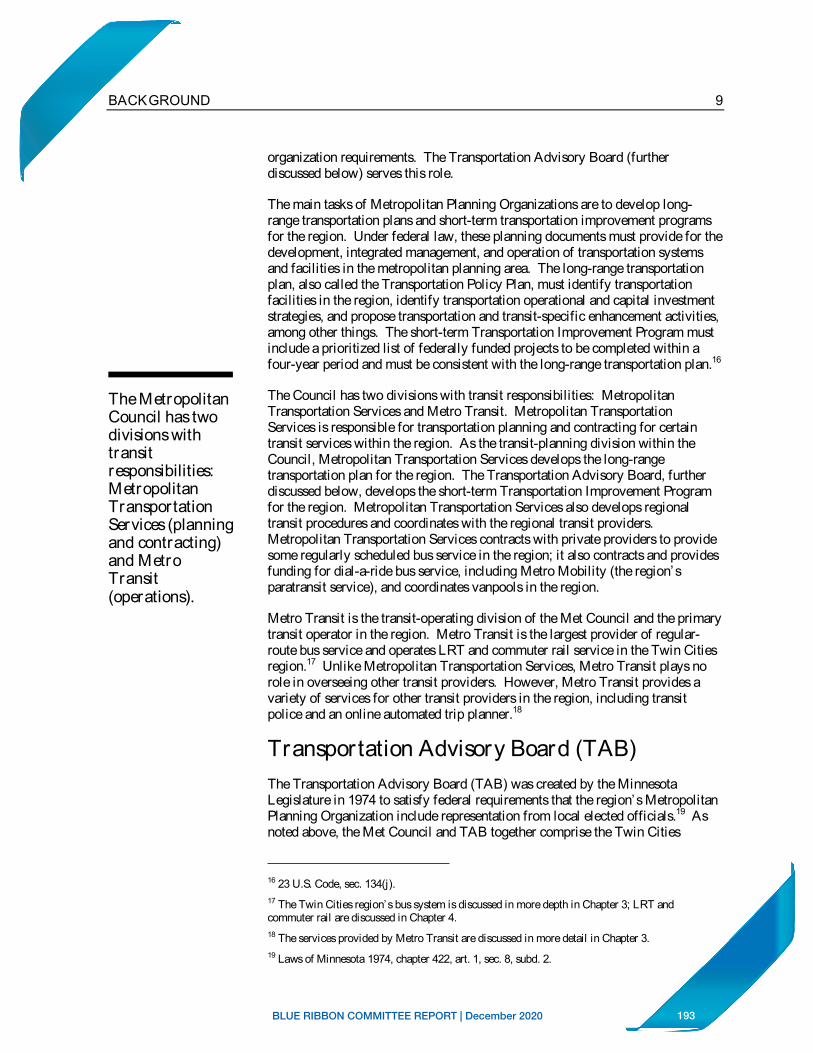
193BLUE RIBBON COMMITTEE REPORT | December 2020
9BACKGROUND
The Metropolitan Council has two divisions with transitresponsibilities:MetropolitanTransportationServices (planning and contracting) and Metro Transit (operations).
organization requirements. The Transportation Advisory Board (further discussed below) serves this role.
The main tasks of Metropolitan Planning Organizations are to develop long-range transportation plans and short-term transportation improvement programs for the region. Under federal law, these planning documents must provide for the development, integrated management, and operation of transportation systems and facilities in the metropolitan planning area. The long-range transportation plan, also called the Transportation Policy Plan, must identify transportation facilities in the region, identify transportation operational and capital investment strategies, and propose transportation and transit-specific enhancement activities, among other things. The short-term Transportation Improvement Program must include a prioritized list of federally funded projects to be completed within a four-year period and must be consistent with the long-range transportation plan.16
The Council has two divisions with transit responsibilities: Metropolitan Transportation Services and Metro Transit. Metropolitan Transportation Services is responsible for transportation planning and contracting for certain transit services within the region. As the transit-planning division within the Council, Metropolitan Transportation Services develops the long-range transportation plan for the region. The Transportation Advisory Board, further discussed below, develops the short-term Transportation Improvement Program for the region. Metropolitan Transportation Services also develops regional transit procedures and coordinates with the regional transit providers. Metropolitan Transportation Services contracts with private providers to provide some regularly scheduled bus service in the region; it also contracts and provides funding for dial-a-ride bus service, including Metro Mobility (the region’s paratransit service), and coordinates vanpools in the region.
Metro Transit is the transit-operating division of the Met Council and the primary transit operator in the region. Metro Transit is the largest provider of regular-route bus service and operates LRT and commuter rail service in the Twin Cities region.17 Unlike Metropolitan Transportation Services, Metro Transit plays no role in overseeing other transit providers. However, Metro Transit provides a variety of services for other transit providers in the region, including transit police and an online automated trip planner.18
Transportation Advisory Board (TAB) The Transportation Advisory Board (TAB) was created by the Minnesota Legislature in 1974 to satisfy federal requirements that the region’s Metropolitan Planning Organization include representation from local elected officials.19 As noted above, the Met Council and TAB together comprise the Twin Cities
16 23 U.S. Code, sec. 134(j).17 The Twin Cities region’s bus system is discussed in more depth in Chapter 3; LRT and commuter rail are discussed in Chapter 4. 18 The services provided by Metro Transit are discussed in more detail in Chapter 3. 19 Laws of Minnesota 1974, chapter 422, art. 1, sec. 8, subd. 2.
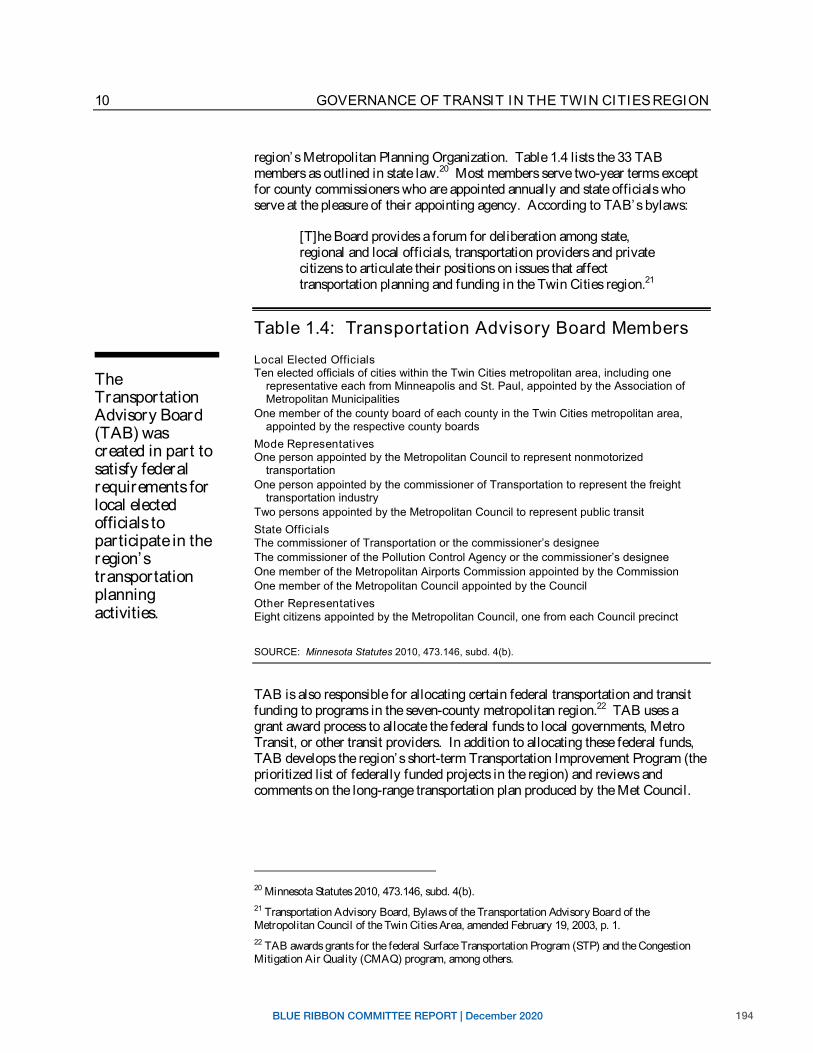
194BLUE RIBBON COMMITTEE REPORT | December 2020
10 GOVERNANCE OF TRANSIT IN THE TWIN CITIES REGION
TheTransportationAdvisory Board (TAB) was created in part to satisfy federal requirements for local elected officials to participate in the region’stransportation planning activities.
region’s Metropolitan Planning Organization. Table 1.4 lists the 33 TAB members as outlined in state law.20 Most members serve two-year terms except for county commissioners who are appointed annually and state officials who serve at the pleasure of their appointing agency. According to TAB’s bylaws:
[T]he Board provides a forum for deliberation among state, regional and local officials, transportation providers and private citizens to articulate their positions on issues that affect transportation planning and funding in the Twin Cities region.21
Table 1.4: Transportation Advisory Board Members
Local Elected Officials Ten elected officials of cities within the Twin Cities metropolitan area, including one
representative each from Minneapolis and St. Paul, appointed by the Association of Metropolitan Municipalities
One member of the county board of each county in the Twin Cities metropolitan area, appointed by the respective county boards
Mode Representatives One person appointed by the Metropolitan Council to represent nonmotorized
transportation One person appointed by the commissioner of Transportation to represent the freight
transportation industry Two persons appointed by the Metropolitan Council to represent public transit State Officials The commissioner of Transportation or the commissioner’s designee The commissioner of the Pollution Control Agency or the commissioner’s designee One member of the Metropolitan Airports Commission appointed by the Commission One member of the Metropolitan Council appointed by the Council Other Representatives Eight citizens appointed by the Metropolitan Council, one from each Council precinct
SOURCE: Minnesota Statutes 2010, 473.146, subd. 4(b).
TAB is also responsible for allocating certain federal transportation and transit funding to programs in the seven-county metropolitan region.22 TAB uses a grant award process to allocate the federal funds to local governments, Metro Transit, or other transit providers. In addition to allocating these federal funds, TAB develops the region’s short-term Transportation Improvement Program (the prioritized list of federally funded projects in the region) and reviews and comments on the long-range transportation plan produced by the Met Council.
20 Minnesota Statutes 2010, 473.146, subd. 4(b). 21 Transportation Advisory Board, Bylaws of the Transportation Advisory Board of the Metropolitan Council of the Twin Cities Area, amended February 19, 2003, p. 1. 22 TAB awards grants for the federal Surface Transportation Program (STP) and the Congestion Mitigation Air Quality (CMAQ) program, among others.
195BLUE RIBBON COMMITTEE REPORT | December 2020
11BACKGROUND
Counties are involved in transit through county boards, county regional railroad authorities, and the Counties Transit ImprovementBoard (CTIB).
County Organizations As shown in Table 1.3, counties in the region are involved in transit through their actions as separate county boards and regional railroad authorities, and through their membership on the Counties Transit Improvement Board (CTIB). Collectively this represents 15 separate county organizations involved in regional transit issues, although many of the same county commissioners serve on multiple county organizations. Each type of county organization is further discussed below.
The county boards of the seven metropolitan counties are active in identifying potential transitways and evaluating alternative routes and corridors for these transitways.23 As discussed further in Chapter 4, counties in the Twin Cities region often take the lead in developing local support for new transitways.24
The 1980 Legislature authorized the creation of county regional railroad authorities.25 In the seven-county metropolitan area, each county’s regional railroad authority is made up of its county commissioners. For example, all Hennepin County commissioners also serve on the Hennepin County Regional Railroad Authority. By law, the county regional railroad authorities can levy a tax to raise funding for the “preservation and improvement of local rail service for agriculture, industry, or passenger traffic and provide for the preservation of abandoned rail right-of-way for future transportation uses.” 26 Additionally, state law says that the regional railroad authorities may:
Plan, establish, acquire, develop, construct, purchase, enlarge, extend, improve, maintain, equip, operate, regulate, and protect railroads and railroad facilities, including but not limited to terminal buildings, roadways, crossings, bridges, causeways, tunnels, equipment, and rolling stock.27
In other words, the regional railroad authorities have broad authority regarding rail projects, including commuter rail and light rail transit.
The Legislature authorized the creation of the Counties Transit Improvement Board in 2008.28 Through the enabling legislation, the seven counties in the
23 The term “ transitway” is used throughout this report to mean corridors with features that enable transit to travel more quickly than personal vehicles, such as commuter rail or light rail transit. 24 Counties are also responsible for developing comprehensive plans, which must include matters related to transportation. See Minnesota Statutes 2010, 473.858 and 473.859, subd. 3(1). 25 Laws of Minnesota 1980, chapter 616. By law, counties may, but are not required to, establish a regional railroad authority. 26 The tax rate may not exceed an annual rate of 0.04835 percent of market value of all taxable property within the municipality. Minnesota Statutes 2010, 398A.04, subd. 8, and 398A.02. 27 Minnesota Statutes 2010, 398A.04, subd. 2. The 2005 Legislature extended this authority for the Dakota County Regional Railroad Authority to include a bus rapid transit system along Cedar Avenue in Dakota County. See Laws of Minnesota First Special Session 2005, chapter 6, art. 3, sec. 90. 28 Laws of Minnesota 2008, chapter 152, art. 4, sec. 2.
196BLUE RIBBON COMMITTEE REPORT | December 2020
12 GOVERNANCE OF TRANSIT IN THE TWIN CITIES REGION
CTIB, created in 2008, provides a reliable funding source for transit in the region.
Twin Cities region were authorized to levy a one-quarter cent sales tax, levy a $20 per motor vehicle excise tax, and form a joint-powers board to fund transit improvements and provide a reliable funding source for transit in the region. As outlined in law, CTIB must allocate grant awards only for the following transit purposes:
(i) capital improvements to transit ways, including, but not limited to, commuter rail rolling stock, light rail vehicles, and transit way buses;
(ii) capital costs for park-and-ride facilities . . . ;
(iii) feasibility studies, planning, alternatives analyses, environmental studies, engineering, property acquisition for transit way purposes, and construction of transit ways; and
(iv) operating assistance for transit ways.29
Currently, five of the seven metropolitan counties have joined CTIB (Anoka, Dakota, Hennepin, Ramsey, and Washington). These five counties have all levied the one-quarter cent sales tax and have voting representation on the Board.The chair of the Met Council is also a voting member of the Board. CTIB has a weighted voting system that ensures representation based on both sales tax revenue and population. The two metropolitan-area counties that did not levy the sales tax, Carver and Scott counties, are nonvoting members of the Board.
By law, the Counties Transit Improvement Board must establish a Grant Evaluation and Ranking System (GEARS) committee, which must include: (1) one county commissioner from each county on CTIB, (2) one elected city representative from each county on CTIB, (3) an additional elected city representative from each county for every additional 400,000 in population, and (4) the chair of the Metropolitan Council’s Transportation Committee.30 The committee is required to evaluate grant applications according to criteria established by CTIB and make recommendations to the Board.
Suburban Transit Providers In 1981, the Minnesota Legislature allowed certain communities that felt they were not receiving adequate transit services to “opt out” of the regional regular-route transit services on the condition that they provide alternative transit services. Twelve communities have chosen to opt out of Metro Transit’ s
29 Minnesota Statutes 2010, 297A.992, subd. 6. “Transitways” is not defined in law, and there are different interpretations of its meaning, as further discussed in Chapter 4. 30 Minnesota Statutes 2010, 297A.992, subd. 5(c).
197BLUE RIBBON COMMITTEE REPORT | December 2020
13BACKGROUND
Six suburban transit providers serve 12 communities that have “ opted out” of Metro Transit bus service.
We identified six functions involved in governance of transit.
services, and these communities are currently served by six suburban transit providers.31
The opt-out communities receive funding through a formula outlined in law and determine the level of transit service provided in their communities. All six of the suburban transit providers offer express bus service from their communities to downtown Minneapolis; several also offer express service to the University of Minnesota. One suburban provider, the Minnesota Valley Transit Authority, offers express bus service to downtown St. Paul and service to the Mall of America. The suburban providers also offer a range of local bus service.
GOVERNANCE RESPONSIBILITIES The term “governance” implies a range of responsibilities. In this report, we consider the governance of transit to include the following: (1) planning for the development of transit lines, which includes identifying potential corridors for new transit; (2) developing and building transit, which includes conducting analyses to determine optimal routes and transit modes; (3) providing transit; (4) generating revenue for transit, typically through imposing a levy or tax or collecting passenger fares; (5) allocating revenue for transit; and (6) measuring the performance of transit. Table 1.5 identifies the governance responsibilities of the transit entities in the Twin Cities region.
As Table 1.5 illustrates:
Multiple entities have over lapping responsibilities for transit governance in the Twin Cities region.
For every transit governance role outlined in Table 1.5, there are several organizations in the Twin Cities region with responsibility for that function. For example, the Counties Transit Improvement Board, the county boards, the county regional railroad authorities, the Metropolitan Council (through Metropolitan Transportation Services), the transit corridor commissions, and the Transportation Advisory Board all have a role in planning transit in the region. They each help to identify potential corridors where transit could be developed or fund the process for identifying potential transit corridors. Similarly, the region has several transit providers: the Metropolitan Council (through Metro Transit and Metropolitan Transportation Services), private contractors, and the six suburban transit providers. Notably, the Council—through Metropolitan Transportation Services—is the only entity that has responsibility for all six transit governance areas.
31 The six suburban transit providers and the communities they serve are: Maple Grove Transit (Maple Grove); the Minnesota Valley Transit Authority (Apple Valley, Burnsville, Eagan, Rosemount, and Savage); Plymouth Metrolink (Plymouth); Prior Lake Transit (Prior Lake); Shakopee Transit (Shakopee); and SouthWest Transit (Chanhassen, Chaska, and Eden Prairie). As permitted through one-time legislation, Minnetonka elected to have “opt-out” status in 2002. However, Minnetonka entered into a service agreement with, and continues to receive bus service from, Metro Transit. The suburban transit providers are discussed in depth in Chapter 3.
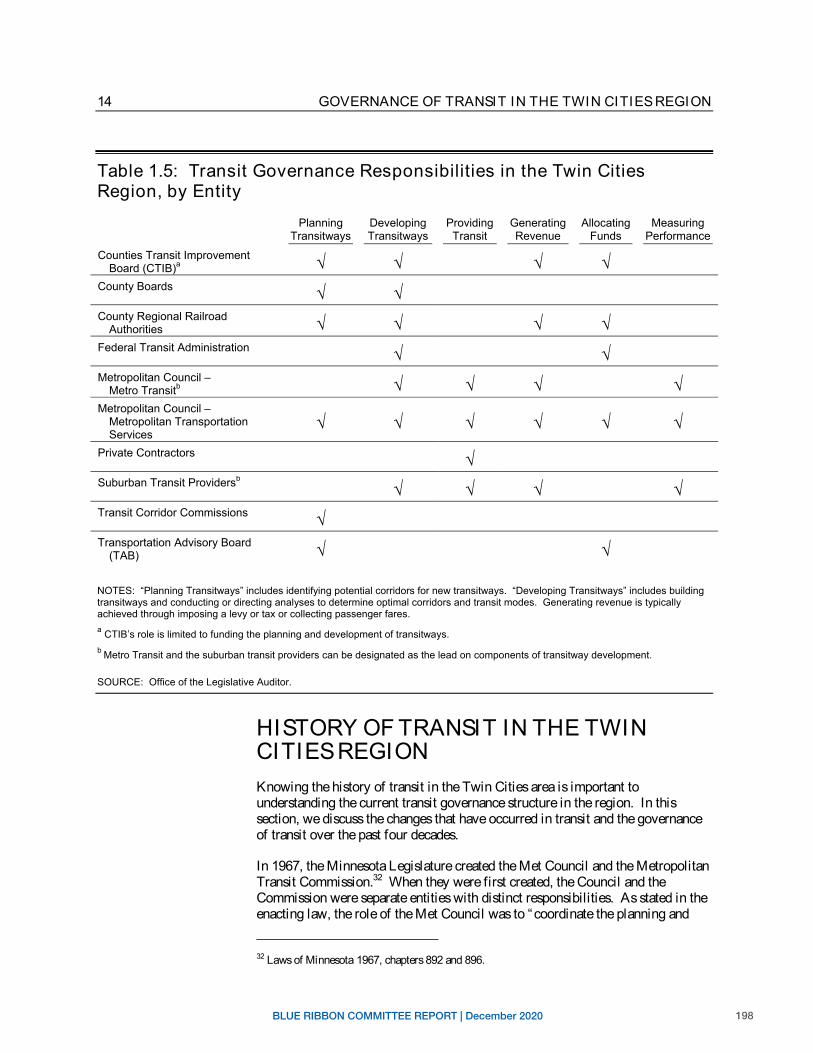
198BLUE RIBBON COMMITTEE REPORT | December 2020
14 GOVERNANCE OF TRANSIT IN THE TWIN CITIES REGION
Table 1.5: Transit Governance Responsibilities in the Twin Cities Region, by Entity
Planning Developing Providing Generating Allocating Measuring Transitways Transitways Transit Revenue Funds Performance
Counties Transit Improvement Board (CTIB)a √ √ √ √
County Boards √ √County Regional Railroad
Authorities √ √ √ √Federal Transit Administration √ √Metropolitan Council –
Metro Transitb √ √ √ √Metropolitan Council –
Metropolitan Transportation Services
√ √ √ √ √ √Private Contractors √Suburban Transit Providersb
√ √ √ √Transit Corridor Commissions √Transportation Advisory Board
(TAB) √ √
NOTES: “Planning Transitways” includes identifying potential corridors for new transitways. “Developing Transitways” includes building transitways and conducting or directing analyses to determine optimal corridors and transit modes. Generating revenue is typicallyachieved through imposing a levy or tax or collecting passenger fares. a CTIB’s role is limited to funding the planning and development of transitways. b Metro Transit and the suburban transit providers can be designated as the lead on components of transitway development.
SOURCE: Office of the Legislative Auditor.
HISTORY OF TRANSIT IN THE TWIN CITIES REGION Knowing the history of transit in the Twin Cities area is important to understanding the current transit governance structure in the region. In this section, we discuss the changes that have occurred in transit and the governance of transit over the past four decades.
In 1967, the Minnesota Legislature created the Met Council and the Metropolitan Transit Commission.32 When they were first created, the Council and the Commission were separate entities with distinct responsibilities. As stated in the enacting law, the role of the Met Council was to “coordinate the planning and
32 Laws of Minnesota 1967, chapters 892 and 896.
199BLUE RIBBON COMMITTEE REPORT | December 2020
15BACKGROUND
development of the metropolitan area.” 33 As part of this coordination role, the Council was required to prepare a “development guide” that addressed the needs of the region, including transit, parks, airports, and libraries, among other regional amenities.34
In contrast to the Council, the Commission’s sole focus was transit. In law, the Metropolitan Transit Commission’s primary objective was to:
Make recommendations and suggestions to improve public transit systems now or hereafter operating in the transit area and strengthen the operation thereof by assisting the operators in experimenting with new services, extending routes, adjusting fares, and other appropriate expedients.35
The Metropolitan Transit Commission was also charged with developing a “plan for a complete, integrated mass transit system for the metropolitan transit area” in cooperation with the Met Council.36 The Council was responsible for reviewing the Commission’s comprehensive plan.
In examining the evolution of transit and the governance of transit since the Met Council and the Metropolitan Transit Commission were created in 1967, we found that:
Transit and the governance of transit in the Twin Cities region have become more complicated over the past 40 years.
In the following two sections, we discuss these changes in more detail. We first examine the changes in transit services provided in the region. This is followed by a discussion of the changes in transit governance that have occurred over the past four decades.
Expansion in Transit Services In the 1960s the only mode of transit in the Twin Cities was privately provided bus service.37 In 1970, the Metropolitan Transit Commission acquired the region’s privately held bus system. During the 1970s, the Met Council and the Commission disagreed over whether to develop a regionwide rail system—the Commission wanted to develop a 37-mile heavy rail system similar to those operating in Washington, DC, and San Francisco. The Met Council ultimately prevailed, and it was not until the Legislature mandated the Council to conduct a
33 Laws of Minnesota 1967, chapter 896, sec. 1. 34 Laws of Minnesota 1967, chapter 896, sec. 6, subd. 5. 35 Laws of Minnesota 1967, chapter 892, sec. 6, subd. 2. 36 Laws of Minnesota 1967, chapter 892, sec. 6, subd. 1. 37 In the late 1800s and early 1900s, streetcars were the primary mode of transit in the Twin Cities region. By the mid 1950s, however, streetcars had largely been replaced by buses.
200BLUE RIBBON COMMITTEE REPORT | December 2020
16 GOVERNANCE OF TRANSIT IN THE TWIN CITIES REGION
Since 1996, the numbers of transit modes and r iders have increased in the Twin Cities region.
feasibility study of light rail in 1980 that the region took steps towards developing modes of transit other than bus.38
In 1984, the Legislature allocated $12.6 million for planning and engineering designs related to developing light rail in the Hiawatha Avenue, University Avenue, and Southwest corridors.39 It was not until 1998, however, that the Legislature approved funding to help build the Hiawatha LRT line.40 The Hiawatha LRT began passenger service in 2004, which was followed by the introduction of the Northstar commuter rail line in November 2009.41
In addition to the changes in transit modes, the number of transit passengers has also increased. Between 1996 and 2008, transit ridership in the Twin Cities region increased more than 45 percent, from more than 65 million rides in 1996 to almost 95 million rides in 2008.42
Changes in Transit Governance Table 1.6 provides an overview of the major changes that have occurred in transit governance in the Twin Cities area over the past 40 years. When we examined the history of transit governance in the Twin Cities region, we found that:
Over the past 40 years, regional transit governance has exper ienced per iods of consolidation followed by per iods of fragmentation.
From their creation in 1967 until the 1980s, the Met Council and the Metropolitan Transit Commission were largely responsible for transit in the region.43 In the 1980s, there was a period of increased fragmentation with the creation of the regional railroad authorities, the suburban transit providers, and the Regional Transit Board. In 1994, however, the Legislature merged several transit organizations into the Met Council, thus consolidating many transit responsibilities into the Council. Most recently, transit responsibilities have again become more fragmented with the creation of the Counties Transit Improvement Board in 2008.
In 1980, the Legislature authorized the county regional railroad authorities.44
Hennepin County formed the first regional rail authority in the Twin Cities region in 1980; the other counties in the region formed their own regional railroad authorities by the end of the decade. The regional railroad authorities became advocates and funders of developing rail transit, especially LRT, in the
38 Laws of Minnesota 1980, chapter 607, art. 13, sec. 3. 39 Laws of Minnesota 1984, chapter 654, art. 3. 40 Laws of Minnesota 1998, chapter 404, sec. 17, subd. 3. 41 I-35W South bus rapid transit (BRT) began express service from Lakeville to downtown Minneapolis in September 2009. Full station-to-station BRT service is expected to begin in 2012. 42 Ridership represents the number of passenger trips (boardings) on transit services. 43 In 1974, the Legislature established the Transportation Advisory Board (TAB) to comply with federal requirements. See Laws of Minnesota 1974, chapter 422, art. 3, sec. 8, subd. 2. 44 Laws of Minnesota 1980, chapter 616.
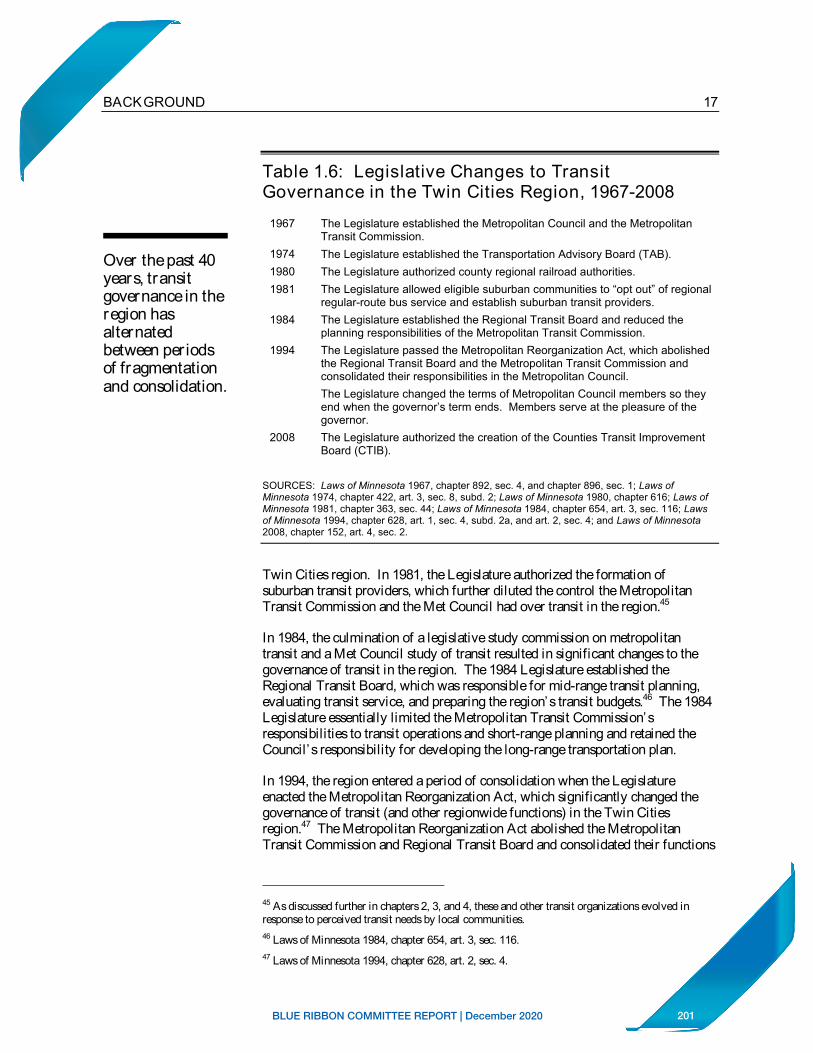
201BLUE RIBBON COMMITTEE REPORT | December 2020
17BACKGROUND
Over the past 40 years, transit governance in the region has alternated between periods of fragmentation and consolidation.
Table 1.6: Legislative Changes to Transit Governance in the Twin Cities Region, 1967-2008
1967 The Legislature established the Metropolitan Council and the Metropolitan Transit Commission.
1974 The Legislature established the Transportation Advisory Board (TAB). 1980 The Legislature authorized county regional railroad authorities. 1981 The Legislature allowed eligible suburban communities to “opt out” of regional
regular-route bus service and establish suburban transit providers. 1984 The Legislature established the Regional Transit Board and reduced the
planning responsibilities of the Metropolitan Transit Commission. 1994 The Legislature passed the Metropolitan Reorganization Act, which abolished
the Regional Transit Board and the Metropolitan Transit Commission and consolidated their responsibilities in the Metropolitan Council. The Legislature changed the terms of Metropolitan Council members so they end when the governor’s term ends. Members serve at the pleasure of the governor.
2008 The Legislature authorized the creation of the Counties Transit Improvement Board (CTIB).
SOURCES: Laws of Minnesota 1967, chapter 892, sec. 4, and chapter 896, sec. 1; Laws of Minnesota 1974, chapter 422, art. 3, sec. 8, subd. 2; Laws of Minnesota 1980, chapter 616; Laws of Minnesota 1981, chapter 363, sec. 44; Laws of Minnesota 1984, chapter 654, art. 3, sec. 116; Lawsof Minnesota 1994, chapter 628, art. 1, sec. 4, subd. 2a, and art. 2, sec. 4; and Laws of Minnesota 2008, chapter 152, art. 4, sec. 2.
Twin Cities region. In 1981, the Legislature authorized the formation of suburban transit providers, which further diluted the control the Metropolitan Transit Commission and the Met Council had over transit in the region.45
In 1984, the culmination of a legislative study commission on metropolitan transit and a Met Council study of transit resulted in significant changes to the governance of transit in the region. The 1984 Legislature established the Regional Transit Board, which was responsible for mid-range transit planning, evaluating transit service, and preparing the region’s transit budgets.46 The 1984 Legislature essentially limited the Metropolitan Transit Commission’s responsibilities to transit operations and short-range planning and retained the Council’s responsibility for developing the long-range transportation plan.
In 1994, the region entered a period of consolidation when the Legislature enacted the Metropolitan Reorganization Act, which significantly changed the governance of transit (and other regionwide functions) in the Twin Cities region.47 The Metropolitan Reorganization Act abolished the Metropolitan Transit Commission and Regional Transit Board and consolidated their functions
45 As discussed further in chapters 2, 3, and 4, these and other transit organizations evolved in response to perceived transit needs by local communities. 46 Laws of Minnesota 1984, chapter 654, art. 3, sec. 116. 47 Laws of Minnesota 1994, chapter 628, art. 2, sec. 4.
202BLUE RIBBON COMMITTEE REPORT | December 2020
18 GOVERNANCE OF TRANSIT IN THE TWIN CITIES REGION
In 2009, the Twin Cities region spent about $319 million on transit operations and budgeted more than $320 million for transit capital.
into a new Met Council.48 As a result of this Act, all transit responsibilities, except for service provided by the suburban transit providers, were consolidated in the Met Council.
The Metropolitan Reorganization Act of 1994 also changed the terms of Met Council members. Prior to 1994, the Council members were appointed by the governor and served staggered terms. In 1994, the Legislature changed this language so that Met Council members’ terms were coterminous with the governor’s term and members served “at the pleasure of the governor.” 49
Recently, transit in the region has again become more fragmented. In 2008, the Legislature passed a major transportation bill, which, among other things, authorized the creation of the Counties Transit Improvement Board.50
TRANSIT EXPENDITURES AND REVENUESEarlier in this chapter we discussed the organizational complexity of transit in the Twin Cities region as reflected in the number of transit organizations and transit modes operated in the region. In this section, we examine expenditures and revenues for transit in the region and find that it, too, is complex because of the numerous funding sources. The section begins with an examination of transit expenditures in the region. That discussion is followed by an overview of the various sources of revenue for transit in the region and how these sources have changed over time.
Transit Expenditures Transit expenditures can be divided into operating and capital expenditures. Operating expenditures include costs associated with operating transit, such as bus drivers and fuel, as well as maintenance costs associated with keeping the services and facilities operating. Capital expenditures include costs associated with preserving, enhancing, and expanding the existing transit system, such as building new transitways, constructing park-and-ride facilities, purchasing vehicles, and implementing technology improvements. In 2009, the Twin Cities region spent almost $319 million on transit operations and budgeted more than $320 million for transit capital. In this section, we discuss expenditures associated with transit in the Twin Cities region. We first discuss operating expenditures and then review capital expenditures.
48 The Metropolitan Reorganization Act of 1994 also abolished the Metropolitan Waste Control Commission and transferred its responsibilities to the Met Council. 49 Laws of Minnesota 1994, chapter 628, art. 1, sec. 4, subd. 2a. 50 Laws of Minnesota 2008, chapter 152, art. 4, sec. 2. As discussed further in chapters 2 and 4, the Counties Transit Improvement Board was created in response to a perceived need for a more reliable source of transit funding for the region.
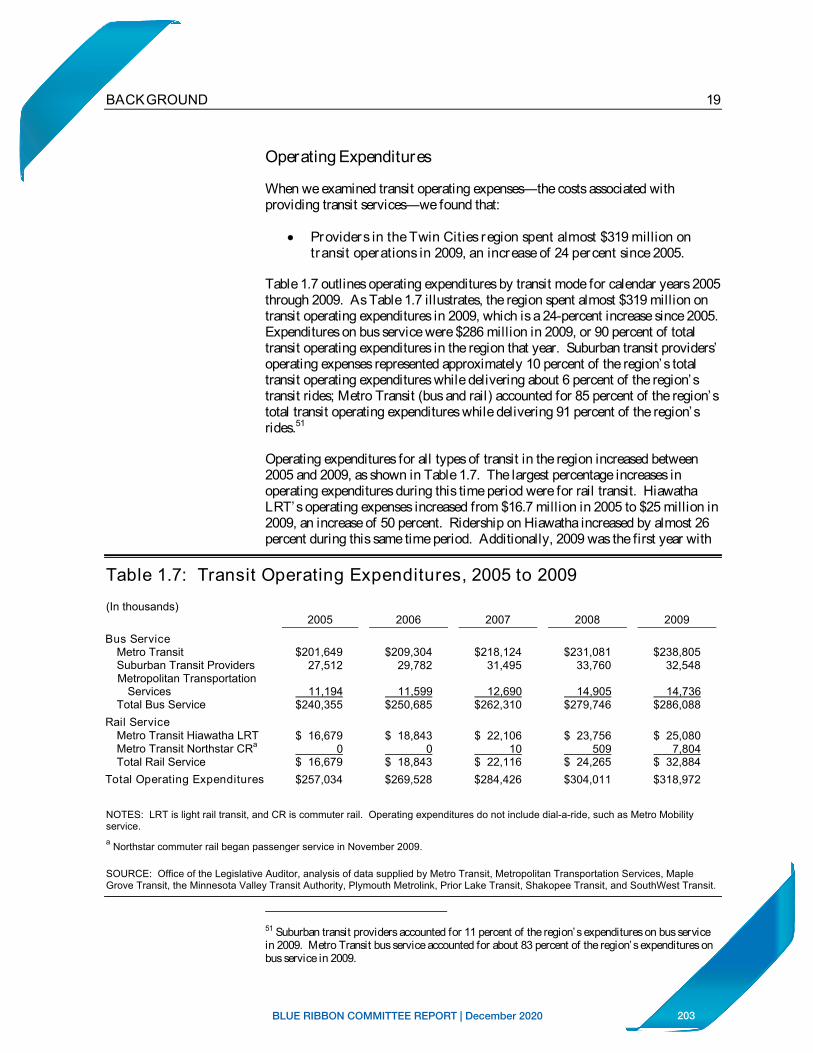
203BLUE RIBBON COMMITTEE REPORT | December 2020
19BACKGROUND
Operating Expenditures
When we examined transit operating expenses—the costs associated with providing transit services—we found that:
Providers in the Twin Cities region spent almost $319 million on transit operations in 2009, an increase of 24 percent since 2005.
Table 1.7 outlines operating expenditures by transit mode for calendar years 2005 through 2009. As Table 1.7 illustrates, the region spent almost $319 million on transit operating expenditures in 2009, which is a 24-percent increase since 2005. Expenditures on bus service were $286 million in 2009, or 90 percent of total transit operating expenditures in the region that year. Suburban transit providers’ operating expenses represented approximately 10 percent of the region’s total transit operating expenditures while delivering about 6 percent of the region’s transit rides; Metro Transit (bus and rail) accounted for 85 percent of the region’s total transit operating expenditures while delivering 91 percent of the region’s rides.51
Operating expenditures for all types of transit in the region increased between 2005 and 2009, as shown in Table 1.7. The largest percentage increases in operating expenditures during this time period were for rail transit. Hiawatha LRT’s operating expenses increased from $16.7 million in 2005 to $25 million in 2009, an increase of 50 percent. Ridership on Hiawatha increased by almost 26 percent during this same time period. Additionally, 2009 was the first year with
Table 1.7: Transit Operating Expenditures, 2005 to 2009
(In thousands) 2005 2006 2007 2008 2009
Bus Service Metro Transit $201,649 $209,304 $218,124 $231,081 $238,805 Suburban Transit Providers 27,512 29,782 31,495 33,760 32,548 Metropolitan Transportation
Services 11,194 11,599 12,690 14,905 14,736 Total Bus Service $240,355 $250,685 $262,310 $279,746 $286,088
Rail Service Metro Transit Hiawatha LRT $ 16,679 $ 18,843 $ 22,106 $ 23,756 $ 25,080 Metro Transit Northstar CRa 0 0 10 509 7,804 Total Rail Service $ 16,679 $ 18,843 $ 22,116 $ 24,265 $ 32,884
Total Operating Expenditures $257,034 $269,528 $284,426 $304,011 $318,972
NOTES: LRT is light rail transit, and CR is commuter rail. Operating expenditures do not include dial-a-ride, such as Metro Mobilityservice. a Northstar commuter rail began passenger service in November 2009.
SOURCE: Office of the Legislative Auditor, analysis of data supplied by Metro Transit, Metropolitan Transportation Services, MapleGrove Transit, the Minnesota Valley Transit Authority, Plymouth Metrolink, Prior Lake Transit, Shakopee Transit, and SouthWest Transit.
51 Suburban transit providers accounted for 11 percent of the region’s expenditures on bus service in 2009. Metro Transit bus service accounted for about 83 percent of the region’s expenditures on bus service in 2009.
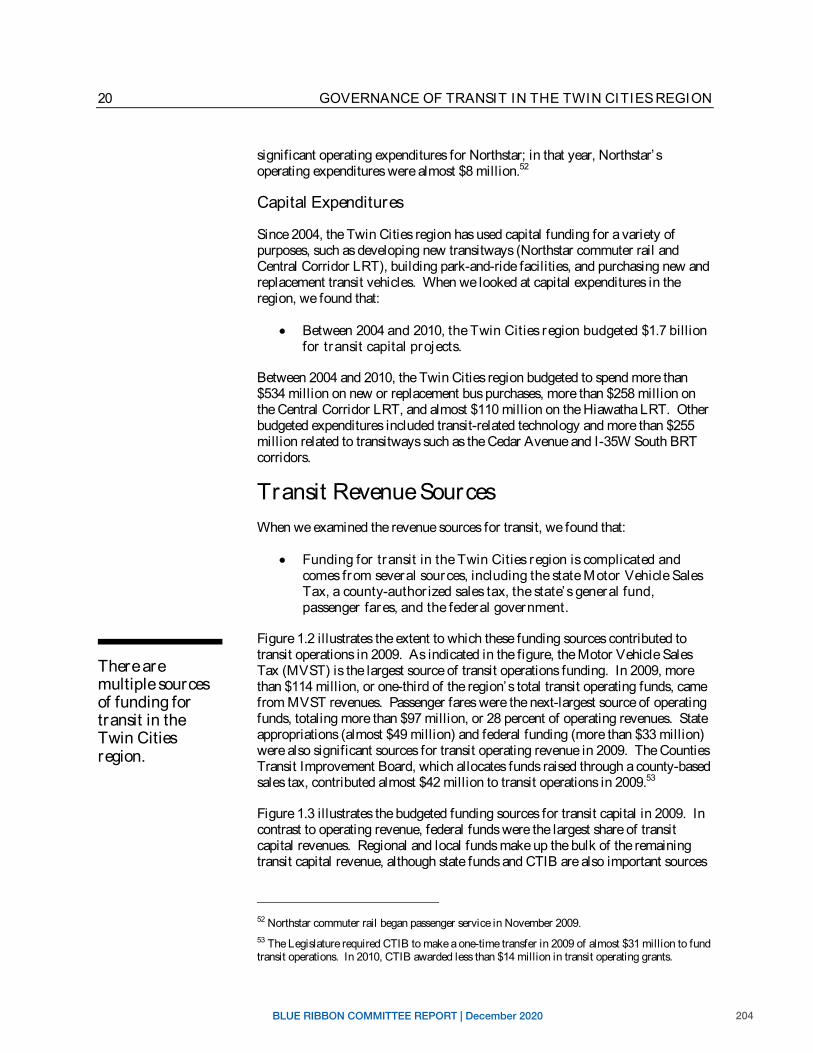
204BLUE RIBBON COMMITTEE REPORT | December 2020
20 GOVERNANCE OF TRANSIT IN THE TWIN CITIES REGION
There are multiple sources of funding for transit in the Twin Cities region.
significant operating expenditures for Northstar; in that year, Northstar’s operating expenditures were almost $8 million.52
Capital Expenditures
Since 2004, the Twin Cities region has used capital funding for a variety of purposes, such as developing new transitways (Northstar commuter rail and Central Corridor LRT), building park-and-ride facilities, and purchasing new and replacement transit vehicles. When we looked at capital expenditures in the region, we found that:
Between 2004 and 2010, the Twin Cities region budgeted $1.7 billion for transit capital projects.
Between 2004 and 2010, the Twin Cities region budgeted to spend more than $534 million on new or replacement bus purchases, more than $258 million on the Central Corridor LRT, and almost $110 million on the Hiawatha LRT. Other budgeted expenditures included transit-related technology and more than $255 million related to transitways such as the Cedar Avenue and I-35W South BRT corridors.
Transit Revenue Sources When we examined the revenue sources for transit, we found that:
Funding for transit in the Twin Cities region is complicated and comes from several sources, including the state Motor Vehicle Sales Tax, a county-author ized sales tax, the state’s general fund, passenger fares, and the federal government.
Figure 1.2 illustrates the extent to which these funding sources contributed to transit operations in 2009. As indicated in the figure, the Motor Vehicle Sales Tax (MVST) is the largest source of transit operations funding. In 2009, more than $114 million, or one-third of the region’s total transit operating funds, came from MVST revenues. Passenger fares were the next-largest source of operating funds, totaling more than $97 million, or 28 percent of operating revenues. State appropriations (almost $49 million) and federal funding (more than $33 million) were also significant sources for transit operating revenue in 2009. The Counties Transit Improvement Board, which allocates funds raised through a county-based sales tax, contributed almost $42 million to transit operations in 2009.53
Figure 1.3 illustrates the budgeted funding sources for transit capital in 2009. In contrast to operating revenue, federal funds were the largest share of transit capital revenues. Regional and local funds make up the bulk of the remaining transit capital revenue, although state funds and CTIB are also important sources
52 Northstar commuter rail began passenger service in November 2009. 53 The Legislature required CTIB to make a one-time transfer in 2009 of almost $31 million to fund transit operations. In 2010, CTIB awarded less than $14 million in transit operating grants.
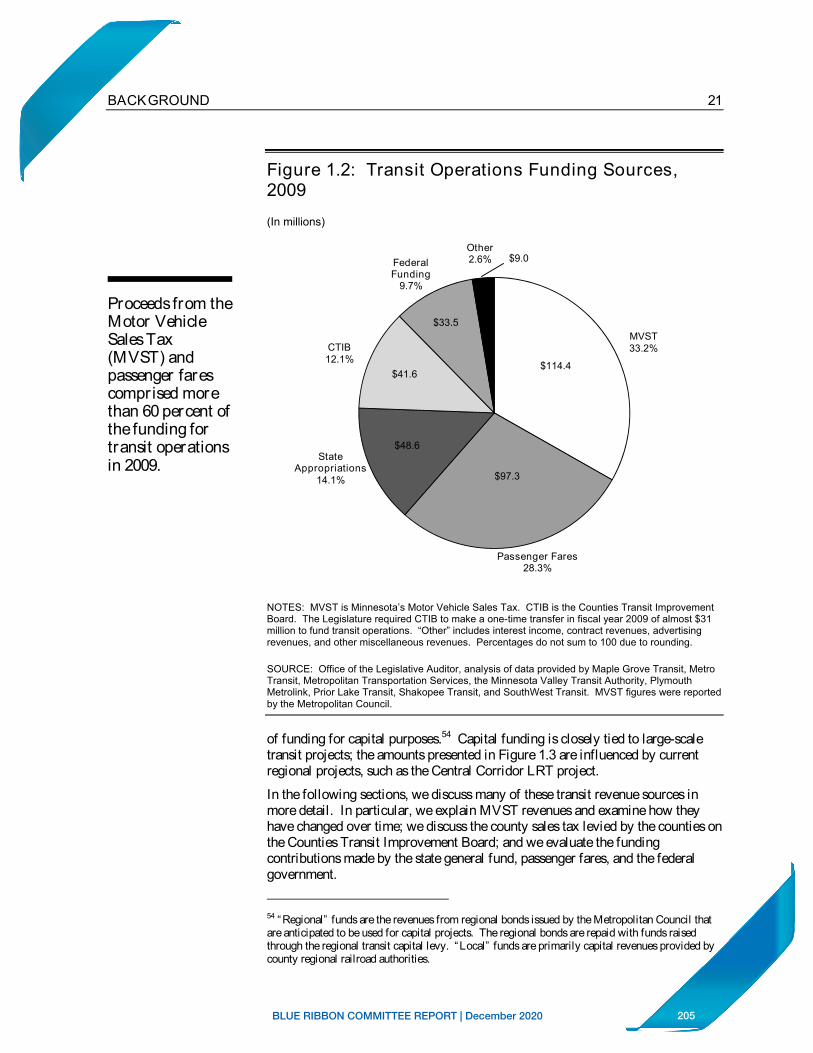
205BLUE RIBBON COMMITTEE REPORT | December 2020
21BACKGROUND
Proceeds from the Motor Vehicle Sales Tax (MVST) and passenger fares comprised more than 60 percent of the funding for transit operations in 2009.
Figure 1.2: Transit Operations Funding Sources, 2009
(In millions)
Other 2.6% $9.0Federal
Funding 9.7%
$114.4
$97.3
Passenger Fares 28.3%
$48.6
$41.6
$33.5MVST
CTIB 33.2% 12.1%
State Appropriations
14.1%
NOTES: MVST is Minnesota’s Motor Vehicle Sales Tax. CTIB is the Counties Transit Improvement Board. The Legislature required CTIB to make a one-time transfer in fiscal year 2009 of almost $31 million to fund transit operations. “Other” includes interest income, contract revenues, advertising revenues, and other miscellaneous revenues. Percentages do not sum to 100 due to rounding.
SOURCE: Office of the Legislative Auditor, analysis of data provided by Maple Grove Transit, Metro Transit, Metropolitan Transportation Services, the Minnesota Valley Transit Authority, Plymouth Metrolink, Prior Lake Transit, Shakopee Transit, and SouthWest Transit. MVST figures were reported by the Metropolitan Council.
of funding for capital purposes.54 Capital funding is closely tied to large-scale transit projects; the amounts presented in Figure 1.3 are influenced by current regional projects, such as the Central Corridor LRT project.
In the following sections, we discuss many of these transit revenue sources in more detail. In particular, we explain MVST revenues and examine how they have changed over time; we discuss the county sales tax levied by the counties on the Counties Transit Improvement Board; and we evaluate the funding contributions made by the state general fund, passenger fares, and the federal government.
54 “Regional” funds are the revenues from regional bonds issued by the Metropolitan Council that are anticipated to be used for capital projects. The regional bonds are repaid with funds raised through the regional transit capital levy. “Local” funds are primarily capital revenues provided by county regional railroad authorities.
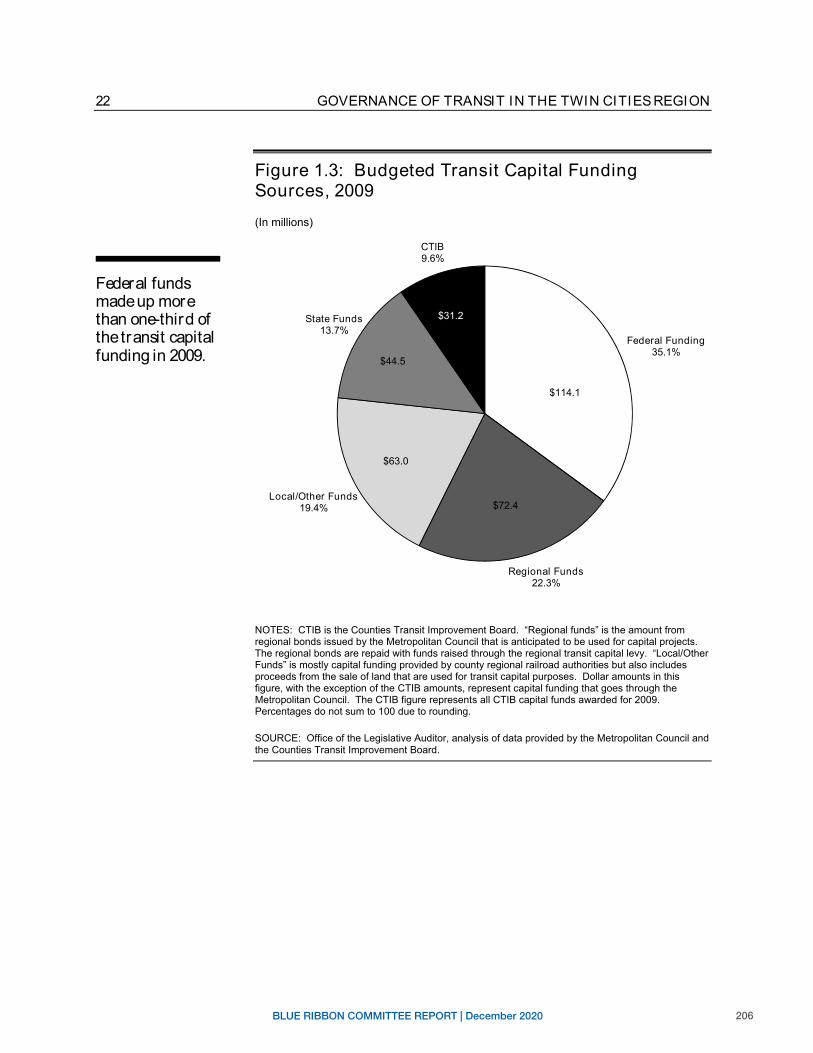
206BLUE RIBBON COMMITTEE REPORT | December 2020
22
$114.1
$72.4
$63.0
$44.5
$31.2
GOVERNANCE OF TRANSIT IN THE TWIN CITIES REGION
Federal funds made up more than one-third of the transit capital funding in 2009.
Figure 1.3: Budgeted Transit Capital Funding Sources, 2009
(In millions)
CTIB9.6%
State Funds 13.7%
Federal Funding 35.1%
Local/Other Funds 19.4%
Regional Funds 22.3%
NOTES: CTIB is the Counties Transit Improvement Board. “Regional funds” is the amount from regional bonds issued by the Metropolitan Council that is anticipated to be used for capital projects. The regional bonds are repaid with funds raised through the regional transit capital levy. “Local/Other Funds” is mostly capital funding provided by county regional railroad authorities but also includes proceeds from the sale of land that are used for transit capital purposes. Dollar amounts in this figure, with the exception of the CTIB amounts, represent capital funding that goes through the Metropolitan Council. The CTIB figure represents all CTIB capital funds awarded for 2009. Percentages do not sum to 100 due to rounding.
SOURCE: Office of the Legislative Auditor, analysis of data provided by the Metropolitan Council and the Counties Transit Improvement Board.
207BLUE RIBBON COMMITTEE REPORT | December 2020
23BACKGROUND
The share of MVST allocated to transit in the region has increased since 2001.
However, in recent years MVST has not performed as projected.
Motor Vehicle Sales Tax (MVST)
By law, a Motor Vehicle Sales Tax is imposed on the purchase of most motor vehicles registered in Minnesota.55 Over the past decade, an increasing share of MVST revenues has been allocated to transit in the Twin Cities region. In 2000, MVST revenues were not directly allocated to transit; instead, transit was largely funded through property taxes and MVST revenues were deposited into the state’s general fund. In 2001, the Legislature prohibited the use of property taxes to fund transit operations in the Twin Cities region and instead allocated 20.5 percent of MVST funds to transit in the metropolitan area, starting in fiscal year 2003.56 The 2003 Legislature increased the amount of MVST revenue allocated to transit in the metropolitan area from 20.5 percent to 21.5 percent beginning in fiscal year 2004.57
In 2006, Minnesota voters approved a constitutional amendment to dedicate MVST revenue to highway and transit purposes. As outlined in the Minnesota Constitution, the phase-in for dedicating the revenues to transit began in fiscal year 2008 and is scheduled to be completed in fiscal year 2012. By 2012, 36 percent of MVST revenue will be allocated to transit in the Twin Cities region. When we examined the MVST revenues allocated to transit in the region, we found that:
Although the amount of Motor Vehicle Sales Tax revenues dedicated to transit in the Twin Cities region has increased over the past decade, it has not increased as much as had been projected.
In large part due to the increased share of MVST dedicated for transit purposes in the Twin Cities region, the total amount of MVST revenue allocated to transit in the region has increased. In 2005, almost $120 million of MVST revenue was distributed to the region for transit; in 2010, the region received almost $141 million in MVST revenue for transit. MVST revenues dedicated to transit in the Twin Cities region increased more than 17 percent over this five-year period.
Despite this increase in the region’s MVST revenues, MVST itself has not performed as projected in recent years. Specifically, the May 2007 projections published by the Department of Minnesota Management and Budget anticipated that more than $169 million of MVST revenues would be available for transit in the Twin Cities region in fiscal year 2010; instead, not quite $141 million was allocated to transit in the region—a difference of almost 17 percent between what was projected and what was allocated. Nevertheless, $141 million in MVST revenues is more than had previously been distributed to transit in the Twin
55 As outlined in law, an excise tax of 6.5 percent is imposed on the purchase price of “any motor vehicle purchased or acquired, either in or outside of the state of Minnesota, which is required to be registered under the laws of this state.” The law also identifies some exemptions to this tax. Minnesota Statutes 2010, 297B.02. 56 The 2001 Legislature also allocated 1.25 percent of MVST revenues for transit in greater Minnesota. See Laws of Minnesota First Special Session 2001, chapter 5, art. 3, secs. 65 and 72. 57 Laws of Minnesota First Special Session 2003, chapter 19, art. 2, sec. 48.
208BLUE RIBBON COMMITTEE REPORT | December 2020
24 GOVERNANCE OF TRANSIT IN THE TWIN CITIES REGION
Using money collected through the county sales tax, CTIB contr ibuted almost 10 percent of the region’s transit capital funds in 2009.
Cities from MVST. As shown in Figure 1.2, MVST revenues comprised one-third of the region’s transit operating funds in 2009.58
County Sales Tax
As discussed previously, the 2008 Legislature authorized the seven counties in the Twin Cities region to establish the Counties Transit Improvement Board and enact a one-quarter cent sales tax and $20 per motor vehicle excise tax to fund transit improvements in the Twin Cities region.59 Five counties—Anoka, Dakota, Hennepin, Ramsey, and Washington—chose to enact the sales tax in their counties. We found that:
The county quar ter -cent sales tax is a significant operating and capital funding source for transit in the region.
The counties began levying the sales tax in July 2008 and CTIB received its first collection of revenue in September 2008. During its first full year of taxation (2009), CTIB raised $88.7 million for transit in the Twin Cities region. As illustrated in Figures 1.2 and 1.3, CTIB contributed 12 percent of the region’s transit operating funds and almost 10 percent of the region’s capital funds in 2009.60 In 2009, CTIB awarded $31.2 million in capital funds for transitways in the region—$13.4 million for Central Corridor LRT, almost $10 million for Northstar commuter rail, and $7 million for Cedar Avenue BRT.61
Minnesota law limits the purposes for which CTIB may award funding, and selected transit projects must be located within the metropolitan area and be consistent with the transit portion of the Met Council’s Transportation Policy Plan. Any grant awarded to the Met Council must supplement, not supplant, operating and capital assistance provided by the state. Additionally, CTIB has created policies limiting the types of transit for which it grants awards. For example, CTIB does not grant awards for “arterial” bus rapid transit.62
While the county sales tax is a new and important funding source for transit in the Twin Cities region, many regions across the country have a dedicated sales tax for transit purposes that is a higher rate than in the Twin Cities region. For example, Atlanta, Boston, Cleveland, Dallas, Denver, and Seattle all have a one-cent or greater sales tax dedicated to transit. Additionally, CTIB officials and others have noted that the revenue generated through the CTIB sales tax is not
58 In Chapter 3, we discuss the distribution of MVST revenues among transit providers in the Twin Cities region. 59 Laws of Minnesota 2008, chapter 152, art. 4, sec. 2. 60 As noted previously, the Legislature required CTIB to make a one-time transfer in 2009 of almost $31 million to fund Metro Transit operations. In 2010, CTIB awarded less than $14 million in transit operating grants. 61 CTIB was created in 2008, and it awarded grants using the sales tax revenues from 2008 and 2009 in 2009. It plans to award funds on an annual basis in subsequent years. 62 Arterial bus rapid transit service is provided along existing routes with significant ridership that operate on arterial roads, such as Nicollet Avenue in south Minneapolis.
209BLUE RIBBON COMMITTEE REPORT | December 2020
25BACKGROUND
The Legislature appropriatedapproximately$49 million for transit operations in 2009.
sufficient to develop transit in the region at the rate the counties had initially anticipated.
State Funds
As illustrated in Figure 1.2, state appropriations provided 14 percent of the region’s transit operating funds in 2009. We found that:
While state funding for transit operations increased from 2005 to 2009, state funding levels decreased significantly between 2007 and 2009.
In 2005, the state appropriated more than $42 million for transit operations in the Twin Cities region.63 This amount increased to almost $70 million in 2007 before decreasing to approximately $49 million in 2009. The decline in state funding between 2007 and 2009 represents a 30-percent decrease in state general fund appropriations for transit in the region. The Legislature required CTIB to make a one-time transfer in fiscal year 2009 of almost $31 million to fund transit operations. The $31 million contribution from CTIB more than made up for the difference between the 2007 and 2009 general fund contributions to transit in the region. However, the CTIB transfer was a one-time requirement.
In addition to revenue from the state’s general fund, the Minnesota Legislature has issued state general-obligation bonds for the Met Council to use for transit capital purposes. Table 1.8 lists the amount of bonding allocated to transit capital between 2003 and 2009 and the purposes of the bonds. As the table shows, bonding amounts vary from year to year. During this seven-year time period, the state issued more than $243 million in general-obligation bonds for transit capital purposes.
The Legislature has also regularly authorized the Met Council to issue bonds that are repaid with proceeds generated through the regional transit capital levy. Thislevy is imposed on all municipalities in the transit taxing district and other communities that have entered into a service agreement with the Council.64 The transit taxing district is discussed in more detail in Chapter 3.
Passenger Fares
By law, the Met Council is responsible for establishing a uniform fare policy for regular-route transit in the metropolitan region.65 As a result, all providers in the region charge the same amount for the same type of service. For example, currently all local regular-route bus service in the region, regardless of operator, cost $1.75 for nonpeak and $2.25 for peak service; express bus service is $2.25
63 The amount reported here is for transit services included in this evaluation and does not include revenue allocated to dial-a-ride service, such as Metro Mobility. 64 As discussed in Chapter 3, the transit taxing district includes a subset of municipalities within the Met Council’s jurisdiction. 65 Minnesota Statutes 2010, 473.408, subd. 2a.
210BLUE RIBBON COMMITTEE REPORT | December 2020
26 GOVERNANCE OF TRANSIT IN THE TWIN CITIES REGION
The Legislature also authorizes state bonds for transit capital purposes.
Table 1.8: State General-Obligation Bonds for Transit, 2003-2009
Amount (thousands) Purpose
2003 $ 1,000 Northwest Corridor Buswaya
2004 02005 10,000 Cedar Avenue bus rapid transit (BRT)
5,250 Central Corridor light rail transit (LRT) 1,000 Rush Line and Red Rock corridors
37,500 Northstar commuter rail 2006 3,300 I-35W South
5,000 Cedar Avenue BRT 7,800 Central Corridor LRT 1,000 Robert Street and Red Rock corridors
60,000 Northstar commuter rail 2007 02008 16,700 I-35W South
4,000 Cedar Avenue BRT 70,000 Central Corridor LRT
2009 8,500 Central Corridor LRT 12,500 One or more transitway corridorsb
Total $243,550
a The Northwest Corridor Busway was a bus rapid transit corridor being considered along Bottineau Boulevard from downtown Minneapolis to the city of Rogers in Northwest Hennepin County. b This funding was to be spent in consultation with the Counties Transit Improvement Board (CTIB) and other stakeholders, as appropriate. See Laws of Minnesota 2009, chapter 93, art. 1, sec. 12, subd. 2. Of the $12.5 million, $313,000 was mandated by law to be used for the State Capitol area related to the Central Corridor LRT. The remaining funds were distributed by the Met Council, after consultation with CTIB, among four projects: $3.287 million for Cedar Avenue BRT, $3.4 million for the Rush Line Corridor, $5 million for the Southwest Corridor, and $500,000 for the Union Depot.
SOURCES: Metropolitan Council; Laws of Minnesota First Special Session 2003, chapter 20, art. 1, sec. 10; Laws of Minnesota 2005, chapter 20, art. 1, sec. 18, subd. 5, and sec. 19, subds. 2-5; Lawsof Minnesota 2006, chapter 258, sec. 16, subd. 4, and sec. 17, subds. 2-6; Laws of Minnesota 2008,chapter 179, sec. 17, subds. 2-4, and chapter 365, sec. 4, subd. 2; and Laws of Minnesota 2009,chapter 93, art. 1, sec. 12, subd. 2.
and $3.00 in nonpeak and peak times, respectively.66 Light rail service follows the same fare schedule as local bus service, and commuter rail fares range from $3.25 to $7.00, depending on how far the passenger travels.67 We found that:
Passenger fare revenue exceeded $97 million in 2009, accounting for more than one-quar ter of the region’s transit operating revenues.
66 “Peak” service is Monday through Friday, 6:00 to 9:00 in the morning and 3:00 to 6:30 in the afternoon. 67 There are some exceptions to this fare policy. For example, there are a number of discounted fares for seniors, disabled riders, and students. Additionally, some suburban transit providers offer discounted or free service on their local suburban routes.
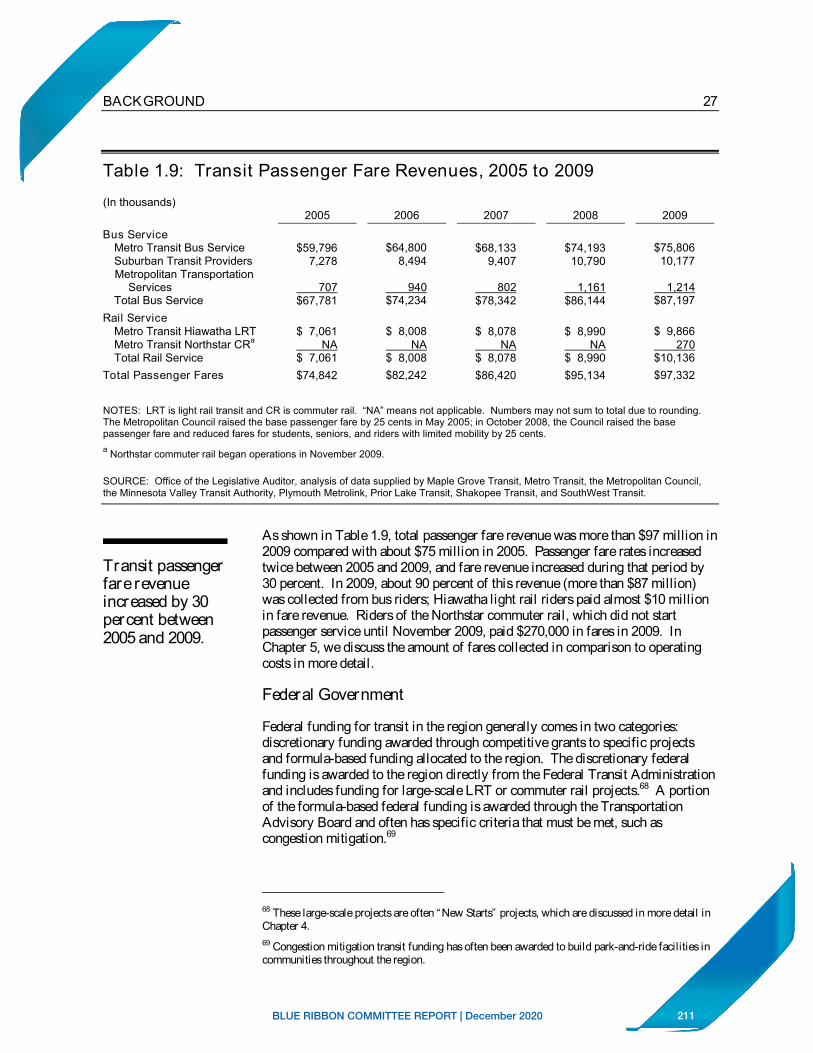
211BLUE RIBBON COMMITTEE REPORT | December 2020
27BACKGROUND
Table 1.9: Transit Passenger Fare Revenues, 2005 to 2009
(In thousands) 2005 2006 2007 2008 2009
Bus Service Metro Transit Bus Service $59,796 $64,800 $68,133 $74,193 $75,806 Suburban Transit Providers 7,278 8,494 9,407 10,790 10,177 Metropolitan Transportation
Services 707 940 802 1,161 1,214 Total Bus Service $67,781 $74,234 $78,342 $86,144 $87,197
Rail Service Metro Transit Hiawatha LRT $ 7,061 $ 8,008 $ 8,078 $ 8,990 $ 9,866 Metro Transit Northstar CRa NA NA NA NA 270 Total Rail Service $ 7,061 $ 8,008 $ 8,078 $ 8,990 $10,136
Total Passenger Fares $74,842 $82,242 $86,420 $95,134 $97,332
NOTES: LRT is light rail transit and CR is commuter rail. “NA” means not applicable. Numbers may not sum to total due to rounding.The Metropolitan Council raised the base passenger fare by 25 cents in May 2005; in October 2008, the Council raised the base passenger fare and reduced fares for students, seniors, and riders with limited mobility by 25 cents. a Northstar commuter rail began operations in November 2009.
SOURCE: Office of the Legislative Auditor, analysis of data supplied by Maple Grove Transit, Metro Transit, the Metropolitan Council,the Minnesota Valley Transit Authority, Plymouth Metrolink, Prior Lake Transit, Shakopee Transit, and SouthWest Transit.
Transit passenger fare revenue increased by 30 percent between 2005 and 2009.
As shown in Table 1.9, total passenger fare revenue was more than $97 million in 2009 compared with about $75 million in 2005. Passenger fare rates increased twice between 2005 and 2009, and fare revenue increased during that period by 30 percent. In 2009, about 90 percent of this revenue (more than $87 million) was collected from bus riders; Hiawatha light rail riders paid almost $10 million in fare revenue. Riders of the Northstar commuter rail, which did not start passenger service until November 2009, paid $270,000 in fares in 2009. In Chapter 5, we discuss the amount of fares collected in comparison to operating costs in more detail.
Federal Government
Federal funding for transit in the region generally comes in two categories: discretionary funding awarded through competitive grants to specific projects and formula-based funding allocated to the region. The discretionary federal funding is awarded to the region directly from the Federal Transit Administration and includes funding for large-scale LRT or commuter rail projects.68 A portion of the formula-based federal funding is awarded through the Transportation Advisory Board and often has specific criteria that must be met, such as congestion mitigation.69
68 These large-scale projects are often “New Starts” projects, which are discussed in more detail in Chapter 4. 69 Congestion mitigation transit funding has often been awarded to build park-and-ride facilities in communities throughout the region.
212BLUE RIBBON COMMITTEE REPORT | December 2020
28 GOVERNANCE OF TRANSIT IN THE TWIN CITIES REGION
Federal funding has contr ibuted a substantial portion of the capital funding for the region’s large-scale transit projects.
Between 2004 and 2010, the federal government has provided more than $869 million for transit in the Twin Cities region. We found that:
Federal transit funding is pr imar ily targeted for capital purposes.
Regardless of whether it is discretionary or formula-based funding, federal funding is typically used for transit capital expenses, such as those related to building transitways or park-and-ride facilities in the region. As shown in figures 1.2 and 1.3, federal funding comprised 10 percent of the region’s transit operating funds in 2009 but more than 35 percent of the region’s transit capital funds. More than three-quarters of the federal funding allocated to transit in the region for 2009 was for capital purposes.
In the last decade, the federal government has provided a substantial portion of funding for three of the region’s new transitways. This funding was awarded through competitive grants and was critical in the construction of Hiawatha LRT, Northstar commuter rail, and the Central Corridor LRT. The federal government provided $424 million in capital funds for Hiawatha LRT—more than half of the total $715 million used to design and construct the line. Similarly, the federal government provided $162 million of the $320 million it cost to build the Northstar commuter rail. Federal funds are expected to provide $478 million of the total $957 million capital costs of Central Corridor LRT.
The majority of the formula-based federal funds awarded through the Transportation Advisory Board are for capital expenses. For example, in 2009 the Board awarded $7 million to purchase three vehicles for the Hiawatha LRT, $7 million for the Maplewood Transit Center park-and-ride facility, and $1 million for streetscaping and pedestrian enhancements along the Cedar Avenue transitway.
213BLUE RIBBON COMMITTEE REPORT | December 2020
2
Transit governanceincludesdeveloping and implementing a vision, allocating revenue, and measuring performance.
Transit Governance Challenges and Options
Chapter 1 provided an overview of the Twin Cities region’s transit system and illustrated that the current governance of transit in the region is complex,
with many organizations involved in several overlapping responsibilities. In this chapter, we set forth principles of effective governance and evaluate how well the region’s transit governance structure meets those principles. We also discuss a number of transit governance challenges facing the region. The chapter concludes with four governance options for legislative consideration and recommendations for improved governance of transit in the region. Chapters 3, 4, and 5 provide more detail regarding the topics discussed in this chapter and offer additional recommendations for improvement related specifically to bus service, transitways, and performance measurement.
PRINCIPLES OF EFFECTIVE GOVERNANCEAs discussed in Chapter 1, transit governance includes specific responsibilities, such as planning, developing, and providing transit; generating and allocating resources for transit; and measuring the performance of transit in the region. Governance also includes providing leadership and a vision for transit in the region.
Table 2.1 provides an overview of effective governance principles. As detailed in the table, effective governance of transit includes nine key principles:
(1) Accountability,
(2) Consensus building and participation,
(3) Credibility,
(4) Effectiveness,
(5) Equity,
(6) Flexibility,
(7) Stability,
(8) Strategic vision, and
(9) Transparency.
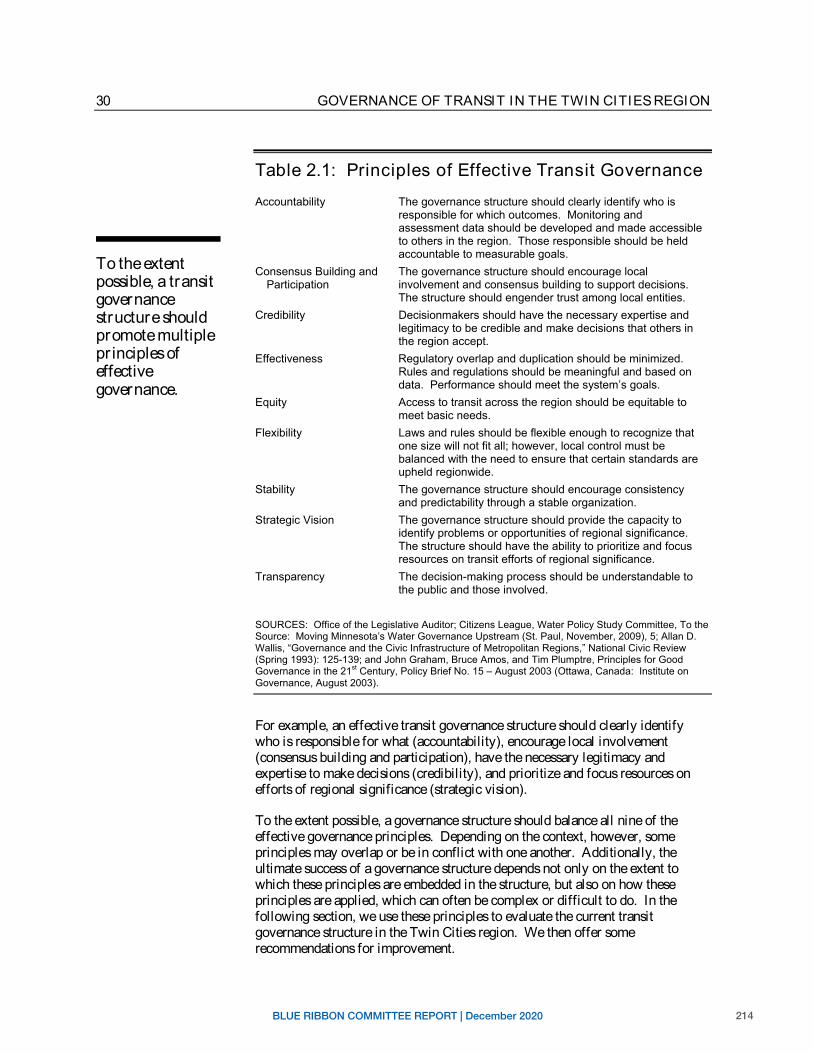
214BLUE RIBBON COMMITTEE REPORT | December 2020
30 GOVERNANCE OF TRANSIT IN THE TWIN CITIES REGION
To the extent possible, a transit governancestructure should promote multiple pr inciples of effectivegovernance.
Table 2.1: Principles of Effective Transit Governance
Accountability The governance structure should clearly identify who is responsible for which outcomes. Monitoring and assessment data should be developed and made accessible to others in the region. Those responsible should be held accountable to measurable goals.
Consensus Building and The governance structure should encourage local Participation involvement and consensus building to support decisions.
The structure should engender trust among local entities. Credibility Decisionmakers should have the necessary expertise and
legitimacy to be credible and make decisions that others in the region accept.
Effectiveness Regulatory overlap and duplication should be minimized. Rules and regulations should be meaningful and based on data. Performance should meet the system’s goals.
Equity Access to transit across the region should be equitable to meet basic needs.
Flexibility Laws and rules should be flexible enough to recognize that one size will not fit all; however, local control must be balanced with the need to ensure that certain standards are upheld regionwide.
Stability The governance structure should encourage consistency and predictability through a stable organization.
Strategic Vision The governance structure should provide the capacity to identify problems or opportunities of regional significance. The structure should have the ability to prioritize and focus resources on transit efforts of regional significance.
Transparency The decision-making process should be understandable to the public and those involved.
SOURCES: Office of the Legislative Auditor; Citizens League, Water Policy Study Committee, To the Source: Moving Minnesota’s Water Governance Upstream (St. Paul, November, 2009), 5; Allan D. Wallis, “Governance and the Civic Infrastructure of Metropolitan Regions,” National Civic Review (Spring 1993): 125-139; and John Graham, Bruce Amos, and Tim Plumptre, Principles for Good Governance in the 21st Century, Policy Brief No. 15 – August 2003 (Ottawa, Canada: Institute on Governance, August 2003).
For example, an effective transit governance structure should clearly identify who is responsible for what (accountability), encourage local involvement (consensus building and participation), have the necessary legitimacy and expertise to make decisions (credibility), and prioritize and focus resources on efforts of regional significance (strategic vision).
To the extent possible, a governance structure should balance all nine of the effective governance principles. Depending on the context, however, some principles may overlap or be in conflict with one another. Additionally, the ultimate success of a governance structure depends not only on the extent to which these principles are embedded in the structure, but also on how these principles are applied, which can often be complex or difficult to do. In the following section, we use these principles to evaluate the current transit governance structure in the Twin Cities region. We then offer some recommendations for improvement.
215BLUE RIBBON COMMITTEE REPORT | December 2020
31TRANSIT GOVERNANCE CHALLENGES AND OPTIONS
As a result of complexity and mistrust, the transitgovernancestructure in the Twin Cities region faces a number of challenges.
TRANSIT GOVERNANCE CHALLENGES According to various key performance measures, the current transit system in the Twin Cities region works reasonably well. For example, 90 percent or more of transit users who responded to surveys are satisfied with the transit they use, the buses generally operate on time, the Twin Cities region offers cost-effective services and performs relatively well compared with its peers, and the amount of transit available in the region has increased in recent years. A more detailed discussion of these performance measures is in Chapter 5. Although the existing transit system has managed to successfully provide services, it is facing increasing challenges; these are further discussed below.
Complexity and Distrust As discussed in Chapter 1, multiple organizations are involved in the governance and operation of transit, including the Met Council (both Metro Transit and Metropolitan Transportation Services); the Transportation Advisory Board; the Counties Transit Improvement Board; six suburban transit providers (Maple Grove Transit, the Minnesota Valley Transit Authority, Plymouth Metrolink, Prior Lake Transit, Shakopee Transit, and SouthWest Transit); private bus operators; boards of the seven metropolitan counties; regional railroad authorities of the seven metropolitan counties; and various local corridor commissions. We found that:
Governance of transit in the Twin Cities region is complex and fraught with distrust.
Each of the entities listed above serves a distinct but somewhat overlapping role for transit in the region. Each entity can operate independently to some extent but also must cooperate with others in the region. For example, the Counties Transit Improvement Board can decide which transitways to fund, but its funding decisions must be consistent with the Met Council’s Transportation Policy Plan. Similarly, the suburban transit providers can determine the amount of service they provide within their communities, but they must comply with regional standards and federal transit requirements. The complexity of the system makes it difficult to know which entity is accountable for which transit outcome, a departure from the principles of effective governance outlined in Table 2.1. To the extent there is duplication in some of these overlapping roles, the region’s transit structure may also not be as effective (another governance principle in Table 2.1) as it could be.
Complexity itself is not necessarily a bad thing. Even if there are a number of entities involved in transit in the region, they could have clearly defined roles and work well together. For such complexity to work, however, there needs to be coordination in areas where there is overlap and some degree of trust among the different entities. In contrast, we found a significant amount of distrust between many of the transit entities in the Twin Cities region. This distrust makes coordination among the organizations difficult.
216BLUE RIBBON COMMITTEE REPORT | December 2020
32 GOVERNANCE OF TRANSIT IN THE TWIN CITIES REGION
The relationship between the Met Council and the suburban transit providers is particular ly difficult.
Bluntly stated, the relationship between the Metropolitan Council and the suburban transit providers has broken down. In interviews we had with suburban transit providers and Met Council staff, the conflict and distrust between these two groups was evident. Recent newspaper articles and discussions in other local media regarding the differences between Metro Transit and suburban transit bus services have further illustrated the distrust between the Met Council and the suburban providers. The relationship between the Met Council and the suburban transit providers raises questions about whether the current structure limits the ability of transit organizations in the region to build consensus, one of the principles identified in Table 2.1.
The interests of the Met Council and the suburban transit providers often conflict, and their difficult relationship has weakened the effectiveness of the transit governance structure in the region. The Met Council is the regional transit planner and the recipient of state transit funds for the region. In this role, the Council is responsible for setting regional transit priorities, distributing resources accordingly, and ensuring that state standards are met. Additionally, as the recipient of federal transit funding, the Met Council is responsible for ensuring that all transit providers in the region comply with federal requirements. In interviews, however, the suburban transit providers told us that while they recognize a broad role for the Council as a regional body, they would like less oversight from the Council and more autonomy to provide transit services to their communities.
The relationship between the Met Council and the Counties Transit Improvement Board (CTIB) is also uneasy. Both the Council and CTIB have control over different sources of transit revenues for the region and have different ideas for how that funding should be used. For example, the two entities disagree over the definition of “ transitway”—the Council includes arterial bus rapid transit (BRT) while CTIB does not—which has led to tension regarding CTIB’s funding priorities.1 Similarly, CTIB developed its own transitway map for the region, which conflicted with the map adopted by the Met Council in the region’s Transportation Policy Plan.2
The difficult relationships between the Met Council and both the suburban transit providers and CTIB affect the credibility (another principle of effective governance) of the Council and the other transit organizations in the region, and therefore the transit governance structure. The strained relationships among the transit organizations result in stakeholders not always accepting decisions made by others in the region. Yet, the complexity of the region’s transit governance structure requires these various entities to work together.
1 Arterial BRT is bus rapid transit service provided along existing routes with significant ridership that operate on arterial roads, such as Nicollet Avenue in south Minneapolis. 2 As discussed in Chapter 4, the CTIB and Met Council maps identified different modes for some potential transitways, and the CTIB map did not include arterial bus rapid transit routes that the Council included on its map.
217BLUE RIBBON COMMITTEE REPORT | December 2020
33TRANSIT GOVERNANCE CHALLENGES AND OPTIONS
The complexity of the region’s transitgovernancestructure requires coordinationamong various organizations,and the lack of trust makes it difficult to reach agreements.
CoordinationDespite the importance of coordination among the transit organizations in the Twin Cities region, we found that:
Coordination among transit organizations in the region is time consuming and inefficient.
As discussed more in Chapter 3, coordination between the Met Council and suburban transit providers has required a significant amount of time and energy from both Council and suburban transit staff, as evidenced through innumerable staff meetings, committee meetings, e-mails, required approvals, and letters shared between the Council and suburban transit providers. Staff on both sides of this relationship think that coordination between the organizations has become increasingly inefficient and time consuming, and the lack of trust between these two groups makes it difficult to reach an agreement.
For example, recent efforts to develop the Cedar Avenue BRT transitway have required coordination among the Met Council, Metro Transit, the Minnesota Valley Transit Authority (MVTA), the Dakota County Regional Railroad Authority, CTIB, representatives from the cities of Eagan, Apple Valley, and Lakeville, and others. Decisions regarding the size and design of park-and-ride facilities along the Cedar Avenue corridor have involved numerous meetings between Met Council and MVTA staff, as well as representatives from the cities in which the facilities are located. Interviews we had with staff from the Council and MVTA highlighted frustration and distrust between these two groups regarding coordination and decisions for the Cedar Avenue transitway.
Coordination between the Met Council and the Counties Transit Improvement Board has also been time consuming. As discussed in more detail in Chapter 4, CTIB decides how it will allocate the funds raised by the one-quarter cent county sales tax, but its projects must be consistent with the Met Council’s Transportation Policy Plan. Although Council staff told us that it is not difficult to verify that CTIB’s spending decisions are consistent with the Plan, having two bodies (the Met Council and CTIB) making decisions about transit investments in the region leads to overlap and inevitably requires additional coordination.
Similarly, the Met Council and CTIB must coordinate on funding the operations of the region’s transitways. As discussed in more detail in Chapter 4, CTIB has committed to fund 50 percent of the net operating costs of the Hiawatha and Central Corridor light rail lines, Northstar commuter rail, and the I-35W South and Cedar Avenue bus rapid transit lines. Because Metro Transit (a division within the Council) is the operator of these transitways, the entities must work together to determine CTIB’s share of the operating costs. However, according to Council staff, CTIB and the Met Council do not agree on what to include as “operating costs” related to the Central Corridor transitway. At issue is whether CTIB will cover 50 percent of the net operating costs related only to the Central Corridor light rail line, or 50 percent of the net operating costs related to all transit changes in the corridor. Disagreement over which operating costs should be included has made the process more arduous.
218BLUE RIBBON COMMITTEE REPORT | December 2020
34 GOVERNANCE OF TRANSIT IN THE TWIN CITIES REGION
The region has fallen short in meeting the governanceprinciples of transparency, effectiveness, and consensus building.
These problems with coordination and overlap are counter to some of the principles of effective governance outlined in Table 2.1. For example, under the principle of transparency, the decision-making process should be understandable to the public and those involved. Given the numerous misunderstandings and disagreements that have occurred between the Met Council and the suburban transit providers, and the overlap in decision making regarding transitways between the Met Council and CTIB, the region has fallen short in meeting this principle. The overlap among these entities also undermines the principle of effectiveness, which states that the governance structure should minimize duplication. Finally, the distrust between the Council and the suburban providers impedes the region’s ability to have consensus building and participation among local stakeholders, another principle highlighted in Table 2.1.
To its credit, the Met Council has tried to increase transparency by creating procedures for the suburban transit providers and transitway guidelines. As discussed further in Chapter 3, the Council has developed procedures regarding fleet management, procurement, facilities, revenue allocation, and service improvement for regional transit providers, including the suburban transit providers. Similarly, the Met Council is developing transitway guidelines to promote regional consistency along transitways. Both the suburban transit procedures and the transitway guidelines are a step towards improved consistency and transparency in the region.
Additionally, transit organizations have coordinated to achieve some key successes for the region. For example, the Minnesota Department of Transportation, the Met Council, Dakota County, the Minnesota Valley Transit Authority, and others worked together to win a $133 million Urban Partnership Agreement grant to address congestion in the region. Similarly, the Met Council, CTIB, Hennepin and Ramsey counties, and others coordinated successfully to win a $5 million planning grant in October 2010 from the U.S. Department of Housing and Urban Development to support planning along the region’s transit corridors.
Credibility and Accountability The Met Council, as a regional planning entity and the largest transit operator in the region, has a unique role in the regional transit system. However, we found that:
The Metropolitan Council’s role as the regional transit planner has been hampered by how Council members are appointed; as a result, the Council has little credibility among many stakeholders and other transit organizations in the region.
The Metropolitan Council’s limited credibility stems from the governance structure of the Council itself. Because Council members are appointed by the governor rather than elected, many stakeholders we interviewed do not think that Met Council members are sufficiently accountable for their decisions. Additionally, some local officials and transit providers we interviewed said that their Met Council representative does not adequately represent their communities
219BLUE RIBBON COMMITTEE REPORT | December 2020
35TRANSIT GOVERNANCE CHALLENGES AND OPTIONS
The way Met Council members are appointed has led to diminished credibility among elected officials and other transit stakeholders.
Rather than change the Met Council’sstructure, the Legislature has circumvented the Council and authorized new and more accountable transit entities.
regarding transit concerns or that their representative does not have relevant expertise regarding transit issues. Many stakeholders with whom we met believe that Met Council members primarily represent the views of the governor and not necessarily the region as a whole or the district from which they were appointed. Because Met Council members are appointed by the governor, local elected officials often question the legitimacy of Council decisions. Additionally, the Council levies a transit capital tax on most residents of the Twin Cities region without being directly accountable (through an election process) to the public.The Met Council’s structure leads to diminished credibility and accountability,both principles of effective governance listed in Table 2.1.
Amplifying concerns about the Council’s credibility is the belief among some stakeholders that the Met Council is biased towards Metro Transit and has a conflict of interest. As discussed in Chapter 1, the Met Council is both the transit planning organization for the Twin Cities region and the primary provider of transit in the region through Metro Transit and Metropolitan Transportation Services. In interviews, staff from suburban transit providers and some county commissioners questioned the Met Council’ s ability to make unbiased decisions about the transit needs of the region when the Council is responsible for providing bus, light rail, and commuter rail service through Metro Transit.
The Legislature’s Role In several instances, the Legislature has circumvented the Met Council and authorized new transit entities, rather than improve the existing structure. We found that:
The Legislature has contr ibuted to the complexity, and therefore the challenges, of the transit governance structure in the Twin Cities region.
In particular, the Legislature has made the governance of transit in the region more complex by authorizing the suburban transit providers and the Counties Transit Improvement Board; identifying the Met Council as the Metropolitan Planning Organization for the region with the Transportation Advisory Board also playing a role; and naming different builders and owners for the three large-scale transitways constructed in the region (as discussed further in Chapter 4). Contrary to the governance principles detailed in Table 2.1, these decisions have made it difficult to know which entity is accountable for which outcomes and have led to diminished transparency regarding the decisions being made.
Authorizing New Transit Entities
When the Legislature authorized suburban transit providers in 1981, there was dissatisfaction among some communities with the service they received from the regional transit provider (at the time, the Metropolitan Transit Commission). Rather than work within the existing Commission structure, the Legislature authorized municipalities that met certain criteria to form their own transit service providers. This law spawned a number of transit providers and thus increased the complexity of transit in the region. Similarly, several counties in
220BLUE RIBBON COMMITTEE REPORT | December 2020
36 GOVERNANCE OF TRANSIT IN THE TWIN CITIES REGION
The Met Council and the TransportationAdvisory Board jointly serve as the region’s MetropolitanPlanning Organization.
the Twin Cities metropolitan area perceived the need for a reliable source of funding to better leverage federal funding to expand transit services in the region. In 2008, the Legislature authorized the creation of the Counties Transit Improvement Board to levy a transit sales tax, rather than either levying the tax directly or giving the Met Council the authority to do so. By authorizing CTIB, the Legislature again went outside the existing transit governance structure (this time, the Met Council) and created another layer of governance within the region’s transit structure.
As one respondent to our survey of elected city officials and city managers commented in response to the question, “What does not work well with the existing transit governance system in the Twin Cities region?” :
Opt-out independent transit agencies, regional railroad authorities, and the CTIB undercut the ability to have an integrated regional approach to transit planning and funding. Although all these mechanisms filled a need, they did so because the Metropolitan Council was not given the necessary funding authority to implement an integrated regional system. . . .
Another survey respondent stated:
. . . The State Legislature has changed the governance structure so often through reorganization (Metropolitan Transit Commission, Regional Transit Board, Metro Transit, opt-out communities) and established new entities (Regional Railroad Authorities) due to its lack of commitment to provide clear goals and adequate dedicated funding sources for transit. This failure has put Minnesota/Twin Cities decades behind its peers. . . .
In other words, by creating new transit organizations rather than improving existing ones, the Legislature has contributed to the transit governance challenges in the region.
The Region’s Metropolitan Planning Organization
In law, the Legislature has named the Met Council as the region’s Metropolitan Planning Organization. However, federal law requires that a region’s planning organization include local elected representatives. Because of the structure of the Met Council, and because the Legislature identified the Council as the Metropolitan Planning Organization, the Twin Cities region must have two organizations—the Met Council and the Transportation Advisory Board—share the planning organization’s responsibilities. Met Council staff told us the Twin Cities region is the only region in the country they are aware of with this structure for its Metropolitan Planning Organization.
Having two entities serve jointly as the Metropolitan Planning Organization contributes to the complexity of transit governance in the region. Not only do the Met Council and the Transportation Advisory Board have to coordinate with each other regarding the long-term Transportation Policy Plan and the short-term Transportation Improvement Plan, but other transit entities in the region have to
221BLUE RIBBON COMMITTEE REPORT | December 2020
37TRANSIT GOVERNANCE CHALLENGES AND OPTIONS
The Twin Cities region has not achieved an agreed-upon set of pr ior ities for transit expansion.
work with both the Council and the Board rather than one Metropolitan Planning Organization for the region.
“ New Starts” Transitways Project Leadership
Finally, as discussed in more detail in Chapter 4, the Legislature gave control over developing and building large-scale (“New Starts” ) transitway projects (Hiawatha light rail transit [LRT], Northstar commuter rail, and Central Corridor LRT) to different entities.3 This division of responsibilities has caused confusion with the Federal Transit Administration, created a need for different entities to learn the federal New Starts process, and required additional coordination among these entities. As with the other legislative actions highlighted above, assigning transitway responsibilities to different entities for each project increased the complexity of transit governance in the region.
Multiple Regional Transit Visions In part because there are many transit entities in the region, and in part because the Met Council has limited credibility as a regional transit planning organization among local stakeholders, we found that:
No agreed-upon set of pr ior ities exists for transitway development in the Twin Cities region.
Instead, the process for developing transitways in the region relies on local initiatives and funding, as detailed in Chapter 4. As a result, there are multiple transit corridors being considered in the region with no common agreement on the region’s transit priorities. Understandably, each community is interested in developing transit to meet its local needs, and communities typically believe their transit project should be a priority. However, the local priorities may not reflect the region’s priorities. In view of the principles of effective governance outlined in Table 2.1, the region has too much flexibility at the expense of an agreed-upon regional strategic vision. The region’s multiple strategic visions undermine the effectiveness of the governance of transit in the region.
Additionally, neither the Council nor the Legislature has prioritized potential transitways for development in the region. While there is agreement on transitway development in the short term (for example, Central Corridor LRT and Southwest Corridor LRT), future transitway priorities are less clear. Further complicating things is the lack of clarity in state statute regarding the goals and purposes of transit for the region, as discussed further in Chapter 5.
Several respondents to our survey of elected city officials and city managers commented on the transit vision for the region. For example, one respondent
3 The “New Starts” program, discussed in more detail in Chapter 4, is a competitive program through which the Federal Transit Administration allocates federal funding for large-scale transit projects. As discussed in Chapter 4, the Minnesota Department of Transportation, the Metropolitan Airports Commission, and the Met Council had varying roles on the region’s three New Starts projects.
222BLUE RIBBON COMMITTEE REPORT | December 2020
38 GOVERNANCE OF TRANSIT IN THE TWIN CITIES REGION
Limited resources underscore the need for regional transit pr ior ities.
wrote in response to the question, “What does not work well with the existing transit governance system in the Twin Cities region?” :
There seems to be many entities involved in transit governance making me wonder how efficient and effective it is. Is there one overall vision for the region?
Another survey respondent wrote:
If we have a regional plan that has been developed through needs and alternatives analysis FOR THE REGION, I am not aware of it. We need a regional vision, a regional plan, a comprehensive communication plan, and political will to implement it on a regional basis at a rate that will meet our regional economic objectives (if we have regional economic objectives!). Any plan has to start with a definition of what we are trying to achieve, which seems to be missing. . . .
The lack of an agreed-upon regional vision weakens the effectiveness of the Met Council as the regional transit planner and poses another challenge to the governance of transit in the region.
Scarce Resources As discussed in Chapter 1, the Twin Cities region spends more than $300 million annually to operate transit in the region; planning and building a new transitway can cost almost $1 billion in capital expenses over the course of the project. Clearly, building and operating transit are expensive and require reliable funding sources. However,
Scarce resources for transit are likely to become scarcer as the state confronts another significant budget deficit.
As detailed in Chapter 1, Motor Vehicle Sales Tax (MVST) revenues are the largest single source of operating funds for transit in the Twin Cities region. As discussed previously, however, MVST revenues have not grown as projected. Specifically, the state’s May 2007 projections anticipated that more than $169 million of MVST revenues would be allocated to transit in the Twin Cities region in fiscal year 2010; instead, $140.7 million was allocated to transit in the region. In addition, state general fund contributions to transit (for both operating and capital purposes) are uncertain given the budget deficit the 2011 Legislature must address. Scarce resources pose yet another challenge to the governance of transit and may affect the stability (a principle of effective governance) of the transit system in the region. Scarce resources also underscore the importance of having a regional transit vision that prioritizes the use of the region’s transit resources.
Unmet Demand In 2004, the Met Council set a goal of doubling transit ridership to about 147 million rides by 2030. In its 2030 Transportation Policy Plan, published in 2008,
223BLUE RIBBON COMMITTEE REPORT | December 2020
39TRANSIT GOVERNANCE CHALLENGES AND OPTIONS
Transit corr idors being evaluated for development do not appear as promising as existing transitways in the region.
the Council noted that demand for transit in the Twin Cities region is increasing. We found that:
There is unmet demand for additional transit services in the Twin Cities region.
Surveys conducted by Metro Transit of potential transit riders demonstrate an interest in additional transit services. Specifically, more than 50 percent of potential riders surveyed by Metro Transit in 2007 indicated they would use transit if more services were available or their expected trip times were faster. Metro Transit staff told us that opportunities exist to grow transit services and ridership in the region if funding were available. Similarly, some suburban transit providers would seek to expand their express commuter bus service.
In addition to an interest in increasing the amount of bus service in the region, a number of counties and local communities are conducting studies to evaluate the viability of new transitways. For example, counties and local project sponsors are evaluating alternatives for the Bottineau Boulevard, Gateway Corridor, Red Rock Corridor, and Rush Line Corridor transitways.4
With scarce resources and no unified regional vision for transit, effectively meeting this unmet demand will be difficult. The need for an agreed-upon strategic vision for the region (one of the principles of effective governance in Table 2.1) is especially important for addressing this challenge.
Increasingly Difficult Decisions Given the scarce transit resources available to the region, it is important that any expansion of transit services be done in a reasoned and logical process. However, we found that:
Future transit development decisions are likely to be more difficult.
Potential transitways currently being evaluated for development in the Twin Cities region do not appear as promising as existing transitways in the region. According to the Met Council’s 2008 Transit Master Study, ridership projections for the proposed transitways do not reach those for rail lines already built or under development, such as Hiawatha, Central Corridor, and Southwest Corridor LRTs and Northstar commuter rail. These existing transitways have relatively high actual or projected ridership. In fact, the Central Corridor LRT is ranked first in the country among federal New Starts projects, meaning that it is the most promising yet-to-be-built transit line in the country. None of the transitways being considered currently have ridership and cost information that make them seem as ripe for development. Deciding which (if any) transitway to develop next, when none are standouts, will be difficult. As discussed earlier, having a strategic vision for the region that prioritizes transit projects in the region would help determine which transitways in the region to develop next.
4 More information about these potential transitway corridors is provided in Chapter 4.
224BLUE RIBBON COMMITTEE REPORT | December 2020
40 GOVERNANCE OF TRANSIT IN THE TWIN CITIES REGION
Addressing the structure of the Met Council is the first step towards improving the governance of transit in the region.
Additionally, local preferences may lead to financially unsustainable outcomes. The success of Hiawatha LRT has spurred a preference among local communities for light rail transit over bus rapid transit or other bus service when considering new transitways. For example, Bottineau Boulevard was initially moving ahead as a BRT transitway but is now also undergoing consideration as an LRT transitway. LRT can be a cost-effective way to move large numbers of people in high-density corridors; however, it may not be cost-effective in all corridors because the capital expense of LRT is significantly more than that of BRT. Abias towards LRT may result in transitways with high capital expenditures that may not be justified by ridership.
Finally, political concerns, such as the geographic imbalance in transitways, may outweigh ridership projections and other analyses regarding where the next transitway should be developed. For example, with the completion of Central Corridor, Hennepin County will have three operating rail transitways (Hiawatha, Northstar, and Central Corridor) along with I-35W South BRT within its borders, yet there are no transitways in operation east of St. Paul. Concerns for regional equity could become a driving factor in developing the next transitway, rather than ridership and cost projections.
In sum, the current governance structure has led to (1) diminished accountability for the Council, (2) difficulty in building consensus across transit organizations in the region, (3) diminished credibility for the Council, (4) reduced effectiveness due to an increased need for coordination, and (5) multiple visions for transit in the region. In other words, the transit governance structure in the region does not reflect the principles of effective governance.
GOVERNANCE OPTIONS FOR THE METROPOLITAN COUNCIL Given the challenges outlined above, we think the Legislature should consider an alternative governance structure for transit in the Twin Cities region. We have concluded that the problems with the governance of transit stem partly from having an appointed Met Council. Moreover, we have concluded that the structure of the Met Council must be addressed before other aspects of transit governance in the region can be corrected. As a result, we focus in this section on the composition of the Met Council. The next section discusses other aspects of the transit governance structure in the Twin Cities region.
We acknowledge that we only evaluated the role of the Met Council with respect to transit and not its other regional responsibilities, such as wastewater management and land use planning. As a result, we have not assessed how the changes to the Met Council proposed below would affect its functions in those areas. Nevertheless, we recommend that:
225BLUE RIBBON COMMITTEE REPORT | December 2020
41TRANSIT GOVERNANCE CHALLENGES AND OPTIONS
There are a number of disadvantages to maintaining the currentgovernancestructure.
RECOMMENDATIONS
The Legislature should restructure the governance of the Metropolitan Council.
Although several governance structures have merit, we recommend the Legislature follow Option 2, which calls for a mix of appointed and elected Council members serving staggered terms.
Below we present four options for restructuring the Met Council. They are presented along a spectrum of the smallest to biggest change, with having staggered terms for appointed members at one end and directly electing Council members by popular vote at the other end. There are numerous potential governance structures for the Council; the four presented below represent the range of options to consider. Before we discuss the four options for restructuring, however, we start by assessing the status quo.
Status Quo If there is no change, Met Council members would continue to be appointed by the governor and serve terms coterminous with, and at the pleasure of, the governor. The primary advantage to maintaining the status quo is that it requires no change. Transit in the region has operated relatively successfully thus far (as discussed more in Chapter 5) and would likely continue to do so from riders’ perspectives. Additionally, having appointed rather than elected members is more likely to result in regional, rather than parochial, decisions.5
The disadvantages to maintaining the status quo are numerous. Maintaining an appointed Met Council would continue the Council’ s accountability problems. The Council makes transit decisions that directly affect residents of the region, including taxing residents, allocating revenue, and identifying or approving transitways to be developed. Because Council members are appointed by the governor, however, they are not directly accountable to the public for these decisions. Being appointed by the governor also leads to a credibility problem for Met Council members. As one city council member commented in our survey:
. . . The problem starts at the top of the regional governance pyramid with the composition of the Met Council, itself, an appointed body that is not responsive to local communities. . . .
Another survey respondent stated:
5 For a discussion regarding the relationship between whether members of a Metropolitan Planning Organization are appointed or elected and their decisions regarding funding local or regional priorities, see Elisabeth R. Gerber and Clark C. Gibson, “Balancing Regionalism and Localism: How Institutions and Incentives Shape American Transportation Policy,” American Journal of Political Science 53, no. 3 (July 2009): 633-648.
226BLUE RIBBON COMMITTEE REPORT | December 2020
42 GOVERNANCE OF TRANSIT IN THE TWIN CITIES REGION
Staggered terms would give the Met Council more independence and stability.
With the Met Council appointed by the Governor, our system makes transit investment vulnerable to the attitude of a sole entity; if the Governor is hostile to transit, the Met Council reflects that. . . .
Having an appointed Council whose members’ terms are coterminous with the governor also makes it difficult for the Council to have stability and carry out its strategic vision over time. Every time a new governor is elected, the Council is subject to a complete turnover in membership, which leads to a loss of institutional knowledge and a disruption to ongoing strategic initiatives. For example, the Council recently began developing transitway guidelines to establish standards for the development of future transitways. However, some stakeholders we spoke with expressed concern about investing time and energy into these guidelines before the new Council members were appointed in 2011. There was concern that the new Council would disagree with the guidelines initiative and undo all of the effort put into developing them.
Maintaining the status quo would also continue the complexity of the governance of transit in the region. Coordination across transit organizations in the region would continue to require a significant amount of effort among all involved and would divert energy and time that could otherwise be spent on setting priorities and improving the region’s transit system. Strained relationships would continue to make this coordination more difficult than it already is. As funding tightens and decisions become more difficult, the existing problems with the governance of transit will be exacerbated if the structure remains the same. Table 2.2 outlines the advantages and disadvantages of maintaining the status quo.
Option 1: Staggered Terms of AppointedCouncil Members Our first governance option is for Met Council members to be appointed by the governor to staggered terms. Members’ terms would not be coterminous with the governor, nor would members serve at the pleasure of the governor. This option would restore how Met Council members were appointed prior to the Metropolitan Reorganization Act of 1994.
Option 1 is perhaps the most politically feasible option that also provides some improvement to the governance structure. The previous chair of the Met Council has publicly suggested, at a minimum, having staggered terms for members as a way to improve continuity from one administration to the next. Staggered terms would give the Council more independence from the governor, would provide some stability for the Council, and would enable the Council to implement a more unified strategic vision for the region. Additionally, efforts begun during one governor’s term could easily be continued during a succeeding governor’s term. As with the status quo, having appointed members is also more likely to result in regional, rather than parochial, decisions.
Despite the advantages associated with this option, staggered terms would not fully address all of the concerns raised by the current Council governance structure. An appointed Council, with or without staggered terms, would still
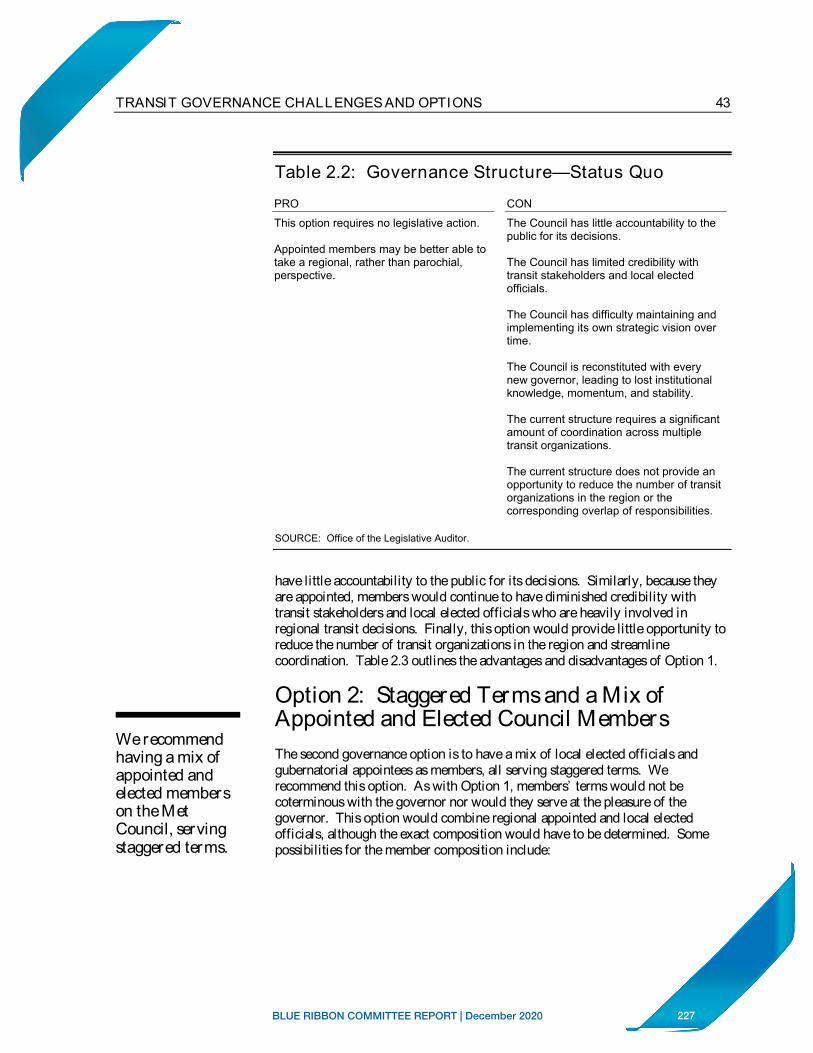
227BLUE RIBBON COMMITTEE REPORT | December 2020
43TRANSIT GOVERNANCE CHALLENGES AND OPTIONS
Table 2.2: Governance Structure—Status Quo
PRO CON
This option requires no legislative action.
Appointed members may be better able to take a regional, rather than parochial, perspective.
SOURCE: Office of the Legislative Auditor.
The Council has little accountability to the public for its decisions.
The Council has limited credibility with transit stakeholders and local elected officials.
The Council has difficulty maintaining and implementing its own strategic vision over time.
The Council is reconstituted with every new governor, leading to lost institutional knowledge, momentum, and stability.
The current structure requires a significant amount of coordination across multiple transit organizations.
The current structure does not provide an opportunity to reduce the number of transit organizations in the region or the corresponding overlap of responsibilities.
We recommend having a mix of appointed and elected members on the Met Council, serving staggered terms.
have little accountability to the public for its decisions. Similarly, because they are appointed, members would continue to have diminished credibility with transit stakeholders and local elected officials who are heavily involved in regional transit decisions. Finally, this option would provide little opportunity to reduce the number of transit organizations in the region and streamline coordination. Table 2.3 outlines the advantages and disadvantages of Option 1.
Option 2: Staggered Terms and a Mix ofAppointed and Elected Council Members The second governance option is to have a mix of local elected officials and gubernatorial appointees as members, all serving staggered terms. We recommend this option. As with Option 1, members’ terms would not be coterminous with the governor nor would they serve at the pleasure of the governor. This option would combine regional appointed and local elected officials, although the exact composition would have to be determined. Some possibilities for the member composition include:
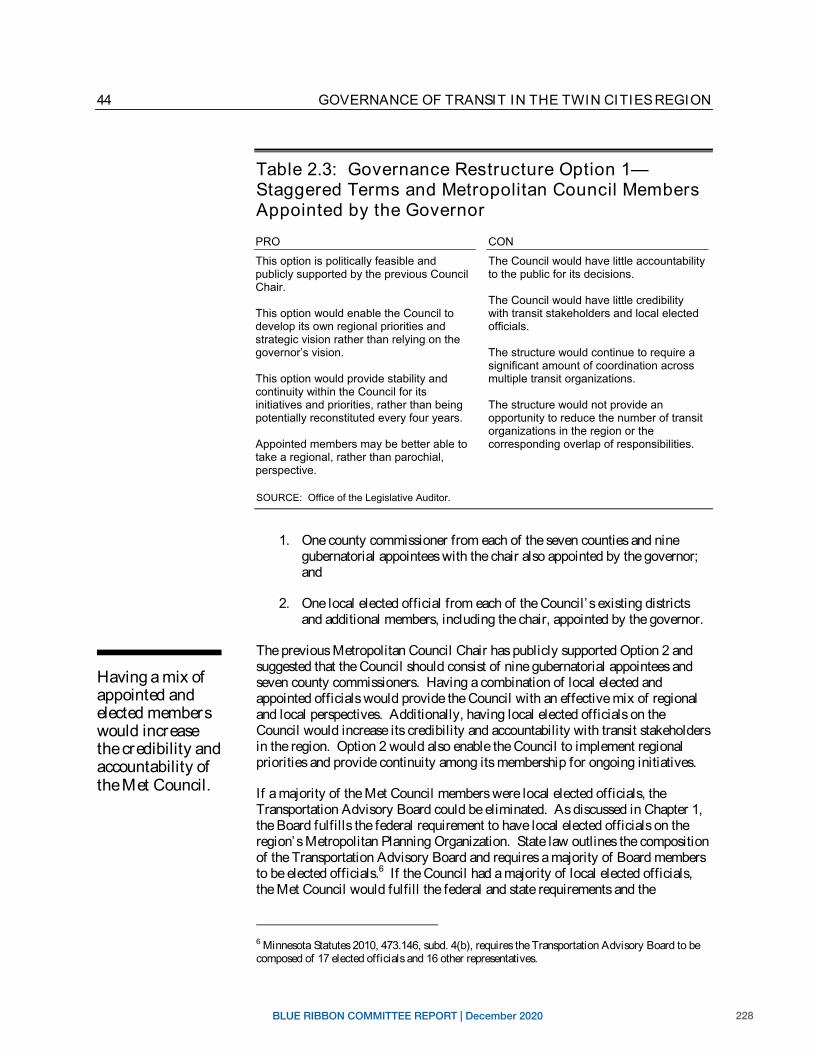
228BLUE RIBBON COMMITTEE REPORT | December 2020
44 GOVERNANCE OF TRANSIT IN THE TWIN CITIES REGION
Table 2.3: Governance Restructure Option 1— Staggered Terms and Metropolitan Council Members Appointed by the Governor
PRO CON
This option is politically feasible and publicly supported by the previous Council Chair.
This option would enable the Council to develop its own regional priorities and strategic vision rather than relying on the governor’s vision.
This option would provide stability and continuity within the Council for its initiatives and priorities, rather than being potentially reconstituted every four years.
Appointed members may be better able to take a regional, rather than parochial, perspective.
SOURCE: Office of the Legislative Auditor.
The Council would have little accountability to the public for its decisions.
The Council would have little credibility with transit stakeholders and local elected officials.
The structure would continue to require a significant amount of coordination across multiple transit organizations.
The structure would not provide an opportunity to reduce the number of transit organizations in the region or the corresponding overlap of responsibilities.
Having a mix of appointed and elected members would increase the credibility and accountability of the Met Council.
1. One county commissioner from each of the seven counties and nine gubernatorial appointees with the chair also appointed by the governor; and
2. One local elected official from each of the Council’ s existing districts and additional members, including the chair, appointed by the governor.
The previous Metropolitan Council Chair has publicly supported Option 2 and suggested that the Council should consist of nine gubernatorial appointees and seven county commissioners. Having a combination of local elected and appointed officials would provide the Council with an effective mix of regional and local perspectives. Additionally, having local elected officials on the Council would increase its credibility and accountability with transit stakeholders in the region. Option 2 would also enable the Council to implement regional priorities and provide continuity among its membership for ongoing initiatives.
If a majority of the Met Council members were local elected officials, the Transportation Advisory Board could be eliminated. As discussed in Chapter 1, the Board fulfills the federal requirement to have local elected officials on the region’s Metropolitan Planning Organization. State law outlines the composition of the Transportation Advisory Board and requires a majority of Board members to be elected officials.6 If the Council had a majority of local elected officials, the Met Council would fulfill the federal and state requirements and the
6 Minnesota Statutes 2010, 473.146, subd. 4(b), requires the Transportation Advisory Board to be composed of 17 elected officials and 16 other representatives.
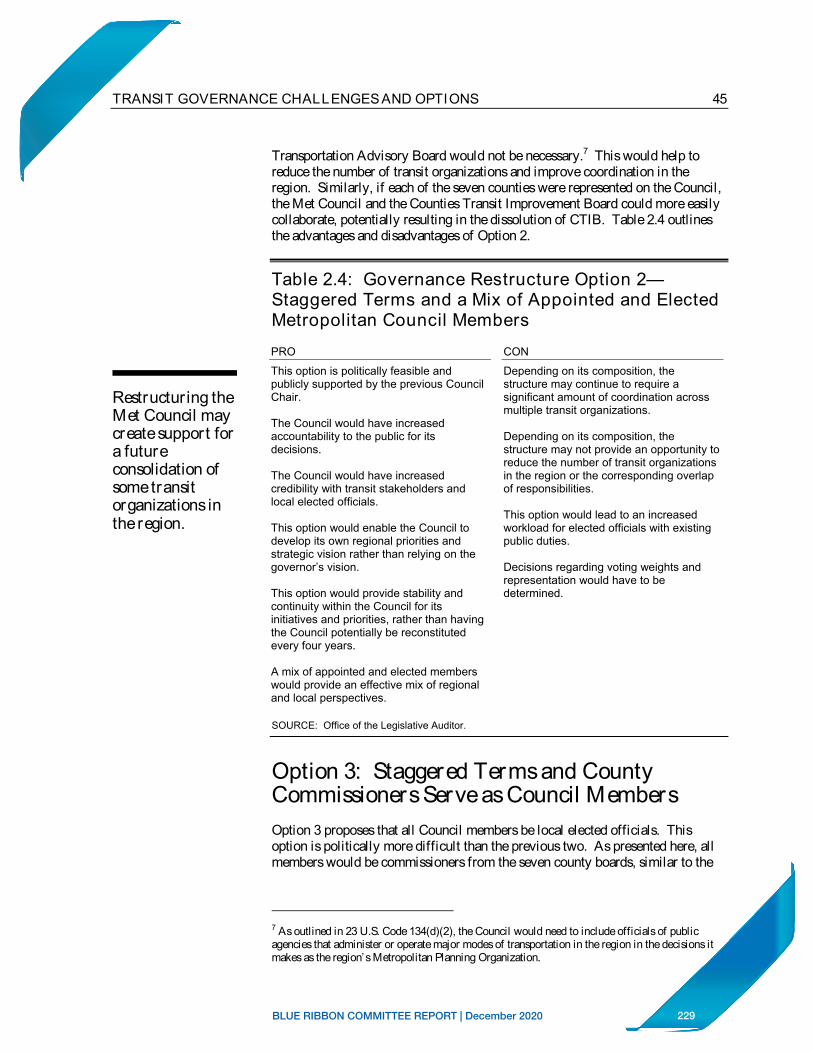
229BLUE RIBBON COMMITTEE REPORT | December 2020
45TRANSIT GOVERNANCE CHALLENGES AND OPTIONS
Transportation Advisory Board would not be necessary.7 This would help to reduce the number of transit organizations and improve coordination in the region. Similarly, if each of the seven counties were represented on the Council, the Met Council and the Counties Transit Improvement Board could more easily collaborate, potentially resulting in the dissolution of CTIB. Table 2.4 outlines the advantages and disadvantages of Option 2.
Table 2.4: Governance Restructure Option 2— Staggered Terms and a Mix of Appointed and Elected Metropolitan Council Members
PRO CON
Restructuring the Met Council may create support for a future consolidation of some transit organizations in the region.
This option is politically feasible and publicly supported by the previous Council Chair.
The Council would have increased accountability to the public for its decisions.
The Council would have increased credibility with transit stakeholders and local elected officials.
This option would enable the Council to develop its own regional priorities and strategic vision rather than relying on the governor’s vision.
This option would provide stability and continuity within the Council for its initiatives and priorities, rather than having the Council potentially be reconstituted every four years.
A mix of appointed and elected members would provide an effective mix of regional and local perspectives.
SOURCE: Office of the Legislative Auditor.
Depending on its composition, the structure may continue to require a significant amount of coordination across multiple transit organizations.
Depending on its composition, the structure may not provide an opportunity to reduce the number of transit organizations in the region or the corresponding overlap of responsibilities.
This option would lead to an increased workload for elected officials with existing public duties.
Decisions regarding voting weights and representation would have to be determined.
Option 3: Staggered Terms and CountyCommissioners Serve as Council Members Option 3 proposes that all Council members be local elected officials. This option is politically more difficult than the previous two. As presented here, all members would be commissioners from the seven county boards, similar to the
7 As outlined in 23 U.S. Code 134(d)(2), the Council would need to include officials of public agencies that administer or operate major modes of transportation in the region in the decisions it makes as the region’s Metropolitan Planning Organization.
230BLUE RIBBON COMMITTEE REPORT | December 2020
46 GOVERNANCE OF TRANSIT IN THE TWIN CITIES REGION
Having all members of the Met Council be countycommissionerswould also increase its accountabilityand credibility but may result in more parochial decisions.
structure of the Metropolitan Mosquito Control District.8 Appropriate representation based on population and county would need to be determined.
Having all Met Council members be county commissioners would increase the accountability and the credibility of the Council. Members would be accountable to voters and their county boards for their actions on the Met Council. This option would enable the Council to develop its own regional priorities, rather than relying on the governor’s vision, and provide continuity among its membership. However, it may be difficult for county commissioners to take a regional, rather than parochial, view when considering Council matters. Additionally, having county commissioners serve as Council members would lead to a significant increase in their workload.
As with Option 2, this option would allow the Transportation Advisory Board to be eliminated. If the Council were composed of local elected officials, the Met Council would fulfill the federal requirements for a Metropolitan Planning Organization and the Transportation Advisory Board would not be necessary.9Eliminating the Board would help to reduce the number of organizations in charge of planning and allocating funds for transit in the region. Similarly, if county commissioners were the Met Council members, the Met Council and the Counties Transit Improvement Board could more easily collaborate, potentially resulting in the dissolution of CTIB. Eliminating CTIB would reduce the need to coordinate with another organization regarding funding and developing transitways in the region. Similar to Options 1 and 2, Option 3 would enable the Council to develop its own regional priorities and provide continuity among its membership for ongoing initiatives. Table 2.5 outlines the advantages and disadvantages of Option 3.
Option 4: Council Members Directly Elected This option is at the far end of the spectrum from the status quo and would be politically difficult to accomplish. Rather than the governor appointing Met Council members as is currently the case, Option 4 proposes that all members be directly elected by voters in the Twin Cities region. Under this option, election districts would have to be identified that take into consideration representation by both population and county. Some possibilities include: (1) members elected by Metropolitan Council District, (2) members elected by county, or (3) members elected by a regionwide vote. The Portland, Oregon, regional government agency is directly elected by the region’s voters.
Under this option, members would be directly accountable to voters for their actions on the Met Council, increasing members’ accountability and credibility with voters. Option 4 would enable the Council to develop its own priorities, rather than relying on the governor’s vision. However, Council members may
8 As outlined in Minnesota Statutes 2010, 473.703, subd. 1, the Metropolitan Mosquito Control District Commission consists of three members each from Anoka, Dakota, Hennepin, and Ramsey counties and two members each from Carver, Scott, and Washington counties. 9 As noted previously, the Council would need to include officials of public agencies that administer or operate major modes of transportation in the region in the decisions it makes as the region’s Metropolitan Planning Organization. See 23 U.S. Code 134(d)(2).
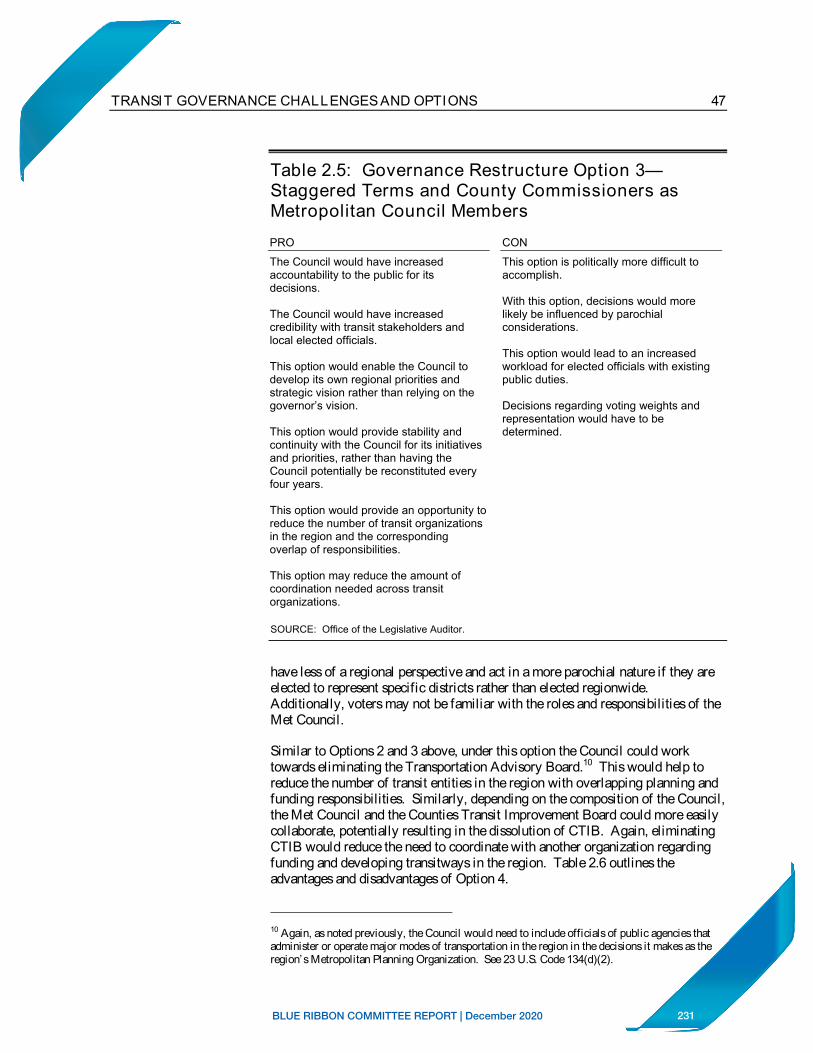
231BLUE RIBBON COMMITTEE REPORT | December 2020
47TRANSIT GOVERNANCE CHALLENGES AND OPTIONS
Table 2.5: Governance Restructure Option 3— Staggered Terms and County Commissioners as Metropolitan Council Members
PRO CON
The Council would have increased accountability to the public for its decisions.
The Council would have increased credibility with transit stakeholders and local elected officials.
This option would enable the Council to develop its own regional priorities and strategic vision rather than relying on the governor’s vision.
This option would provide stability and continuity with the Council for its initiatives and priorities, rather than having the Council potentially be reconstituted every four years.
This option would provide an opportunity to reduce the number of transit organizations in the region and the corresponding overlap of responsibilities.
This option may reduce the amount of coordination needed across transit organizations.
SOURCE: Office of the Legislative Auditor.
This option is politically more difficult to accomplish.
With this option, decisions would more likely be influenced by parochial considerations.
This option would lead to an increased workload for elected officials with existing public duties.
Decisions regarding voting weights and representation would have to be determined.
have less of a regional perspective and act in a more parochial nature if they are elected to represent specific districts rather than elected regionwide. Additionally, voters may not be familiar with the roles and responsibilities of the Met Council.
Similar to Options 2 and 3 above, under this option the Council could work towards eliminating the Transportation Advisory Board.10 This would help to reduce the number of transit entities in the region with overlapping planning and funding responsibilities. Similarly, depending on the composition of the Council, the Met Council and the Counties Transit Improvement Board could more easily collaborate, potentially resulting in the dissolution of CTIB. Again, eliminating CTIB would reduce the need to coordinate with another organization regarding funding and developing transitways in the region. Table 2.6 outlines the advantages and disadvantages of Option 4.
10 Again, as noted previously, the Council would need to include officials of public agencies that administer or operate major modes of transportation in the region in the decisions it makes as the region’s Metropolitan Planning Organization. See 23 U.S. Code 134(d)(2).
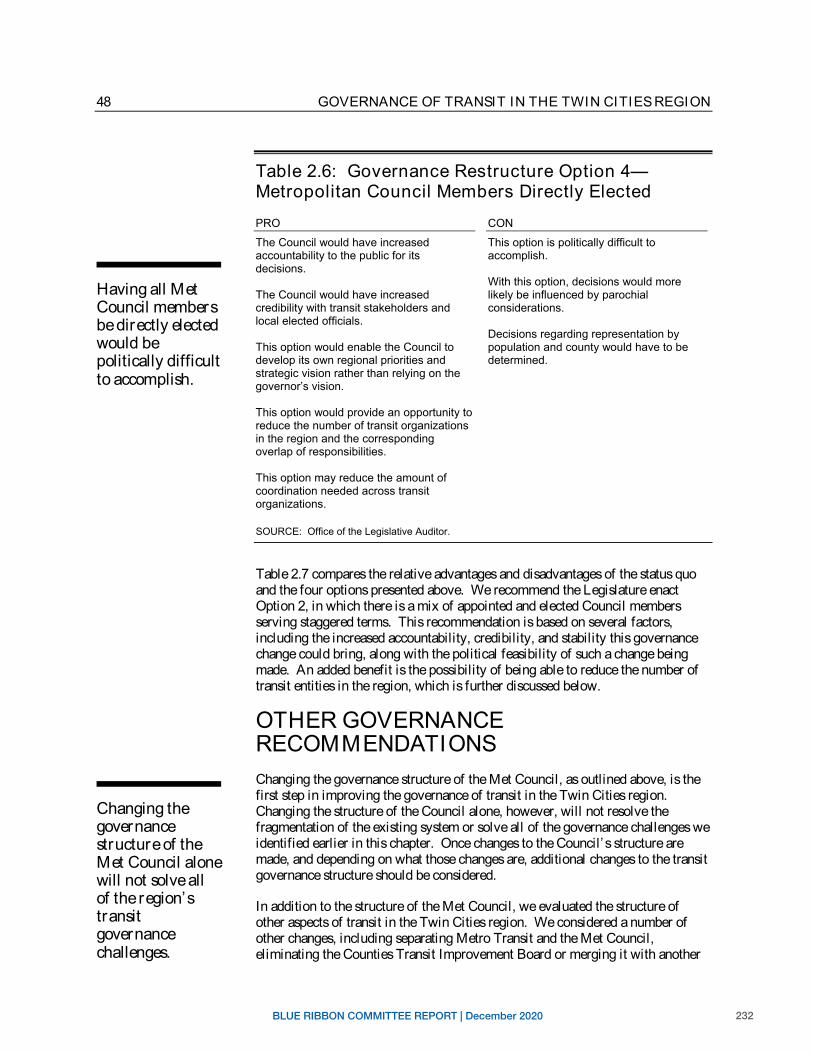
232BLUE RIBBON COMMITTEE REPORT | December 2020
48 GOVERNANCE OF TRANSIT IN THE TWIN CITIES REGION
Table 2.6: Governance Restructure Option 4— Metropolitan Council Members Directly Elected
PRO CON
Having all Met Council members be directly elected would be politically difficult to accomplish.
The Council would have increased accountability to the public for its decisions.
The Council would have increased credibility with transit stakeholders and local elected officials.
This option would enable the Council to develop its own regional priorities and strategic vision rather than relying on the governor’s vision.
This option would provide an opportunity to reduce the number of transit organizations in the region and the corresponding overlap of responsibilities.
This option may reduce the amount of coordination needed across transit organizations.
SOURCE: Office of the Legislative Auditor.
This option is politically difficult to accomplish.
With this option, decisions would more likely be influenced by parochial considerations.
Decisions regarding representation by population and county would have to be determined.
Changing the governancestructure of the Met Council alone will not solve all of the region’s transitgovernancechallenges.
Table 2.7 compares the relative advantages and disadvantages of the status quo and the four options presented above. We recommend the Legislature enact Option 2, in which there is a mix of appointed and elected Council members serving staggered terms. This recommendation is based on several factors, including the increased accountability, credibility, and stability this governance change could bring, along with the political feasibility of such a change being made. An added benefit is the possibility of being able to reduce the number of transit entities in the region, which is further discussed below.
OTHER GOVERNANCE RECOMMENDATIONS Changing the governance structure of the Met Council, as outlined above, is the first step in improving the governance of transit in the Twin Cities region. Changing the structure of the Council alone, however, will not resolve the fragmentation of the existing system or solve all of the governance challenges we identified earlier in this chapter. Once changes to the Council’s structure are made, and depending on what those changes are, additional changes to the transit governance structure should be considered.
In addition to the structure of the Met Council, we evaluated the structure of other aspects of transit in the Twin Cities region. We considered a number of other changes, including separating Metro Transit and the Met Council, eliminating the Counties Transit Improvement Board or merging it with another
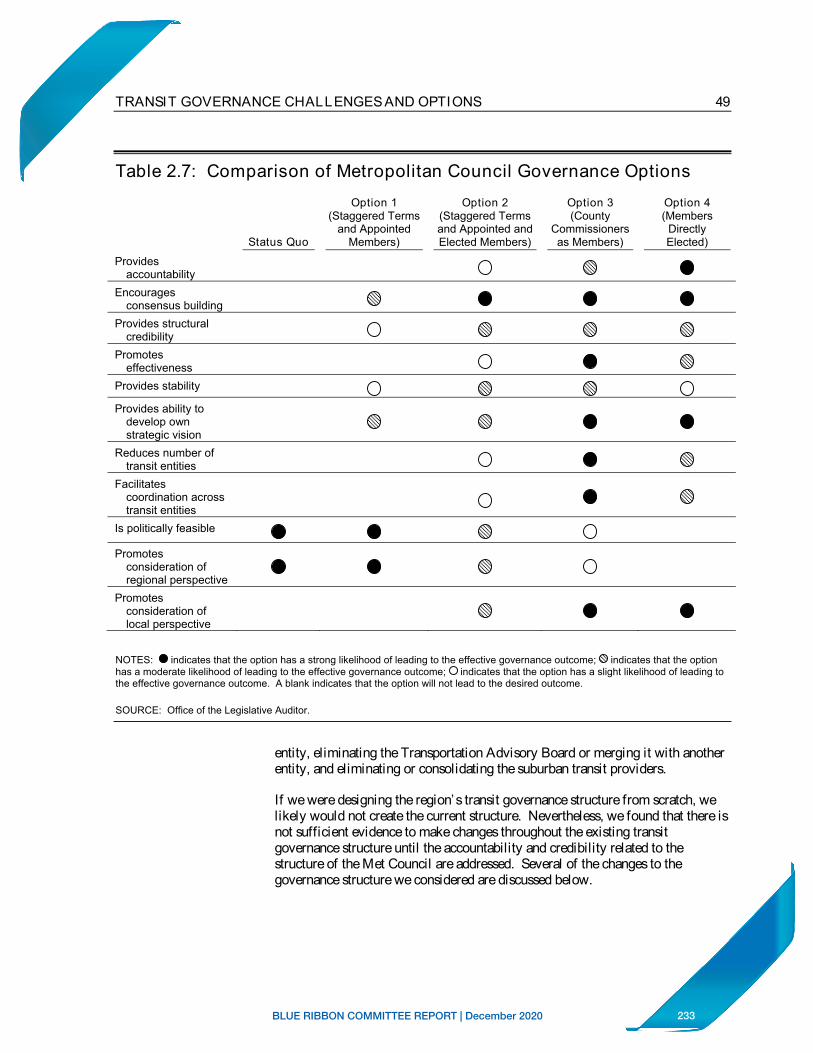
233BLUE RIBBON COMMITTEE REPORT | December 2020
49TRANSIT GOVERNANCE CHALLENGES AND OPTIONS
Table 2.7: Comparison of Metropolitan Council Governance Options
Option 1 (Staggered Terms
Option 2 (Staggered Terms
Option 3 (County
Option 4 (Members
and Appointed and Appointed and Commissioners Directly Status Quo Members) Elected Members) as Members) Elected)
Provides accountability
Encourages consensus building
Provides structural credibility
Promoteseffectiveness
Provides stability
Provides ability to develop own strategic vision
Reduces number of transit entities
Facilitatescoordination across transit entities
Is politically feasible
Promotesconsideration of regional perspective
Promotesconsideration of local perspective
NOTES: indicates that the option has a strong likelihood of leading to the effective governance outcome; indicates that the option has a moderate likelihood of leading to the effective governance outcome; indicates that the option has a slight likelihood of leading to the effective governance outcome. A blank indicates that the option will not lead to the desired outcome.
SOURCE: Office of the Legislative Auditor.
entity, eliminating the Transportation Advisory Board or merging it with another entity, and eliminating or consolidating the suburban transit providers.
If we were designing the region’s transit governance structure from scratch, we likely would not create the current structure. Nevertheless, we found that there is not sufficient evidence to make changes throughout the existing transit governance structure until the accountability and credibility related to the structure of the Met Council are addressed. Several of the changes to the governance structure we considered are discussed below.
0 @ • @ • • • 0 @ @ ®
0 • @
0 @ @ 0 @ @ • •
0 • @
0 • ®
• • @ 0
• • @ 0
@ • • • 0
234BLUE RIBBON COMMITTEE REPORT | December 2020
50 GOVERNANCE OF TRANSIT IN THE TWIN CITIES REGION
The Metropolitan Council and Metro Transit Many transit stakeholders with whom we met expressed concern about the Met Council having a conflict of interest. Because Metro Transit is a division within the Council, some stakeholders claimed, the Met Council is biased in Metro Transit’s favor when it allocates regional transit funding or otherwise makes regional transit decisions. Several respondents to our survey of city officials and administrators, all from communities served by suburban transit providers, also commented on the conflict of interest posed by the co-location of the Met Council and Metro Transit. We could not substantiate these claims. We considered recommending that Metro Transit be separated from the Met Council and ultimately determined that:
RECOMMENDATION
Separating Metro Transit and the Metropolitan Council would provide some benefits but would also likely present drawbacks. Given the current structure, Metro Transit and the Council should not be separated.
Separating Metro Transit from the Met Council would eliminate the possibility of a conflict of interest between the two organizations. It would allow the Council to focus on planning for the region and Metro Transit to focus on operations. Other regions, including San Diego and Portland, are structured this way.
However, there are benefits to having the transit planning entity (Met Council) familiar with the operating opportunities and challenges in the region (experienced by Metro Transit). Additionally, having the two entities in one organization facilitates coordination, especially regarding routes contracted out by the Met Council through its Metropolitan Transportation Services division.
Pulling Metro Transit out of the Met Council would further add to the complexity of the system—there would be yet another transit organization in the region with which to coordinate, and some of the existing coordination between the Met Council’s planning division and Metro Transit’s operations would be lost. Finally, if Metro Transit were separated from the Met Council, Metro Transit would either need to establish its own governing board; merge into an existing organization, such as MnDOT; or reside in a new statewide transit agency. None of these options are without their challenges. For example, if Metro Transit established its own board, the issue of governance structure and composition— who would be elected or appointed to serve on the Metro Transit board—would again be an issue.
The Council has made strides towards increasing the transparency of its policies and procedures. The procedures for regional providers (discussed in Chapter 3) and the transitway guidelines (discussed in Chapter 4) have the potential to reduce concerns about a possible conflict of interest.
235BLUE RIBBON COMMITTEE REPORT | December 2020
51TRANSIT GOVERNANCE CHALLENGES AND OPTIONS
Counties Transit Improvement Board
RECOMMENDATION
Given the current structure of the Metropolitan Council and the taxing authority of the Counties Transit Improvement Board (CTIB), CTIB should not be eliminated.
As detailed in Chapter 1, the Counties Transit Improvement Board was authorized to provide a reliable funding source to develop transitways in the Twin Cities region. Currently, the CTIB member counties levy a one-quarter cent sales tax that is dedicated to transit purposes. As long as the CTIB counties are responsible for levying this tax, we think it makes sense for CTIB to have control over how these funds are spent. If the funding mechanism changes—for example, if the Legislature levies the transit sales tax directly or requires the Met Council to do so—we would suggest eliminating CTIB.
Ideally, the Twin Cities region would not have multiple entities developing transitways or communicating different transit visions. Under the current structure, both the Met Council and CTIB are, to some extent, developing and promoting different transit visions for the region. This is unlikely to yield the best result for the region. Nevertheless, unless the Met Council governance structure is changed to include county commissioners, or the taxing authority is removed from the Counties Transit Improvement Board, we did not find sufficient evidence to recommend disbanding CTIB. In the meantime, we encourage CTIB and the Council to work together to further a regional transit vision, as discussed in more detail in Chapter 4.
Transportation Advisory Board
RECOMMENDATION
Given federal requirements and the current structure of the Metropolitan Council, the Transportation Advisory Board should not be eliminated.
As discussed in this chapter and Chapter 1, federal law requires the region’s Metropolitan Planning Organization to include local elected officials. Because state law identifies the Met Council as the region’s planning organization, the Transportation Advisory Board fulfills the federal requirement for elected official representation. Additionally, the Transportation Advisory Board provides an opportunity for local transit perspectives to be considered.
If the governance of the Met Council changes to have elected officials as members (as suggested in Options 2, 3, and 4 presented above), we think the
236BLUE RIBBON COMMITTEE REPORT | December 2020
52 GOVERNANCE OF TRANSIT IN THE TWIN CITIES REGION
Legislature should consider eliminating the Transportation Advisory Board and having the Council assume its responsibilities.11
Suburban Transit Providers As discussed in more detail in Chapter 3, the suburban transit providers were created to address a need for more transit services in certain suburban areas.Almost 30 years later, six suburban transit providers offer a range of bus services in 12 communities. These providers have evolved from relatively autonomous entities providing transit service in their communities to service providers that must fit into an increasingly complex regional transit system. The amount of effort required to coordinate between the Met Council and the suburban providers, and the potential for duplication, caused us to consider recommending that the suburban transit providers be eliminated. However, we ultimately concluded that:
RECOMMENDATION
The suburban transit providers should not be eliminated, although there are opportunities for consolidation.
The suburban transit providers add to the complexity of transit in the region and, as discussed in Chapter 3, contribute to system inefficiencies. For the most part, however, they have established themselves as a productive piece of the regional transit system. As discussed in detail in Chapter 3, the suburban transit providers have developed close relationships with the communities they serve. The largest suburban providers have also been able to pilot test new approaches and technology that may help improve transit in the region as a whole. Nevertheless, there is a wide range in the levels of service provided by the suburban providers, and we think there are natural partners for consolidation. Specifically, we recommend that Prior Lake Transit and Shakopee Transit consider consolidating their operations, especially since they already share express bus service. Similarly, we recommend that Maple Grove Transit and Plymouth Metrolink consider consolidating their operations. Consolidating these providers would reduce the number of transit entities in the region and make coordination less burdensome.
Although we do not recommend eliminating the suburban transit providers, we think it is important that the suburban providers work within the regional transit system. Specifically, the suburban providers should comply with the Met Council’s regional provider procedures and work collaboratively with the Council to improve the transit system in the region.
11 As noted previously, the Council would need to include officials of public agencies that administer or operate major modes of transportation in the region in the decisions it makes as the region’s Metropolitan Planning Organization. See 23 U.S. Code 134(d)(2).
237BLUE RIBBON COMMITTEE REPORT | December 2020
Bus Transit 3
Regular-route bus service follows a fixed schedule along a specific route.
Of the several types of transit operating in the Twin Cities region, regular-route bus service provides more rides than any other mode in the region—
almost 88 percent in 2009. In this chapter, we first provide an overview of regular-route bus transit in the Twin Cities region and the providers of this service. Next, we discuss the services and innovations offered by bus providers and their relationships with the communities they serve. We then examine the need for coordination among regional bus providers, the Met Council’s oversight role, and funding for bus service in the region. The chapter concludes with a discussion of the challenges of having numerous bus providers in the region and recommendations for improvement.
BUS SERVICE OVERVIEW As discussed in Chapter 1, many types of bus service are offered in the Twin Cities region, including regular-route and dial-a-ride. In evaluating bus service, we focused on regular-route bus service—service that follows a fixed schedule along a specific route—and excluded dial-a-ride. Regular-route bus service has three categories: urban-local, suburban-local, and express.1
Regular-route buses pick up and drop off passengers at a variety of locations, including bus stops and park-and-ride facilities, where commuters park their automobiles and board transit. Park-and-ride facilities are typically served by express buses that provide service to downtown Minneapolis, downtown St. Paul, or the University of Minnesota. These facilities range from shared-use surface lots (typically at churches or retail centers, where a portion of the parking lot is dedicated to transit users) to transit stations that have multi-level parking ramps and waiting areas in heated and air-conditioned buildings that have televisions and restrooms. In 2009, there were 104 park-and-ride facilities in the Twin Cities region that had a total of more than 25,000 available parking spaces.2
We looked at regular-route bus providers in the region and noted that:
There are eight providers of regular -route bus service in the Twin Cities region.
The eight regular-route bus service providers in the Twin Cities region are: Metro Transit, Metropolitan Transportation Services, Maple Grove Transit, the
1 See Table 1.1 for a description of these services. 2 This does not include park-and-ride facilities at rail stations or those provided by the city of Ramsey or the Northstar Corridor Development Authority.
238BLUE RIBBON COMMITTEE REPORT | December 2020
54 GOVERNANCE OF TRANSIT IN THE TWIN CITIES REGION
Metro Transit is the largest transit provider in the Twin Cities region.
Twelve suburban communities have opted out of Metro Transit service and provide their own bus services.
Minnesota Valley Transit Authority (MVTA), Plymouth Metrolink, Prior Lake Transit, Shakopee Transit, and SouthWest Transit.3
Metro Transit is the largest of two transit divisions within the Met Council, and it is the largest transit provider in the Twin Cities region. In addition to bus, Metro Transit also operates light rail and commuter rail, which are discussed in Chapter 4. Metropolitan Transportation Services, the other transit division within the Met Council, contracts with private bus companies to operate routes that Metro Transit cannot operate cost effectively.4
As described in Chapter 1, some suburban communities have “opted out” of Metro Transit service and provide their own transit services. In 1981, the Legislature established the “Metropolitan Transit Service Demonstration Program,” which allowed certain communities that were not receiving adequate transit services to “opt out” of the regional regular-route transit service provided by the Metropolitan Transit Commission.5 In 1984, the Legislature made the demonstration program permanent.6 The 1987 Legislature prohibited additional communities from opting out of regional transit service.7 The Legislature moved responsibility for the program to the Met Council in 1994, the year the Council was given operating responsibility for transit and wastewater services.8
As shown in Figure 3.1, the 12 cities that opted out of Metro Transit service are located in the south and west suburbs in the Twin Cities region and are served by six suburban transit providers.9 The suburban transit providers provided 4.6 million, or 6.5 percent, of the region’s 71.2 million bus rides in 2009.
There are two types of suburban transit providers in the Twin Cities region: (1) city-run suburban transit providers, in which cities provide their own transit services, and (2) suburban transit providers that serve multiple cities and are formed by a joint-powers agreement. Maple Grove Transit, Plymouth Metrolink, Prior Lake Transit, and Shakopee Transit are city-run suburban transit providers; MVTA and SouthWest Transit are formed by joint-powers agreements. As shown in Table 3.1, the suburban transit providers formed by joint-powers agreements serve larger populations than the smaller city-run providers.
3 This excludes regular-route bus services provided by the University of Minnesota, the city of Ramsey, and the Northstar Corridor Development Authority. 4 Metropolitan Transportation Services also administers other transit services in the region that were not included in this evaluation, such as dial-a-ride and vanpool. 5 The 1981 law stated that any statutory or home-rule charter city or town or combination thereof that wanted to opt out must meet all three of the following conditions: (1) be located within the metropolitan transit taxing district, (2) not be served by the Metropolitan Transit Commission or be served only with bus routes that end or begin within the municipality, and (3) have fewer than four scheduled runs of bus service provided by the Metropolitan Transit Commission during nonpeak hours. See Laws of Minnesota 1981, chapter 363, sec. 44. 6 Laws of Minnesota 1984, chapter 654, art. 3, sec. 123. 7 Laws of Minnesota 1987, chapter 278, sec. 16. 8 The Minnesota Department of Transportation oversaw the program between 1982 and 1984, after which the Metropolitan Transit Commission had responsibility for the program until 1994. 9 Metropolitan Transportation Services provides Metro Mobility service in the opt-out communities.
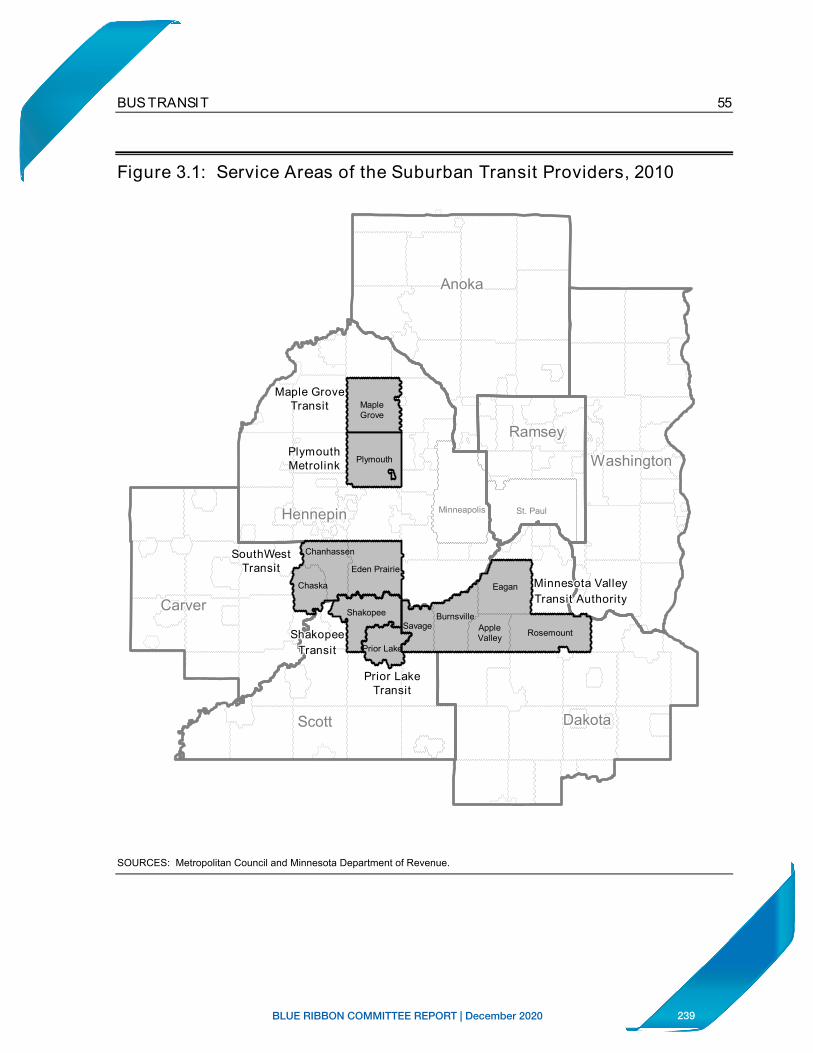
239BLUE RIBBON COMMITTEE REPORT | December 2020
55BUS TRANSIT
Figure 3.1: Service Areas of the Suburban Transit Providers, 2010
AnokaAnokaAnokaAnokaAnokaAnokaAnokaAnokaAnoka
HennepinHennepinHennepinHennepinHennepinHennepinHennepinHennepinHennepin
CarverCarverCarverCarverCarverCarverCarverCarverCarver
ScottScottScottScottScottScottScottScottScott DakotaDakotaDakotaDakotaDakotaDakotaDakotaDakotaDakota
RamseyRamseyRamseyRamseyRamseyRamseyRamseyRamseyRamsey
Maple Grove
Chaska
Chanhassen
Apple Valley
Shakopee
Prior Lake ShakopeeShakopeeShakopeeShakopeeShakopeeShakopeeShakopeeShakopeeShakopee
TransitTransitTransitTransitTransitTransitTransitTransitTransit
Maple Grove Transit
Plymouth Metrolink
Prior Lake Transit
SouthWest Transit
Minnesota ValleyMinnesota ValleyMinnesota ValleyMinnesota ValleyMinnesota ValleyMinnesota ValleyMinnesota ValleyMinnesota ValleyMinnesota Valley Transit AuthorityTransit AuthorityTransit AuthorityTransit AuthorityTransit AuthorityTransit AuthorityTransit AuthorityTransit AuthorityTransit Authority
Minneapolis
WashingtonWashingtonWashingtonWashingtonWashingtonWashingtonWashingtonWashingtonWashington
Burnsville
Eagan
Rosemount
Eden Prairie
Plymouth
Savage
St. Paul
SOURCES: Metropolitan Council and Minnesota Department of Revenue.
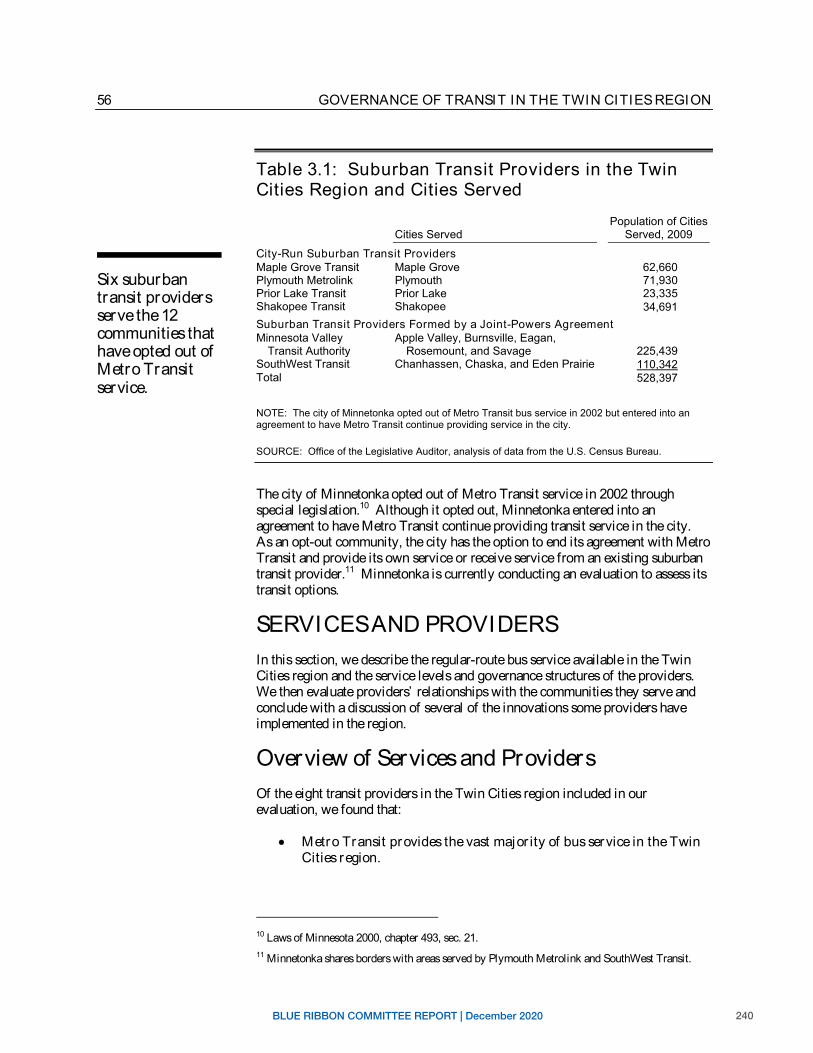
240BLUE RIBBON COMMITTEE REPORT | December 2020
56 GOVERNANCE OF TRANSIT IN THE TWIN CITIES REGION
Table 3.1: Suburban Transit Providers in the Twin Cities Region and Cities Served
Population of Cities Cities Served Served, 2009
City-Run Suburban Transit Providers Maple Grove Transit Maple Grove 62,660
Six suburban Plymouth Metrolink Plymouth 71,930 Prior Lake Transit Prior Lake 23,335 transit providers Shakopee Transit Shakopee 34,691 serve the 12 Suburban Transit Providers Formed by a Joint-Powers Agreement communities that Minnesota Valley Apple Valley, Burnsville, Eagan,
have opted out of Transit Authority Rosemount, and Savage 225,439 SouthWest Transit Chanhassen, Chaska, and Eden Prairie 110,342 Metro Transit Total 528,397
service.NOTE: The city of Minnetonka opted out of Metro Transit bus service in 2002 but entered into an agreement to have Metro Transit continue providing service in the city.
SOURCE: Office of the Legislative Auditor, analysis of data from the U.S. Census Bureau.
The city of Minnetonka opted out of Metro Transit service in 2002 through special legislation.10 Although it opted out, Minnetonka entered into an agreement to have Metro Transit continue providing transit service in the city. As an opt-out community, the city has the option to end its agreement with Metro Transit and provide its own service or receive service from an existing suburban transit provider.11 Minnetonka is currently conducting an evaluation to assess its transit options.
SERVICES AND PROVIDERS In this section, we describe the regular-route bus service available in the Twin Cities region and the service levels and governance structures of the providers. We then evaluate providers’ relationships with the communities they serve and conclude with a discussion of several of the innovations some providers have implemented in the region.
Overview of Services and Providers Of the eight transit providers in the Twin Cities region included in our evaluation, we found that:
Metro Transit provides the vast major ity of bus service in the Twin Cities region.
10 Laws of Minnesota 2000, chapter 493, sec. 21. 11 Minnetonka shares borders with areas served by Plymouth Metrolink and SouthWest Transit.
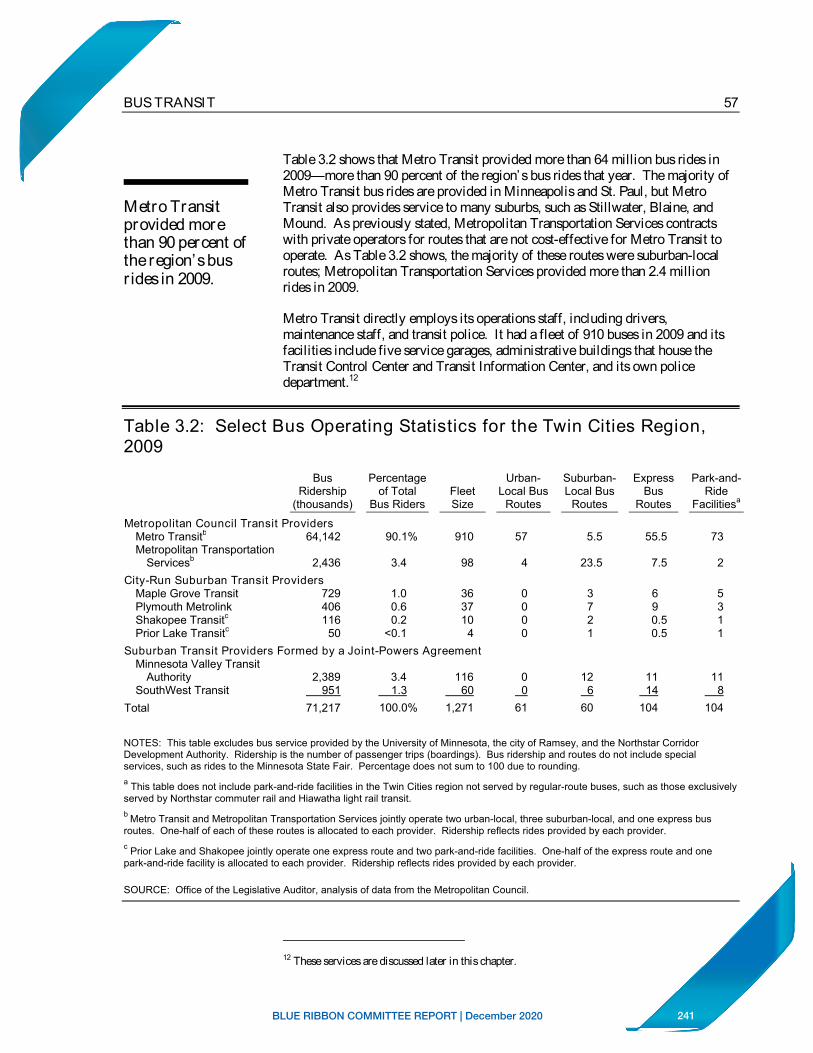
241BLUE RIBBON COMMITTEE REPORT | December 2020
57BUS TRANSIT
Metro Transit provided more than 90 percent of the region’s bus r ides in 2009.
Table 3.2 shows that Metro Transit provided more than 64 million bus rides in 2009—more than 90 percent of the region’s bus rides that year. The majority of Metro Transit bus rides are provided in Minneapolis and St. Paul, but Metro Transit also provides service to many suburbs, such as Stillwater, Blaine, and Mound. As previously stated, Metropolitan Transportation Services contracts with private operators for routes that are not cost-effective for Metro Transit to operate. As Table 3.2 shows, the majority of these routes were suburban-local routes; Metropolitan Transportation Services provided more than 2.4 million rides in 2009.
Metro Transit directly employs its operations staff, including drivers, maintenance staff, and transit police. It had a fleet of 910 buses in 2009 and its facilities include five service garages, administrative buildings that house the Transit Control Center and Transit Information Center, and its own police department.12
Table 3.2: Select Bus Operating Statistics for the Twin Cities Region, 2009
Bus Percentage Urban- Suburban- Express Park-and-Ridership of Total Fleet Local Bus Local Bus Bus Ride
(thousands) Bus Riders Size Routes Routes Routes Facilitiesa
Metropolitan Council Transit Providers Metro Transitb 64,142 90.1% 910 57 5.5 55.5 73Metropolitan Transportation
Servicesb 2,436 3.4 98 4 23.5 7.5 2City-Run Suburban Transit Providers
Maple Grove Transit 729 1.0 36 0 3 6 5Plymouth Metrolink Shakopee Transitc
Prior Lake Transitc
40611650
0.60.2
<0.1
3710
4
000
721
90.50.5
311
Suburban Transit Providers Formed by a Joint-Powers Agreement Minnesota Valley Transit
Authority 2,389 3.4 116 0 12 11 11SouthWest Transit 951 1.3 60 0 6 14 8
Total 71,217 100.0% 1,271 61 60 104 104
NOTES: This table excludes bus service provided by the University of Minnesota, the city of Ramsey, and the Northstar Corridor Development Authority. Ridership is the number of passenger trips (boardings). Bus ridership and routes do not include specialservices, such as rides to the Minnesota State Fair. Percentage does not sum to 100 due to rounding. a This table does not include park-and-ride facilities in the Twin Cities region not served by regular-route buses, such as those exclusively served by Northstar commuter rail and Hiawatha light rail transit. b Metro Transit and Metropolitan Transportation Services jointly operate two urban-local, three suburban-local, and one express busroutes. One-half of each of these routes is allocated to each provider. Ridership reflects rides provided by each provider. c Prior Lake and Shakopee jointly operate one express route and two park-and-ride facilities. One-half of the express route and one park-and-ride facility is allocated to each provider. Ridership reflects rides provided by each provider.
SOURCE: Office of the Legislative Auditor, analysis of data from the Metropolitan Council.
12 These services are discussed later in this chapter.
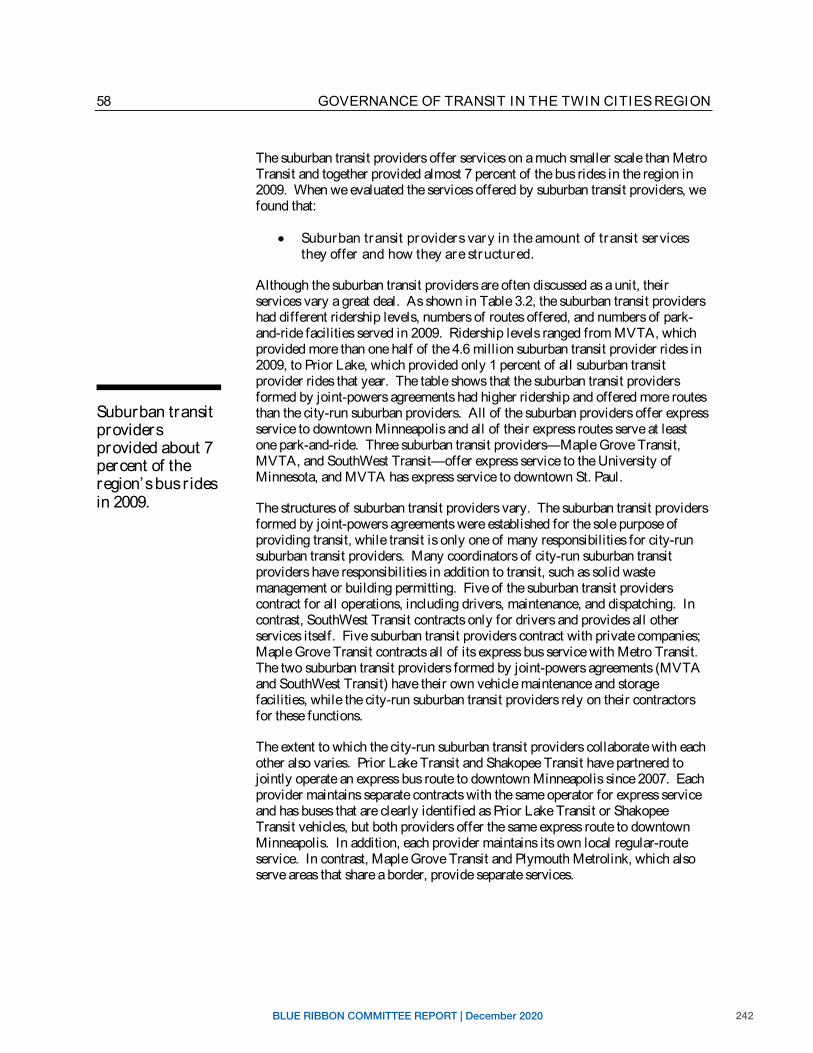
242BLUE RIBBON COMMITTEE REPORT | December 2020
58 GOVERNANCE OF TRANSIT IN THE TWIN CITIES REGION
Suburban transit providersprovided about 7 percent of the region’s bus r ides in 2009.
The suburban transit providers offer services on a much smaller scale than Metro Transit and together provided almost 7 percent of the bus rides in the region in 2009. When we evaluated the services offered by suburban transit providers, we found that:
Suburban transit providers vary in the amount of transit services they offer and how they are structured.
Although the suburban transit providers are often discussed as a unit, their services vary a great deal. As shown in Table 3.2, the suburban transit providers had different ridership levels, numbers of routes offered, and numbers of park-and-ride facilities served in 2009. Ridership levels ranged from MVTA, which provided more than one half of the 4.6 million suburban transit provider rides in 2009, to Prior Lake, which provided only 1 percent of all suburban transit provider rides that year. The table shows that the suburban transit providers formed by joint-powers agreements had higher ridership and offered more routes than the city-run suburban providers. All of the suburban providers offer express service to downtown Minneapolis and all of their express routes serve at least one park-and-ride. Three suburban transit providers—Maple Grove Transit, MVTA, and SouthWest Transit—offer express service to the University of Minnesota, and MVTA has express service to downtown St. Paul.
The structures of suburban transit providers vary. The suburban transit providers formed by joint-powers agreements were established for the sole purpose of providing transit, while transit is only one of many responsibilities for city-run suburban transit providers. Many coordinators of city-run suburban transit providers have responsibilities in addition to transit, such as solid waste management or building permitting. Five of the suburban transit providers contract for all operations, including drivers, maintenance, and dispatching. In contrast, SouthWest Transit contracts only for drivers and provides all other services itself. Five suburban transit providers contract with private companies; Maple Grove Transit contracts all of its express bus service with Metro Transit. The two suburban transit providers formed by joint-powers agreements (MVTA and SouthWest Transit) have their own vehicle maintenance and storage facilities, while the city-run suburban transit providers rely on their contractors for these functions.
The extent to which the city-run suburban transit providers collaborate with each other also varies. Prior Lake Transit and Shakopee Transit have partnered to jointly operate an express bus route to downtown Minneapolis since 2007. Each provider maintains separate contracts with the same operator for express service and has buses that are clearly identified as Prior Lake Transit or Shakopee Transit vehicles, but both providers offer the same express route to downtown Minneapolis. In addition, each provider maintains its own local regular-route service. In contrast, Maple Grove Transit and Plymouth Metrolink, which also serve areas that share a border, provide separate services.
243BLUE RIBBON COMMITTEE REPORT | December 2020
59BUS TRANSIT
All suburban transit providers are governed by organizations that consist at least partly of local elected officials.
Responsiveness to Local Communities Met Council, Metro Transit, and suburban transit provider staff told us that suburban providers’ governance structures enable them to have close ties to their communities and quickly respond to transit needs in their service areas. When we looked at bus providers’ relationships with local communities, we found that:
The suburban transit providers and Metro Transit have different governance structures, which impacts how service decisions are made and how they receive input from their r iders and the communities they serve.
All of the suburban transit providers are governed by a body that consists partly or wholly of local elected officials. The city-run suburban transit providers are governed by their respective city councils. In addition, all four of the city-run suburban transit providers have transit advisory boards that help identify their communities’ transit needs. Maple Grove, Plymouth, and Shakopee have advisory boards composed of riders and city residents, and Prior Lake and Shakopee share a combined Transit Review Board that is made up of elected officials from Scott County, Prior Lake, Shakopee, and other cities in the county.
The suburban transit providers established by joint-powers agreements are governed by boards made up of elected officials and other representatives from the communities they serve. For example, the MVTA Board consists of eight members—one from each city of the joint powers agreement (five), one from each county served (Dakota and Scott), and one at-large representative. The SouthWest Transit Commission has seven members—two from each city served by SouthWest Transit (one of which must be an elected official) and one rider representative. SouthWest Transit also has a Rider Advisory Committee made up of riders, which provides input to the Commission.
Staff from all of the suburban transit providers said that their governance structures create close communications with the communities they serve and enable local communities to regularly provide direction, insight, and feedback on transit services. For example, after receiving complaints from customers about loud and distracting cell phone calls on its buses and at the suggestion of its rider committee, SouthWest Transit instituted a “Quiet Zone” approach that limits cell phone use on its express routes. In addition, staff from all six of the suburban transit providers, Metropolitan Transportation Services, and Metro Transit told us that the suburban providers’ smaller size and close ties to the cities they serve allow them to respond to communities’ transit needs more quickly than Metro Transit.
Unlike the suburban transit providers, Metro Transit—as a division of the Met Council—is not governed by elected representatives from the communities it serves. However, customers can comment on Metro Transit services through its Web site or customer relations department. In addition, Metro Transit conducts “sector studies,” which examine the transit needs of communities in various
244BLUE RIBBON COMMITTEE REPORT | December 2020
60 GOVERNANCE OF TRANSIT IN THE TWIN CITIES REGION
Innovationsintroduced into the region by Metro Transit include the Go-To fare card and Automatic Vehicle Locator technology.
portions, or “sectors,” of the Metro Transit service area.13 These studies help Metro Transit redesign services in the sectors as needed. Metro Transit staff told us that the agency has done outreach to local communities as part of these studies, and they hope to eventually conduct outreach in every city in Metro Transit’ s service area.
InnovationMinnesota statutes encourage the use of technology to improve the transit system’s performance and productivity.14 When we looked at transit innovations in the region, we found that:
The largest transit providers in the Twin Cities region have introduced numerous transit-related innovations to the region.
Metro Transit has introduced many innovations that have impacted the entire Twin Cities region. For example, it implemented the Go-To Card, which enables customers throughout the region to store fares on a plastic smartcard that can be recharged over the phone or through Metro Transit’s Web site and has resulted in faster boarding times. Metro Transit also introduced Automatic Vehicle Locator technology to the region, which provides real-time information on vehicle location using global positioning systems. Metro Transit staff said that the implementation of the technology has improved the agency’s ability to manage routes, respond to customer comments, plan routes, and conduct system analysis. Metro Transit’ s Automatic Vehicle Locator system has since expanded to almost all providers in the region, including five of the suburban transit providers.15 In addition, Metro Transit implemented the regional trip planner, which riders can access over the phone or through Metro Transit’ s Web site to plan their trip regardless of provider.
SouthWest Transit has utilized transit-oriented development in two of its park-and-ride facilities.16 SouthWest Transit has partnered with private developers to develop housing and businesses at park-and-rides and adjacent properties. Transit-oriented development has generated additional revenue for SouthWest Transit to offset capital expenses and ongoing facility maintenance costs.17
MVTA has introduced new technologies into the region, such as a “driver-assist” system, which provides real-time feedback to bus drivers using bus-only shoulder lanes. MVTA also has a simulator to train drivers how to use the technology—it is the first simulator of its kind to be deployed in the country.
13 These sectors are typically larger than the areas served by suburban transit providers. 14 Minnesota Statutes 2010, 174.01, subd. 2. 15 MVTA decided to not utilize the Automatic Vehicle Locator technology used by Metro Transit. 16 The Federal Transit Administration defines transit-oriented development as compact, mixed-use development that is within walking distance of public transportation. 17 Metro Transit also serves transit-oriented developments in a number of areas throughout the region. Local governments generally lead transit-oriented development projects in areas served by Metro Transit.
245BLUE RIBBON COMMITTEE REPORT | December 2020
61BUS TRANSIT
Metro Transit administers many services for all regional bus providers, including Metro Transit Police and the Transit InformationCenter.
COORDINATION Minnesota statutes encourage cooperation among providers “ to assure the most efficient and coordinated use of existing and planned services.” 18 With eight bus providers in the region, it is not surprising that we found that:
Coordination of transit providers is impor tant because all regular -route bus providers (1) operate routes that begin or end in many of the same areas, (2) share technology, and (3) access regional services such as the transit police.
We also found that:
For the most par t, the suburban transit providers and Metro Transit have successfully coordinated bus service.
All of the suburban providers offer routes that begin or terminate in areas served by other providers, such as downtown Minneapolis and the Mall of America. For example, each suburban transit provider has express routes that begin and end along Marquette and Second Avenues in downtown Minneapolis, which is in Metro Transit’ s service area. Providers must coordinate with each other so that bus layover facilities and bus stops in these shared areas are not overloaded at any one time. After the city of Minneapolis reconstructed Marquette and Second Avenues in 2009, Metro Transit and the suburban providers worked together to develop standard operating procedures that maximize coordination in the shared service area. Some suburban transit providers also offer service to downtown St. Paul, the University of Minnesota, and the Mall of America, which requires similar coordination with Metro Transit.
In addition to sharing service areas, providers share technologies, most of which are administered by Metro Transit. For example, Metro Transit installed Automatic Vehicle Locator equipment on its fleet in 2002 and expanded the technology to most of the region’s providers in 2010. All providers also use the same equipment to accept a variety of prepaid fare passes that customers can use to pay for bus rides. Although the suburban providers rely on Metro Transit for these technologies, all of the providers must work with each other to coordinate installation, repairs, and data sharing and to ensure that implementation is consistent across providers.
Metro Transit administers many other services for all regional providers. For example, it operates the Transit Information Center, which is the repository of all bus and rail schedules in the region. Customers can contact the Transit Information Center to receive personalized trip-planning services and other transit information, regardless of provider. In addition, Metro Transit’ s Transit Control Center monitors bus operations and coordinates the transit police who work with the suburban transit providers in the event of a mechanical breakdown
18 Minnesota Statutes 2010, 473.371, subd. 2(c).
246BLUE RIBBON COMMITTEE REPORT | December 2020
62 GOVERNANCE OF TRANSIT IN THE TWIN CITIES REGION
The Met Council has an important oversight role for all bus service in the region.
or an emergency situation.19 Metro Transit Police respond to all transit situations regardless of provider.
Metro Transit also provides technical assistance to the suburban transit providers. For example, Metro Transit staff told us that they repair fare-collection devices as needed, assist with analyzing Automatic Vehicle Locator data, and help suburban providers comply with federal grant requirements. Staff from both Metro Transit and the suburban transit providers reported that they generally worked well together.20
MET COUNCIL’S OVERSIGHT ROLE In addition to administering shared technologies and other services through Metro Transit, the Met Council has other oversight responsibilities for bus service in the Twin Cities region. We found that:
The Metropolitan Council has substantial oversight responsibilities for bus service in the Twin Cities region due to its Metropolitan Planning Organization designation and as the recipient of federal and state transit funds in the region.
As discussed in Chapter 1, state statutes identify the Met Council as the region’s Metropolitan Planning Organization. The Met Council is also the designated recipient of federal and state transit funds for the Twin Cities region. Further, the Met Council distributes Motor Vehicle Sales Tax funding for transit operations to regional providers and also allocates some capital revenue. As the agent for federal and state funds, the Council must ensure these funds are administered and used properly throughout the region.
All of the suburban transit providers agreed that, as the regional transit planner and recipient of federal and state transit funds, the Met Council should provide some oversight of regional transit providers. The Council exercises this oversight in a number of ways, specifically through maintaining contracts and agreements with the regional providers, collecting National Transit Database information from suburban providers, providing matching funds for capital projects, ensuring that providers meet regional standards, and implementing procedures.21 However, it does not make decisions on where or how frequently suburban transit providers offer services.
A 2009 Federal Transit Administration (FTA) review found that the Met Council did not provide sufficient oversight of all regional transit providers. The FTA
19 The Transit Control Center is also responsible for monitoring Northstar commuter rail. The Hiawatha Light Rail Transit (LRT) Control Center is operated out of an LRT facility. 20 The relationship between the suburban transit providers and the Met Council, as discussed in Chapter 2, is much more difficult than the relationship between the suburban providers and Metro Transit. 21 The Met Council’s 2030 Transportation Policy Plan identifies two regional performance standards: subsidy per passenger and passengers per in-service hour. These performance standards are used to evaluate the relative productivity and efficiency of individual routes. These and additional performance measures are discussed in more detail in Chapter 5.
247BLUE RIBBON COMMITTEE REPORT | December 2020
63BUS TRANSIT
To improve oversight and consistency across the region’s providers, the Met Council establishedseveral regional transit procedures in 2010.
conducts a review of the Met Council every three years to assess compliance with federal requirements. One of the findings in the FTA’s 2009 triennial review found that the Council “does not conduct adequate oversight of its subrecipients and contractors” and that it “does not have a comprehensive oversight plan to monitor all of the activities of the subrecipients to ensure compliance with applicable federal requirements.” 22 The review required the Met Council to develop an oversight and monitoring plan for all of its subrecipients of FTA funds, including the suburban transit providers, in order to address the finding. In response to the FTA triennial review, the Met Council submitted a subrecipient monitoring plan to the FTA in November 2009, which the FTA subsequently accepted.23
In response to the federal audit and to improve consistency across the region, the Metropolitan Council also established five regional transit procedures in 2010: (1) Fleet Management Procedures, (2) Procurement Procedures, (3) Facilities Ownership Procedures, (4) Regional Operating Revenue Allocation Procedures, and (5) Regional Service Improvement Plan Procedures. Table 3.3 provides a description of each of these procedures.
The Met Council developed the procedures over a two-year period beginning in late 2008. A joint committee made up of representatives from the Met Council and the suburban transit providers periodically met over the course of the development process to discuss the procedures. Council staff told us that they developed the regional transit procedures to: (1) establish a clear understanding of roles and responsibilities of the Council, the suburban transit providers, and other providers to ensure compliance with federal and state funding rules and requirements; (2) ensure equity among all regional providers; (3) ensure transparency in Council practices; and (4) avoid misunderstandings, inefficiencies, and delays. Met Council staff also cited the 2009 FTA audit citation as part of their rationale to create these procedures. However, the procedures were not included in the plan the Met Council submitted to the Federal Transit Administration, nor did the FTA require the procedures.
The procedures establish a common approach to various situations. Met Council staff said that some providers had inadvertently been treated inconsistently by the Council because there was not a common understanding among Met Council and suburban transit provider staff of how to handle certain situations and requests. Council staff said they are using the regional transit procedures to create transparency and consistency among providers. For example, the procurement
22 Suburban transit providers are considered subrecipients. Federal Transit Administration, “FY2009 Triennial Review of the Metropolitan Council, St. Paul, Minnesota” (Chicago: Federal Transit Administration, July 2009), 5. 23 The Met Council’s subrecipient plan had four main components: (1) developing a reference document that identifies and describes the FTA requirements applicable to subrecipients; (2) developing a comprehensive training plan for all subrecipients; (3) conducting ongoing monitoring of subrecipient activity at least once every three years; and (4) requiring each subrecipient to sign a Certification of Federal Compliance that states that they understand their obligations under the federal regulations and that they are not aware of violations of FTA requirements.
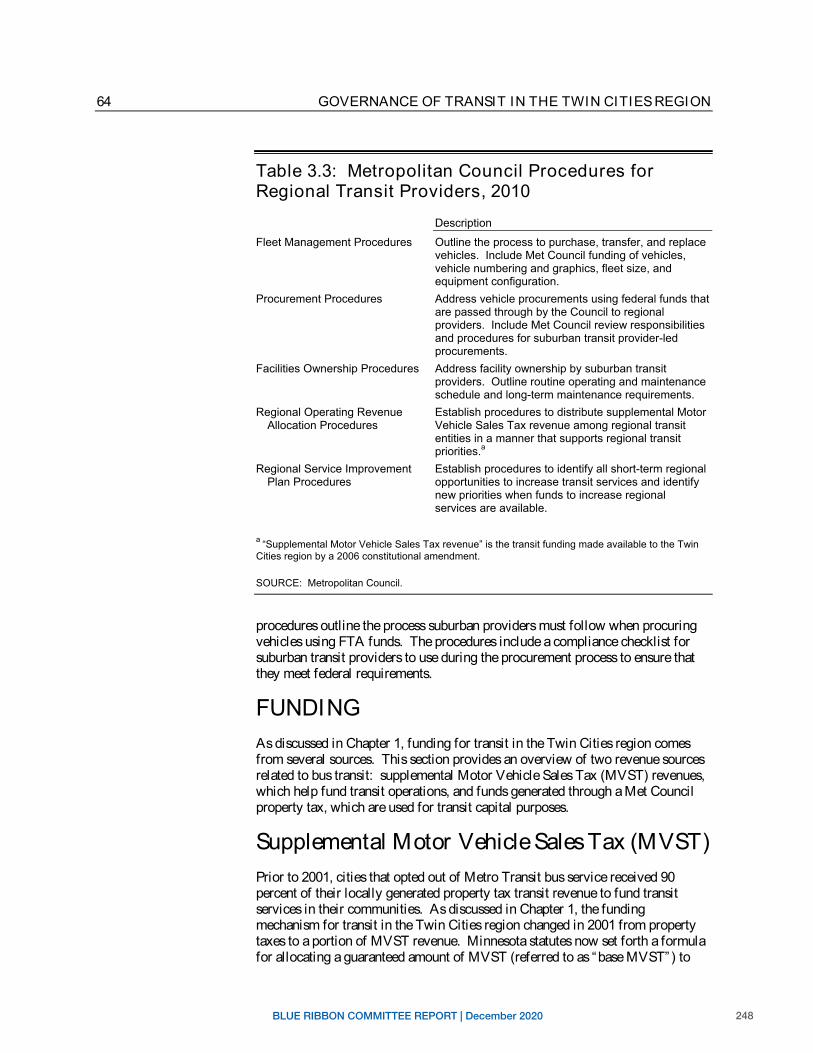
248BLUE RIBBON COMMITTEE REPORT | December 2020
64 GOVERNANCE OF TRANSIT IN THE TWIN CITIES REGION
Table 3.3: Metropolitan Council Procedures for Regional Transit Providers, 2010
Description
Fleet Management Procedures Outline the process to purchase, transfer, and replace vehicles. Include Met Council funding of vehicles, vehicle numbering and graphics, fleet size, and equipment configuration.
Procurement Procedures Address vehicle procurements using federal funds that are passed through by the Council to regional providers. Include Met Council review responsibilities and procedures for suburban transit provider-led procurements.
Facilities Ownership Procedures Address facility ownership by suburban transit providers. Outline routine operating and maintenance schedule and long-term maintenance requirements.
Regional Operating Revenue Establish procedures to distribute supplemental Motor Allocation Procedures Vehicle Sales Tax revenue among regional transit
entities in a manner that supports regional transit priorities.a
Regional Service Improvement Establish procedures to identify all short-term regional Plan Procedures opportunities to increase transit services and identify
new priorities when funds to increase regional services are available.
a “Supplemental Motor Vehicle Sales Tax revenue” is the transit funding made available to the Twin Cities region by a 2006 constitutional amendment.
SOURCE: Metropolitan Council.
procedures outline the process suburban providers must follow when procuring vehicles using FTA funds. The procedures include a compliance checklist for suburban transit providers to use during the procurement process to ensure that they meet federal requirements.
FUNDINGAs discussed in Chapter 1, funding for transit in the Twin Cities region comes from several sources. This section provides an overview of two revenue sources related to bus transit: supplemental Motor Vehicle Sales Tax (MVST) revenues, which help fund transit operations, and funds generated through a Met Council property tax, which are used for transit capital purposes.
Supplemental Motor Vehicle Sales Tax (MVST) Prior to 2001, cities that opted out of Metro Transit bus service received 90 percent of their locally generated property tax transit revenue to fund transit services in their communities. As discussed in Chapter 1, the funding mechanism for transit in the Twin Cities region changed in 2001 from property taxes to a portion of MVST revenue. Minnesota statutes now set forth a formula for allocating a guaranteed amount of MVST (referred to as “base MVST”) to
249BLUE RIBBON COMMITTEE REPORT | December 2020
65BUS TRANSIT
The Met Council levies a property tax for transit capital purposes on municipalities in the transit taxing distr ict, a subregion of the Twin Cities region.
communities that have opted out of Metro Transit service. This formula establishes a minimum amount for each opt-out city and is calculated using the municipality’s 2001 property tax revenue, its 2006 taxable market value, and state revenues generated from MVST for the current fiscal year.24
In 2006, Minnesota voters approved a constitutional amendment to dedicate all of the MVST revenue to highway and transit purposes. When we looked at the constitutional amendment and related statutory language, we found that:
Minnesota law does not state how additional Motor Vehicle Sales Tax transit funding approved through a 2006 constitutional amendment should be allocated among regional transit providers.
As discussed in Chapter 1, prior to 2008, 21.5 percent of MVST revenue was allocated to transit in the Twin Cities region. The constitutional amendment approved in 2006 increased the amount of MVST revenue allocated to transit. The phase-in for dedicating the revenues to transit began in fiscal year 2008 and is scheduled to be completed in fiscal year 2012. By 2012, 36 percent of MVST revenues will be allocated to transit in the Twin Cities region.
The difference between the 21.5 percent of MVST revenues allocated to the region in 2008 and the 36 percent of MVST revenues allocated in 2012 is referred to as “supplemental” MVST revenue. The law does not outline how the supplemental MVST funds allocated to the region should be distributed within the metropolitan area. Instead, the law states that this MVST revenue should be deposited in the “metropolitan area transit account,” which is annually appropriated to the Met Council for funding transit within the Twin Cities region.25
Transit Taxing Distr ict Minnesota state law authorizes the Met Council to levy a property tax for transit capital purposes on municipalities in the “ transit taxing district,” a subset of municipalities within the Met Council’s jurisdiction.26 Figure 3.2 shows a map of the seven-county Twin Cities metropolitan area and the transit taxing district. As illustrated in the map, many municipalities are located within the seven-county Twin Cities region and are not in the transit taxing district.
By law, the Met Council is not required to provide service outside of the transit taxing district boundaries “unless or until payment is therefor received.”27 But, the law permits the Council to provide transit services outside of the taxing district at its discretion. We found that:
24 Minnesota Statutes 2010, 473.388, subd. 4. 25 Minnesota Statutes 2010, 297B.09, subd. 1(f), and 16A.88, subd. 2. 26 Minnesota Statutes 2010, 473.446, subd. 2. Prior to 2002, the revenue raised through the regional transit tax could be used for capital and operating purposes. 27 Ibid.
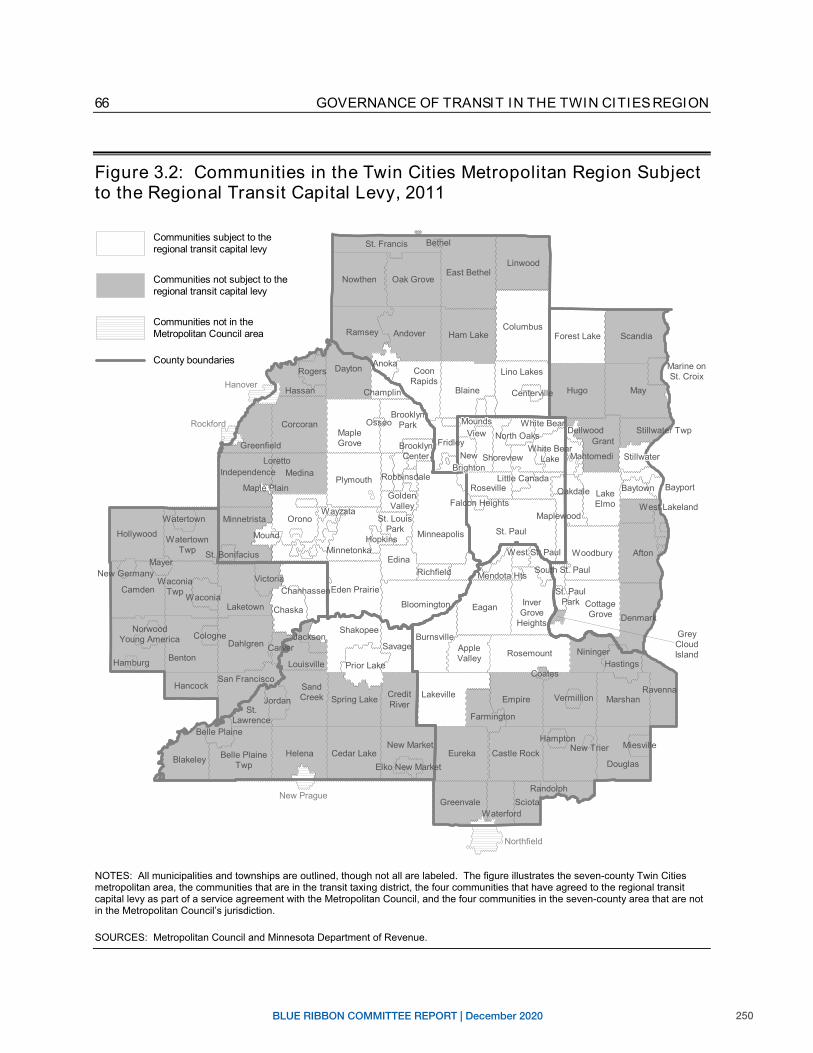
250BLUE RIBBON COMMITTEE REPORT | December 2020
66 GOVERNANCE OF TRANSIT IN THE TWIN CITIES REGION
Figure 3.2: Communities in the Twin Cities Metropolitan Region Subject to the Regional Transit Capital Levy, 2011
Communities subject to the regional transit capital levy
Communities not subject to the regional transit capital levy
Communities not in the Metropolitan Council area
Marine on St. Croix
Grey Cloud Island
New Prague
Northfield
NOTES: All municipalities and townships are outlined, though not all are labeled. The figure illustrates the seven-county Twin Cities metropolitan area, the communities that are in the transit taxing district, the four communities that have agreed to the regional transit capital levy as part of a service agreement with the Metropolitan Council, and the four communities in the seven-county area that are not in the Metropolitan Council’s jurisdiction.
SOURCES: Metropolitan Council and Minnesota Department of Revenue.
White Bear Lake
Lake Elmo
Maplewood
Oakdale
Shoreview Mahtomedi
Mendota Hts
Inver Grove
Heights
West St. Paul
South St. Paul
Minneapolis
St. Paul Park
Shakopee
Louisville
St. Louis Park
Golden Valley
Minnetonka
Robbinsdale
NewNewNewNewNewNewNewNewNew BrightonBrightonBrightonBrightonBrightonBrightonBrightonBrightonBrighton
Brooklyn Center
Cottage Grove
StillwaterStillwaterStillwaterStillwaterStillwaterStillwaterStillwaterStillwaterStillwater
MoundsMoundsMoundsMoundsMoundsMoundsMoundsMoundsMounds ViewViViViViViViViViMaple
Maple Plain
ewewewewewewewew Grove Fridley GrantNorth Oaks
Brooklyn Rockford Corcoran ParkOsseo
Champlin
Coon Rapids
Roseville
Watertown Twp
New Germany Mayer
Waconia Twp
St. Bonifacius
Minnetrista
Waconia
Norwood Young America
Laketown
Belle Plaine Twp Blakeley
St. Lawrence
Dellwood White Bear
Bayport
Stillwater Twp
West Lakeland
Waterford
Greenfield
Hassan
Wayzata
Independence
San Francisco Sand Creek
Benton
Lino Lakes
Farmington
Lakeville
Apple Valley
Credit River
New Market
Douglas
New Trier
Hanover
Andover
Anoka
Bethel
Blaine Centerville Hugo May
Columbus
East Bethel
Ham Lake
Linwood
Nowthen Oak Grove
Ramsey
St. Francis
Camden
Carver
Chanhassen
Chaska
Cologne Dahlgren
Hamburg
Hancock
Hollywood
Victoria
Watertown
Burnsville
Castle Rock
Coates
Eagan
Empire
Eureka
Greenvale Sciota
Hampton
Hastings
Marshan
Miesville
Nininger
Randolph
Ravenna
Rosemount
Vermillion
Bloomington
Dayton
Eden Prairie
Edina
Hopkins
Loretto Medina
Mound
Orono
Plymouth
Richfield
Rogers
Falcon Heights
Little Canada
St. Paul
Belle Plaine
Cedar Lake Elko New Market
Helena
Jackson
Jordan
Prior Lake
Savage
Spring Lake
Afton
Baytown
Denmark
Forest Lake Scandia
Woodbury
County boundaries
CJ
--
251BLUE RIBBON COMMITTEE REPORT | December 2020
67BUS TRANSIT
Some residents who do not pay the transit tax use regional transit services.
Although the transit taxing distr ict does not include the entire Twin Cities seven-county metropolitan area, Metropolitan Council transit services are offered throughout the whole region.
Regular-route bus service is not provided outside of the transit taxing district, nor is it provided in every municipality within the taxing district. However, the Met Council provides dial-a-ride service throughout the Twin Cities region, regardless of whether a municipality is in the taxing district. Dial-a-ride service in the Twin Cities area is specifically intended to serve any rider who needs to travel within the region where regular-route transit service is not available.
Additionally, residents from throughout the seven-county region and beyond use the park-and-ride facilities that have been built using regional transit tax revenues. In its 2008 annual park-and-ride study, the Met Council found that 14 percent of the users of regional park-and-ride facilities reside within the seven-county metropolitan area but outside of the transit taxing district. An additional 8.5 percent of users live in the counties surrounding the seven-county metropolitan area.28
In 2001, the Legislature limited the Met Council’s use of the transit taxing district revenue to capital purposes only.29 As a result, the funds raised in the transit taxing district through the “ transit capital levy” are now used for purposes such as building and preserving park-and-ride facilities, purchasing vehicles, and erecting bus shelters. Met Council staff told us that the transit capital levy is largely used for capital maintenance purposes. In 2009, the Council’ s levy rate ranged from 1.203 percent in Scott County to 1.278 percent in Anoka County. In that year, the Council raised $39.4 million through the regional transit capital tax. Under current law, the Council must annually request authorization to levy this tax.
CHALLENGESThe first part of this chapter provided an overview of the bus service, providers, oversight, and funding in the Twin Cities region. In this section, we focus on the challenges facing the bus transit system in the region.
As previously discussed, coordination among regional bus providers in the Twin Cities region is important. However, this coordination has not been easy and, in general, we found that:
Conflict between the suburban transit providers’ desire for autonomy and the Metropolitan Council’s role as the regional planner has led to tension between the suburban providers and the Council.
As a result of increased complexity and coordination among bus transit providers, the suburban providers are no longer able to exercise the type of
28 Metropolitan Council, 2030 Park-and-Ride Plan (St. Paul, 2010), 1. 29 Laws of Minnesota First Special Session 2001, chapter 5, art. 3, sec. 72.
252BLUE RIBBON COMMITTEE REPORT | December 2020
68 GOVERNANCE OF TRANSIT IN THE TWIN CITIES REGION
Increased complexity of the region’s transit systems has heightened the tension between the Met Council and the suburban transit providers.
autonomy they had when they were created nearly 30 years ago. For example, the development of transitways that cross provider boundaries requires increased coordination between the Met Council and suburban transit providers to make transitway decisions.30 Nevertheless, suburban transit providers want to retain as much autonomy as possible in providing bus service in their communities. At the same time, the Council has regional oversight responsibilities it must fulfill.
Tension between the suburban transit providers and the Met Council was evident in interviews we had with staff and in meetings and correspondence between the Met Council and suburban providers. Recent newspaper articles and reports in other local media have also demonstrated distrust and frustration between these groups. In this section we discuss in more detail the tension between the Council’s oversight role and the suburban transit providers’ desire for autonomy. We first discuss the inefficiencies created by having multiple bus providers in the region. We then describe the difficulties of coordinating among so many providers and the tension related to the Met Council’s regional transit procedures. The section concludes with a discussion of the funding challenges in the region.
Inefficient Bus System When we looked at the complex nature of the transit system in the region, we found that:
Having multiple bus providers in the Twin Cities region creates inefficiencies that would not otherwise exist.
Having numerous bus providers in the region has resulted in inefficiencies, some the result of administrative overlap and others due to the loss of economies of scale given the smaller size of suburban transit provider systems. For example, having multiple transit providers results in a higher number of “spare” vehicles in the region (spare vehicles are the vehicles not in use during peak service). The Federal Transit Administration allows a maximum “spare factor” of 20 percent for providers with fleets greater than 50 vehicles, which applies to Metro Transit, MVTA, and SouthWest Transit.31 In 2008, MVTA and SouthWest Transit had spare factors of more than 20 percent; Metro Transit, in contrast, had a spare factor of 18 percent, which was possible to maintain because of Metro Transit’ s large fleet size.32 As a result of each provider having its own fleet (and therefore its own spare vehicles), the regional fleet is larger than it would be if there were only one provider for the entire region.
30 “Transitways” are corridors where transit has a dedicated running way or other transit advantage. Transitways are discussed in greater detail in Chapter 4. Examples of transitways that cross provider boundaries are the Cedar Avenue transitway, which travels through areas served by Metro Transit and MVTA, and the Southwest Corridor, which travels through areas served by Metro Transit and SouthWest Transit. 31 A provider’s “spare factor” is calculated by dividing the number of spare vehicles by the vehicles required for peak service. For example, a provider with 120 total vehicles that requires 100 vehicles for peak service has 20 spare vehicles and a spare factor of 20 percent. 32 Since 2008, MVTA and SouthWest Transit have lowered their spare factors closer to the 20-percent maximum level allowed by the Federal Transit Administration.
253BLUE RIBBON COMMITTEE REPORT | December 2020
69BUS TRANSIT
There are several inefficienciesassociated with having multiple bus providers in the region.
Staff from the Met Council and suburban transit providers agree that coordination is difficult.
Other examples of inefficiencies include the costs associated with repainting vehicles when they transfer from one provider to another and numerous negotiated agreements between the Met Council and suburban transit providers. In addition, each provider maintains its own operating reserve funds and conducts customer satisfaction surveys.33 Each suburban provider and Metropolitan Transportation Services also administer contracts for bus operations.
Problems with Coordination Despite successful coordination between Metro Transit and the suburban transit providers, we found that:
Coordination between the suburban transit providers and the Metropolitan Council is difficult and time consuming.
As previously discussed, the suburban providers offer varying levels of service to their communities. Suburban transit providers’ different service levels correspond, to some extent, with their levels of expertise and the amount to which they rely on the Met Council for assistance. In general, staff from the city-run suburban transit providers, most of whom have responsibilities outside of transit, told us that they rely on the Council for ongoing support with data gathering and management, interpreting federal requirements, and providing technical assistance. The four city-run providers also rely on the Met Council for vehicle procurement. In contrast, staff from MVTA and SouthWest Transit said that they function more independently, although they still work with the Council on some issues, such as capital funding requests and data reporting. Both of the suburban transit providers formed by joint-powers agreements have initiated their own bus purchases.
In addition to trying to coordinate with providers with differing levels of needs and expertise, Met Council staff reported that they have difficulty getting consensus from all six suburban transit providers. Despite representing themselves as one group (through the Suburban Transit Association), suburban transit providers often interact with the Met Council as individual organizations and do not have a uniform position on many issues. Dealing with six suburban providers instead of a single entity creates complexity and consumes a great deal of Council staff time. Similarly, suburban transit provider staff told us that they spend a lot of time attending meetings that may not be relevant to them and responding to Met Council requests.
Met Council staff spend a large amount of time coordinating with and responding to questions from the suburban providers. Council staff told us that they spend a disproportionate amount of time working on suburban transit provider-related issues, given that suburban providers account for only 6 percent of transit ridership in the region.
33 Prior Lake Transit and Shakopee Transit jointly conduct a customer satisfaction survey for their shared express route.
254BLUE RIBBON COMMITTEE REPORT | December 2020
70 GOVERNANCE OF TRANSIT IN THE TWIN CITIES REGION
The process of developing the regional transit procedures further eroded the relationship between the Met Council and the suburban transit providers.
Tension over Regional Procedures As noted earlier, the Met Council and suburban transit providers met regularly to discuss the regional transit procedures when they were being developed. While the procedures establish consistent expectations for providers in the region, we found that:
The process to establish the regional transit procedures has increased tension between the Metropolitan Council and the suburban transit providers.
Staff from both the Met Council and suburban transit providers told us that developing the regional procedures was a difficult process. Many of the suburban provider staff told us that they did not understand what prompted the creation of the procedures, since they already conduct annual audits and must meet other requirements established in various contracts. Many staff from the suburban transit providers told us that the unclear motives behind the procedures elevated their feelings of mistrust toward the Met Council. In interviews, some suburban transit provider staff told us that they did not trust the Met Council. We also witnessed joint suburban transit provider-Met Council meetings where this mistrust was evident.
In addition, many staff from the suburban transit providers said that the level of Met Council oversight created by the procedures has gone too far, and the Council is “micromanaging” their operations. A number of the suburban provider staff told us they understood the need for regional standards, but they said that the Met Council’s procedures are too detailed and do not allow enough flexibility for the suburban providers to exercise their autonomy. In contrast, Met Council staff stated that while the regional transit procedures establish responsibilities for the Council and regional providers, they still allow providers to respond quickly and flexibly to their riders and communities.
Funding Challenges Funding for bus transit also has challenges. The Met Council and suburban transit providers have disagreed over how supplemental Motor Vehicle Sales Tax revenue should be distributed. Additionally, the transit taxing district law enables municipalities new to the taxing district to negotiate for transit services, an advantage communities already in the taxing district do not have.
Supplemental Motor Vehicle Sales Tax Revenue Challenges
As previously discussed, Minnesota law does not specify how the supplemental MVST funds should be allocated within the Twin Cities region. In the absence of such direction, the Met Council developed a policy to distribute the supplemental MVST funds to providers in the region. We found that:
The Metropolitan Council and suburban transit providers have disagreed over how supplemental Motor Vehicle Sales Tax revenue should be allocated in the Twin Cities region.
255BLUE RIBBON COMMITTEE REPORT | December 2020
71BUS TRANSIT
The Met Council established a procedure to distr ibute supplemental MVST among regional providers.
Some suburban transit providers have projected operating reserve fund balances greater than 100 percent of their operatingexpenses in 2011.
The suburban transit providers wanted a formula-based approach that would provide them with a guaranteed share of these supplemental funds. Instead, the Met Council created a procedure to distribute the additional MVST funds to providers in the Twin Cities region based on regional priorities. The Council’ s Regional Operating Revenue Allocation Procedures establish the process to distribute supplemental MVST revenue among regional transit providers. The procedures prioritize the use of funds as follows: (1) preserve existing services, (2) ensure adequate fund balances among providers, and (3) expand transit services based on regional priorities.
To preserve existing services, according to the Council’ s procedures, current transit services must first be funded using revenue from fares, federal and state revenue, base MVST revenue, and other sources. After these funds have been exhausted, services are paid for with excess reserve funds.34 Finally, if needed, supplemental MVST revenue is used to fund existing services.
Under the Met Council procedures, if supplemental MVST revenue remains after funding existing services, it can be used to bring providers’ reserve fund levels to the policy ceiling. If supplemental MVST revenue still remains after bringing all providers’ reserve balances to the policy ceiling, it will be used to expand the regional transit system.35
The effect of the procedures has been to prevent some suburban transit providers from receiving any supplemental MVST revenue due to high reserve fund balances. The procedures establish a range of reserve fund levels for all transit providers in the region from a minimum of 8.3 percent for Metro Transit to a maximum of 35 percent for suburban transit providers. Transit organizations that maintain reserve funds above these levels are not eligible to receive supplemental MVST revenue. As Table 3.4 shows, the four city-run suburban transit providers had projected operating reserve fund balances greater than 100 percent of their projected operating expenses in 2011. For example, Prior Lake Transit’ s projected reserve fund balance was more than 140 percent of its projected operating expenses. Because the city-run suburban transit providers had fund balances greater than the 35-percent maximum level established in the procedure, they were not eligible to receive supplemental MVST revenue in 2011.
34 The reserve fund levels set forth in the Council’s Regional Operating Revenue Allocation Procedures are as follows: Metro Transit must maintain a minimum 8.3-percent operating reserve fund level, Metropolitan Transportation Services must maintain a 10-percent operating reserve fund level, and suburban transit providers must each maintain a 25-percent operating reserve fund level. When funds are available, Metro Transit’s reserve funds can increase to 12 percent, Metropolitan Transportation Services’ reserve funds can increase to 15 percent, and suburban transit providers’ reserve funds can increase to 35 percent. Any amount above these limits is considered excess reserves.35 The Regional Service Improvement Plan Procedures outline the process to identify and prioritize regional opportunities to increase transit services. Under the procedures, a Regional Service Improvement Plan Review Committee, which has representatives from each suburban transit provider, Metro Transit, and Metropolitan Transportation Services, reviews regional transit providers’ proposed service improvements. The Regional Service Improvement Plan Review Committee then creates a prioritized list that indicates which projects have the greatest potential to meet regional transit goals. The Council adopted the Regional Service Improvement Plan procedure in September 2010. The committee will start meeting in January 2011.
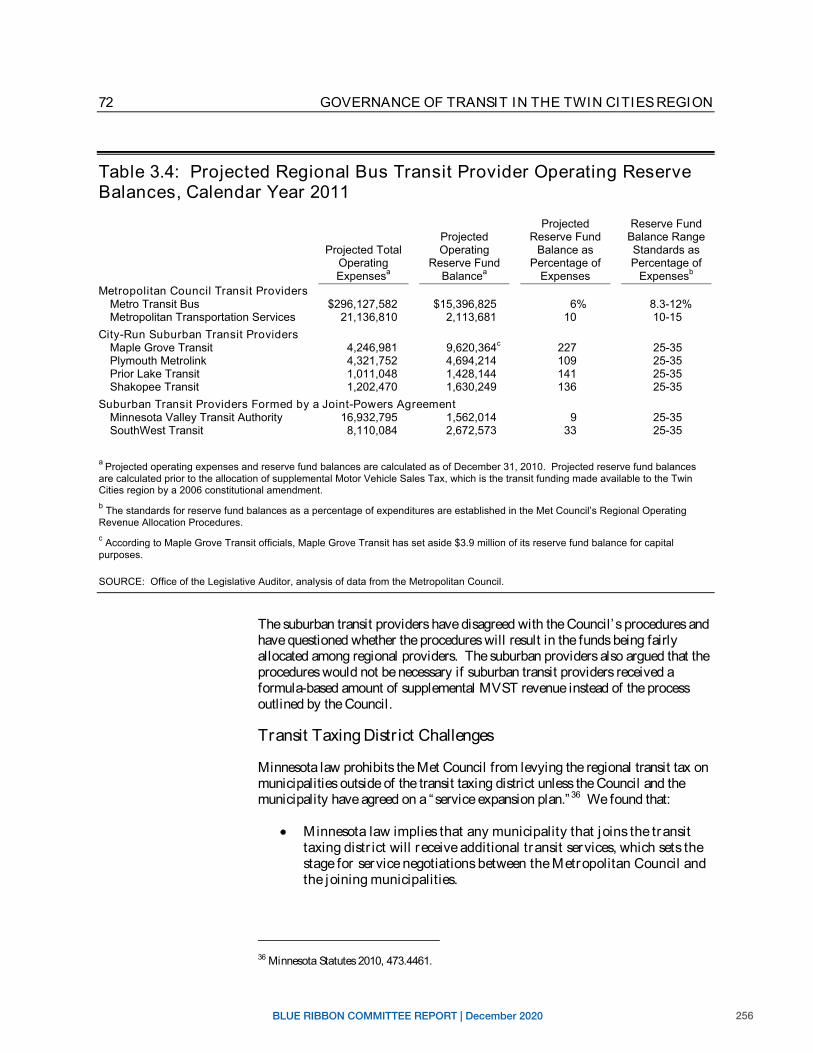
256BLUE RIBBON COMMITTEE REPORT | December 2020
72 GOVERNANCE OF TRANSIT IN THE TWIN CITIES REGION
Table 3.4: Projected Regional Bus Transit Provider Operating Reserve Balances, Calendar Year 2011
Projected Reserve Fund Projected Reserve Fund Balance Range
Projected Total Operating Balance as Standards as Operating Expensesa
Reserve Fund Balancea
Percentage of Expenses
Percentage of Expensesb
Metropolitan Council Transit Providers Metro Transit Bus $296,127,582 $15,396,825 6% 8.3-12% Metropolitan Transportation Services 21,136,810 2,113,681 10 10-15
City-Run Suburban Transit Providers Maple Grove Transit 4,246,981 9,620,364c 227 25-35 Plymouth Metrolink 4,321,752 4,694,214 109 25-35 Prior Lake Transit 1,011,048 1,428,144 141 25-35 Shakopee Transit 1,202,470 1,630,249 136 25-35
Suburban Transit Providers Formed by a Joint-Powers Agreement Minnesota Valley Transit Authority 16,932,795 1,562,014 9 25-35 SouthWest Transit 8,110,084 2,672,573 33 25-35
a Projected operating expenses and reserve fund balances are calculated as of December 31, 2010. Projected reserve fund balances are calculated prior to the allocation of supplemental Motor Vehicle Sales Tax, which is the transit funding made available to the Twin Cities region by a 2006 constitutional amendment. b The standards for reserve fund balances as a percentage of expenditures are established in the Met Council’s Regional OperatingRevenue Allocation Procedures. c According to Maple Grove Transit officials, Maple Grove Transit has set aside $3.9 million of its reserve fund balance for capitalpurposes.
SOURCE: Office of the Legislative Auditor, analysis of data from the Metropolitan Council.
The suburban transit providers have disagreed with the Council’s procedures and have questioned whether the procedures will result in the funds being fairly allocated among regional providers. The suburban providers also argued that the procedures would not be necessary if suburban transit providers received a formula-based amount of supplemental MVST revenue instead of the process outlined by the Council.
Transit Taxing Distr ict Challenges
Minnesota law prohibits the Met Council from levying the regional transit tax on municipalities outside of the transit taxing district unless the Council and the municipality have agreed on a “service expansion plan.”36 We found that:
Minnesota law implies that any municipality that joins the transit taxing distr ict will receive additional transit services, which sets the stage for service negotiations between the Metropolitan Council and the joining municipalities.
36 Minnesota Statutes 2010, 473.4461.
257BLUE RIBBON COMMITTEE REPORT | December 2020
73BUS TRANSIT
Four cities have joined the transit taxing district in recent years: Columbus, Forest Lake, Lakeville, and Maple Plain. As required by law, the Council entered into service agreements with each of these municipalities. For example, the Council agreed to operate a demonstration service for a park-and-ride facility in Maple Plain, once funds are procured for the project. In its service agreement plans with Forest Lake and Columbus, the Council agreed to operate five express bus trips each weekday that start in Forest Lake and make a stop in Columbus before heading to downtown Minneapolis.
The Met Council’s service agreement with Lakeville resulted in the construction of two park-and-ride facilities within the city limits—one along the I-35W South corridor and another on the Cedar Avenue corridor. In accordance with the service agreement, both of these park-and-ride facilities will receive bus rapid transit and/or express bus service. According to Met Council staff, officials from some municipalities that have been in the transit taxing district since it was first established were upset by the Lakeville service agreement because their communities do not receive this level of transit service. The ability of some municipalities to negotiate service terms as a condition of levying the regional transit capital tax gives these communities an advantage and may result in these communities receiving more transit services than other communities already in the taxing district.37
RECOMMENDATIONS
RECOMMENDATION
The Legislature should amend Minnesota Statutes 279B.09 to explicitly give the Metropolitan Council authority to allocate the supplemental Motor Vehicle Sales Tax revenue in the Twin Cities region.
Minnesota law does not specify how the supplemental MVST funds made available through the 2006 constitutional amendment should be allocated within the region. This lack of clarity has caused conflict between the Met Council and the suburban transit providers, which have differing opinions of how the funds should be distributed. As part of the region’s Metropolitan Planning Organization and as the recipient of federal and state funding, the Met Council has substantial oversight responsibilities for transit services in the region. As such, it should explicitly have the authority to allocate the supplemental MVST revenue in the Twin Cities region.
RECOMMENDATION
The Metropolitan Council should allocate supplemental Motor Vehicle Sales Tax revenue based on the needs of the region.
37 As with all existing transit services, services in cities entering the transit taxing district must meet regional performance standards and are based on communities’ transit needs.
258BLUE RIBBON COMMITTEE REPORT | December 2020
74 GOVERNANCE OF TRANSIT IN THE TWIN CITIES REGION
Distributing supplemental MVST revenue based on a formula, as proposed by the suburban transit providers, is not a regional approach and would not consider where funds are needed most in the region. Distributing supplemental MVST revenue following the approach outlined by the Met Council and based on regional priorities would ensure that providers have enough funds to maintain existing operations, while at the same time expanding the transit system through projects that will have the most impact in the region. The process established by the Met Council’ s procedures is appropriate and reasonable, and the Council should continue to allocate supplemental MVST revenue in this manner. It is important that data and criteria used to prioritize expansion projects align with the region’s goals for transit, which are discussed in Chapter 5.
RECOMMENDATION
The Legislature should amend Minnesota Statutes 473.446, subd. 2, to extend the transit taxing district so that all communities under the Metropolitan Council’s jurisdiction are included in the transit taxing district.
Met Council transit services are provided throughout the seven-county Twin Cities region, including in those municipalities that are outside of the transit taxing district. Additionally, residents from outside of the transit taxing district use park-and-ride facilities and other transit investments that are supported by the regional transit capital tax. In our view, the transit taxing district seems like an arbitrary and unjustified boundary given the jurisdiction and transit service area of the Met Council.
Furthermore, the current law leads to a negotiation process where a municipality considering joining the transit taxing district may be able to negotiate with the Met Council for transit services. We recommend, therefore, that the transit taxing district be expanded to include the Met Council’s full area of jurisdiction without requiring that additional services be provided in each community.
RECOMMENDATION
Smaller city-run suburban transit providers should consider consolidating. Those suburban providers that remain should work collaboratively with the Metropolitan Council to improve bus transit service in the region.
Having multiple small providers in the region has consumed large amounts of staff time and resulted in inefficiencies in the provision of transit services in the Twin Cities region. However, suburban transit providers offer valuable services to their communities, have successfully involved local communities in transit decisions, and have introduced innovation in the region.
Weighing the inefficiencies the suburban providers introduce to the region, the positive attributes of their services, and the difficulty of dismantling the existing system, we concluded in Chapter 2 that the suburban transit providers should not
259BLUE RIBBON COMMITTEE REPORT | December 2020
75BUS TRANSIT
be eliminated. However, we think that some of the suburban transit providers should consider consolidating.
Natural consolidating partners already exist among the city-run suburban transit providers. Shakopee and Prior Lake share a border and already jointly operate an express bus route to downtown Minneapolis, although they continue to be separate providers. Plymouth and Maple Grove also share a border, and both providers focus on providing express bus service to downtown Minneapolis.Larger transit providers are able to offer more services than smaller providers; more frequent service and more resources provided within one organization could improve overall transit services. Prior Lake Transit and Shakopee Transit have already experienced the benefits of sharing resources through jointly operating an express bus route. Consolidating into one transit organization may eliminate some management redundancies currently in place. Additionally, having fewer suburban providers would reduce the number of providers that the Met Council must coordinate with, which may enable Council staff to focus more on other regional transit issues.
Those suburban transit providers that remain should work cooperatively with the Met Council to provide regional bus service. Specifically, the suburban providers should comply with the Council’ s regional transit procedures and collaborate to improve bus transit service in the Twin Cities region.
We do not recommend allowing additional cities to opt out of Metro Transit service at this time. Having new regional providers would introduce additional complexities to the regional transit system. Metro Transit should continue working with local communities to address transit needs in their areas through sector studies and other outreach efforts.
260BLUE RIBBON COMMITTEE REPORT | December 2020
Transitways 4
The Twin Cities region currently has two operating transitways:Hiawatha LRT and Northstar commuter rail.
“Transitways” are corridors where transit has a dedicated running way or other feature that enables transit to travel more quickly than personal
vehicles, such as is the case with bus rapid transit (BRT), commuter rail, and light rail transit (LRT). In this chapter, we provide more information about transitways generally and examine how transitways are funded and developed. We discuss challenges associated with transitways and make recommendations for improvement.
TRANSITWAYS OVERVIEW The most appropriate mode of transit (BRT, commuter rail, or LRT) for a particular transitway depends on a number of factors, such as potential ridership, corridor distance, and availability of rights-of-way along roads or rail lines. Many regions around the country, such as Baltimore, Dallas-Fort Worth, Portland, and San Diego, have a mix of transitway modes as part of their regional transit system.
Table 4.1 lists the existing transitways, those under development, and those actively being considered in the Twin Cities region. Figure 4.1 shows these transitways on a map of the region.
Table 4.1 shows that only two transitways currently operate in the region:Hiawatha LRT and Northstar commuter rail. Hiawatha began passenger service in 2004, and Northstar started service in November 2009. Table 4.2 provides an overview of ridership and other operating statistics for the Hiawatha and Northstar transitways. As shown in the table, Hiawatha had operating expenditures of about $25 million and almost 10 million riders in 2009. In that year, Hiawatha LRT provided 12 percent of the rides in the Twin Cities region.
In addition to Hiawatha and Northstar, Table 4.1 shows that four other transitways in the region are in varying stages of development. The first phase of I-35W South BRT—express bus service between downtown Minneapolis and Lakeville—began in September 2009. Additional stations along the I-35W South BRT corridor, including a new station at 46th Street, are under construction or in the planning phase. Service at the 46th Street Station began in late 2010 and full BRT service with stops at every station (similar to how an LRT operates) is expected to begin in 2012. Express bus service along Cedar Avenue is currently operated by the Minnesota Valley Transit Authority (MVTA).1 BRT service along Cedar Avenue between the Mall of America and Lakeville is under development and is expected to begin passenger service in 2012.
1 The Met Council contracts with MVTA to provide express bus service along Cedar Avenue between Lakeville and downtown Minneapolis.
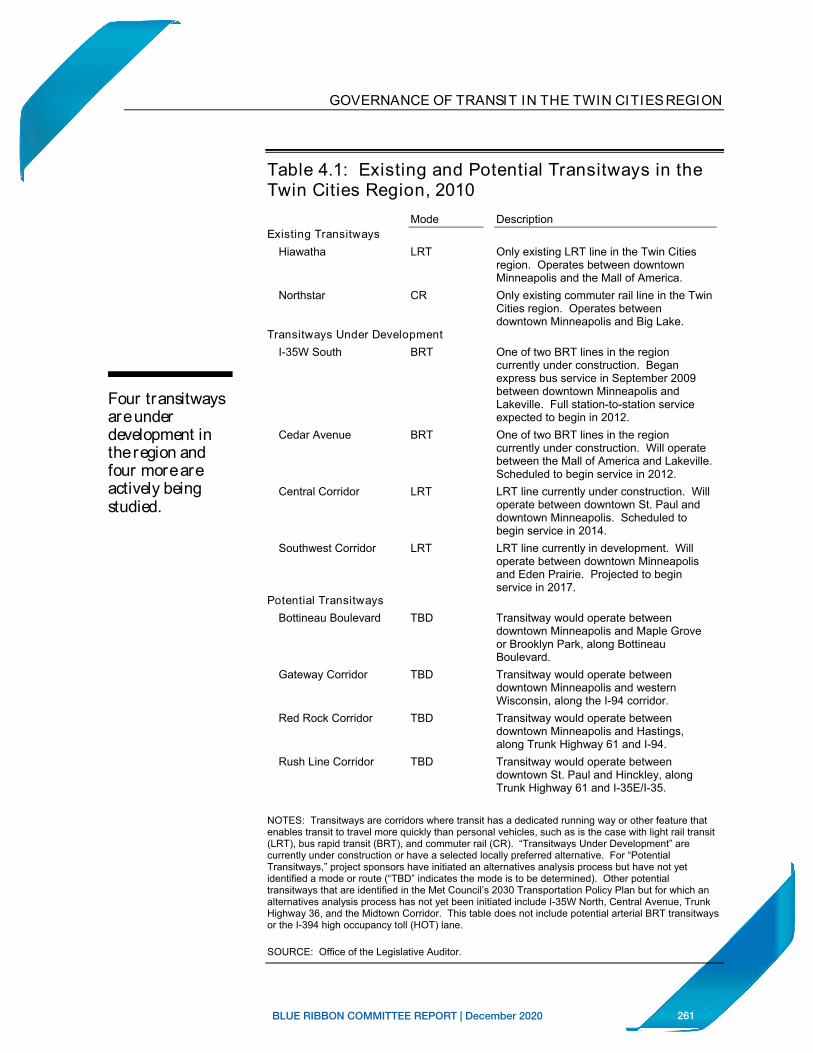
261BLUE RIBBON COMMITTEE REPORT | December 2020
78 GOVERNANCE OF TRANSIT IN THE TWIN CITIES REGION
Table 4.1: Existing and Potential Transitways in the Twin Cities Region, 2010
Mode Description Existing Transitways
Hiawatha LRT Only existing LRT line in the Twin Cities region. Operates between downtown Minneapolis and the Mall of America.
Northstar CR Only existing commuter rail line in the Twin Cities region. Operates between downtown Minneapolis and Big Lake.
Transitways Under Development I-35W South BRT One of two BRT lines in the region
currently under construction. Began express bus service in September 2009 between downtown Minneapolis and Four transitways Lakeville. Full station-to-station service
are under expected to begin in 2012. development in Cedar Avenue BRT One of two BRT lines in the region
currently under construction. Will operate the region and between the Mall of America and Lakeville. four more are Scheduled to begin service in 2012. actively being Central Corridor LRT LRT line currently under construction. Will
operate between downtown St. Paul and studied.downtown Minneapolis. Scheduled to begin service in 2014.
Southwest Corridor LRT LRT line currently in development. Will operate between downtown Minneapolis and Eden Prairie. Projected to begin service in 2017.
Potential Transitways Bottineau Boulevard TBD Transitway would operate between
downtown Minneapolis and Maple Grove or Brooklyn Park, along Bottineau Boulevard.
Gateway Corridor TBD Transitway would operate between downtown Minneapolis and western Wisconsin, along the I-94 corridor.
Red Rock Corridor TBD Transitway would operate between downtown Minneapolis and Hastings, along Trunk Highway 61 and I-94.
Rush Line Corridor TBD Transitway would operate between downtown St. Paul and Hinckley, along Trunk Highway 61 and I-35E/I-35.
NOTES: Transitways are corridors where transit has a dedicated running way or other feature that enables transit to travel more quickly than personal vehicles, such as is the case with light rail transit (LRT), bus rapid transit (BRT), and commuter rail (CR). “Transitways Under Development” are currently under construction or have a selected locally preferred alternative. For “Potential Transitways,” project sponsors have initiated an alternatives analysis process but have not yet identified a mode or route (“TBD” indicates the mode is to be determined). Other potential transitways that are identified in the Met Council’s 2030 Transportation Policy Plan but for which an alternatives analysis process has not yet been initiated include I-35W North, Central Avenue, Trunk Highway 36, and the Midtown Corridor. This table does not include potential arterial BRT transitways or the I-394 high occupancy toll (HOT) lane.
SOURCE: Office of the Legislative Auditor.
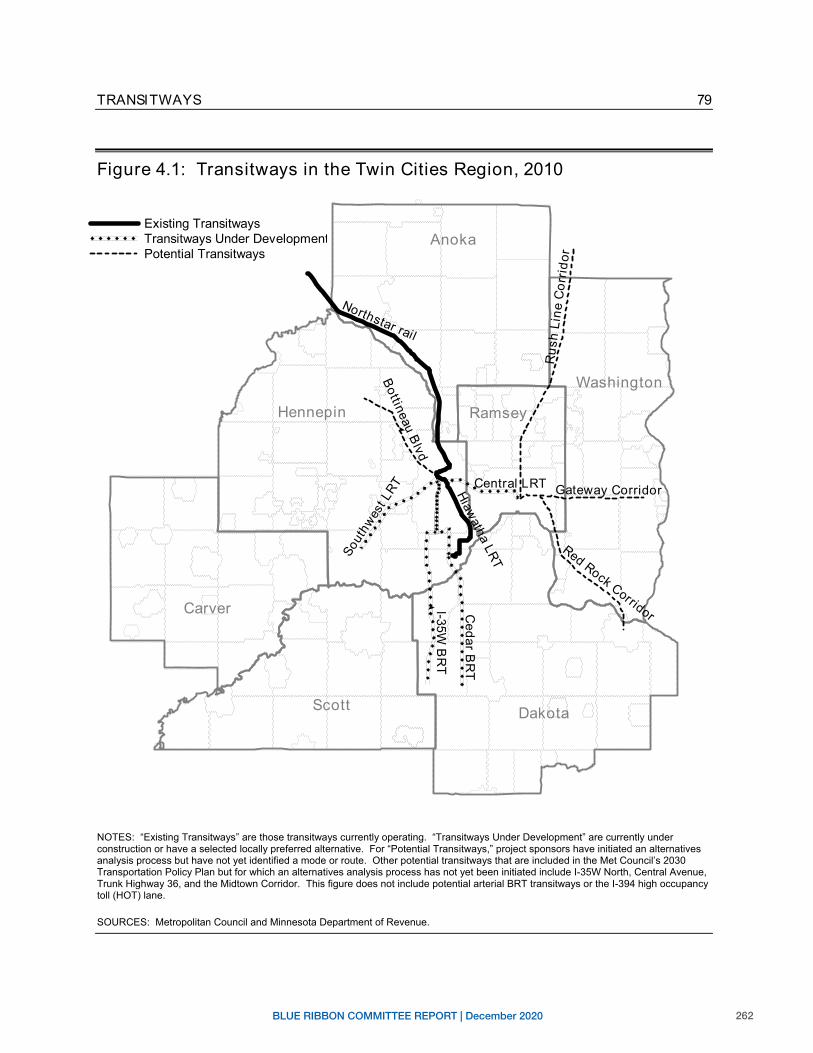
262BLUE RIBBON COMMITTEE REPORT | December 2020
79TRANSITWAYS
Figure 4.1: Transitways in the Twin Cities Region, 2010
Hennepin
Washington
Ramsey
Dakota
Carver
Scott
Anoka
BottineauB
lvd
Hiawatha
LRTSout
hwes
t LRT
Cedar
BR
T
I-3 5WB
RT
Central LRT Gateway Corridor
Rus
hLi
neC
orrid
orRed Rock Corridor
Northstar rail
Existing Transitways Transitways Under DevelopmentPotential Transitways
NOTES: “Existing Transitways” are those transitways currently operating. “Transitways Under Development” are currently under construction or have a selected locally preferred alternative. For “Potential Transitways,” project sponsors have initiated an alternatives analysis process but have not yet identified a mode or route. Other potential transitways that are included in the Met Council’s 2030 Transportation Policy Plan but for which an alternatives analysis process has not yet been initiated include I-35W North, Central Avenue, Trunk Highway 36, and the Midtown Corridor. This figure does not include potential arterial BRT transitways or the I-394 high occupancy toll (HOT) lane.
SOURCES: Metropolitan Council and Minnesota Department of Revenue.
' ( l c I I "- , C C
\
q __ J L
-iJ:J-\ f
5 ' r • 5 ' i\. r
!
-- ~ ---~! 1,------r I ; -
- ,.__ ....J '
/ ! I --~ - ...... ----:-7 ? :
) '
=~-r , __ L_J ___ J
i -r:';:-_:_ + t- , r
~ 1J ! l : - I I I l - -, IC' )' I
I I C! ! I I
! \_ __
-!- )
1
-~L
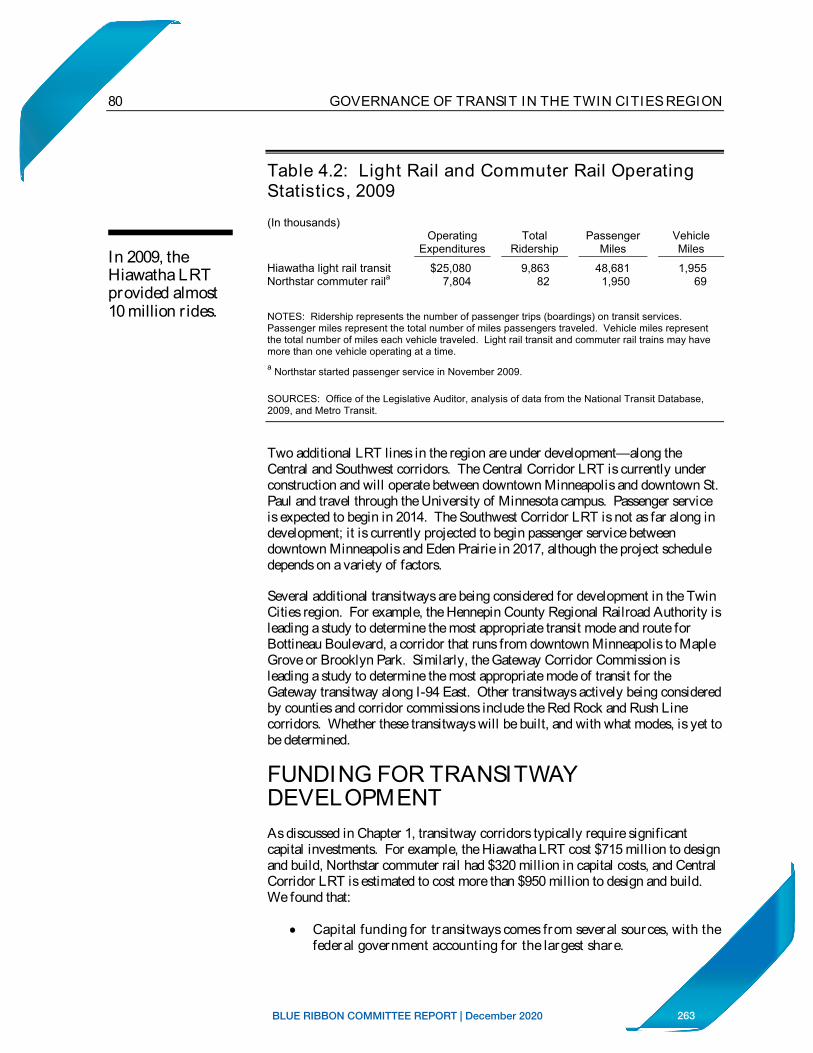
263BLUE RIBBON COMMITTEE REPORT | December 2020
80 GOVERNANCE OF TRANSIT IN THE TWIN CITIES REGION
In 2009, the Hiawatha LRT provided almost 10 million r ides.
Table 4.2: Light Rail and Commuter Rail Operating Statistics, 2009
(In thousands) Operating
Expenditures Total
Ridership Passenger
MilesVehicle Miles
Hiawatha light rail transit Northstar commuter raila
$25,0807,804
9,863 82
48,681 1,950
1,95569
NOTES: Ridership represents the number of passenger trips (boardings) on transit services. Passenger miles represent the total number of miles passengers traveled. Vehicle miles represent the total number of miles each vehicle traveled. Light rail transit and commuter rail trains may have more than one vehicle operating at a time. a Northstar started passenger service in November 2009.
SOURCES: Office of the Legislative Auditor, analysis of data from the National Transit Database, 2009, and Metro Transit.
Two additional LRT lines in the region are under development—along the Central and Southwest corridors. The Central Corridor LRT is currently under construction and will operate between downtown Minneapolis and downtown St. Paul and travel through the University of Minnesota campus. Passenger service is expected to begin in 2014. The Southwest Corridor LRT is not as far along in development; it is currently projected to begin passenger service between downtown Minneapolis and Eden Prairie in 2017, although the project schedule depends on a variety of factors.
Several additional transitways are being considered for development in the Twin Cities region. For example, the Hennepin County Regional Railroad Authority is leading a study to determine the most appropriate transit mode and route for Bottineau Boulevard, a corridor that runs from downtown Minneapolis to Maple Grove or Brooklyn Park. Similarly, the Gateway Corridor Commission is leading a study to determine the most appropriate mode of transit for the Gateway transitway along I-94 East. Other transitways actively being considered by counties and corridor commissions include the Red Rock and Rush Line corridors. Whether these transitways will be built, and with what modes, is yet to be determined.
FUNDING FOR TRANSITWAY DEVELOPMENTAs discussed in Chapter 1, transitway corridors typically require significant capital investments. For example, the Hiawatha LRT cost $715 million to design and build, Northstar commuter rail had $320 million in capital costs, and Central Corridor LRT is estimated to cost more than $950 million to design and build. We found that:
Capital funding for transitways comes from several sources, with the federal government accounting for the largest share.
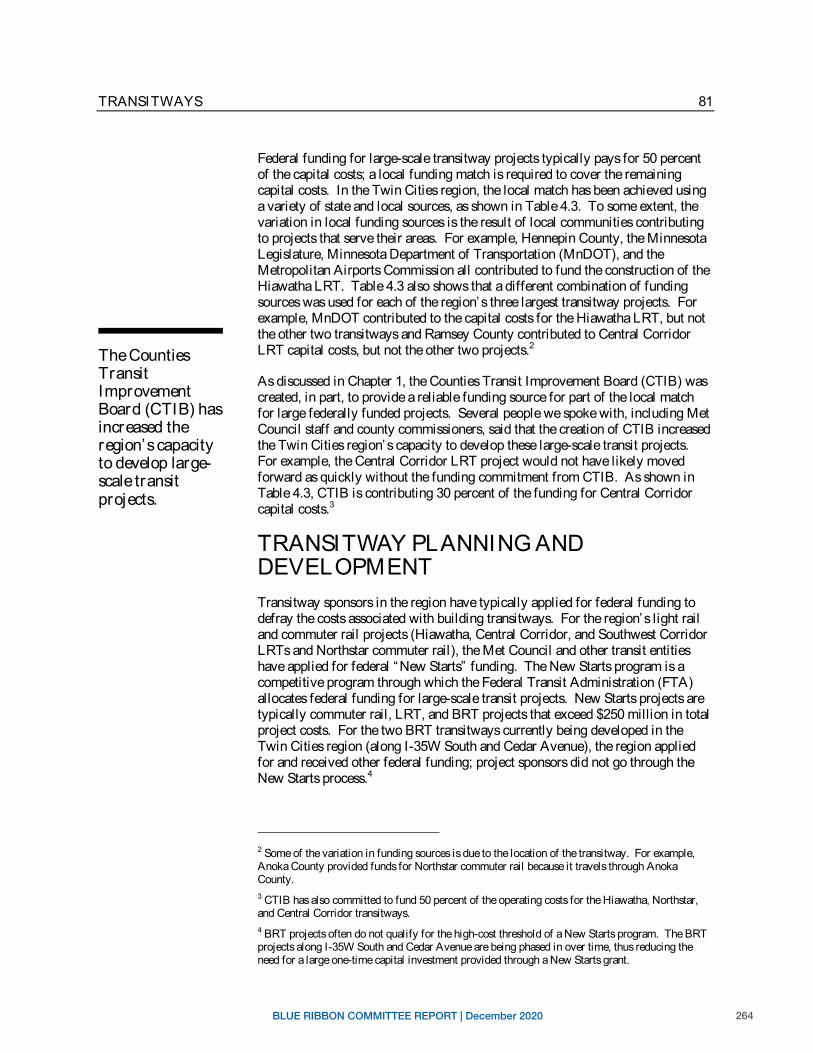
264BLUE RIBBON COMMITTEE REPORT | December 2020
81TRANSITWAYS
The Counties Transit ImprovementBoard (CTIB) has increased the region’s capacity to develop large-scale transit projects.
Federal funding for large-scale transitway projects typically pays for 50 percent of the capital costs; a local funding match is required to cover the remaining capital costs. In the Twin Cities region, the local match has been achieved using a variety of state and local sources, as shown in Table 4.3. To some extent, the variation in local funding sources is the result of local communities contributing to projects that serve their areas. For example, Hennepin County, the Minnesota Legislature, Minnesota Department of Transportation (MnDOT), and the Metropolitan Airports Commission all contributed to fund the construction of the Hiawatha LRT. Table 4.3 also shows that a different combination of funding sources was used for each of the region’s three largest transitway projects. For example, MnDOT contributed to the capital costs for the Hiawatha LRT, but not the other two transitways and Ramsey County contributed to Central Corridor LRT capital costs, but not the other two projects.2
As discussed in Chapter 1, the Counties Transit Improvement Board (CTIB) was created, in part, to provide a reliable funding source for part of the local match for large federally funded projects. Several people we spoke with, including Met Council staff and county commissioners, said that the creation of CTIB increased the Twin Cities region’s capacity to develop these large-scale transit projects. For example, the Central Corridor LRT project would not have likely moved forward as quickly without the funding commitment from CTIB. As shown in Table 4.3, CTIB is contributing 30 percent of the funding for Central Corridor capital costs.3
TRANSITWAY PLANNING AND DEVELOPMENTTransitway sponsors in the region have typically applied for federal funding to defray the costs associated with building transitways. For the region’s light rail and commuter rail projects (Hiawatha, Central Corridor, and Southwest Corridor LRTs and Northstar commuter rail), the Met Council and other transit entities have applied for federal “New Starts” funding. The New Starts program is a competitive program through which the Federal Transit Administration (FTA) allocates federal funding for large-scale transit projects. New Starts projects are typically commuter rail, LRT, and BRT projects that exceed $250 million in total project costs. For the two BRT transitways currently being developed in the Twin Cities region (along I-35W South and Cedar Avenue), the region applied for and received other federal funding; project sponsors did not go through the New Starts process.4
2 Some of the variation in funding sources is due to the location of the transitway. For example, Anoka County provided funds for Northstar commuter rail because it travels through Anoka County. 3 CTIB has also committed to fund 50 percent of the operating costs for the Hiawatha, Northstar, and Central Corridor transitways. 4 BRT projects often do not qualify for the high-cost threshold of a New Starts program. The BRT projects along I-35W South and Cedar Avenue are being phased in over time, thus reducing the need for a large one-time capital investment provided through a New Starts grant.
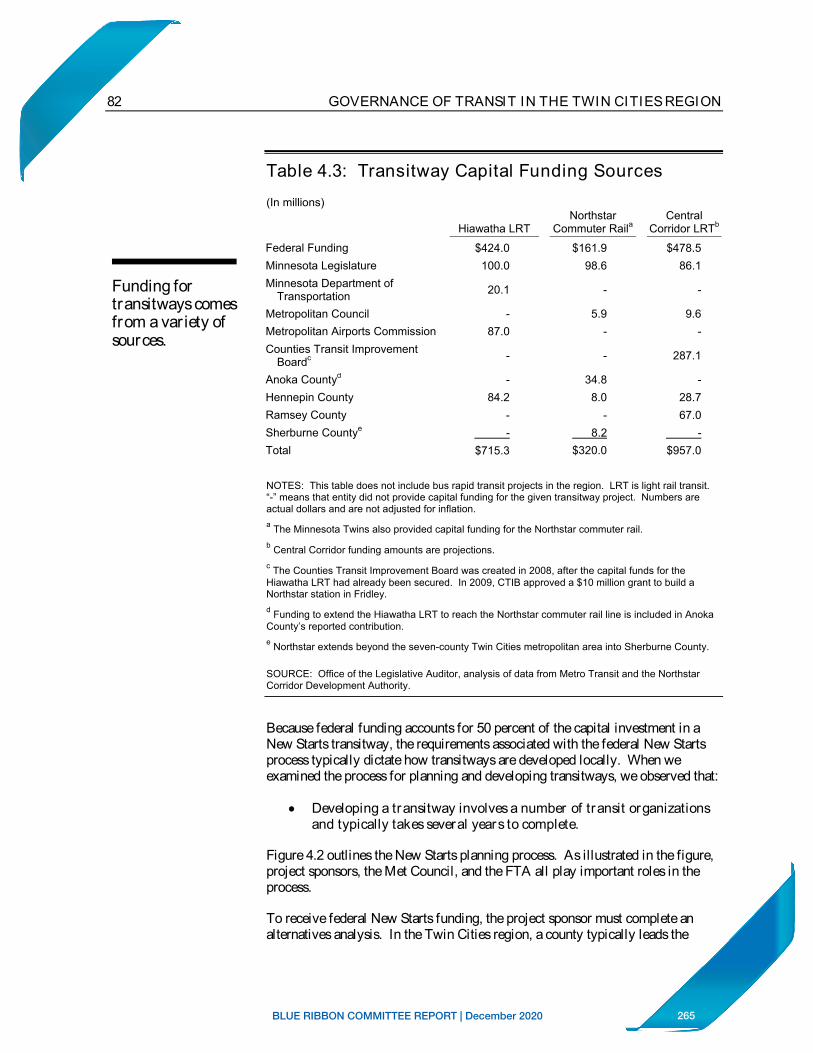
265BLUE RIBBON COMMITTEE REPORT | December 2020
82 GOVERNANCE OF TRANSIT IN THE TWIN CITIES REGION
Table 4.3: Transitway Capital Funding Sources
(In millions) Northstar Central
Hiawatha LRT Commuter Raila Corridor LRTb
Federal Funding $424.0 $161.9 $478.5 Minnesota Legislature 100.0 98.6 86.1
Funding for Minnesota Department of 20.1 - -Transportation transitways comes Metropolitan Council - 5.9 9.6from a variety of Metropolitan Airports Commission 87.0 - -sources. Counties Transit Improvement - - 287.1Boardc
Anoka Countyd - 34.8 -Hennepin County 84.2 8.0 28.7 Ramsey County - - 67.0Sherburne Countye - 8.2 -Total $715.3 $320.0 $957.0
NOTES: This table does not include bus rapid transit projects in the region. LRT is light rail transit.“-” means that entity did not provide capital funding for the given transitway project. Numbers are actual dollars and are not adjusted for inflation. a The Minnesota Twins also provided capital funding for the Northstar commuter rail. b Central Corridor funding amounts are projections. c The Counties Transit Improvement Board was created in 2008, after the capital funds for the Hiawatha LRT had already been secured. In 2009, CTIB approved a $10 million grant to build a Northstar station in Fridley. d Funding to extend the Hiawatha LRT to reach the Northstar commuter rail line is included in Anoka County’s reported contribution. e Northstar extends beyond the seven-county Twin Cities metropolitan area into Sherburne County.
SOURCE: Office of the Legislative Auditor, analysis of data from Metro Transit and the Northstar Corridor Development Authority.
Because federal funding accounts for 50 percent of the capital investment in a New Starts transitway, the requirements associated with the federal New Starts process typically dictate how transitways are developed locally. When we examined the process for planning and developing transitways, we observed that:
Developing a transitway involves a number of transit organizations and typically takes several years to complete.
Figure 4.2 outlines the New Starts planning process. As illustrated in the figure, project sponsors, the Met Council, and the FTA all play important roles in the process.
To receive federal New Starts funding, the project sponsor must complete an alternatives analysis. In the Twin Cities region, a county typically leads the
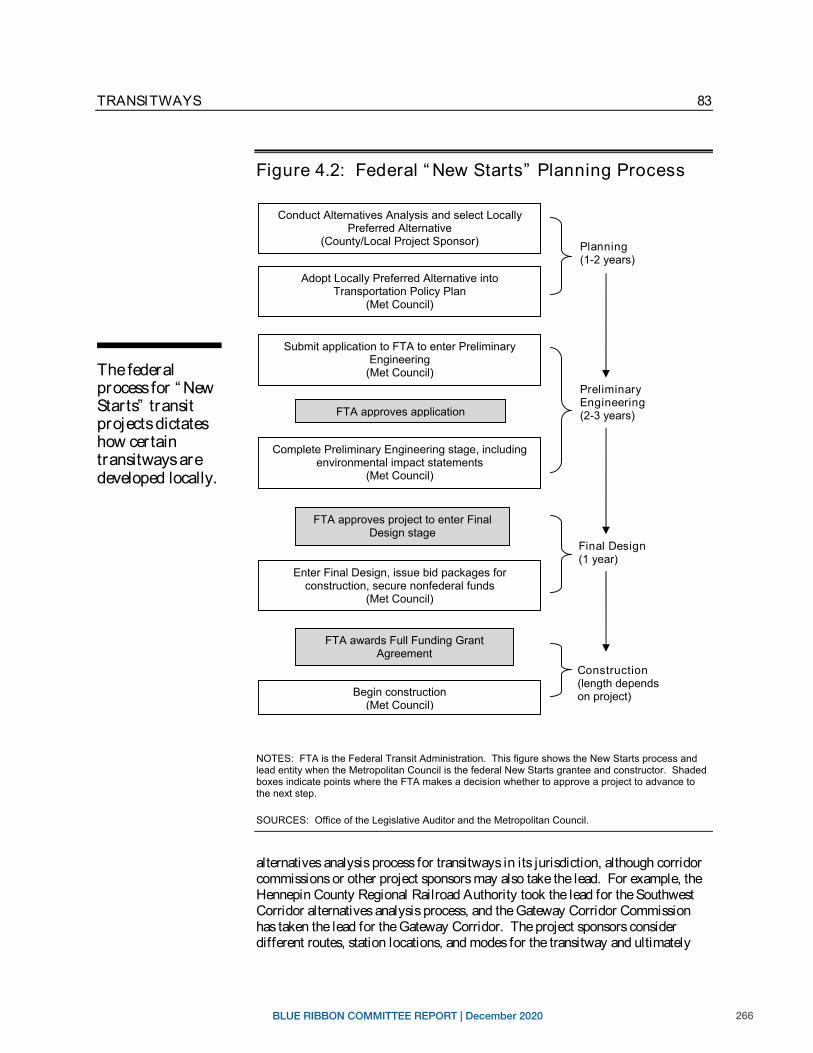
266BLUE RIBBON COMMITTEE REPORT | December 2020
83TRANSITWAYS
The federal process for “ New Starts” transit projects dictates how certain transitways are developed locally.
Figure 4.2: Federal “ New Starts” Planning Process
Conduct Alternatives Analysis and select Locally Preferred Alternative
(County/Local Project Sponsor) Planning (1-2 years)
Adopt Locally Preferred Alternative into Transportation Policy Plan
(Met Council)
FTA approves application
FTA approves project to enter Final Design stage
FTA awards Full Funding Grant Agreement
Preliminary Engineering (2-3 years)
Final Design (1 year)
Construction (length depends on project)
NOTES: FTA is the Federal Transit Administration. This figure shows the New Starts process and lead entity when the Metropolitan Council is the federal New Starts grantee and constructor. Shaded boxes indicate points where the FTA makes a decision whether to approve a project to advance to the next step.
SOURCES: Office of the Legislative Auditor and the Metropolitan Council.
alternatives analysis process for transitways in its jurisdiction, although corridor commissions or other project sponsors may also take the lead. For example, the Hennepin County Regional Railroad Authority took the lead for the Southwest Corridor alternatives analysis process, and the Gateway Corridor Commission has taken the lead for the Gateway Corridor. The project sponsors consider different routes, station locations, and modes for the transitway and ultimately
Submit application to FTA to enter Preliminary Engineering
(Met Council)
Complete Preliminary Engineering stage, including environmental impact statements
(Met Council)
Enter Final Design, issue bid packages for construction, secure nonfederal funds
(Met Council)
Begin construction (Met Council)
--1 I
I_-----~~ I I }
267BLUE RIBBON COMMITTEE REPORT | December 2020
84 GOVERNANCE OF TRANSIT IN THE TWIN CITIES REGION
The Met Council must adopt a transitway into its TransportationPolicy Plan before the project is eligible to receive federal funding.
recommend a locally preferred alternative, which is identified based on local priorities but typically considers ridership and cost figures. The alternatives analysis phase typically takes one to two years to complete and can cost transitway sponsors more than $1 million.
Once the locally preferred alternative is recommended, the Met Council must adopt the transitway into its Transportation Policy Plan before the project is eligible to receive New Starts or other federal funds. This is the first step where the Council has an official role in the corridor planning process, although Metro Transit and Met Council staff told us they are typically involved earlier as technical advisors. Once the transitway has been adopted into the Met Council’s transportation plan, the Council develops and submits an application to the FTA to enter the Preliminary Engineering phase. The Met Council submitted the application for the Southwest Corridor to enter this phase in August 2010.5
During the Preliminary Engineering phase, the Council and project sponsors complete environmental impact statements, finalize the engineering plans, and refine the financial plans. This phase takes about two to three years to complete. Once this is done, the Council submits an application to the FTA to enter the final design stage. During the final design stage, the Council develops a final cost estimate and secures the nonfederal matching funds. Once the final design is approved, which typically takes about one year, the FTA awards the Full Funding Grant Agreement, which is a commitment of federal dollars to the project. The grant agreement for the Central Corridor LRT project is expected to be awarded in the first quarter of 2011.
Projects that seek New Starts funding must meet federal requirements. The federal government has a number of factors it considers for projects applying for New Starts funding. These factors include:
1. Mobility improvements. Mobility improvements include how much time potential riders will save using the proposed system and the number of transit-dependent riders using the proposed system.
2. Land use. Land use considers development plans around proposed stations to determine whether they would support transit.
3. Cost effectiveness. Cost effectiveness compares the annualized capital and annual operating costs to the projected user benefit (expressed in terms of travel time savings) of the proposed transitway.
4. Financial plan. The financial plan must demonstrate sufficient local financial support for the project.
Other criteria include the economic development effects, environmental benefits, and operating efficiencies that would accrue to the whole transit system as a result of the proposed project.
5 The Hennepin County Regional Railroad Authority was also involved in the preparation of the Preliminary Engineering application for the Southwest Corridor LRT.
268BLUE RIBBON COMMITTEE REPORT | December 2020
85TRANSITWAYS
The two bus rapid transit projects in the region did not follow the New Starts process, took several years to develop, and involvedcoordinationamong several organizations.
Construction typically commences once the Full Funding Grant Agreement has been awarded, although construction on the Central Corridor started prior to the agreement being finalized.6 Construction itself takes several years, depending on the project. For example, the Hiawatha LRT took about four years and Northstar took two years to construct. The project timeline for the Central Corridor indicates that it will take four years to construct the Central Corridor LRT, and project plans indicate the Southwest Corridor LRT will take about three years to construct.
Although the two BRT projects in the region (Cedar Avenue and I-35W South) did not follow the New Starts process, they have also involved a number of entities and have taken several years to develop. The Dakota County Regional Railroad Authority is the lead entity for the Cedar Avenue project and received special legislation to allow it to levy for the BRT transitway.7 Dakota County’s Cedar Avenue BRT project partners include the Minnesota Valley Transit Authority, the Met Council, CTIB, and Metro Transit. There are more than ten funding sources for the Cedar Avenue transitway, including the cities of Apple Valley and Lakeville, several federal programs, Dakota County, the Dakota County Regional Railroad Authority, and state bonds. Planning for the Cedar Avenue BRT began in the 1990s. Unlike rail transitways, BRT service can be phased in over time. Service along the transitway is scheduled to begin in 2012, and Dakota County and its partners plan to expand the service by 2030.
The Met Council is the lead entity for developing the I-35W South BRT transitway. This project implementation was advanced in part due to the availability of federal Urban Partnership Agreement funds. Project partners for the I-35W South BRT transitway include CTIB and Metro Transit. As with the Cedar Avenue transitway, the Met Council plans to phase in BRT service along I-35W South. Full BRT service along I-35W South is scheduled to begin in 2012, and the Council also plans to implement expanded service along this corridor by 2030.
TRANSITWAY CHALLENGES Transitway projects are large, expensive, and complicated. It is not surprising then, that the planning and development of transitways involve a number of challenges. This section details the challenges in the Twin Cities region associated with planning, developing, and operating transitways, largely focused on New Starts projects.
6 The Met Council received several Letters of No Prejudice from the FTA indicating that construction costs incurred for the Central Corridor before the final grant agreement was finalized would be eligible for partial reimbursement by federal funds. 7 Laws of Minnesota First Special Session 2005, chapter 6, sec. 90.
269BLUE RIBBON COMMITTEE REPORT | December 2020
86 GOVERNANCE OF TRANSIT IN THE TWIN CITIES REGION
The region depends on local initiatives to move transit projects forward, in part because there are no agreed-upon regionwide cr iter ia for pr ior itizing potential transitways.
Transitway Planning Challenges As discussed above, several entities are involved in planning transitways in the region, including local communities, counties, the Met Council, and the FTA. As a result, we found that:
The process for planning transitways in the Twin Cities region is fragmented.
Transitways are developed by counties and local stakeholders through the alternatives analysis process. Many stakeholders with whom we met, including Met Council staff, Metro Transit staff, and county commissioners, said the region depends on local initiatives to move transit projects forward. There is broad acknowledgement that these local efforts are important for gaining support for transit projects in the region. However, the local efforts are based on local, and not necessarily regional, priorities. As noted earlier, the Met Council, which is the only transit agency with regionwide responsibilities in the Twin Cities, officially becomes involved in the development of a transitway only once the local stakeholders have recommended the locally preferred alternative to the Met Council and the transitway is adopted by the Council into the Transportation Policy Plan.
In addition, the region now relies on CTIB, with its own set of priorities, to provide the largest local share (30 percent of the capital costs) for federally funded projects. Although CTIB funding decisions must be consistent with the Met Council’s Transportation Policy Plan, CTIB selects transitways to fund based on its own priorities, not necessarily the priorities of the region as a whole.For example, CTIB has stated it will not provide funding for BRT transit on arterial roads even though the Met Council has identified “arterial BRT” as a priority for the coming years.8 CTIB’s stated vision is “a network of connected transitways” throughout the five-county member area. This is clearly a narrower vision for transit than is held by the Met Council, which oversees transit for the seven-county metropolitan area and is not limited to transitways.
CTIB’s role in identifying potential transitways complicates the planning process. For example, CTIB has published maps of potential transitways in the region that conflict with transitway maps published by the Met Council.9 These competing maps make it difficult for policymakers and the public to understand the region’s transit priorities regarding transitways. Additionally, we found that:
Neither the Metropolitan Council nor the Legislature has identified cr iter ia to pr ior itize the development of some transitways ahead of others.
8 Arterial BRT is bus rapid transit service provided along existing routes with significant ridership that operate on arterial roads, such as Nicollet Avenue in south Minneapolis. 9 CTIB’s and the Met Council’s maps identified different modes for some potential transitways, and the CTIB map did not include arterial BRT routes that the Council included on its map.
270BLUE RIBBON COMMITTEE REPORT | December 2020
87TRANSITWAYS
Othermetropolitanareas have set pr ior ities for transitwaydevelopment.
Beginning in 2001, the Met Council conducted an analysis of 29 proposed transitway corridors and identified which corridors could support LRT or BRT. In 2004, the Council grouped the corridors into “Tier 1” and “Tier 2” projects, based on readiness and geographic distribution. Most of the Tier 1 corridors have been developed or are under development, including Hiawatha LRT, Northstar commuter rail, Central Corridor LRT, and BRT on I-35W South and Cedar Avenue. However, the Council did not prioritize one transitway before another, nor did the Council identify what criteria should be used to prioritize the transitways. In fact, Bottineau Boulevard, identified in 2004 as a Tier 1 corridor, is further behind in the development process than Southwest Corridor, which was identified as a Tier 2 transitway.10
In 2008, the Met Council published the 2030 Transit Master Study, an updated study of potential transitways that evaluated potential corridors on the basis of ridership and cost. In this study, the Council recommended some transitway corridors for additional development or study, including Bottineau Boulevard, Southwest Corridor, I-35W North, I-94 East (Gateway Corridor), and Rush Line Corridor. However, the Council did not recommend which transitway should be developed next. Several transitways, including Bottineau Boulevard and the Gateway, Red Rock, Robert Street, and Rush Line corridors, are moving forward with the alternatives analysis process. There is widespread belief among people we interviewed that the next transitway developed will be the one that is next to complete the alternatives analysis process, not necessarily the one that will most benefit the region. This is in part based on how the development of transit in the region has occurred in the past, and in part because there are no agreed-upon regionwide criteria for prioritizing potential transitways.
In contrast to the Twin Cities region’s approach, other metropolitan areas have taken a broader view towards developing transit systems. The Regional Transportation District of Denver prioritized a set of transitway corridors to build a comprehensive regional transit system. Through its process, Denver’s Regional Transportation District identified an order for building the transitways through 2018. Similarly, the Utah Transit Authority, with the aid of a voter-approved sales tax, accelerated the construction of five additional rail projects in the region to develop a comprehensive regional transit system. Originally planned to be completed by 2030, these five rail transitways are now scheduled to be completed by 2015.
The 2008 Legislature encouraged the Met Council to take an approach similar to the Utah Transit Authority to secure funding and required the Council to:
[I]nitiate negotiations with the federal Transit Administration to secure federal funds for a single comprehensive program of rail transit way development, to include Rush Line, Red Rock,
10 In 2002, the Legislature allocated funding to develop BRT along Bottineau Boulevard. For a variety of reasons, Hennepin County did not move forward with BRT in the corridor. The county has since initiated a study to evaluate an LRT transitway along the Bottineau Boulevard corridor.
271BLUE RIBBON COMMITTEE REPORT | December 2020
88 GOVERNANCE OF TRANSIT IN THE TWIN CITIES REGION
Current law prohibits the study of the Dan Patch corr idor for transitdevelopment.
Southwest Corridor, and an extension of Northstar commuter rail to St. Cloud.11
Met Council staff pursued such negotiations with the FTA with no success. In a letter addressed to Met Council staff dated December 18, 2009, the FTA Regional Administrator stated that although the FTA supports comprehensive regional planning of future major transit investments, the FTA must evaluate each potential transit project individually on its own merits.12
Although the Legislature encouraged the Met Council to develop a comprehensive transit plan for the region, we found that:
Existing Minnesota law prohibits consideration of all potential transitways in the region.
Laws of Minnesota 2002, chapter 393, sec. 85, prohibits the consideration or study of the Dan Patch Corridor for development as a commuter rail line. The Dan Patch Corridor is a potential commuter rail corridor that runs between Minneapolis and Northfield. In 2002, the Legislature prohibited the Met Council, the Minnesota Department of Transportation, and regional railroad authorities from spending any money for “study, planning, preliminary engineering, final design, or construction for the Dan Patch commuter rail line.”13
Additionally, the Met Council was required to:
Remove all references, other than references for historical purposes, to the Dan Patch commuter rail line from any future revisions to the council’s transportation development guide and the council’s regional transit master plan.14
Many stakeholders we spoke with disagree with the Dan Patch prohibition. Some people we interviewed noted that the prohibition regarding the Dan Patch Corridor had implications when planning the Southwest Corridor LRT, since those two corridors would potentially be parallel to each other.
Transitway Development Challenges Once a transitway is ready to be developed in the Twin Cities region, there are other challenges. We found that:
11 Laws of Minnesota 2008, chapter 152, art. 6, sec. 8. 12 Marisol Simon, Regional Administrator, Federal Transit Administration, letter to Arlene McCarthy, Director, Metropolitan Transportation Services, Metropolitan Council, December 18, 2009.13 Laws of Minnesota 2002, chapter 393, sec. 85, subds. 2-4. 14 The commissioner of the Minnesota Department of Transportation was also required to “ remove all references, other than references for historical purposes, to the Dan Patch commuter rail line from any future revisions to the state transportation plan and the commissioner’s commuter rail system plan.” See Laws of Minnesota 2002, chapter 393, sec. 85, subds. 2-3.
272BLUE RIBBON COMMITTEE REPORT | December 2020
89TRANSITWAYS
Having different agencies assume different roles on transitwayprojects has led to confusion between the region and the Federal Transit Administration.
Each New Star ts transitway that has been developed in the region— Hiawatha, Nor thstar , and Central Corr idor—has followed a different development model.
According to Met Council staff, there are three primary roles for each New Starts project: (1) federal grantee, (2) builder, and (3) owner-operator. There has been a different configuration of these roles for each of the three New Starts projects built in the Twin Cities region. For the Hiawatha LRT project, the Met Council was the federal grantee, MnDOT and the Metropolitan Airports Commission constructed the line, and the Met Council/Metro Transit is the owner-operator. On Northstar commuter rail, MnDOT was the federal grantee and constructed the line and the Met Council/Metro Transit is the owner-operator. For the Central Corridor LRT, the Met Council is the federal grantee and constructor, and the Met Council/Metro Transit is the owner-operator.
Met Council staff said these changing roles have led to confusion between the region and the FTA. Staff said that because of the number of entities involved in transit in the region, the FTA has had to work with a number of different local representatives. Council staff said this can contribute to uncertainty about which entity is leading New Starts projects in the region. Staff said this uncertainty is likely to continue given the current project sponsors on future projects, including Hennepin County (Bottineau Boulevard); the Gateway Corridor Commission, which includes representatives from Ramsey and Washington counties and several cities along the corridor (Gateway Corridor); the Rush Line Corridor Task Force, which includes representatives from Anoka, Chisago, Pine, Ramsey, and Washington counties (Rush Line Corridor); and the Red Rock Corridor Commission, which includes representatives from Dakota, Hennepin, Ramsey, and Washington counties (Red Rock Corridor).
In addition to the number and variety of entities involved in planning and developing transitways, the different entities have varying levels of expertise. The Met Council has developed expertise in planning, building, and operating light rail and commuter rail through its experience on the Hiawatha, Northstar, and Central Corridor transitways. In 2010, the Met Council identified a New Starts Rail Projects Director to shepherd the region’s New Starts transit projects through the process. While some project sponsors have experience with the New Starts process, others do not, and they will require additional technical assistance from Metro Transit and the Met Council.
As mentioned in Chapter 2, the Met Council is developing a series of transitway guidelines to increase consistency among the region’s transitways. These guidelines will address a range of issues, including transitway stations, vehicles, and operations. The guidelines will also address the project development process and management. Council staff told us the guidelines will help evaluate and develop transit corridors as part of a regional system and will provide benchmarks for policymakers to use when evaluating proposed transit projects.
273BLUE RIBBON COMMITTEE REPORT | December 2020
90 GOVERNANCE OF TRANSIT IN THE TWIN CITIES REGION
Whether funding is available to build a transitway may not relate to whether funding is available to operate the transitway.
Transitway Operating Challenges Once the transitways are planned and developed, they need to be operated and maintained. We found that:
Transit organizations in the region are not required to consider (1) the ongoing operating and maintenance obligations that result from developing transitways or (2) how transitways should be balanced with other regional transit pr ior ities.
As detailed throughout this chapter, a variety of organizations are involved in planning and developing transitways. The organizations involved in the beginning stages (local transitway sponsors and/or counties) are not the organizations that will ultimately be responsible for operating most transitways (the Met Council and Metro Transit). Similarly, whether funding is available for the development and construction of a transitway may not relate to whether funding is available for its operations.
For example, the FTA typically provides funding for 50 percent of the capital costs of a transitway, but it does not provide funding for the transitway’s ongoing operations. Similarly, county regional railroad authorities may, by law, provide up to 10 percent of the capital costs of a light rail or commuter rail transitway in the region, but Minnesota law prohibits them from contributing “any funds to pay the operating and maintenance costs for a light rail transit or commuter rail project.” 15 CTIB has committed to paying for 30 percent of the costs of developing the Central Corridor and 50 percent of the net operating costs of Hiawatha LRT, Northstar commuter rail, Central Corridor LRT, I-35W South BRT, and Cedar Avenue BRT.16 However, CTIB does not bear the burden of operating the entire transit system or ensuring there are adequate funds to do so.
By law, the state must pay for 50 percent of light rail net operating costs.17 The state’s obligation, coupled with the commitment by CTIB to cover 50 percent of the net operating costs, should mean that sufficient funds are available to cover the operating costs of Hiawatha and Central Corridor LRTs. However, in 2009 the Legislature did not explicitly fund its full share of operating costs for Hiawatha. As a result, Met Council staff told us, the Council had to make adjustments throughout the transit system to compensate for the reduced funding.
Given the region’s scarce transit operating resources and unpredictable revenue sources (as discussed in Chapter 1), the Met Council and other regional transit providers will need to prioritize services. Transitway projects may or may not be a priority for the region. If the transitways are constructed, however, there will be increased pressure on the Met Council to fund their operations even though there may be other regional transit priorities, such as improving bus service throughout the region. Although the FTA requires that transitways not be built at
15 Minnesota Statutes 2010, 398A.10, subds. 1-2. This limit on regional railroad authorities’ contributions for operating costs was enacted when CTIB was created in 2008. 16 Net operating costs are the operating costs that remain after subtracting fare revenue. 17 Minnesota Statutes 2010, 473.4051, subd. 2.
274BLUE RIBBON COMMITTEE REPORT | December 2020
91TRANSITWAYS
Additional coordination is required when transitways run through the service areas of multipleproviders.
the expense of the existing bus system, in our interviews several regional bus providers expressed concern that the operating costs for the region’s rail transitways would crowd out funding for bus operations.
Additionally, staff from the Met Council and suburban transit providers told us that:
The development of transitways in the region has fur ther complicated the relationship between the Metropolitan Council and suburban transit providers.
In particular, staff told us the Cedar Avenue BRT transitway has required significant coordination between the Met Council and the Minnesota Valley Transit Authority (MVTA) because the corridor runs through service areas of both providers. The transitway will start in Lakeville and end at the Mall of America, both of which are in Metro Transit’ s service area. The bulk of the BRT route will be along Cedar Avenue through MVTA’s service area. These changing jurisdictions will require additional coordination between the two providers regarding operating and funding the BRT line. Similar coordination will need to occur between the Met Council and SouthWest Transit once the Southwest Corridor transitway is developed and between the Met Council and Maple Grove Transit if the Bottineau Boulevard transitway is developed. Issues regarding the potential overlap of bus and LRT services along the Southwest Corridor and Bottineau Boulevard will need to be resolved. The Council’s draft transitway guidelines include guidance for when a transitway travels through the service areas of multiple providers; the guidelines may be helpful in these corridors.18
In large part because of the strained relationship between the Council and suburban transit providers regarding bus service, as discussed in Chapter 3, coordination among these entities regarding transitways is also difficult. There have been numerous meetings, letters, and e-mails among the Cedar Avenue project partners regarding a variety of issues, such as the park-and-ride facilities, the type of service provided during construction, and ongoing operations. Because the relationship between the Council and MVTA is already difficult, this coordination has been more complicated than it otherwise would be.
RECOMMENDATIONS
RECOMMENDATION
The Metropolitan Council should coordinate with stakeholders to establish regional transit priorities and prioritize potential transitways for future development based on data and the needs of the region.
As the regional transit planning entity, the Met Council should lead the effort to establish transit priorities for the region. The priorities for transitways should
18 The Council’s transitway guidelines are expected to be adopted in 2011.
275BLUE RIBBON COMMITTEE REPORT | December 2020
92 GOVERNANCE OF TRANSIT IN THE TWIN CITIES REGION
consider projected ridership, cost estimates, and other transit goals for the region. The Met Council should also develop a comprehensive program for developing transitways similar to what Denver and Utah have done and as was required by the2008 Legislature. In contrast to the law, however, we recommend that the Met Council start with a blank slate and select those transitways that, based on the data, present the best opportunity for the region. Given the current economic conditions, we do not recommend that the Met Council attempt to build the entire system all at once, as was done in Utah, but we think it is important for the Council to have a comprehensive and prioritized plan.
The Council should make an effort to involve stakeholders throughout the process. Successfully implementing this recommendation requires that local project sponsors work with the Council to take a regional view of transit projects and priorities. Counties and other transitway sponsors would still be able to advocate for and evaluate potential transitway corridors and modes; project sponsors would continue to lead alternatives analysis processes and identify locally preferred alternatives. However, decisions about whether a transitway project moves forward should be based on local and regional priorities.
The Met Council has taken the first step toward developing a comprehensive plan through its 2030 Transportation Policy Plan and its 2030 Transit Master Study. However, we think the Council needs to go further and prioritize the corridors identified in these plans.
Developing a comprehensive and prioritized plan requires that the Met Council has the credibility to lead this initiative so that local sponsors support the end result. As the Met Council is currently structured, it may not have the necessary credibility to do so. In Chapter 2, we suggested changes to the Council’s governance structure that may enhance its credibility. Establishing transitway priorities also requires clear goals. In Chapter 5, we discuss the Legislature’s and the Met Council’s responsibilities for identifying goals and priorities for transit in the region.
RECOMMENDATION
The Metropolitan Council should only incorporate into the region’s Transportation Policy Plan those transitways that are at or near the top of the region’s transit priority list.
As discussed previously in this chapter, transitways must be adopted into the Met Council’s Transportation Policy Plan before a project is eligible for federal funding. The Council should only adopt into its transportation plan those transitways that are identified as regional transit priorities. By excluding from the plan transitways that are not a priority for the region, the Met Council would demonstrate that it does not “approve” of those transitways. Corridors for which
276BLUE RIBBON COMMITTEE REPORT | December 2020
93TRANSITWAYS
counties have completed an alternatives analysis would not be developed unless the Council revised the plan to include them.19
This recommendation increases the Council’ s role in developing transitways in the region. As with the previous recommendation, the Met Council as currently structured may not have the necessary credibility among local transit stakeholders to effectively implement this recommendation. See Chapter 2 for a discussion regarding the Council’s credibility and suggested changes to its governance structure that would enhance its standing among other transit organizations in the region.
RECOMMENDATION
The Minnesota Legislature should repeal Laws of Minnesota 2002, chapter 393, sec. 85, and allow consideration of the Dan Patch corridor.
If the Met Council is expected to take a regional view in planning and developing transit, it needs to be able to consider all potential transit corridors in the region and evaluate them using objective measures to determine where development should occur. As transit corridors in the region are developed, the interconnections between the corridors become increasingly important. A full understanding of all potential corridors is important to maximize the potential of the transit system. As a result, it is important that the Met Council and other transit organizations in the region are able to consider all potential corridors, including the Dan Patch Corridor, and their potential impact on the region’s transit system.
RECOMMENDATION
The Legislature should designate in law the Metropolitan Council as the federal grantee and constructor of New Starts transitway projects in the region.
Through its work on Hiawatha LRT, Northstar commuter rail, and the Central Corridor LRT, the Met Council has developed expertise on New Starts projects. It has also identified a Director of New Starts Rail Projects to help the region navigate through the federal requirements associated with these projects. To facilitate the process and to maximize the region’s relationship with the FTA, the Met Council should be designated as the region’s lead entity on New Starts projects. This will help the region leverage what it has learned on previous New Starts projects and improve the relationship between the region and the FTA.
Under this recommendation, counties and local transitway sponsors could still take the lead on the alternatives analysis process and identify a locally preferred alternative. Once the locally preferred alternative is adopted by the Council into
19 The Met Council’s Transportation Policy Plan is revised at least every four years and can be amended in the interim.
277BLUE RIBBON COMMITTEE REPORT | December 2020
94 GOVERNANCE OF TRANSIT IN THE TWIN CITIES REGION
the region’s Transportation Policy Plan, however, the Council should be the project lead.
This recommendation does not address the complexity of developing a transitway that does not go through the New Starts process. Smaller projects that are not eligible for the federal New Starts process will likely continue to be complicated and involve a number of planning and funding partners. Because each one of these projects will be unique, we do not offer a regionwide recommendation. Nevertheless, we encourage all entities involved in developing a transitway to coordinate their efforts and ensure consistency with the regional transit priorities.
RECOMMENDATION
The Legislature should not commit capital funds to a transitway development project without ensuring that operating revenues for the first five to ten years have been identified.
As discussed previously, CTIB has committed to fund 50 percent of the operating costs of the transitways it helps build. Although statutes require the state to provide 50 percent of the operating costs for LRT, the Legislature has not always followed through on this commitment. The uncertainty of transit funding and shortfalls in the state’s general fund have led to concerns that the state will not fulfill its commitments to fund transitway operating costs in the future. If sufficient operating funds are not available once a transitway is developed, the Met Council (as the operator of the transitway) will need to make service and maintenance decisions that could affect transit operations throughout the region. Depending on priorities and available funding, bus or other types of service could be negatively affected by the need to accommodate transitway operating costs.
The Legislature can encourage transit entities in the region to fully account for transitway operating revenue by requiring operating revenue sources to be identified before the Legislature commits transitway capital funds. The federal New Starts application also requires documentation demonstrating that operating revenue is available for the proposed transitway project. While the commitment of future operating funds cannot be guaranteed, this requirement will help ensure that revenue sources for operating costs are identified before the region commits to building additional transitways.
278BLUE RIBBON COMMITTEE REPORT | December 2020
Transit Per formance 5
State statutes identify a number of goals related to transit.
I n this chapter, we evaluate the performance of transit services in the Twin Cities region. First, we discuss the goals for transit in the region and identify
potential measures to evaluate how well the system addresses these goals. We then provide an assessment of the Twin Cities region’s overall performance compared to peer regions in the country. Finally, we examine how well each transit provider in the Twin Cities region performed on selected measures.
GOALS FOR TRANSIT We reviewed state laws related to transit and transportation to determine what goals the Legislature has identified for regional transit. Table 5.1 lists the transit and transit-related transportation goals identified in law. Among the goals identified in state statute are to “assure the most efficient and coordinated use of existing and planned transit resources” and to “meet the needs of transit users.”
In reviewing the transit-related laws, we found that:
State statutes do not sufficiently clar ify or pr ior itize the goals of transit in the Twin Cities region.
The goals specific to transit are vague and in some cases duplicative, as shown in Table 5.1. For example, the goal to “provide transit services . . . to meet the needs of transit users [italics added]” (Goal 6) seems to be a subset of the goal to provide “a comprehensive set of transit . . . services to meet the needs of allpeople in the metropolitan area [italics added]” (Goal 1). In addition, the goal to provide “a basic level of mobility for all people” (Goal 5) could be interpreted in many ways.
The state’s goals for transit are scattered across two sections of Minnesota statutes. Many of the transit goals that stakeholders believe are important for the region are not identified as such. For instance, in interviews, staff from the Met Council and some suburban transit providers mentioned reducing traffic congestion (Goal 13) and safety (Goal 10) as transit goals. However, Minnesota statutes do not identify these as regional transit goals. Instead, they are identified more generally as transportation goals for the state.
Statutes do not provide direction about priorities among the transit goals. As an example, the goal of providing access to tourist locations (Goal 7) may be a lower priority than meeting the needs of transit users (Goal 6), but the law does not indicate that such a priority order exists. Similarly, it is not clear whether goals directly related to regional transit, such as the efficient use of transit resources (Goal 2), are of a higher priority than transit-related transportation goals, such as congestion mitigation (Goal 13).
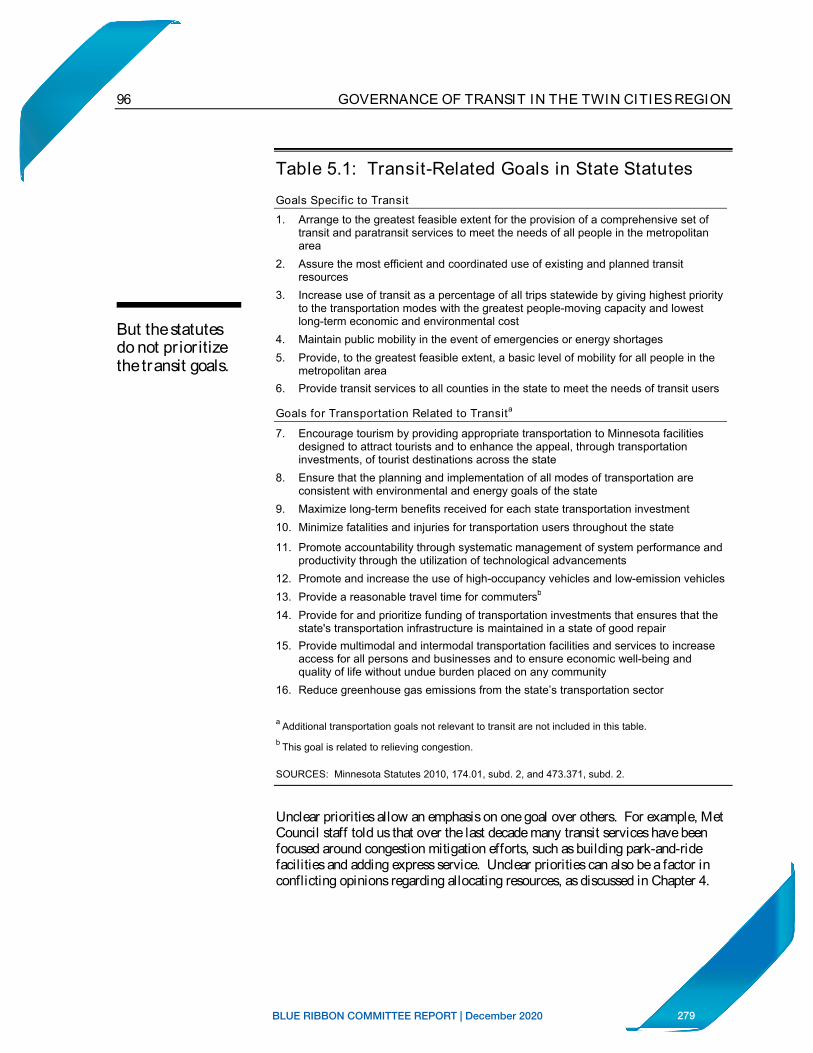
279BLUE RIBBON COMMITTEE REPORT | December 2020
96 GOVERNANCE OF TRANSIT IN THE TWIN CITIES REGION
But the statutes do not pr ior itize the transit goals.
Table 5.1: Transit-Related Goals in State Statutes
Goals Specific to Transit
1. Arrange to the greatest feasible extent for the provision of a comprehensive set of transit and paratransit services to meet the needs of all people in the metropolitan area
2. Assure the most efficient and coordinated use of existing and planned transit resources
3. Increase use of transit as a percentage of all trips statewide by giving highest priority to the transportation modes with the greatest people-moving capacity and lowest long-term economic and environmental cost
4. Maintain public mobility in the event of emergencies or energy shortages 5. Provide, to the greatest feasible extent, a basic level of mobility for all people in the
metropolitan area 6. Provide transit services to all counties in the state to meet the needs of transit users
Goals for Transportation Related to Transita
7. Encourage tourism by providing appropriate transportation to Minnesota facilities designed to attract tourists and to enhance the appeal, through transportation investments, of tourist destinations across the state
8. Ensure that the planning and implementation of all modes of transportation are consistent with environmental and energy goals of the state
9. Maximize long-term benefits received for each state transportation investment 10. Minimize fatalities and injuries for transportation users throughout the state
11. Promote accountability through systematic management of system performance and productivity through the utilization of technological advancements
12. Promote and increase the use of high-occupancy vehicles and low-emission vehicles 13. Provide a reasonable travel time for commutersb
14. Provide for and prioritize funding of transportation investments that ensures that the state's transportation infrastructure is maintained in a state of good repair
15. Provide multimodal and intermodal transportation facilities and services to increase access for all persons and businesses and to ensure economic well-being and quality of life without undue burden placed on any community
16. Reduce greenhouse gas emissions from the state’s transportation sector
a Additional transportation goals not relevant to transit are not included in this table. b This goal is related to relieving congestion.
SOURCES: Minnesota Statutes 2010, 174.01, subd. 2, and 473.371, subd. 2.
Unclear priorities allow an emphasis on one goal over others. For example, Met Council staff told us that over the last decade many transit services have been focused around congestion mitigation efforts, such as building park-and-ride facilities and adding express service. Unclear priorities can also be a factor in conflicting opinions regarding allocating resources, as discussed in Chapter 4.
280BLUE RIBBON COMMITTEE REPORT | December 2020
97TRANSIT PERFORMANCE
Evaluating transit with multiple measures provides a more comprehensiveview of performance.
Federal law also adds to the lack of clarity around transit goals.1 Specifically, federal law requires the Metropolitan Planning Organization to consider “projects and strategies” that meet certain goals, such as protecting the environment, and allocates funding to certain areas for projects that focus on congestion mitigation and improving air quality.2 It is not clear, however, how these federal goals compare to, or whether they take priority over, the transit goals identified in state law.
TRANSIT PERFORMANCE MEASURES We identified measures that correspond with many of the state’s transit goals, as shown in Table 5.2. To select our measures, we reviewed the Met Council’ s 2009 evaluation of the Twin Cities region’s transit system for the measures it used, literature on transit performance measures, and available data, but our list is not exhaustive.3 In identifying these measures, we found that:
No single measure is appropr iate for assessing transit per formance.
Many factors, such as the character istics of the service area, affect the comparability of transit systems, modes, or transit providers.
As shown in Table 5.2, the goals of transit address three performance areas: efficiency, effectiveness, and impact.4 Because of the number and nature of transit goals, some goals may inherently conflict with others. For example, providing access to transit for all people in the region may conflict with goals of efficiency. If the only goal of the transit system were access, then transit agencies could focus on achieving this goal regardless of the operating cost per passenger. Similarly, if the only goal were efficiency, transit agencies might be willing to sacrifice broad access to services to ensure less costly services.
Examining performance through multiple measures is useful because each measure has drawbacks. Some services may perform better on some measures but worse on others. For example, urban-local bus routes that have a high turnover in passengers tend to have lower subsidies per passenger than express
1 An exception is that federal law requires that recipients of Federal Transit Administration funds be compliant with Title VI of the Civil Rights Act of 1964. To be compliant, agencies must ensure that services and systemwide service changes, such as the addition of a light rail service, do not have an adverse impact on minority and low-income populations. 2 23 U.S. Code, secs. 134(h)(1) and 149(b). As discussed in Chapter 1, the Met Council and the Transportation Advisory Board jointly serve as the region’s Metropolitan Planning Organization. 3 Minnesota Statutes 2010, 473.1466(a), require the Met Council to prepare a biennial performance evaluation of the transit system. The evaluation includes operating data for each provider along with calculated measures of subsidy per passenger and operating cost per revenue hour. For additional measures, see Jason Keith Phillips, “An Application of the Balanced Scorecard to Public Transit System Performance Assessment,” Transportation Journal (Winter 2004): 26-55; and Transit Cooperative Research Program, Transit Capacity and Quality of Service Manual, 2nd ed. (Washington, DC: Transportation Research Board, 2003). 4 Impact measures demonstrate the effect of transit services on social well being, such as improving environmental quality or people’s mobility.
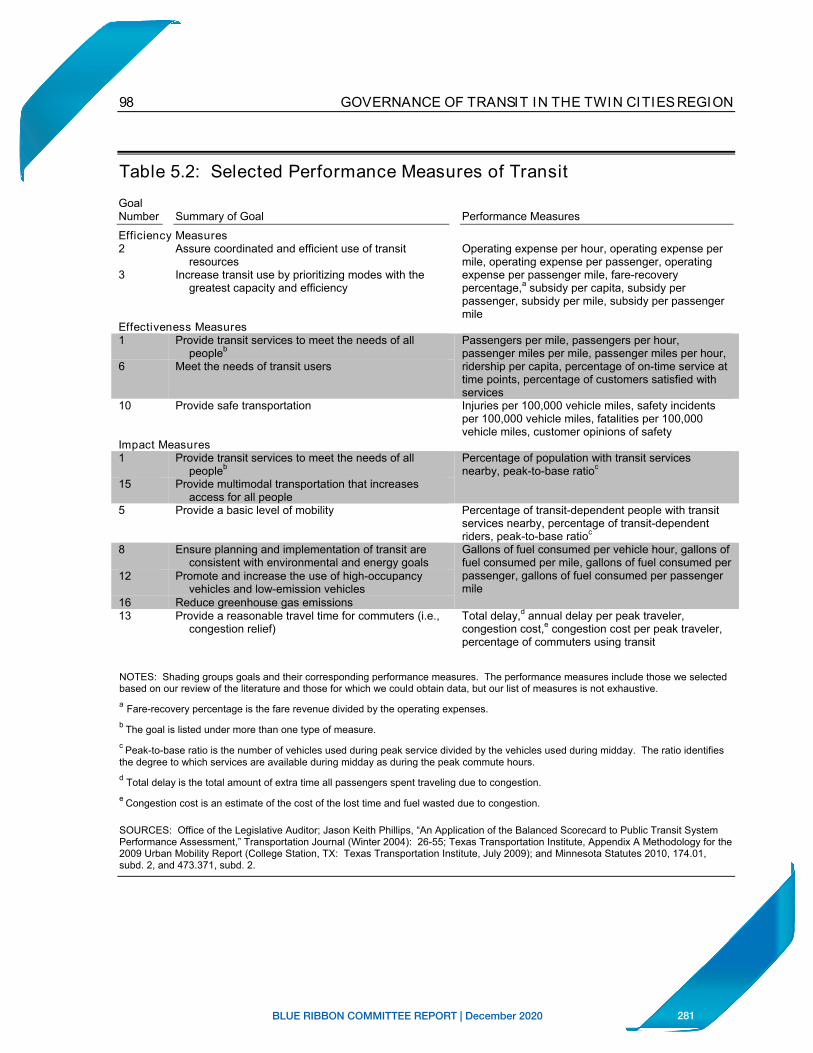
281BLUE RIBBON COMMITTEE REPORT | December 2020
98 GOVERNANCE OF TRANSIT IN THE TWIN CITIES REGION
Table 5.2: Selected Performance Measures of Transit
GoalNumber Summary of Goal
Efficiency Measures 2 Assure coordinated and efficient use of transit
resources 3 Increase transit use by prioritizing modes with the
greatest capacity and efficiency
Effectiveness Measures 1 Provide transit services to meet the needs of all
peopleb
6 Meet the needs of transit users
10 Provide safe transportation
Impact Measures Provide transit services to meet the needs of all
peopleb
Provide multimodal transportation that increases access for all people
1
15
Performance Measures
Operating expense per hour, operating expense per mile, operating expense per passenger, operating expense per passenger mile, fare-recovery percentage,a subsidy per capita, subsidy per passenger, subsidy per mile, subsidy per passenger mile
Passengers per mile, passengers per hour, passenger miles per mile, passenger miles per hour, ridership per capita, percentage of on-time service at time points, percentage of customers satisfied with servicesInjuries per 100,000 vehicle miles, safety incidents per 100,000 vehicle miles, fatalities per 100,000 vehicle miles, customer opinions of safety
Percentage of population with transit services nearby, peak-to-base ratioc
5
8
Provide a basic level of mobility
Ensure planning and implementation of transit are consistent with environmental and energy goals
Percentage of transit-dependent people with transit services nearby, percentage of transit-dependent riders, peak-to-base ratioc
Gallons of fuel consumed per vehicle hour, gallons of fuel consumed per mile, gallons of fuel consumed per
12 Promote and increase the use of high-occupancy vehicles and low-emission vehicles
passenger, gallons of fuel consumed per passenger mile
1613
Reduce greenhouse gas emissions Provide a reasonable travel time for commuters (i.e.,
congestion relief) Total delay,d annual delay per peak traveler, congestion cost,e congestion cost per peak traveler, percentage of commuters using transit
NOTES: Shading groups goals and their corresponding performance measures. The performance measures include those we selected based on our review of the literature and those for which we could obtain data, but our list of measures is not exhaustive. a Fare-recovery percentage is the fare revenue divided by the operating expenses. b The goal is listed under more than one type of measure. c Peak-to-base ratio is the number of vehicles used during peak service divided by the vehicles used during midday. The ratio identifies the degree to which services are available during midday as during the peak commute hours. d Total delay is the total amount of extra time all passengers spent traveling due to congestion. e Congestion cost is an estimate of the cost of the lost time and fuel wasted due to congestion.
SOURCES: Office of the Legislative Auditor; Jason Keith Phillips, “An Application of the Balanced Scorecard to Public Transit System Performance Assessment,” Transportation Journal (Winter 2004): 26-55; Texas Transportation Institute, Appendix A Methodology for the 2009 Urban Mobility Report (College Station, TX: Texas Transportation Institute, July 2009); and Minnesota Statutes 2010, 174.01, subd. 2, and 473.371, subd. 2.
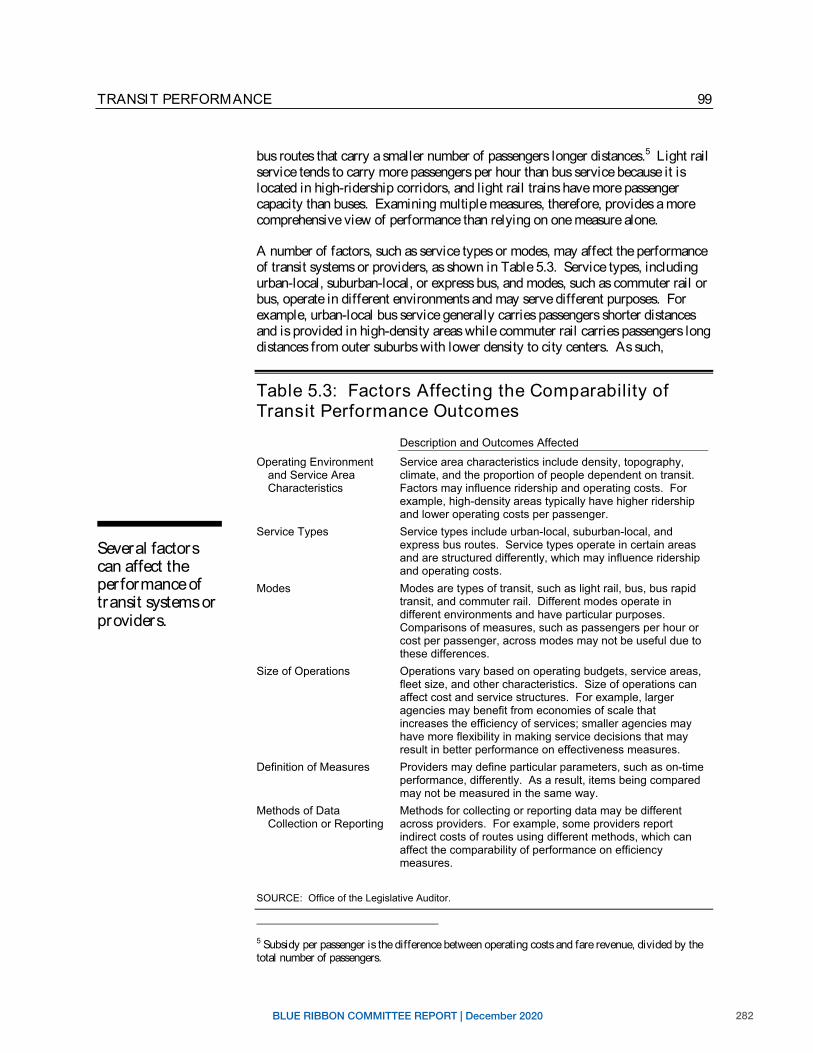
282BLUE RIBBON COMMITTEE REPORT | December 2020
99TRANSIT PERFORMANCE
bus routes that carry a smaller number of passengers longer distances.5 Light rail service tends to carry more passengers per hour than bus service because it is located in high-ridership corridors, and light rail trains have more passenger capacity than buses. Examining multiple measures, therefore, provides a more comprehensive view of performance than relying on one measure alone.
A number of factors, such as service types or modes, may affect the performance of transit systems or providers, as shown in Table 5.3. Service types, including urban-local, suburban-local, or express bus, and modes, such as commuter rail or bus, operate in different environments and may serve different purposes. For example, urban-local bus service generally carries passengers shorter distances and is provided in high-density areas while commuter rail carries passengers long distances from outer suburbs with lower density to city centers. As such,
Several factors can affect the performance of transit systems or providers.
Table 5.3: Factors Affecting the Comparability of Transit Performance Outcomes
Description and Outcomes Affected
Operating Environment Service area characteristics include density, topography, and Service Area climate, and the proportion of people dependent on transit. Characteristics Factors may influence ridership and operating costs. For
example, high-density areas typically have higher ridership and lower operating costs per passenger.
Service Types Service types include urban-local, suburban-local, and express bus routes. Service types operate in certain areas and are structured differently, which may influence ridership and operating costs.
Modes Modes are types of transit, such as light rail, bus, bus rapid transit, and commuter rail. Different modes operate in different environments and have particular purposes. Comparisons of measures, such as passengers per hour or cost per passenger, across modes may not be useful due to these differences.
Size of Operations Operations vary based on operating budgets, service areas, fleet size, and other characteristics. Size of operations can affect cost and service structures. For example, larger agencies may benefit from economies of scale that increases the efficiency of services; smaller agencies may have more flexibility in making service decisions that may result in better performance on effectiveness measures.
Definition of Measures Providers may define particular parameters, such as on-time performance, differently. As a result, items being compared may not be measured in the same way.
Methods of Data Methods for collecting or reporting data may be different Collection or Reporting across providers. For example, some providers report
indirect costs of routes using different methods, which can affect the comparability of performance on efficiency measures.
SOURCE: Office of the Legislative Auditor.
5 Subsidy per passenger is the difference between operating costs and fare revenue, divided by the total number of passengers.
283BLUE RIBBON COMMITTEE REPORT | December 2020
100 GOVERNANCE OF TRANSIT IN THE TWIN CITIES REGION
The Twin Cities region’s transit system generally performed well when compared with 11 peer regions.
comparing the subsidy per passenger of commuter rail with that of urban-local bus service may not be useful. Instead, performance comparisons are most useful when made among services using similar modes and providing similar service types. While steps can be taken to improve the validity of comparisons, it is often difficult to make “pure” comparisons that hold all factors constant.
In the remainder of this chapter, we use a variety of measures to evaluate the performance of the region’s transit system. We make comparisons by region and provider to gauge how well the Twin Cities region and individual transit providers have performed. To the extent possible, we compare the Twin Cities region to peer regions with similar characteristics and providers within the region based on similar service types. However, for the reasons discussed earlier, we encourage readers to view these results in the context in which the services are provided.
PEER REGION COMPARISONS In this section, we compare the performance of the transit system in the Twin Cities region to peer regions. On most measures, we evaluate the results of the region’s transit system as a whole and by mode.
Overall, we found that:
The Twin Cities region’s transit system per formed well on most measures of efficiency, effectiveness, and impact in compar ison with peer regions.
The following sections discuss the results of our peer region comparisons. First, we provide an overview of the peer regions that includes several key indicators of transit services. Then, we summarize the results on three types of measures: efficiency, effectiveness, and impact. More detailed results are available in an online appendix.6
Overview of Peer Regions We selected 11 peer regions that were similar to the Twin Cities region in population, density, and transit modes, and that were identified as a peer region by other organizations in Minnesota.7 The 11 peer metropolitan areas are: Baltimore, Cleveland, Dallas-Fort Worth, Denver, Phoenix, Pittsburgh, Portland, St. Louis, San Diego, Seattle, and Tampa. As shown in Table 5.4, the population of the peer regions ranged from 1.7 million (Pittsburgh) to more than 4.5 million (Dallas-Fort Worth). Density, a key factor that can affect transit productivity, ranged from fewer than 2,000 residents per square mile (Pittsburgh) to more than 4,000 residents per square mile (Denver and Phoenix). The Twin Cities region
6 The appendix is available at: http://www.auditor.leg.state.mn.us/ped/2011/transit-app.pdf.7 We examined the lists of peers used by the Met Council and Transit for Livable Communities. The population and density of regions were based on the urbanized area, which is an area defined by the U.S. Census Bureau based on population density. The urbanized area of the Twin Cities is smaller than the seven-county region.
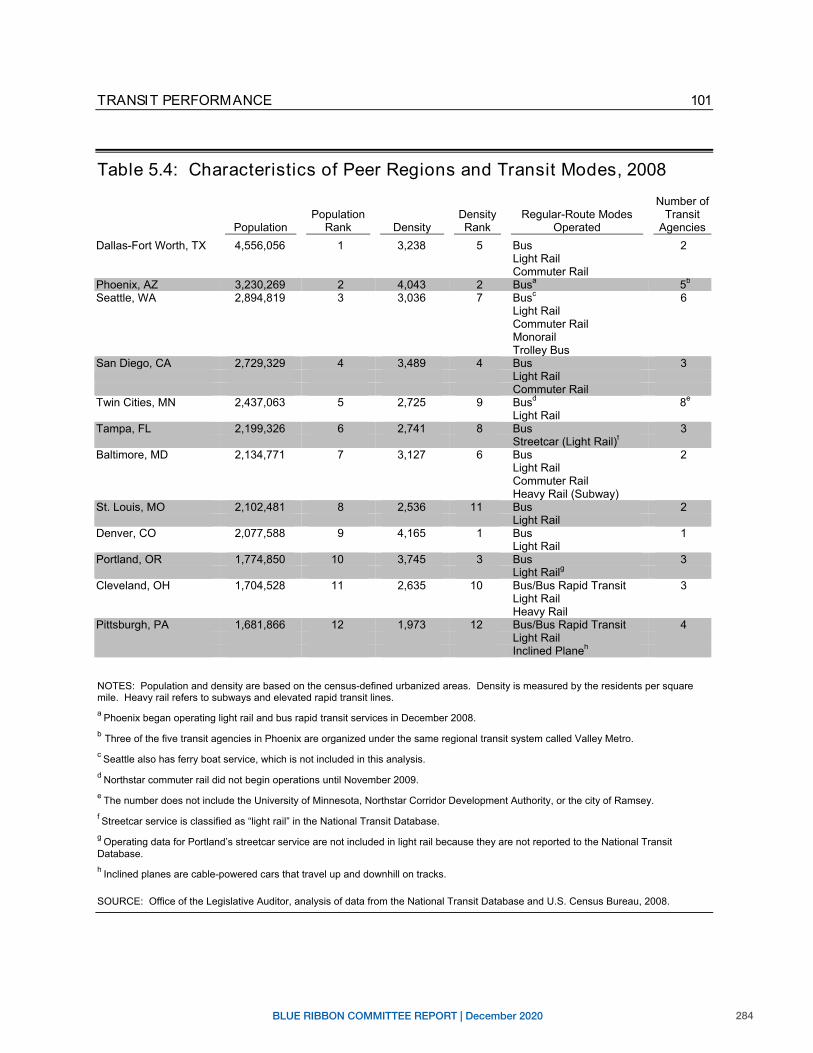
284BLUE RIBBON COMMITTEE REPORT | December 2020
101TRANSIT PERFORMANCE
Table 5.4: Characteristics of Peer Regions and Transit Modes, 2008
Number of Population Density Regular-Route Modes Transit
Population Rank Density Rank Operated Agencies Dallas-Fort Worth, TX 4,556,056 1 3,238 5 Bus 2
Light Rail Commuter Rail
Phoenix, AZ Seattle, WA
3,230,269 2,894,819
23
4,0433,036
27
Busa
Busc5b
6Light Rail Commuter Rail Monorail Trolley Bus
San Diego, CA 2,729,329 4 3,489 4 Bus 3Light Rail Commuter Rail
Twin Cities, MN 2,437,063 5 2,725 9 Busd 8e
Light Rail Tampa, FL 2,199,326 6 2,741 8 Bus 3
Streetcar (Light Rail)f
Baltimore, MD 2,134,771 7 3,127 6 BusLight Rail Commuter Rail Heavy Rail (Subway)
St. Louis, MO 2,102,481 8 2,536 11 Bus 2Light Rail
Denver, CO 2,077,588 9 4,165 1 Bus Light Rail
Portland, OR 1,774,850 10 3,745 3 Bus 3Light Railg
Cleveland, OH 1,704,528 11 2,635 10 Bus/Bus Rapid Transit 3 Light Rail Heavy Rail
1,681,866 12 1,973 12 4
Inclined Planeh
Pittsburgh, PA Bus/Bus Rapid Transit Light Rail
NOTES: Population and density are based on the census-defined urbanized areas. Density is measured by the residents per squaremile. Heavy rail refers to subways and elevated rapid transit lines. a Phoenix began operating light rail and bus rapid transit services in December 2008. b Three of the five transit agencies in Phoenix are organized under the same regional transit system called Valley Metro. c Seattle also has ferry boat service, which is not included in this analysis. d Northstar commuter rail did not begin operations until November 2009. e The number does not include the University of Minnesota, Northstar Corridor Development Authority, or the city of Ramsey. f Streetcar service is classified as “light rail” in the National Transit Database. g Operating data for Portland’s streetcar service are not included in light rail because they are not reported to the National Transit Database. h Inclined planes are cable-powered cars that travel up and downhill on tracks.
SOURCE: Office of the Legislative Auditor, analysis of data from the National Transit Database and U.S. Census Bureau, 2008.
2
1
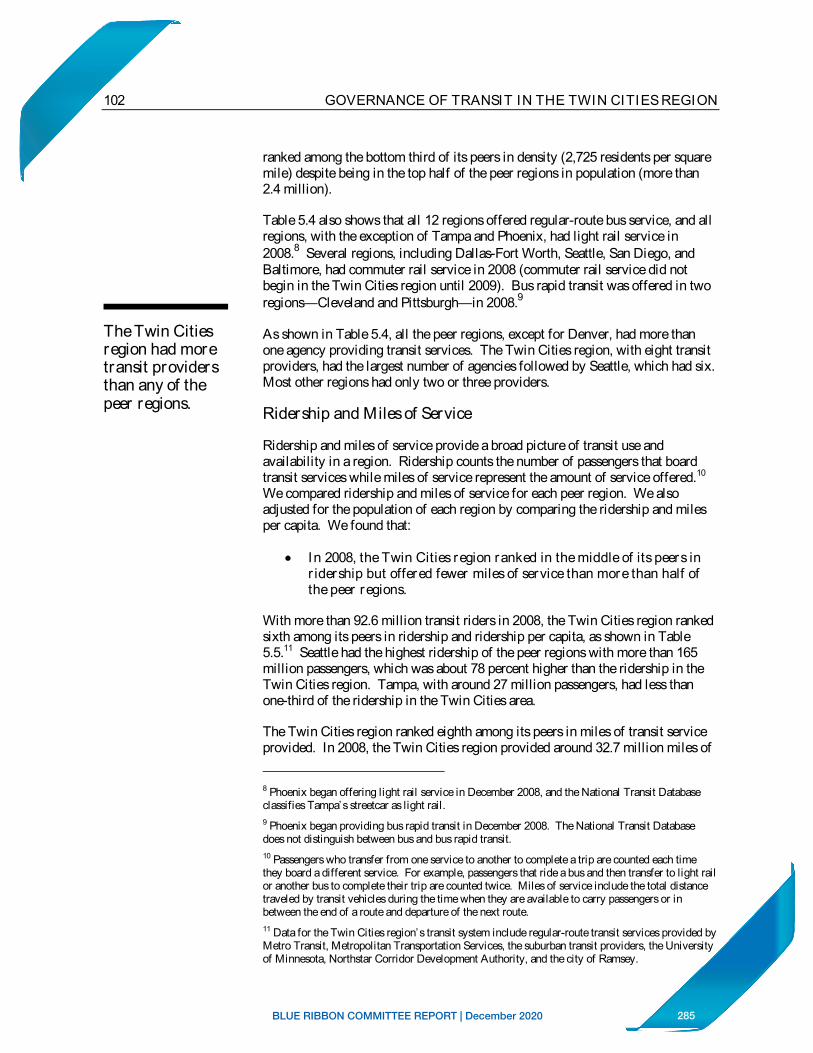
285BLUE RIBBON COMMITTEE REPORT | December 2020
102 GOVERNANCE OF TRANSIT IN THE TWIN CITIES REGION
The Twin Cities region had more transit providers than any of the peer regions.
ranked among the bottom third of its peers in density (2,725 residents per square mile) despite being in the top half of the peer regions in population (more than 2.4 million).
Table 5.4 also shows that all 12 regions offered regular-route bus service, and all regions, with the exception of Tampa and Phoenix, had light rail service in 2008.8 Several regions, including Dallas-Fort Worth, Seattle, San Diego, and Baltimore, had commuter rail service in 2008 (commuter rail service did not begin in the Twin Cities region until 2009). Bus rapid transit was offered in two regions—Cleveland and Pittsburgh—in 2008.9
As shown in Table 5.4, all the peer regions, except for Denver, had more than one agency providing transit services. The Twin Cities region, with eight transit providers, had the largest number of agencies followed by Seattle, which had six. Most other regions had only two or three providers.
Ridership and Miles of Service
Ridership and miles of service provide a broad picture of transit use and availability in a region. Ridership counts the number of passengers that board transit services while miles of service represent the amount of service offered.10
We compared ridership and miles of service for each peer region. We also adjusted for the population of each region by comparing the ridership and miles per capita. We found that:
In 2008, the Twin Cities region ranked in the middle of its peers in r idership but offered fewer miles of service than more than half of the peer regions.
With more than 92.6 million transit riders in 2008, the Twin Cities region ranked sixth among its peers in ridership and ridership per capita, as shown in Table 5.5.11 Seattle had the highest ridership of the peer regions with more than 165 million passengers, which was about 78 percent higher than the ridership in the Twin Cities region. Tampa, with around 27 million passengers, had less than one-third of the ridership in the Twin Cities area.
The Twin Cities region ranked eighth among its peers in miles of transit service provided. In 2008, the Twin Cities region provided around 32.7 million miles of
8 Phoenix began offering light rail service in December 2008, and the National Transit Database classifies Tampa’s streetcar as light rail. 9 Phoenix began providing bus rapid transit in December 2008. The National Transit Database does not distinguish between bus and bus rapid transit. 10 Passengers who transfer from one service to another to complete a trip are counted each time they board a different service. For example, passengers that ride a bus and then transfer to light rail or another bus to complete their trip are counted twice. Miles of service include the total distance traveled by transit vehicles during the time when they are available to carry passengers or in between the end of a route and departure of the next route. 11 Data for the Twin Cities region’s transit system include regular-route transit services provided by Metro Transit, Metropolitan Transportation Services, the suburban transit providers, the University of Minnesota, Northstar Corridor Development Authority, and the city of Ramsey.
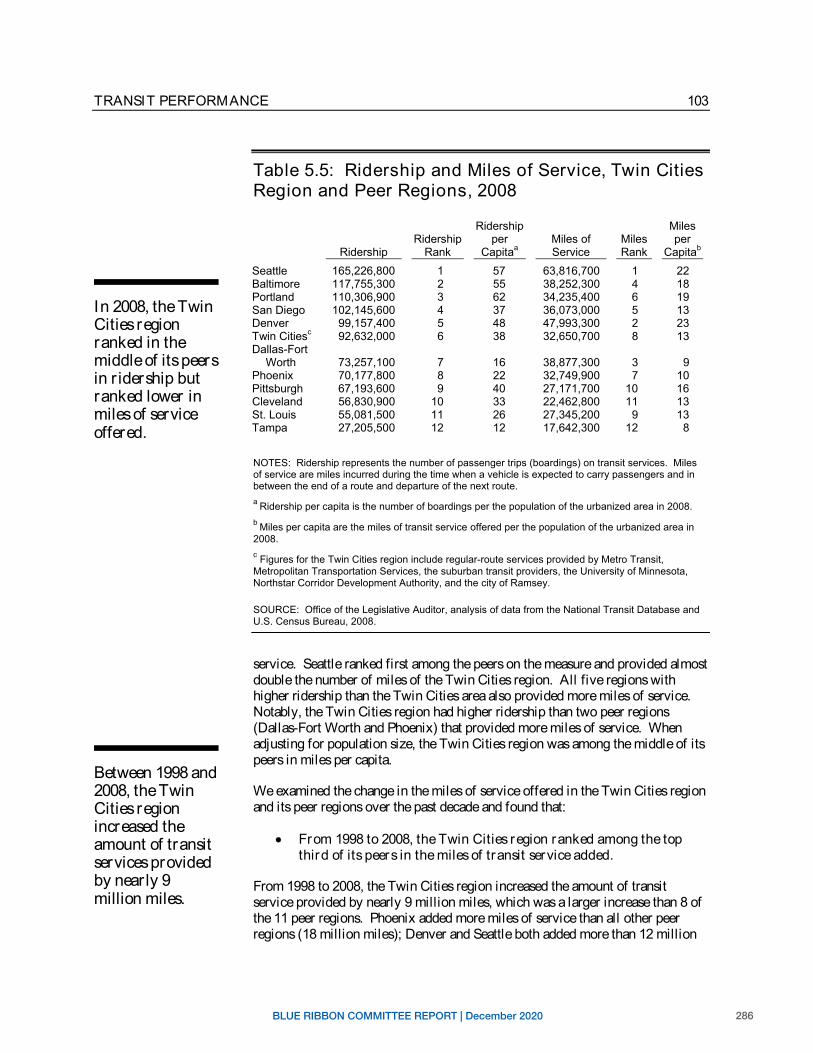
286BLUE RIBBON COMMITTEE REPORT | December 2020
103TRANSIT PERFORMANCE
In 2008, the Twin Cities region ranked in the middle of its peers in r idership but ranked lower in miles of service offered.
Table 5.5: Ridership and Miles of Service, Twin Cities Region and Peer Regions, 2008
Ridership Miles
Ridership Ridership
Rankper
CapitaaMiles of Service
MilesRank
perCapitab
Seattle 165,226,800 1 57 63,816,700 1 22Baltimore 117,755,300 2 55 38,252,300 4 18Portland 110,306,900 3 62 34,235,400 6 19San Diego 102,145,600 4 37 36,073,000 5 13Denver 99,157,400 5 48 47,993,300 2 23Twin Citiesc 92,632,000 6 38 32,650,700 8 13Dallas-Fort
Worth 73,257,100 7 16 38,877,300 3 9Phoenix 70,177,800 8 22 32,749,900 7 10Pittsburgh 67,193,600 9 40 27,171,700 10 16Cleveland 56,830,900 10 33 22,462,800 11 13St. Louis 55,081,500 11 26 27,345,200 9 13Tampa 27,205,500 12 12 17,642,300 12 8
NOTES: Ridership represents the number of passenger trips (boardings) on transit services. Miles of service are miles incurred during the time when a vehicle is expected to carry passengers and in between the end of a route and departure of the next route. a Ridership per capita is the number of boardings per the population of the urbanized area in 2008. b Miles per capita are the miles of transit service offered per the population of the urbanized area in 2008.c Figures for the Twin Cities region include regular-route services provided by Metro Transit, Metropolitan Transportation Services, the suburban transit providers, the University of Minnesota, Northstar Corridor Development Authority, and the city of Ramsey.
SOURCE: Office of the Legislative Auditor, analysis of data from the National Transit Database and U.S. Census Bureau, 2008.
Between 1998 and 2008, the Twin Cities region increased the amount of transit services provided by nearly 9 million miles.
service. Seattle ranked first among the peers on the measure and provided almost double the number of miles of the Twin Cities region. All five regions with higher ridership than the Twin Cities area also provided more miles of service. Notably, the Twin Cities region had higher ridership than two peer regions (Dallas-Fort Worth and Phoenix) that provided more miles of service. When adjusting for population size, the Twin Cities region was among the middle of its peers in miles per capita.
We examined the change in the miles of service offered in the Twin Cities region and its peer regions over the past decade and found that:
From 1998 to 2008, the Twin Cities region ranked among the top third of its peers in the miles of transit service added.
From 1998 to 2008, the Twin Cities region increased the amount of transit service provided by nearly 9 million miles, which was a larger increase than 8 of the 11 peer regions. Phoenix added more miles of service than all other peer regions (18 million miles); Denver and Seattle both added more than 12 million
287BLUE RIBBON COMMITTEE REPORT | December 2020
104 GOVERNANCE OF TRANSIT IN THE TWIN CITIES REGION
In 2008, the Twin Cities region had the second fewest light rail route miles among the peers that offered light rail service.
miles. On the other end, Cleveland provided about 4 million fewer miles of transit service in 2008 than in 1998.
Ridership by Mode
As noted earlier in this chapter, all peer regions offered bus service in 2008 and most offered one or more types of rail service. When we looked at ridership on the different modes of transit, we found that:
Compared with its peer regions, the Twin Cities region had a higher percentage of r idership on bus service than rail, par tly due to having fewer route miles of light rail than most peers.
In 2008, the share of riders on bus service compared with other modes was higher in the Twin Cities region than most other peer regions. Approximately 89 percent of the transit rides provided in the Twin Cities region were by bus compared with only 61 percent in San Diego, as shown in Figure 5.1. Several peer regions, including Portland, Dallas-Fort Worth, and St. Louis, provided less than 70 percent of rides by bus with the remaining portion of rides supplied mostly by light rail. Only Tampa and Phoenix, which provided bus service only, had a larger share of bus rides than the Twin Cities region.
Light rail service likely provided a smaller proportion of the rides in the Twin Cities area partly because the region had fewer light rail route miles. The Twin Cities region, with 24.4 miles, had the second-fewest route miles of light rail of the 10 peer regions that offered light rail. In 2008, San Diego, with 152.4 miles, and Portland, with 95.9 miles, were the peer regions with the most route miles of light rail.
Efficiency Performance As discussed in the beginning of this chapter, several of the statutory goals of transit address service efficiency. To assess the efficiency of transit in the Twin Cities region compared with its peers, we examined its performance on the efficiency measures listed in Table 5.2. These efficiency measures, such as operating cost per hour or per passenger, identify how well a transit system utilizes operating funds to provide services. Some of these measures also identify the extent to which a transit system generates fare revenues in relation to its operating costs and ridership. Such measures include fare-recovery percentage, which is the fare revenue divided by the operating cost, and subsidy per passenger, which is the subsidy—the operating expenses minus the fare revenue—divided by the total number of passengers.
In examining the performance of the Twin Cities region and its peers on measures of efficiency, we found that:
In 2008, the Twin Cities region’s transit system per formed better than most of its peers on efficiency measures.
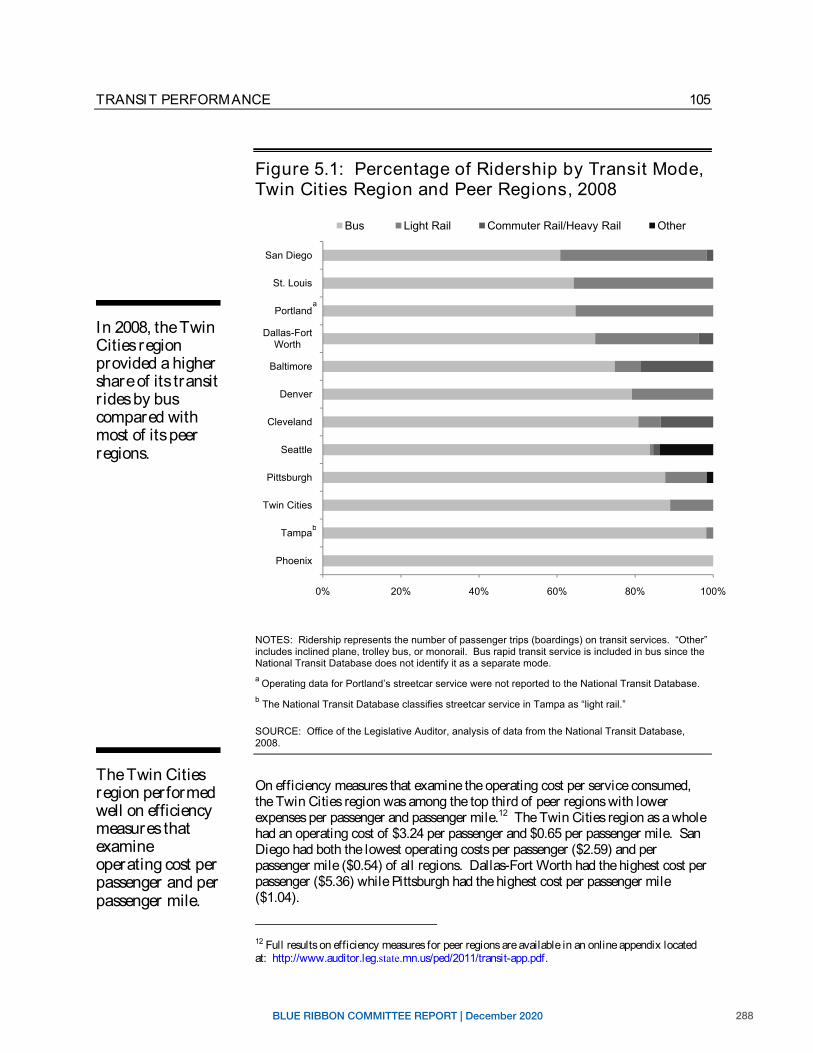
288BLUE RIBBON COMMITTEE REPORT | December 2020
105TRANSIT PERFORMANCE
In 2008, the Twin Cities region provided a higher share of its transit r ides by bus compared with most of its peer regions.
Figure 5.1: Percentage of Ridership by Transit Mode, Twin Cities Region and Peer Regions, 2008
Bus Light Rail Commuter Rail/Heavy Rail Other
San Diego
St. Louis
a Portland
Dallas-Fort Worth
Baltimore
Denver
Cleveland
Seattle
Pittsburgh
Twin Cities
bTampa
Phoenix
0% 20% 40% 60% 80% 100%
NOTES: Ridership represents the number of passenger trips (boardings) on transit services. “Other” includes inclined plane, trolley bus, or monorail. Bus rapid transit service is included in bus since the National Transit Database does not identify it as a separate mode. a Operating data for Portland’s streetcar service were not reported to the National Transit Database. b The National Transit Database classifies streetcar service in Tampa as “light rail.”
SOURCE: Office of the Legislative Auditor, analysis of data from the National Transit Database, 2008.
The Twin Cities region performed well on efficiency measures that examineoperating cost per passenger and per passenger mile.
On efficiency measures that examine the operating cost per service consumed, the Twin Cities region was among the top third of peer regions with lower expenses per passenger and passenger mile.12 The Twin Cities region as a whole had an operating cost of $3.24 per passenger and $0.65 per passenger mile. San Diego had both the lowest operating costs per passenger ($2.59) and per passenger mile ($0.54) of all regions. Dallas-Fort Worth had the highest cost per passenger ($5.36) while Pittsburgh had the highest cost per passenger mile ($1.04).
12 Full results on efficiency measures for peer regions are available in an online appendix located at: http://www.auditor.leg.state.mn.us/ped/2011/transit-app.pdf.
• • • •
•
I
289BLUE RIBBON COMMITTEE REPORT | December 2020
106 GOVERNANCE OF TRANSIT IN THE TWIN CITIES REGION
In 2008, passenger fares covered a relatively high percentage of transit operating costs in the Twin Cities region.
The Twin Cities region performed near the top of its peers on several efficiency measures that consider fare revenue. Overall, fare revenue in the Twin Cities region accounted for 31 percent of operating costs. The region ranked behind only San Diego, which had a 35 percent fare-recovery percentage. All other regions had fare-recovery percentages of 26 percent or lower. The Twin Cities region’s fare structure likely contributed to its performance on these measures. In 2008, the Twin Cities region had a higher base bus fare than the national average and, unlike most other regions in the country, the Twin Cities region charged a higher fare for peak-hour service.13
Partly due to its higher fare-recovery percentage, the Twin Cities region, with a subsidy per passenger of $2.24 and subsidy per passenger mile of $0.45, ranked behind only San Diego ($1.68 and $0.35, respectively) in having the lowest subsidies. Dallas-Fort Worth had the highest subsidy per passenger ($4.65) and subsidy per passenger mile ($0.82) among the peer regions.
When compared with a subset of peers by mode, the Twin Cities bus system performed well on most efficiency measures, and the region’s light rail service performed better than more than half of its peers. Specifically, the Twin Cities region’s bus system generated higher average fares and required lower subsidies than most of its peers. Additionally, the region’s light rail ranked either third or fourth out of ten regions on all measures of efficiency. Light rail service in San Diego and Denver, regions that provided the most miles of light rail service among all of the peers, outperformed light rail in the Twin Cities region on all efficiency measures.
Effectiveness Performance While there are many ways to measure transit effectiveness, we focus on service use, on-time performance, customer satisfaction, and safety.
Service Use
To assess whether the transit system meets riders’ needs, we examined measures of “service use,” which indicate the extent to which the services provided in a region are utilized.14 We compared the performance of the Twin Cities and peer regions’ transit systems overall and by mode and found that:
In 2008, the Twin Cities region’s transit system ranked higher than most peers on measures of service utilization.
13 In 2008, the adult base fare in the Twin Cities region was $1.50 from January to September and was raised to $1.75 in October. The average adult base cash fare in the nation was $1.43 in 2008. In the same year, less than 4 percent of bus systems charged higher fares for peak periods and around 17 percent of bus systems charged higher fares based on distance traveled or zones. See American Public Transportation Association, 2010 Public Transportation Fact Book (Washington, DC: APTA, April 2010), 23, http://www.apta.com/resources/statistics/pages/transitstats.aspx,accessed October 20, 2010. 14 The service-use measures we examined include passengers per hour, passengers per mile, passenger miles per hour, and passenger miles per mile.
290BLUE RIBBON COMMITTEE REPORT | December 2020
107TRANSIT PERFORMANCE
The Twin Cities region’s bus system ranked among the top three peer regions on all “ service-use” measures.
The Twin Cities region’s transit system as a whole performed among the top third of its peer regions in 2008 on measures of service use, such as passengers per mile of service provided.15 When comparing bus performance alone, the Twin Cities region was among the top three regions on all service-use measures we analyzed. For light rail, the Twin Cities region ranked first among its peers in the miles passengers traveled on light rail per the miles of light rail service provided. On other service-use measures, the region’s light rail ranked third or fourth out of the ten peer regions that offered light rail service.
On-time Performance and Customer Satisfaction
We also examined how well transit services met transit riders’ needs by assessing the on-time performance of Metro Transit’ s services and customer satisfaction of all providers in the region. On-time performance indicates whether the bus system operated according to schedule, which we calculated by comparing actual departure times to scheduled departure times at certain points along bus routes. We considered a bus to be on time if it left a particular timepoint no more than one minute early and no more than five minutes late.16 Due to data concerns, we limited our analysis to Metro Transit’ s bus service.17 For customer perspectives, we examined responses from the customer satisfaction surveys conducted by each provider. Since each provider’s survey asked different questions and were conducted in different years, we provide more detailed results for only Metro Transit’ s survey in this section and discuss other providers’ results later in the chapter.
We found that:
Metro Transit’s bus service generally operated according to schedule, and most r iders who responded to surveys were satisfied with transit services in the region.
For the most part, Metro Transit’ s bus routes operated on time from February to June 2010. Specifically, Metro Transit’ s buses adhered to the schedule 88.7 percent of the time, which was close to, but did not meet, Metro Transit’s goal of 89 percent. While no national standard for on-time performance is available, according to transit industry ranges, Metro Transit’ s results were near the top of the range (85.0 percent to 89.9 percent) where a regular customer would
15 Full results on service-use measures for peer regions are available in an online appendix located at: http://www.auditor.leg.state.mn.us/ped/2011/transit-app.pdf.16 Buses that were more than 30 minutes early or late departing from a timepoint were not counted. 17 The source of on-time performance data is Metro Transit’s Automatic Vehicle Locator system. Because the implementation of this technology is still in progress for many of the suburban transit providers and Metropolitan Transportation Services, we were unable to obtain reliable information for their routes. Minnesota Valley Transit Authority uses a different Automatic Vehicle Locator system, and the data were not comparable to Metro Transit’s.
291BLUE RIBBON COMMITTEE REPORT | December 2020
108 GOVERNANCE OF TRANSIT IN THE TWIN CITIES REGION
Most r iders who responded to surveys were satisfied with Metro Transit’s services.
The Twin Cities region’s bus service had among the fewest safety incidents of the peer regions.
experience, on average, about three late buses every two weeks.18 Metro Transit’ s performance by route type varied slightly, with lower adherence to scheduled times (84.9 percent) for express routes. On the whole, Metro Transit’ s on-time performance was acceptable, but even a small improvement would be beneficial to customers, especially for those riding express routes.
Another gauge of whether services met riders’ needs is customer opinions of transit services. Customer satisfaction surveys from each of the transit providers in the Twin Cities region found that transit riders who responded were generally satisfied with the transit services they received. For example, Metro Transit’ s customer satisfaction survey found that 90 percent of bus customers and 95 percent of light rail customers responding to surveys agreed or strongly agreed that they were satisfied with Metro Transit’ s services.19 A high percentage of bus customers responding to questions about on-time performance agreed or strongly agreed that morning rush-hour service ran on schedule (81 percent); however, fewer (72 percent) were in agreement when asked about afternoon rush-hour service.
Safety
To assess whether transit services provided in the Twin Cities region offered a safe means of transportation, we compared the performance of the region to its peers on a number of safety measures. We also examined Metro Transit’ s customer survey responses to questions about safety. We found that:
In 2009, the Twin Cities region’s bus system was among the safest of its peers; however , from 2005 to 2009, the light rail system ranked among the bottom half of its peers on safety measures.
In 2009, the Twin Cities region’s transit system as a whole had fewer safety incidents and injuries per 100,000 miles than most of its peers.20 The region’s bus service, in particular, had the second-lowest safety incident rate of all peer regions and had lower injury and fatality rates than two-thirds of its peer regions.
However, from 2005 to 2009, the region’s light rail system had more incidents, injuries, and fatalities per 100,000 miles of service than more than half of the
18 This range is the third of six estimated ranges of on-time performance. The top two ranges of on-time performance include 95.0 to 100.0 percent (one late transit vehicle every two weeks) and 90.0 to 94.9 percent (one late transit vehicle every week). The ranges assume a regular customer makes five round trips per week and does not make any transfers. See Transit Cooperative Research Program, Transit Capacity and Quality of Service Manual, 2nd ed. (Washington, DC: Transportation Research Board, 2003), 3-47, http://www.trb.org/Main/Blurbs/Transit_Capacity _and_Quality_of_Service_Manual_2nd_153590.aspx, accessed November 3, 2010. 19 For information about Metro Transit’s customer surveys, see http://www.metrocouncil.org/directions/transit/transit2009/SurveyMar09.htm, accessed November 19, 2010. 20 A safety incident includes collisions; derailments; fires; hazardous spills; and other occurrences, such as theft or vandalism, suicides, and other security events. Commuter rail was not included in this analysis. Full results on safety measures for peer regions are available in an online appendix located at: http://www.auditor.leg.state.mn.us/ped/2011/transit-app.pdf.
292BLUE RIBBON COMMITTEE REPORT | December 2020
109TRANSIT PERFORMANCE
Several of the state’s transit goals are about increasingpeople’s access or mobility.
peers that have light rail service. Over the five years, the region had seven fatalities from light rail, although none of the fatalities were light rail passengers. When compared with its peers, the Twin Cities region’s light rail had the second-highest fatalities per 100,000 miles of service during this time period.
Customer responses to Metro Transit’ s survey questions about safety indicate that most respondents felt that transit services were safe. For example, 92 percent of bus customers and 98 percent of light rail customers who responded to the relevant survey questions said they felt drivers operate vehicles in a safe manner. However, lower percentages of customers who responded to survey questions (less than 70 percent) felt safe waiting for or riding transit services in the evening.
Impact Performance Impact measures, such as the percentage of the transit-dependent population with access to transit services, identify the effects transit has on communities. We examined performance on several types of impact goals outlined in statutes, including access, congestion mitigation, and energy consumption.
Access
Several of the transit goals in statute are about access, including goals to increase “access for all persons,” provide a “basic level of mobility,” and arrange comprehensive services “ to meet the needs of all people.” 21 To determine how well transit in the Twin Cities region met these goals, we examined measures that indicated whether the general population and the transit-dependent population had reasonable access to transit services. For these measures, we analyzed service data from the Twin Cities region and peer regions, population data from the 2000 U.S. Census, and survey data from Metro Transit.
Access for the General Population
One indicator of access to transit services is the extent to which people have transit services relatively close to where they live. In the seven-county Twin Cities region, we identified the percentage of the population with regular-route transit services provided near their home in 2010.22 We defined nearby transit services as a bus stop within one-quarter mile or a light rail or commuter rail stop within one-half mile of a resident’s neighborhood.23 Also, to assess whether the level of transit services met the needs of residents, we examined responses to Metro Transit’s survey of potential customers. We found that:
21 Minnesota Statutes 2010, 174.01, subd. 2(2), and 473.371, subd. 2. 22 We examined the entire seven-county region even though regular-route services are currently mostly offered within the transit taxing district, as noted in Chapter 3. 23 We defined neighborhood according to census block groups, which are areas defined by the U.S. Census Bureau that vary in size but generally contain between 600 and 3,000 people.
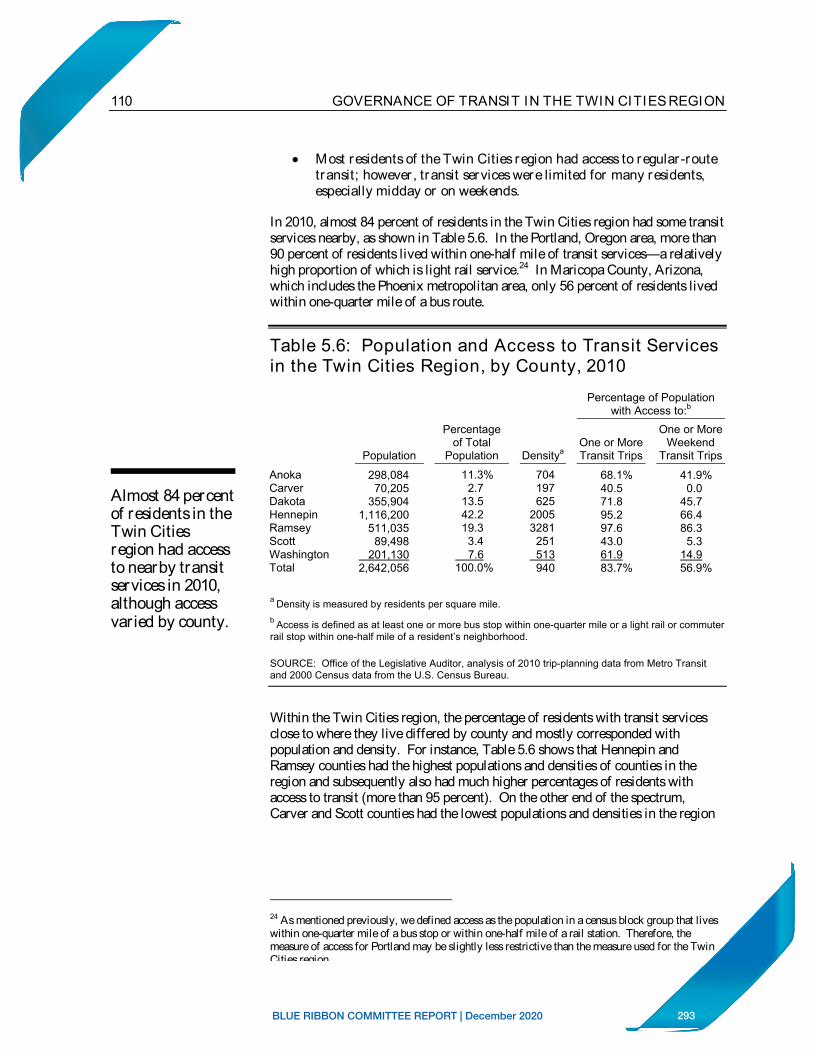
293BLUE RIBBON COMMITTEE REPORT | December 2020
110 GOVERNANCE OF TRANSIT IN THE TWIN CITIES REGION
Almost 84 percent of residents in the Twin Cities region had access to nearby transit services in 2010, although access varied by county.
Most residents of the Twin Cities region had access to regular -route transit; however , transit services were limited for many residents, especially midday or on weekends.
In 2010, almost 84 percent of residents in the Twin Cities region had some transit services nearby, as shown in Table 5.6. In the Portland, Oregon area, more than 90 percent of residents lived within one-half mile of transit services—a relatively high proportion of which is light rail service.24 In Maricopa County, Arizona, which includes the Phoenix metropolitan area, only 56 percent of residents lived within one-quarter mile of a bus route.
Table 5.6: Population and Access to Transit Services in the Twin Cities Region, by County, 2010
Percentage of Population with Access to:b
Percentage One or More of Total One or More Weekend
Population Population Densitya Transit Trips Transit Trips
Anoka 298,084 11.3% 704 68.1% 41.9% Carver 70,205 2.7 197 40.5 0.0 Dakota 355,904 13.5 625 71.8 45.7 Hennepin 1,116,200 42.2 2005 95.2 66.4 Ramsey 511,035 19.3 3281 97.6 86.3 Scott 89,498 3.4 251 43.0 5.3 Washington 201,130 7.6 513 61.9 14.9 Total 2,642,056 100.0% 940 83.7% 56.9%
a Density is measured by residents per square mile. b Access is defined as at least one or more bus stop within one-quarter mile or a light rail or commuter rail stop within one-half mile of a resident’s neighborhood.
SOURCE: Office of the Legislative Auditor, analysis of 2010 trip-planning data from Metro Transit and 2000 Census data from the U.S. Census Bureau.
Within the Twin Cities region, the percentage of residents with transit services close to where they live differed by county and mostly corresponded with population and density. For instance, Table 5.6 shows that Hennepin and Ramsey counties had the highest populations and densities of counties in the region and subsequently also had much higher percentages of residents with access to transit (more than 95 percent). On the other end of the spectrum, Carver and Scott counties had the lowest populations and densities in the region
24 As mentioned previously, we defined access as the population in a census block group that lives within one-quarter mile of a bus stop or within one-half mile of a rail station. Therefore, the measure of access for Portland may be slightly less restrictive than the measure used for the Twin Cities region.
294BLUE RIBBON COMMITTEE REPORT | December 2020
111TRANSIT PERFORMANCE
However, only 57 percent of residents in the Twin Cities region had access to nearby transit service on the weekends.
and had smaller percentages (41 and 43 percent, respectively) of their population with access to regular-route transit.25
Transit services in the Twin Cities region were more limited on weekends and during weekday nonpeak hours. Only 57 percent of residents in the Twin Cities region lived in areas with nearby weekend transit service. In many suburban areas of the region, regular-route bus service was offered only during weekday peak hours; therefore, no midday service was available. Also, when comparing the amount of service available during nonpeak weekday hours with the peak hours, the Twin Cities area provided relatively fewer services during the nonpeak hours than other regions.26
Since people only consider transit as a viable option if the service goes where they need to travel and in a reasonable amount of travel time, we also examined the extent to which survey respondents agreed that transit was a transportation option for them. In a 2009 survey by Metro Transit of potential transit riders who currently drive to work, around 55 percent said that the lack of routes near their home or destination or the walk to the bus stop had “some” to a “heavy” influence on their decisions to not ride the bus.27 Additionally, for more than 62 percent of the respondents, travel time had “some” to a “heavy” influence on their decisions to not commute by bus.
Access to Transit Services for Transit-Dependent Households
For transit-dependent households, defined as those that do not have a vehicle, transit can be an essential mode of transportation. As another measure of access, we identified whether transit-dependent households in the region had access to weekday and weekend regular-route transit services. To evaluate the goal of mobility, we used the number of available transit trips in an area as a proxy for the frequency of service and number of routes. While data were not available to make direct comparisons with other regions, we used the Portland region’s access rate of 90 percent as a benchmark. We found that:
In the Twin Cities region, most areas with high percentages of transit-dependent households have transit services nearby; however , some of these areas have relatively few transit services available.
Only a small percentage of households in the Twin Cities region (8.5 percent) did not have a vehicle, as shown in Table 5.7. Almost 96 percent of these transit-dependent households lived near some transit services, but a smaller percentage
25 As mentioned in Chapter 1, regional dial-a-ride service is available in all locations in the region where regular-route services are not available. 26 This is measured through the peak-to-base ratio, which is calculated by dividing the number of vehicles in use during maximum service (peak) by the number of vehicles in use during midday (nonpeak). The Twin Cities region had a ratio of 2.59, while most peer regions had ratios of fewer than 2.0. 27 Metro Transit conducted a survey of 1,165 potential transit riders from around the seven-county Twin Cities region in 2009. Respondents were screened and commuters who drove to work and did not indicate that they would never take a bus in their commute were identified as potential riders.
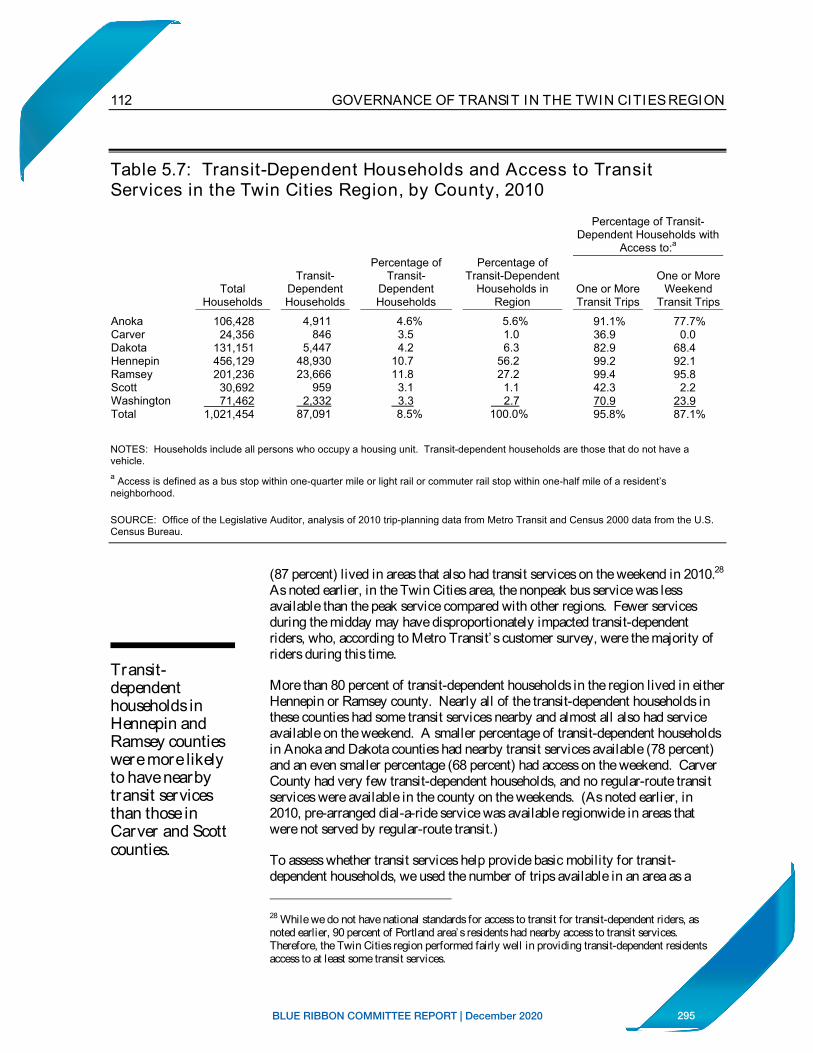
295BLUE RIBBON COMMITTEE REPORT | December 2020
112 GOVERNANCE OF TRANSIT IN THE TWIN CITIES REGION
Table 5.7: Transit-Dependent Households and Access to Transit Services in the Twin Cities Region, by County, 2010
Percentage of Transit- Dependent Households with
Access to:a
Percentage of Percentage of Transit- Transit- Transit-Dependent One or More
Total Dependent Dependent Households in One or More Weekend Households Households Households Region Transit Trips Transit Trips
Anoka 106,428 4,911 4.6% 5.6% 91.1% 77.7% Carver 24,356 846 3.5 1.0 36.9 0.0 Dakota 131,151 5,447 4.2 6.3 82.9 68.4 Hennepin 456,129 48,930 10.7 56.2 99.2 92.1 Ramsey 201,236 23,666 11.8 27.2 99.4 95.8 Scott 30,692 959 3.1 1.1 42.3 2.2 Washington 71,462 2,332 3.3 2.7 70.9 23.9 Total 1,021,454 87,091 8.5% 100.0% 95.8% 87.1%
NOTES: Households include all persons who occupy a housing unit. Transit-dependent households are those that do not have a vehicle.a Access is defined as a bus stop within one-quarter mile or light rail or commuter rail stop within one-half mile of a resident’sneighborhood.
SOURCE: Office of the Legislative Auditor, analysis of 2010 trip-planning data from Metro Transit and Census 2000 data from the U.S. Census Bureau.
Transit-dependent households in Hennepin and Ramsey counties were more likely to have nearby transit services than those in Carver and Scott counties.
(87 percent) lived in areas that also had transit services on the weekend in 2010.28
As noted earlier, in the Twin Cities area, the nonpeak bus service was less available than the peak service compared with other regions. Fewer services during the midday may have disproportionately impacted transit-dependent riders, who, according to Metro Transit’ s customer survey, were the majority of riders during this time.
More than 80 percent of transit-dependent households in the region lived in either Hennepin or Ramsey county. Nearly all of the transit-dependent households in these counties had some transit services nearby and almost all also had service available on the weekend. A smaller percentage of transit-dependent households in Anoka and Dakota counties had nearby transit services available (78 percent) and an even smaller percentage (68 percent) had access on the weekend. Carver County had very few transit-dependent households, and no regular-route transit services were available in the county on the weekends. (As noted earlier, in 2010, pre-arranged dial-a-ride service was available regionwide in areas that were not served by regular-route transit.)
To assess whether transit services help provide basic mobility for transit-dependent households, we used the number of trips available in an area as a
28 While we do not have national standards for access to transit for transit-dependent riders, as noted earlier, 90 percent of Portland area’s residents had nearby access to transit services. Therefore, the Twin Cities region performed fairly well in providing transit-dependent residents access to at least some transit services.
296BLUE RIBBON COMMITTEE REPORT | December 2020
113TRANSIT PERFORMANCE
Express bus routes and commuter rail are among the transit services provided, in part, to help mitigatecongestion.
proxy for frequency of service and multiple routes. For the most part, areas with high concentrations of transit-dependent households were more likely to have access to higher levels of transit service than other areas. For example, 67 percent of the areas in the region with the highest concentrations of transit-dependent households (more than 30 percent) had more than 2,000 weekly transit trips available nearby. However, 7 percent of areas where 17 to 30 percent of the households were transit dependent had 500 or fewer trips available per week.
Congestion Mitigation
Although not explicitly mentioned in statute, one of the goals of transit suggested by transit providers and Met Council staff we interviewed was relieving traffic congestion.29 Some transit services in the Twin Cities region, such as express routes and commuter rail, have been designed, in part, to address this goal and are among several strategies the region is using to address congestion.30 Since 2002, the region has expanded the capacity of park-and-ride facilities and the number of express routes serving them to help mitigate congestion.
To gauge how well the Twin Cities region performed on minimizing congestion, we compared the performance of the region with a subset of the peer regions on several measures of congestion.31 These measures estimate the delay in travel for all vehicles during peak periods due to congestion and the cost of the congestion in both the value of the time and fuel wasted due to the delay. To gauge the degree to which transit may have an impact on congestion, we also examined the share of workers in the Twin Cities region that travel to work using transit compared with the share commuting to work by transit in the peer regions. We found that:
The Twin Cities region ranked around the middle of its peers on measures of congestion.
The Twin Cities region ranked fifth out of nine peer regions on most measures of congestion. From 2002 to 2007, the amount of time the average peak traveler in the Twin Cities region was delayed during rush-hour travel did not change substantially nor did the rank of the Twin Cities region among its peers on this measure change over this time. In other words, for the average traveler, the delay from congestion in the Twin Cities metropolitan area neither worsened nor improved.
29 Goal 13 in Table 5.1 is related to reducing congestion. 30 For a description of other congestion mitigation efforts, see Metropolitan Council, “TDM Evaluation and Implementation Study” (St. Paul, MN: Met Council, August 2010), 9-28, http://www.metrocouncil.org/planning/transportation/TDMStudy.pdf, accessed November 12, 2010.31 Congestion is closely related to population size, so we used a subset of the peer regions that were most similar in population to the Twin Cities region. These regions are: Baltimore, Cleveland, Denver, Pittsburgh, Portland, San Diego, St. Louis, and Tampa. See Texas Transportation Institute, Appendix A Methodology for the 2009 Urban Mobility Report (College Station, TX: Texas Transportation Institute, July 2009).
297BLUE RIBBON COMMITTEE REPORT | December 2020
114 GOVERNANCE OF TRANSIT IN THE TWIN CITIES REGION
From 2005 to 2007, about 5 percent of workers in the Twin Cities region commuted to work by transit.
In 2007, congestion cost the Twin Cities region $1.1 billion in lost time and fuel wasted, which was slightly higher than the average of its peers.32 The San Diego region had the highest cost of congestion ($1.8 billion) while Cleveland had the lowest ($0.2 billion). In the same year, the average annual cost of the delay for the peak traveler in the Twin Cities region was $812. The cost per traveler increased 21 percent from 2002 due to an increased cost in the value of time and fuel wasted. In four other regions, however, the cost per peak traveler increased at higher rates than in the Twin Cities region.33
The Twin Cities region was also near the middle of its peer regions in the percentage of workers commuting to work by transit. From 2005 to 2007, about 5 percent of workers in the Twin Cities region commuted to work by transit. In comparison, nearly 8 percent of workers in Baltimore commuted to work by transit from 2005 to 2007 and only 1.3 percent of workers in Tampa used transit for their commute.
Energy Consumption
Another statutory goal of transit is to ensure consistency with state energy and environmental goals, which include efficiently using energy resources and minimizing the environmental impact of energy use.34 Studies have shown that transit usage in the United States has helped increase energy efficiency and lessen carbon dioxide emissions by reducing the amount of gasoline that would have been consumed had transit passengers driven personal vehicles.35
To assess the extent to which bus transit in the Twin Cities region efficiently used energy resources and minimized its environmental impact, we examined Metro Transit’ s efforts to use technological advances to meet these goals.36 We also examined Metro Transit’ s bus performance compared with peer agencies on several measures of fuel efficiency, as listed in Table 5.2 under Goal 8.37 We found that:
32 Texas Transportation Institute, Performance Measure Summary-Minneapolis-St. Paul, MN (College Station, TX: Texas Transportation Institute, July 2009), http://mobility.tamu.edu /ums/congestion_data/tables/minneapolis.pdf, accessed October 14, 2010. 33 The four regions are: Baltimore (31 percent), Tampa (30 percent), Portland (30 percent), and Denver (26 percent). 34 Minnesota Statutes 2010, 116D.02, subd. 2(9); 174.01, subd. 2(10); and 174.03, subd. 7. 35 See Linda Bailey, Public Transportation and Petroleum Savings in the U.S.: Reducing Dependence on Oil, prepared for the American Public Transportation Association (Fairfax, VA: ICF International, 2007); and Todd David and Monica Hale, Public Transportation’s Contribution to U.S. Greenhouse Gas Reduction, prepared for the American Public Transportation Association (McLean, VA: Science Applications International Corporation, 2007). 36 We limited our analysis to Metro Transit (including the express bus service provided through contract with Maple Grove Transit) because it was the only provider in the Twin Cities region to directly operate bus service. 37 Due to data limitations, this analysis includes only bus service directly operated by Metro Transit and the larger transit agencies of the peer regions and excludes Phoenix.
298BLUE RIBBON COMMITTEE REPORT | December 2020
115TRANSIT PERFORMANCE
In 2008, Metro Transit used biodiesel to power its entire fleet, and in 2010, the agency had almost 100 hybrid buses.
Metro Transit’s bus operations utilized technologies to reduce fuel consumption and per formed better than most of its peers on fuel efficiency measures.
Of the 11 peer agencies, Metro Transit was one of only two agencies that used biodiesel blends to power its entire fleet in 2008.38 Biodiesel, compared with petroleum-based diesel, produces fewer carbon dioxide emissions and other pollutants.39 Several peer agencies utilized other clean fuels, such as compressed natural gas or liquefied natural gas, for a portion of their vehicles.40 According to the American Public Transportation Association, biodiesel and natural gas were only about 28 percent of the total fuel consumed by bus vehicles in 2008.41
Similar to some of its peer agencies, Metro Transit has adopted technology to reduce energy consumption by replacing some of its fleet with hybrid vehicles. In 2010, Metro Transit utilized 97 hybrid buses, which represented about 11 percent of its fleet; it plans to have 150 hybrids by 2012. According to the Met Council, hybrid vehicles, while more expensive to purchase, produce 90 percent fewer emissions, have 28 percent better fuel economy, and are quieter than the buses they replace.42 While some peer transit agencies, such as those in Seattle and Denver, also use hybrid vehicles, the American Public Transportation Association found that in 2008 only 4.9 percent of bus vehicles used in the nation were hybrids.43
On measures of fuel efficiency, Metro Transit bus service ranked higher than more than half of the 11 peer agencies for having the lowest fuel consumption per passenger mile and per passenger.44 In 2008, Metro Transit consumed about .02 gallons of fuel per bus passenger mile, which was about half the consumption of fuel per mile of the average car in the United States.45
38 The other agency is Tri-County Metropolitan Transportation District from Portland, Oregon. The King County Department of Transportation – Metro Transit Division from Seattle also used biodiesel fuel, but only for less than 7 percent of all the fuel it used in 2008. 39 U.S. Department of Energy, “Just the Basics: Biodiesel,” (August 2003), http://www1.eere.energy.gov/vehiclesandfuels/pdfs/basics/jtb_biodiesel.pdf, accessed November 4, 2010. 40 These include San Diego Metropolitan Transit System, Denver Regional Transportation District, Pinellas Suncoast Transit Authority (Tampa), Bi-State Development Agency (St. Louis), the Greater Cleveland Regional Transit Authority, and Dallas Area Rapid Transit. 41 See American Public Transportation Association (APTA), 2010 Public Transportation Fact Book (Washington, DC: APTA, April 2010), 18, http://www.apta.com/resources/statistics/pages /transitstats.aspx, accessed October 20, 2010. 42 Metropolitan Council, Twin Cities Transit System 2009 Transit Evaluation (March 2010), 104. 43 See American Public Transportation Association (APTA), 2010 Public Transportation Fact Book (Washington, DC: APTA, April 2010), 18, http://www.apta.com/resources/statistics/pages /transitstats.aspx, accessed October 20, 2010. 44 Full results on energy consumption measures for peer regions are available in an online appendix located at: http://www.auditor.leg.state.mn.us/ped/2011/transit-app.pdf.45 The Bureau of Transportation estimates the average fuel economy of a passenger car in 2008 to be 22.6 miles per gallon, which translates to about .04 gallons per mile.
299BLUE RIBBON COMMITTEE REPORT | December 2020
116 GOVERNANCE OF TRANSIT IN THE TWIN CITIES REGION
We also compared the performance of bus transit providers within the Twin Cities region.
INTRA-REGIONAL COMPARISONS In addition to comparing the Twin Cities region as a whole to peer regions elsewhere in the country, we also compared the performance of bus service of transit providers within the region to one another. As discussed in Chapter 3, the eight bus providers in the region are: the Met Council providers (Metro Transit and Metropolitan Transportation Services), the city-run suburban transit providers (Maple Grove Transit, Plymouth Metrolink, Prior Lake Transit, and Shakopee Transit), and the suburban transit providers formed by joint-powers agreements (the Minnesota Valley Transit Authority and SouthWest Transit).46
We examined the performance of bus providers in 2009 according to a set of efficiency and effectiveness measures for which we had data available by provider and route type.47 To improve the comparability of the results, we examined the performance of providers by service type. However, as shown earlier in Table 5.3, many factors outside a transit provider’s control can impact performance, so we express caution in drawing conclusions based solely on these results. We first provide an overview of the service types in the region and then examine the performance of providers on express and suburban-local bus services.
Overview of Service Types The Twin Cities region offered 225 bus routes in 2009. Different route types serve different transportation needs in the region. Express service is primarily offered to transport commuters from suburban areas into downtown Minneapolis and downtown St. Paul during peak hours. Urban-local and some suburban-local services tend to provide shorter trips within communities, provide service throughout the day and on weekends, and serve a higher proportion of transit-dependent riders.
In 2009, urban-local routes served 78 percent of the bus passengers in the region, express routes served 16 percent, and suburban-local routes served 6 percent, as shown in Figure 5.2.48 The figure also shows that urban-local routes traveled 60 percent of the miles of bus transit service in the region, compared with 14 percent of suburban-local routes, and 26 percent of express routes. Urban-local routes also provided the most hours of service.
In 2009, Metro Transit served the highest share of passengers in the region using urban-local and express bus services, and it served a large portion of suburban-local passengers. As shown in Figure 5.3, Metro Transit served nearly
46 The data in this section do not include regular-route services provided by the University of Minnesota, the Northstar Corridor Development Authority, or the city of Ramsey and do not include special bus services, such as service to the Minnesota State Fair. 47 We were unable to make comparisons on impact measures, but performance on access—a type of impact measure discussed earlier—identified variation among the counties in the Twin Cities region.48 Passengers are counted each time they board vehicles no matter how many vehicles they use to travel from their origin to their destination.
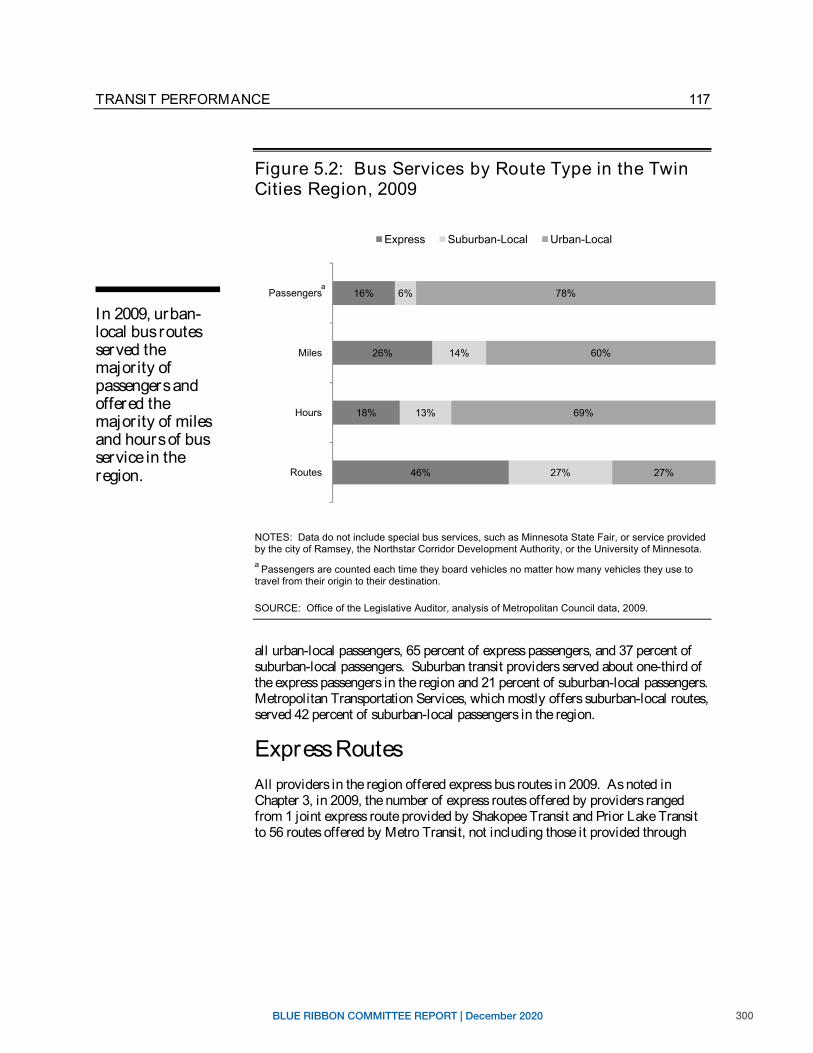
300BLUE RIBBON COMMITTEE REPORT | December 2020
117TRANSIT PERFORMANCE
In 2009, urban-local bus routes served the majority of passengers and offered the majority of miles and hours of bus service in the region.
Figure 5.2: Bus Services by Route Type in the Twin Cities Region, 2009
Express Suburban-Local Urban-Local
aPassengers 6% 78%
Miles 14% 60%
Hours 13% 69%
Routes 46%
18%
26%
16%
27% 27%
NOTES: Data do not include special bus services, such as Minnesota State Fair, or service provided by the city of Ramsey, the Northstar Corridor Development Authority, or the University of Minnesota. a Passengers are counted each time they board vehicles no matter how many vehicles they use to travel from their origin to their destination.
SOURCE: Office of the Legislative Auditor, analysis of Metropolitan Council data, 2009.
all urban-local passengers, 65 percent of express passengers, and 37 percent of suburban-local passengers. Suburban transit providers served about one-third of the express passengers in the region and 21 percent of suburban-local passengers. Metropolitan Transportation Services, which mostly offers suburban-local routes, served 42 percent of suburban-local passengers in the region.
Express Routes All providers in the region offered express bus routes in 2009. As noted in Chapter 3, in 2009, the number of express routes offered by providers ranged from 1 joint express route provided by Shakopee Transit and Prior Lake Transit to 56 routes offered by Metro Transit, not including those it provided through
• • •
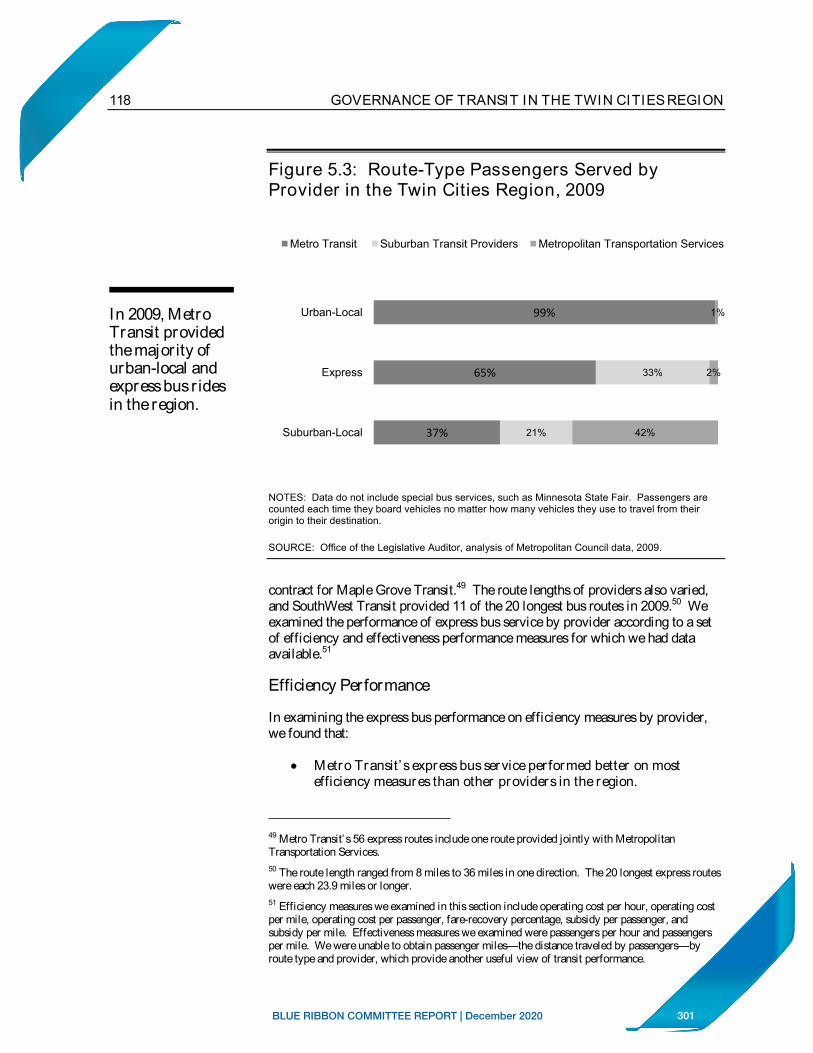
301BLUE RIBBON COMMITTEE REPORT | December 2020
118 GOVERNANCE OF TRANSIT IN THE TWIN CITIES REGION
Figure 5.3: Route-Type Passengers Served by Provider in the Twin Cities Region, 2009
Metro Transit Suburban Transit Providers Metropolitan Transportation Services
In 2009, Metro Urban-Local 99% 1%
Transit provided the majority of urban-local and Express 65% 33% 2% express bus r ides in the region.
Suburban-Local 37% 21% 42%
NOTES: Data do not include special bus services, such as Minnesota State Fair. Passengers are counted each time they board vehicles no matter how many vehicles they use to travel from their origin to their destination.
SOURCE: Office of the Legislative Auditor, analysis of Metropolitan Council data, 2009.
contract for Maple Grove Transit.49 The route lengths of providers also varied, and SouthWest Transit provided 11 of the 20 longest bus routes in 2009.50 We examined the performance of express bus service by provider according to a set of efficiency and effectiveness performance measures for which we had data available.51
Efficiency Performance
In examining the express bus performance on efficiency measures by provider, we found that:
Metro Transit’s express bus service per formed better on most efficiency measures than other providers in the region.
49 Metro Transit’s 56 express routes include one route provided jointly with Metropolitan Transportation Services. 50 The route length ranged from 8 miles to 36 miles in one direction. The 20 longest express routes were each 23.9 miles or longer. 51 Efficiency measures we examined in this section include operating cost per hour, operating cost per mile, operating cost per passenger, fare-recovery percentage, subsidy per passenger, and subsidy per mile. Effectiveness measures we examined were passengers per hour and passengers per mile. We were unable to obtain passenger miles—the distance traveled by passengers—by route type and provider, which provide another useful view of transit performance.
• • •
__ I
302BLUE RIBBON COMMITTEE REPORT | December 2020
119TRANSIT PERFORMANCE
Metro Transit’s express bus service was provided at the lowest cost per passenger and with the highest fare-recovery percentage of all providers in the region in 2009.
In examining the express service Metro Transit provides—both through contract for Maple Grove Transit and on its own routes—it performed better than other providers in the region on almost all of the efficiency measures we evaluated.52
Specifically, Metro Transit’ s express bus service and those it provided through contract for Maple Grove Transit were provided at the lowest cost per passenger and with the highest fare-recovery percentage of all regional providers in 2009.53
Metro Transit’ s express service also had a lower subsidy per passenger than other providers in the region, as shown in Table 5.8. While the express service Metro Transit provided for Maple Grove Transit had the lowest subsidy per mile, its own express routes had higher subsidies per mile than the express service of Plymouth Metrolink and the Minnesota Valley Transit Authority.
Metro Transit staff told us that with the addition of light rail and commuter rail, Metro Transit has been able to leverage administrative costs, which has allowed them to minimize administrative cost increases in all three modes of operation, including bus service. Metro Transit staff noted that if Metro Transit bus, light rail, and commuter rail were operated separately, each mode would require separate administrative staff and related costs.
The suburban transit providers vary in the size of their express operations, which may affect their performance on efficiency measures. In 2009, the Minnesota Valley Transit Authority (MVTA), the largest suburban transit provider, performed better on several efficiency measures than the other suburban providers that did not contract with Metro Transit for express service. For instance, MVTA’s subsidy per passenger for express bus service was $2.84. All other suburban transit providers (with the exception of Maple Grove Transit) and Metropolitan Transportation Services had subsidies per passenger of $3.83 or more. MVTA and Plymouth had the lowest subsidy per mile of the suburban providers (not including Maple Grove Transit) at $3.90, while the three other suburban providers and Metropolitan Transportation Services had subsidies per mile of more than $4.50.
SouthWest Transit, Shakopee Transit, and Prior Lake Transit had higher costs per hour and mile and higher subsidies per passenger and mile than other providers in the region in 2009. However, as noted earlier, SouthWest Transit provided many of the longest bus routes in the region. While not all longer express routes had higher subsidies than shorter routes, some components of operations, such as fuel and driver costs, can be higher for longer routes, especially those with longer travel times. Also, Shakopee Transit and Prior Lake Transit each had only one shared express bus route and few local routes, so the overhead costs for each provider were allocated onto a small number of routes.
52 The express service Metro Transit provided for Maple Grove Transit performed the best on all efficiency measures except for one, and Metro Transit’s own express service performed second to its express service for Maple Grove Transit on three of the six measures. 53 Full results on efficiency measures for express bus service of each Twin Cities region provider are available in an online appendix located at: http://www.auditor.leg.mn.us/ped/2011/ped/transit -app.pdf.
303BLUE RIBBON COMMITTEE REPORT | December 2020
120 GOVERNANCE OF TRANSIT IN THE TWIN CITIES REGION
Table 5.8: Performance on Selected Measures by Transit Service Type and Provider, 2009
Operating Expenses Passengersa Subsidy per Subsidy per Passengers
(thousands) (thousands) Passengerb Mileb per Hour
Express Bus Maple Grove (operated by Metro Transit) $ 2,799 709 $ 1.41 $ 2.29 43 Metro Transit 36,875 7,467 2.61 4.49 36 Metropolitan Transportation Services 2,086 289 4.75 4.58 24 Minnesota Valley Transit Authority 8,936 1,720 2.84 3.90 34 Plymouth Metrolink 2,205 349 3.83 3.90 21 Prior Lake Transit 521 48 7.77 6.73 23 Shakopee Transit 686 92 5.04 8.91 26 SouthWest Transit 6,703 898 4.96 5.89 31
Express Bus Total/Average $ 60,812 11,572 $ 2.89 $ 4.43 34 Suburban-Local Bus
Maple Grove $ 141 20 $ 6.97 $ 8.39 13 Metro Transit 6,851 1,445 3.81 7.53 33 Metropolitan Transportation Services 8,299 1,664 4.03 3.28 12 Minnesota Valley Transit Authority 6,045 669 8.04 5.23 12 Plymouth Metrolink 855 57 14.92 7.94 10 Prior Lake Transit 30 1 20.22 3.42 2 Shakopee Transit 319 23 12.93 3.19 4SouthWest Transit 645 52 10.65 10.57 14
Suburban-Local Bus Total/Average $ 23,185 3,933 $ 4.95 $ 4.77 15 Urban-Local Bus
Metro Transit $186,361 55,230 $ 2.42 $ 7.84 42 Metropolitan Transportation Services 2,206 482 3.51 5.13 19
Urban-Local Bus Total/Average $188,568 55,713 $ 2.43 $ 7.79 42 Metro Transit–Light Rail $ 23,113 9,863 $ 1.34 $12.92 157 Metro Transit–Commuter Railc $ 7,608 333 $19.36 $89.74 57
NOTES: Subcategories may not sum to totals due to rounding. Bus data do not include services for special events, such as the Minnesota State Fair. Results on additional performance measures are available in an online appendix located at: http://www.auditor.leg .mn.us/ped/2011/ped/transit.app.pdf.a Passengers are counted each time they board vehicles no matter how many vehicles they use to travel from their origin to their destination.b Subsidy is the operating cost minus the passenger fare revenue. c Commuter rail figures include data from January to June 2010 (except passengers per hour, which includes data through September 2010) since commuter rail service began operations in November 2009.
SOURCE: Office of the Legislative Auditor, analysis of data provided by Metropolitan Council and Metro Transit., 2009
Effectiveness Performance
When examining the measures of service use, including passengers per hour, passengers per mile, and customer satisfaction, we found that:
The per formance of express bus service providers on measures of service utilization was mixed; however , customers responding to surveys were generally satisfied with the services they received.
304BLUE RIBBON COMMITTEE REPORT | December 2020
121TRANSIT PERFORMANCE
Across all regional providers, very high percentages of express bus r iders indicated their satisfaction with transit services.
Differentproviders offer different levels of suburban-local bus service.
In 2009, Metro Transit’ s express routes served the most passengers per hour (including the service provided for Maple Grove) of all providers and served the second-highest number of passengers per mile among all providers in the region.54 Shakopee Transit, which was in the middle of providers in the number of passengers per hour, served the highest number of passengers per mile.
All providers in the Twin Cities region have conducted customer satisfaction surveys since 2003.55 While the survey data for each provider were not comparable due to different methodologies, questions, and response choices, all surveys asked a question about overall satisfaction with services. For all providers, very high percentages of express bus riders surveyed indicated their satisfaction with transit services. For example, 99 percent of SouthWest Transit survey respondents were satisfied or very satisfied overall with services, and 97 percent of the Minnesota Valley Transit Authority’s survey respondents said that the service they received met or exceeded their expectations. Similarly, about 90 percent of Metro Transit’ s express passengers who responded to surveys agreed or strongly agreed that they were satisfied with transit services.
Suburban-Local Routes We also compared the performance of each bus provider in the region using measures of efficiency and effectiveness for their suburban-local routes. In 2009, suburban-local routes represented only 14 percent of the bus transit miles traveled in the region and amounted to only 9 percent of bus operating costs.
We found that:
Regional providers’ per formance on suburban-local service was difficult to compare due to var iations in service.
Different providers offer different levels of suburban-local service. In 2009, Metropolitan Transportation Services provided many more suburban-local routes than Metro Transit but served a somewhat similar percentage of passengers, as shown earlier in Figure 5.3.56 Some providers, such as Prior Lake Transit and Shakopee Transit, had very few local routes. Plymouth Metrolink, Maple Grove Transit, and Shakopee Transit did not collect fares for their local “ feeder” routes because all of the feeder riders paid a fare when they boarded the express bus route. With the exception of one SouthWest Transit route that was discontinued in 2009, Metro Transit, Metropolitan Transportation Services, and the Minnesota Valley Transit Authority were the only providers that offered suburban-local service on weekends.
54 Full results on effectiveness measures for express service of each Twin Cities region provider are available in an online appendix located at: http://www.auditor.leg.mn.us/ped/2011/ped/transit -app.pdf.55 Maple Grove Transit conducted its most recent survey in 2003; Metro Transit’s most recent survey, which included responses from riders of Metropolitan Transportation Services’ routes, was conducted in 2008; and the Minnesota Valley Transit Authority, SouthWest Transit, Plymouth Metrolink, and Prior Lake Transit/Shakopee Transit conducted their most recent surveys in 2009. 56 In 2009, Metropolitan Transportation Services provided 22 suburban-local routes, Metro Transit operated 4, and the two providers jointly provided 3 routes.
305BLUE RIBBON COMMITTEE REPORT | December 2020
122 GOVERNANCE OF TRANSIT IN THE TWIN CITIES REGION
Likely due to variations in service, the performance on efficiency measures varied across providers from one measure to the next in 2009.57 For example, Metro Transit’ s and Metropolitan Transportation Services’ suburban-local routes had lower costs and subsidies per passenger than the suburban-local routes provided by the suburban transit providers, but Metro Transit’s service required a higher subsidy per mile than one-half of the providers in the region, as shown in Table 5.8. At the same time, Shakopee Transit had higher subsidies per passenger than most providers but had the lowest subsidy per mile of all providers.
On measures of effectiveness, Metro Transit’ s suburban-local routes served a substantially higher number of passengers per hour and per mile than the other providers in 2009. Specifically, Metro Transit’s suburban-local routes served 33 passengers per hour while the other providers ranged from 2 to 14. However, some of the suburban areas served by Metro Transit, such as Brooklyn Center, had higher densities than some areas served by the suburban transit providers, which likely contributed to the productivity of their suburban-local routes. Also, Metropolitan Transportation Services, which contracted for routes that were not cost-effective for Metro Transit to operate, ranked near the middle of all providers in the region in its performance on effectiveness measures for its suburban-local routes.
RECOMMENDATIONS
RECOMMENDATION
The Legislature should clarify the goals and priorities of transit in the Twin Cities region.
Clear and identifiable goals for the Twin Cities region’s transit system would help focus stakeholders on the purpose of providing transit in the region. Clarity from the Legislature about the goals for the transit system as a whole is especially important because the region has many organizations involved in transit governance, many of which only focus on one part of the system. Therefore, we suggest that the Legislature clarify and consolidate the goals specific to transit in statute.
Because some goals inherently conflict with others, it would be useful for the Legislature to prioritize goals for transit. The goals for transit should guide decisions about what services to provide and what the services should achieve. As such, identifying priorities will help in making decisions about where to allocate the region’s scarce transit resources.
57 Full results on efficiency and effectiveness measures of each Twin Cities region provider are available in an online appendix located at: http://www.auditor.leg.mn.us/ped/2011/ped/transit -app.pdf.
306BLUE RIBBON COMMITTEE REPORT | December 2020
123TRANSIT PERFORMANCE
RECOMMENDATION
The Metropolitan Council should work with stakeholders to adopt a set of measures that examine the performance of the transit system as a whole, according to the goals outlined in statute.
The transit providers in the region should work with the Metropolitan Council to identify such measures and ensure that data are comparable across the providers in the region.
Once the Legislature has clarified the goals of transit, the Met Council should work with transit providers and other stakeholders in the region to develop a set of measures that comprehensively evaluates how well the transit system is meeting its goals. Any single measure will have drawbacks and can only assess progress toward certain goals, so we encourage the Met Council and stakeholders to select a set of measures that can provide a comprehensive perspective of the transit system’s performance.
The transit providers in the region should work with the Met Council to identify appropriate performance measures and standard definitions to allow for measurement of the region’s system as a whole. Given the distrust among providers in the region discussed throughout this report, it may be difficult to agree on which measures to include. Additionally, the number of different transit organizations under the current transit governance structure makes evaluating the performance of the transit system more difficult. However, it is important for providers to work together to develop a set of measures that will help legislators, stakeholders, and the public understand the extent to which the system is meeting its goals. For such measures to be useful, it is crucial that data be collected in a similar manner across providers.
As noted earlier, the Met Council is already required by statute to prepare a performance evaluation periodically. We recommend that once the goals are identified and measures are selected, the performance evaluation include an assessment of the region’s transit system according to the complete set of transit performance measures that are identified.
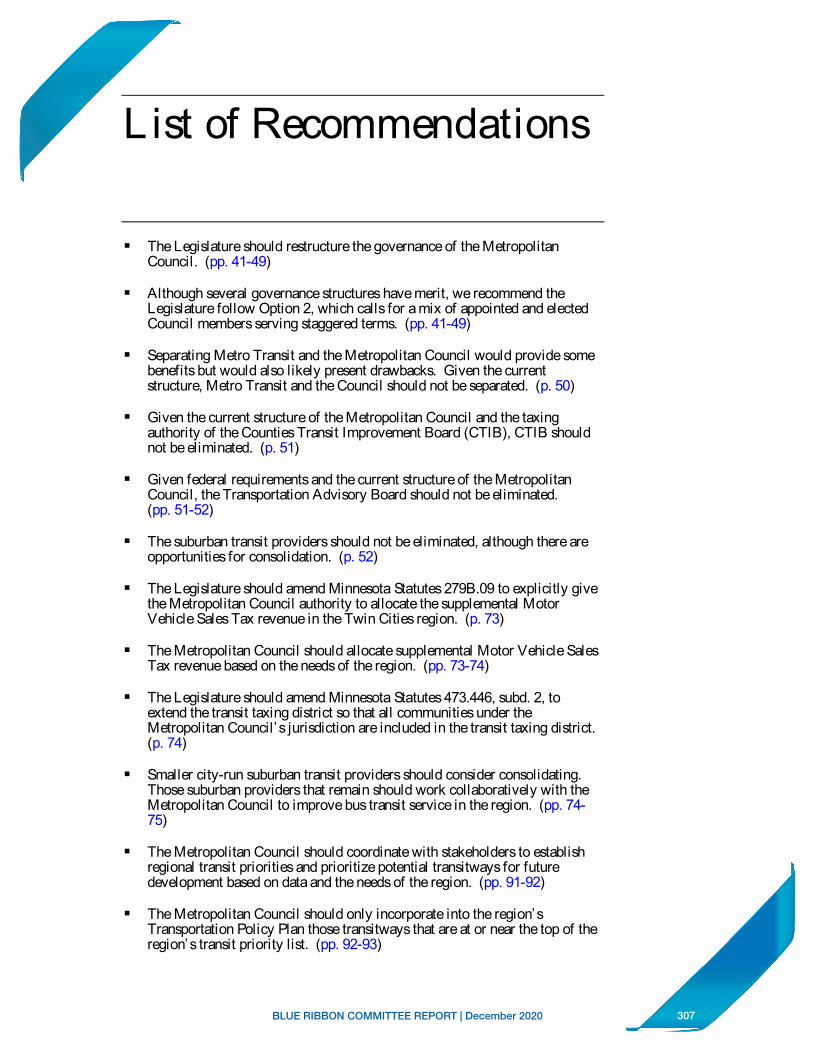
307BLUE RIBBON COMMITTEE REPORT | December 2020
List of Recommendations
The Legislature should restructure the governance of the Metropolitan Council. (pp. 41-49)
Although several governance structures have merit, we recommend the Legislature follow Option 2, which calls for a mix of appointed and elected Council members serving staggered terms. (pp. 41-49)
Separating Metro Transit and the Metropolitan Council would provide somebenefits but would also likely present drawbacks. Given the current structure, Metro Transit and the Council should not be separated. (p. 50)
Given the current structure of the Metropolitan Council and the taxing authority of the Counties Transit Improvement Board (CTIB), CTIB should not be eliminated. (p. 51)
Given federal requirements and the current structure of the Metropolitan Council, the Transportation Advisory Board should not be eliminated. (pp. 51-52)
The suburban transit providers should not be eliminated, although there are opportunities for consolidation. (p. 52)
The Legislature should amend Minnesota Statutes 279B.09 to explicitly give the Metropolitan Council authority to allocate the supplemental Motor Vehicle Sales Tax revenue in the Twin Cities region. (p. 73)
The Metropolitan Council should allocate supplemental Motor Vehicle Sales Tax revenue based on the needs of the region. (pp. 73-74)
The Legislature should amend Minnesota Statutes 473.446, subd. 2, to extend the transit taxing district so that all communities under the Metropolitan Council’s jurisdiction are included in the transit taxing district. (p. 74)
Smaller city-run suburban transit providers should consider consolidating. Those suburban providers that remain should work collaboratively with the Metropolitan Council to improve bus transit service in the region. (pp. 74-75)
The Metropolitan Council should coordinate with stakeholders to establish regional transit priorities and prioritize potential transitways for future development based on data and the needs of the region. (pp. 91-92)
The Metropolitan Council should only incorporate into the region’s Transportation Policy Plan those transitways that are at or near the top of the region’s transit priority list. (pp. 92-93)
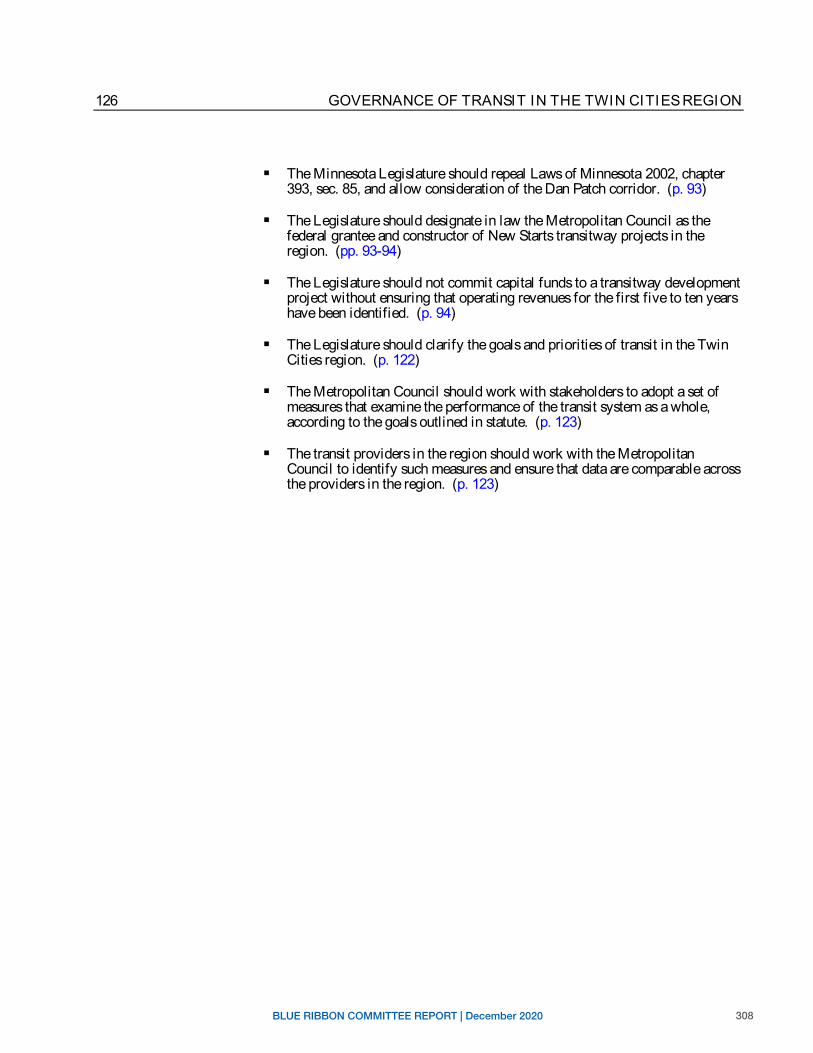
308BLUE RIBBON COMMITTEE REPORT | December 2020
126 GOVERNANCE OF TRANSIT IN THE TWIN CITIES REGION
The Minnesota Legislature should repeal Laws of Minnesota 2002, chapter 393, sec. 85, and allow consideration of the Dan Patch corridor. (p. 93)
The Legislature should designate in law the Metropolitan Council as the federal grantee and constructor of New Starts transitway projects in the region. (pp. 93-94)
The Legislature should not commit capital funds to a transitway development project without ensuring that operating revenues for the first five to ten years have been identified. (p. 94)
The Legislature should clarify the goals and priorities of transit in the Twin Cities region. (p. 122)
The Metropolitan Council should work with stakeholders to adopt a set of measures that examine the performance of the transit system as a whole, according to the goals outlined in statute. (p. 123)
The transit providers in the region should work with the Metropolitan Council to identify such measures and ensure that data are comparable across the providers in the region. (p. 123)
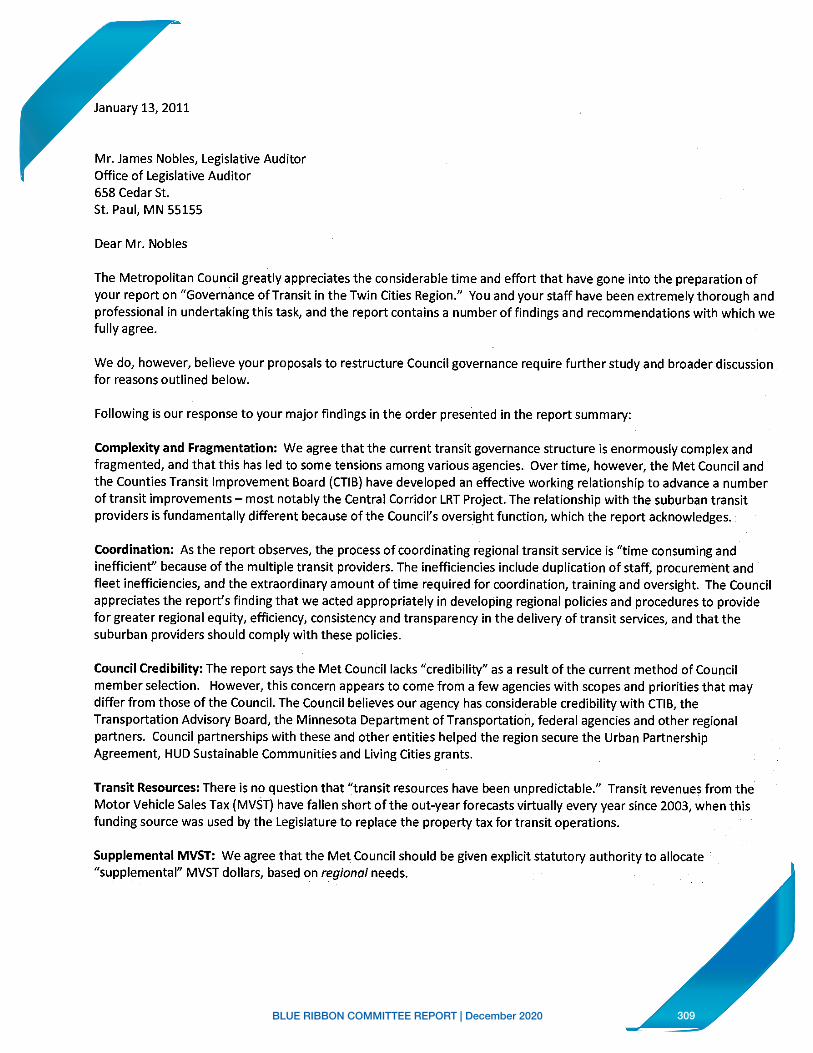
309BLUE RIBBON COMMITTEE REPORT | December 2020
Mr. James Nobles, Legislative Auditor Office of Legislative Auditor 658 Cedar St. St. Paul, MN 55155
Dear Mr. Nobles
The Metropolitan Council greatly appreciates the considerable time and effort that have gone into the preparation of your report on "Governance of Transit in the Twin Cities Region." You and your staff have been ex1remely thorough and professional in undertaking th is task, and the report contains a number of findings and recommendations with which we fully agree.
We do, however, believe your proposals to restructure Council governance require further study and broader discussion. for reasons outlined below.
Following is our response to your major findings in the order prese.nted in the report summary:
Complexity and Fragmentation: We agree that the current transit governance structure is enormously complex and fragmented, and that this has led to some tensions among various agencies. Over time, however, the Met Council and the Counties Transit Improvement Board (CTIB) have developed an effective working relationship to advance a number of transit improvements - most notably the Central Corridor LRT Project. The relationship with the suburban transit providers is fundamentally different because of the Council's oversight function, which the report acknowledges.•
Coordination: As the report observes, the process of coordinating regional transit service is "time consuming and inefficient" because of the multiple transit providers. The inefficiencies include duplication of staff, procurement and· fleet inefficiencies, and the extraordinary amount of time required for coordination, training and oversight. The Council appreciates the report's finding that we acted appropriately in developing regional policies and procedures to provide for greater regional equity, efficiency, consistency and transparency in the delivery of transit services, and that the suburban providers should comply with these policies.
Council Credibility: The report says the Met Council lacks "ere di bi lity" as a result of the current method of Council member selection. However, this concern appears to come from a few agencies with scopes and priorities that may differ from those ofthe Council. The Council believes our agency has considerable credibility with CTIB, the Transportation Advisory Board, the Minnesota Department ofTransportation, federal agencies and other regional partners. Council partnerships with these and other entities helped the region secure the Urban Partnership Agreement, HUD Sustainable Communities and Living Cities grants.
Transit Resources: There is no question that ''.transit resources have been unpredictable." Transit revenues from the Motor Vehicle Sales Tax (MVST) have fallen short of the out-year forecasts virtually every year since 2003, when this funding source was used by the Legislature to replace the property tax for transit operations.
Supplemental MVST: We agree that the Met Council should be given explicit statutory authority to allocate • "supplemental" MVST dollars, based on regionql needs. ·
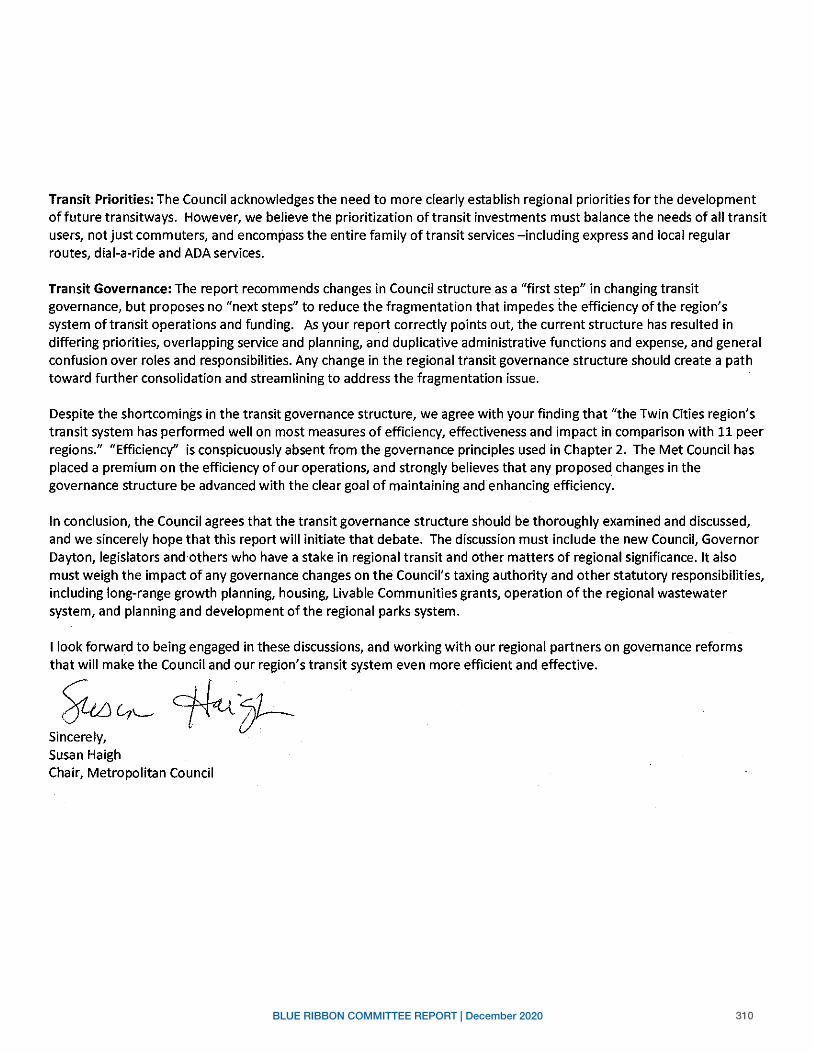
310BLUE RIBBON COMMITTEE REPORT | December 2020
Transit Priorities: The Council acknowledges the need to more clearly establish region a I priorities for the development of future transitways. However, we believe the prioritization of transit investments must balance the needs of all transit . users, not just commuters, and encompass the entire family of transit services-including express and local regular routes, dial-a-ride and ADA services.
Transit Governance: The report recommends changes in Council structure as a "first step" in changing transit governance, but proposes no "next steps" to reduce the fragmentation that impedes the efficiency of the region's system of transit operations and funding. As your repo,rt correctly points out, the current structure has resulted in differing priorities, overlapping service and planning, and duplicative administrative functions and expense, and general confusion over roles and responsibilities. Any change in the regional transit governance structure should create a path toward further consolidation and streamlining to address the fragmentation issue. ·
Despite the shortcomings in the transit governance structure, we agree with your finding that "the Twin Cities region's transit system has performed well on most measures of efficiency, effectiveness and impact in comparison with 11 peer regions." "Efficiency" is conspicuously absent from the governance principles used in Chapter 2. The Met Council has placed a premium on the efficiency of our operations, and strongly believes that any proposed changes in the governance structure be advanced with the clear goal of maintaining and· enhancing efficiency.
In conclusion, the Council agrees that the transit governance structure should be thoroughly examined and discussed, . and we sincerely hope that this report will initiate that debate. The discussion must include the new Council, Governor Dayton, legislators and·others who have a stake in regional transit and other matters of regional significance. It also must weigh the impact of any governance changes on the Council's taxing authority and other statutory responsibilities, including long-range growth planning, housing, Livable Communities grants, operation of the regional wastewater system, and planning and development ofthe regional parks system.
I look forward to being engaged in these discussions, and working with our regional partners on governance reforms that will make the Council and our region's transit system even more efficient and effective.
~~~11-Sincerely, · . · Susan Haigh Chair, Metropolitan Council
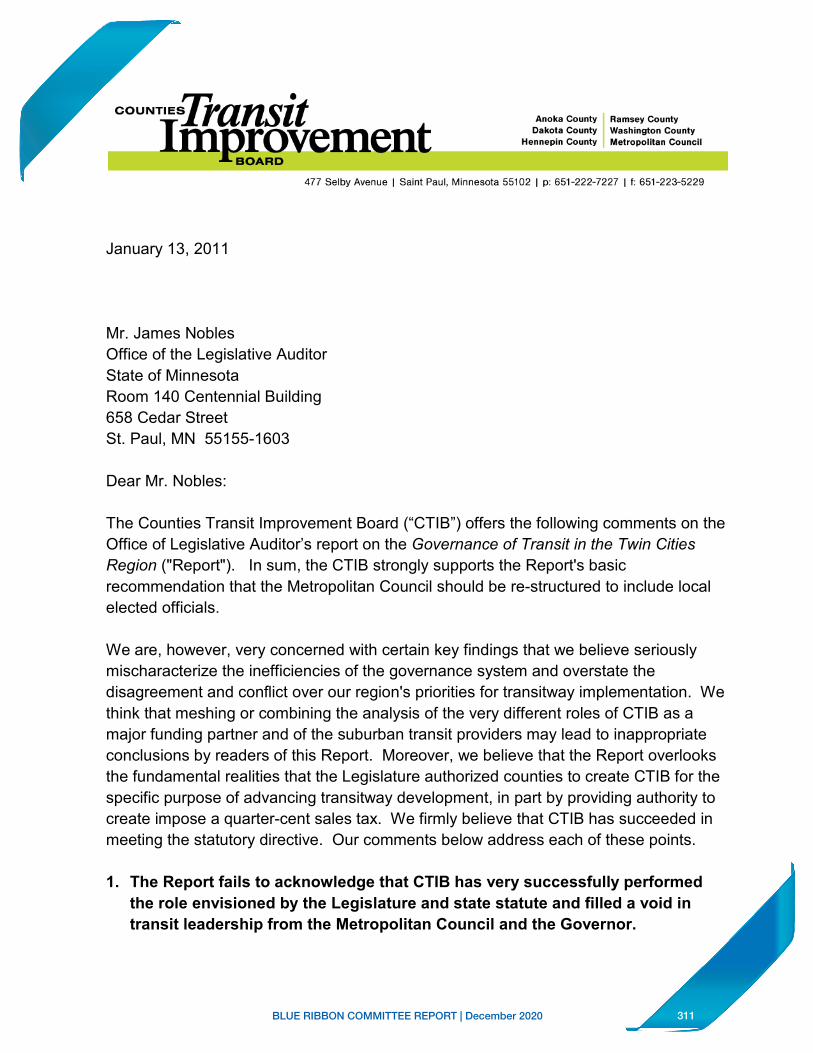
311BLUE RIBBON COMMITTEE REPORT | December 2020
January 13, 2011
Mr. James Nobles Office of the Legislative Auditor State of Minnesota Room 140 Centennial Building 658 Cedar Street St. Paul, MN 55155-1603
Dear Mr. Nobles:
The Counties Transit Improvement Board (“CTIB”) offers the following comments on the Office of Legislative Auditor’s report on the Governance of Transit in the Twin Cities Region ("Report"). In sum, the CTIB strongly supports the Report's basic recommendation that the Metropolitan Council should be re-structured to include local elected officials.
We are, however, very concerned with certain key findings that we believe seriously mischaracterize the inefficiencies of the governance system and overstate the disagreement and conflict over our region's priorities for transitway implementation. We think that meshing or combining the analysis of the very different roles of CTIB as a major funding partner and of the suburban transit providers may lead to inappropriate conclusions by readers of this Report. Moreover, we believe that the Report overlooks the fundamental realities that the Legislature authorized counties to create CTIB for the specific purpose of advancing transitway development, in part by providing authority to create impose a quarter-cent sales tax. We firmly believe that CTIB has succeeded in meeting the statutory directive. Our comments below address each of these points.
1. The Report fails to acknowledge that CTIB has very successfully performed the role envisioned by the Legislature and state statute and filled a void in transit leadership from the Metropolitan Council and the Governor.
COUNTIEPransit ______ mP.rQvement
Anoka County I Ramsey County Dakota County Washinglon County
Hennepin County Metropolitan Council
477 Selby Avenue I Saint Paul, Minnesota 55102 I p: 651-222-7227 I f: 651-223-5229
312BLUE RIBBON COMMITTEE REPORT | December 2020
Mr. James Nobles January 13, 2011 Page 2
We believe it is fair to assert that CTIB has performed as envisioned and directed by the law, i.e., it has operated efficiently to invest significant sums of money to expand the transitway system and to elicit even larger sums of federal funds in a very short time on the region’s top priority corridors. Far from merely making the system “more fragmented,” the creation of CTIB actually allowed major investment in the expansion of the transit system to occur. As acknowledged in the Report, there would be no Central Corridor project without the funds provided by CTIB. No other governmental entity, including the Metropolitan Council, was willing to make the $315 million in transit investments that CTIB has authorized since its creation in 2008. One more body with a clear vision, consistent with the Council’s, as provided by the law, and the political will to gather the resources needed to make the vision a reality should be viewed as a positive, not a negative.
It is important to note that funding transit projects that can cost up to $1 billion is not an easy task. It is not merely a technical or engineering undertaking requiring certain professional knowledge or expertise; it requires the political commitment to raise and secure the necessary funds. Over the last decade, funding of transit has been the problem. CTIB was created by the Legislature and the Counties to address that very specific issue.
CTIB members understand that CTIB’s existence creates some need for additional coordination and staff time to responsibly manage grants with CTIB funds. Good stewardship of public resources demands nothing less. Simply handing the funds over to an appointed Metropolitan Council that has no accountability to the voters would seem to undermine basic notions of clear lines of responsibility. Finally, the tradeoff of coordination for the critically needed capital and operating funds, huge sums of additional federal funds for the region and improvement in the effectiveness of the transit system seems, on balance, to be a huge win for the region. As a measure of our success, according to Metropolitan Council sources, two-thirds of the recent increases in ridership came from transitways.
2. The Report consistently overstates the differences between the Metropolitan Council and CTIB’s priorities for transitway implementation.
While it is fair to say that there is a difference between the Metropolitan Council and CTIB regarding the speed at which transit ridership should increase, in the short and medium term, there are virtually no major differences on priorities. Specifically:
313BLUE RIBBON COMMITTEE REPORT | December 2020
Mr. James Nobles January 13, 2011 Page 3
a. There have been and are no major differences between the Council and CTIB on Central as the next LRT line, Cedar and I-35W South as the priority BRT lines, Northstar as the first commuter rail line and Southwest as the third LRT line.
b. The fact that the Counties Transit Improvement Board developed a different map that shows another transit vision for the region is likewise a serious overstatement. A comparison of the maps would demonstrate that, in fact, relatively minor differences exist. The region’s vision, as reflected in both maps is a system of high quality transitways that will connect Minneapolis, St. Paul, the U of M, Eden Prairie, the airport, the Mall of America, Dakota County, Washington County, Anoka County and eventually, St. Cloud. There is little argument about that. There are understandable disagreements about timing and sequencing in the long term, but the key points that need to be connected are known and shared.
c. In Chapter 4, the Report finds that the process for planning transitways is fragmented. It is true the lines are studied independently in the early stage of project development, but the statement shows a misunderstanding of the alternatives analysis process in which the local stakeholders analyze the best alternative to meet their needs. This is a very inclusive process, paid for by the local government (typically the regional railroad authorities, not the Metropolitan Council), and ultimately approved by the Council. This process should not be viewed as a negative but as a truly participatory method of addressing local needs in the regional context.
d. Chapter 4 also asserts that fragmentation results because CTIB has a “narrower vision” for transitways that it funds. The Metropolitan Council, in fact, includes a broader array of services for which it is responsible (specifically including “arterial BRT” and regular route bus service). CTIB shares the Council’s vision, but excludes arterial BRT from eligibility for funding simply because it lacks sufficient funds to build out the entire system. We believe that posture is consistent with the direction of statute to CTIB to expand transitways and not supplant pre-existing funding by the Council. It has chosen to fund major transitways while still advocating funding for the buildout of the balance of the system. CTIB fully supports the development of arterial BRT; the Board simply believes that aspect of the system should be funded by the Council. Thus, there is no difference in vision. The difference is a product of limited resources.
314BLUE RIBBON COMMITTEE REPORT | December 2020
Mr. James Nobles January 13, 2011 Page 4
e. Longer term goals and priorities for the region remain a matter of considerable debate. We would contend that sufficient study has not yet been undertaken to make the bulk of those decision, though the counties are engaged in a number of studies (e.g., Gateway, Bottineau, Robert Street), and phased development (Rush, Red Rock) at this time. Excluding potential corridors form the Policy Plan at this early stage, as recommended on page 17 in Chapter 4, will impede the very lengthy development process. It takes many years to develop a corridor; starting the process early should be encouraged in order to ready the corridors for funding as the need becomes clearer.
f. On page 12, in Chapter 4, the Report asserts, based on conversations with Metropolitan Council staff, that each of the operating transitways has followed a different development model, causing confusion at the Federal Transit Administration (“FTA”). This observation fails to acknowledge that dramatic differences in federal programs and policies existed at key moments in the development of the various transitways. It should come as no surprise that the projects evolved in difference ways. The region as been successfully opportunistic in seeking federal funds. The Urban Partnership (UPA) project on 35W South and Cedar Avenue, which netted the region over $130 million in federal funds, is a prime example of this pattern. A lockstep approach would likely have squandered this great opportunity for the region.
g. The Report finds that transitway organizations are not “required” to consider on-going operating and maintenance costs that result from developing transitways. CTIB is not required but it does in practice consider the operating “tails” of each of its transitway investments. The requirement that CTIB provide 50 percent of the operating costs of transitways in which it invests makes consideration of operating costs a necessity.
We agree that it is essential that sufficient operating revenue for transitways be available without degrading the rest of the transit system. It is in fact required by the federal government for New Starts projects. Currently, CTIB tracks operating costs associated with the transitways in which it invests and builds into its Long-Term Financial plans our long-term commitment of 50 percent of the net operating subsidy of these transitways. The recommendation and text discussing this issue (Chapter 4, pp. 18-19) does not acknowledge our solid work on this issue.
315BLUE RIBBON COMMITTEE REPORT | December 2020
Mr. James Nobles January 13, 2011 Page 5
h. Finally, it should be noted that CTIB has formally adopted a two-armed strategy for advancing transit in the region. First, it uses the proceeds of its sales tax to invest in high priority transitway improvements and to cover half of their net operating subsidy. Second, CTIB actively advocates for a wider range of projects, including arterial busways, transit operating support, investment in key transportation hubs, etc. So, far from abandoning the council’s broad plans and strategies for transit, CTIB embraces and advances them, sometimes more vigorously than the Council can or does.
3. We agree that the Metropolitan Council should be re-structured to better address transit governance; and the Council should include county commissioners and other local elected officials. The representation and process for appointment will require significant thought and discussion.
We have some concerns, however, about the discussion in the Report relating to governance in Chapter 2. The Report identifies and defines 9 principles for effective transit governance. It is not clear, however, how these broad principles were operationalized to support the evaluation of the current transit governance structure.
No discussion is given to whether these principles, which make sense from an administrative and policy standpoint, are achievable in the current political context. Was it possible to establish a common, strategic vision, with stability and effectiveness developed through consensus given the deep divisions between the legislative and executive branches of the state? The Report failed to acknowledge that transit systems develop over decades and require consistent political (policy) and economic (dedicated revenues for capital and operations) support or run the risk of performing poorly or stalling completely. Development and operation of transit systems cannot be turned “on” and “off,” and trying to do serves neither transit nor other transportation interests.
We agree with the appointment of local elected officials to the Council, not just county commissioners. City participation is essential, and not just by the Mayors of Minneapolis and St. Paul. The latter reflects old thinking and flawed politics. The two options offered for appointment of county commissioners to the Council, however, fly in the face of the basic concept of equity (articulated in the one-person-one-vote ruling of the courts). To give Scott and Carver Counties (with about 8% of the region’s population combined) the same representation as Hennepin and Ramsey Counties (nearly 60%) is unjust and potentially unconstitutional. A more equitable option that we believe should be included in the report would be to grant
316BLUE RIBBON COMMITTEE REPORT | December 2020
Mr. James Nobles January 13, 2011 Page 6
the Governor (or the countties) the authority to appoint local elected offficials to the Council within the existing structure of districts. That would assure eq qual representation while providding the increased voice for local elected offficials that you seek.
The suggestion that inclusi sion of all counties on the Council would leadd to easier collaboration between the Council and CTIB (Chapter 2, page 22) mig ght be true; then again, maybe not. Th here is so much attempted collaboration bettween the Council and CTIB that in o other places in the report it is identified as timme-consuming and inefficient. You can’t hhave it both ways. It is important to note tha at CTIB includes five of the seven cocounties and contains over 90 percent of th he region’s population.
Finally, we would note thatt the reported concerns that the Council has s an internal conflict of interest seem to o elevate the problems of the opt-outs (much ch less than 10 percent of the region’s ride es) to too great a level of influence. Thus w we agree with the recommendation on paages 2-25 and would suggest that it be stren ngthened by adding the descriptor “sign nificant” before the word drawbacks.
In closing, the Counties Tr ransit Improvement Board thanks you for the e opportunity to discuss the complex issue es of transit governance with you. We hope that our comments have been help pful; and we look forward to further discussio on of the issuesduring the legislative sessi ssion.
Sincerely,
Peter McLaughlin, Chair Counties Transit Improvem ment Board
317BLUE RIBBON COMMITTEE REPORT | December 2020
S UBURBAN
TRANSIT
AssocIATION
January 13, 201 1
James Nobles Office of the Legislative Auditor Room 140 Centennial Building 658 Cedar Street St. Paul, Minnesota 55 155-1603
Dear Auditor Nobles,
League ol'Mi11nesota Cities 1311iltli11g 145 University Avenue West, Suite 450 St. Paul, MN 55103
Telephone: (651) 228-9757 Facsimile: (651) 228-9787
On behalf of the Suburban Transit Association, I would like to thank you and your staff for the extensive work and exhaustive effo1t that went into preparing the report on Governance of Transit in the Twin Cities Region. We recognize what a huge undertaking this was. Judy Randall, Emi Bennett and Julie Trupke-Bastidas conducted themselves in a most professional manner throughout the entire process and were a pleasure to work with. Our members appreciated meeting colleclively, as well as individually, 1,vith your oflice and applaud their collective efforts.
We would like to amplify the many positive outcomes of the regional transit system and take this oppmtunity to expand upon and tespond to the OLA's Major Findings and Key Recommendations and other recommendations in the report.
• We are very pleased that your study has conri1med that the region's transit sy~tem has performed well on measures of efficiency and effectiveness on a comparative basis with other peer regions. The report also recognizes that transit operations are well-coordinated among the regional providers resulting in seamless, high quality service to transit users. Transit riders are pleased with the services of all providers and ridership has increased throughout the region. \Ve believe that the efficiency and effectiveness of our regional hus trdllsit system is, in part, a result of the competitive nature among providers that has led to valuable innovations and other regional transpmtation benefils.
• We acknowledge that the administration of transit governance in the region is complex; however, this is a common characteristic of most regional transit systems, including those in the cities/regions that were used for peer review purpMes, and is not unique to the metropolitan area. While complex, the region has benefited from expanded services, reduced congestion, and regional innovations as a result of the suburban providers' presence and initiatives. We believe an important role of the regional planning agency should be to build consensus among the various stakeholders, which would help mitigate the complexities of the governance structure.
24249\1
Members: Maple Grove Transit.-Nl i1111cso1a Valley hansit Authority Plymouth Mctrolink. Prior Lake Laker Lines. Shakopee Transit. South West Tran, it
318BLUE RIBBON COMMITTEE REPORT | December 2020
• We believe that the relationship between the suburban providers and the Metropolitan Council has been strained due to the scarce financial resources, which has further hampered planning of our future services. We also believe a lack of consensus over regional allocation of funding among the region's bus-transit providers and between the different modes of transit has exacerbated and highlighted these conflicts.
• As a member organization, we have not taken a position on the form of Metropolitan Council governance, although the city councils of our member cities may choose to do so. Still, we recognize the opportunities for governance consolidation presented in the report as a potential benefit to the region.
• We appreciate the report's recognition of the important role that the suburban transit providers play within the regional transit system through your recommendation that the suburban providers continue in operation. Our ability to stay close to the needs of our riders and communities has increased ridership in areas previously underserved, has brought innovative transit solutions to the region and has reduced congestion on the regional highway and road system. We will continue to look for areas to improve the efficiency and effectiveness of our operations between and among the various suburban providers and Metro Transit.
• We strongly agree with the report's recognition that the Legislature, and by association other funding bodies, should not commit capital funds to transitways without first ensuring that operating revenues for the first 5 to 10 years have been identified. As the rep01t also highlights, funding resources for transit services are scarce and likely to become scarcer. Funding capital investments in transitways without committing the corresponding operating funding is likely to aggravate the already difficult funding allocation process among existing providers.
• We believe that suburban providers should receive a proportional share of the "supplemental" MVST revenue. However, if the Metropolitan Council is given authority to allocate the "supplemental" revenue, in order to ensure accountability and transparency in its decisions relating to revenue sharing, the governance changes recommended by the report should first be enacted.
• We are concerned with the repott's recommendation to expand the transit taxing district. While we recognize the issues raised in the repmt relating to the inequitable allocation of transit services through the negotiated expansion process that currently exists, expanding the transit district without providing the additional capital and operating funding necessary to provide transit services to areas in which the district was expanded would simply create new inequities.
319BLUE RIBBON COMMITTEE REPORT | December 2020
Thank you once again for all of your hard work and for the opportunity lo participate in your prncess and comment on your repo11. We look forward to discussing this rcpott with legislators.
With best reuards ~ ,
Tom Furlong Chairman Suburban Transit Association
320BLUE RIBBON COMMITTEE REPORT | December 2020
For thcoming Evaluations Medical Nonemergency Transportation, January 2011 Environmental Review and Permitting, February 2011 Civil Commitment of Sex Offenders, February 2011
Recent Evaluations Agriculture “ Green Acres” and Agricultural Land Preservation
Programs, February 2008 Pesticide Regulation, March 2006
Criminal Justice Public Defender System, February 2010 MINNCOR Industries, February 2009 Substance Abuse Treatment, February 2006 Community Supervision of Sex Offenders, January 2005 CriMNet, March 2004
Education, K-12, and Preschool Alternative Education Programs, February 2010 Q Comp: Quality Compensation for Teachers,
February 2009 Charter Schools, June 2008 School District Student Transportation, January 2008 School District Integration Revenue, November 2005 No Child Left Behind, February/March 2004 Charter School Financial Accountability, June 2003 Teacher Recruitment and Retention: Summary of Major
Studies, March 2002
Education, Postsecondary MnSCU System Office, February 2010 MnSCU Occupational Programs, March 2009 Compensation at the University of Minnesota, February 2004 Higher Education Tuition Reciprocity, September 2003
EnergyRenewable Energy Development Fund, October 2010 Biofuel Policies and Programs, April 2009 Energy Conservation Improvement Program, January 2005
Environment and Natural Resources Natural Resource Land, March 2010 Watershed Management, January 2007 State-Funded Trails for Motorized Recreation, January 2003 Water Quality: Permitting and Compliance Monitoring,
January 2002 Minnesota Pollution Control Agency Funding, January 2002 Recycling and Waste Reduction, January 2002
Financial Institutions, Insurance, and Regulated Industries Liquor Regulation, March 2006 Directory of Regulated Occupations in Minnesota,
February 1999 Occupational Regulation, February 1999
Government Operations Capitol Complex Security, May 2009 County Veterans Service Offices, January 2008
Government Operations (continued) Pensions for Volunteer Firefighters, January 2007 Postemployment Benefits for Public Employees,
January 2007 State Grants to Nonprofit Organizations, January 2007 Tax Compliance, March 2006 Professional/Technical Contracting, January 2003 State Employee Health Insurance, February 2002
HealthFinancial Management of Health Care Programs,
February 2008 Nursing Home Inspections, February 2005 MinnesotaCare, January 2003
Human Services Personal Care Assistance, January 2009 Human Services Administration, January 2007 Public Health Care Eligibility Determination for
Noncitizens, April 2006 Substance Abuse Treatment, February 2006 Child Support Enforcement, February 2006 Child Care Reimbursement Rates, January 2005 Medicaid Home and Community-Based Waiver Services for
Persons with Mental Retardation or Related Conditions,February 2004
Controlling Improper Payments in the Medicaid Assistance Program, August 2003
Economic Status of Welfare Recipients, January 2002
Housing and Local Government Preserving Housing: A Best Practices Review, April 2003 Managing Local Government Computer Systems: A Best
Practices Review, April 2002 Local E-Government: A Best Practices Review, April 2002 Affordable Housing, January 2001
Jobs, Training, and Labor Workforce Programs, February 2010 E-Verify, June 2009 Oversight of Workers’ Compensation, February 2009 JOBZ Program, February 2008 Misclassification of Employees as Independent Contractors,
November 2007 Prevailing Wages, February 2007 Workforce Development Services, February 2005 Financing Unemployment Insurance, January 2002
Miscellaneous Public Libraries, March 2010 Economic Impact of Immigrants, May 2006 Gambling Regulation and Oversight, January 2005 Minnesota State Lottery, February 2004
Transportation Governance of Transit in the Twin Cities Region,
January 2011 State Highways and Bridges, February 2008 Metropolitan Airports Commission, January 2003
Evaluation reports can be obtained free of charge from the Legislative Auditor’s Office, Program Evaluation Division, Room 140 Centennial Building, 658 Cedar Street, Saint Paul, Minnesota 55155, 651-296-4708. Full text versions of recent reports are also available at the OLA Web site: http://www.auditor.leg.state.mn.us
321BLUE RIBBON COMMITTEE REPORT | December 2020
ACKNOWLEDGEMENTSThe Panel was greatly assisted in its discussions by presentations from, or conversations with, the following individuals:
• Lisa Barajas, Director, Community Development, Metropolitan Council
• Mike Beard, Scott County Commissioner
• Pat Born, Board Chair, Citizens League
• Matt Burress, Legislative Analyst, House Research
• Ann Goering, Metro Governance Transparency Initiative
• Tim Henkel, Assistant Commissioner, Modal Planning and Program Management, Minnesota Department of Transportation
• Pahoua Hoffman, former Executive Director, Citizens League
• Clint Hooppaw, Chair, Suburban Transit Association
• Wes Kooistra, General Manager, Metro Transit
• Matt Massman, Executive Director, Minnesota Inter-County Association
• Patty Nauman, Executive Director, Metro Cities
• Judy Randall, Deputy Legislative Auditor, Program Evaluation Division
• Karen Schaffer, Chair, Council of Metropolitan Area Leagues of Women Voters
• Leisa Thompson, General Manager, Environmental Services
• Nick Thompson, Director, Metropolitan Transportation Services
• Amy Vennewitz, Deputy Director, Metropolitan Transportation Services
• Luther Wynder, CEO, Minnesota Valley Transit Authority
Special thanks are also in order for the Metropolitan Council staff provided staffing and administrative support to the Committee:
• Mary Bogie, Acting Regional Administrator
• Brooke Bordson, Senior Projects Coordinator, Intergovernmental Relations
• Terri Dresen, Director, Communications
• Michelle Fure, Manager, Communications
• Linda Jones, Senior Communications Specialist
• Lesley Kandaras, Chief of Staff, Metro Transit
• Sara Maaske, Outreach Coordinator
• Greg Ricci, Systems Engineer
• Judd Schetnan, Director, Government Affairs
• Bridget Toskey, Executive Assistant
• Charlie Zelle, Chair
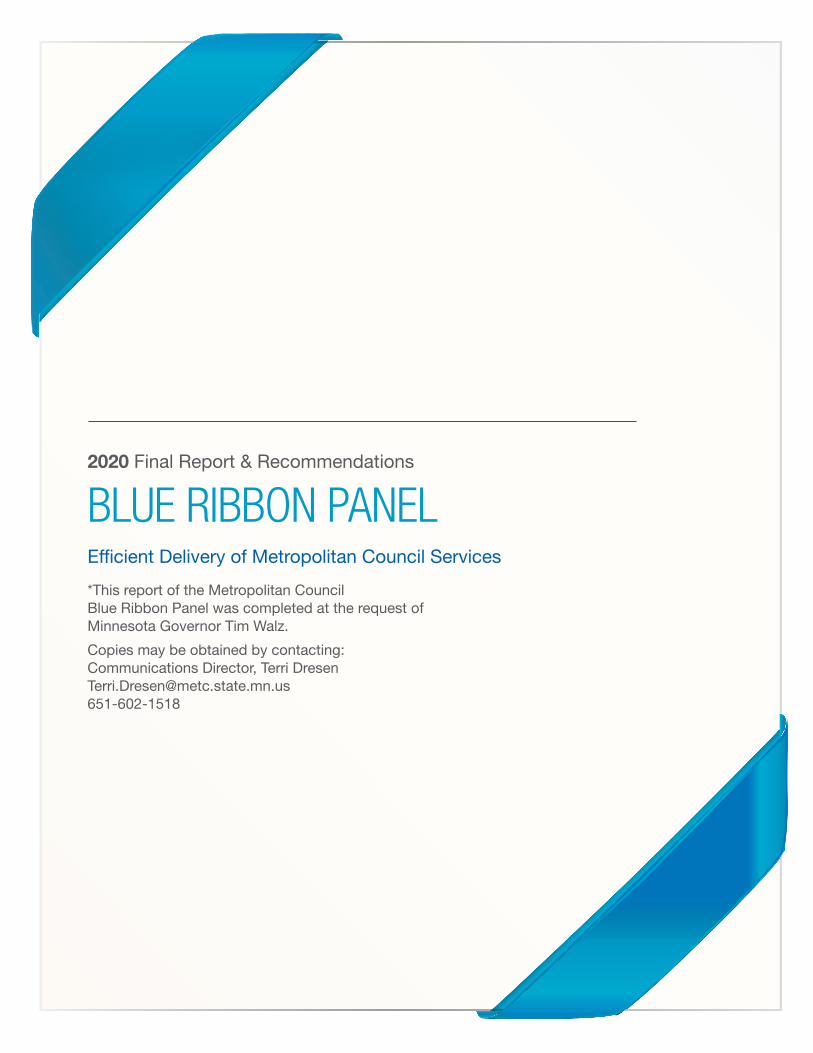
2020 Final Report & Recommendations
BLUE RIBBON PANEL
*This report of the Metropolitan Council Blue Ribbon Panel was completed at the request of Minnesota Governor Tim Walz.
Copies may be obtained by contacting:Communications Director, Terri [email protected]
Efficient Delivery of Metropolitan Council Services