1975annualreport.pdf - montana state legislature
TRANSCRIPT

montanaenvironmental
indicators
^X.^^^
.\\#-
ENVIRONMENTALQUALITYCOUNCIL
FOURTH ANNUAL REPORTDECEMBER, 1975
3 0864 1003 9047 8
COVER
mourning dove n: a wild dove (Zenaidura
mdcroura carolmensis) of the United States with a
plaintive call.
The mourning dove is common along Montana
roadsides. Because of its extreme sensitivity to
chemical contamint'n's, it is a useful indicator of
environmental quality. The mourning dove is one
of man}/ environmental indicators presented in
this report. Tlie cover drawing is in pen and ink by
Jack .[asper.
Environmental Quality Council Members
MonUna House of Representatives
THOM.\S O. HAGER, Chairman
WILLIAM M. DAYGARY N. KIMBLE
A. THOMAS RASMUSSEN
Montana Senate
L.M. (LARRY) ABERTERRY L. MURPHY
ED B. SMITHMARGARET S. WARDEN
Montana Public
G.W. (POR) DESCHAMPSCHARLES W. DOHENYHARRIET MARBLEJACK D. REHBERG
Governor's Representative, ex officio:
G. STEVEN BROWN
I
Environmental Qualit
Staff
JOHN W. REUSSLOREN L. BAHLS
RICHARD L. BOURKECHARLES E. BRANDESMAXINE R. BROWNMARL\N HIGGINS
STEVEN J. PERLMUTTER
Executive Director
Ecologist
Economist
Land Use Analyst
Administrative Assistant
Secretary
A ttorney
Production Staff
Fourth Annual Report
RONALD J. SCHLEYER Editing
DANIEL VICHOREK Editing
ediaCotn Design and Graphic
LETTER OF TRANSMITTAL
Honorable Thomas L. Judge
Governor
State of Montana
Members of the Legislative Assembly
The People of Montana
The Environmental Quality &)uncil herewith submits its Fourth Annual Report for the fiscal year
ending June 30, 1975, in accordance with Sec. 69-6514 of the Montana Environmental Policy Act.
Rep. Thomas 0. Hager
Chairman
John W. Reuss
Executive Director
THIS REPORT PRINTED ON RECVaED PAPER.
CONTENTS
Montana Environmental Indicators: 1975
Preface "
Introduction "'
Montana Environmental Indicators: 1975
A Guide to Readers ^
Montana Environmental Indicators: 1975
Introduction ^
Acknowledgments ^
Indicators Statewide: A Summary of Data '
Montana's Environmental Regions *^"
Rocky Mountain Montana ^Broad Valley Rockies 29
Columbia Rockies '*'
Yellowstone Rockies '^
Great Plains Montana "'
Rocky Mountain Foreland""
Sweetgrass Plains "''
Big Dry
Two Rivers
.
The EQC Indicators Program .
Ill
123
Brief Review of Other Indicator Efforts 129
Environmental Monitoring in Montana l^^l
Glossary133
Bibliography1^^
Photo Credits1'*^
Appendices
A. Biographies of EQC Members and Executive Director 141
B. The Montana Environmental Policy Act 142
C. Uniform Rules for Environmental Impact Statements 14'
D. Documents Submitted in Compliance with MEPA 1^4
E. EQC Program Cost Summary ^^^
List of Figures
Figure 1 Montana Population, 1950-1974'^
Figure 2 Montana Population Density, 1950-1974"^
Figure 3 Size of Montana's Urban, Farm, and Rural Non-Farm Population, 1930-1970 8
Figure 4 Percent of Montana's Urban, Farm, and Rural Non-Farm Population, 1930-1970 8
Figure 5 Montana Population Changes (A) Reflected by Births minus
Deaths and Net Migration, 1950-1954 8
Figure 6 Montana Coal Production, 1970-1974 9
Figure 7 Montana Oil Production, 1970-1974 9
Figure 8 Montana Natural Gas Production, 1970-1974 1'
Figure 9 Montana Hydroelectric Generation, 1972 and 1974 1"
Figure 10 Montana Agricultural Land in Farms, 1959 and 1969 H
Figure 11 Distribution of Montana Agricultural Land by Type, 1964 and 1969 H
Figure 12 Montana Cropland, Pasture and Range, 1958 and 1967 H
Figure 13 Distribution of Montana Cropland, Pasture and Range, 1958 and 1967 H
Figure 14 Private and State Forestland in Montana, 1958 and 1967 12
10
Figure 15 Federal Forestland in Montana, 1970 and 1974 12
Figure 16 Montana Water Withdrawals and Consumption of Withdrawals, 1970 13
Figure 17 Montana Gold and Silver Production, 1964-1974 14
Figure 18 Montana Copper, Lead, and Zinc Production, 1964-1974 15
Figure 19 Avian Diversity in Montana, 1968-1974 15
Figure 20 Montana Mourning Dove and Starling Populations, 1968-1974 15
Figure 21 Montana Population Delivered Unsatisfactory Drinking Water, 1971 and 1974 17
Figure 22 Point Source Degradation of Montana Streams, 1960, 1972, and 1975 18
Figure 23 Montana Cropland, Range and Pasture Needing Treatment,
Land Damaged by Saline Seep, and Land Disturbed by Strip
Mining 19
Figure 24 Stocked and Non-Stocked Commercial Forest in Montana Managed by USPS, 1970 and 1974 20
Figure 25 Range Condition and Trend for Montana Land under BLM Management, 1963-64 21
Figure 26 Montana Perinatal Death Rate, 1965-1973 21
Figure 27 Offenses Known to Police in Montana, 1972-1974 21
Figure 28 Total Employment in Montana, 1968-1974 22
Figure 29 Montana Employment by Sector, 1968-1973 22
Figure 30 Montana Unemployment Rate and Employment Ratio, 1970-1974 23
Figure 31 Per Capita Income: U.S. and Montana, 1968-1974 23
Figure 32 Montana Per Employee Earnings by Sector, 1968-1973 24
Figure 33 Montana Families Earning Less Than $3000/Year in 1960 and $4000/Year in 1970 24
Figure 34 Library Circulation in Montana, 1%6-1974 24
Figure 35 Children Added to Child Welfare Services in Montana, 1970-1974 25
Figure 36 Rural Area and Population Served by Rural Road System in Montana, 1970 25
Figure 37 Broad Valley Rockies Population Size, 1950-1974 31
Figure 38 Broad Valley Rockies Population Density, 1950-1974 31
Figure 39 Broad Valley Rockies Urban, Farm, and Rural Non-Farm Popula-
tion, 1930-1970 31
Figure 40 Broad Valley Rockies Percent of Population Urban, Farm, and
Rural Non-Farm, 1930-1970 32
Figure 41 Broad Valley Rockies Population Changes (A ) Reflected by
Births minus Deaths and Net Migration, 1950-1974 32
Figure 42 Broad Valley Rockies Hydroelectric Generation, 1972-1974 32
Figure 43 Broad Valley Rockies Agricultural Land in Farms, 1959-1969 33
Figure 44 Broad Valley Rockies Distribution of Agricultural Land, 1964 and 1%9 33
Figure 45 Broad Valley Rockies Cropland, Range, and Pasture, 1958-1967 33
Figure 46 Broad Valley Rockies Distribution of Cropland, Pasture,
and Range, 1958 and 1967 34
Figure 47 Broad Valley Rockies Private and State Forestland, 1958
and 1967 34
Figure 48 Broad Valley Rockies Federal Forestland, 1970 and 1974 34
Figure 49 Broad Valley Rockies Water Withdrawals and Consumption of
Withdrawals, 1970 35
Figure 50 Broad Valley Rockies Avian Diversity, 1968-1974 35
Figure 51 Annual Average Sulfur Dioxide Levels Recorded at East Helena
and Anaconda, 1969-1975 36
Figure 52 Annual Average Fluoride Concentrations Recorded at Garrison
and Columbia Falls, 1%9-1975 36
Figure 53 Annual Geometric Mean Particulate Levels Recorded at
Philipsburg and Missoula, 1971-1975 37
Figure 54 Broad Valley Rockies Population Delivered Unsatisfactory
Drinking Water, 1971 and 1974 37
Figure 55 Broad Valley Rockies Point and Non-Point Source Stream Degradation, 1975 38
Figure 56 Broad Valley Rockies Private and State Agricultural and
Forestland Requiring Conservation Treatment, 1%7 38
Figure 57 Broad Valley Rockies Stocked and Non-Stocked Commercial
Forest under USFS Control, 1970 and 1974 38
Figure 58 Broad Valley Rockies Range Condition and Trend for Land under BLM Control, 1963-1964 39
Figure 59 Broad Valley Rockies Perinatal Death Rate, 1%5-1973 39Figure 60 Broad Valley Rockies Offenses Known to Police, 1972-1974 39Figure 61 Broad Valley Rockies Total Employment, 1968-1973 40Figure 62 Broad Valley Rockies Employment by Sector, 1968-1974 40Figure 63 Broad Valley Rockies Unemployment Rate and Employment
Ratio, 1970'and 1974 4OFigure 64 Broad Valley Rockies Per Capita Income, 1968-1973 41
Figure 65 Broad Valley Rockies Earnings Per Employee 1968-1973 41
Figure 66 Broad Valley Rockies Families Earning Less Than $3(X)0/Year
in 1960 and «4000/Year in 1970 41
Figure 67 Broad Valley Rockies Library Circulation, 1966-1974 42
Figure 68 Broad Valley Rockies Children Added to Child Welfare
Service, 1970-1974 42
Figure 69 Broad Valley Rockies Area and Population Served by Rural
Road System, 1970 42
Figure 70 Columbia Rockies Population Size, 1950-1974 46Figure 71 Columbia Rockies Population Density, 1950-1974 47
Figure 72 Columbia Rockies Urban, Farm, and Rural Non-Farm Popula-
tion, 1930-1970 47
Figure 73 Columbia Rockies Percent of Population Urban, Farm, and Rural Non-Farm, 1930-1970 47
Figure 74 Columbia Rockies Population Changes (A) Rejected by Births
minus Deaths and Net Migration, 1950-1974 48Figure 75 Columbia Rockies Hydroelectric Generation, 1972-1974 48Figure 76 Columbia Rockies Agricultural Land in Farms, 1959, 1964, 1969 48
Figure 77 Columbia Rockies Distribution of Agricultural Land, 1964
and 1969 48Figure 78 Columbia Rockies Cropland, Range, and Pasture, 1958 and 1967 49Figure 79 Columbia Rockies Distribution of Cropland, Range, and Pasture, 1958 and 1967 49Figure 80 Columbia Rockies Private and State Forestland, 1958 and 1968 49
Figure 81 Columbia Rockies Federal Forestland, 1970 and 1974 49
Figure 82 Columbia Rockies Water Withdrawals and Consumption of With-
drawals, 1970 50
Figure 83 Columbia Rockies Avian Diversity, 1968-1974 50
Figure 84 Annual Geometric Mean Particulate Levels Recorded at Libby, 1972-1975 51
Figure 85 Columbia Rockies Population Delivered Unsatisfactory
Drinking water, 1971 and 1974 51
Figure 86 Columbia Rockies Point and Non-Point Source Stream Degrada-
tion, 1975 52
Figure 87 Columbia Rockies Private and State Agricultural and Forest-
land Requiring Conservation Treatment, 1967 52
Figure 88 Columbia Rockies Stocked and Non-Stocked Commercial Forest
under USES Control, 1970 and 1974 53
Figure 89 Columbia Rockies Perinatal Death Rate, 1965-1973 53
Figure 90 Columbia Rockies Offenses Known to Police, 1972-1974 53
Figure 91 Columbia Rockies Total Employment, 1968-1973 53
Figure 92 Columbia Rockies Employment by Sector, 1968-1973 54
Figure 93 Columbia Rockies Unemployment Rate and Employment Ratio, 1970-1974 54
Figure 94 Columbia Rockies Per Capita Income, 1968-1973... 55
Figure 95 Columbia Rockies Earnings Per Employee, 1968-1973 55
Figure % Columbia Rockies Families Earning Less Than $3000/Year in 1960 and $4000/Year in 1970 55
Figure 97 Columbia Rockies Library Circulation, 1%6-1974 56Figure 98 Columbia Rockies Children Added to Child Welfare Services,
1970-1974 56Figure 99 Columbia Rockies Rural Area and Population Served by Rural Road System, 1970 56Figure 100 Yellowstone Rockies Hydroelectric Generation, 1972-1974 60Figure 101 Yellowstone Rockies .Agricultural Land in Farms, 1959,
1964, and 1969 61
Figure 102 Yellowstone Rockies Distribution of Agricultural Land, 1964 and 1%9 61
Figure 103 Yellowstone Rockies Cropland, Range and Pasture,
1958 and 1967 61
Figure 104 Yellowstone Rockies Distribution of Cropland, Range, and
Pasture, 1958 and 1967 61
Figure 105 Yellowstone Rockies Private and State Forestland, 1958
and 1967 62
Figure 106 Yellowstone Rockies Federal Forestland, 1970 and 1974 62
Figure 107 Yellowstone Rockies Water Withdrawals and Consumption
of Withdrawals, 1970 62
Figure 108 Yellowstone Rockies Avian Diversity, 1968-1974 63
Figure 109 Yellowstone Rockies Population Delivered Satisfactory
Drinking Water, 1971 and 1974 63
Figure 110 Yellowstone Rockies Point and Non-Point Source Stream Degradation, 1975 64
Figure 111 Yellowstone Rockies Private and State Agricultural and
Forestland Requiring Conservation Treatment, 1967 64
Figure 112 Yellowstone Rockies Stocked and Non-Stocked Commercial
Forest under USPS Control, 1970 and 1974 64
Figure 113 Yellowstone Rockies Rural Area and Population Served by
Rural Road System, 1970 65
Figure 114 Rocky Mountain Foreland Population Size, 1950-1974 71
Figure 115 Rocky Mountain Foreland Population Density, 1950-1974 71
Figure 116 Rocky Mountain Foreland Urban, Farm, and Rural Non-Farm
Population, 1930-1970 72
Figure 117 Rocky Mountain Foreland Percent of Population Urban, Farm,
and Rural Non-Farm, 1930-1970 72
Figure 118 Rocky Mountain Foreland Population Changes (A) Reflected
by Births minus Deaths and Net Migration, 1950-1974 72
Figure 119 Rocky Mountain Foreland Coal Production, 1970-1974 73
Figure 120 Rocky Mountain Foreland Oil Production, 1970-1974 73
Figure 121 Rocky Mountain Foreland Natural Gas Production, 1970-1974 73
Figure 122 Rocky Mountain Foreland Hydroelectric Generation, 1972-1974 74
Figure 123 Rocky Mountain Foreland Agricultural Land in Farms, 1959,
1964, 1969 74
Figure 124 Rocky Mountain Foreland Distribution of Agricultural Land,
1964 and 1969 74
Figure 125 Rocky Mountain Foreland Cropland, Range, and Pasture, 1958
and 1%7 75
Figure 126 Rocky Mountain Foreland Distribution of Cropland, Range,
and Pasture, 1958 and 1%7 75
Figure 127 Rocky Mountain Foreland Private and State Forestland, 1958
and 1967 75
Figure 128 Rocky Mountain Foreland Water Withdrawals and Consumption
of Withdrawals, 1970 76
Figure 129 Rocky Mountain Foreland Avian Diversity, 1968-1974 76
Figure 130 Annual Geometric Mean Particulate Levels Recorded in Billings
and Great Falls, 1971-1975 77
Figure 131 Rocky Mountain Foreland Population Delivered Unsatisfactory
Drinking Water, 1971 and 1974 77
Figure 132 Rocky Mountain Foreland Point and Non-Point Source Stream
Degradation, 1975 78
Figure 133 Rocky Mountain Foreland Private and State Agricultural and
Forestland Requiring Conservation Treatment, 1967 78
Figure 134 Rocky Mountain Foreland Acres Damaged by Saline Seep,
1%9-1974 78
Figure 135 Rocky Mountain Foreland Range Condition and Trend for Land
under BLM Management, l%3-64 79
Figure 136 Rocky Mountain Foreland Perinatal Death Rate, 1965-1974 ,-79
Figure 137 Rocky Mountain Foreland Offenses Known to Police, 1972-1974 79
Figure 138 Rocky Mountain Foreland Total Employment, 1968-1973 79
Figure 139 Rocky Mountain Foreland Employment by Sector, 1968-1973 80
Figure 140 Rocky Mountain Foreland Unemployment Rate and Employment
Ratio, 1970-1974 80
Figure 141 Rocky Mountain Foreland Per Capita Income, 1968-1973 81
Figure 142 Rocky Mountain Foreland Earnings Per Employee, 1968-1973 81
Figure 143 Rocky Mountain Foreland Families Eiarning Less Than $3000/Year
in 1960 and $4000/Year in 1970 81
Figure 144 Rocky Mountain Foreland Library Circulation, 1966-1974 82
Figure 145 Rocky Mountain Foreland Children Added to Child Welfare
Services, 1970-1974 82
Figure 146 Rocky Mountain Foreland Rural Area and Population Served by Rural Road System, 1970 82
Figure 147 Sweetgrass Plains Population, 1950-1974 86
Figure 148 Sweetgrass Plains Population Density, 1950-1974 86
Figure 149 Sweetgrass Plains Urban, Farm, and Rural Non-Farm
Population, 1930-1970 86
Figure 150 Sweetgrass Plains Percent of Population Urban, Farm and
Rural Non-Farm, 1930-1970 87
Figure 151 Sweetgrass Plains Population Changes (A) Reflected by
Births minus Deaths and Net Migration, 1950-1974 87
Figure 152 Sweetgrass Plains Oil Production, 1970-1974 88
Figure 153 Sweetgrass Plains Natural Gas Production, 1970-1974 88
Figure 154 Sweetgrass Plains Agricultural Land in Farms, 1959,
1964, and 1969 88
Figure 155 Sweetgrass Plains Distribution of Agricultural Land,
1964 and 1969 88
Figure 156 Sweetgrass Plains Cropland, Range, and Pasture,
1958 and 1967 89
Figure 157 Sweetgrass Plains Distribution of Cropland, Range, and
Pasture, 1958 and 1967 89
Figure 158 Sweetgrass Plains Private and State Forestland,
1958 and 1967 89
Figure 159 Sweetgrass Plains Water Withdrawals and Consumption
of Withdrawals, 1970 89
Figure 160 Sweetgrass Plains Avian Diversity, 1968-1974 90
Figure 161 Sweetgrass Plains Population Delivered Satisfactory
Drinking Water, 1971 and 1974 90
Figure 162 Sweetgrass Plains Point and Non-Point Source Stream
Degradation, 1975 91
Figure 163 Sweetgrass Plains Private and State Agricultural and
Forestland Requiring Conservation Treatment, 1967 91
Figure 164 Sweetgrass Plains Perinatal Death Rate, 1965-1973 91
Figure 165 Sweetgrass Plains Offenses Known to Police, 1972-1974 92
Figure 166 Sweetgrass Plains Total Employment, 1970-1973 92
Figure 167 Sweetgrass Plains Employment by Sector, 1968-1973 92
Figure 168 Sweetgrass Plains Unemployment Rate and Employment
Ratio, 1970-1974 92
Figure 169 Sweetgrass Plains Per Capita Income, 1968-1973 93
Figure 170 Sweetgrass Plains Earnings Per Employee, 1968-1973 93
Figure 171 Sweetgrass Plains Families Earnings Less Than $3000/Year
in 1960 and $4000/Year in 1970 94
Figure 172 Sweetgrass Plains Library Circulation, 1%6-1974 94
Figure 173 Sweetgrass Plains Children Added to Child Welfare
Services, 1970-1974 94
Figure 174 Sweetgrass Plains Rural Area and Population Served by
Rural Road System, 1970 94
Figure 175 Big Dry Population, 1950-1974 98
Figure 176 Big Dry Population Density, 1950-1974 98
Figure 177 Big Dry Urban, Farm, and Rural Non-Farm Population, 1930-1970 99Figure 178 Big Dry Percent of Population Urban, Farm and Rural
Non-Farm, 1930-1970 99
Figure 179 Big Dry Population Changes (A) Reflected by Births
minus Deaths and Net Migration, 1950-1974 99Figure 180 Big Dry Oil Production, 1970-1974 100
Figure 181 Big Dry Natural Gas Production, 1970-1974 100
Figure 182 Big Dry Hydroelectric Generation, 1972-1974 100
Figure 183 Big Dry Agricultural Land in Farms, 1959, 1964, and 1969 101
Figure 184 Big Dry Distribution of Agricultural I^nd, 1964 and 1%9 101
Figure 185 Big Dry Cropland, Range, and Pasture, 1958 and 1967 101
Figure 186 Big Dry Distribution of Cropland, Range, and Pasture,
1958 and 1967 102
Figure 187 Big Dry Private and State Forestland, 1958 and 1967 102
Figure 188 Big Dry Water Withdrawals and Consumption of
Withdrawals, 1970 102
Figure 189 Big Dry Avian Diversity, 1968-1974 103
Figure 190 Big Dry Population Delivered Unsatisfactory Drinking
Water, 1971 and 1974 103
Figure 191 Big Dry Point and Non-Point Source Stream Degradation,
1975 103
Figure 192 Big Dry Pivate and State Agricultural and Forestland
Requiring Conservation Treatment, 1967 104
Figure 193 Big Dry Range Condition and Trend for Land under BLMManagement, 1963-64 104
Figure 194 Big Dry Perinatal Death Rate, 1965-1973 104
Figure 195 Big Dry Offenses Known to Police, 1972-1974 105
Figure 1% Big Dry Total Employment, 1968-1973 105
Figure 197 Big Dry Employment by Sector, 1968-1973 105
Figure 198 Big Dry Unemployment Rate and Employment Ratio,
1970-1974 106
Figure 199 Big Dry Per Capita Income, 1968-1973 106
Figure 200 Big Dry Earnings Per Employee, 1968-1973 107
Figure 201 Big Dry Families Earning Less Than $3,000/Year in
1960 and $4,000/Year in 1970 107
Figure 202 Big Dry Library Circulation, 1966-1974 107
Figure 203 Big Dry Children Added to Child Welfare Services,
1970-1974 108
Figure 204 Big Dry Rural Area and Population Served by Rural RoadSystem, 1970 108
Figure 205 Two Rivers Population, 1950-1974 112
Figure 206 Two Rivers Population Density, 1950-1974 112
Figure 207 Two Rivers Urban, Farm, and Rural Non-FarmPopulation, 1930-1970 112
Figure 208 Two Rivers Percent of Population Urban, Farm and
Rural Non-Farm, 1930-1970 113
Figure 209 Two Rivers Population Changes (A) Reflected by Births
minus Deaths and Net Migration, 1950-1974 113
Figure 210 Two Rivers Coal Production, 1970-1974 113
Figure 211 Two Rivers Oil Production, 1970-1974 114Figure 212 Two Rivers Natural Gas Production, 1970-1974 114Figure 213 Two Rivers Agricultural Land in Farms, 1959, 1964,
and 1969 114Figure 214 Two Rivers Distribution of Agricultural Land, 1964 and 1969 115
Figure 215 Two Rivers Cropland, Range, and Pasture, 1958 and 1967 115
Figure 216 Two Rivers Distribution of Cropland, Range, and Pasture, 1958 and 1%7 115
Figure 217 Two Rivers Private and State Forestland, 1958 and 1967 115
Figure 218 Two Rivers Water Withdrawals and Consumption of Withdrawals, 1970 116

Figure 219 Two Rivers Avian Diversity, 1968-1974 116
Figure 220 Two Rivers Population Delivered Unsatisfactory Drinking
Water, 1971 and 1974 117
Figure 221 Two Rivers Point and Non-Point Source Stream
Degradation, 1975 117
Figure 222 Two Rivers Private and State Agricultural and Forestland
Requiring Conservation Treatment, 1%7 117
Figure 223 Two Rivers Acres Damaged by Saline Seep, 1969-1974 118
Figure 224 Two Rivers Perinatal Death Rate, 1965-1973 118
Figure 225 Two Rivers Offenses Known to Police, 1972-1974 118
Figure 226 Two Rivers Total Employment, 1968-1973 118
Figure 227 Two Rivers Employment by Sector, 1968-1973 119
figure 228 Two Rivers Unemployment Rate and Employment Ratio,
1970-1974 119
Figure 229 Two Rivers Per Capita Income, 1968-1973 120
Figure 230 Two Rivers Earnings Per Employee, 1968-1973 120
Figure 231 Two Rivers Families Earning Less than 13000/Year
in 1960 and $4000/Year in 1970 120
Figure 232 Two Rivers Library Grculation, 1966-1974 121
Figure 233 Two Rivers Children Added to Child Welfare Services,
1970-1974 121
Figure 234 Two Rivers Rural Area and Population Served by Rural
Road System, 1970 121
Ust of Tables
Table 1 Montana Environmental Indicators: 1975 4Table 2 Economically Recoverable Montana Coal Reserves, 1973 9Table 3 Potentially Recoverable Montana Coal Reserves, 1973 9
Table 4 Proven Recoverable Montana Oil Reserves, 1974 9
Table 5 Proven Recoverable Montana Natural Gas, 1974 10
Table 6 Montana Installed Hydroelectric Generating Capacity, 1973 10
Table 7 Wildlands in Montana, 1975 12
Table 8 Broad Valley Rockies Installed Hydroelectric
Generating Capacity, 1973 33
Table 9 Broad Valley Rockies Potentially Recoverable Coal
Reserves, 1973 33
Table 10 Broad Valley Rockies Wildlands, 1975 34
Table 11 Broad Valley Rockies Health Status Index, 1968-1972 39
Table 12 Columbia Rockies Installed Hydroelectric Generating
Capacity, 1973 48
Table 13 Columbia Rockies Wildlands 50
Table 14 Columbia Rockies Health Status Index, 1968-1972 53
Table 15 Yellowstone Rockies Installed Hydroelectric Generating
Capacity, 1973 60
Table 16 Yellowstone Rockies Potentially Recoverable Coal
Reserves, 1973 60
Table 17 Yellowstone Rockies Wildlands, 1975 62
Table 18 Rocky Mountain Foreland Economically Recoverable
Coal Reserves, 1973 73
Table 19 Rocky Mountain Foreland Potentially Recoverable Coal
Reserves, 1973 73

Table 20 Rocky Mountain Foreland Proven Recoverable Oil
Reserves, 1974 "^-^
Table 21 Rocky Mountain Foreland Proven Recoverable Natural
Gas Reserves, 1974"74
Table 22 Rocky Mountain Foreland Installed Hydroelectric
Generating Capacity, 1973 74
Table 23 Rocky Mountain Foreland Wildlands, 1975 75
Table 24 Rocky Mountain Foreland Health Status Index, 1%8-1972 79
Table 25 Sweetgrass Plains Potentially Recoverable Coal
Reserves, 1973 87
Table 26 Sweetgrass Plains Proven Recoverable Oil
Reserves, 1974 88
Table 27 Sweetgrass Plains Proven Recoverable Natural Gas
Reserves, 1974 88
Table 28 Sweetgrass Plains Health Status Index, 1968-1972 91
Table 29 Big Dry Economically Recoverable Coal Reserves, 1973 99
Table 30 Big Dry Potentially Recoverable Coal Reserves, 1973 KK)
Table 31 Big Dry Proven Recoverable Oil Reserves, 1974 100
Table 32 Big Dry Proven Recoverable Natural Gas Reserves, 1974 100
Table 33 Big Dry Installed Hydroelectric Generating
Capacity, 1973 101
Table 34 Big Dry Wildlands, 1975 101
Table 35 Big Dry Health Status Index, 1968-1972 105
Table 36 Two Rivers Economically Recoverable Coal Reserves, 1973 113
Table 37 Two Rivers Potentially Recoverable Coal Reserves, 1973 114
Table 38 Two Rivers Proven Oil Reserves, 1974 114
Table 39 Two Rivers Proven Natural Gas Reserves, 1974 114
Table 40 Two Rivers Wildlands, 1975 115
Table 41 Two Rivers Health Status Index, 1968-1972 118
Preface
This past year and the 1975 session of the Legislature were times of testing and review of
the Environmental Quality Council. Two bills were introduced which allowed the Legislature to
assess the role of the EQCand modify its membership to reflect more accurately the interests of
the Legislature — the branch of government the Council was designed to serve. One bill, SB
332, would have repealed the Montana Environmental Policy Act. This was rejected by the
House, which passed HB 401, generally revising the composition of the Council, removing the
Governor's vote on the Council and having the legislative leadership appoint the four citizen
members. These revisions (Ch. 492, L. 1975) helped clarify the status of the EQC as a legislative
agency. Retention of the citizen members also reinforced the belief that the Council's work is
strengthened and given added credibility by their active participation and assistance.
Another important environmental issue considered by the 1975 Legislature was whether
state agencies preparing environmental impact statements required by the Montana Environ-
mental Policy Act could assess fees from applicants reflecting EIS costs (HB 340). It is note-
worthy that the legislative debate focused on the size of the fee rather than on the usefulness of
the EIS process. The Legislature feels that the EIS process is a valuable agency decision-making
tool.
One important MEPA action occurred outside the Legislature. The District Court (Helena)
decision in Montana Wilderness Association vs. The Board of Land Commissioners declared that
state agencies should adopt rules for preparing environmental impact statements and
incorporate those into the Montana Administrative Code. In response to this. Governor Judge
established the Commission on Environmental Quality and directed it to draft model EIS rules.
It is important to note that the EQC staffadvised and worked very closely with the Commission.
As the Legislature took steps to make the EQC more responsive to its needs, the Council
and EQC staff acted to implement a program that contained several projects designed to aid the
Legislature in its consideration of complex environmental-agricultural-natural resource issues.
One important element of this is the environmental indicators program, presented here as the
EQC Fourth Annual Report (1975). Others now underway that will be available for legislators
when they convene in 1977 are a study reviewing the agricultural and wood products sectors of
Montana's economy and outlining an ecologically sound legislative program to strengthen these
vital renewable resource sectors. Another EQC program is reviewing Montana environmental-
natural resource statutes and agency programs. The product here will be a state environmental
index, a convenient reference to important laws that will facilitate legislative examination of
state agency operations in these program areas.
I believe all these developments— modifications of Council membership, strengthening of
EIS procedures, and new EQC programs — move the Council closer to fulfilling its charter in
the Montana Environmental Policy Act and will enable the Council to provide the Legislature
with the information and technical assistance it needs to act decisively and effectively to
maintain and enhance Montana's environment and way of life.
Representative Thomas 0. Hager
Chairman
Environmental Quality Council
Introduction
Publication of the EQC Fourth Annual Report (1975) marks the return of an effort to assemble
and report information on the conditions and trends of the Montana environment initiated in the
EQC First Annual Report (1972). The 1975 report adopts the reporting framework of Montana
environmental regions developed by Professor John M. Crowley for the 1972 report, updates the
biophysical data it presented, and incorporates social-economic-demographic data for the first
time.
Two main reasons account for the selection of the environmental indicators theme for this
annual report. First, a major task of the Environmental Quality Council, as required by the
Montana Environmental Policy Act, is "to gather timely and authoritative information concern-
ing the conditions and trends in the quality of the environment. .." (Sec. 69-6514 (a) ). The Fourth
Annual Report (1975) attempts to do exactly that. Secondly, it appears to us that Montana will be
subject to enormous forces of change in the coming years. To the extent Montanans can or want to
guide these forces, they need accurate information on the state of the state's environment. These
forces — the demand for Montana coal, growing materials shortages which will increase the
demand for Montana minerals, the likely increase in demand for Montana agricultural products,
the redistribution to more rural areas of people from large cities, and the ever increasing demand
for high quality recreation — have significant implications for all Montanans, regardless of
individual value judgments as to whether the changes coming are "good" or "bad".
The major premise upon which this report is based is that maintenance of a high quality
environment and fostering those conditions that allow man and nature to live in "productive
harmony" require more than simple caring. Action is necessary and that action must be informed if
it is to be effective.
Since its creation in 1971, and throughout all of its reports, the EQC has maintained that no
greater challenge confronts the citizens and leaders of Montana than identifying what it is about
the state that makes Montana a good place to live and establishing policies and designing programs
to maintain and protect those characteristics through democratic processes. Forces are at work that
unchallenged and unmanaged will destroy those things most citizens associate with why they are
here and why they choose to remain.
Sensitively used, the EQC Fourth Annual Report (1975) can be of considerable assistance in
the difficult and complex process of finding out where we are, discovering where we want to go, and
doing what is required to enhance and protect those things we cherish.
Responsibility for coordinating the EQC environmental indicators program, the results of
which are published here, fell to Loren L. Bahls, EQC staff ecologist. The Fourth Annual Report is
testimony to his skill and determination in reviewing other indicator efforts, collecting current
state indicator data, assembHng state agency and University System review committees, assigning
research and writing tasks to other EQC staffers, and the other hundred chores that go into
producing such a report.
John W. Reuss
Executive Director
Environmental Quality Council

Montana Environmental
Quality Council
FOURTH
ANNUAL
REPORT
MONTANA ENVIRONMENTAL INDICATORS: 1975A GUIDE TO READERS
The EQC Fourlh Annual Report (1975) is a handbook containing
data on the state of the state's environment. The usefulness of the report to
citizens and decision makers ivill be enhanced if thefollowing limitations and
guidelines are understood and kept in mind:
—the report contains little new or original data. An objective of the report is
to assemble, integrate, and report existing and periodically collected or
monitored data on conditions and trends of the Montana environment. If
the report highlights inadequate orfaulty data or identifies areas where
new data are needed, the report has been successful.
—the report organizes indicator data using Montana's seven major
environmental regions. Thepurpose ofthis is not topromote yet another set
of state districts or suggest a new scheme to redraw political boundaries.
The system used here does not prevent getting "the big picture" — a
straightforward statewide summary begins the report; the system does not
precludefinding data about where you live— ample maps precede each
section ofthe report and a large state map is inserted. Organizing the report
around the state's environmental regions is the EQC's way ofstimulating
more systematic thinking about man-nature relationships and interactions
in the state.
— the report does not attempt to interpret whether the conditions and trends
contained here are "good" or "bad". Likewise, it is not organized around
any preconceived notions of what Montana should be or do to protect and
enhance the ' 'quality oflife" ofits citizens. The effort here is topresent the
data required to make these choices in an informed, as opposed to intuitive,
manner.
— the report is partial and tentative. The data contained here represent the
EQC staffs judgment about the full-range of currently available,
statistically reliable, and periodically monitored data on the Montana
environment, broadly defined. As readers review the contents ofthis report,
they should note the gaps and identify conditions for which no data are
reported and send their comments to the EQC on thepage provided in the
back. Readers are urged to assist the EQC in recommending improvement
in and/or additions to state agency monitoring activities.
— the report places heavy demands on its readers. The report was carefully
designed and edited to present the data in a clear and understandable
fashion. Nonetheless, the amount ofmaterial it contains appears awesome.
Some readers will come across unfamiliar terms and wonder why certain
variables were selectedfor inclusion in the report. To assist readers we have
provided, as separate chapters, a comprehensive Glossary which explains
how certain terms are used and a discussion ofThe EQC Indicators
Program which analyzes the indicators used here. Frequent reference to
both will improve the usefulness of this report.
— the report asks readers to evaluate the report and help theEQC increase the
utility of the environmental indicators project. The EQC believes that
critical choices confront the citizens ofMontana and thatfor action to be
effective it must, among other things, be informed. A page at the back of
this report allows you to evaluate the report and make recomm endationsfor
changes thai will assist the EQC in preparing subsequent summaries. You
are urged to help in this effort.

MONTANA ENVIRONMENTAL INDICATORS: 1975
Research Coordinated
by
Loren L. Bahls
INTRODUCTION
Passage of the Montana Environmental Policy Act in
1971 established a state policy for the environment "to use
all practicable means and measures ... to create and
maintain conditions under which man and nature can
coexist in productive harmony, and fulfill the social,
economic, and other requirements of present and future
generations of Montanans." This policy was strengthened
when Montanans ratified the new state Constitution in
1972. Article IX — Environment and Natural Resources —declares that "the state and each person shall maintain and
improve a clean and healthful environment in Montana for
present and future generations."
Important responsibilities were assigned the Montana
Environmental Quality Council for monitoring, document-
ing, and reporting changes in environmental conditions in
the state. The tasks given the Montana Environmental
Quality Council were important and difficult: How to get
environmental issues out of the realm of heated emotions
and into the cold light of objective science? How to deter-
mine realistically the conditions of human existence in
Montana and the prospects for the future? How to assure
that the public has a chance to speak out and be heard on
environmental issues?
This Fourth Annual Report (1975) represents another
step toward answering those difficult and elusive questions.
Adapting and expanding the reporting framework of the
EQC's First Annual Report (1972) , this report offers a list of
environmental indicators representing individual factors
believed to be attributes of "a clean and healthy environ-
ment." In an attempt to portray objectively and clearly
environmental conditions in Montana, some 30 indicators
are used on a tentative basis. If some of the indicators prove
not to be useful, they will be dropped and new ones
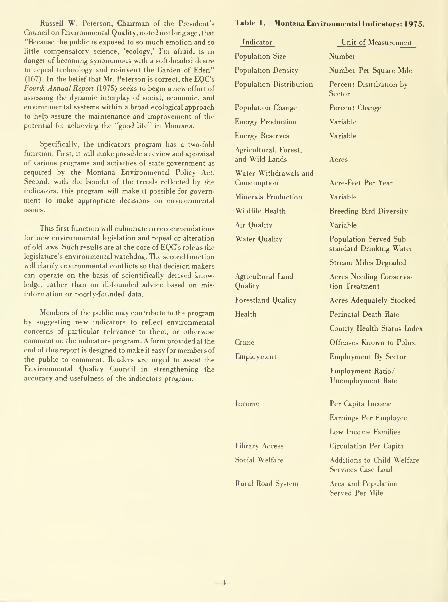
examined. Table 1 lists the indicators selected for inclusion
in this report. The critical prerequisite for selecting the
indicators for this year's report was the availability of
monitored data.
The EQC's Fourth Annual Report (1975) represents a
major effort to assemble comprehensive baseline data,
reported in a systematic format, on the current state of the
Montana environment. The EQC intends a long-term
commitment of refining the indicators and of issuing
updated and revised summaries periodically (30).* .A
detailed explanation and analysis of the indicators
presented here is contained in the section of this report
entitled The EQC Indicators Program. A complete listing of
the data sources indicative of environmental conditions in
Montana is presented in Environmental Monitoring in
Montana, inserted in this report as a supplement. .\ section
of this report examines in depth the origin and purpose of
the monitoring directory.
To provide a coherent and ecologically sound system
for reporting environmental conditions, the Environ-
mental Quality Council commissioned Dr. John M.
Crowley, a University of Montana geographer, to classify
Montana into environmental regions. This system was used
in the EQCs First Annual Report (1972) and it has been
revised for inclusion in this report.
•Throughout, all numbers within parentheses refer
the Bibliography section of this report.
-3-
Russell W. Peterson, Chairman of the President's
Council on Environmental Quality, noted not long ago, that
"Because the public is exposed to so much emotion and so
little compensatory science, 'ecology,' I'm afraid, is in
danger of becoming synonomous with a soft-headed desire
to repeal technology and re-invent the Garden of Elden"
(167). In thebelief that Mr. Peterson is correct, the EQC's
Fourth Annual Report (1975) seeks to begin a new effort of
assessing the dynamic interplay of social, economic, and
environmental systems within a broad ecological approach
to help assure the maintenance and improvement of the
potential for achieving the "good life" in Montana.
Specifically, the indicators program has a two-fold
function. First, it will make possible a review and appraisal
of various programs and activities of state government as
required by the Montana Environmental Policy Act.
Second, with the benefit of the trends reflected by the
indicators, this program will make it possible for govern-
ment to make appropriate decisions on environmental
issues.
This first function will culminate in recommendations
for new environmental legislation and repeal or alteration
of old laws. Such results are at the core of EQC's role as the
legislature's environmental watchdog. The second function
will clarify environmental conflicts so that decision makers
can operate on the basis of scientifically derived know-
ledge, rather than on ill-founded advice based on mis-
information or poorly-founded data.
Members of the public may contribute to the program
by suggesting new indicators to reflect environmental
concerns of particular relevance to them, or otherwise
comment on the indicators program. A form provided at the
end of this report is designed to make it easy for members of
the public to comment. Readers are urged to assist the
Environmental Quality Council in strengthening the
accuracy and usefulness of the indicators program.
Table 1. Montana Environmental Indicators: 1975.
Indicator
Population Size
Population Density
Population Distribution
Population Change
Energy Production
Energy Reserves
Agricultural, Forest,
and Wild Lands
Water Withdrawals and
Consumption
Minerals Production
Wildlife Health
Air Quality
Water Quality
Agricultural Land
Quality
Forestland Quality
Health
Crime
Employment
Unit of Measurement
Number
Number Per Square Mile
Percent Distribution by
Sector
Percent Change
Variable
Variable
Acres
.Acre-Feet Per Year
Variable
Breeding Bird Diversity
Variable
Population Served Sub-
standard Drinking Water
Stream Miles Degraded
Acres Needing Conserva-
tion Treatment
Acres Adequately Stocked
Perinatal Death Rate
County Health Status Index
Offenses Known to Police
Employment By Sector
Employment Ratio/
Unemployment Rate
Library Access
Social Welfare
Rural Road System
Per Capita Income
Earnings Per Employee
Low Income Families
Circulation Per Capita
.Additions to Child Welfare
Services Case Load
Area and Population
Served Per Mile
ACKNOWLEDGMENTSThis Fourth Annual Report (1975) expands and con-
tinues the indicators theme established in the First Annual
Report (1972) by former EQC director Fletcher E. Newby,
now deputy director of the Montana Department of Fish
and Game.
Professor John M. &owley. Department of Geo-
graphy, University of Montana, Missoula, reassessed his
Montana environmental regions, which appeared originally
in the First Annual Report. This effort resulted in adjusting
some boundaries and in updating the descriptions of the
regions. Professor Crowley's contribution to this report is
gratefully acknowledged.
State Librarian Alma S. Jacobs reviewed material
concerning library circulation and provided substantial
assistance in interpreting the significance of that indicator.
Members of the EQC staff were assigned responsibility
for collecting major portions of the data reported here.
Richard L. Bourke, EQCstaff economist, assembled data on
energy, lands in forest, farms, and range, employment and
income, and other areas. Steven J. Perlmutter, EQC staff
attorney, contributed data on population size and distri-
bution, and transportation. Charles E. Brandes, former land
use analyst now with the California Governor's Office of
Planning and Research, collected data on population
changes, library circulation, and social services.
In order to provide a critical review of EQC staff efforts
to develop a statewide environmental indicators system and
other techniques for interpreting environmental monitor-
ing data, an academic advisory committee was established.
The committee consisted of three faculty members from
each of the Bozeman, Butte, and Missoula campuses of the
University System, representing a wide range of scientific
disciplines:
Montana College of Mineral Science and Technology
Charles Herndon, Engineering
Thomas Lester, Humanities
Paul Sawyer, Biology
Montana State University
Charles Bradley, Earth Sciences
Richard McBee, Microbiology
Gene Payne, Range Science
University of Montana
Robert McKelvey, Mathematics
Malinda Schaill, Economics
Wayne Van Meter, Chemistry
A stale interagency advisory committee, consisting of
representatives from 14 environmental agencies, was also
established:
George A. Algard, Department of Agriculture
Charles Brown, Department of Livestock
Ted Qack, Montana Energy Advisory Council
Steve Colberg, Office of the Superintendent of Public
Instruction
C. R. Draper, Department of Community Affairs
Dave Johnson, Department of Highways
Gerhard Knudsen, Department of Natural Resources
and Conservation
Laury Lewis, Department of Revenue
James A. Posewitz, Department of Fish and Game
Frank Smoyer, Department of Social and Rehabilita-
tion Services
Sharon Solomon, Department of State Lands (now
with the Lt. Governor's office)
Ben Wake, Department of Health and Environmental
Sciences
Curt Warner, Department of Labor and Industry
Wallace White, Department of Justice
The task of editing earlier drafts fell to Ronald J.
Schleyer. Daniel Vichorek assisted in assembling a final
version. Members of the Environmental Quality Council
commented on earlier drafts and made many helpful
suggestions that have been incorporated into the final draft.
Responsibility for the contents of this report, however,
rests with the EQC staff.
-5—

INDICATORS STATEWIDE: A SUMMARY OF DATA
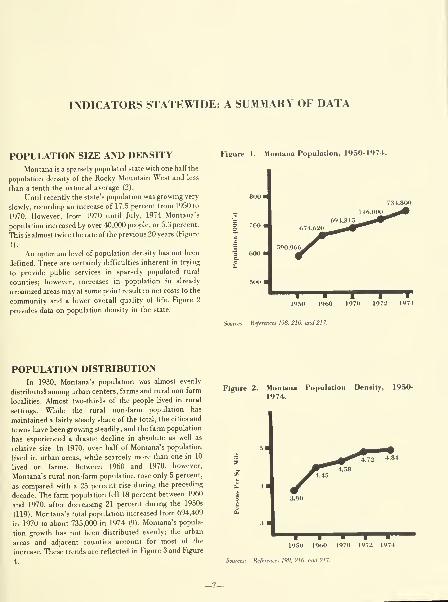
POPULATION SIZE AND DENSITYMontana is a sparsely populated state with one half the
population density of the Rocky Mountain West and less
than a tenth the national average (2).
Until recently the state's population was growing very
slowly, recording an increase of 17.5 percent from 1950 to
1970. However, from 1970 until July, 1974 Montana's
population increased by over 40,000 people, or 5.3 percent.
This is almost twice the rate of the previous 20 years (Figure
1).
An optimum level of population density has not been
defined. There are certainly difficulties inherent in trying
to provide public services in sparsely populated rural
counties; however, increases in population in already
urbanized areas may at some point result in net costs to the
community and a lower overall quality of life. Figure 2
provides data on population density in the state.
Figure 1. Montana Population, 1950-1974.
1972
Refe, 198.216. and 217
POPULATION DISTRIBUTIONIn 1930, Montana's population was almost evenly
distributed among urban centers, farms and rural non-farm
localities. Almost two-thirds of the people lived in rural
settings. While the rural non-farm population has
maintained a fairly steady share of the total, the cities and
towns have been growing steadily, and the farm population
has experienced a drastic decline in absolute as well as
relative size. In 1970, over half of Montana's population
lived in urban areas, while scarcely more than one in 10
lived on farms. Between 1960 and 1970, however,
Montana's rural non-farm population rose only 5 percent,
as compared with a 25 percent rise during the preceding
decade. The farm population fell 18 percent between 1960
and 1970, after decreasing 21 percent during the 1950s
(119). Montana's total population increased from 694,409
in 1970 to about 735,000 in 1974 (9). Montana's popula-
tion growth has not been distributed evenly; the urban
areas and adjacent counties account for most of the
increase. These trends are reflected in Figure 3 and Figure
4.
Figure 2. Montana1974.
Populati Density, 1950-
1..S8
1<>70 1972 1974
Sources: References 198. 216.
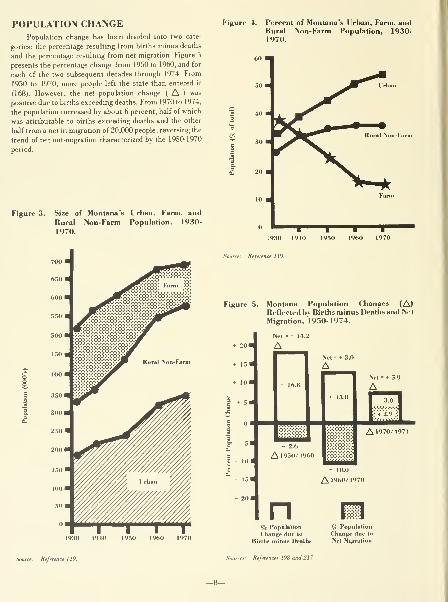
POPULATION CHANGEPopulation change has been divided into two cate-
gories: the percentage resulting from births minus deaths
and the percentage resulting from net migration. Figure 5
presents the percentage change from 1950 to 1960, and for
each of the two subsequent decades through 1974. From
1950 to 1970, more people left the state than entered it
(168). However, the net population change ( A ) was
positive due to births exceeding deaths. From 1970 to 1974,
the population increased by about 6 percent, half of which
was attributable to births exceeding deaths and the other
half from a net in-migration of 20,000 people, reversing the
trend of net out-migration characterized by the 1950-1970
period.
Figure 3. Size of Montana's Urban, Farm, and
Rural Non-Farm Population, 1930-
1970.
Figure 4. Percent of Montana's Urban, Farm, andRural Non-Farm Population, 1930-1970.
I960 19701930 1940
Source: Reference 119.
Figure 5. Montana Population Changes (A)Reflected by Births minus Deaths and Net
Migration, 1950-1974.

ENERGY RESOURCESStatewide, Montana has continually produced much
more energy from coal, oil, natural gas and hydroelectric
dams than it has consumed (81). With the projected
substantial increases in coal production, the state's net
exports of energy will continue and increase greatly for the
foreseeable future (140). Obviously, energy resources are
among Montana's most valuable assets; however, unlike
Montana's agricultural land and forest resources, its fossil
fuels (coal, oil, natural gas) are finite and eventually will be
exhausted.
Any discussion of Montana's energy resources would
be incomplete without mention of uranium. Although there
is no current production of uranium in the state, the
Department of State Lands has issued 28 permits for
uranium prospecting in 17 counties and over 150,000 acres
in Montana have been leased for uranium exploration (140)
(165). This activity suggests a high potential for uranium
extraction in Montana; however, no mineable reserves have
been publicly identified.
Coal production has increased 400 percent since 1970
(Figure 6). Current contracts indicate that there will be
another four-fold increase by 1980 (140). Montana's
economically recoverable coal reserves are large enough to
supply current production rates well into the future as the
resource index, the ratio of reserves to production,
presented in Table 2 illustrates. Table 3 provides data on the
state's potentially recoverable coal reserves.
Annual oil production fell 10 percent between 1970
and 1972 and has remained steady since then (Figure 7).
Montana's recoverable oil reserves apparently are very
small and will last only nine years at present rates of pro-
duction (Table 4) . However, removal of the price ceiling on
"old" oil combined with estimates of upwards of 2 billion
barrels of potential new oil may eventually increase the
proven oil reserves in Montana. This would produce a
higher resource index.
Figure 6. Montana Coal Production, 1970-1974.
1972 1973 197+
Table 2. Economically Recoverable Montana Coal
Reserves, 1973.
Coal Type
Surface
Lignite
Subbituminous
Total
MilH of Tor
8,469
6,818
15,287
Resource Index
1,084
Source: Reference 163.
Table 3. Potentially Recoverable Montana Coal Re-
serves, 1973.
Coal Type
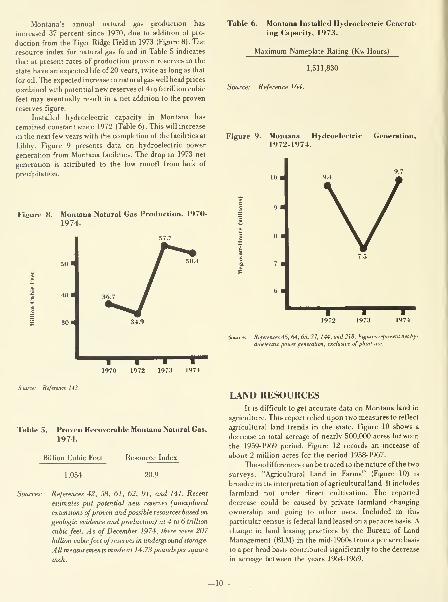
Montana's annual natural gas production has
increased 37 percent since 1970, due to addition of pro-
duction from the Tiger Ridge Field in 1973 (Figure 8). The
resource index for natural gas found in Table 5 indicates
that at present rates of production proven reserves in the
state have an expected life of 20 years, twice as long as that
for oil. The expected increase in natural gas well head prices
combined with potential new reserves of 4 to 6 trillion cubic
feet may eventually result in a net addition to the proven
reserves figure.
Installed hydroelectric capacity in Montana has
remained constant since 1972 (Table 6). This will increase
in the next few years with the completion of the facilities at
Libby. Figure 9 presents data on hydroelectric power
generation from Montana facilities. The drop in 1973 net
generation is attributed to the low runoff from lack of
precipitation.
Figure 8. Montona Natural Gas Production, 1970-
1974.
Table 6. Montana Installed Hydroelectric Generat-
ing Gipacity, 1973.
Maximum Nameplate Rating (Kw-Hours)
Source: Reference 164.
Figure 9. Montana Hydroelectric Generation,
1972-1974.
9.79.4 ^V
Sources: References 45, 64, 65, 77, 144, and 218. Figures represent net hy-
droelectric power generation, exclusive ofplant use.
Il l1970 1972 1973 1974
Source: Reference 143.
Table 5. Proven Recoveral
1974.
Billion Cubic Feet
le Montana Natural Gas,
Resource Index
1,054 20.9
References 42, .58, 61, 62, 91, and 141. Recent
estimates put potential new reserves (unexplored
extensions ofproven and possible resources based on
geologic evidence and production) at 4 to 6 trillion
cubic feet. As of December 1974, there were 207
billion cubicfeet of reserves in underground storage.
All measurements made at 14.73 pounds per square
inch.
LAND RESOURCESIt is difficult to get accurate data on Montana land in
agriculture. This report relied upon two measures to reflect
agricultural land trends in the state. Figure 10 shows a
decrease in total acreage of nearly 500,000 acres between
the 1959-1969 period. Figure 12 records an increase of
about 2 million acres for the period 1958-1967.
These differences can be traced to the nature of the two
surveys. "Agricultural Land in Farms" (Figure 10) is
broader in its interpretation of agricultural land. It includes
farmland not under direct cultivation. The reported
decrease could be caused by private farmland changing
ownership and going to other uses. Included in this
particular census is federal land leased on a per acre basis. A
change in land leasing practices by the Bureau of Land
Management (BLM) in the mid-1960s from a per acre basis
to a per head basis contributed significantly to the decrease
in acreage between the years 1964-1969.
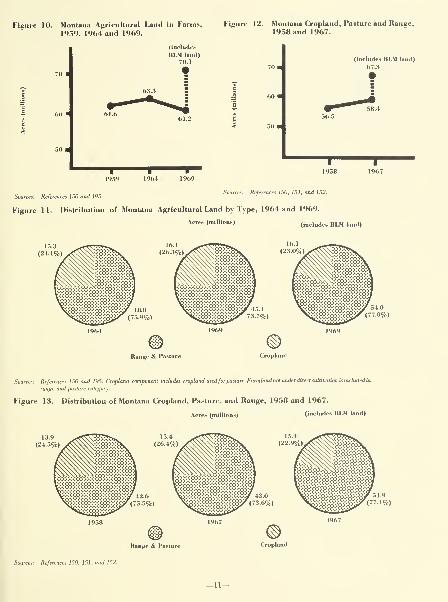
Figure 10. Montana Agricultural Land in Farms, Figure 12. Montana Cropland, Pasture and Range,
1959, 196 t and 1969. 19.58 and 1967.
Sources: References 150 and 195.
(..l,•l..<l.^
BLM land)
1959 1961 1969
(includes BLM land)
67.3
1958 1967
Sources: References 150, 151, and 152.
Figure 11. Distribution of Montana Agricultural Land by Type, 1964 and 1969.
Acres (millions)(includes BLM Und)
Range & Pasture Cropland
Sources: References 150 and 195. Cropland component includes cropland usedfor pasture. Farmland not under direct culdvationis included in
range and pasture category.
Figure 13. Distribution of Montana Cropland, Pasture, and Range, 1958 and 1967.
Acres (millions) (includes BLM land)
Range & Pasture Cropland
Sources: References 150, 151, and 152.
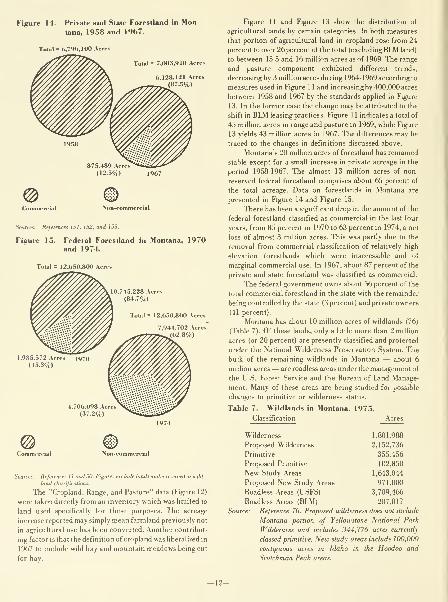
Figur 14. Private and Stale Forestland in Montona, 1958 and 1967.
Toul = 6.796.100 Acres
003.910 Acres
@
875.4«9 Acres
(12.5%) 1967
Non-commercial
Sources: Hefei 151. 152. and 153.
Figure 15. Federal Forestland in Montaand 1974.
Total = 12.650.800 Acres
15.228 Acres
(84.7
2.650.800 Acres
.9+1.702 Acres
(62.8%)
1.935.572 Acre
(15.3%)
4,706,098 Acres
(37.2%)
@Sources: References 4 1 and 50. Figures exclude lands under reserved or wild-
land classifications.
The "Qopland, Range, and Pasture" data (Figure 12)
were taken directly from an inventory which was limited to
land used specifically for these purposes. The acreage
increase reported may simply mean farmland previously not
in agricultural use has been converted. Another contribut-
ing factor is that the definition of cropland was liberalized in
1%7 lo include wild hay and mountain meadows being cut
for hay.
Figure 11 and Figure 13 show the distribution of
agricuhural lands by certain categories. In both measures
that portion of agricultural land in cropland rose from 24
percent to over 26 percent of the total (excluding BLM land)
to between 15.5 and 16 million acres as of 1969. The range
and pasture component exhibited different trends,
decreasing by 3 million acres during 1964- 1969 according to
measures used in Figure 11 and increasing by 400,000 acres
between 1958 and 1%7 by the standards applied in Figure
13. In the former case the change may be attributed to the
shift in BLM leasing practices. Figure 1 1 indicates a total of
45 million acres in range and pasture in 1969, while Figure
13 yields 43 million acres in 1967. The differences may be
traced to the changes in definitions discussed above.
Montana's 20 million acres of forestland has remained
stable except for a small increase in private acreage in the
period 1958-1967. The almost 13 million acres of non-
reserved federal forestland comprises about 65 percent of
the total acreage. Data on forestlands in Montana are
presented in Figure 14 and Figure 15.
There has been a significant drop in the amount of the
federal forestland classified as commercial in the last four
years, from 85 percent in 1970 to 63 percent in 1974, a net
loss of almost 3 million acres. This was partly due to the
removal from commercial classification of relatively high
elevation forestlands which were inaccessible and of
marginal commercial use. In 1967, about 87 percent of the
private and state forestland was classified as commercial.
The federal government owns about 56 percent of the
total commercial forestland in the state with the remainder
being controlled by the state (3 percent) and private owners
(41 percent).
Montana has about 10 million acres of wildlands (76)
(Table 7). Of these lands, only a little more than 2 million
acres (or 20 percent) are presently classified and protected
under the National Wilderness Preservation System. The
bulk of the remaining wildlands in Montana — about 6
million acres — are roadless areas under the management of
the U.S. Forest Service and the Bureau of Land Manage-
ment. Many of these areas are being studied for possible
changes to primitive or wilderness status.
Table 7. Wildlands in Montana, 1975.
Classification .Acres
Wilderness 1,801,988
Proposed Wilderness 2,152,736
Primitive 355,456
Proposed Primitive 102,850
New Study Areas 1,643,044
Proposed New Study Areas 971,000
Roadless Areas (USFS) 3,709,466
Roadless Areas (BLM) 207,017
Source: Reference 76. Proposed wilderness does not include
Montana portion of Yellowstone National Park
Wilderne.'.s and includes 344,776 acres currently-
classed primitive. I\'ew study areas include 100,000
contiguous acres in Idaho in the Hoodoo and
Scotchman Peak areas.
WATERRecent calculations put the average total annual
supply of surface water in Montana at 43,899,580 acre-feet
(134).
This resource is depleted by evaporation and by with-
drawals for consumptive purposes, including irrigation,
municipal and industrial, livestock, rural domestic and
thermoelectric. Total depletion amounts to 7,105,376 acre-
feet per year (afy) ; irrigation alone consumes 5,851,827 afy,
which, together with reservoir evaporation, accounts for 98
percent of all water consumption in Montana. All other uses
account for the remaining 2 percent (134).
Surface waters yield 99 percent of the water used for
irrigation in the state. While supplies are generally
adequate, locally intense irrigation activity may cause
locally severe depletions, stream dewateringand impacts on
aquatic life and recreation. These impacts are most apparent
in the Broad Valley Rockies where irrigated agriculture has
reached greatest development.
In 1967 over 1.6 million acres were irrigated in
Montana (153). Current estimates range between 2.5
million acres (134) and 3.4 million acres with expectations
of reaching 6.5 million irrigated acres by the year 2020
(155). As more acres come under irrigation the amount of
additional water consumed will depend in part on irrigation
efficiency. Although heavy energy users, sprinkler systems
deliver a greater percentage (70 percent) of withdrawn
water to the crop than do gravity ditch and lateral systems
(50 percent). Increased efficiency will result in less
withdrawal per acre, less water consumed unproductively
(through ditch seepage and evaporation), and in less salt
laden water returned to rivers and streams.
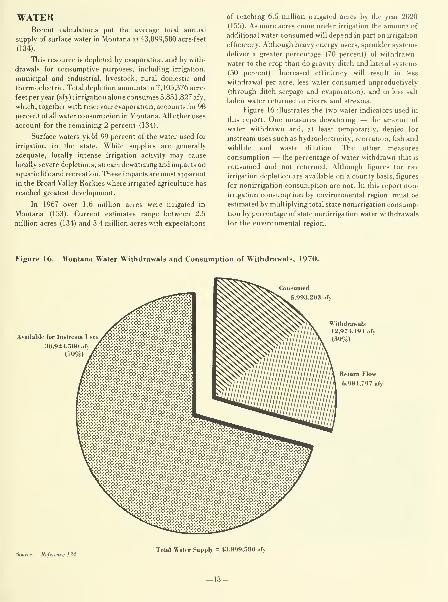
Figure 16 illustrates the two water indicators used in
this report. One measures dewatering — the amount of
water withdrawn and, at least temporarily, denied for
instream uses such as hydroelectricity, recreation, fish and
wildlife and waste dilution. The other measures
consumption — the percentage of water withdrawn that is
consumed and not returned. Although figures for net
irrigation depletion are available on a county basis, figures
for nonirrigation consumption are not. In this report non-
irrigation consumption by environmental region must be
estimated by multiplying total state nonirrigation consump-
tion by percentage of state nonirrigation water withdrawals
for the environmental region.
Figure 16. Montana Water Withdrawals and Consumption of Withdrawals, 1970.
Withdrawals
12,974.191 afy
(30%)
Return Flow
6,981.797 afv
Reference 134.Total Water Supply = 43.899,.580 afy
The most recent estimate puts total water withdrawals
at nearly 13 million afy or almost 30 percent of total annual
supply (134) (Figure 16). Excluding reservoir evaporation
(which is water "consumed" but not withdrawn), 5,993,203
afy or 46 percent of the water withdrawn in Montana is
consumed. Besides increasing irrigation efficiency, national
and international water experts are encouraging waste-
water recycling in order to avoid serious water shortages in
the future (4) (159) (186) (200).
Groundwater diversion in Montana amounts to
250,000 afy, with about 163,000 afy of that consumed
(134). A proposed coal slurry pipeline from Wyoming to
Arkansas would eventually draw 75,000 afy from the
Madison groundwater formation, a portion of which under-
lies eastern Montana (14) (21).
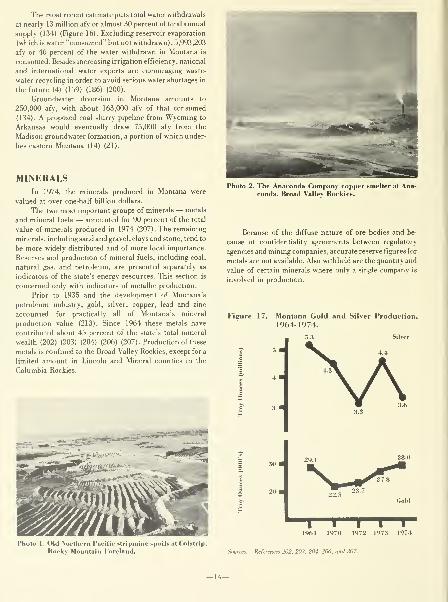
MINERALSIn 1974, the minerals produced in Montana were
valued at over one-half billion dollars.
The two most important groups of minerals — metals
and mineral fuels — accounted for 90 percent of the total
value of minerals produced in 1974 (207). The remaining
minerals, including sand and gravel, clays and stone, tend to
be more widely distributed and of more local importance.
Reserves and production of mineral fuels, including coal,
natural gas, and petroleum, are presented separately as
indicators of the state's energy resources. This section is
concerned only with indicators of metallic production.
Prior to 1935 and the development of Montana's
petroleum industry, gold, silver, copper, lead and zinc
accounted for practically all of Montana's mineral
production value (213). Since 1964 these metals have
contributed about 45 percent of the state's total mineral
wealth (202) (203) (204) (206) (207). Production of these
metals is confined to the Broad Valley Rockies, except for a
limited amount in Lincoln and Mineral counties in the
Columbia Rockies.
Photo 2. The Anaconda Company copfconda. Broad Valley Rockies.
Because of the diffuse nature of ore bodies and be-
cause of confidentiality agreements between regulatory
agencies and mining companies, accurate reserve figures for
metals are not available. Also withheld are the quantity and
value of certain minerals where only a single company is
involved in production.
Figure 17. Montana Gold and Silver Production,1964-1974.
I I I I I1964 1970 1972 1973 1974
I'holo 1 . Old INorthern Pacific siripminp 8puilt< at Colslrip,
Rocky Mountain Foreland. References. 202. 203. 204. 206. and 207
-14—
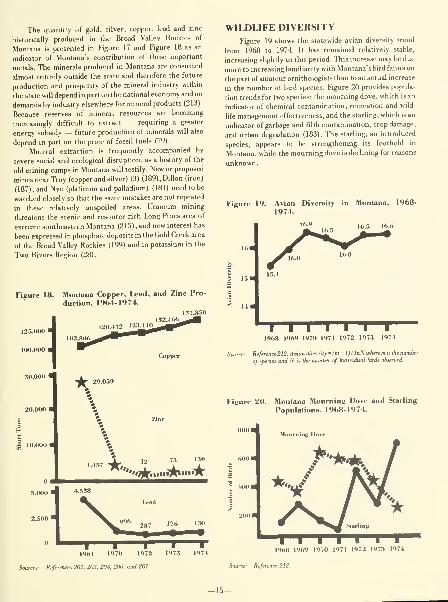
The quantity of gold, silver, copper, lead and zinc
historically produced in the Broad Valley Rockies of
Montana is presented in Figure 17 and Figure 18 as an
indicator of Montana's contribution of these important
metals. The minerals produced in Montana are consumed
almost entirely outside the state and therefore the future
production and prosperity of the mineral industry within
the state will depend in part on the national economy and on
demands by industry elsewhere for mineral products (213)
.
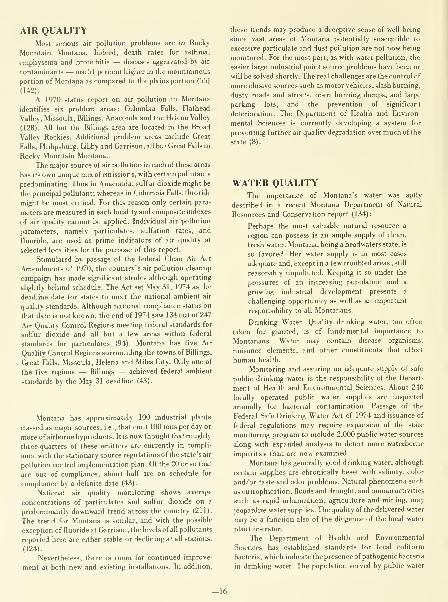
Because reserves of mineral resources are becoming
increasingly difficult to extract — requiring a greater
energy subsidy — future production of minerals will also
depend in part on the price of fossil fuels (79).
Mineral extraction is frequently accompanied by
severe social and ecological disruption, as a history of the
old mining camps in Montana will testify. New or proposed
mines near Troy (copper and silver) (3) (189), Dillon (iron)
(187), and Nye (platinum and palladium) (181) need to be
watched closely so that the same mistakes are not repeated
in these relatively unspoiled areas. Uranium mining
threatens the scenic and resource-rich Long Pines area of
extreme southeastern Montana (215), and new interest has
been expressed in phosphate deposits in the Gold Creek area
of the Broad Valley Rockies (199) and in potassium in the
Two Rivers Region (28).
Figure 18. Montana Copper, Lead, and Zinc Pro-
duction, 1964-1974.
1
120.412 123JI0
Copper
30,000
AIR QUALITYMost serious air pollution problems are in Rocky
Mountain Montana. Indeed, death rates for asthma,
emphysema and bronchitis — diseases aggravated by air
contaminants — are 51 percent higher in the mountainous
portion of Montana as compared to the plains portion (55)
(142).
A 1970 status report on air pollution in Montana
identifies six problem areas: Columbia Falls, Flathead
Valley, Missoula, Billings, Anaconda and the Helena Valley
(128). All but the Billings area are located in the Broad
Valley Rockies. Additional problem areas include Great
Falls, Philipsburg, Libby and Garrison, all but Great Falls in
Rocky Mountain Montana.
The major source of air pollution in each of these areas
has its own unique mix of emissions, with certain pollutants
predominating. Thus in Anaconda, sulfur dioxide might be
the principal pollutant; whereas in Columbia Falls, fluoride
might be most critical. For this reason only certain para-
meters are measured in each locality and composite indexes
of air quality cannot be applied. Individual air pollution
parameters, namely particulates, sulfation rates, and
fluoride, are used as prime indicators of air quality at
selected localities for the purpose of this report.
Stimulated by passage of the federal Clean Air Act
Amendments of 1970, the country's air pollution cleanup
campaign has made significant strides although operating
slightly behind schedule. The Act set May 31, 1974 as the
deadline date for states to meet the national ambient air
quality standards. Although national compliance status on
that date is not known, the end of 1974 saw 134 out of 247
Air Quality Control Regions meeting federal standards for
sulfur dioxide and all but a few areas within federal
standards for particulates (94). Montana has five Air
Quality Control Regions surrounding the towns of Billings,
Great Falls, Missoula, Helena and Miles City. Only one of
the five regions — Billings — achieved federal ambient
standards by the May 31 deadline (43).
Montana has approximately 100 industrial plants
classed as major sources, i.e., that emit 100 tons per day or
more of airborne byproducts. It is now thought that roughly
three-quarters of these emitters are currently in compli-
ance with the stationary source regulations of the state's air
pollution control implementation plan. Of the 20 or so that
are out of compliance, about half are on schedule for
compliance by a definite date (43).
National air quality monitoring shows average
concentrations of particulates and sulfur dioxide on a
predominantly downward trend across the country (211).
The trend for Montana is similar, and with the possible
exception of fluoride at Garrison, the levels of all pollutants
reported here are either stable or declining at all stations.
(124).
Nevertheless, there is room for continued improve-
ment at both new and existing installations. In addition.
these trends may produce a deceptive sense of well being
since vast areas of Montana potentially susceptible to
excessive particulate and dust pollution are not now being
monitored. For the most part, as with water pollution, the
easier large industrial point source problems have been or
will be solved shortly. The real challenges are the control of
more elusive sources such as motor vehicles, slash burning,
dusty roads and streets, open burning dumps, and large
parking lots, and the prevention of significant
deterioration. The Department of Health and Environ-
mental Sciences is currently developing a system for
preventing further air quality degradation over much of the
state (8).
WATER QUALITYThe importance of Montana's water was aptly
described in a recent Montana Department of Natural
Resources and Conservation report (134):
Perhaps the most valuable natural resource a
region can possess is an ample supply of clean,
fresh water. Montana, being a headwaters state, is
so favored. Her water supply is in most cases
adequate and, except in a few troubled areas , still
reasonably unpolluted. Keeping it so under the
pressures of an increasing population and a
growing industrial development presents a
challenging opportunity as well as an important
responsibility to all Montanans.
Drinking Water. Quality drinking water, too often
taken for granted, is of fundamental importance to
Montanans. Water may contain disease organisms,
nuisance elements, and other constituents that affect
human health.
Monitoring and assuring an adequate supply of safe
public drinking water is the responsibility of the Depart-
ment of Health and Environmental Sciences. About 240
locally operated public water supplies are inspected
annually for bacterial contamination. Passage of the
Federal Safe Drinking Water Act of 1974 and issuance of
federal regulations may require expansion of the state
monitoring program to include 2,000 public water sources
along with expanded analysis to detect more waterborne
impurities than are now examined.
Montana has generally good drinking water, although
certain supplies are chronically beset with salinity, color
and/or taste and odor problems. Natural phenomena such
as eutrophication, floods and drought, and human activities
such as rapid urbanization, agriculture and mining, may
jeopardize water supplies. The quality of the delivered water
may be a function also of the diligence of the local water
plant operator.
The Department of Health and Environmental
Sciences has established standards for fecal coliform
bacteria, which indicate the presence of pathogenic bacteria
in drinking water. The population served by public water
-16—
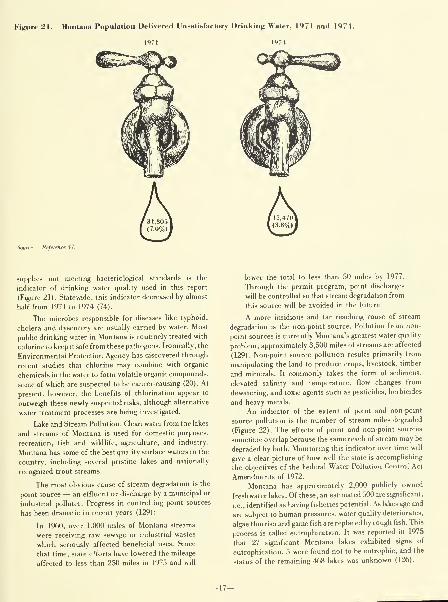
Figure 21. Montana Population Delivered Unsatisfactory Drinking Water, 1971 and 1974.
Source: Refei
supplies not meeting bacteriological standards is the
indicator of drinking water quality used in this report
(Figure 21). Statewide, this indicator decreased by almost
half from 1971 to 1974 (74).
The microbes responsible for diseases like typhoid,
cholera and dysentery are usually carried by water. Most
public drinking water in Montana is routinely treated with
chlorine to keep it safe from these pathogens. Ironically, the
Environmental Protection Agency has discovered through
recent studies that chlorine may combine with organic
chemicals in the water to form volatile organic compounds,
some of which are suspected to be cancer-causing (20). At
present, however, the benefits of chlorination appear to
outweigh these newly suspected risks, although alternative
water treatment processes are being investigated.
Lake and Stream Pollution. Clean water from the lakes
and streams of Montana is used for domestic purposes,
recreation, fish and wildlife, agriculture, and industry.
Montana has some of the best quality surface waters in the
country, including several pristine lakes and nationally
recognized trout streams.
The most obvious cause of stream degradation is the
point source — an effluent or discharge by a municipal or
industrial polluter. Progress in controlling point sources
has been dramatic in recent years (129):
In 1960, over 1,000 miles of Montana streams
were receiving raw sewage or industrial wastes
which seriously affected beneficial uses. Since
that time, state efforts have lowered the mileage
affected to less than 250 miles in 1975 and will
lower the total to less than 50 miles by 1977.
Through the permit program, point discharges
will be controlled so that stream degradation from
this source will be avoided in the future.
A more insidious and far reaching cause of stream
degradation is the non-point source. Pollution from non-
point sources is currently Montana's greatest water quality
problem; approximately 3,500 miles of streams are affected
(129). Non-point source pollution results primarily from
manipulating the land to produce crops, livestock, timber
and minerals. It commonly takes the form of sediment,
elevated salinity and temperature, flow changes from
dewatering, and toxic agents such as pesticides, herbicides
and heavy metals.
An indicator of the extent of point and non-point
source pollution is the number of stream miles degraded
(Figure 22). The effects of point and non-point sources
sometime overlap because the same reach of stream may be
degraded by both. Monitoring this indicator over time will
give a clear picture of how well the state is accomplishing
the objectives of the Federal Water Pollution Control Act
Amendments of 1972.
Montana has approximately 2,000 publicly owned
freshwater lakes. Of these, an estimated 500 are significant,
i.e., identified as having fisheries potential. As lakes age and
are subject to human pressures, water quality deteriorates,
algae flourish and game fish are replaced by rough fish. This
process is called eutrophication. It was reported in 1975
that 27 significant Montana lakes exhibited signs of
eutrophication, 5 were found not to be eutrophic, and the
status of the remaining 468 lakes was unknown (126).
-17-

Figure 22. Point Source Degradation of Montana
Streams, 1960, 1972, and 1975.
« i
inevitable erosion that follows. Nature requires
centuries to create topsoil and man can destroy it
in only a few years. Deforestation has been follow-
ed by erosion in many parts of the world.
Cropland, Rangeland, and Woodland — The Private
Sector. As world population grows, so does the demand for
food and forest products, often to the point of surpassing
the land's ability to sustain production without severe
environmental consequences. For example, the Soil
Conservation Service estimates that nearly nine million
acres of previously unfarmed land was plowed during 1974,
about four million acres of which was "marginally
productive, ecolgically fragile wilderness" (170). The
shallowness and dryness of much of Montana's soil make it
extremely susceptible to abuse from grazing, logging,
mining and other activities.
The latest comprehensive inventory of conservation
treatment needs on private and state-owned lands in
Montana was conducted by county conservation needs
committees in 1967 and published in 1970 (153). The
findings of this inventory form the basis for evaluating the
quality of soil, grass and timber on private lands in
Montana. Although a previous inventory was undertaken in
1958 (152), the treatment needs data are not comparable
with those from 1%7 because of different and overlapping
treatments prescribed in the 1964 supplement (151) to the
1958 report. Tentative plans call for updating the inventory
every five years (56).
Montana has about 58 million acres of cropland,
pasture and range in private or state ownership. Over 32
million acres of this land — approximately one-third of the
total land area in the state — were in need of conservation
treatment in 1967 (153), ranging from alternative land use
for some dry cropland to protection from grazing for much
Sources: Refei
LAND QUALITYA recent report of the Committee on Agriculture of the
U.S. House of Representatives sounded an important warn-
ing about the risks of overestimating our ability to increase
agricultural production (214):
Efforts to expand the food supply, either by
expanding the area under cultivation or intensify-
ing cultivation through the use of the agri-
cultural chemicals and irrigation, bring with them
troublesome and disturbing ecological
consequences. Accelerating soil loss, problems
caused by irrigation and eutrophication of
streams and lakes due to increased use of chemical
fertilizers are pressing ecological dangers
associated with efforts to increase food
production. Enlarging livestock herds for food
and draft power has caused overgrazing and the
Photo 3. Refii.se aloiifj the Bilterrool River. Broad Valley
Rockies.
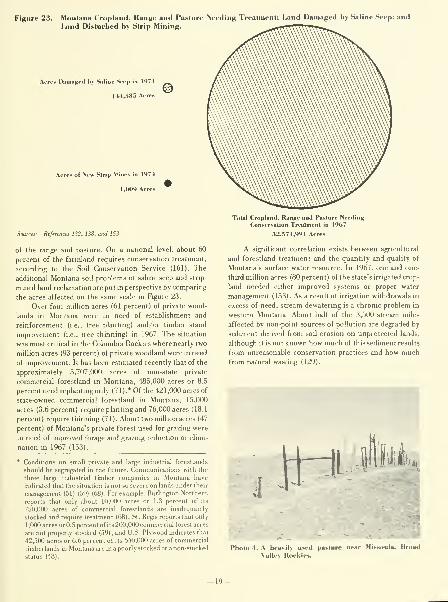
Figure 23. Montana Cropland, Range and Pasture INeeding Treatment; Land Damaged by Saline Seep; andLand Disturbed by Strip Mining.
Acres Damaged by Saline Seep in 197 4-
144.585 Acres©
Acres of New Strip Mines in 1974
1,009 Acres
Sources: References 132. 138. and 153.
of the range and pasture. On a national level, about 60
percent of the farmland requires conservation treatment,
according to the Soil Conservation Service (161). The
additional Montana soil problems of saline seep and strip-
mined land reclamation are put in perspective by comparing
the acres affected on the same scale in Figure 23.
Over four million acres (61 percent) of private wood-
lands in Montana were in need of establishment and
reinforcement (i.e., tree planting) and/or timber stand
improvement (i.e., tree thinning) in 1967. The situation
was most critical in the Columbia Rockies where nearly two
million acres (93 percent) of private woodland were in need
of improvement. It has been estimated recently that of the
approximately 5,707,000 acres of non-state private
commercial forestland in Montana, 485,000 acres or 8.5
percent need replanting only (71).* Of the 42 1,000 acres of
state-owned commercial forestland in Montana, 15,000
acres (3.6 percent) require planting and 76,000 acres (18.1
percent) require thinning (71). About two million acres (47
percent) of Montana's private forest used for grazing were
in need of improved forage and grazing reduction or elimi-
nation in 1967 (153).
* Conditions on small private and large industrial forestlands
should be segregated in the future. Communications with the
three large industrial timber companies in Montana have
indicated that the situation is not so severe on lands under their
management (51) (59) (68). For example, Burlington Northern
reports that only about 10,000 acres or 1.3 percent of its
750,000 acres of commercial forestlands are inadequately
stocked and require treatment (68), St. Regis reports that only
1 ,000 acres or 0.5 percent of its 200,000 commercial forest acres
are not properly stocked (59) , and U.S. Plywood indicates that
42,500 acres or 6.6 percent of its 640,000 acres of commercial
timberlands in Montana are in a poorly stocked or a non-stocked
status (48).
Total Cropland, Range and Pasture NeedingConservation Treatment in 1967
32.574,991 Acres
A significant correlation exists between agricultural
and forestland treatment and the quantity and quality of
Montana's surface water resource. In 1967, one and one-
third million acres (80 percent) of the state's irrigated crop-
land needed either improved systems or proper water
management (153). As a result of irrigation withdrawals in
excess of need, stream dewatering is a chronic problem in
western Montana. About half of the 3,500 stream miles
affected by non-point sources of pollution are degraded by
sediment derived from soil erosion on unprotected lands,
although it is not known how much of this sediment results
from unreasonable conservation practices and how muchfrom natural wasting (129).
Photo J. A heavily used pasture near Missoula. Broad
Vallev Rockies.
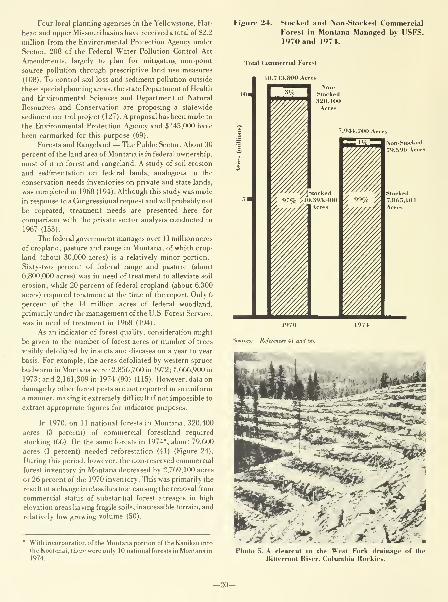
Four local planning agencies in the Yellowstone, Flat-
head and upper Missouri basins have received a total of $2.2
million from the Environmental Protection Agency under
Section 208 of the Federal Water Pollution Control Act
Amendments, largely to plan for mitigating non-point
source pollution through prescriptive land use measures
(108). To control soil loss and sediment pollution outside
these special planning areas, the state Department of Health
and Environmental Sciences and Department of Natural
Resources and Conservation are proposing a statewide
sediment control project ( 127) . A proposal has been made to
the Environmental Protection Agency and S145,000 have
been earmarked for this purpose (69).
Forests and Rangeland — The Public Sector. About 30
percent of the land area of Montana is in federal ownership,
most of if in forest and rangeland. A study of soil erosion
and sedimentation on federal lands, analogous to the
conservation needs inventories on private and state lands,
was completed in 1968 (194). Although this study was made
in response to a Congressional request and will probably not
be repeated, treatment needs are presented here for
comparison with the private sector analysis conducted in
1%7 (153).
The federal government manages over 11 million acres
of cropland, pasture and range in Montana, of which crop-
land (about 30,000 acres) is a relatively minor portion.
Sixty-two percent of federal range and pasture (about
6,800,000 acres) was in need of treatment to alleviate soil
erosion, while 20 percent of federal cropland (about 6,300
acres) required treatment at the time of the report. Only 6
percent of the 14 million acres of federal woodland,
primarily under the management of the U.S. Forest Service,
was in need of treatment in 1968 (194).
As an indicator of forest quality, consideration might
be given to the number of forest acres or number of trees
visibly defoliated by insects and diseases on a year to year
basis. For example, the acres defoliated by western spruce
budworm in Montanawere:2,856,760in 1972; 1,666,900 in
1973; and 2,161,309 in 1974 (90) (115). However, data on
damage by other forest pests are not reported in so uniform
a manner, making it extremely difficult if not impossible to
extract appropriate figures for indicator purposes.
In 1970, on 11 national forests in Montana, 320,400
acres (3 percent) of commercial forestland required
stocking (66). On the same forests in 1974*, about 79,600
acres (1 percent) needed reforestation (41) (Figure 24).
During this period, however, the non-reserved commercial
forest inventory in Montana decreased by 2,769,100 acres
or 26 percent of the 1970 inventory. This was primarily the
result of a change in classification causing the removal from
commercial status of substantial forest acreages in high
elevation areas having fragile soils, inaccessible terrain, and
relatively low growing volume (50).
With incorporation of the Montana portion of the Kaniksu into
the Kootenai, there were only 10 national forests in Montana in
1974.
Figure 24. Stocked and Non-Stocked CommercialForest in Montana Managed by USFS,1970 and 1974.
Total Commercial Forest
10.713.800 Acres
>on-Slocked
79.596 Acres
Sources: References 41 and 66.
j^^'^'^'/m:W-^.Photo .S. A olearrul in the West Fork drainage of the
Bitterrool River, Columbia Rockies.
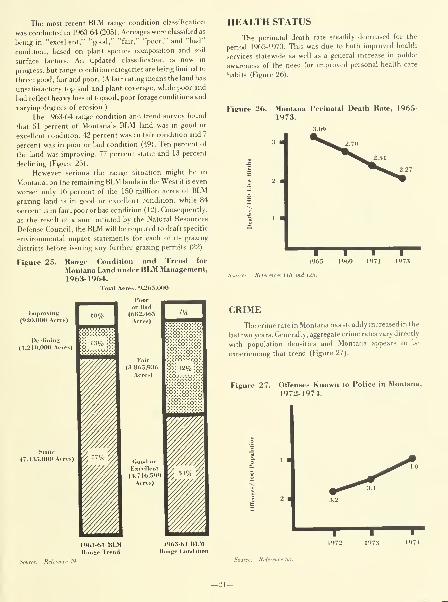
The most recent BLM range condition classification
was conducted in 1963-64 (205) . Acreages were classified as
being in "excellent," "good," "fair," "poor," and "bad"
condition, based on plant species composition and soil
surface factors. An updated classification is now in
progress, but range condition categories are being limited to
three: good, fair and poor. (A fair rating means the land has
unsatisfactory top soil and plant coverage, while poor and
bad reflect heavy loss of topsoil, poor forage conditions and
varying degrees of erosion.)
The 1963-64 range condition and trend survey found
that 51 percent of Montana's BLM land was in good or
excellent condition, 42 percent was in fair condition and 7
percent was in poor or bad condition (49). Ten percent of
the land was improving, 77 percent static and 13 percent
declining (Figure 25)
.
However serious the range situation might be in
Montana, on the remaining BLM lands in the West it is even
worse: only 16 percent of the 150 million acres of BLMgrazing land is in good or excellent condition, while 84
percent is in fair, poor or bad condition (12). Consequently,
as the result of a suit initiated by the Natural Resources
Defense Council, the BLM will be required to draft specific
environmental impact statements for each of its grazing
districts before issuing any further grazing permits (22).
Figure 25. Range Condition and Trend for
Montana Land under BLM Management,
1963-1964.Total Acres: <>,26.S.000
HEALTH STATUS
The perinatal death rate steadily decreased for the
period 1965-1973. This was due to both improved health
services statewide as well as a general increase in public
awareness of the need for improved personal health care
habits (Figure 26).
Figure 26. Montana Perinatal Death Rate, 1965-
1973.
1965 1969 1971 197.1
Sources: References 118 and 125.
(920,0
Declining
(1.210,000 .Acres)
Static
(7.13.S.000 Aci

EMPLOYMENTliased on data provided by the Regional Economic
Information Service (REIS) of the U.S. Department of
Commerce, Montana's employment grew by almost 14
percent between 1968 and 1973 when 37,700 jobs were
added to the state's economy (Figure 28). Over 34,000 of
these were added to the private non-farm sector, with the
government contributing over 4,000. The farm sector lost
about 1,200, declining from 14.5percent of the total in 1968
to 12.4 percent in 1973 (Figure 29).
The most recent information available from the
Figure 28. Total Employment in Montana, 1968-
1974.
§ 300
Ml. Depl. Labor
and Industry
I I I I1968 1970 1972 1973 1974
Montana Department of Labor and Industry shows this tend
continuing with 17,000 jobs added in 1974 and 4,500 more
through the first 8 months of 1975. According to this
source, about 41,000 jobs were added during the period
1970-1974. To put this in perspective, it isalmost double the
natural population increase (births minus deaths) that
occurred in Montana during this period (217). While more
jobs have been added in Montana, the unemployment rate
has also increased, from 5.6 percent in 1970 to 6.7 percent
in 1974, indicating that people have been entering the labor
force faster than jobs have been created. This also holds
true for the nation as a whole. Nationally, the unemploy-
ment rate has also risen over the same period of time from
4.9 percent to 5.6 percent. For a number of years Montana's
rate has remained above the national average, although
lately the gap has narrowed; in fact, for most of 1975,
Montana's rate has been below the national average (131).
It is interesting to note that while the unemployment
rate increased between 1970 and 1973 the employment
ratio also increased, from 76.4 percent to 79.6 percent
(Figure 30). This may be attributable to infercensal
population estimates which are understating true
population growth, hence inflating the employment ratio. It
could also be a result of conceptual differences in the two
measures; the unemployment rate being very dependent on
people's decisions to enter or withdraw from the "civilian
labor force" and the employment ratio being based only on
the size of population aged 18-64. What this apparent data
contradiction implies is that as the employment picture
improved (the percent employed of the population aged 18-
64 increased), more people have been added to Montana's
labor force than were able to find suitable employment.
Another factor may be that liberalized unemployment
benefits have induced an increase in relative demand for
unemployment benefits over time.
Sources: References 131 and 196.
Figure 29. Montana Employment by Sector, 1968-1973.
No. Persons Empio
39,832
(11%)
Private >on-Farm
Smrcr Reference 196.
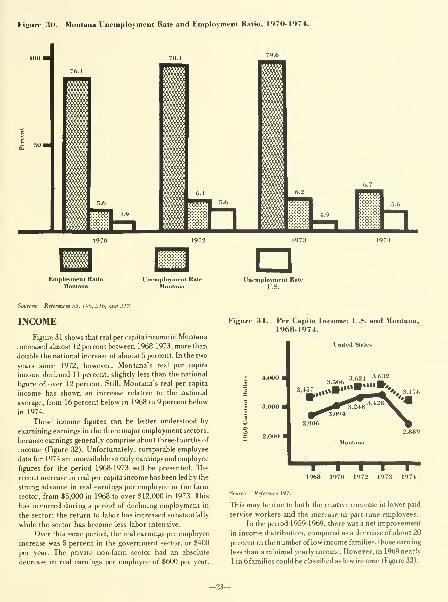
Figure 30. Montana Unemployment Rale and Employment Ratio, 1970-1974.
Eniplcnment RMontana
Sources: References 53, 196. 216, and 21 7.
INCOME
Figure 31 shows that real per capita income in Montana
increased almost 12 percent between 1968-1973, more than
double the national increase of almost 5 percent. In the two
years since 1972, however, Montana's real per capita
income declined 11 percent, slightly less than the national
figure of over 12 percent. Still, Montana's real per capita
income has shown an increase relative to the national
average, from 16 percent below in 1968 to 9 percent below
in 1974.
These income figures can be better understood by
examining earnings in the three major employment sectors,
because earnings generally comprise about three-fourths of
income (Figure 32). Unfortunately, comparable employee
data for 1974 are unavailable so only earnings and employee
figures for the period 1%8-1973 will be presented. The
recent increase in real per capita income has been led by the
strong advance in real earnings per employee in the farm
sector, from $5,000 in 1968 to over $12,000 in 1973. This
has occurred during a period of declining employment in
the sector; the return to labor has increased substantially
while the sector has become less labor intensive.
Over this same period, the real earnings per employee
increase was 5 percent in the government sector, or $400
per year. The private non-farm sector had an absolute
decrease in real earnings per employee of $600 per year.
Figure 31. Per Capita Income: U.S. and Montana,1968-1974.
I
I 3.000 I
E
d
0^ 2.000
.3.506 B...!^
1968 19T0 1972 19T3 1974
Source: Reference 197.
This may be due to both the relative increase in lower paid
service workers and the increase in part-time employees.
In the period 1959-1969, there was a net improvement
in income distribution, computed as a decrease of about 20
percent in the number of low income families, those earning
less than a minimal yearly income. However, in 1%9 nearly
1 in 6 families could be classified as low income (Figure 33).
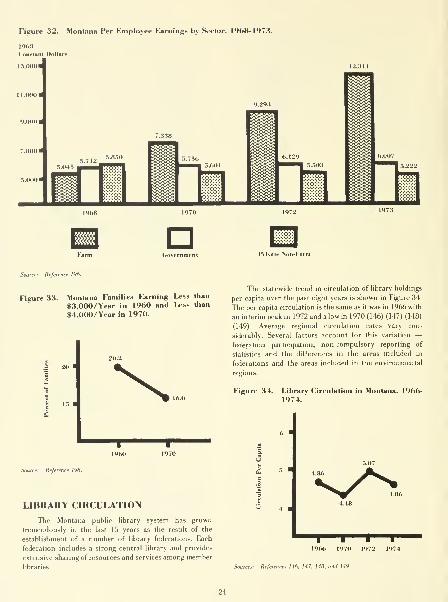
Figure 32. Montana Per Employee Earnings by Sector, 1968-1973.
1968Constant Dollars
13.(M»0
Source: Reference 196.
Figure 33. Montana Families Earning Less than
$3,000/Year in 1960 and Less than
«4,000/Year in 1970.
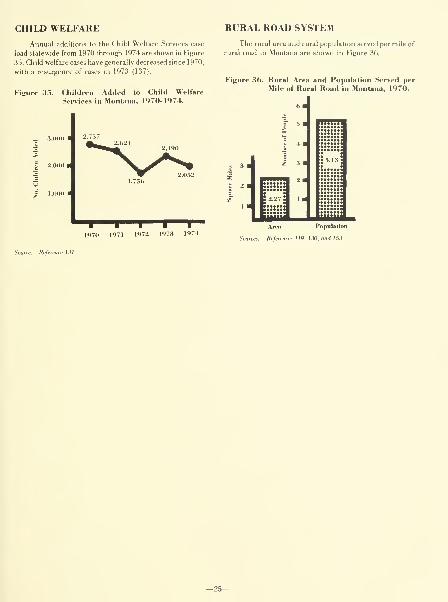
CHILD WELFAREAnnual additions to the Child Welfare Services case
load statewide from 1970 through 1974 are shown in Figure
35. Child welfare cases have generally decreased since 1970,
with a resurgence of cases in 1973 (137).
RURAL ROAD SYSTEM
The rural area and rural population served per i
rural road in Montana are shown in Figure 36.
ileof
Figure 35. Children .4dded
Services in Monlaito Child Welfare
a. 1970-1974.
Figure 36. Rural Area and Population Served perMile of Rural Road in Montana, 1970.
.'i.OOO I
MONTANA S ENVIRONMENTAL REGIONS
Geographically, Montana is a diverse and complex delineate the regions into recognizable environmental
state. There actually are two Montanas: Rocky Mountain units.
Montana and Great Plains Montana, with little in common The environmental regions of Montana as developed
except long term economic activities based on a renewable by Professor John M. Crowley for EQC's First Annual
resource base and a common state government centered in Report (1972) and revised by him for presentation in this
Helena. report are shown in Map 1 . The indicators material for each
The environmental regions used as the reporting region is preceded by a map and environmental perspective
format in this report combine areas on the basis of natural for that region. Each region is designed to stand alone as a
and man-made similarities which, in the aggregate, study unit in this report.

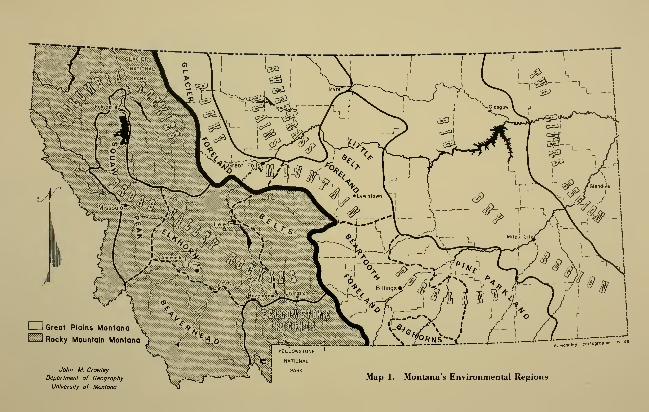
y,cortogropher "is
John M. Crowtey
Department of Geography
University of Montana
1. Montana **$ Environmental Regions
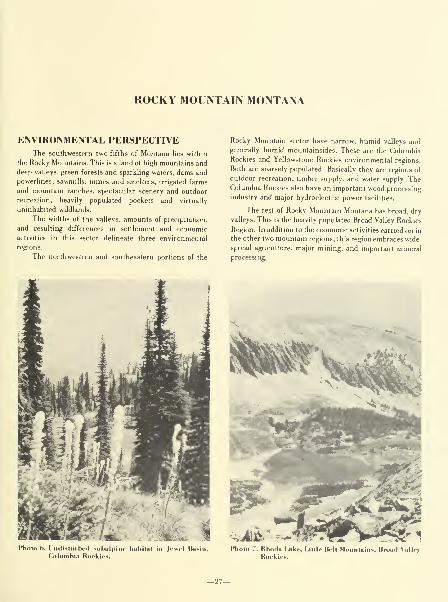
ROCKY MOUNTAIN MONTANA
ENVIRONMENTAL PERSPECTIVEThe southwestern two-fifths of Montana hes within
the Rocky Mountains. This is a land of high mountains and
deep valleys, green forests and sparkling waters, dams and
powerlines, sawmills, mines and smelters, irrigated farms
and mountain ranches, spectacular scenery and outdoor
recreation, heavily populated pockets and virtually
uninhabited wildlands.
The widths of the valleys, amounts of precipitation,
and resulting differences in settlement and economic
activities in this sector delineate three environmental
regions.
The northwestern and southeastern portions of the
Rocky Mountain sector have narrow, humid valleys andgenerally humid mountainsides. These are the Columbia
Rockies and Yellowstone Rockies environmental regions.
Both are sparsely populated. Basically they are regions of
outdoor recreation, timber supply, and water supply. TheColumbia Rockies also have an important wood-processing
industry and major hydroelectric power facilities.
The rest of Rocky Mountain Montana has broad, dry
valleys. This is the heavily populated Broad Valley Rockies
Region. In addition to the economic activities carried on in
the other two mountain regions, this region embraces wide-
spread agriculture, major mining, and important mineral
processing.
Photo 6. liKliKturbetl subalpiiu- habilul in J» \.. 1 Itisiii. Photo 7. Khoda l-ake. Little Belt MounUiii.s. Broad \allf(x)liimbia Rockies. Rockies.
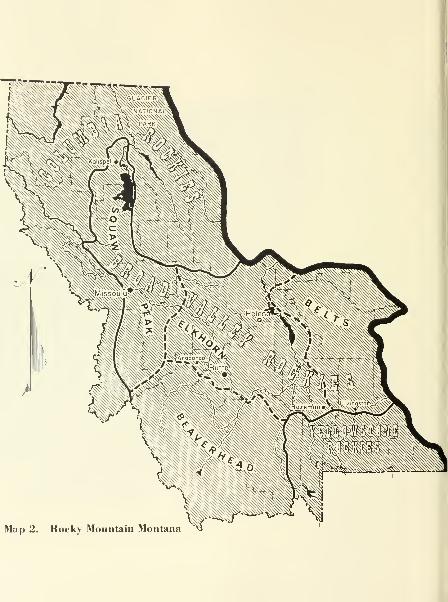
Map 2. Rocky Mountain Montana

ROCKY MOUNTAIN MONTANA
ENVIRONMENTAL PERSPECTIVEThe southwestern two-fifths of Montana hes within
the Rocky Mountains. This is a land of high mountains and
deep valleys, green forests and sparkling waters, dams and
powerlines, sawmills, mines and smelters, irrigated farms
and mountain ranches, spectacular scenery and outdoor
recreation, heavily populated pockets and virtually
uninhabited wildlands.
The widths of the valleys, amounts of precipitation,
and resulting differences in settlement and economic
activities in this sector delineate three environmental
regions.
The northwestern and southeastern portions of the
Rocky Mountain sector have narrow, humid valleys and
generally humid mountainsides. These are the Columbia
Rockies and Yellowstone Rockies environmental regions.
Both are sparsely populated. Basically they are regions of
outdoor recreation, timber supply, and water supply. The
Columbia Rockies also have an important wood-processing
industry and major hydroelectric power facilities.
The rest of Rocky Mountain Montana has broad, dry
valleys. This is the heavily populated Broad Valley Rockies
Region. In addition to the economic activities carried on in
the other two mountain regions, this region embraces wide-
spread agriculture, major mining, and important mineral
processing.
Photo 6. llndisturlied subalpiiie liahilal in J( w. 1 IJu>iii, Photo 7. Rho<la Ijike. Lillle Bell Mountain!*, Broad \alley
Columbia Rockies. Rocki.s.
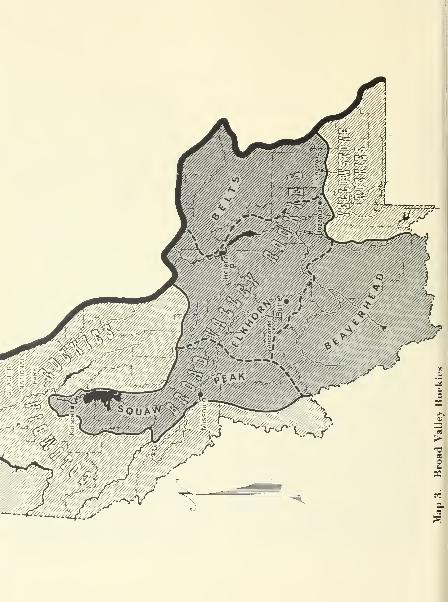
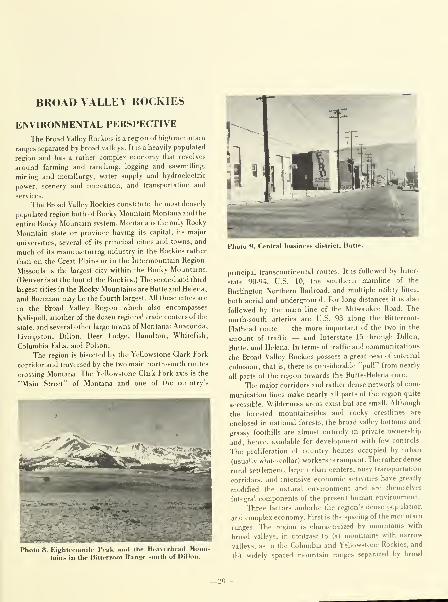
BROAD VALLEY ROCKIES
ENVIRONMENTAL PERSPECTIVE
The Broad Valley Rockies is a region of high mountain
ranges separated by broad valleys. It is a heavily populated
region and has a rather complex economy that revolves
around farming and ranching, logging and sawmilling,
mining and metallurgy, water supply and hydroelectric
power, scenery and recreation, and transportation and
services.
The Broad Valley Rockies constitute the most densely
populated region both of Rocky Mountain Montana and the
entire Rocky Mountain system. Montana is the only Rocky
Mountain state or province having its capital, its major
universities, several of its principal cities and towns, and
much of its manufacturing industry in the Rockies rather
than on the Great Plains or in the Intermountain Region.
Missoula is the largest city within the Rocky Mountains.
(Denver is at the foot of the Rockies.) The second and third
largest cities in the Rocky Mountains are Butte and Helena,
and Bozeman may be the fourth largest. All these cities are
in the Broad Valley Region which also encompasses
Kalispell, another of the dozen regional trade centers of the
state, and several other large towns of Montana: Anaconda,
Livingston, Dillon, Deer Lodge, Hamilton, Whitefish,
Columbia Falls, and Poison.
The region is bisected by the Yellowstone-Clark Fork
corridor and traversed by the two main north-south routes
crossing Montana. The Yellowstone-Clark Fork axis is the
"Main Street" of Montana and one of the country's
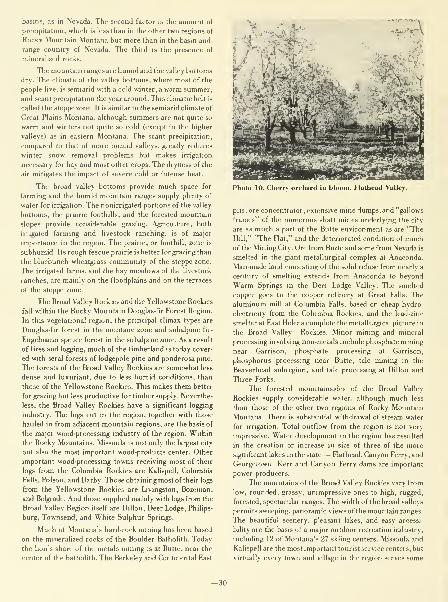
basins, as in Nevada. The second factor is the amount of
precipitation, which is less than in the other two regions of
Rocky Mountain Montana but more than in the basin-and-
range country of Nevada. The third is the presence of
minerahzed rocks.
The mountain ranges are humid and the valley bottoms
dry. The climate of the valley bottoms, where most of the
people live, is semiarid with a cold winter, a warm summer,
and scant precipitation the year around. This climatic belt is
called the steppe zone. It is similar to the semiarid climate of
Great Plains Montana, although summers are not quite so
warm and winters not quite so cold (except in the higher
valleys) as in eastern Montana. The scant precipitation,
compared to that of more humid valleys, greatly reduces
winter snow removal problems but makes irrigation
necessary for hay and most other crops. The dryness of the
air mitigates the impact of severe cold or intense heat.
The broad valley bottoms provide much space for
farming and the humid mountain ranges supply plenty of
water for irrigation. The nonirrigated portions of the valley
bottoms, the prairie foothills, and the forested mountain
slopes provide considerable grazing. Agriculture, both
irrigated farming and livestock ranching, is of major
importance in the region. The prairie, or foothill, zone is
subhumid. Its rough fescue prairie is better for grazing than
the bluebunch wheatgrass community of the steppe zone.
The irrigated farms, and the hay meadows of the livestock
ranches, are mainly on the floodplains and on the terraces
of the steppe zone.
The Broad Valley Rockies and the Yellowstone Rockies
fall within the Rocky Mountain Douglas-fir Forest Region.
In this vegetational region, the principal climax types are
Douglas-fir forest in the montane zone and subalpine fir-
Engelmann spruce forest in the subalpine zone. As a result
of fires and logging, much of the timberland is today cover-
ed with serai forests of lodgepole pine and ponderosa pine.
The forests of the Broad Valley Rockies are somewhat less
dense and luxuriant, due to less humid conditions, than
those of the Yellowstone Rockies. This makes them better
for grazing but less productive for timber supply. Neverthe-
less, the Broad Valley Rockies have a significant logging
industry. The logs cut in the region, together with those
hauled in from adjacent mountain regions, are the basis of
the major wood-processing industry of the region. Within
the Rocky Mountains, Missoula is not only the largest city
but also the most important wood-products center. Other
important wood-processing towns receiving most of their
logs from the Columbia Rockies are Kalispell, Columbia
Falls, Poison, and Darby. Those obtaining most of their logs
from the Yellowstone Rockies are Livingston, Bozeman,
and Belgrade. And those supplied mainly with logs from the
Broad Valley Region itself are Dillon, Deer Lodge, Philips-
burg, Townsend, and White Sulphur Springs.
Much of Montana's hard-rock mining has been based
on the mineralized rocks of the Boulder Batholith. Today
the lion's share of the metals mining is at Butte, near the
center of the batholith. The Berkeley and Continental East
-z:^
loto 10. Cherry orchard in bloom, Flathead Valley
pits, ore concentrator, extensive mine dumps, and "gallows
frames" of the numerous shaft mines underlying the city
are as much a part of the Butte environment as are "The
Hill," "The Flat," and the deteriorated condition of muchof the Mining City. Ore from Butte and some from Nevada is
smelted in the giant metallurgical complex at Anaconda.
Man-made land consisting of the solid refuse from nearly a
century of smelting extends from Anaconda to beyond
Warm Springs in the Deer Lodge Valley. The smelted
copper goes to the copper refinery at Great Falls. The
aluminum mill at Columbia Falls, based on cheap hydro-
electricity from the Columbia Rockies, and the lead-zinc
smelter at East Helena complete the metallurgical picture in
the Broad Valley Rockies. Minor mining and mineral
processing involving non-metals include phosphate mining
near Garrison, phosphate processing at Garrison,
phosphorus processing near Butte, talc mining in the
Beaverhead subregion, and talc processing at Dillon and
Three Forks.
The forested mountainsides of the Broad Valley
Rockies supply considerable water, although much less
than those of the other two regions of Rocky Mountain
Montana. There is substantial withdrawal of stream water
for irrigation. Total outflow from the region is not very
impressive. Water development in the region has resulted
in the creation or increase in size of three of the more
significant lakes in the state — Flathead, Canyon Ferry, and
Georgetown. Kerr and Canyon Ferry dams are important
power producers.
The mountains of the Broad Valley Rockies vary from
low, rounded, grassy, unimpressive ones to high, rugged,
forested, spectacular ranges. The width of the broad valleys
permits sweeping, panoramic views of the mountain ranges.
The beautiful scenery, pleasant lakes, and easy accessi-
bility are the basis of a major outdoor recreation industry,
including 12 of Montana's 27 skiing centers. Missoula and
Kalispell are the most important tourist service centers, but
virtually every town and village in the region serves some
-30-
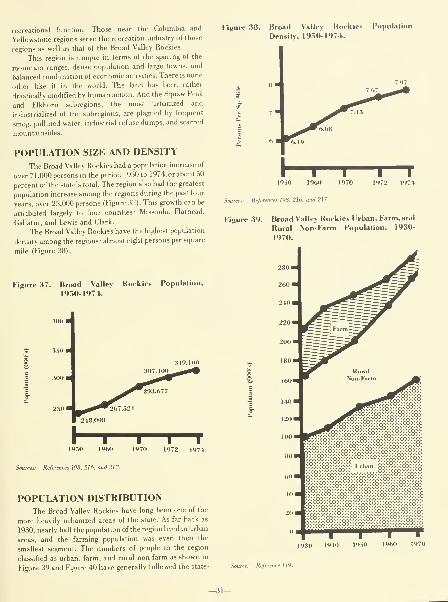
recreational function. Those near the Columbia and
Yellowstone regions serve the recreation industry of those
regions as well as that of the Broad Valley Rockies.
This region is unique in terms of the spacing of the
mountain ranges, dense population and large towns, and
balanced combination of economic activities. There is none
other like it in the world. The land has been rather
drastically modified by human action. And the Squaw Peak
and Elkhorn subregions, the most urbanized and
industrialized of the subregions, are plagued by frequent
smog, polluted water, industrial refuse dumps, and scarred
mountainsides.
POPULATION SIZE AND DENSITY
The Broad Valley Rockies had a population increase of
over 71,000 persons in the period 1950to 1974, or about 50
percent of the state's total. The region also had the greatest
population increase among the regions during the past four
years, over 25,000 persons (Figure 37). This growth can be
attributed largely to four counties: Missoula, Flathead,
Gallatin, and Lewis and Clark.
The Broad Valley Rockies have the highest population
density among the regions: almost eight persons per square
mile (Figure 38).
Figure 37. Broad Valley Rockies Population,
1950-1974.
Figure .S8. Broad Valley Rockies
Densitv, 1950-1971.
Populalit
248,098
I I I19.50 1960 1970 1972 1974
Sources: References 198. 216. and 21 7.
POPULATION DISTRIBUTIONThe Broad Valley Rockies have long been one of the
more heavily urbanized areas of the state. As far back as
1930, nearly half the population of the region lived in urban
areas, and the farming population was even then the
smallest segment. The numbers of people in the region
classified as urban, farm, and rural non-farm as shown in
Figure 39 and Figure 40 have generally followed the state-
Refe,
Figure 39.
ices 198.216. and 217.
Broad Valley Rockies Urban, Farm, and
Rural Non-Farm Population, 19.30-
1970.
1930 1940 1950 1960 1970
Source: Reference 1 19
.
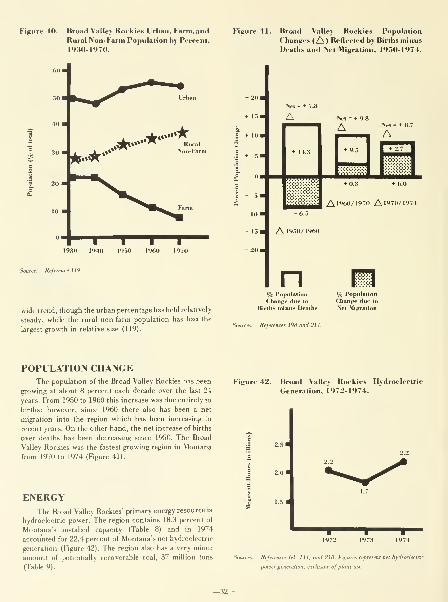
Figure tO. Broad Valley Rockies Urban, Farm, andRural iNon-Farm Population by Percent,
1930-1970.
*.•"...•••*••*'
..»«»1
RuralINon-Farm
I I I I930 1940 1950 1960 1970
Source: Reference 119.
wide trend, though the urban percentage has held relatively
steady, while the rural non-farm population has had the
largest growth in relative size (119).
Figure 41. Broad Valley Rockies Population
Changes (C^) Reflected by Births minusDeaths and Net Migration, 1950-1974.
+ 2oa
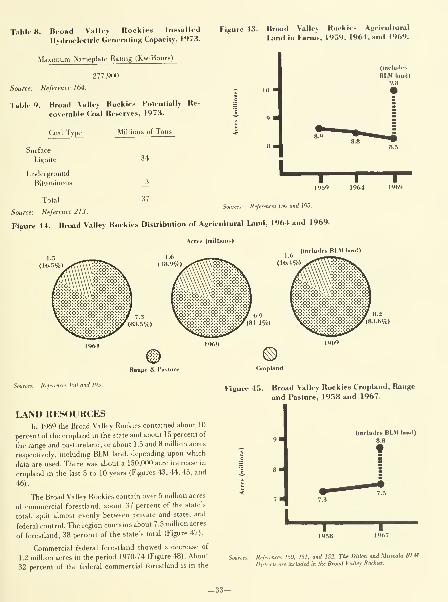
Table 8. Broad Valley Rockies InslalleH
Hydroelectric Generating Capacity, 1973.
Maximum Naineplate Rating (Kw-Hours)
277,900
Source: Reference 164.
Table 9. Broad Valley Rockies Potentially Re-
coverable Coal Reserves, 1973.
Figure 13. Broad Valley Rockies Agricultural
Ijind in Farms, 19.'i9, 1964, and 1969.
(include.
BI.M land)
9.8
•
Coal Type
Surface
Lignite
Underground
Bituminous
Millions of Tons
1964
References 150 and 195.Total i'
Source: Reference 213.
Figure 44. Broad Valley Rockies Distribution of Agricultural Land, 1964 and 1969.
Arrfs (millions)
(includes BLM land)
(16.
Range & Pasture
Sources: References 150 and 195.
LAND RESOURCESIn 1969 the Broad Valley Rockies contained about 10
percent of the cropland in the state and about 15 percent of
the range and pastureland, or about 1.5 and 8 million acres
respectively, including BLM land, depending upon which
data are used. There was about a 150,000 acre increase in
cropland in the last 5 to 10 years (Figures 43, 44, 45, and
46).
The Broad Valley Rockies contain over 5 million acres
of commercial forestland, about 37 percent of the state's
total, split almost evenly between private and state, and
federal control. The region contains about 7.5 million acres
of forestland, 38 percent of the state's total (Figure 47).
Commercial federal forestland showed a decrease of
1.2 million acres in the period 1970-74 (Figure 48). About
32 percent of the federal commercial forestland is in the
Cropland
Figure 45. Broad Valley Rockies Cropland. Range
and Pasture, 1958 and 1967.
rludes BLM land)
8.8
fi
I I1958 1967
References 150. 151. and 152. The Dillon and Missoula BLMDistncLi are included in the Broad Valley Rockies.

Figure 46. Broad Valley Rockies Dislribulion of Cropland. Pasture and Range, 1958 and 196'
Acres (millions)
,2 1.4 IX (includes BLM land)
Range & Pasture Cropland
Sources: References 150. 151. and 152.
Figure 47. Broad Valley Rockies Private and Slate Figure 48. Broad Valley Rockies Federal Forest-
Forestland, 1958 and 1967.
Acres (millions)
Total = 3.03
Commercial Non-Commercial
Sources: References 151. 152. and 153.
Broad Valley Rockies. The region contains about 43 percent
of Montana's private and state commercial forestland.
The Broad Valley Rockies contain about one-quarter of
all wildlands in Montana (76) . These include many roadless
areas and areas under study for inclusion in the National
Wilderness Preservation System as well as three areas
already included in the system: the Anaconda-Pintlar and
Gates of the Mountains wildernesses and the HumbugSpires Primitive Area. The Red Rock Lakes are being
proposed for Wilderness status by the U.S. F'ish and Wild-
life Service and the Centennial Mountains are proposed for
Primitive status by the Bureau of Land Management (Table
10).
land. 1970 and 1974.
Acres (millions)
Total = +.60
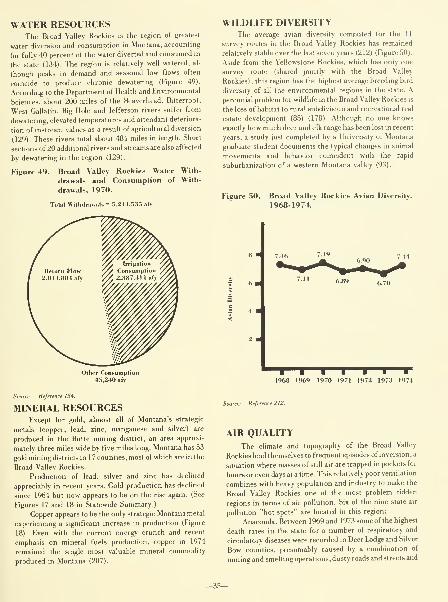
WATER RESOURCESThe Broad Valley Rockies is the region of greatest
water diversion and consumption in Montana, accounting
for fully 40 percent of the water diverted and consumed in
the state (134). The region is relatively well watered, al-
though peaks in demand and seasonal low flows often
coincide to produce chronic dewatering (Figure 49).
According to the Department of Health and Environmental
Sciences, about 200 miles of the Beaverhead, Bitterroot,
West Gallatin, Big Hole and Jefferson rivers suffer from
dewatering, elevated temperatures and attendant deteriora-
tion of instream values as a result of agricultural diversion
(129). These rivers total about 484 miles in length. Short
sections of 20 additional rivers and streams are also affected
by dewatering in the region (129).
Figure 49. Broad Valley Rockies Water With-
drawals and Consumption of With-
drawals, 1970.
Total Withdrawals = 5.2 4-t,535 afy
Other Consumption45,240 afy
Source: Reference 134.
MINERAL RESOURCESExcept for gold, almost all of Montana's strategic
metals (copper, lead, zinc, manganese and silver) are
produced in the Butte mining district, an area approxi-
mately three miles wide by five miles long. Montana has 53
gold mining districts in 17 counties, most of which are in the
Broad Valley Rockies.
Production of lead, silver and zinc has declined
appreciably in recent years. Gold production has declined
since 1964 but now appears to be on the rise again. (See
Figures 17 and 18 in Statewide Summary.)
Copper appears to be the only strategic Montana metal
experiencing a significant increase in production (Figure
18). Even with the current energy crunch and recent
emphasis on mineral fuels production, copper in 1974
remained the single most valuable mineral commodity
produced in Montana (207).
WILDLIFE DIVERSITYThe average avian diversity computed for the 11
survey routes in the Broad Valley Rockies has remained
relatively stable over the last seven years (212) (Figure 50).
Aside from the Yellowstone Rockies, which has only one
survey route (shared jointly with the Broad Valley
Rockies), this region has the highest average breeding bird
diversity of all the environmental regions in the state. A
perennial problem for wildlife in the Broad Valley Rockies is
the loss of habitat to rural subdivision and recreational real
estate development (85) (178). Although no one knows
exactly how much deer and elk range has been lost in recent
years, a study just completed by a University of Montana
graduate student documents the typical changes in animal
movements and behavior coincident with the rapid
suburbanization of a western Montana valley (93).
Figii Broad Valley Rockies Avian Diversity,
1968-1974.
5c.5 4
1968 1969 1970 1971 1972 1973 1974
Source: Reference 212.
AIR QUALITYThe climate and topography of the Broad Valley
Rockies lend themselves to frequent episodes of inversion, a
situation where masses of still air are trapped in pockets for
hours or even days at a time. This relatively poor ventilation
combines with heavy population and industry to make the
Broad Valley Rockies one of the most problem ridden
regions in terms of air pollution. Six of the nine state air
pollution "hot spots" are located in this region:
Anaconda. Between 1969 and 1973 some of the highest
death rates in the state for a number of respiratory and
circulatory diseases were recorded in Deer Lodge and Silver
Bow counties, presumably caused by a combination of
mining and smelting operations, dusty roads and streets and
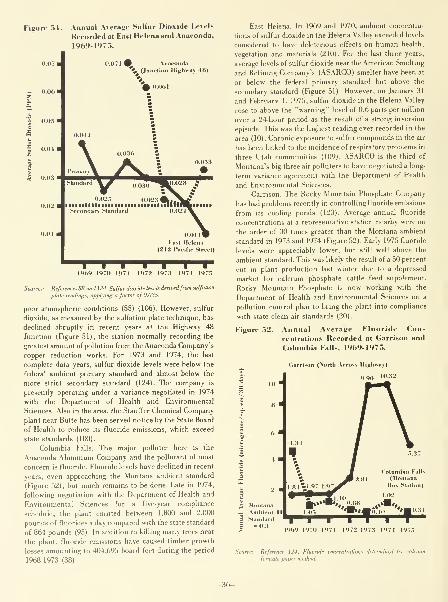
Figure 51. Annual Average Sulfur Dioxide Levels
Recorded at East Helena and Anaconda.
1969-1975.
0.071 4^ Anaconda
\ (Jun.lion Highway 48)
969 1970 1971 1972 1973 1974 1975
Sources: References 88 and 124. Sulfur dioxide lei-els deniedfrom sulfation
plate readings, applying a factor of 0.035.
poor atmospheric conditions (55) (106). However, sulfur
dioxide, as measured by the sulfation plate technique, has
declined abruptly in recent years at the Highway 48
Junction (Figure 51), the station normally recording the
greatest amount of pollution from the Anaconda Company's
copper reduction works. For 1973 and 1974, the last
complete data years, sulfur dioxide levels were below the
federal ambient primary standard and almost below the
more strict secondary standard (124). The company is
presently operating under a variance negotiated in 1974
with the Department of Health and Environmental
Sciences. Also in the area, the Stauffer Chemical Company
plant near Butte has been served notice by the State Board
of Health to reduce its fluoride emissions, which exceed
state standards (100).
Columbia Falls. The major polluter here is the
Anaconda Aluminum Company and the pollutant of most
concern is fluoride. Fluoride levels have declined in recent
years, even approaching the Montana ambient standard
(Figure 52), but much remains to be done. Late in 1974,
following negotiation with the Department of Health and
Environmental Sciences for a five-year compliance
schedule, the plant emitted between 1,800 and 2,000
pounds of fluorides a day compared with the state standard
of 864 pounds (95). In addition to killing many trees near
the plant, fluoride emissions have caused timber growth
losses amounting to 404,695 board feet during the period
1968-1973 (38).
East Helena. In 1%9 and 1970, ambient concentra-
tions of sulfur dioxide in the Helena Valley exceeded levels
considered to have deleterious effects on human health,
vegetation and materials (210). For the last three years,
average levels of sulfur dioxide near the American Smelting
and Refining Company's (ASARCO) smelter have been at
or below the federal primary standard but above the
secondary standard (Figure 51). However, on January 31
and February 1, 1975, sulfur dioxide in the Helena Valley
rose to above the "warning" level of 0.6 parts per million
over a 24-hour period as the result of a strong inversion
episode. This was the highest reading ever recorded in the
area (10) . Chronic exposure to sulfur compounds in the air
has been linked to the incidence of respiratory problems in
three Utah communities (109). ASARCO is the third of
Montana's big three air polluters to have negotiated a long-
term variance agreement with the Department of Health
and Environmental Sciences.
Garrison. The Rocky Mountain Phosphate Company
has had problems recently in controlling fluoride emissions
from its cooling ponds (123). Average annual fluoride
concentrations at a representative station nearby were on
the order of 30 times greater than the Montana ambient
standard in 1973 and 1974 (Figure 52). Early 1975 nuoride
levels were appreciably lower, but still well above the
ambient standard. This was likely the result of a 50 percent
cut in plant production last winter due to a depressed
market for calcium phosphate cattle feed supplement.
Rocky Mountain Phosphate is now working with the
Department of Health and Environmental Sciences on a
pollution control plan to bring the plant into compliance
with state clean air standards (20).
Figure 52. .Annual Average Fluoride Con-
centralions Recorded at Garrison and
Columbia Falls. 1969-1975.
Garrison (!\orlh Across Highway)
Monlan<
Am hie n
Slanilar.
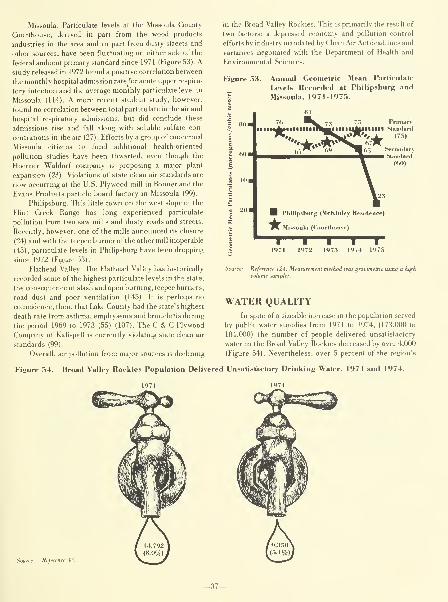
Missoula. Particulate levels at the Missoula County
Courthouse, derived in part from the wood products
industries in the area and in part from dusty streets and
other sources, have been fluctuating on either side of the
federal ambient primary standard since 1971 (Figure 53). A
study released in 1972 found a positive correlation between
the monthly hospital admission rate for acute upper respira-
tory infection and the average monthly particulate level in
Missoula (114). A more recent student study, however,
found no correlation between total particulate in the air and
hospital respiratory admissions, but did conclude these
admissions rise and fall along with soluble sulfate con-
centrations in the air (27) . Efforts by a group of concerned
Missoula citizens to fund additional health-oriented
pollution studies have been thwarted, even though the
Hoerner Waldorf company is proposing a major plant
expansion (23). Violations of state clean air standards are
now occurring at the U.S. Plywood mill in Bonner and the
Evans Products particle board factory in Missoula (99).
Philipsburg. This little town on the west slope of the
Flint Creek Range has long experienced particulate
pollution from two saw mills and dusty roads and streets.
Recently, however, one of the mills announced its closure
(24) and with the teepee burner of the other mill inoperable
(43), particulate levels in Philipsburg have been dropping
since 1972 (Figure 53).
Flathead Valley. The Flathead Valley has historically
recorded some of the highest particulate levels in the state,
the consequence of slash and open burning, teepee burners,
road dust and poor ventilation (145). It is perhaps no
coincidence, then, that Lake County had the state's highest
death rate from asthma, emphysema and bronchitis during
the period 1%9 to 1973 (55) (107). The C & C Plywood
Company of Kalispell is currently violating state clean air
standards (99).
Overall, air pollution from major sources is declining
in the Broad Valley Rockies. This is primarily the result of
two factors: a depressed economy and pollution control
efforts by industry mandated by Clean Air Act deadlines and
variances negotiated with the Department of Health and
Environmental Sciences.
Figure 53. Annual Geometric Mean Particulate
I^evels Recorded at Philipsburg and
I Missoula, 1971-1975.
Reference 124. Measun
volume sampler.
ising a high
WATER QUALITYIn spite of a sizeable increase in the population served
by public water supplies from 1971 to 1974, (173,000 to
184,000) the number of people delivered unsatisfactory
water in the Broad Valley Rockies decreased by over 4,000
(Figure 54). Nevertheless, over 5 percent of the region's
Figure 54. Broad Valley Rockies Population Delivered Unsatisfactory Drinking Water, 1971 and 1974.
Reference 47.

population was delivered unsatisfactory water (by bacterio-
logical standards) in 1974 (47).
The Broad Valley Rockies have the greatest number of
stream miles in the state known to be degraded by either
point or non-point pollution sources (Figure 55). The
region has several major municipal dischargers plus three of
the state's prinicpal industrial water polluters: American
Smelting and Refining Company, Anaconda Company, and
Hoerner Waldorf Corporation. Much of the non-point
source pollution in the region comes from sediment,
dewatering and elevated water temperatures, and nutrients
derived from agriculture, logging, mineral exploration and
extraction (36) (129). In addition to the extensive non-
point source pollution there is a loss of fish habitat in many
of the region's streams: a 1973 Department of Fish and
Game study of 160 miles of six quality fishing streams in the
Broad Valley Rockies revealed that 24 miles of streambed
were recently altered with dragline or bulldozer and
artificial shoreline alterations were accomplished on 44
additional miles (116). Water quality degradation in the
Bitterroot drainage recently was reported to be primarily
"the result of activities in the valley and not in the (upper)
watershed" (182).
Figure 55. Broad Valley Rockies Point and Non-
Point Source Stream Degradation,
1975.
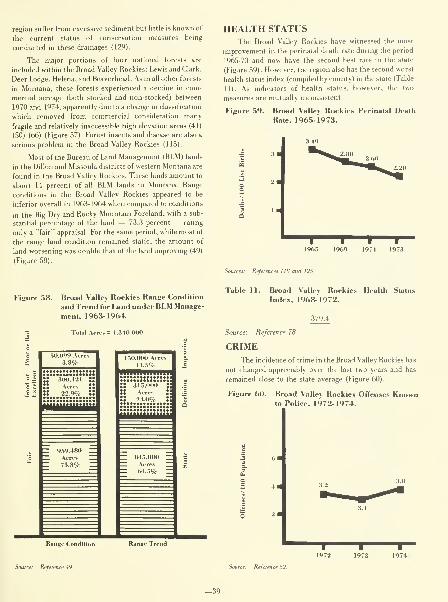
region suffer from excessive sediment but little is known of
the current status of conservation measures being
conducted in these drainages (129).
The major portions of four national forests are
included within the Broad Valley Rockies: Lewis and Clark,
Deer Lodge, Helena, and Beaverhead. As in all other forests
in Montana, these forests experienced a decline in com-
mercial acreage (both stocked and non-stocked) between
1970 and 1974, apparently due to a change in classification
which removed from commercial consideration many
fragile and relatively inaccessible high elevation areas (41)
(50) (66) (Figure 57). Forest insects and disease are also a
serious problem in the Broad Valley Rockies (115).
Most of the Bureau of Land Management (BLM) lands
in the Dillon and Missoula districts of western Montana are
found in the Broad Valley Rockies. These lands amount to
about 14 percent of ail BLM lands in Montana. Range
conditions in the Broad Valley Rockies appeared to be
inferior overall in 196.3-1964 when compared to conditions
in the Big Dry and Rocky Mountain Foreland, with a sub-
stantial percentage of the land — 73.3 percent — rating
only a "fair" appraisal. For the same period, while most of
the range land condition remained static, the amount of
land worsening was double that of the land improving (49)
(Figure 58)
.
HEALTH STATUSThe Broad Valley Rockies have witnessed the most
improvement in the perinatal death rate during the period
1965-73 and now have the second best rate in the state
(Figure 59) . However, the region also has the second worst
health status index (compiled by county) in the state (Table
11). As indicators of health status, however, the two
measures are mutually inconsistent.
Figure 59. Broad VaUey Rockies Perinatal Death
Rate, 1965-1973.
References 118 and 125.
Broad Valley Rockies Range Condition
and Trend for Land under BLM Manage-
ment. 1963-1964.
Table 11. Broad Valley Rockies Health Status
Index. 1968-1972.
Total Acres = 1,310,000
i
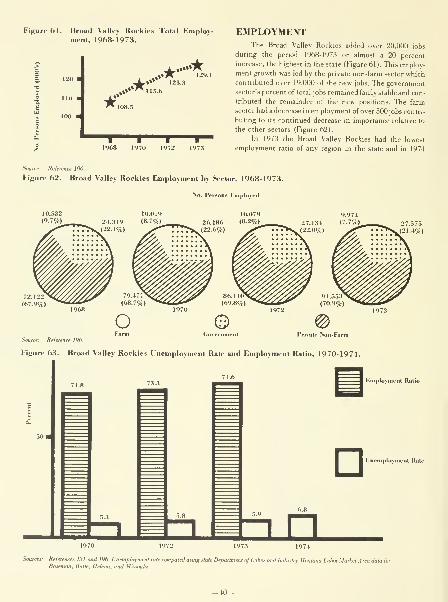
Figure 61. Broad Valley Rockies Total Employ-ment, 1968-1973.
20 1
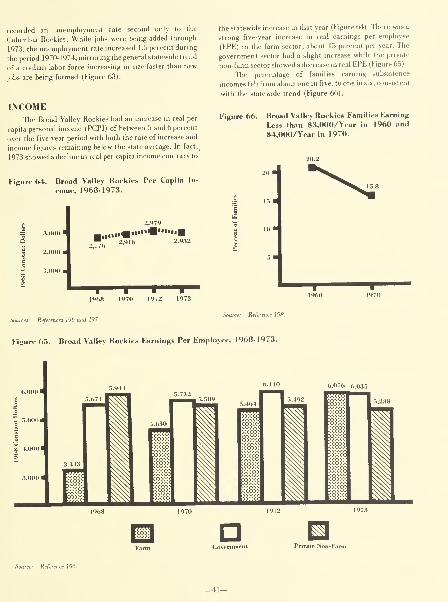
recorded an unemployment rate second only to the
Columbia Rockies. While jobs were being added through
1973, the unemployment rate increased 1.5 percent during
the period 1970-1974, mirroring the general statewide trend
of a civilian labor force increasing in size faster than new
jobs are being formed (Figure 63).
INCOMEThe Broad Vallev
capita personal incom(
over the five-year period with both the rate of increase and
income figures remaining below the state average. In fact,_
1973 showed a decline in real per capita income contrary to
Rockies had an increase in real per
(PCPI) of between 5 and 6 percent
Figure 64. Broad Valley Rockies Per Capita In-
come. 1968-1973.
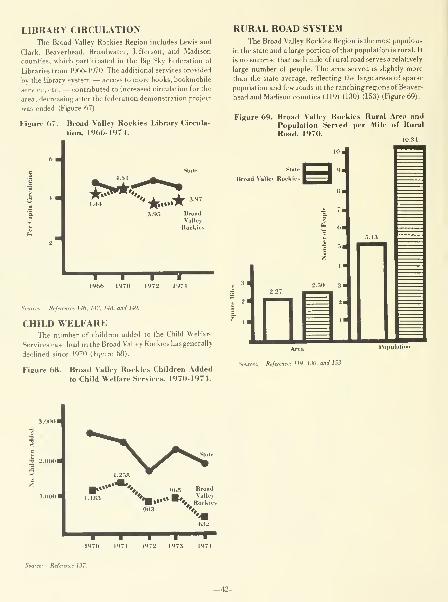
LIBRARY CIRCULATIONThe Broad Valley Rockies Region includes Lewis and
Clark, Beaverhead, Broadwater, Jefferson, and Madison
counties, which participated in the Big Sky Federation of
Libraries from 1966-1970. The additional services provided
by the library system — access to more books, bookmobile
service, etc. — contributed to increased circulation for the
area, decreasing after the federation demonstration project
was ended (Figure 67).
Figure 67. Broad Valley Rockies Library Circula-
tion, 1966-1974.
*•» k -^ 3.9T
3.95 Broad\alley
Rockies
1972 1974
Refe,
CHILD WELFAREThe number of children added to the Child Welfare
Services case load in the Broad Valley Rockies has generally
declined since 1970 (Figure 68).
Figure 68. Broad Valley Rockies Children Added
to Child Welfare Services, 1970-1974.
RURAL ROAD SYSTEMThe Broad Vallev Rockies Region is the most populous
in the state and a large portion of that population is rural. It
is no surprise that each mile of rural road servesa relatively
large number of people. The area served is slightly more
than the state average, reflecting the large areas of sparse
population and few roads in the ranching regions of Beaver-
head and Madison counties (119) (130) (153) (Figure 69).
Figure 69. Broad Valley Rockies Rural Area andPopulation Served per Mile of Rural
Road, 1970.
Stale
road Vallev Rockies
2.27

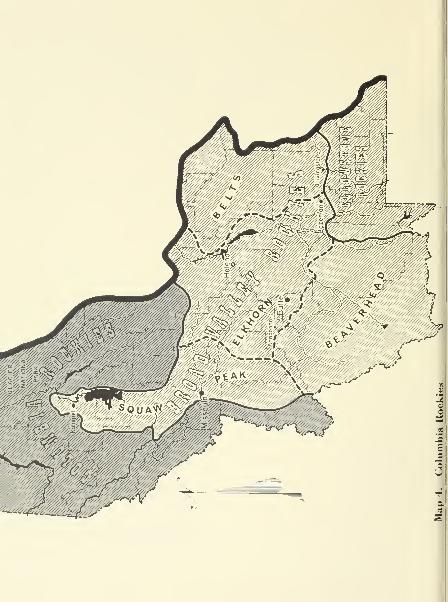
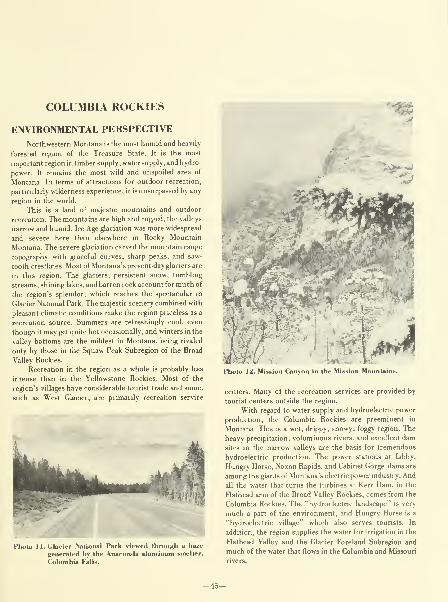
COLUMBIA ROCKIES ^ENVIRONMENTAL PERSPECTIVE
Northwestern Montana is the most humid and heavily
forested region of the Treasure State. It is the most
important region in timber supply, water supply, and hydro-
power. It remains the most wild and unspoiled area of
Montana. In terms of attractions for outdoor recreation,
particularly wilderness experience, it is unsurpassed by any
region in the world.
This is a land of majestic mountains and outdoor
recreation. The mountains are high and rugged, the valleys
narrow and humid. Ice Age glaciation was more widespread
and severe here than elsewhere in Rocky Mountain
Montana. The severe glaciation carved the mountain range
topography with graceful curves, sharp peaks, and saw-
tooth crestlines. Most of Montana's present-day glaciers are
in this region. The glaciers, persistent snow, tumbling
streams, shining lakes, and barren rock account for much of
the region's splendor, which reaches the spectacular in
Glacier National Park. The majestic scenery combined with
pleasant climatic conditions make the region priceless as a
recreation source. Summers are refreshingly cool, even
though it may get quite hot occasionally, and winters in the
valley bottoms are the mildest in Montana, being rivaled
only by those in the Squaw Peak Subregion of the Broad
Valley Rockies.
Recreation in the region as a whole is probably less
intense than in the Yellowstone Rockies. Most of the
region's villages have considerable tourist trade and some,
such as West Glacier, are primarily recreation service
Photo 11. Glacier National Park viewed through a haze
generated by the Anaconda aluminum smelter,
Columbia Falls.
Photo 12. Mission Canyon in the Mission Mountains.
centers. Many of the recreation services are provided by
tourist centers outside the region.
With regard to water supply and hydroelectric power
production, the Columbia Rockies are preeminent in
Montana. This is a wet, drippy, snowy, foggy region. The
heavy precipitation, voluminous rivers, and excellent dam
sites in the narrow valleys are the basis for tremendous
hydroelectric production. The power stations at Libby,
Hungry Horse, Noxon Rapids, and Cabinet Gorge dams are
among the giants of Montana's electric power industry. And
all the water that turns the turbines at Kerr Dam, in the
Flathead arm of the Broad Valley Rockies, comes from the
Columbia Rockies. The "hydroelectric landscape" is very
much a part of the environment, and Hungry Horse is a
"hydroelectric village" which also serves tourists. In
addition, the region supplies the water for irrigation in the
Flathead Valley and the Glacier Foreland Subregion and
much of the water that flows in the Columbia and Missouri

Forests, logging, and sawmills are an integral part of
the environment of the Columbia Rockies. The vegetation,
named the Columbia Forest, is one of the most luxuriant
coniferous forests in the world. The deep green of the
seemingly endless forest contributes much to the region. In
addition to all of the species mentioned in the Rocky
Mountain Douglas-fir Forest, the Columbia Forest contains
western red cedar, western hemlock, grand fir, western
white pine, and western larch — all forest giants — in the
montane zone and mountain hemlock and alpine larch in
the subalpine zone. The tall trees of the Columbia Forest are
the basis of the important logging and wood processing
industries of the region.
The piercing whine of chain saws, roar of logging
trucks, clatter of sawmills, and smell of sawdust are a
characteristic overlay to the environment. Many logs are
hauled out of this region for processing in the Broad Valley
Rockies or in Idaho. But wood processing is the major —and virtually the only — manufacturing industry in the
Columbia Rockies. Libby, largest town in the region, is the
principal wood products center. Other sawmill towns
include Eureka, Thompson Falls, Plains, Troy, and
Superior.
Photo 13. Sawmill at Thompson Falls.
inhabitants, towns, and transportation corridors are
concentrated in linear strips in the narrow valley bottoms.
Consequently, population is rather dense in the settled
areas, where the whine of freightliner tires, whistle of
trains, smell of diesel exhaust and the hum of power lines
are a part of everyday life. One does not have the impression
of living in, or travelling through, a largely empty land.
Nevertheless, the immense mountain ranges separat-
ing these bands of settlement are areas of emptiness almost
entirely enclosed in national forests. And they encompass
most of Montana's wilderness and other wildlands. As a
result, the Columbia Rockies Region constitutes one of the
cleanest and least spoiled environments in Montana. Only
logging, lakeshore cabins, and mining cause much
modification of the natural environment. Progressive
elimination of teepee burners and control of erosion from
logging have probably reduced the impact of the wood
processing industry on air and water quality. The result is
generally clean air, relatively clear water, and a largely
unscarred land.
POPULATION SIZE AND DENSITY
The Columbia Rockies had the greatest percentage
increase in population of any region during the 1950-1974
period — 60 percent — most of which occurred prior to
1970. Since 1970 the region's population has remained
stable but recent indications are it is declining (9) (Figure
70).
Most of the pre-1970 population spurt occurred in
Lincoln County, which was caused by the construction
force and derivative personnel at Libby Dam. Between 1970
and 1974, Lincoln County lost more residents than any
other county in the state — 1,500 or 5.9 percent (9). Figure
71 provides data on population density in the Columbia
Rockies.
Figure 70. Columbia Rockies Population, 1950-
1974.
The only noteworthy mineral extraction in the
Columbia Rockies is vermiculite mining near Libby. This
activity nevertheless makes Lincoln County the second
most important in Rocky Mountain Montana in dollar value
of mineral production.
Inhabitants are few, towns small, and com-
munications corridors widely spaced in the Columbia
Rockies. None of the economic activities of the region —logging, sawmilling, recreation, hydroelectric power pro-
duction, and water supply — supports much population.
The valleys are too narrow to afford much space for
farming, and the forests are too dense to offer much grazing.
As a result, agriculture is unimportant. The region as a
whole remains sparsely populated. It is accessible in the
sense that it is traversed by three main rail lines. Interstate
90, and three other important highways. Virtually all of the
'"»»,|
y^»•*"»* 22.454
r5l
Sources: Refei 198.216, and 217.
-46—
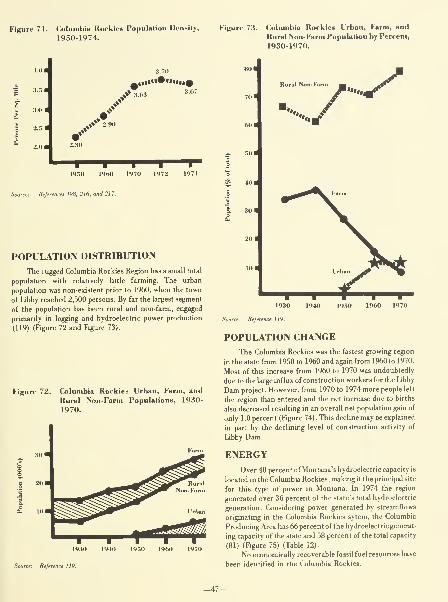
Figure 71. Columbia Rockies Population Density, Figure 73. Columbia Rockies Urban, Farm, and
1950-1974. Rural Non-Farm Population by Percent,
1930-1970.
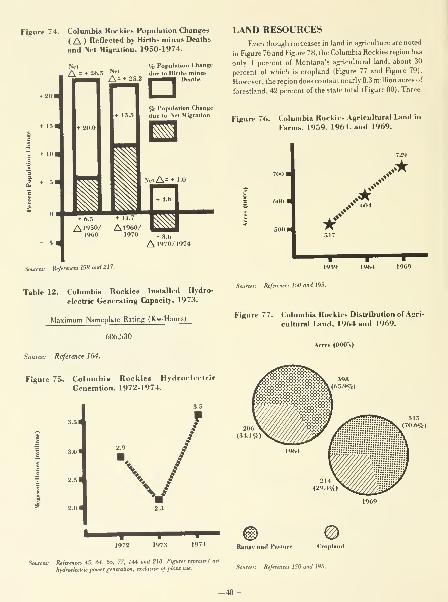
Figure 74. Columbia Rockies Populalion Changes
(A ) Reflected by Births minus Deaths
and Net Migration, 1950-1974.
% Population Change
26.5 '^^' due to Births minusA= + 25.2 VHB^ Deaths
-3.6
A 1970/ 1974
LAND RESOURCESEven though increases in land in agriculture are noted
in Figure 76 and Figure 78, the Columbia Rockies region has
only 1 percent of Montana's agricultural land, about 30
percent of which is cropland (Figure 77 and Figure 79).
However, the region does contain nearly 8.3 million acres of
forestland, 42 percent of the state total (Figure 80). Three-
Figure 76. Columbia Rockies Agricultural Land in
Farms. 1959, 1964, and 1969.
700
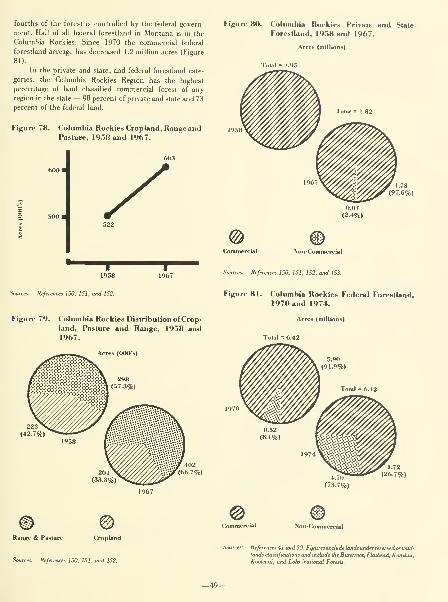
fourths of the forest is controlled by the federal govern-
ment. Half of all federal forestland in Montana is in the
Columbia Rockies. Since 1970 the commercial federal
forestland acreage has decreased 1.2 million acres (Figure
81).
In the private and state, and federal forestland cate-
gories, the G)lumbia Rockies Region has the highest
percentage of land classified commercial forest of any
region in the state — 98 percent of private and state and 73
percent of the federal land.
Figure 7} Columbia Rockies Cropland, Range andPasture, 1958 and 1967.
Refe,
1958
150, 151. and 152.
Figure 80. Columbia Rockies Private and State
Forestland, 19.58 and 1967.
Acres (million)*)
©Refe,
Non-Commercial
150. 151, 152, and 153.
Figure 81. Columbia Rockies Federal Forestland,
1970 and 1974.
Figure 79. Columbia Rockies Distribution ofCrop-land, Pasture and Range, 1958 and1967.
(42.7%)
@INon-Commercial
Range & Pasture Cropland
Sources: References 150, 151, and 152.
Sources: References 41 and 50. Figures exclude lands under reserved or wUd-lands classifications and include the BtUerroot, Flathead, Kaniksu.
Kootenai, and Lolo National Forests.
-49—

The Columbia Rockies contain about half of all the
wildlands in Montana, most of which are included in the
seven classified or proposed wilderness areas: the Bob
Marshall, Cabinet Mountains, Selway-Bitterroot, Scape-
goat and Mission Mountains wilderness areas and the
proposed Great Bear and Glacier wilderness areas. The
region includes no primitive areas but does include about
2.5 million acres of roadless and new study areas (76) (Table
13).
(26,040,000 afy) exits the state through the Columbia
Rockies via the Clark Fork and Kootenai rivers, yet the
region accounts for only 3 percent of all withdrawals in the
state, about half of which are consumed ( 134) (Figure 82)
.
Instream uses, particularly hydroelectric power generation,
are much more important than agricultural water use in the
Columbia Rockies.
Table 13. Columbia Rockies Wildlands, 1975.
Classification Acres
Wilderness
Proposed Wilderness
Primitive
Proposed Primitive
New Study Areas
Proposed New Study Areas
Roadless Areas (USFS)
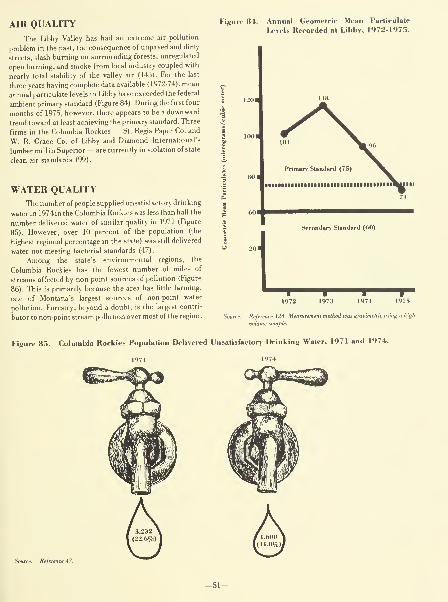
AIR QUALITY
The Libby Valley has had an extreme air pollution
problem in the past, the consequence of unpaved and dirty
streets, slash burning on surrounding forests, unregulated
open burning, and smoke from local industry coupled with
nearly total stability of the valley air (145). For the last
three years having complete data available (1972-74), mean
annual particulate levels in Libby have exceeded the federal
ambient primary standard (Figure 84) . During the first four
months of 1975, however, there appears to be a downward
trend toward at least achieving the primary standard. Three
firms in the Columbia Rockies — St. Regis Paper Co. and
W. R. Grace Co. of Libby and Diamond International's
lumber mill in Superior— are currently in violation of state
clean air standards (99).
WATER QUALITYThe number of people supplied unsatisfactory drinking
water in 1974 in the Columbia Rockies was less than half the
number delivered water of similar quality in 1971 (Figure
85). However, over 10 percent of the population (the
highest regional percentage in the state) was still delivered
water not meeting bacterial standards (47).
Among the state's environmental regions, the
Columbia Rockies has the fewest number of miles of
streams affected by non-point sources of pollution (Figure
86). This is primarily because the area has httle farming,
one of Montana's largest sources of non-point water
pollution. Forestry, beyond a doubt, is the largest contri-
butor to non-point stream pollution over most of the region.
Figure 84. Annual Geomelrio Mean Particulate
Levels Recorded at Libby, 1972-1975.
1201

In fact, the Flathead National Forest has been placed in a
"high risk" category for water pollution, resulting from
past timber harvesting practices and road construction
activities (37). In addition, Libby Dam is causing serious
nitrogen super-saturation problems in the Kootenai River,
and industrial discharges of phosphorus from Canada are
accelerating eutrophication in Lake Koocanusa behind
Libby Dam.
Figure 86. Columbia Rockies Point and Non-Point
Source Stream Degradation, 1975.
3.000
1
t
"o 2,000
Regi<
158 M:i .T>on-Poinl Souries Point Sources
Source: Reference 129.
LAND QUALITY
Most private and state agricultural land in the
Columbia Rockies is classified as forestland. Over 90
percent of this land needed timber establishment and
reinforcement and/or timber stand improvement in 1967
(153) (Figure 87). More recently, reports have been
received indicating poor timber-harvesting practices in the
Bitterroot West Fork drainage in the southern part of the
region and in the Fisher River drainage in the northern
portion (44) (182).
The acreage of non-stocked commercial forest in the
Columbia Rockies declined appreciably between 1970 and
1974, as did the total acreage of commercial forestland (41)
(66) (Figure 88) . It is not clear, however, how much of this
decline in non-stocked acreage was due to reforestation and
how much was due to a change in classification, which
excluded many high elevation areas from commercial
consideration. Insects and disease have seriously affected
timber production over much of the Columbia Rockies
(115) and fluorides from the Anaconda aluminum smelter
at Columbia Falls have significantly reduced lodgepole pine
growth downwind from the plant (38). Oil and gas
exploration contemplated for the Flathead National Forest
could result in reduction of the timber resource base (184)
(192). The Columbia Rockies Region contains the major
parts of four national forests: Kootenai, Flathead, Lolo and
Bitterroot. These constitute well over half the com-
mercially forested acreage in Montana.
Figure 87. Columbia Rockies Private and Sute
Agricultural and Forestland Requiring
Conservation Treatment, 1967.
With only a handful of small municipal dischargers
and one major industrial discharger (St. Regis Paper
Company in Libby), no streams are currently degraded by
point sources (129) (166) . However, a new mineral develop-
ment near Troy (3) (189), a proposed coal mine on Cabin
Creek, a tributary of the Flathead River in British Columbia
(5) (174) , and possible oil and gas exploration and develop-
ment on the Flathead National Forest (179) (192) could
pose serious water quality problems for streams in the
Columbia Rockies, as well as other major environmental
and social problems. Water quality impacts in the Flathead
drainage resulting from these and other proposed land uses
in the Columbia Rockies will be addressed by the Flathead
208 Project, a regional planning organization recently
organized under Section 208 of the 1972 Federal Water
Pollution Control Act Amendments and funded by the
Environmental Protection Agency. A more specific study of
hydrologic impacts from the Cabin Creek coal development
is underway as authorized by House Bill 622 of the 1975
Montana Legislature. •''o"'^'"'' ''</«'
Cropland Range Forest- Forestland
& land Grazed
Pasture
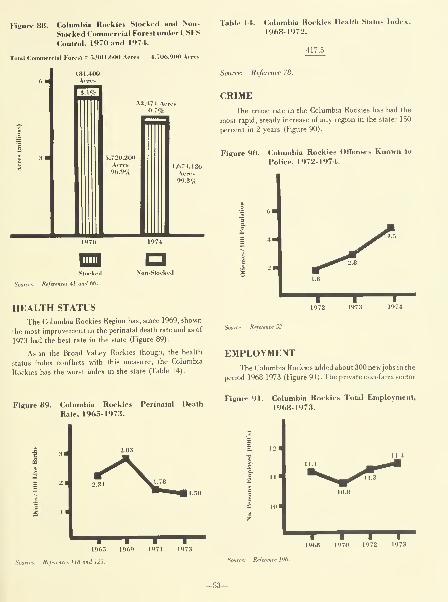
Figure Columbia Rockies Stocked and Non-
Slocked Commercial Foresl under USFS
Control, 1970 and 1974.
iai KoresI = 5.901.600 Acres t.706,900 Acres
Slocked
References 41 and 66.
Non-Slocked
HEALTH STATUSThe Columbia Rockies Region has, since 1969, shown
the most improvement in the perinatal death rate and as of
1973 had the best rate in the state (Figure 89).
As in the Broad Valley Rockies though, the health
status index conflicts with this measure; the Columbia
Rockies has the worst index in the state (Table 14).
Table 14. Columbia Rockies Health Status Index,
1968-1972.
417.5
Source: Reference 78.
CRIME
The crime rate in the Columbia Rockies has had the
most rapid, steady increase of any region in the state: 150
percent in 2 years (Figure 90).
Figure 90. Columbia Rockies Offenses Known to
Police, 1972-1974.
2"<
ie
O
I I1972 1973 1974
Source: Refei
EMPLOYMENTThe Columbia Rockies added about 300 new jobs in the
period 1968-1973 (Figure 91). The private non-farm sector
Figure 89. Columbia Rockies Perinatal Death
Rate, 1965-1973.
1965 1969 1971 1973
Figure 91. Columbia Rockies Total Employment,
1968-1973.
IH
I I1968 1970 1972 1973
Sources: References 1 1 8 and 125
.
Source: Reference 196.
-53—
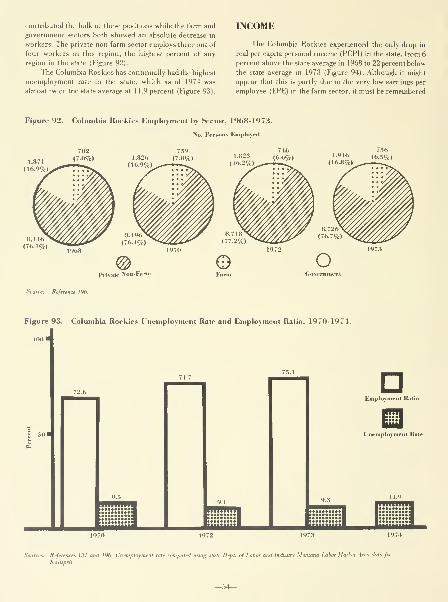
contributed the bulk of these positions while the farm and
government sectors both showed an absolute decrease in
workers. The private non-farm sector employs three out of
four workers in this region, the highest percent of any
region in the state (Figure 92)
.
The Columbia Rockies has continually had the highest
unemployment rate in the state, which as of 1974 was
almost twice the state average at 11.9 percent (Figure 93).
INCOME
The Columbia Rockies experienced the only drop in
real per capita personal income (PCPI) in the state, from 6
percent above the state average in 1968 to 22 percent below
the state average in 1973 (Figure 94). Although it might
appear that this is partly due to the very low earnings per
employee (EPE) in the farm sector, it must be remembered
Figure 92. Columbia Rookies Employment by Sector, 1968-1973.
No. Persons Employed
782(7.0%)
7591,826 (7.0%)
(16.9%)
7461.823 (6.6%)
(16.2%)^
7.361-916 (6.5%)
(16.8%)
Private Non-Farm
Source: Reference 196.
Figure 93. Columbia Rockies Unemployment Rate and Employment Ratio. 1970-1974.
1001
ittiii
aEmployment Ralii
Inemployment Rale
Sources: References 131 and 196. Vnemploymenl rate computed using state Dept. of l.i
Katispell.
id Industry Montana Labor .Market .Irea data for
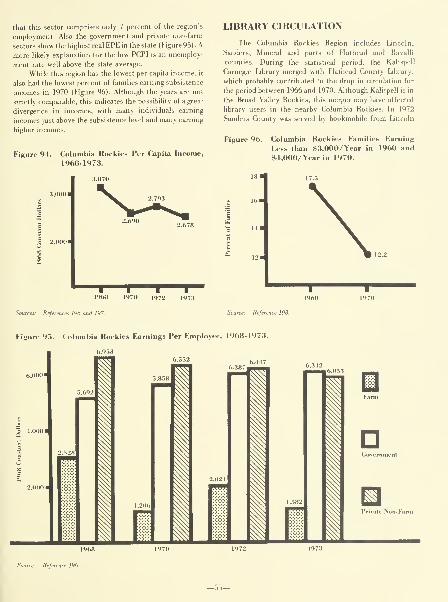
that this sector comprises only 7 percent of the region's
employment. Also the government and private non-farm
sectors show the highest real EPE in the state (Figure 95) . A
more likely explanation for the low PCPI is an unemploy-
ment rate well above the state average.
While this region has the lowest per capita income, it
also had the lowest percent of families earning subsistence
incomes in 1970 (Figure %). Although the years are not
strictly comparable, this indicates the possibility of a great
divergence in incomes, with many individuals earning
incomes just above the subsistence level and many earning
higher incomes.
Figure 94. Columbia Rockies Per Capita Income,
1968-1973.
2,0001
CO
LIBRARY CIRCULATION
The (Columbia Rockies Region includes Lincoln,
Sanders, Mineral and parts of Hathead and Ravalli
counties. During the statistical period, the Kalispell
Carnegie Library merged with Flathead County Library,
which probably contributed to the drop in circulation for
the period between 1966 and 1970. Although Kalispell is in
the Broad Valley Rockies, this merger may have affected
library users in the nearby Columbia Rockies. In 1972
Sanders County was served by bookmobile from Lincoln
Figure 96. Columbia Rockies Families Earning
Less than S.3,000/ Year in 1960 and
$4,000/Year in 1970.
1968 1970 1972 1973
Sources: References 196 and 197
Figure 95. Columbia Rockies Earnings Per Employee, 1968-1973.
6.9,5.3
>..387hhh
^ 1
Government
Private Non-Farm
Source: Reference 196.
-55-
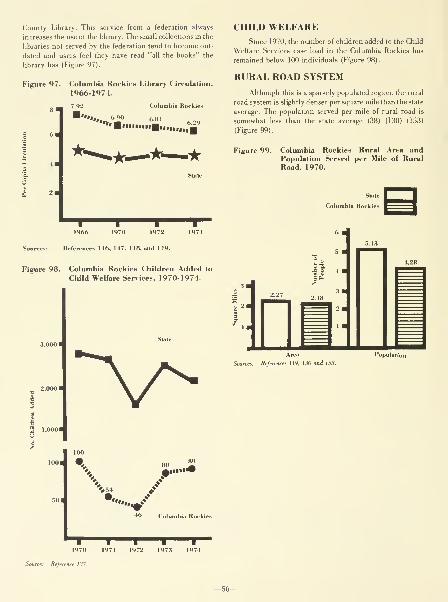
County Library. This service from a federation always
increases the use of the library. The small collections in the
libraries not served by the federation tend to become out-
dated and users feel they have read "all the books" the
library has (Figure 97).
Figure 97. Columbia Rockies Library Circulation.
1966-1974.
7.92 Columbia Rockies
"*'*»»». ^••*0 6 84
"">'B....„„.i: -^
^^^•^
1966 1970 1972 1974
Sources: References 146. 147, 148. and 149.
Figure 98. Columbia Rockies Children Added to
Child Welfare Services, 1970-1974.
CHILD WELFARESince 1970, the number of children added to the Child
Welfare Services case load in the Columbia Rockies has
remained below 100 individuals (Figure 98).
RURAL ROAD SYSTEM
Although this is a sparsely populated region, the rural
road system is slightly denser per square mile than the state
average. The population served per mile of rural road is
somewhat less than the state average (38) (130) (153)
(Figure 99).
Figure 99. Columbia Rockies Rural Area andPopulation Served per Mile of RuralRoad, 1970.
Suie
Columbia Rockie^
Area
Sources: References 119. 130 <
Population
100
""».>^'
Source: Refer
1970
ce 137.
-56-

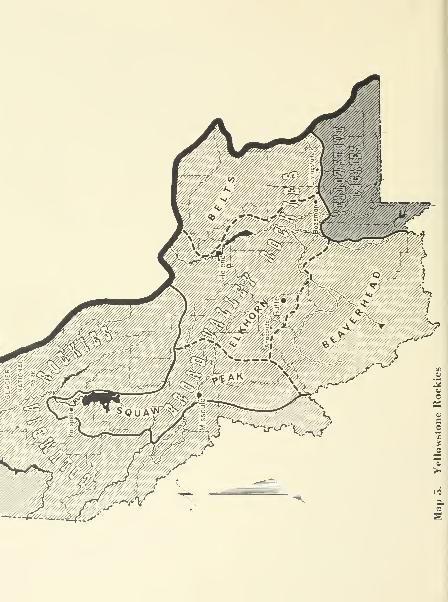
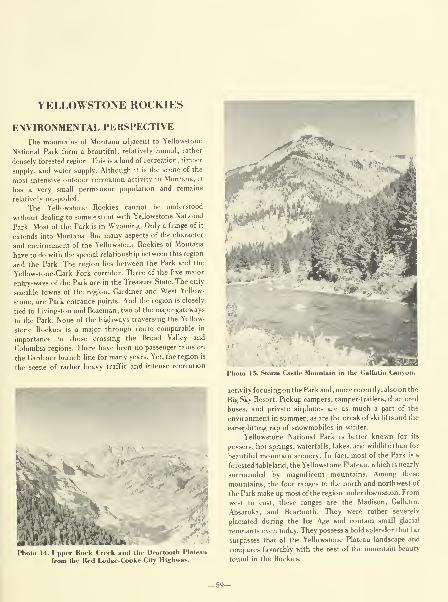
YELLOWSTONE ROCKIES
ENVIRONMENTAL PERSPECTIVE
The mountains of Montana adjacent to Yellowstone
National Park form a beautiful, relatively humid, rather
densely forested region. This is a land of recreation, timber
supply, and water supply. Although it is the scene of the
most intensive outdoor recreation activity in Montana, it
has a very small permanent population and remains
relatively unspoiled.
The Yellowstone Rockies cannot be understood
without dealing to some extent with Yellowstone National
Park. Most of the Park is in Wyoming. Only a fringe of it
extends into Montana. But many aspects of the character
and environment of the Yellowstone Rockies of Montana
have to do with the special relationship between this region
and the Park. The region hes between the Park and the
Yellowstone-Qark Fork corridor. Three of the five major
entry-ways of the Park are in the Treasure State. The only
sizeable towns of the region, Gardiner and West Yellow-
stone, are Park entrance points. And the region is closely
tied to Livingston and Bozeman, two of the major gateways
to the Park. None of the highways traversing the Yellow-
stone Rockies is a major through route comparable in
importance to those crossing the Broad Valley and
Columbia regions. There have been no passenger tains on
the Gardiner branch line for many years. Yet, the region is
the scene of rather heavy traffic and intense recreation
Photo 15. Storm CasUe Mountain in the Gallatin Cany

The mountain ranges themselves are largely
uninhabited, are almost entirely enclosed in national forest,
and embrace three primitive areas and muchde facto wilder-
ness. The only appreciable concentration of population
aside from Gardiner, West Yellowstone, and Big Sky is in
the Paradise Valley— broad, dry , irrigated and quite similar
to the main valleys of the Broad Valley Rockies. The con-
struction of Allenspur Dam (an idea of the Bureau of
Reclamation) would inundate much of this magnificent
valley. The other valleys of the Yellowstone Rockies are
narrow, mostly humid, and provide little room for farming
or settlement. Temperature conditions are similar to those
in the higher valleys of the Broad Valley Rockies.
The region is important in water supply but has very
little hydroelectric power development. The mountains are
more humid than the Broad Valley Rockies, less humid than
the Columbia Rockies. The Yellowstone River derives most
of its water from the Yellowstone Rockies of Montana and
the extension of this region in Wyoming. And the Missouri
River receives part of its water, via its tributaries the
Madison and Gallatin rivers, from this region. Some of the
water supplied by the Yellowstone Rockies is used for
irrigation and hydroelectric power production in the Broad
Valley Rockies and in Great Plains Montana.
The Yellowstone Rockies are within the Rocky
Mountain Douglas-fir Forest, the same forest type that
covers the Broad Valley Rockies. However, due to better
moisture conditions, the forests are somewhat more dense,
luxuriant, and productive than those of the Broad Valley
Region. The Yellowstone Rockies are important as a log
supply region but have only a very modest sawmilling
industry, confined to West Yellowstone. Most of the logs
are hauled out and processed in Livingston, Bozeman, and
Belgrade. The logging trucks add to the traffic from tourists.
The region has a long history of mining, but there is no
mining operation of any importance active today though
new projects are in formative phases. The impacts of
logging, ski center development, and former mining
activities account in the main for the scars on the mountain-
sides. The greatest modification of the natural environ-
fhirjp***
ment has resulted from construction and traffic along the
communications corridors and from irrigation and grazing
in the Paradise Valley. Nevertheless, compared to most of
Montana, the air is unusually clean and the water rather
high in quality.
ENERGY*
The Yellowstone Rockies contain very few of
Montana's energy resources: about 1 percent of its hydro-
electric capacity (Figure 100) (Table 15) and only 10
million tons of potentially recoverable coal reserves (Table
16).
100. Yellowstone Rockies Hydroelectric
Generation, 1972-1974.Figur
T1974
hydroelectric
1972 1973
Sources: References 64, 144, and 218. Figures repi
power generation, exclusive of plant use.
Table 15. Yellowstone Rockies Installed Hydro
electric Generating Capacity, 1973.
Maximum Nameplate Rating (Kw-Hours)
19,000
Source: Reference 164.
Table 16. Yellowstone Rockies Potentially Re
coverable Coal Reserves, 1973.
Coal Type
Surface
Subbituminous
Source: Reference 213.
Millions of Tons
• The absence of demographic and economic indicators for the
Yellowstone Rockies results from the lack of urban centers in
the region. Counties comprising the bulk of the Yellowstone
Rockies — Madison, Gallatin, Park, Sweet Grass, Stillwater and
Carbon — have most of their population and economic activity
outside the region and are considered in either the Broad Valley
Rockies or the Rocky Mountain Foreland. Population and
economic indicators for these counties are therefore
incorporated into one or the other of these adjacent regions.
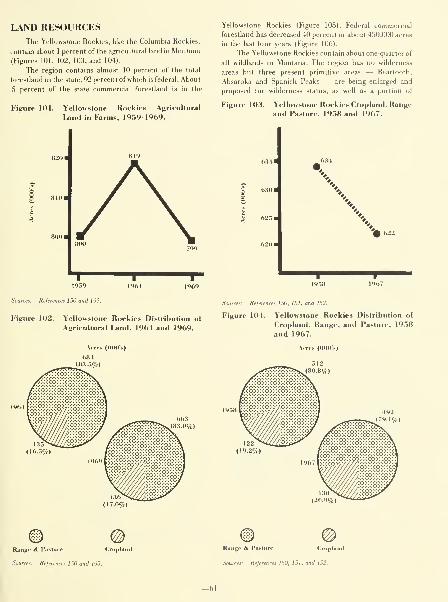
LAND RESOURCESThe Yellowstone Rockies, like the Columbia Rockies,
contain about 1 percent of the agricultural land in Montana
(Figures 101, 102, 103, and 104).
The region contains almost 10 percent of the total
forestland in the state, 92 percent of which is federal. About
5 percent of the state commercial forestland is in the
Fipiure 101. Yellowstone Rockies .Agricultural
Land in Farms, 1959-1969.
§ 8101
Yellowstone Rockies (Figure 105). Federal commercial
forestland has decreased 40 percent or about 450,000 acres
in the last four years (Figure 106).
The Yellowstone Rockies contain about one-quarter of
all wildlands in Montana. The region has no wilderness
areas but three present primitive areas — Beartooth,
Absaroka and Spanish Peaks — are being enlarged and
proposed for wilderness status, as well as a portion of
Fifjure lO.'i. Yellowstone Rockies Cropland, Rangeand Pasture, 1958 and 1967.

Figure 105. Yellowstone Rockies Private and State
Forestland, 1958 and 1967.
Yellowstone National Park lying in Montana. The Beartrap
Canyon Primitive Area is also in the Yellowstone Rockies.
The region has about one million acres in roadless and new
study areas (76) (Table 17).
Table 17. Yellowstone Rockies Wildlands, 1975.
Classification
Wilderness
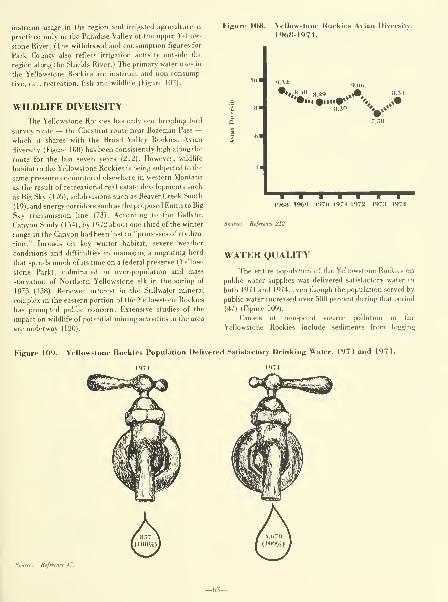
instream usage in the region and irrigated agriculture is
practiced only in the Paradise Valley of the upper Yellow-
stone River. (The withdrawal and consumption figures for
Park County also reflect irrigation activity outside the
region along the Shields River.) The primary water uses in
the Yellowstone Rockies are instream and non-consump-
tive, i.e., recreation, fish and wildlife (Figure 107).
WILDLIFE DIVERSITY
The Yellowstone Rockies has only one breeding bird
survey route — the Chestnut route near Bozeman Pass —which it shares with the Broad Valley Rockies. Avian
diversity (Figure 108) has been consistently high along the
route for the last seven years (212). However, wildlife
habitat in the Yellowstone Rockies is being subjected to the
same pressure encountered elsewhere in western Montana
as the result of recreational real estate developments such
as Big Sky (176), subdivisions such as Beaver Creek South
( 19) , and energy corridors such as the proposed Ennis to Big
Sky transmission line (73). According to the Gallatin
Canyon Study (154), by 1972 about one-third of the winter
range in the Canyon had been lost to "processes of civiliza-
tion." Inroads on key winter habitat, severe weather
conditions and difficulties in managing a migrating herd
that spends much of its time on a federal preserve (Yellow-
stone Park), culminated in over-population and mass
starvation of Northern Yellowstone elk in the spring of
1975 (158). Renewed interest in the Stillwater mineral
complex in the eastern portion of the Yellowstone Rockies
has prompted public concern. Extensive studies of the
impact on wildlife of potential mining activities in the area
are underway (120).
Fifjuro 108. Yellowstone Rockies .4vian Diversity,
1968-1971.
'^- 9.06
7.58
l<>68 !%<> I'>7(» 1<»7I 1<)72 197.1 197 1
Source: Reference 212.
WATER QUALITY
The entire population of the Yellowstone Rockies on
public water supplies was delivered satisfactory water in
both 1971 and 1974, even though the population served by
public water increased over 500 percent during that period
(47) (Figure 109).
Causes of non-point source pollution in the
Yellowstone Rockies include sediments from logging
Figure 109. Yellowstone Rockies Population Delivered Satisfactory Drinking Water. 1971 and 1974.
Refe,
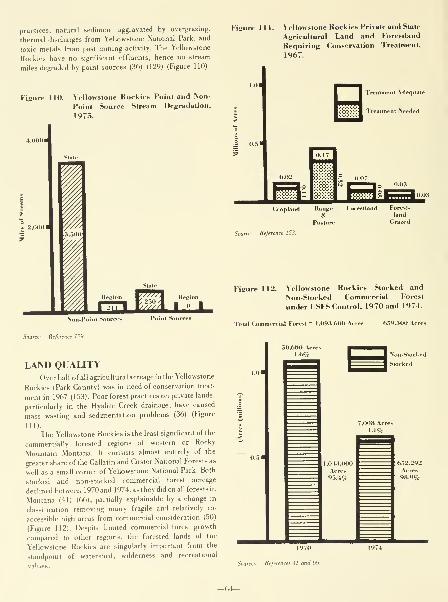
practices, natural sediment aggravated by overgrazing,
thermal discharges from Yellowstone National Park, and
toxic metals from past mining activity. The Yellowstone
Rockies have no significant effluents, hence no stream
miles degraded by point sources (36) (129) (Figure 110).
Figure 110. Yellowstone Rockies Point and INon-
Point Source Stream Degradation.
1975.
Figure 111. Yellowstone Rockies Private and State
.4gricultural Land and Forestland
Requiring Conservation Treatment,
1967.
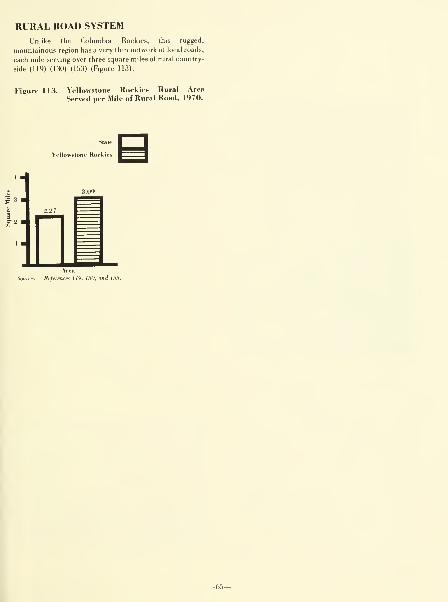
RURAL ROAD SYSTEM
Unlike the Columbia Rockies, this rugged,
mountainous region has a very thin network of local roads,
each mile serving over three square miles of rural country-
side (119) (130) (153) (Figure 113).
Figure 113. Yellowstone Rockies Rural Area
Served per Mile of Rural Road, 1970.
Slair
Yellowstone Rookie*
119. 130. and 153.
-65-
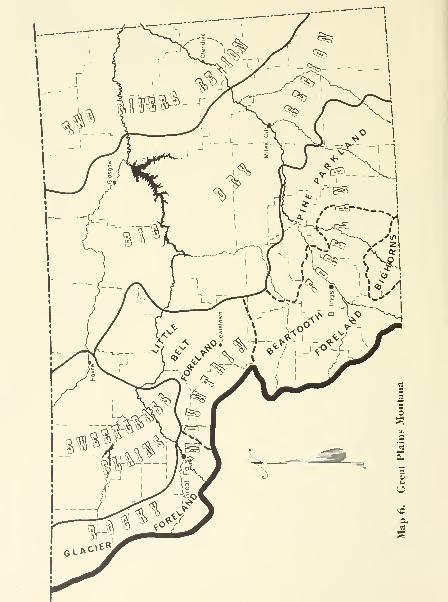
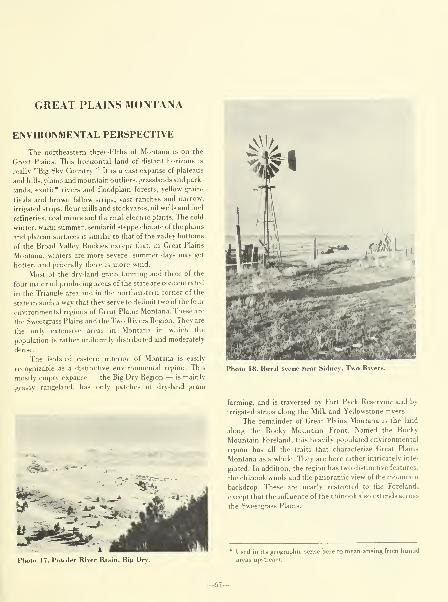
GREAT PLAINS MONTANA
ENVIRONMENTAL PERSPECTIVE
The northeastern three-fifths of Montana is on the
Great Plains. This horizontal land of distant horizons is
really "Big Sky Country." It is a vast expanse of plateaus
and hills, plains and mountain outliers, grasslands and park-
lands, exotic* rivers and floodplain forests, yellow grain-
fields and brown fallow strips, vast ranches and narrow,
irrigated strips, flour mills and stockyards, oil wells and fuel
refineries, coal mines and thermal-electric plants. The cold
winter, warm summer, semiarid steppe climateof the plains
and plateau surfaces is similar to that of the valley bottoms
of the Broad Valley Rockies except that, in Great Plains
Montana, winters are more severe, summer days may get
hotter, and generally there is more wind.
Most of the dry-land grain farming and three of the
four major oil producing areas of the state are concentrated
in the Triangle area and in the northeastern corner of the
state in such a way that they serve to delimit two of the four
environmental regions of Great Plains Montana. These are
the Sweetgrass Plains and the Two Rivers Region. They are
the onlv extensive areas in Montana in which the
population is rather uniformly distributed and moderately
dense.
The isolated eastern interior of Montana is easily
recognizable as a distinctive environmental region. This
mostly emptv expanse — the Big Dry Region — is mainly
grassy rangeland, has only patches of dry-land grain
•holo 17. Powder River Basin. Big Di
Pholo 18. Rural scene near Sidney. Two Rivers
farming, and is traversed by Fort Peck Reservoir and by
irrigated strips along the Milk and Yellowstone rivers.
The remainder of Great Plains Montana is the land
along the Rocky Mountain Front. Named the Rocky
Mountain Foreland, this heavily populated environmental
region has all the traits that characterize Great Plains
Montana as a whole. They are here rather intricately inte-
grated. In addition, the region has two distinctive features,
the chinook winds and the panoramic view of the mountain
backdrop. These are nearly restricted to the Foreland,
except that the influence of the chinook also extends across
the Sweetgrass Plains.
Used in its geographic sense here to mean arising from humid
areas upstream.
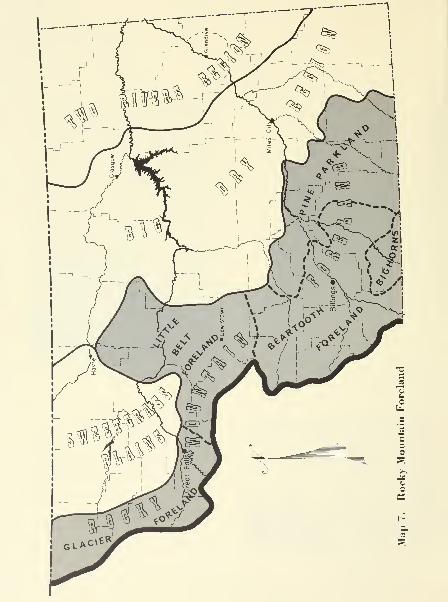
1-. -r
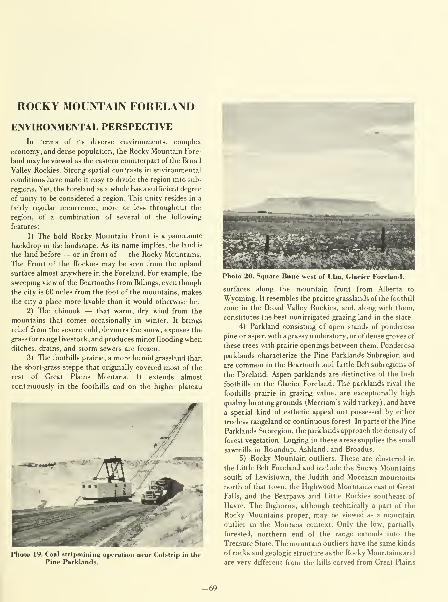
ROCKY MOUNTAIN FORELAND
ENVIRONMENTAL PERSPECTIVEIn terms of its diverse environments, complex
economy, and dense population, the Rocky Mountain Fore-
land may be viewed as the eastern counterpart of the Broad
Valley Rockies. Strong spatial contrasts in environmental
conditions have made it easy to divide the region into sub-
regions. Yet, the Foreland as a whole has a sufficient degree
of unity to be considered a region. This unity resides in a
fairly regular recurrence, more or less throughout the
region, of a combination of several of the following
features:
1) The bold Rocky Mountain Front is a panoramic
backdrop in the landscape. As its name implies, the land is
the land before — or in front of — the Rocky Mountains.
The Front of the Rockies may be seen from the upland
surface almost anywhere in the Foreland. For example, the
sweeping view of the Beartooths from Billings, even though
the city is 60 miles from the foot of the mountains, makes
the city a place more livable than it would otherwise be.
2) The chinook — that warm, dry wind from the
mountains that comes occasionally in winter. It brings
relief from the severe cold, devours the snow, exposes the
grass for range livestock, and produces minor flooding whenditches, drains, and storm sewers are frozen.
3) The foothills prairie, a more humid grassland than
the short-grass steppe that originally covered most of the
rest of Great Plains Montana. It extends almost
continuously in the foothills and on the higher plateau
Photo 19. Coal Mtripiiiiiiin^ operation lu'ur Cul»trip in the
Pine Parkland.s.
Photo 20. Square Butte west of Ulm, Glacier Foreland.
surfaces along the mountain front from Alberta to
Wyoming. It resembles the prairiegrasslands of the foothill
zone in the Broad Valley Rockies, and, along with them,
constitutes the best nonirrigated grazing land in the state.
4) Parkland consisting of open stands of ponderosa
pine or aspen withagrassyunderstory, or of dense groves of
these trees with prairie openings between them. Ponderosa
parklands characterize the Pine Parklands Subregion and
are common in the Beartooth and Little Belt subregions of
the Foreland. Aspen parklands are distinctive of the lush
foothills in the Glacier Foreland. The parklands rival the
foothills prairie in grazing value, are exceptionally high
quality hunting grounds (Merriam's wild turkey), and have
a special kind of esthetic appeal not possessed by either
treeless rangeland or continuous forest. In parts of the Pine
Parklands Subregion, the parklands approach the density of
forest vegetation. Logging in these areas supplies the small
sawmills in Roundup, Ashland, and Broadus.
5) Rocky Mountain outliers. These are clustered in
the Little Belt Foreland and include the Snowy Mountains
south of Lewistown, the Judith and Moccasin mountains
north of that town, the Highwood Mountains east of Great
Falls, and the Bearpaws and Little Rockies southeast of
Havre. The Bighorns, although technically a part of the
Rocky Mountains proper, may be viewed as a mountain
outlier in the Montana context. Only the low, partially
forested, northern end of the range extends into the
Treasure State. The mountain outliers have the same kinds
of rocks and geologic structure as the Rocky Mountains and
are very different from the hills carved from Great Plains
-69-
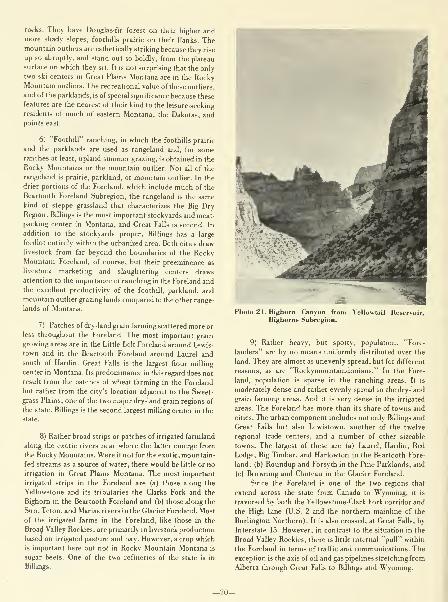
rocks. They have Douglas-fir forest on their higher andmore shady slopes, foothills prairie on their flanks. Themountain outliers are esthetically striking because they rise
up so abruptly, and stand out so boldly, from the plateau
surface on which they sit. It is not surprising that the only
two ski centers in Great Plains Montana are in the RockyMountain outliers. The recreational value of these outliers,
and of the parklands, is of special significance because these
features are the nearest of their kind to the leisure-seeking
residents of much of eastern Montana, the Dakotas, andpoints east.
6) "Foothill" ranching, in which the foothills prairie
and the parklands are used as rangeland and, for someranches at least, upland summer grazing, is obtained in the
Rocky Mountains or the mountain outlier. Not all of the
rangeland is prairie, parkland, or mountain outlier. In the
drier portions of the Foreland, which include much of the
Beartooth Foreland Subregion, the rangeland is the samekind of steppe grassland that characterizes the Big DryRegion . Billings is the most important stockyards and meat-
packing center in Montana, and Great Falls is second. In
addition to the stockyards proper, Billings has a large
feedlot entirely within the urbanized area. Both cities draw
livestock from far beyond the boundaries of the RockyMountain Foreland, of course, but their preeminence as
livestock marketing and slaughtering centers draws
attention to the importance of ranching in the Foreland and
the excellent productivity of the foothill, parkland, andmountain outlier grazing lands compared to the other range-
lands of Montana.
7) Patches of dry-land grain farming scattered more or
less throughout the Foreland. The most important grain
growing areas are in the Little E/o!t Foreland around Lewis-
town and in the Beartooth Foreland around Laurel andsouth of Hardin. Great Falls is the largest flour milling
center in Montana. Its predominance in this regard does not
result from the patches of wheat farming in the Foreland
but rather from the city's location adjacent to the Sweet-
grass Plains, one of the two major dry-land grain regions of
the state. Billings is the second largest milling center in the
8) Rather broad strips or patches of irrigated farmland
along the exotic rivers near where the latter emerge from
the Rocky Mountains. Were it not for the exotic, mountain-
fed streams as a source of water, there would be little or no
irrigation in Great Plains Montana. The most important
irrigated strips in the Foreland are (a) those along the
Yellowstone and its tributaries the Qarks Fork and the
Bighorn in the Beartooth Foreland and (b) those along the
Sun, Teton, and Marias rivers in the Glacier Foreland. Most
of the irrigated farms in the Foreland, like those in the
Broad Valley Rockies, are primarily in livestock production
based on irrigated pasture and hay. However, a crop which
is important here but not in Rocky Mountain Montana is
sugar beets. One of the two refineries of the state is in
Billings.
Pholo 21. Bighorn Canyon from Yellowtail ReservoirBighorns Subregion.
9) Rather heavy, but spotty, population. "Fore-
landers" are by no means uniformly distributed over the
land. They are almost as unevenly spread, but for different
reasons, as are "Rockymountaindonians." In the Fore-
land, population is sparse in the ranching areas. It is
moderately dense and rather evenly spread in the dry-land
grain farming areas. And it is very dense in the irrigated
areas. The Foreland has more than its share of towns and
cities. The urban component includes not only Billings and
Great Falls but also Lewistown, another of the twelve
regional trade centers, and a number of other sizeable
towns. The largest of these are (a) Laurel, Hardin, Red
Lodge, Big Timber, and Harlowton in the Beartooth Fore-
land; (b) Roundup and Forsyth in the Pine Parklands; and
(c) Browning and Choteau in the Glacier Foreland.
Since the Foreland is one of the two regions that
extend across the state from Canada to Wyoming, it is
traversed by both the Yellowstone-Clark Fork corridor and
the High Line (U.S. 2 and the northern mainline of the
Burlington Northern). It is also crossed, at Great Falls, by
Interstate 15. However, in contrast to the situation in the
Broad Valley Rockies, there is little internal "pull" within
the Foreland in terms of traffic and communications. The
exception is the axis of oil and gas pipelines stretching from
Alberta through Great Falls to Billings and Wyoming.
-70-

The Foreland figures rather importantly in the
mineral-extraction, refining, and electric-power picture in
the Treasure State. However, the areas involved are highly
localized and do not characterize the region as a whole.
Two of the major hydroelectric power developments in
Montana are located in the Foreland. One of these is Yellow-
tail Dam, which created Bighorn Lake, the largest reservoir
in the Foreland. The other is the five dams at the Great Falls
of the Missouri. The establishment of the metallurgical
complex at the Electric City was related to the hydro-
electric potential of the Falls.
The Rocky Mountain Foreland is the foremost oil
refining region of the state. Billings and Laurel are the
largest refining centers, and Great Falls has a medium sized
refinery. As a business capital for the petroleum industry,
Billings enjoys somewhat the same role in Montana as does
Calgary in Alberta and Casper in Wyoming. Only a small
part of the petroleum refined in the Foreland comes from
the region itself, which has only one important producing
area. This is the Elk Basin oil-and-gas field near Red Lodge.
Nearly all of the coal mining and exploration and most
of the thermal-electric power production of the state are in
the Rocky Mountain Foreland. Most of the coal exploration
and strip mining activities are in the Decker, Colstrip, and
Roundup areas of the Pine Parklands Subregion, whose
boundaries have been drawn so as to include as much as
possible of the strippable coal. Billings currently produces
the lion's share of Montana's thermal-electric power, and
new thermal plants are being constructed at Colstrip. Coal
mining and power production using coal threaten to modify
drastically the environment in the Pine Parklands and
perhaps other areas of Great Plains Montana.
The natural environment of the Foreland has been
greatly changed by grazing, dry-land cropping, irrigation,
coal mining, power production, pipeline and transmission
line construction, and the numerous manufacturing
industries located primarily in Billings and Great Falls. To
summarize, these industries are flour milling, meat packing,
and copper, oil, and sugar refining. The distinctive
appearance, odors, sounds, and smoke or dust of these
industries are characteristic components of the urban
environment in Montana's two largest cities, Billings and
Great Falls.
POPULATION SIZE AND DENSITYThe Foreland experienced a population increase of
over 63,000 from 1950 to 1974, second only to Broad Valley
Rockies. However in the period 1950 to 1970 the region
grew faster than Broad Valley Rockies. Much of this growth
can be attributed to the two major urban areas. Great Falls
and Billings (Figure 114).
The region's population density is almost six persons
per square mile and is very slowly approaching that of the
Broad Valley Rockies (Figure 115).
Figure 1 I k Rocky Mountain Foreland Popula-
tion, ig.'iO-lQTl.
180.35.^
1"—
r
1950 1960 1970 1972
References 198, 216, and 217.
Figure 115. Rocky Mountain Foreland Population
Density, 1950-1974.
A.̂" »»»*'
,#5.92
1950 1960
References 198. 216, and 21'i
1974
POPULATION DISTRIBUTIONIn 1930, more people in the Rocky Mountain Foreland
Region lived on farms than in urban areas (Figure 116).
Since then, the cities, especially Great Falls and Billings,
have experienced extremely rapid growth, and over two-
thirds of the region's people now live in urban areas.
However, the 55 percent urban growth rate of the 1950s
slowed to an 11 percent rise in the 1960s. As in all regions of
the state, the farm population has decreased in absolute and
relative size. The rural non-farm segment increased slightly
in relative size between 1930 and 1950, but has declined
since then and was slightly lower (in relative size) in 1970
-71—
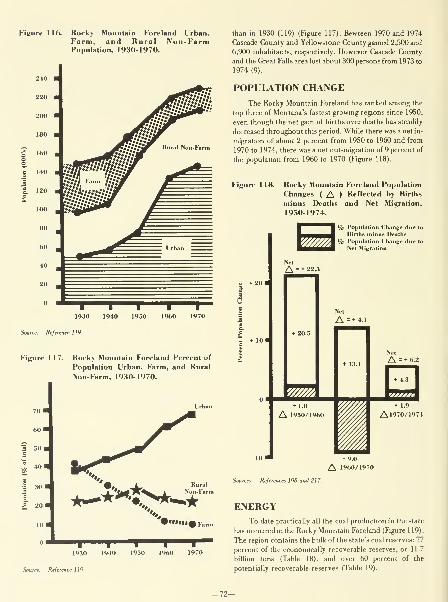
Figure 1 16. Rocky Mountain Foreland UrbarFarm, and Rural Non-FarrPopulation, 1930-1970.
Figure 117. Rocky Mountain Foreland Percent of
Population Urban, Farm, and Rural
Non-Farm, 1930-1970.
60 1
a 50 1
Rural
Farm
10
than in 1930 (119) (Figure 117). Bewteen 1970 and 1974
Cascade County and Yellowstone County gained 2,500 and
6,900 inhabitants, respectively. However Cascade County
and the Great Falls area lost about 300 persons from 1973 to
1974 (9).
POPULATION CHANGEThe Rocky Mountain Foreland has ranked among the
top three of Montana's fastest growing regions since 1950,
even though the net gain of births over deaths has steadily
decreased throughout this period. While there was a net in-
migration of about 2 percent from 1950 to 1960 and from
1970 to 1974, there was a net out-migration of 9 percent of
the population from 1960 to 1970 (Figure 118).
Figure 118. Rocky Mountain Foreland Population
Changes ( A ) Reflected by Births
minus Deaths and Net Migration,
1950-1974.
% Population Change due to
Births minus Deaths
% Population Change due to
Net Migration
1930 1944) 1950 I960 1970
Source: Reference 1 19.
ENERGYTo date practically all the coal production in the state
has occurred in the Rocky Mountain Foreland (Figure 119).
The region contains the bulk of the state's coal reserves: 77
percent of the economically recoverable reserves, or 11.7
billion tons (Table 18), and over 60 percent of the
potentially recoverable reserves (Table 19).

About 4 percent of Montana's 1974 oil production
came from the Foreland (Figure 120) and, similarly, almost
4 percent of the state's proven oil reserves are in the Rocky
Mountain Foreland (Table 20).
Unlike oil, almost 30 percent of Montana's 1974
Rocky Mounlain Foreland Economi-
cally Recoverable Coal Reserves, 1973.
Coal Type
Surface
Lignite
Subbituminous
Total
Millions of Tons
4,920
6,812
Resource Index
11,732
Source: Reference 163.
Figure 119. Rocky Mountain Foreland Coal Pro-
duction, 1970-1974.
.•13.7
..-^'
,..»»»»*?o!
1973 19741970 1972
Source: Reference 140.
Table 19. Rocky Mountain Foreland Potentially
Recoverable Coal Reserves, 1973.
Coal Type
Surface
Lignite
Subbituminous
Underground
Lignite
Subbituminous
Bituminous
Total
Millions of Tons Resource Index
8,200
11,410
9
31,477
689
51,785 3.780
natural gas production came from the Rocky Mountain
Foreland, much of it from the Tiger Ridge Field (Figure
121). The Foreland contains 406 billion cubic feet of proven
natural gas reserves, nearly 40 percent of Montana's total
proven reserve (Table 21).
Table 20. Rocky Mountain Foreland Proven Re-
coverable Oil Reserves, 1974.
Millions of Barrels Resource Index
11.0 7.8
Source: Reference 143.
Figure 120. Rocky Mountain Foreland Oil Pro-
duction, 1970-1974.
2.01
= 1.51
I I I1970 1972 1973
Source: Reference 143.
Figure 121. Rocky Mountain Foreland Natural Gas
Production, 1970-1974.
Sources: References 163, 208, and 213.
Source: Reference 143. Forty percent of Tiger Ridge Field produc
allocated to Rocky Mountain Foreland.
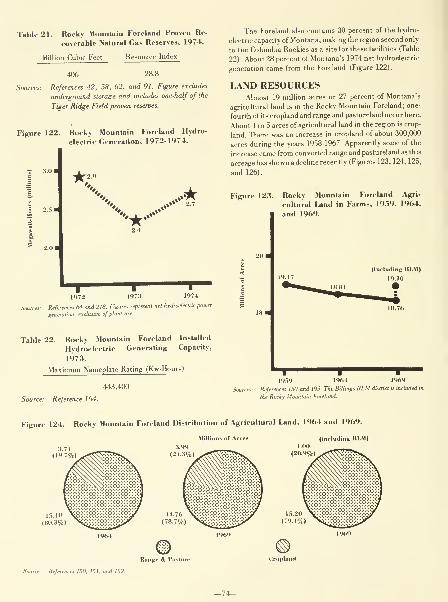
Table 21. Rocky Mountain Foreland Proven Re-
coverable Natural Gas Reserves, 1974.
Billion Cubic Feet Resource Index
406 28.8
Sources: References 42, 58, 62, and 91. Figure excludes
underground storage and includes one-half of the
Tiger Ridge Field proven reserves.
Figure 122. Rocky Mountain Foreland Hydro-
electric Generation, 1972-1974.
•-
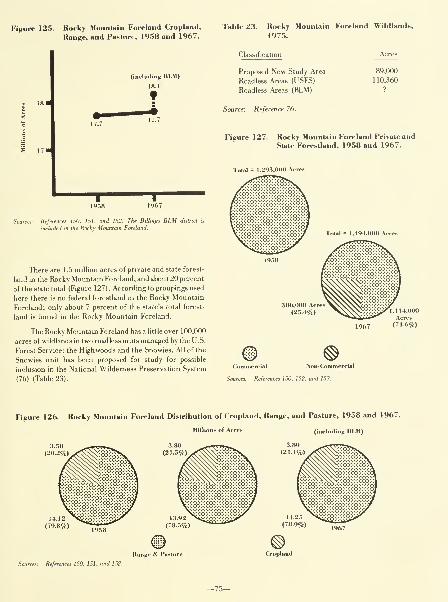
Figure 125. Rooky Mountain Foreland Cropland,
Range, and Paslure. 1958 and 1967.
(including BLM)
Sources: References 150. 151. and 152. The BUlings BLM dis
included in the Rockv Mountain Foreland.
There are 1.5 million acres of private and state forest-
land in the Rocky Mountain Foreland, and about 20 percent
of the state total (Figure 127) . According to groupings used
here there is no federal forestland in the Rocky Mountain
Foreland; only about 7 percent of the state's total forest-
land is found in the Rocky Mountain Foreland.
The Rocky Mountain Foreland has a little over 100,000
acres of wildlands in two roadless units managed by the U.S.
Forest Service: the Highwoods and the Snowies. All of the
Snowies unit has been proposed for study for possible
inclusion in the National Wilderness Preservation System
(76) (Table 23).
Table 23. Rocky Mountain Foreland Wildlands,
1975.
Classification Acres
Proposed New Study Area
Roadless Areas (USFS)
Roadless Areas (BLM)
Source: Refei 76.
Figure 127. Rocky Mountain Foreland Private andStote Forestland, 1958 and 1967.
Toul = 1.2<)."J,000 Acres
380.000 Acres
(25.4%)
Commercial Non-Commercial
Sources: References 150. 152. and 153.
Figure 126. Rocky Mountain Foreland Distribution of Cropland, Range, and Pasture, 1958 and 1967.
Millions of Acres (including BLM)
Cropland
Sources: References 150. 151. and 152.

WATER RESOURCESThe Rocky Mountain Foreland accounts for 30 percent
of the water withdrawn and consumed in the state, ranking
second to the Broad Valley Rockies (134). The Yellowstone
Basin, much of which is located in this region, has
experienced an increase of 20,000 irrigated acres in the last
two years and as many as 631,000 new irrigated acres are
expected by the year 2000 (135). This additional acreage
could consume 1,600,000 afy, nearly doubling the existing
consumption level for the entire Rocky Mountain Fore-
land. Energy related activity could consume an additional
1,300,000 afy in the basin. These demands plus that
required for instream flow protection would exceed Yellow-
stone basin supplies during an average water year (135)
(Figure 128).
Figure 128. Rocky Mountain Foreland Water
Withdrawals and Consumption of
Withdrawals, 1970.
Figure 129. Rocky MounUin Foreland Avian Di-
versitv, 1968-1974.
rrigation Consumption1 737 117afv
Tola! Wilhdrawali
3,961.618 afy
Other Consumption69.274 afy
Source: Reference 134.
WILDLIFE DIVERSITY
Average breeding bird diversity along the six routes of
the Rocky Mountain Foreland has been steadily increasing
over the last three years (212) (Figure 129). Occupying the
tension zone between the plains and the mountains, this
region has a greater average diversity than any of the other
plains regions but a lower average diversity than any of the
regions of Rocky Mountain Montana. Mourning doves,
which are now plentiful in the region, are reported to be
very sensitive to air pollutants, particularly sulfur dioxide
(115). Mourning dove numbers monitored along the
Brandenberg route (about 20 miles downwind from
ac
.5.75
I I I I I I I
1968 1969 1970 1971 1972 1973 1974
Refer
Colstrip) can be expected to give early warning of potential-
ly dangerous emissions from coal conversion plants at
Colstrip. Serious conflicts between coal development and
wildlife have been anticipated in a series of wildlife
inventory reports prepared recently by the Montana
Department of Fish and Game under sponsorship of various
federal agencies and private industries (83) (105) (113).
Although the department reports that "nobody knows what
will happen" regarding the effect of reclamation on wildlife
(175), it is known with some certainty that coal mining
would foreclose certain grouse mating grounds (169), and
that plant emissions would impair wildlife productivity
(133). Water withdrawals for power plants could have a
detrimental effect on fish in the lower Yellowstone drain-
age (16).
AIR QUALITYThe only Great Plains region with known significant
air quality deterioration in Montana is the Rocky Mountain
Foreland, particularly the metropolitan areas of Billings and
Great Falls.
Billings. The year 1974 was the first in which mean
annual particulate levels in Billings fell below either the
primary or secondary ambient standards (Figure 130). The
trend toward clean air appears to be continuing. However,
Billings and Yellowstone County have other pollution
problems besides particulates, including sulfur gases, odors
and fluoride from a number of major industries, and dust
and emissions associated with dirty and unpaved streets and
automobile traffic. Three industries in the Billings area
currently are in violation of state air quality standards: the
Exxon and Cenex refineries and the Montana Power
Company Corette plant (99) . Air pollution control efforts in
Billings have begun to switch from large industrial sources
to small industries, homes and cars (88) (171).

Great Falls. Mean annual particulate levels in Great
Falls have been below the federal ambient secondary
standard for the last five years (Figure 130). For a city of
comparable size, air pollution in Great Falls is not nearly the
problem it is in Billings, due in part to much better
ventilation (particularly chinook winds) and fewer heavy
industries.
Figure 130. Annual Geometric Mean Particulate
Levels Recorded in Billings and Great
Falls, 1971-1975.
II
O " 201
*""'*M.,.,^»»**r^^
# Billings (City Hall) y^y^ Great Falls (hospital rooQ
1971 1972 1973 1974 1975
Source: Reference 124. Measurement method was gravimetric using a high
volume sampler.
WATER QUALITYWith more people on public water supplies than any
other region in 1971 — 174,127 — the Rocky Mountain
Foreland had the third lowest percentage of those receiving
unsatisfactory water: 4.5 percent. This percentage was cut
in half in 1974, the third lowest rate in the state (Figure
131). The public water supply for the energy boom town of
Colstrip was contaminated in the fall of 1974; however, the
problem has been corrected (17) (18) (26).
Most stream degradation in the Rocky Mountain Fore-
land results from natural sediments and salts washed away
through poor land use practices. This includes the
phenomenon of saline seep, potentially the most serious
non-point source pollution problem in Great Plains
Montana. Two major municipal dischargers — Billings and
Great Falls — and seven principal industrial dischargers are
mainly responsible for the 47 miles of streams degraded by
point sources (129) (Figure 132). Significant problem areas
include severe erosion of the Muddy Creek channel near
Great Falls (due largely to poor irrigation practices), acid
mine drainage in the Belt Creek drainage (from past mining
activities), and bacteria in the Missouri River down to Fort
Benton from the Great Falls sewage treatment plant effluent
(35). The Muddy Creek sediment problem, perhaps the
most troublesome in the Foreland, is expected to be the
subject of a $250,000 control feasibility study by the Bureau
of Reclamation, provided funding is appropriated by
Congress (6). In the southern portion of the Foreland the
Yellowstone River is getting cleaner (39), although "the
potential for water quality degradation due to energy
development ... is enormous" (103).
Figure 131. Rocky Mountain Foreland Population Delivered Unsatisfactory Drinking Water, 1971 and 1974.
1971 1971
Refe,
-77—

Figure 132. Rocky Mountain Foreland Point and
Non-Point Source Stream Degrada-
tion, 1975.
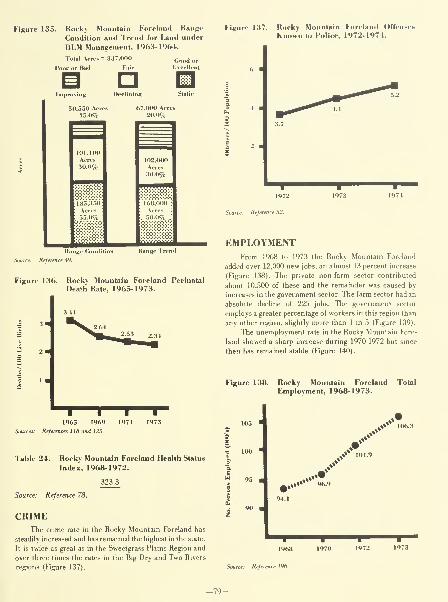
Figure 135. Rocky Mountain Foreland Range
Condition and Trend for Land under
BLM Management, 1963-1964.
Total Acres = S.ST.OOO q„Poor or Bad Fair Es
Improving
Figure 137. Rocky Mountain Foreland Offen8e8
Known to Police. 1972-1974.
aodor
50,550 Acres 67,000 Acres
15.0% 20.0%
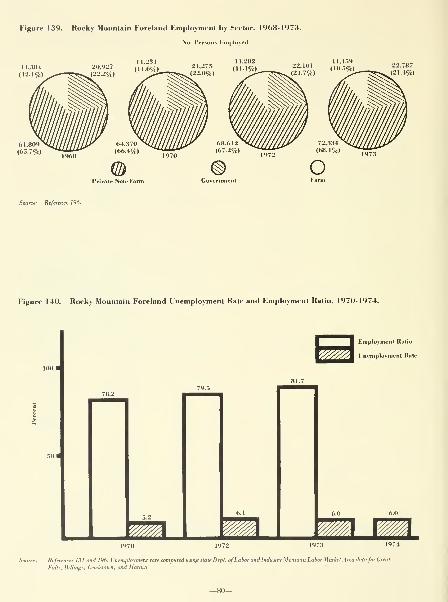
Figure 139. Rocky Mountain Foreland Employment by Sector, 1968-1973.
No. Persons Employed
Source: Reference 196.
Figure 140. Rocky Mountain Foreland Unemployment Rate and Employment Ratio, 1970-1974.
Employment Ratio
I nemployment Rale
Sources: References 131 and 196. Unemployment rate computed using state Dept. ofLabor and Industry Montana Labor Market .Area dataforGreat
Falls. Billings. Lewistown, and Hardin.
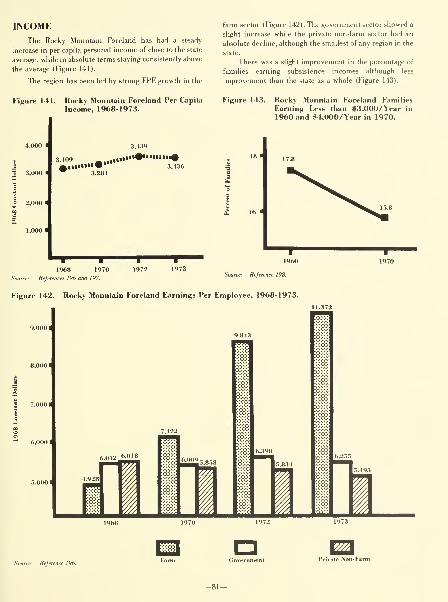
INCOMEThe Rocky Mountain Foreland has had a steady
increase in per capita personal income of close to the state
average, while in absolute terms staying consistently above
the average (Figure 141).
The region has been led by strong EPE growth in the
Figure 141. Rocky Mountain F^oreland Per Capita
Income, 1968-1973.
4,000 1
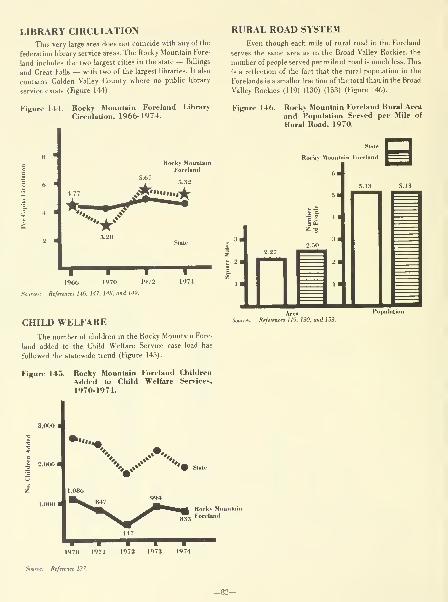
LIBRARY CIRCULATIONThis very large area does not coincide with any of the
federation library service areas. The Rocky Mountain Fore-
land includes the two largest cities in the state — Billings
and Great Falls — with two of the largest libraries. It also
contains Golden Valley County where no public library
service exists (Figure 144).
Figure 144. Rocky Mountain Foreland Library
Circulation, 1966-1974.

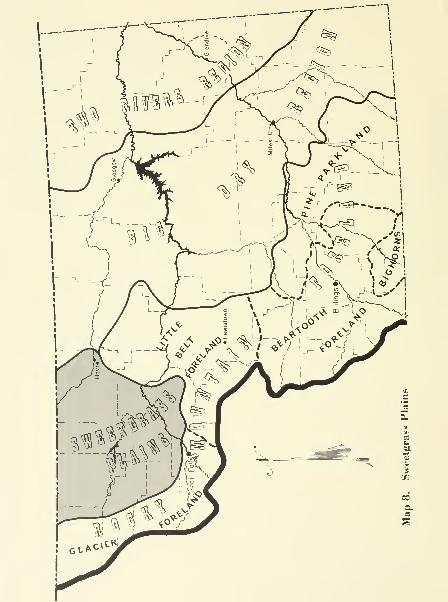
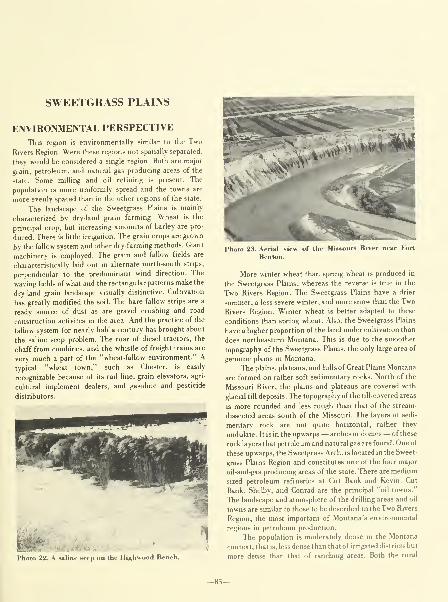
SWEETGRASS PLAINS
ENVIRONMENTAL PERSPECTIVE
This region is environmentally similar to the Two
Rivers Region. Were these regions not spatially separated,
they would be considered a single region. Both are major
grain, petroleum, and natural gas producing areas of the
state. Some milling and oil refining is present. The
population is more uniformly spread and the towns are
more evenly spaced than in the other regions of the state.
The landscape of the Sweetgrass Plains is mainly
characterized by dry-land grain farming. Wheat is the
principal crop, but increasing amounts of barley are pro-
duced. There is little irrigation. The grain crops are grown
by the fallow system and other dry-farming methods. Giant
machinery is employed. The grain and fallow fields are
characteristically laid out in alternate north-south strips,
perpendicular to the predominant wind direction. The
waving fields of what and the rectangular patterns make the
dry-land grain landscape visually distinctive. Cultivation
has greatly modified the soil. The bare fallow strips are a
ready source of dust as are gravel crushing and road
construction activites in the area. And the practice of the
fallow system for nearly half a century has brought about
the saline seep problem. The roar of diesel tractors, the
chaff from combines, and the whistle of freight trains are
very much a part of the "wheat-fallow environment." A
typical "wheat town," such as Chester, is easily
recognizable because of its rail line, grain elevators, agri-
cultural implement dealers, and gasoline and pesticide
distributors.
h^ 1
^2
Pholo 22. A valine seep on the Highwood Bench.
Photo 23. Aerial view of the Missouri River near Fort
Benton.
More winter wheat than spring wheat is produced in
the Sweetgrass Plains, whereas the reverse is true in the
Two Rivers Region. The Sweetgrass Plains have a drier
summer, a less severe winter, and more snow than the Two
Rivers Region. Winter wheat is better adapted to these
conditions than spring wheat. Also, the Sweetgrass Plains
have a higher proportion of the land under cultivation than
does northeastern Montana. This is due to the smoother
topography of the Sweetgrass Plains, the only large area of
genuine plains in Montana.
The plains, plateaus, and hills of Great Plains Montana
are formed on rather soft sedimentary rocks. North of the
Missouri River, the plains and plateaus are covered with
glacial till deposits. The topography of the till-covered areas
is more rounded and less rough than that of the stream-
dissected areas south of the Missouri. The layers of sedi-
mentary rock are not quite horizontal, rather they
undulate. It is in theupwarps — arches or domes— of these
rock layers that petroleum and natural gas are found. One of
these upwarps, the Sweetgrass Arch, is located in the Sweet-
grass Plains Region and constitutes one of the four major
oil-and-gas producing areas of the state. There are medium
sized petroleum refineries at Cut Bank and Kevin. Cut
Bank, Shelby, and Conrad are the principal "oil towns."
The landscape and atmosphere of the drilling areas and oil
towns are similar to those to be described in the Two Rivers
Region, the most important of Montana's environmental
regions in petroleum production.
The population is moderately dense in the Montana
context, that is, less dense than that of irrigated districts but
more dense than that of ranching areas. Both the rural
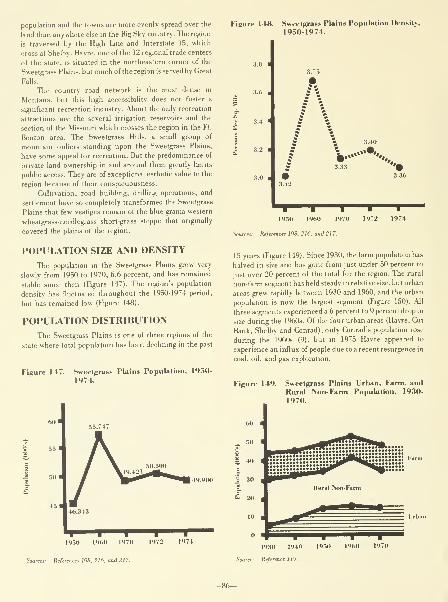
population and the towns are more evenly spread over the
land than anywhere else in the Big Sky country. The region
is traversed by the High Line and Interstate 15, which
cross at Shelby. Havre, one of the 12 regional trade centers
of the state, is situated in the northeastern corner of the
Sweetgrass Plains, but much of the region is served by Great
Falls.
The countrv road network is the most dense in
Montana, but this high accessibility does not foster a
significant recreation industry. About the only recreation
attractions are the several irrigation reservoirs and the
section of the Missouri which crosses the region in the Ft.
Benton area. The Sweetgrass Hills, a small group of
mountain ouliers standing upon the Sweetgrass Plains,
have some appeal for recreation. But the predominance of
private land ownership in and around them greatly limits
public access. They are of exceptional esthetic value to the
region because of their conspicuousness.
Cultivation, road building, drilling operations, and
settlement have so completely transformed the Sweetgrass
Plains that few vestiges remain of the blue grama-western
wheatgrass-needlegrass short-grass steppe that originally
covered the plains of the region.
POPULATION SIZE AND DENSITY
The population in the Sweetgrass Plains grew very
slowlv from 1950 to 1970, 6.6 percent, and has remained
stable since then (Figure 147). The region's population
density has fluctuated throughout the 1950-1974 period,
but has remained low (Figure 148).
POPULATION DISTRIBUTION
The Sweetgrass Plains is one of three regions of the
state where total population has been declining in the past
Figure 148. Sweetgrass Plains Population Density,
1950-1974.
Figure 14'i Sweetgrass Plains Population, 1950-
1974.
60 1
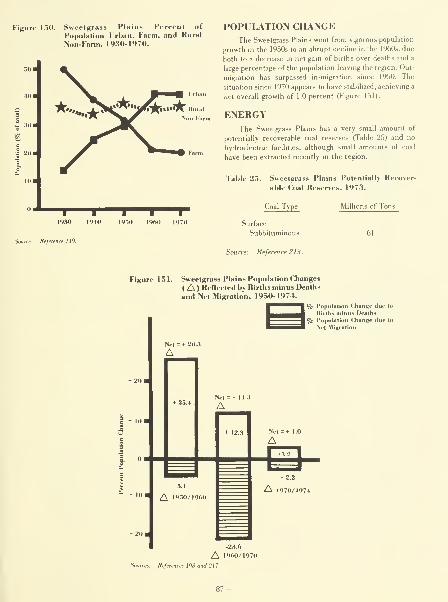
Figure 150. Sweelgrass Plains Percent of
Population Urban, Farm, and Rural
Non-Farm. 1930-1970.
I19.10
Refe,
POPULATION CHANGEThe Sweetgrass Plains went from vigorous population
growth in the 1950s to an ahrupt decline in the 1960s, due
both to a decrease in net gain of births over deaths and a
large percentage of the population leaving the region. Out-
migration has surpassed in-migration since 1950. The
situation since 1970 appears to have stabilized, achieving a
net overall growth of 1.0 percent (Figure 151).
ENERGYThe Sweetgrass Plains has a very small amount of
potentially recoverable coal reserves (Table 25) and no
hydroelectric facilities, although small amounts of coal
have been extracted recently in the region.
Table 25. Sweetgrass Plains Potentially Recover-
able Coal Reserves, 1973.
Coal Type
Surface
Subbituminous
Te.- Reference 213.
Millions of Tons
Figure 151. Sweetgrass Plains Population Changes
(A ) Reflected by Births minus Deaths
and Net Migration, 1950-1974.
I
% Population Change due to
Births minus Deaths
I% Population Change due to
Net Migration
-2.i.«>
A 1960/1970
Sources: References 198 and 217.
-87-
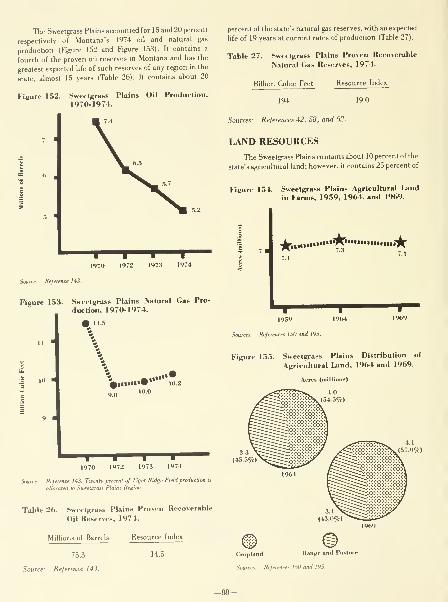
The Sweetgrass Plains accounted for 15 and 20 percent
respectively of Montana's 1974 oil and natural gas
production (Figure 152 and Figure 153). It contains a
fourth of the proven oil reserves in Montana and has the
greatest expected life of such reserves of any region in the
state, almost 15 years (Table 26). It contains about 20
Figure 152. Sweetgrass Plains Oil Production,
1970-1974.
I 6
1970 1972 1973 1974
Source: Reference 143.
Figure 153. Sweetgrass Plains Natural Gas Pro-
duction, 1970-1974.
^...."••'•"'•.
Source: Reference 143. Twenty percent of Tiger Ridge Field produc.
allocated to Sweetgrass Plains Region.
Table 26. Sweetgrass Plains Proven Recoverable
Oil Reserves. 1974.
percent of the state's natural gas reserves, with an expected
life of 19 years at current rates of production (Table 27).
Table 27. Sweetgrass Plains Proven Recoverable
Natural Gas Reserves, 1974.
Billion Cubic Feet Resource Index
194 19.0
Sources: References 42, 58, and 62.
LAND RESOURCES
The Sweetgrass Plains contains about 10 percent of the
state's agricultural land; however, it contains 25 percent of
Figure 154. Sweetgrass Plains Agricultural Land
in Farms, 1959, 1964, and 1969.
1 7 1ruM«».Ul«*"
1959 1964 1969
Sources: References 150 and 195.
Figure 155. Sweetgrass Plains Distribution of
Agricultural Land, 1964 and 1969.
Acres (millions)
Millions of Barrels
75.3
Source: Reference 143.
Resource Index
14.5 Cropland
Sources: Refei
Ranee and Pasture
150 and 195.
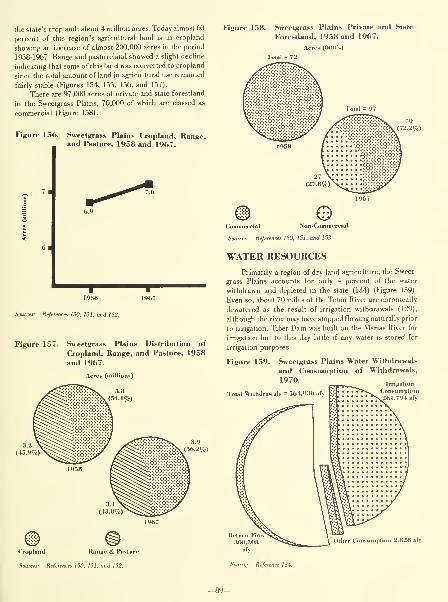
the state's cropland: about 4 million acres. Today almost 60
percent of this region's agricultural land is in cropland
showing an increase of almost 200,000 acres in the period
1958-1%7. Range and pastureland showed a slight decline
indicating that some of this land was converted to cropland
since the total amount of land in agricultural use remained
fairly stable (Figures 154, 155, 156, and 157).
There are 97,000 acres of private and state forestland
in the Sweetgrass Plains, 70,000 of which are classed as
commercial (Figure 158).
Figure 156. Sweetgrass Plains Cropland, Range,and Pasture, 1958 and 1967.
Figure 158. Sweetgrass Plains Private and State
Forestland, 19.58 and 1967.
Arret. (<»()()'s)
Commercial
Sources: Refei
Non-Commercial
150. 151. and 153.
19,58
Sources: References 150, 151. and 152.
Figure 157. Sweetgrass Plains Distribution of
Cropland, Range, and Pasture, 1958
and 1967.
Acres (millions)
WATER RESOURCES
Primarily a region of dry -land agriculture, the Sweet-
grass Plains accounts for only 4 percent of the water
withdrawn and depleted in the state (134) (Figure 159).
Even so, about 70 miles of the Teton River are chronically
dewatered as the result of irrigation withdrawals (129),
although the river may have stopped flowing naturally prior
to irrigation. Tiber Dam was built on the Marias River for
irrigation but to this day little if any water is stored for
irrigation purposes.
Figure 159. Sweetgrass Plains Water Withdrawals
and Consumption of Withdrawals,
1970.,„,^„,„„
Consumption261.794 afv
plion 2.828 afv
Cropland Range & Pasture
Sources: References 150, 151, and 152. Source: Reference 134.
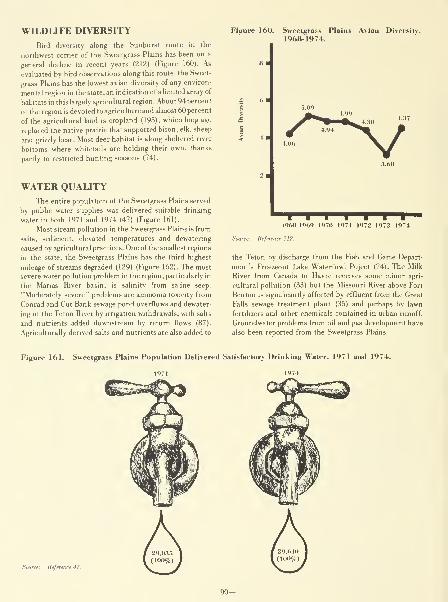
WILDUFE DIVERSITY
Bird diversity along the Sunburst route in the
northwest corner of the Sweetgrass Plains has been on a
general decline in recent years (212) (Figure 160). As
evaluated by bird observations along this route, the Sweet-
grass Plains has the lowest avian diversity of any environ-
mental region in the state, an indication of a limited array of
habitats in this largely agricultural region. .'Vbout 94 percent
of the region is devoted to agriculture and almost 60 percent
of the agricultural land is cropland (195), which long ago
replaced the native prairie that supported bison, elk, sheep
and grizzly bear. Most deer habitat is along sheltered river
bottoms where whitetails are holding their own, thanks
partly to restricted hunting seasons (74).
WATER QUALITYThe entire population of the Sweetgrass Plains served
by public water supplies was delivered suitable drinking
water in both 1971 and 1974 (47) (Figure 161).
Most stream pollution in the Sweetgrass Plains is from
salts, sediment, elevated temperatures and dewatering
caused by agricultural practices. One of the smallest regions
in the state, the Sweetgrass Plains has the third highest
mileage of streams degraded (129) (Figure 162). The most
severe water pollution problem in the region, particularly in
the Marias River basin, is salinity from saline seep.
"Moderately severe" problems are ammonia toxicity from
Conrad and Cut Bank sewage pond overflows and dewater-
ing of the Teton River by irrigation withdrawals, with salts
and nutrients added downstream by return flows (87).
Agriculturally derived salts and nutrients are also added to
Figure 160. Sweetgrass Plains Avian Diversity,
1968-1974.
1968 1969 1970 1971 1972 1973 1974
Source: Reference 212.
the Teton by discharge from the Fish and Game Depart-
ment's Freezeout Lake Waterfowl Poject (74). The Milk
River from Canada to Havre receives some minor agri-
cultural pollution (33) but the Missouri River above Fort
Benton is significantly affected by effluent from the Great
Falls sewage treatment plant (35) and perhaps by lawn
fertilizers and other chemicals contained in urban runoff.
Groundwater problems from oil and gas development have
also been reported from the Sweetgrass Plains.
Figure 161. Sweetgrass Plains Population Delivered Satisfactory Drinking Water. 1971 and 1974.
1971 1974
Source: Reference 47.
-90-
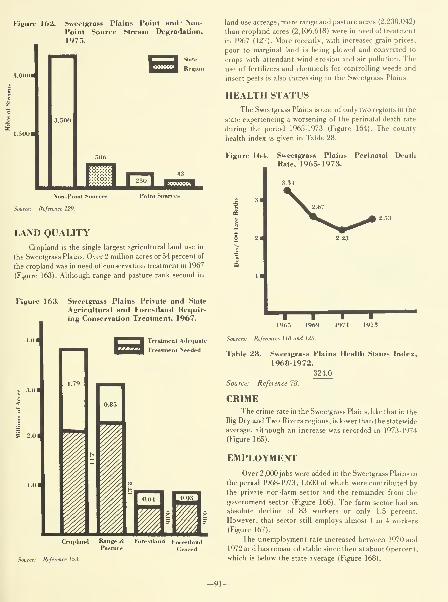
Fijsure 162. Sweetgrass Plains Point and Non-
Point Source Stream Degradation,
1975.
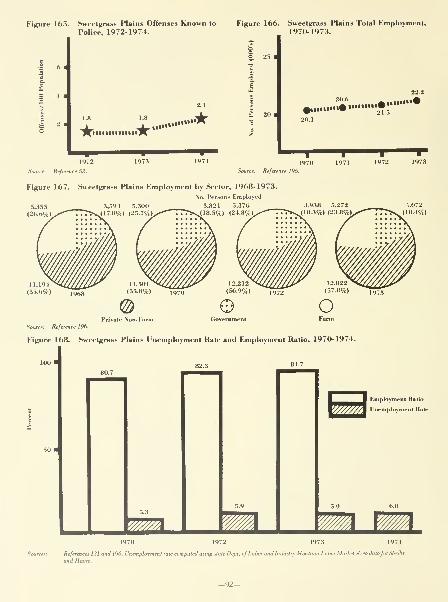
Figure 165. Sweetgra8s Plains Offenses Known to Figure 166. Sweetgrass Plains Total Employment,Police, 1972-1974.
i .s.
.ii«««''ii»»»»
2.4
1970-1973.
'i'. r.—
•
1970 1971
Source: Reference 52 Source: Reference 196.
Figure 167. Sweetgrass Plains Employment by Sector, 1968-1973.
!No. Persons Employed
5'355 3,594 5,300 3,824 5.376
(26.6%)/—rrr>s^( 17.8%) (25.7%)^
Governmenl
Source: Reference 196.
Figure 168. Sweetgrass Plains Unemployment Rate and Employment Ratio, 1970-1974.
1972 1973
Employment Ra
I nemployment
Sources: References 131 and 196. Vnemployment rate computed usin/; stale Dept. of Labor and Industry .Montana Labor Market .Irea datafor Sl,elh\
and Havre.
-92-
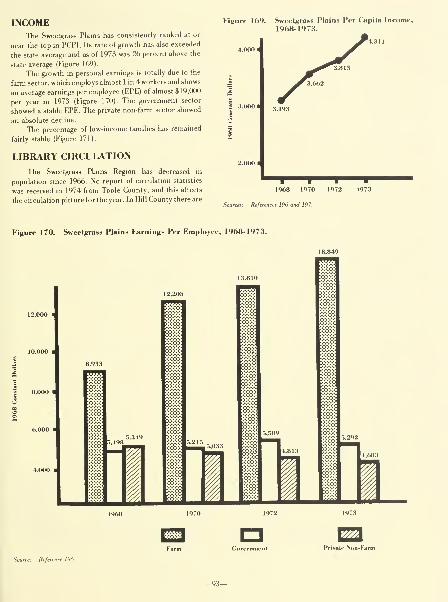
INCOMEThe Sweetgrass Plains has consistently ranked at or
near the top in PCPI. Its rate of growth has also exceeded
the state average and as of 1973 was 26 percent above the
state average (Figure 169).
The growth in personal earnings is totally due to the
farm sector, which employs almost 1 in 4 workers and shows
an average earnings per employee (EPE) of almost $19,000
per year in 1973 (Figure 170). The government sector
showed a stable EPE. The private non-farm sector showed
an absolute decline.
The percentage of low-income families has remained
fairly stable (Figure 171).
LIBRARY CIRCULATION
The Sweetgrass Plains Region has decreased in
population since 1%6. No report of circulation statistics
was received in 1974 from Toole County, and this affects
the circulation picture for the year. In Hill County there are
Figure 169. Sweetgrass Plains Per Capita Income,1968-1973.
Refe>
Figure 170. Sweetgrass Plains Earnings Per Employee, 1968-1973.
r>. 1 vn
Go>friinifnt
^3Private Non-Farm
Source: Reference 196.
-93-

Figure 171. Sweetgrass Plains Families EarningLess than $3,000/Year in 1960 and«4,000/Year in 1970.
Source: Reference 198.
two public libraries which probably could be consolidated
for better and more economical library service to the area.
The combined city-county funding of one strong public
library — easily accessible and well stocked — would
probably generate greater use. The library circulation trend
is contained in Figure 172.
CHILD WELFAREThe number of children receiving child welfare
services in the Sweetgrass Plains decreased 27 percent
between 1973 and 1974 (Figure 173).
RURAL ROAD SYSTEM
In spite of its relatively small population, the
Sweetgrass Plains has the most complete system of local
Figure 172. Sweetgrass Plains Library Circulation,
1966-1974.
Sweetgrass Plains
l'>66 1970 l«;
Sourrey References 146. 147. 148. arui 149.
roads serving the rural population. Rural mileage per square
mile of area is almost double the state average (Figure 174).
This is perhaps because of the gentle terrain and the regular
geometry of agricultural fields in the region. In such rural
regions as the Sweetgrass Plains, there is an almost total
dependence on private transportation. For example, in
Chester there is no bus, train or taxi service.
Figure 173. Sweetgrass Plains Children Added to
Child Welfare Services, 1970-1974.
Sweelprass Plains
89 ^ "" ^. '+"
0iiiii«#ii(iii0tiii"V'>ifi|^
I
1973
Source: Reference 137
Figure 174. Sweetgrass Plains Rural Area andPopulation Served per Mile of RuralRoad, 1970.
State
Sweetgrass Plains
'

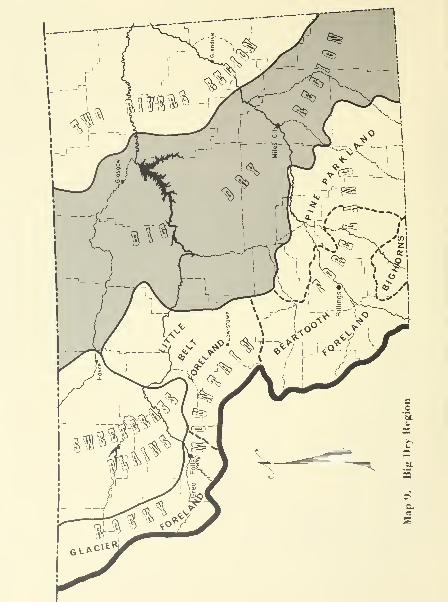
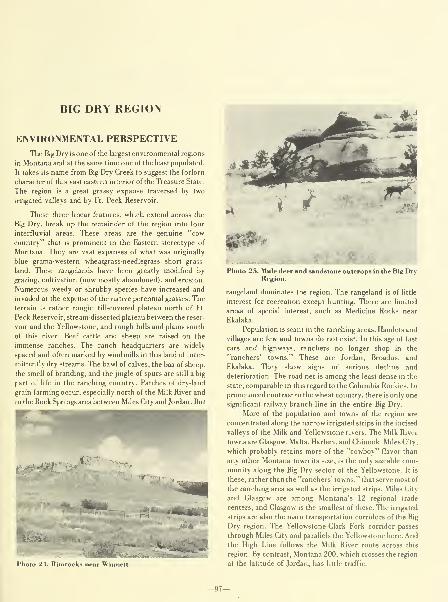
BIG DRY REGION
ENVIRONMENTAL PERSPECTIVE
The Big Dry is one of the largest environmental regions
in Montana and at the same time one of the least populated.
It takes its name from Big Dry Creek to suggest the forlorn
character of this vast eastern interior of the Treasure State.
The region is a great grassy expanse traversed by two
irrigated valleys and by Ft. Peck Reservoir.
These three linear features, which extend across the
Big Dry, break up the remainder of the region into four
interfluvial areas. These areas are the genuine "cow
country" that is prominent in the Eastern stereotype of
Montana. They are vast expanses of what was originally
blue grama-western wheatgrass-needlegrass short grass-
land. These rangelands have been greatly modified by
grazing, cultivation (now mostly abandoned), and erosion.
Numerous weedy or shrubby species have increased and
invaded at the expense of the native perennial grasses. The
terrain is rather rough: till-covered plateau north of Ft.
Peck Reservoir, stream-dissected plateau between the reser-
voir and the Yellowstone, and rough hills and plains south
of this river. Beef cattle and sheep are raised on the
immense ranches. The ranch headquarters are widely
spaced and often marked by windmills in this land of inter-
mittently dry streams. The bawl of calves, the baa of sheep,
the smell of branding, and the jingle of spurs are still a big
part of life in the ranching country. Patches of dry-land
grain farming occur, especially north of the Milk River and
in the Rock Springs area between Miles Qty and Jordan. But
^^'^J^!
%*^.
'hot.. 2 1. Hirnr<,.k- n. .,r W I
Photo 25. Mule deer and sandntone outcrops in the Big DryRegion.
rangeland dominates the region. The rangeland is of little
interest for recreation except hunting. There are limited
areas of special interest, such as Medicine Rocks near
Ekalaka.
Population is scant in the ranching areas. Hamlets and
villages are few and towns do not exist. In this age of fast
cars and highways, ranchers no longer shop in the
"ranchers' towns." These are Jordan, Broadus, and
Ekalaka. They show signs of serious decline and
deterioration. The road net is among the least dense in the
state, comparable in this regard to the Columbia Rockies. In
pronounced contrast to the wheat country, there is only one
significant railway branch line in the entire Big Dry.
More of the population and towns of the region are
concentrated along the narrow irrigated strips in the incised
valleys of the Milk and Yellowstone rivers. The Milk River
towns are Glasgow, Malta, Harlem, and Chinook. Miles City,
which probably retains more of the "cowboy" flavor than
any other Montana town its size, is the only sizeable com-
munity along the Big Dry sector of the Yellowstone. It is
these, rather than the "ranchers' towns," that serve most of
the ranching area as well as the irrigated strips. Miles City
and Glasgow are among Montana's 12 regional trade
centers, and Glasgow is the smallest of these. The irrigated
strips are also the main transportation corridors of the Big
Dry region. The Yellowstone-Clark Fork corridor passes
through Miles Gty and parallels the Yellowstone here. Andthe High Line follows the Milk River route across this
region. By contrast, Montana 200, which crosses the region
at the latitude of Jordan, has little traffic.
-97-
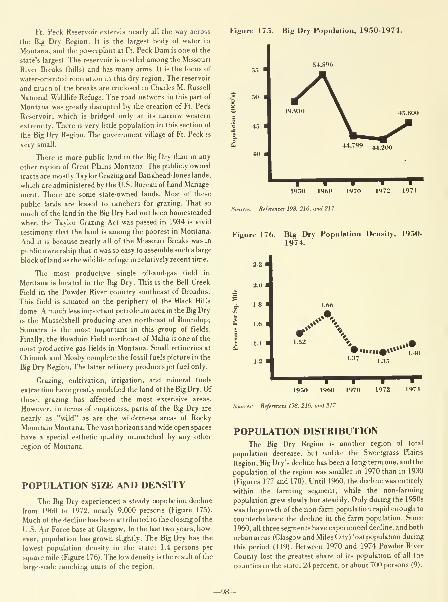
Ft. Peck Reservoir extends nearly all the way across
the Big Dry Region. It is the largest body of water in
Montana, and the powerplant at Ft. Peck Dam is one of the
state's largest. The reservoir is nestled among the Missouri
River Breaks (hills) and has many arms. It is the focus of
water-oriented recreation in this dry region. The reservoir
and much of the breaks are enclosed in Charles M. Russell
National Wildlife Refuge. The road network in this part of
Montana was greatly disrupted by the creation of Ft. Peck
Reservoir, which is bridged only at its narrow western
extremity. There is very little population in this section of
the Big Dry Region. The government village of Ft. Peck is
very small.
There is more public land in the Big Dry than in any
other region of Great Plains Montana. The publicly owned
tracts are mostly Taylor Grazing and Bankhead-Jones lands,
which are administered by the U.S. Bureau of Land Manage-
ment. There are some state-owned lands. Most of these
public lands are leased to ranchers for grazing. That so
much of the land in the Big Dry had not been homesteaded
when the Taylor Grazing Act was passed in 1934 is vivid
testimony that the land is among the poorest in Montana.
And it is because nearly all of the Missouri Breaks was in
public ownership that it was so easy to assemble such a large
block of land as the wildlife refuge in relatively recent time.
The most productive single oil-and-gas field in
Montana is located in the Big Dry. This is the Bell Creek
Field in the Powder River country southeast of Broadus.
This field is situated on the periphery of the Black Hills
dome. A much less important petroleum area in the Big Dry
is the Musselshell producing area northeast of Roundup;
Sumatra is the most important in this group of fields.
Finally, the Bowdoin Field northeast of Malta is one of the
most productive gas fields in Montana. Small refineries at
Chinook and Mosby complete the fossil fuels picture in the
Big Dry Region. The latter refinery produces jet fuel only.
Grazing, cultivation, irrigation, and mineral fuels
extraction have greatly modified the land of the Big Dry. Of
these, grazing has affected the most extensive areas.
However, in terms of emptiness, parts of the Big Dry are
nearly as "wild" as are the wilderness areas of Rocky
Mountain Montana. The vast horizons and wide open spaces
have a special esthetic quality unmatched by any other
region of Montana.
POPULATION SIZE AND DENSITY
The Big Dry experienced a steady population decline
from 1960 to 1972, nearly 9,000 persons (Figure 175).
Much of the decline has been attributed to the closing of the
U.S. Air Force base at Glasgow. In the last two years, how-
ever, population has grown slightly. The Big Dry has the
lowest population density in the state: 1.4 persons per
square mile (Figure 176) . The low density is the result of the
large-scale ranching units of the region.
Figure 175. Big Dry Population, 1950-1974.

Figure 177. Big Dry Urban, Farm, and Rural Nf
Farm Population, 1930-1970.
IQ.W 1940 1950
Reference 119.
1960 1970
Figure 1 78. Big Dry Percent of Population Urban,Farm, and Rural Non-Farm, 1930-
1970.
"o 40
ENERGY RESOURCESThe Big Dry has about 10 percent of Montana's
economically recoverable coal and 20 percent of Montana's
potentially recoverable coal reserves (Tables 29 and 30).
Figure 179. Big Dry Population Changes ( A )
Reflected by Births minus Deaths andNet Migration, 1950-1974.
9^ Population (Ihango due to
Rirlhs minus Drathn
Population CihanKe due to
^el Migration
1930 1940 1950 1960 1970
References
Refe,
Table 29.
POPULATION CHANGEThe Big Dry has experienced the most radical
population fluctuations of all the environmental regions of
the state. The region experienced net growth in the 1950s,
due entirely to in-migration, and a net decline in the 1960s,
due largely to a net out-migration of nearly a third of the
region's population. The Big Dry is the only region having
less than zero population growth in recent times (1950-
1%0). Conditions appear to have stabilized at a modest
growth rate since the beginning of this decade (Figure 179)
.
Big Dry Economically Recoverable Coal
Reserves, 1973.
Coal Types
Source.
Millions of Tons
Surface
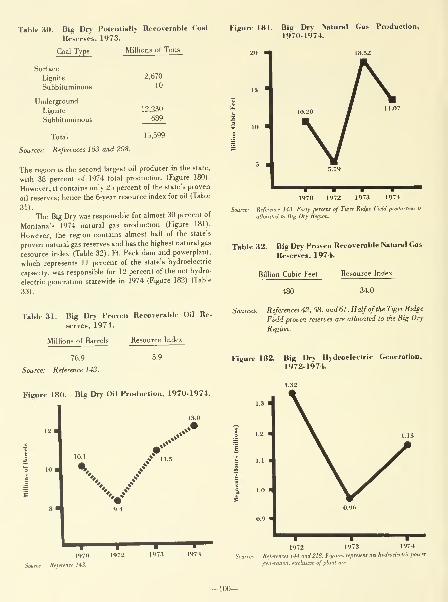
Table 30. Big Dry Potentially Recoverable Coal
Reserves, 1973.
Millions of Tons
Figure 181. Big Dry Natural Gas Production,
1970-1974.
Coal Type
Surface
Lignite
Subbituminous
Underground
Lignite
Subbituminous
2,670
10
12,230
689
Total 15,599
Sources: References 163 and 208.
The region is the second largest oil producer in the state,
with 38 percent of 1974 total production (Figure 180).
However, it contains only 25 percent of the state's proven
oil reserves; hence the 6-year resource index for oil (Table
31).
The Big Dry was responsible for almost 30 percent of
Montana's 1974 natural gas production (Figure 181).
However, the region contains almost half of the state's
proven natural gas reserves and has the highest natural gas
resource index (Table 32). Ft. Peck dam and powerplant,
which represents 11 percent of the state's hydroelectric
capacity, was responsible for 12 percent of the net hydro-
electric generation statewide in 1974 (Figure 182) (Table
33).
20
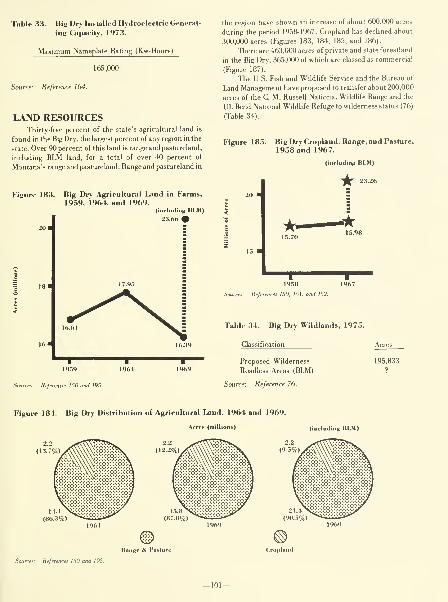
Table 33. Big Dry Installed Hydroelectric Generat-
ing Capacity, 1973.
Maximum Nameplate Rating (Kw-Hours)
165,000
Source: Reference 164.
LAND RESOURCESThirty-five percent of the state's agricultural land is
found in the Big Dry, the largest percent of any region in the
state. Over 90 percent of this land is range and pastureland,
including BLM land, for a total of over 40 percent of
Montana's range and pastureland. Range and pastureland in
Figure 183. Big Drv Agricultural Land in Farms,
1959, i964> and 1969.(including BLM)
2.-i.66 #
19.59
References 150 and 195.
1964
the region have shown an increase of about 600,000 acres
during the period 1958-1967. Cropland has declined about
300,000 acres (Figures 183, 184, 185, and 186).
There are 463,000 acres of private and state forestland
in the Big Dry, .365,000 of which are classed as commercial
(Figure 187).
The U.S. Fish and Wildlife Service and the Bureau of
Land Management have proposed to transfer about 200,000
acres of the C. M. Russell National Wildlife Range and the
UL Bend National Wildlife Refuge to wilderness status (76)
(Table 34).
Figure 185. Big Dry Cropland, Range, and Pasture,
1958 and 1967.
(including BLM)
y^ 23.26
1958
References 150. 151, and 152.
Table 34. Big Dry Wildlands, 1975.
Classification Acres
Proposed Wilderness
Roadless Areas (BLM)
Source: Reference 76.
195,833
Figure 184. Big Dry Distribution of Agricultural Land, 1964 and 1969.
Acres (milli<
Range & Pastui
luding BLM)
Cropland
Sources: References 150 ami 195.
101-
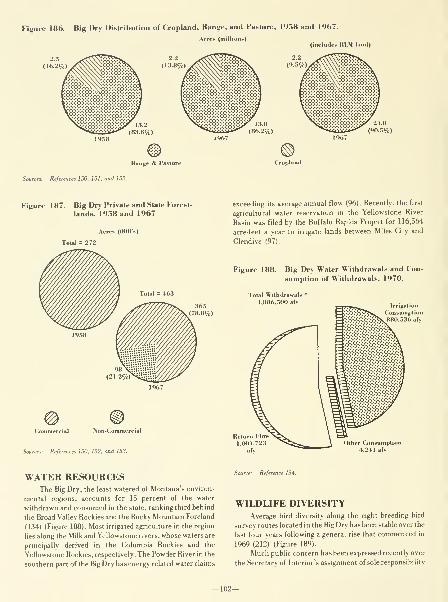
Figure 186. Big Dry Distribution of Cropland. Range, and Pasture. 1958 and 1967.
Acres (millions)(includes BLM land)
Range & Pasture
Sources: References 150, 151. and 152.
Cropland
Figure 187. Big I>ry Private and State Forest-
lands, 1958 and 1967exceeding its average annual flow (96). Recently, the first
agricultural water reservation in the Yellowstone River
Basin was filed by the Buffalo Rapids Project for 116,564
acre-feet a year to irrigate lands between Miles City and
Glendive (97).
Figure 188. Big Dry Water Withdrawals and Con-
sumption of Withdrawals. 1970.
Commercial Non-Commercial
Sources: References 150. 152. and 153.
Other Consumption
4s241 afy
tana s environ-
WATER RESOURCESThe Big Dry, the least watered of Monta
mental regions, accounts for 15 percent of the water
withdrawn and consumed in the state, ranking third behind
the Broad Valley Rockies and the Rocky Mountain Foreland
(134) (Figure 188). Most irrigated agriculture in the region
lies along the Milk and Yellowstone rivers, whose waters are
principally derived in the Columbia Rockies and the
Yellowstone Rockies, respectively. The Powder River in the
southern part of the Big Dry has energy related water claims
Source: Refei
WILDUFE DIVERSITYAverage bird diversitv along the eight breeding bird
survev routes located in the Big Dry has been stable over the
last four years following a general rise that commenced in
1969 (212) (Figure 189).
Much public concern has been expressed recently over
the Secretary of Interior's assignment of sole responsibility
102-
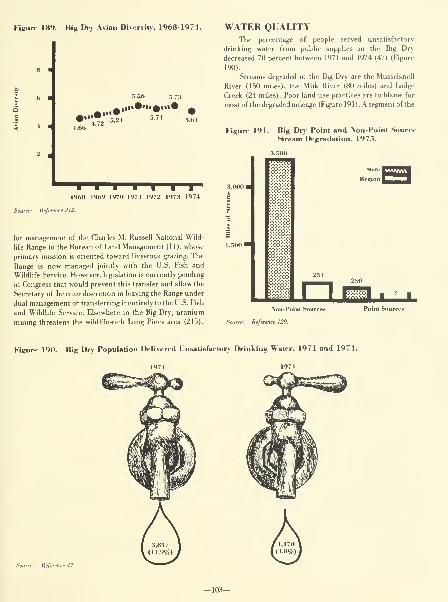
Figure 189. Big Dry Avian Diversity, 1968-1974.
5.86 5.73
5.71
1968 1969 1970 1971 1972 1973 1974
Refer
for management of the Charles M. Russell National Wild-
life Range to the Bureau of Land Management (11), whose
primary mission is oriented toward livestock grazing. The
Range is now managed jointly with the U.S. Fish and
Wildlife Service. However, legislation is currently pending
in Congress that would prevent this transfer and allow the
Secretary of Interior discretion in leaving the Range under
dual management or transferring it entirely to the U.S. Fish
and Wildlife Service. Elsewhere in the Big Dry, uranium
mining threatens the wildlife-rich Long Pines area (215).
WATER QUALITYThe percentage of people served unsatisfactory
drinking water from public supplies in the Big Dry
decreased 70 percent between 1971 and 1974 (47) (Figure
190).
Streams degraded in the Big Dry are the Musselshell
River (150 miles), the Milk River (80 miles) and Lodge
Creek (24 miles). Poor land use practices are to blame for
most of the degraded mileage (Figure 191). A segment of the
Figure 191. Big Dry Point and Non-Point Source
Stream Degradation, 1975.
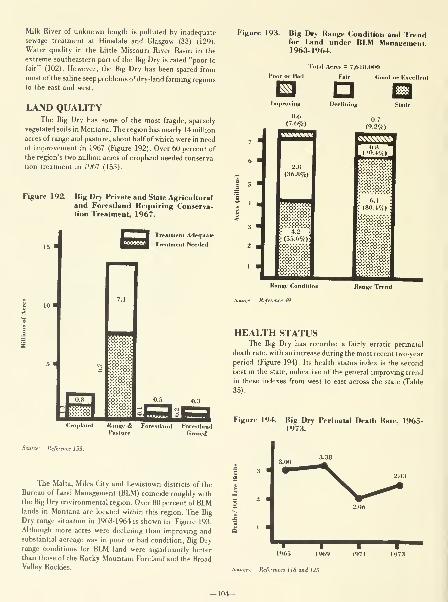
Milk River of unknown length is polluted by inadequate
sewage treatment at Hinsdale and Glasgow (33) (129).
Water quality in the Little Missouri River Basin in the
extreme southeastern part of the Big Dry is rated "poor to
fair" (102). However, the Big Dry has been spared from
most of the saline seep problems of dry-land farming regions
to the east and west.
LAND QUALITYThe Big Dry has some of the most fragile, sparsely
vegetated soils in Montana. The region has nearly 14 million
acres of range and pasture, about half of which were in need
of improvement in 1967 (Figure 192). Over 60 percent of
the region's two million acres of cropland needed conserva-
tion treatment in 1%7 (153).
Figure 192. Big Dry Private and State Agriculturaland Forestiand Requiring Conserva-tion Treatment, 1967.
Treatmenl Adequate
TrearnienI Needed
"•» 0.3
Cropland Range & Foreslland ForestlandPasture Crazed
Source: Refei
The Malta, Miles City and Lewistown districts of the
Bureau of Land Management (BLM) coincide roughly with
the Big Dry environmental region. Over 80 percent of BLMlands in Montana are located within this region. The Big
Dry range situation in 1963-1964 is shown in Figure 193.
Although more acres were declining than improving andsubstantial acreage was in poor or bad condition, Big Dryrange conditions for BLM land were significantly better
than those of the Rocky Mountain Foreland and the BroadValley Rockies.
Figure 193. Big Dry Range Condition and Trendfor Land under BLM Management,1963-1964.
Total Aeres = 7.618,000
Poor or Bad Fair (iood or ExrellenI
o aImprovin); Deelininn
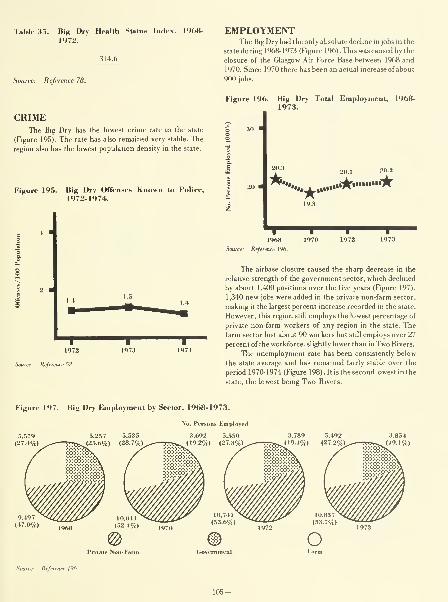
Table 35. Big Dry Health Slalut^
1972.
314.6
Source: Reference 78.
EMPLOYMENTThe Big Dry had the only absolute decline in jobs in the
state during 1968-1973 (Figure 196). This was caused by the
closure of the Glasgow Air Force Base between 1968 and
1970. Since 1970 there has been an actual increase of about
900 jobs.
Figure 196. Big Dry Total Employment, 1968-
CRIMEThe Big Dry has the lowest crime rate in the state
(Figure 195). The rate has also remained very stable. The
region also has the lowest population density in the state.
Figure 195. Big Dry Offenses Known to Police,
1972-1974.
T1972
Source: Refe,
Refe
1968
mce 196.
The airbase closure caused the sharp decrease in the
relative strength of the government sector, which declined
by about 1,400 positions over the five years (Figure 197).
1,340 new jobs were added in the private non-farm sector,
making it the largest percent increase recorded in the state.
However, this region still employs the lowest percentage of
private non-farm workers of any region in the state. The
farm sector lost about 90 workers but still employs over 27
percent of the workforce, slightly lower than in Two Rivers.
The unemployment rate has been consistently below
the state average and has remained fairly stable over the
period 1970-1974 (Figure 198) . It is the second lowest in the
state, the lowest being Two Rivers.
Figure 197. Big Dry Employment by Sector, 1968-1973.
Employed
9,
(47.0%)
Private Non-Farm (Government
.Source: Reference 196.
105—

Figure 198. Big Dry Unemployment Rate and Employment Ratio, 1970-1974.
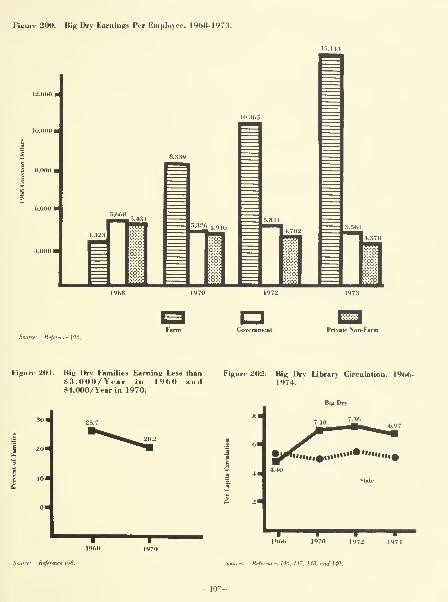
Figure 200. Big Dry Earnings Per Employee, 1968-1973.
i
I8.000
I
c
6
I
6,000 I
Source: Reference 196.
Private INon-Farm
Figure 201. Big Dry Families Earning Less than Figure 202. Big Dry Library Circulation, 1966-S3,000/Year in 1960 and 1974.«4,000/Year in 1970.
Bi)! Dr>
I 201
1960 1970
S>^»tlf!#!»»»»•»**• *••••»•••#
1966 I97<> 1972
Sources: References 146. 147. 148, and 149.
1974
-107-
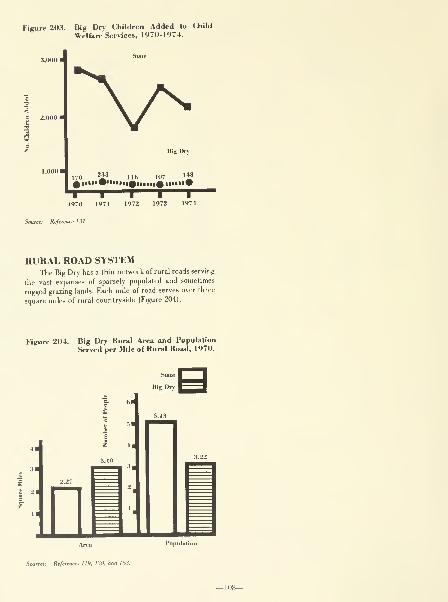
Figure 203. Big Dry Children Added to Child
Welfare Services, 1970-1974.
State
Big Dry
70233
j,(, IP- 1+8
Alllll#*'lllll^llllll^|lllli#
1
1970 1971 1972
Source: Reference 137.
1973 1974
RURAL ROAD SYSTEMThe Big Dry has a thin network of rural roads serving
the vast expanses of sparsely populated and sometimes
rugged grazing lands. Each mile of road serves over three
square miles of rural countryside (Figure 204).
Figure 204. Big Dry Rural Area and Population
Served per Mile of Rural Road, 1970.
State
Big Dry
1 s.

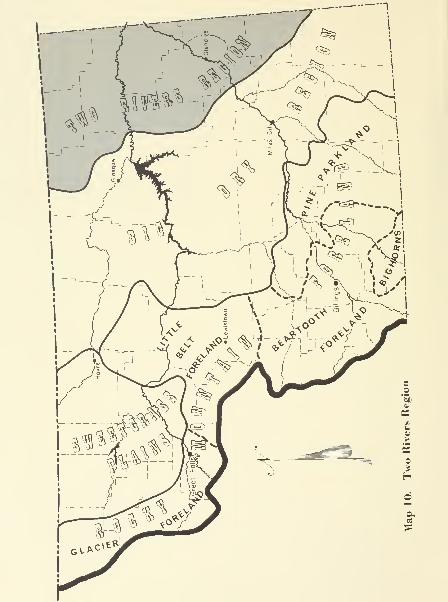

TWO RIVERS REGION
ENVIRONMENTAL PERSPECTIVENortheastern Montana resembles the Sweetgrass
Plains in that it is a grain, petroleum, and natural gas region.
It differs from the Sweetgrass Plains in several respects.
The Two Rivers Region is generally colder because it lacks
the chinook wind of the Sweetgrass Plains. It is not
surprising that a town here was named "Froid," which is
French for "cold"! Due to somewhat different climate from
that of the Sweetgrass Plains, the present region grows
mainly spring, rather than winter, wheat. Also, the Two
Rivers grows a substantial amount of sugar beets, dry beans
and potatoes on irrigated farmland along the Yellowstone
and Missouri rivers, the convergent alignment of which
gives the region its name. (Both regions have frost-free
growing seasons in excess of 130 days along their major
river valleys.) The Two Rivers Region has rougher land
than the Sweetgrass Plains and so proportionally less is
under cultivation. Finally, Two Rivers produces more oil
than any other environmental region of Montana.
The region encompasses two of the four major
petroleum-producing areas of the state. One of these is the
Cedar &eek Arch, which extends from Baker to slightly
beyond Glendive and yields both oil and natural gas. The
other area is in the four counties in the northeastern corner
of Montana, which yields oil without much associated gas
production. A medium sized petroleum refinery is located at
Wolf Point. The rocking, up-and-down motion of the oil-
well pumps, the smell of oil refineries, and many acres of
Photo 26. Farmland v,
Photo 27. Lambert, Montana.
mobile homes are significant features of the environment in
the petroleum areas of this and other Great Plains Montanaregions.
The characteristics of dry-land grain farming and the
resulting modifications of the natural environment are
similar to those described in the Sweetgrass Plains. The TwoRivers Region is an area of till-covered plateau north of the
Missouri, stream-dissected plateau between the two rivers,
and plains with widely spaced hills south of the Yellow-
stone. The greater amount of rough land is the cause of the
smaller proportion of land under cultivation, compared to
the Sweetgrass Plains. The uncultivated areas are used for
grazing of range livestock. More spring wheat than winter
wheat is grown because there is a greater concentration of
precipitation in summer and, being virtually out of reach of
the chinook, the winter is colder than in the Sweetgrass
Plains.
The strips of irrigated farming along the two rivers
are similar to the other irrigated areas of eastern Montana
except that there is a concentration of sugar beet
production along the Yellowstone in this region. There is a
sugar refinery at Sidney.
A noticeable concentration of towns and rural
population occurs along the irrigated strips. However, the
population contrast between the irrigated valleys and the
interfluvial areas is not nearly as pronounced as in the Big
Dry Region. The largest towns of the region — Glendive,
Sidney, and Wolf Point — are located along the irrigated
valleys. Glendive is one of the 12 regional trade centers of
Montana. The northeastern corner of the region is in the
trade area of Williston, North Dakota, which is only 20
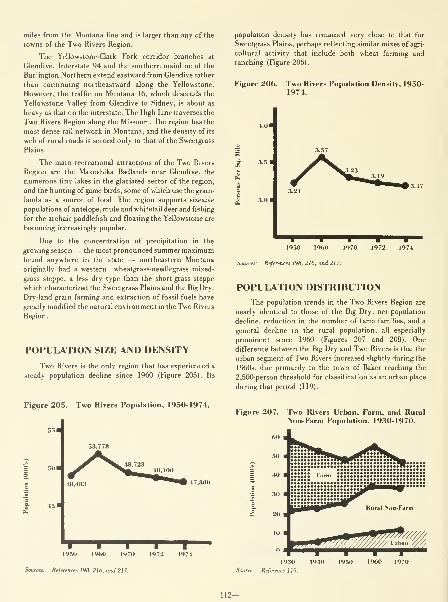
miles from the Montana line and is larger than any of the
towns of the Two Rivers Region.
The Yellowstone-Qark Fork corridor branches at
Glendive. Interstate 94 and the southern mainline of the
Burlington Northern extend eastward from Glendive rather
than continuing northeastward along the Yellowstone.
However, the traffic on Montana 16, which descends the
Yellowstone Valley from Glendive to Sidney, is about as
heavy as that on the interstate. The High Line traverses the
Two Rivers Region along the Missouri. The region has the
most dense rail network in Montana, and the density of its
web of rural roads is second only to that of the Sweetgrass
Plains.
The main recreational attractions of the Two Rivers
Region are the Makoshika Badlands near Glendive, the
numerous tiny lakes in the glaciated sector of the region,
and the hunting of game birds, some of which use the grain-
lands as a source of food. The region supports sizeable
populations of antelope, mule and whitetail deer and fishing
for the archaic paddlefish and floating the Yellowstone are
becoming increasingly popular.
Due to the concentration of precipitation in the
growing season — the most pronounced summer maximumfound anywhere in the state — northeastern Montana
originally had a western wheatgrass-needlegrass mixed-
grass steppe, a less dry type than the short-grass steppe
which characterized the Sweetgrass Plains and the Big Dry.
Dry-land grain farming and extraction of fossil fuels have
greatly modified the natural environment in the Two Rivers
Region.
POPULATION SIZE AND DENSITY
Two Rivers is the only region that has experienced a
steady population decline since 1960 (Figure 205). Its
population density has remained very close to that for
Sweetgrass Plains, perhaps reflecting similar mixes of agri-
cultural activity that include both wheat farming and
ranching (Figure 206).
Figure 206. Two Rivers Population Density, 1950-1974.
Sources: Refe\
POPULATION DISTRIBUTION
The population trends in the Two Rivers Region are
nearly identical to those of the Big Dry: net population
decline, reduction in the number of farm families, and a
general decline in the rural population, all especially
prominent since 1960 (Figures 207 and 208). Onedifference between the Big Dry and Two Rivers is that the
urban segment of Two Rivers increased slightly during the
l%Os, due primarily to the town of Baker reaching the
2,500-person threshold for classification as an urban place
during that period (119).
Figure 205. Two Rivers Population, 1950-1974.
I50
1950 1960 1970 1972 1971
Sources: References 198. 216, and 217.
Figure 207. Two Rivers Urban, Farm, and RuralNon-Farm Population, 1930-1970.
19.30 19 to 1950 I960
Source: Reference 119.
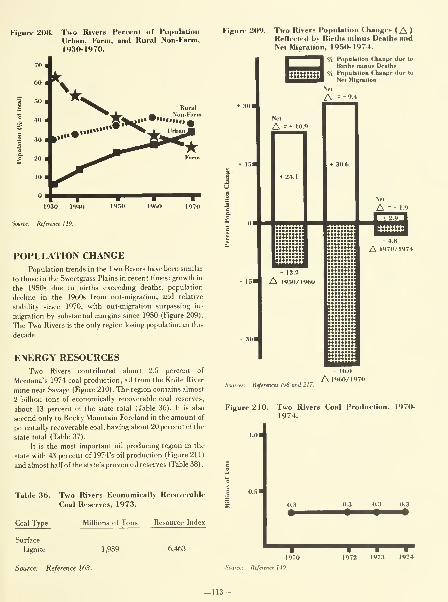
Fipure 208. Two Rivers Percent of Population
llrban. Farm, and Rural Non-Farm,1930-1970.
Riir
Non-Farm^^^L. ^ Non-Fai
S5l^t*« ••"•till,A.......—•'^^^-S
Figii
19.30 19 40 '•'''0
Source: Reference 119.
I9T0
POPULATION CHANGEPopulation trends in the Two Rivers have been similar
to those in the Sweetgrass Plains in recent times: growth in
the 1950s due to births exceeding deaths, population
decline in the 1960s from out-migration, and relative
stability since 1970, with out-migration surpassing in-
migration by substantial margins since 1950 (Figure 209).
The Two Rivers is the only region losing population in this
decade.
ENERGY RESOURCESTwo Rivers contributed about 2.5 percent of
Montana's 1974 coal production, all from the Knife River
mine near Savage (Figure 210). The region contains almost
2 billion tons of economically recoverable coal reserves,
about 13 percent of the state total (Table 36). It is also
second only to Rocky Mountain Foreland in the amount of
potentially recoverable coal, having about 20 percent of the
state total (Table 37).
It is the most important oil producing region in the
state with 43 percent of 1974's oil production (Figure 211)
and almost half of the state's proven oil reserves (Table 38)
.
Table 36. Two Rivers Economically Recoverable
Coal Reserves, 1973.
Coal Type
Surface
Lignite
Source: Reference 163.
Millions of Tons Resource Index
1,939 6,463
Two Rivers Population Changes {/\)Reflected by Births minus Deaths andNet Migration. 1950-1974.
% I'opiilatiun Change due to
BirlhK minus DealhB
% I'opulation Change due to
Net Migration
Net
A =-''•+
A 1970/1974
Sources: References 198 and 21 7.
- to.o
A 1960/1970
Figure 210. Two Rivers Coal Production, 1970-
1974.
s
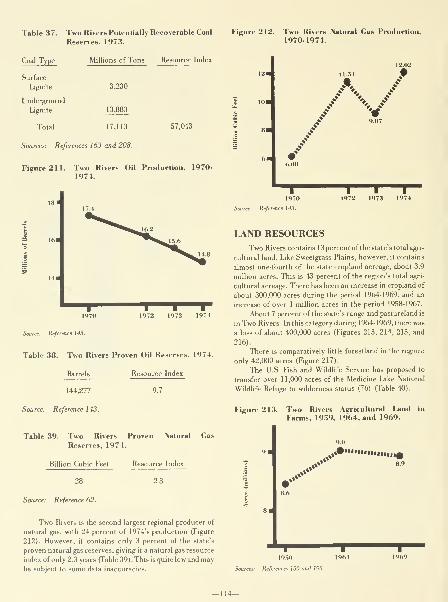
Table 37. Two Rivers Potentially Recoverable Coal
Reserves, 1973.
Figure 212. Two Rivers Natural Gas Production,
1970-1974.
Millions of Tons Resource Index
3,230
13,883
Coal Type
Surface
Lignite
Underground
Lignite
Total 17,113 57,043
Sources: References 163 and 208.
Figure 211. Two Rivers Oil Production, 1970-
1974.
1

Figure 214. Two Rivers Distribution of Agri-cultural Land, 1964 and 1969.
Acres (millions)
5.4
(60..3%)
5.0
_ _ _ (56.6%).3.6
^ ^ "(39.7%)
Figure 216. Two Rivers Distribution of Cropland,Range, and Pasture, 1958 and 1967.
Acrrs (millions)
Range & Pasture Cropland
Somces: References 150 and 195. Range & Pasture Cropland
Sources: References 150, 151, and 152.
Figure 215. Two Rivers Cropland, Range, andPasture, 1958 and 1967.
I I1958 1967
Sources: References 150. 151. and 152.
Table 40. Two Rivers Wildlands, 1975.
Classification Acres
Proposed Wilderness
Roadless Areas (BLM)
Source: Reference 76.
11,366

WATER RESOURCESSimilar to the Sweetgrass Plains in agricultural land
use, the Two Rivers Kegion accounts for only 4 percent of
the water withdrawn and depleted in the state, most of it for
irrigation along the Yellowstone and Missouri rivers (134)
(Figure 218). Proposed coal processing activities along the
Poplar River just north into Saskatchewan and near the Big
Dry Arm of Fort Peck Reservoir west of Grcle would
further diminish water supplies to the region. Burlington
Northern has filed application to divert 67 ,000 afy from the
Big Dry Arm (13) and, when fully developed, the Saskatche-
wan power plant will consume about 7,800 afy from the East
Fork of the Poplar River, a river that yields an average of
1 1 ,900 afy (29) . More than a third of Montana's total water
supply (16,678,000 afy) leaves the state through this region
via the two rivers for which it is named: the Missouri and
the Yellowstone (134).
WILDLIFE DIVERSITY
Average avian diversity along the Redstone, Grcle and
Savage routes in the Two Rivers has been increasing
steadily since 1968 except for a slight drop in 1971 (21)
(Figure 219). Like the Sweetgrass Plains, the Two Rivers is
a region of intensive agriculture and has a correspondingly
low average breeding bird diversity. The effects on wildlife
in the region by the proposed Burlington Northern fertilizer
plant near Grcle are undetermined.
Figure 218. Two Rivers Water Withdrawals andConsumption of Withdra'-vals, 1970.
Total Withdraw
Other Consumption
12.724 afy
Source: Reference 134.
Figure 219. Two Rivers Avian Diversity, 1968-
1974.
WATER QUALITY
In 1974, in the Two Rivers, only about half as many
people were delivered unsatisfactory drinking water from
public supplies as in 1971 (47) (Figure 220). Salt water from
oil drilling operations in the Plentywood area has contami-
nated stockwater wells and affected an estimated 200 acres
of land (84).
Streams degraded in the Two Rivers include the
Redwater River (80 miles) , Muddy Geek (70 miles) and the
Poplar River (100 miles), all affected by natural salts
thought to be aggravated by land use practices (Figure 221).
However, more detailed work is needed to identify the
sources of these problems (32). The extent of pollution
from point sources in the region is not known at this time
(129). In the lower Yellowstone Basin high concentrations
of salts and suspended sediment — much of them natural —are the primary causes of water quality degradation (103).
In the lower Missouri River Basin, saline seep is rated the
most serious non-point source pollution problem with poor
quality irrigation return flows rated second (32). Many
questions remain unanswered regarding impacts on water
quality and quantity of a proposed 1,200 megawatt coal-
fired generating station in Saskatchewan, a few miles north
of the Canadian line along the East Fork of the Poplar River
(15) (25) (29).
J I I I I I I
1968 !•*(>'> 1970 1971 1972 1973 1974
Source: Refei
LAND QUAUTYCropland and range and pasture are about equally
important private land uses in the Two Rivers Region. Over
two million acres each of cropland and range and pasture
were in need of conservation treatment in 1967 (153)
(Figure 222). Although the percentage of agricultural land
116-
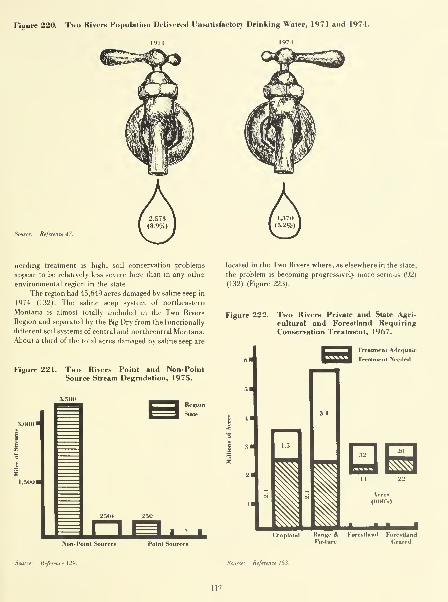
Figure 220. Two Rivers Population Delivered Unsalisfaelory Drinking Water, 1971 and 1974.
Source: Refei
needing treatment is high, soil conservation problems
appear to be relatively less severe here than in any other
environmental region in the state.
The region had 45,649 acres damaged by saline seep in
1974 (132). The saline seep system of northeastern
Montana is almost totally included in the Two Rivers
Region and separated by the Big Dry from the functionally
different soil systems of central and northcentral Montana.
About a third of the total acres damaged by saline seep are
Figure 221. Two Rivers Point and Non-PointSource Stream Degradation, 1975.
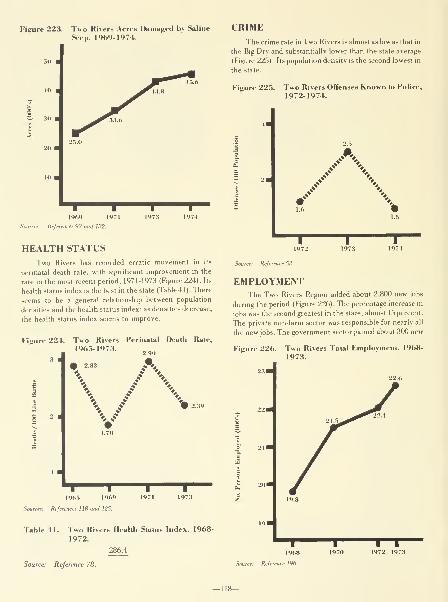
Figure 223. Two Rivers Acres Damaged by Saline
Seep. 1969-1974.
Sources: Refei
1969 I
ces 92 and 132.
1973
HEALTH STATUSTwo Rivers has recorded erratic movement in its
perinatal death rate, with significant improvement in the
rate in the most recent period, 1971-1973 (Figure 224). Its
health status index is the best in the state (Table 41). There
seems to be a general relationship between population
densities and the health status index: as densities decrease,
the health status index seems to improve.
Figure 224. Two Rivers Perinatal Death Rate,
1965-1973.
I I I196,5 1969 1971 197.3
Sources: References 1 18 and 125.
Table 41. Two Rivers Health Status Index. 1968-
1972.
286.4
Source: Reference 78.
CRIMEThe crime rate in Two Rivers is almost as low as that in
the Big Dry and substantially lower than the state average
(Figure 225). Its population density is the second lowest in
the state.
Figure 225. Two Rivers Offenses Know n to Police,
1972-1974.
2..';A
TT1973
T1974
EMPLOYMENTThe Two Rivers Region added about 2,800 new jobs
during the period (Figure 226). The percentage increase in
jobs was the second greatest in the state, almost 15 percent.
The private non-farm sector was responsible for nearly all
the new jobs. The government sector gained about 300 new-
Figure 226. Two Rivers Total Employment, 1968-
1973.
Source: Refei
196K
196.

jobs while the farm sector lost about 200 (Figure 227). The the total region's employment. This region also enjoys the
farm sector is strongest in Two Rivers with 27 percent of the lowest unemployment rate of any region, 4.2 percent; the
total employment; the government sector is the smallest employment ratio is also the highest, exceeding 90 percent
here of any region, accounting for less than 15 percent of (Figure 228).
Figure 227. Two Rivers Employment by Sector, 1968-1973.
iNo. Persons Employed
3,009

INCOMEAmong the regions. Two Rivers showed the greatest
improvement in real per capita personal income, a 60
percent increase. In 1973, it had the highest PCPI in the
state (Figure 229). This large increase was led by the farm
sector which more than tripled its real earnings per
employee, showing the highest absolute increase of any
region in the state (Figure 230). The government sector has
remained the lowest real EPE in the state and the private
non-farm sector had the second largest decline in real EPE
in the state, almost 16 percent during the five year period
1968-1973.
During the 1960-1970 period. Two Rivers showed the
greatest improvement in the percentage of low income
families with a 43 percent decline — from the highest in the
state to slightly below the state average (Figure 231).
Figure 231.
Fi,
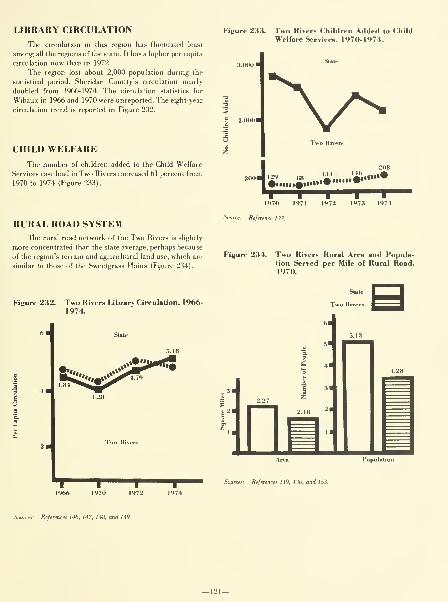
LIBRARY CIRCULATION
The circulation in this region has fluctuated least
among all the regions of the state. It has a higher per capita
circulation now than in 1972.
The region lost about 2,000 population during the
statistical period. Sheridan County's circulation nearly
doubled from 1966-1974. The circulation statistics for
Wibaux in 1966 and 1970 were unreported. The eight-year
circulation trend is reported in Figure 232.
CHILD WELFAREThe number of children added to the Child Welfare
Services case load in Two Rivers increased 61 percent from
1970 to 1974 (Figure 233).
RURAL ROAD SYSTEMThe rural road network of the Two Rivers is slightly
more concentrated than the state average, perhaps because
of the region's terrain and agricultural land use, which are
similar to those of the Sweetgrass Plains (Figure 234).
Figure 233. Two Rivers Children Added to ChildWelfare Services, 1970-1974.
Suie
208
^^llll#^l«"'^"""*
1970 1971 1972 1973 1974
Source: Reference 137.
Figure 234. Two Rivers Rural Area and Popula-tion Served per Mile of Rural Road,1970.
Figure 232. Two Rivers Library Circulation, 1966-
1974.
61


THE EQC INDICATORS PROGRAM
The indicators used in this report were carefully select-
ed in the belief that they most clearly represented environ-
mental conditions in Montana. As the Environmental
Quality Council staff reviewed the indicators reported in
the First Annual Report (1972) and gathered information on
indicator efforts in other statesand some federal agencies, it
was decided that the collection of original data was beyond
the staffs capability and exceeded the Council's duties
outlined in the Montana Environmental Policy Act (30).
Consequently, the task began by examing the current
status of data collecting and monitoring activities of state
and federal agencies operating in Montana. The results of
that project are presented in Environmental Monitoring in
Montana, the insert to this report. Review of these activities
lead to the establishment of four criteria which determined
whether monitoring data could be considered for inclusion
in this EQC report: 1) availability of monitored data; 2)
extensive, preferably statewide, coverage; 3) reflect real
environmental conditions and changes, and 4) relevance to
environmental policymaking and program administration.
The EQC Fourth Annual Report (1975) presents data
that reflect Montana environmental conditions and trends
using this rationale. In analyzing the material considered
for inclusion here, it became clear that some of the
indicators are unclear, inadequate, and perhaps mis-
leading. In addition, the staff became painfully aware of
significant information gaps and recognized that regularly
monitored data in other areas were required to present a
more accurate picture of environmental trends and
conditions in Montana. Some of these information needs
are:
1. Energy consumption and waste by sector
2. Energy exploration activities
3. Aesthetics (litter, billboards, junkyards, etc.)
4. Recreation availability and quality
5. Housing
6. Plant diversity
7. Encroachment on wildlands and wildlife habitat
8. Productive potential of agricultural lands
9. Encroachment on agricultural lands by other
activities
10. Conversion of agricultural land
11. Spread of noxious weeds
12. Access to medical care
13. Access to transportation
Ideally, it is hoped that this report will stimulate a
systematic and comprehensive examination of the current
status of environmental monitoring activities in Montana.Properly conducted, and with enough interest from citizens
who share the EQC's belief that accurate data are pre-
requisite to informed action, that review will utlimately
result in better indicator data.
What follows here is an explanation of the indicators
contained in this report.
POPULATION SIZE AND DENSITYPopulation levels are a basic determinant, along with
income and consumption patterns, of the aggregate demandfor natural resources and environmental amenities.
Resource depletion and environmental degradation are
hastened as the ecosystem is required to support everincreasing numbers of people. The quality of life in a given
area also may be directly related to the population density in
that area because demand for land resources is to an extent
proportional to population density. However, in sparsely
settled regions people are less subject to socializing
influences and suffer from what is commonly termed "the
social cost of space."
POPULATION DISTRIBUTION
The distribution ofa population among urban, rural non-
farm and agricultural sectors is a key to patterns of resource
allocation and intensity of environmental pollution. Ahighly urbanized population is subject to the social stresses
that accompany high density living, but at the same time has
access to many social and cultural amenities not available in
more sparsely settled regions. Monitoring population
distribution figures over time indicates the increase and
decrease of the various segments of Montana's population,
and thus, to an extent, the changing character of life in the
state.
POPULATION CHANGELarge scale change or rapid turnover of a community's
citizens may contribute to instability and stress. Constant
stress inhibits the establishment of social bonds and
personal relationships. Viewed regionally, population
change may reflect the land's long-term ability or inability
-123-
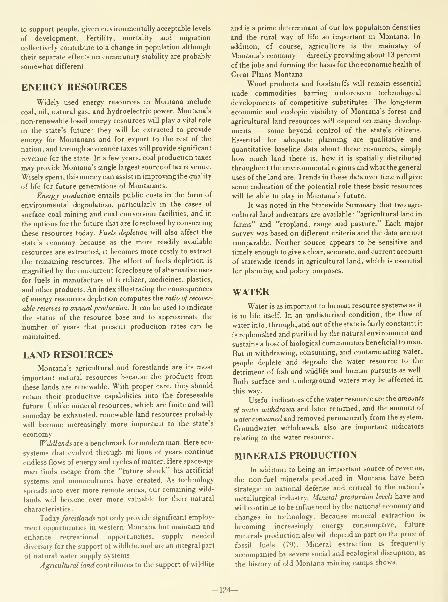
to support people, given environmentally acceptable levels
of development. Fertility, mortality and migration
collectively contribute to a change in population although
their separate effects on community stability are probably
somewhat different.
ENERGY RESOURCES
Widely used energy resources in Montana include
coal, oil, natural gas, and hydroelectric power. Montana's
non-renewable fossil energy resources will play a vital role
in the state's future: they will be extracted to provide
energy for Montanans and for export to the rest of the
nation, and through severance taxes will provide significant
revenue for the state. In a few years, coal production taxes
may provide Montana's single largest source of tax revenue.
Wisely spent, this money can assist in improving the quality
of life for future generations of Montanans.
Energy production entails public costs in the form of
environmental degradation, particularly in the cases of
surface coal mining and coal conversion facilities, and in
the options for the future that are foreclosed by consuming
these resources today. Fuels depletion will also affect the
state's economy because as the more readily available
resources are extracted, it becomes more costly to extract
the remaining resources. The effect of fuels depletion is
magnified by the concurrent foreclosure of alternative uses
for fuels in manufacture of fertilizer, medicines, plastics,
and other products. An index illustrating the consequences
of energy resources depletion computes the ratio of recover-
able reserves to annual production. It can be used to indicate
the status of the resource base and to approximate the
number of years that present production rates can be
maintained.
LAND RESOURCESMontana's agricultural and forestlands are its most
important natural resources because the products from
these lands are renewable. With proper care, they should
retain their productive capabilities into the foreseeable
future. Unlike mineral resources, which are finite and will
someday be exhausted, renewable land resources probably
will become increasingly more important to the state's
economy.
Wddlands are a benchmark for modern man. Here eco-
systems that evolved through millions of years continue
endless flows of energy and cycles of matter. Here space-age
man finds escape from the "future shock" his artificial
systems and monocultures have created. As technology
spreads into ever more remote areas, our remaining wild-
lands will become ever more valuable for their natural
characteristics.
Today forestlands not only provide significant employ-
ment opportunities in western Montana but maintain and
enhance recreational opportunities, supply needed
diversity for the support of wildlife, and are an integral part
of natural water supply systems.
Agricultural /aru/ contributes to the support of wildlife
and is a prime determinant of our low population densities
and the rural way of life so important in Montana. In
addition, of course, agriculture is the mainstay of
Montana's economy — directly providing about 13 percent
of the jobs and forming the basis for the economic health of
Great Plains Montana.
Wood products and foodstuffs will remain essential
trade commodities barring unforeseen technological
developments of competitive substitutes. The long-term
economic and ecologic viability of Montana's forest and
agricultural land resources will depend on many develop-
ments — some beyond control of the state's citizens.
Essential for adequate planning are qualitative and
quantitative baseline data about these resources, simply
how much land there is, how it is spatially distributed
throughout the environmental regions and what the general
uses of the land are. Trends in these data over time will give
some indication of the potential role these basic resources
will be able to play in Montana's future.
It was noted in the Statewide Summary that two agri-
cultural land indicators are available: "agricultural land in
farms" and "cropland, range and pasture." Each major
survey was based on different criteria and the data are not
comparable. Neither source appears to be sensitive and
timely enough to give a clear, accurate, and current account
of statewide trends in agricultural land, which is essential
for planning and policy purposes.
WATERWater is as important to human resource systems as it
is to life itself. In an undisturbed condition, the flow of
water into, through, and out of the state is fairly constant ;it
is replenished and purified by the natural environment and
sustains a host of biological communitiesbeneficial to man.
But in withdrawing, consuming, and contaminating water,
people deplete and degrade the water resource to the
detriment of fish and wildlife and human pursuits as well.
Both surface and underground waters may be affected in
this way.
Useful indicators of the water resource are the amounts
of water withdrawn and later returned, and the amount of
water consumed and removed permanently from the system.
Groundwater withdrawals also are important indicators
relating to the water resource.
MINERALS PRODUCTIONIn addition to being an important source of revenue,
the non-fuel minerals produced in Montana have been
strategic in national defense and critical to the nation's
metallurgical industry. Mineral production levels have and
will continue to be influenced by the national economy and
changes in technology. Because mineral extraction is
becoming increasingly energy consumptive, future
minerals production also will depend in part on the price of
fossil fuels (79). Mineral extraction is frequently
accompanied by severe social and ecological disruption, as
the history of old Montana mining camps shows.
124—

WILDUFE DIVERSITY
Dennis Flath, the Montana Department of Fish and
Game's nongame and threatened species wildUfe biologist,
illustrates the role wildlife diversity plays in the Montana
environment (86):
The welfare of wildlife populations is inextricably
tied to the quality and quantity of available
habitat. This precept applies to mice and moose
alike: A healthy habitat produces healthy wildlife
populations. And nongame species rank among
the most reliable indicators of the land's vigor,
diversity and stability.
In the web of life, a diverse and complex fauna
indicates ecological stability. ... By monitoring
species diversity and population levels of non-
game wildlife, researchers can determine when
and where the ecological integrity of Montana is
at stake.
Statewide, the Montana Department of Fish and Gamemonitors three biological parameters that are keyed to
management of big game species: browse utilization,
fawn/doe ratio, and animal population estimates. These
parameters have many shortcomings that tend to minimize
their value as environmental indicators (70), not the least
of which is their exclusive preoccupation with game species
representing only a small segment of wildlife.
Birds are the largest single group of backboned animals
in Montana and 351 species, including both game and
nongame birds, have been identified (122). Birds are highly
mobile opportunists, taking advantage of nearly every avail-
able ecological niche. Each species requires certain environ-
mental conditions, so the population of a given species
correlates with the extent of that species' preferred habitat.
The number of species in an area indicates the variety of
available habitat types.
Birds are easy to observe and receive attention from
both professional ornithologists and amateur bird watchers.
Annual spring surveys have been conducted over selected
routes statewide since 1968. Christmas bird counts have
been organized at certain localities since the early part of
this century.
The annual spring breeding bird census is Montana's
most comprehensive wildlife monitoring effort. Most of the
state's 28 census routes are covered each year between June
1 and July?. (See map on insert Environmental Monitoring in
Montana.) Qualified observers follow standard procedures
and carefully note prevailing weather conditions (82).
Data on the number of species and individuals
recorded per route were obtained from computer printouts
supplied by the U.S. Fish and Wildlife Service (212). Data
for each route-year were plugged into the following
formula:
J _ m - 1
InN
where d is the avian diversity index, m is the number of
species recorded per route, ire is the natural logarithm
function and A' is the total number of individuals recorded
per route. This index is averaged over each region for each
year that data are available. As the value of d increases, it
can be assumed that community complexity and ecosystem
stability also increase, and as d decreases, ecosystem
integrity is on the decline.
Beyond the avian diversity index, population levels of
certain habitat specific, useful, or nuisance bird species can
be used to indicate more specific environmental conditions.
Wildlife, as an early warning system, works both ways:
either a decrease or an increase in certain species can alert
us to environmental problems (191). The Smithsonian
Institution has developed a list of wildlife species indicative
of aesthetic quality, chemical contamination, garbage and
filth contamination, crop damage, urban degradation,
recreation, and wildlife management effectiveness (183).
Twenty-one of these animals, including 17 bird species,
occur in Montana, making the system applicable in the
state. Population trends of selected indicator species may be
used where population levels are high enough to be
statistically significant.
Use of breeding bird survey data to measure eco-
system stability has some pitfalls, however. First, only one
group of animals is censused. No account is given to floral
diversity or to other animal groups. Secondly, annual
vagaries in the weather may temporarily mask population
fluctuations or long-term changes in diversity caused by
man. Thirdly, avian diversity would remain relatively
constant even if a desirable species were replaced by an
undesirable species. Inspiteof these problems, the breeding
bird surveys and avian diversify remain the best available
indicator of the health and vigor of Montana's wildlife com-
munity and of the effectiveness of managing this resource
under the state's Nongame and Endangered Species Act of
1973.
From the mourning dove to the grizzly bear, "all wild-
life acts as an indicator of a quality environment to man. As
wildlife habitat disappears, human habitat becomes a little
less livable — and certainly less desirable" (177).
AIR QUAUTYThe status of Montana's major air pollution problems
is indicated by data from monitoring stations in nine
problem areas. (See map on insert Environmental Monitor-
ing in Montana.) Individual air pollution parameters,
namely particulates, sulfation rates, and fluoride, are used as
prime indicators of air quality at selected localities for the
purpose of this report. The following five criteria were used
to choose parameters and reporting stations: 1) the station
is active ; 2) at least t hree years of data are available (to showtrends); 3) the station reports the maximum ambient level
in the area; 4) the parameter is most characteristic of the
ambient air pollution problem in thearea; and 5) the station
is close to a population center. In addition, the status of
compliance by industrial plants with the federal Qean Air
Act Amendments of 1970 is used to indicate the progress
toward meeting air quality standards set by law.
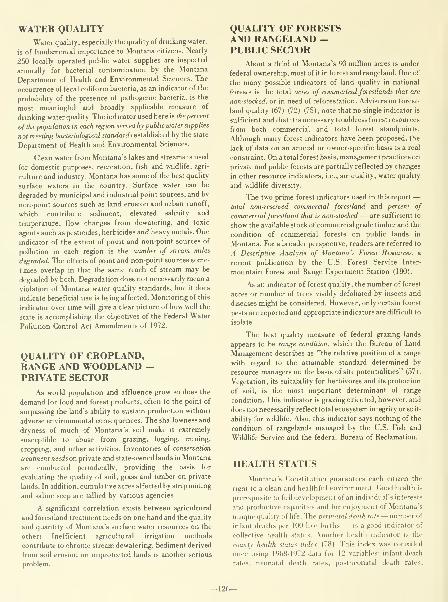
WATER QUALITYWater quality, especially the quality of drinking water,
is of fundamental importance to Montana citizens. Nearly
250 locally operated public water supplies are inspected
annually for bacterial contamination by the Montana
Department of Health and Environmental Sciences. The
occurrence of fecal coliform bacteria, as an indicator of the
probability of the presence of pathogenic bacteria, is the
most meaningful and broadly applicable measure of
drinking water quality. The indicator used here is thepercent
of the population in each region served bypublic water supplies
not meeting bacteriological standards established by the state
Department of Heahh and Environmental Sciences.
Clean water from Montana's lakes and streams is used
for domestic purposes, recreation, fish and wildlife, agri-
culture and industry. Montana has some of the best quality
surface waters in the country. Surface water can be
degraded by municipal and industrial point sources, and by
non-point sources such as land erosion and urban runoff,
which contribute sediment, elevated salinity and
temperature, flow changes from dewatering, and toxic
agents such as pesticides, herbicides and heavy metals. One
indicator of the extent of point and non-point sources of
pollution in each region is the number of stream miles
degraded. The effects of point and non-point sources some-
times overlap in that the same reach of stream may be
degraded by both. Degradation does not necessarily mean a
violation of Montana water quality standards, but it does
indicate beneficial use is being affected. Monitoring of this
indicator over time will give a clear picture of how well the
state is accomplishing the objectives of the Federal Water
Pollution Control Act Amendments of 1972.
QUALITY OF CROPLAND,RANGE AND WOODLAND -PRIVATE SECTOR
As world population and affluence grow so does the
demand for food and forest products, often to the point of
surpassing the land's ability to sustain production without
adverse environmental consequences. The shallowness and
dryness of much of Montana's soil make it extremely
susceptible to abuse from grazing, logging, mining,
cropping, and other activities. Inventories of conservation
treatment needs on private and state-owned lands in Montana
are conducted periodically, providing the basis for
evaluating the quality of soil, grass and timber on private
lands. In addition, cumulative acres affected by strip mining
and saline seep are tallied by various agencies.
A significant correlation exists between agricultural
and forestland treatment needs on one hand and the quality
and quantity of Montana's surface water resources on the
other: Inefficient agricultural irrigation methods
contribute to chronic stream dewatering. Sediment derived
from soil erosion on unprotected lands is another serious
problem.
QUALITY OF FORESTSAND RANGELAND -PUBLIC SECTOR
About a third of Montana's 93 million acres is under
federal ownership, most of it in forest and rangeland. One of
the many possible indicators of land quality in national
forests is the total acres of commerical forestlands that are
non-stocked, or in need of reforestation. Advisers on forest-
land quality (67) (72) (75), note that no single indicator is
sufficient and that it is necessary to address forest resources
from both commercial and total forest standpoints.
Although many forest indicators have been proposed, the
lack of data on an annual or owner-specific basis is a real
constraint. On a total forest basis, management practices on
private and public forests are partially reflected by changes
in other resource indicators, i.e., air quality, water quality
and wildlife diversity.
The two prime forest indicators used in this report —total non-reserved commercial forestland and percent of
commercial forestland that is non-stocked — are sufficient to
show the available stock of commercial grade timber and the
condition of commercial forests on public lands in
Montana. For a broader perspective, readers are referred to
A Descriptive Analysis of Montana's Forest Resources, a
recent publication by the U.S. Forest Service Inter-
mountain Forest and Range Experiment Station (180).
As an indicator of forest quality, the number of forest
acres or number of trees visibly defoliated by insects and
diseases might be considered. However, only certain forest
pests are reported and appropriate indicators are difficult to
isolate.
The best quality measure of federal grazing lands
appears to be range condition, which the Bureau of Land
Management describes as "the relative position of a range
with regard to the attainable standard determined by
resource managers on the basis of site potentialities" (57).
Vegetation, its suitability for herbivores and its protection
of soil, is the most important determinant of range
condition. This indicator is grazing oriented, however, and
does not necessarily reflect total ecosystem integrity or suit-
ability for wildlife. Also, this indicator says nothing of the
condition of rangelands managed by the U.S. Fish and
Wildlife Service and the federal Bureau of Reclamation.
HEALTH STATUS
Montana's Constitution guarantees each citizen the
right to a clean and healthful environment. Good health is
prerequisite to full development of an individual's interests
ami productive capacities and for enjoyment of Montana's
unicjue quality of life. The perinatal death rate— number of
infant deaths per 100 live births — is a good indicator of
collective health status. Another health indicator is the
county health status index (78). This index was compiled
once u.sing 1968-1972 data for 12 variables: infant death
rates, neonatal death rates, postneonatal death rates.
accidental fatality rates (for motor vehicle deaths),
accidental fatality rates (other), low birth weight rates, age
adjusted death rates, combined suicide-homocide death
rates, uterine cancer death rates, fetal death rates, liver
cirrhosis death rates, and lung cancer death rates. Eiach
county was ranked one through 56 for each variable with a
rank of 56 representing the worst case. County ranks for
each variable were added and total county scores aggregated
and averaged for each region giving an average score that
correlates directly with health in that region, i.e., a higher
score represents greater health problems. Individual county
scores range from 143 (best) to 515 (worst) with an average
of 337.
It should be noted that for some environmental
regions, the perinatal death rate and county health status
index contradict each other. This is because the perinatal
death rate is only one of twelve variables used to compute
the index. When that index is high (from 337 to 515) and
the perinatal death rate low, it means other variables used to
calculate the index were high. The county health status
index may reflect more accurately the overall health of a
region, however, its one-shot nature limits its utility as an
indicator over time.
CRIMEThe man-made environment includes a set of laws to
circumscribe human behavior. Violation of these laws
constitutes crime. A personal sense of security is an
important component of a quality human environment.
Increasing crime rates indicate decreasing personal
security. Although subject to differences in local reporting
systems, offenses known to police (all crimes reported to
police) appears to be the best crime indicator available (52)
.
However, about half of all crimes go unreported to police.
situation an increase in employment opportunities can lead
to a higher unemployment rate. Unemployment greatly
inhibits individual and collective achievement. It is also
economically costly in terms of taxes on employers, costs of
administering public employment agencies, and loss of
human productivity and purchasing power. Unemploy-
ment and underemployment also have high social costs.
For these reasons, total employment data are indicators
of the "people" side of Montana's economy and its basic
productivity. Employment by sector illustrates the relative
strengths of the private nonfarm, farm, and government
sectors in providing jobs, as well as indicating structural
changes in the economy overtime. The employment ratiohas
been estimated and included along with the unemployment
rate because the employment ratio takes into account total
working age population and avoids certain problems of
definition connected with the term unemployed (157).
Two sources of employment data have been used in
this report: the Regional Economic Information Service
(REIS) data of the U.S. Department of Commerce and data
compiled by the Montana Department of Labor and
Industry's Employment Security Division. REIS is
generally considered more comprehensive since it utilizes
the state's primary data in addition to those of other federal
sources. Other principal differences are that REIS includes
military employment, has a broader definition of agri-
cultural employment, and does not adjust for dual job
holders, i.e., one person holding two jobs is counted as "2"
for total employment. Strict comparisons of unemploy-
ment rate and employment ratio data are not possible due to
the different geographical boundaries used to compute
each, the unemployment rate corresponding to MontanaDepartment of Labor and Industry "Labor Market Areas"
and the employment ratio to county boundaries.
EMPLOYMENTA job is a basic requirement of a healthy environment
for most adult Montanans. Securing and holding
meaningful work is a prime determinant of individual self-
respect, and hence of social welfare and stability. Employ-
ment and unemployment statistics are perhaps more basic
measures of the health of Montana's economy than average
income since income indicators alone fail to show the
impact of the economy on individual citizens. For example,
real per capita income can rise because some workers are
moving into higher wage brackets while at the same time
unemployment rates can be increasing due to growth in
employment opportunities lagging behind growth in labor
force. In fact, this happened in Montana in the 1970-1972
period.
Interpretations of employment and unemployment
rates should be made with caution. An increase in jobs will
cause an increase in local population to the extent that the
local labor force does not fill the new positions. It is possible
that this in-migration of people will exceed the capacity of
the local economy to fully employ the associated labor
force, hence an increase in unemployment. In such a
INCOMEPersonal income plays a significant role in the environ-
ment, for it provides a perceivable measure of personal
security and freedom and serves to motivate social and
economic activity. The "American dream" has, in large
part, been based on the belief that all citizens are entitled to
increasing levels of affluence that will reach them if the pay
is fair and the work completed satisfactorily. To a great
extent the belief has proven itself.
Yet the direct relationship between income and
consumption has a curiously disturbing side effect. While
the material needs of many citizens largely have been met,
"rising expectations" seem to place never-ending demands
on the environment and public resources. This
phenomenon has, in part, been responsible for recent high
rates of inflation that, ironically, tend to erode the
increased purchasing power originally sought. In short,
acquisition and consumption through increased income,
although it is an important element of individual and
societal well-being, has many other impacts on the quality
of life and must be placed in perspective with the many
-127-
other human needs that cannot be satisfied through
increased purchasing power alone.
The basic measure of income used in this report is per
capita income. Income data include all earnings plus
property, interest and dividend income. The data are
presented here in constant 1%8 dollars. But, because many
citizens are without adequate income to supply even basic
necessities data on families earning less than minimum
incomes are included. So long as some citizens are unable to
sustain minimal living standards, our economic system is
not fulfilling its potential. Earnings per employee for the
private nonfarm, farm, and government sectors shows the
average dollar return to labor in each sector and hence the
ability of each sector to provide a fair wage to its employees.
Earnings are considered wage and salary disbursements,
other labor earnings, and the net business earnings of
individual proprietors.
LIBRARY CIRCULATION
The opportunity, and in a technological world, the
necessity, to read and be informed is basic to life in a free
society (142). As American society grows increasingly
complex, more effort is required by citizens to maintain
contact with the cultural mainstream. Television,
newspapers and radio supply this contact to some degree,
but in a transitory manner; thus, in-depth, thoughtful
commentary is still dependent on the cumulated
information in books and magazines.
Public libraries are a ready source of current books and
magazines and offer educational and personal growth oppor-
tunities in addition to those offered by formal institutions
of learning. Circulation of public library holdings per capita
can be used as an indicator of access to these opportunities.
It should be recognized, however, that access is two-way.
The degree of use depends on the individual initiative and
curiosity of library patrons as well as upon the size and
quality of library collections, the accessibility of the Hbrary
building and professional staffs to administer service.
Another factor contributing to fuller use of libraries is
participation by a small library in a larger unit of service.
These larger units are called federations in Montana and
provide a broader range of resources and services than
individual libraries can offer alone.
In using circulation of public library holdings per
capita in this study, it must be recognized that libraries
often serve two environmental regions although circulation
data are assigned only to one. For example. Park County is
in both the Broad Valley Rockies and the Yellowstone
Rockies and circulation figures for Livingston Public
Library are assigned to the Broad Valley Rockies because
Livingston is located in this region. Similarly, part of
Rosebud County is in Rocky Mountain Foreland and part is
in Big Dry Region. The circulation for Rosebud County
Library, located at Forsyth, is assigned to the Rocky
Mountain Foreland Region.
CHILD WELFAREOne indicator of social well-being is the rmmber of
children added to the Child ff^elfare Services (CWS) case load,
including cases reopened. When a child is added to to the
CWS case load, at least one, but more likely several,
incidents have occureed indicating that the child's family
cannot care responsibly for the child (at least at that time).
Such families are not likely to provide the best environ-
ment for children or adults.
The decision to add a child to the CWS rolls is made by
a county social worker after receiving a complaint from a
neighbor, relative or family member or having the case
referred from another social welfare or other government
agency, including the police. Children are placed on CWSrolls if they are in danger of becoming "dependents" (an
archaic phrase meaning they are begging, spending time in
"houses of ill repute," etc.), physically or mentally en-
dangered due to neglect or abuse, or are the children of
unwed parents to be relinquished for adoption.
Occasionally the children of single-parent households will
be placed on the rolls so they can be cared for when the
parent is temporarily incapacitated, i.e., when the parent
has to go to the hospital.
RURAL ROAD SYSTEM
Highway transportation assumes great importance in
Montana with its vast area and lightly diffuse population.
There are large areas in the state which are remote from rail-
road lines and from the main network of highways. Service
to residents in these areas is complicated by the fact that
ranches are widely spaced and a road of considerable length
may serve only a few places.
It is a public responsibility to provide road facilities for
all residents, despite their isolation. To judge the adequacy
of the transportation system, it is therefore necessary to
look beyond the primary and secondary highway networks
(the major arteries of the system) and consider the
"capillary system" of county and local roads which provide
the rural population with access to the main system. The
indicator used in this report is rural area and rural popula-
tion served per mile of rural road.
Rural roads include all rural mileage outside of the
interstate, primary, secondary and other state and urban
systems; in other words, only local rural systems are
included (130). Rural population excludes all urban areas
(population centers of 2,500 or more persons) (119). Rural
area excludes all urban and built-up areas, which consist of
cities and towns and other built-up areas of more than 10
acres such as highways, roads, railroads, cemeteries,
airports, golf courses, shooting ranges, industrial sites
(except strip mines and borrow pits) and institutional or
public administrative sites (153).
BRIEF REVIEW OF OTHER INDICATOR EFFORTS
Environmental indicators are a product of the environ-
mental movement of the late sixties and early seventies.
They were developed to provide an environmental early
warning system and to make sense out of a morass of data
reflecting a very complex and rapidly changing world.
Additionally, at a time when citizens expect a greater role in
determining the livability of the environment, it is essential
that objective and coherent environmental data be avail-
able.
Indicators or indexes, as they are sometimes called,
were first popularized in 1%9 with publication by the
National Wildlife Federation (NWF) of its first National
Index of Environmental Quality (104) . An update has been
published annually except 1972 (160) (161). These annual
indexes report on conditions and trends in seven cate-
gories: wildlife, living space, soil, timber, minerals, water
and air. Each category is assigned its own numbered index.
The scientific approach to developing national
environmental indexes was pioneered in this country by the
President's Council on Environmental Quality (CEQ). TheCouncil's First Annual Report (1970) identified as "a
major national objective" the development of "a compre-
hensive nationwide system of environmental monitoring,
information, and analysis" including the development of
indexes from measured parameters (80). The CEQ com-
missioned a study, released in 1971, which designed a
system to monitor the nation's environment, described
approximately 110 environmental indexes, and identified
major data gaps in current monitoring programs (31).
Subsequent CEQ annual reports have expanded on the
indicators theme (80).
Late in 1971, a symposium on Indicators of
Environmental Quality was held in conjunction with the
American Association for the Advancement of Science
meeting in Philadelphia. The proceedings of that
symposium concluded as follows (188):
The symposium emphasized the need for public
participation in decisions concerning environ-
mental quality, and all speakers agreed that
indicators facilitate the required communication
among public officials, scientists, and the public.
Designing and testing indicators of environ-
mental quality are not mere academic exercises —scientists have a responsibility to make "environ-
ment" comprehensible to all segments of society
that justifiably demand a greater participatory
role in determining the habitability of our planet.
In the period since the Montana Environmental
Quality Cxiuncil used an indicators approach in its 1972
First Annual Report, two other states, one local govern-
ment, a region and a nation have used indicators in a
systematic manner to varying degrees and for various
purposes. In 1973, North Carolina distributed an
informational indicators brochure covering 1 1 subject areas
ranging from air quality to housing. It was the state's first
environmental overview (162). Louisiana issued a muchmore comprehensive "State of the State"report in 1975,
displaying current information on 16 indicators in three
broad categories: economy, natural resources and the
public sector (111). The County of San Diego initiated a
program to develop environmental quality indexes "in the
attempt to provide citizens and decision makers with a
comprehensive, integrated view of their regional environ-
ment" (172). Emphasis was on biophysical indicators in the
areas of air, water, noise, energy, solid waste and land use.
The (Commission on the Future of the South used
indicators, mainly in social and economic areas, in order to
arrive at a series of regional objectives and recommenda-
tions to the southern states (40). In a more scientific vein,
(Canada's Federal Department of the Environment has
outlined a (Canadian Environmental Quality Index,
including an air quality index, water and land indexes, and a
combined environmental quality index (98).
The fanfare of early environmentalquality indexes was
accompanied by the belief that the objective of indicators
was to produce a single "quality of life" index, that some-
how a methodology could be devised to aggregate all the
individual factors into a single measure. Most practitioners
have concluded that such a measure is unattainable and
have, like the EQC Fourth Annual Report (1975), come to
believe that the most feasible approach is to improve
environmental data collection and reporting systems.
Readers interested in reviewing efforts in this field are
invited to consult U.S. Environmental Protection Agency,
The 'Quality of Life' Concept: A Potential New Tool for
Decision Makers (EPA, Washington, D.C. 1973) and 0. W.Markley and Marilyn D. Bagley, Minimum Standards In
Quality of Life (EPA — 600/5-75-012, Washington, D.C,
May 1975).

ENVIRONMENTAL MONITORING IN MONTANA^
Environmental Monitoring in Montana is a general
directory and guide for officials, technicians, researchers
and citizens. The directory is a first in Montana and requires
some explanation of its limitations and origins. It should be
evident that the chart interprets "environmental" very
broadly; it identifies regular measurements made of a range
of factors not only in the biophysical environment but in
the social and economic spheres as well.
"Monitoring" has also been construed broadly in that
the chart includes regular tabulations of some resources,
which can be seen as environmental "givens" not involved
in the process of change except as their magnitudes respond
symptomatically. Oil and gas reserves furnish one example.
A monitored change here might be symptomatic of a change
in the definition of "reserve," new discoveries, increased
exploitation, or a combination of these. In the broadest
sense, because of the ultimate interconnectivity of all
things in the natural world, causes and effects intermingle
and are most accurately viewed when seen as part of a total
system.
The chart limits the definition of "monitoring" in one
important way. Judgment has been exercised in deciding
whether a monitoring activity qualifies as an environ-
mental indicator for the state as a whole. In most cases,
networks of data collection covering only limited portions
of the state or for limited periods fail to qualify. This is so
even though the data collected, as in the case of current
Environmental Protection Agency air quality monitoring
programs in the Colstrip region, will be important baseline
references against which to measure subsequent changes
over a large area. This includes current U.S. Geological
Survey hydrologic studies and other federal and state
environmental impact studies of specific projects. Failure to
include limited monitoring activites should not be
interpreted as belittling their importance. The chart also
fails toaddress the extent of monitoring by private agencies,
partly because private data collectors are less accountable
than public agencies for bias and error and are not always
accessible.
Environmental Monitoring in Montana was prepared as
part of a comprehensive environmental indicator program
by the Montana Environmental Quality Council (EQC).
The program emphasizes additional uses for existing data,
such as tailoring them to fit an analysis of Montana's
diverse environmental regions, and strives to put environ-
mental issues in their proper perspective by illuminating
not only the biophysical implications of environmental
changes but their social and economic aspects as well.
Issues viewed in this holistic context will allow Montanacitizens and their decision makers to choose wisely from
among many competing uses of Montana's resources.
The monitoring directory project revealed the need for
a coordinated environmental monitoring system. Channels
of communication among data collectors are poorly defined,
as are channels of communication to the public. Increased
public access to monitored data is a chief goal of the
monitoring directory.
Important information that could be collected as part
of routine agency activities is being ignored. The Depart-
ment of Community Affairs, for example, could record and
tabulate subdivision encroachment on wildlife habitat and
agricultural lands as part of its day-to-day administration of
the Montana Subdivision and Platting Act. At a minimum,these impacts should be included in the statewide sub-
division inventory being conducted by the department and
should be updated on a regular basis.
On the other hand, useful interpretation of data
already collected has been foresaken. The Department of
Health and Environmental Sciences, for instance, has
abandoned publishing an analysis of trends and conditions
in Montana air quality, and data used for enforcement are
not extended to the public. The most recent such analysis
was the 1970 booklet. Status of Air Pollution Control in
Montana. The Health Department's Bureau of Records and
Statistics also has abandoned preparation of an annual
health index, based on records of vital statistics, that once
served to focus public attention on county health care and
health status. Other abandoned, but potentially useful
analyses include 1950s studies by the Department of
Highways on rural road improvement and on travel
distances to haul Montana farm products to trade centers.
Regular statistical analysis of the road network could serve
to indicate changes in transportation efficiency, an
important factor in the quality of life and in energy con-
servation.
The quality of data gathered always can be improved,
but certain areas appear to need immediate attention,
especially data on natural gas reserves, uranium reserves.
* The purpose of this section is to explain the origin and purposeof the chart inserted as a supplement to this report.
-131-
changes in employment and unemployment, land use, and
accurate measures of crime.
Citizen attention to government data gathering has too
often had to focus on one of its negative aspects, namely
invasion of privacy. The tremendous amount of
information being gathered about the biophysical, social
and economic systems can be used to improve social
conditions and to help guide public priorities. Combining
and organizing the data into general indicators of environ-
mental quality is one goal of the current EQC program and
is only one of many possible uses of the information that is
being gathered by all state agencies, at public expense.
Citizen groups can use the monitoring directory to help find
the information they need for private studies and investi-
gations. Accelerated and coordinated use of environmental
monitoring data by executive branch agencies also would
have benefits in the preparation of environmental impact
statements, for example. The Environmental Indicators
Interagency Advisory Committee (EIIAC), whose members
reviewed preparation of EQC's environmental indicators.
could continue its work by devising new uses for monitored
data and supervising the refinement of monitoring
techniques.
Legal justification can be given for the latter
suggestion. The Montana Environmental Policy Act
(Section 69-6501 et seq., R.C.M., 1947) directs executive
branch agencies to "use all practicable means'" to "improve
and coordinate" programs and achieve the environmental
goals stated in the Act. Agencies are specifically directed to
"utilize a systematic interdisciplinary approach" in
planning, to make information available that is "useful in
restoring, maintaining and enhancing the quality of the
environment," and to "initiate and utilize environmental
information in the planning and development of resource-
oriented projects" (Section 69-6504 (b)). If new techniques
and methods of data gathering and publishing are necessary
to enhance and coordinate agency environmental programs,
ample justification can be found in the Montana Environ-
mental Policy Act.
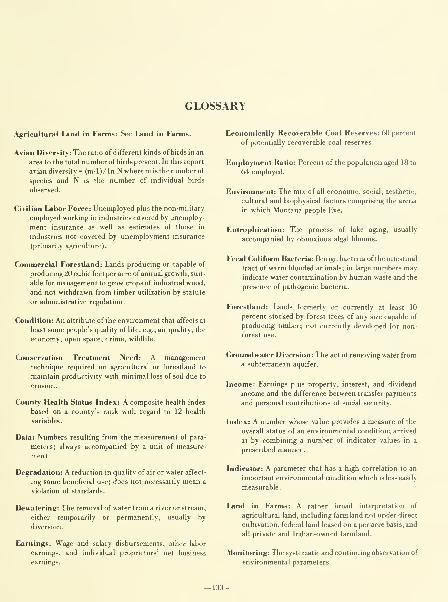
GLOSSARY
Agricultural Land in Farms: See Land in Farms.
Avian Diversity: The ratio of different kinds of birds in an
area to the total numberof birds present. In this report
avian diversity = (m-l)/ln N where mis the number of
species and N is the number of individual birds
observed.
Civilian Labor Force: Unemployed plus the non-military
employed working in industries covered by unemploy-
ment insurance as well as estimates of those in
industries not covered by unemployment insurance
(primarily agriculture).
Commercial Forestland: Lands producing or capable of
producing 20 cubic feet per acre of annual growth, suit-
able for management to grow crops of industrial wood,
and not withdrawn from timber utilization by statute
or administrative regulation.
Condition: An attribute of the environment that affectsat
least some people's quality of life, e.g., air quality, the
economy, open space, crime, wildlife.
Conservation Treatment INeed: A management
technique required on agricultural or forestland to
maintain productivity with minimal loss of soil due to
erosion.
County Health Status Index: A composite health index
based on a county's rank with regard to 12 health
variables.
Data: Numbers resulting from the measurement of para-
meters; always accompanied by a unit of measure-
ment.
Degradation: A reduction in quality of air or water affect-
ing some beneficial use; does not necessarily mean a
violation of standards.
Economically Recoverable Coal Reserves: 60 percent
of potentially recoverable coal reserves.
Employment Ratio: Percent of the population aged 18 to
64 employed.
Environment: The mix of all economic, social, aesthetic,
cultural and biophysical factors comprising the arena
in which Montana people live.
Eutrophication: The process of lake aging, usually
accompanied by obnoxious algal blooms.
Fecal Coliform Bacteria: Benign bacteria of the intestinal
tract of warm blooded animals; in large numbers mayindicate water contamination by human waste and the
presence of pathogenic bacteria.
Forestland: Lands formerly or currently at least 10
percent stocked by forest trees of any size capable of
producing timber; not currently developed for non-
forest use.
Groundwater Diversion: The act of removing water from
a subterranean aquifer.
Income: Earnings plus property, interest, and dividend
income and the difference between transfer payments
and personal contributions of social security.
Index: A number whose value provides a measure of the
overall status of an environmental condition; arrived
at by combining a number of indicator values in a
prescribed manner.
Indicator: A parameter that has a high correlation to an
important environmental condition which is less easily
measurable.
Dewatering: The removal of water from a river or stream,
either temporarily or permanently, usually by
diversion.
Earnings: Wage and salary disbursements, other labor
earnings, and individual proprietors' net business
earnings.
Land in Farms: A rather broad interpretation of
agricultural land, including farmland not under direct
cultivation, federal land leased on a per acre basis, and
all private and Indian-owned farmland.
Monitoring: The systematic and continuing observation of
environmental parameters.
133-
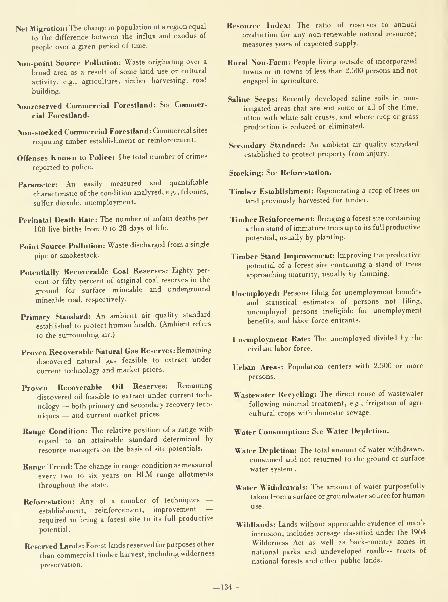
Net Migration: The change in population of a region equal
to the difference between the influx and exodus of
people over a given period of time.
Non-point Source Pollution: Waste originating over a
broad area as a result of some land use or cultural
activity, e.g., agriculture, timber harvesting, road
building.
Nonreserved Commercial Forestland: See Commer-
cial Forestland.
Non-stocked Commercial Forestland: Commercial sites
requiring timber establishment or reinforcement.
Offenses Known to Police: The total number of crimes
reported to police.
Parameter: An easily measured and quantifiable
characteristic of the condition analyzed, e.g., felonies,
sulfur dioxide, unemployment.
Perinatel Death Rate: The number of infant deaths per
100 live births from to 28 days of life.
Point Source Pollution: Waste discharged from a single
pipe or smokestack.
Potentially Recoverable Coal Reserves: Eighty per-
cent or fifty percent of original coal reserves in the
ground for surface mineable and underground
mineable coal, respectively.
Primary Standard: An ambient air quality standard
established to protect human health. (Ambient refers
to the surrounding air.)
Proven Recoverable Natural Gas Reserves: Remaining
discovered natural gas feasible to extract under
current technology and market prices.
Proven Recoverable Oil Reserves: Remaining
discovered oil feasible to extract under current tech-
nology — both primary and secondary recovery tech-
niques — and current market prices.
Range Condition: The relative position of a range with
regard to an attainable standard determined by
resource managers on the basis of site potentials.
Range Trend: The change in range condition as measured
every two to six years on ELM range allotments
throughout the state.
Reforestation: Any of a number of techniques —establishment, reinforcement, improvement —required to bring a forest site to its full productive
potential.
Reserved Lands: Forest lands reserved for purposes other
than commercial limber harvest, including wilderness
preservation.
Resource Index: The ratio of reserves to annual
production for any non-renewable natural resource;
measures years of expected supply.
Rural Non-Farm: People living outside of incorporated
towns or in towns of less than 2,500 persons and not
engaged in agriculture.
Saline Seeps: Recently developed saline soils in non-
irrigated areas that are wet some or all of the time,
often with white salt crusts, and where crop or grass
production is reduced or eliminated.
Secondary Standard: An ambient air quality standard
established to protect property from injury.
Stocking: See Reforestation.
Timber Establishment: Regenerating a crop of trees on
land previously harvested for timber.
Timber Reinforcement: Bringing a forest site containing
a thin stand of immature trees up to its full productive
potential, usually by planting.
Timber SUnd Improvement: Improving the productive
potential of a forest site containing a stand of trees
approaching maturity, usually by thinning.
Unemployed: Persons filing for unemployment benefits
and statistical estimates of persons not filing,
unemployed persons ineligible for unemployment
benefits, and labor force entrants.
Unemployment Rate: The unemployed divided by the
civilian labor force.
Urban Areas: Population centers with 2,500 or more
persons.
Wastewater Recycling: The direct reuse of wastewater
following minimal treatment, e.g., irrigation of agri-
cultural crops with domestic sewage.
Water Consumption: See Water Depletion.
Water Depletion: The total amount of water withdrawn,
consumed and not returned to the ground or surface
water system .
Water Withdrawals: The amount of water purposefully
taken from a surface or groundwater source for human
Wildlands: Lands without appreciable evidence of man's
intrusion; includes acreage classified under the 1964
Wilderness Act as well as back-country zones in
national parks and undeveloped roadless tracts of
national forests and other public lands.
BIBLIOGRAPHY
1. Aderhold, Mike. 1975. "Impact of Canadian Project Spills Over into
Montana." Montana Outdoors, Volume 6, Number 6 (Nov. /Dec).
2. Annison, Michael. 1975. "Rocky Mountain West: Region at a
G-ossroads." Western Wildlands. School of Forestry, University of
Montana, Missoula. Winter.
3. Anonymous. 1974. ".\SARCO Carefully Opens Mine." The
Independent Record (Helena), April 11.
4. Anonymous. 1974. "Clean Water Running Out." The Independent
Record (Helena), November 10.
5. Anonymous, 1975. "Coal and the Flathead." The Water Quality
Standard (August), Northern Rockies Action Group, Helena.
6. Anonvmous. 1975. "Council Supports Muddy Creek Study."
Treasure State Health, Vol. XXIV, No. 6 (August). Montana Dept. of
Health and Environmental Sciences, Helena.
7. Anonymous. 1975. "EPA Will Try to Gauge Health Effects of
Contaminants in U.S. Drinking Water." Wall Street Journal, April
Anonymous. 1975. "Montana Participates in System to Halt Air
Quality Degradation." Treasure State Health, Vol. XXIV, No. 6
(August). Montana Dept. of Health and Environmental Sciences,
Helena.
Anonymous. 1975. "Montana Population up 5,000 in Past Year."
The Independent Record (Helena), July 2.
Anonymous. 1975. "Smelter Pollution Hits Warning Level." The
Independent Record (Helena) , February 28.
Arnst, Wayne. 1975. "The Open Air." Great Falls Tribune. May 4.
Associated Press. 1975. "ELM Ordered to Analyze its Grazing
Policies." The Independent Record (Helena) , January 8.
Associated Press. 1974. "BN Reports on its Water Plan." The
Independent Record (Helena), December 27.
Associated Press. 1975. "BOR Officials Dispute Coal Pipeline
Qaims." The Independent Record (Helena), August 3.
Associated Press. 1975. "Canada Says Power Plant Won't Pollute."
The Independent Record (Helena), February 16.
Associated Press. 1974. "Colstrip Units Could Hurt Fish." The
Independent Record (Helena), December 30.
Associated Press. 1974. "Colstrip Water Contaminated." The
Independent Record (Helena), September 30.
Associated Press. 1974. "Colstrip Water OK to Drink." The
Independent Record (Helena) , October 9.
Associated Press. 1974. "Court Ban Fails to Halt Subdivision OK."Great FalU Tribune, July 30.
20. Associated Press. 1975. "Garrison Pollution has Dropped." The
Independent Record (Helena), July 23.
Associated Press. 1975. "CJovernors Oppose Coal Pipeline." The
Independent Record (Helena), August 1.
22. Associated Press. 1975. "Crazing Land in Poor Shape." The
Independent Record (Helena), March 3.
23. Associated Press. 1974. "Group to Seek Funds for Pollution
Studies." The Independent Record (Helena), December 29.
24. Associated Press. 1975. "Philipsburg Sawmill to be Qosed." The
Independent Record (Helena), July 18.
25. Associated Press. 1975. "Questions Linger After Meeting with
Canadians." The Independent Record (Helena), April 24.
26. Associated Press. 1974. "Shot of CMorine Saves C>)lstrip Wati
The Independent Record (Helena), October 1.
27. Associated Press. 1974. "Students Reveal Respiratory Study." The
Independent Record (Helena), November 3.
Associated Press. 1975. "12,000 NE State Acres Leased in Pota
Hunt." The Great Falls Tribune, May 20.
29. Associated Press. 1975. "U. S. Upset by Power Plant Qnadians
Propose Near Border." The Independent Record (Helena), February
30. Bahls, L. L. 1976. "Environmental Indicators: A Program for
Montana." Proceedings of the Montana Academy ofSciences, Volume
35, pp. 110.
31. Bisselle, C.A., el al. 1971. Monitoring the EmMitre Corporation, McLean, Va.
oftheNa
32. Bloom, D. and M. K. Botz. 1975. Water Quality Inventory and
Management Plan, Lower Missouri River Basin, Montana. Water
Quality Bureau, Environmental Sciences Division, Montana Dept.
of Health and Environmental Sciences, Helena.
33. Bloom D. and M. K. Botz. 1974. Water Quality Inventory and
Management Plan, Milk River Basin, Montana. Water Quality
Bureau, Environmental Sciences Division, Montana Dept. of Health
and Environmental Sciences, Helena.
34. Bradley, Charles C. 1971. "Interdisciplinary Research." Speech
presented to the American Chemical Society meeting, June 16,
Bozeman, Montana.
35. Braico, R. D. and M. K. Botz. 1974. Water Quality Inventory and
Management Plan, .Missouri-Sun-Smith Basin, Montana. Water
Quality Bureau, Environmental Sciences Division, Montana Depl.
of Health and Environmental Sciences, Helena.
135-
36. Braico, R. D. and M. K. Botz. 1975. Water Quality Inventory and
Management Plan, Upper Missour River Basin. Montana. Preliminary
Draft. Water Quality Bureau, Environmental Sciences Division.
Montana Dept. of Health and Environmental Sciences, Helena.
37. Burk, Dale A. 1975. "Flathead Timbering Activities Rapped in
Study." The MissouUan, January 20.
38. Carlson, C. E. and W. P. Hammer. 1975. Impact of Fluorides and
Insects on Radial Growth of Lodgepole Pine. Division of State and
Private Forestry, U.S. Forest Service, Northern Region, Missoula,
Montana.
39. Chaffee, Oscar. 1975. "Yellowstone River Getting Qeaner, State
Officials Say." The Billings Gazette, January 23.
40. Commission on the Future of the South. 1974. The Future of the
South. Report of the Commission to the Southern Growth Policies
Board, .Atlanta, Georgia.
41. Communication with E. Anderson, Acting Chief, Division of Timber
Management, U.S. Forest Service, Region 1, Missoula, Montana.
Letter dated June 4, 1975 in EQC files.
42. Communication with Roger Billings, Vice President of Montana
Power Company, Butte. Letter dated July 14, 1975 to Richard
Bourke, EQC, Helena.
43. Communication with Jon Bolstad, Environmental Engineer, Air
Quality Bureau, Environmental Sciences Division, Dept. of Health
and Environmental Sciences, Helena. Telephone conversation of
August 13, 1975 with Loren Bahls, EQC, Helena.
44. Communication with Samuel Boryflea, citizen, Sandpoint, Idaho.
Telephone conversation of July 21, 1975 with Loren Bahls, EQC,
Helena.
45. Communication with Bill Buyske, Montana Light and Power
Company, Trov, Montana. Telephone conversation of July, 1975
with Richard Bourke, EQC, Helena.
M). Communication with Ted Clack, Montana Energy Advisory Council,
Lt. Governor's Office. Data supplied August, 1975 to Richard
Bourke, EQC, Helena.
47. Communications with Arthur Qarkson, Water Quality Bureau,
Montana Dept. of Health and Environmental Sciences. Data
contained in "Water Supplies with Unsatisfactory Bacteriological
Results or Insufficient Samples," August 14, 1974.
48. Communication with Ernie Corrick, Log and Timber Manager, U.S.
Plywood Company, Bonner, Montana. Letter dated September 29,
1975 to Loren Bahls, EQC, Helena.
49. Communication with R. Cosgriffe, Range Conservationist, Division
of Resources, Bureau of Land Management, Billings, Montana.
Letter dated June 16, 1975 in EQC files.
50. Communication with Richard C. Deden, Division of Timber Manage-
ment, U.S. Forest Service, Region 1, Missoula, Montana. Telephone
conversation of July 31, 1975 with Loren Bahls, EQC, Helena.
51. Communication with John P. Duke, Assistant Vice President, Land
Management, Resources Division, Burlington Northern, Seattle.
Interview of July 17, 1975 with Loren Bahls, EQC, Helena.
52. Communication with Bill Erwin, Crime Control Division, Montana
Dept. of Justice. Data supplied Mav, 1975 to Richard Bourke, EQC,
Helena.
53. Communication with Dave Folsom, Employment Service Bureau,
Employment Security Division, Montana Dept. of Labor and
Industry. Data supplied June, 1975 to Richard Bourke, EQC,
Helena.
54. Communication with John A. Green, Regional Administrator, U.S.
Ejivironmental Protection Agency, Denver. Letter dated March 23,
1972 to Loren Bahls, EQC, Helena.
55. Communication with Dennis Haddow, Air Pollution Control
Specialist, Air Quality Bureau, Environmental Sciences Division,
Montana Dept. of Health and Environmental Sciences, Helena. Data
supplied on August 18, 1975 in an interview with Loren Bahls. EQC,
Helena.
56. Communication with Van K. Haderlie, Montana State
Conservationist, U.S.D.A., Soil Conservation Service. Bozeman.
Letter dated April 21, 1975 in EQC files.
57. Communication with F. Kelly Hammond, Acting Chief, Division of
Resources, Bureau of Land Management, Billings, Montana. Letter
dated June 16, 1975 in EQC files.
58. Communication with W. A. Henry, Manager, Gas Supply
Evaluation, Northern Natural Gas Co., Omaha. Letter dated August
26, 1975 to Richard Bourke, EQC, Helena.
59. Communication with Russ Hudson, Manager, Forestry, Lumber,
Plywood & Door Division, St. Regis Paper Company, Libby,
Montana. Letter dated August 25, 1975 to Loren Bahls, EQC,
Helena.
60. Communication with John Hughes, Oil and Gas Division, Montana
Dept. of Natural Resources and Conservation, Billings. Telephone
of June, 1975 with Richard Bourke, EQC, Helena.
61. Communication with Donald A. Hutton, Manager, Gas Supply
Services, Kansas- Nebraska Natural Gas Co., Hastings, Nebraska.
Letter dated June 27, 1975 to Richard Bourke, EQC, Helena.
62. Communication with J. T. Kasper, Staff Engineer, Montana-Dakota
Utilities, Bismarck. Letter dated June 30, 1975 to Richard Bourke,
EQC, Helena.
63. Communication with Thomas L Kimball, Executive Vice President,
National Wildlife Federation, Washington, D.C. Letter dated
November 1, 1974 to Loren Bahls, EQC, Helena.
64. Communication with L. W. Lloyd, Acting Regional Director, Bureau
of Reclamation, U.S. Dept. of the Interior, Billings. Letter dated
June 23, 1975 to Richard Bourke. EQC, Helena.
65. Communication with Lynn Mills, Pacific Power and Light Co.,
Kalispell, Montana. Telephone conversation of July, 1975 with
Richard Bourke, EQC, Helena.
66. Communication with John R. Milodragovich, Director, Timber
Management, U.S.D.A. Forest Service Region 1 (Missoula). Letters
dated May 7, 1972 to Fletcher Newby, EQC, Helena and July 1, 1975
to Loren Bahls, EQC, Helena.
67. Communication with Gareth C. Moon, Administrator, Division of
Forestry, Montana Dept. of Natural Resources and Conservation,
Missoula. Letter dated July 22, 1975 to Loren Bahls, EQC, Helena.
68. Communication with D. M. Nettleton, Manager, Land Adjustments,
Timber and Land Department, Resources Division, Burlington
Northern, Seattle. Letter dated August 6, 1975 to Loren Bahls, EQC,
Helena.
69. Communication with Steve Pilcher, Water Pollution Control
Specialist, Water Quality Bureau, Montana Dept. of Health and
Environmental Sciences, Helena. Telephone conversation of August
19, 1975 with Loren Bahls, EQC, Helena.
70. Communication with James A. Posewitz, Administrator, Environ-
ment and Information Division, Montana Dept. of Fish and Game,
Helena. Letter dated March 21, 1975 to Loren Bahls, EQC, Helena.
71. Communication with Earl Salmonson. Forestry Division, Montana
Dept. of Natural Resources and Conservation, Missoula. Telephone
I of August 27, 1975 with Loren Bahls, EQC, Helena.
72. Communication with Keith M. Thompson, Director, Planning,
Programming and Budgeting, U.S. Forest Service, Region 1,
Missoula, Montana. Letter dated August 4, 1975 to Loren Bahls,
EQC, Helena.
136-
73. &)mmunication with Larry Thompson, Wildlife Ecologist, Energy
Planning Division, Dept. of Natural Resources and Conservation.
Telephone conversation of August 14, 1975 with Loren Bahls, EQC,
Helena.
74. Communication with Nels Thorsen, Information Officer, Montana
Dept. of Fish and Game, Great Falls. Telephone conversation on
December 1, 1975 with Loren Bahls, EQC, Helena.
75. Communication with Robert F. Wambach, Dean, School of
Forestry, University of Montana, Missoula. Letter dated July 17,
1975 to Loren Bahls, EQC, Helena.
76. Communication with Frank Weigand, Acting Coordinator, Wilder-
ness Institute, School of Forestry, University of Montana, Missoula.
Letter dated August 13, 1975 to Loren Bahls, EQC, Helena.
77. Communication with Ron Wilkerson, Bonneville Power
Administration, U.S. Dept. of the Interior, Kalispell, Montana.
Telephone conversation of June, 1975 with Richard Bourke, EQC,
Helena.
78. Communication with John Wilson, Chief, Records and Statistics
Bureau, Montana Dept. of Health and Environmental Sciences.
Information contained in DHES Office Memorandum dated May 7,
1974.
79. Cook, Earl. 1975. 'The Depletion of Geological Resources."
Technology Review, Volume 77, Number 7 (June).
80. Council on Environmental Quality. 1970, 1971, 1972, 1973, and
1974. The First. Second, Third, Fourth, and Fifth Annual Report ofthe
CEQ. Washington, D.C.
81. Crowley, John M. 1974. "Water and Electric Power in Montana."
Montana Business Quarterly, Vol. 12, No. 4 (Autumn).
82. Davis, Qifford V. 1969. "A 1968 Breeding Bird Survey for
Montana." Proceedings of the Montana Academy ofSciences 29: 1-12.
83. Dusek, Gary L. and Steve McQnn. 1973. Bull Mountains Coai Field
Study. Montana Dept. of Fish and Game, Environment and
Information Division, Helena.
84. Ell, nynn. 1975. "Is Salt Water Ruining Farmland, Water Wells?"
The Billings Gazette. November 30.
85. Environmental Information Center. 1975. "Subdivisions and
Wildlife: 'Inch by Inch, This is Eating Us Up'". Montana LandDetielopmenl. The Montana Subdivision Inventory Project, EIC,
Helena.
86. Rath, Dennis. 1975. "We've Never Met an Animal We Didn't Uke."
Montana Outdoors, Volume 6, Number 1 (Jan. /Feb.)
87. Garvin, W. H. and M. K. Botz. 1975. IVater Quality Inventory and
Management Plan, Marias River Basin, Montana. Water Quality
Bureau, Environmental Sciences Division, Montana Dept. of Health
Sciences, Helena.
88. Glenn, James L. and Steven A. Duganz. 1974. Yellowstone County Air
Pollution Control Status Report. Yellowstone County Air Pollution
Control Program, Billings.
89. Greenwood, Ned and J. M. B. Edwards. 1973. Human Environments
and Natural Systems: .4 Conflict ofDominion. Duxbury Press, North
Sciluate, Mass.
90. Hamel, D. R. and 0. J. Dooling. 1975. Forest Insect and Disease
Conditions in the Northern Region, 1974. Division of State and Private
Forestry, U.S. Forest Service, Northern Region, Missoula, Montana.
91. Harlan Consulting (Dallas, Texas). 1975. Estimated Reserves and
Deliverahility ofNatural Gasfor Certain A creage Dedicated to Colorado
Interstate Gas Co. in theBearpawMountain Area ofMontana as ofMayI, 1975. Federal Power Commission. Docket No. CP 73-340 et al.
Exhibit No. 44(LEH1).
92. Harlow, Michael. 1974. Environmental Impacts of Saline Seep in
Montana. Western Interstate Ommission for Higher Education andMontana Environmental Quality Council, Helena.
93. Hayden, Brace. 1975. Some Effects of Rural Subdivision on Wildlife
and Wildlife Habitat Around Lolo, Montana. M.S. Thesis, University
of Montana, Missoula.
94. Hill, (;iadwin. 1975. "Air Qeanup Behind Schedule, Yet on Courseto Fulfillment." The Billings Gazette, June 15.
95. Hutchinson, Arthur. 1974. "Anaconda Aluminum gets Year's Grace
from Gean Air." The Independent Record (Helena), October 3.
96. Hutchinson, Arthur. 1975. "Conflicting Water Qaims ExceedPowder River Flow." Billings Gazette. January 16.
97. Independent Record State Bureau. 1975. "Irrigators Ask for WaterRights on Yellowstone." The Independent Record (Helena), August24.
98. Inhaber, H. 1974. "Environmental Quality: Outline for a National
Index for Canada." Science, Vol. 186, November 29, pp. 798-805.
99. Johnson, Charles S. 1975. "State Launches Fight Against Air
Violators." The Independent Record (Helena), September 11.
100. Johnson, Charles S. 1975. "State Works on Timetable to Clean
Polluting Plant." The Independent Record (Helena), September 12.
101. Karp, R. W. and M. K. Botz. 1975. Water Quality Inventory andManagement Plan, Middle Yellowstone River Basin. Preliminary
Draft. Water Quality Bureau, Environmental Sciences Division,
Montana Dept. of Health and Environmental Sciences, Billings.
102. Karp, R. and M. K. Botz. 1973. Water Quality Management Planforthe Little Missouri Drainage. Montana. Water Quality Bureau,
Montana Dept. of Health and Environmental Sciences, Helena.
103. Karp, Richard W., Duane A. Klarich and M. K. Botz. 1975. Water
Quality Inventory and Management Plan, Lower Yellowstone Basin,
Montana. Water Quality Bureau, Environmental Sciences Division,
Montana Dept. of Health and Environmental Sciences, Billings.
104. Kimball, Thomas L. 1969. "Our National EQ, The First National
Wildlife Federation Index of Environmental Quality." National
Wildlife, Vol. 7, No. 5 (August-September).
105. Knapp, Stephen J. 1975. Bimey-Decher Wildlife Study. Progress
Report No. 1, Montana Dept. of Fish and Game, Environmental and
Information Division, Helena.
106. Langley, Gary. 1975. "Deadly Diseases Hit Two Counties the
Hardest." The Independent Record (Helena), August 14.
107. Langley, Gary. 1975. "State Has High Fatal Lung Disease Rate." The
Independent Record (Helena), August 14.
108. Lathrop, Rich. 1975. "Funds Boost Water Planning." EPALOG.Vol. Ill, No. 3 (May-June). Region VIH, EPA, Denver.
109. Lathrop, Rich. 1974. "SOX, Health Effects Unked in Utah." EPA-LOG. Vol. Ill, No. 1 (November-December). Region VIH, EPA,Denver.
Lewis, Robert A. 1975. 'The Effects of Coal-Fired Power Plant
Emissions on Vertebrate Animals." Fort Union Coal Symposium,
Billings, Montana, April 25-26.
Louisiana. 1975. The State of the State in 1975: An Economic and
Social Report to the Governor. State Planning Office, Baton Rouge.
MacMillan, Don. 1972. "Butte's Struggle to Abate Air Pollution.
1885-1891." In Bigart, Robert (ed.). Environmental Pollution in
Montana, Mountain Press Publishing Company, Missoula.
•137-
1 13. Martin, Peter R. 1975. Sarpy Basin WiUlife EcologyStudy. Montana
Dept. of Rsh and Came, Environment and Information Division.
Helena.
1 14. McBride. John and Christine Anderson. 1972. Respiratory Illness in
the Missoula Valley . Research Report #4, Student Environmental Re-
search Center, University of Montana, Missoula.
115. McGregor, M. D. and R. E. Williams. 1974. Forest Insect and DUease
Conditions, Northern Region, 1973. Division of State and Private
Forestry, U.S. Forest Service, Northern Region, Missoula, Montana.
1 16. Miller, Bill and Norm Peterson. 1974. "We're Losing Our Streams!"
Montana Outdoors, Vol. 5, No. 1 (January/February).
117. Montana Board of Equahzation. \9T2. 25th Biennial Report. Helena.
December.
1 18. Montana Board of Health. 1965 and 1%9. .Annual Statistical Supple-
ment. Helena.
119. Montana Dept. of Community Affairs. 1974. Montana County
Profiles. Data compiled from 1970 Census of Population, U.S.
Bureau of Census. Division of Research and Information Systems,
Helena.
120. Montana Dept. of Fish and Game. 1973. Beartooth-.ibsaroka Wildlife
— Mining Research. Job Progress Report, Environment and
Information Division, Helena.
133. Montana Dept. of Natural Resources and Conservation. 1974. Draft
Environmental Impact Statement on Colstrip Electric Generating UnitsS
& 4, 500 Kilovolt Transmission Lines & .Associated Facilities. Vol. 3-B
Power Plant, Energy Planning Division, Helena.
134. Montana Dept. of Natural Resources and Conservation. 1975. IVater
Use in Montana. Inventory Series Report No. 13. Water Resources
Division, Helena.
135. Montana Dept. of Natural Resources and Conservation. 1975.
Yellowstone River Basin Water Resources Situation Report. WaterResources Division, Helena.
1.36. Montana Dept. of Revenue. 1974. Report of the Department of
Revenue: 1974. Helena. December.
137. Montana Dept. of Social and Rehabilitation Services. 1970-1974.
Statistical Report. Volume XXXII, Number 1 through VolumeXXXVI, Number 12 (January 1970-December 1974). Helena.
138. Montana Energy Advisory Council. 1974. Coal Deielopment
Information Packet. Office of the Lieutenant Governor, Helena.
139. Montana Environmental Quality Council. 1972. First Annual Report.
Montana State Legislature, Helena.
140. Montana Environmental Qualitv Council. 1975. Montana Energy
Policy Study. Montana State Legislature. Final Report. Revised
Edition, June 1. Helena.
121. Montana Dept. of Fish and Game. 1975. 1975 Grizzly Bear
Regulations. Game Management Division, Helena.
122. Montana Dept. of Fish and Game. 1973. A List of Montana Birds.
(From a listing by Dr. C. V. Davis, Montana State University,
Bozeman.)
123. Montana Dept. of Health and Environmental Sciences. 1975. Agency
Impart Determination on Proposed Installation ofa Rotary Lime Kiln at
Rocky Mountain Phosphate in Garrison. ,\ir Quality Bureau, Helena.
124. Montana Dept. of Health and Environmental Sciences. AirPollution
Data Books. .\ir Quality Bureau, Helena. Data for air pollution
variables tabulated monthly.
125. Montana Dept. of Health and Environmental Sciences. 1971 and
1973. Montana Vital Statistics. Bureau of Records and Statistics,
Helena.
126. Montana Dept. of Health and Environmental Sciences. 1975.
Montana Water Pollution Control Program for Fiscal Year 1976.
Water Quality Bureau, Environmental Sciences Division, Helena.
127. Montana Dept. of Health and Environmental Sciences. 1975.
Statewide Sediment Control Project. Proposal submitted to the
Environmental Protection Agency August 4. Water Quality Bureau,
Environmental Sciences Division, Helena.
Montana Dept. of Health. 1970. Status of Air Pollution Control i
Montana. Division of Air Pollution Control, Industrial Hygiene (
129. Montana Dept. of Health and Environmental Sciences. 1975. Water
Quality in Montana. Water (Quality Bureau, Environmental Sciences
Division, Helena.
141. Montana International Trade Commission. 1975. Montana Natural
Gas Alternatives. Presented at Governor Judge's press conference,
June 1, Helena.
142. Montana Library Association. 1965. Findings of the Legislative
Committee. In "Our Road to Progress" bv M. Warden, MontanaLibraries, Volume XVIII, No. 2 (January).'
143. Montana Oil and Gas Commission. 1970, 1972, 1973, and 1974.
.Annual Review Relating to Oil and Gas. Montana Dept. of Natural
Resources and Conservation. Helena.
144. Montana Power Company. 1972, 1973, and 1974. Form ni. AnnualReport of the Montana Power Company to the Federal PowerCommission for the Year Ending December 31. W'ashington, D.C.
145. Montana State Dept. of Health. 1970. An Air Quality Study of the
Libby and Flathead Valleys. Division of Air Pollution Control and
Industrial Hygiene, Helena.
146. Montana State Library. 1975. Montana Library Directors, 1975 with
Statistics of Montana Public Libraries, July L 1973-June 30, 1974.
Administrative Staff, Helena.
147. Montana State Library. Undated. Statistics of Montana Public
Libraries, July 1, 1969-June30, 1970. Administrative Staff, Helena.
148. Montana State Librarv, 1973. Statistics ofMontana Public Libraries,
July 1, 1971-June 30,' 1972. .administrative Staff, Helena.
149. Montana State Ubrary. 1966-1967. "Statistics of Montana Public
Libraries, July 1, 1%5-June 30, 1%6." In Montana Libraries, Vol.
XX, No. 1 & 2 (October-January).
150. Montana State Office, Bureau of Und Management. 1974. Natural
Resource Lands Digest: 1974. U.S. Dept. of the Interior. Billings.
Montana.
130. Montana Dept. of Highways. 1974. Montana 1974 Federal .Aid RoadLog. Planning and Research Bureau, Helena.
131. Montana Dept. of Labor and Industry. November, 1975. MontanaEmployment and Labor Force: Monthly Report. Employment Security
Division, Helena.
132. Montana Dept. of State Lands. 1974. Salinity Damage Estimates.
Compiled from figures provided by U.S.D.A. County (Committees for
Rural Development.
151. Montana State Soil and Water Conservation Committee. 1964.
Montana Consenation Needs Inventory (1958): Supplement 1.
U.S.D.A. Soil Conservation Service, Bozeman.
152. Montana State Soil and Water Conservation Needs Committee.
1%2. Montana Soil and Water Conservation Needs Inventory (1958).
U.S.D.A. Soil Conservation Service, Bozeman.
153. Montana State Soil and Water Conservation Needs (jjmmittee.
1970. Montana .Soil and Water Conservation Needs Inventory (I%7).,
U.S.D.A., Soil Conservation Service, Bozeman.
154. Montana State University. 1974. Impacts of Large Recreational
Det'elopments Upon Semi-Primitive Environments: The Gallatin
Canyon Case Study. Research Report 66, Onter for Inter-
disciplinary Studies and Agricultural Experiment Station, Bozeman.
155. Montana llniversity Joint Water Resources Research Center. 1975.
"Irrigation Up in Montana." Newsletter, Volume II, Number 3
(July). Montana State University, Bozeman.
156. Montana Water Resources Board. 1970. An Atlas ofWater R,
in Montana by Hydrologic Basins. Inventory Series Report No.
Helena.
175. Schneider, Bill. 1973. "Putting Montana Back Together Again."
Montana Outdoors, Vol. 4, No. 3 (May/June).
176. Schneider, Bill. 1975. "The Gallatin: A Good Chance to Question
Growth or Another Splendor to Squander?" Montana Outdoors, Vol.
6, No. 1 (January/February).
177. Schneider, Bill. 1975. "The Grizzly." Montana Outdoors. Vol. 6, No.
4 (July/August).
178. Schneider, Bill. 1974. "The Subdividers are Here!" MontanaOutdoors, Vol. 5, No. 1 (January/February).
Moore, Geoffrey H. 1975. "A Measuring .Stick for Employment."
The Wall Street Journal. New York edition. May 9.
Moore, Steve. 1975. "Elk Starving to Death in Gallatin Canyon
Area." The Independent Record (Helena), April 25.
National Academy of Sciences. 1974. More Water For Arid Lands:
Promising Technologies and Research Opportunities. Clhapter 4,
Reusing Water. Advisory Committee on Technology Innovation,
Board on Science and Technology for International Development,
(Commission on International Relations, Washington, D.C.
National Wildlife Federation. 1970, 1971, 1973, 1974, and 1975. The
Second, Third, Fourth, Fifth and Sixth Annual Environmental
Quality Index. National Wildlife. Vols. 8, 9, 11, 12, and 13.
Washington, D.C.
National Wildlife Federation. 1975. "Sixth Environmental Quality
Index: The Year of the Trade-Off." National Wildlife. (Feb. -Mar.).
North Carolina. 1973. North Carolina Environmental Indicators.
Interagency Task Force on Environmental and Land Use Planning,
Raleigh.
Northern Great Plains Resources Program. 1974. Mineral Resources
Work Group Report. Denver. February.
Northern Great Plains Resources Program. 1974. National and
Regional Energy Considerations Work Group Report. Denver.
Northern Plains Resource Council. 1975. Energy Companies Active
in Montana. Billings, Montana. February.
Nunnallee, D. and M. K. Botz. 1974. Water Quality Inventory and
Management Plan. Kootenai River Basin, Montana. Water Quality
Bureau, Environmental Sciences Division, Montana Dept. of Health
and Environmental Sciences, Kalispell.
Peterson, Russell W. 1975. Address to the American Association for
the Advancement of Science, January 30, New York Gty.
Polzin, Paul E. 1975. "Montanans on the Move." Montana Business
Quarterly, Vol. 13, No. 3 (Summer).
Posewitz, James A. 1975. "Sage Grouse and Overburden." The
Independent Record (Helena), July 29.
Resberger, Boyce. 1975. "Farmland: U.S. Faces Double-Edged
Problem in More Food Production." (C) 1975 New York Times News
Service. The Independent Record (Helena), January 26.
171. Rubich, Oiris. 1975. "(iunly Air Better 1
Billings Gazette, July 27.
t's Not the Best." T-Ae
172. San Diego County. 1973. Indices of Environmental Quality in the San
Diego Region. Integrated Regional Environmental Management
Project, Environmental Development Agency, San Diego.
173. Schmidt, W. C. and W. P. Dufour. 1975. "Building a Natural Areas
System for Montana." Western Wildlands (Winter).
174. Schneider, Bill. 1974. "Making Molehills Out of Mountains."
Montana Outdoors, Vol. 5, No. 5, (September/October).
179. Schneider, Bill. 1975. "Trouble in the Flathead." The Independent
Record (Helena), August 26.
180. Schweitzer, L. D. and R. J. McConnen. 1975. A Descriptive Analysis
of Montana's Forest Resources. Resource Bulletin INT-11, U.S.D.A.
Forest Service, Intermountain Forest and Range Experiment
Station, Ogden, Utah.
Schwennesen, Don. 1975. "Environmentalii
Exploration." The Missoulian, March 8.
Irked at Plati
182. Schwennesen, Don. 1975. "EPA Ecologist Discusses His Findings
on Bitterroot River." The Missoulian, July 12.
183. Smithsonian Institution. 1972. DevelopmentofaContinuing Program
to Provide Indicators and Indices of Wildlife and the Natural Environ-
ment. Ecology Program, Washington, D.C.
184. Speelman, JoAnn. 1975. "Oil, Gas Impacts on Flathead Forest Said
Unknowable Without Precedent." The Missoulian, May 18.
185. Stolz, Gustav Jr. 1974. Oil and Gas Energy Resources of Montana.
Research report furnished to the Montana Environmental Quality
(Council. Helena.
186. Sullivan, Walter. 1975. "Study Says Water Needs Will Double in 25
Years." New York Times, June 1.
187. Swiger, Pam. 1974. "Beaverhead, Madison Areas Cross Fingers on
Plans to Develop Iron-Ore Deposits." Montana Standard (Butte),
December 16.
188. Thomas, Wm. A. (ed.). 1972. Indicators of Environmental Quality.
Proceedings of a symposium held December 26-31, 1971 in
Philadelphia, Pennsylvania. Plenum Press, N.Y.
189. Tomlinson, William. 1974. Troy Project. Summary of ASARCOBriefing given March 8 in Missoula. Western Montana Scientists'
Committee for Public Information, University of Montana,
Missoula.
190. Toole, K. Ross. 1970. "Environmental Degradation in Montana."
Montana Business Quarterly, Vol. 8, No. 1.
191. Train, Russell E. Administrator, Environmental Protection Agency,
Washington, D.C. Speech before the National Wildlife Federation,
Pittsburgh, Pennsylvania, March 15, 1975.
192. U.S. Dept. of Agriculture, Forest Service. 1975. Draft Environmental
Statement, Oil & Gas Lease Applications Exploration & Development.
Flathead National Forest, Kalispell, Montana.
193. U.S. Department of Agriculture, Forest Service. 1975. "Planning
Area Guides Being Prepared for Northern Region." NEWS From the
Forest Service (August 22). Forest Service, Northern Region,
Missoula, Montana.
194. U.S. Dept. of Agriculture. 1968. Soil Erosion and Sedimentation on
Federal Lands (Montana). U.S.D.A. Soil (Conservation Service.
Bozeman.
195. U.S. Dept. of Commerce. 1964-1969. Census ofAgriculture. Bureau of
the (Census, Washington, D.C.
1Q6. U.S. Dept. of Commerce. Regional Economic Information System.
Bureau of Economic .Analysis, Washington, D.C. Data for Sept. 1974
and Sept. 1975 furnished by R. Thomas Dundas, Research and
Information Systems Division, Montana Dept. of Community
Affairs, Helena.
197. U.S. Dept. of Commerce. August, 1975. Survey of Current Business.
Bureau of Economic Analysis, Social and Economic Statistics
Administration, Washington, D.C.
198. U.S. Dept. of Commerce. 1950, 1960, and 1970. U.S. Census of
Population. Bureau of the Census, Washington, D.C. (U.S. Census
data taken from Montana Dept. of Planning and Economic Develop-
ment. 1970. Montana Data Book. Helena.)
199. U.S. Dept. of the Interior. 1974. Environmental Analysis, Phosphate
Lease Montana, 067173, Ralph M. Parsons Company. Conservation
Division, Geological Survey. Billings.
200. U.S. Dept. of the Interior. 1974. Geological Survey Research 1974.
Professional Paper 900. Geological Survey, Washington, D.C.
201. U.S. Dept. of the Interior. 1975. Grizzly Bear Listed as Threatened
Species. Fish and Wildlife Service News Release, July 28.
202. U.S. Dept. of the Interior. 1972. Minerals Yearbook. Vol. II. Area
Reports: Domestic. Bureau of Mines, Washington, DC.
203. U.S. Dept. of the Interior. 1964. Minerals Yearbook. Bureau of
Mines, Washington, D.C.
204. U.S. Dept. of the Interior. 1970. Minerals Yearbook. Bureau of
Mines, Washington, D.C.
205. U.S. Dept. of the Interior. 1974. Range Condition Report Preparedfor
The Senate Committee on Appropriations. Bureau of Land
Management, Washington, DC.
208. U.S. Dept. of the I
ground Mining in th
Washington, D.C.
1975. The Reserve Base of Coalfor Under-
m UnitedStates. Bureau of Mines 1C8678.
209. U.S. Dept. of Labor. March, 1972 and March, 1974. Monthly Labor
Review. Bureau of Labor Statistics, Washington, DC.
210. U.S. Environmental Protection .Agency. 1972. Helena Valley,
Montana, Area Environmental Pollution Study. Office of Air
Programs, Research Triangle Park, North Carolina.
211. U.S. Environmental Protection Agency. 1975. Progress in the
Prevention & Control of Air Pollution in 1974. Annual report of the
Administrator of the Eiivironmental Protection Agency to Congress
in compliance with the Qean Air Art as amended.
212. U.S. Fish and WildUfe Service. 1968-1974. Montana Breeding Bird
Survey — Slate Summaries. Migratory Bird and Habitat Research
Laboratory. U. S. Dept. of the Interior. Laurel, Maryland.
213. U.S. Geological Survey and Montana Bureau of Mines and Geology.
1%3. Mineral and Water Resources of Montana. Special Publication
28, Bureau of Mines and Geology, Butte.
214. U.S. House of Representatives. 1974. Mo/fAus anrf.4mmca. A Report
about Food and People. Subcommittee on Department Operations,
Committee on Agriculture, Washington, DC.
215. Walcheck, Ken. 1975. "The Long Pines
No. 2 (March/April).
216. Wallwork, Susan Selig. 1974. "MoEstimates: 1972 and 1973." Montana Bu
2 (Spring).
.Montana Outdoors, Vol. 6,
a County Population
sOuarter/v. Vol. 12, No.
206. U.S. Dept. of the Interior. 1974a. TheMinerallndustry ofMontana m1973. Mineral Industry Surveys, Annual Advance Summary,
Division of Nonferrous Metals — Mineral Supply, Bureau of Mines,
Washington, D.C.
207. U.S. Dept. of the Interior. 1974b. The Mineral Industry ofMontana m1974. Mineral Industry Surveys, Annual Summary (Preliminary),
Division of Nonferrous Metals — Mineral Supply. Bureau of Mines,
Washington, D.C.
217. Wallwork. Susan Selig. 1975. "Montana County Population
Estimates: 1973 and 1974." MontanaBusinessQuarterly,\o\. 13, No.
3 (Summer).
218. Washmgton Water Power Company. 1972, 1973 and 1974. fonn#i.
Annual Report of the Washington Water PowerCompany to the Federal
Power Commission for the Year Ending December 31. Washington,
D.C.
PHOTO CREDITS
1. Western Montana
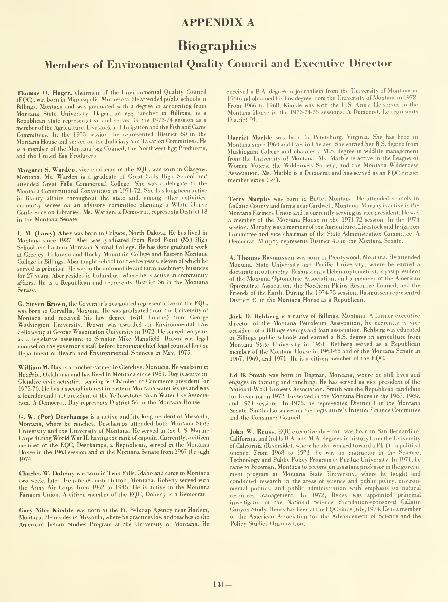
APPENDIX A
Biographies
Members of Environmental Quality Council and Executive Director
Thomas (). Hager, cliairmaii of the Enviroiim<-nlal Quality Counril
(EQC), was bom in Minneapolis, Minnesota. He attended public schools in
Billings, Montana and was graduated with a degree in accounting from
Montana State University. Hager, an egg rancher in Billings, is a
Republican state representative and served in the 1973-74 session as a
member of the Agriculture, Livestock and Irrigation and the Fish and Game
(.ommittees. In the 1975 session, he represented District 60 in the
Montana House and served on the Judiciary and Taxation Gjmmittees. He
is a member of the Montana Egg Council, the Northwest Egg Producers,
and the United Egg Producers.
Margaret S. Warden, vice chairman of the EQC, was born in Glasgow,
Montana. Ms. Warden is a graduate of Great Falls High School and
attended Great Falls Commercial College. She was a delegate to the
Montana Constitutional Convention in 1971-72. She has long been active
in library affairs throughout the state and, among other activities,
currently serves on an advisory committee planning a White House
Conference on Libraries. Ms. Warden, a Democrat, represents District 18
in the Montana Senate.
L. M. (Larry) Aber was born in Colgate, North Dakota. He has lived in
Montana since 1927. Aber was graduated from Reed Point (Mt) High
School and Eastern Montana Normal College. He has done graduate work
at Greeley, Colorado and Rocky Mountain College and Eastern Montana
College in Billings. Aber taught school for twelve years, eleven of which he
served as principal. He was in the automobile and farm machinery business
for 27 years. Aber resides in Columbus, where he is active in community
affairs. He is a Republican and represents District 36 in the Montana
Senate.
G. Steven Brown, the Governor's designated representative on the EQC,
was born in Corvallis, Montana. He was graduated from the University of
Montana and received his law degree (with honors) from George
Washington University. Brown was awarded an Environmental Law
Fellowship at George Washington University in 1972. He served two years
as a legislative assistant to Senator Mike Mansfield. Brown was legal
counsel on the governor's staff before becoming chief legal counsel for the
Department of Health and Environmental Sciences in May, 1975.
William M. Day is a rancher-farmer in Glendive. Montana. He was born in
Hendrix, Oklahoma and has lived in Montana since 1951. Day is active in
Glendive civic activities, serving as Chamber of Commerce president for
1975-76. He has a special interest in eastern Montana water issues and was
a founder and first president of the Yellowstone Basin Water Use Associa-
tion. A Democrat, Day represents District 54 in the Montana House.
G. W. (Per) Deschampe is a native and life-long resident of Missoula,
Montana, where he ranches. Deschamps attended both Montana State
LIniversity and the University of Montana. He served in the U.S. Marine
Corps during World War H, having the rank of captain. Currently, a citizen
member of the EQC, Deschamps, a Republican, served in the Montana
House in the 1963 session and in the Montana Senate from 1967 through
1974.
Charles W. Doheny was born in Twin Falls, Idaho and came to Montana
two weeks later. He ranches near Dutton, Montana. Dohenv served with
the Army Air Corps from 1942 to 1945. He is active in the Montana
Farmers Union. A citizen member of the EQC, Doheny is a Democrat.
Gary INiles Kimble was born at the Ft. Belknap Agency near Harlem,
Montana. He resides in Missoula, where he practices law and teaches in the
American Indian Studies Program at the University of Montana. He
received a B.A. degree in journalism from the University of Montana in
1966 and obtained his law degree from the University of Montana in 1972.
From 1966 to 1968, Kimble was with the U.S. Army. He served in the
Montana House in the 1973-74-75 sessions. A Democrat, he represents
District 94.
Harriet Marble was born in Petersburg, Virginia. She has been in
Montana since 1964 and lives in Chester. She earned her B.S. degree from
Muskingum College and obtained a M.S. degree in wildlife management
from the University of Montana. Ms. Marble is active in the League of
Women Voters, the Wilderness Society, and the Montana Wilderness
Association. Ms. Marble is a Democrat and has served as an EQC citizen
member since 1971.
Terry Murphy was born in Butte, Montana. He attended schools in
Gallatin County and farms near Card well, Montana. Murphy is active in the
Montana Farmers Union and is currently serving as vice president. He was
a member of the Montana House in the 1971-72 session. In the 1974
session. Murphy was a member of the Agriculture, Livestock and Irrigation
Committee and vice chairman of the State Administration Committee. A
Democrat, Murphy represents District 40 in the Montana Senate.
A. Thomas Rasmussen was born in Plentywood, Montana. He attended
Montana State University and Pacific University, where he earned a
doctorate in optometry. Rasmussen, a Helena optometrist , is past president
of the Montana Optometric Association, and a member of the American
Optometric Assocation, the Northern Plains Resource Council, and the
Friends of the Earth. During the 1974-75 session, Rasmussen represented
District 31 in the Montana House as a Republican.
Jack D. Rehberg is a native of Billings. Montana. A former executive
director of the Montana Petroleum Association, he currently is vice
president of a Billings savings and loan association. Rehberg was educated
in Billings public schools and earned a B.S. degree in agriculture from
Montana Stale University in 1951. Rehberg served as a Republican
member of the Montana House in 1963-65 and of the Montana Senate m1967, 1969, and 1971. He is a citizen member of the EQC.
Ed B. Smith was born in Dagmar, Montana, where he still lives and
engages in farming and ranching. He has served as vice president of the
National Wool Growers Association. Smith was the Republican candidate
for Governor in 1972. He served in the Montana House in the 1967, 1%9,and 1971 sessions. In 1975, he represented District 1 in the Montana
Senate. Smith also serves on the Legislature's Interim Finance Committee
and the Consumer Council.
John W. Reuss. EQC executive director, was born in San Bernardino
California, and holds B.A. and MA. degrees in history from the University
of California (Riverside), where he also worked toward a Ph.D. in political
science. From 1968 to 1971, he was an instructor in the Science
Technology and Public Policy Program at Purdue University. In 1971, ht
came to Bozeman, Montana to become an assistant professor in the govern
ment program at Montana State University, where he taught and
conducted research in the areas of science and public policy, environ
mental politics, and public administration with emphasis on natura
resources management. In 1972, Reuss was appointed principa
investigator of the National Science Foundation-sponsored Gallatin
Canyon Study. Reuss has been at the EQC since July, 1974. He is a member
of the American Association for the Advancement of Science and the
Policy Studies Organization.
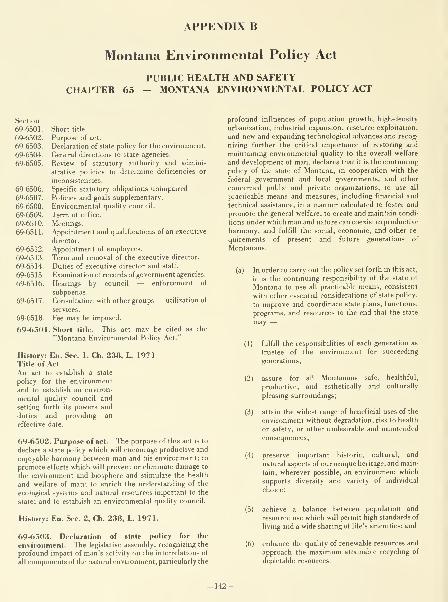
APPENDIX B
Montana Environmental Policy Act
PUBLIC HEALTH AND SAFETYCHAPTER 65 - MONTANA ENVIRONMENTAL POLICY ACT
Section
69-6501.
69-6502.
69-6503.
69-6504.
69-6505.
69-6506.
69-6507.
69-6508.
69-6509.
69-6510.
69-6511.
69-6512.
69-6513.
69-6514.
69-6515.
69-6516.
69-6517.
69-6518.
69-6501
Short title.
Purpose of act.
Declaration of state policy for the environment.
General directions to state agencies.
Review of statutory authority and admini-
strative policies to determine deficiencies or
inconsistencies.
Specific statutory obligations unimpaired.
Policies and goals supplementary.
Environmental quality council.
Term of office.
Meetings.
Appointment and qualifications of an executive
director.
Appointment of employees.
Term and removal of the executive director.
Duties of executive director and staff.
Examination ofrecords ofgovernment agencies.
Hearings by council — enforcement of
subpoenas.
Consultation with other groups — utilization of
services.
Fee may be imposed.
Short title. This act may be cited as the
"Montana Environmental Policy Act."
History: En. Sec. 1, Ch. 238, L. 1971Title of Act
An act to establish a state
policy for the environment
and to establish an environ-
mental quality council and
setting forth its powers and
duties and providing an
effective date.
69-6502. Purpose of act. The purpose of this act is to
declare a state policy which will encourage productive and
enjoyable harmony between man and his environment; to
promote efforts which will prevent or eliminate damage to
the environment and biosphere and stimulate the health
and welfare of man; to enrich the understanding of the
ecological systems and natural resources important to the
state; and to establish an environmental quality council.
History: En. Sec. 2, Ch. 238, L. 1971.
69-6503. Declaration of state policy for the
environment. The legislative assembly, recognizing the
profound impact of man's activity on the interrelations of
all components of the natural environment, particularly the
profound influences of population growth, high-density
urbanization, industrial expansion, resource exploitation,
and new and expanding technological advances and recog-
nizing further the critical importance of restoring and
maintaining environmental quality to the overall welfare
and development of man, declares that it is the continuing
policy of the state of Montana, in cooperation with the
federal government and local governments, and other
concerned public and private organizations, to use all
practicable means and measures, including financial and
technical assistance, in a manner calculated to foster and
promote the general welfare, to create and maintain condi-
tions under which man and nature can coexist in productive
harmony, and fulfill the social, economic, and other re-
quirements of present and future generations of
Montanans.
(a) In order to carry out the policy set forth in this act,
it is the continuing responsibility of the state of
Montana to use all practicable means, consistent
with other essential considerations of state policy,
to improve and coordinate state plans, functions,
programs, and resources to the end that the state
may —
(1) fulfill the responsibilities of each generation as
trustee of the environment for succeeding
generations;
(2) assure for all Montanans safe, healthful,
productive, and esthetically and culturally
pleasing surroundings;
(3) attain the widest range of beneficial uses of the
environment without degradation, risk to health
or safety, or other undesirable and unintended
consequences;
(4) preserve important historic, cultural, and
natural aspects of our unique heritage, and main-
tain, wherever possible, an environment which
supports diversity and variety of individual
choice;
(5) achieve a balance between population and
resource use which will permit high standards of
living and a wide sharing of life's amenities; and
(6) enhance the quality of renewable resources and
approach the maximum attainable recycling of
depletable resources.

(b) The legislative assembly recognizes that each
person shall be entitled to a healthful environment
and that each person has a responsibility to
contribute to the preservation and enhancement of
the environment.
History: En. Sec. 3, Ch. 238, L. 1971.
69-6.S04. General directions to the stale agencies.
The legislative assembly authorizes and directs that, to
the fullest extent possible:
(a) The policies, regulations, and laws of the state shall
be interpreted and administered in accordance with
the policies set forth in this act, and
(b) all agencies of the state shall
(1) utilize a systematic, interdisciplinary approach
which will insure the integrated use of the
natural and social sciences and the environ-
mental design arts in planning and in decision
making which may have an impact on man's
environment;
environmental standards, shall be made available to the
governor, the environmental quality council and to the
public, and shall accompany the proposal through the exist-
ing agency review processes.
(4) study, develop, and describe appropriate
alternatives to recommend courses of action in
any proposal which involves unresolved
conflicts concerning alternative uses of avail-
able resources;
(5) recognize the national and long-range
character of environmental problems and,
where consistent with the policies of the state,
lend appropriate support to initiatives, resolu-
tions, and programs designed to maximize
national co-operation in anticipating and
preventing a decline in the quality of
mankind's world environment;
(6) make available to counties, municipalities,
institutions, and individuals, advice and in-
formation useful in restoring, maintaining,
and enhancing the quality of the environment;
(2) identify and develop methods and procedures,
which will insure that presently unquanfified
environmental amenities and values may be
given appropriate consideration in decision
making along with economic and technical
considerations;
(7) initiate and utilize ecological information in
the planning and development of resource-
oriented projects; and
(8) assist the environmental quality council
established by section 8 (69-6508) of this act.
(3) include in every recommendation or report on
proposals for projects, programs, legislation and
other major actions of state government signifi-
cantly affecting the quality of the humanenvironment, a detailed statement on —
(i) the environmental impact of the proposed ac-
tion,
(ii) any adverse environmental effects which
cannot be avoided should the proposal be
implemented,
(iii) alternatives to the proposed action.
History: En. Sec. 4^ Ch. 238, L. 1971.
69-6505. Review of statutory authority andadministrative policies to determine deficiencies orinconsistencies. All agencies of the state shall review
their present statutory authority, administrative regula-
tions, and current policies and procedures for the purpose
of determining whether there are any deficiencies or incon-
sistencies therein which prohibit full compliance with the
purposes and provisions of this act and shall propose to the
governor and the environmental quality council not later
than July 1, 1972, such measures as may be necessary to
bring their authority and policies into conformity with the
intent, purposes, and procedures set forth in this act.
(iv) the relationship between local short-term uses
of man's environment and the maintenance
and enhancement of long-term productivity,
and
(v) any irreversible and irretrievable commit-
ments of resources which would be involved in
the proposed action should it be implemented.
Prior to making any detailed statement, the responsible
state official shall consult with and obtain the comments of
any state agency which has jurisdiction by law or special
expertise with respect to any environmental impart
involved. Copies of such statement and the comments and
views of the appropriate state, federal, and local agencies,
which are authorized to develop and enforce
History: En. Sec. 5, Ch. 238, L. 1971.
69-6506. Specific statutory obligationsunimpaired. Nothing in section 3 (69-6503) or 4 (69-
6504) shall in any way affect the specific statutory obliga-
tions of any agency of the state
(a) to comply with criteria or standards of
environmental quality,
(b) to co-ordinate or consult with any other state or
federal agency, or
(c) to act, or refrain from acting contingent upon the
recommendations or certification of any other state
or federal agency.
143-

History: En. Sec. 6. Ch. 238. L. 1971.
69-6507. Policies and goals supplementary. The
policies and goals set forth in this act are supplementary to
those set forth in existing authorizations of all boards,
commissions, and agencies of the state.
History: En. Sec. 7, Ch. 238, L. 1971.
69-6508. Environmental quality council. The
environmental quality council shall consist of thirteen (13)
members to be as follows:
(a) The governor or his designated representative shall
be an ex -officio member of the council and shall
participate in council meetings as a nonvoting
member.
(b) Four (4) members of the senate and four (4)
members of the house of representatives appointed
before the fiftieth legislative day in the same
manner as standing committees of the respective
houses are appointed. A vacancy on the council
occurring when the legislature is not in session shall
be filled by the selection of a member of the
legislature by the remaining members of the coun-
cil. No more than two (2) of the appointees of each
house shall be members of the same political party.
(c) Four (4) members of the general public; two (2)
public members shall be appointed by the speaker of
the house with the consent of the house minority
leader, and two (2) shall be appointed by the presi-
dent of the senate with the consent of the senate
minority leader.
In considering the appointments of (b) and (c) above,
consideration shall be given to their qualifications to
analyze and interpret environmental trends and informa-
tion of all kinds; to appraise programs and activities of the
state government in the light of the policy set forth in
section 69-6503 of this act; to be conscious and responsive
to the scientific, economic, social, aesthetic, and cultural
needs and interests of the state and to formulate and recom-
mend state policies to promote the improvement of the
quality of the environment.
History: .Amd. Sec. 1. Ch. 492. L. 1975, eff. April
21, 1975.
69-6509. Term of Office. (1) The terms of office of all
council members shall be two (2) years and shall terminate
upon appointment of a new council before the fiftieth legis-
lative day. Council members may be reappointed; however,
in no case shall a member serve more than six (6) years.
(2) The council shall elect one of its members as chair-
man and such other officers as it deems necessary. Such
officer shall be elected for a term of two (2) years.
History: Amd. Sec. 2, Ch. 492, L. 1975, eff. April 21,
1975.
69-6510. Meetings. The council may determine the time
and place of its meetings but shall meet at least once each
quarter. Eiach member of the council shall, unless he is a
full-time salaried officer or employee of this state, be paid
twenty-five dollars ($25) for each day in which he is actu-
ally and necessarily engaged in the performance of council
duties, and shall also be reimbursed for actual and neces-
sary expenses incurred while in the performance of council
duties. Members who are full-time salaried officers or
employees of this state may not be compensated for their
service as members, but shall be reimbursed for their
expenses.
History: En. Sec. 10, Ch. 238, L. 1971.
69-6511. Appointment and qualifications of anexecutive director. The council shall appoint the
executive director and set his salary. The executive director
shall hold a degree from an accredited college or university
with a major in one of the several environmental sciences
and shall have at least three (3) years of responsible ex-
perience in the field of environmental management.
He shall be a person who, as a result of his training,
experience, and attainments, is exceptionally well qualified
to analyze and interpret environmental trends and
information of all kinds; to appraise programs and activities
of the state government in the light of the policy set forth in
section 3 (69-6503) of this act; to be conscious of and
responsive to the scientific, economic, social, esthetic, and
cultural needs and interests of the state; and to formulate
and recommend state policies to promote the improvement
of the quality of the environment.
History: En. Sec. 11, Ch. 238, L. 1971.
69-6512. Appointment of employees. The executive
director, subject to the approval of the council, may appoint
whatever employees are necessary to carry out the
provisions of this act, within the limitations of legislative
appropriations.
History: En. Sec. 12, Ch. 238, L. 1971.
69-65 13. Term and removal of the executive director.
The executive director is solely responsible to the
environmental quality council. He shall hold office for a
term of two (2) years beginning with July 1 of each odd-
numbered year. The council may remove him for
misfeasance, malfeasance or nonfeasance in office at any
time after notice and hearing.
History: En. Sec. 13, Ch. 238, L. 1971.
69-6514. Duties of executive director and staff. It
shall be the duty and function of the executive director and
his staff
(a) to gather timely and authoritative information
concerning the conditions and trends in the quality
of the environment both current and prospective,
to analyze and interpret such information for the
purpose of determining whether such conditions
and trends are interfering, or are likely to interfere,
with the achievement of the policy set forth in
144-

section 3 (69-6503) of this act, and to compile and
submit to the governor and the legislative assembly
studies relating to such conditions and trends;
(b) to review and appraise the various programs and
activities of the state agencies in the light of the
policy set forth in section 3 (69-6503^ of this act for
the purpose of determining the extent to which
such programs and activitiesarecontributing to the
achievement of such policy, and to make rec-
ommendations to the governor and the legislative
assembly with respect thereto;
(c) to develop and recommend to the governor and the
legislative assembly, state policies to foster and
promote the improvement of environmental quality
to meet the conservation, social, economic, health,
and other requirements and goals of the state;
(d) to conduct investigations, studies, surveys,
research, and analyses relating to ecological
systems and environmental quality;
(e) to document and define changes in the natural en-
vironment, including the plant and animal systems,
and to accumulate necessary data and other infor-
mation for a continuinganalysis of these changes or
trends and an interpretation of their underlying
causes;
(0 to make and furnish such studies, reports thereon,
and recommendations with respect to matters of
policy and legislation as the legislative assembly re-
quests;
(g) to analyze legislative proposals in clearly
environmental areas and in other fields where
legislation might have environmental conse-
quences, and assist in preparation of reports for use
by legislative committees, administrative agencies,
and the public;
(h) to consult with, and assist legislators who are
preparing environmental legislation, to clarify any
deficiencies or potential conflicts with an overall
ecologic plan;
(i) to review and evaluate operating programs in the
environmental field in the several agencies to
identify actual or potential conflicts, both amongsuch activities, and with a general ecologic per-
spective, and to suggest legislation to remedy such
situations;
(j) to transmit to the governor and the legislative
assembly annually, and make available to the
general public annually, beginning July 1, 1972, an
environmental quality report concerning the state
of the environment which shall contain
the aquatic, including surface and ground water,
and the terrestrial environment, including, but
not limited to, the forest, dryland, wetland,
range, urban, suburban, and rural environment;
(2) the adequacy of available natural resources for
fulfilling human and economic requirements of
the state in the light of expected population
pressures;
(3) current and foreseeable trends in the quality,
management and utilization of such environ-
ments and the effects of those trends on the
social, economic, and other requirements of the
state in the light of expected population
pressures;
(4) a review of the programs and activities (including
regulatory activities) of the state and local
governments, and nongovernmental entities or
individuals, with particular reference to their
effect on the environment and on the
conservation, development and utilization of
natural resources; and
(5) a program for remedying the deficiencies of
existing programs and activities, together with
recommendations for legislation.
History: En. Sec. 14, Ch. 238, L. 1971.
69-6515. Examination of records of governmentagencies. The environmental quality council shall have
the authority to investigate, examine and inspect all
records, books and files of any department, agency , commis-
sion, board or institution of the state of Montana.
History: En. See. 15, Ch. 238, L. 1971.
69-6516. Hearings by council—enforcement of sub-
poenas. In the discharge of its duties the environmental
quality council shall have authority to hold hearings,
administer oaths, issue subpoenas, compel the attendance
of witnesses, and the production of any papers, books,
accounts, documents and testimony, and to cause deposi-
tions of witnesses to be taken in the manner prescribed by
law for taking depositions in civil actions in the district
court. In case of disobedience on the part of any person to
comply with any subpoena issued on behalf of the council,
or any committee thereof, or of the refusal of any witness to
testify on any matters regarding which he may be lawfully
interrogated, it shall be the duty of the district court of any
county or the judge thereof, on application of the environ-
mental quality council to compel obedience by proceedings
for contempt as the case of disobedience of the require-
ments of a subpoena issued from such court on a refusal to
testify therein.
History: En. Sec. 16, Ch. 238. L. 1971.
(1) the status and condition of the major natural,
manmade, or altered environmental classes of
the state, including, but not limited to, the air.
69-6517. Consultation with other groups— utiliza-
tion of services. In exercising its powers, functions, and
duties under this act, the council shall
(a) consult with such representatives of science, indus-
try, agriculture, labor, conservation organizations,
educational institutions, local governments and
other groups, as it deems advisable; and
(b) utilize, to the fullest extent possible, the services,
facilities, and information (including statistical
information) of public and private agencies and
organizations, and individuals, in order that
duplication of effort and expense may be avoided,
thus assuring that the commission's activities will
not unnecessarily overlap or conflict with similar
activities authorized by law and performed by
established agencies.
History: En. Sec. 17, Ch. 238, L. 1971.
69-6518. Fee may be imposed. (1) Each agency of state
government charged with the responsibility of issuing a
lease, permit, contract, license or certificate under any
provision of state law may adopt rules prescribing fees
which shall be paid by a person, corporation, partnership,
firm, association, or other private entity when an applica-
tion for a lease, permit, contract, license, or certificate will
require an agency to compile an environmental impact
statement as prescribed by section 69-6504, R. C. M. 1947,
of the Montana Environmental Policy Act. An agency must
determine within thirty (30) days after a completed applica-
tion is filed whether it will be necessary to compile an
environmental impact statement and assess a fee as pre-
scribed by this section. The fee assessed under this section
shall only be used to gather data and information necessary
to compile an environmental impact statement as defined in
the Montana Environmental Policy Act. No fee may be
assessed if an agency intends only to file a negative declara-
tion stating that the proposed project will not have a
significant impact on the human environment.
(2) In prescribing fees to be assessed against applicants
for a lease, permit, contract, license, or certificate, as
specified in subsection (1), an agency may adopt a fee
schedule which may be adjusted depending upon the size
and complexity of the proposed project. No fee may be
assessed unless the application for a lease, permit, contract,
license, or certificate will result in the agency incurring
expenses in excess of two thousand five hundred dollars
($2,500) to compile an environmental impact statement.
The maximum fee that may be imposed by an agency shall
not exceed two per cent (2%) of any estimated cost up to
one million dollars ($1,000,000) ; plus one per cent (1%) of
any estimated cost over one million dollars ($1,000,000)
and up to twenty million dollars ($20,000,000); plus one-
half of one per cent ('/2 of 1%) of any estimated cost over
twenty million dollars ($20,000,000) and up to one hundred
million dollars ($100,000,000); plus one-quarter of one per
cent ('A of 1%) of any estimated cost over one hundred
million dollars ($100,000,000) and up to three hundred
million dollars ($300,000,000); plus one-eighth of one per
cent (Vs of 1%) of anv estimated cost in excess of three
hundred million dollars ($300,000,000). If an application
consists of two (2) or more facilities, the filing fee shall be
based on the total estimated cost of the combined facilities.
The estimated cost shall be determined by the agency and
the applicant at the time the application is filed.
(3) No fee as prescribed by this section may be assessed
against any person, corporation, partnership, firm, associa-
tion, or other private entity filing an application for a
certificate under the provisions of the Montana Utility
Siting Act, Title 70, chapter 8, R. C. M. 1947.
(4) In adopting rules prescribing fees as authorized by
this section, an agency shall comply with the provisions of
the Montana Administrative Procedure Act, Title 82, chap-
ter 42, R. C. M. 1947.
(5) All fees collected under this section shall be
deposited in the state earmarked revenue fund as provided
in section 79-410, R. C. M. 1947. All fees paid pursuant to
this section shall be used as herein provided and each
agency upon completion of the necessary work will make an
accounting to the applicant of the funds expended and re-
fund all unexpended funds without interest.
(6) In cases where a combined facility proposed by an
applicant requires action by more than one (1) agency or
multiple applications for the same facility, the governor
shall designate a lead agency to collect one (1) fee pursuant
to this section, to co-ordinate the preparation of informa-
tion required for all environmental impact statements
which may be required, and to allocate and disburse the
funds necessary to the other agencies which require funds
for the completion of the necessary work.
(7) Each agency shall review and revise its rules im-
posing fees as authorized by this section at least every two
(2) years. Furthermore, each agency shall provide the
legislature with a complete report on the fees collected prior
to the time that a request for an appropriation is made to the
legislature.
History: En. 66-6518 by Sec. 1, Ch. 329, L. 1975.

APPENDIX C
UNIFORM RULES
For Environmental Impact Statements (EIS) Required by the
Montana Environmental Policy Act of 1971
Adopted by the Environmental Quality Council, May 29, 1975
Table of Contents:
I. INTRODUCTION AND POLICY
II. DEFINITIONS
III. PRELIMINARY ENVIRONMENTAL REVIEW CHECKLIST
IV. ENVIRONMENTAL REVIEW PROCEDURES
V. CONTENT OF ENVIRONMENTAL IMPACT STATEMENTS
VI. USE OF ENVIRONMENTAL IMPACT STATEMENT IN
AGENCY DECISIONS
I. INTRODUCTION AND POLICY (1) The legis-
lature in 1971 adopted the Montana Environmental Policy
Act (Sections 69-6501 through 69-6518, Revised Codes of
Montana, 1947). The Act declares a state policy to achieve
and maintain environmental quality and provides a general
procedural framework for state agency decision making that
will give appropriate consideration to environmental
values.
(2) Section 69-6504 directs that all agencies of the
state shall:
"(1) utilize a systematic, interdisciplinary approach
which will insure the integrated use of the natural and social
sciences and the environmental design arts in planning and
decision making which may have an impact on man's
environment;
(2) identify and develop methods and procedures
which will insure that presently unquantified environ-
mental amenities and values may be given appropriate
consideration in decision making along with economic and
technical considerations;
(3) include in every recommendation or report on
proposals for projects, programs, legislation and other
major actions of state government significantly affecting
the quality of the human environment, a detailed statement
on —(i) the environmental impact of theproposedaction,
(ii) any adverse environmental effects which cannot
be avoided should the proposal be implemented,
(iii) alternatives to the proposed action,
(iv) the relationship between local short-term uses of
the environment and the maintenance and enhancement of
long-term productivity, and
(v) any irreversible and irretrievable commitments
of resources which would be involved in the proposed
action should it be implemented."
(3) Section 69-6503 of the Act "declares that it is the
continuing policy of the state of Montana ... to use all
practicable means and measures ... in a manner calculated
to foster and promote the general welfare, to create and
maintain conditions under which man and nature can
coexist in productive harmony, and fulfill the social,
economic and other requirements of present and future
generations of Montanans."
(4) Anticipating the impacts of proposals and
alternatives is a necessary tool that must be utilized by all
agencies of the state so that the state may "fulfill the
responsibilities of each generation as the trustee of the
environment for succeeding generations," according to
Section 69-6503(a) (1). Section 69-6504(b) (1) states that
these efforts must "utilize a systematic, interdisciplinary
approach which will insure the integrated use of the natural
and social sciences and the environmental design arts in
planning and decision making which may have an impact on
man's environment."
(5) As early as possible and in all cases prior to any
agency decision concerning major action or recom-
mendation on a proposal for legislation that significantly
affects the environment, state agencies shall, in
consultation with other appropriate agencies and
individuals, in both the public and private sectors, assess in
detail the potential environmental impact so that adverse
effects are avoided and environmental quality is
maintained, enhanced, or restored to the fullest extent
practicable. In particular, it is especially important that
alternative actions that will minimize adverse impacts be
explored, and both the long and short range effects on the
human environment and on nature be evaluated in order to
avoid, to the fullest extent practicable, undesirable
consequences for the environment as a whole.
(6) The language in Section 69-6504 is intended to
insure that all agencies of the state shall comply with the
directives set out in that section "to the fullest extent
possible" under their statutory authorizations and that no
agency shall utilize an excessively narrow construction of
its existing statutory authorizations to avoid compliance. In
deciding whether or not to approve the action under
consideration, the agency should consider the broad range
of environmental factors covered by the environmental
impact statement in addition to the specific factors
indicated by the statute or regulation authorizing the
agency action.
II. DEFINITIONS (1) "Agency of the state" means
any agency of state government as defined in Title 82A,
R.C.M., 1947.
(2) "Agency listing" is a listing of all state agencies
with environmental expertise or jurisdiction compiled by
the Environmental Quality Council and the Commission on
Environmental Quality. The listing will indicate the areas of
environmental expertise and jurisdiction of each agency,
and will be distributed to assist agencies in conducting
preliminary environmental reviews and preparing draft
environmental impact statements, and in determining
whether a joint impact statement is appropriate.
(3) "Emergency actions" are:
(a) projects undertaken, carried out, or approved by
an agency to maintain, repair, or restore property or
facilities damaged or destroyed as a result of disaster in a
disaster-stricken area in which a state of emergency has
been declared by the governor or other appropriate govern-
ment official;
(b) emergency repairs to public service facilities
necessary to maintain service;
(c) projects undertaken as emergency action
necessary to prevent or mitigate immediate threats to public
health or safety.
(4) "Major actions of state government" include,
but are not limited to:
(a) Facilities development; planning, designing,
or constructing physical facilities to be owned and operated
by state agencies.
(b) Rule making; development and promulgation
of rules and standards.
(c) Policy making; development and formal
recommendation of state policy.
(d) Legislation; agency recommendations or
formal reports relating to legislation, including appropria-
tions. This includes agency recommendations on their own
proposals, and agency reports on proposals initiated
elsewhere. In the latter case, only the agency which has
primary responsibility for the subject matter involved will
be required to conduct an environmental review.
(e) Individual projects; the development of state
programs, proposed projects within state programs, and
continuing activities undertaken by state agencies and
supported in whole or in part by state funds or involving a
state lease, permit, license, certificate, or other entitle-
ment.
(0 any agency action for which a hearing is normally
required by statute or regulation.
(g) any agency action having one or more of the
following characteristics:
(i) The action under consideration is the first or only
governmental decision to be taken on the project;
(ii) The action may generate additional or secondary
impacts which outweight the initial impacts;
(iii) The action is expected to have direct or indirect
local, statewide, or regional implications;
(iv) The action may affect environmental attributes
recognized as being endangered, fragile, or in severely short
supply;
(v) The action is growth-inducing;
(vi) The action may substantially alter environ-
mental conditions in terms of quality or availability;
(vii) The action may have irreversible environ-
mental effects;
(viii) The action is likely to be precedent setting or
controversial;
(ix) The action is one of a number of smaller actions
which have a substantial impact collectively.
(5) "Major actions of state government" do not
include, and an environmental review is not necessary for,
agency actions which are not included in paragraphs (4) (a)
through (4) (f) of this section, and which have none of the
characteristics listed in paragraph (4) (g), and which fall
into one of the following categories:
(a) Ministerial actions; actions in which the
agency exercises no discretion, but rather acts upon a given
state of facts in a prescribed manner pursuant to statutory
or regulatory mandate. In such actions, the responsible
official must act without regard to his own judgment or
opinion as to the wisdom or propriety of the action. Such
actions are in the nature of routine, clerical or similar
actions.
(b) Existing facilities; minor repairs, operation or
maintenance of existing equipment or facilities involving
no expansion of capacity or use beyond that already exist-
ing. Such actions might include interior alteration or repair
of buildings, installation of safety or health protection
devices, minor highway maintenance or repair.
(c) Investigation and enforcement; data
collection, inspection of facilities, enforcement of environ-
mental standards.
(6) "Human environment" is broadly construed to
include the bio-physical, social, economic, cultural, and
aesthetic factors that inter-relate to form the environment
in which Montanans live.
(7) "Lead agency" is the agency of the state that has
primary authority for committing the government to a
course of action with significant environmental impact, or
the agency chosen to supervise the preparation of a joint
environmental impact statement where more than one
agency is involved in the action. The Environmental
Quality Council and the Commission on Environmental
Quality will assist, on request, in resolving questions of lead
agency determination.
(8) "Environmental impact statement" is the
"detailed statement" required by Section 69-6504(b) (3),
and can take several different forms:
(a) "Draft environmental impact statement" is the
initial environmental impact statement prepared in
accordance with section IV. (2) of these rules, and
distributed to the appropriate agencies and the public for
comment prior to filing the final environmental impact
statement.
(b) "Final environmental impact statement" is a
document summarizing or if necessary including the major
conclusions and supporting information of a draft environ-
mental impact statement and specifically including the lead
agency's response to all substantial comments or objections
raised by the public or other agencies since issuance of the
draft environmental impact statement.
(c) "Joint environmental impact statement" is an
environmental impact statement prepared by more than one
agency in cooperation when such agencies are involved in
the same or closely related proposed actions.
(d) "Programmatic environmental impact state-
ment" is an environmental impact statement covering
several related actions, or discussing initiation or
continuance of a broad policy or program which mayinvolve a series of future actions.
(9) "Agency impact determination" is the report or
recommendation by an agency, after completion of the
preliminary environmental review, that serves public
notice of the results of the preliminary environmental
review. Specifically, the agency impact determination
announces the determination whether the proposed action
will or might significantly affect the quality of the humanenvironment. A determination in the negative serves to
announce that a draft environmental impact statement will
not be prepared. A determination in the affirmative
announces that a draft environmental impact statement will
be prepared and serves the additional function of notifying
agencies and individuals who have an interest in the forth-
coming draft environmental impact statement.
(10) "Preliminary environmental review" (PER) is
the initial review of a proposed action to determine whether
the action might significantly affect the quality of the
human environment and therefore require a draft environ-
mental impact statement. Report of the completed PER is
an agency impact determination.
III. PRELIMINARY ENVIRONMENTAL RE-VIEW (PER) CHECKLIST. Once an action is identified as
not categorically exempt from environmental review
requirements, a preliminary environmental review (PER)must be conducted to determine if the action will have a
significant effect on the environment and therefore require
a detailed impact statement. The PER is to be conducted
concurrently with preliminary economic, technical andother review procedures which normally go into the agencyreview process. In order to facilitate this review, a checklist
is to be developed.
(1) Developmenl of PER Checklist:
(a) Eiach agency shall identify those actions typically
undertaken by the agency which do not require an environ-
mental review, in accordance with section 11(5). Nocategory of action may be formally designated as exempt
from the requirements of the Montana Environmental
Policy Act except pursuant to the rule making procedures of
the Montana Administrative Procedure Act, Section 82-
4201 et seq., R.C.M., 1947.
(b) E^ch agency shall identify the types of actions
which it typically undertakes which require environmental
review.
(c) For each type of action identified in paragraph
(b), the agency shall identify the environmental
considerations usually involved in that type of action (e.g.
SO^ emissions, water pollutant discharges, etc.).
(d) For each such environmental consideration, the
agency shall identify the type of information or data whichmust be obtained in order to determine the extent of the
impact which the action will have on the environment.
(e) Based on the information gathered pursuant to
paragraphs (b) through (d), the agency shall prepare a
checklist format for conducting the PER. The agency maydevelop one general checklist which applies to all its
actions, or it may develop a separate format for each of its
major types of actions.
(f) The checklist shall include, at a minimum:(i) an adequate description of the proposed action,
including maps and graphs if appropriate;
(ii) a listing and brief description of alternative
actions;
(iii) a listing of other agencies or groups that mayhave been contacted, or which may have overlapping juris-
diction; a summary of the comments or information
obtained from such agencies or groups;
(iv) an evaluation section which consists of specific
questions which must be considered. These questions shall
reflect the criteria for defining "significant effect on the
quality of the human environment," set out in sectin 111(2)
of these rules, infra.
(v) a recommendation by the responsible official
whether an environmental impact statement is required;
(vi) identification of the person or persons conduct-
ing the PER.
(g) Agencies shall submit their proposed checklist
formats for comment and critique to the Environmental
Quality Council, the Commission on Environmental
Quality, and to other agencies with relevant expertise or
jurisdiction, and shall revise their formats where
appropriate in accordance with the comments received.
(h) Each agency shall submit a list of activity cate-
gories and associated areas of environmental jurisdiction
and concern to the Environmental Quality Council and the
Commission of Environmental Quality for use in compiling
an agency listing.
(i) Each agency shall designate and identify an
official or officials who are responsible for the content and
preparation of preliminary environmental reviews and draft
environmental impact statements, coordinating impact
statement investigatory research with other agencies, andestablishing a "fund file" of available expertise from the
public and private sectors.
(2) Evaluation of Significance of Impact on the
Environment: The determination of whether an agency
action will have a significant effect on the quality of the
human environment necessarily involves careful judgment
on the part of the responsible agency officials.
(a) The PER checklist must consider the effect of the
proposed action on the following factors, where
appropriate:
(i) Terrestrial and aquatic life and habitats;
(ii) Water quality, quantity, and distribution;
(iii) Soil quality, stability, and moisture;
(iv) Vegetation cover, quantity, and quality;
(v) Natural beauty and aesthetics;
(vi) Access to and quality of recreational and wilder-
ness experiences;
(vii) Historical and archeological sites;
(viii) Unique, endangered, fragile, or limited
environmental resources;
(ix) Air quality;
(x) Social structures and mores;
(xi) Cultural uniqueness and diversity;
(xii) Local and state tax base and tax revenues;
(xiii) .Agricultural production;
(xiv) Demands on environmental resources of land,
water, air, and energy;
(xv) Quantity and distribution of community and
personal income;
(xvi) Human health;
(xvii) Transportation networks; traffic flows;
(xviii) Quantity and distribution of employment;
(xix) Distribution and density of population and
housing;
(xx) Demands for government services, i.e. water,
waste disposal, schools, police, fire, health, streets;
(xxi) Industrial and commercial activity;
(b) In addition, the evaluation section of the PERchecklist shall address the following questions:
(i) Would the proposed action conflict with any
environmental plans or goals that have been adopted by the
community where the project is to be located?
(ii) Would the action substantially affect rare or
endangered animal or plant species, or the habitat of such a
species?
(iii) Would the project breach any state, national, or
local standards relating to solid waste or litter control?
(iv) Might the project cause substantial flooding,
erosion, or siltation?
(v) Are there substantial differences of opinion
among experts or affected citizens as to the extent of
adverse impacts on the human environment?
(c) The possibility of a significant effect on any of
the factors listed in subsection (2) (a) , or a "yes" answer to
any of the questions in subsection (2) (b) indicates that a
detailed environmental impact statement is required. The
lists in subsections (2) (a) and (2) (b) are not necessarily
exhaustive, but indicate the range of considerations which
must be addressed during the PER. In addition, the
following factors will influence the weight to be assigned to
the impacts of a proposed action:
(i) The significance of an action may vary with the
setting. For example, an activity which may not be
significant in an urban area may be significant in a rural
setting.
(ii) Primary and secondary effects must be
considered. Secondary, or indirect, effects such as
residential or commercial expansion encouraged by
highway or sewer construction, often may have more
significant environmental impacts than the project itself.
(iii) The significance of an action may depend on its
relationship to other agency decisions. If the action is the
first or only state agency decision to be made on the project,
it is likely to be more significant than if other decisions must
be made which do not depend on the outcome of the present
decision.
(iv) The statutory clause "major actions of state
government significantly affecting the quality of the human
environment" shall be construed by agencies from the
perspective of the overall impact of the action proposed and
the cumulative impacts of further actions contemplated.
Such actions may be localized and seemingly insignificant
in their individual impacts, but if there is a potential that
the environment may be significantly affected as the actions
accumulate, the environmental impact statement shall be
prepared.
(v) When an agency responsible for the issuance of a
lease, permit, license, certificate, or other entitlement can
foresee that the the issuance of a large number of such
entitlements will, cumulatively, have a significant impact
on the environment, a programmatic environmental impact
statement should be prepared which addresses these
cumulative impacts.
(vi) In any situation where cumulative impacts of a
series of related actions may be significant, the agency
should consider the appropriateness of preparing a
programmatic impact statement, as described in Section IV
(2) (e).
IV. ENVIRONMENT.AL REVIEW PROCEDURES.To guide environmental review of proposed actions,
agencies shall adopt the following procedures:
(1) Preliminary Environmental Review (PER).
Concurrent with preliminary technical, economic and other
review procedures which normally go into the agency
review process, the agency shall conduct a preliminary
environmental review sufficient to make a determination
whether the action may have a significant effect on the
human environment. The evaluation should be explicit
enough to make clear to other agencies and the public the
basis for the agency's recommendation whether to prepare
an environmental impact statement. In conducting a PER,
the agency shall proceed as follows:
(a) determine whether the proposed action is a major
action as defined in section 11(4) and as identified in section
III(l) of these rules;
(b) if the proposed action is not a major action, no
further environmental review is necessary;
(c) if the proposed action is an emergency action as
defined in Section 11(3) of these rules, the agency may
proceed with the action immediately, as the emergency
dictates. In this case, however, the agency shall continue
with the environmental review procedures concurrent with
or subsequent to the action, in order to inform other
agencies and the public of the environmental impacts
caused by the action.
(d) if the proposed action is a major action, fill out
the appropriate PER checklist to determine whether the
action would have a significant effect on the human
environment;
(e) in filling out the PER checklist, the agency may
utilize information submitted to it by the applicant. The
agency must take responsibility for the accuracy and
adequacy of the information used to determine the extent of
environmental impact;
(0 the agency may consult with other agencies or
groups in conducting the PER and filling out the checklist.
Where the agency listing indicates other agencies with
relevant expertise or overlapping jurisdiction, such
consultation is required;
(g) after completing the PER, the agency shall
circulate the checklist to all agencies with relevant expertise
and jurisdiction, and to the Environmental Quality Council
and Commission on Environmental Quality, and to any
individuals or groups which have been identified as
interested in or affected by the proposed action. All such
150-
agencies and groups will have fifteen (15) days to submit
comments to the agency. The agency will take no action
towards approval of the proposed action during that period;
(h) commenting agencies should indicate the need
for a joint or programmatic impact statement where
appropriate. Where a joint statement is necessary, the
agencies involved shall confer to determine the lead agency,
or shall make plans to coordinate preparation of a joint
statement;
(i) if the agency's completed checklist indicates
there will be no significant effect on the human environ-
ment, the checklist will serve as an agency impact determi-
nation and the agency's normal decision making process
with respect to the proposed action may continue;
(j) if the agency's completed checklist indicates
there will or may be a significant effect on the humanenvironment, the checklist will serve as an agency impact
determination giving notice of intent to prepare an environ-
mental impact statement. The agency shall then proceed to
prepare a draft environmental impact statement. Until the
environmental impact statement procedure is completed,
the agency will take no further action towards approval of
the proposed action;
(k) agencies shall maintain a listing of all agency
impact determinations. This listing shall be available to the
public.
(2) Preparation of Draft Environmental Impact
Statements.
(a) Once it has been determined that an environ-
mental impact statement is required, the agency shall, at the
earliest feasible time, consult with other agencies with
relevant expertise or jurisdiction with respect to the
contemplated action and its impacts. The agency should
also seek comments from appropriate federal and local
agencies, public and private organizations, groups, and
individuals whose interests are likely to be significantly
affected by the action. In order to facilitate this consul-
tation process, agencies should develop "fund files" of
expertise available from the public and private sectors. This
consultation need not be considered formal. An inter-
disciplinary approach to the preparation of draft environ-
mental impact statements is the chief goal of agency
consultation.
(b) Where the lead agency or another state or federal
agency has already prepared an environmental impact state-
ment on a project which is related geographically or
functionally to the project under consideration, portions of
such an environmental impact statement may be utilized by
the agency. The agency must be careful to insure that all
conditions and impacts peculiar to the action under con-
sideration are adequately dealt with. The Environmental
Quality Council will assist agencies, on request, in deter-
mining whether such related impact statements are avail-
able.
(c) Fees. Under Section 69-6518 of the Act, in any
action involving an application for a lease, permit, license,
certificate or other entitlement, the agency should
determine, after the initial consultations with other
agencies, whether the expected cost of preparing a draft and
final environmental impact statement will exceed two
thousand five hundred dollars (S2,500.00). If this is the
case, the agency may require the applicant to pay a fee to
cover such costs, up to two percent (2%) of the total
projected cost of the proposed project. The agency mayadopt rules to determine how such fees will be assessed.
(d) Joint Impact Statements. Where more than
one agency (inlcuding federal agencies) directly sponsors
an action, or is directly involved in an action through
funding, licensing, or permits, or where more than one
agency is involved in a group of actions directly related to
each other because of their functional interdependence and
geographical proximity, consideration should be given to
preparation of one environmental impact statement for all
the state actions involved. Agencies in such cases should
consider the possibility of joint preparation of an environ-
mental impact statement by all agencies involved, or
designation of a single lead agency to assume supervisory
responsibility over the preparation of the environmental
impact statement. Where a lead agency prepares the
statement, the other agencies involved should provide
assistance with respect to their areas of jurisdiction and
expertise. In either case, the environmental impact state-
ment should assess the total impact of the full range of state
actions involved, should reflect the views of all participat-
ing agencies, and should be prepared before major or
irreversible actions have been taken by any of the
participating agencies. Factors relevant in determining an
appropriate lead agency include the time sequence in which
agencies become involved, the magnitude of their
respective involvements, and their relative expertise with
respect to the project's environmental effects.
(e) Programmatic Impact Statements. Where the
cumulative effects of several related actions are significant,
a programmatic impact statement may be appropriate.
Individual actions that are related either geograpbically
(e.g., several proposed subdivisions within a particular
area), or as logical parts within a contemplated series of
actions (e.g., several segments of a proposed highway) maybe more appropriately evaluated in a single programmatic
statement. Such a programmatic statement may also be
appropriate in the development of rules or policies or other
criteria which will govern the conduct of a continuing
program, or in the development of a new program that
contemplates a number of subsequent actions.
A programmatic statement will not satisfy the require-
ments of the Act if it is superficial or limited to generalities.
The programmatic statement should satisfy all the require-
ments for the content of individual project statements, but
should emphasize cumulative impacts, and alternative
policies or courses of action.
The programmatic statement will serve as an analytical
foundation for subsequent individual project statements,
but subsequent individual projects may require further
analysis where conditions or expected impacts have
changed, or where specific impacts peculiar to the
individual project were not treated in sufficient detail in the
programmatic statement. Where appropriate, subsequent
individual project statements may take the form of addenda
to programmatic statements already issued.
(0 On request, the Environmental Quality Council
will advise agencies concerning the appropriateness of joint
or programmatic statements, and will assist in the determi-
nation of lead agency.
(3) Distribution of the Draft EIS — CommentProcedures.
(a) One copy of the draft environmental impact
151—
statement shall be transmitted to the office of the executive
director of the Environmental Quality Council. The lead
agency shall also circulate the draff environmental impact
statement to other appropriate agencies and selected public
and private groups and individuals, including, at a
minimum, those parties who have already supplied
information and comments to the agency on the proposed
action. The listed transmittal date to the Environmental
Quality Council shall not be earlier than the date of the
draft environmental impact statement mailing to the other
agencies, organizations, and individuals. Agencies seeking
comments shall establish time limits of not less than thirty
(30) days for reply, after which it may be presumed, unless
the commenting agency requests an extension of time not to
exceed fifteen (15) days, that the agency consulted has no
comment to make. All agencies shall make available for
public inspection all reports, studies, and other documents
that underlie the draft and final environmental impact
statements.
(b) At this point, lead agencies may decide to hold a
public hearing on the draff environmental impact state-
ment. In deciding whether a public hearing is appropriate,
the agency should consider:
(i) the magnitude of the proposal in terms of fore-
closing future options; geographic area involved;
irreversible commitment of resources; the amount and
types of energy required; the uniqueness of the required
resources;
(ii) the degree of interest in the action partly
evidenced by requests for a hearing from the public and
from state and local authorities;
(iii) the complexity and potential precedent-setting
aspects of the proposed action and the likelihood that
information will be presented at the hearing which will be of
assistance to the agency in fulfilling its responsibilities
under the Act.
(c) Agencies which hold hearings shall mail or other-
wise transmit the draft environmental impact statement to
interested parties at least twenty (20) days prior to the time
of the hearings. Hearings shall be preceded by adequate
public notice.
(d) If an agency action for which a draft environ-
mental impact statement has been prepared normally
requires a public hearing, the draft environmental impact
statement should be prepared and transmitted at least
twenty (20) days in advance of such hearing.
(e) No action subject to Section 69-6504 (b) (3) of
the Act shall be taken sooner than sixty (60) days after the
transmittal date to the ELnvironmental Quality Council of
the draft environmental impact statement.
(0 If the lead agency has given full and good faith
consideration to the environment in its plans, if this is
reflected in favorable comments from reviewers, and if the
draft environmental impact statement represents the fullest
possible compliance with the Act, the draft environmental
impact statement may be seen as satisfying the requirement
for a detailed statement. If the draft environmental impact
statement is sufficient, the lead agency must submit to the
Environmental Quality Council one copy of all comments
received on the draft environmental impact statement and
at public hearings, together with agency responses to
comments, and formal notification of the final agency
decision on the proposed action. Lead agencies must furnish
the same information to all commenting parties.
(g) The lead agency shall determine, taking into
account all comments received on the draft environmental
impact statement or at public hearings, whether a final
environmental impact statement is required for compliance
to the fullest extent possible with the Act.
(4) Final Environmental Impact Statement.
(a) A final environmental impact statement shall
include, at minimum:(i) a summary of major conclusions and supporting
information based on the draft environmental impact state-
ment and on agency responses to comments received on the
draft environmental impact statement, stating specifically
where such conclusions and information were changed
from those which appeared in the draft.
(ii) a list of all sourcesof written and oral comments,
including those obtained at public hearings, and unless
impractical, shall include the text of comments received by
the agency. In all cases, the text of a representative sample
of comments shall be included.
(iii) agency responses to these comments. These
responses shall include a good faith evaluation of the
comments received, and a substantive disposition of the
issues involved.
(iv) new data, information, and explanations derived
or obtained subsequent to circulation of the draft.
(b) No agency action shall be taken towards approval
of the proposed project sooner than thirty (30) days after
the final environmental impact statement has been
transmitted to the Environmental Quality Council and
concerned parties. The listed transmittal date to the
Environmental Quality Council shall not be earlier than the
date of the final environmental impact statement mailing to
other appropriate agencies, organizations, and individuals.
(c) Where emergency circumstances or conflicting
statutory requirements make it necessary, the lead agency
may take an action having significant environmental
impacts without observing the provisions of these regula-
tions concerning time requirements for agency review and
advance availability of environmental impact statements.
The lead agency shall provide the Environmental Quality
Council with a precise, factual statement detailing the
nature of the emergency or statutory conflict, and the
reasons for departing from normal procedures.
(d) Draft and final environmental impact state-
ments must state the source material used in preparation of
the impact statement, and identify the persons contributing
to the impact statement.
V. CONTENT OF ENVIRONMENTAL IMPACTSTATEMENTS. Each environmental impact statement
shall be prepared in accordance with the precept in Section
69-6504(b) (1) of the Act that all agencies shall "utilize a
systematic, interdisciplinary approach ... in planning and
decision making . .
.""In addition, the Act should be seen as a
"full disclosure" law. This means that environmental
impact statements must describe a//environmental impacts
of a proposed action, even where the impacts are beyond the
control or realm of expertise of the lead agency. It must be
remembered that the environmental impact statement will
be used as a source of information not only for the lead
agency's decision makers, but also for other agencies and
for the public.
The cover of the environmental impact statement
should include, at a minimum, the name of the lead agency
(with the name of the operating division, where
appropriate), whether the statement is a draft or a final, and
the date of transmittal to the Environmental Quality
Council.
Environmental impact statements should cover the
following:
(1) a description of the nature and objectives of the
proposed action;
(2) a description of current environmental
conditions in the area affected by the action, including maps
and charts where appropriate;
(3) a description of alternative actions which could
accomplish some or all of the objectives of the proposed
action. These might include alternative engineering tech-
niques, alternative design or location, or fundamental
institutional alternatives (such as floodway management
programs instead of dam construction.) The description
should include alternatives which are beyond the authority
of the lead agency to implement on its own. The purpose is
to avoid precluding viable alternatives which might have
less severe environmental impacts, and to allocate responsi-
bility among the agencies for achievement of the stated
objectives with minimal adverse impacts. Other agencies
should be consulted in describing such alternatives.
(4) descriptions of the impacts on the humanenvironment of the proposed action and the listed
alternatives including the alternative of taking no action.
The descriptions should include the economic, social,
cultural, aesthetic, and biophysical factors listed in section
111(2) of these rules. The number of factors actually
analyzed in an environmental impact statement is subject to
the lead agency's discretion, and primarily depends on the
type and magnitude of the proposed action. Primary and
secondary impacts should be described. The descriptions
should include:
(a) adverse and beneficial impacts of each
alternative;
(b) potential growth-inducing aspects of each
alternative;
(c) irreversible commitments of environmental
resources including land, air, water and energy resulting
from each alternative;
(d) economic and environmental benefits and costs
resulting from the proposed action and each alternative.
Agencies should attempt to balance the results of their
environmental assessments with their assessments of the
net economic, technical, and other benefits of the proposed
action and alternatives, and use all practicable means to
avoid or minimize undesirable consequences for the
environment;
(e) a comparison of short-term costs and benefits
from the proposed action and alternatives, with the effects
on maintenance and enhancement of the long-term
productivity of the environment.
(5) source material used in the preparation of the
draft; agency personnel contributing to the impact state-
ment and the names of lead agency officials responsible for
the environmental impact statement contents and
distribution.
VI. USE OF THE ENVIRONMENTAL IMPACTSTATEMENT IN AGENCY DECISION MAKING. Section
69-6504(a) of the Act requires that "the policies,
regulations and laws of the state shall be interpreted and
administered in accordance with the policies set forth in
[MEPA]" After reviewing the environmental effects
disclosed in the impact statement, the agency must
carefully weigh the environmental costs against the
expected benefits of the proposed action. The agency's final
decision whether to procede with the project must reflect
this balancing analysis. Wherever adverse environmental
effects are found to be involved in the proposed action, the
agency must indicate in its final recommendation that
interests and considerations of state policy justify those
effects.
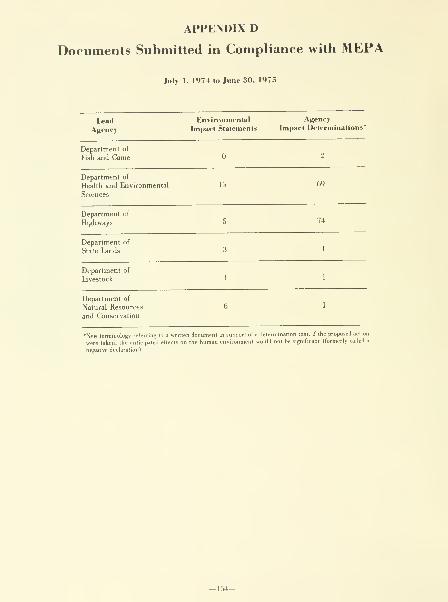
APPENDIX D
Documents Submitted in Compliance with MEPA
July 1, 1974 to June 30. 1975
LeadAgeney

APPENDIX E
Environmental Quality Council
Program Cost Summary
General Fund:
Salaries
Other Gsmpensation
Employee Benefits
July 1, 1974 - June 30, 1975
90,112.97
1,525.00
10,855.76
Contracted Services

READER RESPONSE AND EVALUATION
We need your help. No one knows better than yourself what makes your surroundings pleasant and
meaningful. The usefulness of future EQC efforts to update conditions and trends of the Montana
environment will depend on how well it reflects your needs and values in your surroundings. You can assist
us by filling out this brief response form and mailing it back to us. We can't guarantee your environment will
be better for doing it, but hopefully your understanding of it will be enhanced.
1. What indicator(s) did you find most helpful in evaluating the quality of your envirorimciil?
Most helpful
2nd most helpful
3rd most helpful-
2. What indicator(s) did you find least helpful in evaluating the quality of your environment'.'
Least helpful —
2nd least helpful
3rd least helpful _
3. What improving or declining environmental trends in your region are not covered by any indicator i
this report?
4. What indicators not used in this report would you like to see used in future
5. Are the environmental regions appropriate for reporting indicators?
Yes
Why or why not?
6. What comments on the indicators report do you have?
THANK YOU. PLEASE TEAR OUT AND MAIL TO: EQC Indicators Project
Box 215Capitol Station
Helena, Montana 59601