biphasic characteristic of interactions between stiripentol and carbamazepine in the mouse maximal...
TRANSCRIPT

ORIGINAL ARTICLE
Biphasic characteristic of interactions between stiripentoland carbamazepine in the mouse maximalelectroshock-induced seizure model: a three-dimensionalisobolographic analysis
Jarogniew J. Luszczki & Stanislaw J. Czuczwar
Received: 13 June 2006 /Accepted: 17 July 2006 / Published online: 14 September 2006# Springer-Verlag 2006
Abstract The anticonvulsant effects produced by stiripen-tol (STP), carbamazepine (CBZ), and their combination inthe maximal electroshock (MES)-induced seizures in micewere investigated using three-dimensional (3D) isobolo-graphic analysis. With 3D isobolography, the combinationsof both drugs at the fixed-ratios of 1:3, 1:1, and 3:1 for16%, 50% and 84% antiseizure effects, respectively, wereexamined in order to evaluate the preclinical characteristicsof the interactions between STP and CBZ. Additionally, tocharacterize precisely the types of interactions observed inthe MES test, free plasma and total brain CBZ concen-trations were estimated for all fixed-ratios tested.
The 3D isobolographic analysis showed that STP andCBZ combined at the fixed-ratio of 1:3 produced supra-additive (synergistic) interactions in the MES test for theanticonvulsant effects ranging between 16% and 84%. Incontrast, the combination of STP with CBZ at the fixed-ratio of 3:1 exerted sub-additive (antagonistic) interactionsin 3D isobolography for all antiseizure effects examinedin the MES test. Only the combination of STP and CBZat the fixed-ratio of 1:1 was additive for the investigatedeffects (16%, 50% and 84%) in 3D isobolography.Pharmacokinetic evaluation of CBZ concentrationsrevealed that STP increased both free plasma and totalbrain CBZ concentrations for all fixed-ratio combinationstested (1:3, 1:1 and 3:1).
In conclusion, the 3D isobolographic findings suggestthat the combination of STP with CBZ exerted biphasiccharacteristics of interactions in the MES test, despite the
pharmacokinetic increase in CBZ content in plasma andbrains of experimental animals.
Keywords Three-dimensional isobolographic analysis .
Stiripentol . Carbamazepine . Electroshock maximal .
Pharmacokinetic interaction
Abbreviations3D three-dimensionalAED antiepileptic drugCBZ carbamazepineMES maximal electroshock seizure testSTP stiripentol
Introduction
From a pharmacological point of view, certain combina-tions of two fully-active drugs evoke interactions whosenature may be pharmacodynamic, pharmacokinetic ormixed. Therefore, a detailed knowledge of the potentialinteractions among drugs in vivo is still a challenging issuefor researchers today. The progress in this field requires ameticulous examination of the type and strength ofinteractions in preclinical studies on animals.
Epilepsy is one of the central nervous system disordersthat sometimes requires a combined therapy, especially forpatients with refractory seizures inadequately controlledwith monotherapy. The combined therapy with two or moreantiepileptic drugs (AEDs) for patients with refractoryepilepsy is rationally preselected based on both theoreticalconsiderations about the mechanisms of action of combinedAEDs and the observed effects exerted by these drugs inpreclinical studies. Generally, the AED combinations,
Naunyn-Schmiedeberg’s Arch Pharmacol (2006) 374:51–64DOI 10.1007/s00210-006-0100-3
J. J. Luszczki (*) : S. J. CzuczwarDepartment of Pathophysiology, Medical University of Lublin,Jaczewskiego 8,20-090 Lublin, Polande-mail: [email protected]

exerting supra-additivity (synergy) with respect to theanticonvulsant activity and producing minimal or no sideeffects in animals, are considered as beneficial and may berecommended to clinical practice (Perucca 1995; Peruccaand Levy 2002; Deckers et al. 2000).
To date, several methods analyzing the effects pro-duced by a combined treatment with two or more drugsin preclinical experiments have been published (forreview see Berenbaum 1989; Greco et al. 1995). Of thesemethods, the most commonly used has been an isobolo-graphic analysis proposed by Loewe (1953). This princi-pal method has been modified by Tallarida (1992), whohad evaluated pharmacological characteristics of interac-tions among drugs co-administered in several varyingfixed-ratio combinations. Theoretically, one can distin-guish five types of interactions with isobolography:additivity, supra-additivity (synergy), indifference, sub-additivity (relative antagonism), and infra-additivity(absolute antagonism) (Loewe 1953; Berenbaum 1989;Tallarida et al. 1999).
Generally, when two drugs are combined and investi-gated in preclinical studies, three variables always exist: thedoses of each drug and their resultant biological effect. Inconventional (two-dimensional; 2D) isobolographic analy-sis, one variable must always be constant, so 2D isobolog-raphy is usually performed for median (50%) effects(Berenbaum 1989; Greco et al. 1995). However, withthree-dimensional (3D) isobolographic analysis, one candetect and identify any subtle changes in the existingrelationship between administered doses of two drugs andtheir resultant pharmacological effects (Berenbaum 1989;Greco et al. 1995). Relatively recently, a trend forinvestigating two-drug combinations and their interactionsat several various effect levels with 3D response-surfaceanalysis has appeared (Prichard et al. 1991, 1993; Kanzawaet al. 1997; Tallarida et al. 1999; Tallarida 2001, 2006). Forepilepsy research studies, this modern approach (3Disobolographic analysis) is of pivotal importance allowingthe determination of existing relationship between AEDs.Undoubtedly, the 3D isobolography might contribute to thepreselection of AED combinations whose synergisticanticonvulsant effects in animals would be recommendedand further adopted to rational bi-therapy in patientsrefractory to monotherapy.
In the present study, the anticonvulsant effects producedby stiripentol (STP {4,4-dimethyl-1-[3,4-(methylenedioxy)-phenyl]-1-penten-3-ol} - a novel AED), carbamazepine(CBZ, a conventional AED), and their combination at threefixed-ratios of 1:3, 1:1 and 3:1 were determined in maximalelectroshock (MES)-induced seizures in mice using 3Disobolographic analysis. The rationale for testing thecombination of STP with CBZ in the MES test in micewas based on previous clinical studies showing the efficacy
of both AEDs in add-on therapy in patients with refractorypartial epilepsy (Loiseau et al. 1990; Renard et al. 1993;Tran et al. 1996; Perez et al. 1999). Generally, it is acceptedthat the MES test in rodents is considered as an experi-mental model of tonic-clonic seizures and, to a certainextent, of partial convulsions in humans (Löscher et al.1991; White et al. 2002). In the clinical settings, CBZ iseffective in epileptic patients with partial and tonic-clonicseizures in humans (Brodie and Schachter 2001), whereasSTP suppresses partial seizures and severe myoclonicepilepsy in infants (Chiron et al. 2000). Therefore, it wasappropriate to use the MES test to evaluate the antiseizureeffects produced by the combination of STP with CBZ inmice. Additionally, free plasma and total brain CBZconcentrations were estimated in this study to ascertainwhether the observed effects result from a pharmacody-namic and/or a pharmacokinetic interaction.
Methods
Animals and experimental conditions
All experiments were performed on adult male albino Swissmice weighing 22–26 g. The mice were kept in colonycages with free access to food and tap water, understandardized housing conditions (natural light-dark cycle,temperature of 21±1°C, relative humidity of 55±3%). After7 days of adaptation to laboratory conditions, the animalswere randomly assigned to experimental groups consistingof eight mice. Each mouse was used only once. All testswere performed between 0900 and 1400 hours to minimizeconfounding effects of circadian rhythms. Proceduresinvolving animals and their care were conducted inconformity with the European Communities CouncilDirective of 24 November 1986 (86/609/EEC) and Polishlegislation on animal experimentation. Additionally, allefforts were made to minimize animal suffering and to useonly the number of animals necessary to produce reliablescientific data. The experimental protocols and procedureslisted above were conformed to the Guide for the Care andUse of Laboratory Animals and approved by the LocalEthics Committee at the Medical University of Lublin(License no. 420/2003/446/2003).
Drugs
In this study: STP (a kind gift from Dr. Jean Vincent,Biocodex Laboratoires, Gentilly, France) and CBZ (a kindgift from Polfa, Starogard Gdanski, Poland) were sus-pended in a 1% aqueous solution of Tween 80 (Sigma, St.Louis, Mo., USA) and administered intraperitoneally (i.p.),as two separate injections, in a volume of 5 ml/kg body
52 Naunyn-Schmiedeberg’s Arch Pharmacol (2006) 374:51–64

weight. Fresh drug solutions were prepared on each dayof experimentation and administered: STP at 60 min andCBZ at 30 min before the electroconvulsions and brainsampling for the measurement of AED concentrations.The route of i.p. administration and pre-treatment time ofthe AEDs were based on information about their biolog-ical activity from the literature and our previous experi-ments (Luszczki et al. 2003a,b). The time to the peak ofmaximum anticonvulsant effects for STP and CBZ wasused as the reference time in pharmacokinetic estimation offree (non-protein bound) plasma and total brain CBZconcentrations.
Maximal electroshock seizure (MES) test
Electroconvulsions were produced by means of analternating current (0.2 s stimulus duration, fixed currentintensity of 25 mA, maximum stimulation voltage of500 V, current frequency of 50 Hz) delivered via ear-clipelectrodes by a generator (Rodent Shocker, Type 221;Hugo Sachs, Freiburg, Germany). The criterion for theoccurrence of seizure activity was the tonic hindlimbextension (i.e., the hind limbs of animals outstretched180° to the plane of the body axis). The protectiveactivities of STP and CBZ were evaluated as theireffective doses (ED16, ED50, and ED84 in mg/kg) againstMES-induced seizures. Different drug doses were adminis-tered in order to obtain a variable percentage of protectionof animals against MES, allowing the construction of adose-response relationship curve (DRRC) for each AEDadministered alone, according to Litchfield and Wilcoxon(1949). Subsequently, the ED16, ED50, and ED84 valueswith their 95% confidence limits were calculated. Each ofthe ED16, ED50 and ED84 values represents a drug doserequired to protect 16%, 50%, and 84% of animals againstMES, respectively. Similarly, the anticonvulsant activity ofthe mixture of STP and CBZ was evaluated and expressedas ED16 mix, ED50 mix, and ED84 mix, corresponding to dosesof the mixture of two component drugs necessary to protect16%, 50%, and 84% of animals against tonic hindlimbextension in the MES test. This test has been described inmore detail in our earlier studies (Luszczki and Czuczwar2003, 2004a,b).
Measurement of free (non-protein bound) plasma and totalbrain CBZ concentrations
The measurement of free plasma and total brain concen-trations of CBZ after co-administration of STP wasundertaken at doses of both AEDs, which corresponded totheir ED50 mix values for all fixed-ratio combinations (1:3,1:1 and 3:1) in the MES-induced seizures. Mice were killedby decapitation at the time chosen to coincide with that
scheduled for the MES test, and samples of blood ofapproximately 1 ml were collected into heparinizedEppendorf tubes. Simultaneously, the whole brains of micewere harvested, weighed, and homogenized in distilledwater (2:1 vol/weight) in an Ultra-Turrax T8 homogenizer(Staufen, Germany). The homogenates were centrifuged at10,000 g for 10 min. Blood samples were centrifuged at5,000 g for 5 min and plasma (300 μl) were transferred intoan Amicon Centrifree Micropartition System (MPS-1;Amicon, Danvers, USA) for the separation of free (non-protein bound) CBZ concentrations from those that areprotein bound. The MPS-1 tubes were centrifuged at5,000 g at 25°C for 10 min and the filtrate samples(70 μl) or the supernatant samples (70 μl) containing CBZwere analyzed by fluorescence polarization immunoassay(FPIA) using a TDx analyzer and reagents exactly asdescribed by the manufacturer (Abbott Laboratories, NorthChicago, Ill., USA). The free plasma and total brain CBZconcentrations were expressed in μg/ml of plasma or brainsupernatants as means±SD of at least 8 determinations(separate plasma and brain preparations). Statistical evalu-ation of data was performed with the unpaired Student’st-test.
Isobolographic analysis of interactions
Isobolographic analysis of interactions between STP andCBZ was performed according to the methodology previ-ously detailed in our earlier studies (Luszczki et al. 2003a–c,2006; Luszczki and Czuczwar 2003, 2004a,b, 2005). In thepresent study, 3D isobolographic analysis comprised 5basic stages as follows:
1. Evaluation of the anticonvulsant effects of STP andCBZ followed by the determination of their dose-response relationship curves (DRRCs) by means of log-probit linear regression analysis according to Litchfieldand Wilcoxon (1949). Generally, linear log-probitanalysis yields DRRC with parameter values formedian effective dose (ED50), slope function (S),equation of DRRC and coefficient of determination(r2). The effective doses of STP and CBZ [EDxs (x=16,50 or 84) with their 95% confidence limits or SE] weredirectly calculated from the respective DRRC equationsaccording to Litchfield and Wilcoxon (1949). It isworth of note that the examined DRRCs for AEDsadministered alone have to be parallel in 3D isobolo-graphic analysis and therefore the test for parallelismwas performed in this study (see Appendix). It isimportant to note that log-probit transformation of AEDdoses and their resultant anticonvulsant effects reducessome problems associated with (a)symmetry of non-
Naunyn-Schmiedeberg’s Arch Pharmacol (2006) 374:51–64 53

linear DRRCs for drugs administered alone. Relativelyrecently, there has appeared a trend to fit all experi-mentally derived non-linear data to both symmetricaland asymmetrical DRRC models so as to chose thebest-fit equation describing the existing relationshipbetween drugs and their biological effects (Van derGraaf and Schoemaker 1999; Giraldo et al. 2002).
2. Theoretical choice of three fixed drug dose ratiocombinations of the examined AEDs (1:3, 1:1 and3:1) associated with calculations of the additiveeffective doses (EDx adds) with their SE. The EDx add
represents a total additive dose of the mixture,theoretically providing an x-% (x=16, 50 or 84) effect,i.e., protection of animals against MES-inducedseizures. The additive doses in the mixture of STPand CBZ (EDx adds) were calculated from the generalequation of additivity presented by Loewe (1953), asfollows: a/A+b/B=1; where a and b are doses of STPand CBZ, co-administered in the mixture that exerteda desired effect (an initially established referencepoint). A and B are doses of the drugs administeredseparately, which also exerted the same desired effect(ED16, ED50 or ED84). In isobolography, it is widelyaccepted that half the EDx of one drug added to halfthe EDx of another drug should be as theoreticallyeffective as one EDx of either drugs administeredsingly (where x is an effect ranging between 16% and84%). This basic tenet of isobolography is, however,closely related to linear dose-response analysis fordrugs administered alone.
3. Experimental determination of the effective doses(EDx mixs) with their SE for the respective fixed-ratioAED combinations (1:3, 1:1 and 3:1). The EDx mix isan experimentally determined total dose of the mixtureof two component drugs, at the respective fixed-ratiocombination, sufficient for an x-% (x=16, 50 and 84)protective effect against MES-induced seizures. Theexperimentally-derived EDx mix values (with their95% confidence limits) were calculated from therespective DRRC equations of combined drug mix-tures according to Litchfield and Wilcoxon (1949)and, subsequently, their 95% confidence limits weretransformed to SE, according to the method previouslypresented in our studies (Luszczki et al. 2003a, 2006).
4. Statistical comparison of the experimentally-derivedEDx mixs with their corresponding theoretical additiveEDx adds by the use of unpaired Student’s t-test,according to Porreca et al. (1990) and Tallarida(2000).
5. Graphical illustration of the examined interactions as2D and 3D isobolograms. To display types of inter-actions and determine their strength, 2D isobologramswere drawn by plotting the points reflecting the
respective EDx (x=16, 50, and 84) of STP on the X-axis and these of CBZ on Y-axis. The straight line,connecting EDx values for these drugs, represents thetheoretical isobole for an additive effect. If theexperimentally-derived data points are placed on thisline, the two-drug mixture exerts purely additiveinteraction (Loewe 1953). When the experimentally-derived points reflecting combinations of various fixed-ratios fall significantly below this line, the twocomponent drugs act synergistically. Conversely, an-tagonism may be recognized if these points arelocalized above the additive isobole. In case of 3Disobologram, doses of STP and CBZ are plottedgraphically on X- and Y-axes, whereas their resultantanticonvulsant effects on Z-axis. The convex curve onthe graph represents supra-additive (synergistic) inter-action between STP and CBZ. The concave curvereflects sub-additive (antagonistic) interaction observedbetween the AEDs in the MES test.
To simplify the notation and nomenclature of interac-tions in isobolography, the drug doses were administered atthe fixed-ratio combinations (e.g., 1:3, 1:1, and 3:1). Thefixed drug dose ratios are usually presented in form ofnatural numbers (1:3, 1:1, 3:1) and they reflect fractions ofED50 values denoted for the drugs used separately. Forinstance, the mixture at the fixed-ratio of 1:3 is consisted of¼ of the ED50 of the first drug and ¾ of the ED50 of thesecond drug. Thus, the isobolographic notation of fixed-ratio combinations contains only numerators of fractions ofED50 values for AEDs used in the mixture. In the presentstudy, the ED50 values for STP and CBZ administeredalone in the MES test were 277.7 mg/kg and 11.5 mg/kg,respectively (Table 1). Hence, the mixture of STP withCBZ at the fixed-ratio of 1:3 was composed of STP at (¼ of277.7 mg/kg=69.43 mg/kg) and CBZ (¾ of 11.5 mg/kg=8.63 mg/kg). In this two-drug mixture, CBZ prevailedover STP with respect to its pharmacological activityagainst maximal electroconvulsions, but it did not exceedquantitatively in the mixture (Table 3). Analogously, thetwo-drug mixture for the combination of 1:1 in the MEStest consisted of STP (½ of 277.7 mg/kg=138.85 mg/kg)and CBZ (½ of 11.5 mg/kg=5.75 mg/kg), where the drugswere combined in equi-effective (iso-effective) doses(Table 3). Likewise, the fixed-ratio combination of 3:1was a simple notation of the mixture composed of STP(¾ of 277.7 mg/kg=208.28 mg/kg) and CBZ (¼ of11.5 mg/kg=2.88 mg/kg). In this case, there is no doubtthat STP prevailed over CBZ in the mixture (Table 3). Allthe above-mentioned drug doses for the respective fixed-ratio combinations were primarily considered as additivebecause they were directly calculated from the equation ofadditivity presented by Loewe (1953).
54 Naunyn-Schmiedeberg’s Arch Pharmacol (2006) 374:51–64

Interaction index
Interaction index for all fixed-ratio combinations wascalculated as a ratio of the respective EDx mix and EDx add
values from the MES test. This isobolographic parameterdescribes the strength and magnitude of interactionsbetween two drugs in the mixture (Berenbaum 1989;Tallarida et al. 1999; Tallarida 2002).
Software used
Microsoft’s Excel spreadsheet was used to perform calcu-lations and to graph the results in form of 2D isobolograms.
This spreadsheet was programmed to compute all calcu-lations automatically and determine the DRR lines of AEDsadministered alone from the log-probit linear regressionanalysis according to Litchfield and Wilcoxon (1949). Thetheoretically additive interactions at the fixed-ratio combi-nations of 1:3, 1:1 and 3:1 for various effect levels (i.e.,ED16 add, ED50 add, and ED84 add) were also calculated withthis program. The 3D isobolograms for the experimentally-derived dose-response surfaces were constructed withcommercially available program Statistica.
Results
Anticonvulsant effects of STP and CBZ administered singlyin the MES test in mice
STP and CBZ exerted clear-cut anticonvulsant activitiesagainst MES-induced seizures in mice (Fig. 1) and theirED50 values are presented in Table 1. Log-probit linearregression analysis according to Litchfield and Wilcoxon(1949) followed by χ2 (Chi-square) test revealed that thedata points creating the lines of DRRs for STP and CBZ aregood-to-fit. As the experimentally determined value of χ2
E
for STP (0.930) was considerably lower than the criticalvalue of χ2
T for 2 degrees of freedom (df) (5.991) at P<0.05(Table 1), one can conclude that the DRR line for STP wasgood-to-fit (Litchfield and Wilcoxon 1949). Similarly, theexperimentally calculated value of χ2
E for CBZ (1.641) waslower than the critical value of χ2
T for 1 df (3.841) at P<0.05(Table 1), hence, the DRR line for CBZ was best-fit, too(Litchfield and Wilcoxon 1949). Additionally, to detectvariance influencing the homogeneity of data points ofDRRs for STP and CBZ, the F-distribution statistic wasperformed according to the method described by Glantz andSlinker (2001). The calculated F-value for STP(F1,3=62.173) was greater than the critical F-value of10.13, at P<0.05 (Table 1). Likewise, the calculated F-valuefor CBZ (F1,2=24.917) differed significantly from the criticalF-value of 18.51, at P<0.05 (Table 1). So, the F-distributionstatistic revealed that the log-probit lines for STP and CBZare good-to-fit (Fig. 1). Moreover, the coefficient ofdetermination (r2) for both DRRs (STP and CBZ) wasdetermined. The r2 for the DRR line of STP was 0.969;hence, the straight DRR line (at the equation of y=15.204x−32.151) describes 96.9% of the existing relationship betweenthe doses of STP and the observed anticonvulsant effects inthe MES test (Table 1; Fig. 1). Similarly, the r2 for the DRRline of CBZ was 0.961 and, thus, the linear regressionequation (y=12.368x−8.138) describes 96.1% of the rela-tionship between CBZ doses and the observed antiseizureeffects in the MES test in mice (Table 1; Fig. 1). Finally, thelinear regression analysis followed by the test for parallelism
Table 1 The anticonvulsant activity of stiripentol (STP) andcarbamazepine (CBZ) in the maximal electroshock-induced seizuresin mice
Drug P/T DRR analysis
STP (mg/kg)225 0/8 ED50=277.7 (254.9−302.5) y=15.204x−32.151250 2/8 S=1.164 r2=0.969275 4/8 f=1.089 df=2300 5/8 n=24 χ2
E=0.930325 7/8 SE=12.125 χ2
T=5.991350 8/8 f_S=1.056 F=62.173CBZ (mg/kg)8 0/8 ED50=11.5 (10.1−13.1) y=12.368x−8.13810 2/8 S=1.205 r2=0.96112 4/8 f=1.138 df=114 7/8 n=16 χ2
E =1.64116 8/8 SE=0.759 χ2
T=3.841f_S=1.082 F=24.917
PR (ED50 STP/ED50 CBZ)=24.056Test for parallelism: SR (SCBZ/SSTP)=1.035; f_ratio_SR=1.100Since SR< f_ratio_SR, the examined two DRR lines are parallel(Litchfield and Wilcoxon 1949)Raw data for each AED administered alone allow the calculation oftheir dose-response relationship (DRR) lines. P number of animalsprotected against electroconvulsions; T total number of animalschallenged with the MES test.ED50-median effective dose of an AED protecting 50% of animals tested,calculated according to log-probit method by Litchfield and Wilcoxon(1949); S slope function of DRR line; f-factor for ED50; n total numberof animals used between 4 and 6 probits of expected anticonvulsanteffects; SE standard error of ED50; f_S factor for slope function; y effectin probits; x logarithm of a drug dose to the base 10; r2 coefficient ofdetermination for DRR line; df degrees of freedom from DRR analysis(i.e., number of analyzed points-2); χ2
E value of χ2 (Chi-square)goodness-of-fit test, determined experimentally by means of DRRanalysis; χ2
T tabular χ2 value for the respective df, according to Glantzand Slinker (2001); F value of F-distribution statistic, experimentallycalculated from the DRR analysis. PR potency ratio, is a quotient of theexamined ED50 values; SR slope function ratio, is a quotient ofcalculated slope functions of the examined DRR lines; f_ratio_SR factorratio for slope function ratio. As the DRR analysis was performedaccording to the log-probit method by Litchfield and Wilcoxon (1949),the original notation of DRR parameters was applied in the present study.For more details see the Appendix
Naunyn-Schmiedeberg’s Arch Pharmacol (2006) 374:51–64 55

indicated that the examined DRR lines for STP and CBZfulfilled the criterion of parallelism (Table 1). The slopefunction ratio (SR) for STP and CBZ in the MES test(SR=1.035) was lower than the factor ratio for slope functionratio (f_ratio_SR=1.100; Table 1). Noteworthy, since the testfor parallelism of two log-probit DRR lines was performedaccording to Litchfield and Wilcoxon (1949), the originalnotation for SR and f_ratio_SR was applied in the presentstudy.
Anticonvulsant activity of combinations of STP and CBZin the MES test in mice
The mixture of STP and CBZ at the fixed-ratio of 1:3 exerted apotent anticonvulsant activity in the MES test. In this case, log-probit analysis allowed the determination of DRR equation forthe mixture of both AEDs (y=7.978x−8.931; r2=0.977). Since,the calculated χ2
E value (2.455) was considerably lower, andF-distribution statistic (F1,3=83.058) greatly exceeded the
corresponding critical values (at P<0.05), one can concludethat the DRR for the mixture of STP and CBZ at the fixed-ratio of 1:3 was good-to-fit (Tallarida 2000; Glantz andSlinker 2001). So, the ED50 mix for the mixture at the fixed-ratio of 1:3 was 55.7 (45.6–68.0) mg/kg (Table 2; Fig. 1).Similarly, the DRR equation for the mixture of STP with CBZat the fixed-ratio of 1:1 was y=9.878x−16.399 (r2=0.941). Theexperimentally-derived χ2
E for 2 df was 3.667, andF1,3=32.061, indicating that the DRR for the mixture at thefixed-ratio of 1:1 was good-to-fit. The ED50 mix for this fixed-ratio was 146.6 (128.5–167.2) mg/kg (Table 2; Fig. 1). Thelog-probit analysis allowed the calculation of DRR equationfor the AEDs in the mixture at the fixed-ratio of 3:1(y=12.550x−25.278; r2=0.991). As the calculated χ2
E value(0.474) was considerably lower, and F-distribution statistic(F1,2=106.909) greatly exceeded the corresponding criticalvalues (at P<0.05), the DRR for the mixture of STP andCBZ at the fixed-ratio of 3:1 was good-to-fit. In this case, theED50 mix was 258.6 (227.8–293.7) mg/kg (Table 2; Fig. 1).
Fig. 1 Log-probit analysis of dose-response relationship (DRR) linesfor stiripentol (STP), carbamazepine (CBZ) and their combinations atthree fixed-ratios of 1:3, 1:1 and 3:1 in the maximal electroshock(MES)-induced seizures in mice. Drug doses of STP and CBZ injectedalone were transformed into logarithms to the base 10 and plotted on alog scale (abscissa, x), whereas their corresponding protective effectswere transformed to probits and plotted on a probit scale (ordinate, y).The equation of DRR lines for STP in the MES test, following log-probit analysis, was: y=15.204x−32.151 (r2=0.969), whereas that for
CBZ was y=12.368x−8.138 (r2=0.961). The equations of DRR linesfor the fixed-ratios of 1:3, 1:1 and 3:1 in the MES test were: y=7.978x−8.931 (r2=0.977), y=9.879x−16.399 (r2=0.941), and y=12.55x−25.278 (r2=0.991), respectively. Test for homogeneity of data pointsfor denoted DRR lines, performed with χ2 (Chi-square) goodness-of-fit test and F-distribution statistic, revealed that all data points aregood-to-fit. Test for parallelism of the DRR lines for STP and CBZrevealed that the denoted lines are parallel (Litchfield and Wilcoxon1949). For more details see Tables 1 and 2
56 Naunyn-Schmiedeberg’s Arch Pharmacol (2006) 374:51–64

Isobolographic analysis of interactions between STPand CBZ in the MES test in mice
Isobolographic analysis revealed that the mixture of STPand CBZ at the fixed-ratio of 1:3 exerted supra-additivity(synergy) for all examined effects (ED16, ED50 and ED84)in the MES test (Fig. 2a–c; Fig. 3a,b). The experimentally-derived ED16 mix was 41.8±4.26 mg/kg and significantlydiffered from the theoretically calculated ED16 add, whichwas 66.8±3.08 mg/kg (P<0.001; Table 3; Fig. 2a). Similar-ly, the ED50 mix was 55.7±5.68 mg/kg, whereas the ED50 add
was 78.1±3.60 mg/kg (P<0.01; Table 3; Fig. 2b). TheED84 mix value (74.4±7.58 mg/kg) was considerably lowerthan the ED84 add value (91.2±4.21 mg/kg) at P<0.05,indicating a supra-additive interaction between STP andCBZ at the fixed-ratio of 1:3 (Table 3; Fig. 2c). The mixtureof STP and CBZ at the fixed-ratio of 1:1 displayed additiveinteractions in the MES test for all drug dose-effectsinvestigated (Table 3; Fig. 2a–c; Fig. 3a,b). The experi-mentally denoted ED16 mix, ED50 mix, and ED84 mix valuesdid not differ significantly from their correspondingtheoretically calculated ED16 add, ED50 add, and ED84 add
values (Table 3; Fig. 2a–c). Moreover, the mixture of STPand CBZ at the fixed-ratio of 3:1 exerted sub-additivity(antagonism) for all examined effects (ED16, ED50 andED84) in the MES test (Fig. 2a–c; Fig. 3a,b). In this case,the experimentally-derived ED16 mix was 215.3±13.95 mg/kg,and considerably differed from the theoretically additiveED16 add (181.4±7.97 mg/kg) at P<0.05 (Table 3; Fig. 2a).
Analogously, the ED50 mix (258.6±16.76 mg/kg) wassignificantly greater than the theoretically additive ED50 add
(211.1±9.28) at P<0.05 (Table 3; Fig. 2b). Similarly, theexperimentally-derived ED84 mix was 310.7±20.13 mg/kg,and significantly differed from the ED84 add (245.8±10.81 mg/kg) at P<0.01 (Table 3; Fig. 2c), indicating sub-additive interaction between STP and CBZ at the fixed-ratioof 3:1.
The interaction index values for the fixed-ratio combi-nation of 1:3 increased from 0.63 (ED16) to 0.82 (ED84)and, thus, supra-additivity decreased by 0.19 (19%) alongwith the increase of examined anticonvulsant effects fromED16 to ED84 (Table 3). Similarly, the interaction indexvalues for the fixed-ratio of 1:1 increased from 0.94 (ED16)to 1.10 (ED84) (Table 3). The fixed-ratio combination of 3:1displayed also an increase in interaction index value, whichwas associated with increment of observed anticonvulsanteffects. In this case, the interaction index values wereranged between 1.19 (ED16) and 1.26 (ED84), hence a 7%increase in sub-additivity (antagonism) was observed(Table 3).
Free plasma and total brain CBZ concentrations
The estimation of free plasma and total brain concentrationsof CBZ was performed for all fixed-ratio combinationstested (1:3, 1:1 and 3:1) at doses corresponding to theirED50 mix values from the MES test. The co-administrationof STP (49.5 mg/kg) and CBZ (6.2 mg/kg) at the fixed-ratio
Table 2 Effects of stiripentol (STP) and carbamazepine (CBZ) in combination on the maximal electroshock-induced seizures in mice
FR STP CBZ Mixture P/T DRR analysis(mg/kg) (mg/kg) (mg/kg)
1:3 26.0 3.2 29.2 0/8 ED50mix=55.7 (45.6−68.0) y=7.978 x−8.93134.7 4.3 39.0 1/8 S=1.335 r2=0.97743.4 5.4 48.8 2/8 f=1.221 df=252.1 6.5 58.6 5/8 n=16 χ2E=2.455; χ2
T=5.99169.4 8.6 78.0 7/8 SE=5.679 F=83.05878.1 9.7 87.8 8/8
1:1 69.4 2.9 72.3 0/8 ED50mix=146.6 (128.5−167.2) y=9.879x−16.399104.1 4.4 108.5 1/8 S=1.262 r2=0.941138.8 5.8 144.6 3/8 f=1.141 df=2156.2 6.6 162.8 5/8 n=24 χ2E=3.667; χ2
T=5.991173.5 7.3 180.8 7/8 SE=9.852 F=32.061208.2 8.7 216.9 8/8
3:1 166.6 2.3 168.9 0/8 ED50mix=258.6 (227.8−293.7) y=12.550x−25.278208.3 2.9 211.2 1/8 S=1.201 r2=0.991250.3 3.5 253.8 4/8 f=1.135 df=1291.6 4.1 295.7 6/8 n=16 χ2E=0.474; χ2
T=3.841312.5 4.4 316.9 8/8 SE=16.757 F=106.909
STP + CBZ = MixtureFR fixed-ratio combination; ED50 mix median effective dose of the two-drug mixture, which protects 50% of animals tested against MES-inducedseizures. For more details see the legend to Table 1
Naunyn-Schmiedeberg’s Arch Pharmacol (2006) 374:51–64 57

58 Naunyn-Schmiedeberg’s Arch Pharmacol (2006) 374:51–64

of 1:3 was associated with a significant 21% increase infree plasma CBZ concentrations when compared to animalsadministered CBZ alone (P<0.05; Table 4). Similarly, totalbrain CBZ concentrations increased by 25% following thei.p. administration of STP at 49.5 mg/kg (P<0.05; Table 4).STP (at 140.7 mg/kg) co-administered with CBZ (5.9 mg/kg)at the fixed-ratio of 1:1 produced a significant 29% increasein free plasma CBZ concentration (P<0.01; Table 4).Similarly, STP (140.7 mg/kg) co-administered with CBZ(5.9 mg/kg) significantly elevated (by 33%) total brain CBZconcentration (P<0.01; Table 4). The combination of STP(255.1 mg/kg) with CBZ (3.5 mg/kg) was associated with a39% increase in free plasma CBZ concentrations (P<0.001;Table 4). Simultaneously, total brain concentrations of CBZadministered at 3.5 mg/kg considerably increased (by 48%)following the i.p. administration of STP at 255.1 mg/kg(P<0.001; Table 4).
Discussion
Results presented herein indicate clearly that STP com-bined with CBZ produced a biphasic characteristic ofinteractions in the MES test in mice, exerting both supra-additivity (synergy) and sub-additivity (antagonism)depending on the dose ratio of STP and CBZ used in themixture. When the effects produced by CBZ in the mixtureprevailed over those offered by STP (at the fixed-ratio ofSTP:CBZ=1:3), the interaction was synergistic. In contrast,when the effects exerted by STP exceeded those producedby CBZ (at the fixed-ratio of 3:1), antagonism wasobserved. The 3D isobolographic study revealed thatsupra-additivity was reduced along with the increases inanticonvulsant effects and simultaneously, the sub-additiveinteraction was strengthened in the MES test. Noteworthy,the interaction index, assessing the strength of observedinteractions between STP and CBZ in 3D isobolography,increased along with the increment of the anticonvulsanteffects for all fixed-ratio combinations tested.
Relatively recently, a similar biphasic characteristics ofinteractions between oxcarbazepine (OXC) and clonaze-pam (CZP) has been reported in the MES test in mice(Luszczki and Czuczwar 2003). The mixtures of OXC andCZP at the fixed-ratios of 2:1 and 1:1 exerted supra-additive interactions, whereas the anticonvulsant effectsproduced by OXC and CZP at the fixed-ratios of 1:3, 1:4and 1:7, were sub-additive in the MES test (Luszczki et al.2003a). The transition of the type of interactions fromsynergy to antagonism for the combination of OXC andCZP has been denoted isobolographically at the fixed-ratioof 1:2 (Luszczki and Czuczwar 2003). In the present study,the transition of interactions from synergy to antagonismwas determined at the fixed-ratio combination of 1:1.Moreover, with 3D isobolography, it has been shown thatCZP produced synergistic interactions when combined withlamotrigine (LTG) - an AED with Na+ channel blockerproperties (Luszczki and Czuczwar 2004b). Similarly,synergistic interactions have been documented experimen-tally for the other Na+ channel blockers (i.e., phenytoin[PHT] and CBZ) combined with CZP against MES-inducedseizures in mice (Luszczki et al. 2003a).
Considering the above-mentioned facts, one can ascer-tain that there exists a synergistic relationship between CZPand Na+ channel blockers (PHT, CBZ, LTG and OXC) inthe mouse MES test. Exceptionally, only some fixed-ratiocombinations of OXC with CZP were antagonistic, whereasall fixed-ratios of CZP with LTG, CBZ and PHT weresynergistic or additive with a tendency towards synergy inthe MES test (Luszczki et al. 2003a; Luszczki andCzuczwar 2004b). In light of this fact and results presentedin this study, one can hypothesize that the combinations ofSTP with Na+ channel blockers may also produce similar
�Fig. 2 Two-dimensional isobolograms displaying the interactionsobserved for the combination of stiripentol (STP) with carba-mazepine (CBZ) in the maximal electroshock (MES)-inducedseizure test in mice. Doses of STP and CBZ for variousanticonvulsant effects (ED16, ED50 and ED84) are shown plottedgraphically (a–c), on the X- and Y-axes, respectively. The solidlines on the axes represent the 95% confidence limits for the AEDsadministered alone. The straight diagonal lines connecting therespective EDx values on each graph represent the theoretical linesof additivity for a continuum of different fixed dose ratios(EDx adds). The open points (ο) depict the experimentally-derivedEDx, mix values for a total dose of the mixture of STP and CBZ thatproduced a desired anticonvulsant effect (16%, 50% and 84%) with95% confidence limits. The dashed lines represent the theoreticaladditive 95% confidence limits for EDx add values. a Interactionsbetween STP and CBZ for a 16% anticonvulsant effect (ED16) inthe MES test in mice. The experimentally-derived ED16 mix for themixture of STP and CBZ, at the fixed-ratio of 1:3 is significantlybelow the theoretical line of additivity indicating supra-additive(synergistic) interaction (***P<0.001). In contrast, the ED16 mix atthe fixed-ratio of 3:1 is significantly above the theoretical line ofadditivity, displaying sub-additive (antagonistic) interaction(*P<0.05). Only the ED16 mix for the fixed-ratio of 1:1 is close tothe line of additivity, showing additive interaction in the MES test.b Interactions between STP and CBZ for a 50% antiseizureeffect (ED50) against electroconvulsions in mice. The experimentalED50 mix for the mixture of STP and CBZ at the fixed-ratio of 1:3is significantly below the theoretical line of additivity, and thusindicating supra-additive interaction (**P<0.01). In contrast, theED50 mix at the fixed-ratio of 3:1 is significantly above thetheoretical line of additivity, displaying sub-additive interaction(*P<0.05). The ED50 mix for the fixed-ratio of 1:1 is placed on theline of additivity, showing additive interaction in the MES test.c Interactions between STP and CBZ for an 84% anticonvulsanteffect (ED84) in the MES test. The ED84 mix for the mixture of STPand CBZ at the fixed-ratio of 1:3 is significantly below the line ofadditivity, and thus displaying supra-additive interaction(*P<0.05). Inversely, the ED84 mix at the fixed-ratio of 3:1 issignificantly above the theoretical line of additivity, showing sub-additive interaction (**P<0.01). Only, the ED84 mix for the fixed-ratio of 1:1 is close to the line of additivity, showing additiveinteraction in the MES test
Naunyn-Schmiedeberg’s Arch Pharmacol (2006) 374:51–64 59
interactions as the combinations of CZP with Na+ channelblockers. This hypothesis needs, however, experimentalverification whether LTG and OXC will interact synergis-tically with STP in the MES test in mice. Hence, furtherisobolographic studies are required to confirm or reject this
hypothesis concerning synergistic interactions between STPand AEDs with Na+ channel blocker properties in themouse MES model.
It is worthy of note that the general principle inisobolography is based on the equation of additivity and
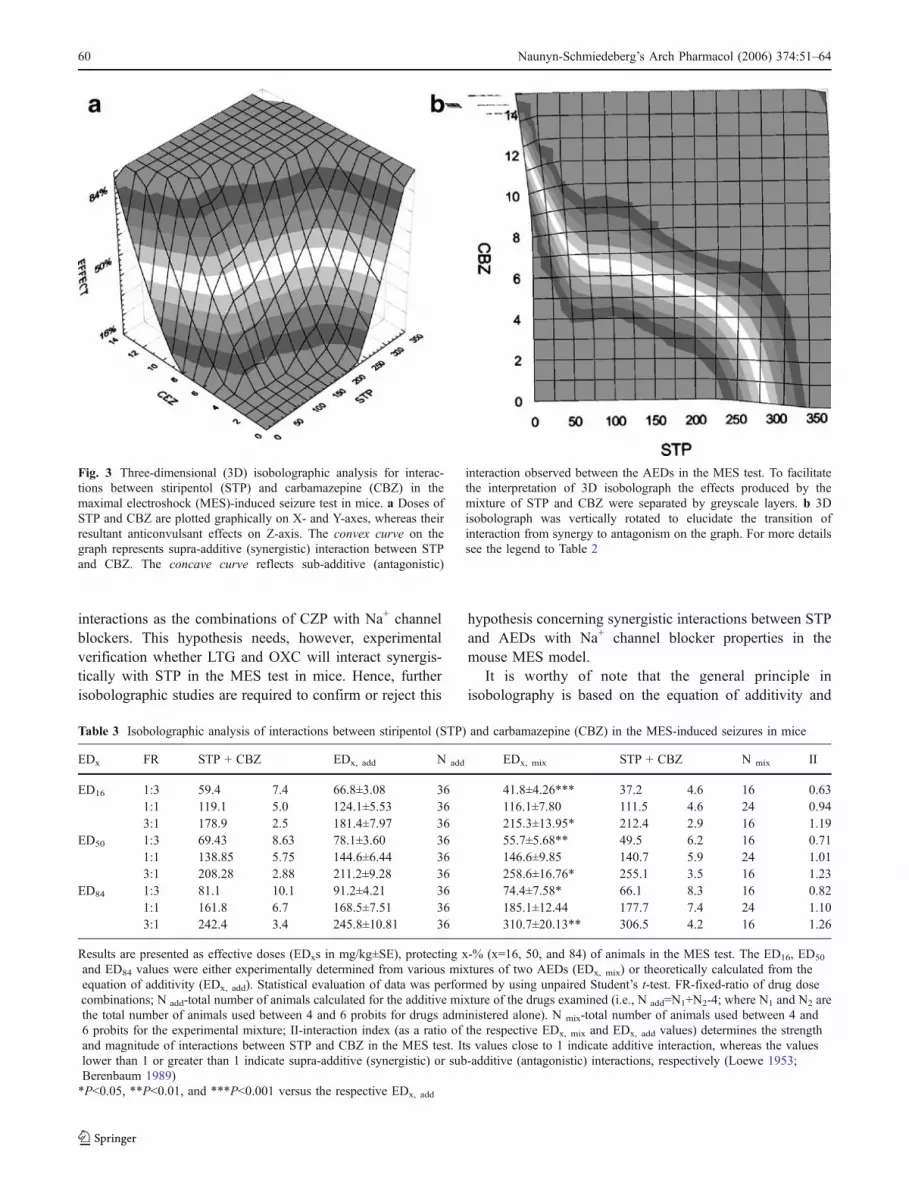
Fig. 3 Three-dimensional (3D) isobolographic analysis for interac-tions between stiripentol (STP) and carbamazepine (CBZ) in themaximal electroshock (MES)-induced seizure test in mice. a Doses ofSTP and CBZ are plotted graphically on X- and Y-axes, whereas theirresultant anticonvulsant effects on Z-axis. The convex curve on thegraph represents supra-additive (synergistic) interaction between STPand CBZ. The concave curve reflects sub-additive (antagonistic)
interaction observed between the AEDs in the MES test. To facilitatethe interpretation of 3D isobolograph the effects produced by themixture of STP and CBZ were separated by greyscale layers. b 3Disobolograph was vertically rotated to elucidate the transition ofinteraction from synergy to antagonism on the graph. For more detailssee the legend to Table 2
Table 3 Isobolographic analysis of interactions between stiripentol (STP) and carbamazepine (CBZ) in the MES-induced seizures in mice
EDx FR STP + CBZ EDx, add N add EDx, mix STP + CBZ N mix II
ED16 1:3 59.4 7.4 66.8±3.08 36 41.8±4.26*** 37.2 4.6 16 0.631:1 119.1 5.0 124.1±5.53 36 116.1±7.80 111.5 4.6 24 0.943:1 178.9 2.5 181.4±7.97 36 215.3±13.95* 212.4 2.9 16 1.19
ED50 1:3 69.43 8.63 78.1±3.60 36 55.7±5.68** 49.5 6.2 16 0.711:1 138.85 5.75 144.6±6.44 36 146.6±9.85 140.7 5.9 24 1.013:1 208.28 2.88 211.2±9.28 36 258.6±16.76* 255.1 3.5 16 1.23
ED84 1:3 81.1 10.1 91.2±4.21 36 74.4±7.58* 66.1 8.3 16 0.821:1 161.8 6.7 168.5±7.51 36 185.1±12.44 177.7 7.4 24 1.103:1 242.4 3.4 245.8±10.81 36 310.7±20.13** 306.5 4.2 16 1.26
Results are presented as effective doses (EDxs in mg/kg±SE), protecting x-% (x=16, 50, and 84) of animals in the MES test. The ED16, ED50
and ED84 values were either experimentally determined from various mixtures of two AEDs (EDx, mix) or theoretically calculated from theequation of additivity (EDx, add). Statistical evaluation of data was performed by using unpaired Student’s t-test. FR-fixed-ratio of drug dosecombinations; N add-total number of animals calculated for the additive mixture of the drugs examined (i.e., N add=N1+N2-4; where N1 and N2 arethe total number of animals used between 4 and 6 probits for drugs administered alone). N mix-total number of animals used between 4 and6 probits for the experimental mixture; II-interaction index (as a ratio of the respective EDx, mix and EDx, add values) determines the strengthand magnitude of interactions between STP and CBZ in the MES test. Its values close to 1 indicate additive interaction, whereas the valueslower than 1 or greater than 1 indicate supra-additive (synergistic) or sub-additive (antagonistic) interactions, respectively (Loewe 1953;Berenbaum 1989)*P<0.05, **P<0.01, and ***P<0.001 versus the respective EDx, add
60 Naunyn-Schmiedeberg’s Arch Pharmacol (2006) 374:51–64

presumptions that the half the EDx of the first drug co-administered with the half the EDx of the second drug areas therapeutically effective as the EDx of both AEDsadministered alone (Loewe 1953). As already mentioned,this general rule is true if both AEDs produce clear-cutanticonvulsant effects and have their DRRCs parallel. Itshould be emphasized that 3D isobolography requires theparallelism of DRRCs of AEDs administered separatelybecause the test for parallelism provides researchers with acertainty that proportions of drugs in the mixture do notchange during the evaluation of various effective doses(i.e., ED16 mix, ED50 mix, ED84 mix; Sühnel 1992, 1998). Inother words, if the DRRCs are parallel, the proportions ofdrugs in the mixture are constant for every investigatedeffect ranging between 16% and 84%. The effects lowerthan 16% and/or higher than 84% are estimated withapproximation and therefore they do not precisely reflectthe existing relationship between the drug doses and theircorresponding biological effects (Finney 1971). This iswhy, in the present study, only the effects ranging between16% and 84% were evaluated. In contrast, the lack ofparallelism between the analyzed DRRCs makes the above-mentioned isobolographic principle true only for mediandoses (ED50 values). In this case, one can apply theaxiomatic theory of parallelism between two non-parallelDRRCs, assuming that two non-parallel DRRCs areexceptionally parallel only for one fixed point-effect inthe Cartesian plot system (the point reflecting ED50 for bothdrugs). With this oversimplification, one can conduct theisobolographic analysis of interactions between drugs, butonly for the fixed-ratio of 1:1, when the effects produced bydrugs are equi-effective (iso-effective). The isobolographicanalysis of interactions at the fixed-ratio combinationsdifferent from 1:1 (especially, at the border fixed-ratios of1:5, 1:3, 3:1, or 5:1, etc.) generates a priori sub- or supra-additive interactions because proportions of both drugs in
the mixture (theoretically calculated from the equation ofadditivity for non-parallel DRRCs) are inadequately deter-mined. Thus, drug doses in the mixture may be too low ortoo high, producing finally the isobolographic interactions,whose nature can be erroneously classified as supra- or sub-additive. Generally, the isobolographic analysis based onlog-probit linear transformation of data is devoid ofproblems related to non-linear DRRCs of drugs. In ouropinion, the replacement of non-linear DRRCs by linearlog-probit DRRCs eliminates some oversimplificationsrelated to asymmetry of DRRCs during 3D responsesurface analysis. For instance, each sigmoidal DRRCshould be verified with regard to its asymmetry (Van derGraaf and Schoemaker 1999; Giraldo et al. 2002).
Relatively recently, there has appeared a trend to evaluateinteractions between two drugs in the clinical setting by theuse of a pharmacokinetic-pharmacodynamic (PK/PD) modelbased on 3D response surface analysis (Minto and Schnider1998; Minto et al. 1997, 2000, 2003; Short et al. 2002). Thismodel allows the determination of mathematical equationsfor interactions between drugs and, thus, it can predict someadvantageous or unfavorable combinations, based on thedrug dose-ratios (Minto et al. 2000). Generally, the PK/PDmathematical models are created to describe the interactionsbetween drugs with firmly established (well-known) molec-ular mechanisms of action (Groten et al. 2001; Jonker et al.2005). In case of AEDs, the drugs exert their antiseizureeffects through various sometimes unknown as yet mecha-nisms of action. Therefore, the determination of mathemat-ical equations describing PK/PD interactions between AEDs,in our opinion, seems to be premature. The detaileddescription of PK/PD models applied during the detectionof drug interactions has lately been presented by Jonker et al.(2005).
It is noteworthy that the 3D isobologram can be used topredict combination effects for any dose combinations
Table 4 Free (non-protein bound) plasma and total brain concentrations of carbamazepine (CBZ) administered singly or in combination withstiripentol (STP)
Treatment Plasma concentration Brain concentration
(mg/kg) (μg/ml) % increasea (μg/ml) % increasea
CBZ (6.2) + vehicle 1.846±0.219 1.605±0.243CBZ (6.2) + STP (49.5) 2.240±0.387* 21 2.009±0.315* 25CBZ (5.9) + vehicle 1.985±0.293 1.805±0.266CBZ (5.9) + STP (140.7) 2.570±0.332** 29 2.393±0.312** 33CBZ (3.5) + vehicle 1.409±0.172 1.164±0.159CBZ (3.5) + STP (255.1) 1.960±0.230*** 39 1.725±0.201*** 48
Results are presented as means±SD of 8 determinations. Statistical evaluation of data was performed using the unpaired Student’s t-test. TheAEDs (CBZ and STP) were administered at doses corresponding to their ED50 mix values from the MES test for all fixed-ratio combinationstested (1:3, 1:1 and 3:1)a Increase in free plasma and total brain CBZ concentrations with respect to the adequate control groups (CBZ + vehicle-treated animals)*P<0.05, **P<0.01, and ***P<0.001 versus the respective control (CBZ administered alone) group
Naunyn-Schmiedeberg’s Arch Pharmacol (2006) 374:51–64 61

within the dose range used for the fitting procedure (Grotenet al. 2001). Moreover, 3D isobologram provides aquantitative measure of the intensity of interaction and,thus, it has a potential to explain characteristics of complexinteractions between drugs. On the other hand, the 3Disobologram reflects the experimentally derived values(plotted in the Cartesian plot system). However, in contrastto 3D response surface analysis, the 3D isobologram doesnot require the knowledge of molecular mechanisms ofaction between the investigated drugs (Tallarida et al.1999).
Another fact is worthy of mentioning while performingthe 3D isobolographic analysis. Although DRRCs forAEDs used separately have to be parallel, the experimen-tally derived DRRCs for the mixture of AEDs at variousfixed-ratios need not fulfill the criterion of parallelism. Insuch a case, a significant difference may appear betweenthe interactions evaluated experimentally for the ED16 andED84 values (Loewe 1953).
In this study, it was confirmed that the log-probitDRRCs of STP and CBZ (administered alone) wereparallel. This is why the detailed presentation of respectiveequations for the test for parallelism (according to Litchfieldand Wilcoxon 1949) was presented in the Appendix. It isnoteworthy that the straightforward procedures required toproperly analyze DRRCs, homogeneity and parallelism ofDRRCs, slope functions and their influence on thesteepness of DRRCs are presented in some statisticaltextbooks (Finney 1971; Pöch 1993; Tallarida 2000; Glantzand Slinker 2001).
It should be stressed that the isobolographic analysisdisplays the final effect resulting from pharmacodynamicand/or pharmacokinetic interactions between drugs. Rela-tively recently, distinct discrepancies during pharmacoki-netic evaluation of AED concentrations in plasma andbiophase of experimental animals (i.e., brain homogenatesor cerebrospinal fluid) have been elicited (Cadart et al.2002; Luszczki et al. 2003c). Therefore, the isobolograph-ically-denoted interactions from the present study wereverified to identify any contribution consequent to apharmacokinetic interaction between STP and CBZ. Theevaluation of CBZ concentrations provided evidence thatSTP increased both free plasma and total brain CBZconcentrations for all fixed-ratio combinations examinedin this study. Comparing the isobolographically determinedinteractions between STP and CBZ in the MES test withtheir pharmacokinetic profiles (at the fixed-ratios of 1:3, 1:1and 3:1), one could surprisingly ascertain that the combi-nation at the fixed-ratio of 3:1 was antagonistic despite thesignificant increase in both free plasma and total brain CBZconcentrations.
It is important to mention that STP administered alonedisplays in vivo pharmacokinetics of the Michaelis–Menten
type (Levy et al. 1984). Therefore, it might be suggestedthat the isobolographically derived fixed-ratio combinationsand fractions of AEDs in the mixture, as well as therespective ED16 add, ED50 add, and ED84 add values, couldnot be exactly and correctly calculated and, thus, sub- andsupra-additivity would occur. This suggestion, concerningerroneous calculations of EDx add values, is less probable inthe present study because: (1) it was found experimentallythat the DRRCs of STP and CBZ administered alone wereparallel, and (2) the combinations of STP with otherconventional AEDs (phenobarbital and valproic acid) inthe MES test did not produce any biphasic interactions withisobolography (unpublished data). These facts may indi-rectly testify that the isobolographic calculations wereperformed correctly, despite the non-linear kinetics of STP.
Based on this preclinical study, one can conclude thatSTP combined with CBZ exerted both synergistic andantagonistic interactions depending on the fixed drug doseratio used in the MES test. The pharmacokinetic increase infree plasma and total brain CBZ concentrations for all fixedratios tested in the MES test provides evidence that thecombination of STP with CBZ should be used with cautionin clinical practice. In our opinion, the test for parallelismof DRRCs for AEDs tested with 3D isobolography shouldbe implemented as a standard procedure in order to avoidmethodological errors associated with false determinationof AED proportions in the mixture for various fixed-ratiocombinations. Further biochemical and pharmacokineticstudies are required to elucidate the exact nature of biphasiccharacteristics of interactions between STP and CBZ in theMES test in mice.
Acknowledgments This study was supported by a grant (KBN2P05D 051 26) from the State Committee for Scientific Research,Warszawa, Poland. The authors express their thanks to Dr. JeanVincent from Biocodex Laboratoires (Gentilly, France) for the kindsupply of stiripentol. Moreover, a kind gift of carbamazepine fromPolfa (Starogard Gdanski, Poland) is greatly appreciated.
Appendix
Test for parallelism of two DRR log-probit lines accordingto Litchfield and Wilcoxon (1949) comprises threecalculations, as follows:
1. The determination of the slope ratio (SR), as a quotientof slope functions for the respective DRR lines. SR=S1/S2 where, S1 and S2 are the slopes of the DRR lines forthe first and second drug. Generally, SR≥1.
2. The calculation of the f ratio for the slope ratio(f_ratio_SR), as follows: f ratio SR¼ sqrtf½logðf ratio SR1Þ�2þ½logðf ratio SR2Þ�2g
62 Naunyn-Schmiedeberg’s Arch Pharmacol (2006) 374:51–64

where, f_ratio_S1 and f_ratio_S2 are the f ratios for the slopefunction for the first and second drug, respectively; sqrt isthe square root of the expression in parentheses {}; log isthe logarithm to the base 10.
Noticeably, the f_ratio_S1 is calculated, as follows:f ratio S1 ¼ A2:77=sqrtðN’Þ
where A=10a
a=1.1×(logS1)2/logR
R=(largest dose)/(smallest dose of a drug used).Hence, A ¼ 101:1�½ ðlog S1Þ ^ 2�=log ðlargest=smallest doseÞ, where
N’ is the total number of animals at those doses whoseexpected anticonvulsant effects ranged between 4 and 6probits; ^2 is the power of 2. Transforming the above-mentioned equations, one can obtain: f ratio S1 ¼f101:1�½ðlogS1Þ^2�=logðlargest=smallest doseÞg2:77=sqrtðN’1Þ and, analogous-ly, f ratio S2 ¼ f101:1�½ðlogS2Þ^2�=logðlargest=smallest doseÞg2:77=sqrtðN’2Þ
Finally, one calculates f_ratio_SR, as presented above:f ratio SR ¼ sqrtf½logðf ratio S1Þ�2 þ ½logðf ratio S2Þ�2g3. The comparison of the SRwith f_ratio_SR. Noticeably, two
DRR lines are parallel if the calculated SR< f_ratio_SR,otherwise the two DRR lines are convergent.
References
Berenbaum MC (1989) What is synergy? Pharmacol Rev 41:93–141.Erratum in (1990) Pharmacol Rev 41:422
Brodie MJ, Schachter SC (2001) Fast Facts-Epilepsy, 2nd edn. HealthPress, Oxford, UK
Cadart M, Marchand S, Pariat C, Bouquet S, Couet W (2002) Ignoringpharmacokinetics may lead to isoboles misinterpretation: illus-tration with the norfloxacin-theophylline convulsant interactionin rats. Pharm Res 19:209–214
Chiron C, Marchand MC, Tran A, Rey E, d’Athis P, Vincent J, DulacO, Pons G (2000) Stiripentol in severe myoclonic epilepsy ininfancy: a randomised placebo-controlled syndrome-dedicatedtrial. STICLO study group. Lancet 356:1638–1642
Deckers CL, Czuczwar SJ, Hekster YA, Keyser A, Kubova H,Meinardi H, Patsalos PN, Renier WO, Van Rijn CM (2000)Selection of antiepileptic drug polytherapy based on mechanismsof action: the evidence reviewed. Epilepsia 41:1364–1374
Finney DJ (1971) Probit analysis. 3rd edn. Cambridge UniversityPress, Cambridge, UK
Giraldo J, Vivas NM, Vila E, Badia A (2002) Assessing the (a)symmetry of concentration-effect curves: empirical versus mech-anistic models. Pharmacol Ther 95:21–45
Glantz SA, Slinker BK (2001) Primer of applied regression andanalysis of variance. 2nd edn. MacGraw-Hill, New York
Greco WR, Bravo G, Parsons JC (1995) The search for synergy: acritical review from response surface perspective. Pharmacol Rev47:331–385
Groten JP, Feron VJ, Sühnel J (2001) Toxicology of simple andcomplex mixtures. Trends Pharmacol Sci 22:316–322
Jonker DM, Visser SA, van der Graaf PH, Voskuyl RA, Danhof M(2005) Towards a mechanism-based analysis of pharmacody-namic drug-drug interactions in vivo. Pharmacol Ther 106:1–18
Kanzawa F, Nishio K, Fukuoka K, Fukuda M, Kunimoto T, Saijo N(1997) Evaluation of synergism by a novel three-dimensionalmodel for the combined action of cisplatin and etoposide on the
growth of a human small-cell lung-cancer cell line, SBC-3. Int JCancer 71:311–319
Levy RH, Loiseau P, Guyot M, Blehaut HM, Tor J, Moreland TA(1984) Michaelis-Menten kinetics of stiripentol in normalhumans. Epilepsia 25:486–491
Litchfield JT, Wilcoxon F (1949) A simplified method of evaluatingdose-effect experiments. J Pharmacol Exp Ther 96:99–113
Loewe S (1953) The problem of synergism and antagonism ofcombined drugs. Arzneimittelforschung 3:285–290
Loiseau P, Levy RH, Houin G, Rascol O, Dordain G (1990)Randomized double-blind, parallel, multicenter trial of stiripentoladded to carbamazepine in the treatment of carbamazepineresistant epilepsies. An interim analysis. Epilepsia 31(Suppl. 5):618–619
Löscher W, Fassbender CP, Nolting B (1991) The role of technical,biological and pharmacological factors in the laboratory evalu-ation of anticonvulsant drugs. II. Maximal electroshock seizuremodels. Epilepsy Res 8:79–94
Luszczki JJ, Czuczwar SJ (2003) Isobolographic and subthresholdmethods in the detection of interactions between oxcarbazepineand conventional antiepileptics-a comparative study. EpilepsyRes 56:27–42
Luszczki JJ, Czuczwar SJ (2004a) Isobolographic profile of inter-actions between tiagabine and gabapentin: a preclinical study.Naunyn-Schmiedeberg’s Arch Pharmacol 369:434–446
Luszczki JJ, Czuczwar SJ (2004b) Three-dimensional isobolographicanalysis of interactions between lamotrigine and clonazepam inmaximal electroshock-induced seizures in mice. Naunyn-Schmiedeberg’s Arch Pharmacol 370:369–380
Luszczki JJ, Czuczwar SJ (2005) Isobolographic characterisation ofinteractions among selected newer antiepileptic drugs in themouse pentylenetetrazole-induced seizure model. NaunynSchmiedeberg’s Arch Pharmacol 372:41–54
Luszczki JJ, Borowicz KK, Swiader M, Czuczwar SJ (2003a)Interactions between oxcarbazepine and conventional antiepilep-tic drugs in the maximal electroshock test in mice: an isobolo-graphic analysis. Epilepsia 44:489–499
Luszczki JJ, Czuczwar M, Kis J, Krysa J, Pasztelan I, Swiader M,Czuczwar SJ (2003b) Interactions of lamotrigine with topiramateand first-generation antiepileptic drugs in the maximal electro-shock test in mice: an isobolographic analysis. Epilepsia44:1003–1013
Luszczki JJ, Swiader M, Czuczwar M, Kis J, Czuczwar SJ (2003c)Interactions of tiagabine with some antiepileptics in the maximalelectroshock in mice. Pharmacol Biochem Behav 75:319–327
Luszczki JJ, Ratnaraj N, Patsalos PN, Czuczwar SJ (2006) Isobolographicanalysis of interactions between loreclezole and conventionalantiepileptic drugs in the mouse maximal electroshock-inducedseizure model. Naunyn Schmiedeberg’s Arch Pharmacol 373:169–181
Minto C, Schnider T (1998) Expanding clinical applications ofpopulation pharmacodynamic modelling. Br J Clin Pharmacol46:321–333
Minto CF, Schnider TW, Shafer SL (1997) Pharmacokinetics andpharmacodynamics of remifentanil. II. Model application.Anesthesiology 86:24–33
Minto CF, Schnider TW, Short TG, Gregg KM, Gentilini A, Shafer SL(2000) Response surface model for anesthetic drug interactions.Anesthesiology 92:1603–1616
Minto CF, Schnider TW, Gregg KM, Henthorn TK, Shafer SL (2003)Using the time of maximum effect site concentration to combinepharmacokinetics and pharmacodynamics. Anesthesiology99:324–333
Perez J, Chiron C, Musial C, Rey E, Blehaut H, d’Athis P, Vincent J,Dulac O (1999) Stiripentol: efficacy and tolerability in childrenwith epilepsy. Epilepsia 40:1618–1626
Naunyn-Schmiedeberg’s Arch Pharmacol (2006) 374:51–64 63

Perucca E (1995) Pharmacological principles as a basis for poly-therapy. Acta Neurol Scand Suppl 162:31–34
Perucca E, Levy RH (2002) Combination therapy and drug inter-actions. In: Levy RH, Mattson RH, Meldrum BS, Perucca E (eds)Antiepileptic drugs, 5th edn. Lippincott Williams & Wilkins,Philadelphia, pp 96–102
Pöch G (1993) Combined effects of drugs and toxic agents. Modernevaluation in theory and practice. Springer, Berlin Heidelberg Wien
Porreca F, Jiang Q, Tallarida RJ (1990) Modulation of morphineantinociception by peripheral [Leu5]enkephalin: a synergisticinteraction. Eur J Pharmacol 179:463–468
Prichard MN, Prichard LE, Baguley WA, Nassiri MR, Shipman C (1991)Three-dimensional analysis of the synergistic cytotoxicity ofgancyclowir and zidovudine. Antimicrob Agents Chemother35:1060–1065
Prichard MN, Prichard LE, Shipman C (1993) Strategic design andtree-dimensional analysis of antiviral drug combinations.Antimicrob Agents Chemother 37:540–545
Renard F, Musial C, Tor J, Dulac O (1993) Single-blind add-on trial ofstiripentol in epileptic children. Epilepsia 34(Suppl 6):74
Short TG, Ho TY, Minto CF, Schnider TW, Shafer SL (2002) Efficienttrial design for eliciting a pharmacokinetic-pharmacodynamicmodel-based response surface describing the interactionbetween two intravenous anesthetic drugs. Anesthesiology96:400–408
Sühnel J (1992) Zero interaction response surfaces, interactionfunctions and difference response surfaces for combinations ofbiologically active agents. Arzneimittelforschung 42:1251–1258
Sühnel J (1998) Parallel dose-response curves in combination experi-ments. Bull Math Biol 60:197–213
Tallarida RJ (1992) Statistical analysis of drug combinations forsynergism. Pain 49:93–97
Tallarida RJ (2000) Drug synergism and dose-effect data analysis.Chapman & Hall/CRC, Boca Raton
Tallarida RJ (2001) Drug synergism: its detection and applications.J Pharmcol Exp Ther 298:865–872
Tallarida RJ (2002) The interaction index: a measure of drugsynergism. Pain 98:163–168
Tallarida RJ (2006) An overview of drug combination analysis withisobolograms. J Pharmcol Exp Ther (in press) DOI 10.1124/jpet.106.104117
Tallarida RJ, Stone DJ, McCary JD, Raffa RB (1999) Responsesurface analysis of synergism between morphine and clonidine.J Pharmcol Exp Ther 289:8–13
Tran A, Vauzelle-Kervroedan F, Rey E, Pous G, d’Athis P, Chiron C,Dulac O, Renard F, Olive G (1996) Effect of stiripentol oncarbamazepine plasma concentration and metabolism in epilepticchildren. Eur J Clin Pharmacol 50:497–500
Van der Graaf PH, Schoemaker RC (1999) Analysis of asymmetry ofagonist concentration-effect curves. J Pharmacol Toxicol Methods41:107–115
White HS, Woodhead JH, Wilcox KS, Stables JP, Kupferberg HJ,Wolf HH (2002) Discovery and preclinical development ofantiepileptic drugs. In: Levy RH, Mattson RH, Meldrum BS,Perucca E (eds) Antiepileptic drugs, 5th edn. Lippincott Williams& Wilkins, Philadelphia, pp 36–48
64 Naunyn-Schmiedeberg’s Arch Pharmacol (2006) 374:51–64