characterization of the time course of carbamazepine deinduction by an enzyme turnover model
TRANSCRIPT

Characterization of the Time Course of CarbamazepineDeinduction by an Enzyme Turnover Model
B. Punyawudho1, J.C. Cloyd1, I.E. Leppik1,2,3, R.E. Ramsay4, S.E. Marino1, P.B. Pennell5,J.R. White2, and A.K. Birnbaum11Experimental and Clinical Pharmacology, University of Minnesota, Minneapolis, MN2Mincep® Epilepsy Care, Minneapolis, MN3Department of Neurology, University of Minnesota, Minneapolis, MN4VA Medical Center, Miami, FL5Department of Neurology, Emory University, Atlanta, GA
AbstractBackground and objective—Carbamazepine is a potent inducer of drug metabolizing enzymes,which results in a number of clinically significant drug-drug interactions. Deinduction occurs whenchronic carbamazepine therapy is discontinued. The goal of this study was to develop a populationpharmacokinetic model to describe the time course of carbamazepine deinduction.
Patients and methods—Stable-labeled carbamazepine was administered intravenously on threeoccasions during the deinduction period to fifteen patients with epilepsy for whom carbamazepinetherapy was being discontinued. Data were analyzed using a nonlinear mixed effect model(NONMEM). An enzyme turnover model consisting of a one compartment model linked with ahypothetical enzyme compartment was applied to characterize the time course of carbamazepinedeinduction. Model evaluation was performed using the bootstrap approach and visual predictivecheck.
Results—In the final model, the deinduction process was accomplished by decreasing the rate ofenzyme synthesis resulting in a decrease in the relative amount of enzymes. The estimated rateconstant for enzyme degradation was 0.00805 hr-1, corresponding to a half-life of the combinedenzymes of 86.1 hours (3.6 days).
Conclusions—An enzyme turnover model adequately characterized the experimental data. Basedon the predicted enzyme half-life from the final model, the deinduction process should be completedwithin 2 weeks after carbamazepine therapy is terminated.
KeywordsNONMEM; carbamazepine; deinduction; population pharmacokinetics
BACKGROUNDCarbamazepine (CBZ) is commonly prescribed for the treatment of epilepsy, bi-polar disorder,and trigeminal neuralgia.[1] Therapy with CBZ is complicated by its complexpharmacokinetics and drug-interaction profile. CBZ is primarily metabolized to
Corresponding Author: Angela K Birnbaum, PhD University of Minnesota Experimental and Clinical Pharmacology College of PharmacyRoom 463, 717 Delaware St., SE Minneapolis, MN 55414 Phone: (612) 624-3158 Fax: (612) 626-0148 [email protected].
NIH Public AccessAuthor ManuscriptClin Pharmacokinet. Author manuscript; available in PMC 2010 September 27.
Published in final edited form as:Clin Pharmacokinet. 2009 ; 48(5): 313–320. doi:10.2165/00003088-200948050-00003.
NIH
-PA Author Manuscript
NIH
-PA Author Manuscript
NIH
-PA Author Manuscript

carbamazepine-10,11-epoxide (CBZ-E) by the cytochrome P450 (CYP)3A4 isoenzyme. As apotent inducer of several drug transporters and drug-metabolizing enzymes including multipleCYP450 and UGT isoenzymes,[2] CBZ can affect the disposition of other agents. Moreover,CBZ is one of the few drugs that, after multiple doses, can stimulate the synthesis of enzymesthat catalyze its own metabolism by a process known as autoinduction.[3-5] An increase ingene transcription resulting in an elevated level of drug metabolizing enzymes is thought to bethe major mechanism of autoinduction.[6] Deinduction, the reverse process of autoinduction,occurs when chronic CBZ therapy is discontinued. An understanding of the time course ofCBZ deinduction is necessary in order to optimally adjust CBZ and co-medication dosingregimens when reducing or terminating CBZ therapy.
An enzyme turnover model has been applied to several drugs in humans in order to characterizethe time course of autoinduction.[7-11] This model links the hypothetical enzyme compartmentwith the drug compartment by allowing drug clearance to be affected by the amount of enzyme.The amount of enzyme is regulated by a zero order rate of enzyme production and a first orderrate of enzyme degradation. During induction, the enzyme amount increases by increasing therate of enzyme production or by decreasing the rate of enzyme degradation. Conversely, duringthe deinduction process, the enzyme amount can be decreased by either decreasing the rate ofenzyme production or by increasing the rate of enzyme degradation. The half-life of the inducedenzymes, an important parameter for characterizing the time course of both autoinduction anddeinduction, can be estimated from this model.[7,10,11]
The aim of this study was to develop a population pharmacokinetic enzyme turnover modelthat would describe the time course of CBZ deinduction under clinical conditions. This wasaccomplished by using a novel stable-labeled CBZ formulation that could be administeredintravenously. The use of an intravenous formulation avoids the problems associated withvariable absorption whereas the stable-label provided us with the means to measure a traceramount of drug enabling measurement of CBZ over a very short duration of time. Thisinformation can provide evidence-based guidelines for management of drug therapy when CBZis discontinued.
METHODSPatients and treatments
Data from fifteen patients with epilepsy receiving oral CBZ therapy in whom CBZ was beingdiscontinued were recruited from epilepsy clinics in Minneapolis, MN, Miami, FL, and Atlanta,GA metropolitan areas. All subjects provided signed consent. The study was approved by thehuman subjects committee at each of the study sites and at the University of Minnesota. Patientswere excluded from the study if they were on comedications that were known to interact withCBZ. On the day of the study, patients were admitted to a clinical research center at therespective sites. A 10-minute intravenous infusion of a 100 mg dose of an investigational,stable-labeled CBZ (SL-CBZ) formulation was administered on three occasions: 1) themorning after the last dose of oral CBZ (mean dose = 140 mg ± 50.7 mg), 2) 6-8 days after thelast oral CBZ dose, and 3) 6-8 weeks after the last oral CBZ dose. Serial plasma SL-CBZconcentrations were measured following SL-CBZ administration at each occasion.
Blood sampling and assaysFourteen blood samples were collected prior to drug administration and at 0.083, 0.25, 0.5, 1,2, 4, 6, 10, 12, 24, 48, 72, and 96 hours after the end of the SL-CBZ infusion. The blood sampleswere immediately centrifuged and plasma was stored frozen until analysis. SL-CBZconcentrations were determined using liquid chromatograph-mass spectrometry (Agilent 1100LCMSD with Electrospray, G 1946). Briefly, prepared samples were dried and reconstituted
Punyawudho et al. Page 2
Clin Pharmacokinet. Author manuscript; available in PMC 2010 September 27.
NIH
-PA Author Manuscript
NIH
-PA Author Manuscript
NIH
-PA Author Manuscript

with ammonium acetate buffer and methanol as a mobile phase. CBZ-d10 was used as aninternal standard. The samples were then separated using a Zorbex LC8/LC18 column (AgilentTechnologies). Data were generated using Agilent ChemStation software (AgilentTechnologies, Palo Alto, CA) and quantified using deuterated CBZ-d10 internal standard viaa validated assay in our research laboratory.
Population pharmacokinetic analysisPlasma SL-CBZ concentrations were fitted to a one-compartment model with a hypotheticalenzyme compartment[7,9] to describe CBZ deinduction pharmacokinetics as presented inFigure 1.
The change in the amount of CBZ (A1, mg) over time can be described by equation 1,
equation (1)
where ko is the rate of infusion (mg/hr), CL is CBZ clearance (L/hr), Cp is CBZ plasmaconcentration (mg/L), and A2 is the proportion of enzymes at time t relative to the total enzymesat time zero in the hypothetical enzyme compartment. CBZ clearance is consideredproportional to the amount of enzymes in a hypothetical enzyme compartment.
The deinduction process is often the result of a decrease in the rate of enzyme production, areverse process of induction, leading to a decrease in the amount of all enzymes[12]. Therefore,our chosen model was the model in which the change of the relative amount of enzymes in ahypothetical enzyme compartment (A2) can be characterized by equation 2,
equation (2)
where kenz, in (relative amount/time) is the zero-order rate constant for enzyme production,k -1 enz, out (time ) is the first-order rate constant for the enzyme degradation, and FACTORdescribes the fractional decrease of enzyme production rate. The apparent half-life of the CBZdeinduction process was estimated by dividing ln(2) by kenz, out. Before the deinduction process(t = 0), the enzyme amount was assumed to be at steady state and was normalized to 1; therefore,the rate of production is equal to the rate of enzyme degradation. In this model, the deinductionprocess was assumed to begin at the first SLCBZ administration (the next morning after thelast dose of CBZ). It is possible that the starting time of the deinduction process may impactthe estimate of the half-life of the enzymes. Therefore, a sensitivity analysis from time 0 (thestart of SL-CBZ infusion) to 48 hours was performed to determine the effect of various startingtimes of the deinduction process on the estimate of kenz, out. The models with the assumedstarting time of the deinduction process at 0, 5, 10, 15, 20, 24 and 48 hours after the start ofSL-CBZ infusion were fit to the data and the estimates of kenz, out were recorded.
Data from all three occasions were analyzed using the nonlinear mixed-effect modelingprogram (NONMEM), subroutine ADVAN 6 (version VI, NONMEM Project Group, UCSF/Globomax and PDx-Pop version 2.0). The first-order conditional estimation method withinteraction (FOCE-I) was used for all analyses. Inter-individual variability (IIV) was modeledusing an exponential error model for all parameters. The residual unexplained variability(RUV) was modeled using a proportional error model. Discrimination between hierarchicalmodels was determined based on the difference in objective function value (OFV) using thelikelihood ratio test and visual inspection of diagnostic plots. A drop in objective function value
Punyawudho et al. Page 3
Clin Pharmacokinet. Author manuscript; available in PMC 2010 September 27.
NIH
-PA Author Manuscript
NIH
-PA Author Manuscript
NIH
-PA Author Manuscript
(OFV) of at least 10.83 (p < 0.001, χ2, df = 1) after adding one parameter was consideredstatistically significant.
Initially, the model was developed without any covariates (base pharmacokinetic model). Dueto the small sample size in this study, only weight was tested as a covariate. The covariatemodel was built in a stepwise fashion. Weight, centered at a convenience weight of 80 kg, wasadded on each parameter (CL, Vd, and kenz , out) one at a time using a linear covariate model.A decrease in OFV of at least 6.64 (p < 0.01, χ2, df = 1) was used to determine the inclusionof weight on each parameter. The full model was developed by including all significant weight-parameter relationships. From the full model, weight was deleted from each parameter one ata time to obtain the final model. An increase of OFV from the full model of at least 10.83(χ2, p ≤ 0.001, df=1) was used as the chosen criteria for retaining weight-parameterrelationships in the covariate model. Xpose[13] and S-plus 2000 (Insightful Corp, Seattle, WA,USA) were used for graphical model diagnostics.
Several possible models other than the chosen model were considered: i) a model where thedeinduction process was characterized by increasing the rate of enzyme degradation rather thandecreasing the rate of enzyme production, ii) a model describing autoinduction of CBZ in whichan increase of enzyme amount is described by a linear relationship between CBZ concentrationsand the rate of enzyme production, and iii) a model describing autoinduction of CBZ in whichan increase of enzyme amount is described by an Emax relationship between CBZconcentrations and the rate of enzyme production.
Model evaluationModel evaluation was assessed using the nonparametric bootstrap method and a visualpredictive check (VPC). The nonparametric bootstrap re-sampling technique was applied forassessing the reliability of the parameter estimates and their 95% confidence intervals (CI).[14,15] Five hundred bootstrap data sets were generated by repeatedly sampling withreplacement from the original data set using Wings for NONMEM (Version 600,http://wfn.sourcefourge.net). The final model was fit to each of 500 bootstrap data sets,therefore parameter estimates were obtained from each data set. These parameter estimateswere rank ordered. The values at 2.5th and 97.5th percentile were used to estimate a bootstrap95% CI for the estimates and were compared with the values obtained from NONMEM.
The visual predictive check was used as a diagnostic tool to assess the adequacy of the model.[16,17] Five hundred data sets were simulated with the same study design using the final modelparameter estimates obtained from NONMEM. The median and 90% prediction intervals(5th and 95th percentile) of the simulated concentrations were calculated at each time point andplotted against the observed concentrations.
RESULTSA total of 524 SL-CBZ concentration-time points from fifteen patients were used in this study.Six women and nine men with a mean weight of 78 kg and age of 39 years participated in thestudy. Fourteen patients completed all three occasions of the study whereas one patient onlycompleted the first two occasions. Data from all fifteen patients were included in the analyses.Figure 2 presents the observed CBZ concentration-time curves and variability for eachindividual at each occasion.
Of the models explored, the one that described the deinduction process as a fractional decreasein the rate of enzyme production best described the data. A model where the deinductionprocess was characterized by an increasing rate of enzyme degradation described the data aswell as the chosen model based on the OFV and goodness-of-fit plots. However, this model is
Punyawudho et al. Page 4
Clin Pharmacokinet. Author manuscript; available in PMC 2010 September 27.
NIH
-PA Author Manuscript
NIH
-PA Author Manuscript
NIH
-PA Author Manuscript

not as physiologically plausible as the chosen model. The concentration-dependentautoinduction models, both linear and Emax models, were not able to fit the data. The modelwith the linear increase in the rate of enzyme production resulted in unreasonable parameterestimates and it was not possible to obtain the parameter estimates from the Emax type model(data not shown).
Weight was tested as a covariate on Vd, CL, and kenz, out. Vd was the only parameter indicatedto have a significant relationship with weight. The addition of Vd to the model resulted in adrop in OFV from the base model (the difference in OFV = -19.7) and an improvement in thegoodness-of-fit plots compared with the base pharmacokinetic model (Figure 3). Therefore,the effect of weight on Vd was included in the final model. The final parameter estimates arepresented in Table I. Based on the kenz, out estimate of 0.00805 hr-1, the model predictedapparent half-life of the deinduction process was 86 hours (3.6 days). Adding IIV intokenz, out or FACTOR did not improve the fit. Therefore, kenz, out and FACTOR were estimatedwithout an estimate of IIV. Not being able to determine variability for an estimated parameteris not unusual if the data are limited and do not allow partitioning of the variability. The resultsfrom the sensitivity analysis showed that when the starting time of the deinduction process wasvaried from 0 to 48 hours, the estimated rate constants for the enzyme degradation were notdifferent (estimates of kenz, out ranged from 0.008 to 0.0087). These results indicate that theassumed starting time points have a small impact on the estimation of kenz, out.
Model evaluationThe reliability of the final parameter estimates were confirmed by re-estimating the modelparameters and their 95% CI using a nonparametric bootstrap approach. From 500 bootstrapruns, 493 were minimized successfully and were included in the bootstrap analysis. The medianparameter estimates and their 95% CI obtained from 500 bootstrap data sets were comparableto the estimates obtained from NONMEM (Table 1). However, the 95% CI of kenz, out obtainedfrom the bootstrap approach was wider than the one obtained from NONMEM. This situationis common when the size of sample is small[18]. As the 95% CI obtained from NONMEMassumes the asymptotic normality, this assumption is true when the sample size is large enough.Therefore, in a small data set, the bootstrap 95% CI can be wider than the one obtained fromNONMEM.
The visual predictive check was used to assess the model performance for the populationpharmacokinetic model. Figure 4 (a-c) presents visual predictive check plots. These plots showthat most of the observed concentrations on all three occasions fell within 90% predictionintervals obtained from the simulated data represented by the shaded area. Less than 10% ofthe observed concentrations lie outside the specific prediction intervals. The results from thevisual predictive check show that the final model adequately describes the majority of theobserved data in this population.
DISCUSSIONThis study is the first to use an intravenous formulation to characterize the deinduction half-life of CBZ in patients with epilepsy. This use of an intravenous formulation avoided issuesassociated with variable absorption of the drug. Furthermore, our results demonstrate that thetime course of CBZ deinduction can be adequately described by an enzyme turnover model.This model yields an estimate of the half-life of the deinduction process from which the timecourse of CBZ deinduction can be determined. It should be noted that this estimated half-lifeof enzyme turnover is a hybrid value encompassing all isoenzymes involved in CBZmetabolism rather than any particular isoenzyme.
Punyawudho et al. Page 5
Clin Pharmacokinet. Author manuscript; available in PMC 2010 September 27.
NIH
-PA Author Manuscript
NIH
-PA Author Manuscript
NIH
-PA Author Manuscript

The mechanism underlying autoinduction/deinduction of CBZ is not well understood. It hasbeen postulated that autoinduction of CBZ metabolism occurs by increasing the synthesis ofenzyme (de novo protein synthesis).[2] There is evidence that both CBZ and CBZ-E canactivate the nuclear receptor, PXR (pregnane X receptor), resulting in a higher expression levelof mRNA of numerous enzymes including several CYP genes, conjugated enzymes, andtransporters.[2] Deinduction is believed to occur via the reverse process of autoinduction.Based on current understanding of the mechanism of CBZ deinduction, the model used in thisstudy, which is based on a decreasing rate of enzyme production is more physiologicallyplausible than a model with an increasing rate of enzyme degradation.
In the situations in which the elimination half-life of an inducer is similar to or longer than theinduced enzymes, the pharmacokinetics of the inducer may impact the accurate estimation ofa half-life of the induction/deinduction process; therefore, pharmacokinetics of the inducercannot be ignored.[19] However, in the case where the elimination half-life of an inducer isconsiderably faster than the half-life of the induced enzymes, the kinetics of the inducer willhave minimal effect on the estimated half-life of the induction/deinduction process. Hence, thetime course of the induction and deinduction processes is determined by the same rate constantof enzyme degradation.[19] The rate constant for the enzyme degradation estimated from ourmodel was 0.00805 hr-1, corresponding to an overall enzyme half-life of 3.6 days (86.1 hours),whereas the elimination rate constant of CBZ in the induced state was estimated to be 0.048hr-1, corresponding to a CBZ half-life of 15 hours. These values are consistent with the enzymehalf-life reported in previous studies of CBZ autoinduction/deinduction.[11,20-22]
In our study, the estimate of CBZ half-life is much faster than the estimated enzyme half-life;therefore, the all-or-none model used in our study, where the pharmacokinetics of the inducerwas not incorporated in the model, should adequately describe the data. It is possible that alonger half-life of CBZ during the deinduced state may be observed. However, even if the half-life of CBZ doubled it would still be much shorter than the half-life of the induced enzymes.Therefore, with the relatively rapid elimination of CBZ during the deinduction processcompared with the turnover half-life of the enzymes, the effect of CBZ kinetics on the estimateof the enzyme degradation rate constant should be negligible. A previous study that used probesubstrates to determine the CBZ-mediated induction of CYP3A4 and CYP1A2 separatelyobtained estimated half-lives of CYP3A4 and CYP1A2 of 70 and 105 hours, respectively.[11] The estimated half-life of enzymes obtained from our study following administration ofan intravenous formulation is within this range.
The model used in this analysis assumed that the deinduction process started when the firstdose of SL-CBZ was given (t=0). Bernus et al.[23] speculate a 1-2 day lag time in thedeinduction process of CBZ. Therefore, different starting times of the deinduction process,varying from time 0-48 hours, were tested in the sensitivity analysis. The results from oursensitivity analysis indicate that the time that deinduction begins has a minimal effect in theestimate of kenz, out. It is also possible that the first two doses of SL-CBZ could delay thedeinduction process causing a slight increase in the deinduction half-life; however, we believethis effect to be minimal.
CONCLUSIONIn summary, a population pharmacokinetic model characterizing the time course of CBZdeinduction was developed using an enzyme turnover model. The bootstrap approach andvisual predictive check confirmed the reliability and adequacy of the final model. Based on akenz, out estimate of 0.00805 hr-1, induction of CBZ metabolizing enzymes is reduced by halfat 3.6 days and by three-fourths at 7.2 days after CBZ is completely discontinued. Therefore,the deinduction process should be completed within 2 weeks after discontinuation of CBZ
Punyawudho et al. Page 6
Clin Pharmacokinet. Author manuscript; available in PMC 2010 September 27.
NIH
-PA Author Manuscript
NIH
-PA Author Manuscript
NIH
-PA Author Manuscript
therapy. There are several clinical implications that arise from our results. The doses of anumber of important drugs such as hormonal contraceptives may need to be adjusted within3-6 days following discontinuation of CBZ. Also, it is common to discontinue CBZ duringmonitoring of persons with epilepsy in inpatient diagnostic units. To the extent that deinductionis the inverse process of induction, the results from this study can be important in estimatingthe optimal doses of CBZ when it is reintroduced after being held for seizure monitoring.
AcknowledgmentsThis work was supported by NIH/ NINDS P50-NS 16308, NCRR-M01-RR00400, M01-RR00039, and M01-RR16587
REFERENCES1. Johannessen Landmark C. Antiepileptic drugs in non-epilepsy disorders: relations between
mechanisms of action and clinical efficacy. CNS Drugs 2008;22(1):27–47. [PubMed: 18072813]2. Oscarson M, Zanger UM, Rifki OF, et al. Transcriptional profiling of genes induced in the livers of
patients treated with carbamazepine. Clin Pharmacol Ther 2006;80(5):440–456. [PubMed: 17112801]3. Eichelbaum M, Ekbom K, Bertilsson L, et al. Plasma kinetics of carbamazepine and its epoxide
metabolite in man after single and multiple doses. Eur J Clin Pharmacol 1975;8(5):337–341. [PubMed:1233232]
4. Pitlick WH, Levy RH. Time-dependent kinetics I: Exponential autoinduction of carbamazepine inmonkeys. J Pharm Sci 1977;66(5):647–649. [PubMed: 406378]
5. Warren JWJ, Benmaman JD, Wannamaker BB, et al. Kinetics of a carbamazepine-ethosuximideinteraction. Clin Pharmacol Ther 1980;28(5):646–651. [PubMed: 7438684]
6. Okey AB. Enzyme induction in the cytochrome P-450 system. Pharmacol Ther 1990;45(2):241–298.[PubMed: 2405437]
7. Hassan M, Svensson US, Ljungman P, et al. A mechanism-based pharmacokinetic-enzyme model forcyclophosphamide autoinduction in breast cancer patients. Br J Clin Pharmacol 1999;48(5):669–677.[PubMed: 10594468]
8. Huitema AD, Mathot RA, Tibben MM, et al. A mechanism-based pharmacokinetic model for thecytochrome P450 drug-drug interaction between cyclophosphamide and thioTEPA and theautoinduction of cyclophosphamide. J Pharmacokinet Pharmacodyn 2001;28(3):211–230. [PubMed:11468938]
9. Kerbusch T, Huitema AD, Ouwerkerk J, et al. Evaluation of the autoinduction of ifosfamide metabolismby a population pharmacokinetic approach using NONMEM. Br J Clin Pharmacol 2000;49(6):555–561. [PubMed: 10848719]
10. Gordi T, Xie R, Huong NV, et al. A semiphysiological pharmacokinetic model for artemisinin inhealthy subjects incorporating autoinduction of metabolism and saturable first-pass hepaticextraction. Br J Clin Pharmacol 2005;59(2):189–198. [PubMed: 15676041]
11. Magnusson MO, Dahl ML, Cederberg J, et al. Pharmacodynamics of Carbamazepine-mediatedInduction of CYP3A4, CYP1A2, and Pgp as Assessed by Probe Substrates Midazolam, Caffeine,and Digoxin. Clin Pharmacol Ther. 2007
12. Fuhr U. Induction of drug metabolising enzymes: pharmacokinetic and toxicological consequencesin humans. Clin Pharmacokinet 2000;38(6):493–504. [PubMed: 10885586]
13. Jonsson EN, Karlsson MO. Xpose--an S-PLUS based population pharmacokinetic/pharmacodynamicmodel building aid for NONMEM. Comput Methods Programs Biomed 1999;58(1):51–64.[PubMed: 10195646]
14. Efron B. Bootstrap methods: another look at the jacknife. Ann Stat 1979;7:1–26.15. Ette EI, Williams PJ, Kim YH, et al. Model appropriateness and population pharmacokinetic
modeling. J Clin Pharmacol 2003;43(6):610–623. [PubMed: 12817524]16. Fang L, Holford NH, Hinkle G, et al. Population pharmacokinetics of humanized monoclonal antibody
HuCC49deltaCH2 and murine antibody CC49 in colorectal cancer patients. J Clin Pharmacol 2007;47(2):227–237. [PubMed: 17244774]
Punyawudho et al. Page 7
Clin Pharmacokinet. Author manuscript; available in PMC 2010 September 27.
NIH
-PA Author Manuscript
NIH
-PA Author Manuscript
NIH
-PA Author Manuscript

17. Yano Y, Beal SL, Sheiner LB. Evaluating pharmacokinetic/pharmacodynamic models using theposterior predictive check. J Pharmacokinet Pharmacodyn 2001;28(2):171–192. [PubMed:11381569]
18. Yafune A, Ishiguro M. Bootstrap approach for constructing confidence intervals for populationpharmacokinetic parameters. I: A use of bootstrap standard error. Stat Med 1999;18(5):581–599.[PubMed: 10209813]
19. Abramson FP. Kinetic models of induction: I. Persistence of the inducing substance. J Pharm Sci1986;75(3):223–228. [PubMed: 3701603]
20. Korth-Bradley JM, Ludden TM. Carbamazepine pharmacokinetics during induction and reversal ofinduction. Pharmacotherapy 1991;11(3):272.
21. Mikati MA, Browne TR, Collins JF. Time course of carbamazepine autoinduction. The VACooperative Study No.118 Group. Neurology 1989;39(4):592–594. [PubMed: 2927687]
22. Schaffler L, Bourgeois BF, Luders HO. Rapid reversibility of autoinduction of carbamazepinemetabolism after temporary discontinuation. Epilepsia 1994;35(1):195–198. [PubMed: 8112245]
23. Bernus I, Dickinson RG, Hooper WD, et al. Early stage autoinduction of carbamazepine metabolismin humans. Eur J Clin Pharmacol 1994;47(4):355–360. [PubMed: 7875188]
Punyawudho et al. Page 8
Clin Pharmacokinet. Author manuscript; available in PMC 2010 September 27.
NIH
-PA Author Manuscript
NIH
-PA Author Manuscript
NIH
-PA Author Manuscript

Figure 1.Pharmacokinetic model of CBZ de-induction. The model represents a one-compartment modelwith a hypothetical enzyme compartment. The amount of CBZ (A1) is determined by rate ofinfusion (k0) and elimination rate constant (CL/Vd). The relative amount of enzyme (A2) in ahypothetical enzyme compartment is characterized by a rate constant for enzyme production(kenz,in) and a rate constant for enzyme degradation (kenz,out).
Punyawudho et al. Page 9
Clin Pharmacokinet. Author manuscript; available in PMC 2010 September 27.
NIH
-PA Author Manuscript
NIH
-PA Author Manuscript
NIH
-PA Author Manuscript

Punyawudho et al. Page 10
Clin Pharmacokinet. Author manuscript; available in PMC 2010 September 27.
NIH
-PA Author Manuscript
NIH
-PA Author Manuscript
NIH
-PA Author Manuscript

Punyawudho et al. Page 11
Clin Pharmacokinet. Author manuscript; available in PMC 2010 September 27.
NIH
-PA Author Manuscript
NIH
-PA Author Manuscript
NIH
-PA Author Manuscript
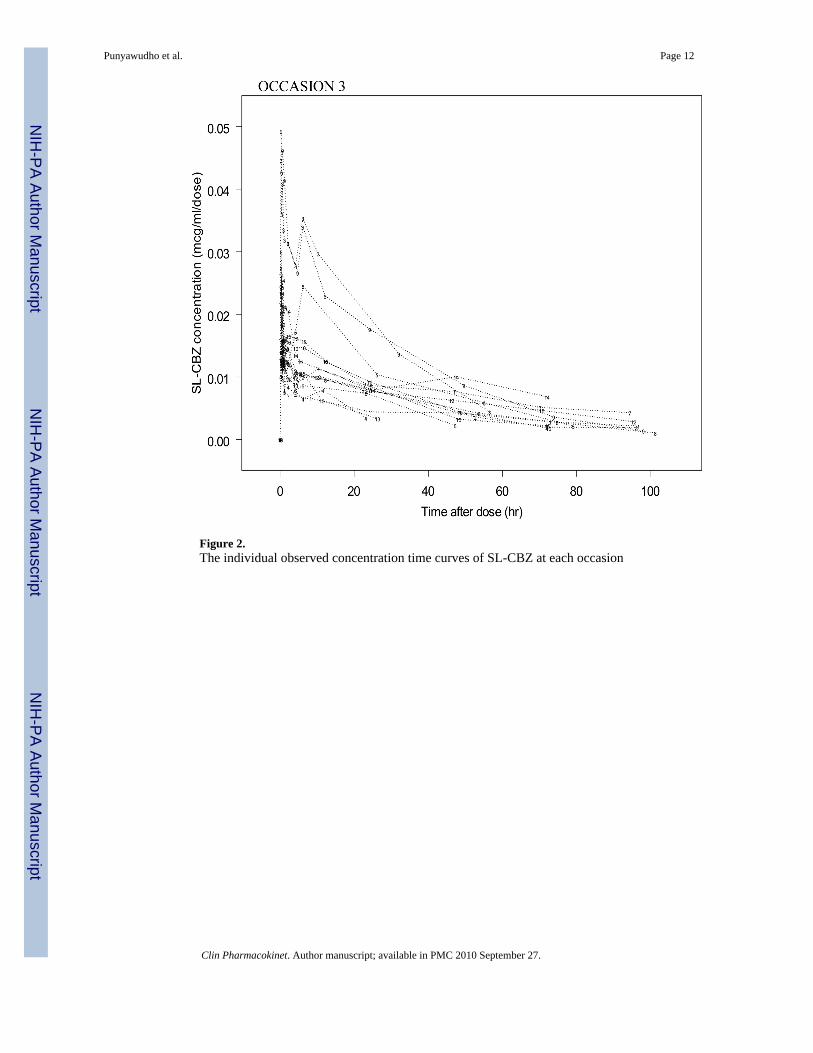
Figure 2.The individual observed concentration time curves of SL-CBZ at each occasion
Punyawudho et al. Page 12
Clin Pharmacokinet. Author manuscript; available in PMC 2010 September 27.
NIH
-PA Author Manuscript
NIH
-PA Author Manuscript
NIH
-PA Author Manuscript

Figure 3.The goodness of fit plot; the observed versus population model predicted concentrations andweighted residuals versus population model predicted concentrations of the base model andthe final model (adding weight into Vd)
Punyawudho et al. Page 13
Clin Pharmacokinet. Author manuscript; available in PMC 2010 September 27.
NIH
-PA Author Manuscript
NIH
-PA Author Manuscript
NIH
-PA Author Manuscript

Figure 4.The visual predictive check plots for occasion 1 (a), occasion 2 (b), and occasion 3 (c). Thesolid lines and shaded area represent median and 90% prediction interval from 500 simulateddata. The circles represent the observed concentrations.
Punyawudho et al. Page 14
Clin Pharmacokinet. Author manuscript; available in PMC 2010 September 27.
NIH
-PA Author Manuscript
NIH
-PA Author Manuscript
NIH
-PA Author Manuscript

NIH
-PA Author Manuscript
NIH
-PA Author Manuscript
NIH
-PA Author Manuscript
Punyawudho et al. Page 15
Table I
Final model parameter estimates and 95% confidence intervals (CI) from NONMEM and the bootstrap analysis
Parameters NONMEM* Bootstrap Analysis†
Estimates 95%CI Median 95% CI
Initial clearance (L/hr) 3.05 [2.62, 3.48] 3.06 [2.67, 4.93]
Vd (L) 64.3 [59.2-69.4] 64.1 [58.54, 70.63]
Coefficient for weight on Vd 0.869 [0.57-1.17] 0.863 [0.5, 1.22]
First order rate constant for enzyme degradation (kenz, out) 0.00805 [0.003-0.0128] 0.0082 [0.005,0.066]
FACTOR 0.494 [0.438-0.55] 0.497 [0.43,0.7]
IIV for initial clearance (%CV) 31.6 [19.52-40.52] 30 [18.4,39.8]
IIV for Vd (%CV) 17.5 [12.57-21.4] 16.16 [9.54, 20.86]
RUV, proportional (%CV) 26.9 [24.7-29.77] 26.7 [23.48, 29.79]
*(Estimate) ± 1.96 × (standard error of the estimate)
†values at 2.5th and 97.5th percentile of the ranked bootstrap parameter estimates IIV, interindividual variability; RUV, residual unexplained
variability; %CV, percent of coefficient of variation; kenz, out, first order rate constant for enzyme degradation.
Clin Pharmacokinet. Author manuscript; available in PMC 2010 September 27.