biometrical analysis of individual growth curves
TRANSCRIPT

Behavior Genetics, VoL 22, No. 2, 1992
Biometrical Analysis of Individual Growth Curves
Laura A. Baker, 1,3 Chandra Reynolds, 1 and Erin Phelps 2
Longitudinal data for height (length) between birth and 2 years of age were examined for 690 Dutch Registry twin pairs. A two-stage analysis was performed, where individual growth curves were first fit to available data for each subject using a linear multiple regression procedure and estimated individual growth curve parameters were then subjected to multivariate biometrical analysis. Quadratic polynomial curves were found to adequately represent observed growth patterns for the majority of cases (median R 2 = .98). A specific scalar model of sex limitation best characterized individual variation in growth curve parameters. That is, there was significantly greater genetic variation for boys than for girls in both the predicted length and rate of growth at 1 year of age and the amount of deceleration in individual growth curves across age.
KEY W O R D S : growth curves; biometrical analysis; Dutch Twin Register.
I N T R O D U C T I O N
The analysis of individual growth curves has become increasingly pop- ular in recent years, as a means of studying individual variations in patterns of change over time. It is recognized that different persons do not necessarily grow or change in a uniform fashion but that, instead, there may be individual differences in several aspects of growth (e.g., initial status; average, minimum, or maximum rate of growth; maximum
This research was supported in part by a Helen Putnam Visiting Scholarship award to Laura Baker while at the Henry Murray Research Center at Radcliffe College.
SGM 501, University of Southern California, Los Angeles, California 90089-1061. z Henry Murray Research Center, Radcliffe College Cambridge, Massachusetts 02138. 3 To whom correspondence should be addressed.
253
0001-8244/92/0300-0253506.50/0 �9 1992 Plenum Publishing Corporation
254 Baker, Reynolds, and Phelps
level reached). Some researchers have approached the study of both inter- and intraindividual differences in patterns of change over time using two- stage analytical procedures (see Willett, 1988; Bryk and Raudenbush, 1987). First, longitudinal observations for each person are reduced to a few parameters reflecting the individual's growth trajectory, then these growth curve parameters are subjected to further analysis. For example, a researcher may be interested in group differences in various parameters or, possibly, in the extent to which parameters of growth correlate with certain covariates.
In addition to studying changes over time at the phenotypic level, a two-stage approach has also provided an interesting framework for examining the genetic and environmental sources of individual differ- ences in growth. In this vein, Vandenberg and Falkner (1965) studied genetic and environmental etiologies of height using twins. Measurement of height has the property rarely seen in the psychological realm in that height can be measured in the same fashion for a 2 year old as for a 10 year old, unlike measures of Personality or intelligence, in which the measuring instrument changes depending on the age of the subject. Van- denberg and Falkner measured height of 60 pairs of twins on at least six occasions between the ages of 1 month and 5 years. Much in the same manner as Willett (1988) describes, Vandenberg and Falkner reduced the number of individual data points into three summary measures: intercept, slope, and quadratic terms. F ratios were then applied to the summary growth data, where identical twins were compared to fraternal twins. Hereditary influences were found for both the slope and the deceleration (quadratic) term but not for the intercept (which reflects estimated birth length). The lack of significant heritable findings on initial birth status demonstrates little differential twin concordance for identical and frater- nal twin pairs. When comparing raw data for height at different ages, it was reported that significant hereditary influences were detected only after the age of 3 months and up to the age of 4 years.
Others have also reported genetic influences in growth curve param- eters of height using older samples and/or different growth curve-fitting procedures. Based on parent-offspring and sibling comparisons from two longitudinal studies of height through age 10.5 years, Welch (1970) found significant hereditary influences for both an overall size constant and the average rate of growth. These results were based on a polynomial regression curve-fitting approach similar to that used by Vandenberg and Falkner (1965). Fitting double-logistic curves to height measured from primary- through secondary-school age for different ethnic groups, John- ston et al. (1976) reported evidence for hereditary factors in amount of growth during adolescence. However, other growth curve parameters,

G r o w t h C u r v e s 255
including maximum preadolescent height and peak velocity of adolescent growth, were influenced primarily by environmental factors. Clearly, the importance of genetic and environmental factors may vary for different parameters of growth as well as for different segments of the age con- tinuum.
The advantages of a growth curve approach for longitudinal data are that one can (1) make use of data for irregularly spaced intervals between measurements, which vary over persons and time; (2) reduce a large data set into smaller number of parameters which characterize change over time; and (3) have the opportunity to examine genetic and environ- mental variations in parameters of change (e.g., rate of growth) rather than simply looking at trait levels at different time points. The most difficult aspect is that one must specify the general form of the individual growth curves, from either theoretical or empirical work. Fortunately, for the study of height, a number of curves have been suggested and shown to be representative of height at different parts of the life span (see Thissen and Bock, 1988).
The present study was conducted to expand on previous research, especially that of Vandenberg and Falkner (1965), in order to make use of more recent techniques in biometrical genetic analyses of using struc- tural equation modeling (e.g., Heath et a l . , 1989) in examining twin data. Furthermore, sex limitation (see Neale and Martin, 1989) was also of interest in order to determine whether males and females differed in phenotypic variation (general scalar limitation) or in genetic and envi- ronmental variation (specific scalar limitation) or whether different genes or environments were influential in the two sexes (nonscalar limitation). A series of models testing for significant genetic and environmental com- ponents as well as sex limitation was fit to height data measured on twins from the Dutch Twin Register. The effects of gestational age were also considered as a covariate in these models in the same manner as described by Vlietinck et aL (1989). Available data were analyzed for subjects who had at least four occasions of measurements between birth and 2 years of age.
M E T H O D
Subjects
Longitudinal data on height (length) were obtained through the Youth Health Services (YHS) in Holland for both same-sex and opposite-sex twin pairs included in the Dutch Twin Register. Although twins were nearly always measured at the same date, the number of occasions as
256 Baker, Reynolds, and Phelps
well as intervals between measurements varied greatly between pairs. The present analyses are based only on subjects with data available for at least four occasions of measurement between (and including) birth and 2 years of age. Furthermore, subjects were required to have at least one of the four measurements taken before the age of 6 months and at least one measurement after 18 months of age. This resulted in a sample of 114 MZ female, 90 MZ male, 135 DZ female, 158 DZ male, and 193 DZ opposite-sex pairs of twins.
Measures and Procedure
Between birth and the second birthday height (length) measure- ments, in centimeters, were taken while the infants were lying down and extended to full length. The number of occasions of measurement ranged from 4 to 17. Measurements beyond the second birthday were not con- sidered in these analyses. These subjects were born between 1986 and 1988 and the data used in the present report were collected between 1986 and 1990 during visits made by the children to the YCS.
Analyses
Second-degree (i.e., quadratic) polynomial growth curves were first fit to each subject's longitudinal data using a linear multiple regression procedure. For the/ th person in the sample his or her estimated height at occasion j is represented by
Yij = Woi + "rrli (tj) + "rr2i ( t f ) (1)
where tj is the person's age (in years) at the jth occasion. Thus, the (p = 4 to 17) observations for each person were reduced to a set of three parameters ('rroi, "rrli, -rr~) characterizing that individual's growth trajec- tory in the first two years of life. To facilitate interpretation of these parameters age was transformed by subtracting 1.0 (year) from every observed value. Therefore, growth curves are "centered," such that the intercept ('rroi) and slope ('nhi) represent, respectively, the predicted height and instantaneous rate of growth at i year of age for person i, while -rr~ indicates the amount of deceleration in the individual's growth curve. This centering procedure also has the advantage of reducing the inter- correlations among the growth curve parameters across subjects, which are otherwise typically quite high in polynomial regression analyses where intercepts are estimated for age = 0.
Twin similarity for these growth parameters was then examined through a model-fitting procedure using the LISREL-VII program (Jo-
Growth Curves 257
reskog and Sorbom, 1989) in order to study genetic and environmental etiologies of growth in height.
RESULTS
Growth Curve Parameter Estimation
Quadratic regression models fit extremely well for the majority of subjects, with total R z changing from .66 to .99 (median R e = .98). Furthermore, the quadratic term added considerable improvement over a linear regression model for over two-thirds of the sample (median R 2 change = .04; median F for R 2 change = 18.24, p < .05). There were no significant mean differences across zygosity or sex for any of the three regression parameters ('fro, wl, rr~), indicating similar overall pat- terns for the five groups used in biometrical analyses (i.e., MZ female, MZ male, DZ female, DZ male, DZ opposite sex). There was, however, considerable individual variation within groups for all three parameters, although the amount of these variations were comparable across the five groups as well.
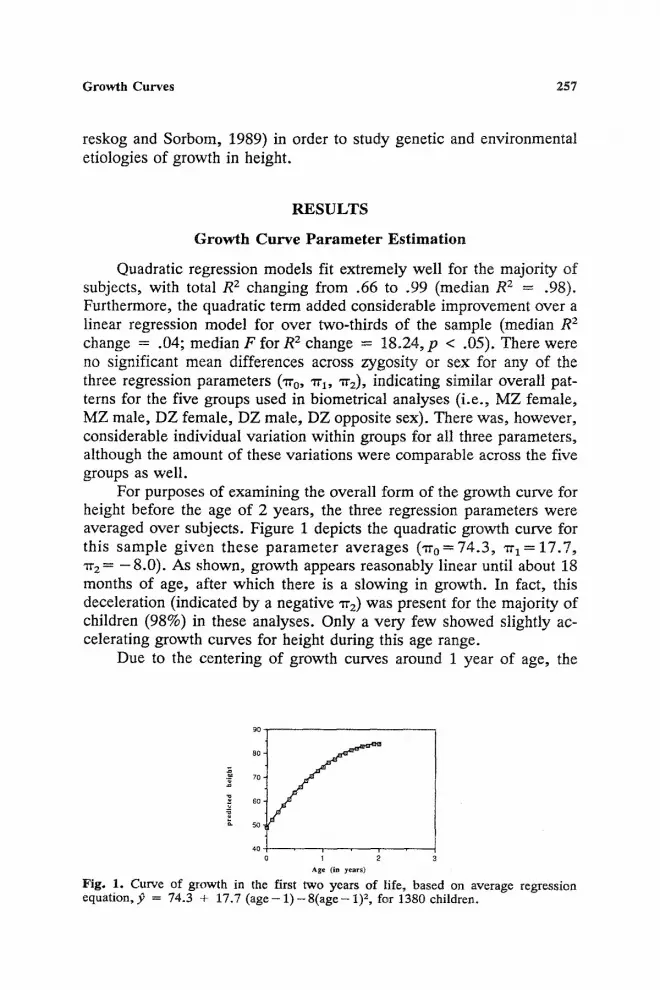
For purposes of examining the overall :form of the growth curve for height before the age of 2 years, the three regression parameters were averaged over subjects. Figure 1 depicts the quadratic growth curve for this sample given these parameter averages ( 'rro=74.3, wl = 17.7, rra = - 8 . 0 ) . As shown, growth appears reasonably linear until about 18 months of age, after which there is a slowing in growth. In fact, this deceleration (indicated by a negative "rra) was present for the majority of children (98%) in these analyses. Only a very few showed slightly ac- celerating growth curves for height during this age range.
Due to the centering of growth curves around 1 year of age, the
90
~--~ 7O,
5O" J
Age (in years)
Fig. 1. Curve of growth in the first two years of life, based on average regression equation, p = 74.3 + 17.7 ( a g e - 1 ) - 8 ( a g e - 1) 2, for 1380 children.
258 Baker, Reynolds, and Phelps
correlations among the three growth curve parameters were only low to moderate. Specifically, intercept values (i.e., predicted height at age 1) showed little association with slopes (r = .10) but correlated inversely and moderately with deceleration parameter estimates (r -- - .56). Thus, height at the first birthday was unrelated to how fast the child was grow- ing at the same time, although taller children at age 1 were showing greater deceleration (i.e., more slowing in rate of change over time). Moreover, slopes and deceleration parameters were positively correlated (r = .42), such that children growing faster than others at 1 year of age had less slowing of their growth rate over time. As noted earlier, the intercorrelations among these regression parameters are considerably less than would have occurred without the centering procedure, which was considered advantageous for purposes of multivariate biometrical anal- yses described below.
Gestational Age Effects
Mean gestational age (GA) was 37.01 weeks, which did not differ among the five groups (MZF, MZM, DZF, DZM, D Z o s ) in this sample. There were significant correlations of gestational age with T0, wl, and ~2, which also did not vary across groups. The less premature twins were generally taller but growing more slowly at I year of age than twins born at an earlier gestational age (rGA,~ 0 = .22; t'GA,~ 1 ---~ -- .29). There was also greater deceleration (i.e., more negative w2) for less premature twins (rGA,W2 = .24). Thus although twins born later in the pregnancy had a tendency to be taller than more premature twins at 1 year of age, they were growing at a slower rate and also showed a greater slowing in their rate of growth over time.
Rather than correcting for gestational age effects in growth curve parameters prior to biometrical analyses described below, they were in- cluded as direct effects in all models (see Neale and Martin, 1989). Gestational age effects were constrained to be equal across both zygosity and sex in the various models fit.
Biometrical Analyses
Twin correlations for the growth curve parameters are shown in Table I. Clearly there is marked twin resemblance for all three parame- ters, with the MZ correlations being generally higher than the DZ cor- relations within each sex (with the exception of "rr2). Also, the correlations among the male pairs of twins are generally higher than for the female twins, suggesting sex limitation effects of some form.
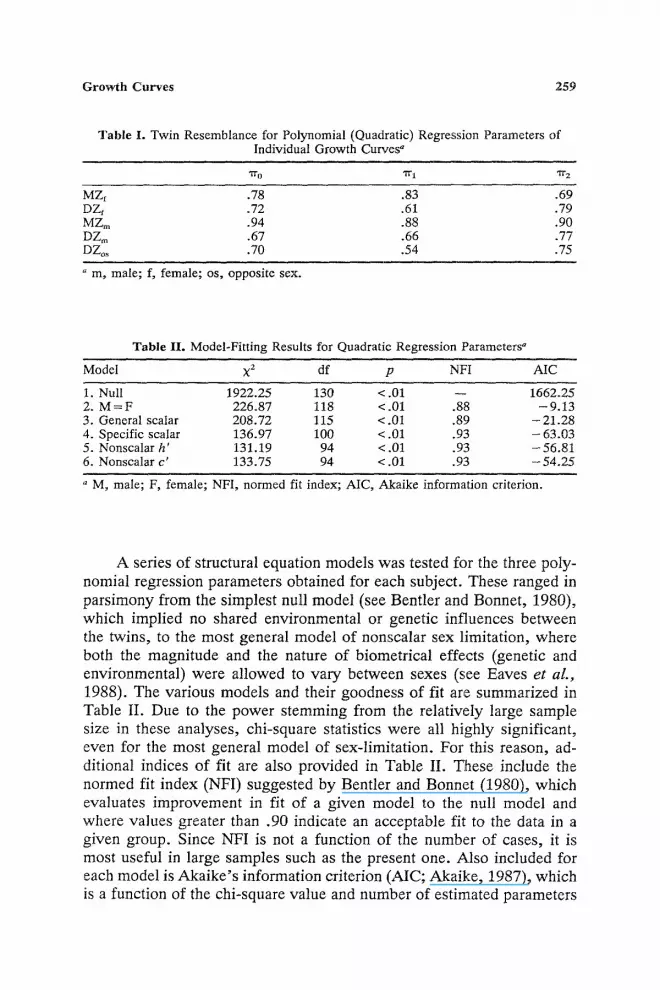
Growth Curves 2S9
Table I. Twin Resemblance for Polynomial (Quadratic) Regression Parameters of Individual Growth Curves"
7 r o "7t" 1 ,I1- 2
MZf .78 .83 .69 DZf .72 .61 .79 MZm .94 .88 .90 DZ~ .67 .66 .77 DZo~ .70 .54 .75
" m, male; f, female; os, opposite sex.
Table II. Model-Fitting Results for Quadratic Regression Parameters"
Model • df p NFI AIC
1. Null 1922.25 130 < .01 -- 1662.25 2. M = F 226.87 I18 < .01 .88 - 9.13 3. General scalar 208.72 115 < .01 .89 - 21.28 4. Specific scalar 136.97 100 < .01 .93 - 63.03 5. Nonscalar h' 131.19 94 <.01 .93 -56.81 6. Nonscalar c' 133.75 94 < .01 .93 - 54.25
a M, male; F, female; NFI, normed fit index; AIC, Akaike information criterion.
A series of structural equation models was tested for the three poly- nomial regression parameters obtained for each subject. These ranged in parsimony from the simplest null model (see Bentler and Bonnet, 1980), which implied no shared environmental or genetic influences between the twins, to the most general model of nonscalar sex limitation, where both the magnitude and the nature of biometrical effects (genetic and environmental) were allowed to vary between sexes (see Eaves et aL, 1988). The various models and their goodness of fit are summarized in Table II. Due to the power stemming from the relatively large sample size in these analyses, chi-square statistics were all highly significant, even for the most general model of sex-limitation. For this reason, ad- ditional indices of fit are also provided in Table II. These include the normed fit index (NFI) suggested by Bentler and Bonnet (1980), which evaluates improvement in fit of a given model to the null model and where values greater than .90 indicate an acceptable fit to the data in a given group. Since NFI is not a function of the number of cases, it is most useful in large samples such as the present one. Also included for each model is Akaike ' s information criterion (AIC; Akaike, 1987), which is a function of the chi-square value and number of estimated parameters
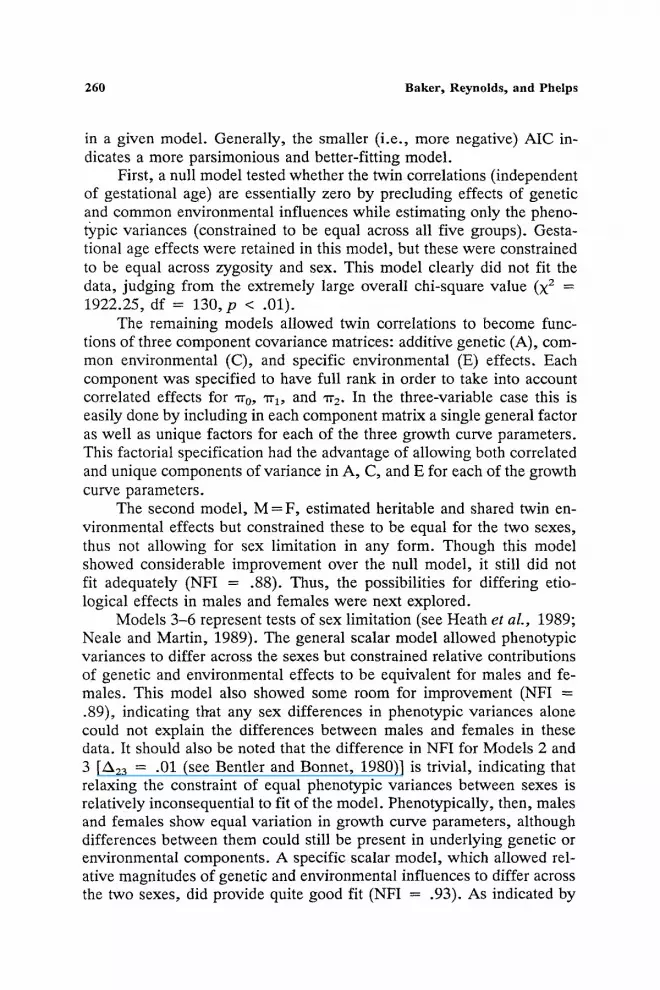
260 Baker, Reynolds, and Phelps
in a given model. Generally, the smaller (i.e., more negative) AIC in- dicates a more parsimonious and better-fitting model.
First, a null model tested whether the twin correlations (independent of gestational age) are essentially zero by precluding effects of genetic and common environmental influences while estimating only the pheno- typic variances (constrained to be equal across all five groups). Gesta- tional age effects were retained in this model, but these were constrained to be equal across zygosity and sex. This model clearly did not fit the data, judging from the extremely large overall chi-square value (X 2 = 1922.25, df = 130, p < .01).
The remaining models allowed twin correlations to become func- tions of three component covariance matrices: additive genetic (A), com- mon environmental (C), and specific environmental (E) effects. Each component was specified to have full rank in order to take into account correlated effects for "fro, "rrl, and "rr2. In the three-variable case this is easily done by including in each component matrix a single general factor as well as unique factors for each of the three growth curve parameters. This factorial specification had the advantage of allowing both correlated and unique components of variance in A, C, and E for each of the growth curve parameters.
The second model, M = F, estimated heritable and shared twin en- vironmental effects but constrained these to be equal for the two sexes, thus not allowing for sex limitation in any form. Though this model showed considerable improvement over the null model, it still did not fit adequately (NFI = .88). Thus, the possibilities for differing etio- logical effects in males and females were next explored.
Models 3-6 represent tests of sex limitation (see Heath et al., 1989; Neale and Martin, 1989). The general scalar model allowed phenotypic variances to differ across the sexes but constrained relative contributions of genetic and environmental effects to be equivalent for males and fe- males. This model also showed some room for improvement (NFI = .89), indicating that any sex differences in phenotypic variances alone could not explain the differences between males and females in these data. It should also be noted that the difference in NFI for Models 2 and 3 [A23 = .01 (see Bentler and Bonnet, 1980)] is trivial, indicating that relaxing the constraint of equal phenotypic variances between sexes is relatively inconsequential to fit of the model. Phenotypically, then, males and females show equal variation in growth curve parameters, although differences between them could still be present in underlying genetic or environmental components. A specific scalar model, which allowed rel- ative magnitudes of genetic and environmental influences to differ across the two sexes, did provide quite good fit (NFI = .93). As indicated by

G r o ~ h C u r v e s 261
the smallest AIC, the specific scalar model is also suggested as the most parsimonious and best-fitting model.
Finally, nonscalar models of sex limitation were fit, which allowed additional sex-specific effects beyond what is specified in either A or C. The nonscalar h ' model tested for additional genetic influences which operate in males but not females, while the nonscalar c' model included additional common environmental effects operating in females but not in males. The decision for modeling h' in males and the c' in females came by observation of the twin correlations: (a) the twin correlations appeared higher in males overall, and (b) the differences between MZ and DZ correlations in males were at least as great as in females for all three parameters. As shown in Table II, both nonscalar models provided rea- sonably good fit (NFI = .93 for both Models 5 and 6), although neither added any real improvement over the specific scalar model.
There are two most noteworthy points in summarizing the biometri- cal models tested. First, models of sex limitation, particularly specific scalar and both nonscalar models, fit the data better than a model con- straining equality across sexes (M = F). Second, nonscalar models (either h' or c') do not fit any better than the specific scalar model, indicating the lack of any sex-specific factors in growth curve parameters for these data. Together these findings indicate that, although the same genetic and environmental factors appear to be important in growth in height for both males and females, these factors are of different relative importance in the two sexes.
Components of variance for genetic and environmental factors based on the specific scalar model of sex limitation are continued in Table III. As shown, heritable factors explain more individual differences in males compared to females in all growth curve parameters, including both level
T a b l e I l l . Heri tabil i ty and Env i ronmenta l i ty Es t imates for Males and Females f rom the Specif ic Scalar Model
h 2 c 2 e 2
Intercept (~ro) Males .45 .49 .06 Females .25 .53 .22
Slope (-rq) Males .57 .26 .17 Females .48 .34 .18
Quadratic term (~r2) Males .12 .74 .I4 Females .01 .72 .27
262 Baker, Reynolds, and Phelps
and rate of growth at 1 year of age, as well as in the amount of decel- eration across age. However, heritable factors appear to be of far less importance for deceleration than other aspects of growth (level and rate) in both sexes. Furthermore, environmental factors common to twins are of considerable importance for both males and females with respect to all parameters of growth in the first 2-years of life, particularly for de- celeration.
Examination of the factor loadings in each of the component ma- trices (A, C, and E) did reveal some similarities between the sexes. For the most part, all three general factor loadings in each component were significant for both males and females, indicating correlated effects for different aspects of the growth curves (level, rate, and deceleration). The only exception was for females, where the general loading in A was nonsignificant for "rr2, which showed near-zero heritability in Table III. Otherwise, genetic and environmental factors important to height at 1 year of age were generally related to those important to growth rate and its change over time, for both males and females. Differences between the sexes laid primarily in unique factor loadings, particularly in A. These were all nonsignificant for females, indicating no additional genetic var- iation for growth curve parameters beyond that explained by the general factor. For males, on the other hand, significant unique genetic factor loadings were present for both ~o and 'rr 2. Thus, the higher heritabilities in males are explained primarily by these unique factor loadings. There were also sex differences in unique factor loadings in C, where females demonstrated significant loadings for both "rro and ~1, while only the unique factor loading for "rr 1 was significant in males. The loadings were also larger in magnitude for females, accounting primarily for their in- creased common environmental effects for intercept and slope compared to males.
DISCUSSION
Summarizing the individual growth curves into a finite set of pa- rameters provided a useful way to determine genetic and environmental influences given data in which there were variable occasions and number of measurements. The present analyses have extended past research on genetic and environmental influences on growth in height by using more recent techniques of model-fitting which provide more accurate estimates of heritability and environmentality than other past procedures (see Plomin et al., 1990; special issue of Behavior Genetics, 1989). Furthermore, sex-limitation models were fit to the data with indications that the pro- portion of heritable and environmental influences differs across the sexes.
Growth Curves 263
Overall , the data suggest that for growth up to 2 years of age, heritable influences were especial ly important for both males and females for both height status and instantaneous growth rate at 1 year of age, although the relative effects o f heredity 'were significantly greater in males. The change or deceleration of the growth rate showed less her- itable influences in both males and females , with most o f the variat ion being explained by c o m m o n environmental influences.
These findings are consistent with those of Vandenberg and Falkner (1965) and Welch (1970), in particular where rate of growth in the early years of life appears significantly related to heritable factors. Regarding absolute levels of stature, our findings also parallel those of Vandenberg and Falkner and other more recent analyses of the longitudinal Louisvil le twin data (Wilson, 1984) showing (a) significant heritabili ty in absolute levels o f height by at least 1 year of age and (b) a sizable effect o f common twin environment in overall size :in the first few years of life. We look forward to the accumulat ion of more extensive longitudinal data for the later ages in the Dutch Twin Register sample , in order to examine other aspects o f growth during different developmental stages.
A C K N O W L E D G M E N T S
We are grateful to D. B oom s m a , J. Orlebeke, and C. M. van Baal for making these data available for analyses. W e also thank D. Thiessen for useful suggestions on fitting growth curves to height.
REFERENCES
Akaike, H. (1987). Factor analysis and AIC. Psychometrika 52:317-332. Bentler, P. M., and Bonnet, D. G. (1980). Significance tests and goodness of fit in the
analysis of covariance structures. PsychoL Bull. 88:588-606. Cudeck, R., and Browne, M. W. (1983). Cross-validation of covariance structures.
Multivar. Behav. Res. 18:147-167. Heath, A. C., Neale, M. C., Hewitt, J. K., Eaves, L. J., and Fulker, D. W. (1989).
Testing structural equation models for twin data using LISREL. Behav. Genet. 19:9- 36.
Johnston, F. E., Wainer, H., Thissen, D., and MacVean, R. (1977). Hereditary and environmental determinants of growth in height in a longitudinal sample of children and youth of Guatemala and European ancestry. Am. J. Phys. AnthropoL 44:468- 475.
Joreskog, K. G., and Sorbom, D. (1989). LISREL VII, 2nd ed., Scientific Software, Inc., Mooresville, IN.
Loehlin, J. C. (1987). Latent Variable Models, Lawrence Erlbaum Associates, NJ. Neale, M. C., and Martin, N. G. (1989). The effects of age, sex, and genotype on self-
report drunkenness following a challenge dose of alcohol. Behav. Genet. 19:63-78. Vandenberg, S. G., and Falkner, F. (1965). Hereditary factors in human growth. Hum.
BioL 37:357-365. Vlietinck, R., Derom, R., Neale, M. C., Haes, H., van Loon, H., Derom, C., and

264 Baker, Reynolds, and Phelps
Thiery, M. (1989). Genetic and environmental variation in the birth weight of twins. Behav. Genet. 19:151-161.
Welch, Q. B. (1970). A genetic interpretation of variation in human growth patterns. Behav. Genet. 1:157-167.
Willett, J. B. (1988). Questions and answers in the measurement of change. In Rothkopf, E. Z. (ed.), Review o f Research in Education, VoL 15. American Educational Research Association, Washington, DC.
Wilson, R. S. (1984). Twins and chronogenetics: Correlated pathways of development. Acta Genet. Med. GernelloL 33:149-157.