biomarker discovery in subclinical mycobacterial infections of cattle
TRANSCRIPT

Biomarker Discovery in Subclinical MycobacterialInfections of CattleMeetu Seth1., Elise A. Lamont1., Harish K. Janagama1, Andrea Widdel1, Lucy Vulchanova2, Judith R.
Stabel3, W. Ray Waters3, Mitchell V. Palmer3, Srinand Sreevatsan1,2*
1 Department of Veterinary Population Medicine, University of Minnesota, St Paul, Minnesota, United States of America, 2 Department of Veterinary and Biomedical
Sciences, University of Minnesota, St Paul, Minnesota, United States of America, 3 National Animal Disease Center, United States Department of Agriculture, Ames, Iowa,
United States of America
Abstract
Background: Bovine tuberculosis is a highly prevalent infectious disease of cattle worldwide; however, infection in theUnited States is limited to 0.01% of dairy herds. Thus detection of bovine TB is confounded by high background infectionwith M. avium subsp. paratuberculosis. The present study addresses variations in the circulating peptidome based on thepathogenesis of two biologically similar mycobacterial diseases of cattle.
Methodology/Principal Findings: We hypothesized that serum proteomes of animals in response to either M. bovis or M.paratuberculosis infection will display several commonalities and differences. Sera prospectively collected from animalsexperimentally infected with either M. bovis or M. paratuberculosis were analyzed using high-resolution proteomicsapproaches. iTRAQ, a liquid chromatography and tandem mass spectrometry approach, was used to simultaneously identifyand quantify peptides from multiple infections and contemporaneous uninfected control groups. Four comparisons wereperformed: 1) M. bovis infection versus uninfected controls, 2) M. bovis versus M. paratuberculosis infection, 3) early, and 4)advanced M. paratuberculosis infection versus uninfected controls. One hundred and ten differentially elevated proteins(P#0.05) were identified. Vitamin D binding protein precursor (DBP), alpha-1 acid glycoprotein, alpha-1B glycoprotein,fetuin, and serine proteinase inhibitor were identified in both infections. Transthyretin, retinol binding proteins, andcathelicidin were identified exclusively in M. paratuberculosis infection, while the serum levels of alpha-1-microglobulin/bikunin precursor (AMBP) protein, alpha-1 acid glycoprotein, fetuin, and alpha-1B glycoprotein were elevated exclusively inM. bovis infected animals.
Conclusions/Significance: The discovery of these biomarkers has significant impact on the elucidation of pathogenesis oftwo mycobacterial diseases at the cellular and the molecular level and can be applied in the development ofmycobacterium-specific diagnostic tools for the monitoring progression of disease, response to therapy, and/or vaccinebased interventions.
Citation: Seth M, Lamont EA, Janagama HK, Widdel A, Vulchanova L, et al. (2009) Biomarker Discovery in Subclinical Mycobacterial Infections of Cattle. PLoSONE 4(5): e5478. doi:10.1371/journal.pone.0005478
Editor: Niyaz Ahmed, University of Hyderabad, India
Received January 8, 2009; Accepted April 9, 2009; Published May 8, 2009
Copyright: � 2009 Seth et al. This is an open-access article distributed under the terms of the Creative Commons Attribution License, which permits unrestricteduse, distribution, and reproduction in any medium, provided the original author and source are credited.
Funding: This study was supported by a Rapid Agricultural Response Fund at U of MN and Johne’s disease integrated program (USDA-CSREES 3 2008-55620-18710) awarded to SS, and in part by an NIH/NIDA grant awarded to LV. The funders had no role in study design, data collection and analysis, decision to publish,or preparation of the manuscript.
Competing Interests: The authors have declared that no competing interests exist.
* E-mail: [email protected]
. These authors contributed equally to this work.
Introduction
Bovine tuberculosis (bovine TB), a zoonotic infection in cattle
caused by the intracellular bacterium Mycobacterium bovis (M. bovis),
is a highly prevalent infectious disease of cattle worldwide [1].
Human tuberculosis caused by M. bovis is underestimated and the
evidence that animal-human and inter-human transmission can
occur underscores the importance of undertaking control pro-
grams based on robust understanding of the pathogenesis of the
disease [2,3,4]. Bovine TB causes a conservative annual loss of
three billion dollars in the United States (U.S.) of which $3.5–4
million is attributed to the current ‘‘test and slaughter’’ eradication
program [5].
Cattle of all ages are susceptible to M. bovis infection; however,
older animals have an increased risk of infection [6,7,8]. In most
cases, M. bovis infection leads to subclinical disease (95%) with
rapid clinical onset occurring in only 5% of exposed animals.
Although M. bovis is wide spread, bovine tuberculosis is limited to
0.01% of dairy herds in the U.S. This is in stark contrast to
another mycobacterial disease of cattle, Johne’s Disease (JD),
which afflicts 68% of U.S. dairy herds (2007, USDA, report).
Consequently, M. bovis detection is confounded by background
infection with M. paratuberculosis (MAP), the causative agent of JD.
Current USDA surveillance for bovine TB fails to address the
aforementioned issue. USDA testing entails a laborious multistep
procedure involving the caudal fold test (CFT) and the
PLoS ONE | www.plosone.org 1 May 2009 | Volume 4 | Issue 5 | e5478

comparative cervical test (CCT) or c-interferon detection. Despite
advancements in diagnostic approaches several problems persist:
CFT lacks specificity for M. bovis and is often and fails to detect all
diseased cattle, while the c-interferon assay is costly and requires
blood samples to be processed within 24 hours of collection.
Although serological tests using recently refined antigens have
offered promising solutions, these also fall short since early
detection relies on an active humoral immune response, which
may not occur in a significant number of animals until the latter
stages of M. bovis infection.
Failure to detect bovine TB poses a significant zoonotic threat
and may result in a substantial loss of resources due to loss of
trading partners, testing costs, culling, and quarantine of animals,
as well as emotional stress to cattle owners. Thus, improved tests
are urgently needed to increase detection, prevent disease
exposure, and differentiate M. bovis infections from other
mycobacterial species [9].
In order to develop sensitive and specific assays for bovine TB it
is necessary to understand the pathogenesis of mycobacterial
infections at the molecular level. Mycobacterial diseases are
intractable infections in which the bacteria persist in granulomas
for decades without disease progression [10]. Granuloma forma-
tion in mycobacterial infections share several commonalities at the
molecular level, which may lead to significant changes in
circulating peptidomes.
Proteomics offers a new approach of addressing early detection
of M. bovis by identifying novel biomarkers. One proteomics
method is isobaric tag for relative and absolute quantification
(iTRAQ), a liquid chromatography and tandem mass spectrom-
etry technique that allows for simultaneous identification and
quantification of peptides between multiple sample groups. The
purpose of this study was to implement iTRAQ in use with serum
samples prospectively collected from cattle experimentally infected
with either M. bovis or M. paratuberculosis for discovery of potential
biomarkers of infection and progression of disease. Sera were used
since respective protein profiles are expected to change concom-
itantly with the dynamics of granuloma formation in early and
chronic infection. The biomarkers identified by iTRAQ were then
validated on individual sera. This is the first study where the
experimental design addresses the effect of progression of
mycobacterial infections in animals on the circulating peptidome.
Results
Serum protein profiling: MALDI – TOFSerum protein profiles (N = 30) from M. bovis infected (n = 5) and
control (n = 5) animals representing three time points pre- and
post-infection (PI) were generated using standard MALDI-TOF
and analyzed by FlexAnalysis and ClinProToolTM software. The
analysis did not result in the identification of statistically significant
proteins unique to infected animals at any PI time point. However,
the identification of similar protein profiles among infected and
control sera confirmed that pooling of equal amounts of sera for
iTRAQ would not lead to any significant variability.
LC/MS/MS analysis: Multiplex analysis of M. bovis infectedsera
Sera from five animals at 1 and 4 months PI and uninfected
controls were pooled and analyzed by iTRAQ (Figure 1). A total
of 104 proteins were identified with 95% CI of which 81 carried
99% confidence. The log ratios of the reporter ions at 4 months PI
versus 1 month PI was compared against uninfected controls.
Figure 1. Experimental design used for four iTRAQ analyses with combinations of sera from M. bovis and/or M. paratuberculosisinfections in calves. Shown in each quadrant is the experimental design for either M. bovis or M. paratuberculosis infections. Pre- and post-infectiontime points at which sera were collected and applied in iTRAQ analyses are identified. Numbers in brackets represent the numbers of sera from eachgroup that was pooled for analysis. Experimental design also included contemporary controls.doi:10.1371/journal.pone.0005478.g001
Bovine TB Biomarkers
PLoS ONE | www.plosone.org 2 May 2009 | Volume 4 | Issue 5 | e5478

Twenty-eight proteins were differentially expressed in this
comparison (P,0.05, EF,2) (Figure 2, Table 1).
Multiplex analysis of M. bovis and M. paratuberculosisinfected sera
M. bovis infected sera (0, 3.5, and 7 months PI) and M.
paratuberculosis sera (12 months PI) were pooled and analyzed. A
total of 138 proteins were detected (CI = 95%) of which 97 carried
a 99% confidence. The log ratios of the reporter ions at 7 months
PI with M. bovis and 12 months PI with M. paratuberculosis were
analyzed against pre- M. bovis infection. Twenty-three proteins
were differentially expressed in this comparison (P,0.05, EF,2)
(Figure 3, Table 2).
Multiplex analysis of sera from early M. paratuberculosisinfection
Sera from five M. paratuberculosis infected animals at baseline, 3
months PI, and uninfected controls were pooled and analyzed. A
total of 146 proteins were identified (CI = 95%) of which 106
carried a 99% confidence. Twenty-eight proteins were differen-
tially expressed in this comparison (P,0.05, EF,2) (Figure 4,
Table 3).
Multiplex analysis of advanced infection with M.paratuberculosis
Sera from five M. paratuberculosis infected animals at baseline, 10
months PI and uninfected controls were pooled and analyzed. A
total of 147 proteins were identified (CI = 95%) of which 109
carried a 99% confidence. Thirty-two proteins were differentially
expressed in this comparison (P,0.05, EF,2) (Figure 5, Table 4).
Comparison of four iTRAQ experimentsComparison of identified proteins in all four iTRAQs
determined that both M. bovis and M. paratuberculosis infected sera
showed elevated expression of Vitamin D Binding Protein (DBP)
relative to age-matched contemporary controls. Vitamin DBP,
serpina 3–4, transthyretin and retinol binding proteins were more
abundant in M. paratuberculosis infection (Figure 3), while increased
expression of alpha-1microglobulin, alpha-1 acid glycoprotein,
serine proteinase inhibitor, fetuin and alpha-1 acid glycoprotein
were detected in M. bovis infection with respect to M. paratuberculosis
(Figure 3). Figure 3 shows MAP infection at 12 months compared
to M. bovis infection at 7 months. As previously stated, vitamin
DBP expression in M. bovis infected sera is comparable to baseline.
Therefore, vitamin DBP is differentially expressed between MAP
Figure 2. Biomarkers identified in M. bovis infection. The bar graph represents the log ratios of the proteins (P,0.05, EF,2) identified in M.bovis infected and control animals. The green bars represent log ratios of serum biomarkers between 4 months and 1 month PI with M. bovis. Shownin red are ratios in within contemporary controls over time. Levels of D-binding protein and alpha-1 B glycoprotein increased as M. bovis infectionprogressed, while that of serpina3 protein decreased. Serum amyloid A1 levels increased only in the control animals over time.doi:10.1371/journal.pone.0005478.g002
Bovine TB Biomarkers
PLoS ONE | www.plosone.org 3 May 2009 | Volume 4 | Issue 5 | e5478
and M. bovis during late infection stages. Thus, we conclude that
vitamin DBP expression is specific for M. bovis infection during
mid-infection stages.
Validation of protein biomarkers identified in infectedanimals
In order to validate iTRAQ data, we performed western blot
and dot blot analyses for vitamin DBP identified in M. bovis and
M. paratuberculosis infection and alpha-1-microglobulin precursor,
alpha-1-acid glycoprotein for M. bovis infection. The control
group (n = 5) had similar expression in all animals at all time
points of infection with the exception of animal 3. Interestingly,
DBP was significantly elevated (P,0.05) during mid-infection (3
months PI) as compared to early (1 month PI) and late (4 months
PI) infection or contemporary controls (Figure 6). Although
animal 3 showed vitamin DBP reactivity, it did not display a
similar expression profile as M. bovis infected animals. Therefore,
animal 3 was considered an outlier. The dot-blot analysis for M.
paratuberculosis infection (n = 4) showed vitamin DBP to be
elevated at 9 months PI. Western blot analysis for alpha-1-
microglobulin precursor and alpha-1-acid glycoprotein in M.
bovis infection did not result in any significant differences
between infected and control animals.
Validation of DBP as a diagnostic biomarker for naturalbovine tuberculosis infection
Inasmuch as iTRAQ of pooled sera identified that DBP could
serve as a diagnostic biomarker, we performed a pilot validation
on individual field sera collected from 20 bovine TB infected and
10 uninfected (control) animals using a dot blot approach. A
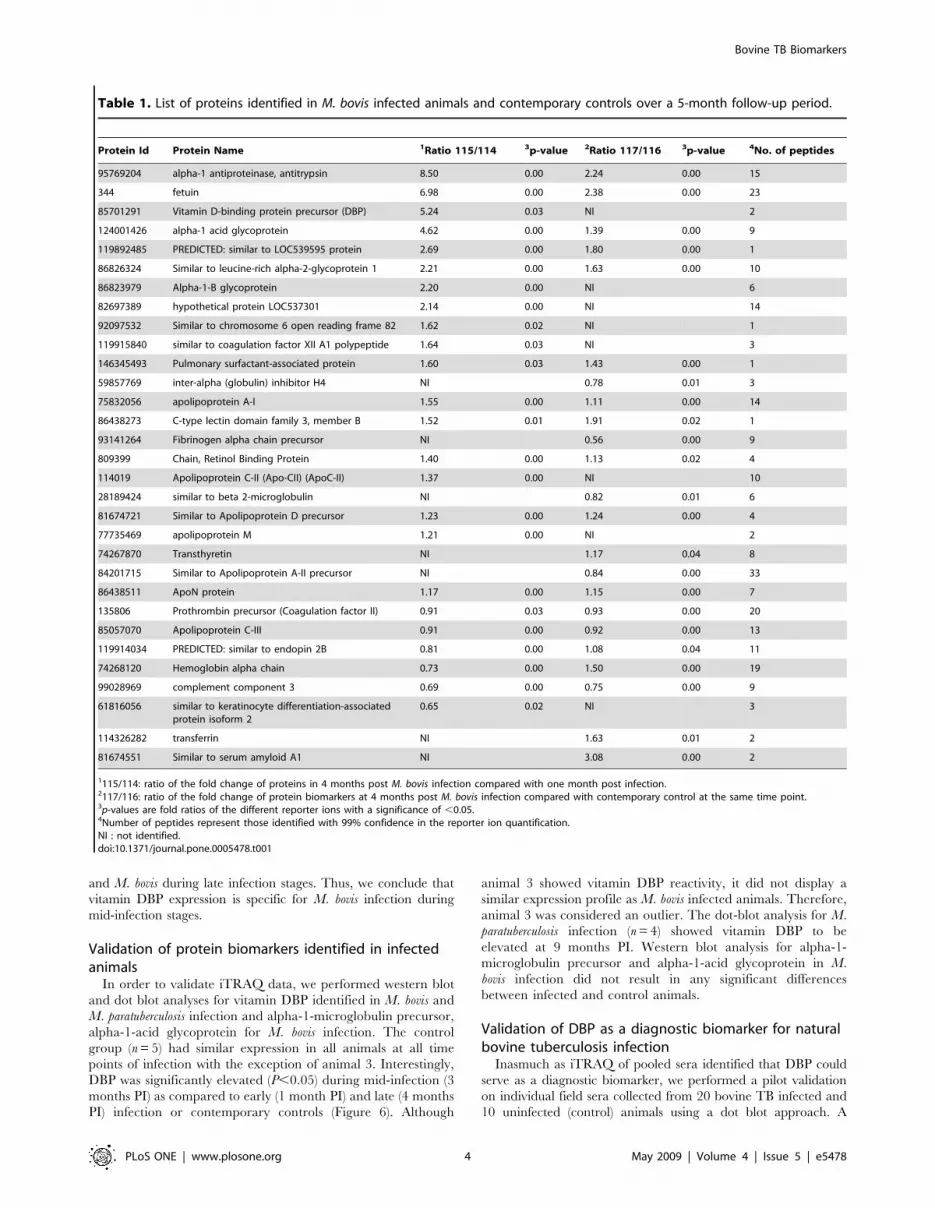
Table 1. List of proteins identified in M. bovis infected animals and contemporary controls over a 5-month follow-up period.
Protein Id Protein Name 1Ratio 115/114 3p-value 2Ratio 117/116 3p-value 4No. of peptides
95769204 alpha-1 antiproteinase, antitrypsin 8.50 0.00 2.24 0.00 15
344 fetuin 6.98 0.00 2.38 0.00 23
85701291 Vitamin D-binding protein precursor (DBP) 5.24 0.03 NI 2
124001426 alpha-1 acid glycoprotein 4.62 0.00 1.39 0.00 9
119892485 PREDICTED: similar to LOC539595 protein 2.69 0.00 1.80 0.00 1
86826324 Similar to leucine-rich alpha-2-glycoprotein 1 2.21 0.00 1.63 0.00 10
86823979 Alpha-1-B glycoprotein 2.20 0.00 NI 6
82697389 hypothetical protein LOC537301 2.14 0.00 NI 14
92097532 Similar to chromosome 6 open reading frame 82 1.62 0.02 NI 1
119915840 similar to coagulation factor XII A1 polypeptide 1.64 0.03 NI 3
146345493 Pulmonary surfactant-associated protein 1.60 0.03 1.43 0.00 1
59857769 inter-alpha (globulin) inhibitor H4 NI 0.78 0.01 3
75832056 apolipoprotein A-I 1.55 0.00 1.11 0.00 14
86438273 C-type lectin domain family 3, member B 1.52 0.01 1.91 0.02 1
93141264 Fibrinogen alpha chain precursor NI 0.56 0.00 9
809399 Chain, Retinol Binding Protein 1.40 0.00 1.13 0.02 4
114019 Apolipoprotein C-II (Apo-CII) (ApoC-II) 1.37 0.00 NI 10
28189424 similar to beta 2-microglobulin NI 0.82 0.01 6
81674721 Similar to Apolipoprotein D precursor 1.23 0.00 1.24 0.00 4
77735469 apolipoprotein M 1.21 0.00 NI 2
74267870 Transthyretin NI 1.17 0.04 8
84201715 Similar to Apolipoprotein A-II precursor NI 0.84 0.00 33
86438511 ApoN protein 1.17 0.00 1.15 0.00 7
135806 Prothrombin precursor (Coagulation factor II) 0.91 0.03 0.93 0.00 20
85057070 Apolipoprotein C-III 0.91 0.00 0.92 0.00 13
119914034 PREDICTED: similar to endopin 2B 0.81 0.00 1.08 0.04 11
74268120 Hemoglobin alpha chain 0.73 0.00 1.50 0.00 19
99028969 complement component 3 0.69 0.00 0.75 0.00 9
61816056 similar to keratinocyte differentiation-associatedprotein isoform 2
0.65 0.02 NI 3
114326282 transferrin NI 1.63 0.01 2
81674551 Similar to serum amyloid A1 NI 3.08 0.00 2
1115/114: ratio of the fold change of proteins in 4 months post M. bovis infection compared with one month post infection.2117/116: ratio of the fold change of protein biomarkers at 4 months post M. bovis infection compared with contemporary control at the same time point.3p-values are fold ratios of the different reporter ions with a significance of ,0.05.4Number of peptides represent those identified with 99% confidence in the reporter ion quantification.NI : not identified.doi:10.1371/journal.pone.0005478.t001
Bovine TB Biomarkers
PLoS ONE | www.plosone.org 4 May 2009 | Volume 4 | Issue 5 | e5478

frequency distribution analysis of optical densities identified a
typical bimodal distribution with perfect separation of infected
animals from uninfected controls (Figure 7). At 2 standard
deviations from positive or negative means, an overlap and thus
misclassification of ,2 animals is expected to occur resulting in
95% sensitivity and 90% specificity. A larger validation study using
sera collected from .650 field cases bovine TB and 150
uninfected animals is currently underway and is expected to
provide more accurate measures of validity.
Discussion
Despite the aggressive USDA test and slaughter protocol for
bovine TB, it remains a significant economic and zoonotic threat.
Bovine TB control and eradication depends on the development of
tests capable of detecting early infection and discriminating bovine
TB from M. paratuberculosis. In this report, we describe a
proteomics approach, iTRAQ, to identify serum biomarkers for
sub-clinical bovine TB and JD. These biomarkers can be applied
in understanding pathogenesis and development of early diagnos-
tic tools for both infections.
We identified several common and distinct serum biomarkers
for bovine TB and JD. Our first finding suggests that LC/MS/MS
approach on distinct biological replicates are reproducible [11].
We used two separate sets of M. bovis infected animals and were
able to reproducibly show consistency in serum protein profiles.
iTRAQ analysis requires ,100 mg of protein for unambiguous
consultation of serum peptidome after depleting for serum
albumin, which represents .80% of the total proteins. Therefore
iTRAQ analyses were performed on sera pooled from 5 animals at
each infection stage. Our data demonstrated similar protein
profiles among individual sera from infected and control animals
using MALDI-TOF confirming that the pooling sera in equal
amounts for iTRAQ did not lead to any significant variability
between pooled samples. Next, we demonstrated that individual
sera from infected animals were indeed positive for DBP indicating
the validity of peptides identified by iTRAQ. Finally, the utility of
DBP as diagnostic marker was demonstrated on individual sera
Figure 3. Biomarkers identified in M. bovis and M. paratuberculosis infection. The bar graph represents log ratios of serum proteins identified(P-value,0.05, EF,2) in M. bovis infected and M. paratuberculosis infected animals. The purple bars represent the log ratios of proteins followinginfection with M. paratuberculosis at 7 months PI vs. pre-infection. The brown bars represent log rations of proteins following infection with M. bovisat seventh month PI vs. pre-infection. The green bars represent log ratio of proteins at 12 months PI vs. M. bovis 7 months PI. Serum levels of D-binding protein and transthyretin were significantly increased in M. paratuberculosis infected animals compared with controls, while the serum levelsof AMBP protein, alpha-1 acid glycoprotein, fetuin, and alpha-1B glycoprotein were elevated exclusively in M. bovis infected animals.doi:10.1371/journal.pone.0005478.g003
Bovine TB Biomarkers
PLoS ONE | www.plosone.org 5 May 2009 | Volume 4 | Issue 5 | e5478

from 20 bovine TB infected and 10 control animals with 95%
sensitivity and 90% specificity.
We identified approximately 30 proteins (P,0.05, EF,2) in all
iTRAQ comparisons. One biologically significant protein com-
mon to both bovine TB and JD was vitamin DBP. Vitamin DBP is
approximately 49 kDa [12] and serves a number of functions in
vivo, including vitamin D transportation and macrophage
activation [13,14,15]. Since 1895, vitamin D has been shown to
play a major role in mycobacterial diseases and was used to treat
pulmonary tuberculosis in humans during the 1920 s [16]. The
role of vitamin D as an anti-tuberculosis agent was recently
demonstrated by Liu et al., in which vitamin D expression via toll-
like receptors 2/1 (TLR2/1) led to increased killing of intracellular
M. tuberculosis by induction of cathelicidin, also known as LL-37
[17,18]. Cathelicidins, a group of antimicrobial peptides that
range from 12 to 80 amino acid residues, disrupt microbial
membranes [19]. In our study cathelicidins were identified at
greater levels in M. paratuberculosis infection at 10 months PI in
comparison to controls, suggesting a possible role in antimyco-
bacterial activity. These findings correlate with a recent M. bovis
Table 2. List of serum proteins identified in M. bovis infected animals at 7 months post-infection and 10 months post-infection inM. paratuberculosis infection.
ProteinId
ProteinName
1Ratio114/116 3p-value
2Ratio117/114 3p-value
3Ratio117/116 3p-value
4No. ofpeptides
74354219 AMBP protein 14.38 0.01 NI 15.46 0.00 4
85701291 Vitamin D-binding protein precursor(DBP)
NI 6.42 0.00 11.00 0.14 4
124001426 alpha-1 acid glycoprotein 5.43 0.00 0.58 0.00 3.16 0.00 8
95769204 alpha-1antiproteinase, antitrypsin 5.03 0.00 0.76 0.00 3.84 0.00 21
344 fetuin 4.84 0.00 0.64 0.00 3.30 0.00 23
86823979 Alpha-1-B glycoprotein 4.09 0.00 NI 4.37 0.00 6
135806 Prothrombin precursor(Coagulationfactor II)
3.71 0.01 NI 6.26 0.01 23
115495209 hypothetical protein LOC531420 2.88 0.02 NI 2.19 0.04 1
119915491 similar to Complement C4-A precursor 2.70 0.00 0.63 0.02 2.05 0.04 22
494449 Chain D, Platelet Factor 4 2.47 0.00 1.57 0.00 4.38 0.00 1
86826324 Similar to Leucine-richalpha-2-glycoprotein
2.54 0.00 1.14 0.01 2.93 0.00 12
809399 Chain, Retinol Binding Protein 2.11 0.00 1.69 0.00 3.59 0.00 8
27806875 histidine-rich glycoprotein 1.54 0.02 0.42 0.00 0.67 0.01 1
75832056 apolipoprotein A-I 1.49 0.00 NI 1.34 0.00 14
81674721 Similar to apolipoprotein D precursor NI 1.53 0.00 NI 4
121531628 SERPINA3–4 1.39 0.00 0.11 0.00 0.15 0.03 2
85057070 Apolipoprotein C-III 0.88 0.00 0.76 0.00 0.68 0.00 18
114019 Apolipoprotein C-II 0.84 0.01 0.59 0.00 0.50 0.00 9
119893035 Similar to alpha-2-macroglobulin NI 0.79 0.02 0.76 0.02 7
151555847 Unknown (protein for MGC:157353) 0.79 0.03 NI NI 1
74267870 Transthyretin 0.78 0.00 2.21 0.00 1.73 0.00 6
84201715 Similar to Apolipoprotein A-II precursor 0.76 0.00 0.90 0.00 0.70 0.00 30
498822 Alpha-2-antiplasmin 0.75 0.02 0.70 0.02 NI 1
61873128 similar to pancreas cationicpretrypsinogen isoform 1
0.72 0.00 NI 0.63 0.01 28
81674551 Similar to serum amyloid A1 0.69 0.00 0.37 0.00 0.26 0.00 3
119908847 similar to Fibrinogen beta chainprecursor
0.65 0.02 NI 0.53 0.00 6
119915840 similar to coagulation factor XIII, A1polypeptide
0.61 0.00 0.51 0.00 0.32 0.00 8
74268410 Alpha-1-antitrypsin 0.59 0.00 NI NI 4
81 Apolioprotein E NI 0.37 0.00 0.59 0.02 1
1114/116: ratio of the fold change of proteins in M. bovis infected animals (7 months post-infection; 114) compared with pre-infection control animals (116).2117/114: ratio of the fold change of proteins in the M. paratuberculosis infection (10 months post-infection; 117) relative to M. bovis infection (7 months post-infection;114).
3117/116: ratio of the fold change of proteins in the M. paratuberculosis infection (10 months post-infection; 117) compared with pre-infection control animals (116).3p-value represents fold ratios of the different reporter ions with a significance of ,0.05.4Number of peptides represent those identified with 99% confidence in the reporter ion quantification.NI: Not Identified.doi:10.1371/journal.pone.0005478.t002
Bovine TB Biomarkers
PLoS ONE | www.plosone.org 6 May 2009 | Volume 4 | Issue 5 | e5478

study conducted by Meade et al. in which several Toll associated
molecules were identified in MBO infection.
Increase of DBP in cattle during early mycobacterial infections
may occur due to the activation of the host’s innate immune
response. Therefore, we propose a common pathway involved in
upregulation of vitamin DBP and cathelicidin in response to
mycobacterial infections in cattle similar to that reported in
humans [18].
In addition to DBP and LL-37, six acute phase proteins were
identified in infected cattle. Acute phase proteins identified in
this study include serine proteinase inhibitor (alpha-1-antitryp-
sin, AAT), fetuin, alpha-1 acid glycoprotein, complement C3
and alpha-1 beta glycoprotein. Since 1984, these acute-phase
proteins have been investigated in relation to human TB.
Grange et al, reported increased levels of eight acute-phase
reactants (AAT, a2-macroglobulin, transferrin, a1-acid glyco-
protein, C-reactive protein, ceruloplasmin, haptoglobin, and the
third component of complement) in human serum from
Indonesian patients with pulmonary tuberculosis [20]. Later in
1989, Wong et al measured these acute phase proteins in
tuberculosis patients from Singapore [21]. Alpha1-acid glyco-
protein is increased in response to systemic infection and has
been shown to modulate apoptosis in bovine monocytes,
probably through caspase-3 inhibition and caspase-9 activation
[22]. AAT, the most abundant serine proteinase inhibitor,
increases rapidly in response to inflammation or infection and
has been shown to suppress M. abscessus infection of monocyte-
derived macrophages [23]. Thus, we hypothesize that these
acute phase proteins are integral to host defense in mycobacterial
infections in cattle.
One other significant discovery related to M. paratuberculosis
infection in cattle, in this study, was the identification of
transthyretin (pre-albumin) and retinol binding protein. Transthy-
retin, a 55-kDa homotetramer in serum, is a transporter of
thyroxine and tri-iodothyronine, as well as vitamin A (retinol or
trans-retinoic acid) through association with retinol-binding
protein [24,25]. Retinoic acid has been demonstrated to stimulate
and differentiate monocytes leading to the inhibition of M.
tuberculosis multiplication in human macrophages [26]. Further-
more, retinoic acid is required for Ig class switching to IgA, which
is ubiquitous in the mucosal immune system. Transthyretin is also
considered a negative acute phase protein and is decreased in
inflammation, malignancy, cirrhosis of the liver and protein
wasting diseases due to reduced synthesis. Transthyretin is used as
a specific clinical indicator for nutritional risk management of
diseases such as HIV/AIDS, renal disease, diabetes, pneumonia
and cancer. It has also been identified as a negative biomarker for
tuberculosis patients in humans [27]. Since malnutrition is the
most common symptom observed in MAP infected animals, we
believe that a transthyretin based screening test can be used to
identify and monitor progression of JD infection in animals. In
addition, increased levels of retinol binding protein supports our
hypothesis of a vitamin A based host response to M. paratuberculosis
infection. Vitamin A may act as a stimulating factor for monocyte
Figure 4. Biomarkers identified in early M. paratuberculosis infection. This bar graph represents log ratios of serum proteins (P-value,0.05,EF,2) identified in early (3-months to follow-up) M. paratuberculosis infected vs. control animals. The blue bars represent log ratios of proteins inanimals infected with M. paratuberculosis over time (3 months PI vs. baseline). The red bars represent log ratios of the same proteins in controlanimals over time.doi:10.1371/journal.pone.0005478.g004
Bovine TB Biomarkers
PLoS ONE | www.plosone.org 7 May 2009 | Volume 4 | Issue 5 | e5478
differentiation, thus inhibiting M. paratuberculosis multiplication in
macrophages similar to that demonstrated in M. tuberculosis [26].
Biomarker discovery by LC/MS/MS based method was
reproducible as previously documented [11]. This method is
also highly sensitive and proteins can be identified in
femtomole quantities and reaching sensitivity up to zeptomole
(10221 M) amounts [28,29]. Thus validation of some of the
identified peptides will require sensitive detection tools. ELISA
may offer optimal sensitivity; however, lack of availability of
bovine specific antibodies for different proteins is one major
hurdle for ELISA development. Large-scale validation studies
utilizing ELISA for several differentially expressed proteins in
bovine TB and JD infected and control field sera are currently
underway and should provide robust specificity data for the
utility of individual and combinations of biomarkers in the
diagnosis of mycobacterial disease among animals. It is likely
that our approach can be extended to discover biomarkers for
diagnosis or therapeutic monitoring of human mycobacterial
infections.
In conclusion, we identified multiple biomarkers for bovine TB
and JD using high-resolution proteomics approaches. Further
validations using field samples are underway. Five different
proteins identified common to both mycobacterial infections can
help us in understanding the pathogenesis of these mycobacterial
infections at the cellular and molecular levels. Elucidation of M.
bovis disease progression as it relates to identified biomarkers in
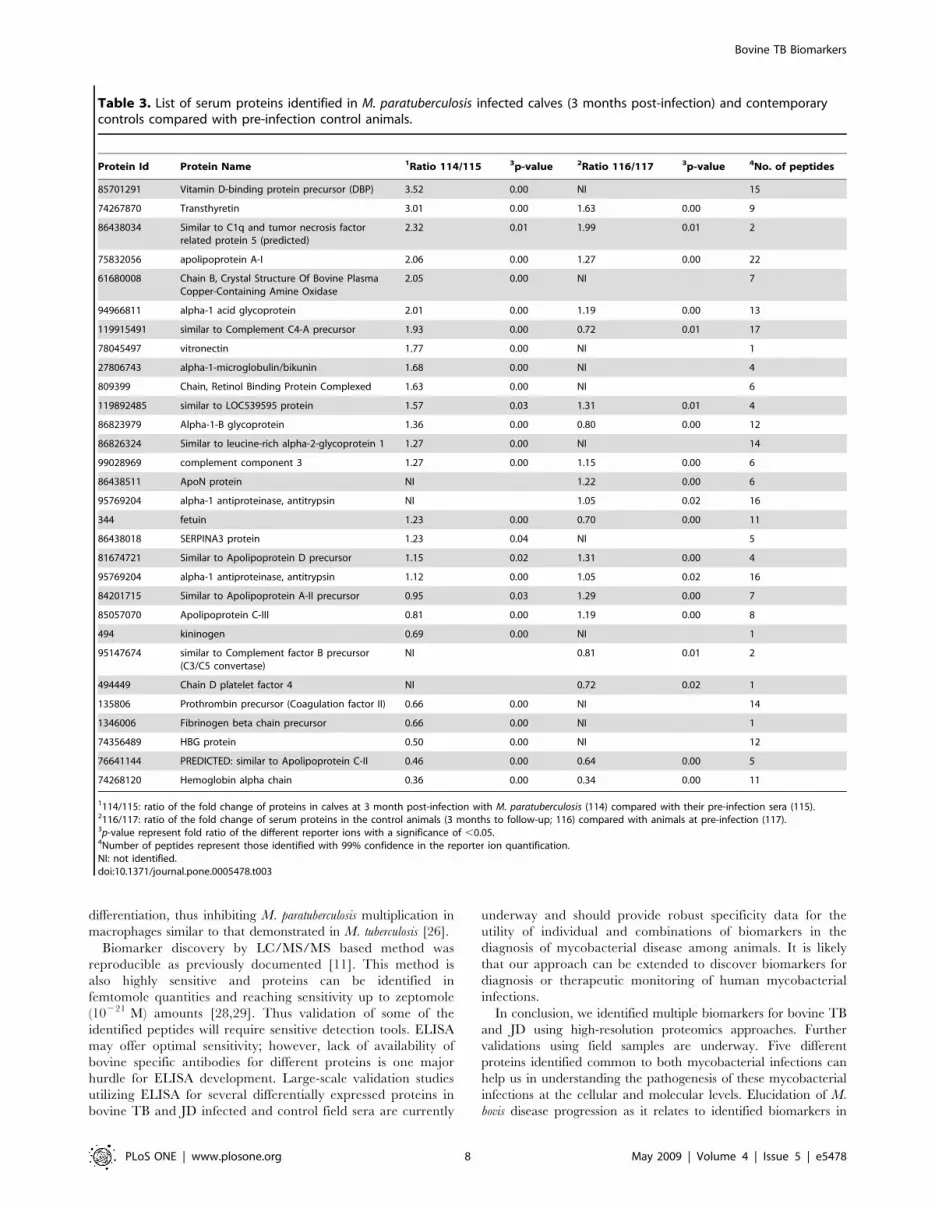
Table 3. List of serum proteins identified in M. paratuberculosis infected calves (3 months post-infection) and contemporarycontrols compared with pre-infection control animals.
Protein Id Protein Name 1Ratio 114/115 3p-value 2Ratio 116/117 3p-value 4No. of peptides
85701291 Vitamin D-binding protein precursor (DBP) 3.52 0.00 NI 15
74267870 Transthyretin 3.01 0.00 1.63 0.00 9
86438034 Similar to C1q and tumor necrosis factorrelated protein 5 (predicted)
2.32 0.01 1.99 0.01 2
75832056 apolipoprotein A-I 2.06 0.00 1.27 0.00 22
61680008 Chain B, Crystal Structure Of Bovine PlasmaCopper-Containing Amine Oxidase
2.05 0.00 NI 7
94966811 alpha-1 acid glycoprotein 2.01 0.00 1.19 0.00 13
119915491 similar to Complement C4-A precursor 1.93 0.00 0.72 0.01 17
78045497 vitronectin 1.77 0.00 NI 1
27806743 alpha-1-microglobulin/bikunin 1.68 0.00 NI 4
809399 Chain, Retinol Binding Protein Complexed 1.63 0.00 NI 6
119892485 similar to LOC539595 protein 1.57 0.03 1.31 0.01 4
86823979 Alpha-1-B glycoprotein 1.36 0.00 0.80 0.00 12
86826324 Similar to leucine-rich alpha-2-glycoprotein 1 1.27 0.00 NI 14
99028969 complement component 3 1.27 0.00 1.15 0.00 6
86438511 ApoN protein NI 1.22 0.00 6
95769204 alpha-1 antiproteinase, antitrypsin NI 1.05 0.02 16
344 fetuin 1.23 0.00 0.70 0.00 11
86438018 SERPINA3 protein 1.23 0.04 NI 5
81674721 Similar to Apolipoprotein D precursor 1.15 0.02 1.31 0.00 4
95769204 alpha-1 antiproteinase, antitrypsin 1.12 0.00 1.05 0.02 16
84201715 Similar to Apolipoprotein A-II precursor 0.95 0.03 1.29 0.00 7
85057070 Apolipoprotein C-III 0.81 0.00 1.19 0.00 8
494 kininogen 0.69 0.00 NI 1
95147674 similar to Complement factor B precursor(C3/C5 convertase)
NI 0.81 0.01 2
494449 Chain D platelet factor 4 NI 0.72 0.02 1
135806 Prothrombin precursor (Coagulation factor II) 0.66 0.00 NI 14
1346006 Fibrinogen beta chain precursor 0.66 0.00 NI 1
74356489 HBG protein 0.50 0.00 NI 12
76641144 PREDICTED: similar to Apolipoprotein C-II 0.46 0.00 0.64 0.00 5
74268120 Hemoglobin alpha chain 0.36 0.00 0.34 0.00 11
1114/115: ratio of the fold change of proteins in calves at 3 month post-infection with M. paratuberculosis (114) compared with their pre-infection sera (115).2116/117: ratio of the fold change of serum proteins in the control animals (3 months to follow-up; 116) compared with animals at pre-infection (117).3p-value represent fold ratio of the different reporter ions with a significance of ,0.05.4Number of peptides represent those identified with 99% confidence in the reporter ion quantification.NI: not identified.doi:10.1371/journal.pone.0005478.t003
Bovine TB Biomarkers
PLoS ONE | www.plosone.org 8 May 2009 | Volume 4 | Issue 5 | e5478

early infection could aid in tracking therapy/vaccine interventions
as well as eradication programs in the U.S. and worldwide.
Materials and Methods
Sample sourceSera were obtained from calves infected with M. bovis 1315 [30] or
M. paratuberculosis K-10 [31] at the National Animal Disease Center
(Ames, IA). All cattle used in this study were housed according to
institutional guidelines and approved animal care and use protocols
at the National Animal Disease Center, Ames, Iowa (NADC). For
M. bovis challenge studies, cattle were housed in a biosafety level 3
(BL-3) facility. M. bovis infected sera were collected at baseline and
prospectively every month post infection (PI) until 5 months, while
M. paratuberculosis sera were collected prior to infection and every
month for 12 months PI [32]. Experimental models included all
disease associated immune response parameters, clinical signs, and
lesion characteristics identified at necropsy [33]. Field samples of sera
from bovine TB or MAP infected animals were obtained from serum
repositories at National Veterinary Services Laboratory or from
routine sample acquisitions into Minnesota Veterinary Diagnostic
Laboratory, respectively. Bovine TB infection status of animals was
confirmed by a combination of antemortem caudal fold test and
histology of lesions at necropsy.
Serum protein profiling using MALDI-TOFSera from infected (n = 3) and control animals (n = 3) repre-
senting different time points (1, 3, and 4 months PI) were Zip-Tip
processed, desalted and spotted on the MALDI-Target [34], per
manufacturer’s instructions (Millipore, Billerica, MA). These
samples were also profiled after organic depletion of abundant
proteins using high performance liquid chromatography acetoni-
trile (ACN) (Sigma, St. Louis, MO).
MALDI-TOF analysisAfter the sample was dried on the MALDI target, profiling was
done with the Bruker Biflex III (Bruker Daltonics, Billerica, MA).
MALDI-TOF mass spectrometer (MS) was operated in linear
mode at a laser power setting of 3861% attenuation [34]. Five
hundred laser shots were collected per sample while changing the
spot at least ten times during data acquisition. The instrument was
externally calibrated with the +1 and +2 charge state of
cytochrome C (Sigma, St. Louis, MO). The spectra were internally
calibrated with consistent protein peaks of m/z values of 8330 and
4165. Peaks between 2 kD–20 kD mass ranges were analyzed by
Bruker XTOF 5.1.1 processing software (Sigma, St. Louis, MO).
The raw data were smoothed (Golay-Savitzky formula using 15
points) and backgrounds were subtracted. The peaks were labeled
and peak intensity lists were generated and compared.
Sample preparation for LC/MS/MSSera from five animals each infected with M. bovis and M.
paratuberculosis and contemporaneous controls were pooled in equal
concentrations (100 ml each at 100 mg/ml) for four separate
iTRAQ experiments - 1) M. bovis infection vs. contemporary
controls, 2) M. bovis vs. M. paratuberculosis infection, 3) early and 4)
Figure 5. Biomarkers identified in advanced (10 months post infection) M. paratuberculosis infection. The bar graph represents log ratiosof serum proteins (P-value,0.05, EF,2) identified in M. paratuberculosis infected (10 months PI) and control animals. Red bars represent log ratios ofserum protein levels in M. paratuberculosis infected animals over time. The black bars represent the temporal trend in log ratios of the same proteinsin control animals.doi:10.1371/journal.pone.0005478.g005
Bovine TB Biomarkers
PLoS ONE | www.plosone.org 9 May 2009 | Volume 4 | Issue 5 | e5478

chronic M. paratuberculosis infection vs. uninfected control (Figure 1).
Due to required protein concentrations (80–100 mg/mL) for
iTRAQ analysis, sera samples were pooled to obtain sufficient
yield. Protein quantities were estimated using the bicinchoninic
acid (BCA) protein assay (Pierce, Rockford, IL). A modified ACN
method was used to deplete abundant proteins and concentrate
limited proteins (31). Briefly, 100 ml of 1:5 saline diluted sera were
mixed with 200 ml of high performance liquid chromatography
(HPLC) grade ACN (Sigma, St. Louis, MO) to a final
concentration of 67%. Samples were vortexed and allowed to
stand at room temperature for 30 min., then centrifuged at
1361000 g for 10 min. in Eppendorf Minifuge tubes (Eppendorf,
Westbury, NY). Supernatants were collected and lyophilized in a
speed vacuum centrifuge. The lyophilized samples were dissolved
in 20 mL of saline and protein concentration was estimated using
BCA protein assay (Pierce, Rockford, IL). Sera were dialyzed
against 20 mM triethyl ammonium bicarbonate buffer (TEAB) in
a Slide-A-Lyzer Dialysis Cassette 2000 (MWCO) (Pierce, Rock-
ford, IL) and stored at 280uC until used. Albumin and IgG
depletion were confirmed by resolving and visualizing proteins on
a 4–20% gradient polyacrylamide gel (Pierce, Rockford, IL), as
well as Western blot analysis using anti-bovine albumin (Bethyl,
Table 4. List of proteins identified in M. paratuberculosis infected animals at 10 months post-infection and contemporary controlsrelative to pre-infection.
Protein Id Protein Name 1Ratio 117/115 3p-value 2Ratio 116/114 3p-value 4No of peptides
146345493 Pulmonary surfactant-associated protein Bprecursor
3.46 0.00 1.38 0.02 1
463 cathelicidin 3.34 0.04 NI 2
86438034 Similar to C1q and tumor necrosis factor relatedprotein 5
3.03 0.01 NI 2
99028969 complement component 3 3.03 0.00 1.76 0.00 8
809399 Chain, Retinol Binding Protein 2.96 0.00 1.42 0.00 7
74267870 Transthyretin 2.55 0.00 1.48 0.00 11
119892485 similar to LOC539595 protein 2.10 0.00 0.83 0.00 4
76615300 similar to GCAP-I/guanylin 1.94 0.04 NI 2
84201715 Similar to Apolipoprotein A-II precursor 1.92 0.00 1.65 0.00 17
85701291 Vitamin D-binding protein precursor (DBP) 1.86 0.00 0.80 0.00 16
135806 Prothrombin precursor (Coagulation factor II) 1.52 0.00 1.36 0.04 23
75832056 apolipoprotein A-I 1.34 0.00 NI 22
51491835 ovarian and testicular apolipoprotein N 1.28 0.00 1.15 0.00 6
81674721 Similar to Apolipoprotein D 1.28 0.00 NI 5
85057070 Apolipoprotein C-III 1.27 0.00 1.54 0.00 17
27806743 alpha-1-microglobulin/bikunin 1.26 0.00 0.68 0.00 6
86826324 Similar to leucine-rich alpha-2-glycoprotein 1 1.13 0.00 0.68 0.00 15
114326282 transferrin 1.12 0.02 1.28 0.00 8
77735469 apolipoprotein M 0.86 0.00 0.76 0.00 5
86826424 Similar to Phosphatidylcholine-sterolacyltransferase
0.73 0.01 NI 1
151556981 Unknown (protein for MGC:157252) 0.73 0.00 0.64 0.00 1
77735387 fetuin B 0.72 0.00 0.55 0.00 2
27806703 CD44 antigen NI 0.53 0.03 1
78045497 vitronectin 0.62 0.03 0.39 0.01 1
124001426 alpha-1 acid glycoprotein 0.60 0.00 0.35 0.00 16
119915494 similar to Complement C4-A 0.59 0.03 0.40 0.02 4
75812932 actin, cytoplasmic 2 0.50 0.00 NI 1
76641144 similar to Apolipoprotein C-II 0.43 0.00 0.76 0.00 8
95769204 alpha-1 antiproteinase, antitrypsin 0.42 0.00 0.34 0.00 27
86823979 Alpha-1-B glycoprotein 0.26 0.00 0.35 0.00 15
344 fetuin 0.24 0.00 0.18 0.00 40
81674551 Similar to serum amyloid A1 NI 0.20 0.00 3
1117/115: ratio of the fold change of protein among animals at 10 months PI with M. paratuberculosis (117) against pre-infection (115).2116/114: ratio of the fold change of protein at 10 months to follow-up among contemporary controls(116) to pre-infection (114).3p-value represent fold ration of the different reporter ions with a significance of ,0.05.4Number of peptides represent those identified with 99% confidence in the reporter ion quantification.NI: not identified.doi:10.1371/journal.pone.0005478.t004
Bovine TB Biomarkers
PLoS ONE | www.plosone.org 10 May 2009 | Volume 4 | Issue 5 | e5478

Montgomery, TX) and anti-bovine IgG (H+L) antibodies (KPL,
Gaithersburg, MD).
Isobaric labelingApproximately 80 mg of ACN depleted serum samples were
labeled with iTRAQ reagents 114, 115, 116 and 117 following
manufacturer’s recommendations (Applied Biosystem (ABI),
Foster City, CA). Briefly, the samples were freeze-dried and
proteins were resuspended in dissolution buffer (0.5 M TEAB
pH 8.5) and 0.1% SDS. Resuspended proteins were reduced,
alkylated and digested with trypsin at 37uC overnight. Peptides
were labeled with iTRAQ reagents at lysine and arginine amino
terminal groups. The labeled peptides were pooled, dried and
resuspended in 0.2% formic acid. The resuspended peptides were
passed through OasisH MCX 3CC (60 mg) extraction cartridges
per manufacturer recommendations (Waters Corporation, Mil-
ford, MA) for desalting prior to strong cation exchange (SCX)
fractionation.
SCX FractionationThe eluted peptides were dried and dissolved in 350 ml of SCX
buffer A (20% v/v ACN and 5 mM KH2PO4 pH 3.2, with
phosphoric acid) and fractionated using a polysulfoethyl A column
(150 mm length61.0 mm ID, 5 mm particles, 300 A pore size)
(PolyLC Inc., Columbia, MD) on a magic 2002 HPLC system
(Michrom BioResources, Inc., Auburn, CA). Peptides were eluted
by running a 0–20% buffer B gradient for greater than 55 min.
and 20%–100% buffer B (20% v/v ACN, 5 mM KH2PO4
pH 3.2, 500 mM KCL) for 20 min. at a column flow rate of
50 ml/min. Thirty fractions were collected at 3 min. intervals, and
each fraction was lyophilized. Fractions that showed mAU280.2
were analyzed by LC-MS/MS.
Mass Spectrometry LC-ESI/MS/MSFractions were reconstituted in reversed-phase load buffer
(10 mM phosphate buffer) and analyzed by LC-ESI/MS/MS [34]
on a QSTAR Pulsar I-Quadrupole TOF MS using Analyst QS
software. Briefly, peptides were loaded onto a LC Packing C18
cartridge and desalted with loading buffer (98:2, water: acetoni-
trile, 0.1% formic acid) for 17 min. at 35 ml/min. Peptides were
eluted by running an increasing ACN concentration gradient (5 to
35%) for greater than 47 min. Tandem mass spectral data were
acquired in 3 s intervals using the information dependent
acquisition (IDA) mode.
Data Analysis and InterpretationProtein pilot SoftwareTM 2.0 and 2.0.1 (Applied Biosystems
Inc., Foster city, CA) and the nr_bos_CTM_20070802 FASTA
database were used to identify labeled peptides and determine
relative abundance at a .95% confidence interval (CI). A
minimum identification of at least two unique peptides per protein
was used as a cutoff for protein analysis (P,0.05 and an error
factor (EF) of ,2). The EF expresses the 95% CI for an average
ratio (EF = 10 95%confidence interval, where 95% CI = (ratio6E-
F)2(ratio/EF)). Relative abundance of identified proteins was
log10 transformed for further analysis.
ImmunoblottingApproximately 50 mg of crude serum was dissolved in SDS-
PAGE loading buffer, heated to 99uC in a thermal cycler
(Eppendorf, Westbury, NY), and resolved on a 4–20% polyacryl-
amide-SDS gradient gel (Pierce, Rockford, IL). Resolved proteins
were electrophoretically transferred onto a nitrocellulose mem-
brane followed by overnight blocking in 0.05% TBE containing
Figure 6. Validation of vitamin DBP in individual sera from M. bovis infected and control animals. Shown is a dot blot of levels of DBP inindividual sera and the bar graph represents quantification of DBP in respective dots using densitometric analysis. Each spot contains 50-mg of totalproteins from M. bovis infected and control sera. The first five lanes contain sera from control animals at first, third and fourth months. Lanes six to tencontains sera from M. bovis infection at 1, 3, and 4 months post infection. All sera were analyzed in duplicates.doi:10.1371/journal.pone.0005478.g006
Bovine TB Biomarkers
PLoS ONE | www.plosone.org 11 May 2009 | Volume 4 | Issue 5 | e5478
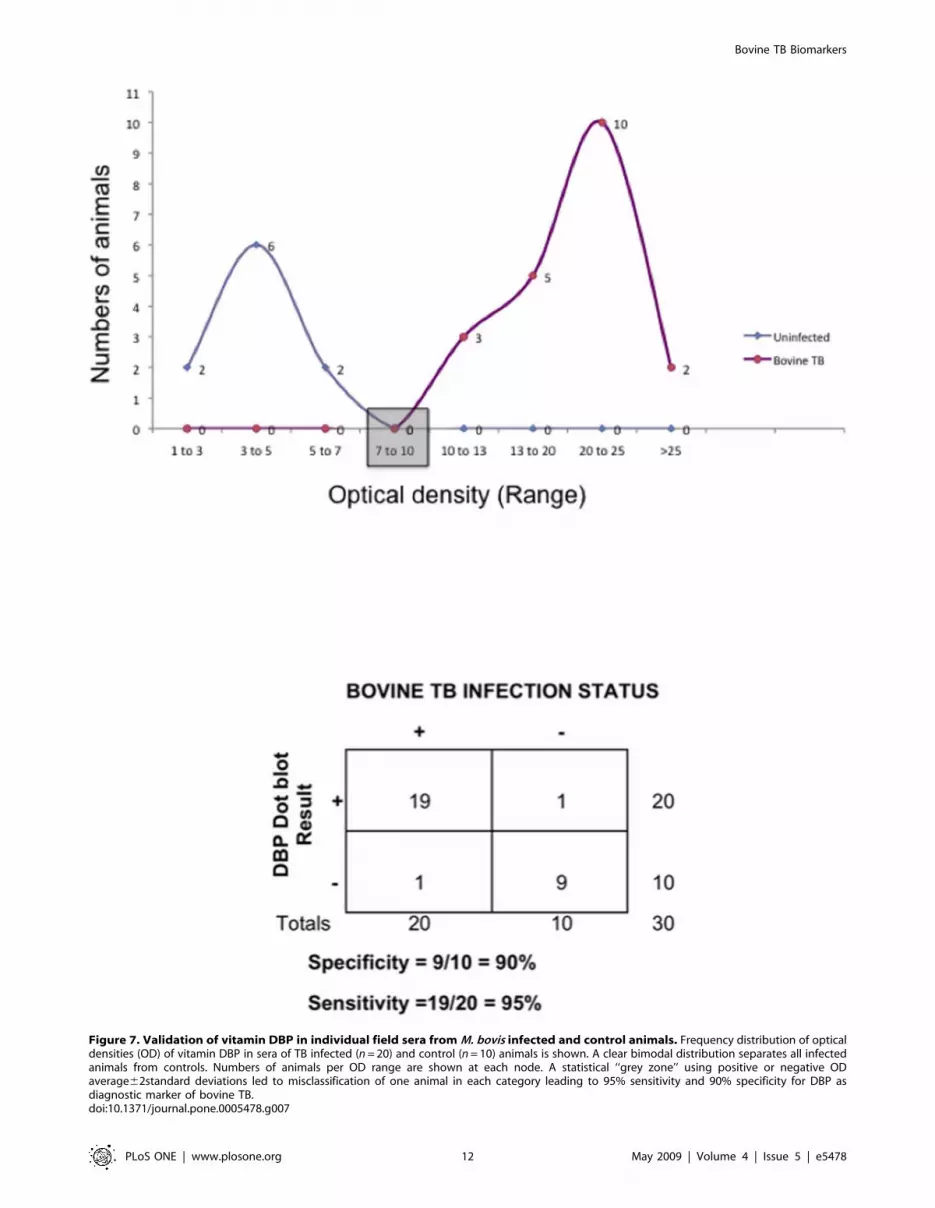
Figure 7. Validation of vitamin DBP in individual field sera from M. bovis infected and control animals. Frequency distribution of opticaldensities (OD) of vitamin DBP in sera of TB infected (n = 20) and control (n = 10) animals is shown. A clear bimodal distribution separates all infectedanimals from controls. Numbers of animals per OD range are shown at each node. A statistical ‘‘grey zone’’ using positive or negative ODaverage62standard deviations led to misclassification of one animal in each category leading to 95% sensitivity and 90% specificity for DBP asdiagnostic marker of bovine TB.doi:10.1371/journal.pone.0005478.g007
Bovine TB Biomarkers
PLoS ONE | www.plosone.org 12 May 2009 | Volume 4 | Issue 5 | e5478

5% skim milk. Primary antibodies used to detect vitamin DBP
(R&D Systems, Minneapolis, MN) and alpha-1-microglobulin
precursor (Gene Tex, San Antonio, TX) were mouse anti-human
monoclonal antibodies. Anti mouse anti rabbit detection antibod-
ies were conjugated to horseradish peroxidase (HRP). Primary
antibody used to detect alpha-1-acid glycoprotein was rabbit anti-
bovine conjugated to HRP (ICL, Newberg, OR).
In dot blot analyses, 0.5 ml of each serum sample was spotted in
duplicate and dried on a nitrocellulose membrane. The nitrocel-
lulose membrane was blocked using 0.05% TBE blocking buffer
containing 0.5% skim milk for 1 hr., and washed with 0.05%
PBST five times in 5 min. increments. Aforementioned primary
and appropriate secondary antibodies were used in a similar
fashion as western blotting. All immunoblots were developed using
the chemiluminiscent detection kit (Pierce, Rockford, IL).
Acknowledgments
We thank the technical help provided by personnel at the Center of Mass
Spectrometry and Proteomics at the University of Minnesota. We also
thank Josephine Siloshini Gnanandarajah for technical advice on
proteomics.
Author Contributions
Conceived and designed the experiments: MS EAL AW LV WRW SS.
Performed the experiments: MS EAL HKJ AW. Analyzed the data: MS
EAL HKJ LV SS. Contributed reagents/materials/analysis tools: LV JRS
WRW MVP SS. Wrote the paper: MS EAL HKJ LV JRS WRW MVP SS.
References
1. Cosivi O, Grange JM, Daborn CJ, Raviglione MC, Fujikura T, et al. (1998)Zoonotic tuberculosis due to Mycobacterium bovis in developing countries. Emerg
Infect Dis 4: 59–70.
2. Evans JT, Smith EG, Banerjee A, Smith RM, Dale J, et al. (2007) Cluster ofhuman tuberculosis caused by Mycobacterium bovis: evidence for person-to-person
transmission in the UK. Lancet 369: 1270–1276.3. Hlavsa MC, Moonan PK, Cowan LS, Navin TR, Kammerer JS, et al. (2008)
Human tuberculosis due to Mycobacterium bovis in the United States, 1995–2005.Clin Infect Dis 47: 168–175.
4. Wilkins MJ, Meyerson J, Bartlett PC, Spieldenner SL, Berry DE, et al. (2008)
Human Mycobacterium bovis infection and bovine tuberculosis outbreak, Michigan,1994–2007. Emerg Infect Dis 14: 657–660.
5. Zinsstag J, Schelling E, Roth F, Kazwala R (2006) Economics of bovinetuberculosis. In: Thoen CO, Steele JH, Gilsdorf MJ, eds (2006) Mycobacterium
bovis infection in animals and humans. Boston, MA: Blackwell Publishing. pp
68–83.6. Mackay CR, Hein WR (1989) A large proportion of bovine T cells express the
gamma delta T cell receptor and show a distinct tissue distribution and surfacephenotype. Int Immunol 1: 540–545.
7. Munroe FA, Dohoo IR, McNab WB (2000) Estimates of within-herd incidence
rates of Mycobacterium bovis in Canadian cattle and cervids between 1985 and1994. Prev Vet Med 45: 247–256.
8. Thoen CO, Barletta BR (2006) Pathogenesis of Mycobacterium bovis. In:Thoen CO, Steele JH, Gilsdorf MJ, eds (2006) Mycobacterium bovis Infection in
Animals and Humans. 2nd ed. Boston, MA: Blackwell publishing. pp 18–33.9. Andersen P, Munk ME, Pollock JM, Doherty TM (2000) Specific immune-based
diagnosis of tuberculosis. Lancet 356: 1099–1104.
10. Palmer MV, Waters WR, Thacker TC (2007) Lesion development andimmunohistochemical changes in granulomas from cattle experimentally
infected with Mycobacterium bovis. Vet Pathol 44: 863–874.11. Song X, Bandow J, Sherman J, Baker JD, Brown PW, et al. (2008) iTRAQ
Experimental Design for Plasma Biomarker Discovery. J Proteome Res.
12. Gomme PT, Bertolini J (2004) Therapeutic potential of vitamin D-bindingprotein. Trends Biotechnol 22: 340–345.
13. Daiger SP, Schanfield MS, Cavalli-Sforza LL (1975) Group-specific component(Gc) proteins bind vitamin D and 25-hydroxyvitamin D. Proc Natl Acad Sci U S
A 72: 2076–2080.14. Kisker O, Onizuka S, Becker CM, Fannon M, Flynn E, et al. (2003) Vitamin D
binding protein-macrophage activating factor (DBP-maf) inhibits angiogenesis
and tumor growth in mice. Neoplasia 5: 32–40.15. Yamamoto N, Naraparaju VR (1996) Role of vitamin D3-binding protein in
activation of mouse macrophages. J Immunol 157: 1744–1749.16. Zasloff M (2006) Fighting infections with vitamin D. Nat Med 12: 388–390.
17. Liu PT, Krutzik SR, Modlin RL (2007) Therapeutic implications of the TLR
and VDR partnership. Trends Mol Med 13: 117–124.18. Liu PT, Stenger S, Li H, Wenzel L, Tan BH, et al. (2006) Toll-like receptor
triggering of a vitamin D-mediated human antimicrobial response. Science 311:1770–1773.
19. Zanetti M (2004) Cathelicidins, multifunctional peptides of the innate immunity.
J Leukoc Biol 75: 39–48.
20. Grange JM, Kardjito T, Setiabudi I (1984) A study of acute-phase reactant
proteins in Indonesian patients with pulmonary tuberculosis. Tubercle 65:
23–39.
21. Wong CT, Saha N (1989) Serum immunoglobulin and acute phase protein
concentrations in pulmonary tuberculosis patients in Singapore. Trop Geogr
Med 41: 218–221.
22. Ceciliani F, Pocacqua V, Miranda-Ribera A, Bronzo V, Lecchi C, et al. (2007)
alpha(1)-Acid glycoprotein modulates apoptosis in bovine monocytes. Vet
Immunol Immunopathol 116: 145–152.
23. Chan ED, Kaminska AM, Gill W, Chmura K, Feldman NE, et al. (2007) Alpha-
1-antitrypsin (AAT) anomalies are associated with lung disease due to rapidly
growing mycobacteria and AAT inhibits Mycobacterium abscessus infection of
macrophages. Scand J Infect Dis 39: 690–696.
24. Desvergne B (2007) Retinaldehyde: more than meets the eye. Nat Med 13:
671–673.
25. Peterson PA (1971) Characteristics of a vitamin A-transporting protein complex
occurring in human serum. J Biol Chem 246: 34–43.
26. Crowle AJ, Ross EJ (1989) Inhibition by retinoic acid of multiplication of
virulent tubercle bacilli in cultured human macrophages. Infect Immun 57:
840–844.
27. Agranoff D, Fernandez-Reyes D, Papadopoulos MC, Rojas SA, Herbster M, et
al. (2006) Identification of diagnostic markers for tuberculosis by proteomic
fingerprinting of serum. Lancet 368: 1012–1021.
28. Shen Y, Tolic N, Masselon C, Pasa-Tolic L, Camp DG 2nd, et al. (2004)
Ultrasensitive proteomics using high-efficiency on-line micro-SPE-nanoLC-
nanoESI MS and MS/MS. Anal Chem 76: 144–154.
29. Trauger SA, Go EP, Shen Z, Apon JV, Compton BJ, et al. (2004) High
sensitivity and analyte capture with desorption/ionization mass spectrometry on
silylated porous silicon. Anal Chem 76: 4484–4489.
30. Palmer MV, Waters WR, Thacker TC, Greenwald R, Esfandiari J, et al. (2006)
Effects of different tuberculin skin-testing regimens on gamma interferon and
antibody responses in cattle experimentally infected with Mycobacterium bovis. Clin
Vaccine Immunol 13: 387–394.
31. Li L, Bannantine JP, Zhang Q, Amonsin A, May BJ, et al. (2005) The complete
genome sequence of Mycobacterium avium subspecies paratuberculosis. Proc Natl
Acad Sci U S A 102: 12344–12349.
32. Stabel JR, Palmer MV, Robbe-Austerman S, Harris B (2007) Pathogenesis of
Mycobacterium avium subsp. paratuberculosis in neonatal calves after oral or
intraperitoneal experimental infection. 9th International Colloquium on
Paratuberculosis. Tsukuba, Japan: ICP. pp 50–53.
33. Palmer MV, Waters WR, Whipple DL (2002) Aerosol delivery of virulent
Mycobacterium bovis to cattle. Tuberculosis (Edinb) 82: 275–282.
34. Nelsestuen GL, Zhang Y, Martinez MB, Key NS, Jilma B, et al. (2005) Plasma
protein profiling: unique and stable features of individuals. Proteomics 5:
4012–4024.
Bovine TB Biomarkers
PLoS ONE | www.plosone.org 13 May 2009 | Volume 4 | Issue 5 | e5478