university of groningen new molecular biomarker discovery
TRANSCRIPT
University of Groningen
New molecular biomarker discovery for diagnosis and prognosis in oral and oropharyngealcancerMelchers, Lieuwe Jurjen
IMPORTANT NOTE: You are advised to consult the publisher's version (publisher's PDF) if you wish to cite fromit. Please check the document version below.
Document VersionPublisher's PDF, also known as Version of record
Publication date:2014
Link to publication in University of Groningen/UMCG research database
Citation for published version (APA):Melchers, L. J. (2014). New molecular biomarker discovery for diagnosis and prognosis in oral andoropharyngeal cancer. s.n.
CopyrightOther than for strictly personal use, it is not permitted to download or to forward/distribute the text or part of it without the consent of theauthor(s) and/or copyright holder(s), unless the work is under an open content license (like Creative Commons).
The publication may also be distributed here under the terms of Article 25fa of the Dutch Copyright Act, indicated by the “Taverne” license.More information can be found on the University of Groningen website: https://www.rug.nl/library/open-access/self-archiving-pure/taverne-amendment.
Take-down policyIf you believe that this document breaches copyright please contact us providing details, and we will remove access to the work immediatelyand investigate your claim.
Downloaded from the University of Groningen/UMCG research database (Pure): http://www.rug.nl/research/portal. For technical reasons thenumber of authors shown on this cover page is limited to 10 maximum.
Download date: 12-07-2022

New molecular biomarker discovery for diagnosis and prognosis in oral and oropharyngeal cancer
L.J. Melchers

New molecular biomarker discovery for diagnosis and prognosis in oral and oropharyngeal cancer
Proefschrift
ter verkrijging van de graad van doctor aan de Rijksuniversiteit Groningen
op gezag van de rector magnificus prof.dr. E. Sterken
en volgens besluit van het College voor Promoties.
De openbare verdediging zal plaatsvinden op
woensdag 23 april 2014 om 14.30 uur
door
Lieuwe Jurjen Melchers
geboren op 14 januari 1983 te Leeuwarden
Note: This thesis was not printed in full colour, therefore we refer to the original published electronic figures when evaluating the immunohistochemical images contained in this thesis.
ISBN: 978-90-367-6889-4 (book)ISBN: 978-90-367-6890-0 (ebook)Bookdesign: Sgaar GroningenPrinted by: Drukkerij van der Eems Heerenveen© Lieuwe Jurjen Melchers, 2014

ParanimfenIng. M.F. MastikM.J.A.M. Clausen, MSc
Promotores Prof.dr. J.L.N. Roodenburg Prof.dr. E. Schuuring
CopromotorDr. J.E. van der Wal
BeoordelingscommissieProf.dr. I. van der WaalProf.dr. H. HollemaProf.dr. F.K.L. Spijkervet

Contents
Chapter 1 General introduction 9
Chapter 2 Tumour infiltration depth ≥4mm is an indication for an elective neck dissection in pT1cN0 oral squamous cell carcinoma
25
Chapter 3 mTHPC-mediated photodynamic therapy of early stage oral squamous cell carcinoma: a comparison to surgical treatment
39
Chapter 4 EpCAM in carcinogenesis: the good, the bad or the ugly 51
Chapter 5 Lack of claudin-7 is a strong predictor of regional recurrence in oral and oropharyngeal squamous cell carcinomaSupplementary data S5
69
83
Chapter 6 FADD expression is associated with regional and distant metastasis in squamous cell carcinoma of the head and neck
91
Chapter 7 Detection of HPV-associated oropharyngeal tumours in a 16-year cohort: more than meets the eye
105
Chapter 8 Identification and validation of methylation markers for the prediction of nodal metastasis in oral & oropharyngeal squamous cell carcinomaSupplementary data S8
125
140
Chapter 9 Head neck squamous cell carcinomas do not express EGFRvIIISupplementary data S9
143156
Chapter 10 Summary & general discussion
Nederlandse samenvattingCited literatureEpiloogCurriculum vitae
159
175183205210

Chapter 1
General introduction
L.J. Melchers

1110
Cha
pter
1
General introductionHead-neck cancerHead-neck cancer is a broad term referring to the heterogeneous group of malignant neoplasms arising in the head-neck region. This would include rare tumours such as orbital and ear tumours and more frequent tumours such as thyroid and skin tumours. Commonly however, the term head-neck cancer refers to cancers of the upper aerodigestive tract, which arise from the epithe-lial lining of the oral cavity, pharynx and larynx. Over 95% of these tumours are squamous cell carcinomas (head-neck squamous cell carcinomas: HNSCC)1. These tumours largely have a com-mon aetiology. Up to 75% of HNSCC are caused by use of tobacco with or without drinking alco-hol2, with the remainder of cases being attributed to dietary factors3, infection with the human papilloma virus (HPV)4 or considered idiopathic. Tobacco and alcohol use (termed ‘classical risk factors’) cause damage to the total aerodigestive tract in a pathological process called ‘field can-cerization’5. This process accounts for the high rate (~17%) of second primary tumours in HNSCC6.This overview focuses on two subgroups of HNSCC (figure 1.1): the tumours arising in the oral cavity (oral squamous cell carcinomas, OSCC) and the tumours arising in the oral part of the pharynx (oropharyngeal squamous cell carcinomas, OpSCC).
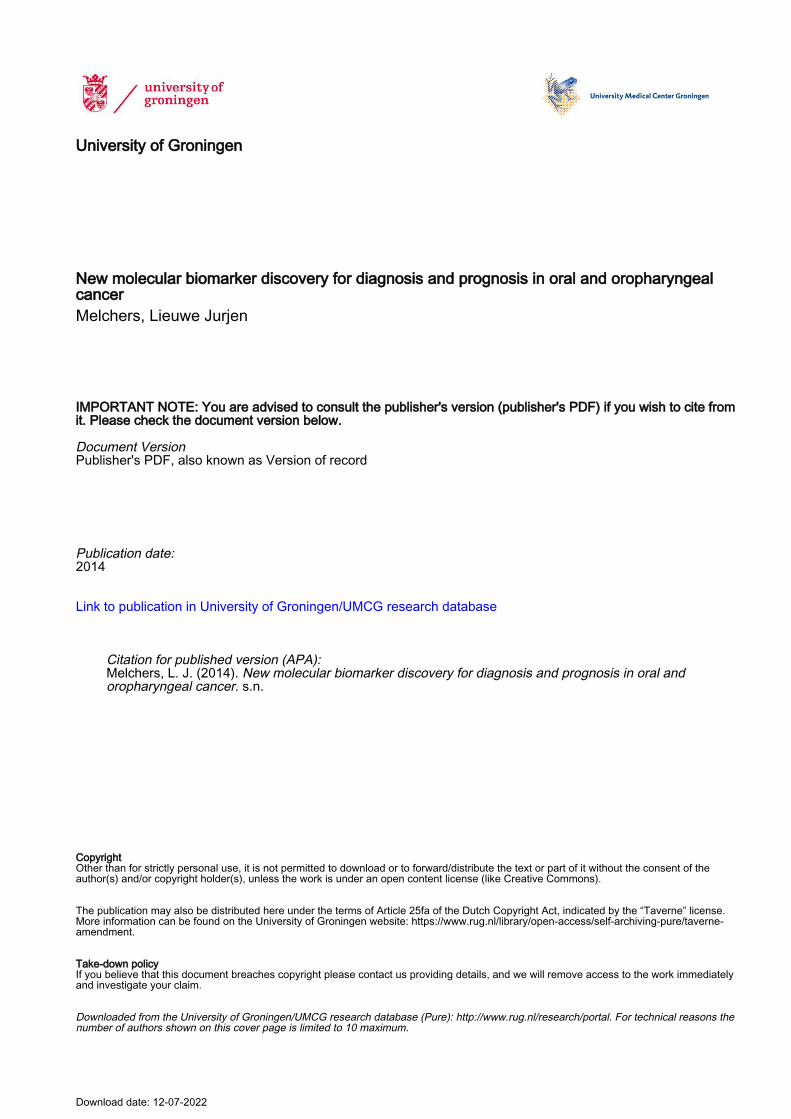
Oral squamous cell carcinomaOral squamous cell carcinoma (OSCC) is the most common tumour of the upper aerodigestive tract, with an estimated worldwide annual incidence of 265,000 cases7. In recent years ~1,000 cases were diagnosed annually in the Netherlands8. The incidence has been increasing slowly but steadily over the last two decades (figure 1.2). The 1.6:1 male predominance reflects the dis-tribution of smoking between both sexes (table 1.1)9. Although the incidence of OSCC in the Netherlands approaches the average worldwide incidence, internationally incidence varies widely. In countries such as India and Pakistan oral cancer may contribute up to 25% of all new cancer cases10, mostly because of the widespread use of chewing tobacco in various forms. OSCC comprises tumours of the floor-of-mouth, anterior tongue, retromolar trigone, and gin-giva. Most patients present to the dentist or general practitioner with a painful ulcer or a swell-ing11. Pre-malignant conditions such as leukoplakia may also be present in up to 50% of patients12.For the local treatment of the primary OSCC, according to several national and international treatment guidelines, surgery is generally preferred13-15. For certain early-stage OSCC, radio-therapy alone may result in comparable local control. Surgery however, has the additional benefit of obtaining tumour tissue and subsequently being able to perform histopathological examination of the tumour. Tumour features, such as size, infiltration depth, grade, perineural- & lymphovascular invasion may then be assessed, as well as the presence of tumour cells in the resection margins (radicality of resection). When several adverse features are present adjuvant treatment, such as re-resection, radiation or chemoradiation therapy may be given13-15. When optimal local treatment is provided, the two most important factors for regional and adjuvant treatment and prognosis, are patient age and the presence of regional metastases, with the primary tumour characteristics of grade and T status being of less importance16.
Figure 1.1. Common tumour localizations in the head-neck area. Adapted from Gibcus, 2008, with permission.
Oropharyngeal squamous cell carcinomaOropharyngeal squamous cell carcinoma (OpSCC) occurs with an estimated worldwide annual incidence of 136,000 cases7, approximately half of the OSCC incidence (table 1.1 and figure 1.2). Although the classical risk factors also seemed to apply to OpSCC, the main risk factors for OpSCC have changed over the last decade. Currently there is a lot of attention for the human papilloma virus (HPV) as a causative factor for the development of OpSCC4. Studies report 40-70% of OpSCC positive for high-risk (oncogenic) HPV types. This percentage varies heavily be-tween different populations, tumour sublocalizations and study periods17. Because HPV DNA is prevalent in the oral cavity of at least 7% of healthy individuals at any given time18, a combina-tion of molecular tests is needed to detect only cases with active HPV infection in the tumour tissue19,20. Although HPV-positive tumours respond significantly better to therapy, to date clini-cal management for this subgroup has not changed21. Therefore, the most important factor in treatment choice and prognosis in both HPV-positive and HPV-negative OpSCC, as in OSCC, is the presence of metastases in the lymph nodes of the neck22.
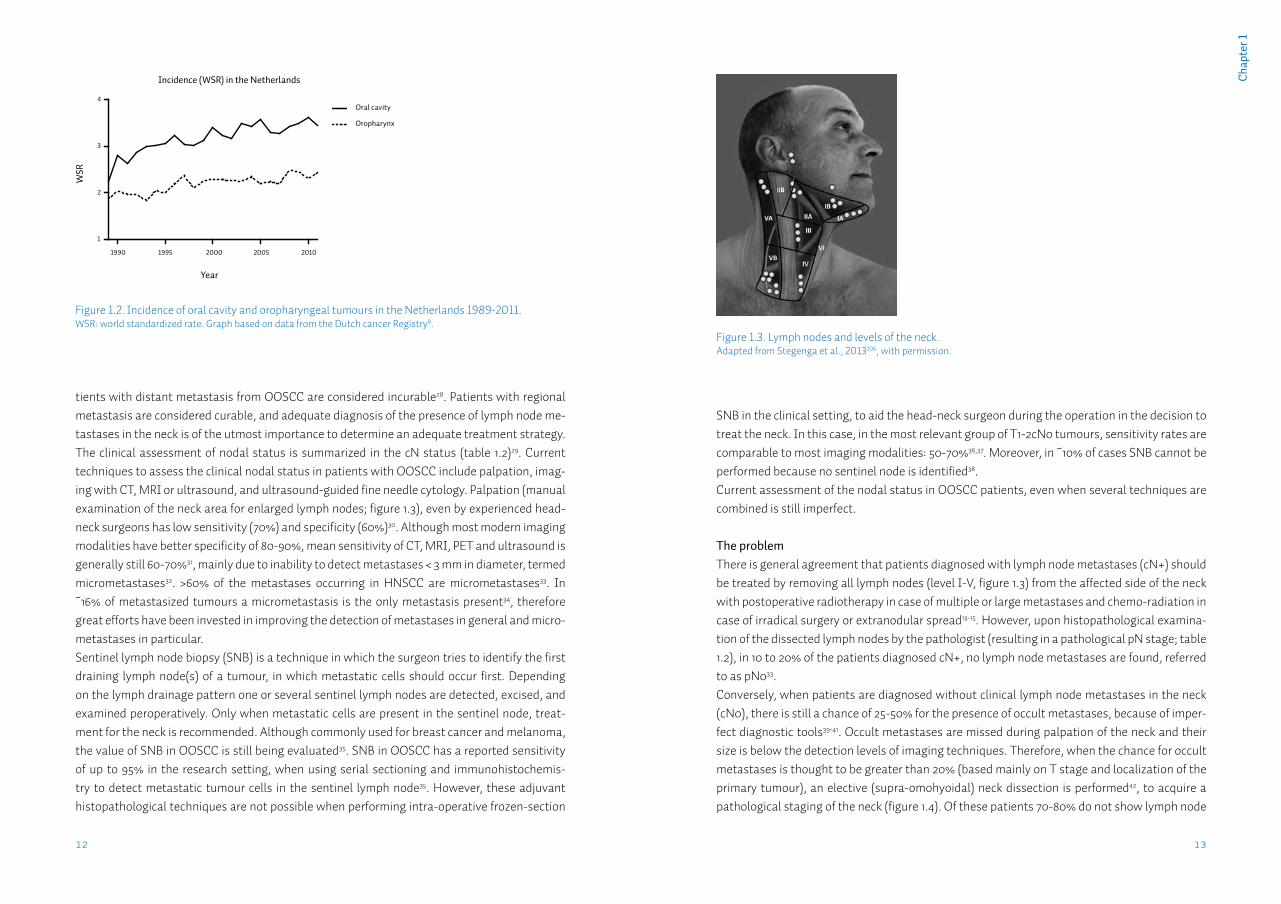
Assessment of the nodal statusOral and oropharyngeal squamous cell carcinomas (OOSCC) metastasize largely according to anatomical patterns to the draining lymph nodes in the neck (figure 1.3). When all OOSCC are considered, these regional metastases occur in ~50% of all patients23-25. Regional metastases significantly affect survival; 5-year survival for patients with a localized OOSCC is 60-75%, how-ever when suffering from a regionally metastasized tumour this rate drops to 40-55%23,26. Patients presenting with distant metastasis of OOSCC are rare, occurring in ~2% of cases27. Pa-
1312
Cha
pter
1
tients with distant metastasis from OOSCC are considered incurable28. Patients with regional metastasis are considered curable, and adequate diagnosis of the presence of lymph node me-tastases in the neck is of the utmost importance to determine an adequate treatment strategy. The clinical assessment of nodal status is summarized in the cN status (table 1.2)29. Current techniques to assess the clinical nodal status in patients with OOSCC include palpation, imag-ing with CT, MRI or ultrasound, and ultrasound-guided fine needle cytology. Palpation (manual examination of the neck area for enlarged lymph nodes; figure 1.3), even by experienced head-neck surgeons has low sensitivity (70%) and specificity (60%)30. Although most modern imaging modalities have better specificity of 80-90%, mean sensitivity of CT, MRI, PET and ultrasound is generally still 60-70%31, mainly due to inability to detect metastases < 3 mm in diameter, termed micrometastases32. >60% of the metastases occurring in HNSCC are micrometastases33. In ~16% of metastasized tumours a micrometastasis is the only metastasis present34, therefore great efforts have been invested in improving the detection of metastases in general and micro-metastases in particular.Sentinel lymph node biopsy (SNB) is a technique in which the surgeon tries to identify the first draining lymph node(s) of a tumour, in which metastatic cells should occur first. Depending on the lymph drainage pattern one or several sentinel lymph nodes are detected, excised, and examined peroperatively. Only when metastatic cells are present in the sentinel node, treat-ment for the neck is recommended. Although commonly used for breast cancer and melanoma, the value of SNB in OOSCC is still being evaluated35. SNB in OOSCC has a reported sensitivity of up to 95% in the research setting, when using serial sectioning and immunohistochemis-try to detect metastatic tumour cells in the sentinel lymph node35. However, these adjuvant histopathological techniques are not possible when performing intra-operative frozen-section
SNB in the clinical setting, to aid the head-neck surgeon during the operation in the decision to treat the neck. In this case, in the most relevant group of T1-2cN0 tumours, sensitivity rates are comparable to most imaging modalities: 50-70%36,37. Moreover, in ~10% of cases SNB cannot be performed because no sentinel node is identified38.Current assessment of the nodal status in OOSCC patients, even when several techniques are combined is still imperfect.
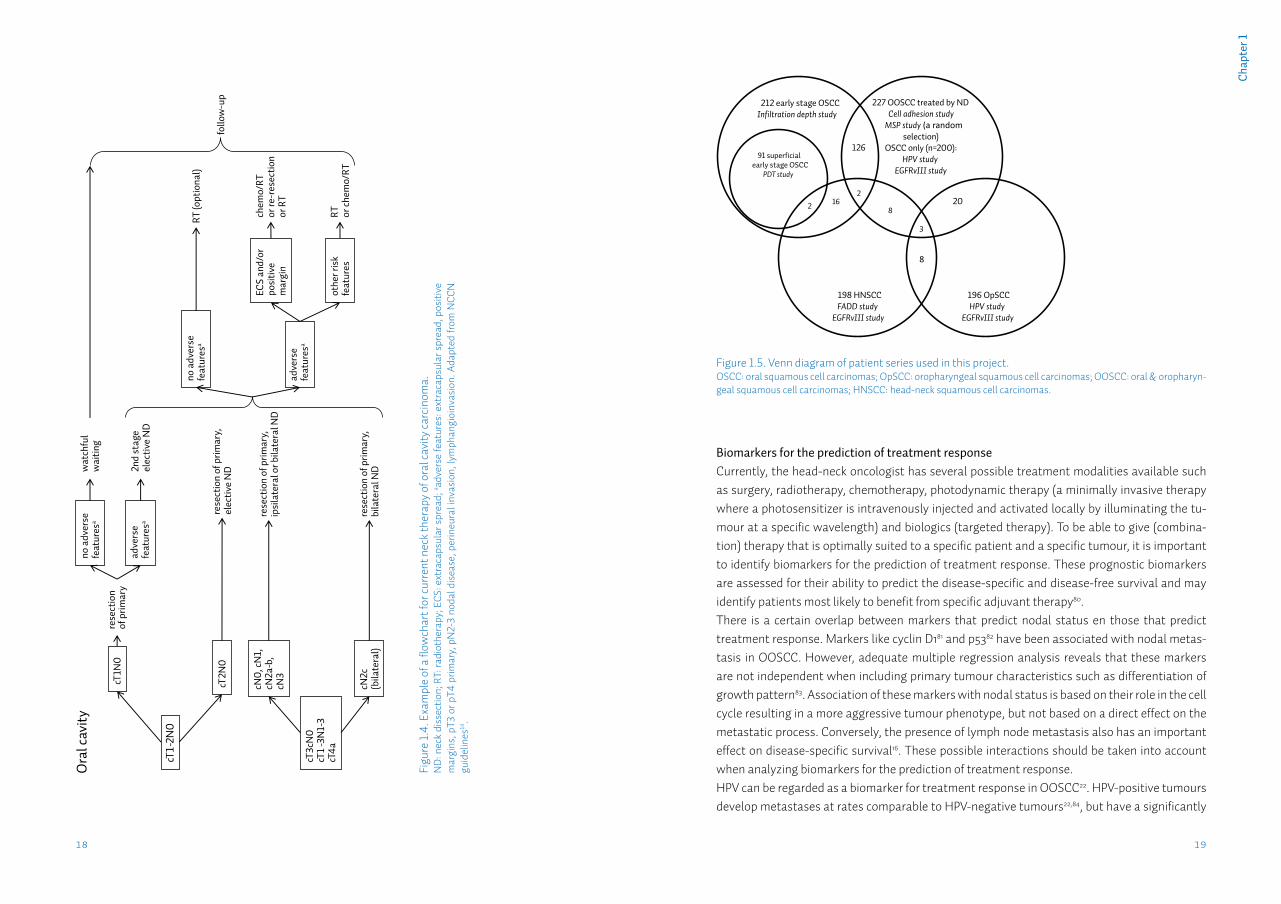
The problemThere is general agreement that patients diagnosed with lymph node metastases (cN+) should be treated by removing all lymph nodes (level I-V, figure 1.3) from the affected side of the neck with postoperative radiotherapy in case of multiple or large metastases and chemo-radiation in case of irradical surgery or extranodular spread13-15. However, upon histopathological examina-tion of the dissected lymph nodes by the pathologist (resulting in a pathological pN stage; table 1.2), in 10 to 20% of the patients diagnosed cN+, no lymph node metastases are found, referred to as pN033.Conversely, when patients are diagnosed without clinical lymph node metastases in the neck (cN0), there is still a chance of 25-50% for the presence of occult metastases, because of imper-fect diagnostic tools39-41. Occult metastases are missed during palpation of the neck and their size is below the detection levels of imaging techniques. Therefore, when the chance for occult metastases is thought to be greater than 20% (based mainly on T stage and localization of the primary tumour), an elective (supra-omohyoidal) neck dissection is performed42, to acquire a pathological staging of the neck (figure 1.4). Of these patients 70-80% do not show lymph node
Figure 1.3. Lymph nodes and levels of the neck.Adapted from Stegenga et al., 2013106, with permission.
Figure 1.2. Incidence of oral cavity and oropharyngeal tumours in the Netherlands 1989-2011.WSR: world standardized rate. Graph based on data from the Dutch cancer Registry8.
Incidence (WSR) in the Netherlands
Year
WSR
1990 1995 2000 2005 2010
1
2
3
4Oral cavity
Oropharynx
1514
Cha
pter
1
some have become criteria for giving adjuvant radiotherapy or chemoradiation13,14,58 (‘adverse features’; figure 1.4).Immunohistochemical studies of protein expression levels in tumours have yielded many can-didate protein biomarkers with associations with nodal status (table 1.3; reviewed by Takes et al.59 and Walk & Weed60). However these studies are not easy to compare, because of inclusion of differing tumour localizations and stages, outcome parameters, antibodies, staining evalu-ation systems et cetera61. Moreover, predictive values of these markers are generally poor62.
Table 1.2. TNM classification for carcinomas of the oral cavity and oropharynx.
T stage
Tx Primary tumour cannot be assessed
T0 No evidence of primary tumour
Tis Carcinoma in situ
T1 Tumour 2 cm or less in greatest diameter
T2 Tumour more than 2 cm but not more than 4 cm in greatest diameter
T3 Tumour more than 4 cm in greatest diameter
T4a (oral cavity) Tumour invades through cortical bone, into deep/extrinsic muscle of tongue (genioglossus, hyo-glossus, palatoglossus, and styloglossus), maxillary sinus, or skin of face
T4a (oropharynx) Tumour invades any of the following: larynx, deep/extrinsic muscle of tongue (genioglossus, hyoglossus, palatoglossus, and styloglossus), medial pterygoid, hard palate, and mandible
T4b (oral cavity) Tumour invades masticator space, pterygoid plates, or skull base, or encases internal carotid artery
T4b (oropharynx) Tumour invades any of the following: lateral pterygoid muscle, pterygoid plates, lateral nasophar-ynx, skull base, or encases the carotid artery
N stage
Nx Regional lymph nodes cannot be assessed
N0 No regional lymph node metastasis
N1 Metastasis in a single ipsilateral lymph node, 3 cm or less in greatest dimension
N2a Metastasis in a single ipsilateral lymph node more than 3 cm but not more than 6 cm in greatest dimension
N2b Metastasis in multiple ipsilateral lymph nodes, none more than 6 cm in greatest dimension
N2c Metastasis in bilateral or contralateral lymph nodes, none more than 6 cm in greatest dimension
N3 Metastasis in a lymph node more than 6 cm in greatest dimension
M stage
Mx Distant metastasis cannot be assessed
M0 No distant metastasis
M1 Distant metastasis
According to the International Agency for Research on Cancer, 200829.
metastases (pN0) and received an unnecessary elective neck dissection, with associated shoul-der and neck morbidity43,44. Of the patients considered to be low risk (<20%) for occult metasta-ses, and consequently do not receive an elective neck dissection, 25-30% develop clinically de-tectable metastases during follow-up45,46. Unfortunately salvage surgery for regional recurrence is not feasible in more than a third of cases because of extent of the recurrence or performance status of the patient47. When performed, salvage surgery has a high complication rate of ~30% and disappointing outcomes, with survival rates of only 6-25%47-49. Costs for salvage surgery for regional recurrence have been estimated at $87-94,000 in the US48. For comparison, costs for the treatment of a local recurrence are less than half of that48. Therefore, management of the clinically negative neck in patients with OOSCC is a major dilemma in head-neck oncology.
Biomarkers for the prediction of nodal statusA tumour biomarker is an indicator of a clinical state, and may correlate to the biological be-haviour of a tumour. Based on the hypothesis that presence or absence of certain character-istics in the primary tumour confers the ability to metastasize, many biomarkers have been studied for their association with the nodal status in OOSCC. Certain histological biomarkers such as T status34, perineural invasion34,50, lymph-angioinvasion34,51, depth of invasion34,52,53, de-gree of differentiation34,53,54 and pattern of invasion34,51,53,54 are reported to be associated with the presence of nodal metastasis for several decades. These biomarkers generally have not been analyzed by rigorous statistical methods, to determine Odds Ratios and independent predic-tive values34,50,52-54. Moreover, assessment of histopathological biomarkers, usually combined in grading systems, may show large inter- and intra-observer variability when reported55-57. There-fore, there is a need for objective biomarkers with an independent predictive value for the nodal status. Despite their limitations and because of a lack of better biomarkers, assessment of his-topathological biomarkers by a head-neck pathologist has become standard procedure13,14, and
Table 1.1. Estimated annual incidence data of head neck tumours worldwide in 2008.
Men Women Men & Women
WW NL WW NL WW NLTumour location N WSR N WSR N WSR N WSR N WSR N WSR
Oral cavity+lip 170496 5.2 689 5.2 92524 2.5 466 3.1 263020 3.8 1155 4.1
Oropharynx 108588 3.4 477 3.7 28034 0.8 164 1.3 136622 2.0 641 2.5
Nasopharynx 57852 1.7 101 0.7 26589 0.8 76 0.5 84441 1.2 177 0.6
Larynx 129651 4.1 608 4.4 21026 0.6 117 0.8 150677 2.2 725 2.6
Total 466587 1875 168173 823 634760 2698
WSR: world standardized rate; WW: worldwide; NL: Netherlands. Table based on data from international and national cancer regis-tries8,107.
1716
Cha
pter
1
One reason for the poor predictive power of single biomarkers is that metastasis is a multistep process, involving loss of cell-cell adhesion, lysis of extracellular matrix, cell motility, invasion in the lymph vessel, extravasation at the site of the future metastasis, and upregulation of cell-cell adhesion, amongst others, to develop into a metastatic tumour63,64. Many proteins have to cooperate in a concerted mechanism to result in only one step of the process and finally result in metastatic lymph nodes. Indeed, microarray expression studies revealed specific gene sets, composed of 46 to 500 genes65,66 that are significantly differentially expressed in metastasized tumours (‘metastatic signatures’). However, when comparing various microarray studies the composition of these signatures varies enormously and only a small number of genes are re-ported in multiple signatures66,67. When validation of a signature is performed, predictive values are disappointing, with an accuracy of 62%, compared to 80% for current clinical assessment68. Thus, also the combination of a large number of genetic markers does not result in a clinically relevant predictive test probably because of inter-tumour heterogeneity on the genetic level.Other clues that combinations of specific markers might have the best association with the multistep process of metastasis come from biological studies. An example is the role of the epithelial cell adhesion molecule (EpCAM) in metastasis. EpCAM is a cell-cell adhesion mol-ecule, and as such has been assessed for associations with lymph node metastases in HNSCC in several studies69-71. It may abrogate E-cadherin induced cell-cell adhesion72. In biologic studies it was found that EpCAM associates with claudin-7 in a complex73, which blocks EpCAM’s ad-hesive functions, and increases cell migration in scratch and transwell assays73. This interaction might explain the lack of association with lymph node metastases when EpCAM expression is assessed as single tumour biomarker in HNSCC. Analyzing the co-expression of EpCAM, E-cad-herin and claudin-7 might provide a better predictor. Such studies have not yet been performed in HNSCC.In addition to studying protein or mRNA expression levels to find tumour biomarkers for the prediction of nodal status in OOSCC, DNA methylation might be a mechanism to identify such markers. DNA hypermethylation is one of the most important mechanisms for the regulation of gene expression, both in physiological and in pathological conditions74. In contrast to DNA mutations, which result in definitive changes in DNA sequence, DNA methylation is a form of epigenetic regulation, where the genetic sequence is not altered, but methyl groups are added to CG dinucleotides present in the promoter region of a gene, leading to transcriptional repres-sion and decreased expression of the associated protein75. DNA methylation is reversible, and hypomethylation leads to reactivation of gene transcription and increased expression of the as-sociated protein75. Because of its dynamic nature, methylation is a promising candidate mecha-nism for the dynamic gene regulation during the multistep metastatic progression of OOSCC cells76. Although different cancer types are epigenetically diverse77, currently only a relatively small set of frequently methylated genes in OOSCC are known, most not specific for this type of cancer. Only a few of these methylation markers have occasionally been associated with nodal status on relatively small patient groups78,79. Therefore, identification of new methylation mark-ers in OOSCC is needed.
Table 1.3. Biomarkers associated with nodal metastasis in HNSCC.
Cell cycle CyclinsEGFRp53p21Ki-67Bcl-2SurvivinH/K/N-RasSigmaCEP55NBS1
Apoptosis FADDCaspasesRSK2
Cell adhesion CD44Syndecan-1E-selectin E-cadherinEpCAMClaudinsFAKα-cateninβ-cateninSnailRhoCConnexinsTwist
Invasion MMP-2, -3, -9 & -14TIMPsCortactinMaspinc-metHGF
Angiogenesis HIF-1 alphaCA IXVEGFA-D
Other processes CXCR4CCR7NFκB
Updated table from Takes et al., 200859.
1918
Cha
pter
1
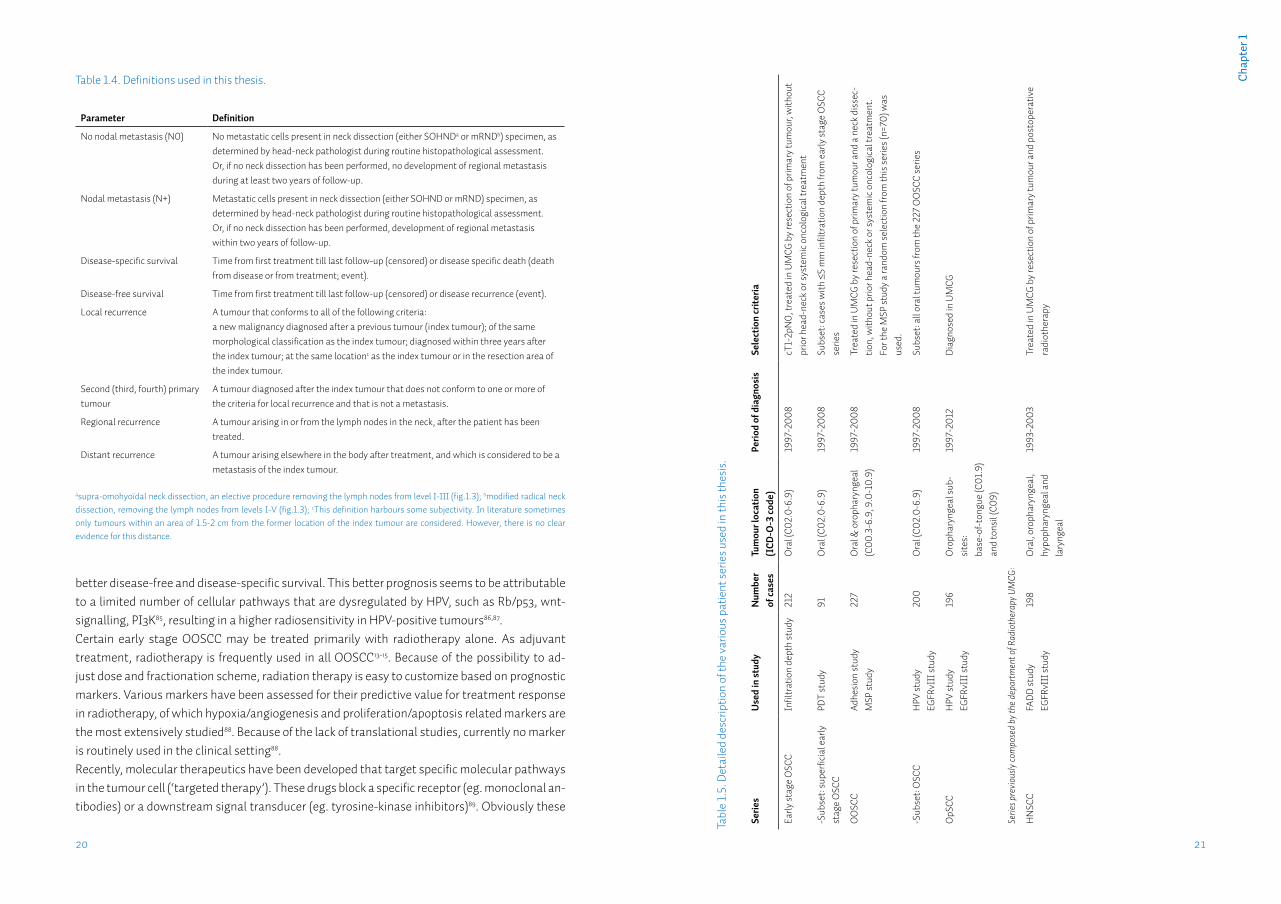
Figure 1.5. Venn diagram of patient series used in this project.OSCC: oral squamous cell carcinomas; OpSCC: oropharyngeal squamous cell carcinomas; OOSCC: oral & oropharyn-geal squamous cell carcinomas; HNSCC: head-neck squamous cell carcinomas.
Figu
re 1.
4. E
xam
ple
of a
flow
char
t for
curr
ent n
eck
ther
apy
of o
ral c
avity
carc
inom
a.N
D: n
eck
diss
ectio
n; R
T: ra
diot
hera
py; E
CS: e
xtra
caps
ular
spr
ead;
a adve
rse
feat
ures
: ext
raca
psul
ar s
prea
d, p
ositi
ve
mar
gins
, pT3
or p
T4 p
rimar
y, p
N2-
3 no
dal d
isea
se, p
erin
eura
l inv
asio
n, ly
mph
angi
oinv
asio
n. A
dapt
ed fr
om N
CCN
gu
idel
ines
14.
212 early stage OSCC Infiltration depth study
91 superficial early stage OSCC
PDT study
227 OOSCC treated by ND Cell adhesion study
MSP study (a random selection)
OSCC only (n=200): HPV study
EGFRvIII study
198 HNSCC FADD study
EGFRvIII study
196 OpSCC HPV study
EGFRvIII study
126
20
3
8
8 16 2
2
cN0,
cN1,
cN
2a-b
, cN
3
rese
ctio
n of
prim
ary,
ip
sila
tera
l or b
ilate
ral N
D
rese
ctio
n of
prim
ary,
bi
late
ral N
D
cT3c
N0
cT
1-3N
1-3
cT4a
cN2c
(b
ilate
ral)
RT
(opt
iona
l)
ECS
and/
or
posi
tive
mar
gin
othe
r ris
k fe
atur
es
chem
o/RT
or
re-r
esec
tion
or
RT
RT
or ch
emo/
RT
cT1-
2N0
cT1N
0
cT2N
0
adve
rse
feat
ures
a
no a
dver
se
feat
ures
a
no a
dver
se
feat
ures
a
adve
rse
feat
ures
a
wat
chfu
l w
aitin
g re
sect
ion
of p
rimar
y 2n
d st
age
elec
tive
ND
rese
ctio
n of
prim
ary,
el
ectiv
e N
D
follo
w-u
p
Ora
l cav
ity
Biomarkers for the prediction of treatment responseCurrently, the head-neck oncologist has several possible treatment modalities available such as surgery, radiotherapy, chemotherapy, photodynamic therapy (a minimally invasive therapy where a photosensitizer is intravenously injected and activated locally by illuminating the tu-mour at a specific wavelength) and biologics (targeted therapy). To be able to give (combina-tion) therapy that is optimally suited to a specific patient and a specific tumour, it is important to identify biomarkers for the prediction of treatment response. These prognostic biomarkers are assessed for their ability to predict the disease-specific and disease-free survival and may identify patients most likely to benefit from specific adjuvant therapy80.There is a certain overlap between markers that predict nodal status en those that predict treatment response. Markers like cyclin D181 and p5382 have been associated with nodal metas-tasis in OOSCC. However, adequate multiple regression analysis reveals that these markers are not independent when including primary tumour characteristics such as differentiation of growth pattern83. Association of these markers with nodal status is based on their role in the cell cycle resulting in a more aggressive tumour phenotype, but not based on a direct effect on the metastatic process. Conversely, the presence of lymph node metastasis also has an important effect on disease-specific survival16. These possible interactions should be taken into account when analyzing biomarkers for the prediction of treatment response.HPV can be regarded as a biomarker for treatment response in OOSCC22. HPV-positive tumours develop metastases at rates comparable to HPV-negative tumours22,84, but have a significantly
2120
Cha
pter
1
better disease-free and disease-specific survival. This better prognosis seems to be attributable to a limited number of cellular pathways that are dysregulated by HPV, such as Rb/p53, wnt-signalling, PI3K85, resulting in a higher radiosensitivity in HPV-positive tumours86,87.Certain early stage OOSCC may be treated primarily with radiotherapy alone. As adjuvant treatment, radiotherapy is frequently used in all OOSCC13-15. Because of the possibility to ad-just dose and fractionation scheme, radiation therapy is easy to customize based on prognostic markers. Various markers have been assessed for their predictive value for treatment response in radiotherapy, of which hypoxia/angiogenesis and proliferation/apoptosis related markers are the most extensively studied88. Because of the lack of translational studies, currently no marker is routinely used in the clinical setting88.Recently, molecular therapeutics have been developed that target specific molecular pathways in the tumour cell (‘targeted therapy’). These drugs block a specific receptor (eg. monoclonal an-tibodies) or a downstream signal transducer (eg. tyrosine-kinase inhibitors)89. Obviously these
Table 1.4. Definitions used in this thesis.
Parameter Definition
No nodal metastasis (N0) No metastatic cells present in neck dissection (either SOHNDa or mRNDb) specimen, as determined by head-neck pathologist during routine histopathological assessment.Or, if no neck dissection has been performed, no development of regional metastasis during at least two years of follow-up.
Nodal metastasis (N+) Metastatic cells present in neck dissection (either SOHND or mRND) specimen, as determined by head-neck pathologist during routine histopathological assessment.Or, if no neck dissection has been performed, development of regional metastasis within two years of follow-up.
Disease-specific survival Time from first treatment till last follow-up (censored) or disease specific death (death from disease or from treatment; event).
Disease-free survival Time from first treatment till last follow-up (censored) or disease recurrence (event).
Local recurrence A tumour that conforms to all of the following criteria:a new malignancy diagnosed after a previous tumour (index tumour); of the same morphological classification as the index tumour; diagnosed within three years after the index tumour; at the same locationc as the index tumour or in the resection area of the index tumour.
Second (third, fourth) primary tumour
A tumour diagnosed after the index tumour that does not conform to one or more of the criteria for local recurrence and that is not a metastasis.
Regional recurrence A tumour arising in or from the lymph nodes in the neck, after the patient has been treated.
Distant recurrence A tumour arising elsewhere in the body after treatment, and which is considered to be a metastasis of the index tumour.
asupra-omohyoïdal neck dissection, an elective procedure removing the lymph nodes from level I-III (fig.1.3); bmodified radical neck dissection, removing the lymph nodes from levels I-V (fig.1.3); cThis definition harbours some subjectivity. In literature sometimes only tumours within an area of 1.5-2 cm from the former location of the index tumour are considered. However, there is no clear evidence for this distance.
Tabl
e 1.
5. D
etai
led
desc
riptio
n of
the
vario
us p
atie
nt se
ries u
sed
in th
is th
esis
.
Serie
sU
sed
in st
udy
Num
ber
of ca
ses
Tum
our l
ocat
ion
(I
CD-O
-3 co
de)
Perio
d of
dia
gnos
isSe
lect
ion
crite
ria
Early
stag
e O
SCC
Infil
trat
ion
dept
h st
udy
212
Ora
l (C0
2.0-
6.9)
1997
-200
8cT
1-2p
N0,
trea
ted
in U
MCG
by
rese
ctio
n of
prim
ary
tum
our,
with
out
prio
r hea
d-ne
ck o
r sys
tem
ic o
ncol
ogic
al tr
eatm
ent
-Sub
set:
supe
rfici
al e
arly
st
age
OSC
CPD
T st
udy
91O
ral (
C02.
0-6.
9)19
97-2
008
Subs
et: c
ases
with
≤5
mm
infil
trat
ion
dept
h fro
m e
arly
stag
e O
SCC
serie
s
OO
SCC
Adhe
sion
stud
y M
SP st
udy
227
Ora
l & o
roph
aryn
geal
(C
00.3
-6.9
, 9.0
-10.
9)
1997
-200
8Tr
eate
d in
UM
CG b
y re
sect
ion
of p
rimar
y tu
mou
r and
a n
eck
diss
ec-
tion,
with
out p
rior h
ead-
neck
or s
yste
mic
onc
olog
ical
trea
tmen
t.Fo
r the
MSP
stud
y a
rand
om se
lect
ion
from
this
serie
s (n=
70) w
as
used
.
-Sub
set:
OSC
CH
PV st
udy
EGFR
vIII
stud
y20
0O
ral (
C02.
0-6.
9)19
97-2
008
Subs
et: a
ll or
al tu
mou
rs fr
om th
e 22
7 O
OSC
C se
ries
OpS
CCH
PV st
udy
EGFR
vIII
stud
y19
6O
roph
aryn
geal
sub-
site
s:
base
-of-t
ongu
e (C
01.9
) an
d to
nsil
(C09
)
1997
-201
2Di
agno
sed
in U
MCG
Serie
s pre
vious
ly co
mpo
sed
by th
e dep
artm
ent o
f Rad
ioth
erap
y UM
CG:
HN
SCC
FADD
stud
y EG
FRvI
II st
udy
198
Ora
l, or
opha
ryng
eal,
hypo
phar
ynge
al a
nd
lary
ngea
l
1993
-200
3Tr
eate
d in
UM
CG b
y re
sect
ion
of p
rimar
y tu
mou
r and
pos
tope
rativ
e ra
diot
hera
py

2322
Cha
pter
1
drugs work only when the specific pathway is hyperactivated, and the tumour has become de-pendent on this specific pathway. Therefore, to have the greatest benefit of targeted therapy, the tumour should be assessed for the presence of hyperactivated pathways for which targeted therapeutics are available90,91. In some more common types of cancer (eg. lung cancer, breast cancer) data on the relative presence of specific hyperactivated pathways, and the effect of tar-geted therapy of these pathways has become widely available. For OOSCC less data is avail-able, however, a few phase III trials using targeted therapy have been performed92-95. Most trials have been performed in patients with metastatic or recurrent disease, targeting the Epidermal Growth Factor Receptor (EGFR), which is present in >95% of included HNSCC patients96-99 and some guidelines have added anti-EGFR therapy to radiation and chemoradiation protocols in treatment of advanced OOSCC14,15. However, these trials show relatively low response rates of 10-16% to cetuximab (an EGFR inhibitor) irrespective of use as single agent or in combination with chemotherapy96-99. Many mutations of the EGFR gene have been reported both in the ty-rosine kinase domain in lung tumours100 and in the extracellular domain in glioblastomas101. The presence of EGFR mutations may account for response or resistance to EGFR-targeted therapy and therefore assessment of EGFR mutational status may be essential to select patients that will benefit from EGFR-targeted therapy102. In HNSCC the presence of a specific activating EGFR mutation103, called EGFRvIII mutation, has been reported to cause resistance to EGFR-targeted therapy104. Although targeted therapy is becoming available for HNSCC, there is still a need for optimization of currently used (EGFR-) targeted therapy as well for the identification of new targets105.
Scope of this thesisGoal of this thesis is to find new molecular biomarkers in the primary tumour that have predic-tive value for the nodal status and for prognosis in patients with oral & oropharyngeal squa-mous cell carcinoma, to improve regional staging and treatment selection based on current clinical and histopathological characteristics.To be able to identify new biomarkers and assess the predictive values of these markers in the clinical setting, tumour tissue and associated clinicopathological and follow-up data of a suffi-ciently large group of patients are necessary. For the project ‘New molecular biomarker discov-ery for diagnosis and prognosis in oral & oropharyngeal cancer’ a large patient database was constructed which contains clinicopathological and follow-up data of several patient cohorts including in total over 600 patients who developed more than 700 OOSCC between January 1st 1997 and December 31st 2012, and of which tumour tissue was available in the archives of the de-partment of Pathology of the University Medical Centre Groningen. To be able to compare the predictive values of newly identified biomarkers with current clinicopathological assessment, over 200 clinicopathological variables per tumour were extracted from the hospital files and registered in the database. Patient follow-up data was also registered and clinical outcomes were defined (table 1.4). From this database several patient selections were made for the vari-ous studies (table 1.5 and figure 1.5). These well-defined patient cohorts and extensive data
registered in our database enables us to address clinically relevant research questions on the predictive and prognostic values of biomarkers in OOSCC.
Infiltration depth has predictive value for the nodal status in OOSCC, however no clinically rele-vant cut-off has been established. In chapter 2 we measured infiltration depth on a homogenous group of pT1-2 OSCC and performed rigorous statistical tests to find the most optimal cut-off for performing a neck dissection. In chapter 3, the surgically treated tumours with ≤ 5 mm infiltra-tion depth were compared with a group of tumours of comparable depth that were treated with photodynamic therapy for response to therapy and disease-free and overall survival. This way we were able to define the patient group that might benefit from photodynamic therapy.EpCAM, a cell adhesion molecule, has been studied extensively for its role in metastasis. It might prevent metastasis as adhesion molecule, but might also promote metastasis because it abrogates another important adhesion molecule, E-cadherin. The role of EpCAM in human carcinogenesis was reviewed in chapter 4. Chapter 5 describes an analysis of the co-expression of E-cadherin, EpCAM and claudin-7, three functionally related cell adhesion proteins, for their predictive value for determining the nodal status. For this purpose, tissue microarrays (TMAs) were generated of the tumour front and tumour centre of 227 OOSCC, to be able to assess these markers in both tumour sublocalizations. The FADD gene is located in a region which is frequently amplified in HNSCC. The protein ex-pression of FADD in a group of generally advanced HNSCC was analyzed for its predictive value for nodal status and distant metastasis-free interval in chapter 6.HPV is a known predictor for less recurrences and longer survival in OpSCC. In chapter 7 the prevalence of high-risk HPV in OOSCC in the Northern Netherlands was analyzed using a vali-dated triple detection algorithm, based on detecting not only the presence of HPV DNA, but also p16 immunohistochemistry and HPV-in situ hybridization to detect active HPV infection in the tumour tissue. The incidence of HPV-associated OpSCC over a period of 16 years (1997-2012) was determined and compared to that in the rest of the Netherlands.DNA methylation of several genes has been associated with nodal status. Chapter 8 describes the selection and testing of 28 new candidate methylation markers for their predictive value for the nodal status on a group of 70 OOSCC.EGFRvIII is the most common form of mutant EGFR and is associated with a more aggressive phenotype, and resistance to chemo and radiation therapy. In chapter 9 the prevalence of this mutant EGFR was determined on a large group of tumours in order to decide whether EGFRvIII could be used as a prognostic marker in patients with OOSCC.
Chapter 2
Tumour infiltration depth ≥4mm is an indication for an elective neck dissection in pT1cN0 oral squamous cell carcinoma
L.J. Melchersa,b, E. Schuuringb, B.A.C. van Dijkc, G.H. de Bockd, M.J.H. Witjesa, B.F.A.M. van der Laane, J.E. van der Walb,*, J.L.N. Roodenburga,*
aDept. of Oral & Maxillofacial Surgery, University of Groningen, University Medical Center Groningen, Groningen, The NetherlandsbDept. of Pathology, University of Groningen, University Medical Center Groningen, Groningen, The NetherlandscComprehensive Cancer Center The Netherlands, Groningen, The NetherlandsdDept. of Epidemiology, University of Groningen, University Medical Center Groningen, Groningen, The NetherlandseDept. of Otorhinolaryngology/Head & Neck Surgery, University of Groningen, University Medical Center Groningen, Groningen, The Netherlands
*Both authors contributed equally
Published in: Oral Oncol. 2012 Apr;48(4):337-42.
2726
Cha
pter
2AbstractObjectives: Patients with pT1cN0 oral squamous cell carcinomas (OSCC) are generally not treated with a neck dissection (ND). However, in 25% of cN0 patients, nodal metastases be-come apparent during follow-up. Infiltration depth of the primary tumour has been consistently associated with the presence of nodal metastasis, but proposed cut-off depths for performing a ND vary considerably. The aim of this study was to explore the infiltration depth as predictor for the nodal status and to recommend a cut-off depth for performing a ND.
Materials and Methods: From our database of 351 primary oral carcinomas, we selected all pT1-2 tumours (n=246). Infiltration depth was measured in 212 cases. Neck status was determined by histopathological examination of the dissection specimen, or by at least two years of follow-up.
Results: Mean infiltration depth was 5.49mm (95%CI: 4.86-6.12) in the N0 and 8.40mm (95%CI: 7.38-9.43) in the N+ group (p<0.001). cN status, lymphovascular invasion and infiltration depth were the only independent predictors for nodal status in multiple logistic regression. ROC-analysis on pT1cN0 tumours resulted in an optimal cut-off for the prediction of the nodal status at a depth of 4.59mm. This cut-off identified a subgroup of patients at increased risk for nodal metastasis (OR=8.3) and with significantly shorter survival.
Conclusion: Tumour infiltration depth is an independent predictor for nodal status in pT1-2 OSCC. In pT1cN0 tumours, a cut-off at 4.59mm results in the best predictive value.We recommend an infiltration depth of ≥4mm as an indication to perform a neck dissection in pT1cN0 OSCC.
IntroductionTreatment of the clinically N0 (cN0) neck is a dilemma in oral squamous cell carcinoma (OSCC) patients, especially in those suffering from small (T1-2) tumours. When considering all stages of OSCC, occult nodal metastases are present in up to 50% of cases108,39, even after clinical and ra-diological assessment by experienced head-neck oncologists. Not every cN0 tumour harbours the same risk for metastases, therefore it is not ethical to consider every patient for an elec-tive neck dissection, due to the associated morbidity44. Moreover, performing a neck dissection might remove a natural barrier for tumour spread, which is of particular importance in OSCC, where recurrences and second primaries are frequent6. Therefore, an elective neck dissection is generally considered in cN0 patients when the risk for occult metastasis, is considered greater than 20%42. This risk assessment focuses mainly on T status and localization of the primary tumour39. Despite these additional criteria, still 20-30% of the cN0 patients considered low risk, and who are consequently not treated with a neck dissection, develop metastases during follow-up46.Research in head-neck oncology has focused on finding additional predictors for the presence of occult nodal metastases, such as lymphovascular invasion108, intratumoural vessel density109,110, the presence of various immunohistochemical or molecular markers59 and tumour infiltration depth52.Currently, only tumour infiltration depth is consistently associated with nodal metastases and has an independent predictive value, as reviewed recently52,111. However, the depth that is sug-gested as cut-off for deciding to treat the neck varies greatly (1.5-10mm) in literature52. There are several explanations for this variation. First, different definitions of infiltration depth are used, either measuring the distance from the deepest level of invasion to the tumour surface (tumour thickness) or measuring from the deepest level of invasion to the reconstructed mucosal sur-face (tumour infiltration depth). In many studies it is not clear which definition was applied. Second, studies suffer from the use of small groups (n≤50)112-114 or widely differing tumour locali-zations115. Finally, cut-off depths are frequently subjectively chosen113,114,116,117 or analysis is done on categorical rather than on continuous measurement data118,119.The aim of this study was to explore the value of infiltration depth for predicting metastases in pT1-2 OSCC and to determine the optimal cut-off depth for performing an elective neck dissec-tion. From a large cohort of patients, we selected a homogeneous group of pT1-2 OSCC, meas-ured infiltration depth and performed rigorous statistical analyses to find the most optimal cut-off for performing a neck dissection.
Materials and MethodsPatient selectionFrom the database of the Netherlands Cancer Registry, all records with the following criteria were retrieved: oral primary tumour location (ICD-O-3120 locations C02.0-6.9), histologically proven squamous cell carcinoma, diagnosed between 1997-2008, treated in the UMC Gronin-gen by resection of the primary tumour without prior head-neck or systemic oncological treat-
2928
Cha
pter
2ResultsStudy populationIn total, 246 patients met the inclusion criteria of this study (pT1-2 OSCC). Cases were excluded due to synchronous multiple tumours (n=3), irretrievable HE-slides (n=12) or unreliable assess-ment of infiltration depth (n=19). Therefore, 212 patients were included in this study. 174 pa-tients were treated with a neck dissection, resulting in 102 pN0 and 72 pN+ dissections. 38 pa-tients did not undergo a neck dissection (watchful waiting group). Median follow-up for these patients was 56.5 months. 7 patients (18%) developed nodal metastases. The distribution of sex, age at diagnosis and tumour site (except for floor of mouth tumours) was comparable between the neck treated and watchful waiting groups (table 2.1). Watchful waiting was performed in 38 (36%) of 106 pT1cN0 tumours. Main reasons for not performing watchful waiting were: a cT status >1 (33 cases), and floor of mouth localization with clinical involvement of the duct of the submandibular gland (30 cases; data not shown).
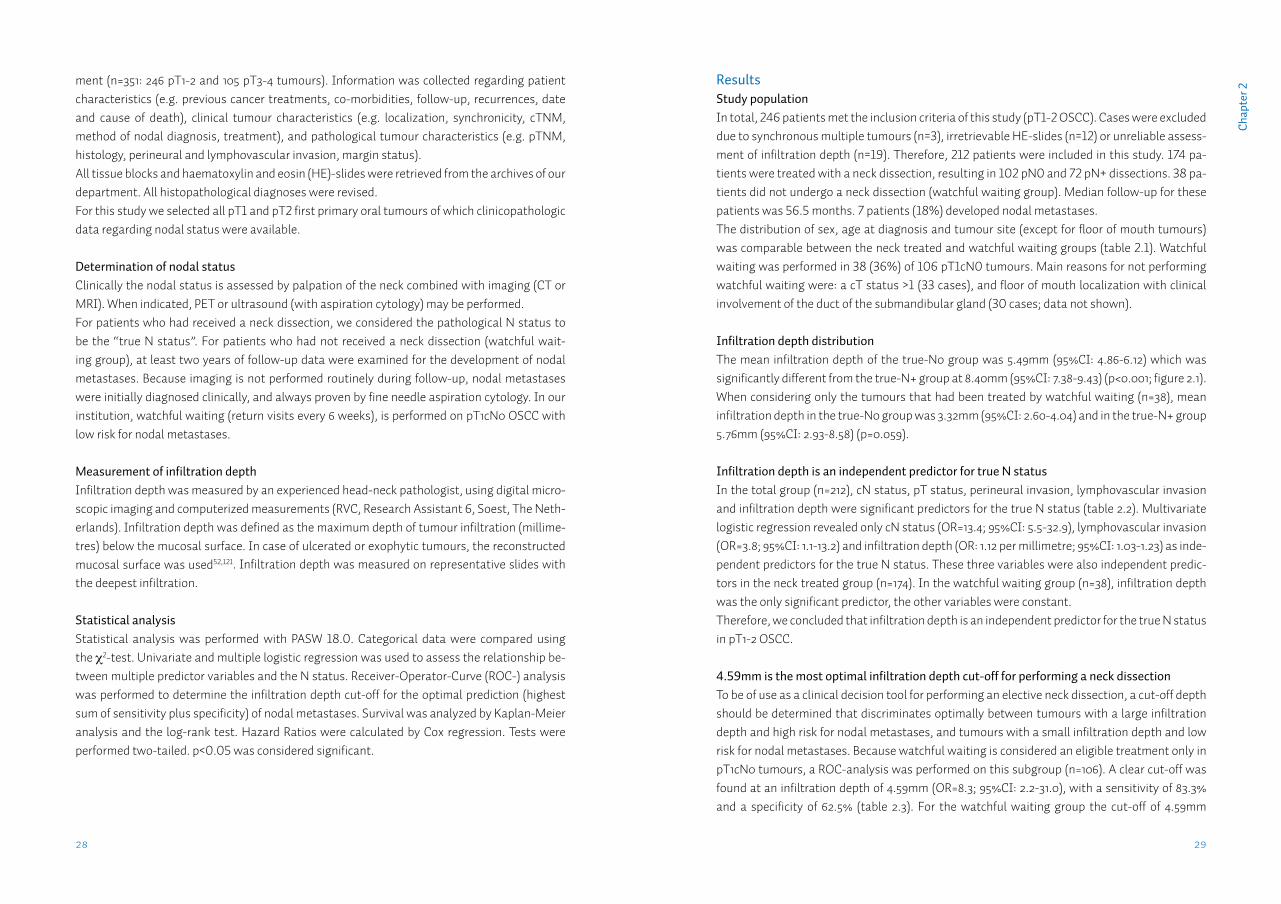
Infiltration depth distributionThe mean infiltration depth of the true-N0 group was 5.49mm (95%CI: 4.86-6.12) which was significantly different from the true-N+ group at 8.40mm (95%CI: 7.38-9.43) (p<0.001; figure 2.1). When considering only the tumours that had been treated by watchful waiting (n=38), mean infiltration depth in the true-N0 group was 3.32mm (95%CI: 2.60-4.04) and in the true-N+ group 5.76mm (95%CI: 2.93-8.58) (p=0.059).
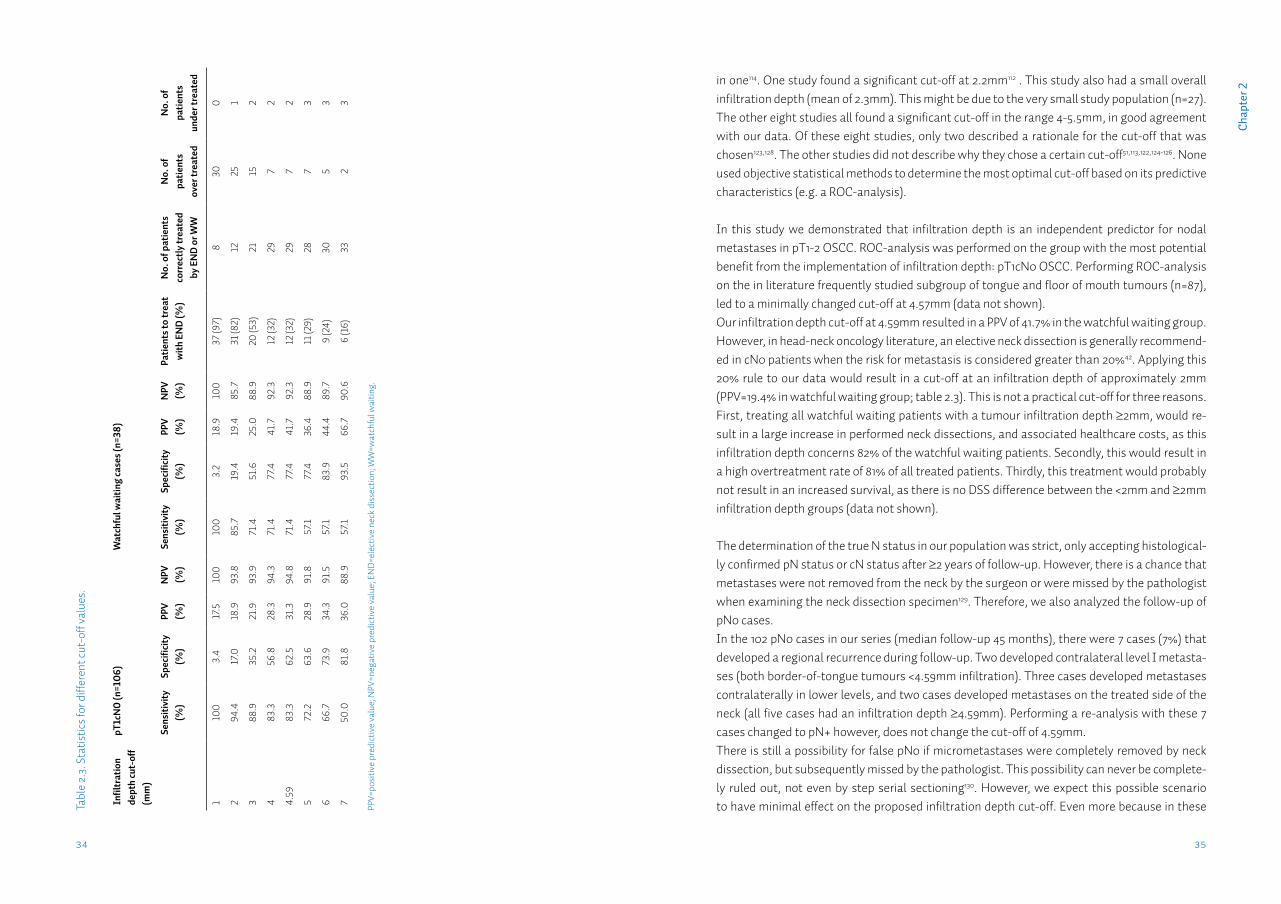
Infiltration depth is an independent predictor for true N statusIn the total group (n=212), cN status, pT status, perineural invasion, lymphovascular invasion and infiltration depth were significant predictors for the true N status (table 2.2). Multivariate logistic regression revealed only cN status (OR=13.4; 95%CI: 5.5-32.9), lymphovascular invasion (OR=3.8; 95%CI: 1.1-13.2) and infiltration depth (OR: 1.12 per millimetre; 95%CI: 1.03-1.23) as inde-pendent predictors for the true N status. These three variables were also independent predic-tors in the neck treated group (n=174). In the watchful waiting group (n=38), infiltration depth was the only significant predictor, the other variables were constant. Therefore, we concluded that infiltration depth is an independent predictor for the true N status in pT1-2 OSCC.
4.59mm is the most optimal infiltration depth cut-off for performing a neck dissectionTo be of use as a clinical decision tool for performing an elective neck dissection, a cut-off depth should be determined that discriminates optimally between tumours with a large infiltration depth and high risk for nodal metastases, and tumours with a small infiltration depth and low risk for nodal metastases. Because watchful waiting is considered an eligible treatment only in pT1cN0 tumours, a ROC-analysis was performed on this subgroup (n=106). A clear cut-off was found at an infiltration depth of 4.59mm (OR=8.3; 95%CI: 2.2-31.0), with a sensitivity of 83.3% and a specificity of 62.5% (table 2.3). For the watchful waiting group the cut-off of 4.59mm
ment (n=351: 246 pT1-2 and 105 pT3-4 tumours). Information was collected regarding patient characteristics (e.g. previous cancer treatments, co-morbidities, follow-up, recurrences, date and cause of death), clinical tumour characteristics (e.g. localization, synchronicity, cTNM, method of nodal diagnosis, treatment), and pathological tumour characteristics (e.g. pTNM, histology, perineural and lymphovascular invasion, margin status).All tissue blocks and haematoxylin and eosin (HE)-slides were retrieved from the archives of our department. All histopathological diagnoses were revised.For this study we selected all pT1 and pT2 first primary oral tumours of which clinicopathologic data regarding nodal status were available.
Determination of nodal statusClinically the nodal status is assessed by palpation of the neck combined with imaging (CT or MRI). When indicated, PET or ultrasound (with aspiration cytology) may be performed.For patients who had received a neck dissection, we considered the pathological N status to be the “true N status”. For patients who had not received a neck dissection (watchful wait-ing group), at least two years of follow-up data were examined for the development of nodal metastases. Because imaging is not performed routinely during follow-up, nodal metastases were initially diagnosed clinically, and always proven by fine needle aspiration cytology. In our institution, watchful waiting (return visits every 6 weeks), is performed on pT1cN0 OSCC with low risk for nodal metastases.
Measurement of infiltration depthInfiltration depth was measured by an experienced head-neck pathologist, using digital micro-scopic imaging and computerized measurements (RVC, Research Assistant 6, Soest, The Neth-erlands). Infiltration depth was defined as the maximum depth of tumour infiltration (millime-tres) below the mucosal surface. In case of ulcerated or exophytic tumours, the reconstructed mucosal surface was used52,121. Infiltration depth was measured on representative slides with the deepest infiltration.
Statistical analysisStatistical analysis was performed with PASW 18.0. Categorical data were compared using the χ2-test. Univariate and multiple logistic regression was used to assess the relationship be-tween multiple predictor variables and the N status. Receiver-Operator-Curve (ROC-) analysis was performed to determine the infiltration depth cut-off for the optimal prediction (highest sum of sensitivity plus specificity) of nodal metastases. Survival was analyzed by Kaplan-Meier analysis and the log-rank test. Hazard Ratios were calculated by Cox regression. Tests were performed two-tailed. p<0.05 was considered significant.
3130
Cha
pter
2
(OR=8.6; 95%CI: 1.4-54.2) resulted in a sensitivity of 71.4% with a specificity of 77.4%, a PPV of 41.7% and a NPV of 92.3% (table 2.3).
Using 4.59mm as cut-off does not result in higher overtreatment ratesTo illustrate the effectiveness of using infiltration depth ≥4.59mm as additional indication for treating the neck, we looked at the watchful waiting patients (n=38) in more detail. If every watchful waiting patient with an infiltration depth of ≥4.59mm would be treated with a neck dissection, this would result in additional neck treatments of 12 patients, of which 7 (58%) would be overtreated, and 5 patients (42%) would be correctly treated. In total 29 pa-tients (76%) would be correctly treated with either neck dissection or watchful waiting (table 2.3). Comparing these numbers with the neck treated group (n=174), shows that the percentage overtreated cases is comparable (59% in neck treated group) and that the percentage correctly treated cases (76% vs.41% in the neck treated group) is much higher when using the infiltration depth cut-off of 4.59mm.
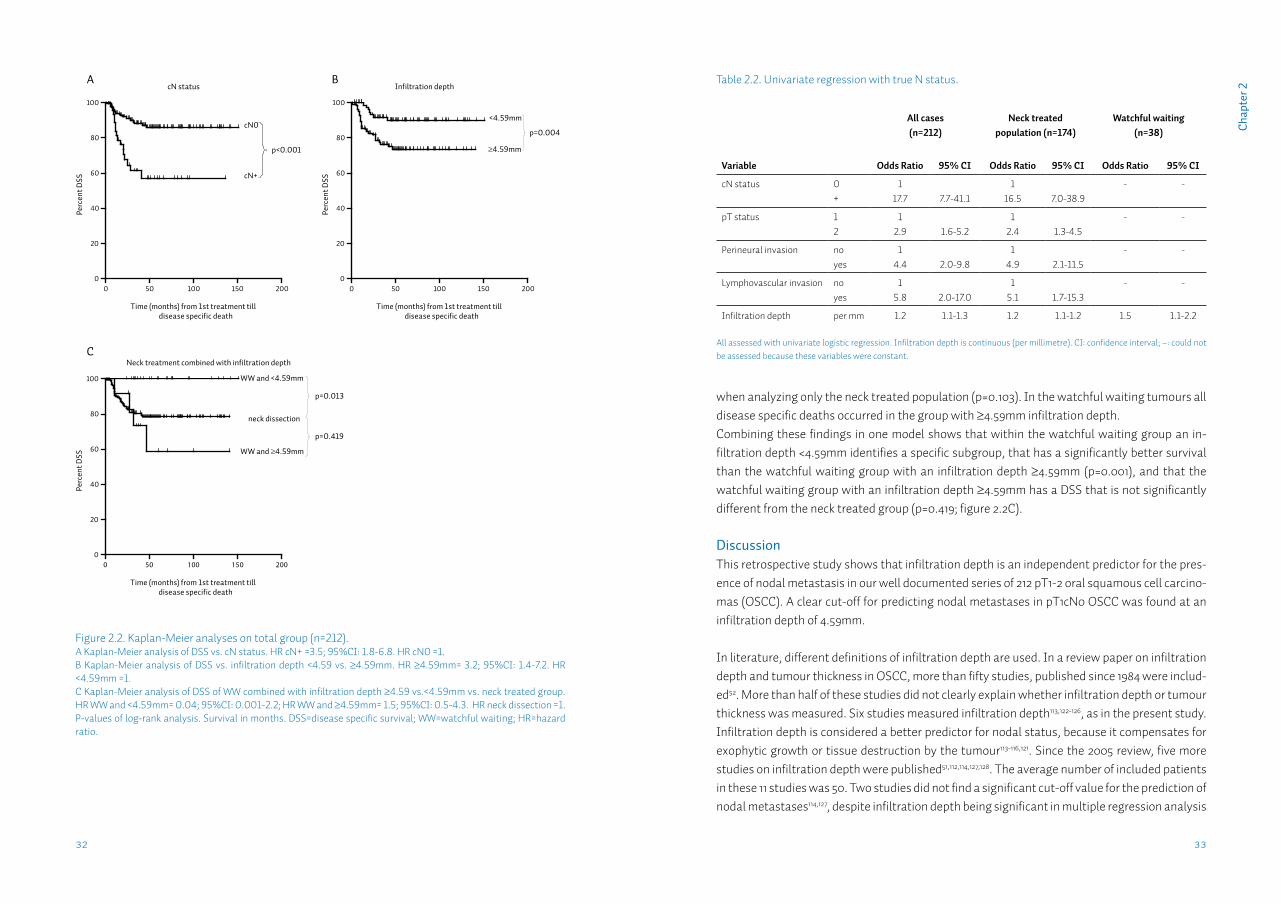
Deeper infiltration is associated with shorter survivalWe analyzed disease specific survival data for all tumours (n=212). There was a significant shorter DSS in cN+ tumours (p<0.001; figure 2.2A). Regarding primary tumour site, there were no differ-ences in DSS when comparing tongue, gum, floor of mouth and other sites. Perineural and lym-phovascular invasion were both significantly associated with shorter DSS. A difference in DSS was found between ≥4.59 and <4.59mm infiltration depth when analyzing all tumours (p=0.004; figure 2.2B), and when analyzing only tumours of the watchful waiting group (p=0.001), but not
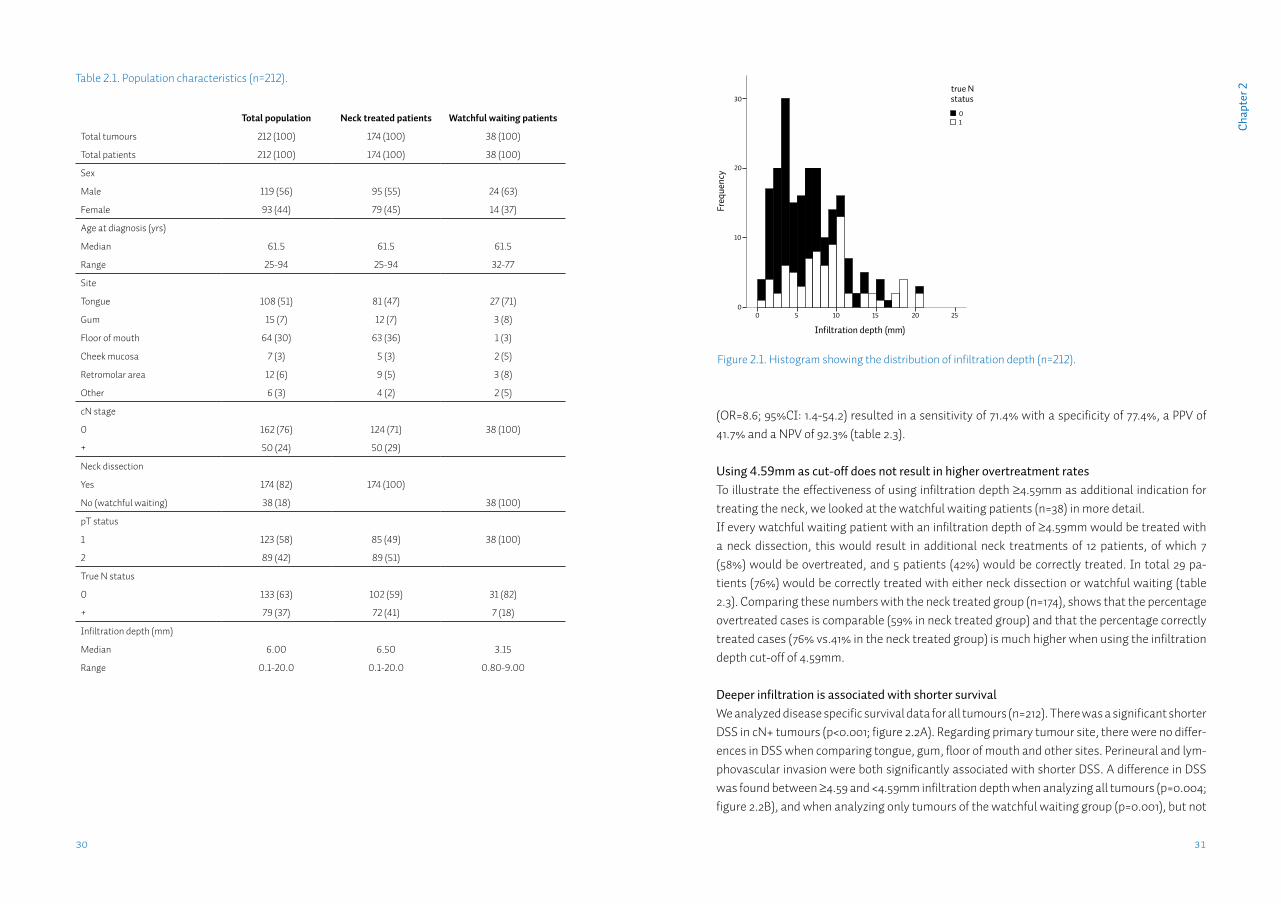
Table 2.1. Population characteristics (n=212).
Total population Neck treated patients Watchful waiting patients
Total tumours 212 (100) 174 (100) 38 (100)
Total patients 212 (100) 174 (100) 38 (100)
Sex
Male 119 (56) 95 (55) 24 (63)
Female 93 (44) 79 (45) 14 (37)
Age at diagnosis (yrs)
Median 61.5 61.5 61.5
Range 25-94 25-94 32-77
Site
Tongue 108 (51) 81 (47) 27 (71)
Gum 15 (7) 12 (7) 3 (8)
Floor of mouth 64 (30) 63 (36) 1 (3)
Cheek mucosa 7 (3) 5 (3) 2 (5)
Retromolar area 12 (6) 9 (5) 3 (8)
Other 6 (3) 4 (2) 2 (5)
cN stage
0 162 (76) 124 (71) 38 (100)
+ 50 (24) 50 (29)
Neck dissection
Yes 174 (82) 174 (100)
No (watchful waiting) 38 (18) 38 (100)
pT status
1 123 (58) 85 (49) 38 (100)
2 89 (42) 89 (51)
True N status
0 133 (63) 102 (59) 31 (82)
+ 79 (37) 72 (41) 7 (18)
Infiltration depth (mm)
Median 6.00 6.50 3.15
Range 0.1-20.0 0.1-20.0 0.80-9.00
Figure 2.1. Histogram showing the distribution of infiltration depth (n=212).
Infiltration depth (mm)
2520151050
Freq
uenc
y
30
20
10
0
10
true N status
3332
Cha
pter
2
when analyzing only the neck treated population (p=0.103). In the watchful waiting tumours all disease specific deaths occurred in the group with ≥4.59mm infiltration depth. Combining these findings in one model shows that within the watchful waiting group an in-filtration depth <4.59mm identifies a specific subgroup, that has a significantly better survival than the watchful waiting group with an infiltration depth ≥4.59mm (p=0.001), and that the watchful waiting group with an infiltration depth ≥4.59mm has a DSS that is not significantly different from the neck treated group (p=0.419; figure 2.2C).
DiscussionThis retrospective study shows that infiltration depth is an independent predictor for the pres-ence of nodal metastasis in our well documented series of 212 pT1-2 oral squamous cell carcino-mas (OSCC). A clear cut-off for predicting nodal metastases in pT1cN0 OSCC was found at an infiltration depth of 4.59mm.
In literature, different definitions of infiltration depth are used. In a review paper on infiltration depth and tumour thickness in OSCC, more than fifty studies, published since 1984 were includ-ed52. More than half of these studies did not clearly explain whether infiltration depth or tumour thickness was measured. Six studies measured infiltration depth113,122-126, as in the present study. Infiltration depth is considered a better predictor for nodal status, because it compensates for exophytic growth or tissue destruction by the tumour113-116,121. Since the 2005 review, five more studies on infiltration depth were published51,112,114,127,128. The average number of included patients in these 11 studies was 50. Two studies did not find a significant cut-off value for the prediction of nodal metastases114,127, despite infiltration depth being significant in multiple regression analysis
Figure 2.2. Kaplan-Meier analyses on total group (n=212). A Kaplan-Meier analysis of DSS vs. cN status. HR cN+ =3.5; 95%CI: 1.8-6.8. HR cN0 =1. B Kaplan-Meier analysis of DSS vs. infiltration depth <4.59 vs. ≥4.59mm. HR ≥4.59mm= 3.2; 95%CI: 1.4-7.2. HR <4.59mm =1.C Kaplan-Meier analysis of DSS of WW combined with infiltration depth ≥4.59 vs.<4.59mm vs. neck treated group. HR WW and <4.59mm= 0.04; 95%CI: 0.001-2.2; HR WW and ≥4.59mm= 1.5; 95%CI: 0.5-4.3. HR neck dissection =1.P-values of log-rank analysis. Survival in months. DSS=disease specific survival; WW=watchful waiting; HR=hazard ratio.
cN status
Time (months) from 1st treatment tilldisease specific death
Perc
ent D
SS
0 50 100 150 2000
20
40
60
80
100
cN0
cN+
p<0.001
Infiltration depth
Time (months) from 1st treatment tilldisease specific death
Perc
ent D
SS
0 50 100 150 2000
20
40
60
80
100
p=0.004
<4.59mm
≥4.59mm
Neck treatment combined with infiltration depth
Time (months) from 1st treatment tilldisease specific death
Perc
ent D
SS
0
20
40
60
80
100
p=0.013
WW and <4.59mm
WW and ≥4.59mm
neck dissection
p=0.419
0 50 100 150 200
Table 2.2. Univariate regression with true N status.
All cases(n=212)
Neck treated population (n=174)
Watchful waiting (n=38)
Variable Odds Ratio 95% CI Odds Ratio 95% CI Odds Ratio 95% CI
cN status 0+
117.7 7.7-41.1
116.5 7.0-38.9
- -
pT status 12
12.9 1.6-5.2
12.4 1.3-4.5
- -
Perineural invasion no yes
14.4 2.0-9.8
14.9 2.1-11.5
- -
Lymphovascular invasion noyes
15.8 2.0-17.0
15.1 1.7-15.3
- -
Infiltration depth per mm 1.2 1.1-1.3 1.2 1.1-1.2 1.5 1.1-2.2
All assessed with univariate logistic regression. Infiltration depth is continuous (per millimetre). CI: confidence interval; –: could not be assessed because these variables were constant.
A
C
B
3534
Cha
pter
2
Tabl
e 2.
3. S
tatis
tics f
or d
iffer
ent c
ut-o
ff va
lues
.
Infil
trat
ion
dept
h cu
t-of
f (m
m)
pT1c
N0
(n=1
06)
Wat
chfu
l wai
ting
case
s (n=
38)
Sens
itivi
ty
(%)
Spec
ifici
ty
(%)
PPV
(%)
NPV
(%
)Se
nsiti
vity
(%
)Sp
ecifi
city
(%
)PP
V (%
)N
PV
(%)
Patie
nts t
o tr
eat
with
EN
D (%
)N
o. o
f pat
ient
s co
rrec
tly tr
eate
d by
EN
D or
WW
No.
of
patie
nts
over
trea
ted
No.
of
patie
nts
unde
r tre
ated
110
03.
417
.510
010
03.
218
.910
037
(97)
830
0
2 94
.417
.018
.993
.885
.719
.419
.485
.731
(82)
1225
1
388
.935
.221
.993
.971
.451
.625
.088
.920
(53)
2115
2
483
.356
.828
.394
.371
.477
.441
.792
.312
(32)
297
2
4.59
83.3
62.5
31.3
94.8
71.4
77.4
41.7
92.3
12 (3
2)29
72
572
.263
.628
.991
.857
.177
.436
.488
.911
(29)
287
3
666
.773
.934
.391
.557
.183
.944
.489
.79
(24)
305
3
750
.081
.836
.088
.957
.193
.566
.790
.66
(16)
332
3
PPV=
posi
tive
pred
ictiv
e va
lue;
NPV
=neg
ativ
e pr
edic
tive
valu
e; E
ND=
elec
tive
neck
dis
sect
ion;
WW
=wat
chfu
l wai
ting.
in one114. One study found a significant cut-off at 2.2mm112 . This study also had a small overall infiltration depth (mean of 2.3mm). This might be due to the very small study population (n=27). The other eight studies all found a significant cut-off in the range 4-5.5mm, in good agreement with our data. Of these eight studies, only two described a rationale for the cut-off that was chosen123,128. The other studies did not describe why they chose a certain cut-off51,113,122,124-126. None used objective statistical methods to determine the most optimal cut-off based on its predictive characteristics (e.g. a ROC-analysis).
In this study we demonstrated that infiltration depth is an independent predictor for nodal metastases in pT1-2 OSCC. ROC-analysis was performed on the group with the most potential benefit from the implementation of infiltration depth: pT1cN0 OSCC. Performing ROC-analysis on the in literature frequently studied subgroup of tongue and floor of mouth tumours (n=87), led to a minimally changed cut-off at 4.57mm (data not shown).Our infiltration depth cut-off at 4.59mm resulted in a PPV of 41.7% in the watchful waiting group. However, in head-neck oncology literature, an elective neck dissection is generally recommend-ed in cN0 patients when the risk for metastasis is considered greater than 20%42. Applying this 20% rule to our data would result in a cut-off at an infiltration depth of approximately 2mm (PPV=19.4% in watchful waiting group; table 2.3). This is not a practical cut-off for three reasons. First, treating all watchful waiting patients with a tumour infiltration depth ≥2mm, would re-sult in a large increase in performed neck dissections, and associated healthcare costs, as this infiltration depth concerns 82% of the watchful waiting patients. Secondly, this would result in a high overtreatment rate of 81% of all treated patients. Thirdly, this treatment would probably not result in an increased survival, as there is no DSS difference between the <2mm and ≥2mm infiltration depth groups (data not shown).
The determination of the true N status in our population was strict, only accepting histological-ly confirmed pN status or cN status after ≥2 years of follow-up. However, there is a chance that metastases were not removed from the neck by the surgeon or were missed by the pathologist when examining the neck dissection specimen129. Therefore, we also analyzed the follow-up of pN0 cases.In the 102 pN0 cases in our series (median follow-up 45 months), there were 7 cases (7%) that developed a regional recurrence during follow-up. Two developed contralateral level I metasta-ses (both border-of-tongue tumours <4.59mm infiltration). Three cases developed metastases contralaterally in lower levels, and two cases developed metastases on the treated side of the neck (all five cases had an infiltration depth ≥4.59mm). Performing a re-analysis with these 7 cases changed to pN+ however, does not change the cut-off of 4.59mm.There is still a possibility for false pN0 if micrometastases were completely removed by neck dissection, but subsequently missed by the pathologist. This possibility can never be complete-ly ruled out, not even by step serial sectioning130. However, we expect this possible scenario to have minimal effect on the proposed infiltration depth cut-off. Even more because in these

3736
Cha
pter
2cases metastatic cells are completely removed and survival is comparable to N0 cases131.
All measurements were performed on formalin-fixed, paraffin embedded (FFPE) tumour resec-tion material. Because of the shrinkage associated with this fixation process132, the cut-off is not readily applicable to, for example, fresh frozen tissue133. Infiltration depth is determined by the pathologist postoperatively. Therefore, when a neck dissection is indicated (infiltration depth ≥4.59mm), this has to be performed in a second procedure.Sentinel lymph node biopsy (SNB) can be performed using intra-operative cryosectioning, therefore eliminating the need for a second procedure. However, single tumour cells and small fields can easily be missed on frozen sections and immunohistochemistry can not be performed at the time of surgery. As most SNB studies are performed on FFPE material134, it is not clear if predictive values will hold on frozen material135. The NPV of an infiltration depth cut-off at 4.59mm (94.8%) is comparable to that found in most recent SNB studies38,136,137. Moreover, infil-tration depth can be assessed in every tumour, whereas in SNB failure to identify the sentinel node, is reported in up to 10% of procedures 38,136,137. The economical costs of implementing infiltration depth as an absolute indication for perform-ing a neck dissection are beyond the scope of this paper, but the costs for extra neck dissections may be balanced by savings on frequent follow-up and imaging due to fewer watchful waiting patients. Fewer patients are being undertreated, and consequently there will be less need for costly salvage surgery, with associated poor outcome.
The advantages of using infiltration depth as predictor for the nodal status in OSCC are plenty. It is easy, quick and cheap to perform. Infiltration depth, defined as in the current study, is al-ready a standard item in the histopathology report according to the Royal College of Patholo-gists (UK)58 and the Dutch Working Group Head-Neck Tumours13, amongst others. Therefore, the established cut-off can be readily implemented in clinical practice.For every-day guidelines for the management of the cN0 neck, a more practical cut-off, in whole millimetres may be considered. We recommend a cut-off at 4mm, because specificity and sensi-tivity are only minimally affected from the optimal values at 4.59mm (table 2.3).
In summary, this study shows that infiltration depth is an independent predictor for the pres-ence of nodal metastasis in pT1-2 OSCC, and that 4.59mm is the most optimal cut-off in pT1cN0 tumours. Infiltration depth was the only independent predictor in watchful waiting tumours. The cut-off of 4.59mm identifies a subgroup of patients at increased risk for nodal metasta-sis (OR=8.3) and with significantly shorter survival. Applying infiltration depth as indication for elective neck dissection in patients currently treated by watchful waiting would result in the correct treatment of 76%, with an overtreatment percentage (58%) comparable to the current neck treated population.We recommend an infiltration depth of ≥4mm to be used as an absolute indication for perform-ing an elective neck dissection in pT1cN0 OSCC.
Chapter 3
mTHPC-mediated photodynamic therapy of early stage oral squamous cell carcinoma: a comparison to surgical treatment
S.A.H.J. de Visschera, L.J. Melchersa, P.U. Dijkstrab, B. Karakullukcuc, I.B. Tanc, C. Hopperd, J.L.N. Roodenburga, M.J.H. Witjesa
aDept. of Oral and Maxillofacial Surgery, University of Groningen, University Medical Center Groningen, Groningen, The NetherlandsbDept. of Rehabilitation medicine, University of Groningen, University Medical Center Groningen, Groningen, The NetherlandscDept. of head neck oncology, The Netherlands cancer institute, Antoni van Leeuwenhoek hospital, Amsterdam, The Netherlands dDept. of Head & Neck, University College Hospital, London, United Kingdom
Published in: Ann Surg Oncol. 2013 Sep;20(9):3076-82.
4140
Cha
pter
3
AbstractBackground: mTHPC mediated Photodynamic Therapy (PDT) is used for treatment of early head and neck squamous cell carcinoma. This study is a retrospective comparison of PDT with trans-oral surgery in the treatment of early primary squamous cell carcinoma of the oral cavity/oropharynx.
Methods: PDT data were retrieved from 4 study databases while surgical results were retrieved from our institutional database. To select similar primary tumors, infiltration depth was re-stricted to 5mm for the surgery group. A total of 126 T1 and 30 T2 tumors were included in the PDT group and 58 T1 and 33 T2 tumors were included in the surgically treated group.
Results: Complete response rates with PDT and surgery were 86% and 76% for T1 respectively, and for T2 63% and 78%. Lower local disease free survival (LDFS) for PDT compared to surgery was found. However, when comparing the need for local retreatment no significant difference for T1 tumors were found, while for T2 tumors surgery resulted in significantly less need for local retreatment. No significant differences in overall survival between surgery and PDT were observed.
Conclusion: PDT for T1 tumors has a similar need for retreatment compared to surgery, while for T2 tumors PDT performs worse. LDFS for surgery is better than for PDT. This may be influ-enced by the benefit surgery has of having histology available. This allows an early decision on re-intervention while for PDT one has to follow a wait and see policy. Future prospective studies should compare efficacy as well as morbidity.
IntroductionThe treatment of early stage (stage I/II) head and neck squamous cell carcinomas (HNSCC) is local resection or radiotherapy138-140. In retrospective studies, radiotherapy and surgery in patients with stage I/II disease have similar cure rates141-143. Usually, surgery is preferred because radiotherapy side-effects can be avoided and histopathological staging can be ob-tained46,139,142,144,145. However, surgery has disadvantages such as impairment of speech, swallowing and poor aesthetics146,147. It has been suggested that photodynamic therapy (PDT) could be a primary treatment option with similar efficacy and without some of the disadvantages associated with standard treatment148-152. The photosensitizer meta-tetra(hydroxyphenyl)chlorin (mTHPC, Foscan®) is licensed for palliation of advanced HNSCC but can also be used for curative treatment of early HN-SCC148,150,151,153-155. Activation of mTHPC is achieved by illuminating tissue with non-thermal light at a wavelength of 652 nm. Intracellular cytotoxic reactive oxygen species are induced which cause cell death156-160. Effective light penetration for PDT is approximately 10 mm at 652 nm. Therefore, curative treatment with surface illumination is limited to tumors with ≤ 5 mm invasion depth150,161,162.A suggested advantage of PDT is the limited scarring and limited loss of function after treat-ment 149,163-167. It is assumed that long term morbidity is less than surgery or radiotherapy in similar cases due to less deformation and the insensitivity of nearby nerves 168,169. Another ben-efit could be the possibility for repeated treatments of the same anatomical area without com-plications for any other (future) treatments 164,170,171. Despite these possible advantages, the role of mTHPC mediated PDT in curative treatment of early stage HNSCC is not clear. A recent systematic review failed to identify any comparative studies of PDT with other modalities155. Therefore, any claim of similar efficacy to surgery could not be confirmed or refuted. However, the review did identify four studies that described treat-ment results after PDT of early stage oral squamous cell carcinoma (OSCC)148-151. The similar treatment protocols and inclusion criteria of these studies allowed pooling of the obtained original PDT study databases155. In an effort to assess the efficacy of PDT for early stage primary OSCC, we compared PDT with surgery on tumor response and survival. Outcomes after trans-oral surgical resection were retrieved from our hospital database.
MethodsIn this retrospective study on the treatment of early stage OSCC, a comparison was made be-tween databases on PDT treatments (a pooled, multicenter database) and surgical treatment (single institutions database of UMCG). The emphasis of our study was on the results after the initial treatment by either PDT or surgery, not on subsequent salvage treatments. The study design required that all cases with a first primary cT1-2N0 OSCC could be identified and ex-tracted from both the pooled PDT database and the surgical database. All tumors in the pooled database had a clinical tumor depth of ≤ 5mm as assessed by imaging. Imaging in the PDT
4342
Cha
pter
3
group consisted of computed tomography (CT), magnetic resonance imaging (MRI) or ultra-sound (US).To ensure adequate comparison, tumors with a pathologically assessed infiltration depth of ≤ 5 mm were selected from the surgical treatment database. A total of 91 surgically treated tumors met the study criteria (table 3.1). The initial local treat-ment was trans-oral resection. Tumor response after surgery was determined by histopathol-ogy and classified as a complete response (CR) or as no CR (table 3.2). Sixty-two patients (68%), including all 33 patients with stage II disease, underwent elective neck dissection (level I – III). Where CR was not achieved (positive margin, table 3.2) or when patients developed a local re-currence, retreatment by surgery or radiotherapy was performed. For assessment of the initial PDT treatment result (CR or not), information was extracted from a pooled database of four original study databases, originating from studies using the standard and thus comparable treatment protocols and inclusion criteria148-151. After rigorous investigation of the database, a total of 126 T1 and 30 T2 first primary oral cavity/oropharyngeal tumors in 152 patients remained (table 3.1)155. All 17 oropharyngeal tumors were located on the soft palate. Of 31 patients originating from one study database, age and gender was missing150. PDT was identical for all patients and included intravenous injection of 0.15 mg/kg mTHPC fol-lowed by surface illumination after 96 hours. Light was delivered by a 652 nm diode laser to a visible and accessible tumor. The calculated dose delivered was 20 J/cm² with a fluence rate of 100mW/cm². The tumor and a margin of at least 5 mm of normal appearing surrounding mu-cosa were illuminated. The database included data on tumor response (CR or non- CR) recorded by the authors of the included pooled studies after clinical examination (table 3.2). To be clas-sified as a CR, no evidence of tumor had to be observed on 2 separate examinations (> 4 weeks apart). In contrast to the surgically treated group, no elective neck treatment was performed; all patients were subject to watchful waiting policy172. As in the surgical cases, when CR was not reached or patients developed a local recurrence they received retreatment by surgery, radio-therapy or repeated PDT.
Statistical analysisLocal CR rate, need for local retreatment, incidence of regional metastases and death of the pa-tient marked the end points of our study. Local disease free survival (LDFS) was defined as ab-sence of tumor recurrence after observation of a CR. The need for local retreatment was defined as absence of CR or recurrence of tumor after an initial CR. For survival analysis, overall survival on a patient specific level was determined. Additionally, survival after local salvage treatment was calculated.Descriptive statistics and 95% confidence interval (CI) were calculated173. Differences in local CR rate, incidence of regional metastases and need for further local treatment were analyzed using χ2 tests. Survival curves for LDFS, need for re-treatment and overall survival were con-structed using the Kaplan-Meier method. Differences in survival curves were analyzed using
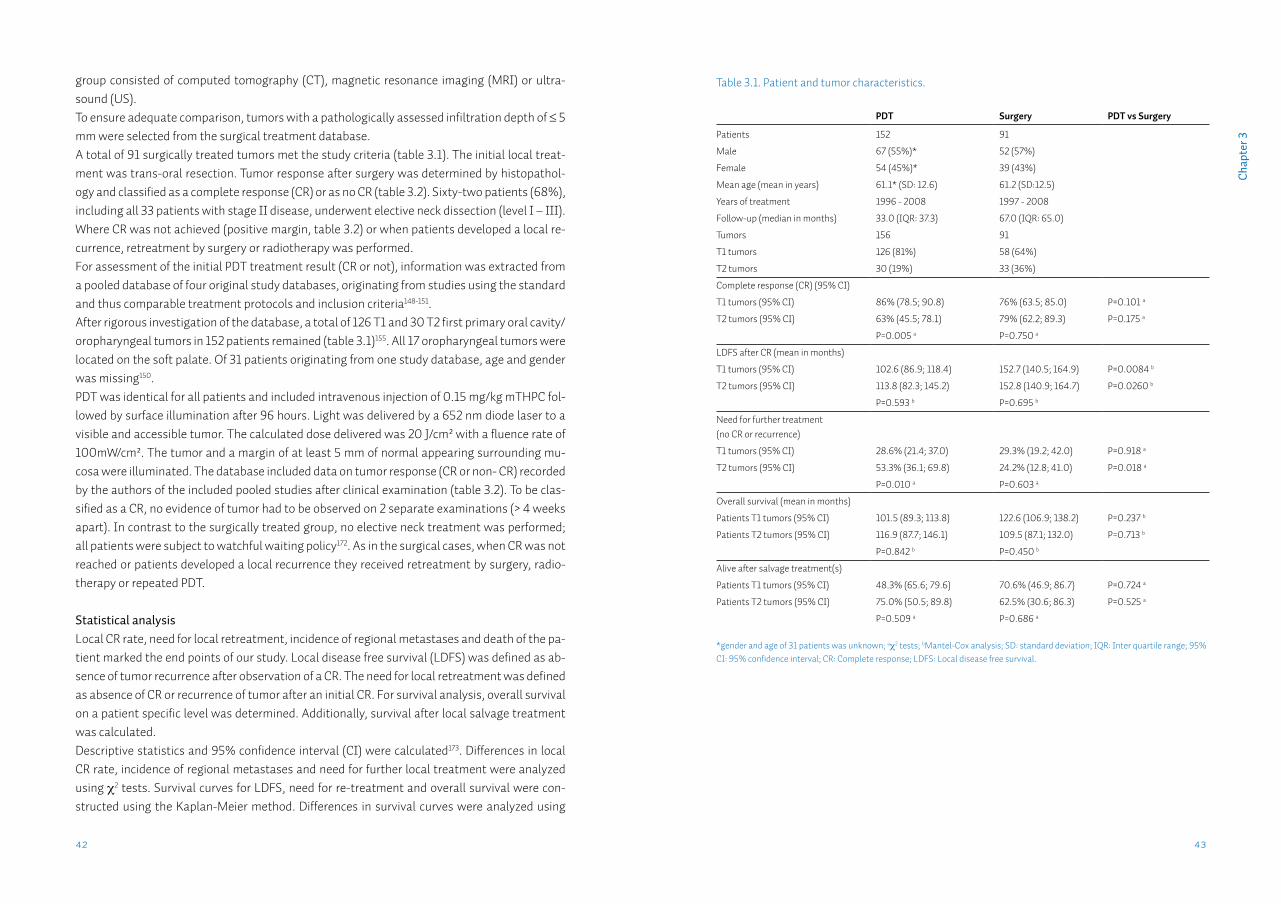
Table 3.1. Patient and tumor characteristics.
PDT Surgery PDT vs Surgery
Patients 152 91
Male 67 (55%)* 52 (57%)
Female 54 (45%)* 39 (43%)
Mean age (mean in years) 61.1* (SD: 12.6) 61.2 (SD:12.5)
Years of treatment 1996 - 2008 1997 - 2008
Follow-up (median in months) 33.0 (IQR: 37.3) 67.0 (IQR: 65.0)
Tumors 156 91
T1 tumors 126 (81%) 58 (64%)
T2 tumors 30 (19%) 33 (36%)
Complete response (CR) (95% CI)
T1 tumors (95% CI) 86% (78.5; 90.8) 76% (63.5; 85.0) P=0.101 a
T2 tumors (95% CI) 63% (45.5; 78.1) 79% (62.2; 89.3) P=0.175 a
P=0.005 a P=0.750 a
LDFS after CR (mean in months)
T1 tumors (95% CI) 102.6 (86.9; 118.4) 152.7 (140.5; 164.9) P=0.0084 b
T2 tumors (95% CI) 113.8 (82.3; 145.2) 152.8 (140.9; 164.7) P=0.0260 b
P=0.593 b P=0.695 b
Need for further treatment(no CR or recurrence)
T1 tumors (95% CI) 28.6% (21.4; 37.0) 29.3% (19.2; 42.0) P=0.918 a
T2 tumors (95% CI) 53.3% (36.1; 69.8) 24.2% (12.8; 41.0) P=0.018 a
P=0.010 a P=0.603 a
Overall survival (mean in months)
Patients T1 tumors (95% CI) 101.5 (89.3; 113.8) 122.6 (106.9; 138.2) P=0.237 b
Patients T2 tumors (95% CI) 116.9 (87.7; 146.1) 109.5 (87.1; 132.0) P=0.713 b
P=0.842 b P=0.450 b
Alive after salvage treatment(s)
Patients T1 tumors (95% CI) 48.3% (65.6; 79.6) 70.6% (46.9; 86.7) P=0.724 a
Patients T2 tumors (95% CI) 75.0% (50.5; 89.8) 62.5% (30.6; 86.3) P=0.525 a
P=0.509 a P=0.686 a
*gender and age of 31 patients was unknown; aχ2 tests; bMantel-Cox analysis; SD: standard deviation; IQR: Inter quartile range; 95% CI: 95% confidence interval; CR: Complete response; LDFS: Local disease free survival.
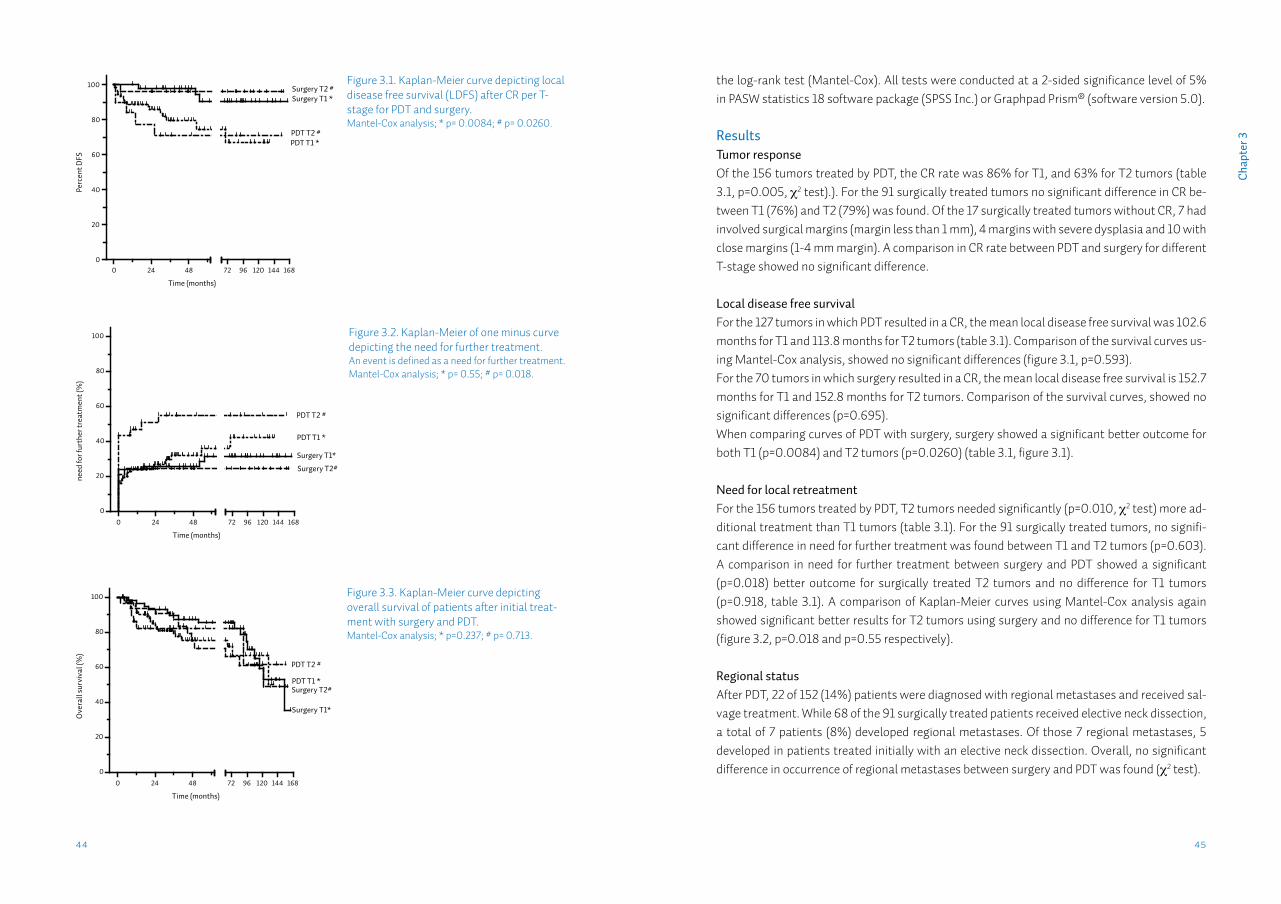
4544
Cha
pter
3
the log-rank test (Mantel-Cox). All tests were conducted at a 2-sided significance level of 5% in PASW statistics 18 software package (SPSS Inc.) or Graphpad Prism® (software version 5.0).
ResultsTumor responseOf the 156 tumors treated by PDT, the CR rate was 86% for T1, and 63% for T2 tumors (table 3.1, p=0.005, χ2 test).). For the 91 surgically treated tumors no significant difference in CR be-tween T1 (76%) and T2 (79%) was found. Of the 17 surgically treated tumors without CR, 7 had involved surgical margins (margin less than 1 mm), 4 margins with severe dysplasia and 10 with close margins (1-4 mm margin). A comparison in CR rate between PDT and surgery for different T-stage showed no significant difference.
Local disease free survivalFor the 127 tumors in which PDT resulted in a CR, the mean local disease free survival was 102.6 months for T1 and 113.8 months for T2 tumors (table 3.1). Comparison of the survival curves us-ing Mantel-Cox analysis, showed no significant differences (figure 3.1, p=0.593).For the 70 tumors in which surgery resulted in a CR, the mean local disease free survival is 152.7 months for T1 and 152.8 months for T2 tumors. Comparison of the survival curves, showed no significant differences (p=0.695). When comparing curves of PDT with surgery, surgery showed a significant better outcome for both T1 (p=0.0084) and T2 tumors (p=0.0260) (table 3.1, figure 3.1).
Need for local retreatmentFor the 156 tumors treated by PDT, T2 tumors needed significantly (p=0.010, χ2 test) more ad-ditional treatment than T1 tumors (table 3.1). For the 91 surgically treated tumors, no signifi-cant difference in need for further treatment was found between T1 and T2 tumors (p=0.603). A comparison in need for further treatment between surgery and PDT showed a significant (p=0.018) better outcome for surgically treated T2 tumors and no difference for T1 tumors (p=0.918, table 3.1). A comparison of Kaplan-Meier curves using Mantel-Cox analysis again showed significant better results for T2 tumors using surgery and no difference for T1 tumors (figure 3.2, p=0.018 and p=0.55 respectively).
Regional statusAfter PDT, 22 of 152 (14%) patients were diagnosed with regional metastases and received sal-vage treatment. While 68 of the 91 surgically treated patients received elective neck dissection, a total of 7 patients (8%) developed regional metastases. Of those 7 regional metastases, 5 developed in patients treated initially with an elective neck dissection. Overall, no significant difference in occurrence of regional metastases between surgery and PDT was found (χ2 test).
Figure 3.1. Kaplan-Meier curve depicting local disease free survival (LDFS) after CR per T-stage for PDT and surgery. Mantel-Cox analysis; * p= 0.0084; # p= 0.0260.
Figure 3.2. Kaplan-Meier of one minus curve depicting the need for further treatment. An event is defined as a need for further treatment. Mantel-Cox analysis; * p= 0.55; # p= 0.018.
Figure 3.3. Kaplan-Meier curve depicting overall survival of patients after initial treat-ment with surgery and PDT. Mantel-Cox analysis; * p=0.237; # p= 0.713.
0 24 480
20
40
60
80
100
72 96 120 144 168
Time (months)
Perc
ent D
FSSurgery T2 #Surgery T1 *
PDT T2 #PDT T1 *
0 24 48
0
20
40
60
80
100
72 96 120 144 168
Time (months)
need
for f
urth
er tr
eatm
ent (
%)
PDT T2 #
PDT T1 *
Surgery T1*
Surgery T2#
0 24 48
0
20
40
60
80
100
72 96 120 144 168
Time (months)
Ove
rall
surv
ival
(%)
PDT T2 #
PDT T1 *
Surgery T1*
Surgery T2#
4746
Cha
pter
3
Overall survivalFor the 152 patients treated by PDT, the overall mean survival time was 101.5 months for pa-tients with T1 tumors and 116.9 months for patients with T2 tumors (table 3.1). Comparison of the survival curves using Mantel-Cox analysis, showed no significant difference in survival between patients with T1 or T2 tumors (figure 3.3, p=0.842). For the 91 patients that were surgically treated the overall mean survival time was 122.6 months for T1 and 109.5 months for T2 tumors. Comparison of the survival curves, showed no significant difference between T1 and T2 tumors (p=0.450). A comparison of overall survival between patients treated by PDT or surgery for their prima-ry tumor, showed no significant differences (table 3.1, figure 3.3). Comparing overall survival between the PDT and surgically treated patients after additional local salvage treatment(s) showed no significant differences stratified for T1 and T2 tumors (table 3.1).
DiscussionIn analysis of efficacy of PDT versus surgery, the definition of what the primary endpoint should be is strongly influenced by the difference in post treatment strategies. The assessment of complete response (CR) after PDT is performed by visual inspection while for surgery this is performed by histo-pathological analysis. In the surgery group, it is therefore possible that a need for retreatment is established and executed when surgical margins are shown to be com-promised. Consequently, interpretation of local disease free survival (LDFS) is different for PDT and surgery. A major portion of the retreatment in the surgery group has taken place at the start of the assessment of the LDFS whereas the retreatment in the PDT group takes place at the end of the LDFS period. Therefore one needs to carefully draw conclusions from these data. In this study, there was no significant difference in CR when PDT was compared to surgery for the treatment of T1 and T2 tumors respectively. When comparing LDFS, PDT was significantly less effective than surgery for both T1 and T2 tumors. This is an immediate consequence of a differ-
ence in post-treatment strategies between PDT and surgery. Because of the visual determina-tion of CR for PDT, the chance of false-negatives is higher than in the surgery group resulting eventually in lower LDFS for PDT. We therefore think that the essential endpoint in our study should be the need for retreatment and disease free survival. For T1 tumors, PDT and surgery showed a similar need for further treatment after initial PDT or surgery. However, for T2 tumors the PDT treated cases needed a significantly higher number of retreatments. Also, within the group of PDT treated tumors, a lower CR and LDFS for T2 versus T1 tumors proved statistically significant. This was not found in surgically treated patients. The lower efficacy of PDT for T2 compared to T1 tumors was described previously by others 148,150. We therefore conclude that in the treatment of T1 tumors the efficacy of PDT is similar to surgery. In the treatment of T2 tumors surgery is more effective.Due to the possibility of salvage treatment, overall survival was not different for PDT and sur-gery. As described in literature, patients who did not achieve a CR still had the option of suc-cessful salvage treatment148,150. In a sub-analysis we studied whether the location of the pri-mary OSSC was relevant since especially PDT outcomes could be influenced by the location of the OSCC. Our data show that exclusion of tongue or soft palate tumors did not significantly change CR, LDFS or overall survival151.Comparison of our results with literature is difficult; as often only local control rates of tumors excised with clear surgical margins are described140,142,174. Exclusion of patients with involved or close margins will influence prognosis as status of surgical margins is widely known to influence local (regional) recurrences and survival 174-177. In a study that did describe the surgical margins after excision, 60% of stage I/II tumors were resected with clear margins and could be consid-ered a CR according to our definition176. This is a lower CR compared to our results. An explana-tion could be our inclusion of patients with tumors with an infiltration depth of ≤5mm, which is associated with a better clinical outcome113,177-180.113
Even though the majority of surgically treated patients received an elective neck dissection, this did not result in differences in survival as described in literature46,144,145. This might be due to the inclusion of only tumours with an infiltration depth ≤5mm, where the additional value of an elective neck dissection is low181. While our results show that the treatment results of PDT for T1 tumors are comparable to surgical treatment, the added benefit of PDT is not adequately stud-ied in literature155. Several studies describe possible advantages of PDT compared to standard treatment like decreased morbidity and possibility of repeated treatments 149,151,163-167,170,171.
Our study has some limitations; all PDT data are retrospectively derived from different centers while all surgically treated patients are derived from our own institution. While our inclusion criteria were chosen so that the cases from this surgical database optimally reflect the cases from the PDT database, differences in both groups are to be expected. For instance, for surgery infiltration depth ≤ 5mm was histologically assessed and can differ from tumor depth assessed by imaging as used for PDT. The pathologically assessed infiltration depth could be influenced by tissue shrinkage associated with fixation and pathological processing 182. A further difficulty
Table 3.2. Definition of complete response (CR) after initial therapy for both surgery and PDT.
PDT Surgery
Complete response Clinical examinationTreatment site is macroscopically normal with no evidence of tumor (observed on 2 occasions at least 4 weeks apart)
Histological examinationNegative surgical margin:- surgical margin free of tumor- surgical margin with low dysplasia
No complete response Clinical examinationpresence of tumor after treatment:- partial response- no response- progressive disease
Histological examinationPositive surgical margin:- involved surgical margin (< 1mm)- “close” surgical margin (1- 4 mm)- surgical margin with severe dysplasia

4948
Cha
pter
3
is what constitutes a positive resection margin. Many studies regard close or involved mar-gins as a “positive” margin 176,182,183. In our current study we adhered to our institutions protocol whereby severe dysplasia at the margins is considered a “positive” margin and thus as a failure of initial excision. As a consequence, our CR rate described for surgery is underestimated. No disease specific survival could be calculated due to insufficient data on cause of death for the PDT group. A recent non-randomized, matched control study described similar local disease control and survival for PDT and surgery in treatment of early stage SCC of the oral cavity 152. However, that study did not stratify according to T1 or T2 tumors. It is clear that a future pro-spective, comparative study should assess the efficacy of PDT compared to standard treatment on a group of well defined tumours. And more importantly, the differences in long term morbid-ity of PDT should be further explored.
In summary, treatment of primary T1 tumors of the oral cavity by either mTHPC mediated PDT or trans-oral surgery seems to result in similar outcomes. For T2 tumors PDT seemed less effec-tive; PDT and surgery showed similar overall survival rates for both T1 and T2 tumors. Besides the need for prospective and comparative studies to assess the efficacy of PDT compared to standard treatment, further emphasis should lay on the comparison of morbidity between mo-dalities.
Chapter 4
EpCAM in carcinogenesis: the good, the bad or the ugly
B.T. van der Guna, L.J. Melchersb,c, M.H. Ruitersd, L.F. de Leija, P.M. McLaughlina, M.G. Rotsa
aEpigenetic Editing group, Dept. of Pathology and Medical Biology, University of Groningen, University Medical Center Groningen, Groningen, The NetherlandsbDept. of Pathology and Medical Biology, University of Groningen, University Medical Center Groningen, Groningen, The NetherlandscDept. of Oral & Maxillofacial Surgery, University of Groningen, University Medical Center Groningen, Groningen, The NetherlandsdSynvolux Therapeutics Inc., Groningen, The Netherlands
Published in: Carcinogenesis. 2010 Nov;31(11):1913-21.
5352
Cha
pter
4
IntroductionThe epithelial cell adhesion molecule (EpCAM; CD326) is a transmembrane glycoprotein origi-nally discovered on colon carcinomas184. EpCAM is expressed by the epithelium of healthy indi-viduals, except by squamous epithelium, and some specific epithelial cell types, such as hepat-ocytes and keratinocytes185, but in most human carcinomas, EpCAM is overexpressed to varying degrees 186. The diagnostic and prognostic characteristics of EpCAM have been demonstrated by many independent research groups186,187 and the EpCAM overexpression is exploited in sever-al EpCAM directed antibody- or vaccine-based clinical trials for a wide variety of carcinomas188. Recently, EpCAM has been identified as an additional marker for cancer-initiating stem cells 189, which makes it an even more interesting target for cancer therapy.Several biological functions of EpCAM have been described: EpCAM is able to abrogate E-cad-herin-mediated cell–cell adhesion by disrupting the link between a-catenin and F-actin thereby loosening cell–cell adhesion72. In addition, association of EpCAM with claudin-7 interferes with EpCAM-mediated homotypic cell–cell adhesion, promoting cell motility, proliferation, survival, carcinogenesis and metastasis formation73. Furthermore, it has been shown that upon intram-embrane proteolysis of EpCAM, the intracellular domain functions as part of a transcriptional complex inducing c-myc and cyclin A and E expression190. These findings support a role for Ep-CAM as an oncogene. Indeed, EpCAM overexpression is associated with decreased overall sur-vival of patients with different types of cancer191-194 (see EpCAM: the Bad). In contrast to its promoting role regarding tumour formation, EpCAM is also described as a tumour suppressive protein. EpCAM was first proposed to function as a cell adhesion molecule since EpCAM is able to mediate homophilic adhesive interactions195, thereby preventing cell scattering. Due to these adhesive properties, EpCAM is likely to play a role in inhibition of in-vasion195,196. Indeed, loss of EpCAM contributed to increased migratory potential197 and EpCAM expression on metastases was lower compared with primary tumours198. Moreover, EpCAM overexpression in some carcinoma types is associated with improved patient survival199-203 (see EpCAM: the Good).The dual role of EpCAM is also reflected by mechanistic studies investigating the role of EpCAM by enforced modulation of EpCAM expression. Murine colorectal carcinoma cells transfected with murine EpCAM complementary DNA (cDNA) increased cell–cell adhesion, attenuated tu-mour cell invasion in matrigel and decreased tumour incidence and metastasis when inoculated in the spleen of the mice196. These data suggest that EpCAM expression antagonizes tumour growth and metastasis. In contrast, induction of EpCAM expression into human embryonic kidney cells (HEK293) as well as into murine fibroblasts showed an enhanced metabolism and colony formation capacity compared with the empty vector-transfected cells204. Furthermore, in four different carcinoma types, forced downregulation of EpCAM expression utilizing antisense or small interfering RNA (siRNA) decreased cell proliferation, migration and invasiveness69,204-207.Whether EpCAM acts as a tumour suppressive gene or as an oncogene might depend on the microenvironment. Since epigenetic regulation is associated with aberrant EpCAM expression, recent advances in epigenetic interference208,209 might be a promising novel approach to either
AbstractThe epithelial cell adhesion molecule (EpCAM) is a membrane glycoprotein that is highly ex-pressed on most carcinomas and therefore of potential use as a diagnostic and prognostic marker for a variety of carcinomas. Interestingly, EpCAM is explored as target in antibody-based therapies. Recently, EpCAM has been identified as an additional marker of cancer-initiat-ing cells. In this review, we describe the controversial biological role of EpCAM with the focus on carcinogenesis: as an adhesion molecule, Ep-CAM mediates homophilic adhesion interactions, which in turn might prevent metastasis. On the other hand, EpCAM abrogates E-cadherin me-diated cell–cell adhesion thereby promoting metastasis. Also, upon cleavage of EpCAM, the intracellular domain functions as a part of a transcriptional complex inducing c-myc and cyc-lin A and E. In line with these seemingly controversial roles, EpCAM overexpression has been associated with both decreased and increased survival of patients. Similarly, either induction or downregulation of EpCAM expression lowers the oncogenic potential depending on the cell type. As epigenetic dysregulation underlies aberrant EpCAM expression, we propose epigenetic editing as a novel approach to investigate the biological role of EpCAM, expanding the options for EpCAM as a therapeutic target in cancer.
55
Cha
pter
4
54
half LIM domain protein 2), b-catenin and the transcription factor Lef-1. This transcription com-plex binds the DNA at the Lef-1 consensus sites inducing c-myc and cyclin A and E expression190. The oncogenic potential of EpICD was demonstrated in a mouse xenograft model, in which HEK293 cells stably expressing EpCAM or EpICD produced nearly equivalent large tumours, whereas control cells only formed a small tumour in a single case190. Interestingly, EpCAM has also been identified as a marker for cancer-initiating stem cells for several carcinoma types: EpCAM expressing pancreatic cancer stem cells showed a 100-fold enhanced tumourigenic po-tential compared with EpCAM-negative pancreatic cancer stem cells219. Also, EpCAM-positive hepatocellular carcinoma stem cells, but not EpCAM-negative hepatocellular carcinoma stem cells, could efficiently initiate tumours in severe combined immunodeficient mice207. Also for breast cancer stem cells, the ability to form tumours in nonobese diabetic/severe combined immunodeficient mice was for EpCAM-positive cells 50-fold greater compared with the unfrac-tioned tumour cells220. Although both EpCAM negative and EpCAM-positive cancer stem cells were able to form tumours, 10-fold less EpCAM-positive cells than EpCAM-negative cells were able to induce tumours. Based on the above and on the application of EpCAM as a therapeutic immune target, it is clear that EpCAM is an important player in carcinogenesis; however, the exact biological roles are not clear. In some carcinoma types, EpCAM is the ‘good guy’, being associated with improved survival, whereas in other carcinoma types, EpCAM is the ‘bad guy’ being associated with de-creased survival. Interestingly, for several types of carcinoma both roles have been reported, which makes EpCAM an ‘ugly player’ for the clinical setting.
EpCAM: the Good?The name EpCAM reflects its function as a homophilic intercellular adhesion molecule as dem-onstrated by Litvinov et al.195. From this, one might expect EpCAM to prevent metastases and as such acting as a good guy. However, only for two tumour types, high EpCAM expression has been consistently associated with improved clinical outcome. In metastases of renal clear cell carcinomas, EpCAM was less frequently expressed than in primaries198 and high EpCAM expres-sion in the primary was associated with improved patient survival202,221. Similarly, in thyroid carcinoma, EpCAM expression was lower in less differentiated tumours and high expression correlated with improved survival199,222. Downregulation of EpCAM in these tumours might reflect general tumour dedifferentiation, rather than a functional downregula-tion for EMT. However, the recent study by Ralhan et al.222 indicates that loss of membranous EpCAM in anaplastic (undifferentiated) thyroid carcinoma might be due to cleavage of EpCAM. More details of these studies are presented in table 4.1.
EpCAM: the Bad?Based on the cell signalling role, EpCAM might very well play a promoting role in carcinogenesis as described for many tumour types (table 4.2). High EpCAM expression has been associated with decreased overall survival in carcinomas of the bladder191, gall bladder194 as well as of the
upregulate or downregulate EpCAM expression, depending on the tumour type. This review comprehensively summarizes the large body of evidence for EpCAM acting either as a tumour suppressor gene (the Good), an oncogene (the Bad) or both (the Ugly). We describe the increas-ing insights into (epi)genetic parameters involved in EpCAM regulation and discuss the carci-noma types that might benefit from future epigenetic approaches interfering with EpCAM gene expression, either inducing or repressing EpCAM expression.
Biological role of EpCAM in carcinogenesisThe highly overexpressed tumour-associated antigen on most carcinomas, currently referred to as EpCAM, has been ‘discovered’ multiple times188.With each discovery, EpCAM received the name of the respective monoclonal antibody or cDNA clone, leading to many synonyms including epithelial glycoprotein-2 (EGP-2), epithelialspecific antigen (ESA), GA733-2 and tumour-associated calcium signal transducer 1 (TACSTD1)188. EpCAM localizes to the basolat-eral membrane in normal epithelial tissue, but in carcinoma, this expression pattern changes to an intense uniform membranous overexpression, frequently also associated with cytoplas-mic staining69,197. In addition, EpCAM was found to be hyperglycosylated in carcinoma tissue as compared with healthy autologous epithelia210,211.EpCAM is a transmembrane protein consisting of an extracellular domain (EpEX), a single trans-membrane domain and a short 26-amino acid intracellular domain (EpICD)188. The extracellular domain comprises an epidermal growth factor-like domain, a thyroglobulin repeat domain fol-lowed by a cysteine-poor domain. The epidermal growth factor-like and thyroglobulin domains form a globular structure and are required for the homophilic cell-cell adhesion of EpCAM212. It has been suggested that the adhesive properties of EpCAM might prevent metastasis because intercellular adhesion should be reduced to gain the ability to migrate. Metastasis involves loss of cell-cell adhesion and cell polarity, an increase in cell motility and invasion. Development of such a mesenchymal phenotype is known as epithelial mesenchymal transition (EMT)213 and seems to require downregulation of EpCAM followed by re-expression at the site of the future metasta-sis. Indeed, EpCAM downregulation has been associated with EMT214,215 and in mice with colon carcinoma, small metastases were EpCAM negative but large metastases in the same mouse displayed an equal level of expression as the primary216, possibly reflecting the re-expression at the metastatic site. In line with these findings, one log reduction in EpCAM expression on circu-lating tumour cells was found compared with various primary tumours and their metastases217.However, EpCAM-mediated homotypic cell-cell adhesion is influenced by association with the tight-junction protein claudin-7. Complex formation of EpCAM, claudin-7, the variant isoform of the cell-matrix adhesion protein CD44v6 and the tetraspanin CO-029, recruited into tetraspa-nin-enriched membrane microdomains, has been shown to facilitate metastasis formation218. EpCAM is also capable of abrogating the E-cadherin-mediated adhesions and to rearrange the cytoskeleton of the cell72. Recently, EpCAM was identified as a signal transducer190: regulated intramembrane proteolysis by tumor necrosis factor-a-converting enzyme cleaves EpEX, and EpICD is cleaved by presenilin-2. EpICD associates with the adaptor protein FHL2 (four and a
57
Cha
pter
4
56
tric cancer, Du et al. reported that EpCAM expression was associated with nodal metastasis and higher EpCAM expression showed an increase in the proliferating cell nuclear antigen. Survival was not analysed here205,235, but in a different study EpCAM-positive disseminated tu-mour cells in pathological tumourfree lymph nodes were an independent prognostic factor for reduced survival236. Yet, other studies found no significant relations with expression228,237. How-ever, a protective role for EpCAM was reported by Songun et al.203: patients with high EpCAM
pancreas192,223. In breast carcinoma, high EpCAM expression was observed in less differenti-ated tumours224 and associated with larger tumours, nodal metastasis and worse survival193,225. Moreover, for this type of carcinoma, EpCAM was upregulated in metastases compared with the matched primary226 and high EpCAM expression was a poor prognostic factor in both, node-positive disease193 as well as in node-negative disease224. In cervical squamous epithelia, EpCAM expression increased from lowgrade to high-grade intraepithelial neoplasia and correlated with an increased proliferation as demonstrated by Ki-67 expression227.In the prostate, EpCAM expression was significantly increased from normal via prostatic in-traepithelial neoplasia to adenocarcinoma, but expression in adenocarcinoma was not asso-ciated with differentiation grade or clinical outcome228,229. Interestingly, hormone refractory carcinomas were found to express EpCAM in a significantly higher frequency than untreated carcinomas186, but this finding was not confirmed in another study230.In squamous cell carcinoma (SCC) of the lung, high EpCAM expression was associated with nodal metastasis, high-stage disease and poor differentiation231. A more recent study found only a trend towards a shorter survival in patients with high EpCAM expression228. In patients with adenocarcinoma of the lung, no clear correlations of EpCAM expression with cancer pro-gression, metastasis or survival have been found228,232. Although, EpCAM has been shown to be an accurate diagnostic marker for reverse transcription-polymerase chain reaction-based identification of lymph node micrometastasis and the presence of EpCAM-positive tumour cells in lymph nodes correlated with reduced survival rates233,234. The lack of a clear effect of EpCAM on survival in lung carcinoma might reflect different effects of EpCAM in various treatment sub-groups. Subgroup analysis, as performed for breast carcinoma, might provide more insights.For many other tumour types, high EpCAM expression has been associated with poor progno-sis, but contradictory reports underline a dual role of EpCAM. In these tumour types for which both protecting and promoting roles for EpCAM have been described, we consider EpCAM to be an ugly player.
EpCAM: the Ugly?For several tumour types, the reported role of EpCAM seems contradictory (table 4.3). In gas-
Table 4.1. Protective (-) role of EpCAM in carcinomas.
Carcinoma Carcinogenesis Progression Metastasis Survival References
Renal Cell ca. -p -p 0p -p Seligson, 2004202
0p -p 0p Went, 2005198
0p -p -p Klatte, 2009221
Thyroid ca. -p 0p -p Ensinger, 2006199
-p Ralhan, 2010222
–: a protecting role or longer survival associated with EpCAM expression; 0: no (significant) role found; p: in patient material; m: in mice/rats; c: in cell lines; ca.: carcinoma.
Table 4.2. Promoting (+) role of EpCAM in carcinomas.
Carcinoma Carcinogenesis Progression Metastasis Survival References
Gastrointestinal:
Gallbladder ca. 0p +p Varga, 2004194
Pancreatic ca. 0p +p Fong, 2008192
+m Li, 2007219
-disseminated cells +p +p Scheunemann, 2008223
Hepatocellular +c Yamashita, 2007255
+c,m +c Yamashita, 2009207
Lung:
SCC +p +p +p 0p Piyathilake, 2000231
Adenoca. 0p 0p 0p Kim, 2009232
Various types 0p 0p 0p Went, 2006228
-disseminated cells +p +p Kubuschok, 1999233
Breast:
+p +c +p,c Osta, 2004206
+c+m Al-Hajj, 2003220
+p +p Gastl, 2000225
+p +p +p Spizzo, 2004193
+p +p Schmidt, 2008224
+p Cimino, 2010226
Gynecological:
Cervix ca. +p Litvinov, 1996227
Urological:
Urothelial bladder ca. +p +p Brunner, 2008191
Prostate ca.
+p 0p Poczatek, 1999229
+p 0p 0p Zellweger, 2005230
0p 0p 0p Went, 2006228
+: a promoting role or shorter survival associated with EpCAM expression; 0: no (significant) role found; p: in patient material; m: in mice/rats; c: in cell lines; ca.: carcinoma.

59
Cha
pter
4
58
expression had a significantly better 10 years survival and loss of EpCAM identified aggressive tumours in early stage disease. Also for colorectal cancer (CRC), contradictory results have been reported. A reduced EpCAM expression at the invasive margin of CRC specimens correlated significantly with higher extent of tumour budding, tumour grade and risk of local recurrence197. Interestingly, this finding was associated with nuclear localization of b-catenin, consistent with the signal transducer func-tion of EpCAM. However, a significant positive correlation of EpCAM expression with survival has only been found in a subgroup of moderately differentiated colon cancers228. The interac-tion of EpCAM with the cell–matrix adhesion molecule CD44v6 and the tight junction molecule claudin-7 in association with the tetraspanin CO-029 in tetraspanin-enriched membrane mi-crodomains was initially found in CRC. Co-expression and complex formation of EpCAM and its partners (but not EpCAM alone) in liver metastases was accompanied by a significantly de-creased disease free survival218. Independently, CD44 and EpCAM were identified as markers of a subpopulation with greatly enhanced tumourigenicity in a human CRC—mouse xenograft238. In addition, EpCAM proved to be a good marker for reverse transcription-polymerase chain reaction-based detection of CRC metastases in lymph nodes239.In specimens of head and neck squamous cell carcinoma (HNSCC), EpCAM messenger RNA (mRNA) expression increased from hyperplasia via dysplasia to tumour, which might suggest a role for EpCAM in carcinogenesis240. EpCAM was also identified as a very good reverse transcrip-tion–polymerase chain reaction marker to detect micrometastases in lymph nodes241 and dissemi-nated HNSCC cells242. EpCAM is expressed de novo in HNSCC, but most studies do not find any re-lation with clinicopathologic variables, including differentiation and survival70,71,243,244. However, in a study looking specifically at tongue SCC, EpCAM expression was associated with larger tumour size, nodal metastasis and tumour dedifferentiation69. Interestingly, recently in a Taiwanese series of oral SCC, EpCAM expression was reported to decrease from normal via dysplasia to carcinoma, and lower EpCAM labeling index was associated with, among others, larger tumour size and pres-ence of nodal metastasis200. These adverse findings might be due to the large number of areca quid chewers in Taiwan. Areca quid has been shown to increase tumor necrosis factor-a produc-tion245 and therefore might downregulate EpCAM246. Additionally, the article also shows nuclear expression and staining of macrophages, which has not been shown in other studies using the same antibody70,186. In general, a lack of consistent association of EpCAM expression in HNSCC might be attributable to the heterogeneity of tumours included in these studies247. In a group of esophageal cancer (mainly SCC) patients, high EpCAM expression indicated a sig-nificantly higher survival rate201. In contrast, Stoecklein et al.248 identified high EpCAM as an independent prognostic factor for decreased survival. Others found no correlations with grade, stage or disease-specific survival187. Furthermore, the presence of EpCAM-positive cells in path-ological tumour-free lymph nodes was an independent indicator for a poor prognosis249. In epithelial ovarian cancer, EpCAM is highly overexpressed compared with normal ovarian surface epithelium and no differences in EpCAM expression were observed among different histological subtypes and grades in two independent studies. In one of these studies, with al-
Table 4.3. Protective (-) or promoting (+) role of EpCAM in carcinomas.
Carcinoma Carcinogenesis Progression Metastasis Survival References
Head & Neck:
Oral SCC 0p 0p 0p Laimer, 200870
+p 0p 0p Shiah, 200871
-p -p -p -p Hwang, 2008200
Hypopharyngeal SCC +c Munz, 2004204
Tongue SCC +p +p,c +p 0p Yanamoto, 200769
Gastrointestinal:
Esophageal ca.
+p 0p 0p 0p Went, 2008187
+p Stoecklein, 2006248
+p -p -p Kimura, 2007201
-disseminated cells +m +p,m +p Hosch, 2000249
Gastric ca. +c +p,m,c Du, 2009205
0p 0p Deveci, 2007237
-p Songun, 2005203
0p 0p Went, 2006228
-disseminated cells +p +p +p Scheunemann, 2009236
Colorectal ca. -p 0p -p/0p Went, 2006*228
-p 0p Gosens, 2007197
-m,c Basak, 1998196
+m Dalerba, 2007238
+p 0p 0p +p Kuhn, 2007§218
-disseminated cells +p Xi, 2006239
Gynecological:
Ovarian ca. +p 0p Heinzelmann, 2004251
+p -p Kim, 2003250
+p +p Spizzo, 2006252
+p +p Bellone, 2009253
+: a promoting role in carcinogenesis (e.g. higher expression in tumour compared to normal), tumour progression (higher in larger tumours), metastasis (higher in metastasized tumours) or shorter survival associated with EpCAM expression; –: a protecting role or longer survival associated with EpCAM expression; 0: no (significant) role found; p: in patient material; m: in mice/rats; c: in cell lines; ca.: carcinoma; * = effect on survival only in subgroup of moderately differentiated tumours; § = as complex.
most half of the tumours being of the borderline type (low malignant potential), International Federation of Gynecology and Obstetrics stage III/IV showed lower EpCAM expression than stage I250. However, in the other study, International Federation of Gynecology and Obstetrics stage III/IV showed significant higher EpCAM expression than stage I/II disease suggesting
61
Cha
pter
4
60
Despite the possible dual role described in patients with gastric carcinoma203,205,235, only down-regulation of EpCAM expression has been investigated. Downregulation of EpCAM by siRNA significantly suppressed proliferation, colony formation, adhesiveness, invasiveness and mi-gration of gastric cancer cell lines205,235, supporting a promoting role for EpCAM in gastric tu-mours. Furthermore, these treated cells with lower EpCAM expression showed a reduced tu-mour growth in nude mice235, and a tail vein metastatic assay showed that intravenous inocula-tion of EpCAM siRNA-treated gastric carcinoma cells led to significantly less visible tumours in the liver compared with non-treated cells205. Inhibition of EpCAM expression by antisense mRNA in an HNSCC cell line showed changes in morphology and reduced proliferation and me-tabolism204, indicating a promoting role for EpCAM in HNSCC.The above forced modulation studies suggest that EpCAM, whether it is a good or a bad guy for a given tumour, can serve as a therapeutic target for upregulation (good guy) or downregulation (bad guy).
Regulation of EpCAM expressionTo better understand why EpCAM is overexpressed in carcinomas, more insights in the regula-tion of the epcam gene itself are required; therefore the (epi)genetic events involved in EpCAM regulation will now be described.
GeneticsThe EpCAM protein is encoded by the TACSTD1 gene originally reported as the GA733-2 gene256. In the present manuscript, however, we prefer to use epcam as gene name because tumour-associated calcium signal transducer protein-1 precursor does not properly reflect the function of the encoded protein188. The epcam gene has a minimal estimated size of ~14 kb and is located on chromosome 2p21257. The epcam gene consists of a total of nine exons256, the mRNA is ~1.5 kb (NCBI: AH003574); all reported open reading frames of EpCAM are identical and encode a pro-tein of 314 amino acids258,259. No splicing variants were found, although a large number of carci-noma cell lines were screened212. To our knowledge, mutations in the epcam gene have only been identified in patients suffering from Lynch syndrome or congenital tufting enteropathy. In Lynch syndrome, different heterozygous germ line deletions disrupt the 3’-end of the epcam gene and lead to inactivation of the adjacent MSH2 gene through methylation induction of its promoter in tissues expressing EpCAM260. In congenital tufting enteropathy, four different point mutations have been described resulting in decreased or no expression of EpCAM on protein level261-263.The EpCAM promoter region that controls the expression of the gene has been cloned and char-acterized264-266. The sequence upstream of the transcription start site (TSS) has been defined266 (NCBI: AY148099). A 3.4 kb fragment of this EpCAM 5’-regulatory sequence is capable of direct-ing heterologous gene expression and the promoter activity is restricted to EpCAM-expressing cells266,267. A complementary study confirmed that the transcriptional activity of a 1.1 kb EpCAM fragment starting 770 bp upstream of the TSS directly correlated with the amount of EpCAM expression265. In silico analysis of the EpCAM promoter revealed several homologies to known
that a higher expression of EpCAM correlates with tumour progression, but no correlation with relapse-free survival or disease-specific survival was found251. A more recent study without bor-derline tumours did find differences among histological subtypes and a significantly higher Ep-CAM expression in poorly differentiated tumours and overexpression correlated with decreased overall survival252. In a study that also looked into the expression in metastastatic and recurrent disease, these tumours were found to express significantly higher levels of EpCAM compared with primaries253.Studies regarding the expression of EpCAM suffer from the use of different antibodies, scoring methods and heterogeneous groups of tumours analyzed, which might lead to differing, pos-sibly even contrasting results. Even when consistent results have been found, interpretation is not straightforward, as for example loss of EpCAM might be due to active downregulation during EMT or an effect of general tumour dedifferentiation. Nevertheless, it is quite clear that EpCAM plays a role in carcinogenesis, tumour progression and metastasis in various carcinoma types, providing opportunities for diagnosis and therapeutic interventions.
Modulation of EpCAM expression to address the biological role of EpCAMThe function of EpCAM as an adhesion molecule was discovered by induction of EpCAM in non-EpCAM-expressing cells195. Transfection of EpCAM murine cDNA in fibroblast and mammary carcinoma cell lines resulted in aggregates of cells caused by increased intercellular adhesion. Moreover, the EpCAM-positive transfectants segregated from the EpCAM-negative parental cells and EpCAM expression inhibited invasive growth in cell colonies. Additional evidence sup-porting the protective role of EpCAM in carcinogenesis has been obtained by either induction of EpCAM expression in colon or reduction of EpCAM in lung adenocarcinoma cell lines. Murine colorectal carcinoma cells transfected with cDNA encoding the murine EpCAM showed signifi-cant lower growth rates, colony formation and invasion through matrigel in vitro compared with the vector-only-transfected cells196. Also cells transfected with cDNA encoding humane EpCAM showed reduced invasion through matrigel196. In syngeneic immunodeficient and immunocom-petent mice, the EpCAM-transfected murine colorectal cells showed a reduction in metastatic potential compared with the control-transfected cells. In a lung adenocarcinoma cell line, reduc-tion of EpCAM expression using short hairpin RNA showed an elevated cell invasion254.Evidence supporting the promoting role of EpCAM in carcinogenesis has also been reported: stable transfection of EpCAM cDNA in HEK293 cells and murine fibroblast cells resulted in an increased metabolic activity and formation of larger and more colonies compared with the empty vector-transfected cells. Moreover, EpCAM expressing HEK293 induced the expression of c-myc and cyclins A and E204. Also silencing of EpCAM expression by siRNA in breast cancer cell lines showed inhibition of proliferation, migration and invasion of the treated cells206, which reflects the correlation between high EpCAM expression and poor prognosis in breast cancer patients. In agreement with its promoting role in patients with hepatocellular carcinoma and SCC of the tongue, siRNA-mediated EpCAM reduction in cell lines decreased the invasion po-tential and proliferation of the cancer cells69,207,255.
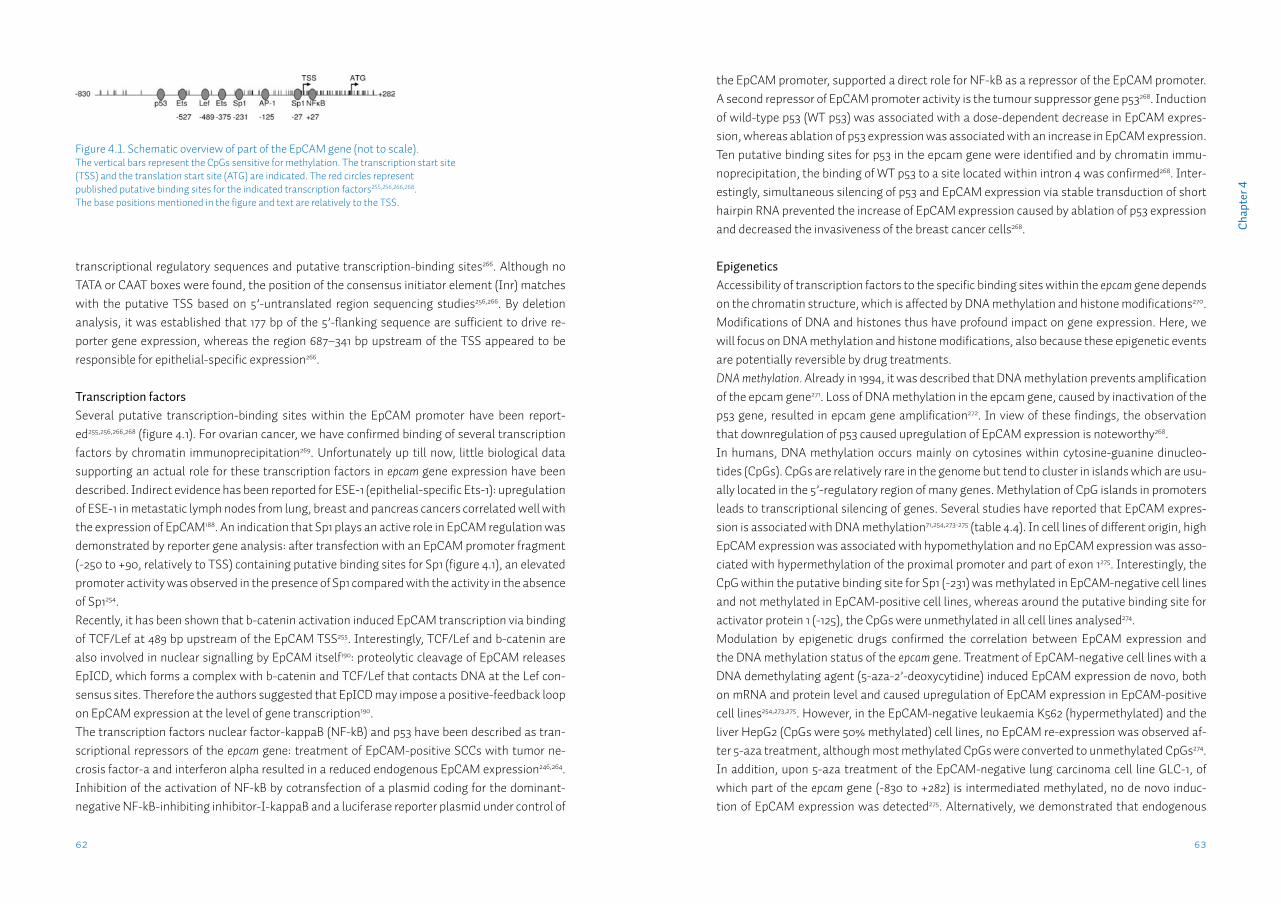
63
Cha
pter
4
62
the EpCAM promoter, supported a direct role for NF-kB as a repressor of the EpCAM promoter. A second repressor of EpCAM promoter activity is the tumour suppressor gene p53268. Induction of wild-type p53 (WT p53) was associated with a dose-dependent decrease in EpCAM expres-sion, whereas ablation of p53 expression was associated with an increase in EpCAM expression. Ten putative binding sites for p53 in the epcam gene were identified and by chromatin immu-noprecipitation, the binding of WT p53 to a site located within intron 4 was confirmed268. Inter-estingly, simultaneous silencing of p53 and EpCAM expression via stable transduction of short hairpin RNA prevented the increase of EpCAM expression caused by ablation of p53 expression and decreased the invasiveness of the breast cancer cells268.
EpigeneticsAccessibility of transcription factors to the specific binding sites within the epcam gene depends on the chromatin structure, which is affected by DNA methylation and histone modifications270. Modifications of DNA and histones thus have profound impact on gene expression. Here, we will focus on DNA methylation and histone modifications, also because these epigenetic events are potentially reversible by drug treatments. DNA methylation. Already in 1994, it was described that DNA methylation prevents amplification of the epcam gene271. Loss of DNA methylation in the epcam gene, caused by inactivation of the p53 gene, resulted in epcam gene amplification272. In view of these findings, the observation that downregulation of p53 caused upregulation of EpCAM expression is noteworthy268.In humans, DNA methylation occurs mainly on cytosines within cytosine-guanine dinucleo-tides (CpGs). CpGs are relatively rare in the genome but tend to cluster in islands which are usu-ally located in the 5’-regulatory region of many genes. Methylation of CpG islands in promoters leads to transcriptional silencing of genes. Several studies have reported that EpCAM expres-sion is associated with DNA methylation71,254,273-275 (table 4.4). In cell lines of different origin, high EpCAM expression was associated with hypomethylation and no EpCAM expression was asso-ciated with hypermethylation of the proximal promoter and part of exon 1275. Interestingly, the CpG within the putative binding site for Sp1 (-231) was methylated in EpCAM-negative cell lines and not methylated in EpCAM-positive cell lines, whereas around the putative binding site for activator protein 1 (-125), the CpGs were unmethylated in all cell lines analysed274.Modulation by epigenetic drugs confirmed the correlation between EpCAM expression and the DNA methylation status of the epcam gene. Treatment of EpCAM-negative cell lines with a DNA demethylating agent (5-aza-2’-deoxycytidine) induced EpCAM expression de novo, both on mRNA and protein level and caused upregulation of EpCAM expression in EpCAM-positive cell lines254,273,275. However, in the EpCAM-negative leukaemia K562 (hypermethylated) and the liver HepG2 (CpGs were 50% methylated) cell lines, no EpCAM re-expression was observed af-ter 5-aza treatment, although most methylated CpGs were converted to unmethylated CpGs274. In addition, upon 5-aza treatment of the EpCAM-negative lung carcinoma cell line GLC-1, of which part of the epcam gene (-830 to +282) is intermediated methylated, no de novo induc-tion of EpCAM expression was detected275. Alternatively, we demonstrated that endogenous
transcriptional regulatory sequences and putative transcription-binding sites266. Although no TATA or CAAT boxes were found, the position of the consensus initiator element (Inr) matches with the putative TSS based on 5’-untranslated region sequencing studies256,266. By deletion analysis, it was established that 177 bp of the 5’-flanking sequence are sufficient to drive re-porter gene expression, whereas the region 687–341 bp upstream of the TSS appeared to be responsible for epithelial-specific expression266.
Transcription factorsSeveral putative transcription-binding sites within the EpCAM promoter have been report-ed255,256,266,268 (figure 4.1). For ovarian cancer, we have confirmed binding of several transcription factors by chromatin immunoprecipitation269. Unfortunately up till now, little biological data supporting an actual role for these transcription factors in epcam gene expression have been described. Indirect evidence has been reported for ESE-1 (epithelial-specific Ets-1): upregulation of ESE-1 in metastatic lymph nodes from lung, breast and pancreas cancers correlated well with the expression of EpCAM188. An indication that Sp1 plays an active role in EpCAM regulation was demonstrated by reporter gene analysis: after transfection with an EpCAM promoter fragment (-250 to +90, relatively to TSS) containing putative binding sites for Sp1 (figure 4.1), an elevated promoter activity was observed in the presence of Sp1 compared with the activity in the absence of Sp1254. Recently, it has been shown that b-catenin activation induced EpCAM transcription via binding of TCF/Lef at 489 bp upstream of the EpCAM TSS255. Interestingly, TCF/Lef and b-catenin are also involved in nuclear signalling by EpCAM itself190: proteolytic cleavage of EpCAM releases EpICD, which forms a complex with b-catenin and TCF/Lef that contacts DNA at the Lef con-sensus sites. Therefore the authors suggested that EpICD may impose a positive-feedback loop on EpCAM expression at the level of gene transcription190.The transcription factors nuclear factor-kappaB (NF-kB) and p53 have been described as tran-scriptional repressors of the epcam gene: treatment of EpCAM-positive SCCs with tumor ne-crosis factor-a and interferon alpha resulted in a reduced endogenous EpCAM expression246,264. Inhibition of the activation of NF-kB by cotransfection of a plasmid coding for the dominant-negative NF-kB-inhibiting inhibitor-I-kappaB and a luciferase reporter plasmid under control of
Figure 4.1. Schematic overview of part of the EpCAM gene (not to scale). The vertical bars represent the CpGs sensitive for methylation. The transcription start site(TSS) and the translation start site (ATG) are indicated. The red circles representpublished putative binding sites for the indicated transcription factors255,256,266,268.The base positions mentioned in the figure and text are relatively to the TSS.
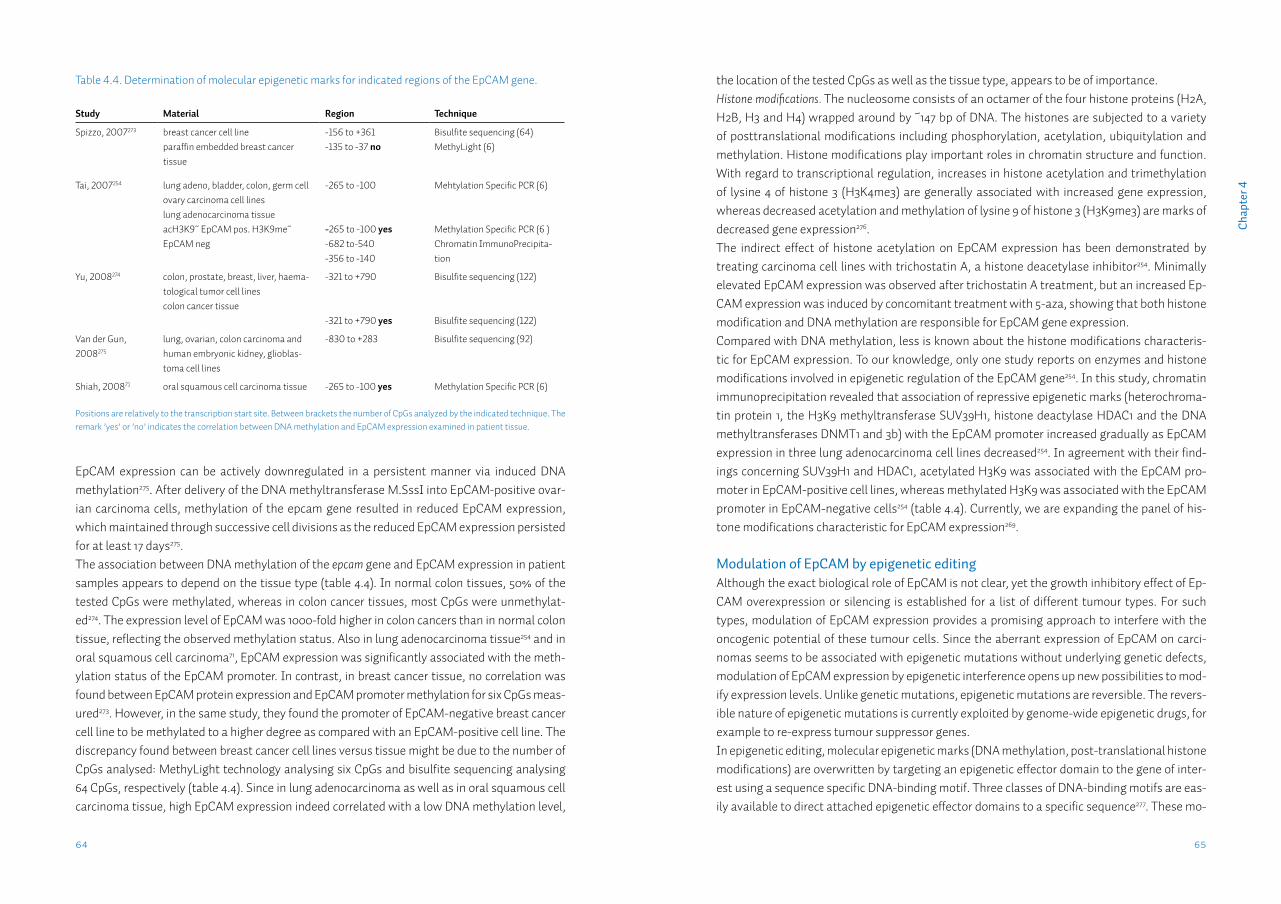
65
Cha
pter
4
64
the location of the tested CpGs as well as the tissue type, appears to be of importance.Histone modifications. The nucleosome consists of an octamer of the four histone proteins (H2A, H2B, H3 and H4) wrapped around by ~147 bp of DNA. The histones are subjected to a variety of posttranslational modifications including phosphorylation, acetylation, ubiquitylation and methylation. Histone modifications play important roles in chromatin structure and function. With regard to transcriptional regulation, increases in histone acetylation and trimethylation of lysine 4 of histone 3 (H3K4me3) are generally associated with increased gene expression, whereas decreased acetylation and methylation of lysine 9 of histone 3 (H3K9me3) are marks of decreased gene expression276.The indirect effect of histone acetylation on EpCAM expression has been demonstrated by treating carcinoma cell lines with trichostatin A, a histone deacetylase inhibitor254. Minimally elevated EpCAM expression was observed after trichostatin A treatment, but an increased Ep-CAM expression was induced by concomitant treatment with 5-aza, showing that both histone modification and DNA methylation are responsible for EpCAM gene expression. Compared with DNA methylation, less is known about the histone modifications characteris-tic for EpCAM expression. To our knowledge, only one study reports on enzymes and histone modifications involved in epigenetic regulation of the EpCAM gene254. In this study, chromatin immunoprecipitation revealed that association of repressive epigenetic marks (heterochroma-tin protein 1, the H3K9 methyltransferase SUV39H1, histone deactylase HDAC1 and the DNA methyltransferases DNMT1 and 3b) with the EpCAM promoter increased gradually as EpCAM expression in three lung adenocarcinoma cell lines decreased254. In agreement with their find-ings concerning SUV39H1 and HDAC1, acetylated H3K9 was associated with the EpCAM pro-moter in EpCAM-positive cell lines, whereas methylated H3K9 was associated with the EpCAM promoter in EpCAM-negative cells254 (table 4.4). Currently, we are expanding the panel of his-tone modifications characteristic for EpCAM expression269.
Modulation of EpCAM by epigenetic editingAlthough the exact biological role of EpCAM is not clear, yet the growth inhibitory effect of Ep-CAM overexpression or silencing is established for a list of different tumour types. For such types, modulation of EpCAM expression provides a promising approach to interfere with the oncogenic potential of these tumour cells. Since the aberrant expression of EpCAM on carci-nomas seems to be associated with epigenetic mutations without underlying genetic defects, modulation of EpCAM expression by epigenetic interference opens up new possibilities to mod-ify expression levels. Unlike genetic mutations, epigenetic mutations are reversible. The revers-ible nature of epigenetic mutations is currently exploited by genome-wide epigenetic drugs, for example to re-express tumour suppressor genes.In epigenetic editing, molecular epigenetic marks (DNA methylation, post-translational histone modifications) are overwritten by targeting an epigenetic effector domain to the gene of inter-est using a sequence specific DNA-binding motif. Three classes of DNA-binding motifs are eas-ily available to direct attached epigenetic effector domains to a specific sequence277. These mo-
EpCAM expression can be actively downregulated in a persistent manner via induced DNA methylation275. After delivery of the DNA methyltransferase M.SssI into EpCAM-positive ovar-ian carcinoma cells, methylation of the epcam gene resulted in reduced EpCAM expression, which maintained through successive cell divisions as the reduced EpCAM expression persisted for at least 17 days275.The association between DNA methylation of the epcam gene and EpCAM expression in patient samples appears to depend on the tissue type (table 4.4). In normal colon tissues, 50% of the tested CpGs were methylated, whereas in colon cancer tissues, most CpGs were unmethylat-ed274. The expression level of EpCAM was 1000-fold higher in colon cancers than in normal colon tissue, reflecting the observed methylation status. Also in lung adenocarcinoma tissue254 and in oral squamous cell carcinoma71, EpCAM expression was significantly associated with the meth-ylation status of the EpCAM promoter. In contrast, in breast cancer tissue, no correlation was found between EpCAM protein expression and EpCAM promoter methylation for six CpGs meas-ured273. However, in the same study, they found the promoter of EpCAM-negative breast cancer cell line to be methylated to a higher degree as compared with an EpCAM-positive cell line. The discrepancy found between breast cancer cell lines versus tissue might be due to the number of CpGs analysed: MethyLight technology analysing six CpGs and bisulfite sequencing analysing 64 CpGs, respectively (table 4.4). Since in lung adenocarcinoma as well as in oral squamous cell carcinoma tissue, high EpCAM expression indeed correlated with a low DNA methylation level,
Table 4.4. Determination of molecular epigenetic marks for indicated regions of the EpCAM gene.
Study Material Region Technique
Spizzo, 2007273 breast cancer cell lineparaffin embedded breast cancer tissue
-156 to +361-135 to -37 no
Bisulfite sequencing (64)MethyLight (6)
Tai, 2007254 lung adeno, bladder, colon, germ cell ovary carcinoma cell lineslung adenocarcinoma tissueacH3K9~ EpCAM pos. H3K9me~ EpCAM neg
-265 to -100
-265 to -100 yes-682 to-540-356 to -140
Mehtylation Specific PCR (6)
Methylation Specific PCR (6 )Chromatin ImmunoPrecipita-tion
Yu, 2008274 colon, prostate, breast, liver, haema-tological tumor cell linescolon cancer tissue
-321 to +790
-321 to +790 yes
Bisulfite sequencing (122)
Bisulfite sequencing (122)
Van der Gun, 2008275
lung, ovarian, colon carcinoma and human embryonic kidney, glioblas-toma cell lines
-830 to +283 Bisulfite sequencing (92)
Shiah, 200871 oral squamous cell carcinoma tissue -265 to -100 yes Methylation Specific PCR (6)
Positions are relatively to the transcription start site. Between brackets the number of CpGs analyzed by the indicated technique. The remark ’yes’ or ’no’ indicates the correlation between DNA methylation and EpCAM expression examined in patient tissue.

67
Cha
pter
4
66
of membrane EpEX was accompanied by increased cytoplasmic and nuclear EpICD and nuclear b-catenin localization222. Moreover, both loss of membranous EpEX as well as the presence of nuclear EpICD correlated with reduced patient survival. To our knowledge, this is the first study on a series of patient material showing the nuclear presence of EpICD. This finding suggests that the loss of membranous EpCAM expression as also observed in another thyroid carcinoma study199 might be due to cleavage more than functional downregulation of EpCAM as proposed in EMT. On the other hand, proteolysis of EpCAM could also explain the association of high EpCAM expression with poor survival. It has been suggested that EpICD in its transcription complex might induce EpCAM transcription via binding of Lef to the EpCAM promoter190,255. Proteolysis of EpCAM induces shedding of EpEX followed by increased nuclear EpICD, which in turn might increase EpCAM expression. However, it is not clear why re-expression of mem-branous EpCAM appears not to take place in thyroid cancer, which directs to a tumour type dependent role for EpCAM.In addition to taking EpICD into account, analysis for concomitant presence of claudin 773, CO-029, CD44v6 and EpCAM expression might give more information regarding patient survival, since not the solitary expression, but the presence of all four molecules in a complex formation has been shown to facilitate metastasis218. Future clinicopathologic studies assessing co-ex-pression of EpCAM in combination with its partners and nuclear EpICD staining may solve the ugly role of EpCAM in cancer. In this review, we classified the tumour types for which EpCAM acts as potential diagnostic marker with some prognostic significance187. EpCAM functions as a target in antibody-based clinical trials and in 2009, the European Medicines Agency approved the use of trifunctional bispecific antibody catumaxomab, which binds to EpCAM and enhances the immunological response against EpCAM-positive cells in malignant ascites285. The emerging function of Ep-CAM in cell proliferation, migration and possibly cancer initiation284 broadens the interest to use EpCAM not only as an immunotarget but also as a target for epigenetic silencing. Cancer stem cells expressing EpCAM are more tumourigenic than EpCAM-negative stem cells286 and because cancer stem cells are radiation and drug resistant, targeting EpCAM might be a prom-ising approach to stop tumour initiation and progression. Since epigenetic dysregulation seems to underly aberrant EpCAM expression, epigenetic editing provides unique tools to elucidate the promoting or protective role of EpCAM by upregulate or downregulate EpCAM expression.
Acknowledgements: We apologize to our colleagues that due to size constraints, we could not profoundly describe all their work on the role of EpCAM in cancer.
Funding: This study has been partially funded by EU FP7 EuroTransBio: ProTuMa ETB09008.
tifs are either based on synthetic polyamides, on designed recombinant zinc finger moieties278 or on oligonucleotides, which can form triple helices with the target double-strand DNA279.Trimeric and hexameric zinc finger proteins have been designed to target the EpCAM promoter and when fused to a transcriptional repressor or an activation domain, these artificial transcrip-tion factors have been shown to modulate the EpCAM promoter activity280. Recently, we also designed an EpCAM-specific triple helix-forming oligonucleotide, which when coupled to a mu-tant methyltransferase is able to target methylation predominantly to a specific DNA sequence in the EpCAM promoter without significant background methylation281. Alternatively, histone modifiers like the histone methyltransferase SUV39H1 and G9a have been successfully used as epigenetic effector domains to silence genes: a minimal catalytic domain of the histone methyl-transferase linked to a zinc finger targeting the vascular endothelial growth factor gene showed enrichment of H3K9 methylation associated with the vascular endothelial growth factor pro-moter, resulting in transcriptional repression of the vascular endothelial growth factor gene282. Similarly, epigenetically silenced genes can be re-expressed: the hypermethylated tumour sup-pressor gene maspin was reactivated by an engineered zinc finger protein targeting the maspin promoter fused to VP64283. As effects from enforced upregulation from its natural promoter can be directly compared with sustained downregulation within the same models, epigenetic mod-ulation of the epcam gene is a promising new tool in unravelling the role of EpCAM, opening up novel approaches in exploiting EpCAM as an anti-carcinoma therapeutic.
EpCAM in perspectiveWhether EpCAM is a good or bad guy in cancer appears to be dependent on the cancer type. The ‘ugly’ role of EpCAM is reflected by studies describing both a protective and a promoting role within the very same cancer type. Tumours are very heterogeneous, consisting of phenotypi-cally diverse cells, which is also reflected in the EpCAM expression. It might be that the role of EpCAM is not tumour type dependent but that the cell environment determines which function of EpCAM will dominate, resulting in the balance to either shift to a protective or promoting role in cancer. Eventually, because of this delicate balance, unravelling what triggers the cancer-promoting role will be a challenge.The identification of EpCAM as a signal transducer has been a step forward towards elucidating a direct promoting role of EpCAM in carcinogenesis190. As suggested by Munz et al.284 studies examining clinicopathologic correlations with surface EpCAM expression should be expanded with EpICD staining to better elucidate the signal-transducing role of EpCAM in tumour tis-sues. It would be interesting to know for example whether the reduced EpCAM expression ob-served at the invasive margin of rectal tumours197 is a result of cleavage of EpEX, followed by cleavage and translocation of EpICD to the nucleus promoting a more tumourigenic phenotype. Such translocation is indeed suggested in rectal tumours by increased cytoplasmic EpCAM staining and nuclear translocation of b-catenin197, a partner of the EpICD transcription com-plex. Nuclear localization of EpICD might have been unambigiously proven by using an EpICD-specific antibody. Interestingly, very recently, a study on thyroid carcinomas reported that loss
Chapter 5
Lack of claudin-7 is a strong predictor of regional recurrence in oral and oropharyngeal squamous cell carcinoma
L.J. Melchersa,b, L. Bruine de Bruinc, U. Schnelld, L. Slagter-Menkemab,c, M.F. Mastikb, G.H. de Bocke, B.A.C. van Dijkf, B.N.G. Giepmansd, B.F.A.M. van der Laanc, J.E. van der Walb,1, J.L.N. Roodenburga, E. Schuuringb
aDept. of Oral & Maxillofacial Surgery, University of Groningen, University Medical Center Groningen, Groningen, The NetherlandsbDept. of Pathology, University of Groningen, University Medical Center Groningen, Groningen, The NetherlandscDept. of Otorhinolaryngology/Head & Neck Surgery, University of Groningen, University Medical Center Groningen, Groningen, The NetherlandsdDept. of Cell Biology, University of Groningen, University Medical Center Groningen, Groningen, The NetherlandseDept. of Epidemiology, University of Groningen, University Medical Center Groningen, Groningen, The Netherlands fComprehensive Cancer Center The Netherlands, Utrecht, The Netherlands
Published in: Oral Oncol. 2013 Oct;49(10):998-1005.

71
Cha
pter
5
AbstractObjectives: Adequate treatment of oral and oropharyngeal squamous cell carcinoma (OSCC) is dependent on correctly predicting the presence of lymph node metastases. Current methods to diagnose nodal metastases partly result in overtreatment with associated morbidity and un-dertreatment with decreased disease-free survival. E-cadherin has been studied extensively as potential marker for lymph node metastases. EpCAM and claudin-7 have a functional relation-ship with E-cadherin, forming a complex that promotes tumourigenicity in vitro. We hypoth-esize that the co-expression patterns of these related molecules is a better prognostic marker for nodal status and regional recurrences.
Materials and Methods: We constructed separate tissue microarrays of tumour centre and tu-mour invasive front of 227 OSCC with complete clinicopathological and follow-up data, includ-ing HPV status, and performed immunohistochemistry for these molecules.
Results: Lack of E-cadherin and presence of cytoplasmic EpCAM expression in the tumour front were predictive for nodal metastasis, but no co-expression pattern was found clinically relevant. Lack of claudin-7 in the tumour centre was highly and independently predictive for shorter regional disease-free survival (HR=0.19; 95%CI:0.06-0.62) and disease-specific survival (HR=0.43; 95%CI:0.21-0.87). High-risk HPV was not associated with any marker.
Conclusions: The expression of E-cadherin and EpCAM, depending on the specific tumour sub-localization, is predictive for nodal status. However, co-expression did not improve the predic-tion of nodal status, indicating that the proposed in vitro complex is not functional in clinical samples. Additionally, lack of claudin-7 expression in the tumour centre may be used to identify patients with increased risk for regional recurrence.
IntroductionThe incidence of cancers of the oral cavity and oropharynx has seen a dramatic increase over the last decades8,107,287. These cancers are predominantly squamous cell carcinomas1 and are treated using the same treatment modalities. 30-50% of oropharyngeal tumours and a lower percentage of oral cavity tumours are positive for human papilloma virus (HPV)17. Although HPV+ tumours respond significantly better to therapy, to date clinical management for this subgroup has not changed21. Therefore, the most important factor in prognosis and treatment choice in oral and oropharyngeal squamous cell carcinoma (OSCC) in both HPV+ and HPV- tumours is the presence of metastases in the lymph nodes of the neck16,22. However, in 10 to 20% of the patients clinically diagnosed with lymph node metastases (cN+), no lymph node metastases are found (pN0)33. Conversely, when patients are clinically diagnosed without lymph node metastases in the neck (cN0) and do not receive a neck dissection, 24-50% develop regional recurrences, associated with decreased survival40,46,288. Therefore, when the chance for occult metastases is thought to be greater than 20% (based on location, stage and tumour infiltration depth), an elective neck dissection is performed39. Of these patients 70-80% do not show lymph node metastases (pN0) and received an unnecessary neck dissection, with associated morbidity43,44.Based on the hypothesis that loss or gain of expression of certain genes in the primary tumour confers the ability to metastasize, many biomarkers have been studied for the prediction of the metastatic potential in OSCC in recent years59. Loss of cell-cell adhesion is considered an essen-tial step in the process of metastasis289, making cell-cell adhesion proteins potential predictive biomarkers for both N status and regional recurrence. E-cadherin is one of the best studied cell-cell adhesion proteins and is expressed in normal epi-thelial tissues. Decreased expression is associated with metastasis in various carcinomas290. In head-neck cancer decreased E-cadherin expression was associated with N status291,292, and with regional recurrence291,293, but many studies reported on a lack of such association294-299. The trans-membrane cell-cell adhesion molecule, EpCAM195, is frequently overexpressed in various cancer types. When expressed in E-cadherin expressing cells, EpCAM weakens the E-cadherin adhe-sion by disrupting the link between alpha-catenin and F-actin, resulting in less cell aggregates in vitro72. In various cancer types, EpCAM overexpression has been associated with nodal metas-tasis191,193,231 and shorter survival192,225,248. In contrast with most other tumour types, in head-neck cancer, EpCAM is expressed de novo69,240,300. As for E-cadherin, EpCAM expression was associ-ated with metastasis in head-neck cancer69, but many studies did not find an association70,71,244. EpCAM was reported to be part of a complex of proteins, including claudin-7 and CD44v6, that is located in tetraspanin-enriched microdomains (TEMs)218. Association of EpCAM with the tight-junction protein claudin-7 has been found to be essential for the functioning of this complex73. This complex prevents the oligomerization of EpCAM, thereby blocking its adhesive functions, and increases HEK cell migration in scratch and transwell assays, amongst others73.The contradictory results found in literature for E-cadherin, EpCAM and claudin-7 as predictive markers for the metastatic potential in OSCC might therefore be due to the interactive modu-
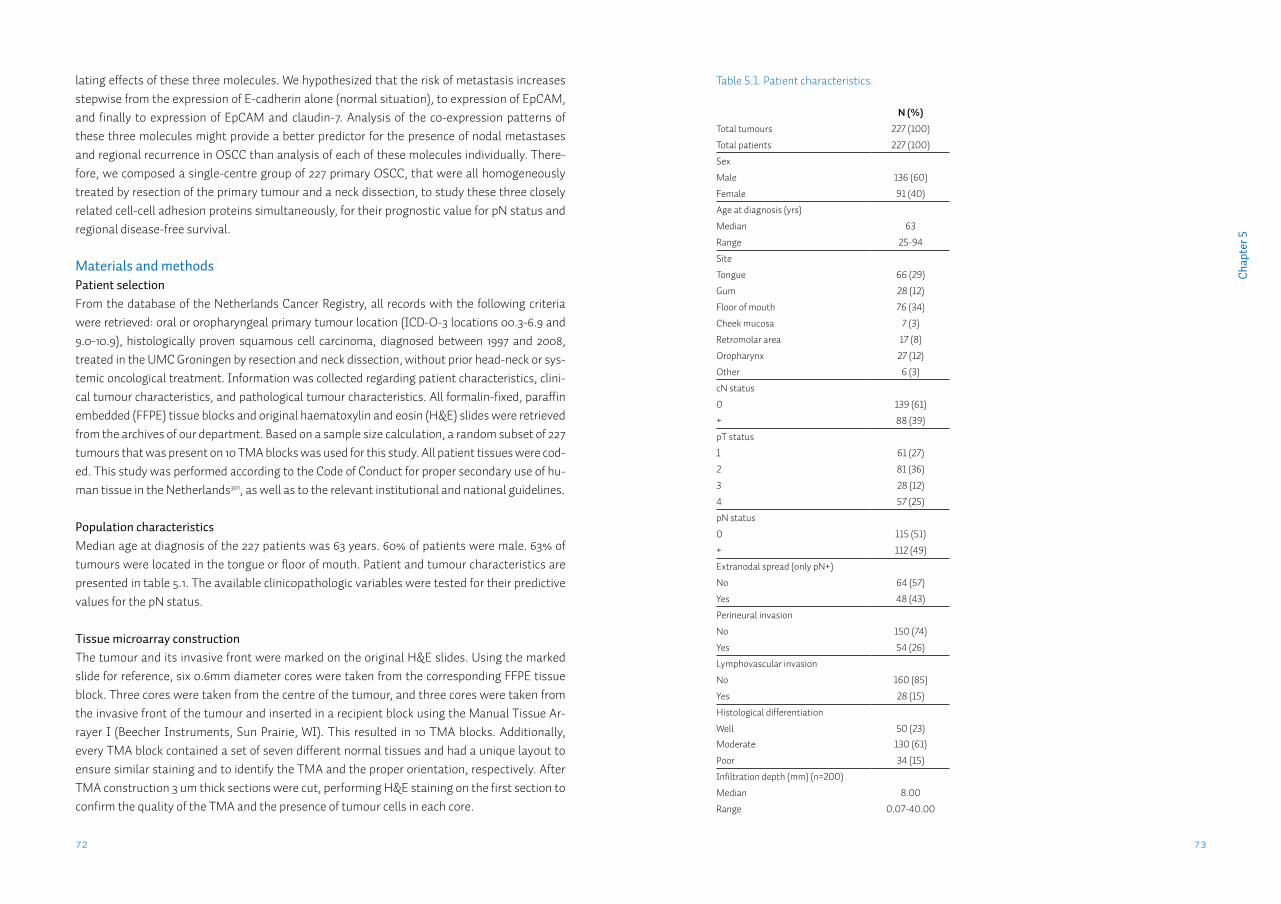
73
Cha
pter
5
72
lating effects of these three molecules. We hypothesized that the risk of metastasis increases stepwise from the expression of E-cadherin alone (normal situation), to expression of EpCAM, and finally to expression of EpCAM and claudin-7. Analysis of the co-expression patterns of these three molecules might provide a better predictor for the presence of nodal metastases and regional recurrence in OSCC than analysis of each of these molecules individually. There-fore, we composed a single-centre group of 227 primary OSCC, that were all homogeneously treated by resection of the primary tumour and a neck dissection, to study these three closely related cell-cell adhesion proteins simultaneously, for their prognostic value for pN status and regional disease-free survival.
Materials and methodsPatient selectionFrom the database of the Netherlands Cancer Registry, all records with the following criteria were retrieved: oral or oropharyngeal primary tumour location (ICD-O-3 locations 00.3-6.9 and 9.0-10.9), histologically proven squamous cell carcinoma, diagnosed between 1997 and 2008, treated in the UMC Groningen by resection and neck dissection, without prior head-neck or sys-temic oncological treatment. Information was collected regarding patient characteristics, clini-cal tumour characteristics, and pathological tumour characteristics. All formalin-fixed, paraffin embedded (FFPE) tissue blocks and original haematoxylin and eosin (H&E) slides were retrieved from the archives of our department. Based on a sample size calculation, a random subset of 227 tumours that was present on 10 TMA blocks was used for this study. All patient tissues were cod-ed. This study was performed according to the Code of Conduct for proper secondary use of hu-man tissue in the Netherlands301, as well as to the relevant institutional and national guidelines.
Population characteristicsMedian age at diagnosis of the 227 patients was 63 years. 60% of patients were male. 63% of tumours were located in the tongue or floor of mouth. Patient and tumour characteristics are presented in table 5.1. The available clinicopathologic variables were tested for their predictive values for the pN status.
Tissue microarray constructionThe tumour and its invasive front were marked on the original H&E slides. Using the marked slide for reference, six 0.6mm diameter cores were taken from the corresponding FFPE tissue block. Three cores were taken from the centre of the tumour, and three cores were taken from the invasive front of the tumour and inserted in a recipient block using the Manual Tissue Ar-rayer I (Beecher Instruments, Sun Prairie, WI). This resulted in 10 TMA blocks. Additionally, every TMA block contained a set of seven different normal tissues and had a unique layout to ensure similar staining and to identify the TMA and the proper orientation, respectively. After TMA construction 3 um thick sections were cut, performing H&E staining on the first section to confirm the quality of the TMA and the presence of tumour cells in each core.
Table 5.1. Patient characteristics.
N (%)Total tumours 227 (100)
Total patients 227 (100)
Sex
Male 136 (60)
Female 91 (40)
Age at diagnosis (yrs)
Median 63
Range 25-94
Site
Tongue 66 (29)
Gum 28 (12)
Floor of mouth 76 (34)
Cheek mucosa 7 (3)
Retromolar area 17 (8)
Oropharynx 27 (12)
Other 6 (3)
cN status
0 139 (61)
+ 88 (39)
pT status
1 61 (27)
2 81 (36)
3 28 (12)
4 57 (25)
pN status
0 115 (51)
+ 112 (49)
Extranodal spread (only pN+)
No 64 (57)
Yes 48 (43)
Perineural invasion
No 150 (74)
Yes 54 (26)
Lymphovascular invasion
No 160 (85)
Yes 28 (15)
Histological differentiation
Well 50 (23)Moderate 130 (61)
Poor 34 (15)
Infiltration depth (mm) (n=200)
Median 8.00
Range 0.07-40.00
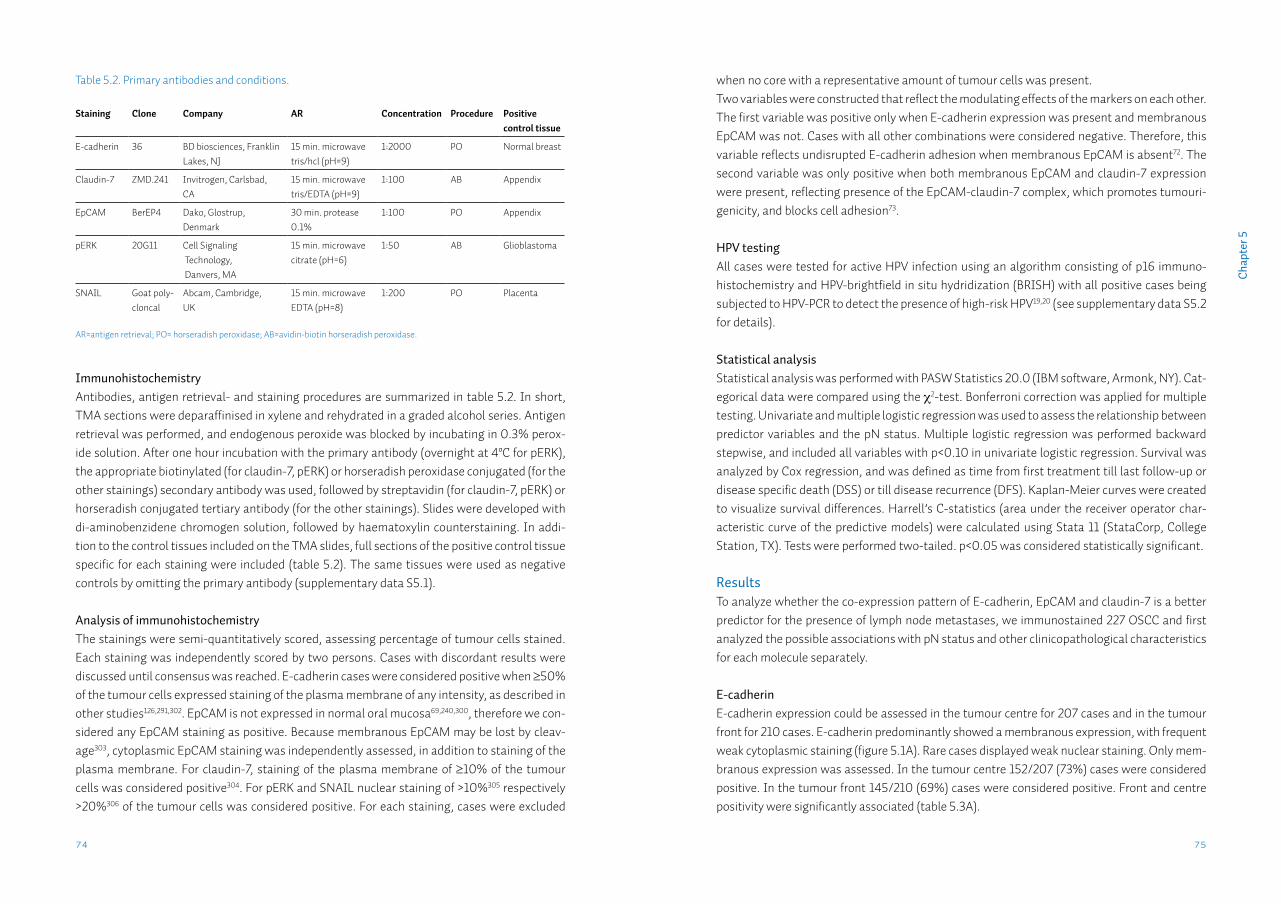
75
Cha
pter
5
74
when no core with a representative amount of tumour cells was present.Two variables were constructed that reflect the modulating effects of the markers on each other. The first variable was positive only when E-cadherin expression was present and membranous EpCAM was not. Cases with all other combinations were considered negative. Therefore, this variable reflects undisrupted E-cadherin adhesion when membranous EpCAM is absent72. The second variable was only positive when both membranous EpCAM and claudin-7 expression were present, reflecting presence of the EpCAM-claudin-7 complex, which promotes tumouri-genicity, and blocks cell adhesion73.
HPV testingAll cases were tested for active HPV infection using an algorithm consisting of p16 immuno-histochemistry and HPV-brightfield in situ hydridization (BRISH) with all positive cases being subjected to HPV-PCR to detect the presence of high-risk HPV19,20 (see supplementary data S5.2 for details).
Statistical analysisStatistical analysis was performed with PASW Statistics 20.0 (IBM software, Armonk, NY). Cat-egorical data were compared using the χ2-test. Bonferroni correction was applied for multiple testing. Univariate and multiple logistic regression was used to assess the relationship between predictor variables and the pN status. Multiple logistic regression was performed backward stepwise, and included all variables with p<0.10 in univariate logistic regression. Survival was analyzed by Cox regression, and was defined as time from first treatment till last follow-up or disease specific death (DSS) or till disease recurrence (DFS). Kaplan-Meier curves were created to visualize survival differences. Harrell’s C-statistics (area under the receiver operator char-acteristic curve of the predictive models) were calculated using Stata 11 (StataCorp, College Station, TX). Tests were performed two-tailed. p<0.05 was considered statistically significant.
ResultsTo analyze whether the co-expression pattern of E-cadherin, EpCAM and claudin-7 is a better predictor for the presence of lymph node metastases, we immunostained 227 OSCC and first analyzed the possible associations with pN status and other clinicopathological characteristics for each molecule separately.
E-cadherinE-cadherin expression could be assessed in the tumour centre for 207 cases and in the tumour front for 210 cases. E-cadherin predominantly showed a membranous expression, with frequent weak cytoplasmic staining (figure 5.1A). Rare cases displayed weak nuclear staining. Only mem-branous expression was assessed. In the tumour centre 152/207 (73%) cases were considered positive. In the tumour front 145/210 (69%) cases were considered positive. Front and centre positivity were significantly associated (table 5.3A).
ImmunohistochemistryAntibodies, antigen retrieval- and staining procedures are summarized in table 5.2. In short, TMA sections were deparaffinised in xylene and rehydrated in a graded alcohol series. Antigen retrieval was performed, and endogenous peroxide was blocked by incubating in 0.3% perox-ide solution. After one hour incubation with the primary antibody (overnight at 4ºC for pERK), the appropriate biotinylated (for claudin-7, pERK) or horseradish peroxidase conjugated (for the other stainings) secondary antibody was used, followed by streptavidin (for claudin-7, pERK) or horseradish conjugated tertiary antibody (for the other stainings). Slides were developed with di-aminobenzidene chromogen solution, followed by haematoxylin counterstaining. In addi-tion to the control tissues included on the TMA slides, full sections of the positive control tissue specific for each staining were included (table 5.2). The same tissues were used as negative controls by omitting the primary antibody (supplementary data S5.1).
Analysis of immunohistochemistryThe stainings were semi-quantitatively scored, assessing percentage of tumour cells stained. Each staining was independently scored by two persons. Cases with discordant results were discussed until consensus was reached. E-cadherin cases were considered positive when ≥50% of the tumour cells expressed staining of the plasma membrane of any intensity, as described in other studies126,291,302. EpCAM is not expressed in normal oral mucosa69,240,300, therefore we con-sidered any EpCAM staining as positive. Because membranous EpCAM may be lost by cleav-age303, cytoplasmic EpCAM staining was independently assessed, in addition to staining of the plasma membrane. For claudin-7, staining of the plasma membrane of ≥10% of the tumour cells was considered positive304. For pERK and SNAIL nuclear staining of >10%305 respectively >20%306 of the tumour cells was considered positive. For each staining, cases were excluded
Table 5.2. Primary antibodies and conditions.
Staining Clone Company AR Concentration Procedure Positivecontrol tissue
E-cadherin 36 BD biosciences, Franklin Lakes, NJ
15 min. microwave tris/hcl (pH=9)
1:2000 PO Normal breast
Claudin-7 ZMD.241 Invitrogen, Carlsbad, CA
15 min. microwave tris/EDTA (pH=9)
1:100 AB Appendix
EpCAM BerEP4 Dako, Glostrup, Denmark
30 min. protease 0.1%
1:100 PO Appendix
pERK 20G11 Cell Signaling Technology, Danvers, MA
15 min. microwave citrate (pH=6)
1:50 AB Glioblastoma
SNAIL Goat poly-cloncal
Abcam, Cambridge, UK
15 min. microwave EDTA (pH=8)
1:200 PO Placenta
AR=antigen retrieval; PO= horseradish peroxidase; AB=avidin-biotin horseradish peroxidase.
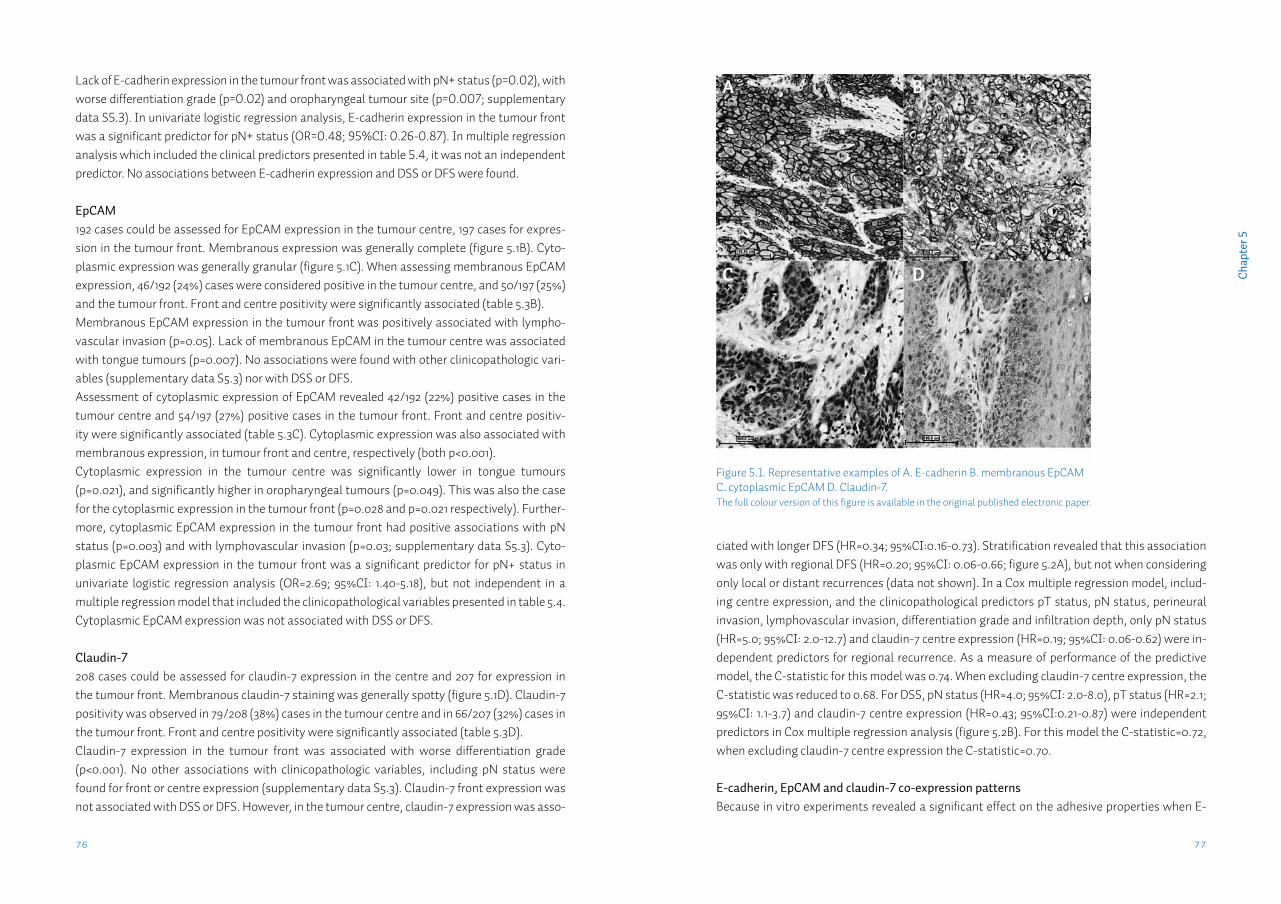
77
Cha
pter
5
76
ciated with longer DFS (HR=0.34; 95%CI:0.16-0.73). Stratification revealed that this association was only with regional DFS (HR=0.20; 95%CI: 0.06-0.66; figure 5.2A), but not when considering only local or distant recurrences (data not shown). In a Cox multiple regression model, includ-ing centre expression, and the clinicopathological predictors pT status, pN status, perineural invasion, lymphovascular invasion, differentiation grade and infiltration depth, only pN status (HR=5.0; 95%CI: 2.0-12.7) and claudin-7 centre expression (HR=0.19; 95%CI: 0.06-0.62) were in-dependent predictors for regional recurrence. As a measure of performance of the predictive model, the C-statistic for this model was 0.74. When excluding claudin-7 centre expression, the C-statistic was reduced to 0.68. For DSS, pN status (HR=4.0; 95%CI: 2.0-8.0), pT status (HR=2.1; 95%CI: 1.1-3.7) and claudin-7 centre expression (HR=0.43; 95%CI:0.21-0.87) were independent predictors in Cox multiple regression analysis (figure 5.2B). For this model the C-statistic=0.72, when excluding claudin-7 centre expression the C-statistic=0.70.
E-cadherin, EpCAM and claudin-7 co-expression patternsBecause in vitro experiments revealed a significant effect on the adhesive properties when E-
Lack of E-cadherin expression in the tumour front was associated with pN+ status (p=0.02), with worse differentiation grade (p=0.02) and oropharyngeal tumour site (p=0.007; supplementary data S5.3). In univariate logistic regression analysis, E-cadherin expression in the tumour front was a significant predictor for pN+ status (OR=0.48; 95%CI: 0.26-0.87). In multiple regression analysis which included the clinical predictors presented in table 5.4, it was not an independent predictor. No associations between E-cadherin expression and DSS or DFS were found. EpCAM192 cases could be assessed for EpCAM expression in the tumour centre, 197 cases for expres-sion in the tumour front. Membranous expression was generally complete (figure 5.1B). Cyto-plasmic expression was generally granular (figure 5.1C). When assessing membranous EpCAM expression, 46/192 (24%) cases were considered positive in the tumour centre, and 50/197 (25%) and the tumour front. Front and centre positivity were significantly associated (table 5.3B). Membranous EpCAM expression in the tumour front was positively associated with lympho-vascular invasion (p=0.05). Lack of membranous EpCAM in the tumour centre was associated with tongue tumours (p=0.007). No associations were found with other clinicopathologic vari-ables (supplementary data S5.3) nor with DSS or DFS.Assessment of cytoplasmic expression of EpCAM revealed 42/192 (22%) positive cases in the tumour centre and 54/197 (27%) positive cases in the tumour front. Front and centre positiv-ity were significantly associated (table 5.3C). Cytoplasmic expression was also associated with membranous expression, in tumour front and centre, respectively (both p<0.001). Cytoplasmic expression in the tumour centre was significantly lower in tongue tumours (p=0.021), and significantly higher in oropharyngeal tumours (p=0.049). This was also the case for the cytoplasmic expression in the tumour front (p=0.028 and p=0.021 respectively). Further-more, cytoplasmic EpCAM expression in the tumour front had positive associations with pN status (p=0.003) and with lymphovascular invasion (p=0.03; supplementary data S5.3). Cyto-plasmic EpCAM expression in the tumour front was a significant predictor for pN+ status in univariate logistic regression analysis (OR=2.69; 95%CI: 1.40-5.18), but not independent in a multiple regression model that included the clinicopathological variables presented in table 5.4. Cytoplasmic EpCAM expression was not associated with DSS or DFS.
Claudin-7208 cases could be assessed for claudin-7 expression in the centre and 207 for expression in the tumour front. Membranous claudin-7 staining was generally spotty (figure 5.1D). Claudin-7 positivity was observed in 79/208 (38%) cases in the tumour centre and in 66/207 (32%) cases in the tumour front. Front and centre positivity were significantly associated (table 5.3D). Claudin-7 expression in the tumour front was associated with worse differentiation grade (p<0.001). No other associations with clinicopathologic variables, including pN status were found for front or centre expression (supplementary data S5.3). Claudin-7 front expression was not associated with DSS or DFS. However, in the tumour centre, claudin-7 expression was asso-
Figure 5.1. Representative examples of A. E-cadherin B. membranous EpCAM C. cytoplasmic EpCAM D. Claudin-7. The full colour version of this figure is available in the original published electronic paper.
A
C
B
D
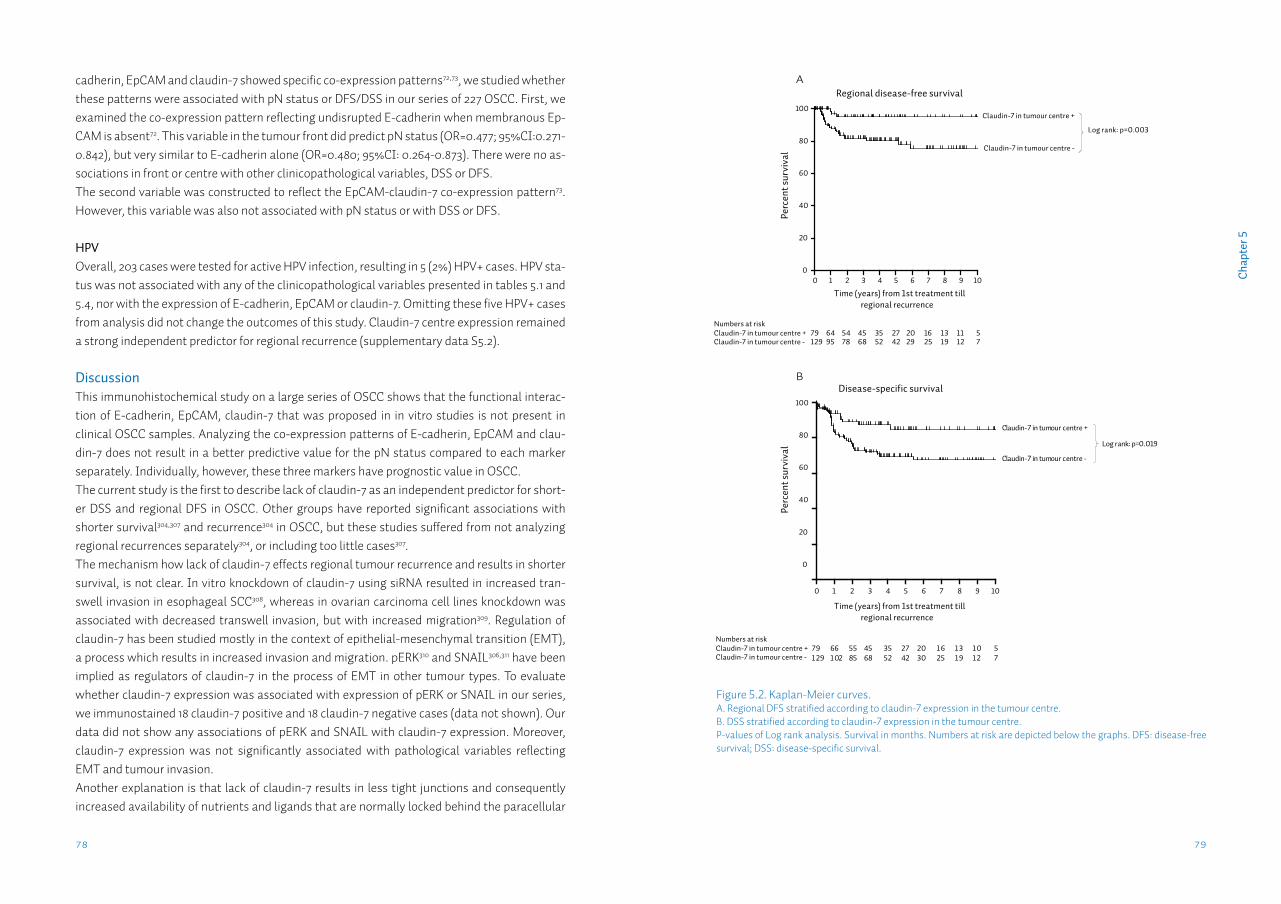
79
Cha
pter
5
78
cadherin, EpCAM and claudin-7 showed specific co-expression patterns72,73, we studied whether these patterns were associated with pN status or DFS/DSS in our series of 227 OSCC. First, we examined the co-expression pattern reflecting undisrupted E-cadherin when membranous Ep-CAM is absent72. This variable in the tumour front did predict pN status (OR=0.477; 95%CI:0.271-0.842), but very similar to E-cadherin alone (OR=0.480; 95%CI: 0.264-0.873). There were no as-sociations in front or centre with other clinicopathological variables, DSS or DFS.The second variable was constructed to reflect the EpCAM-claudin-7 co-expression pattern73. However, this variable was also not associated with pN status or with DSS or DFS.
HPVOverall, 203 cases were tested for active HPV infection, resulting in 5 (2%) HPV+ cases. HPV sta-tus was not associated with any of the clinicopathological variables presented in tables 5.1 and 5.4, nor with the expression of E-cadherin, EpCAM or claudin-7. Omitting these five HPV+ cases from analysis did not change the outcomes of this study. Claudin-7 centre expression remained a strong independent predictor for regional recurrence (supplementary data S5.2).
DiscussionThis immunohistochemical study on a large series of OSCC shows that the functional interac-tion of E-cadherin, EpCAM, claudin-7 that was proposed in in vitro studies is not present in clinical OSCC samples. Analyzing the co-expression patterns of E-cadherin, EpCAM and clau-din-7 does not result in a better predictive value for the pN status compared to each marker separately. Individually, however, these three markers have prognostic value in OSCC.The current study is the first to describe lack of claudin-7 as an independent predictor for short-er DSS and regional DFS in OSCC. Other groups have reported significant associations with shorter survival304,307 and recurrence304 in OSCC, but these studies suffered from not analyzing regional recurrences separately304, or including too little cases307.The mechanism how lack of claudin-7 effects regional tumour recurrence and results in shorter survival, is not clear. In vitro knockdown of claudin-7 using siRNA resulted in increased tran-swell invasion in esophageal SCC308, whereas in ovarian carcinoma cell lines knockdown was associated with decreased transwell invasion, but with increased migration309. Regulation of claudin-7 has been studied mostly in the context of epithelial-mesenchymal transition (EMT), a process which results in increased invasion and migration. pERK310 and SNAIL306,311 have been implied as regulators of claudin-7 in the process of EMT in other tumour types. To evaluate whether claudin-7 expression was associated with expression of pERK or SNAIL in our series, we immunostained 18 claudin-7 positive and 18 claudin-7 negative cases (data not shown). Our data did not show any associations of pERK and SNAIL with claudin-7 expression. Moreover, claudin-7 expression was not significantly associated with pathological variables reflecting EMT and tumour invasion.Another explanation is that lack of claudin-7 results in less tight junctions and consequently increased availability of nutrients and ligands that are normally locked behind the paracellular
Figure 5.2. Kaplan-Meier curves.A. Regional DFS stratified according to claudin-7 expression in the tumour centre. B. DSS stratified according to claudin-7 expression in the tumour centre. P-values of Log rank analysis. Survival in months. Numbers at risk are depicted below the graphs. DFS: disease-free survival; DSS: disease-specific survival.
Regional disease-free survival
Time (years) from 1st treatment tillregional recurrence
Perc
ent s
urvi
val
0
20
40
60
80
100
Perc
ent s
urvi
val
0
20
40
60
80
100
Claudin-7 in tumour centre -
Claudin-7 in tumour centre +
Log rank: p=0.003
Numbers at riskClaudin-7 in tumour centre +Claudin-7 in tumour centre -
79129
6495
5478
4568
3552
2742
2029
1625
1319
1112
57
Time (years) from 1st treatment tillregional recurrence
Numbers at riskClaudin-7 in tumour centre +Claudin-7 in tumour centre -
0 1 2 3 4 5 6 7 8 9 10
Disease-specific survival
Claudin-7 in tumour centre -
Claudin-7 in tumour centre +
Log rank: p=0.019
1 2 3 4 5 6 7 8 9 100
A
B
791 29
661 02
5585
4568
3552
2742
2030
1 625
1 31 9
1 01 2
57
81
Cha
pter
5
80
ICD might be important for the development of nodal metastases in OSCC. Currently available EpICD antibodies did not show sufficient specificity in OSCC FFPE material in our hands.
Based on reports about their functional interaction in vitro, we hypothesized that the combined analysis of the cell-cell adhesion molecules E-cadherin and EpCAM or EpCAM and claudin-7 would result in a better predictor for the pN status than each marker individually. Although in our series of OSCC, EpCAM and claudin-7 expression were positively associated with each other, combinations of these two markers had no associations with metastasis in agreement with the results in colon carcinomas218, nor with other clinicopathological variables. Moreover, the spotty membranous expression pattern of claudin-7 that we observed in our series, has also been described by others304,308 and suggests a localization in TEMs. In our series, EpCAM did not co-localize with this spotty pattern of claudin-7, suggesting that EpCAM might not be available in TEMs to form complexes with claudin-7.The other co-expression pattern that we studied reflected undisrupted E-cadherin when mem-branous EpCAM is absent. This pattern did not have a significantly better predictive value than E-cadherin expression alone. These data suggest that there is no clinically relevant modulating effect of these three markers in OSCC, and that the in vitro models are not reflected in clinical tumour samples.Individually, E-cadherin and cytoplasmic EpCAM in the tumour front are predictive for pN sta-tus. And although they seem to play a role in the process of metastasis, they have no additional predictive value to the currently used clinicopathologic predictors for pN status. Therefore,
barrier312. This would lead to increased proliferation, in agreement with the increased prolifera-tion of epithelial cells in the intestine of claudin-7 deficient mice313. Further research is needed to unravel the role of claudin-7 in the development of regional recurrences in OSCC.We found that membranous EpCAM expression was not associated with pN status. This find-ing is in line with other reports in OSCC70,71 and head-neck cancer244. Cytoplasmic EpCAM expres-sion however, was associated with pN status when expressed in the tumour front. Apart from EpCAM’s cell adhesion properties and its association with claudin-7, it has been demonstrated that membranous EpCAM can be cleaved by juxtacrine activation, resulting in shedding of the extracellular domain303, and subsequent cleavage of the intracellular domain (EpICD). EpICD may translocate to the nucleus, inducing transcription of genes that promote proliferation190. Because the BerEP4 antibody specifically detects the extracellular domain, loss of membranous expression may reflect increased EpCAM cleavage. The granular cytoplasmic expression that we observed could then reflect increased EpCAM turnover in the endoplasmic reticulum or transport vesicles. Loss of membranous EpCAM with an increased cytoplasmic expression has also been observed in budding colorectal tumour cells197. Our results indicate that not only the adhesive function of membranously located EpCAM, but also the cleavage and subsequent signal transduction of Ep-
Table 5.3. Front-centre associations for A. E-cadherin, B. EpCAM membranous, C. EpCAM cytoplasmic and D. claudin-7.
A E-cadherin Front
- +
Centre - 33 20
+ 28 115
B EpCAM membranous Front
- +
Centre - 121 13
+ 12 29
C EpCAM cytoplasmic Front
- +
Centre - 122 17
+ 8 28
D Claudin-7 Front
- +
Centre - 104 19
+ 29 41
χ2-test. All p-values <0.001.
Table 5.4. Univariate logistic regression analysis of clinicopathologic characteristics predictive for pN status (n=227).
Variable Odds Ratio 95% CI
cN status 0+
114.0 7.10-27.8
pT status 1-23-4
11.84 1.07-3.18
Oropharyngeal location noyes
12.73 1.14-6.53
Perineural invasion no yes
13.56 1.82-6.96
Lymphovascular invasion noyes
15.80 2.23-15.1
Histological differentiation wellmoderate-poor
14.64 2.22-9.70
Infiltration depth per mm 1.09 1.04-1.15
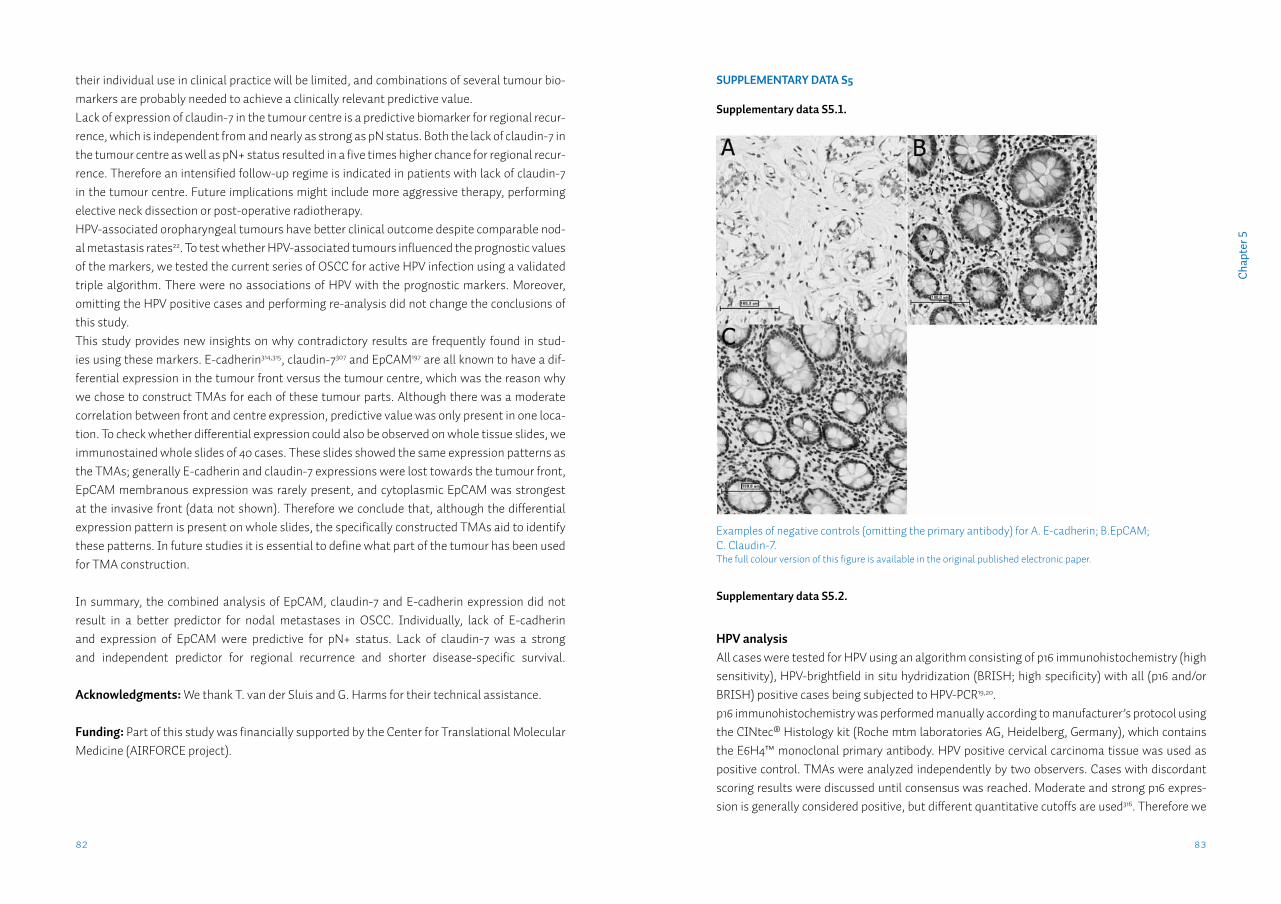
83
Cha
pter
5
82
Supplementary data S5.2.
HPV analysisAll cases were tested for HPV using an algorithm consisting of p16 immunohistochemistry (high sensitivity), HPV-brightfield in situ hydridization (BRISH; high specificity) with all (p16 and/or BRISH) positive cases being subjected to HPV-PCR19,20. p16 immunohistochemistry was performed manually according to manufacturer’s protocol using the CINtec® Histology kit (Roche mtm laboratories AG, Heidelberg, Germany), which contains the E6H4™ monoclonal primary antibody. HPV positive cervical carcinoma tissue was used as positive control. TMAs were analyzed independently by two observers. Cases with discordant scoring results were discussed until consensus was reached. Moderate and strong p16 expres-sion is generally considered positive, but different quantitative cutoffs are used316. Therefore we
their individual use in clinical practice will be limited, and combinations of several tumour bio-markers are probably needed to achieve a clinically relevant predictive value. Lack of expression of claudin-7 in the tumour centre is a predictive biomarker for regional recur-rence, which is independent from and nearly as strong as pN status. Both the lack of claudin-7 in the tumour centre as well as pN+ status resulted in a five times higher chance for regional recur-rence. Therefore an intensified follow-up regime is indicated in patients with lack of claudin-7 in the tumour centre. Future implications might include more aggressive therapy, performing elective neck dissection or post-operative radiotherapy.HPV-associated oropharyngeal tumours have better clinical outcome despite comparable nod-al metastasis rates22. To test whether HPV-associated tumours influenced the prognostic values of the markers, we tested the current series of OSCC for active HPV infection using a validated triple algorithm. There were no associations of HPV with the prognostic markers. Moreover, omitting the HPV positive cases and performing re-analysis did not change the conclusions of this study.This study provides new insights on why contradictory results are frequently found in stud-ies using these markers. E-cadherin314,315, claudin-7307 and EpCAM197 are all known to have a dif-ferential expression in the tumour front versus the tumour centre, which was the reason why we chose to construct TMAs for each of these tumour parts. Although there was a moderate correlation between front and centre expression, predictive value was only present in one loca-tion. To check whether differential expression could also be observed on whole tissue slides, we immunostained whole slides of 40 cases. These slides showed the same expression patterns as the TMAs; generally E-cadherin and claudin-7 expressions were lost towards the tumour front, EpCAM membranous expression was rarely present, and cytoplasmic EpCAM was strongest at the invasive front (data not shown). Therefore we conclude that, although the differential expression pattern is present on whole slides, the specifically constructed TMAs aid to identify these patterns. In future studies it is essential to define what part of the tumour has been used for TMA construction.
In summary, the combined analysis of EpCAM, claudin-7 and E-cadherin expression did not result in a better predictor for nodal metastases in OSCC. Individually, lack of E-cadherin and expression of EpCAM were predictive for pN+ status. Lack of claudin-7 was a strong and independent predictor for regional recurrence and shorter disease-specific survival.
Acknowledgments: We thank T. van der Sluis and G. Harms for their technical assistance.
Funding: Part of this study was financially supported by the Center for Translational Molecular Medicine (AIRFORCE project).
Examples of negative controls (omitting the primary antibody) for A. E-cadherin; B.EpCAM; C. Claudin-7.The full colour version of this figure is available in the original published electronic paper.
SuPPleMentARy dAtA S5
Supplementary data S5.1.
85
Cha
pter
5
84
invasion, differentiation grade and infiltration depth, only pN status (HR=4.2; 95%CI: 1.6-10.8) and claudin-7 centre expression (HR=0.23; 95%CI: 0.07-0.76) were independent predictors for regional recurrence.SNAIL and pERK were performed on the tumour centre TMA of a subset of 36 cases, of which two cases were HPV+. Omitting these cases did not have an effect. SNAIL and pERK did not as-sociate with claudin-7 expression.
Concluding, assessment of the HPV status in our tumour series using a triple algorithm resulted in 5 HPV positive cases. Omitting these cases from analysis did not change the outcomes of this study.
chose to consider all cases with any percentage of moderate or strong p16 expression as p16+. HPV-BRISH was performed automated on a Ventana Benchmark Ultra machine, using the com-mercially available Inform HPV III family 16 probe kit. This kit contains a probe cocktail with re-ported hybridization to 12 high-risk HPV-genotypes: 16, 18, 31, 33, 35, 39, 45, 51, 52, 56, 58, and 66. Slides were developed with the ISH iVIEW Blue detection kit, according to the manufacturer’s protocol (Ventana-Roche, Basel, Switzerland). Cases were evaluated by scoring the percentage of tumour cells with any of three patterns of signals: either punctuate (clear dotted signal), granular (large, irregular, inhomogeneous signal) or diffuse (complete homogenous signal)317,318. All other staining patterns were considered negative. From all p16+ and/or BRISH+ cases, DNA was extracted from the original tissue block, taking all precautions to prevent contamination, as reported previously319. For quality control, genomic DNA was amplified in a multiplex PCR containing a control gene primer set resulting in products of 100, 200 300, 400 and 600 bp according to the BIOMED-2 protocol320. Cases with a product <200 bp were omitted from further analysis. The presence of high-risk HPV-DNA in all DNA samples and adjoining blanks was detected with both the HPV-GP5+/6+ general primers, and HPV16 and HPV18 specific primers319. Eventually, cases with product in the HPV-PCR (16, 18 and/or GP) were considered as HPV positive; all other cases were considered not HPV negative.
Overall, 203 cases were tested for active HPV infection, resulting in 5 (2%) HPV+ cases (sup-plementary figure S5.1, supplementary table S5.1). HPV positivity was associated with an oro-pharyngeal primary tumour location (p<0.001). HPV status was not associated with any of the clinicopathological variables presented in supplementary tables S5.1 and S5.2, nor with the ex-pression of E-cadherin, EpCAM or claudin-7.
We performed a re-analysis of the study data, omitting all HPV+ cases. The same clinicopatho-logical characteristics were found predictive for pN status (supplementary table S5.2), except for oropharyngeal location, which was not a significant predictor for pN+ status anymore (OR=2.23; 95%CI: 0.90-5.52). Lack of E-cadherin expression in the tumour front was associated with worse differentiation grade (p=0.03), but not with pN+ status anymore (p=0.08).Membranous EpCAM in the tumour front was still positively associated with lymphovascular invasion (p=0.006). Cytoplasmic EpCAM expression in the tumour front was associated with pN+ status (p=0.005) and with lymphovascular invasion (p=0.003). It was a significant predic-tor for pN+ status (OR=2.74; 95%CI: 1.35-5.59), but not independent from the clinicopathological variables presented in supplementary table S5.2.Claudin-7 in the tumour front was associated with worse differentiation grade (p=0.001) and also with higher pT status (p=0.02). Claudin-7 front expression was not associated with DSS of DFS. In the tumour centre, claudin-7 was still associated with longer DSS (HR=0.49; 95%CI: 0.24-0.99) and with regional DFS (HR=0.231; 95%CI: 0.07-0.78). In a Cox multiple regression model, including centre expression, pT status, pN status, perineural invasion, lymphovascular
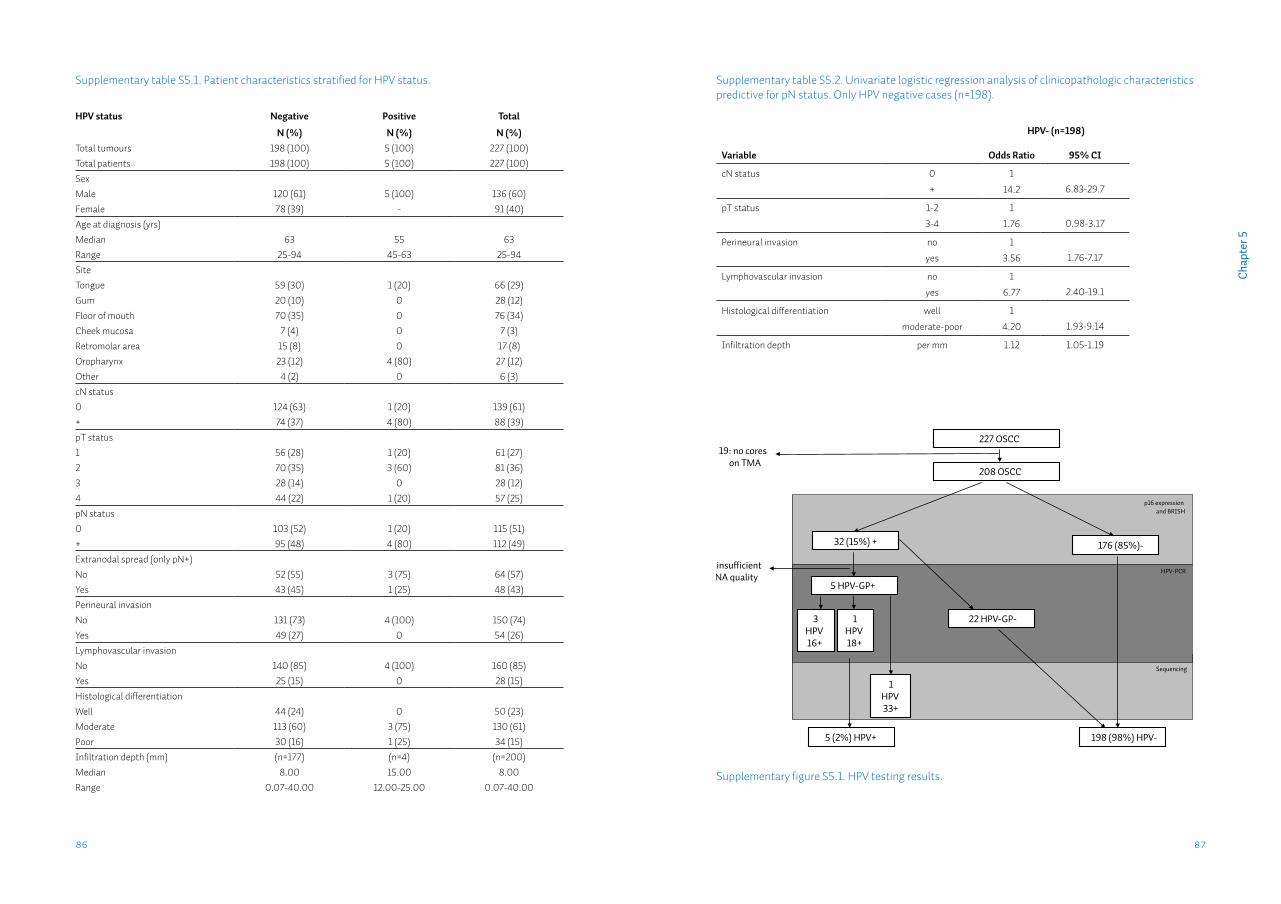
87
Cha
pter
5
86
Supplementary table S5.1. Patient characteristics stratified for HPV status.
HPV status Negative Positive Total
N (%) N (%) N (%)Total tumours 198 (100) 5 (100) 227 (100)Total patients 198 (100) 5 (100) 227 (100)SexMale 120 (61) 5 (100) 136 (60)Female 78 (39) - 91 (40)Age at diagnosis (yrs)Median 63 55 63Range 25-94 45-63 25-94SiteTongue 59 (30) 1 (20) 66 (29)Gum 20 (10) 0 28 (12)Floor of mouth 70 (35) 0 76 (34)Cheek mucosa 7 (4) 0 7 (3)Retromolar area 15 (8) 0 17 (8)Oropharynx 23 (12) 4 (80) 27 (12)Other 4 (2) 0 6 (3)cN status0 124 (63) 1 (20) 139 (61)+ 74 (37) 4 (80) 88 (39)pT status1 56 (28) 1 (20) 61 (27)2 70 (35) 3 (60) 81 (36)3 28 (14) 0 28 (12)4 44 (22) 1 (20) 57 (25)pN status0 103 (52) 1 (20) 115 (51)+ 95 (48) 4 (80) 112 (49)Extranodal spread (only pN+)No 52 (55) 3 (75) 64 (57)Yes 43 (45) 1 (25) 48 (43)Perineural invasionNo 131 (73) 4 (100) 150 (74)Yes 49 (27) 0 54 (26)Lymphovascular invasionNo 140 (85) 4 (100) 160 (85)Yes 25 (15) 0 28 (15)Histological differentiationWell 44 (24) 0 50 (23)Moderate 113 (60) 3 (75) 130 (61)Poor 30 (16) 1 (25) 34 (15)Infiltration depth (mm) (n=177) (n=4) (n=200)Median 8.00 15.00 8.00Range 0.07-40.00 12.00-25.00 0.07-40.00
Supplementary table S5.2. Univariate logistic regression analysis of clinicopathologic characteristics predictive for pN status. Only HPV negative cases (n=198).
HPV- (n=198)
Variable Odds Ratio 95% CI
cN status 0
+
1
14.2 6.83-29.7
pT status 1-2
3-4
1
1.76 0.98-3.17
Perineural invasion no
yes
1
3.56 1.76-7.17
Lymphovascular invasion no
yes
1
6.77 2.40-19.1
Histological differentiation well
moderate-poor
1
4.20 1.93-9.14
Infiltration depth per mm 1.12 1.05-1.19
208 OSCC
p16 expression and BRISH
176 (85%)- 32 (15%) +
HPV-PCR
198 (98%) HPV-
22 HPV-GP-
5 (2%) HPV+
227 OSCC19: no cores
on TMA
3HPV16+
1HPV18+
Sequencing
1HPV33+
5: insufficientDNA quality
5 HPV-GP+
Supplementary figure S5.1. HPV testing results.

89
Cha
pter
5
Supp
lem
enta
ry d
ata
S5.3
. Pat
ient
char
acte
ristic
s, n
umbe
r of c
ases
and
per
cent
age
(N(%
)), p
er st
aini
ng a
nd lo
catio
n.
Tum
our c
entr
eTu
mou
r fro
nt
E-ca
dher
inEp
CAM
mem
EpCA
M cy
toCl
audi
n-7
E-ca
dher
inEp
CAM
mem
EpCA
M cy
toCl
audi
n-7
N (%
)N
=207
(100
)N
=192
(100
)N
=192
(100
)N
=208
(100
)N
=210
(100
)N
=197
(100
)N
=197
(100
)N
=207
(100
)
Tota
l pat
ient
s22
7 (1
00)
-+
-+
-+
-+
-+
-+
-+
-+
Tota
l tum
ours
227
(100
)55
(24)
152
(67)
146
(76)
46 (2
4)15
0 (7
8)42
(22)
129
(62)
79 (3
8)65
(31)
145
(69)
147
(75)
50 (2
5)14
3 (7
3)54
(27)
141 (
68)
66 (3
2)
Sex
Mal
e13
6 (6
0)33
(26)
96 (7
4)94
(76)
30 (2
4)98
(79)
26 (2
1)77
(60)
51 (4
0)43
(33)
86 (6
7)90
(75)
30 (2
5)86
(72)
34 (2
8)84
(66)
44 (3
4)
Fem
ale
91 (4
0)22
(28)
56 (7
2)52
(77)
16 (2
4)52
(77)
16 (2
4)52
(65)
28 (3
5)22
(27)
59 (7
3)57
(74)
20 (2
6)57
(74)
20 (2
6)57
(72)
22 (2
8)
Age
at d
iagn
osis
(yr
s)
Med
ian
6363
6363
6263
5963
6362
6363
6263
6063
63
Rang
e25
-94
42-8
935
-94
35-9
436
-88
35-9
436
-88
35-8
936
-94
38-9
435
-89
35-9
436
-88
35-9
436
-81
35-8
936
-94
Site
a
Tong
ue66
(29)
11 (1
8)50
(82)
54 (9
2)5
(9)
54 (9
2)5
(9)
40 (6
7)20
(33)
12 (1
9)51
(81)
55 (8
6)9
(14)
55 (8
6)9
(14)
46 (7
3)17
(27)
Gum
28 (1
2)7
(29)
17 (7
1)17
(90)
2 (1
1)16
(84)
3 (1
6)17
(68)
8 (3
2)4
(17)
20 (8
3)18
(86)
3 (1
4)18
(86)
3 (1
4)18
(78)
5 (2
2)
Floo
r of m
outh
76 (3
4)21
(30)
49 (7
0)45
(68)
21 (3
2)50
(76)
16 (2
4)43
(62)
26 (3
8)25
(36)
45 (6
4)41
(65)
22 (3
5)40
(64)
23 (3
7)49
(70)
21 (3
0)
Chee
k m
ucos
a7
(3)
3 (4
3)4
(57)
6 (1
00)
0 (0
)6
(100
)0
(0)
7 (1
00)
0 (0
)0
(0)
7 (1
00)
5 (1
00)
0 (0
)5
(100
)0
(0)
6 (8
6)1 (
14)
Retr
omol
ar a
rea
17 (8
)5
(36)
9 (6
4)5
(46)
6 (5
5)6
(55)
5 (4
6)7
(47)
8 (5
3)8
(50)
8 (5
0)10
(71)
4 (2
9)9
(64)
5 (3
6)7
(47)
8 (5
3)
Oro
phar
ynx
27 (1
2)6
(23)
20 (7
7)16
(62)
10 (3
9)15
(58)
11 (4
2)11
(41)
16 (5
9)15
(60)
10 (4
0)14
(56)
11 (4
4)12
(48)
13 (5
2)11
(46)
13 (5
4)
Oth
er6
(3)
2 (4
0)3
(60)
3 (6
0)2
(40)
3 (6
0)2
(40)
4 (8
0)1 (
20)
1 (20
)4
(80)
4 (8
0)1 (
20)
4 (8
0)1 (
20)
4 (8
0)1 (
20)
cN st
atus
013
9 (6
1)39
(31)
89 (7
0)94
(80)
24 (2
0)97
(82)
21 (1
8)78
(61)
50 (3
9)38
(30)
91(7
1)95
(77)
29 (2
3)97
(78)
27 (2
2)87
(69)
40 (3
2)
+88
(39)
16 (2
0)63
(80)
52 (7
0)22
(30)
53 (7
2)21
(28)
51 (6
4)29
(36)
27 (3
3)54
(67)
52 (7
2)21
(29)
46 (6
3)27
(37)
54 (6
8)26
(33)
pT st
atus
161
(27)
36 (2
7)97
(73)
93 (7
6)30
(24)
97 (7
9)26
(21)
84 (6
4)48
(36)
37 (2
7)10
0 (7
3)95
(73)
36 (2
8)95
(73)
36 (2
8)98
(72)
38 (2
8)2
81 (3
6)
328
(12)
19 (2
6)55
(74)
53 (7
7)16
(23)
53 (7
7)16
(23)
45 (5
9)31
(31)
28 (3
8)45
(62)
52 (7
9)14
(21)
48 (7
3)18
(27)
43 (6
1)28
(39)
457
(25)
pN st
atus
011
5 (5
1)28
(26)
79 (7
4)77
(79)
20 (2
1)79
(81)
18 (1
9)65
(61)
42 (3
9)25
(23)
82 (7
7)77
(77)
23 (2
3)82
(82)
18 (1
8)74
(71)
31 (3
0)
+11
2 (4
9)27
(27)
73 (7
3)69
(73)
26 (2
7)71
(75)
24 (2
5)64
(63)
37 (3
7)40
(39)
63 (6
1)70
(72)
27 (2
8)61
(63)
36 (3
7)67
(66)
35 (3
4)
Extr
anod
al sp
read
(onl
y pN
+)
No
64 (5
7)16
(29)
40 (7
1)36
(67)
18 (3
3)39
(72)
15 (2
8)35
(63)
21 (3
8)25
(43)
33 (5
7)38
(69)
17 (3
1)35
(64)
20 (3
6)41
(71)
17 (2
9)
Yes
48 (4
3)11
(25)
33 (7
5)33
(81)
8 (2
0)32
(78)
9 (2
2)29
(64)
16 (3
6)15
(33)
30 (6
7)32
(76)
10 (2
4)26
(62)
16 (3
8)26
(59)
18 (4
1)
Perin
eura
l inv
asio
n
No
150
(74)
38 (2
8)98
(72)
97 (7
6)31
(24)
99 (7
7)29
(23)
81 (5
9)56
(41)
45 (3
3)93
(67)
96 (7
6)31
(24)
98 (7
7)29
(23)
95 (7
0)41
(30)
Yes
54 (2
6)14
(28)
37 (7
3)34
(76)
11 (2
4)36
(80)
9 (2
0)33
(65)
18 (3
5)16
(31)
35 (6
9)38
(76)
12 (2
4)36
(72)
14 (2
8)32
(64)
18 (3
6)
Lym
phov
ascu
lar i
nvas
ion
No
160
(85)
40 (2
7)10
7 (7
3)10
3 (7
7)32
(24)
106
(79)
29 (2
2)90
(61)
57 (3
9)41
(28)
106
(72)
107
(78)
31 (2
3)10
9 (7
9)29
(21)
101 (
70)
44 (3
0)
Yes
28 (1
5)4
(16)
21 (8
4)17
(68)
8 (3
2)17
(68)
8 (3
2)14
(54)
12 (4
6)11
(42)
15 (5
8)14
(58)
10 (4
2)14
(58)
10 (4
2)17
(68)
8 (3
2)
His
tolo
gica
l diff
eren
tiatio
n
Wel
l50
(23)
16 (3
3)32
(67)
34 (8
3)7
(17)
33 (8
1)8
(20)
35 (7
3)13
(27)
8 (1
7)38
(83)
34 (8
5)6
(15)
34 (8
5)6
(15)
40 (8
9)5
(11)
Mod
erat
e13
0 (6
1)35
(24)
112
(76)
103
(74)
37 (2
6)10
9 (7
8)31
(22)
86 (5
8)62
(42)
54 (3
5)99
(65)
106
(73)
39 (2
7)10
3 (7
1)42
(29)
92 (6
1)59
(39)
Poor
34 (1
5)
Infil
trat
ion
dept
h (m
m) (
n=20
0)
Med
ian
8.0
7.09.
08.
09.
08.
08.
08.
09.
09.
08.
09.
07.5
8.0
10.0
8.0
9.0
Rang
e.0
7-40
.02.
0-30
.0.0
7-40
.0.0
7-30
.01.
5-40
.0.5
2-40
.0.0
7-22
.0.0
7-25
.0.5
2-40
.02.
0-30
.0.0
7-40
.0.5
2-30
.0.0
7-40
.0.5
2-30
.0.0
7-40
.0.0
7-40
.02.
0-30
.0
Age
at d
iagn
osis
and
infil
trat
ion
dept
h w
ere
asse
ssed
by
Man
n-W
hitn
ey U
test
. All
othe
r var
iabl
es w
ere
asse
ssed
by χ
2 -tes
ts. S
igni
fican
t ass
ocia
tions
are
dis
play
ed in
bol
d. S
ee te
xt fo
r exa
ct p
-val
ues.
a Ev
ery
site
was
test
ed a
gain
st a
ll ot
her s
ites c
ombi
ned.
Bon
ferr
oni c
orre
ctio
n fo
r mul
tiple
test
ing
was
app
lied.
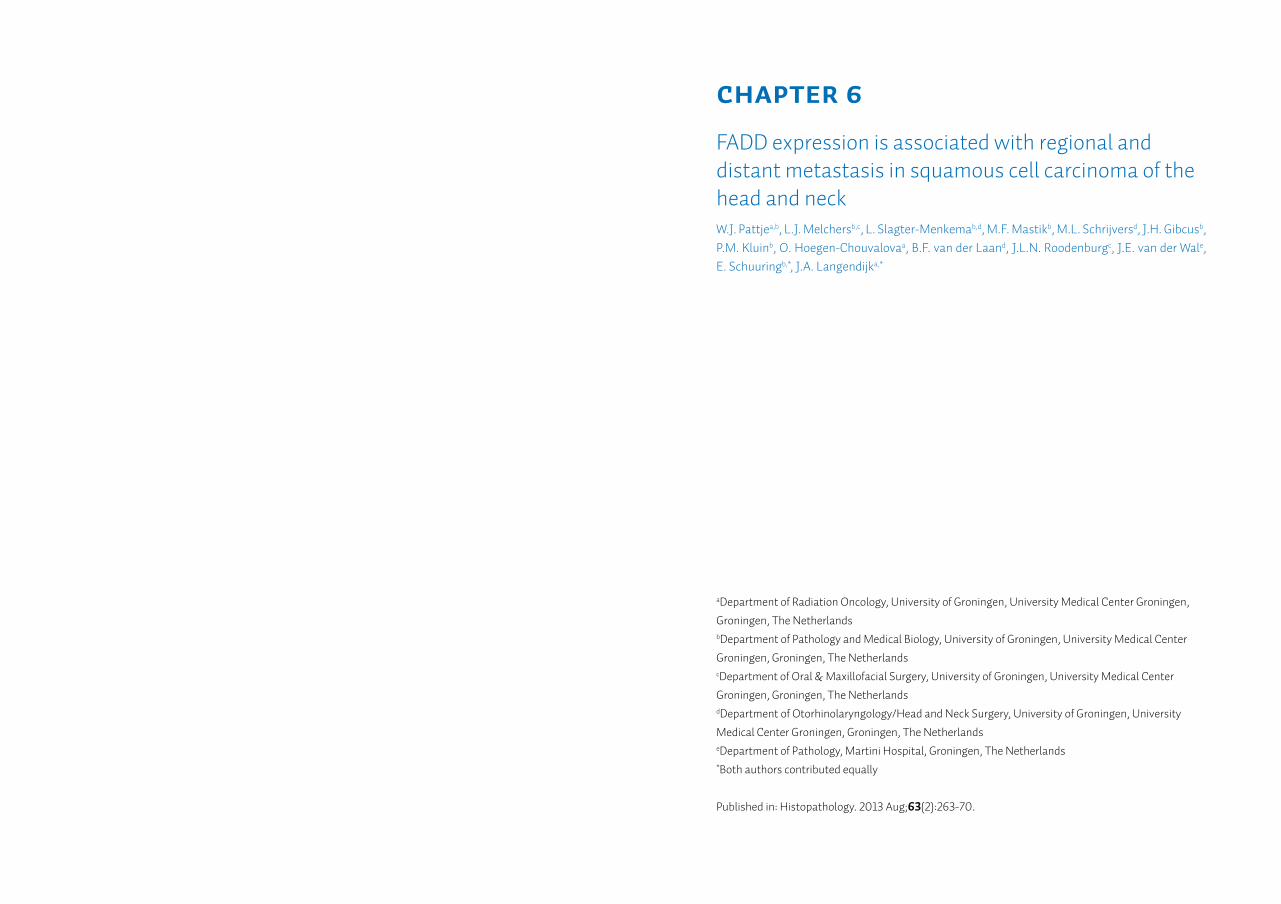
Chapter 6
FADD expression is associated with regional and distant metastasis in squamous cell carcinoma of the head and neckW.J. Pattjea,b, L.J. Melchersb,c, L. Slagter-Menkemab,d, M.F. Mastikb, M.L. Schrijversd, J.H. Gibcusb, P.M. Kluinb, O. Hoegen-Chouvalovaa, B.F. van der Laand, J.L.N. Roodenburgc, J.E. van der Wale, E. Schuuringb,*, J.A. Langendijka,*
aDepartment of Radiation Oncology, University of Groningen, University Medical Center Groningen, Groningen, The NetherlandsbDepartment of Pathology and Medical Biology, University of Groningen, University Medical Center Groningen, Groningen, The NetherlandscDepartment of Oral & Maxillofacial Surgery, University of Groningen, University Medical Center Groningen, Groningen, The NetherlandsdDepartment of Otorhinolaryngology/Head and Neck Surgery, University of Groningen, University Medical Center Groningen, Groningen, The NetherlandseDepartment of Pathology, Martini Hospital, Groningen, The Netherlands*Both authors contributed equally
Published in: Histopathology. 2013 Aug;63(2):263-70.
93
Cha
pter
6
IntroductionHead and neck squamous cell carcinoma (HNSCC) is the 6th most common type of cancer world-wide321,322, with an incidence of approximately 9.2 per 100.000 people in 20087. The most impor-tant risk factors for this type of cancer are smoking, alcohol consumption and infection with the human papillomavirus (HPV)323,324. Although outcome of locally advanced HNSCC has been improved significantly with combined modality approaches, still about half of the patients develop loco-regional recurrences and dis-tant metastases322,325,326. Accurate estimation of outcome in HNSCC based on clinical prognostic factors, such as TNM-stage, remains difficult. Therefore, there is need for a more precise predic-tion of outcome in order to adjust treatment modalities to the risk of either loco-regional failure or distant metastasis. During the last decade, increasing data became available on molecular and genetic changes associated with malignancy and tumor progression. Some of these genetic changes are specifically identified in HNSCC138,327,328 and may be good candidates for predicting clinical outcome in HNSCC patients.The most commonly amplified region in HNSCC is chromosome 11q13.3328,329. Previous studies have shown that amplification of 11q13.3 correlates with worse clinical outcome, both in HNSCC330 and in breast cancer331. In HNSCC, we previously showed that within the commonly amplified 11q13.3 region, a cluster of 13 genes is most frequently co-amplified, including 9 genes (FADD, PP-FIA1, TPCN2, CCND1, FLJ42258, ORAOV1, ANO1, FGF19 and CTTN) that are overexpressed when amplified. From the genes within the core of the amplicon, the expression of the gene coding for the Fas Associated Death Domain (FADD) correlates best with 11q13.3 amplification status327.Originally, FADD was reported in the extrinsic apoptosis pathway to act as an adaptor linking the death receptors to caspase-8 and passing the extracellular apoptosis signals onto the in-tracellular caspases, eventually resulting in apoptosis332-334. However, recently other functions have also have been attributed to FADD, such as enhancing in vitro invasion, inhibiting necrosis in epithelial cells and regulating cell proliferation in both epithelial and lymphoid cells (see for review 333,335-337).The current study was designed to investigate the role of FADD expression in the metastatic potential in terms of regional and distant metastases in a retrospective cohort study consisting of HNSCC patients uniformly treated with surgery and postoperative radiotherapy.
Materials and methodsPatients and tissues The study cohort consisted of consecutive patients diagnosed with HNSCC, uniformly treated with primary surgery and postoperative radiotherapy at the University Medical Center Gronin-gen between 1993 and 2003. Formalin-fixed paraffin-embedded surgically resected tissues of the primary tumors were collected and revised by an experienced pathologist. Clinical and his-topathological data of all patients were collected (n=198) as described previously338. The follow-up was at least 3 years. In the current study we included only patients for whom the immunohistochemical staining for
AbstractAims: The Fas Associated Death Domain (FADD) gene is often overexpressed in squamous cell carcinoma of the head and neck (HNSCC) and is considered to be a driver gene in amplifica-tion of the chromosomal 11q13.3 region. Amplification of 11q13.3 is associated with increased metastasis in HNSCC and breast cancer. The aim of this study was to investigate the associa-tion between FADD expression in advanced stage HNSCC and clinico-pathological features and outcome.
Methods and results: Tumor tissues of 177 HNSCC patients uniformly treated with primary surgery and postoperative radiotherapy were collected. FADD expression was assessed on pre-treatment tumor biopsies using immunohistochemistry. High FADD expression was detected in 44% of the HNSCC patients. High expression was associated with an increased rate of lymph node metastasis (p=0.001) and with shorter distant metastasis free interval (DMFI) (HR: 2.6, 95%CI:1.0-6.7, p=0.046) when lymph node metastases were present.
Conclusions: Our data show that an increase in FADD expression is associated with a higher incidence of lymph node metastasis at presentation and with shorter DMFI when lymph node metastases are present. High FADD expression in the primary tumor could be a useful marker to select patients for systemic treatment strategies that reduce the risk for distant metastases.
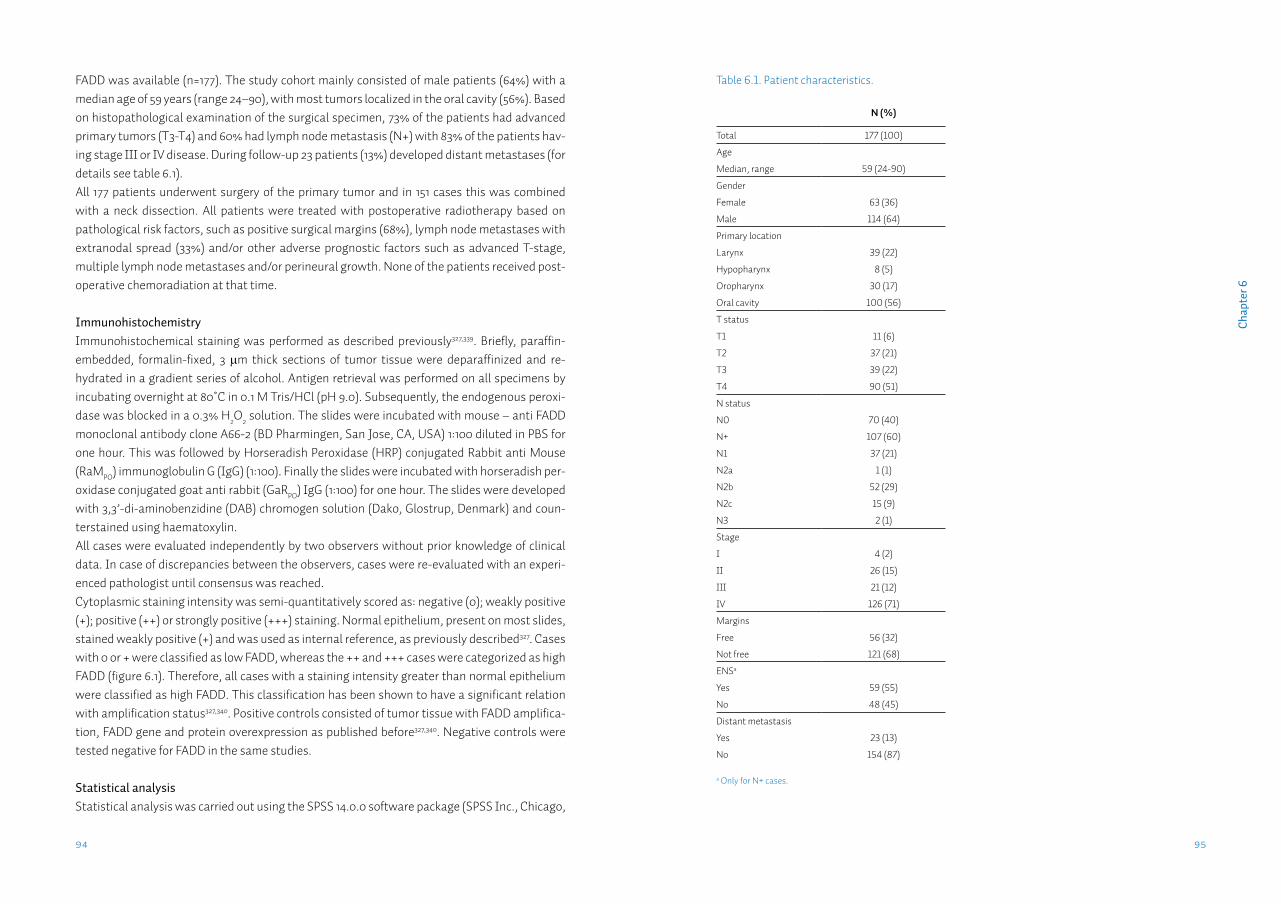
9594
Cha
pter
6
FADD was available (n=177). The study cohort mainly consisted of male patients (64%) with a median age of 59 years (range 24–90), with most tumors localized in the oral cavity (56%). Based on histopathological examination of the surgical specimen, 73% of the patients had advanced primary tumors (T3-T4) and 60% had lymph node metastasis (N+) with 83% of the patients hav-ing stage III or IV disease. During follow-up 23 patients (13%) developed distant metastases (for details see table 6.1).All 177 patients underwent surgery of the primary tumor and in 151 cases this was combined with a neck dissection. All patients were treated with postoperative radiotherapy based on pathological risk factors, such as positive surgical margins (68%), lymph node metastases with extranodal spread (33%) and/or other adverse prognostic factors such as advanced T-stage, multiple lymph node metastases and/or perineural growth. None of the patients received post-operative chemoradiation at that time.
ImmunohistochemistryImmunohistochemical staining was performed as described previously327,339. Briefly, paraffin-embedded, formalin-fixed, 3 µm thick sections of tumor tissue were deparaffinized and re-hydrated in a gradient series of alcohol. Antigen retrieval was performed on all specimens by incubating overnight at 80˚C in 0.1 M Tris/HCl (pH 9.0). Subsequently, the endogenous peroxi-dase was blocked in a 0.3% H2O2 solution. The slides were incubated with mouse – anti FADD monoclonal antibody clone A66-2 (BD Pharmingen, San Jose, CA, USA) 1:100 diluted in PBS for one hour. This was followed by Horseradish Peroxidase (HRP) conjugated Rabbit anti Mouse (RaMPO) immunoglobulin G (IgG) (1:100). Finally the slides were incubated with horseradish per-oxidase conjugated goat anti rabbit (GaRPO) IgG (1:100) for one hour. The slides were developed with 3,3’-di-aminobenzidine (DAB) chromogen solution (Dako, Glostrup, Denmark) and coun-terstained using haematoxylin.All cases were evaluated independently by two observers without prior knowledge of clinical data. In case of discrepancies between the observers, cases were re-evaluated with an experi-enced pathologist until consensus was reached.Cytoplasmic staining intensity was semi-quantitatively scored as: negative (0); weakly positive (+); positive (++) or strongly positive (+++) staining. Normal epithelium, present on most slides, stained weakly positive (+) and was used as internal reference, as previously described327. Cases with 0 or + were classified as low FADD, whereas the ++ and +++ cases were categorized as high FADD (figure 6.1). Therefore, all cases with a staining intensity greater than normal epithelium were classified as high FADD. This classification has been shown to have a significant relation with amplification status327,340. Positive controls consisted of tumor tissue with FADD amplifica-tion, FADD gene and protein overexpression as published before327,340. Negative controls were tested negative for FADD in the same studies.
Statistical analysis Statistical analysis was carried out using the SPSS 14.0.0 software package (SPSS Inc., Chicago,
Table 6.1. Patient characteristics.
N (%)
Total 177 (100)
Age Median, range 59 (24-90)
Gender
Female 63 (36)
Male 114 (64)
Primary location
Larynx 39 (22)
Hypopharynx 8 (5)
Oropharynx 30 (17)
Oral cavity 100 (56)
T status
T1 11 (6)
T2 37 (21)
T3 39 (22)
T4 90 (51)
N status
N0 70 (40)
N+ 107 (60)
N1 37 (21)
N2a 1 (1)
N2b 52 (29)
N2c 15 (9)
N3 2 (1)
Stage
I 4 (2)
II 26 (15)
III 21 (12)
IV 126 (71)
Margins
Free 56 (32)
Not free 121 (68)
ENSa
Yes 59 (55)
No 48 (45)
Distant metastasis
Yes 23 (13)
No 154 (87)
a Only for N+ cases.
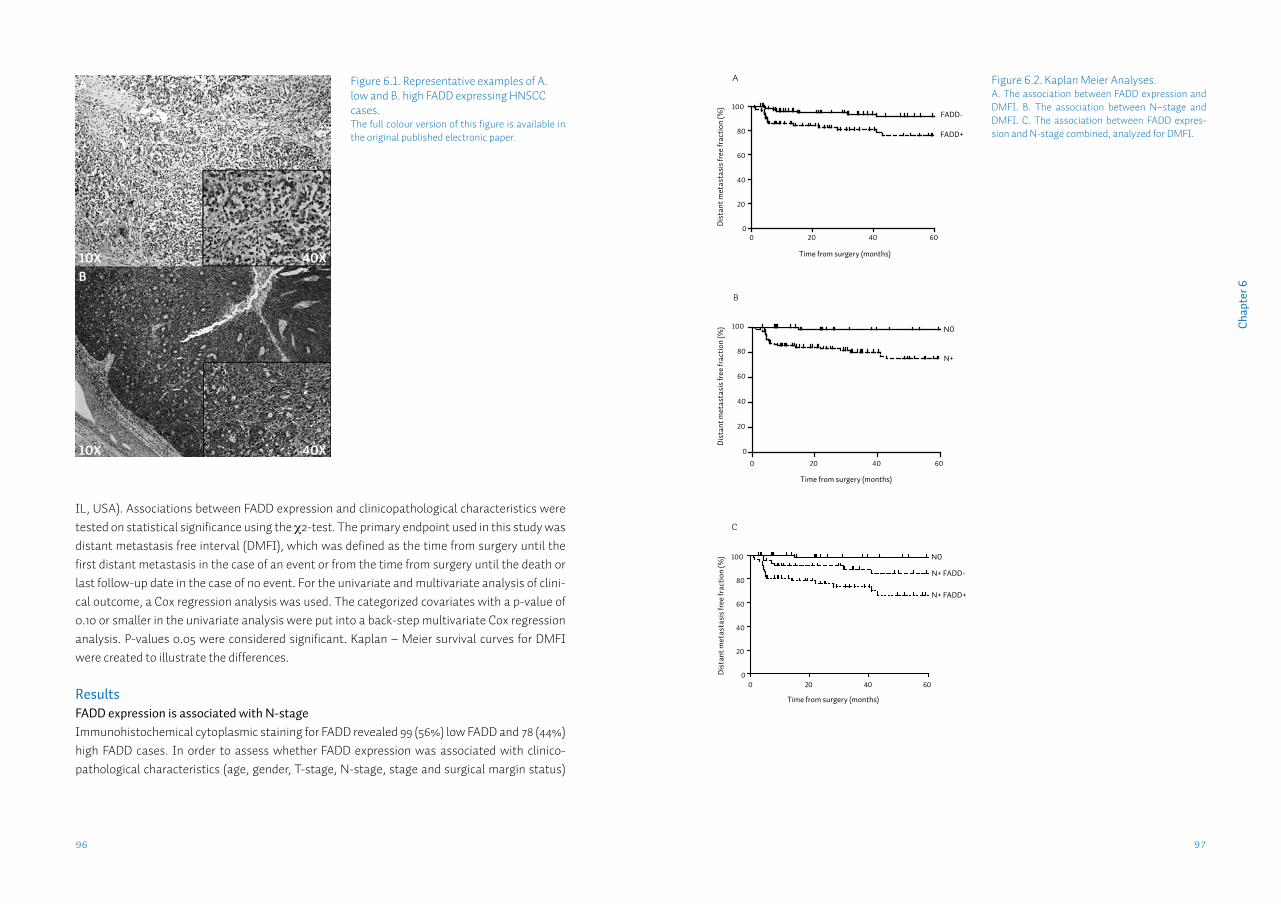
9796
Cha
pter
6
IL, USA). Associations between FADD expression and clinicopathological characteristics were tested on statistical significance using the χ2-test. The primary endpoint used in this study was distant metastasis free interval (DMFI), which was defined as the time from surgery until the first distant metastasis in the case of an event or from the time from surgery until the death or last follow-up date in the case of no event. For the univariate and multivariate analysis of clini-cal outcome, a Cox regression analysis was used. The categorized covariates with a p-value of 0.10 or smaller in the univariate analysis were put into a back-step multivariate Cox regression analysis. P-values 0.05 were considered significant. Kaplan – Meier survival curves for DMFI were created to illustrate the differences.
ResultsFADD expression is associated with N-stageImmunohistochemical cytoplasmic staining for FADD revealed 99 (56%) low FADD and 78 (44%) high FADD cases. In order to assess whether FADD expression was associated with clinico-pathological characteristics (age, gender, T-stage, N-stage, stage and surgical margin status)
Figure 6.1. Representative examples of A. low and B. high FADD expressing HNSCC cases.The full colour version of this figure is available in the original published electronic paper.
Figure 6.2. Kaplan Meier Analyses. A. The association between FADD expression and DMFI. B. The association between N–stage and DMFI. C. The association between FADD expres-sion and N-stage combined, analyzed for DMFI.
Time from surgery (months)
Dis
tant
met
asta
sis f
ree
frac
tion
(%)
0 20 40 600
20
40
60
80
100
A
FADD-
FADD+
Time from surgery (months)
Dis
tant
met
asta
sis f
ree
frac
tion
(%)
0 20 40 60
0
20
40
60
80
100
B C
N0
N+
Time from surgery (months)
Dis
tant
met
asta
sis f
ree
frac
tion
(%)
0 20 40 600
20
40
60
80
100 N0
N+ FADD-
N+ FADD+
Time from surgery (months)
Dis
tant
met
asta
sis f
ree
frac
tion
(%)
0 20 40 600
20
40
60
80
100
A
FADD-
FADD+
Time from surgery (months)
Dis
tant
met
asta
sis f
ree
frac
tion
(%)
0 20 40 60
0
20
40
60
80
100
B C
N0
N+
Time from surgery (months)
Dis
tant
met
asta
sis f
ree
frac
tion
(%)
0 20 40 600
20
40
60
80
100 N0
N+ FADD-
N+ FADD+
A
B10X
10X
40X
40X
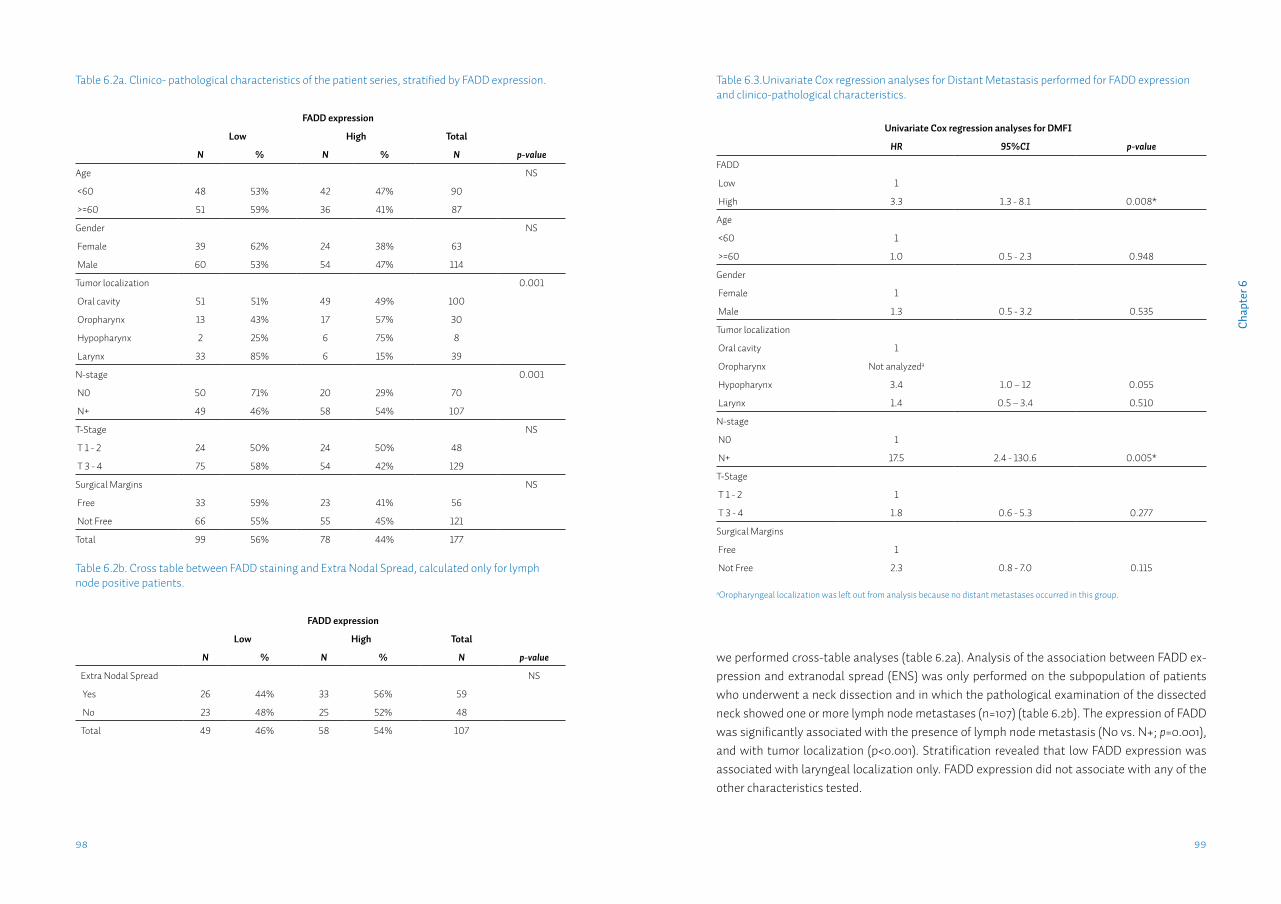
9998
Cha
pter
6
we performed cross-table analyses (table 6.2a). Analysis of the association between FADD ex-pression and extranodal spread (ENS) was only performed on the subpopulation of patients who underwent a neck dissection and in which the pathological examination of the dissected neck showed one or more lymph node metastases (n=107) (table 6.2b). The expression of FADD was significantly associated with the presence of lymph node metastasis (N0 vs. N+; p=0.001), and with tumor localization (p<0.001). Stratification revealed that low FADD expression was associated with laryngeal localization only. FADD expression did not associate with any of the other characteristics tested.
Table 6.2a. Clinico- pathological characteristics of the patient series, stratified by FADD expression.
FADD expression
Low High Total
N % N % N p-value
Age NS
<60 48 53% 42 47% 90
>=60 51 59% 36 41% 87
Gender NS
Female 39 62% 24 38% 63
Male 60 53% 54 47% 114
Tumor localization 0.001
Oral cavity 51 51% 49 49% 100
Oropharynx 13 43% 17 57% 30
Hypopharynx 2 25% 6 75% 8
Larynx 33 85% 6 15% 39
N-stage 0.001
N0 50 71% 20 29% 70
N+ 49 46% 58 54% 107
T-Stage NS
T 1 - 2 24 50% 24 50% 48
T 3 - 4 75 58% 54 42% 129
Surgical Margins NS
Free 33 59% 23 41% 56
Not Free 66 55% 55 45% 121
Total 99 56% 78 44% 177
Table 6.2b. Cross table between FADD staining and Extra Nodal Spread, calculated only for lymph node positive patients.
FADD expression
Low High Total
N % N % N p-value
Extra Nodal Spread NS
Yes 26 44% 33 56% 59
No 23 48% 25 52% 48
Total 49 46% 58 54% 107
Table 6.3.Univariate Cox regression analyses for Distant Metastasis performed for FADD expression and clinico-pathological characteristics.
Univariate Cox regression analyses for DMFI
HR 95%CI p-value
FADD
Low 1
High 3.3 1.3 - 8.1 0.008*
Age
<60 1
>=60 1.0 0.5 - 2.3 0.948
Gender
Female 1
Male 1.3 0.5 - 3.2 0.535
Tumor localization
Oral cavity 1
Oropharynx Not analyzeda
Hypopharynx 3.4 1.0 – 12 0.055
Larynx 1.4 0.5 – 3.4 0.510
N-stage
N0 1
N+ 17.5 2.4 - 130.6 0.005*
T-Stage
T 1 - 2 1
T 3 - 4 1.8 0.6 - 5.3 0.277
Surgical Margins
Free 1
Not Free 2.3 0.8 - 7.0 0.115
aOropharyngeal localization was left out from analysis because no distant metastases occurred in this group.
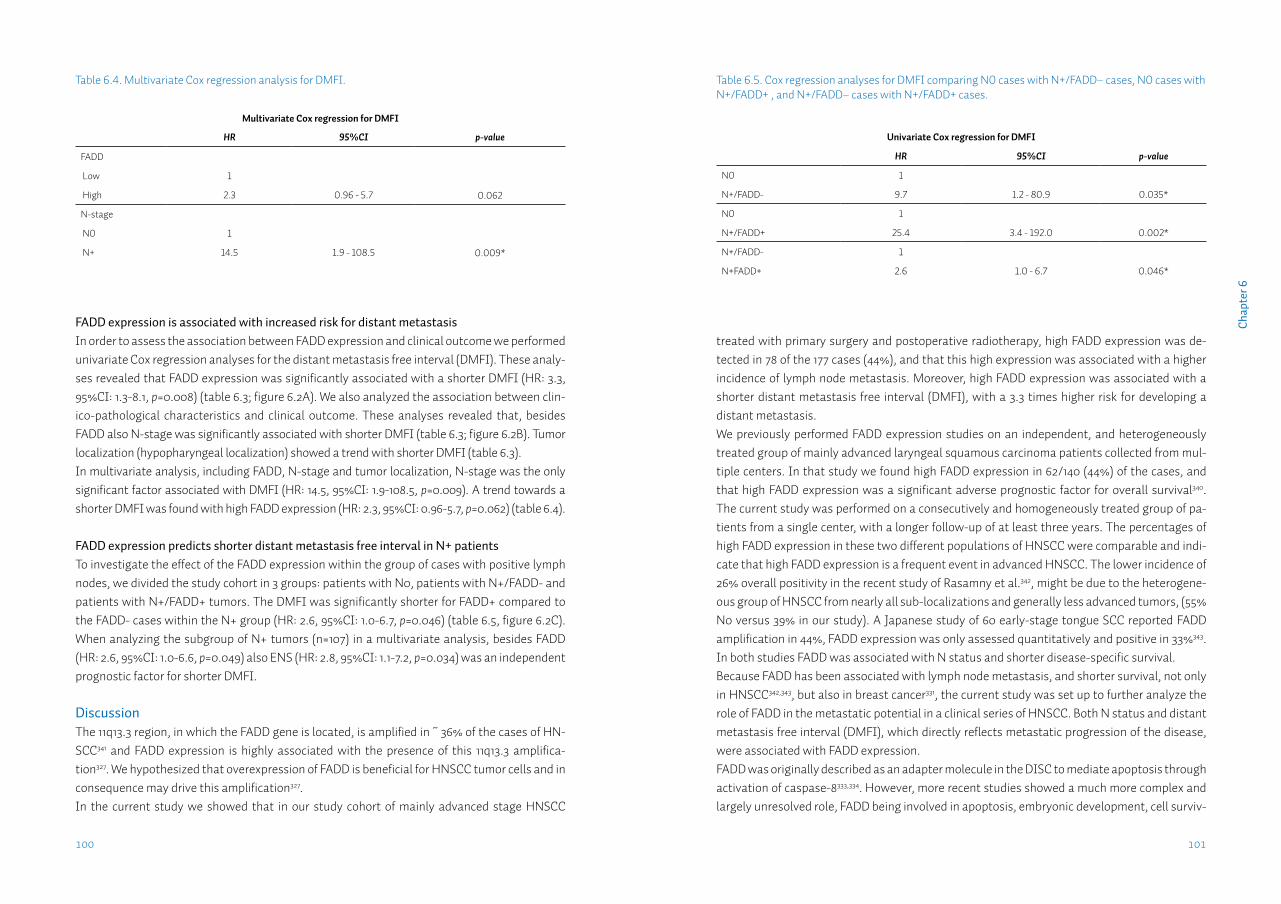
101100
Cha
pter
6
FADD expression is associated with increased risk for distant metastasis In order to assess the association between FADD expression and clinical outcome we performed univariate Cox regression analyses for the distant metastasis free interval (DMFI). These analy-ses revealed that FADD expression was significantly associated with a shorter DMFI (HR: 3.3, 95%CI: 1.3-8.1, p=0.008) (table 6.3; figure 6.2A). We also analyzed the association between clin-ico-pathological characteristics and clinical outcome. These analyses revealed that, besides FADD also N-stage was significantly associated with shorter DMFI (table 6.3; figure 6.2B). Tumor localization (hypopharyngeal localization) showed a trend with shorter DMFI (table 6.3).In multivariate analysis, including FADD, N-stage and tumor localization, N-stage was the only significant factor associated with DMFI (HR: 14.5, 95%CI: 1.9-108.5, p=0.009). A trend towards a shorter DMFI was found with high FADD expression (HR: 2.3, 95%CI: 0.96-5.7, p=0.062) (table 6.4).
FADD expression predicts shorter distant metastasis free interval in N+ patientsTo investigate the effect of the FADD expression within the group of cases with positive lymph nodes, we divided the study cohort in 3 groups: patients with N0, patients with N+/FADD- and patients with N+/FADD+ tumors. The DMFI was significantly shorter for FADD+ compared to the FADD- cases within the N+ group (HR: 2.6, 95%CI: 1.0-6.7, p=0.046) (table 6.5, figure 6.2C). When analyzing the subgroup of N+ tumors (n=107) in a multivariate analysis, besides FADD (HR: 2.6, 95%CI: 1.0-6.6, p=0.049) also ENS (HR: 2.8, 95%CI: 1.1-7.2, p=0.034) was an independent prognostic factor for shorter DMFI.
DiscussionThe 11q13.3 region, in which the FADD gene is located, is amplified in ~ 36% of the cases of HN-SCC341 and FADD expression is highly associated with the presence of this 11q13.3 amplifica-tion327. We hypothesized that overexpression of FADD is beneficial for HNSCC tumor cells and in consequence may drive this amplification327.In the current study we showed that in our study cohort of mainly advanced stage HNSCC
treated with primary surgery and postoperative radiotherapy, high FADD expression was de-tected in 78 of the 177 cases (44%), and that this high expression was associated with a higher incidence of lymph node metastasis. Moreover, high FADD expression was associated with a shorter distant metastasis free interval (DMFI), with a 3.3 times higher risk for developing a distant metastasis.We previously performed FADD expression studies on an independent, and heterogeneously treated group of mainly advanced laryngeal squamous carcinoma patients collected from mul-tiple centers. In that study we found high FADD expression in 62/140 (44%) of the cases, and that high FADD expression was a significant adverse prognostic factor for overall survival340. The current study was performed on a consecutively and homogeneously treated group of pa-tients from a single center, with a longer follow-up of at least three years. The percentages of high FADD expression in these two different populations of HNSCC were comparable and indi-cate that high FADD expression is a frequent event in advanced HNSCC. The lower incidence of 26% overall positivity in the recent study of Rasamny et al.342, might be due to the heterogene-ous group of HNSCC from nearly all sub-localizations and generally less advanced tumors, (55% N0 versus 39% in our study). A Japanese study of 60 early-stage tongue SCC reported FADD amplification in 44%, FADD expression was only assessed quantitatively and positive in 33%343. In both studies FADD was associated with N status and shorter disease-specific survival. Because FADD has been associated with lymph node metastasis, and shorter survival, not only in HNSCC342,343, but also in breast cancer331, the current study was set up to further analyze the role of FADD in the metastatic potential in a clinical series of HNSCC. Both N status and distant metastasis free interval (DMFI), which directly reflects metastatic progression of the disease, were associated with FADD expression.FADD was originally described as an adapter molecule in the DISC to mediate apoptosis through activation of caspase-8333,334. However, more recent studies showed a much more complex and largely unresolved role, FADD being involved in apoptosis, embryonic development, cell surviv-
Table 6.5. Cox regression analyses for DMFI comparing N0 cases with N+/FADD– cases, N0 cases with N+/FADD+ , and N+/FADD– cases with N+/FADD+ cases.
Univariate Cox regression for DMFI
HR 95%CI p-value
N0 1
N+/FADD- 9.7 1.2 - 80.9 0.035*
N0 1
N+/FADD+ 25.4 3.4 - 192.0 0.002*
N+/FADD- 1
N+FADD+ 2.6 1.0 - 6.7 0.046*
Table 6.4. Multivariate Cox regression analysis for DMFI.
Multivariate Cox regression for DMFI
HR 95%CI p-value
FADD
Low 1
High 2.3 0.96 - 5.7 0.062
N-stage
N0 1
N+ 14.5 1.9 - 108.5 0.009*
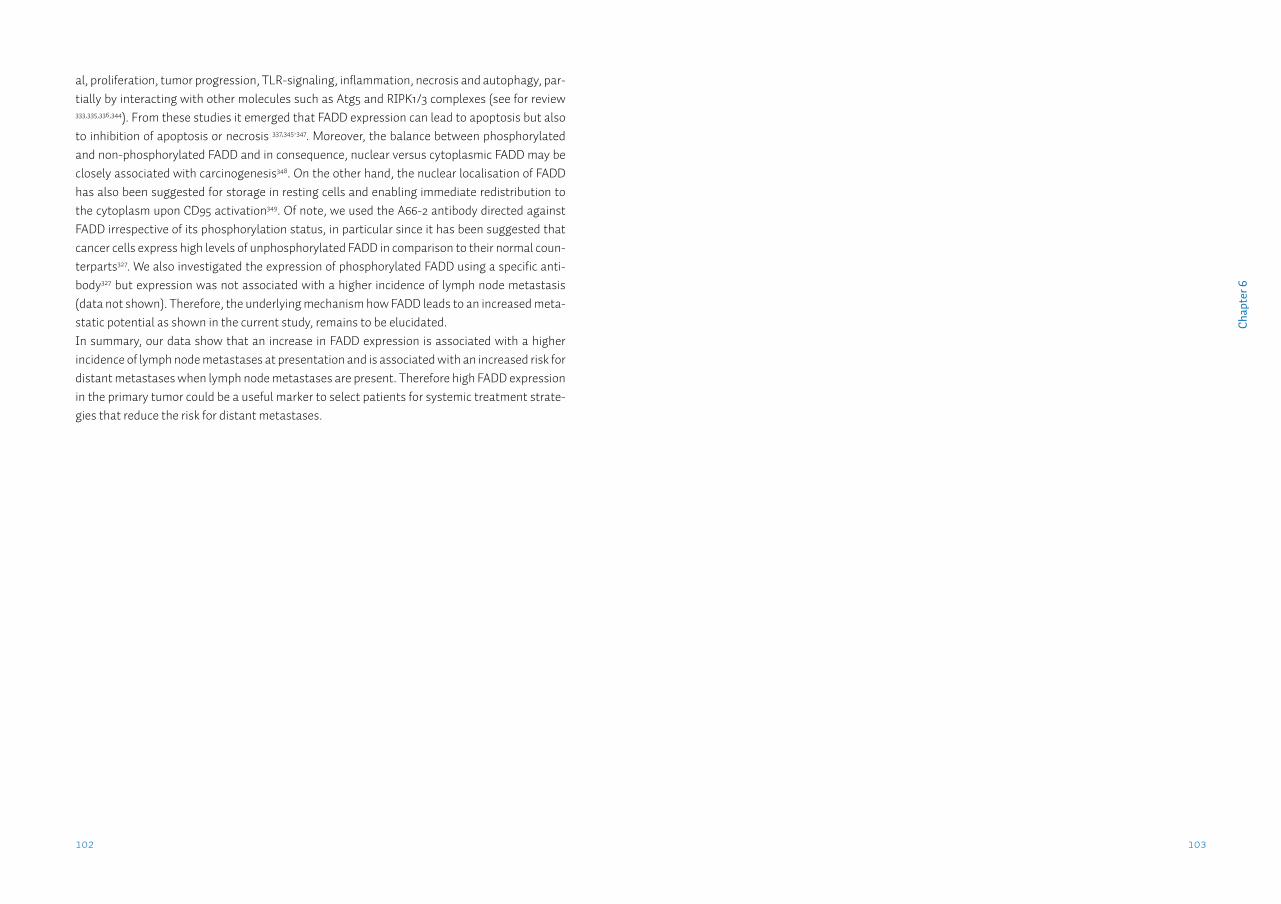
103102
Cha
pter
6
al, proliferation, tumor progression, TLR-signaling, inflammation, necrosis and autophagy, par-tially by interacting with other molecules such as Atg5 and RIPK1/3 complexes (see for review 333,335,336,344). From these studies it emerged that FADD expression can lead to apoptosis but also to inhibition of apoptosis or necrosis 337,345-347. Moreover, the balance between phosphorylated and non-phosphorylated FADD and in consequence, nuclear versus cytoplasmic FADD may be closely associated with carcinogenesis348. On the other hand, the nuclear localisation of FADD has also been suggested for storage in resting cells and enabling immediate redistribution to the cytoplasm upon CD95 activation349. Of note, we used the A66-2 antibody directed against FADD irrespective of its phosphorylation status, in particular since it has been suggested that cancer cells express high levels of unphosphorylated FADD in comparison to their normal coun-terparts327. We also investigated the expression of phosphorylated FADD using a specific anti-body327 but expression was not associated with a higher incidence of lymph node metastasis (data not shown). Therefore, the underlying mechanism how FADD leads to an increased meta-static potential as shown in the current study, remains to be elucidated.In summary, our data show that an increase in FADD expression is associated with a higher incidence of lymph node metastases at presentation and is associated with an increased risk for distant metastases when lymph node metastases are present. Therefore high FADD expression in the primary tumor could be a useful marker to select patients for systemic treatment strate-gies that reduce the risk for distant metastases.

Chapter 7
Detection of HPV-associated oropharyngeal tumours in a 16-year cohort: more than meets the eye
L.J. Melchersa,b, M.F. Mastikb, B. Samaniego Cameronb, B.A.C. van Dijkc,d, G.H. de Bockd, B.F.A.M. van der Laane, B. van der Vegtb, E.J.M. Speelf, J.L.N. Roodenburga, M.J.H. Witjesa, E. Schuuringb
aDept. of Oral & Maxillofacial Surgery, University of Groningen, University Medical Center Groningen, Groningen, The NetherlandsbDept. of Pathology, University of Groningen, University Medical Center Groningen, Groningen, The NetherlandscDept. of Research, Comprehensive Cancer Center The Netherlands, Utrecht, The NetherlandsdDept. of Epidemiology, University of Groningen, University Medical Center Groningen, Groningen, The NetherlandseDept. of Otorhinolaryngology/Head & Neck surgery, University of Groningen, University Medical Center Groningen, Groningen, The NetherlandsfDept. of Pathology, Maastricht University Medical Center, Maastricht, The Netherlands
Submitted.
107
Cha
pter
7
IntroductionInfection with the Human Papilloma Virus (HPV) has been identified as a risk factor for the de-velopment of various cancer types, such as oropharyngeal cancer, anal cancer, penile cancer and most notably, cervical cancer350. In cervical cancer persistent infection with specific types of HPV (mostly HPV16 and 18) is detected in all cases351. In head-neck squamous cell carcino-mas (HNSCC), HPV has been detected for almost 30 years352,353, and was quickly identified as a possible etiological factor354. In the tonsil and base-of-tongue, two specific sublocations of the oropharynx, a high percentage of HPV positivity is found355. Both locations harbour lymphatic tissue (resp. palatine and lingual tonsils) and feature a non-keratinized, stratified squamous epithelium with deep invaginations called crypts. These crypts are lined with reticulated epi-thelium accompanied by disruptions in the basement membrane, which provides direct tran-sepithelial access to antigens356. Interest in HPV surged when several groups reported a growing incidence of HPV-associated oropharyngeal squamous cell carcinomas (OpSCC)4,357-359. The reported prevalence of HPV in OpSCC however, varies widely. Highest rates are reported in Northern America and Asia360, prevalence in Europe is generally reported lower, varying from more than 80% in Stockholm359,361 to 50% in Cologne362 and 24% in Amsterdam363. Accurate assessment of the HPV status in these tumours is important because HPV-positive OpSCC are consistently associated with an improved disease-free and overall survival (reported Hazard Ratios of ~0.4)22,323,364. Also in oral squamous cell carcinomas (OSCC) HPV has been reported. Reported prevalence is generally lower than in OpSCC, but also shows a wide range; 0-60%360,365. Moreover, it is not clear if the effect of HPV status on disease outcome seen in OpSCC is also present in OSCC365.
There are various explanations for the wide range of reported HPV prevalences in HNSCC. (1) Geographical differences, due to socio-cultural differences360; (2) tumour sublocalizations have been defined and grouped in different ways366; (3) various HPV-detection methods have been used with differences in analytical sensitivity, some of which may also detect transient infec-tions367; (4) because of the increasing prevalence, different study periods are not readily compa-rable17; (5) the proportion positivity depends on the incidence of non-HPV associated HNSCC.Several algorithms have been proposed to reliably detect active HPV infection in HNSCC19,367,368. Currently used algorithms consist of p16 immunohistochemistry, followed by HPV-PCR of the p16-positive cases. Recently, in situ hybridization (ISH) has been added to these algorithms be-cause of its high specificity and therefore ability to confirm p16-negative cases19,20.Currently, very little information is available on regional differences in the prevalence of HPV-associated OpSCC. Even within one country, reported prevalences may differ widely. In the southern and central parts of the Netherlands, several studies into HPV prevalence in OpSCC have been performed. Prevalence rates in these studies range from 24-65%19,316,363,369. Previously we identified only two HPV-positive cases in a series of 140 advanced head-neck squamous cell carcinomas from the Northern Netherlands338. However, no complete cohorts have been tested. HPV prevalence in the Northern Netherlands may be different because of more smokers and a
AbstractIntroduction: Accurate assessment of the prevalence of the human papilloma virus (HPV) in oropharyngeal tumours (OpSCC) is important because HPV-positive OpSCC are consistently associated with an improved disease-free and overall survival. Recently, an algorithm has be-come available that reliably detects clinically relevant HPV in tumour tissue, however no com-plete cohorts have been tested. The aim of this study was to determine the prevalence of active high-risk HPV infection in a complete cohort of tonsillar and base-of-tongue squamous cell car-cinomas from the Northern Netherlands collected over a 16-year period.
Methods: Using a triple algorithm of p16 immunohistochemistry, HPV-BRISH and HPV-PCR we assessed the prevalence of active HPV infection in all OpSCC diagnosed in our hospital from 1997-2012 (n=193) and a random selection of 200 OSCC treated from 1997-2008. Both had com-plete clinicopathological and follow-up data available.
Results: 47 OpSCC (24%) were HPVGP PCR-positive; 42 cases were HPV16+, 1 HPV18+, 3 HPV33+ and 1 HPV35+. HPV-associated tumour proportion increased from 13% between 1997-2004, to 30% between 2005-2012. HPV-positivity was an independent predictor for longer disease-spe-cific survival (HR=0.22; 95%CI:0.10-0.47). Only one OSCC was HPV+.
Conclusions: In our cohort the incidence of HPV-associated OpSCC is low but increasing rapid-ly. The strict detection algorithm, analysis of disease-specific survival, and the complete cohort, which included also palliatively treated patients, may influence the reported prevalence and prognostic value of HPV in OpSCC.
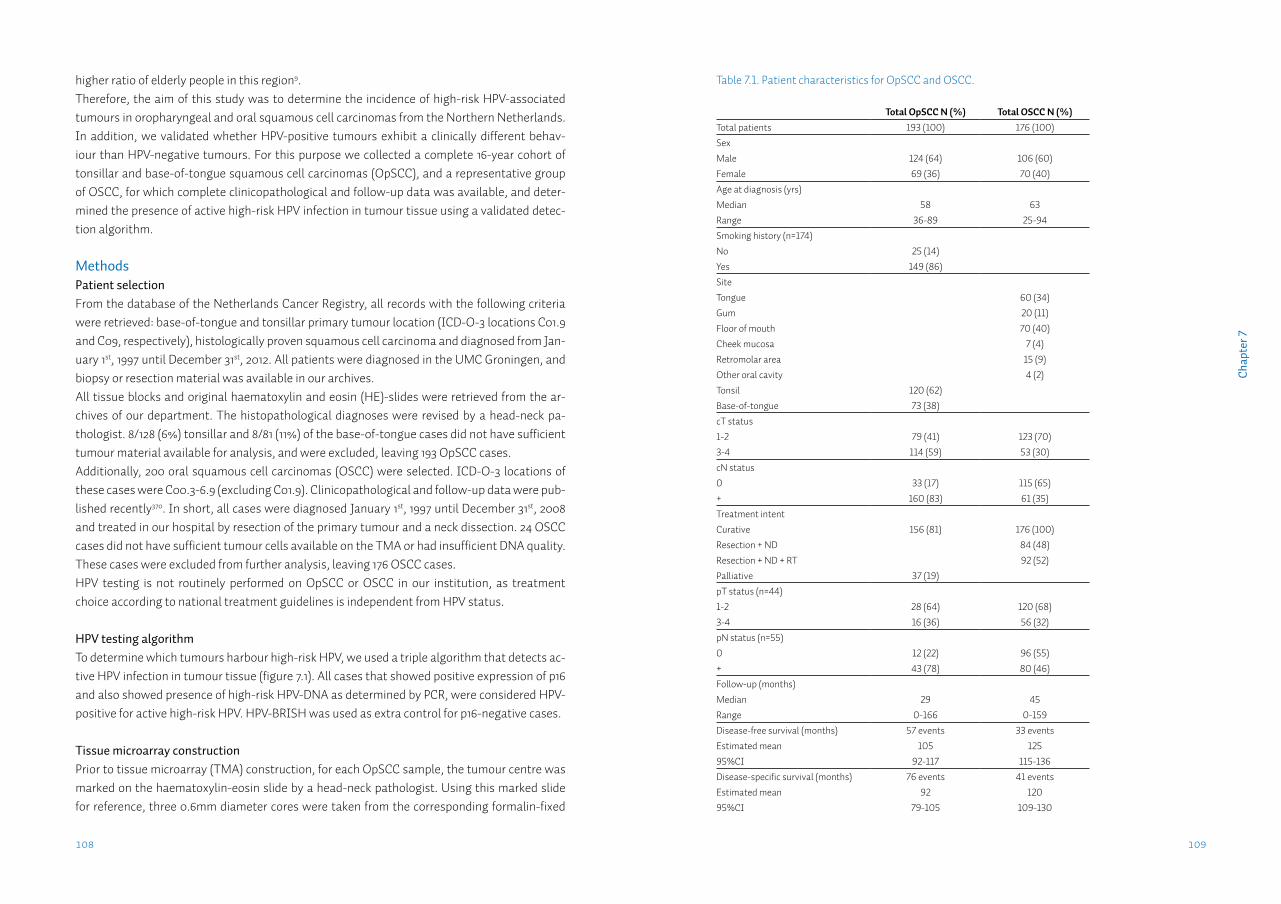
109108
Cha
pter
7
higher ratio of elderly people in this region9.Therefore, the aim of this study was to determine the incidence of high-risk HPV-associated tumours in oropharyngeal and oral squamous cell carcinomas from the Northern Netherlands. In addition, we validated whether HPV-positive tumours exhibit a clinically different behav-iour than HPV-negative tumours. For this purpose we collected a complete 16-year cohort of tonsillar and base-of-tongue squamous cell carcinomas (OpSCC), and a representative group of OSCC, for which complete clinicopathological and follow-up data was available, and deter-mined the presence of active high-risk HPV infection in tumour tissue using a validated detec-tion algorithm.
MethodsPatient selectionFrom the database of the Netherlands Cancer Registry, all records with the following criteria were retrieved: base-of-tongue and tonsillar primary tumour location (ICD-O-3 locations C01.9 and C09, respectively), histologically proven squamous cell carcinoma and diagnosed from Jan-uary 1st, 1997 until December 31st, 2012. All patients were diagnosed in the UMC Groningen, and biopsy or resection material was available in our archives. All tissue blocks and original haematoxylin and eosin (HE)-slides were retrieved from the ar-chives of our department. The histopathological diagnoses were revised by a head-neck pa-thologist. 8/128 (6%) tonsillar and 8/81 (11%) of the base-of-tongue cases did not have sufficient tumour material available for analysis, and were excluded, leaving 193 OpSCC cases.Additionally, 200 oral squamous cell carcinomas (OSCC) were selected. ICD-O-3 locations of these cases were C00.3-6.9 (excluding C01.9). Clinicopathological and follow-up data were pub-lished recently370. In short, all cases were diagnosed January 1st, 1997 until December 31st, 2008 and treated in our hospital by resection of the primary tumour and a neck dissection. 24 OSCC cases did not have sufficient tumour cells available on the TMA or had insufficient DNA quality. These cases were excluded from further analysis, leaving 176 OSCC cases. HPV testing is not routinely performed on OpSCC or OSCC in our institution, as treatment choice according to national treatment guidelines is independent from HPV status.
HPV testing algorithmTo determine which tumours harbour high-risk HPV, we used a triple algorithm that detects ac-tive HPV infection in tumour tissue (figure 7.1). All cases that showed positive expression of p16 and also showed presence of high-risk HPV-DNA as determined by PCR, were considered HPV-positive for active high-risk HPV. HPV-BRISH was used as extra control for p16-negative cases.
Tissue microarray constructionPrior to tissue microarray (TMA) construction, for each OpSCC sample, the tumour centre was marked on the haematoxylin-eosin slide by a head-neck pathologist. Using this marked slide for reference, three 0.6mm diameter cores were taken from the corresponding formalin-fixed
Table 7.1. Patient characteristics for OpSCC and OSCC.
Total OpSCC N (%) Total OSCC N (%)Total patients 193 (100) 176 (100)SexMale 124 (64) 106 (60)Female 69 (36) 70 (40)Age at diagnosis (yrs)Median 58 63Range 36-89 25-94Smoking history (n=174)No 25 (14)Yes 149 (86)SiteTongue 60 (34)Gum 20 (11)Floor of mouth 70 (40)Cheek mucosa 7 (4)Retromolar area 15 (9)Other oral cavity 4 (2)Tonsil 120 (62)Base-of-tongue 73 (38)cT status1-2 79 (41) 123 (70)3-4 114 (59) 53 (30)cN status0 33 (17) 115 (65)+ 160 (83) 61 (35)Treatment intentCurative 156 (81) 176 (100)Resection + ND 84 (48)Resection + ND + RT 92 (52)Palliative 37 (19)pT status (n=44)1-2 28 (64) 120 (68)3-4 16 (36) 56 (32)pN status (n=55)0 12 (22) 96 (55)+ 43 (78) 80 (46)Follow-up (months)Median 29 45Range 0-166 0-159Disease-free survival (months) 57 events 33 eventsEstimated mean 105 12595%CI 92-117 115-136Disease-specific survival (months) 76 events 41 eventsEstimated mean 92 12095%CI 79-105 109-130
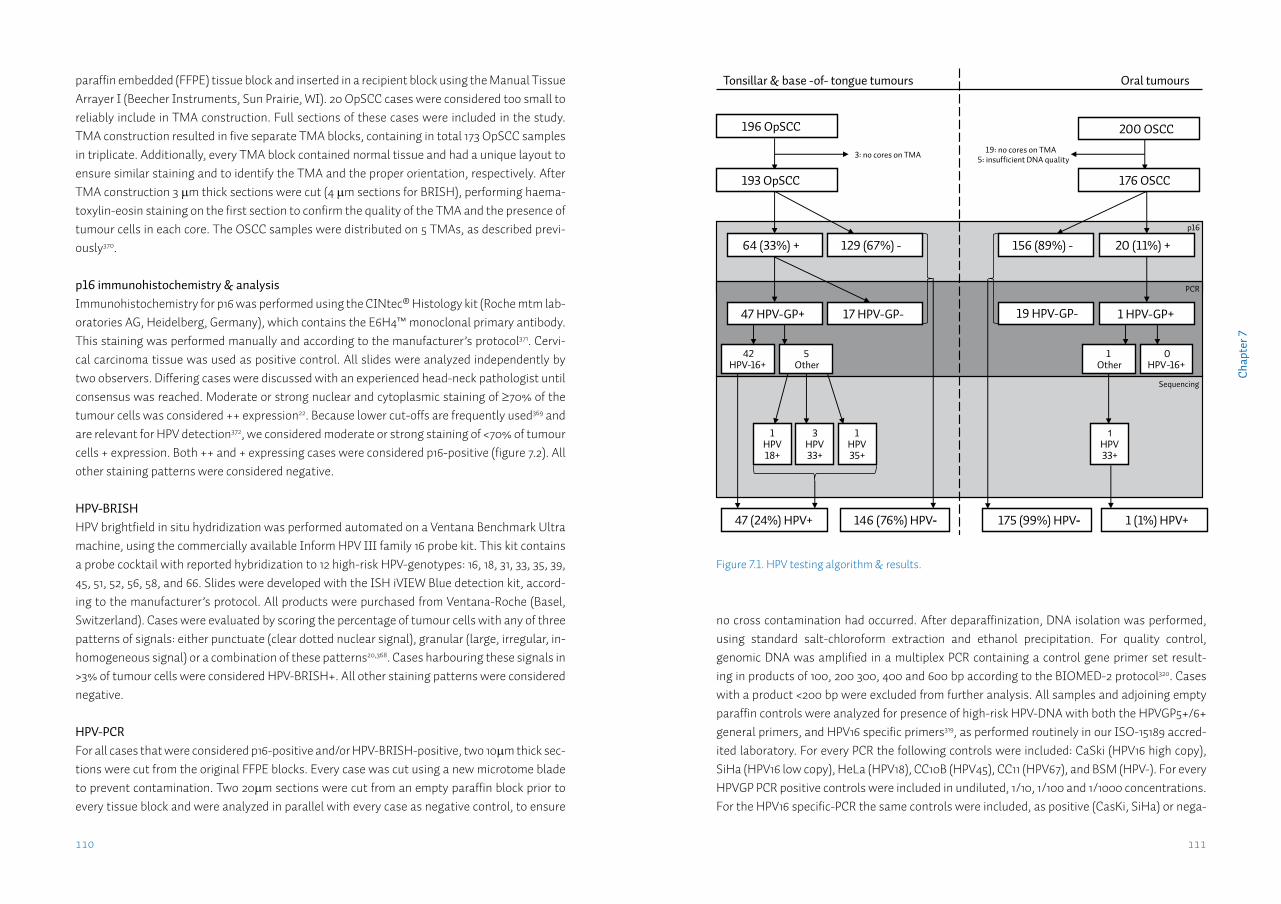
111110
Cha
pter
7
paraffin embedded (FFPE) tissue block and inserted in a recipient block using the Manual Tissue Arrayer I (Beecher Instruments, Sun Prairie, WI). 20 OpSCC cases were considered too small to reliably include in TMA construction. Full sections of these cases were included in the study. TMA construction resulted in five separate TMA blocks, containing in total 173 OpSCC samples in triplicate. Additionally, every TMA block contained normal tissue and had a unique layout to ensure similar staining and to identify the TMA and the proper orientation, respectively. After TMA construction 3 µm thick sections were cut (4 µm sections for BRISH), performing haema-toxylin-eosin staining on the first section to confirm the quality of the TMA and the presence of tumour cells in each core. The OSCC samples were distributed on 5 TMAs, as described previ-ously370.
p16 immunohistochemistry & analysisImmunohistochemistry for p16 was performed using the CINtec® Histology kit (Roche mtm lab-oratories AG, Heidelberg, Germany), which contains the E6H4™ monoclonal primary antibody. This staining was performed manually and according to the manufacturer’s protocol371. Cervi-cal carcinoma tissue was used as positive control. All slides were analyzed independently by two observers. Differing cases were discussed with an experienced head-neck pathologist until consensus was reached. Moderate or strong nuclear and cytoplasmic staining of ≥70% of the tumour cells was considered ++ expression22. Because lower cut-offs are frequently used369 and are relevant for HPV detection372, we considered moderate or strong staining of <70% of tumour cells + expression. Both ++ and + expressing cases were considered p16-positive (figure 7.2). All other staining patterns were considered negative.
HPV-BRISHHPV brightfield in situ hydridization was performed automated on a Ventana Benchmark Ultra machine, using the commercially available Inform HPV III family 16 probe kit. This kit contains a probe cocktail with reported hybridization to 12 high-risk HPV-genotypes: 16, 18, 31, 33, 35, 39, 45, 51, 52, 56, 58, and 66. Slides were developed with the ISH iVIEW Blue detection kit, accord-ing to the manufacturer’s protocol. All products were purchased from Ventana-Roche (Basel, Switzerland). Cases were evaluated by scoring the percentage of tumour cells with any of three patterns of signals: either punctuate (clear dotted nuclear signal), granular (large, irregular, in-homogeneous signal) or a combination of these patterns20,368. Cases harbouring these signals in >3% of tumour cells were considered HPV-BRISH+. All other staining patterns were considered negative.
HPV-PCRFor all cases that were considered p16-positive and/or HPV-BRISH-positive, two 10µm thick sec-tions were cut from the original FFPE blocks. Every case was cut using a new microtome blade to prevent contamination. Two 20µm sections were cut from an empty paraffin block prior to every tissue block and were analyzed in parallel with every case as negative control, to ensure
Figure 7.1. HPV testing algorithm & results.
Tonsillar & base -of- tongue tumours Oral tumours
19: no cores on TMA 5: insufficient DNA quality
p16
129 (67%) - 64 (33%) +
PCR
146 (76%) HPV-
17 HPV-GP-47 HPV-GP+
47 (24%) HPV+
3: no cores on TMA
42 HPV-16+
5 Other
Sequencing
1 HPV 18+
196 OpSCC
3 HPV 33+
1 HPV 35+
193 OpSCC
20 (11%) +
200 OSCC
176 OSCC
156 (89%) -
19 HPV-GP-
0 HPV-16+
1 Other
1 HPV 33+
1 (1%) HPV+
1 HPV-GP+
175 (99%) HPV-
no cross contamination had occurred. After deparaffinization, DNA isolation was performed, using standard salt-chloroform extraction and ethanol precipitation. For quality control, genomic DNA was amplified in a multiplex PCR containing a control gene primer set result-ing in products of 100, 200 300, 400 and 600 bp according to the BIOMED-2 protocol320. Cases with a product <200 bp were excluded from further analysis. All samples and adjoining empty paraffin controls were analyzed for presence of high-risk HPV-DNA with both the HPVGP5+/6+ general primers, and HPV16 specific primers319, as performed routinely in our ISO-15189 accred-ited laboratory. For every PCR the following controls were included: CaSki (HPV16 high copy), SiHa (HPV16 low copy), HeLa (HPV18), CC10B (HPV45), CC11 (HPV67), and BSM (HPV-). For every HPVGP PCR positive controls were included in undiluted, 1/10, 1/100 and 1/1000 concentrations. For the HPV16 specific-PCR the same controls were included, as positive (CasKi, SiHa) or nega-
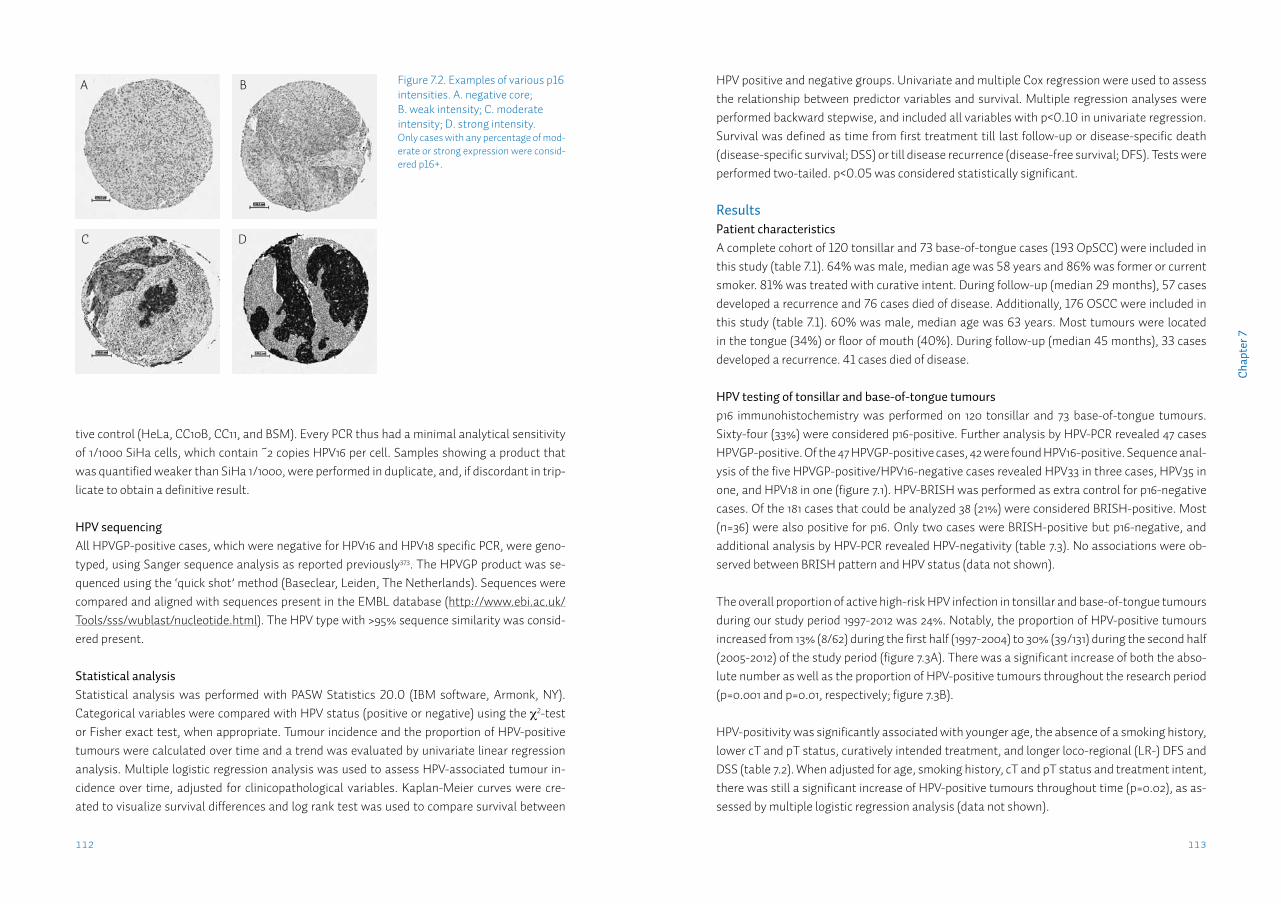
113112
Cha
pter
7
HPV positive and negative groups. Univariate and multiple Cox regression were used to assess the relationship between predictor variables and survival. Multiple regression analyses were performed backward stepwise, and included all variables with p<0.10 in univariate regression. Survival was defined as time from first treatment till last follow-up or disease-specific death (disease-specific survival; DSS) or till disease recurrence (disease-free survival; DFS). Tests were performed two-tailed. p<0.05 was considered statistically significant.
ResultsPatient characteristicsA complete cohort of 120 tonsillar and 73 base-of-tongue cases (193 OpSCC) were included in this study (table 7.1). 64% was male, median age was 58 years and 86% was former or current smoker. 81% was treated with curative intent. During follow-up (median 29 months), 57 cases developed a recurrence and 76 cases died of disease. Additionally, 176 OSCC were included in this study (table 7.1). 60% was male, median age was 63 years. Most tumours were located in the tongue (34%) or floor of mouth (40%). During follow-up (median 45 months), 33 cases developed a recurrence. 41 cases died of disease.
HPV testing of tonsillar and base-of-tongue tumoursp16 immunohistochemistry was performed on 120 tonsillar and 73 base-of-tongue tumours. Sixty-four (33%) were considered p16-positive. Further analysis by HPV-PCR revealed 47 cases HPVGP-positive. Of the 47 HPVGP-positive cases, 42 were found HPV16-positive. Sequence anal-ysis of the five HPVGP-positive/HPV16-negative cases revealed HPV33 in three cases, HPV35 in one, and HPV18 in one (figure 7.1). HPV-BRISH was performed as extra control for p16-negative cases. Of the 181 cases that could be analyzed 38 (21%) were considered BRISH-positive. Most (n=36) were also positive for p16. Only two cases were BRISH-positive but p16-negative, and additional analysis by HPV-PCR revealed HPV-negativity (table 7.3). No associations were ob-served between BRISH pattern and HPV status (data not shown).
The overall proportion of active high-risk HPV infection in tonsillar and base-of-tongue tumours during our study period 1997-2012 was 24%. Notably, the proportion of HPV-positive tumours increased from 13% (8/62) during the first half (1997-2004) to 30% (39/131) during the second half (2005-2012) of the study period (figure 7.3A). There was a significant increase of both the abso-lute number as well as the proportion of HPV-positive tumours throughout the research period (p=0.001 and p=0.01, respectively; figure 7.3B).
HPV-positivity was significantly associated with younger age, the absence of a smoking history, lower cT and pT status, curatively intended treatment, and longer loco-regional (LR-) DFS and DSS (table 7.2). When adjusted for age, smoking history, cT and pT status and treatment intent, there was still a significant increase of HPV-positive tumours throughout time (p=0.02), as as-sessed by multiple logistic regression analysis (data not shown).
tive control (HeLa, CC10B, CC11, and BSM). Every PCR thus had a minimal analytical sensitivity of 1/1000 SiHa cells, which contain ~2 copies HPV16 per cell. Samples showing a product that was quantified weaker than SiHa 1/1000, were performed in duplicate, and, if discordant in trip-licate to obtain a definitive result.
HPV sequencingAll HPVGP-positive cases, which were negative for HPV16 and HPV18 specific PCR, were geno-typed, using Sanger sequence analysis as reported previously373. The HPVGP product was se-quenced using the ‘quick shot’ method (Baseclear, Leiden, The Netherlands). Sequences were compared and aligned with sequences present in the EMBL database (http://www.ebi.ac.uk/Tools/sss/wublast/nucleotide.html). The HPV type with >95% sequence similarity was consid-ered present.
Statistical analysisStatistical analysis was performed with PASW Statistics 20.0 (IBM software, Armonk, NY). Categorical variables were compared with HPV status (positive or negative) using the χ2-test or Fisher exact test, when appropriate. Tumour incidence and the proportion of HPV-positive tumours were calculated over time and a trend was evaluated by univariate linear regression analysis. Multiple logistic regression analysis was used to assess HPV-associated tumour in-cidence over time, adjusted for clinicopathological variables. Kaplan-Meier curves were cre-ated to visualize survival differences and log rank test was used to compare survival between
Figure 7.2. Examples of various p16 intensities. A. negative core; B. weak intensity; C. moderate intensity; D. strong intensity.Only cases with any percentage of mod-erate or strong expression were consid-ered p16+.
A
C
B
D
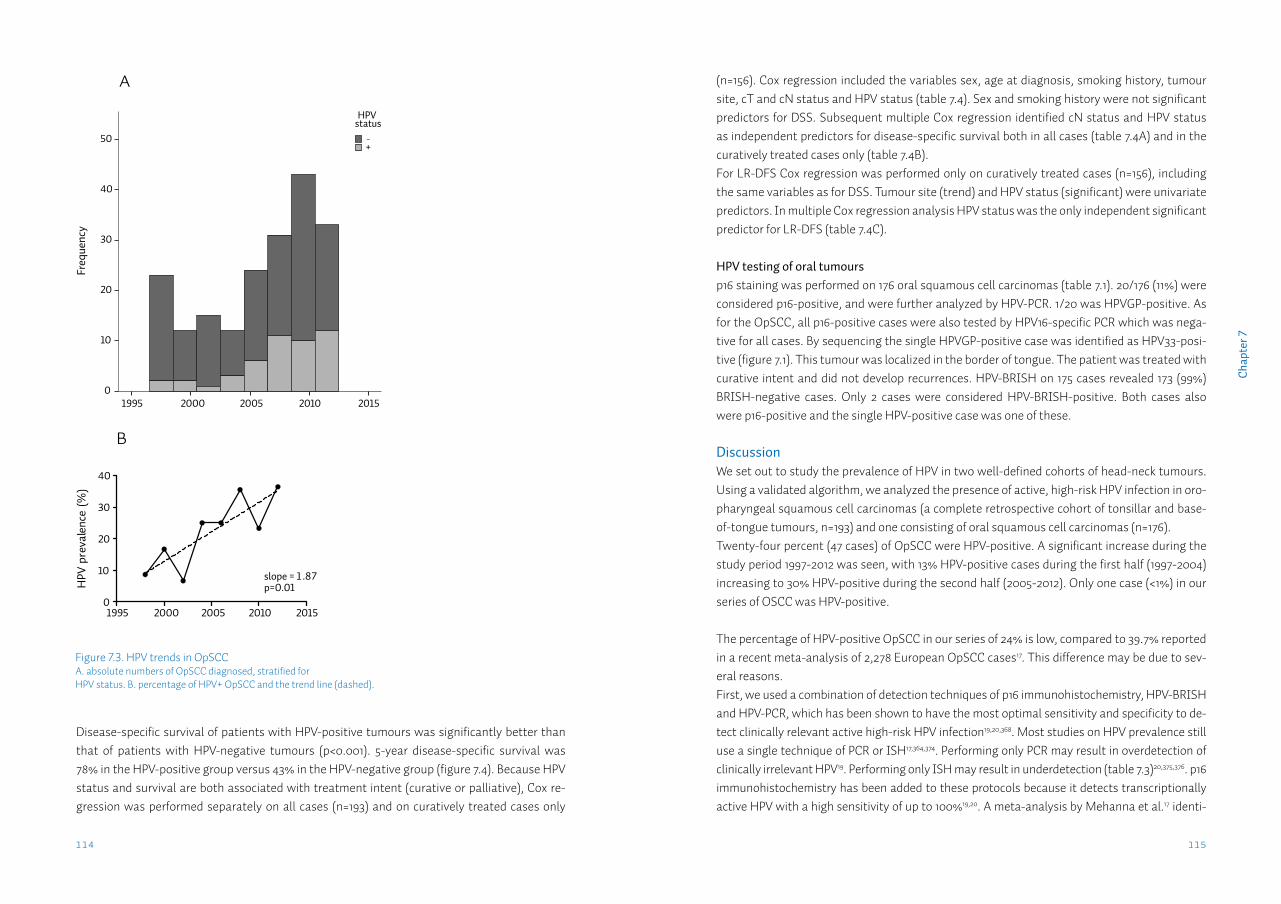
115114
Cha
pter
7
(n=156). Cox regression included the variables sex, age at diagnosis, smoking history, tumour site, cT and cN status and HPV status (table 7.4). Sex and smoking history were not significant predictors for DSS. Subsequent multiple Cox regression identified cN status and HPV status as independent predictors for disease-specific survival both in all cases (table 7.4A) and in the curatively treated cases only (table 7.4B). For LR-DFS Cox regression was performed only on curatively treated cases (n=156), including the same variables as for DSS. Tumour site (trend) and HPV status (significant) were univariate predictors. In multiple Cox regression analysis HPV status was the only independent significant predictor for LR-DFS (table 7.4C).
HPV testing of oral tumoursp16 staining was performed on 176 oral squamous cell carcinomas (table 7.1). 20/176 (11%) were considered p16-positive, and were further analyzed by HPV-PCR. 1/20 was HPVGP-positive. As for the OpSCC, all p16-positive cases were also tested by HPV16-specific PCR which was nega-tive for all cases. By sequencing the single HPVGP-positive case was identified as HPV33-posi-tive (figure 7.1). This tumour was localized in the border of tongue. The patient was treated with curative intent and did not develop recurrences. HPV-BRISH on 175 cases revealed 173 (99%) BRISH-negative cases. Only 2 cases were considered HPV-BRISH-positive. Both cases also were p16-positive and the single HPV-positive case was one of these.
DiscussionWe set out to study the prevalence of HPV in two well-defined cohorts of head-neck tumours. Using a validated algorithm, we analyzed the presence of active, high-risk HPV infection in oro-pharyngeal squamous cell carcinomas (a complete retrospective cohort of tonsillar and base-of-tongue tumours, n=193) and one consisting of oral squamous cell carcinomas (n=176).Twenty-four percent (47 cases) of OpSCC were HPV-positive. A significant increase during the study period 1997-2012 was seen, with 13% HPV-positive cases during the first half (1997-2004) increasing to 30% HPV-positive during the second half (2005-2012). Only one case (<1%) in our series of OSCC was HPV-positive.
The percentage of HPV-positive OpSCC in our series of 24% is low, compared to 39.7% reported in a recent meta-analysis of 2,278 European OpSCC cases17. This difference may be due to sev-eral reasons.First, we used a combination of detection techniques of p16 immunohistochemistry, HPV-BRISH and HPV-PCR, which has been shown to have the most optimal sensitivity and specificity to de-tect clinically relevant active high-risk HPV infection19,20,368. Most studies on HPV prevalence still use a single technique of PCR or ISH17,364,374. Performing only PCR may result in overdetection of clinically irrelevant HPV19. Performing only ISH may result in underdetection (table 7.3)20,375,376. p16 immunohistochemistry has been added to these protocols because it detects transcriptionally active HPV with a high sensitivity of up to 100%19,20. A meta-analysis by Mehanna et al.17 identi-
Figure 7.3. HPV trends in OpSCCA. absolute numbers of OpSCC diagnosed, stratified for HPV status. B. percentage of HPV+ OpSCC and the trend line (dashed).
Year of diagnosis
20152010200520001995
Freq
uenc
y
50
40
30
20
10
0
+-
HPV status
A
Year of diagnosis
HPV
pre
vale
nce
(%)
1995 2000 2005 2010 20150
10
20
30
40
slope = 1 .87p=0.01
B
Disease-specific survival of patients with HPV-positive tumours was significantly better than that of patients with HPV-negative tumours (p<0.001). 5-year disease-specific survival was 78% in the HPV-positive group versus 43% in the HPV-negative group (figure 7.4). Because HPV status and survival are both associated with treatment intent (curative or palliative), Cox re-gression was performed separately on all cases (n=193) and on curatively treated cases only
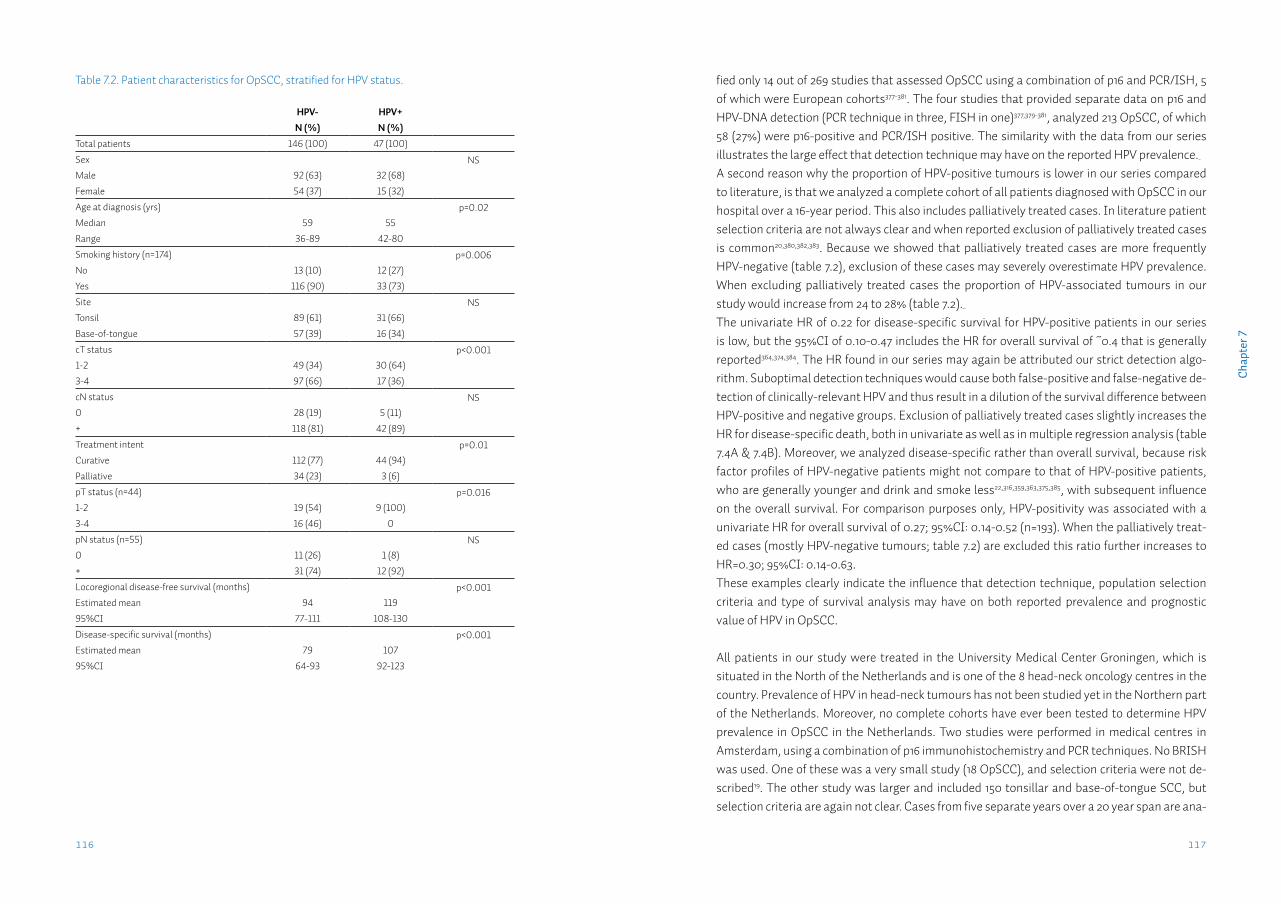
117116
Cha
pter
7
fied only 14 out of 269 studies that assessed OpSCC using a combination of p16 and PCR/ISH, 5 of which were European cohorts377-381. The four studies that provided separate data on p16 and HPV-DNA detection (PCR technique in three, FISH in one)377,379-381, analyzed 213 OpSCC, of which 58 (27%) were p16-positive and PCR/ISH positive. The similarity with the data from our series illustrates the large effect that detection technique may have on the reported HPV prevalence. A second reason why the proportion of HPV-positive tumours is lower in our series compared to literature, is that we analyzed a complete cohort of all patients diagnosed with OpSCC in our hospital over a 16-year period. This also includes palliatively treated cases. In literature patient selection criteria are not always clear and when reported exclusion of palliatively treated cases is common20,380,382,383. Because we showed that palliatively treated cases are more frequently HPV-negative (table 7.2), exclusion of these cases may severely overestimate HPV prevalence. When excluding palliatively treated cases the proportion of HPV-associated tumours in our study would increase from 24 to 28% (table 7.2). The univariate HR of 0.22 for disease-specific survival for HPV-positive patients in our series is low, but the 95%CI of 0.10-0.47 includes the HR for overall survival of ~0.4 that is generally reported364,374,384. The HR found in our series may again be attributed our strict detection algo-rithm. Suboptimal detection techniques would cause both false-positive and false-negative de-tection of clinically-relevant HPV and thus result in a dilution of the survival difference between HPV-positive and negative groups. Exclusion of palliatively treated cases slightly increases the HR for disease-specific death, both in univariate as well as in multiple regression analysis (table 7.4A & 7.4B). Moreover, we analyzed disease-specific rather than overall survival, because risk factor profiles of HPV-negative patients might not compare to that of HPV-positive patients, who are generally younger and drink and smoke less22,316,359,363,375,385, with subsequent influence on the overall survival. For comparison purposes only, HPV-positivity was associated with a univariate HR for overall survival of 0.27; 95%CI: 0.14-0.52 (n=193). When the palliatively treat-ed cases (mostly HPV-negative tumours; table 7.2) are excluded this ratio further increases to HR=0.30; 95%CI: 0.14-0.63. These examples clearly indicate the influence that detection technique, population selection criteria and type of survival analysis may have on both reported prevalence and prognostic value of HPV in OpSCC.
All patients in our study were treated in the University Medical Center Groningen, which is situated in the North of the Netherlands and is one of the 8 head-neck oncology centres in the country. Prevalence of HPV in head-neck tumours has not been studied yet in the Northern part of the Netherlands. Moreover, no complete cohorts have ever been tested to determine HPV prevalence in OpSCC in the Netherlands. Two studies were performed in medical centres in Amsterdam, using a combination of p16 immunohistochemistry and PCR techniques. No BRISH was used. One of these was a very small study (18 OpSCC), and selection criteria were not de-scribed19. The other study was larger and included 150 tonsillar and base-of-tongue SCC, but selection criteria are again not clear. Cases from five separate years over a 20 year span are ana-
Table 7.2. Patient characteristics for OpSCC, stratified for HPV status.
HPV- HPV+N (%) N (%)
Total patients 146 (100) 47 (100)
Sex NSMale 92 (63) 32 (68)
Female 54 (37) 15 (32)
Age at diagnosis (yrs) p=0.02Median 59 55
Range 36-89 42-80
Smoking history (n=174) p=0.006No 13 (10) 12 (27)
Yes 116 (90) 33 (73)
Site NSTonsil 89 (61) 31 (66)
Base-of-tongue 57 (39) 16 (34)
cT status p<0.0011-2 49 (34) 30 (64)
3-4 97 (66) 17 (36)
cN status NS0 28 (19) 5 (11)
+ 118 (81) 42 (89)
Treatment intent p=0.01Curative 112 (77) 44 (94)
Palliative 34 (23) 3 (6)
pT status (n=44) p=0.0161-2 19 (54) 9 (100)
3-4 16 (46) 0
pN status (n=55) NS0 11 (26) 1 (8)
+ 31 (74) 12 (92)
Locoregional disease-free survival (months) p<0.001Estimated mean 94 119
95%CI 77-111 108-130
Disease-specific survival (months) p<0.001Estimated mean 79 107
95%CI 64-93 92-123
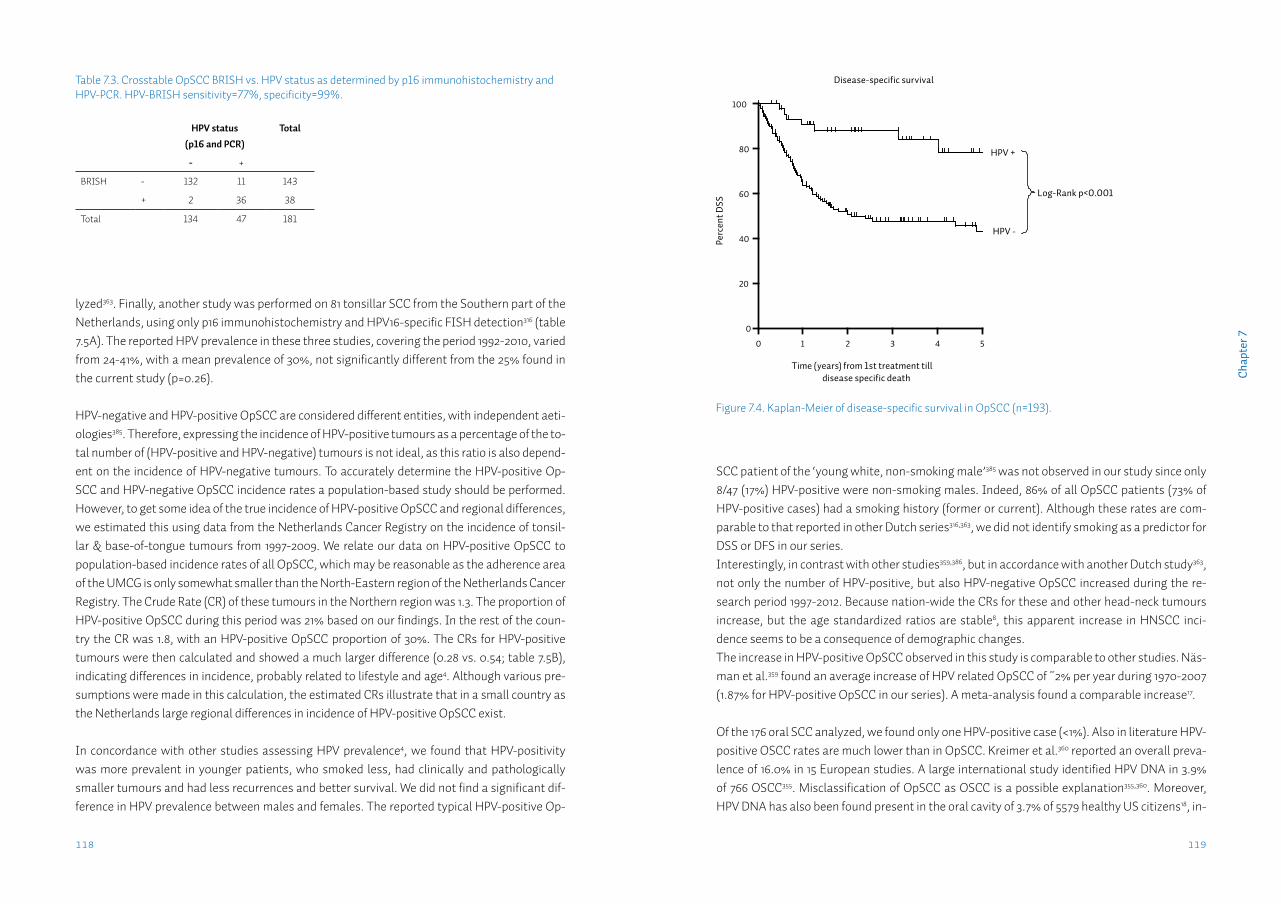
119118
Cha
pter
7
lyzed363. Finally, another study was performed on 81 tonsillar SCC from the Southern part of the Netherlands, using only p16 immunohistochemistry and HPV16-specific FISH detection316 (table 7.5A). The reported HPV prevalence in these three studies, covering the period 1992-2010, varied from 24-41%, with a mean prevalence of 30%, not significantly different from the 25% found in the current study (p=0.26).
HPV-negative and HPV-positive OpSCC are considered different entities, with independent aeti-ologies385. Therefore, expressing the incidence of HPV-positive tumours as a percentage of the to-tal number of (HPV-positive and HPV-negative) tumours is not ideal, as this ratio is also depend-ent on the incidence of HPV-negative tumours. To accurately determine the HPV-positive Op-SCC and HPV-negative OpSCC incidence rates a population-based study should be performed. However, to get some idea of the true incidence of HPV-positive OpSCC and regional differences, we estimated this using data from the Netherlands Cancer Registry on the incidence of tonsil-lar & base-of-tongue tumours from 1997-2009. We relate our data on HPV-positive OpSCC to population-based incidence rates of all OpSCC, which may be reasonable as the adherence area of the UMCG is only somewhat smaller than the North-Eastern region of the Netherlands Cancer Registry. The Crude Rate (CR) of these tumours in the Northern region was 1.3. The proportion of HPV-positive OpSCC during this period was 21% based on our findings. In the rest of the coun-try the CR was 1.8, with an HPV-positive OpSCC proportion of 30%. The CRs for HPV-positive tumours were then calculated and showed a much larger difference (0.28 vs. 0.54; table 7.5B), indicating differences in incidence, probably related to lifestyle and age4. Although various pre-sumptions were made in this calculation, the estimated CRs illustrate that in a small country as the Netherlands large regional differences in incidence of HPV-positive OpSCC exist.
In concordance with other studies assessing HPV prevalence4, we found that HPV-positivity was more prevalent in younger patients, who smoked less, had clinically and pathologically smaller tumours and had less recurrences and better survival. We did not find a significant dif-ference in HPV prevalence between males and females. The reported typical HPV-positive Op-
Figure 7.4. Kaplan-Meier of disease-specific survival in OpSCC (n=193).
Disease-specific survival
Time (years) from 1st treatment tilldisease specific death
Perc
ent D
SS
0
20
40
60
80
100
1 2 3 4 5
HPV -
HPV +
Log-Rank p<0.001
Numbers at risk
HPV+
HPV-47
146
38
78
29
51
23
37
15
27
6
18
0
SCC patient of the ‘young white, non-smoking male’385 was not observed in our study since only 8/47 (17%) HPV-positive were non-smoking males. Indeed, 86% of all OpSCC patients (73% of HPV-positive cases) had a smoking history (former or current). Although these rates are com-parable to that reported in other Dutch series316,363, we did not identify smoking as a predictor for DSS or DFS in our series. Interestingly, in contrast with other studies359,386, but in accordance with another Dutch study363, not only the number of HPV-positive, but also HPV-negative OpSCC increased during the re-search period 1997-2012. Because nation-wide the CRs for these and other head-neck tumours increase, but the age standardized ratios are stable8, this apparent increase in HNSCC inci-dence seems to be a consequence of demographic changes.The increase in HPV-positive OpSCC observed in this study is comparable to other studies. Näs-man et al.359 found an average increase of HPV related OpSCC of ~2% per year during 1970-2007 (1.87% for HPV-positive OpSCC in our series). A meta-analysis found a comparable increase17.
Of the 176 oral SCC analyzed, we found only one HPV-positive case (<1%). Also in literature HPV-positive OSCC rates are much lower than in OpSCC. Kreimer et al.360 reported an overall preva-lence of 16.0% in 15 European studies. A large international study identified HPV DNA in 3.9% of 766 OSCC355. Misclassification of OpSCC as OSCC is a possible explanation355,360. Moreover, HPV DNA has also been found present in the oral cavity of 3.7% of 5579 healthy US citizens18, in-
Table 7.3. Crosstable OpSCC BRISH vs. HPV status as determined by p16 immunohistochemistry and HPV-PCR. HPV-BRISH sensitivity=77%, specificity=99%.
HPV status (p16 and PCR)
Total
- +
BRISH - 132 11 143
+ 2 36 38
Total 134 47 181
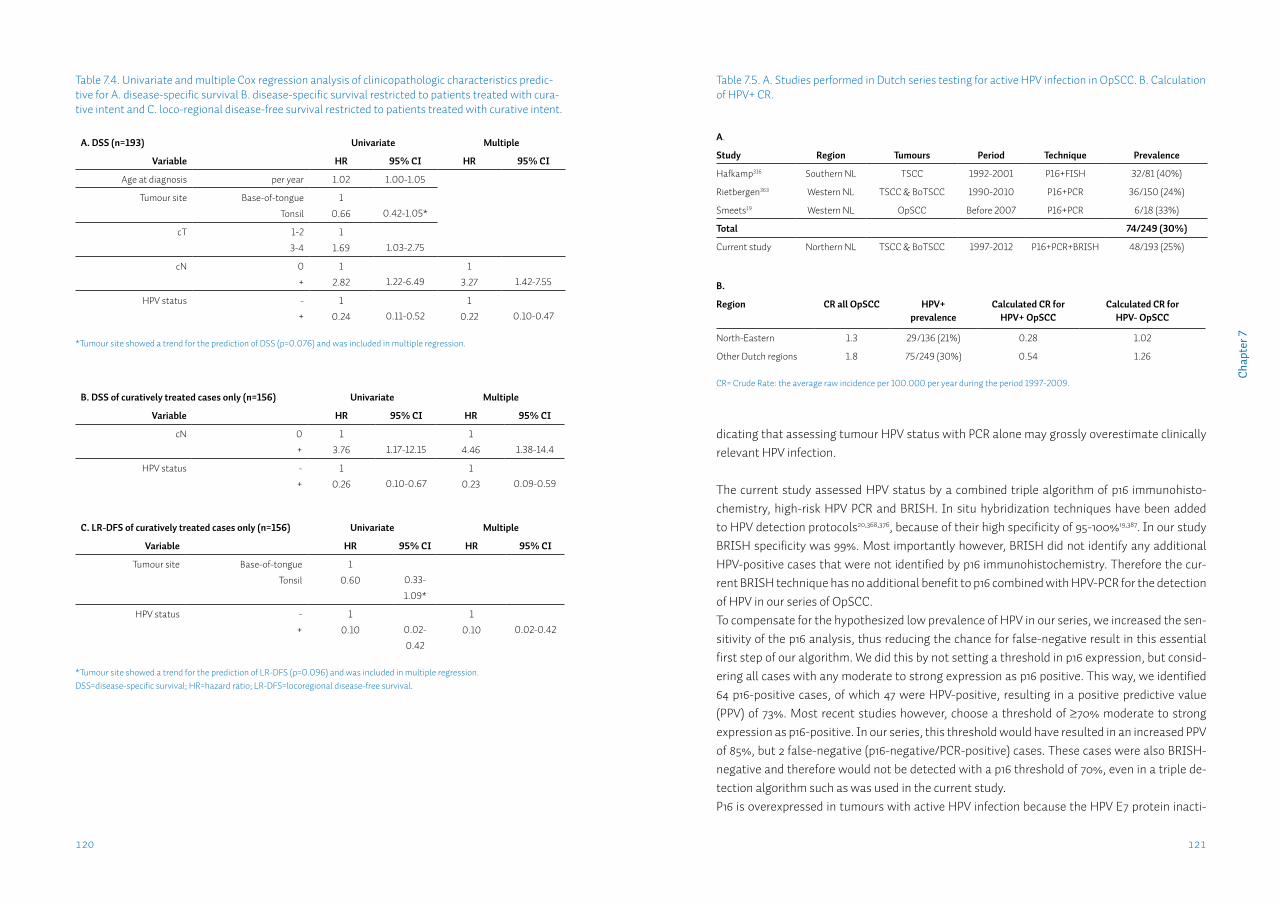
121120
Cha
pter
7
dicating that assessing tumour HPV status with PCR alone may grossly overestimate clinically relevant HPV infection.
The current study assessed HPV status by a combined triple algorithm of p16 immunohisto-chemistry, high-risk HPV PCR and BRISH. In situ hybridization techniques have been added to HPV detection protocols20,368,376, because of their high specificity of 95-100%19,387. In our study BRISH specificity was 99%. Most importantly however, BRISH did not identify any additional HPV-positive cases that were not identified by p16 immunohistochemistry. Therefore the cur-rent BRISH technique has no additional benefit to p16 combined with HPV-PCR for the detection of HPV in our series of OpSCC.To compensate for the hypothesized low prevalence of HPV in our series, we increased the sen-sitivity of the p16 analysis, thus reducing the chance for false-negative result in this essential first step of our algorithm. We did this by not setting a threshold in p16 expression, but consid-ering all cases with any moderate to strong expression as p16 positive. This way, we identified 64 p16-positive cases, of which 47 were HPV-positive, resulting in a positive predictive value (PPV) of 73%. Most recent studies however, choose a threshold of ≥70% moderate to strong expression as p16-positive. In our series, this threshold would have resulted in an increased PPV of 85%, but 2 false-negative (p16-negative/PCR-positive) cases. These cases were also BRISH-negative and therefore would not be detected with a p16 threshold of 70%, even in a triple de-tection algorithm such as was used in the current study.P16 is overexpressed in tumours with active HPV infection because the HPV E7 protein inacti-
Table 7.4. Univariate and multiple Cox regression analysis of clinicopathologic characteristics predic-tive for A. disease-specific survival B. disease-specific survival restricted to patients treated with cura-tive intent and C. loco-regional disease-free survival restricted to patients treated with curative intent.
A. DSS (n=193) Univariate Multiple
Variable HR 95% CI HR 95% CI
Age at diagnosis per year 1.02 1.00-1.05
Tumour site Base-of-tongue
Tonsil
1
0.66 0.42-1.05*
cT 1-2
3-4
1
1.69 1.03-2.75
cN 0
+
1
2.82 1.22-6.491
3.27 1.42-7.55
HPV status -
+
1
0.24 0.11-0.521
0.22 0.10-0.47
*Tumour site showed a trend for the prediction of DSS (p=0.076) and was included in multiple regression.
B. DSS of curatively treated cases only (n=156) Univariate Multiple
Variable HR 95% CI HR 95% CI
cN 0
+
1
3.76 1.17-12.151
4.46 1.38-14.4
HPV status -
+
1
0.26 0.10-0.671
0.23 0.09-0.59
C. LR-DFS of curatively treated cases only (n=156) Univariate Multiple
Variable HR 95% CI HR 95% CI
Tumour site Base-of-tongue
Tonsil
1
0.60 0.33-
1.09*
HPV status -
+
1
0.10 0.02-
0.42
1
0.10 0.02-0.42
*Tumour site showed a trend for the prediction of LR-DFS (p=0.096) and was included in multiple regression.DSS=disease-specific survival; HR=hazard ratio; LR-DFS=locoregional disease-free survival.
Table 7.5. A. Studies performed in Dutch series testing for active HPV infection in OpSCC. B. Calculation of HPV+ CR.
A.
Study Region Tumours Period Technique Prevalence
Hafkamp316 Southern NL TSCC 1992-2001 P16+FISH 32/81 (40%)
Rietbergen363 Western NL TSCC & BoTSCC 1990-2010 P16+PCR 36/150 (24%)
Smeets19 Western NL OpSCC Before 2007 P16+PCR 6/18 (33%)
Total 74/249 (30%)
Current study Northern NL TSCC & BoTSCC 1997-2012 P16+PCR+BRISH 48/193 (25%)
B.
Region CR all OpSCC HPV+ prevalence
Calculated CR for HPV+ OpSCC
Calculated CR for HPV- OpSCC
North-Eastern 1.3 29/136 (21%) 0.28 1.02
Other Dutch regions 1.8 75/249 (30%) 0.54 1.26
CR= Crude Rate: the average raw incidence per 100.000 per year during the period 1997-2009.
123122
Cha
pter
7
vates the Rb protein, which normally represses p16 transcription19. However, p16 is a tumour suppressor protein and may also be upregulated by other mechanisms. As such, p16 expres-sion has been associated with a favourable prognosis also in absence of HPV infection376. In our series, the 17 p16-positive/PCR-negative cases (of which 14 could be BRISH tested, all were negative) displayed intermediate DSS and DFS curves, but these were not significantly different from the p16 negative curves (data not shown).
In conclusion, in our complete cohort 1997-2012 of tonsillar and base-of-tongue squamous cell carcinomas from the Northern Netherlands, there is evidence for a rapid increase of the incidence of HPV-associated OpSCC. Moreover, there may be large regional differences in the incidence of HPV-associated OpSCC within countries. In our series of oral squamous cell carci-nomas, HPV is rare and therefore seems of minimal clinical relevance. This study illustrates the influence that detection technique, population selection criteria and type of survival analysis may have on both reported prevalence and prognostic value of HPV in OpSCC.
Acknowledgements: The authors would like to thank J. Holewijn for his help in performing the HPV testing.
Funding: This work was partly funded by the CTMM Air Force consortium (http://www.ctmm.nl). CTMM pays for part of the salary of MFM and had no role in study design, data collection and analysis, decision to publish and preparation of the manuscript.
Chapter 8
Identification and validation of methylation markers for the prediction of nodal metastasis in oral & oropharyngeal squamous cell carcinomaL.J. Melchersa,b, M.J.A.M. Clausena,b, M.F. Mastikb, L. Slagter-Menkemab, J.E. van der Walb, G.B.A. Wismanc, J.L.N. Roodenburga,*, E. Schuuringb,*
aDept. of Oral & Maxillofacial Surgery, University of Groningen, University Medical Center Groningen, Groningen, The NetherlandsbDept. of Pathology, University of Groningen, University Medical Center Groningen, Groningen, The NetherlandscDept. of Gynecological Oncology, University of Groningen, University Medical Center Groningen, Groningen, The Netherlands*Both authors contributed equally
In preparation.
127126
Cha
pter
8
IntroductionOral and oropharyngeal squamous cell carcinomas (OOSCC) compose the largest subgroup of head & neck cancer, and are estimated to cause over 40,000 new cases in the United States in 2013388. OOSCC are characterized by regional metastatic spread to the lymph nodes of the neck in an early stage. Patients with regional lymph node metastases are generally treated with curative intent. When regional metastases are not adequately treated distant spread results, which is considered as incurable disease. Therefore, it is essential to make an accurate assess-ment of the nodal (N) status of the neck to adequately treat patients with OOSCC. The presence of regional metastases in the neck is the most important factor in prognosis and treatment choice in OOSCC16. However, current imaging methods to assess the presence of metastases in the palpation-negative neck show a sensitivity of 60-70%31. Sentinel lymph node biopsy, when performed intra-operatively on frozen sections, has a comparable sensitivity of 50-70%36,37.It is well established that an increasing number of OOSCC are HPV-related. Although HPV-related tumours are characterized by better clinical outcome, HPV status has not yet changed current therapeutic management of these OOSCC21. Moreover, because HPV status has not been associated with nodal status, accurate diagnosis of the nodal status is still of the utmost importance for adequate treatment.Based on the hypothesis that the presence or absence of gene expression in the primary tumour confers the ability to invade, migrate and metastasize, many tumour biomarkers have been studied to identify associations with the development of nodal metastases in OOSCC59.DNA hypermethylation is an important mechanism for the regulation of gene expression, in both physiological and pathological conditions74. DNA hypermethylation is a form of epigenetic regulation, as the genetic sequence is not altered, but CH3-groups are added to the cytosine of CpG dinucleotides which, when present in the promoter region of a gene, leads to transcrip-tional repression and decreased expression of the associated protein. This process is reversible, and hypomethylation leads to reactivation of gene transcription and increased expression of the associated protein75. Thus, hypermethylation of tumour suppressor genes and hypometh-ylation of oncogenes may contribute to carcinogenesis and cancer progression389. Because of its dynamic nature, methylation is a possible candidate mechanism for the dynamic regulation of gene expression during metastatic progression of OOSCC cells76.Moreover, several demethylating drugs have been developed and show that treatment results in re-expression of formerly hypermethylated genes. Decitabine and Azacytidine are therapeutic demethylating agents and have already been used in treatment of specific haematological ma-lignancies390. Therefore, methylation is also a mechanism that can be therapeutically targeted391.DNA methylation can be detected using methylation-specific PCR (MSP) on bisulfite treated DNA. Sodium bisulfite treatment converts only unmethylated cytosine residues to uracil, but leaves methylated cytosines unaffected. Methylated and non-methylated sequences may then be detected by various methods. Of these, MSP is one of the most widely used methods, be-cause of its cost-effectiveness and high sensitivity392. The availability of such a sensitive detec-tion method may allow methylation to become a prognostic or diagnostic tool in the clinical set-
AbstractIntroduction: Hypermethylation is an important mechanism for the dynamic regulation of gene expression. Consequently, genes regulated via hypermethylation are perfect candidate genes for regulating the metastatic potential of tumour cells. The aim is to identify methylation tumour markers that have a predictive value for the presence of regional lymph node metasta-ses in patients with oral and oropharyngeal squamous cell carcinoma (OOSCC).
Methods: To identify novel methylation markers, significantly differentially expressed genes were retrieved from four reported microarray expression profiles comparing pN0 and pN+ head-neck tumours, and one expression array identifying functionally hypermethylated genes. Ad-ditionally several metastasis-associated genes were included from the literature. Thus genes were selected that play a role in the development of nodal metastases and might be regulated by methylation. Methylation-specific PCR (MSP) primers were designed and tested on 8 HN-SCC cell lines and technically validated on 10 formalin-fixed paraffin-embedded (FFPE) OOSCC cases. Predictive value was assessed in a homogenous series of 70 FFPE OOSCC with pathologi-cally determined nodal (pN-)status.
Results: Five out of 28 methylation markers (OCLN, CDKN2A, MGMT, MLH1 and DAPK1) were fre-quently differentially methylated in OOSCC. Of these, MGMT methylation was associated with pN0 status (p=0.02) and with lower immunoexpression (p=0.02). DAPK1 methylation was asso-ciated with pN+ status (p=0.008). DAPK1 methylation did not associate with protein expression.
Conclusions: We identified 28 candidate genes, of which only two (7%) showed a predictive val-ue for the pN status. Both genes, DAPK1 and MGMT, have predictive value for nodal metastasis in a homogeneous group of OOSCC. To efficiently identify additional new methylation markers, the use of a genome-wide method is needed.
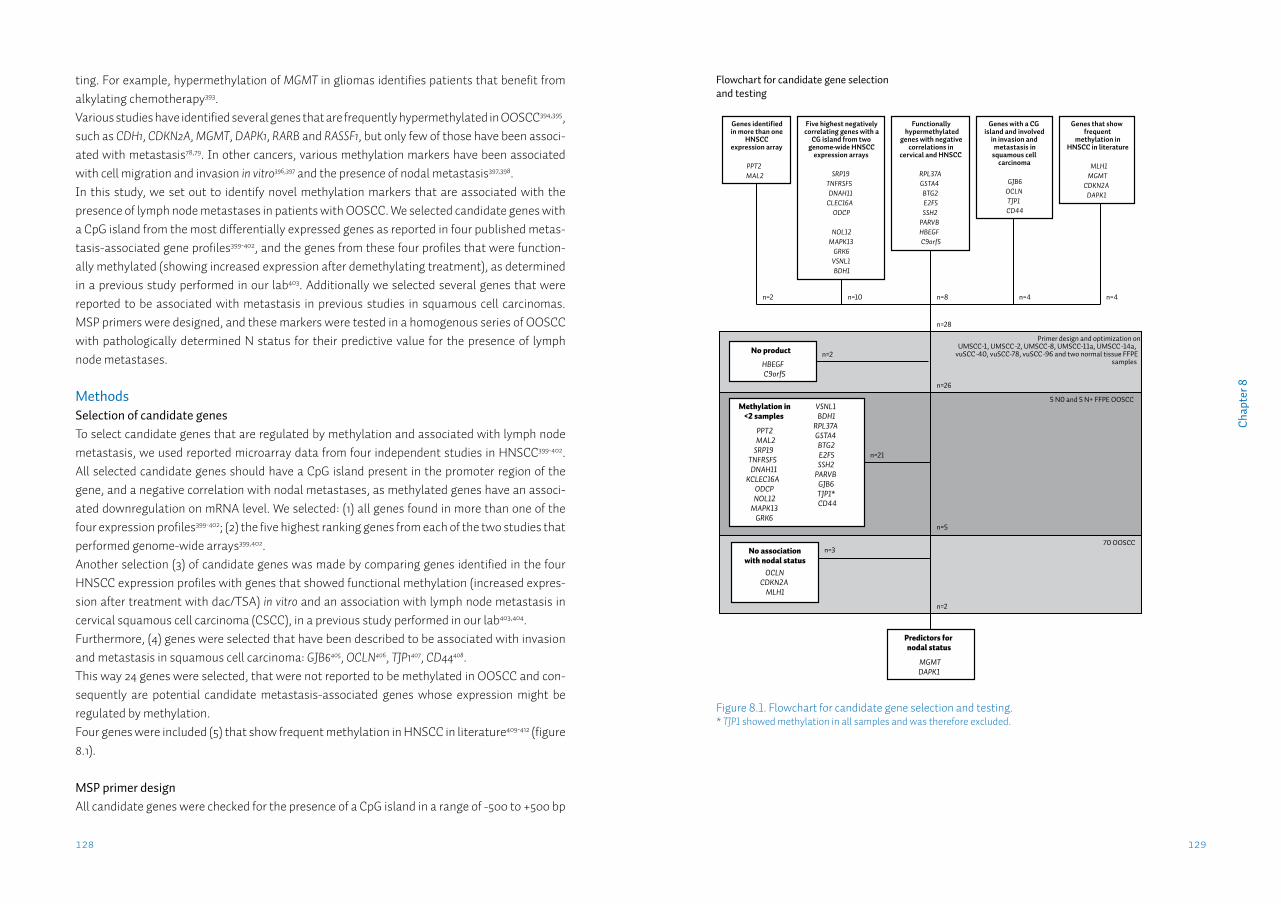
129128
Cha
pter
8
ting. For example, hypermethylation of MGMT in gliomas identifies patients that benefit from alkylating chemotherapy393.Various studies have identified several genes that are frequently hypermethylated in OOSCC394,395, such as CDH1, CDKN2A, MGMT, DAPK1, RARB and RASSF1, but only few of those have been associ-ated with metastasis78,79. In other cancers, various methylation markers have been associated with cell migration and invasion in vitro396,397 and the presence of nodal metastasis397,398.In this study, we set out to identify novel methylation markers that are associated with the presence of lymph node metastases in patients with OOSCC. We selected candidate genes with a CpG island from the most differentially expressed genes as reported in four published metas-tasis-associated gene profiles399-402, and the genes from these four profiles that were function-ally methylated (showing increased expression after demethylating treatment), as determined in a previous study performed in our lab403. Additionally we selected several genes that were reported to be associated with metastasis in previous studies in squamous cell carcinomas. MSP primers were designed, and these markers were tested in a homogenous series of OOSCC with pathologically determined N status for their predictive value for the presence of lymph node metastases.
MethodsSelection of candidate genesTo select candidate genes that are regulated by methylation and associated with lymph node metastasis, we used reported microarray data from four independent studies in HNSCC399-402. All selected candidate genes should have a CpG island present in the promoter region of the gene, and a negative correlation with nodal metastases, as methylated genes have an associ-ated downregulation on mRNA level. We selected: (1) all genes found in more than one of the four expression profiles399-402; (2) the five highest ranking genes from each of the two studies that performed genome-wide arrays399,402.Another selection (3) of candidate genes was made by comparing genes identified in the four HNSCC expression profiles with genes that showed functional methylation (increased expres-sion after treatment with dac/TSA) in vitro and an association with lymph node metastasis in cervical squamous cell carcinoma (CSCC), in a previous study performed in our lab403,404.Furthermore, (4) genes were selected that have been described to be associated with invasion and metastasis in squamous cell carcinoma: GJB6405, OCLN406, TJP1407, CD44408. This way 24 genes were selected, that were not reported to be methylated in OOSCC and con-sequently are potential candidate metastasis-associated genes whose expression might be regulated by methylation. Four genes were included (5) that show frequent methylation in HNSCC in literature409-412 (figure 8.1).
MSP primer designAll candidate genes were checked for the presence of a CpG island in a range of -500 to +500 bp
Figure 8.1. Flowchart for candidate gene selection and testing.* TJP1 showed methylation in all samples and was therefore excluded.
Genes identified in more than one
HNSCC expression array
PPT2MAL2
Five highest negatively correlating genes with a
CG island from two genome-wide HNSCC
expression arrays
SRP19TNFRSF5DNAH11
CLEC16AODCP
NOL12MAPK13
GRK6VSNL1BDH1
Functionally hypermethylated
genes with negative correlations in
cervical and HNSCC
RPL37AGSTA4BTG2E2F5SSH2
PARVBHBEGFC9orf5
Genes with a CG island and involved
in invasion and metastasis in
squamous cell carcinoma
GJB6OCLNTJP1CD44
n=2 n=10 n=8 n=4
n=28
Primer design and optimization onUMSCC-1, UMSCC-2, UMSCC-8, UMSCC-11a, UMSCC -14a,
vuSCC-40, vuSCC-78, vuSCC-96 and two normal tissue FFPE samples
5 N0 and 5 N+ FFPE OOSCC
No product
HBEGFC9orf5
n=2
Methylation in <2 samples
PPT2MAL2
SRP19TNFRSF5DNAH11
KCLEC16AODCPNOL12
MAPK13GRK6
VSNL1BDH1
RPL37AGSTA4BTG2E2F5SSH2
PARVBGJB6TJP1*CD44
n=26
n=21
n=5
70 OOSCCNo association
with nodal statusOCLN
CDKN2AMLH1
n=3
Predictors for nodal status
MGMTDAPK1
Flowchart for candidate gene selection and testing
n=2
Genes that show frequent
methylation in HNSCC in literature
MLH1MGMT
CDKN2ADAPK1
n=4
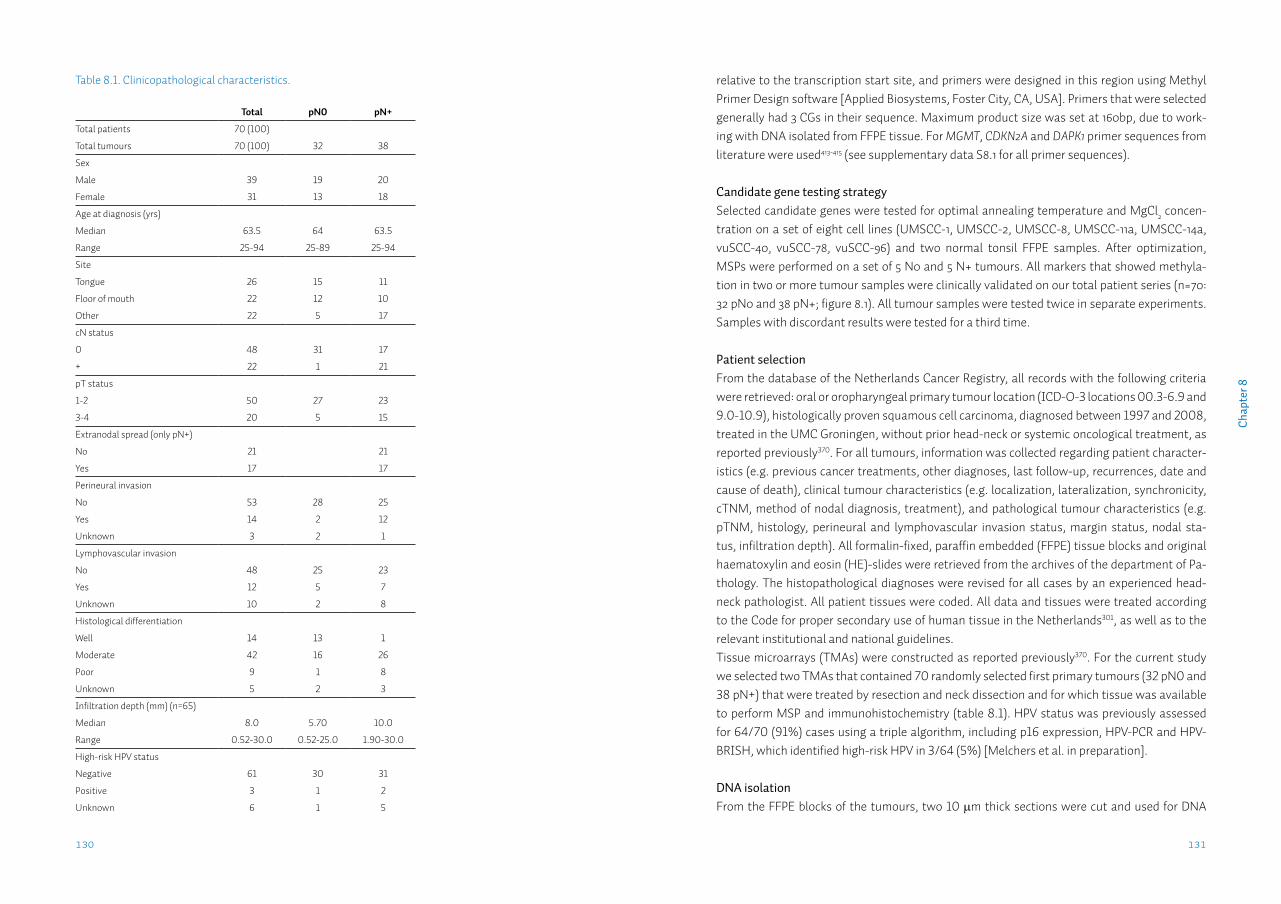
131130
Cha
pter
8
relative to the transcription start site, and primers were designed in this region using Methyl Primer Design software [Applied Biosystems, Foster City, CA, USA]. Primers that were selected generally had 3 CGs in their sequence. Maximum product size was set at 160bp, due to work-ing with DNA isolated from FFPE tissue. For MGMT, CDKN2A and DAPK1 primer sequences from literature were used413-415 (see supplementary data S8.1 for all primer sequences).
Candidate gene testing strategySelected candidate genes were tested for optimal annealing temperature and MgCl2 concen-tration on a set of eight cell lines (UMSCC-1, UMSCC-2, UMSCC-8, UMSCC-11a, UMSCC-14a, vuSCC-40, vuSCC-78, vuSCC-96) and two normal tonsil FFPE samples. After optimization, MSPs were performed on a set of 5 N0 and 5 N+ tumours. All markers that showed methyla-tion in two or more tumour samples were clinically validated on our total patient series (n=70: 32 pN0 and 38 pN+; figure 8.1). All tumour samples were tested twice in separate experiments. Samples with discordant results were tested for a third time.
Patient selectionFrom the database of the Netherlands Cancer Registry, all records with the following criteria were retrieved: oral or oropharyngeal primary tumour location (ICD-O-3 locations 00.3-6.9 and 9.0-10.9), histologically proven squamous cell carcinoma, diagnosed between 1997 and 2008, treated in the UMC Groningen, without prior head-neck or systemic oncological treatment, as reported previously370. For all tumours, information was collected regarding patient character-istics (e.g. previous cancer treatments, other diagnoses, last follow-up, recurrences, date and cause of death), clinical tumour characteristics (e.g. localization, lateralization, synchronicity, cTNM, method of nodal diagnosis, treatment), and pathological tumour characteristics (e.g. pTNM, histology, perineural and lymphovascular invasion status, margin status, nodal sta-tus, infiltration depth). All formalin-fixed, paraffin embedded (FFPE) tissue blocks and original haematoxylin and eosin (HE)-slides were retrieved from the archives of the department of Pa-thology. The histopathological diagnoses were revised for all cases by an experienced head-neck pathologist. All patient tissues were coded. All data and tissues were treated according to the Code for proper secondary use of human tissue in the Netherlands301, as well as to the relevant institutional and national guidelines.Tissue microarrays (TMAs) were constructed as reported previously370. For the current study we selected two TMAs that contained 70 randomly selected first primary tumours (32 pN0 and 38 pN+) that were treated by resection and neck dissection and for which tissue was available to perform MSP and immunohistochemistry (table 8.1). HPV status was previously assessed for 64/70 (91%) cases using a triple algorithm, including p16 expression, HPV-PCR and HPV-BRISH, which identified high-risk HPV in 3/64 (5%) [Melchers et al. in preparation].
DNA isolationFrom the FFPE blocks of the tumours, two 10 μm thick sections were cut and used for DNA
Table 8.1. Clinicopathological characteristics.
Total pN0 pN+
Total patients 70 (100)
Total tumours 70 (100) 32 38
Sex
Male 39 19 20
Female 31 13 18
Age at diagnosis (yrs)
Median 63.5 64 63.5
Range 25-94 25-89 25-94
Site
Tongue 26 15 11
Floor of mouth 22 12 10
Other 22 5 17
cN status
0 48 31 17
+ 22 1 21
pT status
1-2 50 27 23
3-4 20 5 15
Extranodal spread (only pN+)
No 21 21
Yes 17 17
Perineural invasion
No 53 28 25
Yes 14 2 12
Unknown 3 2 1
Lymphovascular invasion
No 48 25 23
Yes 12 5 7
Unknown 10 2 8
Histological differentiation
Well 14 13 1
Moderate 42 16 26
Poor 9 1 8
Unknown 5 2 3
Infiltration depth (mm) (n=65)
Median 8.0 5.70 10.0
Range 0.52-30.0 0.52-25.0 1.90-30.0
High-risk HPV status
Negative 61 30 31
Positive 3 1 2
Unknown 6 1 5
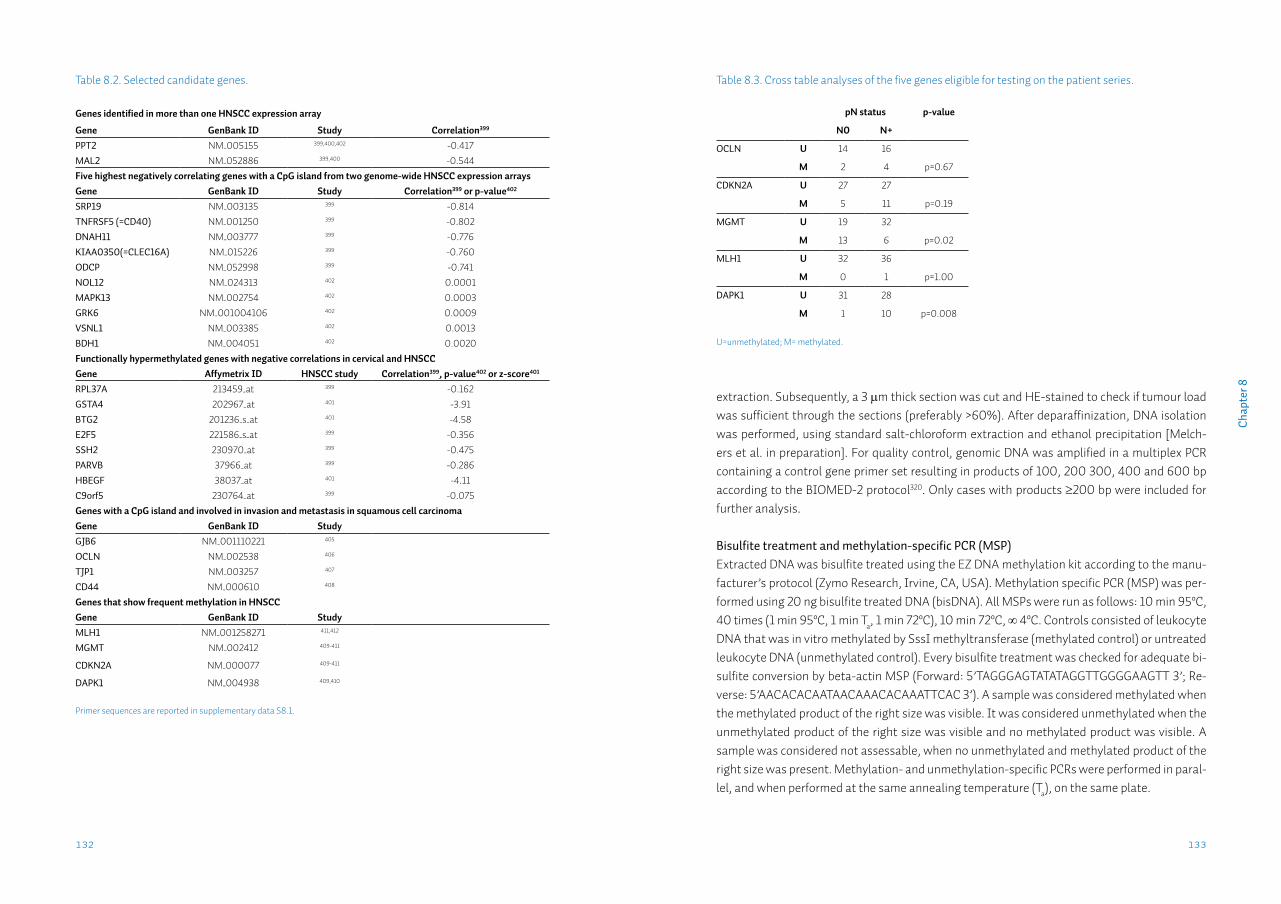
133132
Cha
pter
8
extraction. Subsequently, a 3 μm thick section was cut and HE-stained to check if tumour load was sufficient through the sections (preferably >60%). After deparaffinization, DNA isolation was performed, using standard salt-chloroform extraction and ethanol precipitation [Melch-ers et al. in preparation]. For quality control, genomic DNA was amplified in a multiplex PCR containing a control gene primer set resulting in products of 100, 200 300, 400 and 600 bp according to the BIOMED-2 protocol320. Only cases with products ≥200 bp were included for further analysis.
Bisulfite treatment and methylation-specific PCR (MSP)Extracted DNA was bisulfite treated using the EZ DNA methylation kit according to the manu-facturer’s protocol (Zymo Research, Irvine, CA, USA). Methylation specific PCR (MSP) was per-formed using 20 ng bisulfite treated DNA (bisDNA). All MSPs were run as follows: 10 min 95ºC, 40 times (1 min 95ºC, 1 min Ta, 1 min 72ºC), 10 min 72ºC, ∞ 4ºC. Controls consisted of leukocyte DNA that was in vitro methylated by SssI methyltransferase (methylated control) or untreated leukocyte DNA (unmethylated control). Every bisulfite treatment was checked for adequate bi-sulfite conversion by beta-actin MSP (Forward: 5’TAGGGAGTATATAGGTTGGGGAAGTT 3’; Re-verse: 5’AACACACAATAACAAACACAAATTCAC 3’). A sample was considered methylated when the methylated product of the right size was visible. It was considered unmethylated when the unmethylated product of the right size was visible and no methylated product was visible. A sample was considered not assessable, when no unmethylated and methylated product of the right size was present. Methylation- and unmethylation-specific PCRs were performed in paral-lel, and when performed at the same annealing temperature (Ta), on the same plate.
Table 8.2. Selected candidate genes.
Genes identified in more than one HNSCC expression array
Gene GenBank ID Study Correlation399
PPT2 NM_005155 399,400,402 -0.417MAL2 NM_052886 399,400 -0.544Five highest negatively correlating genes with a CpG island from two genome-wide HNSCC expression arraysGene GenBank ID Study Correlation399 or p-value402
SRP19 NM_003135 399 -0.814TNFRSF5 (=CD40) NM_001250 399 -0.802DNAH11 NM_003777 399 -0.776KIAA0350(=CLEC16A) NM_015226 399 -0.760ODCP NM_052998 399 -0.741NOL12 NM_024313 402 0.0001MAPK13 NM_002754 402 0.0003GRK6 NM_001004106 402 0.0009VSNL1 NM_003385 402 0.0013BDH1 NM_004051 402 0.0020Functionally hypermethylated genes with negative correlations in cervical and HNSCCGene Affymetrix ID HNSCC study Correlation399, p-value402 or z-score401
RPL37A 213459_at 399 -0.162GSTA4 202967_at 401 -3.91BTG2 201236_s_at 401 -4.58E2F5 221586_s_at 399 -0.356SSH2 230970_at 399 -0.475PARVB 37966_at 399 -0.286HBEGF 38037_at 401 -4.11C9orf5 230764_at 399 -0.075Genes with a CpG island and involved in invasion and metastasis in squamous cell carcinomaGene GenBank ID StudyGJB6 NM_001110221 405
OCLN NM_002538 406
TJP1 NM_003257 407
CD44 NM_000610 408
Genes that show frequent methylation in HNSCCGene GenBank ID StudyMLH1 NM_001258271 411,412
MGMT NM_002412 409-411
CDKN2A NM_000077 409-411
DAPK1 NM_004938 409,410
Primer sequences are reported in supplementary data S8.1.
Table 8.3. Cross table analyses of the five genes eligible for testing on the patient series.
pN status p-value
N0 N+
OCLN U 14 16
M 2 4 p=0.67
CDKN2A U 27 27
M 5 11 p=0.19
MGMT U 19 32
M 13 6 p=0.02
MLH1 U 32 36
M 0 1 p=1.00
DAPK1 U 31 28
M 1 10 p=0.008
U=unmethylated; M= methylated.

135134
Cha
pter
8
reached. MGMT positivity was defined as moderate to strong nuclear expression in ≥10% of tu-mour cells as reported previously418-420. For DAPK1 scores were given to cell proportion: 0: stain-ing in <1% of tumour cells; 1: staining in 1–10%; 2: staining in 11–50%; and 3: staining in >50% of tumour cells. Intensity was then scored as 0: negative; 1: weak; 2: moderate; and 3: strong. The final score (ranging 0-9) was obtained by multiplying the cell proportion by the intensity. A final score of <4 was considered to indicate low expression, and ≥4 high expression421,422.
Statistical analysisStatistical analysis was performed with SPSS version 20. Categorical data were compared using the χ2-test, or Fisher’s exact test when appropriate. Univariate logistic regression was used to assess the relationship between predictor variables and the dichotomous pN status. All predic-tor variables with p<0.10 in univariate logistic regression were entered in multiple logistic re-gression. All tests were performed two-tailed. Results were considered significant when p<0.05.
ResultsCandidate gene selection & initial testingUsing the strategy as outlined in figure 8.1, 28 candidate genes were selected for analysis (ta-ble 8.2). Using bisulfite-treated DNA from eight HNSCC cell lines and two normal FFPE tonsil samples for optimization, two markers did not show any product during the optimization phase and were excluded. Of the 26 markers tested on the initial set of 5 N0 and 5 N+ FFPE OOSCC samples, 17 markers were methylated in none of the 10 OOSCC samples, 3 markers (PPT2, BTG2, CAV1) in only one sample and one marker (TJP1) in all samples. Five markers showed methyla-tion in two or more tumour samples and were considered eligible for clinical validation (OCLN, CDKN2A, MGMT, MLH1 and DAPK1).
Predictor gene identificationOCLN, CDKN2A, MGMT, MLH1 and DAPK1 were tested on the total population of 70 cases, con-sisting of 32 pN0 and 38 pN+ cases (table 8.3). MGMT showed a significant association with nodal status (p=0.02), and was methylated in 13/32 (41%) of pN0 and 6/38 (16%) of pN+ cases. DAPK1 methylation was also significantly associated with nodal status (p=0.008), however, in contrast to MGMT, DAPK1 was more frequently methylated in pN+ (10/38, 26%) than in pN0 cases (1/32, 3%). OCLN, CDKN2A and MLH1 showed more methylation in pN+ tumours also, but this was not statistically significant (table 8.3).The value of MGMT and DAPK1, as well as clinicopathological variables for predicting the pN sta-tus was assessed by univariate logistic regression which showed a predictive value for MGMT of OR=0.28 (95%CI:0.09-0.84) and OR=11.1 (95%CI:1.33-92.1) for DAPK1 (table 8.4). Multivariate regression analysis revealed that both markers were not independent from currently used clin-icopathological predictors, reflected in the cN status. However, the predictive values of MGMT and DAPK1 were independent from each other (table 8.5A). The combined regression model of MGMT and DAPK1 had a negative predictive value for the pN status of 76% (table 8.5B).
ImmunohistochemistryTMA sections were deparaffinised in xylene and rehydrated in a graded alcohol series. Antigen retrieval was performed by heating in a microwave oven for 15 min in either Tris/EDTA pH=9.0 (MGMT) or EDTA pH=8.0 (DAPK1). After antigen retrieval endogenous peroxide was blocked by incubating the slide in 0.3% peroxide solution. After one hour incubation with MGMT 1:100 (MT3.1, Millipore, Billerica, MA, USA) or DAPK1 1:200 (D1319, Sigma-Aldrich, St.Louis MO, USA) a horseradish peroxidise conjugated secondary antibody was used, followed by a horse-radish conjugated tertiary antibody. Slides were developed with di-aminobenzidene chromo-gen solution, followed by haematoxylin counterstaining. In addition to the control tissues in-cluded on the TMA slide, full sections of the control tissue specific for each staining were also included (normal liver for MGMT416; normal duodenum for DAPK1417). Analysis of immunohistochemistryStaining intensity was semi-quantitatively scored, assessing percentage of tumour cells stained and the intensity of staining (0, no staining; 1, weak; 2, moderate; 3, strong). Each staining was scored by two authors, independently. Discordant results were discussed until consensus was
Table 8.4. Logistic regression with pN status.
Univariate logistic regression Multiple logistic regression
Variable OR 95% CI OR 95%CI
cN status 0
+
1
38.3 4.7-3101
38.5 3.5-422
pT status 1
2
1
3.5 1.11-11.2
Perineural invasion no
yes
1
6.7 1.4-33.0
Lymphovascular invasion no
yes
NS
Histological
differentiation
well
moderate-poor
1
26.0 3.1-2151
25.9 1.9-351
Infiltration depth per mm 1.1 1.0-1.3
HR-HPV status negative
positive
NS
MGMT U
M
1
0.28 0.09-0.84
DAPK1 U
M
1
11.1 1.33-92.1
All assessed with univariate logistic regression. Infiltration depth is continuous (per millimetre). CI: confidence interval; U=unmethylated; M= methylated.
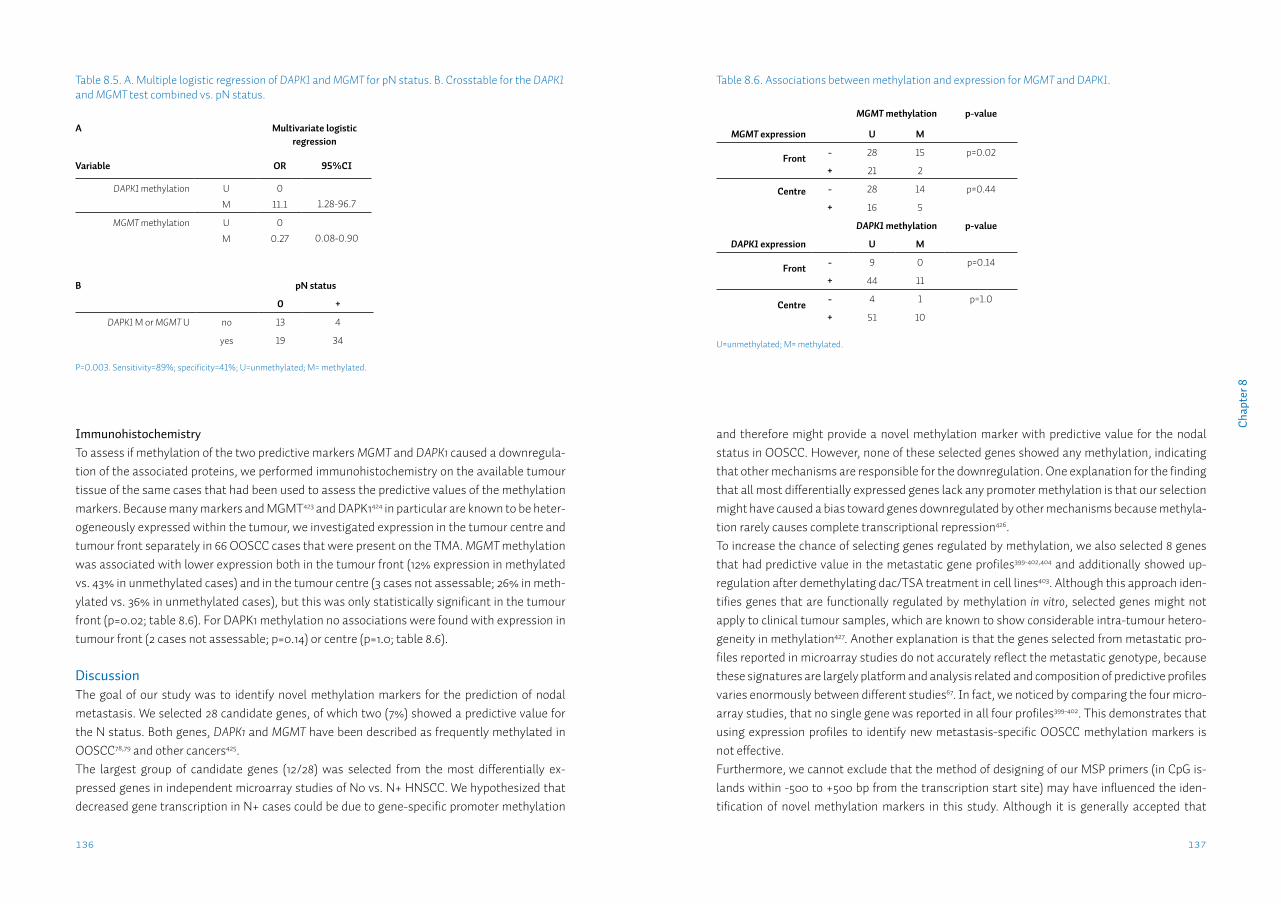
137136
Cha
pter
8
and therefore might provide a novel methylation marker with predictive value for the nodal status in OOSCC. However, none of these selected genes showed any methylation, indicating that other mechanisms are responsible for the downregulation. One explanation for the finding that all most differentially expressed genes lack any promoter methylation is that our selection might have caused a bias toward genes downregulated by other mechanisms because methyla-tion rarely causes complete transcriptional repression426. To increase the chance of selecting genes regulated by methylation, we also selected 8 genes that had predictive value in the metastatic gene profiles399-402,404 and additionally showed up-regulation after demethylating dac/TSA treatment in cell lines403. Although this approach iden-tifies genes that are functionally regulated by methylation in vitro, selected genes might not apply to clinical tumour samples, which are known to show considerable intra-tumour hetero-geneity in methylation427. Another explanation is that the genes selected from metastatic pro-files reported in microarray studies do not accurately reflect the metastatic genotype, because these signatures are largely platform and analysis related and composition of predictive profiles varies enormously between different studies67. In fact, we noticed by comparing the four micro-array studies, that no single gene was reported in all four profiles399-402. This demonstrates that using expression profiles to identify new metastasis-specific OOSCC methylation markers is not effective.Furthermore, we cannot exclude that the method of designing of our MSP primers (in CpG is-lands within -500 to +500 bp from the transcription start site) may have influenced the iden-tification of novel methylation markers in this study. Although it is generally accepted that
ImmunohistochemistryTo assess if methylation of the two predictive markers MGMT and DAPK1 caused a downregula-tion of the associated proteins, we performed immunohistochemistry on the available tumour tissue of the same cases that had been used to assess the predictive values of the methylation markers. Because many markers and MGMT423 and DAPK1424 in particular are known to be heter-ogeneously expressed within the tumour, we investigated expression in the tumour centre and tumour front separately in 66 OOSCC cases that were present on the TMA. MGMT methylation was associated with lower expression both in the tumour front (12% expression in methylated vs. 43% in unmethylated cases) and in the tumour centre (3 cases not assessable; 26% in meth-ylated vs. 36% in unmethylated cases), but this was only statistically significant in the tumour front (p=0.02; table 8.6). For DAPK1 methylation no associations were found with expression in tumour front (2 cases not assessable; p=0.14) or centre (p=1.0; table 8.6).
DiscussionThe goal of our study was to identify novel methylation markers for the prediction of nodal metastasis. We selected 28 candidate genes, of which two (7%) showed a predictive value for the N status. Both genes, DAPK1 and MGMT have been described as frequently methylated in OOSCC78,79 and other cancers425.The largest group of candidate genes (12/28) was selected from the most differentially ex-pressed genes in independent microarray studies of N0 vs. N+ HNSCC. We hypothesized that decreased gene transcription in N+ cases could be due to gene-specific promoter methylation
Table 8.5. A. Multiple logistic regression of DAPK1 and MGMT for pN status. B. Crosstable for the DAPK1 and MGMT test combined vs. pN status.
A Multivariate logistic regression
Variable OR 95%CI
DAPK1 methylation U
M
0
11.1 1.28-96.7
MGMT methylation U
M
0
0.27 0.08-0.90
B pN status
0 +
DAPK1 M or MGMT U no 13 4
yes 19 34
P=0.003. Sensitivity=89%; specificity=41%; U=unmethylated; M= methylated.
Table 8.6. Associations between methylation and expression for MGMT and DAPK1.
MGMT methylation p-value
MGMT expression U M
Front - 28 15 p=0.02
+ 21 2
Centre - 28 14 p=0.44
+ 16 5
DAPK1 methylation p-value
DAPK1 expression U M
Front - 9 0 p=0.14
+ 44 11
Centre - 4 1 p=1.0
+ 51 10
U=unmethylated; M= methylated.
139138
Cha
pter
8
ence is in line with the reported heterogeneity of both methylation markers and their associated proteins423,427, and with the fact that methylation is associated with heterogeneous expression more than with an overall low expression426.
The predictive values of MGMT and DAPK1 methylation are relatively high (OR=0.28 and 11.1, respectively), however the 95% confidence interval is wide (95%CI:0.09-0.84 and 1.33-92.1, re-spectively). This is probably attributable to the relatively small patient series (n=70) used in this study. Because DAPK1 and MGMT have significant predictive values for N status indepen-dently from each other (table 8.5A), we combined both methylation markers. Considering every tumour with either DAPK1 methylation or absence of MGMT methylation as positive, this test has a sensitivity of 89% and a specificity of 41% (table 8.5B). These numbers are comparable to a recently validated 696-gene expression signature to predict N status, which shows 86% sensitivity and 37% specificity68. In the future DAPK1 and MGMT might be included in a panel of methylation markers that aid the clinician in the assessment of the N status. Obviously further validation, especially on the clinically most relevant subgroup of pT1-2cN0 cases, is needed. Treatment of OOSCC patients using demethylating drugs may not be effective, as our study shows that demethylation of DAPK1 might be beneficial, but demethylation of MGMT might result in nodal disease.
MSP is a quick, low-cost and sensitive technique, able to detect 1 methylated allele in a back-ground of 1000 unmethylated alleles415. It is not a quantitative technique. Performing quantita-tive (Q)MSP for DAPK1 and MGMT enables the setting of specific cut-off values, thus custom-izing sensitivity and specificity. However, because of its characteristics, MSP is a very suitable technique for assessing a set of markers. However, selecting and testing of various possible methylation markers is still an inefficient method to identify new predictive markers. To effi-ciently identify new methylation markers, the use of genome-wide methods is needed440.In conclusion, we analyzed 28 candidate methylation markers for their predictive value for N status by MSP on a large, homogeneous group of OOSCC. MGMT and DAPK1 were identified as predictors of nodal metastasis in OOSCC. Methylation is not the mechanism regulating expres-sion of the most predictive genes identified in microarray studies. To identify additional meth-ylation markers in OOSCC, a genome-wide approach is needed.
Funding: This work was partly funded by the CTMM Air Force consortium (http://www.ctmm.nl).CTMM pays for part of the salary of MJAMC and MFM and had no role in study design, data col-lection and analysis, decision to publish and preparation of the manuscript.
methylation of CpG islands located near the transcription start site results in downregulation of expression of the specific gene428, recently it has been shown for several tumour types that changes in methylation occur especially in specific regions outside the promoter (CpG island shores)429. Because CpG content in these regions is low, designing specific MSP primers will be difficult.The selection of four genes that show frequent methylation in HNSCC produced the two meth-ylation markers that were ultimately found to have predictive value for the presence of lymph node metastases. DAPK1 (death-associated protein kinase 1) is one of the most widely studied methylated genes. DAPK1 methylation is frequently found in a wide array of over 20 tumour types430. DAPK1 is a tumour suppressor gene, and methylation of this gene has been associated with shorter dis-ease-free survival in several tumour types430. DAPK1 methylation has been associated in only a few studies with metastasis among which in head-neck tumours431. This latter study, that used similar primers, found comparable rates of DAPK1 methylation of 15/79 (19%) overall (16% in our study), and a significant association with N-status (27% methylation in N+ group, comparable to 26% in our study). Although the underlying mechanisms are not well understood, DAPK1 is a serine/threonine kinase involved in several mechanisms linked to cell death and autophagy. It has pro-apoptotic activity by suppressing integrin-mediated survival signals thus inducing a specific form of apoptosis, called anoikis. Tumour cells that have loss of anoikis by inactivated DAPK1 are more likely to survive during migration, and therefore more likely to cause metas-tases432. Related, but independently from this apoptosis-inducing function, DAPK1 has an an-timigratory effect by blocking integrin-mediated cell polarization433. DAPK1 downregulation by hypermethylation might well lead to increased metastases, as observed in the current study.MGMT (O-6-methylguanine-DNA methyltransferase) is a DNA repair enzyme that removes alkyl groups from guanine residues. MGMT methylation is mostly known for being predictive for better response to alkylating chemotherapy in glioblastoma, and to a lesser extent also for response to radiotherapy434. In OOSCC several studies assessing MGMT methylation using vari-ous techniques did not find associations with N status409,435. However, in a large study of >200 laryngeal and hypopharyngeal tumours, MGMT methylation was found to be significantly as-sociated with N0 status410. In this study, using the same primers as we did, a comparable MGMT methylation rate of 27% was found (also 27% in our study). How the higher methylation rates in pN0 cases affect the metastatic potential of OOSCC is not clear. Loss of the repair function of MGMT may increase the accumulation of mutations, especially in smoking-induced tumours, such as OOSCC. Because smoking is associated with higher methylation rates in general436 and methylation of MGMT specifically437, MGMT methylation might be a pseudomarker for smoking-induced tumours, rather than for HPV-associated tumours, which are more frequently pN+, ac-cording to some authors438. However, MGMT methylation was not associated with HPV status in our study (data not shown), nor in another study with more HPV-positive cases439. In our series we show for the first time that in OOSCC, MGMT methylation is associated with a decreased expression in the invasive tumour front, but not in the tumour centre. This front-centre differ-
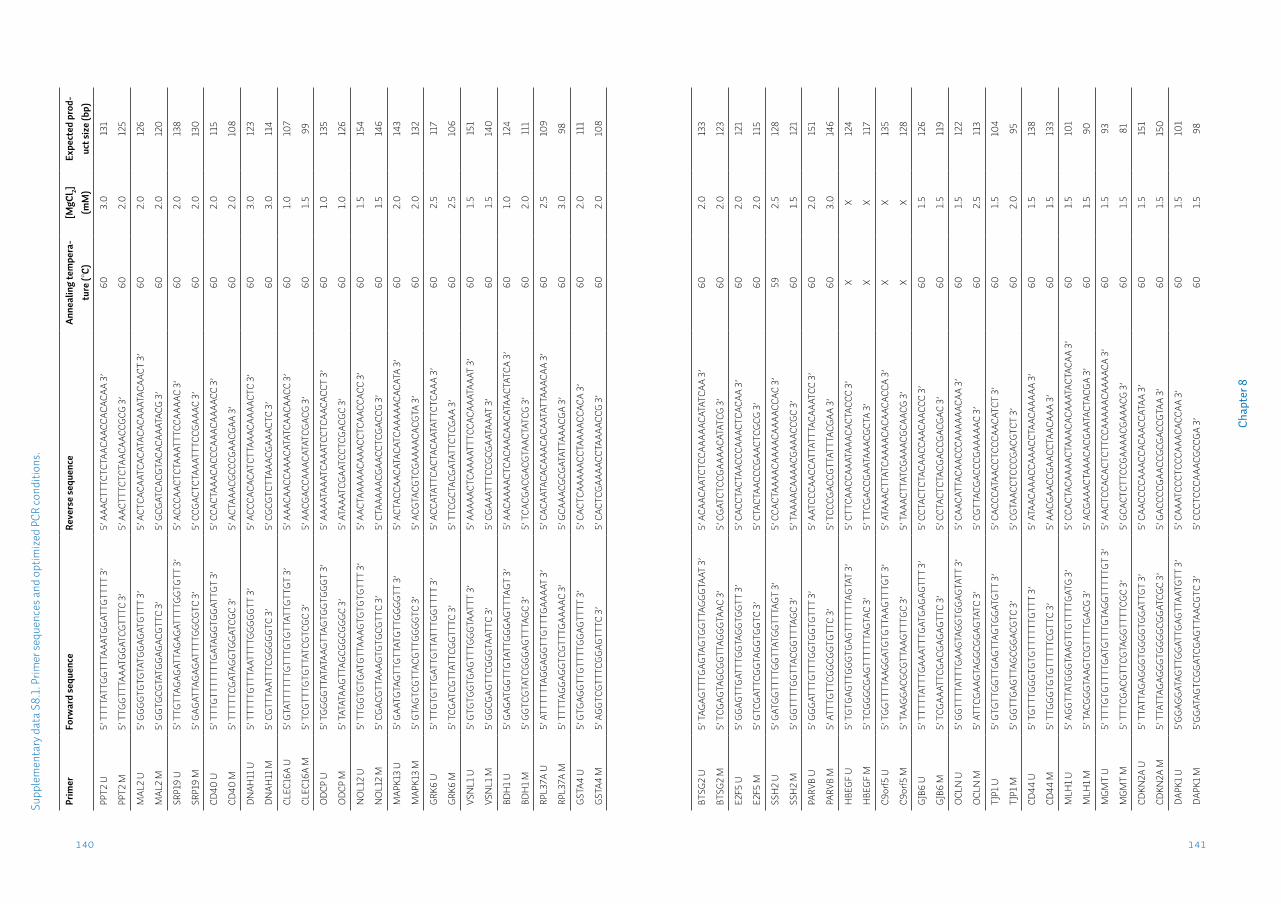
141140
Cha
pter
8
Supp
lem
enta
ry d
ata
S8.1
. Prim
er se
quen
ces a
nd o
ptim
ized
PCR
cond
ition
s.
Prim
erFo
rwar
d se
quen
ceRe
vers
e se
quen
ceAn
neal
ing
tem
pera
-tu
re (°
C)[M
gCl 2]
(mM
)Ex
pect
ed p
rod-
uct s
ize
(bp)
PPT2
U5’
TTT
TATT
GGTT
TAAA
TGGA
TTGT
TTT
3’5’
AAA
CTTT
CTCT
AACA
ACCA
CACA
A 3’
603.
013
1
PPT2
M5’
TTG
GTTT
AAAT
GGAT
CGTT
TC 3
’5’
AAC
TTTC
TCTA
ACAA
CCGC
G 3’
602.
012
5
MAL
2 U
5’ G
GGGT
GTGT
ATGG
AGAT
GTTT
3’
5’ A
CTCA
CAAT
CACA
TACA
CAAA
TACA
ACT
3’60
2.0
126
MAL
2 M
5’ G
GTGC
GTAT
GGAG
ACGT
TC 3
’5’
GCG
ATCA
CGTA
CACA
AATA
CG 3
’60
2.0
120
SRP1
9 U
5’ T
TGTT
AGAG
ATTA
GAGA
TTTT
GGTG
TT 3
’5’
ACC
CAAC
TCTA
AATT
TCCA
AAAC
3’
602.
013
8
SRP1
9 M
5’ G
AGAT
TAGA
GATT
TTGG
CGTC
3’
5’ C
CGAC
TCTA
AATT
TCCG
AAAC
3’
602.
013
0
CD40
U5’
TTT
GTTT
TTTT
GATA
GGTG
GATT
GT 3
’5’
CCA
CTAA
ACAC
CCAA
ACAA
AACC
3’
602.
011
5
CD40
M5’
TTT
TTCG
ATAG
GTGG
ATCG
C 3’
5’ A
CTAA
ACGC
CCGA
ACGA
A 3’
602.
010
8
DNAH
11 U
5’ T
TTTT
GTTT
AATT
TTGG
GGGT
T 3’
5’ A
CCCA
CACA
TCTT
AAAC
AAAA
CTC
3’60
3.0
123
DNAH
11 M
5’ C
GTTT
AATT
TCGG
GGGT
C 3’
5’ C
GCGT
CTTA
AACG
AAAC
TC 3
’60
3.0
114
CLEC
16A
U5’
GTA
TTTT
TTGT
TTGT
GTTA
TTGT
TGT
3’5’
AAA
CAAC
CAAA
CATA
TCAA
CAAC
C 3’
601.
010
7
CLEC
16A
M5’
TCG
TTTG
TGTT
ATCG
TCGC
3’
5’ A
ACGA
CCAA
ACAT
ATCG
ACG
3’60
1.5
99
ODC
P U
5’ T
GGGG
TTAT
ATAA
GTTA
GTGG
TGGG
T 3’
5’ A
AAAT
AAAT
CAAA
TCCT
CAAC
ACCT
3’
601.
013
5
ODC
P M
5’ T
ATAT
AAGT
TAGC
GGCG
GGC
3’5’
ATA
AATC
GAAT
CCTC
GACG
C 3’
601.
012
6
NO
L12
U5’
TTG
GTGT
GATG
TTAA
AGTG
TGTG
TTT
3’5’
AAC
TAAA
AACA
AACC
TCAA
CCAC
C 3’
601.
515
4
NO
L12
M5’
CGA
CGTT
AAAG
TGTG
CGTT
C 3’
5’ C
TAAA
AACG
AACC
TCGA
CCG
3’60
1.5
146
MAP
K13
U5’
GAA
TGTA
GTTG
TTAT
GTTG
GGGT
T 3’
5’ A
CTAC
CAAC
ATAC
ATCA
AAAA
CACA
TA 3
’60
2.0
143
MAP
K13
M5’
GTA
GTCG
TTAC
GTTG
GGGT
C 3’
5’ A
CGTA
CGTC
GAAA
ACAC
GTA
3’60
2.0
132
GRK6
U5’
TTG
TGTT
GATT
GTTA
TTTG
GTTT
T 3’
5’ A
CCAT
ATTC
ACTA
CAAT
ATTC
TCAA
A 3’
602.
511
7
GRK6
M5’
TCG
ATCG
TTAT
TCGG
TTTC
3’
5’ T
TCGC
TACG
ATAT
TCTC
GAA
3’60
2.5
106
VSN
L1 U
5’ G
TGTG
GTGA
GTTT
GGGT
AATT
T 3’
5’ A
AAAA
CTCA
AAAT
TTCC
ACAA
ATAA
AT 3
’60
1.5
151
VSN
L1 M
5’ G
GCGA
GTTC
GGGT
AATT
C 3’
5’ C
GAAA
TTTC
CGCG
AATA
AAT
3’60
1.5
140
BDH
1 U5’
GAG
ATGG
TTGT
ATTG
GGAG
TTTA
GT 3
’5’
AAC
AAAA
CTCA
CAAC
AACA
TAAC
TATC
A 3’
601.
012
4
BDH
1 M5’
GGT
CGTA
TCGG
GAGT
TTAG
C 3’
5’ T
CACG
ACGA
CGTA
ACTA
TCG
3’60
2.0
111
RPL3
7A U
5’ A
TTTT
TTAG
GAGG
TTGT
TTGA
AAAT
3’
5’ C
ACAA
TACA
CAAA
CACA
ATAT
TAAA
CAA
3’60
2.5
109
RPL3
7A M
5’ T
TTTA
GGAG
GTCG
TTTG
AAAA
C 3’
5’ G
CAAA
CGCG
ATAT
TAAA
CGA
3’60
3.0
98
GSTA
4 U
5’ G
TGAG
GTTG
TTTT
GGAG
TTTT
3’
5’ C
ACTC
AAAA
ACCT
AAAA
CCAC
A 3’
602.
011
1
GSTA
4 M
5’ A
GGTC
GTTT
CGGA
GTTT
C 3’
5’ C
ACTC
GAAA
ACCT
AAAA
CCG
3’60
2.0
108
BTSG
2 U
5’ T
AGAG
TTTG
AGTA
GTGG
TTAG
GGTA
AT 3
’5’
ACA
ACAA
TCTC
CAAA
AACA
TATC
AA 3
’60
2.0
133
BTSG
2 M
5’ T
CGAG
TAGC
GGTT
AGGG
TAAC
3’
5’ C
GATC
TCCG
AAAA
CATA
TCG
3’60
2.0
123
E2F5
U5’
GGA
GTTG
ATTT
GGTA
GGTG
GTT
3’5’
CAC
CTAC
TAAC
CCAA
ACTC
ACAA
3’
602.
012
1
E2F5
M5’
GTC
GATT
CGGT
AGGT
GGTC
3’
5’ C
TACT
AACC
CGAA
CTCG
CG 3
’60
2.0
115
SSH
2 U
5’ G
ATGG
TTTT
GGTT
ATGG
TTTA
GT 3
’5’
CCA
CTAA
AACA
AAAC
AAAA
CCAC
3’
592.
512
8
SSH
2 M
5’ G
GTTT
TGGT
TACG
GTTT
AGC
3’5’
TAA
AACA
AAAC
GAAA
CCGC
3’
601.
512
1
PARV
B U
5’ G
GGAT
TTGT
TTGG
TGGT
GTTT
3’
5’ A
ATCC
CAAC
CATT
ATTT
ACAA
ATCC
3’
602.
015
1
PARV
B M
5’ A
TTTG
TTCG
GCGG
TGTT
C 3’
5’ T
CCCG
ACCG
TTAT
TTAC
GAA
3’60
3.0
146
HBE
GF U
5’ T
GTGA
GTTG
GGTG
AGTT
TTTT
AGTA
T 3’
5’ C
TTCA
ACCA
AATA
AACA
CTAC
CC 3
’X
X12
4
HBE
GF M
5’ T
CGGG
CGAG
TTTT
TTAG
TAC
3’5’
TTC
GACC
GAAT
AAAC
GCTA
3’
XX
117
C9or
f5 U
5’ T
GGTT
TTAA
GGAT
GTGT
TAAG
TTTG
T 3’
5’ A
TAAA
CTTA
TCAA
AACA
CAAC
ACCA
3’
XX
135
C9or
f5 M
5’ T
AAGG
ACGC
GTTA
AGTT
TGC
3’5’
TAA
ACTT
ATCG
AAAC
GCAA
CG 3
’X
X12
8
GJB6
U5’
TTT
TTAT
TTGA
AATT
TGAT
GAGA
GTTT
3’
5’ C
CTAC
TCTA
CAAC
CAAC
AACC
C 3’
601.
512
6
GJB6
M5’
TCG
AAAT
TCGA
CGAG
AGTT
C 3’
5’ C
CTAC
TCTA
CGAC
CGAC
GAC
3’60
1.5
119
OCL
N U
5’ G
GTTT
TATT
TGAA
GTAG
GTGG
AGTA
TT 3
’5’
CAA
CATT
ACAA
CCCA
AAAA
ACAA
3’
601.
512
2
OCL
N M
5’ A
TTCG
AAGT
AGGC
GGAG
TATC
3’
5’ C
GTTA
CGAC
CCGA
AAAA
C 3’
602.
511
3
TJP1
U5’
GTG
TTGG
TTGA
GTTA
GTGG
ATGT
T 3’
5’ C
ACCC
ATAA
CCTC
CCAA
CATC
T 3’
601.
510
4
TJP1
M5’
GGT
TGAG
TTAG
CGGA
CGTC
3’
5’ C
GTAA
CCTC
CCGA
CGTC
T 3’
602.
095
CD44
U5’
TGT
TTGG
GTGT
GTTT
TTTG
TTT
3’5’
ATA
ACAA
ACCA
AACC
TAAC
AAAA
A 3’
601.
513
8
CD44
M5’
TTG
GGTG
TGTT
TTTC
GTTC
3’
5’ A
ACGA
ACCG
AACC
TAAC
AAA
3’60
1.5
133
MLH
1 U5’
AGG
TTAT
GGGT
AAGT
TGTT
TTGA
TG 3
’5’
CCA
CTAC
AAAA
CTAA
ACAC
AAAT
ACTA
CAA
3’60
1.5
101
MLH
1 M5’
TAC
GGGT
AAGT
CGTT
TTGA
CG 3
’5’
ACG
AAAC
TAAA
CACG
AATA
CTAC
GA 3
’60
1.5
90
MGM
T U
5’ T
TTGT
GTTT
TGAT
GTTT
GTAG
GTTT
TTGT
3’
5’ A
ACTC
CACA
CTCT
TCCA
AAAA
CAAA
ACA
3’60
1.5
93
MGM
T M
5’ T
TTCG
ACGT
TCGT
AGGT
TTTC
GC 3
’5’
GCA
CTCT
TCCG
AAAA
CGAA
ACG
3’60
1.5
81
CDKN
2A U
5’ T
TATT
AGAG
GGTG
GGGT
GGAT
TGT
3’5’
CAA
CCCC
AAAC
CACA
ACCA
TAA
3’60
1.5
151
CDKN
2A M
5’ T
TATT
AGAG
GGTG
GGGC
GGAT
CGC
3’5’
GAC
CCCG
AACC
GCGA
CCGT
AA 3
’60
1.5
150
DAPK
1 U5’
GGAG
GATA
GTTG
GATT
GAGT
TAAT
GTT
3’5’
CAA
ATCC
CTCC
CAAA
CACC
AA 3
’60
1.5
101
DAPK
1 M5’
GGAT
AGTC
GGAT
CGAG
TTAA
CGTC
3’
5’ C
CCTC
CCAA
ACGC
CGA
3’60
1.5
98

Chapter 9
Head neck squamous cell carcinomas do not express EGFRvIII
L.J. Melchersa,b, M.J.A.M. Clausena,b, M.F. Mastikb, L. Slagter-Menkemab,c , J.A. Langendijkd, B.F.A.M. van der Laanc, J.E. van der Walb,I, B. van der Vegtb, J.L.N. Roodenburga, E. Schuuringb
aDept. of Oral & Maxillofacial Surgery, University of Groningen, University Medical Center Groningen, Groningen, The NetherlandsbDept. of Pathology, University of Groningen, University Medical Center Groningen, Groningen, The NetherlandscDept. of Otorhinolaryngology/Head & Neck Surgery, University of Groningen, University Medical Center Groningen, Groningen, The NetherlandsdDept. of Radiation Oncology, University of Groningen, University Medical Center Groningen, Groningen, The Netherlands
Submitted.
145144
Cha
pter
9
IntroductionHigh expression of Epidermal Growth Factor Receptor (EGFR) is common in many human ma-lignancies, such as glioblastoma multiforme (GBM) and head-neck squamous cell carcinomas (HNSCC), and is associated with worse outcome441. EGFR signalling is involved in several path-ways, such as PI3K and MAPK, leading to increased proliferation and loss of apoptosis442. Be-cause of its high prevalence and important role in cancer, several EGFR-targeted drugs such as monoclonal antibodies and tyrosine-kinase inhibitors have been developed. These targeted agents are considered standard in the treatment of several tumour types443.In HNSCC anti-EGFR monoclonal antibodies are routinely used for several years14,15. The benefit of the addition of cetuximab to radiotherapy in the curative setting has been shown in one ran-domized controlled trial (RCT)92. Moreover, in the recurrent/metastatic setting, overall survival significantly improved with the addition of cetuximab to chemotherapy99. However, trials show low response rates of 10-16% attributed to cetuximab, irrespective of use as single agent or in combination with another modality96-99. These results illustrate that, despite EGFR expression in >95% of included patients96-99 only a small group of patients will benefit from therapy targeting the EGFR molecule. Despite many efforts, EGFR gene amplification444 and EGFR protein expres-sion level445 do not accurately identify patients who will benefit from EGFR-targeted therapy.More recently, expression of a specific mutant form of EGFR, called EGFR variant III (EGFRvIII) was found to be expressed in GBM. EGFRvIII is not readily distinguished from normal EGFR, and might be responsible for the lack of effect of EGFR-targeted therapy.
EGFRvIII is a specific variant of EGFR, that harbours a deletion of exons 2-7, encoding the ex-tracellular ligand-binding domain. It is the most common and best described EGFR mutation in various malignancies441. The EGFRvIII protein is present in 20-30% of unselected GBM, and in comparable rates in breast carcinoma, while not being expressed in normal tissues (reviewed in446). The truncated protein is constitutively active103 and, unlike EGFR, does not need dimeriza-tion to link to downstream targets447. Moreover, degradation of EGFRvIII is slow because of im-paired internalization and sorting to lysozomes448. EGFRvIII has been associated with increased tumour cell proliferation in a mouse model104, lower response to carboplatin104 and radioresist-ance through increased double-strand break repair449 in vitro. Because of loss of the extracellular ligand-binding domain anti-EGFR monoclonal antibodies do not affect EGFRvIII. Moreover, EG-FRvIII is relatively resistant to tyrosine kinase inhibitors450. Therefore, EGFRvIII might account for the lack of response to monoclonal antibody therapy in HNSCC. Also, EGFRvIII-associated radioresistance could be relevant in HNSCC, which are frequently treated by radiotherapy14,15. Therefore, it is important to know the prevalence of EGFRvIII in HNSCC.Although EGFR expression is ubiquitous in HNSCC, expression of EGFRvIII has been reported at rates varying from 0-80%104,451-458. All studies have been performed in small patient groups (n<50), selected with unclear criteria, and using a single detection technique in nearly all cases. Therefore, the exact prevalence of EGFRvIII in a representative group of HNSCC remains to be determined.
AbstractIntroduction: EGFRvIII is a specific variant of EGFR, and is the most common EGFR mutation in glioblastoma and several other tumour types. The truncated EGFRvIII protein is constitutively active and degradation is impaired. Expression has been associated with increased tumour cell proliferation and resistance to chemotherapy and irradiation in vitro. Expression of EGFRvIII is reported in HNSCC and not readily distinguished from normal EGFR, and might be responsible for the lack of effect of EGFR-targeted therapy. Because EGFR-targeted therapy is an accepted treatment modality in HNSCC, it is important to assess the prevalence of this mutation in HN-SCC.
Methods: Immunohistochemistry for the specific detection of EGFRvIII using the L8A4 anti-body was optimized on formalin-fixed, paraffin-embedded (FFPE) tissue using glioblastoma tissue. It was compared to EGFR and EGFRvIII RNA expression using a specific rt-PCR also opti-mized for FFPE tissue. Tissue microarrays including 531 HNSCC of various stages with complete clinicopathological and follow-up data were tested for the presence of EGFRvIII.
Results: None of the 531 cases showed EGFRvIII protein expression. Using an immunohisto-chemistry protocol reported by others revealed cytoplasmic staining in 8% of cases. rt-PCR for the EGFRvIII transcript of the 28 highest cytoplasmic staining cases, as well as 67 negative cases did not show expression in any of the tested cases, suggesting aspecific staining by a non-optimal protocol.
Conclusions: The EGFRvIII mutation is not present in HNSCC. Therefore, EGFRvIII does not influence treatment response in HNSCC and is not a usable clinical prognostic marker.
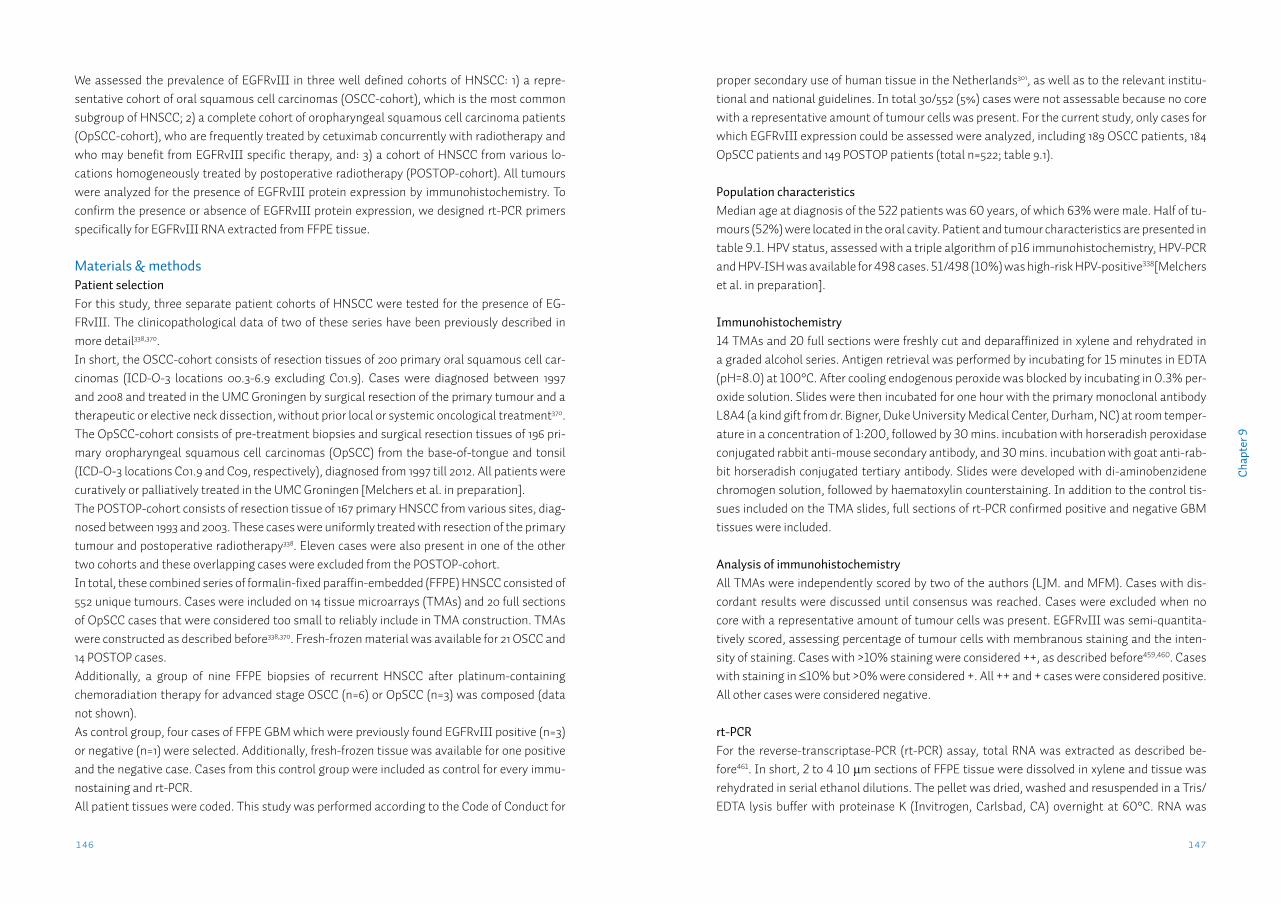
147
Cha
pter
9
146
proper secondary use of human tissue in the Netherlands301, as well as to the relevant institu-tional and national guidelines. In total 30/552 (5%) cases were not assessable because no core with a representative amount of tumour cells was present. For the current study, only cases for which EGFRvIII expression could be assessed were analyzed, including 189 OSCC patients, 184 OpSCC patients and 149 POSTOP patients (total n=522; table 9.1).
Population characteristicsMedian age at diagnosis of the 522 patients was 60 years, of which 63% were male. Half of tu-mours (52%) were located in the oral cavity. Patient and tumour characteristics are presented in table 9.1. HPV status, assessed with a triple algorithm of p16 immunohistochemistry, HPV-PCR and HPV-ISH was available for 498 cases. 51/498 (10%) was high-risk HPV-positive338[Melchers et al. in preparation].
Immunohistochemistry14 TMAs and 20 full sections were freshly cut and deparaffinized in xylene and rehydrated in a graded alcohol series. Antigen retrieval was performed by incubating for 15 minutes in EDTA (pH=8.0) at 100°C. After cooling endogenous peroxide was blocked by incubating in 0.3% per-oxide solution. Slides were then incubated for one hour with the primary monoclonal antibody L8A4 (a kind gift from dr. Bigner, Duke University Medical Center, Durham, NC) at room temper-ature in a concentration of 1:200, followed by 30 mins. incubation with horseradish peroxidase conjugated rabbit anti-mouse secondary antibody, and 30 mins. incubation with goat anti-rab-bit horseradish conjugated tertiary antibody. Slides were developed with di-aminobenzidene chromogen solution, followed by haematoxylin counterstaining. In addition to the control tis-sues included on the TMA slides, full sections of rt-PCR confirmed positive and negative GBM tissues were included.
Analysis of immunohistochemistryAll TMAs were independently scored by two of the authors (LJM. and MFM). Cases with dis-cordant results were discussed until consensus was reached. Cases were excluded when no core with a representative amount of tumour cells was present. EGFRvIII was semi-quantita-tively scored, assessing percentage of tumour cells with membranous staining and the inten-sity of staining. Cases with >10% staining were considered ++, as described before459,460. Cases with staining in ≤10% but >0% were considered +. All ++ and + cases were considered positive. All other cases were considered negative.
rt-PCRFor the reverse-transcriptase-PCR (rt-PCR) assay, total RNA was extracted as described be-fore461. In short, 2 to 4 10 µm sections of FFPE tissue were dissolved in xylene and tissue was rehydrated in serial ethanol dilutions. The pellet was dried, washed and resuspended in a Tris/EDTA lysis buffer with proteinase K (Invitrogen, Carlsbad, CA) overnight at 60°C. RNA was
We assessed the prevalence of EGFRvIII in three well defined cohorts of HNSCC: 1) a repre-sentative cohort of oral squamous cell carcinomas (OSCC-cohort), which is the most common subgroup of HNSCC; 2) a complete cohort of oropharyngeal squamous cell carcinoma patients (OpSCC-cohort), who are frequently treated by cetuximab concurrently with radiotherapy and who may benefit from EGFRvIII specific therapy, and: 3) a cohort of HNSCC from various lo-cations homogeneously treated by postoperative radiotherapy (POSTOP-cohort). All tumours were analyzed for the presence of EGFRvIII protein expression by immunohistochemistry. To confirm the presence or absence of EGFRvIII protein expression, we designed rt-PCR primers specifically for EGFRvIII RNA extracted from FFPE tissue.
Materials & methodsPatient selectionFor this study, three separate patient cohorts of HNSCC were tested for the presence of EG-FRvIII. The clinicopathological data of two of these series have been previously described in more detail338,370.In short, the OSCC-cohort consists of resection tissues of 200 primary oral squamous cell car-cinomas (ICD-O-3 locations 00.3-6.9 excluding C01.9). Cases were diagnosed between 1997 and 2008 and treated in the UMC Groningen by surgical resection of the primary tumour and a therapeutic or elective neck dissection, without prior local or systemic oncological treatment370.The OpSCC-cohort consists of pre-treatment biopsies and surgical resection tissues of 196 pri-mary oropharyngeal squamous cell carcinomas (OpSCC) from the base-of-tongue and tonsil (ICD-O-3 locations C01.9 and C09, respectively), diagnosed from 1997 till 2012. All patients were curatively or palliatively treated in the UMC Groningen [Melchers et al. in preparation].The POSTOP-cohort consists of resection tissue of 167 primary HNSCC from various sites, diag-nosed between 1993 and 2003. These cases were uniformly treated with resection of the primary tumour and postoperative radiotherapy338. Eleven cases were also present in one of the other two cohorts and these overlapping cases were excluded from the POSTOP-cohort.In total, these combined series of formalin-fixed paraffin-embedded (FFPE) HNSCC consisted of 552 unique tumours. Cases were included on 14 tissue microarrays (TMAs) and 20 full sections of OpSCC cases that were considered too small to reliably include in TMA construction. TMAs were constructed as described before338,370. Fresh-frozen material was available for 21 OSCC and 14 POSTOP cases.Additionally, a group of nine FFPE biopsies of recurrent HNSCC after platinum-containing chemoradiation therapy for advanced stage OSCC (n=6) or OpSCC (n=3) was composed (data not shown).As control group, four cases of FFPE GBM which were previously found EGFRvIII positive (n=3) or negative (n=1) were selected. Additionally, fresh-frozen tissue was available for one positive and the negative case. Cases from this control group were included as control for every immu-nostaining and rt-PCR.All patient tissues were coded. This study was performed according to the Code of Conduct for
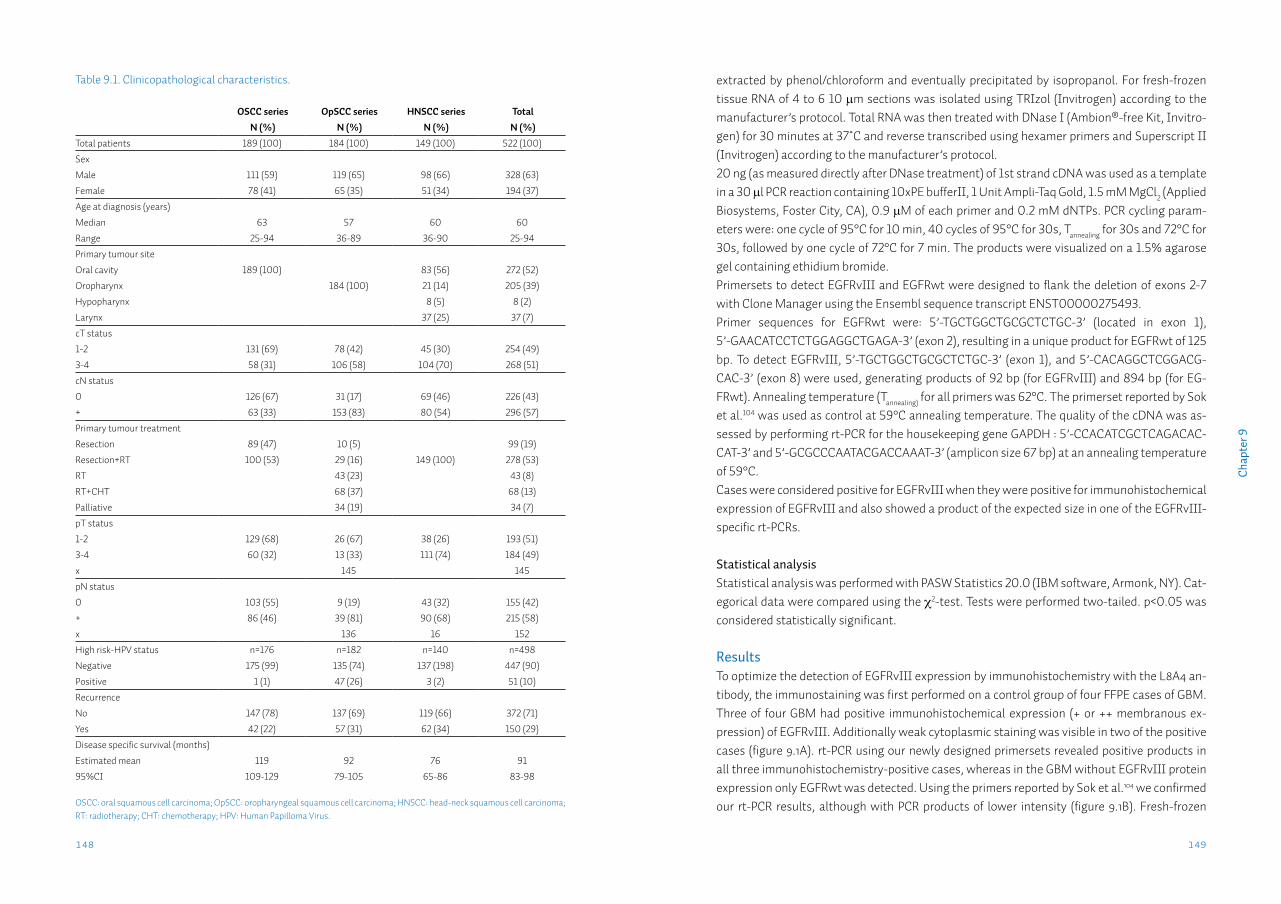
149148
Cha
pter
9
extracted by phenol/chloroform and eventually precipitated by isopropanol. For fresh-frozen tissue RNA of 4 to 6 10 µm sections was isolated using TRIzol (Invitrogen) according to the manufacturer’s protocol. Total RNA was then treated with DNase I (Ambion®-free Kit, Invitro-gen) for 30 minutes at 37˚C and reverse transcribed using hexamer primers and Superscript II (Invitrogen) according to the manufacturer’s protocol.20 ng (as measured directly after DNase treatment) of 1st strand cDNA was used as a template in a 30 µl PCR reaction containing 10xPE bufferII, 1 Unit Ampli-Taq Gold, 1.5 mM MgCl2 (Applied Biosystems, Foster City, CA), 0.9 µM of each primer and 0.2 mM dNTPs. PCR cycling param-eters were: one cycle of 95°C for 10 min, 40 cycles of 95°C for 30s, Tannealing for 30s and 72°C for 30s, followed by one cycle of 72°C for 7 min. The products were visualized on a 1.5% agarose gel containing ethidium bromide. Primersets to detect EGFRvIII and EGFRwt were designed to flank the deletion of exons 2-7 with Clone Manager using the Ensembl sequence transcript ENST00000275493.Primer sequences for EGFRwt were: 5’-TGCTGGCTGCGCTCTGC-3’ (located in exon 1), 5’-GAACATCCTCTGGAGGCTGAGA-3’ (exon 2), resulting in a unique product for EGFRwt of 125 bp. To detect EGFRvIII, 5’-TGCTGGCTGCGCTCTGC-3’ (exon 1), and 5’-CACAGGCTCGGACG-CAC-3’ (exon 8) were used, generating products of 92 bp (for EGFRvIII) and 894 bp (for EG-FRwt). Annealing temperature (Tannealing) for all primers was 62°C. The primerset reported by Sok et al.104 was used as control at 59°C annealing temperature. The quality of the cDNA was as-sessed by performing rt-PCR for the housekeeping gene GAPDH : 5’-CCACATCGCTCAGACAC-CAT-3’ and 5’-GCGCCCAATACGACCAAAT-3’ (amplicon size 67 bp) at an annealing temperature of 59°C.Cases were considered positive for EGFRvIII when they were positive for immunohistochemical expression of EGFRvIII and also showed a product of the expected size in one of the EGFRvIII-specific rt-PCRs.
Statistical analysisStatistical analysis was performed with PASW Statistics 20.0 (IBM software, Armonk, NY). Cat-egorical data were compared using the χ2-test. Tests were performed two-tailed. p<0.05 was considered statistically significant.
ResultsTo optimize the detection of EGFRvIII expression by immunohistochemistry with the L8A4 an-tibody, the immunostaining was first performed on a control group of four FFPE cases of GBM. Three of four GBM had positive immunohistochemical expression (+ or ++ membranous ex-pression) of EGFRvIII. Additionally weak cytoplasmic staining was visible in two of the positive cases (figure 9.1A). rt-PCR using our newly designed primersets revealed positive products in all three immunohistochemistry-positive cases, whereas in the GBM without EGFRvIII protein expression only EGFRwt was detected. Using the primers reported by Sok et al.104 we confirmed our rt-PCR results, although with PCR products of lower intensity (figure 9.1B). Fresh-frozen
Table 9.1. Clinicopathological characteristics.
OSCC series OpSCC series HNSCC series TotalN (%) N (%) N (%) N (%)
Total patients 189 (100) 184 (100) 149 (100) 522 (100)
Sex
Male 111 (59) 119 (65) 98 (66) 328 (63)
Female 78 (41) 65 (35) 51 (34) 194 (37)
Age at diagnosis (years)
Median 63 57 60 60
Range 25-94 36-89 36-90 25-94
Primary tumour site
Oral cavity 189 (100) 83 (56) 272 (52)
Oropharynx 184 (100) 21 (14) 205 (39)
Hypopharynx 8 (5) 8 (2)
Larynx 37 (25) 37 (7)
cT status
1-2 131 (69) 78 (42) 45 (30) 254 (49)
3-4 58 (31) 106 (58) 104 (70) 268 (51)
cN status
0 126 (67) 31 (17) 69 (46) 226 (43)
+ 63 (33) 153 (83) 80 (54) 296 (57)
Primary tumour treatment
Resection 89 (47) 10 (5) 99 (19)
Resection+RT 100 (53) 29 (16) 149 (100) 278 (53)
RT 43 (23) 43 (8)
RT+CHT 68 (37) 68 (13)
Palliative 34 (19) 34 (7)
pT status
1-2 129 (68) 26 (67) 38 (26) 193 (51)
3-4 60 (32) 13 (33) 111 (74) 184 (49)
x 145 145
pN status
0 103 (55) 9 (19) 43 (32) 155 (42)
+ 86 (46) 39 (81) 90 (68) 215 (58)
x 136 16 152
High risk-HPV status n=176 n=182 n=140 n=498
Negative 175 (99) 135 (74) 137 (198) 447 (90)
Positive 1 (1) 47 (26) 3 (2) 51 (10)
Recurrence
No 147 (78) 137 (69) 119 (66) 372 (71)
Yes 42 (22) 57 (31) 62 (34) 150 (29)
Disease specific survival (months)
Estimated mean 119 92 76 91
95%CI 109-129 79-105 65-86 83-98
OSCC: oral squamous cell carcinoma; OpSCC: oropharyngeal squamous cell carcinoma; HNSCC: head-neck squamous cell carcinoma; RT: radiotherapy; CHT: chemotherapy; HPV: Human Papilloma Virus.
151150
Cha
pter
9
our designed set as well as that reported by Sok et al.104. All 9 cases were positive for the EGFRwt (data not shown).
Because other studies in HNSCC report high EGFRvIII frequencies detected by immunohisto-chemistry104,455, we tested whether this might be due to the conditions at which immunohis-tochemistry was performed. Only one HNSCC study using the L8A4 antibody described the immunohistochemistry method used (a streptavidin-biotin detection method)455. Therefore we performed immunohistochemistry for the OSCC and HNSCC series (total n=338) again using RAMbio as second and avidin-biotin complex (Dako, Glostrup, Denmark) as third step. Moreo-ver because tissue sections are generally stored and often used up to several months after cut-ting, we used sections that were not freshly cut. Using this method, no positive membranous expression was observed. However, 9/189 (5%) OSCC and 19/149 (13%) HNSCC now showed a tumour cell-specific cytoplasmic staining in >10% of tumour cells (supplementary data S9.1). All 28 cases that displayed this staining pattern were subjected to rt-PCR by our primersets. 33 negative staining cases were also included in the rt-PCR (total n=61). In none of these 61 pa-tients expression of EGFRvIII was observed, while 49/61 (80%) were positive for EGFRwt (data not shown), confirming that RNA extracted from these samples was of sufficient quality to de-tect EGFRvIII expression. Using the primers reported by Sok et al.104 also no EGFRvIII expres-sion was observed. With the avidin-biotin immunostaining method the four GBM control cases
material was available for one positive and the negative case, and analysis provided the same results (figure 9.1B). To test the analytical sensitivity of our rt-PCR, we performed rt-PCR on se-rial dilutions of FFPE material of a GBM case that was both EGFRwt and EGFRvIII positive. Both transcripts were detectable diluting RNA at least 3125 times (up to approximately 0.006 ng; figure 9.2). Next, expression of EGFRvIII, as determined by immunohistochemistry using the L8A4 anti-body was assessed on 189 OSCC and 184 OpSCC (table 9.1). No case with + or ++ immunohisto-chemical expression was identified.Because some of the highest percentages of EGFRvIII have been reported in advanced stage and recurrent HNSCC454,455,457, we subsequently tested the group of 149 mainly advanced-stage HNSCC of the POSTOP-cohort (table 9.1). Again, immunohistochemistry did not identify any positive case. Finally a group of 9 FFPE biopsies of recurrent HNSCC after chemoradiation ther-apy was tested both by immunohistochemistry and rt-PCR. All of these 9 recurrent cases were negative for both EGFRvIII immunohistochemistry and EGFRvIII rt-PCR as assessed by both
Figure 9.1. EGFRvIII expression in four GBM controls A. EGFRvIII immunohistochemistry with the L8A4 antibody. Case 1: negative, case 2: +, case 3: ++, case 4: +. B. rt-PCR results on FFPE material (case 1-4) and fresh-frozen material (case 1 and 2 only). In fresh-frozen material of case 1 both EGFRvIII-specific primersets resulted in a 894 bp product which included exons 2-7, representing EGFRwt transcript.
Figure 9.2. Serial dilutions of positive GBM number 3 (figure 9.1A and 9.1B), showing detection of both A. EGFRvIII and B. EGFRwt transcripts after 3000 times dilution (0.006 ng RNA input).
A B
153152
Cha
pter
9
showed a lightly increased cytoplasmic staining in addition to the membranous staining that was also present with the RAMpo-GARpo immunostaining (supplementary data S9.1).Additionally, we performed rt-PCR on 21 OSCC and 14 HNSCC cases for which fresh-frozen ma-terial was available. All 35 cases were negative for EGFRvIII immunoexpression in the corre-sponding FFPE slides. 10/35 cases had also been tested negative by rt-PCR on FFPE material. Rt-PCR with our primersets revealed no cases expressing the EGFRvIII transcript in this fresh-frozen material. 34/35 (97%) were positive for the EGFRwt transcript.
DiscussionThis study analyzed 531 head-neck squamous cell carcinomas for the presence of the EGFRvIII mutation. Immunohistochemistry using the L8A4 antibody revealed that none of the 531 cases expressed EGFRvIII. Because this was in contrast with two previous studies that used the L8A4 antibody on HNSCC cases, we also performed rt-PCR for EGFRvIII with primers optimized for FFPE material. Rt-PCR confirmed the absence of EGFRvIII in all of the 70 FFPE cases tested and all of the 35 fresh-frozen cases tested (total 95 unique cases). Moreover, we showed that the immunohistochemistry conditions may greatly influence the specificity of the L8A4 antibody.
EGFRvIII is a promising target for specific therapy for several reasons. It is not expressed in normal tissues, its biology has been extensively described, and the presence of this specific mu-tation confers increased proliferation and resistance to platinum containing chemotherapy and radiotherapy in vitro104,449. Because of the well established expression in 20-30% of GBM several trials on EGFRvIII-specific therapeutics in patients with GBM are currently in progress446.In HNSCC however, the reported rates of EGFRvIII expression vary widely (0-80%). Today, nine studies have assessed the prevalence of EGFRvIII in HNSCC (table 9.2). The average sample size in these nine studies was only 44 cases. Although patient selection criteria were not always clearly described, most head-neck tumour sites and stages are included in these studies. All studies used a single detection technique; either rt-PCR (n=6), or immunohistochemistry (n=3). Because most rt-PCR based studies used primersets that were optimized for fresh-frozen mate-rial, for the current study we designed our own primerset to perform optimally on FFPE tissue. Validation was performed on GBM tissue that showed positive L8A4 immunohistochemistry and rt-PCR using published primers104.It has been well described that cases with the EGFRvIII transcript detected by rt-PCR do not al-ways express the associated protein. This is not only a problem in HNSCC104,455, but in all tumour types446. The reverse, positive immunohistochemical expression without detection of the mRNA transcript, has also been reported104,446,455. Because of the discordance between both methods, a combined approach, detecting protein and mRNA has been proposed, with cases considered EGFRvIII only when both assays yield positive results446. This combined approach was used in the current study. None of the previous studies in HNSCC used a combined approach. However, two of the immunohistochemical studies in HNSCC did perform rt-PCR on several cases. In one study, 3 out of 14 L8A4-positive cases were subjected to
Tabl
e 9.
2. S
tudi
es th
at h
ave
asse
ssed
EGF
RvII
I in
HN
SCC.
Stud
yYe
ar
publ
ishe
dTe
chni
que
Mat
eria
lH
NSC
C ty
peN
/tot
al (%
) EG
FRvI
II p
ositi
veRe
mar
ks
Jung
blut
h451
2003
IHC:
DH
8.3
FFM
HN
SCC
0/10
(0)
Sok10
420
06IH
C: L
8A4
IHC
on F
FPE,
rt
on
FFVa
rious
stag
es
and
site
s14
/33
(42)
1/3
was
confi
rmed
by
RT-P
CR.
F: 5
’-ATG
CGAC
CCTC
CGGG
ACG-
3’R:
5’-T
TCCG
TTAC
ACAC
TTTG
CGGC
-3’
Ham
a452
2009
Sequ
enci
ng o
f fu
ll le
ngth
RT-
PCR
prod
uct
FFVa
rious
stag
es
and
site
s0/
82 (0
)
Yang
453
2009
RT-P
CRFF
Lary
nx, v
ario
us
stag
es6/
39 (1
5)F:
5’-G
GGCT
CTGG
AGGA
AAAG
AAAG
G-3’
R: 5
’-TCC
GTTA
CACA
CTTT
GCGG
C-3’
Prob
e: 5
’FAM
-CGA
CAGC
TATG
AGAT
GGAG
GAAG
ACGG
CGT-
TAM
RA3’
Chau
454
2011
RT-P
CRFF
PER/
M H
NSC
C22
/53
(42)
Prim
ers n
ot m
entio
ned.
Tinh
ofer
455
2011
IHC:
L8A
4IH
C: F
FPE
on T
MA
Rt: o
n FF
PER/
M H
NSC
C37
/46?
(80)
RT-P
CR co
nfirm
ed 3
/4 IH
C+ca
ses,
als
o 1/
4 of
IHC-
case
s was
RT+
.Pr
imer
s acc
ordi
ng to
Yos
him
oto/
Mel
lingh
of:
5’-C
TTCG
GGGA
GCAG
CGAT
GCGA
C-3’
5’
-ACC
AATA
CCTA
TTCC
GTTA
CAC-
3’Th
ese
prim
ers g
ener
ate
a 10
44 b
p PC
R pr
oduc
t for
the
wild
type
EGF
R tr
an-
scrip
t com
pare
d to
a 2
43 b
p PC
R pr
oduc
t for
the
EGFR
vIII
tran
scrip
t.
McI
ntyr
e456
2012
RT-P
CRFF
PEO
SCC,
var
ious
st
ages
1/50
(2)
F: 5
’-TCT
GCCC
GGCG
AGTC
-3’
R: 5
’-GCC
GTGA
TCTG
TCAC
CACA
TAAT
T-3’
FAM
-labe
lled
prob
e 5’
-TTT
CTTT
TCCT
CCAG
AGCC
C-3’
Smile
k457
2012
RT-P
CRFF
Stag
e II
I-IV
H
NSC
C6/
29 (2
1)F:
5’-A
GTCG
GGCT
CTGG
AGGA
A-3’
R: 5
’-GCC
GTCT
TCCT
CCAT
CTCA
TA-3
’Pr
obe:
5’-A
TCAC
GGCT
CGTG
CGTC
CG-3
’
Whe
eler
458
2012
RT-P
CRFF
HN
SCC,
var
ious
si
tes
12/5
2 (2
3)Sa
me
prim
ers a
s Sok
et a
l.104
TOTA
L98
/394
(25)
IHC:
imm
unoh
isto
chem
istr
y; F
F: fr
esh-
froze
n; M
: met
asta
tic; F
FPE:
form
alin
-fixe
d pa
raffi
n em
bedd
ed; R
: rec
urre
nt.
155154
Cha
pter
9
In summary, we analyzed the presence of the EGFRvIII mutation in a total number of 531 HN-SCC by immunohistochemistry and rt-PCR with FFPE optimized primers. None of the HNSCC cases expressed EGFRvIII. Therefore EGFRvIII is not part of the malignant phenotype in these tumours and does not influence the response to EGFR-targeted therapy in HNSCC. It is there-fore not a usable clinical prognostic marker.
Funding: This work was partly funded by the CTMM Air Force consortium (http://www.ctmm.nl). CTMM pays for the salaries of MJAMC and MFM (partly) and had no role in study design, data collection and analysis, decision to publish and preparation of the manuscript.
rt-PCR. Only one of those 3 cases was rt-PCR positive104. In the other study 37 cases were L8A4-positive, of which 4 were subjected to rt-PCR, with three of those positive for the transcript. Interestingly, using the EGFRvIII primers, a PCR product was also found in one of 4 tested L8A4-negative cases455. One explanation for this is the occurrence of aspecific (non-related) EGFRvIII variants. However, no sequencing data was presented to confirm the specificity455. One study that used sequence analysis of rt-PCR products did not detect the EGFRvIII variant in 82 HN-SCC cases452, which is in very good agreement with our data.
Using the combined approach, we were able to screen a large number of HNSCC, using the L8A4 antibody, followed by rt-PCR of the L8A4-positive cases. In total we performed immunohisto-chemistry on 531 unique HNSCC cases and rt-PCR on 95 of these. Immunohistochemistry was performed on TMAs, but did not show any positive staining in the HNSCC cases. Indeed, even staining of less than 10% of tumour cells (below our criterion for positive expression) was not observed. Because several cores were taken from the tumour blocks, it could be hypothesized that a heterogeneously expressed protein will not be detected in all cases on TMA. To check the homogeneity of immunoexpression we additionally immunostained 20 full FFPE sections of OpSCC cases, which were homogeneously negative. Also in literature, EGFRvIII, as detected by the L8A4 antibody in HNSCC, is reported to be homogeneously expressed104,455. Moreover, us-ing the same immunohistochemistry protocol 130 primary GBM were recently tested in our lab. 24/130 (18%) were considered positive for membranous expression [Conroy et al., manuscript in preparation], in good agreement with the expected prevalence in GBM446.
To test the influence of the immunohistochemistry protocol, we performed the L8A4 staining again using a different protocol also used in many labs on older TMA slides. This resulted in cytoplasmic immunostaining in 28/338 cases (8%). Because cytoplasmic expression of EGFRvI-II has been described by others460,462,463, we performed rt-PCR on the cases with cytoplasmic staining. No case was found positive for the EGFRvIII mRNA transcript. Cytoplasmic EGFRvIII expression was also not associated with mRNA expression in fresh- frozen breast cancer tis-sue463. Because the observed cytoplasmic staining was not associated with mRNA expression, we considered this an artefact of this specific staining protocol. Because it seems to be tumour cell-specific staining, it might explain some of the high rates of EGFRvIII expression that are reported in HNSCC. HNSCC is not the only tumour type where EGFRvIII is not expressed. Ovarian459,464, colorectal carcinomas451,465,466 and lung adenocarcinomas451,467-469 have generally been found negative in mul-tiple studies using various techniques. The clinical implications of the absence of EGFRvIII in HNSCC are that there is currently no reason to set up EGFRvIII-specific clinical trials in HNSCC. The lack of EGFRvIII expression in HNSCC also implies that the response or resistance to chemo-therapy, radiotherapy and EGFR-targeted therapy is not influenced by the presence of EGFRvIII and consequently EGFRvIII is not a usable marker to predict response to treatment in HNSCC.

157156
Cha
pter
9
A. example of a negative case immunostained by the RAMpo-GARpo method on a freshly cut slide. B. ex-ample of the same core showing cytoplasmic staining for EGFRvIII immunostained by the avidin-biotin method on an older slide. C. Higher magnification of A. D. Higher magnification of B. E. Control glioblas-toma 3 immunostained by the RAMpo-GARpo method on a freshly cut slide. F. Control glioblastoma 3 immunostained by the avidin-biotin method on an older slide.
SuPPleMentARy dAtA S9
Supplementary data S9.1.

Chapter 10
Summary & general discussionL.J. Melchers

161160
Cha
pter
10
mend a cut-off depth for performing a neck dissection. ‘True N status’ was determined based on neck dissection or at least two years of follow-up in case of watchful waiting. We showed that infiltration depth was not only significantly different between trueN0 and trueN+ cases, but also a predictive factor for trueN+ status, independently from cN status. By ROC-analysis a cut-off at an infiltration depth of 4.59 mm was defined. Using this cut-off on the group of pT1cN0 OSCC resulted in a considerable increase of correctly treated patients, from 41% to 76%. There-fore, we recommend an infiltration depth of ≥4 mm (a more practical cut-off with the same pre-dictive value) to be used as a biomarker with an absolute indication for performing an elective neck dissection in pT1cN0 OSCC.
Photodynamic therapy (PDT) is a minimally invasive therapy which may be used for the treat-ment of superficial tumours. A photosensitizer is intravenously injected and activated locally by illuminating the tumour at a specific wavelength, which induces the release of reactive oxygen species causing cell death158. Because of limitations of light penetration in tissue, curative treat-ment is limited to tumours ≤5 mm infiltration depth162. No studies have been performed that compare PDT with standard surgical therapy in OOSCC. Therefore, treatment response of 156 OOSCC treated with PDT from a pooled multi-centre database, was compared with treatment response of 91 surgically treated cT1-2N0 OOSCC ≤5 mm infiltration depth from our database in chapter 3. Complete response rates did not differ between the two groups. However, local disease-free survival after complete response was longer and the need for further treatment was lower in T2 OOSCC treated with surgery. For T1 OOSCC all outcome measures did not sig-nificantly differ between surgical and PDT treatment. This study shows that PDT might be an effective modality in the curative treatment of a subgroup of cT1N0 OOSCC, that was selected based on a histopathological biomarker, paving the way for randomized-controlled trials com-paring both modalities.
In chapter 4, the biological role of the epithelial cell adhesion molecule (EpCAM) in carcinogen-esis, tumour progression, metastasis and patient survival of human carcinomas was reviewed. EpCAM is a membrane protein that is overexpressed in most carcinomas. In HNSCC EpCAM is expressed de novo. Because of its cell adhesion properties, EpCAM expression has been studied for associations with metastasis in HNSCC. However, no clear associations have been reported. In other tumour types EpCAM is clearly associated with either a better outcome, or a worse outcome. This might be because the role of EpCAM depends on a specific cell environment. Indeed, various biological functions of EpCAM have been described in vitro: EpCAM is a cell adhesion protein and able to disrupt E-cadherin-mediated cell adhesion72, but EpCAM also associates with claudin-7 in a complex, which interferes with its adhesion function and which promotes proliferation, cell motility and metastasis218. The co-expression pattern of these three closely related proteins might therefore provide a better predictive marker for nodal status than each marker separately.
Summary
Oral & oropharyngeal squamous cell carcinoma (OOSCC) are two of the most common head-neck tumours, with ~400,000 new cases worldwide and ~1,500 new cases in the Netherlands annually. Regional metastases occur in ~50% of all OOSCC patients. The nodal status is the most important factor for treatment choice and prognosis. However, current clinical assess-ment of the nodal status, using various imaging techniques has only a moderate sensitivity (60-70%), which is mainly due to the inability to detect micrometastases <3 mm in diameter. Because of the inaccurate assessment of the nodal status in OOSCC, a significant number of patients are over- or undertreated. Overtreatment consists of performing an elective neck dis-section in a patient clinically suspect for metastases (clinically (c)N+) in which no metastases are found upon histopathological examination (pathological (p)N0), resulting in loss of qual-ity of life and increased healthcare costs. Undertreatment consists of undiagnosed metastases (cN0 but pN+) which give rise to recurrences or distant metastases, resulting in loss of quality of life, shorter survival and increased healthcare costs when salvage treatment is undertaken. Therefore there is a need for better predictors of nodal status in OOSCC. Biomarkers in the primary tumour may associate with the biological behaviour of a tumour such as the ability to develop metastases. Histopathological tumour characteristics are associated with nodal status, but suffer from unclear predictive values and observer variability. Single pro-tein biomarkers are not likely to accurately predict the multistep process of metastasis. Genetic signatures, composed of hundreds of genes are too heterogeneous. Methylation is a promising candidate mechanism for the dynamic gene regulation during the multistep metastatic pro-gression in OOSCC.Biomarkers for the prediction of treatment response (prognostic markers), may aid the clinician in choosing the most optimal treatment for a specific patient and tumour, which is increasingly important now that targeted therapy is becoming available for the treatment of OOSCC.Goal of this thesis was to find new molecular biomarkers in the primary tumour that have predictive value for the nodal status and for prognosis in patients with oral & oropharyngeal squamous cell carcinoma, to improve regional staging and treatment selection which is cur-rently based solely on clinical and histopathological characteristics. To achieve this goal, we constructed a large database with clinicopathological and follow-up data of over 600 patients who developed more than 700 OOSCC, of which tumour tissue was available in the archives of the department of Pathology of the University Medical Centre Groningen.
Patients with an early stage pT1cN0 oral squamous cell carcinoma (OSCC) are generally not treated with a neck dissection. However, when these patients are treated by watchful waiting (strict 6-weekly follow-up of the clinical nodal status), ~25% develop clinically detectable nodal metastases during follow-up. The histopathological biomarker, tumour infiltration depth has predictive value for the nodal status in OSCC, however to date no clinically relevant cut-off has been established52. In chapter 2 we measured infiltration depth of 212 pT1-2cN0 OSCC to recom-
163
Cha
pter
10
162
for the dynamic gene regulation during metastatic progression of OOSCC. In chapter 8 we searched for new methylation biomarkers for the prediction of nodal status. Various search strategies were used to select candidate methylation markers (genes with a CpG island and a negative association with nodal metastasis) from four independent microarray expression studies which identified differentially expressed genes in N0 vs. N+ HNSCC399-402. All genes re-ported in more than one of the four studies were selected as well as the five highest ranking genes from each of the two genome-wide studies. Secondly, genes from the HNSCC microar-ray studies were selected when they showed functional methylation (increased expression af-ter treatment with dac/TSA) in vitro and an association with lymph node metastasis in cervi-cal squamous cell carcinoma, in a previous study performed in our lab403,404. Additionally, four genes were selected that have been associated with lymph node metastasis in literature. Thus, 24 genes were selected that had not been reported previously to be regulated by methylation. Another four genes that show frequent methylation in HNSCC literature were also included in the analysis. We investigated these 28 genes for their predictive value for the nodal status in a group of 70 OOSCC. After optimization and screening, only 2/28 (7%) markers showed predic-tive value for the nodal status. MGMT methylation was associated with pN0 status (p=0.02). DAPK1 methylation was associated with pN+ status (p=0.008). The two markers combined had a sensitivity (89%) and specificity (41%) comparable to gene expression signatures for the de-tection of nodal status. Both markers have been described previously as methylated in HNSCC. The expression of genes that are the most differentially expressed between N0 and N+ cases, as identified in the four expression array studies, are not regulated by methylation. To efficiently identify additional new methylation markers, use of a high throughput, genome-wide methyla-tion detection method is needed.
High expression of Epidermal Growth Factor Receptor (EGFR) is common in many human ma-lignancies and has a strong association with worse prognosis. Despite EGFR expression in >95% of HNSCC, only 10-16% of patients benefit from therapy targeting the EGFR molecule. EGFRvIII is a common mutant of EGFR, harbouring a deletion of exons 2-7. Expression of EGFRvIII is not readily distinguished from its wildtype counterpart. The truncated EGFRvIII protein is con-stitutively active and degradation is impaired. EGFRvIII expression is associated with a more aggressive phenotype, and resistance to chemotherapy and radiation therapy. Presence of EG-FRvIII has been reported in HNSCC and therefore EGFRvIII might be a biomarker for treat-ment response in HNSCC. To assess the clinical relevance of EGFRvIII as prognostic biomarker, we determined the prevalence of this protein in a large series of 531 HNSCC in chapter 9. Im-munohistochemistry for EGFRvIII was performed and compared to EGFR and EGFRvIII RNA expression using a specific rt-PCR. None of the 531 HNSCC expressed the EGFRvIII mutation. Therefore EGFRvIII does not contribute to the malignant phenotype and is not a suitable clini-cal prognostic marker in HNSCC. The expression that is reported in several small studies is most probably due to immunostaining artefacts, which seems to be associated with the use of a streptavidin-biotin detection method.
In chapter 5 the co-expression patterns of EpCAM, E-cadherin and claudin-7 was investigated in a group of 227 OOSCC to determine whether these patterns might provide a better predictor for the presence of nodal metastases and regional recurrence in OOSCC than each of these mol-ecules individually. Expression was investigated in both tumour centre and tumour front. The co-expression patterns of E-cadherin, EpCAM and claudin-7 did not provide a better predictive value for the pN status compared to each marker separately. Individually, lack of E-cadherin and presence of cytoplasmic EpCAM were predictive biomarkers for nodal status, however not independent from current clinical assessment. Lack of claudin-7 in the tumour centre is an in-dependent predictive biomarker for regional recurrence. These data suggest that there is no clinically relevant modulating effect of these three markers in OOSCC.
Amplification of the chromosomal 11q13.3 region is a frequent event in HNSCC. Of the genes located in this amplicon, the expression of the gene encoding the Fas-associated death domain (FADD) protein correlates best with amplification status. Overexpression of FADD may be ben-eficial for HNSCC and therefore drive this amplification327. In chapter 6 expression of FADD was analyzed in a series of 177 mainly advanced HNSCC treated with postoperative radiotherapy. High FADD expression was associated with the presence of nodal metastases, and shorter dis-tant metastasis-free survival. FADD may be used as biomarker for patients with high risk for dis-tant metastasis. How FADD causes the metastatic progression of HNSCC is currently not clear.
Presence of high-risk human papilloma virus (hrHPV) in OpSCC is a marker for longer disease-free and overall survival. A growing but widely varying incidence of HPV-associated OpSCC has been reported in several countries. Recently, a validated triple detection algorithm, consisting of p16 immunohistochemistry, hrHPV-ISH and hrHPV-PCR became available, which detects clinically relevant hrHPV infection in the tumour tissue. However, no complete cohorts have been tested with this algorithm. In chapter 7 we determined the prevalence and predictive val-ues of hrHPV using the triple algorithm in a complete historic cohort of OpSCC diagnosed dur-ing a 16-year period (1997-2012) in our hospital (n=193) as well as in a group of 176 OSCC. hrHPV-positivity was an independent predictor for longer disease-specific survival and loco-regional disease-free survival. 24% of OpSCC and <1% of OSCC were hrHPV-positive. A clear increase during the study period 1997-2012 was seen, with 13% hrHPV-positive cases during the first half (1997-2004) increasing to 30% hrHPV-positive during the second half (2005-2012). hrHPV may be used as prognostic marker in OpSCC, but not in OSCC. Detection technique, population se-lection criteria and type of survival analysis may influence both reported prevalence and prog-nostic value of hrHPV in OpSCC.
Methylation of specific genes is being used as biomarker for diagnosis and prognosis in glioma and prostate cancer470. DNA methylation is a form of epigenetic gene regulation. Hypermeth-ylation leads to transcriptional repression, and hypomethylation leads to reactivation of gene transcription. Because of its dynamic nature, methylation is a possible candidate mechanism
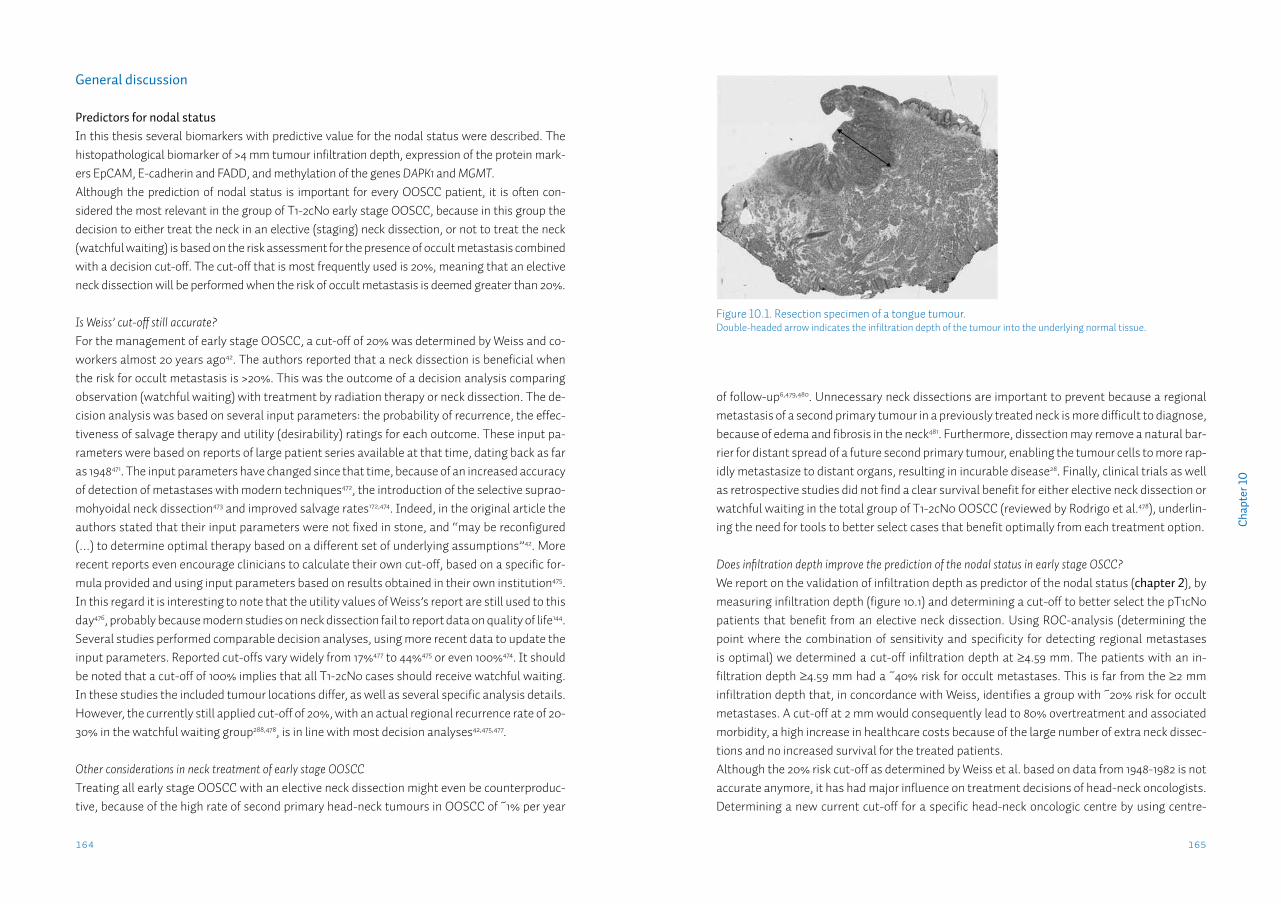
165164
Cha
pter
10
of follow-up6,479,480. Unnecessary neck dissections are important to prevent because a regional metastasis of a second primary tumour in a previously treated neck is more difficult to diagnose, because of edema and fibrosis in the neck481. Furthermore, dissection may remove a natural bar-rier for distant spread of a future second primary tumour, enabling the tumour cells to more rap-idly metastasize to distant organs, resulting in incurable disease28. Finally, clinical trials as well as retrospective studies did not find a clear survival benefit for either elective neck dissection or watchful waiting in the total group of T1-2cN0 OOSCC (reviewed by Rodrigo et al.478), underlin-ing the need for tools to better select cases that benefit optimally from each treatment option.
Does infiltration depth improve the prediction of the nodal status in early stage OSCC?We report on the validation of infiltration depth as predictor of the nodal status (chapter 2), by measuring infiltration depth (figure 10.1) and determining a cut-off to better select the pT1cN0 patients that benefit from an elective neck dissection. Using ROC-analysis (determining the point where the combination of sensitivity and specificity for detecting regional metastases is optimal) we determined a cut-off infiltration depth at ≥4.59 mm. The patients with an in-filtration depth ≥4.59 mm had a ~40% risk for occult metastases. This is far from the ≥2 mm infiltration depth that, in concordance with Weiss, identifies a group with ~20% risk for occult metastases. A cut-off at 2 mm would consequently lead to 80% overtreatment and associated morbidity, a high increase in healthcare costs because of the large number of extra neck dissec-tions and no increased survival for the treated patients.Although the 20% risk cut-off as determined by Weiss et al. based on data from 1948-1982 is not accurate anymore, it has had major influence on treatment decisions of head-neck oncologists. Determining a new current cut-off for a specific head-neck oncologic centre by using centre-
General discussion
Predictors for nodal statusIn this thesis several biomarkers with predictive value for the nodal status were described. The histopathological biomarker of >4 mm tumour infiltration depth, expression of the protein mark-ers EpCAM, E-cadherin and FADD, and methylation of the genes DAPK1 and MGMT. Although the prediction of nodal status is important for every OOSCC patient, it is often con-sidered the most relevant in the group of T1-2cN0 early stage OOSCC, because in this group the decision to either treat the neck in an elective (staging) neck dissection, or not to treat the neck (watchful waiting) is based on the risk assessment for the presence of occult metastasis combined with a decision cut-off. The cut-off that is most frequently used is 20%, meaning that an elective neck dissection will be performed when the risk of occult metastasis is deemed greater than 20%.
Is Weiss’ cut-off still accurate?For the management of early stage OOSCC, a cut-off of 20% was determined by Weiss and co-workers almost 20 years ago42. The authors reported that a neck dissection is beneficial when the risk for occult metastasis is >20%. This was the outcome of a decision analysis comparing observation (watchful waiting) with treatment by radiation therapy or neck dissection. The de-cision analysis was based on several input parameters: the probability of recurrence, the effec-tiveness of salvage therapy and utility (desirability) ratings for each outcome. These input pa-rameters were based on reports of large patient series available at that time, dating back as far as 1948471. The input parameters have changed since that time, because of an increased accuracy of detection of metastases with modern techniques472, the introduction of the selective suprao-mohyoidal neck dissection473 and improved salvage rates172,474. Indeed, in the original article the authors stated that their input parameters were not fixed in stone, and “may be reconfigured (…) to determine optimal therapy based on a different set of underlying assumptions”42. More recent reports even encourage clinicians to calculate their own cut-off, based on a specific for-mula provided and using input parameters based on results obtained in their own institution475. In this regard it is interesting to note that the utility values of Weiss’s report are still used to this day476, probably because modern studies on neck dissection fail to report data on quality of life144. Several studies performed comparable decision analyses, using more recent data to update the input parameters. Reported cut-offs vary widely from 17%477 to 44%475 or even 100%474. It should be noted that a cut-off of 100% implies that all T1-2cN0 cases should receive watchful waiting. In these studies the included tumour locations differ, as well as several specific analysis details. However, the currently still applied cut-off of 20%, with an actual regional recurrence rate of 20-30% in the watchful waiting group288,478, is in line with most decision analyses42,475,477.
Other considerations in neck treatment of early stage OOSCCTreating all early stage OOSCC with an elective neck dissection might even be counterproduc-tive, because of the high rate of second primary head-neck tumours in OOSCC of ~1% per year
Figure 10.1. Resection specimen of a tongue tumour.Double-headed arrow indicates the infiltration depth of the tumour into the underlying normal tissue.
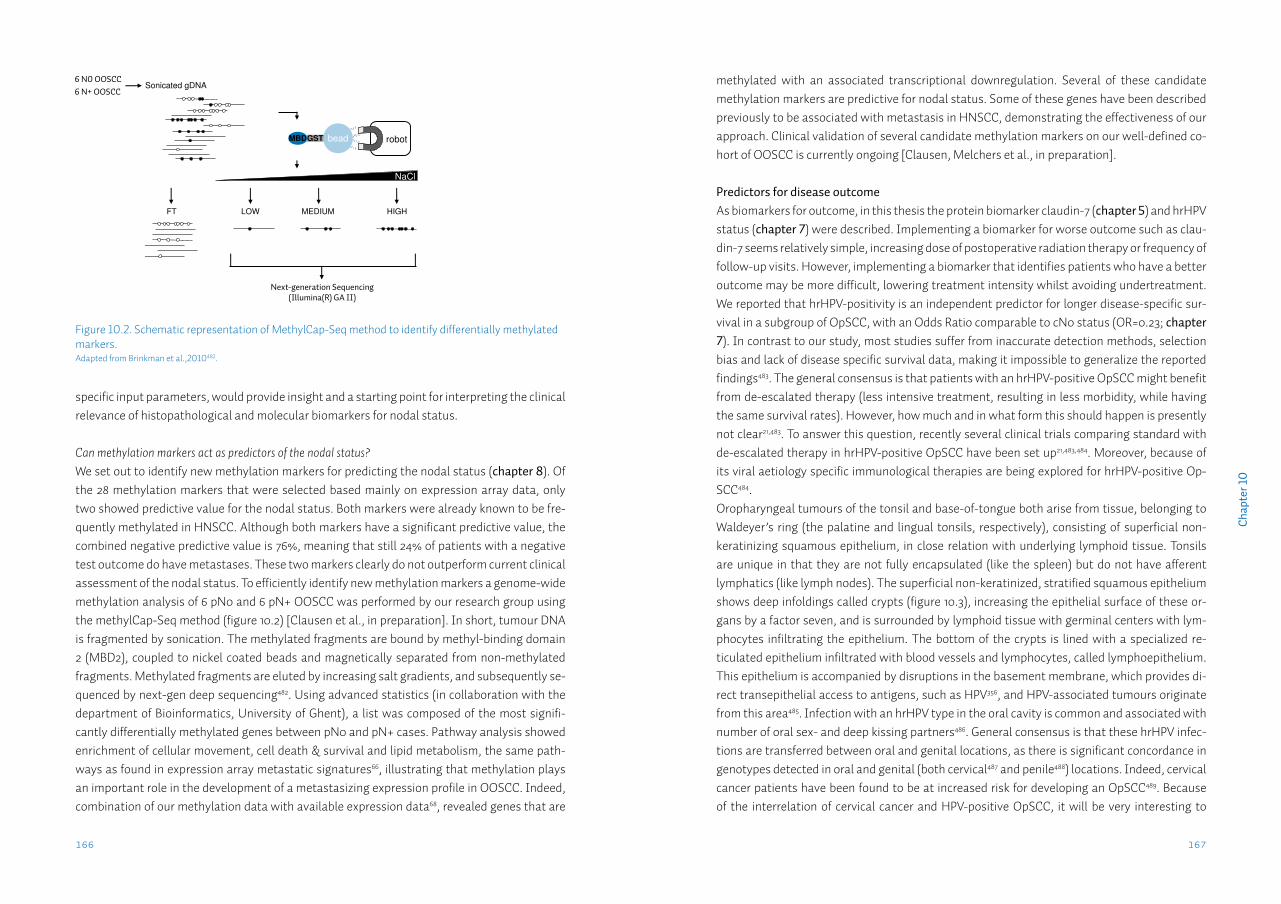
167166
Cha
pter
10
specific input parameters, would provide insight and a starting point for interpreting the clinical relevance of histopathological and molecular biomarkers for nodal status.
Can methylation markers act as predictors of the nodal status?We set out to identify new methylation markers for predicting the nodal status (chapter 8). Of the 28 methylation markers that were selected based mainly on expression array data, only two showed predictive value for the nodal status. Both markers were already known to be fre-quently methylated in HNSCC. Although both markers have a significant predictive value, the combined negative predictive value is 76%, meaning that still 24% of patients with a negative test outcome do have metastases. These two markers clearly do not outperform current clinical assessment of the nodal status. To efficiently identify new methylation markers a genome-wide methylation analysis of 6 pN0 and 6 pN+ OOSCC was performed by our research group using the methylCap-Seq method (figure 10.2) [Clausen et al., in preparation]. In short, tumour DNA is fragmented by sonication. The methylated fragments are bound by methyl-binding domain 2 (MBD2), coupled to nickel coated beads and magnetically separated from non-methylated fragments. Methylated fragments are eluted by increasing salt gradients, and subsequently se-quenced by next-gen deep sequencing482. Using advanced statistics (in collaboration with the department of Bioinformatics, University of Ghent), a list was composed of the most signifi-cantly differentially methylated genes between pN0 and pN+ cases. Pathway analysis showed enrichment of cellular movement, cell death & survival and lipid metabolism, the same path-ways as found in expression array metastatic signatures66, illustrating that methylation plays an important role in the development of a metastasizing expression profile in OOSCC. Indeed, combination of our methylation data with available expression data68, revealed genes that are
methylated with an associated transcriptional downregulation. Several of these candidate methylation markers are predictive for nodal status. Some of these genes have been described previously to be associated with metastasis in HNSCC, demonstrating the effectiveness of our approach. Clinical validation of several candidate methylation markers on our well-defined co-hort of OOSCC is currently ongoing [Clausen, Melchers et al., in preparation]. Predictors for disease outcomeAs biomarkers for outcome, in this thesis the protein biomarker claudin-7 (chapter 5) and hrHPV status (chapter 7) were described. Implementing a biomarker for worse outcome such as clau-din-7 seems relatively simple, increasing dose of postoperative radiation therapy or frequency of follow-up visits. However, implementing a biomarker that identifies patients who have a better outcome may be more difficult, lowering treatment intensity whilst avoiding undertreatment. We reported that hrHPV-positivity is an independent predictor for longer disease-specific sur-vival in a subgroup of OpSCC, with an Odds Ratio comparable to cN0 status (OR=0.23; chapter 7). In contrast to our study, most studies suffer from inaccurate detection methods, selection bias and lack of disease specific survival data, making it impossible to generalize the reported findings483. The general consensus is that patients with an hrHPV-positive OpSCC might benefit from de-escalated therapy (less intensive treatment, resulting in less morbidity, while having the same survival rates). However, how much and in what form this should happen is presently not clear21,483. To answer this question, recently several clinical trials comparing standard with de-escalated therapy in hrHPV-positive OpSCC have been set up21,483,484. Moreover, because of its viral aetiology specific immunological therapies are being explored for hrHPV-positive Op-SCC484.Oropharyngeal tumours of the tonsil and base-of-tongue both arise from tissue, belonging to Waldeyer’s ring (the palatine and lingual tonsils, respectively), consisting of superficial non-keratinizing squamous epithelium, in close relation with underlying lymphoid tissue. Tonsils are unique in that they are not fully encapsulated (like the spleen) but do not have afferent lymphatics (like lymph nodes). The superficial non-keratinized, stratified squamous epithelium shows deep infoldings called crypts (figure 10.3), increasing the epithelial surface of these or-gans by a factor seven, and is surrounded by lymphoid tissue with germinal centers with lym-phocytes infiltrating the epithelium. The bottom of the crypts is lined with a specialized re-ticulated epithelium infiltrated with blood vessels and lymphocytes, called lymphoepithelium. This epithelium is accompanied by disruptions in the basement membrane, which provides di-rect transepithelial access to antigens, such as HPV356, and HPV-associated tumours originate from this area485. Infection with an hrHPV type in the oral cavity is common and associated with number of oral sex- and deep kissing partners486. General consensus is that these hrHPV infec-tions are transferred between oral and genital locations, as there is significant concordance in genotypes detected in oral and genital (both cervical487 and penile488) locations. Indeed, cervical cancer patients have been found to be at increased risk for developing an OpSCC489. Because of the interrelation of cervical cancer and HPV-positive OpSCC, it will be very interesting to
Figure 10.2. Schematic representation of MethylCap-Seq method to identify differentially methylated markers.Adapted from Brinkman et al.,2010482.
6 N0 OOSCC6 N+ OOSCC
Next-generation Sequencing(Illumina(R) GA II)
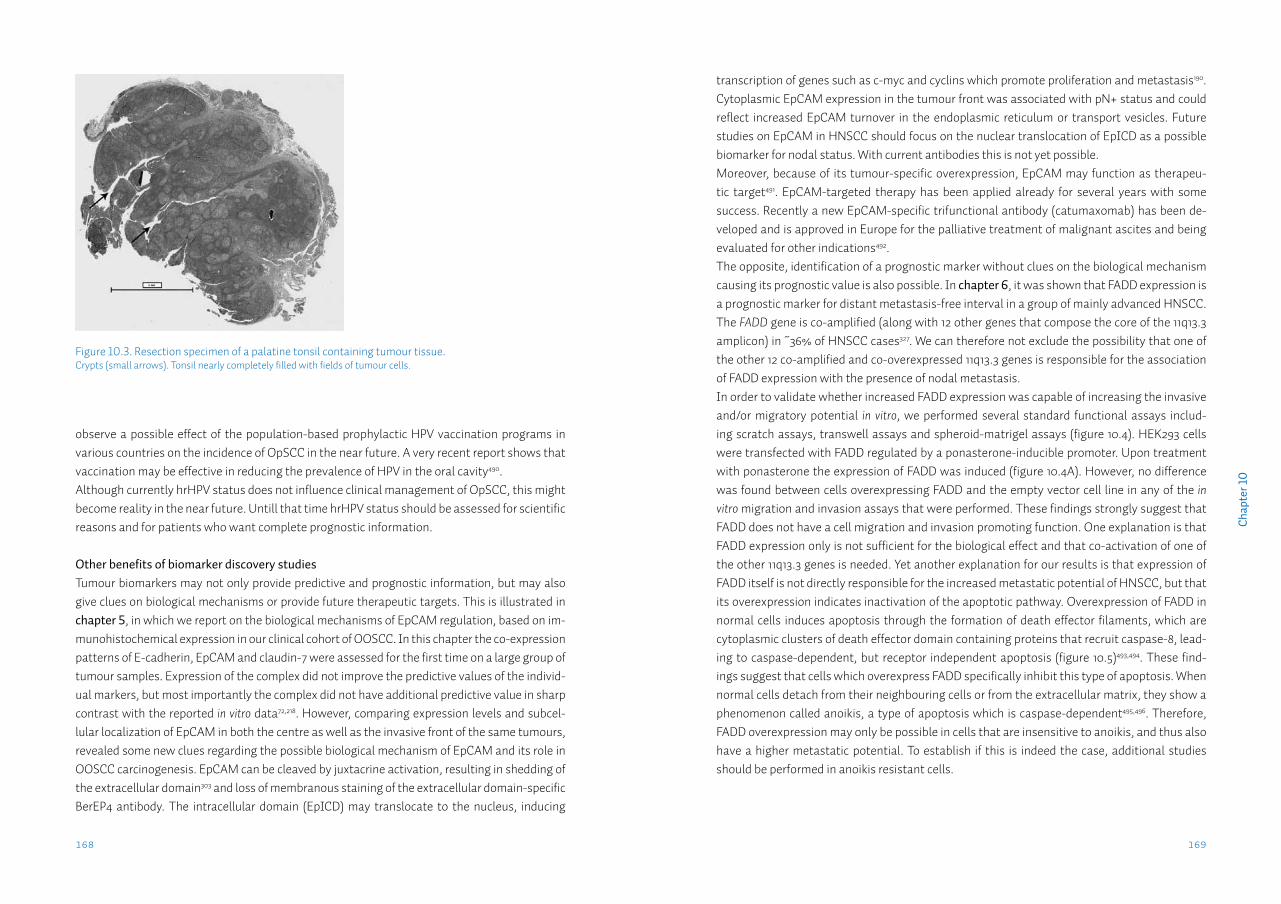
169168
Cha
pter
10
transcription of genes such as c-myc and cyclins which promote proliferation and metastasis190. Cytoplasmic EpCAM expression in the tumour front was associated with pN+ status and could reflect increased EpCAM turnover in the endoplasmic reticulum or transport vesicles. Future studies on EpCAM in HNSCC should focus on the nuclear translocation of EpICD as a possible biomarker for nodal status. With current antibodies this is not yet possible.Moreover, because of its tumour-specific overexpression, EpCAM may function as therapeu-tic target491. EpCAM-targeted therapy has been applied already for several years with some success. Recently a new EpCAM-specific trifunctional antibody (catumaxomab) has been de-veloped and is approved in Europe for the palliative treatment of malignant ascites and being evaluated for other indications492.The opposite, identification of a prognostic marker without clues on the biological mechanism causing its prognostic value is also possible. In chapter 6, it was shown that FADD expression is a prognostic marker for distant metastasis-free interval in a group of mainly advanced HNSCC. The FADD gene is co-amplified (along with 12 other genes that compose the core of the 11q13.3 amplicon) in ~36% of HNSCC cases327. We can therefore not exclude the possibility that one of the other 12 co-amplified and co-overexpressed 11q13.3 genes is responsible for the association of FADD expression with the presence of nodal metastasis.In order to validate whether increased FADD expression was capable of increasing the invasive and/or migratory potential in vitro, we performed several standard functional assays includ-ing scratch assays, transwell assays and spheroid-matrigel assays (figure 10.4). HEK293 cells were transfected with FADD regulated by a ponasterone-inducible promoter. Upon treatment with ponasterone the expression of FADD was induced (figure 10.4A). However, no difference was found between cells overexpressing FADD and the empty vector cell line in any of the in vitro migration and invasion assays that were performed. These findings strongly suggest that FADD does not have a cell migration and invasion promoting function. One explanation is that FADD expression only is not sufficient for the biological effect and that co-activation of one of the other 11q13.3 genes is needed. Yet another explanation for our results is that expression of FADD itself is not directly responsible for the increased metastatic potential of HNSCC, but that its overexpression indicates inactivation of the apoptotic pathway. Overexpression of FADD in normal cells induces apoptosis through the formation of death effector filaments, which are cytoplasmic clusters of death effector domain containing proteins that recruit caspase-8, lead-ing to caspase-dependent, but receptor independent apoptosis (figure 10.5)493,494. These find-ings suggest that cells which overexpress FADD specifically inhibit this type of apoptosis. When normal cells detach from their neighbouring cells or from the extracellular matrix, they show a phenomenon called anoikis, a type of apoptosis which is caspase-dependent495,496. Therefore, FADD overexpression may only be possible in cells that are insensitive to anoikis, and thus also have a higher metastatic potential. To establish if this is indeed the case, additional studies should be performed in anoikis resistant cells.
observe a possible effect of the population-based prophylactic HPV vaccination programs in various countries on the incidence of OpSCC in the near future. A very recent report shows that vaccination may be effective in reducing the prevalence of HPV in the oral cavity490.Although currently hrHPV status does not influence clinical management of OpSCC, this might become reality in the near future. Untill that time hrHPV status should be assessed for scientific reasons and for patients who want complete prognostic information.
Other benefits of biomarker discovery studiesTumour biomarkers may not only provide predictive and prognostic information, but may also give clues on biological mechanisms or provide future therapeutic targets. This is illustrated in chapter 5, in which we report on the biological mechanisms of EpCAM regulation, based on im-munohistochemical expression in our clinical cohort of OOSCC. In this chapter the co-expression patterns of E-cadherin, EpCAM and claudin-7 were assessed for the first time on a large group of tumour samples. Expression of the complex did not improve the predictive values of the individ-ual markers, but most importantly the complex did not have additional predictive value in sharp contrast with the reported in vitro data72,218. However, comparing expression levels and subcel-lular localization of EpCAM in both the centre as well as the invasive front of the same tumours, revealed some new clues regarding the possible biological mechanism of EpCAM and its role in OOSCC carcinogenesis. EpCAM can be cleaved by juxtacrine activation, resulting in shedding of the extracellular domain303 and loss of membranous staining of the extracellular domain-specific BerEP4 antibody. The intracellular domain (EpICD) may translocate to the nucleus, inducing
Figure 10.3. Resection specimen of a palatine tonsil containing tumour tissue.Crypts (small arrows). Tonsil nearly completely filled with fields of tumour cells.
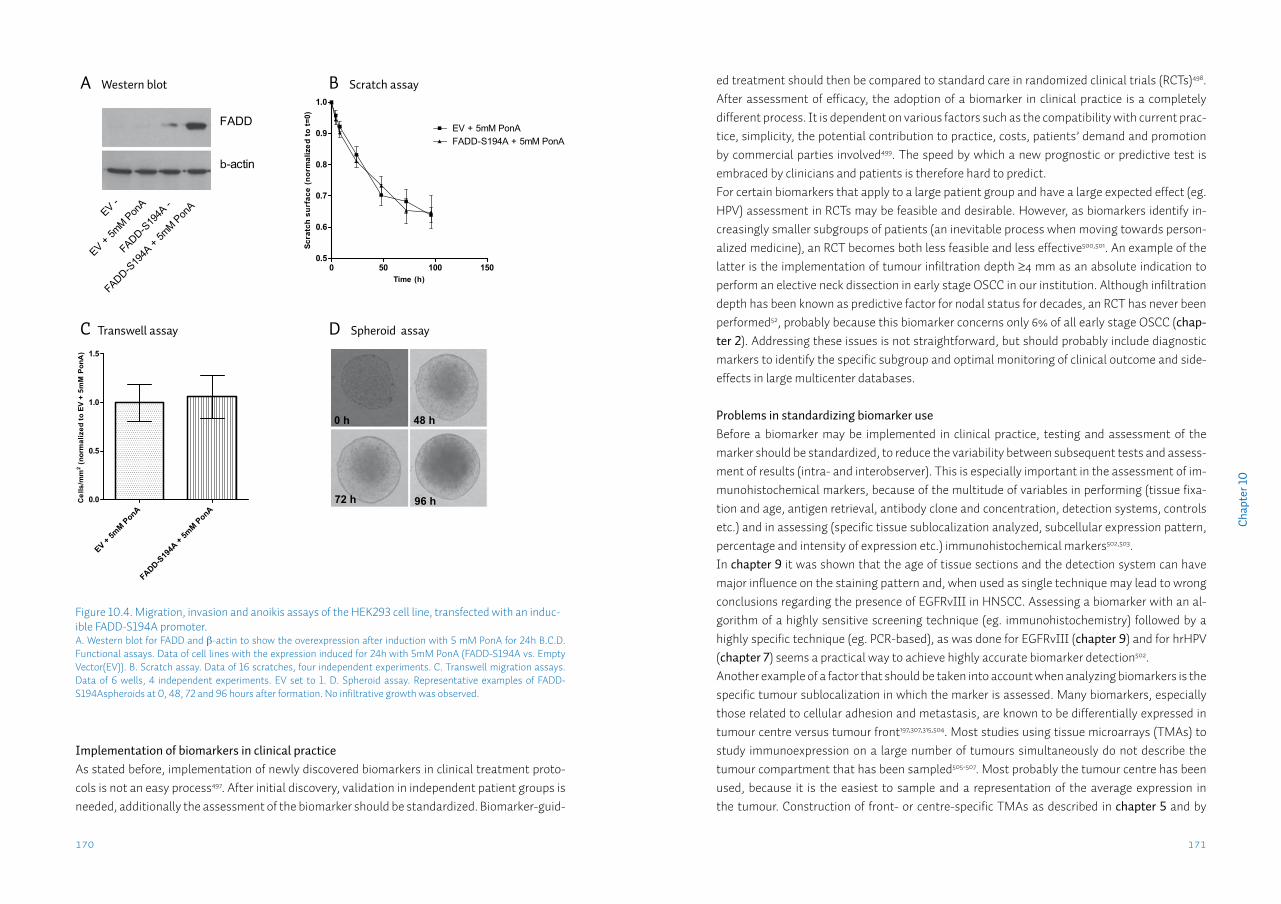
171170
Cha
pter
10
ed treatment should then be compared to standard care in randomized clinical trials (RCTs)498. After assessment of efficacy, the adoption of a biomarker in clinical practice is a completely different process. It is dependent on various factors such as the compatibility with current prac-tice, simplicity, the potential contribution to practice, costs, patients’ demand and promotion by commercial parties involved499. The speed by which a new prognostic or predictive test is embraced by clinicians and patients is therefore hard to predict. For certain biomarkers that apply to a large patient group and have a large expected effect (eg. HPV) assessment in RCTs may be feasible and desirable. However, as biomarkers identify in-creasingly smaller subgroups of patients (an inevitable process when moving towards person-alized medicine), an RCT becomes both less feasible and less effective500,501. An example of the latter is the implementation of tumour infiltration depth ≥4 mm as an absolute indication to perform an elective neck dissection in early stage OSCC in our institution. Although infiltration depth has been known as predictive factor for nodal status for decades, an RCT has never been performed52, probably because this biomarker concerns only 6% of all early stage OSCC (chap-ter 2). Addressing these issues is not straightforward, but should probably include diagnostic markers to identify the specific subgroup and optimal monitoring of clinical outcome and side-effects in large multicenter databases.
Problems in standardizing biomarker useBefore a biomarker may be implemented in clinical practice, testing and assessment of the marker should be standardized, to reduce the variability between subsequent tests and assess-ment of results (intra- and interobserver). This is especially important in the assessment of im-munohistochemical markers, because of the multitude of variables in performing (tissue fixa-tion and age, antigen retrieval, antibody clone and concentration, detection systems, controls etc.) and in assessing (specific tissue sublocalization analyzed, subcellular expression pattern, percentage and intensity of expression etc.) immunohistochemical markers502,503. In chapter 9 it was shown that the age of tissue sections and the detection system can have major influence on the staining pattern and, when used as single technique may lead to wrong conclusions regarding the presence of EGFRvIII in HNSCC. Assessing a biomarker with an al-gorithm of a highly sensitive screening technique (eg. immunohistochemistry) followed by a highly specific technique (eg. PCR-based), as was done for EGFRvIII (chapter 9) and for hrHPV (chapter 7) seems a practical way to achieve highly accurate biomarker detection502.Another example of a factor that should be taken into account when analyzing biomarkers is the specific tumour sublocalization in which the marker is assessed. Many biomarkers, especially those related to cellular adhesion and metastasis, are known to be differentially expressed in tumour centre versus tumour front197,307,315,504. Most studies using tissue microarrays (TMAs) to study immunoexpression on a large number of tumours simultaneously do not describe the tumour compartment that has been sampled505-507. Most probably the tumour centre has been used, because it is the easiest to sample and a representation of the average expression in the tumour. Construction of front- or centre-specific TMAs as described in chapter 5 and by
Figure 10.4. Migration, invasion and anoikis assays of the HEK293 cell line, transfected with an induc-ible FADD-S194A promoter.A. Western blot for FADD and β-actin to show the overexpression after induction with 5 mM PonA for 24h B.C.D. Functional assays. Data of cell lines with the expression induced for 24h with 5mM PonA (FADD-S194A vs. Empty Vector(EV)). B. Scratch assay. Data of 16 scratches, four independent experiments. C. Transwell migration assays. Data of 6 wells, 4 independent experiments. EV set to 1. D. Spheroid assay. Representative examples of FADD-S194Aspheroids at 0, 48, 72 and 96 hours after formation. No infiltrative growth was observed.
Implementation of biomarkers in clinical practiceAs stated before, implementation of newly discovered biomarkers in clinical treatment proto-cols is not an easy process497. After initial discovery, validation in independent patient groups is needed, additionally the assessment of the biomarker should be standardized. Biomarker-guid-
0 50 100 1500.5
0.6
0.7
0.8
0.9
1.0
EV + 5mM P
onA
EV -
FADD-S19
4A + 5m
M Pon
A
FADD-S19
4A -
FADD
b-actin
Time (h)
Scra
tch
surf
ace
(nor
mal
ized
to t=
0)
0 50 100 1500.5
0.6
0.7
0.8
0.9
1.0
EV + 5mM PonAFADD-S194A + 5mM PonA
Cel
ls/m
m2 (n
orm
aliz
ed to
EV
+ 5m
M P
onA
)
EV + 5mM PonA
FADD-S19
4A +
5mM PonA
0.0
0.5
1.0
1.5
B Scratch assay
D Spheroid assay
0 h 48 h
72 h 96 h
A Western blot
C Transwell assay
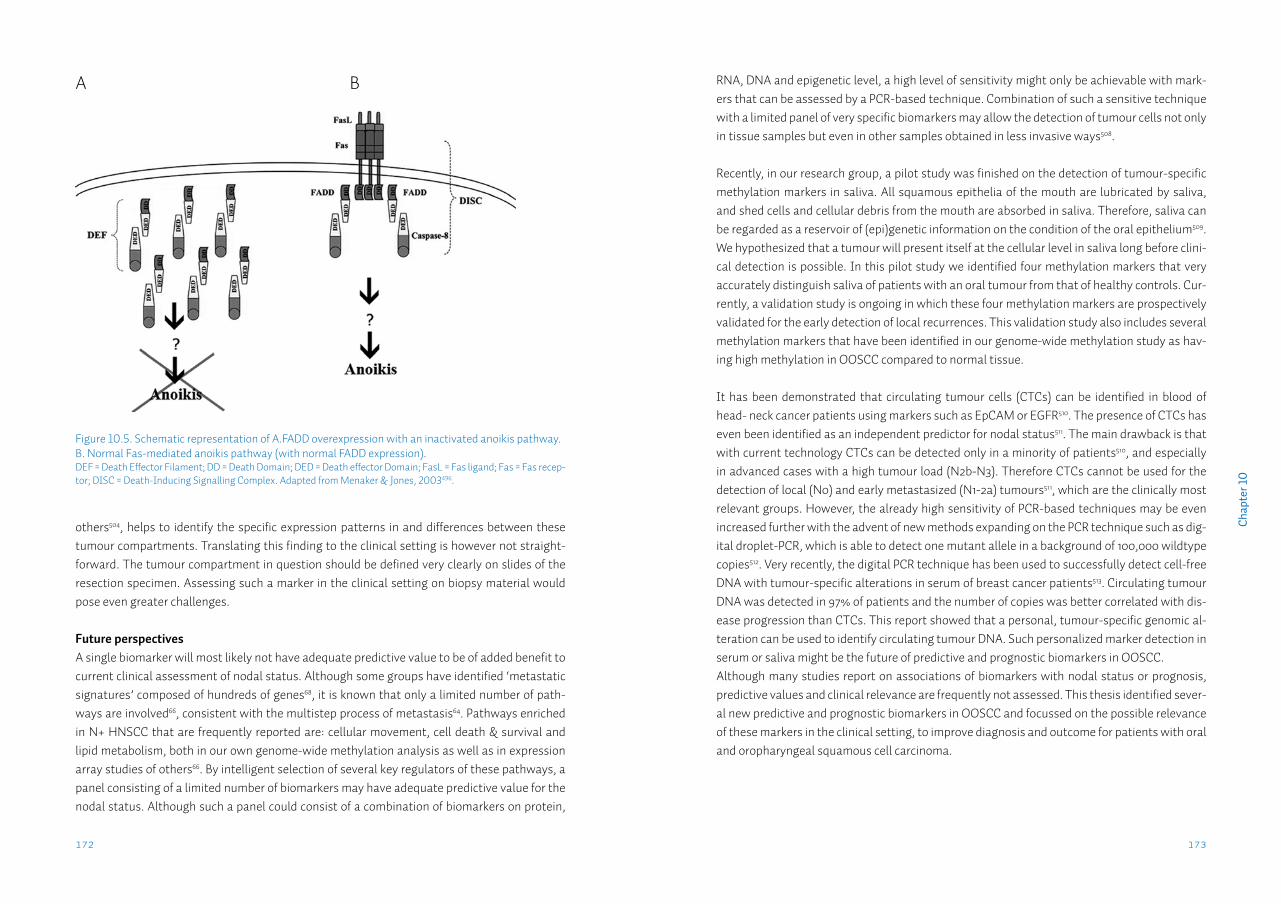
173172
Cha
pter
10
RNA, DNA and epigenetic level, a high level of sensitivity might only be achievable with mark-ers that can be assessed by a PCR-based technique. Combination of such a sensitive technique with a limited panel of very specific biomarkers may allow the detection of tumour cells not only in tissue samples but even in other samples obtained in less invasive ways508.
Recently, in our research group, a pilot study was finished on the detection of tumour-specific methylation markers in saliva. All squamous epithelia of the mouth are lubricated by saliva, and shed cells and cellular debris from the mouth are absorbed in saliva. Therefore, saliva can be regarded as a reservoir of (epi)genetic information on the condition of the oral epithelium509. We hypothesized that a tumour will present itself at the cellular level in saliva long before clini-cal detection is possible. In this pilot study we identified four methylation markers that very accurately distinguish saliva of patients with an oral tumour from that of healthy controls. Cur-rently, a validation study is ongoing in which these four methylation markers are prospectively validated for the early detection of local recurrences. This validation study also includes several methylation markers that have been identified in our genome-wide methylation study as hav-ing high methylation in OOSCC compared to normal tissue.
It has been demonstrated that circulating tumour cells (CTCs) can be identified in blood of head- neck cancer patients using markers such as EpCAM or EGFR510. The presence of CTCs has even been identified as an independent predictor for nodal status511. The main drawback is that with current technology CTCs can be detected only in a minority of patients510, and especially in advanced cases with a high tumour load (N2b-N3). Therefore CTCs cannot be used for the detection of local (N0) and early metastasized (N1-2a) tumours511, which are the clinically most relevant groups. However, the already high sensitivity of PCR-based techniques may be even increased further with the advent of new methods expanding on the PCR technique such as dig-ital droplet-PCR, which is able to detect one mutant allele in a background of 100,000 wildtype copies512. Very recently, the digital PCR technique has been used to successfully detect cell-free DNA with tumour-specific alterations in serum of breast cancer patients513. Circulating tumour DNA was detected in 97% of patients and the number of copies was better correlated with dis-ease progression than CTCs. This report showed that a personal, tumour-specific genomic al-teration can be used to identify circulating tumour DNA. Such personalized marker detection in serum or saliva might be the future of predictive and prognostic biomarkers in OOSCC.Although many studies report on associations of biomarkers with nodal status or prognosis, predictive values and clinical relevance are frequently not assessed. This thesis identified sever-al new predictive and prognostic biomarkers in OOSCC and focussed on the possible relevance of these markers in the clinical setting, to improve diagnosis and outcome for patients with oral and oropharyngeal squamous cell carcinoma.
others504, helps to identify the specific expression patterns in and differences between these tumour compartments. Translating this finding to the clinical setting is however not straight-forward. The tumour compartment in question should be defined very clearly on slides of the resection specimen. Assessing such a marker in the clinical setting on biopsy material would pose even greater challenges.
Future perspectivesA single biomarker will most likely not have adequate predictive value to be of added benefit to current clinical assessment of nodal status. Although some groups have identified ‘metastatic signatures’ composed of hundreds of genes68, it is known that only a limited number of path-ways are involved66, consistent with the multistep process of metastasis64. Pathways enriched in N+ HNSCC that are frequently reported are: cellular movement, cell death & survival and lipid metabolism, both in our own genome-wide methylation analysis as well as in expression array studies of others66. By intelligent selection of several key regulators of these pathways, a panel consisting of a limited number of biomarkers may have adequate predictive value for the nodal status. Although such a panel could consist of a combination of biomarkers on protein,
Figure 10.5. Schematic representation of A.FADD overexpression with an inactivated anoikis pathway. B. Normal Fas-mediated anoikis pathway (with normal FADD expression).DEF = Death Effector Filament; DD = Death Domain; DED = Death effector Domain; FasL = Fas ligand; Fas = Fas recep-tor; DISC = Death-Inducing Signalling Complex. Adapted from Menaker & Jones, 2003496.
A B

Nederlandse samenvatting
177176
Ned
erla
ndse
sam
enva
ttin
g
Bij patiënten met een pT1cN0 mondholte carcinoom (OSCC) wordt in het algemeen geen elec-tieve halsklierdissectie uitgevoerd. Echter indien deze patiënten worden gevolgd met watchful waiting (strikte 6-weekse follow-up van de klinische lymfklierstatus), ontwikkelt circa 25% als-nog klinisch detecteerbare lymfkliermetastasen gedurende deze follow-up. De histopathologi-sche biomarker tumor infiltratiediepte heeft een voorspellende waarde voor de lymfklierstatus in OSCC. Tot op heden is echter geen klinisch relevant afkappunt voor de infiltratiediepte vast-gesteld. In hoofdstuk 2 is de infiltratiediepte van 212 pT1-2cN0 OSCC gemeten om de optimale afkapwaarde te bepalen als indicatie om een halsklierdissectie uit te voeren. De ‘ware N status’ (trueN status) werd gebaseerd op halsklierdissectie of minimaal twee jaar follow-up (watchful waiting). Er werd aangetoond dat de infiltratiediepte niet alleen verschilde tussen trueN0 en trueN+ cases, maar infiltratiediepte was ook een onafhankelijke voorspellende factor voor tru-eN+ status. Door middel van ROC-analyse werd een afkapwaarde vastgesteld bij een infiltratie-diepte van 4.59 mm. Gebruik van dit afkappunt in de groep van pT1cN0 OSCC resulteerde in een forse toename van correct behandelde patiënten, van 41% tot 76%. Daarom is onze aanbeveling dat een infiltratiediepte van ≥4 mm (een praktischer afkapwaarde met dezelfde voorspellende waarde), gebruikt moet worden als biomarker met een absolute indicatie voor het verrichten van een halsklierdissectie in pT1cN0 OSCC.
Fotodynamische therapie (PDT) is een minimaal invasieve therapie, die gebruikt kan worden voor het behandelen van oppervlakkig groeiende tumoren. Een photosensitizer wordt intrave-neus geïnjecteerd en lokaal geactiveerd door de tumor te bestralen met licht van een specifieke golflengte. Hierbij worden zuurstofradicalen gevormd welke tot celdood leiden. Doordat licht slechts beperkt doordringt in weefsel is curatieve behandeling beperkt tot tumoren met ≤5 mm infiltratiediepte. Er zijn geen vergelijkende studies tussen PDT en chirurgische therapie in OO-SCC uitgevoerd. Daarom is de behandelrespons van 156 OOSCC behandeld met PDT vergele-ken met 91 chirurgisch behandelde cT1-2N0 OOSCC met ≤5 mm infiltratiediepte afkomstig uit onze database in hoofdstuk 3. Het deel tumoren met een complete respons verschilde niet tus-sen beide groepen. Echter lokale ziekte-vrije overleving na complete respons was langer en de noodzaak tot aanvullende behandeling lager in T2 OOSCC behandeld met chirurgie. Voor de T1 OOSCC verschilden alle uitkomstmaten niet significant tussen PDT en chirurgisch behandelde cases. Deze studie toonde aan dat PDT een effectieve behandelmodaliteit is bij de curatieve behandeling van een subgroep van cT1N0 OOSCC, geselecteerd op basis van een histopatholo-gische biomarker (≤5 mm infiltratiediepte). Dit onderzoek maakt de weg vrij voor het opzetten van een gerandomiseerde studie waarin beide modaliteiten worden vergeleken.
In hoofdstuk 4, werd een literatuuroverzicht gegeven van de biologische rol van het epithelial cell adhesion molecule (EpCAM) in carcinogenese, tumorprogressie, metastasering en overle-ving van kankerpatiënten. EpCAM is een membraaneiwit dat tot overexpressie gebracht wordt in de meeste carcinomen. In HNSCC wordt EpCAM de novo tot expressie gebracht. Omdat dit eiwit celadhesie-eigenschappen heeft, is de expressie in de primaire tumor onderzocht op as-
Nederlandse samenvatting
Het plaveiselcelcarcinoom van de mondholte en van de orofarynx (OOSCC) zijn twee van de meest voorkomende hoofd-hals plaveiselcelcarcinomen (HNSCC) met ongeveer 400.000 nieuwe gevallen per jaar wereldwijd. In Nederland worden er ongeveer 1500 nieuwe gevallen per jaar gediagnosticeerd. De belangrijkste prognostische factor is het aan- of afwezig zijn van metastasen (uitzaaiingen) in de lymfklieren in de hals (lymfklierstatus). Metastasen in de hals komen voor in gemiddeld 50% van alle OOSCC patiënten. Echter met de huidige diagnostische beeldvormingstechnieken worden slechts 60-70% van de metastasen ontdekt. Dit komt met name door het missen van micrometastasen, metastasen kleiner dan 3 mm in diameter. Door de suboptimale detectie van metastasen wordt een aanzienlijk aantal patiënten over- of juist onderbehandeld. Overbehandeling is bijvoorbeeld het verrichten van een halsklierdissectie bij een patiënt die een klinische verdenking heeft op metastasen (cN+), maar waarbij na onderzoek van de lymfklieren door de patholoog, geen metastasen worden gevonden (pN0). Dit resulteert in verlies van kwaliteit van leven en toegenomen zorgkosten. Er is sprake van onderbehandeling indien metastasen niet gediagnosticeerd worden (cN0, maar in werkelijkheid pN+), waardoor de patiënt een regionaal recidief of afstandsmetastasen zal ontwikkelen. Dit leidt tot verlies van kwaliteit van leven, kortere overleving en toegenomen zorgkosten. Het is daarom belangrijk om in de primaire tumor betere voorspellers te vinden voor de lymfklierstatus.Een biologisch of moleculair kenmerk van de tumor, zoals de aan- of afwezigheid van een be-paald eiwit of mutatie kan gerelateerd zijn met het biologisch en daarmee klinische gedrag van deze tumor zoals het vormen van metastasen. We noemen dit een tumor biomarker. Er zijn al verschillende histopathologische biomarkers beschreven die zijn geassocieerd met lymfklier-status maar deze biomarkers tonen wisselende voorspellende waarden en inter-beoordelaar variabiliteit. Indien biomarkers separaat gebruikt worden, hebben ze een matige voorspellende waarde voor het multistep metastaseringsproces in OOSCC.Biomarkers voor het voorspellen van respons op behandeling (zogenaamde prognostische markers) kunnen helpen om de meest optimale behandeling te kiezen voor een specifieke kan-kerpatiënt. Dit is in toenemende mate van belang aangezien er steeds meer “personalized tar-geted therapy” beschikbaar komt voor de behandeling van OOSCC. Hiervoor zijn medicijnen ontwikkeld die gericht zijn tegen een specifiek moleculair target dat aanwezig is in de tumorcel.Doel van deze dissertatie was om nieuwe moleculaire, biologische en histopathologische bio-markers in de primaire tumor te vinden, die een waarde hebben voor het voorspellen van de lymfklierstatus en van de prognose in patiënten met een mondholte- of orofarynxcarcinoom. Deze gegevens kunnen behulpzaam zijn om de behandelkeuze te optimaliseren. Om dit doel te bereiken hebben we een database geconstrueerd met hierin klinisch-pathologische-, thera-pie- en follow-up gegevens van meer dan 600 patiënten met meer dan 700 tumoren, waarvan tumorweefsel beschikbaar was in de archieven van de afdeling Pathologie van het Universitair Medisch Centrum Groningen.
179178
vante hrHPV infectie in het tumorweefsel. Er zijn echter nog geen complete cohorten getest met dit algoritme. In hoofdstuk 7 werd de prevalentie en voorspellende waarden van hrHPV vastgesteld met behulp van het tripel algoritme in een compleet historisch cohort van OpSCC, gediagnosticeerd in een periode van 16 jaren (1997-2012) in het UMCG (n=193). Ook werd een groep van 176 OSCC getest. HrHPV-positiviteit was een onafhankelijke voorspeller voor lan-gere ziekte-specifieke- en ziekte-vrije overleving. 24% van de OpSCC en <1% van de OSCC was hrHPV-positief. Een duidelijke toename gedurende de studieperiode 1997-2012 werd gezien met 13% hrHPV-positieve cases in de eerste helft (1997-2004), toenemend tot 30% hrHPV-positief in de tweede helft (2005-2012). HrHPV kan gebruikt worden als prognostische marker in OpSCC, maar niet in OSCC. Detectietechniek, populatie selectiecriteria en type overlevingsanalyse kun-nen de prevalentie en prognostische waarde van hrHPV in OpSCC beïnvloeden.
Methylering van specifieke genen wordt gebruikt als biomarker voor diagnose en prognose in glioma en prostaatkanker. DNA methylering is een vorm van epigenetische genexpressie regu-lering. Hypermethylering leidt tot transcriptionele repressie en hypomethylering leidt tot reac-tivering van gentranscriptie. Door deze dynamische eigenschappen is methylering een mogelijk kandidaat mechanisme voor de dynamische genregulatie bij de metastasering van OOSCC. In hoofdstuk 8 is er gezocht naar nieuwe gemethyleerde biomarkers met een voorspellende waarde voor lymfklierstatus. Verschillende zoekstrategieën werden gebruikt om kandidaat markers (genen met een CpG eiland en een negatieve associatie met lymfklierstatus) te selec-teren uit vier onafhankelijke microarray expressie studies die genen met significant verschil-lende expressie tussen N0 en N+ HNSCC identificeerden. Alle genen die in meer dan een van de vier studies gevonden waren werden geselecteerd, net als de vijf hoogst geplaatste genen uit de twee genome-wide studies. Verder werden de genen geselecteerd die functionele methyle-ring (verhoogde expressie na behandeling met de demethylerende middelen dac/TSA) in vitro toonden en genen met een associatie met lymfklierstatus in baarmoederhalskanker, zoals eer-der in ons lab onderzocht. Als laatste werden vier genen geselecteerd die geassocieerd waren met lymfklierstatus in de literatuur. In totaal werden er 24 genen geselecteerd, allemaal zonder eerder beschreven regulering door methylering. Nog eens vier genen die frequent methylering vertonen in HNSCC literatuur werden meegenomen in de analyse. De 28 genen werden onder-zocht op hun voorspellende waarde voor de lymfklierstatus in een groep van 70 OOSCC. Na optimalisatie en screening toonden slechts 2/28 (7%) markers een voorspellende waarde voor lymfklierstatus. MGMT methylering was geassocieerd met pN0 status (p=0,02). DAPK1 methyle-ring was geassocieerd met pN+ status (p=0,008). De twee markers gecombineerd toonden een sensitiviteit (89%) en specificiteit (41%) vergelijkbaar met de gen expressie profielen voor lymf-klierstatus. Beide markers zijn eerder beschreven als gemethyleerd in HNSCC. De expressie van genen die het meest verschillend tot expressie komen tussen N0 en N+ cases, zoals vastgesteld in de microarray expressie studies, worden niet gereguleerd door methylering.
Hoge expressie van Epidermal Growth Factor Receptor (EGFR) is frequent aanwezig in verschil-
sociaties met de aanwezigheid van lymfkliermetastasen. In de literatuur zijn geen duidelijke as-sociaties beschreven. In andere tumoren wordt EpCAM duidelijk geassocieerd met een beter of juist slechter ziektebeloop. Mogelijk is de rol van EpCAM afhankelijk van de specifieke cellulaire omgeving. Zo zijn er verschillende biologische functies van EpCAM beschreven in vitro: EpCAM is een celadhesie eiwit en een verhoogde expressie kan E-cadherin-gemedieerde celadhesie verstoren, maar EpCAM associeert ook met claudin-7 in een complex welke de adhesiefunctie verstoort en leidt tot proliferatie, cel motiliteit en metastasering. Het co-expressie patroon van deze drie gerelateerde eiwitten zou daarom een betere voorspeller voor lymfklierstatus kunnen zijn dan elk van deze drie markers separaat.
In hoofdstuk 5 zijn de co-expressie patronen van EpCAM, E-cadherin en claudin-7 onderzocht in een groep van 227 OOSCC, om vast te stellen of deze patronen een betere voorspeller zijn voor de aanwezigheid van lymfkliermetastasen en regionale recidieven (lymfkliermetastasen die pas na de behandeling gediagnosticeerd worden) dan iedere marker separaat. Expressie werd vastgesteld in zowel het tumorcentrum als in het tumorfront. De co-expressie patro-nen van E-cadherin, EpCAM en claudin-7 toonden geen betere voorspellende waarde voor de lymfklierstatus dan de separate markers. Als individuele marker waren de afwezigheid van E-cadherin expressie en aanwezigheid van cytoplasmatische EpCAM expressie voorspellend voor de aanwezigheid van lymfkliermetastasen, maar deze voorspellende waarden waren niet onaf-hankelijk van de huidige klinische stadiëring. Een opmerkelijke bevinding was dat de afwezig-heid van claudin-7 in het tumorcentrum een onafhankelijke voorspellende biomarker is voor het ontwikkelen van een regionaal recidief. Deze uitkomsten suggereren dat er geen klinisch relevant modulerend effect is van deze drie markers in OOSCC.
Amplificatie van de chromosomale 11q13.3 regio komt frequent voor in HNSCC. Van de verschil-lende genen gelegen in dit amplicon correleert de expressie van het gen dat codeert voor het Fas-associated death domain (FADD) eiwit het beste met de amplificatiestatus. Overexpressie van FADD zou de tumorcel voordeel kunnen opleveren en daarom de drijvende kracht achter de amplificatie kunnen zijn (de ‘driver’ mutatie). In hoofdstuk 6 is de expressie van FADD geana-lyseerd in 177 grotendeels laat-stadium HNSCC die behandeld waren met chirurgie en post-operatieve radiotherapie. Hoge FADD expressie was geassocieerd met de aanwezigheid van lymfkliermetastasen, en het sneller ontwikkelen van afstandsmetastasen. FADD kan gebruikt worden als biomarker voor patiënten met een hoog risico op ontwikkeling van metastasen op afstand. Hoe FADD deze metastasen veroorzaakt is momenteel niet duidelijk.
De aanwezigheid van hoog-risico humaan papilloma virus (hrHPV) in orofarynx plaveiselcel-carcinomen (OpSCC) is een marker voor een langere overall overleving. In verschillende lan-den wordt een toenemende, maar sterk wisselende incidentie van HPV-geassocieerde OpSCC beschreven. Recent is een gevalideerd tripel detectie algoritme beschreven, welke bestaat uit p16 immunohistochemie, hrHPV-ISH en hrHPV-PCR. Dit algoritme detecteert klinisch rele-
Ned
erla
ndse
sam
enva
ttin
g
181180
lende tumoren en heeft een sterke associatie met een slechte prognose. Ondanks de aanwezig-heid van EGFR expressie in >95% van HNSCC, ondervindt slechts 10-16% van de patiënten voor-deel van therapie gericht tegen het EGFR molecuul. EGFRvIII is een veelvoorkomende mutant van EGFR, met een deletie van exon 2-7. Expressie van EGFRvIII kan in het algemeen niet direct onderscheiden worden van de wildtype EGFR. Het verkorte EGFRvIII eiwit is continu actief en wordt niet goed afgebroken. EGFRvIII expressie is geassocieerd met een agressief fenotype en resistentie tegen chemo- en radiotherapie. De aanwezigheid van EGFRvIII is beschreven in HN-SCC en daarom zou EGFRvIII een biomarker kunnen zijn voor behandelrespons in HNSCC. Om de klinische relevantie van EGFRvIII als biomarker te onderzoeken, hebben we de prevalentie van dit eiwit in een grote serie van 531 HNSCC vastgesteld in hoofdstuk 9. Immunohistochemie voor EGFRvIII werd verricht en vergeleken met EGFR en EGFRvIII RNA expressie door middel van specifieke rt-PCRs. Geen van de 531 HNSCC bracht het EGFRvIII eiwit tot expressie. EG-FRvIII draagt daarom niet bij aan het maligne fenotype en is geen geschikte prognostische mar-ker in HNSCC. De expressie welke wordt gerapporteerd in enkele kleine studies is waarschijnlijk veroorzaakt door immunohistochemische artefacten, die geassocieerd zijn met het gebruik van een streptavidine-biotine detectie methode.
Ned
erla
ndse
sam
enva
ttin
g

Cited literature
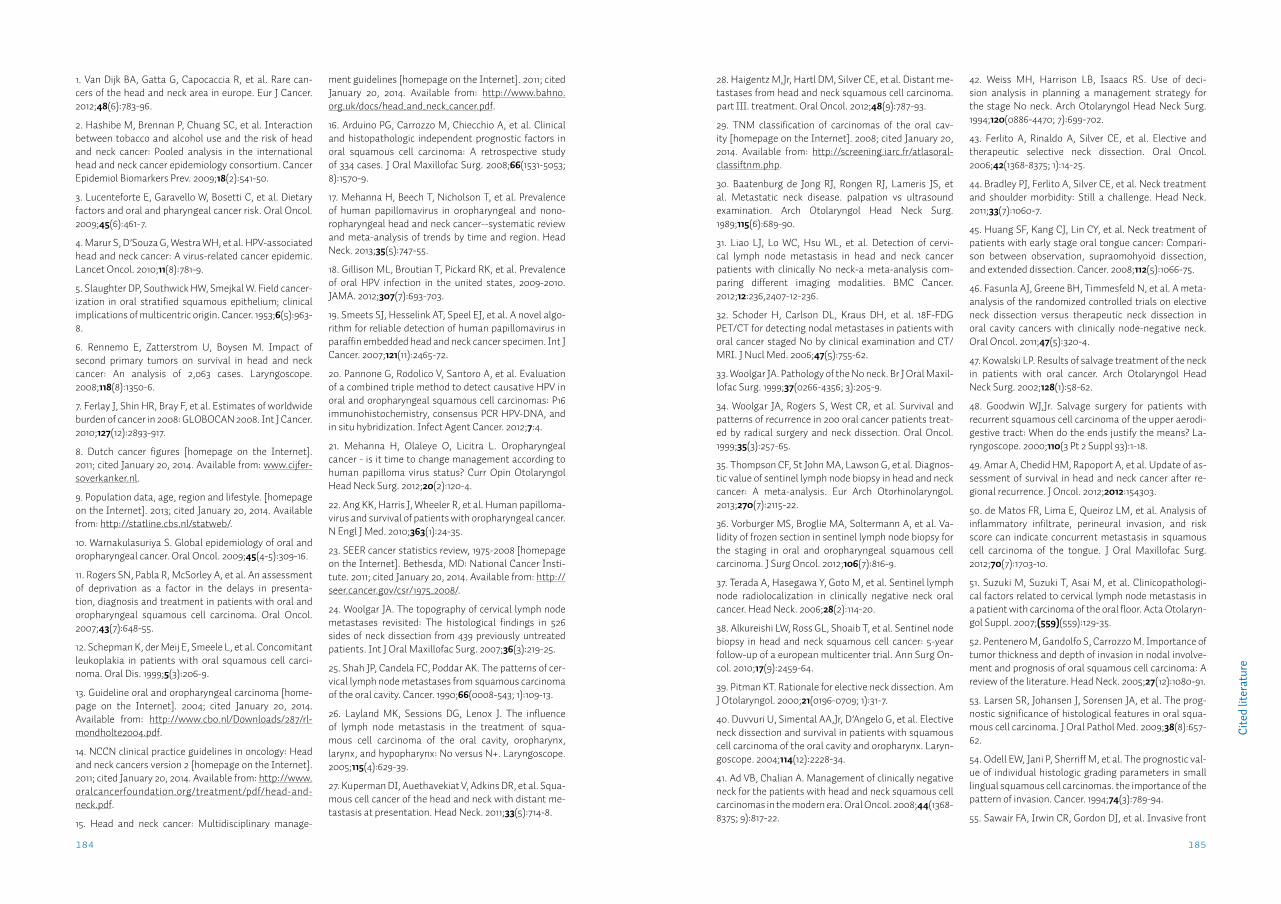
185184
Cite
d lit
erat
ure
28. Haigentz M,Jr, Hartl DM, Silver CE, et al. Distant me-tastases from head and neck squamous cell carcinoma. part III. treatment. Oral Oncol. 2012;48(9):787-93.
29. TNM classification of carcinomas of the oral cav-ity [homepage on the Internet]. 2008; cited January 20, 2014. Available from: http://screening.iarc.fr/atlasoral-classiftnm.php.
30. Baatenburg de Jong RJ, Rongen RJ, Lameris JS, et al. Metastatic neck disease. palpation vs ultrasound examination. Arch Otolaryngol Head Neck Surg. 1989;115(6):689-90.
31. Liao LJ, Lo WC, Hsu WL, et al. Detection of cervi-cal lymph node metastasis in head and neck cancer patients with clinically N0 neck-a meta-analysis com-paring different imaging modalities. BMC Cancer. 2012;12:236,2407-12-236.
32. Schoder H, Carlson DL, Kraus DH, et al. 18F-FDG PET/CT for detecting nodal metastases in patients with oral cancer staged N0 by clinical examination and CT/MRI. J Nucl Med. 2006;47(5):755-62.
33. Woolgar JA. Pathology of the N0 neck. Br J Oral Maxil-lofac Surg. 1999;37(0266-4356; 3):205-9.
34. Woolgar JA, Rogers S, West CR, et al. Survival and patterns of recurrence in 200 oral cancer patients treat-ed by radical surgery and neck dissection. Oral Oncol. 1999;35(3):257-65.
35. Thompson CF, St John MA, Lawson G, et al. Diagnos-tic value of sentinel lymph node biopsy in head and neck cancer: A meta-analysis. Eur Arch Otorhinolaryngol. 2013;270(7):2115-22.
36. Vorburger MS, Broglie MA, Soltermann A, et al. Va-lidity of frozen section in sentinel lymph node biopsy for the staging in oral and oropharyngeal squamous cell carcinoma. J Surg Oncol. 2012;106(7):816-9.
37. Terada A, Hasegawa Y, Goto M, et al. Sentinel lymph node radiolocalization in clinically negative neck oral cancer. Head Neck. 2006;28(2):114-20.
38. Alkureishi LW, Ross GL, Shoaib T, et al. Sentinel node biopsy in head and neck squamous cell cancer: 5-year follow-up of a european multicenter trial. Ann Surg On-col. 2010;17(9):2459-64.
39. Pitman KT. Rationale for elective neck dissection. Am J Otolaryngol. 2000;21(0196-0709; 1):31-7.
40. Duvvuri U, Simental AA,Jr, D’Angelo G, et al. Elective neck dissection and survival in patients with squamous cell carcinoma of the oral cavity and oropharynx. Laryn-goscope. 2004;114(12):2228-34.
41. Ad VB, Chalian A. Management of clinically negative neck for the patients with head and neck squamous cell carcinomas in the modern era. Oral Oncol. 2008;44(1368-8375; 9):817-22.
42. Weiss MH, Harrison LB, Isaacs RS. Use of deci-sion analysis in planning a management strategy for the stage N0 neck. Arch Otolaryngol Head Neck Surg. 1994;120(0886-4470; 7):699-702.
43. Ferlito A, Rinaldo A, Silver CE, et al. Elective and therapeutic selective neck dissection. Oral Oncol. 2006;42(1368-8375; 1):14-25.
44. Bradley PJ, Ferlito A, Silver CE, et al. Neck treatment and shoulder morbidity: Still a challenge. Head Neck. 2011;33(7):1060-7.
45. Huang SF, Kang CJ, Lin CY, et al. Neck treatment of patients with early stage oral tongue cancer: Compari-son between observation, supraomohyoid dissection, and extended dissection. Cancer. 2008;112(5):1066-75.
46. Fasunla AJ, Greene BH, Timmesfeld N, et al. A meta-analysis of the randomized controlled trials on elective neck dissection versus therapeutic neck dissection in oral cavity cancers with clinically node-negative neck. Oral Oncol. 2011;47(5):320-4.
47. Kowalski LP. Results of salvage treatment of the neck in patients with oral cancer. Arch Otolaryngol Head Neck Surg. 2002;128(1):58-62.
48. Goodwin WJ,Jr. Salvage surgery for patients with recurrent squamous cell carcinoma of the upper aerodi-gestive tract: When do the ends justify the means? La-ryngoscope. 2000;110(3 Pt 2 Suppl 93):1-18.
49. Amar A, Chedid HM, Rapoport A, et al. Update of as-sessment of survival in head and neck cancer after re-gional recurrence. J Oncol. 2012;2012:154303.
50. de Matos FR, Lima E, Queiroz LM, et al. Analysis of inflammatory infiltrate, perineural invasion, and risk score can indicate concurrent metastasis in squamous cell carcinoma of the tongue. J Oral Maxillofac Surg. 2012;70(7):1703-10.
51. Suzuki M, Suzuki T, Asai M, et al. Clinicopathologi-cal factors related to cervical lymph node metastasis in a patient with carcinoma of the oral floor. Acta Otolaryn-gol Suppl. 2007;(559)(559):129-35.
52. Pentenero M, Gandolfo S, Carrozzo M. Importance of tumor thickness and depth of invasion in nodal involve-ment and prognosis of oral squamous cell carcinoma: A review of the literature. Head Neck. 2005;27(12):1080-91.
53. Larsen SR, Johansen J, Sorensen JA, et al. The prog-nostic significance of histological features in oral squa-mous cell carcinoma. J Oral Pathol Med. 2009;38(8):657-62.
54. Odell EW, Jani P, Sherriff M, et al. The prognostic val-ue of individual histologic grading parameters in small lingual squamous cell carcinomas. the importance of the pattern of invasion. Cancer. 1994;74(3):789-94.
55. Sawair FA, Irwin CR, Gordon DJ, et al. Invasive front
1. Van Dijk BA, Gatta G, Capocaccia R, et al. Rare can-cers of the head and neck area in europe. Eur J Cancer. 2012;48(6):783-96.
2. Hashibe M, Brennan P, Chuang SC, et al. Interaction between tobacco and alcohol use and the risk of head and neck cancer: Pooled analysis in the international head and neck cancer epidemiology consortium. Cancer Epidemiol Biomarkers Prev. 2009;18(2):541-50.
3. Lucenteforte E, Garavello W, Bosetti C, et al. Dietary factors and oral and pharyngeal cancer risk. Oral Oncol. 2009;45(6):461-7.
4. Marur S, D’Souza G, Westra WH, et al. HPV-associated head and neck cancer: A virus-related cancer epidemic. Lancet Oncol. 2010;11(8):781-9.
5. Slaughter DP, Southwick HW, Smejkal W. Field cancer-ization in oral stratified squamous epithelium; clinical implications of multicentric origin. Cancer. 1953;6(5):963-8.
6. Rennemo E, Zatterstrom U, Boysen M. Impact of second primary tumors on survival in head and neck cancer: An analysis of 2,063 cases. Laryngoscope. 2008;118(8):1350-6.
7. Ferlay J, Shin HR, Bray F, et al. Estimates of worldwide burden of cancer in 2008: GLOBOCAN 2008. Int J Cancer. 2010;127(12):2893-917.
8. Dutch cancer figures [homepage on the Internet]. 2011; cited January 20, 2014. Available from: www.cijfer-soverkanker.nl.
9. Population data, age, region and lifestyle. [homepage on the Internet]. 2013; cited January 20, 2014. Available from: http://statline.cbs.nl/statweb/.
10. Warnakulasuriya S. Global epidemiology of oral and oropharyngeal cancer. Oral Oncol. 2009;45(4-5):309-16.
11. Rogers SN, Pabla R, McSorley A, et al. An assessment of deprivation as a factor in the delays in presenta-tion, diagnosis and treatment in patients with oral and oropharyngeal squamous cell carcinoma. Oral Oncol. 2007;43(7):648-55.
12. Schepman K, der Meij E, Smeele L, et al. Concomitant leukoplakia in patients with oral squamous cell carci-noma. Oral Dis. 1999;5(3):206-9.
13. Guideline oral and oropharyngeal carcinoma [home-page on the Internet]. 2004; cited January 20, 2014. Available from: http://www.cbo.nl/Downloads/287/rl-mondholte2004.pdf.
14. NCCN clinical practice guidelines in oncology: Head and neck cancers version 2 [homepage on the Internet]. 2011; cited January 20, 2014. Available from: http://www.oralcancerfoundation.org/treatment/pdf/head-and-neck.pdf.
15. Head and neck cancer: Multidisciplinary manage-
ment guidelines [homepage on the Internet]. 2011; cited January 20, 2014. Available from: http://www.bahno.org.uk/docs/head_and_neck_cancer.pdf.
16. Arduino PG, Carrozzo M, Chiecchio A, et al. Clinical and histopathologic independent prognostic factors in oral squamous cell carcinoma: A retrospective study of 334 cases. J Oral Maxillofac Surg. 2008;66(1531-5053; 8):1570-9.
17. Mehanna H, Beech T, Nicholson T, et al. Prevalence of human papillomavirus in oropharyngeal and nono-ropharyngeal head and neck cancer--systematic review and meta-analysis of trends by time and region. Head Neck. 2013;35(5):747-55.
18. Gillison ML, Broutian T, Pickard RK, et al. Prevalence of oral HPV infection in the united states, 2009-2010. JAMA. 2012;307(7):693-703.
19. Smeets SJ, Hesselink AT, Speel EJ, et al. A novel algo-rithm for reliable detection of human papillomavirus in paraffin embedded head and neck cancer specimen. Int J Cancer. 2007;121(11):2465-72.
20. Pannone G, Rodolico V, Santoro A, et al. Evaluation of a combined triple method to detect causative HPV in oral and oropharyngeal squamous cell carcinomas: P16 immunohistochemistry, consensus PCR HPV-DNA, and in situ hybridization. Infect Agent Cancer. 2012;7:4.
21. Mehanna H, Olaleye O, Licitra L. Oropharyngeal cancer - is it time to change management according to human papilloma virus status? Curr Opin Otolaryngol Head Neck Surg. 2012;20(2):120-4.
22. Ang KK, Harris J, Wheeler R, et al. Human papilloma-virus and survival of patients with oropharyngeal cancer. N Engl J Med. 2010;363(1):24-35.
23. SEER cancer statistics review, 1975-2008 [homepage on the Internet]. Bethesda, MD: National Cancer Insti-tute. 2011; cited January 20, 2014. Available from: http://seer.cancer.gov/csr/1975_2008/.
24. Woolgar JA. The topography of cervical lymph node metastases revisited: The histological findings in 526 sides of neck dissection from 439 previously untreated patients. Int J Oral Maxillofac Surg. 2007;36(3):219-25.
25. Shah JP, Candela FC, Poddar AK. The patterns of cer-vical lymph node metastases from squamous carcinoma of the oral cavity. Cancer. 1990;66(0008-543; 1):109-13.
26. Layland MK, Sessions DG, Lenox J. The influence of lymph node metastasis in the treatment of squa-mous cell carcinoma of the oral cavity, oropharynx, larynx, and hypopharynx: N0 versus N+. Laryngoscope. 2005;115(4):629-39.
27. Kuperman DI, Auethavekiat V, Adkins DR, et al. Squa-mous cell cancer of the head and neck with distant me-tastasis at presentation. Head Neck. 2011;33(5):714-8.
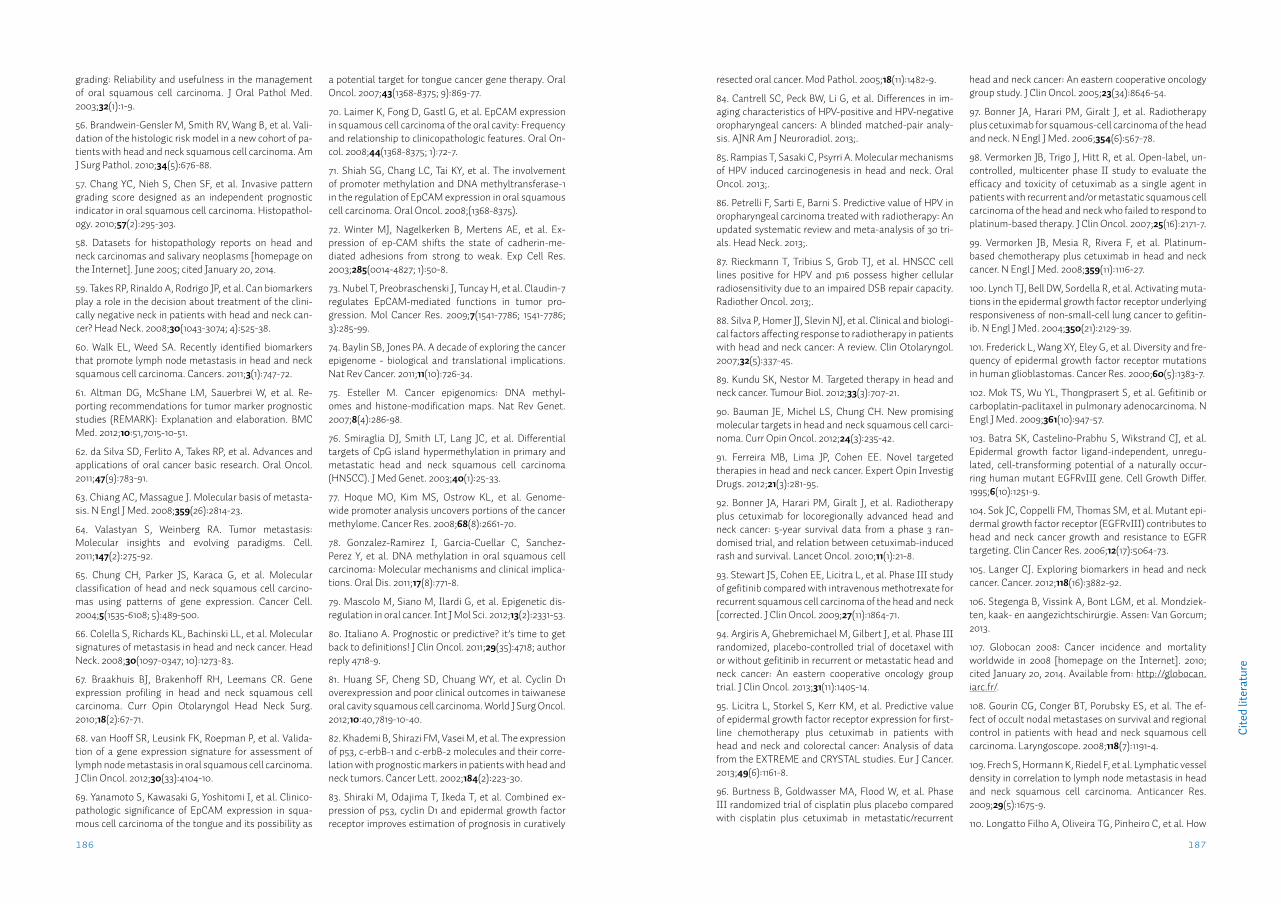
187186
resected oral cancer. Mod Pathol. 2005;18(11):1482-9.
84. Cantrell SC, Peck BW, Li G, et al. Differences in im-aging characteristics of HPV-positive and HPV-negative oropharyngeal cancers: A blinded matched-pair analy-sis. AJNR Am J Neuroradiol. 2013;.
85. Rampias T, Sasaki C, Psyrri A. Molecular mechanisms of HPV induced carcinogenesis in head and neck. Oral Oncol. 2013;.
86. Petrelli F, Sarti E, Barni S. Predictive value of HPV in oropharyngeal carcinoma treated with radiotherapy: An updated systematic review and meta-analysis of 30 tri-als. Head Neck. 2013;.
87. Rieckmann T, Tribius S, Grob TJ, et al. HNSCC cell lines positive for HPV and p16 possess higher cellular radiosensitivity due to an impaired DSB repair capacity. Radiother Oncol. 2013;.
88. Silva P, Homer JJ, Slevin NJ, et al. Clinical and biologi-cal factors affecting response to radiotherapy in patients with head and neck cancer: A review. Clin Otolaryngol. 2007;32(5):337-45.
89. Kundu SK, Nestor M. Targeted therapy in head and neck cancer. Tumour Biol. 2012;33(3):707-21.
90. Bauman JE, Michel LS, Chung CH. New promising molecular targets in head and neck squamous cell carci-noma. Curr Opin Oncol. 2012;24(3):235-42.
91. Ferreira MB, Lima JP, Cohen EE. Novel targeted therapies in head and neck cancer. Expert Opin Investig Drugs. 2012;21(3):281-95.
92. Bonner JA, Harari PM, Giralt J, et al. Radiotherapy plus cetuximab for locoregionally advanced head and neck cancer: 5-year survival data from a phase 3 ran-domised trial, and relation between cetuximab-induced rash and survival. Lancet Oncol. 2010;11(1):21-8.
93. Stewart JS, Cohen EE, Licitra L, et al. Phase III study of gefitinib compared with intravenous methotrexate for recurrent squamous cell carcinoma of the head and neck [corrected. J Clin Oncol. 2009;27(11):1864-71.
94. Argiris A, Ghebremichael M, Gilbert J, et al. Phase III randomized, placebo-controlled trial of docetaxel with or without gefitinib in recurrent or metastatic head and neck cancer: An eastern cooperative oncology group trial. J Clin Oncol. 2013;31(11):1405-14.
95. Licitra L, Storkel S, Kerr KM, et al. Predictive value of epidermal growth factor receptor expression for first-line chemotherapy plus cetuximab in patients with head and neck and colorectal cancer: Analysis of data from the EXTREME and CRYSTAL studies. Eur J Cancer. 2013;49(6):1161-8.
96. Burtness B, Goldwasser MA, Flood W, et al. Phase III randomized trial of cisplatin plus placebo compared with cisplatin plus cetuximab in metastatic/recurrent
head and neck cancer: An eastern cooperative oncology group study. J Clin Oncol. 2005;23(34):8646-54.
97. Bonner JA, Harari PM, Giralt J, et al. Radiotherapy plus cetuximab for squamous-cell carcinoma of the head and neck. N Engl J Med. 2006;354(6):567-78.
98. Vermorken JB, Trigo J, Hitt R, et al. Open-label, un-controlled, multicenter phase II study to evaluate the efficacy and toxicity of cetuximab as a single agent in patients with recurrent and/or metastatic squamous cell carcinoma of the head and neck who failed to respond to platinum-based therapy. J Clin Oncol. 2007;25(16):2171-7.
99. Vermorken JB, Mesia R, Rivera F, et al. Platinum-based chemotherapy plus cetuximab in head and neck cancer. N Engl J Med. 2008;359(11):1116-27.
100. Lynch TJ, Bell DW, Sordella R, et al. Activating muta-tions in the epidermal growth factor receptor underlying responsiveness of non-small-cell lung cancer to gefitin-ib. N Engl J Med. 2004;350(21):2129-39.
101. Frederick L, Wang XY, Eley G, et al. Diversity and fre-quency of epidermal growth factor receptor mutations in human glioblastomas. Cancer Res. 2000;60(5):1383-7.
102. Mok TS, Wu YL, Thongprasert S, et al. Gefitinib or carboplatin-paclitaxel in pulmonary adenocarcinoma. N Engl J Med. 2009;361(10):947-57.
103. Batra SK, Castelino-Prabhu S, Wikstrand CJ, et al. Epidermal growth factor ligand-independent, unregu-lated, cell-transforming potential of a naturally occur-ring human mutant EGFRvIII gene. Cell Growth Differ. 1995;6(10):1251-9.
104. Sok JC, Coppelli FM, Thomas SM, et al. Mutant epi-dermal growth factor receptor (EGFRvIII) contributes to head and neck cancer growth and resistance to EGFR targeting. Clin Cancer Res. 2006;12(17):5064-73.
105. Langer CJ. Exploring biomarkers in head and neck cancer. Cancer. 2012;118(16):3882-92.
106. Stegenga B, Vissink A, Bont LGM, et al. Mondziek-ten, kaak- en aangezichtschirurgie. Assen: Van Gorcum; 2013.
107. Globocan 2008: Cancer incidence and mortality worldwide in 2008 [homepage on the Internet]. 2010; cited January 20, 2014. Available from: http://globocan.iarc.fr/.
108. Gourin CG, Conger BT, Porubsky ES, et al. The ef-fect of occult nodal metastases on survival and regional control in patients with head and neck squamous cell carcinoma. Laryngoscope. 2008;118(7):1191-4.
109. Frech S, Hormann K, Riedel F, et al. Lymphatic vessel density in correlation to lymph node metastasis in head and neck squamous cell carcinoma. Anticancer Res. 2009;29(5):1675-9.
110. Longatto Filho A, Oliveira TG, Pinheiro C, et al. How
grading: Reliability and usefulness in the management of oral squamous cell carcinoma. J Oral Pathol Med. 2003;32(1):1-9.
56. Brandwein-Gensler M, Smith RV, Wang B, et al. Vali-dation of the histologic risk model in a new cohort of pa-tients with head and neck squamous cell carcinoma. Am J Surg Pathol. 2010;34(5):676-88.
57. Chang YC, Nieh S, Chen SF, et al. Invasive pattern grading score designed as an independent prognostic indicator in oral squamous cell carcinoma. Histopathol-ogy. 2010;57(2):295-303.
58. Datasets for histopathology reports on head and neck carcinomas and salivary neoplasms [homepage on the Internet]. June 2005; cited January 20, 2014.
59. Takes RP, Rinaldo A, Rodrigo JP, et al. Can biomarkers play a role in the decision about treatment of the clini-cally negative neck in patients with head and neck can-cer? Head Neck. 2008;30(1043-3074; 4):525-38.
60. Walk EL, Weed SA. Recently identified biomarkers that promote lymph node metastasis in head and neck squamous cell carcinoma. Cancers. 2011;3(1):747-72.
61. Altman DG, McShane LM, Sauerbrei W, et al. Re-porting recommendations for tumor marker prognostic studies (REMARK): Explanation and elaboration. BMC Med. 2012;10:51,7015-10-51.
62. da Silva SD, Ferlito A, Takes RP, et al. Advances and applications of oral cancer basic research. Oral Oncol. 2011;47(9):783-91.
63. Chiang AC, Massague J. Molecular basis of metasta-sis. N Engl J Med. 2008;359(26):2814-23.
64. Valastyan S, Weinberg RA. Tumor metastasis: Molecular insights and evolving paradigms. Cell. 2011;147(2):275-92.
65. Chung CH, Parker JS, Karaca G, et al. Molecular classification of head and neck squamous cell carcino-mas using patterns of gene expression. Cancer Cell. 2004;5(1535-6108; 5):489-500.
66. Colella S, Richards KL, Bachinski LL, et al. Molecular signatures of metastasis in head and neck cancer. Head Neck. 2008;30(1097-0347; 10):1273-83.
67. Braakhuis BJ, Brakenhoff RH, Leemans CR. Gene expression profiling in head and neck squamous cell carcinoma. Curr Opin Otolaryngol Head Neck Surg. 2010;18(2):67-71.
68. van Hooff SR, Leusink FK, Roepman P, et al. Valida-tion of a gene expression signature for assessment of lymph node metastasis in oral squamous cell carcinoma. J Clin Oncol. 2012;30(33):4104-10.
69. Yanamoto S, Kawasaki G, Yoshitomi I, et al. Clinico-pathologic significance of EpCAM expression in squa-mous cell carcinoma of the tongue and its possibility as
a potential target for tongue cancer gene therapy. Oral Oncol. 2007;43(1368-8375; 9):869-77.
70. Laimer K, Fong D, Gastl G, et al. EpCAM expression in squamous cell carcinoma of the oral cavity: Frequency and relationship to clinicopathologic features. Oral On-col. 2008;44(1368-8375; 1):72-7.
71. Shiah SG, Chang LC, Tai KY, et al. The involvement of promoter methylation and DNA methyltransferase-1 in the regulation of EpCAM expression in oral squamous cell carcinoma. Oral Oncol. 2008;(1368-8375).
72. Winter MJ, Nagelkerken B, Mertens AE, et al. Ex-pression of ep-CAM shifts the state of cadherin-me-diated adhesions from strong to weak. Exp Cell Res. 2003;285(0014-4827; 1):50-8.
73. Nubel T, Preobraschenski J, Tuncay H, et al. Claudin-7 regulates EpCAM-mediated functions in tumor pro-gression. Mol Cancer Res. 2009;7(1541-7786; 1541-7786; 3):285-99.
74. Baylin SB, Jones PA. A decade of exploring the cancer epigenome - biological and translational implications. Nat Rev Cancer. 2011;11(10):726-34.
75. Esteller M. Cancer epigenomics: DNA methyl-omes and histone-modification maps. Nat Rev Genet. 2007;8(4):286-98.
76. Smiraglia DJ, Smith LT, Lang JC, et al. Differential targets of CpG island hypermethylation in primary and metastatic head and neck squamous cell carcinoma (HNSCC). J Med Genet. 2003;40(1):25-33.
77. Hoque MO, Kim MS, Ostrow KL, et al. Genome-wide promoter analysis uncovers portions of the cancer methylome. Cancer Res. 2008;68(8):2661-70.
78. Gonzalez-Ramirez I, Garcia-Cuellar C, Sanchez-Perez Y, et al. DNA methylation in oral squamous cell carcinoma: Molecular mechanisms and clinical implica-tions. Oral Dis. 2011;17(8):771-8.
79. Mascolo M, Siano M, Ilardi G, et al. Epigenetic dis-regulation in oral cancer. Int J Mol Sci. 2012;13(2):2331-53.
80. Italiano A. Prognostic or predictive? it’s time to get back to definitions! J Clin Oncol. 2011;29(35):4718; author reply 4718-9.
81. Huang SF, Cheng SD, Chuang WY, et al. Cyclin D1 overexpression and poor clinical outcomes in taiwanese oral cavity squamous cell carcinoma. World J Surg Oncol. 2012;10:40,7819-10-40.
82. Khademi B, Shirazi FM, Vasei M, et al. The expression of p53, c-erbB-1 and c-erbB-2 molecules and their corre-lation with prognostic markers in patients with head and neck tumors. Cancer Lett. 2002;184(2):223-30.
83. Shiraki M, Odajima T, Ikeda T, et al. Combined ex-pression of p53, cyclin D1 and epidermal growth factor receptor improves estimation of prognosis in curatively
Cite
d lit
erat
ure
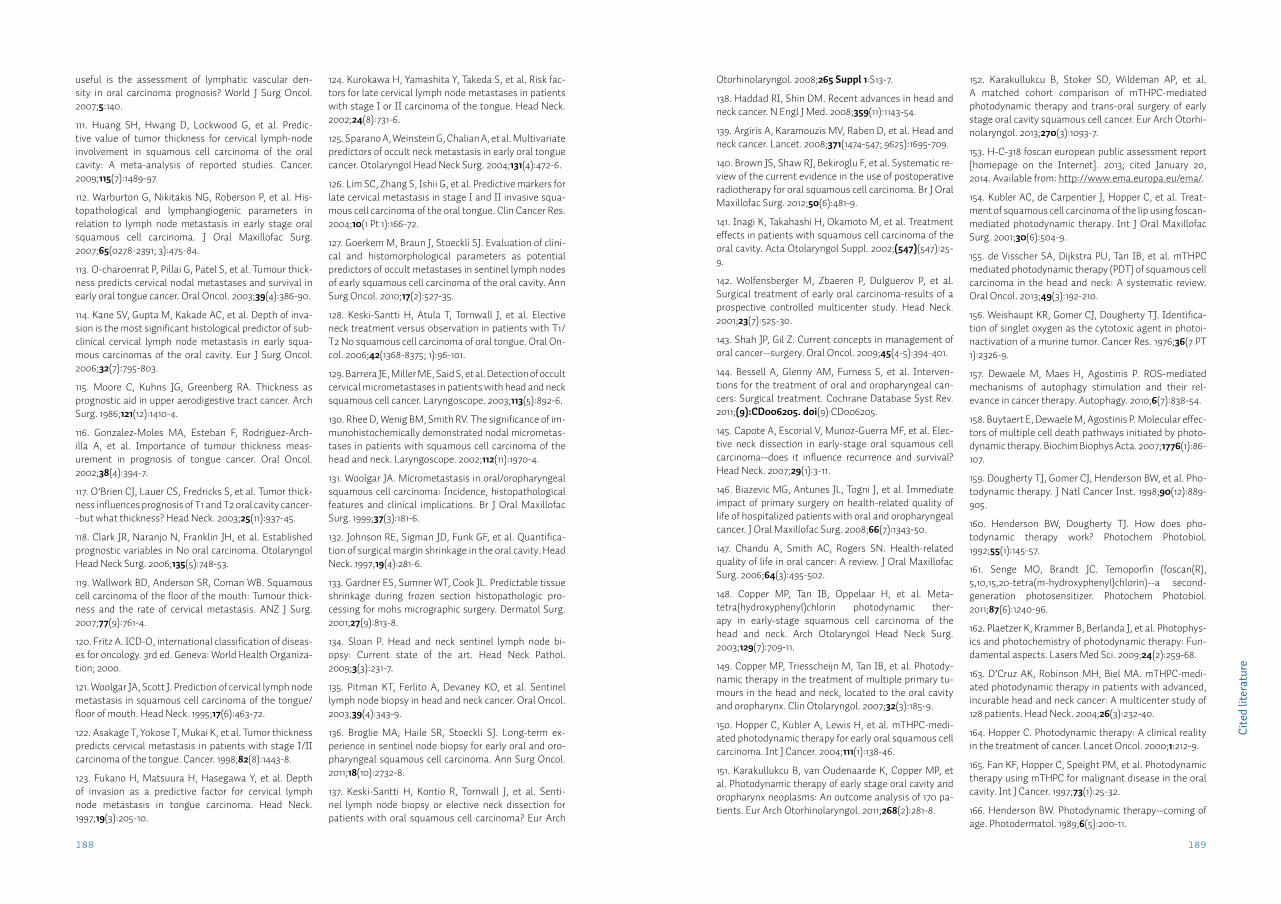
189188
Otorhinolaryngol. 2008;265 Suppl 1:S13-7.
138. Haddad RI, Shin DM. Recent advances in head and neck cancer. N Engl J Med. 2008;359(11):1143-54.
139. Argiris A, Karamouzis MV, Raben D, et al. Head and neck cancer. Lancet. 2008;371(1474-547; 9625):1695-709.
140. Brown JS, Shaw RJ, Bekiroglu F, et al. Systematic re-view of the current evidence in the use of postoperative radiotherapy for oral squamous cell carcinoma. Br J Oral Maxillofac Surg. 2012;50(6):481-9.
141. Inagi K, Takahashi H, Okamoto M, et al. Treatment effects in patients with squamous cell carcinoma of the oral cavity. Acta Otolaryngol Suppl. 2002;(547)(547):25-9.
142. Wolfensberger M, Zbaeren P, Dulguerov P, et al. Surgical treatment of early oral carcinoma-results of a prospective controlled multicenter study. Head Neck. 2001;23(7):525-30.
143. Shah JP, Gil Z. Current concepts in management of oral cancer--surgery. Oral Oncol. 2009;45(4-5):394-401.
144. Bessell A, Glenny AM, Furness S, et al. Interven-tions for the treatment of oral and oropharyngeal can-cers: Surgical treatment. Cochrane Database Syst Rev. 2011;(9):Cd006205. doi(9):CD006205.
145. Capote A, Escorial V, Munoz-Guerra MF, et al. Elec-tive neck dissection in early-stage oral squamous cell carcinoma--does it influence recurrence and survival? Head Neck. 2007;29(1):3-11.
146. Biazevic MG, Antunes JL, Togni J, et al. Immediate impact of primary surgery on health-related quality of life of hospitalized patients with oral and oropharyngeal cancer. J Oral Maxillofac Surg. 2008;66(7):1343-50.
147. Chandu A, Smith AC, Rogers SN. Health-related quality of life in oral cancer: A review. J Oral Maxillofac Surg. 2006;64(3):495-502.
148. Copper MP, Tan IB, Oppelaar H, et al. Meta-tetra(hydroxyphenyl)chlorin photodynamic ther-apy in early-stage squamous cell carcinoma of the head and neck. Arch Otolaryngol Head Neck Surg. 2003;129(7):709-11.
149. Copper MP, Triesscheijn M, Tan IB, et al. Photody-namic therapy in the treatment of multiple primary tu-mours in the head and neck, located to the oral cavity and oropharynx. Clin Otolaryngol. 2007;32(3):185-9.
150. Hopper C, Kubler A, Lewis H, et al. mTHPC-medi-ated photodynamic therapy for early oral squamous cell carcinoma. Int J Cancer. 2004;111(1):138-46.
151. Karakullukcu B, van Oudenaarde K, Copper MP, et al. Photodynamic therapy of early stage oral cavity and oropharynx neoplasms: An outcome analysis of 170 pa-tients. Eur Arch Otorhinolaryngol. 2011;268(2):281-8.
152. Karakullukcu B, Stoker SD, Wildeman AP, et al. A matched cohort comparison of mTHPC-mediated photodynamic therapy and trans-oral surgery of early stage oral cavity squamous cell cancer. Eur Arch Otorhi-nolaryngol. 2013;270(3):1093-7.
153. H-C-318 foscan european public assessment report [homepage on the Internet]. 2013; cited January 20, 2014. Available from: http://www.ema.europa.eu/ema/.
154. Kubler AC, de Carpentier J, Hopper C, et al. Treat-ment of squamous cell carcinoma of the lip using foscan-mediated photodynamic therapy. Int J Oral Maxillofac Surg. 2001;30(6):504-9.
155. de Visscher SA, Dijkstra PU, Tan IB, et al. mTHPC mediated photodynamic therapy (PDT) of squamous cell carcinoma in the head and neck: A systematic review. Oral Oncol. 2013;49(3):192-210.
156. Weishaupt KR, Gomer CJ, Dougherty TJ. Identifica-tion of singlet oxygen as the cytotoxic agent in photoi-nactivation of a murine tumor. Cancer Res. 1976;36(7 PT 1):2326-9.
157. Dewaele M, Maes H, Agostinis P. ROS-mediated mechanisms of autophagy stimulation and their rel-evance in cancer therapy. Autophagy. 2010;6(7):838-54.
158. Buytaert E, Dewaele M, Agostinis P. Molecular effec-tors of multiple cell death pathways initiated by photo-dynamic therapy. Biochim Biophys Acta. 2007;1776(1):86-107.
159. Dougherty TJ, Gomer CJ, Henderson BW, et al. Pho-todynamic therapy. J Natl Cancer Inst. 1998;90(12):889-905.
160. Henderson BW, Dougherty TJ. How does pho-todynamic therapy work? Photochem Photobiol. 1992;55(1):145-57.
161. Senge MO, Brandt JC. Temoporfin (foscan(R), 5,10,15,20-tetra(m-hydroxyphenyl)chlorin)--a second-generation photosensitizer. Photochem Photobiol. 2011;87(6):1240-96.
162. Plaetzer K, Krammer B, Berlanda J, et al. Photophys-ics and photochemistry of photodynamic therapy: Fun-damental aspects. Lasers Med Sci. 2009;24(2):259-68.
163. D’Cruz AK, Robinson MH, Biel MA. mTHPC-medi-ated photodynamic therapy in patients with advanced, incurable head and neck cancer: A multicenter study of 128 patients. Head Neck. 2004;26(3):232-40.
164. Hopper C. Photodynamic therapy: A clinical reality in the treatment of cancer. Lancet Oncol. 2000;1:212-9.
165. Fan KF, Hopper C, Speight PM, et al. Photodynamic therapy using mTHPC for malignant disease in the oral cavity. Int J Cancer. 1997;73(1):25-32.
166. Henderson BW. Photodynamic therapy--coming of age. Photodermatol. 1989;6(5):200-11.
useful is the assessment of lymphatic vascular den-sity in oral carcinoma prognosis? World J Surg Oncol. 2007;5:140.
111. Huang SH, Hwang D, Lockwood G, et al. Predic-tive value of tumor thickness for cervical lymph-node involvement in squamous cell carcinoma of the oral cavity: A meta-analysis of reported studies. Cancer. 2009;115(7):1489-97.
112. Warburton G, Nikitakis NG, Roberson P, et al. His-topathological and lymphangiogenic parameters in relation to lymph node metastasis in early stage oral squamous cell carcinoma. J Oral Maxillofac Surg. 2007;65(0278-2391; 3):475-84.
113. O-charoenrat P, Pillai G, Patel S, et al. Tumour thick-ness predicts cervical nodal metastases and survival in early oral tongue cancer. Oral Oncol. 2003;39(4):386-90.
114. Kane SV, Gupta M, Kakade AC, et al. Depth of inva-sion is the most significant histological predictor of sub-clinical cervical lymph node metastasis in early squa-mous carcinomas of the oral cavity. Eur J Surg Oncol. 2006;32(7):795-803.
115. Moore C, Kuhns JG, Greenberg RA. Thickness as prognostic aid in upper aerodigestive tract cancer. Arch Surg. 1986;121(12):1410-4.
116. Gonzalez-Moles MA, Esteban F, Rodriguez-Arch-illa A, et al. Importance of tumour thickness meas-urement in prognosis of tongue cancer. Oral Oncol. 2002;38(4):394-7.
117. O’Brien CJ, Lauer CS, Fredricks S, et al. Tumor thick-ness influences prognosis of T1 and T2 oral cavity cancer--but what thickness? Head Neck. 2003;25(11):937-45.
118. Clark JR, Naranjo N, Franklin JH, et al. Established prognostic variables in N0 oral carcinoma. Otolaryngol Head Neck Surg. 2006;135(5):748-53.
119. Wallwork BD, Anderson SR, Coman WB. Squamous cell carcinoma of the floor of the mouth: Tumour thick-ness and the rate of cervical metastasis. ANZ J Surg. 2007;77(9):761-4.
120. Fritz A. ICD-O, international classification of diseas-es for oncology. 3rd ed. Geneva: World Health Organiza-tion; 2000.
121. Woolgar JA, Scott J. Prediction of cervical lymph node metastasis in squamous cell carcinoma of the tongue/floor of mouth. Head Neck. 1995;17(6):463-72.
122. Asakage T, Yokose T, Mukai K, et al. Tumor thickness predicts cervical metastasis in patients with stage I/II carcinoma of the tongue. Cancer. 1998;82(8):1443-8.
123. Fukano H, Matsuura H, Hasegawa Y, et al. Depth of invasion as a predictive factor for cervical lymph node metastasis in tongue carcinoma. Head Neck. 1997;19(3):205-10.
124. Kurokawa H, Yamashita Y, Takeda S, et al. Risk fac-tors for late cervical lymph node metastases in patients with stage I or II carcinoma of the tongue. Head Neck. 2002;24(8):731-6.
125. Sparano A, Weinstein G, Chalian A, et al. Multivariate predictors of occult neck metastasis in early oral tongue cancer. Otolaryngol Head Neck Surg. 2004;131(4):472-6.
126. Lim SC, Zhang S, Ishii G, et al. Predictive markers for late cervical metastasis in stage I and II invasive squa-mous cell carcinoma of the oral tongue. Clin Cancer Res. 2004;10(1 Pt 1):166-72.
127. Goerkem M, Braun J, Stoeckli SJ. Evaluation of clini-cal and histomorphological parameters as potential predictors of occult metastases in sentinel lymph nodes of early squamous cell carcinoma of the oral cavity. Ann Surg Oncol. 2010;17(2):527-35.
128. Keski-Santti H, Atula T, Tornwall J, et al. Elective neck treatment versus observation in patients with T1/T2 N0 squamous cell carcinoma of oral tongue. Oral On-col. 2006;42(1368-8375; 1):96-101.
129. Barrera JE, Miller ME, Said S, et al. Detection of occult cervical micrometastases in patients with head and neck squamous cell cancer. Laryngoscope. 2003;113(5):892-6.
130. Rhee D, Wenig BM, Smith RV. The significance of im-munohistochemically demonstrated nodal micrometas-tases in patients with squamous cell carcinoma of the head and neck. Laryngoscope. 2002;112(11):1970-4.
131. Woolgar JA. Micrometastasis in oral/oropharyngeal squamous cell carcinoma: Incidence, histopathological features and clinical implications. Br J Oral Maxillofac Surg. 1999;37(3):181-6.
132. Johnson RE, Sigman JD, Funk GF, et al. Quantifica-tion of surgical margin shrinkage in the oral cavity. Head Neck. 1997;19(4):281-6.
133. Gardner ES, Sumner WT, Cook JL. Predictable tissue shrinkage during frozen section histopathologic pro-cessing for mohs micrographic surgery. Dermatol Surg. 2001;27(9):813-8.
134. Sloan P. Head and neck sentinel lymph node bi-opsy: Current state of the art. Head Neck Pathol. 2009;3(3):231-7.
135. Pitman KT, Ferlito A, Devaney KO, et al. Sentinel lymph node biopsy in head and neck cancer. Oral Oncol. 2003;39(4):343-9.
136. Broglie MA, Haile SR, Stoeckli SJ. Long-term ex-perience in sentinel node biopsy for early oral and oro-pharyngeal squamous cell carcinoma. Ann Surg Oncol. 2011;18(10):2732-8.
137. Keski-Santti H, Kontio R, Tornwall J, et al. Senti-nel lymph node biopsy or elective neck dissection for patients with oral squamous cell carcinoma? Eur Arch
Cite
d lit
erat
ure
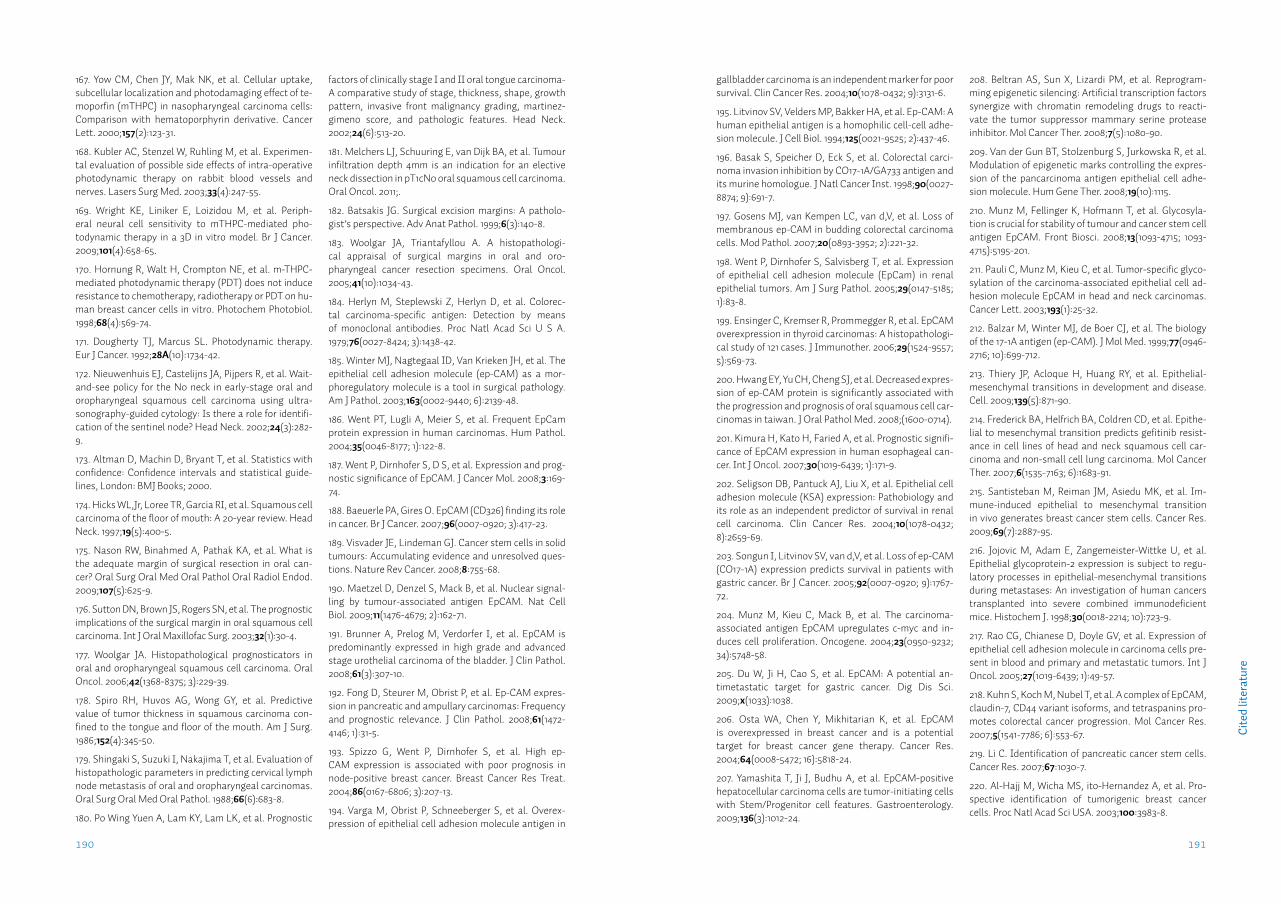
191190
gallbladder carcinoma is an independent marker for poor survival. Clin Cancer Res. 2004;10(1078-0432; 9):3131-6.
195. Litvinov SV, Velders MP, Bakker HA, et al. Ep-CAM: A human epithelial antigen is a homophilic cell-cell adhe-sion molecule. J Cell Biol. 1994;125(0021-9525; 2):437-46.
196. Basak S, Speicher D, Eck S, et al. Colorectal carci-noma invasion inhibition by CO17-1A/GA733 antigen and its murine homologue. J Natl Cancer Inst. 1998;90(0027-8874; 9):691-7.
197. Gosens MJ, van Kempen LC, van d,V, et al. Loss of membranous ep-CAM in budding colorectal carcinoma cells. Mod Pathol. 2007;20(0893-3952; 2):221-32.
198. Went P, Dirnhofer S, Salvisberg T, et al. Expression of epithelial cell adhesion molecule (EpCam) in renal epithelial tumors. Am J Surg Pathol. 2005;29(0147-5185; 1):83-8.
199. Ensinger C, Kremser R, Prommegger R, et al. EpCAM overexpression in thyroid carcinomas: A histopathologi-cal study of 121 cases. J Immunother. 2006;29(1524-9557; 5):569-73.
200. Hwang EY, Yu CH, Cheng SJ, et al. Decreased expres-sion of ep-CAM protein is significantly associated with the progression and prognosis of oral squamous cell car-cinomas in taiwan. J Oral Pathol Med. 2008;(1600-0714).
201. Kimura H, Kato H, Faried A, et al. Prognostic signifi-cance of EpCAM expression in human esophageal can-cer. Int J Oncol. 2007;30(1019-6439; 1):171-9.
202. Seligson DB, Pantuck AJ, Liu X, et al. Epithelial cell adhesion molecule (KSA) expression: Pathobiology and its role as an independent predictor of survival in renal cell carcinoma. Clin Cancer Res. 2004;10(1078-0432; 8):2659-69.
203. Songun I, Litvinov SV, van d,V, et al. Loss of ep-CAM (CO17-1A) expression predicts survival in patients with gastric cancer. Br J Cancer. 2005;92(0007-0920; 9):1767-72.
204. Munz M, Kieu C, Mack B, et al. The carcinoma-associated antigen EpCAM upregulates c-myc and in-duces cell proliferation. Oncogene. 2004;23(0950-9232; 34):5748-58.
205. Du W, Ji H, Cao S, et al. EpCAM: A potential an-timetastatic target for gastric cancer. Dig Dis Sci. 2009;x(1033):1038.
206. Osta WA, Chen Y, Mikhitarian K, et al. EpCAM is overexpressed in breast cancer and is a potential target for breast cancer gene therapy. Cancer Res. 2004;64(0008-5472; 16):5818-24.
207. Yamashita T, Ji J, Budhu A, et al. EpCAM-positive hepatocellular carcinoma cells are tumor-initiating cells with Stem/Progenitor cell features. Gastroenterology. 2009;136(3):1012-24.
208. Beltran AS, Sun X, Lizardi PM, et al. Reprogram-ming epigenetic silencing: Artificial transcription factors synergize with chromatin remodeling drugs to reacti-vate the tumor suppressor mammary serine protease inhibitor. Mol Cancer Ther. 2008;7(5):1080-90.
209. Van der Gun BT, Stolzenburg S, Jurkowska R, et al. Modulation of epigenetic marks controlling the expres-sion of the pancarcinoma antigen epithelial cell adhe-sion molecule. Hum Gene Ther. 2008;19(10):1115.
210. Munz M, Fellinger K, Hofmann T, et al. Glycosyla-tion is crucial for stability of tumour and cancer stem cell antigen EpCAM. Front Biosci. 2008;13(1093-4715; 1093-4715):5195-201.
211. Pauli C, Munz M, Kieu C, et al. Tumor-specific glyco-sylation of the carcinoma-associated epithelial cell ad-hesion molecule EpCAM in head and neck carcinomas. Cancer Lett. 2003;193(1):25-32.
212. Balzar M, Winter MJ, de Boer CJ, et al. The biology of the 17-1A antigen (ep-CAM). J Mol Med. 1999;77(0946-2716; 10):699-712.
213. Thiery JP, Acloque H, Huang RY, et al. Epithelial-mesenchymal transitions in development and disease. Cell. 2009;139(5):871-90.
214. Frederick BA, Helfrich BA, Coldren CD, et al. Epithe-lial to mesenchymal transition predicts gefitinib resist-ance in cell lines of head and neck squamous cell car-cinoma and non-small cell lung carcinoma. Mol Cancer Ther. 2007;6(1535-7163; 6):1683-91.
215. Santisteban M, Reiman JM, Asiedu MK, et al. Im-mune-induced epithelial to mesenchymal transition in vivo generates breast cancer stem cells. Cancer Res. 2009;69(7):2887-95.
216. Jojovic M, Adam E, Zangemeister-Wittke U, et al. Epithelial glycoprotein-2 expression is subject to regu-latory processes in epithelial-mesenchymal transitions during metastases: An investigation of human cancers transplanted into severe combined immunodeficient mice. Histochem J. 1998;30(0018-2214; 10):723-9.
217. Rao CG, Chianese D, Doyle GV, et al. Expression of epithelial cell adhesion molecule in carcinoma cells pre-sent in blood and primary and metastatic tumors. Int J Oncol. 2005;27(1019-6439; 1):49-57.
218. Kuhn S, Koch M, Nubel T, et al. A complex of EpCAM, claudin-7, CD44 variant isoforms, and tetraspanins pro-motes colorectal cancer progression. Mol Cancer Res. 2007;5(1541-7786; 6):553-67.
219. Li C. Identification of pancreatic cancer stem cells. Cancer Res. 2007;67:1030-7.
220. Al-Hajj M, Wicha MS, ito-Hernandez A, et al. Pro-spective identification of tumorigenic breast cancer cells. Proc Natl Acad Sci USA. 2003;100:3983-8.
167. Yow CM, Chen JY, Mak NK, et al. Cellular uptake, subcellular localization and photodamaging effect of te-moporfin (mTHPC) in nasopharyngeal carcinoma cells: Comparison with hematoporphyrin derivative. Cancer Lett. 2000;157(2):123-31.
168. Kubler AC, Stenzel W, Ruhling M, et al. Experimen-tal evaluation of possible side effects of intra-operative photodynamic therapy on rabbit blood vessels and nerves. Lasers Surg Med. 2003;33(4):247-55.
169. Wright KE, Liniker E, Loizidou M, et al. Periph-eral neural cell sensitivity to mTHPC-mediated pho-todynamic therapy in a 3D in vitro model. Br J Cancer. 2009;101(4):658-65.
170. Hornung R, Walt H, Crompton NE, et al. m-THPC-mediated photodynamic therapy (PDT) does not induce resistance to chemotherapy, radiotherapy or PDT on hu-man breast cancer cells in vitro. Photochem Photobiol. 1998;68(4):569-74.
171. Dougherty TJ, Marcus SL. Photodynamic therapy. Eur J Cancer. 1992;28A(10):1734-42.
172. Nieuwenhuis EJ, Castelijns JA, Pijpers R, et al. Wait-and-see policy for the N0 neck in early-stage oral and oropharyngeal squamous cell carcinoma using ultra-sonography-guided cytology: Is there a role for identifi-cation of the sentinel node? Head Neck. 2002;24(3):282-9.
173. Altman D, Machin D, Bryant T, et al. Statistics with confidence: Confidence intervals and statistical guide-lines, London: BMJ Books; 2000.
174. Hicks WL,Jr, Loree TR, Garcia RI, et al. Squamous cell carcinoma of the floor of mouth: A 20-year review. Head Neck. 1997;19(5):400-5.
175. Nason RW, Binahmed A, Pathak KA, et al. What is the adequate margin of surgical resection in oral can-cer? Oral Surg Oral Med Oral Pathol Oral Radiol Endod. 2009;107(5):625-9.
176. Sutton DN, Brown JS, Rogers SN, et al. The prognostic implications of the surgical margin in oral squamous cell carcinoma. Int J Oral Maxillofac Surg. 2003;32(1):30-4.
177. Woolgar JA. Histopathological prognosticators in oral and oropharyngeal squamous cell carcinoma. Oral Oncol. 2006;42(1368-8375; 3):229-39.
178. Spiro RH, Huvos AG, Wong GY, et al. Predictive value of tumor thickness in squamous carcinoma con-fined to the tongue and floor of the mouth. Am J Surg. 1986;152(4):345-50.
179. Shingaki S, Suzuki I, Nakajima T, et al. Evaluation of histopathologic parameters in predicting cervical lymph node metastasis of oral and oropharyngeal carcinomas. Oral Surg Oral Med Oral Pathol. 1988;66(6):683-8.
180. Po Wing Yuen A, Lam KY, Lam LK, et al. Prognostic
factors of clinically stage I and II oral tongue carcinoma-A comparative study of stage, thickness, shape, growth pattern, invasive front malignancy grading, martinez-gimeno score, and pathologic features. Head Neck. 2002;24(6):513-20.
181. Melchers LJ, Schuuring E, van Dijk BA, et al. Tumour infiltration depth 4mm is an indication for an elective neck dissection in pT1cN0 oral squamous cell carcinoma. Oral Oncol. 2011;.
182. Batsakis JG. Surgical excision margins: A patholo-gist’s perspective. Adv Anat Pathol. 1999;6(3):140-8.
183. Woolgar JA, Triantafyllou A. A histopathologi-cal appraisal of surgical margins in oral and oro-pharyngeal cancer resection specimens. Oral Oncol. 2005;41(10):1034-43.
184. Herlyn M, Steplewski Z, Herlyn D, et al. Colorec-tal carcinoma-specific antigen: Detection by means of monoclonal antibodies. Proc Natl Acad Sci U S A. 1979;76(0027-8424; 3):1438-42.
185. Winter MJ, Nagtegaal ID, Van Krieken JH, et al. The epithelial cell adhesion molecule (ep-CAM) as a mor-phoregulatory molecule is a tool in surgical pathology. Am J Pathol. 2003;163(0002-9440; 6):2139-48.
186. Went PT, Lugli A, Meier S, et al. Frequent EpCam protein expression in human carcinomas. Hum Pathol. 2004;35(0046-8177; 1):122-8.
187. Went P, Dirnhofer S, D S, et al. Expression and prog-nostic significance of EpCAM. J Cancer Mol. 2008;3:169-74.
188. Baeuerle PA, Gires O. EpCAM (CD326) finding its role in cancer. Br J Cancer. 2007;96(0007-0920; 3):417-23.
189. Visvader JE, Lindeman GJ. Cancer stem cells in solid tumours: Accumulating evidence and unresolved ques-tions. Nature Rev Cancer. 2008;8:755-68.
190. Maetzel D, Denzel S, Mack B, et al. Nuclear signal-ling by tumour-associated antigen EpCAM. Nat Cell Biol. 2009;11(1476-4679; 2):162-71.
191. Brunner A, Prelog M, Verdorfer I, et al. EpCAM is predominantly expressed in high grade and advanced stage urothelial carcinoma of the bladder. J Clin Pathol. 2008;61(3):307-10.
192. Fong D, Steurer M, Obrist P, et al. Ep-CAM expres-sion in pancreatic and ampullary carcinomas: Frequency and prognostic relevance. J Clin Pathol. 2008;61(1472-4146; 1):31-5.
193. Spizzo G, Went P, Dirnhofer S, et al. High ep-CAM expression is associated with poor prognosis in node-positive breast cancer. Breast Cancer Res Treat. 2004;86(0167-6806; 3):207-13.
194. Varga M, Obrist P, Schneeberger S, et al. Overex-pression of epithelial cell adhesion molecule antigen in
Cite
d lit
erat
ure

193192
248. Stoecklein NH, Siegmund A, Scheunemann P, et al. Ep-CAM expression in squamous cell carcinoma of the esophagus: A potential therapeutic target and prognos-tic marker. BMC Cancer. 2006;6(1471-2407):165.
249. Hosch S, Kraus J, Scheunemann P, et al. Malignant potential and cytogenetic characteristics of occult dis-seminated tumor cells in esophageal cancer. Cancer Res. 2000;60(0008-5472; 24):6836-40.
250. Kim JH, Herlyn D, Wong KK, et al. Identification of epithelial cell adhesion molecule autoantibody in pa-tients with ovarian cancer. Clin Cancer Res. 2003;9(1078-0432; 13):4782-91.
251. Heinzelmann-Schwarz VA, Gardiner-Garden M, Henshall SM, et al. Overexpression of the cell adhesion molecules DDR1, claudin 3, and ep-CAM in metaplastic ovarian epithelium and ovarian cancer. Clin Cancer Res. 2004;10(1078-0432; 13):4427-36.
252. Spizzo G, Went P, Dirnhofer S, et al. Overexpres-sion of epithelial cell adhesion molecule (ep-CAM) is an independent prognostic marker for reduced survival of patients with epithelial ovarian cancer. Gynecol Oncol. 2006;103(0090-8258; 2):483-8.
253. Bellone S, Siegel ER, Cocco E, et al. Overexpression of epithelial cell adhesion molecule in primary, meta-static, and recurrent/chemotherapy-resistant epithelial ovarian cancer: Implications for epithelial cell adhesion molecule-specific immunotherapy. Int J Gynecol Cancer. 2009;19(1525-1438; 1525-1438; 5):860-6.
254. Tai KY, Shiah SG, Shieh YS, et al. DNA methylation and histone modification regulate silencing of epithelial cell adhesion molecule for tumor invasion and progres-sion. Oncogene. 2007;26(0950-9232; 27):3989-97.
255. Yamashita T, Budhu A, Forgues M, et al. Activa-tion of hepatic stem cell marker EpCAM by wnt {beta}-catenin signaling in hepatocellular carcinoma. Cancer Res. 2007;67(22):10831-9.
256. Linnenbach AJ, Seng BA, Wu S, et al. Retroposition in a family of carcinoma-associated antigen genes. Mol Cell Biol. 1993;13(3):1507-15.
257. Calabrese G, Crescenzi C, Morizio E, et al. Assign-ment of TACSTD1 (alias TROP1, M4S1) to human chro-mosome 2p21 and refinement of mapping of TACSTD2 (alias TROP2, M1S1) to human chromosome 1p32 by in situ hybridization. Cytogenet Cell Genet. 2001;92(0301-0171; 1-2):164-5.
258. Szala S, Froehlich M, Scollon M, et al. Molecular cloning of cDNA for the carcinoma-associated antigen GA733-2. PNAS. 1990;87(9):3542-6.
259. Perez MS, Walker LE. Isolation and characteriza-tion of a cDNA encoding the KS1/4 epithelial carcinoma marker 32. J Immunol. 1989;142(0022-1767; 0022-1767; 10):3662-7.
260. Ligtenberg MJ, Kuiper RP, Chan TL, et al. Heritable somatic methylation and inactivation of MSH2 in fami-lies with lynch syndrome due to deletion of the 3’ exons of TACSTD1. Nat Genet. 2009;41(1546-1718; 1):112-7.
261. Al-Mayouf SM, Alswaied N, Alkuraya FS, et al. Tuft-ing enteropathy and chronic arthritis: A newly recog-nized association with a novel EpCAM gene mutation. [report]. Journal of Pediatric Gastroenterology & Nutri-tion. 2009;49(5):642-4.
262. Sivagnanam M, Mueller JL, Lee H, et al. Identifi-cation of EpCAM as the gene for congenital tufting en-teropathy. Gastroenterology. 2008;135(1528-0012; 1528-0012; 2):429-37.
263. Sivagnanam M, Schaible T, Szigeti R, et al. Further evidence for EpCAM as the gene for congenital tufting enteropathy. Am J Med Genet A. 2010;152A(1552-4833; 1):222-4.
264. Gires O, Eskofier S, Lang S, et al. Cloning and char-acterisation of a 1.1 kb fragment of the carcinoma-asso-ciated epithelial cell adhesion molecule promoter. Anti-cancer Res. 2003;23(0250-7005; 4):3255-61.
265. Gires O, Pockl S, Chapman RD, et al. Targeted gene expression using a 1.1 kilobase promoter fragment of the tumour-associated antigen EpCAM. Anticancer Res. 2004;24(0250-7005; 6):3715-21.
266. McLaughlin PM, Trzpis M, Kroesen BJ, et al. Use of the EGP-2/Ep-CAM promoter for targeted expression of heterologous genes in carcinoma derived cell lines. Can-cer Gene Ther. 2004;11(0929-1903; 9):603-12.
267. Gommans WM, van Eert SJ, McLaughlin PM, et al. The carcinoma-specific epithelial glycoprotein-2 promot-er controls efficient and selective gene expression in an adenoviral context. Cancer Gene Ther. 2006;13(2):150-8.
268. Sankpal NV, Willman MW, Fleming TP, et al. Tran-scriptional repression of epithelial cell adhesion mole-cule contributes to p53 control of breast cancer invasion. Cancer Res. 2009;:0008-5472.
269. van der Gun BT, de Groote ML, Kazemier HG, et al. Transcription factors and molecular epigenetic marks underlying EpCAM overexpression in ovarian cancer. Br J Cancer. 2011;105(2):312-9.
270. Esteller M. Epigenetics in cancer. N Engl J Med. 2008;358(1533-4406; 11):1148-59.
271. Alberti S, Nutini M, Herzenberg LA. DNA methyla-tion prevents the amplification of TROP1, a tumor-asso-ciated cell surface antigen gene. PNAS. 1994;91(13):5833-7.
272. Nasr AF, Nutini M, Palombo B, et al. Mutations of TP53 induce loss of DNA methylation and amplifica-tion of the TROP1 gene. Oncogene. 2003;22(0950-9232; 11):1668-77.
221. Klatte T, Pantuck AJ, Said JW, et al. Cytogenetic and molecular tumor profiling for type 1 and type 2 papillary renal cell carcinoma. Clin Cancer Res. 2009;15(4):1162-9.
222. Ralhan R, Cao J, Lim T, et al. EpCAM nuclear localiza-tion identifies aggressive thyroid cancer and is a marker for poor prognosis. BMC Cancer. 2010;10:331,2407-10-331.
223. Scheunemann P, Stoecklein NH, Rehders A, et al. Occult tumor cells in lymph nodes as a predictor for tumor relapse in pancreatic adenocarcinoma. Langen-becks Arch Surg. 2008;393(1435-2443; 3):359-65.
224. Schmidt M, Hasenclever D, Schaeffer M, et al. Prog-nostic effect of epithelial cell adhesion molecule overex-pression in untreated node-negative breast cancer. Clin Cancer Res. 2008;14(18):5849-55.
225. Gastl G, Spizzo G, Obrist P, et al. Ep-CAM overex-pression in breast cancer as a predictor of survival. Lan-cet. 2000;356(0140-6736; 9246):1981-2.
226. Cimino A, Halushka M, Illei P, et al. Epithelial cell adhesion molecule (EpCAM) is overexpressed in breast cancer metastases. Breast Cancer Res Treat. 2010;123(3):701-8.
227. Litvinov SV, van DW, van Rhijn CM, et al. Expression of ep-CAM in cervical squamous epithelia correlates with an increased proliferation and the disappearance of markers for terminal differentiation. Am J Pathol. 1996;148(0002-9440; 3):865-75.
228. Went P, Vasei M, Bubendorf L, et al. Frequent high-level expression of the immunotherapeutic target ep-CAM in colon, stomach, prostate and lung cancers. Br J Cancer. 2006;94(0007-0920; 1):128-35.
229. Poczatek RB, Myers RB, Manne U, et al. Ep-cam lev-els in prostatic adenocarcinoma and prostatic intraepi-thelial neoplasia. J Urol. 1999;162(4):1462-6.
230. Zellweger T, Ninck C, Bloch M, et al. Expression pat-terns of potential therapeutic targets in prostate cancer. Int J Cancer. 2005;113(0020-7136; 0020-7136; 4):619-28.
231. Piyathilake CJ, Frost AR, Weiss H, et al. The expres-sion of ep-CAM (17-1A) in squamous cell cancers of the lung. Hum Pathol. 2000;31(0046-8177; 4):482-7.
232. Kim Y, Kim HS, Cui ZY, et al. Clinicopathological implications of EpCAM expression in adenocarcinoma of the lung. Anticancer Res. 2009;29(0250-7005; 0250-7005; 5):1817-22.
233. Kubuschok B, Passlick B, Izbicki JR, et al. Dissemi-nated tumor cells in lymph nodes as a determinant for survival in surgically resected non-small-cell lung can-cer. J Clin Oncol. 1999;17(1):19-24.
234. Mitas M, Cole DJ, Hoover L, et al. Real-time reverse transcription-PCR detects KS1/4 mRNA in mediastinal lymph nodes from patients with non-small cell lung can-cer. Clin Chem. 2003;49(2):312-5.
235. Wenqi D, Li W, Shanshan C, et al. EpCAM is over-expressed in gastric cancer and its downregulation sup-presses proliferation of gastric cancer 6. J Cancer Res Clin Oncol. 2009;135(1432-1335; 1432-1335; 9):1277-85.
236. Scheunemann P, Stoecklein NH, Hermann K, et al. Occult disseminated tumor cells in lymph nodes of patients with gastric carcinoma. A critical appraisal of assessment and relevance. Langenbecks Arch Surg. 2009;394(1435-2443; 1):105-13.
237. Deveci MS, Deveci G. Prognostic value of p53 pro-tein and MK-1 (a tumor-associated antigen) expression in gastric carcinoma. Gastric Cancer. 2007;10(1436-3291; 2):112-6.
238. Dalerba P, Dylla SJ, Park IK, et al. Phenotypic charac-terization of human colorectal cancer stem cells. PNAS. 2007;104(24):10158-63.
239. Xi L, Gooding W, McCarty K, et al. Identification of mRNA markers for molecular staging of lymph nodes in colorectal cancer. Clin Chem. 2006;52(3):520-3.
240. Andratschke M, Hagedorn H, Luebbers CW, et al. Limited suitability of EpCAM for molecular staging of tumor borders in head and neck cancer. Anticancer Res. 2006;26(0250-7005; 1):153-8.
241. Ferris RL, Xi L, Raja S, et al. Molecular staging of cervical lymph nodes in squamous cell carcinoma of the head and neck. Cancer Res. 2005;65(6):2147-56.
242. Chaubal S, Wollenberg B, Kastenbauer E, et al. Ep-CAM--a marker for the detection of disseminated tumor cells in patients suffering from SCCHN. Anticancer Res. 1999;19(0250-7005; 3):2237-42.
243. Takes RP, Baatenburg de Jong RJ, Schuuring E, et al. Markers for assessment of nodal metastasis in la-ryngeal carcinoma. Arch Otolaryngol Head Neck Surg. 1997;123(0886-4470; 4):412-9.
244. Takes RP, Baatenburg de Jong RJ, Alles MJ, et al. Markers for nodal metastasis in head and neck squa-mous cell cancer. Arch Otolaryngol Head Neck Surg. 2002;128(0886-4470; 5):512-8.
245. Jeng JH, Wang YJ, Chiang BL, et al. Roles of keratino-cyte inflammation in oral cancer: Regulating the prosta-glandin E2, interleukin-6 and TNF-alpha production of oral epithelial cells by areca nut extract and arecoline. Carcinogenesis. 2003;24(8):1301-15.
246. Gires O, Kieu C, Fix P, et al. Tumor necrosis factor alpha negatively regulates the expression of the carci-noma-associated antigen epithelial cell adhesion mol-ecule. Cancer. 2001;92(0008-543; 3):620-8.
247. Rossen K, Thomsen HK. Ber-EP4 immunoreactivity depends on the germ layer origin and maturity of the squamous epithelium. Histopathology. 2001;39(0309-0167; 4):386-9.
Cite
d lit
erat
ure

195194
300. High AS, Robinson PA, Klein CE. Increased ex-pression of a 38kd cell-surface glycoprotein MH99 (KS 1/4) in oral mucosal dysplasias. J Oral Pathol Med. 1996;25(1):10-3.
301. Code for proper secondary use of human tissue in the netherlands [homepage on the Internet]. 2011; cited January 20, 2014. Available from: www.federa.org.
302. Kurtz KA, Hoffman HT, Zimmerman MB, et al. De-creased E-cadherin but not beta-catenin expression is associated with vascular invasion and decreased surviv-al in head and neck squamous carcinomas. Otolaryngol Head Neck Surg. 2006;134(1):142-6.
303. Denzel S, Maetzel D, Mack B, et al. Initial activation of EpCAM cleavage via cell-to-cell contact. BMC Cancer. 2009;9(1471-2407; 1471-2407):402.
304. Lourenco SV, Coutinho-Camillo CM, Buim ME, et al. Claudin-7 down-regulation is an important fea-ture in oral squamous cell carcinoma. Histopathology. 2010;57(5):689-98.
305. Eijsink JJ, Noordhuis MG, ten Hoor KA, et al. The epidermal growth factor receptor pathway in relation to pelvic lymph node metastasis and survival in early-stage cervical cancer. Hum Pathol. 2010;41(12):1735-41.
306. Usami Y, Satake S, Nakayama F, et al. Snail-asso-ciated epithelial-mesenchymal transition promotes oesophageal squamous cell carcinoma motility and pro-gression. J Pathol. 2008;215(3):330-9.
307. Bello IO, Vilen ST, Niinimaa A, et al. Expression of claudins 1, 4, 5, and 7 and occludin, and relationship with prognosis in squamous cell carcinoma of the tongue. Hum Pathol. 2008;(0046-8177).
308. Lioni M, Brafford P, Andl C, et al. Dysregulation of claudin-7 leads to loss of E-cadherin expression and the increased invasion of esophageal squamous cell carci-noma cells. Am J Pathol. 2007;170(0002-9440; 2):709-21.
309. Dahiya N, Becker KG, Wood WH,3rd, et al. Claudin-7 is frequently overexpressed in ovarian cancer and pro-motes invasion. PLoS One. 2011;6(7):e22119.
310. Lu Z, Ding L, Hong H, et al. Claudin-7 inhibits human lung cancer cell migration and invasion through ERK/MAPK signaling pathway. Exp Cell Res. 2011;317(13):1935-46.
311. Ikenouchi J, Matsuda M, Furuse M, et al. Regulation of tight junctions during the epithelium-mesenchyme transition: Direct repression of the gene expression of claudins/occludin by snail. J Cell Sci. 2003;116(Pt 10):1959-67.
312. Tsukita S, Yamazaki Y, Katsuno T, et al. Tight junc-tion-based epithelial microenvironment and cell prolif-eration. Oncogene. 2008;27(55):6930-8.
313. Ding L, Lu Z, Foreman O, et al. Inflammation and
disruption of the mucosal architecture in claudin-7-defi-cient mice. Gastroenterology. 2012;142(2):305-15.
314. Bankfalvi A, Krassort M, Buchwalow IB, et al. Gains and losses of adhesion molecules (CD44, E-cadherin, and beta-catenin) during oral carcinogenesis and tu-mour progression. J Pathol. 2002;198(3):343-51.
315. Wang X, Zhang J, Fan M, et al. The expression of E-cadherin at the invasive tumor front of oral squamous cell carcinoma: Immunohistochemical and RT-PCR anal-ysis with clinicopathological correlation. Oral Surg Oral Med Oral Pathol Oral Radiol Endod. 2009;107(4):547-54.
316. Hafkamp HC, Manni JJ, Haesevoets A, et al. Marked differences in survival rate between smokers and non-smokers with HPV 16-associated tonsillar carcinomas. Int J Cancer. 2008;122(12):2656-64.
317. Cooper K, Herrington CS, Stickland JE, et al. Episo-mal and integrated human papillomavirus in cervical neoplasia shown by non-isotopic in situ hybridisation. J Clin Pathol. 1991;44(12):990-6.
318. Evans MF, Mount SL, Beatty BG, et al. Biotinyl-tyr-amide-based in situ hybridization signal patterns distin-guish human papillomavirus type and grade of cervical intraepithelial neoplasia. Mod Pathol. 2002;15(12):1339-47.
319. Wisman GB, Nijhuis ER, Hoque MO, et al. Assess-ment of gene promoter hypermethylation for detection of cervical neoplasia. Int J Cancer. 2006;119(0020-7136; 8):1908-14.
320. van Dongen JJ, Langerak AW, Bruggemann M, et al. Design and standardization of PCR primers and proto-cols for detection of clonal immunoglobulin and T-cell receptor gene recombinations in suspect lymphopro-liferations: Report of the BIOMED-2 concerted action BMH4-CT98-3936. Leukemia. 2003;17(12):2257-317.
321. Hunter KD, Parkinson EK, Harrison PR. Profiling early head and neck cancer. Nat Rev Cancer. 2005;5(2):127-35.
322. Vermorken JB, Specenier P. Optimal treatment for recurrent/metastatic head and neck cancer. Ann Oncol. 2010;21 Suppl 7:vii252-61.
323. Ragin CC, Modugno F, Gollin SM. The epidemiology and risk factors of head and neck cancer: A focus on hu-man papillomavirus. J Dent Res. 2007;86(2):104-14.
324. Leemans CR, Braakhuis BJ, Brakenhoff RH. The mo-lecular biology of head and neck cancer. Nat Rev Cancer. 2011;11(1):9-22.
325. Licitra L, Felip E, ESMO Guidelines Working Group. Squamous cell carcinoma of the head and neck: ESMO clinical recommendations for diagnosis, treatment and follow-up. Ann Oncol. 2009;20 Suppl 4:121-2.
326. Vermorken JB. Medical treatment in head and neck cancer. Ann Oncol. 2005;16 Suppl 2:ii258-64.
273. Spizzo G, Gastl G, Obrist P, et al. Methylation sta-tus of the ep-CAM promoter region in human breast cancer cell lines and breast cancer tissue. Cancer Lett. 2007;246(0304-3835; 1-2):253-61.
274. Yu G, Zhang X, Wang H, et al. CpG island methyla-tion status in the EpCAM promoter region and gene ex-pression. Oncol Rep. 2008;20(1021-335; 5):1061-7.
275. van der Gun BT, Wasserkort R, Monami A, et al. Per-sistent downregulation of the pancarcinoma-associated epithelial cell adhesion molecule via active intranuclear methylation. Int J Cancer. 2008;123(1097-0215; 2):484-9.
276. Kouzarides T. Chromatin modifications and their function. Cell. 2007;128(4):693-705.
277. Uil TG, Haisma HJ, Rots MG. Therapeutic modula-tion of endogenous gene function by agents with de-signed DNA-sequence specificities. Nucleic Acids Res. 2003;31(1362-4962; 0305-1048; 21):6064-78.
278. Sera T. Zinc-finger-based artificial transcription fac-tors and their applications. Advanced Drug Delivery Re-views. 2009;61(7-8):513-26.
279. Duca M, Vekhoff P, Oussedik K, et al. The triple helix: 50 years later, the outcome. Nucl Acids Res. 2008;36(16):5123-38.
280. Gommans WM, McLaughlin PM, Lindhout BI, et al. Engineering zinc finger protein transcription fac-tors to downregulate the epithelial glycoprotein-2 pro-moter as a novel anti-cancer treatment. Mol Carcinog. 2007;46(0899-1987; 0899-1987; 5):391-401.
281. van der Gun BT, Maluszynska-Hoffman M, Kiss A, et al. Targeted DNA methylation by a DNA methyltrans-ferase coupled to a triple helix forming oligonucleotide to down-regulate the epithelial cell adhesion molecule. Bioconjug Chem. 2010;21(7):1239-45.
282. Snowden AW, Gregory PD, Case CC, et al. Gene-spe-cific targeting of H3K9 methylation is sufficient for ini-tiating repression in vivo. Curr Biol. 2002;12(0960-9822; 0960-9822; 24):2159-66.
283. Beltran A, Parikh S, Liu Y, et al. Re-activation of a dormant tumor suppressor gene maspin by designed transcription factors. Oncogene. 2007;26(0950-9232; 0950-9232; 19):2791-8.
284. Munz M, Baeuerle PA, Gires O. The emerging role of EpCAM in cancer and stem cell signaling. Cancer Res. 2009;69(14):5627-9.
285. Bokemeyer C. Catumaxomab--trifunctional anti-EpCAM antibody used to treat malignant ascites. Expert Opin Biol Ther. 2010;10(8):1259-69.
286. Gires O, Klein CA, Baeuerle PA. On the abun-dance of EpCAM on cancer stem cells. Nat Rev Cancer. 2009;9(2):143; author reply 143,c1. Epub 2009 Jan 9.
287. Surveillance epidemiology and end results [home-
page on the Internet]. 2012; cited January 20, 2014. Avail-able from: http://seer.cancer.gov/faststats.
288. Boscke R, Cakir BD, Hoffmann AS, et al. Outcome after elective neck dissection and observation for the treatment of the clinically node-negative neck (cN0) in squamous cell carcinoma of the oropharynx. Eur Arch Otorhinolaryngol. 2013;.
289. Hanahan D, Weinberg RA. The hallmarks of cancer. Cell. 2000;100(0092-8674; 1):57-70.
290. Wijnhoven BP, Dinjens WN, Pignatelli M. E-cadher-in-catenin cell-cell adhesion complex and human can-cer. Br J Surg. 2000;87(8):992-1005.
291. Foschini MP, Cocchi R, Morandi L, et al. E-cadherin loss and delta Np73L expression in oral squamous cell carcinomas showing aggressive behavior. Head Neck. 2008;30(11):1475-82.
292. Huber GF, Zullig L, Soltermann A, et al. Down regu-lation of E-cadherin (ECAD) - a predictor for occult meta-static disease in sentinel node biopsy of early squamous cell carcinomas of the oral cavity and oropharynx. BMC Cancer. 2011;11:217.
293. Mattijssen V, Peters HM, Schalkwijk L, et al. E-cad-herin expression in head and neck squamous-cell carci-noma is associated with clinical outcome. Int J Cancer. 1993;55(4):580-5.
294. Eriksen JG, Steiniche T, Sogaard H, et al. Expression of integrins and E-cadherin in squamous cell carcinomas of the head and neck. APMIS. 2004;112(9):560-8.
295. Nijkamp MM, Span PN, Hoogsteen IJ, et al. Expres-sion of E-cadherin and vimentin correlates with metas-tasis formation in head and neck squamous cell carci-noma patients. Radiother Oncol. 2011;.
296. Andrews NA, Jones AS, Helliwell TR, et al. Expres-sion of the E-cadherin-catenin cell adhesion complex in primary squamous cell carcinomas of the head and neck and their nodal metastases. Br J Cancer. 1997;75(10):1474-80.
297. Liu M, Lawson G, Delos M, et al. Prognostic value of cell proliferation markers, tumour suppressor pro-teins and cell adhesion molecules in primary squamous cell carcinoma of the larynx and hypopharynx. Eur Arch Otorhinolaryngol. 2003;260(1):28-34.
298. Mahomed F, Altini M, Meer S. Altered E-cadher-in/beta-catenin expression in oral squamous carci-noma with and without nodal metastasis. Oral Dis. 2007;13(4):386-92.
299. Mostaan LV, Khorsandi MT, Sharifian SM, et al. Cor-relation between E-cadherin and CD44 adhesion mol-ecules expression and cervical lymph node metastasis in oral tongue SCC: Predictive significance or not. Pathol Res Pract. 2011;207(7):448-51.
Cite
d lit
erat
ure
197196
356. Perry M, Whyte A. Immunology of the tonsils. Im-munol Today. 1998;19(9):414-21.
357. Frisch M, Hjalgrim H, Jaeger AB, et al. Changing pat-terns of tonsillar squamous cell carcinoma in the united states. Cancer Causes Control. 2000;11(6):489-95.
358. Syrjanen S. HPV infections and tonsillar carcinoma. J Clin Pathol. 2004;57(5):449-55.
359. Nasman A, Attner P, Hammarstedt L, et al. Inci-dence of human papillomavirus (HPV) positive tonsillar carcinoma in stockholm, sweden: An epidemic of viral-induced carcinoma? Int J Cancer. 2009;125(2):362-6.
360. Kreimer AR, Clifford GM, Boyle P, et al. Human pap-illomavirus types in head and neck squamous cell car-cinomas worldwide: A systematic review. Cancer Epide-miol Biomarkers Prev. 2005;14(2):467-75.
361. Attner P, Du J, Nasman A, et al. The role of human papillomavirus in the increased incidence of base of tongue cancer. Int J Cancer. 2010;126(12):2879-84.
362. Klussmann JP, Weissenborn SJ, Wieland U, et al. Prevalence, distribution, and viral load of human pap-illomavirus 16 DNA in tonsillar carcinomas. Cancer. 2001;92(11):2875-84.
363. Rietbergen MM, Leemans CR, Bloemena E, et al. Increasing prevalence rates of HPV attributable oro-pharyngeal squamous cell carcinomas in the nether-lands as assessed by a validated test algorithm. Int J Cancer. 2012;.
364. Dayyani F, Etzel CJ, Liu M, et al. Meta-analysis of the impact of human papillomavirus (HPV) on cancer risk and overall survival in head and neck squamous cell carcino-mas (HNSCC). Head Neck Oncol. 2010;2:15,3284-2-15.
365. Isayeva T, Li Y, Maswahu D, et al. Human papillo-mavirus in non-oropharyngeal head and neck cancers: A systematic literature review. Head Neck Pathol. 2012;6 Suppl 1:S104-20.
366. Hocking JS, Stein A, Conway EL, et al. Head and neck cancer in australia between 1982 and 2005 show increasing incidence of potentially HPV-associated oro-pharyngeal cancers. Br J Cancer. 2011;104(5):886-91.
367. Braakhuis BJ, Brakenhoff RH, Meijer CJ, et al. Hu-man papilloma virus in head and neck cancer: The need for a standardised assay to assess the full clinical impor-tance. Eur J Cancer. 2009;45(17):2935-9.
368. Thavaraj S, Stokes A, Guerra E, et al. Evaluation of human papillomavirus testing for squamous cell car-cinoma of the tonsil in clinical practice. J Clin Pathol. 2011;64(4):308-12.
369. van Monsjou HS, van Velthuysen ML, van den Brekel MW, et al. Human papillomavirus status in young patients with head and neck squamous cell carcinoma. Int J Cancer. 2012;130(8):1806-12.
370. Melchers LJ, Bruine de Bruin L, Schnell U, et al. Lack of claudin-7 is a strong predictor of regional recurrence in oral and oropharyngeal squamous cell carcinoma. Oral Oncol(0).
371. mtm laboratories AG. Instructions for use CINtec histology kit, ref.9511. ; 2007.
372. Lewis JS,Jr, Chernock RD, Ma XJ, et al. Partial p16 staining in oropharyngeal squamous cell carcinoma: Ex-tent and pattern correlate with human papillomavirus RNA status. Mod Pathol. 2012;25(9):1212-20.
373. Krul EJ, Van De Vijver MJ, Schuuring E, et al. Human papillomavirus in malignant cervical lesions in surinam, a high-risk country, compared to the netherlands, a low-risk country. Int J Gynecol Cancer. 1999;9(3):206-11.
374. O’Rorke MA, Ellison MV, Murray LJ, et al. Human papillomavirus related head and neck cancer survival: A systematic review and meta-analysis. Oral Oncol. 2012;48(12):1191-201.
375. Schache AG, Liloglou T, Risk JM, et al. Evaluation of human papilloma virus diagnostic testing in oro-pharyngeal squamous cell carcinoma: Sensitivity, speci-ficity, and prognostic discrimination. Clin Cancer Res. 2011;17(19):6262-71.
376. Lewis JS,Jr, Thorstad WL, Chernock RD, et al. p16 positive oropharyngeal squamous cell carcinoma:An en-tity with a favorable prognosis regardless of tumor HPV status. Am J Surg Pathol. 2010;34(8):1088-96.
377. Hafkamp HC, Speel EJ, Haesevoets A, et al. A sub-set of head and neck squamous cell carcinomas exhib-its integration of HPV 16/18 DNA and overexpression of p16INK4A and p53 in the absence of mutations in p53 exons 5-8. Int J Cancer. 2003;107(3):394-400.
378. Paradiso A, Ranieri G, Stea B, et al. Altered p16INK4a and fhit expression in carcinogenesis and progression of human oral cancer. Int J Oncol. 2004;24(2):249-55.
379. Licitra L, Perrone F, Bossi P, et al. High-risk human papillomavirus affects prognosis in patients with surgi-cally treated oropharyngeal squamous cell carcinoma. J Clin Oncol. 2006;24(36):5630-6.
380. Reimers N, Kasper HU, Weissenborn SJ, et al. Com-bined analysis of HPV-DNA, p16 and EGFR expression to predict prognosis in oropharyngeal cancer. Int J Cancer. 2007;120(8):1731-8.
381. O’Regan EM, Toner ME, Finn SP, et al. p16(INK4A) genetic and epigenetic profiles differ in relation to age and site in head and neck squamous cell carcinomas. Hum Pathol. 2008;39(3):452-8.
382. Settle K, Posner MR, Schumaker LM, et al. Racial survival disparity in head and neck cancer results from low prevalence of human papillomavirus infection in black oropharyngeal cancer patients. Cancer Prev Res
327. Gibcus JH, Menkema L, Mastik MF, et al. Amplicon mapping and expression profiling identify the fas-asso-ciated death domain gene as a new driver in the 11q13.3 amplicon in laryngeal/pharyngeal cancer. Clin Cancer Res. 2007;13(1078-0432; 21):6257-66.
328. Chen Y, Chen C. DNA copy number variation and loss of heterozygosity in relation to recurrence of and survival from head and neck squamous cell carcinoma: A review. Head Neck. 2008;30(10):1361-83.
329. Gibcus JH, Kok K, Menkema L, et al. High-resolution mapping identifies a commonly amplified 11q13.3 region containing multiple genes flanked by segmental dupli-cations. Hum Genet. 2007;121(0340-6717; 2):187-201.
330. Liu HS, Lu HH, Lui MT, et al. Detection of copy number amplification of cyclin D1 (CCND1) and cortactin (CTTN) in oral carcinoma and oral brushed samples from areca chewers. Oral Oncol. 2009;45(12):1032-6.
331. Brown LA, Johnson K, Leung S, et al. Co-amplifica-tion of CCND1 and EMSY is associated with an adverse outcome in ER-positive tamoxifen-treated breast can-cers. Breast Cancer Res Treat. 2010;121(2):347-54.
332. Baker SJ, Reddy EP. Transducers of life and death: TNF receptor superfamily and associated proteins. On-cogene. 1996;12(1):1-9.
333. Tourneur L, Chiocchia G. FADD: A regulator of life and death. Trends Immunol. 2010;31(7):260-9.
334. Lavrik IN, Krammer PH. Regulation of CD95/Fas signaling at the DISC. Cell Death Differ. 2012;19(1):36-41.
335. Green DR, Oberst A, Dillon CP, et al. RIPK-depend-ent necrosis and its regulation by caspases: A mystery in five acts. Mol Cell. 2011;44(1):9-16.
336. Gordy C, He YW. The crosstalk between autophagy and apoptosis: Where does this lead? Protein Cell. 2012;3(1):17-27.
337. Werner MH, Wu C, Walsh CM. Emerging roles for the death adaptor FADD in death receptor avidity and cell cycle regulation. Cell Cycle. 2006;5(20):2332-8.
338. Pattje WJ, Schuuring E, Mastik MF, et al. The phos-phatase and tensin homologue deleted on chromosome 10 mediates radiosensitivity in head and neck cancer. Br J Cancer. 2010;102(12):1778-85.
339. Schrijvers ML, Pattje WJ, Slagter-Menkema L, et al. FADD expression as a prognosticator in early-stage glottic squamous cell carcinoma of the larynx treated primarily with radiotherapy. Int J Radiat Oncol Biol Phys. 2012;83(4):1220-6.
340. Gibcus JH, Mastik MF, Menkema L, et al. Cortactin expression predicts poor survival in laryngeal carcino-ma. Br J Cancer. 2008;98(0007-0920; 5):950-5.
341. Schuuring E. The involvement of the chromosome 11q13 region in human malignancies: Cyclin D1 and EMS1
are two new candidate oncogenes--a review. Gene. 1995;159(0378-1119; 1):83-96.
342. Rasamny JJ, Allak A, Krook KA, et al. Cyclin D1 and FADD as biomarkers in head and neck squamous cell car-cinoma. Otolaryngol Head Neck Surg. 2012;146(6):923-31.
343. Prapinjumrune C, Morita K, Kuribayashi Y, et al. DNA amplification and expression of FADD in oral squa-mous cell carcinoma. J Oral Pathol Med. 2010;39(7):525-32.
344. Peter ME. Programmed cell death: Apoptosis meets necrosis. Nature. 2011;471(7338):310-2.
345. Welz PS, Wullaert A, Vlantis K, et al. FADD prevents RIP3-mediated epithelial cell necrosis and chronic intes-tinal inflammation. Nature. 2011;477(7364):330-4.
346. Feoktistova M, Geserick P, Panayotova-Dimitrova D, et al. Pick your poison: The ripoptosome, a cell death platform regulating apoptosis and necroptosis. Cell Cy-cle. 2012;11(3):460-7.
347. Galluzzi L, Kepp O, Kroemer G. FADD: An endog-enous inhibitor of RIP3-driven regulated necrosis. Cell Res. 2011;21(10):1383-5.
348. Matsuyoshi S, Shimada K, Nakamura M, et al. FADD phosphorylation is critical for cell cycle regulation in breast cancer cells. Br J Cancer. 2006;94(4):532-9.
349. Foger N, Bulfone-Paus S, Chan AC, et al. Subcel-lular compartmentalization of FADD as a new level of regulation in death receptor signaling. FEBS J. 2009;276(15):4256-65.
350. Arbyn M, de Sanjose S, Saraiya M, et al. EUROGIN 2011 roadmap on prevention and treatment of HPV-relat-ed disease. Int J Cancer. 2012;131(9):1969-82.
351. Walboomers JM, Jacobs MV, Manos MM, et al. Hu-man papillomavirus is a necessary cause of invasive cer-vical cancer worldwide. J Pathol. 1999;189(1):12-9.
352. de Villiers EM, Weidauer H, Otto H, et al. Papillo-mavirus DNA in human tongue carcinomas. Int J Cancer. 1985;36(5):575-8.
353. Syrjanen K, Syrjanen S, Lamberg M, et al. Morpho-logical and immunohistochemical evidence suggesting human papillomavirus (HPV) involvement in oral squa-mous cell carcinogenesis. Int J Oral Surg. 1983;12(6):418-24.
354. Snijders PJ, Cromme FV, van den Brule AJ, et al. Prevalence and expression of human papillomavirus in tonsillar carcinomas, indicating a possible viral etiology. Int J Cancer. 1992;51(6):845-50.
355. Herrero R, Castellsague X, Pawlita M, et al. Hu-man papillomavirus and oral cancer: The international agency for research on cancer multicenter study. J Natl Cancer Inst. 2003;95(23):1772-83.
Cite
d lit
erat
ure
199198
methylation of multiple genes in head and neck squa-mous cell carcinoma. Am J Otolaryngol. 2005;26(1):12-7.
412. Tawfik HM, El-Maqsoud NM, Hak BH, et al. Head and neck squamous cell carcinoma: Mismatch repair im-munohistochemistry and promoter hypermethylation of hMLH1 gene. Am J Otolaryngol. 2011;32(6):528-36.
413. Rosas SL, Koch W, da Costa Carvalho MG, et al. Promoter hypermethylation patterns of p16, O6-methyl-guanine-DNA-methyltransferase, and death-associated protein kinase in tumors and saliva of head and neck cancer patients. Cancer Res. 2001;61(3):939-42.
414. Esteller M, Hamilton SR, Burger PC, et al. Inactiva-tion of the DNA repair gene O6-methylguanine-DNA methyltransferase by promoter hypermethylation is a common event in primary human neoplasia. Cancer Res. 1999;59(4):793-7.
415. Herman JG, Graff JR, Myohanen S, et al. Meth-ylation-specific PCR: A novel PCR assay for methyla-tion status of CpG islands. Proc Natl Acad Sci U S A. 1996;93(0027-8424; 18):9821-6.
416. Grafstrom RC, Pegg AE, Trump BF, et al. O6-alkyl-guanine-DNA alkyltransferase activity in normal human tissues and cells. Cancer Res. 1984;44(7):2855-7.
417. Datasheet DAPK (H-300) [homepage on the In-ternet]. 2013; cited September 11, 2013. Available from: www.scbt.com/datasheet-10805-dapk-h-300-antibody.html.
418. Rodriguez MJ, Acha A, Ruesga MT, et al. Loss of ex-pression of DNA repair enzyme MGMT in oral leukopla-kia and early oral squamous cell carcinoma. A prognostic tool? Cancer Lett. 2007;245(1-2):263-8.
419. Sawhney M, Rohatgi N, Kaur J, et al. MGMT expres-sion in oral precancerous and cancerous lesions: Cor-relation with progression, nodal metastasis and poor prognosis. Oral Oncol. 2007;43(5):515-22.
420. Huang SH, Lee HS, Mar K, et al. Loss expression of O6-methylguanine DNA methyltransferase by promoter hypermethylation and its relationship to betel quid chewing in oral squamous cell carcinoma. Oral Surg Oral Med Oral Pathol Oral Radiol Endod. 2010;109(6):883-9.
421. Kawaguchi K, Oda Y, Saito T, et al. Death-associated protein kinase (DAP kinase) alteration in soft tissue leio-myosarcoma: Promoter methylation or homozygous de-letion is associated with a loss of DAP kinase expression. Hum Pathol. 2004;35(10):1266-71.
422. Chen WT, Hung WC, Kang WY, et al. Urothelial car-cinomas arising in arsenic-contaminated areas are as-sociated with hypermethylation of the gene promoter of the death-associated protein kinase. Histopathology. 2007;51(6):785-92.
423. Cao VT, Jung TY, Jung S, et al. The correlation and
prognostic significance of MGMT promoter methyla-tion and MGMT protein in glioblastomas. Neurosurgery. 2009;65(5):866,75; discussion 875.
424. de Meneses IS, de Souza RR, Jeraldo, Verónica de Lourdes Sierpe, et al. Death-associated protein kinase is underexpressed in high-grade oral squamous cell carci-noma. Int J Morphol. 2010;28(2):609-13.
425. Esteller M, Corn PG, Baylin SB, et al. A gene hy-permethylation profile of human cancer. Cancer Res. 2001;61(8):3225-9.
426. Ingold B, Schraml P, Heppner FL, et al. Homoge-neous MGMT immunoreactivity correlates with an un-methylated MGMT promoter status in brain metastases of various solid tumors. PLoS One. 2009;4(3):e4775.
427. Rastetter M, Schagdarsurengin U, Lahtz C, et al. Frequent intra-tumoural heterogeneity of promoter hypermethylation in malignant melanoma. Histol His-topathol. 2007;22(9):1005-15.
428. Deaton AM, Bird A. CpG islands and the regulation of transcription. Genes Dev. 2011;25(10):1010-22.
429. Irizarry RA, Ladd-Acosta C, Wen B, et al. The human colon cancer methylome shows similar hypo- and hy-permethylation at conserved tissue-specific CpG island shores. Nat Genet. 2009;41(2):178-86.
430. Gozuacik D, Kimchi A. DAPk protein family and can-cer. Autophagy. 2006;2(2):74-9.
431. Sanchez-Cespedes M, Esteller M, Wu L, et al. Gene promoter hypermethylation in tumors and se-rum of head and neck cancer patients. Cancer Res. 2000;60(0008-5472; 4):892-5.
432. Wang WJ, Kuo JC, Yao CC, et al. DAP-kinase induces apoptosis by suppressing integrin activity and disrupt-ing matrix survival signals. J Cell Biol. 2002;159(1):169-79.
433. Kuo JC, Wang WJ, Yao CC, et al. The tumor suppres-sor DAPK inhibits cell motility by blocking the integrin-mediated polarity pathway. J Cell Biol. 2006;172(4):619-31.
434. Olson RA, Brastianos PK, Palma DA. Prognostic and predictive value of epigenetic silencing of MGMT in pa-tients with high grade gliomas: A systematic review and meta-analysis. J Neurooncol. 2011;105(2):325-35.
435. Su PF, Huang WL, Wu HT, et al. p16(INK4A) pro-moter hypermethylation is associated with invasiveness and prognosis of oral squamous cell carcinoma in an age-dependent manner. Oral Oncol. 2010;46(10):734-9.
436. Zeilinger S, Kuhnel B, Klopp N, et al. Tobacco smok-ing leads to extensive genome-wide changes in DNA methylation. PLoS One. 2013;8(5):e63812.
437. Christmann M, Kaina B. O(6)-methylguanine-DNA methyltransferase (MGMT): Impact on cancer risk in re-sponse to tobacco smoke. Mutat Res. 2012;736(1-2):64-74.
(Phila). 2009;2(9):776-81.
383. Cerezo L, Lopez C, de la Torre A, et al. Incidence of HPV-related oropharyngeal cancer and outcomes after chemoradiation in a population of heavy smokers. Head Neck. 2013;.
384. Ragin CC, Taioli E. Survival of squamous cell carci-noma of the head and neck in relation to human papil-lomavirus infection: Review and meta-analysis. Int J Cancer. 2007;121(8):1813-20.
385. Chaturvedi AK. Epidemiology and clinical aspects of HPV in head and neck cancers. Head Neck Pathol. 2012;6 Suppl 1:S16-24.
386. Chaturvedi AK, Engels EA, Pfeiffer RM, et al. Human papillomavirus and rising oropharyngeal cancer incidence in the united states. J Clin Oncol. 2011;29(32):4294-301.
387. Jordan RC, Lingen MW, Perez-Ordonez B, et al. Vali-dation of methods for oropharyngeal cancer HPV status determination in US cooperative group trials. Am J Surg Pathol. 2012;36(7):945-54.
388. Siegel R, Naishadham D, Jemal A. Cancer statistics, 2013. CA Cancer J Clin. 2013;63(1):11-30.
389. Roossink F, de Jong S, Wisman GB, et al. DNA hyper-methylation biomarkers to predict response to cisplatin treatment, radiotherapy or chemoradiation: The present state of art. Cell Oncol (Dordr). 2012;35(4):231-41.
390. Rius M, Lyko F. Epigenetic cancer therapy: Ration-ales, targets and drugs. Oncogene. 2012;31(39):4257-65.
391. Cock-Rada A, Weitzman JB. The methylation land-scape of tumour metastasis. Biol Cell. 2013;105(2):73-90.
392. Kristensen LS, Hansen LL. PCR-based methods for detecting single-locus DNA methylation biomarkers in cancer diagnostics, prognostics, and response to treat-ment. Clin Chem. 2009;55(8):1471-83.
393. Jacinto FV, Esteller M. MGMT hypermethylation: A prognostic foe, a predictive friend. DNA Repair (Amst). 2007;6(8):1155-60.
394. Gasche JA, Goel A. Epigenetic mechanisms in oral carcinogenesis. Future Oncol. 2012;8(11):1407-25.
395. Jithesh PV, Risk JM, Schache AG, et al. The epige-netic landscape of oral squamous cell carcinoma. Br J Cancer. 2013;108(2):370-9.
396. Borges S, Doppler H, Perez EA, et al. Pharmacologic reversion of epigenetic silencing of the PRKD1 promoter blocks breast tumor cell invasion and metastasis. Breast Cancer Res. 2013;15(2):R66.
397. Li Y, Zhu CL, Nie CJ, et al. Investigation of tumor suppressing function of CACNA2D3 in esophageal squa-mous cell carcinoma. PLoS One. 2013;8(4):e60027.
398. Xing X, Cai W, Shi H, et al. The prognostic value of CDKN2A hypermethylation in colorectal cancer: A meta-
analysis. Br J Cancer. 2013;108(12):2542-8.
399. Roepman P, Wessels LF, Kettelarij N, et al. An ex-pression profile for diagnosis of lymph node metastases from primary head and neck squamous cell carcinomas. Nat Genet. 2005;37(1061-4036; 2):182-6.
400. Schmalbach CE, Chepeha DB, Giordano TJ, et al. Molecular profiling and the identification of genes as-sociated with metastatic oral cavity/pharynx squamous cell carcinoma. Arch Otolaryngol Head Neck Surg. 2004;130(0886-4470; 3):295-302.
401. Mendez E, Houck JR, Doody DR, et al. A genetic ex-pression profile associated with oral cancer identifies a group of patients at high risk of poor survival. Clin Can-cer Res. 2009;15(1078-0432; 4):1353-61.
402. O’Donnell RK, Kupferman M, Wei SJ, et al. Gene expression signature predicts lymphatic metastasis in squamous cell carcinoma of the oral cavity. Oncogene. 2005;24(0950-9232; 7):1244-51.
403. Ongenaert M, Wisman GB, Volders HH, et al. Dis-covery of DNA methylation markers in cervical can-cer using relaxation ranking. BMC Med Genomics. 2008;1(1755-8794; 1):57.
404. Noordhuis MG, Fehrmann RS, Wisman GB, et al. In-volvement of the TGF-beta and beta-catenin pathways in pelvic lymph node metastasis in early-stage cervical cancer. Clin Cancer Res. 2011;17(6):1317-30.
405. Erdem NF, Carlson ER, Gerard DA. Characteriza-tion of gene expression profiles of 3 different human oral squamous cell carcinoma cell lines with different inva-sion and metastatic capacities. J Oral Maxillofac Surg. 2008;66(5):918-27.
406. Martin TA, Mansel RE, Jiang WG. Loss of occludin leads to the progression of human breast cancer. Int J Mol Med. 2010;26(5):723-34.
407. Blanco D, Vicent S, Elizegi E, et al. Altered expres-sion of adhesion molecules and epithelial-mesenchymal transition in silica-induced rat lung carcinogenesis. Lab Invest. 2004;84(8):999-1012.
408. Perez A, Neskey DM, Wen J, et al. CD44 interacts with EGFR and promotes head and neck squamous cell carcinoma initiation and progression. Oral Oncol. 2013;49(4):306-13.
409. Supic G, Kozomara R, Brankovic-Magic M, et al. Gene hypermethylation in tumor tissue of advanced oral squamous cell carcinoma patients. Oral Oncol. 2009;45(12):1051-7.
410. Dikshit RP, Gillio-Tos A, Brennan P, et al. Hypermeth-ylation, risk factors, clinical characteristics, and survival in 235 patients with laryngeal and hypopharyngeal can-cers. Cancer. 2007;110(8):1745-51.
411. Puri SK, Si L, Fan CY, et al. Aberrant promoter hyper-
Cite
d lit
erat
ure

201200
J Pathol. 2001;158(2):419-29.
462. Wikstrand CJ, McLendon RE, Friedman AH, et al. Cell surface localization and density of the tumor-asso-ciated variant of the epidermal growth factor receptor, EGFRvIII. Cancer Res. 1997;57(18):4130-40.
463. Ge H, Gong X, Tang CK. Evidence of high incidence of EGFRvIII expression and coexpression with EGFR in human invasive breast cancer by laser capture microdis-section and immunohistochemical analysis. Int J Cancer. 2002;98(3):357-61.
464. Lassus H, Sihto H, Leminen A, et al. Gene ampli-fication, mutation, and protein expression of EGFR and mutations of ERBB2 in serous ovarian carcinoma. J Mol Med (Berl). 2006;84(8):671-81.
465. Spindler KL, Olsen DA, Nielsen JN, et al. Lack of the type III epidermal growth factor receptor mutation in colorectal cancer. Anticancer Res. 2006;26(6C):4889-93.
466. Azuma M, Danenberg KD, Iqbal S, et al. Epidermal growth factor receptor and epidermal growth factor re-ceptor variant III gene expression in metastatic colorec-tal cancer. Clin Colorectal Cancer. 2006;6(3):214-8.
467. Ji H, Zhao X, Yuza Y, et al. Epidermal growth factor receptor variant III mutations in lung tumorigenesis and sensitivity to tyrosine kinase inhibitors. Proc Natl Acad Sci U S A. 2006;103(20):7817-22.
468. Ohtsuka K, Ohnishi H, Furuyashiki G, et al. Clinico-pathological and biological significance of tyrosine ki-nase domain gene mutations and overexpression of epi-dermal growth factor receptor for lung adenocarcinoma. J Thorac Oncol. 2006;1(8):787-95.
469. Ohtsuka K, Ohnishi H, Fujiwara M, et al. Abnormali-ties of epidermal growth factor receptor in lung squa-mous-cell carcinomas, adenosquamous carcinomas, and large-cell carcinomas: Tyrosine kinase domain mu-tations are not rare in tumors with an adenocarcinoma component. Cancer. 2007;109(4):741-50.
470. Heyn H, Esteller M. DNA methylation profiling in the clinic: Applications and challenges. Nat Rev Genet. 2012;13(10):679-92.
471. Barkley HT,Jr, Fletcher GH, Jesse RH, et al. Manage-ment of cervical lymph node metastases in squamous cell carcinoma of the tonsillar fossa, base of tongue, supraglottic larynx, and hypopharynx. Am J Surg. 1972;124(4):462-7.
472. Shah GV, Wesolowski JR, Ansari SA, et al. New directions in head and neck imaging. J Surg Oncol. 2008;97(8):644-8.
473. Ferlito A, Rinaldo A, Silver CE, et al. Neck dissection: Then and now. Auris Nasus Larynx. 2006;33(4):365-74.
474. Kaneko S, Yoshimura T, Ikemura K, et al. Primary neck management among patients with cancer of the
oral cavity without clinical nodal metastases: A decision and sensitivity analysis. Head Neck. 2002;24(6):582-90.
475. Okura M, Aikawa T, Sawai NY, et al. Decision analysis and treatment threshold in a management for the N0 neck of the oral cavity carcinoma. Oral Oncol. 2009;45(10):908-11.
476. Govers TM, Takes RP, Baris Karakullukcu M, et al. Management of the N0 neck in early stage oral squa-mous cell cancer: A modeling study of the cost-effective-ness. Oral Oncol. 2013;49(8):771-7.
477. Song T, Bi N, Gui L, et al. Elective neck dissection or “watchful waiting”: Optimal management strategy for early stage N0 tongue carcinoma using decision analy-sis techniques. Chin Med J (Engl). 2008;121(17):1646-50.
478. Rodrigo JP, Shah JP, Silver CE, et al. Management of the clinically negative neck in early-stage head and neck cancers after transoral resection. Head Neck. 2011;33(8):1210-9.
479. Day GL, Blot WJ. Second primary tumors in patients with oral cancer. Cancer. 1992;70(1):14-9.
480. Chuang SC, Scelo G, Tonita JM, et al. Risk of sec-ond primary cancer among patients with head and neck cancers: A pooled analysis of 13 cancer registries. Int J Cancer. 2008;123(10):2390-6.
481. Mak D, Corry J, Lau E, et al. Role of FDG-PET/CT in staging and follow-up of head and neck squamous cell carcinoma. Q J Nucl Med Mol Imaging. 2011;55(5):487-99.
482. Brinkman AB, Simmer F, Ma K, et al. Whole-genome DNA methylation profiling using MethylCap-seq. Meth-ods. 2010;52(3):232-6.
483. Pytynia KB, Dahlstrom KR, Sturgis EM. Clinical management of squamous cell carcinoma of the oro-pharynx: How does this differ for HPV-related tumors? Future Oncol. 2013;.
484. Kofler B, Laban S, Busch CJ, et al. New treatment strategies for HPV-positive head and neck cancer. Eur Arch Otorhinolaryngol. 2013;.
485. Kim SH, Koo BS, Kang S, et al. HPV integration be-gins in the tonsillar crypt and leads to the alteration of p16, EGFR and c-myc during tumor formation. Int J Can-cer. 2007;120(7):1418-25.
486. D’Souza G, Agrawal Y, Halpern J, et al. Oral sexual behaviors associated with prevalent oral human papil-lomavirus infection. J Infect Dis. 2009;199(9):1263-9.
487. Termine N, Giovannelli L, Matranga D, et al. Oral hu-man papillomavirus infection in women with cervical HPV infection: New data from an italian cohort and a metanal-ysis of the literature. Oral Oncol. 2011;47(4):244-50.
488. Beder Ribeiro CM, Ferrer I, Santos de Farias AB, et al. Oral and genital HPV genotypic concordance be-tween sexual partners. Clin Oral Investig. 2013;.
438. Lassen P. The role of human papillomavirus in head and neck cancer and the impact on radiotherapy out-come. Radiother Oncol. 2010;95(3):371-80.
439. Weiss D, Basel T, Sachse F, et al. Promoter meth-ylation of cyclin A1 is associated with human papillo-mavirus 16 induced head and neck squamous cell car-cinoma independently of p53 mutation. Mol Carcinog. 2011;50(9):680-8.
440. Bock C, Tomazou EM, Brinkman AB, et al. Quantita-tive comparison of genome-wide DNA methylation map-ping technologies. Nat Biotechnol. 2010;28(10):1106-14.
441. Ciardiello F, Tortora G. Epidermal growth factor receptor (EGFR) as a target in cancer therapy: Under-standing the role of receptor expression and other mo-lecular determinants that could influence the response to anti-EGFR drugs. Eur J Cancer. 2003;39(10):1348-54.
442. Han W, Lo HW. Landscape of EGFR signaling net-work in human cancers: Biology and therapeutic re-sponse in relation to receptor subcellular locations. Cancer Lett. 2012;318(2):124-34.
443. Modjtahedi H, Essapen S. Epidermal growth fac-tor receptor inhibitors in cancer treatment: Advanc-es, challenges and opportunities. Anticancer Drugs. 2009;20(10):851-5.
444. Licitra L, Mesia R, Rivera F, et al. Evaluation of EGFR gene copy number as a predictive biomarker for the ef-ficacy of cetuximab in combination with chemotherapy in the first-line treatment of recurrent and/or metastatic squamous cell carcinoma of the head and neck: EX-TREME study. Ann Oncol. 2011;22(5):1078-87.
445. Tan EH, Goh C, Lim WT, et al. Gefitinib, cisplatin, and concurrent radiotherapy for locally advanced head and neck cancer: EGFR FISH, protein expression, and mutational status are not predictive biomarkers. Ann Oncol. 2012;23(4):1010-6.
446. Gan HK, Cvrljevic AN, Johns TG. The epidermal growth factor receptor variant III (EGFRvIII): Where wild things are altered. FEBS J. 2013;.
447. Chu CT, Everiss KD, Wikstrand CJ, et al. Receptor dimerization is not a factor in the signalling activity of a transforming variant epidermal growth factor receptor (EGFRvIII). Biochem J. 1997;324 ( Pt 3)(Pt 3):855-61.
448. Chen YG, Wang Z, Ma J, et al. Endofin, a FYVE do-main protein, interacts with Smad4 and facilitates transforming growth factor-beta signaling. J Biol Chem. 2007;282(13):9688-95.
449. Mukherjee B, McEllin B, Camacho CV, et al. EG-FRvIII and DNA double-strand break repair: A molecular mechanism for radioresistance in glioblastoma. Cancer Res. 2009;69(10):4252-9.
450. Learn CA, Hartzell TL, Wikstrand CJ, et al. Resist-
ance to tyrosine kinase inhibition by mutant epidermal growth factor receptor variant III contributes to the neoplastic phenotype of glioblastoma multiforme. Clin Cancer Res. 2004;10(9):3216-24.
451. Jungbluth AA, Stockert E, Huang HJ, et al. A mon-oclonal antibody recognizing human cancers with amplification/overexpression of the human epider-mal growth factor receptor. Proc Natl Acad Sci U S A. 2003;100(2):639-44.
452. Hama T, Yuza Y, Saito Y, et al. Prognostic signifi-cance of epidermal growth factor receptor phosphoryla-tion and mutation in head and neck squamous cell carci-noma. Oncologist. 2009;14(9):900-8.
453. Yang B, Chen J, Zhang X, et al. Expression of epider-mal growth factor receptor variant III in laryngeal car-cinoma tissues. Auris Nasus Larynx. 2009;36(6):682-7.
454. Chau NG, Perez-Ordonez B, Zhang K, et al. The as-sociation between EGFR variant III, HPV, p16, c-MET, EGFR gene copy number and response to EGFR inhibi-tors in patients with recurrent or metastatic squamous cell carcinoma of the head and neck. Head Neck Oncol. 2011;3:11,3284-3-11.
455. Tinhofer I, Klinghammer K, Weichert W, et al. Ex-pression of amphiregulin and EGFRvIII affect outcome of patients with squamous cell carcinoma of the head and neck receiving cetuximab-docetaxel treatment. Clin Cancer Res. 2011;17(15):5197-204.
456. McIntyre JB, Bose P, Klimowicz AC, et al. Spe-cific and sensitive hydrolysis probe-based real-time PCR detection of epidermal growth factor receptor variant III in oral squamous cell carcinoma. PLoS One. 2012;7(2):e31723.
457. Smilek P, Neuwirthova J, Jarkovsky J, et al. Epider-mal growth factor receptor (EGFR) expression and mu-tations in the EGFR signaling pathway in correlation with anti-EGFR therapy in head and neck squamous cell carcinomas. Neoplasma. 2012;59(5):508-15.
458. Wheeler SE, Morariu EM, Bednash JS, et al. Lyn kinase mediates cell motility and tumor growth in EG-FRvIII-expressing head and neck cancer. Clin Cancer Res. 2012;18(10):2850-60.
459. de Graeff P, Crijns AP, Ten Hoor KA, et al. The ErbB signalling pathway: Protein expression and prog-nostic value in epithelial ovarian cancer. Br J Cancer. 2008;99(2):341-9.
460. Cunningham MP, Essapen S, Thomas H, et al. Coex-pression, prognostic significance and predictive value of EGFR, EGFRvIII and phosphorylated EGFR in colorectal cancer. Int J Oncol. 2005;27(2):317-25.
461. Specht K, Richter T, Muller U, et al. Quantitative gene expression analysis in microdissected archival formalin-fixed and paraffin-embedded tumor tissue. Am
Cite
d lit
erat
ure
203202
489. Visconti V, Antonilli M, Bellati F, et al. HPV induced triple neoplasms: A case report. Am J Obstet Gynecol. 2009;201(2):e9-e12.
490. Herrero R, Quint W, Hildesheim A, et al. Reduced prevalence of oral human papillomavirus (HPV) 4 years after bivalent HPV vaccination in a randomized clinical trial in costa rica. PLoS One. 2013;8(7):e68329.
491. Schnell U, Cirulli V, Giepmans BN. EpCAM: Structure and function in health and disease. Biochim Biophys Acta. 2013;1828(8):1989-2001.
492. Seimetz D, Lindhofer H, Bokemeyer C. Develop-ment and approval of the trifunctional antibody catu-maxomab (anti-EpCAM x anti-CD3) as a targeted cancer immunotherapy. Cancer Treat Rev. 2010;36(6):458-67.
493. Siegel RM, Martin DA, Zheng L, et al. Death-effector filaments: Novel cytoplasmic structures that recruit cas-pases and trigger apoptosis. J Cell Biol. 1998;141(5):1243-53.
494. Simpson CD, Anyiwe K, Schimmer AD. Anoikis resistance and tumor metastasis. Cancer Lett. 2008;272(2):177-85.
495. Frisch SM, Screaton RA. Anoikis mechanisms. Curr Opin Cell Biol. 2001;13(0955-0674; 5):555-62.
496. Menaker RJ, Jones NL. Fascination with bacteria-triggered cell death: The significance of fas-mediated apoptosis during bacterial infection in vivo. Microbes Infect. 2003;5(12):1149-58.
497. Khoury MJ, Gwinn M, Ioannidis JP. The emergence of translational epidemiology: From scientific dis-covery to population health impact. Am J Epidemiol. 2010;172(5):517-24.
498. Ransohoff DF. How to improve reliability and ef-ficiency of research about molecular markers: Roles of phases, guidelines, and study design. J Clin Epidemiol. 2007;60(12):1205-19.
499. Wilson CB. Adoption of new surgical technology. BMJ. 2006;332(7533):112-4.
500. Woodcock J. The prospects for “personalized medi-cine” in drug development and drug therapy. Clin Phar-macol Ther. 2007;81(2):164-9.
501. Freidlin B, McShane LM, Korn EL. Randomized clini-cal trials with biomarkers: Design issues. J Natl Cancer Inst. 2010;102(3):152-60.
502. Yaziji H, Barry T. Diagnostic immunohistochemistry: What can go wrong? Adv Anat Pathol. 2006;13(5):238-46.
503. Fritschy JM. Is my antibody-staining specific? how to deal with pitfalls of immunohistochemistry. Eur J Neurosci. 2008;28(12):2365-70.
504. Kroepil F, Fluegen G, Vallbohmer D, et al. Snail1 expression in colorectal cancer and its correlation with
clinical and pathological parameters. BMC Cancer. 2013;13:145,2407-13-145.
505. Goke F, Bode M, Franzen A, et al. Fibroblast growth factor receptor 1 amplification is a common event in squamous cell carcinoma of the head and neck. Mod Pathol. 2013;.
506. Xie W, Aisner S, Baredes S, et al. Alterations of smad expression and activation in defining 2 subtypes of hu-man head and neck squamous cell carcinoma. Head Neck. 2013;35(1):76-85.
507. Jakscha J, Zlobec I, Storck C, et al. The clinical im-pact of p16 status in fine-needle aspirates of cervical lymph node metastasis of head and neck squamous cell carcinomas. Eur Arch Otorhinolaryngol. 2013;270(2):661-7.
508. Schiller JH. Noninvasive monitoring of tumors. N Engl J Med. 2008;359(4):418-20.
509. El-Naggar AK, Mao L, Staerkel G, et al. Genetic het-erogeneity in saliva from patients with oral squamous carcinomas: Implications in molecular diagnosis and screening. J Mol Diagn. 2001;3(4):164-70.
510. Mockelmann N, Laban S, Pantel K, et al. Circulat-ing tumor cells in head and neck cancer: Clinical impact in diagnosis and follow-up. Eur Arch Otorhinolaryngol. 2013;.
511. Hristozova T, Konschak R, Stromberger C, et al. The presence of circulating tumor cells (CTCs) correlates with lymph node metastasis in nonresectable squamous cell carcinoma of the head and neck region (SCCHN). Ann Oncol. 2011;22(8):1878-85.
512. Hindson BJ, Ness KD, Masquelier DA, et al. High-throughput droplet digital PCR system for abso-lute quantitation of DNA copy number. Anal Chem. 2011;83(22):8604-10.
513. Dawson SJ, Tsui DW, Murtaza M, et al. Analysis of circulating tumor DNA to monitor metastatic breast cancer. N Engl J Med. 2013;368(13):1199-209.
Cite
d lit
erat
ure

Epiloog

207206
Dr. J.E. van der Wal, beste Jacqueline, je was een ideale co-promotor in dit onderzoek, met veel pathologische, moleculaire en klinische expertise. In de eerste jaren van mijn onderzoek heb-ben we de meeste patiëntseries aangelegd. Enkele duizenden coupes hebben we gereviseerd. Dat was al een heel werk, maar daarbij nam je ook tijd om mij veel uit te leggen waardoor ik later grotendeels zelfvoorzienend ben geworden. Tijdens de laatste fase van mijn onderzoek was je iets meer op afstand, maar je gaf nog steeds graag ondersteuning waar mogelijk, of dat nu het beoordelen van een bak met coupes was of reageren op een manuscript. Bedankt! Dr. B. van der Vegt, beste Bert, jij hebt de directe pathologische begeleiding voor mijn latere studies op je genomen. Bedankt voor de laagdrempelige ondersteuning.
De leden van de beoordelingscommissie, prof.dr. I. van der Waal, prof.dr. H. Hollema en prof.dr. F.K.L. Spijkervet wil ik bedanken voor hun snelle en deskundige beoordeling van mijn proef-schrift.
Prof.dr. F.K.L. Spijkervet, ik ben u tevens erkentelijk voor het mogen volgen van de opleiding tot MKA-chirurg op uw afdeling, waar een zeer open en prettig opleidingsklimaat heerst. Ik kijk dan ook uit naar de komende opleidingsjaren.
Voormalig afdelingshoofd MKA-chirurgie, prof.dr. L.G.M. de Bont, hartelijk dank voor de aan-stelling die ik in 2008 kreeg om onderzoek te verrichten. Hoewel ik op een andere afdeling ge-stationeerd was, wist iedereen toch altijd waar ik mee bezig was, en faciliteerde de afdeling MKA-chirurgie mij waar dat nodig was.
Hoewel mijn project vanuit de MKA-chirurgie nieuw was, prijs ik mijzelf gelukkig dat mijn on-derzoek was ingebed in een multidisciplinaire hoofd-hals oncopathologische onderzoeksgroep. Martijn Clausen en Emiel Kop en daarvoor Leonie Bruine de Bruin, Jasper Wachters en Wouter Pattje: bedankt voor de inspiratie, ondersteuning en gezelligheid. Martijn Clausen: net als ik in dienst van de MKA-chirurgie en gestationeerd bij de Pathologie, ik heb bewondering voor hoe je je als ‘bioloog’ verdiept hebt in de klinische problematiek en hoe je je project invulling hebt gegeven. Ik ben verheugd dat jij mijn paranimf wilt zijn. Analisten Mirjam Mastik en Lorian Slagter-Menkema: zonder jullie ondersteuning was dit proefschrift er nooit gekomen. Vrijwel alle lab vaardigheden heb ik van jullie geleerd. Jullie gaven me ruimte om zoveel mogelijk zelf te doen, maar waren ook bereid zaken over te nemen als ik er eens niet aan toe kwam door drukte met Tandheelkunde. Lorian: je uitgebreide kennis van technieken en de volledige over-gave waarmee je je werk doet bewonder ik. Je leven gaat zeer spoedig veranderen…Geniet er van, dat is je gegund. Mirjam: je rust en relativeringsvermogen heb ik zeer gewaardeerd in onze samenwerking de afgelopen jaren. Ik ben dan ook blij dat jij mijn paranimf wilt zijn.Stagiaires Jasper Holewijn en Brenda Samaniego-Cameron hebben een belangrijke bijdrage ge-leverd aan hoofdstuk 7. Bedankt voor de prettige samenwerking.
Epiloog
Het voelt als de dag van gisteren dat ik in 2008 met mijn onderzoek begon op de afdeling Pa-thologie. Vanuit de soms hectische drukte als anios in een perifere kliniek was het een omscha-keling om ineens fulltime met onderzoek bezig te zijn. Hoewel ik in dienst was van de afdeling Kaakchirurgie (tegenwoordig Mond-, Kaak- en Aangezichts (MKA-)chirurgie) was mijn werk-plek op de afdeling Pathologie, een prachtige afdeling om onderzoek te verrichten, zo heb ik mogen ervaren. Ik heb mij de afgelopen jaren compleet kunnen onderdompelen in een resear-chomgeving waarin ik zeer veel geleerd heb van alle analisten, mede-promovendi, bursalen, as-sistenten en stafleden. Ik had mijn onderzoek zoals het nu voor u ligt niet kunnen uitvoeren als ik niet op deze afdeling gestationeerd was. Inmiddels heb ik meer dan vijf jaar op deze afdeling gewerkt, en dat is langer dan mijn opleiding tot MKA-chirurg zal gaan duren. Het is duidelijk dat deze afdeling mij wetenschappelijk maar ook persoonlijk heeft gevormd. Ik ben blij dat ik met zoveel kundige, professionele, stimulerende en gezellige mensen heb mogen samenwerken. Hartelijk dank daarvoor.
Een aantal personen hebben een grote rol gespeeld bij het tot stand komen van dit proefschrift, en ik wil hen graag met naam noemen.
Allereerst had ik dit promotieonderzoek nooit gedaan, en waarschijnlijk was ik zelfs niet bij de MKA-chirurgie terecht gekomen zonder mijn eerste promotor, prof.dr. J.L.N. Roodenburg. Ge-achte professor, ik wil u hartelijk bedanken voor het vertrouwen dat u in mij had om samen deze nieuwe samenwerking van de afdeling MKA-chirurgie met de afdeling Pathologie aan te gaan. U was altijd trouw aanwezig bij de wekelijkse overlegmomenten, ook bij langdurige discussies over de juiste controles bij een kleuring of bijbandjes in een MSP. Bij een ‘bilateraaltje’ had u altijd wat bemoedigende woorden, waardoor ik met hernieuwde energie weer verder ging. U gaf mij de mogelijkheid mezelf helemaal te verliezen in een eindeloze hoeveelheid moleculaire markers, maar zorgde voor evenwicht in het geheel door nooit het belang van de patiënt uit het oog te verliezen. Hartelijk dank daarvoor.
Geachte prof.dr. E. Schuuring, beste Ed, jij hebt mij laten zien hoe verbonden wetenschap en kliniek met elkaar kunnen zijn. Dat uit zich in dit proefschrift, in het moleculair-diagnostisch lab waar het meeste werk is verricht, en vanzelfsprekend in jou als persoon. Het is duidelijk dat jouw begeleiding, waarin je mij veel vrijheid gaf en mijn ideeën serieus nam, maar je ook altijd stimulerend en kritisch was, mij wetenschappelijk heeft gevormd. Naast onze vaste overleg momenten was het altijd mogelijk even binnen te lopen voor overleg. Daarnaast ben ik blij dat we elkaar ook op persoonlijk vlak hebben leren kennen. Er zijn nog genoeg projecten die door-lopen en daarnaast vele plannen voor nieuwe projecten, dus ik hoop ook in de toekomst met je te kunnen samenwerken.
Epilo
og
209208
Ik ben mijn ouders veel verschuldigd. Zij hebben mij gestimuleerd in alles wat ik deed. De be-langrijkste benodigdheden voor het voltooien van dit proefschrift waren interesse en discipline. Het ontwikkelen van een brede interesse is altijd gestimuleerd door mijn moeder. Het is een groot gemis dat zij mijn wetenschappelijke en medische carrière niet heeft mogen meemaken. Mijn vader ben ik zeer dankbaar voor het bijbrengen van discipline. De discipline benodigd voor het maken van een proefschrift valt in het niet bij de discipline die hij heeft gehad na het overlij-den van mijn moeder. Eerst voor het op de baan zetten van het leven van zijn kinderen, daarna om weer wat moois te maken van zijn eigen leven. Dat is hem zeer goed gelukt. Ik ben dan ook zeer blij met mijn stiefmoeder en haar kinderen. Deze grote, samengestelde familieclub met verschillende personen en aanhang is zeer prettig om op terug te kunnen vallen.
Amarens, mijn liefste, bedankt voor je photoshop-hulp, kledingadvies, ondersteuning, begrip en liefde. Mede dankzij jou heb ik mijn promotieonderzoek tot een goed einde gebracht. Daar-naast heb je er voor gezorgd dat ik eens iets anders deed dan onderzoek of studie. Het was niet altijd gemakkelijk om me van mijn werk weg te trekken, maar als het je gelukt was, deed het me erg goed. Ik kijk uit naar onze toekomst samen.
Dankzij de prettige samenwerking met, en ondersteuning van al deze personen heb ik mijn pro-motieonderzoek met veel plezier en voldoening verricht en…voltooid. Bedankt!
Lieuwe Jurjen Melchers, februari 2014
Ook buiten onze hoofdhals groep zijn er vele personen waarmee ik zonder uitzondering prettig mee heb samen gewerkt: dr. Ieneke van der Gun, dr. Ulrike Schnell, dr. Sebastiaan de Visscher, prof.dr. B.F.A.M. van der Laan, prof.dr. J.A. Langendijk, prof.dr. G.H. de Bock, prof.dr. M. Rots, prof.dr. E.J. Speel, dr. B.N.G. Giepmans en dr. M.J.H. Witjes.
Dr. B. van Dijk, beste Boukje, de data van het IKNL is een van de belangrijke bouwstenen ge-weest van mijn database. Daarnaast heb je met jouw kunde en je uitgebreide reacties op ma-nuscripten de kwaliteit en leesbaarheid van de uiteindelijke papers veel goeds gedaan. Bedankt daarvoor.
Verder ben ik dank verschuldigd aan de vele analisten en onderzoekers op de Pathologie. Jan Donga (cytologie) voor de HPV-BRISH en enkele andere kleuringen op de Benchmark. Freke Dijk-huis, Wiebe en de andere archief medewerkers, die meer dan 10.000 coupes en meer dan 3000 blokjes voor mij opzochten. Bedankt ook Geert Harms en Tineke van der Sluis, die enkele TMAs geconstrueerd hebben een niet onaanzienlijk aantal coupes gesneden en gekleurd hebben. Ver-der alle analisten van de moleculaire diagnostiek en het ‘DNA-lab’ die mij met raad en daad heb-ben bijgestaan tijdens mijn onderzoek. Het was altijd mogelijk een extra sample mee te nemen bij isolatie of sequencing. Bedankt ook voor de gezelligheid zowel op het lab als daarbuiten.
Tijdens mijn onderzoek heb ik mijn studie Tandheelkunde gedaan. Teamdocent Albert Smith, bedankt voor de prettige begeleiding in team 8. Voltooiing van deze studie was mij niet gelukt zonder mijn kliniekpartner Laura Schipper: ik had het mogelijk niet overleefd toen ik een servet per ongeluk in brand stak met een heet wasmes en deze wilde blussen met een fles alcohol. Bedankt dat je me tegen hield. Verder heb ik twee goede vrienden over gehouden aan de studie. Christiaan van Heereveld en Gert-Jan Kamphuis: na mijn promotie heb ik iets meer tijd om weer eens resp. een filmpje te kijken en ‘projecten’ uit te werken.
Sinds enkele maanden ben ik begonnen met mijn opleiding tot MKA-chirurg. Ik wil van deze mogelijkheid gebruik maken om alle stafleden, AIOS en al het ondersteunend personeel van de afdeling MKA-chirurgie te bedanken voor de zeer prettige sfeer die ik iedere dag ervaar. In het bijzonder wil ik opleidingsmaatjes Artur Matthews-Brzozowski en Petra Meiners bedanken voor de prettige samenwerking in het eerste half jaar van de opleiding.
Eén van de grote voordelen van onderzoek doen is mogelijkheid om je eigen tijd in te plannen. Ik heb hier gebruik van gemaakt door de afgelopen jaren bij vele prachtige orkesten als trompet-tist in te vallen, oa. bij Harmonie ’67, Kamerfilharmonie Der Aa, Fanfareorkest CWO, GSO Mira, GSMG Bragi, en de vele ad hoc groepjes. Daarnaast had ik natuurlijk mijn vaste orkesten: het Veenkoloniaal Symfonieorkest en fanfareorkest Concordia Middelstum. Door de vele muzikale activiteiten waren mijn weekenden soms voller dan mijn werkweken, maar deze ontspanning door inspanning zorgde er voor dat ik met verse energie aan de werkweek begon.
Epilo
og

211210
Curriculum vitae
Lieuwe Jurjen Melchers (Leeuwarden, The Netherlands, 1983) re-ceived his gymnasium diploma cum laude from Bornego College Heerenveen, in 2001. That same year he started his medical educa-tion at the University of Groningen. After obtaining his medical de-gree (MD), he worked at the departments of internal medicine, cardi-ology and pulmonology of the Scheper Hopital, Emmen. He began his research activities at the departments of Oral & Maxillofacial Surgery and Pathology of the University Medical Center Groningen (UMCG) in 2008. This work was later combined with his dental training at the same institution. In 2013 he started as resident in the department of Oral & Maxillofacial Surgery, UMCG. In his spare time he is an avid classical trumpet player.
Curr
icul
um v
itae

212
Printing and distribution of this thesis was kindly supported by:
University of Groningen www.rug.nlUniversity Medical Center Groningen, Graduate School of Medical Sciences www.umcg.nlNederlandse Vereniging voor Mondziekten, Kaak- en Aangezichtschirurgie (NVMKA) www.nvmka.nlDam Medical www.dammedical.nlDentaid www.dentaid.nlTandtechnisch Laboratorium Laverman www.ttllaverman.nlExam Vision www.examvision.nlBoehringer-Ingelheim www.boehringer-ingelheim.nlRoche Diagnostics www.roche.nl