characterization of mycobacterial virulence genes through genetic interaction mapping
TRANSCRIPT
Characterization of mycobacterial virulence genesthrough genetic interaction mappingSwati M. Joshi*, Amit K. Pandey*, Nicole Capite*, Sarah M. Fortune†, Eric J. Rubin†, and Christopher M. Sassetti*‡
*Department of Molecular Genetics and Microbiology, University of Massachusetts Medical School, Worcester, MA 01655; and †Department of Immunologyand Infectious Diseases, Harvard School of Public Health, Boston, MA 02115
Edited by John J. Mekalanos, Harvard Medical School, Boston, MA, and approved June 13, 2006 (received for review April 19, 2006)
We have previously shown that �5% of the genes encoded by thegenome of Mycobacterium tuberculosis are specifically requiredfor the growth or survival of this bacterium during infection. Thiscorresponds to hundreds of genes, most of which have no iden-tifiable function. As a unique approach to characterize these genes,we developed a method to rapidly delineate functional pathwaysby identifying mutations that modify each other’s phenotype, i.e.,‘‘genetic interactions’’. Using this method, we have defined acomplex set of interactions between virulence genes in this patho-gen, and find that the products of unlinked genes associate to formmultisubunit transporters that are required for bacterial survival inthe host. These findings implicate a previously undescribed familyof transport systems in the pathogenesis of tuberculosis, andidentify genes that are likely to function in the metabolism of theirsubstrates. This method can be readily applied to other organismsat either the single pathway level, as described here, or at thesystem level to define quantitative genetic interaction networks.
epistasis � mce � transport � tuberculosis
Functional assignments cannot be made for a large fraction ofgenes in even the most thoroughly studied organisms (1). It
has been even more difficult to characterize the genomes ofpathogens, because a large fraction of the encoded functions arespecialized for survival in experimentally intractable environ-ments. Genes of unknown function are generally classifiedthrough the identification of physical (2–4) regulatory (5), orphylogenetic (6) associations that allow genes to be associatedwith pathways of known function. A more comprehensive ap-proach is the definition of genetic interactions. In this type ofanalysis, the phenotypes of single and double mutants arecompared to find mutations that alter the phenotypic conse-quence of inactivating a gene of interest. This general phenom-enon is termed ‘‘epistasis,’’ and encompasses several types ofinteraction (7). ‘‘Negative’’ (i.e., synthetic or synergistic) inter-actions are defined as mutations that produce a larger thanadditive phenotypic effect when present together, and ‘‘positive’’(i.e., buffering or antagonistic) interactions occur between mu-tations produce a less than additive effect. ‘‘Suppressors’’ are adistinct subcategory of positive interactions, which alleviate theconsequence of gene loss.
Although the interpretation of these interactions is not alwaysstraightforward, for null alleles, negative interactions are oftenfound between genes of separate pathways that perform redun-dant functions. Positive interactions, excluding suppressors, oc-cur largely between genes of the same pathway that depend oneach other for their function. Suppressor mutations can act byinducing a compensatory pathway or by relieving a toxic effectof the primary mutation. Thus, genetic interactions can be usedto define the individual steps of a pathway, identify parallelpathways that contribute to similar biological processes, andeven provide clues to the molecular basis of a mutant phenotype.
Large scale maps of genetic interactions have previously onlybeen generated in a small number of easily manipulated modelorganisms by determining the relative in vitro growth rates ofthousands of individually constructed single and double mutant
strains. With notable exceptions (8, 9), these cumbersomescreens provide largely qualitative data and define only the mostdramatic interactions. We developed a microarray-based tech-nique, called transposon site hybridization (TraSH), which canbe used to compare the growth rates of individual transposonmutants in large pools and is easily applied to less tractablepathogenic organisms (10). The mutant libraries used in thesestudies were made by using a minitransposon that encodesoutward-facing T7 RNA polymerase promoters. The labeledRNA probe generated from these promoters is complementaryto the chromosomal DNA flanking each insertion in the mutantpool, and effectively marks the approximate position of eachtransposon. The relative composition of any two pools can berapidly determined by competitively hybridizing the correspond-ing probes to a microarray. Because mutant pools can beanalyzed after being subjected to any number of selectiveconditions, including passage through animal hosts, this ap-proach can be used to study virulence genes that are onlyessential during infection.
We have used this method to identify genes that interact withthe ‘‘mce loci’’ of M. tuberculosis, which have been implicated asimportant determinants of virulence. These loci consist of fourhomologous 8-13 gene operons, mce1–mce4, that appear to havearisen by the duplication of a single ancestral locus (11). The firstmce gene to be discovered was found to promote the uptake ofbacteria into nonphagocytic cells (12, 13) and was thus desig-nated to function in mycobacterial cell entry (‘‘mce’’). However,mutations in these loci have been reported to have varyingeffects, either increasing or decreasing virulence (14–16), leav-ing their role during infection unclear. A systematic geneticanalysis of the mce loci has yet to be performed, and nobiochemical function for their products has been proposed.
The identification of unlinked genes that genetically interactwith the mce loci has provided numerous functional insights.Most significantly, we report that the product of one interactinggene represents an ATPase that associates with mce-encodedtransmembrane proteins to form multisubunit transport systemsresembling ATP-binding cassette (ABC) transporters. Mutagen-esis of this essential subunit indicates that Mce-mediated trans-port is critical for tuberculosis pathogenesis, and other geneticinteractions suggest that these transporters may function in thetranslocation of lipid substrates. In addition to defining a mech-anism by which this pathogen interacts with the host, this workdemonstrates the general utility of this approach for the char-acterization of virulence genes for which little functional infor-mation is available.
Conflict of interest statement: No conflicts declared.
This paper was submitted directly (Track II) to the PNAS office.
Abbreviations: TraSH, transposon site hybridization; ABC, ATP-binding cassette; NBD,nucleotide-binding domain.
Data deposition: The sequences reported in this paper have been deposited in the GenBankdatabase (accession nos. DQ823230–DQ823235).
‡To whom correspondence should be addressed. E-mail: [email protected].
© 2006 by The National Academy of Sciences of the USA
11760–11765 � PNAS � August 1, 2006 � vol. 103 � no. 31 www.pnas.org�cgi�doi�10.1073�pnas.0603179103
ResultsGeneration of a Genetic Interaction Map for the mce Loci. PreviousTraSH analyses indicated that mutations in the mce1 and mce4operons produced distinct in vivo growth defects (15). To
characterize these loci further, we used TraSH to identify genesthat positively interact with them and are, therefore, likely tofunction in the same pathway (Fig. 1). Whole genome data areprovided in Tables 1 and 2, which are published as supportinginformation on the PNAS web site. Interacting genes weredefined by mutations that reduced the in vivo growth rate ofwild-type bacteria, but had a significantly less severe effect inmce-deficient backgrounds (see Experimental Procedures). Thirty-five and 31 positively interacting mutations were identified forthe mce1 and mce4 loci, respectively, approximately one-third ofwhich appear to act as suppressors (Tables 3 and 4, which arepublished as supporting information on the PNAS web site). Thetotal number of interactions corresponds to �1% of the genome,which is similar to large-scale interaction screens in Saccharo-myces cerevisiae (8, 9, 17).
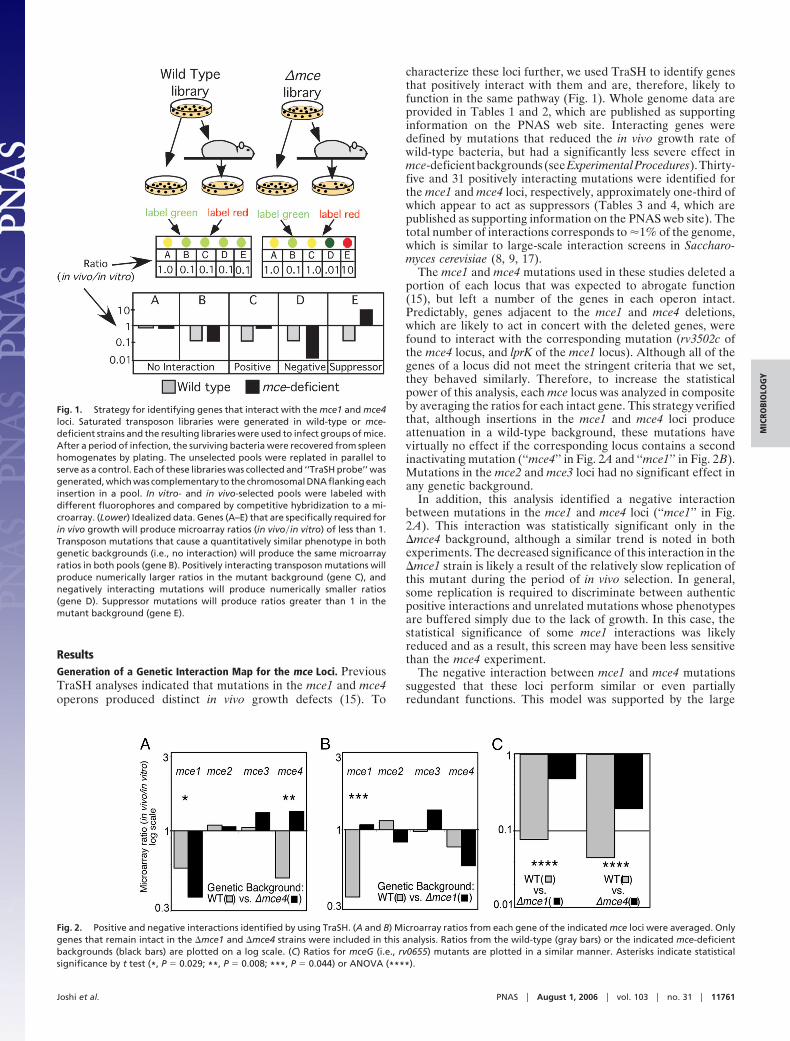
The mce1 and mce4 mutations used in these studies deleted aportion of each locus that was expected to abrogate function(15), but left a number of the genes in each operon intact.Predictably, genes adjacent to the mce1 and mce4 deletions,which are likely to act in concert with the deleted genes, werefound to interact with the corresponding mutation (rv3502c ofthe mce4 locus, and lprK of the mce1 locus). Although all of thegenes of a locus did not meet the stringent criteria that we set,they behaved similarly. Therefore, to increase the statisticalpower of this analysis, each mce locus was analyzed in compositeby averaging the ratios for each intact gene. This strategy verifiedthat, although insertions in the mce1 and mce4 loci produceattenuation in a wild-type background, these mutations havevirtually no effect if the corresponding locus contains a secondinactivating mutation (‘‘mce4’’ in Fig. 2A and ‘‘mce1’’ in Fig. 2B).Mutations in the mce2 and mce3 loci had no significant effect inany genetic background.
In addition, this analysis identified a negative interactionbetween mutations in the mce1 and mce4 loci (‘‘mce1’’ in Fig.2A). This interaction was statistically significant only in the�mce4 background, although a similar trend is noted in bothexperiments. The decreased significance of this interaction in the�mce1 strain is likely a result of the relatively slow replication ofthis mutant during the period of in vivo selection. In general,some replication is required to discriminate between authenticpositive interactions and unrelated mutations whose phenotypesare buffered simply due to the lack of growth. In this case, thestatistical significance of some mce1 interactions was likelyreduced and as a result, this screen may have been less sensitivethan the mce4 experiment.
The negative interaction between mce1 and mce4 mutationssuggested that these loci perform similar or even partiallyredundant functions. This model was supported by the large
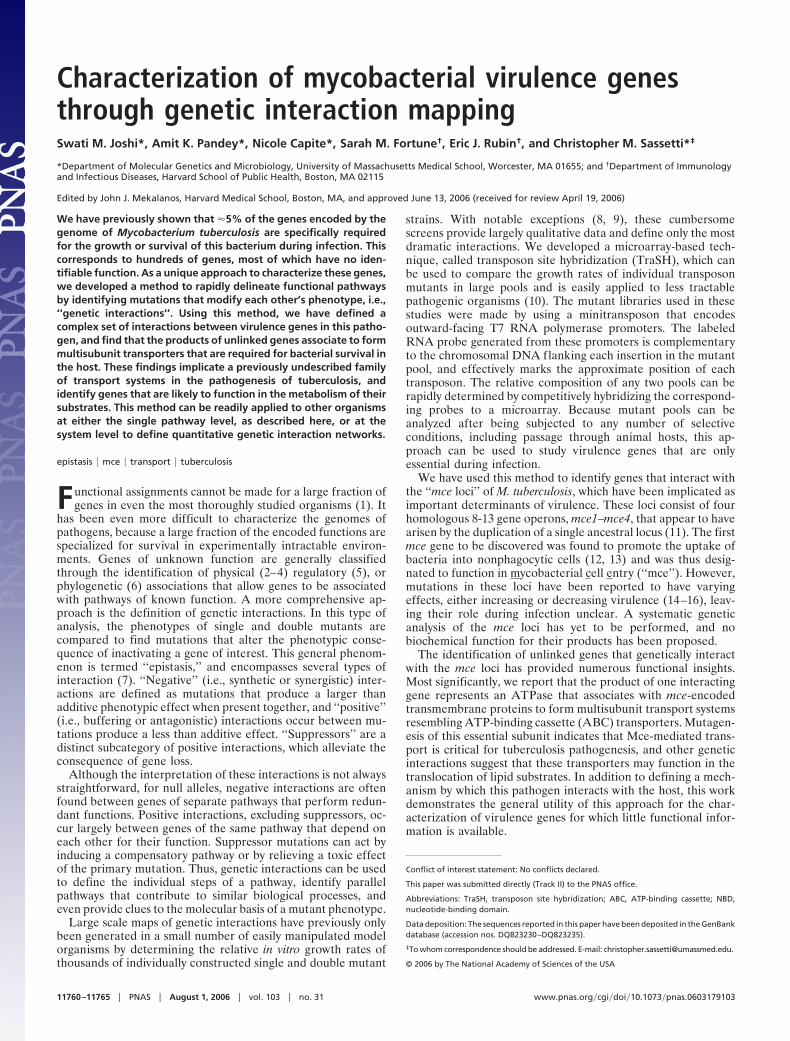
Fig. 1. Strategy for identifying genes that interact with the mce1 and mce4loci. Saturated transposon libraries were generated in wild-type or mce-deficient strains and the resulting libraries were used to infect groups of mice.After a period of infection, the surviving bacteria were recovered from spleenhomogenates by plating. The unselected pools were replated in parallel toserve as a control. Each of these libraries was collected and ‘‘TraSH probe’’ wasgenerated, which was complementary to the chromosomal DNA flanking eachinsertion in a pool. In vitro- and in vivo-selected pools were labeled withdifferent fluorophores and compared by competitive hybridization to a mi-croarray. (Lower) Idealized data. Genes (A–E) that are specifically required forin vivo growth will produce microarray ratios (in vivo�in vitro) of less than 1.Transposon mutations that cause a quantitatively similar phenotype in bothgenetic backgrounds (i.e., no interaction) will produce the same microarrayratios in both pools (gene B). Positively interacting transposon mutations willproduce numerically larger ratios in the mutant background (gene C), andnegatively interacting mutations will produce numerically smaller ratios(gene D). Suppressor mutations will produce ratios greater than 1 in themutant background (gene E).
Fig. 2. Positive and negative interactions identified by using TraSH. (A and B) Microarray ratios from each gene of the indicated mce loci were averaged. Onlygenes that remain intact in the �mce1 and �mce4 strains were included in this analysis. Ratios from the wild-type (gray bars) or the indicated mce-deficientbackgrounds (black bars) are plotted on a log scale. (C) Ratios for mceG (i.e., rv0655) mutants are plotted in a similar manner. Asterisks indicate statisticalsignificance by t test (*, P � 0.029; **, P � 0.008; ***, P � 0.044) or ANOVA (****).
Joshi et al. PNAS � August 1, 2006 � vol. 103 � no. 31 � 11761
MIC
ROBI
OLO
GY
proportion of genes that interacted positively with both loci, asdepicted in Fig. 3. Greater than 25% of the genes that interactedwith each mce mutation were also found to interact with theother mce locus.
The first two genes of each mce operon (annotated as yrbEAand yrbEB genes) (11) are similar in both sequence and predictedsecondary structure to the transmembrane permease subunits ofABC transporters, suggesting a potential role for these proteinsin transmembrane transport. However, all ABC transport sys-tems require an additional nucleotide-binding domain (NBD)subunit to energize transport, and no such gene is encoded in themce loci. The set of genes that was predicted to positively interactwith both mce mutations included rv0655 (Fig. 2C), whichencodes a protein homologous to the NBD subunits of ABCtransporters (18). rv0655 lacks predicted transmembrane helicesand is not encoded near other transporter components. Thus, wehypothesized that the product of this gene might associate withthe YrbEAB proteins of both the mce1 and mce4 loci and formtransport systems. To indicate a role for this gene in mcefunction, we will henceforth refer to rv0655 as ‘‘mceG.’’
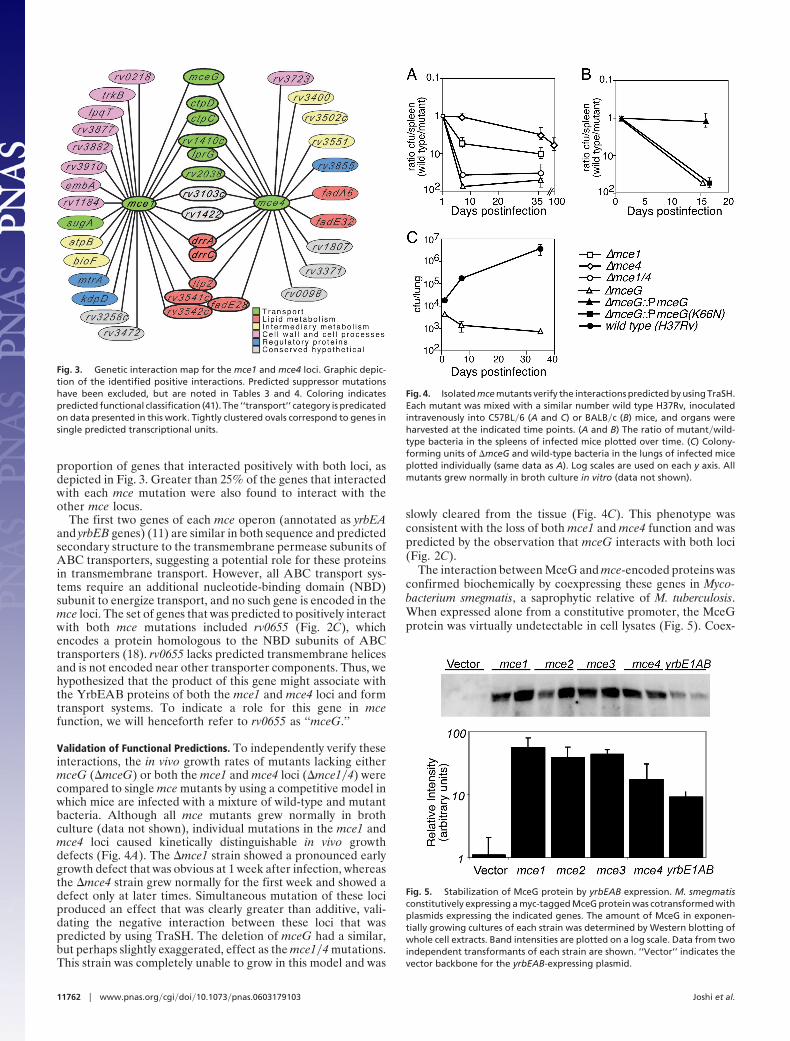
Validation of Functional Predictions. To independently verify theseinteractions, the in vivo growth rates of mutants lacking eithermceG (�mceG) or both the mce1 and mce4 loci (�mce1�4) werecompared to single mce mutants by using a competitive model inwhich mice are infected with a mixture of wild-type and mutantbacteria. Although all mce mutants grew normally in brothculture (data not shown), individual mutations in the mce1 andmce4 loci caused kinetically distinguishable in vivo growthdefects (Fig. 4A). The �mce1 strain showed a pronounced earlygrowth defect that was obvious at 1 week after infection, whereasthe �mce4 strain grew normally for the first week and showed adefect only at later times. Simultaneous mutation of these lociproduced an effect that was clearly greater than additive, vali-dating the negative interaction between these loci that waspredicted by using TraSH. The deletion of mceG had a similar,but perhaps slightly exaggerated, effect as the mce1�4 mutations.This strain was completely unable to grow in this model and was
slowly cleared from the tissue (Fig. 4C). This phenotype wasconsistent with the loss of both mce1 and mce4 function and waspredicted by the observation that mceG interacts with both loci(Fig. 2C).
The interaction between MceG and mce-encoded proteins wasconfirmed biochemically by coexpressing these genes in Myco-bacterium smegmatis, a saprophytic relative of M. tuberculosis.When expressed alone from a constitutive promoter, the MceGprotein was virtually undetectable in cell lysates (Fig. 5). Coex-
Fig. 3. Genetic interaction map for the mce1 and mce4 loci. Graphic depic-tion of the identified positive interactions. Predicted suppressor mutationshave been excluded, but are noted in Tables 3 and 4. Coloring indicatespredicted functional classification (41). The ‘‘transport’’ category is predicatedon data presented in this work. Tightly clustered ovals correspond to genes insingle predicted transcriptional units.
Fig. 4. Isolated mce mutants verify the interactions predicted by using TraSH.Each mutant was mixed with a similar number wild type H37Rv, inoculatedintravenously into C57BL�6 (A and C) or BALB�c (B) mice, and organs wereharvested at the indicated time points. (A and B) The ratio of mutant�wild-type bacteria in the spleens of infected mice plotted over time. (C) Colony-forming units of �mceG and wild-type bacteria in the lungs of infected miceplotted individually (same data as A). Log scales are used on each y axis. Allmutants grew normally in broth culture in vitro (data not shown).
Fig. 5. Stabilization of MceG protein by yrbEAB expression. M. smegmatisconstitutively expressing a myc-tagged MceG protein was cotransformed withplasmids expressing the indicated genes. The amount of MceG in exponen-tially growing cultures of each strain was determined by Western blotting ofwhole cell extracts. Band intensities are plotted on a log scale. Data from twoindependent transformants of each strain are shown. ‘‘Vector’’ indicates thevector backbone for the yrbEAB-expressing plasmid.
11762 � www.pnas.org�cgi�doi�10.1073�pnas.0603179103 Joshi et al.
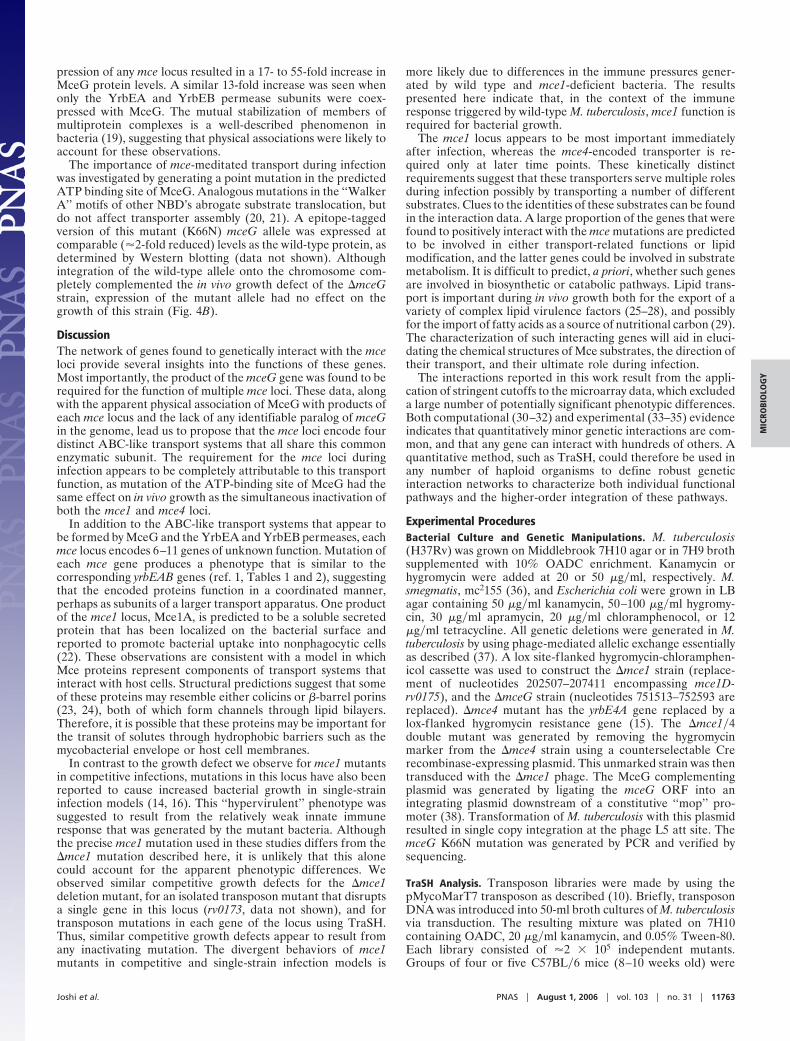
pression of any mce locus resulted in a 17- to 55-fold increase inMceG protein levels. A similar 13-fold increase was seen whenonly the YrbEA and YrbEB permease subunits were coex-pressed with MceG. The mutual stabilization of members ofmultiprotein complexes is a well-described phenomenon inbacteria (19), suggesting that physical associations were likely toaccount for these observations.
The importance of mce-meditated transport during infectionwas investigated by generating a point mutation in the predictedATP binding site of MceG. Analogous mutations in the ‘‘WalkerA’’ motifs of other NBD’s abrogate substrate translocation, butdo not affect transporter assembly (20, 21). A epitope-taggedversion of this mutant (K66N) mceG allele was expressed atcomparable (�2-fold reduced) levels as the wild-type protein, asdetermined by Western blotting (data not shown). Althoughintegration of the wild-type allele onto the chromosome com-pletely complemented the in vivo growth defect of the �mceGstrain, expression of the mutant allele had no effect on thegrowth of this strain (Fig. 4B).
DiscussionThe network of genes found to genetically interact with the mceloci provide several insights into the functions of these genes.Most importantly, the product of the mceG gene was found to berequired for the function of multiple mce loci. These data, alongwith the apparent physical association of MceG with products ofeach mce locus and the lack of any identifiable paralog of mceGin the genome, lead us to propose that the mce loci encode fourdistinct ABC-like transport systems that all share this commonenzymatic subunit. The requirement for the mce loci duringinfection appears to be completely attributable to this transportfunction, as mutation of the ATP-binding site of MceG had thesame effect on in vivo growth as the simultaneous inactivation ofboth the mce1 and mce4 loci.
In addition to the ABC-like transport systems that appear tobe formed by MceG and the YrbEA and YrbEB permeases, eachmce locus encodes 6–11 genes of unknown function. Mutation ofeach mce gene produces a phenotype that is similar to thecorresponding yrbEAB genes (ref. 1, Tables 1 and 2), suggestingthat the encoded proteins function in a coordinated manner,perhaps as subunits of a larger transport apparatus. One productof the mce1 locus, Mce1A, is predicted to be a soluble secretedprotein that has been localized on the bacterial surface andreported to promote bacterial uptake into nonphagocytic cells(22). These observations are consistent with a model in whichMce proteins represent components of transport systems thatinteract with host cells. Structural predictions suggest that someof these proteins may resemble either colicins or �-barrel porins(23, 24), both of which form channels through lipid bilayers.Therefore, it is possible that these proteins may be important forthe transit of solutes through hydrophobic barriers such as themycobacterial envelope or host cell membranes.
In contrast to the growth defect we observe for mce1 mutantsin competitive infections, mutations in this locus have also beenreported to cause increased bacterial growth in single-straininfection models (14, 16). This ‘‘hypervirulent’’ phenotype wassuggested to result from the relatively weak innate immuneresponse that was generated by the mutant bacteria. Althoughthe precise mce1 mutation used in these studies differs from the�mce1 mutation described here, it is unlikely that this alonecould account for the apparent phenotypic differences. Weobserved similar competitive growth defects for the �mce1deletion mutant, for an isolated transposon mutant that disruptsa single gene in this locus (rv0173, data not shown), and fortransposon mutations in each gene of the locus using TraSH.Thus, similar competitive growth defects appear to result fromany inactivating mutation. The divergent behaviors of mce1mutants in competitive and single-strain infection models is
more likely due to differences in the immune pressures gener-ated by wild type and mce1-deficient bacteria. The resultspresented here indicate that, in the context of the immuneresponse triggered by wild-type M. tuberculosis, mce1 function isrequired for bacterial growth.
The mce1 locus appears to be most important immediatelyafter infection, whereas the mce4-encoded transporter is re-quired only at later time points. These kinetically distinctrequirements suggest that these transporters serve multiple rolesduring infection possibly by transporting a number of differentsubstrates. Clues to the identities of these substrates can be foundin the interaction data. A large proportion of the genes that werefound to positively interact with the mce mutations are predictedto be involved in either transport-related functions or lipidmodification, and the latter genes could be involved in substratemetabolism. It is difficult to predict, a priori, whether such genesare involved in biosynthetic or catabolic pathways. Lipid trans-port is important during in vivo growth both for the export of avariety of complex lipid virulence factors (25–28), and possiblyfor the import of fatty acids as a source of nutritional carbon (29).The characterization of such interacting genes will aid in eluci-dating the chemical structures of Mce substrates, the direction oftheir transport, and their ultimate role during infection.
The interactions reported in this work result from the appli-cation of stringent cutoffs to the microarray data, which excludeda large number of potentially significant phenotypic differences.Both computational (30–32) and experimental (33–35) evidenceindicates that quantitatively minor genetic interactions are com-mon, and that any gene can interact with hundreds of others. Aquantitative method, such as TraSH, could therefore be used inany number of haploid organisms to define robust geneticinteraction networks to characterize both individual functionalpathways and the higher-order integration of these pathways.
Experimental ProceduresBacterial Culture and Genetic Manipulations. M. tuberculosis(H37Rv) was grown on Middlebrook 7H10 agar or in 7H9 brothsupplemented with 10% OADC enrichment. Kanamycin orhygromycin were added at 20 or 50 �g�ml, respectively. M.smegmatis, mc2155 (36), and Escherichia coli were grown in LBagar containing 50 �g�ml kanamycin, 50–100 �g�ml hygromy-cin, 30 �g�ml apramycin, 20 �g�ml chloramphenocol, or 12�g�ml tetracycline. All genetic deletions were generated in M.tuberculosis by using phage-mediated allelic exchange essentiallyas described (37). A lox site-f lanked hygromycin-chloramphen-icol cassette was used to construct the �mce1 strain (replace-ment of nucleotides 202507–207411 encompassing mce1D-rv0175), and the �mceG strain (nucleotides 751513–752593 arereplaced). �mce4 mutant has the yrbE4A gene replaced by alox-f lanked hygromycin resistance gene (15). The �mce1�4double mutant was generated by removing the hygromycinmarker from the �mce4 strain using a counterselectable Crerecombinase-expressing plasmid. This unmarked strain was thentransduced with the �mce1 phage. The MceG complementingplasmid was generated by ligating the mceG ORF into anintegrating plasmid downstream of a constitutive ‘‘mop’’ pro-moter (38). Transformation of M. tuberculosis with this plasmidresulted in single copy integration at the phage L5 att site. ThemceG K66N mutation was generated by PCR and verified bysequencing.
TraSH Analysis. Transposon libraries were made by using thepMycoMarT7 transposon as described (10). Briefly, transposonDNA was introduced into 50-ml broth cultures of M. tuberculosisvia transduction. The resulting mixture was plated on 7H10containing OADC, 20 �g�ml kanamycin, and 0.05% Tween-80.Each library consisted of �2 � 105 independent mutants.Groups of four or five C57BL�6 mice (8–10 weeks old) were
Joshi et al. PNAS � August 1, 2006 � vol. 103 � no. 31 � 11763
MIC
ROBI
OLO
GY
inoculated intravenously with a mixture of 106 colony-formingunits (cfu) of mutant library and an equal number of wild-typeH37Rv. At 1 week (for mce1 interactions) or 8 weeks (for mce4interactions), the mice were killed, and the surviving mutantswere collected by plating spleen homogenates on 7H10 contain-ing kanamycin. The ratio of mutant�wild type was determined atthis time, and the mutant libraries were �10-fold underrepre-sented relative to wild type. The inoculating libraries werereplated in parallel to serve as controls. Each library wascollected separately by scraping the plates, chromosomal DNAwas isolated from each, and TraSH probe was generated andhybridized to custom microarrays as described (10). Two TraSHprobes were generated and hybridized independently for eachmutant pool. The data from these microarrays (8–10 per exper-imental group) were averaged by using GeneSpring software.Spots that did not produce an intensity �300 fluorescence units,were not detected in six of eight replicates, or corresponded togenes that were independently predicted to be required for invitro growth (39) were discarded. Genetic interactions wereidentified by comparing the ratios for each gene in the mce-deficient libraries to the corresponding wild-type library usingtwo-way ANOVA testing and a false-discovery rate of 5%. Thepositive interactions were defined as the genes selected byANOVA that were also predicted to be required for optimal invivo growth in a wild-type background (15) and whose ratiodecreased by �2-fold in the mutant background. The fraction ofthese interactions that represent suppressor mutations weredefined as those with microarray ratios �2 in the mutantbackground. The ‘‘mce loci’’ are defined as in ref. 11: mce1,yrbE1A-rv0178; mce2, yrbE2A-mce2F; mce3, yrbE3A-rv1975;mce4, yrbE4A-mce4F.
Animal Infections. Log phase cultures of bacteria were washedtwice in PBS containing 0.05% Tween-80, frozen in 10% glyc-erol, and titered. Eight- to 10-week-old C57BL�6 mice wereinoculated with the 200 �l of PBS containing �2 � 105 cfu ofwild type and �8 � 104 cfu of mutant via the lateral tail vein. Atthe indicated times, lungs and spleens were removed, homoge-nized in PBS containing 0.05% Tween-80, and plated on 7H10
agar (for total bacterial counts) or 7H10 agar containing hygro-mycin (to enumerate cfu of mutant).
M. smegmatis Expression. To generate the epitope tagged allele ofmceG, the following sequence (encoding 6xHis and c-myc tags)was added to the 3� end of the peptide by PCR: HHHHHH-MAEQKLISEEDL. The mceG fusion was cloned downstream ofa mycobacterial hsp60 promoter of an episomal shuttle vector,which expresses apramycin resistance to generate pSJ7 (Gen-Bank accession no. DQ823234). To express isolated yrbEABgenes, these ORFs were amplified from the mce1 locus by PCR.This product was cloned into an episomal shuttle vector express-ing hygromycin resistance resulting in pCS59 (GenBank acces-sion no. DQ823235). To isolate intact mce loci, a cosmid libraryof H37Rv chromosomal DNA was generated in a modifiedsupercos-1 vector (39). The ends of random clones were se-quenced, and a clone containing each mce locus was isolated. Aconstitutive hsp60 promoter, a composite hygromycin-chloramphenicol marker, and mycobacterial origin of replicationwere recombined immediately upstream of each mce locus byusing the �-red recombination system (40). Plasmid sequencesare available in GenBank (accession nos. DQ823230 –DQ823233). Cultures (100 ml) of M. smegmatis transformed withthe indicated plasmids were collected by centrifugation, resus-pended in 1 ml of PBS containing protease inhibitor mixture(Sigma, St. Louis, MO), lysed by sonication, heated to 50°C for10 min in SDS sample buffer containing 1% 2-mercaptoethanol,and separated by 4–20% gradient SDS�PAGE. Proteins weretransferred to PVDF membranes, stained with a polyclonalrabbit anti-myc antibody (Abcam, Cambridge, MA) followed byHRP-conjugated anti-rabbit IgG (Promega, Madison, WI), andvisualized with ECL reagent (Pierce, Rockford, IL). Lightemission was quantified by using a LAS-1000 Plus Gel Docu-mentation System and Intelligent Dark Box II. Images wereprocessed by using the ImageGauge program (Fujifilm, Toyko,Japan)
We thank Ilona Breiterene for expert technical assistance; John Leong,Doyle Ward, and Jennifer Phillips for critical review of this manuscript;and John Mckinney and James Gomez for insightful conversation. Thiswork was supported by National Institutes of Health Grant AI48704.
1. Costanzo, M. C., Hogan, J. D., Cusick, M. E., Davis, B. P., Fancher, A. M.,Hodges, P. E., Kondu, P., Lengieza, C., Lew-Smith, J. E., Lingner, C., et al.(2000) Nucleic Acids Res. 28, 73–76.
2. Ho, Y., Gruhler, A., Heilbut, A., Bader, G. D., Moore, L., Adams, S. L.,Millar, A., Taylor, P., Bennett, K., Boutilier, K., et al. (2002) Nature 415,180–183.
3. Gavin, A. C., Bosche, M., Krause, R., Grandi, P., Marzioch, M., Bauer, A.,Schultz, J., Rick, J. M., Michon, A. M., Cruciat, C. M., et al. (2002) Nature 415,141–147.
4. Uetz, P., Giot, L., Cagney, G., Mansfield, T. A., Judson, R. S., Knight, J. R.,Lockshon, D., Narayan, V., Srinivasan, M., Pochart, P., et al. (2000) Nature 403,623–627.
5. Wu, L. F., Hughes, T. R., Davierwala, A. P., Robinson, M. D., Stoughton, R.& Altschuler, S. J. (2002) Nat. Genet. 31, 255–265.
6. Srinivasan, B. S., Caberoy, N. B., Suen, G., Taylor, R. G., Shah, R., Tengra, F.,Goldman, B. S., Garza, A. G. & Welch, R. D. (2005) Nat. Biotechnol. 23,691–698.
7. Phillips, P. C. (1998) Genetics 149, 1167–1171.8. Schuldiner, M., Collins, S. R., Thompson, N. J., Denic, V., Bhamidipati, A.,
Punna, T., Ihmels, J., Andrews, B., Boone, C., Greenblatt, J. F., et al. (2005)Cell 123, 507–519.
9. Pan, X., Yuan, D. S., Xiang, D., Wang, X., Sookhai-Mahadeo, S., Bader, J. S.,Hieter, P., Spencer, F. & Boeke, J. D. (2004) Mol. Cell 16, 487–496.
10. Sassetti, C. M., Boyd, D. H. & Rubin, E. J. (2001) Proc. Natl. Acad. Sci. USA98, 12712–12717.
11. Cole, S. T., Brosch, R., Parkhill, J., Garnier, T., Churcher, C., Harris, D.,Gordon, S. V., Eiglmeier, K., Gas, S., Barry, C. E., III, et al. (1998) Nature 393,537–544.
12. Casali, N., Konieczny, M., Schmidt, M. A. & Riley, L. W. (2002) Infect Immun.70, 6846–6852.
13. Arruda, S., Bomfim, G., Knights, R., Huima-Byron, T. & Riley, L. W. (1993)Science 261, 1454–1457.
14. Shimono, N., Morici, L., Casali, N., Cantrell, S., Sidders, B., Ehrt, S. & Riley,L. W. (2003) Proc. Natl. Acad. Sci. USA 100, 15918–15923.
15. Sassetti, C. M. & Rubin, E. J. (2003) Proc. Natl. Acad. Sci. USA 100, 12989–12994.16. Gioffre, A., Infante, E., Aguilar, D., De la Paz Santangelo, M., Klepp, L.,
Amadio, A., Meikle, V., Etchechoury, I., Romano, M. I., Cataldi, A., et al.(2005) Microbes Infect. 7, 325–334.
17. Tong, A. H., Evangelista, M., Parsons, A. B., Xu, H., Bader, G. D., Page, N.,Robinson, M., Raghibizadeh, S., Hogue, C. W., Bussey, H., et al. (2001) Science294, 2364–2368.
18. Marchler-Bauer, A. & Bryant, S. (2004) Nucleic Acids Res. 32, W327–W331.19. Berger, B. R. & Christie, P. J. (1994) J. Bacteriol. 176, 3646–3660.20. Henriksen, U., Gether, U. & Litman, T. (2005) J. Cell Sci. 118, 1417–1426.21. Sexton, J. A., Yeo, H. J. & Vogel, J. P. (2005) Mol. Microbiol. 57, 70–84.22. Chitale, S., Ehrt, S., Kawamura, I., Fujimura, T., Shimono, N., Anand, N., Lu,
S., Cohen-Gould, L. & Riley, L. W. (2001) Cell Microbiol. 3, 247–254.23. Pajon, R., Yero, D., Lage, A., Llanes, A. & Borroto, C. J. (2006) Tuberculosis
(Edinburgh) 86, 290–302.24. Das, A. K., Mitra, D., Harboe, M., Nandi, B., Harkness, R. E., Das, D. & Wiker,
H. G. (2003) Biochem. Biophys. Res. Commun. 302, 442–447.25. Cox, J. S., Chen, B., McNeil, M. & Jacobs, W. R., Jr. (1999) Nature 402,
79–83.26. Reed, M. B., Domenech, P., Manca, C., Su, H., Barczak, A. K., Kreiswirth,
B. N., Kaplan, G. & Barry, C. E., III (2004) Nature 431, 84–87.27. Ryll, R., Kumazawa, Y. & Yano, I. (2001) Microbiol. Immunol. 45, 801–811.28. Converse, S. E., Mougous, J. D., Leavell, M. D., Leary, J. A., Bertozzi, C. R.
& Cox, J. S. (2003) Proc. Natl. Acad. Sci. USA 100, 6121–6126.29. McKinney, J. D., Honer zu Bentrup, K., Munoz-Elias, E. J., Miczak, A., Chen,
B., Chan, W. T., Swenson, D., Sacchettini, J. C., Jacobs, W. R., Jr., & Russell,D. G. (2000) Nature 406, 735–738.
11764 � www.pnas.org�cgi�doi�10.1073�pnas.0603179103 Joshi et al.
30. Segre, D., Deluna, A., Church, G. M. & Kishony, R. (2005) Nat. Genet 37,77–83.
31. You, L. & Yin, J. (2002) Genetics 160, 1273–1281.32. Lenski, R. E., Ofria, C., Collier, T. C. & Adami, C. (1999) Nature 400,
661–664.33. Elena, S. F. (1999) J. Mol. Evol. 49, 703–707.34. Elena, S. F. & Lenski, R. E. (1997) Nature 390, 395–398.35. Burch, C. L., Turner, P. E. & Hanley, K. A. (2003) J. Evol. Biol. 16,
1223–1235.36. Snapper, S. B., Melton, R. E., Mustafa, S., Kieser, T. & Jacobs, W. R. J. (1990)
Mol. Microbiol. 4, 1911–1919.
37. Bardarov, S., Bardarov, S., Jr., Pavelka, M. S., Jr., Sambandamurthy, V.,Larsen, M., Tufariello, J., Chan, J., Hatfull, G. & Jacobs, W. R., Jr. (2002)Microbiology 148, 3007–3017.
38. Guinn, K. M., Hickey, M. J., Mathur, S. K., Zakel, K. L., Grotzke, J. E.,Lewinsohn, D. M., Smith, S. & Sherman, D. R. (2004) Mol. Microbiol. 51,359–370.
39. Sassetti, C. M., Boyd, D. H. & Rubin, E. J. (2003) Mol. Microbiol. 48, 77–84.40. Datsenko, K. A. & Wanner, B. L. (2000) Proc. Natl. Acad. Sci. USA 97,
6640–6645.41. Camus, J. C., Pryor, M. J., Medigue, C. & Cole, S. T. (2002) Microbiology 148,
2967–2973.
Joshi et al. PNAS � August 1, 2006 � vol. 103 � no. 31 � 11765
MIC
ROBI
OLO
GY