bio-optics in integrated ocean observing networks: potential for studying harmful algal blooms
TRANSCRIPT

3
Bio-optics in integrated ocean observing networks: potential for studying harmfulalgal blooms O. Schofield, J. Bosch, S. Glenn, G. Kirkpatrick, J. Kerfoot, S. Lohrenz, M. Moline, M. Oliver and P. Bissett
3 . 1 I n t r o d u c t i o n
The problem. If I were to choose a single phrase to characterize the first century of modern oceanography, it would be a century of under-sampling. Walter Munk The new reality. The ocean sciences are now on the threshold of another major technological advance as the scientific community begins to establish a global, long-term presence in the ocean. Robert Detrick
Ships have a difficult time sampling the time and space scales relevant for understanding how physics and chemistry regulate marine ecosystems (National Research Council 2000, 2003, Figure 3.1); therefore the biology in the oceans is chronically under-sampled. This is a major problem for policy makers and local governments charged with managing coastal resources who are increasingly being asked to develop ‘ecosystem-based management’ plans (US Ocean Commission on Ocean Policy, 2004). This is especially true in regions where Harmful Algal Blooms (HABs) are present (Hallegraeff, 1993). Ecosystem-based management requires a quantitative understanding of the processes controlling marine food webs. These processes include physical (mixing, stratification, advection) and chemical (micro, macro, and organic nutrients) factors as well as trophic interactions within the marine food webs. These food-web interactions are especially difficult to study as they are modulated by complex climate (global warming, storms, winter cooling/summer heating), pelagic (mixing and stratification), lithospheric (nutrient weathering), and anthropogenic (terrestrially derived macro and micro nutrients, buoyant plumes, human grazing pressures) forcing functions. Understanding these food webs require an integrated view of physics, chemistry, and phytoplankton community dynamics.
Phytoplankton communities often appear to be relatively stable and diverse (the paradox of the plankton, described by Hutchinson, 1961); however the communities occasionally undergo sudden and dramatic fluctuations where the diverse phytoplankton communities shift to rapidly growing monospecific populations. Harmful algal blooms (HABs) are one such manifestation of this phenomena. Theoretical constructs for community shifts have been developed as disturbance hypotheses in ecology (e.g. Paine and Vadas, 1969; Connell, 1978) and catastrophe hypotheses in geology (Berggren and van Couvering, 1984). These theories underlie many of the
85

Real-time Coastal Observing Systems
Figure 3.1 The time and space scales relevant for the study of HABs delineated by circles. The squares indicate the time and space scales that can be sampled using the different components central to building an integrated ocean observatory. Note that all available assets are required to span the relevant scales. Source: modified from Dickey (1993).
conceptual models that are useful in understanding phytoplankton evolution and succession. The essence of these hypotheses is that stochastic as well as periodic environmental fluctuations provide opportunities for some species to temporarily dominate a given assemblage; however, because the environment is dynamic, any competitive advantage afforded to one species or group of species is fleeting (Giller et al., 1994). Given this, identifying the conditions that favour HABs has been a major research effort for the research community; however comprehensive understanding remains elusive due to our limited ability to collect data on ecosystem scales.
Traditional sampling approaches are reactive, slow to respond, and often operate with fixed time and space sampling grids (Figure 3.1). The resulting data do a poor job in resolving the real dynamics of the system and therefore it is not surprising that the causal mechanisms (climate, anthropogenic nutrients, mixing rates, etc.) underlying HAB dynamics remains an active research topic. Recent advances in ocean observation capabilities no longer consign us to operate in an under-sampled environment (Figure 3.2). Ocean observation networks are constructed from multiple platforms and are an operational reality (Smith et al., 1987; Dickey, 1993; Schofield et al., 2002). Platforms available include remote (satellites, aircraft and shore-based), stationary (surface and subsurface), mobile (ships and AUVs), and drifting (surface or vertically mobile) systems, that can provide spatially extensive observational updates on timescales of an hour or better for extended periods (Glenn and Schofield, 2003). These observatories will improve coastal water quality management by providing an environmental context over the ecologically relevant space/timescales in real time to facilitate adaptive sampling of the oceans (Schofield et al., 2003).
86

Bio-optics in integrated ocean observing networks
Figure 3.2 The time and space scale variability in ocean colour. A, annual global chlorophyll a map derived from SeaWiFS.14
B, backscattering coefficient (wavelength) in summer 2001 in the Mid-Atlantic Bight derived from SeaWiFS. C, enlarged section of panel B; the satellite’s 1 km pixel is clearly visible and illustrates the features in the coastal ocean that are poorly resolved. Note the newer ocean-colour satellites that have spatial resolutions down to 250 km; ocean-colour satellites with 30 m resolution are proposed. D, enlargement from panel C showing the backscattering coefficient at 442 nm derived from aircraft data. Note the features clearly visible in the aircraft imagery that are missed with the standard 1 km pixels in the satellite imagery. E, visible image viewed by aircraft, with resolution of the order of tens of metres, showing the dramatic colour change associated with crossing an upwelling front in the Mid-Atlantic Bight. The visible ‘greening’ of the water is associated with enhanced blue light absorption probably from phytoplankton and/or chromophoric dissolved organic matter (CDOM). This colour shift underlies empirical algorithms for ocean-colour remote sensing. F, time series of CDOM absorption, estimated from inverting bulk absorption measured with an ac-9 mounted on the Long-term Ecosystem Observatory (LEO) electro-optic fibre-optic cabled seafloor node. This system uses an in situ profiling system to obtain both highly resolved depth and time observations. Rapid changes in CDOM concentration are associated with the passage of storms and a large plume of Hudson River water.
14seawifs.gsfc.nasa.gov/SEAWIFS.html
87

Real-time Coastal Observing Systems
Physical measurements (temperature, salinity, currents, wind speed and direction) have long been available to the community; however the ability to make biological measurements has historically been limited. Over the past three decades, optical techniques have made great advances in mapping ocean ecosystems and phytoplankton biology (see e.g. Limnology and Oceanography, 1989, 34(8), Mobley, 1994; Journal of Geophysical Research, 1995, 100(C7); Oceanography, 2004, 17). These optical measurements, while once exotic, have now matured and are available as off-the-shelf technology (Glenn et al., 2004), providing information on the physical, chemical and biological properties in the ocean. Most importantly, these optical measurements are amenable for the growing number of integrated ocean observatories (Glenn et al., 2004). These observing networks offer great potential for HAB research and management by providing (a) a data-rich environment for interpreting bloom dynamics; (b) a means for remote detection of HABs; and (c) a means for adaptive sampling. This chapter will highlight the present capabilities, problems to be overcome, and the potential for optics and integrated ocean observing networks to provide the backbone for developing ecosystem-based management approaches.
3 . 2 I d e n t i f y i n g a n d t r a c k i n g w a t e r m a s s e s a n d t h e a s s o c i a t e d p h y t o p l a n k t o n ( ‘ w h e r e i s i t i n t h e o c e a n ’ p r o b l e m )
The first problem confronting the researcher and water quality manager is finding, identifying and tracking the HAB events before landfall, which means that it is critical to identify the water mass the algal population is in. Water masses (or water types) have historically been defined by their physical (Helland-Hansen, 1916; Tomczak, 1999) and chemical (Broecker et al., 1985; Weiss et al., 1985; Smethie, 1993; Jenkins, 1980; Jenkins, 1982) properties. These features influence the overall productivity and structure of the biological communities present within the water mass as it is advected by local currents. This movement is regulated by many processes (weather, local topography, river plumes) and therefore tracking a specific water mass (or a HAB population) is difficult using traditional ship-based sampling strategies. Development of approaches that identify and spatially track water masses overtime is one of the central problems confronting the HAB researcher. Such a capability would allow the community to (a) determine water masses that favour HAB initiation; (b) provide a means for tracking specific phytoplankton populations; and (c) identify the environmental conditions and locations that promote the growth of HAB species to be defined.
3.2.1 Current capabilities and obstacles
Two general strategies are currently used to identify water masses. One approach uses clustering techniques to identify water masses based on unique physical, chemical, and biological signatures (Tomczak, 1999). While, traditionally ‘conservative’ parameters (e.g. temperature and salinity) have been used to identify water masses, developing additional parameters for water mass discrimination based on optical properties shows promise (Oliver et al., 2004a). This is not surprising, as optical oceanographers have classified water masses based on their optical properties for decades (Jerlov, 1976; Morel and Prieur, 1977). Optical signatures in coastal systems, where HABs most often occur, reflect the contributions of numerous in-water constituents such as water, phytoplankton, coloured
88

Bio-optics in integrated ocean observing networks
dissolved organic matter, non-algal particles, and sediment. This complex matrix of materials provides a potential library of parameters that can be effective for discriminating water types if methods can provide reliable estimates of the optically significant constituents present (Kirk, 1994; Kahru and Brown, 1997; Schofield et al., 2004; Sosik, 2007 – Chapter 8 this volume). Given data, the actual classification of water masses is accomplished through a variety of often commercially available mathematical algorithms (Quackenbush, 2001; Martin-Trayovski and Sosik, 2003). The ‘art’ of using these clustering techniques is that the user is required to define some subjective criteria of what defines a specific water mass (i.e. a certain change in temperature, salinity, optical backscatter etc.). Without guidance the algorithms could potentially designate any difference in the data as a different water mass. These subjective decisions greatly influence the final output of algorithms. Fortunately developments in the field of bioinformatics may provide the foundation for developing objective means to guide these clustering techniques (Yeung et al., 2001; Oliver et al., 2004a, Figure 3.3). These approaches have been demonstrated by short research experiments, but they have yet to be applied operationally.
The difficulty in applying these clustering approaches operationally is 3-fold. First, as these are empirical approaches, local tuning is often required. Second, the choice of appropriate optical input variables is likely to vary with location. For example, optical parameters sensitive to the presence of coloured dissolved organic matter will be effective in delineating river plumes and coastal waters (Bukata et al., 1995; Aarup et al., 1996; Højerslev et al., 1996; Johnsen et al., 2003) but will have little value in offshore continental shelf waters. The third obstacle, arguably the largest, is the limited availability of adequately resolved spatial data.
The second major technique used to identify water masses is based on identifying temporal anomalies in spatial data. This approach differs from the clustering approach as the temporal variations provide the means to identify water mass evolution and episodic events. Deviations of a parameter (chlorophyll a, sediment load, etc.) from a climatological or running mean are used to identify a water mass which is experiencing an ‘event’. This anomaly can be tracked and adaptively sampled (see below). This approach already anchors operational efforts to delineate toxic Karenia brevis in the Gulf of Mexico (Stumpf, 2000). In the Gulf, anomalies are identified as daily chlorophyll a imagery is subtracted from a two month running chlorophyll a mean. Areas that exhibit a chlorophyll a increase of 1 g l 1 are identified as a water mass that is a potential HAB event. This technique is particularly powerful in delineating episodic blooms of K. brevis blooms (Tomilinson et al., 2004). After a bloom has been detected, wind drift models are then used to forecast its potential transport (Stumpf et al., 1998; Culver et al., 2000). Similar to the water mass clustering techniques, the anomaly technique has several problems. First, the approach will identify any episodic events, such as sediment or nepheloid layer resuspension that optically mimic phytoplankton blooms. Local tuning of the temporal averaging is also required. Finally, like the clustering techniques the greatest problem is collecting the spatial and temporal time series of data.
3.2.2 Data sources available for water mass identification and tracking
3.2.2.1 Satellites
To date, remote sensing techniques have been the central tool capable of providing sufficient spatial data for water mass identification on an operational basis (e.g. Figure 3.3). These techniques will expand how satellite data will support HAB
89

Real-time Coastal Observing Systems
Figure 3.3 Examples of ocean colour and derived water mass imagery in the Mid-Atlantic Bight in summer 2001. A, image of chlorophyll a collected on 2 August, 2001, with the Indian Oceansat satellite which has a spatial resolution of 300 m. B, image of chlorophyll a collected on 2 August 2001 with the American SeaWiFS system. C, boundary frequency between water masses measured on 2 August 2001. The boundary frequency objectively defines borders between major water masses based on the combined output from an ensemble of clustering algorithms that combines information from sea surface temperature (SST) and spectral reflectance (R rs) (Yeung et al., 2001; Oliver et al., 2004a). These techniques allow the scientist to quantify the most frequently observed borders between water masses. Note that the boundaries of a large coastal bloom, offshore waters and the Gulf Stream are delineated. D, gradient strengths between the major water masses for 2 August 2001. While the clustering algorithms (Figure 3.C) separate observations into discrete water masses, this does not quantitatively delineate how different the water masses are from one another. Through distance analysis, the relative strengths of these boundaries can be estimated by determining the ratio of the distance between points in parameter space to the distance between points in physical space (Oliver et al., 2004a). In this case, only the edge of the algal bloom represents a significant water mass boundary.
90

Bio-optics in integrated ocean observing networks
Table 3.1 Current suite of available ocean-colour satellites for HAB biologists
Satellite Country of bands Maximum resolution
SeaWiFS United States 8 1 km FY1-D China 10 1 km MODIS (aqua,terra) IRS-P4 (Oceansat)
United StatesIndia
32 8
250 m 300 m
research in future by providing objective tools to analyse available satellite imagery (Cullen et al., 1997; Tester et al., 1998) and this utility will also increase as the number and type of ocean-colour satellites is due to increase in the coming decade (Table 3.1). Remote sensing in coastal waters has historically been hampered by low spatial resolution (1 km or worse) and a limited number of derived proxies that can be used in the water mass identification. Recently launched satellites now have spatial resolutions down to 250 m (Figure 3.2) and these improvements will be especially important in coastal waters where many of the potentially important oceanographic features for understanding HABs occur on spatial scales smaller than one kilometre.
Expanding the number of algorithms that estimate environmental parameters from space is an ongoing process where the parameter of interest (e.g. chlorophyll a, sediment or particle concentrations, coloured dissolved organic matter) is related empirically to the light reflectance measured by the satellite. The reflectance is related to the parameter of interest usually by ratioing different wavelengths or by inverting the spectral reflectance (Rλ) into absorption (aλ) and backscattering (bbλ) values (note R b /(a b ) (Ruddick et al., 2006 – Chapter 9 this volume). The absorption λ bλ λ bλand backscattering components are proportional to the concentration of the optically active components in the water column, however these proportionalities can be location-dependent thus requiring local tuning (Sosik, 2006 – Chapter 8 this volume).
This iterative tuning of satellite algorithms is sometimes interpreted by some in HAB research and the coastal management community that remote sensing is an immature technology and has only limited value especially as satellites do not provide phytoplankton species specific information. The limitations also imposed by the clouds, limited overhead passes, and limited subsurface data (reflectance signals are exponentially weighted to the surface water signals) have also caused some to dismiss developing remote sensing specifically for HAB research. We believe that this view is unfortunate as the number of and accuracy in the satellite derived products has increased dramatically over the last decade (Table 3.2) and satellites remain one of the only available means to collect sufficient spatial data over relevant ecological scales in near real time. Additionally, they remain one of the few observational tools that permit spatial and temporal hindcast views of environmental parameters leading up to an identified HAB event or HAB ‘backtracking’. The spatial data from satellites is thus ideal for water mass identification approaches.
3.2.2.2 Moorings and autonomous vehicles
While satellites provide excellent spatial data for surface waters, the subdaily temporal and subsurface data they provide are limited. Moorings are often used to collect highly resolved time-series measurements and coarse spatial grids can be obtained if
91

Real-time Coastal Observing Systems
Table 3.2 Some of the available products for the MODIS satellite system, including those still under active development
Parameter Normalized water-leaving radiance (412, 443, 488, 531, 551, 667, 678 nm) Chlorophyll a pheopigment (fluorometric, empirical) Chlorophyll a and total pigment concentration (HPLC, empirical) Chlorophyll fluorescence line height and baseline Chlorophyll fluorescence efficiency Total suspended matter concentration in ocean Pigment concentration in coccolithophore blooms Detached coccolithophore concentration Calcite concentration Diffuse attenuation coefficient at 490 nm Phycoerythrobilin and Phycourobilin concentration Chlorophyll a concentration (SeaWiFS analogue – OC3M) Instantaneous photosynthetically available radiation Instantaneous absorbed radiation by phytoplankton for fluorescence Gelbstoff absorption coefficient at 400 nm Phytoplankton absorption coefficient at 675 nm Total absorption coefficient (412, 443, 488, 531, 551 nm) Sea surface temperature (day and night), 4 m and 11 m Behrenfeld-Falkowski primary production index Howard-Yoder-Ryan primary production index Ocean carbon primary production New nitrogen production Export carbon production Annual chlorophyll a concentration Photosynthetically available radiation Mixed-layer depth
multiple moorings are deployed; however it should be noted that moorings are expensive and the number that can be deployed is limited. Therefore mooring data needs to be complemented with subsurface spatial data. There is a growing array of autonomous underwater vehicles (AUVs) that are capable of providing subsurface data operationally (Figure 3.4). These platforms matured rapidly in the late 1990s and no longer require dedicated teams of engineers to operate them. The AUVs that are now commercially available include autonomous propeller (Glenn et al., 1998; Blackwell et al., 2003) and non-propeller vehicles (Stommel, 1989; Schofield et al., 2002) (Figures 3.4A, 3.4B). The duration of the AUV lifetimes on a single battery charge varies with platform, however several AUV systems can remain at sea for months at a time. The sampling from these platforms is dense and provides sufficient spatial subsurface data appropriate for water mass identification and classification methods.
The number of physical and bio-optical instruments that have been miniaturized and are now available for AUVs and moorings has dramatically increased in recent years (Figure 3.4C–E). These platforms can currently measure both apparent and inherent optical properties. The IOPs (a is absorption, b is scattering, c a b, attenuation) are particularly powerful measurements as they are relatively easy to interpret, can be collected even during the night, and can be measured using commercially
92

Bio-optics in integrated ocean observing networks
Figure 3.4 Two examples of autonomous vehicles that are commercially available for HAB researchers. A, propeller class AUVs are operational tools. These systems are highly manoeuvrable and capable of providing high-resolution maps. These systems are capable of carrying a wide range of powerful instruments, with a duration limited to one or two days per battery charge. Shown is a REMUS vehicle as it surveys a kelp garden off southern California. B, glider class vehicles have no propellers and use buoyancy to provide forward momentum. The lack of a propeller allows for extended missions at sea lasting up to several months per battery charge. Given that the goal is to remain at sea for extended periods, these vehicles cannot carry instruments having high power or frequent maintenance requirements. Shown is a Webb Glider patrolling during a Karenia brevis bloom in the Gulf of Mexico. Given the respective strengths and weaknesses of the vehicles, integrated observing networks will require several different classes of vehicles to span the relevant scales. C, miniaturized attenuation meter before it is integrated into a Webb glider. D, belly of a Web Glider. The square instrument is an attenuation meter. The circular panels are backscatter and fluorometer sensors. E, miniaturized hyperspectral spectrometer (liquid guide capillary tube) capable of providing absorption spectra at 0.4 nm resolution.
available instruments (Roesler and Boss, 2007 – Chapter 5 this volume). The AOP measurements are limited to measurements during daylight hours and therefore will not be reviewed extensively in this chapter; however the utility of the AOPs is reviewed in other chapters in this volume (Sosik, 2007 – Chapter 8 this volume ).
Absorption measurements provide information on the composition of material present. The great advantage is that total absorption, at any wavelength, is a linear combination of the absorbing constituents, which makes interpretation straightfoward
93

Real-time Coastal Observing Systems
Figure 3.5 A, relative absorption of phytoplankton, CDOM and non-algal particles. B, wavelength dependency for the relative absorption (normalized to the wavelength of peak absorption for each component) of chlorophyll a, chlorophyll b, chlorophyll c, photosynthetic carotenoids, and water. The absorption of light by water in the red wavelengths is 100 times that of chlorophyll a. Sources: adapted from Bidigare et al. (1989); water absorption Pope and Fry (1997).
especially as the spectral absorption (Figuure 3.5A) for water (Pope and Fry, 1997), phytoplankton (Prezelin and Boczar, 1986), chromophoric dissolved organic matter (CDOM, Kalle et al., 1966), and non-algal particles (Kishino et al., 1985) has been characterized. Given this, the bulk absorption signal can be partitioned into the component spectra (Roesler et al., 1989; Chang et al., 1999; Olivier et al., 2004b; Schofield et al., 2004; Figure 3.5). Until the mid-1990s, measurements of absorption were difficult to make because of the low signal in most ocean waters; however instrumentation has improved in the last decade (Zaneveld et al., 1995; Kirkpatrick et al., 2003). These bulk inversion approaches are actively being applied to study K. brevis blooms in the Gulf of Mexico from ships (Figures 3.6, 3.7) and recent instrument improvements now allow hyperspectral absorption to be made from AUVs (Figure 3.8).
94

Bio-optics in integrated ocean observing networks
While parameter maps from inverted absorption measurements are useful for water mass tracking (Figures 3.6, 3.7), can the data be used to identify specific algal HAB taxa? Recent work suggests that this is possible if hyperspectral information is available (Millie et al., 1997; Schofield et al., 1999; Kirkpatrick et al., 2000; Roesler
Figure 3.6 Spatial maps of salinity, optically derived maps of CDOM optical weight, phytoplankton optical weight (high values to the south included toxic K. brevis), and the exponential spectral slope of the CDOM absorption. The exponential slope for CDOM reflects the composition of the CDOM and low values is often interpreted as freshly derived CDOM (see Carder et al., 1989). The maps of phytoplankton, CDOM, and CDOM slope were all estimated from bulk absorption measurements made with an ac-9 instrument (Zaneveld et al., 1994; Pegau et al., 1995). Often enhanced K. brevis cell numbers are associated with river plumes and it has been suggested that blooms may be triggered by nutrient-rich waters near shore that provide a source of nitrogen (in the form of ammonia and/or DON) and/ or phosphorus. Numerous culture studies with K. brevis have demonstrated the ability of dinoflagellates to use dissolved organic nitrogen for growth (Baden and Mende, 1979; Shimizu and Wrensford, 1993). Because of this the organic rich river water may be an ideal water mass for growth. Source: Kalle (1996).
95

Real-time Coastal Observing Systems
Figure 3.7 An example of IOP measurements during a HAB event which illustrates diel variability in A, phytoplankton; B, non-algal particles; C, chlorophyll fluorescence yields (here estimated as the ratio of chlorophyll fluorescence to phytoplankton optical weight); D, CDOM optical weights (here optical weight refers to the proportion of component absorption to total absorption at 676 nm for phytoplankton and 412 nm for CDOM and non-algal particles, see Schofield et al., 2004) during a Gulf of Mexico cruise in October 2001. These waters were dominated by the toxic red tide Karenia brevis and its vertical migration into surface waters after local noon is clear. Derived swimming speeds compare favourably to measured swimming speeds (approximately 1 m h1; Heil, 1986). Measurements were made with a WetLabs ac-9 from a ship.
et al., 2005). Hyperspectral inherent optical data has recently become available to the community (e.g., Kirkpatrick et al., 2003), and HAB-specific optical indices can now be developed for operational detection and monitoring under certain conditions or with ancillary data. While a difficult research problem, because HAB species do not generally have optical properties significantly different from their non-HAB-forming relatives, approaches have been developed and demonstrated for some specific cases, notably, natural K. brevis populations (Kirkpatrick et al., 2000; Millie et al., 2002). For K. brevis, a ‘similarity index’ is calculated which quantifies the difference between a reference standard (often an absorption spectra from a laboratory culture) and an unknown (a spectrum measured in the field). As small hyperspectral instruments have matured and been integrated into AUVs and moorings, spatial maps of HAB similarity indices are now an operational possibility (Figure 3.8).
96
Bio-optics in integrated ocean observing networks
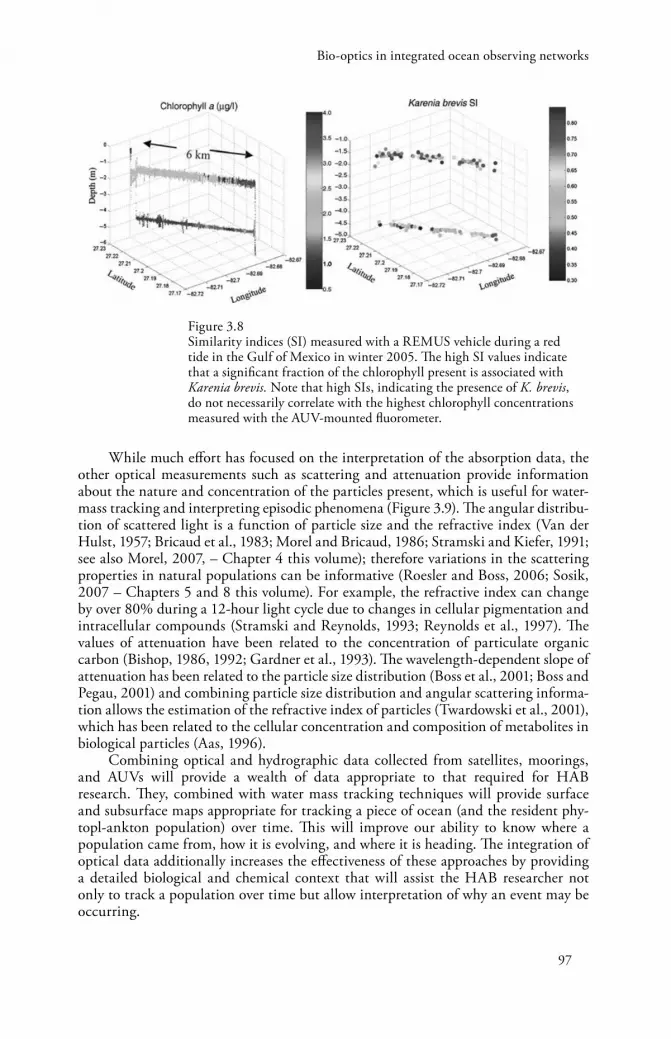
Figure 3.8 Similarity indices (SI) measured with a REMUS vehicle during a red tide in the Gulf of Mexico in winter 2005. The high SI values indicate that a significant fraction of the chlorophyll present is associated with Karenia brevis. Note that high SIs, indicating the presence of K. brevis, do not necessarily correlate with the highest chlorophyll concentrations measured with the AUV-mounted fluorometer.
While much effort has focused on the interpretation of the absorption data, the other optical measurements such as scattering and attenuation provide information about the nature and concentration of the particles present, which is useful for water-mass tracking and interpreting episodic phenomena (Figure 3.9). The angular distribution of scattered light is a function of particle size and the refractive index (Van der Hulst, 1957; Bricaud et al., 1983; Morel and Bricaud, 1986; Stramski and Kiefer, 1991; see also Morel, 2007, – Chapter 4 this volume); therefore variations in the scattering properties in natural populations can be informative (Roesler and Boss, 2006; Sosik, 2007 – Chapters 5 and 8 this volume). For example, the refractive index can change by over 80% during a 12-hour light cycle due to changes in cellular pigmentation and intracellular compounds (Stramski and Reynolds, 1993; Reynolds et al., 1997). The values of attenuation have been related to the concentration of particulate organic carbon (Bishop, 1986, 1992; Gardner et al., 1993). The wavelength-dependent slope of attenuation has been related to the particle size distribution (Boss et al., 2001; Boss and Pegau, 2001) and combining particle size distribution and angular scattering information allows the estimation of the refractive index of particles (Twardowski et al., 2001), which has been related to the cellular concentration and composition of metabolites in biological particles (Aas, 1996).
Combining optical and hydrographic data collected from satellites, moorings, and AUVs will provide a wealth of data appropriate to that required for HAB research. They, combined with water mass tracking techniques will provide surface and subsurface maps appropriate for tracking a piece of ocean (and the resident phytopl-ankton population) over time. This will improve our ability to know where a population came from, how it is evolving, and where it is heading. The integration of optical data additionally increases the effectiveness of these approaches by providing a detailed biological and chemical context that will assist the HAB researcher not only to track a population over time but allow interpretation of why an event may be occurring.
97
Real-time Coastal Observing Systems
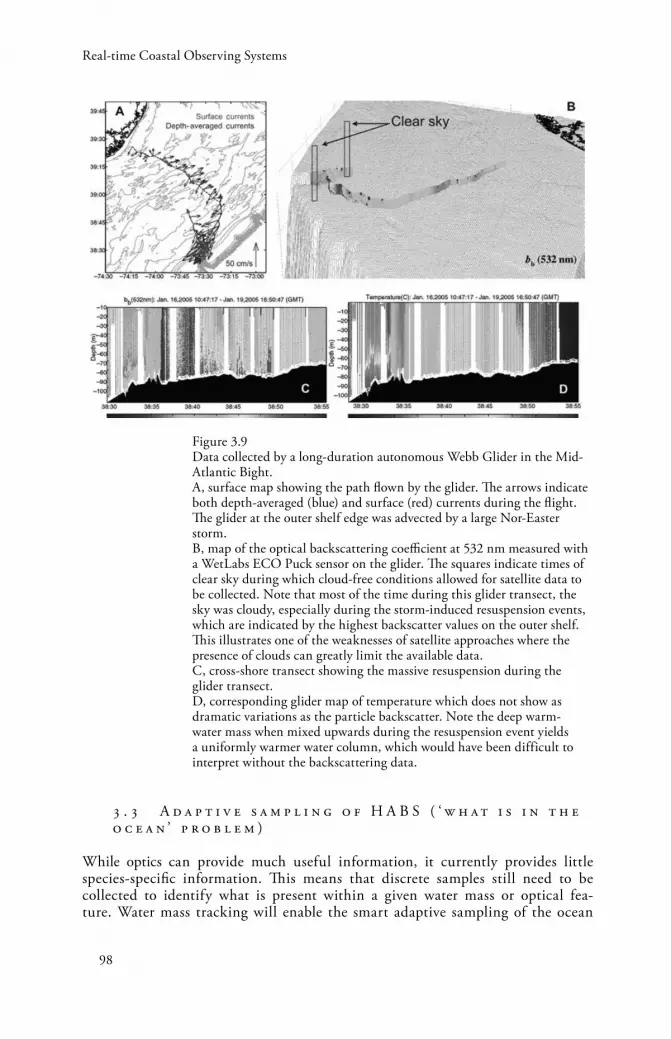
Figure 3.9 Data collected by a long-duration autonomous Webb Glider in the Mid-Atlantic Bight. A, surface map showing the path flown by the glider. The arrows indicate both depth-averaged (blue) and surface (red) currents during the flight. The glider at the outer shelf edge was advected by a large Nor-Easter storm. B, map of the optical backscattering coefficient at 532 nm measured with a WetLabs ECO Puck sensor on the glider. The squares indicate times of clear sky during which cloud-free conditions allowed for satellite data to be collected. Note that most of the time during this glider transect, the sky was cloudy, especially during the storm-induced resuspension events, which are indicated by the highest backscatter values on the outer shelf. This illustrates one of the weaknesses of satellite approaches where the presence of clouds can greatly limit the available data. C, cross-shore transect showing the massive resuspension during the glider transect. D, corresponding glider map of temperature which does not show as dramatic variations as the particle backscatter. Note the deep warm-water mass when mixed upwards during the resuspension event yields a uniformly warmer water column, which would have been difficult to interpret without the backscattering data.
3 . 3 A d a p t i v e s a m p l i n g o f H A B S ( ‘ w h a t i s i n t h e o c e a n ’ p r o b l e m )
While optics can provide much useful information, it currently provides little species-specific information. This means that discrete samples still need to be collected to identify what is present within a given water mass or optical feature. Water mass tracking will enable the smart adaptive sampling of the ocean
98

Bio-optics in integrated ocean observing networks
(Robinson and Glenn, 1999; Schofield et al., 2003). This allows the labour-intensive measurements [detailed biological (productivity or growth parameters, cell cycle phase, toxicity, genomic or proteomic information) or chemical measurements (micronutrients, organic nutrients)] to be made when they will have maximum scientific or management pay-off. This is now possible as modern communication networks allow for two-way communication between shore and ships. Data are combined and then made available often via the internet. This ‘net centric’ capability will improve as wireless communication networks improve in reliability, range, and bandwidth (Figure 3.10).
The availability of real-time data allows the researcher to adjust sampling strategies to compensate for how the ocean is changing over time. An example of adaptive sampling within an observatory was provided during an experiment in summer 2000. During the experiment, an aircraft observed a turbid feature about 15 km offshore. As the experiment was focused on calibrating hyperspectral sensors, it was important to characterize any optically distinct features present in the ocean. The pragmatic challenge was directing ships that were several hours steam-time away from the feature of interest, which was being advected to a new location by local currents. Note, this challenge is not unlike the challenge facing a water quality manager responding to reports of a HAB offshore. Initial locations of the feature where noted and the surface currents were tracked using the observatory shored based radars as a ship transited to the location (Figure 3.11). The optical features were located within a convergence front and were transported offshore within a meander to the north away from the ship in transit. Communication to direct the ship was facilitated through a network of radio modems, which provided the ship real-time web access to onshore hourly current data. As the ship approached the predicted locations at night, there was no significant bioluminescence in the wake. On reaching the predicted location, bioluminescence appeared in its wake. Vertical profiles exhibited near surface (3 m) and subsurface (12 m) peaks in the bioluminescence (Figure 3.12) with discrete samples identifying the presence of the vertical migrating bioluminescent dinoflagellate Ceratium fusus. This red tide, with cell numbers of over several thousand cells per millilitre, was located only within the convergence feature, with bioluminescence and Ceratium sp. absent in profiles 1.5 km to the north or south. The front dissipated with a current reversal later in the evening. Thus, the observatory provided information on the transport of the particles allowing the biologists to sample a small biological feature offshore. Traditional ship-based sampling would not have been able to characterize the feature.
3 . 4 O c e a n f o r e c a s t i n g ( t h e ‘ w h a t w i l l h a p p e n t o m o r r o w ’ p r o b l e m )
Despite improvements in ocean sampling, we will never be able to synoptically sample all the desired biological, chemical, and physical measurements needed to resolve the state and trends of the coastal ocean ecosystem necessary for quantitative ‘ecosystem management’. An alternative to measuring all things at all times is to couple an adaptive sampling strategy with mechanistic models in order to resolve the processes that result in a particular ecosystem state, and provide the tools to predict the direction that the ecological system will take. By linking the observation network to the modelling process, there is a refinement of both the data collection and the
99

Real-time Coastal Observing Systems
Figure 3.10 Wireless communication networks now allow oceanographers to communicate to shore and other ships in real time. This capability is a transformational advance that allows for adaptive sampling. In many locations communication networks are redundant with many different wireless networks of varying ranges and bandwidths being available. This figure shows the communication capabilities within the nearshore waters of the Mid-Atlantic Bight. The medium grey area represents current wireless coverage using Verizon Inc. National Access capabilities (∼100 kbps, coverage up to 20miles (32 km) off Long Island, less for New Jersey). The dark grey area represents the availability of Verizon Inc. Quick2Net (14.4 kbps, coverage up to 20miles off both New Jersey and Long Island). The pale grey circular sector represents the range of line-of-sight Radio Modems (∼80 kbps, coverage for a 18 mile (29 km) radius centred at Sea Bright Fire Department). Finally the AirNet Communications Wireless Broadband range is represented by the dark grey semi-circle (∼1.5 Mbps, coverage 7 miles (11 km) offshore from Sandy Hook). Global coverage is provided by Iridium Satellite communications (2,400 bps, global coverage, data and voice). This provides researchers with a wide range of possibilities of varying bandwidth allowing them to access data.
undestanding of what is required by ecological models. This is illustrated in the simplest form in the equation used to describe the position of a particle at any given time (x):
(3.1)
100

Bio-optics in integrated ocean observing networks
Figure 3.11 An RGB (converted to greyscale) image collected by aircraft showing a small-scale turbid feature about 15 km from shore. The feature was of the order of 1 km to 2 km in size. Inset: medium-range sea surface current map measured by shore-based radars with the position of the initial aircraft sighting marked by the black circle. The currents, updated every hour, allowed scientists onshore to model the advection pattern of the observed slick and direct the research vessel into position in order to characterize the nature of the material present.
Here x is the initial position of the particle, v is velocity, t is time, and a is 0 0 cc acceleration. Observations can provide the initial particle positions (x0) and velocity (v0), yet models (in this case F ma cc) are used to describe the dynamics of the particle’s acceleration (Schofield et al., 2003). If either the model or observing network is missing, the particle’s future position will be unknown. Physical measurements for measuring v0 (Barrick et al., 1887; Glenn et al., 2000; Kohut et al., 2003) and models for measuring a cc (Haidvogel, 2002; Robinson et al., 1999) are relatively mature. Optical measurements will hopefully provide the quantitative measurements of the x0 and x over time for the biological oceanographer.
Traditionally climatologies have been used to drive ecological models; however, many of the processes of interest are often dominated by episodic events (Giller et al., 1994). These events are better described by ocean nowcast/forecast models (Mooers, 1999) which are rapidly evolving with advances in ocean circulation modelling (Holland and Capotondi, 1996) and data assimilation methods (Dalay, 1991). While biological assimilation modelling systems have long been a research focus (Ishizaka, 1990, Lawson et al., 1995; Fasham and Evans, 1995; Matear, 1995; Robinson et al.,
101

Real-time Coastal Observing Systems
Figure 3.12 Bioluminescence potential measured by a ship-based profiling system after being directed into position by data collected from the sea-surface current data illustrated in Figure 3.11. The bioluminescence (light shades of grey) was due to the dinoflagellate Ceratium and it was responsible for the slick observed by the aircraft.
1996), their utility has been hampered by the availability of both the initialization/ validation data and parameterization data required by the models.
In the under-sampled ocean, ocean forecast errors are dominated often by uncertainties in the model initialization; therefore ensemble forecasts with differing initial conditions can be used to identify regions where additional data are required. Here the models provide insight into what has not been sampled and guidance for field efforts. With recent advances in our observational capabilities, we are no longer consigned to operate in an under-sampled environment. Ocean observation networks can now provide spatially extensive observational updates on timescales of hours or better (Glenn et al., 1998). This rapid environmental assessment capability changes the paradigm for adaptive sampling and nowcast/forecast modelling. In the well-sampled ocean, forecast errors may now be dominated by uncertainties in the model formulations or boundary conditions, and ensemble forecasts with differing model parameterizations can be used to identify regions in which additional data can be used to keep a model on track. In the time it takes to prepare the ensemble of forecasts for the well-sampled ocean, additional data has arrived, and on-the-fly model-data metrics can be used to quantify which forecast in the ensemble is most accurate. Thus in the well-sampled ocean, the observations improve our understanding of errors associated with fundamental assumptions within biological models.
This new observational paradigm for the well-sampled ocean will be especially important to improving our ability to understanding biological dynamics in coastal ecosystems. A well-sampled ocean provides the means to run ensemble biological forecasts, where the ensemble represents models of varying ecological or physiological complexity. The ocean observatories provide the data to study which of an ensemble of model forecasts best describes reality, which in turn allows us to ask ‘why?’. This coupled observation approach will provide researchers with the tools to explore marine ecology in unprecedented detail for the next decade.
102

Bio-optics in integrated ocean observing networks
3 . 5 C o n c l u s i o n s
Observation networks will aid efforts to understand HABs as they provide surface and subsurface spatial data in near real-time allowing for water mass tracking and adaptive sampling. The physical data will be complemented with optical data, which provides biological and chemical information. These observations will be coupled to ecological models, providing a tool to improve fundamental understanding of the factors regulating phytoplankton community composition.
R e f e r e n c e s
Aarup, T., Holt, N. and Højerslev, N. K. 1996. Optical measurements in the North Sea-Baltic Sea transition zone. II: Water mass classification along the Jutland west coast from salinity and spectral irradiance measurements.Cont. Shelf Res., 16(10), pp. 1343–53.
Aas, E. 1996. Refractive index of phytoplankton derived from its metabolite composition. J. Plankton Res., 18, pp. 2223–49.
Babin, M., Roesler, C. S. and Cullen, J. J. (eds). 2006. Real-time Coastal Observing Systems for Marine Ecosystem Dynamics and Harmful Algal Blooms: Theory, Instrumentation and Modelling. Paris, Intergovernmental Oceanographic Commission of UNESCO. (Monographs on Oceanographic Methodology)
Baden, D. G. and Mende, T. J. 1979. Amino acid utilization by Gymnodinium breve. Phytochemistry, 18, pp. 247–51.
Barrick, D. E. and Lipa, B. J. 1997. Evolution of bearing determination in HF current mapping radars. Oceanography, 10, pp. 72–75.
Berggren, W. A. and van Couvering, J. A. 1984. Catastrophes and Earth History, the New Uniformitarianism. Princeton, N.J., Princeton University Press.
Bidigare, R. R., Morrow, J. H. and Kiefer, D. A. 1989. Derivative analysis of spectral absorption by photosynthetic pigments in the western Sargasso Sea. J. Mar. Res., 47, pp. 323–41.
Bishop, J. K. B. 1986. The correction and suspended mass calibration of Sea Tech transmissometer data. Deep Sea Res., 33, pp. 121–34.
Bishop, J. K. B., Smith, R. C. and Baker, K. S. 1992. Springtime distributions and variability of biogenic particulate matter in Gulf Stream warm-core ring 82B and surrounding N.W. Atlantic waters. Deep Sea Res., 39, pp. 295–326.
Blackwell, S., Case, J., Glenn, S. M., Kohut, J., Moline, M. A., Purcell, M., Schofield, O. and von Alt, C. 2003. A new AUV platform for studying near shore bioluminescence structure. In: 12th International Symposium on Bioluminescence and Chemiluminescence. Singapore, World Scientific Publishing Company, 197–200.
Boss, E., Twardowski, M. S. and Herring, S. 2001. The shape of the beam attenuation spectrum and its relation to the size distribution of oceanic particles. Appl. Opt., 40, pp. 4885–93.
Boss, E. and Pegau, W. S. 2001. The relationship of light scattering at an angle in the backward direction to the backscattering coefficient. Appl. Opt., 40, pp. 5503–07.
Bricaud, A., Morel, A. and Prieur, L. 1983. Optical efficiency factors of some phytoplankters. Limnol. Oceanogr., 28, pp. 816–73.
Broecker, W. S., Takahashi, T. and Takahashi, T. 1985. Sources and flow patterns of deep-ocean waters as deduced from potential temperature, salinity, and initial phosphate concentration. J. Geophys. Res., 90, pp. 6925–39.
Bukata, R. P., Jerome, J. H., Kondratyev, K. Y. and Pozdnyakov, D. V. 1995. Optical Properties and Remote Sensing of Inland and Coastal Waters. Boca Raton, Fla., CRC Press, 362 pp.
Chang, G. C. and Dickey, T. D. 1999. Partitioning in situ spectral absorption by use of moored spectral absorption-attenuation meters. Appl. Opt., 38, pp. 3876–87.
103
Real-time Coastal Observing Systems
Connell, J. H. 1978. Diversity in tropical rain forests and coral reefs. Science, 199, pp.1302– 10.
Cullen, J. J., Ciotti, A. M., Davis, R. F. and Lewis, M. R. 1997. Optical detection and assessment of algal blooms. Limnol. Oceanogr., 42, pp. 1223–39.
Culver, M. E., Soracco, M. P., Stumpf, R. P., Change, P. S. and Steidinger, K. A. 2000. Integrating wind data to determine the influence on movement of a harmful algal bloom event along the northwest coast of Florida. Proc. Sixth International Conference on Remote Sensing for Marine and Coastal Environments,. Ann Arbor, Mich.,Verdian ERIM Intl., pp. 25–27.
Dalay, R. 1991. Atmospheric Data Analysis. Cambridge, UK, Cambridge University Press. Dickey, T. 1993. Sensors and systems for sampling/measuring ocean processes extending over
nine orders of magnitude. Sea Tech., 34, pp. 47–55. Fasham, M. J. R. and Evans, G. T. 1995. The use of optimization techniques to model ma
rine ecosystems dynamics at the JGOFS station at 47N 20W. Phil. Trans. Roy. Soc., 348, pp. 203–09.
Gardner, W. D., Walsh, I. D. and Richardson, M. J. 1993. Biophysical forcing of particle production and distribution during a spring bloom in the North Atlantic. Deep Sea Res., 40, pp. 171–95.
Giller, P. S., Hildrew, A. G. and Raffaelli, D. G. 1994. Aquatic Ecology: Scale, Pattern and Process. New York, Blackwell Scientific Publications.
Glenn, S., Schofield, O., Dickey, T. D., Chant, R., Kohut, Barrier, H., Bosch, J., Bowers, L., Creed, E., Haldeman, C., Hunter, E., Kerfoot, J., Mudgal, C., Oliver, M., Roarty, H., Romana, E., Crowley, M., Barrick, D. and Jones, C. 2004. The expanding role of ocean color and optics in the changing field of operational oceanography. Oceanography, 17, pp. 86–95.
Glenn, S. M., Dickey, T. D., Parker, B. and Boicourt, W. 2000. Long term real-time coastal ocean observation networks. Oceanography, 13, pp. 24–34.
Glenn, S. M., Haidvogel, D. B., Schofield, O., Grassle, F. J., von Alt, C. J., Levine, E. R. and Webb, D. C. 1998. Coastal predictive skill experiments at the LEO-15 national littoral laboratory. Sea Tech., 39, pp. 63–69.
Glenn, S. M. and Schofield, O. 2003. Observing the oceans from the COOL room: our history, experience, and opinions. Oceanography, 16(4), pp. 37–52.
Haidvogel, D. B. and Beckmann, A. 1999. Numerical Ocean Circulation Modeling. London, Imperial College Press.
Heil, C. A. 1986. Vertical migration of Ptycodiscus brevis (Davis) Steidinger. Master’s thesis, University of South Florida, 118 pp.
Helland-Hansen, B. 1916. Nogen hydrogr London. afiske metoder form. Skand. Naturf. Mote, pp. 357–59.
Højerslev, N. K., Holt, N. and Aarup, T. 1996. Optical measurements in the North Sea-Baltic Sea transition zone. I: On the origin of the deep water in Kattegat.Cont. Shelf Res., 16(10), pp. 1329–42.
Holland, W. R. and Capotondi, A. 1996. Recent developments in prognostic ocean modeling. In: L. Malanotte-Rizzoli (ed.), Modern Approaches to Data Assimilation in Ocean Modeling. Amsterdam, Elsevier Science, pp. 21–56.
Hutchinson, G. E. 1961. The paradox of the plankton. Amer. Nat., 95, pp. 137–40. Ishizaka, J. 1990. Coupling of coastal zone color scanner data to a physical-biological model of
southeastern U.S. continental shelf ecosystems. 3: Nutrient and phytoplankton fluxes and CZCS data assimilation. J. Geophys. Res., 95, pp. 20201–12.
Jenkins, W. J. 1980. Tritium and 3He in the Sargasso Sea. J. Mar. Res., 38, pp. 533–69. Jenkins, W. J. 1982. Oxygen utilization rates in the north Atlantic subtropical gyre and primary
production in the oligotrophic system. Nature, 300, pp. 246–49. Jerlov, N. G. 1976. Marine Optics. New York, Elsevier., Johnson, D. M., Miller, J. and Schofield, O. 2003. Dynamics and optics of the Hudson River
outflow plume. J. Geophys. Res., 108(1–9), 3323, doi:10.1029/2002JC001485.
104

Bio-optics in integrated ocean observing networks
Kahru, M. and Brown, C. W. 1997. Monitoring Algal Blooms: New Techniques for Detecting Large-Scale Environmental Change. New York, Springer-Verlag.
Kalle, K. 1966. The problem of the gelbstoff in the sea. Oceanogr. Mar. Biol. Rev., 4, pp. 91– 104.
Kirk, J. T. O. 1994. Light and Photosynthesis in Aquatic Ecosystems. Cambridge, UK, Cambridge University Press.
Kirkpatrick, G., Millie, D. F., Moline, M. A. and Schofield, O. 2000. Absorption-based discrimination of phytoplankton species in naturally mixed populations. Limnol. Oceanography, 42, pp. 467–71.
Kirkpatrick, G. J., Orrico, C., Oliver, M. J., Moline, M. A. and Schofield, O. 2003. Continuous real-time determination of hyperspectral absorption of colored dissolved organic matter. Appl. Opt., 42, pp. 6564–68.
Kishino, M., Takahashi, M., Okami, N. and Ichimura, S. 1985. Estimation of the spectral absorption coefficients of phytoplankton in the sea. Bull. Mar. Sci., 37, pp. 634–42.
Kohut, J. T. and Glenn, S. M. 2003. Improving HF radar surface current measurements with measured antenna beam patterns. J. Atmos. Ocean. Tech., 20, pp. 1303–16.
Lawson, L. M., Spitz, Y. H., Hofmann, E. E. and Long, R. B. 1995. A data assimilation technique applied to a predator-prey model. Bull. Math. Biol., 57, pp. 593–617.
Martin-Trayovski, L. V. and Sosik, H. M. 2004. Feature-based classification of optical water types in the northwest Atlantic based on satellite ocean color data. J. Geophys. Res., 108, pp. 119.
Matear, R. J. 1995. Parameter optimization and analysis of ecosystem models using simulated annealing: a case study at Station P. J. Mar. Res., 53, pp. 571–607.
Millie, D. F., Schofield, O., Kirkpatrick, G. J., Johnsen, G. and Evens, T. J. 2002. Using absorbance and fluorescence spectra to discriminate microalgae. Eur. J. Phycol., 37, pp. 313–22.
Millie, D. F., Schofield, O., Kirkpatrick, G. J., Johnsen, G., Tester, P. A. and Vinyard, B. T. 1997. Phytoplankton pigments and absorption spectra as potential ‘biomarkers’ for harmful algal blooms: a case study of the Florida red-tide dinoflagellate, Gymnodinium breve. Limnol. Oceanogr., 42, pp. 1240–51.
Mobley, C. D. 1994. Light and Water: Radiative Transfer in Natural Waters. San Diego, Calif., Academic Press.
Mooers, N. K. 1999. Coastal Ocean Prediction.Washington DC, American Geophysical Union. (Coastal and Estuarine Studies 56.)
Morel, A. and Bricaud, A. 1986. Inherent optical properties of algal cells including picoplankton: Theoretical and experimental results. In: T. Platt, and W. K. W. Li, (eds), Photosynthetic Picoplankton. Can. Bull. Fish. Aquat. Sci., pp. 521–59.
Morel, A. and Prieur, L. 1997. Analysis of variations in ocean color. Limnol. Oceanogr., 22, pp. 709–22.
National Research Council. 2000. Illuminating the Hidden Planet: The Future of Seafloor Observatory Science. Washington DC, Ocean Studies Board. (Committee on Seafloor Observatories: Challenges and Opportunities.)
National Research Council. 2004b. Enabling Ocean Research in the 21st Century: Implementation of a Network of Ocean Observatories,Washington DC, Ocean Studies Board. (Committee on Seafloor Observatories: Challenges and Opportunities.)
Oliver, M. J., Kohut, J. T., Irwin, A J., Glenn, S. M., Schofield, O., Moline, M. A. and Bissett, W. P. 2004. Bioinformatic approaches for objective detection of water masses. J. Geophys. Res., 109, C07S04, doi:10.1029/2003JC002072.
Oliver, M. W., Schofield, O., Bergmann, T., Glenn, S. M., Moline, M. A., and Orrico,C. 2003. In situ optically derived phytoplankton absorption properties in coastal waters and its utility for estimating primary productivity rates. J. Geophys. Res., 109, C07S11, doi:10.1029/2002JC001627.
Paine, R. T. and Vadas, R. L. 1969. The effects of grazing by sea urchins, Strongylocentrotus spp., on benthic algal populations. Limnol. Oceanogr., 14, pp. 710–19.
105

Real-time Coastal Observing Systems
Pegau, W. S., Cleveland, J. S., Doss, W., Kennedy, D. W. Maffione, R. A., Mueller, J. L., Stone, R., Trees, C. C., Weidemann, A. D., Wells, W. H. and Zaneveld, R. J. V. 1995. A comparison of methods for the measurement of the absorption coefficient in natural waters. J. Geophys. Res., 100, pp. 13201–21.
Pope, R. M. and Fry, E. S. 1997. Absorption spectrum (380–700 nm) of pure water. II: Integrating cavity measurements. Appl. Opt., 33, pp. 8710–23.
PrÉzelin, B. B. and Boczar, B. A. 1986. Molecular bases of cell absorption and fluorescence in phytoplankton: potential applications to studies in optical oceanography. Progr. Phycol. Res., 4, pp. 350–64.
Quackenbush, J. 2000. Computational analysis of microarray data. Nat. Rev. Gen., 2, pp. 418–27.
Reynolds, R. A., Stramski, D. and Kiefer, D. A. 1997. The effect of nitrogen-limitation on the absorption and scattering properties of the marine diatomThalassiosira pseudonana. Limnol. Oceanogr., 42, pp. 881–92.
Robinson, A. R., Arango, H. G., Warn-Varnas, A., Leslie, W. G., Miller, A. J., Haley, P. J. and Lozano, C. J. 1996. Real-time regional forecasting. In: L. Malanotte-Rizzoli (ed.), Modern Approaches to Data Assimilation in Ocean Modeling. Amsterdam, Elsevier, pp. 377–412.
Robinson, A. R. and Glenn, S. M. 1999. Adaptive sampling for ocean forecasting. Nav. Res. Rev., 51, pp. 26–38.
Roesler, C. S. and Boss, E. 2007. In situ measurement of inherent optical properties and potential for harmful algal bloom detection and coastal ecosystem observations. In: Babin et al. (eds), op. cit., this volume.
Roesler, C. S., Etheridge, S. M. and Pitcher, G. C. 2003. Application of an ocean color algal taxa detection model to red tides in the southern Benguela. In: K. A. Steidinger, J. H. Lansdberg, C. R. Tomas, and G. A. Vargo (eds), Harmful Algae 2002. Proc. X International Conference on Harmful Algae (20–25 October 2002). St Petersburg, Fla./ Paris, Florida Fish and Wildlife Conservation Commission/Intergovernmental Oceanographic Commission of UNESCO.
Ruddick, K., Lacroix, G., Park, Y., Rousseau, V., De Cauwer, V. and Sterckx, S. 2007. Overview of ocean colour: theoretical background, sensors and applicability to detection and monitoring of harmful algal blooms (capabilities and limitations). In: Babin et al. (eds), op. cit., this volume.
Schofield, O., Bergmann, T., Bisset, W. P., Grassle, F., Haidvogel, D., Kohut, J., Moline, M. A. and Glenn, S. 2002. The long-term ecosystem observatory: an integrated coastal observatory. J. Ocean. Eng., 27, pp. 146–54.
Schofield, O., Bergmann, T., Oliver, M. J., Irwin, A., Kirkpatrick, G., Bissett, W. P., Moline, M. A. and Orrico, C. 2004. Inversion of spectral absorption in the optically complex coastal waters of the Mid-Atlantic Bight. J. Geophys. Res., 109, C12S04, doi:10.1029/2003JC002071.
Schofield, O., Bissett, W. P., Frazer, T. K., Iglesias-Rodriguez, D., Moline, M. A. and Glenn, S. 2003. Development of regional coastal ocean observatories and the potential benefits to marine sanctuaries. Mar. Tech. Soc., 37, pp. 54–67.
Schofield, O., Gryzmski, J., Bissett, W. P., Kirkpatrick, G., Millie, D. F., Moline, M. A. and Roesler, C. 1999. Optical monitoring and forecasting systems for harmful algal blooms: possibility or pipedream? J. Phycol., 35, pp. 125–45.
Shimizu, Y. and Wrensford, G. 1993. Peculiarities in the biosynthesis of brevetoxins and metabolism of Gymnodinium breve. In: T. J. Smayda and Y. Shimizu (eds),Toxic Phytoplankton Blooms in the Sea. New York, Elsevier, pp. 919–23.
Sosik, H. M. 2007. Characterizing seawater constituents from optical properties. In: Babin et al. (eds), op. cit., this volume.
Stommel, H. 1989. The SLOCUM Mission.Oceanography, 1, pp. 22–25. Smethie, W. M. 1993. Tracing the thermohaline circulation in the western North Atlantic using
chlorofluorocarbons. Progr. Oceangr., 31, pp. 51–99.
106

Bio-optics in integrated ocean observing networks
Smith, R. S., Brown, O. B., Hoge, F. E., Baker, K. S., Evans, R. H., Swift, R. N. and Esaias, W. E. 1987. Multiplatform sampling (ship, aircraft, and satellite) of a Gulf Stream warm core ring. Appl. Opt., 26, pp. 2068–81.
Stramski, D. and Kiefer, D. A. 1991. Light scattering by microorganisms in the open ocean. Progr. Oceanogr., 28, pp. 250–68.
Stramski, D. and Reynolds, R. A. 1993. Diel variations in the optical properties of a marine diatom. Limnol. Oceanogr., 38, pp. 1347–64.
Stumpf, R. P. 2000. Applications of satellite ocean color sensors for monitoring and predicting harmful algal blooms. Hum. Ecol. Risk Assess., 7, pp. 1363–68.
Stumpf, R. P., Ransibrahmanakal, V., Steindinger, K. A., and Tester, P. A. 1998. Observations of sea surface temperature and winds in association with Florida USA red tides (Gymnodinium breve blooms). In: B. Reguera, J. Blanco, M. L. Fernández and T. Wyatt, (eds), Harmful Algae. Proc. VIII International Conference on Harmful Algae (June 1997, Vigo, Spain). Santiago de Compostela/Paris, Xunta de Galicia/Intergovernmental Oceanographic Commission of UNESCO, pp. 145–48.
Tester, P. A., Stumpf, R. P. and Steindinger, K. A. 1998. Ocean color imagery: what is the minimum potential for early warning? J. Shellfish Res., 17, pp. 1469–71.
Tomczak, M. 1999. Some historical, theoretical and applied aspects of quantitative water mass analysis. J. Mar. Res., 57, pp. 275–303.
Tomlinson, M. C., Stumpf, R. P., Ransibrahmanakul, V., Truby, E. W., Kirkpatrick, G. J., Pederson, B. A., Vargo, G. A. and Heil, C. A. 2004. Evaluation of the use of SeaWiFS imagery for detecting Karenia brevis harmful algal blooms in the eastern Gulf of Mexico. Rem. Sens. Environ., 91, pp. 293–303.
Twardowski, M. S., Boss, E., Macdonald, J. B., Pegau, W. S., Barnhard, A. H. and Zaneveld, J. R. V. 2001. A model for estimating bulk refractive index from the optical backscattering ratio and the implications for understanding particle composition in Case I and Case II waters. J. Geophys. Res., 106, pp. 14129–42.
US Commission on Ocean Policy. 2004. An Ocean Blueprint for the 21st Century. Final Report of the US Commission on Ocean Policy. National Oceanic and Atmospheric Administration, US Department of Commerce.
van de Hulst, H. C. 1957. Light Scattering by Small Particles. New York, John Wiley & Sons. Weiss, R. F., Bullister, J. L., Gammon, R. H. and Warner, M. J. 1985. Atmospheric
chlorofluoromethanes in the deep equatorial Atlantic. Nature, 314, pp. 608–10. Yeung, K. Y., Haynor, D. R. and Ruzzo, W. L. 2001. Validating clustering for gene expression
data. Bioinform., 17(4), pp. 309–18. Zaneveld, J. R. V. 1995. A theoretical derivation of the dependence of the remotely sensed
reflectance of the ocean on the inherent optical properties. J. Geophys. Res., 100, pp. 13135–42.
Zaneveld, J. R. V., Kitchen, J. C. and Moore, C. C. 1994. Scattering correction of reflecting tube absorption meter. Proc. Soc. Photo-Opt. Instrum. Eng., 2258, pp. 44–55.
107