harmful algae - jn medsys
TRANSCRIPT
Harmful Algae 103 (2021) 102008
Available online 15 March 20211568-9883/© 2021 Elsevier B.V. All rights reserved.
Original Article
Development of an absolute quantification method for ribosomal RNA gene copy numbers per eukaryotic single cell by digital PCR
Kyoko Yarimizu a,b, Sirje Sildever a,c, Yoko Hamamoto a, Satoshi Tazawa d, Hiroshi Oikawa a, Haruo Yamaguchi e, Leila Basti f, Jorge I. Mardones g,h, Javier Paredes-Mella g, Satoshi Nagai a,*
a Japan Fisheries Research and Education Agency, Fisheries Resources Institute, Fisheries Stock Assessment Center, 2-12-4 Fukuura, Kanazawa-ku, Yokohama, Kanagawa 236-8648, Japan b Office of Industry-Academia-Government and Community Collaboration, Hiroshima University, 1-3-2 22 Kagamiyama, Higashi-Hiroshima City, Hiroshima 739-8511, Japan c Department of Marine Systems, Tallinn University of Technology, Akadeemia tee 15A, 12618 Tallinn, Estonia d AXIOHELIX Co. Ltd, 12-17 Kandaizumicho, Chiyoda-ku, Tokyo 101-0024, Japan e Faculty of Agriculture and Marine Sciences, Kochi University, Nankoku, Kochi 783-8502, Japan f Department of Ocean Sciences, Tokyo University of Marine Science and Technology, Minato, Tokyo 108-8477, Japan g Instituto de Fomento Pesquero, Centro de Estudios de Algas Nocivas (IFOP-CREAN), Padre Harter 574, Puerto Montt 5501679, Chile h Centro FONDAP de Investigacion en Dinamica de Ecosistemas Marinos de Altas Latitudes (IDEAL), Valdivia, Chile
A R T I C L E I N F O
Keywords: Absolute quantification Digital PCR Universal primer and probe rRNA gene copy number Eukaryotes Phytoplankton HAB
A B S T R A C T
Recent increase of Harmful Algal Blooms (HAB) causes world-wide ecological, economical, and health issues, and more attention is paid to frequent coastal monitoring for the early detection of HAB species to prevent or reduce such impacts. Use of molecular tools in addition to traditional microscopy-based observation has become one of the promising methodologies for coastal monitoring. However, as ribosomal RNA (rRNA) genes are commonly targeted in molecular studies, variability in the rRNA gene copy number within and between species must be considered to provide quantitative information in quantitative PCR (qPCR), digital PCR (dPCR), and meta-barcoding analyses. Currently, this information is only available for a limited number of species. The present study utilized a dPCR technology to quantify copy numbers of rRNA genes per single cell in 16 phytoplankton species, the majority of which are toxin-producers, using a newly developed universal primer set accompanied by a labeled probe with a fluorophore and a double-quencher. In silico PCR using the newly developed primers allowed the detection of taxa from 8 supergroups, demonstrating universality and broad coverage of the primer set. Chelex buffer was found to be suitable for DNA extraction to obtain DNA fragments with suitable size to avoid underestimation of the copy numbers. The study successfully demonstrated the first comparison of ab-solute quantification of 18S rRNA copy numbers per cell from 16 phytoplankton species by the dPCR technology.
1. Introduction
Harmful Algal Blooms (HABs) can cause acute effects on marine ecosystems due to the production of endogenous toxins and/or enor-mous biomass, which can also lead to major impacts on local economies and public health (Imai et al., 2006; Dyson and Huppert, 2010; Lewitus et al., 2012; Grattan et al., 2016; Díaz et al., 2019). Frequent coastal monitoring for early detection of HAB species is a basic and yet the most important strategy to prevent and reduce economic and health impacts (Anderson et al., 2001; Andersen et al., 2003; Todd, 2004; Díaz et al., 2019). Direct counting of HAB species by a microscope is a conventional
monitoring methodology (Edler and Elbrachter, 2010). However, the species can sometimes be undetected in case of being present in low abundances, morphological similarity to other species, and/or changes in morphology by the addition of fixatives (John et al., 2005; Zingone et al., 2006; Reguera and Pizarro, 2008; Karlson et al., 2010; Rodrí-guez-Ramos et al., 2014). To overcome those limitations, several mo-lecular methods have been employed, e.g. metabarcoding and high-throughput sequencing (HTS), quantitative PCR (qPCR), and digi-tal PCR (dPCR; Ebenezer et al., 2012; Penna and Galluzzi, 2013; Medlin and Orozco, 2017; Nagai et al., 2017; 2019; Lee et al., 2020).
Metabarcoding and HTS approach is a powerful tool for HAB species
* Corresponding author. E-mail address: [email protected] (S. Nagai).
Contents lists available at ScienceDirect
Harmful Algae
journal homepage: www.elsevier.com/locate/hal
https://doi.org/10.1016/j.hal.2021.102008 Received 18 December 2020; Received in revised form 4 March 2021; Accepted 4 March 2021
Harmful Algae 103 (2021) 102008
2
detection (Dzhembekova et al., 2017; Elferink et al., 2017; Nagai et al., 2017; Gran-Stadniczenko et al., 2018; Moreno-Pino et al., 2018; Sild-ever et al., 2019; Liu et al., 2020). As the information on the whole community composition can be obtained from the same sample, changes in biodiversity can be detected (Lima-Mendez et al., 2015; Sawaya et al., 2019; Djurhuus et al., 2020). Those changes may serve as potential in-dicators for HAB dynamics (Yang et al., 2015; Hattenrath-Lehmann and Gobler, 2017; Berdjeb et al., 2018; Shin et al., 2018; Hattenrath-Leh-mann et al., 2019; Nagai et al., 2019; Liu et al., 2020). At the same time, the approach is not quantitative as the relative sequence abundances do not reflect the cell abundances directly due to the influence of several factors, e.g. sample preservation (Maki et al., 2017; Majaneva et al., 2018), DNA extraction (van der Loos and Nijland, 2020), choice of po-lymerase (Nichols et al., 2018), PCR bias (Suzuki and Giovannoni, 1996; Aird et al., 2011; Gonzalez et al., 2012), primer specificity (Elbrecht and Leese, 2015; Pinol et al., 2015) and copy number of the target gene (Not et al., 2009; Kembel et al., 2012; Maki et al., 2017; Saad et al., 2020). Although all the mentioned factors may influence the resulting relative sequence abundances, the main influence is due to the variation in the rRNA gene copy numbers (Maki et al., 2017; Saad et al., 2020).
At the same time, qPCR allows identification of target species as well as estimation of cell abundances and gene copy numbers (Bowers et al., 2000; Gray et al., 2003; Dyhrman et al., 2006; Murray et al., 2011; Penna and Galluzzi, 2013; Eckford-Soper and Daugbjerg, 2016; Ruvindy et al., 2018). The method is rapid and suitable for detecting HAB species present in low abundance (Hosoi-Tanabe and Sako, 2005; Kamikawa et al., 2006; Yuan et al., 2012; Zamor et al., 2012; Zhang and Li, 2012). To enumerate the cells, the preparation of standard curves for each target species is necessary (Penna et al., 2013). However, the standard curves generated based on laboratory cultures may be biased compared to DNA extracted from environmental samples (Vaitomaa et al., 2003; Penna and Galluzzi, 2013). This may be due to the presence of PCR inhibitors in natural samples (Flekna et al., 2007; Ellison et al., 2011) influencing amplification efficiency (Coyne et al., 2005) as well as due to the potential difference in the rRNA gene copy number between the laboratory culture and natural cells (Galluzzi et al., 2010; Ruvindy et al., 2018; Meistertzheim et al., 2019; Murray et al., 2019). To reduce the influence of PCR inhibitors and avoid the need for standard curves, an alternative approach, digital PCR (dPCR), can be used for the iden-tification and quantification of target species (Te et al., 2015; Medlin and Orozco, 2017). Due to the partitioning of reaction mix into thou-sands of small reactions (pico- to nanoliters), the influence of PCR in-hibitors is minimized (Basu, 2017; Quan et al., 2018). Also, the partitioning allows estimating the copy number without the standard curve as each droplet or microwell is expected to contain 0 or ≥ 1 copies of the target gene resulting in either positive or negative detection (Medlin and Orozco, 2017; Quan et al., 2018). The number of positive detections is corrected with the Poisson statistic to account for the presence of >1 copies per partition to provide a correct estimate for the target gene copies (Majumdar et al., 2015).
However, the rRNA genes are grouped into one repeat unit consisting of three coding units (18S, 5.8S, 28S), which is separated by the following repeat unit by intergenic spacers (Weider et al., 2005). When several tandemly connected rRNA gene units are contained in a single partition in dPCR, the positive signal is counted as one copy, causing underestimation of copy number measurements. Thus, it is necessary to digest genomic DNAs for sample preparation in dPCR to separate tan-dem gene copies and ensure proper random partitioning into droplets (Alanio et al., 2016; Joaunin, et al. 2020).
In molecular studies rRNA genes are commonly targeted (John et al., 2005; Stoeck et al., 2010; Elferink et al., 2017; Grzebyk et al., 2017; Engesmo et al., 2018; Ruvindy et al., 2018), although other genes have also been used (Koskenniemi et al., 2007; Delaney et al., 2011; Murray et al., 2011; Churro et al., 2012; Savela et al., 2016). Ribosomal rRNA genes are present in many copies per genome that facilitate their amplification, have variable rates of evolution among the different genes
and gene regions that support the identification of various species and genera, as well as contain conserved regions that allow designing uni-versal primers (Hillis and Dixon, 1991). Ribosomal rRNA gene copy number is variable among (Zhu et al., 2005; Godhe et al., 2008; Penna et al., 2013; Maki et al., 2017; Gong and Marchetti, 2019) and within the species (Lee et al., 2009; Galluzzi et al., 2010). To reliably quantify the cells, correction for the copy number is necessary when using quanti-tative qPCR or metabarcoding and HTS (Galluzzi and Penna, 2010; Medinger et al., 2010; Kembel et al., 2012; Maki et al., 2017; Gong and Marchetti, 2019; Saad et al., 2020). However, for many aquatic eu-karyotes, except for several phytoplankton species, the information on the rRNA gene copy number is currently lacking (Galluzzi et al., 2010; Penna et al., 2013; Lee et al., 2017, 2020; Banerji et al., 2018; Gong and Marchetti, 2019).
To provide information on the rRNA gene copy number in eukaryotes with the focus on HAB species, a universal primer set accompanied by a labeled probe with a fluorophore and a double-quencher was developed. Using dPCR, the number of rRNA gene copies per cell was determined for 16 cultured species, the majority of those HAB species. Influence of fragment sizes in template DNAs on the copy number measurement was also examined. The results of this study facilitate the determination of copy numbers for various HAB species and support the precise quanti-fication of HAB species through various molecular methods.
2. Materials and methods
Algal maintenance: A total of 31 clonal strains derived from 16 species from Japan or Chile were maintained in the laboratory cultures (Table 1). To focus on the HAB species, toxin-producing species (Moestrup et al., 2021) were mainly investigated (n = 14). All algal cultures were maintained in sterile plastic flasks with a ventilation sponge containing L1 or F/2 media for dinoflagellates and diatoms, respectively, and exposed to 100 μmol photons m− 2 s− 1 on a 12hL: 12hD light and dark cycle at a temperature of 18 ± 2 ◦C.
DNA extraction: The cells were isolated from the cultures by micropipetting under an inverted microscope or were harvested from 1 mL culture using centrifugation. Prior to DNA extraction, the cells were enumerated by using a Sedgewick-Rafter chamber and an inverted microscope (Nikon TE-300) to estimate the number of cells in a 1 mL culture. In the case of high cell abundances, the samples were diluted as necessary to facilitate enumeration. The 5% Chelex buffer (Chelex 100, Molecular Biology Grade Resin, Bio-Rad, Hercules, CA, USA) with a heating step for 20 min at 97 ◦C was used for the DNA extraction based on its` efficiency as demonstrated for the Alexandrium species and the environmental DNA surveys (Nagai et al., 2012, 2016a, b, 2019; Tanabe et al., 2016; Sildever et al., 2019). The volume of 5% Chelex was adjusted between 50 and 500 µL depending on the species to avoid saturation of the available partitions, which could reduce the mea-surement precision (Majumdar et al., 2015; Table S1). If needed, the samples were further diluted with TE buffer.
From preliminary testing, a relatively low copy number was measured from a single cell of Chattonella marina and Pseudochattonella verruculosa. To confirm the DNA extraction efficiency, three different DNA extraction methods, 5% Chelex buffer (Nagai et al., 2012), CTAB (Lian et al., 2001), and SDS with Proteinase K (Ogura et al., 2018) with slight modifications were applied to these two species. As the low fraction group, 4 cells of C. marina and 10 or 11 cells of P. verruculosa were inoculated into 1.5-mL plastic tubes containing 20 µL of each buffer. As the high fraction group, 10,500 cells of C. marina and 193,750 cells of P. verruculosa were harvested into 1.5-mL plastic tubes con-taining 30 µL of each buffer. The cells were homogenized using a pellet pestle motor (Kontes Glass, Vineland, NJ, USA) for 30 s. In the case of 5% Chelex buffer, the final volume was adjusted to 100 µL and 500 µL for the low and high fractions to avoid over-dilution or over-saturation and the samples were heated at 97 ◦C for 20 min. For CTAB and SDS buffers, the final volume was adjusted to 50 µL for both the low and high fraction
K. Yarimizu et al.
Harmful Algae 103 (2021) 102008
3
groups (Table S1). Since the high fraction group samples were highly concentrated with rRNA copies, these samples were further diluted with appropriate buffers to 1 or 10 pg µL− 1 before applying to dPCR (Table S1 and S2).
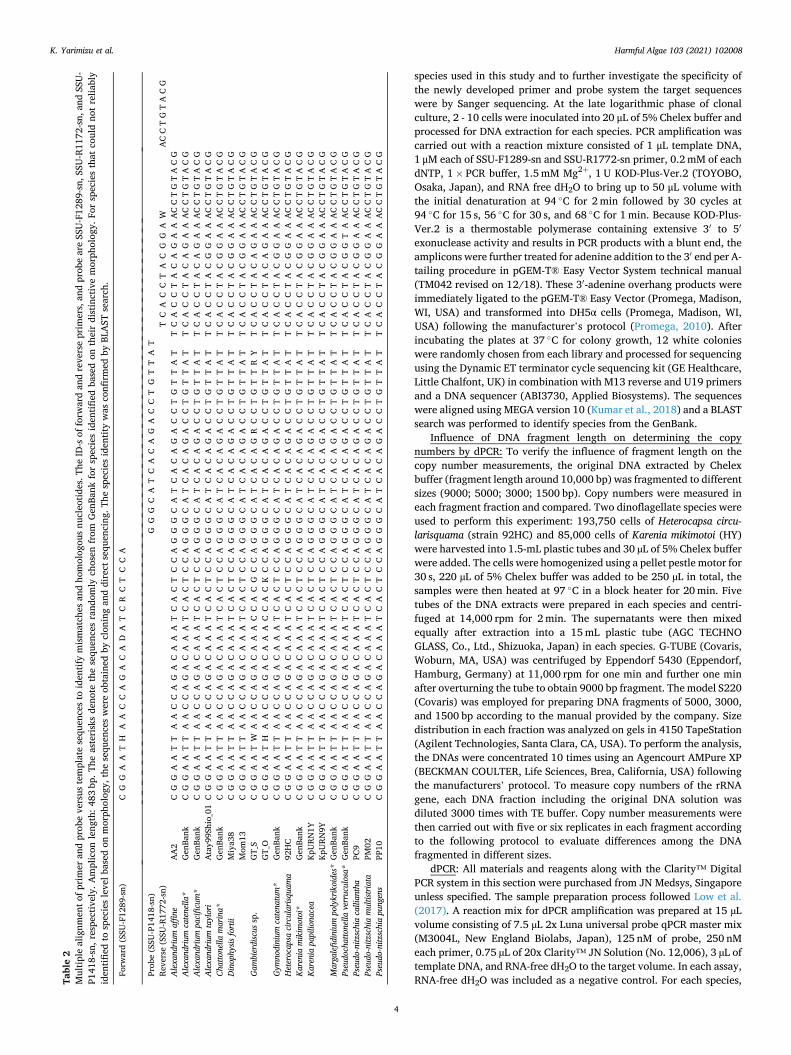
Primer design: A set of universal primer-probe was designed (Table 2) to quantify the copy number of 18S rRNA genes per cell in various eukaryotic species. The primers targeting the V7-V9 region of the 18S rRNA gene were initially designed by Nishitani et al. (2012), slightly modified by Tanabe et al. (2016), Dzhembekova et al. (2018), and further modified in this study (SSU-F1289-sn: 5′-TGG AGY GAT HTG TCT GGT TDA TTC CG-3′, SSU-R1772-sn: 5′-TCA CCT ACG GAW ACC TTG TTA CG-3′). Using only this primer set with qPCRBio SyGreen Mix (PCR Biosystems Inc., London, England) the results could not be sepa-rated from background noise due to the presence of signals derived from non-specific amplicons. Thus, a probe (SSU-P1418-sn) was designed from the sequence in the V7-V8 hypervariable region (Winnepenninckx et al., 1994) and it was conjugated with a fluorescent reporter and a double-quencher (5′ 6-FAM-ATA ACA GGT -ZEN- CTG TGA TGC CC-Iowa Black FQ 3′). Both the probe and primers were synthesized by Integrated DNA Technologies (Iowa, USA).
In Silico PCR: to confirm the robustness of the primers and the probe sequence regions used in this study as the universal method, nucleotide homology and entropy were investigated. First, sequence identification number information (GI) on 18S rRNA gene was downloaded from the National Center for Biotechnology Information nucleotide database (NCBI nt: https://www.ncbi.nlm.nih.gov/) with the following key-words: “18S”, or “SSU”, “not uncultured”, and “not environmental DNA” (n = 990,223). The GI data was converted to fasta format by use of blastdbcmd (version 2.6.0) based on the NCBI nt downloaded on March 22, 2019 (n = 51,045,413). Overlapped GI-s were removed (n = 727,375). The sequences containing V7–9 regions were extracted using a primer pair: 18S F919 (5′ATT GAC GGA AGG GCA CCA 3′; Rosati et al., 2005) and 18S-EukR (5′ TGA TCC TTC YGC AGG TTC ACC
TAC 3′; Medlin et al., 1988; with 10th base replaced from T to Y in this study) by in silico PCR with the aid of ecoPCR v0.8.0 (Bellemain et al., 2010). Longer regions, than those amplified by the universal primers developed for dPCR, were extracted to avoid bias for the check of nucleotide homology and entropy due to stringent in silico PCR condi-tions. In this analysis, four bp mismatches in each primer sequence were allowed, but no mismatch was allowed in the three bases at the 3′-end. Sequences that contained poly-N longer than 4 bp in the amplified re-gion were excluded from the data (n = 15,230 seqs). Clustering of se-quences was carried out by CD-HIT-EST v. 4.6 (Li and Godzik 2006) at 0.99 sequence identity level to avoid phylogenetic and taxonomic bia-ses. The additional command-line parameters “-A 0 -d 0 -r 0 -p 1 -g 1′′
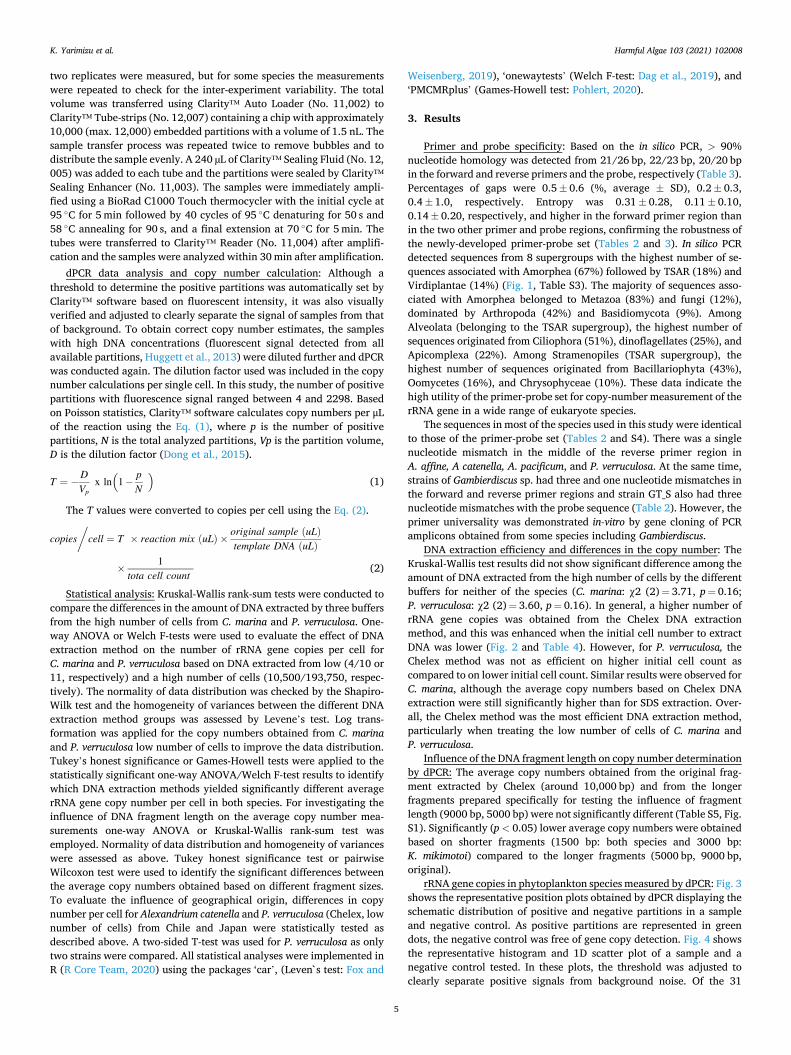
were given in the sequence clustering. The alignment was done by mafft (version: 7.402-with-extensions) (n = 4982). The nucleotide homology was checked to identify the mismatches in the primer and probe se-quences, and the entropy was calculated by GENETYX (ver. 15, Table 3).
Secondly, to investigate the universality of the newly developed primers and the probe for analyzing various eukaryotic taxa, the se-quences which could be amplified by the primers used for dPCR were extracted by in silico PCR with the aid of ecoPCR. Namely, in silico PCR was done using the same dataset of SSU (n = 727,375) under the same conditions mentioned above except for the primer pair, resulting in 21,597 sequences. The taxon information (taxid) was extracted from Entrez DB (https://www.ncbi.nlm.nih.gov/Taxonomy/Browser/www tax.cgi) based on each sequence of the fasta. The data showing the same taxid was removed (n = 13,214). Sequences from environmental samples or uncultured still included in the dataset were also removed (n = 13,095). The relative abundance among the different taxa obtained is shown by the Krona chart (https://github.com/marbl/Krona/ wiki/KronaTools) (Fig. 1) and the taxonomic information is available in (Table S3). Supergroups were defined based on the taxonomic groupings reported by Burki et al. (2020).
rRNA gene cloning and sequencing: To confirm the identity of the
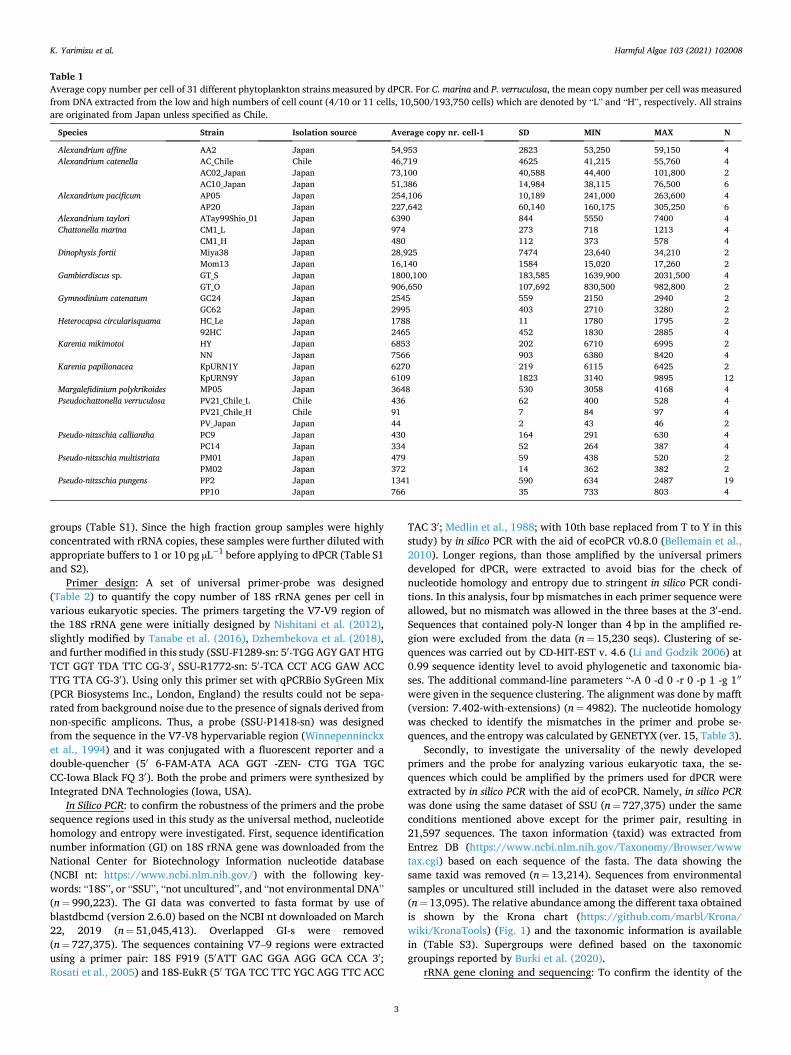
Table 1 Average copy number per cell of 31 different phytoplankton strains measured by dPCR. For C. marina and P. verruculosa, the mean copy number per cell was measured from DNA extracted from the low and high numbers of cell count (4/10 or 11 cells, 10,500/193,750 cells) which are denoted by “L” and “H”, respectively. All strains are originated from Japan unless specified as Chile.
Species Strain Isolation source Average copy nr. cell-1 SD MIN MAX N
Alexandrium affine AA2 Japan 54,953 2823 53,250 59,150 4 Alexandrium catenella AC_Chile Chile 46,719 4625 41,215 55,760 4
AC02_Japan Japan 73,100 40,588 44,400 101,800 2 AC10_Japan Japan 51,386 14,984 38,115 76,500 6
Alexandrium pacificum AP05 Japan 254,106 10,189 241,000 263,600 4 AP20 Japan 227,642 60,140 160,175 305,250 6
Alexandrium taylori ATay99Shio_01 Japan 6390 844 5550 7400 4 Chattonella marina CM1_L Japan 974 273 718 1213 4
CM1_H Japan 480 112 373 578 4 Dinophysis fortii Miya38 Japan 28,925 7474 23,640 34,210 2
Mom13 Japan 16,140 1584 15,020 17,260 2 Gambierdiscus sp. GT_S Japan 1800,100 183,585 1639,900 2031,500 4
GT_O Japan 906,650 107,692 830,500 982,800 2 Gymnodinium catenatum GC24 Japan 2545 559 2150 2940 2
GC62 Japan 2995 403 2710 3280 2 Heterocapsa circularisquama HC_Le Japan 1788 11 1780 1795 2
92HC Japan 2465 452 1830 2885 4 Karenia mikimotoi HY Japan 6853 202 6710 6995 2
NN Japan 7566 903 6380 8420 4 Karenia papilionacea KpURN1Y Japan 6270 219 6115 6425 2
KpURN9Y Japan 6109 1823 3140 9895 12 Margalefidinium polykrikoides MP05 Japan 3648 530 3058 4168 4 Pseudochattonella verruculosa PV21_Chile_L Chile 436 62 400 528 4
PV21_Chile_H Chile 91 7 84 97 4 PV_Japan Japan 44 2 43 46 2
Pseudo-nitzschia calliantha PC9 Japan 430 164 291 630 4 PC14 Japan 334 52 264 387 4
Pseudo-nitzschia multistriata PM01 Japan 479 59 438 520 2 PM02 Japan 372 14 362 382 2
Pseudo-nitzschia pungens PP2 Japan 1341 590 634 2487 19 PP10 Japan 766 35 733 803 4
K. Yarimizu et al.
Harmful Algae 103 (2021) 102008
4
species used in this study and to further investigate the specificity of the newly developed primer and probe system the target sequences were by Sanger sequencing. At the late logarithmic phase of clonal culture, 2 - 10 cells were inoculated into 20 μL of 5% Chelex buffer and processed for DNA extraction for each species. PCR amplification was carried out with a reaction mixture consisted of 1 μL template DNA, 1 μM each of SSU-F1289-sn and SSU-R1772-sn primer, 0.2 mM of each dNTP, 1 × PCR buffer, 1.5 mM Mg2+, 1 U KOD-Plus-Ver.2 (TOYOBO, Osaka, Japan), and RNA free dH2O to bring up to 50 μL volume with the initial denaturation at 94 ◦C for 2 min followed by 30 cycles at 94 ◦C for 15 s, 56 ◦C for 30 s, and 68 ◦C for 1 min. Because KOD-Plus- Ver.2 is a thermostable polymerase containing extensive 3′ to 5′
exonuclease activity and results in PCR products with a blunt end, the amplicons were further treated for adenine addition to the 3′ end per A- tailing procedure in pGEM-T® Easy Vector System technical manual (TM042 revised on 12/18). These 3′-adenine overhang products were immediately ligated to the pGEM-T® Easy Vector (Promega, Madison, WI, USA) and transformed into DH5α cells (Promega, Madison, WI, USA) following the manufacturer’s protocol (Promega, 2010). After incubating the plates at 37 ◦C for colony growth, 12 white colonies were randomly chosen from each library and processed for sequencing using the Dynamic ET terminator cycle sequencing kit (GE Healthcare, Little Chalfont, UK) in combination with M13 reverse and U19 primers and a DNA sequencer (ABI3730, Applied Biosystems). The sequences were aligned using MEGA version 10 (Kumar et al., 2018) and a BLAST search was performed to identify species from the GenBank.
Influence of DNA fragment length on determining the copy numbers by dPCR: To verify the influence of fragment length on the copy number measurements, the original DNA extracted by Chelex buffer (fragment length around 10,000 bp) was fragmented to different sizes (9000; 5000; 3000; 1500 bp). Copy numbers were measured in each fragment fraction and compared. Two dinoflagellate species were used to perform this experiment: 193,750 cells of Heterocapsa circu-larisquama (strain 92HC) and 85,000 cells of Karenia mikimotoi (HY) were harvested into 1.5-mL plastic tubes and 30 µL of 5% Chelex buffer were added. The cells were homogenized using a pellet pestle motor for 30 s, 220 µL of 5% Chelex buffer was added to be 250 µL in total, the samples were then heated at 97 ◦C in a block heater for 20 min. Five tubes of the DNA extracts were prepared in each species and centri-fuged at 14,000 rpm for 2 min. The supernatants were then mixed equally after extraction into a 15 mL plastic tube (AGC TECHNO GLASS, Co., Ltd., Shizuoka, Japan) in each species. G-TUBE (Covaris, Woburn, MA, USA) was centrifuged by Eppendorf 5430 (Eppendorf, Hamburg, Germany) at 11,000 rpm for one min and further one min after overturning the tube to obtain 9000 bp fragment. The model S220 (Covaris) was employed for preparing DNA fragments of 5000, 3000, and 1500 bp according to the manual provided by the company. Size distribution in each fraction was analyzed on gels in 4150 TapeStation (Agilent Technologies, Santa Clara, CA, USA). To perform the analysis, the DNAs were concentrated 10 times using an Agencourt AMPure XP (BECKMAN COULTER, Life Sciences, Brea, California, USA) following the manufacturers’ protocol. To measure copy numbers of the rRNA gene, each DNA fraction including the original DNA solution was diluted 3000 times with TE buffer. Copy number measurements were then carried out with five or six replicates in each fragment according to the following protocol to evaluate differences among the DNA fragmented in different sizes.
dPCR: All materials and reagents along with the Clarity™ Digital PCR system in this section were purchased from JN Medsys, Singapore unless specified. The sample preparation process followed Low et al. (2017). A reaction mix for dPCR amplification was prepared at 15 µL volume consisting of 7.5 µL 2x Luna universal probe qPCR master mix (M3004L, New England Biolabs, Japan), 125 nM of probe, 250 nM each primer, 0.75 µL of 20x Clarity™ JN Solution (No. 12,006), 3 µL of template DNA, and RNA-free dH2O to the target volume. In each assay, RNA-free dH2O was included as a negative control. For each species, Ta
ble
2 M
ultip
le a
lignm
ent o
f pri
mer
and
pro
be v
ersu
s te
mpl
ate
sequ
ence
s to
iden
tify
mis
mat
ches
and
hom
olog
ous
nucl
eotid
es. T
he ID
-s o
f for
war
d an
d re
vers
e pr
imer
s, a
nd p
robe
are
SSU
-F12
89-s
n, S
SU-R
1172
-sn,
and
SSU
- P1
418-
sn, r
espe
ctiv
ely.
Am
plic
on le
ngth
: 483
bp.
The
ast
eris
ks d
enot
e th
e se
quen
ces
rand
omly
cho
sen
from
Gen
Bank
for
spec
ies
iden
tified
bas
ed o
n th
eir
dist
inct
ive
mor
phol
ogy.
For
spe
cies
tha
t co
uld
not
relia
bly
iden
tified
to s
peci
es le
vel b
ased
on
mor
phol
ogy,
the
sequ
ence
s w
ere
obta
ined
by
clon
ing
and
dire
ct s
eque
ncin
g. T
he s
peci
es id
entit
y w
as c
onfir
med
by
BLA
ST s
earc
h.
Forw
ard
(SSU
-F12
89-s
n)
C G
G A
A T
H
A A
C C
A G
A C
A D
A T
C R
C T
C C
A
Prob
e (S
SU-P
1418
-sn)
G G
G C
A T
C A
C A
G A
C C
T G
T T
A T
Re
vers
e (S
SU-R
1772
-sn)
T
C A
C C
T A
C G
G A
W
AC
C T
G T
A C
G
Ale
xand
rium
affi
ne
AA
2 C
G G
A A
T T
A
A C
C A
G A
C A
A A
T C
A C
T C
C A
G G
G C
A T
C A
C A
G A
C C
T G
T T
A T
T
C A
C C
T A
C A
G A
A A
C C
T G
T A
C G
A
lexa
ndriu
m c
aten
ella
* G
enBa
nk
C G
G A
A T
T
A A
C C
A G
A C
A A
A T
C A
C T
C C
A G
G G
C A
T C
A C
A G
A C
C T
G T
T A
T
T C
A C
C T
A C
A G
A A
AC
C T
G T
A C
G
Ale
xand
rium
pac
ificu
m*
Gen
Bank
C
G G
A A
T T
A
A C
C A
G A
C A
A A
T C
A C
T C
C A
G G
G C
A T
C A
C A
G A
C C
T G
T T
A T
T
C A
C C
T A
C A
G A
A A
C C
T G
T A
C G
A
lexa
ndriu
m ta
ylor
i A
tay9
9Shi
o_01
C G
G A
A T
T
A A
C C
A G
A C
A A
A T
C A
C T
C C
A G
G G
C A
T C
A C
A G
A C
C T
G T
T A
T
T C
A C
C T
A C
G G
A A
AC
C T
G T
A C
G
Chat
tone
lla m
arin
a*
Gen
Bank
C
G G
A A
T T
A
A C
C A
G A
C A
A A
T C
A C
T C
C A
G G
G C
A T
C A
C A
G A
C C
T G
T T
A T
T
C A
C C
T A
C G
G A
A A
C C
T G
T A
C G
Di
noph
ysis
fort
ii M
iya3
8 C
G G
A A
T T
A
A C
C A
G A
C A
A A
T C
A C
T C
C A
G G
G C
A T
C A
C A
G A
C C
T G
T T
A T
T
C A
C C
T A
C G
G A
A A
C C
T G
T A
C G
M
om13
C
G G
A A
T T
A
A C
C A
G A
C A
A A
T C
A C
T C
C A
G G
G C
A T
C A
C A
G A
C C
T G
T T
A T
T
C A
C C
T A
C G
G A
A A
C C
T G
T A
C G
G
ambi
erdi
scus
sp.
G
T_S
C G
G A
A T
W A
A C
C A
G A
C A
A A
C C
A C
G C
C A
G G
G C
A T
C A
C A
G R
C C
T G
T T
R Y
T
C A
C C
T A
C A
G A
A A
C C
T G
T A
C G
G
T_O
C
G G
A A
T H
A
A C
C A
G A
C A
A A
C C
A C
K C
C A
G G
G C
A T
C A
C A
G A
C C
T G
T T
A T
T
C A
C C
T A
C A
G A
A A
C C
T G
T A
C G
G
ymno
dini
um c
aten
atum
* G
enBa
nk
C G
G A
A T
T
A A
C C
A G
A C
A A
A T
C A
C T
C C
A G
G G
C A
T C
A C
A G
A C
C T
G T
T A
T
T C
A C
C T
A C
G G
A A
AC
C T
G T
A C
G
Het
eroc
apsa
circ
ular
isqua
ma
92H
C C
G G
A A
T T
A
A C
C A
G A
C A
A A
T C
A C
T C
C A
G G
G C
A T
C A
C A
G A
C C
T G
T T
A T
T
C A
C C
T A
C G
G A
A A
C C
T G
T A
C G
Ka
reni
a m
ikim
otoi
* G
enBa
nk
C G
G A
A T
T
A A
C C
A G
A C
A A
A T
C A
C T
C C
A G
G G
C A
T C
A C
A G
A C
C T
G T
T A
T
T C
A C
C T
A C
G G
A A
AC
C T
G T
A C
G
Kare
nia
papi
liona
cea
KpU
RN1Y
C
G G
A A
T T
A
A C
C A
G A
C A
A A
T C
A C
T C
C A
G G
G C
A T
C A
C A
G A
C C
T G
T T
A T
T
C A
C C
T A
C G
G A
A A
C C
T G
T A
C G
Kp
URN
9Y
C G
G A
A T
T
A A
C C
A G
A C
A A
A T
C A
C T
C C
A G
G G
C A
T C
A C
A G
A C
C T
G T
T A
T
T C
A C
C T
A C
G G
A A
AC
C T
G T
A C
G
Mar
gale
fidin
ium
pol
ykrik
oide
s* G
enBa
nk
C G
G A
A T
T
A A
C C
A G
A C
A A
A T
C A
C T
C C
A G
G G
C A
T C
A C
A G
A C
C T
G T
T A
T
T C
A C
C T
A C
G G
A A
AC
C T
G T
A C
G
Pseu
doch
atto
nella
ver
rucu
losa
* G
enBa
nk
C G
G A
A T
T
A A
C C
A G
A C
A A
A T
C A
C T
C C
A G
G G
C A
T C
A C
A G
A C
C T
G T
T A
T
T C
A C
C T
A C
G G
T A
AC
C T
G T
A C
G
Pseu
do-n
itzsc
hia
calli
anth
a PC
9 C
G G
A A
T T
A
A C
C A
G A
C A
A A
T C
A C
T C
C A
G G
G C
A T
C A
C A
G A
C C
T G
T T
A T
T
C A
C C
T A
C G
G A
A A
C C
T G
T A
C G
Ps
eudo
-nitz
schi
a m
ultis
tria
ta
PM02
C
G G
A A
T T
A
A C
C A
G A
C A
A A
T C
A C
T C
C A
G G
G C
A T
C A
C A
G A
C C
T G
T T
A T
T
C A
C C
T A
C G
G A
A A
C C
T G
T A
C G
Ps
eudo
-nitz
schi
a pu
ngen
s PP
10
C G
G A
A T
T
A A
C C
A G
A C
A A
A T
C A
C T
C C
A G
G G
C A
T C
A C
A G
A C
C T
G T
T A
T
T C
A C
C T
A C
G G
A A
AC
C T
G T
A C
G
K. Yarimizu et al.
Harmful Algae 103 (2021) 102008
5
two replicates were measured, but for some species the measurements were repeated to check for the inter-experiment variability. The total volume was transferred using Clarity™ Auto Loader (No. 11,002) to Clarity™ Tube-strips (No. 12,007) containing a chip with approximately 10,000 (max. 12,000) embedded partitions with a volume of 1.5 nL. The sample transfer process was repeated twice to remove bubbles and to distribute the sample evenly. A 240 µL of Clarity™ Sealing Fluid (No. 12, 005) was added to each tube and the partitions were sealed by Clarity™ Sealing Enhancer (No. 11,003). The samples were immediately ampli-fied using a BioRad C1000 Touch thermocycler with the initial cycle at 95 ◦C for 5 min followed by 40 cycles of 95 ◦C denaturing for 50 s and 58 ◦C annealing for 90 s, and a final extension at 70 ◦C for 5 min. The tubes were transferred to Clarity™ Reader (No. 11,004) after amplifi-cation and the samples were analyzed within 30 min after amplification.
dPCR data analysis and copy number calculation: Although a threshold to determine the positive partitions was automatically set by Clarity™ software based on fluorescent intensity, it was also visually verified and adjusted to clearly separate the signal of samples from that of background. To obtain correct copy number estimates, the samples with high DNA concentrations (fluorescent signal detected from all available partitions, Huggett et al., 2013) were diluted further and dPCR was conducted again. The dilution factor used was included in the copy number calculations per single cell. In this study, the number of positive partitions with fluorescence signal ranged between 4 and 2298. Based on Poisson statistics, Clarity™ software calculates copy numbers per μL of the reaction using the Eq. (1), where p is the number of positive partitions, N is the total analyzed partitions, Vp is the partition volume, D is the dilution factor (Dong et al., 2015).
T = −DVp
x ln(
1 −pN
)(1)
The T values were converted to copies per cell using the Eq. (2).
copies/
cell = T × reaction mix (uL) ×original sample (uL)template DNA (uL)
×1
tota cell count(2)
Statistical analysis: Kruskal-Wallis rank-sum tests were conducted to compare the differences in the amount of DNA extracted by three buffers from the high number of cells from C. marina and P. verruculosa. One- way ANOVA or Welch F-tests were used to evaluate the effect of DNA extraction method on the number of rRNA gene copies per cell for C. marina and P. verruculosa based on DNA extracted from low (4/10 or 11, respectively) and a high number of cells (10,500/193,750, respec-tively). The normality of data distribution was checked by the Shapiro- Wilk test and the homogeneity of variances between the different DNA extraction method groups was assessed by Levene’s test. Log trans-formation was applied for the copy numbers obtained from C. marina and P. verruculosa low number of cells to improve the data distribution. Tukey’s honest significance or Games-Howell tests were applied to the statistically significant one-way ANOVA/Welch F-test results to identify which DNA extraction methods yielded significantly different average rRNA gene copy number per cell in both species. For investigating the influence of DNA fragment length on the average copy number mea-surements one-way ANOVA or Kruskal-Wallis rank-sum test was employed. Normality of data distribution and homogeneity of variances were assessed as above. Tukey honest significance test or pairwise Wilcoxon test were used to identify the significant differences between the average copy numbers obtained based on different fragment sizes. To evaluate the influence of geographical origin, differences in copy number per cell for Alexandrium catenella and P. verruculosa (Chelex, low number of cells) from Chile and Japan were statistically tested as described above. A two-sided T-test was used for P. verruculosa as only two strains were compared. All statistical analyses were implemented in R (R Core Team, 2020) using the packages ‘car’, (Leven`s test: Fox and
Weisenberg, 2019), ‘onewaytests’ (Welch F-test: Dag et al., 2019), and ‘PMCMRplus’ (Games-Howell test: Pohlert, 2020).
3. Results
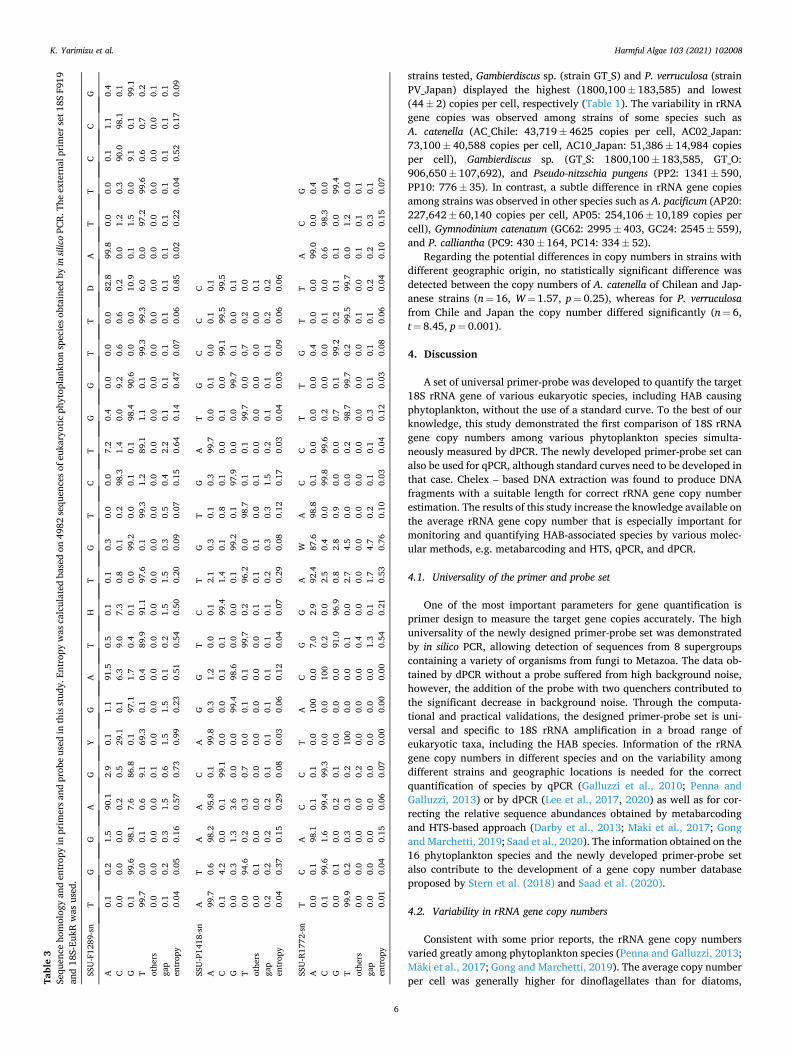
Primer and probe specificity: Based on the in silico PCR, > 90% nucleotide homology was detected from 21/26 bp, 22/23 bp, 20/20 bp in the forward and reverse primers and the probe, respectively (Table 3). Percentages of gaps were 0.5 ± 0.6 (%, average ± SD), 0.2 ± 0.3, 0.4 ± 1.0, respectively. Entropy was 0.31 ± 0.28, 0.11 ± 0.10, 0.14 ± 0.20, respectively, and higher in the forward primer region than in the two other primer and probe regions, confirming the robustness of the newly-developed primer-probe set (Tables 2 and 3). In silico PCR detected sequences from 8 supergroups with the highest number of se-quences associated with Amorphea (67%) followed by TSAR (18%) and Virdiplantae (14%) (Fig. 1, Table S3). The majority of sequences asso-ciated with Amorphea belonged to Metazoa (83%) and fungi (12%), dominated by Arthropoda (42%) and Basidiomycota (9%). Among Alveolata (belonging to the TSAR supergroup), the highest number of sequences originated from Ciliophora (51%), dinoflagellates (25%), and Apicomplexa (22%). Among Stramenopiles (TSAR supergroup), the highest number of sequences originated from Bacillariophyta (43%), Oomycetes (16%), and Chrysophyceae (10%). These data indicate the high utility of the primer-probe set for copy-number measurement of the rRNA gene in a wide range of eukaryote species.
The sequences in most of the species used in this study were identical to those of the primer-probe set (Tables 2 and S4). There was a single nucleotide mismatch in the middle of the reverse primer region in A. affine, A catenella, A. pacificum, and P. verruculosa. At the same time, strains of Gambierdiscus sp. had three and one nucleotide mismatches in the forward and reverse primer regions and strain GT_S also had three nucleotide mismatches with the probe sequence (Table 2). However, the primer universality was demonstrated in-vitro by gene cloning of PCR amplicons obtained from some species including Gambierdiscus.
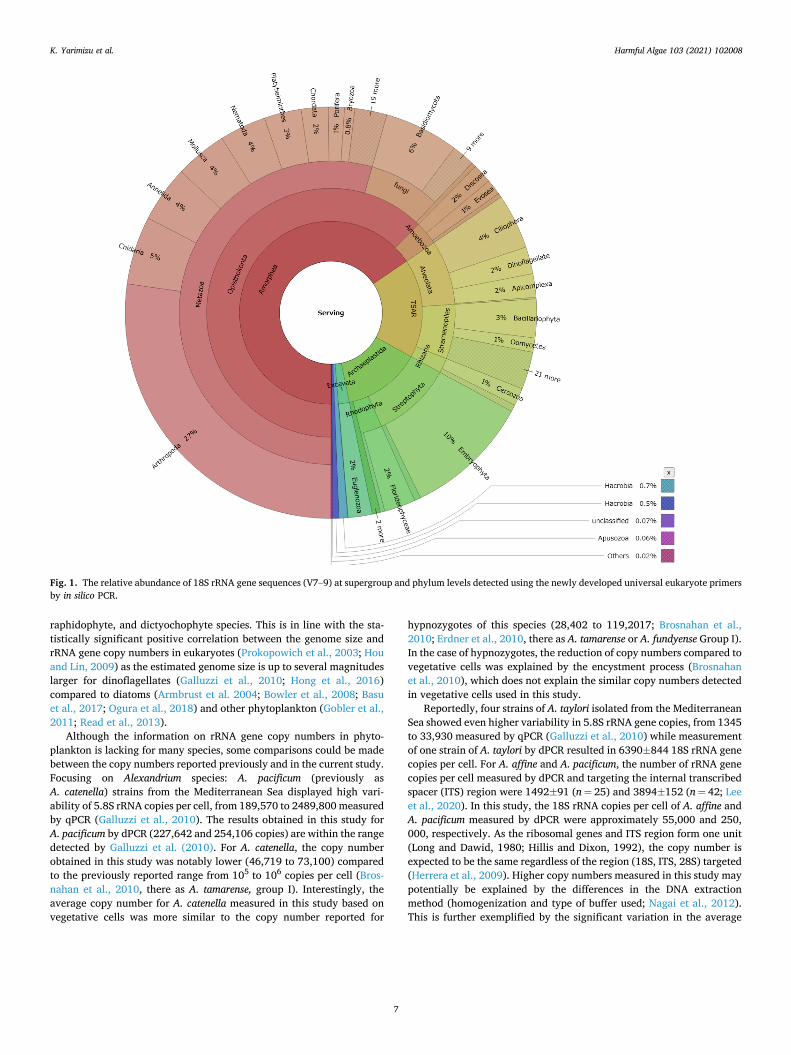
DNA extraction efficiency and differences in the copy number: The Kruskal-Wallis test results did not show significant difference among the amount of DNA extracted from the high number of cells by the different buffers for neither of the species (C. marina: χ2 (2) = 3.71, p = 0.16; P. verruculosa: χ2 (2) = 3.60, p = 0.16). In general, a higher number of rRNA gene copies was obtained from the Chelex DNA extraction method, and this was enhanced when the initial cell number to extract DNA was lower (Fig. 2 and Table 4). However, for P. verruculosa, the Chelex method was not as efficient on higher initial cell count as compared to on lower initial cell count. Similar results were observed for C. marina, although the average copy numbers based on Chelex DNA extraction were still significantly higher than for SDS extraction. Over-all, the Chelex method was the most efficient DNA extraction method, particularly when treating the low number of cells of C. marina and P. verruculosa.
Influence of the DNA fragment length on copy number determination by dPCR: The average copy numbers obtained from the original frag-ment extracted by Chelex (around 10,000 bp) and from the longer fragments prepared specifically for testing the influence of fragment length (9000 bp, 5000 bp) were not significantly different (Table S5, Fig. S1). Significantly (p < 0.05) lower average copy numbers were obtained based on shorter fragments (1500 bp: both species and 3000 bp: K. mikimotoi) compared to the longer fragments (5000 bp, 9000 bp, original).
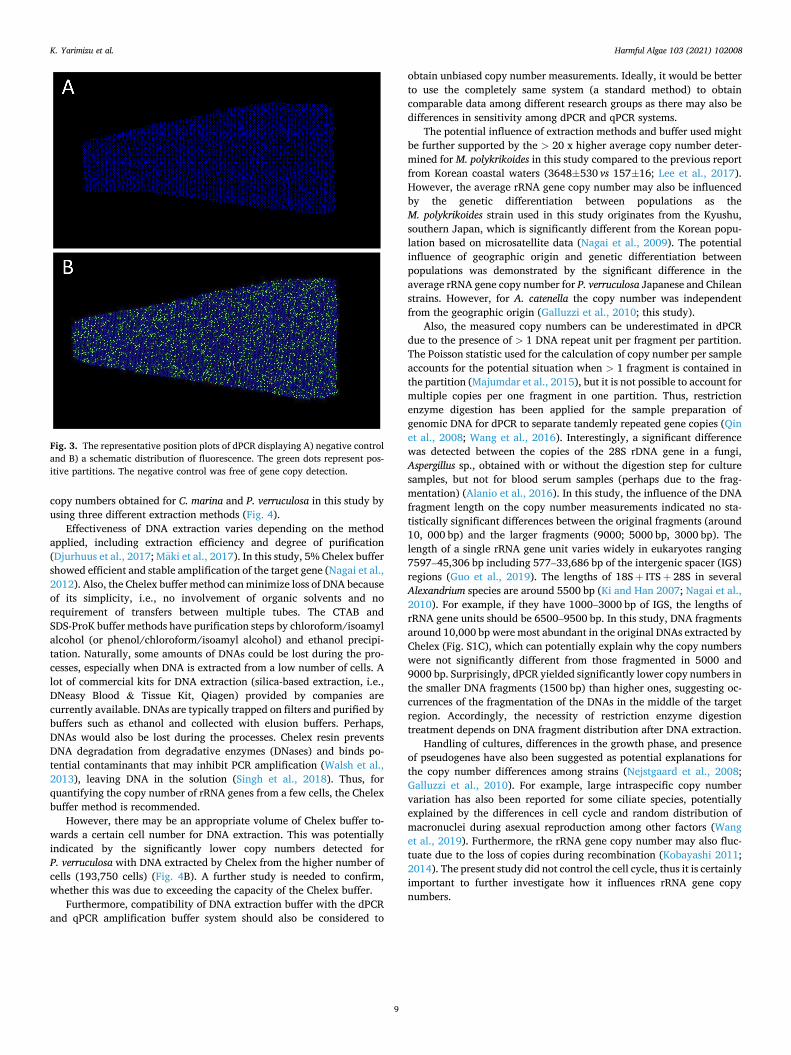
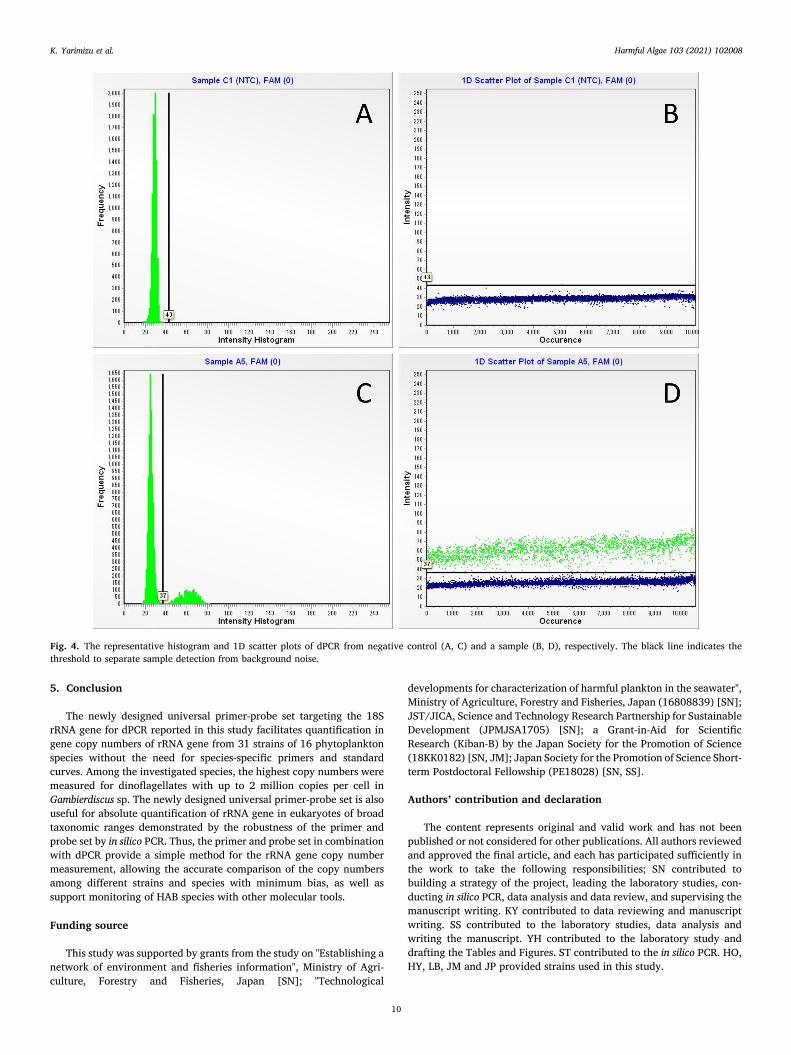
rRNA gene copies in phytoplankton species measured by dPCR: Fig. 3 shows the representative position plots obtained by dPCR displaying the schematic distribution of positive and negative partitions in a sample and negative control. As positive partitions are represented in green dots, the negative control was free of gene copy detection. Fig. 4 shows the representative histogram and 1D scatter plot of a sample and a negative control tested. In these plots, the threshold was adjusted to clearly separate positive signals from background noise. Of the 31
K. Yarimizu et al.
Harmful Algae 103 (2021) 102008
6
strains tested, Gambierdiscus sp. (strain GT_S) and P. verruculosa (strain PV_Japan) displayed the highest (1800,100 ± 183,585) and lowest (44 ± 2) copies per cell, respectively (Table 1). The variability in rRNA gene copies was observed among strains of some species such as A. catenella (AC_Chile: 43,719 ± 4625 copies per cell, AC02_Japan: 73,100 ± 40,588 copies per cell, AC10_Japan: 51,386 ± 14,984 copies per cell), Gambierdiscus sp. (GT_S: 1800,100 ± 183,585, GT_O: 906,650 ± 107,692), and Pseudo-nitzschia pungens (PP2: 1341 ± 590, PP10: 776 ± 35). In contrast, a subtle difference in rRNA gene copies among strains was observed in other species such as A. pacificum (AP20: 227,642 ± 60,140 copies per cell, AP05: 254,106 ± 10,189 copies per cell), Gymnodinium catenatum (GC62: 2995 ± 403, GC24: 2545 ± 559), and P. calliantha (PC9: 430 ± 164, PC14: 334 ± 52).
Regarding the potential differences in copy numbers in strains with different geographic origin, no statistically significant difference was detected between the copy numbers of A. catenella of Chilean and Jap-anese strains (n = 16, W = 1.57, p = 0.25), whereas for P. verruculosa from Chile and Japan the copy number differed significantly (n = 6, t = 8.45, p = 0.001).
4. Discussion
A set of universal primer-probe was developed to quantify the target 18S rRNA gene of various eukaryotic species, including HAB causing phytoplankton, without the use of a standard curve. To the best of our knowledge, this study demonstrated the first comparison of 18S rRNA gene copy numbers among various phytoplankton species simulta-neously measured by dPCR. The newly developed primer-probe set can also be used for qPCR, although standard curves need to be developed in that case. Chelex – based DNA extraction was found to produce DNA fragments with a suitable length for correct rRNA gene copy number estimation. The results of this study increase the knowledge available on the average rRNA gene copy number that is especially important for monitoring and quantifying HAB-associated species by various molec-ular methods, e.g. metabarcoding and HTS, qPCR, and dPCR.
4.1. Universality of the primer and probe set
One of the most important parameters for gene quantification is primer design to measure the target gene copies accurately. The high universality of the newly designed primer-probe set was demonstrated by in silico PCR, allowing detection of sequences from 8 supergroups containing a variety of organisms from fungi to Metazoa. The data ob-tained by dPCR without a probe suffered from high background noise, however, the addition of the probe with two quenchers contributed to the significant decrease in background noise. Through the computa-tional and practical validations, the designed primer-probe set is uni-versal and specific to 18S rRNA amplification in a broad range of eukaryotic taxa, including the HAB species. Information of the rRNA gene copy numbers in different species and on the variability among different strains and geographic locations is needed for the correct quantification of species by qPCR (Galluzzi et al., 2010; Penna and Galluzzi, 2013) or by dPCR (Lee et al., 2017, 2020) as well as for cor-recting the relative sequence abundances obtained by metabarcoding and HTS-based approach (Darby et al., 2013; Maki et al., 2017; Gong and Marchetti, 2019; Saad et al., 2020). The information obtained on the 16 phytoplankton species and the newly developed primer-probe set also contribute to the development of a gene copy number database proposed by Stern et al. (2018) and Saad et al. (2020).
4.2. Variability in rRNA gene copy numbers
Consistent with some prior reports, the rRNA gene copy numbers varied greatly among phytoplankton species (Penna and Galluzzi, 2013; Maki et al., 2017; Gong and Marchetti, 2019). The average copy number per cell was generally higher for dinoflagellates than for diatoms, Ta
ble
3 Se
quen
ce h
omol
ogy
and
entr
opy
in p
rim
ers a
nd p
robe
use
d in
this
stud
y. E
ntro
py w
as c
alcu
late
d ba
sed
on 4
982
sequ
ence
s of e
ukar
yotic
phy
topl
ankt
on sp
ecie
s obt
aine
d by
in si
lico
PCR.
The
ext
erna
l pri
mer
set 1
8S F
919
and
18S-
EukR
was
use
d.
SSU
-F12
89-s
n T
G
G
A
G
Y G
A
T
H
T G
T
C T
G
G
T T
D
A
T T
C C
G
A
0.1
0.2
1.5
90.1
2.
9 0.
1 1.
1 91
.5
0.5
0.1
0.1
0.3
0.0
0.0
7.2
0.4
0.0
0.0
0.0
82.8
99
.8
0.0
0.0
0.1
1.1
0.4
C 0.
0 0.
0 0.
0 0.
2 0.
5 29
.1
0.1
6.3
9.0
7.3
0.8
0.1
0.2
98.3
1.
4 0.
0 9.
2 0.
6 0.
6 0.
2 0.
0 1.
2 0.
3 90
.0
98.1
0.
1 G
0.
1 99
.6
98.1
7.
6 86
.8
0.1
97.1
1.
7 0.
4 0.
1 0.
0 99
.2
0.0
0.1
0.1
98.4
90
.6
0.0
0.0
10.9
0.
1 1.
5 0.
0 9.
1 0.
1 99
.1
T 99
.7
0.0
0.1
0.6
9.1
69.3
0.
1 0.
4 89
.9
91.1
97
.6
0.1
99.3
1.
2 89
.1
1.1
0.1
99.3
99
.3
6.0
0.0
97.2
99
.6
0.6
0.7
0.2
othe
rs
0.0
0.0
0.0
0.0
0.1
0.0
0.0
0.0
0.0
0.0
0.0
0.0
0.0
0.0
0.0
0.0
0.0
0.0
0.0
0.0
0.0
0.0
0.0
0.0
0.0
0.1
gap
0.1
0.2
0.3
1.5
0.6
1.5
1.5
0.1
0.2
1.5
1.5
0.3
0.5
0.4
2.2
0.1
0.1
0.1
0.1
0.1
0.1
0.1
0.1
0.1
0.1
0.1
entr
opy
0.04
0.
05
0.16
0.
57
0.73
0.
99
0.23
0.
51
0.54
0.
50
0.20
0.
09
0.07
0.
15
0.64
0.
14
0.47
0.
07
0.06
0.
85
0.02
0.
22
0.04
0.
52
0.17
0.
09
SSU
-P14
18-s
n A
T
A
A
C A
G
G
T
C T
G
T G
A
T
G
C C
C
A
99
.7
0.6
98.2
95
.8
0.1
99.8
0.
3 1.
2 0.
0 0.
1 2.
1 0.
3 0.
1 0.
3 99
.7
0.0
0.1
0.0
0.1
0.1
C 0.
1 4.
2 0.
0 0.
1 99
.1
0.0
0.0
0.1
0.1
99.4
1.
4 0.
1 0.
8 0.
1 0.
0 0.
1 0.
0 99
.1
99.5
99
.5
G
0.0
0.3
1.3
3.6
0.0
0.0
99.4
98
.6
0.0
0.0
0.1
99.2
0.
1 97
.9
0.0
0.0
99.7
0.
1 0.
0 0.
1
T
0.0
94.6
0.
2 0.
3 0.
7 0.
0 0.
1 0.
1 99
.7
0.2
96.2
0.
0 98
.7
0.1
0.1
99.7
0.
0 0.
7 0.
2 0.
0
ot
hers
0.
0 0.
1 0.
0 0.
0 0.
0 0.
0 0.
0 0.
0 0.
0 0.
1 0.
1 0.
1 0.
0 0.
1 0.
0 0.
0 0.
0 0.
0 0.
0 0.
1
ga
p 0.
2 0.
2 0.
2 0.
2 0.
1 0.
1 0.
1 0.
1 0.
1 0.
1 0.
2 0.
3 0.
3 1.
5 0.
2 0.
1 0.
1 0.
1 0.
2 0.
2
en
trop
y 0.
04
0.37
0.
15
0.29
0.
08
0.03
0.
06
0.12
0.
04
0.07
0.
29
0.08
0.
12
0.17
0.
03
0.04
0.
03
0.09
0.
06
0.06
SSU
-R17
72-s
n T
C A
C
C T
A
C G
G
A
W
A
C
C T
T G
T
T A
C
G
A
0.
0 0.
1 98
.1
0.1
0.1
0.0
100
0.0
7.0
2.9
92.4
87
.6
98.8
0.
1 0.
0 0.
0 0.
0 0.
4 0.
0 0.
0 99
.0
0.0
0.4
C
0.1
99.6
1.
6 99
.4
99.3
0.
0 0.
0 10
0 0.
2 0.
0 2.
5 0.
4 0.
0 99
.8
99.6
0.
2 0.
0 0.
0 0.
1 0.
0 0.
6 98
.3
0.0
G
0.
0 0.
1 0.
0 0.
2 0.
1 0.
0 0.
0 0.
0 91
.0
96.9
0.
8 2.
8 0.
9 0.
0 0.
0 0.
7 0.
1 99
.2
0.2
0.1
0.1
0.0
99.4
T 99
.9
0.2
0.3
0.3
0.2
100
0.0
0.0
0.1
0.0
2.7
4.5
0.0
0.0
0.2
98.7
99
.7
0.2
99.5
99
.7
0.0
1.2
0.0
ot
hers
0.
0 0.
0 0.
0 0.
0 0.
2 0.
0 0.
0 0.
0 0.
4 0.
0 0.
0 0.
0 0.
0 0.
0 0.
0 0.
0 0.
0 0.
0 0.
1 0.
0 0.
1 0.
1 0.
1
gap
0.0
0.0
0.0
0.0
0.0
0.0
0.0
0.0
1.3
0.1
1.7
4.7
0.2
0.1
0.1
0.3
0.1
0.1
0.1
0.2
0.2
0.3
0.1
en
trop
y 0.
01
0.04
0.
15
0.06
0.
07
0.00
0.
00
0.00
0.
54
0.21
0.
53
0.76
0.
10
0.03
0.
04
0.12
0.
03
0.08
0.
06
0.04
0.
10
0.15
0.
07
K. Yarimizu et al.
Harmful Algae 103 (2021) 102008
7
raphidophyte, and dictyochophyte species. This is in line with the sta-tistically significant positive correlation between the genome size and rRNA gene copy numbers in eukaryotes (Prokopowich et al., 2003; Hou and Lin, 2009) as the estimated genome size is up to several magnitudes larger for dinoflagellates (Galluzzi et al., 2010; Hong et al., 2016) compared to diatoms (Armbrust et al. 2004; Bowler et al., 2008; Basu et al., 2017; Ogura et al., 2018) and other phytoplankton (Gobler et al., 2011; Read et al., 2013).
Although the information on rRNA gene copy numbers in phyto-plankton is lacking for many species, some comparisons could be made between the copy numbers reported previously and in the current study. Focusing on Alexandrium species: A. pacificum (previously as A. catenella) strains from the Mediterranean Sea displayed high vari-ability of 5.8S rRNA copies per cell, from 189,570 to 2489,800 measured by qPCR (Galluzzi et al., 2010). The results obtained in this study for A. pacificum by dPCR (227,642 and 254,106 copies) are within the range detected by Galluzzi et al. (2010). For A. catenella, the copy number obtained in this study was notably lower (46,719 to 73,100) compared to the previously reported range from 105 to 106 copies per cell (Bros-nahan et al., 2010, there as A. tamarense, group I). Interestingly, the average copy number for A. catenella measured in this study based on vegetative cells was more similar to the copy number reported for
hypnozygotes of this species (28,402 to 119,2017; Brosnahan et al., 2010; Erdner et al., 2010, there as A. tamarense or A. fundyense Group I). In the case of hypnozygotes, the reduction of copy numbers compared to vegetative cells was explained by the encystment process (Brosnahan et al., 2010), which does not explain the similar copy numbers detected in vegetative cells used in this study.
Reportedly, four strains of A. taylori isolated from the Mediterranean Sea showed even higher variability in 5.8S rRNA gene copies, from 1345 to 33,930 measured by qPCR (Galluzzi et al., 2010) while measurement of one strain of A. taylori by dPCR resulted in 6390±844 18S rRNA gene copies per cell. For A. affine and A. pacificum, the number of rRNA gene copies per cell measured by dPCR and targeting the internal transcribed spacer (ITS) region were 1492±91 (n = 25) and 3894±152 (n = 42; Lee et al., 2020). In this study, the 18S rRNA copies per cell of A. affine and A. pacificum measured by dPCR were approximately 55,000 and 250, 000, respectively. As the ribosomal genes and ITS region form one unit (Long and Dawid, 1980; Hillis and Dixon, 1992), the copy number is expected to be the same regardless of the region (18S, ITS, 28S) targeted (Herrera et al., 2009). Higher copy numbers measured in this study may potentially be explained by the differences in the DNA extraction method (homogenization and type of buffer used; Nagai et al., 2012). This is further exemplified by the significant variation in the average
Fig. 1. The relative abundance of 18S rRNA gene sequences (V7–9) at supergroup and phylum levels detected using the newly developed universal eukaryote primers by in silico PCR.
K. Yarimizu et al.
Harmful Algae 103 (2021) 102008
8
Fig. 2. Mean copy number per cell of P. verruculosa and C. marina measured by dPCR from DNA extracted with Chelex, CTAB, and SDS with Proteinase K methods. DNA was extracted from the low fraction group (11 and 4/10 cells) and a high fraction group (193,750 and 10,500 cells) for P. verruculosa and C. marina, respectively. Asterisks and - indicate statistical significance (p ≤ 0.005) and insignificance between extraction methods, respectively, when compared Chelex with CTAB/ SDS ProK, CTAB with Chelex/SDS ProK, and SDS ProK with Chelex/CTAB.
Table 4 Comparison between average copy numbers per cell based on different extraction methods and the number of cells used for the DNA extraction. CM = Chattonella marina, PV = Pseudochattonella verruculosa, L = low number of cells (CM: 4; PV:10 or 11), H = high number of cells (CM: 10,500, PV: 193,750). Statistically significant (p ≤ 0.05) are indicated in bold.
Species Saphiro-Wilk (W/p value) Levene’s test (F/p value) ANOVA (F/ p value) Tukey HSD (p value) Welch (F/ p value) Games-Howell (p value)
CM_L 0.75/0.003 1.65/0.25 153.9/<0.001 Chelex vs CTAB <0.001 Chelex vs SDS <0.001 CTAB vs SDS 0.89
CM_H 0.93/0.39 8.21/0.01 22.35/0.004 Chelex vs CTAB 0.12 Chelex vs SDS 0.008 CTAB vs SDS 0.007
PV_L 0.84/0.02 1.37/0.31 53.9/<0.001 Chelex vs CTAB <0.001 Chelex vs SDS <0.001 CTAB vs SDS 0.2
PV_H 0.87/0.06 1.37/0.31 86.1/<0.001 Chelex vs CTAB <0.001 Chelex vs SDS 0.001 CTAB vs SDS <0.001
K. Yarimizu et al.
Harmful Algae 103 (2021) 102008
9
copy numbers obtained for C. marina and P. verruculosa in this study by using three different extraction methods (Fig. 4).
Effectiveness of DNA extraction varies depending on the method applied, including extraction efficiency and degree of purification (Djurhuus et al., 2017; Maki et al., 2017). In this study, 5% Chelex buffer showed efficient and stable amplification of the target gene (Nagai et al., 2012). Also, the Chelex buffer method can minimize loss of DNA because of its simplicity, i.e., no involvement of organic solvents and no requirement of transfers between multiple tubes. The CTAB and SDS-ProK buffer methods have purification steps by chloroform/isoamyl alcohol (or phenol/chloroform/isoamyl alcohol) and ethanol precipi-tation. Naturally, some amounts of DNAs could be lost during the pro-cesses, especially when DNA is extracted from a low number of cells. A lot of commercial kits for DNA extraction (silica-based extraction, i.e., DNeasy Blood & Tissue Kit, Qiagen) provided by companies are currently available. DNAs are typically trapped on filters and purified by buffers such as ethanol and collected with elusion buffers. Perhaps, DNAs would also be lost during the processes. Chelex resin prevents DNA degradation from degradative enzymes (DNases) and binds po-tential contaminants that may inhibit PCR amplification (Walsh et al., 2013), leaving DNA in the solution (Singh et al., 2018). Thus, for quantifying the copy number of rRNA genes from a few cells, the Chelex buffer method is recommended.
However, there may be an appropriate volume of Chelex buffer to-wards a certain cell number for DNA extraction. This was potentially indicated by the significantly lower copy numbers detected for P. verruculosa with DNA extracted by Chelex from the higher number of cells (193,750 cells) (Fig. 4B). A further study is needed to confirm, whether this was due to exceeding the capacity of the Chelex buffer.
Furthermore, compatibility of DNA extraction buffer with the dPCR and qPCR amplification buffer system should also be considered to
obtain unbiased copy number measurements. Ideally, it would be better to use the completely same system (a standard method) to obtain comparable data among different research groups as there may also be differences in sensitivity among dPCR and qPCR systems.
The potential influence of extraction methods and buffer used might be further supported by the > 20 x higher average copy number deter-mined for M. polykrikoides in this study compared to the previous report from Korean coastal waters (3648±530 vs 157±16; Lee et al., 2017). However, the average rRNA gene copy number may also be influenced by the genetic differentiation between populations as the M. polykrikoides strain used in this study originates from the Kyushu, southern Japan, which is significantly different from the Korean popu-lation based on microsatellite data (Nagai et al., 2009). The potential influence of geographic origin and genetic differentiation between populations was demonstrated by the significant difference in the average rRNA gene copy number for P. verruculosa Japanese and Chilean strains. However, for A. catenella the copy number was independent from the geographic origin (Galluzzi et al., 2010; this study).
Also, the measured copy numbers can be underestimated in dPCR due to the presence of > 1 DNA repeat unit per fragment per partition. The Poisson statistic used for the calculation of copy number per sample accounts for the potential situation when > 1 fragment is contained in the partition (Majumdar et al., 2015), but it is not possible to account for multiple copies per one fragment in one partition. Thus, restriction enzyme digestion has been applied for the sample preparation of genomic DNA for dPCR to separate tandemly repeated gene copies (Qin et al., 2008; Wang et al., 2016). Interestingly, a significant difference was detected between the copies of the 28S rDNA gene in a fungi, Aspergillus sp., obtained with or without the digestion step for culture samples, but not for blood serum samples (perhaps due to the frag-mentation) (Alanio et al., 2016). In this study, the influence of the DNA fragment length on the copy number measurements indicated no sta-tistically significant differences between the original fragments (around 10, 000 bp) and the larger fragments (9000; 5000 bp, 3000 bp). The length of a single rRNA gene unit varies widely in eukaryotes ranging 7597–45,306 bp including 577–33,686 bp of the intergenic spacer (IGS) regions (Guo et al., 2019). The lengths of 18S + ITS + 28S in several Alexandrium species are around 5500 bp (Ki and Han 2007; Nagai et al., 2010). For example, if they have 1000–3000 bp of IGS, the lengths of rRNA gene units should be 6500–9500 bp. In this study, DNA fragments around 10,000 bp were most abundant in the original DNAs extracted by Chelex (Fig. S1C), which can potentially explain why the copy numbers were not significantly different from those fragmented in 5000 and 9000 bp. Surprisingly, dPCR yielded significantly lower copy numbers in the smaller DNA fragments (1500 bp) than higher ones, suggesting oc-currences of the fragmentation of the DNAs in the middle of the target region. Accordingly, the necessity of restriction enzyme digestion treatment depends on DNA fragment distribution after DNA extraction.
Handling of cultures, differences in the growth phase, and presence of pseudogenes have also been suggested as potential explanations for the copy number differences among strains (Nejstgaard et al., 2008; Galluzzi et al., 2010). For example, large intraspecific copy number variation has also been reported for some ciliate species, potentially explained by the differences in cell cycle and random distribution of macronuclei during asexual reproduction among other factors (Wang et al., 2019). Furthermore, the rRNA gene copy number may also fluc-tuate due to the loss of copies during recombination (Kobayashi 2011; 2014). The present study did not control the cell cycle, thus it is certainly important to further investigate how it influences rRNA gene copy numbers.
Fig. 3. The representative position plots of dPCR displaying A) negative control and B) a schematic distribution of fluorescence. The green dots represent pos-itive partitions. The negative control was free of gene copy detection.
K. Yarimizu et al.
Harmful Algae 103 (2021) 102008
10
5. Conclusion
The newly designed universal primer-probe set targeting the 18S rRNA gene for dPCR reported in this study facilitates quantification in gene copy numbers of rRNA gene from 31 strains of 16 phytoplankton species without the need for species-specific primers and standard curves. Among the investigated species, the highest copy numbers were measured for dinoflagellates with up to 2 million copies per cell in Gambierdiscus sp. The newly designed universal primer-probe set is also useful for absolute quantification of rRNA gene in eukaryotes of broad taxonomic ranges demonstrated by the robustness of the primer and probe set by in silico PCR. Thus, the primer and probe set in combination with dPCR provide a simple method for the rRNA gene copy number measurement, allowing the accurate comparison of the copy numbers among different strains and species with minimum bias, as well as support monitoring of HAB species with other molecular tools.
Funding source
This study was supported by grants from the study on "Establishing a network of environment and fisheries information", Ministry of Agri-culture, Forestry and Fisheries, Japan [SN]; "Technological
developments for characterization of harmful plankton in the seawater", Ministry of Agriculture, Forestry and Fisheries, Japan (16808839) [SN]; JST/JICA, Science and Technology Research Partnership for Sustainable Development (JPMJSA1705) [SN]; a Grant-in-Aid for Scientific Research (Kiban-B) by the Japan Society for the Promotion of Science (18KK0182) [SN, JM]; Japan Society for the Promotion of Science Short- term Postdoctoral Fellowship (PE18028) [SN, SS].
Authors’ contribution and declaration
The content represents original and valid work and has not been published or not considered for other publications. All authors reviewed and approved the final article, and each has participated sufficiently in the work to take the following responsibilities; SN contributed to building a strategy of the project, leading the laboratory studies, con-ducting in silico PCR, data analysis and data review, and supervising the manuscript writing. KY contributed to data reviewing and manuscript writing. SS contributed to the laboratory studies, data analysis and writing the manuscript. YH contributed to the laboratory study and drafting the Tables and Figures. ST contributed to the in silico PCR. HO, HY, LB, JM and JP provided strains used in this study.
Fig. 4. The representative histogram and 1D scatter plots of dPCR from negative control (A, C) and a sample (B, D), respectively. The black line indicates the threshold to separate sample detection from background noise.
K. Yarimizu et al.
Harmful Algae 103 (2021) 102008
11
Declaration of Competing Interest
The authors declare that they have no known competing financial interests or personal relationships that could have appeared to influence the work reported in this paper.
Acknowledgments
We thank Y. Tsushima and K. Hagiya for providing technical support for the JN Medsys Clarity™ Digital PCR system operation. Dr. P. Laas is thanked for the language check of the manuscript.
Supplementary materials
Supplementary material associated with this article can be found, in the online version, at doi:10.1016/j.hal.2021.102008.
References
Aird, D., Ross, M., Chen, W.-.S., Danielsson, M., Fennell, T., Russ, C., Jaffe, D., Nusbaum, C., Gnirke, A., 2011. Analyzing and minimizing PCR amplification bias in Illumina sequencing libraries. Genome Biol. 12 (R18), 1–14.
Alanio, A., Sturny-Leclere, A., Benabou, M., Guigue, N., Bretague, S., 2016. Variation in copy number of the 28S rDNA of Aspergillus fumigatus measured by droplet digital PCR and analog quantitative real-time PCR. J. Microbiol. Methods 127, 160–163.
Andersen, P., Enevoldsen, H., Anderson, D., 2003. Harmful algal monitoring, programme and action plan design. In: Hallegraeff, G.M., Anderson, D.M., Cembella, A.D. (Eds.), Manual on Harmful Marine Microalgae, Second Revised Edition. UNESCO Publishing, Paris, pp. 627–647. https://unesdoc.unesco.org/ark:/48223/pf0000 131711 [Accessed 18.09.2019].
Anderson, D., Andersen, P., Bricelj, V., Cullen, J., Rensel, J., 2001. Monitoring and Management Strategies for Harmful Algal Blooms in Coastal Waters (Vol. APEC #201-MR-01.1). Asia Pacific Economic Program, Singapore, Paris.
Banerji, A., Bagley, M., Elk, M., Pilgrim, E., Martinson, J., Domingo, J., 2018. Spatial and temporal dynamics of a freshwater eukaryotic plankton community revealed via 18S rRNA gene metabarcoding. Hydrobiologia 818.
Basu, S., Patil, S., Mapleson, D., Russo, M.T., Vitale, L., Fevola, C., Maumus, F., Casotti, R., Mock, T., Caccamo, M., Montresor, M., Sanges, R., Ferrante, M.I., 2017. Finding a partner in the ocean: molecular and evolutionary bases of the response to sexual cues in a planktonic diatom. New Phytol. 215 (1), 140–156.
Bellemain, E., Carlsen, T., Brochmann, C., Coissac, E., Taberlet, P., Kauserud, H., 2010. ITS as an environmental DNA barcode for fungi: an in silico approach reveals potential PCR biases. BMC Microbiol. 10, 189. Retrieved from. http://europepmc. org/abstract/MED/20618939.
Berdjeb, L., Parada, A., Needham, D.M., Fuhrman, J.A., 2018. Short-term dynamics and interactions of marine protist communities during the spring-summer transition. ISME J. 12 (8), 1907–1917.
Bowers, H.A., Tengs, T., Glasgow, H.B., Burkholder, J.M., Rublee, P.A., Oldach, D.W., 2000. Development of real-time PCR assays for rapid detection of Pfiesteria piscicida and related dinoflagellates. Appl. Environ. Microbiol. 66 (11), 4641–4648.
Bowler, C., Allen, A.E., Badger, J.H., Grimwood, J., Jabbari, K., et al., 2008. The Phaeodactylum genome reveals the evolutionary history of diatom genomes. Nature 456 (7219), 239–244.
Brosnahan, M.L., Kulis, D.M., Solow, A.R., Erdner, D.L., Percy, L., Lewis, J., Anderson, D. M., 2010. Outbreeding lethality between toxic Group I and nontoxic Group III Alexandrium tamarense spp. isolates: predominance of heterotypic encystment and implications for mating interactions and biogeography. Deep Sea Res. Part II Top. Stud. Oceanogr. 57 (3–4), 175–189.
Burki, F., Roger, A.J., Brown, M.W., Simpson, A.G.B., 2020. The new tree of eukaryotes. Trends Ecol. Evol. 35 (1), 43–55.
Churro, C., Pereira, P., Vasconcelos, V., 2012. Species-specific real-time PCR cell number quantification of the bloom-forming cyanobacterium Planktothrix agardhii. Arch. Microbiol. 194, 749–757.
Coyne, K.J., Handy, S.M., Demir, E., Whereat, E.B., Hutchins, D.A., Portune, K.J., Doblin, M.A., Cary, S.C., 2005. Improved quantitative real-time PCR assays for enumeration of harmful algal species in field samples using an exogenous DNA reference standard. Limnol. Oceanogr. Methods 3 (9), 381–391.
Dag, O., Dolgun, A., Konar N.M., Weerahandi, S., Ananda, M. 2019. Package ‘Onewaytests’. https://cran.r-project.org/web/packages/onewaytests/onewaytests. pdf (Accessed: 14.12.2020).
Darby, B.J., Todd, T., Herman, M.A., 2013. High-throughput amplicon sequencing of rRNA genes requires a copy number correction to accurately reflect the effects of management practices on soil nematode community structure. Mol. Ecol. 22 (21), 5456–5471.
Delaney, J.A., Ulrich, R.M., Paul, J.H., 2011. Detection of the toxic marine diatom Pseudo-nitzschia multiseries using the RuBisCO small subunit (rbcS) gene in two real-time RNA amplification formats. Harmful Algae 11, 54–64.
Díaz, P., Alvarez, G., Varela, D., Santos, I.E., Diaz, M., Molinet, C., Seguel, M., Aguilera, B.A., Guzman, L., Uribe, E., Rengel, J., Hernandez, C., Segura, C.,
Figueroa, R., 2019. Impacts of harmful algal blooms on the aquaculture industry: Chile as a case study. Perspect. Phycol. 6 (1–2), 39–50.
Djurhuus, A., Closek, C.J., Kelly, R.P., Pitz, K.J., Michisaki, R.P., Starks, H.A., Walz, K.R., Andruszkiewicz, E.A., Olesin, E., Hubbard, K., Montes, E., Otis, D., Muller-Karger, F. E., Chavez, F.P., Boehm, A.B., Breitbart, M., 2020. Environmental DNA reveals seasonal shifts and potential interactions in a marine community. Nat. Commun. 11 (1), 1–9.
Djurhuus, A., Port, J., Closek, C.J., Yamahara, K.M., Romero-Maraccini, O., Walz, K.R., Goldsmith, D.B., Michisaki, R., Breitbart, M., Boehm, A.B., Chavez, F.P., 2017. Evaluation of filtration and DNA extraction methods for environmental DNA biodiversity assessments across multiple trophic levels. Front. Mar. Sci. 4, 314. https://doi.org/10.3389/fmars.2017.00314.
Dong, L., Meng, Y., Sui, Z., Wang, J., Wu, L., Fu, B., 2015. Comparison of four digital PCR platforms for accurate quantification of DNA copy number of a certified plasmid DNA reference material. Nat. Sci. Rep. 5 (13174).
Dyhrman, S.T., Erdner, D., Du, J.La, Galac, M., Anderson, D.M., 2006. Molecular quantification of toxic Alexandrium fundyense in the Gulf of Maine using real-time PCR. Harmful Algae 5 (3), 242–250.
Dyson, K., Huppert, D.D., 2010. Regional economic impacts of razor clam beach closures due to harmful algal blooms (HABs) on the Pacific coast of Washington. Harmful Algae 9 (3), 264–271.
Dzhembekova, N., Moncheva, S., Ivanova, P., Slabakova, N., Nagai, S., 2018. Biodiversity of phytoplankton cyst assemblages in surface sediments of the Black Sea based on metabarcoding. Biotechnol. Biotechnol. Equip. 32 (6), 1507–1513.
Dzhembekova, N., Urusizaki, S., Moncheva, S., Ivanova, P., Nagai, S., 2017. Applicability of massively parallel sequencing on monitoring harmful algae at Varna Bay in the Black Sea. Harmful Algae 68, 40–51.
Ebenezer, V., Medlin, L.K., Ki, J.-.S., 2012. Molecular detection, quantification, and diversity evaluation of microalgae. Mar. Biotechnol. 14, 129–142.
Eckford-Soper, L.K., Daugbjerg, N., 2016. A quantitative real-time PCR assay for identification and enumeration of the occasionally co-occurring ichthyotoxic Pseudochattonella farcimen and P. verruculosa (Dictyochophyceae) and analysis of variation in gene copy numbers during the growth phase of single and mixed cultures. J. Phycol 52, 174–183.
Edler, L., Elbracheter, M., 2010. The Utermohl method for quantitative phytoplankton analysis. In: Karlson, B., Cusack, C., Bresnan, E. (Eds.), Microscopic and Molecular Methods for Quantitative Phytoplankton analysis. IOC Manuals and Guides. UNESCO, pp. 13–20. https://unesdoc.unesco.org/ark:/48223/pf0000187824 (Accessed 20.02.2020).
Elbrecht, V., Leese, F., 2015. Can DNA-based ecosystem assessments quantify species abundance? Testing primer bias and biomass-sequence relationships with an innovative metabarcoding protocol. PLoS ONE 10 (7), 1–16 e0130324.
Elferink, S., Neuhaus, S., Wohlrab, S., Toebe, K., Voß, D., Gottschling, M., Lundholm, N., Krock, B., Koch, B.P., Zielinski, O., Cembella, A., John, U., 2017. Deep – Sea Research I Molecular diversity patterns among various phytoplankton size-fractions in West Greenland in late summer. Deep. Res. Part I 121, 54–69.
Ellison, S.L.R., Emslie, K.R., Kassir, Z., 2011. A standard additions method reduces inhibitor-induced bias in quantitative real-time PCR. Anal. Bioanal. Chem. 401 (10), 3221–3227.
Engesmo, A., Strand, D., Gran-Stadniczenko, S., Edvardsen, B., Medlin, L.K., Eikrem, W., 2018. Development of a qPCR assay to detect and quantify ichthyotoxic flagellates along the Norwegian coast, and the first Norwegian record of Fibrocapsa japonica (Raphidophyceae). Harmful Algae 75, 105–117.
Erdner, D.L., Percy, L., Keafer, B., Lewis, J., Anderson, D.M., 2010. A quantitative real- time PCR assay for the identification and enumeration of Alexandrium cysts in marine sediments. Deep Sea Res. Part 2 Top. Stud. Oceanogr. 57 (3–4), 279–287.
Flekna, G., Schneeweiss, W., Smulders, F.J.M., Wagner, M., Hein, I., 2007. Real-time PCR method with statistical analysis to compare the potential of DNA isolation methods to remove PCR inhibitors from samples for diagnostic PCR. Mol. Cell. Probes 21 (4), 282–287.
Fox, J., Weisberg, S., 2019. An R Companion to Applied Regression, Third edition. Sage, Thousand Oaks CA, p. 608.
Galluzzi, L., Bertozzini, E., Penna, A., Perini, F., Garces, E., Magnani, M., 2010. Analysis of rRNA gene content in the Mediterranean dinoflagellate Alexandrium catenella and Alexandrium taylori: implications for the quantitative real-time PCR-based monitoring methods. J. Appl. Phycol. 22, 1–9.
Galluzzi, L., Penna, A., 2010. Quantitative PCR for detection and enumeration of phytoplankton. In: Karlson, B., Cusack, C., Bresnan, E. (Eds.), Microscopic and Molecular Methods for Quantitative Phytoplankton Analysis. IOC Manuals and Guides. UNESCO, pp. 95–101. https://unesdoc.unesco.org/ark:/48223/pf0000 187824 (Accessed 20.02.2020).
Gobler, C., Berry, D.L., Dyhrman, S.T., Wilhelm, S.W., Salamov, A., et al., 2011. Niche of harmful alga Aureococcus anophagefferens revealed through ecogenomics. PNAS 108 (11), 4352–4357.
Godhe, A., Asplund, M.E., Harnstrom, K., Saravanan, V., Tyagi, A., Karunasagar, I., 2008. Quantification of diatom and dinoflagellate biomasses in coastal marine seawater samples by real-time PCR. Appl. Environ. Microbiol. 74 (23), 7174–7182.
Gong, W., Marchetti, A., 2019. Estimation of 18S gene copy number in marine eukaryotic plankton using a next-generation sequencing approach. Front. Mar. Sci. 6 (219).
Gonzalez, J.M., Portillo, M.C., Belda-Ferre, P., Mira, A., 2012. Amplification by PCR artificially reduces the proportion of the rare biosphere in microbial communities. PLoS ONE 7 (1), e29973.
Gran-Stadniczenko, S., Egge, E., Hostyeva, V., Logares, R., Eikrem, W., Edvardsen, B., 2018. Protist diversity and seasonal dynamics in skagerrak plankton communities as revealed by metabarcoding and microscopy. J. Eukar. Microbiol. 66.
K. Yarimizu et al.
Harmful Algae 103 (2021) 102008
12
Grattan, L.M., Holobaugh, S., Morris Jr., J.G., 2016. Harmful algal blooms and public health. Harmful Algae 57 (B), 2–8.
Gray, M., Wawrik, B., Paul, J., Casper, E., 2003. Molecular detection and quantitation of the red tide dinoflagellate karenia brevis in the marine environment. Appl. Environ. Microbiol. 69 (9), 5726–5730.
Grzebyk, D., Audic, S., Lasserre, B., Abadie, E., de Vargas, C., Bec, B., 2017. Insights into the harmful algal flora in northwestern Mediterranean coastal lagoons revealed by pyrosequencing metabarcodes of the 28S rRNA gene. Harmful Algae 68, 1–16.
Guo, Z., Han, L., Liang, Z., Hou, Z., 2019. Comparative analysis of the ribosomal DNA repeat unit (rDNA) of Perna viridis (Linnaeus, 1758) and Perna canaliculus (Gmelin, 1791). PeerJ 7, e7644. https://doi.org/10.7717/peerj.7644.
Hattenrath-Lehmann, T.K., Gobler, C.J., 2017. Identification of unique microbiomes associated with harmful algal blooms caused by Alexandrium fundyense and Dinophysis acuminata. Harmful Algae 68, 17–30.
Hattenrath-Lehmann, T.K., Jankowiak, J., Koch, F., Gobler, J., 2019. Prokaryotic and eukaryotic microbiomes associated with blooms of the ichthyotoxic dinoflagellate Cochlodinium (Margalefidinium) polykrikoides in New York, USA, estuaries. PLoS ONE 14 (11), e0223067.
Herrera, M.L., Vallor, A.C., Gelfond, J.A., Patterson, T.F., Wickes, B.L., 2009. Strain- dependent variation in 18S ribosomal DNA copy numbers in Aspergillus fumigatus. J. Clin. Microbiol. 47 (5), 1325–1332.
Hillis, D.M., Dixon, M.T., 1991. Ribosomal DNA: molecular evolution and phylogenetic inference. Q. Rev. Biol. 66 (4), 411–453.
Hong, H.H., Lee, H.G., Jo, J., Kim, H.M., Kim, S.M., Park, J.Y., Jeon, C., B., Kang, H.S., Park, M.G., Park, C.K., Kwang, Y., 2016. The exceptionally large genome of the harmful red tide dinoflagellate Cochlodinium polykrikoides Margalef (Dinophyceae): determination by flow cytometry. Algae 31 (4), 373–378.
Hosoi-Tanabe, S., Sako, Y., 2005. Species-specific detection and quantification of toxic marine dinoflagellates Alexandrium tamarense and A. catenella by real-time PCR assay. Mar. Biotechnol. 7 (5), 506–514.
Hou, Y., Lin, S., 2009. Distinct gene number-genome size relationships for eukaryotes and non-eukaryotes: gene content estimation for dinoflagellate genomes. PLoS ONE 4 (9), e6978.
Huggett, J.F., Foy, C.A., Benes, V., Emslie, K., Garson, J.A., Haynes, R., Kubista, M., Hellemans, J., Mueller, R.D., Nolan, T., Pfaffl, M.W., Shipley, G.L., Vandesompele, J., Wittwer, C.T., Bustin, S.A., 2013. The digital MIQE guidelines: minimum Information for publication of quantitative digital PCR experiments. Clin. Chem. 59 (6), 892–902.
Imai, I., Yamaguchi, M., Hori, Y., 2006. Eutrophication and occurrences of harmful algal blooms in the Seto Inland Sea, Japan. Plank. Benthos Res. 1 (2), 71–84.
John, U., Medlin, L.K., Groben, R., 2005. Development of specific rRNA probes to distinguish between geographic clades of the Alexandrium tamarense species complex. J. Plankton Res. 27 (2), 199–204.
Kamikawa, R., Asai, J., Miyahara, T., Murata, K., Oyama, K., Yoshimatsu, S., Yoshida, T., Sako, Y., 2006. Application of a real-time PCR Assay to a comprehensive method of monitoring harmful algae. Microb. Environ. 21 (3), 163–173.
Karlson, B., Godhe, A., Cusack, C., Bresnan, E., 2010. Introduction to methods for quantitative phytoplankton analysis. In: Karlson, B., Cusack, C., Bresnan, E. (Eds.), Microscopic and Molecular Methods for Quantitative Phytoplankton Analysis. IOC Manuals and Guides, pp. 5–12. https://unesdoc.unesco.org/ark:/48223/pf0000 187824 (Accessed 20.02.2020).
Kembel, S.W., Wu, M., Eisen, J.A., Green, J.L., 2012. Incorporating 16S gene copy number information improves estimates of microbial diversity and abundance. PLoS Comput. Biol. 8 (10), e1002743.
Ki, J.S., Han, M.S., 2007. Informative characteristics of 12 divergent domains in complete large subunit rDNA sequences from the harmful dinoflagellate genus, Alexandrium (Dinophyceae). J. Eukaryot. Microbiol. 54, 210–219. https://doi.org/ 10.1111/j.1550-7408.2007.00251.x.
Kobayashi, T., 2011. Regulation of ribosomal RNA gene copy number and its role in modulating genome integrity and evolutionary adaptability in yeast. Cell. Mol. Life Sci. 68 (8), 1395–1403.
Kobayashi, T., 2014. Ribosomal RNA gene repeats, their stability and cellular senescence. Proc. Jpn. Acad. Ser. B Phys. Biol. Sci. 90 (4), 119–129.
Koskenniemi, K., Lyra, C., Rajaniemi-Wacklin, P., Jokela, J., Sivonen, K., 2007. Quantitative real-time PCR detection of toxic Nodularia cyanobacteria in the Baltic Sea. Appl. Environ. Microbiol. 73 (7), 2173–2179.
Kumar, S., Stecher, G., Li, M., Knyaz, C., K, T., 2018. Mega X: molecular evolutionary genetics analysis across computing platforms. Mol. Biol. Evol. 35, 1547–1549.
Lee, Z.M.-P., Bussema III, C., Schmidt, T.M., 2009. rrn DB: documenting the number of rRNA and tRNA genes in bacteria and archaea. Nucl. Acids Res. 37, D489–D493.
Lee, H.-.G., Kim, H.M., Min, J., Kim, K., Park, M.G., Jeong, H.J., Kim, K.Y., 2017. An advanced tool, droplet digital PCR (ddPCR), for absolute quantification of the red- tide dinoflagellate, Cochlodinium polykrikoides Margalef (Dinophyceae). ALGAE 32 (3), 189–197.
Lee, H.-.G., Kim, H.M., Min, J., Park, C., Jeong, H.J., Lee, K., Kim, K.Y., 2020. Quantification of the paralytic shellfish poisoning dinoflagellate Alexandrium species using a digital PCR. Harmful Algae 92 (101726), 1–10.
Lewitus, A.J., Horner, R.A., Caron, D.A., Garcia-Mendoza, E., Hickey, B.M., Hunter, M., Huppert, D.D., Kudela, R.M., Langlois, G.W., Largier, J.L., Lessard, E.J., RaLonde, R., Rensel, J.E.J., Strutton, P.G., Trainer, V.L., Tweddle, J.F., 2012. Harmful algal blooms along the North American west coast region: history, trends, causes, and impacts. Harmful Algae 19, 133–159.
Li, W., Godzik, A., 2006. Cd-hit: a fast program for clustering and comparing large sets of protein or nucleotide sequences. Bioinformatics 22 (13), 1658–1659.
Lian, C.L., Miwa, M., Hogetsu, T., 2001. Outcrossing and paternity analysis of Pinus densiflora (Japanese red pine) by microsatellite polymorphism. Hered. Edinb. 87, 88–98.
Lima-Mendez, G., Faust, K., Henry, N., Decelle, J., Colin, S., 2015. Determinants of community structure in the global plankton interactome. Science 348 (6237), 1262073.
Liu, S., Gibson, K., Cui, Z., Chen, Y., Sun, X., Chen, N., 2020. Metabarcoding analysis of harmful algal species in Jiaozhou Bay. Harmful Algae 92, 101772.
van der Loos, L.M., Nijland, R., 2020. Biases in bulk: DNA metabarcoding of marine communities and the methodology involved. Mol. Ecol. 00, 1–19.
Low, H., Chan, S.J., Soo, G.H., Ling, B., Tan, E.L., 2017. Clarity digital PCR system: a novel platform for absolute quantification of nucleic acids. Anal. Bioanal. Chem. 409 (7), 1869–1875.
Majaneva, M., Diseru, O.H., Eagle, S.H.C., Bostrom, E., Hajibabaei, M., Ekrem, T., 2018. Environmental DNA filtration techniques affect recovered biodiversity. Sci. Rep. 8, 4682.
Majumdar, N., Wessel, T., Marks, J., 2015. Digital PCR modeling for maximal sensitivity, dynamic range and measurement precision. PLoS ONE 10 (3), e0118833.
Medinger, R., Nolte, V., Pandey, R.A.M.V., Jost, S., 2010. Diversity in a hidden world : potential and limitation of next-generation sequencing for surveys of molecular diversity of eukaryotic microorganisms. Mol. Ecol. 19 (Suppl. 1), 32–40.
Medlin, L.K., Elwood, H.J., Stickel, S., Sogin, M.L., 1988. The characterization of enzymatically amplified eukaryotic 16S-like rRNA-coding regions. Genetica 71, 491–499.
Medlin, L.K., Orozco, J., 2017. Molecular techniques for the detection of organisms in aquatic environments, with emphasis on armful algal bloom species. Sensors 17, 1184.
Meistertzheim, A.L., Pochon, X., Wood, S.A., François, J., Laetitia, G., 2019. Development of a quantitative PCR – high ‑ resolution melting assay for absolute measurement of coral ‑ Symbiodiniaceae associations and its application to investigating variability at three spatial scales. Mar. Biol. 166 (2), 1–15.
Moestrup, Ø., Akselmann, R., Fraga, S., Hoppenrath, M., Iwataki, M., Komarek, J. et al. (Eds.), 2021. IOC-UNESCO Taxonomic Reference List of Harmful Micro Algae. htt p://www.marinespecies.org/hab [Accessed: 09.03.2021].
Moreno-Pino, M., Krock, B., Dela Iglesia, R., Echenique-Subiabre, I., Pizarro, G., Vasquez, M., Trefault, N., 2018. Next Generation Sequencing and mass spectrometry reveal high taxonomic diversity and complex phytoplankton-phycotoxins patterns in Southeastern Pacific fjords. Toxicon 151, 5–14.
Murray, S.A., Wiese, M., Stüken, A., Brett, S., Kellmann, R., Hallegraeff, G., Neilan, B.A., 2011. SxtA-based quantitative molecular assay to identify saxitoxin-producing harmful algal blooms in marine waters. Appl. Environ. Microbiol. 77 (19), 7050–7057.
Murray, S.A., Ruvindy, R., Kohli, G.S., Anderson, D.M., Brosnahan, M.L., 2019. Evaluation of sxtA and rDNA qPCR assays through monitoring of an inshore bloom of Alexandrium catenella Group 1. Sci. Rep. 9, 14532.
Maki, A., Salmi, P., Mikkonen, A., Kremp, A., Tiirola, M., 2017. Sample preservation, DNA or RNA extraction and data analysis for high-throughput phytoplankton community sequencing. Front. Microbiol. 8, 1848.
Nagai, S., Baba, B., Miyazono, A., Tahvanainen, P., Kremp, A., Godhe, A., MacKenzie, L., Anderson, D.M., 2010. Polymorphisms of the nuclear ribosomal RNA genes found in the different geographic origins in the toxic dinoflagellate Alexandrium ostenfeldii and the species detection from a single cell by LAMP. DNA Polymorph. 18, 122–126 (In Japanese).
Nagai, S., Chen, H., Kawakami, Y., Yamamoto, K., Sildever, S., Kanno, N., Oikawa, H., Yasuike, M., Nakamura, Y., Hogo, Y., Fujiwara, A., Kobayashi, T., Gojobori, T., 2019. Monitoring of the toxic dinoflagellate Alexandrium catenella in Osaka Bay, Japan using a massively parallel sequencing (MPS)-based technique. Harmful Algae 89, 101660.
Nagai, S., Hida, K., Urushizaki, S., Takano, Y., Hongo, Y., Kameda, T., Abe, K., 2016b. Massively parallel sequencing-based survey of eukaryotic community structures in Hiroshima Bay and Ishigaki Island. Gene 576, 681–689.
Nagai, S., Kohsuke, H., Shingo, U., Onitsuka, G., Motoshige, Y., Nakamura, Y., Fujiwara, A., Tajima, S., Kimoto, K., Kobayashi, T., Gojobori, T., Ototake, M., 2016a. Influences of diurnal sampling bias on fixed-point monitoring of plankton biodiversity determined using a massively parallel sequencing-based technique. Gene 576, 667–675.
Nagai, S., Nishitani, G., Sakamoto, S., Suguya, T., Lee, C.K., Kim, C.H., Itakura, S., Yamaguchi, M., 2009. Genetic structuring and transfer of marine dinoflagellateCochlodinium polykrikoides in Japanese and Korean coastal waters revealed by microsatellites. Mol. Ecol. 18 (11), 2337–2352.
Nagai, S., Urusizaki, S., Hongo, Y., Chen, H., Dzhembekova, N., 2017. An attempt to semi-quantify potentially toxic diatoms of the genus Pseudo-nitzschia in Tokyo Bay, Japan by using massively parallel sequencing technology. Plank. Benthos Res. 12 (4), 248–258.
Nagai, S., Yamamoto, K., Hata, N., Itakura, S., 2012. Study of DNA extraction methods for use in loop-mediated isothermal amplification detection of single resting cysts in the toxic dinoflagellates Alexandrium tamarense and A. catenella. Mar. Genom. 7, 51–56.
Nejstgaard, J.C., Frischer, M.E., Simonelli, P., Troedsson, C., Brakel, M., Adiyaman, F., Sazhin, A.F., Artigas, L.F., 2008. Quantitative PCR to estimate copepod feeding. Mar. Biol. 153 (4), 565–577.
Nichols, R.V., Vollmers, C., Newsom, L.A., Wang, Y., Heintzman, P.D., Leighton, M., Green, R.E., Shapiro, B., 2018. Minimizing polymerase biases in metabarcoding. Mol. Ecol. Resour. 18 (5), 927–939.
K. Yarimizu et al.
Harmful Algae 103 (2021) 102008
13
Nishitani, G., Nagai, S., Hayakawa, S., Kosaka, Y., Sakurada, K., Kamiyama, T., Gojoboric, T., 2012. Multiple plastids collected by the Dinoflagellate Dinophysis mitra through Kleptoplastidy. Appl. Environ. Microbiol. 78 (3), 813–821.
Not, F., Campo, J., Balague, V., Vargas, C.De, Massana, R., 2009. New insights into the diversity of marine picoeukaryotes. PLoS ONE 4 (9), e7143.
Ogura, A., Akizuki, Y., Imoda, H., Mineta, K., Gojobori, T., Nagai, S., 2018. Comparative genome and transcriptome analysis of diatom, Skeletonema costatum, reveals evolution of genes for harmful algal bloom. BMC Genom. 19.
Penna, A., Casabianca, S., Perini, F., Bastianini, M., Riccardi, E., Pigozzi, S., Scardi, M., 2013. Toxic Pseudo-nitzschia spp. in the northwestern Adriatic Sea: characterization of species composition by genetic and molecular quantitative analyses. J. Plankton Res. 35 (2), 352–366.
Penna, A., Galluzzi, L., 2013. The quantitative real-time PCR applications in the monitoring of marine harmful algal bloom (HAB) species. Environ. Sci. Pollut. Res 20, 6851–6862.
Pinol, J., Mir, G., Gomez-Polo, P., Agustí, N., 2015. Universal and blocking primer mismatches limit the use of high-throughput DNA sequencing for the quantitative metabarcoding of arthropods. Mol. Ecol. Resour. 15 (4), 819–830.
Pohlert, T. 2020. Package ‘PMCMRplus’. https://cran.r-project.org/web/packages/PM CMRplus/PMCMRplus.pdf (Accessed: 14.12.2020).
Prokopowich, C.D., Gregory, T.R., Crease, T.J., 2003. The correlation between rDNA copy number and genome size in eukaryotes. Genome 46 (1), 48–50.
Promega, 2010. pGEM®- T and pGEM®- T Easy Vector Systems. Tech. Man. pp. 1–28 htt ps://www.promega.co.uk//media/files/resources/protocols/technicalmanuals/0/ pgem-tandpgem-teasyvectorsystemsprotocol.pdf [Accessed 10.01.2020].
Qin, J., Jones, R.C., Ramakrishnan, R., 2008. Studying copy number variations using a nanofluidic platform. Nucl. Acids Res. 36 (18), e116.
Quan, P.-.L., Sauzade, M., Brouzes, E., 2018. dPCR: a technology review. Sensors 18, 1271.
R Core Team, 2020. R: A Language and Environment for Statistical Computing. R Foundation for Statistical Computing, Vienna, Austria. URL. https://www.R-project. org/ [Accessed: 20.01.2020].
Read, B.A., Kegel, J., Klute, M.J., Kuo, A., Lefebvre, S.C., et al., 2013. Pan genome of the phytoplankton Emiliania underpins its global distribution. Nature 499 (7457), 209–213.
Reguera, B., Pizarro, G., 2008. Planktonic dinoflagellates that contain polyether toxins of the old "DSP complex". In: Botana, L.M. (Ed.), Seafood and Freshwater Toxins: Pharmacology, Physiology, and Detection. CRC Press Taylor & Francis Group, New York, pp. 257–284.
Rodríguez-Ramos, T., Dornelas, M., Maranon, E., Cermeno, P., 2014. Conventional sampling methods severely underestimate phytoplankton species richness. J. Plankton Res. 36 (2), 334–343.
Rosati, G., Modeo, L., Melai, M., Petroni, G., Verni, F., 2005. A multidisciplinary approach to describe protists: a morphological, ultrastructural, and molecular study on Peritromus kahli Villeneuve-Brachon, 1940 (Ciliophora, Heterotrichea). J. Eukar. Microbiol. 51 (1), 49–59.
Ruvindy, R., Bolch, C.J., MacKenzie, L., Smith, K.F., Murray, S.A., 2018. qPCR assays for the detection and quantification of multiple paralytic shellfish toxin-producing species of Alexandrium. Front. Microbiol. 9, 3153.
Saad, O.S., Lin, X., Ng, T.Y., Li, L., Ang, P., Lin, S., 2020. Genome Size, rDNA Copy, and qPCR Assays for Symbiodiniaceae. Front. Microbiol. 11, 847.
Savela, H., Harju, K., Spoof, L., Lindehoff, E., Meriluoto, J., Vehniainen, M., Kremp, A., 2016. Quantity of the dinoflagellate sxtA4 gene and cell density correlates with paralytic shellfish toxin production in Alexandrium ostenfeldii blooms. Harmful Algae 52, 1–10.
Sawaya, N.A., Djurhuus, A., Closek, C.J., Hepner, M., Olesin, E., Visser, L., Kelble, C., Hubbard, K., Breitbart, M., 2019. Assessing eukaryotic biodiversity in the Florida keys national marine sanctuary through environmental DNA metabarcoding. Ecol. Evol. 9 (3), 1029–1040.
Shin, H., Lee, E., Shin, J., Ko, S., Oh, H., Ahn, C., 2018. Elucidation of the bacterial communities associated with the harmful microalgae Alexandrium tamarense and Cochlodinium polykrikoides using nanopore sequencing. Sci. Rep. 8, 5323.
Sildever, S., Kawakami, Y., Kanno, N., Kasai, H., Shiomoto, A., Katakura, S., Nagai, S., 2019. Toxic HAB species from the Sea of Okhotsk detected by a metagenetic approach, seasonality and environmental drivers. Harmful Algae 87 (101631).
Singh, U.A., Kumai, M., Lyengar, S., 2018. Method for improving the quality of genomic DNA obtained from minute quantities of tissue and blood samples using Chelex 100 resin. Biol. Proced. Online 20, 12. https://doi.org/10.1186/s12575-018-0077-6.
Stern, R., Kraberg, A., Bresnan, E., Kooistra, W.H.C.F., Lovejoy, C., Montresor, M., Moran, X.A., Not, F., Salas, R., Siano, R., Vaulot, D., Amaral-Zettler, L., Zingone, A., Metfies, K., 2018. Molecular analyses of protists in long-term observation programmes - current status and future perspectives. J. Plankton Res. 40 (5), 519–536.
Stoeck, T., Bass, D., Nebel, M., Christen, R., Meredith, D., 2010. Multiple marker parallel tag environmental DNA sequencing reveals a highly complex eukaryotic community in marine anoxic water. Mol. Ecol. 19 (Suppl. 1), 21–31.
Suzuki, M.T., Giovannoni, S.J., 1996. Bias caused by template annealing in the amplification of mixtures of 16S rRNA genes by PCR. Appl. Environ. Microbiol. 62 (2), 625–630.
Tanabe, A.S., Nagai, S., Hida, K., Yasuike, M., Fujiwara, A., Nakamura, Y., Takano, Y., Katakura, S., 2016. Comparative study of the validity of three regions of the 18S- rRNA gene for massively parallel sequencing-based monitoring of the planktonic eukaryote community. Mol. Ecol. Resour. 16, 402–414.
Te, S.H., Chen, E.Y., Gin, K.Y.-H., 2015. Comparison of quantitative PCR and droplet digital PCR multiplex assays for two genera of bloom-forming cyanobacteria, cylindrospermopsis and microcystis. Appl. Environ. Microbiol. 81 (15), 5203–5211.
Todd, K., 2004. Role of phytoplankton monitoring in marine biotoxin programmes. In: Hallegraeff, G.M., Anderson, D.M., Cembella, A.D. (Eds.), Manual on Harmful Marine Microalgae, Second Revised Edition. UNESCO Publishing, Paris, pp. 649–655. https://unesdoc.unesco.org/ark:/48223/pf0000131711 [Accessed 18.09.2019].
Vaitomaa, J., Rantala, A., Halinen, K., Rouhiainen, L., Tallberg, P., Mokelke, L., Sivonen, K., 2003. Quantitative real-time PCR for determination of microcystin synthetase E copy numbers for microcystis and anabaena in lakes. Appl. Environ. Microbiol. 69 (12), 7289–7297.
Walsh, P.S., Metzger, D.A., Higuchi, R., 2013. Chelex 100 as a medium for simple extraction of DNA for PCR-based typing from forensic material. BioTechniques 10 (4), 506–513.
Wang, D., Yamahara, K.M., Cao, Y., Boehm, A.B., 2016. Absolute quantification of enterococcal 23S gene using digital PCR. Environ. Sci. Technol. 50, 3399–3408.
Wang, Y., Wang, C., Jiang, Y., Katz, L.A., Gao, F., Yan, Y., 2019. Further analyses of variation of ribosome DNA copy number and polymorphism in ciliates provide insights relevant to studies of both molecular ecology and phylogeny. Science China. Life Sci. 62 (2), 203–214.
Weider, L.J., Elser, J.J., Crease, T.J., Mateos, M., Cotner, J.B., Markow, T.A., 2005. The functional significance of ribosomal (r)DNA variation: impacts on the evolutionary ecology of organisms. Annu. Rev. Ecol. Evol. Syst. 36, 219–242.
Winnepenninckx, B., Backeljau, T., Wachter, R., 1994. Small ribosomal subunit RNA and the phylogeny of Mollusca. Nautilus 2, 98–110.
Yang, C., Li, Y., Zhou, B., Zhou, Y., Zheng, W., Tian, Y., Van Nostrand, J.D., Wu, L., He, Z., Zhou, J., Zheng, T., 2015. Illumina sequencing-based analysis of free-living bacterial community dynamics during an Akashiwo sanguine bloom in Xiamen sea, China. Sci. Rep. 5, 1–11.
Yuan, J., Mi, T., Zhen, Y., Yu, Z., 2012. Development of a rapid detection and quantification method of Karenia mikimotoi by real-time quantitative PCR. Harmful Algae 17, 83–91.
Zamor, R.M., Glenn, K.L., Hambright, K.D., 2012. Incorporating molecular tools into routine HAB monitoring programs: using qPCR to track invasive Prymnesium. Harmful Algae 15, 1–7.
Zhang, F., Li, Z., 2012. Detection and quantification of cultured marine Alexandrium species by real-time PCR. World J. Microbiol. Biotechnol. 28 (12), 3255–3260.
Zhu, F., Massana, R., Not, F., Marie, D., Vaulot, D., 2005. Mapping of picoeucaryotes in marine ecosystems with quantitative PCR of the 18S rRNA gene. FEMS Microb. Ecol. 52 (1), 79–92.
Zingone, A., Siano, R., D’Alelio, D., Sarno, D., 2006. Potentially toxic and harmful microalgae from coastal waters of the Campania region (Tyrrhenian Sea, Mediterranean Sea). Harmful Algae 5 (3), 321–337.
K. Yarimizu et al.