bim-based software for construction waste
TRANSCRIPT
BIM-BASED SOFTWARE FOR CONSTRUCTION
WASTE ANALYTICS USING ARTIFICIAL
INTELLIGENCE HYBRID MODELS
By
OLUGBENGA OLAWALE AKINADE
A thesis submitted in partial fulfilment of the requirements of the
University of the West of England, Bristol
for the degree of Doctor of Philosophy

ii
DECLARATION
I declare that this thesis represents my own work carried out by me, except where due
acknowledgement has been made in the text, and that it has not been submitted either in part
or full for any other award than the degree of Doctor of Philosophy of the University of the
West of England. Materials from other sources have been duly acknowledged and referenced
in line with ethical standards, and the list of publications made from the thesis has been
provided.
Signed: OLUGBENGA OLAWALE AKINADE
Signature …………………………………
Date ………………………………………
iii
ABSTRACT
The Construction industry generates about 30% of the total waste in the UK. Current high landfill cost and severe environmental impact of waste reveal the need to reduce waste generated from construction activities. Although literature shows that the best approach to Construction Waste (CW) management is minimization at the design stage, current tools are not robust enough to support architects and design engineers. Review of extant literature reveals that the key limitations of existing CW management tools are that they are not integrated with the design process and that they lack Building Information Modelling (BIM) compliance. This is because the tools are external to design BIM tools used by architects and design engineers. This study, therefore, investigates BIM-based strategies for CW management and develops Artificial Intelligence (AI) hybrid models to predict CW at the design stage. The model was then integrated into Autodesk Revit as an add-in (BIMWaste) to provide CW analytics.
Based on a critical realism paradigm, the study adopts exploratory sequential mixed methods, which combines both qualitative and quantitative methods into a single study. The study starts with the review of extant literature and Focus Group Interviews (FGIs) with industry practitioners. The transcripts of the FGIs were subjected to thematic analysis to identify prevalent themes from the quotations. The factors from the literature review and FGIs were then combined and put together in a questionnaire survey and distributed to industry practitioners. The questionnaire responses were subjected to a rigorous statistical process to identify key strategies for BIM-based approach to waste efficient design coordination.
Results of factor analysis revealed five groups of BIM strategies for CW management, which are: (i) BIM-based collaboration for waste management, (ii) waste-driven design process and solutions, (iii) lifecycle waste analytics, (iv) innovative technologies for waste intelligence and analytics, and (v) improved documentation for waste management. The results improve the understanding of BIM functionalities and how they could improve the effectiveness of existing CW management tools. After that, the key strategies were developed into a holistic BIM framework for CW management. This was done to incorporate industrial and technological requirements for BIM enabled waste management into an integrated system.
The framework guided the development of AI hybrid models and BIM-based tool for CW management. Adaptive Neuro-Fuzzy Inference System (ANFIS) model was developed for CW prediction and mathematical models were developed for CW minimisation. Based on historical Construction Waste Record (CWR) from 117 building projects, the model development reveals that two key predictors of CW are “Gross Floor Area (GFA)” and “Construction Type”. The models were then incorporated into Autodesk Revit as an add-in to enable the prediction of CW from building designs. The performance of the add-in was tested using a test plan and two test cases. The results show that the tool performs well and that it predicts CW according to waste types, element types, and building levels. The study generated several implications that would be of interest to stakeholders in the construction industry. Particularly, the study provides a clear direction on how CW management strategies could be integrated into a BIM platform to streamline CW analytics.

iv
DEDICATION
, ,
,
, ,,
,

v
ACKNOWLEDGEMENT
My profound gratitude to God Almighty, the giver of life for the grace to complete this
research.
My sincere appreciation goes to my mentor and director of studies, Professor Lukumon
Oyedele for his tremendous supervision, exemplary leadership, guidance, and encouragement
throughout the PhD research journey. Your incredible patience and support were invaluable to
the success of the study. I will also like to appreciate the contributions and support of my
second supervisor, Dr. Kamran Munir.
I am grateful for the financial support provided by Innovate UK and Balfour Beatty
Construction Services (CSUK). I would like to thank Jonathan Law (Technical Manager at
CSUK) and Peter Trebilcock (Director of BIM at CSUK) for facilitating part of the data
collection process.
I acknowledge the supports from other staff members at the University of the West of England,
Bristol. I am indeed grateful to Dr Svetlana Cicmil, Dr. Ximing Ruan, Dr Vikas Kumar, Dr.
Charles Booth, Prof. Lamine Mahdjoubi, Dr Ismail Adelopo, Dr Akin Ojolo, Dr Bolanle
Karimu, Dr Anu Ajayi, Dr Lukman Akanbi, and Dr Juan Manuel Davila Delgado. I must
express my sincere gratitude to FBL Graduate School, particularly Dr Helen Frisby, Samantha
Watts, and Dr Paul Spencer who diligently provided the required support and for stimulating a
vibrant research environment.
Many thanks to Pastor and Deaconess Olujimmy Apata for their spiritual support. A big thank
you to my friends and colleagues, Saheed Ajayi, Muhammad Bilal, Hafiz Alaka Hakeem
Owolabi, and Udonna Okeke.
I am deeply and forever indebted to my family: my parents (Mr. Emmanuel Akinade and Mrs.
Margaret Akinade), my parents-in-law (Prof. Gabriel Arawomo and Mrs. Francesca
Arawomo), my brothers and brothers-in-law (Akintunde, Akindeji, Olatunji, Omosola,
Omotola, Olabade and Adeyinka) and my sisters and sisters-in-law (Foluso, Omowumi,
Olayemi, Tolulope, Omobola - Pepper, Oreoluwa, Adenike, and Ese). Words are not enough
to describe my gratitude for your constant support.

vi
I am eternally grateful to my wife and heartbeat, Omolola for her sincere love, prayers, and
encouragement. To my little princess, Jemima for the smile that brightens me up after a long
day.
God bless you all.
vii
LIST OF PUBLICATIONS
1) Olugbenga O. Akinade, Lukumon O. Oyedele, Kamil Omoteso, Saheed O. Ajayi,
Muhammad Bilal, Hakeem A. Owolabi, Hafiz A. Alaka, Lara Ayris, John Henry
Looney, BIM-based deconstruction tool: Towards essential functionalities,
International Journal of Sustainable Built Environment, Available online 29 January
2017
2) Akinade, O.O., Oyedele, L.O., Ajayi, S.O., Bilal, M., Alaka, H.A., Owolabi, H.A.,
Bello, S.A., Jaiyeoba, B.E. and Kadiri, K.O., 2016. Design for Deconstruction (DfD):
Critical success factors for diverting end-of-life waste from landfills. Waste
Management.
3) Akinade, O.O., Oyedele, L.O., Munir, K., Bilal, M., Ajayi, S.O., Owolabi, H.A.,
Alaka, H.A. and Bello, S.A., 2016. Evaluation criteria for construction waste
management tools: towards a holistic BIM framework. International Journal of
Sustainable Building Technology and Urban Development, pp. 1-19.
4) Akinade, O.O., Oyedele, L.O., Bilal, M., Ajayi, S.O., Owolabi, H.A., Alaka, H.A. and
Bello, S.A., 2015. Waste minimisation through deconstruction: A BIM based
Deconstructability Assessment Score (BIM-DAS). Resources, Conservation and
Recycling, 105, pp. 167-176.
5) Bilal, M., Oyedele, L.O., Munir, K., Ajayi, S.O., Akinade, O.O., Owolabi, H.A. and
Alaka, H.A., 2017. The application of web of data technologies in building materials
information modelling for construction waste analytics. Sustainable Materials and
Technologies.
6) Bilal, M., Oyedele, L.O., Qadir, J., Munir, K., Ajayi, S.O., Akinade, O.O., Owolabi,
H.A., Alaka, H.A. and Pasha, M., 2016. Big Data in the construction industry: A review
of present status, opportunities, and future trends. Advanced Engineering Informatics,
30(3), pp. 500-521.
7) Bilal, M., Oyedele, L.O., Akinade, O.O., Ajayi, S.O., Alaka, H.A., Owolabi, H.A.,
Qadir, J., Pasha, M. and Bello, S.A., 2016. Big data architecture for construction waste
analytics (CWA): A conceptual framework. Journal of Building Engineering, 6, pp.
144-156.
8) Bilal, M., Oyedele, L.O., Qadir, J., Munir, K., Akinade, O.O., Ajayi, S.O., Alaka, H.A.
and Owolabi, H.A., 2015. Analysis of critical features and evaluation of BIM software:
towards a plug-in for construction waste minimization using big data. International
viii
Journal of Sustainable Building Technology and Urban Development, 6(4), pp. 211-
228.
9) Ajayi, S.O., Oyedele, L.O., Akinade, O.O., Bilal, M., Alaka, H.A. and Owolabi, H.A.,
2017. Optimising material procurement for construction waste minimization: An
exploration of success factors. Sustainable Materials and Technologies.
10) Ajayi, S.O., Oyedele, L.O., Bilal, M., Akinade, O.O., Alaka, H.A. and Owolabi, H.A.,
2017. Critical management practices influencing on-site waste minimization in
construction projects. Waste management, 59, pp.330-339.
11) Ajayi, S.O., Oyedele, L.O., Akinade, O.O., Bilal, M., Alaka, H.A., Owolabi, H.A. and
Kadiri, K.O., 2017. Attributes of design for construction waste minimization: A case
study of waste-to-energy project. Renewable and Sustainable Energy Reviews, 73,
pp.1333-1341.
12) Ajayi, S.O., Oyedele, L.O., Akinade, O.O., Bilal, M., Owolabi, H.A., Alaka, H.A. and
Kadiri, K.O., 2016. Reducing waste to landfill: A need for cultural change in the UK
construction industry. Journal of Building Engineering, 5, pp. 185-193.
13) Ajayi, S.O., Oyedele, L.O., Kadiri, K.O., Akinade, O.O., Bilal, M., Owolabi, H.A. and
Alaka, H.A., 2016. Competency-based measures for designing out construction waste:
task and contextual attributes. Engineering, Construction and Architectural
Management, 23(4).
14) Ajayi, S.O., Oyedele, L.O., Bilal, M., Akinade, O.O., Alaka, H.A., Owolabi, H.A. and
Kadiri, K.O., 2015. Waste effectiveness of the construction industry: Understanding
the impediments and requisites for improvements. Resources, Conservation and
Recycling, 102, pp.101-112.
ix
TABLE OF CONTENTS
DECLARATION ...................................................................................................................... ii
ABSTRACT ............................................................................................................................. iii
DEDICATION .......................................................................................................................... iv
ACKNOWLEDGEMENT ......................................................................................................... v
LIST OF PUBLICATIONS .................................................................................................... vii
LIST OF FIGURES ................................................................................................................. xv
LIST OF TABLES ............................................................................................................... xviii
LIST OF ACRONYMS ........................................................................................................... xx
1 INTRODUCTION ............................................................................................................. 1
1.1 Background of study ................................................................................................... 1
1.2 BIM for Construction Waste Management ................................................................. 2
1.3 Hybrid Models for Construction Waste Analytics ...................................................... 4
1.4 Problem statement ....................................................................................................... 5
1.5 Gap in Knowledge and Research Justification ............................................................ 6
1.6 Research Questions ..................................................................................................... 7
1.7 Aim and Objectives ..................................................................................................... 7
1.8 Research methodology ................................................................................................ 8
1.8.1 Methodology for Objective 1 ............................................................................... 8
1.8.2 Methodology for Objective 2 ............................................................................. 10
1.8.3 Methodology for Objective 3 ............................................................................. 11
1.8.4 Methodology for Objective 4 ............................................................................. 12
1.9 Unit of Analysis ........................................................................................................ 12
1.10 Thesis contribution ................................................................................................ 13
1.11 Scope of Research ................................................................................................. 14
1.12 Layout of thesis ..................................................................................................... 15
2 CONSTRUCTION WASTE MANAGEMENT STRATEGIES AND TOOLS ............. 18
2.1 Overview ................................................................................................................... 18
2.2 Definition and Sources of Construction Waste ......................................................... 18
2.3 Design for Construction Waste Prediction ................................................................ 20
2.4 Design for Construction Waste Minimisation ........................................................... 21
2.4.1 Design for Material Optimisation ...................................................................... 22
2.4.2 Design for Waste Efficient Procurement ........................................................... 23
x
2.4.3 Design for Material Recovery and Reuse .......................................................... 24
2.4.4 Design for Offsite Construction ......................................................................... 26
2.4.5 Design for Deconstruction and Flexibility ......................................................... 26
2.5 Construction Waste Management Tools ................................................................... 27
2.5.1 Waste Management Plan Templates and Guides ............................................... 28
2.5.2 Waste Data Collection and Audit Tools ............................................................ 30
2.5.3 Waste Prediction Tools ...................................................................................... 30
2.5.4 Waste Quantification Models ............................................................................ 31
2.5.5 GIS Tools ........................................................................................................... 31
2.6 Limitations of existing construction waste management tools ................................. 32
2.6.1 Existing CW management Tools are Completely Detached from the Design
Process 34
2.6.2 Existing CW Management Tools Lack Interoperability Capabilities ................ 35
2.6.3 Construction Waste Data are not Sufficient ....................................................... 36
2.6.4 Waste management responsibilities are not clear .............................................. 37
2.6.5 Lifecycle Analysis (LCA) of CW Performance is not available ....................... 37
2.7 Summary ................................................................................................................... 38
3 BUILDING INFORMATION MODELLING (BIM) AND ARTIFICIAL
INTELLIGENCE (AI) SYSTEMS .......................................................................................... 40
3.1 Overview ................................................................................................................... 40
3.2 Building Information Modelling: Concepts and Benefits ......................................... 41
3.3 BIM in the Changing UK Construction Industry ...................................................... 43
3.3.1 UK BIM Level 2 Programme ............................................................................ 44
3.4 Building Information Modelling Platforms ............................................................... 47
3.5 BIM for Designing out Construction Waste ............................................................. 48
3.5.1 Team Communication and Integration .............................................................. 50
3.5.2 Parametric Modelling and Visualisation ............................................................ 50
3.5.3 Building Performance Analysis and Simulation ................................................ 51
3.5.4 Automatic Documentation Generation .............................................................. 52
3.5.5 Improved Building Lifecycle Management ....................................................... 53
3.5.6 Interoperability with Other Applications ........................................................... 53
3.6 BIM Development Tools ........................................................................................... 54
3.6.1 IFC Development Tools ..................................................................................... 55
xi
3.6.2 BIM Application Programming Interfaces ........................................................ 56
3.7 Artificial Intelligence System Development ............................................................. 58
3.7.1 Review of Relevant Theories in Artificial Intelligence and Associated Areas . 59
3.7.2 Implications of the Theories for the Study ........................................................ 65
3.7.3 Types of Artificial Intelligence Systems ............................................................ 66
3.8 Summary ................................................................................................................... 77
4 RESEARCH METHODOLOGY..................................................................................... 79
4.1 Overview ................................................................................................................... 79
4.2 Research Paradigms .................................................................................................. 81
4.2.1 Ontological and Epistemological Requirements of the Study ........................... 81
4.2.2 Available Research Paradigms .......................................................................... 82
4.2.3 Adopted Research Paradigm for the Study ........................................................ 87
4.3 Research Strategy and Methods ................................................................................ 89
4.3.1 Qualitative Research .......................................................................................... 90
4.3.2 Quantitative Research ........................................................................................ 91
4.3.3 Mixed Methods Research .................................................................................. 92
4.4 Exploratory Sequential Mixed Methods Design ....................................................... 93
4.5 Ethical Considerations ............................................................................................... 96
4.6 Software Development Methodologies ..................................................................... 96
4.6.1 Waterfall Model ................................................................................................. 97
4.6.2 Incremental Development .................................................................................. 97
4.6.3 Spiral Development ........................................................................................... 98
4.6.4 Agile Programming ............................................................................................ 98
4.6.5 Rapid Application Development ........................................................................ 99
4.7 Summary ................................................................................................................. 100
5 HOLISTIC BIM FRAMEWORK FOR CONSTRUCTION WASTE MANAGEMENT
102
5.1 Overview ................................................................................................................. 102
5.2 Sampling Techniques .............................................................................................. 102
5.3 Qualitative Data Collection ..................................................................................... 104
5.4 Qualitative Data Analysis ........................................................................................ 105
5.5 Evaluative Criteria for Construction Waste Tools .................................................. 108
5.6 Quantitative data collection ..................................................................................... 108
xii
5.6.1 Questionnaire Design ....................................................................................... 108
5.7 Quantitative Data Analyses ..................................................................................... 112
5.7.1 Reliability analysis and Descriptive Statistics ................................................. 113
5.7.2 Exploratory Factor Analysis ............................................................................ 115
5.8 Data Validity and Reliability ................................................................................... 116
5.9 BIM Framework for Construction Waste Management .......................................... 117
5.10 Summary .............................................................................................................. 119
6 AI HYBRID MODEL DEVELOPMENT FOR CONSTRUCTION WASTE
PREDICTION ........................................................................................................................ 122
6.1 Overview ................................................................................................................. 122
6.2 Model Development Process and Experimental Setup ........................................... 122
6.3 Construction Waste Data Collection and Exploration ............................................ 123
6.4 Data Preparation for ANFIS Model Development .................................................. 134
6.5 Adaptive Neuro-Fuzzy Inference System (ANFIS) ................................................ 135
6.6 ANFIS Model Development and Training .............................................................. 139
6.6.1 Input selection for ANFIS Models ................................................................... 139
6.6.2 ANFIS Structure and Training ......................................................................... 142
6.6.3 ANFIS Model Evaluation ................................................................................ 146
6.6.4 Computing Waste by Material Types and Management Routes ..................... 149
6.7 Mathematical Model for Dimensional Coordination .............................................. 151
6.7.1 Computing Required Bricks ............................................................................ 152
6.8 Summary ................................................................................................................. 159
7 BIM-BASED SYSTEM FOR CONSTRUCTION WASTE PREDICTION AND
MINIMISATION (BIMWASTE) .......................................................................................... 160
7.1 Overview ................................................................................................................. 160
7.2 Software Development Environment ...................................................................... 160
7.2.1 C# Programming Environment ........................................................................ 160
7.2.2 Revit 2017 Application Programming Interface (API) .................................... 162
7.2.3 User Interface (UI) and Presentation Frameworks .......................................... 166
7.3 System Design for BIMWASTE ............................................................................. 167
7.4 BIM-based software for Construction Waste Prediction ........................................ 167
7.4.1 User Interface Module ..................................................................................... 168
7.4.2 Custom Parameters Module ............................................................................. 174
xiii
7.4.3 Material Database for BIMWaste .................................................................... 178
7.4.4 Material Take-Off Calculation Module ........................................................... 179
7.4.5 Report Generation Module .............................................................................. 180
7.5 BIM-Based Design Advisor for Material Optimisation .......................................... 185
7.6 System Testing for BIMWaste ................................................................................ 192
7.6.1 Results for Test Case 1 .................................................................................... 195
7.6.2 Results for Test Case 2 .................................................................................... 197
7.7 Summary ................................................................................................................. 198
8 DISCUSSION OF RESULTS ....................................................................................... 200
8.1 Overview ................................................................................................................. 200
8.2 Evaluative Criteria for Construction Waste Tools .................................................. 200
8.2.1 Waste Prediction Criteria ................................................................................. 200
8.2.2 Waste Data Criteria .......................................................................................... 202
8.2.3 BIM Criteria ..................................................................................................... 203
8.2.4 Commercial and Procurement Criteria ............................................................ 204
8.2.5 Design Criteria ................................................................................................. 206
8.2.6 Technological Criteria ..................................................................................... 207
8.3 BIM Strategies for Design-based Construction Waste Management ...................... 208
8.3.1 BIM-based Collaboration for Waste Management .......................................... 208
8.3.2 Waste-Driven Design Process and Solutions ................................................... 210
8.3.3 Lifecycle Waste Analytics ............................................................................... 212
8.3.4 Innovative Technologies for Waste Intelligence and Analytics ...................... 213
8.3.5 Improved Documentation for Waste Management .......................................... 215
8.4 Holistic BIM Framework for Construction Waste Management ............................ 216
8.4.1 Infrastructure Layer ......................................................................................... 216
8.4.2 Data Layer ........................................................................................................ 217
8.4.3 Presentation Layer ........................................................................................... 218
8.4.4 BIM Business Domain Layer ........................................................................... 218
8.4.5 Service Domain Layer ..................................................................................... 219
8.4.6 Application Layer ............................................................................................ 220
8.5 BIM-Based Construction Waste Prediction using Hybrid Models ......................... 220
8.6 Summary ................................................................................................................. 223
9 CONCLUSION, RECOMMENDATIONS, AND FUTURE WORKS ........................ 225
xiv
9.1 Overview ................................................................................................................. 225
9.2 Summary of the Study ............................................................................................. 225
9.3 Main Findings of the Study ..................................................................................... 227
9.3.1 Strategies for BIM-Based Construction Waste Management .......................... 228
9.3.2 Development of AI Hybrid Models for CW Prediction ................................... 231
9.3.3 Development and Testing of BIM-Based Tool for CW Management ............. 232
9.4 Implications of the Study ........................................................................................ 233
9.4.1 Implications for practice .................................................................................. 233
9.4.2 Theoretical Implications .................................................................................. 236
9.5 Limitations of the Study .......................................................................................... 237
9.6 Areas of Future Research ........................................................................................ 238
REFERENCES ...................................................................................................................... 240
APPENDIX A: FOCUS GROUP INTERVIEW SCHEDULE ............................................. 277
APPENDIX B: SURVEY COVER LETTER AND QUESTIONNAIRE SAMPLE ............ 279
xv
LIST OF FIGURES
Figure 1.1: Layout of Thesis .................................................................................................... 16
Figure 2.1: Strategies for Construction Material Recovery ..................................................... 25
Figure 2.2: Current Waste Management Tools ........................................................................ 29
Figure 3.1: Concepts of Building Information Modelling ....................................................... 42
Figure 3.2: BIM Collaborative Platform .................................................................................. 43
Figure 3.3: Reform Movements and Important Milestones within the UK Construction Industry
.................................................................................................................................................. 45
Figure 3.4: BIM Maturity Model by Bew and Richards (2008) .............................................. 46
Figure 3.5: BIM Functionalities Framework for Construction Waste Management ............... 51
Figure 3.6: Theoretical Underpinning of Study ....................................................................... 60
Figure 3.7: Balance Theory for Recycling of Construction and Demolition Wastes .............. 63
Figure 3.8: Architecture of a Knowledge Based System ......................................................... 71
Figure 3.9: Processes in Knowledge Based System Development .......................................... 72
Figure 4.1: Paradigms Framework Proposed by Burrell and Morgan (1979) ......................... 83
Figure 4.2: An Overview of the Sequential Exploratory Mixed Method Design Process ....... 93
Figure 5.1: Methodological flowchart ................................................................................... 103
Figure 5.2: A Framework of Criteria for Evaluating the Performances of Waste Management
Tools ...................................................................................................................................... 109
Figure 5.3: Framework for a BIM-Based Construction Waste Management System ........... 120
Figure 6.1: Process of Model Development .......................................................................... 123
Figure 6.2: Distribution of Waste Data Record by Waste Type ............................................ 127
Figure 6.3: Distribution of Total Waste Output by Construction Type ................................. 128
Figure 6.4: Waste Management Routes of Waste Types ....................................................... 131
Figure 6.5: Waste Management Routes of Construction Type .............................................. 132
Figure 6.6: Distribution of GFA according to Construction Type ......................................... 132
Figure 6.7 Distribution of Cost according to Construction Type .......................................... 133
Figure 6.8: Distribution of Total Waste Output according to Construction Type ................. 133
Figure 6.9: Block Diagram of Proposed ANFIS Model ........................................................ 134
Figure 6.10: ANFIS Model Development Flowchart ............................................................ 135
Figure 6.11: A Two Inputs and one Output ANFIS System .................................................. 137
Figure 6.12: RMSE for two-input ANFIS Model for CW Prediction ................................... 142
Figure 6.13: Block Diagram of the Final ANFIS Model ....................................................... 143
xvi
Figure 6.14: Network Structure of ANFIS Model with Grid Partitioning ............................. 144
Figure 6.15: Fuzzy Rules for the ANFIS Model .................................................................... 146
Figure 6.16: Rule Viewer for the ANFIS Model ................................................................... 147
Figure 6.17: Gaussian Membership Function for Variable “Gross Floor Area” ................... 148
Figure 6.18: Gaussian Membership Function for Variable “Gross Floor Area” ................... 148
Figure 6.19: Comparison of Actual and Predicted Values ................................................... 149
Figure 6.20: Standard Cavity Wall Fully Filled with Insulation ........................................... 152
Figure 6.21: Stretcher Bond using 215x102.5x65 Brick ....................................................... 154
Figure 6.22: Graph of Wall Length against br+ ..................................................................... 156
Figure 7.1: Visual Studio Community Integrated Development Environment ..................... 161
Figure 7.2: Debugging Revit Plugin in Visual Studio ........................................................... 162
Figure 7.3: Enabling Managed Compatibility Mode in Visual Studio .................................. 162
Figure 7.4: The Two DLL References (RevitAPI.dll and RevitAPIUI.dll) Needed for Add-in
Development .......................................................................................................................... 163
Figure 7.5: Autodesk Revit API Framework ......................................................................... 163
Figure 7.6: Code Structure for External Command Class ..................................................... 164
Figure 7.7: Code Structure for External Application Class ................................................... 165
Figure 7.8: Structure of a .addin manifest file for External Application ............................... 165
Figure 7.9: Process flow for BIMWaste ................................................................................ 169
Figure 7.10: Class Implementation for BIMWaste Ribbon Panel ......................................... 170
Figure 7.11: BIMWaste Ribbon Panel ................................................................................... 170
Figure 7.12: Welcome Page for BIMWaste ........................................................................... 171
Figure 7.13: BIMWaste About Dialog ................................................................................... 171
Figure 7.14: BIMWaste Preferences Dialog .......................................................................... 172
Figure 7.15: BIMWaste Application Settings Page .............................................................. 172
Figure 7.16: Create CWA Model Dialog ............................................................................... 173
Figure 7.17: BIMWaste Reports Window ............................................................................. 175
Figure 7.18: Sample Dashboard of a CWA Report ............................................................... 175
Figure 7.19: Sample Waste Distribution by Levels Stacked Chart ....................................... 176
Figure 7.20: Sample Waste Distribution by Element and Material Types ............................ 176
Figure 7.21: Sample of Exported Bill of Quantity in Excel Format ...................................... 177
Figure 7.22: Project Parameters for CWA ............................................................................. 177
Figure 7.23: Create Project Parameters Function .................................................................. 178
xvii
Figure 7.24: Material Database Class .................................................................................... 179
Figure 7.25: Functions for Collecting All Element and Materials ......................................... 181
Figure 7.26: Functions for Getting all Level and Their Elevation ......................................... 181
Figure 7.27: Function for Getting Elements According to Level .......................................... 182
Figure 7.28: Function for Calculating Gross Floor Area ....................................................... 182
Figure 7.29: HTML Code for Report Head Tag .................................................................... 182
Figure 7.30: HTML Code for Element-Material Waste Distribution Panel .......................... 183
Figure 7.31: JavaScript Code for Stacked Bar Chart ............................................................. 183
Figure 7.32: Sample Element-Material Waste Distribution Stacked Chart ........................... 184
Figure 7.33: Menu Bar to Access Panels of the Reports ....................................................... 184
Figure 7.34: Design Advisor Button on BIMWaste Ribbon .................................................. 185
Figure 7.35: Material Optimisation Design Advisor Dialog ................................................. 187
Figure 7.36: Selecting Single and All Elements in Document Preview ................................ 188
Figure 7.37: Updating Element Details Table and Chart. The selected element is shown in the
preview panel ......................................................................................................................... 189
Figure 7.38: Selecting all Elements of Type CL_W1 ............................................................ 190
Figure 7.39: Possible Replacement Elements for Basic Wall CL_W1 .................................. 191
Figure 7.40: Save Chart as PNG image ................................................................................. 192
Figure 7.41: CWA Dashboard for Test Case 1 ...................................................................... 195
Figure 7.42:Waste Output by Element Type for Test Case 1 ................................................ 196
Figure 7.43: Waste Distribution by Building Levels for Test Case 1 .................................... 196
Figure 7.44: CWA Dashboard for Test Case 2 ...................................................................... 197
Figure 7.45: Waste Output by Element Type for Test Case 2 ............................................... 198
Figure 7.46: Waste Distribution by Building Levels for Test Case 2 .................................... 199
xviii
LIST OF TABLES
Table 1.1: Research Road Map, Methodologies, and Outputs .................................................. 9
Table 2.1: Design-based Causes of Construction Waste ......................................................... 19
Table 2.2: Existing Tools for Construction Waste Management and their Limitation ............ 33
Table 3.1: A Comparison of API of top BIM Software ........................................................... 49
Table 3.2: IFC Development Tools ......................................................................................... 57
Table 3.3: Comparison of Artificial Intelligence Techniques ................................................. 67
Table 3.4: Artificial Intelligence Techniques in Construction Studies .................................... 68
Table 3.5: Comparison of Different AI Techniques ................................................................ 75
Table 3.6: Classification of Hybrid Systems ........................................................................... 76
Table 4.1: Critical Choice of Methodology ............................................................................. 80
Table 4.2: Comparison of Alternative Inquiry Paradigms ....................................................... 84
Table 4.3 Comparison of Qualitative and Quantitative Research ............................................ 89
Table 5.1: Overview of the focus group discussions and the participants ............................. 105
Table 5.2: Descriptive interpretive analysis process .............................................................. 106
Table 5.3: Example of classification based on the coding scheme ........................................ 107
Table 5.4: Evaluative Criteria for Existing Waste Management Tools (a) ............................ 110
Table 5.5: Evaluative Criteria for Existing Waste Management Tools (b) ........................... 111
Table 5.6: Demographics of survey respondents ................................................................... 113
Table 5.7: Reliability analysis and ranking of critical factors for designing out waste ......... 114
Table 5.8: Component labelling and corresponding criteria from exploratory factor analysis
................................................................................................................................................ 116
Table 6.1: Cost Classification Range ..................................................................................... 124
Table 6.2: Gross Floor Classification Range ......................................................................... 124
Table 6.3: Sample Construction Waste Data Record ............................................................. 125
Table 6.4: Total Waste Output by Waste Type ...................................................................... 126
Table 6.5: Total Waste Output by Construction Type ........................................................... 127
Table 6.6: Total Waste Output by Project Usage .................................................................. 128
Table 6.7: GFA Classification of Waste Data Record ........................................................... 129
Table 6.8: Cost Classification of Waste Data Record ............................................................ 129
Table 6.9: Waste Data Distribution with respect to Construction Type, Project Use Type and
Waste Type ............................................................................................................................ 130
Table 6.10: Construction Waste Management Routes ........................................................... 131
xix
Table 6.11: Input and Output Variables for ANFIS .............................................................. 139
Table 6.12: Sample of Waste Data ........................................................................................ 140
Table 6.13: Details of Hybrid Learning Algorithm ............................................................... 140
Table 6.14: Results of Input Selection for ANFIS Model ..................................................... 141
Table 6.15: Input Membership Functions for ANFIS ............................................................ 145
Table 6.16: Performance of ANFIS Using Different Membership Functions ....................... 147
Table 6.17: Construction Waste Output Distribution by Construction Types and Waste Types
................................................................................................................................................ 150
Table 6.18: Distribution of Waste Management Route ......................................................... 151
Table 6.19: Composition of Standard Cavity Wall ................................................................ 152
Table 6.20: Metrics for Dimensional Coordination of Cavity Wall ...................................... 153
Table 6.21: Bricks Requirement and Potential Waste (height, lh = 3000mm) ....................... 157
Table 7.1: Test Plan for BIMWaste ....................................................................................... 193
Table 7.2: Test Cases for BIMWaste ..................................................................................... 194
Table 7.3: Overview of Test Results ...................................................................................... 195
xx
LIST OF ACRONYMS
3D Three Dimensional ACO Ant Colony Optimisation
AEC Architectural, Engineering and Construction AI Artificial Intelligence
ANFIS Adaptive Neuro-Fuzzy Inference System ANN Artificial Neural Network
API Application Programming Interface BIM Building Information Modelling
BQ Bill of Quantity BRE Building Research Establishment
BREEAM Building Research Establishment Environmental Assessment Method BWAS Building Waste Assessment Score
CAD Computer Aided Design CW Construction Waste
CDW Construction and demolition waste CO2 Carbon dioxide
COBie Construction Operations Building Information Exchange CW Construction Waste
DEFRA Department for Environment, Food, and Rural Affairs DfD Design for Deconstruction
DoW Design out Waste DoWT-B Designing Out Waste Tool for Buildings
DRWE Demolition and Renovation Waste Estimator FGI Focus Group Interview
FS Fuzzy System FST Fuzzy Set Theory
gbXML Green Building Extensible Markup Language GFA Gross Floor Area
GIS Geographic Information System GPS Global Positioning System
ICE Institution of Civil Engineers ICT Information and Communication Technology
IDE Integrated Development Environment
xxi
IES Integrated Environmental Solutions IFC Industry Foundation Classes
IPD Integrated Product Delivery KBS Knowledge Based System
n-D N-Dimensional NBS National Building Specification
NRM 2 New Rules of Measurement for detailed measurement of building works NWT Net Waste Tool
RAD Rapid Application Development RIBA Royal Institute of British Architects
RMSE Root Mean Square Error SDK Software Development Kit
SMARTWaste Site Methodology to Audit, Reduce and Target Waste SMM Standard Method of Measurement for building works
SPSS Statistical Package for the Social Sciences SWMP Site Waste Management Plan
UI User Interface UK United Kingdom
UML Unified Modelling Language USA United States of America
USEPA United States Environmental Protection Agency WDR Waste Data Records
WPM Waste Prediction Models WRAP Waste and Resources Action Programme
1
1 INTRODUCTION
1.1 Background of study
The rapid urbanisation across the globe has led to the inevitably large volume of Construction
Waste (CW). From 2004 to 2012, CW contributed the largest percentage (about 30%) of the
total waste sent to landfill in the UK (DEFRA, 2011, 2012). According to Osmani (2012b), this
percentage of waste requires a payment close to £200 million as annual landfill tax. Apart from
the high landfill cost, the disposal of waste has resulted into severe ecological damage (Lu et
al., 2011; Nagapan et al., 2012b; Oyedele et al., 2013), shortage of land (Gavilan and Bernold,
1994), and increased transportation and project costs (Yuan, 2012). The constant increase in
landfill charges instituted by most countries to discourage waste disposal to landfills has not
reduced the amount of CW sent to landfills (Matsueda and Nagase, 2012). Still, the volume of
waste sent to landfill sites is a major concern owing to the cost of waste disposal and its adverse
environmental impacts. To avoid the undesirable impacts of waste disposal, there is need for
an overall change in strategy towards preservation of the finite natural resources, reduction in
demand for landfill, and reduction in the total project cost (Oyedele et al. 2013). According to
Ajayi et al. (2016), a number of construction waste management strategies have been
encouraged to ensure a tighter loop of material and building components.
With so many building construction taking place annually, the environmental and economic
impacts of CW cannot be ignored. Tackling the challenges of CW requires a strategic approach
to planning for CW reduction and recovery of building materials for reuse or recycling. This
requires dealing with the problem at source, which is usually at the design stage by designing
out waste. Despite the consensus in the literature that CW could be reduced through design
(Faniran and Caban, 1998; Mcdonald and Smithers, 1998; Poon, Yu and Jaillon, 2004; Liu et
al., 2011; Osmani, 2012b, 2013), waste minimisation is still not given priority during the design
process (Poon, Yu and Jaillon, 2004; Osmani, Glass and Price, 2008).

2
The opportunities in designing out waste have motivated various stakeholders to develop
initiatives such as “designing out waste” by Waste and Resources Action Programme (WRAP)
and SMARTWaste by Building Research Establishment (BRE) (BRE, 2008b; Langdon, 2011).
The UK government also commissioned waste minimisation and sustainability initiatives,
which include “halving waste to landfill by 2012 relative to 2008” (Oyedele et al., 2013), “Zero
waste to landfill by 2020” (Phillips et al., 2011), and Site Waste Management Plan (SWMP)
Regulation (WRAP, 2008). Likewise, the United States Environmental Protection Agency
(USEPA) has also set targets to characterise and understand CW material stream as well as
promoting research on best practices for CW reduction and recovery (USEPA, 2003). All of
these suggest an operational shift from on-site CW management to design based CW
management (Osmani, 2013). However, a review of existing CW management tools reveals
key underlying problems to design-based CW management. This is because the tools either are
too late at the design stage or are not embedded within the design process (Akinade et al.,
2016). This makes the tools difficult to be used by architects and design engineers. To
overcome these problems, evidence shows that techniques in Building Information Modelling
(BIM) could be adopted by design teams for the purpose of waste minimisation (Liu et al.,
2011). The BIM-based approach allows CW process to be tightly integrated into the design
process and into existing software used by architects and design engineers.
This study therefore assists in accomplishing set targets for the adoption of BIM and the
implementation of favourable design strategies for CW minimisation. Thus, the study
contributes significant economic, social, and environmental gains by reducing demand for
landfills, reducing CO2 emission, conserving embodied energy, preserving natural
environment, and reducing project cost.
1.2 BIM for Construction Waste Management
The recent wide adoption of BIM has revolutionised the approach to timely project delivery
across the world (Eastman et al., 2011). The benefits accruable from BIM have stimulated
several nations to set a deadline for its adoption. For example, the UK government has
stipulated that from April 2016, all procurement in public sector work must adopt BIM
approach. This deadline has forced most companies in the UK to integrate BIM into their
3
activities to sustain their competitive advantage. A recent survey of about 1,000 UK
construction professionals by National BIM Survey (RIBA, 2016) reveals an uptake in the
adoption of BIM from 48% in 2015 to 54% in 2016. The survey also reveals that 95% of people
expect to adopt BIM on their project within three years. This means that the UK now ranks
alongside USA, Finland, Singapore, New Zealand, Hong Kong. with regards to BIM adoption.
The increasing adoption of BIM in the construction industry (Azhar, 2011) has improved
system interoperability (Steel, Drogemuller and Toth, 2012), information sharing, visualisation
of n-D models and decision making processes (Eastman et al., 2011). BIM also provides a
platform for seamless collaboration among stakeholders from different disciplines (Grilo and
Jardim-Goncalves, 2010). Accordingly, BIM knowledge taps into various fields, which
include project management, construction, engineering, information technology, policy and
regulation. Accordingly, the expectations of BIM cut across these fields (Singh, Gu and Wang,
2011). Considering the numerous benefits of BIM, there is a need to systematically structure
such diverse knowledge in an efficient way to enhance the understanding and efficient
development of BIM for CW management. However, none of the existing BIM software offers
CW management functionality.
The foregoing reveals the need for a system to organise the different modules and components
of BIM-enabled CW management tool into an integrated system. Chief among the
functionalities of such BIM-enabled CW management are: (i) CW prediction at the design stage
and (ii) CW minimisation through designing out waste. This means that an efficient CW
management strategy must incorporate a means of predicting the waste potentials of building
right from the design stage. In addition, the tool must provide a mechanism that could be used
to reduce the waste potentials of building at the design stage. This is based on dealing with the
problem of CW at source before waste is generated rather than “end-of-pipe” treatment when
waste has been generated. These tasks therefore necessitate the need to understand the
complexity of intertwined processes of building design practice, CW management techniques,
sources of CW, and Design-out-Waste (DoW) process. As such, this study takes a holistic
approach to assess perspectives on BIM-based building design principles and how interplay
among them could ensure successful CW prediction and minimisation.
4
1.3 Hybrid Models for Construction Waste Analytics
Advancement in Information and Communication Technologies (ICT) and BIM technologies
reveals that any promising innovation within the Architectural, Engineering, and Construction
(AEC) industry requires BIM compliance (Liu et al., 2011) and that computer support is
indispensable in construction related tasks to achieve the required flexibility, reliability, and
efficiency (Eastman et al., 2009). It is based on the foregoing that this study explores an
intersection of research frontier in Artificial Intelligence (AI), BIM, sustainability and building
construction studies to understand how CW management could be integrated into existing BIM
platforms. This study therefore lays on this premise to formalise CW prediction and
minimisation strategies into a hybrid AI computational system. This is with the aim of
integrating the computational system with existing BIM framework to support architects during
the early design stages.
Hybrid systems is a promising research field that integrate multiple AI techniques to find
synergetic solution to specific problems. As such, hybrid systems overcome specific limitations
of individual techniques and they combine their strengths (Son, Kim and Kim, 2012; Kim,
2013). For example, Fuzzy Inference System (FIS) may be suited to domain knowledge
representation and uncertainty handling but it lacks good learning ability (Munakata, Jani and
Engineering, 1994). However, machine learning techniques such as NN that possess good
learning capability are not uncertainty nor imprecision tolerant. Therefore, the hybridization of
complementary AI techniques could produce powerful intelligent systems that could solve
practical computing problems (Mohanty, Ravi and Patra, 2013).
The motivation to the development of hybrid systems is the awareness that combined
approaches could be necessary to tackle complex AI problems. This means that hybridization
of AI techniques focuses on the integration of AI techniques than the creation of new
techniques (Abraham, 2005; Melin et al., 2007; Heemels et al., 2009). As such, well-
understood techniques should be integrated to address weaknesses of complementary methods
and leverage their strengths. According to Abraham (2003), the hybridization of AI techniques
has resulted into outstanding results in different areas of study, which include decision support,
image recognition, process control, and other areas.
5
To achieve CW prediction and minimisation capabilities for the proposed BIM system, AI
hybrid models were adopted. The study uses Adaptive Neuro-Fuzzy Inference System (ANFIS)
method that integrates the strengths of Artificial Neural Networks (ANN) and Fuzzy Systems
(FS) into a single hybrid system (Jang, 1993). The proposed hybrid systems provide
exceptional capability by synergising human-like reasoning of FS with connectionist learning
based structure of ANN. Adequate CW record data were therefore collected for the purpose of
model development, training and testing.
1.4 Problem statement
Evidence from literature suggests that an operational shift from on-site waste management to
design based waste management is needed for effective CW management (Faniran and Caban,
1998; Mcdonald and Smithers, 1998; Poon, Yu and Jaillon, 2004; Liu et al., 2011; Osmani,
2012b, 2013). This requires dealing with the problem at source, which is usually at the design
stage by designing out CW before it occurs. Tackling this problem calls for a strategic approach
to planning for CW reduction using appropriate design tools. However, a review of existing
CW management tools reveals key underlying problems to design-based CW management.
First, despite the general knowledge that taking the right decisions during design could
minimise CW, none of the existing tools has been fully integrated into building design process.
This makes the tools too late at the design stage and therefore makes their usage by architects
and design engineers difficult. Second, none of the existing waste management tools is BIM
compliant (Cheng and Ma, 2011). This is because the tools are external to BIM software used
by designers, thereby limiting their usability. Third, despite the current effort to achieve full
software interoperability in the AEC industry, existing CW management tools lack
interoperability capabilities with other software. Overcoming these problems require tight
integration of BIM-based approach to CW management into design process and software used
by architects and design engineers.
Achieving this offers huge opportunities for an effective and economical waste quantification,
waste minimisation, collaboration amongst stakeholders and supply-chain integration. This
means that bringing together design, procurement, and commercial processes into BIM
software provides a means of economical CW management. BIM capability for CW
6
management tools would favour automatic capture of design parameters for CW analytics. It
would also help to mitigate errors from manual entry of parameters as done in existing CW
management tools. Pointedly, integrating CW management with BIM increases the usability
of CW management tools to make appropriate waste minimisation decisions within BIM
software. Such system would leverage BIM modelling platforms and their material database to
understand and visualise the effects of design decisions on CW generation. The integration also
offers a powerful synergy for simulating performances of buildings with respect to CW. In
addition, BIM would provide a powerful collaboration platform for all stakeholders towards an
effective CW management, seamless information sharing, and software interoperability. This
would enable all stakeholders to participate actively in CW decision-making.
1.5 Gap in Knowledge and Research Justification
Despite the benefits accruable from the use of BIM and the steep rise its adoption, the use of
BIM for CW management is often neglected (Akinade et al., 2015). Although there are several
studies that have stimulated the consciousness of BIM for CW management (Liu et al., 2011;
Won, Cheng and Lee, 2016), none of the studies has provided clear instructions on how BIM
could be used for this purpose. Besides, this lack of provision for clear instructions raises
serious concerns on how CW management could be incorporated into BIM. The set of studies
only provides conceptual frameworks by identifying factors that must be considered during
design (Liu et al., 2011; Osmani, Glass and Price, 2008; Won, Cheng and Lee, 2016). Thus,
the studies fail to provide a methodological mechanism needed to understand how to implement
the design principles for CW management. Another challenge is that none of the studies
provides an objective measure of performance for DoW principles. These limitations therefore
reveal the need to take a holistic approach to investigating CW management principles
empirically and to develop a framework for integrating the principles into BIM.
Design out Waste Tool for Buildings (DoWT-B) (WRAP, 2011a) seems to be the most
practical of all the existing tools in the sense that it could forecast the impact of design changes
on waste output. However, it does not engage all stakeholders, and it is external to BIM
software, thereby limiting its usability. The only BIM enabled waste management tool is the
Demolition and Renovation Waste Estimation (DRWE) tool (Cheng and Ma, 2013), which
7
leveraged on the BIM technology through the Autodesk Revit API. However, the system only
estimates waste generation from demolition and renovation of existing buildings. This clearly
shows that the development of a BIM-enabled tool for simulating the different aspects of waste
reduction is timely. Considering the foregoing reveals that the use of BIM for CW management
would be an effort channelled in the right direction. This is because literature reveals that design
decisions have high impact on CW generation (Faniran and Caban, 1998; Osmani et al., 2008).
Based on the identified gap in knowledge, this study seeks to identify key BIM functionalities
that could provide effective decision-making mechanisms for CW prediction and minimisation
at the design stages. At the end, this study develops a BIM-based CW management tool that is
code named BIMWaste.
1.6 Research Questions
Based on the research aim and objectives, this study would answer the following research
questions:
a) What are the underlying strategies for BIM-based CW prediction and
minimisation at the design stage?
b) What are the critical features of BIM for CW prediction and minimisation?
c) How can the strategies for CW prediction and minimisation be formalised into
a computational system?
d) How can the computational system for CW prediction and minimisation be
integrated into existing BIM platforms?
1.7 Aim and Objectives
The overall aim of this study is to investigate how design-based CW management capabilities
could be incorporated into existing BIM platforms. The study is targeted towards the
development of a BIM-based tool for CW management, which could be used by architects and
design engineers to quantify CW output of buildings at the design stage. To achieve the overall
aim of the study, the following specific objectives were proposed:
8
a) To investigate strategies for enabling BIM-based CW management at the design
stage
b) To formalise strategies for CW prediction and minimisation into computational
systems using Artificial Intelligence (AI) hybrid models
c) To integrate the computational systems for CW management into existing BIM
platform
d) To test the performance of the BIM-based CW management tool
1.8 Research methodology
This mixed methods study adopts several techniques to achieve the specific objectives. The
techniques include systematic literature review, focus group discussions, questionnaire survey,
thematic analysis of qualitative data, statistical analysis of quantitative data, hybrid AI
techniques, Rapid Application Development (RAD) framework, and software testing
techniques. Table 1.1 presents the tasks required to accomplish the research objectives and the
corresponding expected outputs. The following subsections briefly describe the
methodological approaches adopted for the each of the research objectives.
1.8.1 Methodology for Objective 1
Objective: To investigate strategies for enabling BIM-based construction
waste management at the design stage.
To achieve this objective, strategies for enabling BIM-based CW management were identified
using a mixed methods strategy. Second, a holistic BIM framework for CW management was
then developed.
a) Review of extant literature on concept of waste management, types and causes of
construction waste, construction waste management techniques, and CW management
tools was carried out.
9
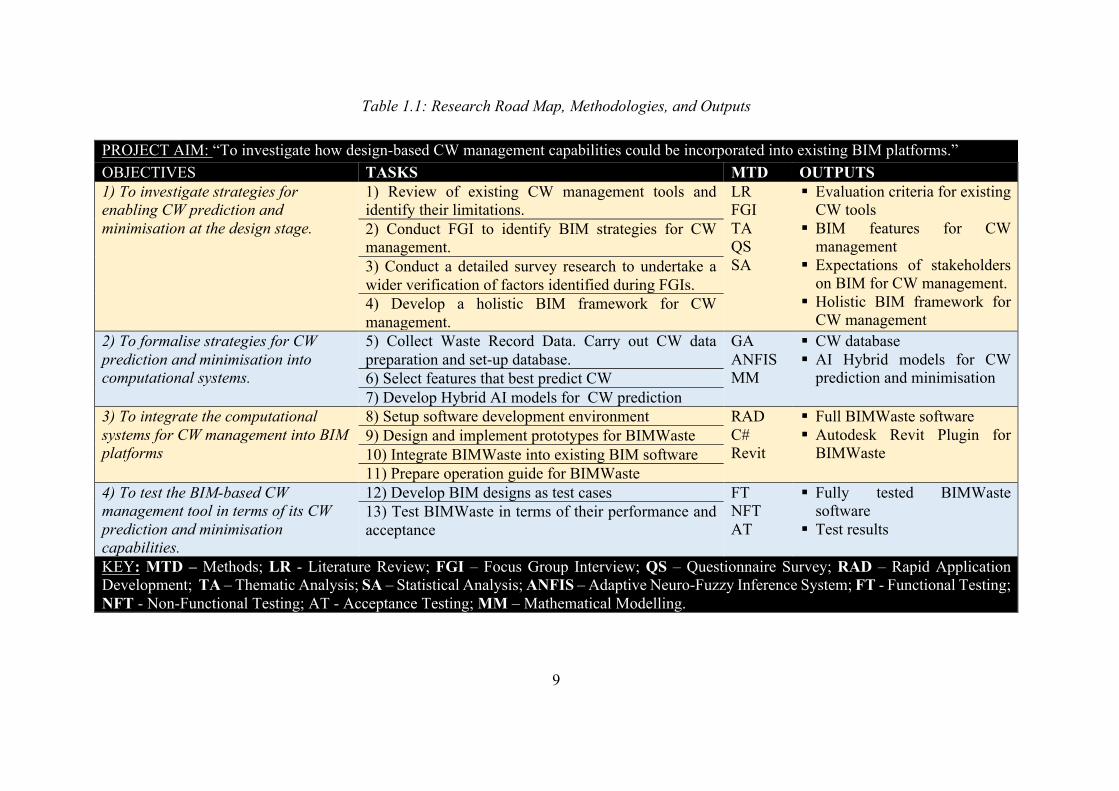
Table 1.1: Research Road Map, Methodologies, and Outputs
PROJECT AIM: “To investigate how design-based CW management capabilities could be incorporated into existing BIM platforms.” OBJECTIVES TASKS MTD OUTPUTS 1) To investigate strategies for enabling CW prediction and minimisation at the design stage.
1) Review of existing CW management tools and identify their limitations.
LR FGI TA QS SA
§ Evaluation criteria for existing CW tools
§ BIM features for CW management
§ Expectations of stakeholders on BIM for CW management.
§ Holistic BIM framework for CW management
2) Conduct FGI to identify BIM strategies for CW management. 3) Conduct a detailed survey research to undertake a wider verification of factors identified during FGIs. 4) Develop a holistic BIM framework for CW management.
2) To formalise strategies for CW prediction and minimisation into computational systems.
5) Collect Waste Record Data. Carry out CW data preparation and set-up database.
GA ANFIS MM
§ CW database § AI Hybrid models for CW
prediction and minimisation
6) Select features that best predict CW 7) Develop Hybrid AI models for CW prediction
3) To integrate the computational systems for CW management into BIM platforms
8) Setup software development environment RAD C# Revit
§ Full BIMWaste software § Autodesk Revit Plugin for
BIMWaste
9) Design and implement prototypes for BIMWaste 10) Integrate BIMWaste into existing BIM software 11) Prepare operation guide for BIMWaste
4) To test the BIM-based CW management tool in terms of its CW prediction and minimisation capabilities.
12) Develop BIM designs as test cases FT NFT AT
§ Fully tested BIMWaste software
§ Test results 13) Test BIMWaste in terms of their performance and acceptance
KEY: MTD – Methods; LR - Literature Review; FGI – Focus Group Interview; QS – Questionnaire Survey; RAD – Rapid Application Development; TA – Thematic Analysis; SA – Statistical Analysis; ANFIS – Adaptive Neuro-Fuzzy Inference System; FT - Functional Testing; NFT - Non-Functional Testing; AT - Acceptance Testing; MM – Mathematical Modelling.
10
The limitations of existing CW management tools were also identified. A
comprehensive review of the concept of BIM, BIM development tools,
BIM features for designing out waste, and Artificial Intelligence Hybrid models was
carried out.
b) Focus Group Interviews (FGIs) were conducted with architects, design managers, M&E
engineers, construction project managers, civil engineers, structural engineers, and
BIM specialists. The FGI was conducted to establish a baseline for the expectations of
UK construction stakeholders in terms of BIM for CW management. The transcripts of
the FGIs were then subjected to thematic analysis to identify the themes across the
discussions. The results were used to identify a list of evaluative criteria for CW tools
and strategies for BIM-based CW management.
c) The factors identified from the qualitative data analysis were developed into a
questionnaire survey to verify the factors using a larger population sample.
Respondents for the questionnaire survey were chosen from the UK construction
industry. The questionnaire survey was adequately pilot-tested and administered. The
completed questionnaires were then subjected to exploratory factor analysis to identify
the underlying structure of the factors.
d) Based on the foregoing, a holistic BIM framework for CW management was developed
using an architecture-based layered approach. This approach allows related components
to be grouped into layers and to ensure hierarchical categorisation of components.
1.8.2 Methodology for Objective 2
To formalise strategies for construction waste prediction and minimisation
into computational systems.
To achieve this objective, appropriate CW data was compiled from waste contractors. The data
was cleaned and prepared into a database to aid analysis and model development. Accordingly,
the following methods were employed:
11
a) Historical Waste Data Records (WDR) was collected from reputable waste contractors
and put in a database.
b) The data was subjected to exploratory data analysis to understand the distribution and
structure of the data.
c) A hybrid model based on Adaptive Neuro-Fuzzy Inference System (ANFIS) was
developed to predict CW from a set of features.
d) A Dimensional Coordination Model (DCM) was then developed for CW minimisation
using mathematical modelling.
1.8.3 Methodology for Objective 3
To integrate the computational systems for construction waste management
with BIM platforms
First, requirement gathering for the proposed BIM plugin was carried out. Autodesk Revit was
chosen as the BIM platform for the plugin development because it is widely used and it
provides a rich Application Programme Interface (API) and Software Development Toolkit
(SDK). In addition, Revit provides a powerful BIM parametric modelling platform and a robust
material database. The following methods were used to achieve the development and
integration of the Revit plugin:
a) The development of the full system is based on Rapid Application Development (RAD)
framework. RAD employs a sequence of activities that encourages rapid response to
users’ needs.
b) Software development environment was setup and configured. The environment is
made up of C# programming Integrated Development Environment (IDE) using Visual
Studio Community 2015, Revit 2017 Software Development Kit (SDK), and User
Interface (UI) frameworks such as JQuery, Bootstrap, and ChartJS.
12
c) System design was done using Unified Modelling Language (UML) in StarUML
environment.
d) The modules of the full BIM-based software for CW prediction and minimisation
(BIMWaste) were developed in C# and integrated into Autodesk Revit as a Plugin.
1.8.4 Methodology for Objective 4
To test the performance of the BIM-based CW management tool
The full system was eventually tested for CW prediction accuracy, usability, and acceptability.
Accordingly, the following activities were carried out to achieve the objective:
a) A plan for functional and non-functional testing of BIMWaste was developed. The test
plan contains a list of activities that was carried out during the test and the objectives.
b) Test cases of BIM designs were then developed in Autodesk Revit.
c) The full software was then tested based on the plan and test cases.
1.9 Unit of Analysis
According to Trochim (2006), it is important to identify the unit of analysis for a study to
ensure that results are correctly interpreted. Unit of analysis is the major entity that would be
studied and analysed in a research. This entails the identification of “who” or “what” is
analysed to draw conclusions. The unit of analysis of a study could be individuals, groups,
organisations, partnership, communities, projects, artefacts, or geographical units. The choice
among these options is dependent on the problem a study tries to address.
Drawing upon the focus of this study to investigate how design-based CW prediction and
minimisation could be incorporated into BIM platforms, the most concrete unit of analysis is
building designs. Building design of 117 projects were analysed using the developed
computational tools to predict their material waste generation potential. Considering that this
13
study also seeks to understand stakeholders’ expectations on the use of BIM for CW
management, this study also includes individuals as less significant unit of analysis. However,
the focus of identifying stakeholders’ expectations is to develop a holistic BIM framework for
CW management, which guides the development of the full BIM system for CW prediction
and minimisation. Based on the foregoing, the results, conclusions, and recommendations from
this study must be interpreted and used within the context of building designs.
1.10 Thesis contribution
It is generally accepted in the literature that the best approach to CW management is
minimisation through design (Faniran and Caban, 1998; Osmani, Glass and Price, 2008; Zhang,
Wu and Shen, 2012). This is because design based philosophy offers flexible and cost-effective
approach to CW management before it occurs. This places huge responsibilities on architects
and design engineers to ensure that waste is given high priority in addition to project time and
cost during design. Despite the willingness of architects and design engineers to carry out these
duties, existing waste management tools cannot support them effectively. Besides, none of the
existing CW management tools is BIM compatible despite the benefits of BIM in improving
building process performances. Therefore, this study contributes to knowledge in two major
ways: Academic knowledge and industrial practices.
This research made significant academic contribution to CW management at the design stages
in several ways. The study identified the limitations of existing CW management tools. The
two key limitations are: (i) the tools are completely detached from the design process, and (ii)
existing tools lack interoperability capability. Accordingly, the study employed BIM to address
the key limitations identified. This study therefore improves the understanding of how CW
prediction and minimisation strategies could be captured and represented using AI artefacts.
Particularly, the study contributed significantly to BIM studies by developing a system to
streamline the estimation and minimisation of CW in BIM environment. The study also helps
to understand expectations of industry stakeholders on the use of BIM for CW management.
In terms of industrial practices, the study creates awareness on the roles of design in CW
minimisation and it broadens the understanding of how design-related factors influence CW
generation. The software (code named BIMWaste) developed as part of this study is useful to
architects and design engineers by providing them with insights into identifying sources of CW
14
during design. BIMWaste predicts the potential CW output of a building design and it provides
suggestion on how CW could be minimised through dimensional coordination and material
optimisation. BIMWaste also provides a basis for comparative analysis of building designs and
for selecting the one with the least CW potential among options without affecting building
forms or function. In addition, BIMWaste could provide a guideline or benchmark for
monitoring building CW in the AEC industry.
1.11 Scope of Research
This study explores a multi-disciplinary intersection of research frontier in AI, BIM, and
construction sustainability, which are all individually vast areas of study. As such, it is
important to define the scope of the study with respect to definition of waste, types of projects
considered, building lifecycle stages, and implementation scope. Although, LEAN include
non-material waste such as waste associated with transportation, time loss, under-utilisation,
inadequate training, and waiting (Koskela, 2004), material waste has the highest environmental
impact (Faniran and Caban, 1998; Osmani et al. 2008; Oyedele et al. 2013). As such, waste
considered in this study is limited to building material waste and the definition of waste used
in the study does not cover non-material waste. Material waste could be explored in three
sustainability dimensions depending on the scope of assessment (BS EN 15643-1, 2010), which
are economic, environmental, and social. However, this study only considers environmental
dimension of sustainability.
Projects in the construction industry fall under three broad sectors, which are building,
infrastructure, and industrial. Projects that are classified under building includes residential and
non-residential, such as retail, commercial and institutional buildings. Infrastructure includes
projects such as highway, bridges, dams, and utility distribution. Projects that are classified
under industrial include refineries, manufacturing plants, process plants, and related projects.
However, this study has only considered building construction projects and the software
produced from this study should be used within this scope. In terms of the scope of the building
lifecycle stage, this study focused on the prediction of CW at the design stages, which include
Stage 2 (Concept Design) to Stage 4 (Technical Design). Software developed in this study is
useful to architects and design engineers at these stages to predict and minimise CW.
15
1.12 Layout of thesis
This thesis consists of ten chapters as shown in Figure 1.1. The summaries of other chapters
and their place in the research process are summarised as follows:
Chapter 2 contains a review of extant literature on CW management. The chapter defines the
concept of CW and it identifies key causes of waste. The chapter discusses CW prediction and
the role of design in CW minimisation. The chapter also contains a discussion of existing
strategies and tools for CW management. The chapter ends with the discussion of the
limitations of existing CW management tools.
Chapter 3 details the significance of BIM in the changing construction ecosystem and how
BIM could be leveraged for CW management. The chapter discusses the current BIM
implementation strategy and presents a review of existing BIM software. The state of the art in
BIM development is also discussed to identify how BIM capacities could be employed for CW
management. The chapter ends with the review of Artificial Intelligence techniques and the
theoretical underpinnings of the thesis. The chapter reviews relevant theories and it discusses
their place in the study. The theories are tragedy of the commons, graph theory, theories of
evidential reasoning, and theory of building layers.
Chapter 4 contains the methodological approach of the study. The chapter covers the research
philosophy, strategies, and approaches that were adopted for this study. Details of the data
collection and analyses techniques adopted for the study are presented. After the discussion of
software development frameworks, the chapter ends with the presentation of the adopted
framework for software development.
Chapter 5 discusses the expectations of stakeholders on the use of BIM for CW management.
Sequential exploratory mixed methods strategy was employed using focus group interviews
and questionnaire survey. The exploratory factor analysis of the responses reveals five major
groups of BIM expectations for CW management, which are important considerations for the
deployment of BIM-based practices for CW management. The chapter ends with the
development of a holistic BIM framework for CW management.
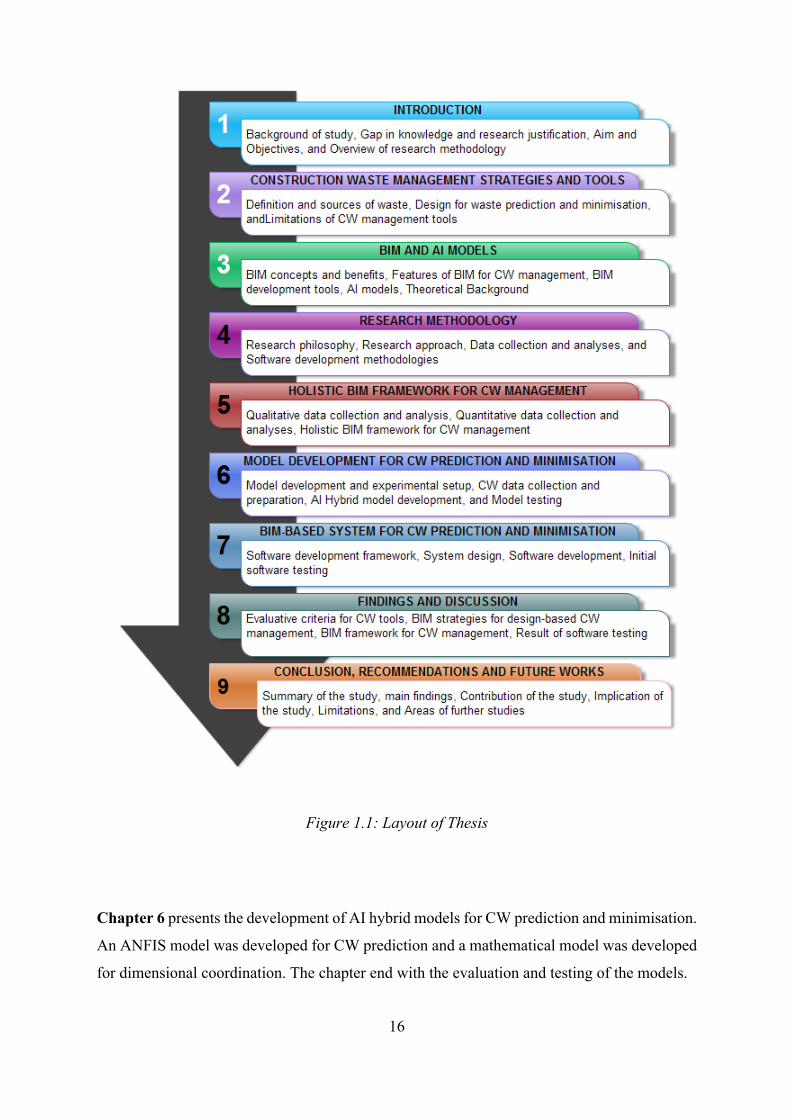
16
Figure 1.1: Layout of Thesis
Chapter 6 presents the development of AI hybrid models for CW prediction and minimisation.
An ANFIS model was developed for CW prediction and a mathematical model was developed
for dimensional coordination. The chapter end with the evaluation and testing of the models.
17
Chapter 7 contains the integration of the developed models for CW prediction and
minimisation into BIM software. As such, a BIM system for CW prediction and minimisation
(BIMWaste) was developed. The chapter discusses the development environment needed for
BIM development, system design for BIMWaste, and the development process for BIMWaste.
At the end, BIMWaste was tested with some test cases to verify its operations and accuracy.
Chapter 8 contains the discussion of the findings of the study. It presents a set of evaluative
criteria for CW tools and it discusses the features of BIM that are relevant to CW management.
After this, the chapter discusses a holistic BIM framework for CW management, which
presents functional systems of a robust CW management tool. The chapter ends with the
discussion of findings from CW data record exploratory analysis and software testing.
Chapter 9 concludes the thesis with a summary of the study and its key results. The
contribution of the study to both academic and industry practices are discussed in details. The
chapter also highlights limitations of the study and areas of future research.
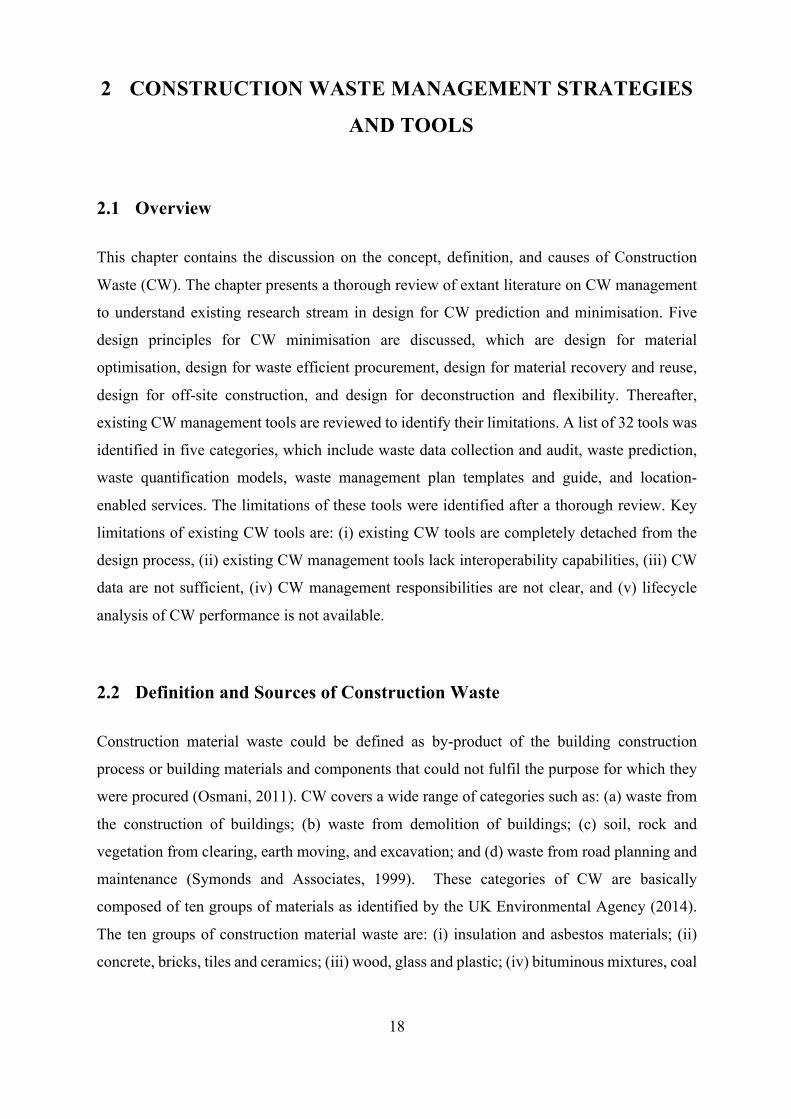
18
2 CONSTRUCTION WASTE MANAGEMENT STRATEGIES
AND TOOLS
2.1 Overview
This chapter contains the discussion on the concept, definition, and causes of Construction
Waste (CW). The chapter presents a thorough review of extant literature on CW management
to understand existing research stream in design for CW prediction and minimisation. Five
design principles for CW minimisation are discussed, which are design for material
optimisation, design for waste efficient procurement, design for material recovery and reuse,
design for off-site construction, and design for deconstruction and flexibility. Thereafter,
existing CW management tools are reviewed to identify their limitations. A list of 32 tools was
identified in five categories, which include waste data collection and audit, waste prediction,
waste quantification models, waste management plan templates and guide, and location-
enabled services. The limitations of these tools were identified after a thorough review. Key
limitations of existing CW tools are: (i) existing CW tools are completely detached from the
design process, (ii) existing CW management tools lack interoperability capabilities, (iii) CW
data are not sufficient, (iv) CW management responsibilities are not clear, and (v) lifecycle
analysis of CW performance is not available.
2.2 Definition and Sources of Construction Waste
Construction material waste could be defined as by-product of the building construction
process or building materials and components that could not fulfil the purpose for which they
were procured (Osmani, 2011). CW covers a wide range of categories such as: (a) waste from
the construction of buildings; (b) waste from demolition of buildings; (c) soil, rock and
vegetation from clearing, earth moving, and excavation; and (d) waste from road planning and
maintenance (Symonds and Associates, 1999). These categories of CW are basically
composed of ten groups of materials as identified by the UK Environmental Agency (2014).
The ten groups of construction material waste are: (i) insulation and asbestos materials; (ii)
concrete, bricks, tiles and ceramics; (iii) wood, glass and plastic; (iv) bituminous mixtures, coal
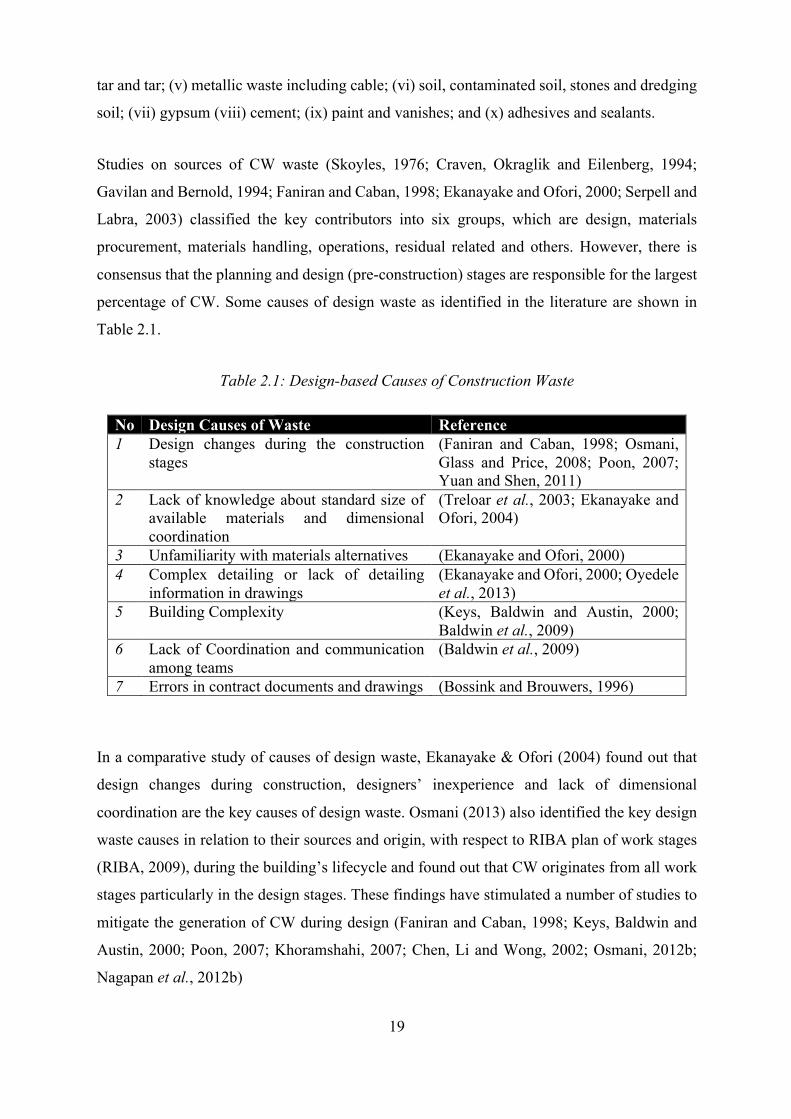
19
tar and tar; (v) metallic waste including cable; (vi) soil, contaminated soil, stones and dredging
soil; (vii) gypsum (viii) cement; (ix) paint and vanishes; and (x) adhesives and sealants.
Studies on sources of CW waste (Skoyles, 1976; Craven, Okraglik and Eilenberg, 1994;
Gavilan and Bernold, 1994; Faniran and Caban, 1998; Ekanayake and Ofori, 2000; Serpell and
Labra, 2003) classified the key contributors into six groups, which are design, materials
procurement, materials handling, operations, residual related and others. However, there is
consensus that the planning and design (pre-construction) stages are responsible for the largest
percentage of CW. Some causes of design waste as identified in the literature are shown in
Table 2.1.
Table 2.1: Design-based Causes of Construction Waste
No Design Causes of Waste Reference 1 Design changes during the construction
stages (Faniran and Caban, 1998; Osmani, Glass and Price, 2008; Poon, 2007; Yuan and Shen, 2011)
2 Lack of knowledge about standard size of available materials and dimensional coordination
(Treloar et al., 2003; Ekanayake and Ofori, 2004)
3 Unfamiliarity with materials alternatives (Ekanayake and Ofori, 2000) 4 Complex detailing or lack of detailing
information in drawings (Ekanayake and Ofori, 2000; Oyedele et al., 2013)
5 Building Complexity (Keys, Baldwin and Austin, 2000; Baldwin et al., 2009)
6 Lack of Coordination and communication among teams
(Baldwin et al., 2009)
7 Errors in contract documents and drawings (Bossink and Brouwers, 1996)
In a comparative study of causes of design waste, Ekanayake & Ofori (2004) found out that
design changes during construction, designers’ inexperience and lack of dimensional
coordination are the key causes of design waste. Osmani (2013) also identified the key design
waste causes in relation to their sources and origin, with respect to RIBA plan of work stages
(RIBA, 2009), during the building’s lifecycle and found out that CW originates from all work
stages particularly in the design stages. These findings have stimulated a number of studies to
mitigate the generation of CW during design (Faniran and Caban, 1998; Keys, Baldwin and
Austin, 2000; Poon, 2007; Khoramshahi, 2007; Chen, Li and Wong, 2002; Osmani, 2012b;
Nagapan et al., 2012b)
20
Despite the literature that abounds for causes and management of CW, few studies have been
carried out to develop tools for design-based waste management. Besides, most of these few
studies focus on CW management frameworks (Jun, Qiuzhen and Qingguo, 2011; Liu et al.,
2011; Osmani, 2012b), disposal cost estimation (Chen et al., 2006; Yuan et al., 2011; Cheng
and Ma, 2011) and demolition waste quantification (Cochran et al., 2007a; Wu et al., 2014;
Rosmani and Hassan, 2012). This therefore reveals a huge gap in knowledge because no design
tool exists to assist architects and design engineers to estimate the CW output potential of a
building design and to proffer ways of reducing the CW. Laying on a solid premise of the
importance of reducing the amount of CW to landfills, this study therefore seeks to integrate
favourable design strategies for construction waste prediction and management into BIM. This
is to ensure that the tool is practicable for use at the design stages.
2.3 Design for Construction Waste Prediction
In achieving effective CW management, robust Waste Prediction Models (WPMs) are needed
to estimate the waste potentials of building models accurately before construction. This is
because an increase in CW disposal costs will affect the project cost considerably. The review
of extant literature reveals four broad categories of WPMs, which are: (i) waste generation rate
based models (Poon, Yu and Jaillon, 2004; Masudi et al., 2011; Li et al., 2013); (ii) construction
activities based models (Fatta et al., 2003; Ekanayake and Ofori, 2004; Wang et al., 2004); (iii)
building elements and materials based models (Shen et al., 2005; Jalali, 2007; Bergsdal, Bohne
and Brattebø, 2007; Cochran et al., 2007b; Solís-Guzmán et al., 2009); and (iv) simulation
based models (Wu, Fan and Liu, 2013; Salem et al., 2008; Zaman and Lehmann, 2013). These
models have set the foundation for CW quantification, however, their reliability is not
guaranteed. This is because the peculiarity of building properties and activities affecting CW
generation are quite diverse. As such, treating every building the same way could be
misleading.
For example, similar building designs in different locations cannot be treated the same way
despite their similar GFA and material specification because there are numerous factors such
as soil type, construction type, and project use class, which could influence CW generation.
This means that results of WPM may have been implicitly over-generalised to all buildings.
This therefore reveals the need to examine the critical factors that have direct impacts on CW
generation at a granular level. This is because there are wide varieties of unique factors, which
21
can be used to predict CW during design stages. The expectation of a robust WPM therefore
taps into the perceived degree of accuracy from relationship among specific variables, which
goes beyond waste generation rates, construction activities, building materials, and historical
waste data. There are certain factors, such as soil type, construction methodology, design
quality, and competency of site workers that are associated with waste output potentials of
building models. This calls for a rethink of the development of a robust and holistic
quantification model for an accurate estimation of CW at the design stage. This thus sets the
stage for the full integration of WPMs into existing design tools.
2.4 Design for Construction Waste Minimisation
Over the decades, building construction activities have generated the largest volume of waste
across the globe (Faniran and Caban, 1998; USEPA, 2003; Osmani, 2013). This waste is
attributed to the constant uptake of construction, demolition and renovation activities during
which villages are built into towns, towns into cities and cities into mega cities (Jaillon and
Poon, 2014a). In fact, this uptake of building activities results in about 30% of the total annual
waste generation worldwide (Jun, Qiuzhen and Qingguo, 2011). This thus puts immense
pressure on the depleting landfill sites and affects the environment adversely. To ensure the
conservation of natural resources and to reduce the cost and impacts of waste disposal, effective
waste management practices must be put in place. This will ensure that flow of construction
materials in a closed loop to minimise waste generation, preserve natural resources and reduce
demand for landfills. To achieve this, effective management strategies such as waste reduction,
component reuse, and material recycling are needed to divert CW from landfills (Oyedele et
al., 2013).
Ekanayake & Ofori (2004) classified waste minimisation strategies into two groups: planning
and control. Waste minimisation strategies based on planning is preferable because it focuses
on preventive measures rather than remedial measures. It was suggested that quality design,
efficient construction scheduling, and site layout are planning strategies that embrace waste
minimisation. Amongst strategies identified, quality design stands as the most preferred
strategy because the largest percentage of CW is caused by activities at pre-construction stages
and that design decisions have high impact on CW generation (Faniran and Caban, 1998;
Ekanayake and Ofori, 2004; Osmani, 2012a). Accordingly, effective decision-making
mechanisms are needed during the design stages to minimise waste. In line with this, WRAP,
22
(2009) produced a design guideline to assist the design team with opportunities for designing
out waste based on five principles, which are:
i) Design for materials optimisation,
ii) Design for waste efficient procurement,
iii) Design for material recovery and reuse,
iv) Design for off-site construction, and
v) Design for deconstruction and flexibility.
2.4.1 Design for Material Optimisation
Material optimisation approach to CW minimisation focuses on lean design towards material
resources efficiency without compromising the design functions and aesthetics. Lean design
applies lean production principles to eliminate waste and to improve engineering processes.
The lean design principle considers design process in five areas of improvement (Freire and
Alarcón, 2002). The five areas are client, administration, project, resource, and information.
However, in terms of CW, material optimisation is key to waste elimination. This is because
evidence across extant literature reveals that the construction industry consumes about 50% of
the natural resources and contributes a large proportion of waste (about 30%) to landfills. These
percentages have raised concerns among stakeholders about the environmental sustainability
of the construction industry because material depletion is inevitable if the current rate of natural
resources extraction and waste generation continues. Likewise, this will affect the environment
negatively by increasing the likelihood of greenhouse effect and CO2 emission.
As such, design for material optimisation as a lean design process considers design process as
a value generation activity (Freire and Alarcón, 2002). This approach is helpful to determine
how resources are efficiently utilised and to ensure that the needs of the clients are met
(Koskela, 2007). Huovila (1997) highlights that the value generation model therefore
emphasises reduction in loss of value, optimal performance of design functions, and lack of
defect. Based on this concept, areas of potential waste reduction for material optimisation
include standardisation of available building elements, efficient material substitution, and
dimensional coordination of the entire design. Achieving all these will minimise excessive
cutting and it will help to reduce the number of variables for operational refinement. In
23
addition, dimensional coordination of design will potentially encourage reuse of offcuts and
formworks.
Therefore, architects and design engineers must be equipped with the knowledge of material
specifications and standards to understand the constituent of materials, their performance,
design code of practice, and materials that favour the design intentions. In this regard, the
materials’ fitness for use and quality could be assesses by a list of parameters, which include
function, composition, waste potential, strength, reliability, durability among others. Green
Guide (Anderson and Shiers, 2009), which is a specification guide for the relative
environmental performance of over 250 materials and components, could be employed to
achieve effective building material substitution at the design stage,. The Green guide was
developed to provide material standardisation and to provide a wide range of alternatives for
different material and components types. The foregoing reveals that it is important to tackle
the challenge of material specification optimisation from three perspectives: (a) material fit for
purpose, (b) material composition of components, and (c) material performance for assurance
of quality control.
2.4.2 Design for Waste Efficient Procurement
Evidence shows that inefficiencies in the coordination of procurement activities could lead to
CW (Greenwood, 2003; Dainty and Brooke, 2004; Wang, Kang and Tam, 2008; Khanh and
Kim, 2014). Considering that cost of building materials could take up to 50% of the project
cost, appropriate strategies must be employed to ensure that accurate materials are purchased
and that materials are delivered efficiently (Faniran and Caban, 1998; Oyedele et al., 2013).
Waste efficient procurement could be achieved through just-in-time delivery (Dainty and
Brooke, 2004; Al-Hajj and Hamani, 2011), efficient delivery schedule (Khanh and Kim, 2014),
procurement of preassembled components (Formoso et al., 2002), and provision for take back
scheme for unused materials (Al-Hajj and Hamani, 2011; Nagapan et al., 2012a).
According to Daniel and Koskela (2008), a mutual relationship exists between building design
and material procurement. This means that design methodology could influence the
procurement process (Burguet, Ganuza and Hauk, 2012). As such, design for waste efficient
procurement is concerned with how building design process and methodologies could achieve
low waste supply chains. According to Osmani et al. (2008), a key task in this regard is
24
freezing design process before starting procurement process. This is to avoid possible reworks
and variation of orders. In additions, architects and design engineers needs to ensure the use of
preassembled components (Formoso et al., 2002), modular building design, use of standardised
materials to reduce off-cuts (McKechnie and Brown, 2007), specification of materials with less
packaging (Yuan, 2013). During material specification, accurate material take-off must be
ensured to avoid excessive order. Appropriate communication must also be ensured between
the project team and suppliers in terms of preferred methods of waste reduction.
2.4.3 Design for Material Recovery and Reuse
To accomplish design for material recovery, it is desired to employ commonly observed design
rules, which satisfies both offsite construction and deconstruction needs (Warszawski, 1999).
These rules would help to maximise the flexibility of design and to minimise CW generation.
According to Crowther (2005), material recovery could be for four main purposes, which are:
(i) relocation of buildings, (ii) component reuse in other buildings, (iii) material reprocessing,
and (iv) material recycling. This is in line with the viewpoint of Kibert (2003) who suggests
that realisation of material recovery for multiple purposes will significantly reduce
Construction and Demolition Waste (CDW) and helps to divert waste from landfills. Material
recovery for building relocation involves the salvage of all the building materials and
components without waste generation. This is only possible if all the building materials and
components are separable and reusable (Crowther, 2005). Although it is impracticable to
achieve 100% material recovery, McDonough and Braungart (2002) argued that recovery of
building components for relocation and reuse remains the most preferred recovery purpose
because they require the least energy and new resources (Oyedele, Ajayi and Kadiri, 2014).
According to Jaillon and Poon (2014a), other purposes of material recovery require additional
energy and materials to reprocess or recycle the materials. Although it is becoming common
practice to recycle an entire building, a more significant challenge is designing a building
whose materials could be recovered with minimal reprocessing.
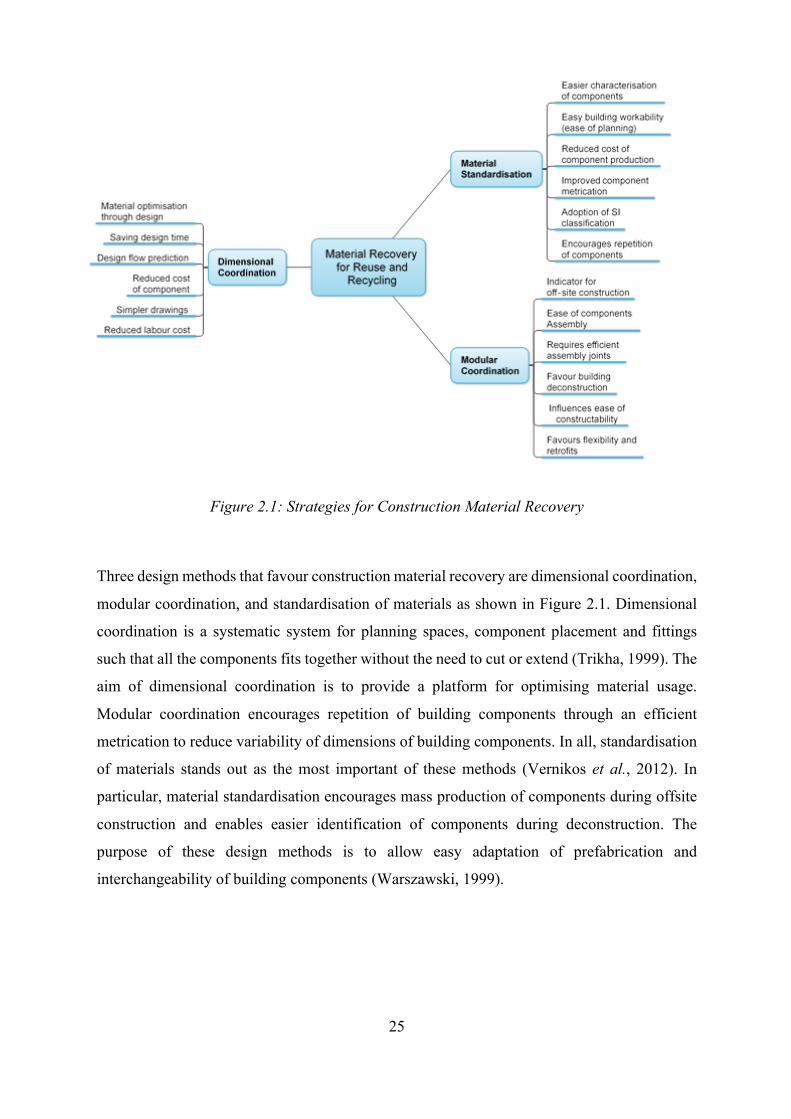
25
Figure 2.1: Strategies for Construction Material Recovery
Three design methods that favour construction material recovery are dimensional coordination,
modular coordination, and standardisation of materials as shown in Figure 2.1. Dimensional
coordination is a systematic system for planning spaces, component placement and fittings
such that all the components fits together without the need to cut or extend (Trikha, 1999). The
aim of dimensional coordination is to provide a platform for optimising material usage.
Modular coordination encourages repetition of building components through an efficient
metrication to reduce variability of dimensions of building components. In all, standardisation
of materials stands out as the most important of these methods (Vernikos et al., 2012). In
particular, material standardisation encourages mass production of components during offsite
construction and enables easier identification of components during deconstruction. The
purpose of these design methods is to allow easy adaptation of prefabrication and
interchangeability of building components (Warszawski, 1999).
26
2.4.4 Design for Offsite Construction
Offsite construction is a process where components are prefabricated and preassembled offsite
within a controlled environment and transported to site (Jaillon and Poon, 2014b). The most
common offsite construction practices include formworks, scaffolding, rebar works, concrete
placements, welding, masonry works, façade, bathroom pods, stairs, roof structures, windows
and doors. (Jaillon, Poon and Chiang, 2009; Baldwin et al., 2009; Kozlovská and Spišáková,
2013). A key indicator for offsite construction is modular coordination (Addis, 2008; Tam et
al., 2007). Advantages of adopting offsite construction practices include improved
environmental performance through waste reduction, reduced construction cost and shortened
construction time, and early standardisation and freezing of design layout. Even, Tam et al.
(2007) argues that offsite construction could reduce waste generation by 100% and cost of
waste management by 84.7%.
Despite the well documented benefits of offsite construction, it has not been fully adopted by
contractors (Tam et al., 2007; Jaillon and Poon, 2014b; Begum, Satari and Pereira, 2010;
Jaillon, Poon and Chiang, 2009). Major constraints to the adoption of offsite construction
include lack of research information and expert advice at early design stage, transportation and
vertical movement of components, time required for the initial design development, lack of
offsite construction experience, limited space for holding offsite components, and lack of hoist
equipment capacity. Besides, the decision to employ off-site construction is mostly based on
familiarity and personal preferences but not on rigorous data analysis and research information
(Pasquire and Gibb, 2002).
2.4.5 Design for Deconstruction and Flexibility
Deconstruction is “the whole or partial disassembly of buildings to facilitate component reuse
and material recycling” (Kibert, 2008) to eliminate demolition through the recovery of reusable
materials (Gorgolewski, 2006). This is with the aim of rapid relocation of building, reduced
demolition waste, improved flexibility and retrofitting. (Addis, 2008). Despite a growing
discrepancy of opinion on whether CDW could be completely eradicated (Yuan and Shen,
2011; Zaman and Lehmann, 2013), existing studies show that effective deconstruction could
drive effective CDW eradication initiatives (Guy, Shell and Esherick, 2006; Tingley, 2012;
Akbarnezhad, Ong and Chandra, 2014). Apart from helping to divert waste from landfills,
deconstruction also enables other benefits, which include: (a) environmental benefits: by
27
reducing site disturbance (Lassandro, 2003), minimising harmful emission, reducing health
hazard (Chini and Acquaye, 2001) and preserving embodied energy (Thormark, 2001) through
material reuse; (b) social and economic benefits: by providing business opportunities through
material recovery, reuse and recycling; and providing employment to support deconstruction
infrastructure.
To enable a well-planned deconstruction, conscious efforts must be taken by architects and
engineers right from the design stages (Kibert, 2008). As such, the eventual purpose of
deconstruction must be identified to guarantee the success of Design for Deconstruction (DfD).
This will enhance understanding of relevant design strategies and tools required for
deconstruction. Several studies have discussed existing perspectives on DfD principles and
how interplay among them could ensure successful building deconstruction. These studies
provide a solid foundation for contemporary DfD process and are majorly driven by efficient
building elements selection to facilitate easy disassembly (Addis, 2008). The highlight of
building elements selection process include: (i) the specification of durable materials (Tingley,
2012); (ii) using materials with no secondary finishes (Guy and Ciarimboli, 2008); (iii) using
bolt/nuts joints instead of gluing (Chini and Balachandran, 2002; Webster and Costello, 2005);
(iv) avoiding toxic materials (Guy, Shell and Esherick, 2006); and (v) using prefabricated
assemblies (Jaillon, Poon and Chiang, 2009).
In addition, Guy et al. (2006) noted that the types and numbers of building materials,
components, and connectors must be minimised to simplify disassembly and sorting process.
The use of recycled and reused materials is also encouraged (Hobbs and Hurley, 2001;
Crowther, 2005) during design specification to broaden existing supply-demand chain for
future deconstructed products. Evidence shows that reusing concrete components could reduce
material cost by 56% (Charlson, 2008). These requirements place huge responsibilities on
architects and engineers at ensuring that design has the least impact on the ecosystem
throughout the building’s lifecycle (Yeang, 1995).
2.5 Construction Waste Management Tools
The increasing attention received by CW from the industry and academia and the recent
advancement in Information and Communication Technologies (ICT) and Computer Aided
Design (CAD) technologies have favoured the development of various tools to assist
28
practitioners in the implementation of waste management strategies. In fact, computer support
is indispensable in construction related tasks to achieve the required flexibility, reliability, and
efficiency (Eastman et al., 2009). It is on this basis that this section reviews existing CW
management tools to assess their functionalities and limitations.
After compiling the relevant papers from peer-reviewed journals, a filtering process was carried
out to ensure that the papers match the research scope. This was accomplished by scanning the
titles and abstracts and imposing certain exclusion criteria to remove papers outside the scope
of this study. As such, publications on nuclear/radioactive waste, municipal solid waste and
waste from electronic and electrical equipment were excluded. The scope of the literature
review is to include publications that have a direct impact on construction waste management.
After the filtering process, 22 tools were identified from the collected papers. Thereafter, a
cross-examination of the identified papers was undertaken by manually scanning through the
references cited. As a result, 10 additional tools were identified, thus bringing the total number
of tools to 32. After a careful assessment of the primary functions of these tools identified from
the literature review, five broad classifications of tools emerged, which are:
i) Waste management plan templates and guides,
ii) Waste data collection and audit tools,
iii) Waste quantification models,
iv) Waste prediction tools, and
v) Geographic Information System (GIS)-enabled waste tools.
The five classifications along with their associated tools are illustrated in Figure 2.2 and their
corresponding descriptions are given in the following sections.
2.5.1 Waste Management Plan Templates and Guides
A typical Waste Management Plan (WMP) captures information such as quantities and
specification of materials, procurement details, volume of waste generated, and costs
(transportation, labour, and disposal) to determine the economic and environmental feasibility
of waste management. As such, WMPs provide automated spreadsheet templates to facilitate
the computation of variables of interest such as waste output and costs. Examples of WMPs
include cost-effective waste management plans (Mills, Showalter and Jarman, 1999), Site
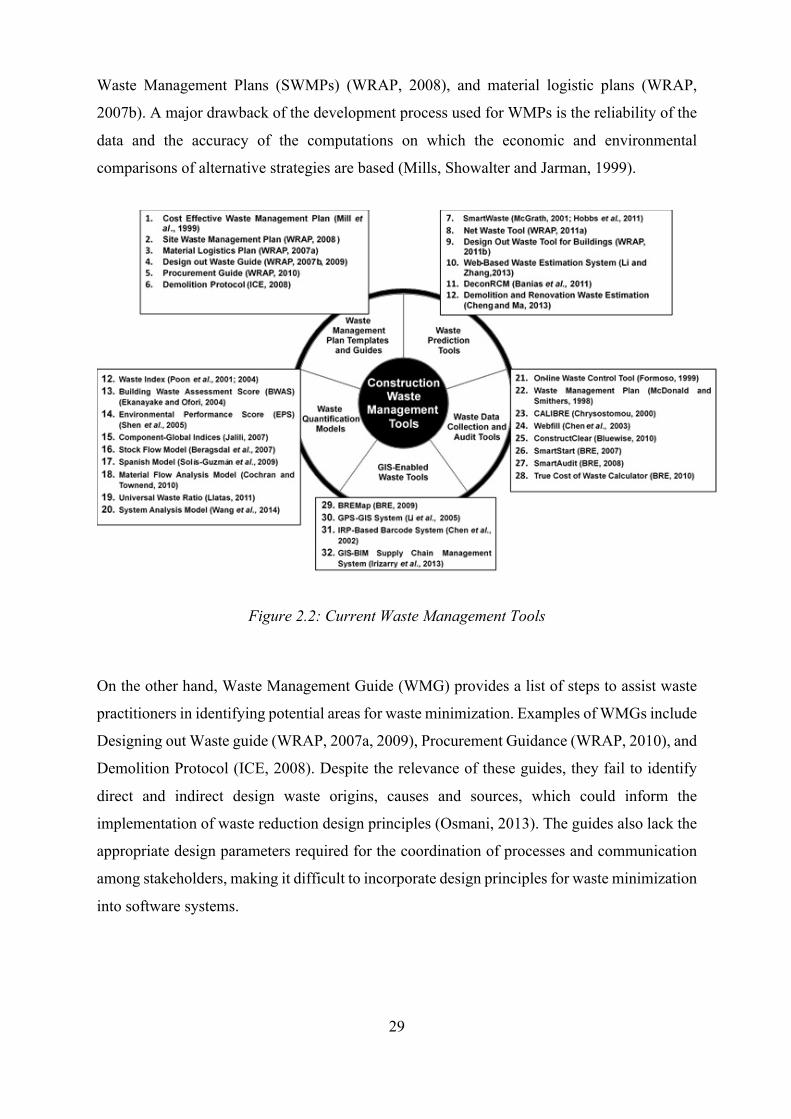
29
Waste Management Plans (SWMPs) (WRAP, 2008), and material logistic plans (WRAP,
2007b). A major drawback of the development process used for WMPs is the reliability of the
data and the accuracy of the computations on which the economic and environmental
comparisons of alternative strategies are based (Mills, Showalter and Jarman, 1999).
Figure 2.2: Current Waste Management Tools
On the other hand, Waste Management Guide (WMG) provides a list of steps to assist waste
practitioners in identifying potential areas for waste minimization. Examples of WMGs include
Designing out Waste guide (WRAP, 2007a, 2009), Procurement Guidance (WRAP, 2010), and
Demolition Protocol (ICE, 2008). Despite the relevance of these guides, they fail to identify
direct and indirect design waste origins, causes and sources, which could inform the
implementation of waste reduction design principles (Osmani, 2013). The guides also lack the
appropriate design parameters required for the coordination of processes and communication
among stakeholders, making it difficult to incorporate design principles for waste minimization
into software systems.
30
2.5.2 Waste Data Collection and Audit Tools
A key challenge to the study of construction waste management is deficiency in waste data
(Hobbs, Blackwell and Adams, 2011). Therefore, to tackle this challenge, a number of tools
have been developed to provide means of logging the amount, type, and sources of waste
generated in a building project. In turn, the data could be used to mitigate future waste
generation, produce a benchmark for waste generation, forecast waste generation, or properly
compute disposal charges. Examples of such tools include online waste control tool (Formoso,
Isatto and Hirota, 1999), waste management planning online tool (Mcdonald and Smithers,
1998), Calibre (Chrysostomou, 2000), Webfill (Chen, Li and Wong, 2003), and ConstructClear
(BlueWise, 2010).
In addition, the Building Research Establishment (BRE) developed SMARTStart (BRE, 2007),
SMARTAudit (BRE, 2008a), and True Cost of Waste Calculator (BRE, 2010), Site
Methodology to Audit, Reduce and Target Waste (SMARTWaste) (Mcgrath, 2001; Hobbs,
Blackwell and Adams, 2011). To sum up, waste data collection and audit activities are
primarily aimed at improving waste quantification. For this reason, the quality of the waste
data must be ensured to guarantee the accuracy of waste quantification (Cochran et al., 2007b).
A major setback to this is that most CW is not segregated and it is referred to as general waste.
2.5.3 Waste Prediction Tools
Waste prediction tools were developed to assist practitioners to estimate the expected waste
output of building projects. Examples of waste prediction tools include SMARTWaste
(Mcgrath, 2001; Hobbs, Blackwell and Adams, 2011), Net Waste Tool (NWT) (WRAP,
2011b), Designing-out Waste Tool for Buildings (DoWT-B) (WRAP, 2011a), Web-based
Construction Waste Estimation System (WCWES) (Li and Zhang, 2013), DeconRCM (Banias
et al., 2011), Demolition and Renovation Waste Estimation (DRWE) tool (Cheng and Ma,
2011).
The main contribution of these tools is the ability to estimate, with varying degrees of accuracy,
construction waste before it is generated. They capture and analyse building design
specifications to produce waste forecasts and identify the most appropriate construction
materials and options. The NWT and the DoWT-B produce a more accurate estimation, but
they can only be used after the bill of quantity has been produced and are not compliant with
31
BIM. Although the DRWE tool is BIM-integrated, it is not actively employed during the design
process. Therefore, engaging these tools during the design stages becomes important for real-
time waste analysis and reduction.
2.5.4 Waste Quantification Models
The strength of waste prediction tools largely depends on mathematical and analytical waste
quantification models. The waste quantification models provide techniques for computing the
quantity of waste generated from building projects. Examples of waste quantification models
include Waste Index (Poon, Yu and Jaillon, 2004), Building Waste Assessment Score (BWAS)
model (Ekanayake and Ofori, 2004), Environmental Performance Score (Shen et al., 2005),
Component-Global Indices (Jalali, 2007), Stock-Flow model (Bergsdal, Bohne and Brattebø,
2007), Spanish model (Solís-Guzmán et al., 2009), and Material Flow Analysis model
(Cochran and Townsend, 2010).
However, the majority of these models are based on aggregating waste indices and volumetric
data, in spite of the multi-dimensional nature of waste generation factors. As such, a major
drawback of these waste quantification models is that most of them were developed without
adequate consideration for detailed material information and waste causative factors, thus
bringing their reliability into question. The majority of the models were developed using
location-specific data as well, therefore rendering them unsuitable for universal application, as
the estimation could be influenced by the project type, location, size, and construction methods
(Mokhtar et al., 2011).
2.5.5 GIS Tools
A Geographical Information System (GIS) captures and analyses geographical information to
provide visual representation for location-based services (Foote and Lynch, 1996). In fact, GIS
integrated technology provides a platform for many location-based services, which can be
employed for enterprise decision-making (Maliene et al., 2011). Examples of GIS tools for
waste management include BREMap (BRE, 2009), Global Position System (GPS) and GIS
technology (Li et al., 2005), and GIS-BIM based supply chain management system (Irizarry,
Karan and Jalaei, 2013). A direct application of GIS tools in CW management is urban mining
(Brunner, 2011), which is concerned with the preservation of product information for the
32
purpose of end of life recovery of resources. To achieve this in the most effective way, GIS
services could be used to locate the nearest recycling facilities, which will significantly reduce
the energy required for the transportation of waste and recyclables.
In spite of the availability of BIM-based GIS tools to capture different aspects of a construction
project (Isikdag, Underwood and Aouad, 2008; Choi et al., 2008; Zhang et al., 2009; Elbeltagi
and Dawood, 2011), none of them provide waste management functionality. A major drawback
to the implementation of such tools is interoperability between architecture, engineering, and
construction (AEC) and GIS standards.
From the review of all the construction waste management tools, a key underlying problem is
that these tools are designed to be used at the late design stage or not embedded within the
design process. This makes the tools difficult to be used by architects and design engineers.
The implication of this is that construction waste cannot be minimized by architects and design
engineers who are using existing tools.
2.6 Limitations of existing construction waste management tools
To identify inefficacies of CW management tools, this study carried out in-depth performance
assessment of existing CW tools to identify their limitations. Knowing the limitations of
existing CW tools is a key mechanism for understanding how the capabilities of BIM could be
used to improve them. After an exhaustive review of existing CW management tools, five main
limitations that impede their effectiveness and usability were identified. These limitations are
summarised thus:
(i) Existing CW tools are completely detached from the design process,
(ii) Existing CW management tools lack interoperability capabilities,
(iii) CW data are not sufficient,
(iv) CW management responsibilities are not clear, and
(v) Lifecycle analysis of CW performance is not available.
A summary of existing tools with respect to the year of latest version, locality, BIM
compliance, and the five limitations is presented in Table 2.2. Further discussions on these five
limitations are presented in the following sub-sections.
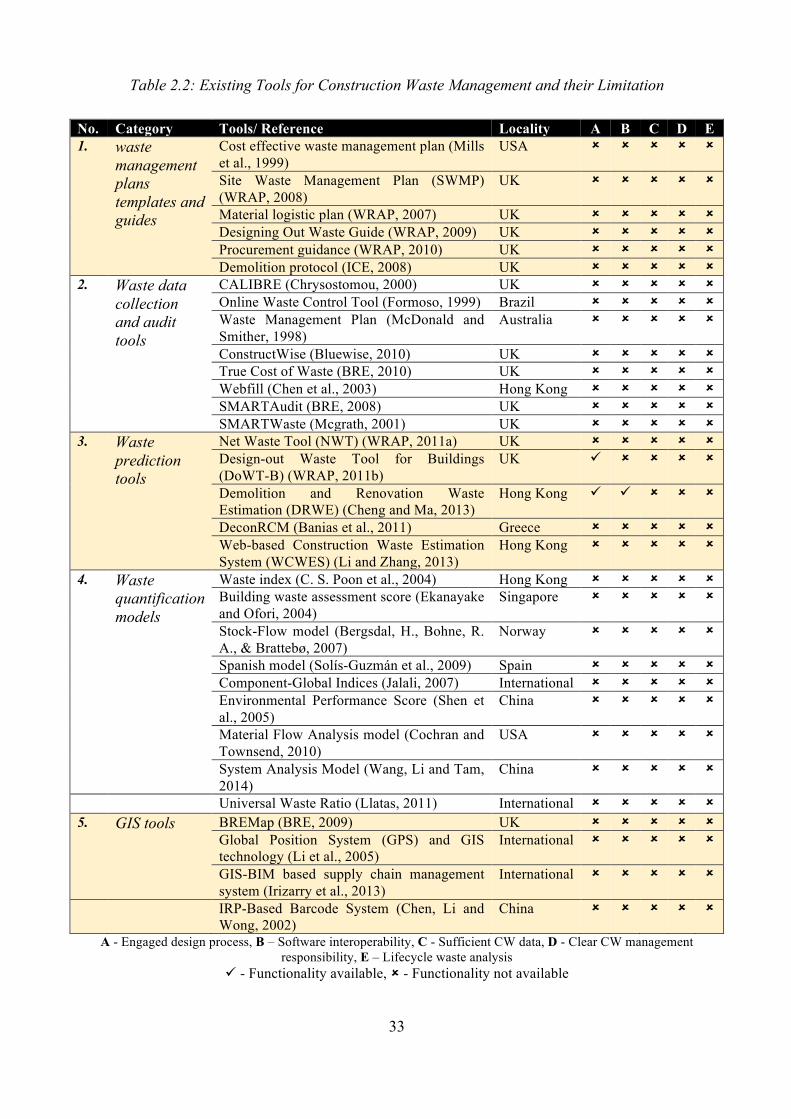
33
Table 2.2: Existing Tools for Construction Waste Management and their Limitation
No. Category Tools/ Reference Locality A B C D E 1. waste
management plans templates and guides
Cost effective waste management plan (Mills et al., 1999)
USA û û û û û
Site Waste Management Plan (SWMP) (WRAP, 2008)
UK û û û û û
Material logistic plan (WRAP, 2007) UK û û û û û Designing Out Waste Guide (WRAP, 2009) UK û û û û û Procurement guidance (WRAP, 2010) UK û û û û û Demolition protocol (ICE, 2008) UK û û û û û
2. Waste data collection and audit tools
CALIBRE (Chrysostomou, 2000) UK û û û û û Online Waste Control Tool (Formoso, 1999) Brazil û û û û û Waste Management Plan (McDonald and Smither, 1998)
Australia û û û û û
ConstructWise (Bluewise, 2010) UK û û û û û True Cost of Waste (BRE, 2010) UK û û û û û Webfill (Chen et al., 2003) Hong Kong û û û û û SMARTAudit (BRE, 2008) UK û û û û û SMARTWaste (Mcgrath, 2001) UK û û û û û
3. Waste prediction tools
Net Waste Tool (NWT) (WRAP, 2011a) UK û û û û û Design-out Waste Tool for Buildings (DoWT-B) (WRAP, 2011b)
UK ü û û û û
Demolition and Renovation Waste Estimation (DRWE) (Cheng and Ma, 2013)
Hong Kong ü ü û û û
DeconRCM (Banias et al., 2011) Greece û û û û û Web-based Construction Waste Estimation System (WCWES) (Li and Zhang, 2013)
Hong Kong û û û û û
4. Waste quantification models
Waste index (C. S. Poon et al., 2004) Hong Kong û û û û û Building waste assessment score (Ekanayake and Ofori, 2004)
Singapore û û û û û
Stock-Flow model (Bergsdal, H., Bohne, R. A., & Brattebø, 2007)
Norway û û û û û
Spanish model (Solís-Guzmán et al., 2009) Spain û û û û û Component-Global Indices (Jalali, 2007) International û û û û û Environmental Performance Score (Shen et al., 2005)
China û û û û û
Material Flow Analysis model (Cochran and Townsend, 2010)
USA û û û û û
System Analysis Model (Wang, Li and Tam, 2014)
China û û û û û
Universal Waste Ratio (Llatas, 2011) International û û û û û 5. GIS tools BREMap (BRE, 2009) UK û û û û û
Global Position System (GPS) and GIS technology (Li et al., 2005)
International û û û û û
GIS-BIM based supply chain management system (Irizarry et al., 2013)
International û û û û û
IRP-Based Barcode System (Chen, Li and Wong, 2002)
China û û û û û
A - Engaged design process, B – Software interoperability, C - Sufficient CW data, D - Clear CW management responsibility, E – Lifecycle waste analysis
ü - Functionality available, û - Functionality not available
34
2.6.1 Existing CW management Tools are Completely Detached from the Design
Process
The design process is usually an iterative process that contains a number of stages to meet the
client’s needs. The design process happens in RIBA work stages 2 - concept design, 3 -
developed design, and 4 - technical design (RIBA, 2013). These design process stages help to
determine design workflow, tools and software requirements, and to produce building design
documents (such as building drawings, materials specification, Computer Aided Design (CAD)
models, schedule of work, bill of quantity, and others).
Meanwhile, studies on sources of CW show that the pre-construction (planning and design)
stages are responsible for the largest percentage of CW (Faniran and Caban, 1998; Osmani,
2012a; Oyedele et al., 2013; Poon, Yu and Jaillon, 2004). This is primarily due to making
inappropriate design decisions, which could lead to design changes (Osmani, Glass and Price,
2008; Poon, 2007). Other sources of CW due to design include unfamiliarity with material
alternatives (Ekanayake and Ofori, 2000), lack of knowledge about standard size of materials
and dimensional coordination (Treloar et al., 2003), errors in contract documents and drawings
(Bossink and Brouwers, 1996), and industry cultural related factors (Ajayi et al., 2016).
Despite the general acceptance that taking the right decisions during design could minimise
CW, none of the existing tools has been fully integrated into the design process. Although
recent advancements in ICT have culminated in the development of various tools to assist
construction industry stakeholders in waste management, these tools are still external to the
design process and they can only be used after design is completed. For example, NWT and
DoWT-B, which is believed to produce a more accurate waste estimation (Langdon, 2011),
could only be used after the bill of quantity has been produced. Thus, this makes it difficult for
architects and design engineers to identify possible ways of CW management during design.
Besides, advice on CW minimisation at this point is too late and will require significant effort
and time to implement.
Despite the increasing adoption of BIM in building design, most of the existing waste
management tools are not BIM compliant (Cheng and Ma, 2013). These tools have limited
usability because they are external to the BIM software used by designers. This reveals a huge
gap in capability since evidence in literature suggest that effective waste minimisation must
35
start from the design stage (Faniran and Caban, 1998; Wang, Li and Tam, 2014) and this can
only be achieved if waste management functionalities are incorporated into design tools.
2.6.2 Existing CW Management Tools Lack Interoperability Capabilities
Due to the emerging importance of BIM in the AEC industry, several companies have adopted
BIM to improve multidisciplinary collaboration. Grilo and Jardim-Goncalves (2010) highlights
that BIM ensures that all project teams can communicate easily, contribute to decision making
and access information about the project. Despite various attempts to encourage
communication standards among CAD and BIM tools, software interoperability issues persist.
Users essentially focus on interoperability and total cost of ownership as important software
selection criteria (Cyon, 2009). Lack of software operability causes problems especially in
terms of reduced efficiency and waste (time and cost) (Jackson and Prawel, 2013). According
to Brunnermeier and Martin (2002), lack of software interoperability in the USA alone resulted
into a yearly loss of at least $1 billion.
Participating teams therefore expend immense effort to ensure software interoperability
because teams have different software needs and varied expertise on the use of software (Cyon,
2009; Hu et al., 2016). This is to ensure that collaborating teams are able to exchange building
data without loss of information. This consideration makes the adoption of BIM imperative in
the construction industry to satisfy the requirements for software interoperability and effective
collaborative practices (Ajayi et al., 2015a; Hu et al., 2016; Grilo and Jardim-Goncalves,
2010). This is to allow collaborating teams to exchange building models among BIM software
without loss of information. Despite the current effort to achieve full software interoperability
in the AEC industry, most of the existing CW management tools lack interoperability
capabilities with other software. Moreover, the process of how CW management can be
implemented in BIM environment has not been well documented. This gap has impeded the
exploitation of capabilities of BIM software for CW analytics at the design stage.
The support for model exchange among heterogeneous BIM software is engendered by the
development of BIM standards such as IFC (Laakso and Kiviniemi, 2012) and gbXML (Dong
et al., 2007). The BIM standards provide not only means of cross-platform representation of
building materials, but also the representation of building forms and functionalities. While IFC
is generally acceptable as the industry standard (Eastman et al., 2011), its current
36
implementation is not efficient to tackle the always changing demand of the AEC industry
(Tibaut, Rebolj and Perc, 2014). This limitation therefore constitutes a great problem to be
addressed by BIM and CW practitioners considering the recent rate of BIM adoption and the
environmental and economic benefits accruable from effective CW management. Overcoming
this challenge of software interoperability among CW management tools and BIM software
will engender the exploitation of BIM functionalities within CW analysis tools and vice versa.
2.6.3 Construction Waste Data are not Sufficient
Current efforts in CW management have been focused on understanding how waste output
expected from building projects could be estimated at the design stage. Accordingly, existing
CW estimation tools calculate waste potentials of buildings using historical regional or national
waste generation rates and Gross Floor Areas (GFA) (Poon et al., 2004; Zade and Noori, 2008;
Li and Zhang, 2013). However, Mills et al. (1999) highlighted that a major limitation of these
models is insufficient data about waste. Most waste estimation tools are developed using
location specific information thereby making them not universally applicable. Consequently,
the reliability of using these tools for CW estimation in other locations could not be guaranteed
(Mokhtar et al., 2011). For example, SMARTWaste (Mcgrath, 2001) estimates CW from
statistical waste data collected from previous building projects in the UK only. This restriction
limits the use of the tool in other countries. Even so, the accuracy of the waste data collected
could not be guaranteed because data entry involves a high level of human intervention, which
is prone to errors.
A major challenge to developing a robust CW database is that most of the construction waste
arising from building projects is not segregated (Langdon, 2011). On further work, Mcgrath
(2001) noted that unsegregated waste are mostly collected and transported as general waste.
This therefore does not allow data about waste to be properly labelled. In addition, majority of
existing CW estimation tools are based on aggregating waste indices and volumetric data
despite the multi-dimensional nature of waste generation factors. This raises serious concerns
because the tools were developed without adequate consideration for detailed material
information and building methodology, among others. Notably, the peculiarities of building
activities influencing CW generation are quite diverse and treating them the same way could
be misleading.
37
2.6.4 Waste management responsibilities are not clear
According to Ajayi et al. (2015a), waste generation in building projects is largely dependent
on the attitude of stakeholders in taking up waste management responsibilities. Out of these
stakeholders, clients make up the core of the building project process (Latham, 1994) and have
the greatest influence on waste management issues. Understandably, clients set environmental
standards that other stakeholders must meet. Similarly, Teo and Loosemore (2001) highlighted
that implementing effective waste management strategies requires cooperation among all
participating team, especially in accepting responsibilities towards CW management.
Examples of such waste management responsibilities include involvement in analysis of
potential waste of project during design, organising and attending waste management meetings,
training on waste management tools, setting waste management goals and preparing list of
recoverable waste material to be reused or recycled. From these responsibilities, Osmani et al.
(2008) show that only 2% of building project teams hold waste management meetings and that
only 32% of them implemented waste management goals. This is primarily because most
people believe that CW is inevitable and can only be managed, reactively mitigated or ignored.
In addition, Osmani et al. (2008) highlighted that poorly defined individual responsibilities
have contributed to the laxness of individual’s commitment to waste management. This gap
reveals the need for a clear definition of stakeholders’ responsibilities at an early stage of
building projects. More importantly, this is imperative to create a synergy of roles on waste
management strategies, goals, and choice of tools. To achieve this, contracts and contractual
agreements are employed to assign decisive waste management responsibilities. So, contractual
clauses are used to communicate waste management responsibilities and penalise poor CW
performance (Greenwood, 2003; Dainty and Brooke, 2004). Understandably, Poon et al.
(2004) suggest that sub-contractors could be assigned additional waste management duties.
This is because sub-contractors could be willing to take more responsibilities at the same price
due to high competition.
2.6.5 Lifecycle Analysis (LCA) of CW Performance is not available
Lifecycle Analysis (LCA) evaluates impact of a process or product from its origin to the end
of use on the environment (Ortiz, Castells and Sonnemann, 2009). Existing studies on waste
management and minimisation show that waste is produced throughout the building lifecycle
(Kozlovská and Spišáková, 2013; Osmani, 2013; Yeheyis et al., 2013; Jaillon and Poon,
38
2014b). This means that CW arises from design stages to the end-of-life of buildings. This has
made LCA an important tool in waste management planning and policy-making (Klöpffer,
2006; Ekvall et al., 2007). Accordingly, LCA offers environmental methodology for
comparing waste management options in the construction industry. Despite the belief that LCA
methodologies could be used for CW management and minimisation (Llatas, 2011), none of
the existing CW tools has functionality for LCA for waste. This is because existing tools are
useful at specific work stages (Liu et al., 2011) but not throughout the entire building lifecycle.
For example, tools such as SMARTWaste, SMARTStart, and Webfill are useful at only the
construction stage (RIBA stage K). This however reveals a huge limitation because evidence
shows that efficient waste management approach requires a “cradle-to-grave” appraisal of
building projects (Morrissey and Browne, 2004; Guy, Shell and Esherick, 2006).
2.7 Summary
In this chapter, discussion of the concept, definition, and causes of CW is presented. The
chapter starts with a thorough review of extant literature on CW management to understand
existing research stream in design for CW prediction and minimisation. Five design principles
for CW minimisation were identified and discussed, which are design for material optimisation,
design for waste efficient procurement, design for material recovery and reuse, design for off-
site construction, and design for deconstruction and flexibility. After which existing CW
management tools were reviewed to identify their strengths and limitations. A list of 32 tools
was identified in five categories, which include waste data collection and audit, waste
prediction, waste quantification models, waste management plan templates and guide, and
location-enabled services.
Existing CW management tools provide encouraging results for waste forecast and reduction
at the design stage, however, the review of literature revealed that they are not comprehensive
enough to tackle the challenges of CW management. It was also revealed that existing CW
management suffers from five key limitations, which are: (i) existing CW tools are completely
detached from the design process, (ii) existing CW management tools lack
interoperability capabilities, (iii) CW data are not sufficient, (iv) CW management
responsibilities are not clear, and (v) lifecycle analysis of CW performance is not available.
These limitations revealed the need for the development of a holistic CW management tool that

39
incorporates the strengths and take into consideration the weaknesses of existing CW
management tools.
The next chapter contains discussion on the concepts of BIM and AI systems. The discussion
is done in two parts: (i) the first part of the chapter focuses three underpinning concepts of
BIM, i.e., collaborative practices, technology as digital delivery vehicle, and integrated project
data. After this, a critical review of existing BIM software is presented, (ii) the second part of
the next chapter focuses on AI systems and associated theories. This part also contains
discussion of four main groups of AI models, which are machine-learning techniques,
knowledge based systems, evolutionary algorithms, and hybrid systems.
40
3 BUILDING INFORMATION MODELLING (BIM) AND
ARTIFICIAL INTELLIGENCE (AI) SYSTEMS
3.1 Overview
This chapter contains discussion on the concepts of Building Information Modelling (BIM)
and Artificial Intelligence (AI) systems in two parts. The first part of the chapter focuses on
BIM and its benefits to the construction industry. The three underpinning concepts of BIM,
i.e., collaborative practices, technology as digital delivery vehicle, and integrated project data,
are discussed. The chapter also presents UK BIM maturity levels and the significance of BIM
in the changing UK construction industry. Thereafter, a critical review of existing BIM
software is presented with the aim of identifying features of BIM that are needed to overcome
the limitations of existing CW management tools. After this, BIM development tools are
identified and discussed. The categories of tools discussed are IFC development tools and BIM
software Application Programming Interface (API).
The second part of the chapter focuses on AI systems and associated theories. Theories perform
significant functions in research by aiding the understanding of observed phenomena and
providing direction for future behaviour (Koskela and Howell, 2008). As such, theory provides
a common framework for furthering knowledge development and coordinating the process of
research. Seymour et al. (1997) highlight that existence of well-established theories reveals the
maturity of an area of study. Therefore, construction management studies cannot be built using
only empirical evidence, but has to be underpinned by a solid theoretical background
(Söderlund, 2004). However, construction management as a field of study lacks significant
theoretical underpinnings (Shenhar and Dvir, 1996) and particular theories needs to be adopted
(Koskela and Howell, 2008). Söderlund (2004) argued that such theoretical perspectives exist
in other fields of study and it should be plausible to adopt them in construction management
context. This chapter therefore examines the theoretical background of this study. In particular,
theories from machine intelligence, evaluation practices, resources management, and decision-
making are discussed to determine how they influence the study. The chapter ends with the
discussion of four main groups of AI models, which are machine-learning techniques,
knowledge based systems, evolutionary algorithms, and hybrid systems.
41
3.2 Building Information Modelling: Concepts and Benefits
An underlying concept of Building Information Modelling (BIM) is provisioning of an
inclusive environment for entire project lifecycle (Grilo and Jardim-Goncalves, 2010). As such,
BIM is more of a collaborative process than a piece of software. Although technology provides
an implementation delivery vehicle for BIM, resultant effect of BIM on organisations is more
from a sociology perspective. This primarily reflects a more collaborative work practice and
early involvement of stakeholders (Eastman et al., 2011; Sacks, Radosavljevic and Barak,
2010). In addition, BIM goes beyond the use of an electronic drawing tool or the adoption of
technology, but it represents the process of using technology to create, refine, simulate,
manage, and communicate virtual representation (form and functions) of buildings to optimise
the construction delivery process. This clearly shows that BIM is underpinned by three main
concepts: Collaborative practices, Technology as digital delivery vehicle, and integrated
project data as shown in Figure 3.1.
Central to the role of Integrated Product Delivery (IPD) in shaping the future of the
Architecture, Engineering and Construction (AEC) industry is the adoption of BIM (Ilozor and
Kelly, 2012). IPD strives to streamline construction efforts through intensified collaborative
planning and clear definition of goals at the early stages of a projects (Mihic, Sertic and Zavrski,
2014). BIM therefore provides the needed technology and framework for successful
implementation of IPD. BIM also enables the required platform to engage all the stakeholders
throughout the buildings lifecycle. As such, the main purpose of BIM is stakeholders’
communication and collaboration to facilitate shared project models, single point of
information access, controlled coordination of data, and data transparency (Grilo and Jardim-
Goncalves, 2010).
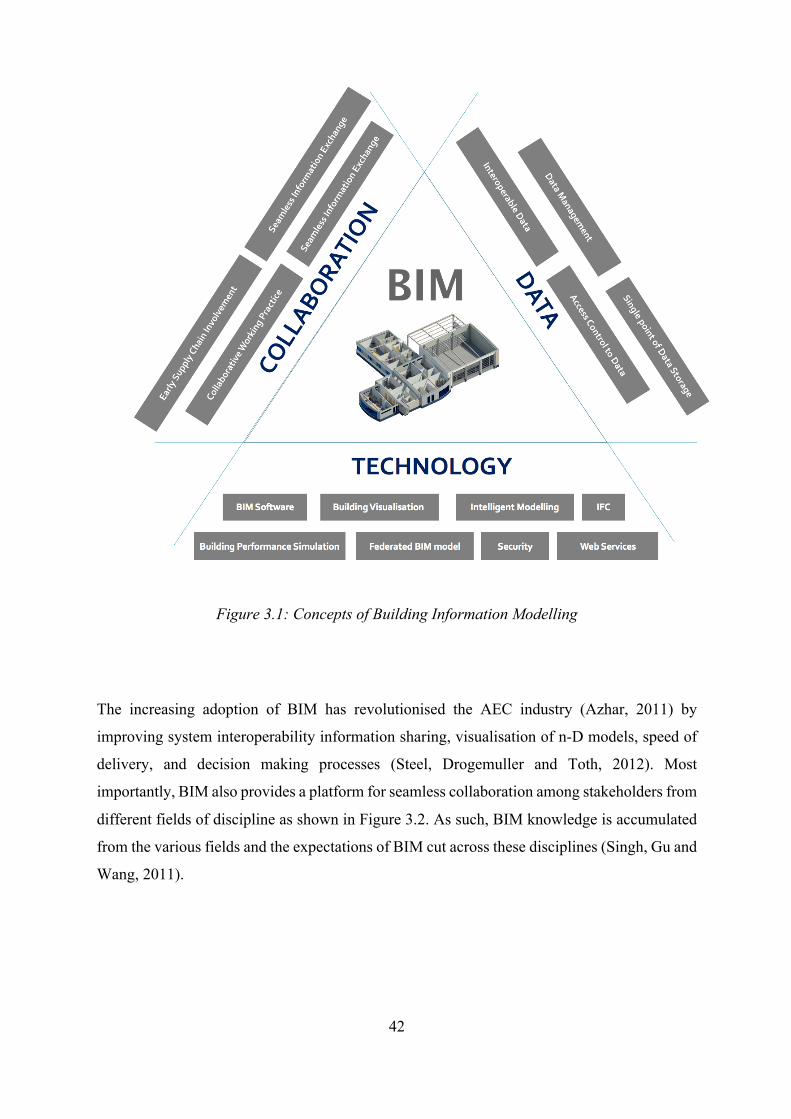
42
Figure 3.1: Concepts of Building Information Modelling
The increasing adoption of BIM has revolutionised the AEC industry (Azhar, 2011) by
improving system interoperability information sharing, visualisation of n-D models, speed of
delivery, and decision making processes (Steel, Drogemuller and Toth, 2012). Most
importantly, BIM also provides a platform for seamless collaboration among stakeholders from
different fields of discipline as shown in Figure 3.2. As such, BIM knowledge is accumulated
from the various fields and the expectations of BIM cut across these disciplines (Singh, Gu and
Wang, 2011).
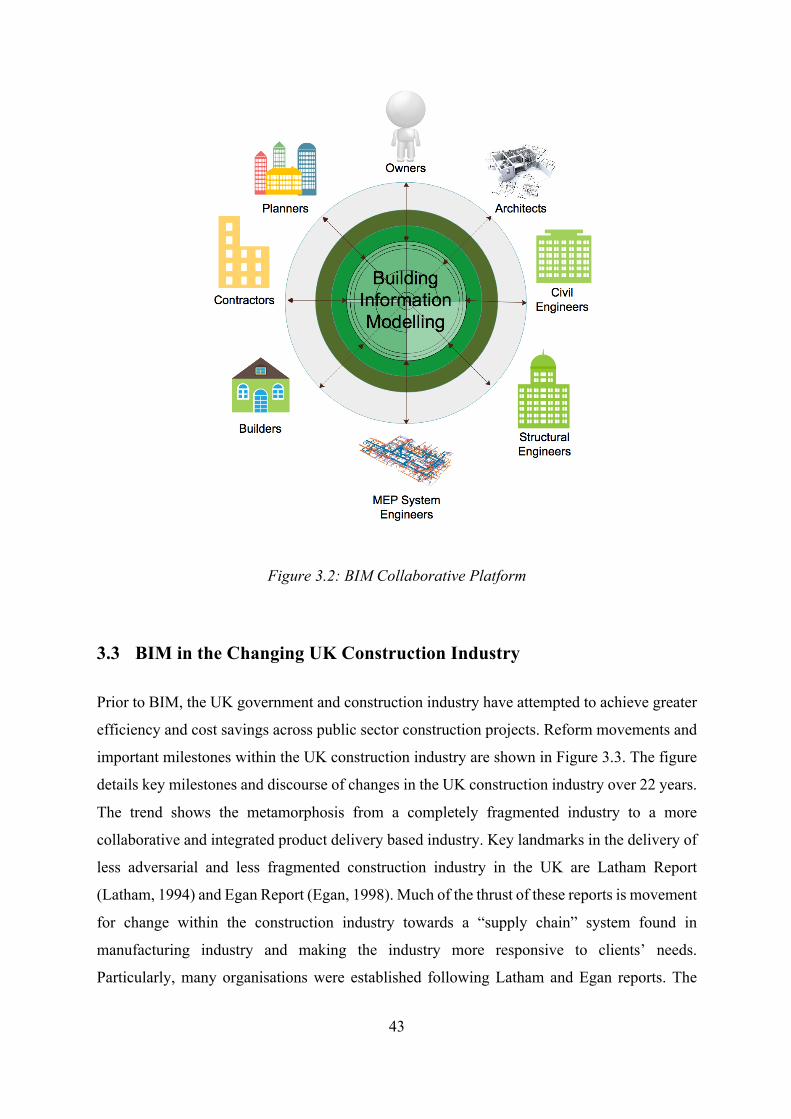
43
Figure 3.2: BIM Collaborative Platform
3.3 BIM in the Changing UK Construction Industry
Prior to BIM, the UK government and construction industry have attempted to achieve greater
efficiency and cost savings across public sector construction projects. Reform movements and
important milestones within the UK construction industry are shown in Figure 3.3. The figure
details key milestones and discourse of changes in the UK construction industry over 22 years.
The trend shows the metamorphosis from a completely fragmented industry to a more
collaborative and integrated product delivery based industry. Key landmarks in the delivery of
less adversarial and less fragmented construction industry in the UK are Latham Report
(Latham, 1994) and Egan Report (Egan, 1998). Much of the thrust of these reports is movement
for change within the construction industry towards a “supply chain” system found in
manufacturing industry and making the industry more responsive to clients’ needs.
Particularly, many organisations were established following Latham and Egan reports. The
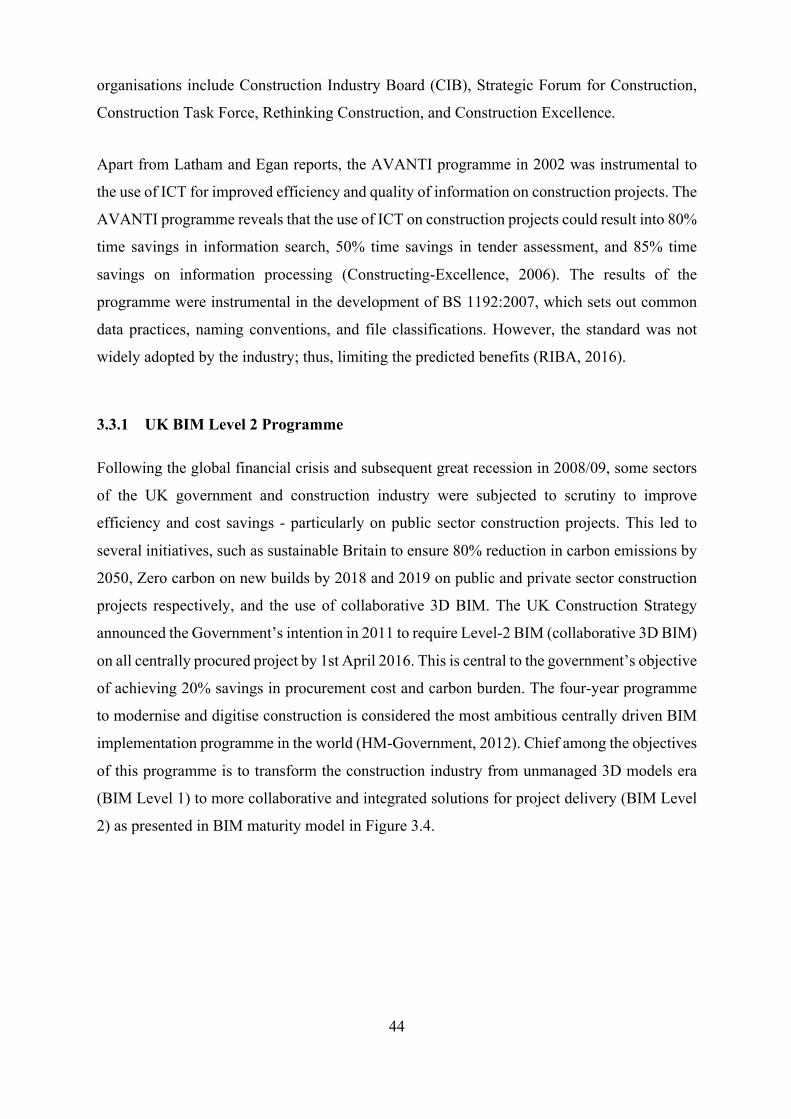
44
organisations include Construction Industry Board (CIB), Strategic Forum for Construction,
Construction Task Force, Rethinking Construction, and Construction Excellence.
Apart from Latham and Egan reports, the AVANTI programme in 2002 was instrumental to
the use of ICT for improved efficiency and quality of information on construction projects. The
AVANTI programme reveals that the use of ICT on construction projects could result into 80%
time savings in information search, 50% time savings in tender assessment, and 85% time
savings on information processing (Constructing-Excellence, 2006). The results of the
programme were instrumental in the development of BS 1192:2007, which sets out common
data practices, naming conventions, and file classifications. However, the standard was not
widely adopted by the industry; thus, limiting the predicted benefits (RIBA, 2016).
3.3.1 UK BIM Level 2 Programme
Following the global financial crisis and subsequent great recession in 2008/09, some sectors
of the UK government and construction industry were subjected to scrutiny to improve
efficiency and cost savings - particularly on public sector construction projects. This led to
several initiatives, such as sustainable Britain to ensure 80% reduction in carbon emissions by
2050, Zero carbon on new builds by 2018 and 2019 on public and private sector construction
projects respectively, and the use of collaborative 3D BIM. The UK Construction Strategy
announced the Government’s intention in 2011 to require Level-2 BIM (collaborative 3D BIM)
on all centrally procured project by 1st April 2016. This is central to the government’s objective
of achieving 20% savings in procurement cost and carbon burden. The four-year programme
to modernise and digitise construction is considered the most ambitious centrally driven BIM
implementation programme in the world (HM-Government, 2012). Chief among the objectives
of this programme is to transform the construction industry from unmanaged 3D models era
(BIM Level 1) to more collaborative and integrated solutions for project delivery (BIM Level
2) as presented in BIM maturity model in Figure 3.4.
45
Figure 3.3: Reform Movements and Important Milestones within the UK Construction
Industry
The BIM maturity model as stipulated by the UK BIM Industry Working Group is made up of
four levels, which are:
BIM Level 0 – Computer Aided Design (CAD): Unmanaged Computer Aided Design
(CAD) coordination and data exchange through paper and electronic papers such as 2D
drawings and PDF files.
BIM Level 1 – 2D/3D Managed Models: Managed CAD in 2D or 3D format with
common data environment that provides standard data structures and standardisation.
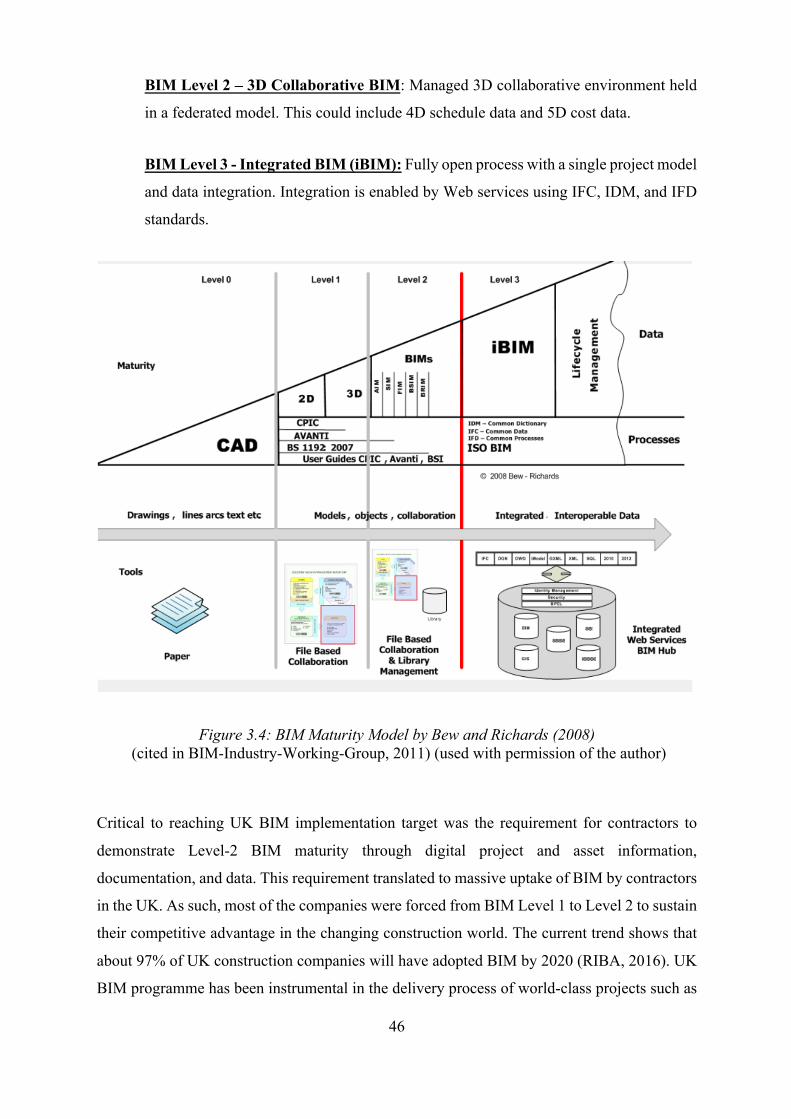
46
BIM Level 2 – 3D Collaborative BIM: Managed 3D collaborative environment held
in a federated model. This could include 4D schedule data and 5D cost data.
BIM Level 3 - Integrated BIM (iBIM): Fully open process with a single project model
and data integration. Integration is enabled by Web services using IFC, IDM, and IFD
standards.
Figure 3.4: BIM Maturity Model by Bew and Richards (2008) (cited in BIM-Industry-Working-Group, 2011) (used with permission of the author)
Critical to reaching UK BIM implementation target was the requirement for contractors to
demonstrate Level-2 BIM maturity through digital project and asset information,
documentation, and data. This requirement translated to massive uptake of BIM by contractors
in the UK. As such, most of the companies were forced from BIM Level 1 to Level 2 to sustain
their competitive advantage in the changing construction world. The current trend shows that
about 97% of UK construction companies will have adopted BIM by 2020 (RIBA, 2016). UK
BIM programme has been instrumental in the delivery process of world-class projects such as
47
2012 London Olympics, Crossrail, and HS2. Successful delivery of BIM Level-2 in the UK
paved the way for “Digital Built Britain” initiative for the adoption of Level 3 BIM. BIM Level
3 employs a fully connected interoperable data chain from start to finish through a robust Web-
service based federated model. Level 3 is where the future of Digital construction innovation
lies.
3.4 Building Information Modelling Platforms
Recent advances in CAD and ICT has culminated in the development of various BIM software
for several purposes. These purposes include architecture, structures, sustainability, MEP,
facility management, simulation, and others. The top 10 BIM software used in the industry
include Autodesk Revit, Bentley Architecture, Graphisoft ArchiCAD, Nemetschek
Vectorworks, Gehry Technology Digital Projects, Nemetschek AllPlan, Trimble SketchUp,
4MSA IDEA Architectural, Tekla Structure, and RhinoBIM (NBS, 2016) as shown in Table
3.2. In addition, several analysis software applications are available to simulate a wide range
of building performances. The analysis software include Ecotect (thermal efficiency, lighting,
visibility, solar shading and exposure), Green Building Studio (CO2 emission, energy
consumption), and IES (airflow, sound and acoustic quality).
Autodesk Revit is the most popular BIM design software in the AEC industry and it is made
up of three integrated products, which are Revit Architecture, Revit Structural, and Revit MEP.
The wide adoption of Revit across the industry is motivated by its intuitive user interface,
powerful drawing production tools, and large set of product libraries. Revit SEEK library has
information from about 850 companies and about 13,750 product lines (Eastman et al., 2011).
Revit also supports several building performance simulations, which include energy analysis,
environment impact analysis, quantity take-off, construction planning and monitoring. A key
limitation of Revit is its in-memory management system. This significantly slows Revit down
when memory requirement of projects exceeds 300MB (Eastman et al., 2011).
The level of adoption and the dominant market position of Revit reveals its popular choice for
BIM application development (Cheng and Ma, 2013; Kota et al., 2014; Ajayi et al., 2015b).
Revit has about 31% of UK CAD software market share (RIBA, 2016). This is because Revit
provides an API that could be used to extend the functionalities of Revit. Revit is also popular
because of its compatibility with several BIM and CAD platforms (Navisworks, AutoCAD,
48
SketchUp, form Z, MagiCAD, SismiCAD, and ArchiCAD) and simulation software (Green
Building Studio, Eotect, EnergyPlus, TOKMO, Archibus, and Google Earth). This is made
possible because of Revit compatibility with popular exchange formats such as IFC, gbXML,
DWG, DXF, SAT, ASDK, FBX, ODBC, and others.. Comparison of existing BIM software is
shown in Table 3.1.
3.5 BIM for Designing out Construction Waste
In addressing the limitations of existing CW management tools, it is important to adopt
solutions available within tools used throughout the entire lifecycle of buildings. This is to
ensure effective management of CW right from the planning stages, through subsequent stages,
i.e., design, construction, commission, usage and maintenance stages, to the end of life. As
such, integrating existing tools with BIM would offer greater flexibility to influence cost and
performance of buildings at a stage where design change is cheaper. As such, six BIM
functionalities must be adopted for CW management as shown in Figure 3.5. The BIM
functionalities are:
i) Team communication and integration,
ii) Parametric modelling and visualisation,
iii) Building performance analysis and simulation,
iv) Automatic document generation,
v) Improved building lifecycle management, and
vi) Software interoperability with other applications.
The features of BIM for designing out CW are discussed as follows:
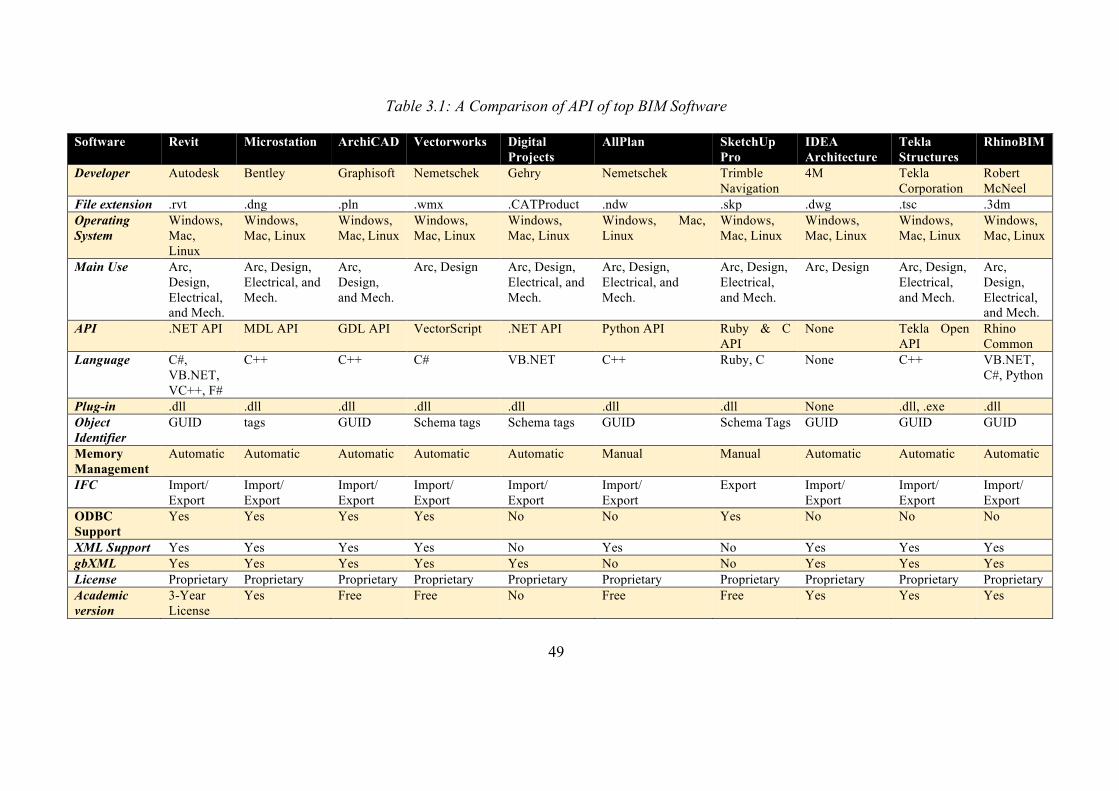
49
Table 3.1: A Comparison of API of top BIM Software
Software Revit Microstation ArchiCAD Vectorworks Digital Projects
AllPlan SketchUp Pro
IDEA Architecture
Tekla Structures
RhinoBIM
Developer Autodesk Bentley Graphisoft Nemetschek Gehry Nemetschek Trimble Navigation
4M Tekla Corporation
Robert McNeel
File extension .rvt .dng .pln .wmx .CATProduct .ndw .skp .dwg .tsc .3dm Operating System
Windows, Mac, Linux
Windows, Mac, Linux
Windows, Mac, Linux
Windows, Mac, Linux
Windows, Mac, Linux
Windows, Mac, Linux
Windows, Mac, Linux
Windows, Mac, Linux
Windows, Mac, Linux
Windows, Mac, Linux
Main Use Arc, Design, Electrical, and Mech.
Arc, Design, Electrical, and Mech.
Arc, Design, and Mech.
Arc, Design Arc, Design, Electrical, and Mech.
Arc, Design, Electrical, and Mech.
Arc, Design, Electrical, and Mech.
Arc, Design Arc, Design, Electrical, and Mech.
Arc, Design, Electrical, and Mech.
API .NET API MDL API GDL API VectorScript .NET API Python API Ruby & C API
None Tekla Open API
Rhino Common
Language C#, VB.NET, VC++, F#
C++ C++ C# VB.NET C++ Ruby, C None C++ VB.NET, C#, Python
Plug-in .dll .dll .dll .dll .dll .dll .dll None .dll, .exe .dll Object Identifier
GUID tags GUID Schema tags Schema tags GUID Schema Tags GUID GUID GUID
Memory Management
Automatic Automatic Automatic Automatic Automatic Manual Manual Automatic Automatic Automatic
IFC Import/ Export
Import/ Export
Import/ Export
Import/ Export
Import/ Export
Import/ Export
Export Import/ Export
Import/ Export
Import/ Export
ODBC Support
Yes Yes Yes Yes No No Yes No No No
XML Support Yes Yes Yes Yes No Yes No Yes Yes Yes gbXML Yes Yes Yes Yes Yes No No Yes Yes Yes License Proprietary Proprietary Proprietary Proprietary Proprietary Proprietary Proprietary Proprietary Proprietary Proprietary Academic version
3-Year License
Yes Free Free No Free Free Yes Yes Yes
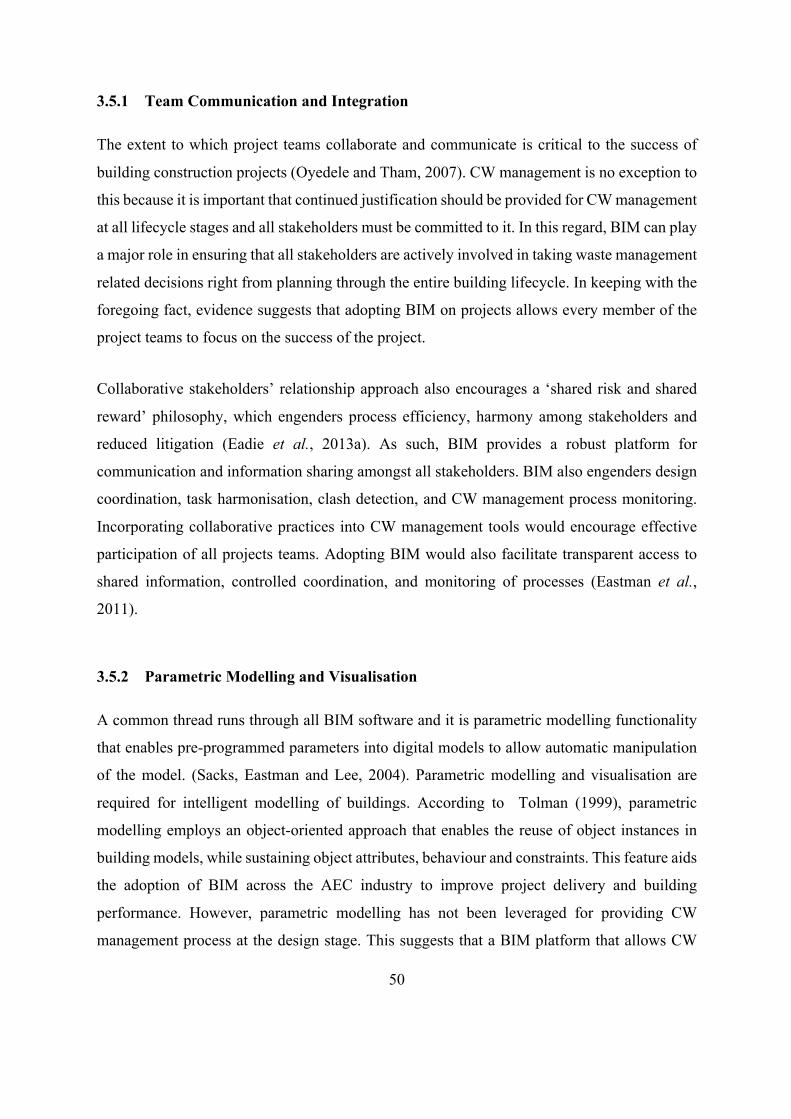
50
3.5.1 Team Communication and Integration
The extent to which project teams collaborate and communicate is critical to the success of
building construction projects (Oyedele and Tham, 2007). CW management is no exception to
this because it is important that continued justification should be provided for CW management
at all lifecycle stages and all stakeholders must be committed to it. In this regard, BIM can play
a major role in ensuring that all stakeholders are actively involved in taking waste management
related decisions right from planning through the entire building lifecycle. In keeping with the
foregoing fact, evidence suggests that adopting BIM on projects allows every member of the
project teams to focus on the success of the project.
Collaborative stakeholders’ relationship approach also encourages a ‘shared risk and shared
reward’ philosophy, which engenders process efficiency, harmony among stakeholders and
reduced litigation (Eadie et al., 2013a). As such, BIM provides a robust platform for
communication and information sharing amongst all stakeholders. BIM also engenders design
coordination, task harmonisation, clash detection, and CW management process monitoring.
Incorporating collaborative practices into CW management tools would encourage effective
participation of all projects teams. Adopting BIM would also facilitate transparent access to
shared information, controlled coordination, and monitoring of processes (Eastman et al.,
2011).
3.5.2 Parametric Modelling and Visualisation
A common thread runs through all BIM software and it is parametric modelling functionality
that enables pre-programmed parameters into digital models to allow automatic manipulation
of the model. (Sacks, Eastman and Lee, 2004). Parametric modelling and visualisation are
required for intelligent modelling of buildings. According to Tolman (1999), parametric
modelling employs an object-oriented approach that enables the reuse of object instances in
building models, while sustaining object attributes, behaviour and constraints. This feature aids
the adoption of BIM across the AEC industry to improve project delivery and building
performance. However, parametric modelling has not been leveraged for providing CW
management process at the design stage. This suggests that a BIM platform that allows CW
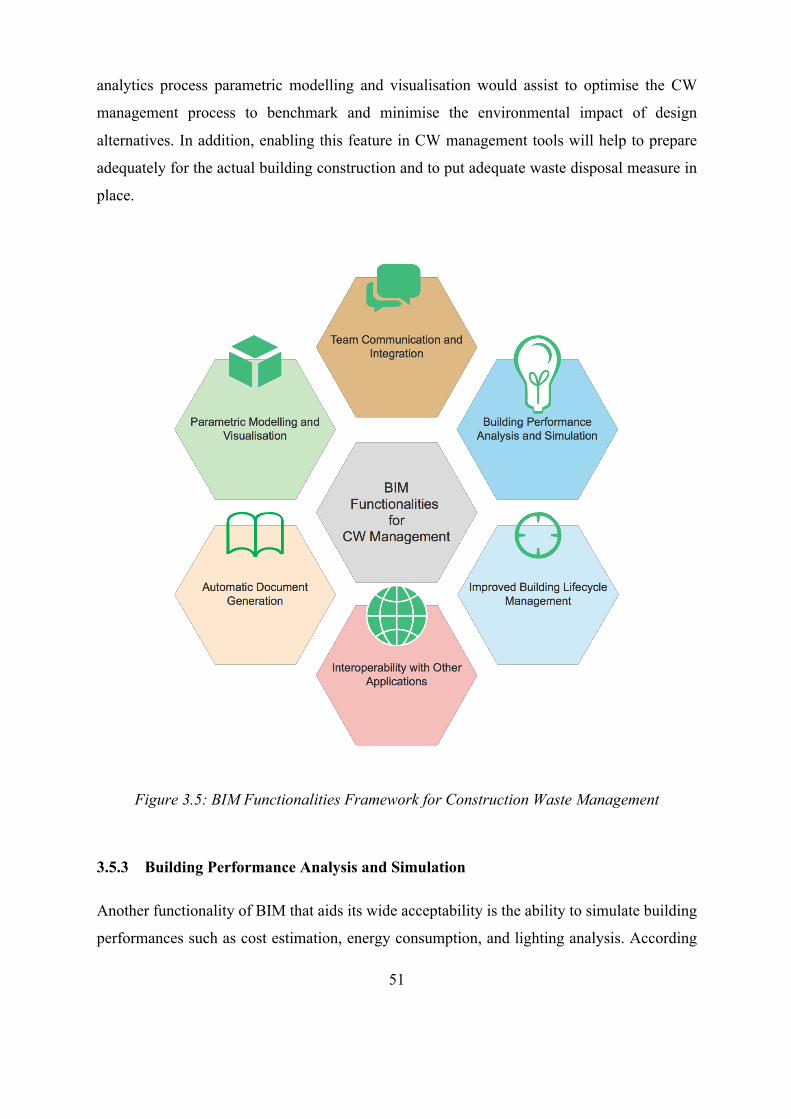
51
analytics process parametric modelling and visualisation would assist to optimise the CW
management process to benchmark and minimise the environmental impact of design
alternatives. In addition, enabling this feature in CW management tools will help to prepare
adequately for the actual building construction and to put adequate waste disposal measure in
place.
Figure 3.5: BIM Functionalities Framework for Construction Waste Management
3.5.3 Building Performance Analysis and Simulation
Another functionality of BIM that aids its wide acceptability is the ability to simulate building
performances such as cost estimation, energy consumption, and lighting analysis. According
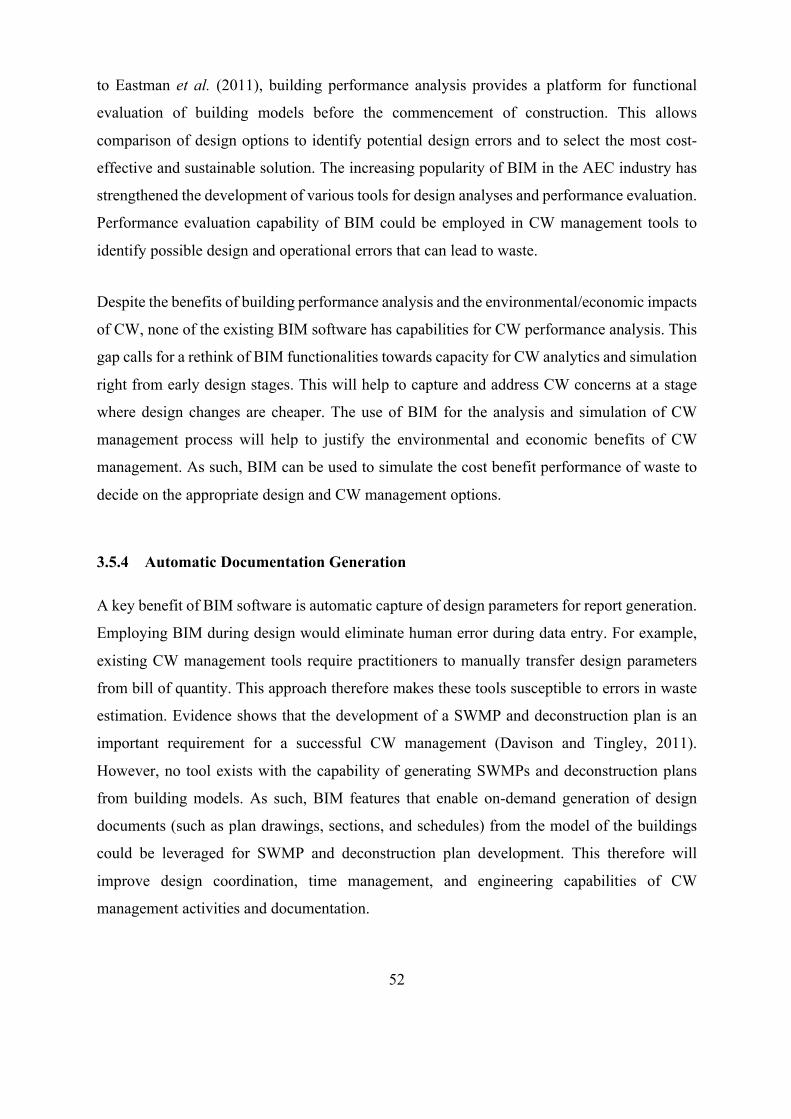
52
to Eastman et al. (2011), building performance analysis provides a platform for functional
evaluation of building models before the commencement of construction. This allows
comparison of design options to identify potential design errors and to select the most cost-
effective and sustainable solution. The increasing popularity of BIM in the AEC industry has
strengthened the development of various tools for design analyses and performance evaluation.
Performance evaluation capability of BIM could be employed in CW management tools to
identify possible design and operational errors that can lead to waste.
Despite the benefits of building performance analysis and the environmental/economic impacts
of CW, none of the existing BIM software has capabilities for CW performance analysis. This
gap calls for a rethink of BIM functionalities towards capacity for CW analytics and simulation
right from early design stages. This will help to capture and address CW concerns at a stage
where design changes are cheaper. The use of BIM for the analysis and simulation of CW
management process will help to justify the environmental and economic benefits of CW
management. As such, BIM can be used to simulate the cost benefit performance of waste to
decide on the appropriate design and CW management options.
3.5.4 Automatic Documentation Generation
A key benefit of BIM software is automatic capture of design parameters for report generation.
Employing BIM during design would eliminate human error during data entry. For example,
existing CW management tools require practitioners to manually transfer design parameters
from bill of quantity. This approach therefore makes these tools susceptible to errors in waste
estimation. Evidence shows that the development of a SWMP and deconstruction plan is an
important requirement for a successful CW management (Davison and Tingley, 2011).
However, no tool exists with the capability of generating SWMPs and deconstruction plans
from building models. As such, BIM features that enable on-demand generation of design
documents (such as plan drawings, sections, and schedules) from the model of the buildings
could be leveraged for SWMP and deconstruction plan development. This therefore will
improve design coordination, time management, and engineering capabilities of CW
management activities and documentation.
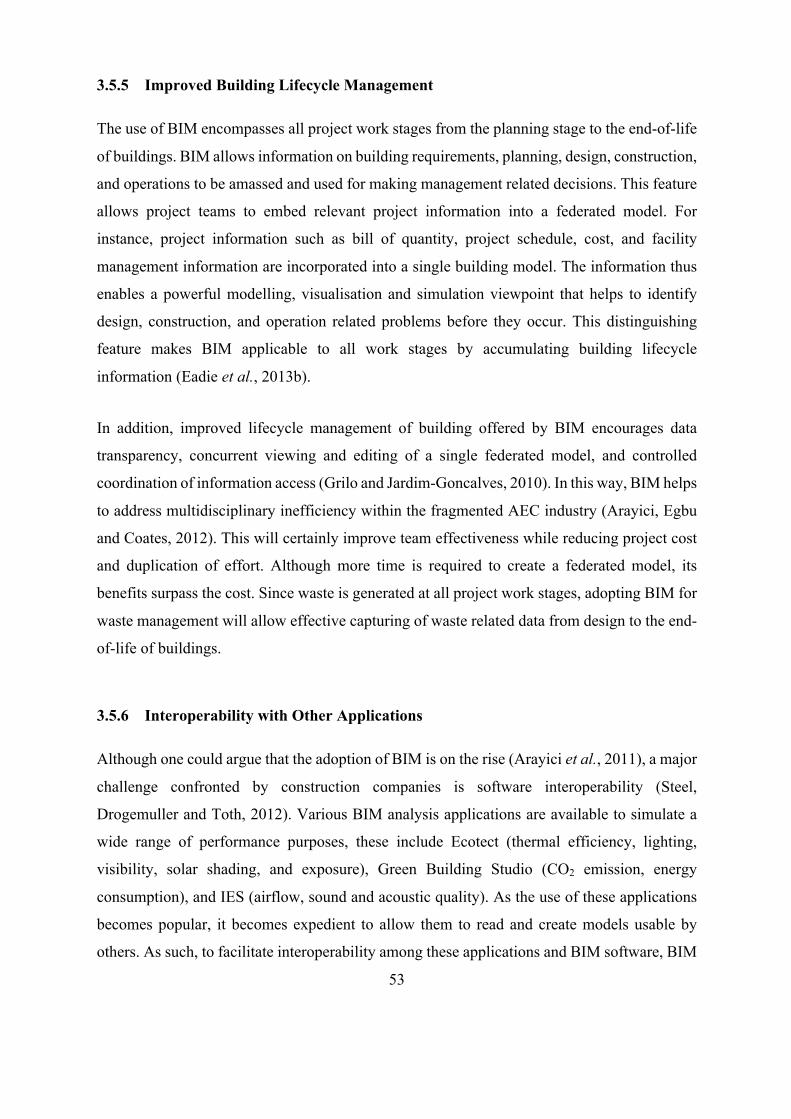
53
3.5.5 Improved Building Lifecycle Management
The use of BIM encompasses all project work stages from the planning stage to the end-of-life
of buildings. BIM allows information on building requirements, planning, design, construction,
and operations to be amassed and used for making management related decisions. This feature
allows project teams to embed relevant project information into a federated model. For
instance, project information such as bill of quantity, project schedule, cost, and facility
management information are incorporated into a single building model. The information thus
enables a powerful modelling, visualisation and simulation viewpoint that helps to identify
design, construction, and operation related problems before they occur. This distinguishing
feature makes BIM applicable to all work stages by accumulating building lifecycle
information (Eadie et al., 2013b).
In addition, improved lifecycle management of building offered by BIM encourages data
transparency, concurrent viewing and editing of a single federated model, and controlled
coordination of information access (Grilo and Jardim-Goncalves, 2010). In this way, BIM helps
to address multidisciplinary inefficiency within the fragmented AEC industry (Arayici, Egbu
and Coates, 2012). This will certainly improve team effectiveness while reducing project cost
and duplication of effort. Although more time is required to create a federated model, its
benefits surpass the cost. Since waste is generated at all project work stages, adopting BIM for
waste management will allow effective capturing of waste related data from design to the end-
of-life of buildings.
3.5.6 Interoperability with Other Applications
Although one could argue that the adoption of BIM is on the rise (Arayici et al., 2011), a major
challenge confronted by construction companies is software interoperability (Steel,
Drogemuller and Toth, 2012). Various BIM analysis applications are available to simulate a
wide range of performance purposes, these include Ecotect (thermal efficiency, lighting,
visibility, solar shading, and exposure), Green Building Studio (CO2 emission, energy
consumption), and IES (airflow, sound and acoustic quality). As the use of these applications
becomes popular, it becomes expedient to allow them to read and create models usable by
others. As such, to facilitate interoperability among these applications and BIM software, BIM
54
open standards were developed to represent the information in a building information model
and openly exchange this information. These standards include the Industry Foundation
Classes (IFC, 2008), Green Building XML (gbXML, 2013) and the newer Construction
Operations Building Information Exchange (East, 2007) for level 2 UK BIM adoption. As such,
the increasing uptake in the adoption of BIM (RIBA, 2016) suggests that BIM is now becoming
a valuable tool in facilitating successful collaboration and coordination among the team
members throughout the lifecycle of both existing and new buildings.
In view of this, project teams expend much effort in carefully selecting appropriate BIM
software for effective collaboration and communication. As such, the use of IFC standard
(BuildingSMART, 2013) has improved model exchange among BIM software for design
analyses (Pazlar and Turk, 2008). It is worth noting that IFC schema allows the extension of
its tags to capture various parameters for building objects (Laakso et al., 2012). Despite this
opportunity, IFC schema has not been equipped with adequate mechanism to streamline CW
analytics. This gap calls for a closer look into how IFC could be extended to support data
exchange between CW management tools and BIM software. As such, information exchange
requirement of CW analytics processes need to be identified and captured within existing BIM
and IFC models.
3.6 BIM Development Tools
Recent innovation in ICT has resulted in tremendous breakthroughs in the development and
deployment of BIM software solutions. So considering the need for software interoperability
and various application areas of BIM, it becomes necessary to provide means of extending the
functionalities of BIM software. This section of the chapter covers the state-of-the-art on BIM
software development. Accordingly, a comparative analysis of the tools and techniques were
carried out to reveal of their potentials in developing tools for BIM. The review covers IFC
development tools, IFC query languages, and BIM software Application Programming
Interfaces (APIs).
55
3.6.1 IFC Development Tools
IFC standard captures 3-D parametric information as well as metadata describing other aspects
(such as thermal performance, lighting, costing, and fire safety performance) of the model. This
feature makes IFC semantically rich. IFC is the industrial open standard for exchanging BIM
models and it is the most supported by major BIM software vendors (Autodesk, Graphisoft,
Bentley, and Nemetschek). The IFC schema was developed on the EXPRESS definition
language (ISO10303-11:1994) which contains about 327 data types, 653 entity definitions, and
317 property set, and thousands of attributes (Steel, Drogemuller and Toth, 2012). Considering
the size and complexity of this schema, it needs to be properly managed for optimal usefulness.
As such, several IFC development tools and query languages were developed to maximise the
potentials of the IFC schema.
Existing IFC development tools include BIMServer, Solibri Model Checker, IFC Webserver,
IFCHub, Constructivity Model Server, BIM Collaboration Hub, EDM Server, cBIM Manager,
HOOPS Exchange, IFC OpenShell, IFC Gear, Open IFC Tools (Beetz and Berlo, 2010; Solibri,
2016; IFCWebServer, 2016; IFChub, 2017; Constructivity, 2016). A comparison of these tools
is presented in Table 3.2. All these tools could source IFC data from BIM software for
interpretation, verification, and analysis. In choosing among these tools, the support for the
import and export of IFC is important. Thus, this makes BIMServer a popular choice for IFC
development.
BIMServer provides a robust platform to extract details of objects from an IFC model by
providing a global unique identifier. BIMServer was developed to provide a low cost open
collaboration platform for small business and to support research and development. This was
achieved by providing multi-domain model repositories for concurrent creation, visualisation,
and maintenance of BIM data by all stakeholders. Being an open source project, it is easy to
integrate more functionalities. BIMServer provides support for IFC, ifcZIP and ifcXML
formats, IFC versioning, support for Geographic Information System, Model merging
capabilities, revision management, and simple queries and filters through a robust web service
interface. BIMServer also supports selective retrieval of building models. It is also compatible
with NoSQL key-value store based on the BerkeleyDB and it provides means of connecting to
other databases backend (Beetz and Berlo, 2010). Several IFC applications have been
56
developed using the BIMServer framework. These include automated validation of building
models (Zhang et al., 2014); clash detection (van den Helm, Böhms and van Berlo, 2010);
location-based applications (Hijazi, Ehlers and Zlatanova, 2010; de Laat and van Berlo, 2011)
; and energy efficiency simulation (Yu et al., 2013).
Several query languages have been developed to allow Create, Read, Update, and Delete
(CRUD) operations on object and attributes of building models. These include Express Query
Language – EQL (Koonce, Huang and Judd, 1998), Partial Model Query Language – PMQL
(Adachi, 2003), Generalized Model Subset Definition – GMSD (Weise, Katranuschkov and
Scherer, 2003), Spatial query language (Borrmann, Van Treeck and Rank, 2006), Building
Environment Rule and Analysis - BERA (Lee, 2011), Model View Definition – mvdXML
(Chipman, Liebich and Weise, 2012), BIMQL (Mazairac and Beetz, 2013). These languages
and schema provide several ways of selecting and viewing parts of the building information
models.
3.6.2 BIM Application Programming Interfaces
Application Programming Interface (API) provides the means of extending the functionalities
of software applications and it also serve as a means of data exchange among heterogeneous
software systems. As such, BIM software APIs provide the means of providing functionalities
that are not available in out-of-the-box BIM software. This is made possible through add-ins,
which utilise CAD and visualisation capabilities of the existing BIM software to achieve
specialised tasks. The ability to extend BIM software functionalities allows for automation of
repetitive tasks and time-consuming tasks. Examples of BIM software APIs include Revit
.NET API, MicroStation Development Library (MDL) API, ArchiCAD Geometric Description
Language (GDL), VectorWorks Vectorscript, and Digital project .NET API. A comparison of
features of BIM software and their APIs is presented in Table 3.1. These APIs serve as building
blocks for software applications thereby providing developers with the ability to customise
application by leveraging functionality of existing BIM platforms. Software developers could
therefore tailor BIM software to suit the needs of businesses.
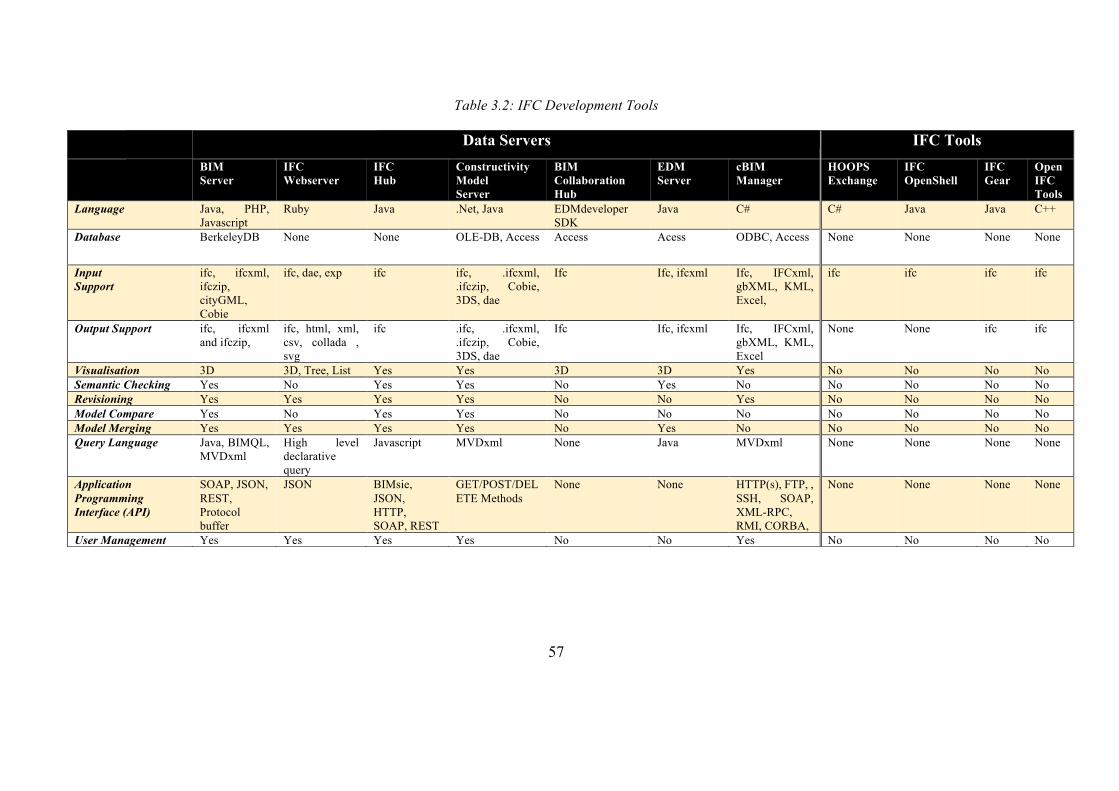
57
Table 3.2: IFC Development Tools
Data Servers IFC Tools BIM
Server IFC Webserver
IFC Hub
Constructivity Model Server
BIM Collaboration Hub
EDM Server
cBIM Manager
HOOPS Exchange
IFC OpenShell
IFC Gear
Open IFC Tools
Language Java, PHP, Javascript
Ruby Java .Net, Java EDMdeveloper SDK
Java C# C# Java Java C++
Database BerkeleyDB None None OLE-DB, Access Access Acess ODBC, Access None None None None
Input Support
ifc, ifcxml, ifczip, cityGML, Cobie
ifc, dae, exp ifc ifc, .ifcxml, .ifczip, Cobie, 3DS, dae
Ifc Ifc, ifcxml Ifc, IFCxml, gbXML, KML, Excel,
ifc ifc ifc ifc
Output Support ifc, ifcxml and ifczip,
ifc, html, xml, csv, collada , svg
ifc .ifc, .ifcxml, .ifczip, Cobie, 3DS, dae
Ifc Ifc, ifcxml Ifc, IFCxml, gbXML, KML, Excel
None None ifc ifc
Visualisation 3D 3D, Tree, List Yes Yes 3D 3D Yes No No No No Semantic Checking Yes No Yes Yes No Yes No No No No No Revisioning Yes Yes Yes Yes No No Yes No No No No Model Compare Yes No Yes Yes No No No No No No No Model Merging Yes Yes Yes Yes No Yes No No No No No Query Language Java, BIMQL,
MVDxml High level declarative query
Javascript MVDxml None Java MVDxml None None None None
Application Programming Interface (API)
SOAP, JSON, REST, Protocol buffer
JSON BIMsie, JSON, HTTP, SOAP, REST
GET/POST/DELETE Methods
None None HTTP(s), FTP, , SSH, SOAP, XML-RPC, RMI, CORBA,
None None None None
User Management Yes Yes Yes Yes No No Yes No No No No
58
After a careful review of the existing BIM software and their APIs, it was evident that Revit API
offers more flexibility in integrating third party tools. This is because Revit API provides a highly
customisable .NET Software Development Toolkit (SDK) for user interface and software logic
development. In addition, Revit utilises a Global Unique Identifier (GUID), which the API could
access to identify and characterise every unit of a building model. The Revit API also has full
support for IFC and IFCXML import and export. These capabilities coupled with the robust
database and parametric modelling embedded within Revit provides the API with a rich platform
for add-in development. All these reveal opportunities to harness the strengths of Revit API for
rapid BIM application development. A number of studies (Goedert and Meadati, 2008; Schlueter
and Thesseling, 2009; Nepal et al., 2009; Cheng and Ma, 2011; Kota et al., 2014) have leveraged
on the Revit API to simulate, analyse, and visualise several aspects of BIM.
Examples of existing Revit plugins include: (a) COBie Toolkit: Extends Revit to support COBie
BIM data standard; (b) BIMObject: Allows the search and filtering of BIM objects from real-world
manufacturers; (c) CADtoEarth: Integrates BIM models with Google earth and Google maps; (d)
IFC 2015: Improves IFC import and export capability of Revit; (e) Lighting Analysis: Provides a
cloud-based service to expose electric and solar details of Revit models; and (f) Solibri Model
Viewer: Allows improved IFC and Solibri files processing.
3.7 Artificial Intelligence System Development
The term Artificial Intelligence (AI) was first adopted during the Dartmouth conference
(McCarthy and Hayes, 1968) organised by researchers with keen interest in machine intelligence.
Major issues in the field of AI were discussed to answer fundamental questions relating to machine
intelligence such as neuron nets, self-improvement, automatic computing, computer use of
language and abstraction. The term AI broadly describes machines that exhibit a degree of
intelligence (Russell and Norvig, 2010). This include machine that mimic human decision making
and thought process to solve a problem. The influence of AI cuts across several fields and
applications, which include game playing, natural language processing, image processing, speech
recognition, computer vision, clustering, and others.
59
3.7.1 Review of Relevant Theories in Artificial Intelligence and Associated Areas
Several theories are evaluated for their theoretical and methodological relevance to the study.
Although several theories contribute to construction management studies, only theories that are
relevant to understand and address the theoretical and methodological issues in design based CW
management practice are reviewed. On this basis, four theories were adopted to satisfy the
theoretical requirements of the study. These theories were chosen from different fields, which
include machine intelligence (theory of AI), resource management (tragedy of the commons),
evaluative practices (Scriven’s logic of evaluation), evidential reasoning (fuzzy set theory). How
these theories influence the theoretical underpinning of study is represented in Figure 3.6.
The theory of AI offers philosophical lenses to issues in machine intelligence in terms of
epistemologically and heuristically adequacy of AI systems. Theories of evidential reasoning
provide mechanisms for dealing with uncertainties and imprecise information in intelligent
systems. Tragedy of the commons is associated with concepts of sustenance of finite resources and
interdisciplinary resource management. A full discussion of tragedy of the common is provided in
Section 3.7.1.3. Theories of evaluation practices specify a systematic way for assessing the merit,
worth or significance of processes or artefacts based on a set of criteria.
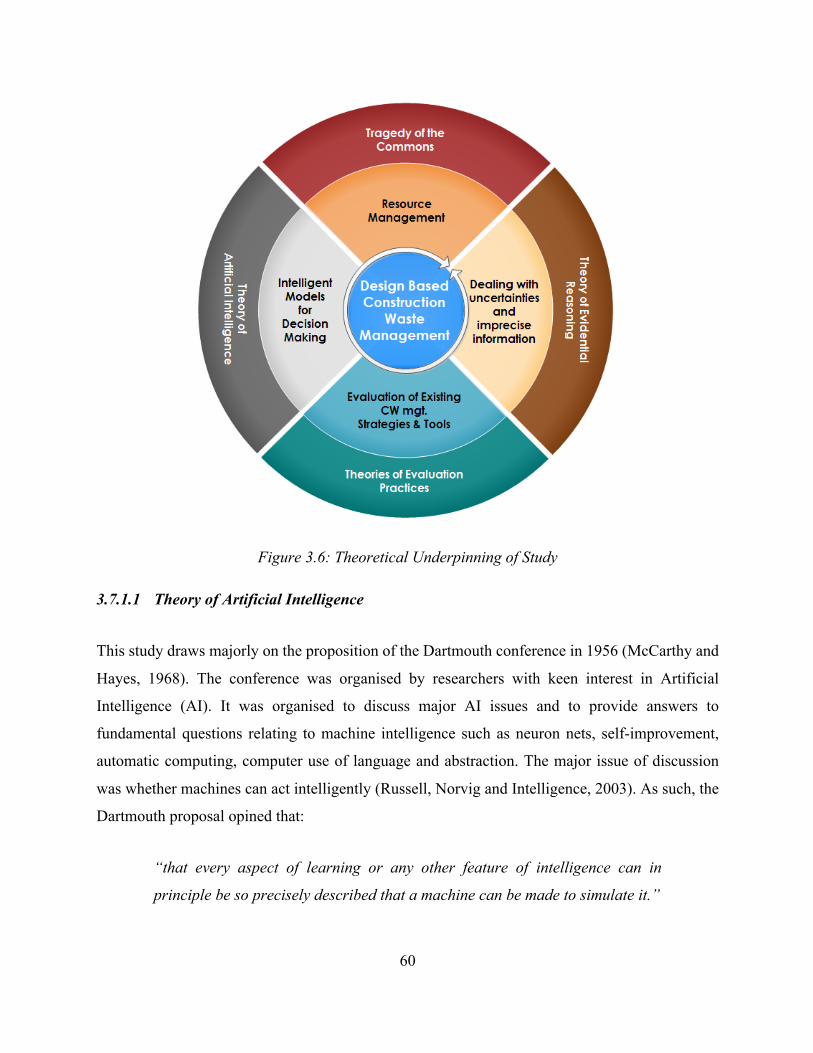
60
Figure 3.6: Theoretical Underpinning of Study
3.7.1.1 Theory of Artificial Intelligence
This study draws majorly on the proposition of the Dartmouth conference in 1956 (McCarthy and
Hayes, 1968). The conference was organised by researchers with keen interest in Artificial
Intelligence (AI). It was organised to discuss major AI issues and to provide answers to
fundamental questions relating to machine intelligence such as neuron nets, self-improvement,
automatic computing, computer use of language and abstraction. The major issue of discussion
was whether machines can act intelligently (Russell, Norvig and Intelligence, 2003). As such, the
Dartmouth proposal opined that:
“that every aspect of learning or any other feature of intelligence can in
principle be so precisely described that a machine can be made to simulate it.”
61
This presupposition however raises serious philosophical issues on whether machines could act
intelligently as humans. This is still hotly debated and the question of whether machines can think
or have a mind is beyond the scope of the current discussion. However, the concern of the current
study is to explore two forms of machine intelligence i.e. epistemological part and heuristic part
(McCarthy and Hayes, 1990). The epistemological part of AI is concerned with the nature of
information about the world or a phenomenon that could be represented in a machine and the
information that should be sufficient to find a solution in the problem space. On the other hand,
the heuristic part is concerned with mechanisms that use the information stored in the memory of
machines to solve problems and to interpret the solutions. The heuristic adequacy of a machine
also requires the ability to express the reasoning process unambiguously using a language.
The foregoing implies that epistemological and heuristic adequacy is required to formalise existing
design-out-waste strategies into a computational tool. In this case, the information stored in
memory must be sufficient to determine a strategy for predicting CW output of a BIM design and
must possess adequate mechanism to find the strategy to minimise the predicted waste output.
3.7.1.2 Theories of Evidential Reasoning
A major challenge in the development of an intelligent system is how plausible decisions are made
using both quantitative and qualitative information that have a level of uncertainty and
imprecision. To deal with these uncertainties and imprecise information in computation, it is
important to adopt evidential reasoning mechanisms to draw out plausible course of actions. This
allows the collection and combination of evidence in support or against some hypotheses (Sii,
Ruxton and Wang, 2002). As such, computational intelligence techniques employed in handling
uncertainty and imprecision in evidential reasoning include: (i) Bayesian Probability Theory (BPT)
(ii) Fuzzy Set Theory (FST) (Zadeh, 1965), and (iii) Dempster-Shafer Theory of Evidence (DST)
(Dempster, 1967, Shafer, 1976).
BPT, influenced by the traditional probability theory, is by far the most understood of these
theories but has very low performance when it comes to using imprecise evidence for decision-
making (Sii, Ruxton and Wang, 2002). However, the strength of FST lies in its ability to represent
62
and process imprecise information and it enables the representation of concepts using linguistic
variables (Zadeh, 1965). A number of fuzzy sets variants have been developed, notably
Intuitionistic Fuzzy Sets (IFS) (Atanassov, 1986) to extend the applicability of FST in decision
making (Qian, Wang and Feng, 2013). With the recent advancements in the application of fuzzy
sets variants to decision making, it becomes important to harness the strengths of these systems in
every human endeavour, including construction.
DST on the other hand is a generalisation of the Bayesian theory of subjective probability, which
came to the attention of researchers in the early 1980s, for dealing with uncertainty in expert
systems (Zadeh, 1986). DST originates from the idea of lower and upper probability induced by a
multivalued mapping by computing a belief function for aggregating evidence from various
sources (Dempster, 1967). This empowers DST to measure the degree of likelihood using a
probability interval rather than point probabilities used in BPT, thereby providing a useful measure
for the evaluation of the subjective evidence. Zadeh (1986) provided an extensive discussion of
DST and its application in the development of expert systems. As a result, a synthesis of FST and
DST has been shown to be useful with knowledge-based systems.
Since real-world decision making requires different sources of evidence and their combination,
Dempster’s rule of combination becomes useful (Zadeh, 1986) to aggregate decision alternatives
in a multi-criteria environment. This shows a strong link between fuzzy based systems and DST
(Dymova and Sevastjanov, 2010); and that a synthesis of FST and DST is useful within knowledge
based systems (Ishizuka et al., 1982; Yager, 1982; Binaghi et al., 2000; Yen, 1990); though it may
provide counter intuitive results (Dymova and Sevastjanov, 2012). However, Dymova and
Sevastjanov (2014) demonstrated that an interpretation of IFS in DST’s framework provides more
information during the evidential reasoning process; thus, making the synthesis of IFS and DST a
viable option for evidential reasoning in a multi-criteria environment.
3.7.1.3 Tragedy of the Commons
Resources are inevitably depleted when a limited shared resource is accessed by several
individuals acting independently of each other’s interest contrary to the group’s interest. Avoiding
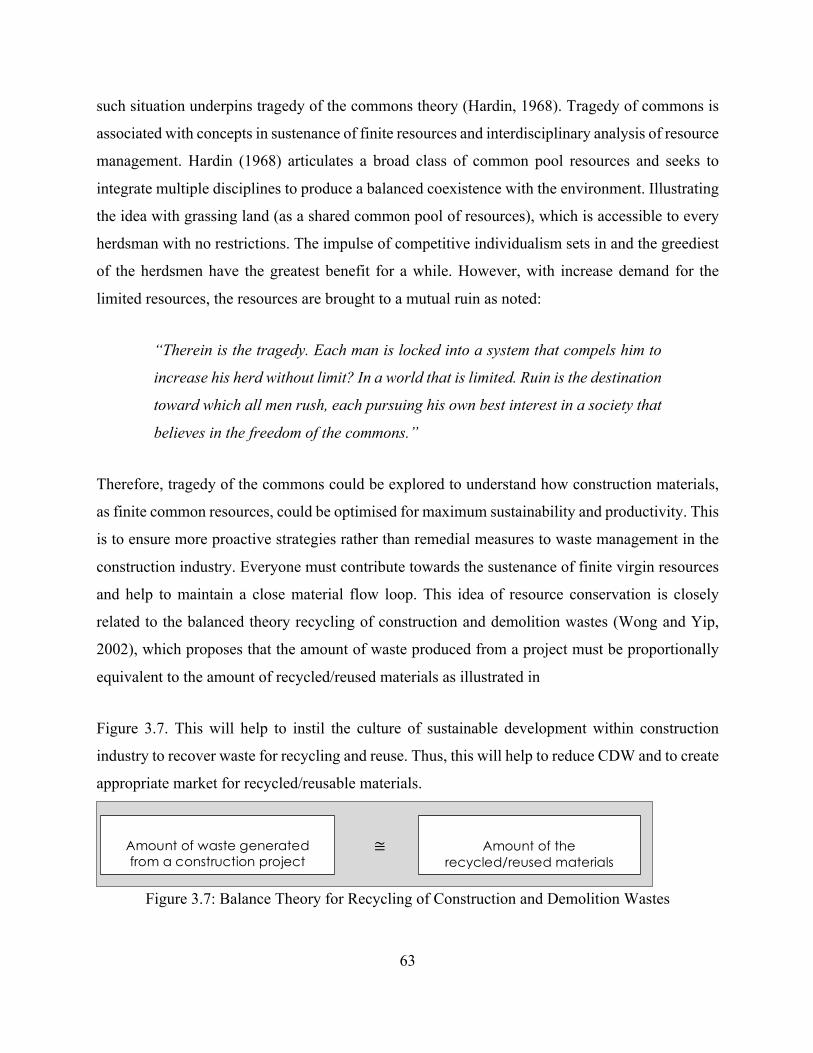
63
such situation underpins tragedy of the commons theory (Hardin, 1968). Tragedy of commons is
associated with concepts in sustenance of finite resources and interdisciplinary analysis of resource
management. Hardin (1968) articulates a broad class of common pool resources and seeks to
integrate multiple disciplines to produce a balanced coexistence with the environment. Illustrating
the idea with grassing land (as a shared common pool of resources), which is accessible to every
herdsman with no restrictions. The impulse of competitive individualism sets in and the greediest
of the herdsmen have the greatest benefit for a while. However, with increase demand for the
limited resources, the resources are brought to a mutual ruin as noted:
“Therein is the tragedy. Each man is locked into a system that compels him to
increase his herd without limit? In a world that is limited. Ruin is the destination
toward which all men rush, each pursuing his own best interest in a society that
believes in the freedom of the commons.”
Therefore, tragedy of the commons could be explored to understand how construction materials,
as finite common resources, could be optimised for maximum sustainability and productivity. This
is to ensure more proactive strategies rather than remedial measures to waste management in the
construction industry. Everyone must contribute towards the sustenance of finite virgin resources
and help to maintain a close material flow loop. This idea of resource conservation is closely
related to the balanced theory recycling of construction and demolition wastes (Wong and Yip,
2002), which proposes that the amount of waste produced from a project must be proportionally
equivalent to the amount of recycled/reused materials as illustrated in
Figure 3.7. This will help to instil the culture of sustainable development within construction
industry to recover waste for recycling and reuse. Thus, this will help to reduce CDW and to create
appropriate market for recycled/reusable materials.
Figure 3.7: Balance Theory for Recycling of Construction and Demolition Wastes
≅
Amount of waste generated from a construction project
Amount of the
recycled/reused materials used for the project
64
3.7.1.4 Theories of Evaluation Practices
Evaluation is a process of assessing the merit, worth or significance of objects based on a set of
criteria (Scriven, 1967). The objects could include services, personnel, products, services,
organisations, and others. According to Shadish et al. (Shadish, Cook and Leviton, 1991), the
theories of evaluation practices specify, in a systematic way, feasible approaches that could be
adopted by evaluators. In applying any of the available theories of evaluation practices, Davidson
(Davidson, 2005) argued that it is important to start with a clear understanding of the purpose for
which the evaluation is carried out. According to Scriven (Scriven, 1991), two purposes of
evaluation exist, i.e., summative and formative. Summative evaluation is carried out to pass
judgement on something while formative evaluation is a form of constructive assessment to
improve the performance of the evaluands. In this study, the evaluation of CW management was
carried out towards a formative purpose to identify shortcomings of existing tools to improve
current and future tools. As such, the identification of the evaluation criteria for existing CW
management tools and the development of the holistic BIM framework for CW management are
underpinned by theories of evaluation practice.
While the existence of several evaluation approaches is acknowledged, the current study takes a
cue from Scriven’s logic of evaluation (Scriven, 1967), which starts by identifying the objects to
be evaluated and proceeds to establish criteria for merit for the objects. Thereafter, the performance
of the objects in relation to the criteria of merit must be determined before drawing valid
conclusions. To achieve the objectives of this logic of evaluation, a social agenda approach, which
favours constructivist evaluation (Guba and Lincoln, 2001) and qualitative methodology, was
adopted. According to Bryson et al. (2011), it is important to consider stakeholders’ views and
needs in a valid evaluation. Constructivist evaluation therefore allows the engagement of relevant
stakeholders in obtaining an in-depth understanding of a phenomenon. The logic of constructivist
evaluation practice employed in this study is enumerated below:
1) Determine the purpose of evaluation
2) Seek stakeholders’ involvement to build learning capacity and seek understanding from
multiple perspectives
65
3) Identify list of evaluative criteria during stakeholders’ engagement.
4) Organise list of evaluative criteria into common themes and choosing sources of evidence.
5) Determine the performance merit of evaluands based on the evaluative criteria
6) Produce outcome of evaluation process
3.7.2 Implications of the Theories for the Study
Theories that have theoretical and methodological relevance to the study were reviewed and
analysed in this chapter. The theories provide a common framework coordinating the research
process of the study. As such, theories from other fields of study were adopted in the context CW
management. As such, five theories from various areas were adopted to satisfy the theoretical
requirements of the study. These theories include theory of AI, tragedy of the commons, theories
of evaluative practices, and theories of evidential reasoning.
Theory of AI offers philosophical lenses to philosophical issues in machine intelligence in terms
of epistemological adequacy and heuristic adequacy of intelligent systems. This is required to
understand how a system could be developed to capture mechanisms required for design based
CW management and to guide decision-making for CW minimisation. Theories of evidential
reasoning provide mechanisms for dealing with uncertainties and imprecise information in
intelligent systems. As such, three intelligent techniques for handling uncertainty and imprecision
in evidential reasoning were reviewed, i.e., Bayesian Probability Theory, Fuzzy Set Theory (FST),
and Dempster-Shafer Theory of Evidence. It was revealed that an interpretation of IFS in DST’s
framework provides more information during evidential reasoning process; thus, making the
synthesis of IFS and DST a viable option for evidential reasoning in a multi-criteria environment.
Tragedy of the commons is associated with concepts of sustenance of finite resources in an
interdisciplinary environment. The discussion reveals that tragedy of the commons could be
employed to understand how construction materials could be optimised for maximum
sustainability. This is to encourage more proactive strategies rather than remedial measures to
waste management. Theories of evaluation practices specify a systematic way for assessing the
merit, worth or significance of processes or artefacts based on a set of criteria. The study takes a
66
cue from Scriven’s logic of evaluation. To achieve the objectives of this logic of evaluation, a
social agenda approach, which favours constructivist evaluation and qualitative methodology, was
adopted. This is to consider stakeholders’ view and needs in evaluation practices. Constructivist
evaluation therefore allows the engagement of relevant stakeholders in obtaining an in-depth
understanding of a phenomenon. Scriven’s logic of evaluation was therefore employed to assess
the performance of existing CW management practice and tools in relation to criteria of merit.
3.7.3 Types of Artificial Intelligence Systems
Within the construction industry, several computational models have been employed for different
purposes such as cost estimation (Cheng, Tsai and Hsieh, 2009), occupational risk prediction
(Tsoukalas and Fragiadakis, 2016), time estimation (Hong et al., 2011), constructability analysis
(Yu and Skibniewski, 1999), and insolvency prediction (Jackson and Wood, 2013; Alaka et al.,
2016). After a review of extant literature, it was discovered that AI intelligent model development
methods that are commonly used in the construction industry could be categorised under four
groups, which are: (a) machine learning techniques, (b) knowledge-based techniques, (c)
evolutionary techniques, and (d) hybrid systems. Each of these groups was explored to identify
their strengths and weaknesses. A comparison of the four group is presented in Table 3.3. AI
Techniques in Construction Studies are presented in Table 3.4.
3.7.3.1 Machine Learning Techniques
Machine Leaning (ML) techniques are intelligent techniques that can learn from data (Russell and
Norvig, 2010). ML techniques have become so popular because of their inherent abilities to handle
uncertainty and to perform efficiently with incomplete data. ML techniques works by judging new
case using acquired experiences from similar cases. However, a major disadvantage of ML
techniques is that they lack technical justification for results and decisions. As such, ML
techniques are called black-box systems (Russell and Norvig, 2010). Despite this limitation, ML
techniques have been widely used in the construction industry. Out of the numerous ML
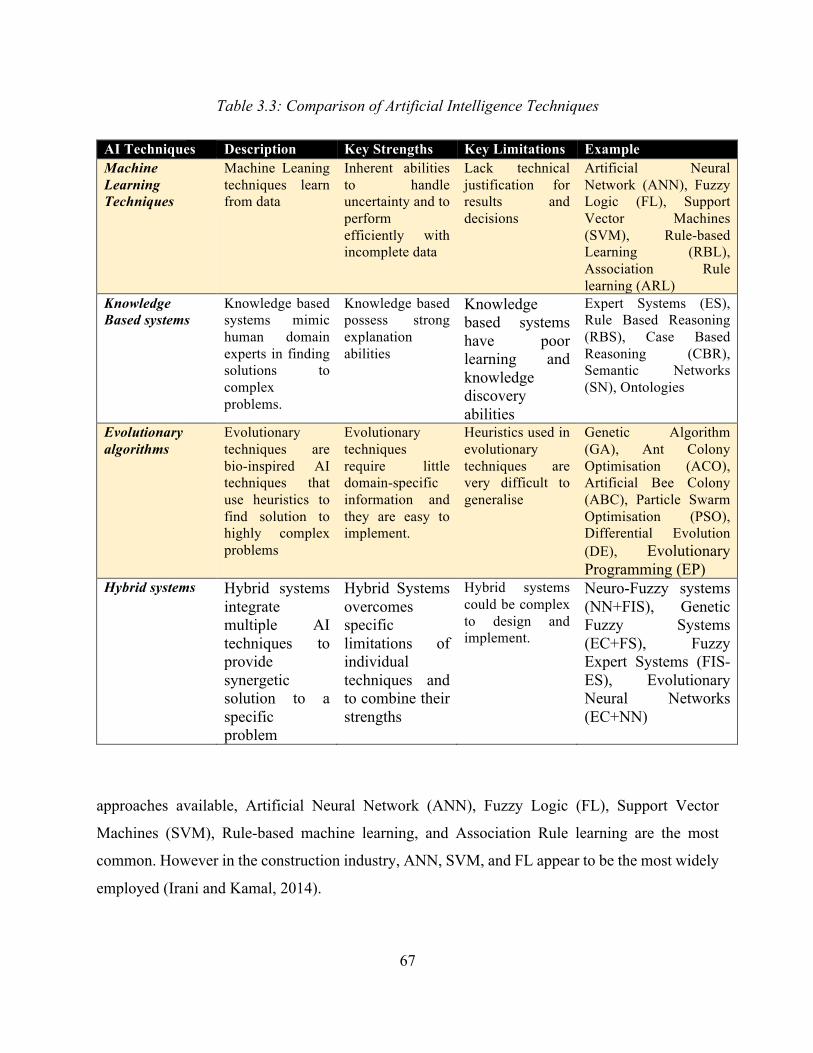
67
Table 3.3: Comparison of Artificial Intelligence Techniques
AI Techniques Description Key Strengths Key Limitations Example Machine Learning Techniques
Machine Leaning techniques learn from data
Inherent abilities to handle uncertainty and to perform efficiently with incomplete data
Lack technical justification for results and decisions
Artificial Neural Network (ANN), Fuzzy Logic (FL), Support Vector Machines (SVM), Rule-based Learning (RBL), Association Rule learning (ARL)
Knowledge Based systems
Knowledge based systems mimic human domain experts in finding solutions to complex problems.
Knowledge based possess strong explanation abilities
Knowledge based systems have poor learning and knowledge discovery abilities
Expert Systems (ES), Rule Based Reasoning (RBS), Case Based Reasoning (CBR), Semantic Networks (SN), Ontologies
Evolutionary algorithms
Evolutionary techniques are bio-inspired AI techniques that use heuristics to find solution to highly complex problems
Evolutionary techniques require little domain-specific information and they are easy to implement.
Heuristics used in evolutionary techniques are very difficult to generalise
Genetic Algorithm (GA), Ant Colony Optimisation (ACO), Artificial Bee Colony (ABC), Particle Swarm Optimisation (PSO), Differential Evolution (DE), Evolutionary Programming (EP)
Hybrid systems Hybrid systems integrate multiple AI techniques to provide synergetic solution to a specific problem
Hybrid Systems overcomes specific limitations of individual techniques and to combine their strengths
Hybrid systems could be complex to design and implement.
Neuro-Fuzzy systems (NN+FIS), Genetic Fuzzy Systems (EC+FS), Fuzzy Expert Systems (FIS-ES), Evolutionary Neural Networks (EC+NN)
approaches available, Artificial Neural Network (ANN), Fuzzy Logic (FL), Support Vector
Machines (SVM), Rule-based machine learning, and Association Rule learning are the most
common. However in the construction industry, ANN, SVM, and FL appear to be the most widely
employed (Irani and Kamal, 2014).
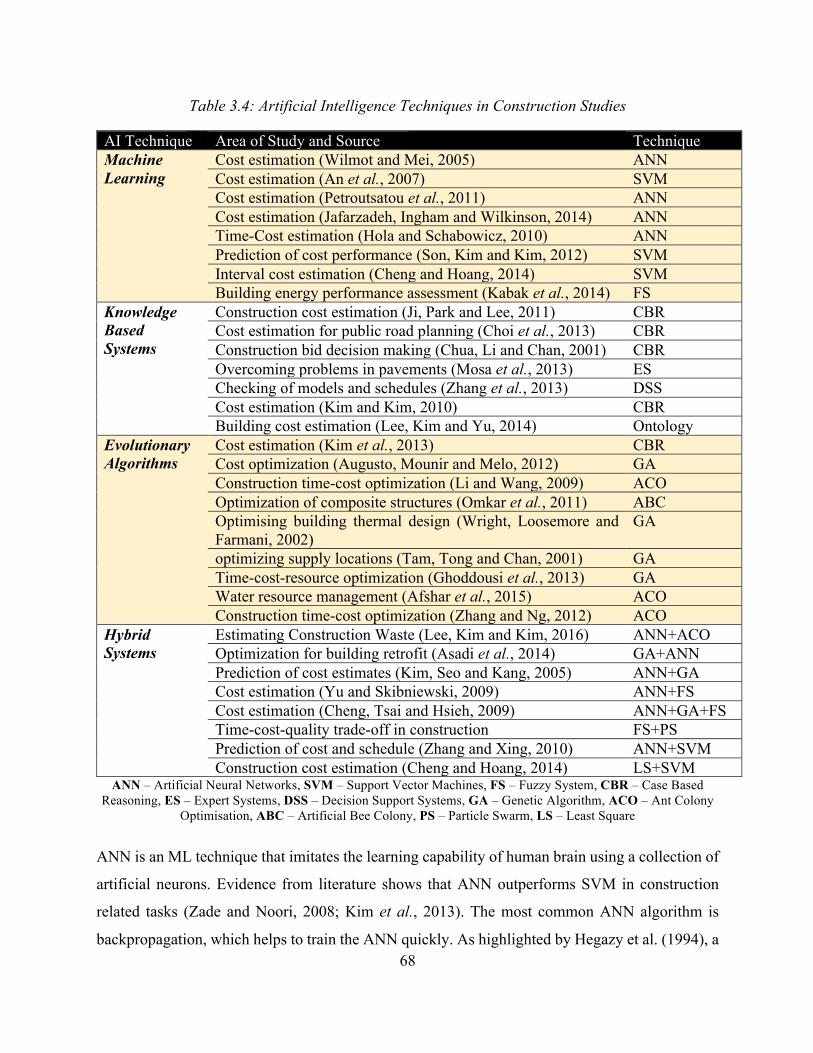
68
Table 3.4: Artificial Intelligence Techniques in Construction Studies
AI Technique Area of Study and Source Technique Machine Learning
Cost estimation (Wilmot and Mei, 2005) ANN Cost estimation (An et al., 2007) SVM Cost estimation (Petroutsatou et al., 2011) ANN Cost estimation (Jafarzadeh, Ingham and Wilkinson, 2014) ANN Time-Cost estimation (Hola and Schabowicz, 2010) ANN Prediction of cost performance (Son, Kim and Kim, 2012) SVM Interval cost estimation (Cheng and Hoang, 2014) SVM Building energy performance assessment (Kabak et al., 2014) FS
Knowledge Based Systems
Construction cost estimation (Ji, Park and Lee, 2011) CBR Cost estimation for public road planning (Choi et al., 2013) CBR Construction bid decision making (Chua, Li and Chan, 2001) CBR Overcoming problems in pavements (Mosa et al., 2013) ES Checking of models and schedules (Zhang et al., 2013) DSS Cost estimation (Kim and Kim, 2010) CBR Building cost estimation (Lee, Kim and Yu, 2014) Ontology
Evolutionary Algorithms
Cost estimation (Kim et al., 2013) CBR Cost optimization (Augusto, Mounir and Melo, 2012) GA Construction time-cost optimization (Li and Wang, 2009) ACO Optimization of composite structures (Omkar et al., 2011) ABC Optimising building thermal design (Wright, Loosemore and Farmani, 2002)
GA
optimizing supply locations (Tam, Tong and Chan, 2001) GA Time-cost-resource optimization (Ghoddousi et al., 2013) GA Water resource management (Afshar et al., 2015) ACO Construction time-cost optimization (Zhang and Ng, 2012) ACO
Hybrid Systems
Estimating Construction Waste (Lee, Kim and Kim, 2016) ANN+ACO Optimization for building retrofit (Asadi et al., 2014) GA+ANN Prediction of cost estimates (Kim, Seo and Kang, 2005) ANN+GA Cost estimation (Yu and Skibniewski, 2009) ANN+FS Cost estimation (Cheng, Tsai and Hsieh, 2009) ANN+GA+FS Time-cost-quality trade-off in construction FS+PS Prediction of cost and schedule (Zhang and Xing, 2010) ANN+SVM Construction cost estimation (Cheng and Hoang, 2014) LS+SVM
ANN – Artificial Neural Networks, SVM – Support Vector Machines, FS – Fuzzy System, CBR – Case Based Reasoning, ES – Expert Systems, DSS – Decision Support Systems, GA – Genetic Algorithm, ACO – Ant Colony
Optimisation, ABC – Artificial Bee Colony, PS – Particle Swarm, LS – Least Square
ANN is an ML technique that imitates the learning capability of human brain using a collection of
artificial neurons. Evidence from literature shows that ANN outperforms SVM in construction
related tasks (Zade and Noori, 2008; Kim et al., 2013). The most common ANN algorithm is
backpropagation, which helps to train the ANN quickly. As highlighted by Hegazy et al. (1994), a
69
major setback of backpropagation is that it does not have efficient methodology for identifying
suitable parameter settings. As such, optimisation methods such as gradient-descent, Genetic
Algorithm (GA), Ant Colony Optimisation (ACO) are used to overcome this challenge.
Deep learning is also becoming popular because of its capacity to extrapolate new features from a
limited set of features. Based on the concept of neural networks, deep learning is creating
renaissance in the Artificial Intelligence (AI) world. Deep learning allows the development of
computational models with multiple processing layers to learn data representation with multiple
levels of abstraction. This equips the technique to identify intricate structures in large datasets. As
such, the internal parameters are changed to compute the representation in each layer from the
representation in the previous layer. Types of deep learning architectures include deep neural
networks, deep Boltzmann machines, recurrent neural networks, deep neural networks,
convolutional deep neural networks, deep belief networks, and long short-time memory.
Another ML technique that is becoming popular is Association Rule Learning (ARL). Since the
introduction of association rule learning by Agrawal et al. (1996), it has been employed in several
field especially in market basket analysis. The idea behind association rule learning is to uncover
shared attributes among objects of a database. Association rules learning seeks to find associations
and correlation among set of objects in the database. Uncovering associations in a large database
is a difficult and expensive procedure because it requires series of iterations of database scans. As
such, efficient algorithms are required to achieve the association rule-learning task.
3.7.3.2 Knowledge Based Systems
Knowledge based system (KBS) are software programmes that mimic human domain experts in
finding solutions to a complex problem. KBS are developed to provide high intelligence level and
to simulate real-life scenarios in unknown situations (Turban and Aronson, 2005). Types of
Knowledge Based Systems include expert systems, Decision Support Systems (DSS), intelligent
agents, intelligent tutoring systems. DSS uses interactive, flexible, adaptable, computer based
information system to replicate human’s ability to analyse decision alternatives for optimum
performance in a situation. DSS and ES could be distinguished within four primary areas, which
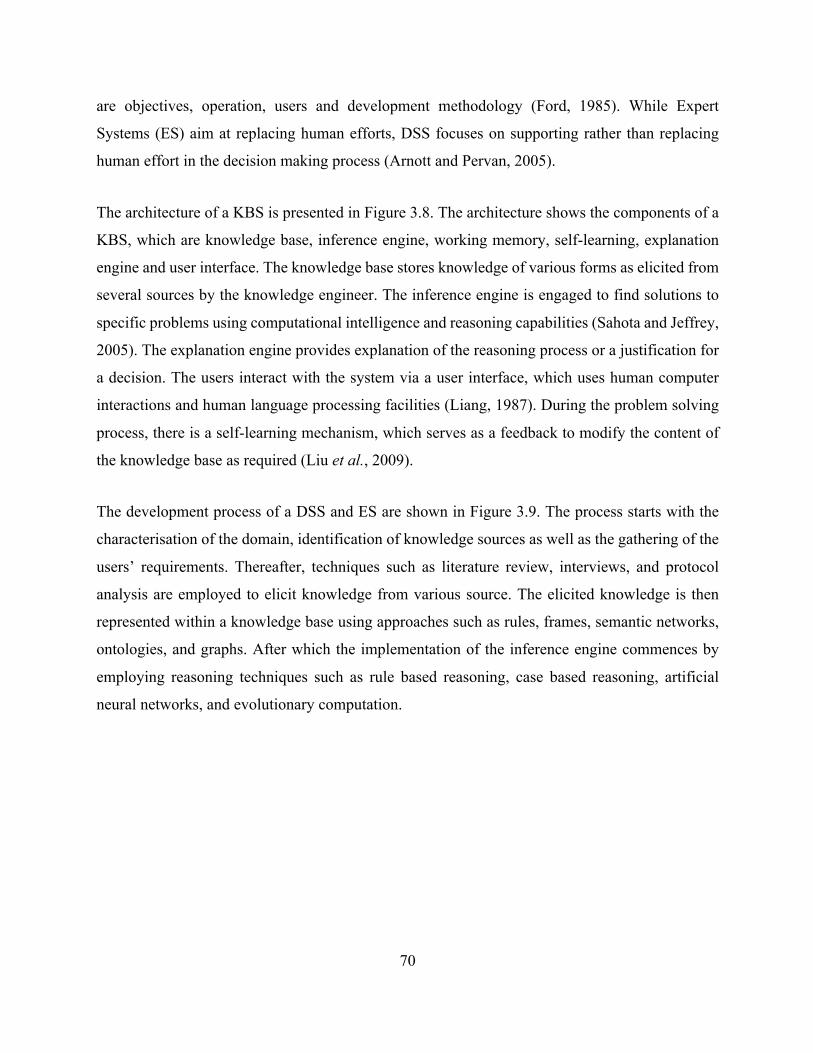
70
are objectives, operation, users and development methodology (Ford, 1985). While Expert
Systems (ES) aim at replacing human efforts, DSS focuses on supporting rather than replacing
human effort in the decision making process (Arnott and Pervan, 2005).
The architecture of a KBS is presented in Figure 3.8. The architecture shows the components of a
KBS, which are knowledge base, inference engine, working memory, self-learning, explanation
engine and user interface. The knowledge base stores knowledge of various forms as elicited from
several sources by the knowledge engineer. The inference engine is engaged to find solutions to
specific problems using computational intelligence and reasoning capabilities (Sahota and Jeffrey,
2005). The explanation engine provides explanation of the reasoning process or a justification for
a decision. The users interact with the system via a user interface, which uses human computer
interactions and human language processing facilities (Liang, 1987). During the problem solving
process, there is a self-learning mechanism, which serves as a feedback to modify the content of
the knowledge base as required (Liu et al., 2009).
The development process of a DSS and ES are shown in Figure 3.9. The process starts with the
characterisation of the domain, identification of knowledge sources as well as the gathering of the
users’ requirements. Thereafter, techniques such as literature review, interviews, and protocol
analysis are employed to elicit knowledge from various source. The elicited knowledge is then
represented within a knowledge base using approaches such as rules, frames, semantic networks,
ontologies, and graphs. After which the implementation of the inference engine commences by
employing reasoning techniques such as rule based reasoning, case based reasoning, artificial
neural networks, and evolutionary computation.
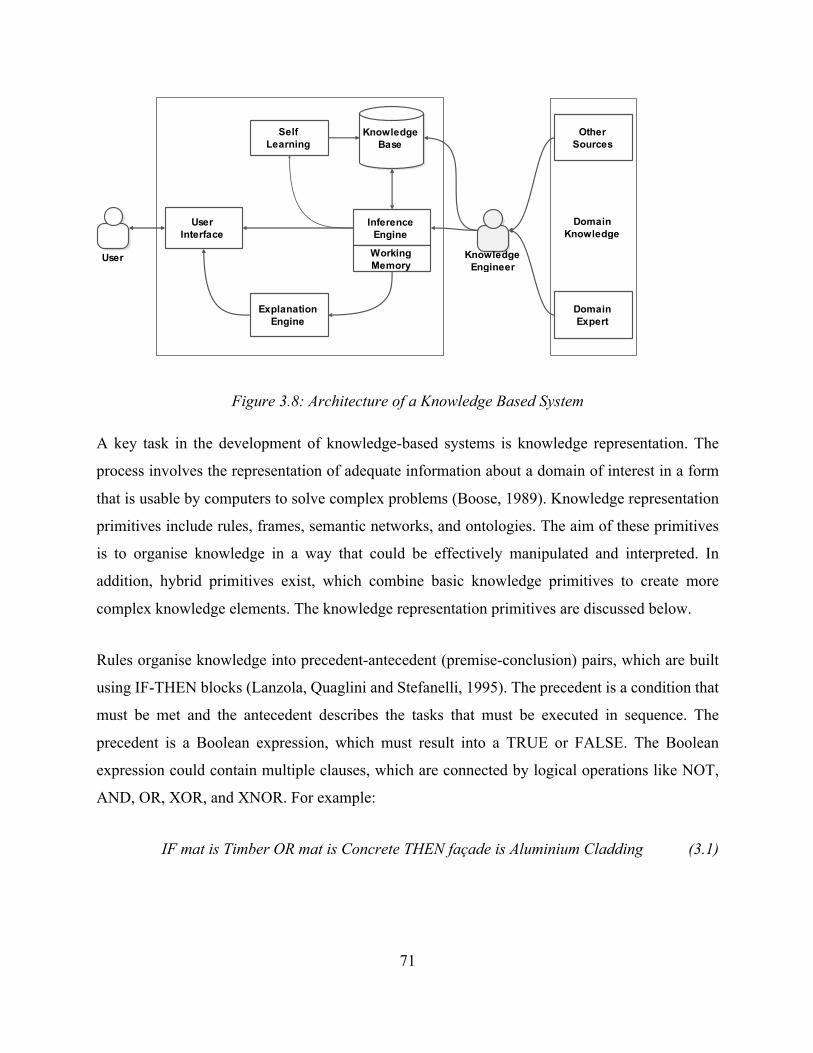
71
Figure 3.8: Architecture of a Knowledge Based System
A key task in the development of knowledge-based systems is knowledge representation. The
process involves the representation of adequate information about a domain of interest in a form
that is usable by computers to solve complex problems (Boose, 1989). Knowledge representation
primitives include rules, frames, semantic networks, and ontologies. The aim of these primitives
is to organise knowledge in a way that could be effectively manipulated and interpreted. In
addition, hybrid primitives exist, which combine basic knowledge primitives to create more
complex knowledge elements. The knowledge representation primitives are discussed below.
Rules organise knowledge into precedent-antecedent (premise-conclusion) pairs, which are built
using IF-THEN blocks (Lanzola, Quaglini and Stefanelli, 1995). The precedent is a condition that
must be met and the antecedent describes the tasks that must be executed in sequence. The
precedent is a Boolean expression, which must result into a TRUE or FALSE. The Boolean
expression could contain multiple clauses, which are connected by logical operations like NOT,
AND, OR, XOR, and XNOR. For example:
IF mat is Timber OR mat is Concrete THEN façade is Aluminium Cladding (3.1)
DomainKnowledge
DomainExpert
KnowledgeBase
OtherSources
KnowledgeEngineer
InferenceEngine
Working Memory
UserInterface
SelfLearning
ExplanationEngine
User
72
Figure 3.9: Processes in Knowledge Based System Development
The statement in Equation 3.1 clearly represents a piece of reusable knowledge because it states
that Aluminium cladding will be used if the condition that “material is timber or concrete” is
TRUE. This form of structure is a simple knowledge representation scheme, which is well
understood. However, a large rule-based knowledge representation model will require an equal
amount of rules and time to maintain its consistency (Akerkar and Sajja, 2010).
Using frames is a hierarchical way of mimicking human knowledge and reasoning, which
organises knowledge using IS-A relationships (Minsky, 1975). This makes a frame more
structured way of knowledge representation than rules (Davis, Shrobe and Szolovits, 1993). The
main strength of frame is that it allows a combination of procedural and declarative knowledge
within the same structure and reduces complexity by allowing hierarchical organisation of frames.
However, using frames could be inefficient as it does not provide an efficient way to store data
(Russell and Norvig, 2010).
KNOWLEDGE IDENTIFICATION
Knowledge sources and users' requirements
Conceptualisation
KNOWLEDGE ACQUISITION
Literature review, interviews, protocol analysis, observations etc.
Formalisation
KNOWLEDGE REPRESENTATION
Rules, frames, semantic networks, ontologies
Implementation
DECISION SUPPORT SYSTEM (DSS)
Reasoning techniques, computational thinking, AI
Testing
KNOWLEDGE VERIFICATION
To test efficiency of system
Usage
DSS USAGE AND INTEGRATION
User interface, integration with existing systems
Evaluation
Training
73
The limitation of rules and frames led to the development of more structured knowledge
representation techniques. Structured knowledge encapsulates the conceptual notion that
knowledge relies on entities to be represented as well as the interrelationships among the entities.
In most cases, this type of structure is achieved through a graph by representing entities as nodes
and relationships as edges/vertices. As such, semantic networks allow knowledge to be represented
as directed graphs to represent conceptual relationships among entities. A more robust structured
knowledge network is ontology (Corcho, Fernández-López and Gómez-Pérez, 2003). Ontology is
a commonly used term in analytical philosophy and computer science with conflicting definitions.
The broad use of ontology from a philosophical perspective is associated with the study of being.
However, in computer science studies, ontology refers to formal structured systems used to
represent knowledge about a particular concept (Gruber, 1993).
3.7.3.3 Evolutionary Algorithms
Evolutionary techniques are bio-inspired AI techniques that use metaheuristics to find solution to
a complex problem (Fogel, 2006). According to Blum and Roli (2003), metaheuristics combines
basic heuristics to explore search space of a problem for a solution at a reasonable computational
cost. However, heuristics are very difficult to generalise (Fogel, 2006). This means that
evolutionary techniques cannot guarantee optimality and it cannot determine how far a solution is
from optimum. Despite this limitation, evolutionary techniques are very effective for solving
highly complex problems such as optimisation and classification problems (Banzhaf, 2013; Eiben
and Smith, 2015). The main strength of evolutionary techniques is that they require little domain-
specific information and that they are easy to implement.
According to de la Fraga et al. (2011) the process of general evolutionary algorithm is as follows:
a) Generate the population of Parents: The first step in the identification of potential parents
for reproduction. This involves the identification of a set of possible solutions to the
problem using a random process. The solutions are benchmarked with the objective
functions and the solutions that best represent the function are selected
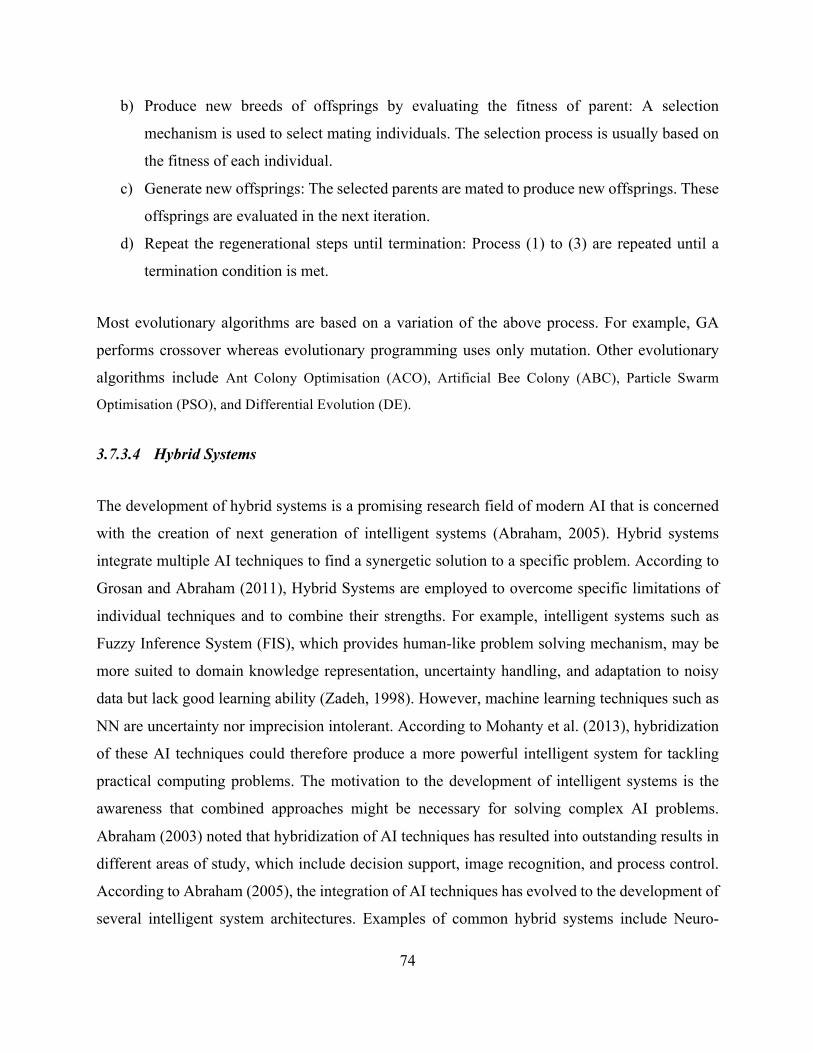
74
b) Produce new breeds of offsprings by evaluating the fitness of parent: A selection
mechanism is used to select mating individuals. The selection process is usually based on
the fitness of each individual.
c) Generate new offsprings: The selected parents are mated to produce new offsprings. These
offsprings are evaluated in the next iteration.
d) Repeat the regenerational steps until termination: Process (1) to (3) are repeated until a
termination condition is met.
Most evolutionary algorithms are based on a variation of the above process. For example, GA
performs crossover whereas evolutionary programming uses only mutation. Other evolutionary
algorithms include Ant Colony Optimisation (ACO), Artificial Bee Colony (ABC), Particle Swarm
Optimisation (PSO), and Differential Evolution (DE).
3.7.3.4 Hybrid Systems
The development of hybrid systems is a promising research field of modern AI that is concerned
with the creation of next generation of intelligent systems (Abraham, 2005). Hybrid systems
integrate multiple AI techniques to find a synergetic solution to a specific problem. According to
Grosan and Abraham (2011), Hybrid Systems are employed to overcome specific limitations of
individual techniques and to combine their strengths. For example, intelligent systems such as
Fuzzy Inference System (FIS), which provides human-like problem solving mechanism, may be
more suited to domain knowledge representation, uncertainty handling, and adaptation to noisy
data but lack good learning ability (Zadeh, 1998). However, machine learning techniques such as
NN are uncertainty nor imprecision intolerant. According to Mohanty et al. (2013), hybridization
of these AI techniques could therefore produce a more powerful intelligent system for tackling
practical computing problems. The motivation to the development of intelligent systems is the
awareness that combined approaches might be necessary for solving complex AI problems.
Abraham (2003) noted that hybridization of AI techniques has resulted into outstanding results in
different areas of study, which include decision support, image recognition, and process control.
According to Abraham (2005), the integration of AI techniques has evolved to the development of
several intelligent system architectures. Examples of common hybrid systems include Neuro-
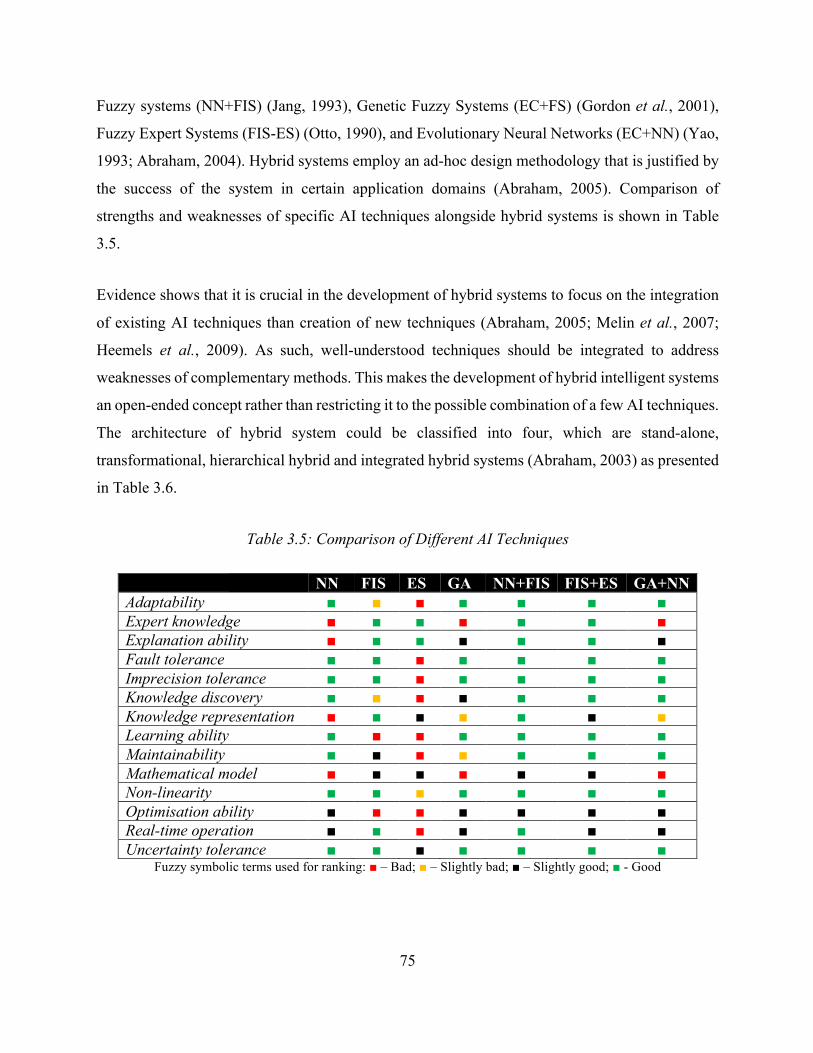
75
Fuzzy systems (NN+FIS) (Jang, 1993), Genetic Fuzzy Systems (EC+FS) (Gordon et al., 2001),
Fuzzy Expert Systems (FIS-ES) (Otto, 1990), and Evolutionary Neural Networks (EC+NN) (Yao,
1993; Abraham, 2004). Hybrid systems employ an ad-hoc design methodology that is justified by
the success of the system in certain application domains (Abraham, 2005). Comparison of
strengths and weaknesses of specific AI techniques alongside hybrid systems is shown in Table
3.5.
Evidence shows that it is crucial in the development of hybrid systems to focus on the integration
of existing AI techniques than creation of new techniques (Abraham, 2005; Melin et al., 2007;
Heemels et al., 2009). As such, well-understood techniques should be integrated to address
weaknesses of complementary methods. This makes the development of hybrid intelligent systems
an open-ended concept rather than restricting it to the possible combination of a few AI techniques.
The architecture of hybrid system could be classified into four, which are stand-alone,
transformational, hierarchical hybrid and integrated hybrid systems (Abraham, 2003) as presented
in Table 3.6.
Table 3.5: Comparison of Different AI Techniques
NN FIS ES GA NN+FIS FIS+ES GA+NN Adaptability ■ ■ ■ ■ ■ ■ ■ Expert knowledge ■ ■ ■ ■ ■ ■ ■ Explanation ability ■ ■ ■ ■ ■ ■ ■ Fault tolerance ■ ■ ■ ■ ■ ■ ■ Imprecision tolerance ■ ■ ■ ■ ■ ■ ■ Knowledge discovery ■ ■ ■ ■ ■ ■ ■ Knowledge representation ■ ■ ■ ■ ■ ■ ■ Learning ability ■ ■ ■ ■ ■ ■ ■ Maintainability ■ ■ ■ ■ ■ ■ ■ Mathematical model ■ ■ ■ ■ ■ ■ ■ Non-linearity ■ ■ ■ ■ ■ ■ ■ Optimisation ability ■ ■ ■ ■ ■ ■ ■ Real-time operation ■ ■ ■ ■ ■ ■ ■ Uncertainty tolerance ■ ■ ■ ■ ■ ■ ■
Fuzzy symbolic terms used for ranking: ■ – Bad; ■ – Slightly bad; ■ – Slightly good; ■ - Good
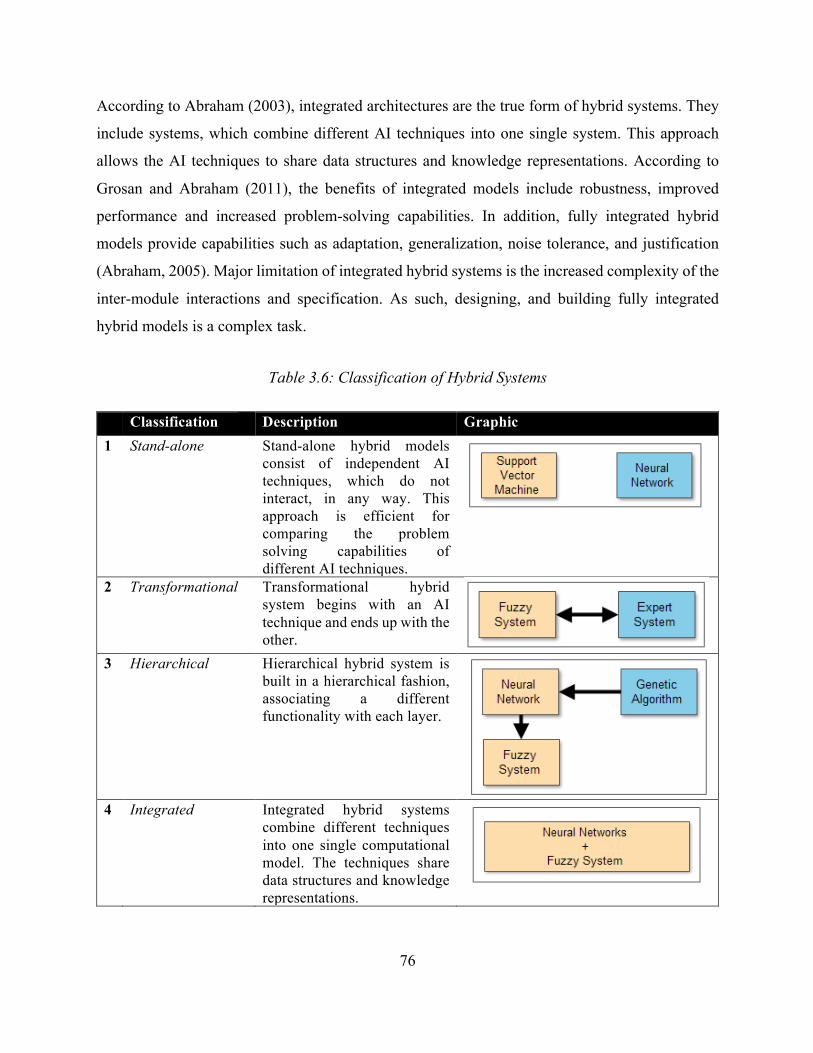
76
According to Abraham (2003), integrated architectures are the true form of hybrid systems. They
include systems, which combine different AI techniques into one single system. This approach
allows the AI techniques to share data structures and knowledge representations. According to
Grosan and Abraham (2011), the benefits of integrated models include robustness, improved
performance and increased problem-solving capabilities. In addition, fully integrated hybrid
models provide capabilities such as adaptation, generalization, noise tolerance, and justification
(Abraham, 2005). Major limitation of integrated hybrid systems is the increased complexity of the
inter-module interactions and specification. As such, designing, and building fully integrated
hybrid models is a complex task.
Table 3.6: Classification of Hybrid Systems
Classification Description Graphic 1 Stand-alone Stand-alone hybrid models
consist of independent AI techniques, which do not interact, in any way. This approach is efficient for comparing the problem solving capabilities of different AI techniques.
2 Transformational Transformational hybrid system begins with an AI technique and ends up with the other.
3 Hierarchical Hierarchical hybrid system is built in a hierarchical fashion, associating a different functionality with each layer.
4 Integrated Integrated hybrid systems
combine different techniques into one single computational model. The techniques share data structures and knowledge representations.
77
3.8 Summary
This chapter presents a detailed discussion of the concepts and benefits of BIM in the construction
industry. The three underpinning concepts of BIM are collaborative practices, technology as digital
delivery vehicle, and integrated project data. UK BIM maturity levels and the significance of BIM
in the changing UK construction industry were also discussed. Thereafter, review of BIM platform
was presented. The review of BIM platforms reveals the dominant market position of Revit and
its popular choice for BIM application development. This is because Revit platform provides
robust API that helps to extend Revit functionalities and it is compatible with several BIM and
CAD platforms. Afterwards, key features of BIM that are relevant for CW management were
identified and discussed. The key BIM features for CW management are: (i) team communication
and integration, (ii) parametric modelling and visualisation, (iii) building performance analysis
and simulation, (iv) automatic document generation, (v) improved building lifecycle management,
and (vi) software interoperability with other applications. BIM development tools were also
discussed. The categories of tools that were discussed include IFC development tools and BIM
software API.
The chapter also discusses the theoretical underpinning for the study. The study integrates theories
from various field to fulfil the epistemological and heuristic requirement of the study. It was
pointed out that the study majorly stems from the Dartmouth conference on the issue of machine
intelligence. Other theories include tragedy of the commons, theories of evaluation practices, and
evidential reasoning theories. These theories were used to formalise design-out-waste strategies
and to develop a mechanism to predict areas of possible waste reduction in the early design stages.
Pointedly, none of the theories is robust enough to fulfil the requirements of the proposed system.
As such, the goal of the study is not to verify these theories or use them to develop another theory.
However, their combination was employed to accomplish the aim of the study.
The last part of the chapter focuses on AI system development techniques. This part discusses four
main groups of AI models, which are machine learning techniques, knowledge based systems,
evolutionary algorithms, and hybrid systems. After a review of extant literature on AI model
development techniques, it was revealed that integrated hybrid systems provides the robustness
78
needed for solving complex real-life problems. Integrated hybrid models combine different AI
techniques into one single system for the AI techniques to share data structures and knowledge
representations.
The next chapter contains the research methodology adopted to achieve the objectives of the study.
As such, the next chapter presents the research design for the mixed methods study. The
justification for employing the research strategy as well as the data collection and analysis
procedure are also discussed.
79
4 RESEARCH METHODOLOGY
4.1 Overview
This chapter presents a detailed discussion of critical choice of methodology adopted to
accomplish the objectives of the study. The chapter presents the research design adopted for the
mixed methods study that incorporates results from qualitative data analysis into the design of the
quantitative inquiry. The justification for employing this research strategy as well as the data
collection and analysis procedure are also presented. An overview of the research methodology is
given in Table 4.1. The study adopted critical realism as a theoretical perspective in the spirit of
methodological plurality, which allows retrofitting of methods from competing paradigms. The
chapter starts with a discussion of the philosophical perspective adopted in the study and presents
justifications for the choice of critical realism. After this, discussion of the following is presented:
rationale for research approach, description of research sample, details of the research design, data
collection and analysis methods, ethical considerations, and issues of data validity and reliability.
The later part of the chapter contains model and software development methodologies. A review
of extant literature on software development reveals that there are several methodologies and
deciding among the available options is not trivial. As such, five software development
methodologies, which are waterfall model, incremental development, spiral development, agile
programming, and Rapid Application Development (RAD) were reviewed. RAD methodology
was adopted because the project is of small-to-medium scale and of short duration. In addition, the
objectives of the study and the user groups are well defined.
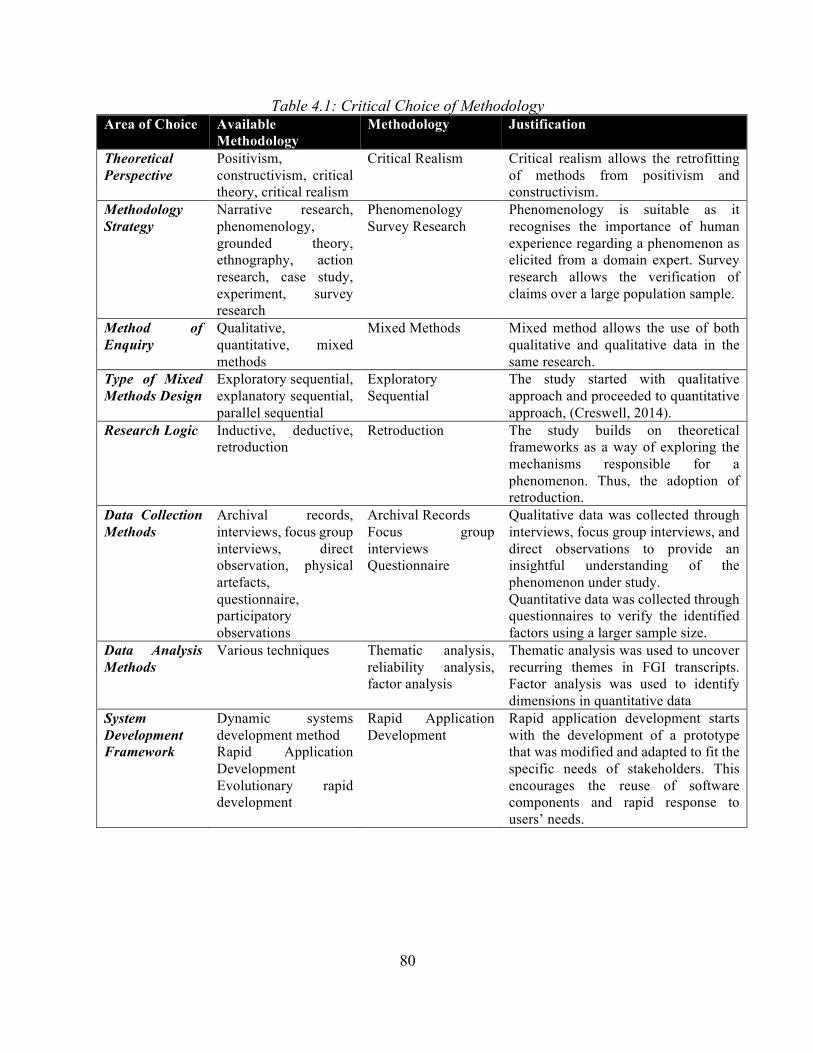
80
Table 4.1: Critical Choice of Methodology Area of Choice Available
Methodology Methodology Justification
Theoretical Perspective
Positivism, constructivism, critical theory, critical realism
Critical Realism Critical realism allows the retrofitting of methods from positivism and constructivism.
Methodology Strategy
Narrative research, phenomenology, grounded theory, ethnography, action research, case study, experiment, survey research
Phenomenology Survey Research
Phenomenology is suitable as it recognises the importance of human experience regarding a phenomenon as elicited from a domain expert. Survey research allows the verification of claims over a large population sample.
Method of Enquiry
Qualitative, quantitative, mixed methods
Mixed Methods Mixed method allows the use of both qualitative and qualitative data in the same research.
Type of Mixed Methods Design
Exploratory sequential, explanatory sequential, parallel sequential
Exploratory Sequential
The study started with qualitative approach and proceeded to quantitative approach, (Creswell, 2014).
Research Logic Inductive, deductive, retroduction
Retroduction The study builds on theoretical frameworks as a way of exploring the mechanisms responsible for a phenomenon. Thus, the adoption of retroduction.
Data Collection Methods
Archival records, interviews, focus group interviews, direct observation, physical artefacts, questionnaire, participatory observations
Archival Records Focus group interviews Questionnaire
Qualitative data was collected through interviews, focus group interviews, and direct observations to provide an insightful understanding of the phenomenon under study. Quantitative data was collected through questionnaires to verify the identified factors using a larger sample size.
Data Analysis Methods
Various techniques Thematic analysis, reliability analysis, factor analysis
Thematic analysis was used to uncover recurring themes in FGI transcripts. Factor analysis was used to identify dimensions in quantitative data
System Development Framework
Dynamic systems development method Rapid Application Development Evolutionary rapid development
Rapid Application Development
Rapid application development starts with the development of a prototype that was modified and adapted to fit the specific needs of stakeholders. This encourages the reuse of software components and rapid response to users’ needs.
81
4.2 Research Paradigms
Research Paradigms determine how the world and associated phenomena are perceived,
understood, and interpreted. Within social science field of study, paradigms are also referred to as
theoretical perspectives (Crotty, 1998), research methodologies (Neuman, 2009), and worldviews
(Creswell, 2014). However, the term research paradigm is adopted in this study to represent the
perceived view of the world. Paradigms are set of logically organised assumptions, concepts, and
propositions that shape the thinking of researchers (Bogdan and Biklen, 1998). This therefore
necessitates the adoption of a paradigm to ground a research in a consistent way. As such,
paradigms provide foundational beliefs that guide the frames of reference that researchers use to
choose of research strategies and methods as well as ontological and epistemological requirements
(Guba and Lincoln, 1994). This means that research paradigm addresses issues in research that
relates to ontology, epistemology, research methodology, and logic of reasoning.
4.2.1 Ontological and Epistemological Requirements of the Study
Ontology provides explanation about the nature of social reality (Crotty, 1998). It is a study of
being and it reflects how researchers interpret a phenomenon. As such, ontology helps to know
what actually exists, the nature of what exists, the constituents of what exists, and the interactions
amongst the constituents (Blaikie, 2007). This helps individuals to ascertain whether an entity is
real or relative in a social setting. Realism holds when social phenomenon could exist independent
of social actors. On the other hand, relativism holds when reality is constructed in active
correspondence with social actors. Based on the aim of the study to construct an instrument for
CW management at the design stage, a realist ontology was adopted. This is because it is widely
believed in the AEC industry that CW could be managed using well-established procedures. This
assumption reveals that there exist design-based approaches (either known or unknown) that could
be used to achieve low waste building project. This brings to the fore the need to develop a tool
that is independent of any social actor. The foregoing reveals that relativism could not underpin
the study as an ontological assumption.
82
The epistemological stance of a study depicts the ways through which knowledge could be
apprehended (Neuman, 2009). There are two basic epistemological perspectives, which are
objective and subjective epistemologies (Crotty, 1998). Objective epistemology requires that
research should be independent of the researcher and that an entity could be studied without being
influenced or influencing the entity (Guba and Lincoln, 1994). As such, Objectivists use pre-
defined research instrument, such as questionnaires and structured interview among others, for
data collection. Subjective epistemology requires that the researcher ensure a distance from the
phenomenon being investigated. This means that the phenomenon under study must be
investigated without influencing it (Burrell and Morgan, 1979). Thus, this makes the research
independent of the researcher because subjective epistemology opined that reality and meaning
are inter-subjectively constructed (Burrell and Morgan, 1979). This means that the world can only
be socially reconstructed while understanding it. Thus, subjective epistemology advocates
adequate interaction between the researcher and the phenomenon being studied.
Based on the objectives of the study, the two ways of knowing are relevant to the study. At the
start of the study, subjective epistemology is employed to gain in-depth understanding into existing
CW management practices and tools. In addition, it provides insights into the expectations of
industry practitioners on the use of BIM for CW management. This helps to identify list of factors,
which could be further tested through an objective epistemology. As such, the later part of the
study adopts objective epistemology to ensure that the results are representative of the research
population (Creswell, 2014). A research instrument was thereby developed and distributed to many
participants.
4.2.2 Available Research Paradigms
Several frameworks exist for understanding research paradigms. Two key frameworks are those
proposed by Burrell & Morgan (1979) and Guba & Lincoln (1994). The framework proposed by
Burrell and Morgan (1979) organises research into ‘mutually exclusive views of the social world’,
which include functionalist, interpretive, radical structuralist, and radical humanist paradigms as
shown in Figure 4.1. This classification has a much narrower perspective on paradigms and
incommensurability debate than Kuhn’s definition (Kuhn, 1970). However, this rigid view
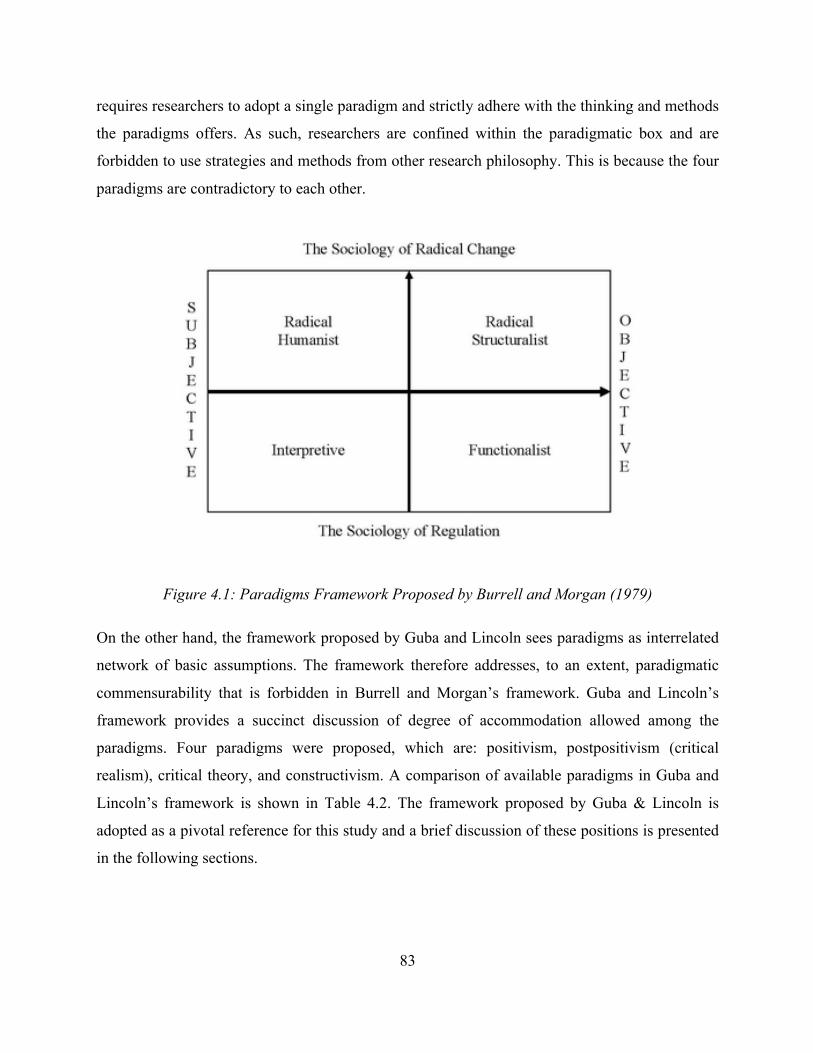
83
requires researchers to adopt a single paradigm and strictly adhere with the thinking and methods
the paradigms offers. As such, researchers are confined within the paradigmatic box and are
forbidden to use strategies and methods from other research philosophy. This is because the four
paradigms are contradictory to each other.
Figure 4.1: Paradigms Framework Proposed by Burrell and Morgan (1979)
On the other hand, the framework proposed by Guba and Lincoln sees paradigms as interrelated
network of basic assumptions. The framework therefore addresses, to an extent, paradigmatic
commensurability that is forbidden in Burrell and Morgan’s framework. Guba and Lincoln’s
framework provides a succinct discussion of degree of accommodation allowed among the
paradigms. Four paradigms were proposed, which are: positivism, postpositivism (critical
realism), critical theory, and constructivism. A comparison of available paradigms in Guba and
Lincoln’s framework is shown in Table 4.2. The framework proposed by Guba & Lincoln is
adopted as a pivotal reference for this study and a brief discussion of these positions is presented
in the following sections.
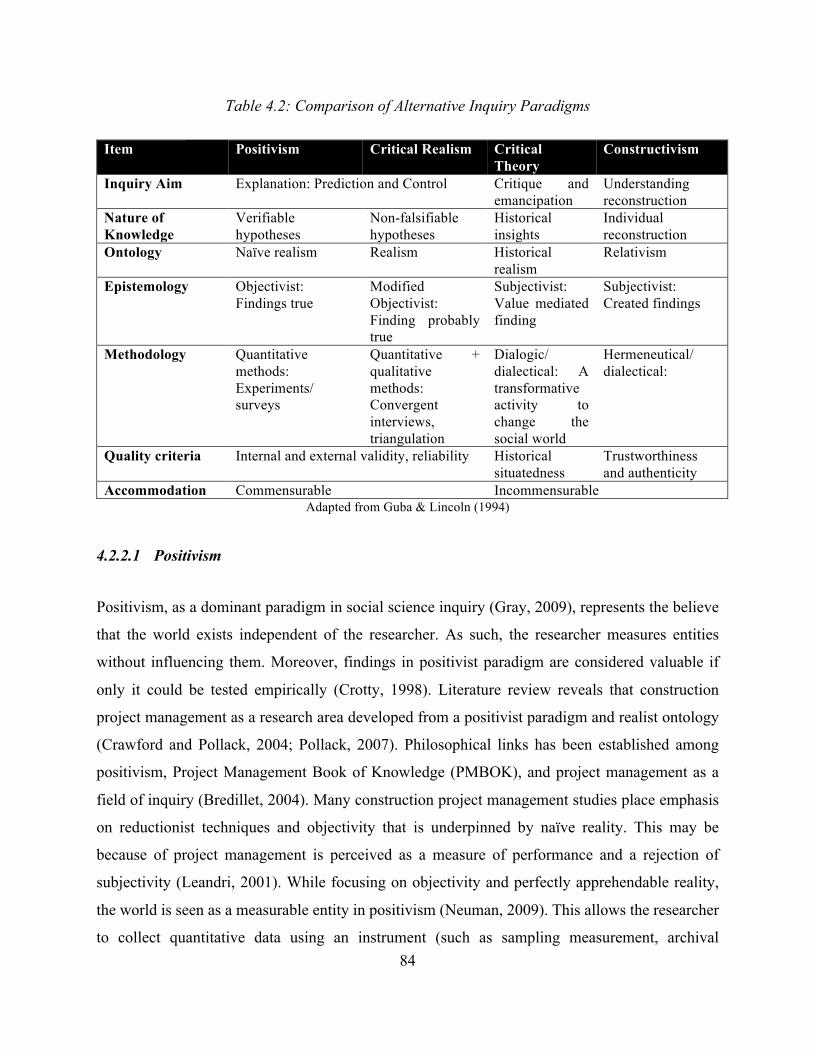
84
Table 4.2: Comparison of Alternative Inquiry Paradigms
Item Positivism Critical Realism Critical Theory
Constructivism
Inquiry Aim Explanation: Prediction and Control Critique and emancipation
Understanding reconstruction
Nature of Knowledge
Verifiable hypotheses
Non-falsifiable hypotheses
Historical insights
Individual reconstruction
Ontology Naïve realism Realism Historical realism
Relativism
Epistemology Objectivist: Findings true
Modified Objectivist: Finding probably true
Subjectivist: Value mediated finding
Subjectivist: Created findings
Methodology Quantitative methods: Experiments/ surveys
Quantitative + qualitative methods: Convergent interviews, triangulation
Dialogic/ dialectical: A transformative activity to change the social world
Hermeneutical/ dialectical:
Quality criteria Internal and external validity, reliability Historical situatedness
Trustworthiness and authenticity
Accommodation Commensurable Incommensurable Adapted from Guba & Lincoln (1994)
4.2.2.1 Positivism
Positivism, as a dominant paradigm in social science inquiry (Gray, 2009), represents the believe
that the world exists independent of the researcher. As such, the researcher measures entities
without influencing them. Moreover, findings in positivist paradigm are considered valuable if
only it could be tested empirically (Crotty, 1998). Literature review reveals that construction
project management as a research area developed from a positivist paradigm and realist ontology
(Crawford and Pollack, 2004; Pollack, 2007). Philosophical links has been established among
positivism, Project Management Book of Knowledge (PMBOK), and project management as a
field of inquiry (Bredillet, 2004). Many construction project management studies place emphasis
on reductionist techniques and objectivity that is underpinned by naïve reality. This may be
because of project management is perceived as a measure of performance and a rejection of
subjectivity (Leandri, 2001). While focusing on objectivity and perfectly apprehendable reality,
the world is seen as a measurable entity in positivism (Neuman, 2009). This allows the researcher
to collect quantitative data using an instrument (such as sampling measurement, archival
85
documents, and questionnaires) and use the data objectively rather than relying on subjective
judgements. In such studies, the researcher ensures a distance from the phenomenon being
investigated without influencing it (Guba & Lincoln, 1994).
Positivism remains the dominant methodological perspective in construction management studies.
As such, researchers employ quantitative methods such as questionnaires (Ahadzie, Proverbs and
Sarkodie-Poku, 2014; Hartono et al., 2014), regression analysis (Ghapanchi, Wohlin and Aurum,
2014; Liu and Wang, 2014), structural equation modelling (Bernroider, Wong and Lai, 2014; Ding,
Ng and Li, 2014), and experimental designs (Iorio and Taylor, 2014; Ishii, Takano and Muraki,
2014).
4.2.2.2 Constructivism
Constructivism is in total contrast with positivism; thus, rejecting its objectivist claims. This stance
opposes the claim that there is a single truth, which could be accurately discovered or apprehended.
As such, constructivism sees meaning as entities constructed through the active engagement of
human beings with the phenomenon being studied (Crotty, 1998). Thus, findings and meanings
are creations of the researcher’s mind through a subjectivist lens (Neuman, 2009). In rejection of
the positivist view, more studies in construction project management are becoming aligned
towards constructivism paradigm. This clearly shows a “paradigm shift” within the construction
project management inquiry, which has been dominated by positivism for a long time. Researchers
adopting constructivism as a paradigm employ methodologies such as grounded theory (Aubry,
Richer and Lavoie-Tremblay, 2014; Davies and Mackenzie, 2014) and ethnography (Maier and
Branzei, 2014; Musca et al., 2014). In addition, adopting qualitative methods such as interviews
(Ahern, Leavy and Byrne, 2014; Fulford and Standing, 2014), direct observation (van den Ende
and van Marrewijk, 2014; Liu and Wilkinson, 2014), and focus group discussion (Magnaye et al.,
2014).
A major criticism of constructivism is that, the concept of truth is socially constructed and relative
(Guba and Lincoln, 1994). As such, what is considered true in a social setting may be regarded as
false in other social formations. This therefore could be illustrated with the notion of “we may see
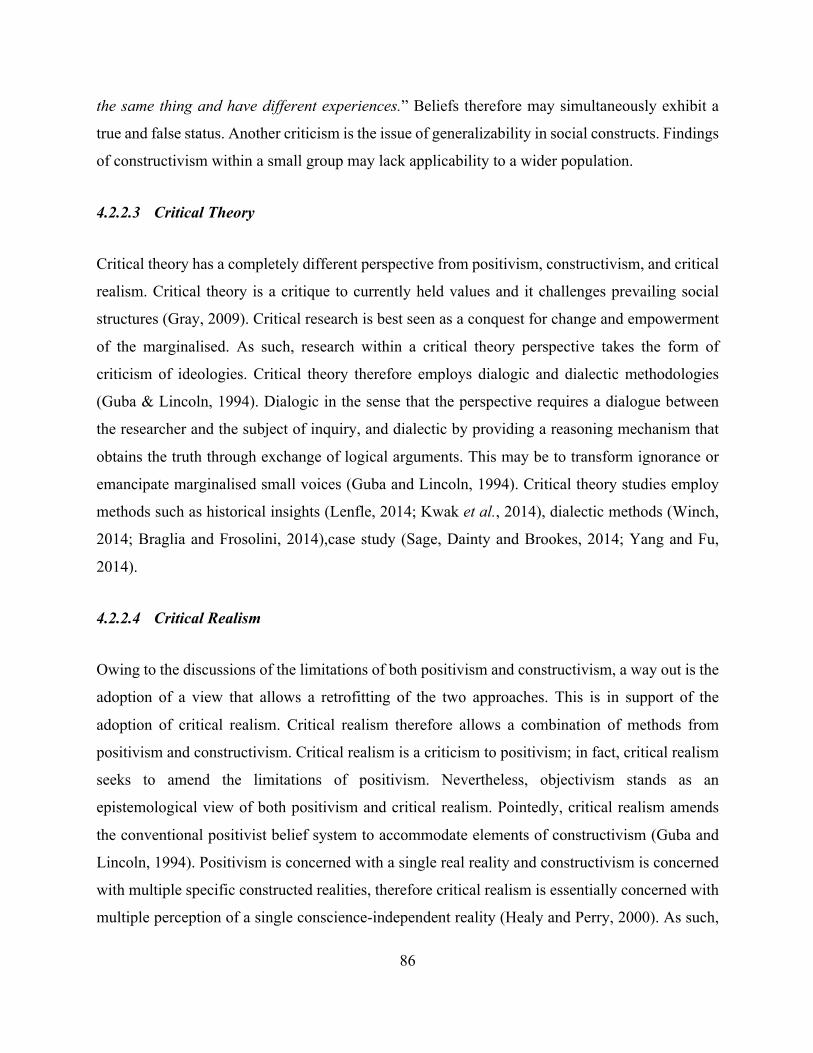
86
the same thing and have different experiences.” Beliefs therefore may simultaneously exhibit a
true and false status. Another criticism is the issue of generalizability in social constructs. Findings
of constructivism within a small group may lack applicability to a wider population.
4.2.2.3 Critical Theory
Critical theory has a completely different perspective from positivism, constructivism, and critical
realism. Critical theory is a critique to currently held values and it challenges prevailing social
structures (Gray, 2009). Critical research is best seen as a conquest for change and empowerment
of the marginalised. As such, research within a critical theory perspective takes the form of
criticism of ideologies. Critical theory therefore employs dialogic and dialectic methodologies
(Guba & Lincoln, 1994). Dialogic in the sense that the perspective requires a dialogue between
the researcher and the subject of inquiry, and dialectic by providing a reasoning mechanism that
obtains the truth through exchange of logical arguments. This may be to transform ignorance or
emancipate marginalised small voices (Guba and Lincoln, 1994). Critical theory studies employ
methods such as historical insights (Lenfle, 2014; Kwak et al., 2014), dialectic methods (Winch,
2014; Braglia and Frosolini, 2014),case study (Sage, Dainty and Brookes, 2014; Yang and Fu,
2014).
4.2.2.4 Critical Realism
Owing to the discussions of the limitations of both positivism and constructivism, a way out is the
adoption of a view that allows a retrofitting of the two approaches. This is in support of the
adoption of critical realism. Critical realism therefore allows a combination of methods from
positivism and constructivism. Critical realism is a criticism to positivism; in fact, critical realism
seeks to amend the limitations of positivism. Nevertheless, objectivism stands as an
epistemological view of both positivism and critical realism. Pointedly, critical realism amends
the conventional positivist belief system to accommodate elements of constructivism (Guba and
Lincoln, 1994). Positivism is concerned with a single real reality and constructivism is concerned
with multiple specific constructed realities, therefore critical realism is essentially concerned with
multiple perception of a single conscience-independent reality (Healy and Perry, 2000). As such,
87
critical realism combines features of both positivism and constructivism. This perspective
therefore subjects real objects to value laden observations.
Critical realism as a paradigm extends positivism beyond the conscience-free reality, which is
probabilistically discoverable, to allow experience based mechanisms. Therefore, both quantitative
and qualitative methodologies are permissible in critical realism researches. As such, a mixture of
methods such as case studies, interviews, surveys, and statistical analysis techniques are allowed.
This approach is known as triangulation (Denzin, 1970). In the current literature, critical realism
is also referred to as neopostpositivism or realism (Krauss and Putra, 2005). However, the term
critical realism encompasses current discussions on realism, postpositivism, and
neopostpositivism.
Critical realism researchers may choose to combine interviews with questionnaire survey (Cheng,
2014; Tasevska, Damij and Damij, 2014), experimental designs (Yang, 2014), structural equation
modelling (Yang, Huang and Hsu, 2014; Feng et al., 2014), or system dynamics (Zhang et al.,
2014). This perspective is becoming popular because it gives researchers more freedom in the
choice of methods.
4.2.3 Adopted Research Paradigm for the Study
From the critical evaluation of the paradigms, a positivist paradigm is not a viable choice. This is
because the researcher needs to immerse himself/herself in the experience of the researched to
understand how he thinks. As such, the study is not only concerned with prediction and control, in
fact understanding too plays a major role in this case. Reconstructing the designers’ world is
needed to understand the form of knowledge for designing out waste. This therefore points in the
adoption of constructivism in the construction of the design out waste strategies; however, it is
also confronted by challenges that have been discussed. Owing to the rigour and flexibility that
critical realism paradigm offers, the study therefore adopts a critical realism philosophical
standpoint that focuses on applications that work in obtaining a solution to a problem
(Onwuegbuzie and Leech, 2005). Thus, critical realism empowers researchers with all available
resources to understand the research problems. This helps researchers to focus their attention on
88
the research problems and using pluralistic approaches to extract knowledge to the solution of the
problem (Morgan, 2007).
Critical realism, as a philosophical underpinning, is not committed to one system of reality. As a
result, it confers on the researcher the freedom of choice among methods, procedures, tools, and
techniques that best suit the need and purpose of the research. Thus, this gives the researcher the
liberty to use data collection and analysis methods from both quantitative and qualitative
approaches. This therefore makes critical realism the most appropriate for this study within a
mixed methods research design.
Within a critical realism viewpoint, mixed methods research combines both quantitative and
qualitative research approaches to meet the needs of a larger audience (Smith, 1997). A comparison
of qualitative and quantitative research methodologies is presented in Table 4.3. A mix of this
research approaches is beneficial as organisational decisions are mostly made by multiple
individuals with different philosophical background and diverse interests and perspectives on the
validity or/and credibility of information (Patton, 1997). Some of the individuals may believe that
positivist studies are the most reliable information while others may believe that constructivism
provides a more authentic representation of information. This may result to a conflict of interest
on which of the two types of information, quantitative or qualitative, will be used for decision-
making.
Critical realism, as a mixed methods philosophy, is equipped to address the practical challenges
and uncertainties of research (O’Cathain, Murphy and Nicholl, 2007). Thus, critical realism allows
researchers to combine the benefits of conflicting philosophical perspectives in seeking solution
to a particular problem. As popularly acknowledged in the literature, positivist and constructivist
philosophical worldview have serious limitations. Critical realism therefore addresses these
limitations by allowing critical retrofitting of beneficial strategies from the two paradigms.
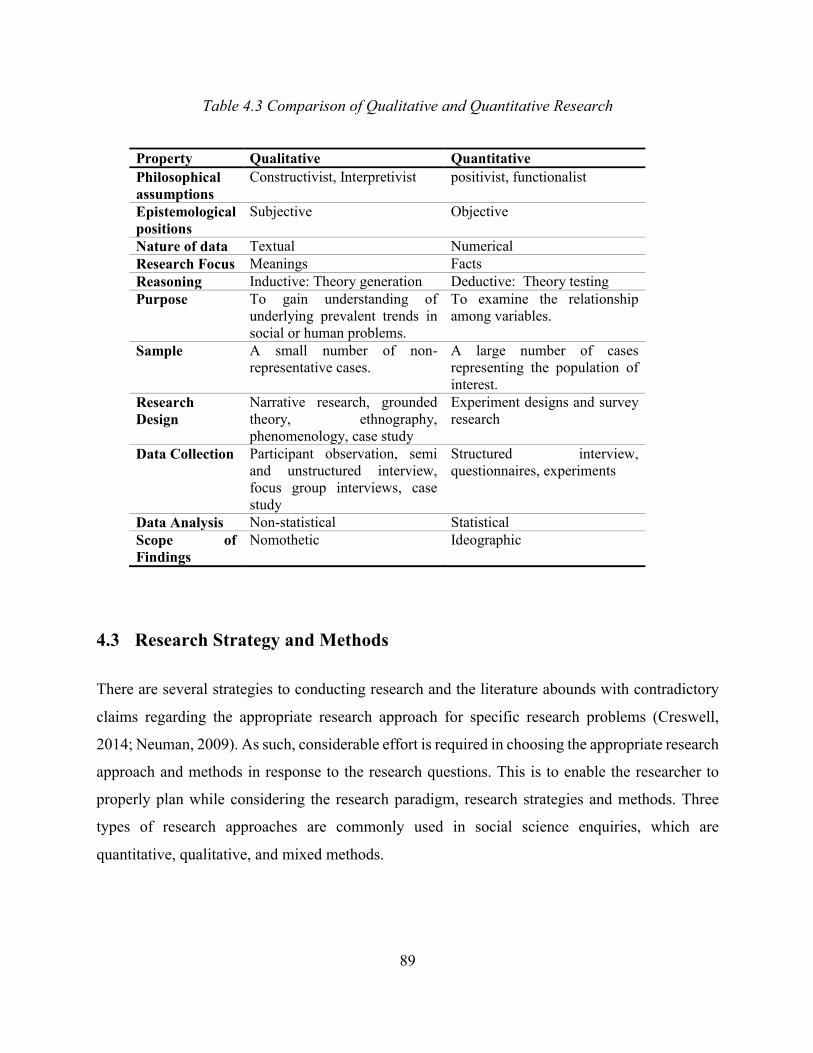
89
Table 4.3 Comparison of Qualitative and Quantitative Research
4.3 Research Strategy and Methods
There are several strategies to conducting research and the literature abounds with contradictory
claims regarding the appropriate research approach for specific research problems (Creswell,
2014; Neuman, 2009). As such, considerable effort is required in choosing the appropriate research
approach and methods in response to the research questions. This is to enable the researcher to
properly plan while considering the research paradigm, research strategies and methods. Three
types of research approaches are commonly used in social science enquiries, which are
quantitative, qualitative, and mixed methods.
Property Qualitative Quantitative Philosophical assumptions
Constructivist, Interpretivist positivist, functionalist
Epistemological positions
Subjective Objective
Nature of data Textual Numerical Research Focus Meanings Facts Reasoning Inductive: Theory generation Deductive: Theory testing Purpose To gain understanding of
underlying prevalent trends in social or human problems.
To examine the relationship among variables.
Sample A small number of non-representative cases.
A large number of cases representing the population of interest.
Research Design
Narrative research, grounded theory, ethnography, phenomenology, case study
Experiment designs and survey research
Data Collection Participant observation, semi and unstructured interview, focus group interviews, case study
Structured interview, questionnaires, experiments
Data Analysis Non-statistical Statistical Scope of Findings
Nomothetic Ideographic
90
4.3.1 Qualitative Research
Qualitative research mostly adopts an inductive approach that is concerned with theory generation.
In this form of research approach, textual data are most appropriate. The research process starts
data collection and analysis to identify themes towards theory creation (Gray, 2009). The major
strength of qualitative research strategies is that they provide more depth into the phenomenon
under investigation; however, it requires a long time to accomplish. The most widely used
qualitative research strategies are ethnography, grounded theory, phenomenology, and case study.
Ethnography is a research methodology where the researcher is in contact with a cultural group
in natural settings over a long time (Denscombe, 2014). This allows researchers to collect
observational data as well as artefacts in support of a fact. Thus, the strategy provides an in-depth
understanding of the research questions. Ethnography allows researchers to understand what the
cultural groups under study do and how they do it. The major strength of ethnography is its
flexibility and access for lived realities (Walford, 2010); however, it requires a long period to
conduct. Primary research methods often employed include observation (participant and non-
participant) and interviews.
Grounded theory is a research strategy in which a theory of process or behaviour is derived and
grounded in the views of the participants (Creswell, 2014). This strategy adopts an inductive
reasoning approach towards theory generation. On the other hand, phenomenology involves an
investigation into participant’s worldview and experiences. As such, the researcher’s experience
is suppressed to understand the experience of the participants. Research methods commonly in
grounded theory and phenomenology include semi-structured and unstructured interviews.
Stake (2005) and Simons (2009) argues that case study is not a method of choice but a choice to
focus on the case for a period for an in-depth exploration. According to Yin (2009), case studies
are employed in research for several reasons that include: (a) when the focus of a research study
is to seek answers to “how” and “why” types of questions; (b) when the researchers have no control
over the behaviour of those under study; (c) when researchers want to learn more on the contextual
conditions relevant to the phenomenon under study; and (d) when researchers need to understand
the boundaries between the subject of study and the context. All these four reasons provide a
91
justification for the inclusion of case studies in this study. Pointedly, case studies help to
demonstrate how theories work in reality and to test whether a particular theoretical approach will
work under specific settings. Two varieties of case study approaches exist, which are single, case
study and multisite case studies. Single case study employs a single site of study while multiple
case studies employs data from multiple sites using multiple methods and multiple data analysis
approaches. A multisite case study is selected for this study because it provides a holistic view of
a complex phenomenon and provides a wide range of generalizability (Denscombe, 2014).
4.3.2 Quantitative Research
Quantitative research mostly adopts a deductive research approach that is concerned with
hypothesis/theory testing and examining relationships among variables. The research process
starts with the formulation of hypotheses or conceptual models, informed by theories and literature,
and followed by data collection and analysis to verify the prior formulations (Gray, 2009). This
approach is in support of the adoption of a positivist theoretical perspective (Creswell and Clark,
2007). The major strengths of quantitative research strategies are that they do not require a long
time in data collection and quantitative data analysis techniques are quite familiar.
The most widely used quantitative research strategies are experimental designs and survey
research. Survey is the most widely adopted research strategy in construction project management
studies. Survey research provides a powerful mechanism to investigate a phenomenon using a
representative sample of the entire population. Survey enables the numeric description of opinion
and trend (Creswell, 2014), as such, helping to generalise from a sample to a population. Galiers
(1992) argues that surveys help to identify more variables/factors than experimental approaches.
The major data collection instrument used in surveys is questionnaire, which could contain closed-
ended and/or open-ended questions.
The most common questionnaire surveys are self-administered and posted questionnaires but web-
based questionnaire (using services such as SurveyMonkey, QuestionPro, and KwikSurveys) are
becoming popular. Using a web questionnaire helps to ensure good practice, encourage
92
completion, reduce potential errors and to aid data processing/analysis (Bhaskaran and LeClaire,
2010).
4.3.3 Mixed Methods Research
Mixed methods research strategy involves the combination of both qualitative and qualitative data
in a research. In this way, both forms of data are collected and analysed to gain a deeper insight
into the research problem. Although several terms are used to refer to this approach, such as multi-
methods, mixed methodology, integrating methodology, and quantitative and qualitative methods,
however, the term mixed methods strategy is the most used in recent times (Tashakkori and
Creswell, 2007). Mixed methods became popular in the early 1990 (Creswell, 2014) among
researchers in education, health sciences, demography, sociology, and management. This is
because mixed methods allow the comparison of different perspectives drawn from both
qualitative and quantitative data. And the use of both qualitative and quantitative research methods
in a single study has been proved to be more effective than a single strategy (Sandelowski, 2000;
Brannen, 2005). As such, maximising the merits of both qualitative and quantitative strategies
while minimising the limitations of both strategies. As such, mixed methods strategy primarily
draws on the concept of triangulation where different data sources are examined for evidence to
build research themes.
Although there are several typologies for classifying mixed methods strategies, three basic
classifications are common, which are: (i) Convergent Parallel Mixed Methods: Which starts with
both qualitative and quantitative data concurrently and comparing results; (ii) Explanatory
Sequential Mixed Methods: which starts with quantitative data collection and analysis followed
by qualitative data collection and analysis; and (iii) Exploratory Sequential Mixed Methods:
Which starts with qualitative data collection and analysis followed by quantitative data collection
and analysis (Creswell, 2014).
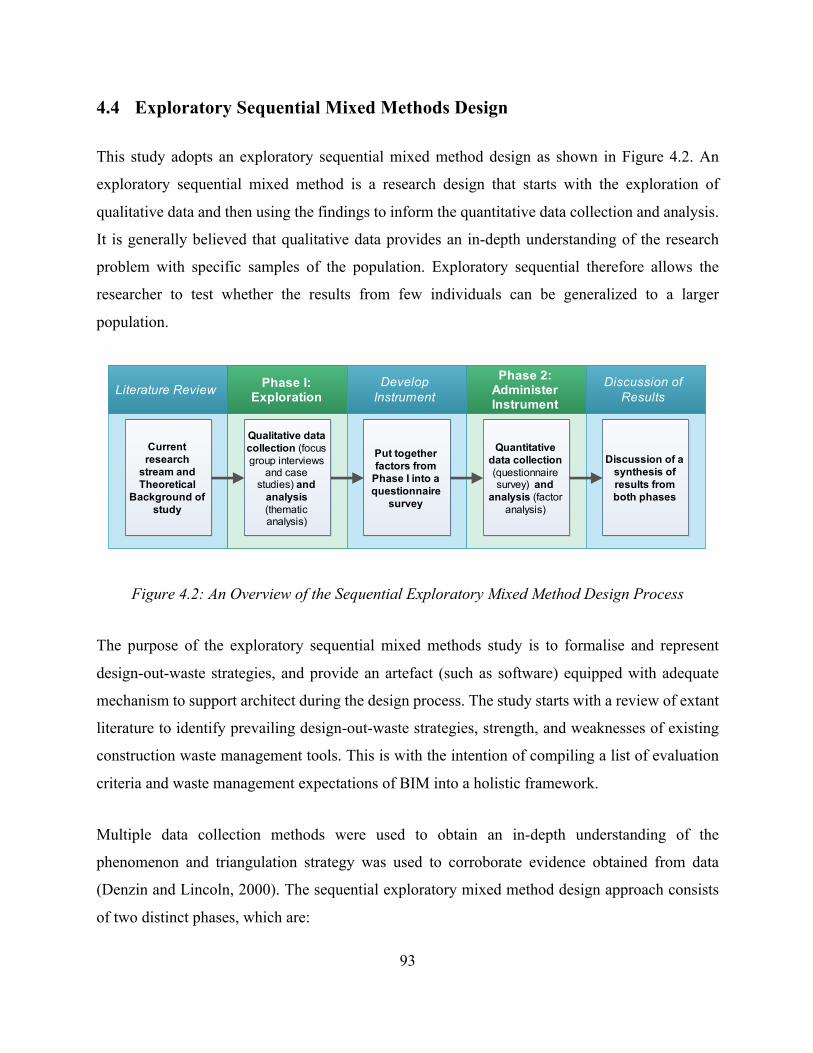
93
4.4 Exploratory Sequential Mixed Methods Design
This study adopts an exploratory sequential mixed method design as shown in Figure 4.2. An
exploratory sequential mixed method is a research design that starts with the exploration of
qualitative data and then using the findings to inform the quantitative data collection and analysis.
It is generally believed that qualitative data provides an in-depth understanding of the research
problem with specific samples of the population. Exploratory sequential therefore allows the
researcher to test whether the results from few individuals can be generalized to a larger
population.
Figure 4.2: An Overview of the Sequential Exploratory Mixed Method Design Process
The purpose of the exploratory sequential mixed methods study is to formalise and represent
design-out-waste strategies, and provide an artefact (such as software) equipped with adequate
mechanism to support architect during the design process. The study starts with a review of extant
literature to identify prevailing design-out-waste strategies, strength, and weaknesses of existing
construction waste management tools. This is with the intention of compiling a list of evaluation
criteria and waste management expectations of BIM into a holistic framework.
Multiple data collection methods were used to obtain an in-depth understanding of the
phenomenon and triangulation strategy was used to corroborate evidence obtained from data
(Denzin and Lincoln, 2000). The sequential exploratory mixed method design approach consists
of two distinct phases, which are:
Literature Review Phase I: Exploration
Develop Instrument
Phase 2: Administer Instrument
Discussion of Results
Current research
stream and Theoretical
Background of study
Quantitative data collection (questionnaire survey) and
analysis (factor analysis)
Qualitative data collection (focus group interviews
and case studies) and
analysis (thematic analysis)
Put together factors from
Phase I into a questionnaire
survey
Discussion of a synthesis of results from both phases
94
PHASE 1: Qualitative data collection and analysis – After an extensive review of
literature, this phase used phenomenology approach to collect textual data through focus
group interviews. The data was analysed using appropriate coding scheme to uncover the
themes and structures within the data. The results of the analysis from this phase was used
to develop an instrument with good reliability and validity.
PHASE 2: Quantitative data collection and analysis – This phase built on the results
of the initial qualitative data collection and analysis. Quantitative data was collected using
questionnaire survey and the data was subjected to exploratory factor analysis. The goal of
this phase is to help rank the factors obtained from Phase 1 according to their significance
in designing-out construction waste.
The results obtained from the two phases were then synthesised and used to discuss the outcome
of the entire study. Prior to the qualitative phase 1 of the study, review of extant literature was
done by compiling of relevant papers (on construction waste management strategies and tools)
from peer reviewed journals. This was followed by a filtering process to ensure the papers match
the research scope. This was done by scanning the titles and abstract, and imposing certain
exclusion criteria to remove papers outside the scope of this study. As such, publications on
nuclear/radioactive waste, municipal solid waste and waste from electronic and electrical
equipment were excluded. The scope of the literature review is to include publications that have
direct impacts on construction waste reduction. After the filtering process, a cross-examination of
the identified papers was done by manually scanning through the references cited. The literature
review was done with the aim of identifying: (a) current research streams in CW management, (b)
current strategies for designing out construction waste, (c) strengths and weaknesses of existing
CW management tools, and (d) BIM requirements for CW management. All these provide an
expository overview of the current waste management practices within the construction industry.
Methods of collecting qualitative data include interviews, focus group interviews, direct
observation, participatory observation, and case studies (Hancock, Ockleford and Windridge,
1998). These qualitative data collection methods facilitate in-depth study and detailed
understanding of a phenomenon using a small sample size. However, qualitative data collection
requires a great deal of time to plan and the data analysis/interpretation also requires a level of
95
expertise and experience. Therefore, after a thorough review of extant literature on existing waste
management strategies and tools (software and toolkits), a qualitative study involving Focus Group
Interviews (FGI) with professionals within the top UK construction industry was carried out. The
FGIs provide the avenue to bring together real-life project team participants with the aim of
discussing different ways by which construction waste related issues are addressed. The choice of
FGIs were made as over individual interviews with participants, since it allows participants to
express their personal opinions based on their experiences and allows participants to build on
responses by others. Thus, FGIs enables deeper insights into group thinking and shared beliefs
(Creswell, 2014).
FGI was selected to provide a wide access to a range of evaluation criteria beyond those identified
in the literature. It would also help to confirm the validity and applicability of the criteria discussed
in the literature before been used to develop a BIM framework for waste management. The FGIs
would also help to identify the perception and expectations of BIM and industry needs of
construction waste management tools, and to understand the role of BIM-based technologies in
the adoption and implementation of construction waste management strategies and tools. The FGIs
was proactively moderated by the research team to maintain openness and contributions from
every member of each FGI.
The discussion by each group was based on how the team have employed strategies and tools in
mitigating against construction waste in different projects. The participants were encouraged to
discuss openly the attributes that have been useful for effective construction waste prevention and
reduction. Interaction among the participants of the FGIs was recorded and later compared
alongside all the notes taken to ensure important information is captured. After this exercise, a list
of design-out-waste factors was compiled and put together in a questionnaire survey. The
questionnaire survey was carried out to validate our finding from the literature review, FGIs and
case studies on a larger sample.
96
4.5 Ethical Considerations
The research does not target any group of people that require special ethical considerations. Since
the research involves professionals (contractors, architects, suppliers, and lean practitioners), only
the privacy, confidentiality, and anonymity of FGIs participants and questionnaire respondents are
required. During the literature review, all sources of scholarly information was accurately
referenced. Sources of data was also acknowledged during research dissemination to ensure data
reliability.
During the FGIs, the research complies with the Economic and Social Research Council (ESRC)
ethical requirements by seeking appropriate ethical permission for the study. Accordingly, the
consent of the participants was sought before conducting the FGIs. A consent note was developed
to provide participants with the purpose of the research, their role in the research, how the data
was protected, and how their privacy and confidentiality was ensured. The consent note provides
an opportunity to participants to see the interview transcript before analysis. The analysis of the
interview transcripts adopts a coding scheme to protect the respondents’ privacy, confidentiality,
and anonymity. Data from the FGIs was also securely protected against theft or unauthorised
usage. Likewise, the first section of the questionnaire survey provides respondent with information
such as the purpose of the research as well as how data will be stored, used, and destroyed.
4.6 Software Development Methodologies
Following the development of appropriate hybrid system for CW prediction is the development of
BIM software to implement the models. As such, a software development methodology is required
to plan and manage the activities of the development process. It also provides a means of tracking
specific deliverables across the software development lifecycle (Livermore, 2007). Geambaşu et
al. (2011) highlights that there are several factors that could influence the choice of software
development methodology. These factors include software complexity, team size, cost, and clarity
of requirement. A review of extant literature on software development reveals that there are several
and deciding among the available options is not trivial. This section reviews five software
97
development methodologies, which are waterfall model, incremental development, spiral
development, agile programming, and Rapid Application Development (RAD).
4.6.1 Waterfall Model
Waterfall model is a traditional and the most basic methodology in software development. It is a
sequential methodology where software development is carried out as a steady flow of activities.
According to Royce (1970), basic principle of waterfall model follows three stages, which are: (a)
Division of project into sequential phases, (b) Planning of time, cost, and resources for the entire
system at the beginning, and (c) Tight control of resources is maintained over the development
lifecycle of software. Despite its simplicity, a major criticism of waterfall methodology is that it
does not allow a prior phase to be revisited after completion. This makes the approach to be
inflexible and it seldom result in cost overrun. In addition, waterfall methodology requires clarity
of system specification and requirement at an initial stage. Therefore, clients that do not know the
exact requirement and may change their requirement as development progresses may hinder the
success of this approach (Parnas and Clements, 1986). Changes during development could
eventually lead to system redesign, and redevelopment, which will eventually increase the costs.
It has also been shown that cost overrun may be inevitable because software developers may be
unaware of future challenges that would be encountered as the development process proceeds in a
strict waterfall model framework.
4.6.2 Incremental Development
Incremental software development reduces project risk by breaking software development project
into series of linked mini projects. Each mini project helps to add specific functionality to the
system. The mini projects also provide ease of incorporating changes to requirements during the
software development process. Incremental development could be done in different ways. The first
variant is completing a series of mini-waterfall tasks for various parts of the system. The second
variant is defining the overall requirement for the system before starting series of mini-waterfall
development for each component. A major weakness of incremental development is that there is
no consideration of the business needs and the technical requirements for the entire system
98
especially when parts of the system are implemented using waterfall approach (CMS, 2005).
Another limitation is that difficult tasks tend to be implemented towards the end of the project to
demonstrate early success.
4.6.3 Spiral Development
Spiral development methodology combines some key aspect of the waterfall model and rapid
prototyping methodologies (Boehm, 1988). As such, spiral development helps to combine the
strengths of top-down and bottom-up software development concepts. CMS (2005) highlights four
principles of spiral development as follows:
1) Risk assessment: This is done by dividing the project into smaller segment. This enables
ease of incorporating changes and risk evaluation
2) A cycle involves the same sequence of steps.
3) Each segment transverses a spiral using the following steps: (i) determine objectives and
alternatives (ii) evaluate alternatives, (iii) verify deliverables, and (iv) start next iteration
(Boehm, 1988)
4) Stakeholders are identified and a new cycle begins.
A key limitation of spiral development methodology is that it is difficult to know the composition
of methodologies to adopt during each cycle (CMS, 2005). As such, project managers that are
highly skilled and with many years of experience are required to apply spiral development in
projects. In addition, since there are no firm deadlines, the cycles continue with no clear
termination condition. This means there is the risk that the project may not be completed to budget
or to time (Boehm, 2000).
4.6.4 Agile Programming
According to Nerur et al. (2005), Agile software development seeks to overcome the limitations
of traditional development methodology such as Waterfall, iterative, and spiral developments. The
term "Agile Programming" was coined in the Agile manifesto of 2001 (Fowler and Highsmith,
99
2001). The basic principle of agile programming is using simple practices to encourage the
engagement of developers, managers, and clients (Thomas, 2005). As such, the software evolves
over time as client's and managers' requirements change without need for application rebuild. The
main Agile programming methods are Extreme Programming (XP), Crystal methodologies,
Dynamic Software Development Methods, Feature-driven development, Lean Software
development and Scrum (Abrahamsson et al., 2002). However, Extreme Programming (XP) is
most widely used because it shares the same values of the Agile Manifesto (Lindstrom and Jeffries,
2004).
According to Beck (1999), XP is a software development methodology that mitigates risk at all
levels and to the needs of small teams dealing requirements that are vague and that could change.
Kircher et al. (2001) highlights 12 practices of XP, which are planning game, small releases,
metaphor, simple design, testing, refactoring, pair programming, collective ownership, continuous
integration, 40-hour week, on-site customer, and coding standard. These XP practices are based
on assumptions that developers have close physical proximity with each other and that the
development theme has close customer engagement. Although it is possible for team members to
work in a distributed environment (Kircher et al., 2001). According to Turk et al. (2002),
limitations of agile programming methods is limited support for: (i) subcontracting, (ii) reusable
artefacts, (iii) large teams (iv) developing safety-critical software, and (v) developing complex
software.
4.6.5 Rapid Application Development
Rapid Application Development (RAD) methodology condenses software development process to
produce high quality system with relatively low costs than traditional (Beynon-Davies et al.,
1999). This methodology enables software developers to adjust quickly to changing customers’
needs in a dynamic market (Agarwal et al., 2000). Changes are allowed during the development
process because the methodology divides software development into smaller components and it
associates specific deliverable and deadline to each component. Accordingly, priority is assigned
to the components to know which of the requirement can be completed within the time assigned
(Coleman and Verbruggen, 1998). RAD could be seen as a hybrid methodology, which has
100
features of spiral development process. RAD requires active correspondence between the
development team and users to obtain software delivery in a quick way. Key steps in the
development of software system using RAD are:
a) User requirement gathering using methods such as case studies and focus group;
b) Development of a prototype and early iterative involvement of end-users in design testing.
c) Design and user interface improvement to next software version release using a rigidly
paced schedule; and
d) Active correspondence with end users for software reviews. This runs in parallel to the
software development process.
RAD methodology was adopted due to the nature of the study. Considering that the project is of
small-to-medium scale, of short duration favours the choice of RAD, and that the objectives of the
study and the user groups are well defined. Considering that functionalities of the proposed system
are clearly visible at the user interface also reveals that RAD will engender active user
involvement. In addition, RAD methodology offers several benefits, which include quick software
delivery time, reduction in development costs, and mitigation of risks by including the end users
in the development team. As such, RAD allows end users to interact with prototypes of the system
from early development stages. This seamlessly helps to incorporate changing requirements into
the system in a quick way.
4.7 Summary
In summary, this chapter provides a detailed description of the research methodology for the study.
The study adopted a critical realism philosophical viewpoint and employed a mixed method
research design. The sequential exploratory mixed method study starts with qualitative data
collection and analysis followed by the quantitative data collection and analysis. Two data-
collection methods were employed, including focus group interviews, and questionnaire survey.
The data were reviewed against literature as well as emergent themes. Validation and reliability
were accounted for through various strategies, including source and method triangulation. As such,
the result of the qualitative analysis was developed into a questionnaire survey to verify the
101
identified factors with a larger population. The later part of the chapter focused on model and
software development methodologies. A detailed discussion of ANFIS as an integrated hybrid
system was presented. The structure and description of the components of ANFIS were also
presented. After that, software development methodologies were discussed. A review of extant
literature on software development reveals that there are several and deciding among the available
options is not trivial. As such, five software development methodologies, which are waterfall
model, incremental development, spiral development, agile programming, and Rapid Application
Development (RAD) were compared. RAD methodology was adopted due to its nature of the
study. Considering that the project is of small-to-medium scale and of short duration favours the
choice of RAD.
This next chapter assesses the expectations of stakeholders on BIM strategies for CW management
analytics. Understanding the expectations of stakeholders is an important consideration for the
deployment and acceptance of BIM-based practices for CW management within the construction
industry. As such, the next chapter contains a discussion of the data collection and analyses
processes.
102
5 HOLISTIC BIM FRAMEWORK FOR CONSTRUCTION
WASTE MANAGEMENT
5.1 Overview
The need to use BIM for CW management is well documented but most of the existing CW
management tools still lack BIM functionality. This chapter therefore assesses the expectations of
stakeholders on BIM strategies for CW management analytics. The methodological flowchart for
the process is shown in Figure 5.1. After a review of extant literature on the limitations of existing
CW management tools and, qualitative FGIs were conducted with professionals who are familiar
with the use of BIM. The variable identified from the qualitative data analyses were then developed
into a questionnaire survey. The exploratory factor analysis of the responses reveals five major
groups of factors, which include “BIM-based collaboration for waste management”, “waste-driven
design process and solutions”, “lifecycle waste analysis”, “Innovative technologies for waste
intelligence and analytics”, and “improved documentation for waste management”. Considering
these groups of factors is key to meeting the needs of the stakeholders regarding the use of BIM
for CW management. These groups of factors are also important considerations for the deployment
and acceptance of BIM-based practices for CW management within the construction industry.
Taking into the expectations of industry practitioners, a holistic BIM framework for a CW
management system was developed to integrate industrial and technological requirements for
waste management.
5.2 Sampling Techniques
Following Creswell (2014) critical sampling was used during the Focus Group Interviews (FGIs)
to the yearning for generalisation and applicability of finding from this study. Critical sampling
allows researchers to use a set of criteria to select information-rich participants (Gay, Mills and
Airasian, 2006). As such, four FGIs was conducted with 23 participants from the construction
industry. These participants were selected owing to their responsibilities in mitigating against
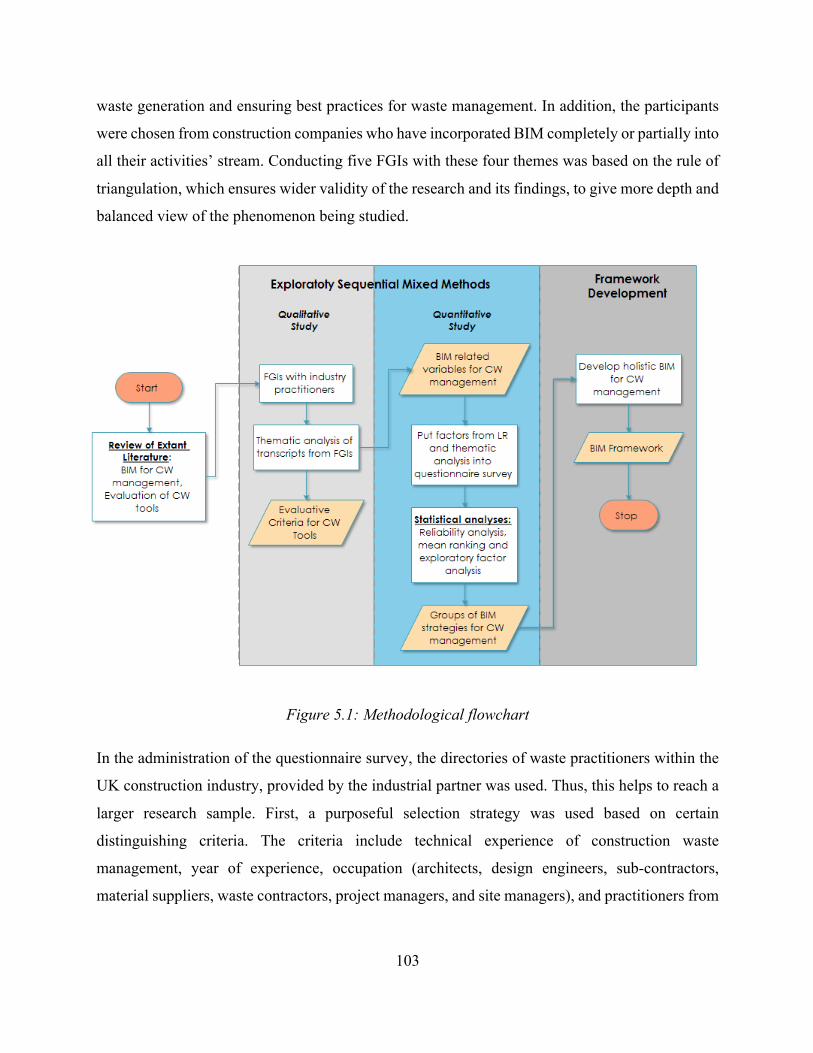
103
waste generation and ensuring best practices for waste management. In addition, the participants
were chosen from construction companies who have incorporated BIM completely or partially into
all their activities’ stream. Conducting five FGIs with these four themes was based on the rule of
triangulation, which ensures wider validity of the research and its findings, to give more depth and
balanced view of the phenomenon being studied.
Figure 5.1: Methodological flowchart
In the administration of the questionnaire survey, the directories of waste practitioners within the
UK construction industry, provided by the industrial partner was used. Thus, this helps to reach a
larger research sample. First, a purposeful selection strategy was used based on certain
distinguishing criteria. The criteria include technical experience of construction waste
management, year of experience, occupation (architects, design engineers, sub-contractors,
material suppliers, waste contractors, project managers, and site managers), and practitioners from
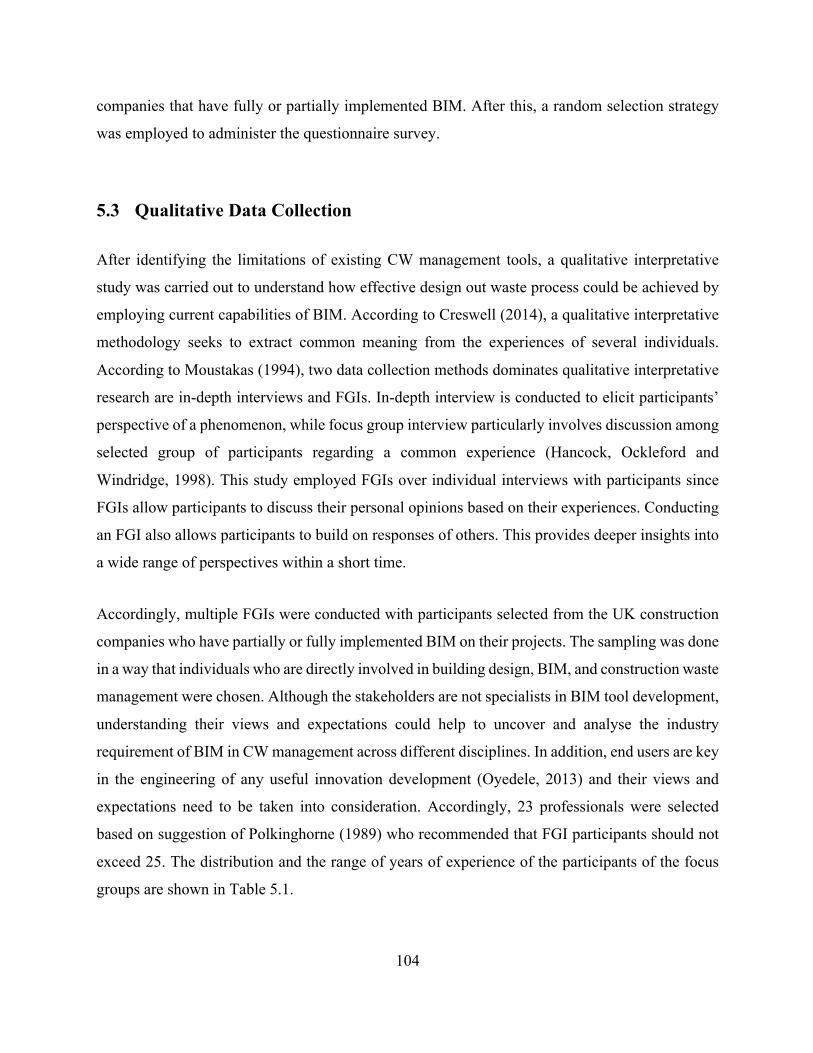
104
companies that have fully or partially implemented BIM. After this, a random selection strategy
was employed to administer the questionnaire survey.
5.3 Qualitative Data Collection
After identifying the limitations of existing CW management tools, a qualitative interpretative
study was carried out to understand how effective design out waste process could be achieved by
employing current capabilities of BIM. According to Creswell (2014), a qualitative interpretative
methodology seeks to extract common meaning from the experiences of several individuals.
According to Moustakas (1994), two data collection methods dominates qualitative interpretative
research are in-depth interviews and FGIs. In-depth interview is conducted to elicit participants’
perspective of a phenomenon, while focus group interview particularly involves discussion among
selected group of participants regarding a common experience (Hancock, Ockleford and
Windridge, 1998). This study employed FGIs over individual interviews with participants since
FGIs allow participants to discuss their personal opinions based on their experiences. Conducting
an FGI also allows participants to build on responses of others. This provides deeper insights into
a wide range of perspectives within a short time.
Accordingly, multiple FGIs were conducted with participants selected from the UK construction
companies who have partially or fully implemented BIM on their projects. The sampling was done
in a way that individuals who are directly involved in building design, BIM, and construction waste
management were chosen. Although the stakeholders are not specialists in BIM tool development,
understanding their views and expectations could help to uncover and analyse the industry
requirement of BIM in CW management across different disciplines. In addition, end users are key
in the engineering of any useful innovation development (Oyedele, 2013) and their views and
expectations need to be taken into consideration. Accordingly, 23 professionals were selected
based on suggestion of Polkinghorne (1989) who recommended that FGI participants should not
exceed 25. The distribution and the range of years of experience of the participants of the focus
groups are shown in Table 5.1.
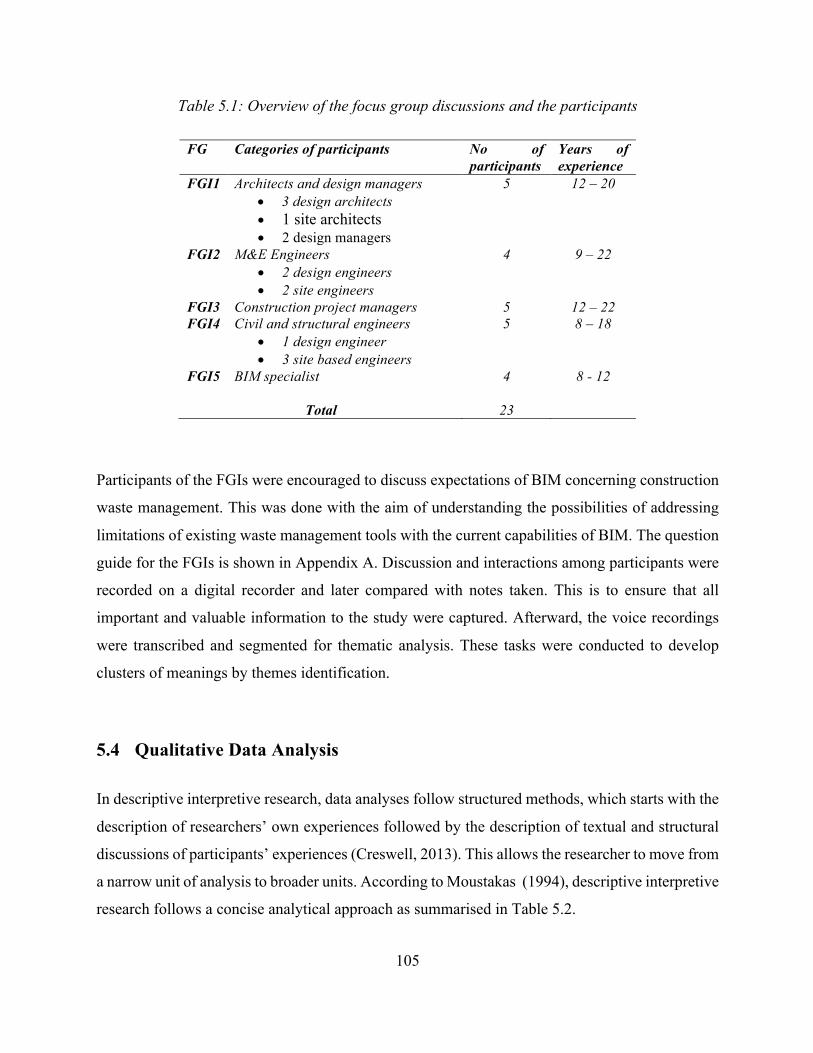
105
Table 5.1: Overview of the focus group discussions and the participants
FG Categories of participants No of participants
Years of experience
FGI1 Architects and design managers • 3 design architects • 1 site architects • 2 design managers
5 12 – 20
FGI2 M&E Engineers • 2 design engineers • 2 site engineers
4 9 – 22
FGI3 Construction project managers 5 12 – 22 FGI4 Civil and structural engineers
• 1 design engineer • 3 site based engineers
5 8 – 18
FGI5 BIM specialist 4 8 - 12
Total 23
Participants of the FGIs were encouraged to discuss expectations of BIM concerning construction
waste management. This was done with the aim of understanding the possibilities of addressing
limitations of existing waste management tools with the current capabilities of BIM. The question
guide for the FGIs is shown in Appendix A. Discussion and interactions among participants were
recorded on a digital recorder and later compared with notes taken. This is to ensure that all
important and valuable information to the study were captured. Afterward, the voice recordings
were transcribed and segmented for thematic analysis. These tasks were conducted to develop
clusters of meanings by themes identification.
5.4 Qualitative Data Analysis
In descriptive interpretive research, data analyses follow structured methods, which starts with the
description of researchers’ own experiences followed by the description of textual and structural
discussions of participants’ experiences (Creswell, 2013). This allows the researcher to move from
a narrow unit of analysis to broader units. According to Moustakas (1994), descriptive interpretive
research follows a concise analytical approach as summarised in Table 5.2.
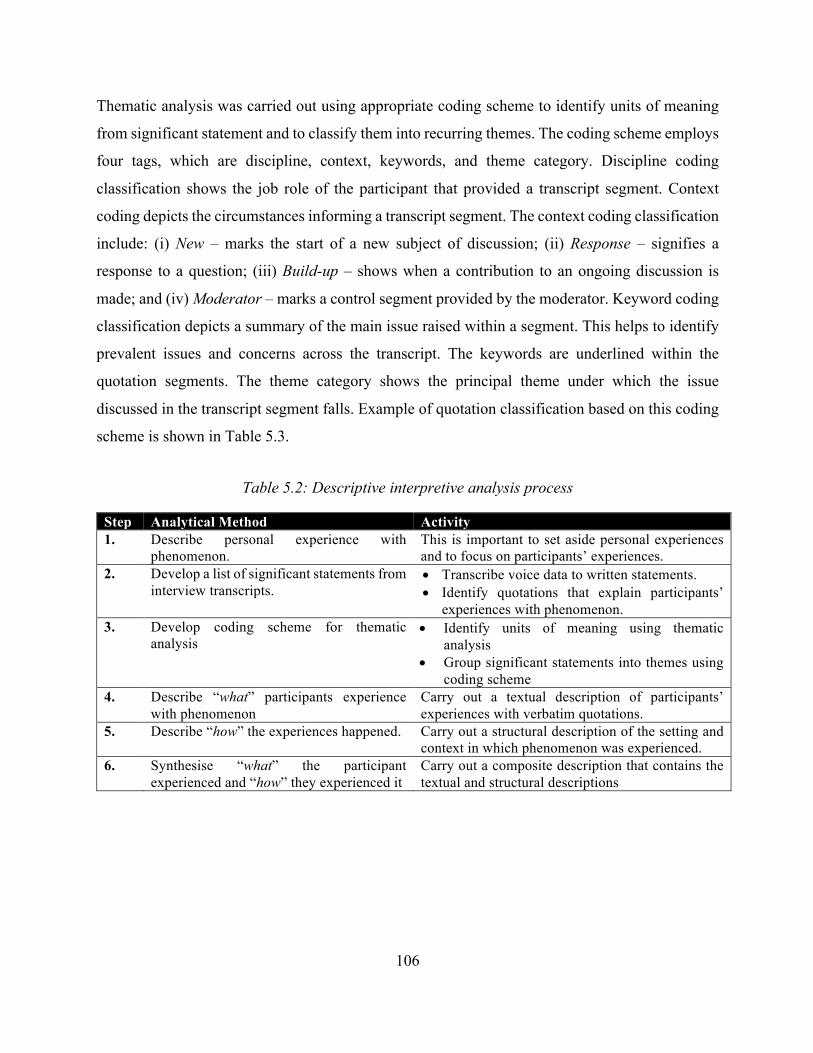
106
Thematic analysis was carried out using appropriate coding scheme to identify units of meaning
from significant statement and to classify them into recurring themes. The coding scheme employs
four tags, which are discipline, context, keywords, and theme category. Discipline coding
classification shows the job role of the participant that provided a transcript segment. Context
coding depicts the circumstances informing a transcript segment. The context coding classification
include: (i) New – marks the start of a new subject of discussion; (ii) Response – signifies a
response to a question; (iii) Build-up – shows when a contribution to an ongoing discussion is
made; and (iv) Moderator – marks a control segment provided by the moderator. Keyword coding
classification depicts a summary of the main issue raised within a segment. This helps to identify
prevalent issues and concerns across the transcript. The keywords are underlined within the
quotation segments. The theme category shows the principal theme under which the issue
discussed in the transcript segment falls. Example of quotation classification based on this coding
scheme is shown in Table 5.3.
Table 5.2: Descriptive interpretive analysis process
Step Analytical Method Activity 1. Describe personal experience with
phenomenon. This is important to set aside personal experiences and to focus on participants’ experiences.
2. Develop a list of significant statements from interview transcripts.
• Transcribe voice data to written statements. • Identify quotations that explain participants’
experiences with phenomenon. 3. Develop coding scheme for thematic
analysis • Identify units of meaning using thematic
analysis • Group significant statements into themes using
coding scheme 4. Describe “what” participants experience
with phenomenon Carry out a textual description of participants’ experiences with verbatim quotations.
5. Describe “how” the experiences happened. Carry out a structural description of the setting and context in which phenomenon was experienced.
6. Synthesise “what” the participant experienced and “how” they experienced it
Carry out a composite description that contains the textual and structural descriptions
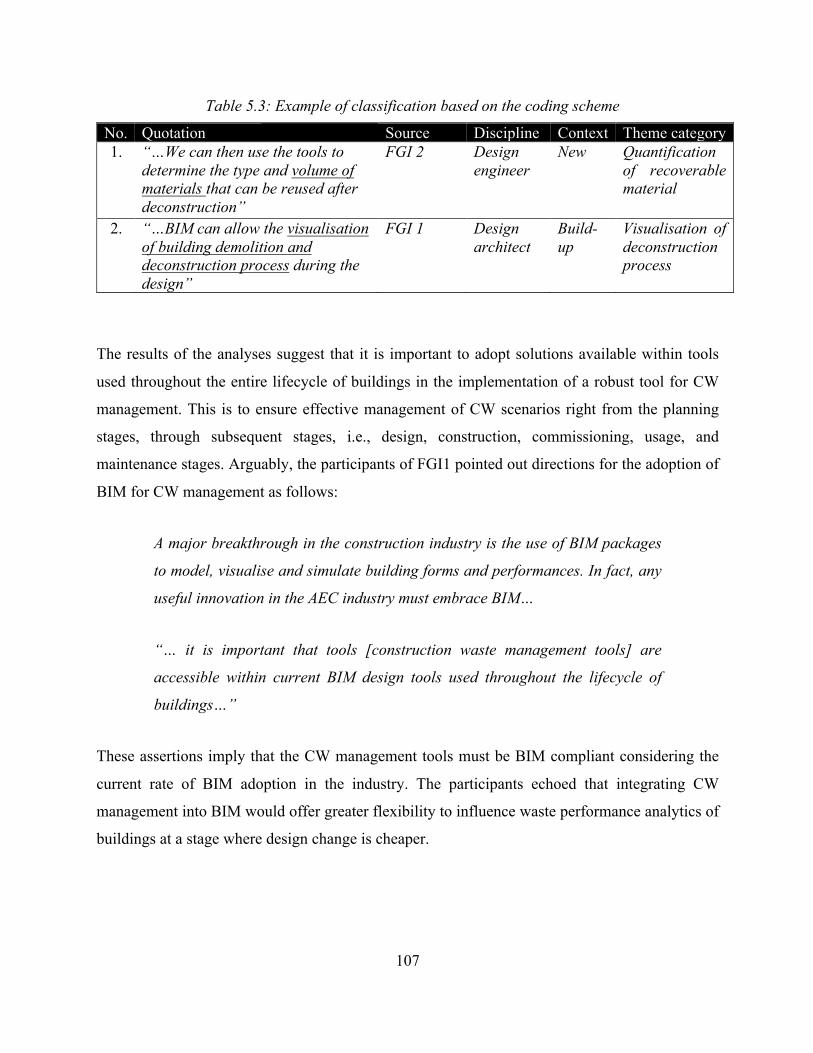
107
Table 5.3: Example of classification based on the coding scheme
No. Quotation Source Discipline Context Theme category 1. “…We can then use the tools to
determine the type and volume of materials that can be reused after deconstruction”
FGI 2 Design engineer
New Quantification of recoverable material
2. “…BIM can allow the visualisation of building demolition and deconstruction process during the design”
FGI 1 Design architect
Build-up
Visualisation of deconstruction process
The results of the analyses suggest that it is important to adopt solutions available within tools
used throughout the entire lifecycle of buildings in the implementation of a robust tool for CW
management. This is to ensure effective management of CW scenarios right from the planning
stages, through subsequent stages, i.e., design, construction, commissioning, usage, and
maintenance stages. Arguably, the participants of FGI1 pointed out directions for the adoption of
BIM for CW management as follows:
A major breakthrough in the construction industry is the use of BIM packages
to model, visualise and simulate building forms and performances. In fact, any
useful innovation in the AEC industry must embrace BIM…
“… it is important that tools [construction waste management tools] are
accessible within current BIM design tools used throughout the lifecycle of
buildings…”
These assertions imply that the CW management tools must be BIM compliant considering the
current rate of BIM adoption in the industry. The participants echoed that integrating CW
management into BIM would offer greater flexibility to influence waste performance analytics of
buildings at a stage where design change is cheaper.
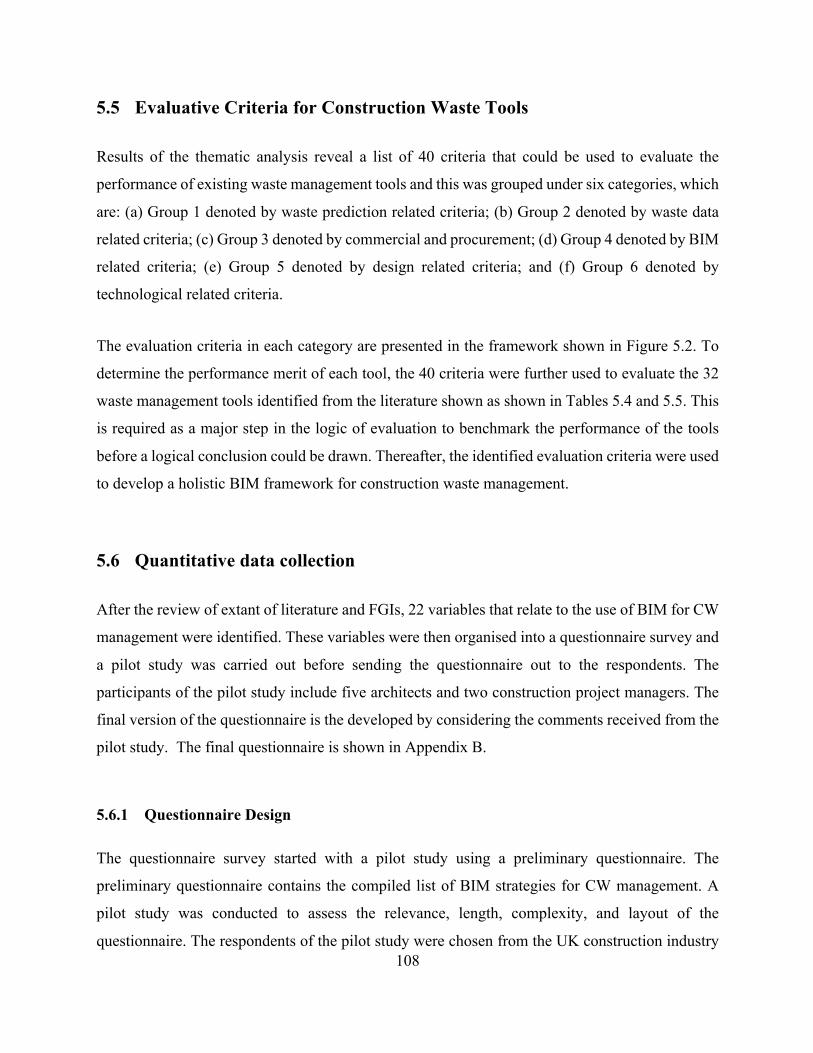
108
5.5 Evaluative Criteria for Construction Waste Tools
Results of the thematic analysis reveal a list of 40 criteria that could be used to evaluate the
performance of existing waste management tools and this was grouped under six categories, which
are: (a) Group 1 denoted by waste prediction related criteria; (b) Group 2 denoted by waste data
related criteria; (c) Group 3 denoted by commercial and procurement; (d) Group 4 denoted by BIM
related criteria; (e) Group 5 denoted by design related criteria; and (f) Group 6 denoted by
technological related criteria.
The evaluation criteria in each category are presented in the framework shown in Figure 5.2. To
determine the performance merit of each tool, the 40 criteria were further used to evaluate the 32
waste management tools identified from the literature shown as shown in Tables 5.4 and 5.5. This
is required as a major step in the logic of evaluation to benchmark the performance of the tools
before a logical conclusion could be drawn. Thereafter, the identified evaluation criteria were used
to develop a holistic BIM framework for construction waste management.
5.6 Quantitative data collection
After the review of extant of literature and FGIs, 22 variables that relate to the use of BIM for CW
management were identified. These variables were then organised into a questionnaire survey and
a pilot study was carried out before sending the questionnaire out to the respondents. The
participants of the pilot study include five architects and two construction project managers. The
final version of the questionnaire is the developed by considering the comments received from the
pilot study. The final questionnaire is shown in Appendix B.
5.6.1 Questionnaire Design
The questionnaire survey started with a pilot study using a preliminary questionnaire. The
preliminary questionnaire contains the compiled list of BIM strategies for CW management. A
pilot study was conducted to assess the relevance, length, complexity, and layout of the
questionnaire. The respondents of the pilot study were chosen from the UK construction industry
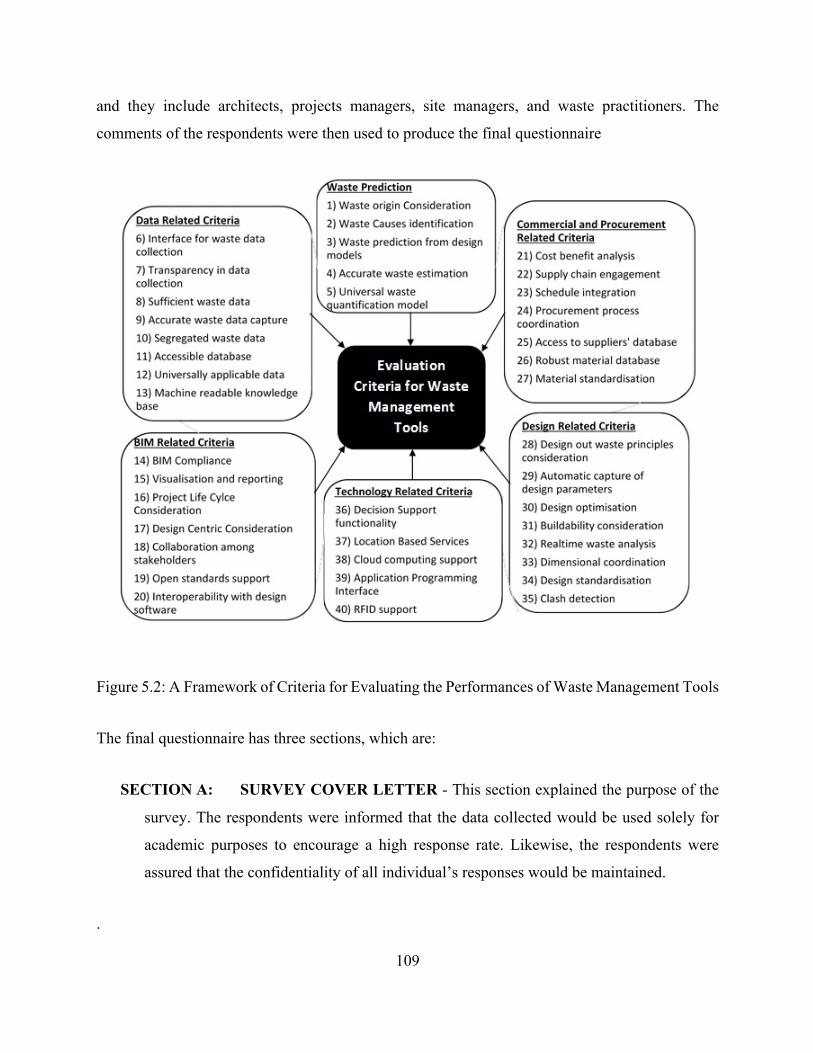
109
and they include architects, projects managers, site managers, and waste practitioners. The
comments of the respondents were then used to produce the final questionnaire
Figure 5.2: A Framework of Criteria for Evaluating the Performances of Waste Management Tools
The final questionnaire has three sections, which are:
SECTION A: SURVEY COVER LETTER - This section explained the purpose of the
survey. The respondents were informed that the data collected would be used solely for
academic purposes to encourage a high response rate. Likewise, the respondents were
assured that the confidentiality of all individual’s responses would be maintained.
.
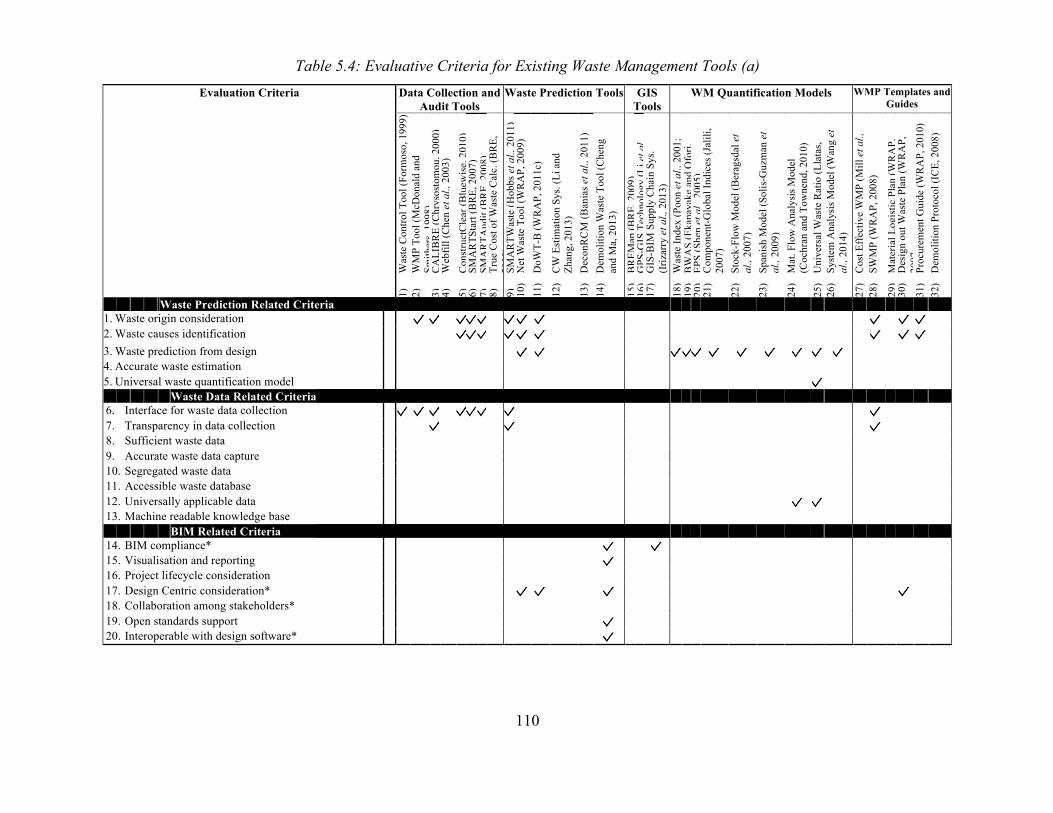
110
Table 5.4: Evaluative Criteria for Existing Waste Management Tools (a)
Evaluation Criteria Data Collection and Audit Tools
Waste Prediction Tools GIS Tools
WM Quantification Models WMP Templates and Guides
1)
Was
te C
ontro
l Too
l (Fo
rmos
o, 1
999)
2)
W
MP
Tool
(McD
onal
d an
d Sm
ither
s, 19
98)
3)
CA
LIB
RE
(Chr
ysos
tom
ou, 2
000)
4)
W
ebfil
l (C
hen
et a
l., 2
003)
5)
C
onst
ruct
Cle
ar (B
luew
ise,
201
0)
6)
SMA
RTS
tart
(BR
E, 2
007)
7)
SM
AR
TAud
it (B
RE,
200
8)
8)
True
Cos
t of W
aste
Cal
c. (B
RE,
20
10)
9)
SMA
RTW
aste
(Hob
bs e
t al.,
201
1)
10)
Net
Was
te T
ool (
WR
AP,
200
9)
11)
DoW
T-B
(WR
AP,
201
1c)
12)
CW
Est
imat
ion
Sys.
(Li a
nd
Zhan
g, 2
013)
13
) D
econ
RC
M (B
ania
s et a
l., 2
011)
14
) D
emol
ition
Was
te T
ool (
Che
ng
and
Ma,
201
3)
15)
BR
EMap
(BR
E, 2
009)
16
) G
PS-G
IS T
echn
olog
y (L
i et a
l.,
2005
) 17
) G
IS-B
IM S
uppl
y C
hain
Sys
. (I
rizar
ry e
t al.,
201
3)
18)
Was
te In
dex
(Poo
n et
al.,
200
1;
2004
) 19
) B
WA
S (E
kana
yake
and
Ofo
ri,
2004
) 20
) EP
S (S
hen
et a
l., 2
005)
21
) C
ompo
nent
-Glo
bal I
ndic
es (J
alili
, 20
07)
22)
Stoc
k-Fl
ow M
odel
(Ber
agsd
al e
t al
., 20
07)
23)
Span
ish
Mod
el (S
olis
-Guz
man
et
al.,
2009
) 24
) M
at. F
low
Ana
lysi
s Mod
el
(Coc
hran
and
Tow
nend
, 201
0)
25)
Uni
vers
al W
aste
Rat
io (L
lata
s, 20
11)
26)
Syst
em A
naly
sis M
odel
(Wan
g et
al
., 20
14)
27)
Cos
t Eff
ectiv
e W
MP
(Mill
et a
l.,
1999
) 28
) SW
MP
(WR
AP,
200
8)
29)
Mat
eria
l Log
istic
Pla
n (W
RA
P,
2007
a)
30)
Des
ign
out W
aste
Pla
n (W
RA
P,
2007
; 31
) Pr
ocur
emen
t Gui
de (W
RA
P, 2
010)
32
) D
emol
ition
Pro
toco
l (IC
E, 2
008)
Waste Prediction Related Criteria 1. Waste origin consideration 2. Waste causes identification 3. Waste prediction from design 4. Accurate waste estimation 5. Universal waste quantification model Waste Data Related Criteria 6. Interface for waste data collection 7. Transparency in data collection 8. Sufficient waste data 9. Accurate waste data capture 10. Segregated waste data 11. Accessible waste database 12. Universally applicable data 13. Machine readable knowledge base BIM Related Criteria 14. BIM compliance* 15. Visualisation and reporting 16. Project lifecycle consideration 17. Design Centric consideration* 18. Collaboration among stakeholders* 19. Open standards support 20. Interoperable with design software*
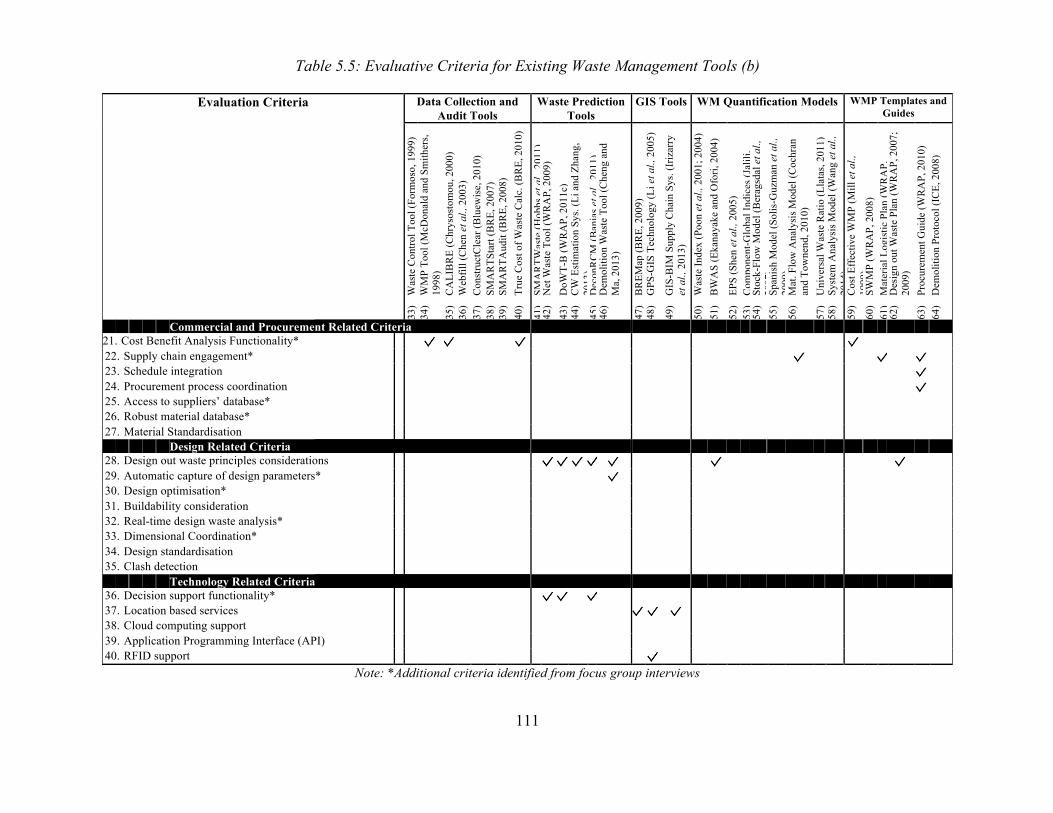
111
Table 5.5: Evaluative Criteria for Existing Waste Management Tools (b)
Evaluation Criteria Data Collection and Audit Tools
Waste Prediction Tools
GIS Tools WM Quantification Models WMP Templates and Guides
33)
Was
te C
ontro
l Too
l (Fo
rmos
o, 1
999)
34
) W
MP
Tool
(McD
onal
d an
d Sm
ither
s, 19
98)
35)
CA
LIB
RE
(Chr
ysos
tom
ou, 2
000)
36
) W
ebfil
l (C
hen
et a
l., 2
003)
37
) C
onst
ruct
Cle
ar (B
luew
ise,
201
0)
38)
SMA
RTS
tart
(BR
E, 2
007)
39
) SM
AR
TAud
it (B
RE,
200
8)
40)
True
Cos
t of W
aste
Cal
c. (B
RE,
201
0)
41)
SMA
RTW
aste
(Hob
bs e
t al.,
201
1)
42)
Net
Was
te T
ool (
WR
AP,
200
9)
43)
DoW
T-B
(WR
AP,
201
1c)
44)
CW
Est
imat
ion
Sys.
(Li a
nd Z
hang
, 20
13)
45)
Dec
onR
CM
(Ban
ias e
t al.,
201
1)
46)
Dem
oliti
on W
aste
Too
l (C
heng
and
M
a, 2
013)
47)
BR
EMap
(BR
E, 2
009)
48
) G
PS-G
IS T
echn
olog
y (L
i et a
l., 2
005)
49)
GIS
-BIM
Sup
ply
Cha
in S
ys. (
Iriz
arry
et
al.,
201
3)
50)
Was
te In
dex
(Poo
n et
al.,
200
1; 2
004)
51
) B
WA
S (E
kana
yake
and
Ofo
ri, 2
004)
52)
EPS
(She
n et
al.,
200
5)
53)
Com
pone
nt-G
loba
l Ind
ices
(Jal
ili,
2007
) 54
) St
ock-
Flow
Mod
el (B
erag
sdal
et a
l.,
2007
) 55
) Sp
anis
h M
odel
(Sol
is-G
uzm
an e
t al.,
20
09)
56)
Mat
. Flo
w A
naly
sis M
odel
(Coc
hran
an
d To
wne
nd, 2
010)
57
) U
nive
rsal
Was
te R
atio
(Lla
tas,
2011
) 58
) Sy
stem
Ana
lysi
s Mod
el (W
ang
et a
l.,
2014
) 59
) C
ost E
ffec
tive
WM
P (M
ill e
t al.,
19
99)
60)
SWM
P (W
RA
P, 2
008)
61
) M
ater
ial L
ogis
tic P
lan
(WR
AP,
20
07a)
62
) D
esig
n ou
t Was
te P
lan
(WR
AP,
200
7;
2009
) 63
) Pr
ocur
emen
t Gui
de (W
RA
P, 2
010)
64
) D
emol
ition
Pro
toco
l (IC
E, 2
008)
Commercial and Procurement Related Criteria 21. Cost Benefit Analysis Functionality* 22. Supply chain engagement* 23. Schedule integration 24. Procurement process coordination 25. Access to suppliers’ database* 26. Robust material database* 27. Material Standardisation Design Related Criteria 28. Design out waste principles considerations 29. Automatic capture of design parameters* 30. Design optimisation* 31. Buildability consideration 32. Real-time design waste analysis* 33. Dimensional Coordination* 34. Design standardisation 35. Clash detection Technology Related Criteria 36. Decision support functionality* 37. Location based services 38. Cloud computing support 39. Application Programming Interface (API) 40. RFID support
Note: *Additional criteria identified from focus group interviews
112
SECTION B: PARTICULARS OF RESPONDENT - This section captures information
about respondents. The respondents were asked to indicate information such as type of
organisation, job title, and years of experience. This would enable the research team to
identify the roles of the respondents within the construction industry.
SECTION C: BODY OF QUESTIONNAIRE - This section allows respondents to rate
the BIM strategies for CW management factors. The respondents were asked to consider
each factor with relevance to their perceived competence and to rank their importance on
a five-point Likert scale ranging from 1 (not Important) to 5 (most Important). This section
also includes a textbox for additional comments from the respondents.
The respondents of the survey were required to indicate the importance of the variables on a five-
point Likert scale, where 1 represents ‘not important’ and 5 represents ‘most important’. The
questionnaire was then developed into a web–based questionnaire to encourage completion, reduce
potential errors and to aid data analysis. By employing the directory of a UK construction
company, 130 respondents were randomly selected for the survey. Table 5.6 shows the
demographic distribution of the respondents. The response rate of the survey was 47.7%, which
indicates that only Sixty-two (62) completed questionnaires were submitted. Three of the
submitted questionnaires were incomplete and discarded, thus leaving only 59 usable responses
for analyses (45.4%).
5.7 Quantitative Data Analyses
The variables from the qualitative data analyses and from the literature review were then put
together into a questionnaire survey and analysed accordingly. The responses of the questionnaire
survey were then subjected to a rigorous statistical process to identify the expectations of industry
stakeholders for BIM adoption for CW management. The statistical analyses include descriptive
statistics, reliability analysis, and exploratory factor analysis.
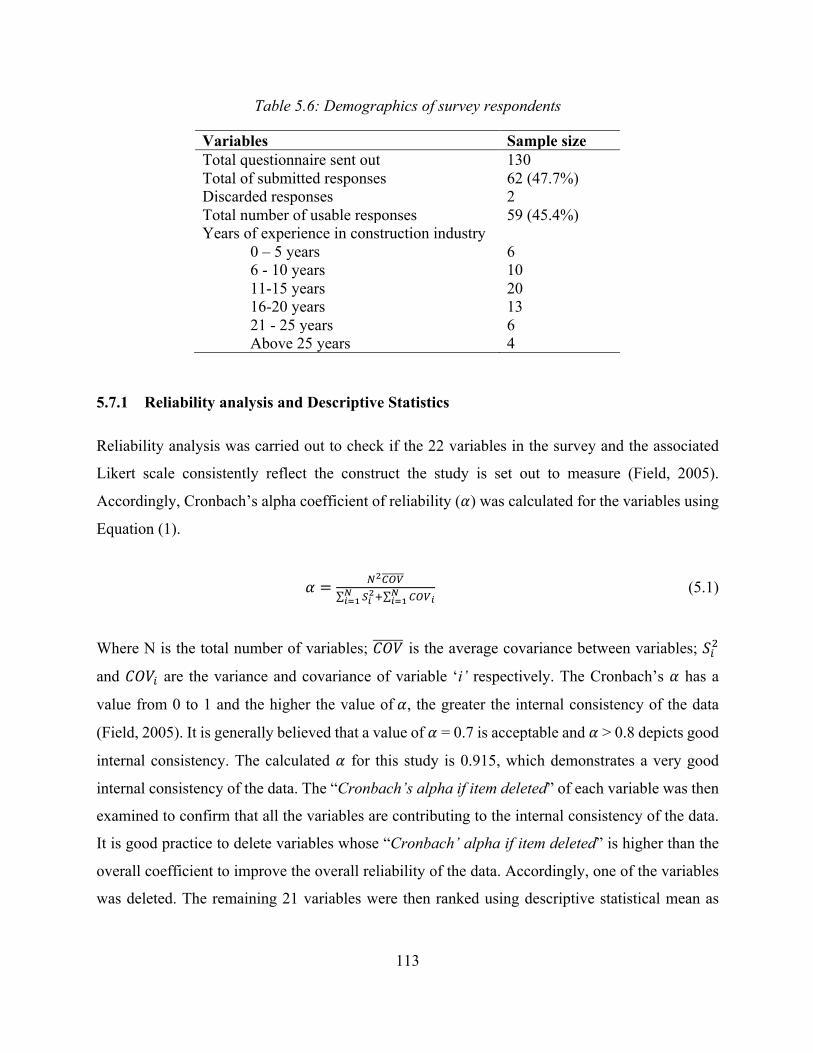
113
Table 5.6: Demographics of survey respondents
Variables Sample size Total questionnaire sent out 130 Total of submitted responses 62 (47.7%) Discarded responses 2 Total number of usable responses 59 (45.4%) Years of experience in construction industry 0 – 5 years 6 6 - 10 years 10 11-15 years 20 16-20 years 13 21 - 25 years 6 Above 25 years 4
5.7.1 Reliability analysis and Descriptive Statistics
Reliability analysis was carried out to check if the 22 variables in the survey and the associated
Likert scale consistently reflect the construct the study is set out to measure (Field, 2005).
Accordingly, Cronbach’s alpha coefficient of reliability (!) was calculated for the variables using
Equation (1).
! = #$%&'()$* %&')+
),-+),-
(5.1)
Where N is the total number of variables; ./0 is the average covariance between variables; 123
and ./02 are the variance and covariance of variable ‘i’ respectively. The Cronbach’s ! has a
value from 0 to 1 and the higher the value of!, the greater the internal consistency of the data
(Field, 2005). It is generally believed that a value of ! = 0.7 is acceptable and ! > 0.8 depicts good
internal consistency. The calculated ! for this study is 0.915, which demonstrates a very good
internal consistency of the data. The “Cronbach’s alpha if item deleted” of each variable was then
examined to confirm that all the variables are contributing to the internal consistency of the data.
It is good practice to delete variables whose “Cronbach’ alpha if item deleted” is higher than the
overall coefficient to improve the overall reliability of the data. Accordingly, one of the variables
was deleted. The remaining 21 variables were then ranked using descriptive statistical mean as
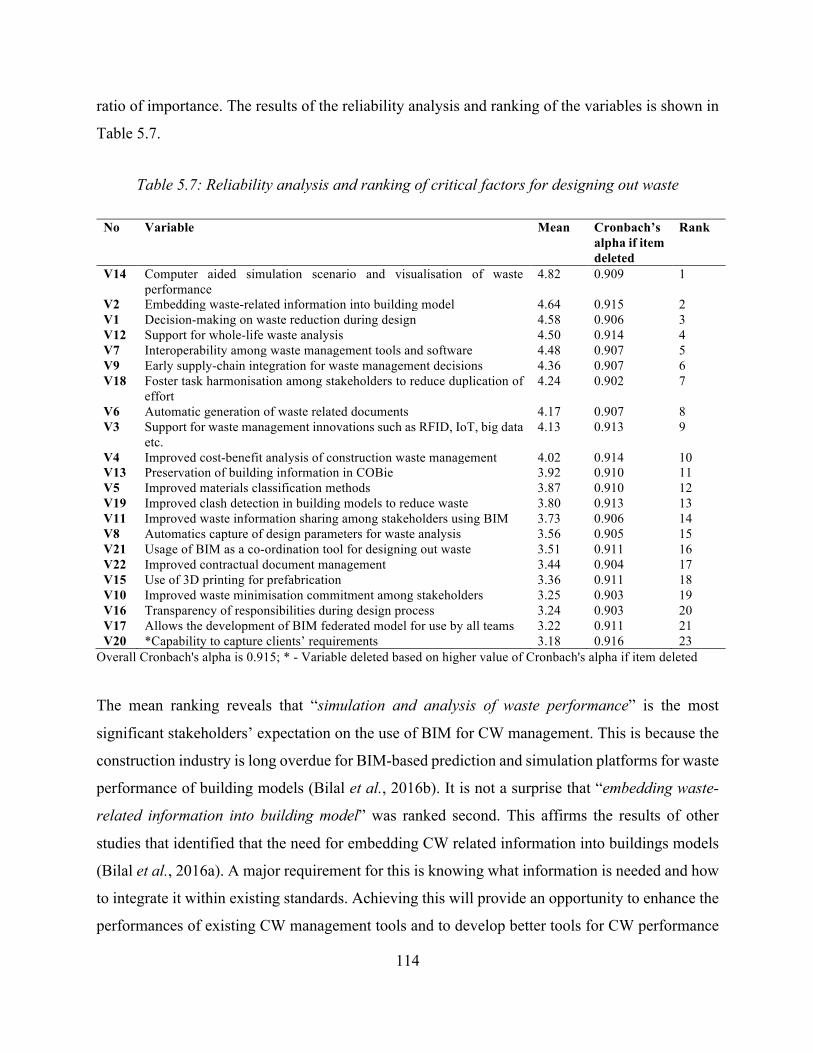
114
ratio of importance. The results of the reliability analysis and ranking of the variables is shown in
Table 5.7.
Table 5.7: Reliability analysis and ranking of critical factors for designing out waste
No Variable Mean Cronbach’s alpha if item deleted
Rank
V14 Computer aided simulation scenario and visualisation of waste performance
4.82 0.909 1
V2 Embedding waste-related information into building model 4.64 0.915 2 V1 Decision-making on waste reduction during design 4.58 0.906 3 V12 Support for whole-life waste analysis 4.50 0.914 4 V7 Interoperability among waste management tools and software 4.48 0.907 5 V9 Early supply-chain integration for waste management decisions 4.36 0.907 6 V18 Foster task harmonisation among stakeholders to reduce duplication of
effort 4.24 0.902 7
V6 Automatic generation of waste related documents 4.17 0.907 8 V3 Support for waste management innovations such as RFID, IoT, big data
etc. 4.13 0.913 9
V4 Improved cost-benefit analysis of construction waste management 4.02 0.914 10 V13 Preservation of building information in COBie 3.92 0.910 11 V5 Improved materials classification methods 3.87 0.910 12 V19 Improved clash detection in building models to reduce waste 3.80 0.913 13 V11 Improved waste information sharing among stakeholders using BIM 3.73 0.906 14 V8 Automatics capture of design parameters for waste analysis 3.56 0.905 15 V21 Usage of BIM as a co-ordination tool for designing out waste 3.51 0.911 16 V22 Improved contractual document management 3.44 0.904 17 V15 Use of 3D printing for prefabrication 3.36 0.911 18 V10 Improved waste minimisation commitment among stakeholders 3.25 0.903 19 V16 Transparency of responsibilities during design process 3.24 0.903 20 V17 Allows the development of BIM federated model for use by all teams 3.22 0.911 21 V20 *Capability to capture clients’ requirements 3.18 0.916 23
Overall Cronbach's alpha is 0.915; * - Variable deleted based on higher value of Cronbach's alpha if item deleted
The mean ranking reveals that “simulation and analysis of waste performance” is the most
significant stakeholders’ expectation on the use of BIM for CW management. This is because the
construction industry is long overdue for BIM-based prediction and simulation platforms for waste
performance of building models (Bilal et al., 2016b). It is not a surprise that “embedding waste-
related information into building model” was ranked second. This affirms the results of other
studies that identified that the need for embedding CW related information into buildings models
(Bilal et al., 2016a). A major requirement for this is knowing what information is needed and how
to integrate it within existing standards. Achieving this will provide an opportunity to enhance the
performances of existing CW management tools and to develop better tools for CW performance
115
analysis. The other three top factors include “support for whole-life waste analysis”,
“interoperability among BIM software” and “early supply-chain integration.”
5.7.2 Exploratory Factor Analysis
To achieve the aim of the study, an Exploratory Factor Analysis (EFA) was used to identify the
underlying structure of the factors identified in the literature, and focus group interviews. The
exploratory factor analysis identifies the underlying dimension of the variables. This is to replace
the entire set of variables with a smaller number of uncorrelated principal factors. This was done
by removing redundant (highly correlated) variables from the data set while retaining the validity
of original information as much as possible. An EFA is chosen as compared to confirmatory factor
analysis due to lack of priori knowledge of the factor structure. EFA was carried out using the
Statistical Package for Social Sciences (SPSS). The factor analysis employed principal
components analysis (PCA) with orthogonal rotation (varimax) of the 22 variables. The PCA was
used for factor extraction and varimax rotation was used as factor rotation. The Kaiser-Meyer-
Olkin (KMO) value and the Bartlett tests of sphericity were 0.518 (above 0.5) and 6.8 x 10-49 (less
than 0.5) respectively. These values show the suitability of the data for factor analysis. The PCA
results reorganises the list of variables into five factors, which account for of the total variance of
84.231% as shown in Table 5.8.
Accordingly, the groups were then interpreted and labelled based on the variables assigned to the
groups. The groups include:
(a) Group 1 denoted by improved collaboration for waste management
(b) Group 2 denoted by waste-driven design process and solutions
(c) Group 3 denoted by lifecycle waste analytics
(d) Group 4 denoted by Innovative technologies for waste intelligence and analytics, and
(e) Group 5 denoted by improved documentation for waste management
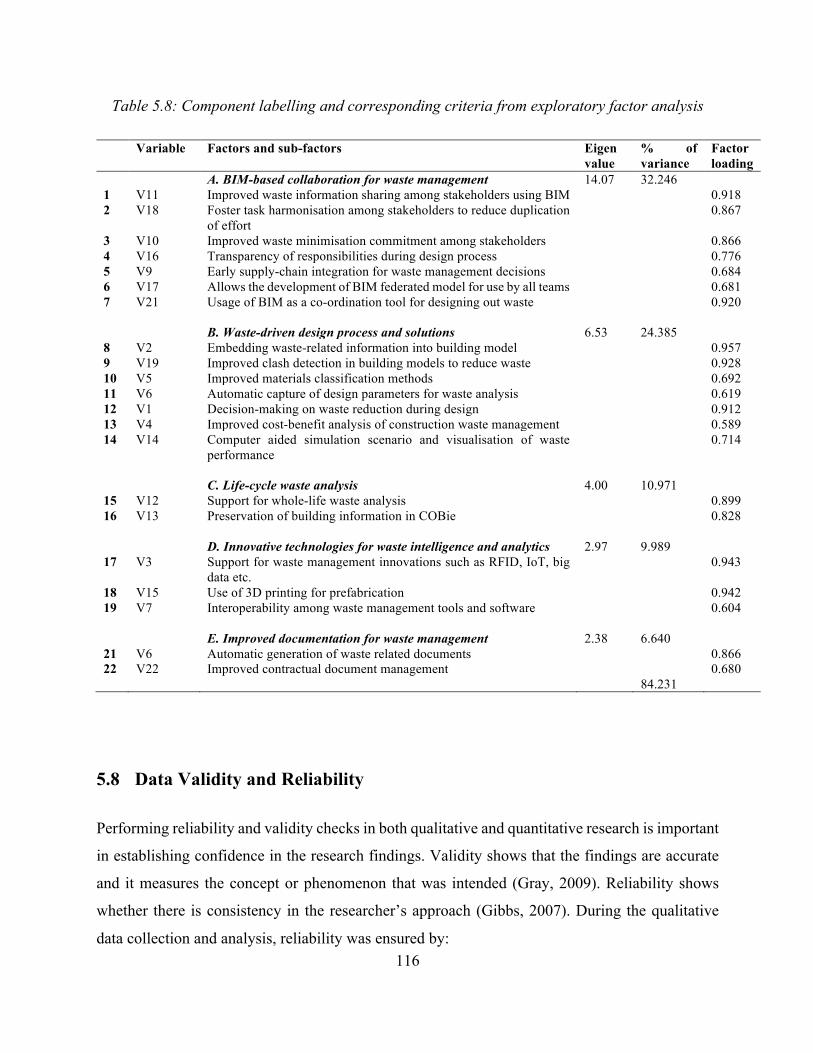
116
Table 5.8: Component labelling and corresponding criteria from exploratory factor analysis
Variable Factors and sub-factors Eigen value
% of variance
Factor loading
A. BIM-based collaboration for waste management 14.07 32.246 1 V11 Improved waste information sharing among stakeholders using BIM 0.918 2 V18 Foster task harmonisation among stakeholders to reduce duplication
of effort 0.867
3 V10 Improved waste minimisation commitment among stakeholders 0.866 4 V16 Transparency of responsibilities during design process 0.776 5 V9 Early supply-chain integration for waste management decisions 0.684 6 V17 Allows the development of BIM federated model for use by all teams 0.681 7 V21 Usage of BIM as a co-ordination tool for designing out waste 0.920 B. Waste-driven design process and solutions 6.53 24.385 8 V2 Embedding waste-related information into building model 0.957 9 V19 Improved clash detection in building models to reduce waste 0.928 10 V5 Improved materials classification methods 0.692 11 V6 Automatic capture of design parameters for waste analysis 0.619 12 V1 Decision-making on waste reduction during design 0.912 13 V4 Improved cost-benefit analysis of construction waste management 0.589 14 V14 Computer aided simulation scenario and visualisation of waste
performance 0.714
C. Life-cycle waste analysis 4.00 10.971 15 V12 Support for whole-life waste analysis 0.899 16 V13 Preservation of building information in COBie 0.828 D. Innovative technologies for waste intelligence and analytics 2.97 9.989 17 V3 Support for waste management innovations such as RFID, IoT, big
data etc. 0.943
18 V15 Use of 3D printing for prefabrication 0.942 19 V7 Interoperability among waste management tools and software 0.604 E. Improved documentation for waste management 2.38 6.640 21 V6 Automatic generation of waste related documents 0.866 22 V22 Improved contractual document management 0.680 84.231
5.8 Data Validity and Reliability
Performing reliability and validity checks in both qualitative and quantitative research is important
in establishing confidence in the research findings. Validity shows that the findings are accurate
and it measures the concept or phenomenon that was intended (Gray, 2009). Reliability shows
whether there is consistency in the researcher’s approach (Gibbs, 2007). During the qualitative
data collection and analysis, reliability was ensured by:
117
a) Proof-reading the interview transcripts to ensure that all mistakes made during the
transcription are identified and corrected;
b) Using the verbatim transcript and demonstrating grounding of the findings in the responses
of interviewees. This was done by providing sample quotes from the respondents’ own
words;
c) Supporting findings with extant literature to demonstrating theoretical agreement.
On the other hand, quantitative validity measure the accuracy and appropriateness of the
questionnaire. Questionnaire validity generally starts with a pilot testing to verify the
appropriateness of the questions, scale, and length of the questionnaire (Burkingham and Saunders,
2004). Content validity of quantitative data is concerned with the degree to which a sample could
be generalised to a wider population. This is important to verify the assumption that a sample
should be an accurate representation of the population. Face validity assesses the extent to which
the instrument appears valid on the surface. Construct validity of quantitative data is the
appropriateness of the questionnaire’s content. Content, face and construct validities were ensured
during the pilot study, which was carried out before administering the questionnaire survey. The
reliability of the questionnaire, which assesses the extent to which the instrument accurately
measures the construct it is designed to measure, was ensured by calculating Cronbach’s alpha
coefficient of reliability (α) for all the variables.
5.9 BIM Framework for Construction Waste Management
Based on the Industry Foundation Classes (IFC) Specification framework (BuildingSMART,
2013), a number of BIM frameworks (Ison, 2008; Succar, 2009; Jung and Joo, 2011; Singh, Gu
and Wang, 2011; Cerovsek, 2011) and Cloud-based BIM frameworks (Kumar, Cheng and
McGibbney, 2010; Sawhney and Maheswari, 2013; Juan and Zheng, 2014; Abrishami et al., 2014)
have been developed. These studies show that an integration of BIM could foster early decision
making throughout a project lifecycle (Porwal and Hewage, 2013; Jiao et al., 2013). However,
none of the existing BIM frameworks has comprehensively captured the construction waste
management domain. So considering the year 2016 deadline for the adoption of full collaborative
118
3D BIM (CabinetOffice, 2011) and the benefits of CW management, integrating waste
minimisation into BIM constitutes a huge opportunity for the construction industry. This will lead
to a cultural change within the industry for the adoption of BIM towards sustainable construction
(Ajayi et al., 2016). As such, a holistic BIM framework for CW management was developed based
on the identified expectations of industry practitioners.
To avoid the complexity of framework development (Garlan, Allen and Ockerbloom, 1995), an
architecture-driven approach, which represents a collection of functional components and the
description of the interactions amongst the components, was employed as proposed by Garlan and
Shaw (1993). This approach identifies the core and common components that are germane to the
development of a uniform and functional waste management system. As such, the integrity of the
system is maintained by avoiding unnecessary duplication and ensuring the reuse of standard
components. This also ensures that all components are loosely coupled (Long et al., 2012) from
each other to ensure independence among components thereby encouraging their implementation
one at a time. The architecture driven approach also encourages the separation of data from
algorithm, and from the technology.
Taking into consideration the factors identified from the literature and BIM strategies for CW
management the FGIs and questionnaire survey, a holistic BIM framework for a robust waste
management system was developed as presented in Figure 5.3. This was done with the intention
of integrating the industrial and technological requirements for waste management. The
framework development employed an architecture-based layered approach, where related
components are grouped into layers, to ensure hierarchical categorisation of components. This
approach also clearly defines boundaries of stakeholders’ responsibilities, supports fair and
efficient allocation of resources, encourages independent implementation of components, and
clearly defines components’ interfaces for information exchange. A summary of the framework
layers is provided below:
(a) Infrastructure Layer: This layer contains physical and virtual enterprise
technologies, i.e., cloud computing platforms, networking, hardware, and GIS
technologies.
119
(b) Data Layer: This layer provides the shared knowledge, which uses decision
making throughout the building’s lifecycle.
(c) Presentation Layer: The presentation layer defines the open BIM standards to
ensure system interoperability and transparency in data exchange.
(d) BIM Business Domain Layer: The BIM business domain layer defines the core
features of BIM as a set of concepts on top of the presentation, data, and
infrastructure layers.
(e) Service Domain Layer: The service domain layer defines specific concepts and
functionalities built on the BIM business domain layer to analyse and simulate
various performances of a building project, particularly construction waste analysis
and management.
(f) Application Layer: This layer allows various stakeholders to access specific
domain services. BIM software resides on this layer.
5.10 Summary
The chapter contains a detailed discussion of the development of a holistic BIM framework for
CW management in response to the expectations of industry stakeholders. After this, a set of FGIs
was conducted with professional from the construction industry to identify their expectations in
terms of adopting BIM for CW management. The factors identified from the literature review and
the FGIs were then organised into a questionnaire survey to test the opinion of a wider population
of stakeholders. The results of the factor analyses reveal five group of factors, which include “BIM-
based collaboration for waste management”, “waste-driven design process and solutions”,
“lifecycle waste analysis”, “Innovative technologies for waste intelligence and analytics”, and
“improved documentation for waste management”.
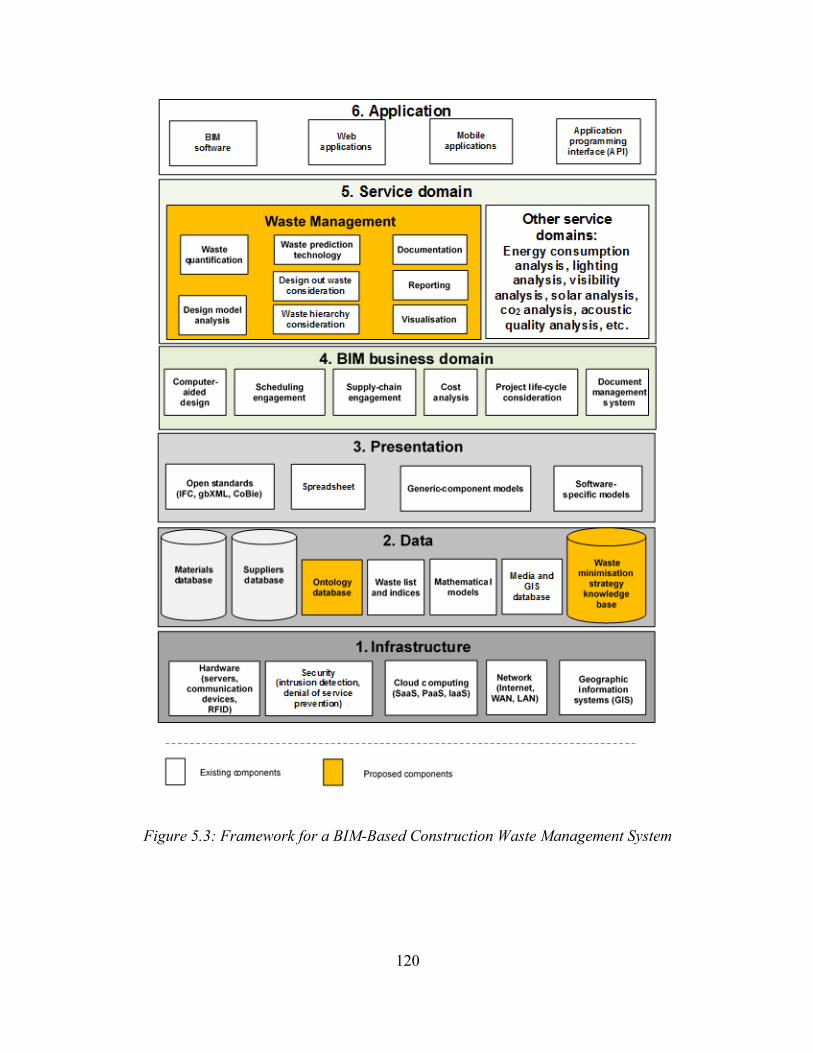
120
Figure 5.3: Framework for a BIM-Based Construction Waste Management System
121
Taking into consideration the factors, a holistic BIM framework for a robust waste management
system was developed. This was done with the intention of integrating the industrial and
technological requirements for waste management. The framework aims at achieving an integrated
approach to design for waste management. In a summarised discussion, this chapter presents dual
contributions: (i) the results improve the understanding of BIM functionalities and how they could
be employed to improve the effectiveness of existing CW management tools, and (ii) the results
help to understand industry expectation on the use of BIM for CW management.
The next chapter details how an Adaptive Neuro-Fuzzy Inference System (ANFIS) model, which
combines the strengths of ANN and FL into a single hybrid system, was developed for construction
waste prediction and minimisation. Accordingly, the model design, the data preparation, the model
development, and model evaluation processes are discussed.
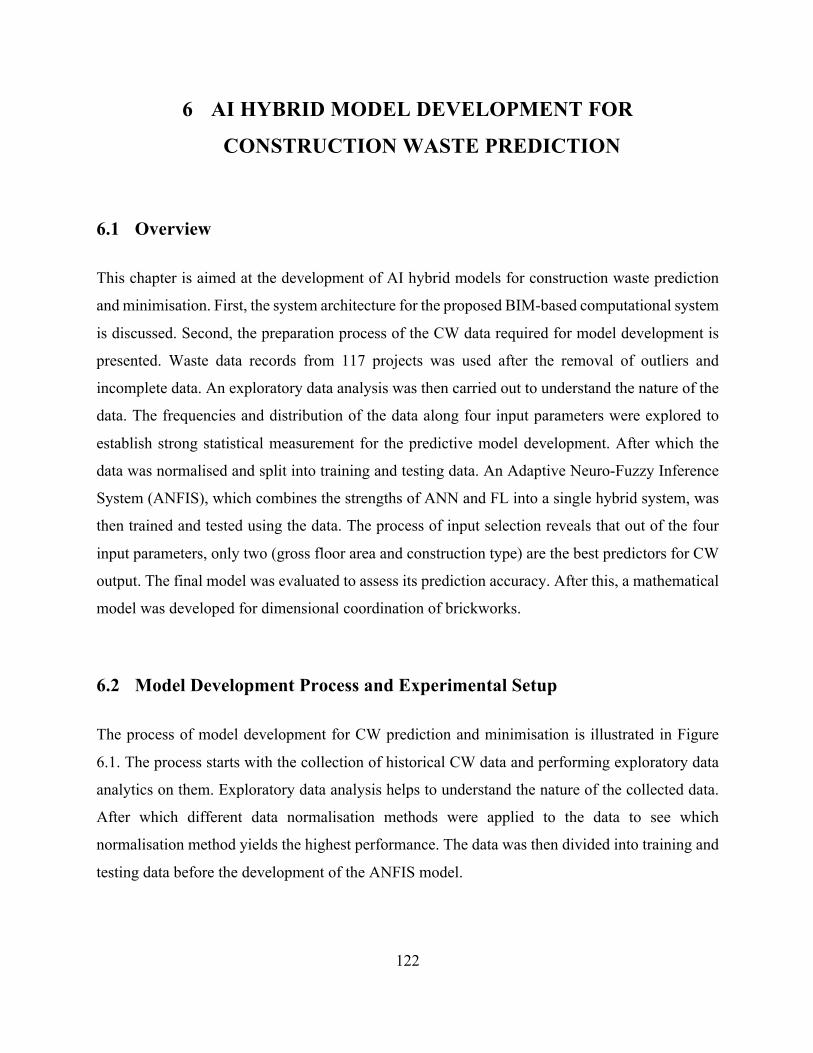
122
6 AI HYBRID MODEL DEVELOPMENT FOR
CONSTRUCTION WASTE PREDICTION
6.1 Overview
This chapter is aimed at the development of AI hybrid models for construction waste prediction
and minimisation. First, the system architecture for the proposed BIM-based computational system
is discussed. Second, the preparation process of the CW data required for model development is
presented. Waste data records from 117 projects was used after the removal of outliers and
incomplete data. An exploratory data analysis was then carried out to understand the nature of the
data. The frequencies and distribution of the data along four input parameters were explored to
establish strong statistical measurement for the predictive model development. After which the
data was normalised and split into training and testing data. An Adaptive Neuro-Fuzzy Inference
System (ANFIS), which combines the strengths of ANN and FL into a single hybrid system, was
then trained and tested using the data. The process of input selection reveals that out of the four
input parameters, only two (gross floor area and construction type) are the best predictors for CW
output. The final model was evaluated to assess its prediction accuracy. After this, a mathematical
model was developed for dimensional coordination of brickworks.
6.2 Model Development Process and Experimental Setup
The process of model development for CW prediction and minimisation is illustrated in Figure
6.1. The process starts with the collection of historical CW data and performing exploratory data
analytics on them. Exploratory data analysis helps to understand the nature of the collected data.
After which different data normalisation methods were applied to the data to see which
normalisation method yields the highest performance. The data was then divided into training and
testing data before the development of the ANFIS model.
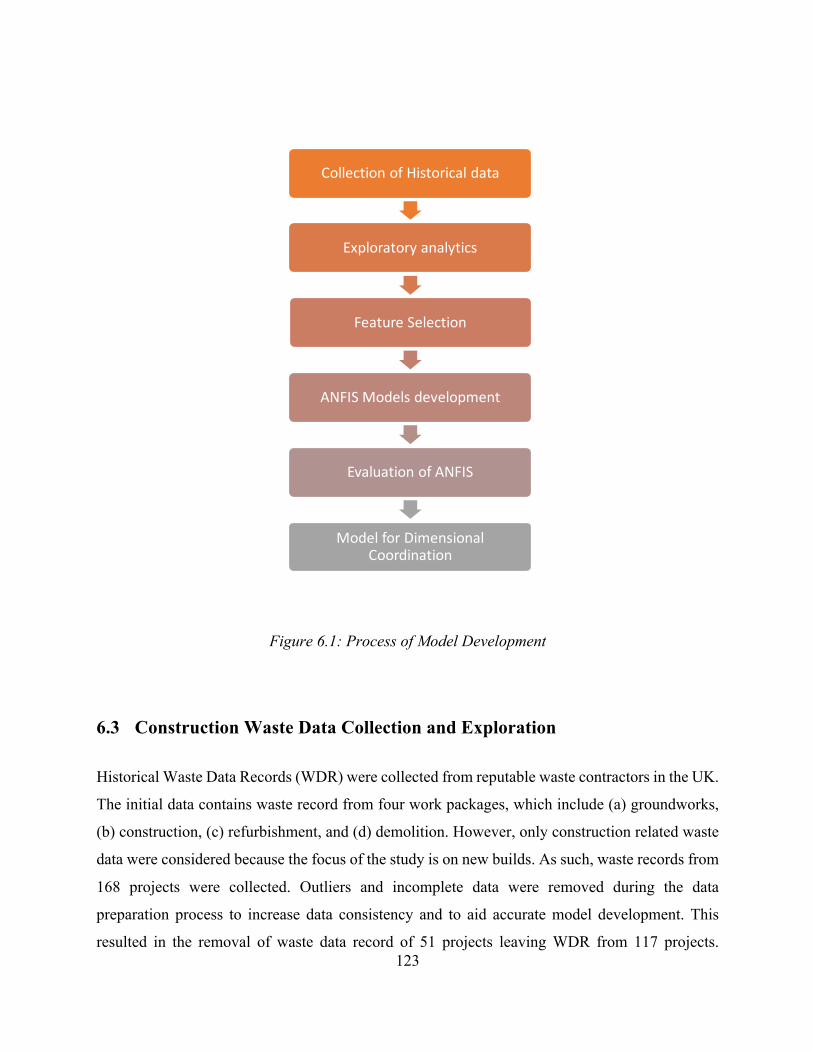
123
Figure 6.1: Process of Model Development
6.3 Construction Waste Data Collection and Exploration
Historical Waste Data Records (WDR) were collected from reputable waste contractors in the UK.
The initial data contains waste record from four work packages, which include (a) groundworks,
(b) construction, (c) refurbishment, and (d) demolition. However, only construction related waste
data were considered because the focus of the study is on new builds. As such, waste records from
168 projects were collected. Outliers and incomplete data were removed during the data
preparation process to increase data consistency and to aid accurate model development. This
resulted in the removal of waste data record of 51 projects leaving WDR from 117 projects.
CollectionofHistoricaldata
Exploratoryanalytics
FeatureSelection
ANFISModelsdevelopment
EvaluationofANFIS
ModelforDimensionalCoordination
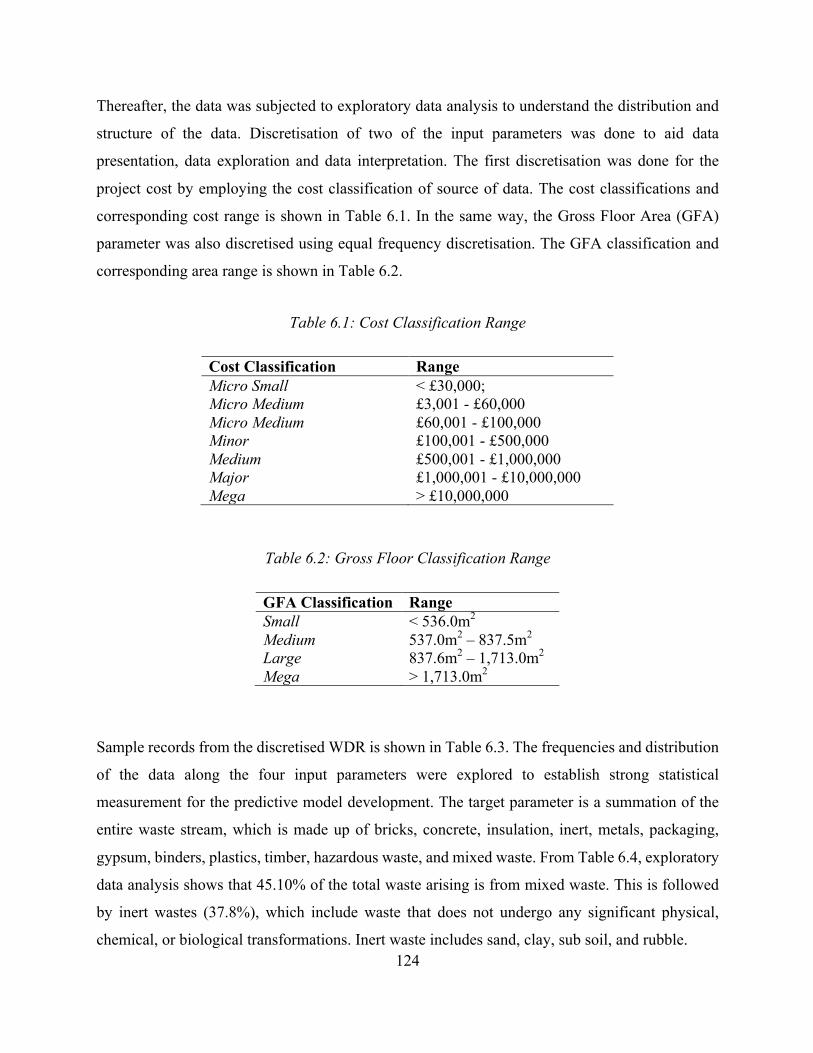
124
Thereafter, the data was subjected to exploratory data analysis to understand the distribution and
structure of the data. Discretisation of two of the input parameters was done to aid data
presentation, data exploration and data interpretation. The first discretisation was done for the
project cost by employing the cost classification of source of data. The cost classifications and
corresponding cost range is shown in Table 6.1. In the same way, the Gross Floor Area (GFA)
parameter was also discretised using equal frequency discretisation. The GFA classification and
corresponding area range is shown in Table 6.2.
Table 6.1: Cost Classification Range
Cost Classification Range Micro Small < £30,000; Micro Medium £3,001 - £60,000 Micro Medium £60,001 - £100,000 Minor £100,001 - £500,000 Medium £500,001 - £1,000,000 Major £1,000,001 - £10,000,000 Mega > £10,000,000
Table 6.2: Gross Floor Classification Range
GFA Classification Range Small < 536.0m2
Medium 537.0m2 – 837.5m2 Large 837.6m2 – 1,713.0m2 Mega > 1,713.0m2
Sample records from the discretised WDR is shown in Table 6.3. The frequencies and distribution
of the data along the four input parameters were explored to establish strong statistical
measurement for the predictive model development. The target parameter is a summation of the
entire waste stream, which is made up of bricks, concrete, insulation, inert, metals, packaging,
gypsum, binders, plastics, timber, hazardous waste, and mixed waste. From Table 6.4, exploratory
data analysis shows that 45.10% of the total waste arising is from mixed waste. This is followed
by inert wastes (37.8%), which include waste that does not undergo any significant physical,
chemical, or biological transformations. Inert waste includes sand, clay, sub soil, and rubble.
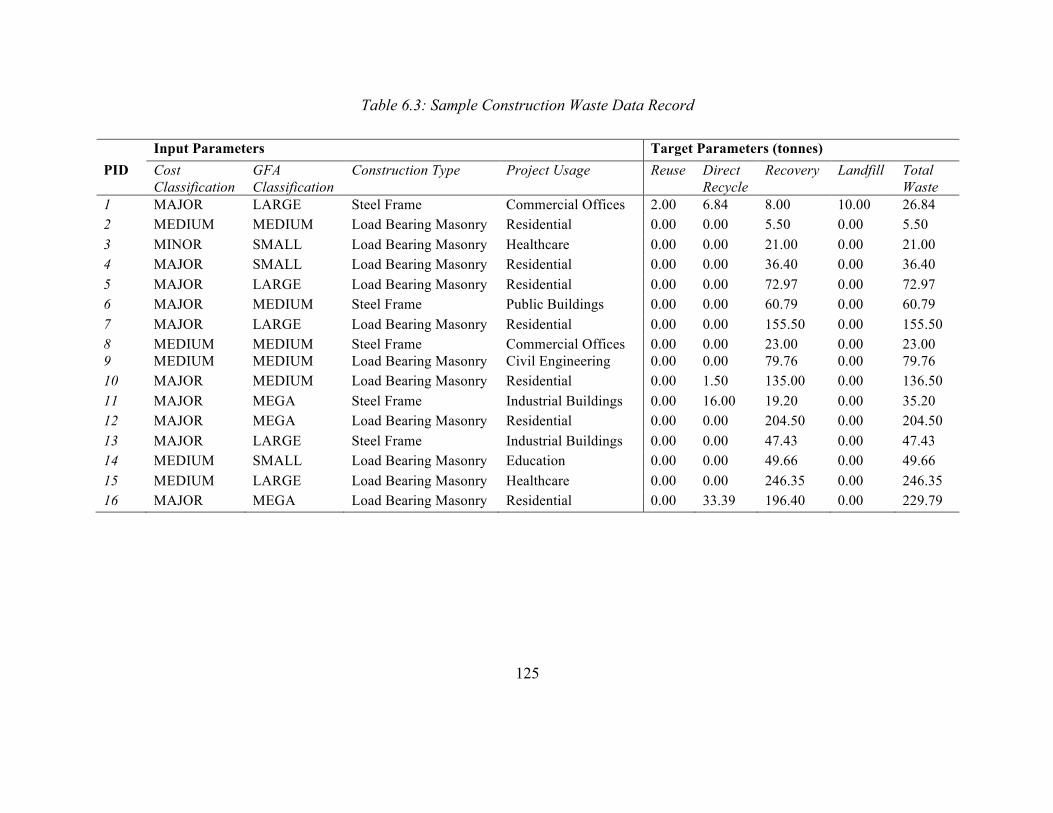
125
Table 6.3: Sample Construction Waste Data Record
Input Parameters Target Parameters (tonnes) PID Cost
Classification GFA Classification
Construction Type Project Usage Reuse Direct Recycle
Recovery Landfill Total Waste
1 MAJOR LARGE Steel Frame Commercial Offices 2.00 6.84 8.00 10.00 26.84 2 MEDIUM MEDIUM Load Bearing Masonry Residential 0.00 0.00 5.50 0.00 5.50 3 MINOR SMALL Load Bearing Masonry Healthcare 0.00 0.00 21.00 0.00 21.00 4 MAJOR SMALL Load Bearing Masonry Residential 0.00 0.00 36.40 0.00 36.40 5 MAJOR LARGE Load Bearing Masonry Residential 0.00 0.00 72.97 0.00 72.97 6 MAJOR MEDIUM Steel Frame Public Buildings 0.00 0.00 60.79 0.00 60.79 7 MAJOR LARGE Load Bearing Masonry Residential 0.00 0.00 155.50 0.00 155.50 8 MEDIUM MEDIUM Steel Frame Commercial Offices 0.00 0.00 23.00 0.00 23.00 9 MEDIUM MEDIUM Load Bearing Masonry Civil Engineering 0.00 0.00 79.76 0.00 79.76 10 MAJOR MEDIUM Load Bearing Masonry Residential 0.00 1.50 135.00 0.00 136.50 11 MAJOR MEGA Steel Frame Industrial Buildings 0.00 16.00 19.20 0.00 35.20 12 MAJOR MEGA Load Bearing Masonry Residential 0.00 0.00 204.50 0.00 204.50 13 MAJOR LARGE Steel Frame Industrial Buildings 0.00 0.00 47.43 0.00 47.43 14 MEDIUM SMALL Load Bearing Masonry Education 0.00 0.00 49.66 0.00 49.66 15 MEDIUM LARGE Load Bearing Masonry Healthcare 0.00 0.00 246.35 0.00 246.35 16 MAJOR MEGA Load Bearing Masonry Residential 0.00 33.39 196.40 0.00 229.79
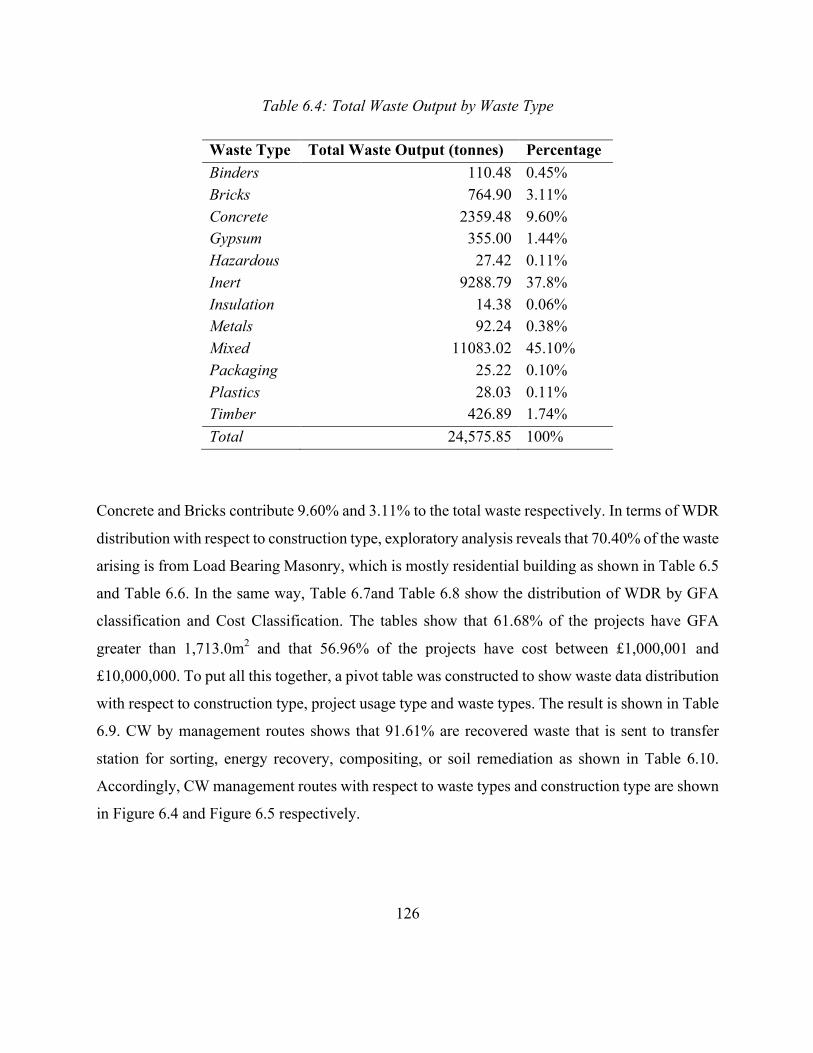
126
Table 6.4: Total Waste Output by Waste Type
Waste Type Total Waste Output (tonnes) Percentage Binders 110.48 0.45% Bricks 764.90 3.11% Concrete 2359.48 9.60% Gypsum 355.00 1.44% Hazardous 27.42 0.11% Inert 9288.79 37.8% Insulation 14.38 0.06% Metals 92.24 0.38% Mixed 11083.02 45.10% Packaging 25.22 0.10% Plastics 28.03 0.11% Timber 426.89 1.74% Total 24,575.85 100%
Concrete and Bricks contribute 9.60% and 3.11% to the total waste respectively. In terms of WDR
distribution with respect to construction type, exploratory analysis reveals that 70.40% of the waste
arising is from Load Bearing Masonry, which is mostly residential building as shown in Table 6.5
and Table 6.6. In the same way, Table 6.7and Table 6.8 show the distribution of WDR by GFA
classification and Cost Classification. The tables show that 61.68% of the projects have GFA
greater than 1,713.0m2 and that 56.96% of the projects have cost between £1,000,001 and
£10,000,000. To put all this together, a pivot table was constructed to show waste data distribution
with respect to construction type, project usage type and waste types. The result is shown in Table
6.9. CW by management routes shows that 91.61% are recovered waste that is sent to transfer
station for sorting, energy recovery, compositing, or soil remediation as shown in Table 6.10.
Accordingly, CW management routes with respect to waste types and construction type are shown
in Figure 6.4 and Figure 6.5 respectively.
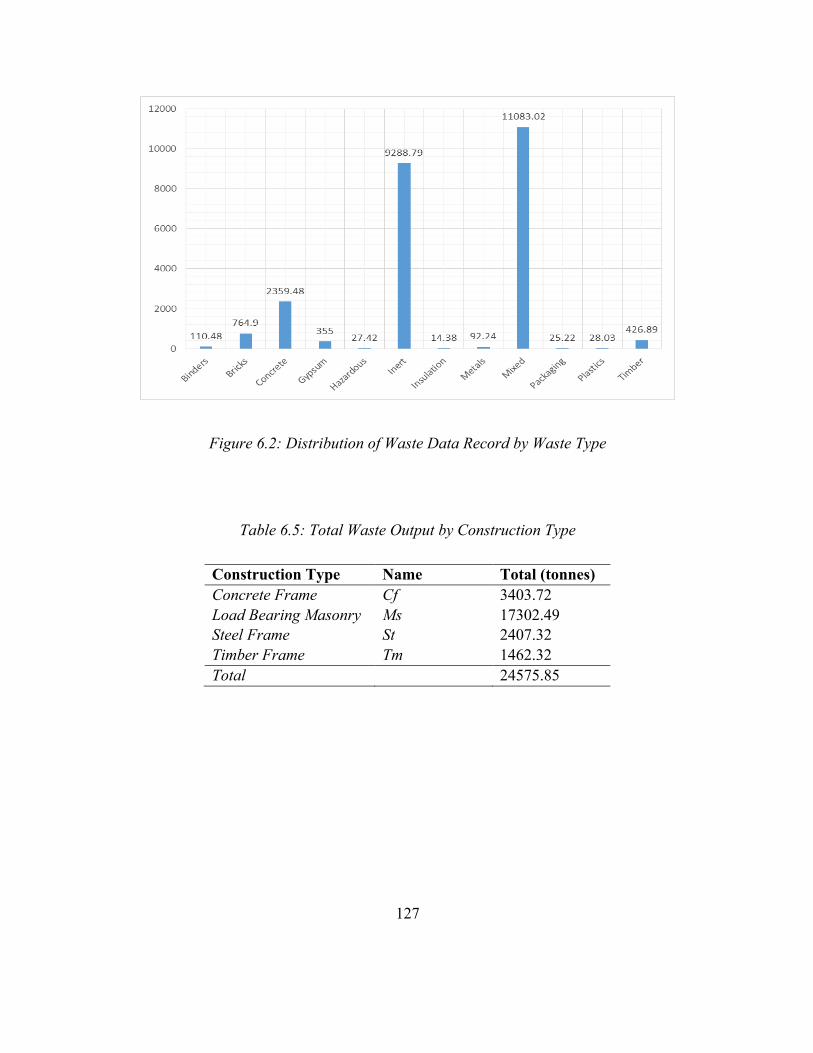
127
Figure 6.2: Distribution of Waste Data Record by Waste Type
Table 6.5: Total Waste Output by Construction Type
Construction Type Name Total (tonnes) Concrete Frame Cf 3403.72 Load Bearing Masonry Ms 17302.49 Steel Frame St 2407.32 Timber Frame Tm 1462.32 Total 24575.85
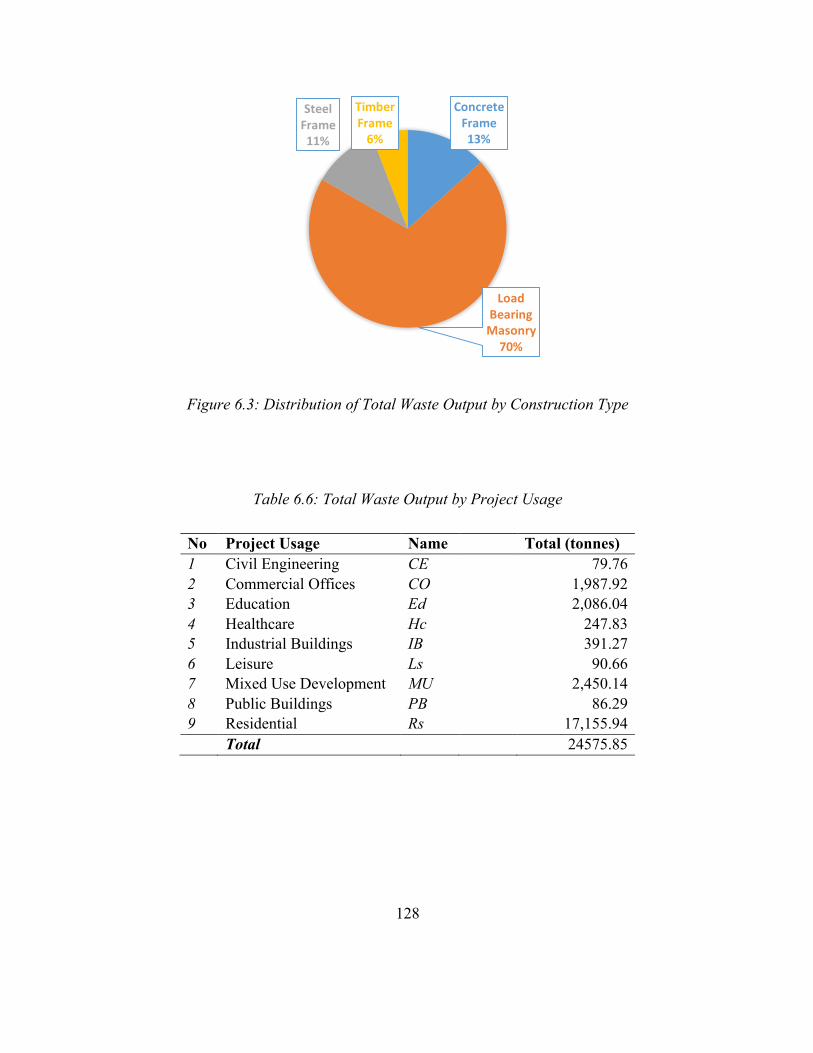
128
Figure 6.3: Distribution of Total Waste Output by Construction Type
Table 6.6: Total Waste Output by Project Usage
No Project Usage Name Total (tonnes) 1 Civil Engineering CE 79.76 2 Commercial Offices CO 1,987.92 3 Education Ed 2,086.04 4 Healthcare Hc 247.83 5 Industrial Buildings IB 391.27 6 Leisure Ls 90.66 7 Mixed Use Development MU 2,450.14 8 Public Buildings PB 86.29 9 Residential Rs 17,155.94 Total 24575.85
ConcreteFrame13%
LoadBearingMasonry70%
SteelFrame11%
TimberFrame6%
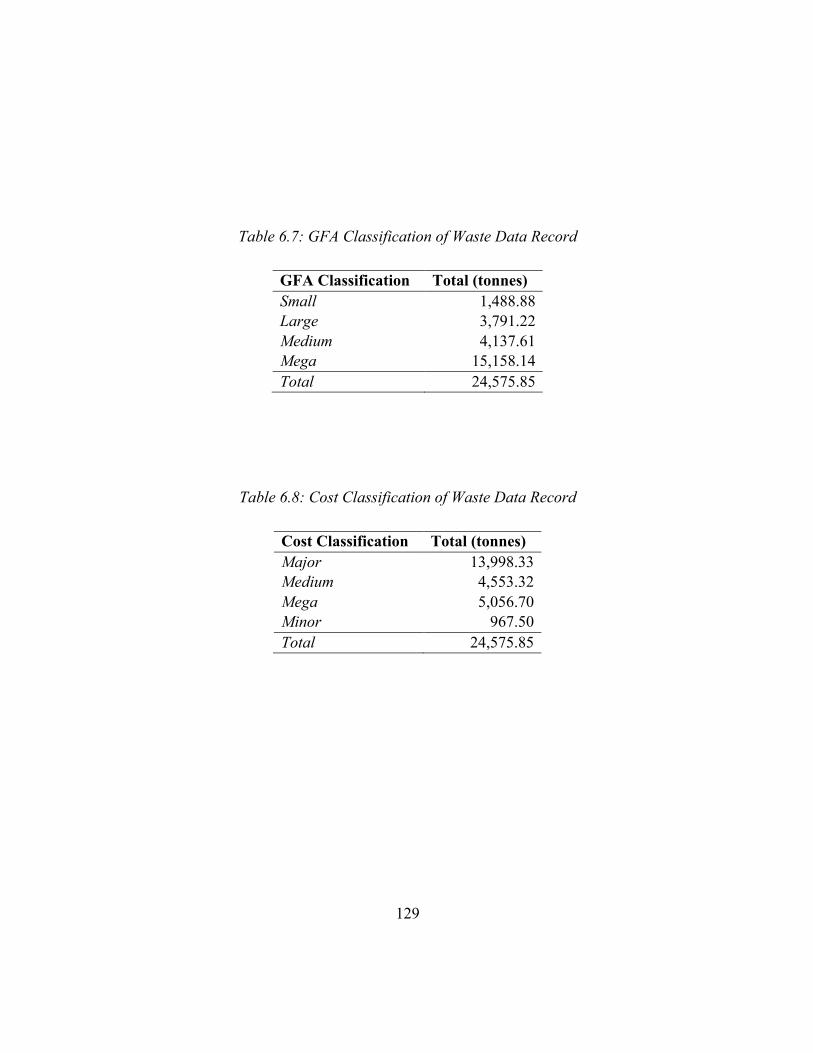
129
Table 6.7: GFA Classification of Waste Data Record
GFA Classification Total (tonnes) Small 1,488.88 Large 3,791.22 Medium 4,137.61 Mega 15,158.14 Total 24,575.85
Table 6.8: Cost Classification of Waste Data Record
Cost Classification Total (tonnes) Major 13,998.33 Medium 4,553.32 Mega 5,056.70 Minor 967.50 Total 24,575.85
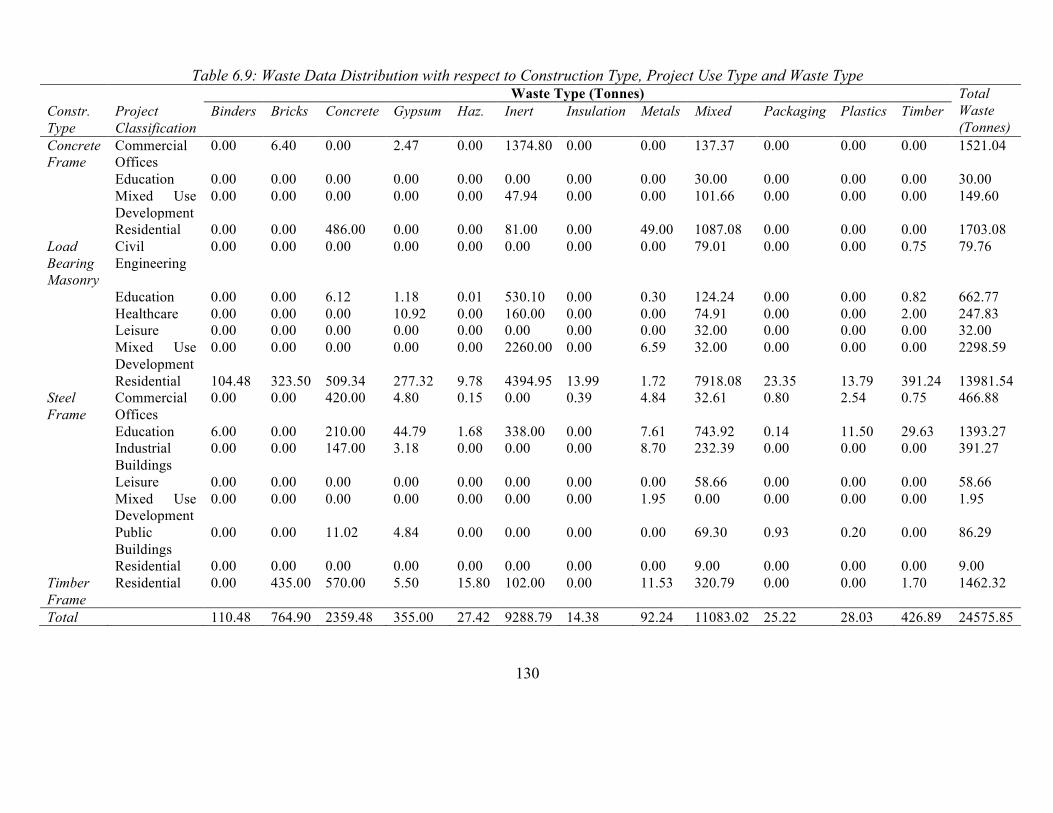
130
Table 6.9: Waste Data Distribution with respect to Construction Type, Project Use Type and Waste Type Waste Type (Tonnes) Total
Waste (Tonnes)
Constr. Type
Project Classification
Binders Bricks Concrete Gypsum Haz. Inert Insulation Metals Mixed Packaging Plastics Timber
Concrete Frame
Commercial Offices
0.00 6.40 0.00 2.47 0.00 1374.80 0.00 0.00 137.37 0.00 0.00 0.00 1521.04
Education 0.00 0.00 0.00 0.00 0.00 0.00 0.00 0.00 30.00 0.00 0.00 0.00 30.00 Mixed Use
Development 0.00 0.00 0.00 0.00 0.00 47.94 0.00 0.00 101.66 0.00 0.00 0.00 149.60
Residential 0.00 0.00 486.00 0.00 0.00 81.00 0.00 49.00 1087.08 0.00 0.00 0.00 1703.08 Load Bearing Masonry
Civil Engineering
0.00 0.00 0.00 0.00 0.00 0.00 0.00 0.00 79.01 0.00 0.00 0.75 79.76
Education 0.00 0.00 6.12 1.18 0.01 530.10 0.00 0.30 124.24 0.00 0.00 0.82 662.77 Healthcare 0.00 0.00 0.00 10.92 0.00 160.00 0.00 0.00 74.91 0.00 0.00 2.00 247.83 Leisure 0.00 0.00 0.00 0.00 0.00 0.00 0.00 0.00 32.00 0.00 0.00 0.00 32.00 Mixed Use
Development 0.00 0.00 0.00 0.00 0.00 2260.00 0.00 6.59 32.00 0.00 0.00 0.00 2298.59
Residential 104.48 323.50 509.34 277.32 9.78 4394.95 13.99 1.72 7918.08 23.35 13.79 391.24 13981.54 Steel Frame
Commercial Offices
0.00 0.00 420.00 4.80 0.15 0.00 0.39 4.84 32.61 0.80 2.54 0.75 466.88
Education 6.00 0.00 210.00 44.79 1.68 338.00 0.00 7.61 743.92 0.14 11.50 29.63 1393.27 Industrial
Buildings 0.00 0.00 147.00 3.18 0.00 0.00 0.00 8.70 232.39 0.00 0.00 0.00 391.27
Leisure 0.00 0.00 0.00 0.00 0.00 0.00 0.00 0.00 58.66 0.00 0.00 0.00 58.66 Mixed Use
Development 0.00 0.00 0.00 0.00 0.00 0.00 0.00 1.95 0.00 0.00 0.00 0.00 1.95
Public Buildings
0.00 0.00 11.02 4.84 0.00 0.00 0.00 0.00 69.30 0.93 0.20 0.00 86.29
Residential 0.00 0.00 0.00 0.00 0.00 0.00 0.00 0.00 9.00 0.00 0.00 0.00 9.00 Timber Frame
Residential 0.00 435.00 570.00 5.50 15.80 102.00 0.00 11.53 320.79 0.00 0.00 1.70 1462.32
Total 110.48 764.90 2359.48 355.00 27.42 9288.79 14.38 92.24 11083.02 25.22 28.03 426.89 24575.85
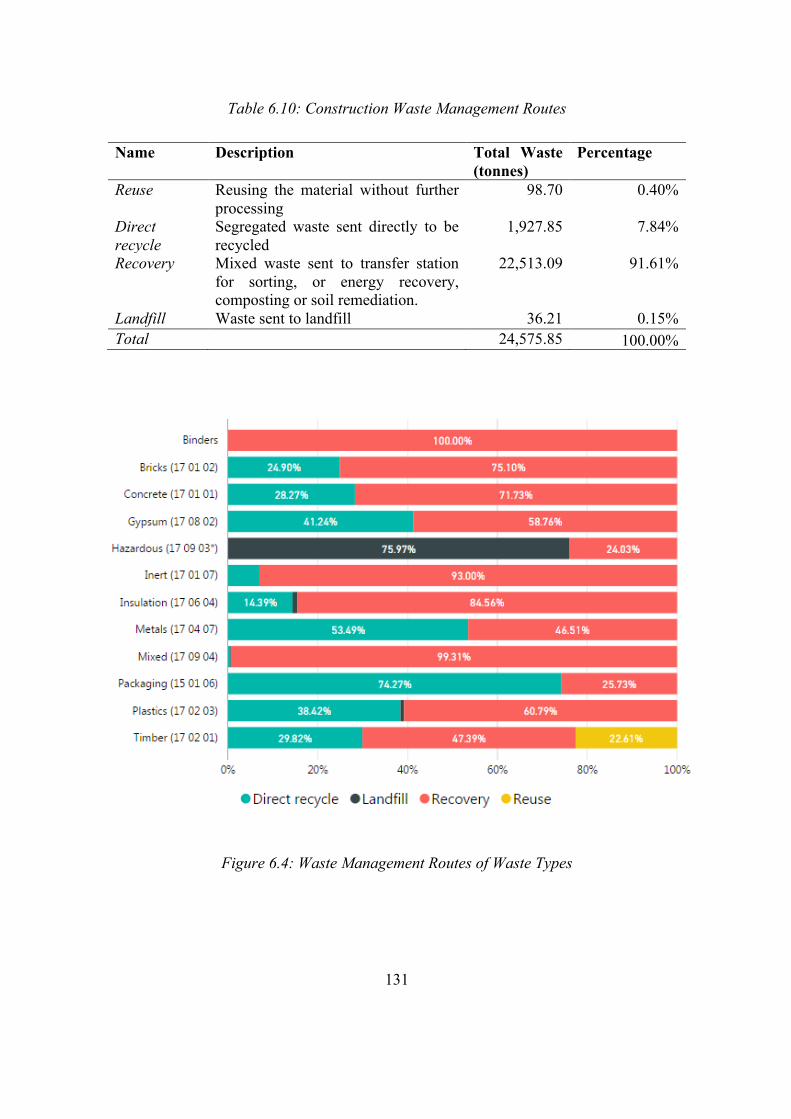
131
Table 6.10: Construction Waste Management Routes
Name Description Total Waste (tonnes)
Percentage
Reuse Reusing the material without further processing
98.70 0.40%
Direct recycle
Segregated waste sent directly to be recycled
1,927.85 7.84%
Recovery Mixed waste sent to transfer station for sorting, or energy recovery, composting or soil remediation.
22,513.09 91.61%
Landfill Waste sent to landfill 36.21 0.15% Total 24,575.85 100.00%
Figure 6.4: Waste Management Routes of Waste Types
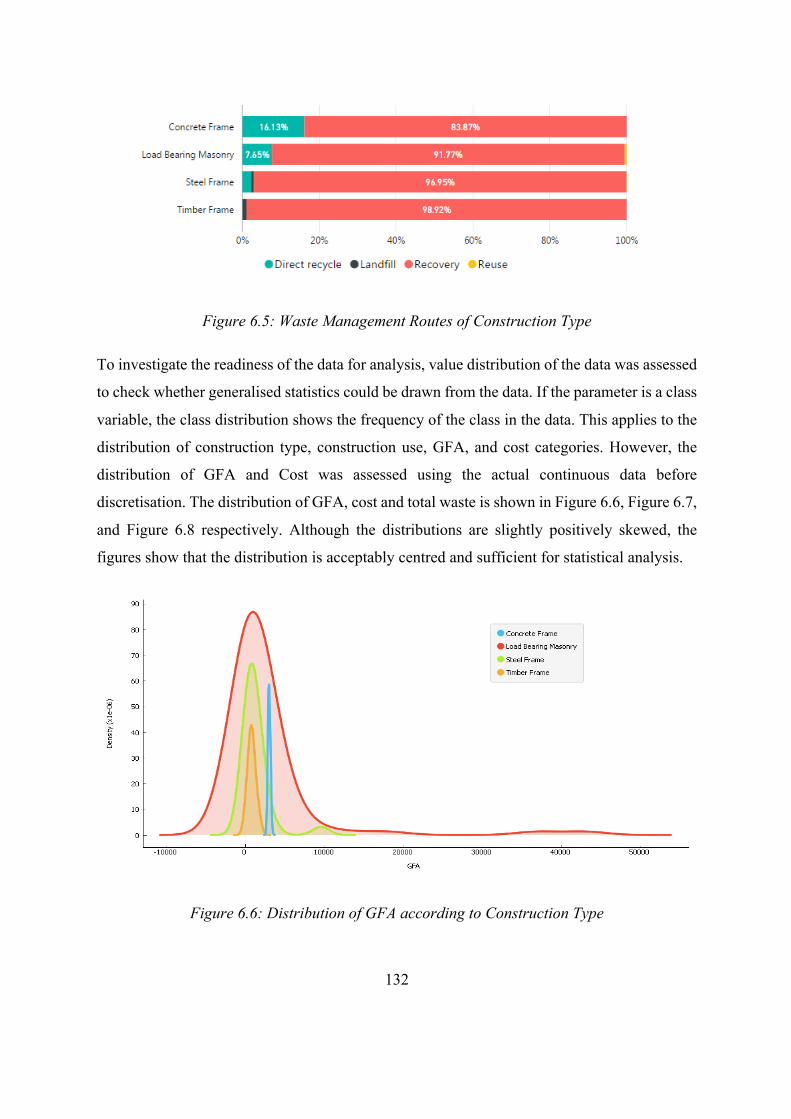
132
Figure 6.5: Waste Management Routes of Construction Type
To investigate the readiness of the data for analysis, value distribution of the data was assessed
to check whether generalised statistics could be drawn from the data. If the parameter is a class
variable, the class distribution shows the frequency of the class in the data. This applies to the
distribution of construction type, construction use, GFA, and cost categories. However, the
distribution of GFA and Cost was assessed using the actual continuous data before
discretisation. The distribution of GFA, cost and total waste is shown in Figure 6.6, Figure 6.7,
and Figure 6.8 respectively. Although the distributions are slightly positively skewed, the
figures show that the distribution is acceptably centred and sufficient for statistical analysis.
Figure 6.6: Distribution of GFA according to Construction Type
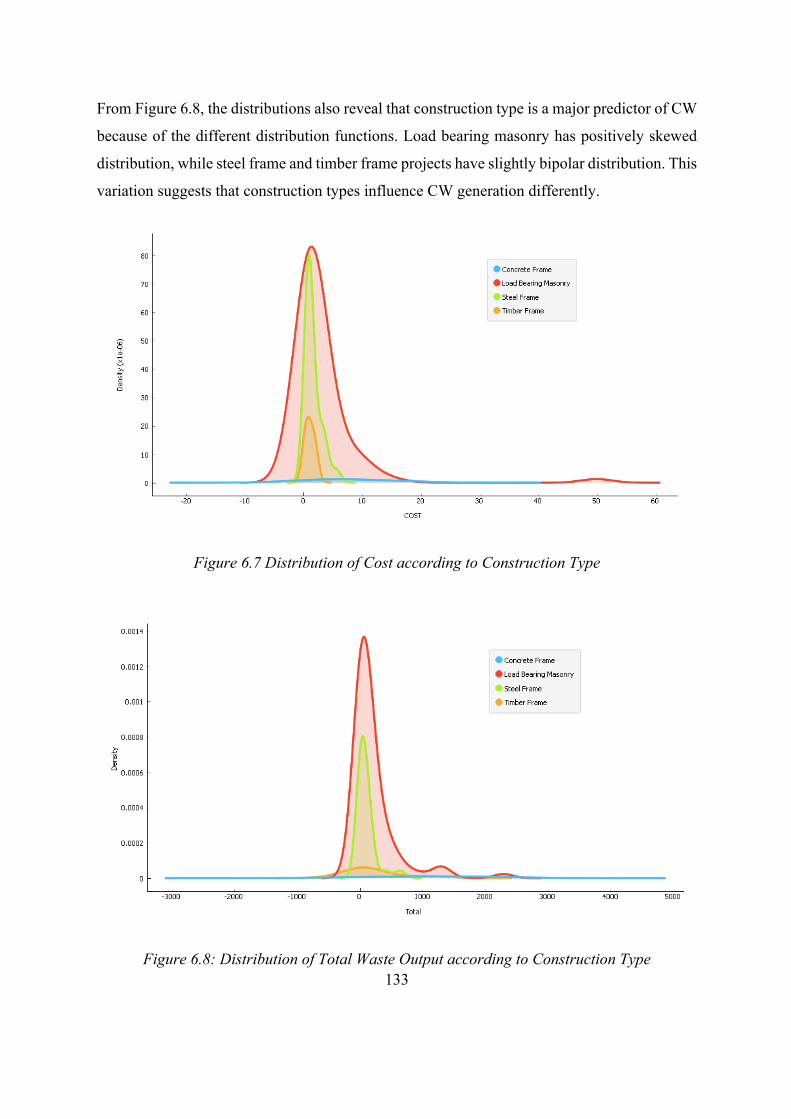
133
From Figure 6.8, the distributions also reveal that construction type is a major predictor of CW
because of the different distribution functions. Load bearing masonry has positively skewed
distribution, while steel frame and timber frame projects have slightly bipolar distribution. This
variation suggests that construction types influence CW generation differently.
Figure 6.7 Distribution of Cost according to Construction Type
Figure 6.8: Distribution of Total Waste Output according to Construction Type
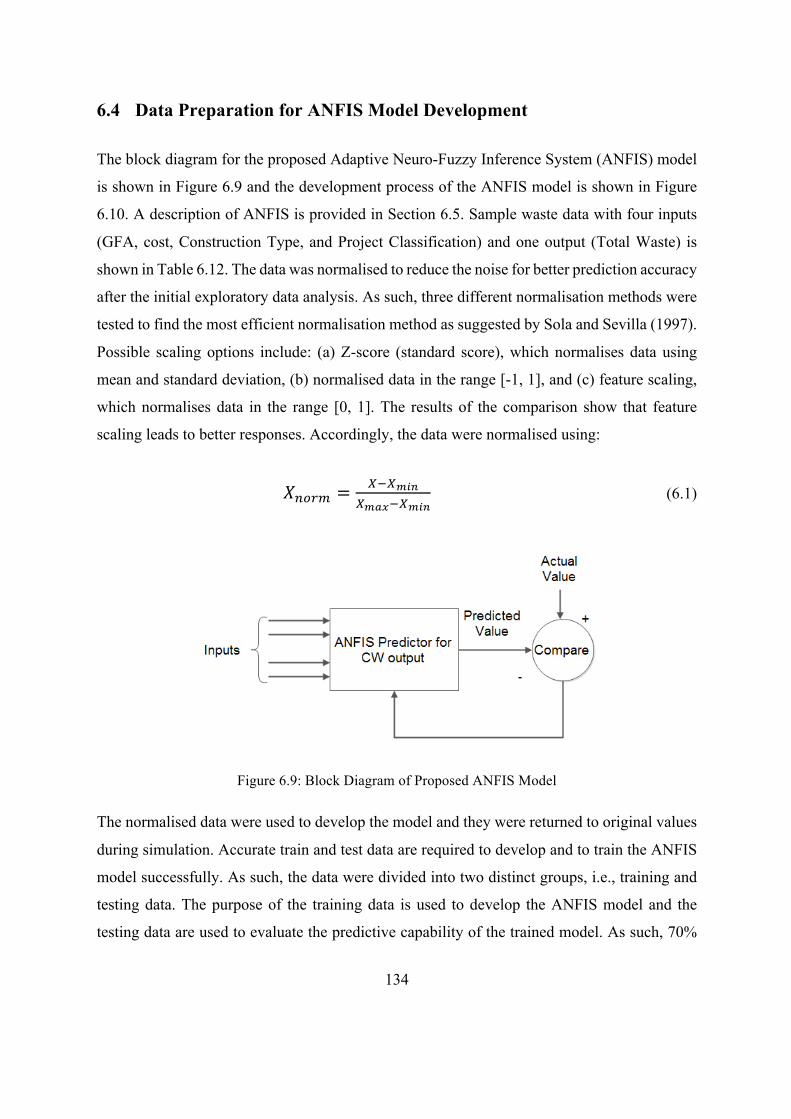
134
6.4 Data Preparation for ANFIS Model Development
The block diagram for the proposed Adaptive Neuro-Fuzzy Inference System (ANFIS) model
is shown in Figure 6.9 and the development process of the ANFIS model is shown in Figure
6.10. A description of ANFIS is provided in Section 6.5. Sample waste data with four inputs
(GFA, cost, Construction Type, and Project Classification) and one output (Total Waste) is
shown in Table 6.12. The data was normalised to reduce the noise for better prediction accuracy
after the initial exploratory data analysis. As such, three different normalisation methods were
tested to find the most efficient normalisation method as suggested by Sola and Sevilla (1997).
Possible scaling options include: (a) Z-score (standard score), which normalises data using
mean and standard deviation, (b) normalised data in the range [-1, 1], and (c) feature scaling,
which normalises data in the range [0, 1]. The results of the comparison show that feature
scaling leads to better responses. Accordingly, the data were normalised using:
!"#$% = '(')*+
'),-(')*+ (6.1)
Figure 6.9: Block Diagram of Proposed ANFIS Model
The normalised data were used to develop the model and they were returned to original values
during simulation. Accurate train and test data are required to develop and to train the ANFIS
model successfully. As such, the data were divided into two distinct groups, i.e., training and
testing data. The purpose of the training data is used to develop the ANFIS model and the
testing data are used to evaluate the predictive capability of the trained model. As such, 70%
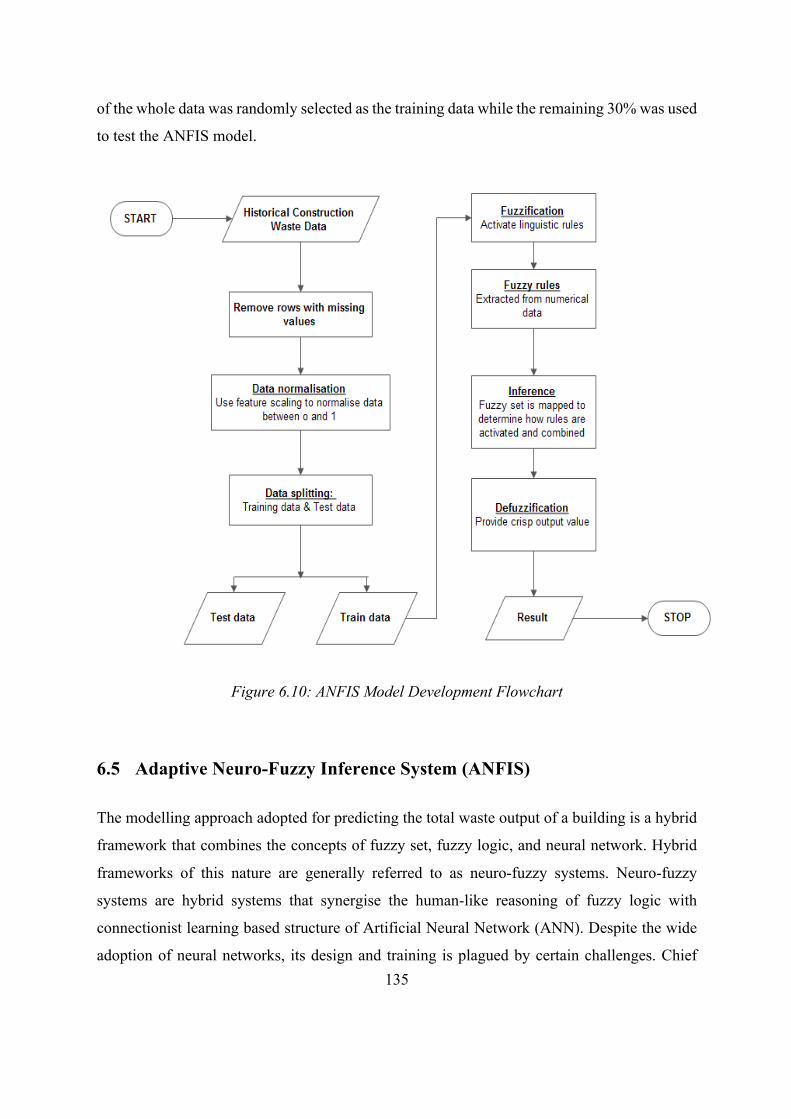
135
of the whole data was randomly selected as the training data while the remaining 30% was used
to test the ANFIS model.
Figure 6.10: ANFIS Model Development Flowchart
6.5 Adaptive Neuro-Fuzzy Inference System (ANFIS)
The modelling approach adopted for predicting the total waste output of a building is a hybrid
framework that combines the concepts of fuzzy set, fuzzy logic, and neural network. Hybrid
frameworks of this nature are generally referred to as neuro-fuzzy systems. Neuro-fuzzy
systems are hybrid systems that synergise the human-like reasoning of fuzzy logic with
connectionist learning based structure of Artificial Neural Network (ANN). Despite the wide
adoption of neural networks, its design and training is plagued by certain challenges. Chief
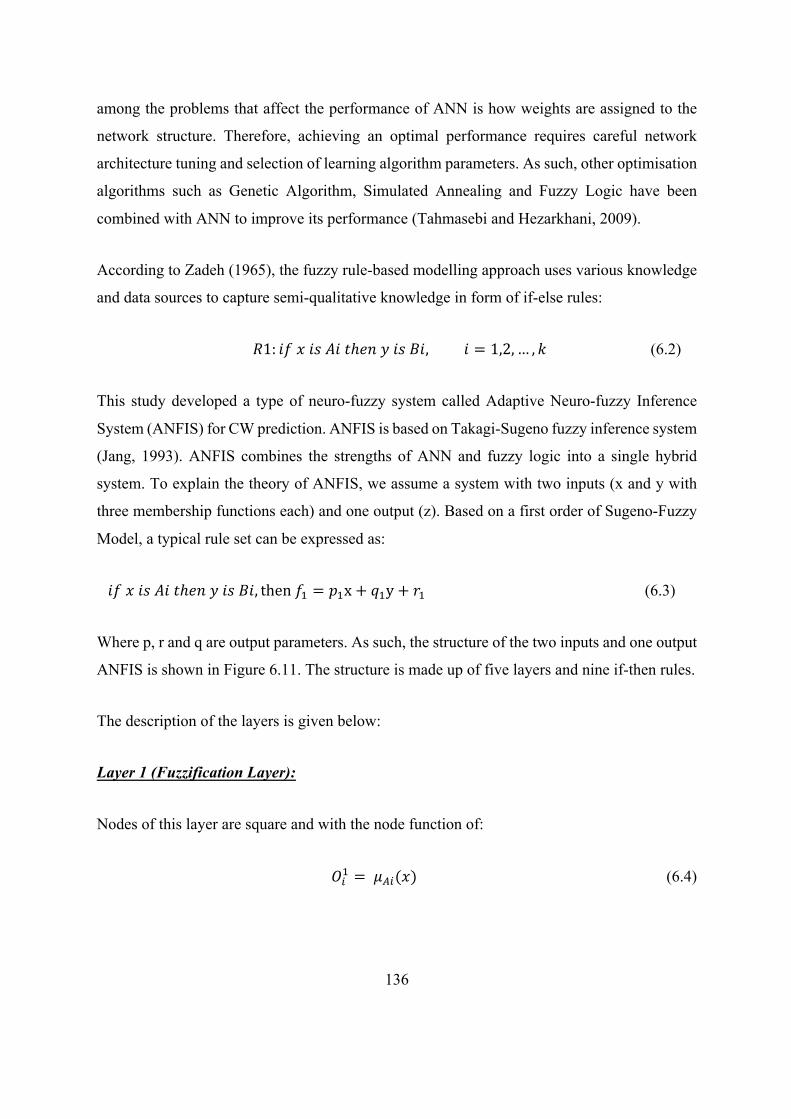
136
among the problems that affect the performance of ANN is how weights are assigned to the
network structure. Therefore, achieving an optimal performance requires careful network
architecture tuning and selection of learning algorithm parameters. As such, other optimisation
algorithms such as Genetic Algorithm, Simulated Annealing and Fuzzy Logic have been
combined with ANN to improve its performance (Tahmasebi and Hezarkhani, 2009).
According to Zadeh (1965), the fuzzy rule-based modelling approach uses various knowledge
and data sources to capture semi-qualitative knowledge in form of if-else rules:
.1: 12415617ℎ9:;15<1,1 = 1,2, … , @ (6.2)
This study developed a type of neuro-fuzzy system called Adaptive Neuro-fuzzy Inference
System (ANFIS) for CW prediction. ANFIS is based on Takagi-Sugeno fuzzy inference system
(Jang, 1993). ANFIS combines the strengths of ANN and fuzzy logic into a single hybrid
system. To explain the theory of ANFIS, we assume a system with two inputs (x and y with
three membership functions each) and one output (z). Based on a first order of Sugeno-Fuzzy
Model, a typical rule set can be expressed as:
12415617ℎ9:;15<1, then2E = FEx + IEy + KE (6.3)
Where p, r and q are output parameters. As such, the structure of the two inputs and one output
ANFIS is shown in Figure 6.11. The structure is made up of five layers and nine if-then rules.
The description of the layers is given below:
Layer 1 (Fuzzification Layer):
Nodes of this layer are square and with the node function of:
LME = NOM(4) (6.4)
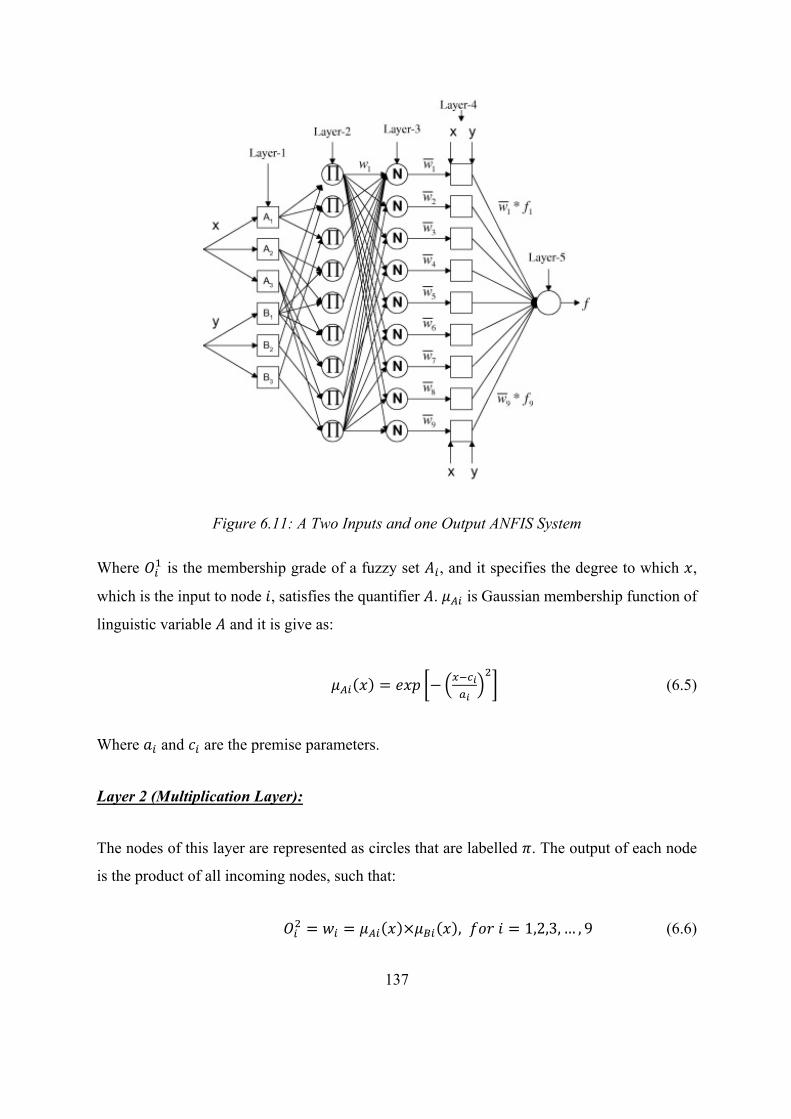
137
Figure 6.11: A Two Inputs and one Output ANFIS System
Where LME is the membership grade of a fuzzy set 6M, and it specifies the degree to which 4,
which is the input to node 1, satisfies the quantifier 6. NOM is Gaussian membership function of
linguistic variable 6 and it is give as:
NOM 4 = 94F − S(T*U*
V (6.5)
Where WM and XM are the premise parameters.
Layer 2 (Multiplication Layer):
The nodes of this layer are represented as circles that are labelled Y. The output of each node
is the product of all incoming nodes, such that:
LMV = ZM = NOM 4 ×N\M 4 , 2]K1 = 1,2,3, … , 9 (6.6)
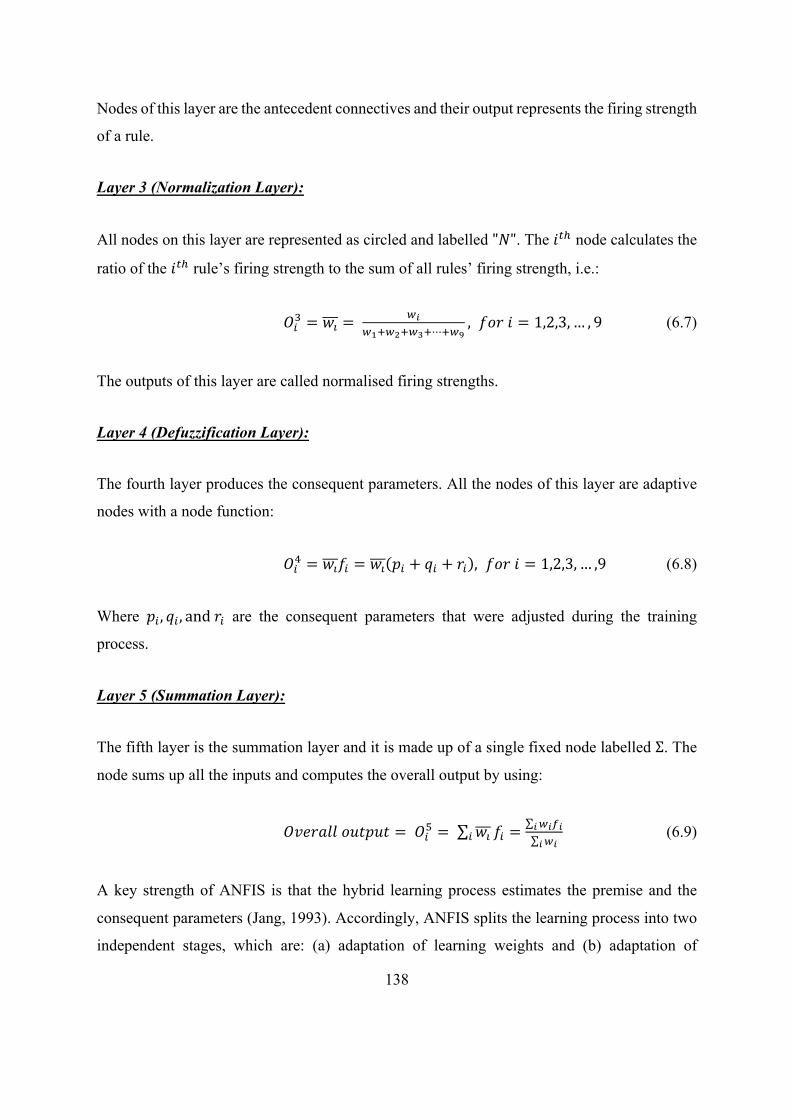
138
Nodes of this layer are the antecedent connectives and their output represents the firing strength
of a rule.
Layer 3 (Normalization Layer):
All nodes on this layer are represented as circled and labelled "a". The 1bc node calculates the
ratio of the 1bc rule’s firing strength to the sum of all rules’ firing strength, i.e.:
LMd = Ze =
f*fghfihfjh⋯hfl
, 2]K1 = 1,2,3, … , 9 (6.7)
The outputs of this layer are called normalised firing strengths.
Layer 4 (Defuzzification Layer):
The fourth layer produces the consequent parameters. All the nodes of this layer are adaptive
nodes with a node function:
LMm = Ze2M = Ze FM + IM + KM , 2]K1 = 1,2,3, … ,9 (6.8)
Where FM, IM, andKM are the consequent parameters that were adjusted during the training
process.
Layer 5 (Summation Layer):
The fifth layer is the summation layer and it is made up of a single fixed node labelled Σ. The
node sums up all the inputs and computes the overall output by using:
Lq9KWrr]s7Fs7 = LMt = ZeM 2M =
f*u**
f** (6.9)
A key strength of ANFIS is that the hybrid learning process estimates the premise and the
consequent parameters (Jang, 1993). Accordingly, ANFIS splits the learning process into two
independent stages, which are: (a) adaptation of learning weights and (b) adaptation of
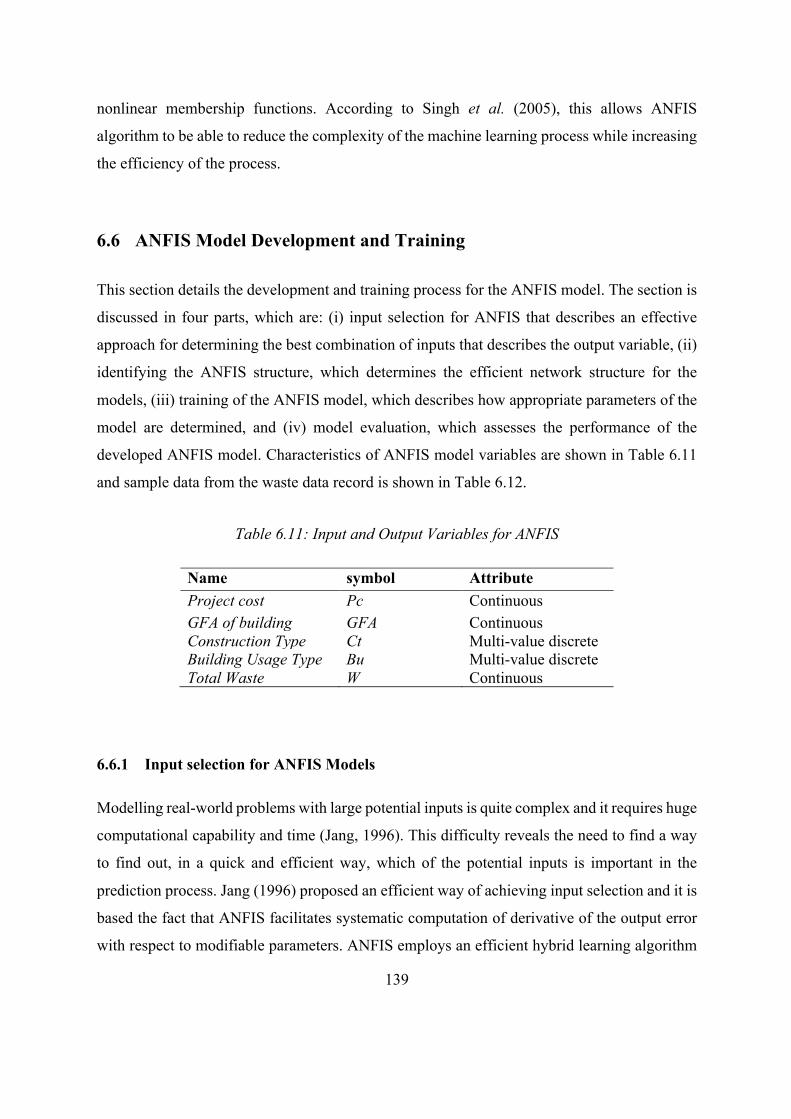
139
nonlinear membership functions. According to Singh et al. (2005), this allows ANFIS
algorithm to be able to reduce the complexity of the machine learning process while increasing
the efficiency of the process.
6.6 ANFIS Model Development and Training
This section details the development and training process for the ANFIS model. The section is
discussed in four parts, which are: (i) input selection for ANFIS that describes an effective
approach for determining the best combination of inputs that describes the output variable, (ii)
identifying the ANFIS structure, which determines the efficient network structure for the
models, (iii) training of the ANFIS model, which describes how appropriate parameters of the
model are determined, and (iv) model evaluation, which assesses the performance of the
developed ANFIS model. Characteristics of ANFIS model variables are shown in Table 6.11
and sample data from the waste data record is shown in Table 6.12.
Table 6.11: Input and Output Variables for ANFIS
Name symbol Attribute Project cost Pc Continuous GFA of building GFA Continuous Construction Type Ct Multi-value discrete Building Usage Type Bu Multi-value discrete Total Waste W Continuous
6.6.1 Input selection for ANFIS Models
Modelling real-world problems with large potential inputs is quite complex and it requires huge
computational capability and time (Jang, 1996). This difficulty reveals the need to find a way
to find out, in a quick and efficient way, which of the potential inputs is important in the
prediction process. Jang (1996) proposed an efficient way of achieving input selection and it is
based the fact that ANFIS facilitates systematic computation of derivative of the output error
with respect to modifiable parameters. ANFIS employs an efficient hybrid learning algorithm
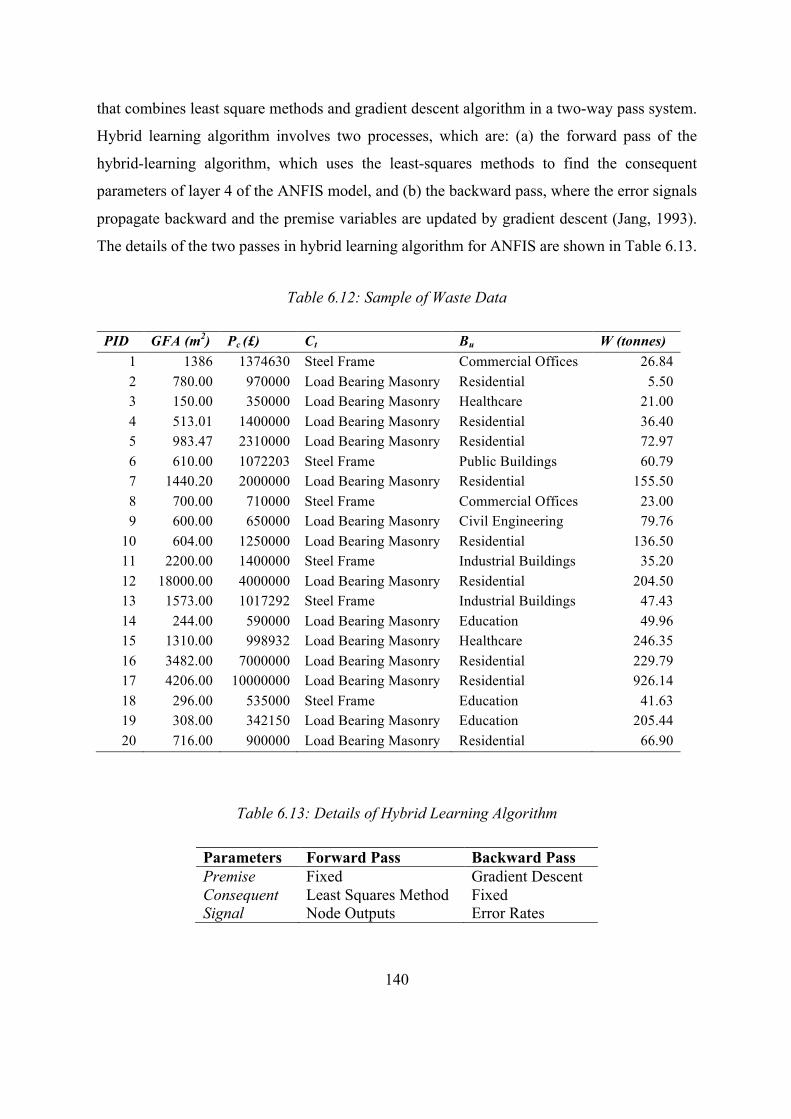
140
that combines least square methods and gradient descent algorithm in a two-way pass system.
Hybrid learning algorithm involves two processes, which are: (a) the forward pass of the
hybrid-learning algorithm, which uses the least-squares methods to find the consequent
parameters of layer 4 of the ANFIS model, and (b) the backward pass, where the error signals
propagate backward and the premise variables are updated by gradient descent (Jang, 1993).
The details of the two passes in hybrid learning algorithm for ANFIS are shown in Table 6.13.
Table 6.12: Sample of Waste Data
PID GFA (m2) Pc (£) Ct Bu W (tonnes) 1 1386 1374630 Steel Frame Commercial Offices 26.84 2 780.00 970000 Load Bearing Masonry Residential 5.50 3 150.00 350000 Load Bearing Masonry Healthcare 21.00 4 513.01 1400000 Load Bearing Masonry Residential 36.40 5 983.47 2310000 Load Bearing Masonry Residential 72.97 6 610.00 1072203 Steel Frame Public Buildings 60.79 7 1440.20 2000000 Load Bearing Masonry Residential 155.50 8 700.00 710000 Steel Frame Commercial Offices 23.00 9 600.00 650000 Load Bearing Masonry Civil Engineering 79.76
10 604.00 1250000 Load Bearing Masonry Residential 136.50 11 2200.00 1400000 Steel Frame Industrial Buildings 35.20 12 18000.00 4000000 Load Bearing Masonry Residential 204.50 13 1573.00 1017292 Steel Frame Industrial Buildings 47.43 14 244.00 590000 Load Bearing Masonry Education 49.96 15 1310.00 998932 Load Bearing Masonry Healthcare 246.35 16 3482.00 7000000 Load Bearing Masonry Residential 229.79 17 4206.00 10000000 Load Bearing Masonry Residential 926.14 18 296.00 535000 Steel Frame Education 41.63 19 308.00 342150 Load Bearing Masonry Education 205.44 20 716.00 900000 Load Bearing Masonry Residential 66.90
Table 6.13: Details of Hybrid Learning Algorithm
Parameters Forward Pass Backward Pass Premise Fixed Gradient Descent Consequent Least Squares Method Fixed Signal Node Outputs Error Rates
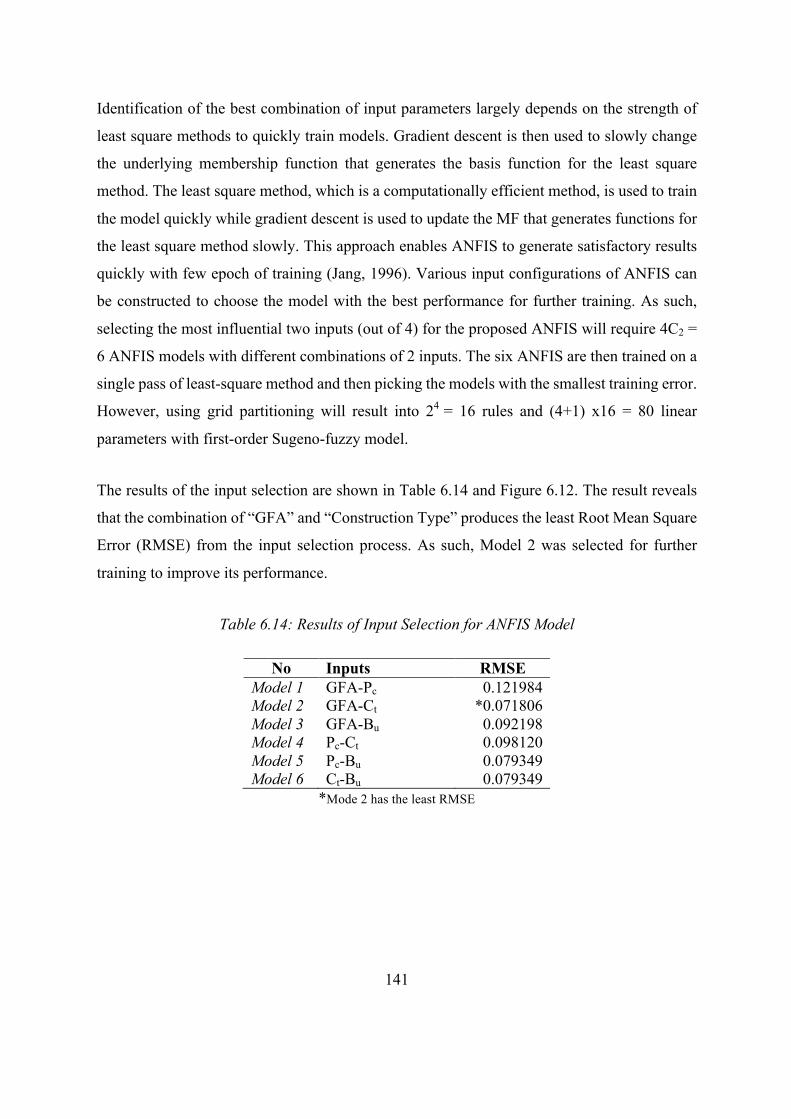
141
Identification of the best combination of input parameters largely depends on the strength of
least square methods to quickly train models. Gradient descent is then used to slowly change
the underlying membership function that generates the basis function for the least square
method. The least square method, which is a computationally efficient method, is used to train
the model quickly while gradient descent is used to update the MF that generates functions for
the least square method slowly. This approach enables ANFIS to generate satisfactory results
quickly with few epoch of training (Jang, 1996). Various input configurations of ANFIS can
be constructed to choose the model with the best performance for further training. As such,
selecting the most influential two inputs (out of 4) for the proposed ANFIS will require 4C2 =
6 ANFIS models with different combinations of 2 inputs. The six ANFIS are then trained on a
single pass of least-square method and then picking the models with the smallest training error.
However, using grid partitioning will result into 24 = 16 rules and (4+1) x16 = 80 linear
parameters with first-order Sugeno-fuzzy model.
The results of the input selection are shown in Table 6.14 and Figure 6.12. The result reveals
that the combination of “GFA” and “Construction Type” produces the least Root Mean Square
Error (RMSE) from the input selection process. As such, Model 2 was selected for further
training to improve its performance.
Table 6.14: Results of Input Selection for ANFIS Model
No Inputs RMSE Model 1 GFA-Pc 0.121984 Model 2 GFA-Ct *0.071806 Model 3 GFA-Bu 0.092198 Model 4 Pc-Ct 0.098120 Model 5 Pc-Bu 0.079349 Model 6 Ct-Bu 0.079349
*Mode 2 has the least RMSE
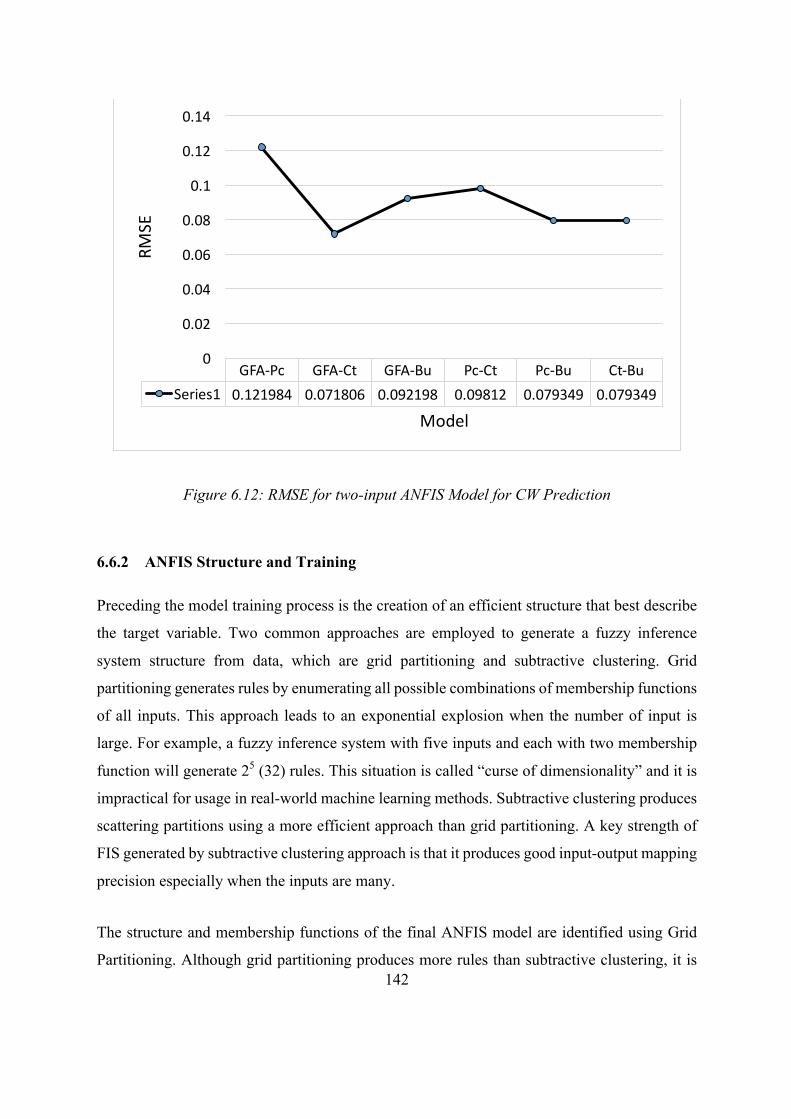
142
Figure 6.12: RMSE for two-input ANFIS Model for CW Prediction
6.6.2 ANFIS Structure and Training
Preceding the model training process is the creation of an efficient structure that best describe
the target variable. Two common approaches are employed to generate a fuzzy inference
system structure from data, which are grid partitioning and subtractive clustering. Grid
partitioning generates rules by enumerating all possible combinations of membership functions
of all inputs. This approach leads to an exponential explosion when the number of input is
large. For example, a fuzzy inference system with five inputs and each with two membership
function will generate 25 (32) rules. This situation is called “curse of dimensionality” and it is
impractical for usage in real-world machine learning methods. Subtractive clustering produces
scattering partitions using a more efficient approach than grid partitioning. A key strength of
FIS generated by subtractive clustering approach is that it produces good input-output mapping
precision especially when the inputs are many.
The structure and membership functions of the final ANFIS model are identified using Grid
Partitioning. Although grid partitioning produces more rules than subtractive clustering, it is
GFA-Pc GFA-Ct GFA-Bu Pc-Ct Pc-Bu Ct-BuSeries1 0.121984 0.071806 0.092198 0.09812 0.079349 0.079349
0
0.02
0.04
0.06
0.08
0.1
0.12
0.14
RMSE
Model
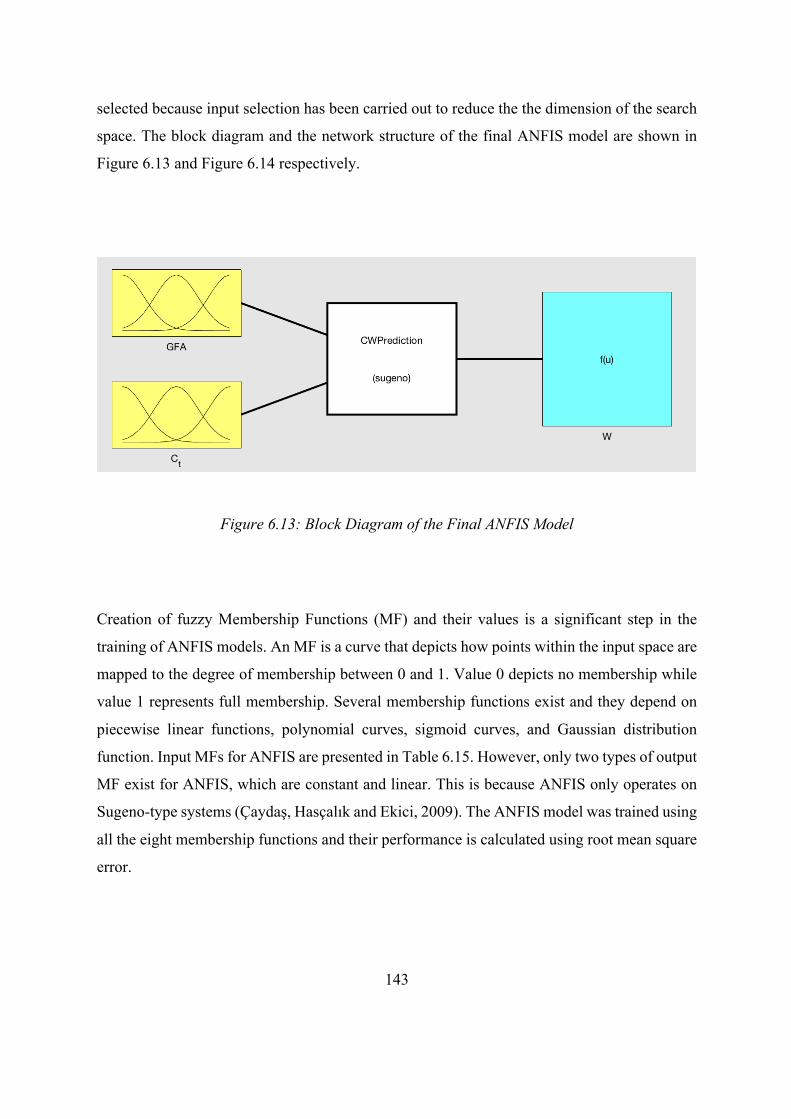
143
selected because input selection has been carried out to reduce the the dimension of the search
space. The block diagram and the network structure of the final ANFIS model are shown in
Figure 6.13 and Figure 6.14 respectively.
Figure 6.13: Block Diagram of the Final ANFIS Model
Creation of fuzzy Membership Functions (MF) and their values is a significant step in the
training of ANFIS models. An MF is a curve that depicts how points within the input space are
mapped to the degree of membership between 0 and 1. Value 0 depicts no membership while
value 1 represents full membership. Several membership functions exist and they depend on
piecewise linear functions, polynomial curves, sigmoid curves, and Gaussian distribution
function. Input MFs for ANFIS are presented in Table 6.15. However, only two types of output
MF exist for ANFIS, which are constant and linear. This is because ANFIS only operates on
Sugeno-type systems (Çaydaş, Hasçalık and Ekici, 2009). The ANFIS model was trained using
all the eight membership functions and their performance is calculated using root mean square
error.
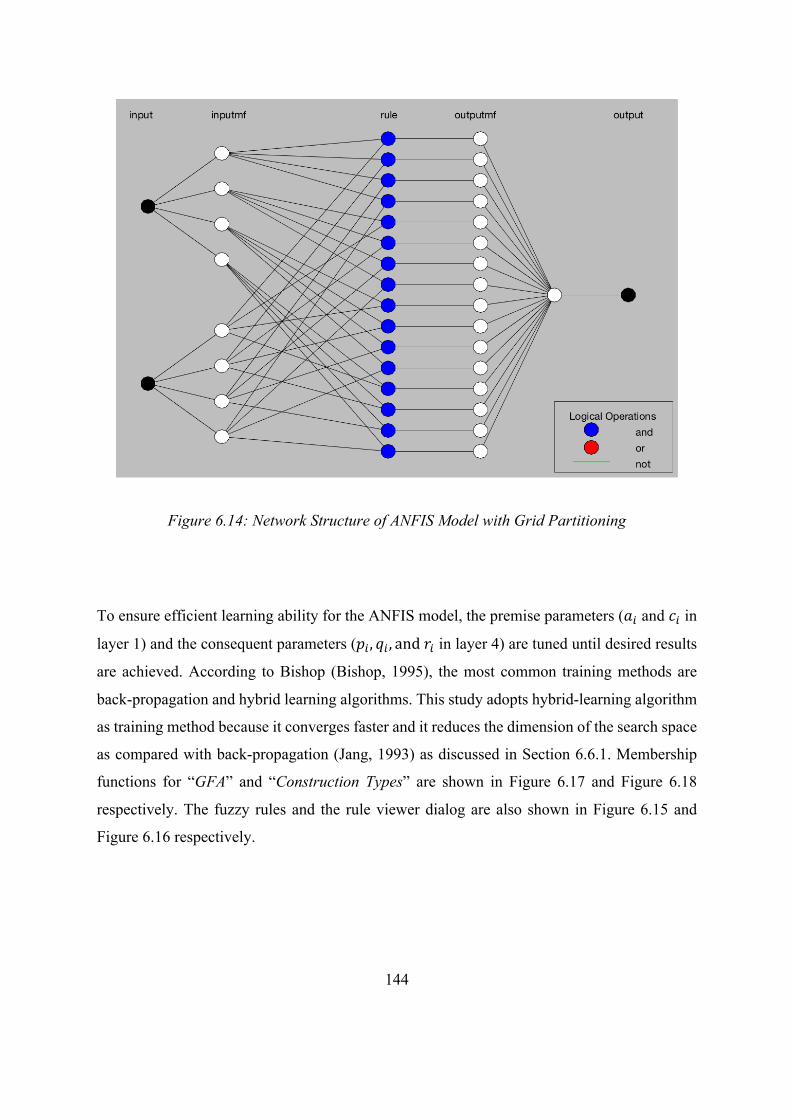
144
Figure 6.14: Network Structure of ANFIS Model with Grid Partitioning
To ensure efficient learning ability for the ANFIS model, the premise parameters (WM and XM in
layer 1) and the consequent parameters (FM, IM, andKM in layer 4) are tuned until desired results
are achieved. According to Bishop (Bishop, 1995), the most common training methods are
back-propagation and hybrid learning algorithms. This study adopts hybrid-learning algorithm
as training method because it converges faster and it reduces the dimension of the search space
as compared with back-propagation (Jang, 1993) as discussed in Section 6.6.1. Membership
functions for “GFA” and “Construction Types” are shown in Figure 6.17 and Figure 6.18
respectively. The fuzzy rules and the rule viewer dialog are also shown in Figure 6.15 and
Figure 6.16 respectively.
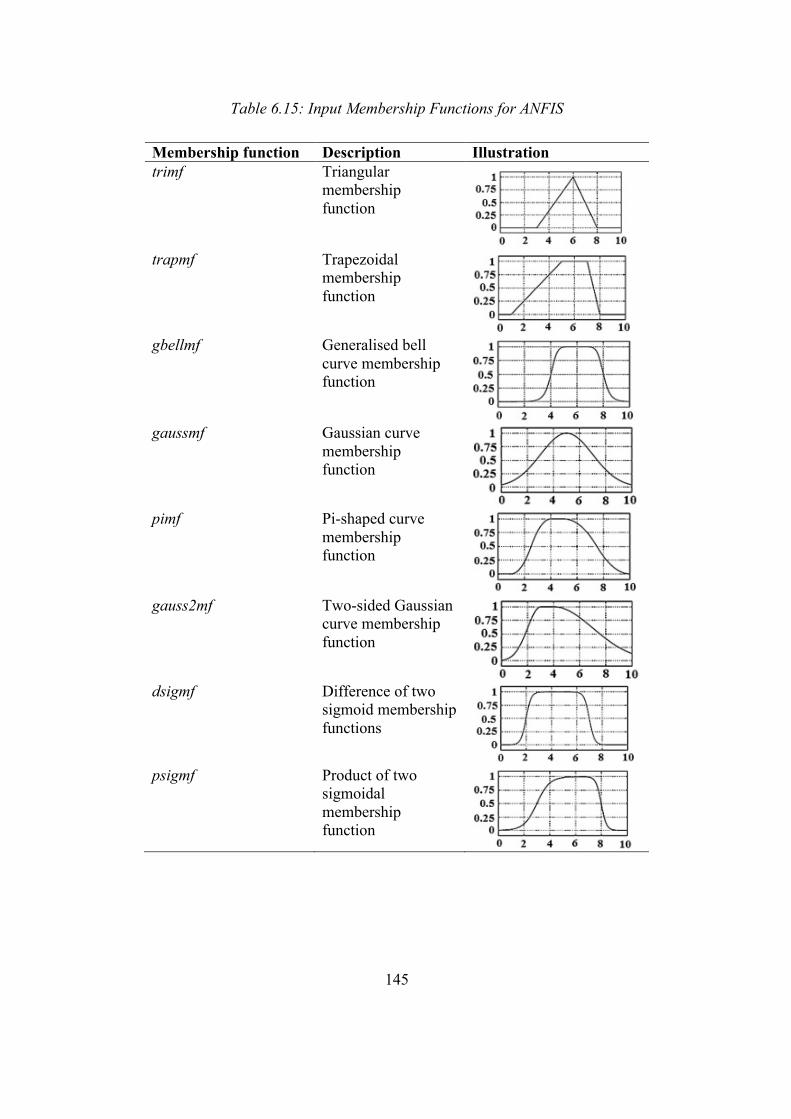
145
Table 6.15: Input Membership Functions for ANFIS
Membership function Description Illustration trimf Triangular
membership function
trapmf Trapezoidal
membership function
gbellmf Generalised bell
curve membership function
gaussmf Gaussian curve
membership function
pimf Pi-shaped curve
membership function
gauss2mf Two-sided Gaussian
curve membership function
dsigmf Difference of two
sigmoid membership functions
psigmf Product of two
sigmoidal membership function
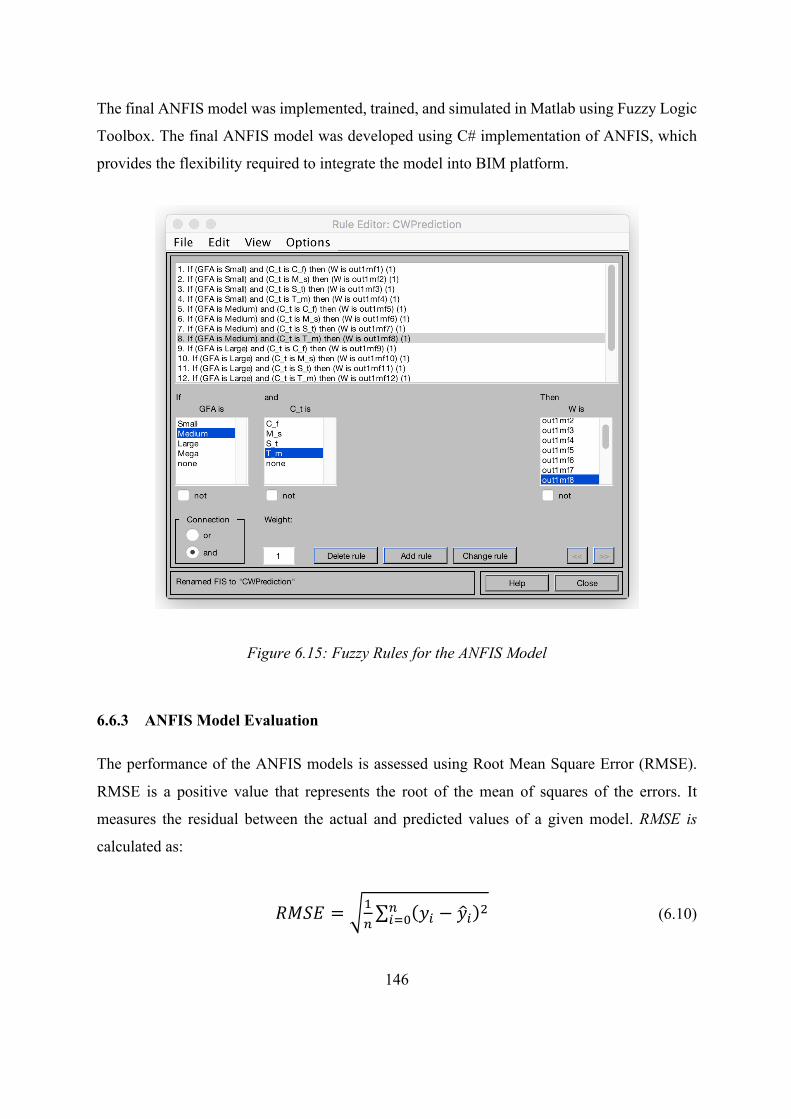
146
The final ANFIS model was implemented, trained, and simulated in Matlab using Fuzzy Logic
Toolbox. The final ANFIS model was developed using C# implementation of ANFIS, which
provides the flexibility required to integrate the model into BIM platform.
Figure 6.15: Fuzzy Rules for the ANFIS Model
6.6.3 ANFIS Model Evaluation
The performance of the ANFIS models is assessed using Root Mean Square Error (RMSE).
RMSE is a positive value that represents the root of the mean of squares of the errors. It
measures the residual between the actual and predicted values of a given model. RMSE is
calculated as:
.vwx = E"
;M − ;M V"Myz (6.10)
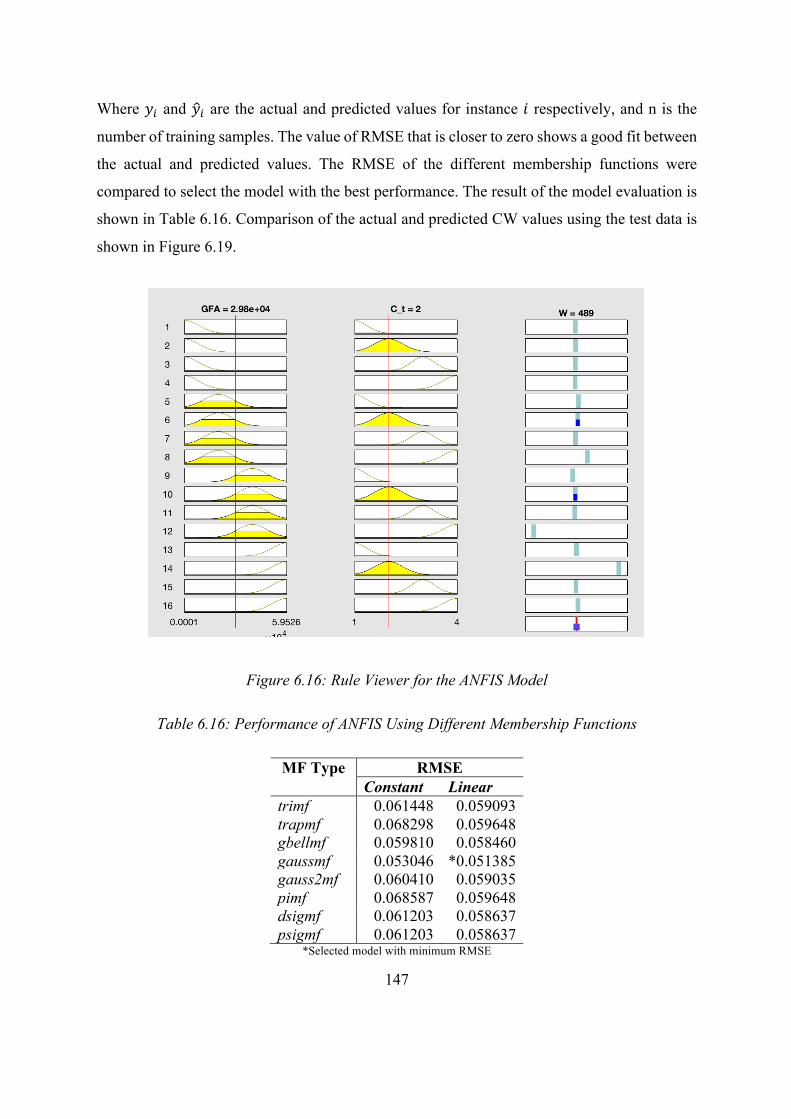
147
Where ;M and ;M are the actual and predicted values for instance 1 respectively, and n is the
number of training samples. The value of RMSE that is closer to zero shows a good fit between
the actual and predicted values. The RMSE of the different membership functions were
compared to select the model with the best performance. The result of the model evaluation is
shown in Table 6.16. Comparison of the actual and predicted CW values using the test data is
shown in Figure 6.19.
Figure 6.16: Rule Viewer for the ANFIS Model
Table 6.16: Performance of ANFIS Using Different Membership Functions
MF Type RMSE Constant Linear
trimf 0.061448 0.059093 trapmf 0.068298 0.059648 gbellmf 0.059810 0.058460 gaussmf 0.053046 *0.051385 gauss2mf 0.060410 0.059035 pimf 0.068587 0.059648 dsigmf 0.061203 0.058637 psigmf 0.061203 0.058637
*Selected model with minimum RMSE
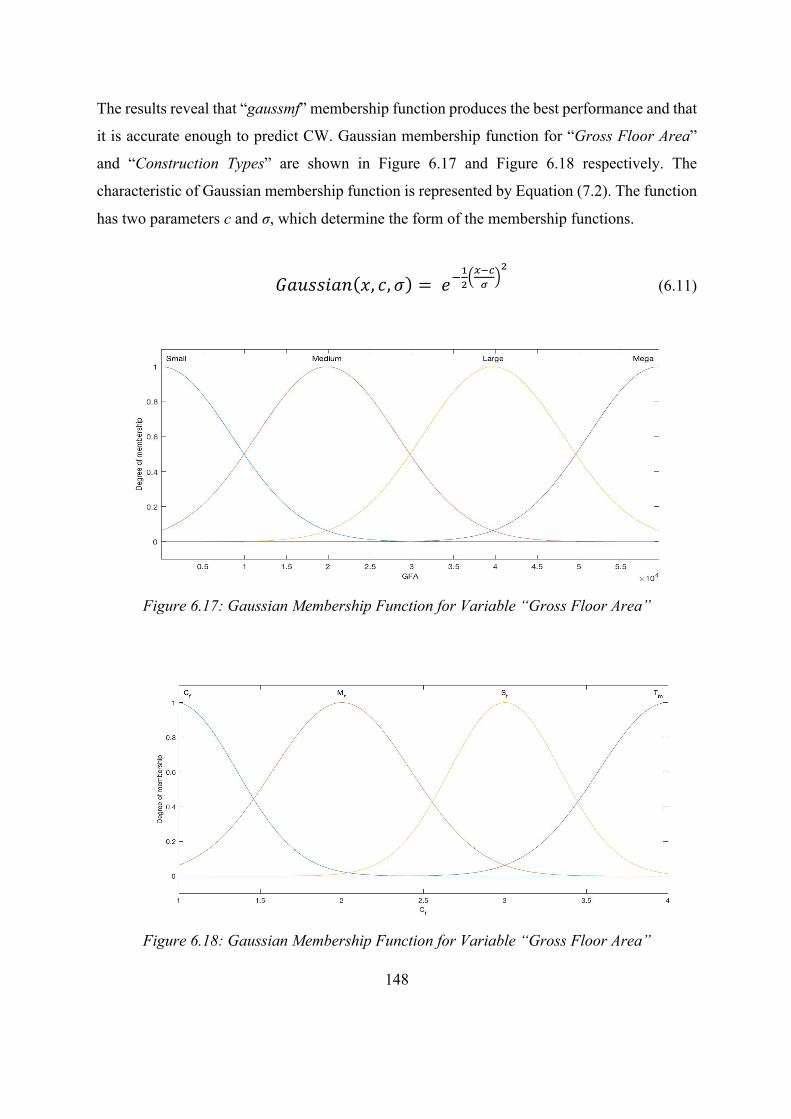
148
The results reveal that “gaussmf” membership function produces the best performance and that
it is accurate enough to predict CW. Gaussian membership function for “Gross Floor Area”
and “Construction Types” are shown in Figure 6.17 and Figure 6.18 respectively. The
characteristic of Gaussian membership function is represented by Equation (7.2). The function
has two parameters c and σ, which determine the form of the membership functions.
{Ws551W: 4, X, | = 9(gi-}~�
i
(6.11)
Figure 6.17: Gaussian Membership Function for Variable “Gross Floor Area”
Figure 6.18: Gaussian Membership Function for Variable “Gross Floor Area”
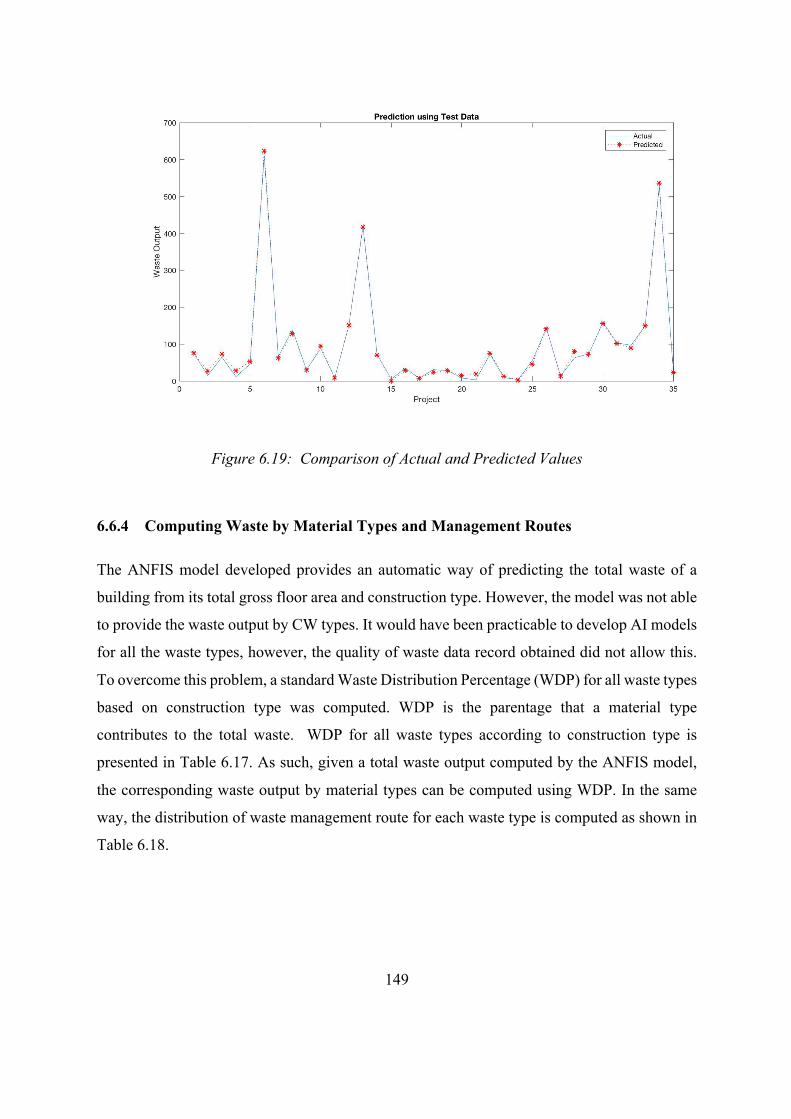
149
Figure 6.19: Comparison of Actual and Predicted Values
6.6.4 Computing Waste by Material Types and Management Routes
The ANFIS model developed provides an automatic way of predicting the total waste of a
building from its total gross floor area and construction type. However, the model was not able
to provide the waste output by CW types. It would have been practicable to develop AI models
for all the waste types, however, the quality of waste data record obtained did not allow this.
To overcome this problem, a standard Waste Distribution Percentage (WDP) for all waste types
based on construction type was computed. WDP is the parentage that a material type
contributes to the total waste. WDP for all waste types according to construction type is
presented in Table 6.17. As such, given a total waste output computed by the ANFIS model,
the corresponding waste output by material types can be computed using WDP. In the same
way, the distribution of waste management route for each waste type is computed as shown in
Table 6.18.
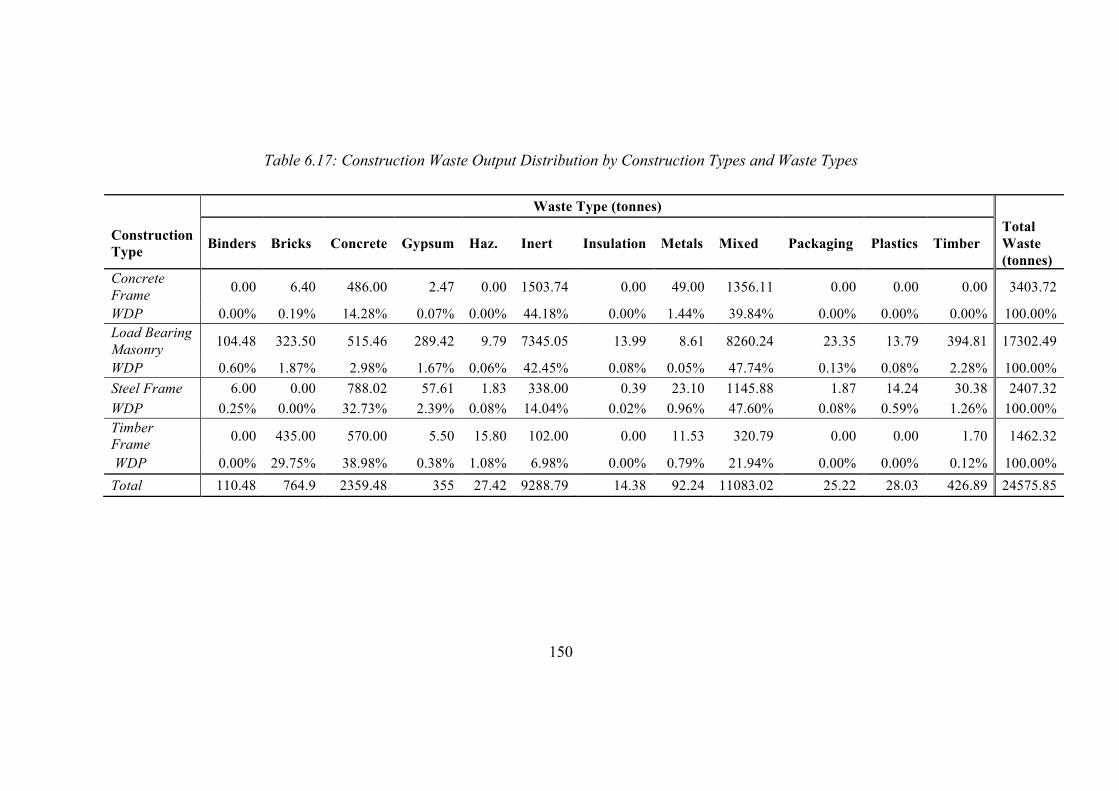
150
Table 6.17: Construction Waste Output Distribution by Construction Types and Waste Types
Waste Type (tonnes)
Construction Type Binders Bricks Concrete Gypsum Haz. Inert Insulation Metals Mixed Packaging Plastics Timber
Total Waste (tonnes)
Concrete Frame 0.00 6.40 486.00 2.47 0.00 1503.74 0.00 49.00 1356.11 0.00 0.00 0.00 3403.72
WDP 0.00% 0.19% 14.28% 0.07% 0.00% 44.18% 0.00% 1.44% 39.84% 0.00% 0.00% 0.00% 100.00% Load Bearing Masonry 104.48 323.50 515.46 289.42 9.79 7345.05 13.99 8.61 8260.24 23.35 13.79 394.81 17302.49
WDP 0.60% 1.87% 2.98% 1.67% 0.06% 42.45% 0.08% 0.05% 47.74% 0.13% 0.08% 2.28% 100.00% Steel Frame 6.00 0.00 788.02 57.61 1.83 338.00 0.39 23.10 1145.88 1.87 14.24 30.38 2407.32 WDP 0.25% 0.00% 32.73% 2.39% 0.08% 14.04% 0.02% 0.96% 47.60% 0.08% 0.59% 1.26% 100.00% Timber Frame 0.00 435.00 570.00 5.50 15.80 102.00 0.00 11.53 320.79 0.00 0.00 1.70 1462.32
WDP 0.00% 29.75% 38.98% 0.38% 1.08% 6.98% 0.00% 0.79% 21.94% 0.00% 0.00% 0.12% 100.00% Total 110.48 764.9 2359.48 355 27.42 9288.79 14.38 92.24 11083.02 25.22 28.03 426.89 24575.85
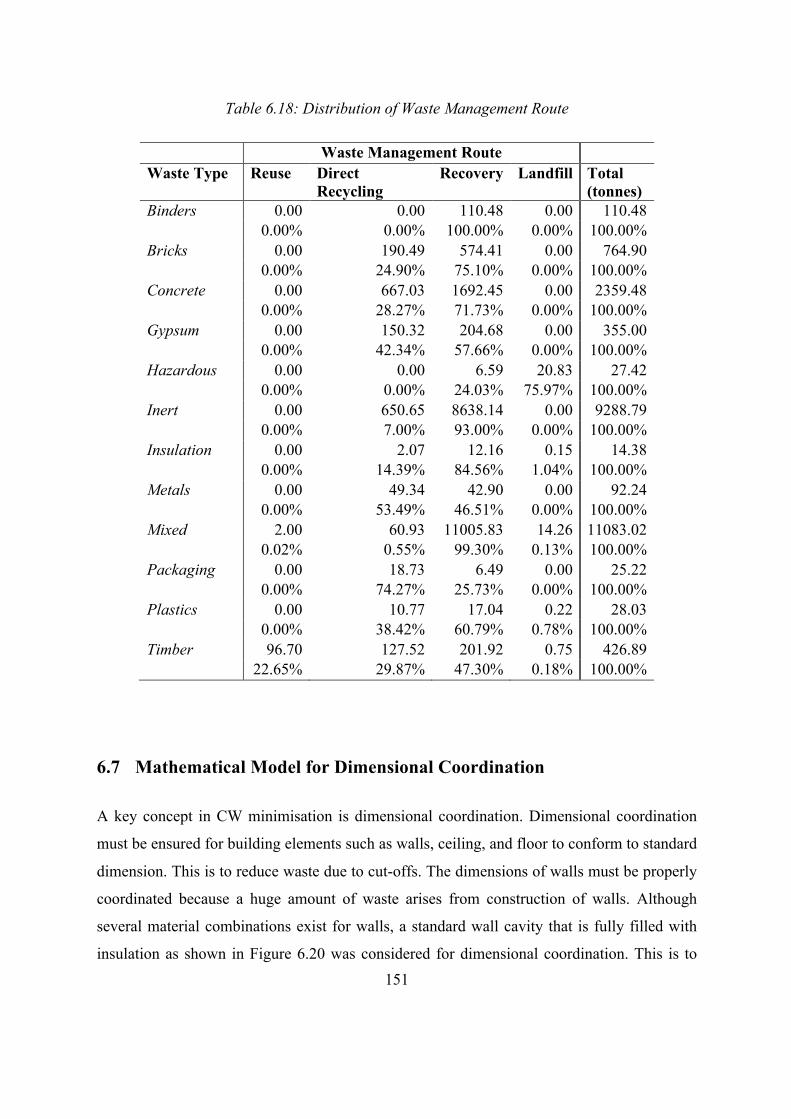
151
Table 6.18: Distribution of Waste Management Route
Waste Management Route Waste Type Reuse Direct
Recycling Recovery Landfill Total
(tonnes) Binders 0.00 0.00 110.48 0.00 110.48
0.00% 0.00% 100.00% 0.00% 100.00% Bricks 0.00 190.49 574.41 0.00 764.90
0.00% 24.90% 75.10% 0.00% 100.00% Concrete 0.00 667.03 1692.45 0.00 2359.48
0.00% 28.27% 71.73% 0.00% 100.00% Gypsum 0.00 150.32 204.68 0.00 355.00
0.00% 42.34% 57.66% 0.00% 100.00% Hazardous 0.00 0.00 6.59 20.83 27.42
0.00% 0.00% 24.03% 75.97% 100.00% Inert 0.00 650.65 8638.14 0.00 9288.79
0.00% 7.00% 93.00% 0.00% 100.00% Insulation 0.00 2.07 12.16 0.15 14.38
0.00% 14.39% 84.56% 1.04% 100.00% Metals 0.00 49.34 42.90 0.00 92.24
0.00% 53.49% 46.51% 0.00% 100.00% Mixed 2.00 60.93 11005.83 14.26 11083.02
0.02% 0.55% 99.30% 0.13% 100.00% Packaging 0.00 18.73 6.49 0.00 25.22
0.00% 74.27% 25.73% 0.00% 100.00% Plastics 0.00 10.77 17.04 0.22 28.03
0.00% 38.42% 60.79% 0.78% 100.00% Timber 96.70 127.52 201.92 0.75 426.89
22.65% 29.87% 47.30% 0.18% 100.00%
6.7 Mathematical Model for Dimensional Coordination
A key concept in CW minimisation is dimensional coordination. Dimensional coordination
must be ensured for building elements such as walls, ceiling, and floor to conform to standard
dimension. This is to reduce waste due to cut-offs. The dimensions of walls must be properly
coordinated because a huge amount of waste arises from construction of walls. Although
several material combinations exist for walls, a standard wall cavity that is fully filled with
insulation as shown in Figure 6.20 was considered for dimensional coordination. This is to
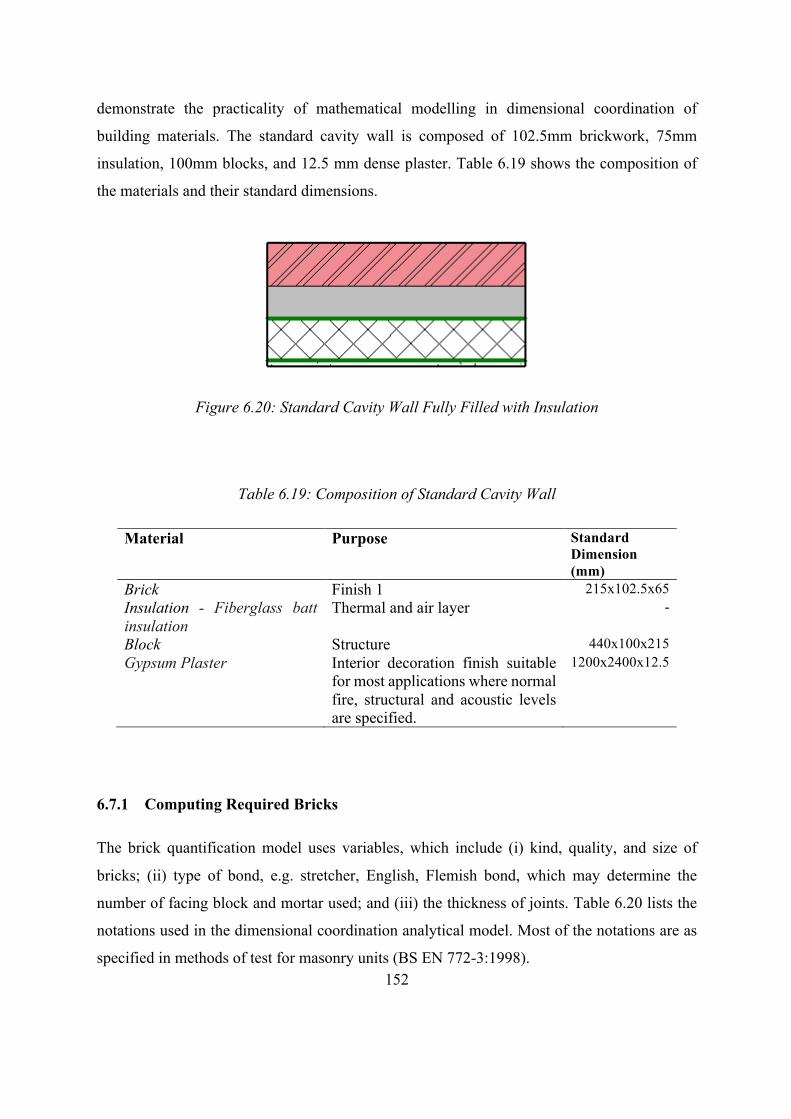
152
demonstrate the practicality of mathematical modelling in dimensional coordination of
building materials. The standard cavity wall is composed of 102.5mm brickwork, 75mm
insulation, 100mm blocks, and 12.5 mm dense plaster. Table 6.19 shows the composition of
the materials and their standard dimensions.
Figure 6.20: Standard Cavity Wall Fully Filled with Insulation
Table 6.19: Composition of Standard Cavity Wall
Material Purpose Standard Dimension (mm)
Brick Finish 1 215x102.5x65 Insulation - Fiberglass batt insulation
Thermal and air layer -
Block Structure 440x100x215 Gypsum Plaster Interior decoration finish suitable
for most applications where normal fire, structural and acoustic levels are specified.
1200x2400x12.5
6.7.1 Computing Required Bricks
The brick quantification model uses variables, which include (i) kind, quality, and size of
bricks; (ii) type of bond, e.g. stretcher, English, Flemish bond, which may determine the
number of facing block and mortar used; and (iii) the thickness of joints. Table 6.20 lists the
notations used in the dimensional coordination analytical model. Most of the notations are as
specified in methods of test for masonry units (BS EN 772-3:1998).
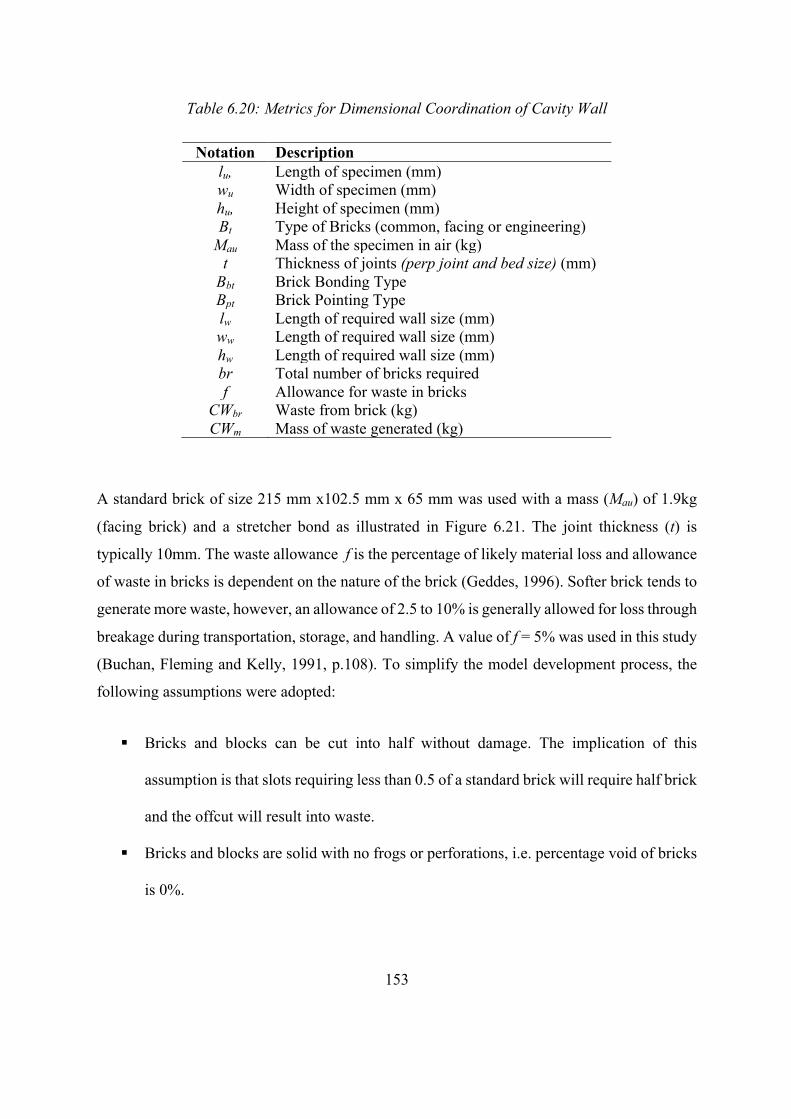
153
Table 6.20: Metrics for Dimensional Coordination of Cavity Wall
Notation Description lu, Length of specimen (mm) wu Width of specimen (mm) hu, Height of specimen (mm) Bt Type of Bricks (common, facing or engineering)
Mau Mass of the specimen in air (kg) t Thickness of joints (perp joint and bed size) (mm)
Bbt Brick Bonding Type Bpt Brick Pointing Type lw Length of required wall size (mm) ww Length of required wall size (mm) hw Length of required wall size (mm) br Total number of bricks required f Allowance for waste in bricks
CWbr Waste from brick (kg) CWm Mass of waste generated (kg)
A standard brick of size 215 mm x102.5 mm x 65 mm was used with a mass (Mau) of 1.9kg
(facing brick) and a stretcher bond as illustrated in Figure 6.21. The joint thickness (t) is
typically 10mm. The waste allowance f is the percentage of likely material loss and allowance
of waste in bricks is dependent on the nature of the brick (Geddes, 1996). Softer brick tends to
generate more waste, however, an allowance of 2.5 to 10% is generally allowed for loss through
breakage during transportation, storage, and handling. A value of f = 5% was used in this study
(Buchan, Fleming and Kelly, 1991, p.108). To simplify the model development process, the
following assumptions were adopted:
§ Bricks and blocks can be cut into half without damage. The implication of this
assumption is that slots requiring less than 0.5 of a standard brick will require half brick
and the offcut will result into waste.
§ Bricks and blocks are solid with no frogs or perforations, i.e. percentage void of bricks
is 0%.
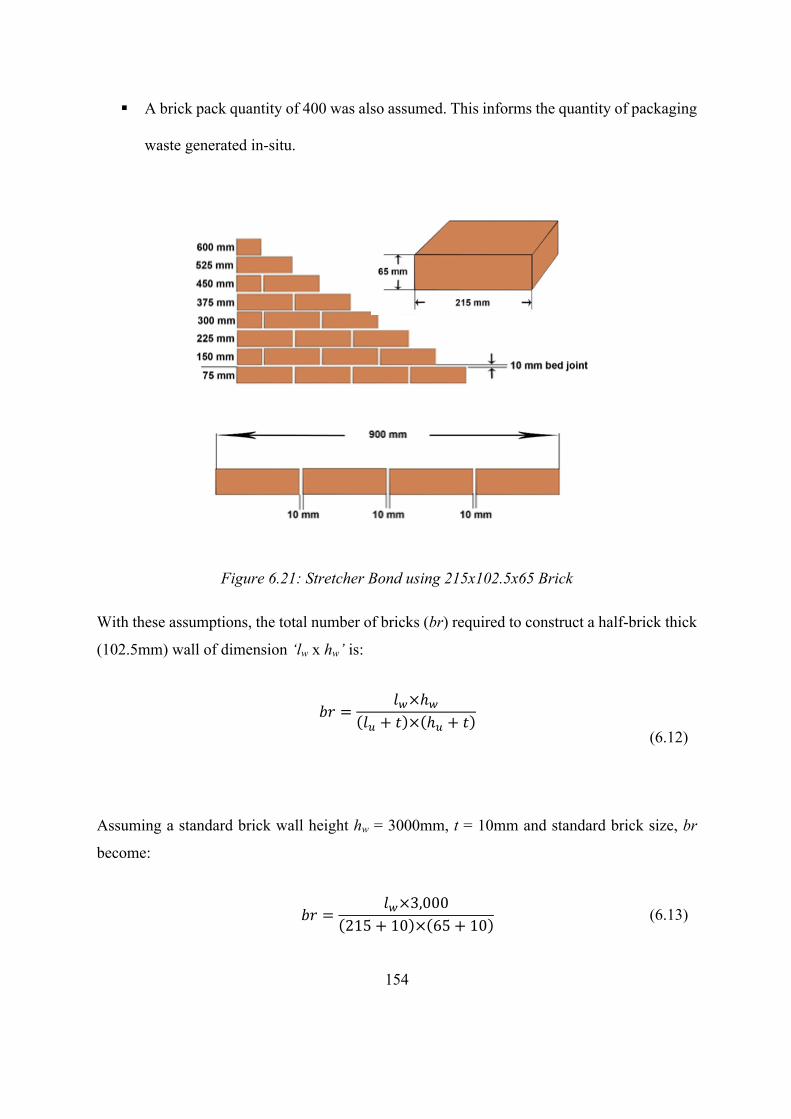
154
§ A brick pack quantity of 400 was also assumed. This informs the quantity of packaging
waste generated in-situ.
Figure 6.21: Stretcher Bond using 215x102.5x65 Brick
With these assumptions, the total number of bricks (br) required to construct a half-brick thick
(102.5mm) wall of dimension ‘lw x hw’ is:
!" =
$%×ℎ%
$( + * × ℎ( + *
(6.12)
Assuming a standard brick wall height hw = 3000mm, t = 10mm and standard brick size, br
become:
!" =
$%×3,000
215 + 10 × 65 + 10 (6.13)
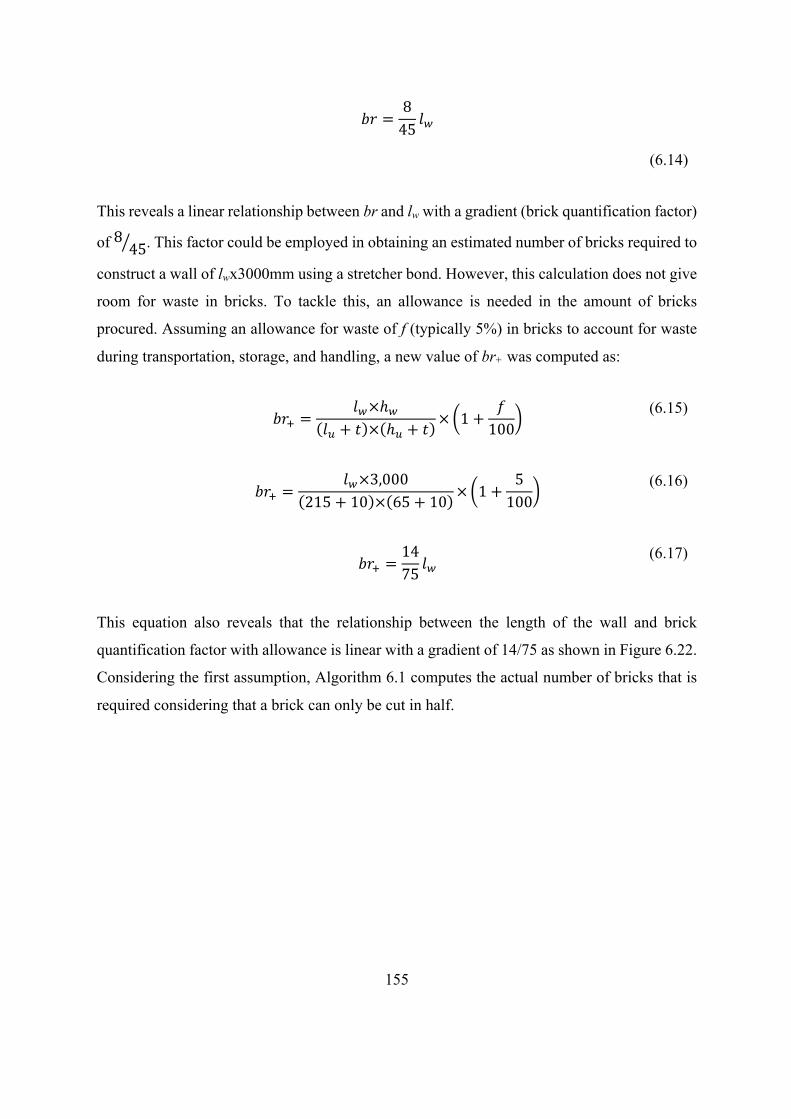
155
!" =
8
45$%
(6.14)
This reveals a linear relationship between br and lw with a gradient (brick quantification factor)
of 845
. This factor could be employed in obtaining an estimated number of bricks required to
construct a wall of lwx3000mm using a stretcher bond. However, this calculation does not give
room for waste in bricks. To tackle this, an allowance is needed in the amount of bricks
procured. Assuming an allowance for waste of f (typically 5%) in bricks to account for waste
during transportation, storage, and handling, a new value of br+ was computed as:
!"4 =
$%×ℎ%
$( + * × ℎ( + *× 1 +
5
100
(6.15)
!"4 =
$%×3,000
215 + 10 × 65 + 10× 1 +
5
100
(6.16)
!"4 =
14
75$%
(6.17)
This equation also reveals that the relationship between the length of the wall and brick
quantification factor with allowance is linear with a gradient of 14/75 as shown in Figure 6.22.
Considering the first assumption, Algorithm 6.1 computes the actual number of bricks that is
required considering that a brick can only be cut in half.
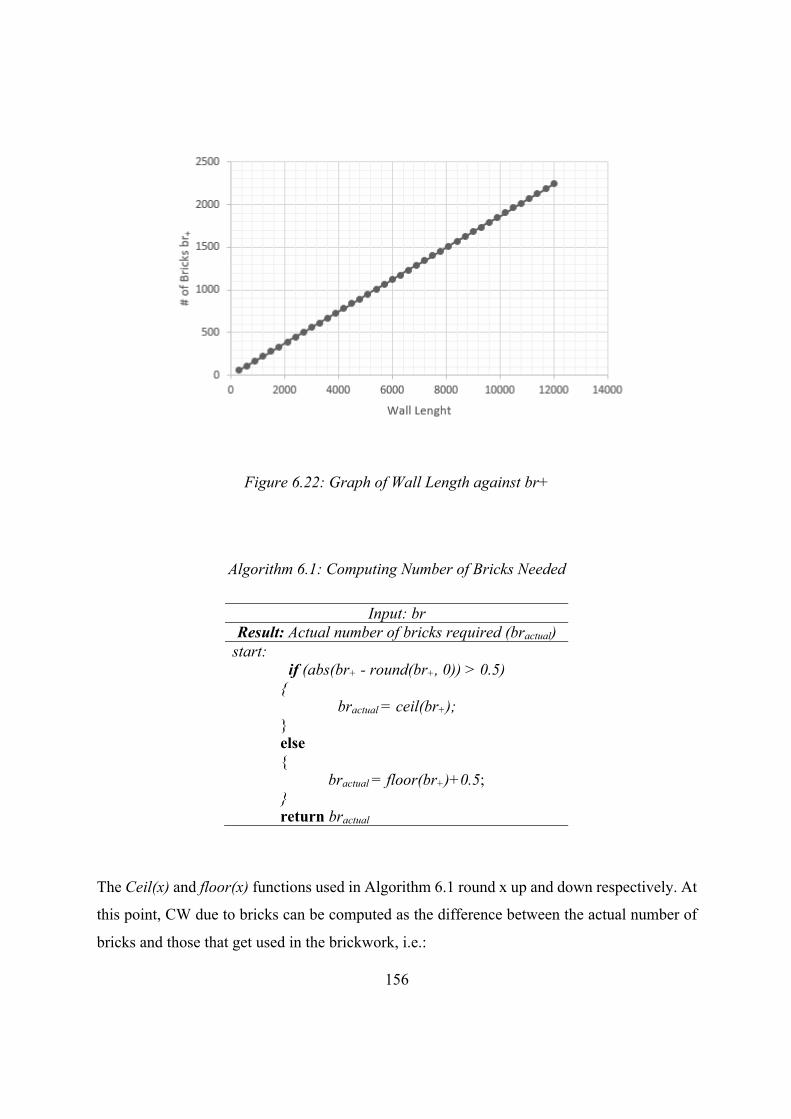
156
Figure 6.22: Graph of Wall Length against br+
Algorithm 6.1: Computing Number of Bricks Needed
Input: br Result: Actual number of bricks required (bractual)
start: if (abs(br+ - round(br+, 0)) > 0.5)
{ bractual = ceil(br+);
} else { bractual = floor(br+)+0.5;
} return bractual
The Ceil(x) and floor(x) functions used in Algorithm 6.1 round x up and down respectively. At
this point, CW due to bricks can be computed as the difference between the actual number of
bricks and those that get used in the brickwork, i.e.:
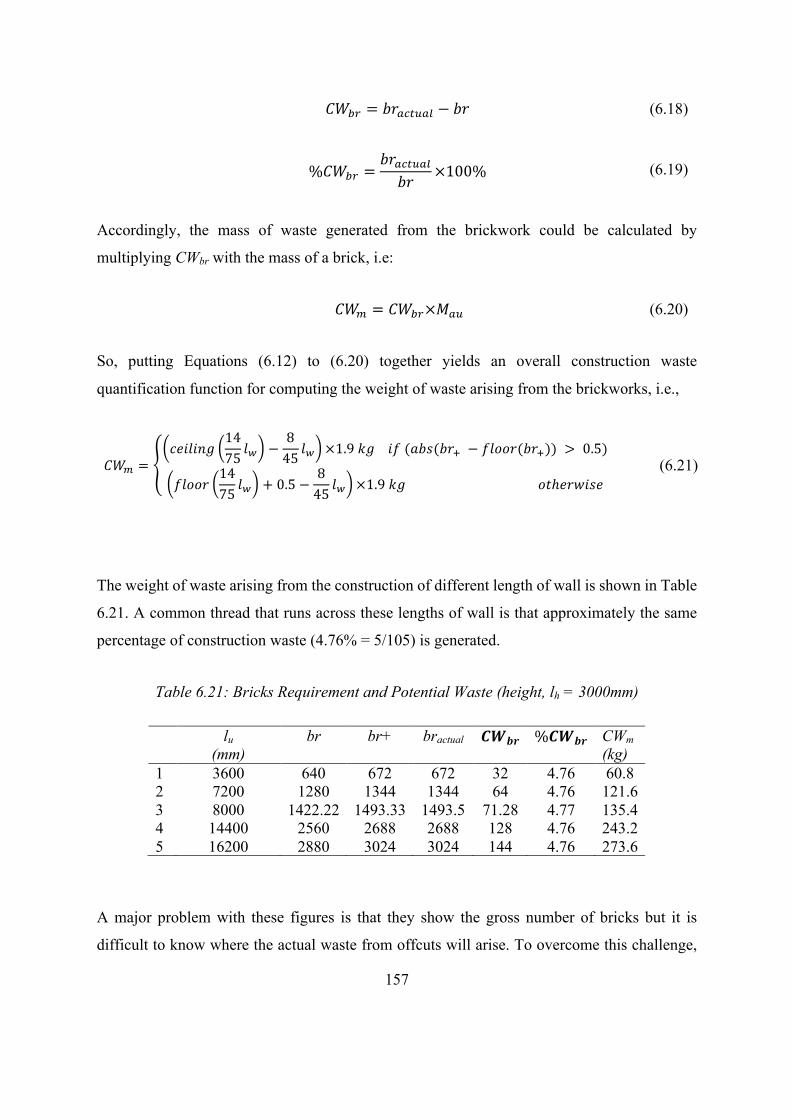
157
789: = !";<=(;> − !" (6.18)
%789: =
!";<=(;>
!"×100% (6.19)
Accordingly, the mass of waste generated from the brickwork could be calculated by
multiplying CWbr with the mass of a brick, i.e:
78A = 789:×B;( (6.20)
So, putting Equations (6.12) to (6.20) together yields an overall construction waste
quantification function for computing the weight of waste arising from the brickworks, i.e.,
78A =
CDE$EFG
14
75$% −
8
45$% ×1.9KGE5(M!N(!"4 − 5$OO"(!"4)) > 0.5)
5$OO"
14
75$% + 0.5 −
8
45$% ×1.9KGO*ℎD"REND
(6.21)
The weight of waste arising from the construction of different length of wall is shown in Table
6.21. A common thread that runs across these lengths of wall is that approximately the same
percentage of construction waste (4.76% = 5/105) is generated.
Table 6.21: Bricks Requirement and Potential Waste (height, lh = 3000mm)
lu (mm)
br br+ bractual STUV %STUV CWm (kg)
1 3600 640 672 672 32 4.76 60.8 2 7200 1280 1344 1344 64 4.76 121.6 3 8000 1422.22 1493.33 1493.5 71.28 4.77 135.4 4 14400 2560 2688 2688 128 4.76 243.2 5 16200 2880 3024 3024 144 4.76 273.6
A major problem with these figures is that they show the gross number of bricks but it is
difficult to know where the actual waste from offcuts will arise. To overcome this challenge,
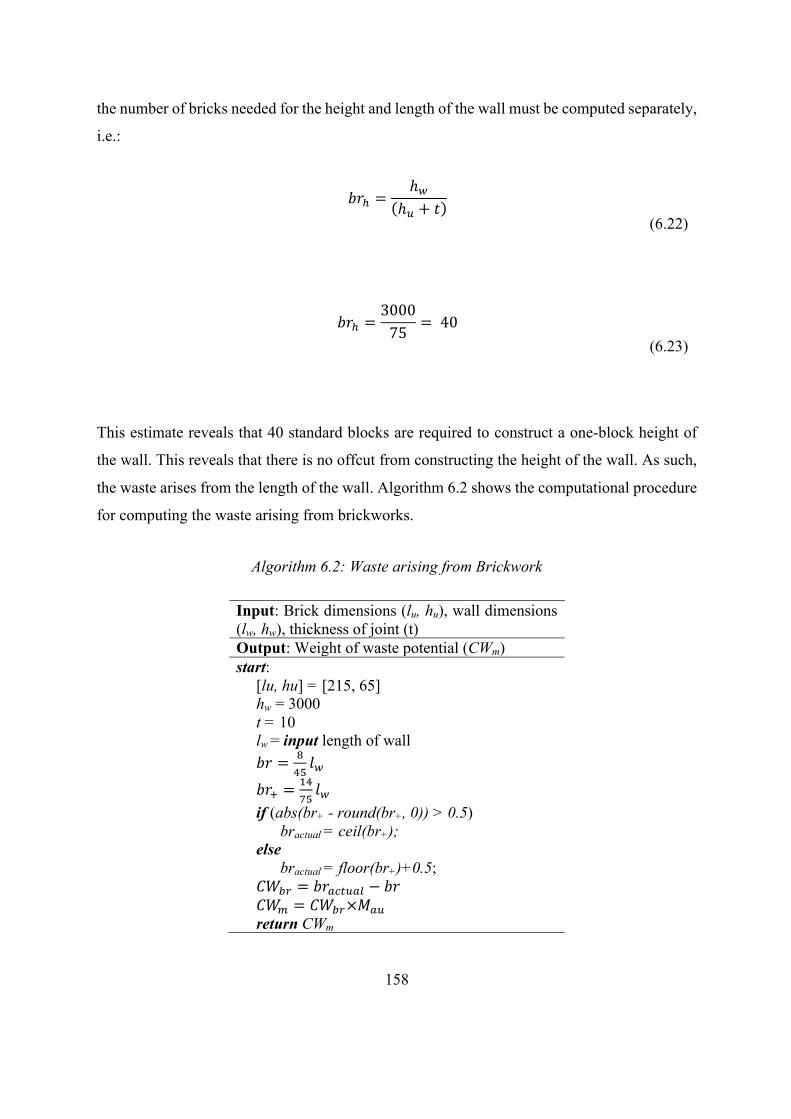
158
the number of bricks needed for the height and length of the wall must be computed separately,
i.e.:
!"W =
ℎ%
ℎ( + *
(6.22)
!"W =
3000
75= 40
(6.23)
This estimate reveals that 40 standard blocks are required to construct a one-block height of
the wall. This reveals that there is no offcut from constructing the height of the wall. As such,
the waste arises from the length of the wall. Algorithm 6.2 shows the computational procedure
for computing the waste arising from brickworks.
Algorithm 6.2: Waste arising from Brickwork
Input: Brick dimensions (lu, hu), wall dimensions (lw, hw), thickness of joint (t) Output: Weight of waste potential (CWm) start: [lu, hu] = [215, 65] hw = 3000 t = 10 lw = input length of wall !" = X
YZ$%
!"4 =[Y
\Z$%
if (abs(br+ - round(br+, 0)) > 0.5) bractual = ceil(br+); else bractual = floor(br+)+0.5; 789: = !";<=(;> − !" 78A = 789:×B;( return CWm
159
6.8 Summary
This chapter details the waste data collection process. WDR was collected from 117 projects
and exploratory data analysis was carried out on them to understand the structure of the data.
The frequencies and distribution of the data along four input parameters were explored to
establish strong statistical measurement for the predictive model development Based on the
data. An AI hybrid model for CW prediction was then developed using ANFIS. A detailed
architecture of ANFIS, which combines the strengths of ANN and FL into a single hybrid
system, was presented and discussed. The process of input selection reveals that only two
parameters, i.e., gross floor area and construction type, are the best predictors for CW output
out of the four input parameters. The final model was trained and evaluated to assess its
prediction accuracy. A mathematical model was then developed for dimensional coordination
of brickworks to optimise material usage and to minimise potential waste output from wall
construction.
The next chapter details how the developed models for CW prediction were integrated into
BIM platform. The chapter discusses the process of model integration and the development of
a BIM-based system for CW prediction and minimisation (BIMWaste).

160
7 BIM-BASED SYSTEM FOR CONSTRUCTION WASTE
PREDICTION AND MINIMISATION (BIMWASTE)
7.1 Overview
The developed models for CW prediction and minimisation were integrated into BIM platform
to enable automatic capture of BIM design parameters and to allow seamless integration of
CW management into existing BIM software. This chapter therefore discusses the process of
model integration and the development of a BIM-based system for CW prediction and
minimisation (BIMWaste). The software development environment is discussed in details. The
discussion covers the setup of C# programming environment, the Revit 2017 application
programming interface, and user interface frameworks. Thereafter, system design for
BIMWaste is presented using appropriate diagrams. This is followed with detailed discussion
of the modules of the software. The modules are: (a) User Interface Module; (b) Custom
parameter module; (c) Material database for BIMWaste; (d) Material Take-Off calculation
module; and (e) Report generation module. To minimise the predicted CW output, the
development process of BIM-based design advisor for material optimisation is presented.
7.2 Software Development Environment
The Software Development Environment (SDE) is made up of C# programming environment
using Visual Studio Community 2015 IDE, Autodesk Revit 2017 and its Application
Programming Interface (API), and User Interface (UI) frameworks. The details of the make-up
of the SDE is given in the following subsections.
7.2.1 C# Programming Environment
The Autodesk Revit .NET API uses any of the .NET programming languages, such as VB.NET,
C#, and F#. However, C# remains the programming language of choice for most developers
because it is easy to use and learn. The software development could be easily coded through
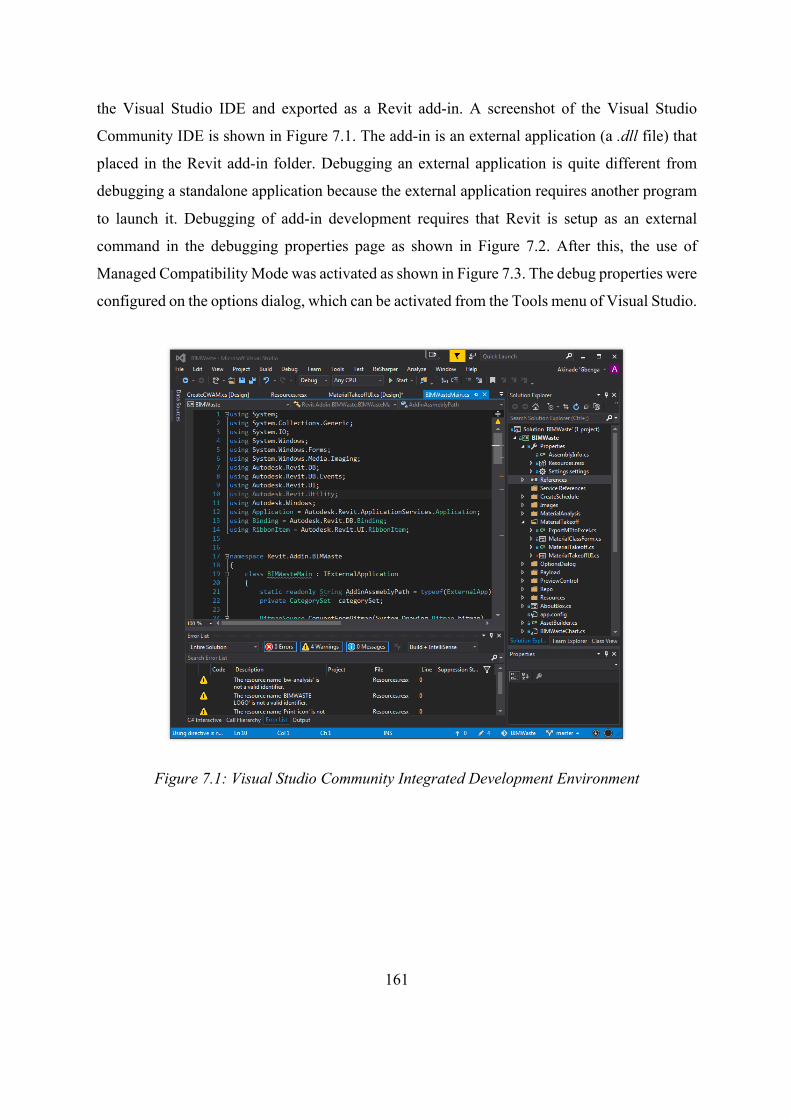
161
the Visual Studio IDE and exported as a Revit add-in. A screenshot of the Visual Studio
Community IDE is shown in Figure 7.1. The add-in is an external application (a .dll file) that
placed in the Revit add-in folder. Debugging an external application is quite different from
debugging a standalone application because the external application requires another program
to launch it. Debugging of add-in development requires that Revit is setup as an external
command in the debugging properties page as shown in Figure 7.2. After this, the use of
Managed Compatibility Mode was activated as shown in Figure 7.3. The debug properties were
configured on the options dialog, which can be activated from the Tools menu of Visual Studio.
Figure 7.1: Visual Studio Community Integrated Development Environment
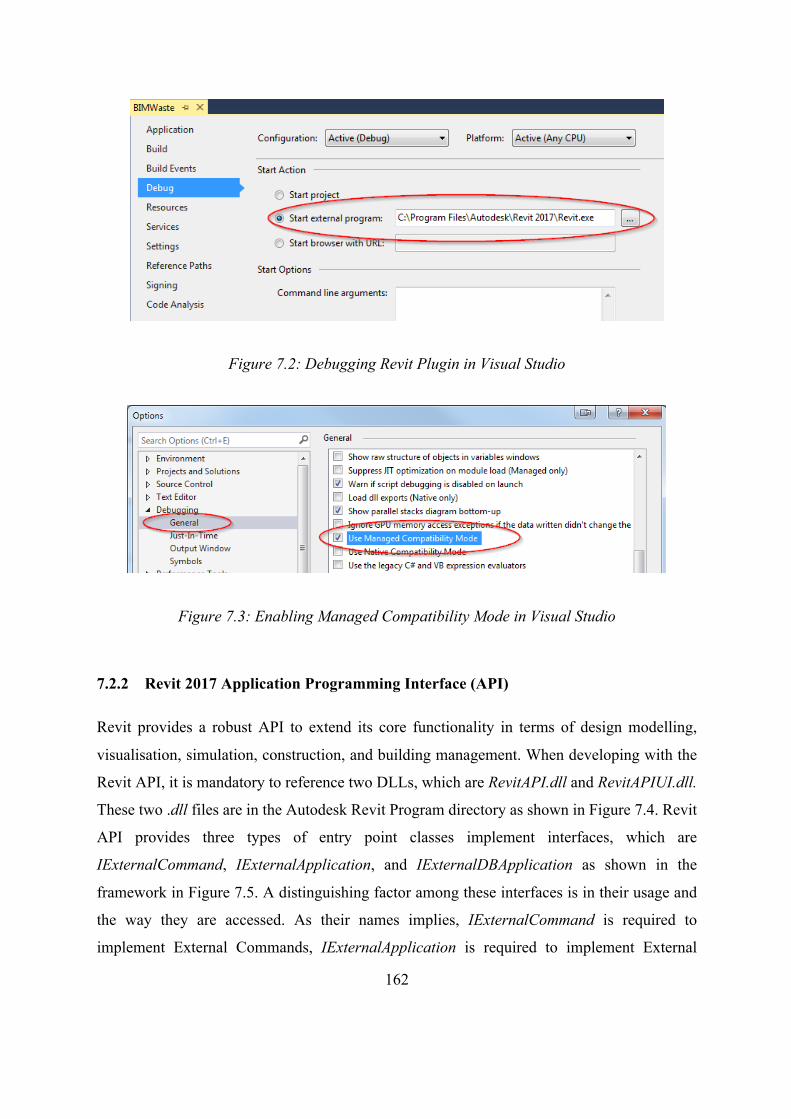
162
Figure 7.2: Debugging Revit Plugin in Visual Studio
Figure 7.3: Enabling Managed Compatibility Mode in Visual Studio
7.2.2 Revit 2017 Application Programming Interface (API)
Revit provides a robust API to extend its core functionality in terms of design modelling,
visualisation, simulation, construction, and building management. When developing with the
Revit API, it is mandatory to reference two DLLs, which are RevitAPI.dll and RevitAPIUI.dll.
These two .dll files are in the Autodesk Revit Program directory as shown in Figure 7.4. Revit
API provides three types of entry point classes implement interfaces, which are
IExternalCommand, IExternalApplication, and IExternalDBApplication as shown in the
framework in Figure 7.5. A distinguishing factor among these interfaces is in their usage and
the way they are accessed. As their names implies, IExternalCommand is required to
implement External Commands, IExternalApplication is required to implement External
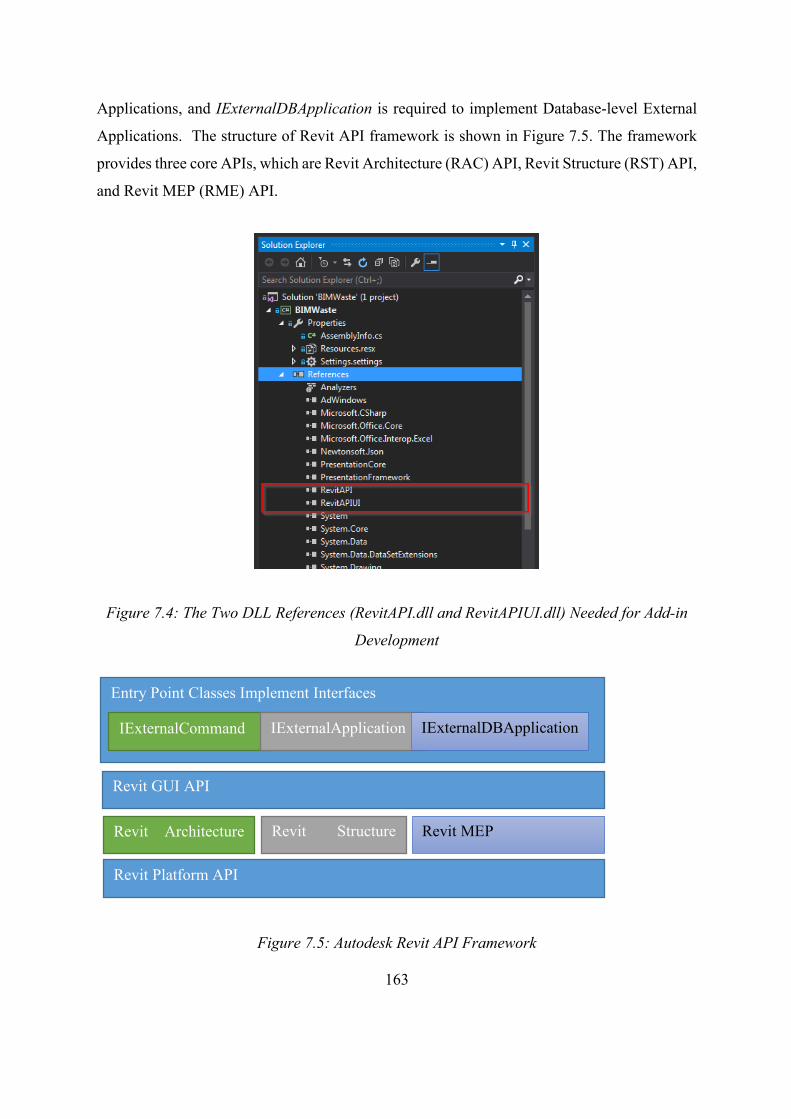
163
Applications, and IExternalDBApplication is required to implement Database-level External
Applications. The structure of Revit API framework is shown in Figure 7.5. The framework
provides three core APIs, which are Revit Architecture (RAC) API, Revit Structure (RST) API,
and Revit MEP (RME) API.
Figure 7.4: The Two DLL References (RevitAPI.dll and RevitAPIUI.dll) Needed for Add-in
Development
Figure 7.5: Autodesk Revit API Framework
Revit Platform API
Revit Architecture
(RAC) API
Revit Structure
(RST) API
Revit MEP
Entry Point Classes Implement Interfaces
Revit GUI API
IExternalCommand IExternalApplication IExternalDBApplication
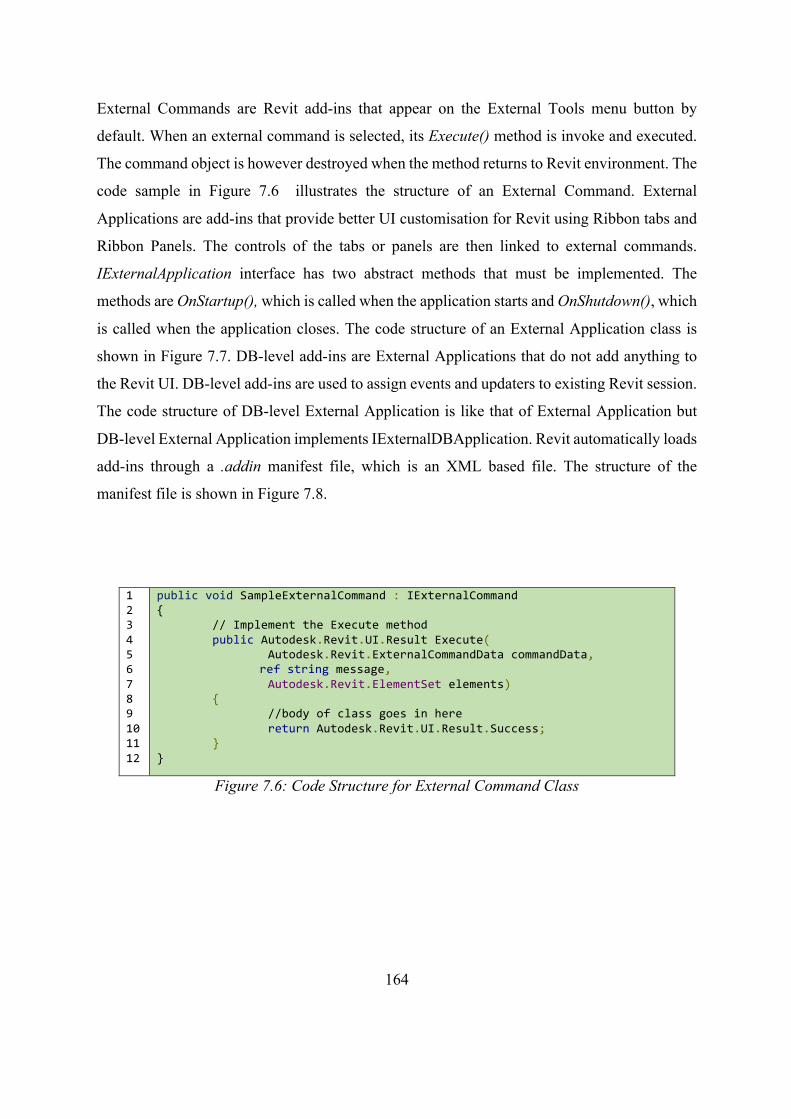
164
External Commands are Revit add-ins that appear on the External Tools menu button by
default. When an external command is selected, its Execute() method is invoke and executed.
The command object is however destroyed when the method returns to Revit environment. The
code sample in Figure 7.6 illustrates the structure of an External Command. External
Applications are add-ins that provide better UI customisation for Revit using Ribbon tabs and
Ribbon Panels. The controls of the tabs or panels are then linked to external commands.
IExternalApplication interface has two abstract methods that must be implemented. The
methods are OnStartup(), which is called when the application starts and OnShutdown(), which
is called when the application closes. The code structure of an External Application class is
shown in Figure 7.7. DB-level add-ins are External Applications that do not add anything to
the Revit UI. DB-level add-ins are used to assign events and updaters to existing Revit session.
The code structure of DB-level External Application is like that of External Application but
DB-level External Application implements IExternalDBApplication. Revit automatically loads
add-ins through a .addin manifest file, which is an XML based file. The structure of the
manifest file is shown in Figure 7.8.
1 2 3 4 5 6 7 8 9 10 11 12
public void SampleExternalCommand : IExternalCommand { // Implement the Execute method public Autodesk.Revit.UI.Result Execute( Autodesk.Revit.ExternalCommandData commandData, ref string message, Autodesk.Revit.ElementSet elements) { //body of class goes in here return Autodesk.Revit.UI.Result.Success; } }
Figure 7.6: Code Structure for External Command Class
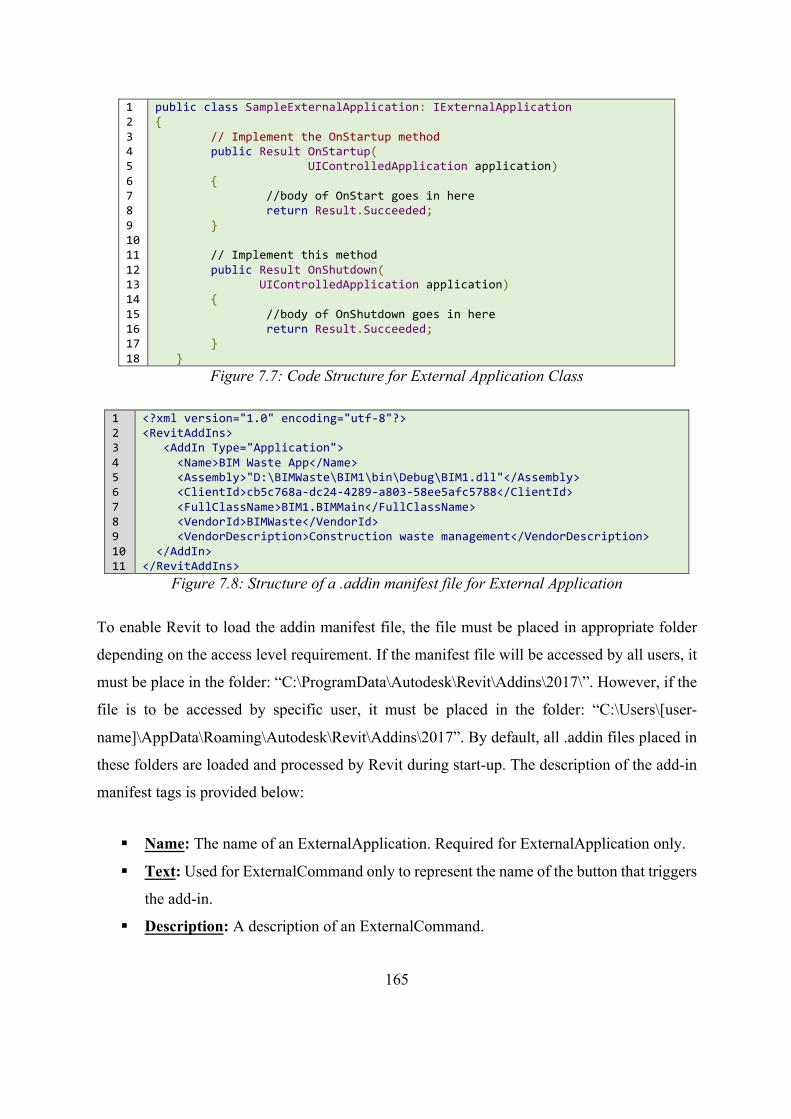
165
1 2 3 4 5 6 7 8 9 10 11 12 13 14 15 16 17 18
public class SampleExternalApplication: IExternalApplication { // Implement the OnStartup method public Result OnStartup( UIControlledApplication application) { //body of OnStart goes in here return Result.Succeeded; } // Implement this method public Result OnShutdown( UIControlledApplication application) { //body of OnShutdown goes in here return Result.Succeeded; } }
Figure 7.7: Code Structure for External Application Class
1 2 3 4 5 6 7 8 9 10 11
<?xml version="1.0" encoding="utf-8"?> <RevitAddIns> <AddIn Type="Application"> <Name>BIM Waste App</Name> <Assembly>"D:\BIMWaste\BIM1\bin\Debug\BIM1.dll"</Assembly> <ClientId>cb5c768a-dc24-4289-a803-58ee5afc5788</ClientId> <FullClassName>BIM1.BIMMain</FullClassName> <VendorId>BIMWaste</VendorId> <VendorDescription>Construction waste management</VendorDescription> </AddIn> </RevitAddIns>
Figure 7.8: Structure of a .addin manifest file for External Application
To enable Revit to load the addin manifest file, the file must be placed in appropriate folder
depending on the access level requirement. If the manifest file will be accessed by all users, it
must be place in the folder: “C:\ProgramData\Autodesk\Revit\Addins\2017\”. However, if the
file is to be accessed by specific user, it must be placed in the folder: “C:\Users\[user-
name]\AppData\Roaming\Autodesk\Revit\Addins\2017”. By default, all .addin files placed in
these folders are loaded and processed by Revit during start-up. The description of the add-in
manifest tags is provided below:
§ Name: The name of an ExternalApplication. Required for ExternalApplication only.
§ Text: Used for ExternalCommand only to represent the name of the button that triggers
the add-in.
§ Description: A description of an ExternalCommand.
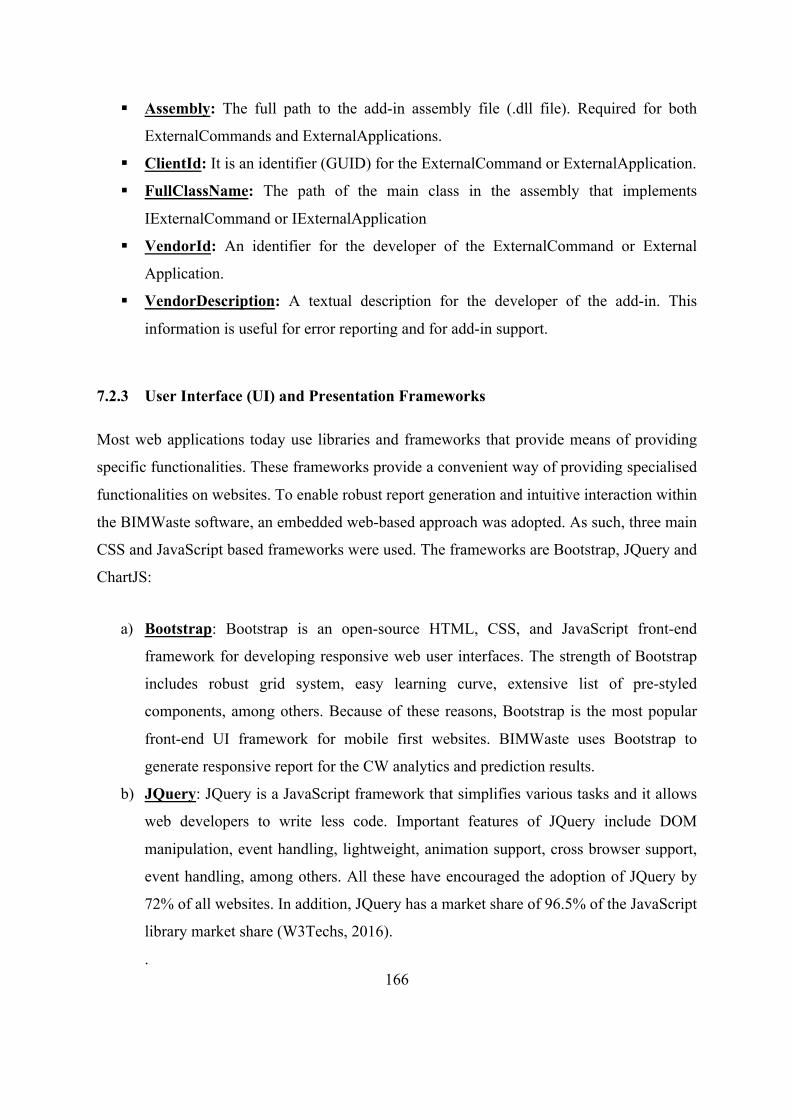
166
§ Assembly: The full path to the add-in assembly file (.dll file). Required for both
ExternalCommands and ExternalApplications.
§ ClientId: It is an identifier (GUID) for the ExternalCommand or ExternalApplication.
§ FullClassName: The path of the main class in the assembly that implements
IExternalCommand or IExternalApplication
§ VendorId: An identifier for the developer of the ExternalCommand or External
Application.
§ VendorDescription: A textual description for the developer of the add-in. This
information is useful for error reporting and for add-in support.
7.2.3 User Interface (UI) and Presentation Frameworks
Most web applications today use libraries and frameworks that provide means of providing
specific functionalities. These frameworks provide a convenient way of providing specialised
functionalities on websites. To enable robust report generation and intuitive interaction within
the BIMWaste software, an embedded web-based approach was adopted. As such, three main
CSS and JavaScript based frameworks were used. The frameworks are Bootstrap, JQuery and
ChartJS:
a) Bootstrap: Bootstrap is an open-source HTML, CSS, and JavaScript front-end
framework for developing responsive web user interfaces. The strength of Bootstrap
includes robust grid system, easy learning curve, extensive list of pre-styled
components, among others. Because of these reasons, Bootstrap is the most popular
front-end UI framework for mobile first websites. BIMWaste uses Bootstrap to
generate responsive report for the CW analytics and prediction results.
b) JQuery: JQuery is a JavaScript framework that simplifies various tasks and it allows
web developers to write less code. Important features of JQuery include DOM
manipulation, event handling, lightweight, animation support, cross browser support,
event handling, among others. All these have encouraged the adoption of JQuery by
72% of all websites. In addition, JQuery has a market share of 96.5% of the JavaScript
library market share (W3Techs, 2016).
.
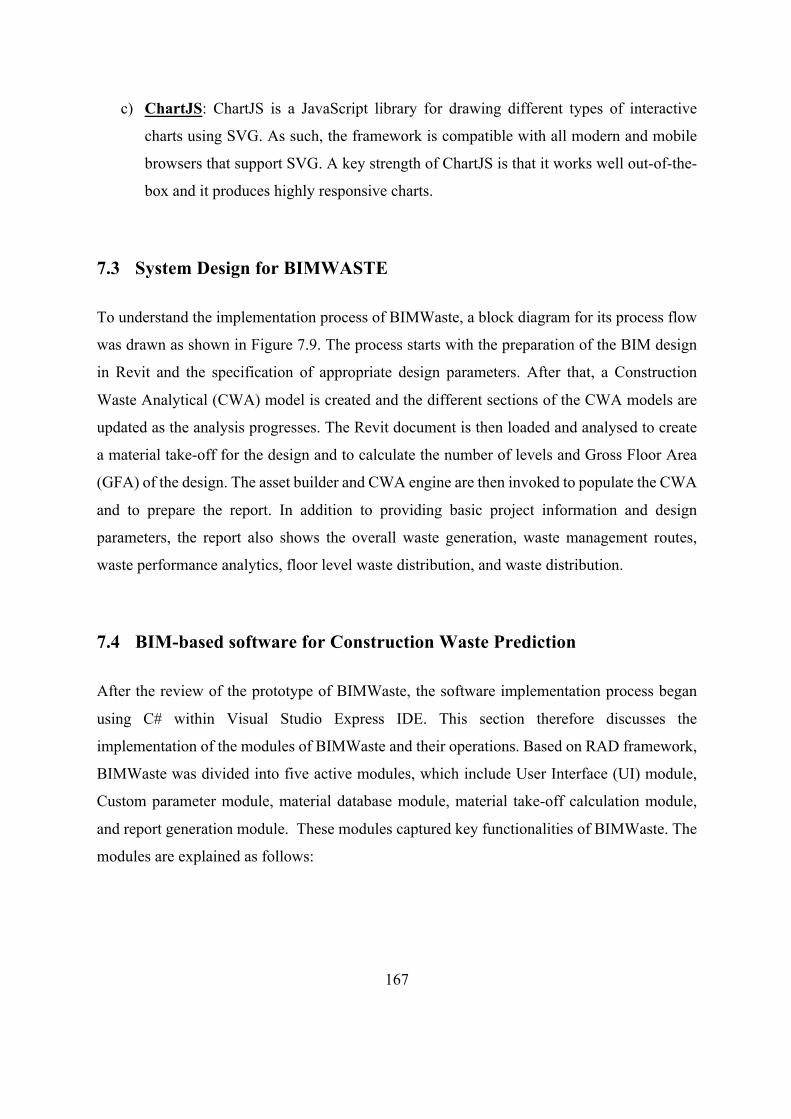
167
c) ChartJS: ChartJS is a JavaScript library for drawing different types of interactive
charts using SVG. As such, the framework is compatible with all modern and mobile
browsers that support SVG. A key strength of ChartJS is that it works well out-of-the-
box and it produces highly responsive charts.
7.3 System Design for BIMWASTE
To understand the implementation process of BIMWaste, a block diagram for its process flow
was drawn as shown in Figure 7.9. The process starts with the preparation of the BIM design
in Revit and the specification of appropriate design parameters. After that, a Construction
Waste Analytical (CWA) model is created and the different sections of the CWA models are
updated as the analysis progresses. The Revit document is then loaded and analysed to create
a material take-off for the design and to calculate the number of levels and Gross Floor Area
(GFA) of the design. The asset builder and CWA engine are then invoked to populate the CWA
and to prepare the report. In addition to providing basic project information and design
parameters, the report also shows the overall waste generation, waste management routes,
waste performance analytics, floor level waste distribution, and waste distribution.
7.4 BIM-based software for Construction Waste Prediction
After the review of the prototype of BIMWaste, the software implementation process began
using C# within Visual Studio Express IDE. This section therefore discusses the
implementation of the modules of BIMWaste and their operations. Based on RAD framework,
BIMWaste was divided into five active modules, which include User Interface (UI) module,
Custom parameter module, material database module, material take-off calculation module,
and report generation module. These modules captured key functionalities of BIMWaste. The
modules are explained as follows:
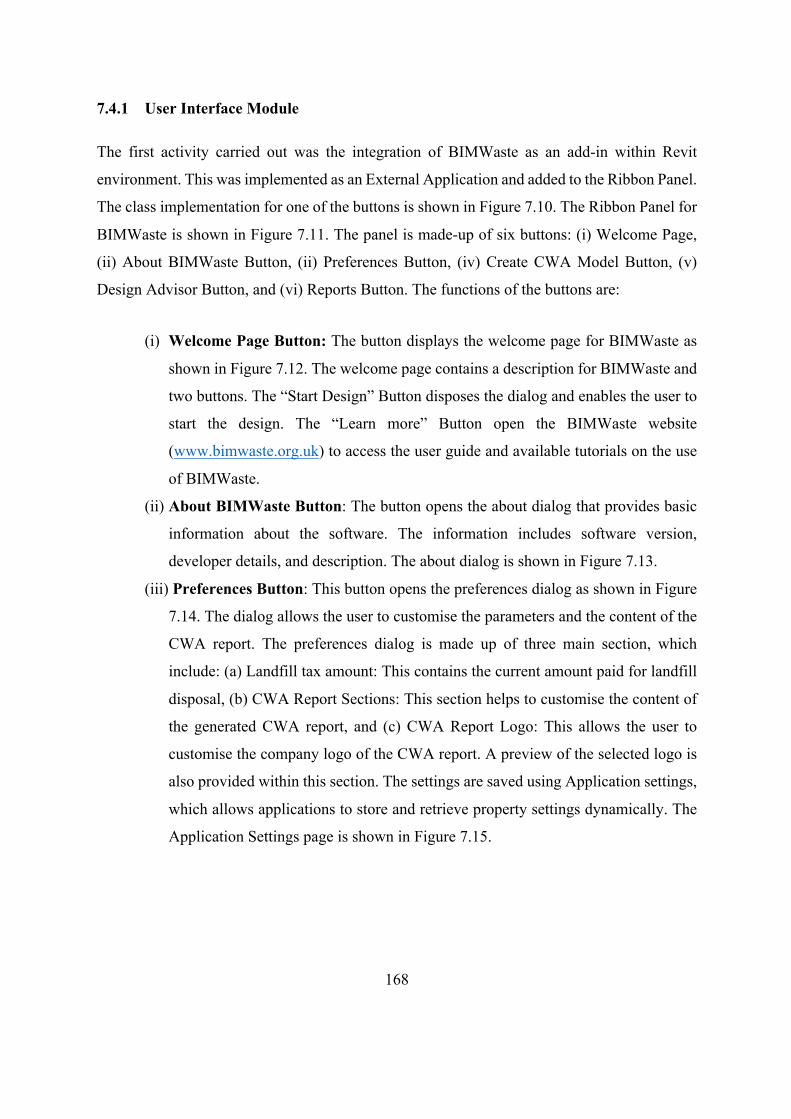
168
7.4.1 User Interface Module
The first activity carried out was the integration of BIMWaste as an add-in within Revit
environment. This was implemented as an External Application and added to the Ribbon Panel.
The class implementation for one of the buttons is shown in Figure 7.10. The Ribbon Panel for
BIMWaste is shown in Figure 7.11. The panel is made-up of six buttons: (i) Welcome Page,
(ii) About BIMWaste Button, (ii) Preferences Button, (iv) Create CWA Model Button, (v)
Design Advisor Button, and (vi) Reports Button. The functions of the buttons are:
(i) Welcome Page Button: The button displays the welcome page for BIMWaste as
shown in Figure 7.12. The welcome page contains a description for BIMWaste and
two buttons. The “Start Design” Button disposes the dialog and enables the user to
start the design. The “Learn more” Button open the BIMWaste website
(www.bimwaste.org.uk) to access the user guide and available tutorials on the use
of BIMWaste.
(ii) About BIMWaste Button: The button opens the about dialog that provides basic
information about the software. The information includes software version,
developer details, and description. The about dialog is shown in Figure 7.13.
(iii) Preferences Button: This button opens the preferences dialog as shown in Figure
7.14. The dialog allows the user to customise the parameters and the content of the
CWA report. The preferences dialog is made up of three main section, which
include: (a) Landfill tax amount: This contains the current amount paid for landfill
disposal, (b) CWA Report Sections: This section helps to customise the content of
the generated CWA report, and (c) CWA Report Logo: This allows the user to
customise the company logo of the CWA report. A preview of the selected logo is
also provided within this section. The settings are saved using Application settings,
which allows applications to store and retrieve property settings dynamically. The
Application Settings page is shown in Figure 7.15.
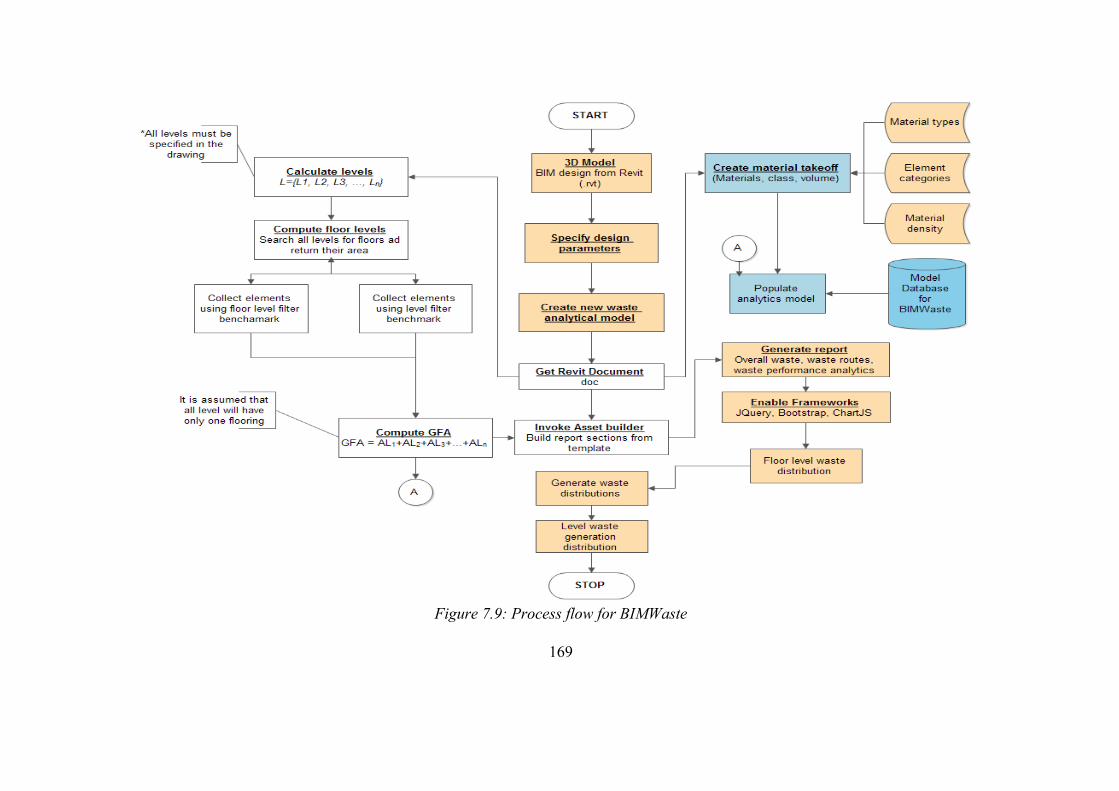
169
Figure 7.9: Process flow for BIMWaste
170
1 2 3 4 5 6 7 8 9 10 11 12 13 14 15 16 17 18 19 20 21 22 23 24 25 26 27 28
class BIMWasteMain : IExternalApplication { void CreateRibbonButton(UIControlledApplication application) { var BIMWasteRibbon = application.CreateRibbonPanel("BIMWaste"); var generateModelButton = new PushButtonData("BIM_Waste_Generate_Model", "Create model", AddinAssmeblyPath, "Revit.Addin.BIMWaste.CWAMHAndler") { LargeImage = ConvertFromBitmap(Properties.Resources.Predict), Image = ConvertFromBitmap(Properties.Resources.Predict), ToolTip = "Generate new waste analytical model for current design" }; var generateModelPB = BIMWasteRibbon.AddItem(generateModelButton) as PushButton; } public Result OnShutdown(UIControlledApplication application) { return Result.Succeeded; } public Result OnStartup(UIControlledApplication application) { CreateRibbonButton(application); return Result.Succeeded; }
Figure 7.10: Class Implementation for BIMWaste Ribbon Panel
Figure 7.11: BIMWaste Ribbon Panel
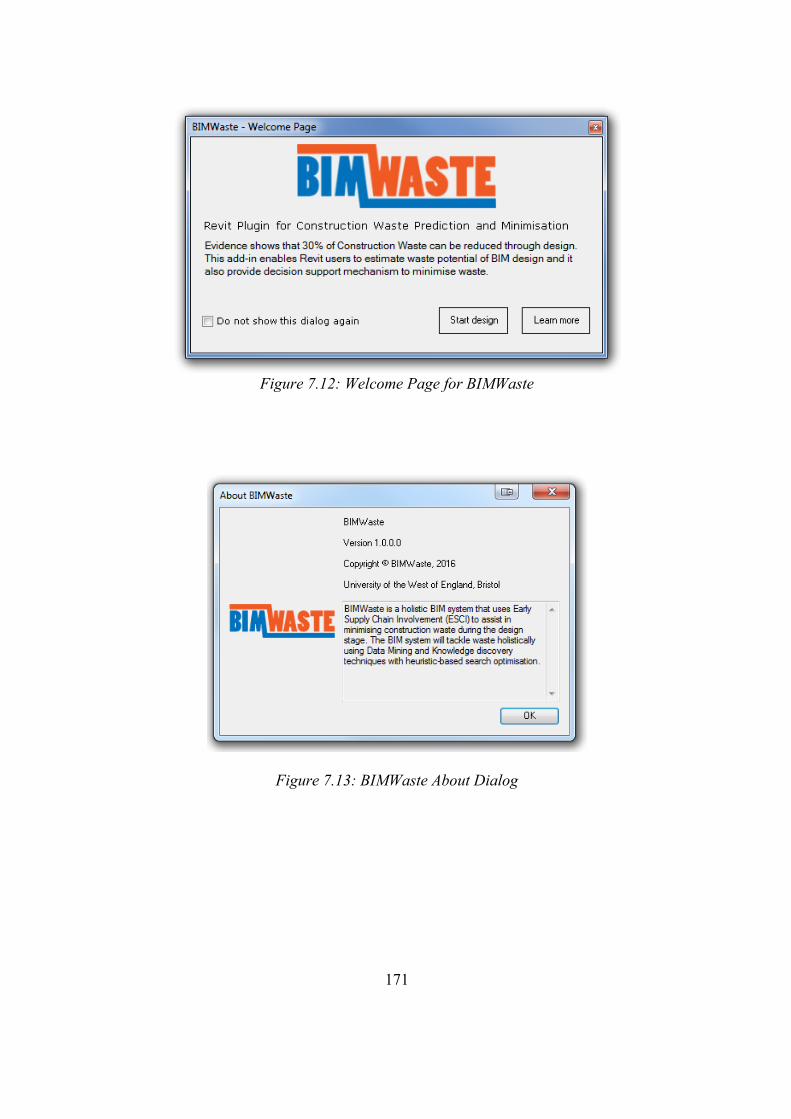
171
Figure 7.12: Welcome Page for BIMWaste
Figure 7.13: BIMWaste About Dialog
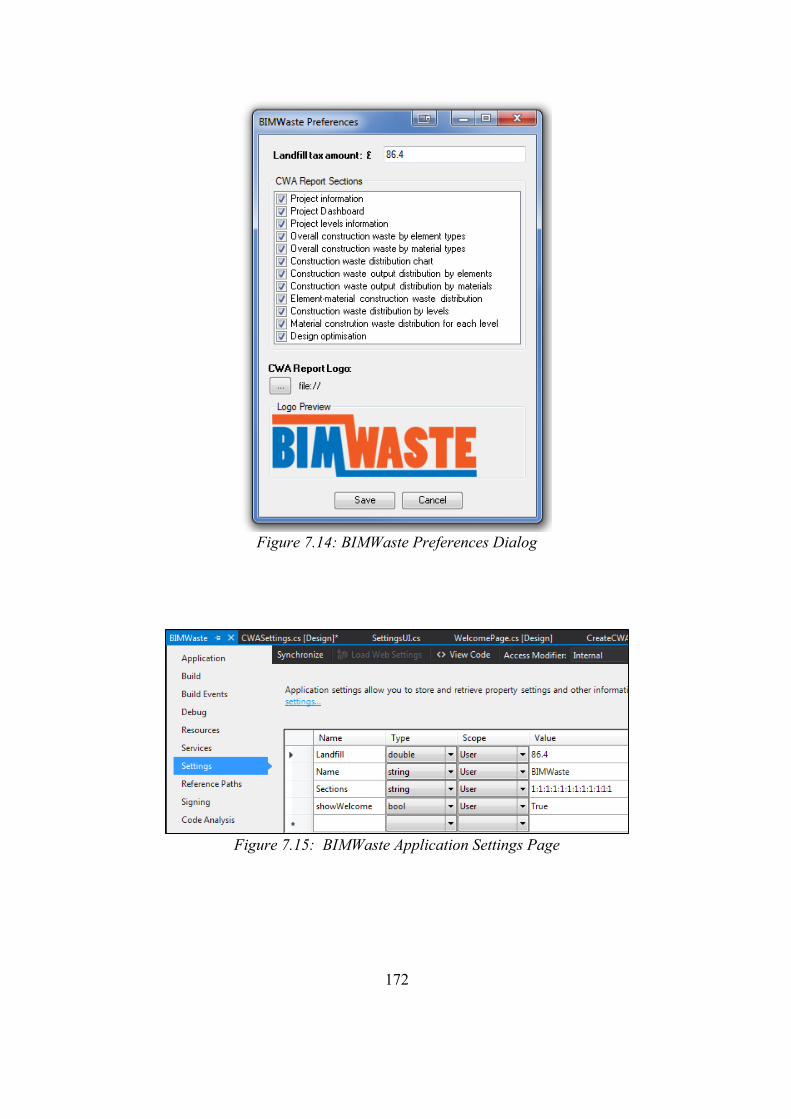
172
Figure 7.14: BIMWaste Preferences Dialog
Figure 7.15: BIMWaste Application Settings Page
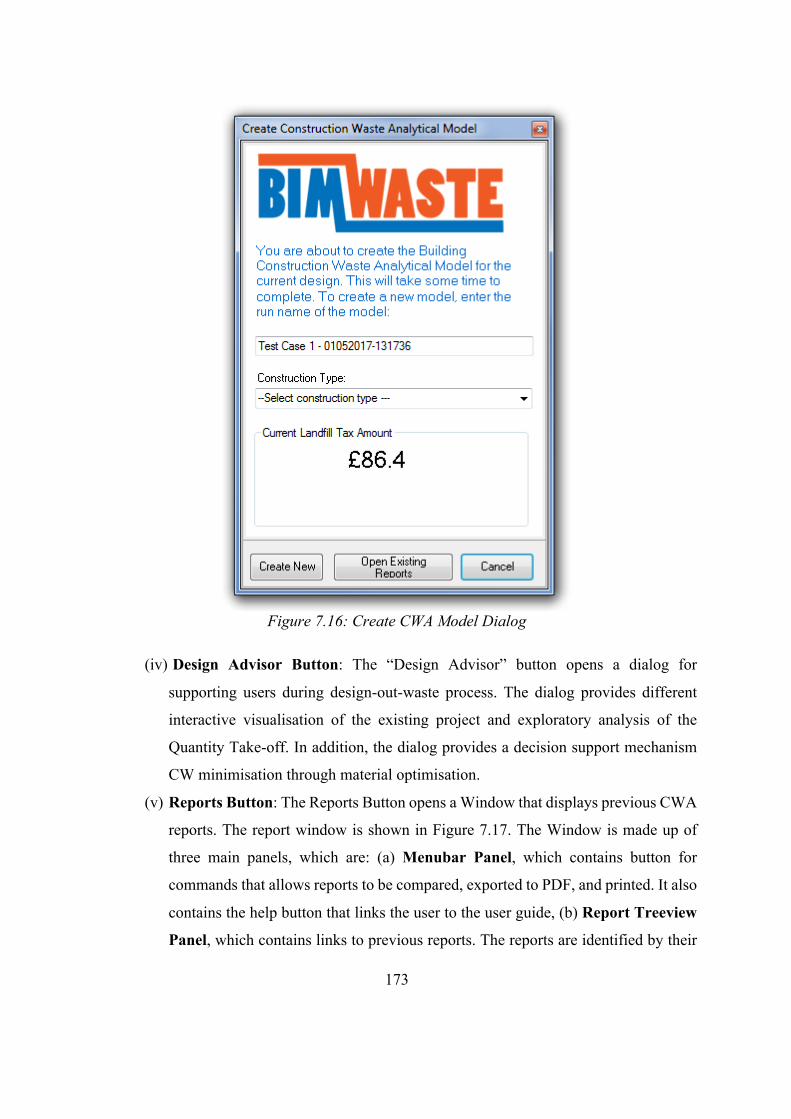
173
Figure 7.16: Create CWA Model Dialog
(iv) Design Advisor Button: The “Design Advisor” button opens a dialog for
supporting users during design-out-waste process. The dialog provides different
interactive visualisation of the existing project and exploratory analysis of the
Quantity Take-off. In addition, the dialog provides a decision support mechanism
CW minimisation through material optimisation.
(v) Reports Button: The Reports Button opens a Window that displays previous CWA
reports. The report window is shown in Figure 7.17. The Window is made up of
three main panels, which are: (a) Menubar Panel, which contains button for
commands that allows reports to be compared, exported to PDF, and printed. It also
contains the help button that links the user to the user guide, (b) Report Treeview
Panel, which contains links to previous reports. The reports are identified by their
174
names. Selecting a project from the Treeview enables specific commands on the
Menubar and displays the corresponding report in the Report View Panel, and (c)
Report View Panel, which contains the report of the selected CWA project selected
on the Report Treeview Panel.
The report view panel is a web-based view that contains the following sections: (a) Project
information that contains basic information and other details such as GFA, number of levels,
and total number of floors; (b) Dashboard that shows the total waste, cost of disposal, predicted
CW management route; (c) Levels details that shows the name and elevation of the levels; (d)
Overall waste output by element types Table; (e) Overall waste output by material type Table;
(f) Waste distribution charts by element type and material type; (g) Element-Material Waste
Distribution Histogram; and (h) Stacked Chart and pie chart for Waste distribution by levels.
Figure 7.18 to Figure 7.20 show sections of a sample CWA report. In addition, the panel
provides a link to download the Bill of Quantity (BoQ) as an Excel file. A sample of the
exported BoQ in Excel format is shown in Figure 7.21.
7.4.2 Custom Parameters Module
An important factor that makes BIM relevant in building design is its ability to capture design
parameters automatically for simulating building performances. To leverage upon this, current
BIM parametric modelling software allows user-specific design parameters to extend the
information about building elements. Revit API provides two types of parameters: shared
parameters and project parameters. Shared parameters can be shared among several projects
but project parameter is specific to a project. Accordingly, project parameters were created to
capture various aspects of CWA from building elements. The custom parameters include
Prefabrication attribute, recyclability attribute, reusability attribute, toxicity of element, and
packaging attribute. The Project parameters were the attached to a CatergorySet that is made
up of Walls, Doors, Floors, Roofs, Windows, Columns, Curtain Wall Panels, Structural
Foundations, and Structural Columns. Figure 7.2 shows the project parameters for a Basic
Wall. The method used to create the project parameters is shown in Figure 7.23.
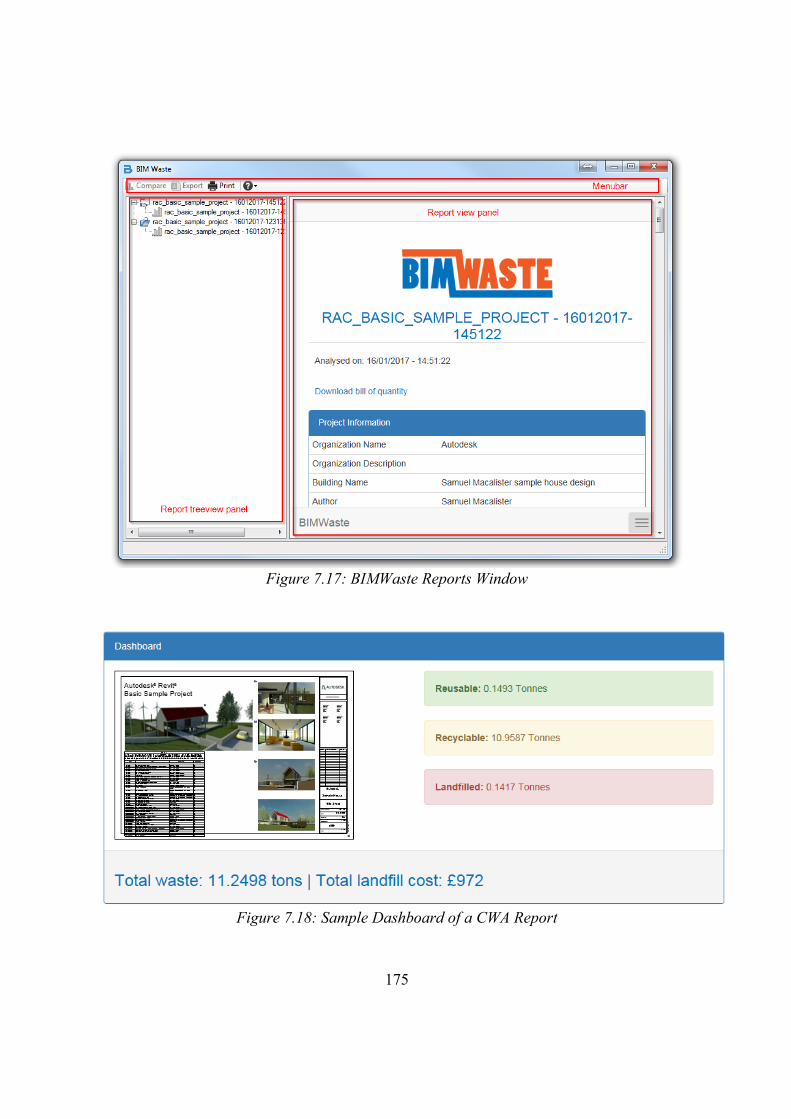
175
Figure 7.17: BIMWaste Reports Window
Figure 7.18: Sample Dashboard of a CWA Report
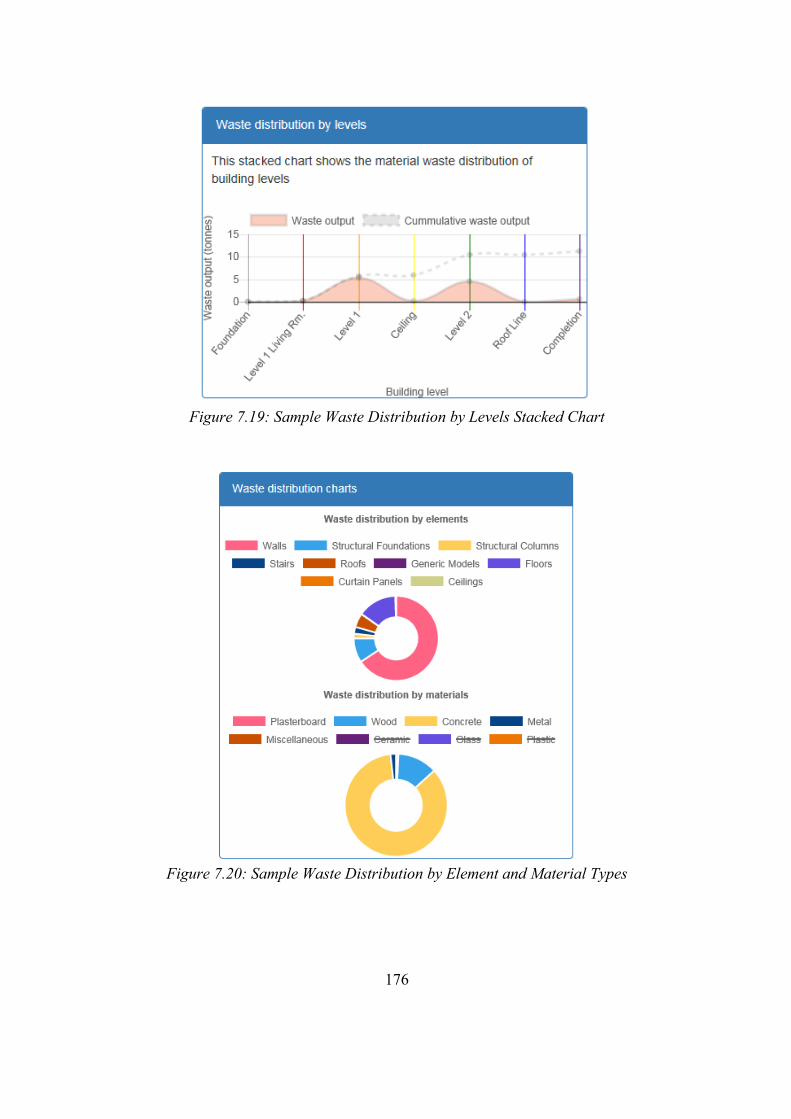
176
Figure 7.19: Sample Waste Distribution by Levels Stacked Chart
Figure 7.20: Sample Waste Distribution by Element and Material Types
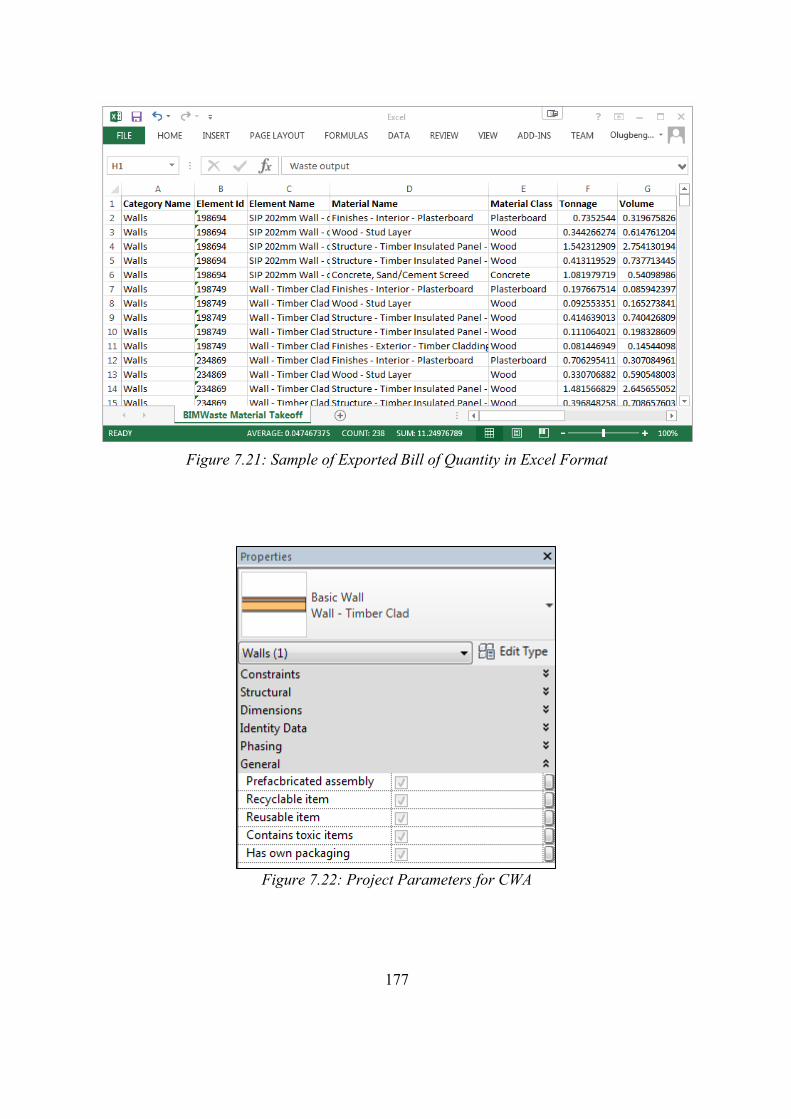
177
Figure 7.21: Sample of Exported Bill of Quantity in Excel Format
Figure 7.22: Project Parameters for CWA
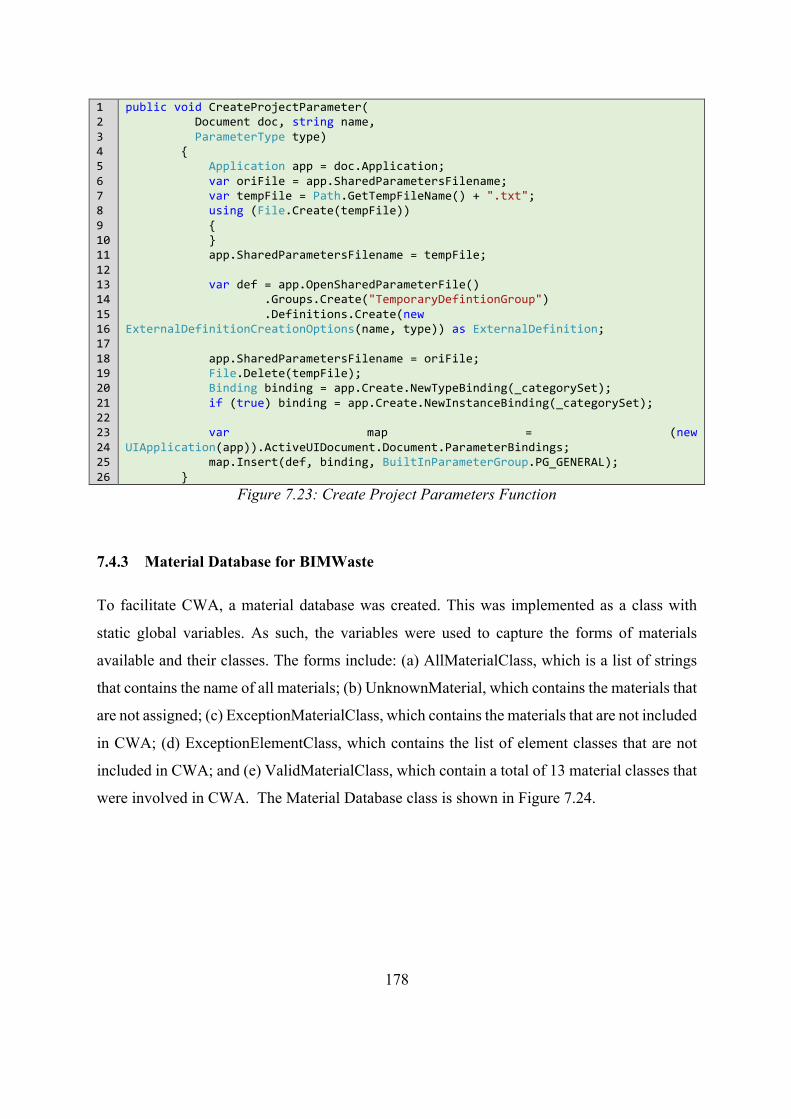
178
1 2 3 4 5 6 7 8 9 10 11 12 13 14 15 16 17 18 19 20 21 22 23 24 25 26
public void CreateProjectParameter( Document doc, string name, ParameterType type) { Application app = doc.Application; var oriFile = app.SharedParametersFilename; var tempFile = Path.GetTempFileName() + ".txt"; using (File.Create(tempFile)) { } app.SharedParametersFilename = tempFile; var def = app.OpenSharedParameterFile() .Groups.Create("TemporaryDefintionGroup") .Definitions.Create(new ExternalDefinitionCreationOptions(name, type)) as ExternalDefinition; app.SharedParametersFilename = oriFile; File.Delete(tempFile); Binding binding = app.Create.NewTypeBinding(_categorySet); if (true) binding = app.Create.NewInstanceBinding(_categorySet); var map = (new UIApplication(app)).ActiveUIDocument.Document.ParameterBindings; map.Insert(def, binding, BuiltInParameterGroup.PG_GENERAL); }
Figure 7.23: Create Project Parameters Function
7.4.3 Material Database for BIMWaste
To facilitate CWA, a material database was created. This was implemented as a class with
static global variables. As such, the variables were used to capture the forms of materials
available and their classes. The forms include: (a) AllMaterialClass, which is a list of strings
that contains the name of all materials; (b) UnknownMaterial, which contains the materials that
are not assigned; (c) ExceptionMaterialClass, which contains the materials that are not included
in CWA; (d) ExceptionElementClass, which contains the list of element classes that are not
included in CWA; and (e) ValidMaterialClass, which contain a total of 13 material classes that
were involved in CWA. The Material Database class is shown in Figure 7.24.
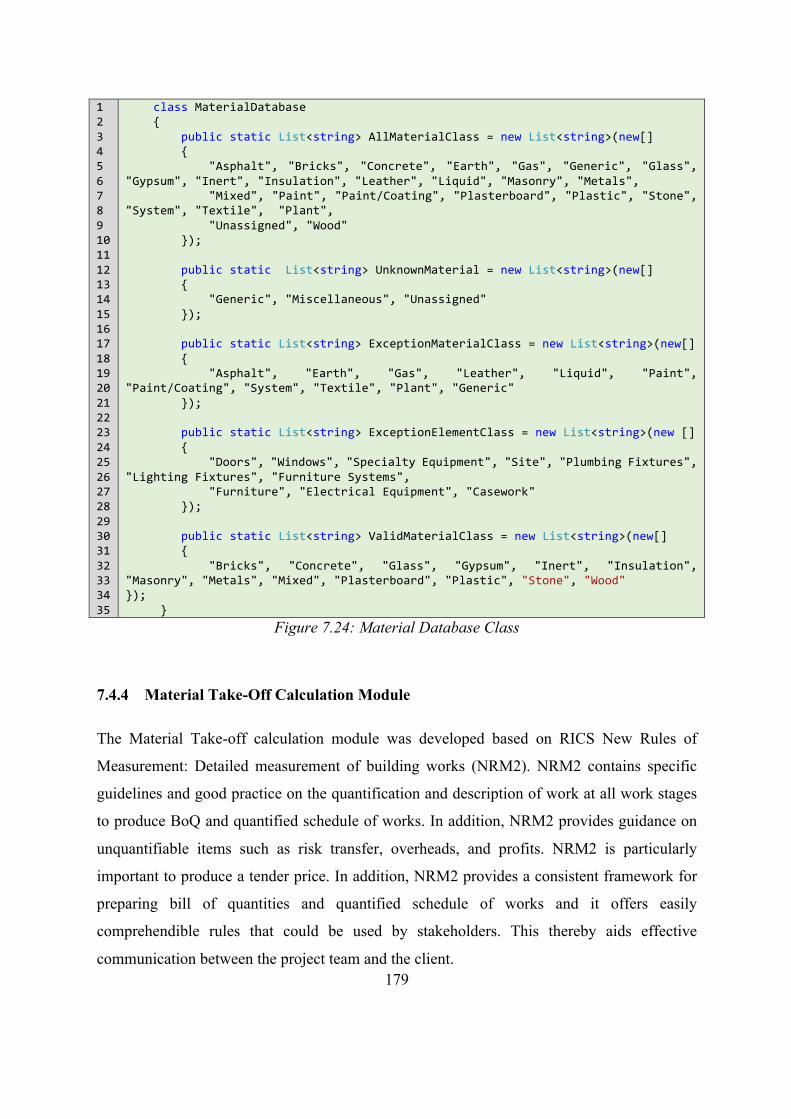
179
1 2 3 4 5 6 7 8 9 10 11 12 13 14 15 16 17 18 19 20 21 22 23 24 25 26 27 28 29 30 31 32 33 34 35
class MaterialDatabase { public static List<string> AllMaterialClass = new List<string>(new[] { "Asphalt", "Bricks", "Concrete", "Earth", "Gas", "Generic", "Glass", "Gypsum", "Inert", "Insulation", "Leather", "Liquid", "Masonry", "Metals", "Mixed", "Paint", "Paint/Coating", "Plasterboard", "Plastic", "Stone", "System", "Textile", "Plant", "Unassigned", "Wood" }); public static List<string> UnknownMaterial = new List<string>(new[] { "Generic", "Miscellaneous", "Unassigned" }); public static List<string> ExceptionMaterialClass = new List<string>(new[] { "Asphalt", "Earth", "Gas", "Leather", "Liquid", "Paint", "Paint/Coating", "System", "Textile", "Plant", "Generic" }); public static List<string> ExceptionElementClass = new List<string>(new [] { "Doors", "Windows", "Specialty Equipment", "Site", "Plumbing Fixtures", "Lighting Fixtures", "Furniture Systems", "Furniture", "Electrical Equipment", "Casework" }); public static List<string> ValidMaterialClass = new List<string>(new[] { "Bricks", "Concrete", "Glass", "Gypsum", "Inert", "Insulation", "Masonry", "Metals", "Mixed", "Plasterboard", "Plastic", "Stone", "Wood" }); }
Figure 7.24: Material Database Class
7.4.4 Material Take-Off Calculation Module
The Material Take-off calculation module was developed based on RICS New Rules of
Measurement: Detailed measurement of building works (NRM2). NRM2 contains specific
guidelines and good practice on the quantification and description of work at all work stages
to produce BoQ and quantified schedule of works. In addition, NRM2 provides guidance on
unquantifiable items such as risk transfer, overheads, and profits. NRM2 is particularly
important to produce a tender price. In addition, NRM2 provides a consistent framework for
preparing bill of quantities and quantified schedule of works and it offers easily
comprehendible rules that could be used by stakeholders. This thereby aids effective
communication between the project team and the client.
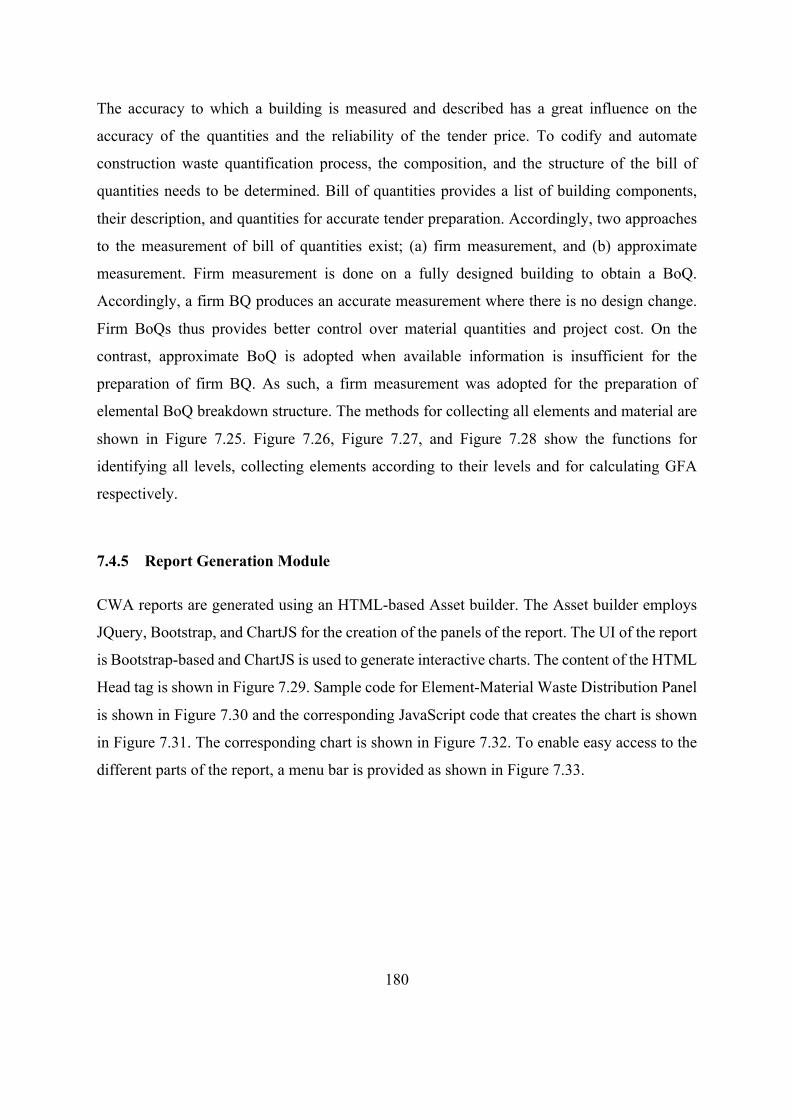
180
The accuracy to which a building is measured and described has a great influence on the
accuracy of the quantities and the reliability of the tender price. To codify and automate
construction waste quantification process, the composition, and the structure of the bill of
quantities needs to be determined. Bill of quantities provides a list of building components,
their description, and quantities for accurate tender preparation. Accordingly, two approaches
to the measurement of bill of quantities exist; (a) firm measurement, and (b) approximate
measurement. Firm measurement is done on a fully designed building to obtain a BoQ.
Accordingly, a firm BQ produces an accurate measurement where there is no design change.
Firm BoQs thus provides better control over material quantities and project cost. On the
contrast, approximate BoQ is adopted when available information is insufficient for the
preparation of firm BQ. As such, a firm measurement was adopted for the preparation of
elemental BoQ breakdown structure. The methods for collecting all elements and material are
shown in Figure 7.25. Figure 7.26, Figure 7.27, and Figure 7.28 show the functions for
identifying all levels, collecting elements according to their levels and for calculating GFA
respectively.
7.4.5 Report Generation Module
CWA reports are generated using an HTML-based Asset builder. The Asset builder employs
JQuery, Bootstrap, and ChartJS for the creation of the panels of the report. The UI of the report
is Bootstrap-based and ChartJS is used to generate interactive charts. The content of the HTML
Head tag is shown in Figure 7.29. Sample code for Element-Material Waste Distribution Panel
is shown in Figure 7.30 and the corresponding JavaScript code that creates the chart is shown
in Figure 7.31. The corresponding chart is shown in Figure 7.32. To enable easy access to the
different parts of the report, a menu bar is provided as shown in Figure 7.33.
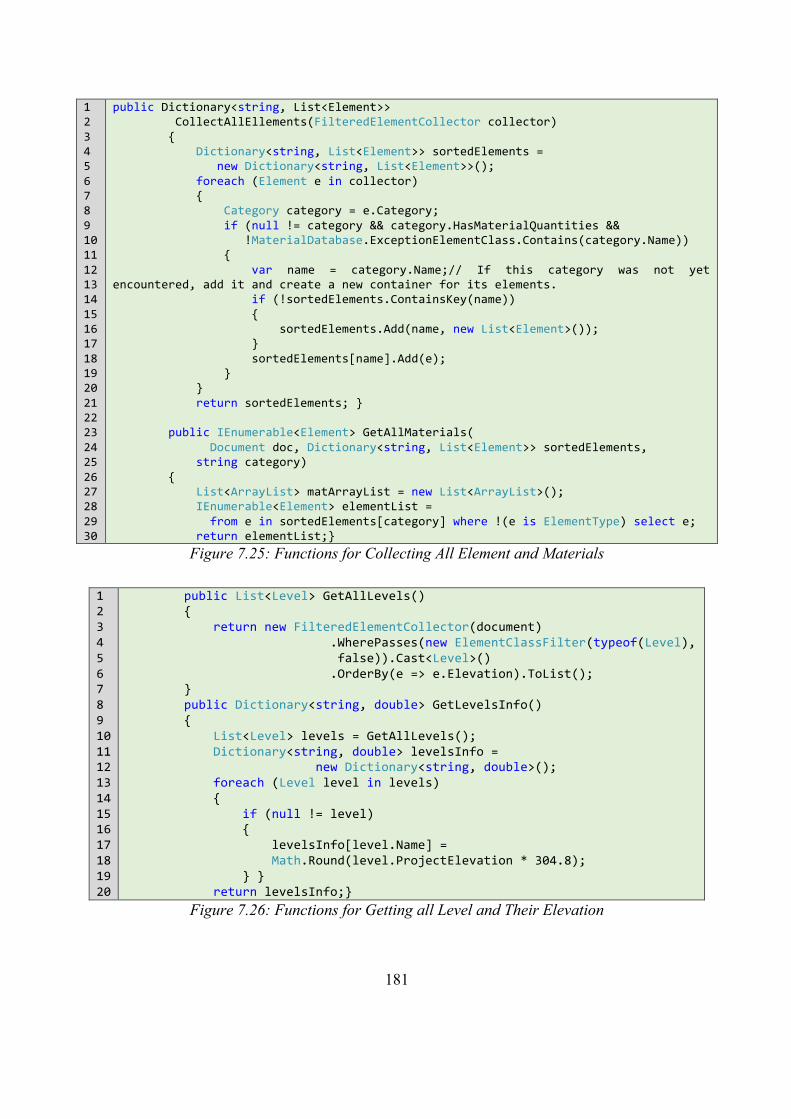
181
1 2 3 4 5 6 7 8 9 10 11 12 13 14 15 16 17 18 19 20 21 22 23 24 25 26 27 28 29 30
public Dictionary<string, List<Element>> CollectAllEllements(FilteredElementCollector collector) { Dictionary<string, List<Element>> sortedElements = new Dictionary<string, List<Element>>(); foreach (Element e in collector) { Category category = e.Category; if (null != category && category.HasMaterialQuantities && !MaterialDatabase.ExceptionElementClass.Contains(category.Name)) { var name = category.Name;// If this category was not yet encountered, add it and create a new container for its elements. if (!sortedElements.ContainsKey(name)) { sortedElements.Add(name, new List<Element>()); } sortedElements[name].Add(e); } } return sortedElements; } public IEnumerable<Element> GetAllMaterials( Document doc, Dictionary<string, List<Element>> sortedElements, string category) { List<ArrayList> matArrayList = new List<ArrayList>(); IEnumerable<Element> elementList = from e in sortedElements[category] where !(e is ElementType) select e; return elementList;}
Figure 7.25: Functions for Collecting All Element and Materials
1 2 3 4 5 6 7 8 9 10 11 12 13 14 15 16 17 18 19 20
public List<Level> GetAllLevels() { return new FilteredElementCollector(document) .WherePasses(new ElementClassFilter(typeof(Level), false)).Cast<Level>() .OrderBy(e => e.Elevation).ToList(); } public Dictionary<string, double> GetLevelsInfo() { List<Level> levels = GetAllLevels(); Dictionary<string, double> levelsInfo = new Dictionary<string, double>(); foreach (Level level in levels) { if (null != level) { levelsInfo[level.Name] = Math.Round(level.ProjectElevation * 304.8); } } return levelsInfo;}
Figure 7.26: Functions for Getting all Level and Their Elevation
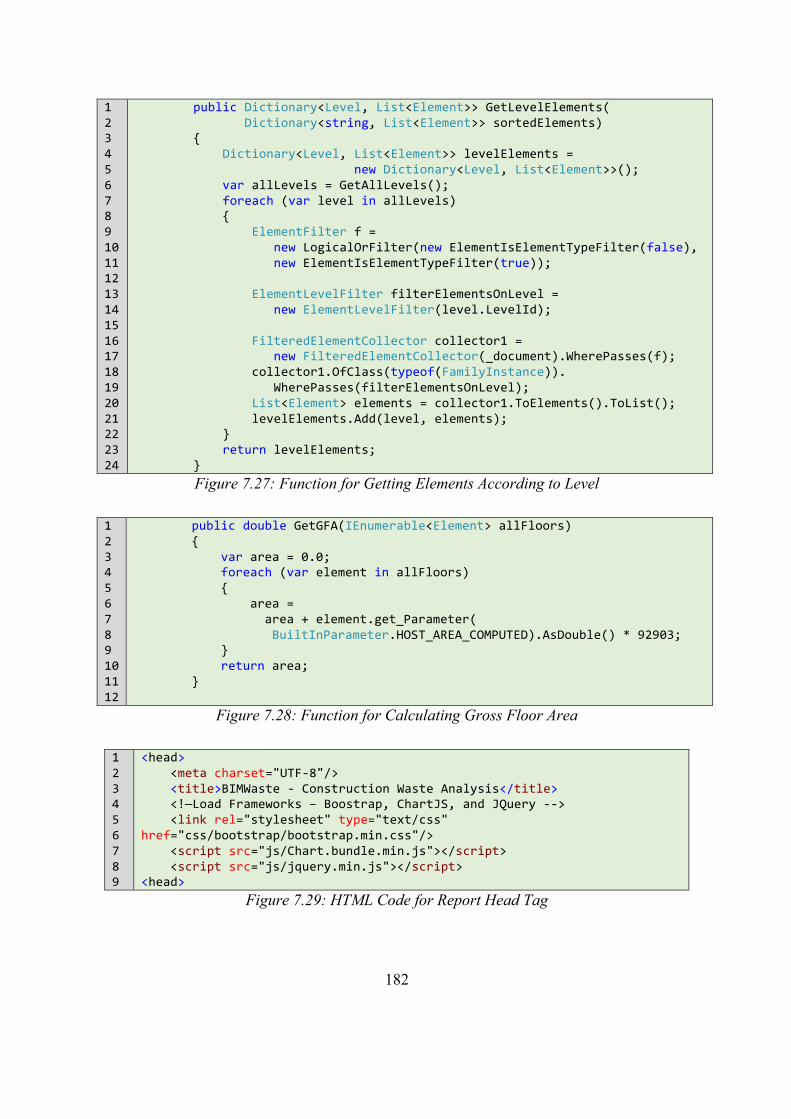
182
1 2 3 4 5 6 7 8 9 10 11 12 13 14 15 16 17 18 19 20 21 22 23 24
public Dictionary<Level, List<Element>> GetLevelElements( Dictionary<string, List<Element>> sortedElements) { Dictionary<Level, List<Element>> levelElements = new Dictionary<Level, List<Element>>(); var allLevels = GetAllLevels(); foreach (var level in allLevels) { ElementFilter f = new LogicalOrFilter(new ElementIsElementTypeFilter(false), new ElementIsElementTypeFilter(true)); ElementLevelFilter filterElementsOnLevel = new ElementLevelFilter(level.LevelId); FilteredElementCollector collector1 = new FilteredElementCollector(_document).WherePasses(f); collector1.OfClass(typeof(FamilyInstance)). WherePasses(filterElementsOnLevel); List<Element> elements = collector1.ToElements().ToList(); levelElements.Add(level, elements); } return levelElements; }
Figure 7.27: Function for Getting Elements According to Level
1 2 3 4 5 6 7 8 9 10 11 12
public double GetGFA(IEnumerable<Element> allFloors) { var area = 0.0; foreach (var element in allFloors) { area = area + element.get_Parameter( BuiltInParameter.HOST_AREA_COMPUTED).AsDouble() * 92903; } return area; }
Figure 7.28: Function for Calculating Gross Floor Area
1 2 3 4 5 6 7 8 9
<head> <meta charset="UTF-8"/> <title>BIMWaste - Construction Waste Analysis</title> <!—Load Frameworks – Boostrap, ChartJS, and JQuery --> <link rel="stylesheet" type="text/css" href="css/bootstrap/bootstrap.min.css"/> <script src="js/Chart.bundle.min.js"></script> <script src="js/jquery.min.js"></script> <head>
Figure 7.29: HTML Code for Report Head Tag
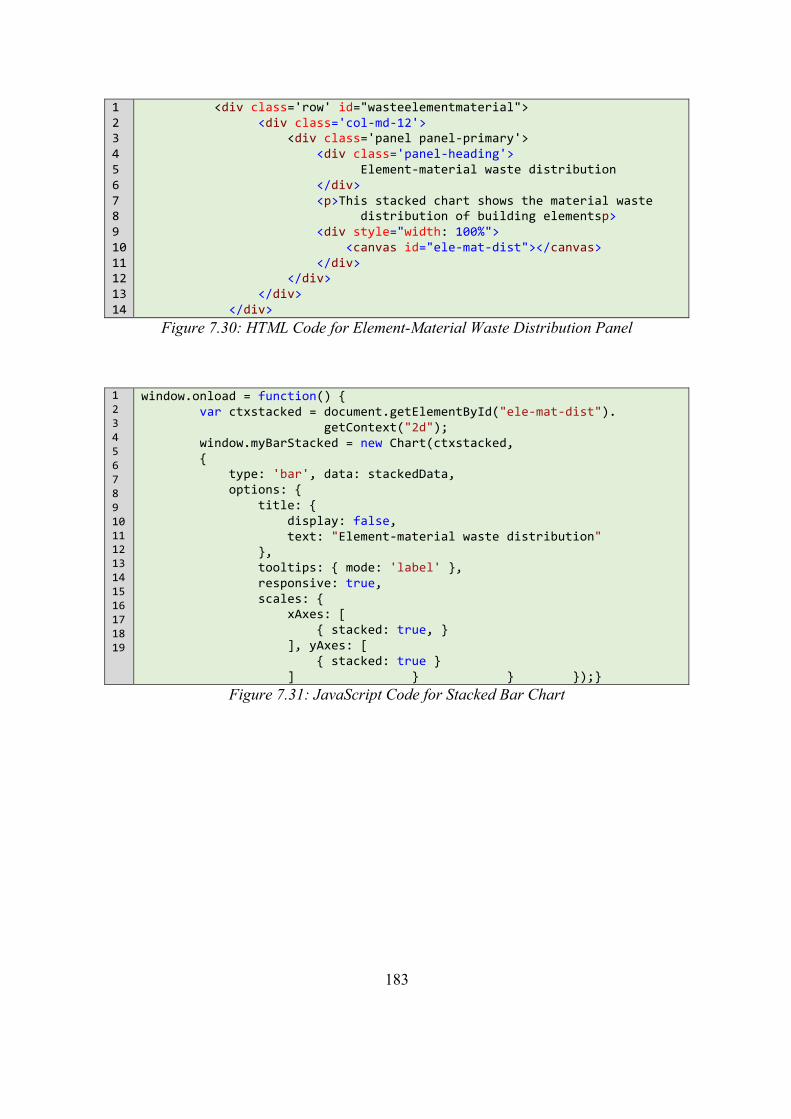
183
1 2 3 4 5 6 7 8 9 10 11 12 13 14
<div class='row' id="wasteelementmaterial"> <div class='col-md-12'> <div class='panel panel-primary'> <div class='panel-heading'> Element-material waste distribution </div> <p>This stacked chart shows the material waste distribution of building elementsp> <div style="width: 100%"> <canvas id="ele-mat-dist"></canvas> </div> </div> </div> </div>
Figure 7.30: HTML Code for Element-Material Waste Distribution Panel
1 2 3 4 5 6 7 8 9 10 11 12 13 14 15 16 17 18 19
window.onload = function() { var ctxstacked = document.getElementById("ele-mat-dist"). getContext("2d"); window.myBarStacked = new Chart(ctxstacked, { type: 'bar', data: stackedData, options: { title: { display: false, text: "Element-material waste distribution" }, tooltips: { mode: 'label' }, responsive: true, scales: { xAxes: [ { stacked: true, } ], yAxes: [ { stacked: true } ] } } });}
Figure 7.31: JavaScript Code for Stacked Bar Chart
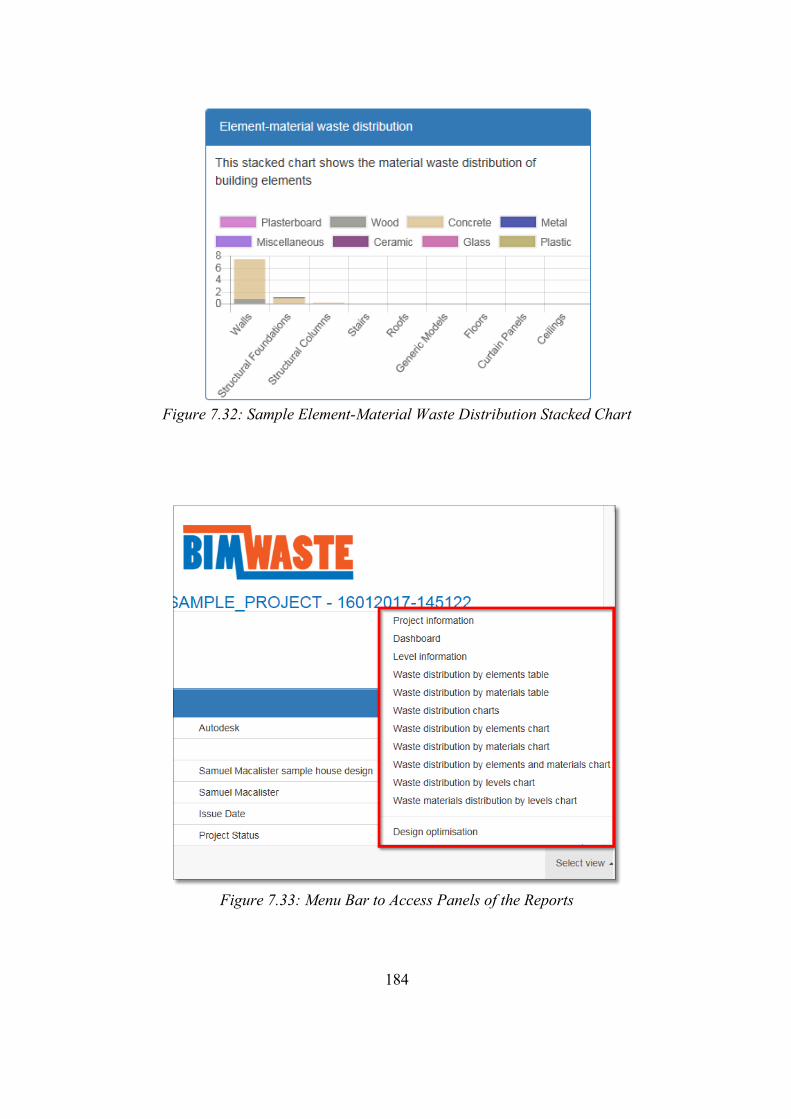
184
Figure 7.32: Sample Element-Material Waste Distribution Stacked Chart
Figure 7.33: Menu Bar to Access Panels of the Reports
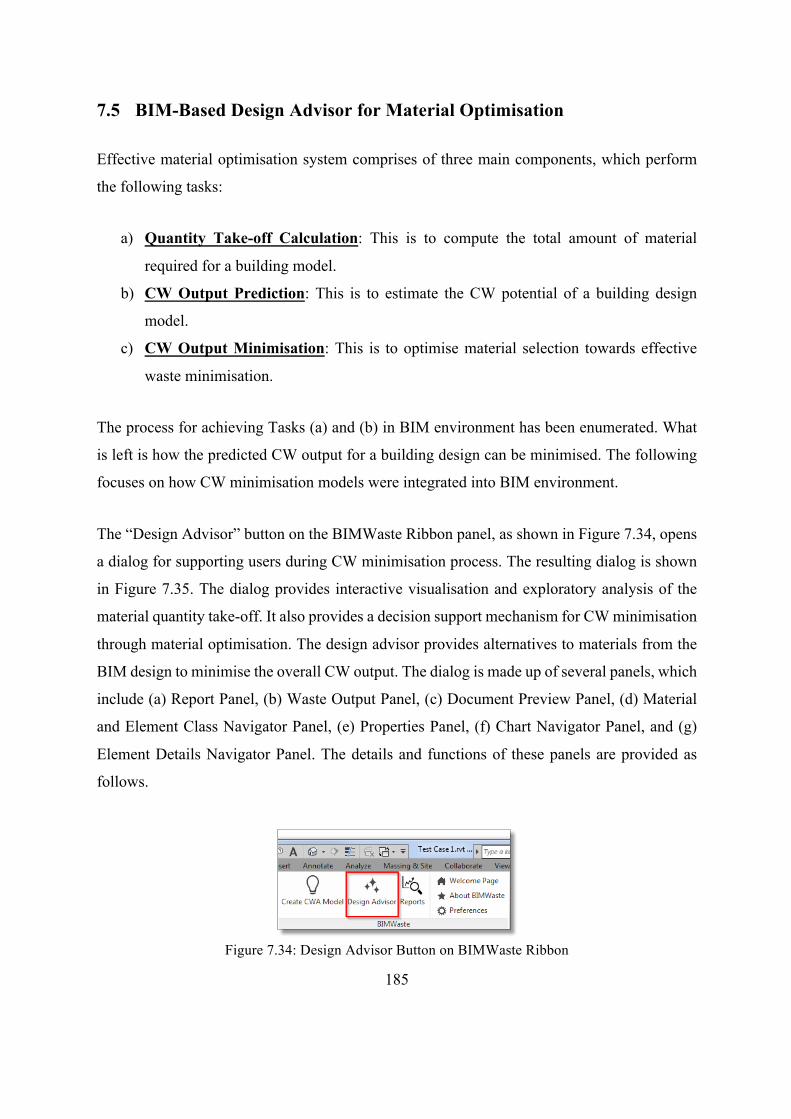
185
7.5 BIM-Based Design Advisor for Material Optimisation
Effective material optimisation system comprises of three main components, which perform
the following tasks:
a) Quantity Take-off Calculation: This is to compute the total amount of material
required for a building model.
b) CW Output Prediction: This is to estimate the CW potential of a building design
model.
c) CW Output Minimisation: This is to optimise material selection towards effective
waste minimisation.
The process for achieving Tasks (a) and (b) in BIM environment has been enumerated. What
is left is how the predicted CW output for a building design can be minimised. The following
focuses on how CW minimisation models were integrated into BIM environment.
The “Design Advisor” button on the BIMWaste Ribbon panel, as shown in Figure 7.34, opens
a dialog for supporting users during CW minimisation process. The resulting dialog is shown
in Figure 7.35. The dialog provides interactive visualisation and exploratory analysis of the
material quantity take-off. It also provides a decision support mechanism for CW minimisation
through material optimisation. The design advisor provides alternatives to materials from the
BIM design to minimise the overall CW output. The dialog is made up of several panels, which
include (a) Report Panel, (b) Waste Output Panel, (c) Document Preview Panel, (d) Material
and Element Class Navigator Panel, (e) Properties Panel, (f) Chart Navigator Panel, and (g)
Element Details Navigator Panel. The details and functions of these panels are provided as
follows.
Figure 7.34: Design Advisor Button on BIMWaste Ribbon
186
a) Report Buttons Panel: The buttons of this panel provide access to new and existing
Construction Waste Analytics (CWA) reports. The “New” button creates a new CWA
report based on the existing configuration of the design advisor. The “Reports” button
opens existing reports for comparison.
b) Waste Output Panel: This panel provides a summary of the waste output and the
amount that could reused, recycled, and landfilled. The panel is automatically updated
based on the current configuration of the design advisor.
c) Document Preview Panel: The document preview panel provides a 3D interactive
visualisation of the Revit model. The panel is bound with the Revit software such that
a change in view in the panel update the preview of the document. The panel provides
a dropdown to determine the layout that would be displayed.
d) Material and Element Class Navigator Panel: This panel provides an exploratory
overview of material and element classes from the BIM design. The panel allows users
to select material and element class that would be explored. The panel also provides
Waste Output in tonnes, Overall Waste Output Percentage (OWOP) and Waste Output
Index (WOI) of the class. OWOP measures the percentage contribution of the material
and element class with respect to the overall waste output. WOI shows the waste
efficiency of the material and element class. This measure the proportion of the material
and element class that is contributing to the overall waste output.
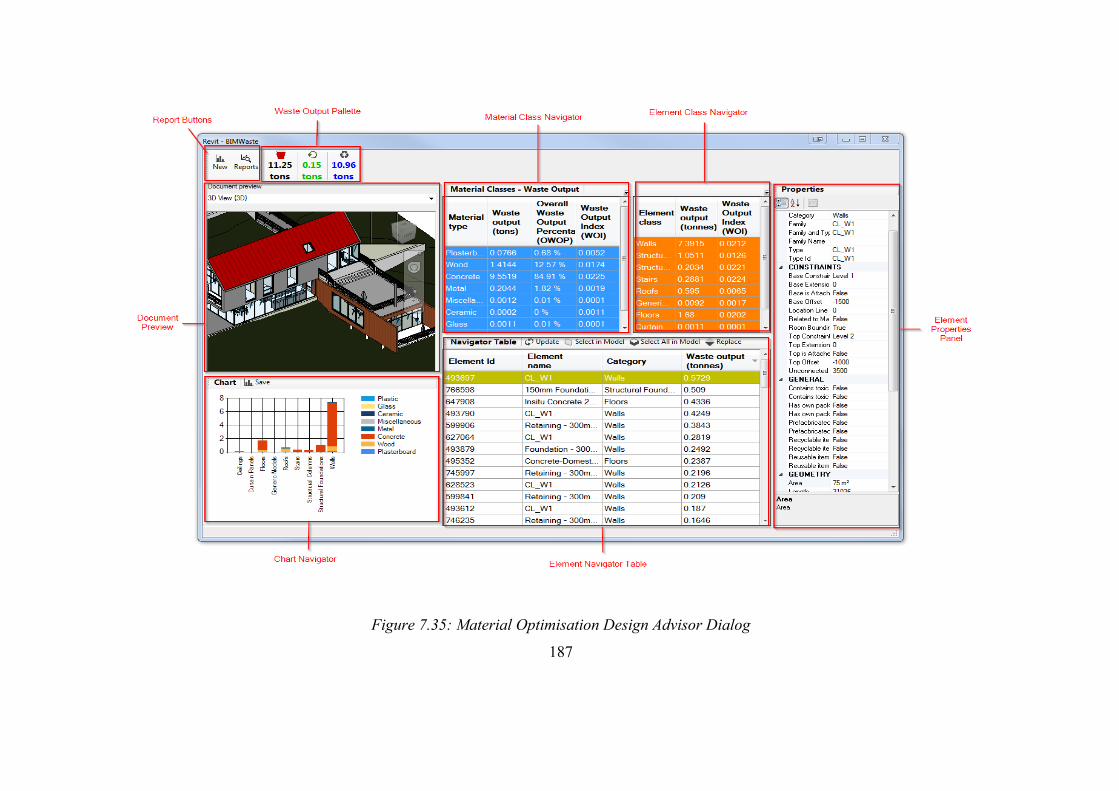
187
Figure 7.35: Material Optimisation Design Advisor Dialog
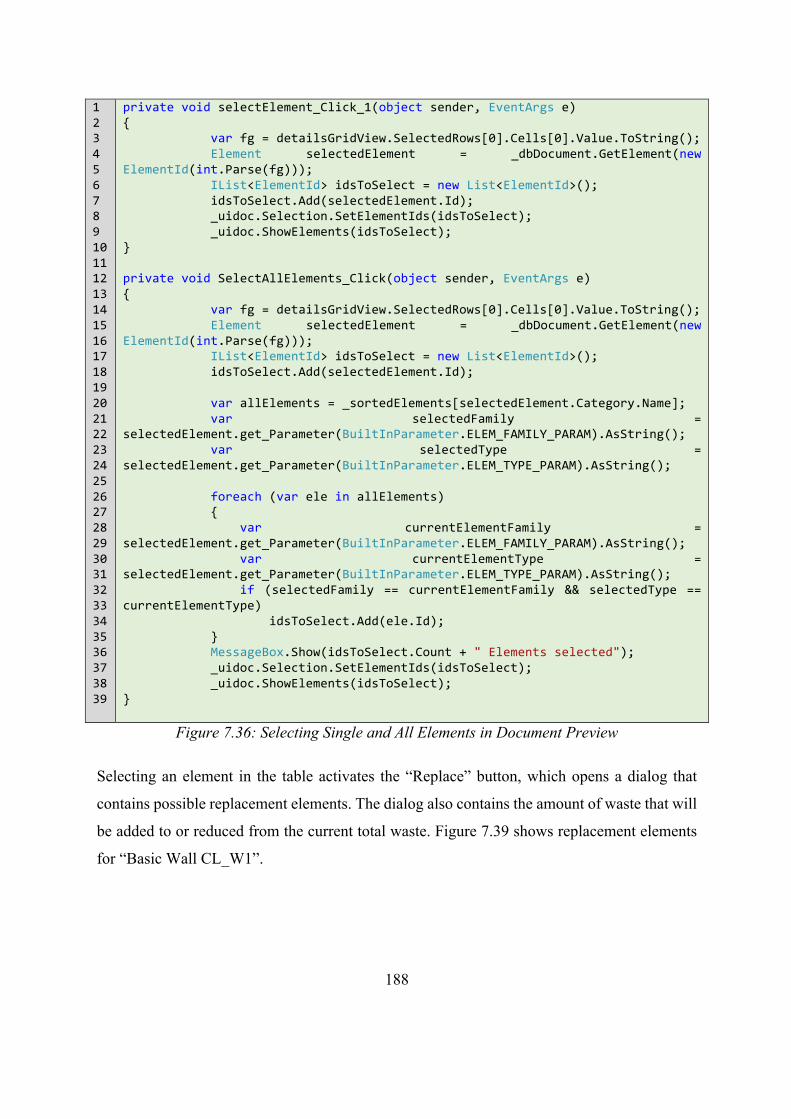
188
1 2 3 4 5 6 7 8 9 10 11 12 13 14 15 16 17 18 19 20 21 22 23 24 25 26 27 28 29 30 31 32 33 34 35 36 37 38 39
private void selectElement_Click_1(object sender, EventArgs e) { var fg = detailsGridView.SelectedRows[0].Cells[0].Value.ToString(); Element selectedElement = _dbDocument.GetElement(new ElementId(int.Parse(fg))); IList<ElementId> idsToSelect = new List<ElementId>(); idsToSelect.Add(selectedElement.Id); _uidoc.Selection.SetElementIds(idsToSelect); _uidoc.ShowElements(idsToSelect); } private void SelectAllElements_Click(object sender, EventArgs e) { var fg = detailsGridView.SelectedRows[0].Cells[0].Value.ToString(); Element selectedElement = _dbDocument.GetElement(new ElementId(int.Parse(fg))); IList<ElementId> idsToSelect = new List<ElementId>(); idsToSelect.Add(selectedElement.Id); var allElements = _sortedElements[selectedElement.Category.Name]; var selectedFamily = selectedElement.get_Parameter(BuiltInParameter.ELEM_FAMILY_PARAM).AsString(); var selectedType = selectedElement.get_Parameter(BuiltInParameter.ELEM_TYPE_PARAM).AsString(); foreach (var ele in allElements) { var currentElementFamily = selectedElement.get_Parameter(BuiltInParameter.ELEM_FAMILY_PARAM).AsString(); var currentElementType = selectedElement.get_Parameter(BuiltInParameter.ELEM_TYPE_PARAM).AsString(); if (selectedFamily == currentElementFamily && selectedType == currentElementType) idsToSelect.Add(ele.Id); } MessageBox.Show(idsToSelect.Count + " Elements selected"); _uidoc.Selection.SetElementIds(idsToSelect); _uidoc.ShowElements(idsToSelect); }
Figure 7.36: Selecting Single and All Elements in Document Preview
Selecting an element in the table activates the “Replace” button, which opens a dialog that
contains possible replacement elements. The dialog also contains the amount of waste that will
be added to or reduced from the current total waste. Figure 7.39 shows replacement elements
for “Basic Wall CL_W1”.
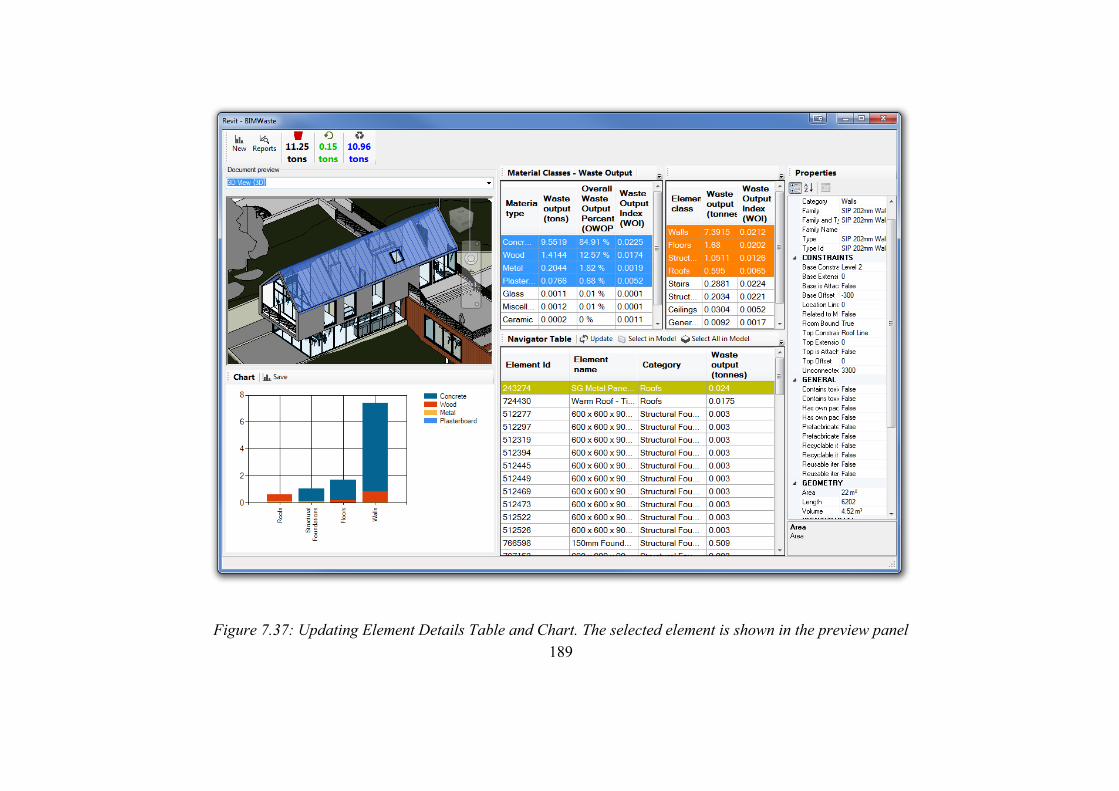
189
Figure 7.37: Updating Element Details Table and Chart. The selected element is shown in the preview panel
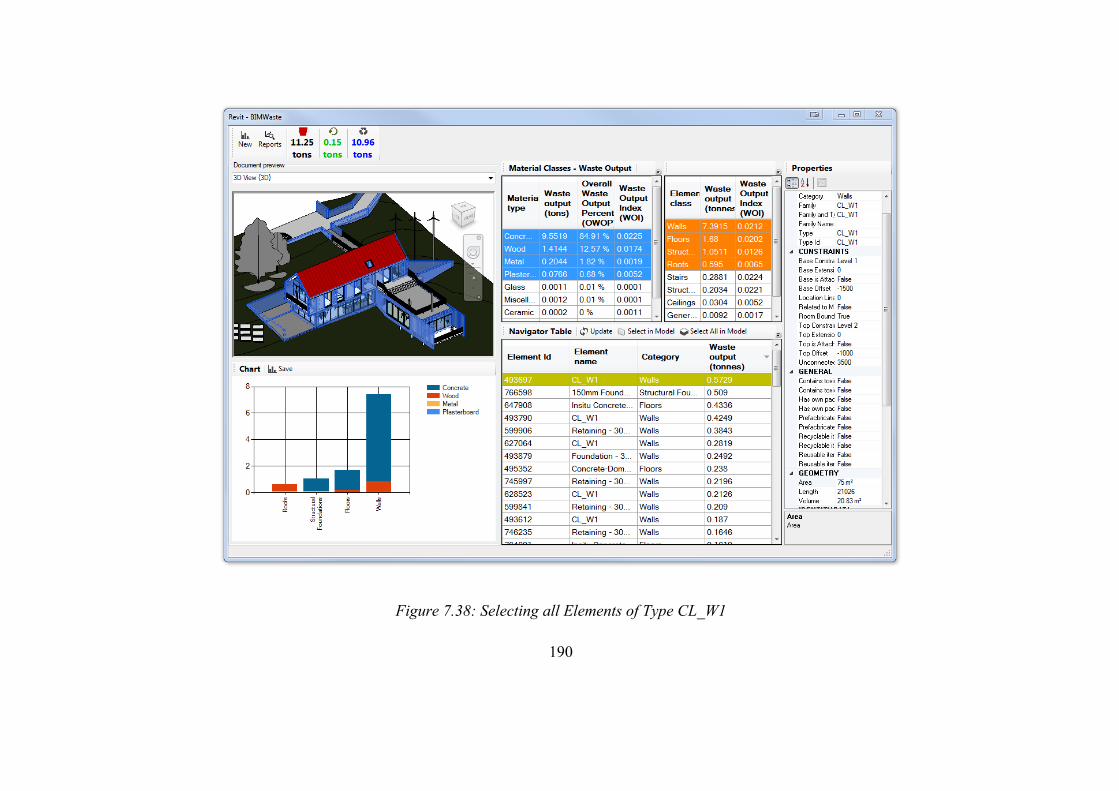
190
Figure 7.38: Selecting all Elements of Type CL_W1
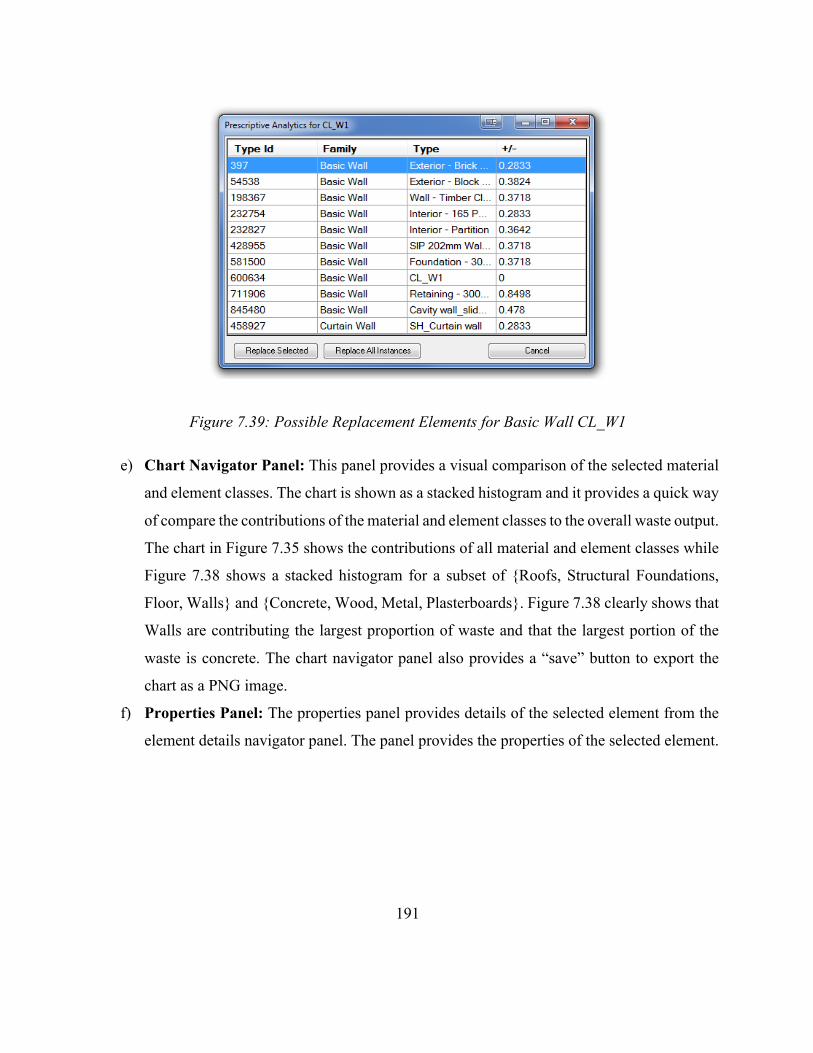
191
Figure 7.39: Possible Replacement Elements for Basic Wall CL_W1
e) Chart Navigator Panel: This panel provides a visual comparison of the selected material
and element classes. The chart is shown as a stacked histogram and it provides a quick way
of compare the contributions of the material and element classes to the overall waste output.
The chart in Figure 7.35 shows the contributions of all material and element classes while
Figure 7.38 shows a stacked histogram for a subset of {Roofs, Structural Foundations,
Floor, Walls} and {Concrete, Wood, Metal, Plasterboards}. Figure 7.38 clearly shows that
Walls are contributing the largest proportion of waste and that the largest portion of the
waste is concrete. The chart navigator panel also provides a “save” button to export the
chart as a PNG image.
f) Properties Panel: The properties panel provides details of the selected element from the
element details navigator panel. The panel provides the properties of the selected element.
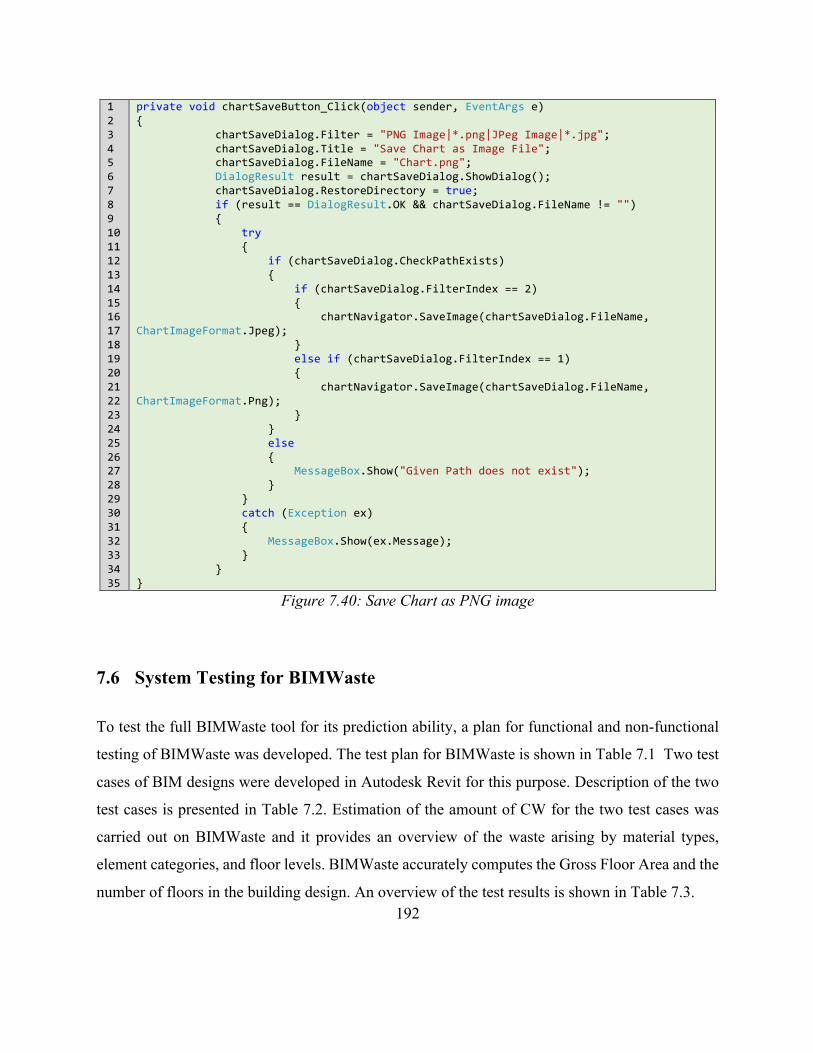
192
1 2 3 4 5 6 7 8 9 10 11 12 13 14 15 16 17 18 19 20 21 22 23 24 25 26 27 28 29 30 31 32 33 34 35
private void chartSaveButton_Click(object sender, EventArgs e) { chartSaveDialog.Filter = "PNG Image|*.png|JPeg Image|*.jpg"; chartSaveDialog.Title = "Save Chart as Image File"; chartSaveDialog.FileName = "Chart.png"; DialogResult result = chartSaveDialog.ShowDialog(); chartSaveDialog.RestoreDirectory = true; if (result == DialogResult.OK && chartSaveDialog.FileName != "") { try { if (chartSaveDialog.CheckPathExists) { if (chartSaveDialog.FilterIndex == 2) { chartNavigator.SaveImage(chartSaveDialog.FileName, ChartImageFormat.Jpeg); } else if (chartSaveDialog.FilterIndex == 1) { chartNavigator.SaveImage(chartSaveDialog.FileName, ChartImageFormat.Png); } } else { MessageBox.Show("Given Path does not exist"); } } catch (Exception ex) { MessageBox.Show(ex.Message); } } }
Figure 7.40: Save Chart as PNG image
7.6 System Testing for BIMWaste
To test the full BIMWaste tool for its prediction ability, a plan for functional and non-functional
testing of BIMWaste was developed. The test plan for BIMWaste is shown in Table 7.1 Two test
cases of BIM designs were developed in Autodesk Revit for this purpose. Description of the two
test cases is presented in Table 7.2. Estimation of the amount of CW for the two test cases was
carried out on BIMWaste and it provides an overview of the waste arising by material types,
element categories, and floor levels. BIMWaste accurately computes the Gross Floor Area and the
number of floors in the building design. An overview of the test results is shown in Table 7.3.
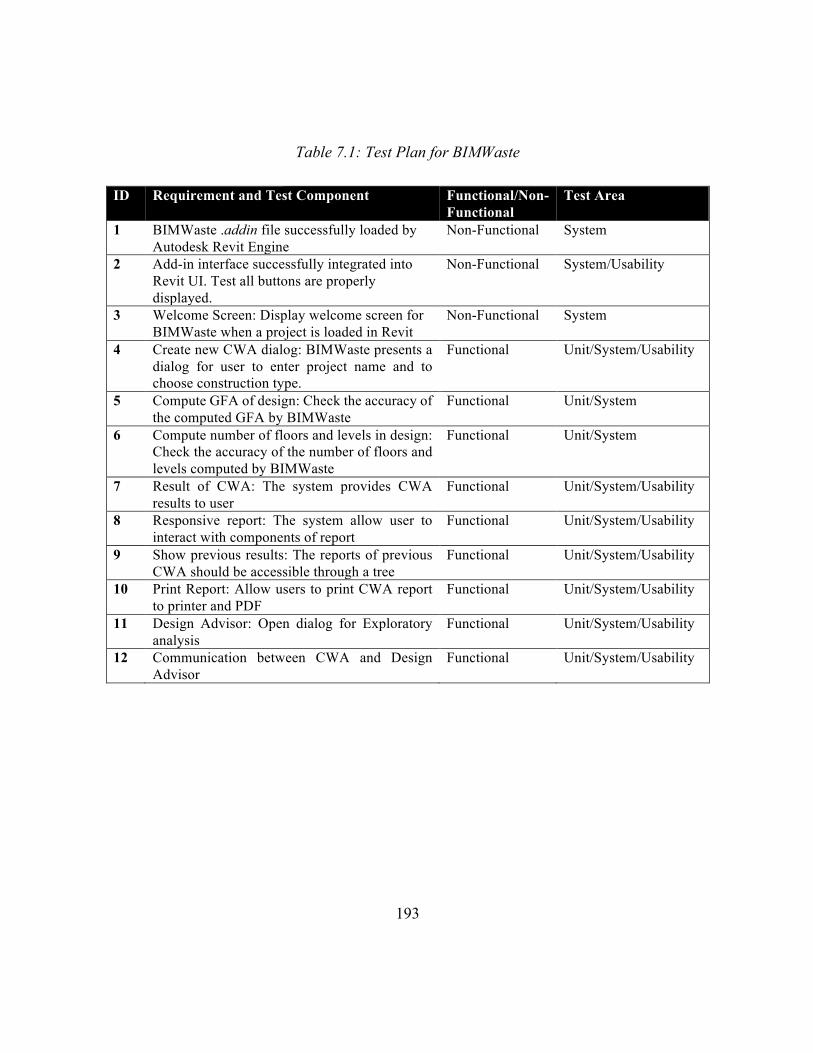
193
Table 7.1: Test Plan for BIMWaste
ID Requirement and Test Component Functional/Non-Functional
Test Area
1 BIMWaste .addin file successfully loaded by Autodesk Revit Engine
Non-Functional System
2 Add-in interface successfully integrated into Revit UI. Test all buttons are properly displayed.
Non-Functional System/Usability
3 Welcome Screen: Display welcome screen for BIMWaste when a project is loaded in Revit
Non-Functional System
4 Create new CWA dialog: BIMWaste presents a dialog for user to enter project name and to choose construction type.
Functional Unit/System/Usability
5 Compute GFA of design: Check the accuracy of the computed GFA by BIMWaste
Functional Unit/System
6 Compute number of floors and levels in design: Check the accuracy of the number of floors and levels computed by BIMWaste
Functional Unit/System
7 Result of CWA: The system provides CWA results to user
Functional Unit/System/Usability
8 Responsive report: The system allow user to interact with components of report
Functional Unit/System/Usability
9 Show previous results: The reports of previous CWA should be accessible through a tree
Functional Unit/System/Usability
10 Print Report: Allow users to print CWA report to printer and PDF
Functional Unit/System/Usability
11 Design Advisor: Open dialog for Exploratory analysis
Functional Unit/System/Usability
12 Communication between CWA and Design Advisor
Functional Unit/System/Usability
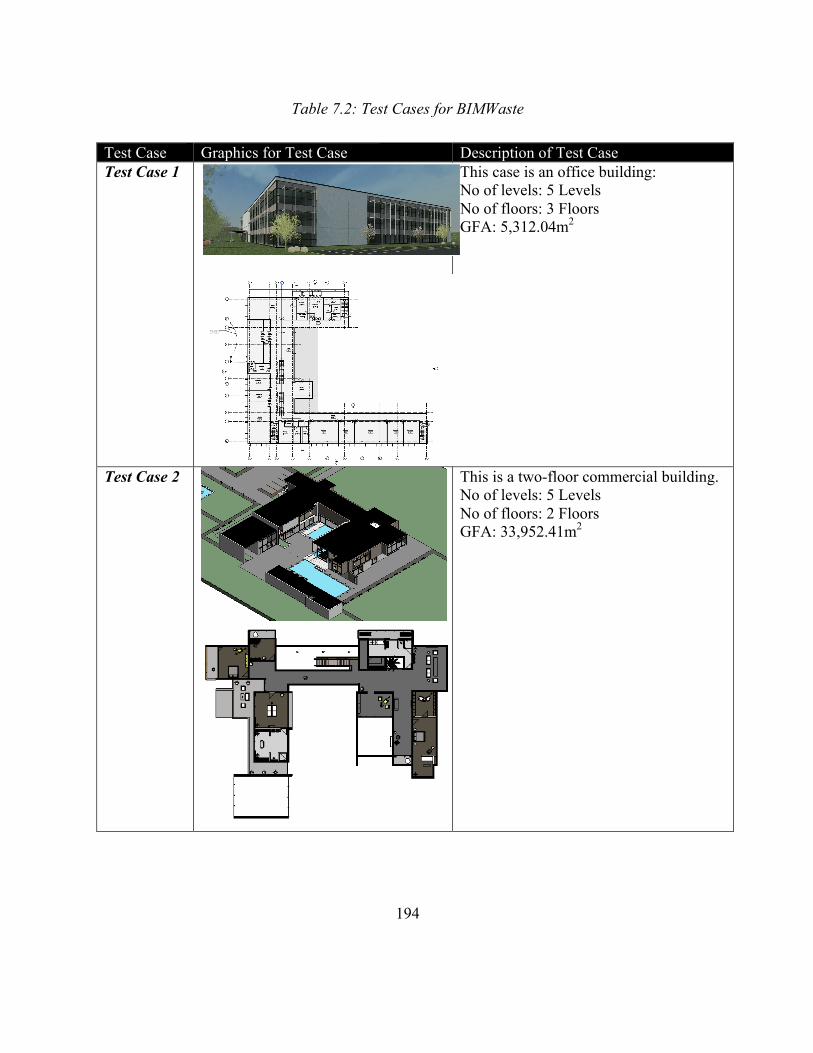
194
Table 7.2: Test Cases for BIMWaste
Test Case Graphics for Test Case Description of Test Case Test Case 1
This case is an office building: No of levels: 5 Levels No of floors: 3 Floors GFA: 5,312.04m2
Test Case 2
This is a two-floor commercial building. No of levels: 5 Levels No of floors: 2 Floors GFA: 33,952.41m2
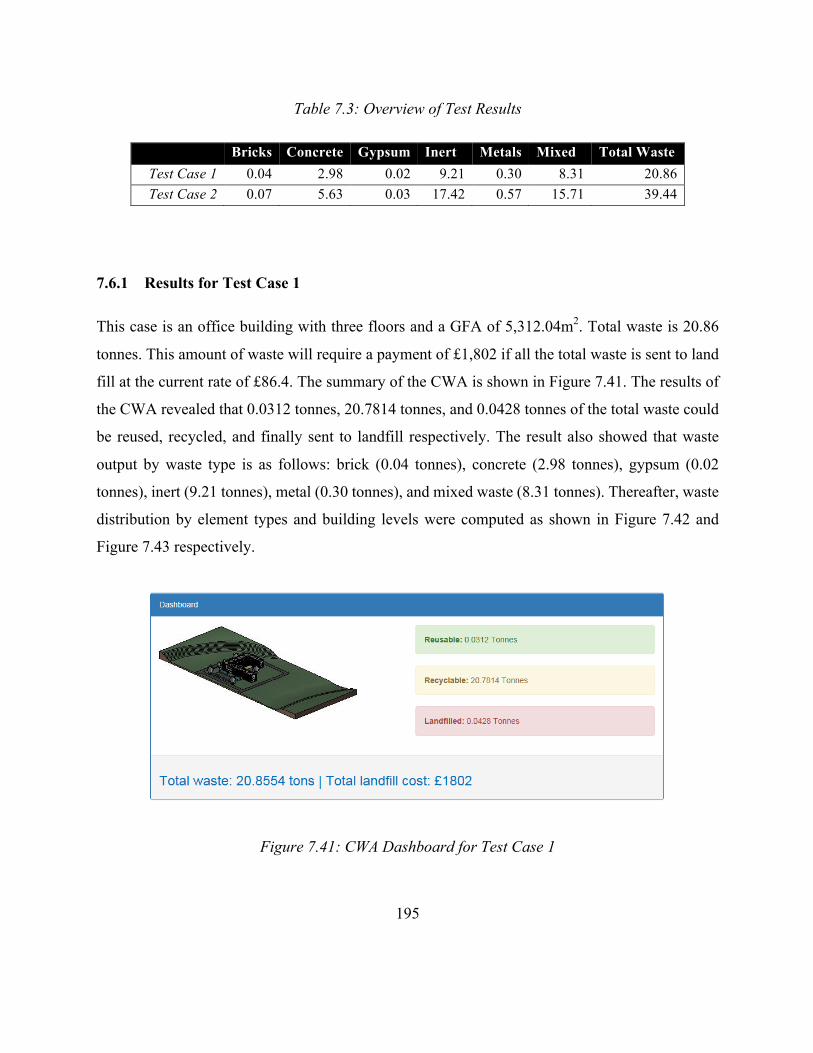
195
Table 7.3: Overview of Test Results
Bricks Concrete Gypsum Inert Metals Mixed Total Waste Test Case 1 0.04 2.98 0.02 9.21 0.30 8.31 20.86 Test Case 2 0.07 5.63 0.03 17.42 0.57 15.71 39.44
7.6.1 Results for Test Case 1
This case is an office building with three floors and a GFA of 5,312.04m2. Total waste is 20.86
tonnes. This amount of waste will require a payment of £1,802 if all the total waste is sent to land
fill at the current rate of £86.4. The summary of the CWA is shown in Figure 7.41. The results of
the CWA revealed that 0.0312 tonnes, 20.7814 tonnes, and 0.0428 tonnes of the total waste could
be reused, recycled, and finally sent to landfill respectively. The result also showed that waste
output by waste type is as follows: brick (0.04 tonnes), concrete (2.98 tonnes), gypsum (0.02
tonnes), inert (9.21 tonnes), metal (0.30 tonnes), and mixed waste (8.31 tonnes). Thereafter, waste
distribution by element types and building levels were computed as shown in Figure 7.42 and
Figure 7.43 respectively.
Figure 7.41: CWA Dashboard for Test Case 1
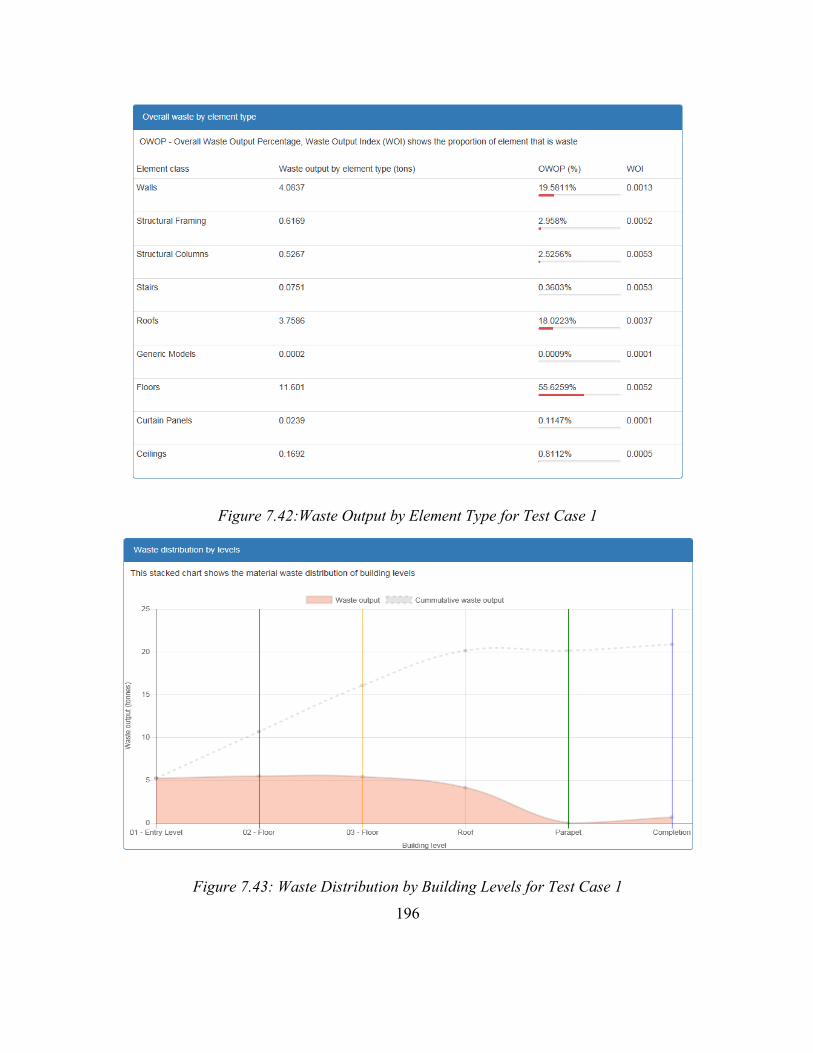
196
Figure 7.42:Waste Output by Element Type for Test Case 1
Figure 7.43: Waste Distribution by Building Levels for Test Case 1
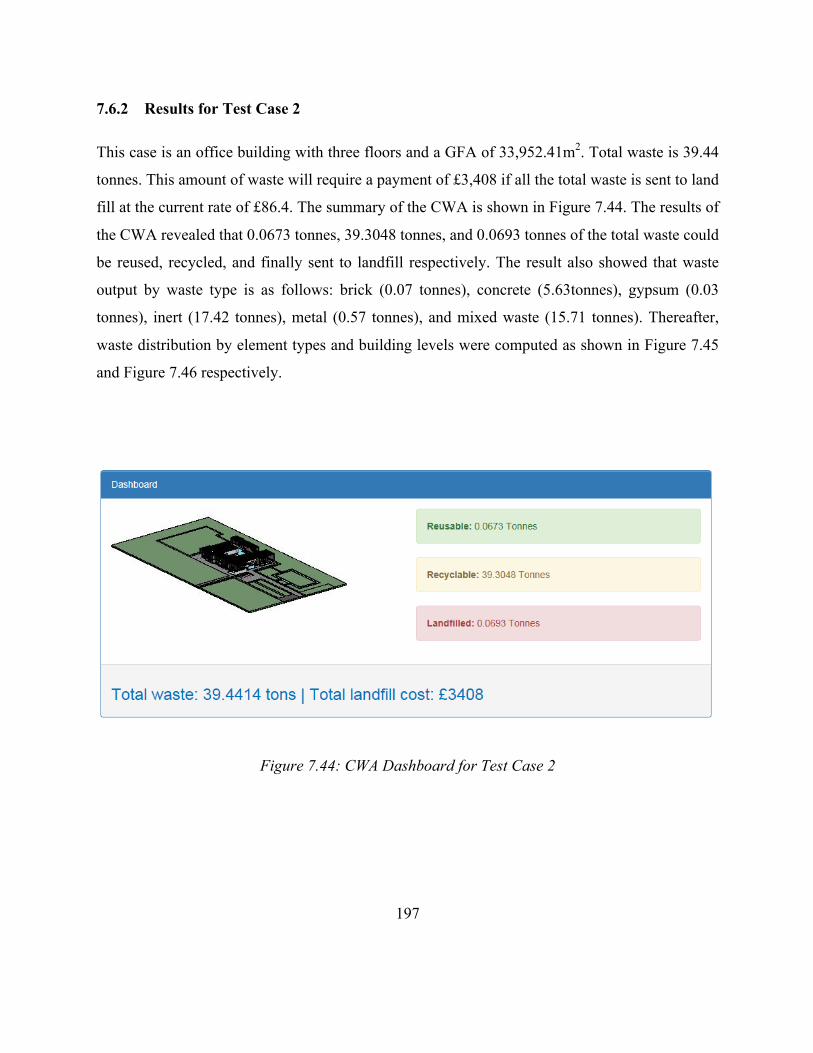
197
7.6.2 Results for Test Case 2
This case is an office building with three floors and a GFA of 33,952.41m2. Total waste is 39.44
tonnes. This amount of waste will require a payment of £3,408 if all the total waste is sent to land
fill at the current rate of £86.4. The summary of the CWA is shown in Figure 7.44. The results of
the CWA revealed that 0.0673 tonnes, 39.3048 tonnes, and 0.0693 tonnes of the total waste could
be reused, recycled, and finally sent to landfill respectively. The result also showed that waste
output by waste type is as follows: brick (0.07 tonnes), concrete (5.63tonnes), gypsum (0.03
tonnes), inert (17.42 tonnes), metal (0.57 tonnes), and mixed waste (15.71 tonnes). Thereafter,
waste distribution by element types and building levels were computed as shown in Figure 7.45
and Figure 7.46 respectively.
Figure 7.44: CWA Dashboard for Test Case 2
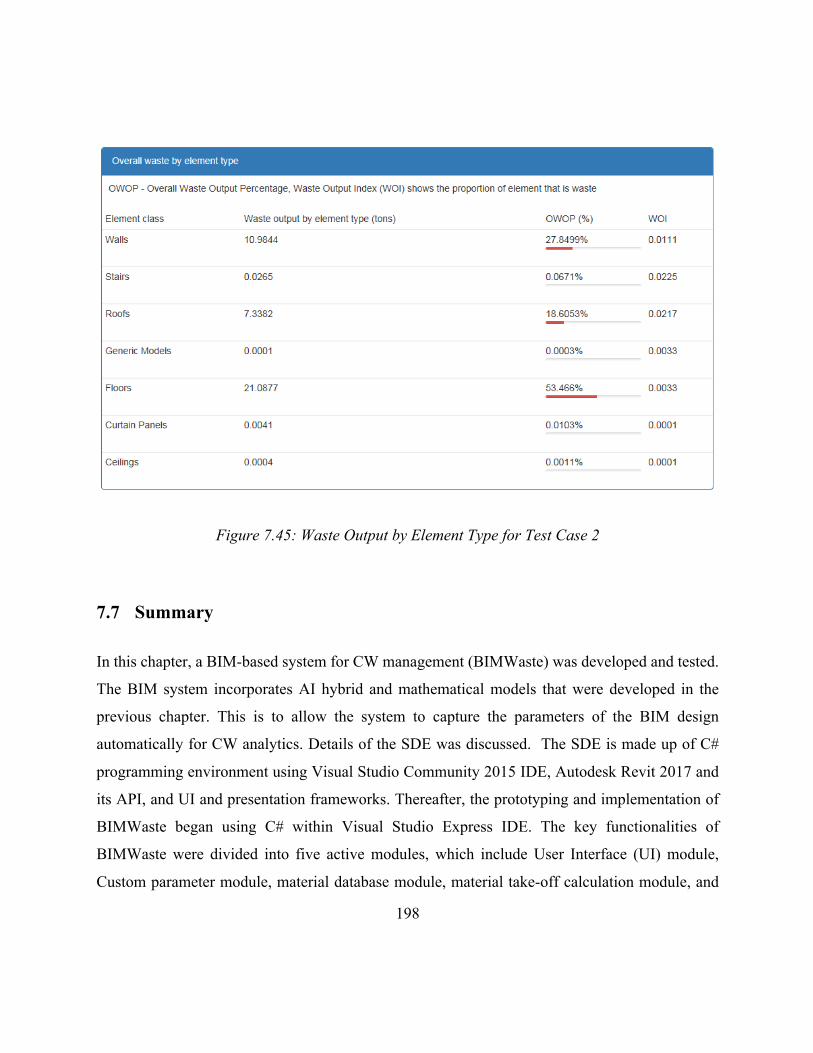
198
Figure 7.45: Waste Output by Element Type for Test Case 2
7.7 Summary
In this chapter, a BIM-based system for CW management (BIMWaste) was developed and tested.
The BIM system incorporates AI hybrid and mathematical models that were developed in the
previous chapter. This is to allow the system to capture the parameters of the BIM design
automatically for CW analytics. Details of the SDE was discussed. The SDE is made up of C#
programming environment using Visual Studio Community 2015 IDE, Autodesk Revit 2017 and
its API, and UI and presentation frameworks. Thereafter, the prototyping and implementation of
BIMWaste began using C# within Visual Studio Express IDE. The key functionalities of
BIMWaste were divided into five active modules, which include User Interface (UI) module,
Custom parameter module, material database module, material take-off calculation module, and
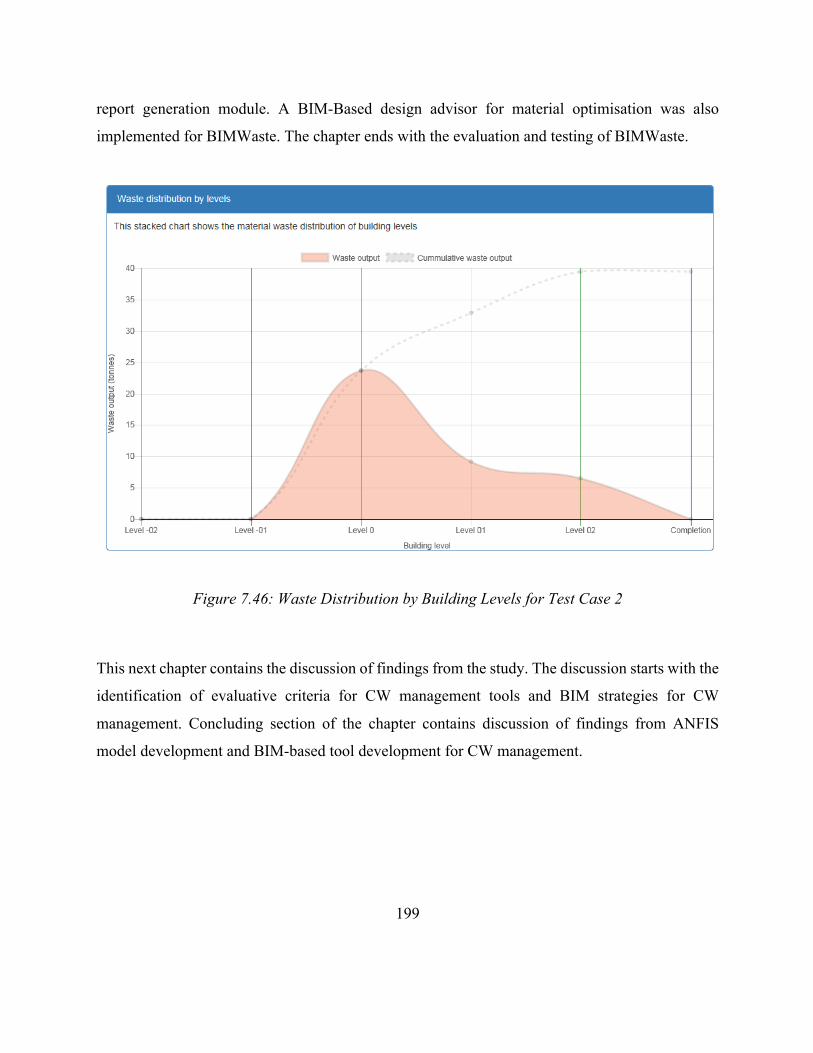
199
report generation module. A BIM-Based design advisor for material optimisation was also
implemented for BIMWaste. The chapter ends with the evaluation and testing of BIMWaste.
Figure 7.46: Waste Distribution by Building Levels for Test Case 2
This next chapter contains the discussion of findings from the study. The discussion starts with the
identification of evaluative criteria for CW management tools and BIM strategies for CW
management. Concluding section of the chapter contains discussion of findings from ANFIS
model development and BIM-based tool development for CW management.
200
8 DISCUSSION OF RESULTS
8.1 Overview
This chapter contains the discussion of findings from the previous chapters. The discussion starts
with the identification of evaluative criteria for CW management tools. Findings revealed a list of
40 criteria that could be used to evaluate the performance of existing CW management tools and
this was grouped under six categories. The chapter proceeds with the discussion of BIM strategies
for CW management and holistic BIM framework for CW management. Concluding section
contains discussion of findings from ANFIS model development and BIM-based tool development
for CW management.
8.2 Evaluative Criteria for Construction Waste Tools
The results of the thematic analysis revealed a list of 40 criteria that could be used to evaluate the
performance of existing waste management tools, grouped into six categories: (a) waste prediction;
(b) waste data; (c) commercial and procurement; (d) BIM; (e) design; and (f) technological. The
six evaluation criteria categories are discussed as follows.
8.2.1 Waste Prediction Criteria
As previously noted, accurate waste quantification and prediction is a prerequisite for the
implementation of effective waste minimization strategies (Bossink and Brouwers, 1996; Solís-
Guzmán et al., 2009). As such, waste prediction tools must be fully engaged during the design
process to identify potential opportunities to reduce waste. However, no such tool exists, as noted
by an architect during the FGIs:
201
While it is possible to reduce waste during design, there is no tool that can
measure waste that is preventable during the design process. (excerpt from FGI-
1)
Although existing tools such as NWT (WRAP, 2011b) and DoWT-B (WRAP, 2011a) require
design parameters for waste forecast, they cannot be used until the design plan – or bill of quantity
– has been prepared, thus revealing a huge gap in knowledge that an operational waste management
tool must provide waste prediction functionality during the model design process. This is carried
out with the knowledge that all building materials and strategies have waste potential, which can
be aggregated and analysed during design. A waste manager suggested:
The process could be like analysing design and then predicting the amount of
waste it would generate. The calculation would be based on the fact that every
material has defined waste potential. Once we know the volume of waste, then
to reduce waste we could apply different strategies to design out waste, followed
by ways to manage the unavoidable waste. (excerpt from FGI-2)
This shows that an appraisal of the effectiveness of designing out waste strategies is important. As
such, the participants of the FGIs agreed that a waste reduction ratio could be used as a measure
of effectiveness of CW management tools, i.e.
Waste Reduction Ratio = Reduced Waste / Original Waste
The scale runs from 0 to 1, such that a value of 0 depicts that noting has been reduced, while a
value of 1 shows that all waste has been reduced.
Another drawback to the use of waste prediction tools is the non-universality of quantification
models. Most of the models depend on location/project-specific data influenced by project type,
202
project location, project size, and construction methods (Mokhtar et al., 2011). To address this
challenge, Llatas (Llatas, 2011) proposed a model, which estimates waste ratio using factors that
depend on the construction technology, country, and project type; and a change in technology,
country or project type only requires a modification of the corresponding factors. As a result, the
model becomes universally applicable for waste quantification, thereby providing an avenue for
the evaluation of alternative construction technologies across several project types in different
locations.
8.2.2 Waste Data Criteria
A key challenge to the study of construction waste management is waste data deficiency (Mokhtar
et al., 2011). To ensure the development of a robust waste prediction and minimization tool, waste
data collection and auditing as well as data analysis functionalities must be incorporated. This
would ensure transparency and uniformity in data collection. The waste data must be stored in a
centrally accessible database for ease of access. Ultimately, the results of the analysis of the data
would provide a benchmark for the waste generation analysis of future projects. A major challenge
regarding waste data collection is that most of the waste from a project is not segregated, as stated
in FGI-2:
Most waste data recorded are for mixed/general waste, they are hardly
segregated due to financial implications, time, and space constraints. The waste
is taken off by third-party agents to waste recycling facilities. They may
segregate the waste and may reuse or recycle it for their own purposes. (excerpt
from FGI-2)
So, to ensure the accuracy of waste data, construction companies, and third party waste segregation
companies must be appropriately engaged during the waste collection process. While discussing
the impact of SWMP for transparent waste data collection, it was claimed that companies comply
to retain their reputation and to fulfil legislative requirements.
203
To sum up, waste data collection and auditing activities are primarily aimed at improving waste
quantification. For this reason, the quality of the waste data collected must be ensured to guarantee
the accuracy of waste quantification (Cochran et al., 2007a). In addition, such waste data must
capture the expert knowledge required for waste quantification and designing out waste.
8.2.3 BIM Criteria
A common thread runs throughout the transcripts of the FGIs, which is the implicit and explicit
references to BIM. Analysis of the transcripts showed that participants believe that BIM offers
huge opportunities for construction waste management. Evidence from the interviews clearly
showed that the integration of waste management and BIM is the way forward for an effective and
economical waste quantification, waste prevention, collaboration amongst stakeholders and
supply-chain integration. It was agreed among the designers in FGI-1 that:
“Gluing together the commercial, design, and procurement processes into a
BIM software system to performing optimisation with little effort may provide
more opportunities to see that it is economical to reduce waste in all the cases.
This software would be a collaborative tool that would be used by all the
stakeholders.” (excerpt from FGI-1)
Ultimately, integrating waste management with BIM would favour the automatic capture of design
parameter for analysis. This would help to mitigate errors committed as a result of entering
parameters manually as done in existing waste tools, in waste prediction. Integrating waste
management with BIM thereby increases the usability of such tools to make appropriate decisions
in favour of waste minimisation within BIM software. In addition, such system would offer
leverage on existing BIM modelling platforms and materials database to understand and visualise
the effects of design decisions. Pointedly, BIM would provide a powerful collaboration platform
for all stakeholders towards an effective construction waste management, seamless information
sharing, and software interoperability as noted by a design engineer:
204
To ensure effective collaboration, the design must be available in pictorial forms
[3D] so that other members [non-designers/contractors] would easily
understand it and use it for decision-making. (excerpt from FGI-2)
Although the DoWT-B (WRAP, 2011a) seems to be the most practical of all the existing tools in
the sense that it can forecast the impact of design changes on waste output, it does not engage all
stakeholders and is external to BIM software, thereby limiting its usefulness. The only BIM-
enabled waste management tool is the DRWE tool (Cheng and Ma, 2013), which leverages BIM
technology through the Autodesk Revit API. However, the system only estimates waste generation
from the demolition and renovation of existing buildings, clearly highlighting the need for the
development of a BIM-enabled tool for simulating the different aspects of waste reduction.
Integrating waste management into BIM would also provide a powerful synergy, which would
favour the simulation of other performance concerns of buildings.
8.2.4 Commercial and Procurement Criteria
It was agreed that a synergy is required between design, commercial, and procurement for a
successful waste management campaign and implementation. The reason for this is that some
people/companies make money from waste; so blocking it in all directions may affect the business.
As such, there is the need to understand the relationship between design and procurement as well as
commercial and sustainability. In fact, it was affirmed that BIM provides the best opportunity to
achieve this through improved coordination and communication among teams. One of the project
managers suggested that:
“Currently, design is divorced from commercial and procurement. Synergy has to be ensured
between finance department and procurement if any waste management strategy would be
successful. And BIM is probably the most appropriate way to do this” (FGI-3)
205
This clearly shows that an efficient waste management strategy requires a tight supply-chain
engagement (Dainty and Brooke, 2004). This synergy would help to understand the financial
implications of waste management and how waste output is influenced by procurement. Despite the
ability of some of the existing waste management tools to provide cost-benefit analysis
functionalities, none of them is fully engaged during the procurement process. During the FGIs, it
was noted that the procurement process contributes significantly to waste output but some
procurement options favour waste reduction. A project manager argued that:
“One of the economic strategy is to procure materials in bulk for the whole project, stock it at
one of the project site, and then move it around on-demand. This is called double-handling
where more construction waste is generated due to material movement and manhandling,
however, it is a cheap option. Contrary to this is just-in-time approach, where only the
required materials are procured to generate lesser waste but it is a costly solution.” (FGI-3)
This clearly shows that it is believed that waste reduction has a cost overhead. Likewise, it was
argued that the generation of waste could be cheaper than avoiding waste especially when choosing
between standard-sized materials and custom-sized materials. Custom-sized materials produce less
waste but are costlier whereas standard-sized materials are cheap but generate construction waste
through off-cuts. As a result, companies tend to give preference to lower cost over waste reduction
in the procurement process. The mind-set that waste reduction is costlier seems plausible at the
procurement stage, however, it is defeated in the end by considering the environmental impacts of
waste and the cost of waste disposal. Although some studies have explored the impacts of
procurement processes on waste reduction (Gamage, Osmani and Glass, 2009; Poon, Yu and Jaillon,
2004), no study has been carried out to measure the financial impact of procurement in relation to
waste reduction.
206
8.2.5 Design Criteria
While discussing the role of design in waste management and the availability of waste design tools,
it was acknowledged that industry practitioners recognise the beneficial roles of design tools in waste
reduction, however, it was confirmed that such tool does not exist. An architect claimed that:
“Although we are aware of waste reduction through design, but no software is available to
simulate these waste reduction processes. Still, designing out waste is done manually and it
requires design expertise knowledge and experience.” (FGI-1)
This assertion was confirmed in the literature as none of the tools reviewed provide a real-time
design-centric approach to waste minimisation. This clearly suggests that architects and design
engineers take it upon themselves to identify possible sources of design waste through design
optimisation. Three sources of design waste were identified as design changes, lack of dimensional
coordination, and non-standardisation of materials. A design engineer argued that:
“Another way-out could be to optimise the design by keeping in mind the standardisation of
materials to avoid off-cuts (often called design optimisation). It therefore means that most of the
design waste is due to changes in the design, lack of dimensional coordination, and
standardisation of materials.” (FGI-4)
This affirms the general consensus in the literature that the largest percentage of construction waste
could be avoided at planning and design (pre-construction) stages (Bossink and Brouwers, 1996;
Faniran and Caban, 1998; Ekanayake and Ofori, 2000; Treloar et al., 2003; Osmani, Glass and Price,
2008; Poon, 2007; Yuan and Shen, 2011; Oyedele et al., 2013). This evidence shows that architects
have huge responsibility to ensure that waste is given high priority, compared to project time and cost during
design (Greenwood, 2003; Poon, Yu and Jaillon, 2004).
This therefore suggests the need for a design tool to identify possible sources of design waste and to
assist in design optimisation. The focus of such design tools would be to capture and codify the
207
knowledge about designing out waste and better understand the impacts of design strategies on waste
output. Therefore, an important step in achieving this would be to create a list of basic parameters
for designing out waste. In order to properly implement this, WRAP (WRAP, 2009) identified 5
principles that must be considered. These principles are: (a) design for material optimisation, (b)
design for waste efficient procurement, (c) design for reuse and recovery, (d) design for off-site
construction, and (e) design for deconstruction and flexibility. Integrating these principles into
design tools would foster real-time construction and end-of-life waste analysis and ensuring
buildability of designs.
8.2.6 Technological Criteria
Based on the interview, it was pointed out that it is possible to integrate all the waste generation
factors into design tools because every building project is unique. Even so, this might be a very
complex task as observed by a lean practitioner and BIM specialist:
“Waste management minimisation is a very complex issue; however, if what causes waste is
known, then, they could be factored into waste management tools.” (FGI-3)
For this reason, it is important for such tools to embrace intelligent technologies such as Decision
Support Systems (DSS), big data analytics, machine learning, and pattern recognition. These
technologies would empower waste minimisation tools with the ability to assist designers to
understand and visualise the impact of design changes in real-time. Thus, supporting decisions by
providing recommendations for the choice of strategies and subsequently revealing avenue for
significant waste reduction.
In addition, a robust waste management tool must be integrated with location-based technology such
as GPS and GIS to provide location-specific services such as material tracking, supply chain
management, and locating nearest waste management facilities. To ensure this, application schema
such as Geographic Mark-Up Language (GML), cityGML, and IFC for GIS (IFG) must be supported
208
to scale the hurdle of interoperability between AEC and GIS standards. Certainly, a full integration
of GIS and BIM (Xu et al., 2014) into appropriate lifecycle stages of a project would assist in
effective waste management (Wang and Chong, 2014).
8.3 BIM Strategies for Design-based Construction Waste Management
Evidence shows that decisions made at the design stage have multiple ripple implications
throughout the lifecycle of the building (Faniran and Caban, 1998; Osmani, Glass and Price, 2008;
Ekanayake and Ofori, 2004). According to Lopez and Love (2012), this means that design
decisions could influence key project performance indicators such as project cost, time, quality,
construction waste, and others. In view of this, MacLeamy (2004) highlights that it is cheaper to
make changes to projects at the design stage than in subsequent stages. This means that CW could
be reduced by ensuring adequate preventive measures at the design stage (Faniran and Caban,
1998; Osmani, Glass and Price, 2008). This is because design based philosophy offers flexible and
cost-effective approach to CW management before its occurence. Accordingly, architects and
design engineers have responsibilities to ensure that waste is given high priority in addition to
project time and cost during design. Despite the willingness of architects and design engineers to
carry out these duties, this study shows that existing CW management tools cannot support them
effectively. Besides, none of the existing CW management tools is BIM compatible despite the
benefits of BIM at improving building process performances. Keeping in mind the BIM strategies
for CW management that were identified in Chapter 6, this section discusses how BIM approach
to waste efficient design coordination has been adopted to meet the expectations and to overcome
limitations of existing CW management tools.
8.3.1 BIM-based Collaboration for Waste Management
The traditional product delivery approaches employed within the AEC industry constitute a
number of inherent problems, which include design errors, clashes, cost and time uncertainty,
209
material wastage, increased risks, among others. (Lichtig, 2010). This is mainly as a result of lack
of communication and collaboration among the stakeholders within the highly fragmented AEC
industry (Ghassemi and Becerik-gerber, 2011). Each stakeholder seems to make decisions in
isolation to maximise personal gains. This is so because the knowledge of building construction is
developed across numerous fields and the needs of all stakeholders (building owners, architects,
MEP engineers, structural engineers, cost managers, contractors, sub-contractors, facility
managers, users, and others.) must be met. This suggests that as several stakeholders begins to
generate digital data of various forms; adequate mechanism must be put in place to share the data.
To therefore mitigate against this unfortunate practice and outcomes, BIM provides a well-
structured collaborative process to harness the expertise of all project stakeholders throughout the
building lifecycle especially at the early design stages (AIA, 2014). The adoption of BIM ensures
early informed decision, waste reduction (in terms of cost, time, material, human resources, among
others), improved project quality and greater cost certainty (Azhar, Hein and Sketo, 2007) among
other benefits.
The use of BIM for improved collaborative CW management has the highest value among the
groups with a total variance of 32.246% and it is made up of seven variables. This being the highest
ranked factor is not a surprise because adequate collaboration and effective communicate is critical
to the success of projects (Oyedele, 2013). In this regard, BIM plays a major role in ensuring that
all stakeholders are actively involved right from the conception of the building project through its
entire lifecycle (Eadie et al., 2013a). The major benefit of adopting BIM for waste management is
that it enables the creation of a federated model that could be assessed and updated by all the
project team. This idea helps to improve the allocation and monitoring of responsibilities and
encourages shared risk and reward’ philosophy. The “shared risk and reward” engenders process
efficiency, harmony among stakeholders, reduced litigation and prevents the culture of blame-
game as well as the transfer of responsibilities (Eadie et al., 2013). The use of BIM also engenders
design coordination, task harmonisation, clash detection, and process monitoring of CW
management activities.
210
Despite the evidence from previous studies that BIM has the potential for waste minimisation, no
clear instructions have been provided on achieving this. The discussions from the FGIs
corroborated this because the participants were aware of the potentials of BIM; however, none of
them had adopted BIM for CW management. While deliberating on the opportunities obtainable
from the adoption of BIM for CW management, it was argued that incorporating waste
management functionalities into BIM would encourage effective participation of all project teams
in making waste management related decisions. In addition, the participants of the FGIs posit that
BIM based design tools must be developed to ensure that participating teams can collaborate
effectively on waste management issues. These tools could be in the form of plugins to existing
BIM software to extend their functionalities. To leverage the collaborative feature of BIM, a
holistic BIM framework for CW management was developed as described in the following section.
8.3.2 Waste-Driven Design Process and Solutions
This group accounts for 24.385% of the total variance and contains seven variables. After an
extensive consideration of the sub-factors brought together under this group, the name “enhanced
performance for waste analysis” was chosen because all the sub-factors contribute towards
automatic analysis of waste performance of building models. Performance analyses of buildings
provide a platform for functional evaluation of buildings before the commencement of
construction (Eastman et al., 2011). This functionality has aided the wide acceptability of BIM in
the AEC industry to improve the performance of the form and functions of buildings right from
the design stage (Manning and Messner, 2008). Alternative design options are therefore compared
to select the most cost-effective and sustainable solution. At the same time, performance evaluation
of design models helps to identify possible design and operational errors issues at a stage where
design changes are cheaper; thus, reducing waste.
In keeping with the foregoing facts, the FGI participants agreed that the increasing popularity of
BIM in the AEC industry has strengthened the development of various tools for design analyses,
such as cost performance, energy consumption, lighting analyses, and acoustic analyses. The
211
majority of these tools are provided as plugins on existing BIM software to carry out specific
design analysis. Despite the benefits of building performance analyses and the
environmental/economic impacts of construction waste, none of the existing BIM software has
capabilities for waste performance analysis. This gap calls for a rethink of BIM functionalities
towards capacity for waste simulation right from early design stages.
In agreement with earlier studies (Eastman et al., 2011), the participants of the FGIs agreed that
another benefit of integrating CW management into BIM is automatic capture of design parameters
for performance analysis. Accordingly, it was highlighted that employing BIM during design
would eliminate human error during data entry. For example, CW management tools such as NWT,
DoWT-B and waste estimation models require practitioners to manually transfer design parameters
from the bill of quantity. This approach therefore makes these tools susceptible to errors in waste
estimation and it requires more effort and time.
While IFC is generally regarded as the industry standard for interoperability (Eastman et al., 2011),
its current implementation is not equipped with adequate mechanism to streamline challenges of
the AEC industry such as construction waste analytics (Tibaut, Rebolj and Perc, 2014). This is
because the current IFC implementation does not incorporate enough information to facilitate
waste information analysis. This study therefore took a closer look at how IFC could be extended
to support data exchange between CW management tools and BIM software. Accordingly, the
requirement and schema for information exchange among CW management processes needs are
identified and captured within existing BIM standards. Achieving this enables CW management
tools to exploit BIM standards to read and interpret building models and their parameters for waste
analytics. Achieving this allows CW analytical process to be integrated into design process and
solutions.
212
8.3.3 Lifecycle Waste Analytics
This group produces a total variance of 10.971% and contains two variables. While discussing the
role of BIM in life-cycle performance of buildings, the participants of the FGI agreed that the use
of BIM encompasses all project work stages from the planning stage to the end-of-life of buildings.
Thus, information on building requirements, planning, design, construction, and operations can be
amassed and used majorly for making management related decisions on facilities. Accordingly,
BIM allows all teams to embed relevant project information into a federated model. For instance,
project information such as project schedule, cost, and facility management information. could be
incorporated into BIM using COBie format. Preserving information throughout the lifecycle of
buildings is important for effective facility management and end-of-life decisions for buildings.
The information thus enables a powerful modelling, visualisation and simulation viewpoint that
helps to identify design, construction, operation, and end-of-life related problems before they
occur. This distinguishing feature makes BIM applicable to all work stages by accumulating
building lifecycle information (Eadie et al., 2013). Although many stakeholders in the AEC
industry understand the benefits of adding more information into models, which could extend
parametric BIM into 4D, 5D, 6D, and nD, no BIM dimension exist for CW management.
It should be borne in mind that the major limitation of existing CW prediction models is
insufficient waste data (Mills, Showalter and Jarman, 1999) and that most CW collected from
building sites are not segregated (Langdon, 2011). This means that adequate information about
waste collected from construction site may not be provided or the waste data may not be properly
labelled. Even so, majority of existing CW prediction tools are based on waste indices despite the
multi-dimensional nature of waste generation factors. This raises serious concerns because the
tools were developed without adequate consideration for detailed material information and
building methodology. This is because building properties influencing CW generation are quite
diverse and treating them the same way could be misleading. The expectation of a robust waste
estimation tool therefore taps into the perceived degree of accuracy from relationship among
specific variables determining CW generation.
213
To therefore ensure accurate waste record data collection and the integration of waste data into a
BIM federated model, this study provides an intuitive interface for capturing CW collection
activities. The waste collection interface ensures that CW data records are embedded into BIM
models and that they could be retrieved as required. This approach encourages data transparency,
controlled data access, data portability within a single federated model. In this way, BIM helps to
address interdisciplinary inefficiency inherent in current CW management practices. This
approach will certainly improve team effectiveness towards effective management of CW and
reduce duplication of effort. Since CW is generated at all project work stages, adopting BIM for
CW management allows effective capturing of waste related data from design to the end-of -life
of buildings.
A BIM feature that aids its wide acceptability is the ability to analyse and simulate buildings’
performance (Manning and Messner, 2008) such as cost estimation, energy consumption, and
lighting analysis. Building performance analyses provide a platform for functional evaluation of
building models before the commencement of construction and it allow comparison of alternative
design options(Eastman et al., 2011). At the same time, performance evaluation of design models
helps to identify possible design and operational errors. Despite the availability of BIM based tools
for the analyses of various building performances such as airflow, energy, and seismic analyses,
no tool exist for CDW analysis. The tool developed as part of this study is the first software to
provide CW analytics functionality with a BIM platform. The tool provides an intuitive interface
to simulate CW generation of BIM design according to specific metrics, which include building
materials, building elements, building levels,
8.3.4 Innovative Technologies for Waste Intelligence and Analytics
The group “enhanced technological capabilities for waste management” accounts for 9.989% of
the total variance and it contains four variables. The implementation of BIM relies on the
appropriate use of technologies and their effective integration into the design process. Synthesising
emerging technologies such as Internet of Things (IoT), Global Positioning System (GPS), Big
214
Data analytics and RFID help to provide real-time building performance monitoring and analyses
(Bilal et al., 2016a). An integration of these technologies into BIM could facilitate location based
services, tagging and identification of building materials, and remote collection of building data.
In terms of CW management, Radio-Frequency Identification (RFID) could be used to tag
construction materials with waste information and GPS could be employed to track CW
movement. For example, RFID tags could be embedded into building components to collect waste
related data arising from projects. This will help to scale the hurdle of waste data deficiency by
providing technology-enabled methods of waste data tracking and collection. Achieving this will
enable the full automation of waste data collection and analyses of waste performance of buildings.
In addition, technological support such as 3D printing could empower BIM for computer-
controlled prefabrication of building components. This approach would improve design flexibility
as components could be designed and printed to specification without material waste. Accordingly,
synthesising these emerging technologies into BIM computational platform will eventually favour
prefabs and modular construction, which will in turn yield significant reduction in the generation
of CW.
Although one could argue that the adoption of BIM is on the rise (Arayici et al., 2011), a major
challenge confronted by construction companies is the issue interoperability between BIM and
these new technologies (Steel, Drogemuller and Toth, 2012). Accordingly, standards such as IFC
(ISO 16739:2013) for seamless exchange of information among software, IFD (ISO 12006-
3:2007) to harmonise and structure construction terms, and IDM (ISO 29481-1:2010) to unite
construction processes for collaborative practices are adopted to scale the hurdle of
interoperability. In addition, the communication standards such as oBIX (open Building
Information Exchange) and IFG (IFC for GIS) have enabled building systems to communicate
with enterprise applications such as cloud based and location based services.
The BIM-enabled tool (BIMWaste) developed as part of this study is IFC compliant to ensure
interoperability with existing open communication standards and emerging technologies.
215
8.3.5 Improved Documentation for Waste Management
This group contributes 6.64% of the total variance and the group is composed of two variables.
Due to the increasing sophistication of buildings, the need for more information for construction,
operation, maintenance, and end-of-life activities has become vital (Jordani, 2010). This
information is important to track building construction process, performances of building
elements, isolate operation inefficiencies, and to respond to specific client’s requests. Evidence
shows that design quality and documentation forms an important requirement for successful
building construction and facility management (Andi and Minato, 2003; Gann, Salter and Whyte,
2003). In addition, the quality of design documentation could influence the end of life activities of
buildings such as demolition and deconstruction. Albeit, Goedert and Meadati (2008) illustrated
that BIM has capabilities to capture building design and construction process documentation to
provide full inventory of elements and to sustain the relevant information. This is because the use
of BIM and COBie has enabled stakeholders to embed relevant facility maintenance information
into building models.
In line with the foregoing, building documentations such as project schedule, cost profile, site
waste management, site information sheet, complain/incidence logbook, traffic management plan,
and deconstruction plan could be incorporated into BIM models. Accordingly, this capability and
the ability to capture design parameters could enable on-demand extraction of the documents from
the model of the buildings. Achieving this will therefore improve design coordination, time
management and engineering capabilities (Sacks, Radosavljevic and Barak, 2010) to avoid human
errors that could lead to the resource wastage. For example, architects may generate design
drawings with accuracy and high level of detailing for fabrication. Likewise, the same concept
could be adopted for CW management waste reporting and the development of waste management
plans.
216
8.4 Holistic BIM Framework for Construction Waste Management
Taking into consideration the evaluation criteria identified from the literature and during the FGIs,
a holistic BIM framework for a robust waste management system was developed. This was done
with the intention of integrating the industrial and technological requirements for waste
management. The framework aims at achieving a holistic approach to design for waste
minimisation by considering five design principles proposed by WRAP (2009). These design
principles capture waste minimisation strategies at both the construction stages and end-of-life of
the building.
The framework development employs an architecture-based layered approach, where related
components are grouped into layers, to ensure hierarchical categorisation of components. This
approach also clearly defines boundaries of stakeholders’ responsibilities, supports fair and
efficient allocation of resources, encourages independent implementation of components, and
clearly defines components’ interfaces for information exchange. A discussion of these layers is
presented in successions with emphasis on how the components in each layer could be harnessed
for construction waste management. The following sections discuss the layers of the holistic BIM
framework for CW management.
8.4.1 Infrastructure Layer
The infrastructure layer is the first and bottom-most layer, which contains physical and virtual
enterprise technologies, i.e., cloud computing, networking, hardware, and GIS technologies. Most
importantly, this layer facilitates the transfer of the cost and management burdens from individual
companies to the service providers due to the high financial requirement needed for setting up the
infrastructure. As a result, this layer does not provide domain specific services as it creates the
required platform for numerous specialty areas.
217
However, major challenges faced by service providers include security, ownership, and
management issues. To scale the hurdles posed by these challenges, the infrastructure layer also
provides the required security (such as access control, intrusion prevention, and Denial of Service
prevention), scalable, and flexible billing and management models, and transparent user licences
and agreements.
8.4.2 Data Layer
The data layer provides the shared knowledge, which uses decision making throughout the
building’s lifecycle. The layer provides centrally accessible databases, which could be remotely
accessed in favour of efficient collaboration among stakeholders. For the purpose of waste
management, this layer contains the universally applicable waste list and indices, which must be
correctly mapped onto the material database and ontology for the purpose of waste data extraction
from design models. In addition, the layer provides a knowledge base that captures design
competencies required for efficient waste management. This knowledge base captures and codifies
the knowledge about the five design principles proposed by WRAP (WRAP, 2009) to better
understand how the knowledge connects to waste output. An important component of this layer is
the ontology database that captures the semantic relationship among other resources. This could
be represented as a semantic network using Web Ontology Language (OWL), JavaScript Object
Notation (JSON) or Resource Description Framework (RDF) schema.
The data layer also ensures the supply chain engagement by providing a database for suppliers and
their related activities. As previously noted, the quality of construction waste quantification and
prediction largely depends on the quality of data collected (Bossink and Brouwers, 1996; Solís-
Guzmán et al., 2009), as well as the quality of data representation and ease of knowledge
extraction. As a result, the development of a robust waste prediction and minimisation tool must
incorporate Waste Data Collection and Auditing functionality as well as Data Analysis features.
This ensures a uniform standard for data collection, representation, and query. Ultimately, the
result of the data analysis would provide a benchmark for waste generation for future projects.
218
8.4.3 Presentation Layer
For an effective implementation of BIM, all the team members must choose appropriate
interoperable software tools (Steel, Drogemuller and Toth, 2012). Because of this, software and
data interoperability becomes an issue of concern to ensure collaboration among stakeholders.
Thus, BIM open standards were developed to represent and openly exchange BIM information.
These standards include the IFC (BuildingSMART, 2013), Green Building XML (gbXML, 2013)
and the newer Construction Operations Building Information Exchange (CoBie) (East, 2007) for
level 2 UK BIM adoption.
Therefore, the presentation layer defines the open BIM standards to ensure system interoperability
and transparency in data exchange. This layer also contains spreadsheet formats for various forms
of analysis of the performances of buildings, generic component models (such as OBJ, Material
Library File – MTL, and Polygon File Format – PLY), and software specific models (such as .rvt,
.pln, .dng, and others.). Therefore, for a successful integration of waste management tools into
BIM, such tools must incorporate exchange of data using these standard formats. However, there
is a need to extend these standards to accommodate the concepts required for construction waste
analysis.
8.4.4 BIM Business Domain Layer
The BIM business domain layer defines the core features of BIM as a set of concepts on top of the
presentation, data, and infrastructure layers. This layer provides a platform for collaboration
among stakeholders, document management, and seamless information sharing. This layer also
provides a tight integration with CAD software for model visualisation and parametric modelling.
In addition, the BIM business domain layer enables intelligent modelling by extending parametric
properties of objects to capture numerous areas of the performances of buildings such as cost,
scheduling, visibility, and energy rating.
219
The BIM business domain layer also helps to integrate the framework into the project’s lifecycle.
Admittedly, construction waste is produced at all stages of a building’s lifecycle (Esin and Cosgun,
2007) especially at the construction and demolition stages (Dolan, Lampo and Dearborn, 1999).
Therefore, construction waste management tools must emphasise the integration of the entire
lifecycle of a building (Ekanayake and Ofori, 2004; Osmani, Glass and Price, 2008) in favour of
BIM adoption. BIM integration would enable waste management tools to consider waste from
preparation stage to the end of life of the facility. However, conscious effort should be made to
focus more on the pre-construction stages (0 - 4) where design changes are easier and cheaper.
8.4.5 Service Domain Layer
The service domain layer defines specific concepts and functionalities built on the BIM business
domain layer to analyse and simulate various performances of a building project, particularly
construction waste analysis and management. The waste management service domain contains the
operational and supports technical requirements for designing out waste through BIM such as
waste quantification, design model analysis, waste hierarchy consideration, waste prediction,
reporting and visualisation functionalities.
Equally important, an effective design-based waste management system must provide
recommendations for the choice of strategies and subsequently revealing avenue for significant
waste reduction. These design-out-waste strategies include dimensional coordination, modular
coordination, and standardisation in favour of off-site construction, deconstruction, and material
recovery. Accordingly, the waste management service domain could be used with various BIM
analysis software applications in other service domains to simulate a wide range of performance
purposes. This software include Ecotect (thermal efficiency, lighting, visibility, solar shading, and
exposure), Green Building Studio (CO2 emission and energy consumption), and IES (airflow,
sound, and acoustic quality).
220
8.4.6 Application Layer
The application layer is the sixth and topmost layer through which the various stakeholders access
the specific domain services. This layer contains BIM software, which provides intelligent
parametric modelling and n-D visualisation, web applications which provide access to the service
domain through web interfaces, and mobile application, which provides access to the service
domain on handheld devices like smart phones and tablets.
Since most BIM software, web, and mobile application provide Application Programming
Interface (API) to extend their functionalities, it becomes important to harness this strength for
rapid application development. API serves as building blocks for software applications thereby
providing developers with the ability to customise application by leveraging on functionality of
existing platforms. Available APIs include Revit .NET API, Vectorworks scripting language,
ArchiCAD Geometric Description Language (GDL), among others. Several studies (Goedert and
Meadati, 2008; Schlueter and Thesseling, 2009; Nepal et al., 2012; Cheng and Ma, 2013; Kota et
al., 2014) have used the leverage of the Revit API (Autodesk, 2014) to simulate and analyse several
aspects of BIM. Thus, this reveals the need to harness the strength of APIs for the development of
waste management software.
8.5 BIM-Based Construction Waste Prediction using Hybrid Models
Waste Data Records (WDR) from 117 construction projects was collected and subjected to
exploratory data analysis to understand the distribution and structure of the data. The results of the
exploratory data analysis of the WDR revealed that 45% of CW arises as mixed waste, this is
followed by inert (37.8%), Concrete (9.6%) and Bricks (3.11%). This supports the general practice
in the industry that most CW is not segregated and that it is recorded under mixed or general waste.
This general practice could be attributed to the extra cost required for onsite segregation. As such,
contractors send the mixed waste to third party waste treatment plants, where they are segregated
into appropriate waste stream and processed for reuse, recycling, and safe disposal. It was revealed
221
from the exploratory data analysis that 22,513 tonnes, which represents 91.61% of the entire waste,
was sent to transfer station for sorting, or energy recovery, composting or soil remediation.
Adopting this approach is cost effective as the waste from several contractors are aggregated and
processed in large scale. This challenge constitutes a great hindrance to CW prediction because
the data are not adequately recorded. Overcoming this requires taking an integrated approach to
CW data collection and record keeping. As such, BIM strategies for CW record keeping and
auditing is timely. This will require the integration of CW data with BIM federated models.
Achieving this will ensure that future CW prediction models are able to access CW data right from
the building model vis-à-vis BIM design parameters.
This study proposes a design based CW prediction method using ANFIS. ANFIS integrates the
advantages of fuzzy inference system the learning ability of ANN into a single hybrid system.
Evidence from literature revealed that combining fuzzy logic and neural network could overcome
the challenges that are inherent in both systems (Jang, 1996). The main challenge with fuzzy
systems is that its membership function and rules are determined by trial and error. As such, fuzzy
logic requires significant time and effort to compute correct membership and rule in a complex
system. In addition, fuzzy logic is not particularly efficient in its generalisation capability because
it uses heuristic algorithms for defuzzification and rule evolution. In the same way, neural
networks also have their limitations. Chief among the limitations is how to determine the optimal
structure of the network. These limitations led to the combination of ANN and FL into a single
system to produce system with better prediction capability.
Prior to the training of the ANFIS model, input selection was carried out to select the best input
parameters for predicting CW. Input selection process for ANFIS model employs an efficient
hybrid learning algorithm that combines least square methods and gradient descent algorithm in a
two-way pass system. Identification of the best combination of input parameters largely depends
on the strength of least square methods to quickly train models. The least square method was used
to train the model quickly while gradient descent was used to update the MF that generateed
functions for the least square method. Accordingly, six ANFIS models were constructed and
222
trained. The RMSE of the models were then compared to select the model that best predicts CW.
The results revealed that two inputs, i.e., “Gross Floor Area” and “Construction Type (GFA-Ct
model with RMSE of 7.56), are the best predictors for CW. An explanation for the exclusion of
project cost and building usage could be that project cost exceeds the value of the building
materials. The total project cost includes other cost such as cost of plant and fleets, transportation
cost, consultancy cost, and design cost. This means that it is difficult to correlate project cost to
CW output of a building design because a breakdown of the costs is not provided. Also, the cost
of building project could be influenced by the building usage intentions. This is because building
usage will determine the amount of equipment and amenities that will be provided within the
building.
The selected model was then trained using a hybrid algorithm with grid partitioning. As such,
hybrid algorithm was applied to optimize and adjust the Membership Function (MF) parameters
and coefficients of the output linear equations (Fijani et al., 2013). The RMSE of the model using
various MFs was compared to select the best MF for the ANFIS model. The ANFIS with Gaussian
MF produced the best results, achieving up to 91.4% improvement in error with a maximum
residual error of ±2.1094 tons.
The final ANFIS model provided an efficient way of predicting the total waste of a building given
its total gross floor area and construction type. However, a more challenging task is computing the
waste output by construction waste type. A practicable way of achieving this would have been to
develop AI models for all the waste types, however, the nature and quality of waste data record
obtained could not allow this. To achieve this task, standard Waste Distribution Percentage (WDP)
for all waste types based on construction type was developed to estimate the parentage that a
material type contributes to the total waste. Distribution of waste management route for each waste
type is computed using the same approach. Although this is not an accurate measure of waste
output by waste types and waste management routes, this approach provided a good reference
point for computing these values. In addition to the ANFIS model, a mathematical model was
developed for dimensional coordination of brickworks. Mathematical equations were formulated
223
for calculating the amount of brick required for the construction of walls and the corresponding
waste output. The Equations were then employed in the selection of appropriate brick dimensions
to minimise offcuts. This enables appropriate design for material optimisation by appropriate
material substitution.
The developed models were then integrated into Autodesk Revit as an Add-in. Integrating CW
management into BIM platforms addresses two main limitations of existing CW management
tools. These limitations are: (i) existing CW tools are completely detached from the design process,
and (ii) existing CW management tools lack interoperability capabilities. The final software
(BIMWaste) was implemented using C# and Revit API based on a RAD software development
framework. As such, BIMWaste was implemented using five active modules, which include UI
module, Custom parameter module, material database module, material take-off calculation
module, and report generation module. To test the performance of BIMWaste, a test plan and two
test cases were developed. The testing process showed that BIMWaste passed all functional and
non-functional tests. The results also showed that the tool predicted CW according to waste types,
element types, and building levels. It was also revealed that BIMWaste accurately computed Gross
Floor Area and the number of floors in building designs.
8.6 Summary
This chapter presents the discussion of findings from the study. A list of 40 criteria used to evaluate
the performance of existing CW management tools was presented. The evaluative criteria were
grouped under six categories, which are: (a) waste prediction; (b) waste data; (c) commercial and
procurement; (d) BIM; (e) design; and (f) technological. The chapter also contains discussion of
BIM strategies for CW management that were identified from the exploratory sequential mixed
methods process. The strategies are presented in five groups, which are: (a) Group 1 denoted by
improved collaboration for waste management, (b) Group2 denoted by waste-driven design
process and solutions, (c) Group 3 denoted by lifecycle waste analytics, (d) Group 4 denoted by
Innovative technologies for waste intelligence and analytics, and (e) Group 5 denoted by improved
224
documentation for waste management. These strategies are required to enable BIM approach to
waste efficient design coordination. Thereafter, a holistic BIM framework for CW management
was discussed. The last section discusses key findings from ANFIS model development and BIM-
based tool development for CW management.
This next chapter concludes the study. The chapter gives a summary of the study by discussing the
research objectives, research design, data collection and analysis techniques, model development
process and software development approach adopted for the study. The chapter also presents key
findings vis-à-vis the specific objectives of the study.
225
9 CONCLUSION, RECOMMENDATIONS, AND FUTURE
WORKS
9.1 Overview
This chapter provides the conclusion to the study. The chapter starts with a summary of the study
by discussing the research objectives, research design, data collection and analysis techniques,
model development process and software development approach adopted for the study. The key
findings of the study are the presented vis-à-vis the specific objectives of the study. As such, the
key findings are presented in three sections, which are: (i) the first section focusses on the
identification of limitations of existing CW management tools and a list of evaluative criteria. In
addition, the section also discusses key BIM features that are relevant to the development of CW
management tools and the development of a holistic BIM framework for CW management, (ii) the
second section is on the development of an ANFIS model for CW prediction using historical waste
record data, (iii) while the third section focusses on the development of a BIM-based tool as an
add-in for Autodesk Revit, and the evaluation of the developed BIM tool. The chapter also
provides implications of the study by discussing implications for practice and theoretical
implications, the limitations of the study, and areas of future research.
9.2 Summary of the Study
Evidence showed that about 30% of the total waste generated in the UK originated from
construction related activities (Osmani, Glass and Price, 2008). Considering high landfill cost,
severe ecological damage (Yuan et al., 2011), shortage of land (Gavilan and Bernold, 1994), and
increased transportation and project costs (Yuan, 2012), there is the need to reduce waste generated
from construction activities. Despite the consensus in the literature that the best approach to
mitigating causes of CW is designing out waste (Faniran and Caban, 1998; Poon, Yu and Jaillon,
226
2004; Osmani, Glass and Price, 2008; Liu et al., 2011), existing CW management tools are not
robust enough to support architects and design engineers during the design stage. Key limitations
of existing CW management tools are that they are completely detached from the design process
and that they lack interoperability capabilities. Overcoming these limitations require tight
integration of BIM-based approach to CW management into design tools used by architects and
design engineers. Achieving this will offer huge opportunities for an effective and economical
waste quantification and minimisation. BIM capability for CW management tools would offer a
powerful synergy for simulating performances of buildings with respect to CW.
It based on the foregoing that this study addresses how design-based CW prediction and
minimisation capabilities could be incorporated into existing BIM platforms. The study is targeted
towards the development of a BIM-based tool, which could be used by architects and design
engineers to estimate CW output of buildings and to minimise CW at the design stage. The specific
objectives of the study are: (a) to investigate strategies for enabling BIM-based prediction and
minimisation at the design stage, (b) to formalise strategies for CW prediction and minimisation
into computational systems, (c) to integrate the computational systems for CW management into
BIM platforms, and (d) to test the performance of the BIM-based CW management tool in terms
of its CW prediction and minimisation capabilities.
The study adopted several techniques to achieve the specific objectives. Based on a critical realism
paradigm, the study adopted exploratory sequential mixed methods, which combines both
qualitative and quantitative methods in a single study. The study started with a review of extant
literature and FGIs with industry practitioners to assess the limitations of existing CW management
tools and to understand the expectations of industry stakeholders. The transcripts of the FGIs were
subjected to thematic analysis to identify prevalent themes from the quotations. The factors from
literature review and FGIs were then combined and put together in a questionnaire survey. The
questionnaires were then distributed to industry practitioners.
227
To identify the BIM strategies for CW management based on the experience and opinion of
industry practitioners, the questionnaire responses were subjected to rigorous statistical processes.
These include reliability analysis and factor analysis. Reliability analysis helps to statistically
check if the factors in the questionnaire consistently reflect the construct it is meant to measure,
while exploratory factor analysis helps to identify clusters of factors that measure aspects of the
same underlying dimension. Factor analysis revealed key strategies for BIM-based approach to
waste efficient design coordination. Thereafter, the key strategies were developed into a holistic
BIM framework for CW management. This framework served as a guide to the development of
AI hybrid models and BIM based tool for CW management.
An ANFIS model was developed for CW prediction and mathematical models were developed for
CW minimisation. Based on historical CWR from 117 projects, the model development revealed
that two key predictors of CW are “GFA” and “Construction Type”. The final models were then
incorporated into Autodesk Revit to enable the prediction of CW from building designs. The
performance of the final tool was tested using a test plan and two test cases. The results showed
that the tool performed well and that it predicted CW according to waste types, element types, and
building levels.
9.3 Main Findings of the Study
Main findings of the study are discussed vis-à-vis the research objectives that the study was set
out to achieve. The first section was based on the first objective of the study, which is to investigate
strategies for enabling BIM-based construction waste prediction and minimisation at the design
stage. After the extant review of literature on existing CW management tools and key BIM features
for CW management, an exploratory sequential mixed methods strategy was used. A combination
of FGIs and questionnaire survey were used to assess the expectations of industry practitioners in
terms of BIM strategies for CW management. A combination of thematic and statistical analyses
was employed to obtain the results. The first section ends with the development of a holistic BIM-
based framework for CW management. The second part focuses on the second objective, which is
228
to formalise strategies for construction prediction and minimisation into computational systems.
After an exploratory analysis of the collected waste record data, a hybrid model based on ANFIS
was developed to predict CW from a set of features. In addition, a Dimensional Coordination
Model (DCM) was developed for CW minimisation using mathematical modelling. The last
section provides key findings in line with the third and fourth objectives, which are to integrate
computational systems for construction waste management with BIM platforms and to test the
BIM-based CW management tool.
9.3.1 Strategies for BIM-Based Construction Waste Management
Evidence from literature reveals most CW arises from the design stage and appropriate design
decisions could be employed to mitigate waste (Faniran and Caban, 1998; Osmani, Glass and
Price, 2008; Ekanayake and Ofori, 2004; Poon, 2007; Yuan and Shen, 2011). Potential design-
based causes of CW include design changes during the construction stages (Faniran and Caban,
1998; Yuan and Shen, 2011), lack of knowledge about standard size of available materials and
dimensional coordination (Ekanayake and Ofori, 2004), unfamiliarity with materials alternatives
(Ekanayake and Ofori, 2000), complex detailing (Oyedele et al., 2013), and building complexity
(Baldwin et al., 2009). Despite the opportunity to manage CW at the design stage, it was revealed
that existing CW management tools are not robust enough to tackle CW at the source. As a result,
32 existing CW management tools were identified and reviewed to identify inefficacies of the
tools. After a careful assessment of the primary functions of these tools, five broad classifications
of tools emerged: (a) waste management plan templates and guides, (b) waste data collection and
audit tools (c) waste quantification models, (d) waste prediction tools, and (e) Geographic
Information System (GIS)-enabled waste tools. An in-depth performance assessment of these tools
was carried out to identify their limitations. It was revealed that five main limitations impede the
effectiveness and usability of existing tools. These limitations are: (a) existing CW tools are
completely detached from the design process, (b) existing CW management tools lack
interoperability capabilities, (c) CW data are not sufficient, (d) CW management responsibilities
are not clear, and (vi) lifecycle analysis of CW performance is not available.
229
Accordingly, FGIs were conducted to identify evaluative criteria for existing CW management
tools and to explore BIM features for addressing the limitations of the tools. The results of the
thematic analysis of the transcripts from the FGI revealed a list of 40 evaluative criteria that could
be used to appraise the performance of existing waste management tools. These evaluative criteria
were grouped into six categories. The first group is waste prediction related criteria which assessed
how the tool could accurately estimate waste potentials of buildings. It contains evaluative criteria
that are related to identifying potential waste origins and causes. The next group is waste data
related criteria, which contains evaluative criteria that are related to waste data collection and
provisioning of waste data in a format that is usable for decision making. The third group is
commercial and procurement related criteria, which contains evaluative criteria that are related to
early supply chain engagement, procurement process coordination, provision of robust suppliers’
database, and material standardisation. The fourth is BIM related criteria, which measures the level
of compliance of the tool with basic BIM features such as visualisation, project lifecycle
management, collaboration, and interoperability. The fifth group is design related criteria, which
assessed the usability of the tool for designing out CW. This group contains evaluative criteria
such as design out waste principles consideration, automatic capture of design parameters, design
optimisation, buildability consideration, real-time waste analytics, and dimensional coordination.
The last group technological support related criteria, which measures the readiness of the tool to
integrate with existing technology. Relevant technology includes decision support mechanism,
location based services, cloud computing support, APIs, and RFID support.
Twenty-two (22) variables that relate to the use of BIM for CW management were identified after
the review of extant of literature and FGIs. The variables were put together in a questionnaire
survey and distributed to 130 respondents. Fifty-nine (59) completed questionnaires were used,
which represents a response rate of 45.4%, were subjected to rigorous statistical analyses using
Statistical Package for Social Sciences (SPSS) software. Results of factor analysis revealed five
groups of BIM strategies for CW management. Group 1 denoted by improved collaboration for
waste management, which is required to enable effective communication among teams. This group
is made up of seven variables, which include improved waste information sharing among
230
stakeholders using BIM, task harmonisation among stakeholders to reduce duplication of effort,
improved waste minimisation commitment among stakeholders, transparency of responsibilities
during design process, early supply-chain integration for waste management decisions,
development of BIM federated model for use by all teams, and use of BIM as a co-ordination tool
for designing out waste.
Group 2 denoted by waste-driven design process and solutions contains variables that contribute
to automatic analysis of waste performance of building models. Performance analyses of buildings
allows for functional evaluation of buildings before the commencement of construction to identify
possible design and operational errors issues at a stage where design changes are cheaper. The
group contains seven variables, which are embedding waste-related information into building
model, improved clash detection in building models to reduce waste, improved materials
classification methods, automatic capture of design parameters for waste analysis, decision-
making on waste reduction during design, improved cost-benefit analysis of construction waste
management, and computer aided simulation scenario and visualisation of waste performance.
Group 3 denoted by lifecycle waste analytics with two variables, which are support for whole-life
waste analysis and preservation of deconstruction information in COBie. These variables bother
on how information on building requirements, planning, design, construction, and operations can
be amassed and used majorly for making management related decisions on facilities. It was
revealed that preserving information throughout the lifecycle of buildings is important for effective
facility management and end-of-life decisions.
Group 4 denoted by Innovative technologies for waste intelligence and analytics, which represents
appropriate use of technologies in design out waste process. It was revealed that synthesising
emerging technologies such as Internet of Things (IoT), GPS, Big Data analytics and RFID would
provide real-time building performance monitoring and analyses. In addition, an integration of
these technologies into BIM would facilitates location based services, tagging and identification
of building materials, and remote collection of building data. Group 5 denoted by improved
documentation for waste management contains variables related to on-demand extraction of the
231
design documents from the building models. It was revealed that building documentation such as
project schedule, cost profile, site waste management, site information sheet, complain/incidence
logbook, traffic management plan, and deconstruction plan needs to be tightly integrated into BIM
models for effective CW management.
Based on the identified evaluative criteria for CW management tools and BIM strategies for CW
management, a holistic BIM framework for CW management was developed using an architecture-
based layered approach. The architecture-based layered approach allows related components to be
grouped into layers and to ensure hierarchical categorisation of components. The framework helps
to identify key knowledge units towards the enhancement of existing tools and to enable the
implementation of BIM compliant CW management tools. The framework consists of six layers,
which are: infrastructure layer, which contains physical and virtual enterprise technologies, data
layer, which provides the shared knowledge, presentation Layer, which defines open BIM
standards to ensure system interoperability, BIM Business Domain Layer that defines the core
features of BIM, Service Domain Layer that defines specific concepts and functionalities built on
the BIM business domain layer to analyse and simulate waste performances, and Application
Layer, to allow various stakeholders access to specific domain services.
9.3.2 Development of AI Hybrid Models for CW Prediction
An ANFIS model was developed for CW prediction. A major strength of ANFIS is that it integrates
advantages of fuzzy inference system and learning ability of ANN into a single hybrid system. A
hybrid training algorithm with grid partitioning was used to optimize and adjust MF parameters
and coefficients of the ANFIS model. The Root Mean Square Error (RMSE) of the model using
various Membership Functions (MFs) was then compared to select the best MF for CW prediction.
The results showed that Gaussian MF produced the best results, achieving up to 91.4%
improvement in error with a maximum RMSE of ±2.1094 tons. The training process of the ANFIS
model also revealed that that two key predictors of CW are “Gross Floor Area” and “Construction
Type.
232
To compute waste output by construction waste type, standard Waste Distribution Percentage
(WDP) for all waste types based on construction type was developed. WDP helps to estimate the
parentage that a material type contributes to the total waste. Distribution of waste management
route for each waste type is computed using the same approach. Although this is not an accurate
measure of waste output by waste types and waste management routes, this approach provides a
good reference point for computing these values. In addition to the ANFIS model, a mathematical
model was developed for dimensional coordination of brickworks. Mathematical equations were
formulated for calculating the amount of brick required for the construction of walls and the
corresponding waste output. The Equations were then employed in the selection of appropriate
brick dimensions that will minimise offcuts to enable appropriate design for material optimisation.
9.3.3 Development and Testing of BIM-Based Tool for CW Management
The developed AI hybrid and mathematical models were integrated into Autodesk Revit as an
Add-in. Integrating CW management into BIM platforms addressed two main limitations of
existing CW management tools. These limitations are: (i) existing CW tools are completely
detached from the design process, and (ii) existing CW management tools lack interoperability
capabilities. The final software (BIMWaste) was implemented using C# and Revit API based on a
RAD software development framework. As such, BIMWaste was implemented using five active
modules, which include UI module, Custom parameter module, material database module, material
take-off calculation module, and report generation module. To test the performance of BIMWaste,
a test plan and two test cases were developed. The testing process showed that BIMWaste passed
all functional and non-functional tests. The results also showed that the tool predicts CW according
to waste types, element types, and building levels. It was also revealed that BIMWaste accurately
computes Gross Floor Area and the number of floors in building designs.
233
9.4 Implications of the Study
This research has huge implications to CW management at the design stages in several ways, which
include implications for practice and theoretical implications. This study has generated several
implications that would be of interest to BIM professionals, sustainability experts, material
suppliers, architects, design engineers, software developers, and academics. These implications
are discussed in subsequent subsections. It is worthy of note that the implications presented are by
no means exhaustive. They are, however, intended to stimulate thinking on how the insights from
this study might impact current practices.
9.4.1 Implications for practice
Findings from this study showed that integrating CW management into BIM is key for efficient
waste prediction and minimisation at the design stage. This study therefore offers significant
implications for industrial practice and various industry stakeholders.
9.4.1.1 Architects and Design Engineers
This study has significant implications for practice especially at the design stage. The design stage
is crucial for CW management because it is cheaper to make changes at this stage. The study
creates awareness on the roles of design in CW management and it broadens the understanding of
how design-related factors influence CW generation. Although architects and design engineers are
becoming more interested in designing out waste, existing tools are not robust enough to support
them. Software (BIMWaste) developed as part of this study is therefore useful for architects and
design engineers by providing them with insights into identifying sources of CW during design.
BIMWaste predicts the potential CW output of a building design and it provides suggestion on
how CW could be minimised through dimensional coordination and material optimisation.
BIMWaste also provides a basis for comparative analysis of building design for selecting the one
with the least CW potential among options without affecting building forms or function.
234
9.4.1.2 BIM professionasl
This research makes a huge contribution to CW management at the design stages in several ways.
The study identified the limitations of existing CW management tools. The two key limitations
are: (i) the tools are completely detached from the design process, and (ii) existing tools lack
interoperability capability. Accordingly, the study employs BIM to address the key limitations
identified. Although there are several studies that have provided evidence that BIM is required for
efficient CW management, the use of BIM for CW management is often neglected. Due to the
steep rise in BIM adoption and the importance of environmental sustainability, BIM professionals
are becoming interested in ways of integrating sustainable practices in BIM platform. This study
therefore provides clear direction on how BIM could be used for this purpose. The study also
significantly to BIM by developing a system to streamline the estimation and minimisation of CW
in BIM environment.
9.4.1.3 Circular Economy and Sustainability Management
Construction activities have major impacts on social, environmental, and economic aspects of
sustainability. Although, construction industry contributes to Gross Domestic Product (GDP) of a
nation, it consumes the largest percentage of resources and it generates huge waste. As such, the
circular economy ensures that the added value of building materials is kept within an economic
circle to avoid waste generation and demand for virgin resources. The circular economy therefore
maximises material usage through recycling and reuse. This study therefore has huge implications
for circular economy and sustainability because it offers an effective way for measuring the
environmental impact (in terms of CW generation) of building design. It also offers an objective
means of measuring which of the predicted waste could be recycled and reused. This is important
for effective material economic circle, resource allocation, and resource utilization.
235
9.4.1.4 Material Manufacturers
Although, waste in LEAN philosophy include non-material waste such as waste associated with
time loss, transportation, under-utilisation, and waiting. (Koskela, 2004), material waste
constitutes the largest proportion of waste and it has the highest environmental impact (Osmani et
al. 2008; Oyedele et al. 2013). Although materials suppliers are usually considered as external
stakeholders in building projects, this study suggests that adequate waste management requires
active involvement of materials suppliers. This means that early supply chain involvement is more
beneficial rather that the fragmented approach in traditional procurement. BIM is therefore
required to ensure communication among stakeholders and design coordination. Early
involvement of material suppliers will allow them to engage in decision making for driving waste
minimization. In addition, it is important for material manufacturers to ensure that their products
have minimal impact on the environment. BIMWaste will therefore assist material manufacturers
to test the potential impact their products on waste potentials of buildings.
9.4.1.5 Software Developers
The recent advancement in ICT and BIM technologies reveals that any promising innovation
within the Architectural, Engineering, and Construction (AEC) industry requires BIM compliance.
It is also important that complex and repetitive construction related tasks are automated to achieve
the required flexibility, reliability, and efficiency. The foregoing thus revealed the importance of
software development for BIM and construction activities. This study therefore has three key
implications for software developers. First, the holistic framework developed as part of this study
provides a methodological basis for developing BIM-enabled software for CW management. The
framework details components that must be considered when developing tools for CW prediction
and minimisation. Second, ANFIS and mathematical models developed could be adapted by
software developers to extend their tools for CW management. Lastly, the development process of
BIMWaste detailed in this study provides a blueprint for the integration of construction related
tasks into BIM. As such, software developer could adopt the procedures enumerated in this study
236
to achieve tasks such as extracting BoQ from building design, calculating GFA, and calculating
number of floors.
9.4.2 Theoretical Implications
A major theoretical implication that this study provides is that CW management process could be
described into a computational system such that it could be simulated. This confirms the relevance
of theory of Artificial Intelligence to the study. This study satisfies epistemological and heuristic
adequacy that is required to formalise existing design-out-waste strategies into a computational
tool. Key objectives of the tool are to ensure that building designs have minimal impact on the
environment and that finite natural resources are preserved through material recycling and reuse.
This reveals the relevance of Tragedy of the commons, which informs the understanding of how
construction materials, as finite common resources, could be optimised for maximum
sustainability and productivity. This is needed to ensure that more proactive strategies rather than
remedial measures to waste management are put in place in the construction industry. As such, the
BIM based tool contributes towards the sustenance of finite virgin resources and help to maintain
a close material flow loop.
A key requirement of this study is to identify evaluative criteria for existing CW management
tools. The exercise was based on Scriven’s logic of evaluation, which details steps that must be
followed during evaluation. The evaluation started by identifying a list of 32 CW management
tools and proceeds to establish criteria for merit for the tools. Thereafter, the performance of the
objects in relation to the criteria of merit was determined before drawing valid conclusions. Based
on the tenets of theories of evaluative practices, a constructivist evaluation and qualitative
methodology was adopted to understand stakeholders’ views and needs in a valid evaluation. The
results reveal a list of 40 evaluative criteria that could be used to evaluate the performance of
existing CW management tools. The six groups of evaluative criteria are: (a) Group 1 denoted by
waste prediction related criteria; (b) Group 2 denoted by waste data related criteria; (c) Group 3
237
denoted by commercial and procurement; (d) Group 4 denoted by BIM related criteria; (e) Group
5 denoted by design related criteria; and (f) Group 6 denoted by technological related criteria.
It has been shown that a major challenge to the development of intelligent system is how plausible
decisions are made using both quantitative and qualitative information that have a level of
uncertainty and imprecision. It is therefore important to adopt evidential reasoning mechanism to
draw out plausible course of actions. This allows the collection and combination of evidence in
support or against some hypotheses. The study adopted Fuzzy set theory to represent and process
imprecise information by using linguistic variables. Concepts in fuzzy set theory were integrated
with ANN to obtain a more powerful hybrid system.
9.5 Limitations of the Study
Despite the contributions of this study, it has some limitations in terms of its scope and data
availability. A major limitation of this study is that the study was undertaken in the context of the
UK so the findings have a UK bias. Effort has been made to enhance generalisability of findings
using survey research and probabilistic sampling, however, findings of the study should not be
generalised beyond the UK. Although projects in construction industry falls under three broad
sectors, which are building, infrastructure, and industrial, data collection for the study was focused
only on building project. This means that infrastructure projects (such as highway, bridges, and
dams) and industrial projects (such as refineries, manufacturing plants, and process plants) were
not considered in the study.
Although, LEAN include non-material waste such as waste associated with transportation, time
loss, under-utilisation, inadequate training, and waiting. (Koskela, 2004), only material waste was
considered in this study. This is because materials contribute the largest proportion of waste
compared with other sources. As such, waste considered in this study is limited to building material
waste and the definition of waste used in the study does not cover non-material waste. In addition,
this study only considered environmental dimension of sustainability. The impact of waste was
238
not assessed along other two sustainability dimensions, which are economic, and social. In terms
of the scope of the building lifecycle stage, this study focused on the prediction of CW at the design
stages, which include Stage 2 (Concept Design) to Stage 4 (Technical Design). Software developed
in this study is useful to architects and design engineers at these stages to predict and minimise
CW. However, the study did not consider excavation waste and demolition waste. Other limitation
of the study is in terms of data used for the model development. The data lacks information about
the bill of quantity for the designs. In addition, the data did not provide information about the
building methodology employed. The availability of information such as data on prefabrication,
procurement route, material procurement, material delivery, recycling rate, material reuse, and
waste transportation would enable more accurate prediction of CW along other dimensions.
9.6 Areas of Future Research
Since this study was carried out within the UK, future research could investigate generalisability
of findings from this study to other countries. Future research could also extend the scope of this
study beyond material waste. Based on LEAN philosophy, non-material sources of CW could be
investigated and integrated into BIM. In the same way, the scope of future studies could be
extended to cover civil engineering and infrastructure projects. Future research could also go
beyond just construction waste to consider prediction of excavation, operational, and demolition
waste.
As earlier stated that the data used for model development are limited in some areas, future
research could develop BIM-based waste collection tools. This is to integrate waste data record
into federated BIM models. In addition, IFC standard could be extended for a more robust waste
analysis and simulation. This will offer IFC based framework to streamline the performance
analysis of waste within BIM software. Accordingly, waste information generation could be stored
appropriately within the scope of material management routes, element prefabrication,
procurement route, material procurement details, material delivery schedule, recycling rate,
material reuse, and waste transportation. Achieving this would enable more accurate prediction of
239
CW along other dimensions other than GFA and construction type. Integrating waste related data
into IFC schema would provide huge opportunities for developing a structured knowledge base
for waste management and would enable a standard schema for construction waste analytics.
Another area of future research could be integration of BIM-based waste management capability
with immersive technologies such as Augmented Reality (AR) and Virtual Reality (VR).
Achieving this would help to visualise virtual building material in real world, and how these
materials and building practices could influence waste generation. AR particularly overlays digital
information over the real-world environment using a piece of head-mounted display like Google
Glass and Microsoft HoloLens. As such, these technologies could help to visualise and simulate
waste management activities during building construction, site planning, building maintenance,
transportation route planning, and hazardous waste management. In addition, other learning
algorithms, particularly those with distributed representation such as convolutional deep neural
networks, deep belief networks, and deep Boltzmann machines could be explored for CW
prediction.
The Autodesk plugin developed in this study could lead to the development of a complementary
plugin for Autodesk Navisworks. This will enable CW generation to be visualised vis-à-vis
building project timeline and construction sequence. Achieving this will enable building operators
to simulate CW generation and to plan for waste collection activities effectively.
240
REFERENCES
Abraham, A. (2003) Intelligent systems: Architectures and perspectives. In: Recent advances in intelligent paradigms and applications. (no place) Springer. pp. 1–35.
Abraham, A. (2004) Meta learning evolutionary artificial neural networks Neurocomputing 56 (1–4) p.pp. 1–38. doi:10.1016/S0925-2312(03)00369-2.
Abraham, a (2005) Hybrid intelligent systems: evolving intelligence in hierarchical layers. Do Smart Adaptive Systems Exist? [online]. 179 pp. 159–179. Available from: http://link.springer.com/content/pdf/10.1007/3-540-32374-0_8.pdf.
Abrahamsson, P., Salo, O., Ronkainen, J. and Warsta, J. (2002) Agile software development methods: Review and analysis VTT Publications (478) p.pp. 3–107. doi:10.1076/csed.12.3.167.8613.
Abrishami, S., Goulding, J.S., Rahimian, F.P. and Ganah, A. (2014) Integration of BIM and generative design to exploit AEC conceptual design innovation. Journal of Information Technology in Construction. 19 (1), pp. 350–359.
Adachi, Y. (2003) Overview of partial model query language. In: Proc. ISPE Conf. Concurrent Engineering. 2003 pp. 549–555.
Addis, B. (2008) Briefing: Design for deconstruction. Proceedings of the ICE - Waste and Resource Management. 161 (1), pp. 9–12. doi:10.1680/warm.2008.161.1.9.
Afshar, A., Massoumi, F., Afshar, A. and Mariño, M.A. (2015) State of the art review of ant colony optimization applications in water resource management. Water Resources Management. 29 (11), pp. 3891–3904.
Agarwal, R., Prasad, J., Tanniru, M. and Lynch, J. (2000) Risks of rapid application development. Communications of the ACM. 43 (1), pp. 177–188. doi:10.1145/352515.352516.
Agrawal, R., Mannila, H., Srikant, R., Toivonen, H. and Verkamo, a I. (1996) Fast discovery of association rules [online].
Ahadzie, D.K., Proverbs, D.G. and Sarkodie-Poku, I. (2014) Competencies required of project managers at the design phase of mass house building projects. International Journal of Project Management. 32 (6), pp. 958–969. doi:10.1016/j.ijproman.2013.10.015.
Ahern, T., Leavy, B. and Byrne, P.J. (2014) Knowledge formation and learning in the management of projects: A problem solving perspective. International Journal of Project Management. 32 (8), pp. 1423–1431. doi:10.1016/j.ijproman.2014.02.004.
241
AIA (2014) Integrated Project Delivery: An Updated Working Definition AIA California Council, Sacramento, CA [online]. Available from: http://www.aiacc.org/wp-content/uploads/2014/07/AIACC_IPD.pdf.
Ajayi, S.O., Oyedele, L.O., Akinade, O.O., Bilal, M., Owolabi, H.A., Alaka, H.A. and Kadiri, K.O. (2016) Reducing waste to landfill: A need for cultural change in the UK construction industry. Journal of Building Engineering [online]. 5 pp. 185–193. Available from: http://www.sciencedirect.com/science/article/pii/S2352710215300590doi:10.1016/j.jobe.2015.12.007 [Accessed 6 February 2016].
Ajayi, S.O., Oyedele, L.O., Bilal, M., Akinade, O.O., Alaka, H.A., Owolabi, H.A. and Kadiri, K.O. (2015a) Waste effectiveness of the construction industry: Understanding the impediments and requisites for improvements. Resources, Conservation and Recycling [online]. 102 pp. 101–112. Available from: http://www.sciencedirect.com/science/article/pii/S0921344915300203doi:10.1016/j.resconrec.2015.06.001 [Accessed 10 March 2016].
Ajayi, S.O., Oyedele, L.O., Ceranic, B., Gallanagh, M. and Kadiri, K.O. (2015b) Life cycle environmental performance of material specification: a BIM-enhanced comparative assessment. International Journal of Sustainable Building Technology and Urban Development [online]. 6 (1), pp. 14–24. Available from: http://www.tandfonline.com/doi/full/10.1080/2093761X.2015.1006708#.Vk94qXbhDcsdoi:10.1080/2093761X.2015.1006708 [Accessed 20 November 2015].
Akbarnezhad, A., Ong, K.C.G. and Chandra, L.R. (2014) Economic and environmental assessment of deconstruction strategies using building information modeling. Automation in Construction. 37 pp. 131–144. doi:10.1016/j.autcon.2013.10.017.
Akerkar, R. and Sajja, P. (2010) Knowledge-Based Systems [online]. (no place) Jones and Bartlett.
Akinade, O.O., Oyedele, L.O., Bilal, M., Ajayi, S.O., Owolabi, H.A., Alaka, H.A. and Bello, S.A. (2015) Waste minimisation through deconstruction: A BIM based Deconstructability Assessment Score (BIM-DAS). Resources, Conservation and Recycling [online]. 105 pp. 167–176. Available from: http://www.sciencedirect.com/science/article/pii/S0921344915301166doi:10.1016/j.resconrec.2015.10.018 [Accessed 20 November 2015].
Akinade, O.O., Oyedele, L.O., Munir, K., Bilal, M., Ajayi, S.O., Owolabi, H.A., Alaka, H.A. and Bello, S.A. (2016) Evaluation criteria for construction waste management tools: towards a holistic BIM framework (in press). International journal of building technology and urban development. pp. 1–19.
Al-Hajj, A. and Hamani, K. (2011) Material Waste in the UAE Construction Industry: Main Causes and Minimization Practices. Architectural Engineering and Design Management
242
[online]. 7 (4), pp. 221–235. Available from: http://ucd.summon.serialssolutions.com/2.0.0/link/0/eLvHCXMw3V1La9wwEBZtTqUlpC_iPECX9hLcypItyYUelpISCnsomyW5CdmSwKVrCnGgPz8aPXbdbaD33nbtXdtoPms0o5nvQ4jRD6TcmxN4pXllvavUXFbMeEfhJKFauNaKloSm12_f-WLZ3q7Yaic-ujv2Pxh-qadw8Ysb7S2Y6xjXi8sgzpnpYi-SZkcgfFpq6P3T93cdoi:10.1080/17452007.2011.594576.
Alaka, H.A., Oyedele, L.O., Owolabi, H.A., Oyedele, A.A., Akinade, O.O., Bilal, M. and Ajayi, S.O. (2016) Critical factors for insolvency prediction: towards a theoretical model for the construction industry. International Journal of Construction Management. doi:10.1080/15623599.2016.1166546.
An, S.-H., Park, U.-Y., Kang, K.-I., Cho, M.-Y. and Cho, H.-H. (2007) Application of support vector machines in assessing conceptual cost estimates. Journal of Computing in Civil Engineering. 21 (4), pp. 259–264.
Anderson, J. and Shiers, D. (2009) Green guide to specification. 4th edition. Oxford: John Wiley & Sons.
Andi and Minato, T. (2003) Design documents quality in the Japanese construction industry: factors influencing and impacts on construction process. International Journal of Project Management [online]. 21 (7), pp. 537–546. Available from: http://www.sciencedirect.com/science/article/pii/S0263786302000832doi:10.1016/S0263-7863(02)00083-2 [Accessed 21 June 2015].
Arayici, Y., Coates, P., Koskela, L., Kagioglou, M., Usher, C. and O’Reilly, K. (2011) BIM adoption and implementation for architectural practices. Structural survey. 29 (1), pp. 7–25.
Arayici, Y., Egbu, C. and Coates, P. (2012) Building information modelling (Bim) implementation and remote construction projects: Issues, challenges, and critiques Electronic Journal of Information Technology in Construction 17 p.pp. 75–92. doi:ISSN 1874-4753.
Arnott, D. and Pervan, G. (2005) A critical analysis of decision support systems research. Journal of Information Technology. 20 pp. 67–87. doi:10.1057/palgrave.jit.2000035.
Asadi, E., da Silva, M.G., Antunes, C.H., Dias, L. and Glicksman, L. (2014) Multi-objective optimization for building retrofit: A model using genetic algorithm and artificial neural network and an application. Energy and Buildings. 81 pp. 444–456.
Atanassov, K. (1986) Intuitionistic Fuzzy Sets.pdf. Fuzzy Sets and Systems. 20 (1), pp. 87–96.
Aubry, M., Richer, M.-C. and Lavoie-Tremblay, M. (2014) Governance performance in complex environment: The case of a major transformation in a university hospital. International Journal of Project Management. 32 (8), pp. 1333–1345. doi:10.1016/j.ijproman.2013.07.008.
243
Augusto, T., Mounir, K. and Melo, A.M.C. (2012) A cost optimization-based design of precast concrete floors using genetic algorithms. Automation in Construction. 22 pp. 348–356.
Autodesk (2014) Revit 2009 API Developer’s Guide.
Azhar, S. (2011) Building information modeling (BIM): Trends, benefits, risks, and challenges for the AEC industry. Leadership and Management in Engineering. 11 (3), pp. 241–252.
Azhar, S., Hein, M. and Sketo, B. (2007) Building Information Modeling ( BIM ): Benefits , Risks and Challenges. Leadership and Management in Engineering. 11 (3), pp. 241–252.
Baldwin, A., Poon, C.-S., Shen, L.-Y., Austin, S. and Wong, I. (2009) Designing out waste in high-rise residential buildings: Analysis of precasting methods and traditional construction. Renewable Energy. 34 (9), pp. 2067–2073. doi:10.1016/j.renene.2009.02.008.
Banias, G., Achillas, C., Vlachokostas, C., Moussiopoulos, N. and Papaioannou, I. (2011) A web-based Decision Support System for the optimal management of construction and demolition waste. Waste management (New York, N.Y.). 31 (12), pp. 2497–2502. doi:10.1016/j.wasman.2011.07.018.
Banzhaf, W. (2013) Evolutionary Computation and Genetic Programming. In: Engineered Biomimicry. pp. 429–447. doi:10.1016/B978-0-12-415995-2.00017-9.
Beck, K. (1999) Extreme Programming Explained: Embrace Change.
Beetz, J. and Berlo, L. Van (2010) BIMSERVER . ORG – AN OPEN SOURCE IFC MODEL SERVER. (Weise 2006), pp. 16–18.
Begum, R.A., Satari, S.K. and Pereira, J.J. (2010) Waste generation and recycling: Comparison of conventional and industrialized building systems. American Journal of Environmental Sciences. 6 pp. 383–388. doi:10.3844/ajessp.2010.383.388.
Bergsdal, H., Bohne, R.A. and Brattebø, H. (2007) Projection of construction and demolition waste in Norway. Journal of Industrial Ecology. 11 (3), pp. 27–39.
Bernroider, E.W.N., Wong, C.W.Y. and Lai, K. (2014) From dynamic capabilities to ERP enabled business improvements: The mediating effect of the implementation project. International Journal of Project Management. 32 (2), pp. 350–362. doi:10.1016/j.ijproman.2013.05.006.
Beynon-Davies, P., Carne, C., Mackay, H. and Tudhope, D. (1999) Rapid application development (RAD): an empirical review. European Journal of Information Systems. 8 (3), pp. 211–223.
Bilal, M., Oyedele, L.O., Akinade, O.O., Ajayi, S.O., Alaka, H.A., Owolabi, H.A., Qadir, J., Pasha, M. and Bello, S.A. (2016a) Big data architecture for construction waste analytics (CWA): A conceptual framework. Journal of Building Engineering [online]. Available from:
244
http://www.sciencedirect.com/science/article/pii/S2352710216300262doi:10.1016/j.jobe.2016.03.002 [Accessed 15 March 2016].
Bilal, M., Oyedele, L.O., Qadir, J., Munir, K., Akinade, O.O., Ajayi, S., Alaka, H.A. and Owolabi, H.A. (2016b) Analysis of critical features and evaluation of BIM software: towards a plug-in for construction waste minimization using big data. International Journal of Sustainable Building Technology and Urban Development. pp. 1–18.
BIM-Industry-Working-Group (2011) Strategy Paper for the Government Construction Client Group. Her majesty’s Government, UK2011.
Bishop, C.M. (1995) Neural networks for pattern recognition. (no place) Oxford university press.
Blaikie, N. (2007) Approaches to social enquiry: Advancing knowledge. (no place) Polity.
BlueWise (2010) ConstructCLEAR. Available from: http://www.constructclear.co.uk [online]. Available from: http://www.constructclear.co.uk.
Blum, C. and Roli, A. (2003) Metaheuristics in combinatorial optimization: Overview and conceptual comparison. ACM Computing Surveys (CSUR). 35 (3), pp. 268–308.
Boehm, B. (2000) Spiral Development : Experience , Principles , and Refinements. Spiral Development Workshop February 9, 2000. (July), pp. 49. doi:CMU/SEI-2000-SR-008.
Boehm, B.W. (1988) SPIRAL MODEL OF SOFTWARE DEVELOPMENT AND ENHANCEMENT. Computer. 21 (5), pp. 61–72. doi:10.1109/2.59.
Bogdan, R.C. and Biklen, S.K. (1998) Qualitative research in education. An introduction to theory and methods. Boston: Allyn and Bacon.
Boose, J.H. (1989) A survey of knowledge acquisition techniques and tools Knowledge Acquisition 1 p.pp. 3–37. doi:10.1016/S1042-8143(89)80003-2.
Borrmann, A., Van Treeck, C. and Rank, E. (2006) Towards a 3D spatial query language for building information models. In: Proc. Joint Int. Conf. of Computing and Decision Making in Civil and Building Engineering (ICCCBE-XI). 2006
Bossink, B.A.G. and Brouwers, H.J.H. (1996) Construction waste: quantification and source evaluation. Journal of Construction Engineering and Management. 122 (1), pp. 55–60.
Braglia, M. and Frosolini, M. (2014) An integrated approach to implement Project Management Information Systems within the Extended Enterprise. International Journal of Project Management. 32 (1), pp. 18–29. doi:10.1016/j.ijproman.2012.12.003.
Brannen, J. (2005) Mixing Methods: The Entry of Qualitative and Quantitative Approaches into
245
the Research Process. International Journal of Social Research Methodology. 8 (3), pp. 173–184. doi:10.1080/13645570500154642.
BRE (2009) BreMap. Available from: http://www.bremap.co.uk/Default.aspx [online]. Available from: http://www.bremap.co.uk/Default.aspx (23rd O [Accessed 23 July 2014].
BRE (2008a) SMARTAudit. Available from: http://www.smartwaste.co.uk/smartaudit/about.jsp [online]. Available from: http://www.smartwaste.co.uk/smartaudit/about.jsp [Accessed 23 July 2014].
BRE (2007) SMARTStart. Available from: http://www.smartwaste.co.uk/smartstart/about.jsp [online]. Available from: http://www.smartwaste.co.uk/smartstart/about.jsp [Accessed 23 July 2014].
BRE (2008b) SMARTWASTE. Available from: http://www.smartwaste.co.uk/index.jsp [Accessed 25 April 2016].
BRE (2010) True cost of waste calculator. Available from: http://www.wastecalculator.co.uk/login.jsp [online]. Available from: http://www.wastecalculator.co.uk/login.jsp [Accessed 23 July 2014].
Bredillet, C. (2004) Beyond the positivist mirror: Towards a project management’gnosis’. International Research Network for Organizing by Projects-IRNOP VI.
Brunner, P.H. (2011) Urban Mining - A Contribution to Reindustrializing the City. Journal of Industrial Ecology. 15 (3), pp. S-339.
Brunnermeier, S.B. and Martin, S.A. (2002) Interoperability costs in the US automotive supply chain. Supply Chain Management: An International Journal [online]. 7 (2), pp. 71–82. Available from: http://www.emeraldinsight.com/doi/10.1108/13598540210425821doi:10.1108/13598540210425821 [Accessed 22 April 2017].
Bryson, J.M., Patton, M.Q. and Bowman, R.A. (2011) Working with evaluation stakeholders: A rationale, step-wise approach and toolkit. Evaluation and program planning [online]. 34 (1), pp. 1–12. Available from: http://www.sciencedirect.com/science/article/pii/S0149718910000637doi:10.1016/j.evalprogplan.2010.07.001 [Accessed 7 September 2015].
Buchan, R.D., Fleming, F.W. and Kelly, J.R. (1991) Estimating for builders and quantity surveyors. Oxford: Newnes.
BuildingSMART (2013) Industry Fondation Classes IFC4 Official Release, buildingSMART. Available from: http://www.buildingsmart-tech.org [online]. Available from: http://www.buildingsmart-tech.org [Accessed 23 August 2014].
246
Burguet, R., Ganuza, J.-J. and Hauk, E. (2012) Limited liability and mechanism design in procurement. Games and Economic Behavior [online]. 76 (1), pp. 15–25. Available from: http://www.sciencedirect.com/science/article/pii/S0899825612000723doi:10.1016/j.geb.2012.04.004 [Accessed 12 April 2017].
Burkingham, A. and Saunders, P. (2004) The Survey Methods Workbook: From Design To Analysis.
Burrell, G. and Morgan, G. (1979) Sociological paradigms and organisational analysis. London: Heinemann Educational.
CabinetOffice (2011) Government Construction Strategy. Available from: https://www.gov.uk/government/uploads/system/uploads/attachment data/ file/61152/Government-Construction-Strategy 0.pdf. [online]. Available from: https://www.gov.uk/government/uploads/system/uploads/attachment data/ file/61152/Government-Construction-Strategy 0.pdf.
Çaydaş, U., Hasçalık, A. and Ekici, S. (2009) An adaptive neuro-fuzzy inference system (ANFIS) model for wire-EDM. Expert Systems with Applications. 36 (3), pp. 6135–6139. doi:10.1016/j.eswa.2008.07.019.
Cerovsek, T. (2011) A review and outlook for a ‘Building Information Model’ (BIM): A multi-standpoint framework for technological development. Advanced Engineering Informatics. 25 (2), pp. 224–244. doi:10.1016/j.aei.2010.06.003.
Charlson, A. (2008) Recycling and reuse of waste in the construction industry. The Structural Engineer. 86 (4), pp. 32–37.
Chen, Z., Li, H., Kong, S.C.W., Hong, J. and Xu, Q. (2006) E-commerce system simulation for construction and demolition waste exchange. Automation in Construction. 15 (6), pp. 706–718. doi:10.1016/j.autcon.2005.09.003.
Chen, Z., Li, H. and Wong, C.T.C. (2002) An application of bar-code system for reducing construction wastes. 11 pp. 521–533.
Chen, Z., Li, H. and Wong, C.T.C. (2003) Webfill before landfill: an e-commerce model for waste exchange in Hong Kong. Construction Innovation. 3 (1), pp. 27–43.
Cheng, J.C.P. and Ma, L.Y.H. (2013) A BIM-based system for demolition and renovation waste estimation and planning. Waste management (New York, N.Y.). 33 (6), pp. 1539–1551. doi:10.1016/j.wasman.2013.01.001.
Cheng, J.C.P. and Ma, L.Y.H. (2011) A BIM-based System for Demolition and Renovation Waste Quantification and Planning. In: 14th International Conference on Computing in Civil Engineering. 2011
247
Cheng, M.-Y. and Hoang, N.-D. (2014) Interval estimation of construction cost at completion using least squares support vector machine. Journal of Civil Engineering and Management. 20 (2), pp. 223–236.
Cheng, M.-Y., Tsai, H.-C. and Hsieh, W.-S. (2009) Web-based conceptual cost estimates for construction projects using Evolutionary Fuzzy Neural Inference Model. Automation in Construction. 18 (2), pp. 164–172.
Cheng, Y.-M. (2014) An exploration into cost-influencing factors on construction projects. International Journal of Project Management. 32 (5), pp. 850–860. doi:10.1016/j.ijproman.2013.10.003.
Chini, A.R. and Acquaye, L. (2001) Grading and mechanical properties of salvaged lumber. In: Proceedings of the CIB Task Group 39-Deconstruction Meeting. 2001 pp. 138–162.
Chini, A.R. and Balachandran, S. (2002) Anticipating and responding to deconstruction through building design. Design for Deconstruction and Materials Reuse, CIB Publication. 272 .
Chipman, T., Liebich, T. and Weise, M. (2012) mvdXML: Specification of a standardized format to define and exchange Model View Definitions with Exchange Requirements and Validation Rules. buildingSMART International.
Choi, J.W., Kim, S.A., Lertlakkhanakul, J. and Yeom, J.H. (2008) Developing ubiquitous space information model for indoor gis service in ubicomp environment. In: Networked Computing and Advanced Information Management, 2008. NCM’08. Fourth International Conference on. 2008 (no place) IEEE. pp. 381–388.
Choi, S., Kim, D.Y., Han, S.H. and Kwak, Y.H. (2013) Conceptual cost-prediction model for public road planning via rough set theory and case-based reasoning. Journal of Construction Engineering and Management. 140 (1), pp. 4013026.
Chrysostomou, V. (2000) CALIBRE-the uk’s construction industry added value toolkit. In: International Conference on the Use of Automatic Data Collection in Construction. 2000
Chua, D.K.H., Li, D.Z. and Chan, W.T. (2001) Case-based reasoning approach in bid decision making. Journal of construction engineering and management. 127 (1), pp. 35–45.
CMS (2005) Selecting a Development Approach. Available from: https://sms.unikom.ac.id/taryana/download/jad/SelectingDevelopmentApproach.pdf [Accessed 2 April 2017].
Cochran, K., Townsend, T., Reinhart, D. and Heck, H. (2007a) Estimation of regional building-related C&D debris generation and composition: case study for Florida, US. Waste management (New York, N.Y.). 27 (7), pp. 921–931. doi:10.1016/j.wasman.2006.03.023.
248
Cochran, K., Townsend, T., Reinhart, D. and Heck, H. (2007b) Estimation of regional building-related C&D debris generation and composition: case study for Florida, US. Waste management (New York, N.Y.) [online]. 27 (7), pp. 921–931. Available from: http://www.sciencedirect.com/science/article/pii/S0956053X06001449doi:10.1016/j.wasman.2006.03.023 [Accessed 19 February 2015].
Cochran, K.M. and Townsend, T.G. (2010) Estimating construction and demolition debris generation using a materials flow analysis approach. Waste management (New York, N.Y.). 30 (11), pp. 2247–2254. doi:10.1016/j.wasman.2010.04.008.
Coleman, G. and Verbruggen, R. (1998) A quality software process for rapid application development. Software Quality Journal [online]. 7 (2), pp. 107–122. Available from: http://dx.doi.org/10.1023/A:1008856624790doi:10.1023/A:1008856624790.
Constructing-Excellence (2006) AVANTI - Constructing Excellence. Available from: http://constructingexcellence.org.uk/resources/avanti/ [Accessed 12 March 2017].
Constructivity (2016) Constructivity Model Server. Available from: http://www.constructivity.com/about.htm [Accessed 24 April 2016].
Corcho, O., Fernández-López, M. and Gómez-Pérez, A. (2003) Methodologies, tools and languages for building ontologies. Where is their meeting point? Data & Knowledge Engineering [online]. 46 (1), pp. 41–64. Available from: http://linkinghub.elsevier.com/retrieve/pii/S0169023X02001957doi:10.1016/S0169-023X(02)00195-7 [Accessed 18 December 2014].
Craven, D.J., Okraglik, H.M. and Eilenberg, I.M. (1994) Construction waste and a new design methodology. In: Proceedings of the First Conference of CIB TG. 1994 pp. 89–98.
Crawford, L. and Pollack, J. (2004) Hard and soft projects: a framework for analysis. International Journal of Project Management. 22 (8), pp. 645–653. doi:10.1016/j.ijproman.2004.04.004.
Creswell, J.W. (2013) Qualitative inquiry and research design: Choosing among five approaches. 3rd edition. London: Sage Publications.
Creswell, J.W. (2014) Research design: Qualitative, quantitative, and mixed methods approaches. London: Sage Publications.
Creswell, J.W. and Clark, V.L.P. (2007) Designing and conducting mixed methods research.
Crotty, M. (1998) The foundations of social research: meaning and perspective in the research process. London: Sage publications.
Crowther, P. (2005) Design for disassembly - themes and principles RAIA/BDP Environment Design Guide [online] p.pp. 1–9. Available from: http://eprints.qut.edu.au/2888/1/Crowther-
249
RAIA-2005.PDFdoi:10.1115/1.2991134.
Cyon (2009) Cyon Research 2009 Survey of Engineering Software Users. Available from: http://cyonresearch.com/Portals/0/files/whitepapers/Cyon Research 2009 User Survey.pdf [Accessed 12 May 2016].
Dainty, A.R.J. and Brooke, R.J. (2004) Towards improved construction waste minimisation: a need for improved supply chain integration? Structural Survey. 22 (1), pp. 20–29. doi:10.1108/02630800410533285.
Daniel Forgues D and Lauri Koskela (2008) Can Procurement affect Design Performance. Journal of Construction Procurement [online]. 14 (2), pp. 130–141. Available from: http://usir.salford.ac.uk/9363/1/2008_Can_procurement_affect_design_performance.PDF [Accessed 12 April 2017].
Davidson, E.J. (2005) Evaluation methodology basics: The nuts and bolts of sound evaluation. (no place) Sage.
Davies, A. and Mackenzie, I. (2014) Project complexity and systems integration: Constructing the London 2012 Olympics and Paralympics Games. International Journal of Project Management. 32 (5), pp. 773–790. doi:10.1016/j.ijproman.2013.10.004.
Davis, R., Shrobe, H. and Szolovits, P. (1993) What Is a Knowledge Representation ? AI magazine. 14 (1), pp. 17–33.
Davison, B. and Tingley, D.D. (2011) Design for deconstruction and material reuse. Proceedings of the ICE - Energy. 164 pp. 195–204. doi:10.1680/ener.2011.164.4.195.
DEFRA (2012) Construction, Demolition and Excavation waste generation estimate: England, 2008 to 2010. Available from: https://www.gov.uk/government/uploads/system/uploads/attachment data/ file/142006/CDE-generation-estimates.xls [online]. Available from: https://www.gov.uk/government/uploads/system/uploads/attachment_data/file/400534/CDE-generation-estimates.xls [Accessed 16 June 2014].
DEFRA (2011) Total UK Waste Generation by Sector 2004 to 2008. Available from: https://www.gov.uk/government/uploads/system/uploads/ attachment data/file/141980/wrfg01 gensec.xls [online]. Available from: https://www.gov.uk/government/uploads/system/uploads/ attachment data/file/141980/wrfg01 gensec.xls [Accessed 16 June 2014].
Denscombe, M. (2014) The Good Research Guide: For Small-Scale Social Research Projects: For small-scale social research projects. (no place) McGraw-Hill International.
Denzin, N. (1970) Strategies of multiple triangulation. The research act in sociology: A theoretical
250
introduction to sociological method. pp. 297–313.
Denzin, N.K. and Lincoln, Y.S. (2000) The discipline and practice of qualitative research. Handbook of qualitative research. pp. 1–28.
Ding, Z., Ng, F. and Li, J. (2014) A parallel multiple mediator model of knowledge sharing in architectural design project teams. International Journal of Project Management. 32 (1), pp. 54–65. doi:10.1016/j.ijproman.2013.04.004.
Dolan, P.J., Lampo, R.G. and Dearborn, J.C. (1999) Concepts for reuse and recycling of construction and demolition waste.
Dong, B., Lam, K.P., Huang, Y.C. and Dobbs, G.M. (2007) A comparative study of the IFC and gbXML informational infrastructures for data exchange in computational design support environments. In: Tenth International IBPSA Conference. 2007 pp. 1530–1537.
Eadie, R., Browne, M., Odeyinka, H., McKeown, C. and McNiff, S. (2013a) BIM implementation throughout the UK construction project lifecycle: An analysis. Automation in Construction. 36 pp. 145–151. doi:10.1016/j.autcon.2013.09.001.
Eadie, R., Browne, M., Odeyinka, H., McKeown, C. and McNiff, S. (2013b) BIM implementation throughout the UK construction project lifecycle: An analysis. Automation in Construction. 36 pp. 145–151. doi:10.1016/j.autcon.2013.09.001.
East, E.W. (2007) Construction Operations Building Information Exchange (COBIE): Requirements Definition and Pilot Implementation Standard Construction Engineering Research Laboratory ERDC/CERL TR-07-30.
Eastman, C., Lee, J., Jeong, Y. and Lee, J. (2009) Automatic rule-based checking of building designs. Automation in Construction [online]. 18 (8), pp. 1011–1033. Available from: http://www.sciencedirect.com/science/article/pii/S0926580509001198doi:10.1016/j.autcon.2009.07.002 [Accessed 18 January 2016].
Eastman, C., Teicholz, P., Sacks, R. and Liston, K. (2011) BIM handbook: A guide to building information modeling for owners, managers, designers, engineers and contractors. (no place) John Wiley & Sons.
Egan, J. (1998) Rethinking construction Department of the Environment, Transport and the Regions, London [online]. Available from: http://scholar.google.com/scholar?hl=en&btnG=Search&q=intitle:Rethinking+Construction#0%5Cnhttp://scholar.google.com/scholar?hl=en&btnG=Search&q=intitle:Rethinking+Construction.#0.
Eiben, A.E. and Smith, J. (2015) From evolutionary computation to the evolution of things. Nature [online]. 521 (7553), pp. 476–482. Available from:
251
http://www.nature.com/nature/journal/v521/n7553/full/nature14544.html%5Cnhttp://www.nature.com/nature/journal/v521/n7553/pdf/nature14544.pdfdoi:10.1038/nature14544.
Ekanayake, L.L. and Ofori, G. (2004) Building waste assessment score: design-based tool. Building and Environment. 39 (7), pp. 851–861.
Ekanayake, L.L. and Ofori, G. (2000) Construction material waste source evaluation. Proceedings of Strategies for a Sustainable Built Environment, Pretoria. pp. 23–25.
Ekvall, T., Assefa, G., Björklund, A., Eriksson, O. and Finnveden, G. (2007) What life-cycle assessment does and does not do in assessments of waste management. Waste management (New York, N.Y.) [online]. 27 (8), pp. 989–996. Available from: http://www.sciencedirect.com/science/article/pii/S0956053X07000724doi:10.1016/j.wasman.2007.02.015 [Accessed 1 August 2015].
Elbeltagi, E. and Dawood, M. (2011) Integrated visualized time control system for repetitive construction projects. Automation in Construction. 20 (7), pp. 940–953.
van den Ende, L. and van Marrewijk, A. (2014) The ritualization of transitions in the project life cycle: A study of transition rituals in construction projects. International Journal of Project Management. 32 (7), pp. 1134–1145. doi:10.1016/j.ijproman.2014.02.007.
Esin, T. and Cosgun, N. (2007) A study conducted to reduce construction waste generation in Turkey. Building and Environment. 42 (4), pp. 1667–1674.
Faniran, O. and Caban, G. (1998) Minimizing waste on construction project sites. Engineering, Construction and …. 5 (2), pp. 182–188.
Fatta, D., Papadopoulos, A., Avramikos, E., Sgourou, E., Moustakas, K., Kourmoussis, F., Mentzis, A. and Loizidou, M. (2003) Generation and management of construction and demolition waste in Greece—an existing challenge. Resources, Conservation and Recycling [online]. 40 (1), pp. 81–91. Available from: http://www.sciencedirect.com/science/article/pii/S0921344903000351doi:10.1016/S0921-3449(03)00035-1 [Accessed 25 February 2015].
Feng, Y., Teo, E.A.L., Ling, F.Y.Y. and Low, S.P. (2014) Exploring the interactive effects of safety investments, safety culture and project hazard on safety performance: An empirical analysis. International Journal of Project Management. 32 (6), pp. 932–943. doi:10.1016/j.ijproman.2013.10.016.
Field, A. (2005) Discovering Statistics using SPSS. 3rd edition. London: Sage Publications.
Fijani, E., Nadiri, A.A., Asghari Moghaddam, A., Tsai, F.T.-C. and Dixon, B. (2013) Optimization of DRASTIC method by supervised committee machine artificial intelligence to assess groundwater vulnerability for Maragheh–Bonab plain aquifer, Iran. Journal of Hydrology
252
[online]. 503 pp. 89–100. Available from: http://linkinghub.elsevier.com/retrieve/pii/S0022169413006252doi:10.1016/j.jhydrol.2013.08.038 [Accessed 21 July 2017].
Fogel, D.B. (2006) Evolutionary computation: toward a new philosophy of machine intelligence. (no place) John Wiley & Sons.
Foote, K.E. and Lynch, M. (1996) Geographic Information Systems as an integrating technology: context, concepts, and definitions. Austin, University of Texas.
Ford, N.F. (1985) Decision support systems and expert systems: A comparison. Information & Management [online]. 8 (1), pp. 21–26. Available from: http://linkinghub.elsevier.com/retrieve/pii/0378720685900667doi:10.1016/0378-7206(85)90066-7 [Accessed 17 April 2017].
Formoso, C.T., Isatto, E.L. and Hirota, E.H. (1999) Method for Waste Control in the Building Industry. In: Proceedings IGLC-7 - 7th Conference of the International Group for Lean Construction. 1999 Berkeley, Califonia: . pp. 325–334.
Formoso, C.T., Soibelman, L., De Cesare, C. and Isatto, E.L. (2002) Material Waste in Building Industry: Main Causes and Prevention. Journal of Construction Engineering and Management. 128 (4), pp. 316–325. doi:10.1061/(ASCE)0733-9364(2002)128:4(316).
Fowler, M. and Highsmith, J. (2001) The agile manifesto. Software Development [online]. 9 (August), pp. 28–35. Available from: http://www.pmp-projects.org/Agile-Manifesto.pdf%5Cnhttp://andrey.hristov.com/fht-stuttgart/The_Agile_Manifesto_SDMagazine.pdf%5Cnhttp://www.pmp-projects.org/Agile-Manifesto.pdfdoi:10.1177/004057368303900411.
Freire, J. and Alarcón, L.F. (2002) Achieving lean design process: Improvement methodology. Journal of Construction Engineering and management. 128 (3), pp. 248–256.
Fulford, R. and Standing, C. (2014) Construction industry productivity and the potential for collaborative practice. International Journal of Project Management. 32 (2), pp. 315–326. doi:10.1016/j.ijproman.2013.05.007.
Galiers, R. (1992) Information System Research: Issues, Methods and Practical Guidelines. Oxford: Blackwell Scientific.
Gamage, I.S.W., Osmani, M. and Glass, J. (2009) An investigation into the impact of procurement systems on waste generation: The contractors’ perspective. Proceedings of the Association of Researchers in Construction Management (ARCOM), Nottingham, UK. pp. 103–104.
Gann, D., Salter, A. and Whyte, J. (2003) Design Quality Indicator as a tool for thinking. Building Research & Information [online]. 31 (5), pp. 318–333. Available from:
253
http://www.tandfonline.com/doi/abs/10.1080/0961321032000107564doi:10.1080/0961321032000107564 [Accessed 25 June 2015].
Garlan, D., Allen, R. and Ockerbloom, J. (1995) Architectural mismatch: Why reuse is so hard. IEEE software. 12 (6), pp. 17.
Garlan, D. and Shaw, M. (1993) An introduction to software architecture. Advances in software engineering and knowledge engineering. 1 (3.4), .
Gavilan, R.M. and Bernold, L.E. (1994) Source evaluation of solid waste in building construction. Journal of Construction Engineering and Management. 120 (3), pp. 536–552.
Gay, L.R., Mills, G.E. and Airasian, P. (2006) Education research: Competencies for analysis and applications Columbus, OH: Pearson Education.
gbXML (2013) The Green Building XML (gbXML) open schema [online]. Available from: http://www.gbxml.org/ [Accessed 14 April 2014].
Geambaşu, C.V., Jianu, I., Jianu, I. and Gavrilă, A. (2011) Influence factors for the choice of a software development methodology. Accounting and Management Information Systems. 10 (4), pp. 479–494.
Geddes, S. (1996) Estimating for building and civil engineering works. Oxford: Butterworth-Heinemann.
Ghapanchi, A.H., Wohlin, C. and Aurum, A. (2014) Resources contributing to gaining competitive advantage for open source software projects: An application of resource-based theory. International Journal of Project Management. 32 (1), pp. 139–152. doi:10.1016/j.ijproman.2013.03.002.
Ghassemi, R. and Becerik-gerber, B. (2011) Transitioning to Integrated Project Delivery : Potential barriers and lessons learned Differences between ipd and traditional delivery methods. pp. 32–52.
Ghoddousi, P., Eshtehardian, E., Jooybanpour, S. and Javanmardi, A. (2013) Multi-mode resource-constrained discrete time–cost-resource optimization in project scheduling using non-dominated sorting genetic algorithm. Automation in Construction. 30 pp. 216–227.
Gibbs, G. (2007) Analysing Qualitative Data - The Sage Qualitative Research Kit [online].
Goedert, J.D. and Meadati, P. (2008) Integrating construction process documentation into building information modeling. Journal of construction engineering and management. 134 (7), pp. 509–516.
Gordon, O., Herrera, F., Hoffmann, F. and Luis, M. (2001) Genetic fuzzy systems: Fuzzy
254
Knowledge Extraction by Evolutionary Algorithms. Scientific Publishing Co. Pte. Ltd, UK [online]. Available from: http://citeseerx.ist.psu.edu/viewdoc/download?doi=10.1.1.48.9985&rep=rep1&type=pdfdoi:10.1142/4177.
Gorgolewski, M. (2006) The implications of reuse and recycling for the design of steel buildings. Canadian Journal of Civil Engineering. 33 (4), pp. 489–496.
Gray, D.E. (2009) Doing Research in the Real World. London: Sage Publications Ltd.
Greenwood, R. (2003) Construction Waste Minimisation: Good Practice Guide. United Kingdom: Cardiff University, Centre for Research in the Built Environment (CRiBE).
Grilo, A. and Jardim-Goncalves, R. (2010) Value proposition on interoperability of BIM and collaborative working environments. Automation in Construction [online]. 19 (5), pp. 522–530. Available from: http://www.sciencedirect.com/science/article/pii/S0926580509001733doi:10.1016/j.autcon.2009.11.003 [Accessed 13 October 2014].
Grosan, C. and Abraham, A. (2011) Hybrid Intelligent Systems. In: Intelligent Systems [online]. pp. 423–450. Available from: http://link.springer.com/10.1007/978-3-642-21004-4_17doi:10.1007/978-3-642-21004-4_17.
Gruber, T.R. (1993) Toward Principles for the Design of Ontologies Used for Knowledge Sharing. International journal of human-computer studies.
Guba, E. and Lincoln, Y. (1994) Competing paradigms in qualitative research. Handbook of qualitative research. pp. 105–117.
Guba, E.G. and Lincoln, Y.S. (2001) Guidelines and checklist for constructivist (aka fourth generation) evaluation. Design, monitoring and evaluation for peacebuilding. Available online: http://www.wmich.edu/evalctr/checklists/constructivisteval.htm, Accessed 23 September 2016 [online]. Available from: http://www.wmich.edu/evalctr/checklists/constructivisteval.htm [Accessed 23 September 2015].
Guy, B. and Ciarimboli, N. (2008) DfD: Design for Disassembly in the Built Environment: a Guide to Closed-loop Design and Building. (no place) Hamer Center.
Guy, B., Shell, S. and Esherick, H. (2006) Design for Deconstruction and Materials Reuse. In: Proceedings of the CIB Task Group 39. 2006 pp. 189–209.
Hancock, B., Ockleford, E. and Windridge, K. (1998) An introduction to qualitative research. Nottingham: Trent focus group.
255
Hartono, B., Sulistyo, S.R., Praftiwi, P.P. and Hasmoro, D. (2014) Project risk: Theoretical concepts and stakeholders’ perspectives. International Journal of Project Management. 32 (3), pp. 400–411. doi:10.1016/j.ijproman.2013.05.011.
Healy, M. and Perry, C. (2000) Comprehensive criteria to judge validity and reliability of qualitative research within the realism paradigm. Qualitative Market Research: An International Journal. 3 (3), pp. 118–126.
Heemels, W.P.M.., Lehmann, D., Lunze, J. and De Schutter, B. (2009) Introduction to Hybrid Systems. In: Handbook of Hybrid Systems Control: Theory, Tools, Applications. pp. 3–30. doi:10.1007/0-8176-4404-0_5.
Hegazy, T., Fazio, P. and Moselhi, O. (1994) Developing Practical Neural Network Applications Using Back-Propagation Computer-Aided Civil and Infrastructure Engineering 9 (2) p.pp. 145–159. doi:10.1111/j.1467-8667.1994.tb00369.x.
van den Helm, P., Böhms, M. and van Berlo, L. (2010) IFC-based clash detection for the open-source BIMserver. In: Computing in civil and building engineering, proceedings of the international conference. Nottingham University Press, Nottingham, UK. 2010 pp. 181.
Hijazi, I., Ehlers, M. and Zlatanova, S. (2010) BIM for geo-analysis (BIM4GEOA): set up of 3D information system with open source software and open specification (OS). In: 5th International 3D Geoinfo Conference, Berlin, November 3-2, 2010. International archives of photogrammetry, remote sensing and spatial information sciences, vol. 38-4/W15. 2010 (no place) ISPRS.
HM-Government (2012) Industrial Strategy: Governement and Idustry in partnership [online] Vol.1. Available from: http://hdl.handle.net/10204/3364doi:10.1016/j.aei.2007.03.001.
Hobbs, G., Blackwell, M. and Adams, K. (2011) Understanding and predicting construction waste. 164 pp. 239–245.
Hobbs, G. and Hurley, J. (2001) Deconstruction and the reuse of construction materials. Deconstruction and Materials Reuse: Technology, Economic, and Policy. pp. 98.
Hola, B. and Schabowicz, K. (2010) Estimation of earthworks execution time cost by means of artificial neural networks. Automation in Construction. 19 (5), pp. 570–579.
Hong, T., Cho, K., Hyun, C. and Han, S. (2011) Simulation-Based Schedule Estimation Model for ACS-Based Core Wall Construction of High-Rise Building. Journal of Construction Engineering and Management. 137 (6), pp. 393–402. doi:10.1061/(ASCE)CO.1943-7862.0000300.
Hu, Z.-Z., Zhang, X.-Y., Wang, H.-W. and Kassem, M. (2016) Improving interoperability between architectural and structural design models: An industry foundation classes-based approach
256
with web-based tools. Automation in Construction [online]. Available from: http://www.sciencedirect.com/science/article/pii/S0926580516300152doi:10.1016/j.autcon.2016.02.001 [Accessed 18 March 2016].
Huovila, P., Koskela, L. and Lautanala, M. (1997) Fast or concurrent: the art of getting construction improved. Lean construction. 20 (2), pp. 143–159.
ICE (2008) Institution of Civil Engineers (ICE) Demolition Protocol. Available from: http://www.ice.org.uk/Information-resources/Document-Library/Demolition-Protocol-2008 [online]. Available from: http://www.ice.org.uk/Information-resources/Document-Library/Demolition-Protocol-2008 [Accessed 23 August 2014].
IFC (2008) Industry Foundation Classes (IFC) data model [online]. Available from: http://www.buildingsmart.org/standards/ifc [Accessed 14 April 2014].
IFChub (2017) IFC server for construction and built environment. Available from: http://ifchub.com/ [Accessed 24 January 2017].
IFCWebServer (2016) IFC Web Server | Your BIM data model server and online viewer. Available from: http://ifcwebserver.org/ [Accessed 24 April 2016].
Ilozor, B.D. and Kelly, D.J. (2012) Building Information Modeling and Integrated Project Delivery in the Commercial Construction Industry : A Conceptual Study. Journal of Engineering, Project, and Production Management. 2 pp. 23–36.
Iorio, J. and Taylor, J.E. (2014) Boundary object efficacy: The mediating role of boundary objects on task conflict in global virtual project networks. International Journal of Project Management. 32 (1), pp. 7–17. doi:10.1016/j.ijproman.2013.04.001.
Irani, Z. and Kamal, M.M. (2014) Intelligent Systems Research in the Construction Industry. Expert Systems with Applications. 41 (4), pp. 934–950. doi:10.1016/j.eswa.2013.06.061.
Irizarry, J., Karan, E.P. and Jalaei, F. (2013) Integrating BIM and GIS to improve the visual monitoring of construction supply chain management. Automation in Construction. 31 pp. 241–254. doi:10.1016/j.autcon.2012.12.005.
Ishii, N., Takano, Y. and Muraki, M. (2014) An order acceptance strategy under limited engineering man-hours for cost estimation in Engineering–Procurement–Construction projects. International Journal of Project Management. 32 (3), pp. 519–528. doi:10.1016/j.ijproman.2013.07.009.
Isikdag, U., Underwood, J. and Aouad, G. (2008) An investigation into the applicability of building information models in geospatial environment in support of site selection and fire response management processes. Advanced engineering informatics. 22 (4), pp. 504–519.
257
Ison, R.L. (2008) Systems Thinking and Practice for Action Research. In: Peter W. Reason and Hilary Bradbury (eds.). The Sage Handbook of Action Research Participative Inquiry and Practice 2nd edition. London: SAGE publications. pp. 139–158.
Jackson, C. and Prawel, D. (2013) The 2013 State of 3D Collaboration and Interoperability Report. Available from: http://www.plm.automation.siemens.com/en_us/Images/Lifecycle-Insights-2013-Collaboration-Interoperability_tcm1023-210162.pdf [Accessed 24 May 2016].
Jackson, R.H.G. and Wood, A. (2013) The performance of insolvency prediction and credit risk models in the UK: A comparative study. British Accounting Review. 45 (3), pp. 183–202. doi:10.1016/j.bar.2013.06.009.
Jafarzadeh, R., Ingham, J.M. and Wilkinson, S. (2014) A seismic retrofit cost database for buildings with a framed structure. Earthquake Spectra. 30 (2), pp. 625–637.
Jaillon, L. and Poon, C.S. (2014a) Life cycle design and prefabrication in buildings: A review and case studies in Hong Kong. Automation in Construction. 39 pp. 195–202. doi:10.1016/j.autcon.2013.09.006.
Jaillon, L. and Poon, C.S. (2014b) Life cycle design and prefabrication in buildings: A review and case studies in Hong Kong. Automation in Construction [online]. 39 pp. 195–202. Available from: http://linkinghub.elsevier.com/retrieve/pii/S0926580513001556doi:10.1016/j.autcon.2013.09.006 [Accessed 23 December 2014].
Jaillon, L., Poon, C.S. and Chiang, Y.H. (2009) Quantifying the waste reduction potential of using prefabrication in building construction in Hong Kong. Waste management (New York, N.Y.). 29 (1), pp. 309–320. doi:10.1016/j.wasman.2008.02.015.
Jalali, S. (2007) Quantification of Construction Waste Amount. In: 6th International Technical Conference of Waste. 2007
Jang, J.-S.R. (1993) ANFIS : Adap tive-Ne twork-Based Fuzzy Inference System. IEEE TRANSACTIONS ON SYSTEMS, MAN, AND CYBERNETICS. 23 (3), .
Jang, J.-S.R. (1996) Input selection for ANFIS learning. Proceedings of IEEE 5th International Fuzzy Systems. 2 pp. 1493–1499. doi:10.1109/FUZZY.1996.552396.
Ji, S.-H., Park, M. and Lee, H.-S. (2011) Case adaptation method of case-based reasoning for construction cost estimation in Korea. Journal of Construction Engineering and Management. 138 (1), pp. 43–52.
Jiao, Y., Zhang, S., Li, Y., Wang, Y. and Yang, B. (2013) Towards cloud Augmented Reality for construction application by BIM and SNS integration. Automation in Construction. 33 pp.
258
37–47. doi:10.1016/j.autcon.2012.09.018.
Jordani, D.A. (2010) BIM and FM: The portal to lifecycle facility management. Journal of Building Information Modeling. 6 pp. 13–16.
Juan, D. and Zheng, Q. (2014) Cloud and Open BIM-Based Building Information Interoperability Research. Journal of Service Science and Management. 7 (2), pp. 47–56.
Jun, L., Qiuzhen, W. and Qingguo, M. (2011) The effects of project uncertainty and risk management on IS development project performance: A vendor perspective. International Journal of Project Management [online]. 29 (7), pp. 923–933. Available from: http://www.sciencedirect.com/science/article/pii/S0263786310001468doi:10.1016/j.ijproman.2010.11.002 [Accessed 13 December 2014].
Jung, Y. and Joo, M. (2011) Building information modelling (BIM) framework for practical implementation. Automation in Construction. 20 (2), pp. 126–133. doi:10.1016/j.autcon.2010.09.010.
Kabak, M., Köse, E., Kırılmaz, O. and Burmaoğlu, S. (2014) A fuzzy multi-criteria decision making approach to assess building energy performance. Energy and Buildings. 72 pp. 382–389.
Keys, A., Baldwin, A. and Austin, S. (2000) DESIGNING TO ENCOURAGE WASTE MINIMISATION IN THE CONSTRUCTION INDUSTRY. Proceedings of CIBSE National Conference, Dublin, September.
Khanh, H.D. and Kim, S.Y. (2014) Identifying causes for waste factors in high-rise building projects: A survey in Vietnam. KSCE Journal of Civil Engineering [online]. 18 (4), pp. 865–874. Available from: http://link.springer.com/10.1007/s12205-014-1327-zdoi:10.1007/s12205-014-1327-z.
Khoramshahi, F. (2007) Waste Management Practices in Construction Sites. International Project Management Conference. pp. 1–13.
Kibert, C.J. (2003) Deconstruction: the start of a sustainable materials strategy for the built environment. Industry and environment. 26 (2–3), pp. 84–88.
Kibert, C.J. (2008) Sustainable Construction: Green Building Design and Delivery: Green Building Design and Delivery. (no place) John Wiley & Sons.
Kim, G., Shin, J., Kim, S. and Shin, Y. (2013) Comparison of school building construction costs estimation methods using regression analysis, neural network, and support vector machine. Journal of Building Construction and … [online]. 1 (March), pp. 1–7. Available from: http://www.scirp.org/journal/PaperInformation.aspx?paperID=29576.
259
Kim, G.H., Seo, D.S. and Kang, K.I. (2005) Hybrid models of neural networks and genetic algorithms for predicting preliminary cost estimates. Journal of Computing in Civil Engineering. 19 (2), pp. 208–211.
Kim, K.J. and Kim, K. (2010) Preliminary cost estimation model using case-based reasoning and genetic algorithms. Journal of Computing in Civil Engineering. 24 (6), pp. 499–505.
Kim, S. (2013) Hybrid forecasting system based on case-based reasoning and analytic hierarchy process for cost estimation. Journal of Civil Engineering and Management. 19 (1), pp. 86–96.
Kircher, M., Jain, P., Corsaro, A. and Levine, D. (2001) Distributed extreme programming. Extreme Programming and Flexible Processes in Software Engineering [online]. (September 2013), pp. 66–71. Available from: http://cf.agilealliance.org/articles/system/article/file/1057/file.pdf.
Klöpffer, W. (2006) The role of SETAC in the development of LCA. The International Journal of Life Cycle Assessment. 11 (1), pp. 116–122.
Koonce, D., Huang, L. and Judd, R. (1998) EQL an express query language. Computers & industrial engineering. 35 (1), pp. 271–274.
Koskela, L. (2007) Foundations of concurrent engineering. Concurrent Engineering in construction projects. 1 pp. 12–29.
Koskela, L. and Howell, G. (2008) The underlying theory of project management is obsolete. IEEE Engineering Management Review. 36 (2), pp. 22–34. doi:10.1109/EMR.2008.4534317.
Koskela, L.J. (2004) Moving on-beyond lean thinking. Lean Construction Journal. 1 (1), pp. 24–37.
Kota, S., Haberl, J.S., Clayton, M.J. and Yan, W. (2014) Building Information Modeling (BIM)-based daylighting simulation and analysis. Energy and Buildings. 81 pp. 391–403. doi:10.1016/j.enbuild.2014.06.043.
Kozlovská, M. and Spišáková, M. (2013) Contruction waste generation across construction project life-cycle. pp. 687–695. doi:10.5592/otmcj.2013.1.5.
Krauss, S.E. and Putra, U. (2005) Research Paradigms and Meaning Making : A Primer. 10 (4), pp. 758–770.
Kuhn, T. (1970) The Structure of Scientific Revolutions. 2nd edition. Chicago, IL: University of Chicago Press.
Kumar, B., Cheng, J.C.P. and McGibbney, L. (2010) Cloud Computing and its Implications for
260
Construction IT. In: Computing in Civil and Building Engineering, Proceedings of the International Conference. 2010 (no place) Nottingham University press. pp. 312.
Kwak, Y.H., Walewski, J., Sleeper, D. and Sadatsafavi, H. (2014) What can we learn from the Hoover Dam project that influenced modern project management? International Journal of Project Management. 32 (2), pp. 256–264. doi:10.1016/j.ijproman.2013.04.002.
de la Fraga, L., Coello Coello, C., Fraga, L. de la and Coello, C. (2011) A Review of Applications of Evolutionary Algorithms in Pattern Recognition. Pattern Recognition, Machine Intelligence and Biometrics [online]. pp. 3–28. Available from: http://link.springer.com/chapter/10.1007/978-3-642-22407-2_1%5Cnhttp://dx.doi.org/10.1007/978-3-642-22407-2_1doi:10.1007/978-3-642-22407-2_1.
Laakso, M. and Kiviniemi, A. (2012) The IFC standard - A review of history, development, and standardization Electronic Journal of Information Technology in Construction 17 p.pp. 134–161.
Laakso, M., Student, D., Science, I.S. and Kiviniemi, A. (2012) THE IFC STANDARD - A REVIEW OF HISTORY , DEVELOPMENT , AND STANDARDIZATION. 17 (May), pp. 134–161.
de Laat, R. and van Berlo, L. (2011) Integration of BIM and GIS: The development of the CityGML GeoBIM extension. In: Advances in 3D geo-information sciences. (no place) Springer. pp. 211–225.
Langdon, D. (2011) Designing out Waste : a design team guide for buildings Waste and Resource Action Plan (WRAP) 462.
Lanzola, G., Quaglini, S. and Stefanelli, M. (1995) Knowledge-acquisition tools for medical knowledge-based systems. In: Methods of Information in Medicine. 1995 pp. 25–39.
Lassandro, P. (2003) Deconstruction case study in Southern Italy: economic and environmental assessment. In: CIB Publication. 2003
Latham, M. (1994) Constructing the team: joint review of procurement and contractual arrangements in the United Kingdom construction industry: final report. Available from: http://www.cewales.org.uk/cew/wp-content/uploads/Constructing-the-team-The-Latham-Report.pdf [online]. Available from: http://www.cewales.org.uk/cew/wp-content/uploads/Constructing-the-team-The-Latham-Report.pdf.
Leandri, S.J. (2001) Measures that matter: How to fine-tune your performance measures. Journal for Quality & Participation. 24 (1), pp. 39.
Lee, D., Kim, S. and Kim, S. (2016) Development of Hybrid Model for Estimating Construction
261
Waste for Multifamily Residential Buildings Using Artificial Neural Networks and Ant Colony Optimization. Sustainability. 8 (9), pp. 870.
Lee, J.K. (2011) Building Environment Rule and Analysis (BERA) Language. (no place) PhD Thesis: Georgia Institute of Technology.
Lee, S.-K., Kim, K.-R. and Yu, J.-H. (2014) BIM and ontology-based approach for building cost estimation. Automation in construction. 41 pp. 96–105.
Lenfle, S. (2014) Toward a genealogy of project management: Sidewinder and the management of exploratory projects. International Journal of Project Management. 32 (6), pp. 921–931. doi:10.1016/j.ijproman.2013.10.017.
Li, H., Chen, Z., Yong, L. and Kong, S.C.W. (2005) Application of integrated GPS and GIS technology for reducing construction waste and improving construction efficiency. Automation in Construction. 14 (3), pp. 323–331. doi:10.1016/j.autcon.2004.08.007.
Li, H.M. and Wang, Z.F. (2009) Applying self-adaptive ant colony optimization for construction time-cost optimization. In: 2009 International Conference on Management Science and Engineering - 16th Annual Conference Proceedings, ICMSE 2009. 2009 pp. 283–289. doi:10.1109/ICMSE.2009.5317463.
Li, J., Ding, Z., Mi, X. and Wang, J. (2013) A model for estimating construction waste generation index for building project in China. Resources, Conservation and Recycling. 74 pp. 20–26. doi:10.1016/j.resconrec.2013.02.015.
Li, Y. and Zhang, X. (2013) Web-based construction waste estimation system for building construction projects. Automation in Construction. 35 (1), pp. 142–156. doi:10.1016/j.autcon.2013.05.002.
Liang, T. (1987) User interface design for decision support systems: A self-adaptive approach. Information & Management [online]. 12 (4), pp. 181–193. Available from: http://www.sciencedirect.com/science/article/pii/0378720687900413doi:10.1016/0378-7206(87)90041-3 [Accessed 10 January 2015].
Lichtig, W.A. (2010) The Integrated Agreement for Lean Project Delivery. In: Improving Healthcare through Built Environment Infrastructure. pp. 85–101. doi:10.1002/9781444319675.ch6.
Lindstrom, L. and Jeffries, R. (2004) Extreme Programming and Agile Software Development Methodologies. Information Systems Management [online]. 21 (3), pp. 41–52. Available from: http://www.tandfonline.com/doi/pdf/10.1201/1078/44432.21.3.20040601/82476.7%5Cnhttp://www.tandfonline.com/doi/abs/10.1201/1078/44432.21.3.20040601/82476.7doi:10.1201/1078/44432.21.3.20040601/82476.7.
262
Liu, S., Duffy, A.H.B., Whitfield, R.I. and Boyle, I.M. (2009) Integration of decision support systems to improve decision support performance. Knowledge and Information Systems [online]. 22 (3), pp. 261–286. Available from: http://link.springer.com/10.1007/s10115-009-0192-4doi:10.1007/s10115-009-0192-4 [Accessed 29 December 2014].
Liu, S. and Wang, L. (2014) Understanding the impact of risks on performance in internal and outsourced information technology projects: The role of strategic importance. International Journal of Project Management. 32 (8), pp. 1494–1510. doi:10.1016/j.ijproman.2014.01.012.
Liu, T. and Wilkinson, S. (2014) Large-scale public venue development and the application of Public–Private Partnerships (PPPs). International Journal of Project Management. 32 (1), pp. 88–100. doi:10.1016/j.ijproman.2013.01.003.
Liu, Z., Osmani, M., Demian, P. and Baldwin, A. (2011) The potential use of BIM to aid construction waste minimalisation. In: Proceedings of the CIB W78-W102 2011: International Conference. 2011 Sophia Antipolis, France: .
Livermore, J. (2007) Factors that impact implementing an agile software development methodology. Proceedings 2007 IEEE SoutheastCon [online]. pp. 82–86. Available from: http://apps.webofknowledge.com.db.ub.oru.se/full_record.do?product=WOS&search_mode=GeneralSearch&qid=3&SID=P2awwaI4gR5EcT2yRvu&page=6&doc=56doi:10.1109/SECON.2007.342860.
Llatas, C. (2011) A model for quantifying construction waste in projects according to the European waste list. Waste management (New York, N.Y.). 31 (6), pp. 1261–1276. doi:10.1016/j.wasman.2011.01.023.
Long, T., Yoon, I., Porter, A., Sussman, A. and Memon, A. (2012) Overlap and Synergy in Testing Software Components across Loosely Coupled Communities. In: Software Reliability Engineering (ISSRE), 2012 IEEE 23rd International Symposium on. 2012 (no place) IEEE. pp. 171–180.
Lopez, R. and Love, P.E.D. (2012) Design Error Costs in Construction Projects Journal of Construction Engineering and Management 138 p.pp. 585–593. doi:10.1061/(ASCE)CO.1943-7862.0000454.
Lu, W., Yuan, H., Li, J., Hao, J.J.L., Mi, X. and Ding, Z. (2011) An empirical investigation of construction and demolition waste generation rates in Shenzhen city, South China. Waste management. 31 (4), pp. 680–687.
MacLeamy, P. (2004) MacLeamy Curve. Collaboration, Integrated Information, and the Project Lifecycle in Building Design and Construction and Operation (WP-1202).
Magnaye, R., Sauser, B., Patanakul, P., Nowicki, D. and Randall, W. (2014) Earned readiness
263
management for scheduling, monitoring and evaluating the development of complex product systems. International Journal of Project Management. 32 (7), pp. 1246–1259. doi:10.1016/j.ijproman.2014.01.009.
Maier, E.R. and Branzei, O. (2014) ‘On time and on budget’: Harnessing creativity in large scale projects. International Journal of Project Management. 32 (7), pp. 1123–1133. doi:10.1016/j.ijproman.2014.02.009.
Maliene, V., Grigonis, V., Palevičius, V. and Griffiths, S. (2011) Geographic information system: Old principles with new capabilities. Urban Design International. 16 (1), pp. 1–6.
Manning, R. and Messner, J. (2008) Case studies in BIM implementation for programming of healthcare facilities. In: ITcon - IT in Construction, 13 (Special Issue - Case studies of BIM use). 2008 (no place) ITcon.
Masudi, A.F., Rosmani, C., Hassan, C., Mahmood, N.Z. and Mokhtar, S.N. (2011) Construction Waste Quantification and Benchmarking : A Study in Klang Valley , Malaysia. 5 pp. 909–916.
Matsueda, N. and Nagase, Y. (2012) An economic analysis of the packaging waste recovery note system in the UK. Resource and Energy Economics. 34 (4), pp. 669–679.
Mazairac, W. and Beetz, J. (2013) BIMQL–An open query language for building information models. Advanced Engineering Informatics. 27 (4), pp. 444–456.
Mcdonald, B. and Smithers, M. (1998) Implementing a waste management plan during the construction phase of a project: a case study. Construction Management and Economics. 16 (1), pp. 71–78. doi:10.1080/014461998372600.
McDonough, W. and Braungart, M. (2002) Remaking the way we make things: Cradle to cradle. New York: North Point Press.
Mcgrath, C. (2001) Waste minimisation in practice. Resources, Conservation and Recycling. 32 (1), pp. 227–238.
McKechnie, E. and Brown, E. (2007) Achieving effective waste minimisation through design. Waste & Resources Action Programme (WRAP), Oxen.
Melin, P., Castillo, O., Kacprzyk, J. and Pedrycz, W. (2007) Design of Hybrid Intelligent Systems [online].
Mihic, M., Sertic, J. and Zavrski, I. (2014) Integrated Project Delivery as Integration between Solution Development and Solution Implementation. Procedia - Social and Behavioral Sciences [online]. 119 pp. 557–565. Available from: http://www.sciencedirect.com/science/article/pii/S1877042814021533doi:10.1016/j.sbspro.
264
2014.03.062 [Accessed 27 December 2014].
Mills, T.H., Showalter, E. and Jarman, D. (1999) A cost effective waste management plan. Cost Engineering. 41 (3), pp. 35–43.
Minsky, N. (1975) A framework for representing knowledge in the psychology of computer vision (Winston O., ed) McGraw-Hill. New York.
Mohanty, R., Ravi, V. and Patra, M.R. (2013) Hybrid intelligent systems for predicting software reliability. Applied Soft Computing Journal. 13 (1), pp. 189–200. doi:10.1016/j.asoc.2012.08.015.
Mokhtar, S.N., Mahmood, N.Z., Che Hassan, C.R., Masudi, A.F. and Sulaiman, N.M. (2011) Factors that contribute to the generation of construction waste at sites. Advanced Materials Research. 163 pp. 4501–4507.
Morgan, D.L. (2007) Paradigms Lost and Pragmatism Regained: Methodological Implications of Combining Qualitative and Quantitative Methods. Journal of Mixed Methods Research. 1 (1), pp. 48–76. doi:10.1177/2345678906292462.
Morrissey, a J. and Browne, J. (2004) Waste management models and their application to sustainable waste management. Waste management (New York, N.Y.). 24 (3), pp. 297–308. doi:10.1016/j.wasman.2003.09.005.
Mosa, A.M., Taha, M.R., Ismail, A. and Rahmat, R.A.O.K. (2013) A diagnostic expert system to overcome construction problems in rigid highway pavement. Journal of Civil Engineering and Management. 19 (6), pp. 846–861.
Moustakas, C. (1994) Phenomenological research methods. (no place) Sage Publications.
Munakata, T., Jani, Y. and Engineering, S. (1994) Fuzzy systems: An overview. Communications of the ACM [online]. 37 (3), pp. 69–77. Available from: http://doc.utwente.nl/72926/1/Top91qualitative.pdf.
Musca, G.N., Mellet, C., Simoni, G., Sitri, F. and de Vogüé, S. (2014) ‘Drop your boat!’: The discursive co-construction of project renewal. The case of the Darwin mountaineering expedition in Patagonia. International Journal of Project Management. 32 (7), pp. 1157–1169. doi:10.1016/j.ijproman.2014.02.006.
Nagapan, S., Rahman, I.A., Asmi, A., Hameed, A. and Zin, R.M. (2012a) Identifying Causes of Construction Waste - Case of Central Region of Peninsula Malaysia. International Journal of Integrated Engineering, Vol. 4 No. 2 (2012) p. 22-28. 4 (2), pp. 22–28.
Nagapan, S., Rahman, I.A., Asmi, A., Memon, A.H. and Latif, I. (2012b) Issues on Construction Waste : The Need for Sustainable Waste Management. (Chuser), pp. 329–334.
265
Nepal, M.P., Staub-French, S., Pottinger, R. and Webster, A. (2012) Querying a building information model for construction-specific spatial information. In: Advanced Engineering Informatics. 2012 pp. 904–923. doi:10.1016/j.aei.2012.08.003.
Nepal, M.P., Zhang, J., Webster, A., Staub-French, S., Pottinger, R. and Lawrence, M. (2009) Querying IFC-based building information models to support construction management functions. Proceeding of the 2009 Construction Research Congress [online]. pp. 506–515. Available from: http://ascelibrary.org/doi/abs/10.1061/41020(339)52doi:10.1061/41020(339)52.
Nerur, S., Mahapatra, R. and Mangalaraj, G. (2005) Challenges of Migrating to Agile Methodologies. Communications of the ACM. 48 (2), pp. 72–78. doi:10.1145/1060710.1060712.
Neuman, W.L. (2009) Social Research Methods: Qualitative and Qualitative approaches. Boston: Allyn and Bacon.
O’Cathain, A., Murphy, E. and Nicholl, J. (2007) Why, and how, mixed methods research is undertaken in health services research in England: a mixed methods study. BMC health services research. 7 (1), pp. 85. doi:10.1186/1472-6963-7-85.
Omkar, S.N., Senthilnath, J., Khandelwal, R., Naik, G.N. and Gopalakrishnan, S. (2011) Artificial Bee Colony (ABC) for multi-objective design optimization of composite structures. Applied Soft Computing. 11 (1), pp. 489–499.
Onwuegbuzie, A.J. and Leech, N.L. (2005) On Becoming a Pragmatic Researcher: The Importance of Combining Quantitative and Qualitative Research Methodologies. International Journal of Social Research Methodology. 8 (5), pp. 375–387. doi:10.1080/13645570500402447.
Ortiz, O., Castells, F. and Sonnemann, G. (2009) Sustainability in the construction industry: A review of recent developments based on LCA. Construction and Building Materials [online]. 23 (1), pp. 28–39. Available from: http://www.sciencedirect.com/science/article/pii/S0950061807003005doi:10.1016/j.conbuildmat.2007.11.012 [Accessed 14 July 2014].
Osmani, M. (2011) Construction waste. Waste: A Handbook for Management, Elsevier. pp. 207–218.
Osmani, M. (2012a) Construction waste minimization in the UK: current pressures for change and approaches. Procedia - Social and Behavioral Sciences. 40 pp. 37–40.
Osmani, M. (2012b) Construction Waste Minimization in the UK: Current Pressures for Change and Approaches. Procedia - Social and Behavioral Sciences. 40 pp. 37–40. doi:10.1016/j.sbspro.2012.03.158.
266
Osmani, M. (2013) Design waste mapping: a project life cycle approach. Proceedings of the ICE-Waste and Resource Management. 166 (3), pp. 114–127.
Osmani, M., Glass, J. and Price, A.D.F. (2008) Architects’ perspectives on construction waste reduction by design. Waste Management. 28 (7), pp. 1147–1158.
Otto, M. (1990) Fuzzy expert systems [online].
Oyedele, L.O. (2013) Analysis of architects’ demotivating factors in design firms. International Journal of Project Management [online]. 31 (3), pp. 342–354. Available from: http://dx.doi.org/10.1016/j.ijproman.2012.11.009doi:10.1016/j.ijproman.2012.11.009 [Accessed 25 October 2015].
Oyedele, L.O., Ajayi, S.O. and Kadiri, K.O. (2014) Use of recycled products in UK construction industry: An empirical investigation into critical impediments and strategies for improvement. Resources, Conservation and Recycling [online]. 93 pp. 23–31. Available from: http://www.sciencedirect.com/science/article/pii/S0921344914002018doi:10.1016/j.resconrec.2014.09.011 [Accessed 20 November 2015].
Oyedele, L.O., Regan, M., von Meding, J., Ahmed, A., Ebohon, O.J. and Elnokaly, A. (2013) Reducing waste to landfill in the UK: identifying impediments and critical solutions. World Journal of Science, Technology and Sustainable Development. 10 (2), pp. 131–142.
Oyedele, L.O. and Tham, K.W. (2007) Clients’ assessment of architects’ performance in building delivery process: Evidence from Nigeria. Building and Environment [online]. 42 (5), pp. 2090–2099. Available from: http://www.sciencedirect.com/science/article/pii/S0360132306001107doi:10.1016/j.buildenv.2005.06.030 [Accessed 15 March 2016].
Parnas, D.L. and Clements, P.C. (1986) A Rational Design Process: How And Why To Fake It Transactions on Software Engineering 12 (2) p.pp. 251–257. doi:10.1007/3-540-15199-0_6.
Pasquire, C.. and Gibb, A.G.F. (2002) Considerations for assessing the benefits of standardisation and pre- assembly in construction. Journal of Financial Management of Property and Construction. Vol. 7 pp. 151–161.
Patton, M.Q. (1997) Utilisation-focused evaluation: the new century text. Utilisation-focused evaluation: the new century text.
Pazlar, T. and Turk, Ž. (2008) Interoperability in practice: Geometric data exchange using the IFC standard. Electronic Journal of Information Technology in Construction. 13 pp. 362–380.
Petroutsatou, K., Georgopoulos, E., Lambropoulos, S. and Pantouvakis, J.P. (2011) Early cost estimating of road tunnel construction using neural networks. Journal of construction
267
engineering and management. 138 (6), pp. 679–687.
Phillips, P.S., Tudor, T., Bird, H. and Bates, M. (2011) A critical review of a key waste strategy initiative in England: Zero waste places projects 2008–2009. Resources, Conservation and Recycling. 55 (3), pp. 335–343.
Polkinghorne, D.E. (1989) Phenomenological research methods. In: Existential-phenomenological perspectives in psychology. (no place) Springer. pp. 41–60.
Pollack, J. (2007) The changing paradigms of project management. International Journal of Project Management. 25 (3), pp. 266–274.
Poon, C.S. (2007) Reducing construction waste. Waste management (New York, N.Y.) [online]. 27 (12), pp. 1715–1716. Available from: http://www.ncbi.nlm.nih.gov/pubmed/17904489doi:10.1016/j.wasman.2007.08.013 [Accessed 29 December 2014].
Poon, C.S., Yu, A.T.W. and Jaillon, L. (2004) Reducing building waste at construction sites in Hong Kong. Construction Management and Economics. 22 (5), pp. 461–470. doi:10.1080/0144619042000202816.
Poon, C.S., Yu, A.T.W., Wong, S.W. and Cheung, E. (2004) Management of construction waste in public housing projects in Hong Kong. Construction Management & Economics. 22 (7), pp. 675–689.
Porwal, A. and Hewage, K.N. (2013) Building Information Modeling (BIM) partnering framework for public construction projects. Automation in Construction. 31 pp. 204–214. doi:10.1016/j.autcon.2012.12.004.
Qian, G., Wang, H. and Feng, X. (2013) Generalized hesitant fuzzy sets and their application in decision support system. Knowledge-Based Systems [online]. 37 pp. 357–365. Available from: http://linkinghub.elsevier.com/retrieve/pii/S0950705112002390doi:10.1016/j.knosys.2012.08.019 [Accessed 10 January 2015].
RIBA (2016) National BIM Report 2016. Available from: https://www.thenbs.com/-/media/uk/files/pdf/bim-report-2016.pdf?la=en [Accessed 23 October 2016].
RIBA (2013) RIBA Plan of Work. Available from: https://www.architecture.com/files/ribaprofessionalservices/practice/ribaplanofwork2013template.pdf [Accessed 31 October 2015].
Rosmani, C. and Hassan, C. (2012) Waste quantification models for estimation of construction and demolition waste generation : a review Ahmad Firman Masudi * and Noor Zalina Mahmood and Siti Nazziera Mokhtar Nik Meriam Sulaiman. 12 pp. 269–281.
268
Royce, W.W. (1970) Managing the Development of Large Software Systems. Proceedings of IEEE WESCON [online]. 26 (8), pp. 328–338. Available from: http://leadinganswers.typepad.com/leading_answers/files/original_waterfall_paper_winston_royce.pdf.
Russell, S.J. and Norvig, P. (2010) Artificial Intelligence: A Modern Approach [online].
Sacks, R., Eastman, C.M. and Lee, G. (2004) Parametric 3D modeling in building construction with examples from precast concrete. Automation in Construction. 13 (3), pp. 291–312.
Sacks, R., Radosavljevic, M. and Barak, R. (2010) Requirements for building information modeling based lean production management systems for construction. Automation in Construction. 19 (5), pp. 641–655. doi:10.1016/j.autcon.2010.02.010.
Sage, D., Dainty, A. and Brookes, N. (2014) A critical argument in favor of theoretical pluralism: Project failure and the many and varied limitations of project management. International Journal of Project Management. 32 (4), pp. 544–555. doi:10.1016/j.ijproman.2013.08.005.
Sahota, P.S. and Jeffrey, P. (2005) Decision-support tools : moving beyond a technical orientation. Proceedings of the ICE-Engineering Sustainability,. 158 (3), pp. 127–134.
Salem, O., Asce, M., Shahin, A. and Khalifa, Y. (2008) Minimizing Cutting Wastes of Reinforcement Steel Bars Using Genetic Algorithms and Integer Programming Models. 133 (12), pp. 982–992.
Sandelowski, M. (2000) Focus on Research Methods Combining Qualitative and Quantitative Sampling , Data Collection , and Analysis Techniques in Mixed-Method Studies. 23 (3), pp. 246–255.
Sawhney, A. and Maheswari, J.U. (2013) Design Coordination Using Cloud-based Smart Building Element Models. International Journal of Computer Information Systems and Industrial Management Applications. 5 pp. 445–453.
Schlueter, a and Thesseling, F. (2009) Building information model based energy/exergy performance assessment in early design stages. Automation in Construction [online]. 18 pp. 153–163. Available from: http://www.scopus.com/inward/record.url?eid=2-s2.0-57749169961&partnerID=40&md5=24651caed0f356b6d8285d0f33ca19cadoi:10.1016/j.autcon.2008.07.003.
Scriven, M. (1991) Beyond formative and summative evaluation. (no place) University of Chicago Press.
Scriven, M. (1967) The Methodology of Evaluation. In. Tyler, RW, Gagne, RM, Scriven, M.(ed.): Perspectives of Curriculum Evaluation. ‘^’eds.’): Book The Methodology of Evaluation. In. Tyler, Rw, Gagne, Rm, Scriven, M.(Ed.): Perspectives of Curriculum Evaluation, Rand
269
McNally, Chicago.
Serpell, A. and Labra, M. (2003) A study on construction waste in Chile. In: George Ofori and Florence Yean Yng Ling (eds.). Proceedings, Joint Symposium of CIB W55, W65 and W107 on Knowledge Construction. 2003 pp. 102–111.
Seymour, D., Crook, D. and Rooke, J. (1997) The role of theory in construction management: a call for debate. Construction Management and Economics [online]. 15 (1), pp. 117–119. Available from: http://www.tandfonline.com/doi/abs/10.1080/014461997373169doi:10.1080/014461997373169 [Accessed 25 April 2017].
Shadish, W.R., Cook, T.D. and Leviton, L.C. (1991) Foundations of program evaluation: Theories of practice. (no place) Sage.
Shen, L.-Y., Lu, W.-S., Yao, H. and Wu, D.-H. (2005) A computer-based scoring method for measuring the environmental performance of construction activities. Automation in Construction. 14 (3), pp. 297–309. doi:10.1016/j.autcon.2004.08.017.
Shenhar, A.J. and Dvir, D. (1996) Toward a typological theory of project management. Research Policy [online]. 25 (4), pp. 607–632. Available from: http://linkinghub.elsevier.com/retrieve/pii/0048733395008772doi:10.1016/0048-7333(95)00877-2 [Accessed 25 April 2017].
Sii, H.S., Ruxton, T. and Wang, J. (2002) Synthesis using fuzzy set theory and a Dempster—Shafer-based approach to compromise decision-making with multiple-attributes applied to risk control options selection. Proceedings of the Institution of Mechanical Engineers, Part E: Journal of Process Mechanical Engineering. 216 (1), pp. 15–29.
Simons, H. (2009) Case study research in practice. (no place) SAGE publications.
Singh, T.N., Kanchan, R., Verma, A.K. and Saigal, K. (2005) A comparative study of ANN and Neuro-fuzzy for the prediction of dynamic constant of rockmass. J. Earth Syst. Sci.,. 114 (1), pp. 75–86.
Singh, V., Gu, N. and Wang, X. (2011) A theoretical framework of a BIM-based multi-disciplinary collaboration platform. Automation in Construction. 20 (2), pp. 134–144. doi:10.1016/j.autcon.2010.09.011.
Skoyles, E.R. (1976) Materials wastage–a misuse of resources. Building Research and Practice. 4 (4), pp. 232–243.
Smith, M.L. (1997) Mixing and matching: Methods and models. New directions for evaluation. 1997 (74), pp. 73–85.
270
Söderlund, J. (2004) Building theories of project management: past research, questions for the future. International Journal of Project Management [online]. 22 (3), pp. 183–191. Available from: http://www.sciencedirect.com/science/article/pii/S026378630300070Xdoi:10.1016/S0263-7863(03)00070-X [Accessed 25 April 2017].
Sola, J. and Sevilla, J. (1997) Importance of input data normalization for the application of neural networks to complex industrial problems. IEEE Transactions on Nuclear Science. 44 (3), pp. 1464–1468.
Solibri (2016) Solibri | Solibri Model Checker. Available from: https://www.solibri.com/products/solibri-model-checker/ [Accessed 24 April 2016].
Solís-Guzmán, J., Marrero, M., Montes-Delgado, M.V. and Ramírez-de-Arellano, A. (2009) A Spanish model for quantification and management of construction waste. Waste Management. 29 (9), pp. 2542–2548. doi:http://dx.doi.org/10.1016/j.wasman.2009.05.009.
Son, H., Kim, C. and Kim, C. (2012) Hybrid principal component analysis and support vector machine model for predicting the cost performance of commercial building projects using pre-project planning variables. Automation in Construction. 27 pp. 60–66.
Stake, R. (2005) Qualitative case studies. The Sage handbook of qualitative research. pp. 443–466.
Steel, J., Drogemuller, R. and Toth, B. (2012) Model interoperability in building information modelling. Software & Systems Modeling. 11 (1), pp. 99–109. doi:10.1007/s10270-010-0178-4.
Succar, B. (2009) Building information modelling framework: A research and delivery foundation for industry stakeholders. Automation in Construction [online]. 18 (3), pp. 357–375. Available from: http://linkinghub.elsevier.com/retrieve/pii/S0926580508001568doi:10.1016/j.autcon.2008.10.003 [Accessed 11 July 2014].
Symonds and Associates (1999) Construction and Demolition Waste Management Practices and Their Economic Impacts Group [online]. Available from: http://ec.europa.eu/environment/waste/studies/cdw/cdw_chapter1-6.pdf [Accessed 2 December 2014].
Tahmasebi, P. and Hezarkhani, A. (2009) Application of optimized neural network by genetic algorithm. IAMG09Stanford University, California.
Tam, C.M., Tong, T.K.L. and Chan, W.K.W. (2001) Genetic algorithm for optimizing supply locations around tower crane. Journal of construction engineering and management. 127 (4), pp. 315–321.
271
Tam, V.W.Y., Tam, C.M., Zeng, S.X. and Ng, W.C.Y. (2007) Towards adoption of prefabrication in construction. Building and Environment [online]. 42 (10), pp. 3642–3654. Available from: http://linkinghub.elsevier.com/retrieve/pii/S0360132306002873doi:10.1016/j.buildenv.2006.10.003 [Accessed 23 December 2014].
Tasevska, F., Damij, T. and Damij, N. (2014) Project planning practices based on enterprise resource planning systems in small and medium enterprises — A case study from the Republic of Macedonia. International Journal of Project Management. 32 (3), pp. 529–539. doi:10.1016/j.ijproman.2013.08.001.
Tashakkori, a. and Creswell, J.W. (2007) Editorial: The New Era of Mixed Methods. Journal of Mixed Methods Research. 1 (1), pp. 3–7. doi:10.1177/2345678906293042.
Teo, M.M.M. and Loosemore, M. (2001) A theory of waste behaviour in the construction industry. Construction Management and Economics. 19 (7), pp. 741–751. doi:10.1080/01446190110067037.
Thomas, D. (2005) Agile programming: Design to accommodate Change. IEEE Software. 22 (3), pp. 14–16. doi:10.1109/MS.2005.54.
Thormark, C. (2001) Assessing the recycling potential in buildings. In: CIB Task Group 39: Deconstruction and Materials Reuse: Technology, Economic, and Policy. 2001 (no place) University of Florida. pp. 78–86.
Tibaut, A., Rebolj, D. and Perc, M.N. (2014) Interoperability requirements for automated manufacturing systems in construction. Journal of Intelligent Manufacturing. pp. 1–12.
Tingley, D.D. (2012) Design for Deconstruction: An Appraisal. (no place) PhD thesis, The University of Sheffield.
Tolman, F.P. (1999) Product modeling standards for the building and construction industry: past, present and future. Automation in construction. 8 (3), pp. 227–235.
Treloar, G.J., Gupta, H., Love, P.E.D. and Nguyen, B. (2003) An analysis of factors influencing waste minimisation and use of recycled materials for the construction of residential buildings. Management of Environmental Quality: An International Journal. 14 (1), pp. 134–145.
Trikha, D.N. (1999) Industrialised building systems: Prospects in Malaysia. In: Proceedings World Engineering Congress. 1999 Malaysia: .
Trochim, W.M.K. (2006) Unit of Analysis. Available from: http://www.socialresearchmethods.net/kb/unitanal.php [Accessed 10 October 2015].
Tsoukalas, V.D. and Fragiadakis, N.G. (2016) Prediction of occupational risk in the shipbuilding industry using multivariable linear regression and genetic algorithm analysis. Safety Science.
272
83 pp. 12–22. doi:10.1016/j.ssci.2015.11.010.
Turban, E. and Aronson, J. (2005) Decision Support Systems and Intelligent Systems [online]. 7th edition. (no place) Pearson Prentice Hall.
Turk, D., France, R. and Rumpe, B. (2002) Limitations of agile software processes. In: Third International Conference on eXtreme Programming and Agile Processes in Software Engineering. 2002 pp. 43–46.
UK Environmental Agency (2014) Classify different types of waste: Construction and demolition waste [online]. Available from: https://www.gov.uk/how-to-classify-different-types-of-waste/construction-and-demolition-waste [Accessed 13 January 2015].
USEPA (2003) Estimating 2003 Building-Related Construction and Demolition Materials Amounts U.S. Environmental Protection Agency (EPA) [online]. Available from: http://www.epa.gov/osw/conserve/.
Vernikos, V.K., Goodier, C.I., Gibb, a G.F., Robery, P.C. and Broyd, T.W. (2012) Realising offsite construction and standardisation within a leading UK infrastructure consultancy. pp. 1–10.
W3Techs (2016) Most popular JavaScript libraries. Available from: https://w3techs.com/ [Accessed 13 April 2017].
Walford, G. (2010) Site Selection within Comparative Case Study and Ethnographic Research. Compare: A Journal of Comparative and International Education. 31 (2), pp. 151–164. doi:10.1080/03057920120068485.
Wang, J.-Y., Kang, X.-P. and Tam, V.W.-Y. (2008) An investigation of construction wastes: an empirical study in Shenzhen. Journal of Engineering, Design and Technology [online]. 6 pp. 227–236. Available from: http://ezproxy.itcr.ac.cr:2084/doi/pdfplus/10.1108/17260530810918252doi:10.1108/17260530810918252.
Wang, J., Li, Z. and Tam, V.W.Y. (2014) Critical factors in effective construction waste minimization at the design stage: A Shenzhen case study, China. Resources, Conservation and Recycling. 82 pp. 1–7. doi:10.1016/j.resconrec.2013.11.003.
Wang, J.Y., Touran, A., Christoforou, C. and Fadlalla, H. (2004) A systems analysis tool for construction and demolition wastes management. Waste management (New York, N.Y.). 24 (10), pp. 989–997. doi:10.1016/j.wasman.2004.07.010.
Wang, X. and Chong, H. (2014) The Challenges and Trends of Building Information Modelling ( BIM ) for Construction and Resources Sectors. (Isarc), .
Warszawski, A. (1999) Industrialized and automated building systems: A managerial approach.
273
2nd edition. New York: Routledge.
Webster, M.D. and Costello, D. (2005) Designing structural systems for deconstruction: How to extend a new building’s useful life and prevent it from going to waste when the end finally comes. In: Greenbuild Conference, Atlanta, GA. 2005
Weise, M., Katranuschkov, P. and Scherer, R.J. (2003) Generalised Model Subset Definition Schema. In: Proc. CIB-W78 Conf. 2003 - Information Technology for Construction [online]. 2003 Available from: https://www.cs.auckland.ac.nz/w78/papers/ [Accessed 23 October 2014].
Wilmot, C.G. and Mei, B. (2005) Neural network modeling of highway construction costs. Journal of construction engineering and management. 131 (7), pp. 765–771.
Winch, G.M. (2014) Three domains of project organising. International Journal of Project Management. 32 (5), pp. 721–731. doi:10.1016/j.ijproman.2013.10.012.
Won, J., Cheng, J.C.P. and Lee, G. (2016) Quantification of construction waste prevented by BIM-based design validation: Case studies in South Korea. Waste management (New York, N.Y.) [online]. Available from: http://www.sciencedirect.com/science/article/pii/S0956053X15302592doi:10.1016/j.wasman.2015.12.026 [Accessed 16 February 2016].
WRAP (2007a) Achieving effective waste minimisation through design: Guidance on designing out waste for construction clients, design teams and contractors. Available from: http://www2.wrap.org.uk/downloads/Design_FINAL.67813ab5.4821.pdf [online]. Available from: http://www2.wrap.org.uk/downloads/Design_FINAL.67813ab5.4821.pdf [Accessed 14 April 2014].
WRAP (2011a) Designing-out Waste Tool for Buildings. Available from: http://dowtb.wrap.org.uk/ [online]. Available from: http://dowtb.wrap.org.uk/ [Accessed 14 April 2014].
WRAP (2009) Designing out Waste : a design team guide for buildings. Available from: http://www.modular.org/marketing/documents/DesigningoutWaste.pdf [Accessed 14 April 2014].
WRAP (2007b) Material Logistics Plan Good Practice Guidance. Available from: http://www.wrap.org.uk/sites/files/wrap/MLP%20Guidance%20Document.pdf [online]. Available from: http://www.wrap.org.uk/sites/files/wrap/MLP Guidance Document.pdf [Accessed 14 April 2014].
WRAP (2011b) Net Waste Tool. Available from: http://nwtool.wrap.org.uk/ [online]. Available from: http://nwtool.wrap.org.uk/ [Accessed 14 April 2014].
274
WRAP (2010) Setting a requirement for Waste Minimisation and Management. Available from: http://www.wrap.org.uk/sites/files/wrap/WRAP%206pp.pdf [online]. Available from: http://www.wrap.org.uk/sites/files/wrap/WRAP 6pp.pdf [Accessed 14 April 2014].
WRAP (2008) Site Waste Management Plans. Available from: http://www.wrap.org.uk/content/site-waste-management-plans-1 [Accessed 14 April 2014].
Wright, J.A., Loosemore, H.A. and Farmani, R. (2002) Optimization of building thermal design and control by multi-criterion genetic algorithm. Energy and buildings. 34 (9), pp. 959–972.
Wu, Z., Fan, H. and Liu, G. (2013) Forecasting Construction and Demolition Waste Using Gene Expression Programming. Journal of Computing in Civil Engineering. pp. 4014059. doi:10.1061/(ASCE)CP.1943-5487.0000362.
Wu, Z., Yu, A.T.W., Shen, L. and Liu, G. (2014) Quantifying construction and demolition waste: an analytical review. Waste management (New York, N.Y.). 34 (9), pp. 1683–1692. doi:10.1016/j.wasman.2014.05.010.
Xu, X., Ding, L., Luo, H. and Ma, L. (2014) From building information modeling to city information modeling. Journal of Information Technology in Construction, Special Issue BIM Cloud-based Technology in the AEC Sector: Present Status and Future Trends. 19 pp. 292–307.
Yang, L.-R., Huang, C.-F. and Hsu, T.-J. (2014) Knowledge leadership to improve project and organizational performance. International Journal of Project Management. 32 (1), pp. 40–53. doi:10.1016/j.ijproman.2013.01.011.
Yang, R.J. (2014) An investigation of stakeholder analysis in urban development projects: Empirical or rationalistic perspectives. International Journal of Project Management. 32 (5), pp. 838–849. doi:10.1016/j.ijproman.2013.10.011.
Yang, S. and Fu, L. (2014) Critical chain and evidence reasoning applied to multi-project resource schedule in automobile R&D process. International Journal of Project Management. 32 (1), pp. 166–177. doi:10.1016/j.ijproman.2013.01.010.
Yao, X. (1993) A review of evolutionary artificial neural networks. International Journal of Intelligent Systems. 8 (4), pp. 539–567. doi:10.1002/int.4550080406.
Yeang, K. (1995) Designing with nature: the ecological basis for architectural design. (no place) McGraw-Hill New York, NY.
Yeheyis, M., Hewage, K., Alam, M.S., Eskicioglu, C. and Sadiq, R. (2013) An overview of construction and demolition waste management in Canada: a lifecycle analysis approach to sustainability. Clean Technologies and Environmental Policy. 15 (1), pp. 81–91.
275
Yin, R.K. (2009) Case Study Research: Design and Methods. (no place) Sage publications.
Yu, N., Jiang, Y., Luo, L., Lee, S., Jallow, A., Wu, D., Messner, J.I., Leicht, R.M. and Yen, J. (2013) Integrating BIMserver and OpenStudio for energy efficient building. In: Proceedings of 2013 ASCE International Workshop on Computing in Civil Engineering. 2013
Yu, W. and Skibniewski, M.J. (2009) Integrating neurofuzzy system with conceptual cost estimation to discover cost-related knowledge from residential construction projects. Journal of Computing in Civil Engineering. 24 (1), pp. 35–44.
Yu, W.D. and Skibniewski, M.J. (1999) Quantitative constructability analysis with a neuro-fuzzy knowledge-based multi-criterion decision support system. Automation in construction. 8 (5), pp. 553–565. doi:10.1016/S0926-5805(98)00105-8.
Yuan, H. (2012) A model for evaluating the social performance of construction waste management. Waste management. 32 (6), pp. 1218–1228.
Yuan, H. (2013) Key indicators for assessing the effectiveness of waste management in construction projects. Ecological Indicators. 24 pp. 476–484. doi:10.1016/j.ecolind.2012.07.022.
Yuan, H. and Shen, L. (2011) Trend of the research on construction and demolition waste management. Waste management (New York, N.Y.). 31 (4), pp. 670–679. doi:10.1016/j.wasman.2010.10.030.
Yuan, H.P., Shen, L.Y., Hao, J.J.L. and Lu, W.S. (2011) A model for cost–benefit analysis of construction and demolition waste management throughout the waste chain. Resources, Conservation and Recycling. 55 (6), pp. 604–612. doi:10.1016/j.resconrec.2010.06.004.
Zade, J.G. and Noori, R. (2008) Prediction of Municipal Solid Waste Generation by Use of Artificial Neural Network : A Case Study of Mashhad. International Journal of Environmental Research. 2 (1), pp. 13–22.
Zadeh, L.A. (1965) Fuzzy sets. Information and control. 8 (3), pp. 338–353.
Zaman, A.U. and Lehmann, S. (2013) The zero waste index: a performance measurement tool for waste management systems in a ‘zero waste city’. Journal of Cleaner Production. 50 pp. 123–132. doi:10.1016/j.jclepro.2012.11.041.
Zhang, H. and Xing, F. (2010) Fuzzy-multi-objective particle swarm optimization for time–cost–quality tradeoff in construction. Automation in Construction. 19 (8), pp. 1067–1075.
Zhang, S., Teizer, J., Lee, J.-K., Eastman, C.M. and Venugopal, M. (2013) Building information modeling (BIM) and safety: Automatic safety checking of construction models and schedules. Automation in Construction. 29 pp. 183–195.
276
Zhang, X., Arayici, Y., Wu, S., Abbott, C. and Aouad, G. (2009) Integrating BIM and GIS for large-scale facilities asset management: a critical review. Proc. 12th Int. Conference on Civil Structural and Environmental Engineering Computing, Civil-Comp Press, Madeira, Portugal.
Zhang, X., Wu, Y. and Shen, L. (2012) Application of low waste technologies for design and construction: A case study in Hong Kong. Renewable and Sustainable Energy Reviews. 16 (5), pp. 2973–2979. doi:10.1016/j.rser.2012.02.020.
Zhang, X., Wu, Y., Shen, L. and Skitmore, M. (2014) A prototype system dynamic model for assessing the sustainability of construction projects. International Journal of Project Management. 32 (1), pp. 66–76. doi:10.1016/j.ijproman.2013.01.009.
Zhang, Y. and Ng, T.S. (2012) An ant colony system based decision support system for construction time-cost optimization. Journal of Civil Engineering and Management [online]. 18 (4), pp. 580–589. Available from: http://www.scopus.com/inward/record.url?eid=2-s2.0-84866362979&partnerID=tZOtx3y1doi:10.3846/13923730.2012.704164.
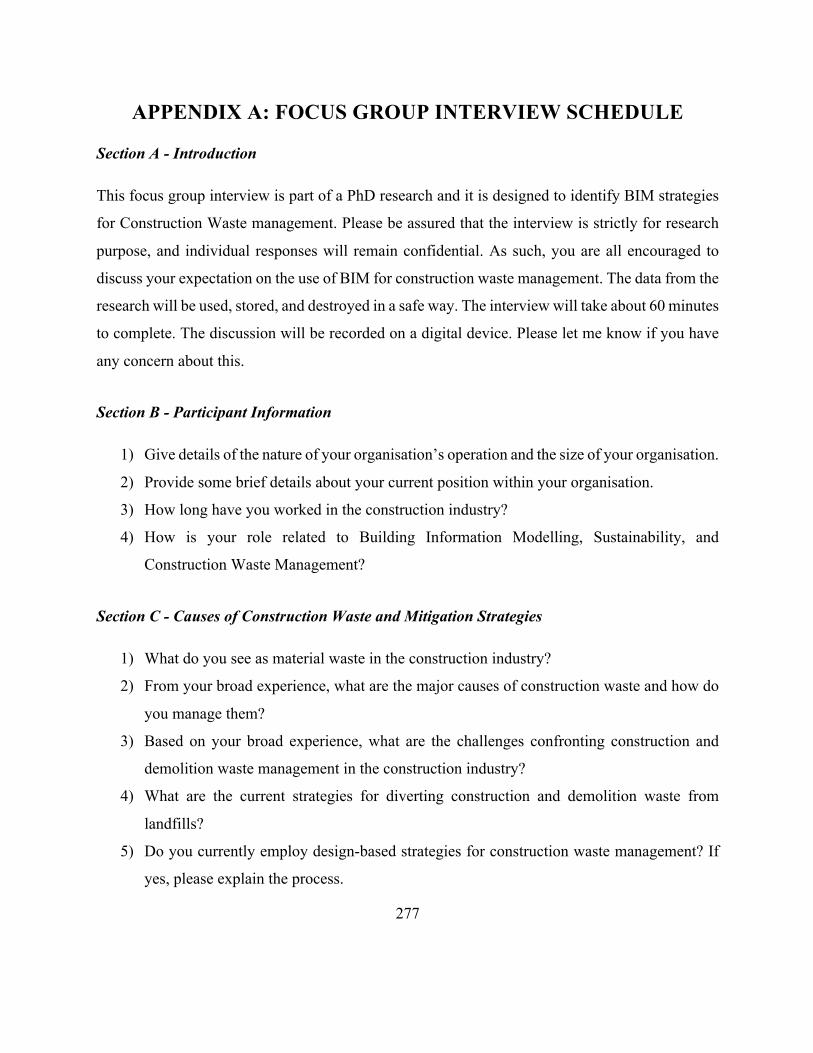
277
APPENDIX A: FOCUS GROUP INTERVIEW SCHEDULE
Section A - Introduction
This focus group interview is part of a PhD research and it is designed to identify BIM strategies
for Construction Waste management. Please be assured that the interview is strictly for research
purpose, and individual responses will remain confidential. As such, you are all encouraged to
discuss your expectation on the use of BIM for construction waste management. The data from the
research will be used, stored, and destroyed in a safe way. The interview will take about 60 minutes
to complete. The discussion will be recorded on a digital device. Please let me know if you have
any concern about this.
Section B - Participant Information
1) Give details of the nature of your organisation’s operation and the size of your organisation.
2) Provide some brief details about your current position within your organisation.
3) How long have you worked in the construction industry?
4) How is your role related to Building Information Modelling, Sustainability, and
Construction Waste Management?
Section C - Causes of Construction Waste and Mitigation Strategies
1) What do you see as material waste in the construction industry?
2) From your broad experience, what are the major causes of construction waste and how do
you manage them?
3) Based on your broad experience, what are the challenges confronting construction and
demolition waste management in the construction industry?
4) What are the current strategies for diverting construction and demolition waste from
landfills?
5) Do you currently employ design-based strategies for construction waste management? If
yes, please explain the process.
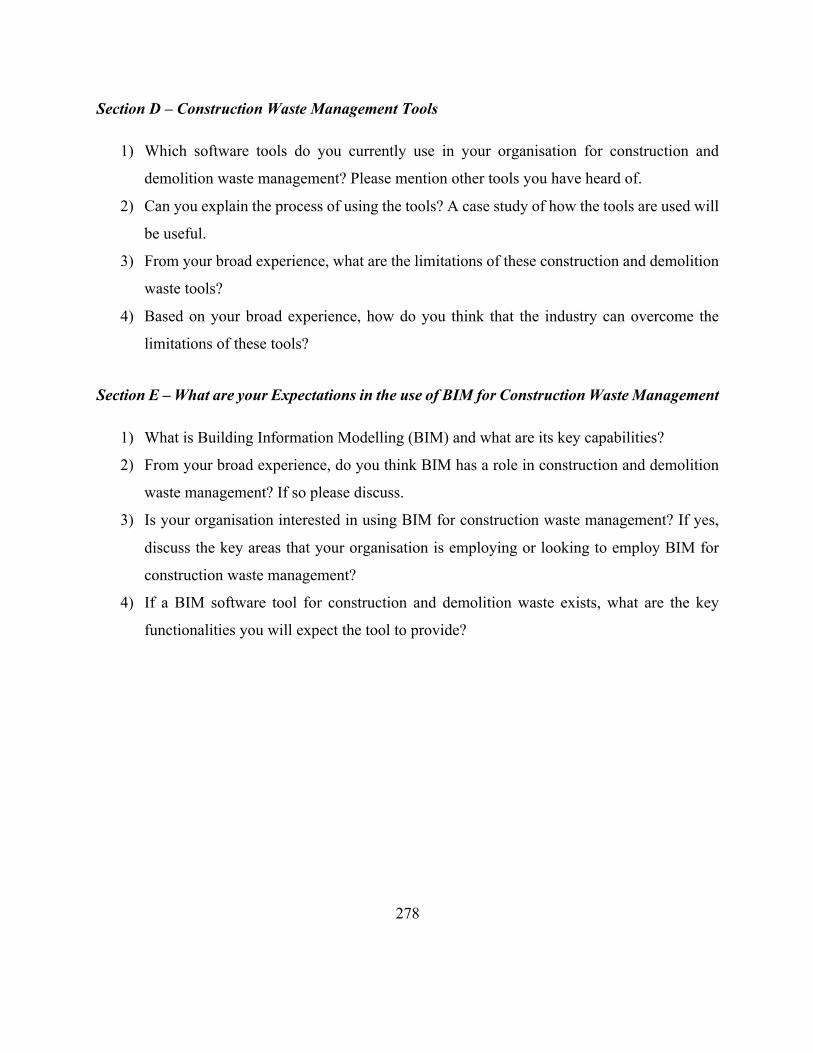
278
Section D – Construction Waste Management Tools
1) Which software tools do you currently use in your organisation for construction and
demolition waste management? Please mention other tools you have heard of.
2) Can you explain the process of using the tools? A case study of how the tools are used will
be useful.
3) From your broad experience, what are the limitations of these construction and demolition
waste tools?
4) Based on your broad experience, how do you think that the industry can overcome the
limitations of these tools?
Section E – What are your Expectations in the use of BIM for Construction Waste Management
1) What is Building Information Modelling (BIM) and what are its key capabilities?
2) From your broad experience, do you think BIM has a role in construction and demolition
waste management? If so please discuss.
3) Is your organisation interested in using BIM for construction waste management? If yes,
discuss the key areas that your organisation is employing or looking to employ BIM for
construction waste management?
4) If a BIM software tool for construction and demolition waste exists, what are the key
functionalities you will expect the tool to provide?

279
APPENDIX B: SURVEY COVER LETTER AND
QUESTIONNAIRE SAMPLE
REDUCING CONSTRUCTION WASTE USING BUILDING INFORMATION
MODELLING
I am a doctoral researcher at the University of the West of England Bristol. This
questionnaire is the basis of my PhD research, and it has been designed to develop BIM
strategies for Construction Waste management. Inputs is solicited from all professionals
within the built industry, including architects, engineers, project managers, BIM
specialists, sustainability experts, etc. Please be assured that this survey is strictly for
research purpose, and individual responses will remain confidential. The data from the
research will be used, stored, and destroyed in a safe way.
The questionnaire will take about 15 minutes to complete. Should you require further
details or clarification, you can please contact me through the details provided below. If
you will like to receive a copy of the research findings, please provide your email in the
last section of the questionnaire.
Thank you for your anticipated help.
Olugbenga Akinade PhD Student University of the West of England, Bristol Email:[email protected]

280
Particulars of Respondent
Please mark answers with a ‘�’
1. Type of organisation
� Architectural firm � Engineering consultancy
� Contractor � Project Management � Demolition Contractor
� Waste management � Building materials supply
� Others (please specify) 2. Job title of respondent;
� Architect � M&E Engineer � Project Manager
� Civil/Structural Engineer � Demolition specialist � Lean Practitioner
� BIM Specialist � Supply-chain Manager � Site Waste Manager
� Construction operative � Architectural Technologist
� Others (please specify)
3. Years of experience of respondent in construction industry;
� 1 - 5 � 6 – 10 � 11 - 15 � 16 – 20 � 21 – 25
� above 25
BIM Strategies for Construction Waste Management
Please consider each factor with relevance to your perceived competence and kindly rank their importance on a scale of 1-5, where; 1 = Not Important 2 = Less Important 3 = Moderately Important 4 = Important 5 = Most Important
ID
How important are the following design factors in reducing construction waste using BIM?
Importance of factor
1 2 3 4 5 1. Decision-making on waste reduction during design 2. Embedding waste-related information into building model 3. Support for waste management innovations such as RFID, IoT,
big data etc.
4. Improved cost-benefit analysis of construction waste management
5. Improved materials classification methods 6. Automatic generation of waste related documents
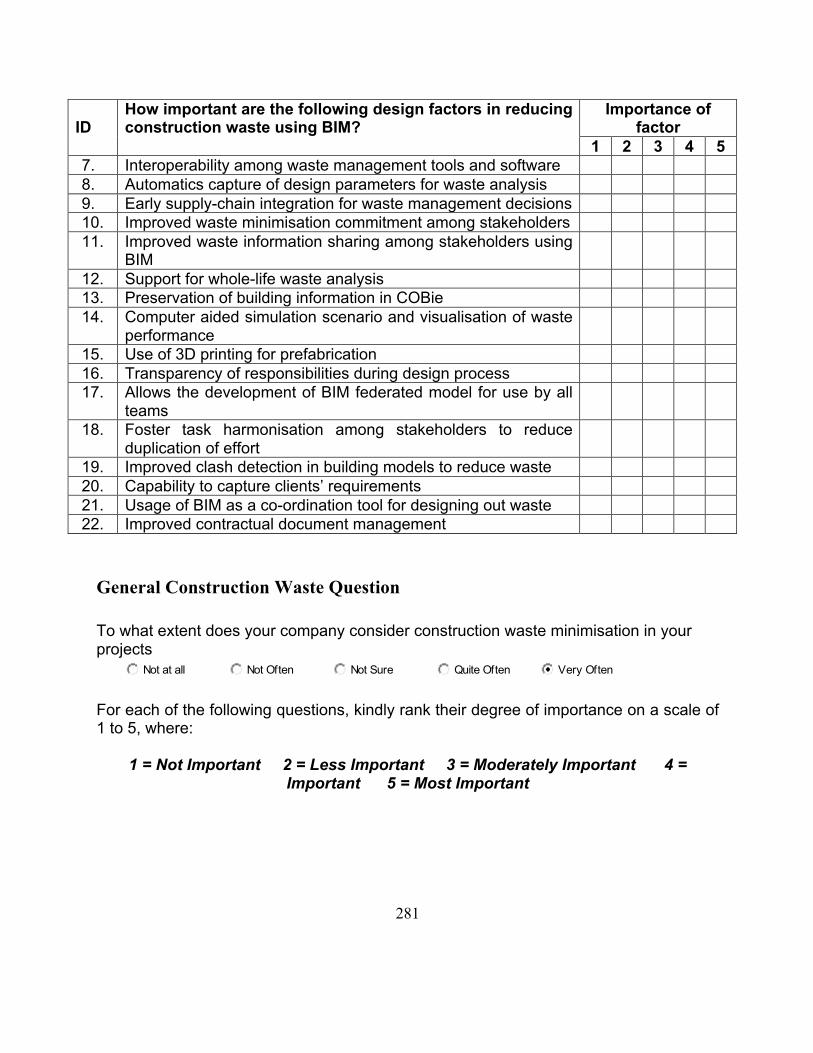
281
ID
How important are the following design factors in reducing construction waste using BIM?
Importance of factor
1 2 3 4 5 7. Interoperability among waste management tools and software 8. Automatics capture of design parameters for waste analysis 9. Early supply-chain integration for waste management decisions 10. Improved waste minimisation commitment among stakeholders 11. Improved waste information sharing among stakeholders using
BIM
12. Support for whole-life waste analysis 13. Preservation of building information in COBie 14. Computer aided simulation scenario and visualisation of waste
performance
15. Use of 3D printing for prefabrication 16. Transparency of responsibilities during design process 17. Allows the development of BIM federated model for use by all
teams
18. Foster task harmonisation among stakeholders to reduce duplication of effort
19. Improved clash detection in building models to reduce waste 20. Capability to capture clients’ requirements 21. Usage of BIM as a co-ordination tool for designing out waste 22. Improved contractual document management
General Construction Waste Question
To what extent does your company consider construction waste minimisation in your projects
For each of the following questions, kindly rank their degree of importance on a scale of 1 to 5, where:
1 = Not Important 2 = Less Important 3 = Moderately Important 4 = Important 5 = Most Important
Not at all Not Often Not Sure Quite Often Very Often
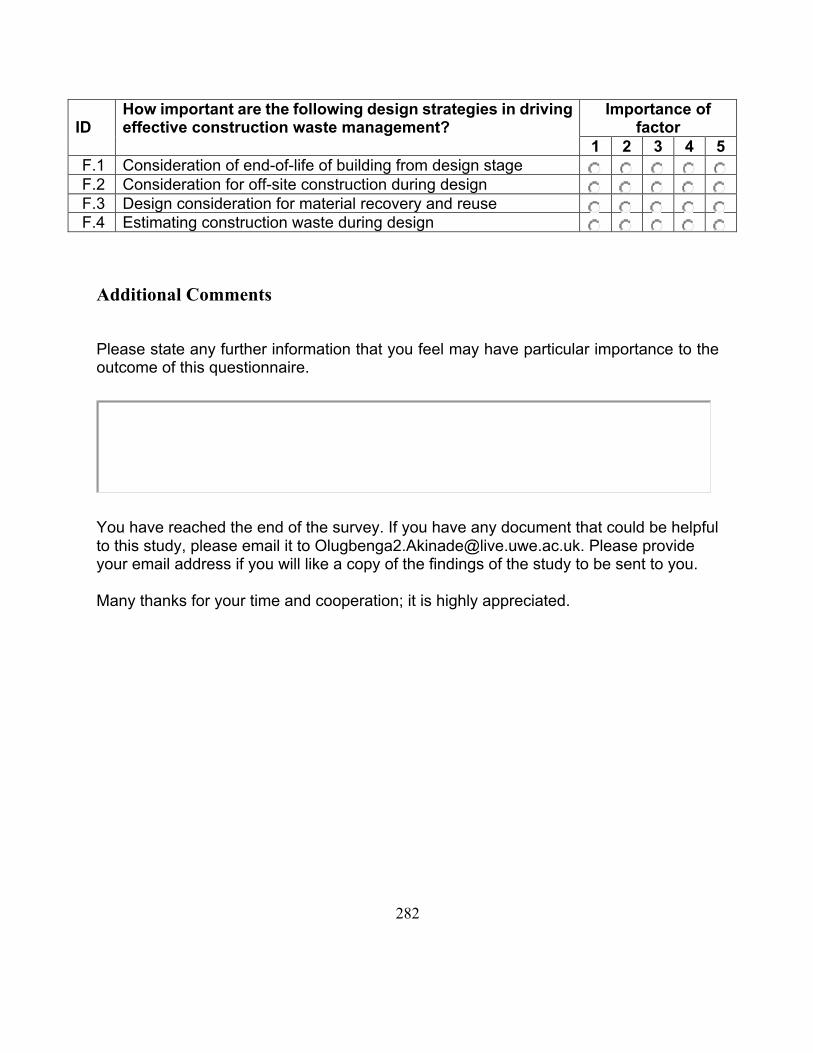
282
ID
How important are the following design strategies in driving effective construction waste management?
Importance of factor
1 2 3 4 5 F.1 Consideration of end-of-life of building from design stage F.2 Consideration for off-site construction during design F.3 Design consideration for material recovery and reuse F.4 Estimating construction waste during design
Additional Comments
Please state any further information that you feel may have particular importance to the outcome of this questionnaire.
You have reached the end of the survey. If you have any document that could be helpful to this study, please email it to [email protected]. Please provide your email address if you will like a copy of the findings of the study to be sent to you. Many thanks for your time and cooperation; it is highly appreciated.