recycling of construction and demolition waste materials: a chemical–mineralogical appraisal
TRANSCRIPT

www.elsevier.com/locate/wasman
Waste Management 25 (2005) 149–159
Recycling of construction and demolition waste materials:a chemical–mineralogical appraisal
G. Bianchini *, E. Marrocchino, R. Tassinari, C. Vaccaro
Department of Earth Sciences, University of Ferrara, Corso Ercole I D�Este n.32, 44100 Ferrara, Italy
Accepted 7 September 2004
Abstract
Building activity is currently demanding remarkable amounts of inert materials (such as gravel and sand) that are usually pro-
vided by alluvial sediments. The EU directives and Italian Legislation are encouraging the re-use of construction and demolition
waste provided by continuous urban redevelopment. The re-utilisation of building waste is a relatively new issue for Italy: unfor-
tunately the employment of recycled inert materials is still limited to general bulk and drainage fills, while a more complete re-eval-
uation is generally hampered by the lack of suitable recycling plants. In this paper, chemical–mineralogical characterization of
recycled inert materials was carried out after preliminary crushing and grain-size sorting. XRF and XRD analysis of the different
grain-size classes allowed us to recognise particular granulometric classes that can be re-utilised as first-order material in the building
activity. Specifically, the presented chemical–mineralogical appraisal indicates that the recycled grain-size fraction 0.6–0.125 mm
could be directly re-employed in the preparation of new mortar and concrete, while finer fractions could be considered as compo-
nents for industrial processing in the preparation of cements and bricks/tiles.
� 2004 Elsevier Ltd. All rights reserved.
1. Introduction
Building activity is currently demanding remarkable
amounts of inert materials (such as gravel and sand) that
are usually provided by alluvial sediments. The direct
quarrying of sediments from rivers modifies river-profilesand their equilibrium, and is consequently forbidden by
law. At the same time, excavation of palaeo-river depos-
its could also induce environmental problems, as the
hydrological and hydrogeological framework of the area
is often modified.
Quarrying inert materials from rocky formations in
hilly/mountainous areas is also perceived as dangerous
for the environment, as it alters the landscape andpotentially triggers stability problems.
0956-053X/$ - see front matter � 2004 Elsevier Ltd. All rights reserved.
doi:10.1016/j.wasman.2004.09.005
* Corresponding author. Tel.: +39 532 293740; fax: +39 532 210161.
E-mail address: [email protected] (G. Bianchini).
For these reasons, the Italian Legislation is encourag-
ing the re-use of construction and demolition waste
(hereafter named C&D as proposed by Poon et al.,
2001) provided by continuous urban redevelopment,
an approach which must be promoted in order to face
the pressing landfill shortage problem.The use of recycled aggregates is also promoted by
the EU which, in the framework of an environmental
protection and waste management policy, has provided
guidelines for common strategies for a correct re-use
of C&D (DG ENV. E.3, 2000).
SomeEUcountries (Germany,UK,Netherlands) have
already developed a suitable program of building waste
recycling, while in others (such as Italy, France, Spain)the amount of recycled inert material is still limited, and
does not exceed 10% (Corinaldesi, 2002; Bressi, 2003).
As concerns Italy, re-utilisation of C&D materials is
hampered by the scarcity of suitable plants for size
reduction and sorting of waste material, and its employ-
ment is limited to general bulk and drainage fills.
150 G. Bianchini et al. / Waste Management 25 (2005) 149–159
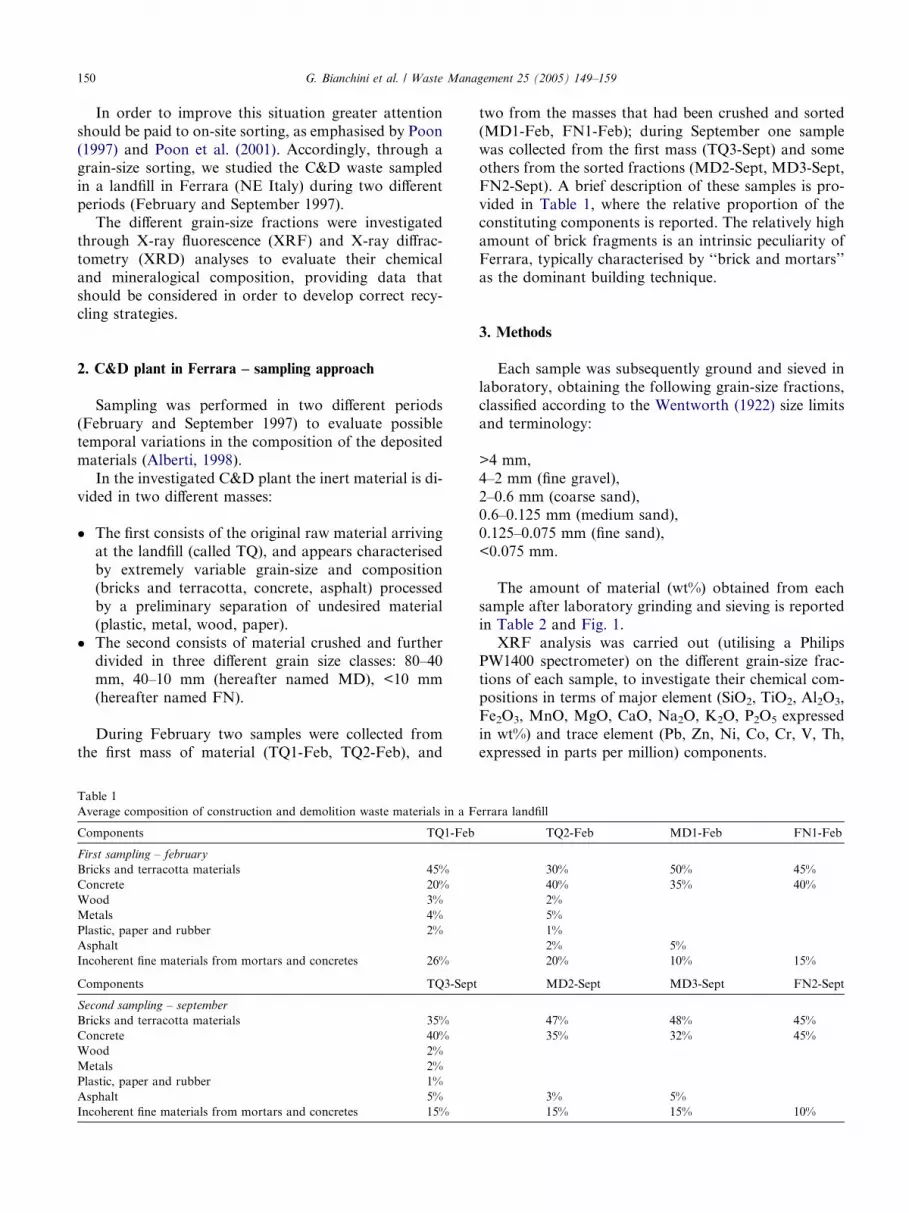
In order to improve this situation greater attention
should be paid to on-site sorting, as emphasised by Poon
(1997) and Poon et al. (2001). Accordingly, through a
grain-size sorting, we studied the C&D waste sampled
in a landfill in Ferrara (NE Italy) during two different
periods (February and September 1997).The different grain-size fractions were investigated
through X-ray fluorescence (XRF) and X-ray diffrac-
tometry (XRD) analyses to evaluate their chemical
and mineralogical composition, providing data that
should be considered in order to develop correct recy-
cling strategies.
2. C&D plant in Ferrara – sampling approach
Sampling was performed in two different periods
(February and September 1997) to evaluate possible
temporal variations in the composition of the deposited
materials (Alberti, 1998).
In the investigated C&D plant the inert material is di-
vided in two different masses:
� The first consists of the original raw material arriving
at the landfill (called TQ), and appears characterised
by extremely variable grain-size and composition
(bricks and terracotta, concrete, asphalt) processed
by a preliminary separation of undesired material
(plastic, metal, wood, paper).
� The second consists of material crushed and furtherdivided in three different grain size classes: 80–40
mm, 40–10 mm (hereafter named MD), <10 mm
(hereafter named FN).
During February two samples were collected from
the first mass of material (TQ1-Feb, TQ2-Feb), and
Table 1
Average composition of construction and demolition waste materials in a F
Components TQ1-Feb
First sampling – february
Bricks and terracotta materials 45%
Concrete 20%
Wood 3%
Metals 4%
Plastic, paper and rubber 2%
Asphalt
Incoherent fine materials from mortars and concretes 26%
Components TQ3-Sept
Second sampling – september
Bricks and terracotta materials 35%
Concrete 40%
Wood 2%
Metals 2%
Plastic, paper and rubber 1%
Asphalt 5%
Incoherent fine materials from mortars and concretes 15%
two from the masses that had been crushed and sorted
(MD1-Feb, FN1-Feb); during September one sample
was collected from the first mass (TQ3-Sept) and some
others from the sorted fractions (MD2-Sept, MD3-Sept,
FN2-Sept). A brief description of these samples is pro-
vided in Table 1, where the relative proportion of theconstituting components is reported. The relatively high
amount of brick fragments is an intrinsic peculiarity of
Ferrara, typically characterised by ‘‘brick and mortars’’
as the dominant building technique.
3. Methods
Each sample was subsequently ground and sieved in
laboratory, obtaining the following grain-size fractions,
classified according to the Wentworth (1922) size limits
and terminology:
>4 mm,
4–2 mm (fine gravel),
2–0.6 mm (coarse sand),0.6–0.125 mm (medium sand),
0.125–0.075 mm (fine sand),
<0.075 mm.
The amount of material (wt%) obtained from each
sample after laboratory grinding and sieving is reported
in Table 2 and Fig. 1.
XRF analysis was carried out (utilising a PhilipsPW1400 spectrometer) on the different grain-size frac-
tions of each sample, to investigate their chemical com-
positions in terms of major element (SiO2, TiO2, Al2O3,
Fe2O3, MnO, MgO, CaO, Na2O, K2O, P2O5 expressed
in wt%) and trace element (Pb, Zn, Ni, Co, Cr, V, Th,
expressed in parts per million) components.
errara landfill
TQ2-Feb MD1-Feb FN1-Feb
30% 50% 45%
40% 35% 40%
2%
5%
1%
2% 5%
20% 10% 15%
MD2-Sept MD3-Sept FN2-Sept
47% 48% 45%
35% 32% 45%
3% 5%
15% 15% 10%
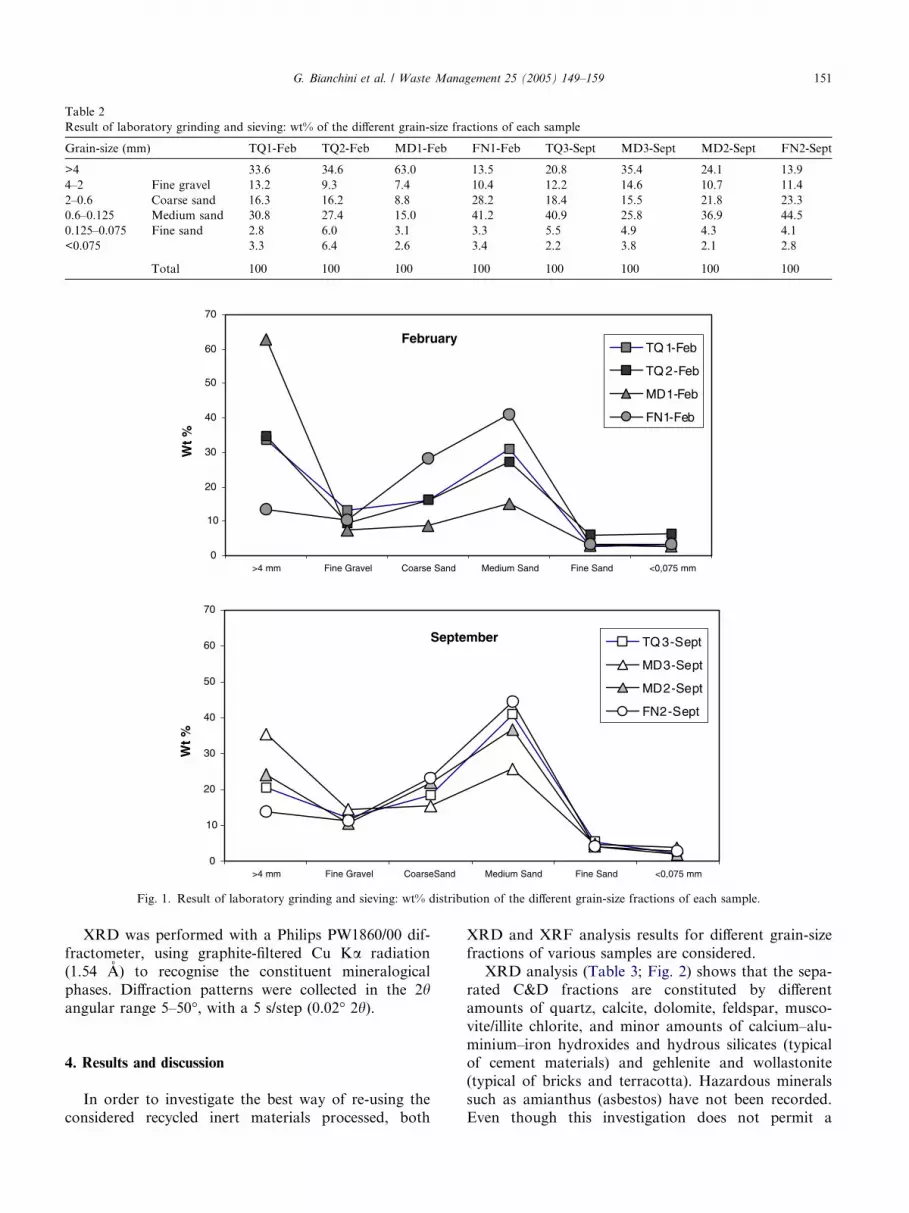
Table 2
Result of laboratory grinding and sieving: wt% of the different grain-size fractions of each sample
Grain-size (mm) TQ1-Feb TQ2-Feb MD1-Feb FN1-Feb TQ3-Sept MD3-Sept MD2-Sept FN2-Sept
>4 33.6 34.6 63.0 13.5 20.8 35.4 24.1 13.9
4–2 Fine gravel 13.2 9.3 7.4 10.4 12.2 14.6 10.7 11.4
2–0.6 Coarse sand 16.3 16.2 8.8 28.2 18.4 15.5 21.8 23.3
0.6–0.125 Medium sand 30.8 27.4 15.0 41.2 40.9 25.8 36.9 44.5
0.125–0.075 Fine sand 2.8 6.0 3.1 3.3 5.5 4.9 4.3 4.1
<0.075 3.3 6.4 2.6 3.4 2.2 3.8 2.1 2.8
Total 100 100 100 100 100 100 100 100
0
10
20
30
40
50
60
70
>4 mm Fine Gravel Coarse Sand Medium Sand Fine Sand <0,075 mm
Wt
%
TQ 1-Feb
TQ 2-Feb
MD1-Feb
FN1-Feb
February
0
10
20
30
40
50
60
70
>4 mm Fine Gravel CoarseSand Medium Sand Fine Sand <0,075 mm
Wt
%
TQ 3-Sept
MD3-Sept
MD2-Sept
FN2-Sept
September
Fig. 1. Result of laboratory grinding and sieving: wt% distribution of the different grain-size fractions of each sample.
G. Bianchini et al. / Waste Management 25 (2005) 149–159 151
XRD was performed with a Philips PW1860/00 dif-
fractometer, using graphite-filtered Cu Ka radiation
(1.54 A) to recognise the constituent mineralogical
phases. Diffraction patterns were collected in the 2hangular range 5–50�, with a 5 s/step (0.02� 2h).
4. Results and discussion
In order to investigate the best way of re-using the
considered recycled inert materials processed, both
XRD and XRF analysis results for different grain-size
fractions of various samples are considered.
XRD analysis (Table 3; Fig. 2) shows that the sepa-
rated C&D fractions are constituted by different
amounts of quartz, calcite, dolomite, feldspar, musco-
vite/illite chlorite, and minor amounts of calcium–alu-
minium–iron hydroxides and hydrous silicates (typicalof cement materials) and gehlenite and wollastonite
(typical of bricks and terracotta). Hazardous minerals
such as amianthus (asbestos) have not been recorded.
Even though this investigation does not permit a

Table 3
XRD mineralogical investigation of different grain-size fractions of samples TQ1, TQ3, MD3, FN1
Mineralogical phases >4 mm 4–2 mm 2–0.6 mm 0.6–0.125 mm 0.125–0.075 mm <0.075 mm
TQ1
Qz *** *** *** **** **** ****Feld * * * ** * *Cal *** *** *** ** ** **Dol **** *** *** ** ** **Phyll * * * * ** **Wo + Ghl * * * * * *
TQ3
Qz **** **** **** **** **** ***Feld * * * ** ** *Cal *** ** ** ** ** **Dol *** ** ** ** ** **Phyll * * * * ** **Wo + Ghl * * * * * *
MD3
Qz *** *** **** **** **** ***Feld * * * ** * *Cal *** *** *** ** *** ***Dol *** *** *** ** ** **Phyll * * * ** ** **Wo + Ghl * * * * * *
FN1
Qz **** **** **** **** **** ***Feld * * * ** * *Cal *** *** *** ** ** **Dol *** *** *** ** ** **Phyll * * * ** ** **Wo + Ghl * * * * * *
Mineral abbreviations: Qz, quartz; Calc, calcite; Dol, dolomite; Feld, feldspars; Phyll, phyllosilicates; Wo, wollastonite; Ghl, gehlenite. ****, very
abundant; ***, abundant; **, scarce; *, traces.
Fig. 2. Selected XRD patterns of medium sand fractions (0.6–0.125 mm). Abbreviations: Qz, quartz; Feld, feldspar; Calc, calcite; Dol, dolomite; Chl,
chlorite; Mu, muscovite/illite; Wo, wollastonite.
152 G. Bianchini et al. / Waste Management 25 (2005) 149–159

Table 4
Major (wt%) and trace elements (ppm) concentration of the different grain-size fractions of each sample
mm >4 4-2 fine
gravel
2-0.6
Coarse
sand
0.6-0.125
Medium
sand
0.125-0.075
Fine sand
<0.075 >4 4-2 fine
gravel
2-0.6
Coarse
sand
0.6-0.125
Medium
sand
0.125-0.075
Fine sand
<0.075
TQ1-Feb TQ2-Feb
TQ1 A TQ1 B TQ1 C TQ1 D TQ1E TQ1 F TQ2 A TQ2 B TQ2 C TQ2 D TQ2 E TQ2 F
SiO2 38.57 34.01 47.32 60.20 39.96 36.64 30.99 25.15 37.18 57.13 46.51 40.34
TiO2 0.29 0.24 0.28 0.30 0.41 0.42 0.16 0.17 0.24 0.30 0.51 0.50
Al2O3 7.26 6.04 7.64 8.75 8.39 8.60 5.55 4.50 6.51 8.55 9.07 8.93
Fe2O3 2.87 2.94 2.95 2.82 3.72 3.86 1.82 1.43 2.09 2.66 3.68 3.68
MnO 0.11 0.14 0.12 0.10 0.14 0.14 0.07 0.06 0.08 0.09 0.12 0.12
MgO 5.27 5.09 3.75 2.78 2.91 3.14 7.71 8.97 6.12 3.37 3.81 4.21
CaO 21.74 23.96 17.64 11.60 20.76 22.04 23.32 26.52 21.57 12.61 16.67 19.15
Na2O 0.86 0.71 1.08 1.53 0.92 0.82 0.96 0.55 0.93 1.48 1.23 1.09
K2O 1.43 1.10 1.57 1.84 1.58 1.60 1.35 0.90 1.48 1.87 1.77 1.72
P2O5 0.15 0.21 0.21 0.17 0.35 0.42 0.72 0.29 0.67 0.60 1.17 1.41
LOI 21.44 25.55 17.45 9.92 20.85 22.31 27.35 31.44 23.13 11.33 15.45 18.84
Totale 100 100 100 100 100 100 100 100 100 100 100 100
Pb* 29 90 97 86 50 50 46 15 126 125 171 98
Zn* 221 190 154 108 172 189 34 34 85 105 177 211
Ni 47 47 68 69 78 86 22 21 37 56 69 73
Co 7 7 10 9 13 14 3 4 6 10 11 12
Cr 60 59 93 113 116 114 25 28 52 91 117 107
V 48 41 45 47 63 69 29 31 39 44 61 65
Th 5 4 7 1 7 7 6 5 5 5 7 8
TQ3-Sept MD2-Sept
TQ3 A TQ3 B TQ3 C TQ3 D TQ3 E TQ3 F MD2 A MD2 B MD2 C MD2 D MD2 E MD2 F
SiO2 34.12 47.43 47.68 58.87 43.03 41.39 38.65 39.62 48.27 54.42 42.85 42.10
TiO2 0.25 0.36 0.39 0.36 0.53 0.54 0.29 0.32 0.36 0.38 0.54 0.53
Al2O3 6.40 8.07 9.31 9.62 10.88 10.40 7.26 7.92 9.15 9.59 10.85 10.55
Fe2O3 2.65 3.60 3.67 3.16 4.52 4.35 3.09 3.44 3.41 3.31 4.36 4.24
MnO 0.11 0.12 0.11 0.10 0.14 0.14 0.12 0.12 0.11 0.10 0.13 0.13
MgO 4.77 3.68 3.63 3.16 3.48 3.48 4.67 4.32 3.63 3.28 3.49 3.48
CaO 22.78 18.03 17.49 11.71 18.34 18.73 22.80 21.53 16.95 14.10 18.68 18.66
Na2O 0.80 0.87 0.99 1.53 0.86 0.88 0.94 0.87 1.09 1.38 0.87 0.90
K2O 1.05 1.50 1.79 1.89 1.80 1.70 1.31 1.48 1.80 1.92 1.86 1.77
P2O5 0.31 0.66 0.76 0.50 0.95 0.76 0.21 0.26 0.31 0.27 0.49 0.49
LOI 26.77 15.69 14.18 9.10 15.47 17.63 20.66 20.13 14.92 11.24 15.89 17.16
Totale 100 100 100 100 100 100 100 100 100 100 100 100
Pb* 25 89 129 112 84 99 39 29 51 53 62 70
Zn* 68 122 147 108 189 201 175 89 149 115 170 179
Ni 46 73 87 76 88 89 50 62 83 77 89 93
Co 8 10 12 12 14 13 9 10 12 11 14 13
Cr 56 96 120 123 139 123 66 82 129 122 144 129
V 40 54 59 49 80 79 42 50 57 55 80 80
Th 6 3 5 5 6 7 4 2 3 8 6 11
(continued on next page)
G.Bianchiniet
al./Waste
Managem
ent25(2005)149–159
153
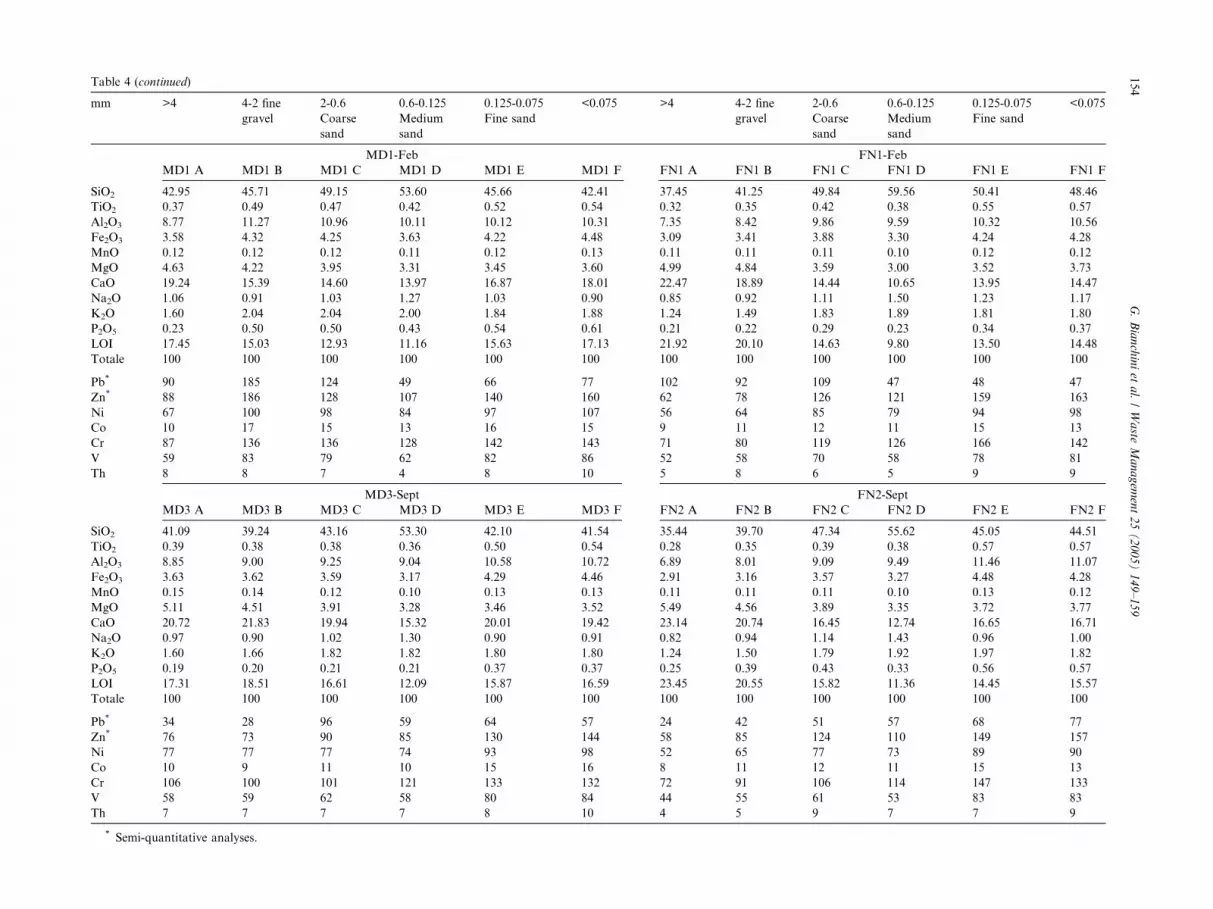
Table 4 (continued)
mm >4 4-2 fine
gravel
2-0.6
Coarse
sand
0.6-0.125
Medium
sand
0.125-0.075
Fine sand
<0.075 >4 4-2 fine
gravel
2-0.6
Coarse
sand
0.6-0.125
Medium
sand
0.125-0.075
Fine sand
<0.075
MD1-Feb FN1-Feb
MD1 A MD1 B MD1 C MD1 D MD1 E MD1 F FN1 A FN1 B FN1 C FN1 D FN1 E FN1 F
SiO2 42.95 45.71 49.15 53.60 45.66 42.41 37.45 41.25 49.84 59.56 50.41 48.46
TiO2 0.37 0.49 0.47 0.42 0.52 0.54 0.32 0.35 0.42 0.38 0.55 0.57
Al2O3 8.77 11.27 10.96 10.11 10.12 10.31 7.35 8.42 9.86 9.59 10.32 10.56
Fe2O3 3.58 4.32 4.25 3.63 4.22 4.48 3.09 3.41 3.88 3.30 4.24 4.28
MnO 0.12 0.12 0.12 0.11 0.12 0.13 0.11 0.11 0.11 0.10 0.12 0.12
MgO 4.63 4.22 3.95 3.31 3.45 3.60 4.99 4.84 3.59 3.00 3.52 3.73
CaO 19.24 15.39 14.60 13.97 16.87 18.01 22.47 18.89 14.44 10.65 13.95 14.47
Na2O 1.06 0.91 1.03 1.27 1.03 0.90 0.85 0.92 1.11 1.50 1.23 1.17
K2O 1.60 2.04 2.04 2.00 1.84 1.88 1.24 1.49 1.83 1.89 1.81 1.80
P2O5 0.23 0.50 0.50 0.43 0.54 0.61 0.21 0.22 0.29 0.23 0.34 0.37
LOI 17.45 15.03 12.93 11.16 15.63 17.13 21.92 20.10 14.63 9.80 13.50 14.48
Totale 100 100 100 100 100 100 100 100 100 100 100 100
Pb* 90 185 124 49 66 77 102 92 109 47 48 47
Zn* 88 186 128 107 140 160 62 78 126 121 159 163
Ni 67 100 98 84 97 107 56 64 85 79 94 98
Co 10 17 15 13 16 15 9 11 12 11 15 13
Cr 87 136 136 128 142 143 71 80 119 126 166 142
V 59 83 79 62 82 86 52 58 70 58 78 81
Th 8 8 7 4 8 10 5 8 6 5 9 9
MD3-Sept FN2-Sept
MD3 A MD3 B MD3 C MD3 D MD3 E MD3 F FN2 A FN2 B FN2 C FN2 D FN2 E FN2 F
SiO2 41.09 39.24 43.16 53.30 42.10 41.54 35.44 39.70 47.34 55.62 45.05 44.51
TiO2 0.39 0.38 0.38 0.36 0.50 0.54 0.28 0.35 0.39 0.38 0.57 0.57
Al2O3 8.85 9.00 9.25 9.04 10.58 10.72 6.89 8.01 9.09 9.49 11.46 11.07
Fe2O3 3.63 3.62 3.59 3.17 4.29 4.46 2.91 3.16 3.57 3.27 4.48 4.28
MnO 0.15 0.14 0.12 0.10 0.13 0.13 0.11 0.11 0.11 0.10 0.13 0.12
MgO 5.11 4.51 3.91 3.28 3.46 3.52 5.49 4.56 3.89 3.35 3.72 3.77
CaO 20.72 21.83 19.94 15.32 20.01 19.42 23.14 20.74 16.45 12.74 16.65 16.71
Na2O 0.97 0.90 1.02 1.30 0.90 0.91 0.82 0.94 1.14 1.43 0.96 1.00
K2O 1.60 1.66 1.82 1.82 1.80 1.80 1.24 1.50 1.79 1.92 1.97 1.82
P2O5 0.19 0.20 0.21 0.21 0.37 0.37 0.25 0.39 0.43 0.33 0.56 0.57
LOI 17.31 18.51 16.61 12.09 15.87 16.59 23.45 20.55 15.82 11.36 14.45 15.57
Totale 100 100 100 100 100 100 100 100 100 100 100 100
Pb* 34 28 96 59 64 57 24 42 51 57 68 77
Zn* 76 73 90 85 130 144 58 85 124 110 149 157
Ni 77 77 77 74 93 98 52 65 77 73 89 90
Co 10 9 11 10 15 16 8 11 12 11 15 13
Cr 106 100 101 121 133 132 72 91 106 114 147 133
V 58 59 62 58 80 84 44 55 61 53 83 83
Th 7 7 7 7 8 10 4 5 9 7 7 9
* Semi-quantitative analyses.
154
G.Bianchiniet
al./Waste
Managem
ent25(2005)149–159

0
10
20
30
40
50
60
70
>4 mm Fine Gravel Coarse Sand Medium Sand Fine Sand <0,075 mm
TQ1-Feb
TQ2-Feb
TQ3-Sept
SiO2
CaO
Wt %
Al2O3
Fe2O3
Variations in the TQ samples
0
10
20
30
40
50
60
>4 mm Fine Gravel Coarse Sand Medium Sand Fine Sand <0,075 mm
MD1-Feb
MD2-Sept
MD3-Sept
Al2O3
Fe2O3
Wt %
Variations in the MD samples
SiO2
CaO
0
10
20
30
40
50
60
70
>4 mm Fine Gravel Coarse Sand Medium Sand Fine Sand <0,075 mm
FN1-Feb
FN2-Sept
SiO2
CaO
Al2O3
Fe2O3
Wt
%
Variations in the FN samples
Fig. 3. Diagrams reporting SiO2, CaO, Al2O3, Fe2O3 variations in the grain-size fractions of each sample. Samples grouped according to the
collecting strategy: TQ (a) represents original raw material arriving at the landfill. MD (b) and FN (c) represent material after ‘‘in situ’’ crushing and
sorting (MD = 4–1 cm; FN = <1 cm).
G. Bianchini et al. / Waste Management 25 (2005) 149–159 155
quantitative determination of the mineral abundance,
the relative heights of the different peaks suggest that
quartz is more abundant in the sand fractions, and phyl-
losilicates, such as illite/muscovite and chlorite tend to
increase in the fraction characterised by finer grain-size.
XRF chemical composition of the separated fractions
obtained from the starting samples is shown in Table 4
and Fig. 3, highlighting compositional variations
induced by the sorting process. It can be observed
that, in all the investigated samples, a peak of SiO2

0
3
6
9
12
15
18
TQ
2AT
Q2B
MD
2AFN
2AFN
1A
TQ
3AT
Q1B
TQ
2CT
Q2D
TQ
1DT
Q3D
MD
1D
MD
3DFN
2DFN
1DT
Q2E
MD
2BFN
2BM
D1A
FN1B
TQ
3BT
Q1C
TQ
3CM
D2C
FN2C
FN1C
MD
3AM
D3B
MD
3C
TQ
1FT
Q1E
TQ
2FT
Q3E
MD
2EFN
2EFN
1EM
D3E
TQ
3FM
D2F
MD
3FFN
2FM
D1B
MD
1FM
D1E
MD
1CFN
1F
Dis
sim
ilari
ty
Euclidean distance
TQ
1A
MD
2D
Fig. 4. Cluster analysis dendrogram highlighting ‘‘medium sands’’ (labels ending with D) as a quite homogeneous group. ‘‘Fine sands’’ and fraction
<0.075 mm (labels ending with E and F, respectively) also seem to be homogeneous groups.
156 G. Bianchini et al. / Waste Management 25 (2005) 149–159
concentration characterises the medium sands (0.6–0.125
mm) fraction. An antithetic behaviour is shown by CaO,
characterised by a negative peak corresponding to the
medium sand fraction. On the other hand, Al2O3 and
Fe2O3 contents within each sample appear roughly con-
stant, regardless of the considered grain-size fraction.
Transition metals such as Ni, Co, Cr, V, Zn, Pb tend
to increase in the finer fraction, as they are plausiblytrapped by clay minerals that are more abundant in
the <0.075 mm fraction.
Statistical evaluation of these chemical data through
a cluster analysis shows that hierarchical grouping is
based on grain-size class; this approach is useful to re-
duce the multi-dimensionality of the data to two-dimen-
sional data that can be easily visualized and plotted, and
to highlight similarities between different samples. Inparticular, Euclidean distance-cluster analysis demon-
strates that sorting and sieving leads to a progressive
homogenisation (Fig. 4).
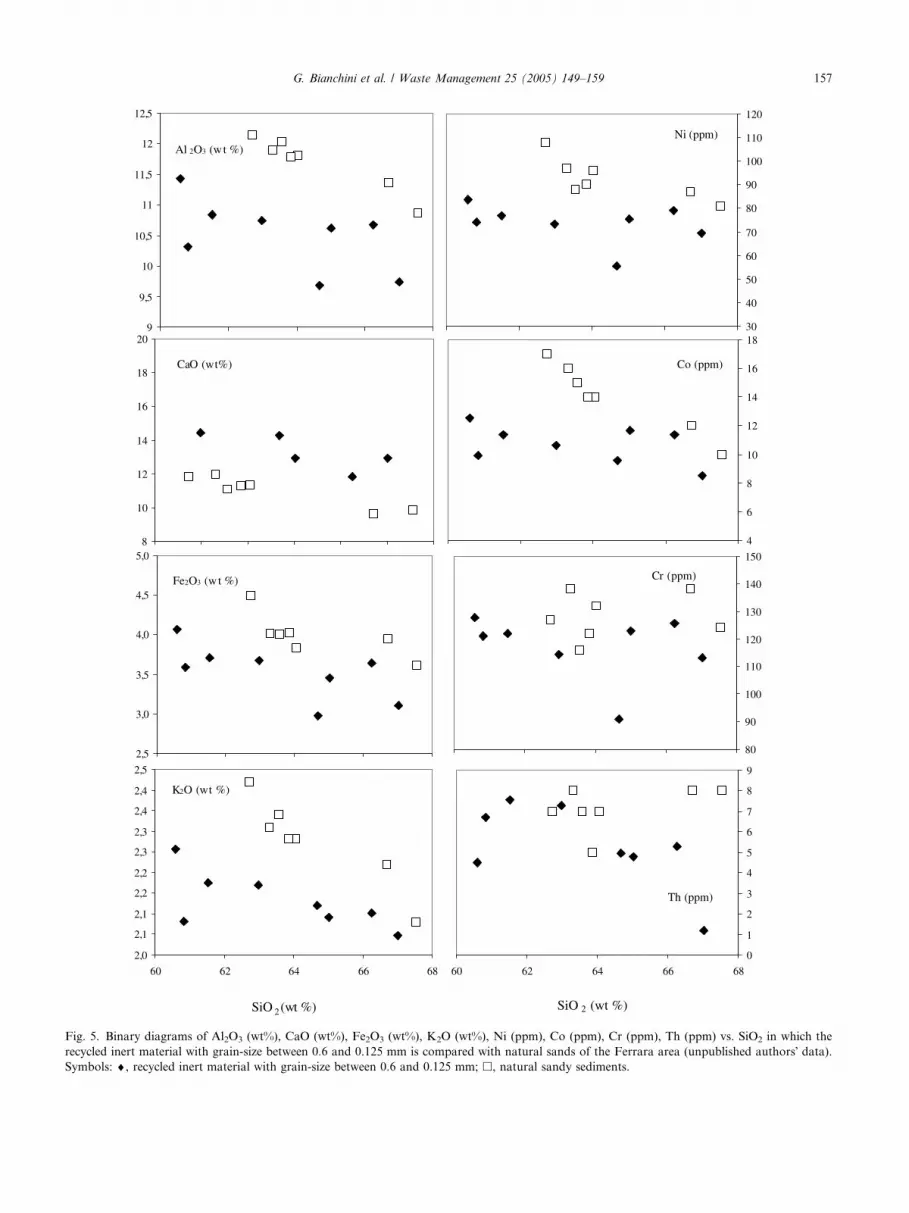
Considering the different grain-size fractions, it can be
envisaged that the medium sands (0.6–0.125 mm) repre-
sent a homogeneous group, showing analogies with nat-
ural sediments of comparable grain-size. In particular, if
compared with natural sands from the Ferrara area (Fig.5), these recycled inert materials are richer in CaO and
poorer in Al2O3–K2O. This simply means that the 0.6–
0.125 mm fraction of the recycled inert samples contains
more carbonate and/or more calcium-bearing alumin-
ium–iron hydroxides and hydrous silicates, and less clay
minerals than the natural sands of the area.
The content of hazardous elements, such as the tran-
sition metals of these recycled inert samples, is compara-
ble to or even lower than that recorded in the natural
sands (Fig. 5). These elements are not associated with
meta-stable phases, as they are plausibly concentrated
within the clay fraction. This suggests, in turn, that these
harmful elements cannot be easily leached and released
in solution (this statement should be verified with properleaching tests as proposed by Trankler et al., 1996 and
Wahlstrom et al., 2000).
Chemical analyses of finer fractions (0.125–0.075
mm; <0.075 mm) are also quite homogeneous and,
if calculated on anhydrous basis, reveal a comparative
enrichment in Al2O3. This suggests that these fractions
could be employed as a raw material component in
cement preparation. To test this hypothesis, chemicalcompositions of the 0.125–0.075 mm and <0.075 mm
fractions have been included in the phase diagram
for the system CaO–Al2O3–SiO2, in which components
that make up cements are easily represented (Fig. 6).
It has to be noted that suitable composition for the
cement preparation, enclosed in the sub-triangle C3S,
C2S, C3A (Manning, 1995), could be obtained by
blending �40% of the considered recycled inert mate-rials with �60% of lime. The same C&D fine-fractions
could also be considered by the ceramic industry –
although not matching the starting requirements for
preparation of bricks and tiles – to provide compo-
nents for compositional corrections of other raw
materials (Fig. 7).
9
9,5
10
10,5
11
11,5
12
12,5
Al 2O3 (wt %)
2,5
3,0
3,5
4,0
4,5
5,0
Fe2O3 (wt %)
8
10
12
14
16
18
20
CaO (wt%)
30
40
50
60
70
80
90
100
110
120
Ni (ppm)
4
6
8
10
12
14
16
18
Co (ppm)
80
90
100
110
120
130
140
150
Cr (ppm)
2,0
2,1
2,1
2,2
2,2
2,3
2,3
2,4
2,4
2,5
60 62 64 66 68
K2O (wt %)
0
1
2
3
4
5
6
7
8
9
60 62 64 66 68
Th (ppm)
SiO 2 (wt %) SiO 2 (wt %)
Fig. 5. Binary diagrams of Al2O3 (wt%), CaO (wt%), Fe2O3 (wt%), K2O (wt%), Ni (ppm), Co (ppm), Cr (ppm), Th (ppm) vs. SiO2 in which the
recycled inert material with grain-size between 0.6 and 0.125 mm is compared with natural sands of the Ferrara area (unpublished authors� data).Symbols: ¤, recycled inert material with grain-size between 0.6 and 0.125 mm; h, natural sandy sediments.
G. Bianchini et al. / Waste Management 25 (2005) 149–159 157

CaO Al2O3
C2S
C3S
C3A
Suitable compositions forthe Cement industry
Average composition ofrecycled inert materials
SiO2
Fig. 6. Ternary diagrams describing the system CaO–Al2O3–SiO2,
reporting the composition of mineral phases typically recognised in
cements: tricalcium silicate (alite; C3S), dicalcium silicate (belite; C2S)
and tricalcium aluminate (C3A). In accordance with Manning (1995),
raw material compositions required for cement preparation are
included in the sub-triangle C3S–C2S–C3A. Similar compositions can
be achieved by blending lime (�60%) with compositions comparable to
those of the recycled inert fractions 0.125–0.075 mm and <0.075 mm.
Symbols: · = recycled inert fractions 0.125–0.075 mm and <0.075 mm;
� = average composition of the recycled inert fractions 0.125–0.075
mm and <0.075 mm; * = phases classically recognised in cements;
} = lime composition; dotted line = mixing calculation.
Fig. 7. Fe2O3–(Na2O + K2O)–(CaO + MgO) triangular diagram
reporting compositions of the analysed recycled C&D materials
(· = C&D fractions 0.125–0.075 mm and <0.075 mm) as well as
compositional field typical of terracotta (Bianchini et al., 2002 and
references therein).
158 G. Bianchini et al. / Waste Management 25 (2005) 149–159
5. Conclusions
This study indicates that, through an opportune
crushing and sorting operation for C&D material, it is
possible to obtain grain-size fractions with roughly
homogenous chemical and mineralogical composition.
In particular, chemical–mineralogical characterisa-
tion of different grain-size classes, obtained through lab-
oratory sieving of C&D waste material, has allowed usto recognise a particular grain-size fraction (0.6–0.125
mm) that can be directly re-utilised as first-order mate-
rial in the building-related activities. In particular, this
fraction could be employed in the preparation of new
mortar and concrete. Similar applications have already
been tested (Zakaria and Cabrera, 1996; Limbachiya
et al., 2000; Sagoe-Crentsil et al., 2001; Ajdukiewicz
and Kliszczewicz, 2002; Corinaldesi and Morioni,
2002; Olorunsogo and Padayachee, 2002) and appear
to provide excellent results especially if coupled with
the introduction of polypropylene fibers (Mesbah andBuyle-Bodin, 1999; Corinaldesi et al., 2002).
The finer fractions could be used for direct mortar
preparation only if the fraction of ‘‘cocciopesto’’ (i.e.,
fragments of bricks, tiles and terracotta) is relevant,
thus providing material characterised by a significant
pozzolanic attitude (Baronio et al., 1997; Corinaldesi
et al., 2002; Zendri et al., 2004). This could only be ob-
tained with a careful differentiation of the initial C&Dmaterials that has to be preliminarily performed on-site
(directly at the landfill). Within the investigated C&D
materials, XRD analysis reveals that ‘‘cocciopesto’’
materials (evidenced by minerals such as ghelenite, wol-
lastonite, mullite) are diluted by other components,
while phyllosilicates (that can induce swelling/shrinkage
processes) are significantly represented thus precluding
utilization for mortar preparation. In this light, thesefine recycled fractions would require an industrial
treatment (e.g., sintering process) to be re-utilised; as
to the ceramic industry, these materials do not have
a composition totally fitting the requirements for the
preparation of bricks and tiles, but can be utilised for
compositional correction of other raw materials. Simi-
larly, we also propose a possible reuse of these fine
fractions in cement preparation, after suitable mixingwith lime and subsequent calcination process. In that
case, cement prepared with recycled fine fractions could
be subsequently employed to bind the coarser fractions
(gravel/cobbles) in the preparation of molded blocks
(Poon et al., 2002) that would represent building ele-
ments prepared entirely with recycled components.
Acknowledgements
Profs. L. Beccaluva and F. Siena are kindly acknowl-
edged as the promoters of this research and for their
helpful discussion. The authors are also grateful to the
anonymous Referees for the useful suggestions reported
in their constructive reviews, and to Prof. C.S. Poon for
the careful editorial comments which ultimately led to asignificant improvement of the paper.
References
Ajdukiewicz, A., Kliszczewicz, A., 2002. Influence of recycled aggre-
gates on mechanical characteristics of HS/HPC. Cement and
Concrete Composites 24, 279–296.
Alberti, L., 1998. Indagine petrografica-applicativa dei materiali inerti
della discarica di Ca Leona (Ferrara). Unpublished Thesis (Super-

G. Bianchini et al. / Waste Management 25 (2005) 149–159 159
visors: Prof. L. Beccaluva and Prof. C. Vaccaro). University of
Ferrara.
Baronio, G., Binda, L., Bombardini, N., 1997. The role of brick
pebbles and dust in conglomerates based on hydrated lime and
crushed bricks. Construction and Building Materials 11, 33–40.
Bianchini, G., Martucci, A., Vaccaro, C., 2002. Petro-archeometric
characterisation of ‘‘cotto ferrarese’’: bricks and terracotta ele-
ments from historic buildings of Ferrara. Periodico di Mineralogia
71, 101–111.
Bressi, G., 2003. Recupero di risorse dai rifiuti da costruzione e
demolizione:problematiche e prerogative. In the ANPAR (Associ-
azione Nazionale Produttori Aggregati Riciclati) web-site
(www.anpar.org), pp. 1–21.
Corinaldesi, V., 2002. Recupero e riutilizzo di materiali da demolizi-
one: aspetti tecnici ed economici. Enco Journal 20, 1–5.
Corinaldesi, V., Morioni, G., 2002. I materiali inerti da demolizioni
nelle malte e nei calcestruzzi: nuove prospettive. Recycling,
demolizioni & riciclaggio 6 (2), 95–99.
Corinaldesi, V., Giuggioloni, M., Moriconi, G., 2002. Use of rubble
from building demolition in mortars. Waste management 22, 893–
899.
European Commission, Directorate – General Environment, DG
ENV. E.3, 2000. Management of construction and demolition
waste. Working document No. 1, 4th April 2000, pp. 1–26.
Limbachiya, M.C., Leelawat, T., Dhir, R.K., 2000. Use of recycled
concrete aggregate in high-strength concrete. Materials and Struc-
tures 33, 574–580.
Manning, D.A.C., 1995. Cement and Plasters Industrial Minerals.
Editor, Chapman & Hall, London, pp. 141–155.
Mesbah, H.A., Buyle-Bodin, F., 1999. Efficiency of polypropylene and
metallic fibres on control of shrinkage and cracking of recycled
aggregate mortars. Construction and building materials 13, 439–
447.
Olorunsogo, F.T., Padayachee, N., 2002. Performance of recycled
aggregate concrete monitored by durability indexes. Cement and
Concrete Research 32, 179–185.
Poon, C.S., 1997. Management and recycling of demolition waste in
Hong Kong. Waste Management and Research 15, 561–572.
Poon, C.S., Yu, A.T.W., Ng, L.H., 2001. On-site sorting of construc-
tion and demolition waste in Hong Kong. Resources, Conservation
and Recycling 32, 157–172.
Poon, C.S., Kou, S.C., Lam, L., 2002. Use of recycled aggregates in
molded concrete bricks and blocks. Construction and Building
Materials 16, 281–289.
Sagoe-Crentsil, K.K., Brown, T., Taylor, A.H., 2001. Performance of
concrete made with commercially produced coarse recycled
concrete aggregate. Cement and Concrete Research 31, 707–712.
Trankler, J.O.V., Walker, I., Dohmann, M., 1996. Environmental
impact of demolition waste – an overview on 10 years of research
and experience. Waste Management 16, 21–26.
Wahlstrom, M., Laine-Ylijoki, J., Maattanen, A., Luotojarvi, T.,
Kivecas, L., 2000. Environmental quality assurance system for use
of crushed mineral demolition wastes in road constructions. Waste
Management 20, 225–232.
Wentworth, C.K., 1922. A scale of grade and class terms for clastic
sediments. Journal of Geology 30, 377–392.
Zakaria, M., Cabrera, J.G., 1996. Performance and durability of
concrete made with demolition waste and artificial fly ash-clay
aggregates. Waste Management 16, 151–158.
Zendri, E., Lucchini, V., Biscontin, G., Morabito, M., 2004. Interac-
tion between clay and lime in ‘‘cocciopesto’’ mortars: a study by
29Si MAS spectroscopy. Applied Clay Science 25, 1–7.