practical recycling economics
TRANSCRIPT
New Jersey Department of Environmental ProtectionDivision of Solid and Hazardous Waste
Making the
For your program
Numbers
Work
l l l l l l l l l l l l l l l
l l l l l l l l l l l l l l l l l l l l l l l l
Practical
Recycling
Economics
Printed on recycled paper
Practical Recycling Economics:Making the Numbers Work for Your Program
Edited by:
Written by:
Graphics and Design by:
Produced by:
Funded by:
Jim Morris
Jim Morris
Wayne DeFeo
Betsy Saul
Copyright © 1999 Rutgers, the State University of New Jersey
Cook CollegeOffice of Continuing Professional EducationRutgers, the State University of New JerseyNew Brunswick, NJ
Cook CollegeRutgers, the State University of New Jersey
Private Independent ContractorWarren Township
Somerville, NJ
Cook CollegeOffice of Continuing Professional EducationRutgers, the State University of New Jersey
102 Ryders Lane
New Brunswick, NJ 08901-8519
732-932-9271
New Jersey Department of Environmental ProtectionDivision of Solid and Hazardous Waste
l l l l l l l l l l l l l l l l l l l l l l l l l
Making the Numbers
Work For your program
PracticalRecyclingEconomics
l l l l l l l l l l l l l l l l l l l l l l l l l
SThe target audienceCoordinators of municipal and county recycling programs. Theexamples and discussion are heavily weighted towards collectionand marketing issues because those are the areas where localcoordinators have the greatest control. Processing receives farless attention because in New Jersey it�s done primarily by a fewcounties or private processors.
The intent of the manualThis is written as a reference and instructional manual to providespecific information, tools and strategies to make recycling morecost-effective for individual recycling programs. It does notcritique or study the economic and environmental returns ofrecycling. Instead, it suggests concrete, practical ways to makeexisting programs more cost-effective.
The tone of the manualLet�s be honest: this topic could be killer boring. The manualattempts to avoid that with an informal tone that is always andonly meant to make the information more enjoyable. All theexamples are intended to be honest, representative numbers thatreflect costs and revenues in New Jersey.
l l l l l l l l l l l l l l l l l l l l l lome Important Context
3
l l l l l l l l l l l l l l l l l l l l l l l l l
Introduction to Practical Recycling Economics .... 5
How to Enjoy This Manual ...................................... 7
1. Understanding Recycling Economics .................. 8Fundamentals of supply and demand ........................................ 8Economics: What�s the use? .................................................... 11
2. Fully Understanding Costs ................................. 19The weird world of costs ......................................................... 20Full cost accounting ................................................................. 32Cost benchmarks ..................................................................... 42The route audit: The numbers you need to reduce costs.......... 50
3. Putting the Numbers Together:Tools for Cost-Benefit Analysis ........................ 55
Recycling�s head start to a better bottom line .......................... 56Doing the math ........................................................................ 57Designing a system for financial success ................................ 65Strategies for recovering avoided costs ................................... 66
l l l l l l l l l l l l l l l l l l l l l lC ontents
4
l l l l l l l l l l l l l l l l l l l l l l l l l
4. Marketing Recyclables .......................................69It�s all about marketing ............................................................ 70Forces that drive markets ......................................................... 71Long-term vs. short-term markets ........................................... 74Market players ......................................................................... 74Cooperative marketing ............................................................ 77Market indicators ..................................................................... 78Talking to markets: A checklist ............................................... 81
5. Contracts ...............................................................83Smart contracting ..................................................................... 84Definitions ............................................................................... 85From bid to contract ................................................................ 85Legal considerations ................................................................ 97Negotiating contracts with markets ....................................... 100
Conclusion: Recycling your way tosustainability ..................................................... 103
References ................................................................ 105Talking like an accountant ..................................................... 107Appendices ............................................................................ 110Appendix A: Market indicators ............................................. 110Appendix B: PSI Specifications ............................................ 113Appendix C:Local Public Contracts Law Reference Guide ....................... 118Appendix D: Uniform Solid WasteBid Specifications Reference Guide ...................................... 121Appendix E: Worksheets ....................................................... 123
Acknowledgments ................................................... 131
l l l l l l l l l l l l l l l l l l l l l l l l l
5
Changing timesFor reasons perhaps only psychiatrists can understand, passions run deep aboutgarbage. Professionals may call it solid waste, but customers still call it garbage.And, as many public works managers will attest, messing with people�s garbageroutines can invite trouble.
Passions run equally high about recycling. Since passage of mandatoryrecycling in New Jersey, an entire generation has grown up with recycling as away of life � as a moral and legal responsibility of all citizens. It has enjoyedhigh popularity as the right and smart thing to do.
An increasing number of voices, however, have questioned both the practiceof recycling and the premise upon which it was created. The criticisms initiallycame from free-market advocates, including the Reason Foundation and theCato Institute. They argued that recycling had needlessly increased the cost ofsolid waste management in return for little environmental benefit. When theNew York Times Magazine came to the same conclusion in its cover article�Recycling is Garbage,� this critique of recycling had migrated from the free-market libertarians to the mainstream media.
Recycling highs and lowsAmidst this nationwide questioning of recycling, the economic and regulatoryfoundation of our statewide solid waste management system was crumbling.From 1994 to 1997, a series of court decisions challenged core sections of New
ntroductionIl l l l l l l l l l l l l l l l l l l l
l l l l l l l l l l l l l l l l l l l l l l l l l
6
Jersey�s system of flow control. This regulatory system had dictated thedestination and disposal price of all solid waste generated within New Jersey�sborders.
Flow control is a powerful financial tool. For solid waste managers, itguarantees a reliable supply of waste at a price that can�t be undercut bycompetition. With a guaranteed stream of waste and money, counties couldconfidently invest in their chosen tools of solid waste management, includingincinerators, landfills, transfer stations, recycling processing centers andrecycling education and collection programs.
Flow control helped make the financial case for recycling. Flow control,and the environmental program investments initiated during the flow controlera, resulted in some of the highest garbage disposal rates in the country. Thosesolid waste system rates, which averaged $92 per ton statewide and topped$125 per ton in some counties, provided powerful economic incentives to recycle.The system essentially gave recycling a hefty head start in any cost competitionwith solid waste disposal. And when prices paid for recyclable commodities hitastronomic highs in 1994-95, the net costs of recycling never looked better.
The 1994-95 price peaks, however, were just that � peaks. And prices werealready heading south when the New York Times Magazine article hit thenewsstands in June 1996. After the U.S. Supreme Court chose not to hear afinal appeal from New Jersey regarding regulatory flow control, garbage disposalprices began to plummet. Within months, rates in some counties had fallenalmost 50%. Even though the reduced rates in some cases did not fully captureall operating and debt costs of the disposal facilities, the financial effect onrecycling was immediate.
At once, two main economic benefits of recycling � sale of materials andavoided cost of garbage disposal � had plunged drastically.
The more things change�So where does this leave the economics of recycling in New Jersey?
Ironically � exactly where it has remained all along. Mandatory recycling remainsthe law throughout the state. New Jersey�s solid waste policy does not requirerecycling to be more cost-effective than garbage disposal. In fact, state policy isbuilt on and sustained by the premise that recycling provides environmentaland economic benefits, from job creation to resource conservation, that maynot be reflected in a simple accounting of today�s costs and revenues.
Promoting recycling in New Jersey is an environmental policy; it is not alicense to run inefficient recycling programs. Given the state mandate, the goalof all recycling coordinators has always been to design programs that minimizecosts and maximize returns. The methods of analysis and decision-making havenever changed � only the numbers we plug into the equations have. And NewJersey still has some of the most promising recycling cost-benefit numbers inthe country. We may have to look harder for savings, but the opportunities arethere.
Mandatory recyclingremains the law,and New Jersey stillhas some of themost promisingcost-benefit num-bers in the country.
l l l l l l l l l l l l l l l l l l l l l l l l l
7
How to Enjoy This Manual
Start Anywhere...Read It Any Way You WantThe content is structured to flow from big-picture issues to small ones, but feelfree to go against the flow. You should be able to read any chapter and anysection of any chapter without reading other parts. Sometimes the manual willrefer you to other sections for more detail, but go there only if you want.
Chapter 1What You Can Skip Without Financial PenaltyYou can skip all of Chapter 1 and still run the world�s most cost-effectiverecycling program. Chapter 1 discusses the laws of supply and demand andtheir peculiar relationship to recycling in New Jersey. It can help you betteranalyze how economic news and government policies may affect your program,but many of these forces are beyond your control.
Chapter 2If You Just Want to Know How Much Recycling CostsThe �Weird World of Costs� in Chapter 2 introduces some bizarre cost behaviors,and �Cost Benchmarks� helps measure a program�s success. To calculate costof service, read �Full Cost Accounting� and use that section�s worksheet.
Chapters 2 & 3For the Ruthless, or the Tentative, Cost CutterTo get right down to business, read the �Cost Benchmarks� section in Chapter2 and gather the �Route Audit� data at the end of the chapter. Chapter 3 oncost-benefit analysis will help you decide whether a given project is cost-effective. To make that call for an overall program, compare total solid wastemanagement costs with and without recycling. Chapter 2 and Chapter 3 aremost helpful with that.
Chapters 4 & 5If You Work with Contractors or Like to Sell Your StuffChapter 5 is nothing but contracts. Elect not to read it at your cost peril. Itcontains the manual�s highest proportion of legal words, but hey, that�s lifewith contracts! It includes specific language to save you money and headaches.The markets chapter and the contracts chapter have some specific language andstrategies you may want to consider.
How costs act
How to cut costs
l l l l l l l l l l l l l l l l l l l l l l l l l
l l l l
Buying and selling tips
8 Fundamentals of supply and demand Economics: What�s the use?l l l l l l l l l l l l l l l l l l l l l l l l l
Understanding Recycling Economics1 l l l l l l l l l l l l l l l l l l l l
Fundamentals of supply and demand
Predicting the unpredictable
Economics: What�s the use?
It�s hard to stand on a shaky price floor
Shifting the demand curve out
Increasing demand for recycled products
Economics in action: Mandatory recycling
Pushing supply and pulling demand
Fundamentals of supply and demandRecycling markets are controlled by the same laws of supply and demand thatcontrol markets for everything from breakfast cereals to beauty products. That�sgood news and bad news. The good news is that you can expect markets tobehave rationally in the long run. The bad news is that �in the long run, we allare dead,� as the famous economist John Maynard Keynes noted. In themeantime, we all live and work in the short run where markets seem anythingbut rational. Fluctuations in supply and demand can cause prices to soar oneday and plummet the next. And no one � no broker, no market analyst, no tradepublication � can accurately predict where prices are going or when they willget there. No matter how confident �experts� may sound, they cannot accuratelypredict price movements in a free market.
Predicting the unpredictableIn free markets, prices are determined by a combination of the individualdecisions of thousands, hundreds of thousands or millions of buyers. Incompetitive markets, these buyers don�t coordinate their decisions with eachother. They make decisions based on their own needs and budgets. To predict
9
l l l l l l l l l l l l l l l l l l l l l l l l l
Fundamentals of supply and demand Economics: What�s the use?
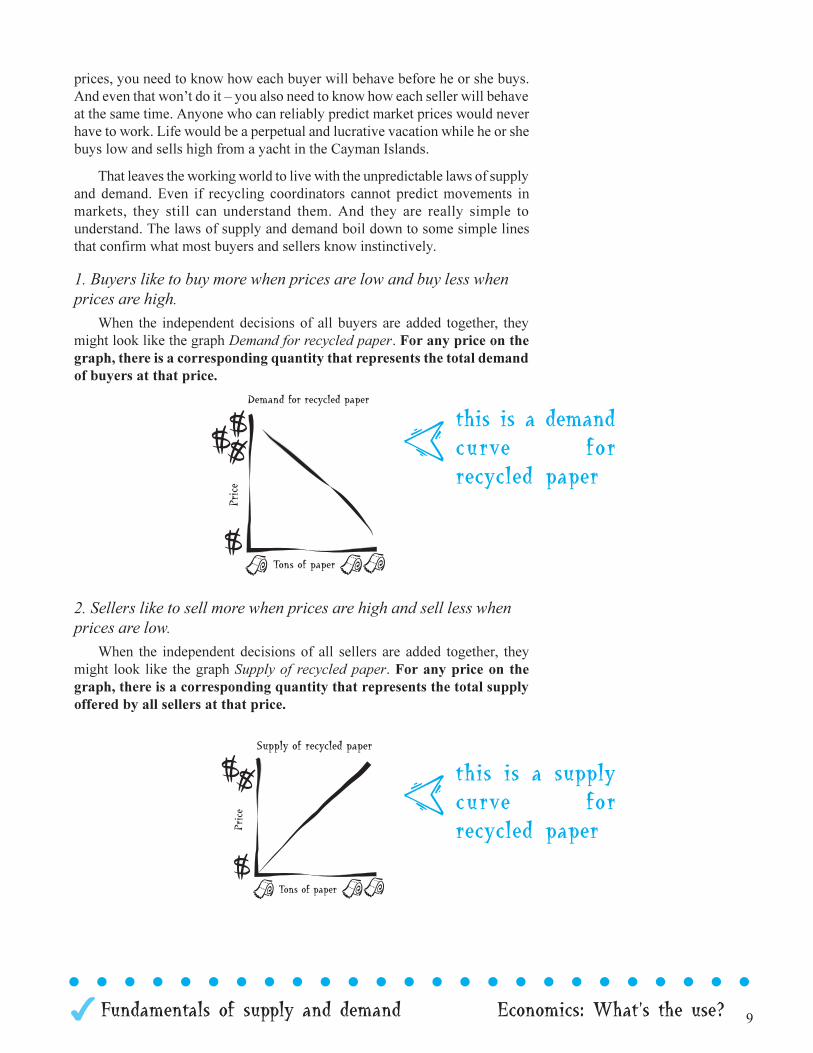
this is a supplycurve forrecycled paper
this is a demandcurve forrecycled paper
prices, you need to know how each buyer will behave before he or she buys.And even that won�t do it � you also need to know how each seller will behaveat the same time. Anyone who can reliably predict market prices would neverhave to work. Life would be a perpetual and lucrative vacation while he or shebuys low and sells high from a yacht in the Cayman Islands.
That leaves the working world to live with the unpredictable laws of supplyand demand. Even if recycling coordinators cannot predict movements inmarkets, they still can understand them. And they are really simple tounderstand. The laws of supply and demand boil down to some simple linesthat confirm what most buyers and sellers know instinctively.
1. Buyers like to buy more when prices are low and buy less whenprices are high.
When the independent decisions of all buyers are added together, theymight look like the graph Demand for recycled paper. For any price on thegraph, there is a corresponding quantity that represents the total demandof buyers at that price.
2. Sellers like to sell more when prices are high and sell less whenprices are low.
When the independent decisions of all sellers are added together, theymight look like the graph Supply of recycled paper. For any price on thegraph, there is a corresponding quantity that represents the total supplyoffered by all sellers at that price.
10 Fundamentals of supply and demand Economics: What�s the use?l l l l l l l l l l l l l l l l l l l l l l l l l
l l l l l l l l l l l l l l l l l l l l l l l l l
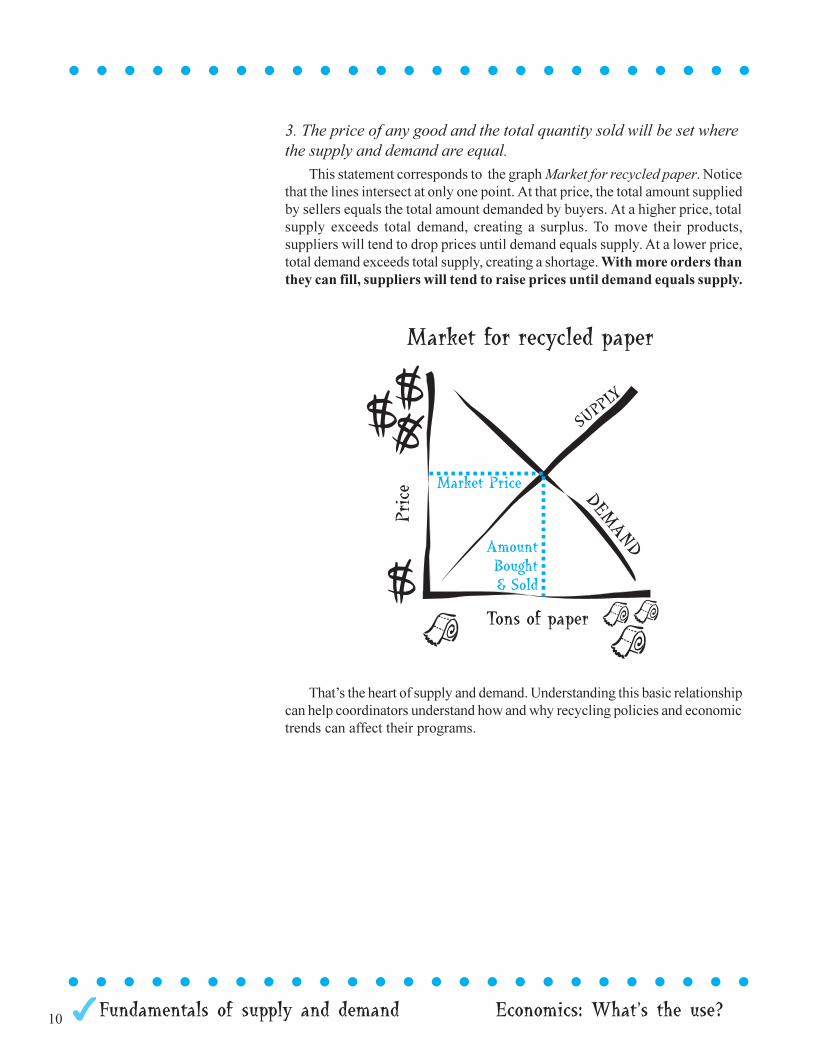
3. The price of any good and the total quantity sold will be set wherethe supply and demand are equal.
This statement corresponds to the graph Market for recycled paper. Noticethat the lines intersect at only one point. At that price, the total amount suppliedby sellers equals the total amount demanded by buyers. At a higher price, totalsupply exceeds total demand, creating a surplus. To move their products,suppliers will tend to drop prices until demand equals supply. At a lower price,total demand exceeds total supply, creating a shortage. With more orders thanthey can fill, suppliers will tend to raise prices until demand equals supply.
That�s the heart of supply and demand. Understanding this basic relationshipcan help coordinators understand how and why recycling policies and economictrends can affect their programs.
11
l l l l l l l l l l l l l l l l l l l l l l l l l
Fundamentals of supply and demand Economics: What�s the use?
Economics: What�s the use?Economists have a bad habit of oversimplifying the real world with convenientassumptions. For supply and demand to work in its purest form, economists�assume� several conditions are met in �perfect competition.� Some of theirassumptions may not apply neatly to recycling markets.
1. The market consists of many sellers and many buyers, and noneis big enough by itself to affect prices in the market.
In many recyclable markets this assumption often is not true. For example,when one large paper mill closes, it often does affect prices throughout regionalmarkets. Markets may exist in other cities or regions, but the added cost oftransporting materials to those markets may effectively close them to localsuppliers.
2. Each seller provides a product that is indistinguishable from allothers like it.
For recycling markets, this condition is often met to a large degree. That is,an identical amount of clean, baled corrugated cardboard from one source isusually not preferred over the same quantity of clean, baled corrugated cardboardfrom another source. Markets can, and often do, penalize sellers who cannotmeet contamination standards or who cannot supply minimum quantities. Inboth cases, however, those sellers are providing a less valuable commodity, soit is not indistinguishable from all others.
3. Buyers and sellers can easily enter or exit the marketplace.Mandatory recycling establishes a legal requirement to remain as a seller
in the market, almost regardless of price. This is discussed in Economics inaction: Mandatory recycling later in this chapter.
If mastering the laws of supply and demand won�t help you predict prices,and if perfect competition depends on assumptions that often ignore the realityof recycling markets, exactly what are these pillars of economics good for?Plenty. They can help guide statewide and nationwide recycling policies, andthey are powerful tools to analyze everything from market upheavals togovernment regulations. Understanding those forces can help you make moreeducated guesses about future directions of markets, even if you can�t predictexact price movements. Price floors and mandatory recycling laws provideuseful examples.
12 Fundamentals of supply and demand Economics: What�s the use?l l l l l l l l l l l l l l l l l l l l l l l l l
l l l l l l l l l l l l l l l l l l l l l l l l ll l l l l l l
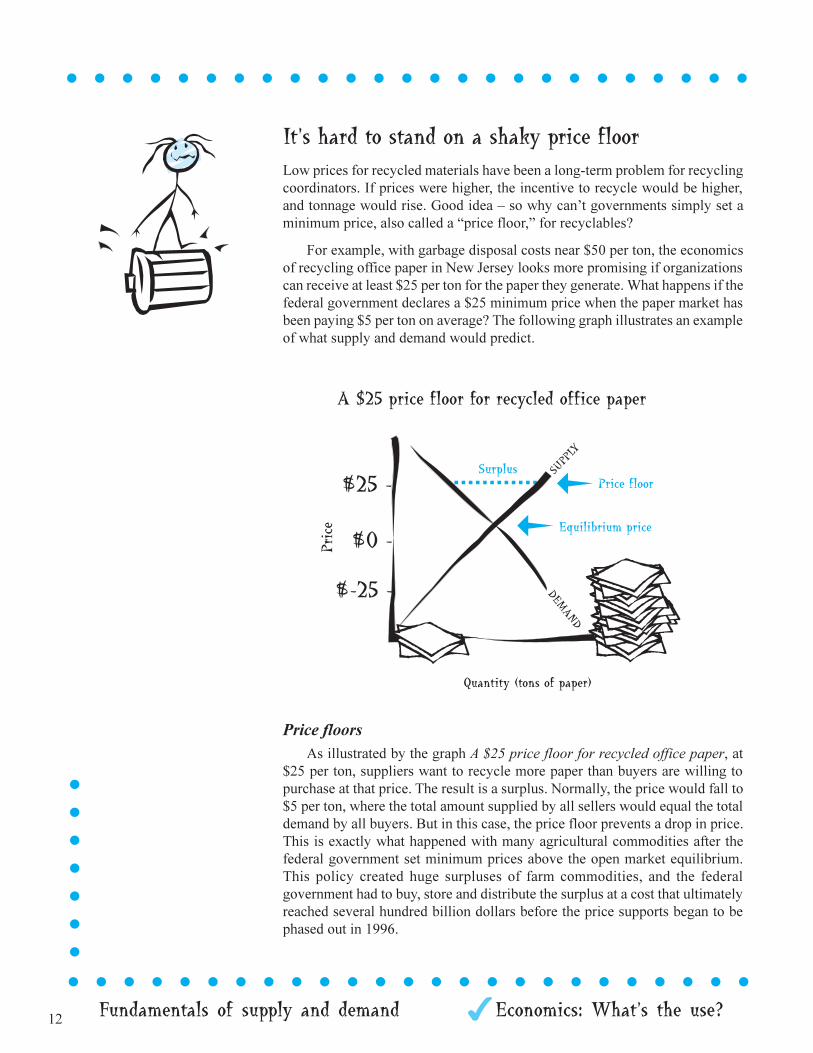
It�s hard to stand on a shaky price floorLow prices for recycled materials have been a long-term problem for recyclingcoordinators. If prices were higher, the incentive to recycle would be higher,and tonnage would rise. Good idea � so why can�t governments simply set aminimum price, also called a �price floor,� for recyclables?
For example, with garbage disposal costs near $50 per ton, the economicsof recycling office paper in New Jersey looks more promising if organizationscan receive at least $25 per ton for the paper they generate. What happens if thefederal government declares a $25 minimum price when the paper market hasbeen paying $5 per ton on average? The following graph illustrates an exampleof what supply and demand would predict.
Price floorsAs illustrated by the graph A $25 price floor for recycled office paper, at
$25 per ton, suppliers want to recycle more paper than buyers are willing topurchase at that price. The result is a surplus. Normally, the price would fall to$5 per ton, where the total amount supplied by all sellers would equal the totaldemand by all buyers. But in this case, the price floor prevents a drop in price.This is exactly what happened with many agricultural commodities after thefederal government set minimum prices above the open market equilibrium.This policy created huge surpluses of farm commodities, and the federalgovernment had to buy, store and distribute the surplus at a cost that ultimatelyreached several hundred billion dollars before the price supports began to bephased out in 1996.
13
l l l l l l l l l l l l l l l l l l l l l l l l l
Fundamentals of supply and demand Economics: What�s the use?
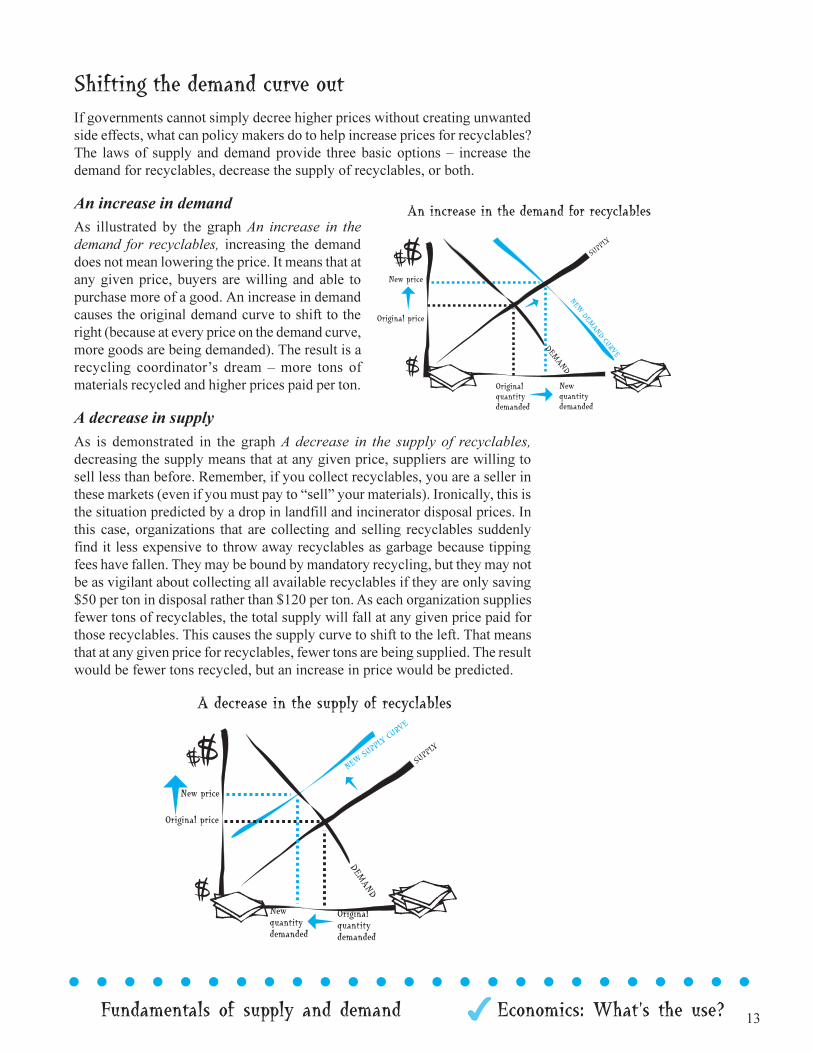
Shifting the demand curve outIf governments cannot simply decree higher prices without creating unwantedside effects, what can policy makers do to help increase prices for recyclables?The laws of supply and demand provide three basic options � increase thedemand for recyclables, decrease the supply of recyclables, or both.
An increase in demandAs illustrated by the graph An increase in thedemand for recyclables, increasing the demanddoes not mean lowering the price. It means that atany given price, buyers are willing and able topurchase more of a good. An increase in demandcauses the original demand curve to shift to theright (because at every price on the demand curve,more goods are being demanded). The result is arecycling coordinator�s dream � more tons ofmaterials recycled and higher prices paid per ton.
A decrease in supplyAs is demonstrated in the graph A decrease in the supply of recyclables,decreasing the supply means that at any given price, suppliers are willing tosell less than before. Remember, if you collect recyclables, you are a seller inthese markets (even if you must pay to �sell� your materials). Ironically, this isthe situation predicted by a drop in landfill and incinerator disposal prices. Inthis case, organizations that are collecting and selling recyclables suddenlyfind it less expensive to throw away recyclables as garbage because tippingfees have fallen. They may be bound by mandatory recycling, but they may notbe as vigilant about collecting all available recyclables if they are only saving$50 per ton in disposal rather than $120 per ton. As each organization suppliesfewer tons of recyclables, the total supply will fall at any given price paid forthose recyclables. This causes the supply curve to shift to the left. That meansthat at any given price for recyclables, fewer tons are being supplied. The resultwould be fewer tons recycled, but an increase in price would be predicted.
14 Fundamentals of supply and demand Economics: What�s the use?l l l l l l l l l l l l l l l l l l l l l l l l l
Increasing demand for recycled productsThe two graphs Increase in demand forrecyclables and Decrease in supply ofrecyclables show why �demand side� policieslike �Buy Recycled� campaigns are soattractive. They increase both the price andthe quantity recycled. That�s why they are sopopular with recycling policy makers.However, increasing the demand for anyproduct is easy to suggest, but difficult toaccomplish because aggregate demand is thesum total of countless individual,uncoordinated decisions by buyers. The mostcreative marketing and advertising minds in the country are constantlyexperimenting with campaigns to increase demand for everything from cars tocomputers to corn chips.
Here are some ways that policy makers, recycling coordinators and allconsumers can affect demand for recyclables.
Change consumer preferences
�Buy Recycled� campaigns and minimum-recycled-content legislation are allabout increasing demand. These campaigns recruit or enlist buyers for all kindsof recycled products � from plumbing fixtures to parkas � so that at any givenprice, more recycled products will be bought in the marketplace. As a recyclingcoordinator, and as a consumer, you can help increase demand by choosing tobuy recycled-content products. Economists tend to favor voluntary measures,such as �Buy Recycled� campaigns, over mandated purchasing regulationsbecause voluntary campaigns expand rather than reduce consumer choice.
Change the prices of related goods
Pay-As-You-Throw (PAYT) solid waste pricing works on the premise thatrecycling is a substitute for garbage disposal. Demand for recycling serviceshould increase when the cost of a substitute, garbage disposal, rises. In PAYT,consumers are charged for each can, bag or pound of garbage they generate. Intraditional pricing systems, consumers pay a flat monthly fee (or the cost ofthis service may be hidden in their tax bill), so they pay no additional, ormarginal, cost for setting out two cans a week rather than one. It costs consumersno more to put their mixed paper into the garbage can than into the recyclingbin.
By charging consumers for each additional garbage can (or bag or pound),PAYT raises the cost of creating more garbage. That makes substitutes to garbagedisposal � including waste prevention, composting, recycling, and unfortunately,illegal dumping � more financially attractive. Successful PAYT systems usually
15
l l l l l l l l l l l l l l l l l l l l l l l l l
Fundamentals of supply and demand Economics: What�s the use?
combine convenient, comprehensive recycling programs with waste preventioneducation to encourage legal waste reduction. At the same time, they establishcredible enforcement programs that include fines to raise the cost of illegaldiversion. PAYT pricing complements mandatory recycling. It provides voluntaryprice incentives to encourage each household to maximize its participation inrecycling and waste reduction programs, such as food and yard wastecomposting.
Promote changes in technology
Technological advances can make a big difference in recycling�s bottom line.For example, plastics sorting equipment dramatically reduced the cost ofprocessing post-consumer plastics. Cost-effective methods for turning plasticbottles collected at the curb into raw materials for manufacturers dramaticallyincreased the demand for PETE and HDPE containers. This is a key reason theDEP has invested in research and technology development to spur demand forrecycling.
Increase incomes of buyersand increase the number of buyers
When mandatory recycling was implemented in 1987, the New JerseyDepartment of Environmental Protection also created low-interest loans toincrease both the number and capacity of processors and end-users of recycledproducts. These subsidized loans reduced costs (which in turn increased netincome) and increased the buying power of these firms. They also lowered thecost barrier to enter the market, which helped cultivate new buyers.
l l l l l l l l l l l l l l l l l l l l l l l l l
l l l l l l l
16 Fundamentals of supply and demand Economics: What�s the use?l l l l l l l l l l l l l l l l l l l l l l l l l
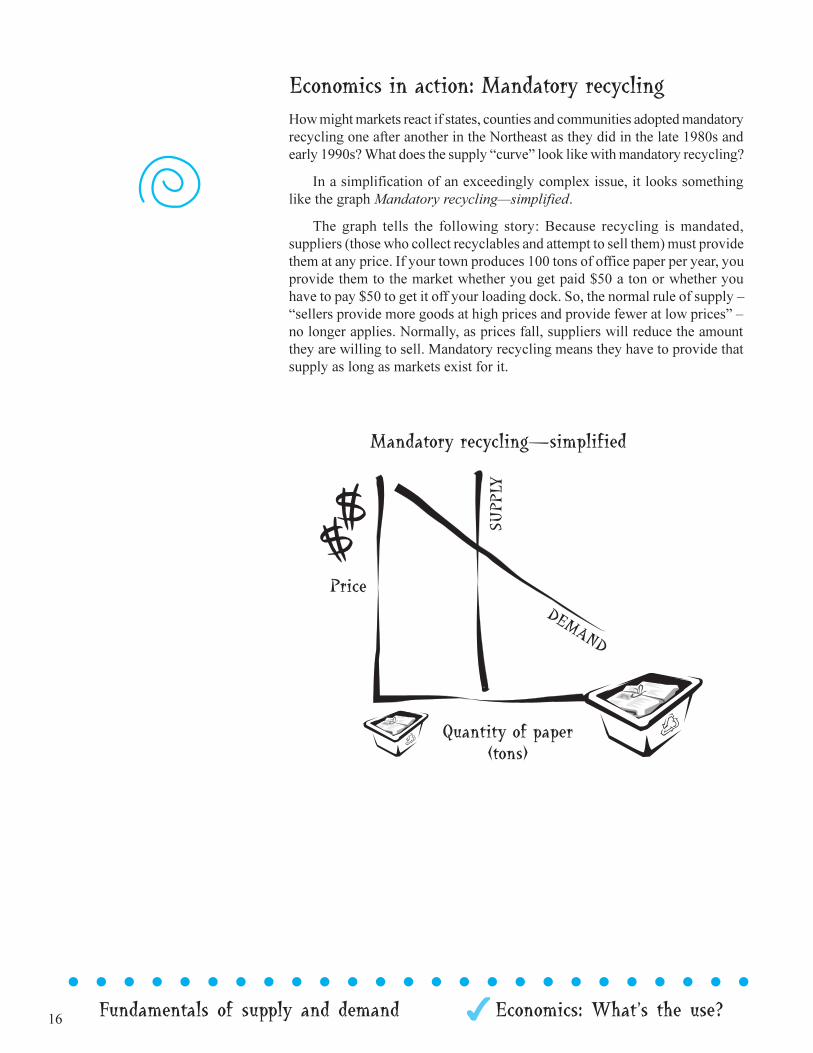
Economics in action: Mandatory recyclingHow might markets react if states, counties and communities adopted mandatoryrecycling one after another in the Northeast as they did in the late 1980s andearly 1990s? What does the supply �curve� look like with mandatory recycling?
In a simplification of an exceedingly complex issue, it looks somethinglike the graph Mandatory recycling�simplified.
The graph tells the following story: Because recycling is mandated,suppliers (those who collect recyclables and attempt to sell them) must providethem at any price. If your town produces 100 tons of office paper per year, youprovide them to the market whether you get paid $50 a ton or whether youhave to pay $50 to get it off your loading dock. So, the normal rule of supply ��sellers provide more goods at high prices and provide fewer at low prices� �no longer applies. Normally, as prices fall, suppliers will reduce the amountthey are willing to sell. Mandatory recycling means they have to provide thatsupply as long as markets exist for it.
17
l l l l l l l l l l l l l l l l l l l l l l l l l
Fundamentals of supply and demand Economics: What�s the use?
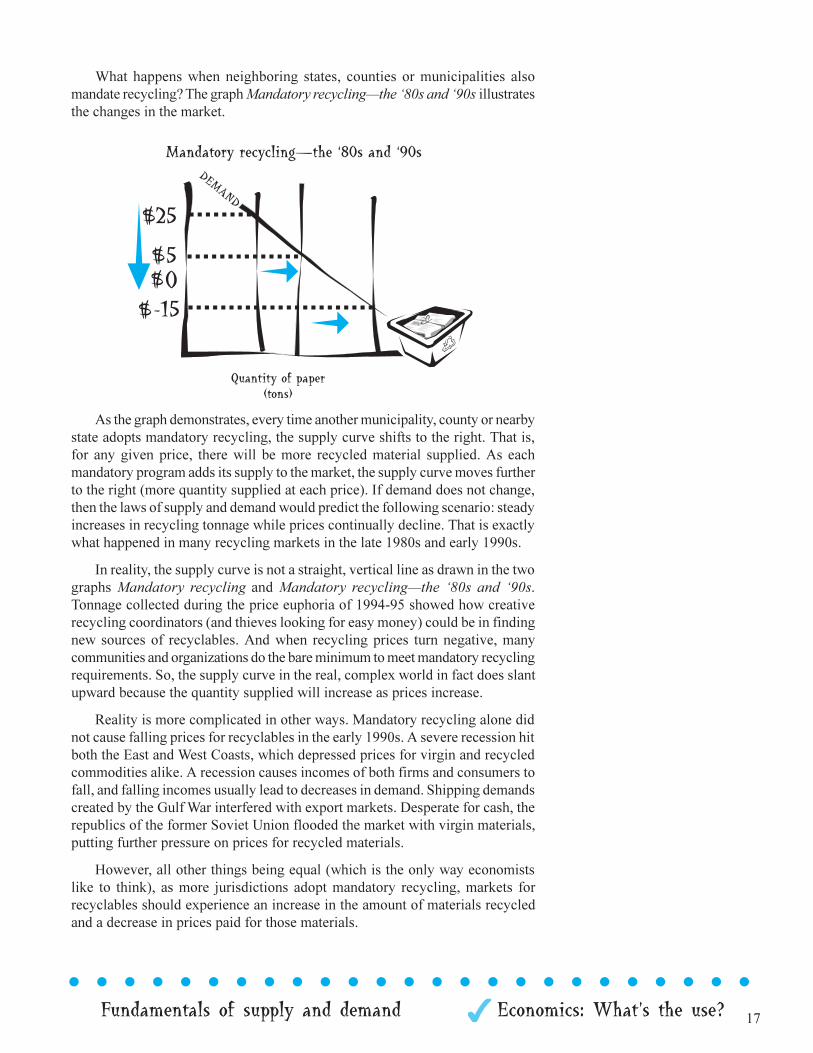
What happens when neighboring states, counties or municipalities alsomandate recycling? The graph Mandatory recycling�the �80s and �90s illustratesthe changes in the market.
As the graph demonstrates, every time another municipality, county or nearbystate adopts mandatory recycling, the supply curve shifts to the right. That is,for any given price, there will be more recycled material supplied. As eachmandatory program adds its supply to the market, the supply curve moves furtherto the right (more quantity supplied at each price). If demand does not change,then the laws of supply and demand would predict the following scenario: steadyincreases in recycling tonnage while prices continually decline. That is exactlywhat happened in many recycling markets in the late 1980s and early 1990s.
In reality, the supply curve is not a straight, vertical line as drawn in the twographs Mandatory recycling and Mandatory recycling�the �80s and �90s.Tonnage collected during the price euphoria of 1994-95 showed how creativerecycling coordinators (and thieves looking for easy money) could be in findingnew sources of recyclables. And when recycling prices turn negative, manycommunities and organizations do the bare minimum to meet mandatory recyclingrequirements. So, the supply curve in the real, complex world in fact does slantupward because the quantity supplied will increase as prices increase.
Reality is more complicated in other ways. Mandatory recycling alone didnot cause falling prices for recyclables in the early 1990s. A severe recession hitboth the East and West Coasts, which depressed prices for virgin and recycledcommodities alike. A recession causes incomes of both firms and consumers tofall, and falling incomes usually lead to decreases in demand. Shipping demandscreated by the Gulf War interfered with export markets. Desperate for cash, therepublics of the former Soviet Union flooded the market with virgin materials,putting further pressure on prices for recycled materials.
However, all other things being equal (which is the only way economistslike to think), as more jurisdictions adopt mandatory recycling, markets forrecyclables should experience an increase in the amount of materials recycledand a decrease in prices paid for those materials.
18 Fundamentals of supply and demand Economics: What�s the use?l l l l l l l l l l l l l l l l l l l l l l l l l
Pushing supply and pulling demandFortunately for New Jersey recycling coordinators, our policy makers did notsimply mandate recycling and call it a day. The �New Jersey StatewideMandatory Source Separation and Recycling Act� also created incentives toincrease demand for recyclables. These included low-interest loans to processorsand end-users of recyclables as well as investment in research to identify new,more cost-effective technologies to process and upgrade the value of recyclables.Working with recycling advocacy groups, such as the New Jersey Buy RecycledBusiness Network, the state has also organized �Buy Recycled� campaigns toincrease the demand for recyclables.
With these tools, the state is simultaneously pursuing both a �supply push�strategy that mandates collection of recyclables and a �demand pull� policythat increases both the number and purchasing power of consumers of recycledproducts.
Notes:
19
l l l l l l l l l l l l l l l l l l l l l l l l l
Weird world of costs Full cost accounting Cost benchmarks Route audit
The weird world of costs
Direct and indirect costs
Fixed and variable costs
Marginal costs
Controllable costs
Operating, capital and overhead costs
Sunk costs
The time value of money
Opportunity costs
Full cost accounting
Costs versus outlays
Full cost accounting for recycling crews
Exactly how full is full cost accounting?
Cost benchmarks
1. Cost per household
2. Cost per ton
3. Tonnage per household
4. Recovery rates
5. Participation rates
6. Compliance rates
7. Stops per crew or stops per crew member
The real cost story: On the whole, I�d ratherrecycle in New Jersey
The route audit:The numbers you needto reduce costs
Fully Understanding Costs2 l l l l l l l l l l l l l l l l l l l l l l
20 Weird world of costs Full cost accounting Cost benchmarks Route auditl l l l l l l l l l l l l l l l l l l l l l l l l
The weird world of costsCosts seldom seem in short supply, and you may not have been looking to incurnew ones. However, this chapter will introduce ways to analyze all kinds ofcosts, including some that are genuinely hard to identify, much less quantify.But why bother?
First, costs are notoriously devious. Understanding marginal costs, forexample, can explain how a program that appears to reduce costs can actuallyincrease them. Also, failing to understand capital and overhead costs has causedcountless solid waste agencies around the country to underprice the full cost oflandfill service.
Second, lots of other people are already doing the figuring, and you may notagree with their conclusions. When the Cato Institute called recycling in NewJersey an �inexcusable waste,� it used many of the tools of cost analysis explainedhere. You need to understand the nature of costs to argue your point.
Third, you need to understand these costs if you ever consider sharing serviceswith another department or organization or you want to recover money for workyou have done. In shared service agreements, failing to understand your cost ofservice is a license to get soaked. Get your fair share by getting your numbersright. Ocean City does. This Cape May municipality prides itself onreimbursements it has received from insurance funds. When coastal storms hitthis beachfront town, the public works department submits thoroughly andaccurately documented bills for the emergency clean-up work it performs. Thetown would get less cash if its public works manager didn�t understand costs sowell.
Finally, privatization is a force to be reckoned with. Because they need notgenerate a profit, public agencies can compete dollar-for-dollar with private-sector service providers � if, and only if, they understand their cost of service.
Recycling coordinators may routinely encounter any of these kinds of costs,which are explained in this chapter:
� fixed � variable � semi-fixed
� direct � indirect � capital
� operating � overhead � marginal
� controllable � sunk � opportunity
With the right program design and a sharp eye on costs, many recyclingprograms can be reasonably competitive, if not more cost-effective, than simplycarting everything to a landfill or incinerator. That remains true even after recent
l l l l l l l
Why Bother?
Reduce cost ofservices
Answerrecycling�s critics
Generate morerevenue
21
l l l l l l l l l l l l l l l l l l l l l l l l l
Weird world of costs Full cost accounting Cost benchmarks Route audit
declines in landfill and incinerator fees. Without these basic tools for cost-control, recycling programs can be � and should be � easy targets for anyonewith a calculator and a dislike of mandatory recycling.
Cost control begins with understanding how and why costs change, andthat can be best determined by asking a few basic questions about the nature ofcosts.
Question 1: Is the cost directly linked to the serviceprovided?If a cost is directly linked to the service provided, it�s a direct cost. Direct costscan be identified with a specific activity, product or service. Direct materials,direct equipment and direct labor are three main categories of direct costs.
A composting site, for example, may have direct wages of employees whostaff the site, direct equipment for the composting operation and direct materials,including educational brochures and utility expenses that are billed for thecomposting site only. Even the fringe benefits of compost site employees areconsidered direct costs � because those costs can be linked to employees whowork directly on that project. If a salaried employee splits her time equallybetween recycling and public health, 50% of her total salary and benefits wouldbe a direct cost to the recycling program. If a recycling program is managed bya supervisor who oversees a total of five programs, recycling might be assignedone-fifth, or 20%, of her salary and benefits as a direct cost. However, if recyclingis one-third, or 33%, of the supervisor�s budget, then 33% may be a betterapproximation of the direct cost of this supervision expense.
If you can�t link the cost directly to a product or service, it probably qualifiesas an indirect cost or overhead cost. When you�re costing out a service likerecycling, many indirect costs may seem neither obvious nor fair because thelist of indirect expenses is long, and often expensive.
Overhead costs have one thing in common: They are either too tedious ortoo time-consuming to link them to any one activity. A receptionist, for example,could track each phone call received and try to assign it to a specific department,but recording and tracking that information may take more time than the data isworth. And how about the time the receptionist is not on the phone? He or shemay be opening mail that applies to many or all departments. Instead of tryingto bill the receptionist�s time as a direct cost, most organizations throw thereceptionist costs into a pool of indirect costs that is split among all departments.How to split those costs is discussed in the Full cost accounting section of thischapter.
22 Weird world of costs Full cost accounting Cost benchmarks Route auditl l l l l l l l l l l l l l l l l l l l l l l l l
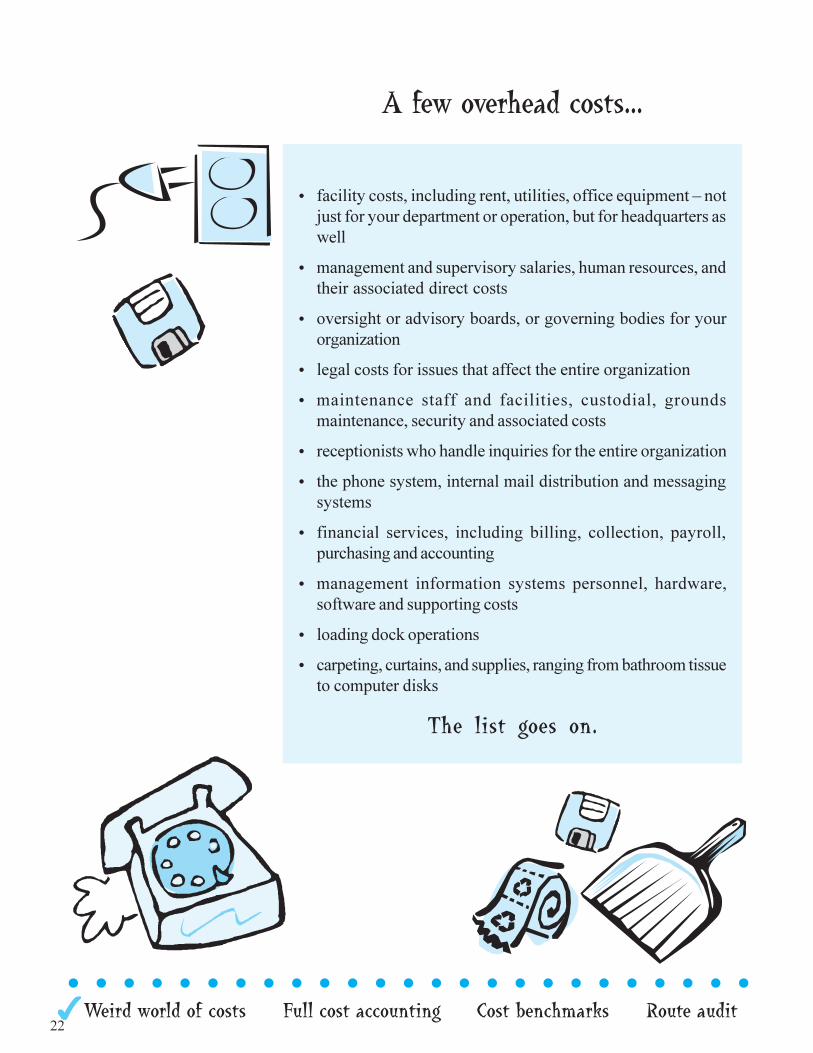
• facility costs, including rent, utilities, office equipment � notjust for your department or operation, but for headquarters aswell
• management and supervisory salaries, human resources, andtheir associated direct costs
• oversight or advisory boards, or governing bodies for yourorganization
• legal costs for issues that affect the entire organization
• maintenance staff and facilities, custodial, groundsmaintenance, security and associated costs
• receptionists who handle inquiries for the entire organization
• the phone system, internal mail distribution and messagingsystems
• financial services, including billing, collection, payroll,purchasing and accounting
• management information systems personnel, hardware,software and supporting costs
• loading dock operations
• carpeting, curtains, and supplies, ranging from bathroom tissueto computer disks
The list goes on.
A few overhead costs...
23
l l l l l l l l l l l l l l l l l l l l l l l l l
Weird world of costs Full cost accounting Cost benchmarks Route audit
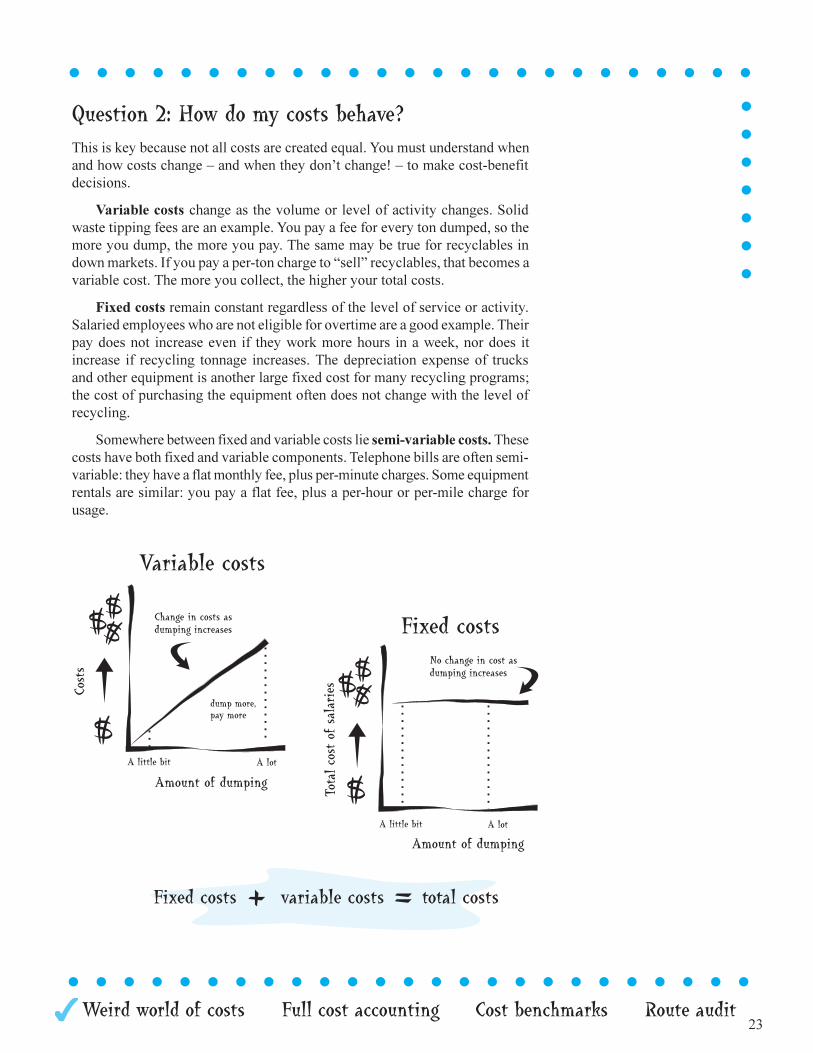
Question 2: How do my costs behave?This is key because not all costs are created equal. You must understand whenand how costs change � and when they don�t change! � to make cost-benefitdecisions.
Variable costs change as the volume or level of activity changes. Solidwaste tipping fees are an example. You pay a fee for every ton dumped, so themore you dump, the more you pay. The same may be true for recyclables indown markets. If you pay a per-ton charge to �sell� recyclables, that becomes avariable cost. The more you collect, the higher your total costs.
Fixed costs remain constant regardless of the level of service or activity.Salaried employees who are not eligible for overtime are a good example. Theirpay does not increase even if they work more hours in a week, nor does itincrease if recycling tonnage increases. The depreciation expense of trucksand other equipment is another large fixed cost for many recycling programs;the cost of purchasing the equipment often does not change with the level ofrecycling.
Somewhere between fixed and variable costs lie semi-variable costs. Thesecosts have both fixed and variable components. Telephone bills are often semi-variable: they have a flat monthly fee, plus per-minute charges. Some equipmentrentals are similar: you pay a flat fee, plus a per-hour or per-mile charge forusage.
l l l l l l l l l l l l l l l l l l l l l l l l l
l l l l l l l
24 Weird world of costs Full cost accounting Cost benchmarks Route auditl l l l l l l l l l l l l l l l l l l l l l l l l
Question 3: Which costs change when theprogram changes?This is a big one for anyone interested in cost control. It is the question ofmarginal costs, and it�s at the core of cost-benefit analysis. Which costswill change and which costs won�t when you make changes to your solidwaste management system? The question may seem obvious, but it is oftenanything but. It depends on the mix of direct, indirect, fixed and variablecosts.
Consider a town that contracts with a hauler to collect five materials inits curbside program. Under this contract, the town is paying $90 per ton onaverage for collection � a reasonably good rate for New Jersey. Becausemarkets for recyclables have been somewhat weak, the town must pay anaverage price of $5 per ton to �sell� its recyclables to a private processingfacility. Its direct cost of recycling would be $95 per ton. Now, in this sametown, solid waste collection costs an average of $40 per ton and disposalcosts another $60, for a combined total of $100 per ton. These numbersshow that recycling is more cost-effective than not recycling. Recycling winsthe cost competition by $5 per ton.
Or does it?
Ask the marginal cost question. What would happen if recycling werediscontinued? If recycling is more cost-effective than simply throwing garbageaway, shouldn�t total costs rise if the town stops recycling? That depends.We need to look more closely at which costs would change if recycling weredisbanded.
Clearly, if the town pays the tipping fee, the solid waste disposal costswould change. Every ton that is currently recycled would now be disposedof at $60 per ton. We will simplify the case by assuming that all currentrecycling tonnage would be landfilled. Beyond that, the question getscomplicated fast.
l l l l l l l l l l l l l l l l l l l l l l l l l
Costs and tonnageWhy does recycling cost moreto collect per ton at the curbthan garbage?
Weight is the difference. Ahousehold that recycles 1/3 ofits waste is throwing out theother 2/3 as garbage, or twiceas much by weight.
A household that recycles1/4 of its waste is throwing out3/4, or three times that amount,as garbage. It costs about thesame to send a worker andtruck to your house whether forrecycling or garbage, so thosecollection costs are spread outover more pounds of garbage.
The result: recyclingcollection costs are usuallysubstantially higher thangarbage collection on a perpound, or per ton, basis.
25
l l l l l l l l l l l l l l l l l l l l l l l l l
Weird world of costs Full cost accounting Cost benchmarks Route audit
Marginal costs at the curbThe town�s average cost of garbage collection is $40per ton. But if recyclables suddenly get tossed intothe garbage can, will garbage collection costsincrease by $40 for each extra (or marginal) tonpicked up? Not likely. That $40 figure includes plentyof fixed costs that won�t change if garbage canssuddenly become more full of stuff that used to be inrecycling bins. Yes, garbage trucks will take longerto complete their routes because more and heaviercans will be set out, and the trucks will fill up fasterbecause each stop has more trash. But don�t expectcosts to increase anywhere near $40 per ton. In fact,some models predict that garbage collection costswould increase by less than 5%, or about $2 per ton,in a town with a 25% curbside recycling rate. Thinkabout all the fixed costs that are not changing, suchas:
• the cost of sending the truck to and from the route
• the time it takes driving between stops
• all overhead costs
• wages of salaried employees
• any other cost not affected by the amount of garbage collected
Think of this cost-benefit problem another way. The cost of bringing thegarbage collection crew to your house has already been paid. So, in analyzingthis decision, you may find only two additional, or marginal costs, for garbagecollection:
• the extra time it takes to load more cans, bigger cans or heavier cansat each stop
• the time it takes to dump additional loads because trucks fill upfaster
The final savings may depend on collection crew costs, truck size andconfiguration, travel time to and from the disposal facility, and additional wearon vehicles from increased tonnage. But as you can see, this is no simpleequation.
26 Weird world of costs Full cost accounting Cost benchmarks Route auditl l l l l l l l l l l l l l l l l l l l l l l l l
Let�s say that in this case, garbage collection costs would rise by $10 perton if recycling were discontinued. We would also have to pay the $60 tippingfee for each ton we are currently recycling. That�s a total additional, or marginalcost, of $70 per ton if recycling suddenly went away. But we would be savingthe $95 per ton direct cost of recycling.
Recycling may indeed be cheaper per ton than solid waste ($95 vs. $100),but if recycling were discontinued, the town�s total solid waste managementcosts would fall. Discontinuing the contract to collect recyclables would reducecosts by $95 per ton. That savings would be partially offset by a $60 per tonincrease in disposal fees and a $10 per ton increase in garbage collection costs.Total solid waste management costs would be expected to fall by $25 per ton.Remember, this is all happening in a town where it costs less per ton to recyclea ton of material than to dump it. That is the paradox marginal costs can produce.
Marginal savings: Reducing frequency of garbage collectionMarginal costs and marginal savings work the other way as well. A school oroffice building might implement a new recycling program by directing custodialcrews to empty garbage cans and recycling bins on alternate days rather thanemptying garbage cans every night. In this case, the marginal labor cost ofcollection is zero, or very close to it.
This recycling program is simply displacing labor time spent collectinggarbage with time spent collecting recyclables. Even though the company cancalculate an average cost of collecting recyclables (hours spent on the taskmultiplied by the labor and benefits of the custodial staff), the marginal cost iszero because labor costs were reduced by an equal amount by reducing thefrequency of emptying garbage cans.
A curbside recycling program plays the marginal cost game effectively, too.By reducing the frequency of garbage collection from twice per week to onceper week and reassigning the crews and equipment to recycling, a recyclingcoordinator may be able to add curbside recycling at little or no marginal increasein total collection costs.
The obvious lessons of this cost story:
• you should identify the marginal costs and savings from your programoptions
• you should design a program that maximizes the savings you cancapture
l l l l l l l l l l l l l l l l l l l l l l l l l
The numbersin this ex-ample areshown in�The paradoxof marginalcosts.�
27
l l l l l l l l l l l l l l l l l l l l l l l l l
Weird world of costs Full cost accounting Cost benchmarks Route audit
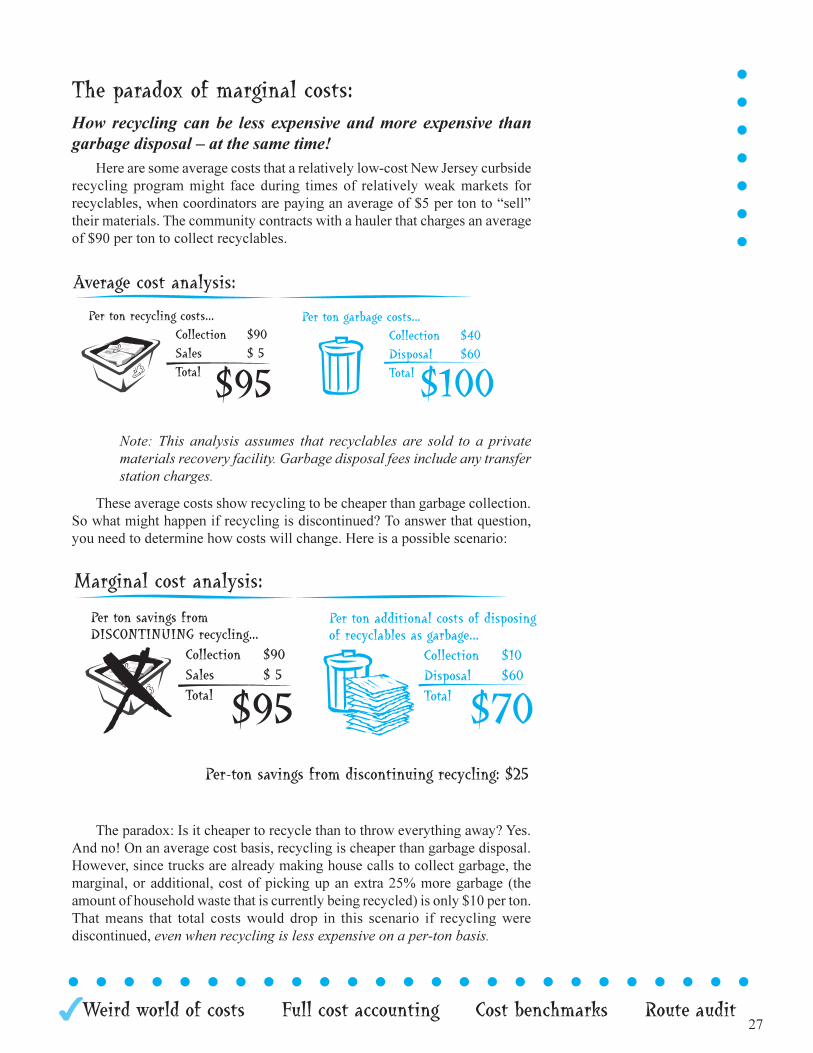
The paradox of marginal costs:How recycling can be less expensive and more expensive thangarbage disposal � at the same time!
Here are some average costs that a relatively low-cost New Jersey curbsiderecycling program might face during times of relatively weak markets forrecyclables, when coordinators are paying an average of $5 per ton to �sell�their materials. The community contracts with a hauler that charges an averageof $90 per ton to collect recyclables.
Note: This analysis assumes that recyclables are sold to a privatematerials recovery facility. Garbage disposal fees include any transferstation charges.
These average costs show recycling to be cheaper than garbage collection.So what might happen if recycling is discontinued? To answer that question,you need to determine how costs will change. Here is a possible scenario:
Per-ton savings from discontinuing recycling: $25
The paradox: Is it cheaper to recycle than to throw everything away? Yes.And no! On an average cost basis, recycling is cheaper than garbage disposal.However, since trucks are already making house calls to collect garbage, themarginal, or additional, cost of picking up an extra 25% more garbage (theamount of household waste that is currently being recycled) is only $10 per ton.That means that total costs would drop in this scenario if recycling werediscontinued, even when recycling is less expensive on a per-ton basis.
l l l l l l l
28 Weird world of costs Full cost accounting Cost benchmarks Route auditl l l l l l l l l l l l l l l l l l l l l l l l l
Question 4: Can I control these costs?This is the question of controllable costs vs. uncontrollable costs. If you haveauthority to select the vehicles, routes, collection methods and staffing to collectcurbside materials, collection can be considered a controllable cost. But, if yourcommunity has signed a multi-year agreement to contract for collection at afixed yearly fee, that cost may be considered uncontrollable during the life ofthe contract.
Most variable costs are considered controllable. Hourly labor, the largestcost component of most service operations, is usually a variable cost. You maynot control the labor rate, but if labor rates rise, you can reduce staff time devotedto collection by changing collection vehicles, routes, methods, level ofsupervision, or some combination of all four. In fact, supervision is one of thelargest factors explaining the difference between high-cost and low-cost solidwaste collection programs, according to a nationwide study.1
Question 5: How long will these costs benefit myoperation?This is a key question that affects how you account for certain costs. This questionand these costs are discussed in more detail in the Full cost accounting sectionof this chapter, but here�s how the story turns out. Costs that are incurred on aregular basis during a short time period (usually less than a year) to support on-going operations are classified as operating costs and are recorded in full ascosts during that time period. Costs that are incurred for expensive items thatare useful for long periods (usually more than one year) are classified as capitalcosts. Because their price tags substantially affect the cost of operation andbecause capital items are useful for more than a year, their costs are spread outover their useful life with an accounting method known as depreciation, whichis explained with examples and more detail later in this chapter.
When controllingcosts, don�t un-der-estimate thevalue of good man-agement.
29
l l l l l l l l l l l l l l l l l l l l l l l l l
Weird world of costs Full cost accounting Cost benchmarks Route audit
Question 6: Is the money already out the door?Another way to ask this question is: When is a dollar not adollar? When you can�t get it back! If money has already beenspent, it may be irrelevant to the financial decision you facetoday. Money that has been spent and can�t be recovered isknown as a sunk cost. And for the purpose of cost-benefitdecision-making, sunk costs are valued at $0 because theywill not change no matter which option you choose. No doubtthe largest and most painful example of sunk costs are thehundreds of millions of dollars invested in siting and planningfor New Jersey solid waste disposal facilities that have sincebeen cancelled. The debate has raged over who should payfor those costs, but one economic fact is simple: Costs thatcannot be recovered are irrelevant to cost-benefit decisionsbecause no matter what option the state, county or municipalitychooses to follow, the planning, engineering and legal costsalready incurred, a.k.a the sunk costs, must still be paid.
To examine sunk costs up close, let�s look at some smaller numbers thatdon�t stir the same passions as multi-million-dollar debts for cancelledincinerators. Let�s say your county signs on as a sponsor of an Earth Dayfundraising concert. Benefits will go to school recycling programs in the county.The fundraising committee spends $10,000 in advance to advertise the concertwith flyers, newspaper ads, posters and radio spots. Its contract with theperformer allows the committee to cancel with no penalty up to 90 days beforethe event. After that date, the committee must cough up the entire $20,000performance fee. With the fundraiser 91 days away and ticket sales runningbelow expectations, the committee meets to decide whether to risk it. In lookingat the numbers, you realize that the $10,000 in advertising costs is irrelevant tomaking the go/no go decision. Why? Because no matter what you decide, that$10,000 is out the door. It is a sunk cost that will not change regardless ofwhether you run the concert or not. The relevant costs are the $20,000performance fee and any marginal costs of deciding to present the concert,such as hiring security and staff for the event. Because the $10,000 in advertisingis a sunk cost, your best move may be to run the concert even at a loss. Whencan choosing to lose money be the smart choice? When your only other optionis to lose even more!
This fundraising example is intended to show on a small scale how largenumbers may be costly, but irrelevant, to making the right cost-benefit decision.If tickets sell for $100, making the mistake of including the sunk costs in itscost-benefit calculation would cause the committee to overestimate by 100($10,000/100 = 100) the number of tickets needed to approve the contract withthe performer.
Q When is a dol-lar
not a dollar?
A When you can�t get it back.
l l l l l l l l l l l l l l l l l l l l l l l l l
30 Weird world of costs Full cost accounting Cost benchmarks Route auditl l l l l l l l l l l l l l l l l l l l l l l l l
Question 7: What�s tomorrow�s dollar worth today?In finance, there is a time value of money, and that value is based on a simplerule: A dollar received tomorrow is worth less than a dollar in your pockettoday.
It�s easy to see why. Rather than using $1 to illustrate the point, let�s raisethe stakes and use $1 million instead. If you have $1 million today, you can earnsome interest. At 5%, it earns $50,000 a year. That�s $137 per day, every day.So, at a 5% interest rate, the opportunity cost of getting your $1 milliontomorrow rather than today is $137. The higher the interest rate, the more yougain by grabbing your dollar today.
For any interest rate, you can calculate the value today of receiving a dollarin the future � whether that�s tomorrow, next year, in three years, or in 30 years(the term of many public bonds). At 5%, $1 million received next year is worthonly $952,380.95 today because at 5% interest you can put that $952,380.95 inthe bank, and one year later it will be worth $1 million. At that interest rate, thevalue of receiving $1 million 30 years from now is worth only $231,000 today.When inflation was running around 10 to 12% in the late 1970s and early 1980s,15% interest rates were common. At a 15% �cost of money,� $1 million receivedin 30 years is worth only $15,000 today! So a dollar is only equal to a dollar ifyou can spend or invest it today. If you have to wait for your money, that dollaris worth less to you today.
Now think about the many cost-benefit decisions recycling coordinators areasked to consider. You decide to invest in something today � a truck, a baler, atub grinder, computer software, an educational brochure or campaign � and thepayoff flows in gradually over the next few years. If the up-front money comesout of your organization�s budget (rather than borrowing it), you are paying outtoday�s dollars and collecting payoffs in future dollars, which are worth lessthan today�s dollars because of the time value of money. How much less they�reworth depends on how far into the future you will receive them and how muchinterest you are forfeiting each year (the interest rate).
l l l l l l l
l l l l l l l l l l l l l l l l l l l l l l l l l
31
l l l l l l l l l l l l l l l l l l l l l l l l l
Weird world of costs Full cost accounting Cost benchmarks Route audit
Question 8: What else could I do with this money?This is the question of opportunity costs, and this answer, too, can get tricky.Opportunity costs are the things you can�t do because your resources (money,staff, equipment, buildings, etc.) are committed to a given project.
Let�s start with an easy one. You need to buy a $100,000 truck, and you aredeciding whether to plunk the $100,000 up front or borrow the money. Onpaper, it might look cheaper to pay cash up front. If you borrow the money, youhave to pay interest. At a 7% interest rate, it costs $7,000 a year to borrow$100,000. If you pay cash, there is no $7,000 payment. But you definitely losesomething by spending the cash up front. As we saw with the time value ofmoney, if you had the $100,000 in an account that pays interest, you would beearning money on that stash. That lost interest doesn�t appear on any ledger,but it�s an easy way to quantify an opportunity cost even when there is no lineitem cost to your organization�s budget.
Many opportunity costs are harder to calculate. That $100,000 might havehelped build a park or school. We elect representatives to make decisions abouthow public money should be spent, but a fundamental concept of economics isthat all decisions involve trade-offs and recycling is no exception.
Opportunity costs in action: What�s a warehouse worth?The reality of opportunity costs helps explain why so few paper processorsare willing to warehouse recycled paper until markets and prices for paperimprove. If recycled commodity markets are volatile � and they are �why not simply wait out the down cycles and cash in when prices improve?The answer lies partly in opportunity costs. Warehouse space is valuable.In North Jersey, it can easily rent for $5 per square foot per year. For theowner of a 50,000-square-foot warehouse, that means forfeiting morethan $20,000 every month waiting for prices to improve.
Then there�s the risk factor in playing the markets. No one canguarantee when and where market prices will go, so renting the spacemay not only be more lucrative, but less risky as well.
Finally, there�s the cash flow issue. Paper sitting in a warehouse doesnot pay the bills. Selling the paper today allows you to invest the proceedsand earn a return. Holding recycled paper, like holding any other asset,means forfeiting that return until you sell it. Inventory is expensive inmany ways, and most of the expenses are related to opportunity costs.
32 Weird world of costs Full cost accounting Cost benchmarks Route auditl l l l l l l l l l l l l l l l l l l l l l l l l
Full cost accountingHaving identified all these different kinds of costs that behave inso many conflicting ways, how can you calculate the cost of arecycling program? Over the past decade, a rising number of voiceshave been answering that question with three words: full costaccounting, or FCA.
In truth, full cost accounting can really be reduced to oneword � accounting. The principles and practices of FCA now beingapplied to solid waste management are essentially the toolsaccountants have used for decades to record and report costs. It�snot the accounting that has changed � it�s the people doing theaccounting. The U.S. Environmental Protection Agency has beenpromoting a move to full cost accounting because many publicly-funded solid waste programs have been unintentionally
underpricing their services. Their accounting systems did not reflect the fullcosts of providing solid waste management services. That means that recyclingcoordinators, solid waste planners, public works officials, custodians and evenelected officials are being asked to learn the language and tools of accounting,so they can make more informed solid waste management decisions. In itssuccinct and useful guide, Full Cost Accounting for Municipal Solid WasteManagement: A Handbook (cited in the reference section of this manual), theEPA defines FCA as a �systematic approach for identifying, summing andreporting the actual costs of solid waste management.�2
FCA is based on some core principles that differ from the cash-basedaccounting systems that many public agencies use. A cash-based system is muchlike a checking account: revenues go in, costs come out, and what�s left at theend of the month or year is a surplus or deficit. Pretty straightforward. It�s alsothe way the world works. You can�t pay bills without money in the account, socash flow is the lifeblood of all organizations, and managing cash flow has tobe a financial priority. It may not be the most accurate reflection of costs,however. Many big-ticket costs, such as buildings and equipment, may requirea one-time payout, but are used over many years. In these cases, cash flowaccounting poorly matches outlays of cash with actual costs.
FCA, on the other hand, does not focus on when money comes in or comesout. Instead, it tries to assign revenues when they are earned and costs whenthey are incurred � regardless of when the money actually changes hands. Thatsimple change can translate to some substantial changes in reported costs. Ratherthan using cash-flow accounting, FCA relies on �accrual accounting,� whichassigns costs to the time period in which their benefits accumulate, or �accrue.�Converting from cash-flow accounting to accrual accounting requires convertingoutlays (the money that comes out of your account) into costs.
33
l l l l l l l l l l l l l l l l l l l l l l l l l
Weird world of costs Full cost accounting Cost benchmarks Route audit
Costs versus outlaysWhat is the difference between a cost and an outlay? It depends on the kind ofcost. And for the purpose of full cost accounting, let�s revisit a few costs:operating costs, capital costs and overhead costs � and introduce a new one,hidden costs.
Operating costsOperating costs are regularly recurring costs that are consumed or used over ashort period, usually less than one year, and are routinely incurred for ongoingoperations. For most service operations, salaries, wages and benefits are usuallythe largest component of operating costs. Other operating costs include rent orlease payments, routine maintenance costs, utilities, fuel, supplies and interestpayments. All these expenses have one thing in common: They are paid for(with an outlay) in the same period they are consumed. The monthly payrolloutlay gives you the services of your staff for the month. The outlay for anannual lease payment provides access to that space for the year. The outlay foran interest payment each month allows you to �use� that principal for another30 days. For full cost accounting purposes, therefore, outlays are the same asoperating costs because the outlay and the cost occur in the same period.
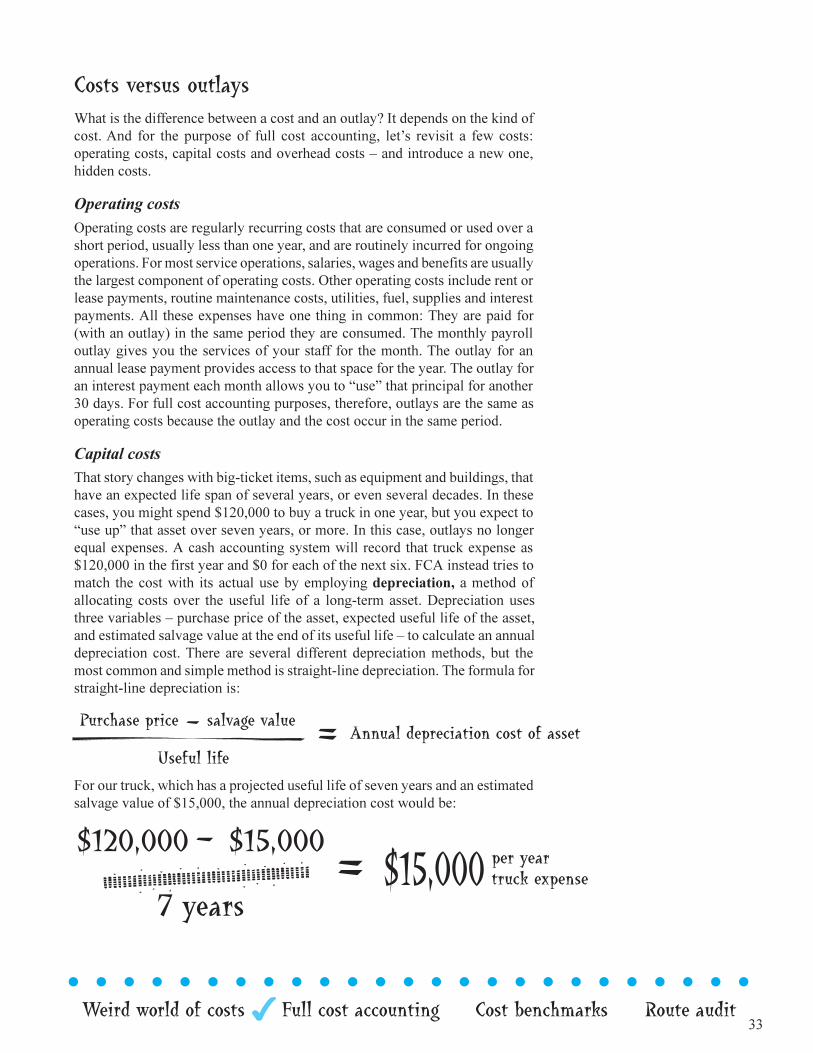
Capital costsThat story changes with big-ticket items, such as equipment and buildings, thathave an expected life span of several years, or even several decades. In thesecases, you might spend $120,000 to buy a truck in one year, but you expect to�use up� that asset over seven years, or more. In this case, outlays no longerequal expenses. A cash accounting system will record that truck expense as$120,000 in the first year and $0 for each of the next six. FCA instead tries tomatch the cost with its actual use by employing depreciation, a method ofallocating costs over the useful life of a long-term asset. Depreciation usesthree variables � purchase price of the asset, expected useful life of the asset,and estimated salvage value at the end of its useful life � to calculate an annualdepreciation cost. There are several different depreciation methods, but themost common and simple method is straight-line depreciation. The formula forstraight-line depreciation is:
For our truck, which has a projected useful life of seven years and an estimatedsalvage value of $15,000, the annual depreciation cost would be:
34 Weird world of costs Full cost accounting Cost benchmarks Route auditl l l l l l l l l l l l l l l l l l l l l l l l l
Capital costs include more than buildings and equipment. Up-front developmentand design costs, such as graphic arts and signs for recycling programs or thecost of purchasing recycling containers, can be depreciated as well. There aresome notable exceptions to the depreciation rule. First, to be depreciated, anasset must have a �material� cost to the program it serves. This rule saves usfrom depreciating low-cost items like hammers and nails, which may have auseful life of more than one year, but are simply too small to make a �material�difference in our annual costs. Second, land is not depreciated because, unlikea truck or even a building, the value of land is not �used up,� according to theprinciples of FCA.
Overhead costsOverhead costs are indirect costs required to run any kind of organization, andthey are quite often underestimated by the people who rely on them. They arecosts that cannot be directly related to any one product or service, yet withoutthe support of these indirect costs, most operations would break downimmediately.
As demonstrated in What�s the big deal about overhead costs?, workingwithout overhead support is no way to do business. These services can and do
What�s the big deal about overhead costs?To understand how and why overhead costs need to be included in costcalculations, try starting your day this way.
Get rid of your phone. No one is paying for the monthly serviceanymore. You�ll have to take all your messages � and complaints! � inperson. Turn off the heat and lights in your building. In fact, leave thebuilding and stand out in the street. If you have any mechanics, tell them toleave, too, because your organization no longer owns or rents any property.Don�t worry, there won�t be any maintenance department anymore. Losethe ability to write checks to anybody, including paychecks for you andyour staff. And if you want cash to buy anything, raise it or collect ityourself because there won�t be any billing or collection departmentanymore. Be sure to pick up after yourself and consider learning a martialart because the grounds, custodial and security staff are gone.
Now � do your job just as well as you do it now!
l l l l l l l l l l l l l l l l l l l l l l l l ll l l l l l l
35
l l l l l l l l l l l l l l l l l l l l l l l l l
Weird world of costs Full cost accounting Cost benchmarks Route audit
add to the cost of delivering services, and to ignore them is to seriouslyunderestimate the full cost of service. And, as was demonstrated on page 20with A few overhead costs, these can add up. In some service organizations, theindirect cost rate can run as high as 70% of the direct cost of service (whichtranslates to about 40% of total costs), although several studies have estimatedthe rate near 20% for solid waste management organizations.
Slicing the overhead pie
Once all overhead costs have been identified, they must be allocated to thedifferent departments or activities within an organization. These costs can beallocated many ways, but they all boil down to the same basic question: Howbig is your slice of the organizational pie? You can answer that question usingmany variables, but here are three common ones.
• People � how many in your department compared to the wholeorganization?
• Money � how big is your budget compared to the whole organization?
• Space � how many square feet do you occupy compared to the wholeorganization?
l l l l l l l
36 Weird world of costs Full cost accounting Cost benchmarks Route auditl l l l l l l l l l l l l l l l l l l l l l l l l
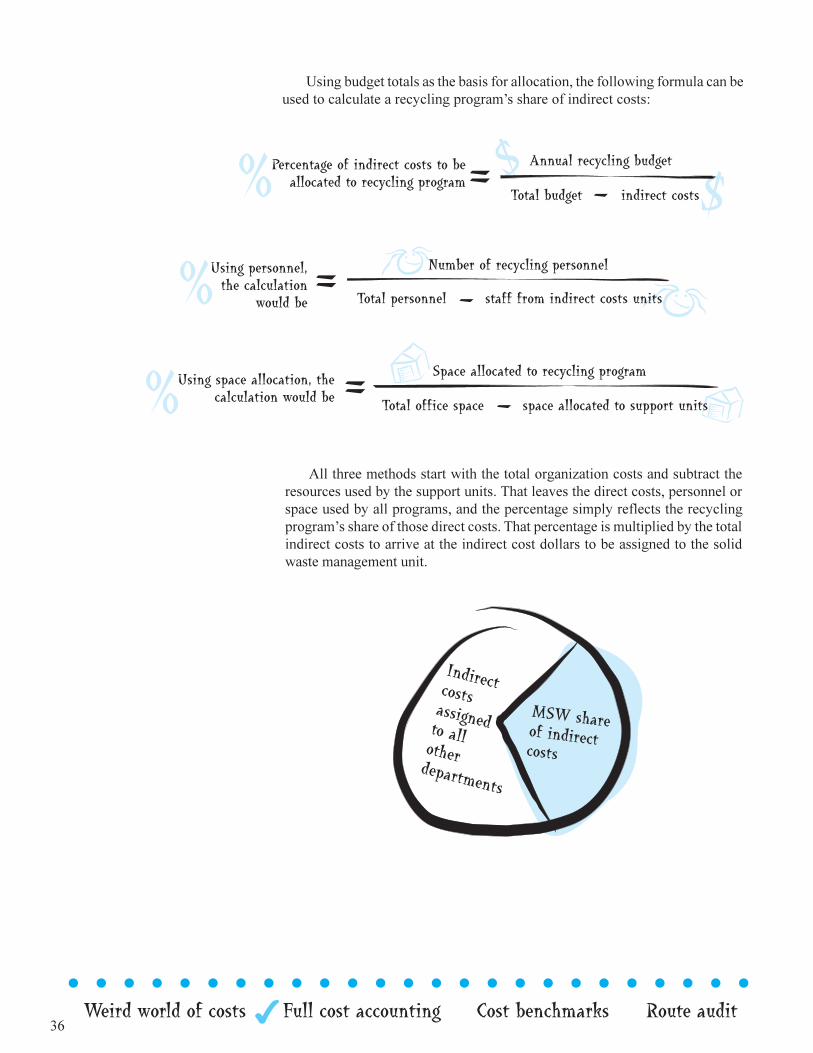
Using budget totals as the basis for allocation, the following formula can beused to calculate a recycling program�s share of indirect costs:
All three methods start with the total organization costs and subtract theresources used by the support units. That leaves the direct costs, personnel orspace used by all programs, and the percentage simply reflects the recyclingprogram�s share of those direct costs. That percentage is multiplied by the totalindirect costs to arrive at the indirect cost dollars to be assigned to the solidwaste management unit.
37
l l l l l l l l l l l l l l l l l l l l l l l l l
Weird world of costs Full cost accounting Cost benchmarks Route audit
Future costsWith recycling programs under scrutiny all over the country, it seems untimely,if not cruel, to begin asking them to include overhead costs in their cost ofservice. Untimely, perhaps, but accurate. Failing to include overhead costsunderstates the cost of any operation, not just recycling. In fact, the EPA drivetowards full cost accounting was motivated in part because many communitieswere seriously underpricing their landfill space by focusing on the cash outlaysduring the operating life of the landfill. This pricing looks fine during the short-run while the landfill is accepting garbage, but ignores the substantial up-frontcosts of siting, designing and building the landfill, and the costly functions ofcapping, closure and post-closure maintenance and monitoring.
Because this manual is designed for recycling coordinators, it does notdiscuss the issue of allocated future costs associated with solid waste disposalfacilities, such as post-closure costs. However, the EPA�s Full Cost Accountingfor Solid Waste Management: A Handbook addresses this issue.
Hidden costsFull cost accounting includes one more cost category that many recycling
managers are happy to leave uncovered: hidden costs. Hidden costs are rarelyever really hidden � they�re just camping out in someone else�s ledger. Grants,gifts, donations and subsidies are prime examples of hidden costs that mayserve to understate the total cost of a program. For example, a recyclingcoordinator under pressure to demonstrate the cost-effectiveness of his or herprogram may be understandably reluctant to include equipment bought fromgrant funds or the difference between a low-interest loan and the market interestrate. The rationale for including these costs, however, is to accurately reflectthe cost of service, and to avoid making future decisions based on numbers thatare skewed by hidden costs.
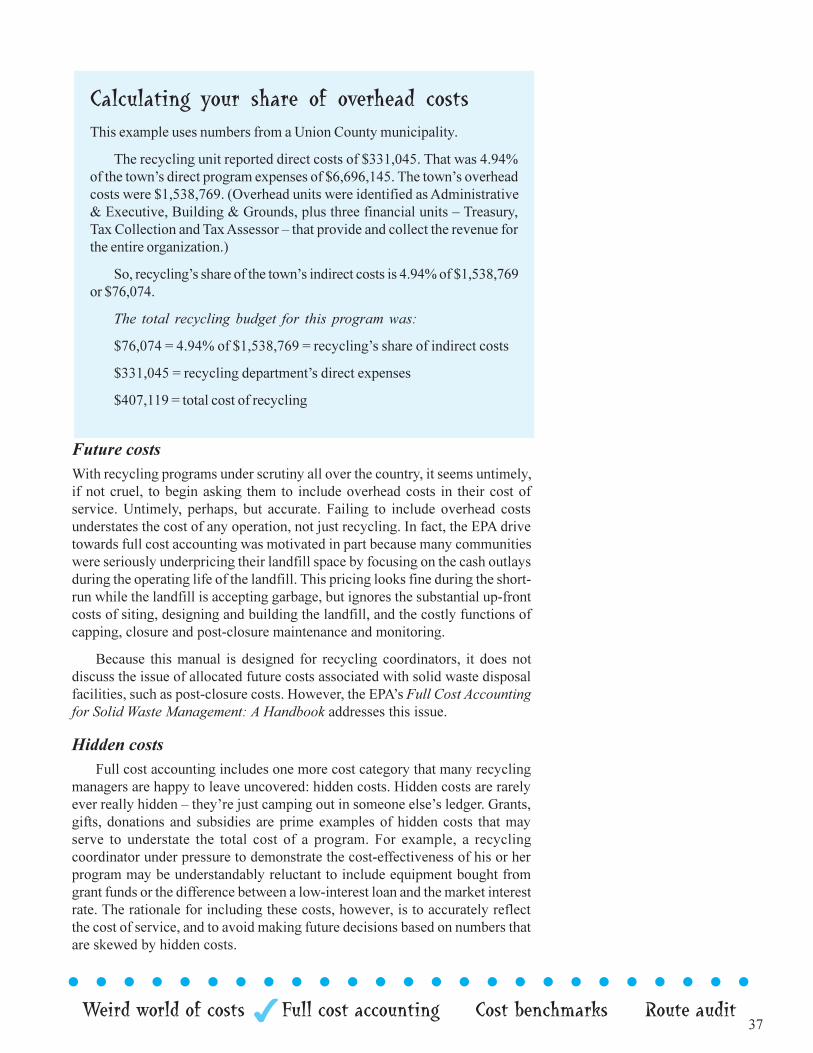
Calculating your share of overhead costsThis example uses numbers from a Union County municipality.
The recycling unit reported direct costs of $331,045. That was 4.94%of the town�s direct program expenses of $6,696,145. The town�s overheadcosts were $1,538,769. (Overhead units were identified as Administrative& Executive, Building & Grounds, plus three financial units � Treasury,Tax Collection and Tax Assessor � that provide and collect the revenue forthe entire organization.)
So, recycling�s share of the town�s indirect costs is 4.94% of $1,538,769or $76,074.
The total recycling budget for this program was:
$76,074 = 4.94% of $1,538,769 = recycling�s share of indirect costs
$331,045 = recycling department�s direct expenses
$407,119 = total cost of recycling
38 Weird world of costs Full cost accounting Cost benchmarks Route auditl l l l l l l l l l l l l l l l l l l l l l l l l
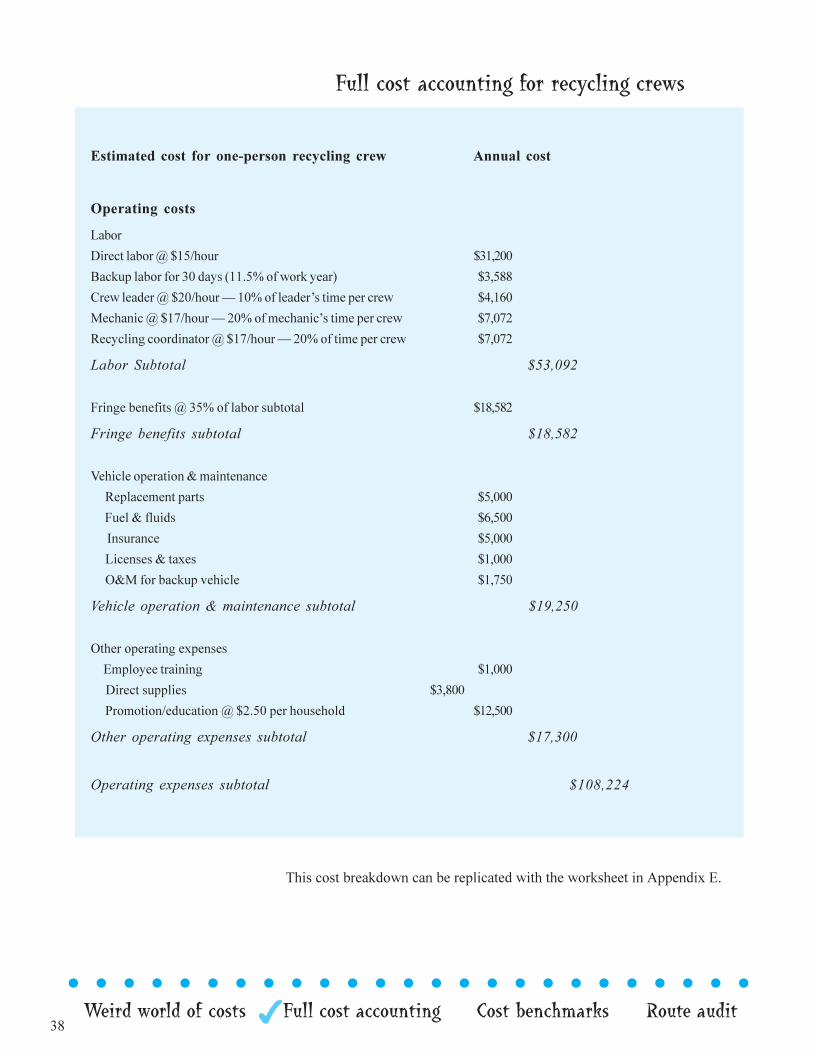
Full cost accounting for recycling crews
Estimated cost for one-person recycling crew Annual cost
Operating costs
Labor
Direct labor @ $15/hour $31,200
Backup labor for 30 days (11.5% of work year) $3,588
Crew leader @ $20/hour � 10% of leader�s time per crew $4,160
Mechanic @ $17/hour � 20% of mechanic�s time per crew $7,072
Recycling coordinator @ $17/hour � 20% of time per crew $7,072
Labor Subtotal $53,092
Fringe benefits @ 35% of labor subtotal $18,582
Fringe benefits subtotal $18,582
Vehicle operation & maintenance
Replacement parts $5,000
Fuel & fluids $6,500
Insurance $5,000
Licenses & taxes $1,000
O&M for backup vehicle $1,750
Vehicle operation & maintenance subtotal $19,250
Other operating expenses
Employee training $1,000
Direct supplies $3,800
Promotion/education @ $2.50 per household $12,500
Other operating expenses subtotal $17,300
Operating expenses subtotal $108,224
This cost breakdown can be replicated with the worksheet in Appendix E.
39
l l l l l l l l l l l l l l l l l l l l l l l l l
Weird world of costs Full cost accounting Cost benchmarks Route audit
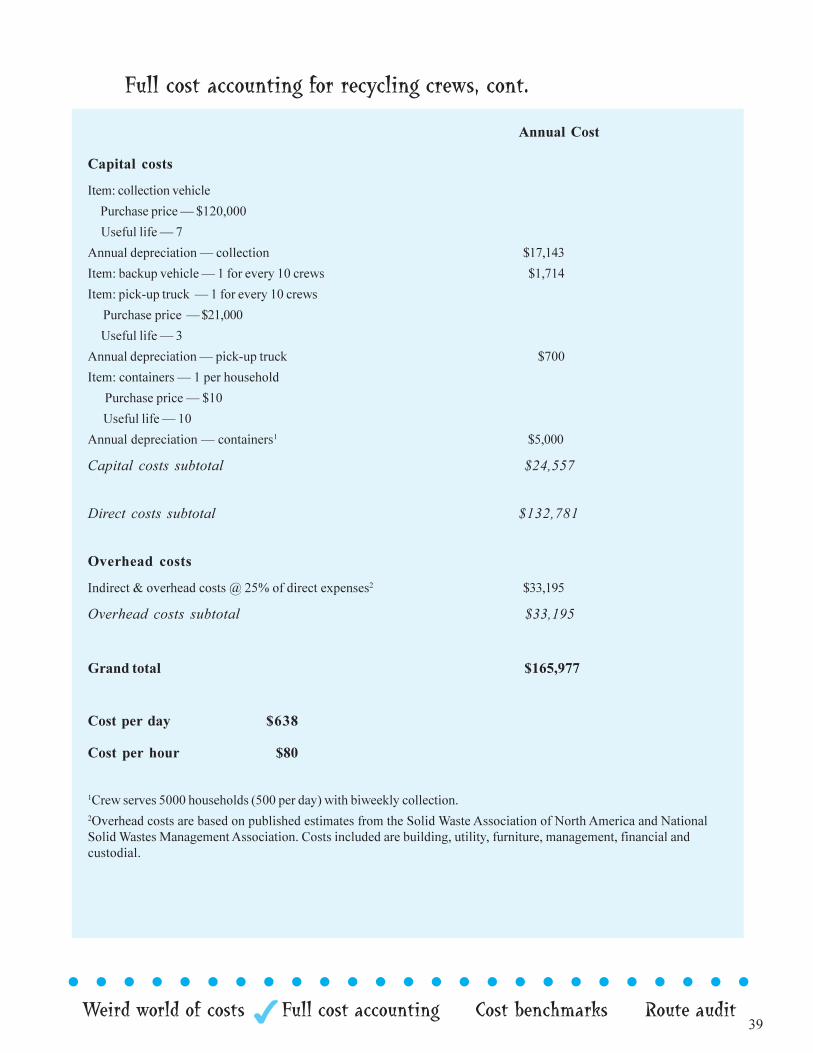
Annual Cost
Capital costs
Item: collection vehicle
Purchase price � $120,000
Useful life � 7
Annual depreciation � collection $17,143
Item: backup vehicle � 1 for every 10 crews $1,714
Item: pick-up truck � 1 for every 10 crews
Purchase price � $21,000
Useful life � 3
Annual depreciation � pick-up truck $700
Item: containers � 1 per household
Purchase price � $10
Useful life � 10
Annual depreciation � containers1 $5,000
Capital costs subtotal $24,557
Direct costs subtotal $132,781
Overhead costs
Indirect & overhead costs @ 25% of direct expenses2 $33,195
Overhead costs subtotal $33,195
Grand total $165,977
Cost per day $638
Cost per hour $80
1Crew serves 5000 households (500 per day) with biweekly collection.2Overhead costs are based on published estimates from the Solid Waste Association of North America and NationalSolid Wastes Management Association. Costs included are building, utility, furniture, management, financial andcustodial.
Full cost accounting for recycling crews, cont.
40 Weird world of costs Full cost accounting Cost benchmarks Route auditl l l l l l l l l l l l l l l l l l l l l l l l l
Exactly how full is full cost accounting?It is not entirely clear just how full full cost accounting should be. Both thismanual and the EPA guide for solid waste managers include the operating,capital, future, overhead and hidden costs already discussed. They do not includelarger social and environmental costs.
The EPA�s Full Cost Accounting For Municipal Solid Waste Management:A Handbook defines environmental costs as �the cost of environmentaldegradation that cannot be easily measured or remedied, are difficult to value,and are not subject to legal liability.� Environmental costs include issues suchas depletion of non-renewable resources, energy use, and upstream anddownstream environmental impacts (for example, impacts incurred in themanufacturing and decommissioning of solid waste equipment, or in thepotential for groundwater contamination 100 years from now).
In 1998, for example, the EPA published estimates for recycling�s role inreducing greenhouse gas emissions. The study noted that recycling reducesgreenhouse gas emissions by consuming less energy than manufacturingproducts from virgin materials, producing less methane than landfilling waste,and by permitting carbon to remain stored in trees for longer periods. Increasedrecycling and source reduction �can make a significant contribution to U.S.greenhouse gas emission reduction,� the study found.4
Economists often refer to these issues as �externalities� because their costsare not included, or �internalized,� in market prices. Accounting methodologiesfor these costs have not been standardized, and even honest attempts atquantifying them can produce widely different results. These costs may behard to count, but New Jersey�s solid waste policies do recognize that recyclingprovides larger economic and environmental benefits than landfilling orincineration.
l l l l l l l l l l l l l
Even honestattempts atquantifyingexternali-ties canproduce
l l l l l l l
41
l l l l l l l l l l l l l l l l l l l l l l l l l
Weird world of costs Full cost accounting Cost benchmarks Route audit
Social costs produce similar quantification problems. For example, whatprice do you place on odors by disposal facilities? What is the dollar impact onproperty values, on community image or pride? How do those costs comparewith increased investment and job opportunities generated by those facilities?And how do you account for costs of a solid waste management system that fallmost heavily on certain groups, such as those immediately surrounding a facility(or at least within nose-shot of it), while its benefits are widely distributedaround a region? Host-community taxes, in which a community is compensatedfor agreeing to site a solid waste facility, begin to address only a few of thesequestions.
Like some of the larger environmental costs, these social costs arechallenging to identify and quantify. They are often included under the termTrue cost accounting, which seeks to place a dollar value on these externalitiesthat are not reflected in market prices. However, unlike traditional accounting,which is governed by rule-making bodies, true cost accounting has no standardmethodology for putting a price on these wider cost questions.
Finally, full cost accounting, as defined in this manual, does not examinethe issue of economic impact or economic multipliers for recycling or othersolid waste management options. Several studies have quantified the economicdevelopment benefits of recycling.5 Burying and burning garbage generallyrequire fewer employees than processing and upgrading recyclables, so divertingeach ton to a processing facility or end-user helps create jobs, according to astudy of the economic impact of recyclables in the Northeast. However, ifrecycling also increases the cost of solid waste management, this cost � and itsmultipliers � must be weighed against the benefit of increased employment.
The only sure way to capture the full extent of these larger benefits is todesign a system that reduces the total cost of solid waste management. That iswhy this manual focuses on reducing the cost of delivering those services.
l l l l l l l l l l l l l l l l l l l l l l l l l
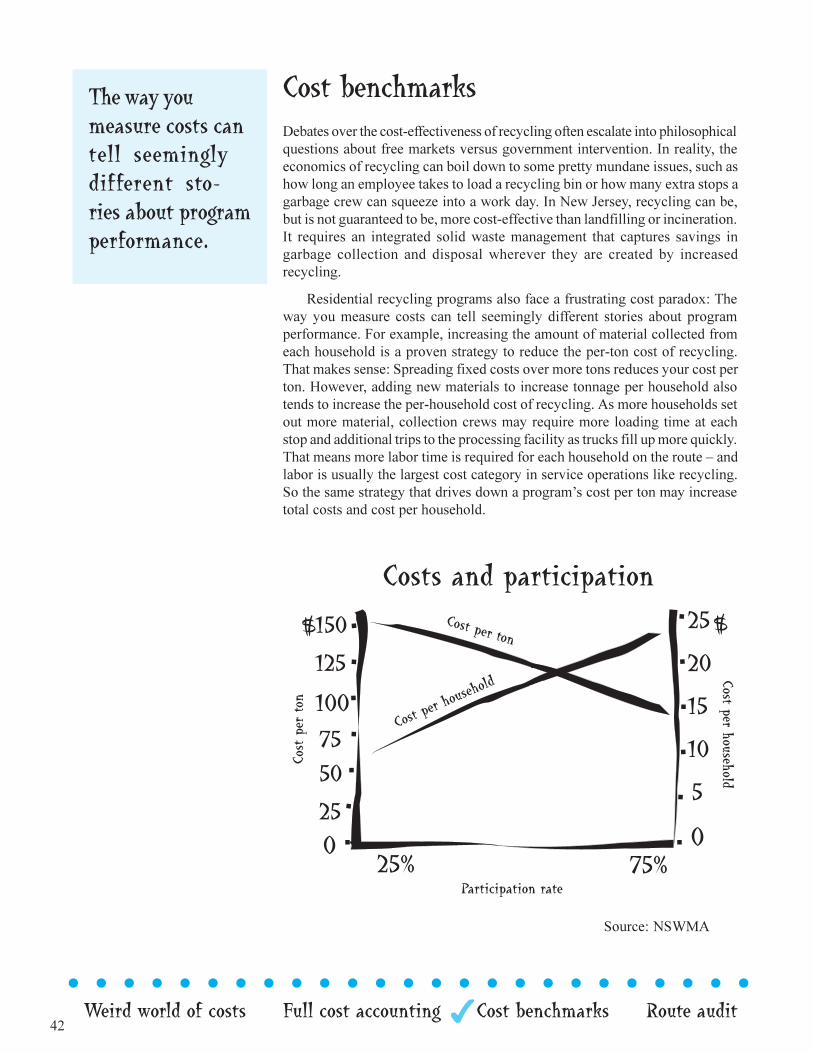
42 Weird world of costs Full cost accounting Cost benchmarks Route auditl l l l l l l l l l l l l l l l l l l l l l l l l
Cost benchmarksDebates over the cost-effectiveness of recycling often escalate into philosophicalquestions about free markets versus government intervention. In reality, theeconomics of recycling can boil down to some pretty mundane issues, such ashow long an employee takes to load a recycling bin or how many extra stops agarbage crew can squeeze into a work day. In New Jersey, recycling can be,but is not guaranteed to be, more cost-effective than landfilling or incineration.It requires an integrated solid waste management that captures savings ingarbage collection and disposal wherever they are created by increasedrecycling.
Residential recycling programs also face a frustrating cost paradox: Theway you measure costs can tell seemingly different stories about programperformance. For example, increasing the amount of material collected fromeach household is a proven strategy to reduce the per-ton cost of recycling.That makes sense: Spreading fixed costs over more tons reduces your cost perton. However, adding new materials to increase tonnage per household alsotends to increase the per-household cost of recycling. As more households setout more material, collection crews may require more loading time at eachstop and additional trips to the processing facility as trucks fill up more quickly.That means more labor time is required for each household on the route � andlabor is usually the largest cost category in service operations like recycling.So the same strategy that drives down a program�s cost per ton may increasetotal costs and cost per household.
The way youmeasure costs cantell seeminglydifferent sto-ries about programperformance.
Source: NSWMA
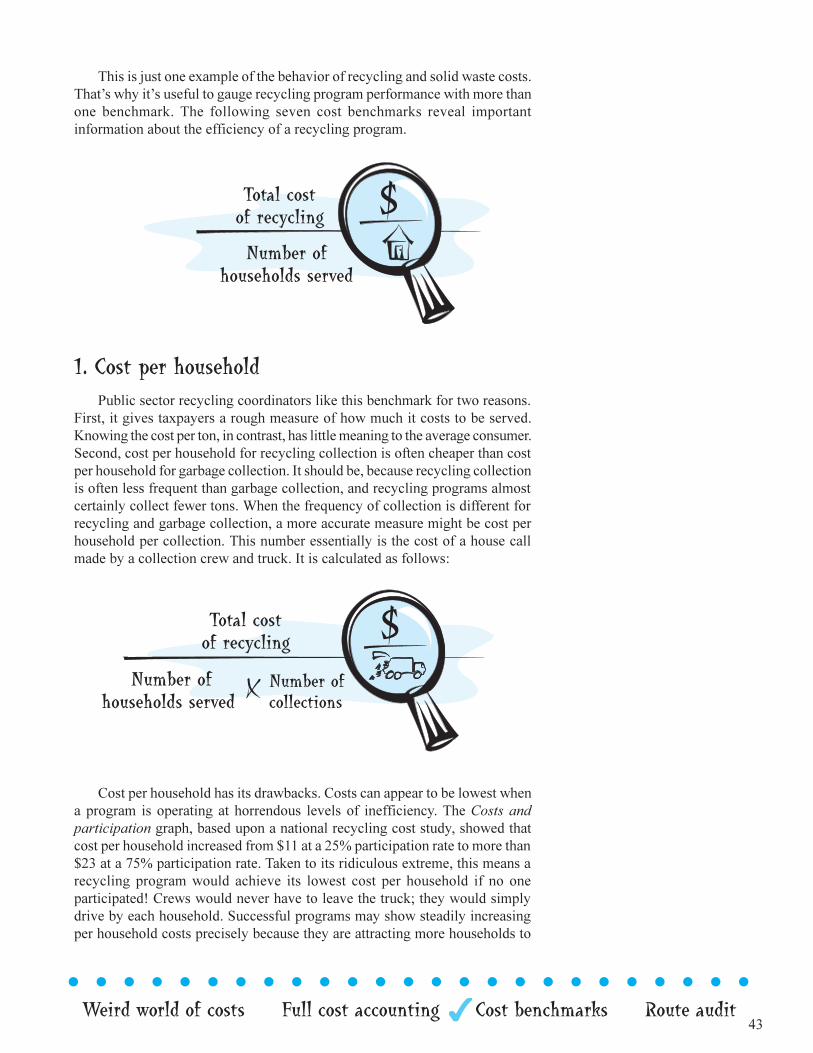
43
l l l l l l l l l l l l l l l l l l l l l l l l l
Weird world of costs Full cost accounting Cost benchmarks Route audit
This is just one example of the behavior of recycling and solid waste costs.That�s why it�s useful to gauge recycling program performance with more thanone benchmark. The following seven cost benchmarks reveal importantinformation about the efficiency of a recycling program.
1. Cost per householdPublic sector recycling coordinators like this benchmark for two reasons.
First, it gives taxpayers a rough measure of how much it costs to be served.Knowing the cost per ton, in contrast, has little meaning to the average consumer.Second, cost per household for recycling collection is often cheaper than costper household for garbage collection. It should be, because recycling collectionis often less frequent than garbage collection, and recycling programs almostcertainly collect fewer tons. When the frequency of collection is different forrecycling and garbage collection, a more accurate measure might be cost perhousehold per collection. This number essentially is the cost of a house callmade by a collection crew and truck. It is calculated as follows:
Cost per household has its drawbacks. Costs can appear to be lowest whena program is operating at horrendous levels of inefficiency. The Costs andparticipation graph, based upon a national recycling cost study, showed thatcost per household increased from $11 at a 25% participation rate to more than$23 at a 75% participation rate. Taken to its ridiculous extreme, this means arecycling program would achieve its lowest cost per household if no oneparticipated! Crews would never have to leave the truck; they would simplydrive by each household. Successful programs may show steadily increasingper household costs precisely because they are attracting more households to
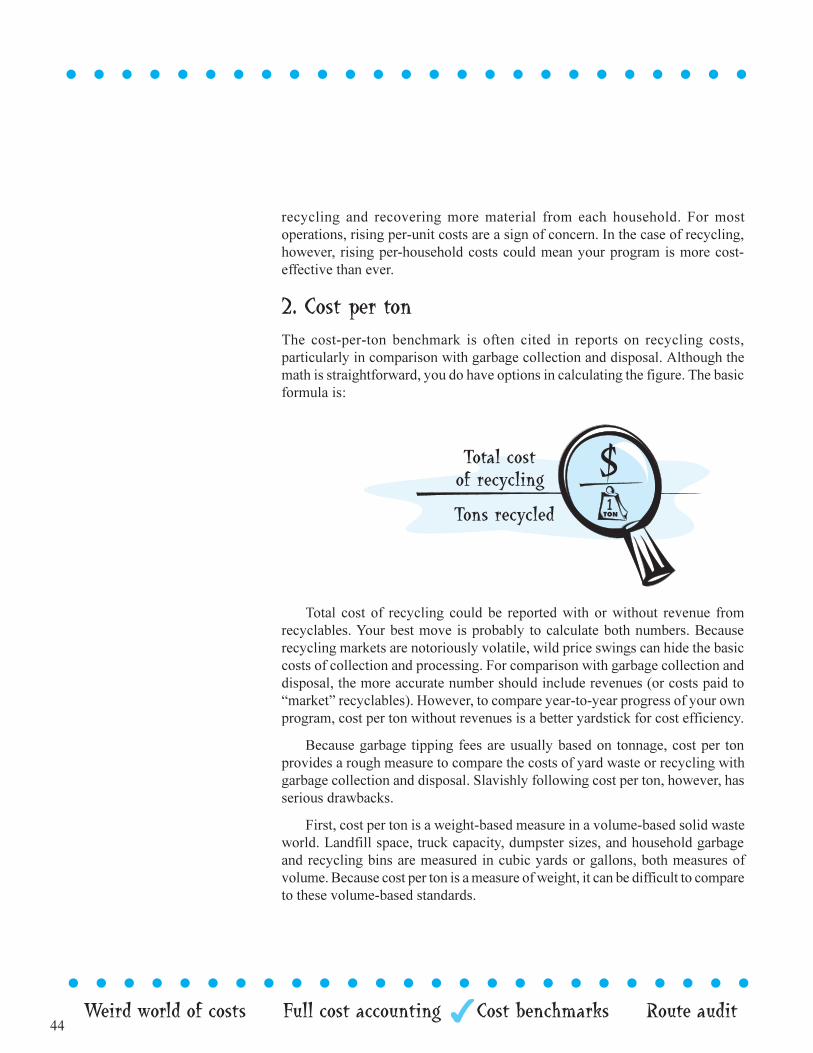
44 Weird world of costs Full cost accounting Cost benchmarks Route auditl l l l l l l l l l l l l l l l l l l l l l l l l
recycling and recovering more material from each household. For mostoperations, rising per-unit costs are a sign of concern. In the case of recycling,however, rising per-household costs could mean your program is more cost-effective than ever.
2. Cost per tonThe cost-per-ton benchmark is often cited in reports on recycling costs,particularly in comparison with garbage collection and disposal. Although themath is straightforward, you do have options in calculating the figure. The basicformula is:
Total cost of recycling could be reported with or without revenue fromrecyclables. Your best move is probably to calculate both numbers. Becauserecycling markets are notoriously volatile, wild price swings can hide the basiccosts of collection and processing. For comparison with garbage collection anddisposal, the more accurate number should include revenues (or costs paid to�market� recyclables). However, to compare year-to-year progress of your ownprogram, cost per ton without revenues is a better yardstick for cost efficiency.
Because garbage tipping fees are usually based on tonnage, cost per tonprovides a rough measure to compare the costs of yard waste or recycling withgarbage collection and disposal. Slavishly following cost per ton, however, hasserious drawbacks.
First, cost per ton is a weight-based measure in a volume-based solid wasteworld. Landfill space, truck capacity, dumpster sizes, and household garbageand recycling bins are measured in cubic yards or gallons, both measures ofvolume. Because cost per ton is a measure of weight, it can be difficult to compareto these volume-based standards.
l l l l l l l l l l l l l l l l l l l l l l l l l
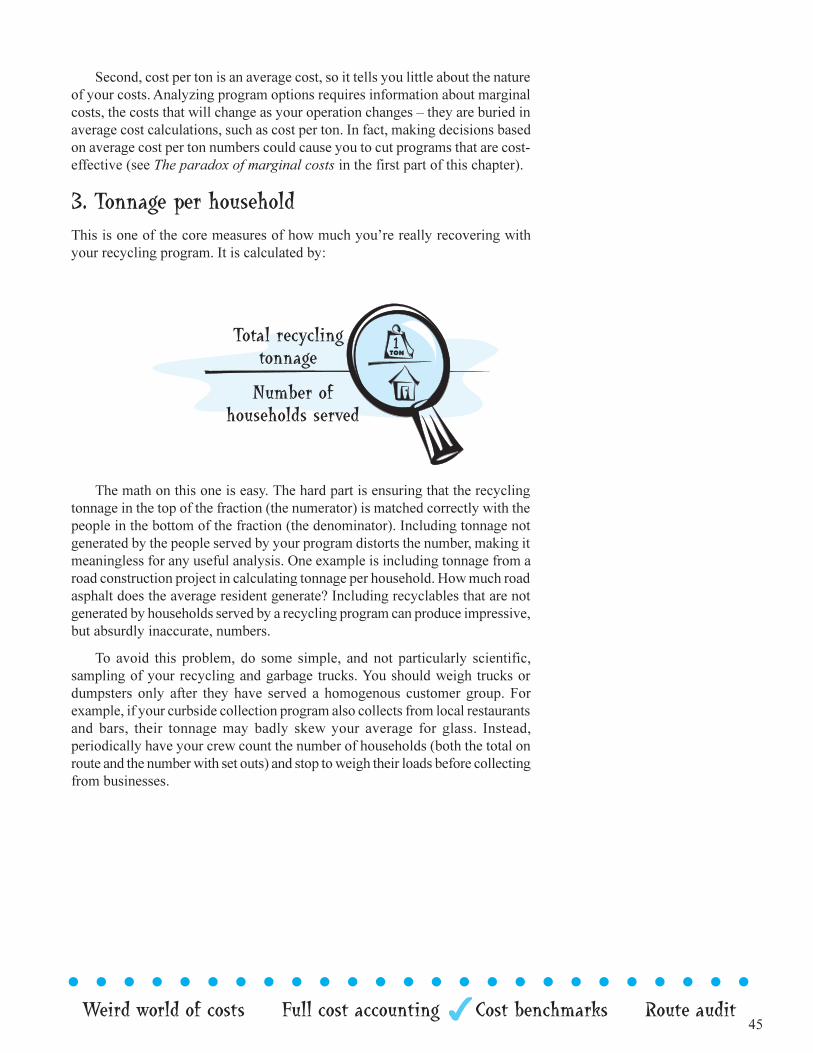
45
l l l l l l l l l l l l l l l l l l l l l l l l l
Weird world of costs Full cost accounting Cost benchmarks Route audit
Second, cost per ton is an average cost, so it tells you little about the natureof your costs. Analyzing program options requires information about marginalcosts, the costs that will change as your operation changes � they are buried inaverage cost calculations, such as cost per ton. In fact, making decisions basedon average cost per ton numbers could cause you to cut programs that are cost-effective (see The paradox of marginal costs in the first part of this chapter).
3. Tonnage per householdThis is one of the core measures of how much you�re really recovering withyour recycling program. It is calculated by:
The math on this one is easy. The hard part is ensuring that the recyclingtonnage in the top of the fraction (the numerator) is matched correctly with thepeople in the bottom of the fraction (the denominator). Including tonnage notgenerated by the people served by your program distorts the number, making itmeaningless for any useful analysis. One example is including tonnage from aroad construction project in calculating tonnage per household. How much roadasphalt does the average resident generate? Including recyclables that are notgenerated by households served by a recycling program can produce impressive,but absurdly inaccurate, numbers.
To avoid this problem, do some simple, and not particularly scientific,sampling of your recycling and garbage trucks. You should weigh trucks ordumpsters only after they have served a homogenous customer group. Forexample, if your curbside collection program also collects from local restaurantsand bars, their tonnage may badly skew your average for glass. Instead,periodically have your crew count the number of households (both the total onroute and the number with set outs) and stop to weigh their loads before collectingfrom businesses.
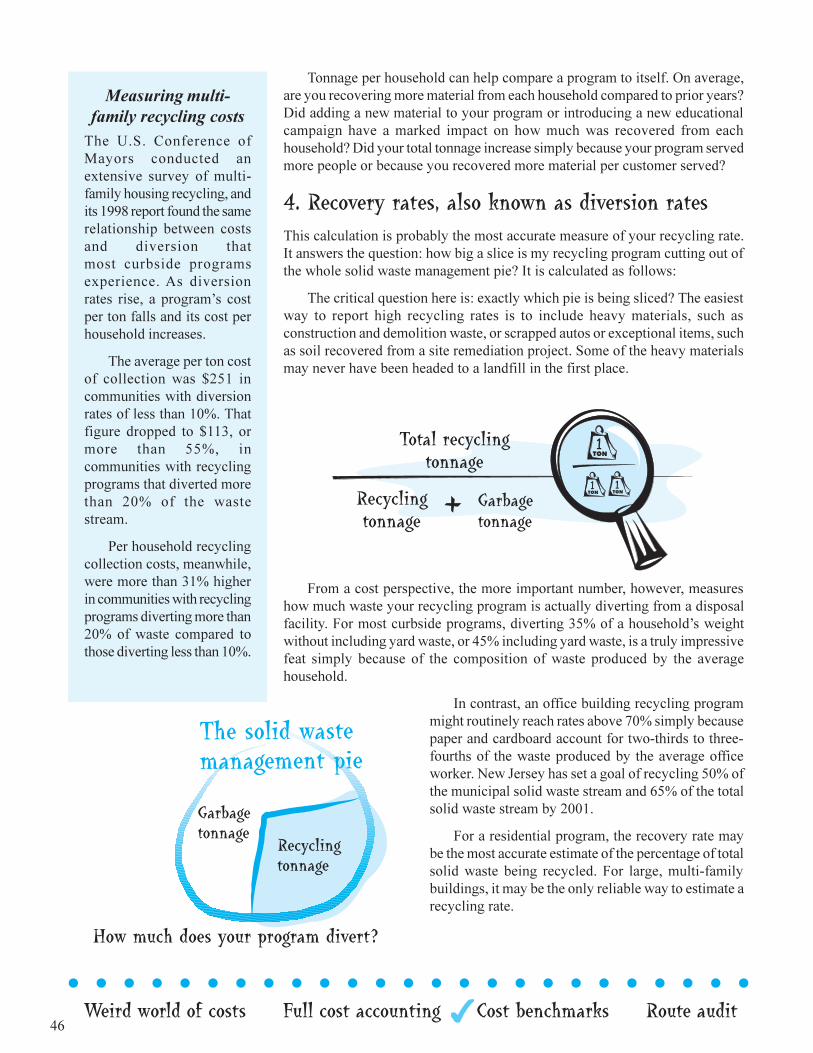
46 Weird world of costs Full cost accounting Cost benchmarks Route auditl l l l l l l l l l l l l l l l l l l l l l l l l
Tonnage per household can help compare a program to itself. On average,are you recovering more material from each household compared to prior years?Did adding a new material to your program or introducing a new educationalcampaign have a marked impact on how much was recovered from eachhousehold? Did your total tonnage increase simply because your program servedmore people or because you recovered more material per customer served?
4. Recovery rates, also known as diversion ratesThis calculation is probably the most accurate measure of your recycling rate.It answers the question: how big a slice is my recycling program cutting out ofthe whole solid waste management pie? It is calculated as follows:
The critical question here is: exactly which pie is being sliced? The easiestway to report high recycling rates is to include heavy materials, such asconstruction and demolition waste, or scrapped autos or exceptional items, suchas soil recovered from a site remediation project. Some of the heavy materialsmay never have been headed to a landfill in the first place.
From a cost perspective, the more important number, however, measureshow much waste your recycling program is actually diverting from a disposalfacility. For most curbside programs, diverting 35% of a household�s weightwithout including yard waste, or 45% including yard waste, is a truly impressivefeat simply because of the composition of waste produced by the averagehousehold.
In contrast, an office building recycling programmight routinely reach rates above 70% simply becausepaper and cardboard account for two-thirds to three-fourths of the waste produced by the average officeworker. New Jersey has set a goal of recycling 50% ofthe municipal solid waste stream and 65% of the totalsolid waste stream by 2001.
For a residential program, the recovery rate maybe the most accurate estimate of the percentage of totalsolid waste being recycled. For large, multi-familybuildings, it may be the only reliable way to estimate arecycling rate.
Measuring multi-family recycling costs
The U.S. Conference ofMayors conducted anextensive survey of multi-family housing recycling, andits 1998 report found the samerelationship between costsand diversion thatmost curbside programsexperience. As diversionrates rise, a program�s costper ton falls and its cost perhousehold increases.
The average per ton costof collection was $251 incommunities with diversionrates of less than 10%. Thatfigure dropped to $113, ormore than 55%, incommunities with recyclingprograms that diverted morethan 20% of the wastestream.
Per household recyclingcollection costs, meanwhile,were more than 31% higherin communities with recyclingprograms diverting more than20% of waste compared tothose diverting less than 10%.
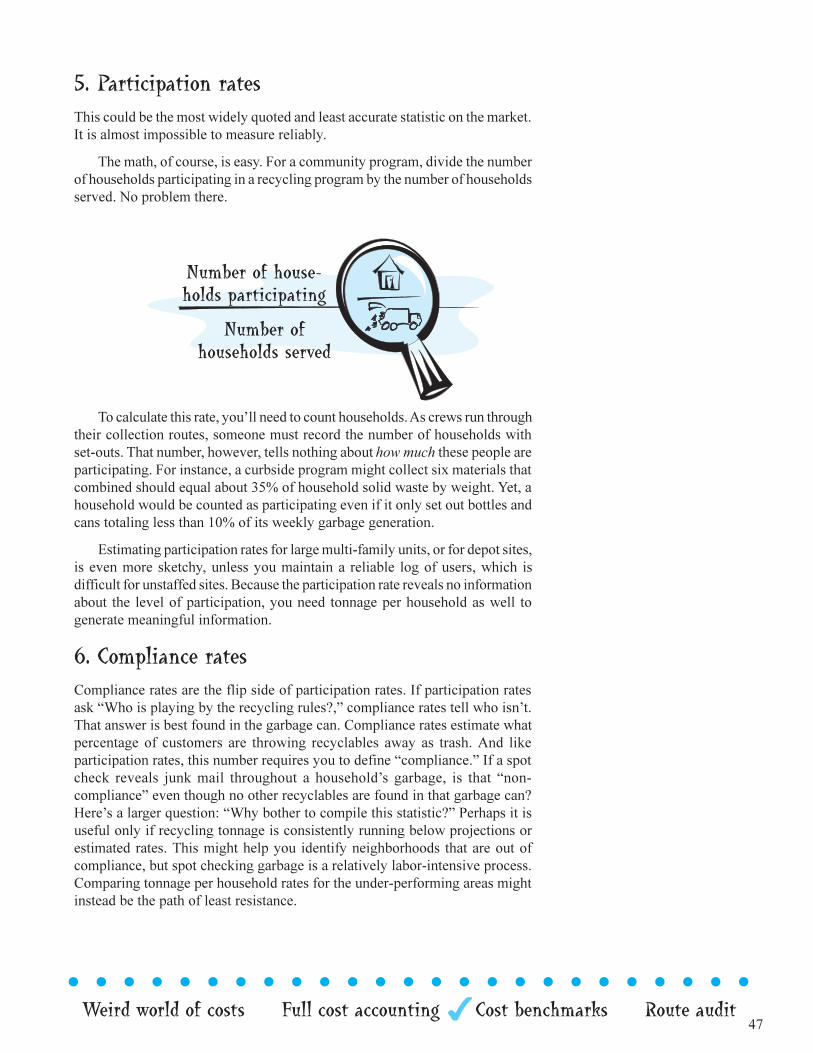
47
l l l l l l l l l l l l l l l l l l l l l l l l l
Weird world of costs Full cost accounting Cost benchmarks Route audit
5. Participation ratesThis could be the most widely quoted and least accurate statistic on the market.It is almost impossible to measure reliably.
The math, of course, is easy. For a community program, divide the numberof households participating in a recycling program by the number of householdsserved. No problem there.
To calculate this rate, you�ll need to count households. As crews run throughtheir collection routes, someone must record the number of households withset-outs. That number, however, tells nothing about how much these people areparticipating. For instance, a curbside program might collect six materials thatcombined should equal about 35% of household solid waste by weight. Yet, ahousehold would be counted as participating even if it only set out bottles andcans totaling less than 10% of its weekly garbage generation.
Estimating participation rates for large multi-family units, or for depot sites,is even more sketchy, unless you maintain a reliable log of users, which isdifficult for unstaffed sites. Because the participation rate reveals no informationabout the level of participation, you need tonnage per household as well togenerate meaningful information.
6. Compliance ratesCompliance rates are the flip side of participation rates. If participation ratesask �Who is playing by the recycling rules?,� compliance rates tell who isn�t.That answer is best found in the garbage can. Compliance rates estimate whatpercentage of customers are throwing recyclables away as trash. And likeparticipation rates, this number requires you to define �compliance.� If a spotcheck reveals junk mail throughout a household�s garbage, is that �non-compliance� even though no other recyclables are found in that garbage can?Here�s a larger question: �Why bother to compile this statistic?� Perhaps it isuseful only if recycling tonnage is consistently running below projections orestimated rates. This might help you identify neighborhoods that are out ofcompliance, but spot checking garbage is a relatively labor-intensive process.Comparing tonnage per household rates for the under-performing areas mightinstead be the path of least resistance.
48 Weird world of costs Full cost accounting Cost benchmarks Route auditl l l l l l l l l l l l l l l l l l l l l l l l l
7. Stops per crew or stops per crew memberA �route audit� is the only reliable way to calculate this key measure ofproductivity. Here�s why: As your recycling program collects more and morematerial, you are gradually creating opportunities to reduce garbage collectioncosts. As households divert more tonnage from the garbage can to the recyclingbin, garbage collection crews should be spending less time at the curb (as theypick up fewer and lighter garbage cans) and less time driving to and from disposalfacilities (because trucks are filling up more slowly). The flip side, of course,is that recycling crews may be taking more time at the curb and more trips tothe processing facility because residents are setting out more material.
As solid waste disposal fees have dropped drastically (in some counties bymore than 50%), recycling programs need to capture savings in garbagecollection costs to make recycling cost-effective. Capturing those savings meansserving more households per crew and per crew member on each garbage route.If you have not audited your routes by having an observer on each route as it iscollected, how and where can you find those savings? The steps and informationneeded to perform a route audit are described in The route audit section at theend of this chapter.
The real cost story: On the whole, I�d ratherrecycle in New JerseySo each of these seven numbers tells you something about your costs, but what�sthe bottom line? Is your recycling program cost-effective? Does recycling trulypay in today�s markets with today�s dollars? The answer is a definitive�maybe.Or put more optimistically, it can be. But it�s crucial to ask the right question toarrive at the correct answer. And the right question is: Does recycling raise orlower the total cost of solid waste management? It�s a simple question, but it�seasy to forget. You are comparing the cost of solid waste management with andwithout recycling. If you can design and operate a recycling program thathonestly reduces the total cost of solid waste management, you win. At thatpoint, recycling is cost-effective in today�s dollars and today�s markets, andyou can argue that recycling is not only the better environmental and socialoption, it�s cheaper than landfilling or incinerating everything we discard.
And it is still plenty possible in New Jersey. Reduced landfill and incineratorprices definitely make it harder to work the numbers in recycling�s favor.Disposal fees in New Jersey have fallen from highs in the range of $120 to$130 per ton to $50 to $60 per ton. But New Jersey still has some of the nation�smost favorable economics for recycling, including the following factors.
l l l l l l l
49
l l l l l l l l l l l l l l l l l l l l l l l l l
Weird world of costs Full cost accounting Cost benchmarks Route audit
The most densely populated state in the nationThat means high land costs, which drive up disposal costs. Our garbage disposalcosts are still among the highest in the country, even after the declines of thelate 1990s. Our population density also means lots of buyers and sellers rightin our backyards, so we have a large supply of recyclables and some of the bestaccess to recycling markets in the country.
Well-developed recycling infrastructureSince implementing mandatory recycling, the NJDEP has cultivated the growthof recycling processors and end-users with a mix of grants, loans and directedresearch. As a result, recycling is a powerful industry in the state, ranking 13th
in total employment when all recycling-related jobs are counted. That translatesto more buyers vying for the recyclables collected by New Jersey coordinators.
A business and residential population that supports recyclingNew Jersey�s recycling rates are already among the highest in the nation. That�sgreat news for the cost-effectiveness of recycling. Maximizing the amount ofrecyclable material collected per person is a proven strategy for reducing theper-ton cost of recycling, and it creates opportunities for reducing both garbagecollection and disposal costs.
High labor costsThat sounds like a disadvantage, but high labor costs provide a greateropportunity for savings gained by reducing garbage collection costs. Thosesavings might come from reducing the frequency of garbage collection, or byredesigning garbage collection routes because recycling has reduced the amountof garbage set out each week. For example, a program that replaces twice-a-week garbage collection with once-a-week garbage collection and biweeklyrecycling collection reduces the number of monthly collection visits from eightto six. Where labor costs are high, that reduction saves more money.
l l l l l l l l l l l l l l l l l l l l l l l l l
50 Weird world of costs Full cost accounting Cost benchmarks Route auditl l l l l l l l l l l l l l l l l l l l l l l l l
The route audit: The numbers you needto reduce costs
l l l l l l l l l l l l l l l l l l l l l l l l l
What separates a high-cost collection program from a low-cost one? Lots ofthings � some you can control and many you can�t. Some communities simplycost more to serve. In a rural area, where drive time between stops may bemeasured in minutes rather than seconds, drivers spend a lot of time just toreach the house. In a compact suburb that�s long on small multi-family housingunits, your crews may be able to scoop up recyclables from 10 families withoutmoving the truck. Wage rates, too, are a major cost factor over which you mayhave no control. So given the hand you�re dealt � local wage rates, communitydemographics, the materials you�re required to collect � how do you measurewhether your collection routes and crews are operating efficiently?
A route audit is the answer. It reveals where and how your crew�s time isbeing spent � and where they might be able to spend less of it. Start by askingyour crew; they are the experts on their routes. Where do they see the greatestdelays and inefficiencies? What do they recommend to overcome them?
Next, send an observer to ride with collection crews on each route.Depending on your program, those observations should be made at two, threeor four different times of the year. Obviously, New Jersey winters can affectcollection times, but so can the purchasing, driving, school and vacation patternsof your residents. Just ask any recycling coordinator from a shore community,where summer populations can dwarf the number of year-round residents. Useyour judgment as to how often your program needs an audit.
Data to collect in a route audit lists information to collect for each route.
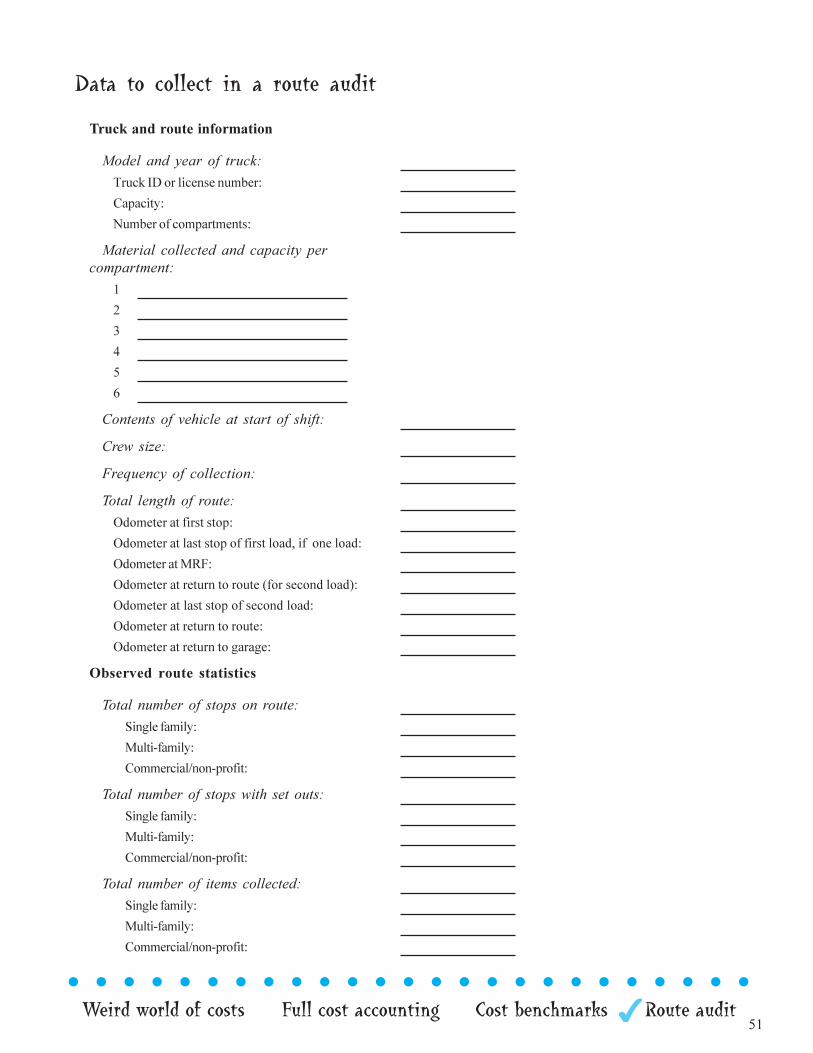
51
l l l l l l l l l l l l l l l l l l l l l l l l l
Weird world of costs Full cost accounting Cost benchmarks Route audit
Truck and route information
Model and year of truck:
Truck ID or license number:
Capacity:
Number of compartments:
Material collected and capacity percompartment:
1
2
3
4
5
6
Contents of vehicle at start of shift:
Crew size:
Frequency of collection:
Total length of route:
Odometer at first stop:
Odometer at last stop of first load, if one load:
Odometer at MRF:
Odometer at return to route (for second load):
Odometer at last stop of second load:
Odometer at return to route:
Odometer at return to garage:
Observed route statistics
Total number of stops on route:
Single family:
Multi-family:
Commercial/non-profit:
Total number of stops with set outs:
Single family:
Multi-family:
Commercial/non-profit:
Total number of items collected:
Single family:
Multi-family:
Commercial/non-profit:
Data to collect in a route audit
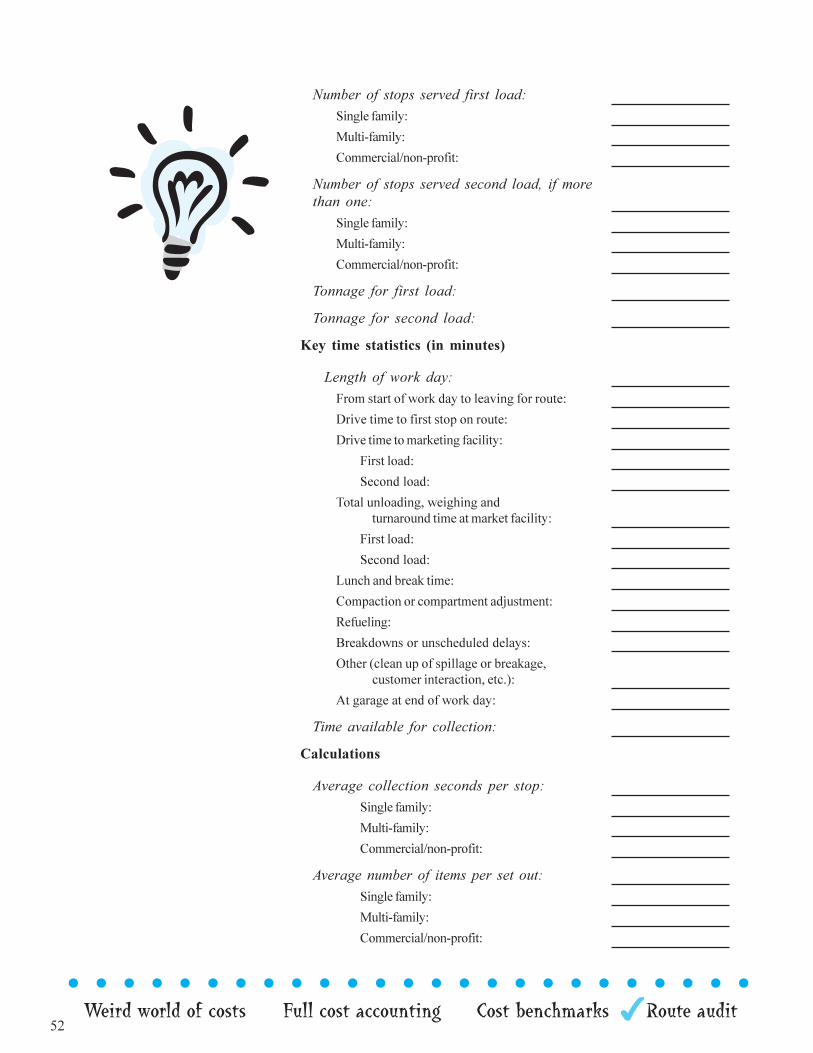
52 Weird world of costs Full cost accounting Cost benchmarks Route auditl l l l l l l l l l l l l l l l l l l l l l l l l
Number of stops served first load:
Single family:
Multi-family:
Commercial/non-profit:
Number of stops served second load, if morethan one:
Single family:
Multi-family:
Commercial/non-profit:
Tonnage for first load:
Tonnage for second load:
Key time statistics (in minutes)
Length of work day:
From start of work day to leaving for route:
Drive time to first stop on route:
Drive time to marketing facility:
First load:
Second load:
Total unloading, weighing andturnaround time at market facility:
First load:
Second load:
Lunch and break time:
Compaction or compartment adjustment:
Refueling:
Breakdowns or unscheduled delays:
Other (clean up of spillage or breakage,customer interaction, etc.):
At garage at end of work day:
Time available for collection:
Calculations
Average collection seconds per stop:
Single family:
Multi-family:
Commercial/non-profit:
Average number of items per set out:
Single family:
Multi-family:
Commercial/non-profit:
53
l l l l l l l l l l l l l l l l l l l l l l l l l
Weird world of costs Full cost accounting Cost benchmarks Route audit
How to analyze and use route audit informationArmed with the results of your audit, how do you identify cost savings? Theaudit tells a minute-by-minute story of how your crew spends its day. Turningspare minutes into saved dollars is the goal.
Maximize a crew�s collection time
This requires minimizing time spent on all other uses of a crew�s time. Startwith the beginning of the work day. How quickly is the crew out of the yardand on the route? How much time is spent on travel to the MRF? At the MRF?How many times does the truck fill up and which compartments are filling upfirst? Can extra truck capacity reduce a second or third load, and how muchtime will that save? How much time is spent traveling between stops? Can it bereduced with new routes that better match local traffic and street patterns?How much time is spent at your facility at the end of the work day?
Alone, each of these items may not account for much time, but takentogether, these lost minutes quickly can add up to unproductive hours in a workweek. But they are hard to find without the specific, accurate information aroute audit provides. The payoff can be huge: one county recycling programidentified more than $240,000 in annual labor savings by getting crews outmore quickly to their routes.
Maximize the number of households collected per crew member
In high-wage areas, low-cost programs tend to maximize labor productivity byminimizing the amount of time each crew member spends collecting from eachcustomer. At the curb, the economics of recycling is all about seconds per stop.For example, one New Jersey county estimated it could save more than $30,000per year simply by reducing average collection time by 1.6 seconds per stop.
Improving crew productivity has been the primary driver for improvementsin vehicle design and capacity. Productivity is not all about trucks, however.Management can be a more important factor. In fact, a comparison of high andlow-cost solid waste collection programs around the country found thatorganizational structure and management �accounted for the majority of thedifferences between highest and lowest cost service providers.�7 The same studyfound that low-cost programs invested the time and money required to keepcollection crews well-trained.
l l l l l l l l l l l l l l l l l l l l l l l l l
l l l l l l l
l l l l l l l l l l l l l l l l l l l l l l l l l
54
Increase participation and amount of material collected per stop
You have already invested equipment, staff and organizational support to collectrecyclables. One way to increase the return on that investment is to collectmore recycled materials. That happens as your fixed costs are spread out overmore tons of recyclables. As noted in the Cost benchmarks section of thischapter, increasing the amount of recyclables collected should reduce the costper ton of recycling, but it also has the nagging tendency to increase the costper household. Remember too � and this is key � that as you collect morerecyclables from each household, you should be collecting less garbage. And ifyou�re collecting less garbage, you should be looking for ways to reduce garbagecollection costs (by serving more customers with the same crew, for example.)
As you can see, the strategies for reducingrecycling collection costs are hardly earthshattering. They are:
• minimize unproductive time
• collect materials as quickly as possible
• if you�re going to the trouble to make house calls, increase theamount you collect at each stop
Notes:
55
l l l l l l l l l l l l l l l l l l l l l l l l l
Reycling�s head start Doing the math Designing a system Strategies
3Putting the numbers together:
Tools of cost-benefit analysisl l l l l l l l l l l l l l l l l l l l l l
Recycling�s head start to a better bottom line
Prices may not measure all the right costs
Three ways to make the numbers work
Doing the math
Break-even levels
Payback periods
Comparing the total cost of solid waste managementwith and without recycling
Designing a system for financial success
Strategies for recovering avoided costs
56
l l l l l l l l l l l l l l l l l l l l l l l l l
Reycling�s head start Doing the math Designing a system Strategies
Recycling�s head startto a better bottom lineIs recycling cost-effective? That core question has been asked andanswered by both the pro-recycling and anti-recycling camps. Notsurprisingly, they find widely different answers. The Cato Institute,for example, singled out New Jersey�s statewide recycling efforts in1994 as �an inexcusable waste of resources.� The EnvironmentalDefense Fund, on the other hand, offers a 14-point analysisdocumenting recycling�s financial benefits.1 This manual, and thischapter in particular, are not the latest entries into the crowded fieldof recycling critiques. They will not prove or disprove recycling�scost-effectiveness. Instead, this chapter will discuss useful tools andmethods of cost-benefit analysis that can be applied to your program.
Recycling�s cost-effectiveness depends on how recyclables, yard waste andgarbage are collected and processed, and at what prices they are sold or disposed.It also depends on who is paying which bills in the solid waste managementsystem. In fact, the cost-effectiveness of recycling depends on so many variablesthat it almost by definition needs to be analyzed individually for each program.
Prices may not measure all the right costsIn New Jersey, the law does not require recycling to be less expensive thangarbage collection and disposal. Operating a recycling program that reducesthe total cost of solid waste management is a goal to shoot for, but the NewJersey recycling law stands on the premise that recycling provides wider, longer-term environmental and economic benefits (externalities, as economists callthem) than burning or burying garbage. And those added benefits may not beaccurately reflected in today�s costs and revenues.
At the core of this financial question, recycling usually starts with a heftyhead start over garbage disposal. The head start is the tipping fee at the disposalsite, plus any revenue received from selling the recyclables. You will alwayshave to pay for disposal, and because New Jersey is the most densely populatedstate in the nation with high land and labor costs, New Jersey�s fees will probablyalways be the highest in the nation. Even with a decline in garbage disposalfees and relatively weak prices for recyclables, that head start in New Jerseyremains in the $50 per ton range, and more in some areas of the state.
57
l l l l l l l l l l l l l l l l l l l l l l l l l
Reycling�s head start Doing the math Designing a system Strategies
Three ways to make the numbers workThe key to making the financial numbers work for recycling is three-fold.
1. Increase recycling�s head start by finding additional savings createdby the recycling program. The basic $50 per ton head start is basedon disposal costs alone. Recycling programs should also reducegarbage collection costs, simply because there�s less garbage tocollect. Be prepared to answer this question: if the current recyclingprogram were disbanded, how much would garbage collection costsincrease? Without that answer, it is hard to show that recycling canbe cost-effective on disposal savings alone.
2. Constantly look for ways to drive down recycling collection costs,so that the difference between garbage collection costs and recyclingcollection costs is in the $50 to $60 per ton range. That�s challenging,but possible, especially if you are able to keep recycling collectioncosts under $100 per ton.
3. Make sure you are getting a fair price for recyclables. You may notbe able to affect market prices, but you can definitely be a smartseller who achieves that delicate balance between assuring reliablemarkets in the long run and receiving competitive prices in the shortrun.
Doing the mathWhy can�t we just generalize about the cost-effectiveness of recycling? As astart, simply compare commercial sector recycling with a residential curbsideprogram. Commercial programs often generate relatively large amounts ofhomogenous waste in a single spot (a factory, warehouse or office building, forinstance), so they enjoy relatively low collection costs. On the other hand, mostresidential curbside programs face high collection costs because small amountsof diverse materials are collected from thousands of locations. Generalizingabout the cost-effectiveness of these two programs is a challenge at best andmeaningless at worst.
The managers of both programs, however, can use the same tools to findthe specific answers for each situation. Those tools include break-even levels,payback periods and total cost comparisons. Managers can use these tools toanalyze their overall programs, or specific program changes they are considering.
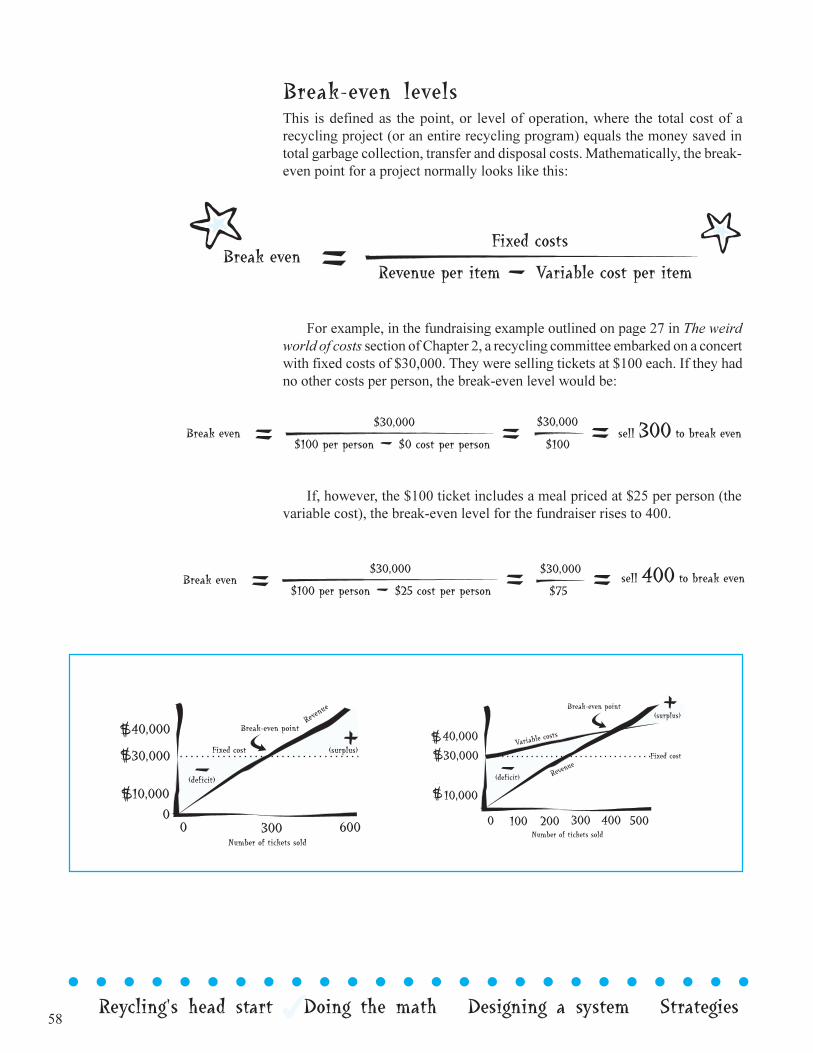
58
l l l l l l l l l l l l l l l l l l l l l l l l l
Reycling�s head start Doing the math Designing a system Strategies
Break-even levelsThis is defined as the point, or level of operation, where the total cost of arecycling project (or an entire recycling program) equals the money saved intotal garbage collection, transfer and disposal costs. Mathematically, the break-even point for a project normally looks like this:
For example, in the fundraising example outlined on page 27 in The weirdworld of costs section of Chapter 2, a recycling committee embarked on a concertwith fixed costs of $30,000. They were selling tickets at $100 each. If they hadno other costs per person, the break-even level would be:
If, however, the $100 ticket includes a meal priced at $25 per person (thevariable cost), the break-even level for the fundraiser rises to 400.
Revenue
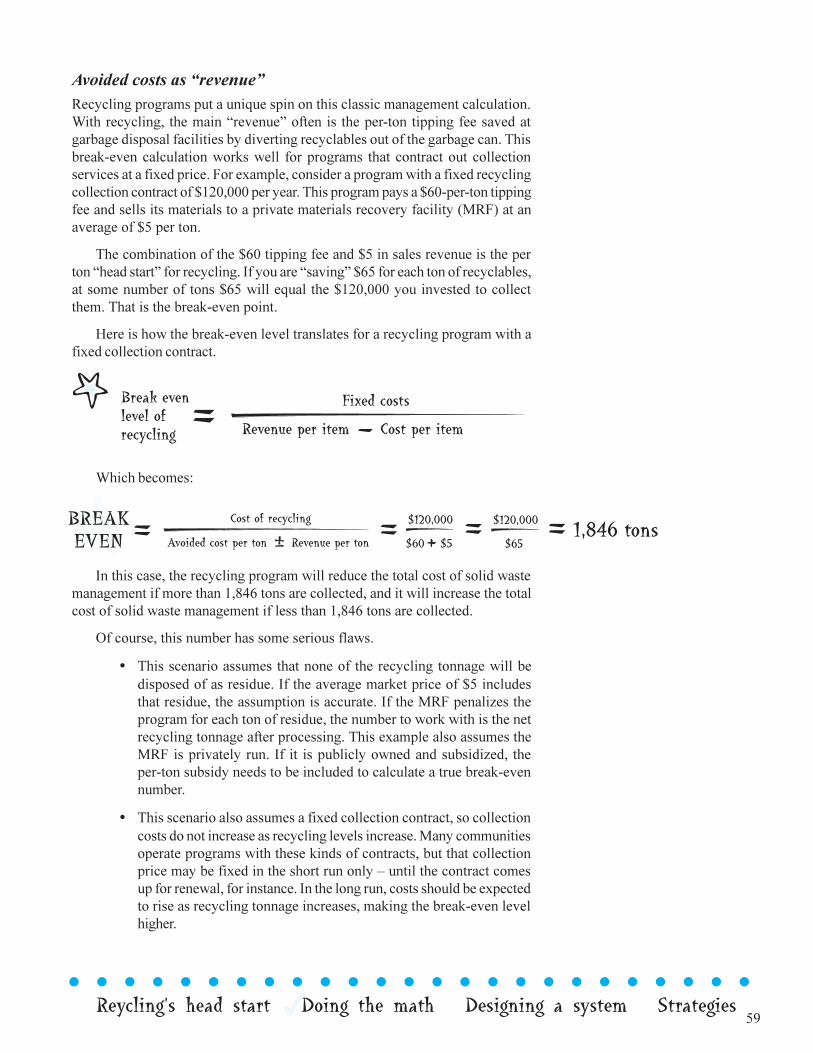
59
l l l l l l l l l l l l l l l l l l l l l l l l l
Reycling�s head start Doing the math Designing a system Strategies
Avoided costs as �revenue�Recycling programs put a unique spin on this classic management calculation.With recycling, the main �revenue� often is the per-ton tipping fee saved atgarbage disposal facilities by diverting recyclables out of the garbage can. Thisbreak-even calculation works well for programs that contract out collectionservices at a fixed price. For example, consider a program with a fixed recyclingcollection contract of $120,000 per year. This program pays a $60-per-ton tippingfee and sells its materials to a private materials recovery facility (MRF) at anaverage of $5 per ton.
The combination of the $60 tipping fee and $5 in sales revenue is the perton �head start� for recycling. If you are �saving� $65 for each ton of recyclables,at some number of tons $65 will equal the $120,000 you invested to collectthem. That is the break-even point.
Here is how the break-even level translates for a recycling program with afixed collection contract.
Which becomes:
In this case, the recycling program will reduce the total cost of solid wastemanagement if more than 1,846 tons are collected, and it will increase the totalcost of solid waste management if less than 1,846 tons are collected.
Of course, this number has some serious flaws.
• This scenario assumes that none of the recycling tonnage will bedisposed of as residue. If the average market price of $5 includesthat residue, the assumption is accurate. If the MRF penalizes theprogram for each ton of residue, the number to work with is the netrecycling tonnage after processing. This example also assumes theMRF is privately run. If it is publicly owned and subsidized, theper-ton subsidy needs to be included to calculate a true break-evennumber.
• This scenario also assumes a fixed collection contract, so collectioncosts do not increase as recycling levels increase. Many communitiesoperate programs with these kinds of contracts, but that collectionprice may be fixed in the short run only � until the contract comesup for renewal, for instance. In the long run, costs should be expectedto rise as recycling tonnage increases, making the break-even levelhigher.
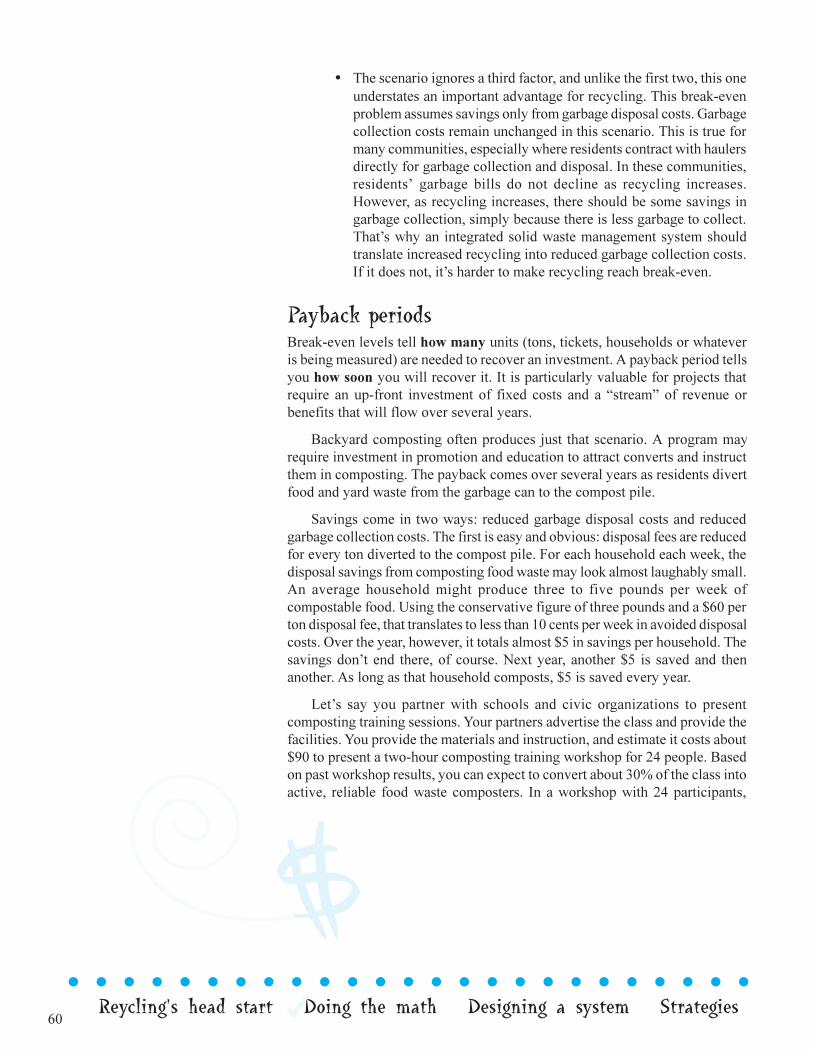
60
l l l l l l l l l l l l l l l l l l l l l l l l l
Reycling�s head start Doing the math Designing a system Strategies
• The scenario ignores a third factor, and unlike the first two, this oneunderstates an important advantage for recycling. This break-evenproblem assumes savings only from garbage disposal costs. Garbagecollection costs remain unchanged in this scenario. This is true formany communities, especially where residents contract with haulersdirectly for garbage collection and disposal. In these communities,residents� garbage bills do not decline as recycling increases.However, as recycling increases, there should be some savings ingarbage collection, simply because there is less garbage to collect.That�s why an integrated solid waste management system shouldtranslate increased recycling into reduced garbage collection costs.If it does not, it�s harder to make recycling reach break-even.
Payback periodsBreak-even levels tell how many units (tons, tickets, households or whateveris being measured) are needed to recover an investment. A payback period tellsyou how soon you will recover it. It is particularly valuable for projects thatrequire an up-front investment of fixed costs and a �stream� of revenue orbenefits that will flow over several years.
Backyard composting often produces just that scenario. A program mayrequire investment in promotion and education to attract converts and instructthem in composting. The payback comes over several years as residents divertfood and yard waste from the garbage can to the compost pile.
Savings come in two ways: reduced garbage disposal costs and reducedgarbage collection costs. The first is easy and obvious: disposal fees are reducedfor every ton diverted to the compost pile. For each household each week, thedisposal savings from composting food waste may look almost laughably small.An average household might produce three to five pounds per week ofcompostable food. Using the conservative figure of three pounds and a $60 perton disposal fee, that translates to less than 10 cents per week in avoided disposalcosts. Over the year, however, it totals almost $5 in savings per household. Thesavings don�t end there, of course. Next year, another $5 is saved and thenanother. As long as that household composts, $5 is saved every year.
Let�s say you partner with schools and civic organizations to presentcomposting training sessions. Your partners advertise the class and provide thefacilities. You provide the materials and instruction, and estimate it costs about$90 to present a two-hour composting training workshop for 24 people. Basedon past workshop results, you can expect to convert about 30% of the class intoactive, reliable food waste composters. In a workshop with 24 participants,
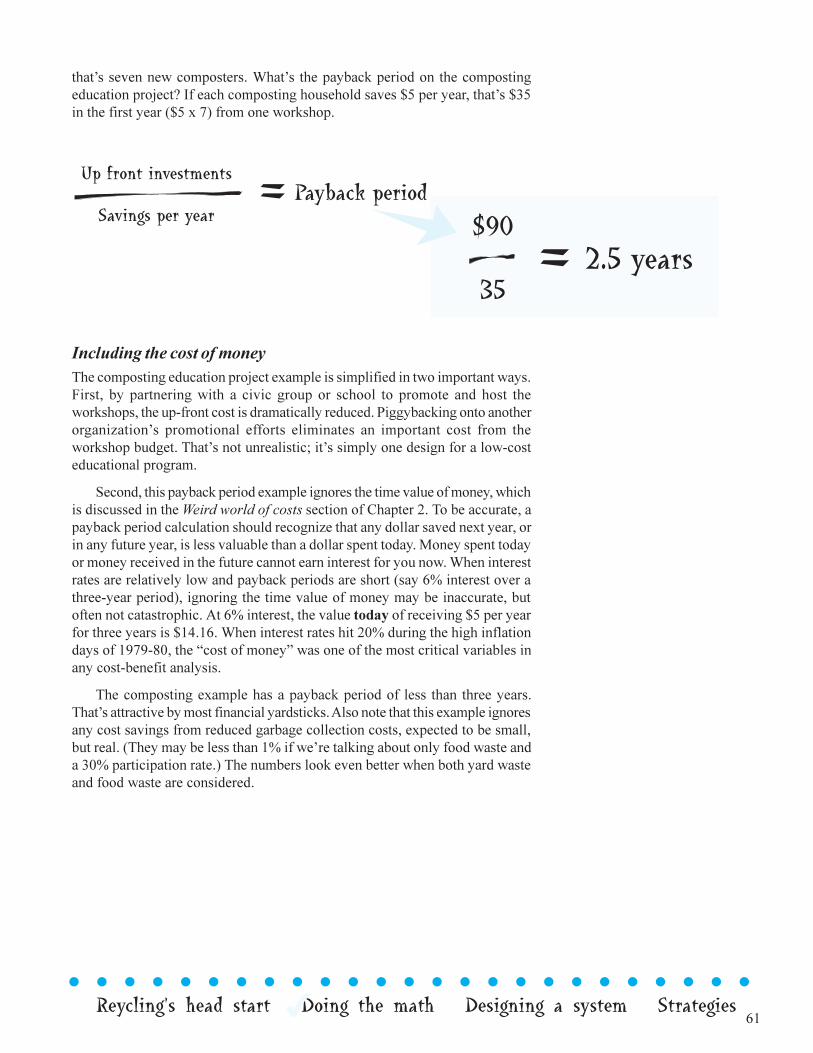
61
l l l l l l l l l l l l l l l l l l l l l l l l l
Reycling�s head start Doing the math Designing a system Strategies
that�s seven new composters. What�s the payback period on the compostingeducation project? If each composting household saves $5 per year, that�s $35in the first year ($5 x 7) from one workshop.
Including the cost of moneyThe composting education project example is simplified in two important ways.First, by partnering with a civic group or school to promote and host theworkshops, the up-front cost is dramatically reduced. Piggybacking onto anotherorganization�s promotional efforts eliminates an important cost from theworkshop budget. That�s not unrealistic; it�s simply one design for a low-costeducational program.
Second, this payback period example ignores the time value of money, whichis discussed in the Weird world of costs section of Chapter 2. To be accurate, apayback period calculation should recognize that any dollar saved next year, orin any future year, is less valuable than a dollar spent today. Money spent todayor money received in the future cannot earn interest for you now. When interestrates are relatively low and payback periods are short (say 6% interest over athree-year period), ignoring the time value of money may be inaccurate, butoften not catastrophic. At 6% interest, the value today of receiving $5 per yearfor three years is $14.16. When interest rates hit 20% during the high inflationdays of 1979-80, the �cost of money� was one of the most critical variables inany cost-benefit analysis.
The composting example has a payback period of less than three years.That�s attractive by most financial yardsticks. Also note that this example ignoresany cost savings from reduced garbage collection costs, expected to be small,but real. (They may be less than 1% if we�re talking about only food waste anda 30% participation rate.) The numbers look even better when both yard wasteand food waste are considered.
62
l l l l l l l l l l l l l l l l l l l l l l l l l
Reycling�s head start Doing the math Designing a system Strategies
Comparing the total cost of solid waste managementwith and without recyclingThis is the acid test. Comparing the total cost of solid waste management withand without recycling side-by-side provides a good estimate of the net cost orsavings of a recycling program � measured in today�s dollars only. It�s criticalto note again that this cost-benefit calculation is based solely on current costsand current markets. It does not include the wide range of potential social andenvironmental costs of landfilling or incineration, or the job-creating benefitsof recycling compared to garbage disposal. In New Jersey, public policyexplicitly prefers recycling for these reasons, even if it increases the total costof solid waste management in today�s markets. Even given that preference,however, we can still aim to design a recycling program that does reduce thetotal cost of solid waste management. This total cost comparison is a goodplace to start.
This calculation is relatively straightforward. Compile all the costs incurredand revenues generated by garbage and recycling programs. For a worksheet ofcosts to be included in the analysis, Appendix E can serve as a useful guide.Then compare those costs with the ones that would be incurred if recyclingwere discontinued and all solid waste were disposed of as garbage.
The cost of more garbage in the canThe numbers get tricky mainly in the collection costs. The core questionbecomes: how much will garbage collection costs increase if all householdssuddenly throw out 20% to 35% more garbage every week because they are no
Costs without a change in collection frequency
SWM costs without recycling SWM costs with recycling
Garbage collection $357,000 $321,300
Garbage transfer& disposal @ $60/ton $683,640 $566,400
Recycling collection $185,250
Sales of recyclables $0 $0
Total cost of SWM $1,040,640 $1,072,950
Net cost of recycling program $32,310
Note: This SWM scenario with recycling assumes that 9,440 tons of waste are disposed of as garbage at $60 per tonand 1,950 tons are recycled at a private MRF, which accepts the recyclables at no fee. Under this scenario, the netcost of recycling would drop to zero if this program received an average of $16.56 per ton for its recyclables.
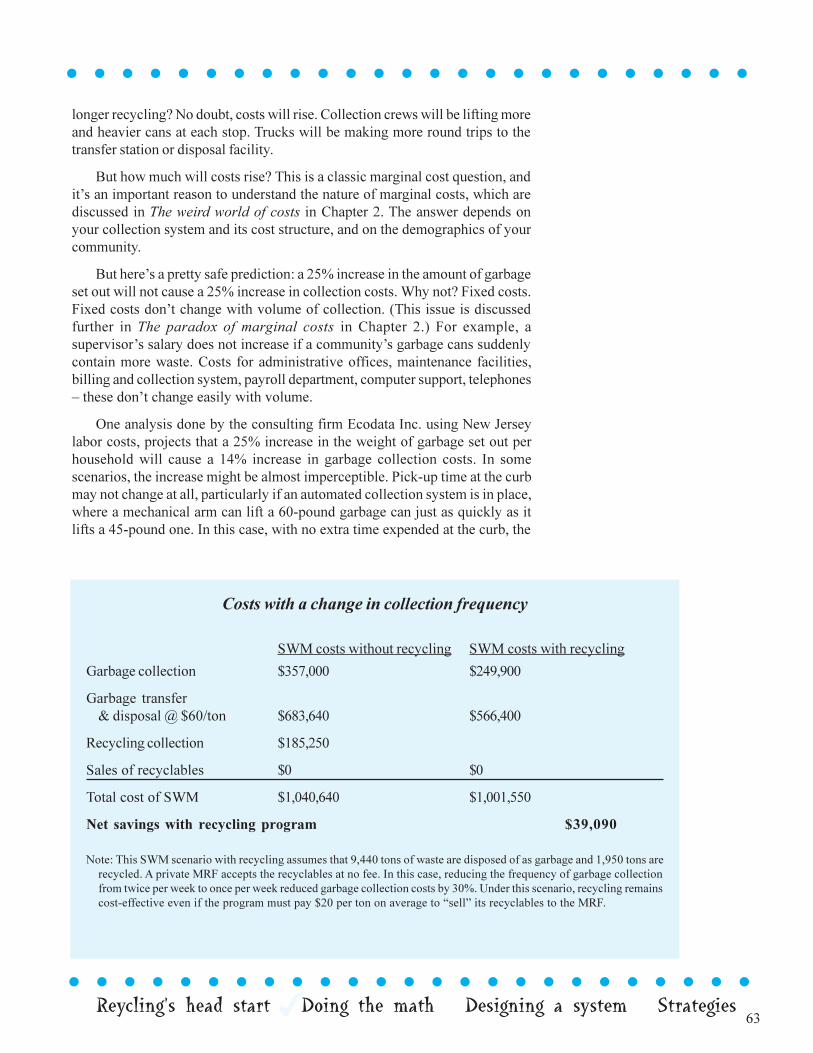
63
l l l l l l l l l l l l l l l l l l l l l l l l l
Reycling�s head start Doing the math Designing a system Strategies
longer recycling? No doubt, costs will rise. Collection crews will be lifting moreand heavier cans at each stop. Trucks will be making more round trips to thetransfer station or disposal facility.
But how much will costs rise? This is a classic marginal cost question, andit�s an important reason to understand the nature of marginal costs, which arediscussed in The weird world of costs in Chapter 2. The answer depends onyour collection system and its cost structure, and on the demographics of yourcommunity.
But here�s a pretty safe prediction: a 25% increase in the amount of garbageset out will not cause a 25% increase in collection costs. Why not? Fixed costs.Fixed costs don�t change with volume of collection. (This issue is discussedfurther in The paradox of marginal costs in Chapter 2.) For example, asupervisor�s salary does not increase if a community�s garbage cans suddenlycontain more waste. Costs for administrative offices, maintenance facilities,billing and collection system, payroll department, computer support, telephones� these don�t change easily with volume.
One analysis done by the consulting firm Ecodata Inc. using New Jerseylabor costs, projects that a 25% increase in the weight of garbage set out perhousehold will cause a 14% increase in garbage collection costs. In somescenarios, the increase might be almost imperceptible. Pick-up time at the curbmay not change at all, particularly if an automated collection system is in place,where a mechanical arm can lift a 60-pound garbage can just as quickly as itlifts a 45-pound one. In this case, with no extra time expended at the curb, the
Costs with a change in collection frequency
SWM costs without recycling SWM costs with recycling
Garbage collection $357,000 $249,900
Garbage transfer& disposal @ $60/ton $683,640 $566,400
Recycling collection $185,250
Sales of recyclables $0 $0
Total cost of SWM $1,040,640 $1,001,550
Net savings with recycling program $39,090
Note: This SWM scenario with recycling assumes that 9,440 tons of waste are disposed of as garbage and 1,950 tons arerecycled. A private MRF accepts the recyclables at no fee. In this case, reducing the frequency of garbage collectionfrom twice per week to once per week reduced garbage collection costs by 30%. Under this scenario, recycling remainscost-effective even if the program must pay $20 per ton on average to �sell� its recyclables to the MRF.
l l l l l l l l l l l l l l l l l l l l l l l l l
64
l l l l l l l l l l l l l l l l l l l l l l l l l
Reycling�s head start Doing the math Designing a system Strategies
only cost increase may come from filling up the garbage truck more quickly.These seemingly small issues can ultimately determine the net cost or savingsof recycling.
The best way to compare solid waste management costs with and withoutrecycling is to actually do it side-by-side, as shown in Costs without a changein collection frequency and Costs with a change in collection frequency.
When garbage disposal fees approach $100 per ton, many recyclingprograms can actually reduce the total cost of solid waste management, even ifthey receive no revenue for their recyclables. In these cases, the $100-per-tondisposal savings exceed the additional, or marginal, costs of recycling collection.With garbage disposal fees closer to $50, disposal savings alone are not usuallybig enough to cover the cost of recycling collection, which can easily exceed$100 per ton in New Jersey.
Garbage collection is the natural place to look for additional savings, andreducing the frequency of garbage collection is one strategy to capture thosesavings. Reducing the frequency of collection, even without reducing the amountset out, can save about 30% in collection costs for some programs.2 Andrecycling�s success creates the rationale for reducing the frequency of garbagecollection. Garbage justifiably can be collected less frequently because strongrecycling and waste reduction can reduce the weight of household garbage byas much as 25% to 35%. Unless recycling prices head far into the negative, acost-efficient recycling program (collection costs near or under $100 per ton),combined with a reduction in garbage collection from twice per week to onceper week, should reduce total solid waste management costs.
Financial sense may not mean political popularityThe system outlined above makes good financial sense. This recycling
program has reduced both garbage collection and disposal costs, so it succeedsin reducing the total cost of solid waste management. It would still reduce costsif the community were forced to pay $20 per ton to �sell� its recyclables.
Don�t confuse good financial sense with politicalpopularity, however. This system may never make it from aspreadsheet to Main Street because residents, or their electedofficials, may not accept reduced garbage service in the nameof economic efficiency. That�s fine. In fact, it�s good. That�swhat democracies do; they let people choose. Recyclingcoordinators and solid waste managers have the responsibilityof identifying the least cost options that meet New Jersey�senvironmental objectives. If residents, or their electedrepresentatives, choose a higher-cost path because they wanta higher level of service, that�s their right. However, they canmake better decisions with better information. They maynever know a lesser-cost option exists unless you find it first.Designing a system that incorporates recycling and reducesoverall costs is the kind of win-win scenario that may carrythe day.
l l l l l l l
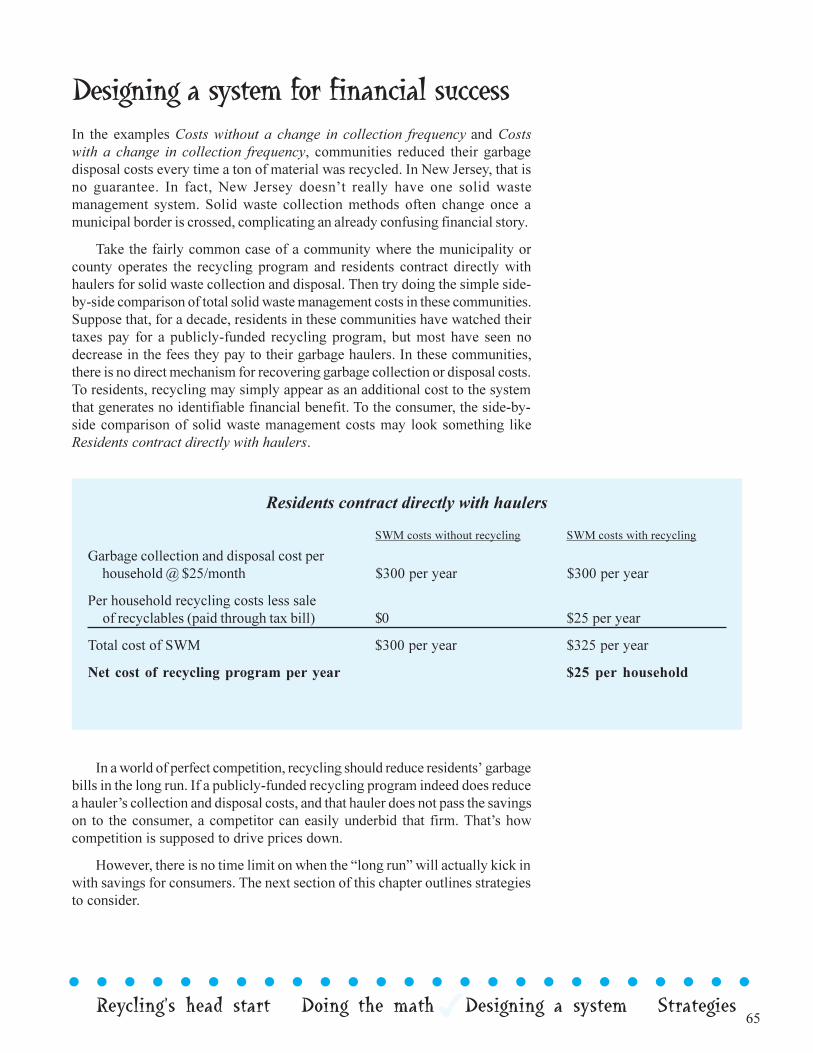
65
l l l l l l l l l l l l l l l l l l l l l l l l l
Reycling�s head start Doing the math Designing a system Strategies
Designing a system for financial successIn the examples Costs without a change in collection frequency and Costswith a change in collection frequency, communities reduced their garbagedisposal costs every time a ton of material was recycled. In New Jersey, that isno guarantee. In fact, New Jersey doesn�t really have one solid wastemanagement system. Solid waste collection methods often change once amunicipal border is crossed, complicating an already confusing financial story.
Take the fairly common case of a community where the municipality orcounty operates the recycling program and residents contract directly withhaulers for solid waste collection and disposal. Then try doing the simple side-by-side comparison of total solid waste management costs in these communities.Suppose that, for a decade, residents in these communities have watched theirtaxes pay for a publicly-funded recycling program, but most have seen nodecrease in the fees they pay to their garbage haulers. In these communities,there is no direct mechanism for recovering garbage collection or disposal costs.To residents, recycling may simply appear as an additional cost to the systemthat generates no identifiable financial benefit. To the consumer, the side-by-side comparison of solid waste management costs may look something likeResidents contract directly with haulers.
In a world of perfect competition, recycling should reduce residents� garbagebills in the long run. If a publicly-funded recycling program indeed does reducea hauler�s collection and disposal costs, and that hauler does not pass the savingson to the consumer, a competitor can easily underbid that firm. That�s howcompetition is supposed to drive prices down.
However, there is no time limit on when the �long run� will actually kick inwith savings for consumers. The next section of this chapter outlines strategiesto consider.
Residents contract directly with haulers
SWM costs without recycling SWM costs with recycling
Garbage collection and disposal cost per household @ $25/month $300 per year $300 per year
Per household recycling costs less sale of recyclables (paid through tax bill) $0 $25 per year
Total cost of SWM $300 per year $325 per year
Net cost of recycling program per year $25 per household
66
l l l l l l l l l l l l l l l l l l l l l l l l l
Reycling�s head start Doing the math Designing a system Strategies
Strategies for recovering avoided costsThe only sure way to recover avoided costs is to first know where to find them.That means fully understanding marginal costs and how they change for differentprogram options. For example, will reduced garbage set-outs allow you to runfewer garbage collection routes? If so, will equipment sit idle after the changes,and what is the cost of allowing it to sit idle? Could dumpster sizes and collectionroutes be reduced more easily if you contract for garbage and recyclingcollection?
Identifying garbage collection savings is crucial to making recycling cost-effective, but those savings are frequently difficult to identify. It requires knowingwhich costs are fixed and variable, and which are controllable over the timeperiod you are analyzing. That�s why every important cost decision should beexamined through the lens of marginal costs.
Here are some suggestions for recovering avoided costs.
1. Use collection-only contractsRather than contracting for garbage collection and disposal, contract for thecollection portion only. If you are paying the tipping fee, you capture the savingseach time you divert a ton away from disposal. If the hauler pays the tippingfee, how are you capturing the savings from your recycling investment?
Collection-only contracts also reduce bonding costs for your contract.Performance bonds (discussed in Chapter 5) are insurance policies. Contractorsbuy them to ensure services will be provided even if the contractor is unable toperform required duties. The cost of these insurance policies is tied to the totalcost of the contract, so excluding disposal fees reduces the cost of theperformance bond.
2. Evaluate contractor rebatesThe garbage hauler pays a specified amount for each ton of material a communityrecycles, so the more a program recycles, the more it receives. The rebate reflectsthe fact that garbage haulers� collection costs should be reduced whenever arecycling program diverts material from the garbage can to the recycling bin.This is especially applicable in communities where tax dollars pay for recyclingeducation and collection (a county program, for example) and a private haulerhas a multi-year contract with a municipality to collect garbage. In these cases,
67
l l l l l l l l l l l l l l l l l l l l l l l l l
Reycling�s head start Doing the math Designing a system Strategies
l l l l l l l l l l l l l l l l l l l l l l l l l
the success of the publicly funded recycling program (when a new material isadded to the program, or through an extensive home-composting educationalcampaign, for example) helps reduce garbage collection costs. The rebate seeksto recover some of those savings.
Be careful with rebates, however. In reality, you should expect this provisionto increase the base price of contractors� bids. Why? Contractors will add theserebates to the core cost of service, so the total price of their bids should rise.The net cost or savings of the rebates, then, truly will depend on the success ofthe recycling program.
3. Consider Pay-As-You-Throw pricingThe EPA reports that as many as 4,000 communities around the country usesome form of Pay-As-You-Throw (PAYT). Residents pay a direct charge foreach bag or can of garbage they set out. This system rewards the individualrather than the community as a whole for waste prevention and recycling. PAYTpricing has proven popular in many areas because it gives customers the powerto reduce their garbage bill. It sends a direct dollar signal to the consumer:generating more garbage costs more money. Because the same dollar signalthat encourages source reduction and recycling also can encourage illegaldumping, successful PAYT programs usually include a credible enforcementprogram.
PAYT may not work in all communities; it is especially difficult toimplement in large multi-family units, for example. However, it has been aneconomic and environmental success story in rural, suburban and urban settings.New Jersey has more than 40 municipalities with some form of PAYT pricing.The USEPA maintains a toll-free hotline (1-888-EPA-PAYT) and website(www.epa.gov/payt) that provide a wealth of valuable technical assistance foranyone considering PAYT.3
4. Encourage competition, cooperation and negotiationUnusually high profits should attract competition, which should increase thenumber of service providers and drive prices downward. But how competitiveis the market, and can you encourage more competition? Contractors facinglittle or no competition may not work as hard to find savings for you.
68
l l l l l l l l l l l l l l l l l l l l l l l l l
Reycling�s head start Doing the math Designing a system Strategies
If you are contracting for garbage or recycling collection, follow therecommendations in Chapter 5 to ensure your bid specifications are clear,complete and supported with the information contractors need to submit accuratebids, and give them at least a month to prepare. Overly complicated bidspecifications will discourage new bidders, as will excessive insurancerequirements and punitive damage provisions. Also, consider coordinatingcollection bids with neighboring towns to create a larger, contiguous servicearea that may be big enough to attract new, hungry bidders.
5. Work with your current vendors to identify cost savingsA vendor�s front-line collection workers may know more about routeinefficiencies than any consultant might find. Remember, lower prices need notmean lower profits for vendors if you provide an incentive for vendors to reducecosts.
6. Go for easy weight firstNew Jersey has mandated recycling for more than a decade, and some of thestate�s mature programs are facing a new challenge. As manufacturers reducethe weight of packaging (called �light weighting�) and plastic containers continueto replace glass and aluminum, some programs are starting to see recyclingtonnages decline. With many fixed recycling costs in place, this translates tohigher per-ton recycling collection and processing costs.
To reach the state�s ambitious recycling goals and reduce average costs, thebest counter strategy to light weighting may be to re-examine the waste eachhousehold produces. Where are the biggest opportunities today to reduce garbagetonnage and increase recycling? For most mature programs with highparticipation among the basic recycling commodities, that answer may be inyard waste, food waste and mixed paper. Although percentages will vary fordifferent communities, paper, cardboard, yard waste and food can exceed 50%of the average household�s weight. With the demographic shift toward home-based offices, mixed paper may grow as a percentage of the waste stream, addingmaterial that will counter the trend toward light weighting.
Notes:
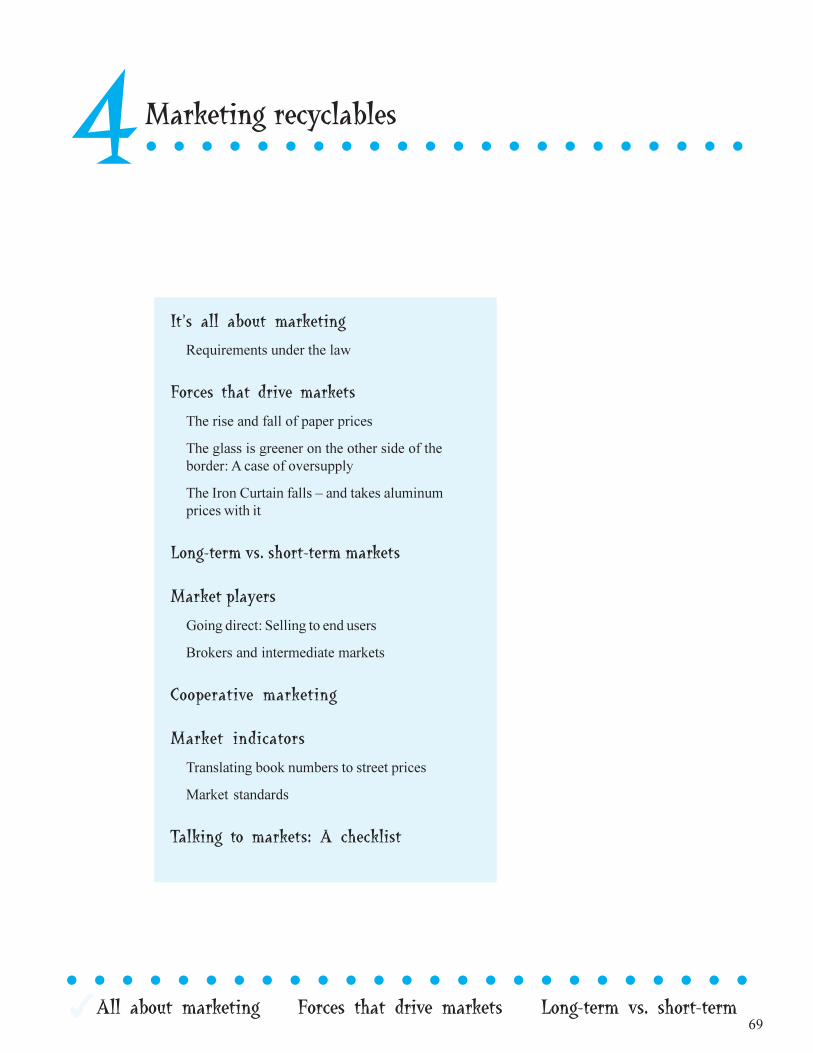
69 All about marketing Forces that drive markets Long-term vs. short-terml l l l l l l l l l l l l l l l l l l l l l l l l
Marketing recyclablesl l l l l l l l l l l l l l l l l l l l l l
It�s all about marketing
Requirements under the law
Forces that drive markets
The rise and fall of paper prices
The glass is greener on the other side of theborder: A case of oversupply
The Iron Curtain falls � and takes aluminumprices with it
Long-term vs. short-term markets
Market players
Going direct: Selling to end users
Brokers and intermediate markets
Cooperative marketing
Market indicators
Translating book numbers to street prices
Market standards
Talking to markets: A checklist
4
70 All about marketing Forces that drive markets Long-term vs. short-terml l l l l l l l l l l l l l l l l l l l l l l l l
It�s all about marketingRegardless of how recyclables are collected, if you don�t have a market foryour materials, your recycling program is literally going nowhere. Recyclingsimply cannot and does not happen without markets. In fact, without willingbuyers for recyclables, you�re essentially still collecting garbage.
A willing buyer, however, may not translate to a positive sale price. Marketsfor recycled materials are notoriously volatile, and prices often turn negative.Paying to �sell� your materials does not mean recycling is no longer cost-effective. After all, the average New Jersey generator still pays more than $50per ton to �sell� its garbage to a transfer station, landfill or incinerator. In bothstrong and weak markets, however, it always pays to be a smart seller. Therefore,the purpose of this chapter is to help recycling coordinators find the best priceand the best terms for sale of their recycled materials.
Requirements under the lawAmendments in 1993 to the �New Jersey Statewide Mandatory Source Separationand Recycling Act� included important changes that directly affect the economicsof recycling.
1. Recycling targets were increased from 25% to 50% of municipalsolid waste, and to 60% of the total solid waste stream.
2. The amendment dropped a provision that required municipalities torecycle a designated material only if the cost of recycling it did notexceed the cost of disposing of it as garbage. That rule had helpedprotect recycling programs against drastic declines in market pricesfor recyclables. With that change, New Jersey�s recycling policyacknowledges that sometimes recycling may indeed be moreexpensive than garbage disposal. The state adopted this policy changeto acknowledge that the full economic and environmental benefitsof recycling � and the corresponding full costs of landfilling orincineration � may not be factored into current market prices.
Marketing by the bookWhat exactly is a market? In New Jersey, the legal definition of a market,for recycling purposes, is �the disposition of designated recyclable materials.�And disposition is legally defined as �the transportation, placement, re-use,sale, donation, transfer or temporary storage for a period not exceeding sixmonths of designated recyclable materials for all possible uses except fordisposal as solid waste.� Both definitions are included in N.J.S.A. 13:1E-99.12, which governs mandatory recycling in New Jersey.
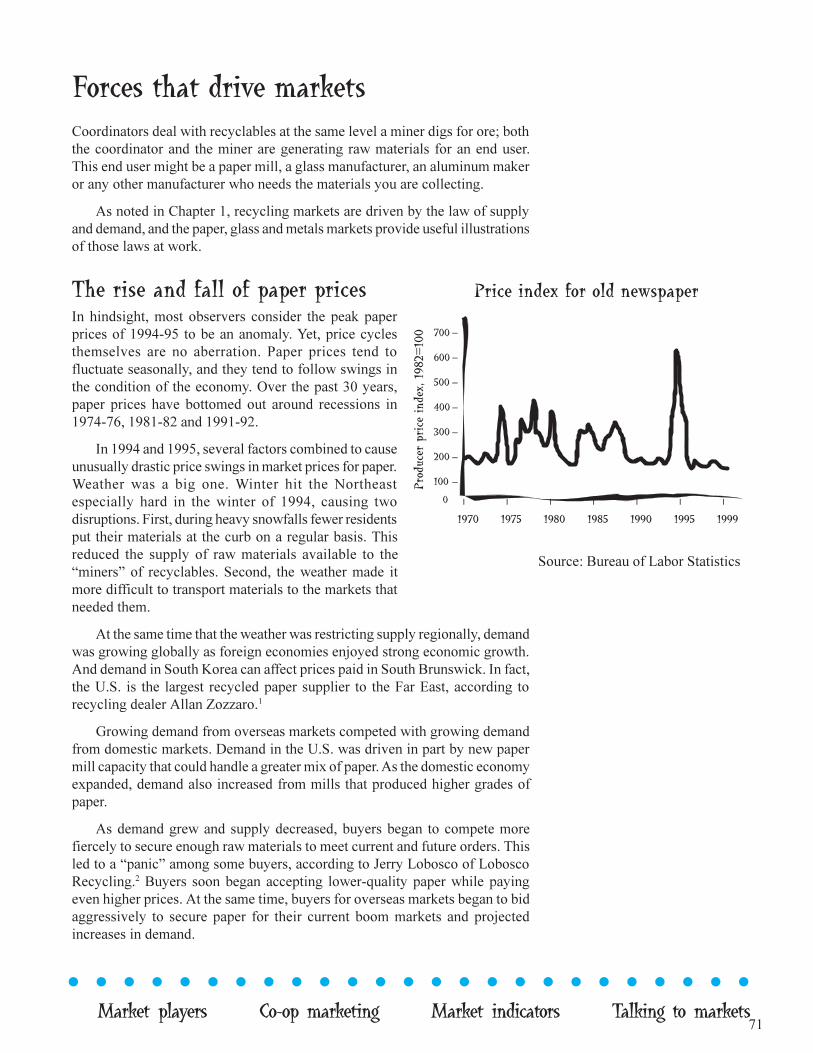
71
l l l l l l l l l l l l l l l l l l l l l l l l l
Market players Co-op marketing Market indicators Talking to markets
Forces that drive marketsCoordinators deal with recyclables at the same level a miner digs for ore; boththe coordinator and the miner are generating raw materials for an end user.This end user might be a paper mill, a glass manufacturer, an aluminum makeror any other manufacturer who needs the materials you are collecting.
As noted in Chapter 1, recycling markets are driven by the law of supplyand demand, and the paper, glass and metals markets provide useful illustrationsof those laws at work.
The rise and fall of paper pricesIn hindsight, most observers consider the peak paperprices of 1994-95 to be an anomaly. Yet, price cyclesthemselves are no aberration. Paper prices tend tofluctuate seasonally, and they tend to follow swings inthe condition of the economy. Over the past 30 years,paper prices have bottomed out around recessions in1974-76, 1981-82 and 1991-92.
In 1994 and 1995, several factors combined to causeunusually drastic price swings in market prices for paper.Weather was a big one. Winter hit the Northeastespecially hard in the winter of 1994, causing twodisruptions. First, during heavy snowfalls fewer residentsput their materials at the curb on a regular basis. Thisreduced the supply of raw materials available to the�miners� of recyclables. Second, the weather made itmore difficult to transport materials to the markets thatneeded them.
At the same time that the weather was restricting supply regionally, demandwas growing globally as foreign economies enjoyed strong economic growth.And demand in South Korea can affect prices paid in South Brunswick. In fact,the U.S. is the largest recycled paper supplier to the Far East, according torecycling dealer Allan Zozzaro.1
Growing demand from overseas markets competed with growing demandfrom domestic markets. Demand in the U.S. was driven in part by new papermill capacity that could handle a greater mix of paper. As the domestic economyexpanded, demand also increased from mills that produced higher grades ofpaper.
As demand grew and supply decreased, buyers began to compete morefiercely to secure enough raw materials to meet current and future orders. Thisled to a �panic� among some buyers, according to Jerry Lobosco of LoboscoRecycling.2 Buyers soon began accepting lower-quality paper while payingeven higher prices. At the same time, buyers for overseas markets began to bidaggressively to secure paper for their current boom markets and projectedincreases in demand.
Source: Bureau of Labor Statistics
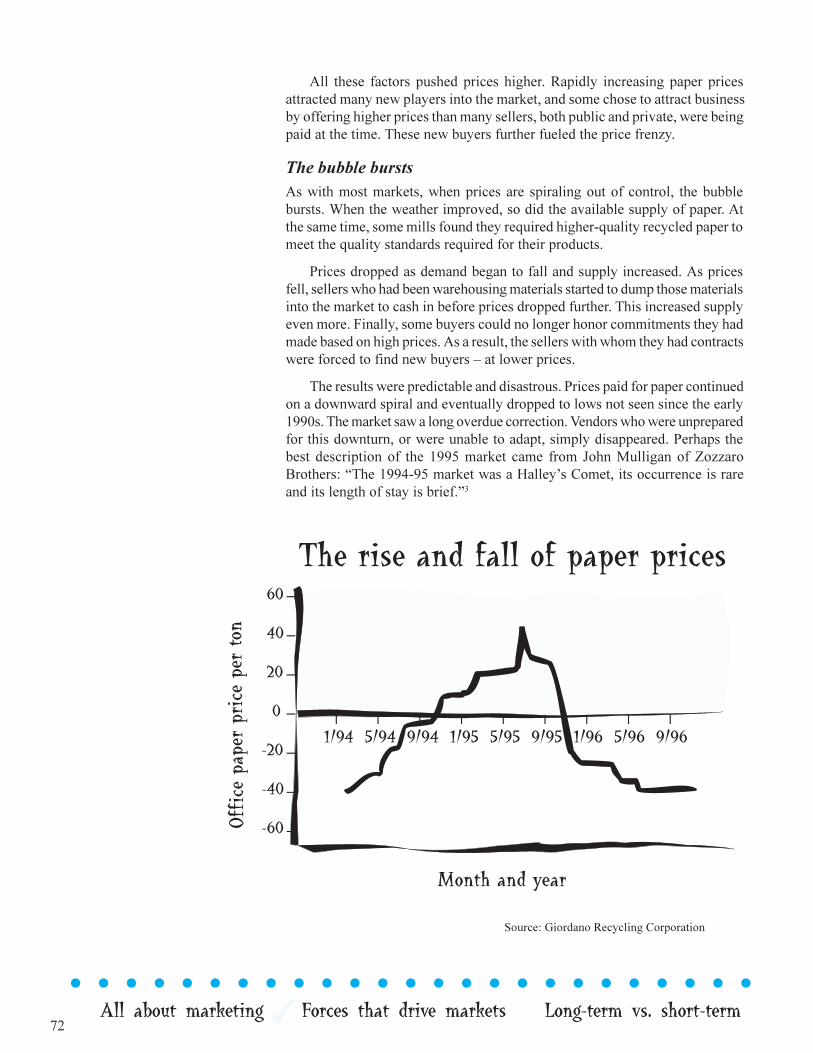
72 All about marketing Forces that drive markets Long-term vs. short-terml l l l l l l l l l l l l l l l l l l l l l l l l
All these factors pushed prices higher. Rapidly increasing paper pricesattracted many new players into the market, and some chose to attract businessby offering higher prices than many sellers, both public and private, were beingpaid at the time. These new buyers further fueled the price frenzy.
The bubble burstsAs with most markets, when prices are spiraling out of control, the bubblebursts. When the weather improved, so did the available supply of paper. Atthe same time, some mills found they required higher-quality recycled paper tomeet the quality standards required for their products.
Prices dropped as demand began to fall and supply increased. As pricesfell, sellers who had been warehousing materials started to dump those materialsinto the market to cash in before prices dropped further. This increased supplyeven more. Finally, some buyers could no longer honor commitments they hadmade based on high prices. As a result, the sellers with whom they had contractswere forced to find new buyers � at lower prices.
The results were predictable and disastrous. Prices paid for paper continuedon a downward spiral and eventually dropped to lows not seen since the early1990s. The market saw a long overdue correction. Vendors who were unpreparedfor this downturn, or were unable to adapt, simply disappeared. Perhaps thebest description of the 1995 market came from John Mulligan of ZozzaroBrothers: �The 1994-95 market was a Halley�s Comet, its occurrence is rareand its length of stay is brief.�3
Source: Giordano Recycling Corporation
73
l l l l l l l l l l l l l l l l l l l l l l l l l
Market players Co-op marketing Market indicators Talking to markets
The glass is greener on the other side of the border:A case of oversupplyGreen glass provides an example of the supply curve at work. According to a1993 study by the Northeast Recycling Council, the sale of green glass posed alarge problem for many municipal and county programs. NERC, at the requestof several of its member states, found that the cause was relatively simple, eventhough finding a solution has been a bit more complicated.
The problem stems from a �regional imbalance between the supply of greenglass containers recovered from the waste stream and the demand for greencullet from domestic glass manufacturers,� according to the NERC study.4 Greenglass is most heavily used in the production of beer and wine from WesternEurope and Canada. Therefore, the U.S. imports more green bottles thandomestic glass producers want to buy here. This historical oversupply keepsconstant downward price pressure on that particular commodity.
The Iron Curtain falls �and takes aluminum prices with itMetal recycling, too, has suffered from oversupply. For example, primaryaluminum is made from alumina extracted from bauxite ore, and some of thelargest concentrations of bauxite are found in the republics of the former SovietUnion. Since the early 1990s, some former Soviet republics, in dire need ofhard currency to shore up their troubled economies, have sold large supplies ofbauxite in international metals markets. As bauxite prices fell, it became cheaperto manufacture primary aluminum. And since primary aluminum competes withrecycled aluminum, falling prices for primary materials caused falling pricesfor used beverage containers.
The paper, green glass and aluminum examples show the diverse forcesthat drive markets for recyclable materials. Those forces include the overallstate of the national, regional and global economies, weather, number of buyersand sellers, technology, as well as some less tangible variables, such as currentand future expectations of players in the market.
74 All about marketing Forces that drive markets Long-term vs. short-terml l l l l l l l l l l l l l l l l l l l l l l l l
Long-term vs. short-term marketsThe primary difference between a long-term and a short-term market is, notsurprisingly, time. A long-term market agreement is generally one that lasts atleast a year and involves the use of a single vendor or a single group of vendors.A short-term market is generally a market agreement that lasts less than a year,and it involves more frequent movement between vendors, according to BruceLogan of Giordano Recycling Corporation.5
The advantages of �playing� the short-term market are not much differentthan they would be if you actively manage any of your personal investments. Ina short-term market, you maintain the ability to move between multiple brokersor market outlets. If one buyer is unable to accept your material, you can switchto another buyer. (This is similar to having a diversified investment portfolio).In order to play the short-term market to its best advantage, you must be able tocontinually track the market forces and trends affecting your commodity. Thatis one of the crucial roles commodity brokers play in the marketplace.
Market playersWhether using a long or short-term market, remember that successful marketingmeans recyclables can be moved to the end user in both good times and bad.
In developing a market, you may be developing a relationship with one ormore of these key players:
• end users (mill, foundry, glass or plastic plant, etc.)
• intermediate markets (companies that consolidate the material and�upgrade� or �improve� it for use by the end user)
• brokers (companies that usually act as liaisons and set up dealsbetween the producers of the material and the end users)
With all three groups, you are attempting to develop a partnership thatachieves three primary objectives:
• maximizing the price received for material, along with any value-added services the buyer might provide, such as report writing,training or storage equipment
• guaranteeing that the material can be moved to market in good andbad economic times
• moving material to market at the lowest possible cost
l l l l l l l l l l l l l l l l l l l l l l l l l
75
l l l l l l l l l l l l l l l l l l l l l l l l l
Market players Co-op marketing Market indicators Talking to markets
Going direct: Selling to end usersIf you are dealing directly with an end user, such as a mill orfoundry, you may be affected by facility shutdowns for routinemaintenance or seasonal production schedules. In addition,your product may be held to a higher standard for purity. Youmay also be required to develop your own truckingarrangements because the mill may rely on you fortransportation.
Providing transportation can be both time-consuming andtroublesome, according to Brian Lefke, director of solid wastefor the Atlantic County Utilities Authority, who markets awide range of ACUA recyclables. Truckers often work formultiple mills, so they may have incentives to �spy� on yourmarket arrangements, including the prices you receive andthe terms of your deal.6 That information is highly valuableto buyers in any market, so guard it closely. Before you decideto sell �mill direct,� be sure to research the history of thefirm, its financial stability and its reputation in the industry.(See the checklist on page 100 of Chapter 5 on how to researcha company).
Brokers and intermediate marketsIf you choose to sell to an intermediate market or a broker,you�re going to rely on their research to buffer you fromrapid changes in the markets. You will also rely on theirrelationships with various end users to help you maximize your product pricingand to move material in depressed markets.
Brokers and intermediate markets provide some similar functions. Forexample, both usually arrange for the transportation of your material, savingyou from developing separate relationships with trucking companies.
But there are important differences. An intermediate market usually takesownership of the material (a.k.a. �takes title�) and often upgrades its quality tostandards demanded by a broader range of end users. Because intermediatemarkets can combine recyclables with materials from other programs, they maybe more flexible about the level of contamination they will permit. By providingmore flexibility with quality standards, these markets give you the greatest levelof protection in bad economic times.
Brokers typically do not take title to materials. Instead, they usually findbuyers willing to take it in the form you provide.
Should you go direct?The advantages in dealing with an end-userdirectly generally include:
• receiving the highest price possiblefor the material
• avoiding the need for multiplecontracts with multiple parties
The disadvantages include:
• typically having to arrange shippingon your own
• being subject to facility downtimes
• being tied to the fortunes of a singlemill or company
• risk of industrial spying fromtransportation firms used bycompeting mills
Source: Brian Lefke
76 All about marketing Forces that drive markets Long-term vs. short-terml l l l l l l l l l l l l l l l l l l l l l l l l
Before considering the type of market to use, or whether to serve as yourown broker, first identify how much material you can supply. A small communitygenerating a limited amount of recyclables should expect to have less flexibilitythan a large generator.
Most municipalities don�t generate enough material to have much impacton the markets. For example, according to the NJDEP, slightly more than 42%of the 7.85 million tons of municipal solid waste generated in the state eachyear is being recycled. This means that some 3.3 million tons of raw materialare being returned to the market. A program that produces 5,000 tons of materialannually accounts for only .15% of the material being returned for remanufacture.
Working with brokers or intermediate marketsAdvantages to using an intermediate market or brokerare:
• the ability to blend materials with others ofhigher quality, thus avoiding rejection of yourload
• developing a series of outlets that helps tomitigate against downturns in the economy ormill shutdowns
• providing transportation
Disadvantages include:
• lower prices paid for your materials
• relying on the relationships of the broker withthe end user rather than your own directrelationship with the ultimate buyer of yourmaterials
77
l l l l l l l l l l l l l l l l l l l l l l l l l
Market players Co-op marketing Market indicators Talking to markets
Cooperative marketingThe issue of selling power in the market is a prime motivator for cooperativemarketing. Similar to the concept of group purchasing agreements, cooperativemarketing combines material collected in neighboring communities to createone larger supplier that commands the collective selling power of its membercommunities.
The best examples of cooperative marketing are in counties where marketingresponsibility is borne at the same level. At the time of this publication, thesecounties included:
• Atlantic (for most municipalities) • Burlington (all)• Cumberland (all) • Hunterdon (some)• Mercer (some) • Middlesex (some)• Morris (some) • Somerset (all)• Union (some) • Sussex (some)
To successfully implement a cooperative marketing program, municipalitiesneed a high degree of coordination.
· Collection programs and material qualityMembers must agree on materials to be collected as well as qualitystandards and market specifications.
· StorageWhere there is a need for temporary storage of material, membersneed to coordinate logistics to minimize transportation impacts tothe final destination.
· TransportationA coordinated collection and transportation schedule needs to bedeveloped.
· MarketsA coordinated contract needs to be developed between themunicipalities and the markets selected.
· Revenue sharingAn equitable formula for revenue sharing (and cost sharing innegative markets) needs to be developed.
· CoordinatorThere should be a single party responsible for the administration ofthe terms of the coordinated agreement.
l l l l l l l l l l l l l l l l l l l l l l l l l
78 All about marketing Forces that drive markets Long-term vs. short-terml l l l l l l l l l l l l l l l l l l l l l l l l
Market indicatorsAll smart sellers need to know the going price for their wares. For recycledmaterials, specific prices for various commodities and market specificationsare listed in trade publications. The greatest number of indicators are publishedabout paper, but many publications deal with the other commodities as well.The following are some of the most common resources:
The Yellow Sheet, Official Board Markets (paper only)
The Fibre Market News (paper only)
Waste News (all commodities)
The Paper Stock Report (paper only)
Recycling Markets (all commodities)
Translating book numbers to street pricesThe primary problem with market indicators is just that: they are only indicators.Publications are not intended to provide an absolute price list for the commoditycovered. Because of the varied nature of these publications, translating a marketindicator price into a fair market price can be confusing.
To better understand how these pricing indicators work, examine the excerptfrom The Paper Stock Report. The sheet lists the common grades of paper andthe prices currently being paid for that grade. The two primary questions thenare:
What do the grades of paper mean?
What price is being paid to whom?
The grade of paper is the most important factor used to determine price.The grades of paper are defined in excerpts from the PSI specifications inAppendix B.
Once you determine the grade of paper, volume becomes the next importantvariable affecting price. As a seller of recyclables, you are a supplier of rawmaterials. The more raw material any seller can provide, the fewer suppliers anend user or an intermediate market will require to meet its raw material needs.If you have enough material to provide directly to a mill, you are more likely tobe paid at a rate closer to the full mill buying price.
Therefore, successful marketing starts by understanding exactly what youhave to sell and then determining how much you can offer to buyers. Workingwith that information, sources like The Paper Stock Report can be useful pricingguides. They can reflect either the full retail price that a mill is willing to payfor each grade of paper or dealer prices, or both. To be considered �mill ready,�the paper must meet the quality standards of the mill for the grade of paper inquestion. You can consider �mill ready� to mean that the mixtures of paper (theraw material) for sale can be added directly into the paper making process as itis received at the mill, without requiring further processing. Mill-ready paper

79
l l l l l l l l l l l l l l l l l l l l l l l l l
Market players Co-op marketing Market indicators Talking to markets
Reprinted by permission.
80 All about marketing Forces that drive markets Long-term vs. short-terml l l l l l l l l l l l l l l l l l l l l l l l l
l l l l l l l must contain few contaminants, or prohibitives. Because mill-ready paper mustmeet tight quality standards, buyers usually are willing to pay the �highest�available price for this �pure� raw material.
Given these variables affecting the final selling price, market indicators arebest used as a baseline for contracts to sell recyclables. The actual price youreceive may be lower than the published price, but your price will move up ordown as a percentage of that market indicator price.
Market standardsSelling recyclables isn�t just about price and quantity. Quality is just as critical.There are a number of ways that material can be rendered useless. By far themost common is to deliver recyclables with contaminant levels that make materialuneconomical, or unfeasible, for use in the manufacturing process.
To research quality specifications for your materials, you can consult thePSI specification book, also known as the ISRI Scrap Specifications Circular,from the Institute of Scrap Recycling Industries. This publication includes adescription of each material as well as detail on applicable quality standards.(See Appendix A for information on obtaining this circular.)
Why not go direct?If you generate enough material and you havethe cash to invest in processing equipment, whynot simply bypass the intermediate processor andsell upgraded materials directly to end users?
Selling directly to end-users is not just aquestion of quality grades and volume. Sellingdirect requires that you study markets constantly,and it requires pockets deep enough to keep yourprocessing operation afloat when markets headsouth.
Negative markets are typically short-termevents, according to veteran buyers AllanZozzaro and Jerry Lobasco, whose companieshave seen 96 years of price movements. Neitherbuyer recalls a negative market lasting for morethan three years since their companies have beenin business. Nonetheless, as a processor, you stillneed to be able to survive for three years.
81
Talking to markets: A checklistThe following checklist for surveying potential buyers of recyclables is adaptedfrom The International City/County Management Association�s reportMarketing Recyclables.7
o contact information (name of buyer and firm, location, phone, fax,e-mail and website)
o type of market (broker, processor or end-user)
o types of material purchased
o specifications for each material, including listing of contaminants,acceptable contamination levels, and the physical form required(baled, loose, compacted)
o shipping requirements, including minimum and maximum size ofloads, method of delivery, capacity, and any distance restrictions
o availability of transportation assistance
o procedures for determining weights and contamination levels
o price and payment schedules, including any pricing tied to a marketindicator
o availability of long-term contract
o number of years in business
o references
l l l l l l l l l l l l l l l l l l l l l l l l l
Market players Co-op marketing Market indicators Talking to markets
Notes:
82 All about marketing Forces that drive markets Long-term vs. short-terml l l l l l l l l l l l l l l l l l l l l l l l l
Notes:
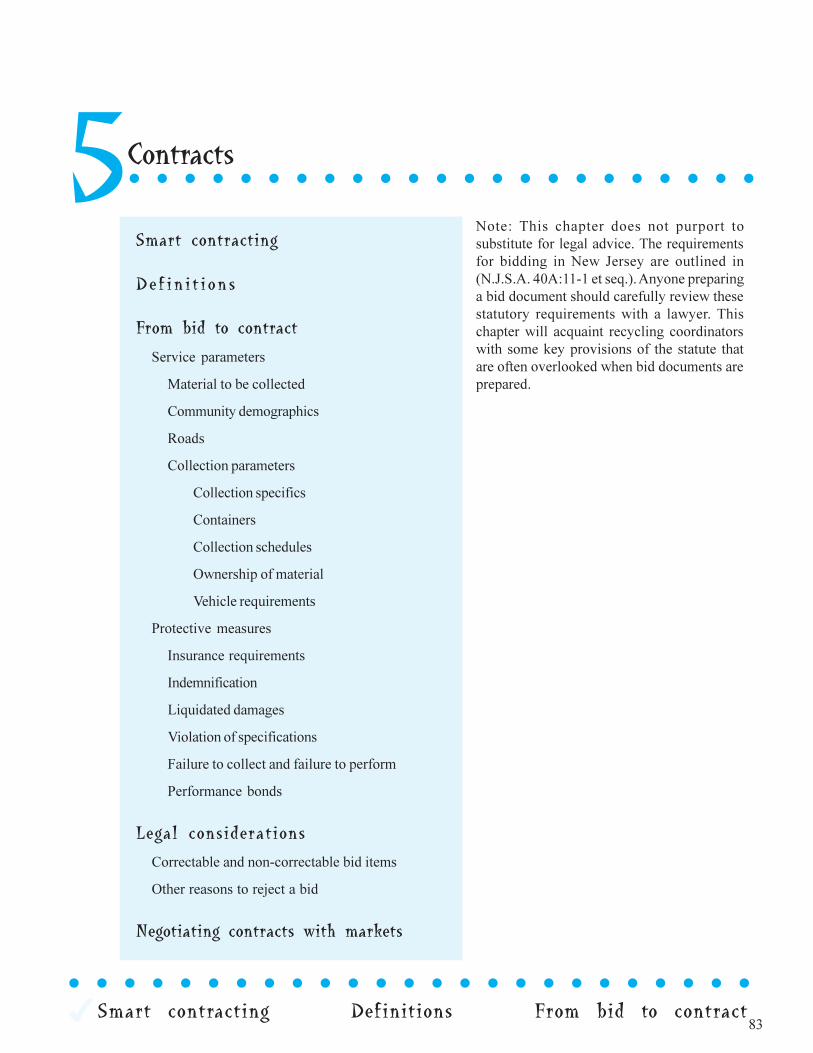
83Smart contracting Definitions From bid to contract
l l l l l l l l l l l l l l l l l l l l l l l l l
Contractsl l l l l l l l l l l l l l l l l l l l l l l
Smart contracting
Def in i t i ons
From bid to contract
Service parameters
Material to be collected
Community demographics
Roads
Collection parameters
Collection specifics
Containers
Collection schedules
Ownership of material
Vehicle requirements
Protective measures
Insurance requirements
Indemnification
Liquidated damages
Violation of specifications
Failure to collect and failure to perform
Performance bonds
Legal considerations
Correctable and non-correctable bid items
Other reasons to reject a bid
Negotiating contracts with markets
5Note: This chapter does not purport tosubstitute for legal advice. The requirementsfor bidding in New Jersey are outlined in(N.J.S.A. 40A:11-1 et seq.). Anyone preparinga bid document should carefully review thesestatutory requirements with a lawyer. Thischapter will acquaint recycling coordinatorswith some key provisions of the statute thatare often overlooked when bid documents areprepared.
84Smart contracting Definitions From bid to contract
l l l l l l l l l l l l l l l l l l l l l l l l l
Smart contractingIn-house or outsource? That�s a cost question many program managers ask.Should you use your own staff and equipment to collect recyclables or shouldyou contract for those services? If you choose to outsource collection, you shouldmaster the practical and legal requirements of the bidding process. Both thelanguage of the contract and the bid process itself must be clear and specific tominimize misunderstandings that can cause delays, increase costs and invitelegal challenges.
For municipalities contracting for recycling collection, your legal guide isthe Local Public Contracts Law (N.J.S.A. 40A -11.1 et seq.). And if recyclingcollection is coupled with a solid waste collection contract, bid specificationsmust also conform with (N.J.A.C. 7:26H - 6.1 et seq.); the Uniform BidSpecifications for Solid Waste Collection.
Thus, if you go the outsourcing route for collection, you have two importantresponsibilities:
1. developing bid specifications
2. writing a contract that is fair to both parties
Legal requirements are different for marketing recyclables, but a similarquestion arises. Do you sell your materials yourself, or contract with a privatecompany? When selling recyclables, coordinators are not legally required to goout for public bid, and can negotiate directly with a buyer. Public bidding isrequired, however, if marketing is combined with collection service. And ifyou choose to solicit public bids to sell recyclables, the process must meet therequirements of the Local Public Contracts law, as explained in Who has to bidwhat?
Who has to bid what?The following guidelines can help public sector recycling coordinators determine which projectsmust follow the requirements of the Local Public Contracts Law; (N.J.S.A. 40A-11.1 et seq.),or The Uniform Solid Waste Collection Bid Specifications; (N.J.A.C 7:26H-6.1 et seq.), orboth.
• If you are bidding for recycling collection and marketing, the bid must conform tothe requirements of the Local Public Contracts Law.
• If you contract only to sell recyclables, you may negotiate directly with a buyer,and don�t need to go out to bid.
• If you choose to publicly solicit bids for buyers of recyclables, you must follow therequirements of the Local Public Contracts Law.
• If you are bidding for recycling collection and garbage collection combined, youmust follow the requirements of the Local Public Contracts Law and the UniformSolid Waste Collection Bid Specifications.
l l l l l l l
85
l l l l l l l l l l l l l l l l l l l l l l l l l
Legal considerations Negotiating contracts with markets
DefinitionsA bid is defined in Barron�s Law Dictionary as �...an offer ...to buy goods orservices at a stated price...� It is the promises made by a service provider thatwants to perform work for another party. First, you define the promises in thebid, then you clearly state them in the contract. Contract disputes often arisebecause two parties have different understandings of the promises upon whichthey base their assumptions.
Barron�s defines a contract as �a promise, or set of promises, for breach ofwhich the law gives a remedy, or the performance of which the law in some wayrecognizes as a duty.� Contracts for collection and marketing of recyclables areoften referred to as �bilateral contracts,� which Barron�s defines as contracts�in which there are mutual promises between two parties to the contract, eachparty being both a promiser and a promisee.�1
In practical language, a contract is the written terms of a promise, and ithelps ensure that both parties keep to their bargain. A good contract must gofurther, advises attorney Joseph Maraziti, Jr. �A good contract is one wheremost of the terms are self-enforced. When one party has a question, that partycan go to the contract and review the terms. The paper often ends the disagreementsince the parties can see the terms, and thus, the confusion is cleared upimmediately.�2
From bid to contractIn addition to meeting the legal requirements of the Local Public ContractsLaw, all contracts should contain two practical elements:
1. service parameters
2. protective measures
Service parametersService parameters define the scope of work expected from the contractor. Theyalso provide standards to measure a contractor�s performance. Because bidspecifications usually become part of the final contract, service parameters arethe heart of your bid.
You can help develop accurate service parameters by giving bidders completeand accurate data about your community and your solid waste managementprogram. The time you invest in data collection can save you money in thecontract price because it reduces guesswork by the bidders. When bidders areforced to guess, they often estimate costs on the high side to ensure they canservice your contract profitably. By providing complete information on thequestions below, you�ll reduce those margins of error.
l l l l l l l l l l l l l l l l l l l l l l l l l
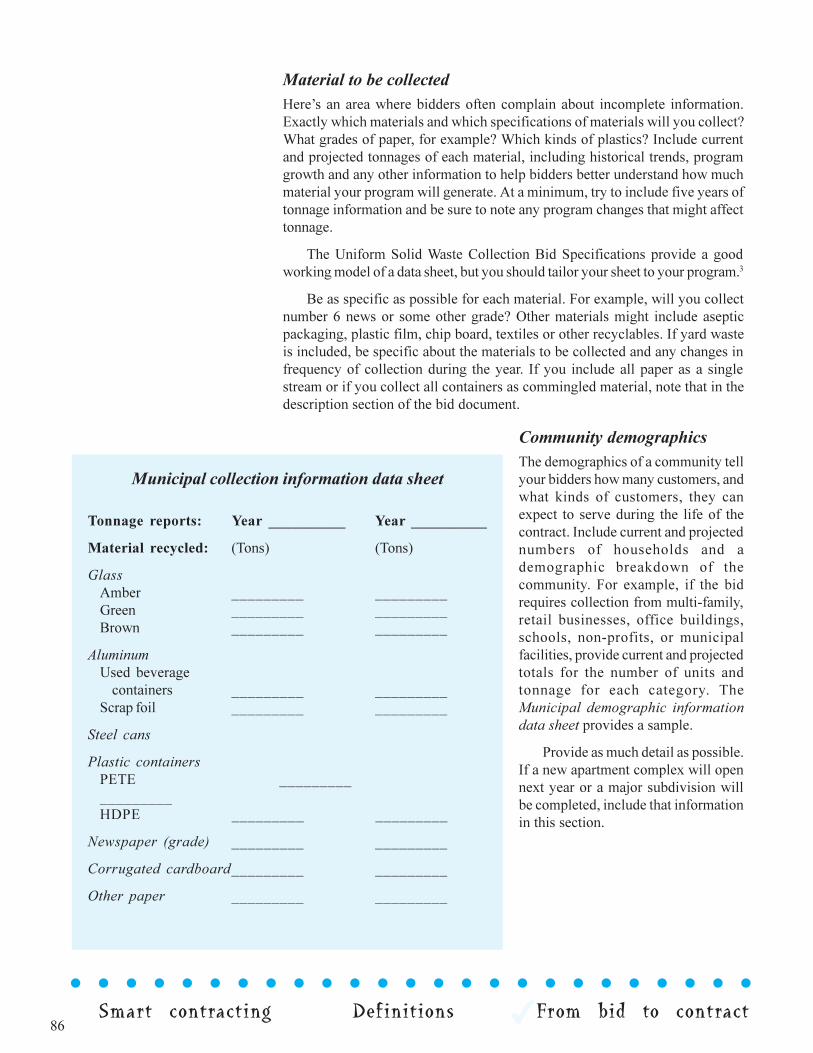
86Smart contracting Definitions From bid to contract
l l l l l l l l l l l l l l l l l l l l l l l l l
Material to be collectedHere�s an area where bidders often complain about incomplete information.Exactly which materials and which specifications of materials will you collect?What grades of paper, for example? Which kinds of plastics? Include currentand projected tonnages of each material, including historical trends, programgrowth and any other information to help bidders better understand how muchmaterial your program will generate. At a minimum, try to include five years oftonnage information and be sure to note any program changes that might affecttonnage.
The Uniform Solid Waste Collection Bid Specifications provide a goodworking model of a data sheet, but you should tailor your sheet to your program.3
Be as specific as possible for each material. For example, will you collectnumber 6 news or some other grade? Other materials might include asepticpackaging, plastic film, chip board, textiles or other recyclables. If yard wasteis included, be specific about the materials to be collected and any changes infrequency of collection during the year. If you include all paper as a singlestream or if you collect all containers as commingled material, note that in thedescription section of the bid document.
Community demographicsThe demographics of a community tellyour bidders how many customers, andwhat kinds of customers, they canexpect to serve during the life of thecontract. Include current and projectednumbers of households and ademographic breakdown of thecommunity. For example, if the bidrequires collection from multi-family,retail businesses, office buildings,schools, non-profits, or municipalfacilities, provide current and projectedtotals for the number of units andtonnage for each category. TheMunicipal demographic informationdata sheet provides a sample.
Provide as much detail as possible.If a new apartment complex will opennext year or a major subdivision willbe completed, include that informationin this section.
Municipal collection information data sheet
Tonnage reports: Year __________ Year __________
Material recycled: (Tons) (Tons)
GlassAmber _________ _________Green _________ _________Brown _________ _________
AluminumUsed beverage containers _________ _________Scrap foil _________ _________
Steel cans
Plastic containersPETE __________________HDPE _________ _________
Newspaper (grade) _________ _________
Corrugated cardboard_________ _________
Other paper _________ _________
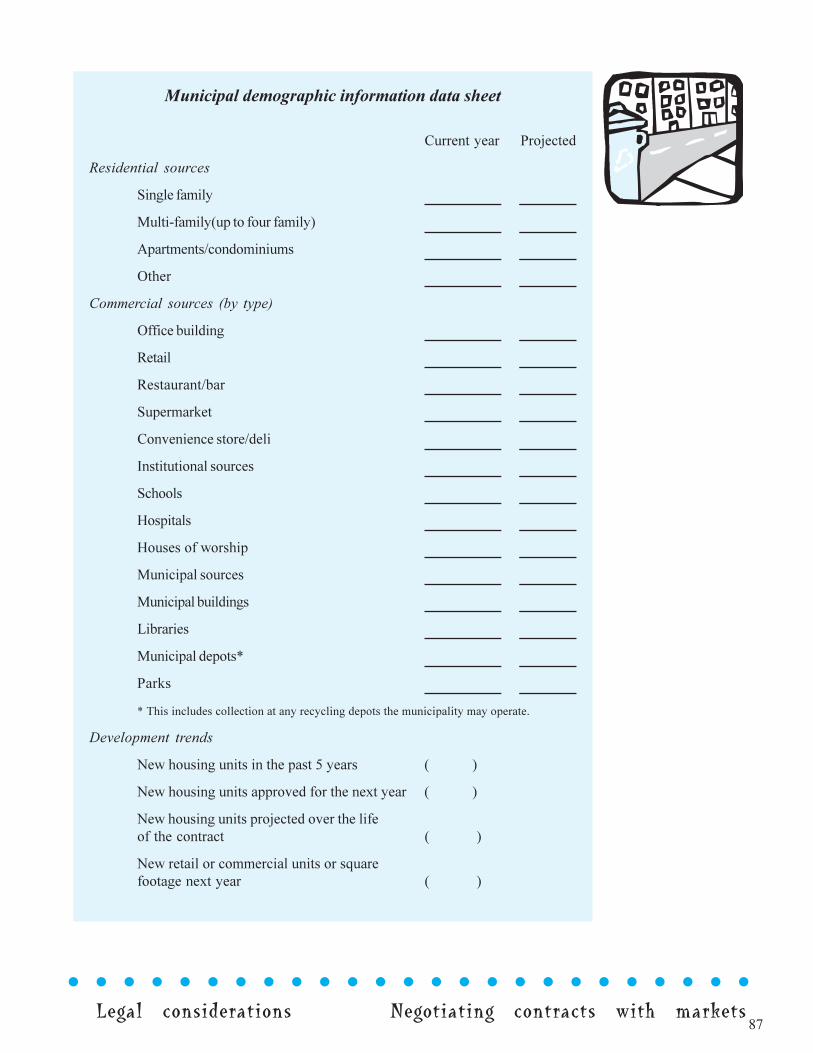
87
l l l l l l l l l l l l l l l l l l l l l l l l l
Legal considerations Negotiating contracts with markets
Municipal demographic information data sheet
Current year Projected
Residential sources
Single family
Multi-family(up to four family)
Apartments/condominiums
Other
Commercial sources (by type)
Office building
Retail
Restaurant/bar
Supermarket
Convenience store/deli
Institutional sources
Schools
Hospitals
Houses of worship
Municipal sources
Municipal buildings
Libraries
Municipal depots*
Parks
* This includes collection at any recycling depots the municipality may operate.
Development trends
New housing units in the past 5 years ( )
New housing units approved for the next year ( )
New housing units projected over the lifeof the contract ( )
New retail or commercial units or squarefootage next year ( )
88Smart contracting Definitions From bid to contract
l l l l l l l l l l l l l l l l l l l l l l l l l
l l l l l l l l l l l l l l l l l l l l l l l l l
RoadsProvide the latest road map with the bid specifications. If you have establishedcollection zones, include them on the map as well. Be sure to highlight anyimportant constraints, such as one-way streets, narrow or restricted roads, lowbridges, weight limits and other traffic or road conditions that might affectcollection efficiency.
Collection parametersConsider the exact level of service you want. But be mindful of what you askfor, because you can expect your bill to increase as your requirements increase.
To avoid �sticker shock,� begin planning the bid at least six months beforeyou expect to put the specifications out for consideration. Allot even more timeif you�re going to bid a service for the first time, or if you�re making substantivechanges to your existing program. Six months lead time gives you a number ofadvantages.
1. You have time to review your existing service parameters and determinewhether you need to provide the same level of service in the future.
2. You have time to prepare an in-house estimate of the service you�rerequesting. This is a valuable, but often ignored, exercise. An in-houseestimate can support the recommendations you make to community decisionmakers. It also gives you a benchmark to use if you decide to reject all bidsbecause their prices are too high.
3. Ample lead time for you helps provide sufficient lead time for the successfulbidder. A new contractor has enough start-up time to serve your community.Contractors need time to secure equipment and labor, survey routes andcoordinate with municipal staff collections. Aim to give the contractor aminimum of 30 days from the date of award to start up.
4. You have time to re-bid if necessary. If you reject all bids, you want to re-bid while you�re still operating under an existing contract. If you need toaward an emergency contract extension, your negotiating position couldbe painfully weak, and you could be forced to accept whatever chargesyour current contractor imposes. (The contractor�s costs may in fact behigher if his or her trucks and personnel are committed to other projects,which is common if the contractor does not participate in, or expect to win,the new bid process.)
Collection specificsThis section outlines the scope of work and level of service contractors willprovide. For example:
The Contractor shall provide recycling collection services for allresidential units within the municipality on a one (1) time per weekbasis.
The Contractor shall provide recycling collection services at allhouses of worship and small commercial businesses as noted.
Begin planning bidsat least six monthsbefore you expect toput specs out forconsideration
89
l l l l l l l l l l l l l l l l l l l l l l l l l
Legal considerations Negotiating contracts with markets
These two, brief sentences contain some critical terms. First, the term �shall�has a specific meaning in contracts. �Shall� is an absolute term. It allows nodebate about the scope of the work to be provided. In contrast, the term �may� ispermissive rather than absolute. Also, note that the number one is both writtenout and repeated as a number in parentheses. This redundant format helps avoidconfusion that can be caused by a typographical error.
The narrative should spell out specific service requirements. For example:
The Contractor shall provide recycling collection services at desig-nated municipal facilities and public properties as indicated on thefollowing pages and on the map on page xxx.
Be as specific as possible. If you require service at multiple locations, list eachone. If you want municipal facilities collected on a different schedule thanresidential collections, state that clearly. The narrative also should be preciseabout miscellaneous locations, such as parks, roadside stops or bins on streets.Include the number of containers at each stop and any collection schedulerequirements.
Avoid ambiguous language regarding the frequency of collection, such asMore frequent collections may be required. Vague language makes it difficultfor bidders to calculate an accurate cost, so they may be forced to guess high,which inflates your final price. This does not stop you from requiring morefrequent collections; simply explain clearly what you require. For example,seasonal populations may dictate twice per week collection between May 15and September 15 and once every two weeks in all other periods. Write thosedates and frequencies in your narrative.
ContainersWho will provide the containers for the curbside collection program? Whatsize, type and color will be provided? Do you require a specific logo? Howmany will you need and at what locations? What performance specifications(expected life, strength, weight, for example) will you require? What brandswill you accept? These are not simply questions of style. If the contractor providesthe containers, these are cost considerations, so your answers should be includedin your bid document.
In some cases, the responsibility may be split between the contractor andthe municipality. Municipalities often have recycling containers in stock forresidential units, but they may lack larger containers, such as roll offs anddumpsters, for multi-family or commercial units. If you do require these kindsof containers, include specific language about safety requirements, such as:
All recycling compactor boxes, dumpsters and roll off containersshall conform to New Jersey Department of Environmental Protec-tion and ANSI Z245.30, Safety Requirements for waste containersstandards and shall be maintained in conformance with the provi-sions of N.J.A.C. 7:26 et. seq.
l l l l l l l l l l l l l l l l l l l l l l l l l
90Smart contracting Definitions From bid to contract
l l l l l l l l l l l l l l l l l l l l l l l l l
Be careful about what you require in addition to safety requirements. Requiringnew containers at the start of the contract term will add to the cost of service.Requiring a specific type of container or requiring a painting schedule or even aspecific color may add to the price as well. Simply be aware that each requirementcan add to the bidder�s cost of operation, and in turn to your cost of service.
Because recycling contracts are bilateral agreements, the municipality alsomust agree to provide safe access to the facilities and containers being serviced.For example:
The Contractor will be provided with safe and reasonable access torecycling containers. The Contractor is not required to render serviceif the presence of any interference prevents access to a recyclingcontainer and/or poses a threat to the Contractor�s employees oragents. The Contractor shall collect all materials from containers assoon as possible, but no later than 24 hours after the problem thatprevented the pick-up is rectified.
Collection schedulesProvide bidders with specific requirements for collection operations. This sectionshould describe when the contractor may begin, or is required to begin, andwhen work must be completed. For example:
All collections as described in these specifications, shall be per-formed between the hours of 7:00 a.m. and 7:00 p.m. EST.
The times are up to you. However, you should note that if your recycling collectioncontract is not combined with solid waste collection, the successful bidder neednot be a licensed public utility. If you award the contract to a non-regulated,non-public utility company, the contractor is subject to local noise ordinances.Therefore, consult those ordinances when you develop your specifications.Conversely, any company that collects solid waste in New Jersey must be licensedaccording to statutes of the Board of Public Utilities and the Department ofEnvironmental Protection. If a company is regulated as a public utility, it is notsubject to municipal noise ordinances. However, it is still subject to the terms ofyour contract, so you can write those noise restrictions into your specifications.
Also be sure to include when collections will be performed. Is it limited toMonday through Friday, or are weekends okay? Include your holiday scheduleinstructions for making up collections missed because of holidays. These areimportant cost considerations. Will you allow the contractor to skip the holidaycollection and pick up on the next scheduled service day for that area? Or willyou require the contractor to collect from those units on the day before or afterthe holiday? Expect prior-day or next-day pick up to cost more because you areessentially requiring twice the work in a single day. The contractor has to pickup the regularly scheduled customers plus the holiday workload. That usuallymeans overtime bills, and it often requires extra equipment. Picking up extramaterials on the next scheduled service day should be less expensive becauseyou are requiring a lower level of service.
l l l l l l l l l l l l l l l l l l l l l l l l l
91
l l l l l l l l l l l l l l l l l l l l l l l l l
Legal considerations Negotiating contracts with markets
l l l l l l l l l l l l l l l l l l l l l l l l l
Ownership of materialWho owns the recyclables can affect what you pay to collect them. If you maintainownership, your collection contract needs to include transportation to the marketsyou select. Your bid specifications should require transporting materials topotential markets or require a per-mile charge for transport.
You also can choose to relinquish ownership of the material. This willsimplify the contract specifications, but also means giving up some control andall the potential value of the material recycled by your program. If you choosethis option, you should still maintain some level of oversight about how thecontractor markets your materials. No one wants headlines revealing that yourrecyclables are being landfilled! Consider inserting language that grants youapproval power over marketing, such as:
The Contractor shall take ownership of all recyclables collected fromthe municipality and shall be responsible for the marketing of thesematerials. Disposition of these materials must be at an approvedmarket or processing facility. An approved market or processingfacility shall be determined by the municipality in consultation withthe contractor. Approval shall not be unreasonably withheld.
Vehicle requirementsSafety, material protection and reasonable appearance are the critical issuesinvolving recycling vehicles.
Safety can be covered with language that ties vehicle maintenance to statutoryrequirements for trucks of the type being used. For example:
All vehicles shall be maintained in conformance with the require-ments of the New Jersey Department of Transportation and the NewJersey Department of Environmental Protection.
To protect the material being collected, consider requiring vehicles to be fullyenclosed.
All recycling collection vehicles shall be completely enclosed andshall be designed so as to prevent spillage of the recyclable materialthat is collected.
To protect against contractors that use dirty or noisy equipment, consider addingthe following language about maintenance requirements and customer complaints.
All vehicles shall be maintained in good working order and shall beconstructed, operated and maintained so as to reduce unnecessarynoise*, spillage, and odor. The Municipality shall have the right toinspect the vehicles at any time during the term of this contract, andthe Contractor shall comply with all reasonable requests relative tothe maintenance and repair of said vehicles.
92Smart contracting Definitions From bid to contract
l l l l l l l l l l l l l l l l l l l l l l l l l
The municipality may order any vehicle used in the performance ofthe contract out of service if the vehicle is not maintained in accor-dance with the requirements of these work specifications. In suchevent, the Contractor shall replace such vehicle, at its sole cost andexpense, with a vehicle satisfactory to the Municipality.
* �Unnecessary noise should be related to local noise ordinances.
This language places a reasonable cost burden on bidders with poorly maintainedor substandard equipment. Of course, these provisions must be administeredreasonably; they are not designed as tools of punishment during disagreementswith the contractor. The term �reasonable� is open to interpretation. In fact,that�s what courts often do. For the record, however, �unreasonable� is definedin Barron�s Law Dictionary as:
�arbitrary, capricious, absurd, immoderate, or exorbitant; notconformable to reason, irrational, beyond bounds of reason ormoderation.�
Protective measuresA good contract must do more than state services to be performed. Its must alsoprotect you from serious problems that may arise during the course of thecontract. Protective measures also can be cost-savers if they prevent problemsthat otherwise might have occurred. However, each level of protection can addto the cost of the service. Your goal is to strike a balance between cost andprotection. Consider the following protection items in developing yourspecifications.
Insurance requirementsThe question of insurance is not whether to have it, but how much is enough.Setting the requirement too high can hurt you in two ways. First, requiring highlevels of general liability insurance tends to limit the number of bidders. Smallcompanies may have difficulty securing more than $3 million in aggregateliability insurance, for example, and this could leave only larger organizationsto bid on your work. Second, your costs rise as your insurance requirementsrise simply because it costs more to get more.
So, how do you determine an insurance limit for a collection contract?Start by reviewing accident records of companies that have historically providedrecycling or solid waste collection in your municipality. If collection has beendone by a public agency, review the local accident history of the departmentthat did the work. Ask the key question: has there ever been an accident thatcaused more than $3 million in total general liability or $1 million in individualliability? If not, you may reasonably decide not to require higher levels.
The Uniform Bid Specifications for Solid Waste Collection limit how muchgeneral liability insurance you may require for solid waste collectionspecifications. The uniform bid law also sets limits for automobile liabilityinsurance ($500,000 for each person and $1 million per occurrence) and for
l l l l l l l l l l l l l l l l l l l l l l l l l
93
l l l l l l l l l l l l l l l l l l l l l l l l l
Legal considerations Negotiating contracts with markets
property damage ($1 million per occurrence). Although these limits do not legallyapply to contracts for collection of recyclables only, they can still serve asuseful guidelines when you consider the risk history of your community.
Finally, consider the risks associated with worker�s compensation insurance.The state law prohibits limits on worker�s compensation in solid wastespecifications. This is an important issue because solid waste and recyclingcollection have high rates of worker injuries compared to other occupations.
IndemnificationRegardless of your insurance protection, you and your organization always facethe risk of being sued by contractors, residents or markets. An indemnificationprovision can help protect you in those cases. The following example haslanguage that covers most contingencies.
The Contractor shall indemnify and hold harmless the municipalityfrom and against all claims, damages, losses, and expenses includingall reasonable expenses incurred by the municipality on any of theaforesaid claims that may result or arise directly or indirectly, fromor by reason of the performance of the Contract or from any act oromission by the Contractor, its agent, servants, employees or anysubcontractors and that results in any loss of life or property or inany injury or damage to persons or property.
Liquidated damagesLiquidated damages are a common source of contract disputes. To summarizethe Barron�s Law Dictionary definition, liquidated damages are �a reasonableestimation of the damages� that are �likely to actually result from� a breach ofcontract. By stating these amounts in the contract, both parties agree to set amaximum limit on the estimated cost of those damages. Be clear on one importantpoint: liquidated damages are not penalties. A penalty punishes a contractor forfailing to perform duties as required by contract, and New Jersey courts do notrecognize penalty provisions of contracts as enforceable. On the other hand,liquidated damages attempt to recover actual costs or economic harm causedby a contractor�s failure to perform contractual duties, and they are enforceable.Here�s an example of a liquidated damages provision:
If the contractor does not clean up spillage as required in thesespecifications, the work will be performed by municipal employees ora designated contractor. As a result, liquidated damages will beassessed against the Contractor in an amount equal to the cost ofmunicipal clean up, but in no event shall the damages be less than$100 per occurrence.
This is an assessment of damages incurred each time the contractor does notperform a specified function. The $100 figure is a cost estimate of workperformed, not a penalty for breach of contract. Similarly, you can includelanguage for failure to complete collection, or for improperly disposing materialbecause they cost your organization lost productivity, revenue or credibility.Missed collections can cause a flood of customer complaints or inquiries that
l l l l l l l l l l l l l l l l l l l l l l l l l
94Smart contracting Definitions From bid to contract
l l l l l l l l l l l l l l l l l l l l l l l l l
l l l l l l l l l l l l l l l l l l l l l l l l l
require staff attention, or they may require special pick-ups by your staff.Improper disposition may require investigation and enforcement time andpersonnel. The key is to estimate the economic damage associated with thoseactivities.
Conversely, language stating that the contractor �shall pay $1,000 to thetownship for each failed pick up� probably could not survive a legal test asliquidated damages. Using the term �payment� rather than �assessment ofdamages� is one indication that the amount may not be based on costs. If thereis no clear explanation of the harm created by missed collection and if the$1,000 amount is unrelated to the projected cost of that harm, the $1,000 wouldprobably be deemed a penalty, and therefore, unenforceable in court.
Violation of specificationsLiquidated damages cannot serve as a penalty, but contract writers have othertools to ensure that contractors perform work as promised. Consider includingthe following language, which establishes a severe potential and justifiableremedy for breach of contract.
Any violation of these specifications shall be sufficient cause for theimmediate cancellation of the contract by the municipality, who maythereupon employ the necessary labor to perform the work or re-advertise or relet the work, at the expense of the offending Contrac-tor and his sureties.
This is a serious step that should be reserved for major contract violations.Therefore, you should establish intermediate steps to be taken before claimingirrevocable violation of specifications. Complaints should be carefullydocumented.
Failure to collect and failure to performThese provisions provide some of those intermediate steps to correct contractorperformance that does not meet specifications. This language can cover mostproblems encountered during the performance of the contract. Here are twoexamples:
The Contractor shall report to the municipality within one (1) hourof the start of the collection day, all cases in which severe weatherconditions preclude the collection of designated recyclable materials.
The Contractor shall promptly and properly attend to all complaintsand all notices, directives and orders of the municipality withintwenty-four (24) hours of receipt of the same. The contractor shall berequired to maintain a log of all complaints received and the actiontaken to remedy the complaints. The municipality shall have the rightto inspect the complaint log upon request.
You may also include language regarding property damage as well asmeetings to discuss service or to resolve complaints.
95
l l l l l l l l l l l l l l l l l l l l l l l l l
Legal considerations Negotiating contracts with markets
Performance bondsPerformance bonds are your protection against the biggest failures. What ifyour contractor goes out of business or is simply unwilling or unable to servicethe contract? A performance bond guarantees that your program and organizationwill be protected financially even if you�re forced to hire a new contractor tocomplete the service. According to attorney Joseph Maraziti, Jr., performancebonds come in three flavors:
• Third Party Guarantee
• Performance Bond
• Letter of Credit
Your strongest protection against contractor failure may be the care andresearch you invest in evaluating and selecting the successful bidder. Evenwith the most thorough research, it�s still prudent to include one of these threekinds of a performance bond.
Third-Party GuaranteeThis is normally used by the subsidiaries of larger companies, and the corporateparent guarantees the subsidiary�s performance. It is the least costly of the threekinds of performance bonds because it simply requires a binding agreementbetween a subsidiary and its parent company. However, it also provides thelowest level of protection. A third-party guarantee assumes the parent companywill be able to honor its promise and provide the services required in the contract.
Performance BondBy far the most common form of protection used in contracts with publicagencies, performance bonds cost more than third-party guarantees, but offer ahigher level of protection. A performance bond is essentially an insurance policythat a contractor buys from an insurance company. The insurance company isputting its money �on the line� in case the contractor fails to perform, so it hasa keen incentive, and financial obligation, to research the company applyingfor insurance. Firms with a history of defaults have trouble buying this kind ofinsurance, so this requirement essentially gives you the expertise of independentreviewers to help weed out unqualified bidders.
There are two potential downsides to performance bonds.
The first one, the bonding level you require, is avoidable. In most cases,it�s a mistake to require a performance bond equal to the full value of the contract.A five-year, $5 million contract, which costs $1 million annually, does notrequire a $5 million performance bond. Instead, it�s far less costly to require abond equal to the annual value of the contract. And big bond requirementsaren�t just more expensive: they also may prevent smaller firms from biddingon your project because larger bonds are harder to obtain.
l l l l l l l l l l l l l l l l l l l l l l l l l
96Smart contracting Definitions From bid to contract
l l l l l l l l l l l l l l l l l l l l l l l l l
The Uniform Bid Specifications for Solid Waste Collection allow publicagencies to require a bond equal to the annual value of a contract. It must be arenewable bond reflecting the annual cost of the contract, and may not exceedthe value of the contract. Although this law does not apply to recycling collectioncontracts, it�s still a good cost containment strategy.
A similar, but more expensive, strategy is to allow use of a depreciatingterm bond. In the first year of a multi-year contract, these bonds insure the fullvalue of the contract. Each year, the insured value of the bond declines to coverthe services still to be delivered.
The second problem with performance bonds is more challenging to solve.Performance bonds can be difficult to collect. The insurance company�s moneyis at risk, so it�s no surprise they will only pay claims that are thoroughlydocumented and tenaciously pursued, according to attorney JosephMaraziti, Jr.4
Letter of CreditThe letter of credit may be your highest level of protection in bid specifications,but it�s so restrictive that it may intimidate many organizations from bidding onyour work. A letter of credit acts more like a certified check than an insurancepolicy. It requires contractors to put their financial assets on the table as collateralagainst a failure to perform.
Remember, your goal is to develop an agreement that allows the contractorto do the job to your specifications with a minimum of interference, disputeand necessary expense. To achieve that goal, your up-front strategy is to writeclear requirements into the bid specifications and to ensure the successful bidderhas the ability to fix problems that may arise.
l l l l l l l l l l l l l l l l l l l l l l l l l
97
l l l l l l l l l l l l l l l l l l l l l l l l l
Legal considerations Negotiating contracts with markets
Legal considerationsFor public agencies, the requirements for bidding in New Jersey are outlined inthe Local Public Contracts Law.5 This manual cannot substitute for legal advice,and anyone preparing a bid document should carefully review these statutoryrequirements with a lawyer. The section will, however, highlight key provisionsof the statute that are often overlooked in preparing bid documents for recycling.
Legal challenges to the bid process cost you in lost time and hard dollars.No surprise there. Bid awards are most often contested when a low bidder isnot awarded a contract, or when unsuccessful bidders claim that the lowestbidder was not the lowest responsible bidder. That�s the tricky legal question:what is the lowest responsible bidder and when is that different than the lowestbidder? The devil is in the details.
For solid waste collectors, a responsible bidder is specifically outlined inN.J.A.C. 7:26H-6.8, lowest responsible bidder. Once again, bids for recyclingcollection alone are not bound by these regulations, but they are useful guides.Specifically this section states that:
(a) The responsible bidder is one who at the time of the bid submis-sion:
1. Conforms to all requirements of the bid specifications
2. Has an approved uniform tariff on file with the Department
3. Has experience in the type of work to be performed
4. Has the equipment necessary to perform the work described inthe bid specifications
5. Has the financial ability to perform the work.
(b) The governing body may reject an otherwise complete bid pro-posal when the bidder has a history of intentional noncompliancewith mandatory terms and conditions of similar collection contractswith any contracting unit or has failed to fully perform a priorcollection contract with the contracting unit.
Only condition 2 is not relevant to recycling collection contracts (no tariffsare required for recycling collection alone).
Price is not the sole determinant in awarding a contract. This languagegives you some flexibility to protect against �lowball� bidders who may not beable to perform the work. Proceed with caution, though. You need tangible,documented reasons for not awarding the contract to the lowest bidder.
Correctable and non-correctable bid itemsMistakes happen. But not all mistakes are created equal. In the language ofbids, they fall into two main classes: correctable and non-correctable errors.The easiest reason to reject a bid is non-conformance with a non-correctabledefect in the bid submission.
l l l l l l l l l l l l l l l l l l l l l l l l l
98Smart contracting Definitions From bid to contract
l l l l l l l l l l l l l l l l l l l l l l l l l
A correctable error (often called a correctable defect) is typically considereda minor mistake in a bid submission, such as failing to write out a price quote inaddition to printing a numeric quote in the document. The mistake is not materialin the bid and can easily be corrected. Of course, the bidder can�t change thenumber being submitted, but otherwise, this mistake is easy to correct.
On the other hand, if a bidder forgets to submit a price at all, that�s a non-correctable error, a material defect, and you must disqualify the bid. Otherexamples of non-correctable errors include:
• failure to submit a bid bond
• failure to submit required documents as outlined in the bidspecifications
N.J.A.C. 7:26H-6.5(a) includes a list of non-correctable defects, includingfailing to comply with the following requirements:
• a completed questionnaire
• a non-collusion affidavit
• a stockholder statement of ownership
• a consent of surety
• a bid proposal
If your recycling bid is combined with solid waste collection, failing toinclude a certificate of public convenience and necessity also would be a non-correctable defect.
Other reasons to reject a bidA public agency also has the right to reject a bid if it fails to conform with theprovisions of the public bidding laws of the state. Thus, you should work closelywith a lawyer in developing bid specifications.
From a practical viewpoint, the reasons for rejection should be clearly spelledout. That�s one advantage of using the Uniform Solid Waste Collection BidSpecifications. These specifications state much of what normally needs to beconsidered in a bid document in relatively clear and concise language.
Finally, if you have a good reason, you can reject all bids. If all of the pricessubmitted are higher than your projection, you can reject all bids based onprice. That�s why it is valuable to perform an in-house estimate before you goout to bid.
The bid processCompetition helps keep a lid on costs, so you want to attract a healthy pool ofbidders. Give bidders plenty of time. New Jersey�s general bidding statutes(N.J.S.A. 40A-11.22) require only 10 days from the day your legal ad for
l l l l l l l l l l l l l l l l l l l l l l l l l
99
l l l l l l l l l l l l l l l l l l l l l l l l l
Legal considerations Negotiating contracts with markets
recycling collections appears to the day bids are due, but 60 days is a bettertarget. By giving bidders ample time for questions, clarifications, addenda andresearch, you should receive more and better quotes. You may want to considerthe following six-month schedule.
• two months to write the specifications
• one month to handle pre-bid questions and addenda
• one month for award
• one month for contingency
• one month for the successful bidder to prepare
AdvertisingThe team that prepares the bid should include a purchasing agent, legal counseland the recycling coordinator. The purchasing agent often prepares theadvertisement for services, but the lawyer and recycling coordinator shouldreview it to ensure the accuracy of services being requested.
Pre-bid conferencesA pre-bid conference is a meeting where anyone interested in submitting a bidcan ask questions of the officials in charge of the bid. Subsequently, thoseofficials issue a response document and any addenda required to clarify the biddocument. A pre-bid conference can help eliminate costly confusion about bidspecifications. When bidders are unsure about assumptions or specifications,they tend to overestimate costs to protect themselves. Pre-bid conferences alsoallow you to see potential bidders face-to-face, so you are no longer dealingwith anonymous third parties.
The downside of pre-bid conferences? They create more work . Somebodyneeds to take accurate notes and prepare a response document and perhaps anaddendum.
AddendumAn addendum is just what its name implies. Because it is an alteration of theoriginal bid document, an addendum must be sent to all bidders and it must beadvertised at least five days prior to the receipt of bids. This process allows youto correct errors, alter specifications problems, and otherwise improve the biddocument before bids are received. This extra step can reduce the likelihood oflitigation caused by a misunderstanding or an error in the bid documents.
Receipt of the bidsThis is a fairly straightforward process, handled in most cases by the purchasingagent. The rules for bid openings are clearly articulated in N.J.S.A. 40A:11-1and are not subject to variation.
l l l l l l l l l l l l l l l l l l l l l l l l l
100Smart contracting Definitions From bid to contract
l l l l l l l l l l l l l l l l l l l l l l l l l
Negotiating contracts with marketsRecycling collection contracts must be put out to public bid. To sell therecyclables you collect, however, you can choose to go through the bid process,or you can negotiate directly with buyers.
Regardless of the route you follow, you need to clearly define the servicesyou require of your buyers and agree on those terms in your contract. This istrue even if you operate solely on a verbal agreement rather than a writtencontract. A verbal agreement may be considered an oral contract, which isdefined by Barron�s Law Dictionary as �...one which is not in writing or whichis not signed by the parties....it is a real existing contract which lacks only theformal requirement of a memorandum (signed by the party to be charged).�
The terms of your contract should include safeguards against poorperformance by your market, such as failure to:
• pick up materials when promised
• provide trucking equipment as promised
• pay as promised
However, because this is a negotiated process, be prepared for the marketto insist on safeguards as well, such as protection against:
• material that does not meet specifications
• damage caused to their equipment
• delivery of promised material
• misrepresentation of what is being marketed
l l l l l l l l l l l l l l l l l l l l l l l l l

101
l l l l l l l l l l l l l l l l l l l l l l l l l
Legal considerations Negotiating contracts with markets
A good marketing agreement requires front-end research.
1. Start with the goals of your marketing program because your aimsoften dictate your negotiation strategy. For example, security maybe your priority. You want a reliable buyer willing to move yourmaterials in even the worst markets. Or revenue may be your priority,so price rather than stability drives your decisions.
2. Determine both the quantity and the quality of each type of materialyou�re marketing. Quality is defined by market specifications foreach type of material, so it�s critical to know your specifications.
3. Decide what services you require of buyers. Do they need to providetransportation, storage, processing, equipment, promotionalmaterials, training, reports or credit? The services you require maydictate whether you will sell directly to an end user or to anintermediary, such as a broker or processor. Intermediaries usuallyprovide a wider range of services than end users.
4. Research your local markets. How do local market conditionscompare to national averages? What buyers are available? How longhave they been in the market and how reliable have they been indifferent kinds of markets? What are local trucking rates? Stay currenton market indicators, which are discussed in Chapter 4. How willyour price change as market indicators change?
After the preliminary research has been completed, it�s time to negotiatewith potential market outlets for each of your materials. Then those terms mustbe written clearly into the contract. The contract should also spell out paymentterms in advance. How, where and by whom will materials be weighed? Willyou use tare or gross weights? When will you expect payment? If cash flow isa priority, you may include a bonus (for example a 1% discount if payment isreceived within 15 days) for prompt payment.
One of the most important elements of any agreement is not the wordsthemselves, but that they are honored with ethical behavior, Lefke advises. Thatmay mean refusing a higher price if you have already promised to deliver yourmaterial to another buyer. Breaking agreements hurts your operation, even if noone ever takes legal action against you. Your reputation as a reliable businesspartner may be irreparably damaged. The result: you may have trouble findingbuyers when you need them most.
One way to ensure both parties retain a clear understanding of theiragreement is to be absolutely clear about the words used in the contract. Or asJoseph Maraziti, Jr. says, �The contract is only as good as its words. The languageis the key.�
l l l l l l l l l l l l l l l l l l l l l l l l l
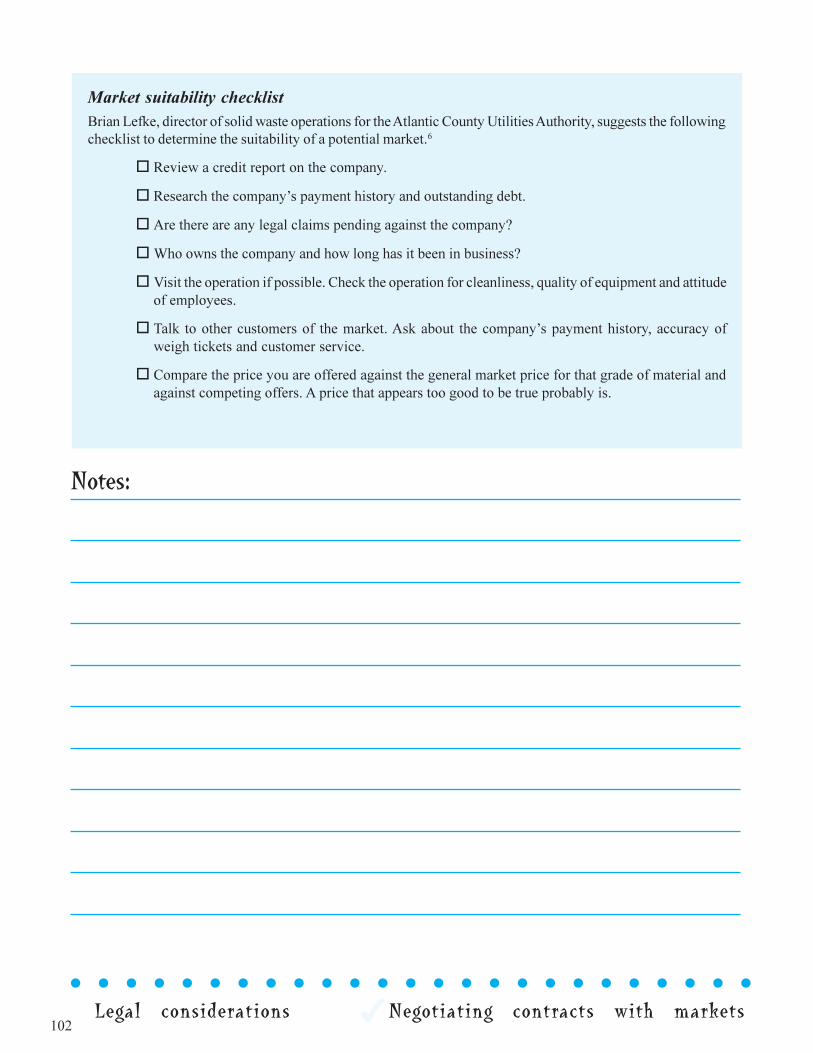
102
l l l l l l l l l l l l l l l l l l l l l l l l l
Legal considerations Negotiating contracts with markets
Market suitability checklistBrian Lefke, director of solid waste operations for the Atlantic County Utilities Authority, suggests the followingchecklist to determine the suitability of a potential market.6
o Review a credit report on the company.
o Research the company�s payment history and outstanding debt.
o Are there are any legal claims pending against the company?
oWho owns the company and how long has it been in business?
o Visit the operation if possible. Check the operation for cleanliness, quality of equipment and attitudeof employees.
o Talk to other customers of the market. Ask about the company�s payment history, accuracy ofweigh tickets and customer service.
o Compare the price you are offered against the general market price for that grade of material andagainst competing offers. A price that appears too good to be true probably is.
Notes:
103
l l l l l l l l l l l l l l l l l l l l l l l l l
This manual combines and condenses information from economics, accounting,finance, law and marketing. It focuses almost exclusively on the financial aspectsof recycling rather than the environmental ones. Yet, New Jersey�s state recyclingpolicy was built on and is sustained by the premise that recycling generateseconomic and environmental benefits that are not covered by the financialanalysis discussed in this manual, including:
• conservation of virgin resources
• job creation and economic development
• extending the life of landfills and incinerators, which are notoriouslyexpensive and difficult to site in New Jersey
• increased self-sufficiency in solid waste management
• energy conservation
• greenhouse gas reductions
• increased exports that improve state and federal trade balances
These benefits are real and quantifiable, so why aren�t they factored intothe financial analysis in this manual? Most recycling coordinators acting alonehave little control over those issues. In many cases, they may be determined byworldwide market forces (or natural forces in the case of greenhouse gasses)that literally no one can control alone. In other cases, they may be determinedby state and federal policies that are beyond the authority of recycling programmanagers.
Cast your dollar vote for recyclingEven if you cannot control these forces, you can help push them in the rightdirection. For example, you can help increase demand for recycled-contentproducts by promoting �Buy Recycled� campaigns to residents and businessesand adopting them for your own purchasing guidelines. Given the law of supplyand demand, your campaigning alone may be too small to affect the markets forpaper, just as your single vote may not affect the outcome of a national election.However, the collective force of millions of people individually casting their�dollar votes� in favor of products with recycled content ultimately may increase
C l l l l l l l l l l l l l l l l l l l l l l
onclusion: Recycling your way to sustainability
Conclusion: Recycling your way to sustainability
104
l l l l l l l l l l l l l l l l l l l l l l l l l
the prices coordinators receive for the recyclables they collect. You may not beable to dictate the outcome, but you can become part of the solution byunderstanding the importance of your dollar vote.
The recycling coordinator as environmental technologistIn the meantime, you can control, or at least recommend how to control, thecosts of your recycling programs. Reducing those costs is guaranteed to increasethe cost-benefit scenario for recycling in their communities, regardless of whathappens to other factors in the equation. That puts coordinators in a powerfulposition. Using tools of financial analysis discussed in this manual, you havethe power to design sustainable recycling programs that provide short and long-term economic and environmental benefits.
The U.S. Office of Science and Technology defines an �environmentaltechnology� as �a technology that advances sustainable development by reducingrisk, enhancing cost-effectiveness, improving process efficiency and creatingproducts that are environmentally beneficial or benign. The word �technology�is intended to include hardware, software, systems and services.�1 That definitionmakes New Jersey�s recycling coordinators �environmental technologists� whoare reducing risks, improving efficiency and cost-effectiveness, and helpingcreate new environmentally beneficial products.
That�s a worthy goal. The recycling programs that reach it will be designedand operated by recycling professionals with a commitment to recycling andan understanding of financial analysis. Take control of your program bymastering these tools and making the numbers work for you.
Conclusion: Recycling your way to sustainability
105
l l l l l l l l l l l l l l l l l l l l l l l l l
l l l l l l l l l l l l l l l l l l l l l l l l l
Practical Recycling Economics: Making the Numbers Work for Your ProgramRutgers University, Cook College Office of Continuing Professional Education. Copyright © 1999.
eferences
Introduction
1. �Wasting Resources to Reduce Waste: Recycling in New Jersey.� GrantSchaumburg Jr. and Katherine Doyle. Cato Institute. 1994.
�Curbside Recycling Comforts the Soul, But Benefits are Scant.� The Wall StreetJournal, January 19, 1995.
�Recycling is Garbage.� John Tierney. New York Times Magazine. June 30, 1996
Chapter 2
1. �Handbook of Municipal Waste Systems: Planning and Practice.� BarbaraStevens. Van Nostrand Reinhold. 1980.
2. �Full Cost Accounting for Solid Waste Management: A Handbook.� U.S.Environmental Protection Agency (EPA 530-R-95-041). September 1997.
3. �The Cost of Recycling at the Curb.� Chaz Miller. National Solid WasteManagement Association. 1993. (Reprinted in �Waste Age�s RecyclingTimes Handbook.� Lewis Publishers. 1995.)
Integrated Municipal Solid Waste Management: Six Case Studies of SystemsCosts and Energy Use.� Solid Waste Association of North America. 1995.
�Economics, Costs and Full Cost Accounting Methods for Integrated MunicipalSolid Waste Management Systems.� Solid Waste Association of NorthAmerica. April 1995.
4. �Greenhouse Gas Emissions from Management of Selected Materials inMunicipal Solid Waste.� U.S. Environmental Protection Agency (EPA 530-R-98-013). September 1998.
5. �Value Added to Recyclable Materials in the Northeast.� The NortheastRecycling Council. May 1994.
�Advantage Recycle. Assessing the Full Costs and Benefits of Curbside Recy-cling.� Environmental Defense Fund. 1995.
6. �The Cost of Recycling at the Curb.� Chaz Miller. National Solid WasteManagement Association. 1993. (Reprinted in �Waste Age�s RecyclingTimes Handbook.� Lewis Publishers. 1995.)
�Multi-family Recycling: Costs, Diversion and Program Characteristics.� BarbaraStevens. U.S. Conference of Mayors. 1998.
7. �Handbook of Municipal Waste Systems: Planning and Practice.� BarbaraStevens. Van Nostrand Reinhold. 1980.
l l l l l l l l l l l l l l l l l l l l l lR
106
l l l l l l l l l l l l l l l l l l l l l l l l l
l l l l l l l l l l l l l l l l l l l l l l l l l
Practical Recycling Economics: Making the Numbers Work for Your ProgramRutgers University, Cook College Office of Continuing Professional Education. Copyright © 1999.
Chapter 3
1. �Wasting Resources to Reduce Waste: Recycling in New Jersey.� GrantSchaumburg Jr. and Katherine Doyle. Cato Institute. 1994.
�Advantage Recycle: Assessing the Full Costs and Benefits of CurbsideRecycling.� Environmental Defense Fund. 1995.
2. �Once Per Week Solid Waste Collection.� Ed Jablonowski and BarbaraStevens. New Jersey Municipalities Magazine. December 1994.
3. �Rate Structure Design: Setting Rates for a Pay-As-You-Throw Pricing Pro-gram.� U.S. Environmental Protection Agency (EPA 530-R-99-006).January 1999.
Chapter Four
1. Interview with Allan Zozzaro, 02/25/98.
2. Interview with Jerry Lobasco, 02/25/98.
3. Interview with John Mulligan, 02/25/98.
4. �A Report on the Discussion of Glass Container Recycling in the Northeast.�The Northeast Recycling Council. Brattleboro, Vermont. September 1993.
5. Interview with Bruce Logan, 12/02/97.
6. Interview with Brian Lefke, 11/17/98.
7. �Marketing Recyclables.� Richard Abramowitz and Jeffrey Foote. MIS Report.International City/County Management Association. January 1994.
Chapter Five
1. Barron�s Law Dictionary, 3rd edition, Barron�s Educational Services, Inc.1991.
2. Interview with Joseph Maraziti Jr. 12/17/98.
3. N.J.A.C. 7:26H-6.1 et seq.
4. Interview with Joseph Maraziti Jr. 12/17/98.
5. N.J.S.A. 40A-11.1 et seq.
6. Interview with Brian Lefke, 11/17/98.
Conclusion
1. �Technology for a Sustainable Future: A Framework for Action.� U.S. Officeof Science and Technology Policy. Undated.
107
l l l l l l l l l l l l l l l l l l l l l l l l l
l l l l l l l l l l l l l l l l l l l l l l l l l
Practical Recycling Economics: Making the Numbers Work for Your ProgramRutgers University, Cook College Office of Continuing Professional Education. Copyright © 1999.
Accrual accounting is a system that recognizes costs when they occur, or accrue,regardless of when cash outlays are made.
Amortization is an accounting method for calculating the current annual costsrelated to obligations for future outlays. For example, current payments neededto retire a debt by maturity are amortization expenses.
Avoided cost is the reduction in costs of one activity made possible by theoperation of a different activity. In solid waste management, avoided costs oftenmean savings realized in the cost of collecting, transferring, transporting, anddisposing garbage that is made possible by waste reduction, recycling andcomposting.
Bid is an offer to buy goods or services at a stated price.
Bilateral contract is a contract in which there are mutual promises betweentwo parties.
Capital outlay is an outlay of cash to acquire a resource that will be used formore than one year. Capital outlays are converted into annual costs using theaccounting method of depreciation.
Cash flow accounting, also known as cash basis accounting or general fundaccounting, is a system where cash outlays for goods and services are recordedas they are actually paid out.
Cost means the dollar value of resources used for an operation during a givenperiod.
Depreciation is an accounting method for allocating costs of capital outlaysover the useful life of a resource. Useful life is a projection of how long aresource is expected to provide services; it may differ significantly from theactual amount of time the resource is used.
Direct costs are costs that can be linked specifically to an activity, program ordepartment.
Externality is a benefit or harm caused by an activity for which there is nocompensation paid by the party generating the activity. In solid wastemanagement, for example, reduced depletion of natural resources is often citedas a positive externality of recycling, and potential for groundwatercontamination in the future is often cited as a negative externality of landfills.
alking like an accountantl l l l l l l l l l l l l l l l l l l l l lT
108
l l l l l l l l l l l l l l l l l l l l l l l l l
l l l l l l l l l l l l l l l l l l l l l l l l l
Practical Recycling Economics: Making the Numbers Work for Your ProgramRutgers University, Cook College Office of Continuing Professional Education. Copyright © 1999.
Fixed costs are costs that do not change with the level of a given activity overa specific time period. In solid waste management, they often include interest,depreciation, overhead and many salaried positions that cannot be changedquickly in response to changes in program operations or service levels.
Full cost accounting is a systematic approach for identifying, summing, andreporting the actual costs of solid waste management, taking into account pastand future outlays, overhead costs and operating costs. It does not include�externalities� that are not reflected in current market prices. In this manual,full cost accounting terms and definitions are used in accordance with the U.S.Environmental Protection Agency�s �Full Cost Accounting for Municipal SolidWaste Management: A Handbook� (Document EPA530-R-95-041).
Future outlay means an expenditure of cash in the future that is obligated bycurrent or prior activities.
GAAP stands for Generally Accepted Accounting Principles, which are therules, procedures and practices that define accepted accounting practices.
GASB stands for the Government Accounting Standards Board, an independentorganization that sets accounting standards for state and local governments.
Hidden costs are costs of activities or resources that appear to be free, or areunderstated, because the actual expense is incurred or recorded by another agencyor organization.
Indirect costs are costs that are not exclusively related to one activity or program.Indirect costs for solid waste can include accounting, collections, payroll,personnel, legal, purchasing, information systems, record keeping, custodial,management, and expenses related to governing bodies of an organization.
Integrated solid waste management incorporates multiple approaches tomanage the entire municipal solid waste stream. In an integrated system,increased activity in one activity � recycling, for example � creates savings thatcan be captured in another activity, such as garbage collection, transfer anddisposal.
Liquidated damages are �reasonable estimates� of damages likely to resultfrom a breach of contract. They are not penalties for failure to perform.
Marginal cost is the change in total costs resulting from a specific decision orchange in activity. Also called incremental cost.
Net cost of a solid waste management activity is its full cost, minus its by-product revenues.
Operating costs are regularly recurring costs of resources that are used over arelatively short period of time (usually less than one year).
Opportunity cost is the value placed on activities or alternatives foregonewhen a decision is made to employ or allocate a resource.
Outlay is an expenditure of cash.
109
l l l l l l l l l l l l l l l l l l l l l l l l l
l l l l l l l l l l l l l l l l l l l l l l l l l
Practical Recycling Economics: Making the Numbers Work for Your ProgramRutgers University, Cook College Office of Continuing Professional Education. Copyright © 1999.
Overhead costs are the management and support costs of running anorganization. They cannot be tied to a particular activity or program, so theyare allocated to all departments or programs using a variety of formulas. Theyare one kind of indirect cost.
Pay-as-you-throw (PAYT) pricing is a strategy for pricing garbage collectionand disposal service in which the total amount paid by a customer is related tothe amount of garbage disposed. Also known as �per-unit pricing� or �variablerate pricing.�
Performance bond is a guarantee that protects an organization or individual inthe event that a contractor fails to perform services required by contract.
Sunk costs are costs that cannot be recovered at the time a decision is madeand, therefore, are irrelevant to any cost-benefit calculation.
Time value of money is the financial principal that a dollar in hand today isworth more than a dollar received tomorrow.
Variable costs change with the level of a given activity, such as recyclingcollection or garbage disposal. They are often operation, maintenance and othercosts that can be reduced quickly in response to lower waste disposal tonnage.
110
l l l l l l l l l l l l l l l l l l l l l l l l l
l l l l l l l l l l l l l l l l l l l l l l l l l
Practical Recycling Economics: Making the Numbers Work for Your ProgramRutgers University, Cook College Office of Continuing Professional Education. Copyright © 1999.
Appendix A: Market indicatorsThe following publications list market indicators for commodity pricing.Publications are subscription-based with the exception of the ISRI Scrap Circular,which is updated at the discretion of the association.
1. The Fibre Market News4012 Bridge AvenueCleveland, Ohio 44113tel. 216-961-4130fax 216-961-0364toll free: 1-800-456-0707Published 24 times per year.
2. Official Board Markets; The Yellow Sheet8 Anchor WayPort Washington, NY 11050tel 516-767-6444fax 516-767-2822Published weekly.Generally, mill direct pricing for paper.
3. Waste NewsPO Box 07942Detroit, Michigan 48207-9862tel 1-800-678-9595fax 313-446-6777Published weekly.This is also a general industry news publication.
4. The Paper Stock Report13727 Holland RoadCleveland, Ohio 44142-3920tel 216-362-7979fax 216-362-6553Published weekly.
5. Pulp and Paper Week525 Market Street, Suite 500San Francisco, California 94105tel 800-289-0969fax 785-841-2634Published 48 times per year.
Appendicesl l l l l l l l l l l l l l l l l l l l l
111
l l l l l l l l l l l l l l l l l l l l l l l l l
l l l l l l l l l l l l l l l l l l l l l l l l l
Practical Recycling Economics: Making the Numbers Work for Your ProgramRutgers University, Cook College Office of Continuing Professional Education. Copyright © 1999.
6. SEFEX121 McBride AvenuePaterson, New Jersey 07501tel 973-278-1199fax 973-278-8686www.sefex.com
7. Recycling Markets255 Revere Drive, #01Northbrook, Illinois 60062tel 1-800-962-3001fax 847-962-3001Published twice per month.Provides paper prices.
8. Platt�s Metals Week (Platt�s Standard and Poor�s)1221 Avenue of the AmericasNew York, New York 10020tel 212-512-3065fax 212-512-4008Published weekly.Non-Ferrous metals pricing.
9. Plastics Recycling UpdatePO Box 10540Portland, Oregon 97296-0540tel 503-227-1319fax 503-227-6135Covers plastics usage and market trends.
10. American Glass Review1011 Clifton Ave. #B-1Clifton, NJ 07013-3518tel 201-779-1600fax 201-779-3242
11. SCRAP MagazineInstitute of Scrap Recyclers1325 G. Street, NW, Suite 1000Washington, D.C. 20005-3104tel 202-737-1770fax 202-626-0900Published bi-monthly.Contains scrap metals and pricing.
112
l l l l l l l l l l l l l l l l l l l l l l l l l
l l l l l l l l l l l l l l l l l l l l l l l l l
Practical Recycling Economics: Making the Numbers Work for Your ProgramRutgers University, Cook College Office of Continuing Professional Education. Copyright © 1999.
12. ISRI Scrap Specifications CircularInstitute of Scrap Recyclers1325 G. Street, NW, Suite 1000Washington, D.C. 20005-3104tel 202-737-1770fax 202-626-0900General publication providing guidelines for scrap specifications,including quality standards.
13. American Metal Market350 Hudson Street, 4th FloorNew York, New York 10014tel 212-887-8550fax 212-887-8493e-mail: [email protected] daily.Covers pricing and market conditions for metals.
14. Recycler�s Worldwww.recycle.net/On-line resource for most commodities.
Other sources of information
1. Glass Packaging Institute1627 K Street, NW, Suite 800-LWashington, DC 20006tel 202-887-4850fax 202-785-5337e-mail: [email protected] packaging trade association.
2. National Association of PET Container Resources2105 Water Ridge ParkwaySuite 570Charlotte, NC 28217tel 704-423-9400fax 704-423-9500PET container trade association.
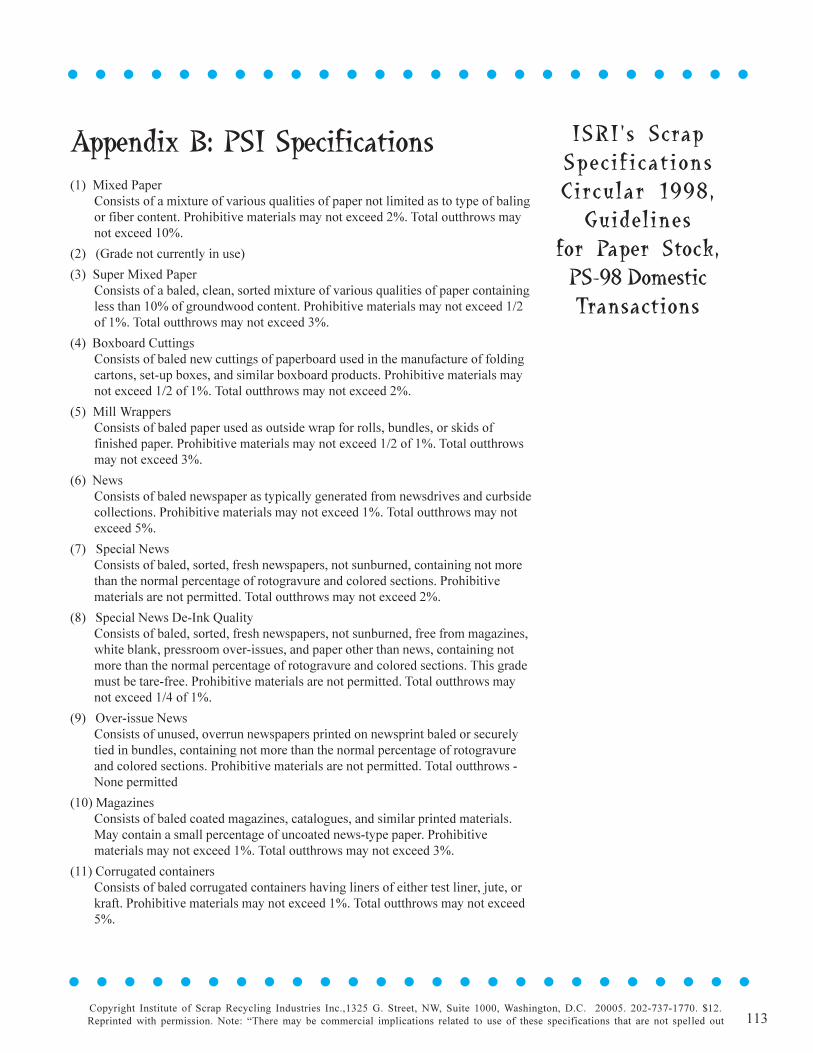
113
l l l l l l l l l l l l l l l l l l l l l l l l l
l l l l l l l l l l l l l l l l l l l l l l l l l
Practical Recycling Economics: Making the Numbers Work for Your ProgramRutgers University, Cook College Office of Continuing Professional Education. Copyright © 1999.
Appendix B: PSI Specifications(1) Mixed Paper
Consists of a mixture of various qualities of paper not limited as to type of balingor fiber content. Prohibitive materials may not exceed 2%. Total outthrows maynot exceed 10%.
(2) (Grade not currently in use)
(3) Super Mixed PaperConsists of a baled, clean, sorted mixture of various qualities of paper containingless than 10% of groundwood content. Prohibitive materials may not exceed 1/2of 1%. Total outthrows may not exceed 3%.
(4) Boxboard CuttingsConsists of baled new cuttings of paperboard used in the manufacture of foldingcartons, set-up boxes, and similar boxboard products. Prohibitive materials maynot exceed 1/2 of 1%. Total outthrows may not exceed 2%.
(5) Mill WrappersConsists of baled paper used as outside wrap for rolls, bundles, or skids offinished paper. Prohibitive materials may not exceed 1/2 of 1%. Total outthrowsmay not exceed 3%.
(6) NewsConsists of baled newspaper as typically generated from newsdrives and curbsidecollections. Prohibitive materials may not exceed 1%. Total outthrows may notexceed 5%.
(7) Special NewsConsists of baled, sorted, fresh newspapers, not sunburned, containing not morethan the normal percentage of rotogravure and colored sections. Prohibitivematerials are not permitted. Total outthrows may not exceed 2%.
(8) Special News De-Ink QualityConsists of baled, sorted, fresh newspapers, not sunburned, free from magazines,white blank, pressroom over-issues, and paper other than news, containing notmore than the normal percentage of rotogravure and colored sections. This grademust be tare-free. Prohibitive materials are not permitted. Total outthrows maynot exceed 1/4 of 1%.
(9) Over-issue NewsConsists of unused, overrun newspapers printed on newsprint baled or securelytied in bundles, containing not more than the normal percentage of rotogravureand colored sections. Prohibitive materials are not permitted. Total outthrows -None permitted
(10) MagazinesConsists of baled coated magazines, catalogues, and similar printed materials.May contain a small percentage of uncoated news-type paper. Prohibitivematerials may not exceed 1%. Total outthrows may not exceed 3%.
(11) Corrugated containersConsists of baled corrugated containers having liners of either test liner, jute, orkraft. Prohibitive materials may not exceed 1%. Total outthrows may not exceed5%.
Copyright Institute of Scrap Recycling Industries Inc.,1325 G. Street, NW, Suite 1000, Washington, D.C. 20005. 202-737-1770. $12.Reprinted with permission. Note: �There may be commercial implications related to use of these specifications that are not spelled out
ISRI�s ScrapSpecificationsCircular 1998,
Guidelinesfor Paper Stock,PS-98 DomesticTransactions
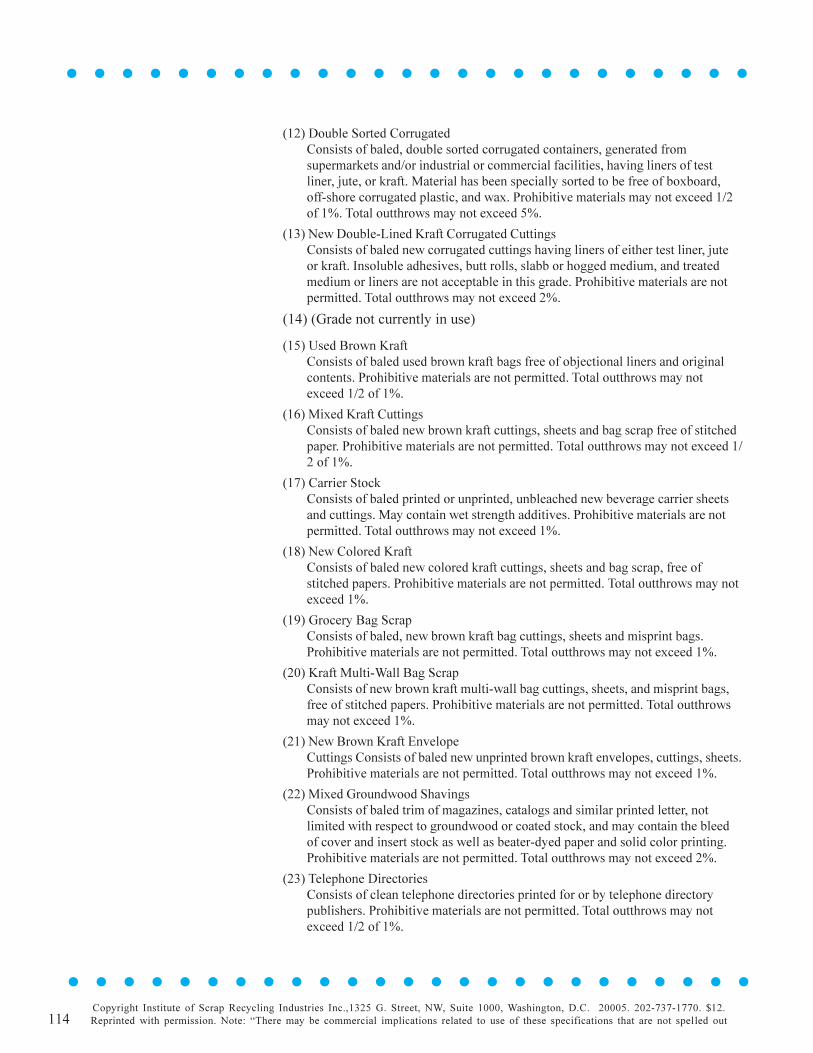
114
l l l l l l l l l l l l l l l l l l l l l l l l l
l l l l l l l l l l l l l l l l l l l l l l l l l
Practical Recycling Economics: Making the Numbers Work for Your ProgramRutgers University, Cook College Office of Continuing Professional Education. Copyright © 1999.
(12) Double Sorted CorrugatedConsists of baled, double sorted corrugated containers, generated fromsupermarkets and/or industrial or commercial facilities, having liners of testliner, jute, or kraft. Material has been specially sorted to be free of boxboard,off-shore corrugated plastic, and wax. Prohibitive materials may not exceed 1/2of 1%. Total outthrows may not exceed 5%.
(13) New Double-Lined Kraft Corrugated CuttingsConsists of baled new corrugated cuttings having liners of either test liner, juteor kraft. Insoluble adhesives, butt rolls, slabb or hogged medium, and treatedmedium or liners are not acceptable in this grade. Prohibitive materials are notpermitted. Total outthrows may not exceed 2%.
(14) (Grade not currently in use)
(15) Used Brown KraftConsists of baled used brown kraft bags free of objectional liners and originalcontents. Prohibitive materials are not permitted. Total outthrows may notexceed 1/2 of 1%.
(16) Mixed Kraft CuttingsConsists of baled new brown kraft cuttings, sheets and bag scrap free of stitchedpaper. Prohibitive materials are not permitted. Total outthrows may not exceed 1/2 of 1%.
(17) Carrier StockConsists of baled printed or unprinted, unbleached new beverage carrier sheetsand cuttings. May contain wet strength additives. Prohibitive materials are notpermitted. Total outthrows may not exceed 1%.
(18) New Colored KraftConsists of baled new colored kraft cuttings, sheets and bag scrap, free ofstitched papers. Prohibitive materials are not permitted. Total outthrows may notexceed 1%.
(19) Grocery Bag ScrapConsists of baled, new brown kraft bag cuttings, sheets and misprint bags.Prohibitive materials are not permitted. Total outthrows may not exceed 1%.
(20) Kraft Multi-Wall Bag ScrapConsists of new brown kraft multi-wall bag cuttings, sheets, and misprint bags,free of stitched papers. Prohibitive materials are not permitted. Total outthrowsmay not exceed 1%.
(21) New Brown Kraft EnvelopeCuttings Consists of baled new unprinted brown kraft envelopes, cuttings, sheets.Prohibitive materials are not permitted. Total outthrows may not exceed 1%.
(22) Mixed Groundwood ShavingsConsists of baled trim of magazines, catalogs and similar printed letter, notlimited with respect to groundwood or coated stock, and may contain the bleedof cover and insert stock as well as beater-dyed paper and solid color printing.Prohibitive materials are not permitted. Total outthrows may not exceed 2%.
(23) Telephone DirectoriesConsists of clean telephone directories printed for or by telephone directorypublishers. Prohibitive materials are not permitted. Total outthrows may notexceed 1/2 of 1%.
Copyright Institute of Scrap Recycling Industries Inc.,1325 G. Street, NW, Suite 1000, Washington, D.C. 20005. 202-737-1770. $12.Reprinted with permission. Note: �There may be commercial implications related to use of these specifications that are not spelled out
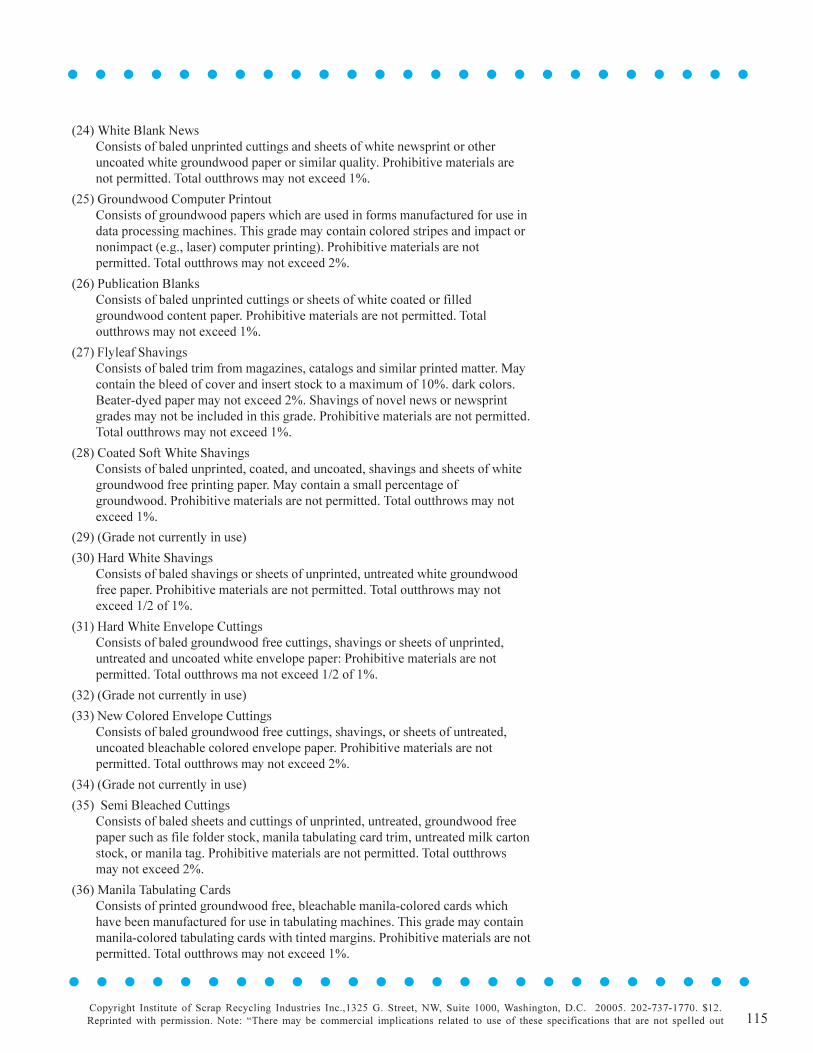
115
l l l l l l l l l l l l l l l l l l l l l l l l l
l l l l l l l l l l l l l l l l l l l l l l l l l
Practical Recycling Economics: Making the Numbers Work for Your ProgramRutgers University, Cook College Office of Continuing Professional Education. Copyright © 1999.
(24) White Blank NewsConsists of baled unprinted cuttings and sheets of white newsprint or otheruncoated white groundwood paper or similar quality. Prohibitive materials arenot permitted. Total outthrows may not exceed 1%.
(25) Groundwood Computer PrintoutConsists of groundwood papers which are used in forms manufactured for use indata processing machines. This grade may contain colored stripes and impact ornonimpact (e.g., laser) computer printing). Prohibitive materials are notpermitted. Total outthrows may not exceed 2%.
(26) Publication BlanksConsists of baled unprinted cuttings or sheets of white coated or filledgroundwood content paper. Prohibitive materials are not permitted. Totaloutthrows may not exceed 1%.
(27) Flyleaf ShavingsConsists of baled trim from magazines, catalogs and similar printed matter. Maycontain the bleed of cover and insert stock to a maximum of 10%. dark colors.Beater-dyed paper may not exceed 2%. Shavings of novel news or newsprintgrades may not be included in this grade. Prohibitive materials are not permitted.Total outthrows may not exceed 1%.
(28) Coated Soft White ShavingsConsists of baled unprinted, coated, and uncoated, shavings and sheets of whitegroundwood free printing paper. May contain a small percentage ofgroundwood. Prohibitive materials are not permitted. Total outthrows may notexceed 1%.
(29) (Grade not currently in use)
(30) Hard White ShavingsConsists of baled shavings or sheets of unprinted, untreated white groundwoodfree paper. Prohibitive materials are not permitted. Total outthrows may notexceed 1/2 of 1%.
(31) Hard White Envelope CuttingsConsists of baled groundwood free cuttings, shavings or sheets of unprinted,untreated and uncoated white envelope paper: Prohibitive materials are notpermitted. Total outthrows ma not exceed 1/2 of 1%.
(32) (Grade not currently in use)
(33) New Colored Envelope CuttingsConsists of baled groundwood free cuttings, shavings, or sheets of untreated,uncoated bleachable colored envelope paper. Prohibitive materials are notpermitted. Total outthrows may not exceed 2%.
(34) (Grade not currently in use)
(35) Semi Bleached CuttingsConsists of baled sheets and cuttings of unprinted, untreated, groundwood freepaper such as file folder stock, manila tabulating card trim, untreated milk cartonstock, or manila tag. Prohibitive materials are not permitted. Total outthrowsmay not exceed 2%.
(36) Manila Tabulating CardsConsists of printed groundwood free, bleachable manila-colored cards whichhave been manufactured for use in tabulating machines. This grade may containmanila-colored tabulating cards with tinted margins. Prohibitive materials are notpermitted. Total outthrows may not exceed 1%.
Copyright Institute of Scrap Recycling Industries Inc.,1325 G. Street, NW, Suite 1000, Washington, D.C. 20005. 202-737-1770. $12.Reprinted with permission. Note: �There may be commercial implications related to use of these specifications that are not spelled out
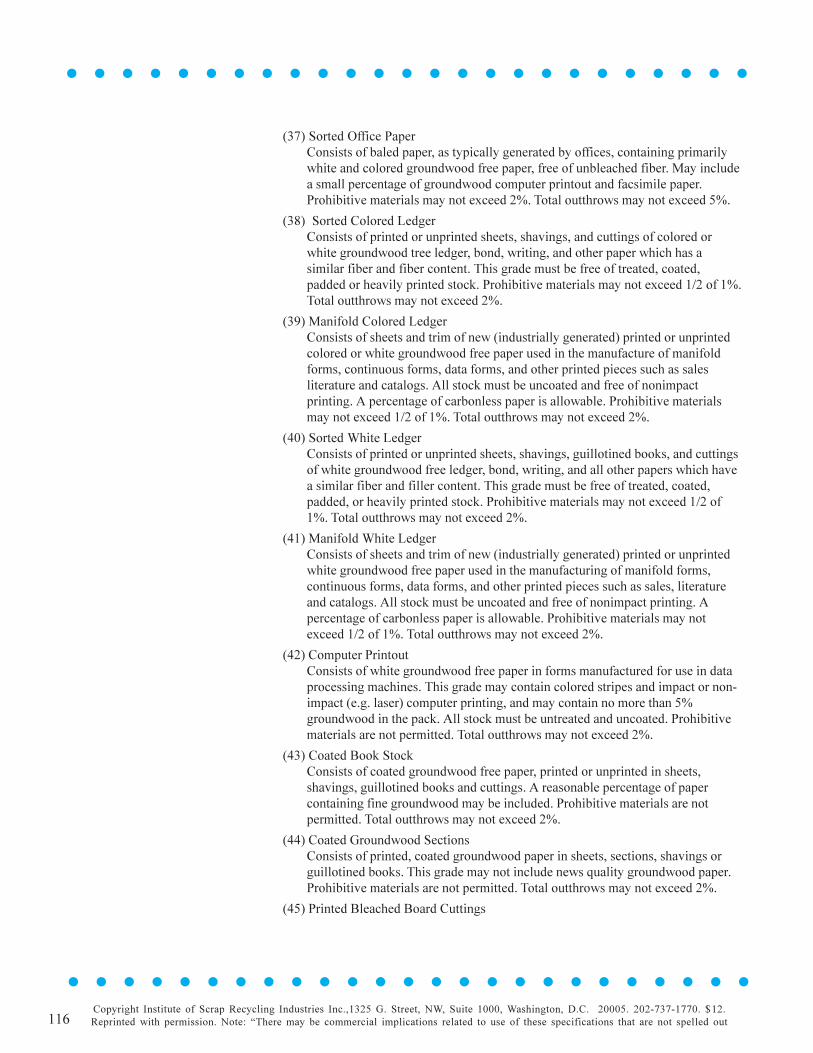
116
l l l l l l l l l l l l l l l l l l l l l l l l l
l l l l l l l l l l l l l l l l l l l l l l l l l
Practical Recycling Economics: Making the Numbers Work for Your ProgramRutgers University, Cook College Office of Continuing Professional Education. Copyright © 1999.
(37) Sorted Office PaperConsists of baled paper, as typically generated by offices, containing primarilywhite and colored groundwood free paper, free of unbleached fiber. May includea small percentage of groundwood computer printout and facsimile paper.Prohibitive materials may not exceed 2%. Total outthrows may not exceed 5%.
(38) Sorted Colored LedgerConsists of printed or unprinted sheets, shavings, and cuttings of colored orwhite groundwood tree ledger, bond, writing, and other paper which has asimilar fiber and fiber content. This grade must be free of treated, coated,padded or heavily printed stock. Prohibitive materials may not exceed 1/2 of 1%.Total outthrows may not exceed 2%.
(39) Manifold Colored LedgerConsists of sheets and trim of new (industrially generated) printed or unprintedcolored or white groundwood free paper used in the manufacture of manifoldforms, continuous forms, data forms, and other printed pieces such as salesliterature and catalogs. All stock must be uncoated and free of nonimpactprinting. A percentage of carbonless paper is allowable. Prohibitive materialsmay not exceed 1/2 of 1%. Total outthrows may not exceed 2%.
(40) Sorted White LedgerConsists of printed or unprinted sheets, shavings, guillotined books, and cuttingsof white groundwood free ledger, bond, writing, and all other papers which havea similar fiber and filler content. This grade must be free of treated, coated,padded, or heavily printed stock. Prohibitive materials may not exceed 1/2 of1%. Total outthrows may not exceed 2%.
(41) Manifold White LedgerConsists of sheets and trim of new (industrially generated) printed or unprintedwhite groundwood free paper used in the manufacturing of manifold forms,continuous forms, data forms, and other printed pieces such as sales, literatureand catalogs. All stock must be uncoated and free of nonimpact printing. Apercentage of carbonless paper is allowable. Prohibitive materials may notexceed 1/2 of 1%. Total outthrows may not exceed 2%.
(42) Computer PrintoutConsists of white groundwood free paper in forms manufactured for use in dataprocessing machines. This grade may contain colored stripes and impact or non-impact (e.g. laser) computer printing, and may contain no more than 5%groundwood in the pack. All stock must be untreated and uncoated. Prohibitivematerials are not permitted. Total outthrows may not exceed 2%.
(43) Coated Book StockConsists of coated groundwood free paper, printed or unprinted in sheets,shavings, guillotined books and cuttings. A reasonable percentage of papercontaining fine groundwood may be included. Prohibitive materials are notpermitted. Total outthrows may not exceed 2%.
(44) Coated Groundwood SectionsConsists of printed, coated groundwood paper in sheets, sections, shavings orguillotined books. This grade may not include news quality groundwood paper.Prohibitive materials are not permitted. Total outthrows may not exceed 2%.
(45) Printed Bleached Board Cuttings
Copyright Institute of Scrap Recycling Industries Inc.,1325 G. Street, NW, Suite 1000, Washington, D.C. 20005. 202-737-1770. $12.Reprinted with permission. Note: �There may be commercial implications related to use of these specifications that are not spelled out
117
l l l l l l l l l l l l l l l l l l l l l l l l l
l l l l l l l l l l l l l l l l l l l l l l l l l
Practical Recycling Economics: Making the Numbers Work for Your ProgramRutgers University, Cook College Office of Continuing Professional Education. Copyright © 1999.
Consists of groundwood free printed bleached board cuttings, free from misprintsheets, cartons, wax, greaseproof lamination, gilt, inks, adhesives or coatingsthat are insoluble. Prohibitive materials may not exceed 1/2 of 1%. Totaloutthrows may not exceed 2%.
(46) Misprinted Bleached BoardConsists of groundwood free misprint sheets and cartons of bleached board, freefrom wax, greaseproof lamination, gilt, and inks, adhesives or coatings that areinsoluble. Prohibitive materials may not exceed 1%. Total outthrows may notexceed 2%.
(47) Unprinted Bleached BoardConsists of groundwood free unprinted, untreated bleached board cuttings,sheets or rolls, free from wax, greaseproof lamination and adhesives or coatingsthat are insoluble. Prohibitive materials are not permitted. Total outthrows maynot exceed 1%.
(48) #1 Bleached Cup StockConsists of baled, untreated cuttings or sheets of coated or uncoated cup basestock. Cuttings with slight bleed may be included. Must be free of wax, poly, andother coatings that are insoluble. Prohibitive materials are not permitted. Totaloutthrows may not exceed 1/2 of 1%.
(49) #2 Printed Bleached Cup StockConsists of baled printed, untreated formed cups, cup die cuts, and misprintsheets of coated or uncoated cup base stock. Glues must be water soluble. Mustbe free of wax, poly, and other coatings that are insoluble. Prohibitive materialsare not permitted. Total outthrows may not exceed 1%.
(50) Unprinted Bleached Plate StockConsists of baled groundwood free bleached coated or uncoated, untreated andunprinted plate cuttings and sheets. Prohibitive materials are not permitted. Totaloutthrows may not exceed 1/2 of 1%.
(51) Printed Bleached Plate StockConsists of baled groundwood free bleached coated or uncoated, untreatedprinted plates and sheets. Must be free of coatings or inks that are insoluble.Prohibitive materials are not permitted. Total outthrows may not exceed 1%.
Copyright Institute of Scrap Recycling Industries Inc.,1325 G. Street, NW, Suite 1000, Washington, D.C. 20005. 202-737-1770. $12.Reprinted with permission. Note: �There may be commercial implications related to use of these specifications that are not spelled out
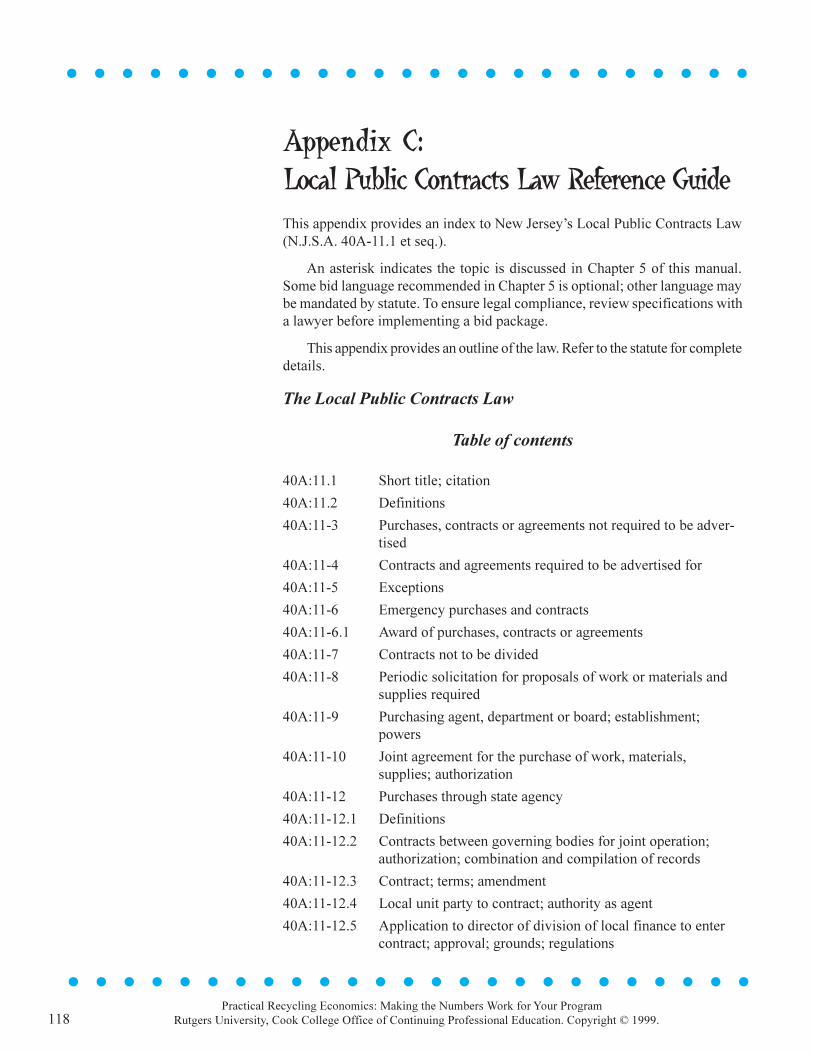
118
l l l l l l l l l l l l l l l l l l l l l l l l l
l l l l l l l l l l l l l l l l l l l l l l l l l
Practical Recycling Economics: Making the Numbers Work for Your ProgramRutgers University, Cook College Office of Continuing Professional Education. Copyright © 1999.
Appendix C:Local Public Contracts Law Reference GuideThis appendix provides an index to New Jersey�s Local Public Contracts Law(N.J.S.A. 40A-11.1 et seq.).
An asterisk indicates the topic is discussed in Chapter 5 of this manual.Some bid language recommended in Chapter 5 is optional; other language maybe mandated by statute. To ensure legal compliance, review specifications witha lawyer before implementing a bid package.
This appendix provides an outline of the law. Refer to the statute for completedetails.
The Local Public Contracts Law
Table of contents
40A:11.1 Short title; citation
40A:11.2 Definitions
40A:11-3 Purchases, contracts or agreements not required to be adver-tised
40A:11-4 Contracts and agreements required to be advertised for
40A:11-5 Exceptions
40A:11-6 Emergency purchases and contracts
40A:11-6.1 Award of purchases, contracts or agreements
40A:11-7 Contracts not to be divided
40A:11-8 Periodic solicitation for proposals of work or materials andsupplies required
40A:11-9 Purchasing agent, department or board; establishment;powers
40A:11-10 Joint agreement for the purchase of work, materials,supplies; authorization
40A:11-12 Purchases through state agency
40A:11-12.1 Definitions
40A:11-12.2 Contracts between governing bodies for joint operation;authorization; combination and compilation of records
40A:11-12.3 Contract; terms; amendment
40A:11-12.4 Local unit party to contract; authority as agent
40A:11-12.5 Application to director of division of local finance to entercontract; approval; grounds; regulations
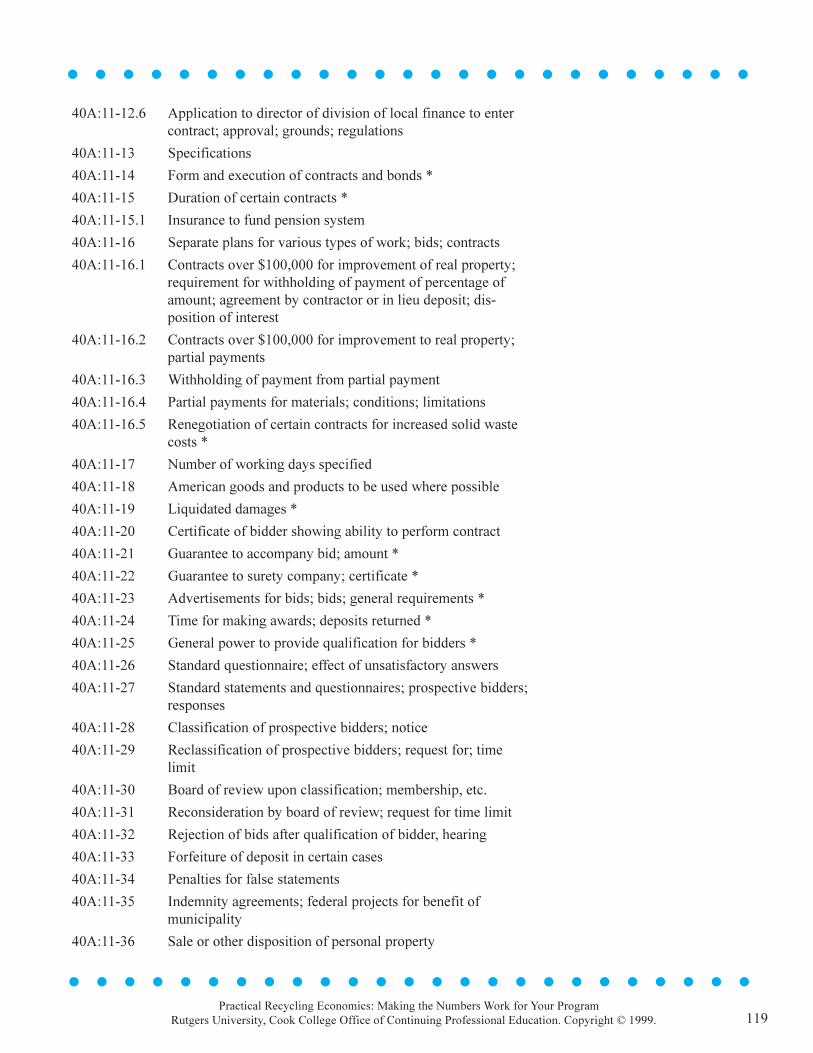
119
l l l l l l l l l l l l l l l l l l l l l l l l l
l l l l l l l l l l l l l l l l l l l l l l l l l
Practical Recycling Economics: Making the Numbers Work for Your ProgramRutgers University, Cook College Office of Continuing Professional Education. Copyright © 1999.
40A:11-12.6 Application to director of division of local finance to entercontract; approval; grounds; regulations
40A:11-13 Specifications
40A:11-14 Form and execution of contracts and bonds *
40A:11-15 Duration of certain contracts *
40A:11-15.1 Insurance to fund pension system
40A:11-16 Separate plans for various types of work; bids; contracts
40A:11-16.1 Contracts over $100,000 for improvement of real property;requirement for withholding of payment of percentage ofamount; agreement by contractor or in lieu deposit; dis-position of interest
40A:11-16.2 Contracts over $100,000 for improvement to real property;partial payments
40A:11-16.3 Withholding of payment from partial payment
40A:11-16.4 Partial payments for materials; conditions; limitations
40A:11-16.5 Renegotiation of certain contracts for increased solid wastecosts *
40A:11-17 Number of working days specified
40A:11-18 American goods and products to be used where possible
40A:11-19 Liquidated damages *
40A:11-20 Certificate of bidder showing ability to perform contract
40A:11-21 Guarantee to accompany bid; amount *
40A:11-22 Guarantee to surety company; certificate *
40A:11-23 Advertisements for bids; bids; general requirements *
40A:11-24 Time for making awards; deposits returned *
40A:11-25 General power to provide qualification for bidders *
40A:11-26 Standard questionnaire; effect of unsatisfactory answers
40A:11-27 Standard statements and questionnaires; prospective bidders;responses
40A:11-28 Classification of prospective bidders; notice
40A:11-29 Reclassification of prospective bidders; request for; timelimit
40A:11-30 Board of review upon classification; membership, etc.
40A:11-31 Reconsideration by board of review; request for time limit
40A:11-32 Rejection of bids after qualification of bidder, hearing
40A:11-33 Forfeiture of deposit in certain cases
40A:11-34 Penalties for false statements
40A:11-35 Indemnity agreements; federal projects for benefit ofmunicipality
40A:11-36 Sale or other disposition of personal property
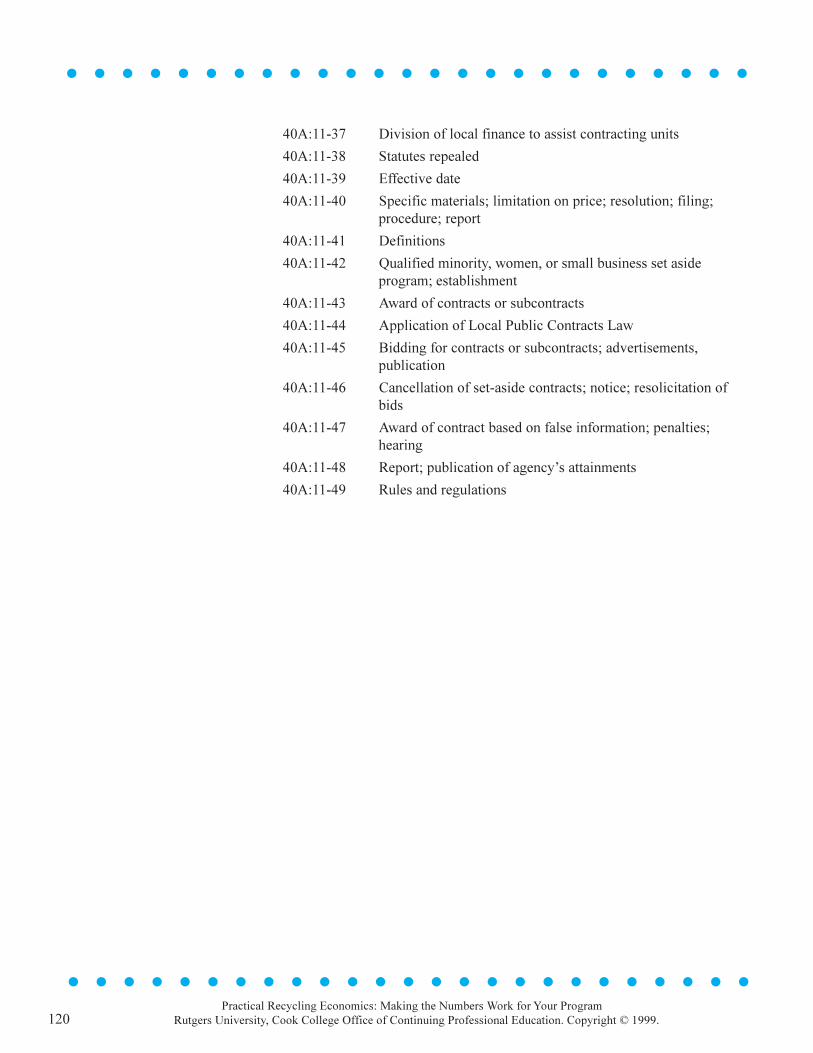
120
l l l l l l l l l l l l l l l l l l l l l l l l l
l l l l l l l l l l l l l l l l l l l l l l l l l
Practical Recycling Economics: Making the Numbers Work for Your ProgramRutgers University, Cook College Office of Continuing Professional Education. Copyright © 1999.
40A:11-37 Division of local finance to assist contracting units
40A:11-38 Statutes repealed
40A:11-39 Effective date
40A:11-40 Specific materials; limitation on price; resolution; filing;procedure; report
40A:11-41 Definitions
40A:11-42 Qualified minority, women, or small business set asideprogram; establishment
40A:11-43 Award of contracts or subcontracts
40A:11-44 Application of Local Public Contracts Law
40A:11-45 Bidding for contracts or subcontracts; advertisements,publication
40A:11-46 Cancellation of set-aside contracts; notice; resolicitation ofbids
40A:11-47 Award of contract based on false information; penalties;hearing
40A:11-48 Report; publication of agency�s attainments
40A:11-49 Rules and regulations
121
l l l l l l l l l l l l l l l l l l l l l l l l l
l l l l l l l l l l l l l l l l l l l l l l l l l
Practical Recycling Economics: Making the Numbers Work for Your ProgramRutgers University, Cook College Office of Continuing Professional Education. Copyright © 1999.
Appendix D: Uniform Solid WasteBid Specifications Reference GuideThis appendix provides an index for the Uniform Solid Waste Bid Specifications(N.J.A.C 7:26H-6.1 et seq.). Bids that combine recycling collection with solidwaste collection must conform to these specifications. A bid for recyclingcollection service alone must conform to the Local Public Contracts Law, butneed not follow the requirements of the Uniform Solid Waste Bid Specifications.
An asterisk indicates the topic is discussed in Chapter 5. Some bid languagerecommended in Chapter 5 is optional; other language may be mandated bystatute. To ensure legal compliance, review specifications with a lawyer beforeimplementing a bid package. This appendix is only an outline of the law. Referto the statute for complete details.
Uniform Solid Waste Bid Specifications Reference Guide
Table of contents
NJAC 7:26H-6.1 Purpose
NJAC 7:26H-6.2 Scope and applicability
NJAC 7:26H-6.3 Definitions
NJAC 7:26H-6.4 General instructions
NJAC 7:26H-6.5 Bidding requirements *
NJAC 7:26H-6.6 Conditions and limitations *
NJAC 7:26H-6.7 Award and execution of contract
NJAC 7:26H-6.8 Lowest responsible bidder *
NJAC 7:26H-6.9 Performance bonds *
NJAC 7:26H-6.10 Vehicle dedication affidavit
NJAC 7:26H-6.11 Contracts required to be filed
NJAC 7:26H-6.12 Work specifications
NJAC 7:26H-6.13 Conditions for curbside and rear yardcollection
122
l l l l l l l l l l l l l l l l l l l l l l l l l
l l l l l l l l l l l l l l l l l l l l l l l l l
Practical Recycling Economics: Making the Numbers Work for Your ProgramRutgers University, Cook College Office of Continuing Professional Education. Copyright © 1999.
NJAC 7:26H-6.14 Authorized disposal facility
NJAC 7:26H-6.15 Additional terms and conditions
NJAC 7:26H-6.16 Invoice and payment procedures
NJAC 7:26H-6.17 Insurance requirements *
NJAC 7:26H-6.18 Recycling *
Appendix A Contains the language and the format of the Uniform SolidWaste Bid Specifications.**
**In some circumstances the New Jersey Department of EnvironmentalProtection allows minor deviations from required language in the specifica-tions. You should consult a lawyer before doing so.
123
l l l l l l l l l l l l l l l l l l l l l l l l l
l l l l l l l l l l l l l l l l l l l l l l l l l
Practical Recycling Economics: Making the Numbers Work for Your ProgramRutgers University, Cook College Office of Continuing Professional Education. Copyright © 1999.
Appendix E: Worksheets
The following worksheets and the informationthey contain may be reproduced and used inyour recycling program. Please acknowledgethe source of the worksheets if they arereproduced for the purposes of distribution.
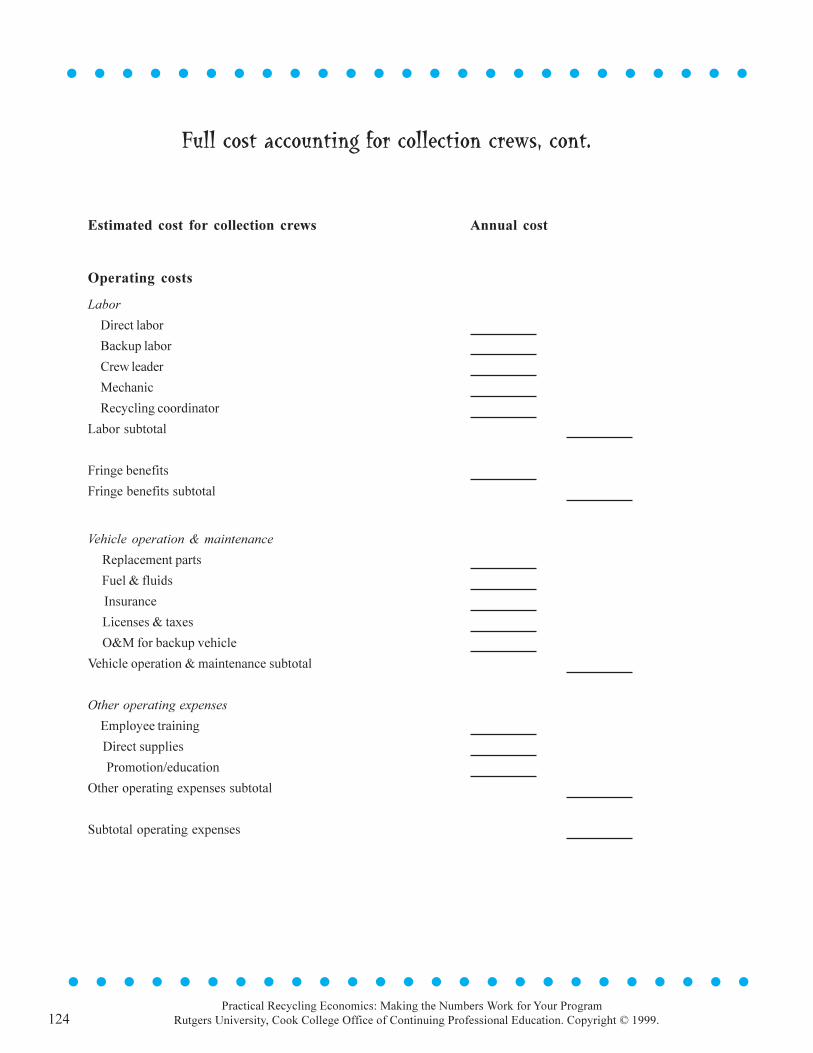
124
l l l l l l l l l l l l l l l l l l l l l l l l l
l l l l l l l l l l l l l l l l l l l l l l l l l
Practical Recycling Economics: Making the Numbers Work for Your ProgramRutgers University, Cook College Office of Continuing Professional Education. Copyright © 1999.
Estimated cost for collection crews Annual cost
Operating costs
Labor
Direct labor
Backup labor
Crew leader
Mechanic
Recycling coordinator
Labor subtotal
Fringe benefits
Fringe benefits subtotal
Vehicle operation & maintenance
Replacement parts
Fuel & fluids
Insurance
Licenses & taxes
O&M for backup vehicle
Vehicle operation & maintenance subtotal
Other operating expenses
Employee training
Direct supplies
Promotion/education
Other operating expenses subtotal
Subtotal operating expenses
Full cost accounting for collection crews, cont.
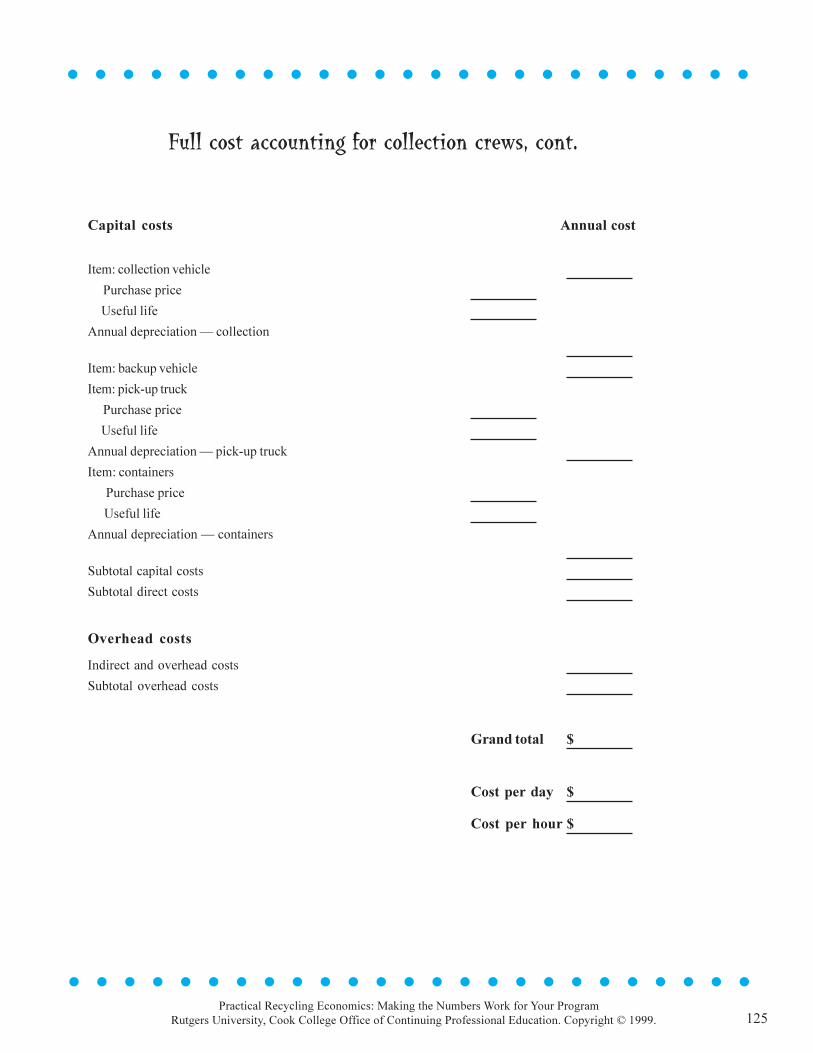
125
l l l l l l l l l l l l l l l l l l l l l l l l l
l l l l l l l l l l l l l l l l l l l l l l l l l
Practical Recycling Economics: Making the Numbers Work for Your ProgramRutgers University, Cook College Office of Continuing Professional Education. Copyright © 1999.
Capital costs Annual cost
Item: collection vehicle
Purchase price
Useful life
Annual depreciation � collection
Item: backup vehicle
Item: pick-up truck
Purchase price
Useful life
Annual depreciation � pick-up truck
Item: containers
Purchase price
Useful life
Annual depreciation � containers
Subtotal capital costs
Subtotal direct costs
Overhead costs
Indirect and overhead costs
Subtotal overhead costs
Grand total $
Cost per day $
Cost per hour $
Full cost accounting for collection crews, cont.
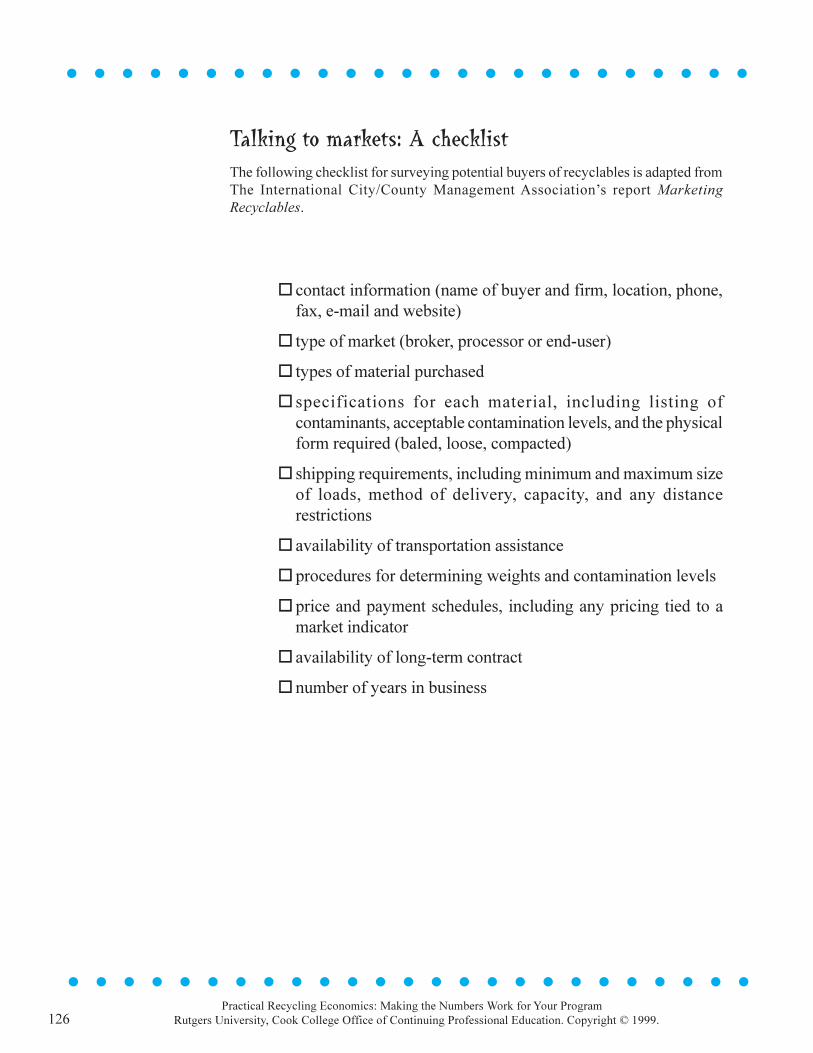
126
l l l l l l l l l l l l l l l l l l l l l l l l l
l l l l l l l l l l l l l l l l l l l l l l l l l
Practical Recycling Economics: Making the Numbers Work for Your ProgramRutgers University, Cook College Office of Continuing Professional Education. Copyright © 1999.
Talking to markets: A checklistThe following checklist for surveying potential buyers of recyclables is adapted fromThe International City/County Management Association�s report MarketingRecyclables.
o contact information (name of buyer and firm, location, phone,fax, e-mail and website)
o type of market (broker, processor or end-user)
o types of material purchased
o specifications for each material, including listing ofcontaminants, acceptable contamination levels, and the physicalform required (baled, loose, compacted)
o shipping requirements, including minimum and maximum sizeof loads, method of delivery, capacity, and any distancerestrictions
o availability of transportation assistance
oprocedures for determining weights and contamination levels
oprice and payment schedules, including any pricing tied to amarket indicator
o availability of long-term contract
onumber of years in business
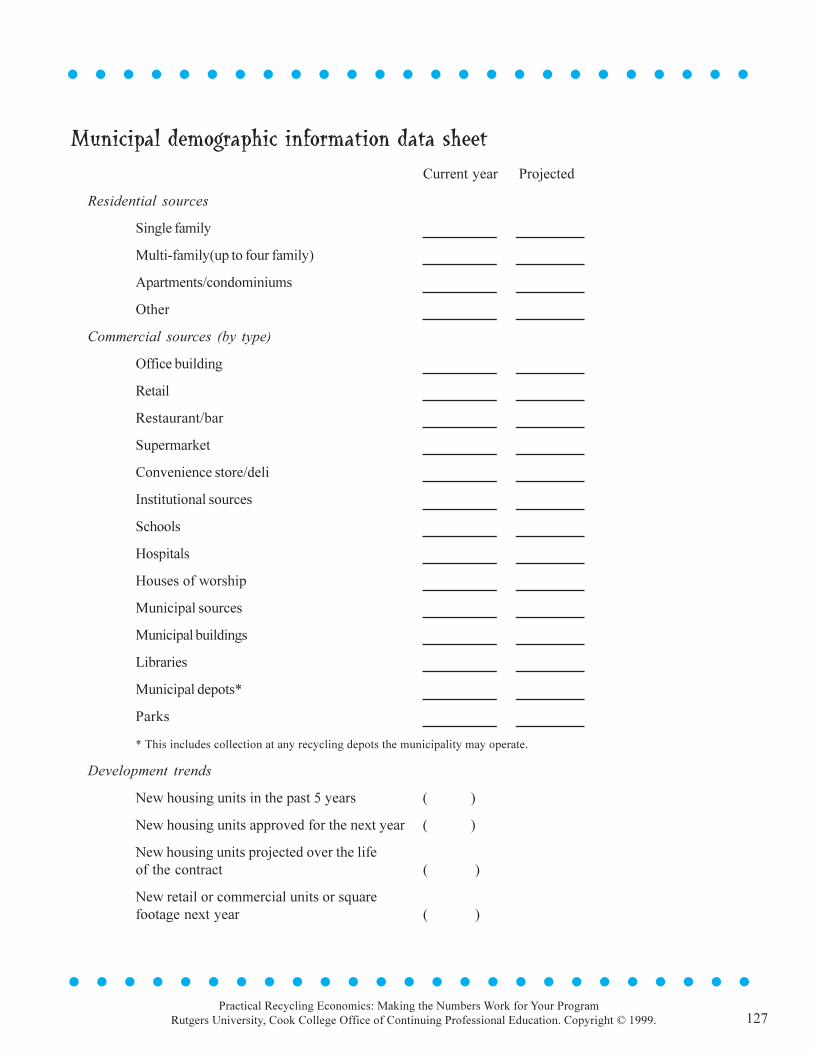
127
l l l l l l l l l l l l l l l l l l l l l l l l l
l l l l l l l l l l l l l l l l l l l l l l l l l
Practical Recycling Economics: Making the Numbers Work for Your ProgramRutgers University, Cook College Office of Continuing Professional Education. Copyright © 1999.
Current year Projected
Residential sources
Single family
Multi-family(up to four family)
Apartments/condominiums
Other
Commercial sources (by type)
Office building
Retail
Restaurant/bar
Supermarket
Convenience store/deli
Institutional sources
Schools
Hospitals
Houses of worship
Municipal sources
Municipal buildings
Libraries
Municipal depots*
Parks
* This includes collection at any recycling depots the municipality may operate.
Development trends
New housing units in the past 5 years ( )
New housing units approved for the next year ( )
New housing units projected over the lifeof the contract ( )
New retail or commercial units or squarefootage next year ( )
Municipal demographic information data sheet
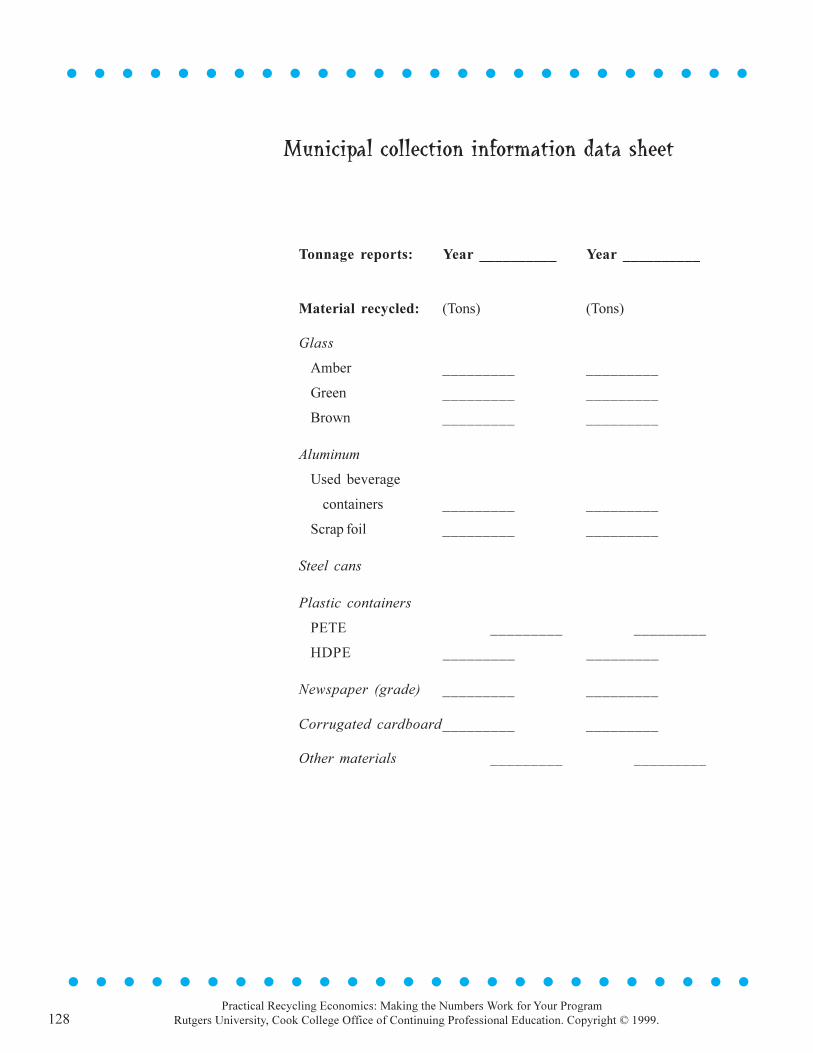
128
l l l l l l l l l l l l l l l l l l l l l l l l l
l l l l l l l l l l l l l l l l l l l l l l l l l
Practical Recycling Economics: Making the Numbers Work for Your ProgramRutgers University, Cook College Office of Continuing Professional Education. Copyright © 1999.
Tonnage reports: Year __________ Year __________
Material recycled: (Tons) (Tons)
Glass
Amber _________ _________
Green _________ _________
Brown _________ _________
Aluminum
Used beverage
containers _________ _________
Scrap foil _________ _________
Steel cans
Plastic containers
PETE _________ _________
HDPE _________ _________
Newspaper (grade) _________ _________
Corrugated cardboard_________ _________
Other materials _________ _________
Municipal collection information data sheet
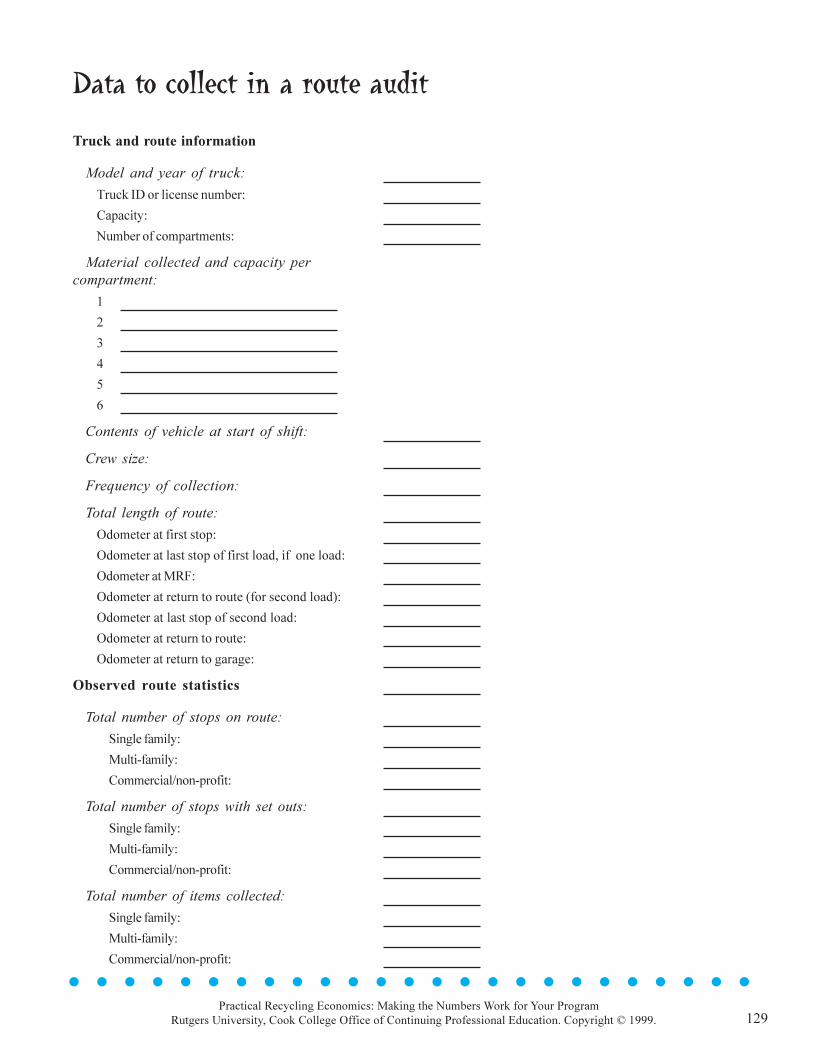
129
l l l l l l l l l l l l l l l l l l l l l l l l l
l l l l l l l l l l l l l l l l l l l l l l l l l
Practical Recycling Economics: Making the Numbers Work for Your ProgramRutgers University, Cook College Office of Continuing Professional Education. Copyright © 1999.
Truck and route information
Model and year of truck:
Truck ID or license number:
Capacity:
Number of compartments:
Material collected and capacity percompartment:
1
2
3
4
5
6
Contents of vehicle at start of shift:
Crew size:
Frequency of collection:
Total length of route:
Odometer at first stop:
Odometer at last stop of first load, if one load:
Odometer at MRF:
Odometer at return to route (for second load):
Odometer at last stop of second load:
Odometer at return to route:
Odometer at return to garage:
Observed route statistics
Total number of stops on route:
Single family:
Multi-family:
Commercial/non-profit:
Total number of stops with set outs:
Single family:
Multi-family:
Commercial/non-profit:
Total number of items collected:
Single family:
Multi-family:
Commercial/non-profit:
Data to collect in a route audit
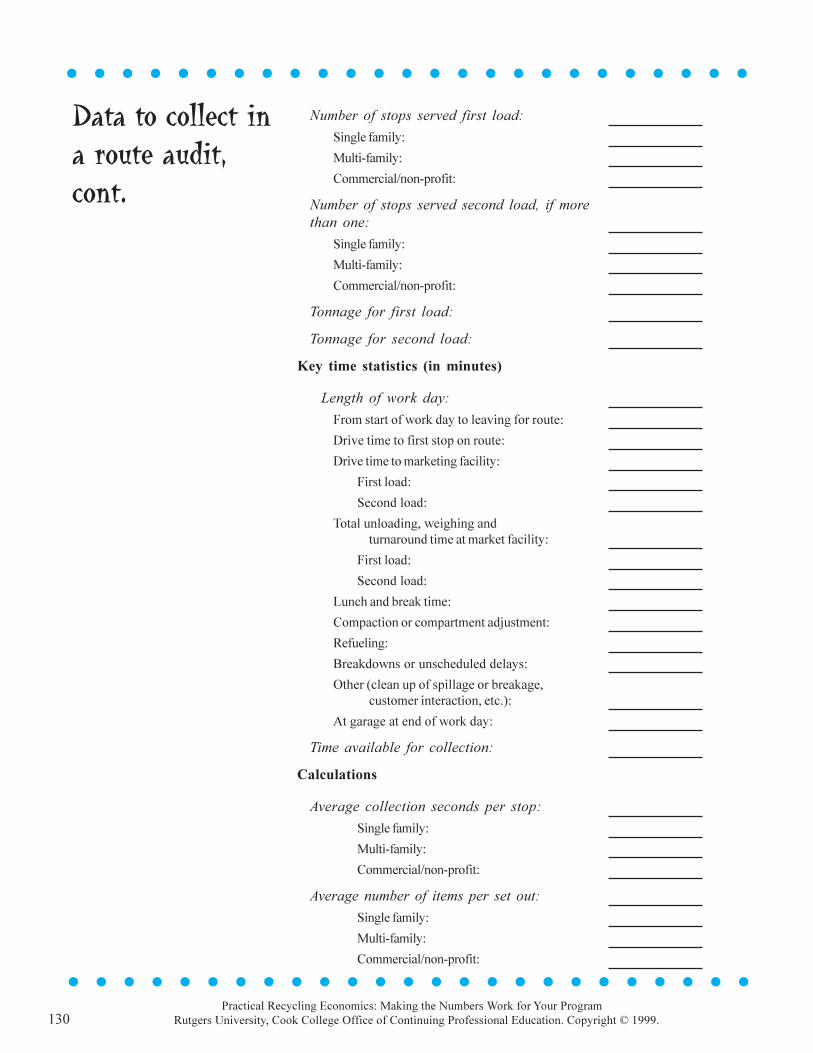
130
l l l l l l l l l l l l l l l l l l l l l l l l l
l l l l l l l l l l l l l l l l l l l l l l l l l
Practical Recycling Economics: Making the Numbers Work for Your ProgramRutgers University, Cook College Office of Continuing Professional Education. Copyright © 1999.
Number of stops served first load:
Single family:
Multi-family:
Commercial/non-profit:
Number of stops served second load, if morethan one:
Single family:
Multi-family:
Commercial/non-profit:
Tonnage for first load:
Tonnage for second load:
Key time statistics (in minutes)
Length of work day:
From start of work day to leaving for route:
Drive time to first stop on route:
Drive time to marketing facility:
First load:
Second load:
Total unloading, weighing andturnaround time at market facility:
First load:
Second load:
Lunch and break time:
Compaction or compartment adjustment:
Refueling:
Breakdowns or unscheduled delays:
Other (clean up of spillage or breakage,customer interaction, etc.):
At garage at end of work day:
Time available for collection:
Calculations
Average collection seconds per stop:
Single family:
Multi-family:
Commercial/non-profit:
Average number of items per set out:
Single family:
Multi-family:
Commercial/non-profit:
Data to collect ina route audit,cont.
131
l l l l l l l l l l l l l l l l l l l l l l l l l
l l l l l l l l l l l l l l l l l l l l l l l l l
Practical Recycling Economics: Making the Numbers Work for Your ProgramRutgers University, Cook College Office of Continuing Professional Education. Copyright © 1999.
AcknowledgmentsMany people generously contributed their time and expertise to produce thisdocument. Graphic artist Betsy Saul and copy editor Nadene Rehnby workedlong days and late nights with good humor under tight deadlines to produce themanual. At the New Jersey Department of Environmental Protection, VickiKerekes patiently and professionally administered the project, and Guy Watsonchampioned it within the department and helped guide the project from conceptto completion. Virginia Lamb, Dom D�Altilio and Penny Jones providedinsightful reviews of the manual.
Many of New Jersey�s most progressive solid waste professionals lentinformation or expertise that was used in the manual. They include: Skip Berg,Roseanne Brown, Mike Elko, Marie Kruzan, Brian Lefke, Ned Lipman, JerryLobosco, Bruce Logan, Patricia Lynn, Joseph Maraziti, Jr., John Metzger,Michael Mastrangelo, John Mulligan, Steve Rinaldi, Barbara Stevens (okay,she�s from Connecticut, but she does great work!), and Allan Zozzaro.
Finally, thanks to the staff members of the Cook College Office ofContinuing Professional Education � Marianne Mecca, Ellen Caruso, LesyleSmaldone, Ruby Hill, Kristen Smith Carlson, Carol McCoskey � for helpingevery step of the way.
132
New JerseyDepartment of Environmental Protection
MISSION STATEMENTVISION: The Department of Environmental Protection is
committed to providing a high quality of life for the residents ofNew Jersey.
MISSION: To assist the residents of New Jersey in preserving,sustaining, protecting and enhancing the environment to ensure theintegration of high environmental quality, public health and economicvitality. We will accomplish our mission in partnership with thegeneral public, business, environmental community and all levels ofgovernment by:
� Developing and integrating an environmental master planto assist the department and our partners in decision-making through increased availability of resource dataon the Geographic Information System
� Defining and publishing reasonable, clear and predictablescientifically based standards
� Achieving the department's goals in a manner thatencourages compliance and innovation
� Employing a decision-making process that is open,comprehensive, timely, predictable and efficient
� Providing residents and visitors with affordable accessto safe and clean open space, historic and natural resources
� Assuring that pollution is prevented in the most efficientand practical way possible
� Assuring that the best technology is planned and appliedto achieve long-term goals
� Assuring that non-treatable wastes are isolated, managedand controlled
� Enhancing environmental awareness and stewardshipthrough education and communication
� Fostering a work environment that attracts and retainsdedicated and talented people
� Committing to an ongoing evaluation of the department'sprogress toward achieving our mission