assessment of long-term gas sampling design at two commercial manure-belt layer barns
TRANSCRIPT
IMPORTANT COPYRIGHT INFORMATION The following PDF article was originally published in the Journal of the Air & Waste Management Association and is fully protected under the copyright laws of the United States of America. The author of this article alone has been granted permission to copy and distribute this PDF. Additional uses of the PDF/article by the author(s) or recipients, including posting it on a Web site, are prohibited without the express consent of the Air & Waste Management Association. If you are interested in reusing, redistributing, or posting online all or parts of the enclosed article, please contact the offices of the Journal of the Air & Waste Management Association at Phone: +1-412-232-3444, ext. 6027 E-mail: [email protected] Web: www.awma.org You may also contact the Copyright Clearance Center for all permissions related to the Journal of the Air & Waste Management Association: www.copyright.com.
Copyright © 2006 Air & Waste Management Association
Assessment of Long-Term Gas Sampling Design at TwoCommercial Manure-Belt Layer Barns
Li-Long Chai, Ji-Qin Ni, Yan Chen, Claude A. Diehl, Albert J. Heber, and Teng T. LimDepartment of Agricultural and Biological Engineering, Purdue University, West Lafayette, IN
ABSTRACTUnderstanding temporal and spatial variations of aerialpollutant concentrations is important for designing airquality monitoring systems. In long-term and continu-ous air quality monitoring in large livestock and poul-try barns, these systems usually use location-sharedanalyzers and sensors and can only sample air at limitednumber of locations. To assess the validity of the gassampling design at a commercial layer farm, a newmethodology was developed to map pollutant gas con-centrations using portable sensors under steady-state orquasi-steady-state barn conditions. Three assessmenttests were conducted from December 2008 to February2009 in two manure-belt layer barns. Each barn was140.2 m long and 19.5 m wide and had 250,000 birds.Each test included four measurements of ammonia andcarbon dioxide concentrations at 20 locations that cov-ered all operating fans, including six of the fans used inthe long-term sampling that represented three zonesalong the lengths of the barns, to generate data forcomplete-barn monitoring. To simulate the long-termmonitoring, gas concentrations from the six long-termsampling locations were extracted from the 20 assess-ment locations. Statistical analyses were performed totest the variances (F-test) and sample means (t test)between the 6- and 20-sample data. The study clearlydemonstrated ammonia and carbon dioxide concentra-tion gradients that were characterized by increasingconcentrations from the west to east ends of the barnsfollowing the under-cage manure-belt travel direction.Mean concentrations increased from 7.1 to 47.7 partsper million (ppm) for ammonia and from 2303 to 3454ppm for carbon dioxide from the west to east of thebarns. Variations of mean gas concentrations were
much less apparent between the south and north sidesof the barns, because they were 21.2 and 20.9 ppm forammonia and 2979 and 2951 ppm for carbon dioxide,respectively. The null hypotheses that the variancesand means between the 6- and 20-sample data wereequal at � � 0.05 (P � 0.05) were accepted for bothgases. The results proved that the long-term gas sam-pling design was valid in this instance and suggestedthat the gas sampling design in these two barns was oneof the best on the basis of available long-term monitor-ing instrumentation at reasonable cost.
INTRODUCTIONThe emissions of agricultural pollutant gases, includingammonia (NH3), hydrogen sulfide (H2S), sulfur dioxide(SO2), carbon dioxide (CO2), nitrous oxide (N2O), andmethane (CH4), have become an important environ-mental issue that has attracted growing attentionworldwide.1 There are many concerns about thesegases, especially for NH3, that relate to the negativeimpacts on animals’ and workers’ health, environmen-tal pollution, and/or ecological damage.2
High concentrations of NH3 inside animal housesrepresent potential health hazards to humans and ani-mals.3,4 Early studies in the 1960s revealed that NH3
adversely affected chickens in their resistance to infec-tion with disease virus5 and reduction of appetite.6
High concentrations of NH3 were also related to animalwelfare. Hens foraged, preened, and rested significantlymore in fresh air than in NH3-polluted environments.7
The National Institute for Occupational Safety andHealth (NIOSH) recommended exposure limit for NH3 is25 parts per million (ppm) or 18 mg/m3 as an 8-hr time-weighted average, and the NIOSH short-term exposurelimit over 15 min for NH3 is 35 ppm (27 mg/m3).8 How-ever, NH3 concentrations in some commercial egg layerhouses often substantially exceed the recommended levelof 25 ppm, especially in winter.9,10
Quality-assured measurements of NH3 and othergases are indispensable for determining indoor air qual-ity and gas emission rates and for developing mitiga-tion technologies at concentrated animal feeding oper-ations (CAFOs).11,12 In early agricultural air qualitystudies conducted from the 1950s to the 1970s, airpollutant concentration measurements in CAFOs usu-ally only lasted for several days or weeks and collectedsmall quantities of discrete samples.5,13–15 However, be-cause of variations in seasonal and diurnal gas and
IMPLICATIONSReliable air pollutant emission inventories are based onfield measurements and modeling that are constructedbased on sound scientific data. They are essential for gov-ernmental policy-making and regulation to protect the en-vironment without being unfair to livestock and poultryproducers. Methodology and technology used in field sam-pling and measurement can affect the validity and quality ofthe emission data. Assessment of the sampling methodol-ogy provides information that can assist in the uncertaintyevaluation of field measurement data and improve accura-cies of emission inventories.
TECHNICAL PAPER ISSN:1047-3289 J. Air & Waste Manage. Assoc. 60:702–710DOI:10.3155/1047-3289.60.6.702Copyright 2010 Air & Waste Management Association
702 Journal of the Air & Waste Management Association Volume 60 June 2010
building ventilation rates, long-term and continuousmonitoring is needed to cover day and night hours andseasonal variations. From the 1980s to the 1990s, threeindependent field studies in Europe and North Americaexpanded the monitoring duration to 6 months.16–18
Since the 2000s, more continuous field monitoring atlivestock and poultry facilities with longer duration tocover four seasons were reported.15 The longest termand largest scale continuous field monitoring in theworld so far is the National Air Emission MonitoringStudy (NAEMS), with 2 yr of monitoring at 14 CAFOs inthe United States.19
Long-term comprehensive agricultural air qualitystudies usually use advanced analytical gas analyzers forcontinuous gas concentration determination. However,because of the high costs of equipment and limitationsin funding, these studies typically can only afford alimited number of gas analyzers even in the mostheavily funded projects. A centralized extraction sam-pling methodology for multipoint pollutant measure-ment using location-shared analyzers and sensors(LSAS) was therefore developed and has been widelyused since the 1990s.17–21
With this method, sample air is extracted fromdifferent locations and transported to a single set ofmeasurement devices, which can be as far as severalhundred meters away from the sampling locations.Sample air is transported continuously via tubing, usu-ally made of Teflon.20 The instruments in the monitor-ing system measure gas concentrations in the sampleair from one sampling location for a certain duration(e.g., 10 min) before switching to the sample air fromanother location. An on-site computer system (OSCS)can be used to regulate the location, duration, se-quence, and frequency of sampling.15 The main advan-tage of using centralized extraction and LSAS is to re-duce total equipment costs. In addition, it reduces theerrors that may be introduced by the variations amonginstruments. This is especially important for compari-son studies (e.g., to test the efficiencies of a pollutionabatement technology).
However, LSAS trades sampling time at each loca-tion for more sampling locations. More sampling loca-tions result in less sampling time at each location.Therefore, there is a balance between the number ofsampling locations and the time committed to eachlocation. Because of the restriction of the system re-sponse time, the minimum sampling time spent at eachlocation cannot be too short, otherwise accuracy will besacrificed. Depending on system configuration, the typeof gas being measured, and response of gas analyzers inthe system, the sampling durations used in variousstudies have been 2 min,22 10 min,19 15 min,23 and 30min.24 NAEMS required sampling durations of 10-minat each barn exhaust air location and 20–30 min foroutdoor background air.
Commercial mechanically ventilated livestock andpoultry barns are usually equipped with multiple ven-tilation exhaust fans that control the quantity of airflowing through the barns. Aerial pollutant concentra-tions in the air exhausted from different fans can be
substantially different because gas concentration gradi-ents exist inside the barn. Therefore, to obtain accuratebarn emission rates, a complete-barn monitoring setupis needed to measure gas concentrations and airflowrates at each of the exhaust fans. Once the correctconcentrations and ventilation rates of all of the fansare known, the emission rate can be accurately calcu-lated using eq 1.
EB � �k�1
n
�Q0,k � �Co,k � Ci�� (1)
where Co,k is the gas concentration in outgoing air atexhaust fan k (mass/volume), Ci is the gas concentra-tion in incoming air flowing into the barn (mass/vol-ume), EB is the gas emission rate from the entire barn(mass/time), n is the total number of ventilation fans inthe barn, and Qo,k is the ventilation rate at fan k (vol-ume/time).
However, complete-barn monitoring at all exhaustfans usually cannot be performed during long-term airpollutant sampling in large commercial layer barns us-ing LSAS methodology because of limited resources. Inaddition, only a small portion of the ventilation fans inthe barns run all of the time. Among the NAEMS mon-itoring sites, the largest number of sampling locationswas six for a single barn that was equipped with 110ventilation fans. The largest number of sampling loca-tions at a multiroom site was 17, which allowed approx-imately 8.5 samples per location per day.19 Designing asampling system with representative sampling loca-tions is therefore critical to obtain reliable pollutantconcentration data in long-term measurement cam-paigns. Assessments of the appropriateness of thesesampling system designs can help to analyze the uncer-tainties of the measurement. Temporal and spatial vari-ations of aerial pollutant concentrations are importanttechnical challenges related to these assessments.Methodologies need to be developed and results ana-lyzed for the assessments. So far this issue has not beenaddressed in the literature.
The objectives of this paper are to (1) develop amethodology to assess sampling design in long-termcomprehensive air quality studies in CAFOs, and (2)evaluate the design of a long-term gas sampling systemat two commercial barns on the basis of field assess-ment tests.
MATERIALS AND METHODSLayer Barns
The study was conducted in two commercial manure-belt layer barns (denoted here as barns A and B) thatwere equipped with manure drying tunnels and werelocated in northern Indiana, where a 2-yr continuousmonitoring period started at the end of 2007 as one ofthe NAEMS’ barn sites (Figure 1). The two barns werealmost identical except for the distribution of fans 20–33. Each barn was 140.2 m long, 19.5 m wide, and11.5 m high and housed 250,000 layers. The ventilationsystem in each barn consisted of 88 130-cm diameter
Chai, Ni, Chen, Diehl, Heber, and Lim
Volume 60 June 2010 Journal of the Air & Waste Management Association 703
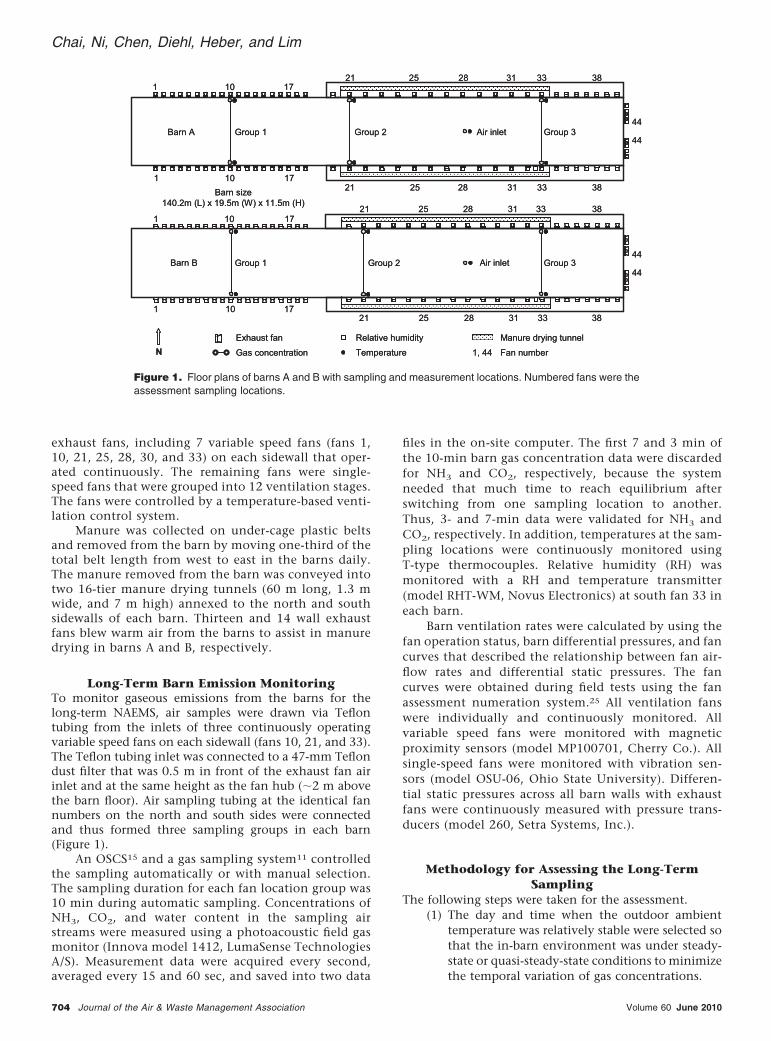
exhaust fans, including 7 variable speed fans (fans 1,10, 21, 25, 28, 30, and 33) on each sidewall that oper-ated continuously. The remaining fans were single-speed fans that were grouped into 12 ventilation stages.The fans were controlled by a temperature-based venti-lation control system.
Manure was collected on under-cage plastic beltsand removed from the barn by moving one-third of thetotal belt length from west to east in the barns daily.The manure removed from the barn was conveyed intotwo 16-tier manure drying tunnels (60 m long, 1.3 mwide, and 7 m high) annexed to the north and southsidewalls of each barn. Thirteen and 14 wall exhaustfans blew warm air from the barns to assist in manuredrying in barns A and B, respectively.
Long-Term Barn Emission MonitoringTo monitor gaseous emissions from the barns for thelong-term NAEMS, air samples were drawn via Teflontubing from the inlets of three continuously operatingvariable speed fans on each sidewall (fans 10, 21, and 33).The Teflon tubing inlet was connected to a 47-mm Teflondust filter that was 0.5 m in front of the exhaust fan airinlet and at the same height as the fan hub (�2 m abovethe barn floor). Air sampling tubing at the identical fannumbers on the north and south sides were connectedand thus formed three sampling groups in each barn(Figure 1).
An OSCS15 and a gas sampling system11 controlledthe sampling automatically or with manual selection.The sampling duration for each fan location group was10 min during automatic sampling. Concentrations ofNH3, CO2, and water content in the sampling airstreams were measured using a photoacoustic field gasmonitor (Innova model 1412, LumaSense TechnologiesA/S). Measurement data were acquired every second,averaged every 15 and 60 sec, and saved into two data
files in the on-site computer. The first 7 and 3 min ofthe 10-min barn gas concentration data were discardedfor NH3 and CO2, respectively, because the systemneeded that much time to reach equilibrium afterswitching from one sampling location to another.Thus, 3- and 7-min data were validated for NH3 andCO2, respectively. In addition, temperatures at the sam-pling locations were continuously monitored usingT-type thermocouples. Relative humidity (RH) wasmonitored with a RH and temperature transmitter(model RHT-WM, Novus Electronics) at south fan 33 ineach barn.
Barn ventilation rates were calculated by using thefan operation status, barn differential pressures, and fancurves that described the relationship between fan air-flow rates and differential static pressures. The fancurves were obtained during field tests using the fanassessment numeration system.25 All ventilation fanswere individually and continuously monitored. Allvariable speed fans were monitored with magneticproximity sensors (model MP100701, Cherry Co.). Allsingle-speed fans were monitored with vibration sen-sors (model OSU-06, Ohio State University). Differen-tial static pressures across all barn walls with exhaustfans were continuously measured with pressure trans-ducers (model 260, Setra Systems, Inc.).
Methodology for Assessing the Long-TermSampling
The following steps were taken for the assessment.(1) The day and time when the outdoor ambient
temperature was relatively stable were selected sothat the in-barn environment was under steady-state or quasi-steady-state conditions to minimizethe temporal variation of gas concentrations.
N
Barn size140.2m (L) x 19.5m (W) x 11.5m (H)
Barn A
1 10 17
1 10 17
1, 44
3825 3321 3128
44
44
Temperature Gas concentration
Manure drying tunnelExhaust fan
Fan number
1 10 17
1 10 17
Barn B Air inletGroup 1 Group 2 Group 3
3825 3321 3128
Air inletGroup 1 Group 2 Group 3
3825 3321 3128
3825 3321 3128
44
44
Relative humidity
Figure 1. Floor plans of barns A and B with sampling and measurement locations. Numbered fans were theassessment sampling locations.
Chai, Ni, Chen, Diehl, Heber, and Lim
704 Journal of the Air & Waste Management Association Volume 60 June 2010
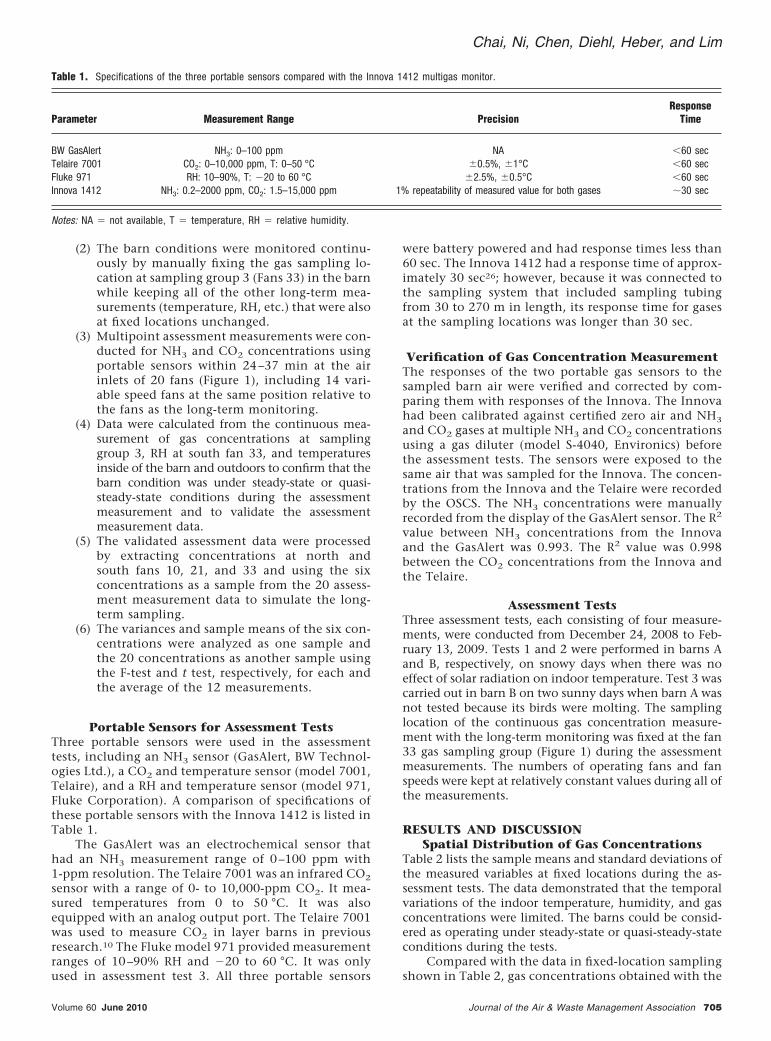
(2) The barn conditions were monitored continu-ously by manually fixing the gas sampling lo-cation at sampling group 3 (Fans 33) in the barnwhile keeping all of the other long-term mea-surements (temperature, RH, etc.) that were alsoat fixed locations unchanged.
(3) Multipoint assessment measurements were con-ducted for NH3 and CO2 concentrations usingportable sensors within 24–37 min at the airinlets of 20 fans (Figure 1), including 14 vari-able speed fans at the same position relative tothe fans as the long-term monitoring.
(4) Data were calculated from the continuous mea-surement of gas concentrations at samplinggroup 3, RH at south fan 33, and temperaturesinside of the barn and outdoors to confirm that thebarn condition was under steady-state or quasi-steady-state conditions during the assessmentmeasurement and to validate the assessmentmeasurement data.
(5) The validated assessment data were processedby extracting concentrations at north andsouth fans 10, 21, and 33 and using the sixconcentrations as a sample from the 20 assess-ment measurement data to simulate the long-term sampling.
(6) The variances and sample means of the six con-centrations were analyzed as one sample andthe 20 concentrations as another sample usingthe F-test and t test, respectively, for each andthe average of the 12 measurements.
Portable Sensors for Assessment TestsThree portable sensors were used in the assessmenttests, including an NH3 sensor (GasAlert, BW Technol-ogies Ltd.), a CO2 and temperature sensor (model 7001,Telaire), and a RH and temperature sensor (model 971,Fluke Corporation). A comparison of specifications ofthese portable sensors with the Innova 1412 is listed inTable 1.
The GasAlert was an electrochemical sensor thathad an NH3 measurement range of 0–100 ppm with1-ppm resolution. The Telaire 7001 was an infrared CO2
sensor with a range of 0- to 10,000-ppm CO2. It mea-sured temperatures from 0 to 50 °C. It was alsoequipped with an analog output port. The Telaire 7001was used to measure CO2 in layer barns in previousresearch.10 The Fluke model 971 provided measurementranges of 10–90% RH and 20 to 60 °C. It was onlyused in assessment test 3. All three portable sensors
were battery powered and had response times less than60 sec. The Innova 1412 had a response time of approx-imately 30 sec26; however, because it was connected tothe sampling system that included sampling tubingfrom 30 to 270 m in length, its response time for gasesat the sampling locations was longer than 30 sec.
Verification of Gas Concentration MeasurementThe responses of the two portable gas sensors to thesampled barn air were verified and corrected by com-paring them with responses of the Innova. The Innovahad been calibrated against certified zero air and NH3
and CO2 gases at multiple NH3 and CO2 concentrationsusing a gas diluter (model S-4040, Environics) beforethe assessment tests. The sensors were exposed to thesame air that was sampled for the Innova. The concen-trations from the Innova and the Telaire were recordedby the OSCS. The NH3 concentrations were manuallyrecorded from the display of the GasAlert sensor. The R2
value between NH3 concentrations from the Innovaand the GasAlert was 0.993. The R2 value was 0.998between the CO2 concentrations from the Innova andthe Telaire.
Assessment TestsThree assessment tests, each consisting of four measure-ments, were conducted from December 24, 2008 to Feb-ruary 13, 2009. Tests 1 and 2 were performed in barns Aand B, respectively, on snowy days when there was noeffect of solar radiation on indoor temperature. Test 3 wascarried out in barn B on two sunny days when barn A wasnot tested because its birds were molting. The samplinglocation of the continuous gas concentration measure-ment with the long-term monitoring was fixed at the fan33 gas sampling group (Figure 1) during the assessmentmeasurements. The numbers of operating fans and fanspeeds were kept at relatively constant values during all ofthe measurements.
RESULTS AND DISCUSSIONSpatial Distribution of Gas Concentrations
Table 2 lists the sample means and standard deviations ofthe measured variables at fixed locations during the as-sessment tests. The data demonstrated that the temporalvariations of the indoor temperature, humidity, and gasconcentrations were limited. The barns could be consid-ered as operating under steady-state or quasi-steady-stateconditions during the tests.
Compared with the data in fixed-location samplingshown in Table 2, gas concentrations obtained with the
Table 1. Specifications of the three portable sensors compared with the Innova 1412 multigas monitor.
Parameter Measurement Range PrecisionResponse
Time
BW GasAlert NH3: 0–100 ppm NA 60 secTelaire 7001 CO2: 0–10,000 ppm, T: 0–50 °C �0.5%, �1°C 60 secFluke 971 RH: 10–90%, T: 20 to 60 °C �2.5%, �0.5°C 60 secInnova 1412 NH3: 0.2–2000 ppm, CO2: 1.5–15,000 ppm 1% repeatability of measured value for both gases �30 sec
Notes: NA � not available, T � temperature, RH � relative humidity.
Chai, Ni, Chen, Diehl, Heber, and Lim
Volume 60 June 2010 Journal of the Air & Waste Management Association 705
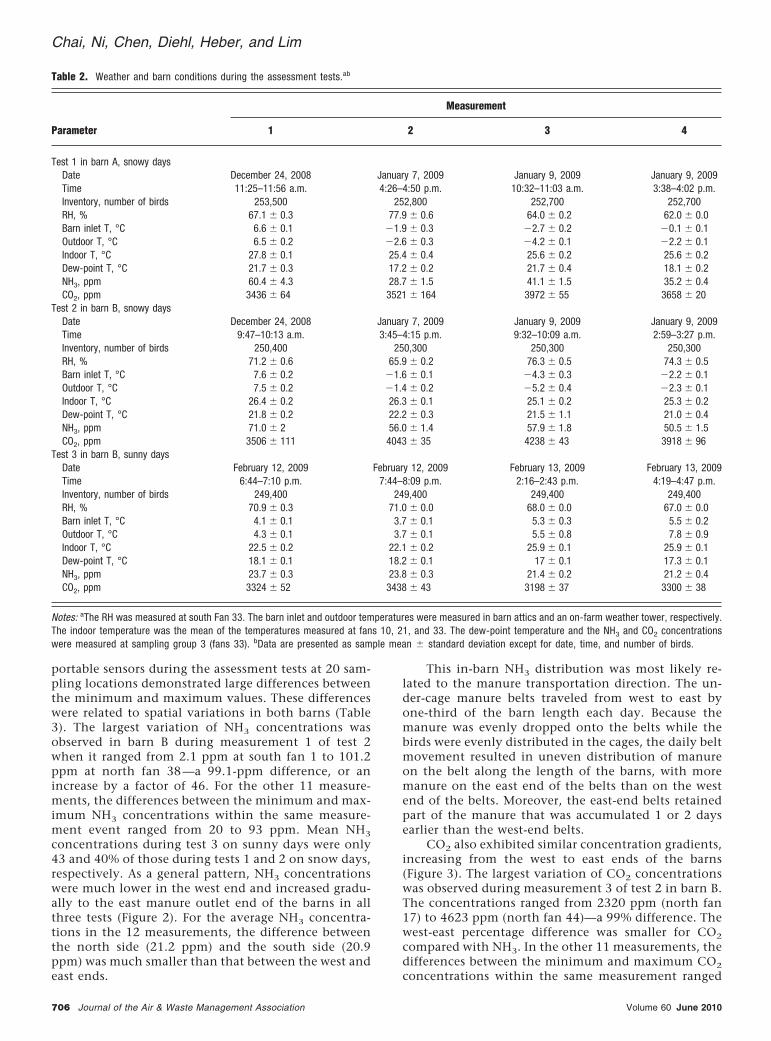
portable sensors during the assessment tests at 20 sam-pling locations demonstrated large differences betweenthe minimum and maximum values. These differenceswere related to spatial variations in both barns (Table3). The largest variation of NH3 concentrations wasobserved in barn B during measurement 1 of test 2when it ranged from 2.1 ppm at south fan 1 to 101.2ppm at north fan 38—a 99.1-ppm difference, or anincrease by a factor of 46. For the other 11 measure-ments, the differences between the minimum and max-imum NH3 concentrations within the same measure-ment event ranged from 20 to 93 ppm. Mean NH3
concentrations during test 3 on sunny days were only43 and 40% of those during tests 1 and 2 on snow days,respectively. As a general pattern, NH3 concentrationswere much lower in the west end and increased gradu-ally to the east manure outlet end of the barns in allthree tests (Figure 2). For the average NH3 concentra-tions in the 12 measurements, the difference betweenthe north side (21.2 ppm) and the south side (20.9ppm) was much smaller than that between the west andeast ends.
This in-barn NH3 distribution was most likely re-lated to the manure transportation direction. The un-der-cage manure belts traveled from west to east byone-third of the barn length each day. Because themanure was evenly dropped onto the belts while thebirds were evenly distributed in the cages, the daily beltmovement resulted in uneven distribution of manureon the belt along the length of the barns, with moremanure on the east end of the belts than on the westend of the belts. Moreover, the east-end belts retainedpart of the manure that was accumulated 1 or 2 daysearlier than the west-end belts.
CO2 also exhibited similar concentration gradients,increasing from the west to east ends of the barns(Figure 3). The largest variation of CO2 concentrationswas observed during measurement 3 of test 2 in barn B.The concentrations ranged from 2320 ppm (north fan17) to 4623 ppm (north fan 44)—a 99% difference. Thewest-east percentage difference was smaller for CO2
compared with NH3. In the other 11 measurements, thedifferences between the minimum and maximum CO2
concentrations within the same measurement ranged
Table 2. Weather and barn conditions during the assessment tests.ab
Parameter
Measurement
1 2 3 4
Test 1 in barn A, snowy daysDate December 24, 2008 January 7, 2009 January 9, 2009 January 9, 2009Time 11:25–11:56 a.m. 4:26–4:50 p.m. 10:32–11:03 a.m. 3:38–4:02 p.m.Inventory, number of birds 253,500 252,800 252,700 252,700RH, % 67.1 � 0.3 77.9 � 0.6 64.0 � 0.2 62.0 � 0.0Barn inlet T, °C 6.6 � 0.1 1.9 � 0.3 2.7 � 0.2 0.1 � 0.1Outdoor T, °C 6.5 � 0.2 2.6 � 0.3 4.2 � 0.1 2.2 � 0.1Indoor T, °C 27.8 � 0.1 25.4 � 0.4 25.6 � 0.2 25.6 � 0.2Dew-point T, °C 21.7 � 0.3 17.2 � 0.2 21.7 � 0.4 18.1 � 0.2NH3, ppm 60.4 � 4.3 28.7 � 1.5 41.1 � 1.5 35.2 � 0.4CO2, ppm 3436 � 64 3521 � 164 3972 � 55 3658 � 20
Test 2 in barn B, snowy daysDate December 24, 2008 January 7, 2009 January 9, 2009 January 9, 2009Time 9:47–10:13 a.m. 3:45–4:15 p.m. 9:32–10:09 a.m. 2:59–3:27 p.m.Inventory, number of birds 250,400 250,300 250,300 250,300RH, % 71.2 � 0.6 65.9 � 0.2 76.3 � 0.5 74.3 � 0.5Barn inlet T, °C 7.6 � 0.2 1.6 � 0.1 4.3 � 0.3 2.2 � 0.1Outdoor T, °C 7.5 � 0.2 1.4 � 0.2 5.2 � 0.4 2.3 � 0.1Indoor T, °C 26.4 � 0.2 26.3 � 0.1 25.1 � 0.2 25.3 � 0.2Dew-point T, °C 21.8 � 0.2 22.2 � 0.3 21.5 � 1.1 21.0 � 0.4NH3, ppm 71.0 � 2 56.0 � 1.4 57.9 � 1.8 50.5 � 1.5CO2, ppm 3506 � 111 4043 � 35 4238 � 43 3918 � 96
Test 3 in barn B, sunny daysDate February 12, 2009 February 12, 2009 February 13, 2009 February 13, 2009Time 6:44–7:10 p.m. 7:44–8:09 p.m. 2:16–2:43 p.m. 4:19–4:47 p.m.Inventory, number of birds 249,400 249,400 249,400 249,400RH, % 70.9 � 0.3 71.0 � 0.0 68.0 � 0.0 67.0 � 0.0Barn inlet T, °C 4.1 � 0.1 3.7 � 0.1 5.3 � 0.3 5.5 � 0.2Outdoor T, °C 4.3 � 0.1 3.7 � 0.1 5.5 � 0.8 7.8 � 0.9Indoor T, °C 22.5 � 0.2 22.1 � 0.2 25.9 � 0.1 25.9 � 0.1Dew-point T, °C 18.1 � 0.1 18.2 � 0.1 17 � 0.1 17.3 � 0.1NH3, ppm 23.7 � 0.3 23.8 � 0.3 21.4 � 0.2 21.2 � 0.4CO2, ppm 3324 � 52 3438 � 43 3198 � 37 3300 � 38
Notes: aThe RH was measured at south Fan 33. The barn inlet and outdoor temperatures were measured in barn attics and an on-farm weather tower, respectively.The indoor temperature was the mean of the temperatures measured at fans 10, 21, and 33. The dew-point temperature and the NH3 and CO2 concentrationswere measured at sampling group 3 (fans 33). bData are presented as sample mean � standard deviation except for date, time, and number of birds.
Chai, Ni, Chen, Diehl, Heber, and Lim
706 Journal of the Air & Waste Management Association Volume 60 June 2010
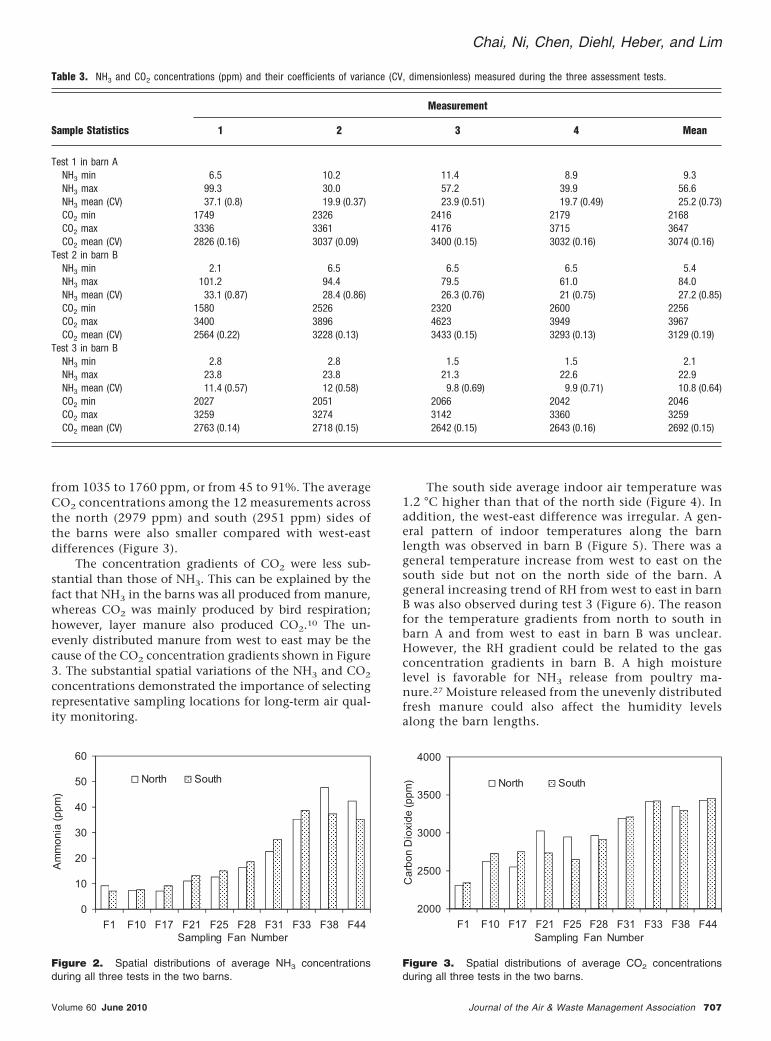
from 1035 to 1760 ppm, or from 45 to 91%. The averageCO2 concentrations among the 12 measurements acrossthe north (2979 ppm) and south (2951 ppm) sides ofthe barns were also smaller compared with west-eastdifferences (Figure 3).
The concentration gradients of CO2 were less sub-stantial than those of NH3. This can be explained by thefact that NH3 in the barns was all produced from manure,whereas CO2 was mainly produced by bird respiration;however, layer manure also produced CO2.10 The un-evenly distributed manure from west to east may be thecause of the CO2 concentration gradients shown in Figure3. The substantial spatial variations of the NH3 and CO2
concentrations demonstrated the importance of selectingrepresentative sampling locations for long-term air qual-ity monitoring.
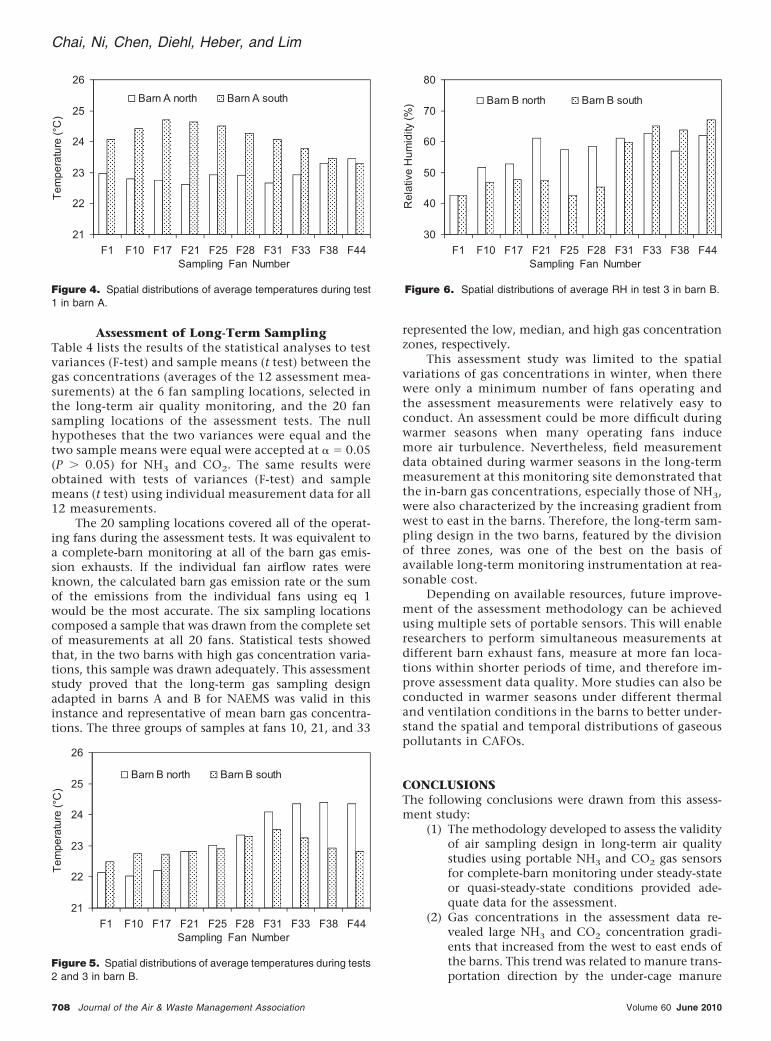
The south side average indoor air temperature was1.2 °C higher than that of the north side (Figure 4). Inaddition, the west-east difference was irregular. A gen-eral pattern of indoor temperatures along the barnlength was observed in barn B (Figure 5). There was ageneral temperature increase from west to east on thesouth side but not on the north side of the barn. Ageneral increasing trend of RH from west to east in barnB was also observed during test 3 (Figure 6). The reasonfor the temperature gradients from north to south inbarn A and from west to east in barn B was unclear.However, the RH gradient could be related to the gasconcentration gradients in barn B. A high moisturelevel is favorable for NH3 release from poultry ma-nure.27 Moisture released from the unevenly distributedfresh manure could also affect the humidity levelsalong the barn lengths.
0
10
20
30
40
50
60
F1 F10 F17 F21 F25 F28 F31 F33 F38 F44Sampling Fan Number
Am
mo
nia
(p
pm
)
North South
Figure 2. Spatial distributions of average NH3 concentrationsduring all three tests in the two barns.
2000
2500
3000
3500
4000
F1 F10 F17 F21 F25 F28 F31 F33 F38 F44Sampling Fan Number
Ca
rbo
n D
ioxi
de
(p
pm
) North South
Figure 3. Spatial distributions of average CO2 concentrationsduring all three tests in the two barns.
Table 3. NH3 and CO2 concentrations (ppm) and their coefficients of variance (CV, dimensionless) measured during the three assessment tests.
Sample Statistics
Measurement
1 2 3 4 Mean
Test 1 in barn ANH3 min 6.5 10.2 11.4 8.9 9.3NH3 max 99.3 30.0 57.2 39.9 56.6NH3 mean (CV) 37.1 (0.8) 19.9 (0.37) 23.9 (0.51) 19.7 (0.49) 25.2 (0.73)CO2 min 1749 2326 2416 2179 2168CO2 max 3336 3361 4176 3715 3647CO2 mean (CV) 2826 (0.16) 3037 (0.09) 3400 (0.15) 3032 (0.16) 3074 (0.16)
Test 2 in barn BNH3 min 2.1 6.5 6.5 6.5 5.4NH3 max 101.2 94.4 79.5 61.0 84.0NH3 mean (CV) 33.1 (0.87) 28.4 (0.86) 26.3 (0.76) 21 (0.75) 27.2 (0.85)CO2 min 1580 2526 2320 2600 2256CO2 max 3400 3896 4623 3949 3967CO2 mean (CV) 2564 (0.22) 3228 (0.13) 3433 (0.15) 3293 (0.13) 3129 (0.19)
Test 3 in barn BNH3 min 2.8 2.8 1.5 1.5 2.1NH3 max 23.8 23.8 21.3 22.6 22.9NH3 mean (CV) 11.4 (0.57) 12 (0.58) 9.8 (0.69) 9.9 (0.71) 10.8 (0.64)CO2 min 2027 2051 2066 2042 2046CO2 max 3259 3274 3142 3360 3259CO2 mean (CV) 2763 (0.14) 2718 (0.15) 2642 (0.15) 2643 (0.16) 2692 (0.15)
Chai, Ni, Chen, Diehl, Heber, and Lim
Volume 60 June 2010 Journal of the Air & Waste Management Association 707
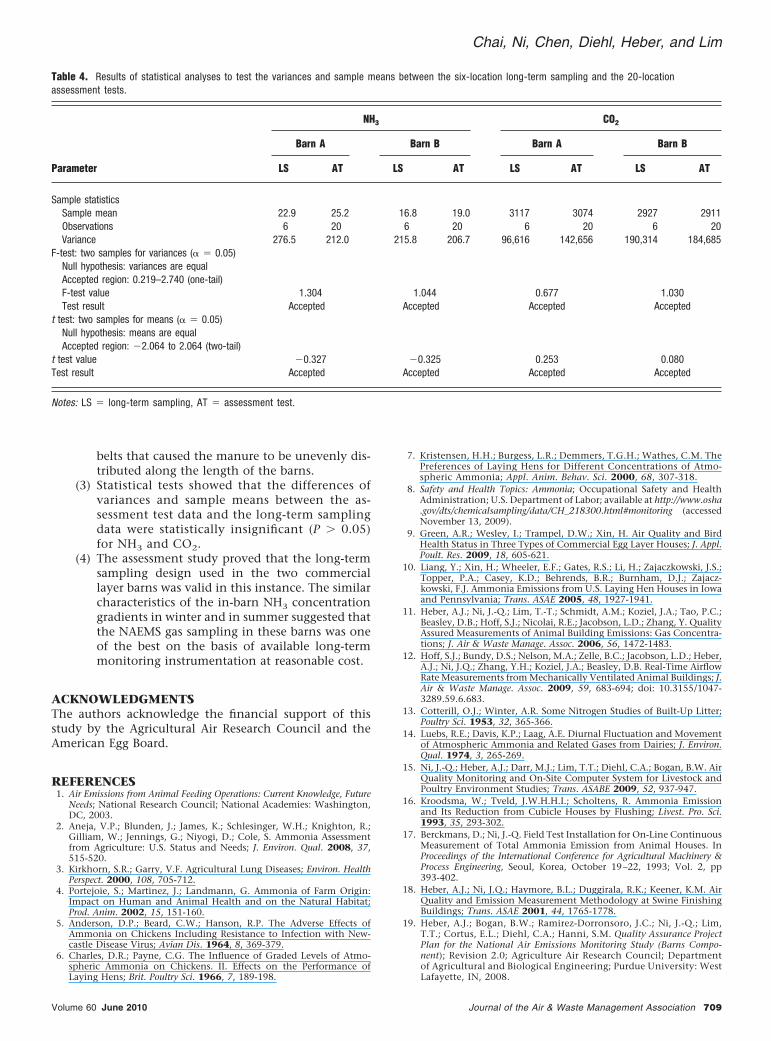
Assessment of Long-Term SamplingTable 4 lists the results of the statistical analyses to testvariances (F-test) and sample means (t test) between thegas concentrations (averages of the 12 assessment mea-surements) at the 6 fan sampling locations, selected inthe long-term air quality monitoring, and the 20 fansampling locations of the assessment tests. The nullhypotheses that the two variances were equal and thetwo sample means were equal were accepted at � � 0.05(P � 0.05) for NH3 and CO2. The same results wereobtained with tests of variances (F-test) and samplemeans (t test) using individual measurement data for all12 measurements.
The 20 sampling locations covered all of the operat-ing fans during the assessment tests. It was equivalent toa complete-barn monitoring at all of the barn gas emis-sion exhausts. If the individual fan airflow rates wereknown, the calculated barn gas emission rate or the sumof the emissions from the individual fans using eq 1would be the most accurate. The six sampling locationscomposed a sample that was drawn from the complete setof measurements at all 20 fans. Statistical tests showedthat, in the two barns with high gas concentration varia-tions, this sample was drawn adequately. This assessmentstudy proved that the long-term gas sampling designadapted in barns A and B for NAEMS was valid in thisinstance and representative of mean barn gas concentra-tions. The three groups of samples at fans 10, 21, and 33
represented the low, median, and high gas concentrationzones, respectively.
This assessment study was limited to the spatialvariations of gas concentrations in winter, when therewere only a minimum number of fans operating andthe assessment measurements were relatively easy toconduct. An assessment could be more difficult duringwarmer seasons when many operating fans inducemore air turbulence. Nevertheless, field measurementdata obtained during warmer seasons in the long-termmeasurement at this monitoring site demonstrated thatthe in-barn gas concentrations, especially those of NH3,were also characterized by the increasing gradient fromwest to east in the barns. Therefore, the long-term sam-pling design in the two barns, featured by the divisionof three zones, was one of the best on the basis ofavailable long-term monitoring instrumentation at rea-sonable cost.
Depending on available resources, future improve-ment of the assessment methodology can be achievedusing multiple sets of portable sensors. This will enableresearchers to perform simultaneous measurements atdifferent barn exhaust fans, measure at more fan loca-tions within shorter periods of time, and therefore im-prove assessment data quality. More studies can also beconducted in warmer seasons under different thermaland ventilation conditions in the barns to better under-stand the spatial and temporal distributions of gaseouspollutants in CAFOs.
CONCLUSIONSThe following conclusions were drawn from this assess-ment study:
(1) The methodology developed to assess the validityof air sampling design in long-term air qualitystudies using portable NH3 and CO2 gas sensorsfor complete-barn monitoring under steady-stateor quasi-steady-state conditions provided ade-quate data for the assessment.
(2) Gas concentrations in the assessment data re-vealed large NH3 and CO2 concentration gradi-ents that increased from the west to east ends ofthe barns. This trend was related to manure trans-portation direction by the under-cage manure
21
22
23
24
25
26
F1 F10 F17 F21 F25 F28 F31 F33 F38 F44Sampling Fan Number
Te
mpe
ratu
re (
°C)
Barn A north Barn A south
Figure 4. Spatial distributions of average temperatures during test1 in barn A.
21
22
23
24
25
26
F1 F10 F17 F21 F25 F28 F31 F33 F38 F44Sampling Fan Number
Te
mpe
ratu
re (
°C)
Barn B north Barn B south
Figure 5. Spatial distributions of average temperatures during tests2 and 3 in barn B.
30
40
50
60
70
80
F1 F10 F17 F21 F25 F28 F31 F33 F38 F44Sampling Fan Number
Re
lativ
e H
um
idity
(%
) Barn B north Barn B south
Figure 6. Spatial distributions of average RH in test 3 in barn B.
Chai, Ni, Chen, Diehl, Heber, and Lim
708 Journal of the Air & Waste Management Association Volume 60 June 2010
belts that caused the manure to be unevenly dis-tributed along the length of the barns.
(3) Statistical tests showed that the differences ofvariances and sample means between the as-sessment test data and the long-term samplingdata were statistically insignificant (P � 0.05)for NH3 and CO2.
(4) The assessment study proved that the long-termsampling design used in the two commerciallayer barns was valid in this instance. The similarcharacteristics of the in-barn NH3 concentrationgradients in winter and in summer suggested thatthe NAEMS gas sampling in these barns was oneof the best on the basis of available long-termmonitoring instrumentation at reasonable cost.
ACKNOWLEDGMENTSThe authors acknowledge the financial support of thisstudy by the Agricultural Air Research Council and theAmerican Egg Board.
REFERENCES1. Air Emissions from Animal Feeding Operations: Current Knowledge, Future
Needs; National Research Council; National Academies: Washington,DC, 2003.
2. Aneja, V.P.; Blunden, J.; James, K.; Schlesinger, W.H.; Knighton, R.;Gilliam, W.; Jennings, G.; Niyogi, D.; Cole, S. Ammonia Assessmentfrom Agriculture: U.S. Status and Needs; J. Environ. Qual. 2008, 37,515-520.
3. Kirkhorn, S.R.; Garry, V.F. Agricultural Lung Diseases; Environ. HealthPerspect. 2000, 108, 705-712.
4. Portejoie, S.; Martinez, J.; Landmann, G. Ammonia of Farm Origin:Impact on Human and Animal Health and on the Natural Habitat;Prod. Anim. 2002, 15, 151-160.
5. Anderson, D.P.; Beard, C.W.; Hanson, R.P. The Adverse Effects ofAmmonia on Chickens Including Resistance to Infection with New-castle Disease Virus; Avian Dis. 1964, 8, 369-379.
6. Charles, D.R.; Payne, C.G. The Influence of Graded Levels of Atmo-spheric Ammonia on Chickens. II. Effects on the Performance ofLaying Hens; Brit. Poultry Sci. 1966, 7, 189-198.
7. Kristensen, H.H.; Burgess, L.R.; Demmers, T.G.H.; Wathes, C.M. ThePreferences of Laying Hens for Different Concentrations of Atmo-spheric Ammonia; Appl. Anim. Behav. Sci. 2000, 68, 307-318.
8. Safety and Health Topics: Ammonia; Occupational Safety and HealthAdministration; U.S. Department of Labor; available at http://www.osha.gov/dts/chemicalsampling/data/CH_218300.html#monitoring (accessedNovember 13, 2009).
9. Green, A.R.; Wesley, I.; Trampel, D.W.; Xin, H. Air Quality and BirdHealth Status in Three Types of Commercial Egg Layer Houses; J. Appl.Poult. Res. 2009, 18, 605-621.
10. Liang, Y.; Xin, H.; Wheeler, E.F.; Gates, R.S.; Li, H.; Zajaczkowski, J.S.;Topper, P.A.; Casey, K.D.; Behrends, B.R.; Burnham, D.J.; Zajacz-kowski, F.J. Ammonia Emissions from U.S. Laying Hen Houses in Iowaand Pennsylvania; Trans. ASAE 2005, 48, 1927-1941.
11. Heber, A.J.; Ni, J.-Q.; Lim, T.-T.; Schmidt, A.M.; Koziel, J.A.; Tao, P.C.;Beasley, D.B.; Hoff, S.J.; Nicolai, R.E.; Jacobson, L.D.; Zhang, Y. QualityAssured Measurements of Animal Building Emissions: Gas Concentra-tions; J. Air & Waste Manage. Assoc. 2006, 56, 1472-1483.
12. Hoff, S.J.; Bundy, D.S.; Nelson, M.A.; Zelle, B.C.; Jacobson, L.D.; Heber,A.J.; Ni, J.Q.; Zhang, Y.H.; Koziel, J.A.; Beasley, D.B. Real-Time AirflowRate Measurements from Mechanically Ventilated Animal Buildings; J.Air & Waste Manage. Assoc. 2009, 59, 683-694; doi: 10.3155/1047-3289.59.6.683.
13. Cotterill, O.J.; Winter, A.R. Some Nitrogen Studies of Built-Up Litter;Poultry Sci. 1953, 32, 365-366.
14. Luebs, R.E.; Davis, K.P.; Laag, A.E. Diurnal Fluctuation and Movementof Atmospheric Ammonia and Related Gases from Dairies; J. Environ.Qual. 1974, 3, 265-269.
15. Ni, J.-Q.; Heber, A.J.; Darr, M.J.; Lim, T.T.; Diehl, C.A.; Bogan, B.W. AirQuality Monitoring and On-Site Computer System for Livestock andPoultry Environment Studies; Trans. ASABE 2009, 52, 937-947.
16. Kroodsma, W.; Tveld, J.W.H.H.I.; Scholtens, R. Ammonia Emissionand Its Reduction from Cubicle Houses by Flushing; Livest. Pro. Sci.1993, 35, 293-302.
17. Berckmans, D.; Ni, J.-Q. Field Test Installation for On-Line ContinuousMeasurement of Total Ammonia Emission from Animal Houses. InProceedings of the International Conference for Agricultural Machinery &Process Engineering, Seoul, Korea, October 19–22, 1993; Vol. 2, pp393-402.
18. Heber, A.J.; Ni, J.Q.; Haymore, B.L.; Duggirala, R.K.; Keener, K.M. AirQuality and Emission Measurement Methodology at Swine FinishingBuildings; Trans. ASAE 2001, 44, 1765-1778.
19. Heber, A.J.; Bogan, B.W.; Ramirez-Dorronsoro, J.C.; Ni, J.-Q.; Lim,T.T.; Cortus, E.L.; Diehl, C.A.; Hanni, S.M. Quality Assurance ProjectPlan for the National Air Emissions Monitoring Study (Barns Compo-nent); Revision 2.0; Agriculture Air Research Council; Departmentof Agricultural and Biological Engineering; Purdue University: WestLafayette, IN, 2008.
Table 4. Results of statistical analyses to test the variances and sample means between the six-location long-term sampling and the 20-locationassessment tests.
Parameter
NH3 CO2
Barn A Barn B Barn A Barn B
LS AT LS AT LS AT LS AT
Sample statisticsSample mean 22.9 25.2 16.8 19.0 3117 3074 2927 2911Observations 6 20 6 20 6 20 6 20Variance 276.5 212.0 215.8 206.7 96,616 142,656 190,314 184,685
F-test: two samples for variances (� � 0.05)Null hypothesis: variances are equalAccepted region: 0.219–2.740 (one-tail)F-test value 1.304 1.044 0.677 1.030Test result Accepted Accepted Accepted Accepted
t test: two samples for means (� � 0.05)Null hypothesis: means are equalAccepted region: 2.064 to 2.064 (two-tail)
t test value 0.327 0.325 0.253 0.080Test result Accepted Accepted Accepted Accepted
Notes: LS � long-term sampling, AT � assessment test.
Chai, Ni, Chen, Diehl, Heber, and Lim
Volume 60 June 2010 Journal of the Air & Waste Management Association 709
20. Ogink, N.W.M., Kroodsma, W. Reduction of Ammonia Emission froma Cow Cubicle House by Flushing with Water or a Formalin Solution;J. Agric. Eng. Res. 1996, 63, 197-204.
21. Moody, L.B.; Li, H.; Burns, R.T.; Xin, H.; Gates, R. In Proceedings of theWorkshop on Agricultural Air Quality: State of the Science; Aneja, V.P.,Schlesinger, W.H., Knighton, R., Jennings, G., Niyogi, D., Gilliam, W.,Duke, C.S., Eds.; 2006; pp 621-626.
22. Burns, R.T.; Li, H.; Xin, H.; Gates, R.S.; Overhults, D.G.; Earnest, J.;Moody, L. Greenhouse Gas (GHG) Emissions from Broiler Houses inthe Southeastern United States. Presented at the ASABE Annual Inter-national Meeting; American Society of Agricultural and BiologicalEngineers: St. Joseph, MI, 2008; Paper 084649.
23. Neser, S.; Depta, G.; Stegbauer, B.; Gronauer, A.; Schon, H. In Proceed-ings of the International Symposium on Ammonia and Odour Control fromAnimal Production Facilities; Voermans, J.A.M., Monteny, G.J., Eds.;1997; Vol. I, pp 129-136.
24. Ni, J.-Q.; Heber, A.J.; Lim, T.T.; Tao, P.C.; Schmidt, A.M. Methane andCarbon Dioxide Emission from Two Swine Finishing Barns; J. Environ.Qual. 2008, 37, 2001-2011.
25. Gates, R.S.; Casey, K.D.; Xin, H.; Wheeler, E.F.; Simmons, J.D. FanAssessment Numeration System (FANS) Design and Calibration Spec-ifications; Trans. ASAE 2004, 47, 1709-1715.
26. Product Data: 1412 Photoacoustic Field Gas-Monitor; Innova AirTechInstruments A/S: Ballerup, Denmark, 2008; BP 2008-11.
27. Liu, Z.F.; Wang, L.J.; Beasley, D.; Oviedo, E. Effect of Moisture Contenton Ammonia Emissions from Broiler Litter: a Laboratory Study; J.Atmos. Chem. 2007, 58, 41-53.
About the AuthorsLi-Long Chai is a Ph.D. graduate student in the Depart-ment of Agricutural Structures and Bioenvironmental En-gineering at China Agricultural University in Beijing,China, and a visiting scholar in the Department of Agri-cultural and Biological Engineering at Purdue Universityin West Lafayette, IN. Ji-Qin Ni is a research assistantprofessor, Yan Chen is a graduate research assistant,Claude A. Diehl is a field engineer, Albert J. Heber is aprofessor, and Teng T. Lim was a research assistantprofessor in the Department of Agricultural and Biologi-cal Engineering at Purdue University in West Lafayette,IN. Teng T. Lim is currently an assistant professor in theDepartment of Agricultural Systems Management at theUniversity of Missouri in Columbia, MO. Please addresscorrespondence to: Dr. Ji-Qin Ni, Agricultural and Bio-logical Engineering Department, 225 South UniversityStreet, Purdue University, West Lafayette, IN 47907;phone: �1-765-496-1733; fax: �1-765-496-1115;e-mail: [email protected].
Chai, Ni, Chen, Diehl, Heber, and Lim
710 Journal of the Air & Waste Management Association Volume 60 June 2010