assessment of environmental flows under limited data availability: case study of the acheloos river,...
TRANSCRIPT

Assessment of environmental flows under limited data availability ndash Case study of Acheloos River Greece A Efstratiadis1 A Tegos12 A Varveris2 and D Koutsoyiannis1 1Department of Water Resources and Environmental Engineering National Technical University of Athens Heroon Polytechneiou 5 GR-157 80 Zographou Greece andreasitiantuagr 2ECOS Consulting SA Makedonon 10 GR-115 21 Athens Greece Received hellip Citation
Abstract The lower course of Acheloos River is an important hydrosystem of Greece heavily modified by a cascade of four hydropower dams which is now being extended by two more dams in the upper course The design of the dams and hydropower facilities that are in operation has not considered any environmental criteria However in the last fifty years numerous methodologies have been proposed to assess the negative impacts of such projects to both the abiotic and biotic environment and to provide decision support towards establishing appropriate constraints on their operation typically in terms of minimum flow requirements In this study seeking for a more environmental-friendly operation of the hydrosystem we investigate the outflow policy from the most downstream dam examining alternative environmental flow approaches Accounting for data limitations we recommend the Basic Flow Method which is parsimonious and suitable for Mediterranean rivers whose flows exhibit strong variability across seasons We also show that the wetted perimeter ndash discharge method which is an elementary hydraulic approach provides consistent results even without using any flow data Finally we examine the adaptation of the proposed flow policy (including artificial flooding) to the real-time hydropower generation schedule and the management of the resulting conflicts
Key words modified rivers hydroelectric dams reservoir water balance basic maintenance flow wetted perimeter ndash discharge artificial floods
1 INTRODUCTION Because of their potential impacts on the natural morphological and hydrological conditions large-scale dams may cause significant modifications to downstream river systems and consequently to their ecological status Indeed the spatial and temporal regulation of flows caused by large reservoirs may result in major changes to the hydrological regime of the river which in turn may have negative impacts on both biotic and abiotic river conditions On the other hand we cannot ignore the beneficial and multidimensional role of such projects in terms of providing water for various uses (water supply irrigation hydroelectric production navigation etc) together with the reduction of flood risk Another possible benefit is the formation of an attractive lake landscape favouring the touristic development of the surrounding area In this respect it is essential to seek a compromise between the maximization of the socio-economic benefits and the environmental improvement which requires a holistic and rational viewpoint to handle the numerous contrasting or even conflicting interests (Christofides et al 2005 Efstratiadis and Hadjibiros 2011)
The Water Framework Directive (WFD 200060EU) pays particular attention to heavily modified water bodies for which it aims to ensure a good ecological and water quality status In this respect the water policies for regulated rivers have been thoroughly revised to incorporate ecological environmental and water quality criteria within the design and management of reservoirs towards provision (or re-
establishment) of natural conditions to some extent (Acreman et al 2008) In order to guarantee a sufficient level of protection for the downstream aquatic environment it is common practice to establish a minimum outflow rate through the reservoir either temporally steady (static) or variable (dynamic) which is typically called environmental ecological minimum or maintenance flow (Alcaacutezar et al 2008)
In recent decades environmental flow assessment (EFA) has become an issue of continuous research globally As reported by Tharme (2003) early approaches are found from the end of the 1940s in the western USA in the same article are listed 207 different methods within 44 countries In fact regulations of such kind are very old and must have been invented based on common sense and empirical criteria The following example of flow regulation in Greece survives owing to epigraphic evidence from the 5th century BC (Davies 1996 see also Koutsoyiannis 2012) It refers to the ancient site Gortyn crossed by the river Lithaios today called Mitropolianos which dominates the valley of Messara Crete and starts with an invocation to gods (translation by Davies 1996)
laquoΘιοί τocirc ποταmicroocirc αἴ κα κατὰ τὸ microέττον τὰν ῥοὰν θιθῆι ῥῆν κατὰ το Ϝὸν αυτocirc θιθεmicroένōι ἄπατον ἤmicroην Τὰν δὲ ῥοὰν λείπεν ὄττον κατέκει ἀ ἐπrsquo ἀγορᾶι δέπυρα ἤ πλίον microεῖον δὲ microὴraquo
(Gods If anyone makes the flow run from the middle of the river towards his own [property] it is without penalty for the person so doing [He is] to leave the flow as wide as the bridge that the agora holds or more but not less)
EFA has become a major issue in watershed management for which numerous approaches are in use of all levels of complexity in general these are classified in four categories referred to as hydrological hydraulic rating habitat simulation and holistic Comprehensive reviews of these methods are provided by Tharme (2003) Acreman and Dunbar (2004) and Petts (2009) There exist many interpretations of EFA For instance Tharme (2003) defines the problem as ldquoan assessment of how much of the original flow of a river that should continue to flow down it and onto its floodplains in order to maintain specified valued features of the ecosystemrdquo Another definition is provided within the Brisbane Declaration (2007) asserting that ldquoenvironmental flows describe the quantity quality and timing of water flows required to sustain freshwater and estuarine ecosystems and the human livelihoods and well-being that depend on themrdquo While the latter definition is more general it gives the impression that EFA is rather a theoretical issue involving the estimation of the water needs of ecosystems under pristine (ie unmodified) river conditions In contrast the former definition accepts the existence of two flow regimes an original and a modified one Nevertheless any EFA should be accompanied by an operational plan for the management of the water resources This should compromise the environmental needs with the human ones under all technical economical and institutional constraints In this context EFA is an essential yet not unique component in defining sustainable riverdam operation rules which requires an integrated and system-wide viewpoint
After defining the environmental objectives the next step is their incorporation into the management policy of the existing reservoir system Typically these objectives are addressed in terms of external constraints to reservoir stages and outflows (eg Harman and Stewardson 2005 Suen and Eheart 2006 Suen 2011) The outlines of each policy first depend on the purpose of the project because different types of dams alter natural flow regimes in different ways (Richter and Thomas
2007) This article puts emphasis on large-scale hydroelectric reservoirs the role of which is of key importance with regard to scheduling of energy production at the national level Traditionally their management is determined through pre-specified operation rules with the goal of maximizing energy revenue while meeting other water uses In this context the regulation of outflows is determined by both the long- and the short-term energy demand the temporal variability of which is radically different to the variability of the natural flows Obviously the flexibility of the hydropower generation schedule is restricted when the outflow policy is also determined by environmental constraints In general the latter limit the contribution of peak hydropower plants to adapting the power supply to the demand and to providing certain ancillary services to the electrical grid (Peacuterez-Diacuteaz and Wilhelmi 2010) For this reason the task of adapting the operation rules of large-scale hydropower systems to account for environmental requirements is far from straightforward To our knowledge the practical aspects of this issue which is a challenging multidisciplinary problem have gained little attention in the literature For instance Jager and Smith (2008) reviewed decision-making efforts and optimization techniques to problems involving both hydropower and environmental criteria Renoumlfaumllt et al (2010) investigated the impacts of hydropower generation on freshwater ecosystems and discuss efficient mitigation measures Beilfuss (2010) developed a simulation model using a 97-year historical flow series to assess the trade-offs between environmental flow scenarios and hydropower generation in the Lower Zambezi Basin Mozambique A simulation-based approach using the HEC-5 package was also employed by Babel et al (2012) in order to improve the operation of the hydropower system of La Nga river basin Vietnam
In this study we review alternative EFA approaches that are suitable for areas with limited data availability and investigate their implementation within the operation of the hydroelectric scheme of Acheloos River which produces more than 40 of the hydroelectric energy in Greece while its estuary is of major ecological importance protected under the Ramsar Convention In order to estimate the environmental demand at the estuary we attempted to ldquoreconstructrdquo the natural flows along the river for a 42-year period using rather limited hydrological data (ie sparse flow measurements and reservoir level and outflow data on a daily basis) Next we revised the outflow scheduling through the most downstream dam taking into account the results of the EFA analysis and the real-time management of the related infrastructures (power plants channels etc) The whole methodology can be used as a framework for similar studies involving heavily-modified Mediterranean rivers where the only available data are daily discharge records
2 PARSIMONIOUS ENVIRONMENTAL FLOW MODELS OVERVIEW 21 Problem statement It is recognized that the health and sustainability of river ecosystems depends on multiple factors including flow regime river hydraulics (eg geometry of channel and riparian zone) level of exploitation presence of physical barriers to connectivity etc (Acreman and Dunbar 2004) Thus it involves a number of biological geomorphological physical and chemical processes in a river that forms and maintains aquatic ecosystems (Suen and Eheart 2006) However an overall evaluation of all the above factors within an EFA study is extremely difficult Despite the important advances towards understanding the complex eco-hydrological processes and their interactions the amount and time length of the required information (in terms of field observations) remains the most important restricting factor Therefore
in many real-world applications the problem is normally handled under significantly limited data availability (eg Smakhtin et al 2006) In such cases it is essential to seek parsimonious EFA approaches in terms of data requirements
Among the various methodologies that are available in the literature the most parsimonious ones are the so-called hydrological and hydraulic rating approaches In the former category fall a large variety of methods from very simple rules-of-thumb to more sophisticated procedures all of which use streamflow time series as a single input Quoting Palau and Alcaacutezar (1996) streamflow can be considered as the lsquogenetic code of the riverrsquo driving the relationship between the hydrological variability and the physical and biological river structure and dynamics In fact the flow regime determines the hydraulic and geomorphologic characteristics of the river (distribution of velocities and depths bank form bed width bed substrate types sediment transport) which in turn determine both the abiotic structure and the biotic composition of the riverine ecosystems This is a rather straightforward task when such data are available in gauging stations operating for quite a long time (15-20 years) and under natural flow regimes (Richter et al 1997 Alcaacutezar et al 2008 Kennard et al 2010) Yet in case of regulated rivers a pre-processing is essential to obtain the so-called ldquonaturalizedrdquo time series since after the construction of the dam the flow regime is radically modified The suggested time resolution of flow data is at least daily although mean monthly data are also suitable for some simple methods
On the other hand hydraulic rating approaches assume that hydraulics is the key driver of the river ecosystem integrity In this context they evaluate a number of hydraulic morphological and geometrical characteristics (particularly the wetted perimeter) and establish links with habitat availability of target biota 22 Elementary hydrological methods In elementary hydrological approaches also referred to as desktop or lookup-table methods the critical minimum flow is expressed in terms of statistical indices such as percentages of annual flows or percentiles from a flow-duration curve (Acreman and Dunbar 2004) A characteristic index-based approach is imposed by the French Freshwater Fishing Law of 1984 which requires that residual flows in bypassed sections of a river must be at least 140 of the mean annual flow (MAF) for existing schemes and 110 of MAF for new ones (Acreman et al 2008) Similar standards have been employed in many countries and incorporated in the related environmental legislation In particular the minimum average monthly flow has been generally used in Greece to determine the flow to be maintained below dams In Spain the 10 of MAF is generally employed for river basins with limited information while the routine values in Portugal are 25 to 50 of MAF (Tharme 2003)
While most of the aforementioned standards are rather empirical the Tennant (1976) method (also known as Montana method) is the first one attempting to quantify a correlation between the streamflow regime and the resilience of fish fauna Its development required the collection of a huge amount of field habitat hydraulic and biological data during a 20 year-period The method identifies a critical flow rate for the summer and winter months (expressed as percentage of MAF) according to the river conditions For the dry period the proposed ratios are 10 for poor to fair quality (survival) 20 for good habitat and 30 for excellent habitat while for the wet period the corresponding ratios are 30 40 and 50 respectively
The flow targets are also assessed by considering specific exceedence percentiles of flow duration curves derived from statistical analysis of daily discharge records (Smakhtin 2001) For instance the Q95 (ie the flow which is equalled or
exceeded 95 time) is adopted as a minimum standard in UK Australia Taiwan and Bulgaria while Canada and Brazil typically use the Q90 discharge On the other hand some countries consider much less conservative thresholds such as the Q364 which corresponds to the minimum daily flow of the year and it is practically estimated as the 997 discharge quantile Specifically the UK standard ie Q95 was recently specified by a multidisciplinary team of lead water scientists and competent authorities who are responsible for implementing the WFD (Acreman et al 2008) In this context the team of fish ecologists recommended various abstraction thresholds as a percentage of flow on the day in excess of the natural Q95 which is encountered as the lower limit for fish maintenance The Q95 was also proposed by hydrology experts on the basis of hydraulic data retrieved from 65 sites over UK
23 Advanced hydrological methods Instead of imposing a time-constant flow constraint advanced hydrological approaches account for the variability of flows at multiple temporal scales (monthly seasonal and annual) and thus they are purported to be more ecologically relevant The most representative of them are the Basic Flow Method (BFM Palau and Alcaacutezar 1996) and the Range of Variability Approach (RVA Richter et al 1996 1997)
The BFM was developed and broadly applied in Spain (especially across the Ebro watershed) but in recent years it has also gained increasing recognition elsewhere It is based on the study of irregularities in hydrological series of daily mean flows using the simple moving average model as a tool to extract the relevant information Its key assumption is that organisms living in a river system are adapted to it and therefore the biological cycles and ecological requirements are adapted to the seasonal fluctuations of flows Given that the organisms can withstand significantly low flow conditions for limited time periods the method wishes to determine the average duration and magnitude of such periods on the basis of up to 100-day moving average time series (since in Mediterranean rivers the low-flow period lasts about three months) Summarizing Palau and Alcaacutezar (2012) the computational procedure is the following First we identify the so-called basic flow Qb which is the absolutely minimum discharge that should be maintained along the river In this respect we calculate the moving averages of daily flows from one-day to 100-day intervals for at least ten years For each year i and each interval k we extract the minimum flow value qi
k accounting for an annual period starting in April ie the so-called ldquohydrobiologicalrdquo year Next we calculate the relative increment between each pair of consecutive minima as follows
bik = (qi
k ndash qikndash1) qi
kndash1 (1)
For each year i we select the moving average flow qikmax with the largest relative
increment the mean value of all qikmax represents the basic flow Qb
In order to maintain the river ecosystem as close as possible to the natural conditions it is also important to represent the temporal variability in the proposed regulated flow regime In this context for each month j we estimate the so-called basic maintenance flow by the formula
BMFj = Qb (Qmean j Qmin j)050 (2)
where Qmean j and Qmin j are the mean and minimum discharge of month j In reality the BFM constitutes a broad management proposal including a
number of issues affecting the biological functioning of regulated rivers Thus apart from a monthly schedule of minimum maintenance flows it also accounts for the so-
called ldquobankfull flowrdquo which represents the dominant discharge in channels at dynamic equilibrium and it is usually calculated as the 15 year flood (this is a generally accepted value although a wider range of estimates of the corresponding return period have been reported in the literature particularly in semi-arid climates cf Shamir et al 2013) as well as the ldquomaximum flowrdquo estimated as the 25-year flood The method is now incorporated within the Spanish regulation implementing the obligations of the WFD
The RVA is even more complex since it uses 32 parameters to describe the hydrologic changes that are directly related to the quality of ecosystems The so-called indicators of hydrological alteration (IHA) are grouped into five categories
(1) The mean monthly flow values providing a general measure of habitat availability or suitability (eg humidity for riparian vegetation water for land animals)
(2) The magnitude and duration of hydrological extremes (floods and droughts) which are associated with environmental stress and disturbance (eg dehydration for animals anaerobic stress for plants) and also affect the colonization processes
(3) The timing of annual extreme conditions associated with the life cycles of various organisms the reproductive behaviour and the accessibility to specific habitats
(4) The frequency and the duration of high and low flows which are associated with the soil moisture regime in the riparian zone the soil characteristics the duration and extent of specific seasonal habitats the river geomorphology etc
(5) The rate and frequency of change in conditions which describe the abruptness and number of intra-annual cycles of environmental variation and thus provide a measure of the rate and frequency of environmental changes
In a modified flow regime the IHA parameters should be maintained within the limits of their natural variability In the absence of other ecological information a threshold of one standard deviation from the mean value of each parameter is suggested as a default limit in order to set the environmental flow targets 24 Hydraulic rating methodologies Input data for hydraulic rating approaches (also known as habitat retention methods) are both historical flow records and cross-section data Since the available aquatic habitat for given flow conditions is by definition determined by the wetted perimeter of the channel most of these approaches use the above geometrical characteristic as basic tool for ecological evaluation The rationale is that the wetted perimeter of shallow and wide rivers is more sensitive against flow changes in comparison to narrow and deep ones (Acreman and Dunbar 2004) In particular the wetted perimeterndashdischarge breakpoint has been extensively employed to define optimum or minimum flows for fish rearing in the USA from the middle 70s The breakpoint (also referred to as inflection point) is the point where the slope of the stage-discharge curve changes (decreases) so that a large increase of flow results in a small increase of perimeter The lowest breakpoint in the curve is taken to represent a critical discharge below which habitat conditions for aquatic organisms rapidly become unfavourable (Gippel and Stewardson 1998) In the absence of in situ hydrometric data the Manningrsquos equation is generally used to identify the stage-discharge relationship in which the detection of the breakpoint can be made either graphically or analytically The analysis should be implemented in few selected cross-sections particularly in shallow areas (eg riffles) or areas with important ecological characteristics which are considered as critically limiting biotopes The obvious
assumption is that the protection of the most critical hydraulic areas ensures the maintenance of the entire aquatic ecosystem
3 CASE STUDY 31 The river Acheloos and its hydroelectric reservoir system The case study involves the assessment of environmental flows of the Acheloos River and their implementation within an operational management plan The Acheloos River is located in Central Western Greece and is the largest river of the country in terms of flow and the second one in terms of length (~220 km) Its river basin depicted in Fig 1 covers an area of 5027 km2 The mean annual precipitation reaches 1350 mm and the mean annual (naturalized) discharge at the estuary is estimated to be 1369 m3s which corresponds to an equivalent depth of more than 850 mm and a runoff coefficient of 63 In the mountainous areas due to the domination of low permeability formations (flysch) the mean annual runoff exceeds 1000 mm and the runoff coefficient is around 70 ndash an outstanding percentage for Mediterranean catchments
From the early 1960s the Public Power Corporation (PPC) constructed four major dams and interconnected hydropower stations in the middle and lower course of the river Their characteristics are summarized in Table 1 The system hosts 43 of the installed hydropower capacity of the country ie 1302 out of 3060 MW and today produces 42 of the annual hydroelectric energy ie 1880 out of 4500 GWh (official data by the PCC Argirakis 2009) The oldest dam (Plastiras) is located on a tributary of Acheloos (Tavropos) and diverts the entire runoff of its upstream basin (161 km2) to the adjacent plain of Thessaly for irrigation and water supply also taking advantage of an exceptional hydraulic head ranging from 561 to 577 m The other three dams (Kremasta Kastraki Stratos) form a cascade along the main river course In particular the Kremasta dam with a height of 160 m is the highest earth dam in Europe The reservoir with total storage capacity of 4500 hm3 extends up to 80 km2 and it is the largest in Greece while the hydropower station with installed capacity of 160 MW is also the largest in Greece Apart from energy production the system provides water for domestic supply and irrigation as well as flood control to the downstream areas (Aetoloacarnania plain)
Future configurations of the system have been also studied involving the interbasin transport of part of the upstream flows of Acheloos to Thessaly Some components of this system are completed In particular the dam and the hydropower plant of Mesochora in the upper Acheloos course have been operationally ready for more than a decade but the reservoir is kept empty and the project is out of function due to opposition by ecologists and local communities The interbasin transfer tunnel is also almost complete while the dam at Sykia at the beginning of the tunnel is under construction and some of the preliminary works are completed Critical assessments of the situation have been provided by Koutsoyiannis (2011) and Fourniotis (2012) 32 The Acheloos estuary and its ecological importance The environmental value of the entire river basin of Acheloos is indisputable For instance the riverine ecosystems in the upper and middle course have been identified as important habitats for many threatened species of freshwater fish and birds Fortunately this part of the basin is only slightly influenced by human interventions Yet the most important and sensitive ecosystems are hosted in the estuary extended areas of which belong to the NATURA 2000 sites while the Acheloos Delta is protected by the Ramsar Convention (Varveris et al 2010)
The geomorphological and hydrodynamic conditions of the estuary (eg distribution of brackish and freshwater) favoured the development of important wetlands such as lagoons coastal salt lacustrine and freshwater marshes with remarkable biological diversity (Fourniotis 2012) In particular in the lower course and the estuary three main types of riparian forests grow ie riparian forests with Salix alba and Populus nigra as dominant species a forest of Fraxinus angustifolia and clusters with Tamarix parviflora and Vitex agnus-castus Regarding fish fauna 41 species have been identified including Endangered Sturgeon (Acipencer Sturio) Barbus Albanicus Barbus Peloponnesius Trichonovelonitsa (Cobitis Trichonica) Greek Dromitsa (Rutilus Ylikiensis) as well as the unique European species of Silurus Aristotelis Birds are the largest group of vertebrates recording 259 species (Fulica Atra Larus Genei Egretta Alba Phalacrocorax Carbo Aythya ferina Anas Penelope etc) For this reason the Acheloos Delta has also been included in the Special Bird Areas list Finally there exist at least 20 species of reptiles and amphibians that are protected at international level For analytical information on the flora and fauna of the broader area the reader is referred to the Filotis website a database for the natural environment of Greece (httpfilotisitiantuagr) 33 The actual management policy The actual operation of the hydrosystem is mainly determined by the energy demand (usually for peak energy production) the irrigation demand during the summer period is of less importance The management of these uses requires large-scale regulations and abstractions (including the diversion of the sum of runoff of the upstream Tavropos basin) which radically changed the former flow regime of the river particularly in the lower course and the estuary In fact the temporal variability of flows became much smoother and flood phenomena were very rare during the last four decades The substantial differences between the natural and modified hydrological conditions are illustrated in Fig 2 which compares on a monthly basis the main statistical characteristics of historical outflows from the most downstream dam (Stratos) and the ldquonaturalizedrdquo flows The latter are estimated according to the methodology described in section 43 The data refer to the period 1990-2008 ie after the completion of Stratos works (1989)
The hydrological changes were also accompanied by major changes in the land management practices in the Aetoloacarnania plain due to the release of extended fertile areas Even the floodplains of Acheloos very close to the main course have been occupied by agricultural activities and temporary settlements This practice apart from being illegal and dangerous (since the flood risk is reduced but not eliminated) further contributes to the environmental degradation of the lower course areas Moreover the PCC is obliged to adjust its control policy of the reservoirs in order to avoid conflicts with local society in case of damages due to inundations In this context the outflow downstream of Stratos is not allowed to exceed the discharge capacity of the penstocks while the spillway remains ndash except for very rare cases ndash out of use (Koutsoyiannis et al 2012) However this requires keeping empty storage in the reservoirs which is actually inefficient in terms of hydroelectric energy management 34 Update of the environmental terms of Acheloos hydrosystem The environmental terms for the operation of the reservoir system were specified in the mid-1990rsquos within the environmental impact assessment study (EIA) of the upper Acheloos project (Hydroexygiantiki 1995) This was one of the first studies in Greece
dealing with the estimation of environmental flows Among other things it envisaged the maintenance of a seasonally constant minimum flow of 213 m3s downstream of the Stratos dam The above constraint was determined through statistical analysis of the mean monthly naturalized discharges of the drier month (August) The proposed value equals the 5-year minimum discharge ie the discharge with 80 exceedance probability The study also determined the ecological flow downstream of the rest of the dams of the interbasin transport plan (Fig 1)
The environmental terms involving the existing scheme of works (ie Kremasta Kastraki and Stratos) were incorporated within the related legislation only in 2007 In 2009 the PCC appointed a new study (ECOS Consultants 2009 see also Varveris et al 2010) to investigate two key issues (a) the suitability of the formerly proposed environmental flow taking into account the most recent hydrological data as well as the advances in the field and (b) the adaptation of the management practices and the design of the related hydraulic works (if necessary) to implement the proposed environmental policy
4 HYDROLOGICAL ANALYSIS 41 Outline of methodology The investigation of the flow regime of the river is a key step of any environmental flow assessment method from the simplest to the most sophisticated one Modern approaches on environmental flow assessment suggest using flow records of daily or finer time resolution and of length of at least 10 to 20 years in order to extract reliable statistical conclusions (Hughes and Smakhtin 1996 Palau and Alcaacutezar 2012) Moreover the flow time series should correspond to unmodified conditions If the river regime is modified (eg due to the installation of large-scale hydraulic structures) the data have to be adjusted by ldquoremovingrdquo all regulation effects (water storage abstractions water losses etc) This procedure is commonly referred to as ldquonaturalizationrdquo since the adjusted flows are assumed identical to the flows under natural conditions
Unfortunately no hydrometric station exists close to the Acheloos estuary to extract the required flow time series at the exact point of interest the unique flow gauge (Avlaki) is located in the upper course of the river 45 km upstream of the Kremasta dam and controls only 27 of the total basin ie 1358 out of 5027 km2 (Fig 1) However even if a flow record near the outlet was available it would be necessary to correct its data taking into account the operation of the upstream reservoirs Therefore in order to evaluate the flow regime at the estuary it is essential to extract the naturalized flows at each dam site by proceeding from upstream to downstream (in particular from Kremasta next to Kastraki next to Stratos and finally to the estuary) In this context all available hydrological information was considered aiming to provide as much reliable estimates as possible Apart from the flow time series outputs of the hydrological analysis were the flow-duration curves at all points of interest which allowed for estimating characteristic quantities on a probabilistic setting 42 Reproduction of naturalized flows at Kremasta dam Kremasta reservoir is the key regulator of the hydrosystem due to its great storage capacity In order to estimate the naturalized runoff of the upstream sub-basin two types of data were used (a) daily inflow volumes for years 1965-2008 and (b) instantaneous discharge measurements at the Avlaki station which drains about 40 of the sub-basin of interest (1358 out of 3570 km2) The available record covers 30
years (1965-1994) and contains about 900 discharge values non-uniformly distributed over time Sparse flow measurements close to the Kremasta have also been employed before the construction of the dam (1965) yet these were not accessible
The reservoir inflows were directly provided by the PCC These have been estimated from the water balance equation of the reservoir on a daily basis In particular the inflow it was computed by accounting for the storage fluctuation during each day st ndash stndash1 the amounts of water used in energy production rt and the spill losses wt ie
it = st ndash stndash1 + rt + wt (3)
The rest of water balance components ie areal rainfall pt and water losses due to evaporation et and leakage lt were neglected However this approach resulted in systematic underestimations of inflows especially during the summer period In particular the minimum inflow value was found to be just 10 m3s while the minimum observed value before the construction of the dam was 185 m3s The inconsistency of the estimated inflows is easily proved by comparing them with the measured flows at Avlaki The comparison is made is statistical terms ie by contrasting the two empirical flow duration curves As shown in Fig 3 their shapes exhibit significant differences in the low-flow area which is of key importance for the assessment of the environmental needs Moreover about 11 of the flow values at Kremasta are lower than the corresponding measurements at Avlaki which is not realistic
The reason for these inconsistencies is the ignorance of term et + lt ndash pt in the water balance equation together with measurement errors and other uncertainties (eg in the stage-storage relationship) In fact during the summer period the evaporation losses may be as much as 10 mm which corresponds to 70 m3s of additional inflow taking into account the large extent of the lake (40 to 75 km2) Moreover the reservoir losses due to leakages are important since they are estimated to be 60 m3s approximately (seasonal variations are neglected) This value is to be also considered (ie added) in the naturalized flows Finally the rain falling over the lake should be considered although its contribution during the summer months is rather minor
According to the above assumptions we recalculated the water balance equation of Kremasta to obtain a consistent time series of daily inflows for the years 1965-2008 The final record was extracted by adding the upstream flows of Tavropos tributary which are diverted through the Plastiras dam As shown in Fig 3 the updated flow-duration curves are substantially different from the original estimates The key statistical characteristics of the naturalized flows are given in Table 2 In particular the mean annual discharge is 1143 m3s the mean monthly discharge of the driest month (August) is 241 m3s and the overall minimum value is 75 m3s 43 Estimation of naturalized flows at the other sites of interest The next reservoir Kastraki has been in operation since 1969 It receives the outflows of Kremasta and the runoff of the intermediate sub-basin which covers an area of 548 km2 Since no abstractions exist in the river course between the two dams and in order to estimate the naturalized flows at Kastraki we add the daily runoff of the aforesaid sub-basin to the naturalized flows at Kremasta
In theory the runoff generated by the intermediate basin can be estimated by extracting the outflows from Kremasta (ie water releases for energy production abstractions for water supply and spill losses) from the regulated inflows to Kastraki which in turn are estimated by solving the daily water balance equation of the
reservoir However within the daily time interval the level fluctuations of Kastraki are not accurately represented thus leading to major errors is the computation of its inflows For instance about 25 of inflow values appear to be negative Moreover the correlation of the summer flows with the corresponding flows at Kremasta is as low as 10 which is totally unrealistic given that during the dry period the dominant runoff process is baseflow For this reason we employed an approximate approach using monthly water balance data which are more accurate since the measurement errors decrease as the temporal scale increases (in particular at the monthly time scale the level fluctuations are more distinguishable than at the daily one and therefore the calculations of the storage variations st ndash stndash1 are more accurate) Starting from the monthly inflows to Kastraki we estimated the monthly runoff of the intermediate sub-basin and the naturalized runoff of the whole sub-basin Next for each month of the study period we calculated the ratios of the two runoff values (ie Kastraki runoff Kremasta runoff) which was assumed representative of the fraction of the corresponding daily flows (this assumption is reasonable given that summer flows are not significantly affected by local flood events) Finally we multiplied the daily flows at Kremasta by the related ratio to obtain the naturalized flows at Kastraki On a mean monthly basis their values range from 106 to 117 (the highest values exceed 150) while the ratio of the two catchment areas is 115 By employing different values for each month (504 values in total) we accounted for the spatial heterogeneity of runoff as much as possible The results are summarized in Table 2 As shown the mean annual naturalized discharge at the dam site is 1254 m3s and the mean monthly discharge of August is 278 m3s
The most downstream reservoir of Stratos which has been in operation since 1989 drains a local sub-basin of 202 km2 the contribution of which is minor if compared to the whole upstream basin of 4320 km2 Unfortunately in the specific reservoir the historical data (lake level and outflows) are highly uncertain thus the establishment of a consistent water balance was impossible even at the monthly time scale In the absence of any other type of hydrological information we estimated the daily naturalized flows at the dam site by simply increasing the daily flow time series at Kastraki by 4 Finally we employed an additional 5 increase to obtain the daily flow sample at the estuary with total drainage area 5027 km2 The two aforementioned ratios were estimated by taking into account the area of the upstream basins and their mean annual precipitation thus (inevitably) assuming a homogenous response of the two basins to rainfall In addition we made the empirical assumption that the equivalent runoff depth in the lower Acheloos basin is 350 mm on a mean annual basis Under this hypothesis the mean annual naturalized discharge in Stratos is 1303 m3s (1369 m3s at the estuary) and the mean monthly discharge of August is 290 m3s (304 m3s at the estuary) We remark that the heavily modified system downstream of Stratos is very poorly monitored In fact there are no systematic data with regard to agricultural abstractions from the river which could be very helpful for improving our estimations at the estuary especially during the low-flow period
Based on the naturalized time series of daily discharge we implemented a flow-duration analysis at all sites of interest Table 3 gives the flow values for characteristic exceedance probabilities corresponding to specific time percentiles
5 ESTIMATION OF ENVIRONMENTAL FLOWS For the estimation of the ecological requirements downstream of Stratos we employed various EFA approaches based on the naturalized discharge time series averaged at the daily monthly and annual time scales All calculations herein refer to the dam
site In order to ldquotransferrdquo the results to the Acheloos estuary the corresponding flow values at Stratos should be simply increased by 5 in order to roughly account for the runoff generated by the local sub-basin 51 Estimation of minimum 5-year discharge of the driest month As mentioned in section 34 this approach was adopted in the EIA study of 1995 within the investigations of the operation of the Acheloos diversion scheme In the present study we repeated the calculations on the basis of the updated monthly discharge time series downstream of Stratos dam which extend over a period of 42 hydrological years (Oct 1966 to Sep 2008) First we picked up the minimum average monthly discharge of each year (typically the lowest flow appears in August and occasionally in September) thus formulating a sample of 42 values Next we fitted a theoretical statistical distribution to the sample in particular the normal one (as shown in Fig 4 paradoxically it looks suitable) on the basis of which we estimated the discharge value that corresponds to a 5-year return period (ie 80 exceedence probability) The 5-year low flow of the driest month is 211 m3s which is almost identical to the legislative flow constraint (213 m3s) which was proposed within the EIA study This value is equal to 162 of the mean annual discharge 52 Calculation of typical hydrological indices We evaluated a number of indices which are summarized in Table 5 using the following approaches of section 22 (a) Tennant method Since the river is heavily modified we applied the MAF ratios
that correspond to poor quality conditions ie 10 for the dry period and 30 for the wet one Given that the mean annual naturalized discharge in Stratos is 1303 m3s the critical flow values are 130 and 391 m3s respectively
(b) French freshwater fishing law Since Stratos dam is an existing project the minimum flow to leave downstream should be 140 (25) of the naturalized mean annual discharge which is 33 m3s
(c) UK standards for achieving Good Ecological Status According to the flow-duration analysis of Table 3 the Q95 value in Stratos is 180 m3s
(d) Typical practices in Mediterranean countries In Italy Spain and Portugal the standard percentages are 25 50 and 10 of MAF which correspond to 33 65 and 130 m3s
(e) Indices based on flow-duration analysis From the flow-duration curves at Stratos we calculated two typical flow indices specifically the Q90 (218 m3s) and the Q364 (113 m3s)
53 Basic flow method As mentioned in section 23 the BFM has been widely employed for the assessment of environmental flows of river Ebro Spain the hydrological regime of which is expected to have similarities with Acheloos Following the typical procedure by Palau and Alcaacutezar (2012) we calculated the moving averages of the naturalized daily flows at Stratos from one-day to 100-day intervals (Fig 5) and extracted the minimum flow value (Fig 6) In the specific case the flow with the largest relative increment is the one-day moving average minimum The average of all daily minima ie the basic flow for the considered study period (42 years) is 133 m3s while the BMF values which are calculated from eq (1) range from 168 m3s (July) to 325 m3s (January) following the seasonal variability of the naturalized flows (Fig 7) Finally the other two characteristic flows (ldquobankfullrdquo and ldquomaximumrdquo) were estimated using different
return periods from the originally proposed In particular in order to establish an artificial flooding plan through Stratos (section 63) we estimated the maximum daily flow for return periods 2 and 5 years 54 Range of variability approach We used the IHARVA software (version 70) developed by the Nature Conservancy (2009) to evaluate the 32 indicators of hydrological alteration in the two sites of interest (Stratos and estuary) The most important are the 25 and 75 quantiles of monthly discharge which are shown in Fig 8 and they are used to specify the desirable range of monthly outflows through the Stratos reservoir Other characteristic indicators related to extreme hydrological conditions are given in Table 4 55 Wetted perimeter - discharge method We selected five representative cross-sections along the lower course of Acheloos with different geometrical shapes (triangular rectangular) where we employed the maximum curvature approach by Gippel and Stewardson (1998) to define the lower breakpoint of each rating curve on the basis of the Manning equation The critical flow over the five cross-sections ranges from 131 to 204 m3s These values are reasonable and within the range of most of the hydrology-based approaches This is a very important conclusion since the method only uses cross-section geometry and does not require any hydrological information
6 ESTABLISHMENT OF ENVIRONMENTAL FLOW REQUIREMENTS 61 Evaluation of EFM approaches The results of each method in terms of minimum flow targets at the two sites of interest are summarized in Table 5 The already established constant minimum flow of 213 m3s exceeds the critical values obtained by almost all variants of the most representative hydrology-based approaches as well as the wetted perimeter ndash discharge method employed at five cross-sections downstream of Stratos This value is very close to the 5-year minimum monthly discharge and the Q90 daily discharge which provide quite conservative estimations
However the assumption of a constant flow constraint may not be suitable for Mediterranean rivers which are characterized by substantially different hydroclimatic conditions between the wet and dry period of the year For this reason we suggest revising the current environmental terms of the reservoir operation in order to account for the seasonality of flows In this context we recommend to employ the BFM approach which is well-documented for the river Ebro Spain As already mentioned Ebro and Acheloos have many similarities with regard to hydroclimatic regime man-made interventions environmental value and importance to national economy A key advantage of BFM is its parsimony both in terms of data requirements and computations Moreover the outcome of the method ie a specific minimum maintenance flow for each month of the year is easy to understand and incorporate within an environmental policy On the contrary the RVA method provides a wide range of acceptable flows that are not realistic to implement 62 Adaptation of Stratos outflow policy Until any new environmental flow policy is adopted it is essential to ensure that the current standard of 213 m3s can be technically implemented Given that all projects were constructed in past decades without any provision for environmental flows this is a non-trivial engineering problem that requires a technically appropriate and
economically efficient solution Given that the three cascade reservoirs (Kremasta Kastraki Stratos) serve multiple and conflicting water uses the incorporation of any new constraint obviously increases the complexity of their combined management In addition any modification to the actual operation policy requires an agreement between all involved stakeholders (PPC farmers and local authorities)
For convenience the legislative minimum flow constraint for the Acheloos estuary refers to the location just downstream of Stratos given that during the summer period the surface runoff generated over the lower course basin is minor (and it may be further reduced due to agricultural abstractions) Previous studies using advanced simulation models (Koutsoyiannis et al 2002) proved that the application of the aforementioned constraint expressed by means of constant monthly abstraction from Stratos is certainly feasible and can be achieved with negligible risk Therefore in an operational context the implementation of the environmental flow only affects the outflow policy of the most downstream reservoir Yet the monthly time step is too rough to represent all aspects of the real-time operation of the reservoir ie the current scheduling of outflows through the power plant and the technical constraints imposed by the related hydraulic works For this reason it is essential to investigate the adaptation of the minimum flow constraint at finer time steps (eg hourly) Emphasis is given to the summer period when three conflicting water uses arise namely the production of hydroelectric energy the fulfilment of the downstream irrigation demand and the maintenance of the desirable flow target at the estuary
The area of interest downstream of Stratos dam is shown in Fig 9 The system comprises two hydropower plants The major one (Stratos I) with total installed capacity of 150 MW (2 times 75 MW) is located at the right abutment and its discharge capacity is 480 m3s After passing through the turbines the water is conveyed to a tunnel and a trapezoid channel of about 7 km length before reaching the natural river course The small plant (Stratos II) with total installed capacity of 67 MW (2 times 335 MW) is constructed at the left abutment and its maximum discharge is 45 m3s During summer the power plants are put in operation only during the peak energy demand period typically for 2 hours in the morning and 25 hours in the afternoon The time of operation is also restricted because for higher efficiency it is necessary to operate each turbine as close as possible to its discharge capacity The outflow scheduling from each plant is determined such as to satisfy the daily irrigation demand (4 100 000 m3) and the daily environmental demand (1 840 000 m3) Details are specified in the technical study (ECOS 2009)
Under this premise it is impossible to maintain a steady environmental flow for the entire 24-hour period without additional provisions In practice two large-scale water releases are made one in the morning and one in the afternoon which are propagated along the lower course of Acheloos Evidently during their travel the hydrographs are attenuated before arriving at the estuary However preliminary hydraulic simulations indicated that without additional provisions extended parts of the river course remain periodically dry given that the inflows are intermittent
To ensure the continuous flow constraint of 213 m3s along the entire river course it is essential to ensure a time-regulation of the upstream hydrograph using a suitable storage facility to be constructed downstream of the dam The most obvious option is the utilization of the storage in the conveyance channel at the end of Stratos I plant by means of sluice gates downstream Hydraulic simulations showed that the storage capacity attained by this technique is sufficient In this manner ensuring the environmental flow becomes almost independent of the time schedule of the power production and environmental benefits from the improved ecosystem functioning are
gained without any reduction of the economic value of produced energy Other technical options were also examined including the construction of a small regulating reservoir or the exploitation of the neighbouring lake Ozeros but they were found to be substantially more costly 63 Artificial flooding In recent years artificial flooding downstream of dams have gained significant attention It is expected that the periodic release of large amounts of water (much larger than the usual releases) may help to reverse some of the negative impacts caused due to the interruption of the natural flow regime which are thoroughly revised by Petts and Gurnell (2005) Apart from the physical demarcation of the river artificial flooding has beneficial effects on the river geomorphology the sediment transport the water quality and the ecosystemrsquos revitalization In addition it discourages illegal occupation and change of use of the wider river bed which has become very common as after the dam operation people have not seen it inundated by water for years (Koutsoyiannis et al 2012)
In the present study in addition to the implementation of the minimum flow constraint we also aimed to establish a plan for artificial flooding through Stratos dam In this context we estimated the maximum daily flows for two characteristic return periods namely two and five years which are 1400 and 2000 m3s respectively (both values refer to the annual maximum discharge at the estuary) We propose to apply the aforementioned flow values once per one and five years respectively
7 SYNOPSIS AND DISCUSSION Regulated river systems are a typical field for application of environmental
flow assessment (EFA) approaches Yet despite the significant progress made towards a holistic overview of the problem and the development of a large variety of sophisticated eco-hydrological tools their applicability is significantly restricted in cases of limited data availability and quality In such cases hydrological approaches which typically seek for a critical flow to be maintained along the river offer the advantage of parsimony in terms of data requirements and computations Indeed the most elementary of these methods only make use of the mean annual discharge while the more advanced ones employ analyses of daily flow time series The simplicity of their outcomes is also desirable given that the latter are to be incorporated within existing water management policies
In many countries the flow standards implied by hydrological approaches have been incorporated within environmental legislation Their establishment depends on local hydroclimatic conditions but it is also a political issue Some countries adopt quite conservative standards (eg Q90) while other ones apply much more relaxed values (eg 140 of MAF in France) It is interesting to remark that although such standards are clearly expressed in terms of discharge in the WFD the flow regime is not considered a primary quality element to assess water bodies (cf Acreman and Ferguson 2010) which is in our opinion unreasonable
In Greece the assessment and implementation of environmental flows is a very difficult task due to data scarcity as well as due to lack of standards Often even the most essential hydrological information is hardly available and its quality is many times questionable The case study of Acheloos offers valuable lessons on dealing with real-world systems of high complexity under the aforementioned limitations
Most of papers found in the literature handle EFA as a theoretical problem in which the engineering point-of-view is missing A plausible explanation is that the
technical aspects of the problem including the extraction and processing of hydrological data are regarded rather trivial The case of Acheloos proved that this is far from reality The hardest part of the study was the estimation of the naturalized time series along the river A key step was the estimation of the reservoir inflows by solving the water balance equation in daily basis which was only possible for the most upstream reservoir at Kremasta In Kastraki reservoir this method provided realistic results only at the monthly time scale while in the small reservoir of Stratos it proved impossible to extract a consistent water balance Therefore the reliability of the water balance approach (which should be the rule in case of regulated rivers) strongly depends on scale ndash it increases with reservoir scale and decreases with time scale (apparently it also increases with river scale) Moreover as we focus on low flows it is important to carefully account for the loss components of the reservoir balance such as evaporation and leakage the contribution of which may be crucial In general within any EFA study the engineering experience and the empirical evidence are of major importance in order to get consistent estimations of the required hydrological magnitudes
The most representative hydrology-based approaches as well as the wetted perimeter ndash discharge method were employed to assess the environmental flows at the two sites of interest (Stratos dam and Acheloos estuary) These provided a wide range of results in terms of critical flows or allowable range of them In the absence of standards based on the systematic observation of biological parameters under different flow conditions it is impossible to make a proper evaluation of them In this respect the collection of systematic biological data is an essential task in order to provide more comprehensive environmental flow standards However such data if ever obtained will be usable only on the long run A promising solution for such data-scarce areas as proposed by Arthington et al (2006) is to take advantage of flow ndash ecological response relationships obtained by calibrating the flow standards with biological data in well-monitored rivers which could be classified in terms of some characteristic hydrological indices In this context the assessment of environmental flows will be based not on the hydrological data themselves but on the hydrological classification of each specific river
At present a constant flow is established for the Acheloos River which fits the outcomes of the most conservative approaches For the future we recommend imposing a seasonally-varying flow which can better preserve the eco-hydrological regime of the river Among two well-known methods accounting for seasonal variability ie the basic flow maintenance (BFM) and the range of variability approach (RVA) the former seems more suitable For BFM is well-tested in Ebro ie a large-scale heavily-modified Mediterranean river with many similarities with Acheloos The method also provides guidance for artificial flooding which is a new dimension in modern environmental policy On the other hand the RVA is quite complex difficult to interpret and thus difficult to implement in practice
The wetted perimeter ndash discharge method which was employed at five representative cross-sections provided reasonable results within the range of most of hydrological approaches This is a very positive conclusion given that such an elementary hydraulic method can be used for a preliminary assessment of the environmental requirements in areas with total absence of hydrological data
The implementation of the legislative restriction of minimum flow within the actual management policy of the Acheloos reservoir system also was a challenging engineering task The system was designed and operated for more than 50 years without any provision for environmental protection The flow constraint should be
streamlined with the existing technical and operational constraints that are involved in the real-time operation of the system Given that the primary objective is the production of peak hydroelectric energy the maintenance of a continuous discharge downstream of Stratos is not desirable However it is feasible to fulfil the environmental and irrigation demand at the daily scale through an effective scheduling of outflows Preliminary hydraulic analysis indicated that it is possible to take advantage of the storage capacity of the channel downstream of the dam in order to regulate the outflows and ensure the desirable continuous flow in the estuary
The next research step will be the optimization of the overall water resource system including the complex irrigation network in the lower course of Acheloos At least two levels of analysis should be adopted ie a strategic one for the derivation of the long-term management policy and an operational one for the real-time control of the system
Acknowledgements We are grateful to the ECOS Consultants SA for their collaboration within the elaboration of the technical study We also thank P Tsira and A Koukouvinos for their useful comments as well as Y Kouvopoulos Head of the Hydrology Department of PPC for his collaboration We are grateful to the Guest Editor M C Acreman and two anonymous reviewers for their constructive suggestions which helped us to substantially improve the paper
REFERENCES Acreman MC and Dunbar MJ 2004 Defining environmental river flow
requirements ndash a review Hydrology and Earth System Sciences 8 861ndash876 Acreman MC and Ferguson JD 2010 Environmental flows and the European
Water Framework Directive Freshwater Biology 55(1) 32ndash48 Acreman MC Dunbar MJ Hannaford J Mountford O Wood P Holmes N
Cowx I Noble R Extence C Aldrick J King J Black A and Crookall D 2008 Developing environmental standards for abstractions from UK rivers to implement the EU Water Framework Directive Hydrological Sciences Journal 53(6) 1105ndash1120
Alcaacutezar J Palau A and Vega-Garcia C 2008 A neural net model for environmental flow estimation at the EbroRiver Basin Spain Journal of Hydrology 349(1-2) 44ndash55
Argirakis I 2009 Exploitation of hydroelectric stations as multipurpose works In Contribution of hydroelectric works to the energy planning of the country Workshop Technical Chamber of Greece (TEE) and Peripheral Department of Epirus Ioannina (libraryteegrdigitalm2380m2380_argirakispdf in Greek)
Arthington AH Bunn SE Poff NL and Naiman RJ 2006 The challenge of providing environmental flow rules to sustain river ecosystems Ecological Applications 16(4) 1311ndash1318
Babel MS Dinh CN Mullick MRA and Nanduri UV 2012 Operation of a hydropower system considering environmental flow requirements A case study in La Nga river basin Vietnam Journal of Hydro-Environment Research 6(1) 63ndash73
Beilfuss R 2010 Modelling trade-offs between hydropower generation and environmental flow scenarios a case study of the Lower Zambezi River Basin Mozambique International Journal of River Basin Management 8(3-4) 331ndash347
Brisbane Declaration (2007) Available at httpwwwnatureorginitiatives freshwaterfilesbrisbane_declaration_with_organizations_finalpdf
Christofides A Efstratiadis A Koutsoyiannis D Sargentis G-F and Hadjibiros K 2005 Resolving conflicting objectives in the management of the Plastiras Lake can we quantify beauty Hydrology and Earth System Sciences 9(5) 507ndash515
Davies JK 1996 Deconstructing Gortyn when is a code a code In Greek Law in its Political Setting Justifications not Justice (eds Foxhall L and Lewis ADE) Oxford University Press Oxford UK 33ndash56
Directive 200060EC establishing a framework for Community action in the field of water policy Official Journal of the European Communities L327 2000
ECOS Consultants SA 2009 Specific Technical Study for the Ecological Flow through Stratos Dam Public Power Corporation Athens
Efstratiadis A and Hadjibiros K 2011 Can an environment-friendly management policy improve the overall performance of an artificial lake Analysis of a multipurpose dam in Greece Environmental Science and Policy 14(8) 1151ndash1162
Fourniotis NT 2012 A proposal for impact evaluation of the diversion of the Acheloos River on the Acheloos estuary in Western Greece International Journal of Engineering Science and Technology 4(4) 1792ndash1802
Gippel CJ and Stewardson MJ 1998 Use of wetted perimeter in defining minimum environmental flows Regulated Rivers Research and Management 14 53-67
Harman C and Stewardson MJ 2005 Optimizing dam release rules to meet environmental flow targets Rivers Research and Applications 21 113ndash129
Hughes DA and Smakhtin V 1996 Daily flow time series patching or extension a spatial interpolation approach based on flow duration curves Hydrological Sciences Journal 41(6) 851ndash871
Hydroexygiantiki SA 1995 Integrated Study of the Environmental Impacts from Acheloos Diversion Directorate for Acheloos Diversion Works General Secretariat of Public Works Ministry of Environment Planning and Public Works Athens
Jager HI and Smith BT 2008 Sustainable reservoir operation can we generate hydropower and preserve ecosystem values River Research and Applications 24(3) 340-352
Kennard MJ Mackay SJ Pusey BJ Olden JD and Marsh N 2010 Quantifying uncertainty in estimation of hydrologic metrics for ecohydrological studies River Research and Applications 26 137ndash156
Koutsoyiannis D 2011 Scale of water resources development and sustainability Small is beautiful large is great Hydrological Sciences Journal 56(4) 553ndash575
Koutsoyiannis D 2012 Water control in the Greek cities Water systems and urbanization in Africa and beyond Uppsala Sweden (solicited talk available at httpitiantuagrendocinfo1195)
Koutsoyiannis D Efstratiadis A and Karavokiros G 2002 A decision support tool for the management of multi-reservoir systems Journal of the American Water Resources Association 38(4) 945ndash958
Koutsoyiannis D Mamassis N Efstratiadis A Zarkadoulas N and Markonis Y 2012 Floods in Greece In Changes of Flood Risk in Europe edited by Z W
Kundzewicz Chapter 12 238ndash256 IAHS Press Wallingford ndash International Association of Hydrological Sciences
Palau A and Alcaacutezar J 1996 The Basic Flow An alternative approach to calculate minimum environmental instream flows Proceedings of 2nd International Symposium on Habitats Hydraulics Ecohydraulics 2000 Quebec (Can) Vol A 547-558
Palau A and Alcaacutezar J 2012 The Basic Flow method for incorporating flow variability in environmental flows River Research and Applications 28 93ndash102
Peacuterez-Diacuteaz JI and Wilhelmi JR 2010 Assessment of the economic impact of environmental constraints on short-term hydropower plant operation Energy Policy 38(12) 7960ndash7970
Petts GE and Gurnell AM 2005 Dams and geomorphology Research progress and future directions Geomorphology 71 27ndash47
Petts GE 2009 Instream flow science for sustainable river management Journal of the American Water Resources Association 45(5) 1071ndash1086
Renoumlfaumllt BM Jansson R and Nilsson S 2010 Effects of hydropower generation and opportunities for environmental flow management in Swedish riverine ecosystems Freshwater Biology 55(1) 49ndash67
Richter BD and Thomas GA 2007 Restoring environmental flows by modifying dam operations Ecology and Society 12(1) 12
Richter BD Baumgartner JV Powell J and Braun DP 1996 A method for assessing hydrologic alteration within ecosystems Conservation Biology 10 1163ndash1174
Richter BD Baumgartner JV Wigington R and Braun DP 1997 How much water does a river need Freshwater Biology 37 231ndash249
Shamir E Ben-Moshe L Ronen A Grodek T Enzel Y Georgakakos KP and Morin E 2013 Geomorphology-based index for detecting minimal flood stages in arid alluvial streams Hydrology and Earth System Sciences 17 1021-1034
Smakhtin VU 2001 Low flow hydrology a review Journal of Hydrology 240 147ndash186
Smakhtin VU Shilpakar RL and Hugues DA 2006 Hydrology-based assessment of environmental flows an example from Nepal Hydrological Sciences Journal 51(2) 207ndash222
Suen JP and Eheart JW 2006 Reservoir management to balance ecosystem and human needs incorporating the paradigm of the ecological flow regime Water Resources Research 42(3) W03417
Suen J-P 2011 Determining the ecological flow regime for existing reservoir operation Water Resources Management 25(3) 818ndash835
Tennant DL 1976 Instream flow regimens for fish wildlife recreation and related environmental resources Fisheries 1(4) 6ndash10
Tharme RE 2003 A global perspective on environmental flow assessment Emerging trends in the development and application of environmental flow methodologies for rivers River Research and Applications 19 397ndash441
The Nature Conservancy 2009 Indicators of hydrologic alteration version 71 userrsquos manual
Varveris A Panagopoulos P Triantafillou K Tegos A Efstratiadis A Mamassis N and Koutsoyiannis D 2010 Assessment of environmental flows of Acheloos Delta European Geosciences Union General Assembly
2010 Geophysical Research Abstracts Vol 12 Vienna 12046 European Geosciences Union (httpitiantuagrendocinfo963)
TABLES Table 1 Characteristic data of Acheloos reservoir system (existing development scheme) Plastiras Kremasta Kastraki Stratos Mesohora First year of operation 1959 1966 1969 1989 ndash Dam height (m) 830 1603 957 260 1350 Total drainage area (km2) 161 3570 4118 4320 633 Total storage capacity (hm3) 362 4500 800 70 358 Useful storage capacity (hm3) 286 3500 50 10 225 Maximum level (m) 7920 2820 1442 686 7700 Intake level (m) 7760 2270 1420 670 7310 Maximum reservoir area (km2) 240 790 244 74 78 Spillway capacity (m3s) 460 3000 3700 4000 3300 Installed capacity (MW) 130 436 420 156 160 Maximum head (m) 577 136 76 37 220 Annual energy production (GWh) 198 848 598 237 ndash
Note The sum of runoff upstream of Plastiras dam is diverted to the adjacent plain of Thessaly
Table 2 Mean monthly naturalized flows across the Acheloos river basin (m3s) Plastiras Kremasta Kastraki Stratos EstuaryOct 25 524 597 621 652Nov 52 1212 1354 1408 1478Dec 100 2167 2397 2493 2618Jan 78 1822 2012 2092 2197Feb 95 1926 2154 2240 2352Mar 96 1818 1972 2051 2154Apr 86 1795 1903 1979 2078May 51 1126 1187 1234 1296June 18 532 574 597 626July 11 325 359 374 393Aug 08 250 279 290 304
Sep 06 257 294 306 321
Year 53 1143 1253 1303 1369
Table 3 Daily flows for various exceedance probability values (m3s) Exceedence probability Avlaki Kremasta Kastraki Stratos Estuary
099 45 116 132 137 144 098 46 130 144 150 158 096 49 146 164 171 179 095 51 154 173 180 189 090 62 186 209 218 228 080 94 247 278 290 304 070 142 330 370 385 404 060 211 464 513 534 561 050 338 682 740 770 809 040 446 953 1029 1070 1123 030 589 1294 1402 1458 1531 020 793 1733 1882 1957 2055 010 1048 2446 2674 2781 2920 005 1394 3431 3783 3935 4131 002 1958 5373 5933 6171 6479 001 2463 7344 8149 8475 8898
Table 4 Characteristic daily flow values at Stratos (m3s) calculated within the RVA method
Mean value Lower limit Upper limit1-day minimum 131 106 1563-day minimum 159 128 1897-day minimum 178 141 21430-day minimum 225 174 27690-day minimum 291 230 3511-day maximum 15031 8148 219133-day maximum 10255 6159 143517-day maximum 6980 4402 955830-day maximum 3781 2622 494090-day maximum 2725 1928 3521
Table 5 Summary of environmental flow requirements at Stratos dam and Acheloos estuary (flow values in m3s) estimated by different methods Method Stratos Estuary Remarks 5-year minimum monthly flow (EIA study 1995)
ndash 213 Legislative constraint incorporated within outflow policy of Stratos reservoir
5-year minimum monthly flow (updated data)
211 222 Statistical analysis of annual minimum monthly flows (1965-2008)
Tennant method (10-30 MAF for drywet months)
130 ndash 391
137 ndash 411
Poor conditions are assumed since the river system is heavily modified
French freshwater fishing law (25 MAF)
33 35 140 of mean annual flow is assumed for existing works
UK standards (Q95) 180 189 Q90 218 229 Q364 113 119
Estimated on the basis of empirical flow-duration curves of daily flow data
BFM basic flow (Qb) 133 140 BFM basic maintenance flow seasonally varying
168 ndash 325
176 ndash 341
Estimated through statistical analysis of daily to up to 100-day moving average flow time series
RVA 25 quantile of monthly discharge
146 ndash 1353
153 ndash 1421
RVA 75 quantile of monthly discharge
353 ndash 3901
371 ndash 4096
Main indicators of hydrological alteration computed by the IHARVA 70 package
Wetted perimeter ndash discharge
131 ndash 204 Breakpoint analysis at five characteristic cross-sections between Stratos and estuary
FIGURE CAPTIONS Figure 1 The Acheloos river basin and its reservoir system also containing future works of the Acheloos interbasin transfer (diversion) plan which are annotated in italics (map by A Koukouvinos) Figure 2 Comparison of statistics (left mean values right standard deviations) of outflows through Stratos dam (regulated flows) and naturalized flows for period 1990-2008 Figure 3 Empirical flow-duration curves at Kremasta dam (raw and corrected sample of mean daily discharges) and Avlaki station (discharge measurements) Figure 4 Normal probability plot of minimum monthly flows of Acheloos estuary (dots empirical probability obtained using the Weibull plotting position line fitted normal distribution) Figure 5 Logarithmic plot of daily and 100-day moving average time series of Acheloos discharge at Stratos used within the BFM Figure 6 Mean annual daily minima for various time intervals used for the estimation of the basic flow in the context of the BFM Figure 7 Logarithmic plot of mean and minimum monthly naturalized flows at Stratos vs basic and basic maintenance flows estimated through the BFM Figure 8 Logarithmic plot of mean and minimum monthly naturalized flows at Stratos vs desirable low and high flow limits estimated through by the RVA Figure 9 Overview of the area around Stratos dam (source Hellenic Cadastre)
FIGURES
Figure 1 The Acheloos river basin and its reservoir system also containing future works of the Acheloos interbasin transfer (diversion) plan which are annotated in italics (map by A
Koukouvinos)
0
50
100
150
200
250
Oct
Nov
Dec Jan
Feb
Mar
Apr
May
June
July
Aug Sep
Mea
n m
ontlh
y flo
w (m
3 s)Regulated flowsNaturalized flows
0
20
40
60
80
100
120
140
Oct
Nov
Dec Jan
Feb
Mar
Apr
May
June
July
Aug Sep
Mon
tlhy
stan
dard
dev
iatio
n (m
3 s)
Regulated flowsNaturalized flows
Figure 2 Comparison of monthly statistics (left mean values right standard deviations) of outflows through Stratos dam (regulated flows) and naturalized flows for period 1990-2008
10
100
1000
10000
100000
000 010 020 030 040 050 060 070 080 090 100
Exceedance probability
Dai
ly d
ischa
rge
(m3 s)
Kremasta raw sampleKremasta corrected sampleObserved flows at Avlaki
Figure 3 Empirical flow-duration curves at Kremasta dam (raw and corrected sample of
mean daily discharges) and Avlaki station (discharge measurements)
Weibull Normal
Exceedance probability () - scale Normal distribution
999
5
998
99
5
98
95
90
80
70
50
30
20
10
5 2 5
2
05
msup3
s
50
45
40
35
30
25
20
15
10
5
0
Figure 4 Normal probability plot of minimum monthly flows of Acheloos estuary (dots empirical probability obtained using the Weibull plotting position line fitted normal
distribution)
10
100
1000
10000
110
66
110
69
110
72
110
75
110
78
110
81
110
84
110
87
110
90
110
93
110
96
110
99
110
02
110
05
110
08N
atur
aliz
ed fl
ow a
t Stra
tos
(m3 s
)
Daily time series 100-day moving average
Figure 5 Logarithmic plot of daily and 100-day moving average time series of Acheloos
discharge at Stratos used within the BFM
00
50
100
150
200
250
300
1 7 13 19 25 31 37 43 49 55 61 67 73 79 85 91 97
Time interval (days)
Mea
n of
ann
ual m
inim
um
mov
ing
aver
age
flow
(m3 s
)
Figure 6 Mean annual daily minima for various time intervals used for the estimation of the
basic flow in the context of the BFM
10
100
1000
Oct Nov Dec Jan Feb Mar Apr May Jun Jul Aug Sep
Mea
n flo
w a
t Stra
tos (
m3 s)
Mean monthly Minimum monthlyBasic maintenance (BMF) Basic flow (Qb)
Figure 7 Logarithmic plot of mean and minimum monthly naturalized flows at Stratos vs
basic and basic maintenance flows estimated through the BFM
10
100
1000
Oct Nov Dec Jan Feb Mar Apr May Jun Jul Aug Sep
Mea
n flo
w a
t Stra
tos (
m3 s)
Mean monthly Minimum monthlyRVA low RVA high
Figure 8 Logarithmic plot of mean and minimum monthly naturalized flows at Stratos vs
desirable low and high flow limits estimated through by the RVA
Figure 9 Overview of the area around Stratos dam (source Hellenic Cadastre)
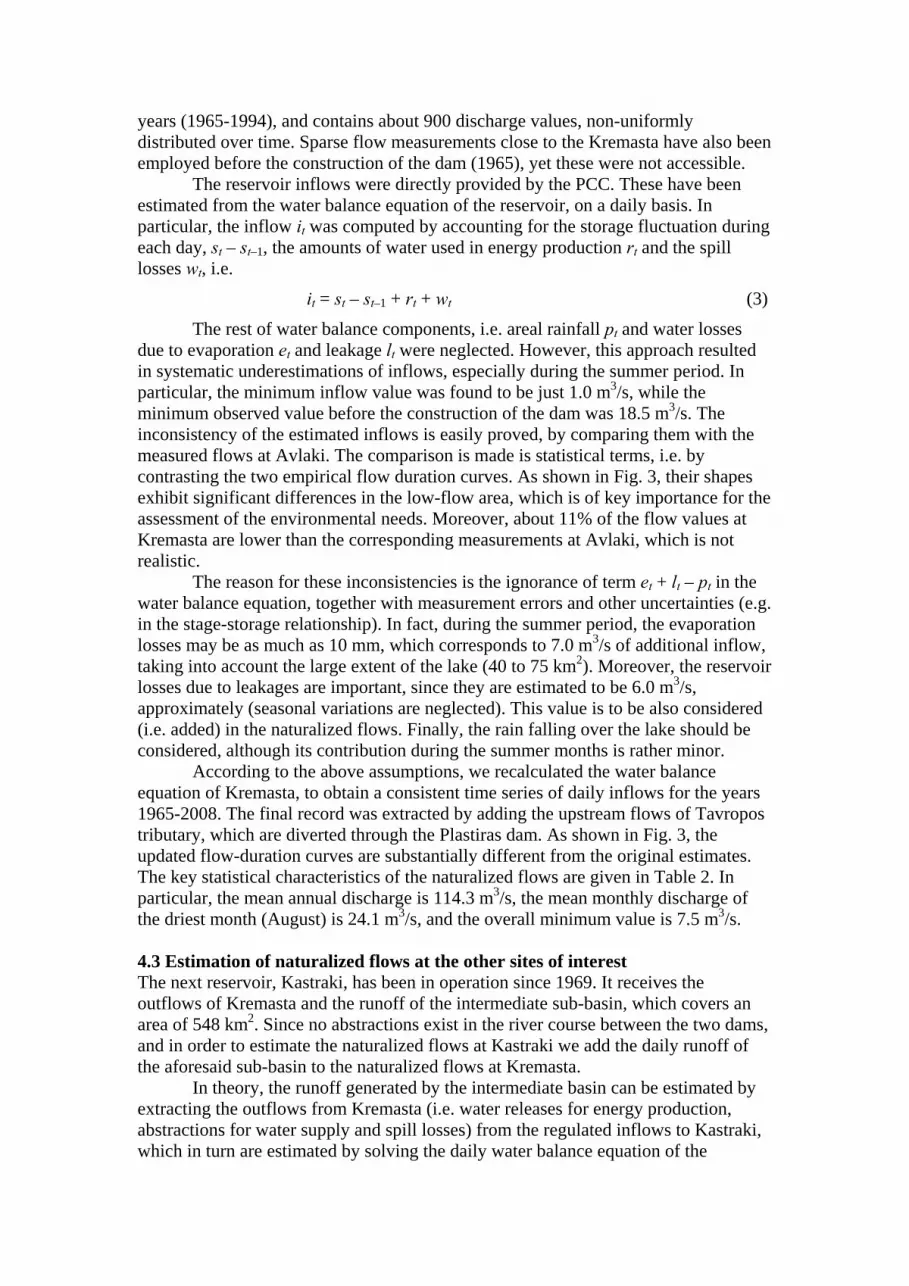
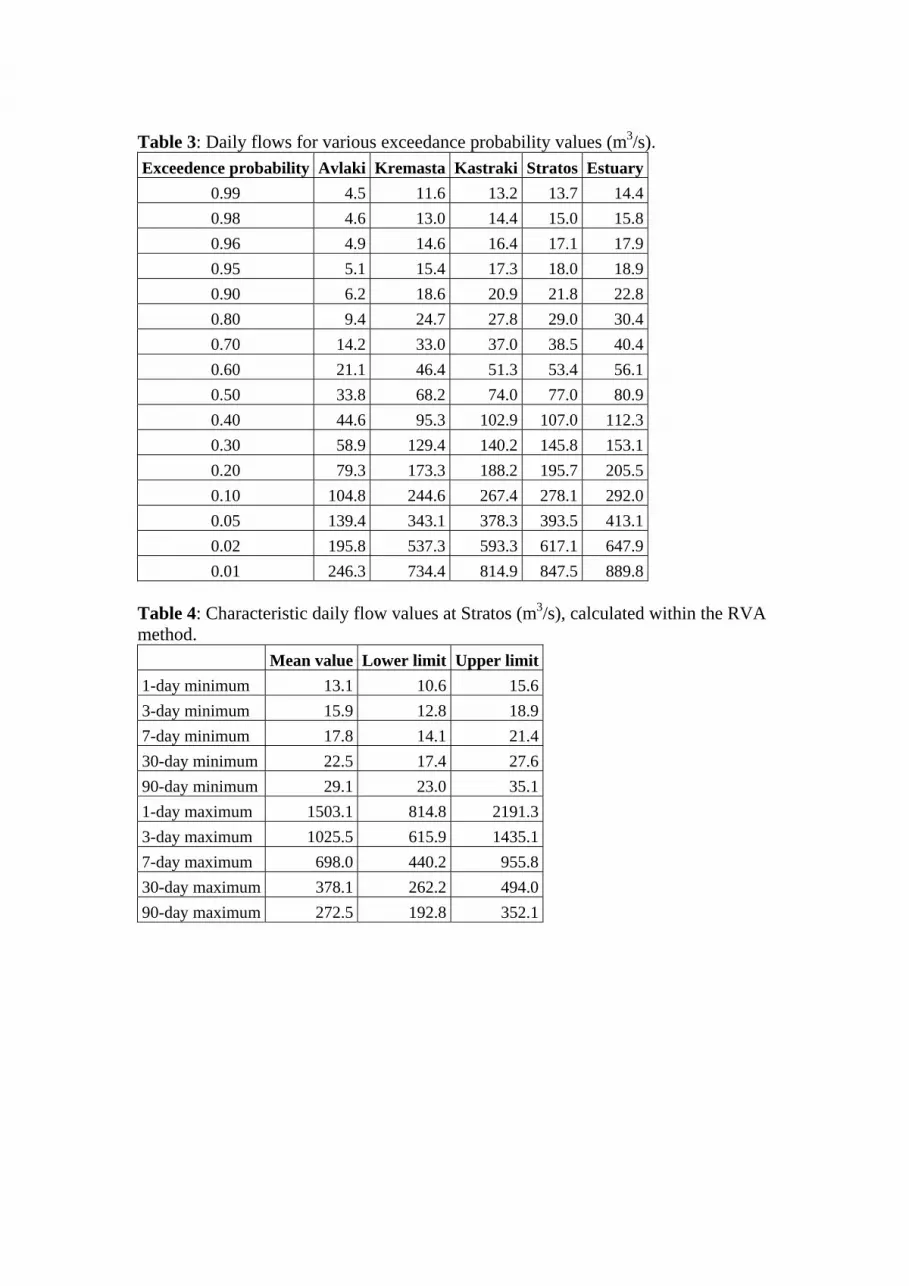

0
50
100
150
200
250
Oct
Nov
Dec Jan
Feb
Mar
Apr
May
June
July
Aug Sep
Mea
n m
ontlh
y flo
w (m
3 s)Regulated flowsNaturalized flows
0
20
40
60
80
100
120
140
Oct
Nov
Dec Jan
Feb
Mar
Apr
May
June
July
Aug Sep
Mon
tlhy
stan
dard
dev
iatio
n (m
3 s)
Regulated flowsNaturalized flows
Figure 2 Comparison of monthly statistics (left mean values right standard deviations) of outflows through Stratos dam (regulated flows) and naturalized flows for period 1990-2008
10
100
1000
10000
100000
000 010 020 030 040 050 060 070 080 090 100
Exceedance probability
Dai
ly d
ischa
rge
(m3 s)
Kremasta raw sampleKremasta corrected sampleObserved flows at Avlaki
Figure 3 Empirical flow-duration curves at Kremasta dam (raw and corrected sample of
mean daily discharges) and Avlaki station (discharge measurements)
Weibull Normal
Exceedance probability () - scale Normal distribution
999
5
998
99
5
98
95
90
80
70
50
30
20
10
5 2 5
2
05
msup3
s
50
45
40
35
30
25
20
15
10
5
0
Figure 4 Normal probability plot of minimum monthly flows of Acheloos estuary (dots empirical probability obtained using the Weibull plotting position line fitted normal
distribution)
10
100
1000
10000
110
66
110
69
110
72
110
75
110
78
110
81
110
84
110
87
110
90
110
93
110
96
110
99
110
02
110
05
110
08N
atur
aliz
ed fl
ow a
t Stra
tos
(m3 s
)
Daily time series 100-day moving average
Figure 5 Logarithmic plot of daily and 100-day moving average time series of Acheloos
discharge at Stratos used within the BFM
00
50
100
150
200
250
300
1 7 13 19 25 31 37 43 49 55 61 67 73 79 85 91 97
Time interval (days)
Mea
n of
ann
ual m
inim
um
mov
ing
aver
age
flow
(m3 s
)
Figure 6 Mean annual daily minima for various time intervals used for the estimation of the
basic flow in the context of the BFM
10
100
1000
Oct Nov Dec Jan Feb Mar Apr May Jun Jul Aug Sep
Mea
n flo
w a
t Stra
tos (
m3 s)
Mean monthly Minimum monthlyBasic maintenance (BMF) Basic flow (Qb)
Figure 7 Logarithmic plot of mean and minimum monthly naturalized flows at Stratos vs
basic and basic maintenance flows estimated through the BFM
10
100
1000
Oct Nov Dec Jan Feb Mar Apr May Jun Jul Aug Sep
Mea
n flo
w a
t Stra
tos (
m3 s)
Mean monthly Minimum monthlyRVA low RVA high
Figure 8 Logarithmic plot of mean and minimum monthly naturalized flows at Stratos vs
desirable low and high flow limits estimated through by the RVA
Figure 9 Overview of the area around Stratos dam (source Hellenic Cadastre)

Figure 9 Overview of the area around Stratos dam (source Hellenic Cadastre)