assessment actual evapotranspiration with r program
TRANSCRIPT
Assessment actual evapotranspiration with R program
Khanittha Chaibandit 1*, Waree Srison1, and Somphinith Muangthong2
1 Rajamangala University of Technology Isan, Department of Agricultural Machinery, Faculty of
Engineering and Architecture, Thailand
2 Rajamangala University of Technology Isan, Department of Surveying Engineering, Faculty of
Engineering and Architecture, Thailand
Abstract. The aim is an assessment of the actual evapotranspiration of plants
by using climate data in Nakhon Ratchasima with the R in the hydrological
modeling function of Abtew and Morton CRAE formulation. There are
using meteorological data from 2012 - 2016 at Nakhon Ratchasima station.
The case analysis shows the results of evapotranspiration are the potential
of evaporation of plants each year. Abtew analysis gave higher monthly
evapotranspiration results during the dry season than Morton CRAE, but
with Abtew formulation gave lower monthly evapotranspiration results
during the rainy season than that of the method. The results are 2 ways to
use evapotranspiration for water management, which is to analyze the
amount of evapotranspiration for use in irrigation systems in order to water
for plants should use the form of Abtew form because it can be seen that
during the dry season and the plant has a high evapotranspiration value.
Form Morton CRAE should be used to assess the potential water use of
plants that can be seen in the dry season, the evaporation of plants is also
less because in the surrounding environment there isn’t water and has little
moisture causing plants to use less water.
1 Introduction
The current climate has a huge impact on countries that produce food to feed the world.
Especially in the area of Thailand, which is considered a food-producing country, export to
take care of the population in many countries such as Japan, China, America, and ASEAN.
Economics for Agriculturist in Thailand [1] has shown the agricultural situation from the past
to the present that technology and innovation should be used to increase productivity per unit
area with climate control. Agriculture products in Thailand are rice, rubber, tapioca, and
processed food, which can be processed into a variety of food. We cannot control the effects
of climate that have changed. Preparing to cope with the changing conditions that are
necessary for the analysis to be accurate and to consider the changing conditions in all
aspects. Therefore, changing weather factors should be used in limited water management.
Plants are the main consumers of water use, both natural water sources such as rain,
ravines, swamps, lakes, as well as the pleasure in the soil. And water resources that humans
* Corresponding author: [email protected]
E3S Web of Conferences 187, 06001 (2020)
TSAE 2020https://doi.org/10.1051/e3sconf /202018706001
© The Authors, published by EDP Sciences. This is an open access article distributed under the terms of the CreativeCommons Attribution License 4.0 (http://creativecommons.org/licenses/by/4.0/).
are allocated to include irrigation water. We cannot deny that plants are the main organisms
that we should focus on. Humans and animals are all-consuming plants as the main food. In
this situation, changing weather will affect the water consumption of plants. When the
weather is hot, high-temperature evaporation and water loss are also high. When the amount
is available during the dry season and lacking rain to come to the original water source or
soil moisture will cause plants to lack water. The growth stops and eventually dies without
moisture. We can see clearly during the dry season in Thailand, which often faces drought
and damaged crops. Farmers have suffered, production costs are higher in value but less in
quantity.
For analyzing the water usage of plants, the most important factor that must be considered
is the evaporation calculation. At present, the Office of Water Management and Hydrology
(Royal Irrigation Department in Thailand) [2] reported evaporation of plants is used to
calculate the water demand of plants which is widely used. Such calculation results require
weather data to be used for analysis such as temperature, relative humidity, sunshine hours,
wind speed, etc. These factors have changed and there are unique in each area. In this study
is an analysis of volatile emission estimates by using the correlation model of hydrological
data with R program in the hydrological model function of Abtew and Morton CRAE
formulation, using meteorological data from 2012 - 2016 to study the changes in plant
evaporation in Nakhon Ratchasima province. The method was in the agreement with the
research from an earlier study [3].
2 Materials and methods
Materials and methods for assessment actual evapotranspiration with R program is calculated
using climate data with the program which can be described as follows.
2.1 Materials
Package " Evapotranspiration " [ 4] is a database calculation method based on data from
Penman, Penman-Monteith, FAO 56, Priestley-Taylor and Morton formulations with the
usage characteristics of the instruction set, including.
ET (data, constants, ts="monthly" , est="potential ET" , solar="sunshine hours" , Tdew=
T, alpha = NULL, message="yes", AdditionalStats="yes", save.csv="yes", ...).
2.2 Methods Input data
The characteristics of the data used in the analysis to avoid confusion will be presented in the
form that must be used in the analysis of writing a set of instructions and data preparation
consisting of Tmax, Tmin (degree Celcius) , Rs ( Megajoules per sqm) or n (hour) or Cd
(okta) daily 2012 - 2016 and use various constants including
1. Elev - ground elevation above mean sea level in m,
2. lambda - latent heat of vaporisation = 2.45 MJ/kg,
3. lat_rad - latitude in radians,
4. Gsc - solar constant = 0.0820 MJ/m2/min,
5. sigma - Stefan-Boltzmann constant = 4.903*10-9 MJ/K4/m2/day,
6. as - fraction of extraterrestrial radiation reaching earth on sunless days,
7. bs - difference between fraction of extraterrestrial radiation reaching full-sun days
and that on sunless days.
E3S Web of Conferences 187, 06001 (2020)
TSAE 2020https://doi.org/10.1051/e3sconf /202018706001
2
2.3 Input data
1. Proceed to prepare the import data for the model 2012-2016, including Year Month Day
Tmax.daily Tmin.daily Tdew.daily n.daily RHmax.daily RHmin.daily uz.daily
2. Importing data in the form of text documents (.txt) files for convenience by suggesting to
create data files in the form of Microsoft Excel Worksheet (.xlsx) files converted to .xlsx
data files in .txt file for the model to read information
3. Write a command to read data using the table name as named and change the specific
values to use the calculation data in the study area and display Abtew and Morton CRAE
formulation as follows
# Change some data
> constants$lat <- 14.6333333 # degree
> constants$lat_rad <- 0.255399847 # radian
> constants$Elev <- 386.12 # m
> constants$z <- 11 # m
> constants$PA <- 1163.0 # mm
# Call ET.MortonCRAE
> Morton <- read.table("climate _2012-2016.txt", header = TRUE)
> Data <- ReadInputs(Morton,constants,stopmissing=c(10,10,3), timestep = "daily")
> Results <- ET.MortonCRAE(Data, constants, ts=" monthly" , est=" actual areal ET" ,
solar="sunshine hours", Tdew=TRUE, alpha = NULL)
#Abtew
> Abtew <- read.table("climate _2012-2016.txt", header = TRUE)
> Data <- ReadInputs(Abtew,constants,stopmissing=c(10,10,3),timestep = "daily")
# Call ET.Abtew
> Results <- ET. Abtew( Data, constants, est= " actual areal ET" , ts= " daily" ,
solar="sunshine hours")
3 Results and discussion
3.1 Annual actual ET
Annual evapotranspiration analysis using the R program using the Abtew and Morton CRAE
formulation methods with the analysis data for the year 2012-2016 in the Meteorological
Station area of Nakhon Ratchasima province. The monthly changes in each year can be
displayed using the Model R as shown in Table 1. The Abtew study has the highest
evaporation rate in 2015 equal to 1,340.04 mm./year. For Morton CRAE there is the highest
evaporation rate in 2016 is 1,389.21 mm./year.
E3S Web of Conferences 187, 06001 (2020)
TSAE 2020https://doi.org/10.1051/e3sconf /202018706001
3
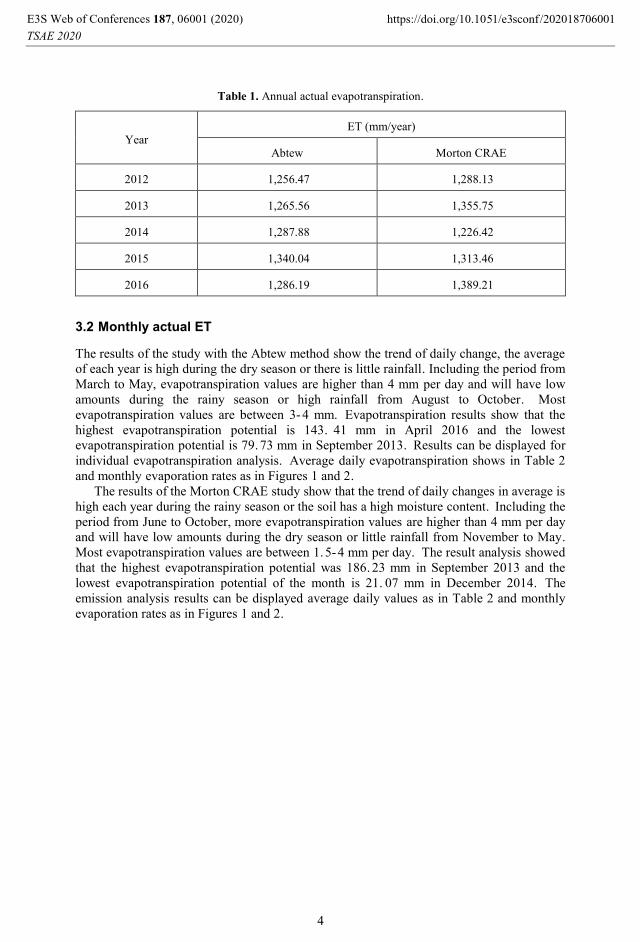
Table 1. Annual actual evapotranspiration.
Year ET (mm/year)
Abtew Morton CRAE
2012 1,256.47 1,288.13
2013 1,265.56 1,355.75
2014 1,287.88 1,226.42
2015 1,340.04 1,313.46
2016 1,286.19 1,389.21
3.2 Monthly actual ET
The results of the study with the Abtew method show the trend of daily change, the average
of each year is high during the dry season or there is little rainfall. Including the period from
March to May, evapotranspiration values are higher than 4 mm per day and will have low
amounts during the rainy season or high rainfall from August to October. Most
evapotranspiration values are between 3-4 mm. Evapotranspiration results show that the
highest evapotranspiration potential is 143. 41 mm in April 2016 and the lowest
evapotranspiration potential is 79.73 mm in September 2013. Results can be displayed for
individual evapotranspiration analysis. Average daily evapotranspiration shows in Table 2
and monthly evaporation rates as in Figures 1 and 2.
The results of the Morton CRAE study show that the trend of daily changes in average is
high each year during the rainy season or the soil has a high moisture content. Including the
period from June to October, more evapotranspiration values are higher than 4 mm per day
and will have low amounts during the dry season or little rainfall from November to May.
Most evapotranspiration values are between 1.5-4 mm per day. The result analysis showed
that the highest evapotranspiration potential was 186. 23 mm in September 2013 and the
lowest evapotranspiration potential of the month is 21. 07 mm in December 2014. The
emission analysis results can be displayed average daily values as in Table 2 and monthly
evaporation rates as in Figures 1 and 2.
E3S Web of Conferences 187, 06001 (2020)
TSAE 2020https://doi.org/10.1051/e3sconf /202018706001
4
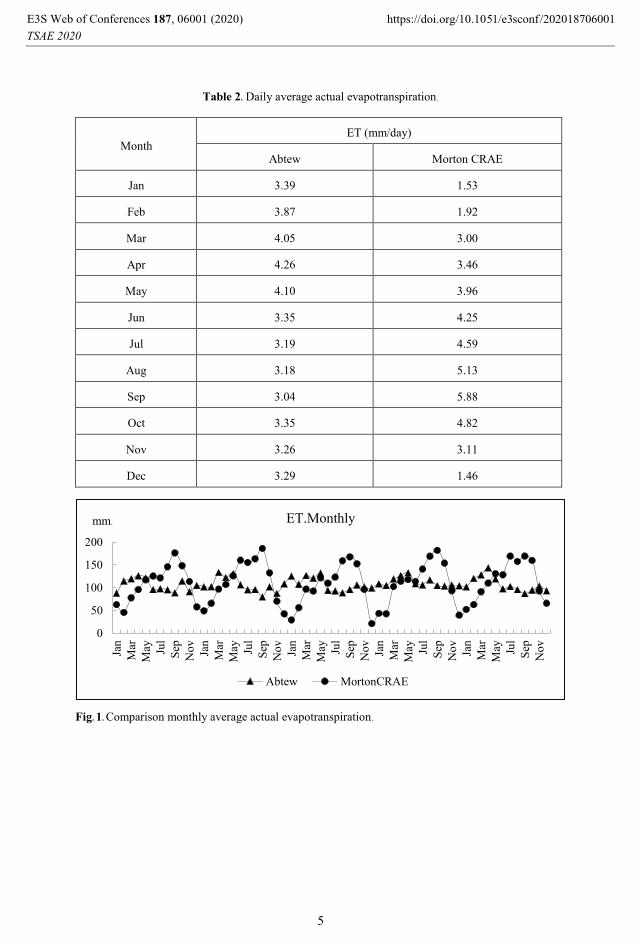
Table 2. Daily average actual evapotranspiration.
Month ET (mm/day)
Abtew Morton CRAE
Jan 3.39 1.53
Feb 3.87 1.92
Mar 4.05 3.00
Apr 4.26 3.46
May 4.10 3.96
Jun 3.35 4.25
Jul 3.19 4.59
Aug 3.18 5.13
Sep 3.04 5.88
Oct 3.35 4.82
Nov 3.26 3.11
Dec 3.29 1.46
Fig. 1. Comparison monthly average actual evapotranspiration.
0
50
100
150
200
Jan
Mar
May Ju
l
Sep
No
v
Jan
Mar
May Ju
l
Sep
No
v
Jan
Mar
May Ju
l
Sep
No
v
Jan
Mar
May Ju
l
Sep
No
v
Jan
Mar
May Ju
l
Sep
No
v
ET.Monthly
Abtew MortonCRAE
mm.
E3S Web of Conferences 187, 06001 (2020)
TSAE 2020https://doi.org/10.1051/e3sconf /202018706001
5
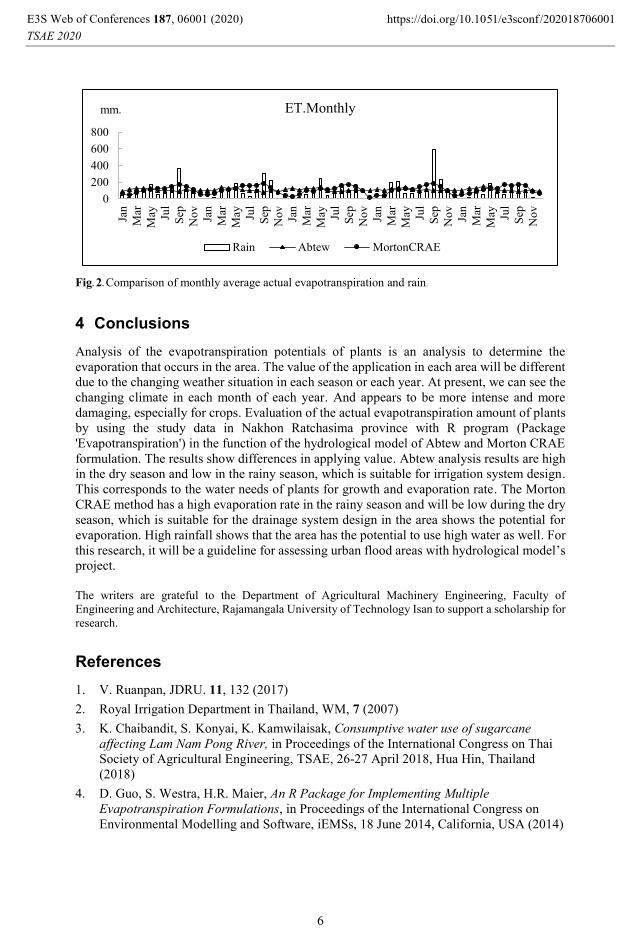
Fig. 2. Comparison of monthly average actual evapotranspiration and rain.
4 Conclusions
Analysis of the evapotranspiration potentials of plants is an analysis to determine the
evaporation that occurs in the area. The value of the application in each area will be different
due to the changing weather situation in each season or each year. At present, we can see the
changing climate in each month of each year. And appears to be more intense and more
damaging, especially for crops. Evaluation of the actual evapotranspiration amount of plants
by using the study data in Nakhon Ratchasima province with R program (Package
'Evapotranspiration') in the function of the hydrological model of Abtew and Morton CRAE
formulation. The results show differences in applying value. Abtew analysis results are high
in the dry season and low in the rainy season, which is suitable for irrigation system design.
This corresponds to the water needs of plants for growth and evaporation rate. The Morton
CRAE method has a high evaporation rate in the rainy season and will be low during the dry
season, which is suitable for the drainage system design in the area shows the potential for
evaporation. High rainfall shows that the area has the potential to use high water as well. For
this research, it will be a guideline for assessing urban flood areas with hydrological model’s
project.
The writers are grateful to the Department of Agricultural Machinery Engineering, Faculty of
Engineering and Architecture, Rajamangala University of Technology Isan to support a scholarship for
research.
References
1. V. Ruanpan, JDRU. 11, 132 (2017)
2. Royal Irrigation Department in Thailand, WM, 7 (2007)
3. K. Chaibandit, S. Konyai, K. Kamwilaisak, Consumptive water use of sugarcane
affecting Lam Nam Pong River, in Proceedings of the International Congress on Thai
Society of Agricultural Engineering, TSAE, 26-27 April 2018, Hua Hin, Thailand
(2018)
4. D. Guo, S. Westra, H.R. Maier, An R Package for Implementing Multiple
Evapotranspiration Formulations, in Proceedings of the International Congress on
Environmental Modelling and Software, iEMSs, 18 June 2014, California, USA (2014)
0
200
400
600
800Ja
n
Mar
May Ju
l
Sep
No
v
Jan
Mar
May Ju
l
Sep
No
v
Jan
Mar
May Ju
l
Sep
No
v
Jan
Mar
May Ju
l
Sep
No
v
Jan
Mar
May Ju
l
Sep
No
v
ET.Monthly
Rain Abtew MortonCRAE
mm.
E3S Web of Conferences 187, 06001 (2020)
TSAE 2020https://doi.org/10.1051/e3sconf /202018706001
6