actual report
TRANSCRIPT
Economic Viability of Dissolved Oxygen Amelioration
in Tailwater of Hydroelectric Dams to Ensure Wildlife
Indemnity
CEE 361: Environmental Engineering
Date Submitted: April 9th, 2015
Course Instructor: Arjun Venkatesan
Teacher Assistant: Maurissa Charles
Author: Hugo Ponsonnet, Ali Ibrahim, David Resler, Roy Sims, Pinquan Li, Christian Castillo, Kachun Tsui & Matt Starks
Key words: Lake turnover, eutrophication, dissolved oxygen, lake stratification, hypolimnion layer, tailwater

Abstract
Dissolved oxygen consists of microscopic bubbles of gaseous O2 mixed in liquid
water and is required for marine life respiration. Any anthropogenic process that results
in the depletion of DO in the surrounding water is called cultural eutrophication. If DO
drops below minimum levels in a body of water, the water quality is compromised and
aquatic life will perish. This paper specifically addresses water released from
hydroelectric dams. The goal of this paper is to determine the most cost effective
method of increasing dissolved oxygen (DO) levels in the tailwater of hydroelectric
dams which subsequently minimizes the negative impacts on aquatic organisms
downstream. A literature review was conducted to summarize the current knowledge of
DO quality issues related to hydroelectric dams. Table Rock Dam, located on the White
River in Arkansas, will be used as a case study for this paper.
Literature data shows two widely used processes by which low DO levels in a
dam’s tailwater can be increased. The first method of influencing DO levels consists of
injections of liquid oxygen (LOX) into the tailwater of a dam. The second method
involves the introduction of atmospheric oxygen via vents in the turbines housed within
the dam, which is then mixed with the water as it passes through the turbines. Both
methods are effective with regards to raising DO levels in a dam’s tailwater. The
majority of hydroelectric dams possess both of the previously mention DO manipulation
methods. It is expected that LOX injections will rectify low DO levels more economically
when compared to turbine venting due to the loss of turbine efficiency associated with
venting.

Introduction/Background
DO is an issue to companies that operate hydroelectric dams due to the fact that
fish kills are highly visible and make great news on a slow day. Dams, by their very
nature, are highly prone to creating low DO conditions in their tailwater due to the
physical nature of the project. A dam create a large, slow-moving body of water that
serves as an accumulation point for cultural eutrophication processes. In addition, a
natural phenomenon known as lake stratification creates a hypolimnion layer where low
DO conditions can persist for an extended duration. Unfortunately, dams must use
water from the hypolimnion layer to generate electricity because that layer provides the
most head to the turbine units. The low DO water is run through the turbines and into
the dam’s tailwater where fish tend to accumulate. Fish tend to die when DO drops
below 2 ppm resulting in large kills when this condition is met. Hydroelectric companies
use several methods to increase tailwater DO, the two most prevalent being turbine
venting and LOX injections. Turbine venting results in efficiency losses and LOX
purchases can run a large bill. The goal of this report is to determine which method is
more cost effective.
Lake Turnover

Lake Turnover is the process of a lake’s water turning from top (epilimnion) to bottom
(hypolimnion) (1). During the fall, the warm surface water starts to cool. As the water cools
down, it become more dense and therefore causes to sink. This dense water forces the water
of the hypolimnion (bottom surface) to rise, turning over the layers. During the summer, the
epilimnion or surface layer is the warmest as it is heated by the sun. The deepest layer, the
hypolimnion is the coldest as the sun’s radiations do not reach this cold, dark layer. The most
efficient way to determine if a lake is turning over it to check the temperature with an electric
thermometer. When the turnover is in progress, the entire water temperature readings will be
the same,
give or take a
couple of
degrees.
Figure 1: Lake Turnover Illustration (2)
The set of diagram above well illustrates the year-round lake turnover. In our project, we
will only focus on the summer and winter season, as the turnover does not occur during spring

or fall. Lake turnover happens depending on many factors. Large reservoirs or natural lakes
that have constant wind or a frequent current will not typically turn over (3). The wind and
current keep the water mixed at all time, leading to similar temperatures at the bottom and top
layers. In our case, the Little Rock Lake does turn over, as the current and wind are fairly weak.
The consequences of lake turnovers are greater than just a change in water density and
temperature. It eliminates oxygen barriers. After the lake has stratifies in early summer and
water in the depths no longer mixes, a stagnation process starts. Decaying organic materials at
the lake bottom, along with living organisms in the water, consumes the dissolved oxygen. With
no circulation to restore the level of oxygen and no aquatic plants to produce it, this leads to the
oxygen levels in the hypolimnion layer to decline. Furthermore, in our particular case, the Table
Rock dam pumps the bottom water in which contains a deficiency of oxygen and pumps it out
on the other side of the dam in the river (4). This river is then contaminated with low
oxygenated water, which drastically impacts its eco-system.
DO Limits and Reactions
One of the most important elements for a healthy water quality is the amount of
dissolved oxygen present (DO). The amount of DO in water affects the water activity. Nethers
too high level of DO nor too low DO are good to the environment because both too high and too
low level of DO will be harm aquatic life. Therefore, it is important to understand what are the
factors affect the amount of DO available.
Some of the major factors are list as the following:
● Volume and velocity of water flow
● Climate and season
● Type and amount of organisms
● Organic wastes

Some of the factors might seem to be negotiable; however, they are very important. A small
change of the above factors affect significantly in DO levels. Since there are so many factors
can cause the effects of DO levels, a healthy water depend on the amount of DO present.
The minimum amount of Oxygen in lakes depend on the environment. Different kind of
species required different DO levels. Some species can easily tolerate DO level below 1 ppm;
while some other species can survive at 2 ppm DO levels for only a short period of time. In
order to determine what is the DO levels best for certain types of living environment, we have to
know what kind of species do live in the area. In the case study of the Table Rock Dam
tailwater, some of the fish species live in that area is listed below:
1)Bass, Hybrid Black
2)Bass, Spotted
3)Bass, White
4)Spotted/smallmouth hybrid (see bass, hybrid black)

(Figure of minimum dissolved oxygen requirements of fish species)
Base on the above information, most of the fish species that live in the Table Rock Dam
tailwater belong into a group of bass fish. The bass fish requires at least a minimum of 5 ppm
DO in order to grow and thrive. DO of a level 5 ppm is a most steady state for the species to
live.
Consequences of fail DO levels leads to rise fish mortality rates. For example of Trout
and Salmon, from the figure Salmon has to live in a DO level of 6 ppm. Once the DO levels drop
below the DO levels requirement. Those kind of fish species will no longer to be able to
reproduce. The reason is because the Trout eggs are not only delicate, but the Trout fry (baby
Trout fish) are also very sensitive and require higher DO levels. Therefore, those kind of fish has
to have above 7.0 ppm in order to reproduce.

Additionally, the DO levels drop below a certain level, fish kill may happen. A sudden
appearance of dead fish is to alarm people for the unusual activities. A fish kill is a larger
amount of fish die, and float on the water surface is usually associated the low DO levels.
The DO levels in Table Rock Dam tailwater is definitely not a good environment for fish
to live. In order to sustain the DO levels on health level, the turbine vent operate runs more
oxygen dissolve into the water. If the DO continuous drop to, once the DO levels reach less than
4 ppm, the LOX injection and generation limitations will run. All of the operations included
turbine vent, LOX injection and generation limitations are intended to manage the DO levels to
keep on a level of 6 ppm.
In order to have the operations occupy when the DO levels reach below 4ppm, a
prediction of sudden drop of DO levels will be helpful. This involves some of the chemical
reaction that happens in the tailwater.
The Dissolved Oxygen in the tailwater is mainly depleted by the following chemical and
relative reactions. Three major chemicals are: manganese sulfate (Mn(SO4)), potassium
hydroxide (KOH), and sulfuric acid (H2SO4)(5). The main processes of the reactions are shown
below(6).
First, an excess of Mn(SO4), hydroxide (OH-) ions is added to a water causing a white
precipitate of Mn(OH)2 to form. This precipitate is then oxidized by the dissolved oxygen in the
water sample into a brown manganese precipitate:
MnSO4 + 2KOH ↔ Mn(OH)2 + K2SO4
Manganese Sulfate + Potassium Hydroxide ≡ Manganese Hydroxide + Potassium Sulfate
In the next step, a strong acid (either hydrochloric acid or sulfuric acid) is added to acidify the
solution, this acid provide huge number of free protons and create a complete redox reaction:

2Mn(OH)3 + 3H2SO4 ≡ Mn2(SO4)3 + 6H2O
Manganese Hydroxide + Sulfuric Acid ≡ Manganese Sulfate + Water
Also, the oxygen in the water oxidizes an equivalent amount of the manganous hydroxide to
brown-coloured manganic hydroxide. For every molecule of oxygen in the water, four molecules
of manganous hydroxide are converted to manganic hydroxide. Chemically, this reaction can be
written as:
4Mn(OH)2 + O2 + 2H2O ↔ 4Mn(OH)3
(Manganese Hydroxide + Oxygen + Water ≡ Manganese Hydroxide)
This last reaction is the final process that the dissolved oxygen being depleted. Also,
because it is colorimetric modification, where the trivalent manganese produced on acidifying
the brown suspension is directly reacted with EDTA to give a pink color, so these reactions can
be easily monitor and the volume of depleted dissolved oxygen can be recorded.
For the resources of these two main consumers of dissolved oxygen, Magnesium's
effect on the environment results from the emission of hazardous air pollutants from magnesium
industrial plants. Potassium hydroxide KOH is a colorless, odorless, corrosive, deliquescent
crystalline solid. It readily absorbs water and carbon dioxide from air. KOH has a good solubility
in water, 49.4% wt at 0°C, its solvation is highly exothermic. It also dissolves in methyl alcohol
(35.5% wt at 28°C), ethanol (27.9% wt at 28°C)(7). Normally, Potassium hydroxide is found in
varied items such as liquid soaps, lotions, shampoos, hairsprays, and denture cleaners, but is

also found in more industrial compounds such as oven cleaners, drain cleaners, driveway and
concrete cleaners, in non-phosphate detergents, and in drain and pipe cleaners(8).
Engineering solutions/Technology options
There are many different methods to ameliorate DO levels in a dam’s tailwater.
The three methods that are commonly used and that will be discussed are aerating
turbines, liquid oxygen (LOX), and natural aeration. Dams can either use the turbines
that are already installed and simply retrofit them or use turbines that are already able to
aerate.
The most popular and widely used type of turbine used for hydropower are
Francis turbines. These turbines have varying designs, the two predominant being
active and passive, or automatic, aeration [23,19]. Active turbines mechanically force
oxygen into the water passing through, either by motorized blowers or air compressors.
There are a few variants of the passive turbine designs. In Hydro Performance
Processes Incorporated’s report [19] to the U.S. Department of Energy, they suggest
the best passive turbine design is done by modifying the runner or draft tube, creating
localized zones of low pressure that draw atmospheric air into the turbine, aerating the
water. This is the cheapest and easiest way to retrofit an older turbine that does not
have an active aeration design.
Aeration by passivated turbines are primarily done by three different means,
central aeration, peripheral aeration, and distributed aeration [22]. In central aeration,
air bubbles are brought down through the draft tube, it is inexpensive but is most
effective at partial loads, and is inefficient at raising the DO levels at full load. In
peripheral aeration, oxygen bubbles are added from the inner walls of the draft cone,

this method more evenly distributes the oxygen into the water than does central
aeration, it is good with medium to high loads but decreases the turbines efficiency. In
distributed aeration, oxygen is injected into the runner bucket and utilizes the low
pressure area at the very edge of the turbine’s blades, injecting the air directly into the
runner, this allows for most thorough mixing and most efficiency. All passive aeration
injection areas are located on Figure ###.
Figure ###: Francis Turbine [19]
The cost associated with turbine venting is the loss of power production
efficiency due to cavitation. Cavitation is the largest sources of inefficiency in a hydraulic
turbine. The loss occur when bubbles of air are formed in the turbine and collide with
the runner [24]. When this occurs, the bubbles collapse, sending waves through the
runner and surrounding water, at the high flow turbines see and multiplied by the
number of bubbles in the turbines, this can destroy runner blades. The efficiency loss is
generally less than 1.3% [13].
Certain hydroelectric facilities are outfitted with the ability to augment discharged
turbine water with liquid oxygen injections (LOX). LOX is typically stored onsite in large

tanks, used to supplement the tailwater during periods of exceptionally low DO levels.
For Table Rock Dam (see Case Study), two, 20 short ton tanks, approximately 4200
gallons each, are kept onsite. The company that owns the project will typically have a
standing order with a contracted provider.
Figure xxx: LOX storage at dams [26]
When the DO is low in the tailwater of the dam, LOX will be released directly to
the tailwater to aerate it. This method requires either a substantial amount of storage
space for multiple LOX tanks or frequent refilling of the two current tanks. Using either
method, the cost to use LOX are expensive and will have to be compared to turbine
efficiency losses.
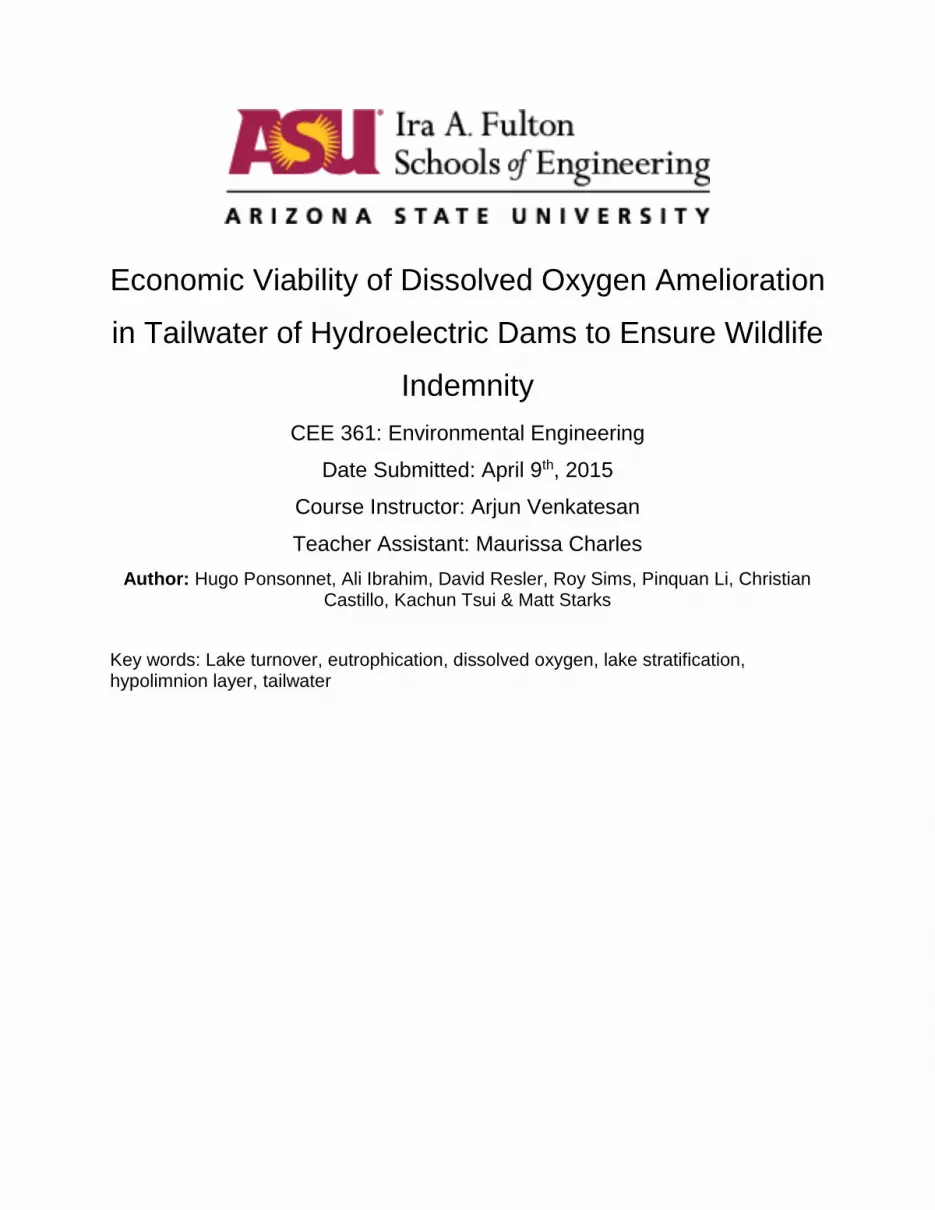
Two natural aeration processes that will be discussed, but not compared to either
turbines or LOX, are siphons and weirs. Some projects use what is known as a siphon
to foster freshwater habitats. For example Norfork Dam in Arkansas uses a 42-inch-
diameter pipe to carry water through the dam and down the structure's face, discharging
it into the Norfork tailwater (North Fork River) [10].
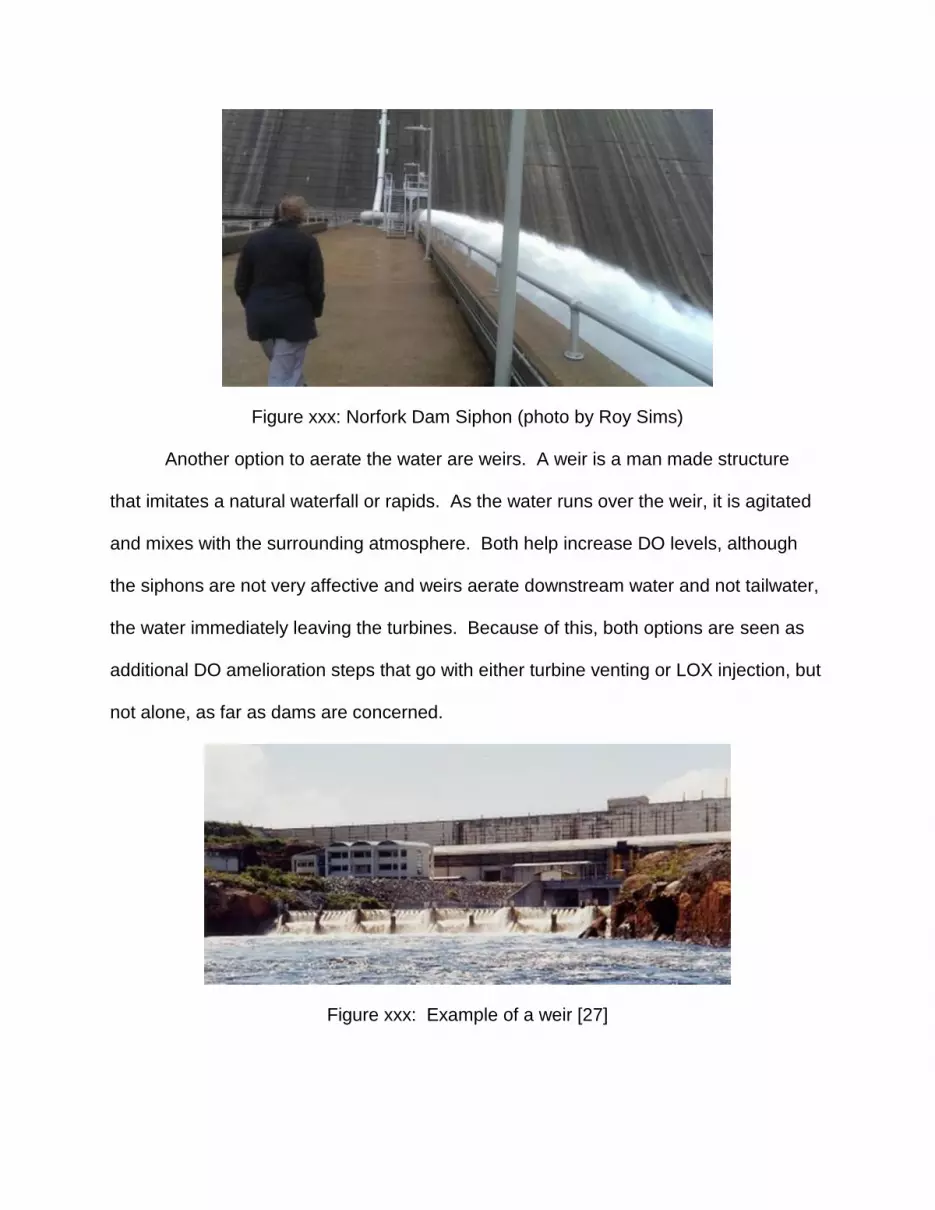
Figure xxx: Norfork Dam Siphon (photo by Roy Sims)
Another option to aerate the water are weirs. A weir is a man made structure
that imitates a natural waterfall or rapids. As the water runs over the weir, it is agitated
and mixes with the surrounding atmosphere. Both help increase DO levels, although
the siphons are not very affective and weirs aerate downstream water and not tailwater,
the water immediately leaving the turbines. Because of this, both options are seen as
additional DO amelioration steps that go with either turbine venting or LOX injection, but
not alone, as far as dams are concerned.
Figure xxx: Example of a weir [27]
Additionally a project can self-limit generation which is referred to as
recommended maximum generation rates (RMGR). The reduced influx of low DO
outflow into the dam’s tailwater is a common practice, but all water must eventually be
released in order for flooding attenuation requirements.
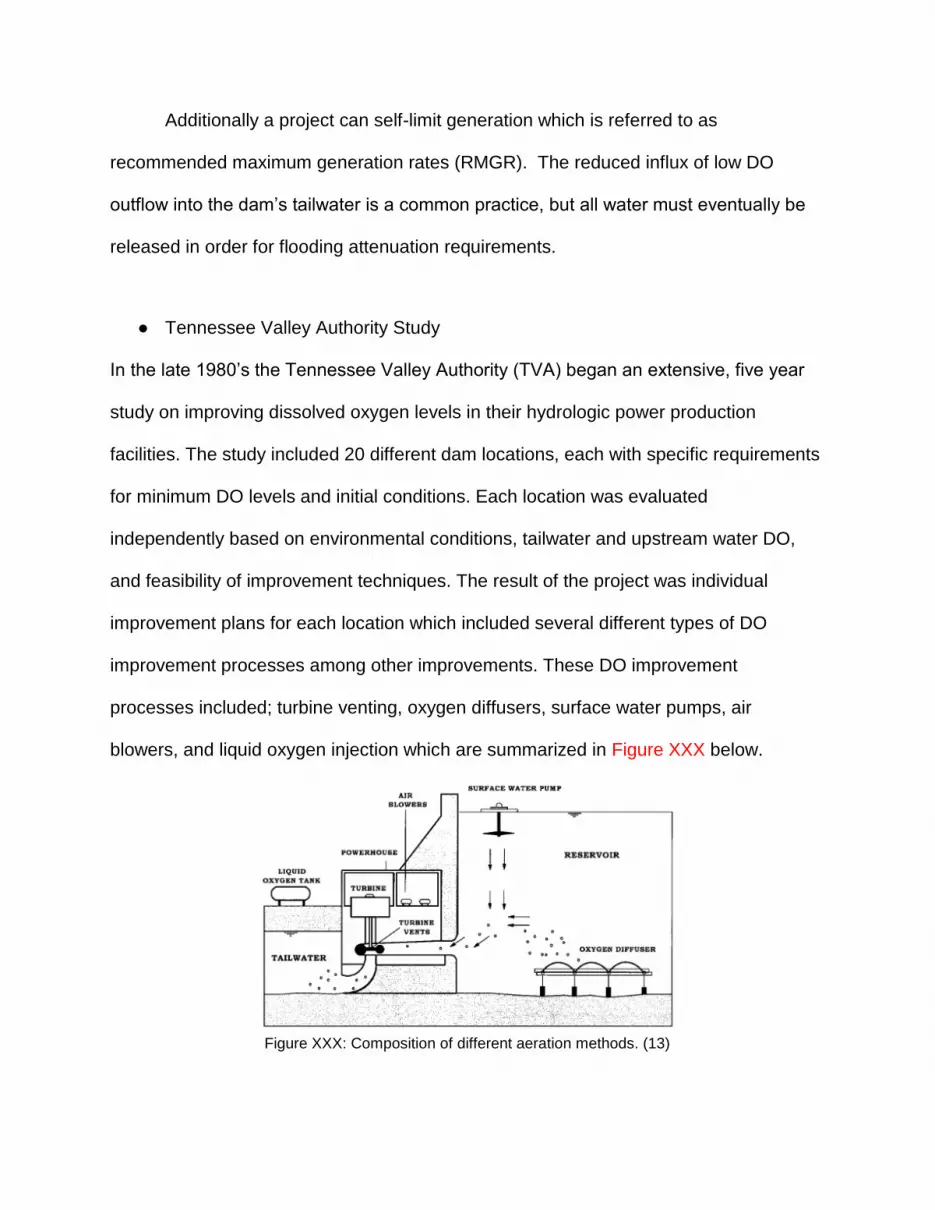
● Tennessee Valley Authority Study
In the late 1980’s the Tennessee Valley Authority (TVA) began an extensive, five year
study on improving dissolved oxygen levels in their hydrologic power production
facilities. The study included 20 different dam locations, each with specific requirements
for minimum DO levels and initial conditions. Each location was evaluated
independently based on environmental conditions, tailwater and upstream water DO,
and feasibility of improvement techniques. The result of the project was individual
improvement plans for each location which included several different types of DO
improvement processes among other improvements. These DO improvement
processes included; turbine venting, oxygen diffusers, surface water pumps, air
blowers, and liquid oxygen injection which are summarized in Figure XXX below.
Figure XXX: Composition of different aeration methods. (13)

Each location, having its own unique needs and conditions, was fitted with the most
appropriate DO improvement method, as selected by the TVA. After improvements for the
locations were completed, each location was monitored for DO, along with other critical
information, to determine whether the methods were successful. The study gathered historical
data, when available, taken from each location from 1971 through 1995 and averaged for the
historical data. The historical average was then compared against the data taken in the four
years after the completion of the projects, in 1994 through 1997 and is summarized in Figure
XXX below.
Figure XXX shows days below dissolved oxygen target vs year by dam location.
As seen in Figure XXX, the number of days when the dissolved oxygen fell below the
target limit by location decreased significantly in most locations when compared to the
respective historical average. This effect was directly attributed to the improvement
projects undertaken by the TVA.

● Table Rock Dam (TRD) Case Study

○ TRD reservoir volume: 3,462,000 Acre-ft
○ TRD reservoir maximum depth: 220 ft
○ TRD surface area: 43,100 Acres
○ Power generation capabilities: 4(50 MW vertically mounted turbines)
○ TRD low DO season typically begins in July and ends in December.
○ 2012 low DO season:
■ Energy production: 73,289.5 MWh
■ Average turbine release: 1380.9 cfs
■ DO amelioration methods used:
● Vents opened: 7/6/2012
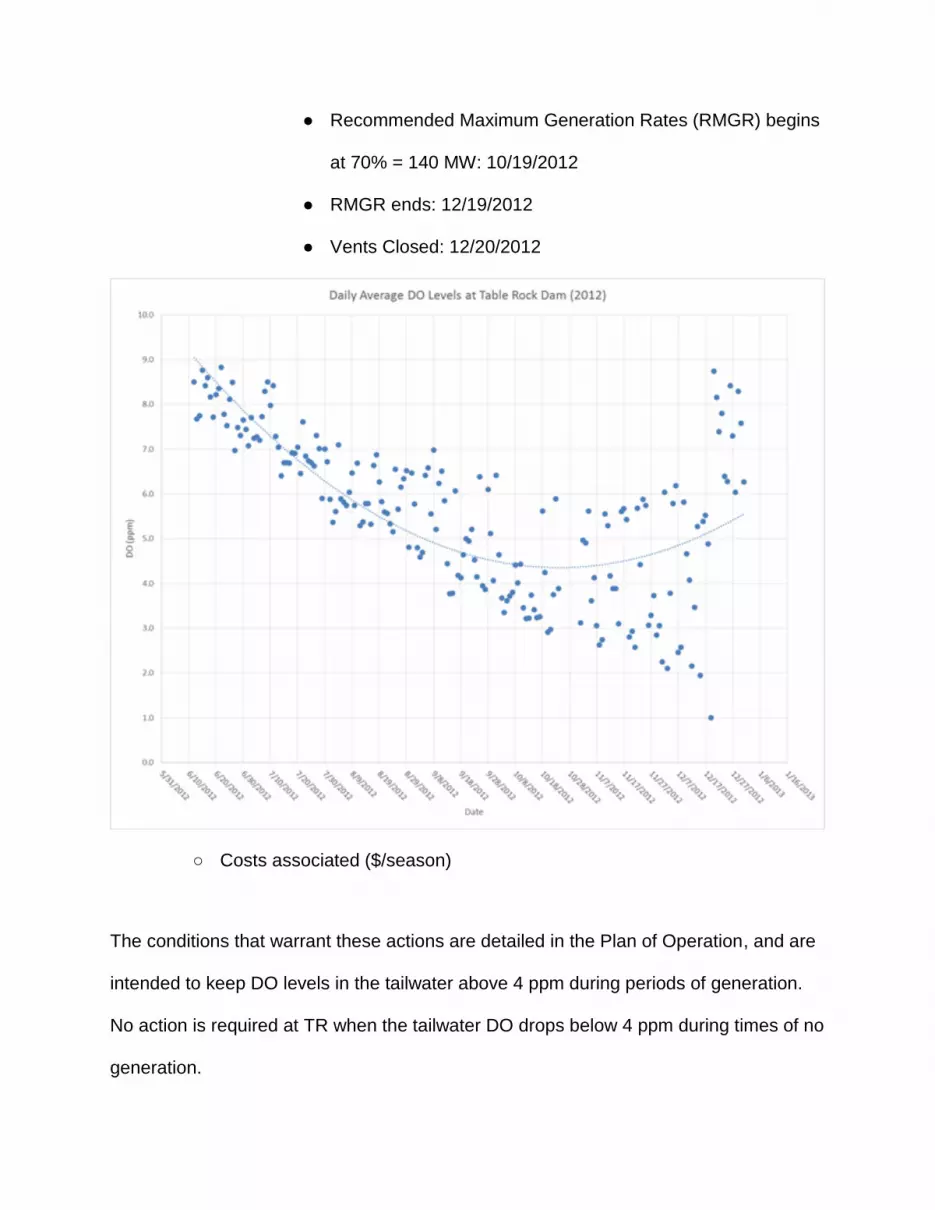
● Recommended Maximum Generation Rates (RMGR) begins
at 70% = 140 MW: 10/19/2012
● RMGR ends: 12/19/2012
● Vents Closed: 12/20/2012
○ Costs associated ($/season)
The conditions that warrant these actions are detailed in the Plan of Operation, and are
intended to keep DO levels in the tailwater above 4 ppm during periods of generation.
No action is required at TR when the tailwater DO drops below 4 ppm during times of no
generation.
Discussion
– Comparison of different solutions/technologies
- Which method was more cost effective at removing low DO at TRD (cost
analysis)
- Cost analysis table
- Will all other areas benefit the same from the most cost effective option?
Conclusions
It was expected that the liquid oxygen injection would be a more economic
approach to solving the low tailwater DO issue. This was due to a comparatively low
cost of liquid oxygen when compared to the loss of efficiency in the turbine generation,
which translates into a loss in revenue. This expectation was entirely incorrect, the cost
“Two findings guided the selection of alternatives. First, no single alternative or set of solutions is
appropriate for all projects. Each dam is physically different and requires a unique set of facilities and
operations. Second, some redundancy or mix of alternatives is
needed to provide operational flexibility. These principles are apparent in the diversity and combinations
of facilities installed at the 20 projects “ Reword and cite for conclusion paragraph.
References
References for lake turnover section:

1) Johns, David. "The Truth about Fall Turnover." Bassmaster. N.p., 28 Oct. 2011. Web. 20 Mar. 2015.
2) "Lake Turnover." - National Geographic Education. N.p., n.d. Web. 20 Mar. 2015
3) "Water on the Web | Understanding | Lake Ecology | Density Stratification. "Water on the Web |
Understanding | Lake Ecology | Density Stratification. N.p., 31 Jan. 2011. Web. 20 Mar. 2015.
4) Heidorn, Keith. "Fall/Spring Lake Turnover." Weather Elements:. N.p., 1 Sept. 2005. Web. 20 Mar.
2015.
Reference for D.O test chemical reactions:
5) M. Lambert, B.A. Leven, and R.M. Green, “New Methods of Cleaning Up Heavy Metal in Soils
and Water”, Web. 2015. http://www.engg.ksu.edu/HSRC/Tosc/metals.pdf
6) “Dissolved Oxygen”, Main processes consuming dissolved oxygen, Osprey Scientific inc. Web.
http://www.ospreyscientific.com/uploads/Tech%20Papers/Microsoft%20Word%20-
%20Dissolved%20Oxygen.pdf
7) “potassium hydroxide”. Chemindustry.ru. Web.
http://chemindustry.ru/Potassium_Hydroxide_solution.php
8) Robin Wasserman, “Uses of Potassium hydroxide”, Livestrong.com, Web. Aug 16, 2013.
http://www.livestrong.com/article/122647-uses-potassium-hydroxide/.
Liquid oxygen data
9) Praxair. (n.d.). Pure Gases: Oxygen. Retrieved March 23, 2015, from
http://www.praxair.com/gases/buy-liquid-oxygen-or-compressed-oxygen-gas.
Alternative methods (siphon)
10) Garver. (2012). Norfork Dam Siphon. Retrieved from Garver USA:
https://garverusa.com/markets/federal/65/norfork-dam-siphon/
Jan Jones’ Email
11) Jones, J. (2015, March). U.S. Army Corps. of Engineers' Chief, Little Rock Reservior control branch.
United States of America.
Energy Prices
12) U.S. Energy Information Administration. (2012). Today in Energy. Retrieved from EIA.gov:
http://www.eia.gov/todayinenergy/detail.cfm?id=9510
Link to research paper by TVA to prove this is not an isolated issue
13) Higgins, J. M., & Brock, W. G. (1999). Overview of Reservoir Release Improvements at 20 TVA Dams.
JOURNAL OF ENERGY ENGINEERING.
http://ascelibrary.org/doi/pdf/10.1061/%28ASCE%290733-9402%281999%29125%3A1%281%29

Reference for D.O limits:
14) State of Florida (2005). Causes and Prevention of Fish Kill. FLORIDA FISH AND WILDLIFE
CONSERVATION COMMISSION. Web. 4 Mar, 2015.
Retrieved http://myfwc.com/conservation/you-conserve/recreation/pond-management/fish-kills/
15) Water’s the Matter. (n.d.). Lesson Presentation: Dissolved Oxygen. Web. 11 Mar, 2015.
Retrieved http://peer.tamu.edu/curriculum_modules/Water_Quality/module_3/lesson3.htm
16) (2 February, 2015). Missouri State Record Fish. MISSOURI CONSERVATION DEPARTMENT. Web. 18
Mar, 2015.
Retrieved http:// mdc.mo.gov/fishing/state-record-fish/resource/state-record-fish-list
17) Sheila Murphy. (23 April, 2007). General Information on Dissolved Oxygen. CITY OF BOULDER. Web.
25 Mar, 2015.
Retrieved http://bcn.boulder.co.us/basin/data/NEW/info/DO.html
18) Figure
Environmental Measurement Systems. (n.d). Dissolved Oxygen. FUNDAMENTALS OF ENVIRONMENTAL
MEASUREMENTS. 25 Web. Mar, 2015.
Retrieved http://www.fondriest.com/environmental-measurements/parameters/water-
quality/dissolve oxygen/
DO Amelerization:
19) "Best Practice Catalogue for Hydropower." Scribd. Web. 30 Mar. 2015.
<http://www.scribd.com/doc/144004307/Best-Practice-Catalogue-for-Hydropower#scribd>.
20) Wahl, Tony L. “Venting Hydroturbines for Dissolved Oxygen Enhancement.” (n.d.) Water
Resources Research Laboratory. U.S.B.R. D-8560. PDF file.
http://www.usbr.gov/pmts/hydraulics_lab/pubs/PAP/PAP-0684.pdf
21) Bevelhimer, Mark S., Coutant, Charles C. “Assessment of Dissolved Oxygen Mitigation at
Hydropower Dams Using an Integrated HydrodynamicNVater Quality/Fish Growth Model.” July
2006. Energy Efficiency and Renewable Energy: Wind and Hydropower Technologies. PDF
file. http://web.ornl.gov/info/reports/2006/3445605662075.pdf
22) Hopping, Paul, et al. “Update on Development of Auto-Venting Turbine
Technology.” (n.d.) PDF file. http://www.tva.gov/environment/pdf/rri_autovent.pdf
23) "Equipment: Aerating Turbines for Duke Energy's New Bridgewater Powerhouse." -

HydroWorld. Web. 06 Apr. 2015. <http://www.hydroworld.com/articles/hr/print/volume-
29/issue-3/articles/equipment--aerating.html>.
24) "Causes & Effects of Cavitation. What Is Cavitation in Hydraulic
Turbines?"Brighthub Engineering. Web. 06 Apr. 2015.
<http://www.brighthubengineering.com/fluid-mechanics-hydraulics/27427-cavitation-in-
hydraulic-turbines-causes-and-effects/>.
25) Air Products. “Liquid Oxygen.” (n.d.) PDF file.
http://www.airproducts.com/~/media/Files/PDF/company/safetygram-6.pdf
26) "Richard B. Russell Lake and Dam." AIM. Web. 10 Apr. 2015.
<http://www.independentmail.com/news/local-news/richard-b-russell-lake-and-dam>.
27) "Gwen Abril Personal Page." Gwen Abril Personal Page. Web. 10 Apr. 2015.
<http://www.epoc.u-bordeaux.fr/indiv/Abril/Petit_saut.html>.