goes surface insolation to estimate wetlands evapotranspiration
TRANSCRIPT

GOES surface insolation to estimate wetlands evapotranspiration
Jennifer M. Jacobsa,*, David A. Myersa, Martha C. Andersonb, George R. Diakc
aDepartment of Civil Engineering and Coastal Engineering, University of Florida, Gainesville, FL 32611-6580, USAbDepartment of Soil Science, University of Wisconsin, Madison, WI 53706, USA
cCooperative Institute for Meteorological Satellite Studies (CIMSS/SSEC), Space Science and Engineering Center, University of Wisconsin,
Madison, WI 53706, USA
Received 1 October 2001; revised 8 May 2002; accepted 14 May 2002
Abstract
Incoming solar radiation derived from GOES-8 satellite observations, in combination with local meteorological
measurements, were used to model evapotranspiration from a wetland. The wetland experiment was conducted in the Paynes
Prairie Preserve, North Central Florida during a growing season characterized by significant convective activity. The satellite
solar radiation measurements generally agreed with pyranometer data gathered at the site. The satellite net radiation estimates
were in good agreement with the 30-min averages of measured net radiometer data. Satellite derived net radiation estimates
were used in the Penman–Monteith and Priestley–Taylor models to calculate evapotranspiration. The calculated instantaneous
evaporative fluxes were in good agreement with 30-min average ground-based eddy correlation system measurements. The
daily averages of modeled evapotranspiration were in very good agreement ðr2 ¼ 0:90Þ with reference eddy flux
measurements. q 2002 Elsevier Science B.V. All rights reserved.
Keywords: Evapotranspiration; Geostationary operational environmental satellite; Solar radiation; Wetlands
1. Introduction
Distributed climate parameters available from
satellites can offer significantly enhanced information
for improving the understanding of climate, water
supply, agricultural production, and ecosystems over
lumped or point indices. The application of remote
sensing methods to estimate evapotranspiration has
the advantage of good spatial resolution and excellent
spatial coverage, but may have the disadvantage of
infrequent sampling and considerable expense (Kite
and Drooger, 2000). The Geostationary Operational
Environmental Satellite (GOES) provides enhanced
temporal resolution with hourly estimates of solar
radiation that are critical to evapotranspiration
calculations and has a spatial resolution, that is,
significantly better than that available from most
ground-based pyranometer networks.
The earliest satellite insolation studies were
conducted in the Western Hemisphere using the first
generation GOES systems (GOES 1–7). Pinker et al.
(1995), Schmetz (1989) reviewed the observations
made using the visible band from the GOES and other
satellites. The results show that the instantaneous
solar insolation estimation errors are typically less
than 10% on a daily basis and hourly values range
from 15 to 20%. In addition, as a geostationary
satellite, the GOES systems’ temporal resolution
provides numerous measurements throughout a day
0022-1694/02/$ - see front matter q 2002 Elsevier Science B.V. All rights reserved.
PII: S0 02 2 -1 69 4 (0 2) 00 1 17 -8
Journal of Hydrology 266 (2000) 53–65
www.elsevier.com/locate/jhydrol
* Corresponding author. Tel.: þ1-352-392-9237.
E-mail address: [email protected] (J.M. Jacobs).

that may be adequate to estimate daily shortwave
fluxes. The second generation of GOES, GOES-8 and
GOES-10, provides significant improvements over
the previous GOES system with respect to the visible
sensor.
The GOES solar radiation product may be applied
directly to estimate evapotranspiration from well-
watered regions. Diak et al. (1998) routinely apply
GOES derived solar radiation to estimate daily crop
evapotranspiration for Wisconsin using ground-
truthed surface insolation measures (Diak et al.,
1996). Stewart et al. (1999) used GOES incoming
solar radiation estimates in a comparison among three
evapotranspiration formulations for an irrigated
agricultural setting in northwest Mexico. Garatuza--
Payan et al. (2001) successfully validated the GOES
derived evapotranspiration estimates using measured
values at the same northwest Mexico location.
The general objective of this research was to
evaluate the applicability of satellite derived solar
insolation to evapotranspiration estimation in a
Florida wetland during the growing season. Atmos-
pheric conditions during the growing season are
characterized by active convective systems with
extremely dynamic cloud systems. These conditions
represent a significant challenge for remote sensing.
This paper first compares the GOES estimates of solar
radiation and net radiation to measured values. Then,
the wetland evapotranspiration is modeled using the
Penman–Monteith and Priestley–Taylor approaches
and compared to evapotranspiration measured by an
eddy flux system.
2. Experimental data
This study was conducted for 18 days in July (day
of year 183–201) during the 2001 growing season in
Paynes Prairie State Preserve, a large highland marsh
system in North Central Florida, USA. The exper-
imental period occurred 3 years into a drought that
commenced April 1998, where the rainfall deficit was
approximately 1.1 m from April 1998 to June 2001.
The period immediately preceding the experiment
coincided with a return to a wetter rainfall pattern that
maintained the water table near the surface during the
experiment. The energy flux and meteorological
observations shown in Fig. 1 illustrate the daily
Fig. 1. The daily total measured values of rainfall (vertical bars), evapotranspiration (A) and net radiation (D) during the experiment period.
J.M. Jacobs et al. / Journal of Hydrology 266 (2000) 53–6554

rainfall, net radiation and evapotranspiration values
observed during the experiment. Six days had rainfall
events with 7.8 cm of total rainfall during the
experiment. Considerable variability in evapotran-
spiration occurred during the observation period. This
is primarily attributed to the variability in the net
radiation, as soil water was not limited during the
experiment.
The Paynes Prairie State Preserve study area is
described in detail by Jacobs et al. (2002). The study
was conducted in a wet prairie community located in
the Preserve (2983401400N, 8281604600W). The wet
prairie is a relatively flat, treeless plain with a
moderately dense ground cover. In the wet prairies,
the emergent herbaceous perennials between 0.4 and
1.2 m tall were predominant and dense. The common
species were Panicum hemitomon Schultes (maiden
cane), Polygonum hydropiperoides Michx. (mild
water-pepper), and Ptilimnium capillaceum Michx.
(mock bishop’s weed) (Patton and Judd, 1986; Tobe
et al., 1998). Eupatorium capillifolium Lam. (dog
fennel) was prevalent and Sesbania sp. was scattered
throughout; both species were up to 1.5 m tall. The
mean canopy height was 1.0 m. Field observations
showed that the majority of the root zone was
contained in the upper 10 cm soil layer with
approximately 95% of the root zone contained in the
upper 25 cm soil layer. The site’s soils include
Emeralda fine sandy loam, Wauberg sand, and
Ledwith Muck.
2.1. Surface insolation from GOES visible satellite
data
NASA and National Oceanic and Atmospheric
Administration (NOAA) cooperatively designed, built
and deployed the GOES system. The GOES-8 system
provides hourly observations of emitted radiation in
18 thermal infrared bands over the eastern US, from
which atmospheric temperature, winds, moisture, and
cloud cover can be derived. The visible band of the
GOES can be used to detect cloud cover and
subsequently to provide estimates of incoming solar
radiation or insolation.
The approach used to estimate insolation from the
visible Earth images is described in detail by Gautier
et al. (1980) with modifications by Diak and Gautier
(1983). The algorithm is described here only briefly.
A simple physical model of radiative transfer is used.
Images are compared against a reference clear sky
image of the surface albedo. The surface albedo
comparison indicates if a point is clear or cloudy. If
the point is clear, a clear model of bulk radiative
transfer is used to adjust the insolation for effects of
ozone adsorption, Rayleigh scattering and water
vapor absorption. If the point is cloudy, the cloudy
radiation model is applied to determine the cloud
albedo. The cloudy model, assuming plane-parallel
clouds, calculates the atmospheric effects above and
below the cloud separately.
The solar radiation data were developed using the
methods of Diak et al. (1996). The data collection and
processing has been automated by the Man-computer
Interactive Data Processing System (McIDAS) at the
University of Wisconsin Space Science and Engin-
eering Center (SSEC). The GOES data are archived
and processed to yield hourly fields of insolation
values. For this experiment, hourly data were
extracted from a 20 km grid cell centered at 29.68N
and 82.28W, but resolution to approximately 1 km
grid size is possible. Up to 12 hourly images were
available daily during the study period.
2.2. Reference flux measurements
Energy flux measurements were made within an
energy balance framework. All instruments were
mounted on a 6.1 m tower. The net radiation was
measured with a net radiometer (Radiation Energy
Balance Systems Q7.1). The temperature and relative
humidity were measured using a shielded Vaisala
model HMP 45C sensor (Vaisala, Inc.). Wind speed
and direction were measured with an CS 800-L
anemometer (RM Young, Inc.). These instruments
were mounted approximately 4.0 m above the ground
surface. Measurements were made every minute and
averaged over 30 min intervals. Ground heat flux was
measured by RFT 3.1 heat fluxes plates installed
approximately 2 cm below the surface (Radiation
Energy Balance Systems). Evapotranspiration was
measured directly using the eddy covariance
approach. The sensible and latent heat flux measure-
ments were made using CSI CSAT3 3-D Sonic
Anemometer (Campbell Scientific Instruments, Inc.
(CSI)) that measures the three wind components and
the virtual temperature, and a CSI KH20 Krypton
J.M. Jacobs et al. / Journal of Hydrology 266 (2000) 53–65 55

hygrometer. The flux instruments were installed at
4.0 m above the ground surface. Fluctuations in wind
speed, virtual air temperature and vapor density were
sampled at 6 Hz and 30-min average co-variances
were calculated to estimate the fluxes. The latent heat
fluxes were corrected for temperature-induced fluctu-
ations in air density (Webb et al., 1980) and for the
hygrometer sensitivity to oxygen (Tanner and Greene,
1989). Sensible heat fluxes were corrected for
differences between the sonic temperature and the
actual air temperature (Schotanus et al., 1983). Both
the sensible and latent heat fluxes were corrected for
misalignment with respect to the natural wind
coordinate system (Baldocchi et al., 1988). The
Bowen-ratio method was used to close the surface
energy balance relationship (Twine et al., 2000).
3. Theory and models
Jacobs et al. (2002) found that the Penman–
Monteith equation coupled with an empirical soil
water parameterization method provided the best
estimates of actual evapotranspiration for the study
site among the methods tested. During the experiment
period, the vegetation was not water-limited, thus the
evapotranspiration estimates were made directly from
the Penman–Monteith equation. The Penman–Mon-
teith method is an extension of the Penman equation
that allows the approach to be applied to a range of
vegetated surfaces through the introduction of plant
specific resistance factors (Monteith, 1965):
LEPM ¼DðRN 2 GÞ þ racpðes 2 eaÞ=ra
Dþ gð1 þ rs=raÞð1Þ
where LEPM is the modeled latent heat flux; D, the
slope of the saturation vapor pressure temperature
relationship; g, the psychrometric constant; RN, the
net radiation; G, the ground heat flux; ra; the mean air
density at constant pressure; cp; the specific heat of
air; es 2 ea; the vapor pressure deficit of the air; es; the
saturation vapor pressure of the air; ea; the actual
vapor pressure of the air; rs; the bulk surface
resistance, and ra; the aerodynamic resistance. The
aerodynamic resistance was estimated by
ra ¼ln½ðz 2 dÞ=z0�ln½ðz 2 dÞ=z0v�
k2Uð2Þ
where z is the height at which the wind speed U was
measured, d is the displacement height estimated to be
0.7zveg, where zveg is the vegetation height, z0 is the
roughness height approximated as 0.1zveg, z0v is the
roughness height for water vapor approximated as
0:1z0; and k is the Von Karmen’s constant (0.4). The
surface resistance, determined by back solution of Eq.
(1) during wet periods, was on average 50 s m21 and
was invariant with time of day (Jacobs et al., 2002).
Jacobs et al. (2002) provide further details on the
determination of plant specific resistance factors.
An alternative method to estimate evapotranspira-
tion under potential conditions is the Priestley–Taylor
method. For well-watered conditions, typically found
in wetlands and irrigated agricultural settings, the
Priestley–Taylor method may be advantageous as it
requires significantly less meteorological data than the
Penman–Monteith method. The basis for the Priest-
ley–Taylor method is the theoretical lower limit of
evaporation from a wet surface known as the
‘equilibrium’ evaporation (Priestley 1959; Slatyer
and McIlroy 1961):
LEPT ¼ aD
Dþ gðRN 2 GÞ ð3Þ
where a ¼ 1: Equilibrium conditions reflect evapor-
ation from a wet surface under conditions of minimum
advection that result in the actual vapor pressure of the
air approaching the saturation vapor pressure. Priest-
ley and Taylor (1972) showed that for conditions of
minimum advection with no edge effects, a ¼ 1:26:In this case, the aerodynamic term of the combination
equation is effectively assigned a constant percent of
the radiation term. The Priestley–Taylor equation
with a values ranging from 1 to 1.26 has been
successfully applied in wetland environments (Price
and Woo, 1988; Souch et al., 1998; Thompson et al.,
1999). In this research, the equilibrium form of the
Priestley–Taylor equation was found to give the best
results.
4. Results and discussion
4.1. Incoming solar radiation
The satellite estimates of incoming solar radiation
were compared to measurements made at the Paynes
J.M. Jacobs et al. / Journal of Hydrology 266 (2000) 53–6556

Fig. 2. The diurnal cycle of solar radiation measured by the pyranometer and estimated from GOES images for (a) day 186, (b) day 187, and (c)
day 188.
J.M. Jacobs et al. / Journal of Hydrology 266 (2000) 53–65 57
Prairie Preserve. The visible GOES imagery was used
to estimate an instantaneous measurement of incom-
ing solar radiation at 15 min past every hour during
the daytime. The ground-based pyranometer provided
half-hour estimates of the mean incoming solar
radiation beginning on the hour and the half-hour.
Fig. 2 shows examples of the diurnal evolution of
incoming solar radiation measurements. The obser-
vations on days 186 and 187 (Fig. 2(a) and (b)) are
typical of most days during the experiment. These
days have an irregular diurnal energy cycle due to the
high cloud cover, that is, typical of the Florida
summer-time convective system patterns. Day 188
(Fig. 2(c)) had the lowest convective activity of any
day during the measurement period. Day 188 exhibits
a well-defined diurnal cycle and demonstrates the
agreement between the satellite and the ground-based
solar radiation measurements typical under low cloud
conditions (Stewart et al., 1999).
During cloudless periods, the pyranometer
measurements and the GOES estimates agree well.
During cloudy periods, larger discrepancies exist
between the pyranometer measurements and the
GOES estimates. These discrepancies may be
explained by the differences in the observation scales
between the two instruments. The satellite’s larger
spatial scale serves as a spatial smoothing filter, while
the pyranometer smoothes the solar radiation data
temporally. Under convective cloud cover conditions,
a mix of clear and cloudy sky, the satellite
measurement reflects the regional mix, while the
local measurement can range from completely clear to
completely cloudy. Some relationship between the
temporal and the spatial averaging may exist and
serve to reduce the discrepancy between the two
measurements. However, the dynamic wind patterns
and convective cloud development suggest a highly
non-stationary field that reduces the likelihood of a
simple scaling relationship.
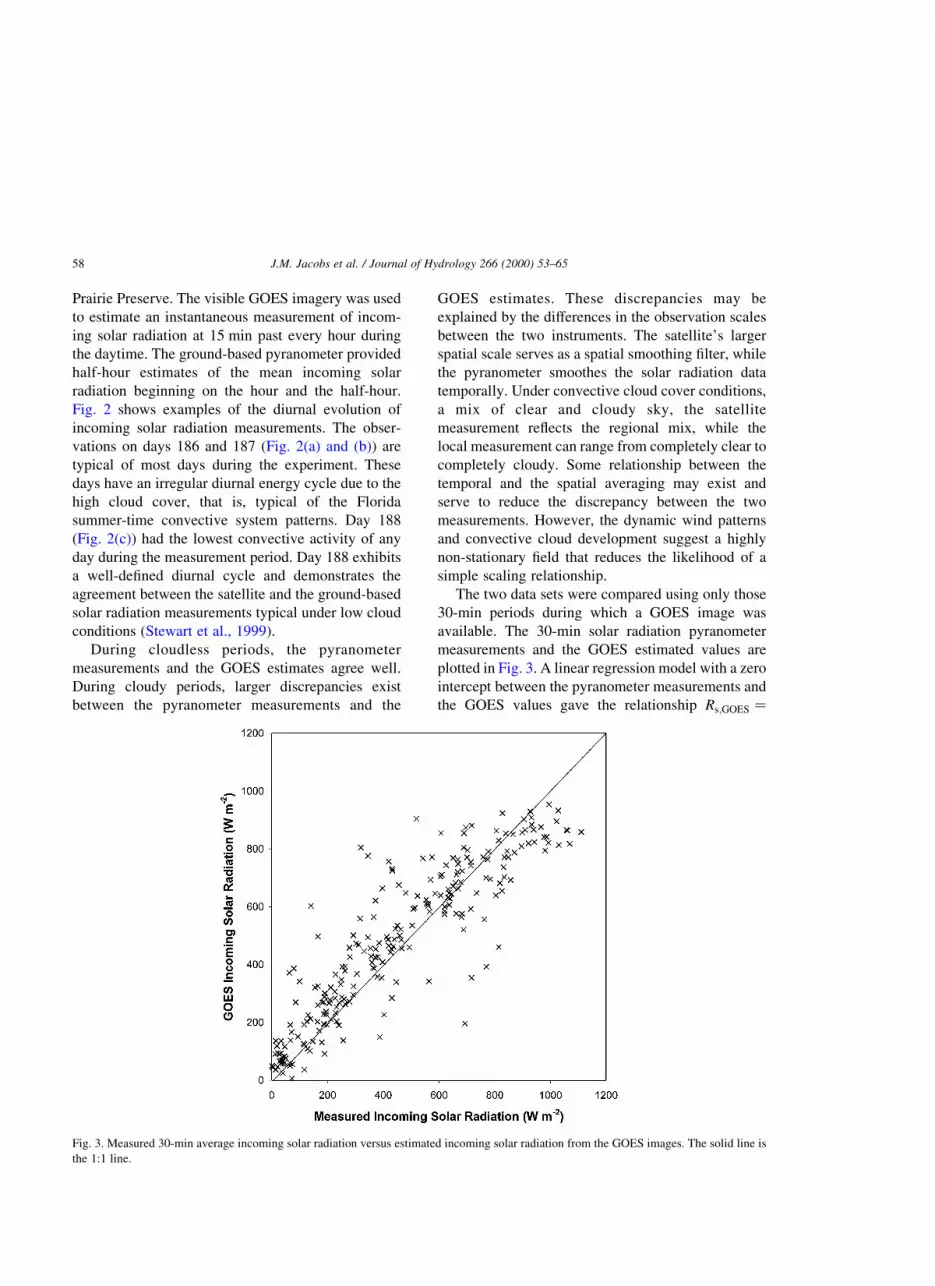
The two data sets were compared using only those
30-min periods during which a GOES image was
available. The 30-min solar radiation pyranometer
measurements and the GOES estimated values are
plotted in Fig. 3. A linear regression model with a zero
intercept between the pyranometer measurements and
the GOES values gave the relationship Rs;GOES ¼
Fig. 3. Measured 30-min average incoming solar radiation versus estimated incoming solar radiation from the GOES images. The solid line is
the 1:1 line.
J.M. Jacobs et al. / Journal of Hydrology 266 (2000) 53–6558

0:99Rs;pyro with a coefficient of determination ðr2Þ of
0.75. The regression slope was not significantly
different than 1 ðp , 0:0001Þ: However, the GOES
values on average were somewhat larger than the
pyranometer values 477 and 448 W m22, respect-
ively. Inspection of Fig. 3 and the linear regression
residuals versus the fitted values (not shown) indicate
that there is a slight non-linear relationship in which
the GOES values underestimate those measured solar
radiation values, which exceed 900 W m22.
The Root Mean Squared Error (RMSE) of the 30-
min values is 135 W m22 or 28.3% of the mean daily
values of solar radiation. These differences are
slightly larger than those found in previous studies;
Dedieu et al. (1987) obtained RMSE values of 20% in
France, while Garatuza-Payan et al. (2001), Stewart
et al. (1999) reported RMSE of 14.2 and 20.2%,
respectively, for the Yaqui Valley. The maximum
observed radiation for these earlier studies was less
than 900 W m22. As the RMSE is highly sensitive to
extreme values, the Mean Absolute Error (MAE) may
provide a better measure for comparison to the earlier
studies. In this experiment, the MAE is 97.5 W m22
or 20.4% of the mean daily solar radiation values. On
a daily basis, the RMSE of 46 W m22 (9.9%) is
consistent with the results from earlier studies
(Raphael and Hay, 1984; Stewart et al., 1999;
Garatuza-Payan et al., 2001).
4.2. Net radiation
Net radiation at the surface was estimated from the
incoming solar radiation, surface parameters, and
surface measurements by
RN ¼ Rsð1 2 aÞ þ 1a1ssT4a2 1ssT4
s ð4Þ
where Rs is the incoming solar radiation, a is the
surface albedo, 1a is the atmospheric emissivity, 1s is
the surface emissivity, s is the Stefan–Boltzman
constant, Ta is the air temperature and Ts is the surface
temperature. The surface albedo for a wetland surface
was estimated to be 0.20, a value representative of
tall, green vegetated surfaces (Eagleson, 1970). The
atmospheric emissivity was calculated as a function of
air temperature and atmospheric vapor pressure
(Brutsaert, 1975):
1a ¼ 1:24ea
Ta
� �1=7
ð5Þ
The surface emissivity was estimated to be 0.98. Ta
was used in Eq. (4) instead of Ts: This approach is
commonly applied, since Ts is rarely measured
(Brutsaert, 1982) and is most reliable for well-
watered, high coverage vegetation surfaces as com-
pared to arid regions or areas of lower canopy cover
(Diak et al., 2000).
Net radiation was estimated using Eqs. (4) and (5)
with both the solar radiation from the pyranometer
and the GOES solar radiation estimates. The net
radiation estimates were compared to those measured
by the net radiometer at the Paynes Prairie Preserve
using 30-min intervals and cumulative daily totals.
The 30-min measurements plotted in Fig. 4 are from
the daytime periods during which GOES estimates
were available (7:00–18:30 Eastern Standard Time
(EST)). The cumulative totals are the sum of all
periods having positive net radiation measurements.
For each combination method, Table 1 lists the
analysis results including the sample counts (N ), the
net radiation values’ mean and standard deviation
(S.D.), the fitted linear regression models RNcak ¼
ARNobs þ B and their corresponding r2; the MAE, the
RMSE, the systematic RMSE (RMSEs) and the
unsystematic error RMSE (RMSEu) of the estimated
30-min and the daily total net radiation in comparison
to the in situ measured net radiation. While the
regression model and the coefficient of determination
provide the correct measures to evaluate model
performance (Krzysztofowicz, 1992), the RMSE and
MAE values are included to facilitate intercomparison
among studies.
The net radiation results using pyranometer data
indicate that Eqs. (4) and (5) provide a reasonable
approach to estimate net radiation. The pyranometer
linear correlation results show excellent agreement;
the slope is close to one, the intercept is close to zero
and the coefficient of determination is very high. The
30-min pyranometer derived values overestimate the
net radiation slightly, while the daily total values are
nearly identical. The RMSEs are fairly small; 12.4 and
1.9% of the mean 30-min and daytime total values,
respectively.
J.M. Jacobs et al. / Journal of Hydrology 266 (2000) 53–65 59

The GOES results have considerably more varia-
bility than the pyranometer estimates and also appear
to have a low bias for the highest net radiation values.
On average, the GOES data overestimate net radiation
by 11.6% and have a RMSE of 107.7 W m22 (33.7%)
and 0.50 MJ m22 (3.7%) for the 30-min and the
daytime total values, respectively. The regression
results show a fairly strong relationship based on the
coefficient of determination (r2 ¼ 0:75 and
r2 ¼ 0:88) for the 30-min and the daily total values,
respectively. In addition, a large portion of the GOES
RMSE is systematic indicating that it may be possible
to significantly improve the accuracy of the net
radiation estimates (Willmott, 1982). Few studies are
available that have evaluated the calculated net
radiation using GOES data using measured values.
Our results compare favorably to those of Gu et al.
(1999) whose 30-min GOES RN values for sites in the
Table 1
Sample counts (N ), mean and S.D., linear regression slope (A ), intercept (B ) and coefficient of determination ðr2Þ; MAE, RMSE, RMSEs and
RMSEu of estimated 30-min and total daily net radiation in comparison to in situ measured net radiation. The terms N, A, and r2 are
dimensionless, the remaining terms for the 30-min and the total daily measures have the units W m22 and MJ m22, respectively. The linear
regression model is RNcalc ¼ ARNobs þ B: Thirty-minute measurements were made during the daytime (7:00–18:30 EST). Total daily values
are the sum of all periods with positive net radiation measurements
N RNcalc
(mean)
RNobs
(mean)
RNcalc
(S.D.)
RNobs
(S.D.)
A B r2 MAE RMSE RMSEs RMSEu
30-min
Pyranometer 210 344.7 319.1 214.6 200.9 1.05 212.77 0.97 24.7 39.5 11.0 38.0
GOES 217 356.4 319.3 190.3 204.7 0.81 90.36 0.75 73.5 107.7 49.4 95.7
Total daily
Pyranometer 19 13.7 13.7 3.7 3.8 0.96 0.65 0.97 0.05 0.26 0.05 0.25
GOES 19 14.7 13.7 3.0 3.8 0.73 4.69 0.88 0.11 0.50 0.41 0.29
Fig. 4. Measured net radiation versus estimated net radiation with 30-min average pyranometer measurements of incoming solar radiation and
estimated incoming solar radiation from the GOES images. The solid line is the 1:1 line.
J.M. Jacobs et al. / Journal of Hydrology 266 (2000) 53–6560

Fig. 5. The diurnal cycle of evapotranspiration measured with the eddy flux system and modeled using Eq. (1) with net radiation estimated using
pyranometer measurements and GOES solar radiation estimates for (a) day 186, (b) day 187, and (c) day 188.
J.M. Jacobs et al. / Journal of Hydrology 266 (2000) 53–65 61

Boreal Ecosystem-Atmosphere Study (BOREAS)
underestimated measured values by 7.7% and had a
RMSE of 68% and a coefficient of determination of
46%.
4.3. Modeled evapotranspiration
The evapotranspiration fluxes were estimated
using both the Penman–Monteith method and the
Priestley–Taylor method. For both evapotranspira-
tion equations, three different sets of net radiation data
were analyzed; the measured net radiation values, the
modeled net radiation from the pyranometer data and
the modeled net radiation from the GOES data. All
modeled fluxes were compared to the fluxes measured
by the eddy-correlation method using the 30-min
measurements and the daytime total values.
Fig. 5 shows examples of the diurnal evolution of
the evapotranspiration estimates and measurements.
Typically, the GOES estimated values agreed well
with the measured values until midday. However, as
exhibited on Days 186 and 187 (Fig. 5(a) and (b)) the
afternoon convective patterns can result in significant
differences between local and regional evapotran-
spiration estimates. The differences result in both
overestimation and underestimation errors over the
course of a day. During the relatively cloud free
conditions on Day 188 (Fig. 6(c)), the GOES data
slightly underestimate afternoon evapotranspiration
measurements. These underestimates may be due to
the development of clouds outside the region sampled
by the flux instruments, but within the GOES
sampling grid.
Tables 2 and 3 summarize the relationships among
the estimated evapotranspiration and the measured
evapotranspiration values for the 30-min and the
daytime total values, respectively. Excellent agree-
ment was found between the measured and the
modeled evapotranspiration values using the net
radiometer values for both the Penman–Monteith
and the Priestley–Taylor models. Based on the
regression relationship and the RMSE, the Penman–
Monteith is slightly preferable to the Priestley–Taylor
type model. For data-limited sites, the Priestley–
Taylor model appears to be quite suitable. Both
models may be applied at either the 30-min or the
daily time interval. As expected from the net
radiation results, the pyranometer measurements
also provide a reasonable means to estimate evapo-
transpiration. Although, the pyranometer results
Fig. 6. Measured 30-min average evapotranspiration versus modeled evapotranspiration using Eq. (1) with measured net radiation, estimated net
radiation from pyranometer measurements, and estimated net radiation from the GOES images. The solid line is the 1:1 line.
J.M. Jacobs et al. / Journal of Hydrology 266 (2000) 53–6562

slightly overestimate the evapotranspiration at both
the 30-min and the daily time scales, the regression
results are quite good with r2 values from 0.88 to 0.95,
slopes near to one, and intercepts near to zero. The
RMSEs appear to reflect the error in estimating RN
using Rs measurements.
As Fig. 6 shows, the pyranometer measurements
clearly are preferable to GOES measurements for
estimating LE on a 30-min basis. However, even at
this high temporal resolution, the GOES measure-
ments are able to provide LE estimates that slightly
overestimate the measured values on average
(15.9 W m22), that provide good, albeit somewhat
skewed, estimates overall ðr2 ¼ 0:67Þ and that result
in reasonable RMSE errors on the order of 30%.
Overall, these results appear to be largely a reflection
of the solar radiation errors caused by sampling scale
differences. Higher temporal and spatial resolution
should improve the solar radiation estimates and, in
turn, enhance the potential evapotranspiration results.
On a daily basis as shown in Fig. 7, the correlation
between the measured evapotranspiration and the
GOES modeled evapotranspiration is dramatically
improved and the scatter and the skew are signifi-
cantly reduced. Based on a visual inspection, it is
difficult to distinguish whether the GOES data or the
pyranometer data provide the better evapotranspira-
tion estimates. The statistical summary presented in
Table 3 indicates that for daily measurements, the
GOES data set can provide nearly comparable results
to those of the pyranometer based on the r2 values of
0.90 and 0.89, respectively. While the skew is still
present for the GOES LE estimates, the large portion
of the systematic GOES LE RMSE as compared to
Table 2
Sample counts (N ), mean and S.D., linear regression slope (A ), intercept (B ) and coefficient of determination ðr2Þ; MAE, RMSE, RMSEs and
RMSEu of estimated 30-min evapotranspiration rates in comparison to in situ measured evapotranspiration. The terms N, A, and r2 are
dimensionless, the remaining terms have the units W m22. The linear regression model is LEcalc ¼ ALEobs þ B: Measurements were made
during the daytime (7:00–18:30 EST)
N LEcalc
(mean)
LEobs
(mean)
LEcalc
(S.D.)
LEobs
(S.D.)
A B r2 MAE RMSE RMSEs RMSEu
Penman–Monteith
Net radiometer 167 273.8 272.0 140.88 134.54 1.04 28.14 0.98 16.03 20.68 4.95 20.08
Pyranometer 167 279.0 272.0 150.92 134.54 1.09 218.04 0.95 27.58 37.18 13.84 34.51
GOES 167 287.9 272.0 131.87 134.54 0.80 70.87 0.67 62.72 82.28 30.61 76.37
Priestley–Taylor
Net radiometer 167 270.0 272.0 140.73 134.54 1.04 211.58 0.98 17.57 22.36 4.95 21.80
Pyranometer 167 275.2 272.0 151.12 134.54 1.09 221.67 0.94 29.18 39.08 13.84 36.54
GOES 167 284.6 272.0 132.12 134.54 0.79 69.13 0.65 64.32 84.12 30.61 78.35
Table 3
Same as Table 2, but for daily totals that sum all periods with positive net radiation measurements. The terms N, A, and r2 are dimensionless, the
remaining terms have the units MJ m22
N LEcalc
(mean)
LEobs
(mean)
LEcalc
(S.D.)
LEobs
(S.D.)
A B r2 MAE RMSE RMSEs RMSEu
Penman–Monteith
Net radiometer 18 11.67 11.60 2.69 2.57 1.04 20.35 0.98 0.03 0.13 0.03 0.12
Pyranometer 18 11.91 11.60 2.72 2.57 1.00 0.32 0.89 0.07 0.30 0.10 0.29
GOES 18 12.38 11.60 2.32 2.57 0.86 2.18 0.90 0.10 0.32 0.21 0.24
Priestley–Taylor
Net radiometer 18 11.55 11.60 2.62 2.57 1.01 20.15 0.97 0.04 0.13 0.02 0.13
Pyranometer 18 11.78 11.60 2.65 2.57 0.97 0.54 0.88 0.07 0.30 0.07 0.30
GOES 18 12.28 11.60 2.23 2.57 0.82 2.74 0.89 0.10 0.35 0.27 0.23
J.M. Jacobs et al. / Journal of Hydrology 266 (2000) 53–65 63

that of the pyranometer suggests that an enhanced
GOES LE model to provide a higher quality daily
evapotranspiration estimates is feasible. Overall, the
daily RMSEs 1.1–3.1% are quite low. The GOES LE
estimates are 0.78 MJ m22 (0.32 mm) on average
higher than the flux measurements and the pyran-
ometer LE estimates are 0.31 MJ m22 (0.13 mm)
higher than the flux measurements. This is compar-
able to Garatuza-Payan et al.’s (2001) reported
GOES-based LE estimates of 0.8 and 0.25 mm for a
cotton crop and a wheat crop, respectively.
5. Summary and conclusions
The Florida environment, with small cumulus
clouds and potential rapid development and decay,
is a challenge for the GOES system when comparing
point insolation measurements to the GOES areally
averaged estimates. Under these conditions, the solar
radiation estimated from satellite measurements can
be used to calculate evaporative fluxes successfully on
short time scales ðr2 ¼ 0:67Þ and with confidence on
daily times scales ðr2 ¼ 0:90Þ: The methods of
calculation employed were the Penman–Monteith
and the Priestley–Taylor method and a simple net
radiation estimation procedure. The satellite measure-
ments were made using the GOES-8 satellite visible
imagery and coupled with local meteorological
measurements.
The GOES solar radiation data tended to somewhat
underestimate the highest rates of evapotranspiration
and to overestimate the more moderate rates of
evapotranspiration. These errors may be due to the
difference in observation scales between the satellite
and the ground-truthing instrument. The errors may
also have been compounded by the significant
convective activity. An improved relationship may
be possible by using a smaller grid spacing and higher
frequency sampling. Finally, as the GOES solar
radiation cloudy model assumes plane-parallel clouds,
error reduction may be possible through an enhanced
cloud model.
Acknowledgments
This work was performed while D. Myers held a
Florida Space Grant Consortium Summer Scholar-
ship. Additional support for this work was provided
by the NASA NIP Grant NAG5-10567. Development
of the GOES insolation product was supported by
RESAC Grant NAG13-990008. We thank
B. Whitfield, J. Andres, A. Lopera, and
S. Mergelsberg for their role in collecting the field
data set. We thank the Florida Department of
Environmental Protection Division of Recreation
and Parks for providing access to the field sites with
special thanks to J. Weimer for assisting in site
selection and ongoing field support. Two anonymous
reviewers are thanked for their helpful comments and
suggestions.
References
Baldocchi, D.D., Hicks, B.B., Meyers, T.P., 1988. Measuring
biosphere–atmosphere exchanges of biologically related gases
with micrometeorological methods. Ecology 69, 1331–1340.
Brutsaert, W., 1975. On a derivable formula for long-wave radiation
from clear skies. Water Resour. Res. 11, 742–744.
Fig. 7. Daily totals of measured evapotranspiration versus daily
totals of modeled evapotranspiration using Eq. (1) with measured
net radiation, estimated net radiation from pyranometer measure-
ments, and estimated net radiation from the GOES images. The
solid line is the 1:1 line.
J.M. Jacobs et al. / Journal of Hydrology 266 (2000) 53–6564

Brutsaert, W., 1982. Evaporation into the Atmosphere: Theory,
History, and Applications, Kluwer Academic Publishers,
Boston, MA.
Dedieu, G., Deschamps, P.Y., Kerr, Y.H., 1987. Satellite estimation
of solar irradiance at the surface of the Earth and of surface
albedo using a physical model applied to Meteosat data. J. Clim.
Appl. Meteorol. 26, 79–87.
Diak, G.R., Bland, W.L., Mecikalski, J.R., Anderson, M.C., 2000.
Satellite-based estimates on longwave radiation for agricultural
applications. Agricultural and Forest Meteorology 103, 349–
355.
Diak, G.R., Anderson, M.C., Bland, W.L., Norman, J.M.,
Mecikalski, J.M., Aune, R.M., 1998. Agricultural management
decision aids driven by real-time satellite data. Bull. Am.
Meteorol. Soc. 79, 1345–1355.
Diak, G.R., Bland, W.L., Mecikalski, J., 1996. A note on first
estimates of surface insolation from GOES-8 visible satellite
data. Agric. Forest Meteorol. 82, 219–226.
Diak, G.R., Gautier, C., 1983. Improvements to a simple physical
model to estimate insolation from GOES data. J. Clim. Appl.
Meteorol. 22, 505–508.
Eagleson, P.S., 1970. Dynamic Hydrology, McGraw-Hill, New
York.
Garatuza-Payan, J., Pinker, R.T., Shuttleworth, W.J., Watts, C.J.,
2001. Solar radiation and evapotranspiration in northern Mexico
estimated from remotely sensed measurements of cloudiness.
Hydrol. Sci. J. 46 (3), 465–478.
Gautier, C., Diak, G.R., Masse, S., 1980. A simple physical model
to estimate incident solar radiation at the surface from GOES
satellite data. J. Appl. Meteorol. 19, 1007–1012.
Gu, J., Smith, E.A., Merritt, J.D., 1999. Testing energy balance
closure with GOES-retrieved net radiation and in situ measured
eddy correlation fluxes in BOREAS. J. Geophys. Res. 104
(D22), 27881–27893.
Jacobs, J.M., Lopera, A., Myers, D.A., Mergelsberg, S.L., 2002.
Evapotranspiration from a wet prairie wetlands under drought
conditions: Paynes Prairie Preserve, Florida. Wetlands 22 (2),
374–385.
Kite, G.W., Drooger, P., 2000. Comparing evapotranspiration
estimates from satellites, hydrological models and field data.
J. Hydrol. 229, 3–18.
Krzysztofowicz, R., 1992. Bayesian correlation score: a utilitarian
measure of forecast skill. Mon. Weather Rev. 120, 208–219.
Monteith, J.L., 1965. Evaporation and surface temperature. Q. J. R.
Meteorol. Soc. 107, 1–27.
Patton, J.E., Judd, W.S., 1986. Vascular flora of Paynes Prairie
Basin and Alachua Sink Hammock, Alachua County, Florida.
Castanea 51, 88–110.
Pinker, R.T., Frouin, R., Li, Z., 1995. A review of satellite methods
to derive surface shortwave irradiance. Remote Sens. Environ.
51, 105–124.
Price, J.S., Woo, M.K., 1988. Studies of a subarctic coastal marsh.
I. Hydrology. J. Hydrol. 103, 275–292.
Priestley, C.H.B., 1959. Turbulent Transfer in the Lower Atmos-
phere, University of Chicago Press, Chicago, IL.
Priestley, C.H.B., Taylor, R.J., 1972. On the assessment of surface
heat flux and evaporation using large-scale parameters. Mon.
Weather Rev. 100, 81–92.
Raphael, C., Hay, J.E., 1984. An assessment of models which use
satellite data to estimate solar irradiance at the Earth’s surface.
J. Clim. Appl. Meteorol. 23, 832–844.
Schmetz, J., 1989. Towards a surface radiation climatology.
Retrieval of downward irradiance from satellites. Atmos. Res.
23, 287–321.
Schotanus, P., Nieuwstadt, F.T.M., De Bruin, H.A.R., 1983.
Temperature measurement with a sonic anemometer and its
application to heat and moisture fluxes. Boundary-Layer
Meteorol. 26, 81–93.
Slatyer, R.O., McIlroy, I.C., 1961. Practical Microclimatology,
CSIRO, Melbourne, Australia.
Souch, C., Wolfe, C.P., Grimmond, C.S.B., 1998. Evapotranspira-
tion rates from wetlands with different disturbance histories:
Indiana Dunes National Lakeshore. Wetlands 18, 216–229.
Stewart, J.B., Watts, C.J., Rodriguez, J.C., De Bruin, H.A.R., van
den Berg, A.R., Garatuz-Payan, J., 1999. Use of satellite data to
estimate radiation and evaporation for northwest Mexico. Agric.
Water Mgmt 38, 181–193.
Tanner, B.D., Greene, J.P., 1989. Measurements of sensible heat
flux and water vapor fluxes using eddy correlation methods.
Final Report to US Army Dugway Proving Grounds, DAAD 09-
87 D-0088, p. 94.
Thompson, M.A., Campbell, D.I., Spronken-Smith, R.A., 1999.
Evaporation from natural and modified raised peat bogs in New
Zealand. Agric. Forest Meteorol. 95, 85–98.
Tobe, J.D., 1988. Florida Wetland Plants: an Identification manual.
Florida Department of Environmental Protection, Tallahassee,
FL, USA.
Twine, T.E., Kustas, W.P., Norman, J.M., Cook, D.R., Houser, P.R.,
Meyers, T.P., Prueger, J.H., Starks, P.J., Wesely, M.L., 2000.
Correcting eddy-covariance flux underestimates over a grass-
land. Agric. Forest Meteorol. 103, 279–300.
Webb, E.K., Pearman, G.I., Leuning, R., 1980. Correction of flux
measurements for density effects due to heat and water vapour
transfer. Q. J. R. Meteorol. Soc. 106, 85–100.
Wilmott, C.J., 1982. Some comments on the evaluation of model
performance. Bull. Am. Meteorol. Soc. 11, 1309–1313.
J.M. Jacobs et al. / Journal of Hydrology 266 (2000) 53–65 65