assessing the sustainability of underground space usage — a toolkit for testing possible urban...
TRANSCRIPT


In stage 3 the UF toolkit is used to test the per-formance, resilience and robustness of today’s solu-tions (deduced from the baseline information) in all four future scenarios. This can be done in general terms at UK level, but also needs to take into ac-count solutions that are locally derived (based on lo-cal priorities and local conditions). Case studies are adopted for this purpose. The toolkit is used to de-rive case study baselines for 2009 and revised case study future scenarios for 2050.
This paper reports on work being carried out re-lating to Stages 1 and 2 only. Progress on Stage 3 will be detailed in future publications.
3 UF SCENARIOS & CHARACTERISTICS
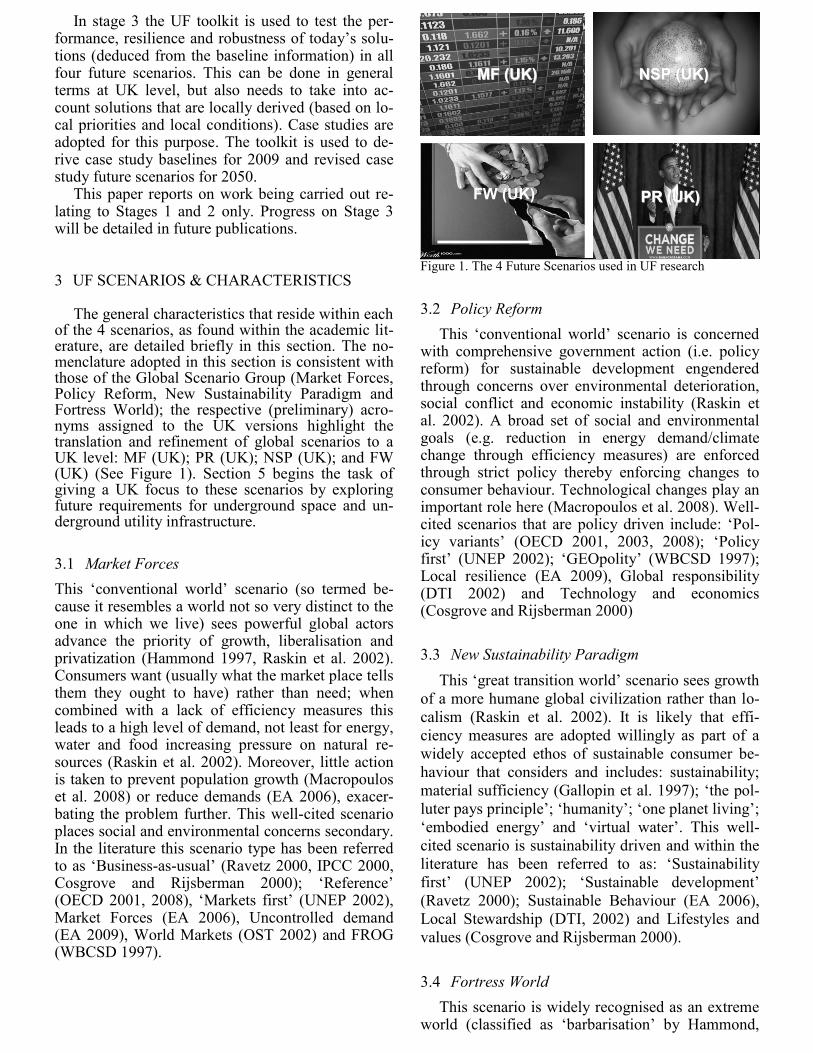
The general characteristics that reside within each of the 4 scenarios, as found within the academic lit-erature, are detailed briefly in this section. The no-menclature adopted in this section is consistent with those of the Global Scenario Group (Market Forces, Policy Reform, New Sustainability Paradigm and Fortress World); the respective (preliminary) acro-nyms assigned to the UK versions highlight the translation and refinement of global scenarios to a UK level: MF (UK); PR (UK); NSP (UK); and FW (UK) (See Figure 1). Section 5 begins the task of giving a UK focus to these scenarios by exploring future requirements for underground space and un-derground utility infrastructure.
3.1 Market Forces
This ‘conventional world’ scenario (so termed be-cause it resembles a world not so very distinct to the one in which we live) sees powerful global actors advance the priority of growth, liberalisation and privatization (Hammond 1997, Raskin et al. 2002). Consumers want (usually what the market place tells them they ought to have) rather than need; when combined with a lack of efficiency measures this leads to a high level of demand, not least for energy, water and food increasing pressure on natural re-sources (Raskin et al. 2002). Moreover, little action is taken to prevent population growth (Macropoulos et al. 2008) or reduce demands (EA 2006), exacer-bating the problem further. This well-cited scenario places social and environmental concerns secondary. In the literature this scenario type has been referred to as ‘Business-as-usual’ (Ravetz 2000, IPCC 2000, Cosgrove and Rijsberman 2000); ‘Reference’ (OECD 2001, 2008), ‘Markets first’ (UNEP 2002), Market Forces (EA 2006), Uncontrolled demand (EA 2009), World Markets (OST 2002) and FROG (WBCSD 1997).
FW (UK) PR (UK)PR (UK)
NSP (UK)NSP (UK)MF (UK)MF (UK)
Figure 1. The 4 Future Scenarios used in UF research
3.2 Policy Reform
This ‘conventional world’ scenario is concerned with comprehensive government action (i.e. policy reform) for sustainable development engendered through concerns over environmental deterioration, social conflict and economic instability (Raskin et al. 2002). A broad set of social and environmental goals (e.g. reduction in energy demand/climate change through efficiency measures) are enforced through strict policy thereby enforcing changes to consumer behaviour. Technological changes play an important role here (Macropoulos et al. 2008). Well-cited scenarios that are policy driven include: ‘Pol-icy variants’ (OECD 2001, 2003, 2008); ‘Policy first’ (UNEP 2002); ‘GEOpolity’ (WBCSD 1997); Local resilience (EA 2009), Global responsibility (DTI 2002) and Technology and economics (Cosgrove and Rijsberman 2000)
3.3 New Sustainability Paradigm
This ‘great transition world’ scenario sees growth
of a more humane global civilization rather than lo-
calism (Raskin et al. 2002). It is likely that effi-
ciency measures are adopted willingly as part of a
widely accepted ethos of sustainable consumer be-
haviour that considers and includes: sustainability;
material sufficiency (Gallopin et al. 1997); ‘the pol-
luter pays principle’; ‘humanity’; ‘one planet living’;
‘embodied energy’ and ‘virtual water’. This well-
cited scenario is sustainability driven and within the
literature has been referred to as: ‘Sustainability
first’ (UNEP 2002); ‘Sustainable development’
(Ravetz 2000); Sustainable Behaviour (EA 2006),
Local Stewardship (DTI, 2002) and Lifestyles and
values (Cosgrove and Rijsberman 2000).
3.4 Fortress World
This scenario is widely recognised as an extreme world (classified as ‘barbarisation’ by Hammond,
1997 and Raskin et al. 1998) where an authoritarian response to threat has been adopted. The elite live in protected enclaves where strong planning control and NIMBY-ism prevail (Macropoulos et al. 2008). An impoverished majority live outside the fortress in unsustainable conditions exemplified through adop-tion of unplanned urban forms (Demspsey 2009) leading to a world of ‘gates’ and ‘ghettoes’. This dystopic security-driven scenario is not dissimilar to the ‘security first’ scenario described as part of the Global Environment Outlook (GEO1-4) series (UNEP 2002, 2007) and National Enterprise (DTI, 2002). At first glance one could be forgiven for re-voking such a world as highly un-plausible for the UK and yet when we begin to scratch beneath the surface we see that parallels already exist between fortresses and ‘gated communities’ of which in the UK there are more than 1000 examples (Blakely and Snyder 1998, Randerson 2008). The split between ‘haves’ and ‘have-nots’ (those inside and outside the gates respectively) is well reported.
4 KEY QUESTIONS & UK BASELINE (2008/9)
This section outlines a series of generic ‘key’ ques-tions (relevant now and in the future) for the follow-ing subject areas:
(a) General use of underground space (Table 1), (b) Water (Table 2), (c) Energy and related emissions (Table 3) (d) Waste (Table 4).
The questions are outlined at the beginning of each sub-section following which answers are pro-vided using ‘sustainability indicators’ and a ‘contex-tual narrative’ in order to establish a baseline for 2008/9. Section 5 begins the process of answering the same questions for the year 2050 within the four scenarios outlined previously in Section 3. In so do-ing, plausible future scenarios are detailed for each of these topic areas which can be compared to the baseline in order to see what changes have occurred.
4.1 General use of underground space
Table 1. ‘Key’ questions relating to land use underground
Q1. How is underground space being used (i.e. what variety
of end-uses have been adopted)?
Q2. How many types of utilities are located below ground,
where are they located and how are they placed?
Q3. In what condition are the utilities and how is mainte-
nance being carried out?
Q4. Are assets replaced on schedule consistent with life ex-
pectancy? Historically, the predominant use for under-
ground space in the UK has been for transportation (London Underground opened in 1863) and utility placement (town gas was the first utility placed be-low ground in London in 1807, Rogers and Hunt
2006). In 2008/9 London Underground had grown to >408 km of underground railways and 275 stations and continued to expand at great pace. In addition utility placement included communications, gas, electricity (HV, LV) and water pipes (stormwater, wastewater and combined sewers); unfortunately utility locations were not always known or placed according to best practice, even though guidance ex-isted (e.g. NJUG 2003). Moreover whilst location devices existed (e.g. ground penetrating radar) these were not always effective, therefore problems with location was readily apparent. In addition >200 companies could dig up the road at any point in time (dft 2008). When considering the service life of as-sets it is reported that water supply pipes will last for 80-100 years and sewers pipes will last for 65-95 years. Unfortunately utility maintenance is (and his-torically always has been) reactive, lagging consid-erably behind the service-life for this type of infra-structure. For example in the UK it is suggested that 8% of water mains are still Victorian, of which ap-proximately a quarter were located in London (Of-wat 2009). Here the average age of assets was high compared to the rest of the UK with more than half of mains reported to be >100 yrs old and a third > 150 yrs old (Defra 2008a). It was reported that the picture is similar in other major UK cities (Defra 2008a), reports suggesting the average age of water mains network in the UK was 45 years. The oldest and youngest networks had an average age of 68 years and 29 years respectively, 97% of these assets being reported to perform satisfactory or better (Of-wat 2009). However, this does not appear to be evi-denced by the high levels of leakage that ensued for the same time period [3.4 GL/day, ≈ 160 li-tres/property/day, Defra 2008a].
4.2 Water
Table 2. ‘Key’ questions relating to water
Q1. Where is water supplied from?
Q2. How is water being distributed?
Q3. What are end-user demands for the network?
Q4. How is water being disposed of / treated?
Q5. How is flooding avoided / dealt with?
Some 17.6 x 10⁹ L/day of water are sourced from
surface water (650 reservoirs ranging in size up to
200 GL, and 600 river abstraction points) and
groundwater (1,500 boreholes exist in the UK) in
order to serve a population of 52.5 million. In 2009
Wales sourced 96% of its supplies from surface wa-
ter whereas in South East England this accounted for
31% only. This water was distributed via 325,000
km of mains supply pipeline, 7,500 km of which is
>600 mm in diameter (Ofwat 2009), and millions of
connections to meet a range of end-user demands –
the highest demand (52% of UK total) being from
the domestic sector for potable, i.e. drinkable qual-
ity, water (Water UK 2009). In 2008/9 it was esti-
mated that the average UK demand for this water
was around 148.1L/person/day with only 30% of all
houses being metered (Water UK, 2008). The most
common form of stormwater and wastewater dis-
posal was through combined sewer systems, ~50%
being thought to be privately owned. Around
347,000 km of sewers collected over 11 billion litres
of wastewater per day and collectively this was
treated (using a three phase process) at 9,000 indi-
vidual sewage treatment works before the treated ef-
fluent was discharged to inland waters, estuaries and
the sea (Defra 2002). In 2008/9 an estimated 3847
properties were affected by sewer flooding with 26
in 100,000 properties likely to be affected by a 1 in
10 year flood (Water UK, 2008). High volumes of
run-off were likely in urban areas (due to high up-
take of impermeable surfaces) and the trend for
flash-flooding increased, evidenced by the flooding
of 2007/8. Flood prevention was reactive and with a
tendency toward large-scale flood defence schemes.
4.3 Energy & related emissions
Table 3. ‘Key’ questions relating to energy
Q1. How is energy being generated?
Q2. How are CO2 emissions being dealt with?
Q3. How is energy being distributed and stored?
Q4. What are the end-user demands for the network?
In 2008/9 the UK had a generating capacity for
electricity of 75GW and peak winter demand of 57GW (Berr 2007). This was achieved through a va-riety of supply sources (e.g. wind and biomass – 1%, hydro – 5%, nuclear – 16%, gas – 34%, coal – 38%) and was delivered through a national grid transmis-sion system (11,500 km of 400kV overhead lines and underground cables, 9,800km of 275kV cables, 5,250km of 132kV (or lower) cables and 1000 trans-formers). The annual demand for gas in 2008 was around 100 billion m
3 and showed an upward trend
(due to ever increasing demands). The average an-nual UK domestic energy demands for electricity were 22000kwh for gas and 4500kwh for electricity with CO2 emissions factors of 0.19 kg/kWh and 0.43 kg/kWh respectively.
4.4 Waste
Table 4. ‘Key’ questions relating to waste
Q1. How much waste is being generated (e.g. recyclable and
Non-recyclable)?
Q2. How is waste being collected, and how often?
Q3. How is waste being treated (e.g. physical, chemical,
biological) and disposed of?
In 2008/9 municipal solid waste (MSW) for the
UK was ~28.5 million tonnes/yr, 25.3 million tonnes
(89%) of which was household waste. In 1996 the
annual UK household waste per person was reported
to be in the region of 400kg and by 2001/2 this was
reported to have increased steadily year on year to
575kg (Defra 2004). In 2008/9 a level of 583 kg had
been reached (Defra 2008b). Domestic waste was
made up of the following types:
(Type I) kitchen/garden/soil (41%);
(Type II) paper/cardboard (18%);
(Type III) glass, plastic and metal cans (17%);
(Type IV) wood, white goods, textiles etc (24%).
Waste collection was typically via a Refuse Col-lection Vehicle (RCV) using alternate weekly col-lections for normal waste and weekly collections for recycling. In 2008/9 some 15.5 million tonnes (54%) of waste was sent to landfill and 35.5% of household waste (Type II and III) was recycled (Defra 2008b).
5 FOUR UK SCENARIOS (2050)
This section begins the process of answering the ‘key questions’ (outlined in Section 4) for the year 2050. Based around the characteristics outlined in Section 3, this section shows how four distinct sce-narios, which provide a focus for infrastructure and use of underground space, can begin to be devel-oped. To help in this task some well-reported uses for underground space (e.g. Sterling et al. 1993) are shown in Table 5. This section considers how they might translate onto the four distinct scenarios.
Ultimately the way in which we live in 2050 will depend heavily upon how infrastructure systems of the past have been planned, designed, constructed, then operated and maintained. This section (written assuming 2050 is the present day) will show a vari-ety of ways in which this has been considered since 2008/9. By considering a series of changes (i.e. to urban areas in the UK in terms of housing; retail; transport; food; water, energy, emissions and waste - solid and water) future pressures on the use of the sub-surface can be considered and associated impli-cations for engineering geology reviewed.
5.1 General use of underground space
In this passage we explore (using the key ques-tions presented in Table 1) the different ways in which the underground landscape might have evolved in 2050 within each of the four scenarios:
Under MF (UK) greater use of underground space has occurred in UK urban areas (due to a sub-stantial increase in capacity requirements for trans-port routes and new utility connections). Unfortu-nately a serious lack of any overarching plan for the
Table 5. Topic areas and underground space uses
TOPIC AREA UNDERGROUND SPACE USES
GENERAL Transport Rail, road (pedestrian and goods),
pipeline delivery systems; Utility services Gas, electricity (HV, LV), CHP,
clean water, waste water, stormwa-ter, greywater, solid waste, communications;
Storage Food, water, heat, nuclear waste, CO2;
Retail/ Housing Theatres, cinemas, shopping, dwellings, car parking, cities;
Health Surgeries, operating theatres; Shelters Air raid, nuclear.
WATER Supply / storage Groundwater (storage via re-
charge); rainwater/greywater (stor-age underground for later re-use);
Flood control Sustainable Urban Drainage Sys-tems (SUDS); Stormwater Man-agement And Road Tunnels (SMART).
ENERGY/EMISSIONS Supply Geothermal energy; CHP, hydroe-
lectric schemes. Storage Geothermal, CO2, nuclear reposito-
ries; WASTE
Removal
Food Waste Disposal (FWD) Pneumatic Waste Collection (PWC).
use of underground space still prevails due to short-term planning requirements. In addition this scenario sees existing assets deteriorate due to continued use of an ageing inherited infrastructure system, where maintenance is reactive (likely engendered through the need to remove health risks) and little attention is given to long-term performance and associated ‘three pillar’ costs related to underground space (Rogers and Hunt 2006). As a consequence therefore more utilities are placed below ground, increasing the overall utility density, however little attention is given to how (or where) these utilities are placed. Knowledge of utility location remains fragmented and best practice goes no further than voluntary codes of conduct and adopting colour coded con-duits. Therefore the inevitable disruption caused during utility maintenance, renewal and upgrading through trenching and patching operations continues with high environmental and social costs ensuing.
Under PR (UK) a range of long term UK policies are in place to improve the efficiency of road trans-port systems and utility networks. These policies seek to mitigate re-occurring conflicts between road transport networks and utility networks (Marvin and Slater 1997) through adoption of ‘no-dig’ policies in high density urban public highways [these policies existed pre-2008 in Malaysia, Singapore, Japan, In-dia etc (Rogers and Hunt 2006)]. Importantly, such policies extend to civic urban areas deemed to be of high importance within the public realm – showing a higher regard for social costs. Stricter compulsory codes of conduct and ‘utility placement’ policies are enforced through large fines.
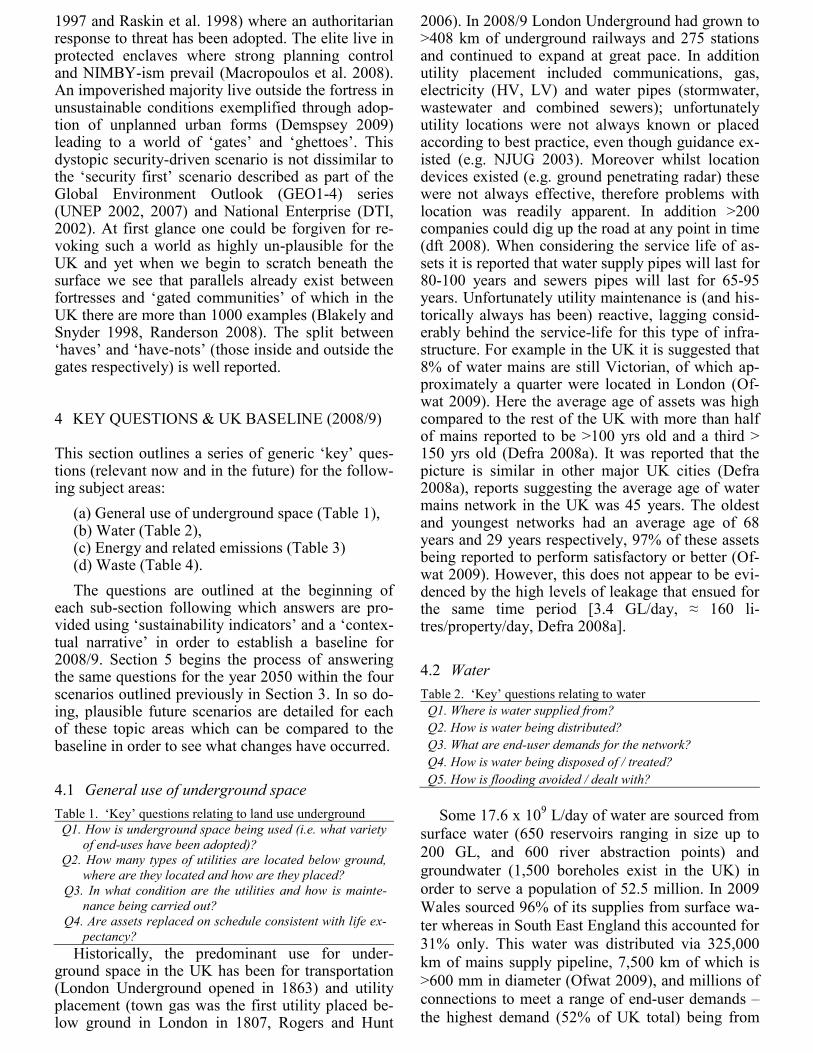
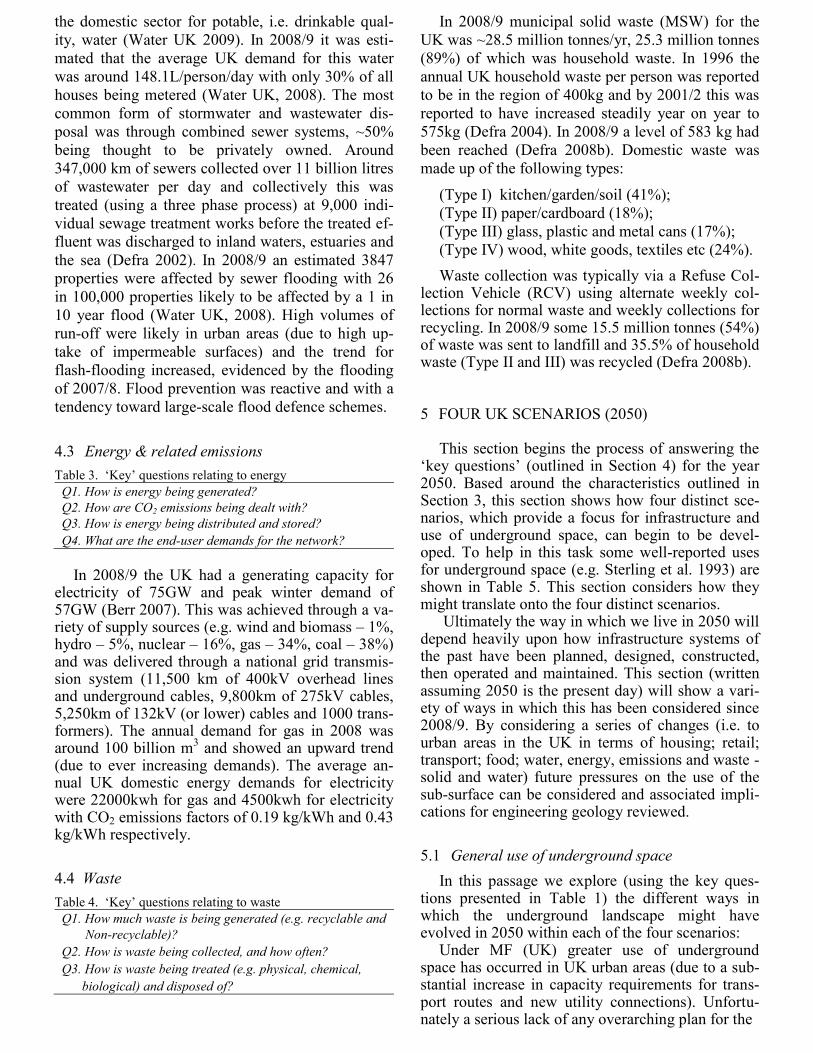
8150
8760
2000
Figure 2. Multi Utility Tunnels (MUT)
Moreover these policies require that databases
cataloguing exact location and capacity of utility in-frastructure are kept. In this scenario the use of trenchless technologies [a method for placing utili-ties below ground without the requirement for trenches] and multi-utility tunnels (MUTs) [a tunnel that houses all of the utilities within one utility cor-ridor, Rogers and Hunt 2006] is a preferred method of utility placement (Figure 2). Importantly the state has greater control over underground space and owns MUTs; renting space out to utility companies. Maintenance in this scenario is well planned and certainly on a schedule consistent with life expec-tancy. A more detailed understanding of the underly-ing geology is vitally important for the PR (UK) scenario where ‘no-dig’ policies are put in place and the ground conditions are potentially unseen before microtunnelling operations take place.
Under NSP (UK) an ethos of ‘one planet living’ (including recycling, re-using, rehabilitating and do-ing more with less) are core threads applied to un-derground space. Increased use of underground space in urban areas is adopted in situations where it can be shown to facilitate a shared vision for more sustainable living and a much improved quality of life. In NSP (UK) the sustainability, especially envi-ronmental, benefits for using underground space are well known (Sellberg 1996) and promote its further use. An ethos for reclaiming ‘green’ space above ground (e.g. placing main artery roads underground as in the Boston artery project) through use of un-derground space prevails. In all cases the feasibility for adopting any ‘hard’ engineered solutions re-quires community buy-in and all projects are as-sessed using four pillar costing schemes (i.e. eco-nomic, social, environmental and natural resources). Sustainable infrastructure is seen as an investment and not a cost. Thus engineering geology plays a vi-tal role in ensuring the ground is fully characterised to maximise efficient use of underground space.
Under FW (UK) greater use of underground space is adopted for the purpose of secu-rity/protectionism; to include safe passage of civil-
ians (between fortresses through underground trans-port networks) and resources (from military guarded supply sources that reside outside the fortress). However, within the fortress a strong resilience to outages, natural disasters, network failures and droughts is facilitated through underground storage systems for: water, energy and food (see Golany 1989 for details of underground grain stores used in China). Underground pipeline systems for delivery of food and retail products are commonplace within FW (UK). Moreover underground cities (to include housing, retail, etc.) have evolved due to the de-creased availability of space within the fortress and the need to ensure protection for the rich against at-tack (more likely as resources continue to dwindle) as part of everyday living. Underground cities, simi-lar to those found in Montreal (RESO) and Toronto (PATH) in Canada (Christozov 1997), are not un-common, due to their increased security.
A detailed description of underlying complex ge-ology, including stratographic details and potential for water flow, is required for FW (UK), since they will affect both ground and lining responses during construction and operation (Yoo et al 2005).
5.2 Water and underground space
In this passage we postulate different ways that water might be supplied, stored, treated and dis-posed of (including the likelihood of flooding and the ability to cope with flash floods) and consider the requirements for and geological implications of underground space use in the four scenarios in 2050.
Under MF (UK), water continues to be supplied through the mains network with high rates of leak-age (>> 30%) from a variety of sources (e.g. lakes, reservoirs, groundwater and desalination) and would be cleaned to drinking (i.e. potable) water standards. Increased output volumes occur for wastewater (from an increased population who use significantly more water per person) and stormwater (due to an increase in run-off volumes, exacerbated through use of combined sewer systems and adoption of more impervious surfaces). Unfortunately, houses continue to be located on/near floodplains and the traditional MF (UK) approach to flooding continues to be ‘hard’ engineered (i.e. provide culverts for riv-ers and build flood defences) as opposed to ‘softer’ engineering options (i.e. detention ponds and pervi-ous surfaces). Where detention ponds are adopted they remain as landscape features rather than func-tion (Macropoulos et al. 2008).
Under PR (UK), dual infrastructure provides po-table and new networked non-potable water systems underground to provide drinking water and water for non-potable uses (e.g. toilet flushing, gardening, car washing). A strong policy programme for replace-ment of all combined sewer systems with separate stormwater and wastewater systems has come to
fruition. Moreover an equally strong ‘polluter pays’ policy for run-off has been adopted within urban de-velopments leading to a diversified yet integrated approach to urban drainage systems; these include ‘hard’ engineered solutions (i.e. large underground stormwater tanks) for dealing with floodwater. The strong policy requirements associated with PR (UK) has made adoption of Stormwater Management And Road Tunnels (SMART) possible. [SMART, as adopted in Kuala Lumpar (Malaysia), allows for al-ternative transport routes, reducing commute times for motorists, in dry periods and can be flooded, re-ducing flood risk, during flash floods]. In this sce-nario the complexity of the underlying geology has a considerable effect on the type of tunnelling con-struction that can be employed to deliver a SMART system and affects considerably the cost of construc-tion. Moreover there are strict implications for all spoil removed from such excavations (Section 5.4).
Under NSP (UK), local networks for water sup-ply of different grades are more widespread (Macro-poulos et al. 2008). The supplies include: (i) groundwater – aquifers would be used as sources of supply and long-term storage (through under-ground recharge); (ii) rainwater harvesting; (iii) greywater recycling, and (iv) wastewater recycling. Separate underground sewer systems are adopted under NSP (UK) (Macropoulos et al. 2008). How-ever, run-off volumes have reduced in urban areas, firstly due to increased integration of pervious sur-faces and ‘soft’ engineering approaches (i.e. SUDS) to mitigate flooding, and secondly due to widespread adoption of small (e.g. 4500 litre capac-ity/household) underground rainfall harvesting tanks. This has led to a large distributed under-ground storage capacity for non-potable water sup-plies. Wastewater volumes have decreased due to lower demands per head of population and wider adoption of very low flush (i.e. >2.5 litre) toilets and waterless toilets (e.g. composting). The decreased capacity requirements for stormwater and wastewa-ter sewers now warrant sewer rehabilitation schemes (e.g. relining) as opposed to underground sewer re-placement via microtunnelling operations. In this scenario the underlying geological conditions, in terms of aquifer position, its storage capacity and likely contamination (existing or imposed) are vi-tally important.
Under FW (UK), drinking water continues to be supplied from existing (well-guarded) reservoirs and aquifers and is pumped/gravity fed through under-ground pipeline systems to the fortress where on-site treatment is undertaken. Strong resilience to outages, natural disasters and droughts is required within the fortress and this is facilitated through fortress-wide adoption of stormwater collection and storage (via large centralized underground tanks). Stormwater and wastewater removal is achieved through sepa-rate oversized underground systems for those who
reside in the fortress. However, combined systems remain for those who reside outside the fortress (Macropoulos et al. 2008). Use of wastewater would not be normal practice within the fortress, although flexibility within the underground sewage treatment system (such as exist in Scandanavia, Parker 2004) facilitates such adoption in times of prolonged out-ages and drought. Hard engineering solutions, in-cluding flood defence schemes are built to protect the rich, in some cases to the detriment of the poor.
5.3 Energy & emissions and underground space
This section considers the different ways that en-ergy is sourced, supplied and stored and the re-quirements for underground space (CO2 emissions from fossil fuels and nuclear waste are considered in Section 5.4) in 2050 within the four scenarios.
Under MF (UK), the demand for energy and its market value is now high. As such extensive map-ping of complex geology worldwide has been under-taken leading to significantly more fossil fuel re-sources being found. Improved efficiency of extraction (through technological advances) has al-lowed for extraction of coal/oil/gas from reservoirs that had previously been thought depleted. Distribu-tion through the underground network remains rela-tively unchanged, although a larger population re-quires more energy (e.g. gas and electricity) to be distributed throughout the UK network, a large per-centage of which still resides above ground. Under MF (UK), it is likely that, due to an increased energy demand, emissions cuts in line with Kyoto have not been reached on a global scale.
Under PR (UK) the demand for fossil fuels has increased, but to a smaller degree than MF (UK). In part this is due to improvements in energy effi-ciency, smart metering and energy certification re-quirements in homes, retail, offices and industry, brought about through an extensive tightening of building regulations requiring increased U-values. Large-scale uptake of city-scale combined heat and power (CHP) schemes have been implemented in all UK cities in order to ensure that waste heat, in addi-tion to electricity from power stations, is being util-ised. This requirement has seen large amounts of CHP ducting placed below ground, adding to the number of utility networks that exist already in PR (UK), although much of these networks are now logically placed within MUTs (see Section 5.1). CO2 is still produced, but is now being stored below ground. Moreover nuclear energy features strongly in PR (UK) due to its inherent ability to reduce CO2 emissions in line with policy. Strict policies now ex-ist in which nuclear waste (which has decreased due to technological advances) is stored below ground. Both of these approaches have required a better un-derstanding of complex underground geology in or-
der that the possibility of leakage (which in the case of nuclear could be catastrophic) is avoided.
Under NSP (UK) the search for cheap clean fuels
underground sees greater utilisation of geothermal
energy. Ranging from commercial scale utilising
deep wells (i.e. >1.5km) through to installation of
small-scale relatively shallow depth (7m) ground
source heat pumps. In addition more innovative
ways of capturing geothermal heat through existing
underground structures have been adopted, for ex-
ample tunnel linings. GIS databases which show the
geologically preferred location for such schemes
have been adopted to facilitate connection with ex-
isting utility systems, not least CHP networks whose
locations are now well-catalogued. Moreover under-
ground storage for heat becomes widely adopted.
Building of underground residential accommodation
(Hall 2004, Von Meijenfeldt et al. 2003) is consid-
ered normal practice in NSP (UK) due to their abil-
ity to (i) meet very high thermal efficiency targets,
(ii) avoid fuel poverty, and (iii) allow for reclama-
tion of valuable green space above ground. Very
strong social and environmental arguments against
nuclear energy have prevented widespread uptake of
nuclear power in NSP (UK) and as nuclear facilities
have been de-commissioned the reliance on fossil
fuels has been avoided through localised (i.e. outside
the grid) renewable energy generation. CO2 emis-
sions are significantly reduced in line with Kyoto. Under FW (UK) energy continues to be sourced
from outside the fortress (in addition to localised networks). As such all overhead power cables now reside below ground to prevent illegal connections from those who reside outside the fortress, and so transmission losses are reduced significantly. ‘Secu-rity’ of supply issues, i.e. the ability of supply to meet demand for the rich, is considered very impor-tant. Therefore more localised networks have been adopted, to include underground nuclear power sta-tions. CO2 emissions are relatively high and emitted to atmosphere; nuclear waste is buried below ground (and certainly well away from the fortress).
5.4 Waste and underground space
Here we consider the different ways that waste is collected, sorted and disposed of and the require-ments for underground space in 2050 within each of the four scenarios.
In MF (UK) waste production has increased sig-nificantly due to high levels of market pressure to purchase packaged goods being placed upon an in-creasing population. Customers continue to be charged per volume of waste produced leading to more frequent waste collection (via waste wagons) being sent to landfill or incinerated.
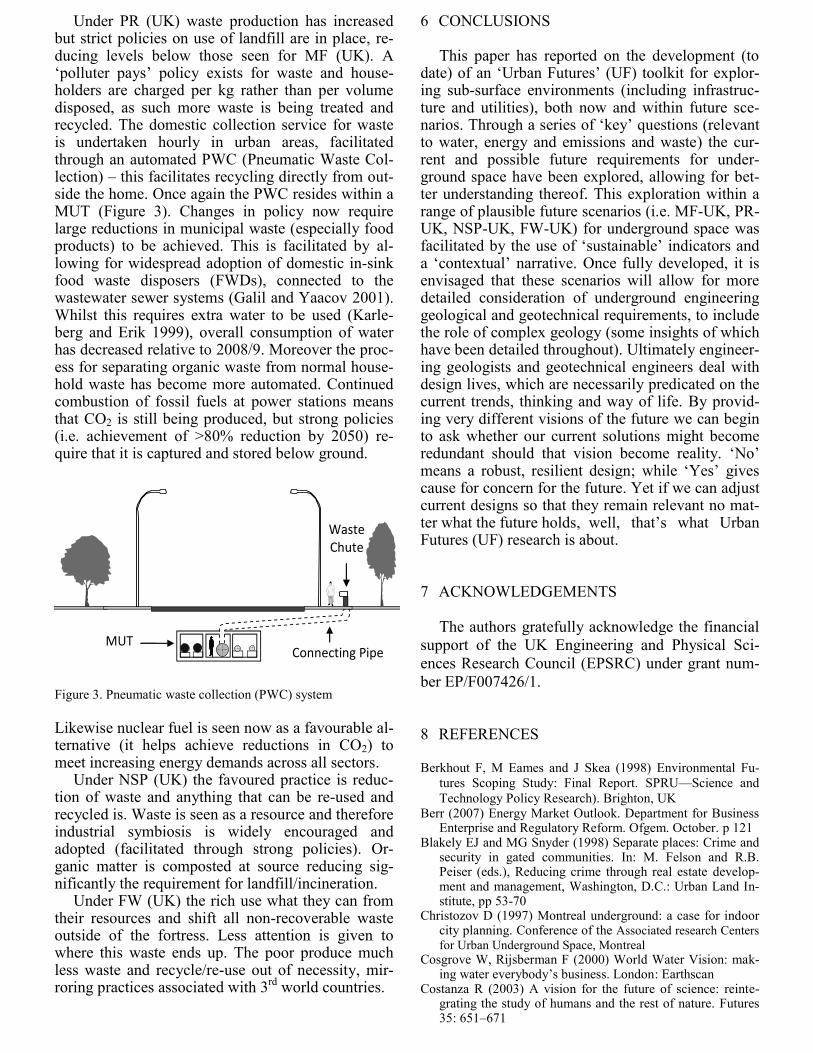
Under PR (UK) waste production has increased but strict policies on use of landfill are in place, re-ducing levels below those seen for MF (UK). A ‘polluter pays’ policy exists for waste and house-holders are charged per kg rather than per volume disposed, as such more waste is being treated and recycled. The domestic collection service for waste is undertaken hourly in urban areas, facilitated through an automated PWC (Pneumatic Waste Col-lection) – this facilitates recycling directly from out-side the home. Once again the PWC resides within a MUT (Figure 3). Changes in policy now require large reductions in municipal waste (especially food products) to be achieved. This is facilitated by al-lowing for widespread adoption of domestic in-sink food waste disposers (FWDs), connected to the wastewater sewer systems (Galil and Yaacov 2001). Whilst this requires extra water to be used (Karle-berg and Erik 1999), overall consumption of water has decreased relative to 2008/9. Moreover the proc-ess for separating organic waste from normal house-hold waste has become more automated. Continued combustion of fossil fuels at power stations means that CO2 is still being produced, but strong policies (i.e. achievement of >80% reduction by 2050) re-quire that it is captured and stored below ground.
MUT
Waste Chute
Connecting Pipe
Y
Y
Waste Chute
Main Waste Pipe
Not to scale
Y
Y
(b)
(a)
Figure 3. Pneumatic waste collection (PWC) system
Likewise nuclear fuel is seen now as a favourable al-ternative (it helps achieve reductions in CO2) to meet increasing energy demands across all sectors.
Under NSP (UK) the favoured practice is reduc-tion of waste and anything that can be re-used and recycled is. Waste is seen as a resource and therefore industrial symbiosis is widely encouraged and adopted (facilitated through strong policies). Or-ganic matter is composted at source reducing sig-nificantly the requirement for landfill/incineration.
Under FW (UK) the rich use what they can from their resources and shift all non-recoverable waste outside of the fortress. Less attention is given to where this waste ends up. The poor produce much less waste and recycle/re-use out of necessity, mir-roring practices associated with 3
rd world countries.
6 CONCLUSIONS
This paper has reported on the development (to date) of an ‘Urban Futures’ (UF) toolkit for explor-ing sub-surface environments (including infrastruc-ture and utilities), both now and within future sce-narios. Through a series of ‘key’ questions (relevant to water, energy and emissions and waste) the cur-rent and possible future requirements for under-ground space have been explored, allowing for bet-ter understanding thereof. This exploration within a range of plausible future scenarios (i.e. MF-UK, PR-UK, NSP-UK, FW-UK) for underground space was facilitated by the use of ‘sustainable’ indicators and a ‘contextual’ narrative. Once fully developed, it is envisaged that these scenarios will allow for more detailed consideration of underground engineering geological and geotechnical requirements, to include the role of complex geology (some insights of which have been detailed throughout). Ultimately engineer-ing geologists and geotechnical engineers deal with design lives, which are necessarily predicated on the current trends, thinking and way of life. By provid-ing very different visions of the future we can begin to ask whether our current solutions might become redundant should that vision become reality. ‘No’ means a robust, resilient design; while ‘Yes’ gives cause for concern for the future. Yet if we can adjust current designs so that they remain relevant no mat-ter what the future holds, well, that’s what Urban Futures (UF) research is about.
7 ACKNOWLEDGEMENTS
The authors gratefully acknowledge the financial
support of the UK Engineering and Physical Sci-
ences Research Council (EPSRC) under grant num-
ber EP/F007426/1.
8 REFERENCES
Berkhout F, M Eames and J Skea (1998) Environmental Fu-
tures Scoping Study: Final Report. SPRU—Science and
Technology Policy Research). Brighton, UK Berr (2007) Energy Market Outlook. Department for Business
Enterprise and Regulatory Reform. Ofgem. October. p 121 Blakely EJ and MG Snyder (1998) Separate places: Crime and
security in gated communities. In: M. Felson and R.B. Peiser (eds.), Reducing crime through real estate develop-ment and management, Washington, D.C.: Urban Land In-stitute, pp 53-70
Christozov D (1997) Montreal underground: a case for indoor city planning. Conference of the Associated research Centers
for Urban Underground Space, Montreal
Cosgrove W, Rijsberman F (2000) World Water Vision: mak-ing water everybody’s business. London: Earthscan
Costanza R (2003) A vision for the future of science: reinte-grating the study of humans and the rest of nature. Futures 35: 651–671
Defra (2002) Sewage Treatment in the UK: UK Implementa-tion of the EC Urban Waste Water Treatment Directive. Dept. for the Environment Food and Rural Affairs, p 20
Defra (2008a) Future Water: The Government’s water strategy for England. Department for the Environment Food and Rural Affairs, p 98
Defra (2008b) Municipal Waste Management Statistics. De-partment for the Environment Food and Rural Affairs. p 2
Dempsey N (2009) Briefing: UK-India Research network. Proc. Inst. of Civil Engineers: Urban Design and Planning.
DTI (2002) Futures 2020: Revised scenarios and guidance. Department of Trade and Industry, p 36
DFT (2008) Regulations for Part 3 of the Traffic Management Act 2004: Permit Schemes (England) Regulations 200[7] [retrieved on January 5
th 2011 from
www.dft.gov.uk/consultations/aboutia/ria/pddraftregria.pdf - 2008-12-19]
EA (2006) Environment Agency Scenarios 2030. Environment Agency: Bristol
EA (2009) Water for people and the environment. Environment Agency: Bristol, p 92
Galil NI and Yaacov L (2001) Analysis of sludge management parameters resulting from the use of domestic garbage dis-posers. Water Science and Technology, 44(10): 27–34
Gallopin G, Hammond AL, Raskin P and Swart R (1997) Branch Points: Global Scenarios and Human Choice. Stockholm Environment Institute, Stockholm, p 55
Golany G (1989) Urban underground space design in China. University of Delaware Press, Newark, p 160
Hammond A (1998) Which World? Scenarios for the 21st Cen-tury, p 293
Hall L (2004), Underground Buildings: More than Meets the Eye, Quill Driver Books, World Dancer Press, inc., Sanger, California, p 215
Hunt DVL, Jefferson I and Rogers CDF (2009). Geotechnics the next 60 years. Discussion Article. Geotechnique, 59(8): 723-724
ICE (2009) The State of the Nation: Defending Critical Infra-structure. Institution of Civil Engineers, London, p 16
IPCC (2000) Emissions Scenarios: Summary for Policy Mak-ers. Intergovernmental Panel on Climate Change. pp 3-12
Kahn H and AJ Wiener (1967) The Year 2000: A Framework for Speculation on the Next Thirty-three Years. Macmillan publishers, New York
Kaplan RD (1994) The coming Anarchy. The Atlantic Monthly, 273(2): 44-76
Karlberg T and Erik N (1999). Food Waste Disposers – Effects on Wastewater Treatment Plants. A Study from the Town of Surahammar. VA-FORSK REPORT
Makropoulos C, Memon FA, Shirley-Smith C and Butler D (2008) Futures: an exploration of scenarios for sustainable urban water management. Water Policy 10(4): 345–373
Marvin S and Slater S (1997) Urban Infrastructure: The Con-temporary conflict between roads and utilities. Progress in Planning, 48: 247-318
NJUG (2003) Utilities guidelines on positioning and colour coding of apparatus. National Joint Utilities Group, Lon-don, UK
OECD (2001) OECD Environmental Outlook. OECD, Paris, p 309
OECD (2008) OECD Environmental Outlook to 2030. Envi-ronment & Sustainable Development 2008, vol. 2008, no. 1, p 523
Ofwat (2009) Service and delivery – performance of the water companies in England and Wales 2008-09. The Water Ser-vices Regulation Authority, Birmingham, p 50
Parker HW (2004) Underground Space: Good for Sustainable Development, and Vice Versa. International Tunnelling As-sociation (ITA) Open Session: World Tunnel Congress, Singapore. May, 2004, p 17
Randerson (2008) Expert warns climate change will lead to 'barbarisation'. The Guardian. Thursday May 15
th.
Raskin P, Gallopın G, Gutman P, Hammond A and Swart R (1998) Bending the Curve: Toward Global Sustainability. Stockholm Environment Institute
Raskin P (2005) Global Scenarios and the Millennium Ecosys-tem Assessment: An Historic Overview. Ecosystems 8: 133–142
Raskin P, Banuri T, Gallopin G, Gutman P, Hammond A, Kates R and Swart R (2002) Great transition: the promise and lure of the times ahead Boston: Stuckholm Environ-ment Institute-Bottom. Available online at: [retrieved on January 5
th 2011 from http://www.gsg.org]
Ratcliffe JS and Sirr L (2004) Futures thinking for the built and human environment - The Prospective Process Through Scenario Thinking for the Built and Human Environment: a tool for exploring urban futures. The Futures Academy. Dublin Institute of Technology, p 14
Ravetz J (2000) City Region 2020: Integrating planning for sustainable environment. Earthscan, London 2000, p 307
Rogers CDF and Hunt DVL (2006) Sustainable Utility Infra-structure via Multi-Utility Tunnels, Proceedings of the Ca-nadian Society of Civil Engineering 2006 conference, To-wards a sustainable future, Calgary, May 23
rd 2006, Paper
CT-001 Sellberg B (1996) Environmental Benefits: A Key to Increased
Underground Space Use in Urban Planning, Editorial in Tunnelling and Underground Space Technology, 11(4): 369
Sterling RL (2000) Planning for cost effective underground space use in urban areas. Tunnels and Underground Struc-tures. Zhao, Shirlaw and Krishnan (eds), pp 51-59
Sterling R and Carmody J (1993) Underground Space Design: A Guide to Subsurface Utilization and Design for People in Underground Spaces, Van Nostrand Reinhold, New York, p 328
UNEP (2002) Global Environment Outlook 3: Past present and future perspectives. United Nations Environment Pro-gramme, p 410
UNEP (2007) Global Environment Outlook 4: Environment for Development. United Nations Environment Programme, p 572
Van Asselt MBA, De Niet R, Peters SSM, Rijkens-Klomp, N, Rotmans J and Slooff W (1998) Towards Visions for a Sus-tainable Europe: An overview and assessment of the last decade of European scenario-studies. 1998, ICIS: Maas-tricht, p 96
Von Meijenfeldt, Ernst (2003) Below Ground Level, Creating New Spaces for Contemporary Architecture, Birkhauser Publisher for Architecture, Basel, p 264
Walton, J.S., El-Haram, M., Castillo, N.H., Horner, R.M.W., Price, A.D.F. and Hardcastle, C. (2005). Integrated As-sessment of Urban Sustainability. Engineering Sustainabil-ity, 158(2): 57-65
Water UK (2009) Water facts: Water Resources [retrieved on January 5
th 2011 from
http://www.water.org.UK/home/resources-and-links/waterfacts/resources]
WBCSD (1997) Exploring Sustainable Development. Sum-mary Brochure. World Business Council for Sustainable Development (WBCSD), Geneva.
Yoo C, Kim SB, Shin HC and Baek SC (2005) Effect of tun-nelling and groundwater interaction on ground and lining responses. Underground space use: Analysis of the past and lessons for the future. Erdem and Sollak (eds), pp 217-223