artificial neural network approach to predict blast-induced
TRANSCRIPT
Scholars' Mine Scholars' Mine
Masters Theses Student Theses and Dissertations
Summer 2016
Artificial neural network approach to predict blast-induced ground Artificial neural network approach to predict blast-induced ground
vibration, airblast and rock fragmentation vibration, airblast and rock fragmentation
Raymond Ninnang Tiile
Follow this and additional works at: https://scholarsmine.mst.edu/masters_theses
Part of the Environmental Health Commons, and the Mining Engineering Commons
Department: Department:
Recommended Citation Recommended Citation Tiile, Raymond Ninnang, "Artificial neural network approach to predict blast-induced ground vibration, airblast and rock fragmentation" (2016). Masters Theses. 7571. https://scholarsmine.mst.edu/masters_theses/7571
This thesis is brought to you by Scholars' Mine, a service of the Missouri S&T Library and Learning Resources. This work is protected by U. S. Copyright Law. Unauthorized use including reproduction for redistribution requires the permission of the copyright holder. For more information, please contact [email protected].
ARTIFICIAL NEURAL NETWORK APPROACH TO PREDICT
BLAST-INDUCED GROUND VIBRATION, AIRBLAST AND ROCK
FRAGMENTATION
by
RAYMOND NINNANG TIILE
A THESIS
Presented to the Faculty of the Graduate School of the
MISSOURI UNIVERSITY OF SCIENCE AND TECHNOLOGY
In Partial Fulfillment of the Requirements for the Degree
MASTER OF SCIENCE IN MINING ENGINEERING
2016
Approved by
Dr. Nassib Aouad, Advisor
Dr. Maochen Ge
Dr. Greg Galecki

2016
Raymond Ninnang Tiile
All Rights Reserved
iii
ABSTRACT
Blasting has been widely used as an economical and cheap way of rock breakage
in mining and civil engineering applications. An optimal blast yields the best
fragmentation in a safe, economic and environmentally friendly manner. The degree of
fragmentation is vital as it determines to a large extent the utilization of equipment,
productivity and mill throughput. Explosive energy, besides rock fragmentation, creates
health and safety issues such as ground vibration, air blast, fly rock, and back breaks
among others. As a result, the explosive energy impacts structures and buildings located
in the vicinity of the blasting operation, and causes human annoyance, as well as exposes
operators in the field to hazardous conditions. There is therefore a need to develop a
model to predict blast-induced ground vibration (PPV), airblast (AOp), and rock
fragmentation. Artificial neural network (ANN) technique is preferred over empirical and
other statistical predictive methods as it is able to incorporate the numerous factors
affecting the outcome of a blast. This study seeks to develop a simultaneous integrated
prediction model for rock fragmentation, ground vibration and air blast using MATLAB-
based artificial neural network system. Training, validation and testing was done with a
total of 180 monitored blast records taken from a gold mining company in Ghana using a
three-layer, feed-forward back-propagation ANN.
Based on the results obtained from the study, ANN model with architecture of
7-13-3 was found optimum having the least root mean square error (RMSE) of 0.307.
Artificial neural network (ANN) technique has been compared to empirical and
conventional statistical methods. Sensitivity analysis has also been conducted to ascertain
the relative influence of each input parameter on rock fragmentation, PPV and AOp.

iv
ACKNOWLEDGMENTS
I am highly indebted to my advisor, Dr. Nassib Aouad, for his technical
knowledge, inspiration and support leading to the successful completion of my research. I
am most grateful to you for funding my research program. I would like to thank the
examining committee members: Dr. Maochen Ge, and Dr. Greg Galecki, both of the
Mining Engineering department of Missouri S&T, for their support and guidance. I am
also grateful to all the faculty members of Mining Engineering department of Missouri
S&T for their advice and assistance during my research.
Further, I extend my appreciation to Perseus Mining Limited (Ghana) especially
Mr. Jesse Bukroh and Mr. Abraham Benin for their technical assistance when hard
decisions had to be made. To Mrs. Tina Alobaidan, Ms. Shirley Hall and Ms. Judy
Russell I say thank you for the role you played during my study.
Special thanks to my friend Francis Arthur and to the entire Ghanaian family here
in Rolla for their diverse support and prayers. To Victoria my lovely Wife I say well done
for the encouragement, advice and love shown me throughout my graduate studies.
I am extremely thankful to my family, especially my father, Mr. George Tiile for
their prayers and support during this period.
Lastly but not the least, gratitude goes to all who directly or indirectly helped me
in one way or the other during the period.

v
TABLE OF CONTENTS
Page
ABSTRACT ....................................................................................................................... iii
ACKNOWLEDGMENTS ................................................................................................. iv
LIST OF FIGURES .......................................................................................................... vii
LIST OF TABLES ............................................................................................................. ix
SECTION
1. INTRODUCTION ...................................................................................................... 1
1.1. BACKGROUND ................................................................................................ 1
1.2. STATEMENT OF THE PROBLEM .................................................................. 2
1.3. PROJECT OBJECTIVES ................................................................................... 4
1.4. MINE BACKGROUND INFORMATION ........................................................ 4
1.4.1. Location and Accessibility ....................................................................... 4
1.4.2. Mine Geology ........................................................................................... 4
1.4.3. Mine Operations ....................................................................................... 5
1.4.4. Drilling and Blasting ................................................................................ 5
1.4.5. Material Handling ..................................................................................... 5
1.4.6. Ore Processing .......................................................................................... 6
1.5. SUMMARY ........................................................................................................ 7
2. LITERATURE REVIEW ........................................................................................... 8
2.1. BLASTING ......................................................................................................... 8
2.2. BLAST-INDUCED GROUND VIBRATION ................................................. 10
2.3. BLAST-INDUCED AIRBLAST ...................................................................... 16
2.3.1. Empirical Predictors of Airblast (AOp) ................................................. 18
2.3.2. Artificial Neural Network (ANN) Predictors of Airblast ....................... 20
2.4. FRAGMENTATION ANALYSIS ................................................................... 21
2.5. ARTIFICIAL NEURAL NETWORK (ANN) .................................................. 23
2.6. SUMMARY ...................................................................................................... 30
3. METHODOLOGY ................................................................................................... 31
3.1. DATA COLLECTION ..................................................................................... 31

vi
3.2. INPUT AND OUTPUT DATA SETS .............................................................. 33
3.3. ARTIFICIAL NEURAL NETWORK (ANN) ARCHITECTURE .................. 35
3.4. REGRESSION ANALYSIS ............................................................................. 42
3.5. EMPIRICAL PREDICTORS FOR GROUND VIBRATION (PPV) ............... 45
3.6. EMPIRICAL PREDICTOR FOR AIRBLAST (AOp) ..................................... 51
3.7. SENSITIVIY ANALYSIS ................................................................................ 53
3.8. SUMMARY ...................................................................................................... 56
4. DATA ANALYSIS AND DISCUSSION ................................................................ 57
4.1. ANN AND MVRA ANALYSIS ...................................................................... 57
4.2. ARTIFICIAL NEURAL NETWORK AND EMPIRICAL PREDICTORS .... 58
4.3. BLAST OPTIMIZATION USING ARTIFICIAL NEURAL NETWORK ..... 59
4.4. SENSITIVITY ANALYSIS ............................................................................. 63
4.5. SUMMARY ...................................................................................................... 63
5. CONCLUSIONS AND RECOMMENDATIONS FOR FUTURE WORKS .......... 65
5.1. CONCLUSIONS............................................................................................... 65
5.2. RECOMMENDATIONS FOR FUTURE WORK ........................................... 66
APPENDICES
A.ARTIFICIAL NEURAL NETWORK (ANN) ARCHITECTURE .......................... 67
B.TRANSFER FUNCTIONS TESTED ....................................................................... 72
REFERENCES ................................................................................................................. 82
VITA. ................................................................................................................................ 89
vii
LIST OF FIGURES
Page
Figure 1.1. Rock formation stationary after blasting .......................................................... 3
Figure 1.2. Visible rock formation after blasting ................................................................ 3
Figure 1.3. Active pit view ................................................................................................. 6
Figure 2.1. Blast design ...................................................................................................... 8
Figure 2.2. Typical ANN process ..................................................................................... 25
Figure 3.1. Image prepared for fragmentation analysis .................................................... 32
Figure 3.2. Particle size distribution curve ....................................................................... 33
Figure 3.3. Typical ANN network window ...................................................................... 36
Figure 3.4. Typical ANN network architecture ................................................................ 36
Figure 3.5. Optimum network architecture ....................................................................... 38
Figure 3.6. Optimum network regression curves .............................................................. 39
Figure 3.7. Relation between predicted and measured PPV by ANN .............................. 41
Figure 3.8. Relation between Predicted and Measured Airblast by ANN ........................ 41
Figure 3.9. Relation between predicted and measured fragmentation by ANN ............... 42
Figure 3.10. Relation between predicted and measured PPV by MVRA ......................... 44
Figure 3.11 Relation between predicted and measured airblast by MVRA ..................... 44
Figure 3.12. Relation between predicted and measured fragmentation by MVR ............. 45
Figure 3.13. PPV and Scaled distance on log–log scale for USBM ................................. 46
Figure 3.14. PPV and Scaled Distance on log–log scale for Ambrasey-Hendron ............ 47
Figure 3.15. PPV and Scaled Distance on log–log scale for Langefors–Kihlstrom ......... 47
Figure 3.16. PPV and scaled distance on log–log scale for Indian standard predictors ... 48
Figure 3.17. Measured and predicted PPV by USBM Equation....................................... 49
Figure 3.18. Measured and predicted PPV by Ambraseys–Hendron equation................. 49
Figure 3.19. Measured and Predicted PPV by Langefors–Kihlstrom equation ................ 50
Figure 3.20. Measured and predicted PPV by Indian Standard Institute .......................... 50
Figure 3.21. Airblast and scaled distance on log–log scale .............................................. 51
Figure 3.22. Measured and predicted Airblast .................................................................. 52
Figure 3.23. Sensitivity analysis of input parameters ....................................................... 54

viii
Figure 3.24. Sensitivity analysis of input parameters ....................................................... 55
Figure 3.25. Sensitivity analysis of input parameter ......................................................... 55
Figure 4.1. Improved fragmentation ................................................................................. 62
Figure 4.2. Uniform pit floor ............................................................................................ 62
ix
LIST OF TABLES
Page
Table 2.1. Suggested damage criteria ............................................................................... 12
Table 2.2. Empirical predictor equations .......................................................................... 13
Table 2.3. Site factors for different blasting conditions (Hajihassani et al., 2014) .......... 19
Table 3.1. Input parameters and their ranges .................................................................... 34
Table 3.2. Output parameters and their ranges ................................................................. 34
Table 3.3. Comparison of different network architectures ............................................... 38
Table 3.4. Measured and predicted outputs ...................................................................... 40
Table 3.5. Predictor equations .......................................................................................... 46
Table 3.6. Calculated values of site constants .................................................................. 48
Table 4.1. Computed RMSE and R2 for comparing ANN and MVRA models ............... 57
Table 4.2. R2 for comparing predicted PPV using ANN and empirical models ............... 58
Table 4.3. R2 for comparing AOP using ANN and empirical model ............................... 59
Table 4.4. Blast outputs and equipment stats without ANN application .......................... 59
Table 4.5. Blast outputs and equipment stats following ANN analysis............................ 60
Table 4.6. Comparison of equipment stats before and after ANN application ................. 61
1
1. INTRODUCTION
1.1. BACKGROUND
Rock fragmentation is a fundamental mining activity that affects the downstream
processes; hence, there is a need of optimizing fragmentation. Optimizing rock
fragmentation results in (i) maximizing crusher throughput; (ii) improving excavator
productivity; (iii) minimizing equipment (i.e. excavator and crusher) maintenance and
repair costs. After the rocks are fragmented, the excess explosive energy creates ill
effects such as ground vibration, air blast, fly rock, and back breaks among others. Air
blast and ground vibration are usually potential causes of property damage and human
annoyance. Effective control of airblast and ground vibration avoids persistent complains
from affected inhabitants and prevents property damages to surrounding area.
A number of conventional statistical, empirical equations and artificial neural
network systems have been employed by various researchers to predict rock
fragmentation, ground vibration and airblast prior to blasting operations. However,
artificial neural network (ANN) is preferred over the other predictive techniques due to
its ability to incorporate the numerous factors affecting the outcome of a blast among
other advantages. However, the ANN model generated is site specific, the input
parameters can be expanded to include mechanical and geotechnical rock parameters
such as rock strength, RQD, rock hardness, number of joints etc. to provide the ANN
model a wider application. Thus, for this research, the ANN system is used to generate an
optimum model for predicting blast-induced ground vibration, airblast and rock
fragmentation.
Artificial neural networks (ANN) are structures of interconnected neurons and
usually involve the exchange of signals between neurons. ANN systems are good at non-
linear fittings as well as recognizing patterns after a successful training process and
outputs can be predicted given new sets of inputs.
2
1.2. STATEMENT OF THE PROBLEM
Blasting operations often focus on controlling fragmentation while neglecting the
environmental consequences. An optimal blast yields the desired fragmentation in a safe,
economic and environmentally friendly manner. On the other hand, a poorly conducted
blast would typically result in poor fragmentation and ill effects such as fly rocks, ground
vibration, airblast and back break. Among these nuisances, ground vibration and airblast
are the potential causes of property damages and noise pollution as noted in a case study
conducted at an open pit gold mine located in Ghana. The mining company had been in
successful business until recently. Complaints from inhabitants over noise and cracks
developed in their buildings comes in the wake of poor excavator productivities, reduced
crusher throughput, low crusher and excavator availabilities, and overall reduction in
ounces realized. Results of investigations conducted proved that the blasting operations
caused the cracks in neighboring structures. Poor fragmentation caused relatively lower
excavator productivities, wear and damages to crusher and excavator teeth, reduced
crusher throughput, and overall reduction in ounces produced. There was therefore an
urgent need for solutions to the blast-related problems.
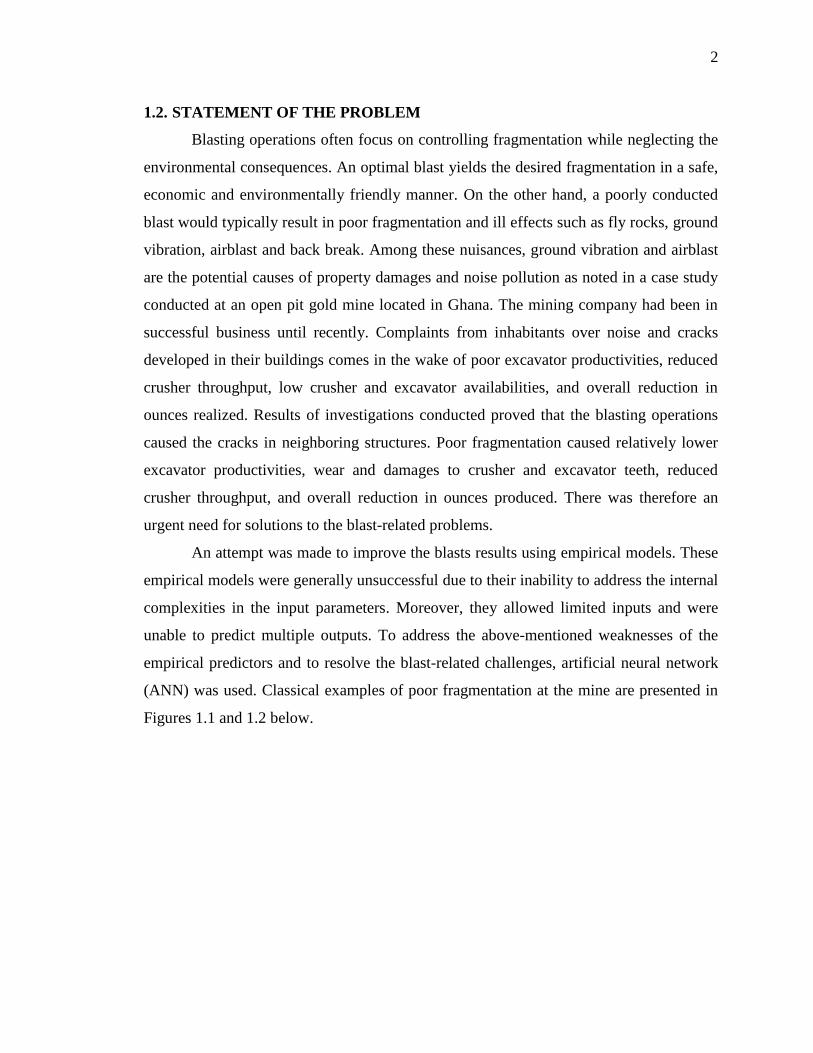
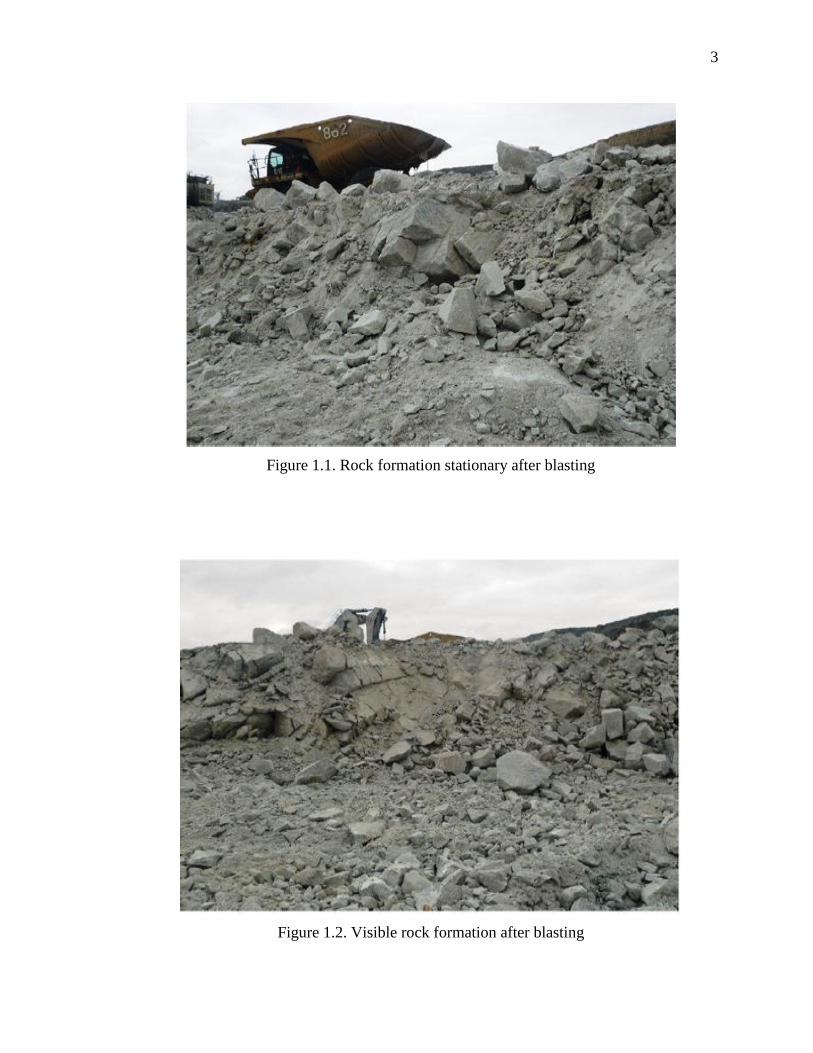
An attempt was made to improve the blasts results using empirical models. These
empirical models were generally unsuccessful due to their inability to address the internal
complexities in the input parameters. Moreover, they allowed limited inputs and were
unable to predict multiple outputs. To address the above-mentioned weaknesses of the
empirical predictors and to resolve the blast-related challenges, artificial neural network
(ANN) was used. Classical examples of poor fragmentation at the mine are presented in
Figures 1.1 and 1.2 below.
3
Figure 1.1. Rock formation stationary after blasting
Figure 1.2. Visible rock formation after blasting
4
1.3. PROJECT OBJECTIVES
Optimized blasts generate the desired fragmentation and minimize the impact of
ground vibration and airbast on the neighborhood of the blasting operations. This
research focuses on four main objectives in order to improve rock fragmentation. These
objectives are to:
Develop an integrated prediction model for rock fragmentation, blast-induced
ground vibration and airblast using MATLAB-based artificial neural network
system.
Compare artificial neural network (ANN) predictions to conventional statistical
(multivariate regression analysis) and other empirical methods to define the best
approach.
Carry out sensitivity analysis on all input parameters to ascertain the relative
influence of each parameter on rock fragmentation, ground vibration (PPV) and
airblast (AOp).
Use optimum ANN model generated to achieve desired fragmentation under
environmentally acceptable limits.
1.4. MINE BACKGROUND INFORMATION
1.4.1. Location and Accessibility. The Mine is located in Ghana, West Africa. It
is approximately 57 km to the south-west of Obuasi and 195 km north-west of the capital
Accra on the eastern flank of the prospective Ashanti Belt and 16 km west of Dunkwa,
near Ayanfuri. The Mine lies between latitude 1°50’00” and 2°00’00’’ and longitude
5°48’49’’ and 6°00’00”. It can be accessed by a 107 km road from Kumasi, which lies to
the north of the mine and a 186 km road from the port of Takoradi south of the mine. The
Dunkwa/Awaso defunct railway line passes 2 km north east of the mine.
1.4.2. Mine Geology. The deposits occur near the western flank of the Ashanti
Greenstone Belt. Numerous small Basin-type or Cape Coast-type granite bodies have
intruded the sediments along several regional structures. The intrusive shapes vary from
nearly ovoid plugs 200 m to 400 m long by 40 m to 150 m wide to relatively long
(+2,000 m) narrow (50 m -100 m) sills or dykes. Gold mineralization has been identified
in a single granitoid intrusive over an open strike of 2 km between Abnabna and Fobinso
5
pits. Most of the gold mineralization is contained within five (5) zones. These main zones
range from 30 m to 140 m in width and have a moderate to steep northerly plunge.
1.4.3. Mine Operations. The gold mine practices open pit mining method to
extract ore in two main productive pits. Mining is selective with bulk waste stripping on
5m and 10m benches. Mining operation runs a two-shift system with 10 hours per shift.
Full capacity commercial production started in 2011 and the mine still has over 10 years
mine life. The mining operation begins with drilling of holes, loading the holes with
explosives and blasting. After the rocks are fragmented, they are loaded into haul trucks
using excavators. Ore is hauled to the stockpile or direct-tipped into crusher while the
waste rock taken to the waste dump. As mining progresses, it is necessary to dewater the
mine to ensure that the water level remains below the pit floor. Thousands of gallons of
water are pumped from the pit each day. Much of the water is reused on site to control
dust. Surplus water is treated and discharged back into nearby rivers.
1.4.4. Drilling and Blasting. Sandvik DP1500 hydraulic rigs are used for drilling.
Blast holes with diameters of 115 mm are drilled vertically to depths of 5m, 7.5m and
10m. A 3.2 m x 3.7 m and a 3.5 m x 4.1 m staggered drill pattern are used for the ore and
waste shots respectively.
Ammonium nitrate fuel oil, ANFO (P100 bulk emulsion) with average density of
1.13 g/cm3 is used as the main blasting agent and the detonating cord as initiation system.
Priming is carried out using non-electric (NONEL) detonators and pentolite cartridges.
The inter hole delays are 17ms or 25ms and the inter row delays are 42ms or 67ms.
1.4.5. Material Handling. Loading is done mainly by two Liebherr 9250 and two
Liebherr 984 excavators in 5 m lifts and 10 m lifts depending on the type of material
being loaded. Two Liebherr 984 excavators are used to supplement production in times of
unscheduled breakdowns. Each excavator is assigned five or six Caterpillar 777D dump
trucks in a single back-up spotting configuration depending on the haul road distance.
The haul roads have average grades of 0 to 10% that lead to three main active dumps.
These main dumps are the oxide and transition waste dump, the Run-of-Mine (ROM) pad
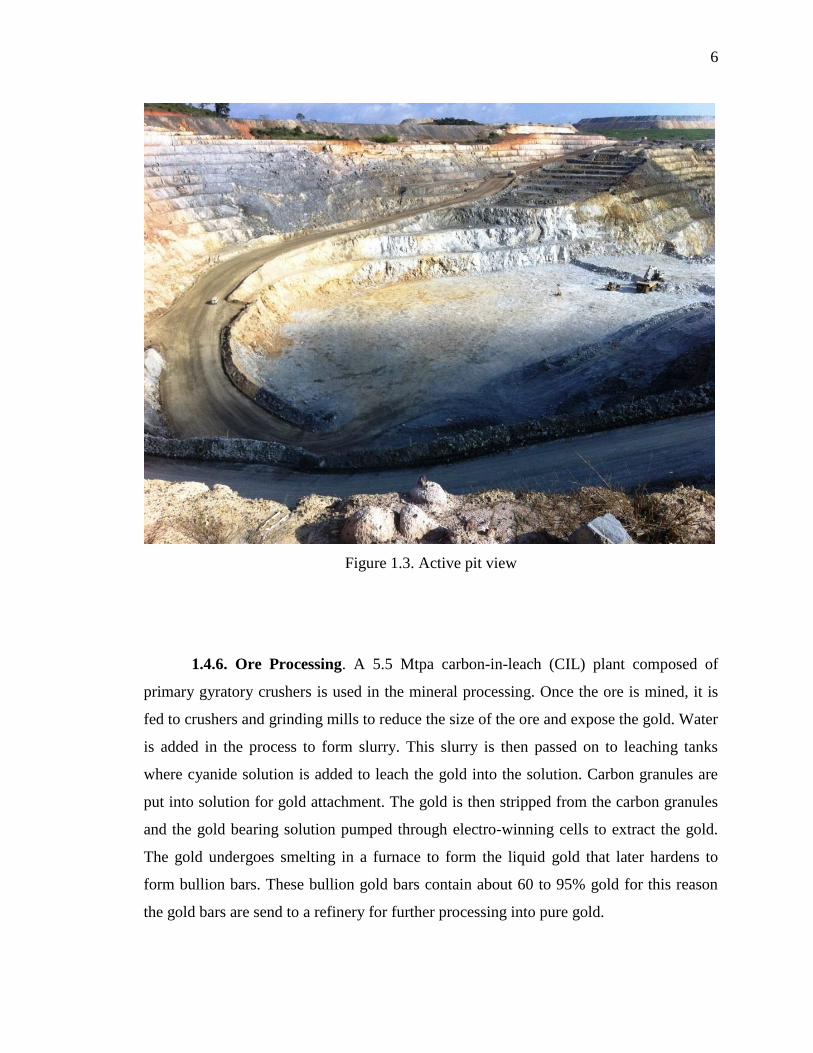
or the crusher and the tailings embankment dump. Figure 1.3 illustrates one of the
operational pits in the mine.
6
Figure 1.3. Active pit view
1.4.6. Ore Processing. A 5.5 Mtpa carbon-in-leach (CIL) plant composed of
primary gyratory crushers is used in the mineral processing. Once the ore is mined, it is
fed to crushers and grinding mills to reduce the size of the ore and expose the gold. Water
is added in the process to form slurry. This slurry is then passed on to leaching tanks
where cyanide solution is added to leach the gold into the solution. Carbon granules are
put into solution for gold attachment. The gold is then stripped from the carbon granules
and the gold bearing solution pumped through electro-winning cells to extract the gold.
The gold undergoes smelting in a furnace to form the liquid gold that later hardens to
form bullion bars. These bullion gold bars contain about 60 to 95% gold for this reason
the gold bars are send to a refinery for further processing into pure gold.
7
1.5. SUMMARY
This research work produces an optimum artificial neural network (ANN) model
that has the ability to optimize blasting operations. Optimized blasts yield desired
fragmentation leading to maximized crusher throughput, improved excavator
productivity, and reduced equipment maintenance and repair costs. Optimizing blasting
operations also prevent or minimize the impact of ground vibration and airbast on the
neighborhood of the blasting operations preventing property damage and human
annoyance. Section 2 reviews literature on blasting and ANN.
8
2. LITERATURE REVIEW
2.1. BLASTING
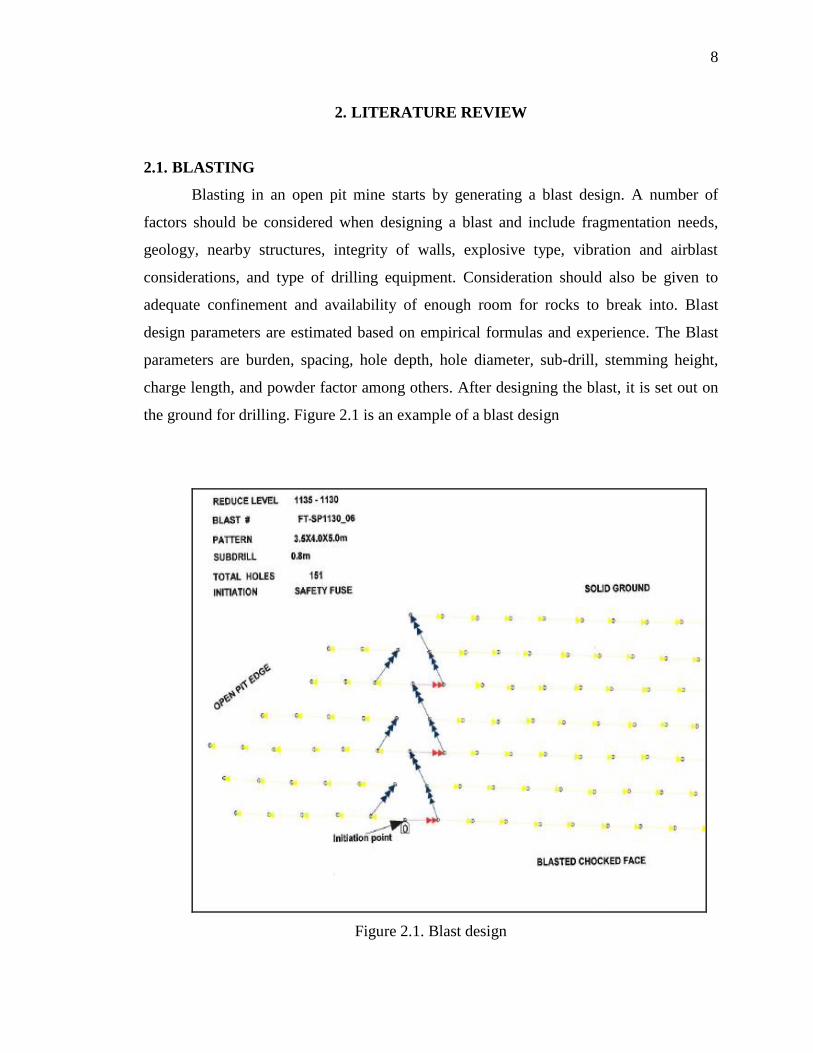
Blasting in an open pit mine starts by generating a blast design. A number of
factors should be considered when designing a blast and include fragmentation needs,
geology, nearby structures, integrity of walls, explosive type, vibration and airblast
considerations, and type of drilling equipment. Consideration should also be given to
adequate confinement and availability of enough room for rocks to break into. Blast
design parameters are estimated based on empirical formulas and experience. The Blast
parameters are burden, spacing, hole depth, hole diameter, sub-drill, stemming height,
charge length, and powder factor among others. After designing the blast, it is set out on
the ground for drilling. Figure 2.1 is an example of a blast design
Figure 2.1. Blast design
9
Drilling pattern is set out on the field and drilling of holes started. The blast holes
are drilled to required depths and loaded with appropriate explosives. The surface
connections done using the right delays and blasting initiated. Best blasting results are
achieved by paying close attention to the drilling and blasting process.
When a charge explodes, it generates high-pressure, high-temperature gases
against the containing borehole thus creating a strain field in the rock. The drill hole
pressure build-up depends on the physical characteristics of the rock and explosive
composition. The shockwave initiates the fragmentation process once it contacts the drill
hole wall. The immediate surrounding rock is crushed when the compressive strength of
the rock is exceeded. Beyond the crushed zone, surrounding rocks develop radial cracks
as the shockwave intensity exceeds the tensile strength of rock. The resulting gas pressure
travels through the cracks extending them further. The shockwaves radiating from the
drill hole are converted to tensile waves when they encounter a free face.
Blasting has been the cheapest means of rock breakage in the mining industry. It
is a vital step to the entire mining operation. Competence of all the subsystems (e.g.
loading, hauling and crushing) is dependent on the fragmentation quality (Mackenzie
1966; Monjezi et al., 2010). Optimum size distribution can enhance the overall
mine/plant economics (Hustrulid, 1999; Michaux and Djordjevic, 2005; Kanchibotla,
2001; Morin and Francesco 2006; Monjezi et al., 2010). Every blast regardless of the
design would produce a certain amount of unwanted energy that radiates from the blast
area in the form of ground vibrations and airblast (Hagan, 1973). Airblast and ground
vibrations cause objects to rattle making noise, as well as results in vibration of structures
in the neighboring premises. Excessive ground vibration can also affect the groundwater,
and ecology of the nearby area (Khandelwal and Singh, 2009). Proper control of blasting
practices is therefore necessary to ensure both the safety of employees and the protection
of the community from adverse effects. To prevent and reduce the adverse effect of
blasting operation, special attention should be given to the generation and propagation
mechanism of blast-induced ground vibrations (McKenzie, 1990).
Ground vibration usually reaches structure foundations before airblast pressure
does because of different wave propagation velocities in geomaterials and in the air.
Airblast and ground vibrations might act on the structure simultaneously, depending on
10
the distance between the explosion center and the structure. Hence, proper analysis of
structure response and damage to a nearby surface explosion should take into accounts
both ground shock and airblast pressure (Wu and Hao, 2007).
A number of damage criteria have been established to enhance blasting efficiency
(Duvall et al., 1963; Nicholls eta al., 1971; Siskind et al., 1989; Elseman and Rasoul,
2000). Adequate airblast and ground vibration standards have been set by many countries
to avoid structural damages and to reduce human complaints. Thus, blasting activities are
to be planned and conducted to comply with these standards.
2.2. BLAST-INDUCED GROUND VIBRATION
An important environmental aspect of mining is the evaluation of blast- induced
ground vibration transmitted through the ground. Railways, highway traffic and
machinery in nearby locations are other potential sources of ground vibration. When
transmitted ground vibrations strike the face of buildings, they impart momentum to the
exterior components of the building. The kinetic energy of these transmissions are
converted to strain energy in the structure causing partial damage to the extent of
complete collapse of structure (Dusenberry, 2010). These Ground vibrations take the
form of propagating waves that travel in the rock or soil away from the blast zone.
Ground vibrations are associated with mostly Rayleigh waves, longitudinal waves and
shear waves propagating through the ground. These wavelengths are influenced by both
controllable and uncontrollable factors. The controllable factors include the pattern, hole
depth, stemming length, and the charge column among others. On the other hand, the
uncontrollable factors are rock conditions, geology and rock properties (Mohamed,
2009). Ground vibration is directly related to the quantity of explosive used and the
distance between blast face to the monitoring point (Khandelwal and Singh, 2009).
A small amount of energy is converted into ground vibration in a properly
designed blast, with great deal of energy used in fragmenting and throws of rock.
Immediately surrounding the detonating hole is a crater zone, where the rock has been
fractured and displaced by the shockwave and by the pressure of the hot gasses produced
during the combustion process. Outside this crater zone, the shockwave is propagated
through the medium as elastic waves. The energy transmitted from particle to particle
11
within rocks is termed as ground vibration. These waves radiating outward are
categorized as body waves traveling through the ground and surface waves traveling on
the surface of the ground. These body waves travel outwards in a spherical manner until
they reach a boundary between two materials. At the intersection point, shear and surface
waves are generated. A common type of the surface wave is the Rayleigh wave and is
associated with energy flow along the surface. This wave arrives after the compression
and shear wave as it has a relatively lower phase velocity. The Rayleigh wave is very
important as it suffers less geometric spreading loss than body waves. In general, the
amplitude of the vibration decreases with increasing distance away from the center of
action due to diminishing energy levels.
Parameters often used to define the magnitude of ground vibration at any location
are as follows:
Particle displacement: The distance a particle moves before returning to its
original position (measured in mm).
Particle velocity: This is the rate of change of displacement (measured in mm/s).
Particle acceleration: This is the rate of change of velocity (measured in mm/s2).
Frequency: This is the number of oscillations per second that a particle undergoes
(measured in Hz).
Peak particle velocity (PPV) has been used in practice for the measurement of
blast damage to structures. Some of the proposed damage criteria that are established
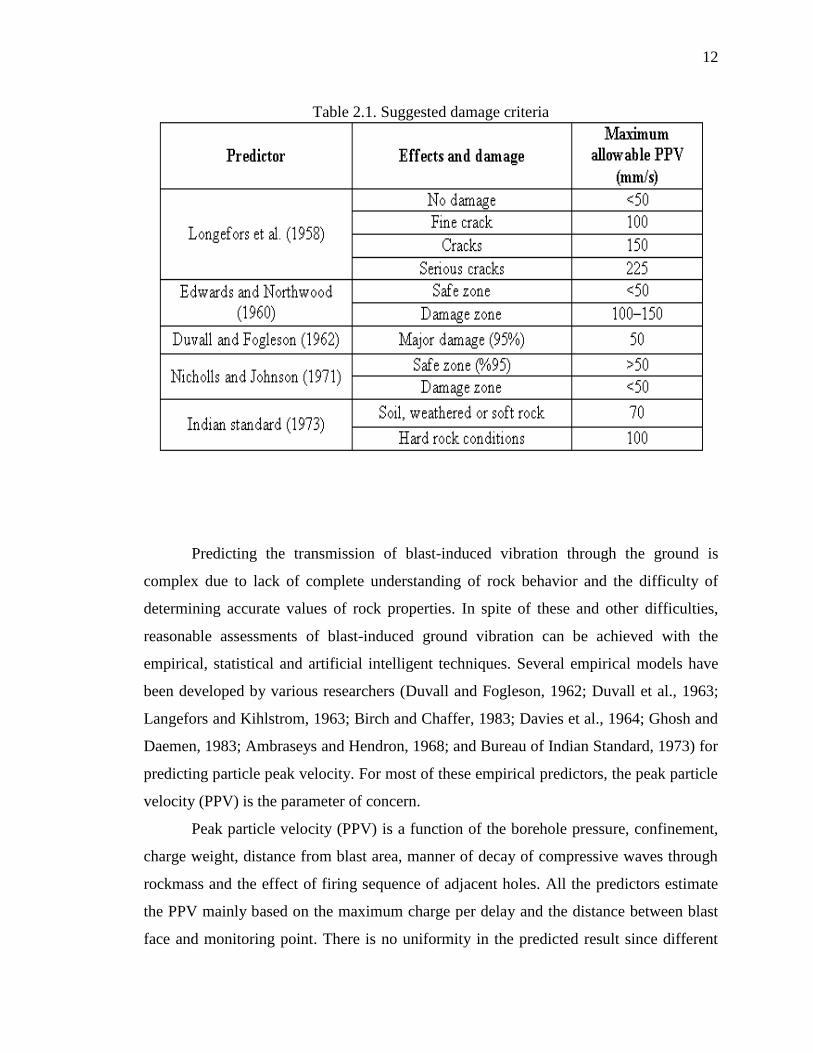
mainly on the peak particle velocity (PPV mm/s) are presented in Table 2.1 (Nateghi,
2012). These recommendations are based on author experiences for blast-induced
vibration limits near different types of structures in urban areas and are different for the
same structures found in different countries (Pal, 2005).
12
Table 2.1. Suggested damage criteria
Predicting the transmission of blast-induced vibration through the ground is
complex due to lack of complete understanding of rock behavior and the difficulty of
determining accurate values of rock properties. In spite of these and other difficulties,
reasonable assessments of blast-induced ground vibration can be achieved with the
empirical, statistical and artificial intelligent techniques. Several empirical models have
been developed by various researchers (Duvall and Fogleson, 1962; Duvall et al., 1963;
Langefors and Kihlstrom, 1963; Birch and Chaffer, 1983; Davies et al., 1964; Ghosh and
Daemen, 1983; Ambraseys and Hendron, 1968; and Bureau of Indian Standard, 1973) for
predicting particle peak velocity. For most of these empirical predictors, the peak particle
velocity (PPV) is the parameter of concern.
Peak particle velocity (PPV) is a function of the borehole pressure, confinement,
charge weight, distance from blast area, manner of decay of compressive waves through
rockmass and the effect of firing sequence of adjacent holes. All the predictors estimate
the PPV mainly based on the maximum charge per delay and the distance between blast
face and monitoring point. There is no uniformity in the predicted result since different
13
predictors give different values of PPV for various amount of allowable charge per delays
in the same operating area. These predictors are not able to predict other important
parameters such as frequency, air over pressure, and fly rocks (Dowding,
1985; Khandelwal and Singh, 2007; and Monjezi et al., 2011). Moreover, empirical
methods are unable to incorporate the numerous factors that affect the PPV and their
complex interrelationships, paving way for other techniques. Hence, approaches such as
artificial neural network (ANN), Support Vector machines (SVM), Genetic Algorithm
(GA) and Maximum likelihood classification are recently in use (Khandelwal, 2010).
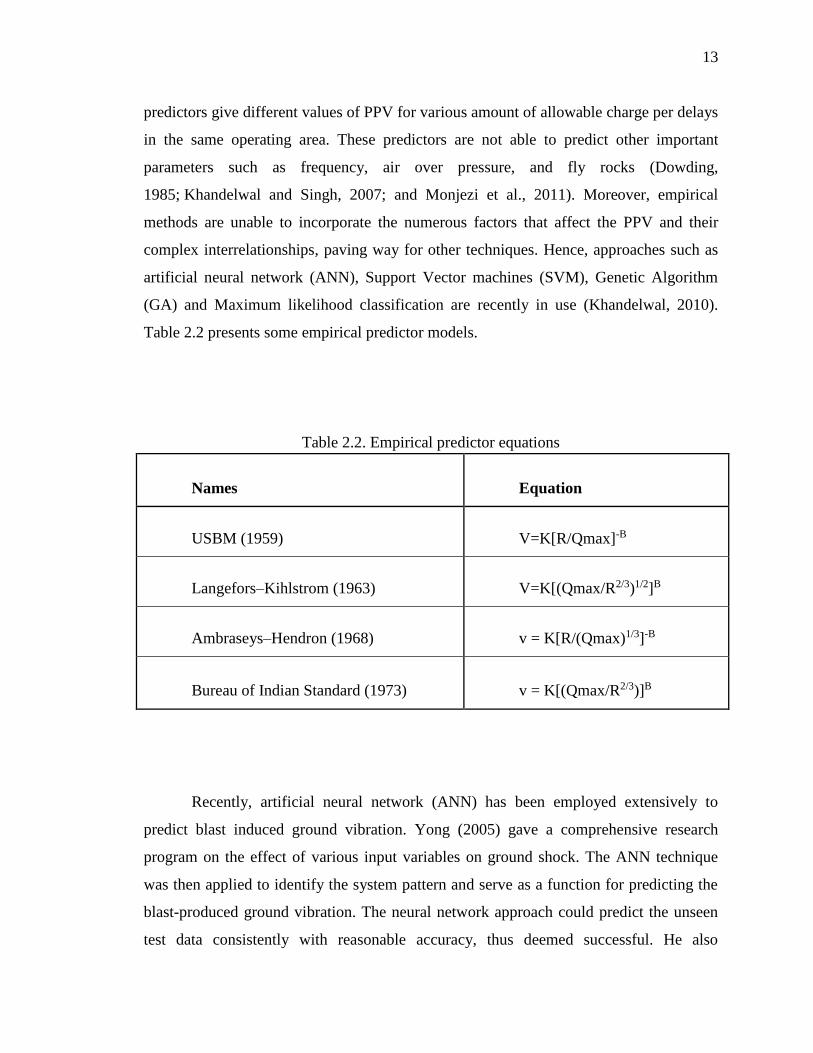
Table 2.2 presents some empirical predictor models.
Table 2.2. Empirical predictor equations
Recently, artificial neural network (ANN) has been employed extensively to
predict blast induced ground vibration. Yong (2005) gave a comprehensive research
program on the effect of various input variables on ground shock. The ANN technique
was then applied to identify the system pattern and serve as a function for predicting the
blast-produced ground vibration. The neural network approach could predict the unseen
test data consistently with reasonable accuracy, thus deemed successful. He also
Names Equation
USBM (1959) V=K[R/Qmax]-B
Langefors–Kihlstrom (1963) V=K[(Qmax/R2/3)1/2]B
Ambraseys–Hendron (1968) v = K[R/(Qmax)1/3]-B
Bureau of Indian Standard (1973) v = K[(Qmax/R2/3)]B
14
demonstrated that the directional angle, in addition to the scaled distance, is a crucial
factor influencing the ground shock at a particular target point.
Khandelwal and Singh (2006) devised a neural network approach for predicting
ground vibration and frequency by all impelling parameters of rock mass, explosive
characteristics and blast design. This network was trained by 150 dataset with 458 epochs
and 20 datasets tested. The suitability of this method was examined by comparing
artificial neural network (ANN) with a conventional statistical relation. The correlation
coefficient determined by ANN for peak particle velocity (PPV) and frequency were
relatively higher than the correlation coefficient determined by statistical analysis.
Khandelwal and Singh (2007) considered the prediction of blast-induced ground
vibration level at a Magnesite Mine in tecto-dynamically vulnerable hilly terrain in
Himalayan region in India. The ground vibrations were observed to calculate the safe
charge of explosive to avoid continuous complaints from nearby villagers. A total of 150
blast data sets was considered. Based on this study, it was established that the feed-
forward back-propagation neural network approach seems to be the better option for
predicting PPV to protect surrounding environment and structures.
Khandelwal and Singh (2009) investigated and predicted blast-induced ground
vibration and frequency in a coal mine in india based on some parameters using ANN
technique. A three-layer, feed-forward back-propagation neural network having 15
hidden neurons, 10 input parameters and two output parameters were trained using 154
experimental and monitored blast records. Results were then compared using correlation
and mean absolute error (MAE) for monitored and predicted values of PPV and
frequency. They concluded that ANN results for the PPV and frequency were very close
to the field data sets compared to the conventional predictors and MVRA predictions.
Monjezi et al. (2010) presented the prediction of blast-induced ground vibration
using various types of neural networks such as multi-layer perceptron neural network
(MLPNN), radial basis function neural network (RBFNN) and general regression neural
network (GRNN) in Sarcheshmeh copper mine, Iran. MLPNN gave the best results with
root mean square error and coefficient of correlation of 0.03 and 0.954 respectively.
Furthermore, Sensitivity analysis disclosed that distance from the blast, number of holes
15
per delay and maximum charge per delay are the most effective parameters in blast
induced ground vibration analysis.
Artificial neural networks (ANN), Multi-variate regression analysis (MVRA) and
empirical, analysis have been used by Kamali and Ataei (2010) to predict the blast-
induced PPV in the structures of the Karoun III power plant and dam. The best model
was the ANN since its outputs were highly correlated to the measured and observed data.
Monjezi et al. (2011) developed a predictive model for blast-induced ground
vibration using artificial neural network (ANN) in the Siahbisheh project, Iran. Input
parameters like maximum charge per delay, distance from blasting face to the monitoring
point, stemming and hole depth were considered. From the prepared database, 162
datasets were used for the training and testing of the network, 20 randomly selected
datasets were used to validate the ANN model. A four-layer feed-forward back-
propagation neural network with architecture 4-10-5-1 was found to be optimum. The
ANN model was compared with empirical predictors as well as regression analysis for
performance. The comparison results showed that the ANN model demonstrated a high
level of performance over the empirical predictors and statistical model. It was also
realized from sensitivity analysis that the distance from blasting face to the monitoring
point was the most effective parameter on PPV and stemming the least effective
parameter on the PPV.
Application of soft computing to predict blast-induced ground vibration was the
focus of research by Khandelwal et al. (2011). A Total of 130 experimental and
monitored blast records from surface coal mines at different locations were trained and
tested on a three-layer feed-forward back-propagation neural network with 2-5-1
architecture. Results were compared based on coefficient of determination and mean
absolute error between monitored and predicted values of PPV. Based on this study, it
was established that the feed-forward back-propagation neural network approach was the
best option for close and appropriate prediction of PPV.
Gao et al. (2012) implemented ANN to develop a predictive model for PPV in a
blasting operation. A three-layer ANN was found to be optimum with topology 2-5-1.
Monitored and predicted PPV values were compared using coefficient of determination
16
(CoD) and mean absolute error (MAE). The comparison results showed that the ANN
model predictions were closer to the actual values.
Mohamad et al. (2012) used artificial neural networks (ANN) to evaluate and
predict blast-induced ground vibration by incorporating blast design and rock strength in
the enquiry. His conclusion was that ANN method produced more accurate prediction
than the empirical formula.
Monjezi et al. (2013) directed their research towards the evaluation and prediction
of blast-induced ground vibration at Shur River Dam in Iran using different empirical
vibration predictors and ANN model. A total of 20 blast vibration records were
monitored with 16 out of them used for training of the ANN model. The remaining 4
blast vibration data sets were used for validation purposes. Performances of the different
predictor models were assessed using standard statistical evaluation criteria and it was
established that the ANN model is more accurate compared to the other empirical models
evaluated.
Field measurements were carried out and their results were assessed to determine
blast-induced ground vibrations at the Eti Mine Tülü Boron Mining Facility, Turkey by
Görgülü et al. (2013). The results presented different field constants for the propagating
blast vibrations depending on the direction of propagation (K = 211.25–3,671.13 and β =
1.04–1.90) and the damping behavior of the particle velocity. They also noticed that the
field constants decrease as the rock mass rating (%) values diminish. A much higher
correlation coefficient (R 2 = 0. 95) between the predicted and measured peak particle
velocity (PPV) values was attained for artificial neural networks compared to classical
evaluation methods.
2.3. BLAST-INDUCED AIRBLAST
Blast-induced airblast or overpressure is one of the negative effects of blasting
operations. The resulting noise usually generates a lot of uneasiness and irritation to
neighbors giving rise to complaints. Blast-induced airblast can be minimized by properly
designing and implementing blasts. Blast-induced airblast is the shock wave that is
refracted horizontally by density variations in the atmosphere and dies out gradually with
time and distance. This pressure wave consists of audible sound and sub-audible sound.
17
The higher frequency portion (>15 Hz) of the pressure wave which emerges in the
immediate blast premises is audible while the sub-audible is the lower frequency portion
lying in the infra sound (<15 Hz) region. The sub audible portion usually occurs in the
region distant from the blast site (Faramarzi et al., 2014). When an explosive charge is
detonated on a flat surface, where no weather enhancement prevails, the resulting airblast
overpressure levels attenuate evenly in all directions. The resulting airblast levels may be
represented schematically by circular contours of decreasing intensity (Richards, 2010).
Air overpressure (AOp) waves are generally generated from four main sources:
Air pressure pulse: displacement of the rock at bench face as the blast progresses
Rock pressure pulse: induced by ground vibration
Gas release pulse: escape of gases through rock fractures
Stemming release pulse: escape of gases from the blasthole when the stemming is
ejected
Air pressure pulse and rock pressure pulse are unavoidable airblast sources in
bench blasting, both gases release pulse and stemming release pulse can be avoided
through the blast design (Segarra et al., 2010). AOp is directly influenced by the
maximum charge per delay, the distance from transducer, burden and spacing, stemming,
direction of initiation and charged depth. AOp is also influenced by other parameters
such as atmospheric conditions, overcharging, weak strata and conditions resulting from
secondary blasting (Rodrigues et al., 2007; and Siskid et al., 1980). AOp affects
structures and can result in conflict between company and those who are affected (Siskid
et al., 1980; Hopler 1998; Mohanty 1998; Persson et al., 1994; Konya and Walter, 1990;
and Hajihassani et al., 2014).
Seven conditions notably cause high over-pressure levels. These conditions
include the following:
1. Inadequate stemming
2. Mud or weak seam venting
3. Inadequate burden confinement
4. Poor blasting timing
5. Focusing by wind or temperature inversions
6. Uncovered detonation cord
18
7. Overloading
2.3.1. Empirical Predictors of Airblast (AOp). Several empirical formulae and
empirical curves are available in literature for the prediction of peak overpressure
attenuation (Barker 2012; TM-5-855-1, 1986; Bulson, 1997).
AOp from confined blasthole charges can be obtained from the empirical equation
as illustrated in Equation (2.1) (National Association of Australian State, 1983) below:
P = (2.1)
where, P is overpressure in kPa, E is mass of charge in kg, and d is distance from center
of blasthole in meter.
The air blasts or air overpressures at the blast area may be predicted using
Equation (2.2) (Persson et al., 1994) below:
P=0.7(W1/3/D) (2.2)
where P = Air Overpressure, mbar; W = Cooperating Charge, kg; and D = Distance, m
McKenzine (1990) suggested an equation to describe the decay of overpressure as
shown in Equation (2.3):
dB = 165-24 log(D/W1/3) (2.3)
where, dB is the decibel reading, D is distance in meters, W is the maximum charge per
delay.
19
The cube-root scaled distance factor (SD) is generally used to predict AOp, in the
absence of monitoring. A relation connecting air overpressure and scaled distance is
given below in Equation (2.4):
P=K (D/Q1/3)-β (2.4)
where, P is the Air Overpressure in linear decibels (dBL), D is the distance of measuring
transducer, Q is maximum charge weight per delay, K and β are site constants, and
(D/Q1/3) is the scaled distance.
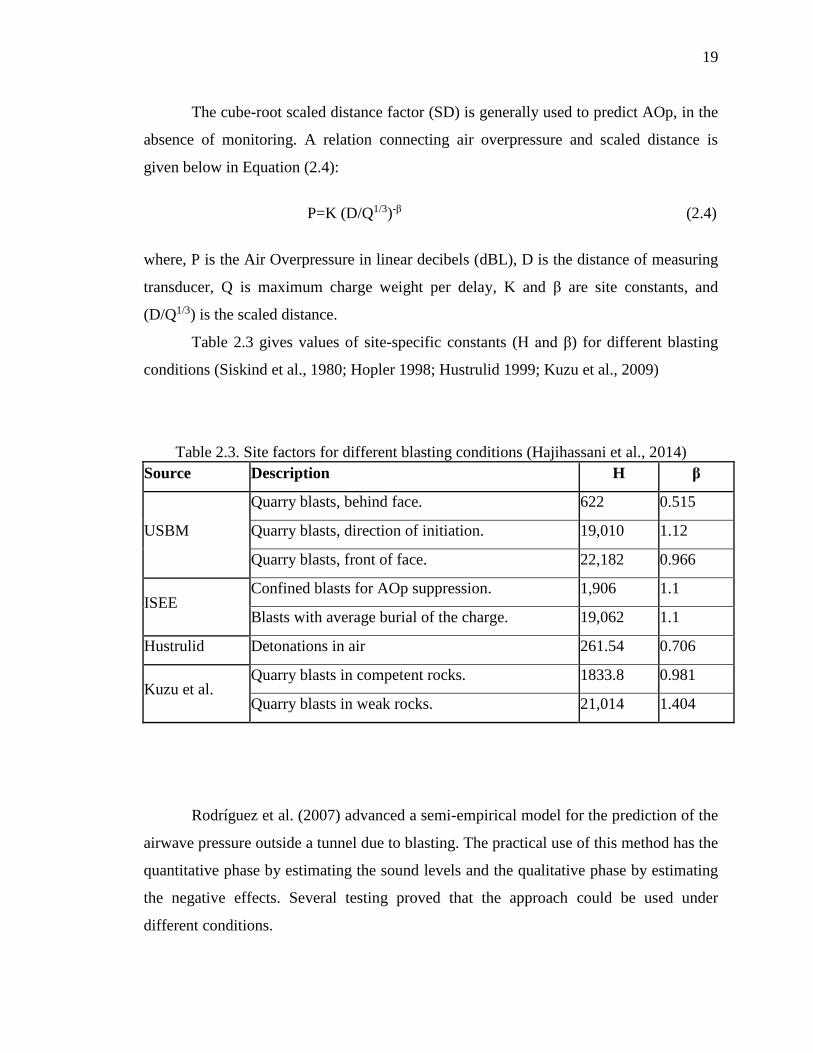
Table 2.3 gives values of site-specific constants (H and β) for different blasting
conditions (Siskind et al., 1980; Hopler 1998; Hustrulid 1999; Kuzu et al., 2009)
Table 2.3. Site factors for different blasting conditions (Hajihassani et al., 2014)
Source Description H β
USBM
Quarry blasts, behind face. 622 0.515
Quarry blasts, direction of initiation. 19,010 1.12
Quarry blasts, front of face. 22,182 0.966
ISEE Confined blasts for AOp suppression. 1,906 1.1
Blasts with average burial of the charge. 19,062 1.1
Hustrulid Detonations in air 261.54 0.706
Kuzu et al. Quarry blasts in competent rocks. 1833.8 0.981
Quarry blasts in weak rocks. 21,014 1.404
Rodríguez et al. (2007) advanced a semi-empirical model for the prediction of the
airwave pressure outside a tunnel due to blasting. The practical use of this method has the
quantitative phase by estimating the sound levels and the qualitative phase by estimating
the negative effects. Several testing proved that the approach could be used under
different conditions.
20
Wu and Hao (2007) investigated the influence of simultaneous ground shock and
airblast forces on structures. It was found that in general, airblast load governs structural
response and damage when the scaled distance is small.
Kuzu et al. (2009) used site-specific scaled distances (SD) instead of conservative
SD values to generate environmentally friendly and technically practicable results. They
established a new empirical relationship between AOp and two parameters, the distance
between blast face and the monitoring point, and the weight of explosive materials.
Rodríguez et al. (2010) reviewed the results of a previous research and pointed
out that only the magnitude of the blasting airwave at the tunnel portal depends on the
tunnel and blasting design parameters. Phonometric and iso-attenuation curves were
proposed in order to represent the phenomenon and to synthesize the solution for a given
case. For easy solutions to the problem, a charge–distance curve was proposed.
Segarra et al. (2010) investigated the propagation of airblast or pressure waves in
air produced by bench blasting (i.e. detonation of the explosive in a row of blastholes,
breaking the burden of rock towards the free vertical face of the block). A new AOp
predictive equation based on monitoring data in two quarries was established.
2.3.2. Artificial Neural Network (ANN) Predictors of Airblast. Many
investigators have applied soft computing methods like ANN, support vector machine
(SVM) and fuzzy inference system to predict AOp. Khandelwal and Singh (2005) used
ANN to predict air blast by incorporating the maximum charge per delay and distance
between blast face to the monitoring point. The network was trained by 41 datasets with
50 epochs and tested by 15 dataset. ANN was also compared with generalized equation
of air overpressure and conventional statistical relations. ANN model was the best
predictor.
Mohamed (2011) predicted the AOp using fuzzy inference system and ANN.
Comparison between the results of fuzzy inference system and ANN with the values
obtained by regression analysis indicated that the ANN and fuzzy models have accurate
prediction relative to regression analysis.
Mohamad et al. (2012) used ANN to predict AOp datasets obtained from blasting
operations. Input parameters used were the hole diameter, hole depth, spacing, burden,
21
stemming, powder factor, and number of rows were considered. The results demonstrated
the proposed model was the right choice for AOp predictions.
A new approach based on hybrid ANN and particle swarm optimization (PSO)
algorithm to predict AOp in quarry blasting was investigated by hajihassani et al. (2014).
AOp and some input parameters were recorded from 62 blast operations in four granite
quarry sites in Malaysia. Results suggested that the PSO-based ANN model outperformed
the other predictive models.
2.4. FRAGMENTATION ANALYSIS
Fragmentation analysis has been proven useful in the mining, construction and
aggregate industries by helping reduce energy costs, improving efficiency and
minimizing equipment maintenance costs. Mine-to-Mill optimization is the approach
usually employed to accomplish the reduction of energy and cost in mining as well as
processing practices. This approach involves sampling and modeling of blasting and
processing, followed by computer simulation to optimize the operation and develop
alternatives (Adel et al., 2006). The entire operation is taken into consideration, from
blasting to comminution in order to optimize the size reduction process. Mine-to-Mill
optimization has been successfully applied in gold, copper, and lead/zinc operations
worldwide. As a result, the throughput increases from 5 – 18% and cost is reduced in the
neighborhood of 10% (Atasoy et al., 2001; Grundstrom et al., 2001; Paley and Kojovic,
2001; Valery et al., 2001; and Adel et al., 2006).
There are several fragmentation measurement methods available. Among the
methods are oversize boulder count method, sieving, visual analysis, shovel loading rate
method and image analysis method. The split desktop is an example of image analysis
method that is used in this research. This method usually comprises of the split software,
a computer, monitor and a keyboard. The split system should also be capable of
downloading the images onto the computer. To start, images are taken from muck pile or
stockpile and downloaded onto a computer. The fragments in each image are delineated
to determine the fragmentation of the rock fragments. Graphs of the resulting size
distributions can then be plotted.
22
Rock fragmentation is influenced by controllable and non-controllable factors.
The controllable factors include the blast design parameters and the explosive type. The
non-controllable factors on the other hand are the physical and mechanical properties of
the rock concerned. Certain measures should be taken to reduce the effect of these non-
controllable parameters in order to attain a good rock fragmentation. Available empirical
models developed have not been able to incorporate the numerous variables and their
interrelations. To overcome this drawback, the Artificial Neural Network (ANN) in
recent years has been put to good use.
Over the past decade, a number of research works have been executed in the area
of rock fragmentation. Empirical models have been developed by earlier researchers to
predict Rock fragmentation. Kuznetsov (1973) developed a relationship between mean
fragment size and specific charge according to the Rosin-Rammler theory. Cunningham
(1983) later improved the efficiency of this approach. These empirical methods despite
their comprehensive usage failed to inculcate all the relevant input parameters necessary
for the best results.
Many contemporary researchers have used artificial intelligence methods such as
artificial neural network (ANN) to address effectively the weaknesses presented by these
empirical methods of prediction. Monjezi et al. (2010) predicted rock fragmentation due
to blasting in Sarcheshmeh copper mine using ANN. In his research, a model with
architecture 9-8-5-1 trained by back propagation method was found to be optimum.
Artificial neural network (ANN) method was implemented to develop a model to
predict rock fragmentation due to blasting in an iron ore mine (Bahrami et al., 2011). In
developing the proposed model, eight parameters such as the hole diameter, burden,
powder factor, blastability index, etc., were incorporated. Training of the model was
performed by back-propagation algorithm using 220 datasets. A four-layer ANN
architecture 10-9-7-1 was found to be optimum. Sensitivity analysis revealed that the
most effective parameters on rock fragmentation are blastability index (G), charge per
delay (J), burden (C), SMR (F) and powder factor (E).
The simultaneous prediction of rock fragmentation and backbreak in the blasting
operation of Tehran Cement Company limestone mines in Iran was conducted by Sayadi
et al. (2013). Back propagation neural network (BPNN) and radial basis function neural
23
network (RBFNN) are adopted for the simulation. In addition, regression analysis is
performed between independent and dependent variables. For the BPNN modeling, a
network with architecture 6-10-2 was declared optimum whereas for the RBFNN,
architecture 6-36-2 with spread factor of 0.79 provides maximum prediction aptitude.
Sensitivity analysis shows that inputs burden and stemming are the most effective
parameters on the outputs fragmentation and backbreak, respectively.
Enayatollahi et al. (2014) did a Comparison between Neural Networks and
Multiple Regression Analysis to Predict Rock Fragmentation in Open-Pit Mines. It was
concluded that the ANN results possess a greater degree of accuracy, are robust, and
more fault tolerant than any other analysis technique.
2.5. ARTIFICIAL NEURAL NETWORK (ANN)
Artificial neural networks have been the subject of an active field of research that
has developed greatly over the past years. ANN is a computational model based on the
structure and functions of biological neural networks. These networks are good at fitting
non-linear functions and recognizing patterns. Hence ANN are used in mining and civil
departments, military target recognition, aerospace, detection of manufacturing defects,
machine monitoring and machine diagnosis, robotics, as well as Agriculture, control
systems, automotive, banking, insurance, oil and gas, and telecommunications industries.
Success in the mining sector is being confirmed in the areas of blast-induced ground
vibration prediction, blast-produced aiblast predictions, prediction of ground
fragmentation, fly rock prediction, prediction of subsidence due to underground mining
and back break prediction just to mention a few.
ANNs are a form of artificial intelligence that try to mimic the actions of the
human brain and nervous system. They are computational models inspired by biological
neural networks, and are used to approximate functions that are generally unknown. A
particular ANN has three fundamental components; transfer function, network
architecture and learning law (Simpson, 1990). A typical ANN system has three layers;
the input layer, the hidden layer(s) and the output layer. These three layers are
interconnected and each layer consists of one or more nodes. Neurons in the input layer
send data onto the hidden layer, which in turn transmit data to the output layer. ANNs
24
learn from data examples presented to them and use these data to adjust their weights in
an attempt to capture the relationship between the historical set of model inputs and
corresponding outputs. For this reason, ANNs do not need any prior knowledge about the
nature of the relationship between the input/output variables (Shahin et al., 2001).
Neurons can use transfer functions such as logsig, tansig or purelin to generate their
outputs.
The neural network is first trained by processing a large number of datasets.
Different algorithms are available for training, but backpropagation algorithm is the most
proficient as it is able to accommodate large input data and able to solve problems with
vast complexities. Sufficient number of experimental datasets is required to train the
network. For a given set of inputs, we decide on a set of desired outputs. Using random
weights, the network calculates some outputs. The calculated outputs are compared with
the desired output to obtain the network error. The connecting weights are adjusted to
reduce the errors in a process known as back propagation using the same learning rule.
Based on the training process, a pattern is presented to the network. The new weights are
calculated using equation (2.11) based on the old weights, the node input values, errors
and the learning rate. This process goes on until the error is converged to a level defined
by a cost function such as mean square error (MSE). Once the training phase of the
model has been successfully accomplished, the performance of the trained model has to
be validated using an independent testing set. Unsatisfactory network performance can be
improved by retraining, increasing the number of neurons or using a larger training
dataset.
The neural network after a successful training, validation and testing can be used to
predict datasets outputs for given inputs based on the learning pattern. Neural network
simulation often provides faster and accurate prediction compared to other methods of
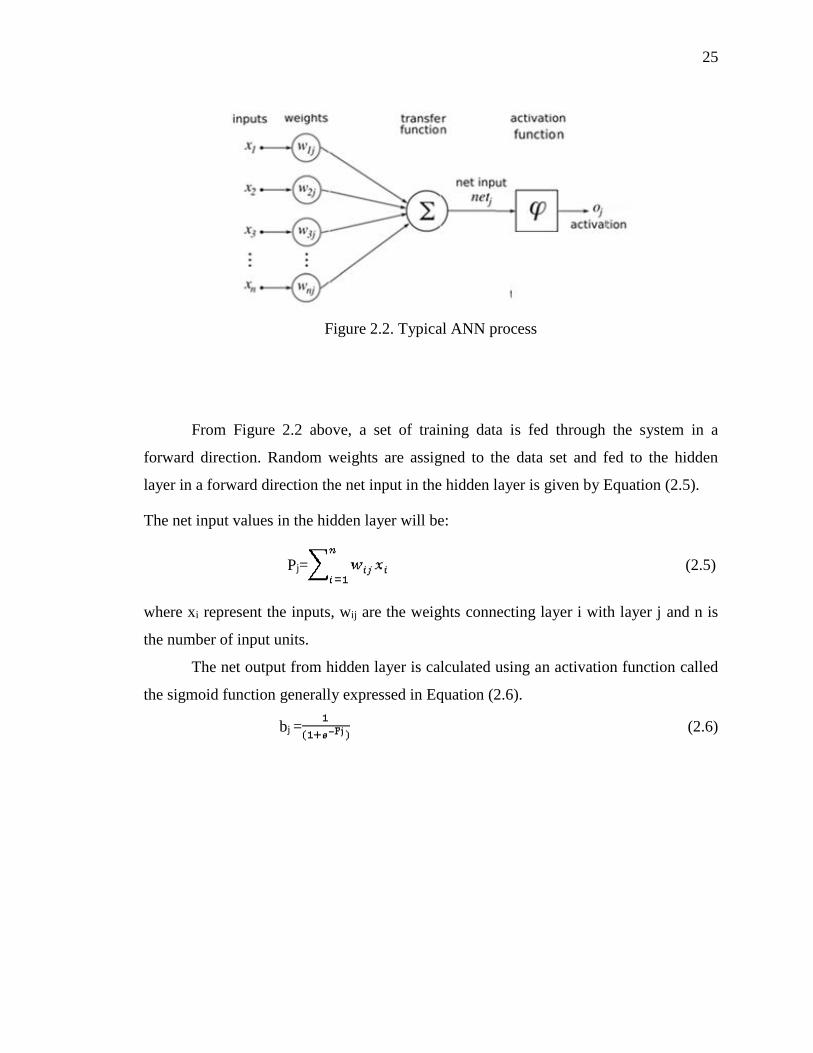
data analysis. Figure 2.2 demonstrates a typical ANN procedure.
25
Figure 2.2. Typical ANN process
From Figure 2.2 above, a set of training data is fed through the system in a
forward direction. Random weights are assigned to the data set and fed to the hidden
layer in a forward direction the net input in the hidden layer is given by Equation (2.5).
The net input values in the hidden layer will be:
Pj= (2.5)
where xi represent the inputs, wij are the weights connecting layer i with layer j and n is
the number of input units.
The net output from hidden layer is calculated using an activation function called
the sigmoid function generally expressed in Equation (2.6).
bj = (2.6)
26
The total input to layer k (the output layer) is expressed as:
Uk= (2.7)
where wjk is the weight connecting layer j with layer k and bj stands for the activation of a
particular function receiving neuron in layer j.
Error is generated by comparing the actual output to the desired output. The error
term in a given output, k is presented in Equation (2.8):
δ=dk-ak (2.8)
where δ is the error term, dk is the desired output and ak is the actual output.
The total error function for the training pattern is given by Equation (2.9):
(2.9)
where dk is the desired output and ak is the actual output.
Changes in weights are calculated using the learning rate, the error term and the
input units as illustrated in Equation (2.10).
∇Wjk=ηδkxjk (2.10)
where ∇Wjk is the change in weight, η is the learning rate, the error term is expressed as
δk and xjk is the input unit.
The calculated weight changes are then used together with the old weights to
calculate new weights as shown in Equation (2.11).
WNjk=Wjk+∇Wjk (2.11)
27
where the new weight is WNjk , Wjk is the old weight and ∇Wjk is the change in weight.
The calculated weights are then implemented throughout the network and the
entire process is repeated as many epochs(cycles) as needed until the error is within the
user specified goal (Khandelwal and Singh, 2009).
The first computational, trainable neural networks were developed by Rosenblatt
(1958). Rosenblatt’s approach was limited to solutions of linear problems. Werbos (1975)
expanded the capabilities of neural networks from linear to nonlinear domains in what is
known as the backpropagation algorithm. Artificial neural networks were popularized by
Rumelhart and McClelland (1986).
Application of artificial neural networks in mining is growing consequently many
researchers have applied the ANN system to predict blast-induced rock fragmentation,
airblast and ground vibration (Khandelwal and Singh, 2005; Monjezi et al., 2010;
Bahrami et al., 2011; Enayatollahi et al., 2014; hajihassani et al., 2014). ANN have also
gain use in other mining and civil related works.
Maulenkamp and Grima (1999) applied neural network for the prediction of the
UCS from hardness tests on rock samples based on input parameters hardness, porosity,
density, grain size and rock type information of a rock sample. The results of the network
were compared to predictions obtained by conventional statistical relations to examine
the suitability of this technique. A dataset containing 194 rock sample records, ranging
from weak sandstones to very strong granodiorites, was used to train the network with the
Levenberg–Marquardt training algorithm. The conclusion was that predictions of uniaxial
compressive strength by artificial neural network (ANN) were closer to the measured
values.
A data mining approach to the prediction of tunnel support stability using ANN
was employed by Leu et al. (2001). Rock mechanical and construction-related parameters
with significant influences on support stability were filtered to train and test the ANN. It
outperformed the discriminant analysis and the multiple non-linear regression method in
predicting tunnel support stability.
Tawadrous (2006) used backpropagation neural network to predict the burden and
spacing of the blast pattern using input parameters such as rock type, stratification,
blasthole diameter, bench height, type of explosive, priming position, powder factor and
28
fragmentation size. He trained the network using 43 case histories collected from the
various literatures and validated it with 16 cases from operational quarries. He found very
high correlation for the prediction of burden and spacing by ANN.
Neaupane and Adhikari (2006) predicted ground movement around tunnels with
artificial neural networks. A MATLAB® based multi-layer backpropagation neural
network model was developed, trained and tested with parameters obtained from the
detailed investigation of different tunnel projects published in literature. The output
parameters were settlement and trough width. Diameter to depth ratio (D/Z), unit weight
of soil and cohesion were among the input parameters considered for the prediction of
horizontal ground movement. The neural network predicted the desired goal effectively.
Sarkar et al. (2010) reports the use of an artificial neural network to predict the
deformation properties of Coal Measure rocks using dynamic wave velocity, point load
index, density and slake durability index. The study confirmed that ANN is a useful tool
for predicting rock strengths that are not clearly established using empirical relationships.
The conclusion was that artificial neural network (ANN) is fast and cost effective.
Evaluation and prediction of the airflow rate in triaxial conditions at various
confining pressures incorporating cell pressure, air inlet pressure, and air outlet pressure
using ANN technique was investigated by Ranjith and Khandelwal (2012). A three-layer
feed forward back propagation neural network having 3-7-1 architecture network was
trained using 37 data sets measured from laboratory investigation. Based on coefficient of
determination (CoD) and mean absolute error (MAE) ANN model was compared with
multi-variate regression analysis (MVRA). ANN proved to be a better predictor.
Rezaei et al. (2012) developed an ANN model to predict burden in the blasting
operation of Mouteh gold mine, using geomechanical properties of rocks as input
parameters. Blastability index (BI), rock quality designation (RQD), unconfined
compressive strength (UCS), density, and cohesive strength were among the input
parameters used. It was observed that the ANN prediction capability is better than that of
MVRA. Further, a sensitivity analysis shows that while BI and RQD were the most
sensitive parameters, cohesive strength was considered as the least sensitive input
parameters on the ANN model output.
29
Monjezi et al. (2013) applied ANN method to predict the flyrock in the blasting
operations of Sungun copper mine, Iran. Architecture 9-5-2-1 was found to be optimum
after training with back-propagation algorithm. Flyrock were also computed from various
available empirical and statistical models. ANN was then compared with the statistical
and empirical methods for superiority in prediction capabilities. Comparison of the
results showed absolute superiority of the ANN modeling over the empirical, as well as,
statistical models. It was also observed that the powder factor, hole diameter, stemming
and charge per delay are the most effective parameters on the flyrock.
Monjezi et al. (2013) utilized artificial neural networks (ANNs) for predicting
backbreak in the blasting operation of the Chadormalu iron mine (Iran). After trying
various hidden layers and neurons, network with topology 10-7-7-1 was deemed
optimum. ANN model proved superior over the conventional regression analysis using
Mean Square Error (MSE), Variance Account for (VAF) and coefficient of determination
(R 2) as the means of comparison. Sensitivity analysis revealed that burden is the most
influencing parameter on the backbreak, whereas water content is the least effective
parameter in the research.
Majdi and Rezaei (2013) developed an ANN and multivariable regression
analysis (MVRA) models in order to predict Uniaxial Compressive Strength (UCS) of
rock surrounding a roadway. Rock type, Schmidt hardness, density and porosity were the
input parameters and UCS the output parameter used for the study. It was concluded that
performance of the ANN model is considerably better than the MVRA model with rock
density and Schmidt hardness being the most effective input parameters.
ANN was used to predict backbreak in blasting operation of the Sangan iron
mine, Iran by Monjezi et al. (2014). Network with two hidden layers was found to be
optimum after trying different types of networks. Predictions by the ANN model
demonstrated a higher correlation (R2 = 0.868) and lesser error (RMSE = 0.495)
compared to the regression model. Rock factor was the most sensitive and number of
rows was the least sensitive parameter on the back break.
Trivedi et al. (2014) focused on predicting the distance covered by the flyrock
induced by blasting using artificial neural network (ANN) and multi-variate regression
analysis (MVRA). Blast design and geotechnical parameters, such as linear charge
30
concentration, burden, stemming length, specific charge, unconfined compressive
strength (UCS), and rock quality designation (RQD) were used as input parameters and
flyrock distance used as output parameter. Comparison of predicted results by ANN and
MVRA showed that Back propagation neural network (BPNN) has been proven to be a
superior predictive tool when compared with MVRA.
2.6. SUMMARY
Numerous empirical and artificial neural network (ANN) predictors are available in
literature to help predict ground vibration, airblast and rock fragmentation. Empirical
equations for predicting ground vibration and airblast are based on the maximum charge
per delay and the distance from blast face to monitoring point. These empirical equations
are unable to concurrently predict more than one output and are restricted to just two
input parameters. To address the above weaknesses of empirical predictors, ANN models
have been used. ANN models have the ability to consider all relevant input parameters
and more than one output can be predicted using ANN models. The methodology of the
research is captured in section 3.
31
3. METHODOLOGY
Input and output data needed for the exercise were extracted from the blast
records of the mining company spanning a three-year period. Seven input and three
output parameters were used for the ANN processing. The inputs considered for the
research are those that are most sensitive to the outputs from literature. The inputs are
inter-related, i.e. changing one parameter affects the other. The inputs are maximum
charge per delay, distance from blast to monitoring point, hole depth, stemming length,
hole diameter, powder factor and spacing to burden ratio. The output parameters on the
other hand are rock fragmentation, ground vibration and airblast. These inputs and
outputs are fed into a MATLAB-based ANN system to establish an optimum model. The
optimum model generated is applied to series of blasts with the view to optimizing the
fragmentation while minimizing the ground vibration and airblast.
3.1. DATA COLLECTION
Ground vibrations and airblasts were recorded using Minimate Plus Base Unit
configured with triaxial geophones and Linear Microphones (2-250Hz). This instrument
was chosen because of its flexibility, reliability and ease of use. Prior to blasting, the
microphone and geophone are connected to the unit and located at selected points in blast
catchment areas. The setup is placed firmly on a strong and levelled ground to allow
accurate and reliable readings. The unit is turned on and the sensors are checked to make
sure they are in good state and functional. Trigger level is set and the instrument begins
recording automatically when the trigger level is exceeded. Recording stops after blasting
when readings fall below the trigger level. The geophone measure ground vibrations
while the sound pressure (airblast) is measured by the microphone. After blasting, the
unit is taken to the office and the results downloaded onto the computer for further
analysis. Fragmentation analysis is then conducted on blasted material using split
technology.
Fragmentation analysis allows the quantification and size estimation of the
fragmented ore, and provides a size distribution of rocks by taking sample images from a
muck pile, a truck tipper or a conveyor belt. Knowledge of results from such analysis is
32
used to predict the fragmentation outputs of subsequent blasts in a comparable geological
area. Rock fragmentation begins with the drilling and blasting process.
Drilling is done by Sandvik DP1500 hydraulic rigs. Blast holes diameters of 115
mm are drilled vertically with staggered drill-hole pattern to different depths (5m, 7.5m
and 10m). Priming is carried out using non-electric (NONEL) detonators and pentolite
cartridges. Drilled holes are checked for correct depths and filled with ANFO (P100 bulk
emulsion) of average density 1.13 g/cm3. The holes are then stemmed with appropriately
sized gravels. The inter hole delays are 17ms or 25ms and the inter row delays are 42ms
or 67ms. Averagely 50 to 300 holes are blasted in a round.
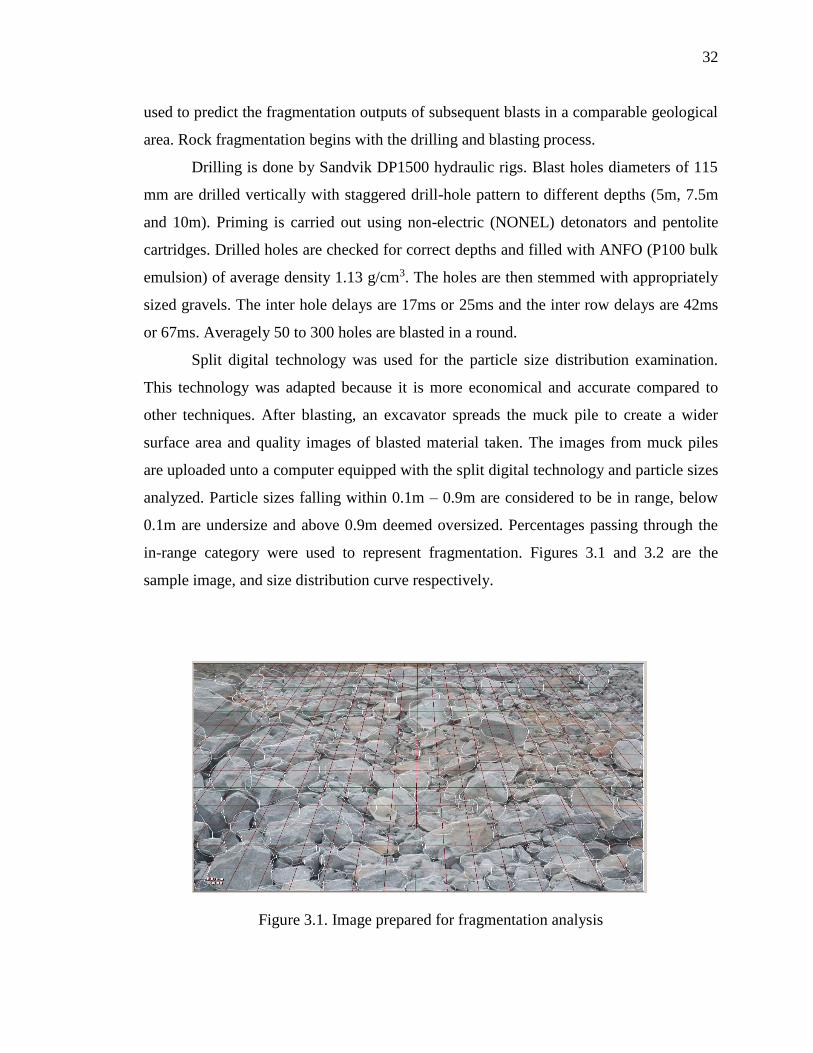
Split digital technology was used for the particle size distribution examination.
This technology was adapted because it is more economical and accurate compared to
other techniques. After blasting, an excavator spreads the muck pile to create a wider
surface area and quality images of blasted material taken. The images from muck piles
are uploaded unto a computer equipped with the split digital technology and particle sizes
analyzed. Particle sizes falling within 0.1m – 0.9m are considered to be in range, below
0.1m are undersize and above 0.9m deemed oversized. Percentages passing through the
in-range category were used to represent fragmentation. Figures 3.1 and 3.2 are the
sample image, and size distribution curve respectively.
Figure 3.1. Image prepared for fragmentation analysis
33
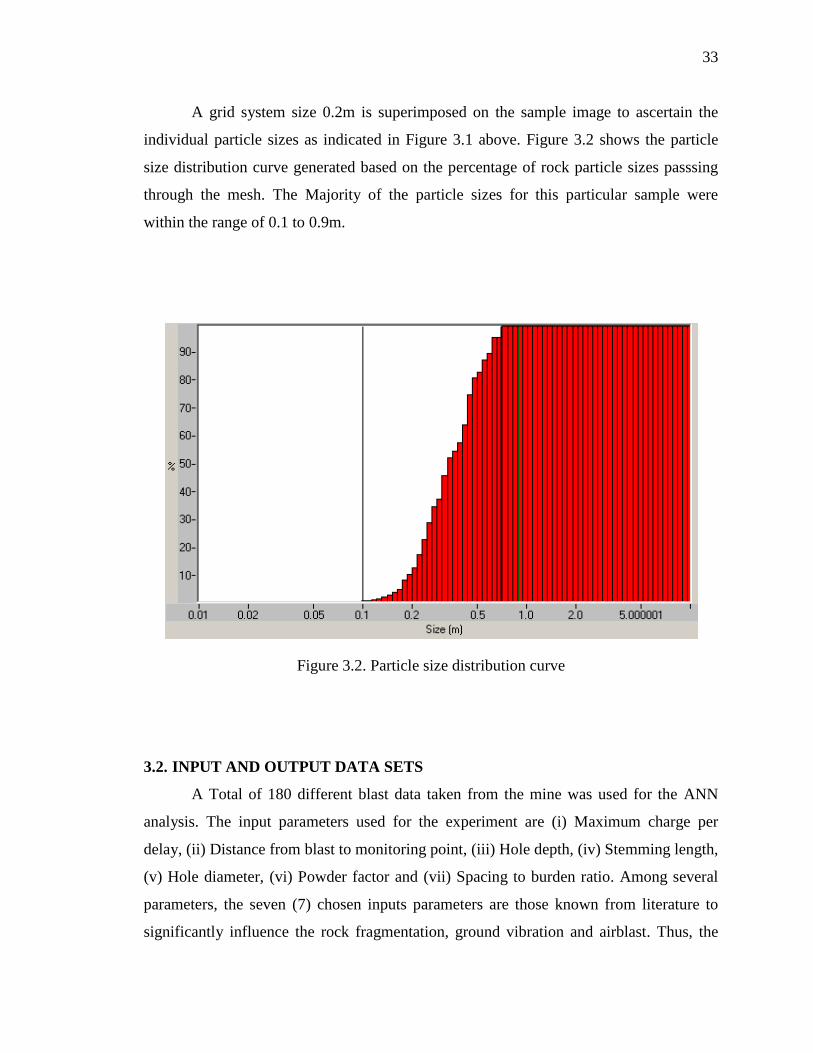
A grid system size 0.2m is superimposed on the sample image to ascertain the
individual particle sizes as indicated in Figure 3.1 above. Figure 3.2 shows the particle
size distribution curve generated based on the percentage of rock particle sizes passsing
through the mesh. The Majority of the particle sizes for this particular sample were
within the range of 0.1 to 0.9m.
Figure 3.2. Particle size distribution curve
3.2. INPUT AND OUTPUT DATA SETS
A Total of 180 different blast data taken from the mine was used for the ANN
analysis. The input parameters used for the experiment are (i) Maximum charge per
delay, (ii) Distance from blast to monitoring point, (iii) Hole depth, (iv) Stemming length,
(v) Hole diameter, (vi) Powder factor and (vii) Spacing to burden ratio. Among several
parameters, the seven (7) chosen inputs parameters are those known from literature to
significantly influence the rock fragmentation, ground vibration and airblast. Thus, the
34
analysis for the experiment was carried out with the seven input parameters and their
corresponding outputs for the 180 different blast data sets. These inputs are enumerated
in Table 3.1 as follows.
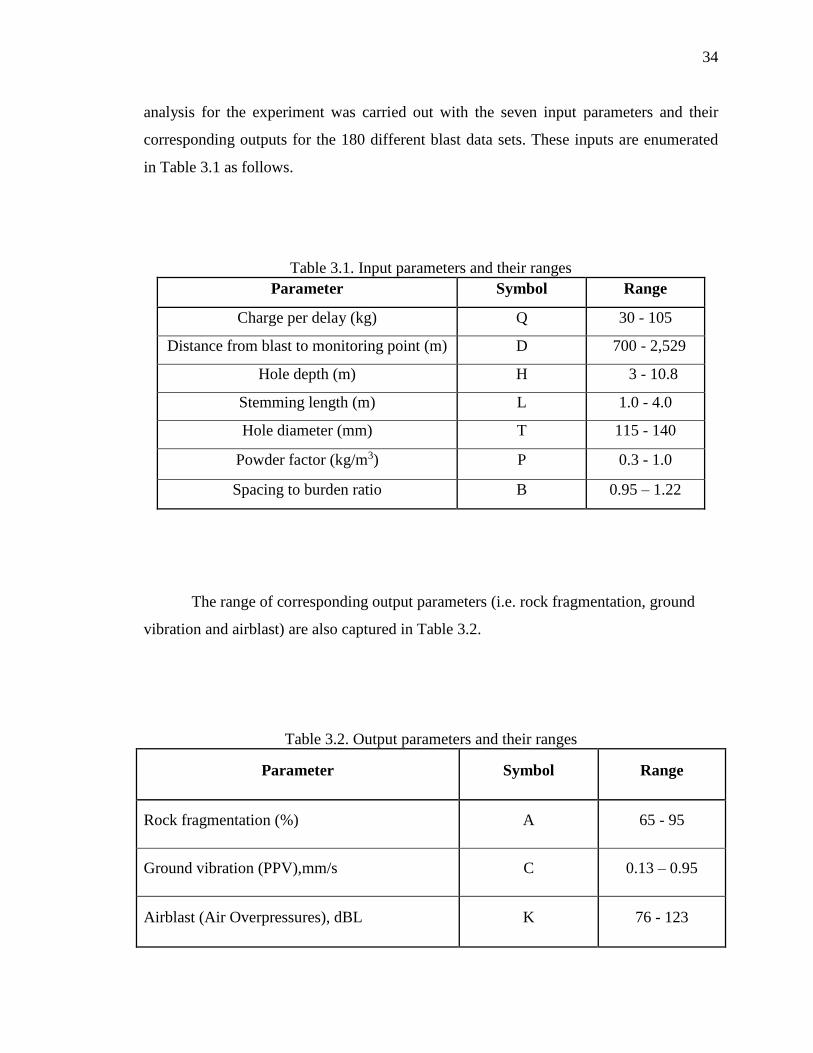
Table 3.1. Input parameters and their ranges
Parameter Symbol Range
Charge per delay (kg) Q 30 - 105
Distance from blast to monitoring point (m) D 700 - 2,529
Hole depth (m) H 3 - 10.8
Stemming length (m) L 1.0 - 4.0
Hole diameter (mm) T 115 - 140
Powder factor (kg/m3) P 0.3 - 1.0
Spacing to burden ratio B 0.95 – 1.22
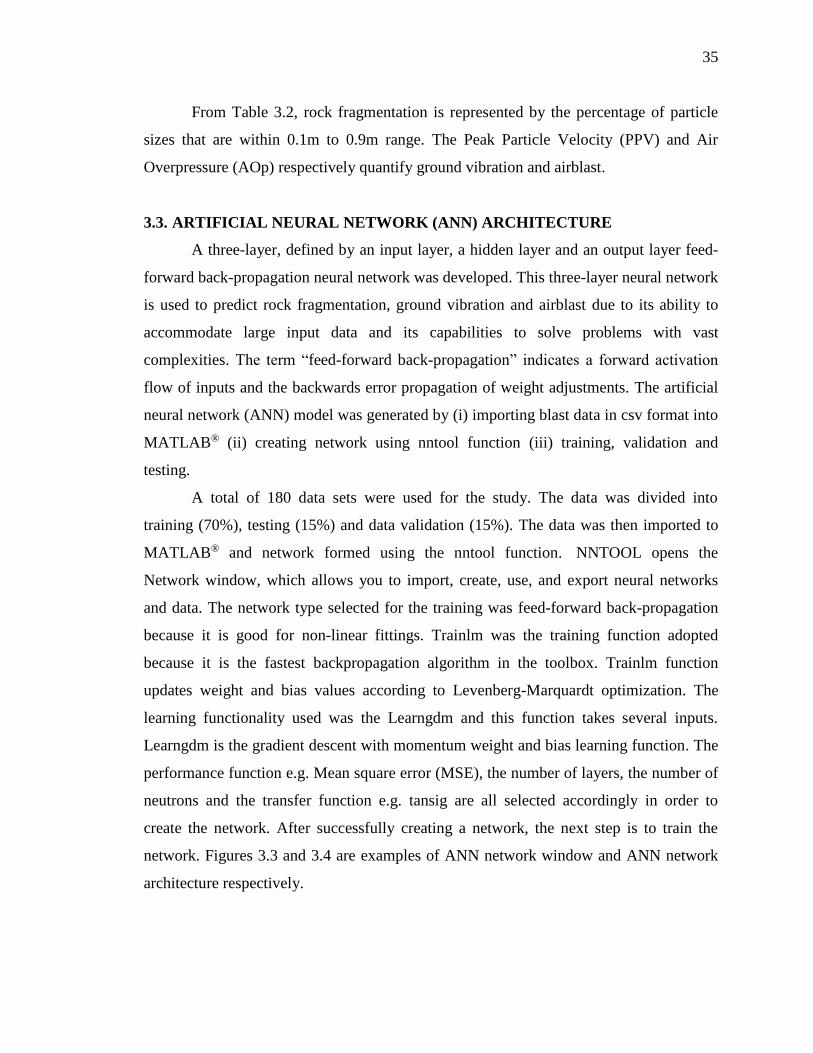
The range of corresponding output parameters (i.e. rock fragmentation, ground
vibration and airblast) are also captured in Table 3.2.
Table 3.2. Output parameters and their ranges
Parameter Symbol Range
Rock fragmentation (%) A 65 - 95
Ground vibration (PPV),mm/s C 0.13 – 0.95
Airblast (Air Overpressures), dBL K 76 - 123
35
From Table 3.2, rock fragmentation is represented by the percentage of particle
sizes that are within 0.1m to 0.9m range. The Peak Particle Velocity (PPV) and Air
Overpressure (AOp) respectively quantify ground vibration and airblast.
3.3. ARTIFICIAL NEURAL NETWORK (ANN) ARCHITECTURE
A three-layer, defined by an input layer, a hidden layer and an output layer feed-
forward back-propagation neural network was developed. This three-layer neural network
is used to predict rock fragmentation, ground vibration and airblast due to its ability to
accommodate large input data and its capabilities to solve problems with vast
complexities. The term “feed-forward back-propagation” indicates a forward activation
flow of inputs and the backwards error propagation of weight adjustments. The artificial
neural network (ANN) model was generated by (i) importing blast data in csv format into
MATLAB® (ii) creating network using nntool function (iii) training, validation and
testing.
A total of 180 data sets were used for the study. The data was divided into
training (70%), testing (15%) and data validation (15%). The data was then imported to
MATLAB® and network formed using the nntool function. NNTOOL opens the
Network window, which allows you to import, create, use, and export neural networks
and data. The network type selected for the training was feed-forward back-propagation
because it is good for non-linear fittings. Trainlm was the training function adopted
because it is the fastest backpropagation algorithm in the toolbox. Trainlm function
updates weight and bias values according to Levenberg-Marquardt optimization. The
learning functionality used was the Learngdm and this function takes several inputs.
Learngdm is the gradient descent with momentum weight and bias learning function. The
performance function e.g. Mean square error (MSE), the number of layers, the number of
neutrons and the transfer function e.g. tansig are all selected accordingly in order to
create the network. After successfully creating a network, the next step is to train the
network. Figures 3.3 and 3.4 are examples of ANN network window and ANN network
architecture respectively.
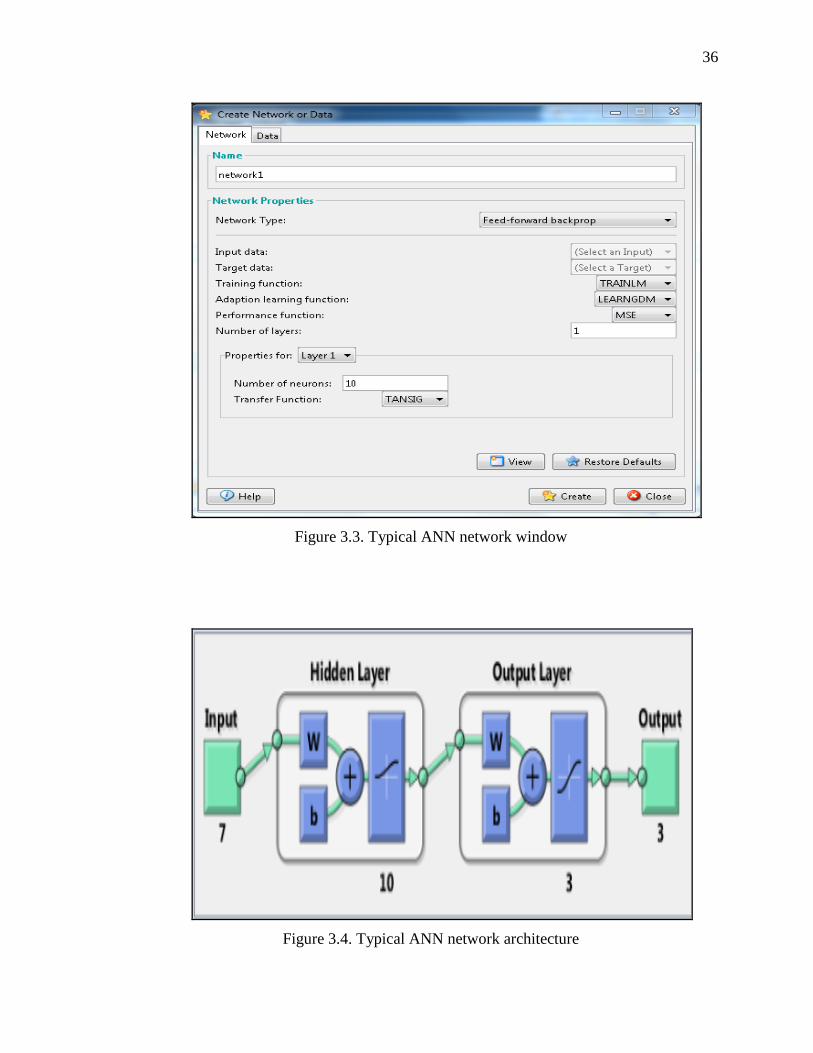
36
Figure 3.3. Typical ANN network window
Figure 3.4. Typical ANN network architecture
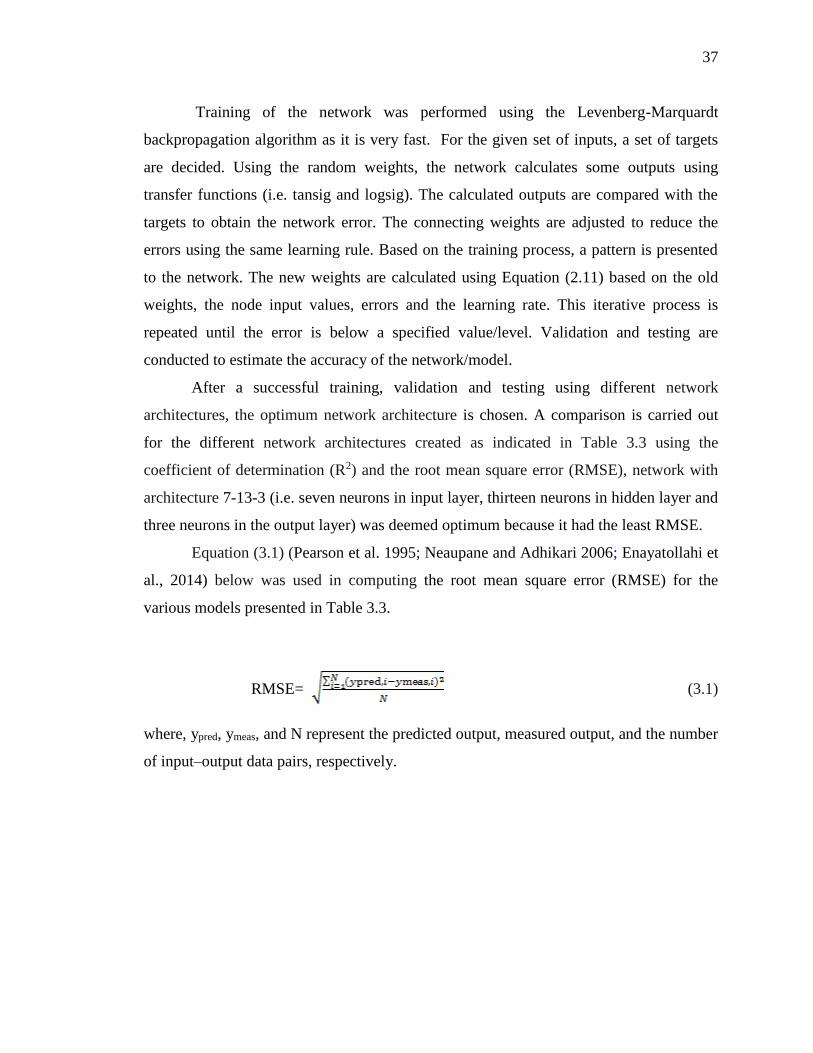
37
Training of the network was performed using the Levenberg-Marquardt
backpropagation algorithm as it is very fast. For the given set of inputs, a set of targets
are decided. Using the random weights, the network calculates some outputs using
transfer functions (i.e. tansig and logsig). The calculated outputs are compared with the
targets to obtain the network error. The connecting weights are adjusted to reduce the
errors using the same learning rule. Based on the training process, a pattern is presented
to the network. The new weights are calculated using Equation (2.11) based on the old
weights, the node input values, errors and the learning rate. This iterative process is
repeated until the error is below a specified value/level. Validation and testing are
conducted to estimate the accuracy of the network/model.
After a successful training, validation and testing using different network
architectures, the optimum network architecture is chosen. A comparison is carried out
for the different network architectures created as indicated in Table 3.3 using the
coefficient of determination (R2) and the root mean square error (RMSE), network with
architecture 7-13-3 (i.e. seven neurons in input layer, thirteen neurons in hidden layer and
three neurons in the output layer) was deemed optimum because it had the least RMSE.
Equation (3.1) (Pearson et al. 1995; Neaupane and Adhikari 2006; Enayatollahi et
al., 2014) below was used in computing the root mean square error (RMSE) for the
various models presented in Table 3.3.
RMSE= (3.1)
where, ypred, ymeas, and N represent the predicted output, measured output, and the number
of input–output data pairs, respectively.
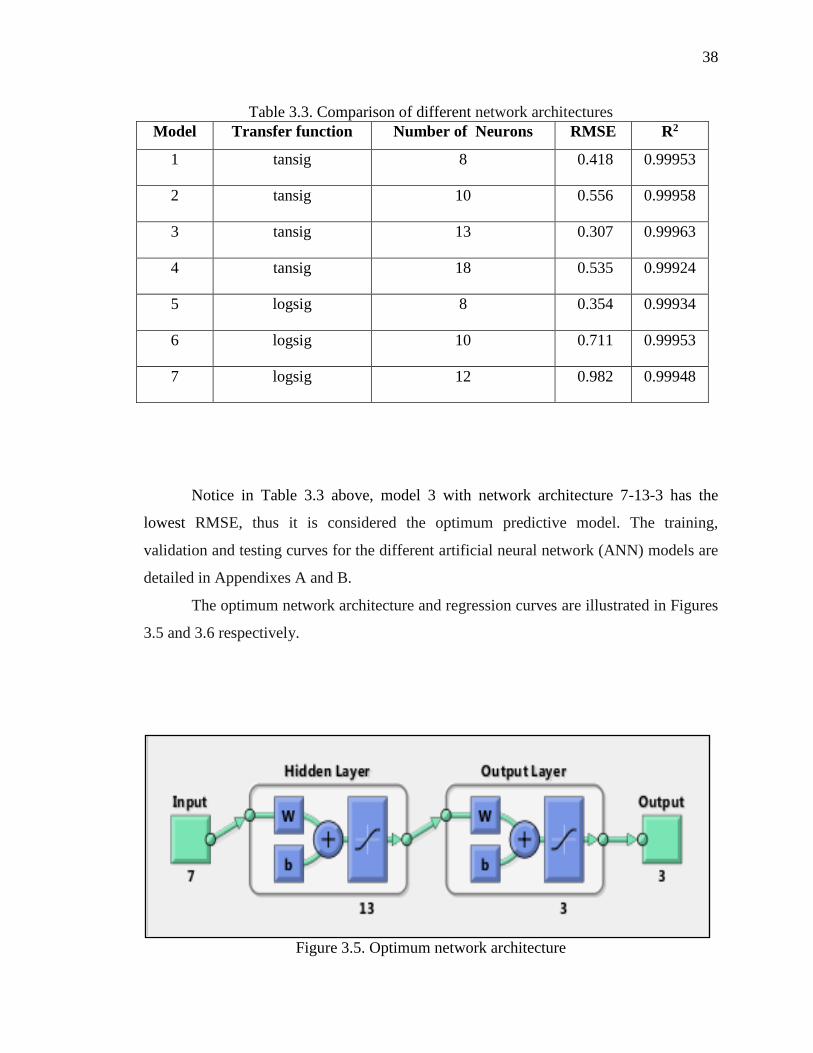
38
Table 3.3. Comparison of different network architectures
Model Transfer function Number of Neurons RMSE R2
1 tansig 8 0.418 0.99953
2 tansig 10 0.556 0.99958
3 tansig 13 0.307 0.99963
4 tansig 18 0.535 0.99924
5 logsig 8 0.354 0.99934
6 logsig 10 0.711 0.99953
7 logsig 12 0.982 0.99948
Notice in Table 3.3 above, model 3 with network architecture 7-13-3 has the
lowest RMSE, thus it is considered the optimum predictive model. The training,
validation and testing curves for the different artificial neural network (ANN) models are
detailed in Appendixes A and B.
The optimum network architecture and regression curves are illustrated in Figures
3.5 and 3.6 respectively.
Figure 3.5. Optimum network architecture
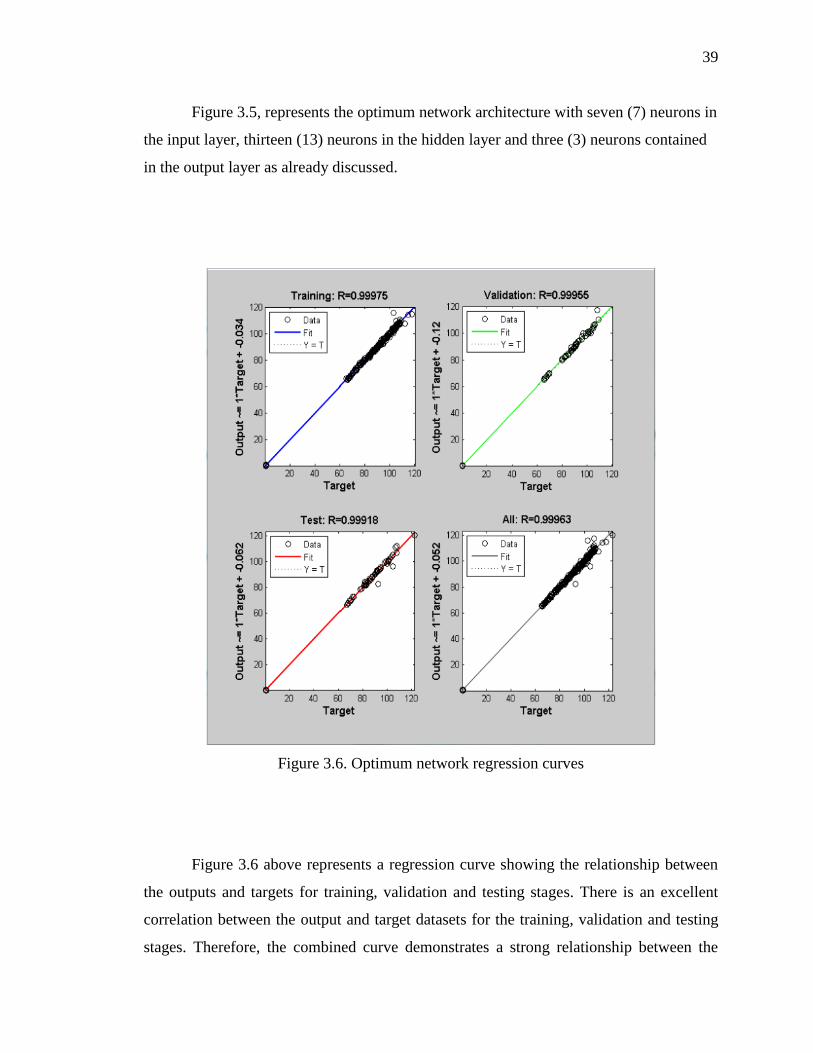
39
Figure 3.5, represents the optimum network architecture with seven (7) neurons in
the input layer, thirteen (13) neurons in the hidden layer and three (3) neurons contained
in the output layer as already discussed.
Figure 3.6. Optimum network regression curves
Figure 3.6 above represents a regression curve showing the relationship between
the outputs and targets for training, validation and testing stages. There is an excellent
correlation between the output and target datasets for the training, validation and testing
stages. Therefore, the combined curve demonstrates a strong relationship between the
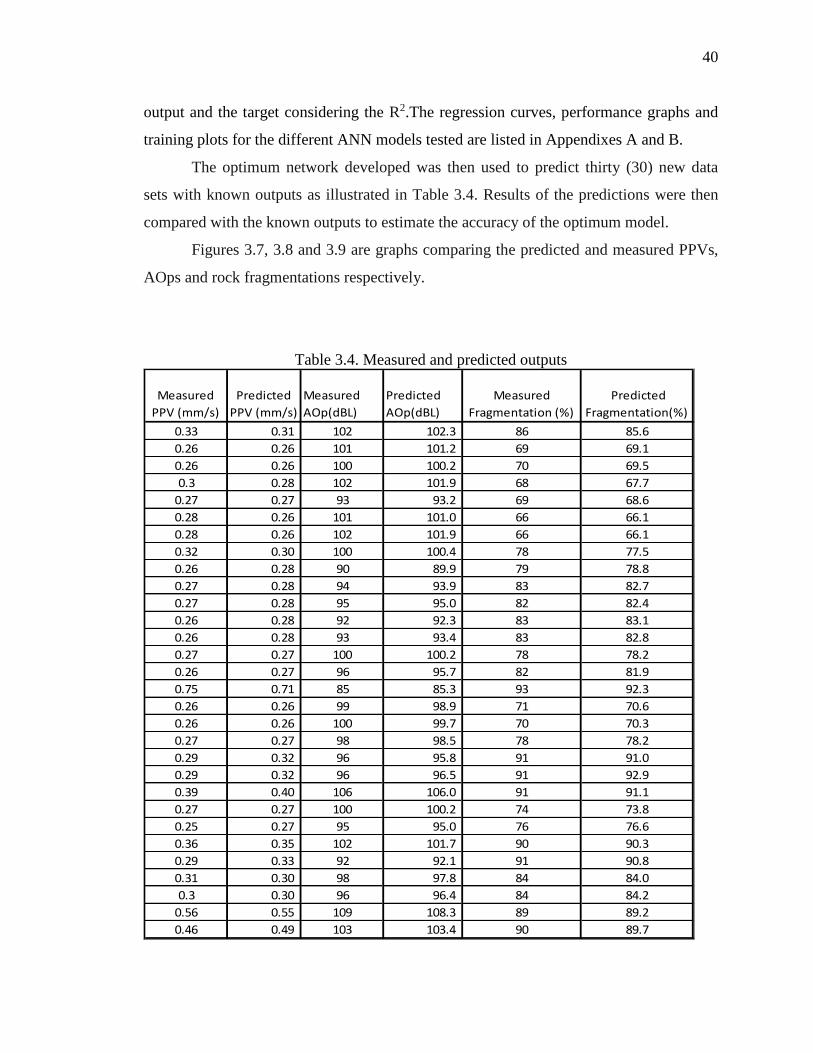
40
output and the target considering the R2.The regression curves, performance graphs and
training plots for the different ANN models tested are listed in Appendixes A and B.
The optimum network developed was then used to predict thirty (30) new data
sets with known outputs as illustrated in Table 3.4. Results of the predictions were then
compared with the known outputs to estimate the accuracy of the optimum model.
Figures 3.7, 3.8 and 3.9 are graphs comparing the predicted and measured PPVs,
AOps and rock fragmentations respectively.
Table 3.4. Measured and predicted outputs
Measured
PPV (mm/s)
Predicted
PPV (mm/s)
Measured
AOp(dBL)
Predicted
AOp(dBL)
Measured
Fragmentation (%)
Predicted
Fragmentation(%)
0.33 0.31 102 102.3 86 85.6
0.26 0.26 101 101.2 69 69.1
0.26 0.26 100 100.2 70 69.5
0.3 0.28 102 101.9 68 67.7
0.27 0.27 93 93.2 69 68.6
0.28 0.26 101 101.0 66 66.1
0.28 0.26 102 101.9 66 66.1
0.32 0.30 100 100.4 78 77.5
0.26 0.28 90 89.9 79 78.8
0.27 0.28 94 93.9 83 82.7
0.27 0.28 95 95.0 82 82.4
0.26 0.28 92 92.3 83 83.1
0.26 0.28 93 93.4 83 82.8
0.27 0.27 100 100.2 78 78.2
0.26 0.27 96 95.7 82 81.9
0.75 0.71 85 85.3 93 92.3
0.26 0.26 99 98.9 71 70.6
0.26 0.26 100 99.7 70 70.3
0.27 0.27 98 98.5 78 78.2
0.29 0.32 96 95.8 91 91.0
0.29 0.32 96 96.5 91 92.9
0.39 0.40 106 106.0 91 91.1
0.27 0.27 100 100.2 74 73.8
0.25 0.27 95 95.0 76 76.6
0.36 0.35 102 101.7 90 90.3
0.29 0.33 92 92.1 91 90.8
0.31 0.30 98 97.8 84 84.0
0.3 0.30 96 96.4 84 84.2
0.56 0.55 109 108.3 89 89.2
0.46 0.49 103 103.4 90 89.7
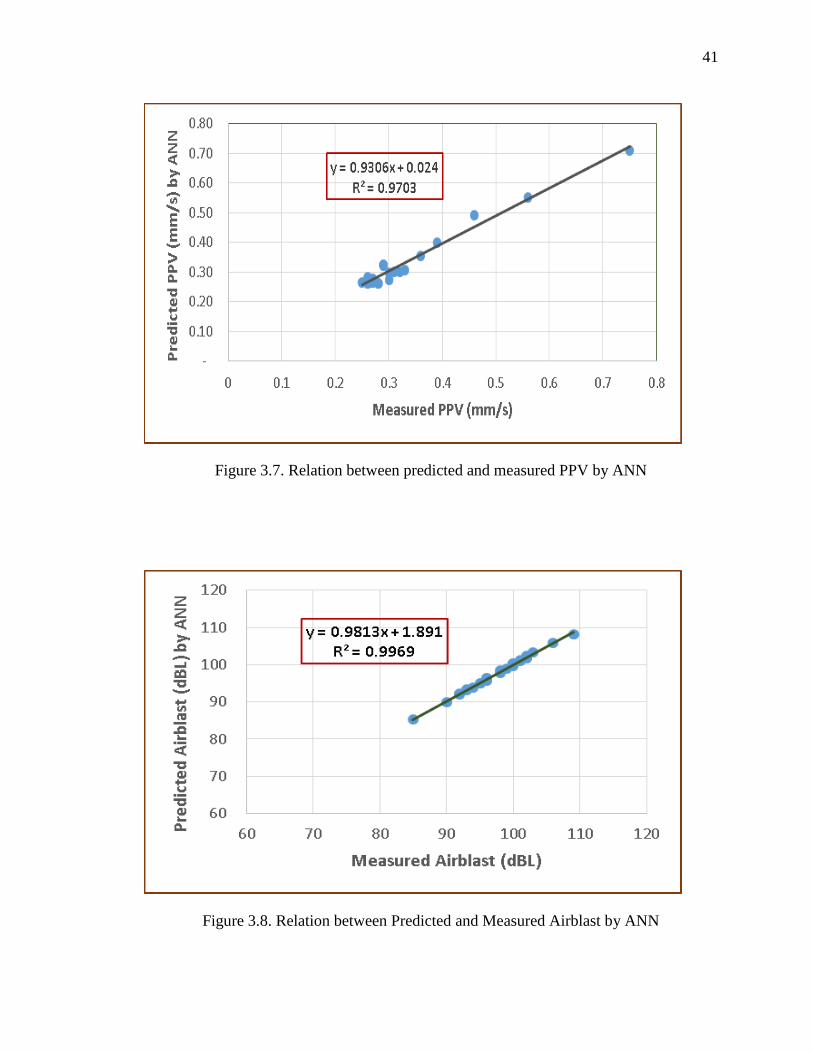
41
Figure 3.7. Relation between predicted and measured PPV by ANN
Figure 3.8. Relation between Predicted and Measured Airblast by ANN
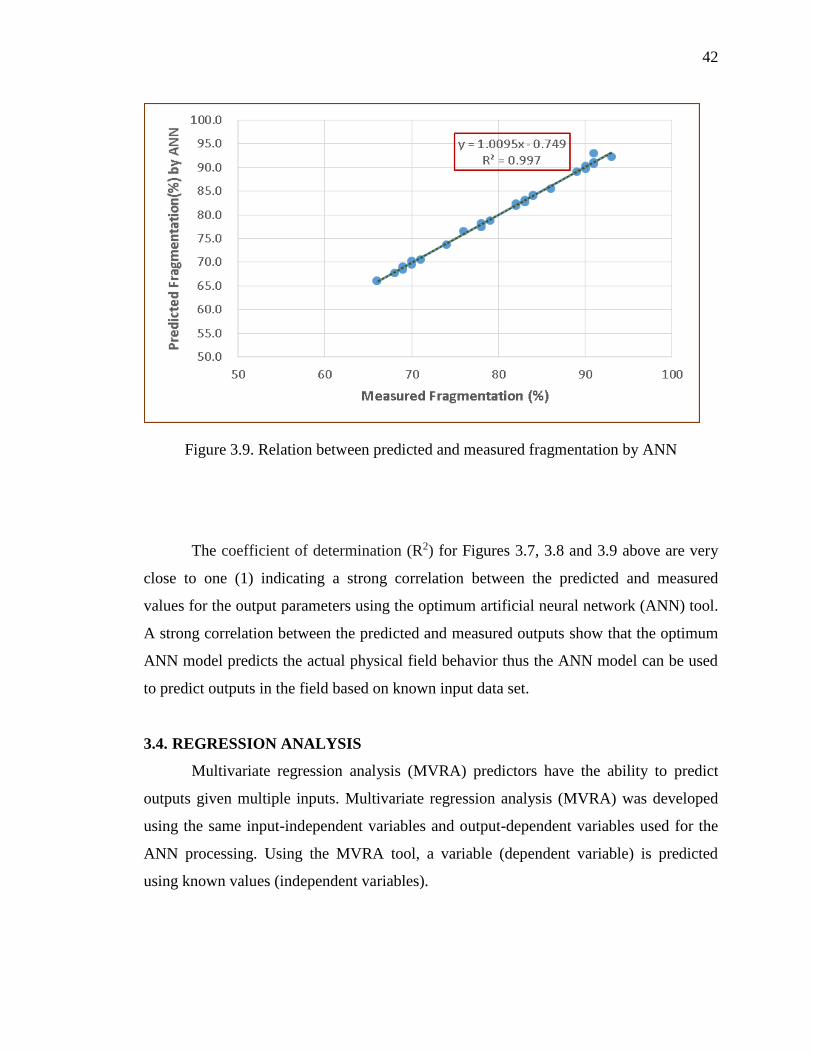
42
Figure 3.9. Relation between predicted and measured fragmentation by ANN
The coefficient of determination (R2) for Figures 3.7, 3.8 and 3.9 above are very
close to one (1) indicating a strong correlation between the predicted and measured
values for the output parameters using the optimum artificial neural network (ANN) tool.
A strong correlation between the predicted and measured outputs show that the optimum
ANN model predicts the actual physical field behavior thus the ANN model can be used
to predict outputs in the field based on known input data set.
3.4. REGRESSION ANALYSIS
Multivariate regression analysis (MVRA) predictors have the ability to predict
outputs given multiple inputs. Multivariate regression analysis (MVRA) was developed
using the same input-independent variables and output-dependent variables used for the
ANN processing. Using the MVRA tool, a variable (dependent variable) is predicted
using known values (independent variables).
43
In general, the multiple regression equation of ẑ on X 1, X2, …, Xk is given by:
ẑ= b0 + b1 X1 + b2 X2 + …………………… + bk Xk (3.2)
where the term ẑ is the predicted value estimated from Xi, b0 is the intercept, and bi are
the partial regression coefficients. The coefficient of determination (R2) is usually used to
test the predictive ability of a multiple regression equation. A closer value of R2 to unity
implies an accurate predictive model. The multiple regression presents two different
overlaps: the overlap for the combined effect and the overlap for the individual effect
(Enayatollahi et al., 2014).
Based on Equation (3.2) above, equivalent equations are derived relating rock
fragmentation, ground vibration (PPV) and airblast (AOp) to their respective input
parameters. The multiple regression equations for the various outputs are defined as
follows:
Ground vibration (mm/s) = 0.0002[D]+0.0080[Q]-0.0561[H]-
0.5604[B]+0.0070[T]+0.0667[P]+0.0511[L]-0.3705 (3.3)
Airblast(dBl) = 0.0174[D]+0.0126[Q]-0.4164[H]+28.2977[B]-0.2298[T]- 23.4536[P]–
0.5281[L]+93.2605 (3.4)
Fragmentation (%) = 0.0009[D]-0.1718[Q]+0.0317[H]-29.2185[B]-0.0366[T] –
70.1293[P]+3.3022[L]+156.8241 (3.5)
Parameters in Equations (3.3), (3.4) and (3.5) are defined in Table 3.3.
The multiple regression model generated was also used to predict ground
vibrations, airblast and rock fragmentation using the same thirty (30) data set used for the
ANN analysis previously. Results of the predictions were compared to measured
outcomes for correlation. Figures 3.10, 3.11 and 3.12 illustrate the relationship between
predicted and measured PPV, AOp and rock fragmentation respectively using
multivariate regression analysis (MVRA).
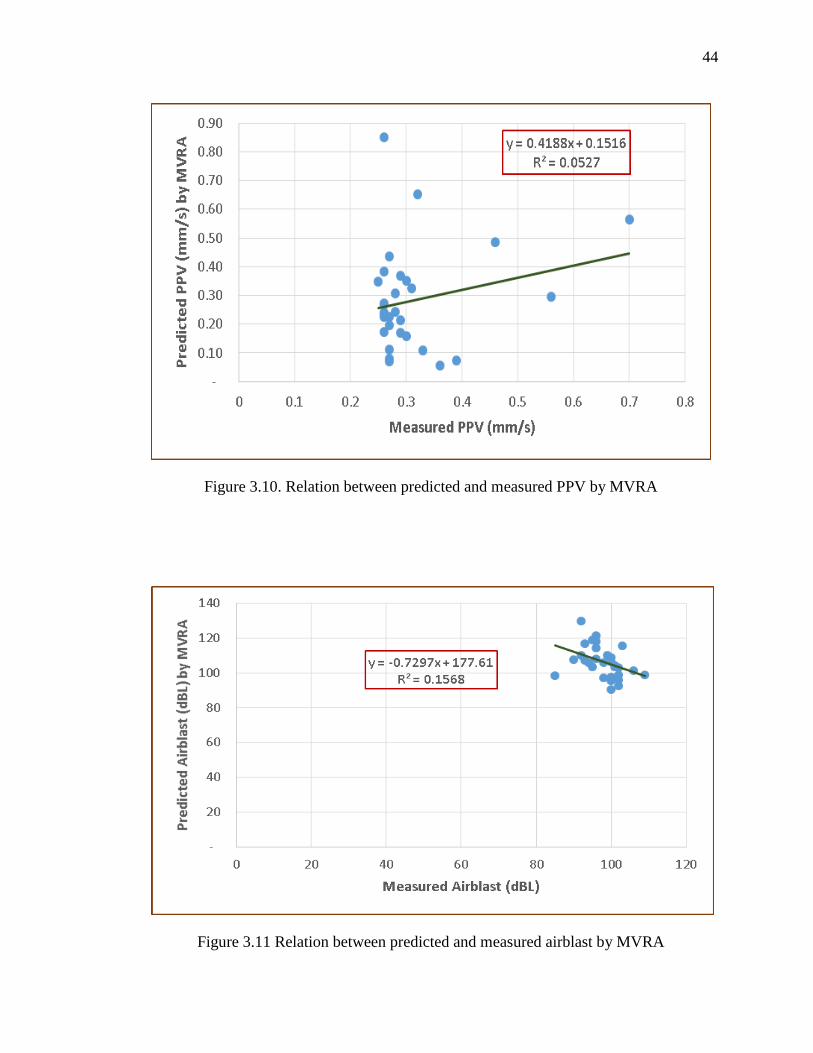
44
Figure 3.10. Relation between predicted and measured PPV by MVRA
Figure 3.11 Relation between predicted and measured airblast by MVRA
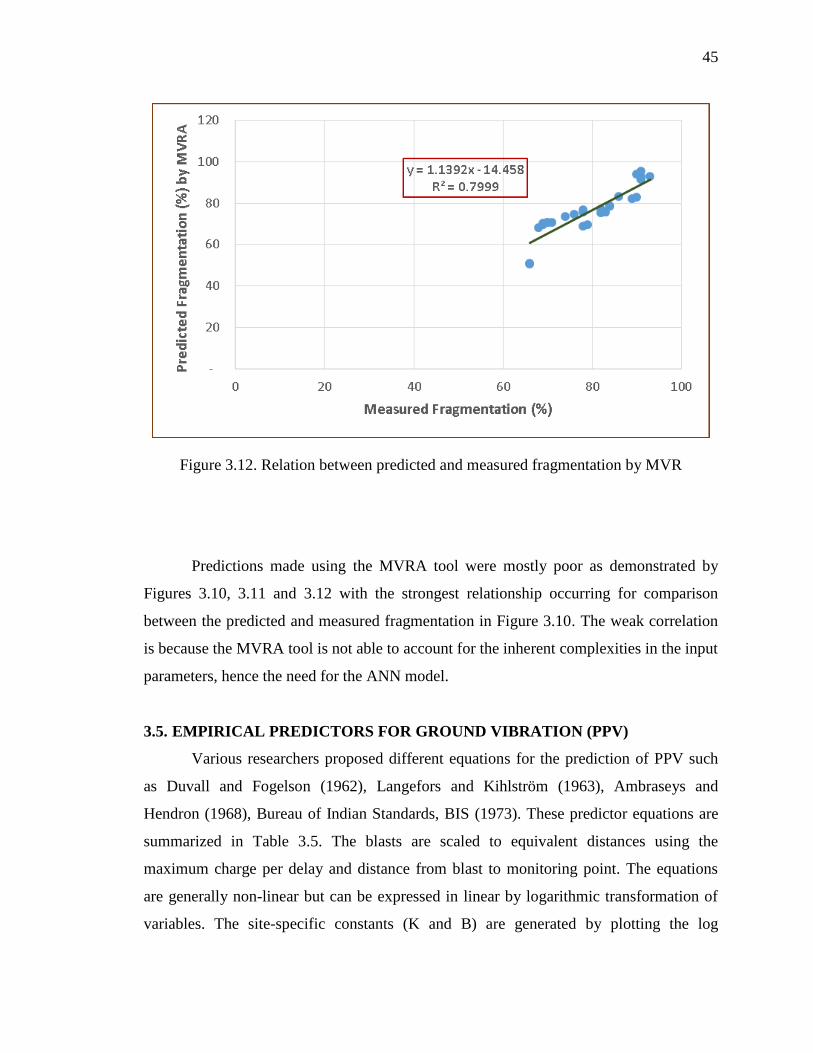
45
Figure 3.12. Relation between predicted and measured fragmentation by MVR
Predictions made using the MVRA tool were mostly poor as demonstrated by
Figures 3.10, 3.11 and 3.12 with the strongest relationship occurring for comparison
between the predicted and measured fragmentation in Figure 3.10. The weak correlation
is because the MVRA tool is not able to account for the inherent complexities in the input
parameters, hence the need for the ANN model.
3.5. EMPIRICAL PREDICTORS FOR GROUND VIBRATION (PPV)
Various researchers proposed different equations for the prediction of PPV such
as Duvall and Fogelson (1962), Langefors and Kihlström (1963), Ambraseys and
Hendron (1968), Bureau of Indian Standards, BIS (1973). These predictor equations are
summarized in Table 3.5. The blasts are scaled to equivalent distances using the
maximum charge per delay and distance from blast to monitoring point. The equations
are generally non-linear but can be expressed in linear by logarithmic transformation of
variables. The site-specific constants (K and B) are generated by plotting the log
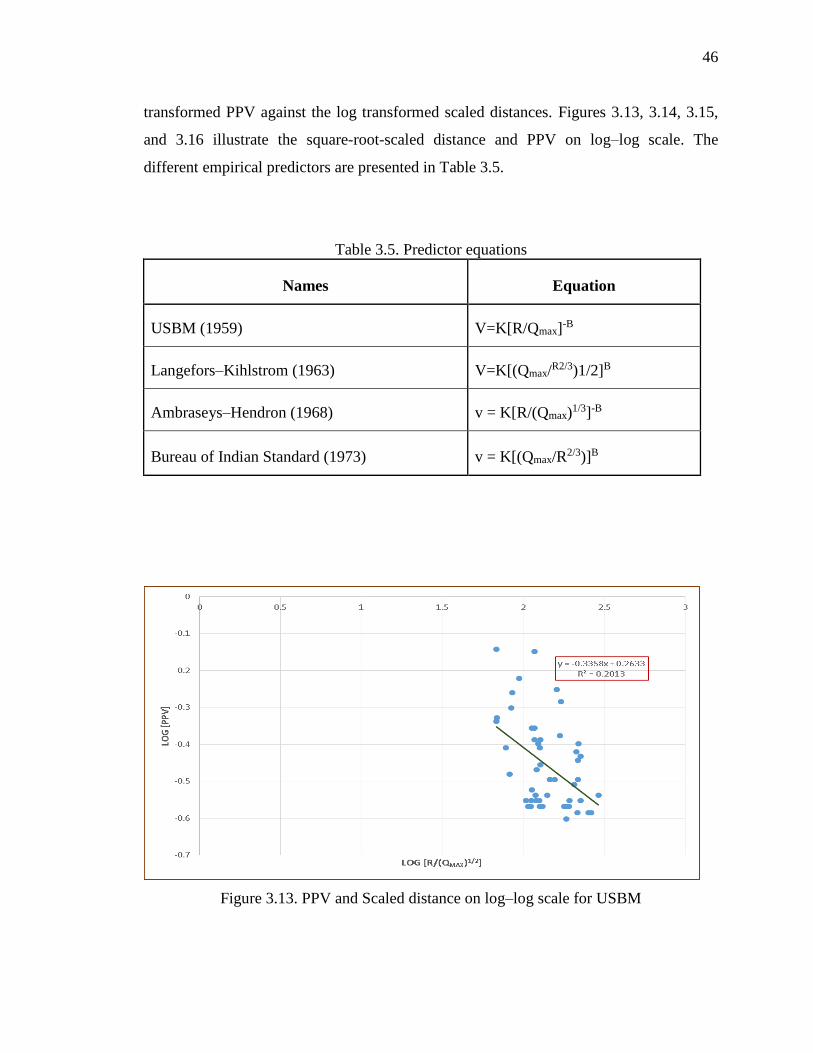
46
transformed PPV against the log transformed scaled distances. Figures 3.13, 3.14, 3.15,
and 3.16 illustrate the square-root-scaled distance and PPV on log–log scale. The
different empirical predictors are presented in Table 3.5.
Table 3.5. Predictor equations
Names Equation
USBM (1959) V=K[R/Qmax]-B
Langefors–Kihlstrom (1963) V=K[(Qmax/R2/3)1/2]B
Ambraseys–Hendron (1968) v = K[R/(Qmax)1/3]-B
Bureau of Indian Standard (1973) v = K[(Qmax/R2/3)]B
Figure 3.13. PPV and Scaled distance on log–log scale for USBM
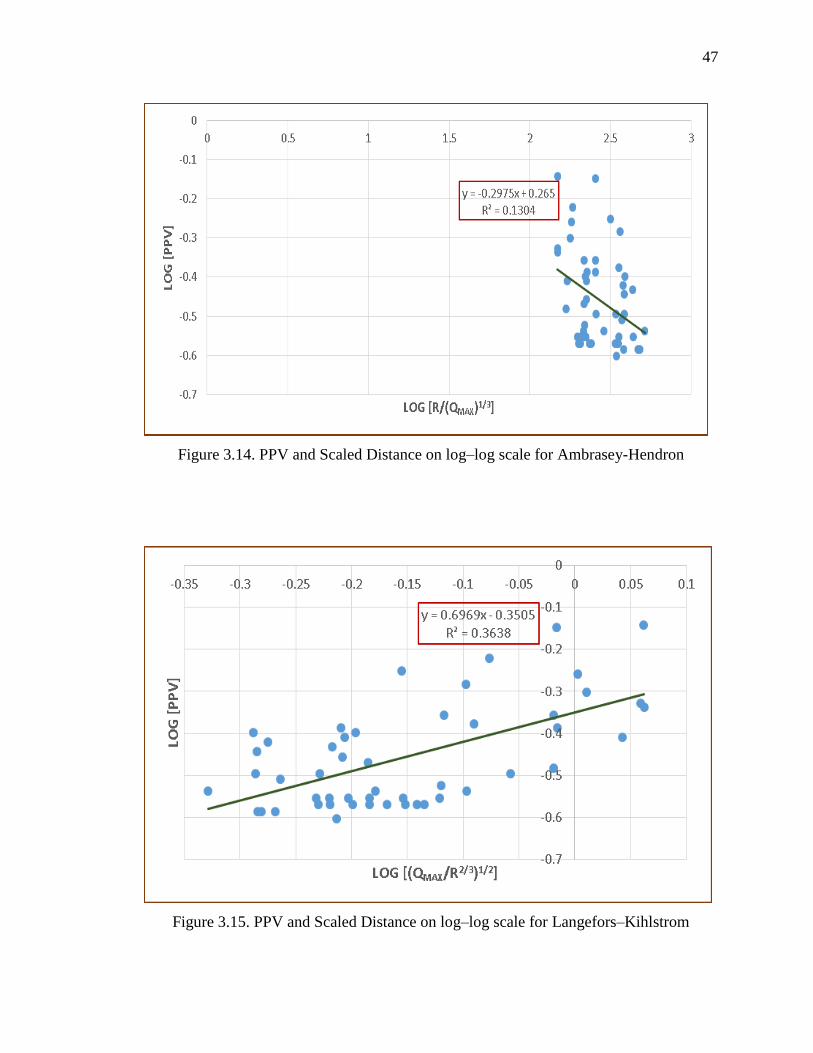
47
Figure 3.14. PPV and Scaled Distance on log–log scale for Ambrasey-Hendron
Figure 3.15. PPV and Scaled Distance on log–log scale for Langefors–Kihlstrom
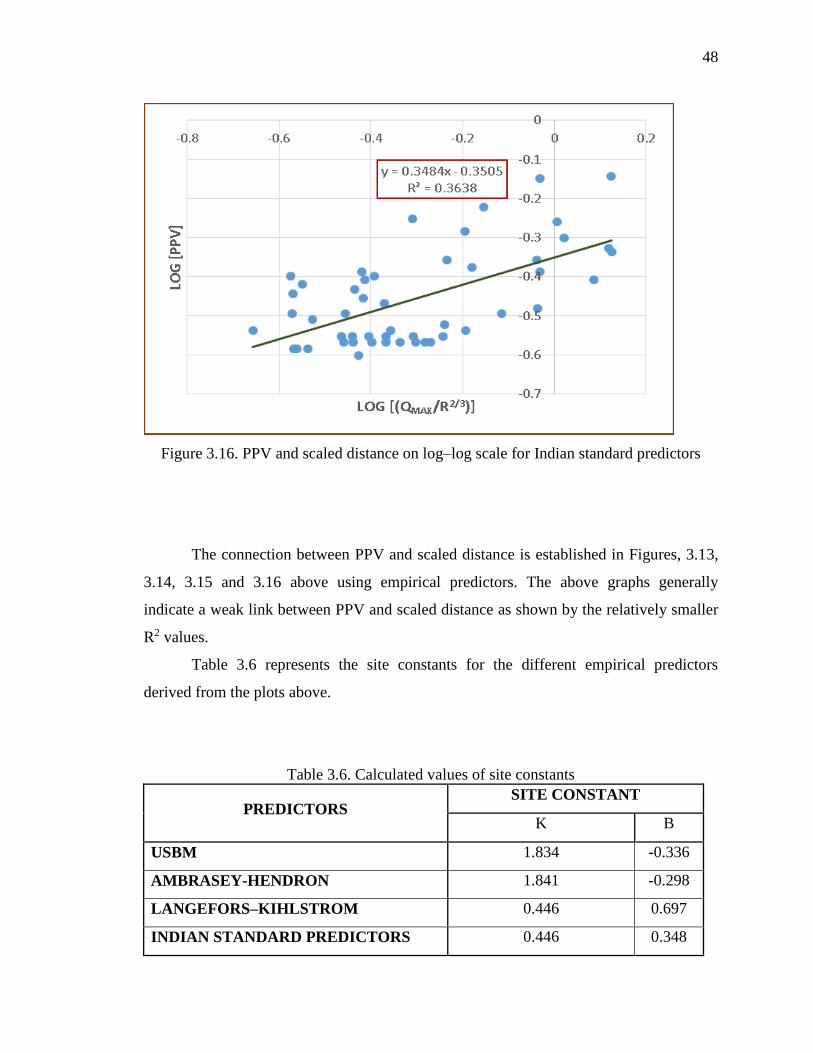
48
Figure 3.16. PPV and scaled distance on log–log scale for Indian standard predictors
The connection between PPV and scaled distance is established in Figures, 3.13,
3.14, 3.15 and 3.16 above using empirical predictors. The above graphs generally
indicate a weak link between PPV and scaled distance as shown by the relatively smaller
R2 values.
Table 3.6 represents the site constants for the different empirical predictors
derived from the plots above.
Table 3.6. Calculated values of site constants
PREDICTORS SITE CONSTANT
K B
USBM 1.834 -0.336
AMBRASEY-HENDRON 1.841 -0.298
LANGEFORS–KIHLSTROM 0.446 0.697
INDIAN STANDARD PREDICTORS 0.446 0.348
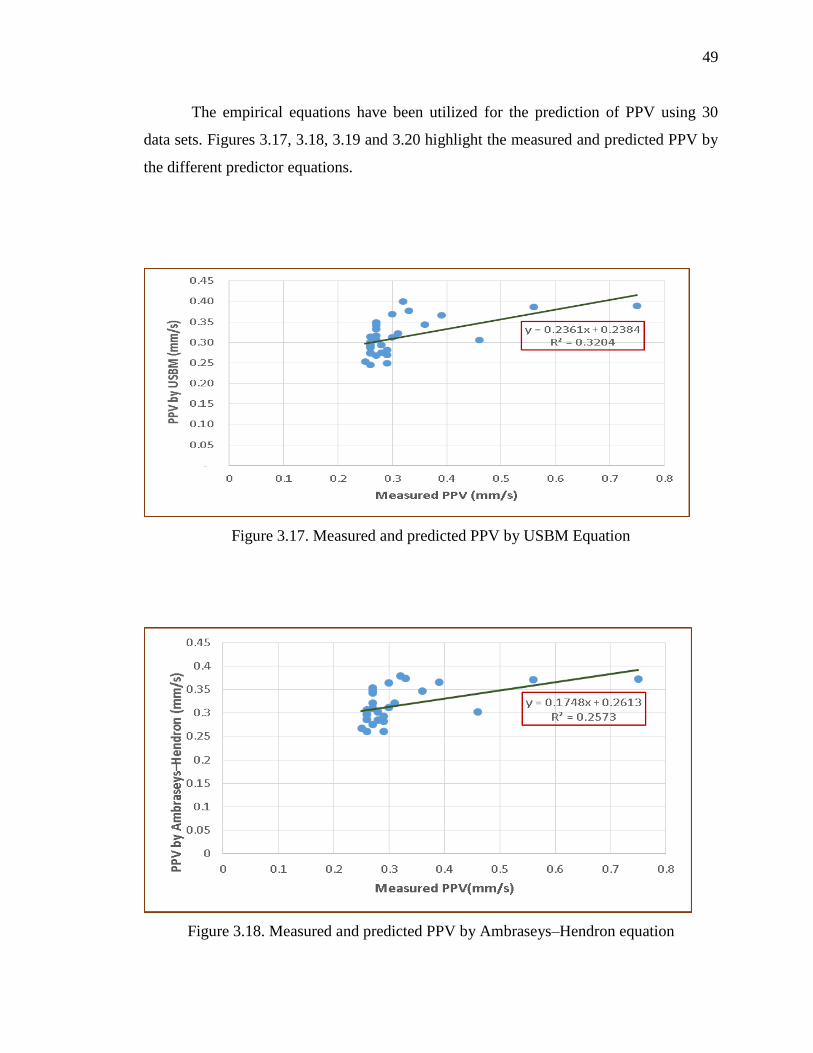
49
The empirical equations have been utilized for the prediction of PPV using 30
data sets. Figures 3.17, 3.18, 3.19 and 3.20 highlight the measured and predicted PPV by
the different predictor equations.
Figure 3.17. Measured and predicted PPV by USBM Equation
Figure 3.18. Measured and predicted PPV by Ambraseys–Hendron equation
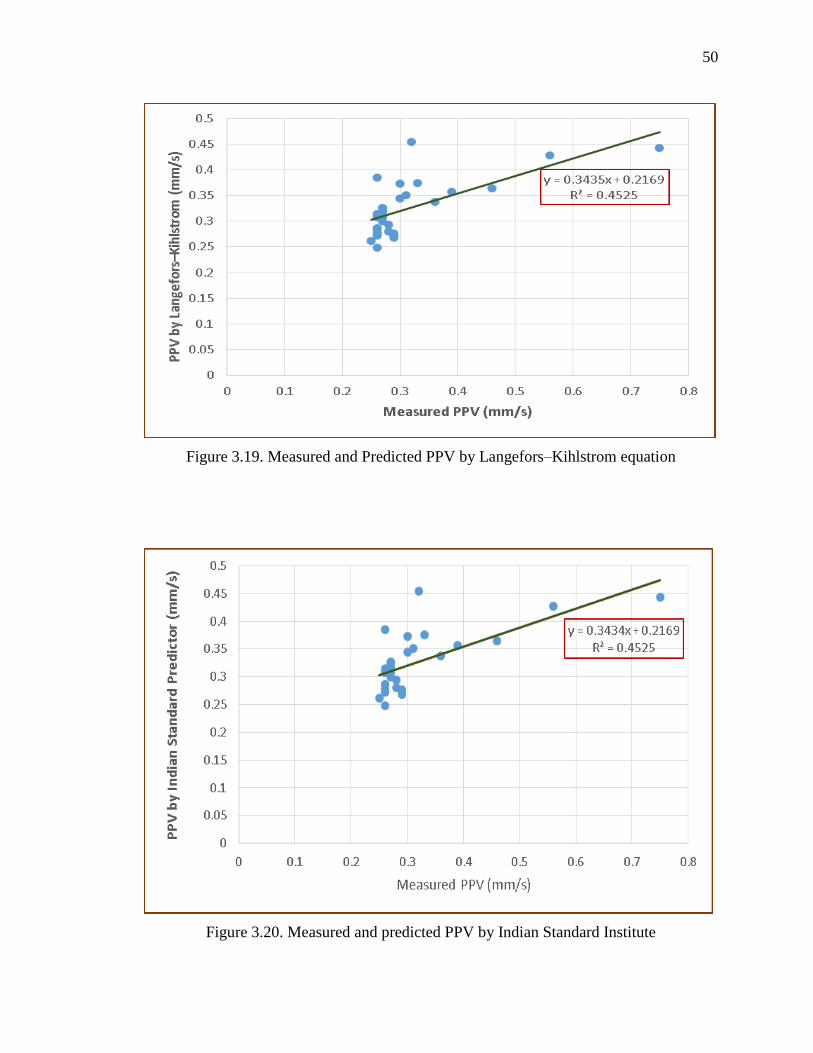
50
Figure 3.19. Measured and Predicted PPV by Langefors–Kihlstrom equation
Figure 3.20. Measured and predicted PPV by Indian Standard Institute
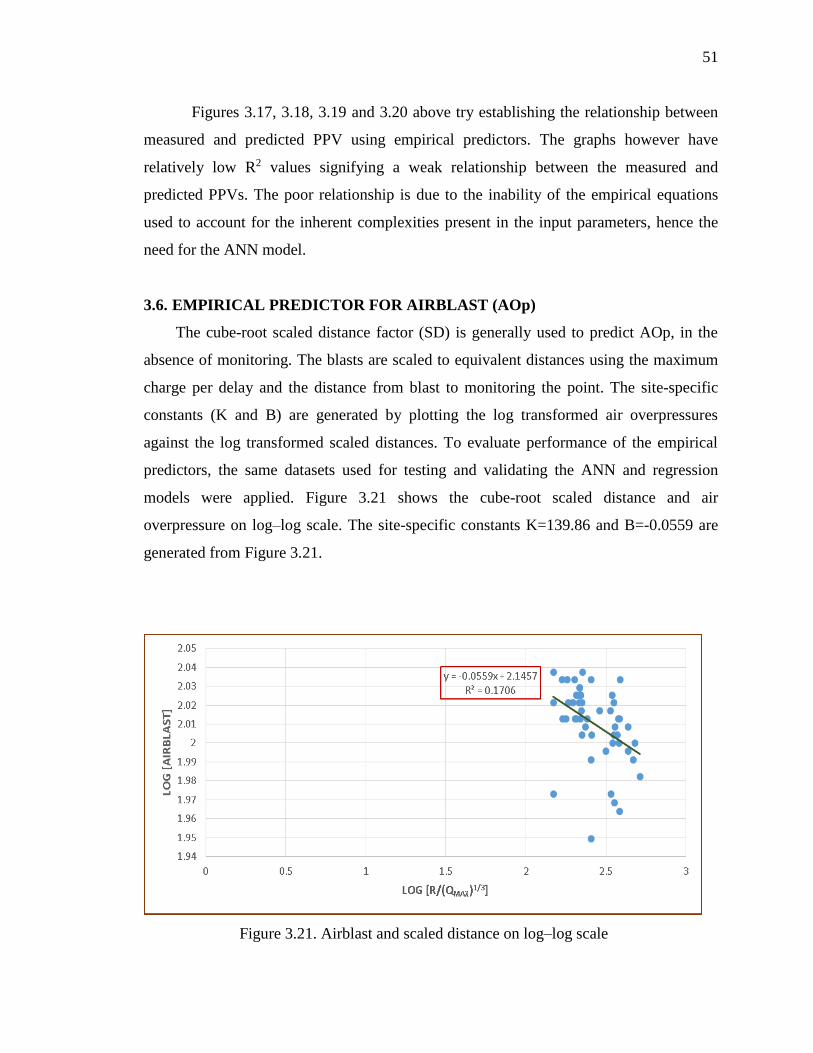
51
Figures 3.17, 3.18, 3.19 and 3.20 above try establishing the relationship between
measured and predicted PPV using empirical predictors. The graphs however have
relatively low R2 values signifying a weak relationship between the measured and
predicted PPVs. The poor relationship is due to the inability of the empirical equations
used to account for the inherent complexities present in the input parameters, hence the
need for the ANN model.
3.6. EMPIRICAL PREDICTOR FOR AIRBLAST (AOp)
The cube-root scaled distance factor (SD) is generally used to predict AOp, in the
absence of monitoring. The blasts are scaled to equivalent distances using the maximum
charge per delay and the distance from blast to monitoring the point. The site-specific
constants (K and B) are generated by plotting the log transformed air overpressures
against the log transformed scaled distances. To evaluate performance of the empirical
predictors, the same datasets used for testing and validating the ANN and regression
models were applied. Figure 3.21 shows the cube-root scaled distance and air
overpressure on log–log scale. The site-specific constants K=139.86 and B=-0.0559 are
generated from Figure 3.21.
Figure 3.21. Airblast and scaled distance on log–log scale
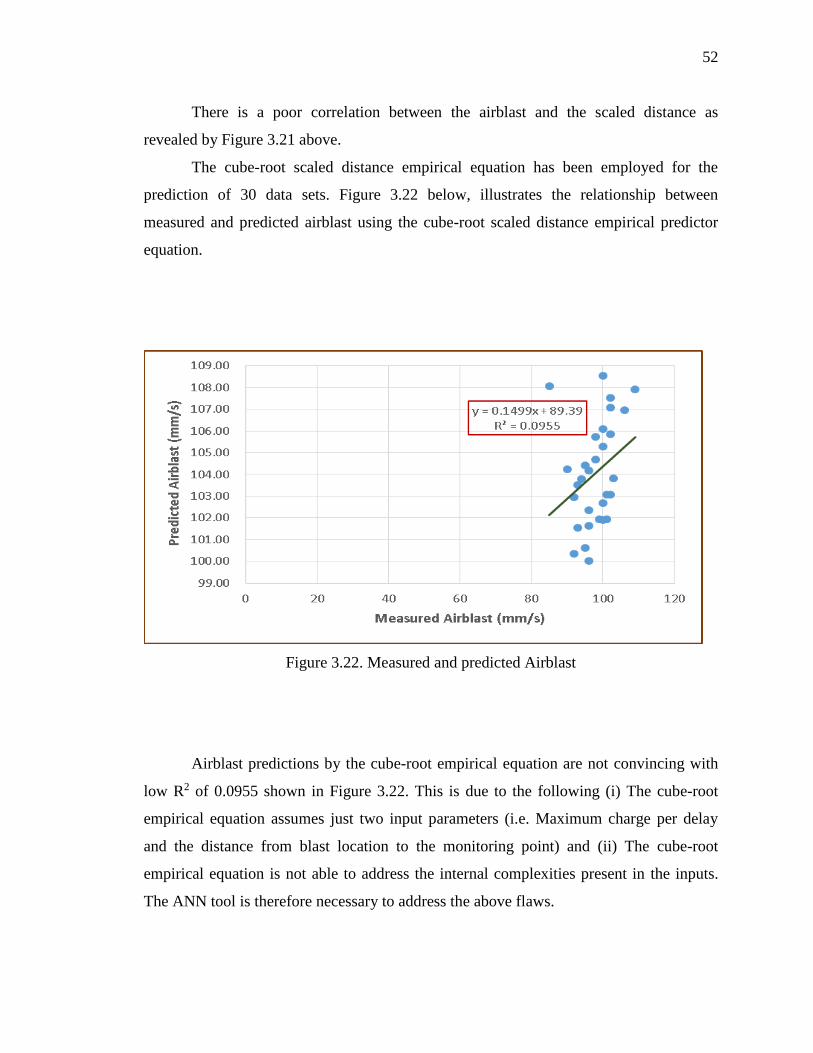
52
There is a poor correlation between the airblast and the scaled distance as
revealed by Figure 3.21 above.
The cube-root scaled distance empirical equation has been employed for the
prediction of 30 data sets. Figure 3.22 below, illustrates the relationship between
measured and predicted airblast using the cube-root scaled distance empirical predictor
equation.
Figure 3.22. Measured and predicted Airblast
Airblast predictions by the cube-root empirical equation are not convincing with
low R2 of 0.0955 shown in Figure 3.22. This is due to the following (i) The cube-root
empirical equation assumes just two input parameters (i.e. Maximum charge per delay
and the distance from blast location to the monitoring point) and (ii) The cube-root
empirical equation is not able to address the internal complexities present in the inputs.
The ANN tool is therefore necessary to address the above flaws.
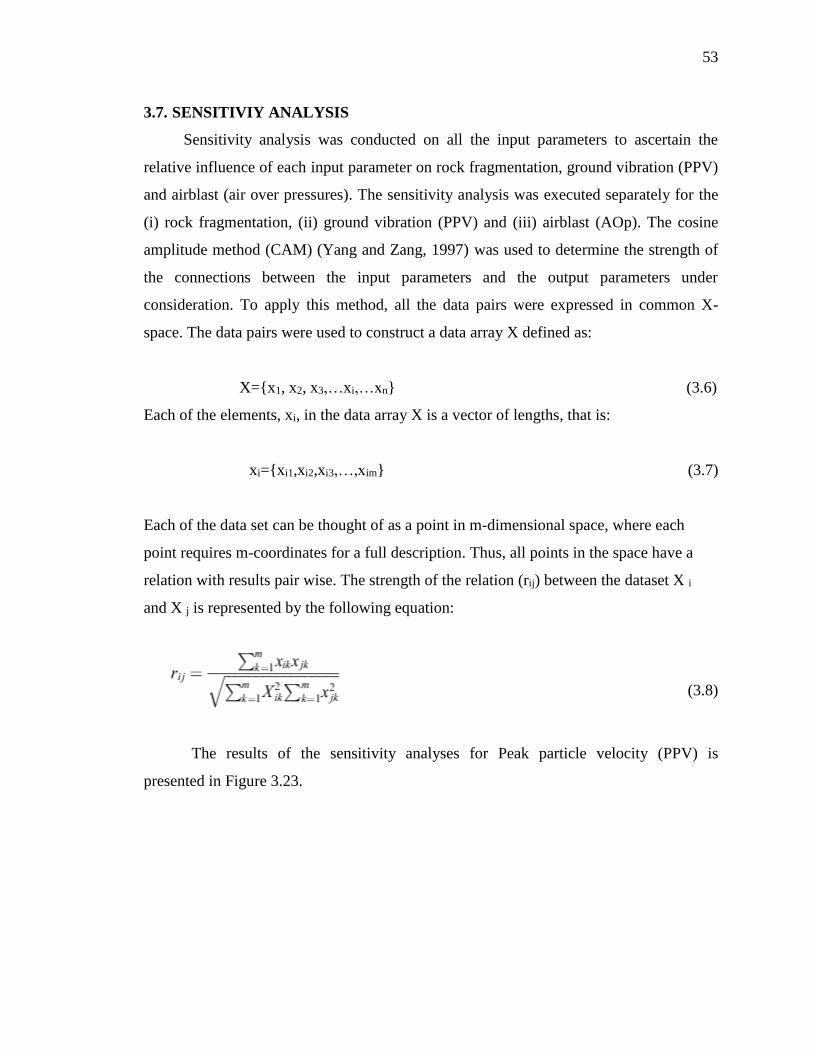
53
3.7. SENSITIVIY ANALYSIS
Sensitivity analysis was conducted on all the input parameters to ascertain the
relative influence of each input parameter on rock fragmentation, ground vibration (PPV)
and airblast (air over pressures). The sensitivity analysis was executed separately for the
(i) rock fragmentation, (ii) ground vibration (PPV) and (iii) airblast (AOp). The cosine
amplitude method (CAM) (Yang and Zang, 1997) was used to determine the strength of
the connections between the input parameters and the output parameters under
consideration. To apply this method, all the data pairs were expressed in common X-
space. The data pairs were used to construct a data array X defined as:
X={x1, x2, x3,…xi,…xn} (3.6)
Each of the elements, xi, in the data array X is a vector of lengths, that is:
xi={xi1,xi2,xi3,…,xim} (3.7)
Each of the data set can be thought of as a point in m-dimensional space, where each
point requires m-coordinates for a full description. Thus, all points in the space have a
relation with results pair wise. The strength of the relation (rij) between the dataset X i
and X j is represented by the following equation:
(3.8)
The results of the sensitivity analyses for Peak particle velocity (PPV) is
presented in Figure 3.23.
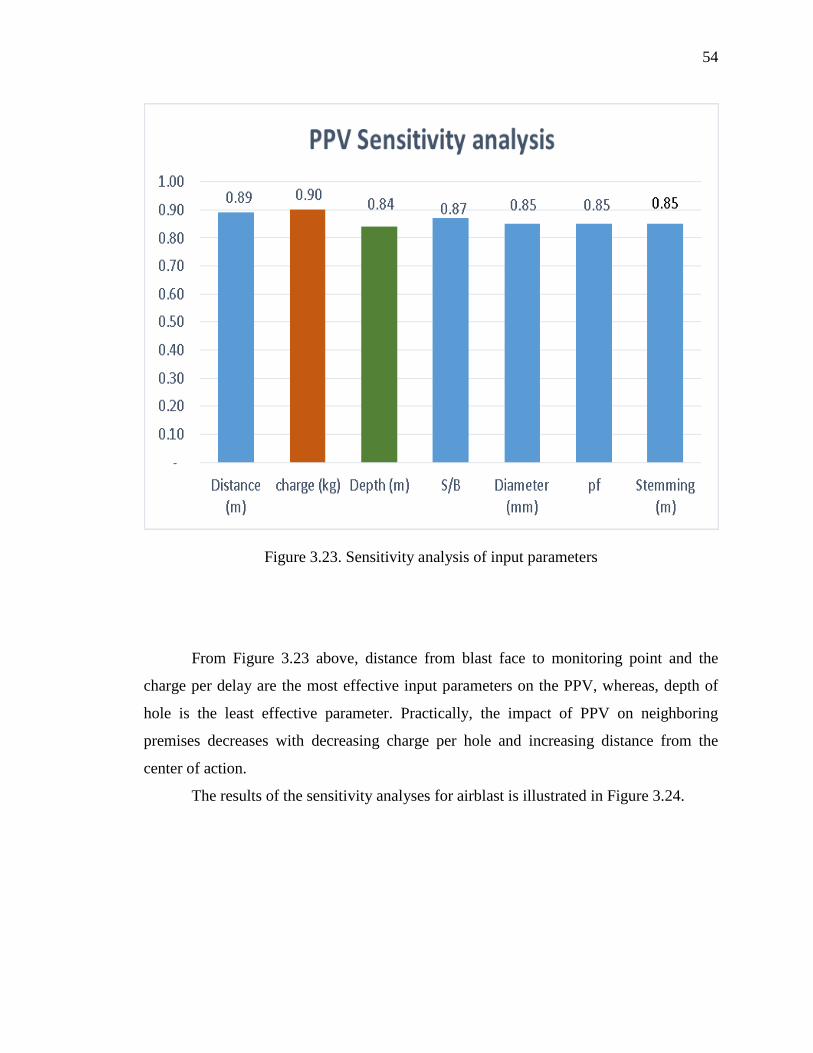
54
Figure 3.23. Sensitivity analysis of input parameters
From Figure 3.23 above, distance from blast face to monitoring point and the
charge per delay are the most effective input parameters on the PPV, whereas, depth of
hole is the least effective parameter. Practically, the impact of PPV on neighboring
premises decreases with decreasing charge per hole and increasing distance from the
center of action.
The results of the sensitivity analyses for airblast is illustrated in Figure 3.24.
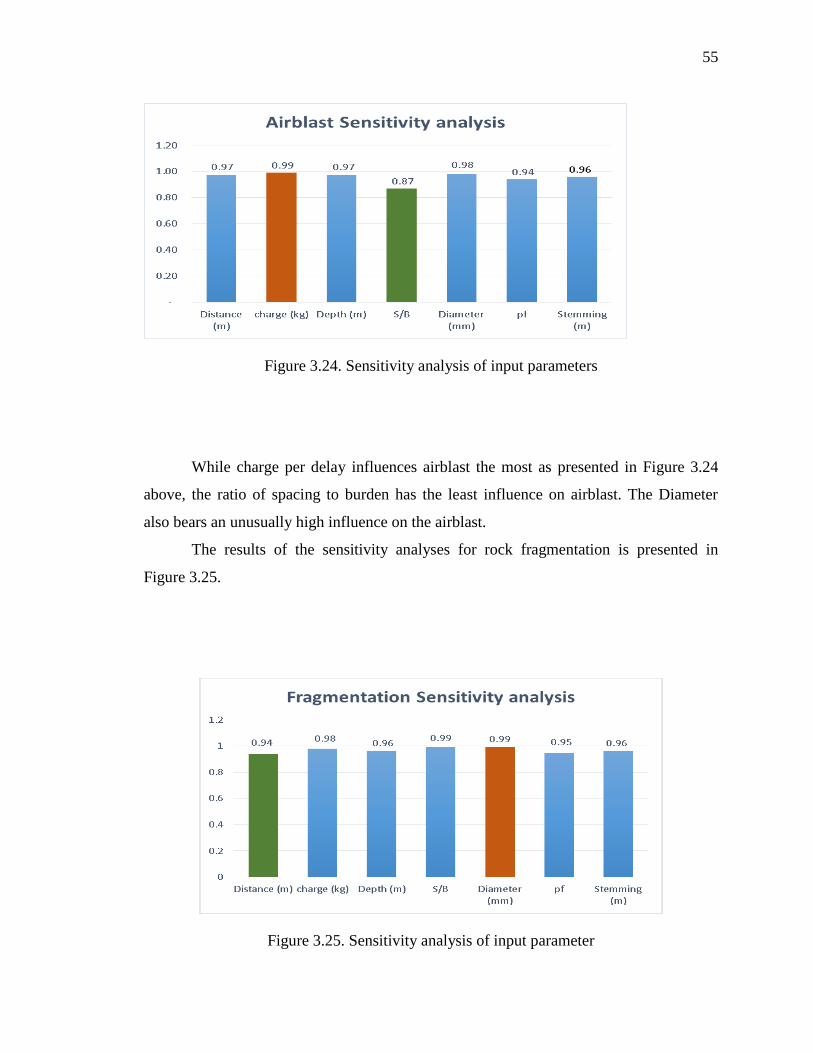
55
Figure 3.24. Sensitivity analysis of input parameters
While charge per delay influences airblast the most as presented in Figure 3.24
above, the ratio of spacing to burden has the least influence on airblast. The Diameter
also bears an unusually high influence on the airblast.
The results of the sensitivity analyses for rock fragmentation is presented in
Figure 3.25.
Figure 3.25. Sensitivity analysis of input parameter
56
As illustrated by Figure 3.25 above, the most influential factors on fragmentation
are the diameter and spacing to burden ratio whiles the distance from the blast point to
the monitoring area is the least sensitive factor.
3.8. SUMMARY
Dataset of inputs and their corresponding outputs are imported into the artificial
neural network (ANN) system in MATLAB®. The ANN network is designed by defining
the training function, the learning function, the transfer function and specifying the
number of neurons in the hidden layer. The network is then trained, tested and validated.
The performance of the ANN model can be improved by retraining or increasing the
number of datasets. The network with the least RMSE is chosen as the optimum ANN
model. This optimum ANN model is used to predict thirty (30) new dataset and the
predicted outputs are compared with the real measured outputs to estimate the accuracy
of the model. The results obtained from ANN model are much closer to reality, thus the
ANN model is suitable for predicting new datasets in the field.
Multivariate regression analysis (MVRA) equations are also used to predict the
same thirty (30) dataset and the predicted results are compared with the measured/actual
outputs. Multivariate regression analysis (MVRA) predictors did not attain the desired
level of accuracy. Ground vibrations (PPVs) and airblasts (AOps) are predicted using
empirical equations based on the same dataset and the predicted outputs are compared
with the measured outputs. Results demonstrate that the predicted outputs are not close to
the actual outputs, thus not recommended for field predictions.
Linear curve fittings are used for comparing the predicted and actual outputs for
the various predictive models in this section. This is due to the fact that most plots of
actual and predicted datasets available in literature show a linear relationship. Moreover,
linear curves make the analysis of uncertainty in dataset tractable and easy to interpret.
Finally, sensitivity analysis using the proposed ANN model is performed to
ascertain the influence of each input parameter on rock fragmentation, ground vibration
and airblast. Section 4 delves into the data analysis and discussions.
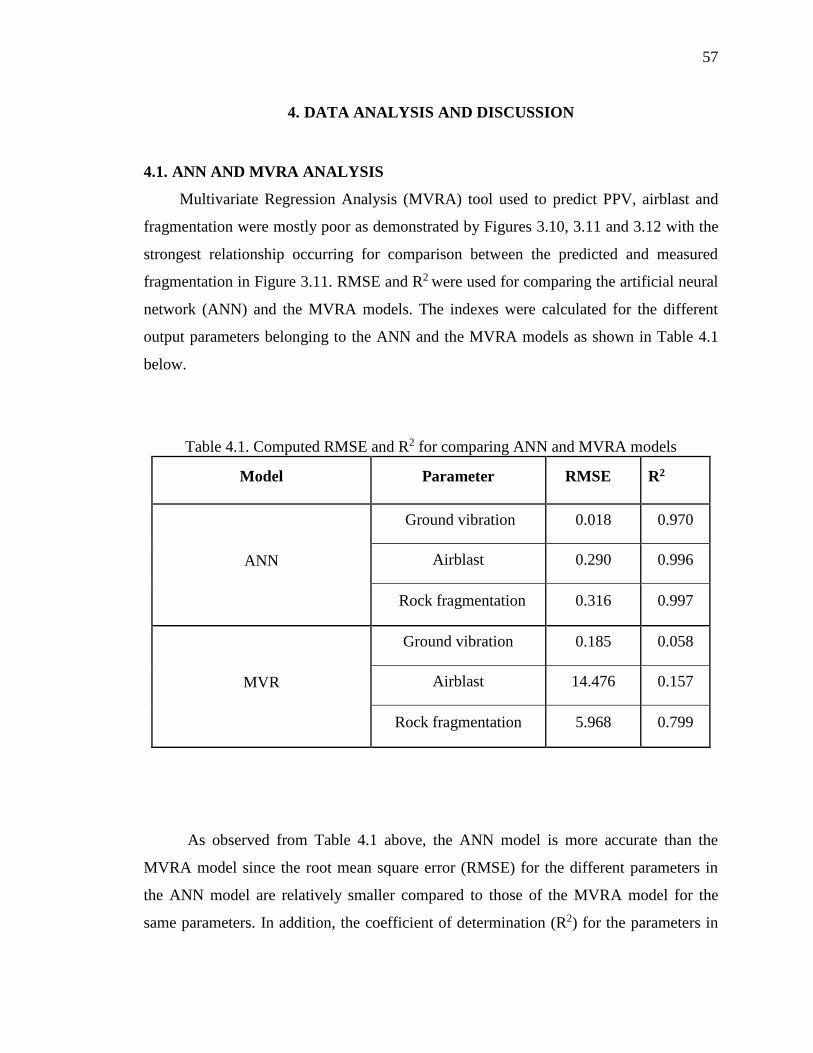
57
4. DATA ANALYSIS AND DISCUSSION
4.1. ANN AND MVRA ANALYSIS
Multivariate Regression Analysis (MVRA) tool used to predict PPV, airblast and
fragmentation were mostly poor as demonstrated by Figures 3.10, 3.11 and 3.12 with the
strongest relationship occurring for comparison between the predicted and measured
fragmentation in Figure 3.11. RMSE and R2 were used for comparing the artificial neural
network (ANN) and the MVRA models. The indexes were calculated for the different
output parameters belonging to the ANN and the MVRA models as shown in Table 4.1
below.
Table 4.1. Computed RMSE and R2 for comparing ANN and MVRA models
As observed from Table 4.1 above, the ANN model is more accurate than the
MVRA model since the root mean square error (RMSE) for the different parameters in
the ANN model are relatively smaller compared to those of the MVRA model for the
same parameters. In addition, the coefficient of determination (R2) for the parameters in
Model Parameter RMSE R2
ANN
Ground vibration 0.018 0.970
Airblast 0.290 0.996
Rock fragmentation 0.316 0.997
MVR
Ground vibration 0.185 0.058
Airblast 14.476 0.157
Rock fragmentation 5.968 0.799
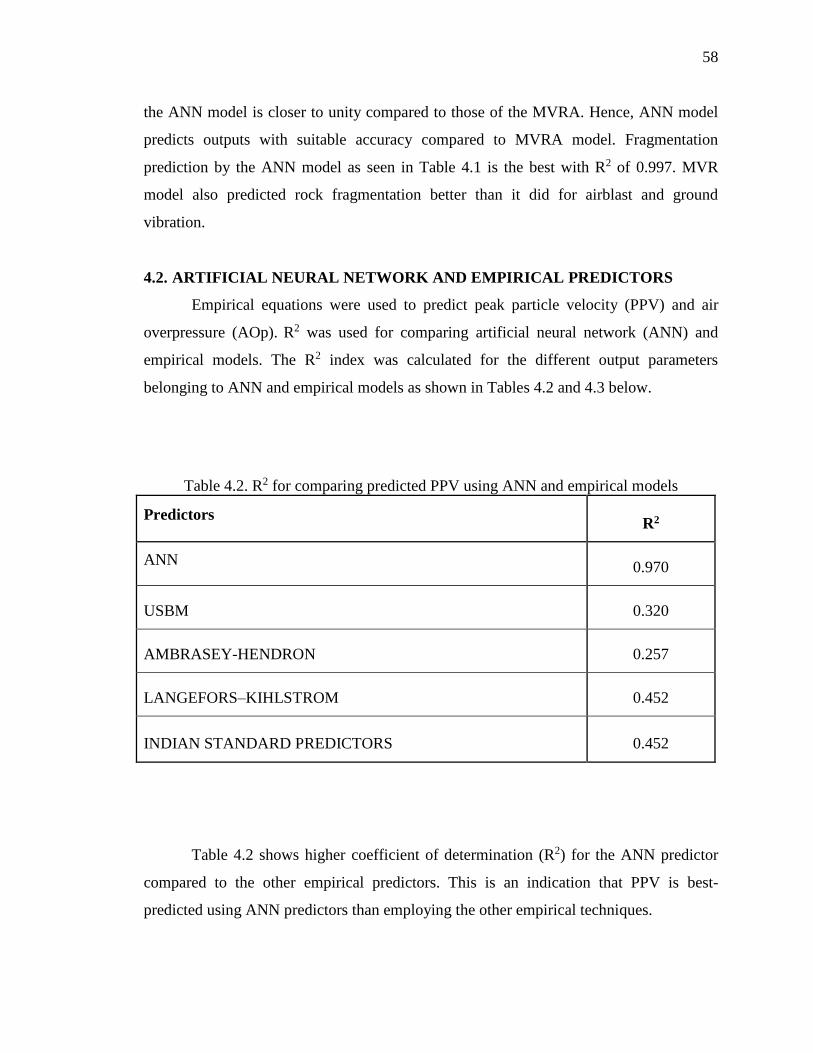
58
the ANN model is closer to unity compared to those of the MVRA. Hence, ANN model
predicts outputs with suitable accuracy compared to MVRA model. Fragmentation
prediction by the ANN model as seen in Table 4.1 is the best with R2 of 0.997. MVR
model also predicted rock fragmentation better than it did for airblast and ground
vibration.
4.2. ARTIFICIAL NEURAL NETWORK AND EMPIRICAL PREDICTORS
Empirical equations were used to predict peak particle velocity (PPV) and air
overpressure (AOp). R2 was used for comparing artificial neural network (ANN) and
empirical models. The R2 index was calculated for the different output parameters
belonging to ANN and empirical models as shown in Tables 4.2 and 4.3 below.
Table 4.2. R2 for comparing predicted PPV using ANN and empirical models
Predictors R2
ANN 0.970
USBM 0.320
AMBRASEY-HENDRON 0.257
LANGEFORS–KIHLSTROM 0.452
INDIAN STANDARD PREDICTORS 0.452
Table 4.2 shows higher coefficient of determination (R2) for the ANN predictor
compared to the other empirical predictors. This is an indication that PPV is best-
predicted using ANN predictors than employing the other empirical techniques.
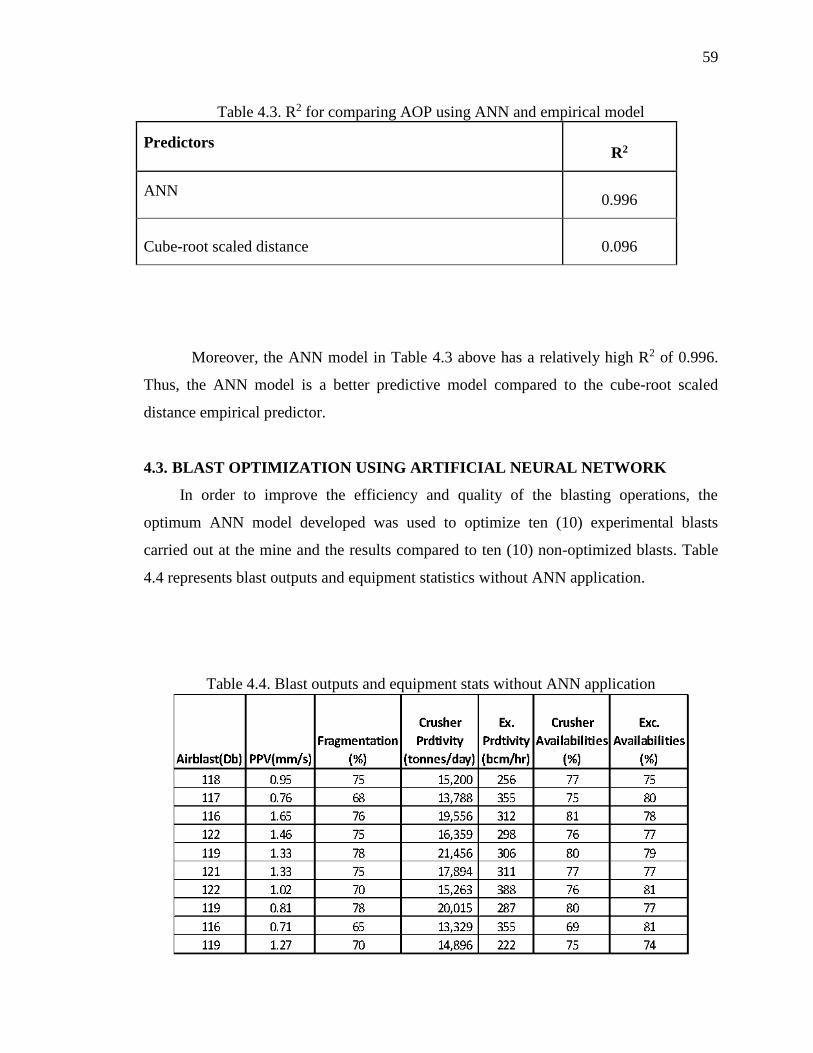
59
Table 4.3. R2 for comparing AOP using ANN and empirical model
Predictors R2
ANN 0.996
Cube-root scaled distance 0.096
Moreover, the ANN model in Table 4.3 above has a relatively high R2 of 0.996.
Thus, the ANN model is a better predictive model compared to the cube-root scaled
distance empirical predictor.
4.3. BLAST OPTIMIZATION USING ARTIFICIAL NEURAL NETWORK
In order to improve the efficiency and quality of the blasting operations, the
optimum ANN model developed was used to optimize ten (10) experimental blasts
carried out at the mine and the results compared to ten (10) non-optimized blasts. Table
4.4 represents blast outputs and equipment statistics without ANN application.
Table 4.4. Blast outputs and equipment stats without ANN application
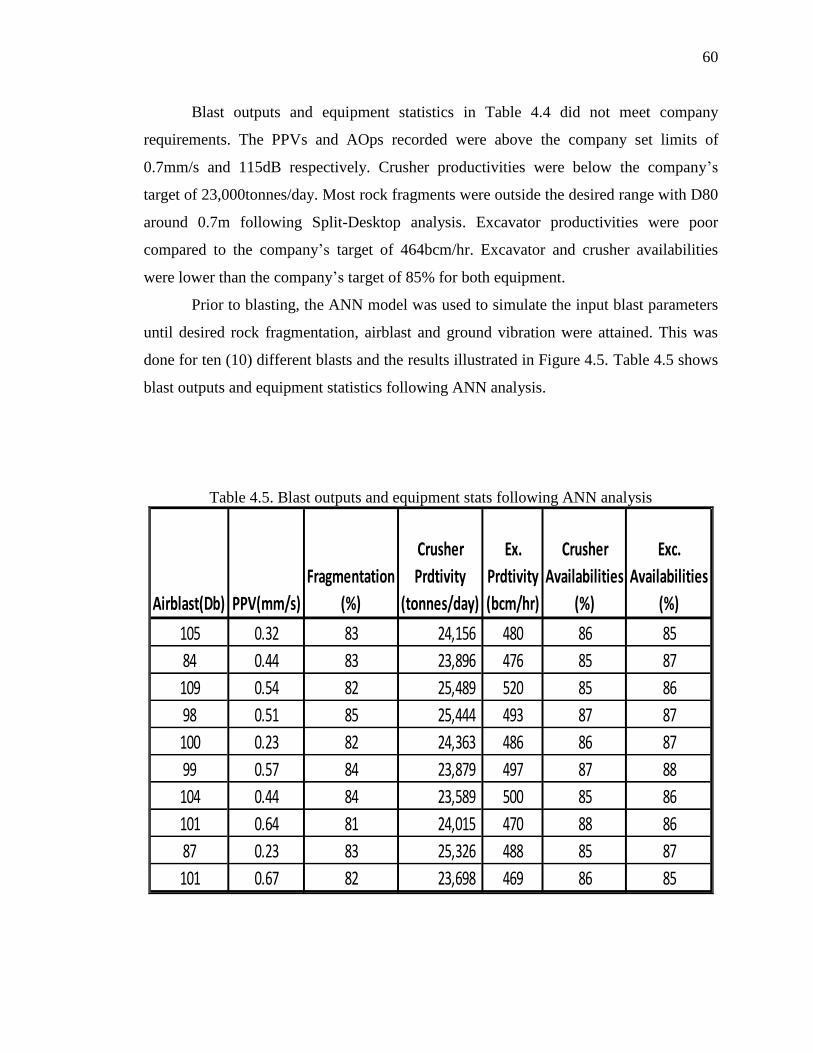
60
Blast outputs and equipment statistics in Table 4.4 did not meet company
requirements. The PPVs and AOps recorded were above the company set limits of
0.7mm/s and 115dB respectively. Crusher productivities were below the company’s
target of 23,000tonnes/day. Most rock fragments were outside the desired range with D80
around 0.7m following Split-Desktop analysis. Excavator productivities were poor
compared to the company’s target of 464bcm/hr. Excavator and crusher availabilities
were lower than the company’s target of 85% for both equipment.
Prior to blasting, the ANN model was used to simulate the input blast parameters
until desired rock fragmentation, airblast and ground vibration were attained. This was
done for ten (10) different blasts and the results illustrated in Figure 4.5. Table 4.5 shows
blast outputs and equipment statistics following ANN analysis.
Table 4.5. Blast outputs and equipment stats following ANN analysis
Airblast(Db) PPV(mm/s)
Fragmentation
(%)
Crusher
Prdtivity
(tonnes/day)
Ex.
Prdtivity
(bcm/hr)
Crusher
Availabilities
(%)
Exc.
Availabilities
(%)
105 0.32 83 24,156 480 86 85
84 0.44 83 23,896 476 85 87
109 0.54 82 25,489 520 85 86
98 0.51 85 25,444 493 87 87
100 0.23 82 24,363 486 86 87
99 0.57 84 23,879 497 87 88
104 0.44 84 23,589 500 85 86
101 0.64 81 24,015 470 88 86
87 0.23 83 25,326 488 85 87
101 0.67 82 23,698 469 86 85
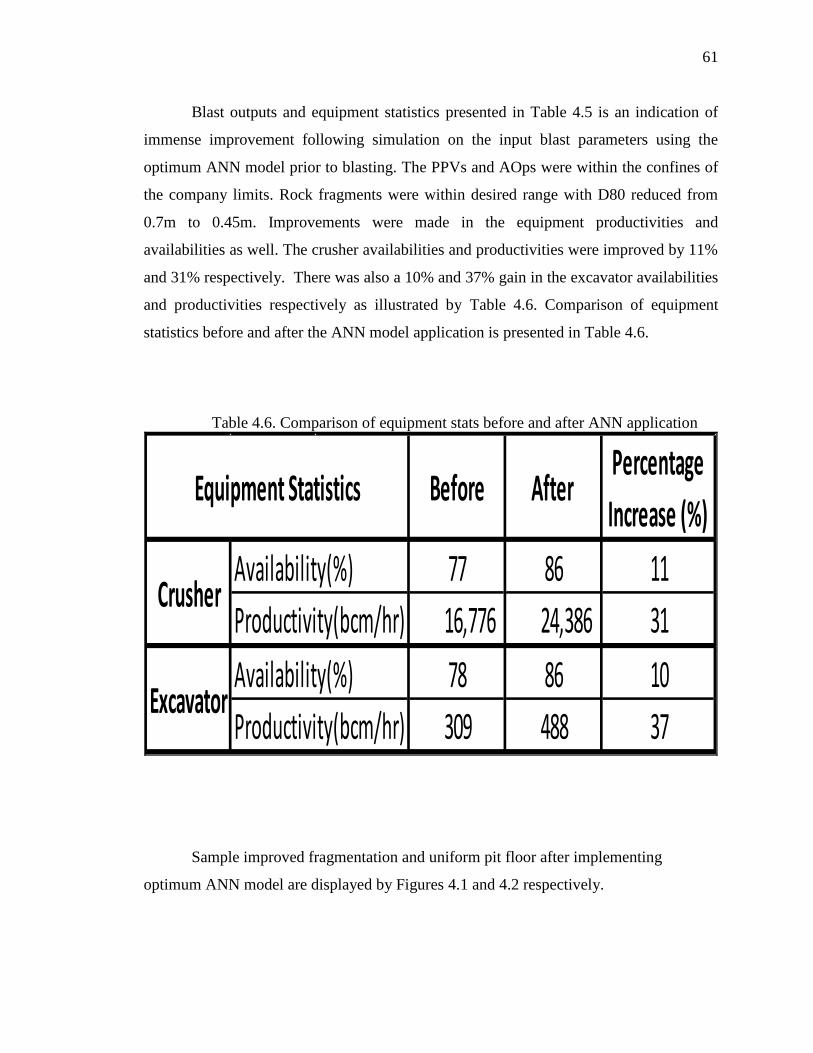
61
Blast outputs and equipment statistics presented in Table 4.5 is an indication of
immense improvement following simulation on the input blast parameters using the
optimum ANN model prior to blasting. The PPVs and AOps were within the confines of
the company limits. Rock fragments were within desired range with D80 reduced from
0.7m to 0.45m. Improvements were made in the equipment productivities and
availabilities as well. The crusher availabilities and productivities were improved by 11%
and 31% respectively. There was also a 10% and 37% gain in the excavator availabilities
and productivities respectively as illustrated by Table 4.6. Comparison of equipment
statistics before and after the ANN model application is presented in Table 4.6.
Table 4.6. Comparison of equipment stats before and after ANN application
Before After Percentage
Increase (%)
Availability(%) 77 86 11
Productivity(bcm/hr) 16,776 24,386 31
Availability(%) 78 86 10
Productivity(bcm/hr) 309 488 37
Crusher
Excavator
Equipment Statistics
Sample improved fragmentation and uniform pit floor after implementing
optimum ANN model are displayed by Figures 4.1 and 4.2 respectively.
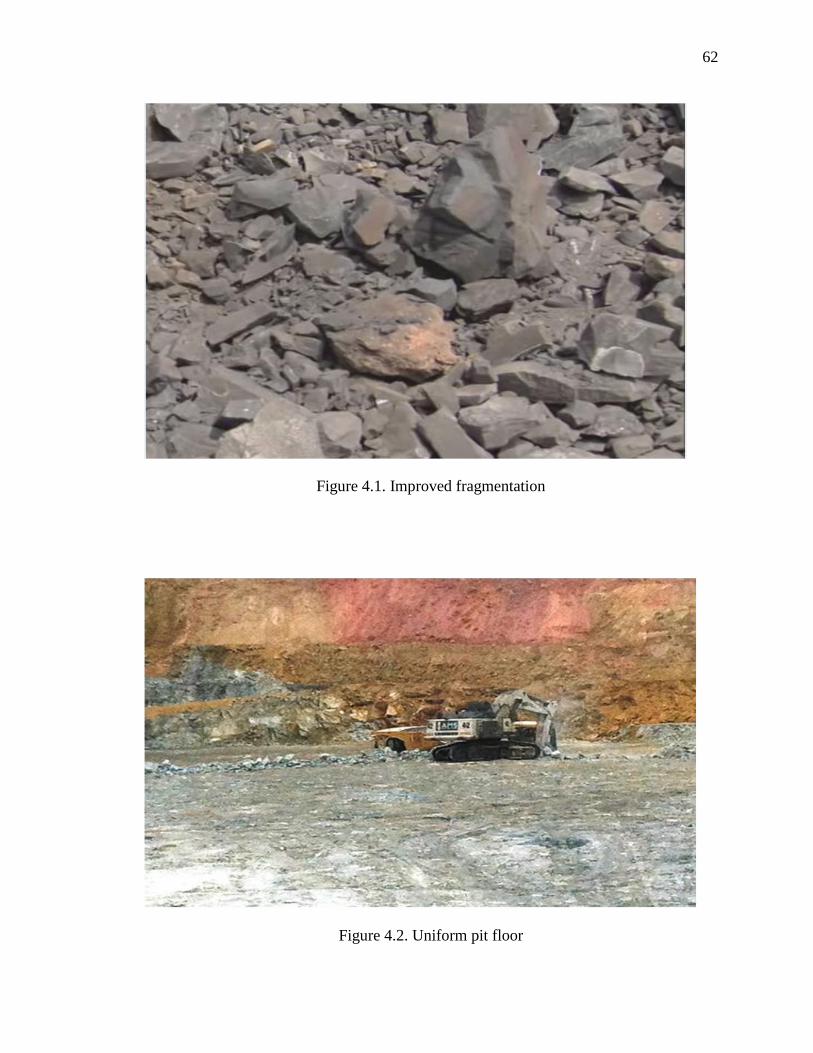
62
Figure 4.1. Improved fragmentation
Figure 4.2. Uniform pit floor
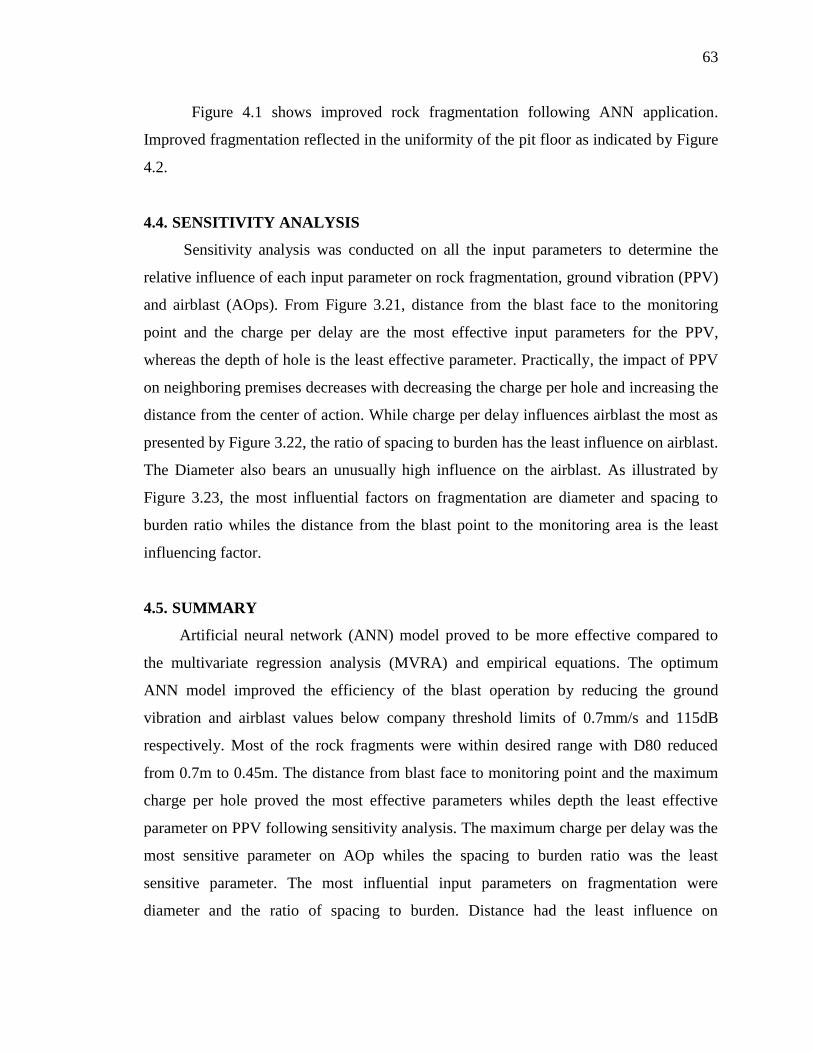
63
Figure 4.1 shows improved rock fragmentation following ANN application.
Improved fragmentation reflected in the uniformity of the pit floor as indicated by Figure
4.2.
4.4. SENSITIVITY ANALYSIS
Sensitivity analysis was conducted on all the input parameters to determine the
relative influence of each input parameter on rock fragmentation, ground vibration (PPV)
and airblast (AOps). From Figure 3.21, distance from the blast face to the monitoring
point and the charge per delay are the most effective input parameters for the PPV,
whereas the depth of hole is the least effective parameter. Practically, the impact of PPV
on neighboring premises decreases with decreasing the charge per hole and increasing the
distance from the center of action. While charge per delay influences airblast the most as
presented by Figure 3.22, the ratio of spacing to burden has the least influence on airblast.
The Diameter also bears an unusually high influence on the airblast. As illustrated by
Figure 3.23, the most influential factors on fragmentation are diameter and spacing to
burden ratio whiles the distance from the blast point to the monitoring area is the least
influencing factor.
4.5. SUMMARY
Artificial neural network (ANN) model proved to be more effective compared to
the multivariate regression analysis (MVRA) and empirical equations. The optimum
ANN model improved the efficiency of the blast operation by reducing the ground
vibration and airblast values below company threshold limits of 0.7mm/s and 115dB
respectively. Most of the rock fragments were within desired range with D80 reduced
from 0.7m to 0.45m. The distance from blast face to monitoring point and the maximum
charge per hole proved the most effective parameters whiles depth the least effective
parameter on PPV following sensitivity analysis. The maximum charge per delay was the
most sensitive parameter on AOp whiles the spacing to burden ratio was the least
sensitive parameter. The most influential input parameters on fragmentation were
diameter and the ratio of spacing to burden. Distance had the least influence on

64
fragmentation. Conclusions and recommendations for future work are presented in
section 5.
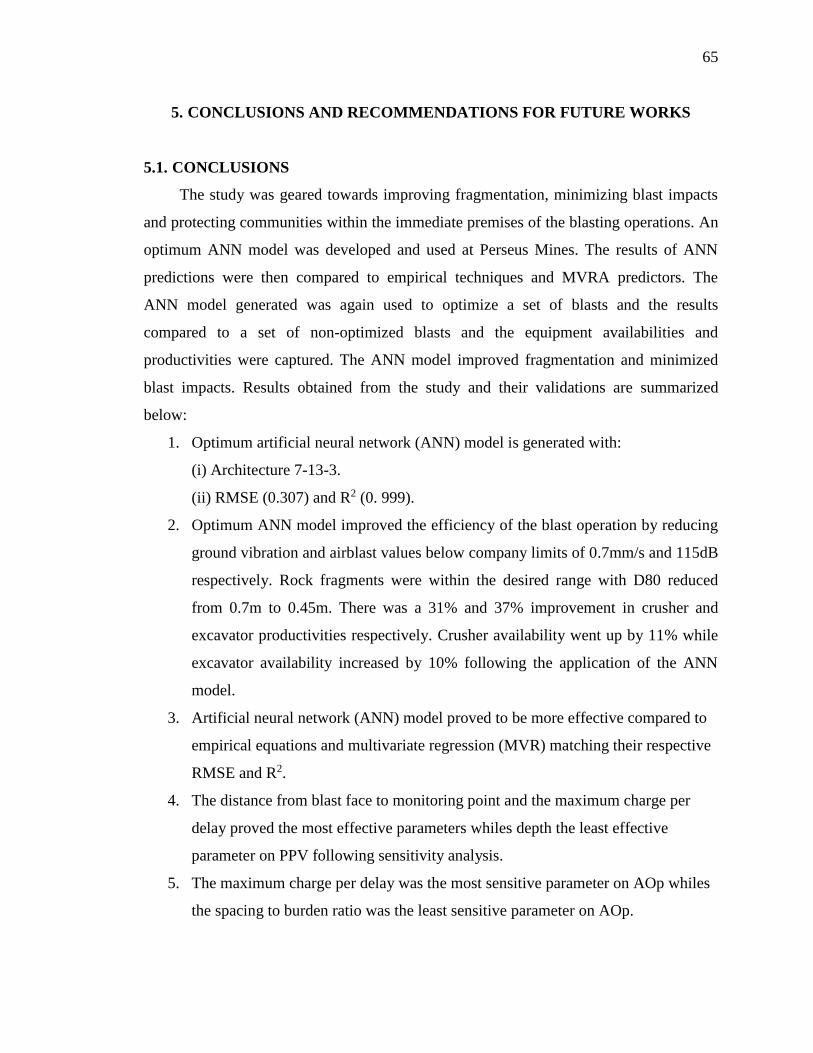
65
5. CONCLUSIONS AND RECOMMENDATIONS FOR FUTURE WORKS
5.1. CONCLUSIONS
The study was geared towards improving fragmentation, minimizing blast impacts
and protecting communities within the immediate premises of the blasting operations. An
optimum ANN model was developed and used at Perseus Mines. The results of ANN
predictions were then compared to empirical techniques and MVRA predictors. The
ANN model generated was again used to optimize a set of blasts and the results
compared to a set of non-optimized blasts and the equipment availabilities and
productivities were captured. The ANN model improved fragmentation and minimized
blast impacts. Results obtained from the study and their validations are summarized
below:
1. Optimum artificial neural network (ANN) model is generated with:
(i) Architecture 7-13-3.
(ii) RMSE (0.307) and R2 (0. 999).
2. Optimum ANN model improved the efficiency of the blast operation by reducing
ground vibration and airblast values below company limits of 0.7mm/s and 115dB
respectively. Rock fragments were within the desired range with D80 reduced
from 0.7m to 0.45m. There was a 31% and 37% improvement in crusher and
excavator productivities respectively. Crusher availability went up by 11% while
excavator availability increased by 10% following the application of the ANN
model.
3. Artificial neural network (ANN) model proved to be more effective compared to
empirical equations and multivariate regression (MVR) matching their respective
RMSE and R2.
4. The distance from blast face to monitoring point and the maximum charge per
delay proved the most effective parameters whiles depth the least effective
parameter on PPV following sensitivity analysis.
5. The maximum charge per delay was the most sensitive parameter on AOp whiles
the spacing to burden ratio was the least sensitive parameter on AOp.

66
6. The most influential input parameters on fragmentation were diameter and the
ratio of spacing to burden. Distance had the least influence on fragmentation.
7. In addition to using the optimum ANN model, it is recommended that best
blasting practices including proper planning, close supervision, correct delay
times and initiation pattern selection, properly selected stemming material and
accurate drilling among others should be considered for best results.
5.2. RECOMMENDATIONS FOR FUTURE WORK
This research has produced significant evidence that ANN models are best for
predicting fragmentation and blast impacts. Further studies are required to enhance work
carried out in this study as discussed below:
1. The input parameters could be expanded to include mechanical and geotechnical
rock parameters such as rock strength, RQD, rock hardness, number of joints etc.
to provide the ANN model a wider platform to operate.
2. Other ill effects resulting from poor blasts such as fly rocks and back breakes
among others could be considered in the outputs since their impacts on production
and immediate communities are significant.
3. Optimum ANN performance could be enhanced by combining ANN model with
other algorithms such as particle swarm optimization algorithm, imperialist
competitive algorithm (ICA) etc.

67
APPENDIX A
ARTIFICIAL NEURAL NETWORK (ANN) ARCHITECTURE
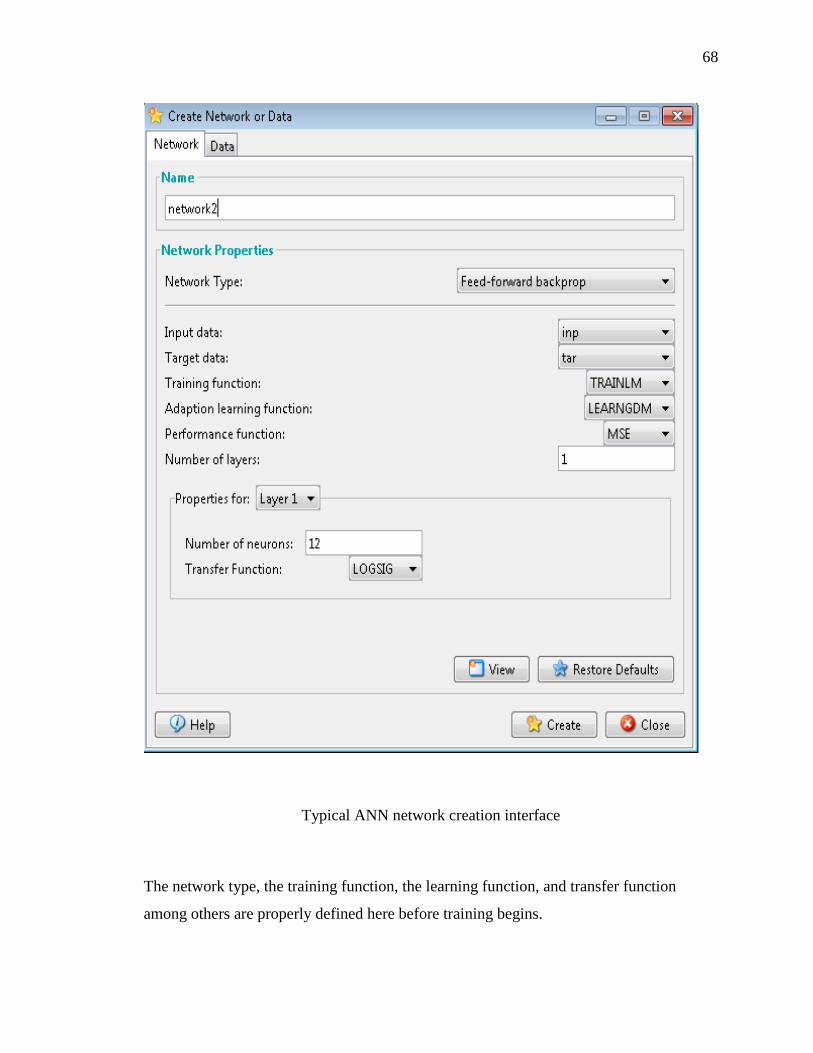
68
Typical ANN network creation interface
The network type, the training function, the learning function, and transfer function
among others are properly defined here before training begins.
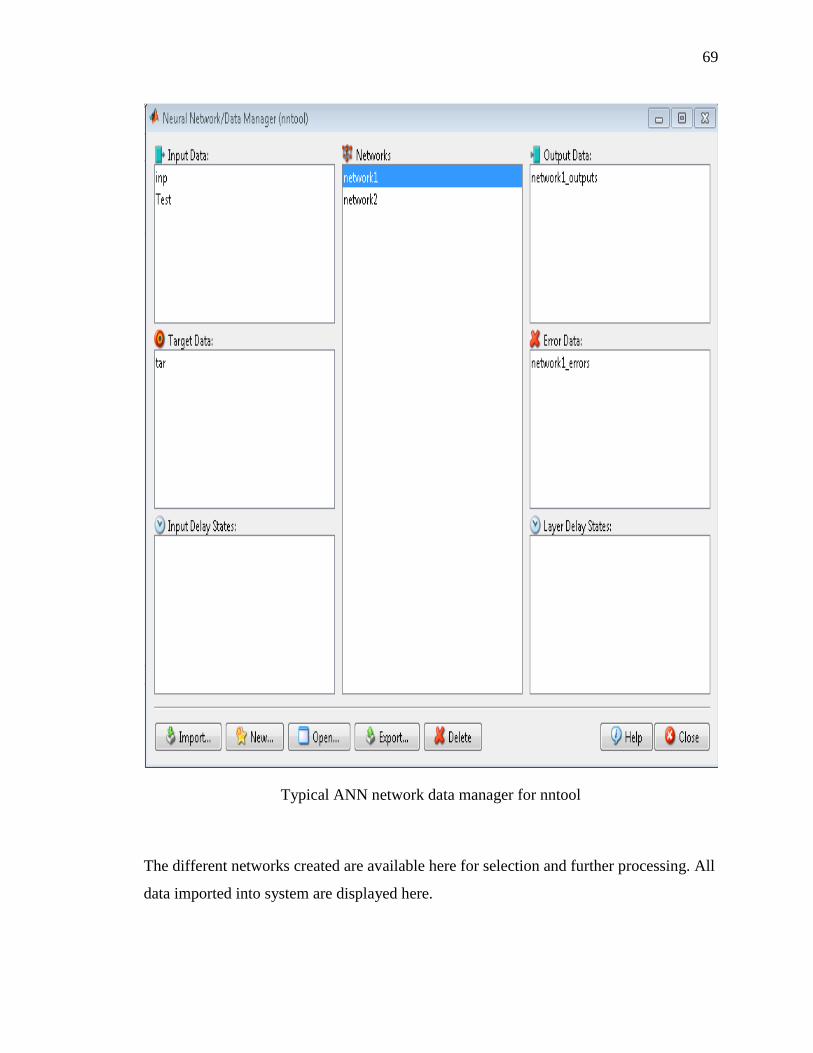
69
Typical ANN network data manager for nntool
The different networks created are available here for selection and further processing. All
data imported into system are displayed here.
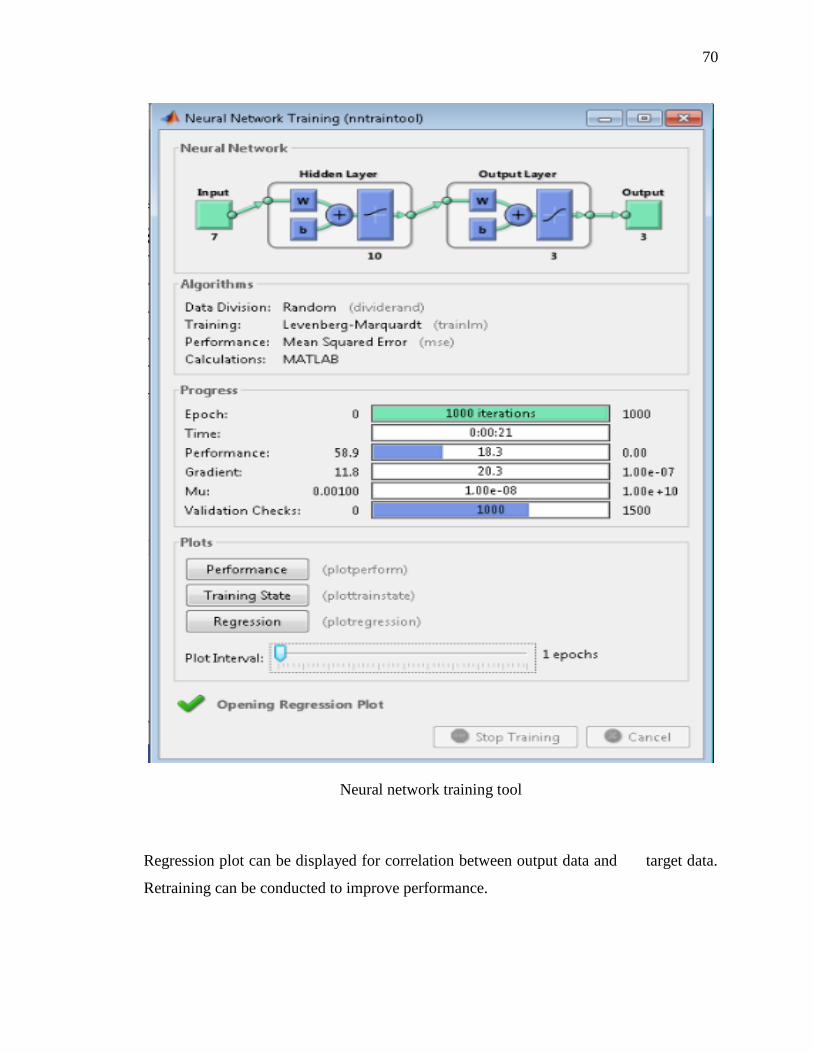
70
Neural network training tool
Regression plot can be displayed for correlation between output data and target data.
Retraining can be conducted to improve performance.
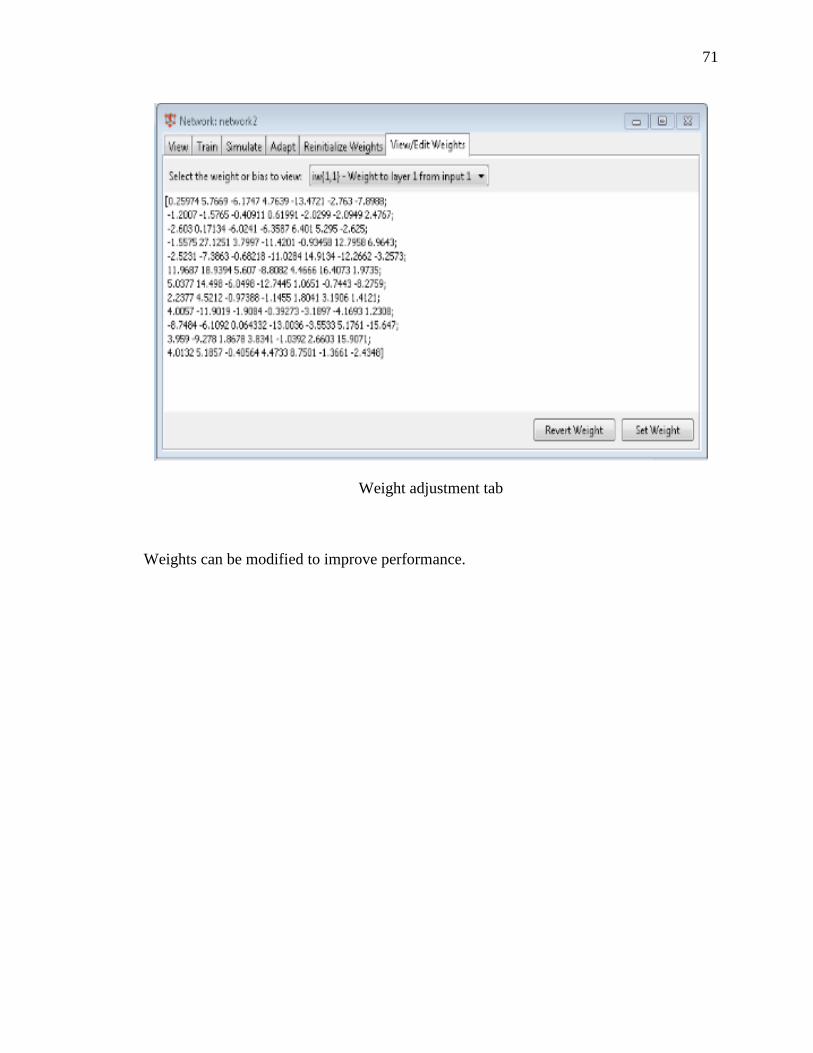
71
Weight adjustment tab
Weights can be modified to improve performance.

72
APPENDIX B
TRANSFER FUNCTIONS TESTED
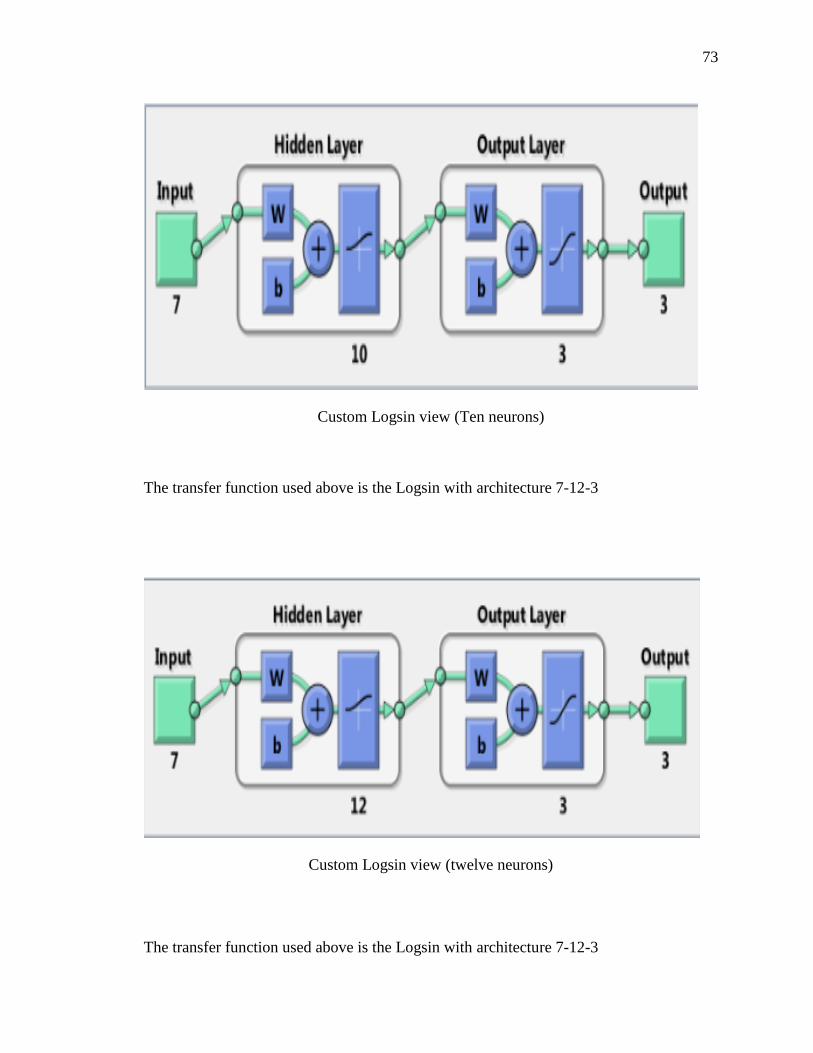
73
Custom Logsin view (Ten neurons)
The transfer function used above is the Logsin with architecture 7-12-3
Custom Logsin view (twelve neurons)
The transfer function used above is the Logsin with architecture 7-12-3
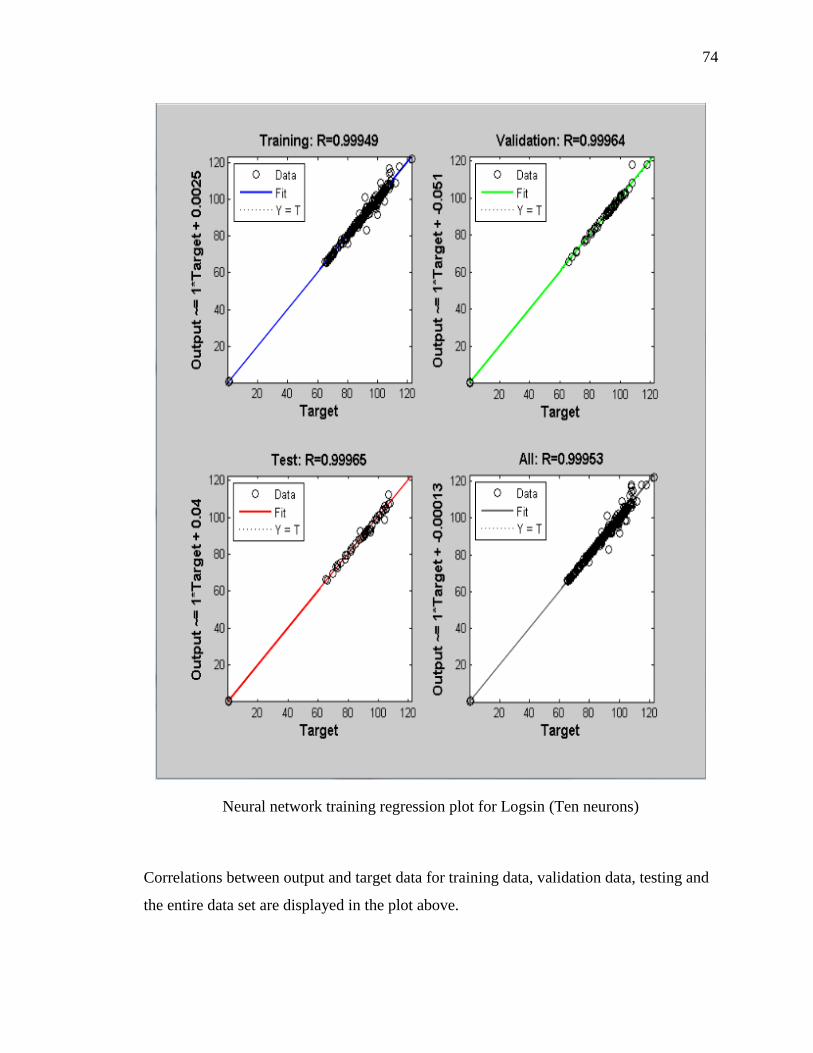
74
Neural network training regression plot for Logsin (Ten neurons)
Correlations between output and target data for training data, validation data, testing and
the entire data set are displayed in the plot above.
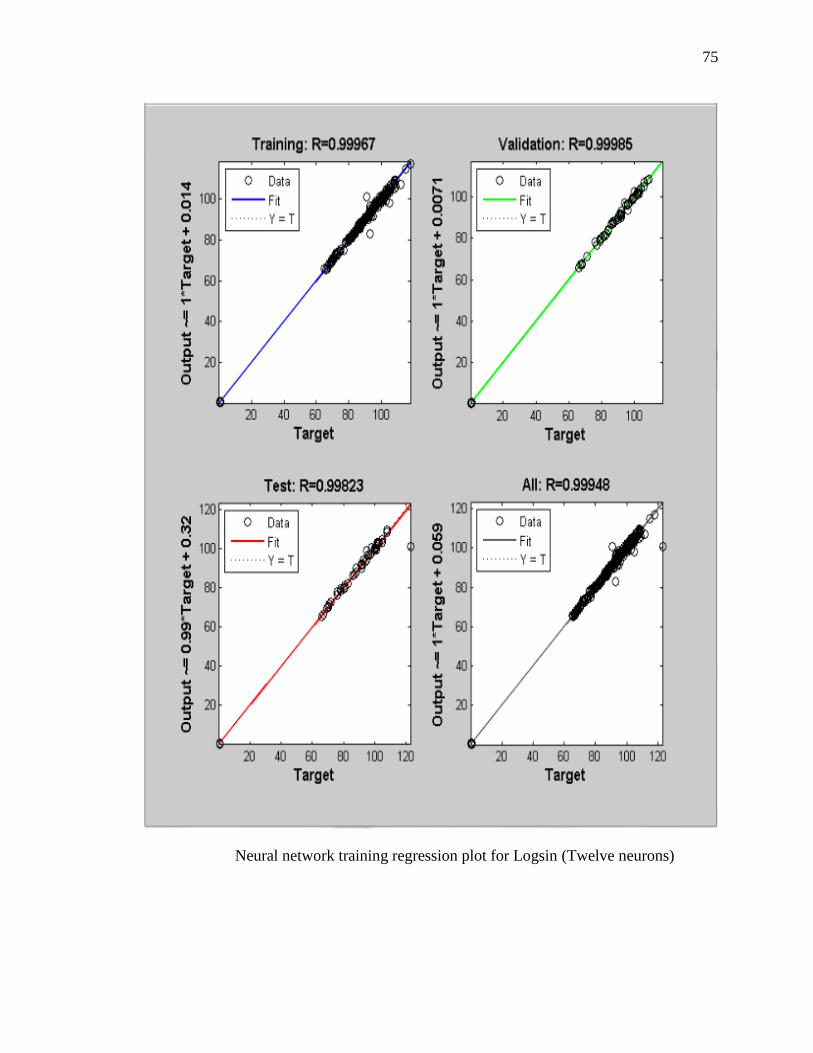
75
Neural network training regression plot for Logsin (Twelve neurons)
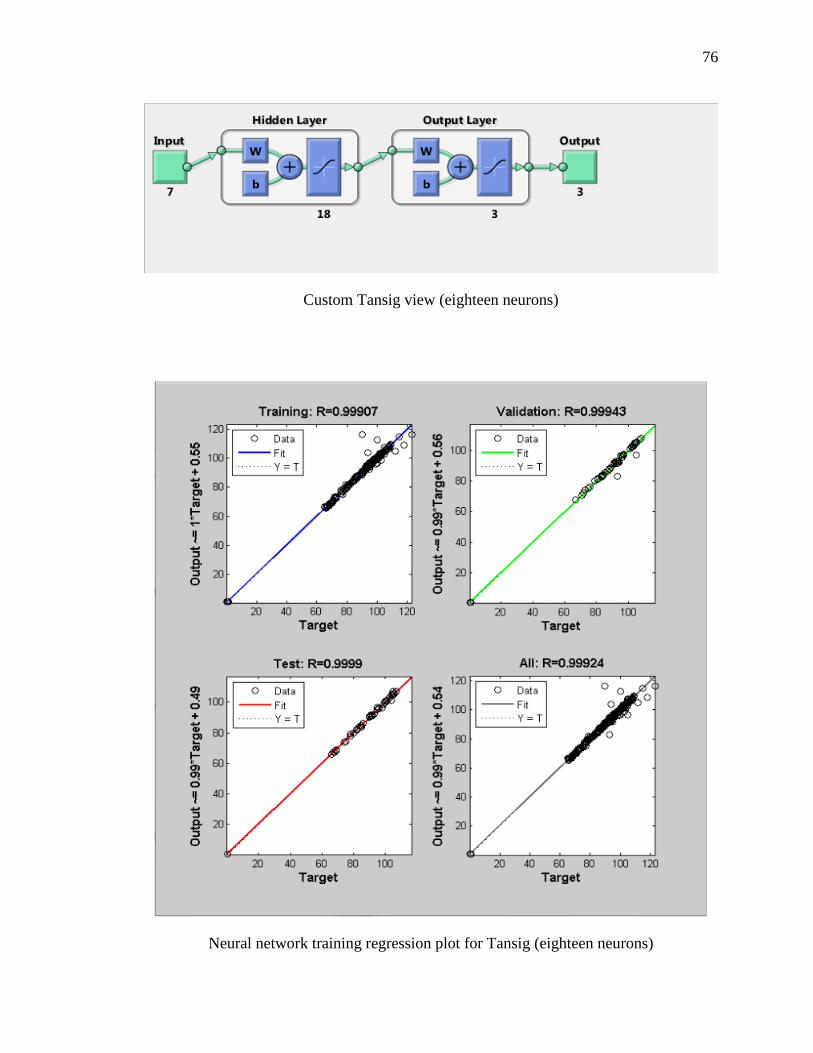
76
Custom Tansig view (eighteen neurons)
Neural network training regression plot for Tansig (eighteen neurons)
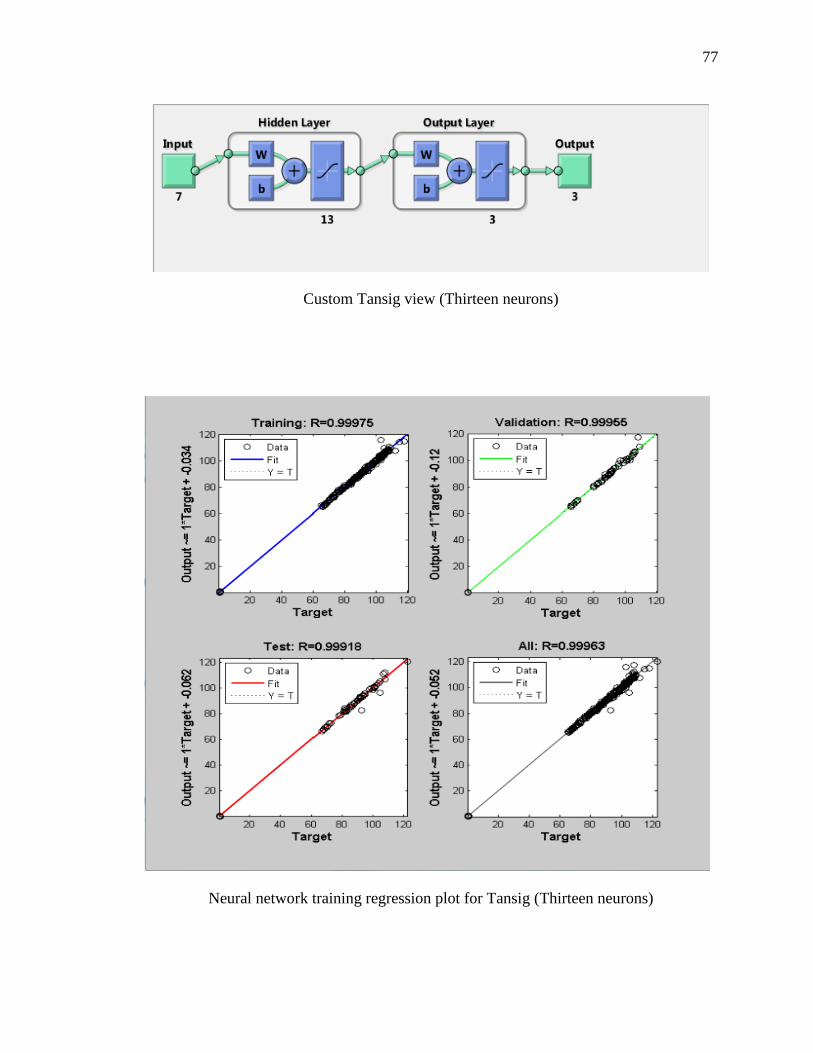
77
Custom Tansig view (Thirteen neurons)
Neural network training regression plot for Tansig (Thirteen neurons)
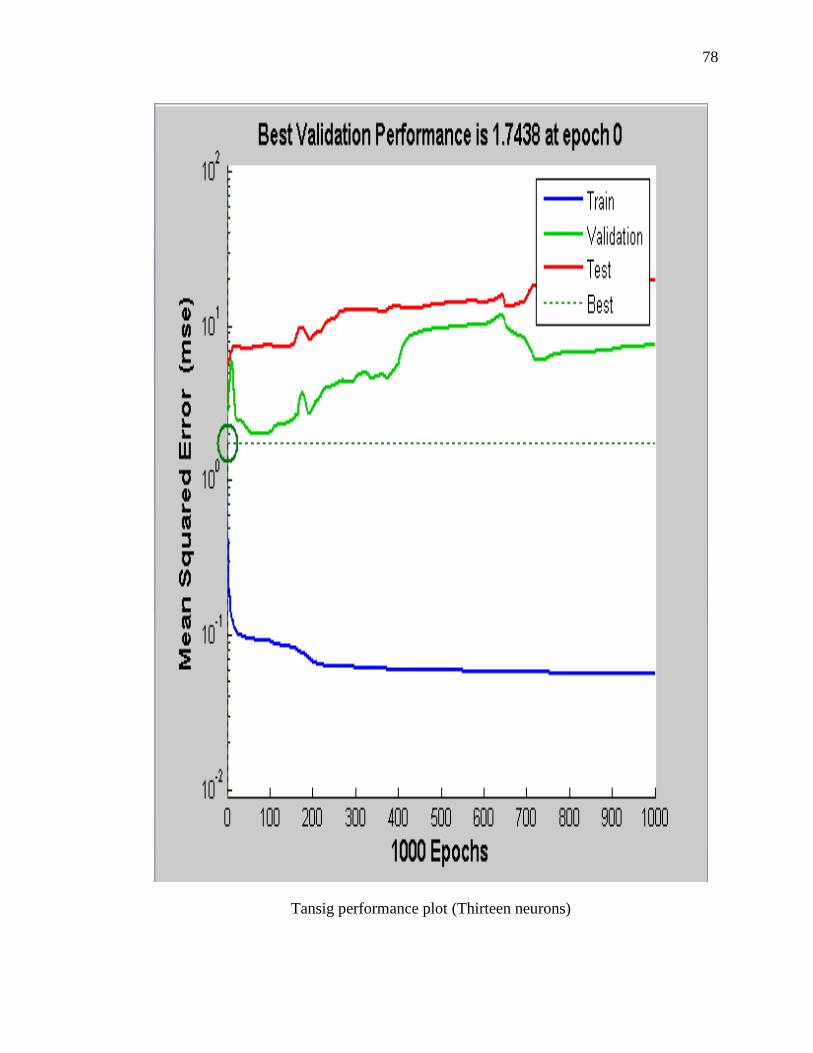
78
Tansig performance plot (Thirteen neurons)
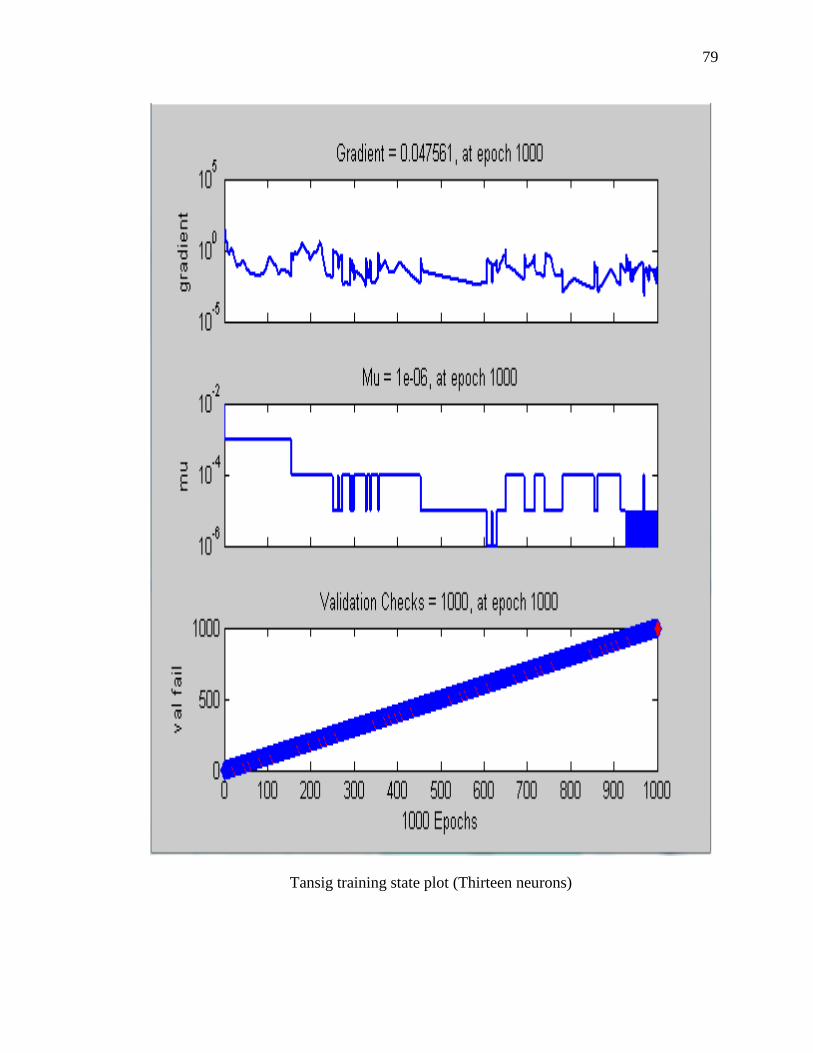
79
Tansig training state plot (Thirteen neurons)
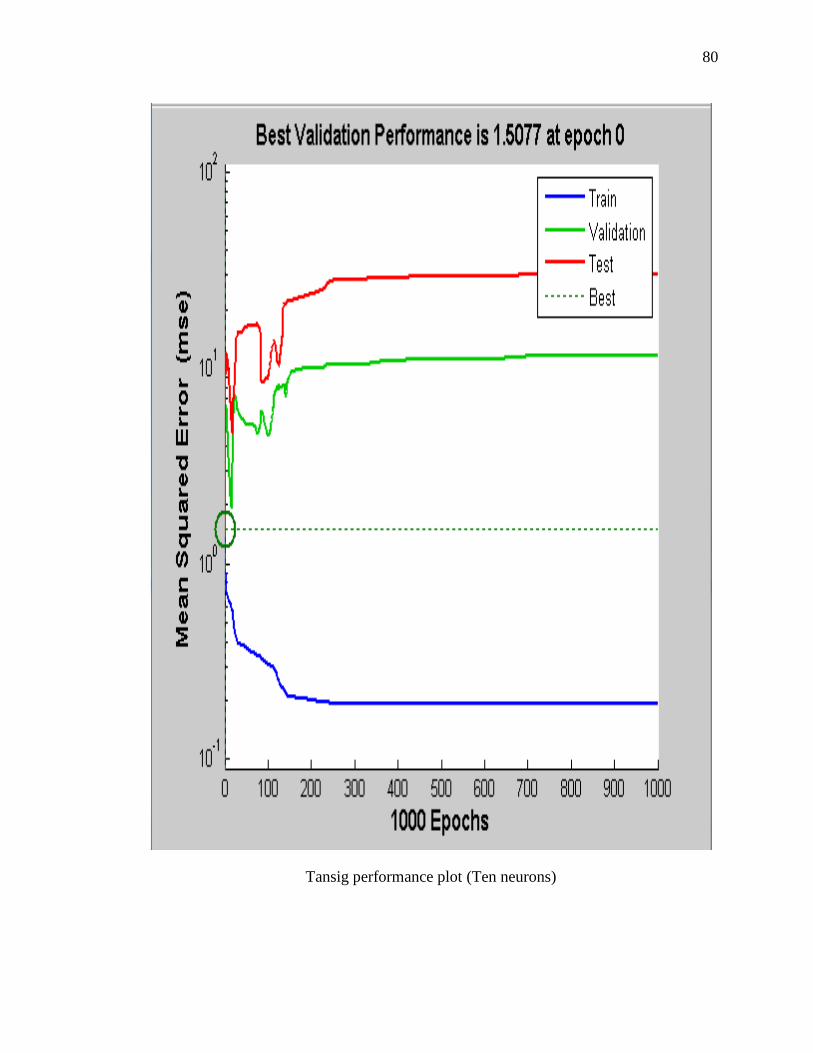
80
Tansig performance plot (Ten neurons)
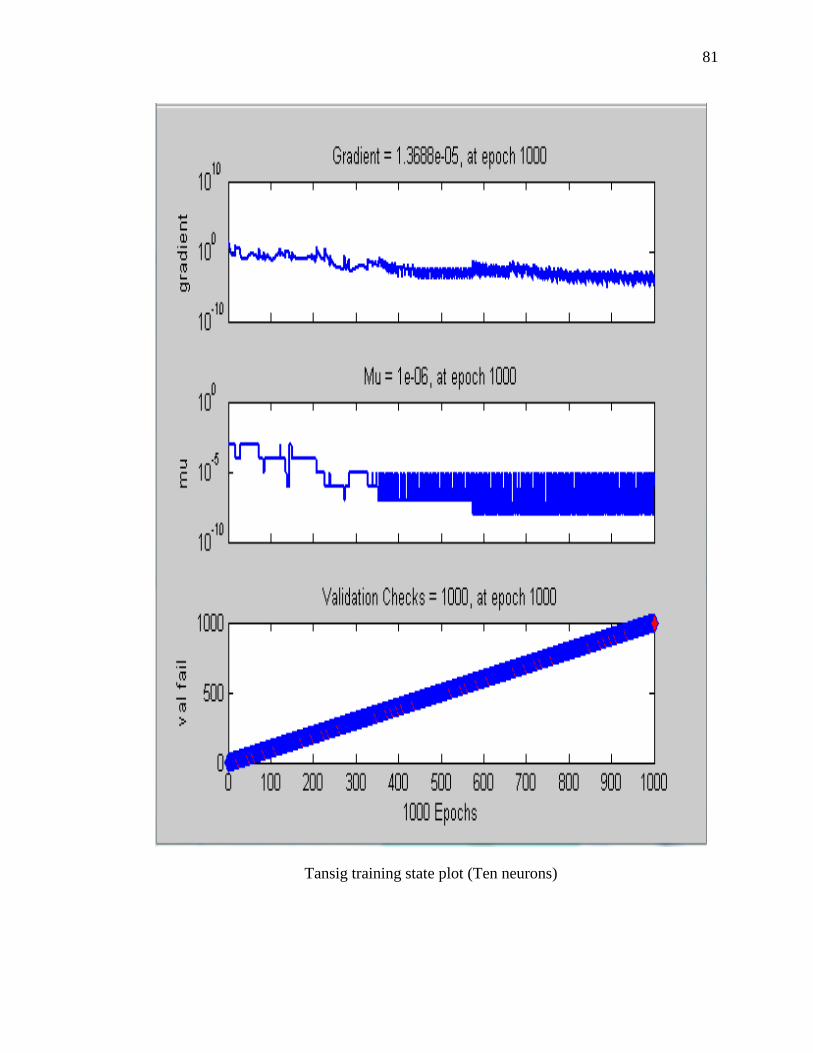
81
Tansig training state plot (Ten neurons)
82
REFERENCES
[1] Enayatollahi, Iman; Aghajani Bazzazi, Abbas; Asadi, Ahamad, 2014. Comparison
between Neural Networks and Multiple Regression Analysis to Predict Rock
Fragmentation in Open-Pit Mines. Rock Mechanics and Rock Engineering, Volume 47,
Issue 2, pp. 799 – 807.
[2] Khandelwal, Manoj and Singh, T.N., 2009. Prediction of blast-induced ground
vibration using artificial neural network. International Journal of Rock Mechanics and
Mining Sciences, Volume 46, Issue 7, pp. 1214 – 1222.
[3] M. Hajihassani; D. Jahed Armaghani; H. Sohaei; E. Tonnizam Mohamad; A. Marto.,
2014. Prediction of airblast-overpressure induced by blasting using a hybrid artificial
neural network and particle swarm optimization. Applied Acoustics, Volume 80,
pp. 57 – 67.
[4] Monjezi, M; Bahrami, A; Yazdian Varjani, A., 2010. Simultaneous prediction of
fragmentation and flyrock in blasting operation using artificial neural networks.
International Journal of Rock Mechanics and Mining Sciences, Volume 47, Issue 3, pp.
476 – 480.
[5] Neaupane, Krishna Murari, and N. R. Adhikari, 2006. Prediction of tunneling-induced
ground movement with the multi-layer perceptron. Tunnelling and Underground Space
Technology 21.2, 151-159.
[6] Monjezi, M., Rizi, S. H., Majd, V. J., and Khandelwal, M., 2014. Artificial neural
network as a tool for backbreak prediction. Geotechnical and Geological
Engineering, 32(1), 21-30.
[7] P.K. Simpson, 1990. Artificial Neural Systems. Foundation, Paradigms, Applications,
and Implementations. Pergamon Press, New York, NY.
[8] Yang Y, Zang O., 1997. A hierarchical analysis for rock engineering using
artificial neural networks. Rock Mech Rock Eng 30:207-222.
[9] Adel Greg, Toni Kojovic, and Darren Thornton, 2006. Mine-to-Mill Optimization of
Aggregate Production. Virginia Polytechnic Institute & State University.
[10] Bahrami, A., Monjezi, M., Goshtasbi, K., & Ghazvinian, A., 2011. Prediction of
rock fragmentation due to blasting using artificial neural network. Engineering with
Computers, 27(2), 177-181.
83
[11] Sayadi, A., Monjezi, M., Talebi, N., and Khandelwal, M., 2013. A comparative
study on the application of various artificial neural networks to simultaneous prediction
of rock fragmentation and backbreak. Journal of Rock Mechanics and Geotechnical
Engineering, 5(4), 318-324.
[12] Mackenzie AS, 1966. Cost of explosives-do you evaluate it properly. Mining Cong J
54:32–41.
[13] Kanchibotla S., 2001. Optimum blasting? Is it minimum cost per broken rock or
maximum value per broken rock? Proceedings of Explo, Australasian institute of mining
and metallurgy.
[14] Hustrulid W., 1999. Blasting principles for open pit mining, vol1. A.A. Balkema,
Rotterdam.
[15] Atasoy, Y., Valery, W., & Skalski, A., 2001. Primary versus secondary crushing at
St Ives (WMC) SAG mill circuit. In SAG 2001 (Vol. 1, pp. 248-261). University of
British Columbia.
[16] Michaux S, Djordjevic N., 2005. Influence of explosive energy on the strength of the
rock fragments and SAG mill throughput. Miner Eng 18:439–448.
[17] Richards, A, 2010. Elliptical airblast overpressure model. Mining Technology, ISSN
1474-9009, Volume 119, pp. 205-211.
[18] Kuzu, C; Fisne, A; Ercelebi, S.G, 2009. Operational and geological parameters in
the assessing blast induced airblast-overpressure in quarries. Applied Acoustics, ISSN
0003-682X, Volume 70, Issue 3, pp. 404 – 411.
[19] Monjezi, M., Amiri, H., Farrokhi, A., & Goshtasbi, K., 2010. Prediction of rock
fragmentation due to blasting in Sarcheshmeh copper mine using artificial neural
networks. Geotechnical and Geological Engineering, 28(4), 423-430.
[20] Wu, Chengqing and Hao, Hong, 2007. Modeling of simultaneous ground shock and
airblast pressure on nearby structures from surface explosions. International Journal of
Impact Engineering, ISSN 0734-743X, Volume 31, Issue 6, pp. 699 – 717.
[21] Baker, W. E., Cox, P. A., Kulesz, J. J., Strehlow, R. A., & Westine, P. S., 2012.
Explosion hazards and evaluation (Vol. 5). Elsevier.
[22] Technical Manual (TM-5-855-1), 1986. Fundamentals of protective design for
conventional weapons. Headquarters, Department of the Army, Washington, DC.
[23] Bulson PS, 1997. Explosive loading of engineering structures. Macmillan Publishers
New Zealand Ltd., E&FN SPON, an Imprint of Chapman & Hall.

84
[24] Mohanty B. Physics of explosions hazards, 1998. In: Beveridge A. editors, Forensic
investigation of explosions. London; p. 22–32.
[25] Persson PA, Holmberg R, Lee J. Rock blasting and explosives engineering, 1994. In:
editors, C.R.C. Press; pp. 375–86, 515.
[26] R.B. Hopler (Ed.), 1998. Blasters’ handbook, International Society of Explosives
Engineers.
[27] Siskind DE, Stachura VJ, Stagg MS, Koop JW, 1980. Structure response and
damage produced by airblast from surface mining. United States Bureau of Mines Report
of Investigation 8485.
[28] Dusenberry, Donald, 2010. Handbook for Blast Resistant Design of Buildings, pages
8-9.
[29] Tawadrous AS., 2006. Evaluation of artificial neural networks as a reliable tool in
blast design. Int Soc Explos Eng, 1,1–12.
[30] Rezaei, M., Monjezi, M., Moghaddam, S. G., & Farzaneh, F., 2012. Burden
prediction in blasting operation using rock geomechanical properties. Arabian Journal of
Geosciences, 5(5), 1031-1037.
[31] Sarkar, Kripamoy, Avyaktanand Tiwary, and T. N. Singh, 2010. Estimation of
strength parameters of rock using artificial neural networks. Bulletin of engineering
geology and the environment, 69.4, 599-606.
[32] Duvall WI, Johnson CF, Meyer AVC, 1963. Vibrations from instantaneous and
millisecond delay quarry blasts. RI. 6151. US, Bureau of Mines, United States
Department of Interior, Washington.
[33] Nicholls HR, Johnson CF, Duvall WI., 1971. Blasting vibrations and their effects on
structures. Bulletin Washington, DC, Bureau of Mines, no. 656.
[34] Siskind DE, Crum SV, Otterness RE, Kopp JW., 1989. Comparative study of
blasting vibrations from Indiana surface coal mines. RI 9226, USBM.
[35] Elseman I, Rasoul A., 2000. Measurement and analysis of the effect of ground
vibration induced by blasting at the limestone quarries of the Egyptian cement company.
Cairo University, Egypt.
[36] Monjezi, Masoud, Mahdi Hasanipanah, and Manoj Khandelwal, 2013. Evaluation
and prediction of blast-induced ground vibration at Shur River Dam, Iran, by artificial
neural network. Neural Computing and Applications, 22.7-8: 1637-1643.
85
[37] Hagan TN., 1973. Rock breakage by explosives. In: Proc Natl Symp on Rock
Fragmentation, Adelaide, Australia, pp 1–17.
[38] Mostafa TM., 2009. Artificial neural network for prediction and control of blasting
vibrations in Assiut (Egypt) limestone quarry. Int J Rock Mech Min Sci 46(2):426–431.
[39] McKenzie, C., 1990. Quarry Blast Monitoring Technical and Environmental
Perspective, Quarry Management, pp. 23–29.
[40] Duvall, W.I., Fogleson, D.E., 1962. Review of criteria for estimating damage to
residences from blasting vibrations. USBM, RI, vol. 5968, p. 19.
[41] Ghosh, A., Daemen, J.K., 1983. A simple new blast vibration predictor. In: Proc.
24th US Symp. Rock Mechanics, Texas, USA, pp. 151–161.
[42] N.R. Ambraseys, A.J. Hendron, 1968. Dynamic behaviour of rock masses: rock
mechanics in engineering practices Wiley, London.
[43] W.J. Birch, R. Chaffer, 1983. Prediction of ground vibration from blasting on
opencast sites. Trans. Inst. Mining Metall., Section A: Mining Ind., pp. A102–A107.
[44] Bureau of Indian Standard, 1973.Bureau of Indian Standard. Criteria for safety and
design of structures subjected to underground blast. ISI Bulletin IS-6922.
[45] Khandelwal, Manoj, D. Lalit Kumar, and Mohan Yellishetty, 2011. Application of
soft computing to predict blast-induced ground vibration. Engineering with Computers,
pp. 117-125.
[46] U. Langefors, B. Kihlstrom, 1963. The modern technique of rock blasting. Wiley,
New York.
[47] B. Davies, I.W. Farmer, P.B. Attewell, 1964.Ground vibrations from shallow sub-
surface blasts. The Engineer, London, pp. 553–559.
[48] C.H. Dowding, 1985.Blast Vibration Monitoring and Control Prentice-Hall Inc.,
Englewood’s Cliffs pp. 288–290.
[49] Khandelwal, Manoj, and T. N. Singh, 2007. Evaluation of blast-induced ground
vibration predictors. Soil Dynamics and Earthquake Engineering, pp. 116-125.
[50] Monjezi, M., M. Ghafurikalajahi, and A. Bahrami, 2011. Prediction of blast-induced
ground vibration using artificial neural networks. Tunnelling and Underground Space
Technology 26.1, 46-50.
86
[51] Rodríguez, Rafael, Cristobal Lombardía, and Susana Torno, 2010. Prediction of the
airwave due to blasting inside tunnels: approximation to a ‘phonometric
curve’. Tunnelling and Underground Space Technology, 25, 483-489.
[52] Khandelwal, Manoj, 2010. Evaluation and prediction of blast-induced ground
vibration using support vector machine. International Journal of Rock Mechanics and
Mining Sciences, ISSN 1365-1609, Volume 47, Issue 3, pp. 509 – 516.
[53] Nateghi, Reza, 2012. Evaluation of blast induced ground vibration for minimizing
negative effects on surrounding structures. Soil Dynamics and Earthquake
Engineering, 43, 133-138.
[54] Grundstrom, C., Kanchibotla, S., Jankovich, A., Thornton, D., & Pacific, D. D. N.
A., 2001. Blast fragmentation for maximizing the sag mill throughput at Porgera Gold
Mine. In proceedings of the annual conference on explosives and blasting technique, Vol.
1, pp. 383-400.
[55] U. Langefors, B. Kihlstrom, 1963. The modern technique of rock blasting. Wiley,
New York.
[56] Cunningham C. V. B., 1983. The Kuz-Ram model for prediction of fragmentation
from blasting, Lulea Fragmentation Conference, pp 439-454.
[57] National Association of Australian State Road Authorities, 1983. Explosives in
Roadworks - A Users Guide, NAASRA, Sydney.
[58] KuznetsovV. M., 1973. The mean diameter of the fragments formed by blasting
rock. Soviet Mining Science, 144-148.
[59] Segarra, P., et al., 2010. Prediction of near field overpressure from quarry blasting.
Applied Acoustics 71(12), 1169-1176.
[60] P. Pal Roy, 2005. Rock blasting effects and operations. Balkema Publisher
[61] Gao, Fuqiang and Wang, Xiaoqiang, 2012. Using artificial neural network to predict
blast-induced ground vibration. Applied Mechanics and Materials, ISSN 1660-9336,
ISBN 9783037854228, Volume 170-173, pp. 1013 – 1016.
[62] Monjezi, M; Ahmadi, M; Sheikhan, M; Bahrami, A; Salimi, A.R, 2010. Predicting
blast-induced ground vibration using various types of neural networks. Soil Dynamics
and Earthquake Engineering, ISSN 0267-7261, Volume 30, Issue 11, pp. 1233 – 1236.
[63] Görgülü, K., Arpaz, E., Demirci, A., Koçaslan, A., Dilmaç, M. K., & Yüksek, A. G.,
2013. Investigation of blast-induced ground vibrations in the Tülü boron open pit mine.
Bulletin of Engineering Geology and the Environment, 72(3-4), 555-564.
87
[64] Khandelwal, Manoj and Singh, T.N, 2006. Prediction of blast induced ground
vibrations and frequency in opencast mine: A neural network approach. Journal of Sound
and Vibration, ISSN 0022-460X, Volume 289, Issue 4, pp. 711 – 725.
[65] Mohamad, Edy Tonnizam; Noorani, Seyed Ahmad; Armaghani, Danial Jahed; Saad,
Rosli, 2012. Simulation of blasting induced ground vibration by using artificial neural
network. Electronic Journal of Geotechnical Engineering, EISSN 1089-3032, Volume 17,
pp. 2571 – 2584.
[66] Kamali M. and Ataei M., 2010. Prediction of blast induced ground vibrations in
Karoun III power plant and dam: a neural network. Journal of the South African institute
of mining and metallurgy, ISSN 0038-223X, Volume 110, Issue 8, pp. 481 – 490.
[67] Lu, Yong, 2005. Underground blast induced ground shock and its modelling using
artificial neural network. Computers and Geotechnics, ISSN 0266-352X, Volume 32,
Issue 3, pp. 164 – 178.
[68] Faramarzi, F., Farsangi, M. A. E., & Mansouri, H., 2014. Simultaneous investigation
of blast induced ground vibration and airblast effects on safety level of structures and
human in surface blasting. International Journal of Mining Science and Technology,
24(5), 663-669.
[69] Majdi, Abbas, and Mohammad Rezaei, 2013. Prediction of unconfined compressive
strength of rock surrounding a roadway using artificial neural network. Neural
Computing and Applications 23.2, 381-389.
[70] C.J. Konya, E.J. Walter, 1990.Surface blast design. Prentice Hall, Englewood Cliffs.
[71] Ranjith, P. G., and Manoj Khandelwal, 2012. Artificial neural network for prediction
of air flow in a single rock joint." Neural Computing and Applications 21.6, 1413-1422.
[72] R. Rodríguez, J. Toraño, M. Menéndez, 2007. Prediction of the airblast wave effects
near a tunnel advanced by drilling and blasting. Tunn Undergr Sp Technol, pp. 241–25.
[73] Leu, Sou-Sen, Chee-Nan Chen, and Shiu-Lin Chang, 2001. Data mining for tunnel
support stability: neural network approach. Automation in Construction 10.4, 429-441.
[74] M.T. Mohamed. Performance of fuzzy logic and artificial neural network in
prediction of ground and air vibrations, 2011. Int J Rock Mech Min Sci, 48, pp.
845–851.
[75] M. Khandelwal, T.N. Singh, 2005. Prediction of blast induced air overpressure in
opencast mine. Noise and Vibration Control Worldwide, 36, pp. 7–16.
88
[76] E. Tonnizam Mohamad, M. Hajihassani, D. Jahed Armaghani, A. Marto, 2012.
Simulation of blasting-induced air overpressure by means of artificial neural networks.
Int Rev Modell Simulations, pp. 2501–2506.
[77] Meulenkamp, F., and M. Alvarez Grima, 1999. Application of neural networks for
the prediction of the unconfined compressive strength (UCS) from Equotip hardness.
International Journal of rock mechanics and mining sciences, 36.1, 29-39.
[78] Shahin, Mohamed A., Mark B. Jaksa, and Holger R. Maier, 2001. Artificial neural
network applications in geotechnical engineering. Australian Geomechanics, 36.1, 49-62.
[79] Monjezi, M., Ahmadi, Z., Varjani, A. Y., and Khandelwal, M., 2013. Backbreak
prediction in the Chadormalu iron mine using artificial neural network. Neural
Computing and Applications, 23(3-4), 1101-1107.
[80] Trivedi, R., T. N. Singh, and A. K. Raina, 2014. Prediction of blast-induced flyrock
in Indian limestone mines using neural networks. Journal of Rock Mechanics and
Geotechnical Engineering, 6.5, 447-454.
[81] Rosenblatt, Frank, 1958. The perceptron: a probabilistic model for information
storage and organization in the brain. Psychological review 65.6, 386.
[82] Paley, N., and Kojovic, T., 2001. Adjusting blasting to increase SAG mill
throughput at the Red Dog mine, Proc 27th ISEE Annual Conference, Orlando, January,
pp. 65-80.
[83] Valery, W., Morrell, S., Kojovic, T., Kanchibotla, S.S., and Thornton, D.M., 2001.
Modeling and Simulation Techniques Applied for Optimisation of Mine to Mill
Operations and Case Studies”, Proceedings - VI Southern Hemisphere Meeting on
Mineral Technology, CETEM/MCT, Rio de Janeiro, Brazil, pp. 107-116.
[84] Werbos, P.J., 1975. Beyond Regression: New Tools for Prediction and Analysis in
the Behavioral Sciences.
[85] Rumelhart, D.E; James McClelland, 1986. Parallel Distributed Processing:
Explorations in the Microstructure of Cognition. Cambridge: MIT Press.
[86] Monjezi, M., Mehrdanesh, A., Malek, A., & Khandelwal, M., 2013. Evaluation of
effect of blast design parameters on flyrock using artificial neural networks. Neural
Computing and Applications, 23(2), 349-356.

89
VITA
Raymond Ninnang Tiile was born in Upper West Region, Ghana. He holds a BS
in Mining Engineering from the University of Mines and Technology, Tarkwa, Ghana.
He is a young ambitious mining engineer with excellent technical training and working
experience with a strong desire to take his career to greater heights.
After successfully attaining his bachelors, he gathered enormous training and
experience working with a number of mining companies in Ghana namely; Strategic
Mining Support services (SMiSS), AngloGold Ashanti mine, Maxam Explosive Limited
and Perseus Mining Limited.
He subsequently gained admission to study MS in Mining Engineering at
Missouri University of Science and Technology in Rolla, Missouri. During this period, he
took a couple of graduate courses and served as a Graduate Research Assistant and
Teaching Assistant. He was also an active member of different professional organizations
including Society for Mining, Metallurgy and Exploration (SME) and Canadian Institute
of Mining, Metallurgy and Petroleum (CIM).
Raymond graduated with MS Mining Engineering in July 2016.