armenia economic report 2014: eurasian integration and trade
TRANSCRIPT
ARMENIA ECONOMIC REPORT 2014
Eurasian Integration and Trade
November 2014
ECONOMIC DEVELOPMENT AND RESEARCH CENTER (EDRC)
RESEARCH TEAM
Mushegh TUMASYAN
Armen GRIGORIAN
Yelena MANUKYAN
Karine HARUTYUNYAN
AER 2014 is drafted and published by the support of Deutsche Gesellschaft fur Internationale
Zusammenarbeit (GIZ).
The authors express their gratitude to the “Republican Union of Employers of Armenia” for their support and
cooperation.
The opinions and conclusions expressed in the Report belong to authors and do not necessarily coincide with official
views or position of any governmental body or GIZ.
Proper reference to the Report when citing is obligatory.
ARMENIA ECONOMIC REPORT 2014
© “ECONOMIC DEVELOPMENT AND RESEARCH CENTER” EDRC, 2014
For questions and suggestion please contact EDRC: +374 (0) 60 540 289, [email protected], www.edrc.am
ABOUT THE ARMENIA ECONOMIC REPORT (AER)
The Armenia Economic Report (hereafter AER or the Report) is an annual analytical periodical which aims
to support accountability and evidence-based decision making culture in Armenia. It particular sets out to
analyse and interpret economic policies and developments, raise awareness, and create a sounder base
for enhanced policy discussions and development.
The Report consists of two main sections. The first section refers to the economic developments of the
previous year. This among others includes global development trends, macroeconomic developments in
Armenia, industrial production, labour market and poverty situation. In addition, economic outlook for
the coming three years are presented in this section.
Section two of the Report is each year dedicated to a certain theme and addresses a specific urgent
issue for Armenia. This part of the Report involves analyses of the chosen topic and discussions on the
direction of economic policy regarding the touched upon thematic.
The general theme of the AER 2014 is Eurasian Integration and Trade. The Report presents (potential)
trade development trends and assessment of the Eurasian Economic Union membership.
Every year, development of the AER involves partnerships and collaboration with various stakeholder
groups, public and private organizations, including governmental bodies and relevant academic and civic
society organizations in Armenia.
AER (2014) is developed by the Economic Development and Research Center (EDRC) which is an
independent analytical center based in Armenia. The Report is prepared with the generous support of the
Deutsche Gesellschaft fur Internationale Zusammenarbeit (GIZ).
The electronic Armenian and English versions of AERs are available at www.edrc.am
Recent Armenia Economic Reports:
AER 2013: Human Capital and Growth Perspectives
AER 2011/2012: Trade Policy and Growth Sustainability
AER 2010: The Necessity in Economy Diversification and Export Expansion
AER 2009: From Crisis to New Development

E D R C ( 2 0 1 4 ) | p a g e 5
TABLE OF CONTENTS
EXECUTIVE SUMMARY .............................................................................................................. 7
ECONOMIC DEVELOPMENT TRENDS ........................................................................................ 9
1.1. Global Economic Trends .............................................................................................. 10
Global Output ........................................................................................................................... 10
Largest Economies .................................................................................................................... 12
Welfare Distribution .................................................................................................................. 13
Commodity Prices ..................................................................................................................... 13
Consumer Prices ....................................................................................................................... 15
1.2. Economic Trends in Armenia ....................................................................................... 16
Economic Growth and GDP ........................................................................................................ 16
GDP Expenditure Structure ........................................................................................................ 17
Foreign Trade and Current Account ............................................................................................ 18
Remittances ............................................................................................................................. 19
Savings and Budget Indicators ................................................................................................... 20
External Debt ........................................................................................................................... 21
Exchange Rates ........................................................................................................................ 22
Consumer Prices ....................................................................................................................... 23
Foreign Investments ................................................................................................................. 23
1.3. Labour Market and Unemployment ............................................................................ 26
Labour Force ............................................................................................................................ 26
Employment Profile ................................................................................................................... 27
Remuneration ........................................................................................................................... 28
Unemployment Trends .............................................................................................................. 29
1.4. Poverty and Social Snapshot ....................................................................................... 33
Overall Trends .......................................................................................................................... 33
Regional Picture of Poverty ........................................................................................................ 34
Main Socio-Demographic Characteristics of the Poor .................................................................... 36
Impact of Social Transfers ......................................................................................................... 38
1.5. Economic Outlook ....................................................................................................... 39
EURASIAN INTEGRATION AND TRADE FLOWS OF ARMENIA ................................................ 43
2.1. Introduction ................................................................................................................ 44
2.2. Eurasian Integration Process ...................................................................................... 46
2.3. Foreign Trade of Armenia ........................................................................................... 50
Overview of Trade Policy ........................................................................................................... 50
Trade Flows and Partners .......................................................................................................... 50
General Geography of Foreign Trade .......................................................................................... 50
The Role of CIS and EEU Countries in Armenian Foreign Trade ..................................................... 57
Importance of the Russia ........................................................................................................... 60
P a g e 6 | ARMENIA ECONOMIC REPORT ( 2 0 1 4 )
2.4. Trade Flows Impact Analysis ...................................................................................... 62
Trade Creation and Diversion Effects .......................................................................................... 62
Trade with EAEU Countries ........................................................................................................ 62
Trade with Countries that have Free Trade Agreements with Armenia ........................................... 63
Trade with Third Countries ........................................................................................................ 63
Trade Overlap .......................................................................................................................... 64
2.5. Tariff Increase and Main Trade Items of High Risk .................................................... 65
Magnitude of Tariff Rate Changes .............................................................................................. 65
Group of Items with High Consumer Impact Risk ......................................................................... 67
2.6. Summary of the Results and Conclusions ................................................................... 69
Positive Consequences and Opportunities .................................................................................... 69
Negative Impact and Risks ........................................................................................................ 70
Conclusions .............................................................................................................................. 71
Suggestions for Further Research ............................................................................................... 72
APPENDICES ........................................................................................................................... 73
Appendix 1. The Traditional Theories of Trade Liberalization ........................................... 73
Appendix 2. Major types of International Economic Integration ...................................... 76
Appendix 3. List of Imported Consumer Goods ................................................................. 77
Appendix 4. Major Imported Goods ................................................................................... 80
LIST OF FIGURES .................................................................................................................... 84
LIST OF TABLES ...................................................................................................................... 85
ABBREVIATIONS .................................................................................................................... 86
E D R C ( 2 0 1 4 ) | p a g e 7
EXECUTIVE SUMMARY
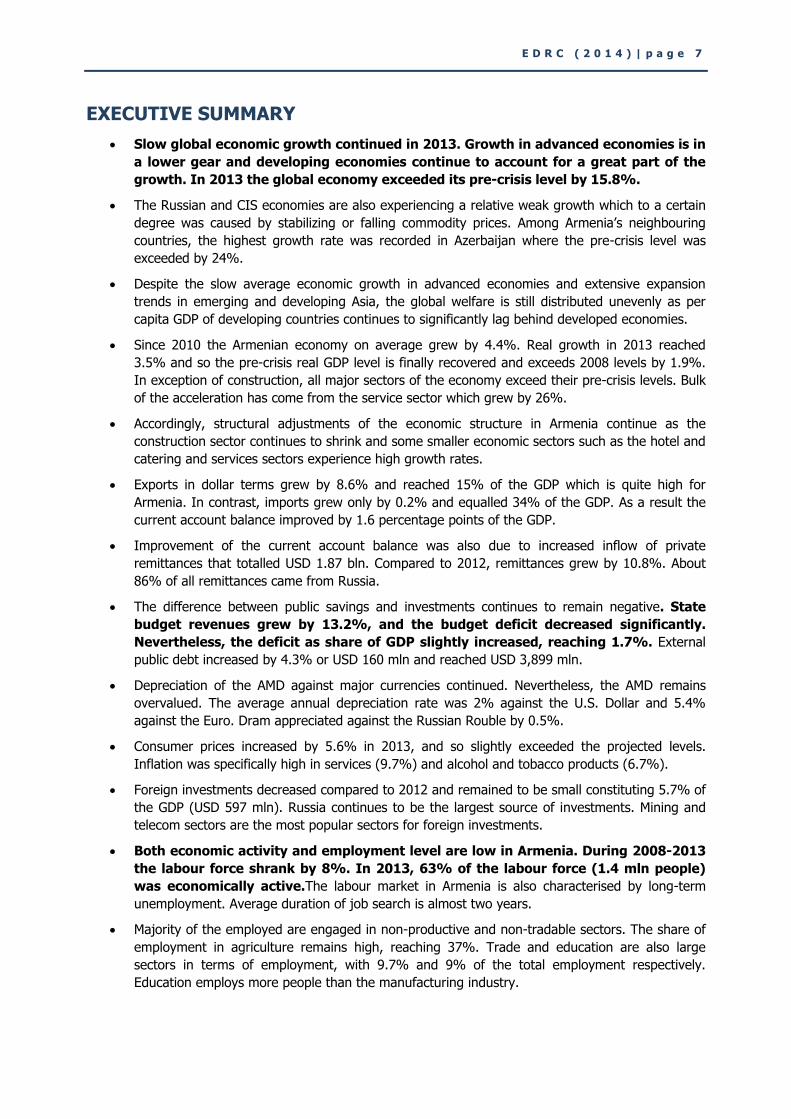
Slow global economic growth continued in 2013. Growth in advanced economies is in
a lower gear and developing economies continue to account for a great part of the
growth. In 2013 the global economy exceeded its pre-crisis level by 15.8%.
The Russian and CIS economies are also experiencing a relative weak growth which to a certain
degree was caused by stabilizing or falling commodity prices. Among Armenia’s neighbouring
countries, the highest growth rate was recorded in Azerbaijan where the pre-crisis level was
exceeded by 24%.
Despite the slow average economic growth in advanced economies and extensive expansion
trends in emerging and developing Asia, the global welfare is still distributed unevenly as per
capita GDP of developing countries continues to significantly lag behind developed economies.
Since 2010 the Armenian economy on average grew by 4.4%. Real growth in 2013 reached
3.5% and so the pre-crisis real GDP level is finally recovered and exceeds 2008 levels by 1.9%.
In exception of construction, all major sectors of the economy exceed their pre-crisis levels. Bulk
of the acceleration has come from the service sector which grew by 26%.
Accordingly, structural adjustments of the economic structure in Armenia continue as the
construction sector continues to shrink and some smaller economic sectors such as the hotel and
catering and services sectors experience high growth rates.
Exports in dollar terms grew by 8.6% and reached 15% of the GDP which is quite high for
Armenia. In contrast, imports grew only by 0.2% and equalled 34% of the GDP. As a result the
current account balance improved by 1.6 percentage points of the GDP.
Improvement of the current account balance was also due to increased inflow of private
remittances that totalled USD 1.87 bln. Compared to 2012, remittances grew by 10.8%. About
86% of all remittances came from Russia.
The difference between public savings and investments continues to remain negative. State
budget revenues grew by 13.2%, and the budget deficit decreased significantly.
Nevertheless, the deficit as share of GDP slightly increased, reaching 1.7%. External
public debt increased by 4.3% or USD 160 mln and reached USD 3,899 mln.
Depreciation of the AMD against major currencies continued. Nevertheless, the AMD remains
overvalued. The average annual depreciation rate was 2% against the U.S. Dollar and 5.4%
against the Euro. Dram appreciated against the Russian Rouble by 0.5%.
Consumer prices increased by 5.6% in 2013, and so slightly exceeded the projected levels.
Inflation was specifically high in services (9.7%) and alcohol and tobacco products (6.7%).
Foreign investments decreased compared to 2012 and remained to be small constituting 5.7% of
the GDP (USD 597 mln). Russia continues to be the largest source of investments. Mining and
telecom sectors are the most popular sectors for foreign investments.
Both economic activity and employment level are low in Armenia. During 2008-2013
the labour force shrank by 8%. In 2013, 63% of the labour force (1.4 mln people)
was economically active.The labour market in Armenia is also characterised by long-term
unemployment. Average duration of job search is almost two years.
Majority of the employed are engaged in non-productive and non-tradable sectors. The share of
employment in agriculture remains high, reaching 37%. Trade and education are also large
sectors in terms of employment, with 9.7% and 9% of the total employment respectively.
Education employs more people than the manufacturing industry.
P a g e 8 | ARMENIA ECONOMIC REPORT ( 2 0 1 4 )
Remuneration levels increased as the average monthly salary in 2013 increased by 33.5%.
Salary levels are relatively high in finance and insurance, IT and telecommunication sectors and
lowest in education, healthcare, social service, culture, trade, and agriculture sectors.
Since 2011 there has been steady decline of unemployment. In 2013 unemployment
reached 16.2% which is slightly lower than its pre-crisis level. Unemployment in
Armenia has an urban character as unemployment in towns and cities is very higher
and reached 23.4% in 2013. Unemployment also continues to have a gender and age
dimension as it is higher among women and youth.
The high real growth in 2012 and increased remittances caused a significant decrease of
poverty. Nevertheless, poverty and particularly extreme poverty indicators still exceed pre-crisis
levels and inequality has continuously increased. In 2012, 32.4% of the Armenian households (or
about 1 mln people) were poor, while 2.8% (85 thousand people) were extremely poor.
Poverty incidence is partially determined by low income from labour. The problem of working
poor continues to remain valid in Armenia. Poverty incidence is not low even in households that
have 3 and more working/employed members.
The global economic outlook is more positive as the global economy is expected to
grow faster in the coming years. WB and IMF project about 3.4-3.6% growth in
global output which exceeds actual growth rates of the last two years.
The Armenian economy is expected to grow by 4-6% in 2014. Projections of international
organizations (IMF and ADB) are more conservative and involve 4.3-4.6%. Growth is expected to
somewhat accelerate in 2015-2016 and reach 4.7%, nevertheless projections remain lower than
the actual average growth rate of the past 3 years (5%).
The Eurasian integration is a manifestation of great geopolitical processes which opposes
western processes. Armenia as a small country is anyhow forced to be a part of this process.
With membership in the EAEU, Armenia is forced to significantly change its trade policy with
third countries which is economically not effective for the country. This is made evident by the
large list of exemptions for the 2015-2022 period.
Positive potential economic benefits of membership are limited and this only can be considerable
in case of increased competition, enhanced administration etc. The main source of economic
benefit will be occurrence of long term dynamic effects which also has limitations and particular
analysis on this topic are needed.
Instead the possible price rise of raw material and capital goods will have a negative impact on
Armenia’s economy. The potential for negative impact of trade diversion and increased prices of
products imported from third countries is very high. If exceptions are not made adequately then
socio-economic consequences will be dramatically large.
E D R C ( 2 0 1 4 ) | p a g e 9
Section 1 ECONOMIC DEVELOPMENT TRENDS
1.1. Global Economic Trends
1.2. Economic Trends in Armenia
1.3. Labour Market and Unemployment
1.4. Poverty and Social Snapshot
1.5. Economic Outlook
P a g e 10 | ARMENIA ECONOMIC REPORT ( 2 0 1 4 )
1.1. Global Economic Trends
Global Output
The global economy continues to grow slowly and with declining growth rates. In 2013, the global output
was estimated to grow by 3% in contrast to average annual growth of 4% during 2010-2012. As a
result, the global economy in 2013 exceeded the pre-crisis level by 16%.
The IMF estimates in April 2014 were more optimistic than the estimates of October 2013. This is mostly
explained by the higher-than-expected performance of the U.S. economy.
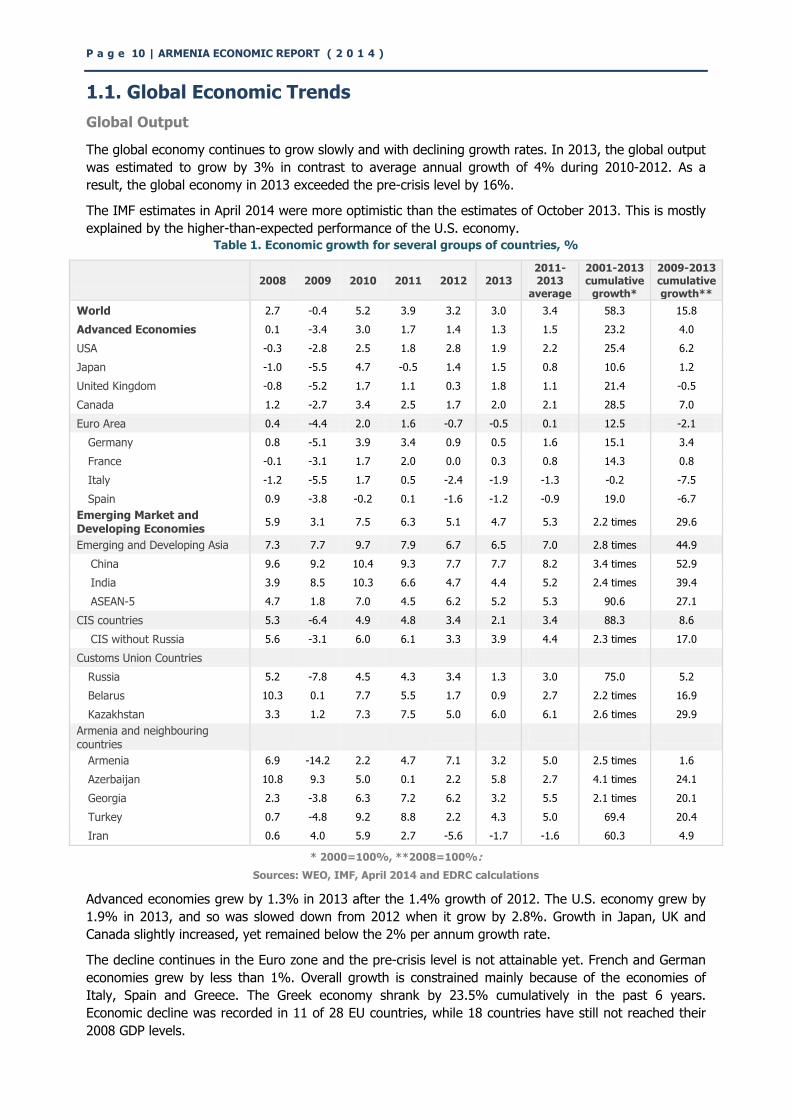
Table 1. Economic growth for several groups of countries, %
2008 2009 2010 2011 2012 2013
2011-2013
average
2001-2013 cumulative
growth*
2009-2013 cumulative growth**
World 2.7 -0.4 5.2 3.9 3.2 3.0 3.4 58.3 15.8
Advanced Economies 0.1 -3.4 3.0 1.7 1.4 1.3 1.5 23.2 4.0
USA -0.3 -2.8 2.5 1.8 2.8 1.9 2.2 25.4 6.2
Japan -1.0 -5.5 4.7 -0.5 1.4 1.5 0.8 10.6 1.2
United Kingdom -0.8 -5.2 1.7 1.1 0.3 1.8 1.1 21.4 -0.5
Canada 1.2 -2.7 3.4 2.5 1.7 2.0 2.1 28.5 7.0
Euro Area 0.4 -4.4 2.0 1.6 -0.7 -0.5 0.1 12.5 -2.1
Germany 0.8 -5.1 3.9 3.4 0.9 0.5 1.6 15.1 3.4
France -0.1 -3.1 1.7 2.0 0.0 0.3 0.8 14.3 0.8
Italy -1.2 -5.5 1.7 0.5 -2.4 -1.9 -1.3 -0.2 -7.5
Spain 0.9 -3.8 -0.2 0.1 -1.6 -1.2 -0.9 19.0 -6.7
Emerging Market and Developing Economies
5.9 3.1 7.5 6.3 5.1 4.7 5.3 2.2 times 29.6
Emerging and Developing Asia 7.3 7.7 9.7 7.9 6.7 6.5 7.0 2.8 times 44.9
China 9.6 9.2 10.4 9.3 7.7 7.7 8.2 3.4 times 52.9
India 3.9 8.5 10.3 6.6 4.7 4.4 5.2 2.4 times 39.4
ASEAN-5 4.7 1.8 7.0 4.5 6.2 5.2 5.3 90.6 27.1
CIS countries 5.3 -6.4 4.9 4.8 3.4 2.1 3.4 88.3 8.6
CIS without Russia 5.6 -3.1 6.0 6.1 3.3 3.9 4.4 2.3 times 17.0
Customs Union Countries
Russia 5.2 -7.8 4.5 4.3 3.4 1.3 3.0 75.0 5.2
Belarus 10.3 0.1 7.7 5.5 1.7 0.9 2.7 2.2 times 16.9
Kazakhstan 3.3 1.2 7.3 7.5 5.0 6.0 6.1 2.6 times 29.9
Armenia and neighbouring countries
Armenia 6.9 -14.2 2.2 4.7 7.1 3.2 5.0 2.5 times 1.6
Azerbaijan 10.8 9.3 5.0 0.1 2.2 5.8 2.7 4.1 times 24.1
Georgia 2.3 -3.8 6.3 7.2 6.2 3.2 5.5 2.1 times 20.1
Turkey 0.7 -4.8 9.2 8.8 2.2 4.3 5.0 69.4 20.4
Iran 0.6 4.0 5.9 2.7 -5.6 -1.7 -1.6 60.3 4.9
* 2000=100%, **2008=100%:
Sources: WEO, IMF, April 2014 and EDRC calculations
Advanced economies grew by 1.3% in 2013 after the 1.4% growth of 2012. The U.S. economy grew by
1.9% in 2013, and so was slowed down from 2012 when it grow by 2.8%. Growth in Japan, UK and
Canada slightly increased, yet remained below the 2% per annum growth rate.
The decline continues in the Euro zone and the pre-crisis level is not attainable yet. French and German
economies grew by less than 1%. Overall growth is constrained mainly because of the economies of
Italy, Spain and Greece. The Greek economy shrank by 23.5% cumulatively in the past 6 years.
Economic decline was recorded in 11 of 28 EU countries, while 18 countries have still not reached their
2008 GDP levels.
E D R C ( 2 0 1 4 ) | p a g e 1 1
Compared to the 5.0% growth of the previous year, economic growth of emerging market and
developing economies slowed down and reached 4.7%. Emerging and developing Asia continues to play
the leading role in the expansion of the global economy. Growth rate of the Chinese economy is high and
stable - 7.7%. Growth in the Indian economy slightly slowed down to 4.4%.
The average CIS growth rate is 2.1% which is considerably lower than the previous year’s growth. The
Russian economy grew by 1.3% following the 3.4% growth in 2012.
Among the neighbouring countries, the highest growth rate in 2013 was recorded in Azerbaijan where
the pre-crisis level was exceeded by 24%. Turkey comes next with 4.3% growth, and a cumulative
growth of 20% since 2008. Against high and stable growth rates in 2010-2012, in 2013, a 3.2% growth
was recorded in Georgia. Iran is still experiencing economic decline that started in 2012.
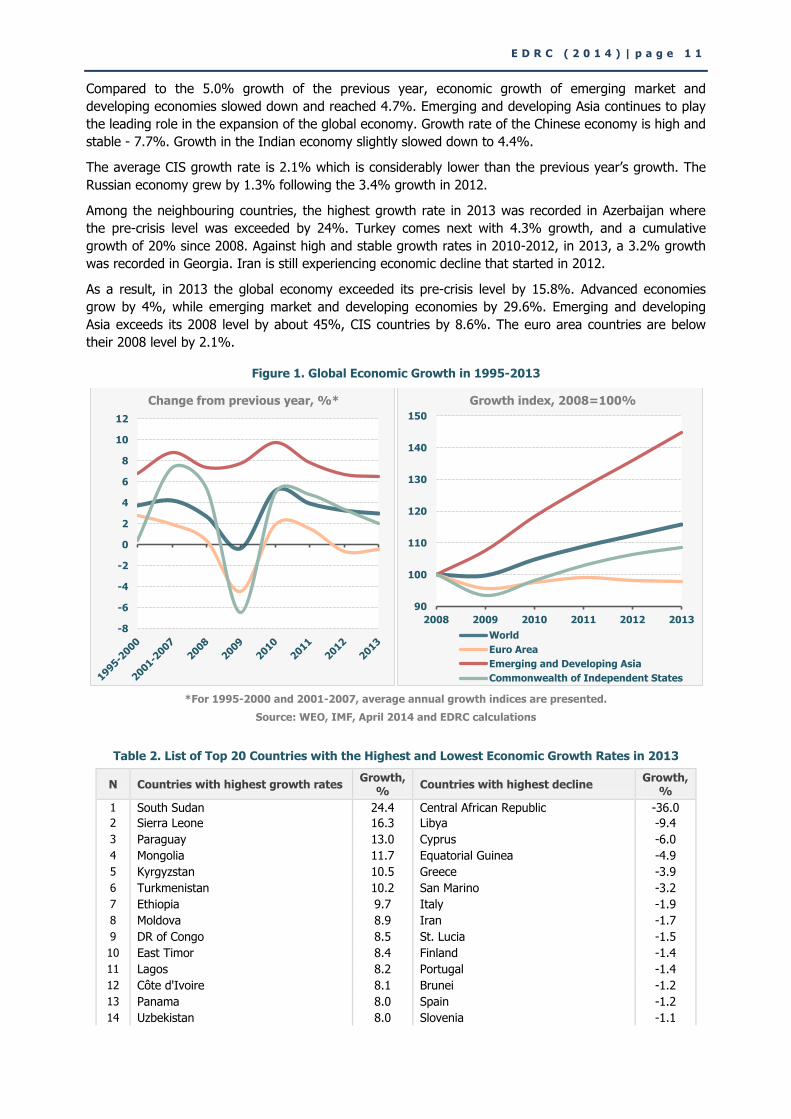
As a result, in 2013 the global economy exceeded its pre-crisis level by 15.8%. Advanced economies
grow by 4%, while emerging market and developing economies by 29.6%. Emerging and developing
Asia exceeds its 2008 level by about 45%, CIS countries by 8.6%. The euro area countries are below
their 2008 level by 2.1%.
Figure 1. Global Economic Growth in 1995-2013
*For 1995-2000 and 2001-2007, average annual growth indices are presented.
Source: WEO, IMF, April 2014 and EDRC calculations
Table 2. List of Top 20 Countries with the Highest and Lowest Economic Growth Rates in 2013
N Countries with highest growth rates Growth,
% Countries with highest decline
Growth, %
1 South Sudan 24.4 Central African Republic -36.0
2 Sierra Leone 16.3 Libya -9.4
3 Paraguay 13.0 Cyprus -6.0
4 Mongolia 11.7 Equatorial Guinea -4.9
5 Kyrgyzstan 10.5 Greece -3.9
6 Turkmenistan 10.2 San Marino -3.2
7 Ethiopia 9.7 Italy -1.9
8 Moldova 8.9 Iran -1.7
9 DR of Congo 8.5 St. Lucia -1.5
10 East Timor 8.4 Finland -1.4
11 Lagos 8.2 Portugal -1.4
12 Côte d'Ivoire 8.1 Brunei -1.2
13 Panama 8.0 Spain -1.2
14 Uzbekistan 8.0 Slovenia -1.1
-8
-6
-4
-2
0
2
4
6
8
10
12
Change from previous year, %*
90
100
110
120
130
140
150
2008 2009 2010 2011 2012 2013
World
Euro Area
Emerging and Developing Asia
Commonwealth of Independent States
Growth index, 2008=100%
P a g e 12 | ARMENIA ECONOMIC REPORT ( 2 0 1 4 )
15 Liberia 8.0 Croatia -1.0
16 China 7.7 Czech Republic -0.9
17 Myanmar 7.5 Netherlands -0.8
18 Tajikistan 7.4 Barbados -0.7
19 Sri Lanka 7.3 Samoa -0.3
20 Philippines 7.2 Ireland -0.3
Note: Some data are estimates. Armenia is 96th by growth rate in 2013.
Source: WEO, IMF, April 2014 and EDRC calculations
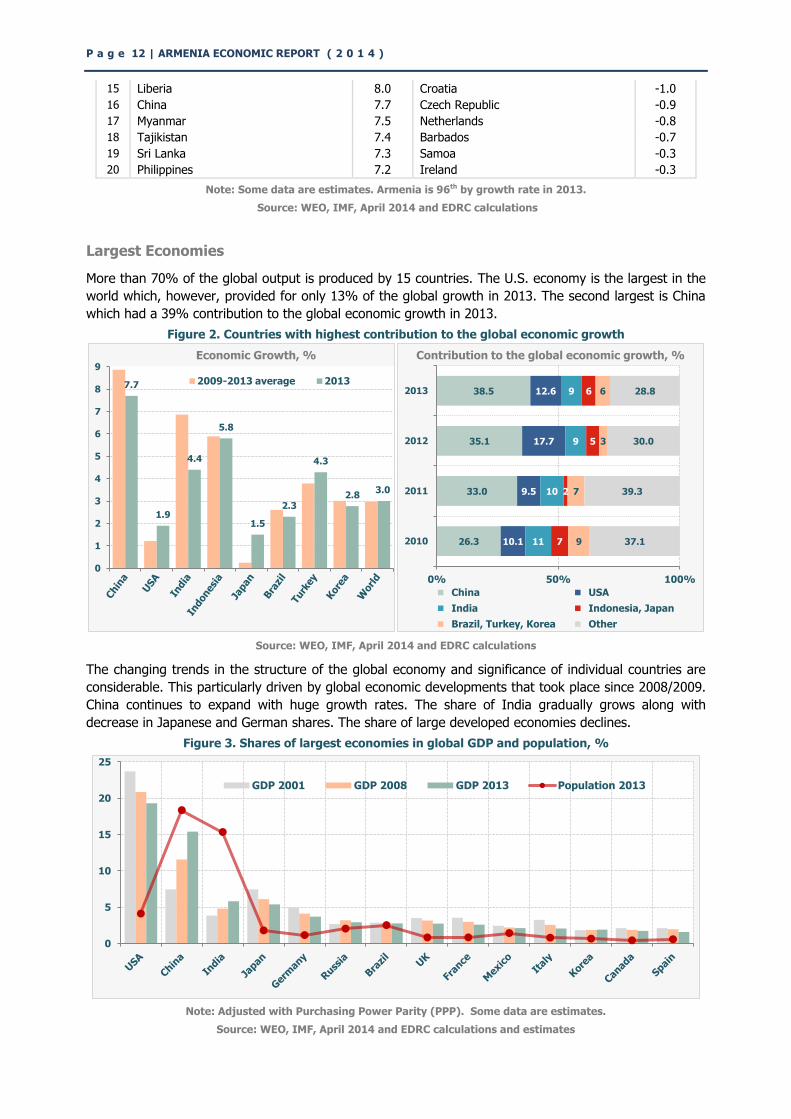
Largest Economies
More than 70% of the global output is produced by 15 countries. The U.S. economy is the largest in the
world which, however, provided for only 13% of the global growth in 2013. The second largest is China
which had a 39% contribution to the global economic growth in 2013.
Figure 2. Countries with highest contribution to the global economic growth
Source: WEO, IMF, April 2014 and EDRC calculations
The changing trends in the structure of the global economy and significance of individual countries are
considerable. This particularly driven by global economic developments that took place since 2008/2009.
China continues to expand with huge growth rates. The share of India gradually grows along with
decrease in Japanese and German shares. The share of large developed economies declines.
Figure 3. Shares of largest economies in global GDP and population, %
Note: Adjusted with Purchasing Power Parity (PPP). Some data are estimates.
Source: WEO, IMF, April 2014 and EDRC calculations and estimates
7.7
1.9
4.4
5.8
1.5
2.3
4.3
2.8 3.0
0
1
2
3
4
5
6
7
8
9
2009-2013 average 2013
Economic Growth, %
26.3
33.0
35.1
38.5
10.1
9.5
17.7
12.6
11
10
9
9
7
2
5
6
9
7
3
6
37.1
39.3
30.0
28.8
0% 50% 100%
2010
2011
2012
2013
China USA
India Indonesia, Japan
Brazil, Turkey, Korea Other
Contribution to the global economic growth, %
0
5
10
15
20
25
GDP 2001 GDP 2008 GDP 2013 Population 2013
E D R C ( 2 0 1 4 ) | p a g e 1 3
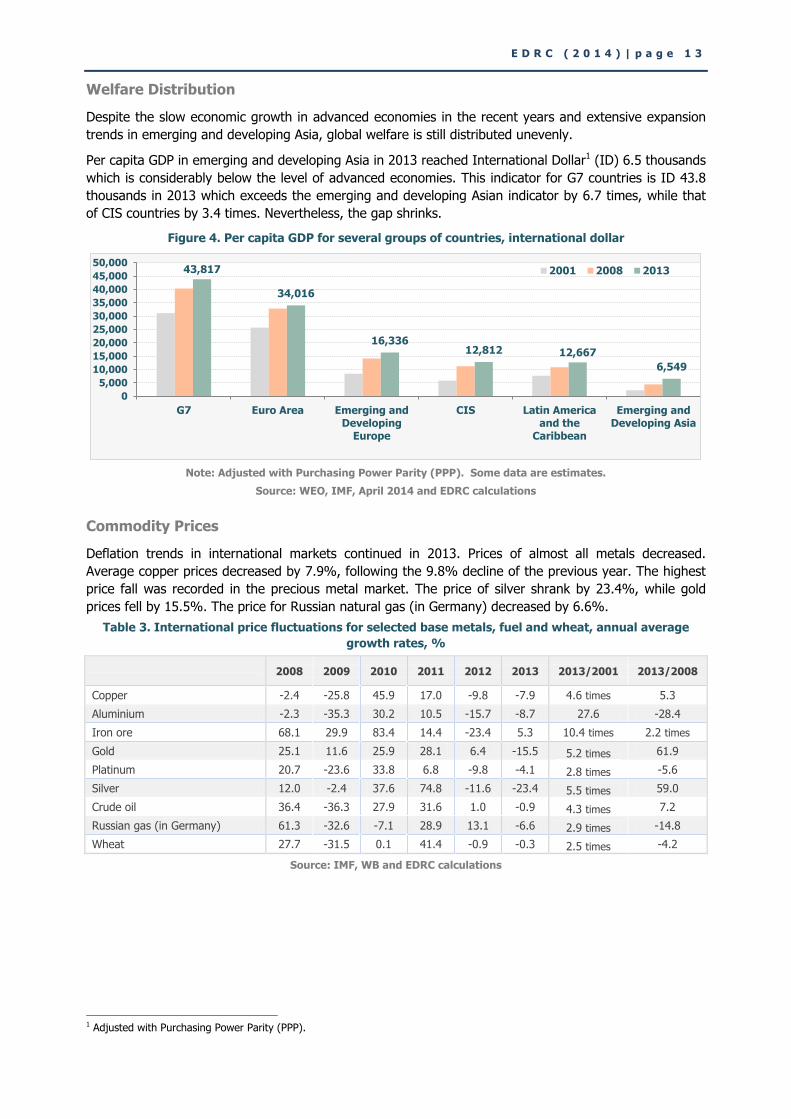
Welfare Distribution
Despite the slow economic growth in advanced economies in the recent years and extensive expansion
trends in emerging and developing Asia, global welfare is still distributed unevenly.
Per capita GDP in emerging and developing Asia in 2013 reached International Dollar1 (ID) 6.5 thousands
which is considerably below the level of advanced economies. This indicator for G7 countries is ID 43.8
thousands in 2013 which exceeds the emerging and developing Asian indicator by 6.7 times, while that
of CIS countries by 3.4 times. Nevertheless, the gap shrinks.
Figure 4. Per capita GDP for several groups of countries, international dollar
Note: Adjusted with Purchasing Power Parity (PPP). Some data are estimates.
Source: WEO, IMF, April 2014 and EDRC calculations
Commodity Prices
Deflation trends in international markets continued in 2013. Prices of almost all metals decreased.
Average copper prices decreased by 7.9%, following the 9.8% decline of the previous year. The highest
price fall was recorded in the precious metal market. The price of silver shrank by 23.4%, while gold
prices fell by 15.5%. The price for Russian natural gas (in Germany) decreased by 6.6%.
Table 3. International price fluctuations for selected base metals, fuel and wheat, annual average
growth rates, %
2008 2009 2010 2011 2012 2013 2013/2001 2013/2008
Copper -2.4 -25.8 45.9 17.0 -9.8 -7.9 4.6 times 5.3
Aluminium -2.3 -35.3 30.2 10.5 -15.7 -8.7 27.6 -28.4
Iron ore 68.1 29.9 83.4 14.4 -23.4 5.3 10.4 times 2.2 times
Gold 25.1 11.6 25.9 28.1 6.4 -15.5 5.2 times 61.9
Platinum 20.7 -23.6 33.8 6.8 -9.8 -4.1 2.8 times -5.6
Silver 12.0 -2.4 37.6 74.8 -11.6 -23.4 5.5 times 59.0
Crude oil 36.4 -36.3 27.9 31.6 1.0 -0.9 4.3 times 7.2
Russian gas (in Germany) 61.3 -32.6 -7.1 28.9 13.1 -6.6 2.9 times -14.8
Wheat 27.7 -31.5 0.1 41.4 -0.9 -0.3 2.5 times -4.2
Source: IMF, WB and EDRC calculations
1 Adjusted with Purchasing Power Parity (PPP).
43,817
34,016
16,336 12,812 12,667
6,549
0
5,000
10,000
15,000
20,000
25,000
30,000
35,000
40,000
45,000
50,000
G7 Euro Area Emerging and Developing
Europe
CIS Latin America and the
Caribbean
Emerging and Developing Asia
2001 2008 2013
P a g e 14 | ARMENIA ECONOMIC REPORT ( 2 0 1 4 )
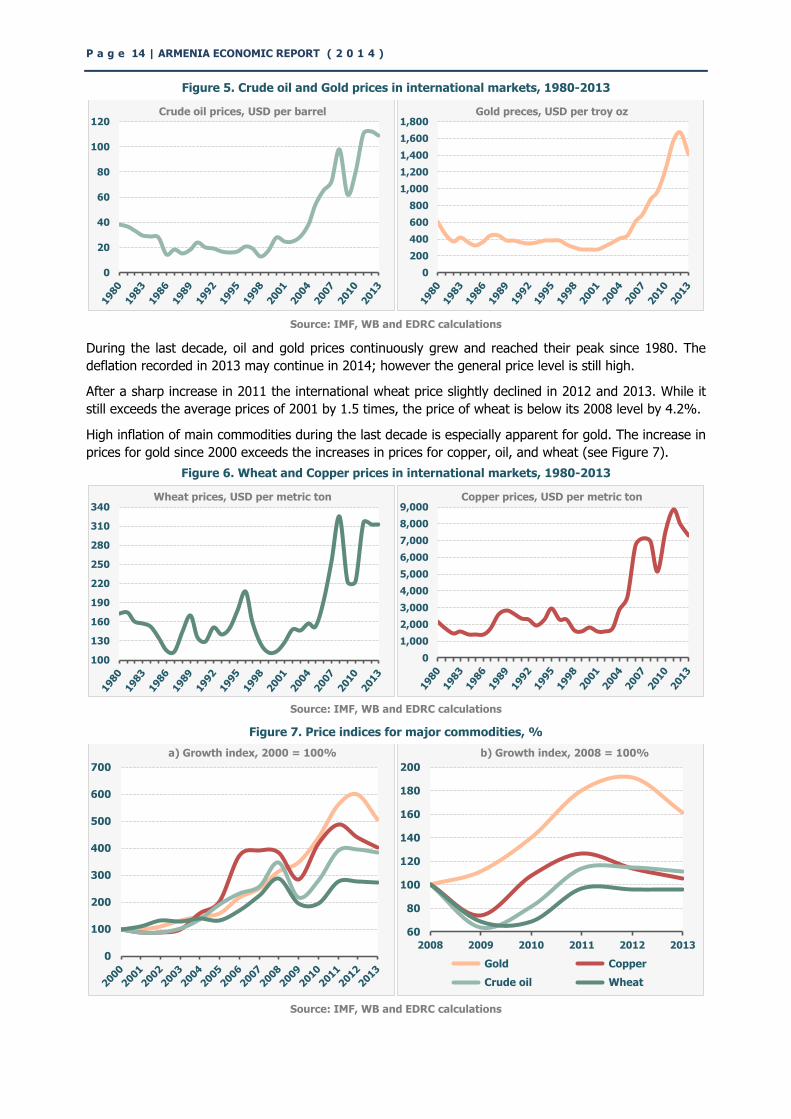
Figure 5. Crude oil and Gold prices in international markets, 1980-2013
Source: IMF, WB and EDRC calculations
During the last decade, oil and gold prices continuously grew and reached their peak since 1980. The
deflation recorded in 2013 may continue in 2014; however the general price level is still high.
After a sharp increase in 2011 the international wheat price slightly declined in 2012 and 2013. While it
still exceeds the average prices of 2001 by 1.5 times, the price of wheat is below its 2008 level by 4.2%.
High inflation of main commodities during the last decade is especially apparent for gold. The increase in
prices for gold since 2000 exceeds the increases in prices for copper, oil, and wheat (see Figure 7).
Figure 6. Wheat and Copper prices in international markets, 1980-2013
Source: IMF, WB and EDRC calculations
Figure 7. Price indices for major commodities, %
Source: IMF, WB and EDRC calculations
0
20
40
60
80
100
120 Crude oil prices, USD per barrel
0
200
400
600
800
1,000
1,200
1,400
1,600
1,800 Gold preces, USD per troy oz
100
130
160
190
220
250
280
310
340 Wheat prices, USD per metric ton
0
1,000
2,000
3,000
4,000
5,000
6,000
7,000
8,000
9,000 Copper prices, USD per metric ton
0
100
200
300
400
500
600
700
a) Growth index, 2000 = 100%
60
80
100
120
140
160
180
200
2008 2009 2010 2011 2012 2013
b) Growth index, 2008 = 100%
Gold Copper
Crude oil Wheat
E D R C ( 2 0 1 4 ) | p a g e 1 5
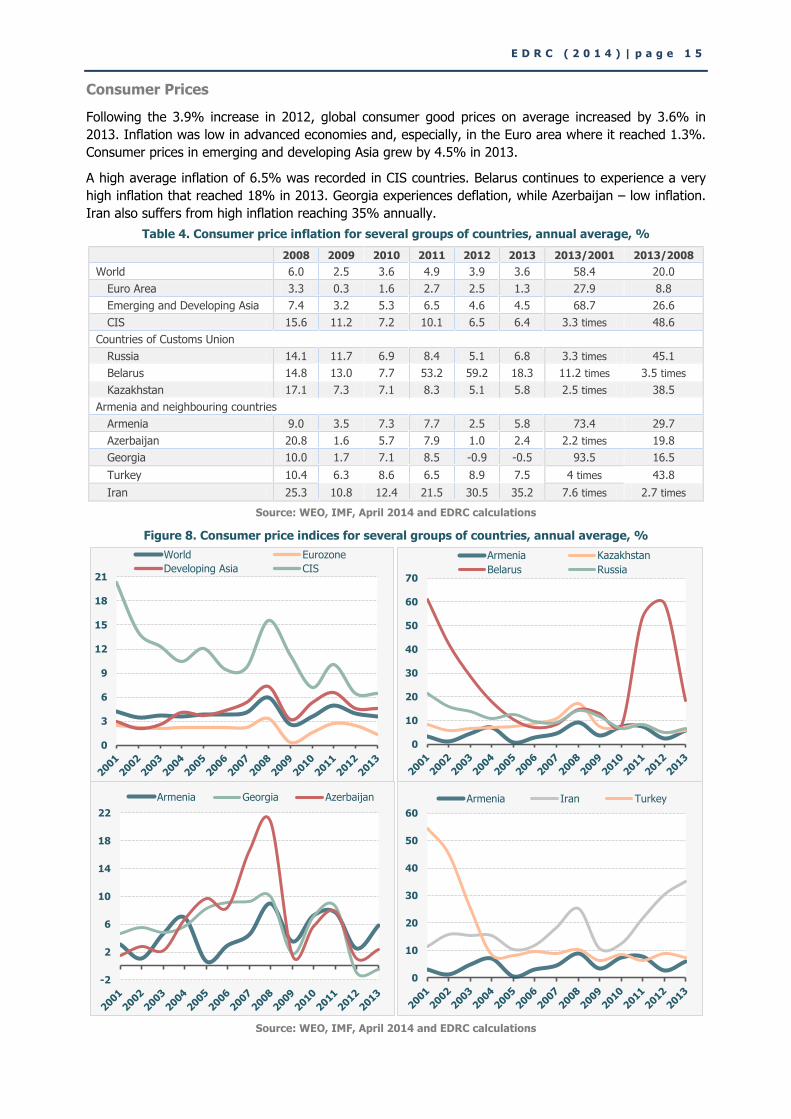
Consumer Prices
Following the 3.9% increase in 2012, global consumer good prices on average increased by 3.6% in
2013. Inflation was low in advanced economies and, especially, in the Euro area where it reached 1.3%.
Consumer prices in emerging and developing Asia grew by 4.5% in 2013.
A high average inflation of 6.5% was recorded in CIS countries. Belarus continues to experience a very
high inflation that reached 18% in 2013. Georgia experiences deflation, while Azerbaijan – low inflation.
Iran also suffers from high inflation reaching 35% annually.
Table 4. Consumer price inflation for several groups of countries, annual average, %
2008 2009 2010 2011 2012 2013 2013/2001 2013/2008
World 6.0 2.5 3.6 4.9 3.9 3.6 58.4 20.0
Euro Area 3.3 0.3 1.6 2.7 2.5 1.3 27.9 8.8
Emerging and Developing Asia 7.4 3.2 5.3 6.5 4.6 4.5 68.7 26.6
CIS 15.6 11.2 7.2 10.1 6.5 6.4 3.3 times 48.6
Countries of Customs Union
Russia 14.1 11.7 6.9 8.4 5.1 6.8 3.3 times 45.1
Belarus 14.8 13.0 7.7 53.2 59.2 18.3 11.2 times 3.5 times
Kazakhstan 17.1 7.3 7.1 8.3 5.1 5.8 2.5 times 38.5
Armenia and neighbouring countries
Armenia 9.0 3.5 7.3 7.7 2.5 5.8 73.4 29.7
Azerbaijan 20.8 1.6 5.7 7.9 1.0 2.4 2.2 times 19.8
Georgia 10.0 1.7 7.1 8.5 -0.9 -0.5 93.5 16.5
Turkey 10.4 6.3 8.6 6.5 8.9 7.5 4 times 43.8
Iran 25.3 10.8 12.4 21.5 30.5 35.2 7.6 times 2.7 times
Source: WEO, IMF, April 2014 and EDRC calculations
Figure 8. Consumer price indices for several groups of countries, annual average, %
Source: WEO, IMF, April 2014 and EDRC calculations
0
3
6
9
12
15
18
21
World Eurozone
Developing Asia CIS
0
10
20
30
40
50
60
70
Armenia Kazakhstan
Belarus Russia
-2
2
6
10
14
18
22
Armenia Georgia Azerbaijan
0
10
20
30
40
50
60
Armenia Iran Turkey
P a g e 16 | ARMENIA ECONOMIC REPORT ( 2 0 1 4 )
1.2. Economic Trends in Armenia
Economic Growth and GDP
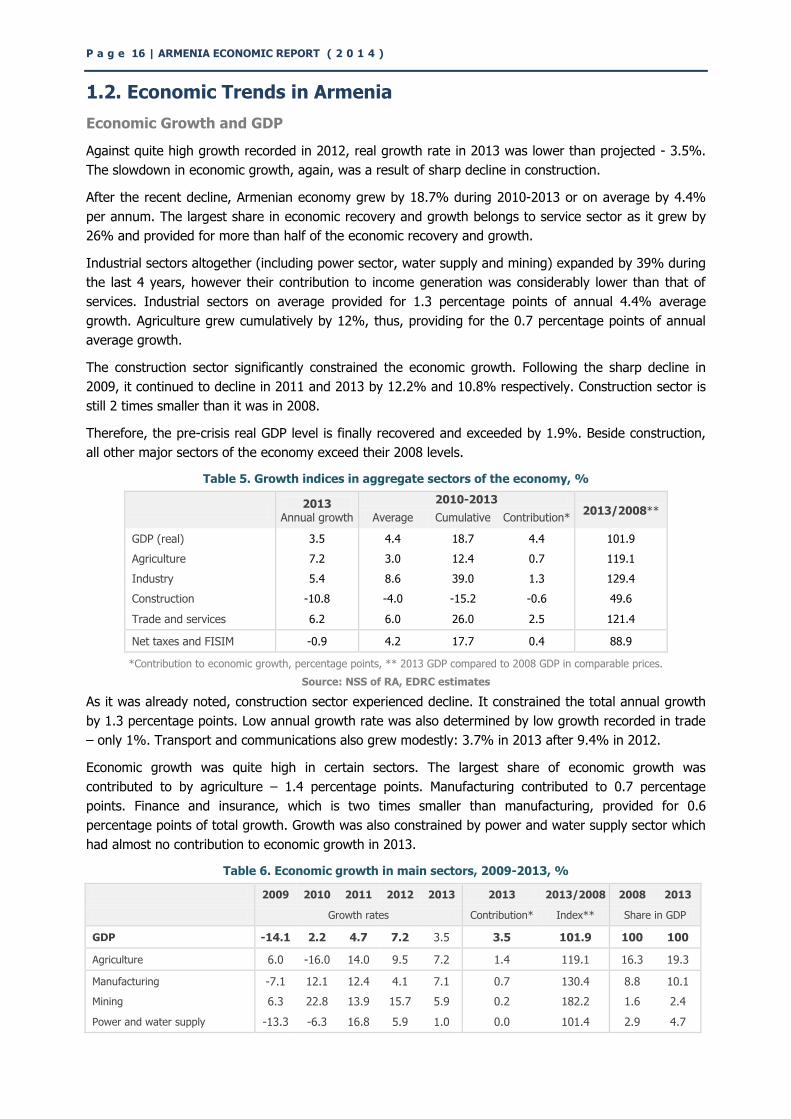
Against quite high growth recorded in 2012, real growth rate in 2013 was lower than projected - 3.5%.
The slowdown in economic growth, again, was a result of sharp decline in construction.
After the recent decline, Armenian economy grew by 18.7% during 2010-2013 or on average by 4.4%
per annum. The largest share in economic recovery and growth belongs to service sector as it grew by
26% and provided for more than half of the economic recovery and growth.
Industrial sectors altogether (including power sector, water supply and mining) expanded by 39% during
the last 4 years, however their contribution to income generation was considerably lower than that of
services. Industrial sectors on average provided for 1.3 percentage points of annual 4.4% average
growth. Agriculture grew cumulatively by 12%, thus, providing for the 0.7 percentage points of annual
average growth.
The construction sector significantly constrained the economic growth. Following the sharp decline in
2009, it continued to decline in 2011 and 2013 by 12.2% and 10.8% respectively. Construction sector is
still 2 times smaller than it was in 2008.
Therefore, the pre-crisis real GDP level is finally recovered and exceeded by 1.9%. Beside construction,
all other major sectors of the economy exceed their 2008 levels.
Table 5. Growth indices in aggregate sectors of the economy, %
2013
Annual growth
2010-2013 2013/2008**
Average Cumulative Contribution*
GDP (real) 3.5 4.4 18.7 4.4 101.9
Agriculture 7.2 3.0 12.4 0.7 119.1
Industry 5.4 8.6 39.0 1.3 129.4
Construction -10.8 -4.0 -15.2 -0.6 49.6
Trade and services 6.2 6.0 26.0 2.5 121.4
Net taxes and FISIM -0.9 4.2 17.7 0.4 88.9
*Contribution to economic growth, percentage points, ** 2013 GDP compared to 2008 GDP in comparable prices.
Source: NSS of RA, EDRC estimates
As it was already noted, construction sector experienced decline. It constrained the total annual growth
by 1.3 percentage points. Low annual growth rate was also determined by low growth recorded in trade
– only 1%. Transport and communications also grew modestly: 3.7% in 2013 after 9.4% in 2012.
Economic growth was quite high in certain sectors. The largest share of economic growth was
contributed to by agriculture – 1.4 percentage points. Manufacturing contributed to 0.7 percentage
points. Finance and insurance, which is two times smaller than manufacturing, provided for 0.6
percentage points of total growth. Growth was also constrained by power and water supply sector which
had almost no contribution to economic growth in 2013.
Table 6. Economic growth in main sectors, 2009-2013, %
2009 2010 2011 2012 2013 2013 2013/2008 2008 2013
Growth rates Contribution* Index** Share in GDP
GDP -14.1 2.2 4.7 7.2 3.5 3.5 101.9 100 100
Agriculture 6.0 -16.0 14.0 9.5 7.2 1.4 119.1 16.3 19.3
Manufacturing -7.1 12.1 12.4 4.1 7.1 0.7 130.4 8.8 10.1
Mining 6.3 22.8 13.9 15.7 5.9 0.2 182.2 1.6 2.4
Power and water supply -13.3 -6.3 16.8 5.9 1.0 0.0 101.4 2.9 4.7
E D R C ( 2 0 1 4 ) | p a g e 1 7
Construction -41.6 3.3 -12.2 4.8 -10.8 -1.3 49.6 25.3 10.5
Trade -4.8 2.9 4.8 4.7 1.0 0.1 108.6 11.6 12.8
Transport and communications -9.9 7.0 2.4 9.4 3.7 0.3 112.1 6.8 6.5
Financial services -1.6 10.6 23.5 19.9 12.9 0.6 182.1 3.4 4.7
Public administration -5.9 -0.7 7.6 -2.1 14.9 0.6 113.1 2.7 4.1
Healthcare, social services -4.0 -1.4 6.6 0.2 5.7 0.2 107.0 2.7 4.2
Education 2.2 4.6 3.4 1.6 -0.0 -0.0 112.2 2.7 3.0
Hotels and catering 23.5 19.6 5.3 23.6 27.8 0.3 245.8 0.4 1.1
Other sectors (including taxes and FISIM)
-15.5 10.0 -0.2 9.0 3.7 0.6 104.8 14.8 16.5
*Contribution to economic growth, percentage points, ** 2013 GDP compared to 2008 GDP in comparable prices.
Source: NSS of RA, EDRC estimates.
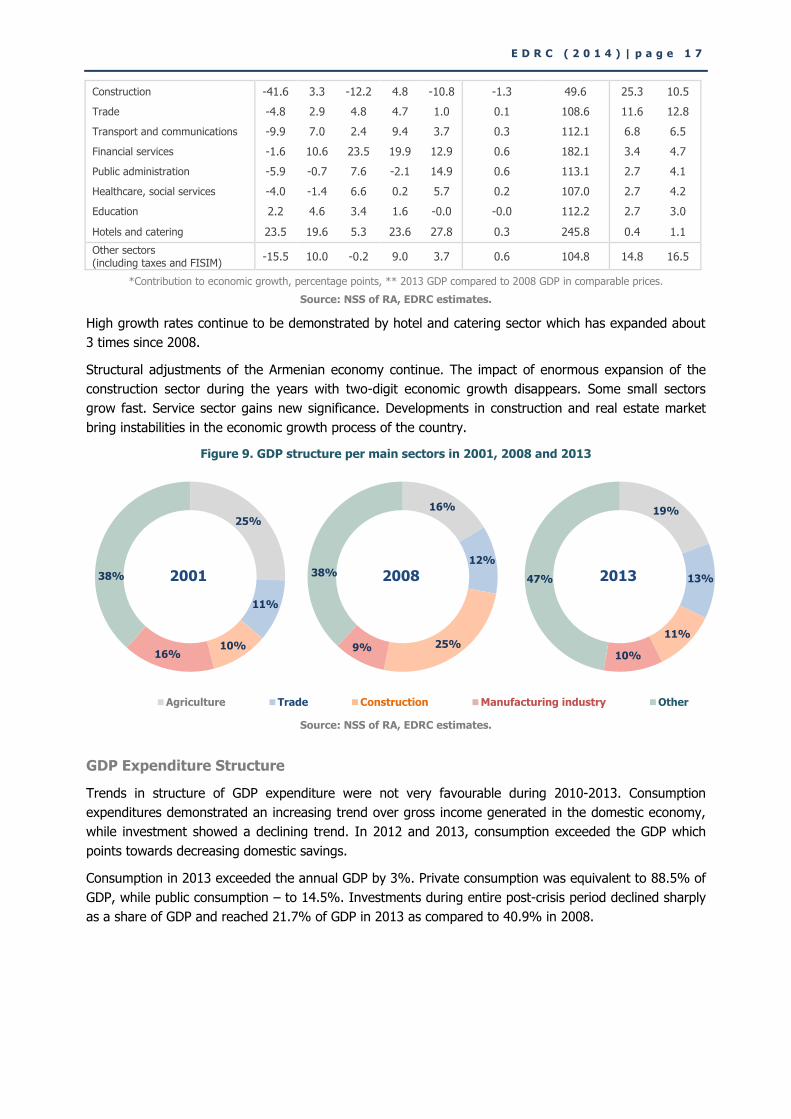
High growth rates continue to be demonstrated by hotel and catering sector which has expanded about
3 times since 2008.
Structural adjustments of the Armenian economy continue. The impact of enormous expansion of the
construction sector during the years with two-digit economic growth disappears. Some small sectors
grow fast. Service sector gains new significance. Developments in construction and real estate market
bring instabilities in the economic growth process of the country.
Figure 9. GDP structure per main sectors in 2001, 2008 and 2013
Source: NSS of RA, EDRC estimates.
GDP Expenditure Structure
Trends in structure of GDP expenditure were not very favourable during 2010-2013. Consumption
expenditures demonstrated an increasing trend over gross income generated in the domestic economy,
while investment showed a declining trend. In 2012 and 2013, consumption exceeded the GDP which
points towards decreasing domestic savings.
Consumption in 2013 exceeded the annual GDP by 3%. Private consumption was equivalent to 88.5% of
GDP, while public consumption – to 14.5%. Investments during entire post-crisis period declined sharply
as a share of GDP and reached 21.7% of GDP in 2013 as compared to 40.9% in 2008.
Agriculture Trade Construction Manufacturing industry Other
16%
12%
25% 9%
38% 2008
19%
13%
11%
10%
47% 2013
25%
11%
10% 16%
38% 2001
P a g e 18 | ARMENIA ECONOMIC REPORT ( 2 0 1 4 )
Table 7. GDP structure per expenditure components, %
2001 2008 2009 2010 2011 2012 2013
Nominal GDP structure, %
GDP 100 100 100 100 100 100 100
Consumption 104.8 81.8 93.7 95.1 96.6 101.2 102.9
Private consumption 93.6 71.6 80.4 82.0 83.7 88.4 88.5
Public consumption 11.3 10.2 13.3 13.1 12.9 12.7 14.5
Gross capital formation 19.8 40.9 34.7 32.9 27.3 25.4 21.7
Gross fixed capital formation 17.7 39.8 36.4 33.4 26.1 23.6 20.9
Changes in inventories 2.1 1.1 -1.7 -0.6 1.2 1.8 0.8
Net exports (G&S) -20.7 -25.6 -27.5 -24.5 -23.6 -24.8 -21.1
Exports 25.5 15.0 15.5 20.8 23.8 24.6 27.0
Imports 46.1 40.7 43.0 45.3 47.4 49.3 48.0
Statistical deviation -3.9 2.9 -0.8 -3.5 -0.3 -1.8 -3.5
Source: NSS of RA, EDRC calculations.
Real growth of private consumption in 2013 slowed down from the previous year as a 0.9% increase was
recorded. Public consumption, after a decline in the previous year, grew sharply in 2013 – by 16%. As a
result, consumption growth contributed to 1.7 percentage points of economic growth in 2013.
Table 8. GDP growth rate, expenditure components, %
2008 2009 2010 2011 2012 2013 2013
Real growth rate, % Contribution*
GDP 6.9 -14.1 2.2 4.7 7.2 3.5 3.5
Consumption 4.5 -4.0 3.9 2.6 7.7 2.8 1.7
Private consumption 5.4 -4.4 3.9 2.7 9.1 0.9 0.5
Public consumption -1.9 -1.2 3.9 1.9 -1.4 16.3 1.2
Gross capital formation 12.6 -30.9 0.5 -5.2 0.5 -11.5 -1.7
Gross fixed capital formation 11.9 -25.4 -2.9 -11.7 -1.9 -7.9 -1.1
Changes in inventories 45.2 .. .. .. 54.0 -58.3 -0.6
Net exports (G&S) 26.8 -24.3 5.1 -15.1 -14.1 -24.5 3.5
Exports -13.1 -10.4 26.5 14.7 8.4 16.3 2.3
Imports 7.3 -19.2 12.8 -1.4 -2.8 -4.2 1.2
*Contribution to economic growth, percentage points; statistical deviation is not included in calculations.
Source: NSS of RA, EDRC calculations.
Impact of increased consumption on real growth was entirely neutralized by the decline in investments.
Real investments decreased by 11.5% in 2013. Instead, external balance improved. In 2011-2013, real
imports decreased, while real exports – increased. Economic growth in 2013 was provided for by the
external sector (see Table 8).
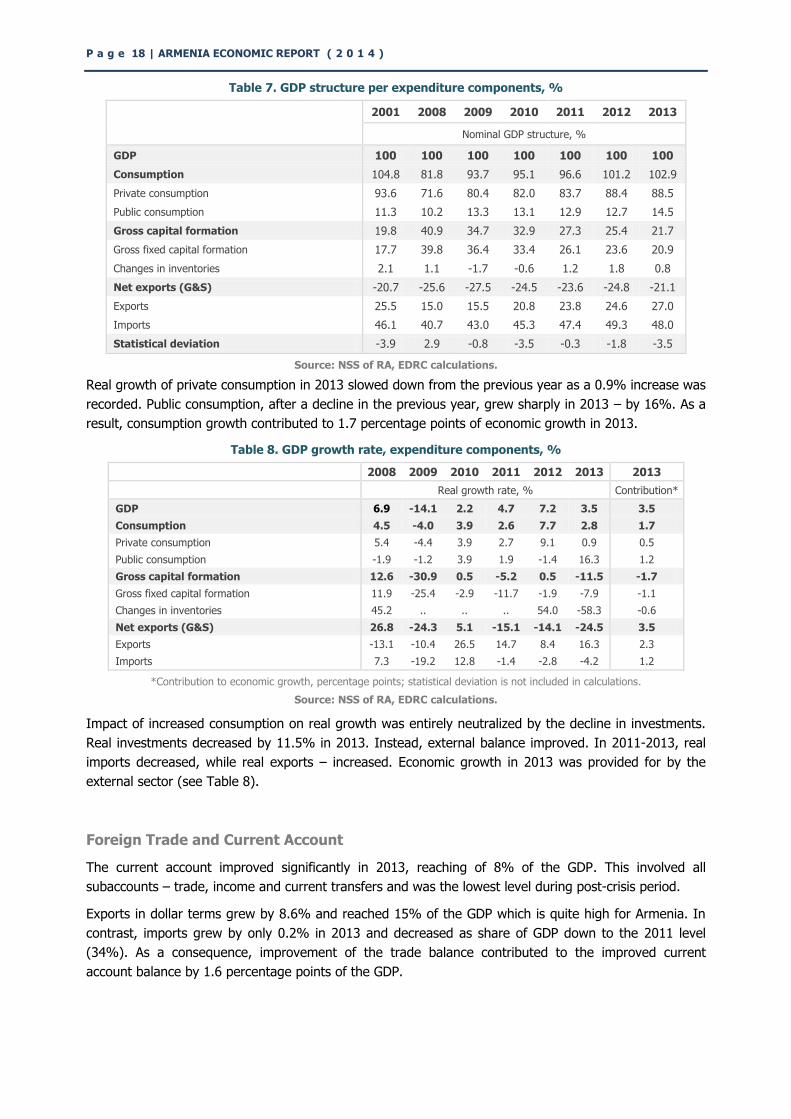
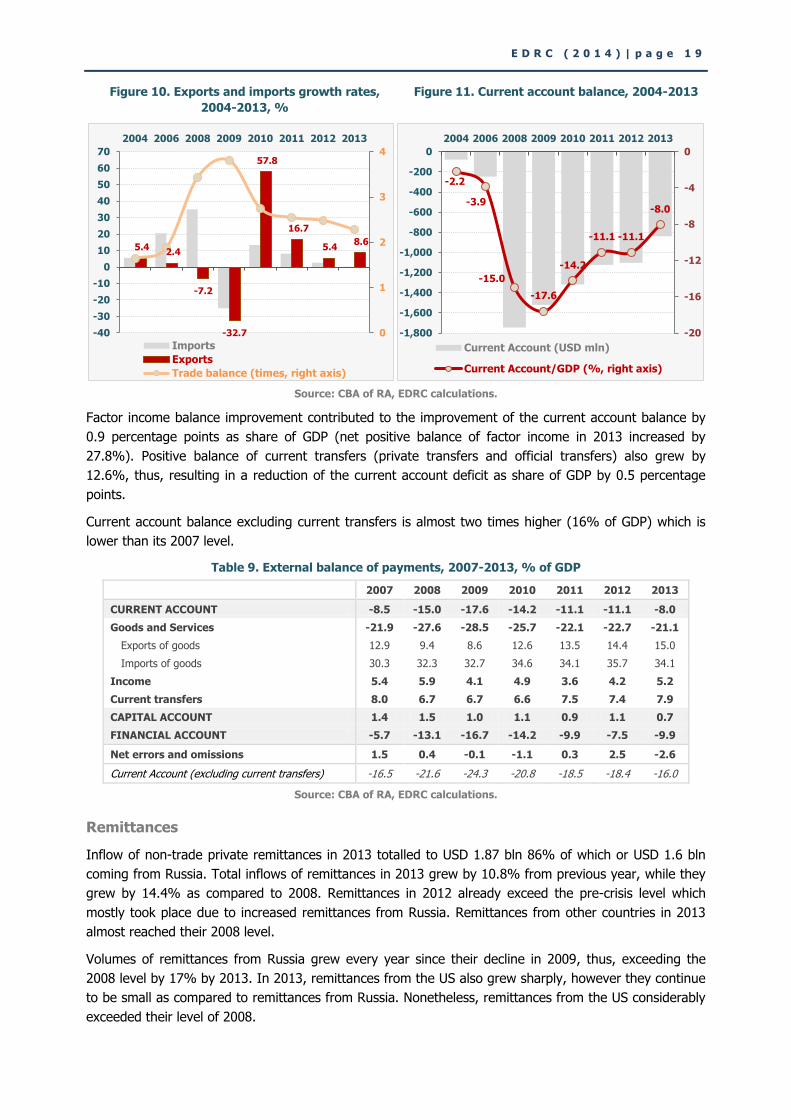
Foreign Trade and Current Account
The current account improved significantly in 2013, reaching of 8% of the GDP. This involved all
subaccounts – trade, income and current transfers and was the lowest level during post-crisis period.
Exports in dollar terms grew by 8.6% and reached 15% of the GDP which is quite high for Armenia. In
contrast, imports grew by only 0.2% in 2013 and decreased as share of GDP down to the 2011 level
(34%). As a consequence, improvement of the trade balance contributed to the improved current
account balance by 1.6 percentage points of the GDP.
E D R C ( 2 0 1 4 ) | p a g e 1 9
Figure 10. Exports and imports growth rates,
2004-2013, %
Figure 11. Current account balance, 2004-2013
Source: CBA of RA, EDRC calculations.
Factor income balance improvement contributed to the improvement of the current account balance by
0.9 percentage points as share of GDP (net positive balance of factor income in 2013 increased by
27.8%). Positive balance of current transfers (private transfers and official transfers) also grew by
12.6%, thus, resulting in a reduction of the current account deficit as share of GDP by 0.5 percentage
points.
Current account balance excluding current transfers is almost two times higher (16% of GDP) which is
lower than its 2007 level.
Table 9. External balance of payments, 2007-2013, % of GDP
2007 2008 2009 2010 2011 2012 2013
CURRENT ACCOUNT -8.5 -15.0 -17.6 -14.2 -11.1 -11.1 -8.0
Goods and Services -21.9 -27.6 -28.5 -25.7 -22.1 -22.7 -21.1
Exports of goods 12.9 9.4 8.6 12.6 13.5 14.4 15.0
Imports of goods 30.3 32.3 32.7 34.6 34.1 35.7 34.1
Income 5.4 5.9 4.1 4.9 3.6 4.2 5.2
Current transfers 8.0 6.7 6.7 6.6 7.5 7.4 7.9
CAPITAL ACCOUNT 1.4 1.5 1.0 1.1 0.9 1.1 0.7
FINANCIAL ACCOUNT -5.7 -13.1 -16.7 -14.2 -9.9 -7.5 -9.9
Net errors and omissions 1.5 0.4 -0.1 -1.1 0.3 2.5 -2.6
Current Account (excluding current transfers) -16.5 -21.6 -24.3 -20.8 -18.5 -18.4 -16.0
Source: CBA of RA, EDRC calculations.
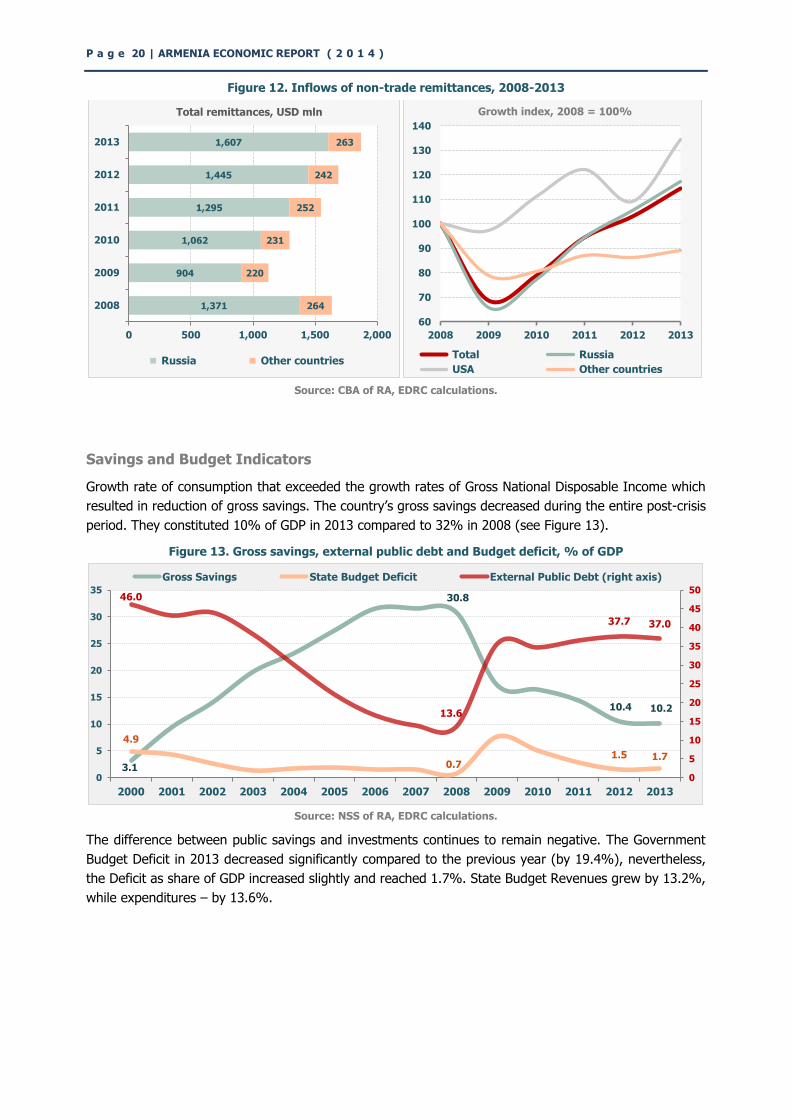
Remittances
Inflow of non-trade private remittances in 2013 totalled to USD 1.87 bln 86% of which or USD 1.6 bln
coming from Russia. Total inflows of remittances in 2013 grew by 10.8% from previous year, while they
grew by 14.4% as compared to 2008. Remittances in 2012 already exceed the pre-crisis level which
mostly took place due to increased remittances from Russia. Remittances from other countries in 2013
almost reached their 2008 level.
Volumes of remittances from Russia grew every year since their decline in 2009, thus, exceeding the
2008 level by 17% by 2013. In 2013, remittances from the US also grew sharply, however they continue
to be small as compared to remittances from Russia. Nonetheless, remittances from the US considerably
exceeded their level of 2008.
5.4 2.4
-7.2
-32.7
57.8
16.7
5.4 8.6
0
1
2
3
4
-40
-30
-20
-10
0
10
20
30
40
50
60
70
2004 2006 2008 2009 2010 2011 2012 2013
Imports
Exports
Trade balance (times, right axis)
-2.2
-3.9
-15.0
-17.6
-14.2
-11.1 -11.1
-8.0
-20
-16
-12
-8
-4
0
-1,800
-1,600
-1,400
-1,200
-1,000
-800
-600
-400
-200
0
2004 2006 2008 2009 2010 2011 2012 2013
Current Account (USD mln)
Current Account/GDP (%, right axis)
P a g e 20 | ARMENIA ECONOMIC REPORT ( 2 0 1 4 )
Figure 12. Inflows of non-trade remittances, 2008-2013
Source: CBA of RA, EDRC calculations.
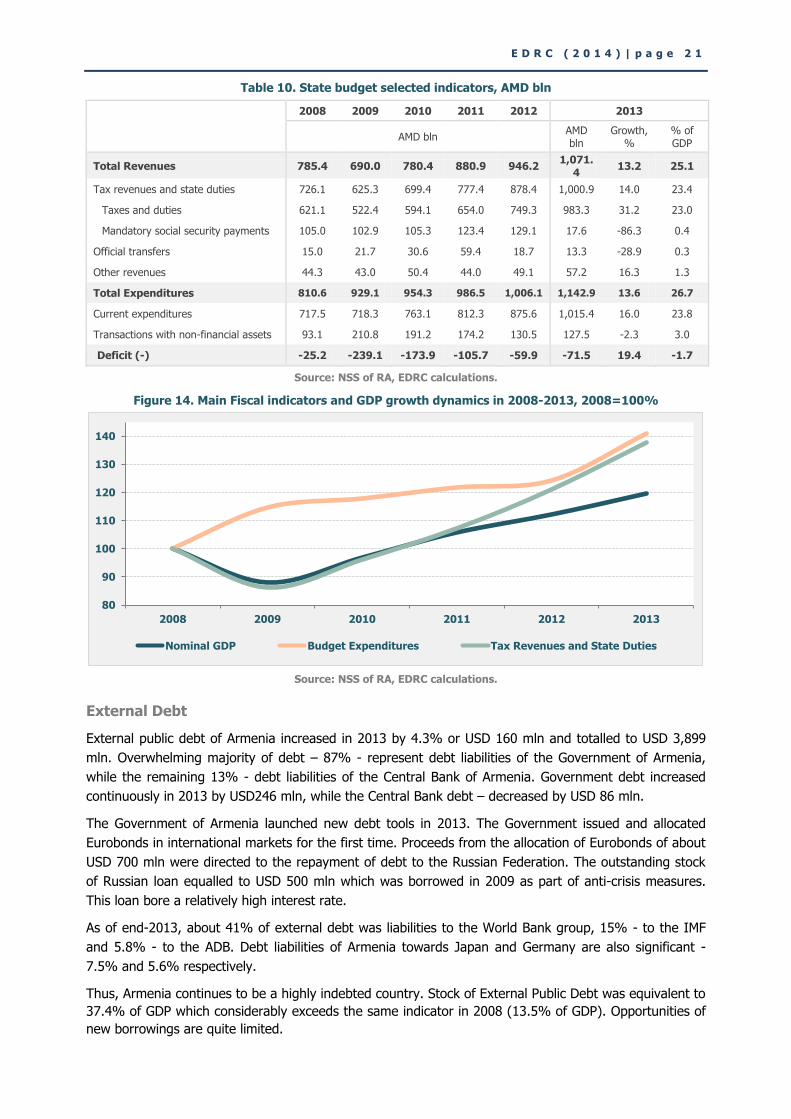
Savings and Budget Indicators
Growth rate of consumption that exceeded the growth rates of Gross National Disposable Income which
resulted in reduction of gross savings. The country’s gross savings decreased during the entire post-crisis
period. They constituted 10% of GDP in 2013 compared to 32% in 2008 (see Figure 13).
Figure 13. Gross savings, external public debt and Budget deficit, % of GDP
Source: NSS of RA, EDRC calculations.
The difference between public savings and investments continues to remain negative. The Government
Budget Deficit in 2013 decreased significantly compared to the previous year (by 19.4%), nevertheless,
the Deficit as share of GDP increased slightly and reached 1.7%. State Budget Revenues grew by 13.2%,
while expenditures – by 13.6%.
1,371
904
1,062
1,295
1,445
1,607
264
220
231
252
242
263
0 500 1,000 1,500 2,000
2008
2009
2010
2011
2012
2013
Russia Other countries
Total remittances, USD mln
60
70
80
90
100
110
120
130
140
2008 2009 2010 2011 2012 2013
Total Russia
USA Other countries
Growth index, 2008 = 100%
3.1
30.8
10.4 10.2
4.9
0.7 1.5 1.7
46.0
13.6
37.7 37.0
0
5
10
15
20
25
30
35
40
45
50
0
5
10
15
20
25
30
35
2000 2001 2002 2003 2004 2005 2006 2007 2008 2009 2010 2011 2012 2013
Gross Savings State Budget Deficit External Public Debt (right axis)
E D R C ( 2 0 1 4 ) | p a g e 2 1
Table 10. State budget selected indicators, AMD bln
2008 2009 2010 2011 2012 2013
AMD bln
AMD bln
Growth, %
% of GDP
Total Revenues 785.4 690.0 780.4 880.9 946.2 1,071.
4 13.2 25.1
Tax revenues and state duties 726.1 625.3 699.4 777.4 878.4 1,000.9 14.0 23.4
Taxes and duties 621.1 522.4 594.1 654.0 749.3 983.3 31.2 23.0
Mandatory social security payments 105.0 102.9 105.3 123.4 129.1 17.6 -86.3 0.4
Official transfers 15.0 21.7 30.6 59.4 18.7 13.3 -28.9 0.3
Other revenues 44.3 43.0 50.4 44.0 49.1 57.2 16.3 1.3
Total Expenditures 810.6 929.1 954.3 986.5 1,006.1 1,142.9 13.6 26.7
Current expenditures 717.5 718.3 763.1 812.3 875.6 1,015.4 16.0 23.8
Transactions with non-financial assets 93.1 210.8 191.2 174.2 130.5 127.5 -2.3 3.0
Deficit (-) -25.2 -239.1 -173.9 -105.7 -59.9 -71.5 19.4 -1.7
Source: NSS of RA, EDRC calculations.
Figure 14. Main Fiscal indicators and GDP growth dynamics in 2008-2013, 2008=100%
Source: NSS of RA, EDRC calculations.
External Debt
External public debt of Armenia increased in 2013 by 4.3% or USD 160 mln and totalled to USD 3,899
mln. Overwhelming majority of debt – 87% - represent debt liabilities of the Government of Armenia,
while the remaining 13% - debt liabilities of the Central Bank of Armenia. Government debt increased
continuously in 2013 by USD246 mln, while the Central Bank debt – decreased by USD 86 mln.
The Government of Armenia launched new debt tools in 2013. The Government issued and allocated
Eurobonds in international markets for the first time. Proceeds from the allocation of Eurobonds of about
USD 700 mln were directed to the repayment of debt to the Russian Federation. The outstanding stock
of Russian loan equalled to USD 500 mln which was borrowed in 2009 as part of anti-crisis measures.
This loan bore a relatively high interest rate.
As of end-2013, about 41% of external debt was liabilities to the World Bank group, 15% - to the IMF
and 5.8% - to the ADB. Debt liabilities of Armenia towards Japan and Germany are also significant -
7.5% and 5.6% respectively.
Thus, Armenia continues to be a highly indebted country. Stock of External Public Debt was equivalent to
37.4% of GDP which considerably exceeds the same indicator in 2008 (13.5% of GDP). Opportunities of
new borrowings are quite limited.
80
90
100
110
120
130
140
2008 2009 2010 2011 2012 2013
Nominal GDP Budget Expenditures Tax Revenues and State Duties
P a g e 22 | ARMENIA ECONOMIC REPORT ( 2 0 1 4 )
Table 11. External public debt of Armenia, breakdown per donors, 2008-2013
2008 2010 2012 2013
USD mln
Share, %
USD mln Share,
% USD mln
Share, %
USD mln Share,
% Change,
%
TOTAL EXTERNAL DEBT STOCK 1,577.2 100.0 3,300.5 100.0 3,739.1 100.0 3,899.1 100.0 4.3
Debt of the Government of RA 1,401.2 88.8 2,737.9 83.0 3,144.5 84.1 3,390.8 87.0 7.8
Debt of the Central Bank of RA 176.0 11.2 562.6 17.0 594.6 15.9 508.3 13.0 -14.5
Multilateral creditors 1,234.7 78.3 2,253.7 68.3 2,638.9 70.6 2,637.0 67.6 -0.1
WB 1,019.1 64.6 1,265.5 38.3 1,470.2 39.3 1,584.9 40.6 7.8
EBRD - - 10.0 0.3 14.3 0.4 25.8 0.7 79.7
IFAD 57.8 3.7 62.0 1.9 67.3 1.8 67.5 1.7 0.4
EU - - - - 85.7 2.3 89.7 2.3 4.6
IMF 134.8 8.5 740.8 22.4 776.1 20.8 584.8 15.0 -24.6
OPEC 15.0 1.0 28.7 0.9 30.7 0.8 34.3 0.9 11.9
ADB 8.1 0.5 146.7 4.4 187.9 5.0 227.9 5.8 21.3
EIB - - - - 6.6 0.2 22.1 0.6 234.7
Bilateral creditors 342.4 21.7 1,045.3 31.7 1,086.6 29.1 548.4 14.1 -49.5
Russian Federation - - 500.0 15.1 500.0 13.4 - - -100.0
Germany 125.3 7.9 132.7 4.0 193.1 5.2 219.8 5.6 13.8
France 5.0 0.3 4.3 0.1 4.0 0.1 5.2 0.1 29.8
USA 37.2 2.4 33.1 1.0 29.3 0.8 27.5 0.7 -6.0
Japan 174.9 11.1 374.4 11.3 355.9 9.5 290.8 7.5 -18.3
Abu-Dhabi Foundation - - 0.9 0.03 4.2 0.1 5.1 0.1 21.1
Borrowings from Commercial Banks
- - - - 12.9 0.3 16.7 0.4 29.8
SBC bank - - - - 4.2 0.1 5.7 0.1 35.8
Austria (Reiffeizen bank) - - - - 8.7 0.2 11.0 0.3 27.0
Bonds purchased by non-residents
0.1 0.01 1.5 0.05 0.8 0.02 696.9 17.9 -
Government bonds in FX - - - - - - 695.3 17.8 -
Government bonds 0.1 0.01 1.5 0.05 0.8 0.02 1.6 0.04 100.9
Source: NSS of RA, EDRC calculations.
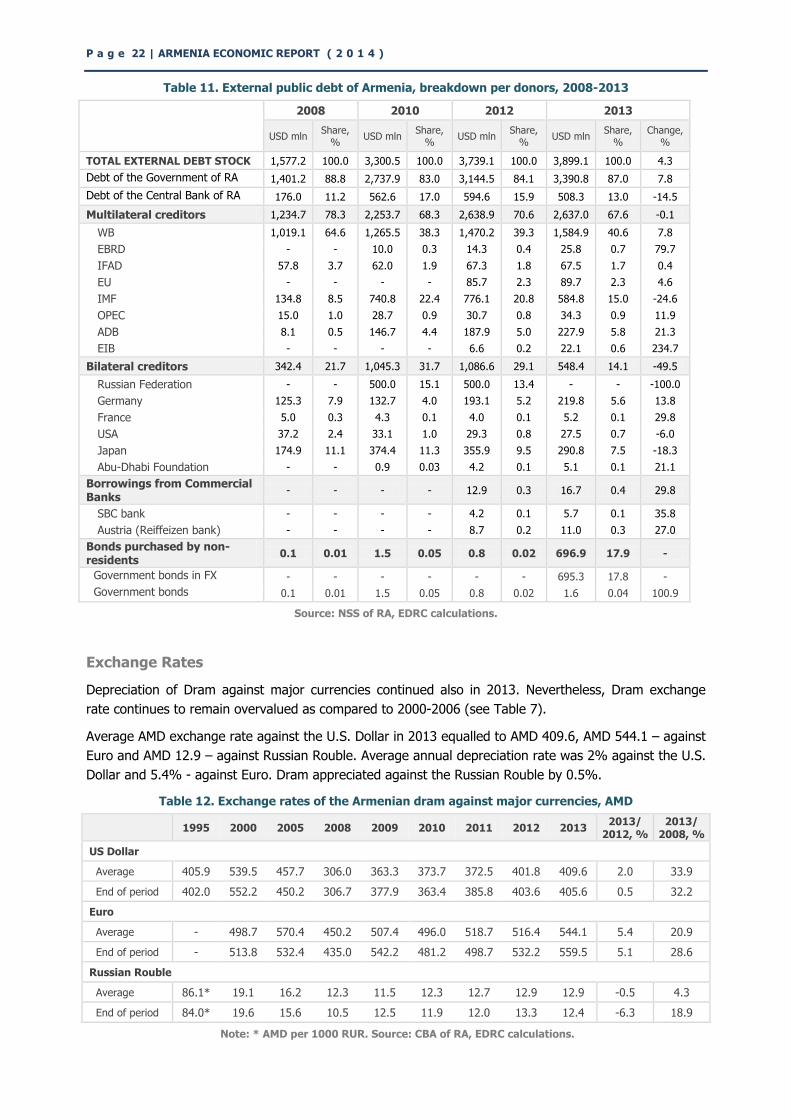
Exchange Rates
Depreciation of Dram against major currencies continued also in 2013. Nevertheless, Dram exchange
rate continues to remain overvalued as compared to 2000-2006 (see Table 7).
Average AMD exchange rate against the U.S. Dollar in 2013 equalled to AMD 409.6, AMD 544.1 – against
Euro and AMD 12.9 – against Russian Rouble. Average annual depreciation rate was 2% against the U.S.
Dollar and 5.4% - against Euro. Dram appreciated against the Russian Rouble by 0.5%.
Table 12. Exchange rates of the Armenian dram against major currencies, AMD
1995 2000 2005 2008 2009 2010 2011 2012 2013
2013/ 2012, %
2013/ 2008, %
US Dollar
Average 405.9 539.5 457.7 306.0 363.3 373.7 372.5 401.8 409.6 2.0 33.9
End of period 402.0 552.2 450.2 306.7 377.9 363.4 385.8 403.6 405.6 0.5 32.2
Euro
Average - 498.7 570.4 450.2 507.4 496.0 518.7 516.4 544.1 5.4 20.9
End of period - 513.8 532.4 435.0 542.2 481.2 498.7 532.2 559.5 5.1 28.6
Russian Rouble
Average 86.1* 19.1 16.2 12.3 11.5 12.3 12.7 12.9 12.9 -0.5 4.3
End of period 84.0* 19.6 15.6 10.5 12.5 11.9 12.0 13.3 12.4 -6.3 18.9
Note: * AMD per 1000 RUR. Source: CBA of RA, EDRC calculations.
E D R C ( 2 0 1 4 ) | p a g e 2 3
Figure 15. Exchange rate dynamics, 1995-2013
Note: data for AMD/RUR in 1995-1998 is in AMD per 1000 RUR.
Source: CBA of RA, EDRC calculations
Consumer Prices
Consumer prices in Armenia increased by 5.6% in 2013 (end-of-period), thus, slightly exceeded the
projected indicator of 4%+/-1.5%. Inflation was high amongst Alcohol and tobacco items (6.7%) and,
especially, amongst services (9.7%).
Table 13. Consumer price trends in 2008-2013, %
2008 2009 2010 2011 2012 2013
2013 / 2008
Consumer price index (end-of-year) 5.2 6.5 9.4 4.7 3.2 5.6 32.9
Food products 3.6 2.3 15.2 6.1 3.0 3.7 33.6
Alcoholic beverages and tobacco 0.3 1.5 1.7 2.0 4.4 6.7 17.3
Non-food products 0.2 14.6 4.6 4.3 5.7 3.5 36.8
Services 11.4 10.3 4.2 2.9 2.1 9.7 32.5
Consumer price index (year-average) 9.0 3.4 8.2 7.7 2.6 5.8 30.8
Food products 11.1 -0.9 9.4 12.3 2.0 5.8 31.4
Alcoholic beverages and tobacco 0.0 1.4 1.5 1.1 5.1 5.9 15.8
Non-food products 5.1 4.7 9.6 3.4 4.6 4.6 29.8
Services 9.0 10.4 6.8 3.6 2.1 6.4 32.7
Source: NSS of RA, EDRC calculations.
Inflation in service tariffs was mostly determined by the increased electricity and natural gas supply tariffs for residential consumers in 2013. In particular, according to the NSS of RA data, electricity tariffs in end-2013 grew by 30% since end-2013, while natural gas tariffs – by 19.2%.
Foreign Investments
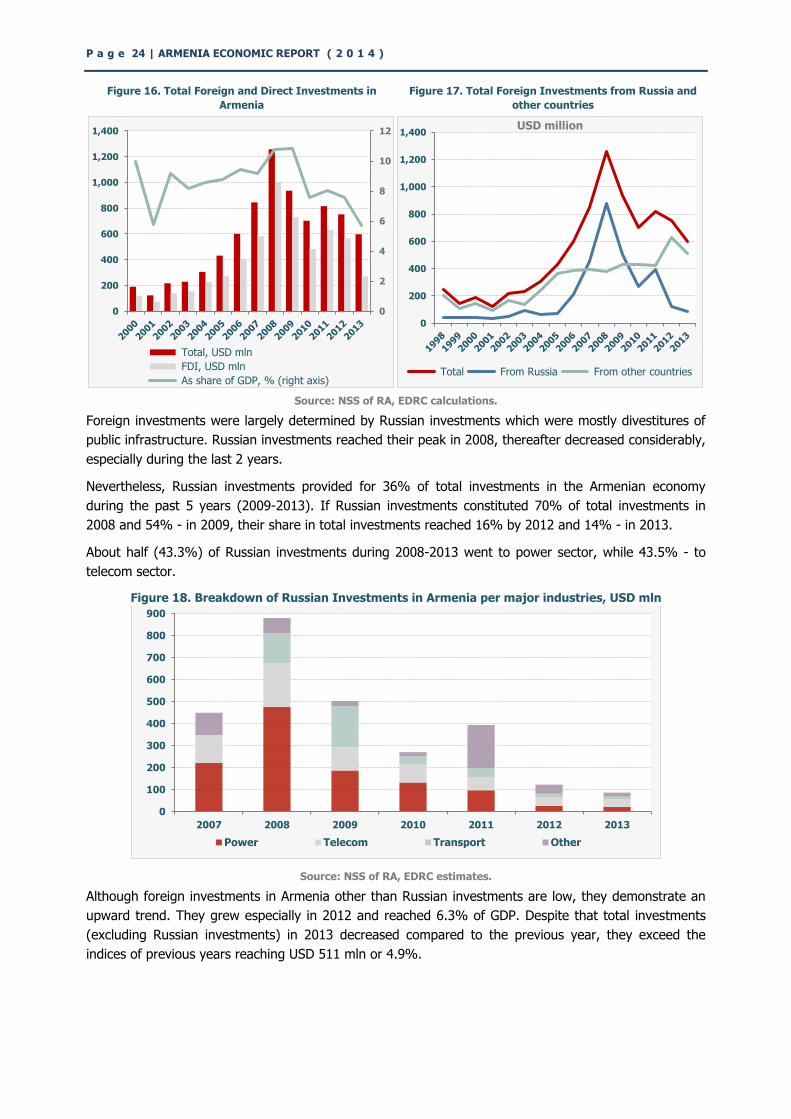
Foreign investments into the Armenian economy are small. They reached their peak in 2008 and fell
sharply and continuously thereafter. Total foreign investments constituted 5.7% of GDP (USD 597 mln)
in 2013, including foreign direct investments constituting 2.6% of GDP (USD 271 mln).
10
20
30
40
50
60
70
80
90
250
300
350
400
450
500
550
600
650
700
1995 1996 1997 1998 1999 2000 2001 2002 2003 2004 2005 2006 2007 2008 2009 2010 2011 2012 2013
AMD/EUR AMD/USD AMD/RUR (right axis)
P a g e 24 | ARMENIA ECONOMIC REPORT ( 2 0 1 4 )
Figure 16. Total Foreign and Direct Investments in
Armenia
Figure 17. Total Foreign Investments from Russia and
other countries
Source: NSS of RA, EDRC calculations.
Foreign investments were largely determined by Russian investments which were mostly divestitures of
public infrastructure. Russian investments reached their peak in 2008, thereafter decreased considerably,
especially during the last 2 years.
Nevertheless, Russian investments provided for 36% of total investments in the Armenian economy
during the past 5 years (2009-2013). If Russian investments constituted 70% of total investments in
2008 and 54% - in 2009, their share in total investments reached 16% by 2012 and 14% - in 2013.
About half (43.3%) of Russian investments during 2008-2013 went to power sector, while 43.5% - to
telecom sector.
Figure 18. Breakdown of Russian Investments in Armenia per major industries, USD mln
Source: NSS of RA, EDRC estimates.
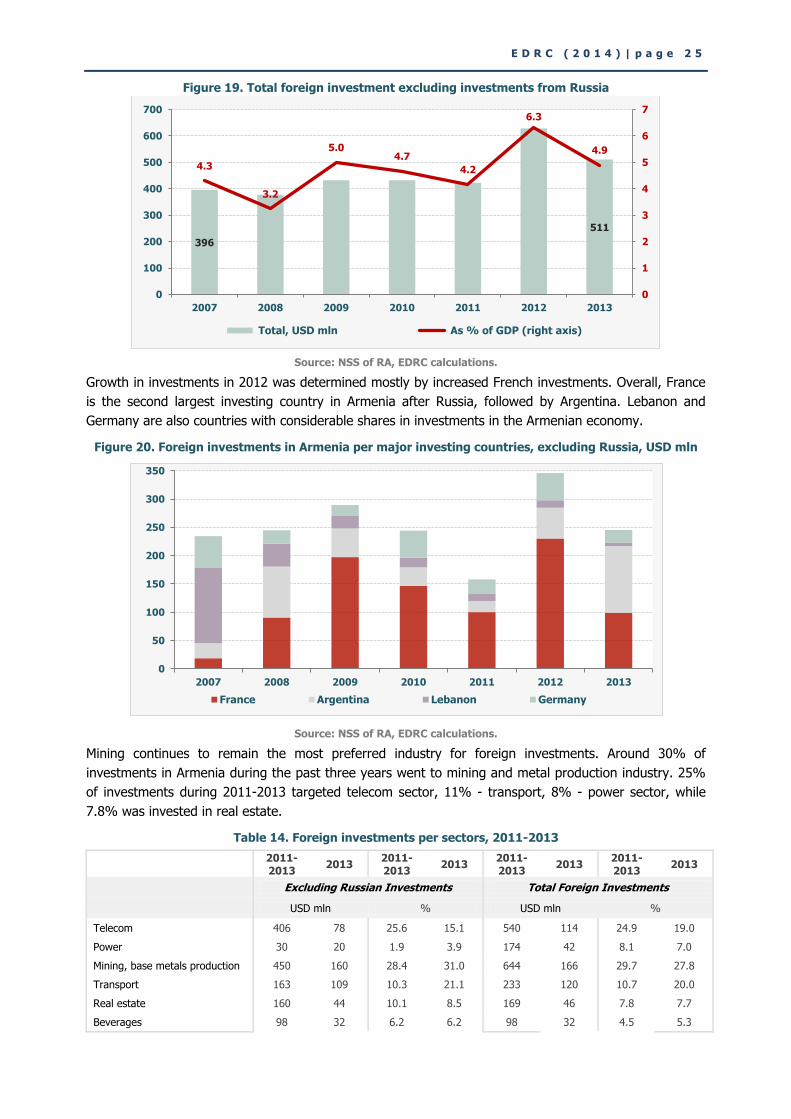
Although foreign investments in Armenia other than Russian investments are low, they demonstrate an
upward trend. They grew especially in 2012 and reached 6.3% of GDP. Despite that total investments
(excluding Russian investments) in 2013 decreased compared to the previous year, they exceed the
indices of previous years reaching USD 511 mln or 4.9%.
0
2
4
6
8
10
12
0
200
400
600
800
1,000
1,200
1,400
Total, USD mln
FDI, USD mln
As share of GDP, % (right axis)
0
200
400
600
800
1,000
1,200
1,400 USD million
Total From Russia From other countries
0
100
200
300
400
500
600
700
800
900
2007 2008 2009 2010 2011 2012 2013
Power Telecom Transport Other
E D R C ( 2 0 1 4 ) | p a g e 2 5
Figure 19. Total foreign investment excluding investments from Russia
Source: NSS of RA, EDRC calculations.
Growth in investments in 2012 was determined mostly by increased French investments. Overall, France
is the second largest investing country in Armenia after Russia, followed by Argentina. Lebanon and
Germany are also countries with considerable shares in investments in the Armenian economy.
Figure 20. Foreign investments in Armenia per major investing countries, excluding Russia, USD mln
Source: NSS of RA, EDRC calculations.
Mining continues to remain the most preferred industry for foreign investments. Around 30% of
investments in Armenia during the past three years went to mining and metal production industry. 25%
of investments during 2011-2013 targeted telecom sector, 11% - transport, 8% - power sector, while
7.8% was invested in real estate.
Table 14. Foreign investments per sectors, 2011-2013
2011-2013
2013 2011-2013
2013 2011-2013
2013 2011-2013
2013
Excluding Russian Investments Total Foreign Investments
USD mln % USD mln %
Telecom 406 78 25.6 15.1 540 114 24.9 19.0
Power 30 20 1.9 3.9 174 42 8.1 7.0
Mining, base metals production 450 160 28.4 31.0 644 166 29.7 27.8
Transport 163 109 10.3 21.1 233 120 10.7 20.0
Real estate 160 44 10.1 8.5 169 46 7.8 7.7
Beverages 98 32 6.2 6.2 98 32 4.5 5.3
396
511
4.3
3.2
5.0 4.7
4.2
6.3
4.9
0
1
2
3
4
5
6
7
0
100
200
300
400
500
600
700
2007 2008 2009 2010 2011 2012 2013
Total, USD mln As % of GDP (right axis)
0
50
100
150
200
250
300
350
2007 2008 2009 2010 2011 2012 2013
France Argentina Lebanon Germany
P a g e 26 | ARMENIA ECONOMIC REPORT ( 2 0 1 4 )
Hotel industry 44 7 2.8 1.4 44 7 2.0 1.2
Agriculture 48 8 3.0 1.6 49 8 2.2 1.4
Other sectors 184 58 11.6 11.2 216 63 10.0 10.6
Total 1,584 516 100.0 100.0 2,165 597 100.0 100.0
Source: NSS of RA, EDRC estimates.
1.3. Labour Market and Unemployment
Labour Force
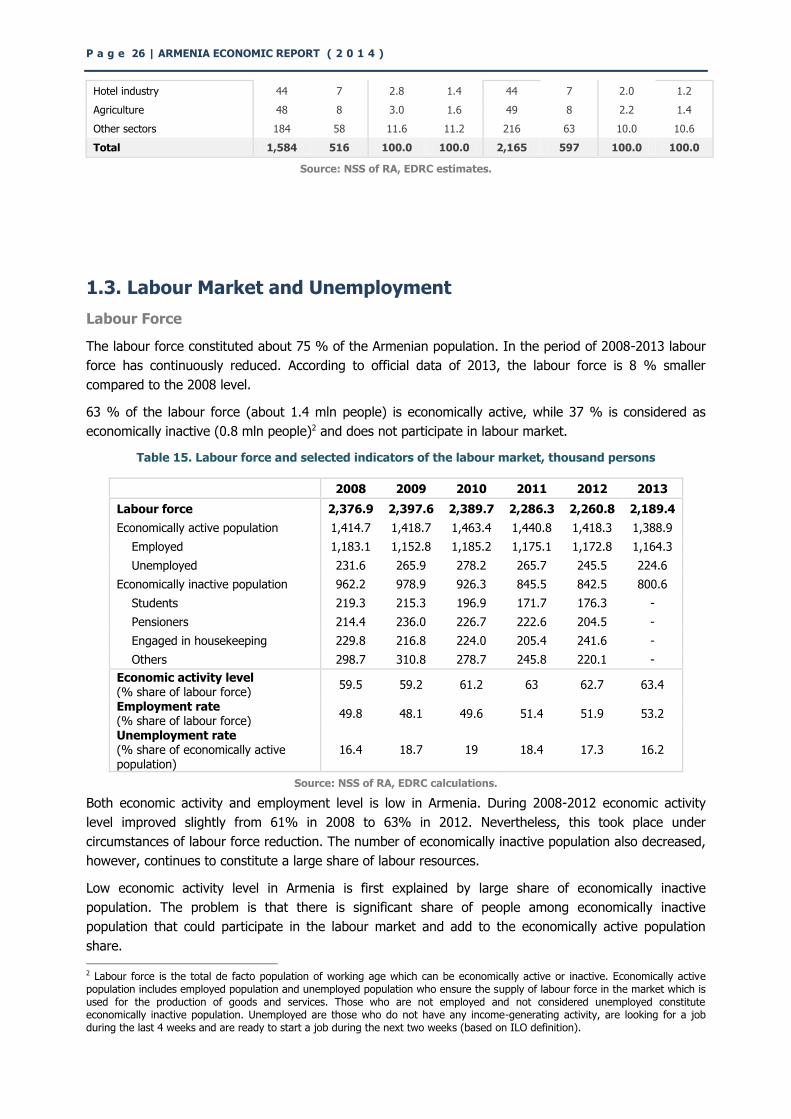
The labour force constituted about 75 % of the Armenian population. In the period of 2008-2013 labour
force has continuously reduced. According to official data of 2013, the labour force is 8 % smaller
compared to the 2008 level.
63 % of the labour force (about 1.4 mln people) is economically active, while 37 % is considered as
economically inactive (0.8 mln people)2 and does not participate in labour market.
Table 15. Labour force and selected indicators of the labour market, thousand persons
2008 2009 2010 2011 2012 2013
Labour force 2,376.9 2,397.6 2,389.7 2,286.3 2,260.8 2,189.4
Economically active population 1,414.7 1,418.7 1,463.4 1,440.8 1,418.3 1,388.9
Employed 1,183.1 1,152.8 1,185.2 1,175.1 1,172.8 1,164.3
Unemployed 231.6 265.9 278.2 265.7 245.5 224.6
Economically inactive population 962.2 978.9 926.3 845.5 842.5 800.6
Students 219.3 215.3 196.9 171.7 176.3 -
Pensioners 214.4 236.0 226.7 222.6 204.5 -
Engaged in housekeeping 229.8 216.8 224.0 205.4 241.6 -
Others 298.7 310.8 278.7 245.8 220.1 -
Economic activity level (% share of labour force)
59.5 59.2 61.2 63 62.7 63.4
Employment rate (% share of labour force)
49.8 48.1 49.6 51.4 51.9 53.2
Unemployment rate (% share of economically active population)
16.4 18.7 19 18.4 17.3 16.2
Source: NSS of RA, EDRC calculations.
Both economic activity and employment level is low in Armenia. During 2008-2012 economic activity
level improved slightly from 61% in 2008 to 63% in 2012. Nevertheless, this took place under
circumstances of labour force reduction. The number of economically inactive population also decreased,
however, continues to constitute a large share of labour resources.
Low economic activity level in Armenia is first explained by large share of economically inactive
population. The problem is that there is significant share of people among economically inactive
population that could participate in the labour market and add to the economically active population
share.
2 Labour force is the total de facto population of working age which can be economically active or inactive. Economically active population includes employed population and unemployed population who ensure the supply of labour force in the market which is used for the production of goods and services. Those who are not employed and not considered unemployed constitute economically inactive population. Unemployed are those who do not have any income-generating activity, are looking for a job during the last 4 weeks and are ready to start a job during the next two weeks (based on ILO definition).
E D R C ( 2 0 1 4 ) | p a g e 2 7
About a quarter of the economically inactive population were students, while one fifth – retired
pensioners. The remaining part of economically inactive population are those who are engaged in
housekeeping (mostly women) – 29 %, and others who are not employed and are not considered
unemployed (26 %).
Weak prospects of finding a decent job are seen as the main reason for not working and not looking for
a job. There are numerous cases when people do not know how to look for a job or there are various
social and family reasons, as well as health issues.
Labour market in Armenia is characterised by long-term unemployment. Average duration of job search
is almost two years. Interestingly, education level of economically inactive population is quite high as 36
% of them have graduate or professional education, while 44.8 % have secondary education.
Out of the economically active population 83.8 % (or 53 % of the labour force) is employed and the
remaining 16.2 % is unemployed.
Employment Profile
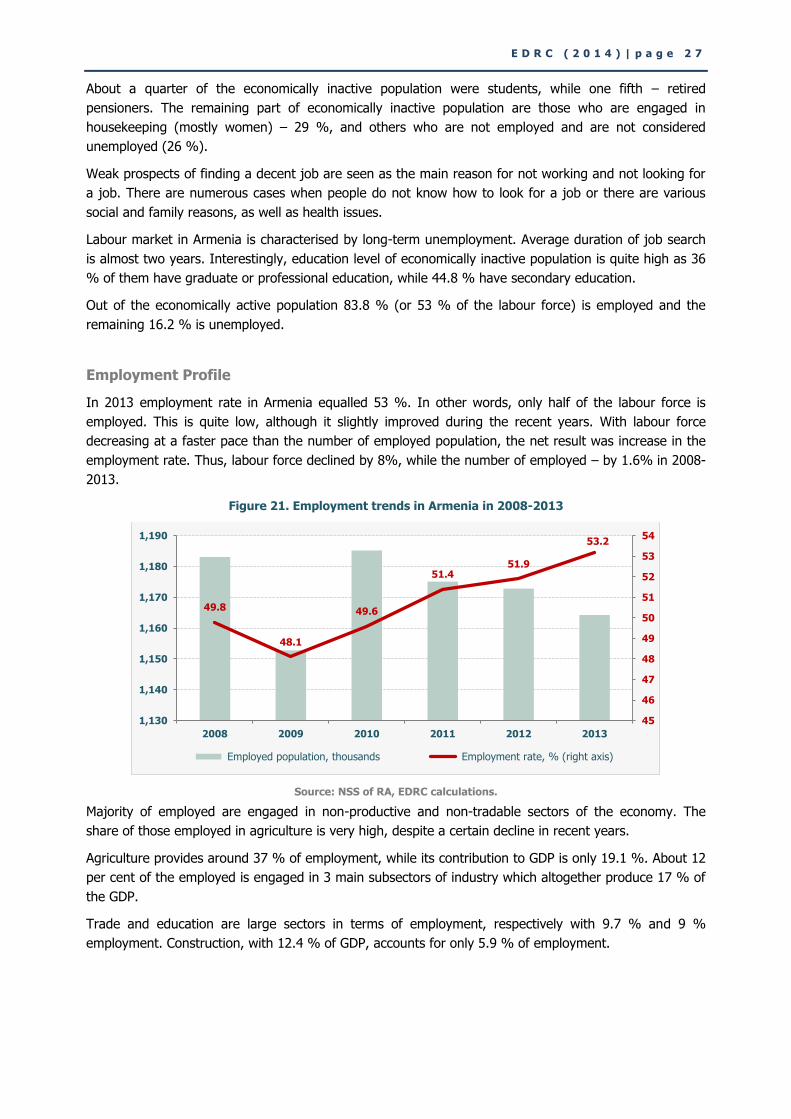
In 2013 employment rate in Armenia equalled 53 %. In other words, only half of the labour force is
employed. This is quite low, although it slightly improved during the recent years. With labour force
decreasing at a faster pace than the number of employed population, the net result was increase in the
employment rate. Thus, labour force declined by 8%, while the number of employed – by 1.6% in 2008-
2013.
Figure 21. Employment trends in Armenia in 2008-2013
Source: NSS of RA, EDRC calculations.
Majority of employed are engaged in non-productive and non-tradable sectors of the economy. The
share of those employed in agriculture is very high, despite a certain decline in recent years.
Agriculture provides around 37 % of employment, while its contribution to GDP is only 19.1 %. About 12
per cent of the employed is engaged in 3 main subsectors of industry which altogether produce 17 % of
the GDP.
Trade and education are large sectors in terms of employment, respectively with 9.7 % and 9 %
employment. Construction, with 12.4 % of GDP, accounts for only 5.9 % of employment.
49.8
48.1
49.6
51.4 51.9
53.2
45
46
47
48
49
50
51
52
53
54
1,130
1,140
1,150
1,160
1,170
1,180
1,190
2008 2009 2010 2011 2012 2013
Employed population, thousands Employment rate, % (right axis)
P a g e 28 | ARMENIA ECONOMIC REPORT ( 2 0 1 4 )
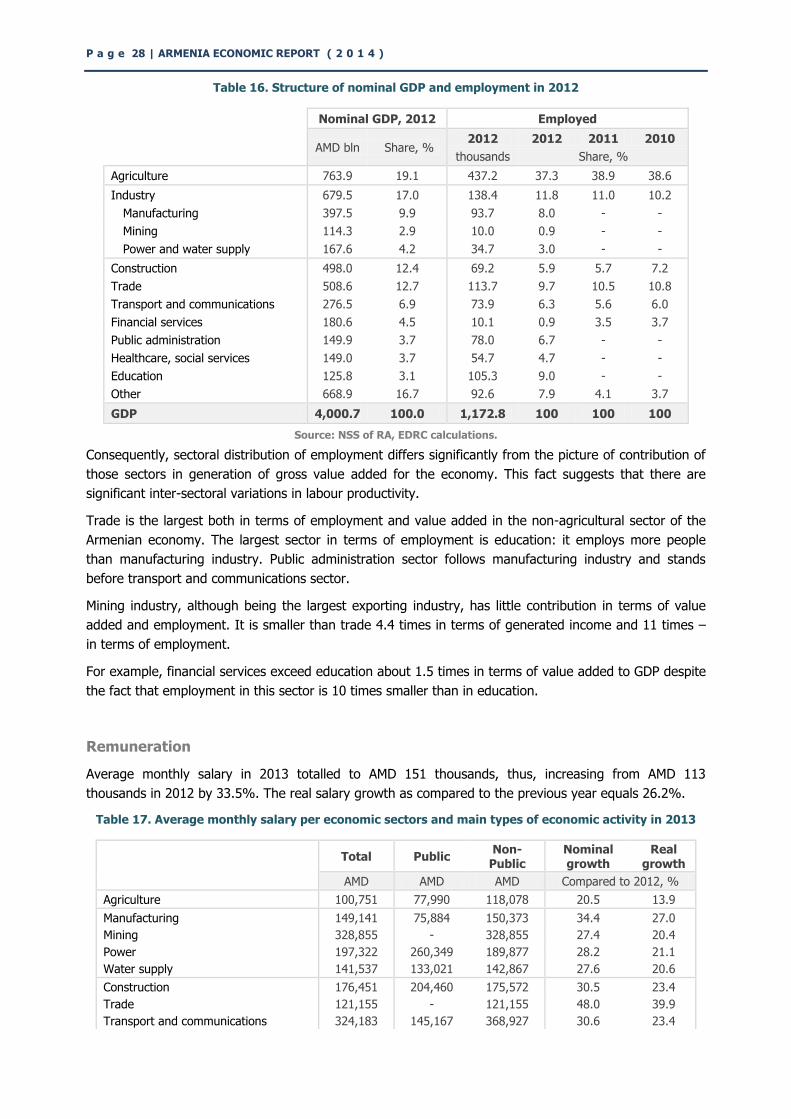
Table 16. Structure of nominal GDP and employment in 2012
Nominal GDP, 2012 Employed
AMD bln Share, % 2012 2012 2011 2010
thousands Share, %
Agriculture 763.9 19.1 437.2 37.3 38.9 38.6
Industry 679.5 17.0 138.4 11.8 11.0 10.2
Manufacturing 397.5 9.9 93.7 8.0 - -
Mining 114.3 2.9 10.0 0.9 - -
Power and water supply 167.6 4.2 34.7 3.0 - -
Construction 498.0 12.4 69.2 5.9 5.7 7.2
Trade 508.6 12.7 113.7 9.7 10.5 10.8
Transport and communications 276.5 6.9 73.9 6.3 5.6 6.0
Financial services 180.6 4.5 10.1 0.9 3.5 3.7
Public administration 149.9 3.7 78.0 6.7 - -
Healthcare, social services 149.0 3.7 54.7 4.7 - -
Education 125.8 3.1 105.3 9.0 - -
Other 668.9 16.7 92.6 7.9 4.1 3.7
GDP 4,000.7 100.0 1,172.8 100 100 100
Source: NSS of RA, EDRC calculations.
Consequently, sectoral distribution of employment differs significantly from the picture of contribution of
those sectors in generation of gross value added for the economy. This fact suggests that there are
significant inter-sectoral variations in labour productivity.
Trade is the largest both in terms of employment and value added in the non-agricultural sector of the
Armenian economy. The largest sector in terms of employment is education: it employs more people
than manufacturing industry. Public administration sector follows manufacturing industry and stands
before transport and communications sector.
Mining industry, although being the largest exporting industry, has little contribution in terms of value
added and employment. It is smaller than trade 4.4 times in terms of generated income and 11 times –
in terms of employment.
For example, financial services exceed education about 1.5 times in terms of value added to GDP despite
the fact that employment in this sector is 10 times smaller than in education.
Remuneration
Average monthly salary in 2013 totalled to AMD 151 thousands, thus, increasing from AMD 113
thousands in 2012 by 33.5%. The real salary growth as compared to the previous year equals 26.2%.
Table 17. Average monthly salary per economic sectors and main types of economic activity in 2013
Total Public
Non-Public
Nominal growth
Real growth
AMD AMD AMD Compared to 2012, %
Agriculture 100,751 77,990 118,078 20.5 13.9
Manufacturing 149,141 75,884 150,373 34.4 27.0
Mining 328,855 - 328,855 27.4 20.4
Power 197,322 260,349 189,877 28.2 21.1
Water supply 141,537 133,021 142,867 27.6 20.6
Construction 176,451 204,460 175,572 30.5 23.4
Trade 121,155 - 121,155 48.0 39.9
Transport and communications 324,183 145,167 368,927 30.6 23.4
E D R C ( 2 0 1 4 ) | p a g e 2 9
Financial services and insurance 372,064 510,292 363,978 26.3 19.4
Public administration 166,764 166,764 - 30.6 23.4
Healthcare, social services 115,888 106,161 148,439 33.2 25.9
Education 102,903 102,447 117,990 28.3 21.3
Total 151,099 120,623 185,630 33.5 26.2
Source: NSS of RA, EDRC estimations.
Salary level is relatively high in finance and insurance, IT and telecommunications sector, as well as in
mining, respectively, 2.5, 2.1 and 2.2 times compared to the average. The lowest salaries are paid in
education, healthcare, social service, culture, trade, and agriculture sectors. Average salary is the
highest in Syunik Marz which is explained by the large share of mining industry.
Table 18. Average monthly salary per economic sectors and Marzes in 2013
Total Public
Non-Public
Nominal growth
Real growth
AMD AMD AMD Compared to 2012, %
Yerevan 165,586 139,019 189,077 32.6 25.4
Aragatsotn 105,540 93,416 146,519 34.5 27.1
Ararat 126,405 99,346 157,471 35.4 28.0
Armavir 130,678 120,886 155,849 29.2 22.1
Gegharkuniq 120,779 99,741 209,922 27.7 20.7
Lori 118,436 98,179 149,685 34.4 27.0
Kotayq 132,734 95,224 162,828 34.4 27.1
Shirak 109,005 97,318 142,894 27.4 20.4
Syunik 195,577 98,173 281,750 40.6 32.9
Vayots Dzor 114,451 92,135 151,924 38.4 30.8
Tavush 114,311 100,568 153,888 38.7 31.1
Total 151,099 120,623 185,630 33.5 26.2
Source: NSS of RA, EDRC estimations.
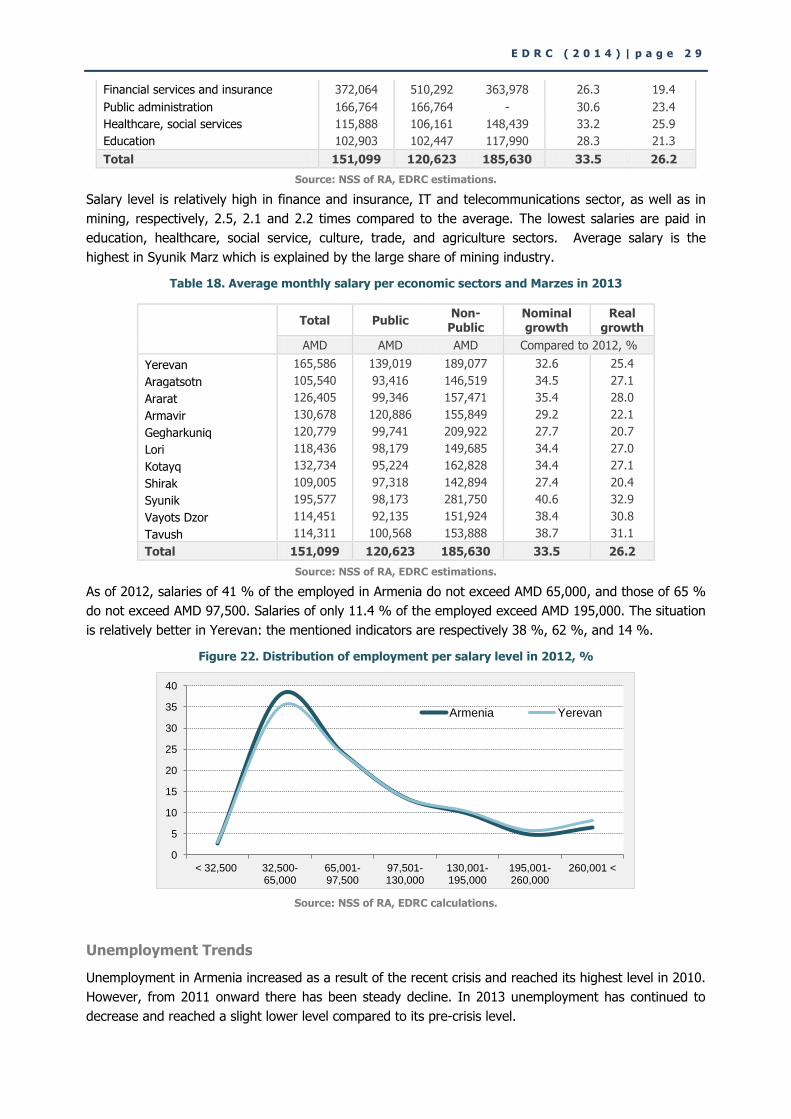
As of 2012, salaries of 41 % of the employed in Armenia do not exceed AMD 65,000, and those of 65 %
do not exceed AMD 97,500. Salaries of only 11.4 % of the employed exceed AMD 195,000. The situation
is relatively better in Yerevan: the mentioned indicators are respectively 38 %, 62 %, and 14 %.
Figure 22. Distribution of employment per salary level in 2012, %
Source: NSS of RA, EDRC calculations.
Unemployment Trends
Unemployment in Armenia increased as a result of the recent crisis and reached its highest level in 2010.
However, from 2011 onward there has been steady decline. In 2013 unemployment has continued to
decrease and reached a slight lower level compared to its pre-crisis level.
0
5
10
15
20
25
30
35
40
< 32,500 32,500- 65,000
65,001- 97,500
97,501- 130,000
130,001- 195,000
195,001- 260,000
260,001 <
Armenia Yerevan
P a g e 30 | ARMENIA ECONOMIC REPORT ( 2 0 1 4 )
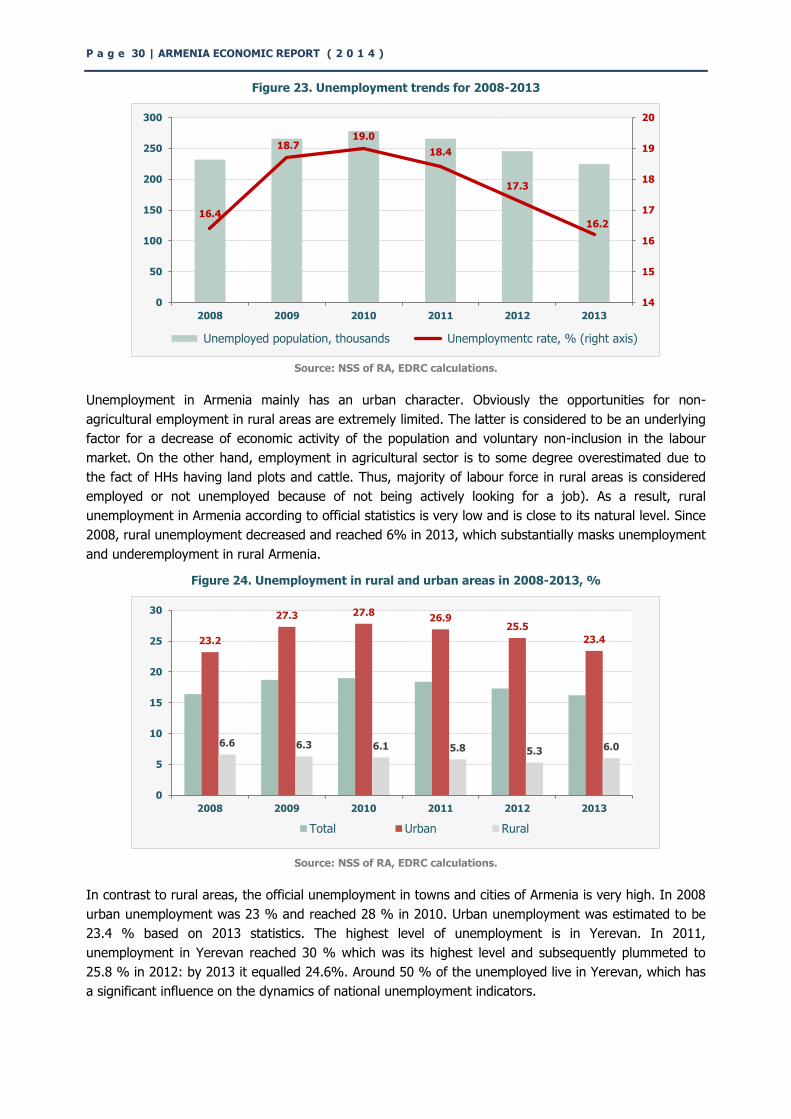
Figure 23. Unemployment trends for 2008-2013
Source: NSS of RA, EDRC calculations.
Unemployment in Armenia mainly has an urban character. Obviously the opportunities for non-
agricultural employment in rural areas are extremely limited. The latter is considered to be an underlying
factor for a decrease of economic activity of the population and voluntary non-inclusion in the labour
market. On the other hand, employment in agricultural sector is to some degree overestimated due to
the fact of HHs having land plots and cattle. Thus, majority of labour force in rural areas is considered
employed or not unemployed because of not being actively looking for a job). As a result, rural
unemployment in Armenia according to official statistics is very low and is close to its natural level. Since
2008, rural unemployment decreased and reached 6% in 2013, which substantially masks unemployment
and underemployment in rural Armenia.
Figure 24. Unemployment in rural and urban areas in 2008-2013, %
Source: NSS of RA, EDRC calculations.
In contrast to rural areas, the official unemployment in towns and cities of Armenia is very high. In 2008
urban unemployment was 23 % and reached 28 % in 2010. Urban unemployment was estimated to be
23.4 % based on 2013 statistics. The highest level of unemployment is in Yerevan. In 2011,
unemployment in Yerevan reached 30 % which was its highest level and subsequently plummeted to
25.8 % in 2012: by 2013 it equalled 24.6%. Around 50 % of the unemployed live in Yerevan, which has
a significant influence on the dynamics of national unemployment indicators.
16.4
18.7 19.0
18.4
17.3
16.2
14
15
16
17
18
19
20
0
50
100
150
200
250
300
2008 2009 2010 2011 2012 2013
Unemployed population, thousands Unemploymentc rate, % (right axis)
23.2
27.3 27.8 26.9
25.5
23.4
6.6 6.3 6.1 5.8 5.3 6.0
0
5
10
15
20
25
30
2008 2009 2010 2011 2012 2013
Total Urban Rural
E D R C ( 2 0 1 4 ) | p a g e 3 1
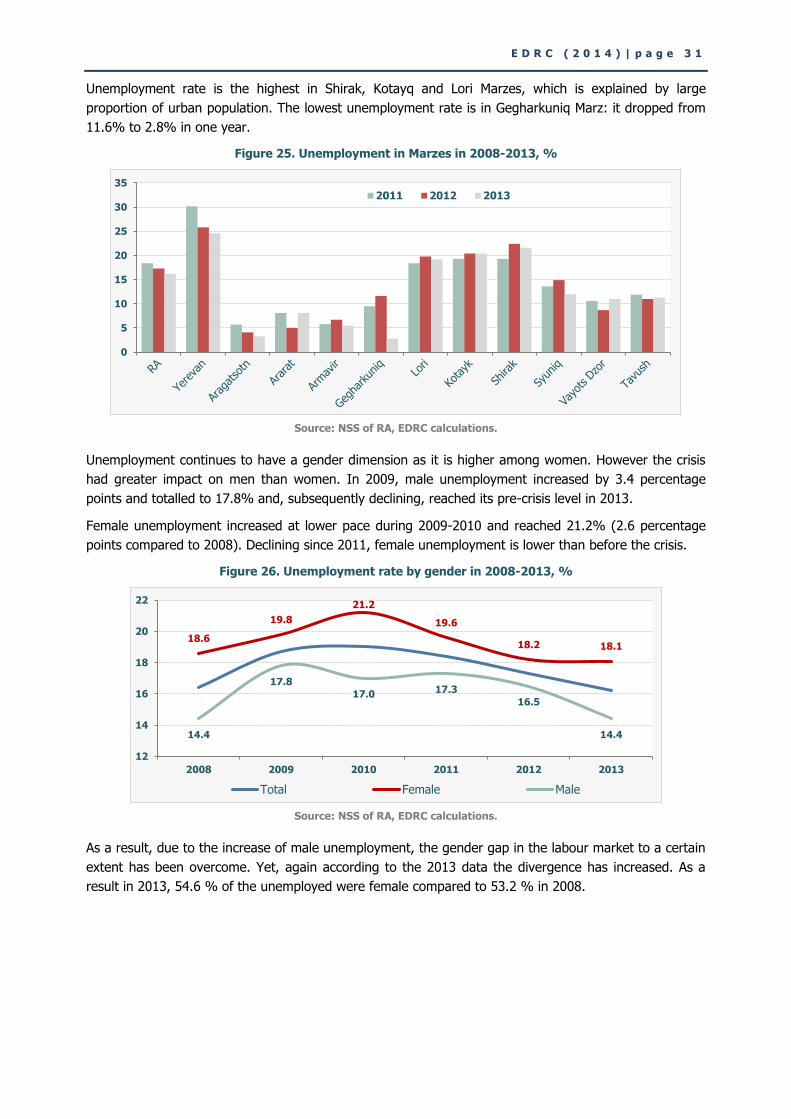
Unemployment rate is the highest in Shirak, Kotayq and Lori Marzes, which is explained by large
proportion of urban population. The lowest unemployment rate is in Gegharkuniq Marz: it dropped from
11.6% to 2.8% in one year.
Figure 25. Unemployment in Marzes in 2008-2013, %
Source: NSS of RA, EDRC calculations.
Unemployment continues to have a gender dimension as it is higher among women. However the crisis
had greater impact on men than women. In 2009, male unemployment increased by 3.4 percentage
points and totalled to 17.8% and, subsequently declining, reached its pre-crisis level in 2013.
Female unemployment increased at lower pace during 2009-2010 and reached 21.2% (2.6 percentage
points compared to 2008). Declining since 2011, female unemployment is lower than before the crisis.
Figure 26. Unemployment rate by gender in 2008-2013, %
Source: NSS of RA, EDRC calculations.
As a result, due to the increase of male unemployment, the gender gap in the labour market to a certain
extent has been overcome. Yet, again according to the 2013 data the divergence has increased. As a
result in 2013, 54.6 % of the unemployed were female compared to 53.2 % in 2008.
0
5
10
15
20
25
30
35
2011 2012 2013
18.6
19.8
21.2
19.6
18.2 18.1
14.4
17.8
17.0 17.3
16.5
14.4
12
14
16
18
20
22
2008 2009 2010 2011 2012 2013
Total Female Male
P a g e 32 | ARMENIA ECONOMIC REPORT ( 2 0 1 4 )
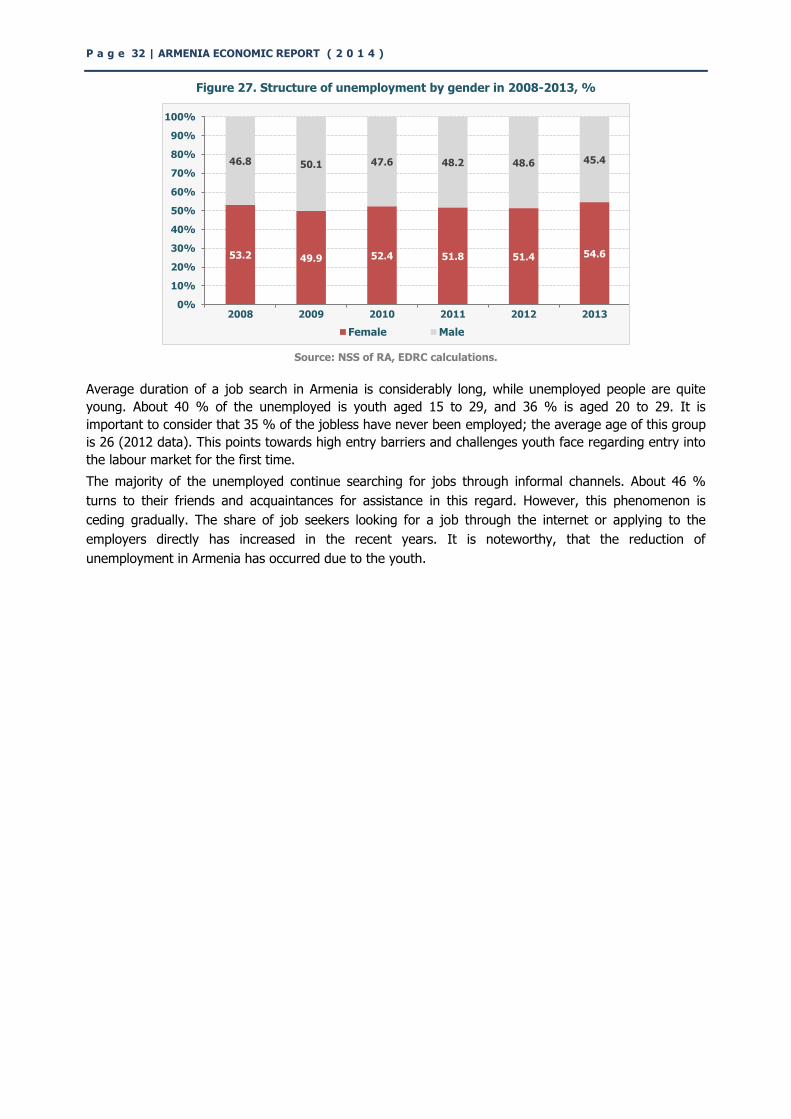
Figure 27. Structure of unemployment by gender in 2008-2013, %
Source: NSS of RA, EDRC calculations.
Average duration of a job search in Armenia is considerably long, while unemployed people are quite
young. About 40 % of the unemployed is youth aged 15 to 29, and 36 % is aged 20 to 29. It is
important to consider that 35 % of the jobless have never been employed; the average age of this group
is 26 (2012 data). This points towards high entry barriers and challenges youth face regarding entry into
the labour market for the first time.
The majority of the unemployed continue searching for jobs through informal channels. About 46 %
turns to their friends and acquaintances for assistance in this regard. However, this phenomenon is
ceding gradually. The share of job seekers looking for a job through the internet or applying to the
employers directly has increased in the recent years. It is noteworthy, that the reduction of
unemployment in Armenia has occurred due to the youth.
53.2 49.9 52.4 51.8 51.4 54.6
46.8 50.1 47.6 48.2 48.6 45.4
0%
10%
20%
30%
40%
50%
60%
70%
80%
90%
100%
2008 2009 2010 2011 2012 2013
Female Male
E D R C ( 2 0 1 4 ) | p a g e 3 3
1.4. Poverty and Social Snapshot
Overall Trends
Poverty indicators increased in Armenia dramatically after the crisis. In 2009 the poverty incidence grew by
6.5 percentage points from 2008 and extreme poverty grew by two percentage points. Poverty continued
to increase in 2010, while in 2011 it decreased slightly along with a slight increase in extreme poverty by
0.7 percentage points. As a consequence, poverty in Armenia reached 35 % in 2011 compared to 27.6
% in 2008, while extreme poverty reached 2.7 % in contrast to 1.6 % in 2008. This implies that the
crisis has had a deep and continues impact on poverty in Armenia.
Considerably high real growth was recorded in Armenia in 2012, namely 7.2 %. Remittances from
foreign countries in 2012 grew by 9 %, thus, exceeding the pre-crisis level (at the expense of increased
remittances received from Russia). This affected poverty in Armenia and according to the recent official
data, poverty decreased significantly in 2012. Nevertheless, poverty and particularly extreme poverty
indicators significantly exceed their pre-crisis levels.
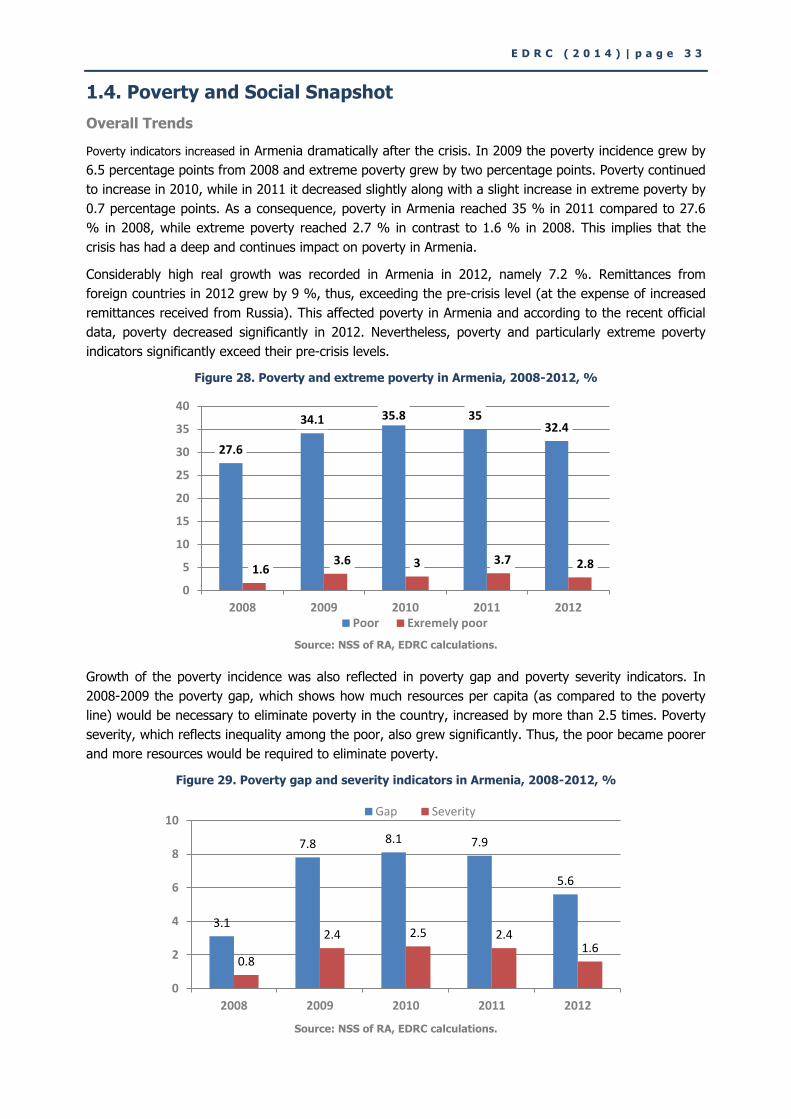
Figure 28. Poverty and extreme poverty in Armenia, 2008-2012, %
Source: NSS of RA, EDRC calculations.
Growth of the poverty incidence was also reflected in poverty gap and poverty severity indicators. In
2008-2009 the poverty gap, which shows how much resources per capita (as compared to the poverty
line) would be necessary to eliminate poverty in the country, increased by more than 2.5 times. Poverty
severity, which reflects inequality among the poor, also grew significantly. Thus, the poor became poorer
and more resources would be required to eliminate poverty.
Figure 29. Poverty gap and severity indicators in Armenia, 2008-2012, %
Source: NSS of RA, EDRC calculations.
27.6
34.1 35.8 35 32.4
1.6 3.6 3 3.7 2.8
0
5
10
15
20
25
30
35
40
2008 2009 2010 2011 2012 Poor Exremely poor
3.1
7.8 8.1 7.9
5.6
0.8
2.4 2.5 2.4 1.6
0
2
4
6
8
10
2008 2009 2010 2011 2012
Gap Severity
P a g e 34 | ARMENIA ECONOMIC REPORT ( 2 0 1 4 )
During 2008-2012, inequality continuously increased. Inequality measured through the Gini coefficient
shows that polarization of Armenian population in terms of income is deeper than in terms of
consumption. Gini coefficient for income increased by 0.3 points reaching 0.37 in 2012 from 0.34 in 2008
(see Table below).
Table 19. Dynamics of Gini coefficient in 2008-2012, %
2008 2009 2010 2011 2012
Gini coefficient, income 0.339 0.355 0.362 0.371 0.372
Gini coefficient, consumption 0.242 0.257 0.265 0.267 0.269
Source: NSS of RA, EDRC calculations.
Thus, the impact of the crisis on poverty and inequality in Armenia is very large. Poverty situation in the
country worsened during 2009-2011. The situation improved in 2012; however poverty is still considered
very high. In 2012, 32.4 % of the Armenian households (or about 1 mln people) were poor, while 2.8 %
(85 thousand people) were extremely poor or suffered from malnutrition. Comparison of the 2012
poverty levels with 2008 reveals that in 2012 the number of poor and extremely people increased by 17
and 75 % respectively.
Poverty gap in 2012 reached 5.6 %, while poverty deficit (average consumption per each poor individual
necessary to overcome poverty as compared to the poverty line) equalled 15.9 %. This implies that
about AMD 69.5 bln would be necessary in 2012 to overcome poverty in Armenia, while to overcome
extreme poverty only – AMD 2 bln would be necessary. These indicators correspond to 1.7 % and 0.1 %
of the GDP respectively.
Regional Picture of Poverty
Armenia is characterised not only by high polarization of income, but also by highly disproportionate
regional development. This fact is apparent even from visual observations in the capital and other
communities of the country. ISLS does not fully reflect income polarization as wealthier households
usually refuse to participate in statistical surveys. Nevertheless, ISLS, despite some reservations, clearly
describes the regional disproportions and regional variations in welfare.
Poverty incidence is the lowest in Yerevan (25.6 %), while the highest in regional cities and towns (40
%). This obviously is explained by the differences in economic activity levels. Poverty and extreme
poverty indicators have been the highest in urban areas in the regions (see Table 10). Extreme poverty
or malnutrition is the lowest in villages (2.1 %) since households in villages have possibilities to produce
food for their own consumption and access to food in villages is higher.
Table 20. Breakdown of poverty and extreme poverty incidence in Armenia per community type, %
2008 2009 2010 2011 2012
Poverty
Armenia 27.6 34.1 35.8 35.0 32.4
Urban areas 27.6 33.7 35.7 35.2 32.5
Yerevan 20.1 26.7 27.1 27.5 25.6
Other urban 35.8 41.5 45.4 43.6 40.2
Rural areas 27.5 34.9 36 34.5 32.1
Extreme poverty
Armenia 1.6 3.6 3.0 3.7 2.8
Urban areas 1.9 4.6 4.1 4.6 3.2
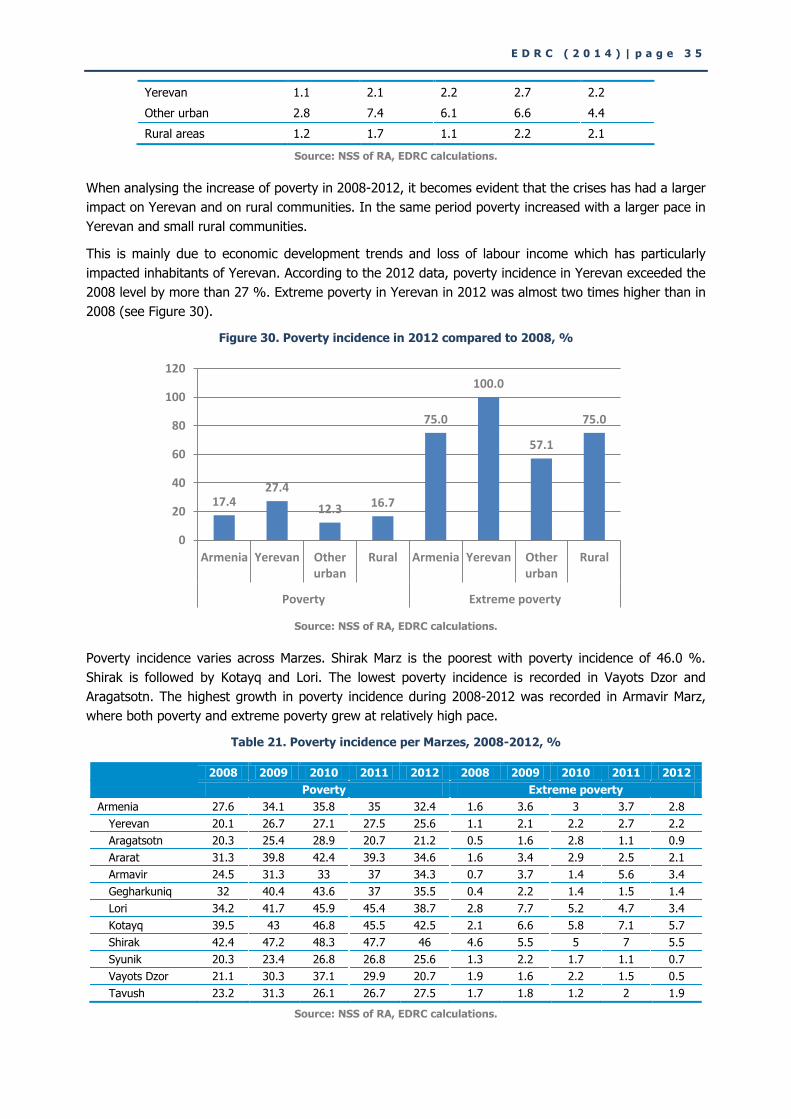
E D R C ( 2 0 1 4 ) | p a g e 3 5
Yerevan 1.1 2.1 2.2 2.7 2.2
Other urban 2.8 7.4 6.1 6.6 4.4
Rural areas 1.2 1.7 1.1 2.2 2.1
Source: NSS of RA, EDRC calculations.
When analysing the increase of poverty in 2008-2012, it becomes evident that the crises has had a larger
impact on Yerevan and on rural communities. In the same period poverty increased with a larger pace in
Yerevan and small rural communities.
This is mainly due to economic development trends and loss of labour income which has particularly
impacted inhabitants of Yerevan. According to the 2012 data, poverty incidence in Yerevan exceeded the
2008 level by more than 27 %. Extreme poverty in Yerevan in 2012 was almost two times higher than in
2008 (see Figure 30).
Figure 30. Poverty incidence in 2012 compared to 2008, %
Source: NSS of RA, EDRC calculations.
Poverty incidence varies across Marzes. Shirak Marz is the poorest with poverty incidence of 46.0 %.
Shirak is followed by Kotayq and Lori. The lowest poverty incidence is recorded in Vayots Dzor and
Aragatsotn. The highest growth in poverty incidence during 2008-2012 was recorded in Armavir Marz,
where both poverty and extreme poverty grew at relatively high pace.
Table 21. Poverty incidence per Marzes, 2008-2012, %
2008 2009 2010 2011 2012 2008 2009 2010 2011 2012
Poverty Extreme poverty
Armenia 27.6 34.1 35.8 35 32.4 1.6 3.6 3 3.7 2.8
Yerevan 20.1 26.7 27.1 27.5 25.6 1.1 2.1 2.2 2.7 2.2
Aragatsotn 20.3 25.4 28.9 20.7 21.2 0.5 1.6 2.8 1.1 0.9
Ararat 31.3 39.8 42.4 39.3 34.6 1.6 3.4 2.9 2.5 2.1
Armavir 24.5 31.3 33 37 34.3 0.7 3.7 1.4 5.6 3.4
Gegharkuniq 32 40.4 43.6 37 35.5 0.4 2.2 1.4 1.5 1.4
Lori 34.2 41.7 45.9 45.4 38.7 2.8 7.7 5.2 4.7 3.4
Kotayq 39.5 43 46.8 45.5 42.5 2.1 6.6 5.8 7.1 5.7
Shirak 42.4 47.2 48.3 47.7 46 4.6 5.5 5 7 5.5
Syunik 20.3 23.4 26.8 26.8 25.6 1.3 2.2 1.7 1.1 0.7
Vayots Dzor 21.1 30.3 37.1 29.9 20.7 1.9 1.6 2.2 1.5 0.5
Tavush 23.2 31.3 26.1 26.7 27.5 1.7 1.8 1.2 2 1.9
Source: NSS of RA, EDRC calculations.
17.4 27.4
12.3 16.7
75.0
100.0
57.1
75.0
0
20
40
60
80
100
120
Armenia Yerevan Other urban
Rural Armenia Yerevan Other urban
Rural
Poverty Extreme poverty
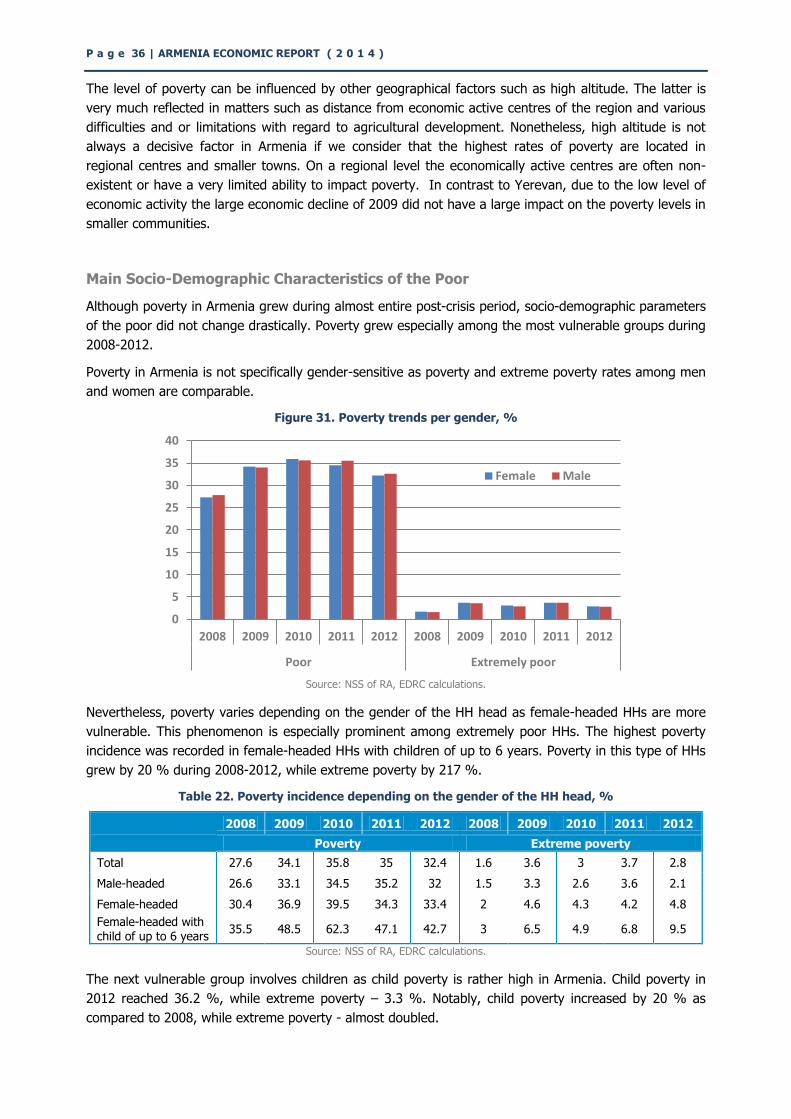
P a g e 36 | ARMENIA ECONOMIC REPORT ( 2 0 1 4 )
The level of poverty can be influenced by other geographical factors such as high altitude. The latter is
very much reflected in matters such as distance from economic active centres of the region and various
difficulties and or limitations with regard to agricultural development. Nonetheless, high altitude is not
always a decisive factor in Armenia if we consider that the highest rates of poverty are located in
regional centres and smaller towns. On a regional level the economically active centres are often non-
existent or have a very limited ability to impact poverty. In contrast to Yerevan, due to the low level of
economic activity the large economic decline of 2009 did not have a large impact on the poverty levels in
smaller communities.
Main Socio-Demographic Characteristics of the Poor
Although poverty in Armenia grew during almost entire post-crisis period, socio-demographic parameters
of the poor did not change drastically. Poverty grew especially among the most vulnerable groups during
2008-2012.
Poverty in Armenia is not specifically gender-sensitive as poverty and extreme poverty rates among men
and women are comparable.
Figure 31. Poverty trends per gender, %
Source: NSS of RA, EDRC calculations.
Nevertheless, poverty varies depending on the gender of the HH head as female-headed HHs are more
vulnerable. This phenomenon is especially prominent among extremely poor HHs. The highest poverty
incidence was recorded in female-headed HHs with children of up to 6 years. Poverty in this type of HHs
grew by 20 % during 2008-2012, while extreme poverty by 217 %.
Table 22. Poverty incidence depending on the gender of the HH head, %
2008 2009 2010 2011 2012 2008 2009 2010 2011 2012
Poverty Extreme poverty
Total 27.6 34.1 35.8 35 32.4 1.6 3.6 3 3.7 2.8
Male-headed 26.6 33.1 34.5 35.2 32 1.5 3.3 2.6 3.6 2.1
Female-headed 30.4 36.9 39.5 34.3 33.4 2 4.6 4.3 4.2 4.8
Female-headed with child of up to 6 years
35.5 48.5 62.3 47.1 42.7 3 6.5 4.9 6.8 9.5
Source: NSS of RA, EDRC calculations.
The next vulnerable group involves children as child poverty is rather high in Armenia. Child poverty in
2012 reached 36.2 %, while extreme poverty – 3.3 %. Notably, child poverty increased by 20 % as
compared to 2008, while extreme poverty - almost doubled.
0
5
10
15
20
25
30
35
40
2008 2009 2010 2011 2012 2008 2009 2010 2011 2012
Poor Extremely poor
Female Male
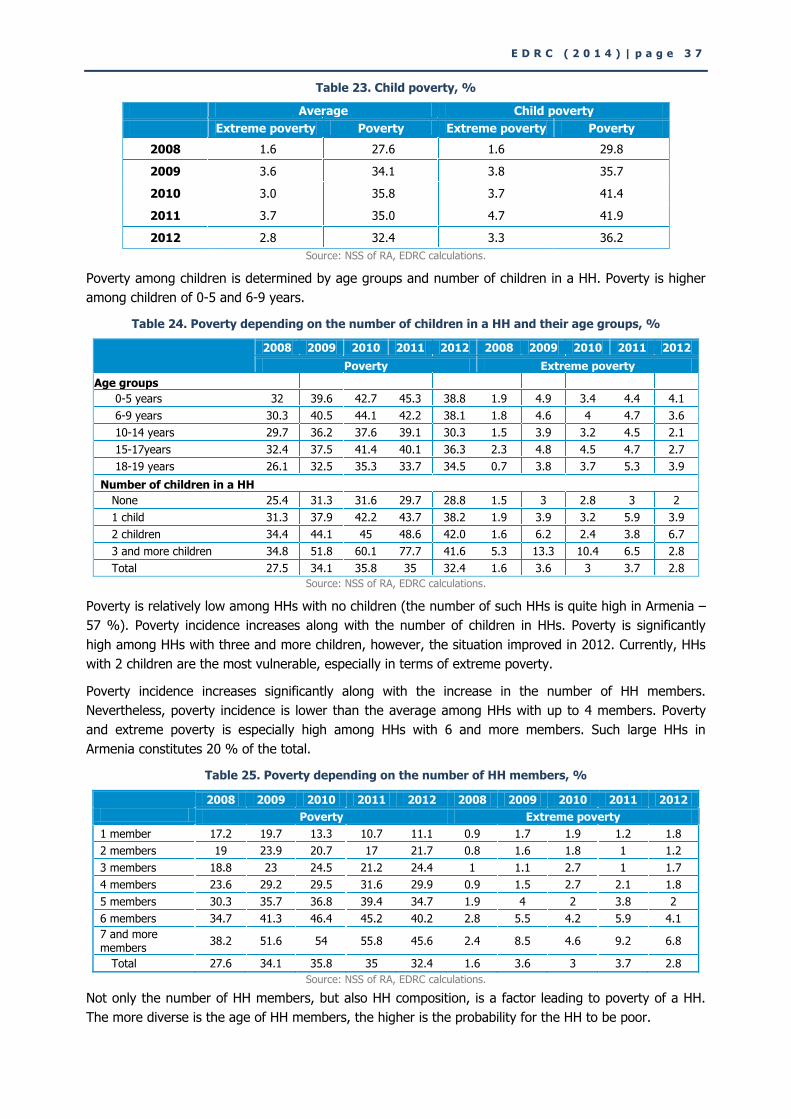
E D R C ( 2 0 1 4 ) | p a g e 3 7
Table 23. Child poverty, %
Average Child poverty
Extreme poverty Poverty Extreme poverty Poverty
2008 1.6 27.6 1.6 29.8
2009 3.6 34.1 3.8 35.7
2010 3.0 35.8 3.7 41.4
2011 3.7 35.0 4.7 41.9
2012 2.8 32.4 3.3 36.2
Source: NSS of RA, EDRC calculations.
Poverty among children is determined by age groups and number of children in a HH. Poverty is higher
among children of 0-5 and 6-9 years.
Table 24. Poverty depending on the number of children in a HH and their age groups, %
2008 2009 2010 2011 2012 2008 2009 2010 2011 2012
Poverty Extreme poverty
Age groups
0-5 years 32 39.6 42.7 45.3 38.8 1.9 4.9 3.4 4.4 4.1
6-9 years 30.3 40.5 44.1 42.2 38.1 1.8 4.6 4 4.7 3.6
10-14 years 29.7 36.2 37.6 39.1 30.3 1.5 3.9 3.2 4.5 2.1
15-17years 32.4 37.5 41.4 40.1 36.3 2.3 4.8 4.5 4.7 2.7
18-19 years 26.1 32.5 35.3 33.7 34.5 0.7 3.8 3.7 5.3 3.9
Number of children in a HH
None 25.4 31.3 31.6 29.7 28.8 1.5 3 2.8 3 2
1 child 31.3 37.9 42.2 43.7 38.2 1.9 3.9 3.2 5.9 3.9
2 children 34.4 44.1 45 48.6 42.0 1.6 6.2 2.4 3.8 6.7
3 and more children 34.8 51.8 60.1 77.7 41.6 5.3 13.3 10.4 6.5 2.8
Total 27.5 34.1 35.8 35 32.4 1.6 3.6 3 3.7 2.8
Source: NSS of RA, EDRC calculations.
Poverty is relatively low among HHs with no children (the number of such HHs is quite high in Armenia –
57 %). Poverty incidence increases along with the number of children in HHs. Poverty is significantly
high among HHs with three and more children, however, the situation improved in 2012. Currently, HHs
with 2 children are the most vulnerable, especially in terms of extreme poverty.
Poverty incidence increases significantly along with the increase in the number of HH members.
Nevertheless, poverty incidence is lower than the average among HHs with up to 4 members. Poverty
and extreme poverty is especially high among HHs with 6 and more members. Such large HHs in
Armenia constitutes 20 % of the total.
Table 25. Poverty depending on the number of HH members, %
2008 2009 2010 2011 2012 2008 2009 2010 2011 2012
Poverty Extreme poverty
1 member 17.2 19.7 13.3 10.7 11.1 0.9 1.7 1.9 1.2 1.8
2 members 19 23.9 20.7 17 21.7 0.8 1.6 1.8 1 1.2
3 members 18.8 23 24.5 21.2 24.4 1 1.1 2.7 1 1.7
4 members 23.6 29.2 29.5 31.6 29.9 0.9 1.5 2.7 2.1 1.8
5 members 30.3 35.7 36.8 39.4 34.7 1.9 4 2 3.8 2
6 members 34.7 41.3 46.4 45.2 40.2 2.8 5.5 4.2 5.9 4.1
7 and more members
38.2 51.6 54 55.8 45.6 2.4 8.5 4.6 9.2 6.8
Total 27.6 34.1 35.8 35 32.4 1.6 3.6 3 3.7 2.8
Source: NSS of RA, EDRC calculations.
Not only the number of HH members, but also HH composition, is a factor leading to poverty of a HH.
The more diverse is the age of HH members, the higher is the probability for the HH to be poor.
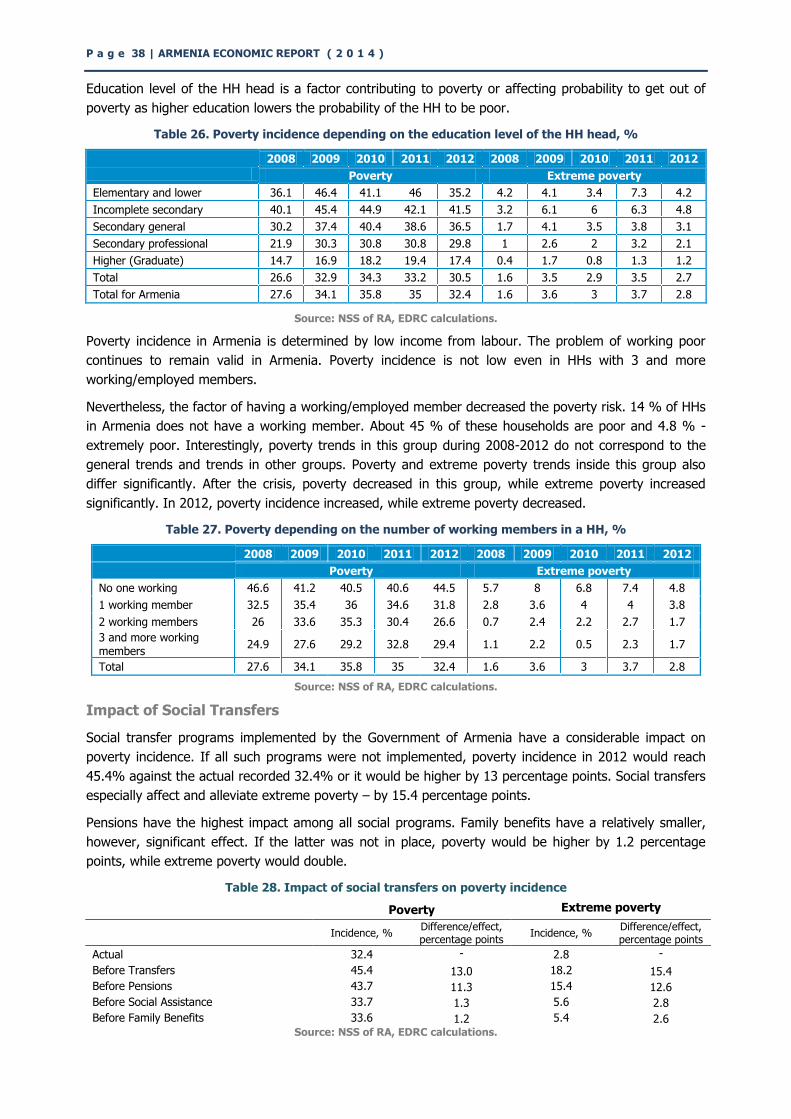
P a g e 38 | ARMENIA ECONOMIC REPORT ( 2 0 1 4 )
Education level of the HH head is a factor contributing to poverty or affecting probability to get out of
poverty as higher education lowers the probability of the HH to be poor.
Table 26. Poverty incidence depending on the education level of the HH head, %
2008 2009 2010 2011 2012 2008 2009 2010 2011 2012
Poverty Extreme poverty
Elementary and lower 36.1 46.4 41.1 46 35.2 4.2 4.1 3.4 7.3 4.2
Incomplete secondary 40.1 45.4 44.9 42.1 41.5 3.2 6.1 6 6.3 4.8
Secondary general 30.2 37.4 40.4 38.6 36.5 1.7 4.1 3.5 3.8 3.1
Secondary professional 21.9 30.3 30.8 30.8 29.8 1 2.6 2 3.2 2.1
Higher (Graduate) 14.7 16.9 18.2 19.4 17.4 0.4 1.7 0.8 1.3 1.2
Total 26.6 32.9 34.3 33.2 30.5 1.6 3.5 2.9 3.5 2.7
Total for Armenia 27.6 34.1 35.8 35 32.4 1.6 3.6 3 3.7 2.8
Source: NSS of RA, EDRC calculations.
Poverty incidence in Armenia is determined by low income from labour. The problem of working poor
continues to remain valid in Armenia. Poverty incidence is not low even in HHs with 3 and more
working/employed members.
Nevertheless, the factor of having a working/employed member decreased the poverty risk. 14 % of HHs
in Armenia does not have a working member. About 45 % of these households are poor and 4.8 % -
extremely poor. Interestingly, poverty trends in this group during 2008-2012 do not correspond to the
general trends and trends in other groups. Poverty and extreme poverty trends inside this group also
differ significantly. After the crisis, poverty decreased in this group, while extreme poverty increased
significantly. In 2012, poverty incidence increased, while extreme poverty decreased.
Table 27. Poverty depending on the number of working members in a HH, %
2008 2009 2010 2011 2012 2008 2009 2010 2011 2012
Poverty Extreme poverty
No one working 46.6 41.2 40.5 40.6 44.5 5.7 8 6.8 7.4 4.8
1 working member 32.5 35.4 36 34.6 31.8 2.8 3.6 4 4 3.8
2 working members 26 33.6 35.3 30.4 26.6 0.7 2.4 2.2 2.7 1.7
3 and more working members
24.9 27.6 29.2 32.8 29.4 1.1 2.2 0.5 2.3 1.7
Total 27.6 34.1 35.8 35 32.4 1.6 3.6 3 3.7 2.8
Source: NSS of RA, EDRC calculations.
Impact of Social Transfers
Social transfer programs implemented by the Government of Armenia have a considerable impact on
poverty incidence. If all such programs were not implemented, poverty incidence in 2012 would reach
45.4% against the actual recorded 32.4% or it would be higher by 13 percentage points. Social transfers
especially affect and alleviate extreme poverty – by 15.4 percentage points.
Pensions have the highest impact among all social programs. Family benefits have a relatively smaller,
however, significant effect. If the latter was not in place, poverty would be higher by 1.2 percentage
points, while extreme poverty would double.
Table 28. Impact of social transfers on poverty incidence
Poverty Extreme poverty
Incidence, % Difference/effect, percentage points
Incidence, % Difference/effect, percentage points
Actual 32.4 - 2.8 -
Before Transfers 45.4 13.0 18.2 15.4
Before Pensions 43.7 11.3 15.4 12.6
Before Social Assistance 33.7 1.3 5.6 2.8
Before Family Benefits 33.6 1.2 5.4 2.6 Source: NSS of RA, EDRC calculations.
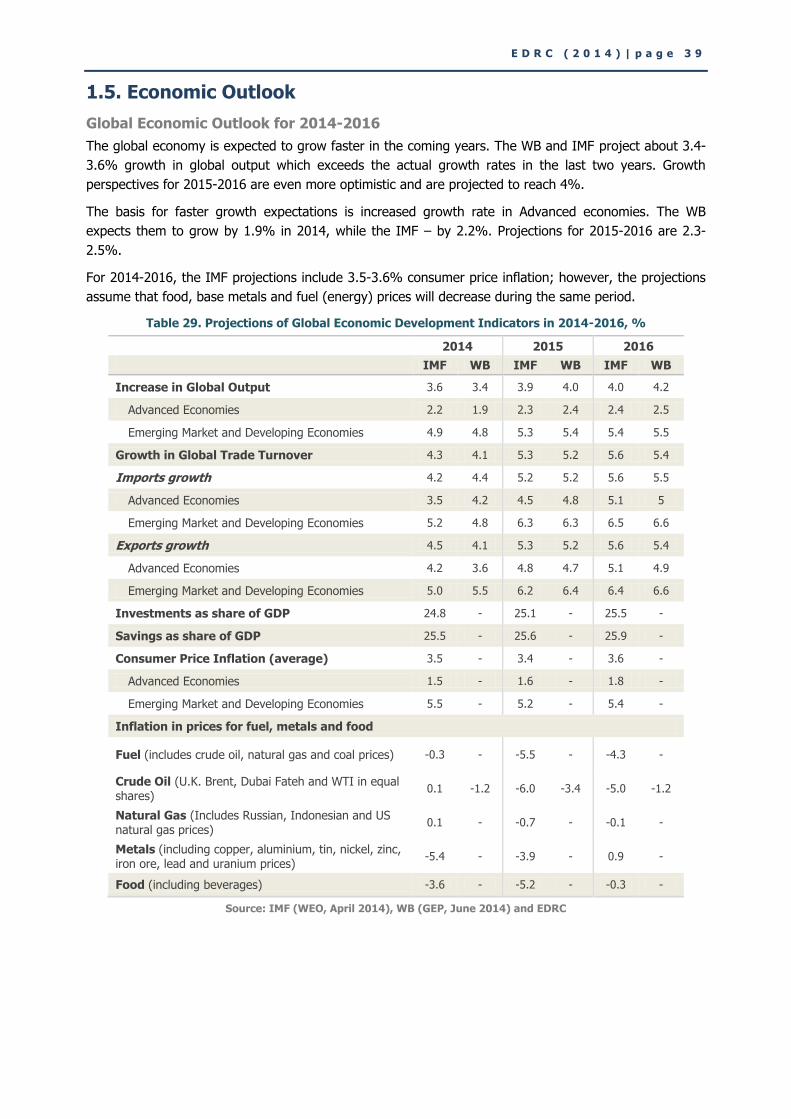
E D R C ( 2 0 1 4 ) | p a g e 3 9
1.5. Economic Outlook
Global Economic Outlook for 2014-2016
The global economy is expected to grow faster in the coming years. The WB and IMF project about 3.4-
3.6% growth in global output which exceeds the actual growth rates in the last two years. Growth
perspectives for 2015-2016 are even more optimistic and are projected to reach 4%.
The basis for faster growth expectations is increased growth rate in Advanced economies. The WB
expects them to grow by 1.9% in 2014, while the IMF – by 2.2%. Projections for 2015-2016 are 2.3-
2.5%.
For 2014-2016, the IMF projections include 3.5-3.6% consumer price inflation; however, the projections
assume that food, base metals and fuel (energy) prices will decrease during the same period.
Table 29. Projections of Global Economic Development Indicators in 2014-2016, %
2014 2015 2016
IMF WB IMF WB IMF WB
Increase in Global Output 3.6 3.4 3.9 4.0 4.0 4.2
Advanced Economies 2.2 1.9 2.3 2.4 2.4 2.5
Emerging Market and Developing Economies 4.9 4.8 5.3 5.4 5.4 5.5
Growth in Global Trade Turnover 4.3 4.1 5.3 5.2 5.6 5.4
Imports growth 4.2 4.4 5.2 5.2 5.6 5.5
Advanced Economies 3.5 4.2 4.5 4.8 5.1 5
Emerging Market and Developing Economies 5.2 4.8 6.3 6.3 6.5 6.6
Exports growth 4.5 4.1 5.3 5.2 5.6 5.4
Advanced Economies 4.2 3.6 4.8 4.7 5.1 4.9
Emerging Market and Developing Economies 5.0 5.5 6.2 6.4 6.4 6.6
Investments as share of GDP 24.8 - 25.1 - 25.5 -
Savings as share of GDP 25.5 - 25.6 - 25.9 -
Consumer Price Inflation (average) 3.5 - 3.4 - 3.6 -
Advanced Economies 1.5 - 1.6 - 1.8 -
Emerging Market and Developing Economies 5.5 - 5.2 - 5.4 -
Inflation in prices for fuel, metals and food
Fuel (includes crude oil, natural gas and coal prices) -0.3 - -5.5 - -4.3 -
Crude Oil (U.K. Brent, Dubai Fateh and WTI in equal shares)
0.1 -1.2 -6.0 -3.4 -5.0 -1.2
Natural Gas (Includes Russian, Indonesian and US natural gas prices)
0.1 - -0.7 - -0.1 -
Metals (including copper, aluminium, tin, nickel, zinc, iron ore, lead and uranium prices)
-5.4 - -3.9 - 0.9 -
Food (including beverages) -3.6 - -5.2 - -0.3 -
Source: IMF (WEO, April 2014), WB (GEP, June 2014) and EDRC
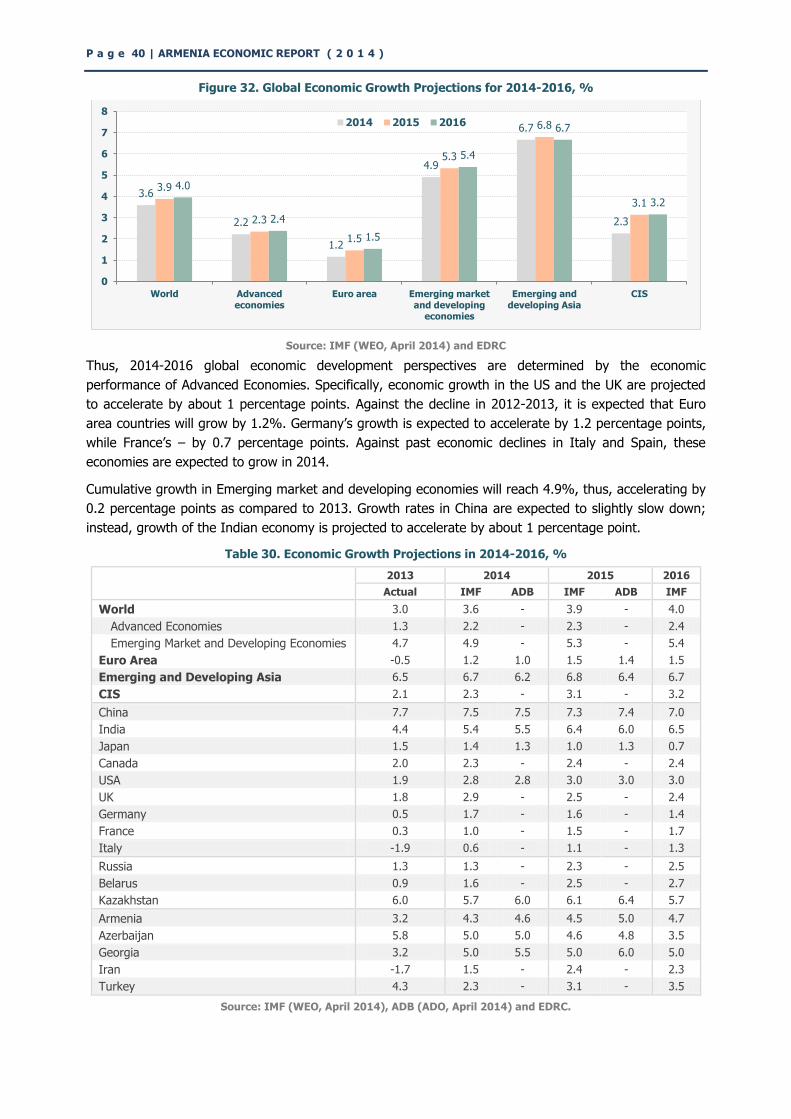
P a g e 40 | ARMENIA ECONOMIC REPORT ( 2 0 1 4 )
Figure 32. Global Economic Growth Projections for 2014-2016, %
Source: IMF (WEO, April 2014) and EDRC
Thus, 2014-2016 global economic development perspectives are determined by the economic
performance of Advanced Economies. Specifically, economic growth in the US and the UK are projected
to accelerate by about 1 percentage points. Against the decline in 2012-2013, it is expected that Euro
area countries will grow by 1.2%. Germany’s growth is expected to accelerate by 1.2 percentage points,
while France’s – by 0.7 percentage points. Against past economic declines in Italy and Spain, these
economies are expected to grow in 2014.
Cumulative growth in Emerging market and developing economies will reach 4.9%, thus, accelerating by
0.2 percentage points as compared to 2013. Growth rates in China are expected to slightly slow down;
instead, growth of the Indian economy is projected to accelerate by about 1 percentage point.
Table 30. Economic Growth Projections in 2014-2016, %
2013 2014 2015 2016
Actual IMF ADB IMF ADB IMF
World 3.0 3.6 - 3.9 - 4.0
Advanced Economies 1.3 2.2 - 2.3 - 2.4
Emerging Market and Developing Economies 4.7 4.9 - 5.3 - 5.4
Euro Area -0.5 1.2 1.0 1.5 1.4 1.5
Emerging and Developing Asia 6.5 6.7 6.2 6.8 6.4 6.7
CIS 2.1 2.3 - 3.1 - 3.2
China 7.7 7.5 7.5 7.3 7.4 7.0
India 4.4 5.4 5.5 6.4 6.0 6.5
Japan 1.5 1.4 1.3 1.0 1.3 0.7
Canada 2.0 2.3 - 2.4 - 2.4
USA 1.9 2.8 2.8 3.0 3.0 3.0
UK 1.8 2.9 - 2.5 - 2.4
Germany 0.5 1.7 - 1.6 - 1.4
France 0.3 1.0 - 1.5 - 1.7
Italy -1.9 0.6 - 1.1 - 1.3
Russia 1.3 1.3 - 2.3 - 2.5
Belarus 0.9 1.6 - 2.5 - 2.7
Kazakhstan 6.0 5.7 6.0 6.1 6.4 5.7
Armenia 3.2 4.3 4.6 4.5 5.0 4.7
Azerbaijan 5.8 5.0 5.0 4.6 4.8 3.5
Georgia 3.2 5.0 5.5 5.0 6.0 5.0
Iran -1.7 1.5 - 2.4 - 2.3
Turkey 4.3 2.3 - 3.1 - 3.5
Source: IMF (WEO, April 2014), ADB (ADO, April 2014) and EDRC.
3.6
2.2
1.2
4.9
6.7
2.3
3.9
2.3
1.5
5.3
6.8
3.1
4.0
2.4
1.5
5.4
6.7
3.2
0
1
2
3
4
5
6
7
8
World Advanced economies
Euro area Emerging market and developing
economies
Emerging and developing Asia
CIS
2014 2015 2016
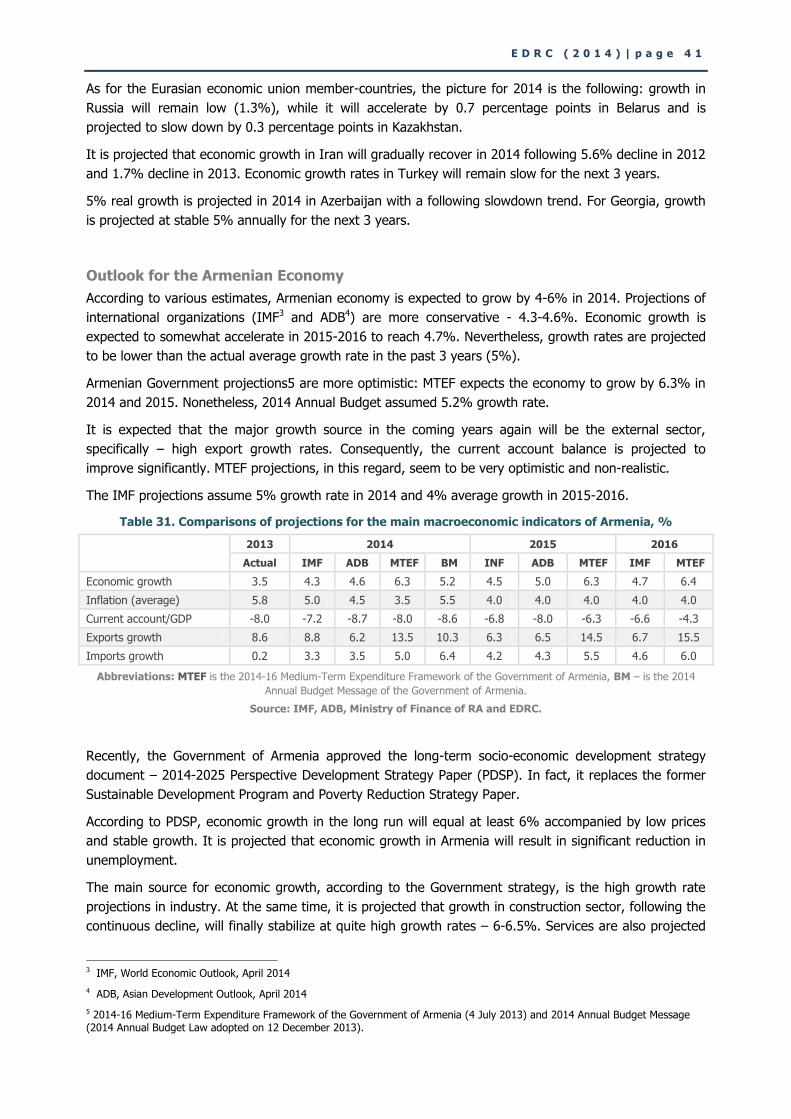
E D R C ( 2 0 1 4 ) | p a g e 4 1
As for the Eurasian economic union member-countries, the picture for 2014 is the following: growth in
Russia will remain low (1.3%), while it will accelerate by 0.7 percentage points in Belarus and is
projected to slow down by 0.3 percentage points in Kazakhstan.
It is projected that economic growth in Iran will gradually recover in 2014 following 5.6% decline in 2012
and 1.7% decline in 2013. Economic growth rates in Turkey will remain slow for the next 3 years.
5% real growth is projected in 2014 in Azerbaijan with a following slowdown trend. For Georgia, growth
is projected at stable 5% annually for the next 3 years.
Outlook for the Armenian Economy
According to various estimates, Armenian economy is expected to grow by 4-6% in 2014. Projections of
international organizations (IMF3 and ADB4) are more conservative - 4.3-4.6%. Economic growth is
expected to somewhat accelerate in 2015-2016 to reach 4.7%. Nevertheless, growth rates are projected
to be lower than the actual average growth rate in the past 3 years (5%).
Armenian Government projections5 are more optimistic: MTEF expects the economy to grow by 6.3% in
2014 and 2015. Nonetheless, 2014 Annual Budget assumed 5.2% growth rate.
It is expected that the major growth source in the coming years again will be the external sector,
specifically – high export growth rates. Consequently, the current account balance is projected to
improve significantly. MTEF projections, in this regard, seem to be very optimistic and non-realistic.
The IMF projections assume 5% growth rate in 2014 and 4% average growth in 2015-2016.
Table 31. Comparisons of projections for the main macroeconomic indicators of Armenia, %
2013 2014 2015 2016
Actual IMF ADB MTEF BM INF ADB MTEF IMF MTEF
Economic growth 3.5 4.3 4.6 6.3 5.2 4.5 5.0 6.3 4.7 6.4
Inflation (average) 5.8 5.0 4.5 3.5 5.5 4.0 4.0 4.0 4.0 4.0
Current account/GDP -8.0 -7.2 -8.7 -8.0 -8.6 -6.8 -8.0 -6.3 -6.6 -4.3
Exports growth 8.6 8.8 6.2 13.5 10.3 6.3 6.5 14.5 6.7 15.5
Imports growth 0.2 3.3 3.5 5.0 6.4 4.2 4.3 5.5 4.6 6.0
Abbreviations: MTEF is the 2014-16 Medium-Term Expenditure Framework of the Government of Armenia, BM – is the 2014
Annual Budget Message of the Government of Armenia.
Source: IMF, ADB, Ministry of Finance of RA and EDRC.
Recently, the Government of Armenia approved the long-term socio-economic development strategy
document – 2014-2025 Perspective Development Strategy Paper (PDSP). In fact, it replaces the former
Sustainable Development Program and Poverty Reduction Strategy Paper.
According to PDSP, economic growth in the long run will equal at least 6% accompanied by low prices
and stable growth. It is projected that economic growth in Armenia will result in significant reduction in
unemployment.
The main source for economic growth, according to the Government strategy, is the high growth rate
projections in industry. At the same time, it is projected that growth in construction sector, following the
continuous decline, will finally stabilize at quite high growth rates – 6-6.5%. Services are also projected
3 IMF, World Economic Outlook, April 2014
4 ADB, Asian Development Outlook, April 2014
5 2014-16 Medium-Term Expenditure Framework of the Government of Armenia (4 July 2013) and 2014 Annual Budget Message (2014 Annual Budget Law adopted on 12 December 2013).
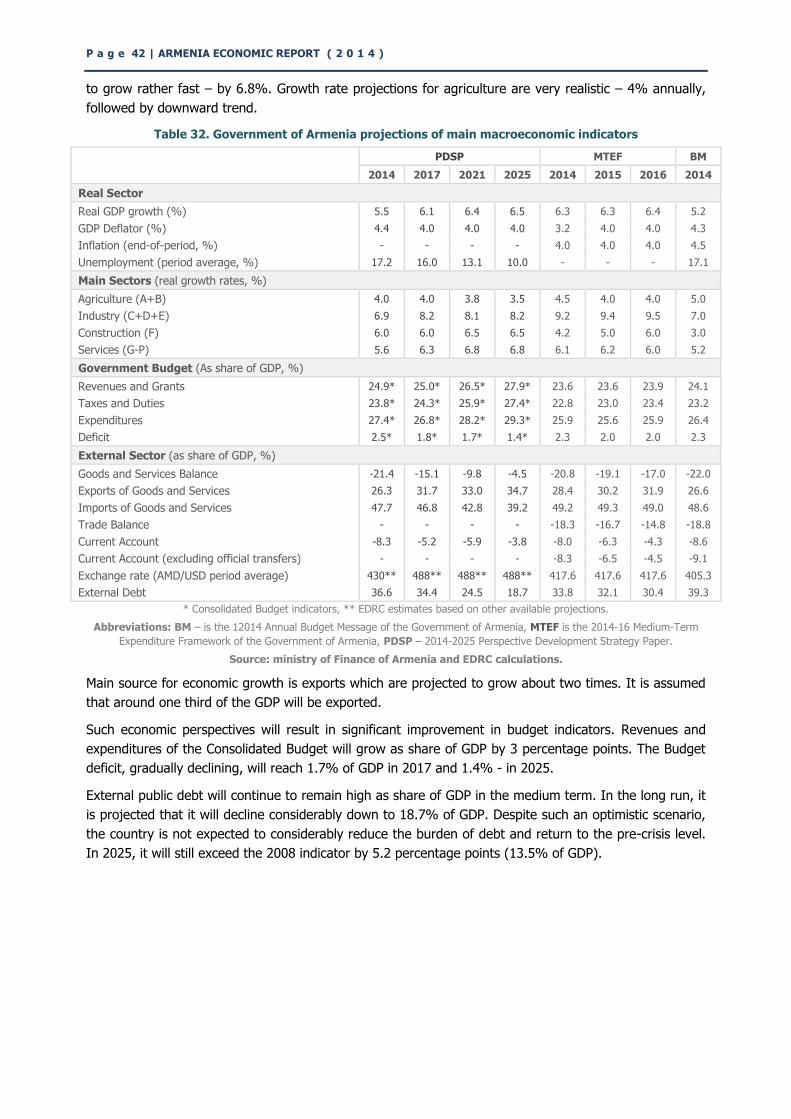
P a g e 42 | ARMENIA ECONOMIC REPORT ( 2 0 1 4 )
to grow rather fast – by 6.8%. Growth rate projections for agriculture are very realistic – 4% annually,
followed by downward trend.
Table 32. Government of Armenia projections of main macroeconomic indicators
PDSP MTEF BM
2014 2017 2021 2025 2014 2015 2016 2014
Real Sector
Real GDP growth (%) 5.5 6.1 6.4 6.5 6.3 6.3 6.4 5.2
GDP Deflator (%) 4.4 4.0 4.0 4.0 3.2 4.0 4.0 4.3
Inflation (end-of-period, %) - - - - 4.0 4.0 4.0 4.5
Unemployment (period average, %) 17.2 16.0 13.1 10.0 - - - 17.1
Main Sectors (real growth rates, %)
Agriculture (A+B) 4.0 4.0 3.8 3.5 4.5 4.0 4.0 5.0
Industry (C+D+E) 6.9 8.2 8.1 8.2 9.2 9.4 9.5 7.0
Construction (F) 6.0 6.0 6.5 6.5 4.2 5.0 6.0 3.0
Services (G-P) 5.6 6.3 6.8 6.8 6.1 6.2 6.0 5.2
Government Budget (As share of GDP, %)
Revenues and Grants 24.9* 25.0* 26.5* 27.9* 23.6 23.6 23.9 24.1
Taxes and Duties 23.8* 24.3* 25.9* 27.4* 22.8 23.0 23.4 23.2
Expenditures 27.4* 26.8* 28.2* 29.3* 25.9 25.6 25.9 26.4
Deficit 2.5* 1.8* 1.7* 1.4* 2.3 2.0 2.0 2.3
External Sector (as share of GDP, %)
Goods and Services Balance -21.4 -15.1 -9.8 -4.5 -20.8 -19.1 -17.0 -22.0
Exports of Goods and Services 26.3 31.7 33.0 34.7 28.4 30.2 31.9 26.6
Imports of Goods and Services 47.7 46.8 42.8 39.2 49.2 49.3 49.0 48.6
Trade Balance - - - - -18.3 -16.7 -14.8 -18.8
Current Account -8.3 -5.2 -5.9 -3.8 -8.0 -6.3 -4.3 -8.6
Current Account (excluding official transfers) - - - - -8.3 -6.5 -4.5 -9.1
Exchange rate (AMD/USD period average) 430** 488** 488** 488** 417.6 417.6 417.6 405.3
External Debt 36.6 34.4 24.5 18.7 33.8 32.1 30.4 39.3
* Consolidated Budget indicators, ** EDRC estimates based on other available projections.
Abbreviations: BM – is the 12014 Annual Budget Message of the Government of Armenia, MTEF is the 2014-16 Medium-Term
Expenditure Framework of the Government of Armenia, PDSP – 2014-2025 Perspective Development Strategy Paper.
Source: ministry of Finance of Armenia and EDRC calculations.
Main source for economic growth is exports which are projected to grow about two times. It is assumed
that around one third of the GDP will be exported.
Such economic perspectives will result in significant improvement in budget indicators. Revenues and
expenditures of the Consolidated Budget will grow as share of GDP by 3 percentage points. The Budget
deficit, gradually declining, will reach 1.7% of GDP in 2017 and 1.4% - in 2025.
External public debt will continue to remain high as share of GDP in the medium term. In the long run, it
is projected that it will decline considerably down to 18.7% of GDP. Despite such an optimistic scenario,
the country is not expected to considerably reduce the burden of debt and return to the pre-crisis level.
In 2025, it will still exceed the 2008 indicator by 5.2 percentage points (13.5% of GDP).
E D R C ( 2 0 1 4 ) | p a g e 4 3
Section 2 EURASIAN INTEGRATION AND
TRADE FLOWS OF ARMENIA
2.1. Introduction
2.2. Eurasian Integration Process
2.3. Foreign Trade of Armenia
2.4. Trade Flows Impact Analysis
2.5. Tariff Increase and Main Trade Items of High Risk
2.6. Summary of the Results and Conclusions
P a g e 44 | ARMENIA ECONOMIC REPORT ( 2 0 1 4 )
2.1. Introduction
Positioned in a not particularly favourable geopolitical position and faced with various socioeconomic and
political challenges, Armenian authorities have always strived to achieve friendly relations with all
countries of the world.
In this framework, Armenia also strived to enhance its relations with the European Union. The RA-EU
relations started to develop since 1996 and deepened further later. As a result of the long-term
cooperation and realized reforms it was envisaged to sign the RA-EU Association Agreement and start
establishment of a Free Trade Area later in 2013.
Yet, in September 2013, following a meeting with the Russian President Vladimir Putin, President Serge
Sargsyan unexpectedly announced Armenia’s intention to join the Eurasian Customs Union of Belarus,
Kazakhstan and Russia.
In May 2014, these three countries continued to deepen their integration by signing the agreement on
forming the Eurasian Economic Union (EAEU). Armenia also announced its intention to join this level of
integration. The preparatory works for joining the EAEU did not take long and already in October 2014
Armenia signed the treaty on joining the union.
These realities have deep geopolitical bases and subtext. It is assumed that Armenia joined the
integration process with anticipations of external political benefits. Many also expect economic benefits.
Financed by the Eurasian Development Bank and the RA Ministry of Finance a study was realized in 2013
according to which integration in the EAEU would in all cases be preferential.6
Membership of the EAEU is a crucial event. Yet discussions and socioeconomic impact evaluations on this
topic are few. The possible benefits and losses of membership for Armenia are not thoroughly assessed.
Moreover, the treaty on EAEU was only presented to the general public after actually being signed.
Consequently, there are various questions which so far did not receive well-founded answers and cause
concern. Of these we have separated the following:
What new opportunities and tangible benefits does the EAEU offer in addition to the already
existent FTAs?
How will trade flows and Armenia’s trade with third countries change due to the application of a
single tariff regime and non-tariff regulations?
What indirect risks and losses may occur and how can the final benefit of Armenia’s membership
to the EAEU be measured?
What short and long term socioeconomic impact can EAEU membership in general have?
It is most obvious that these questions have large implications for internal and external political decisions
and must be subject of comprehensive studies and evaluations. Therefore, considering the importance of
this event, the large ambiguity on respective issues and possible consequences, this edition of the
Armenian Economic Report will focus on Armenia’s membership to the EAEU.
The aim of this study is contribute to policy discussions by presenting various aspects of the issue
through preliminary evaluations and lay foundations for deeper and more divers studies and evaluations
in the future. In particular the aim was to evaluate possible changes in external trade flows and
identification of possible direction and channels of their impact.
Trade statistics (official national and international databases) of Armenia and partner countries and also
official documents and international agreements served as the main sources of information for the study.
This section of the report is consisted of the following subsections:
6 See “Armenia and the Customs Union: Impact of Economic Integration”, 2013 Tavadyan, et al.
E D R C ( 2 0 1 4 ) | p a g e 4 5
Subsection 2.2 which briefly touches upon the Eurasian integration process, historical
development, the institutional structure and nature of the EAEU.
Subsection 2.3 which presents Armenia’s foreign trade, trade regimes and partners
Subsection 2.4 which evaluates possibilities of trade creation and diversion effects and the
consequent impact
Subsection 2.5 in which the possible changes in import duties and consequent impact is
evaluated and product groups which might be the danger zone are highlighted
Subsection 2.6 where the conclusions of the study and recommendations for further research are
presented.
P a g e 46 | ARMENIA ECONOMIC REPORT ( 2 0 1 4 )
2.2. Eurasian Integration Process
Brief History
The historical foundations of the Eurasian integration process date back to the last century and actually
relate to the post-soviet political and economic reunion.
The development of the Commonwealth Independent States (CIS) in 1991 was aimed at political and
economic reintegration in this region. After 1994, the intention of forming a separate trade block became
more obvious in contrary to Eastern integration processes. Although a Free Trade Agreement (FTA) was
signed in the framework of the CIS yet this did not enter into force until 2003. Instead bilateral FTAs
were signed between almost all individual member states.
In 1996 Russia, Belarus, Kazakhstan signed the agreement on enhanced integration in economic and
humanitarian areas. In 1999, Russia, Belarus, Kazakhstan, Kyrgyzstan and Tajikistan agreed to sign a
document which clarified the goals and polices that these countries would have to implement for the
formation of a Custom Unions and the Single Economic Space.
Subsequently for the purpose of enhancing future cooperation and integration, one year later in 2000,
these five counties established the Eurasian Economic Community (EurAsEC). In 2003, Armenia joined
the EurAsEC as an observer. Uzbekistan joined this community in 2006.
As a result of the efforts made during the following years, in 2010, with membership of Belarus,
Kazakhstan and Russia, the Eurasian Customs Union (EACU) was finally established and has been
functioning on a full scale since July 2011. In November, 2011 these countries signed the Declaration on
Eurasian Economic Integration. In 2012 the Eurasian Economic Commission (EEC) was established based
on the example of the European Commission as a coordinating body for the EACU and Later of the EAEU.
In September 2013, Armenia announced its intention to join the EACU. Already in December 2013, the
Supreme Eurasian Economic Council confirmed the “roadmap” for Armenia’s accession to the union.
Consequently on May 29, 2014 the presidents of Russia, Belarus, and Kazakhstan signed the treaty on
establishment of the Eurasian Economic Union. It is expected that the latter after being ratified in
compliance with internal regulations of the founding states will come to force starting from January the
1st, 2015. In October 2014, Armenia joined this agreement and so the EAEU has four member states
and Kirgizstan and Tajikistan are in the list of the next potential member states.
Institutional Structure
The governing bodies of the EAEU are, the:
Supreme Eurasian Economic Council
Eurasian Intergovernmental Council
Eurasian Economic Commission
Eurasian Economic Union Court
The Supreme Eurasian Economic Council is Supreme Body that deals with strategic issues, involving
common interests of its member states. It is consisted of heads of member states and gathers at least
once a year. The Supreme Council determines integration strategies, dimensions and prospects; it adopts
decisions aimed at achieving the EAEU goals and objectives.7
The following figure provides an illustration of the institutional structure of the EAEU.
7 Article 5 of the Treaty on the Establishment of the Eurasian Economic Community of October 10, 2000.
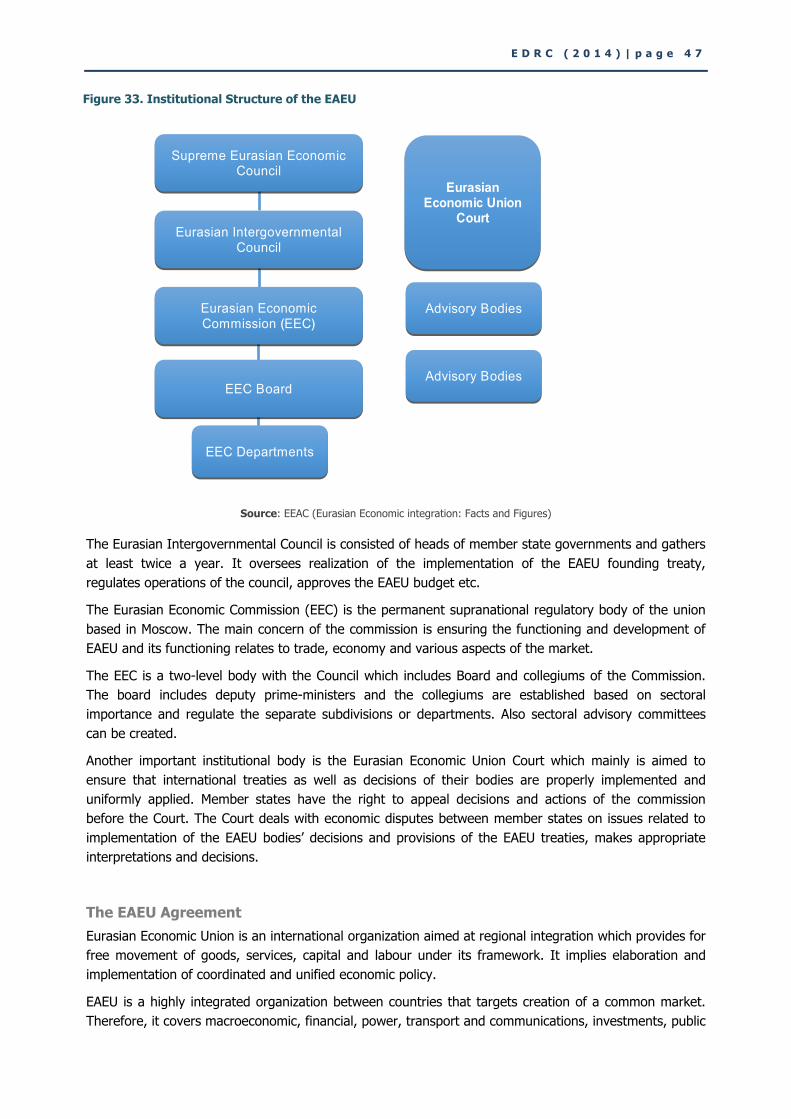
E D R C ( 2 0 1 4 ) | p a g e 4 7
Source: EEAC (Eurasian Economic integration: Facts and Figures)
The Eurasian Intergovernmental Council is consisted of heads of member state governments and gathers
at least twice a year. It oversees realization of the implementation of the EAEU founding treaty,
regulates operations of the council, approves the EAEU budget etc.
The Eurasian Economic Commission (EEC) is the permanent supranational regulatory body of the union
based in Moscow. The main concern of the commission is ensuring the functioning and development of
EAEU and its functioning relates to trade, economy and various aspects of the market.
The EEC is a two-level body with the Council which includes Board and collegiums of the Commission.
The board includes deputy prime-ministers and the collegiums are established based on sectoral
importance and regulate the separate subdivisions or departments. Also sectoral advisory committees
can be created.
Another important institutional body is the Eurasian Economic Union Court which mainly is aimed to
ensure that international treaties as well as decisions of their bodies are properly implemented and
uniformly applied. Member states have the right to appeal decisions and actions of the commission
before the Court. The Court deals with economic disputes between member states on issues related to
implementation of the EAEU bodies’ decisions and provisions of the EAEU treaties, makes appropriate
interpretations and decisions.
The EAEU Agreement
Eurasian Economic Union is an international organization aimed at regional integration which provides for
free movement of goods, services, capital and labour under its framework. It implies elaboration and
implementation of coordinated and unified economic policy.
EAEU is a highly integrated organization between countries that targets creation of a common market.
Therefore, it covers macroeconomic, financial, power, transport and communications, investments, public
Figure 33. Institutional Structure of the EAEU
Eurasian Economic Union
Court
EEC Departments
Eurasian Economic Commission (EEC)
EEC Board
Advisory Bodies
Eurasian Intergovernmental Council
Supreme Eurasian Economic Council
Advisory Bodies
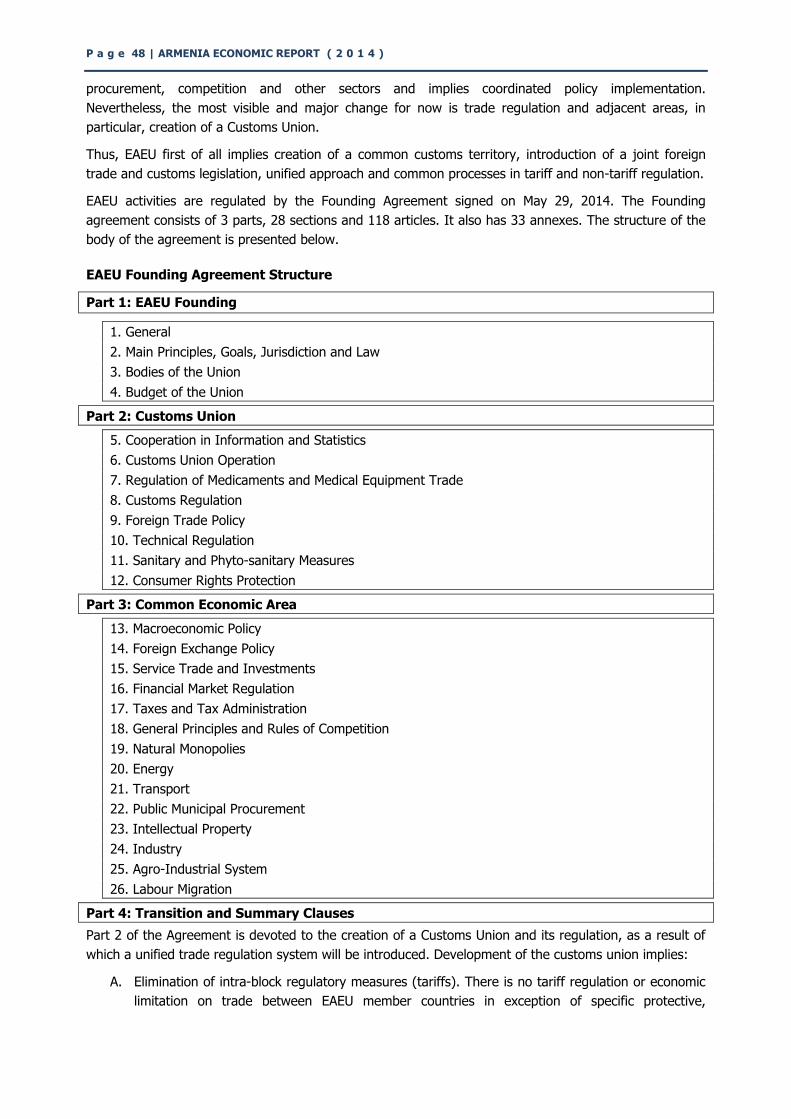
P a g e 48 | ARMENIA ECONOMIC REPORT ( 2 0 1 4 )
procurement, competition and other sectors and implies coordinated policy implementation.
Nevertheless, the most visible and major change for now is trade regulation and adjacent areas, in
particular, creation of a Customs Union.
Thus, EAEU first of all implies creation of a common customs territory, introduction of a joint foreign
trade and customs legislation, unified approach and common processes in tariff and non-tariff regulation.
EAEU activities are regulated by the Founding Agreement signed on May 29, 2014. The Founding
agreement consists of 3 parts, 28 sections and 118 articles. It also has 33 annexes. The structure of the
body of the agreement is presented below.
EAEU Founding Agreement Structure
Part 1: EAEU Founding
1. General
2. Main Principles, Goals, Jurisdiction and Law
3. Bodies of the Union
4. Budget of the Union
Part 2: Customs Union
5. Cooperation in Information and Statistics
6. Customs Union Operation
7. Regulation of Medicaments and Medical Equipment Trade
8. Customs Regulation
9. Foreign Trade Policy
10. Technical Regulation
11. Sanitary and Phyto-sanitary Measures
12. Consumer Rights Protection
Part 3: Common Economic Area
13. Macroeconomic Policy
14. Foreign Exchange Policy
15. Service Trade and Investments
16. Financial Market Regulation
17. Taxes and Tax Administration
18. General Principles and Rules of Competition
19. Natural Monopolies
20. Energy
21. Transport
22. Public Municipal Procurement
23. Intellectual Property
24. Industry
25. Agro-Industrial System
26. Labour Migration
Part 4: Transition and Summary Clauses
Part 2 of the Agreement is devoted to the creation of a Customs Union and its regulation, as a result of
which a unified trade regulation system will be introduced. Development of the customs union implies:
A. Elimination of intra-block regulatory measures (tariffs). There is no tariff regulation or economic
limitation on trade between EAEU member countries in exception of specific protective,
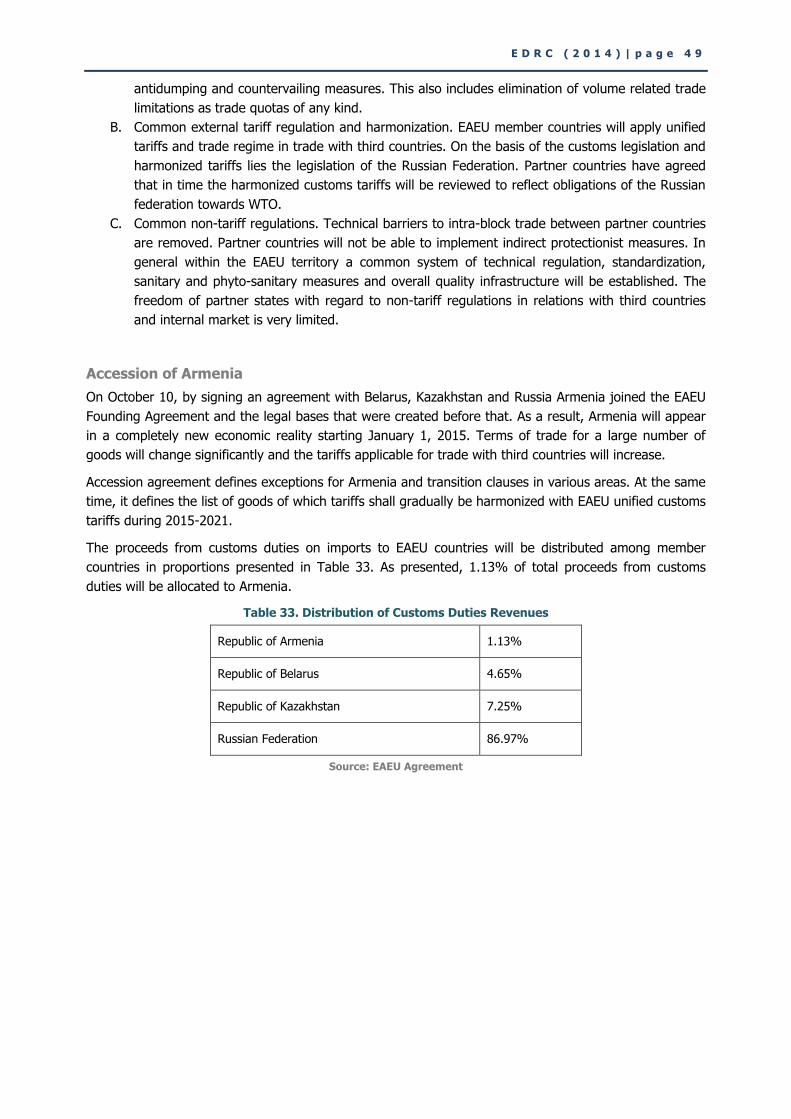
E D R C ( 2 0 1 4 ) | p a g e 4 9
antidumping and countervailing measures. This also includes elimination of volume related trade
limitations as trade quotas of any kind.
B. Common external tariff regulation and harmonization. EAEU member countries will apply unified
tariffs and trade regime in trade with third countries. On the basis of the customs legislation and
harmonized tariffs lies the legislation of the Russian Federation. Partner countries have agreed
that in time the harmonized customs tariffs will be reviewed to reflect obligations of the Russian
federation towards WTO.
C. Common non-tariff regulations. Technical barriers to intra-block trade between partner countries
are removed. Partner countries will not be able to implement indirect protectionist measures. In
general within the EAEU territory a common system of technical regulation, standardization,
sanitary and phyto-sanitary measures and overall quality infrastructure will be established. The
freedom of partner states with regard to non-tariff regulations in relations with third countries
and internal market is very limited.
Accession of Armenia
On October 10, by signing an agreement with Belarus, Kazakhstan and Russia Armenia joined the EAEU
Founding Agreement and the legal bases that were created before that. As a result, Armenia will appear
in a completely new economic reality starting January 1, 2015. Terms of trade for a large number of
goods will change significantly and the tariffs applicable for trade with third countries will increase.
Accession agreement defines exceptions for Armenia and transition clauses in various areas. At the same
time, it defines the list of goods of which tariffs shall gradually be harmonized with EAEU unified customs
tariffs during 2015-2021.
The proceeds from customs duties on imports to EAEU countries will be distributed among member
countries in proportions presented in Table 33. As presented, 1.13% of total proceeds from customs
duties will be allocated to Armenia.
Table 33. Distribution of Customs Duties Revenues
Republic of Armenia 1.13%
Republic of Belarus 4.65%
Republic of Kazakhstan 7.25%
Russian Federation 86.97%
Source: EAEU Agreement
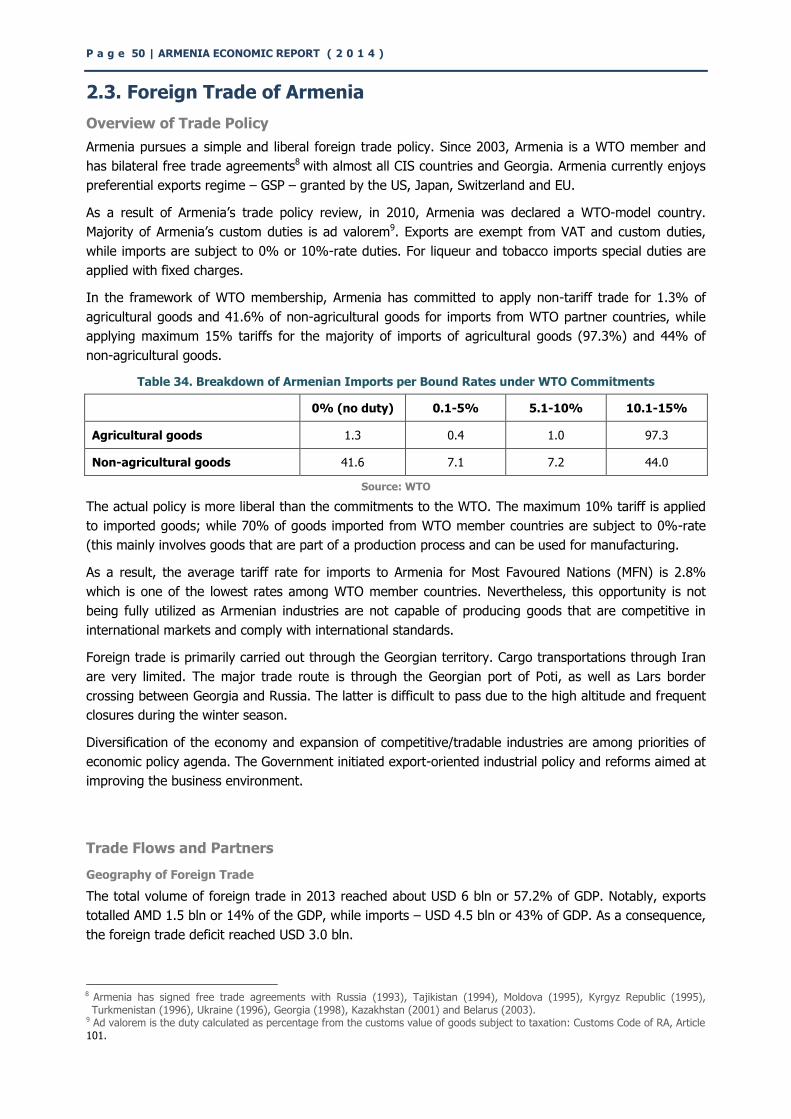
P a g e 50 | ARMENIA ECONOMIC REPORT ( 2 0 1 4 )
2.3. Foreign Trade of Armenia
Overview of Trade Policy
Armenia pursues a simple and liberal foreign trade policy. Since 2003, Armenia is a WTO member and
has bilateral free trade agreements8 with almost all CIS countries and Georgia. Armenia currently enjoys
preferential exports regime – GSP – granted by the US, Japan, Switzerland and EU.
As a result of Armenia’s trade policy review, in 2010, Armenia was declared a WTO-model country.
Majority of Armenia’s custom duties is ad valorem9. Exports are exempt from VAT and custom duties,
while imports are subject to 0% or 10%-rate duties. For liqueur and tobacco imports special duties are
applied with fixed charges.
In the framework of WTO membership, Armenia has committed to apply non-tariff trade for 1.3% of
agricultural goods and 41.6% of non-agricultural goods for imports from WTO partner countries, while
applying maximum 15% tariffs for the majority of imports of agricultural goods (97.3%) and 44% of
non-agricultural goods.
Table 34. Breakdown of Armenian Imports per Bound Rates under WTO Commitments
0% (no duty) 0.1-5% 5.1-10% 10.1-15%
Agricultural goods 1.3 0.4 1.0 97.3
Non-agricultural goods 41.6 7.1 7.2 44.0
Source: WTO
The actual policy is more liberal than the commitments to the WTO. The maximum 10% tariff is applied
to imported goods; while 70% of goods imported from WTO member countries are subject to 0%-rate
(this mainly involves goods that are part of a production process and can be used for manufacturing.
As a result, the average tariff rate for imports to Armenia for Most Favoured Nations (MFN) is 2.8%
which is one of the lowest rates among WTO member countries. Nevertheless, this opportunity is not
being fully utilized as Armenian industries are not capable of producing goods that are competitive in
international markets and comply with international standards.
Foreign trade is primarily carried out through the Georgian territory. Cargo transportations through Iran
are very limited. The major trade route is through the Georgian port of Poti, as well as Lars border
crossing between Georgia and Russia. The latter is difficult to pass due to the high altitude and frequent
closures during the winter season.
Diversification of the economy and expansion of competitive/tradable industries are among priorities of
economic policy agenda. The Government initiated export-oriented industrial policy and reforms aimed at
improving the business environment.
Trade Flows and Partners
Geography of Foreign Trade
The total volume of foreign trade in 2013 reached about USD 6 bln or 57.2% of GDP. Notably, exports
totalled AMD 1.5 bln or 14% of the GDP, while imports – USD 4.5 bln or 43% of GDP. As a consequence,
the foreign trade deficit reached USD 3.0 bln.
8 Armenia has signed free trade agreements with Russia (1993), Tajikistan (1994), Moldova (1995), Kyrgyz Republic (1995), Turkmenistan (1996), Ukraine (1996), Georgia (1998), Kazakhstan (2001) and Belarus (2003).
9 Ad valorem is the duty calculated as percentage from the customs value of goods subject to taxation: Customs Code of RA, Article 101.
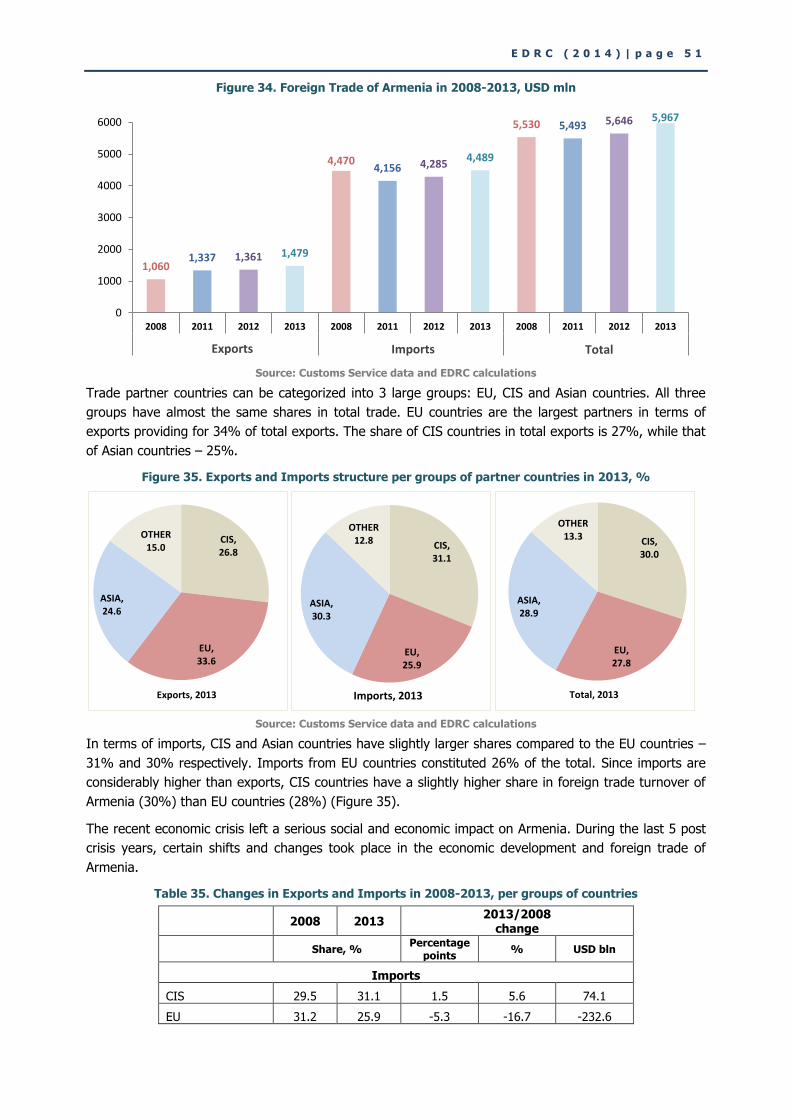
E D R C ( 2 0 1 4 ) | p a g e 5 1
Figure 34. Foreign Trade of Armenia in 2008-2013, USD mln
Source: Customs Service data and EDRC calculations
Trade partner countries can be categorized into 3 large groups: EU, CIS and Asian countries. All three
groups have almost the same shares in total trade. EU countries are the largest partners in terms of
exports providing for 34% of total exports. The share of CIS countries in total exports is 27%, while that
of Asian countries – 25%.
Figure 35. Exports and Imports structure per groups of partner countries in 2013, %
Source: Customs Service data and EDRC calculations
In terms of imports, CIS and Asian countries have slightly larger shares compared to the EU countries –
31% and 30% respectively. Imports from EU countries constituted 26% of the total. Since imports are
considerably higher than exports, CIS countries have a slightly higher share in foreign trade turnover of
Armenia (30%) than EU countries (28%) (Figure 35).
The recent economic crisis left a serious social and economic impact on Armenia. During the last 5 post
crisis years, certain shifts and changes took place in the economic development and foreign trade of
Armenia.
Table 35. Changes in Exports and Imports in 2008-2013, per groups of countries
2008 2013 2013/2008
change
Share, % Percentage
points % USD bln
Imports
CIS 29.5 31.1 1.5 5.6 74.1
EU 31.2 25.9 -5.3 -16.7 -232.6
1,060 1,337 1,361 1,479
4,470 4,156 4,285
4,489
5,530 5,493 5,646 5,967
0
1000
2000
3000
4000
5000
6000
2008 2011 2012 2013 2008 2011 2012 2013 2008 2011 2012 2013
Արտահանում Ներմուծում Ընդամենը Exports Imports Total
CIS, 26.8
EU, 33.6
ASIA, 24.6
OTHER 15.0
Exports, 2013
CIS, 31.1
EU, 25.9
ASIA, 30.3
OTHER 12.8
Imports, 2013
CIS, 30.0
EU, 27.8
ASIA, 28.9
OTHER 13.3
Total, 2013
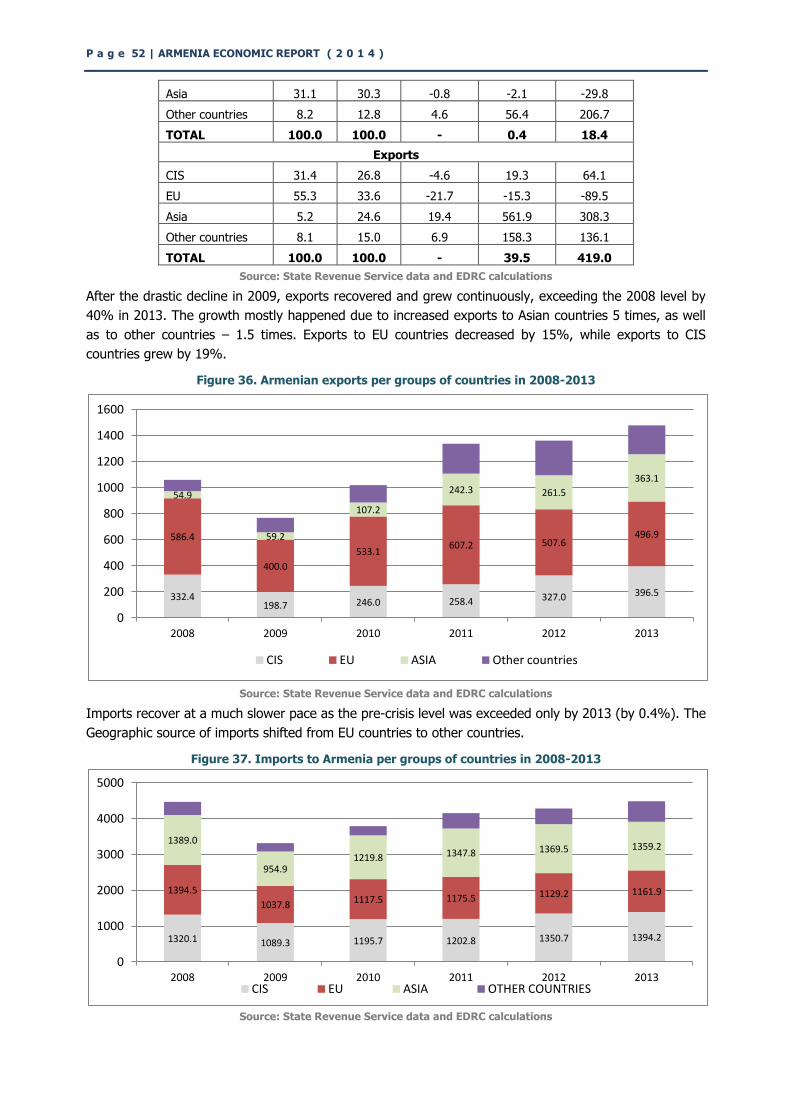
P a g e 52 | ARMENIA ECONOMIC REPORT ( 2 0 1 4 )
Asia 31.1 30.3 -0.8 -2.1 -29.8
Other countries 8.2 12.8 4.6 56.4 206.7
TOTAL 100.0 100.0 - 0.4 18.4
Exports
CIS 31.4 26.8 -4.6 19.3 64.1
EU 55.3 33.6 -21.7 -15.3 -89.5
Asia 5.2 24.6 19.4 561.9 308.3
Other countries 8.1 15.0 6.9 158.3 136.1
TOTAL 100.0 100.0 - 39.5 419.0
Source: State Revenue Service data and EDRC calculations
After the drastic decline in 2009, exports recovered and grew continuously, exceeding the 2008 level by
40% in 2013. The growth mostly happened due to increased exports to Asian countries 5 times, as well
as to other countries – 1.5 times. Exports to EU countries decreased by 15%, while exports to CIS
countries grew by 19%.
Figure 36. Armenian exports per groups of countries in 2008-2013
Source: State Revenue Service data and EDRC calculations
Imports recover at a much slower pace as the pre-crisis level was exceeded only by 2013 (by 0.4%). The
Geographic source of imports shifted from EU countries to other countries.
Figure 37. Imports to Armenia per groups of countries in 2008-2013
Source: State Revenue Service data and EDRC calculations
332.4 198.7 246.0 258.4 327.0 396.5
586.4
400.0
533.1 607.2 507.6
496.9
54.9
59.2
107.2
242.3 261.5
363.1
0
200
400
600
800
1000
1200
1400
1600
2008 2009 2010 2011 2012 2013
CIS EU ASIA Other countries
1320.1 1089.3 1195.7 1202.8 1350.7 1394.2
1394.5
1037.8 1117.5 1175.5 1129.2 1161.9
1389.0
954.9 1219.8 1347.8 1369.5 1359.2
0
1000
2000
3000
4000
5000
2008 2009 2010 2011 2012 2013 CIS EU ASIA OTHER COUNTRIES
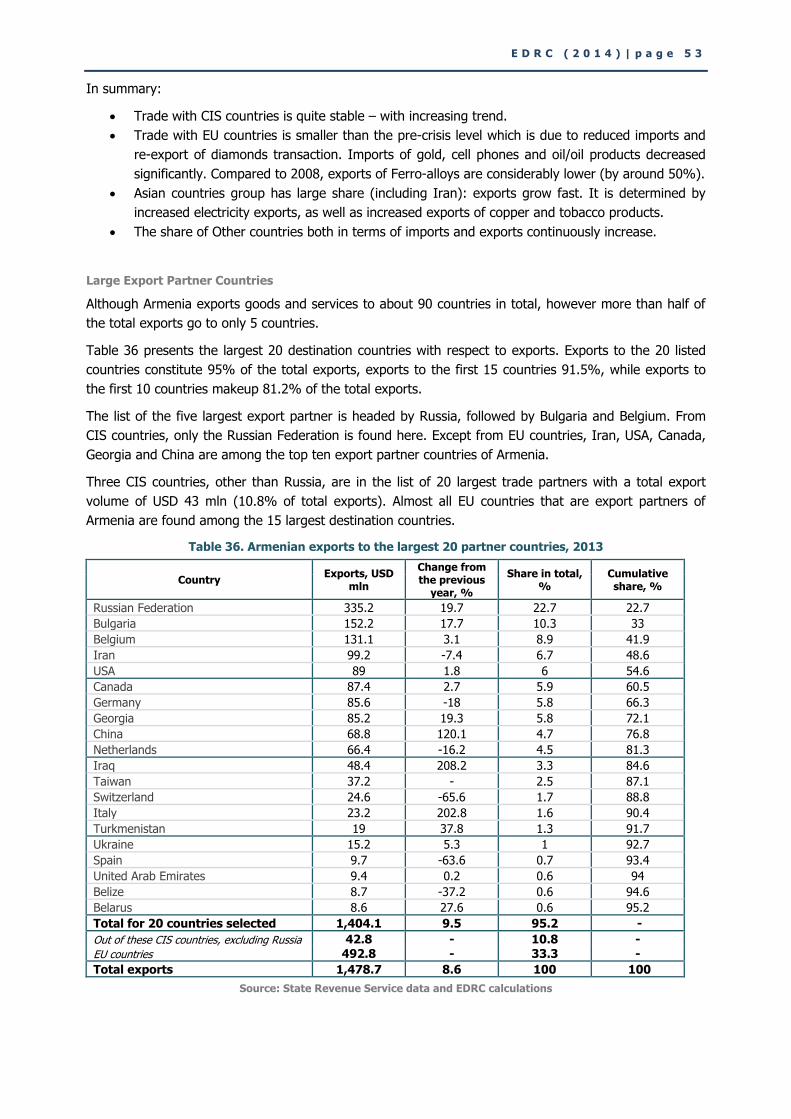
E D R C ( 2 0 1 4 ) | p a g e 5 3
In summary:
Trade with CIS countries is quite stable – with increasing trend.
Trade with EU countries is smaller than the pre-crisis level which is due to reduced imports and
re-export of diamonds transaction. Imports of gold, cell phones and oil/oil products decreased
significantly. Compared to 2008, exports of Ferro-alloys are considerably lower (by around 50%).
Asian countries group has large share (including Iran): exports grow fast. It is determined by
increased electricity exports, as well as increased exports of copper and tobacco products.
The share of Other countries both in terms of imports and exports continuously increase.
Large Export Partner Countries
Although Armenia exports goods and services to about 90 countries in total, however more than half of
the total exports go to only 5 countries.
Table 36 presents the largest 20 destination countries with respect to exports. Exports to the 20 listed
countries constitute 95% of the total exports, exports to the first 15 countries 91.5%, while exports to
the first 10 countries makeup 81.2% of the total exports.
The list of the five largest export partner is headed by Russia, followed by Bulgaria and Belgium. From
CIS countries, only the Russian Federation is found here. Except from EU countries, Iran, USA, Canada,
Georgia and China are among the top ten export partner countries of Armenia.
Three CIS countries, other than Russia, are in the list of 20 largest trade partners with a total export
volume of USD 43 mln (10.8% of total exports). Almost all EU countries that are export partners of
Armenia are found among the 15 largest destination countries.
Table 36. Armenian exports to the largest 20 partner countries, 2013
Country Exports, USD
mln
Change from the previous
year, %
Share in total, %
Cumulative share, %
Russian Federation 335.2 19.7 22.7 22.7
Bulgaria 152.2 17.7 10.3 33
Belgium 131.1 3.1 8.9 41.9
Iran 99.2 -7.4 6.7 48.6
USA 89 1.8 6 54.6
Canada 87.4 2.7 5.9 60.5
Germany 85.6 -18 5.8 66.3
Georgia 85.2 19.3 5.8 72.1
China 68.8 120.1 4.7 76.8
Netherlands 66.4 -16.2 4.5 81.3
Iraq 48.4 208.2 3.3 84.6
Taiwan 37.2 - 2.5 87.1
Switzerland 24.6 -65.6 1.7 88.8
Italy 23.2 202.8 1.6 90.4
Turkmenistan 19 37.8 1.3 91.7
Ukraine 15.2 5.3 1 92.7
Spain 9.7 -63.6 0.7 93.4
United Arab Emirates 9.4 0.2 0.6 94
Belize 8.7 -37.2 0.6 94.6
Belarus 8.6 27.6 0.6 95.2
Total for 20 countries selected 1,404.1 9.5 95.2 -
Out of these CIS countries, excluding Russia 42.8 - 10.8 -
EU countries 492.8 - 33.3 -
Total exports 1,478.7 8.6 100 100
Source: State Revenue Service data and EDRC calculations
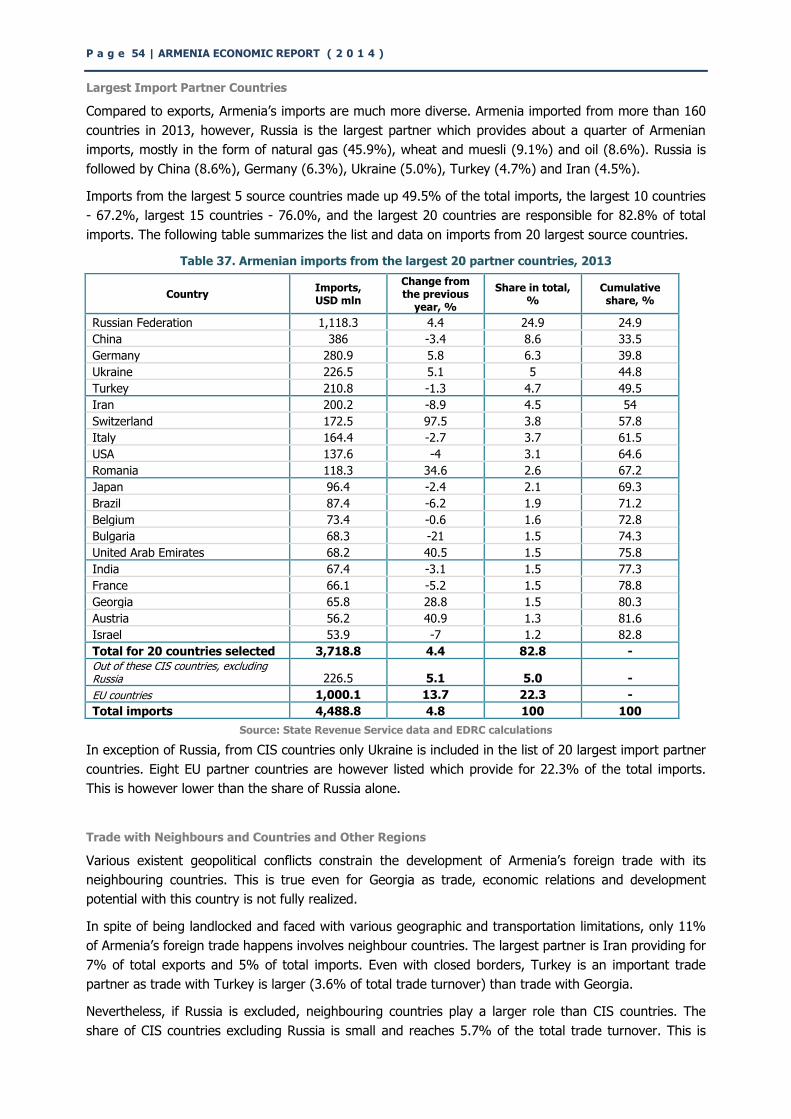
P a g e 54 | ARMENIA ECONOMIC REPORT ( 2 0 1 4 )
Largest Import Partner Countries
Compared to exports, Armenia’s imports are much more diverse. Armenia imported from more than 160
countries in 2013, however, Russia is the largest partner which provides about a quarter of Armenian
imports, mostly in the form of natural gas (45.9%), wheat and muesli (9.1%) and oil (8.6%). Russia is
followed by China (8.6%), Germany (6.3%), Ukraine (5.0%), Turkey (4.7%) and Iran (4.5%).
Imports from the largest 5 source countries made up 49.5% of the total imports, the largest 10 countries
- 67.2%, largest 15 countries - 76.0%, and the largest 20 countries are responsible for 82.8% of total
imports. The following table summarizes the list and data on imports from 20 largest source countries.
Table 37. Armenian imports from the largest 20 partner countries, 2013
Country Imports, USD mln
Change from the previous
year, %
Share in total, %
Cumulative share, %
Russian Federation 1,118.3 4.4 24.9 24.9
China 386 -3.4 8.6 33.5
Germany 280.9 5.8 6.3 39.8
Ukraine 226.5 5.1 5 44.8
Turkey 210.8 -1.3 4.7 49.5
Iran 200.2 -8.9 4.5 54
Switzerland 172.5 97.5 3.8 57.8
Italy 164.4 -2.7 3.7 61.5
USA 137.6 -4 3.1 64.6
Romania 118.3 34.6 2.6 67.2
Japan 96.4 -2.4 2.1 69.3
Brazil 87.4 -6.2 1.9 71.2
Belgium 73.4 -0.6 1.6 72.8
Bulgaria 68.3 -21 1.5 74.3
United Arab Emirates 68.2 40.5 1.5 75.8
India 67.4 -3.1 1.5 77.3
France 66.1 -5.2 1.5 78.8
Georgia 65.8 28.8 1.5 80.3
Austria 56.2 40.9 1.3 81.6
Israel 53.9 -7 1.2 82.8
Total for 20 countries selected 3,718.8 4.4 82.8 - Out of these CIS countries, excluding Russia 226.5 5.1 5.0 -
EU countries 1,000.1 13.7 22.3 -
Total imports 4,488.8 4.8 100 100
Source: State Revenue Service data and EDRC calculations
In exception of Russia, from CIS countries only Ukraine is included in the list of 20 largest import partner
countries. Eight EU partner countries are however listed which provide for 22.3% of the total imports.
This is however lower than the share of Russia alone.
Trade with Neighbours and Countries and Other Regions
Various existent geopolitical conflicts constrain the development of Armenia’s foreign trade with its
neighbouring countries. This is true even for Georgia as trade, economic relations and development
potential with this country is not fully realized.
In spite of being landlocked and faced with various geographic and transportation limitations, only 11%
of Armenia’s foreign trade happens involves neighbour countries. The largest partner is Iran providing for
7% of total exports and 5% of total imports. Even with closed borders, Turkey is an important trade
partner as trade with Turkey is larger (3.6% of total trade turnover) than trade with Georgia.
Nevertheless, if Russia is excluded, neighbouring countries play a larger role than CIS countries. The
share of CIS countries excluding Russia is small and reaches 5.7% of the total trade turnover. This is
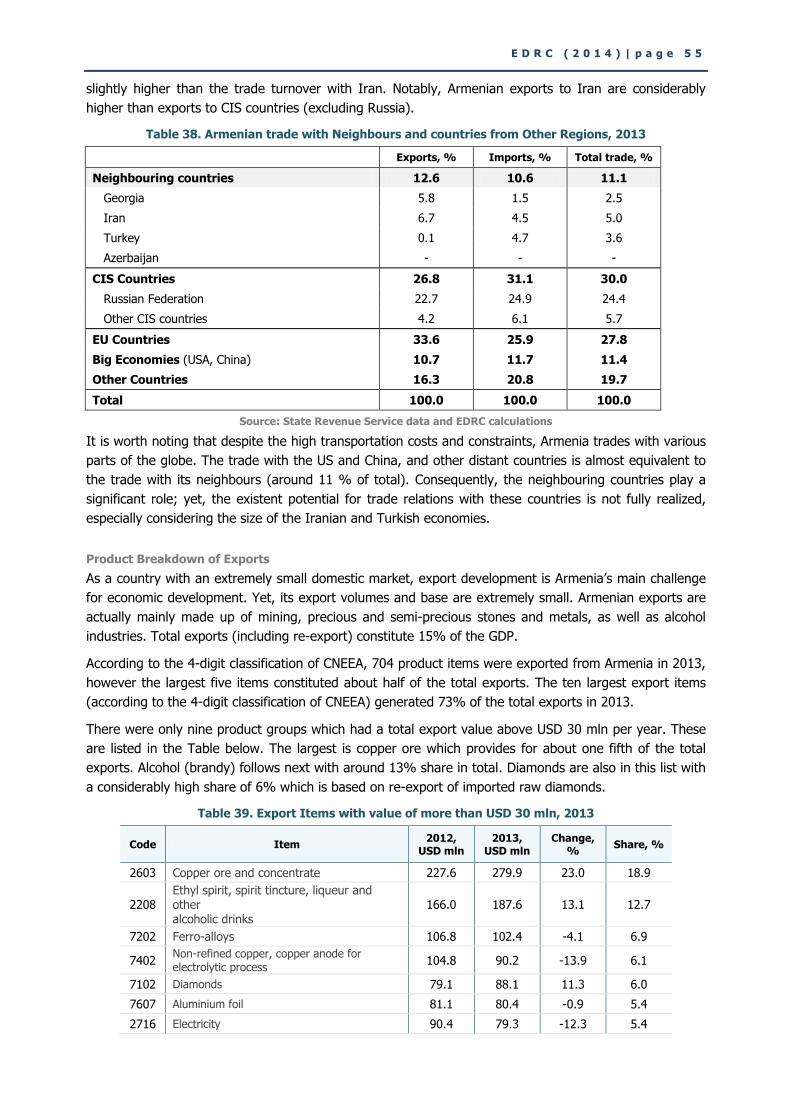
E D R C ( 2 0 1 4 ) | p a g e 5 5
slightly higher than the trade turnover with Iran. Notably, Armenian exports to Iran are considerably
higher than exports to CIS countries (excluding Russia).
Table 38. Armenian trade with Neighbours and countries from Other Regions, 2013
Exports, % Imports, % Total trade, %
Neighbouring countries 12.6 10.6 11.1
Georgia 5.8 1.5 2.5
Iran 6.7 4.5 5.0
Turkey 0.1 4.7 3.6
Azerbaijan - - -
CIS Countries 26.8 31.1 30.0
Russian Federation 22.7 24.9 24.4
Other CIS countries 4.2 6.1 5.7
EU Countries 33.6 25.9 27.8
Big Economies (USA, China) 10.7 11.7 11.4
Other Countries 16.3 20.8 19.7
Total 100.0 100.0 100.0
Source: State Revenue Service data and EDRC calculations
It is worth noting that despite the high transportation costs and constraints, Armenia trades with various
parts of the globe. The trade with the US and China, and other distant countries is almost equivalent to
the trade with its neighbours (around 11 % of total). Consequently, the neighbouring countries play a
significant role; yet, the existent potential for trade relations with these countries is not fully realized,
especially considering the size of the Iranian and Turkish economies.
Product Breakdown of Exports
As a country with an extremely small domestic market, export development is Armenia’s main challenge
for economic development. Yet, its export volumes and base are extremely small. Armenian exports are
actually mainly made up of mining, precious and semi-precious stones and metals, as well as alcohol
industries. Total exports (including re-export) constitute 15% of the GDP.
According to the 4-digit classification of CNEEA, 704 product items were exported from Armenia in 2013,
however the largest five items constituted about half of the total exports. The ten largest export items
(according to the 4-digit classification of CNEEA) generated 73% of the total exports in 2013.
There were only nine product groups which had a total export value above USD 30 mln per year. These
are listed in the Table below. The largest is copper ore which provides for about one fifth of the total
exports. Alcohol (brandy) follows next with around 13% share in total. Diamonds are also in this list with
a considerably high share of 6% which is based on re-export of imported raw diamonds.
Table 39. Export Items with value of more than USD 30 mln, 2013
Code Item 2012,
USD mln 2013,
USD mln Change,
% Share, %
2603 Copper ore and concentrate 227.6 279.9 23.0 18.9
2208 Ethyl spirit, spirit tincture, liqueur and other alcoholic drinks
166.0 187.6 13.1 12.7
7202 Ferro-alloys 106.8 102.4 -4.1 6.9
7402 Non-refined copper, copper anode for electrolytic process
104.8 90.2 -13.9 6.1
7102 Diamonds 79.1 88.1 11.3 6.0
7607 Aluminium foil 81.1 80.4 -0.9 5.4
2716 Electricity 90.4 79.3 -12.3 5.4
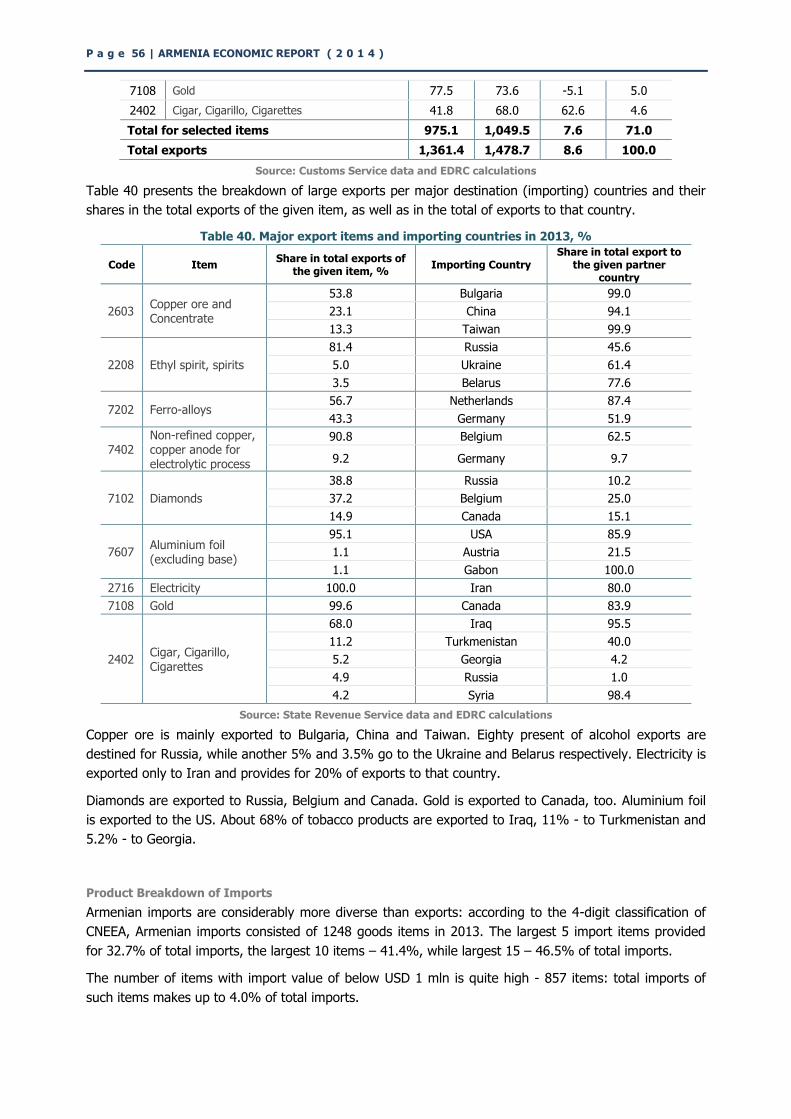
P a g e 56 | ARMENIA ECONOMIC REPORT ( 2 0 1 4 )
7108 Gold 77.5 73.6 -5.1 5.0
2402 Cigar, Cigarillo, Cigarettes 41.8 68.0 62.6 4.6
Total for selected items 975.1 1,049.5 7.6 71.0
Total exports 1,361.4 1,478.7 8.6 100.0
Source: Customs Service data and EDRC calculations
Table 40 presents the breakdown of large exports per major destination (importing) countries and their
shares in the total exports of the given item, as well as in the total of exports to that country.
Table 40. Major export items and importing countries in 2013, %
Code Item Share in total exports of
the given item, % Importing Country
Share in total export to the given partner
country
2603 Copper ore and Concentrate
53.8 Bulgaria 99.0
23.1 China 94.1
13.3 Taiwan 99.9
2208 Ethyl spirit, spirits
81.4 Russia 45.6
5.0 Ukraine 61.4
3.5 Belarus 77.6
7202 Ferro-alloys 56.7 Netherlands 87.4
43.3 Germany 51.9
7402 Non-refined copper, copper anode for electrolytic process
90.8 Belgium 62.5
9.2 Germany 9.7
7102 Diamonds
38.8 Russia 10.2
37.2 Belgium 25.0
14.9 Canada 15.1
7607 Aluminium foil (excluding base)
95.1 USA 85.9
1.1 Austria 21.5
1.1 Gabon 100.0
2716 Electricity 100.0 Iran 80.0
7108 Gold 99.6 Canada 83.9
2402 Cigar, Cigarillo, Cigarettes
68.0 Iraq 95.5
11.2 Turkmenistan 40.0
5.2 Georgia 4.2
4.9 Russia 1.0
4.2 Syria 98.4
Source: State Revenue Service data and EDRC calculations
Copper ore is mainly exported to Bulgaria, China and Taiwan. Eighty present of alcohol exports are
destined for Russia, while another 5% and 3.5% go to the Ukraine and Belarus respectively. Electricity is
exported only to Iran and provides for 20% of exports to that country.
Diamonds are exported to Russia, Belgium and Canada. Gold is exported to Canada, too. Aluminium foil
is exported to the US. About 68% of tobacco products are exported to Iraq, 11% - to Turkmenistan and
5.2% - to Georgia.
Product Breakdown of Imports
Armenian imports are considerably more diverse than exports: according to the 4-digit classification of
CNEEA, Armenian imports consisted of 1248 goods items in 2013. The largest 5 import items provided
for 32.7% of total imports, the largest 10 items – 41.4%, while largest 15 – 46.5% of total imports.
The number of items with import value of below USD 1 mln is quite high - 857 items: total imports of
such items makes up to 4.0% of total imports.
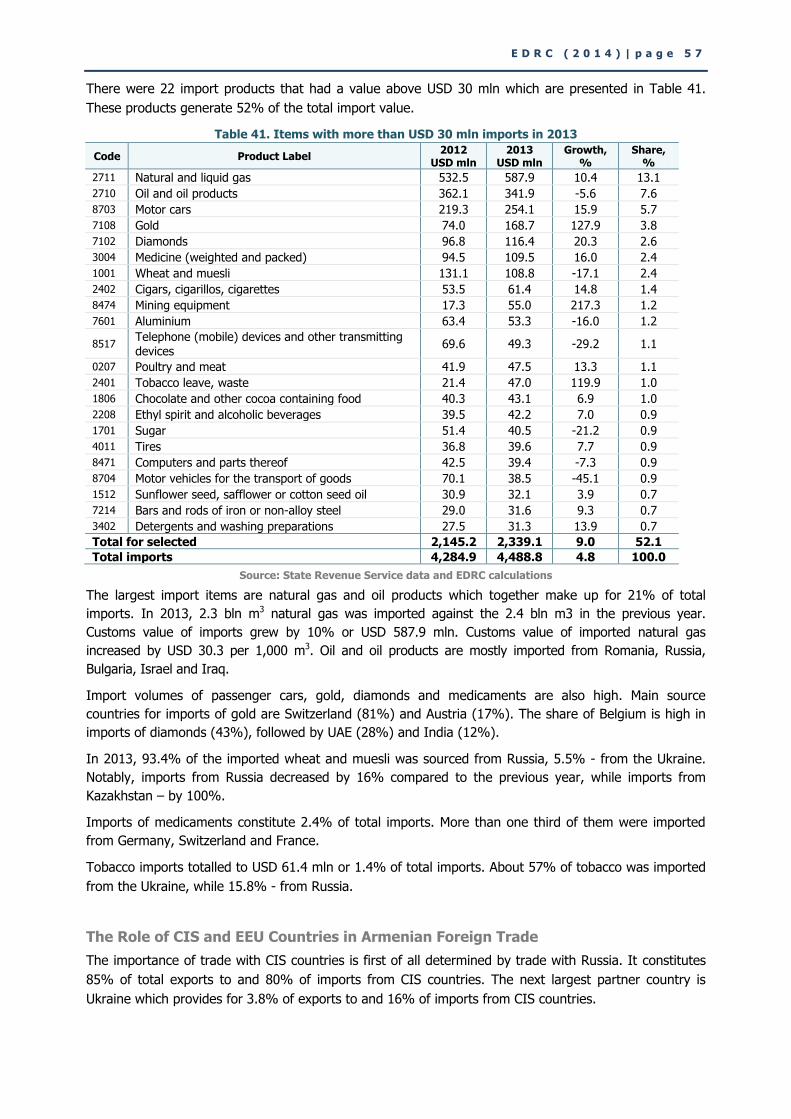
E D R C ( 2 0 1 4 ) | p a g e 5 7
There were 22 import products that had a value above USD 30 mln which are presented in Table 41.
These products generate 52% of the total import value.
Table 41. Items with more than USD 30 mln imports in 2013
Code Product Label 2012
USD mln 2013
USD mln Growth,
% Share,
%
2711 Natural and liquid gas 532.5 587.9 10.4 13.1
2710 Oil and oil products 362.1 341.9 -5.6 7.6
8703 Motor cars 219.3 254.1 15.9 5.7
7108 Gold 74.0 168.7 127.9 3.8
7102 Diamonds 96.8 116.4 20.3 2.6
3004 Medicine (weighted and packed) 94.5 109.5 16.0 2.4
1001 Wheat and muesli 131.1 108.8 -17.1 2.4
2402 Cigars, cigarillos, cigarettes 53.5 61.4 14.8 1.4
8474 Mining equipment 17.3 55.0 217.3 1.2
7601 Aluminium 63.4 53.3 -16.0 1.2
8517 Telephone (mobile) devices and other transmitting devices
69.6 49.3 -29.2 1.1
0207 Poultry and meat 41.9 47.5 13.3 1.1
2401 Tobacco leave, waste 21.4 47.0 119.9 1.0
1806 Chocolate and other cocoa containing food 40.3 43.1 6.9 1.0
2208 Ethyl spirit and alcoholic beverages 39.5 42.2 7.0 0.9
1701 Sugar 51.4 40.5 -21.2 0.9
4011 Tires 36.8 39.6 7.7 0.9
8471 Computers and parts thereof 42.5 39.4 -7.3 0.9
8704 Motor vehicles for the transport of goods 70.1 38.5 -45.1 0.9
1512 Sunflower seed, safflower or cotton seed oil 30.9 32.1 3.9 0.7
7214 Bars and rods of iron or non-alloy steel 29.0 31.6 9.3 0.7
3402 Detergents and washing preparations 27.5 31.3 13.9 0.7
Total for selected 2,145.2 2,339.1 9.0 52.1
Total imports 4,284.9 4,488.8 4.8 100.0
Source: State Revenue Service data and EDRC calculations
The largest import items are natural gas and oil products which together make up for 21% of total
imports. In 2013, 2.3 bln m3 natural gas was imported against the 2.4 bln m3 in the previous year.
Customs value of imports grew by 10% or USD 587.9 mln. Customs value of imported natural gas
increased by USD 30.3 per 1,000 m3. Oil and oil products are mostly imported from Romania, Russia,
Bulgaria, Israel and Iraq.
Import volumes of passenger cars, gold, diamonds and medicaments are also high. Main source
countries for imports of gold are Switzerland (81%) and Austria (17%). The share of Belgium is high in
imports of diamonds (43%), followed by UAE (28%) and India (12%).
In 2013, 93.4% of the imported wheat and muesli was sourced from Russia, 5.5% - from the Ukraine.
Notably, imports from Russia decreased by 16% compared to the previous year, while imports from
Kazakhstan – by 100%.
Imports of medicaments constitute 2.4% of total imports. More than one third of them were imported
from Germany, Switzerland and France.
Tobacco imports totalled to USD 61.4 mln or 1.4% of total imports. About 57% of tobacco was imported
from the Ukraine, while 15.8% - from Russia.
The Role of CIS and EEU Countries in Armenian Foreign Trade
The importance of trade with CIS countries is first of all determined by trade with Russia. It constitutes
85% of total exports to and 80% of imports from CIS countries. The next largest partner country is
Ukraine which provides for 3.8% of exports to and 16% of imports from CIS countries.
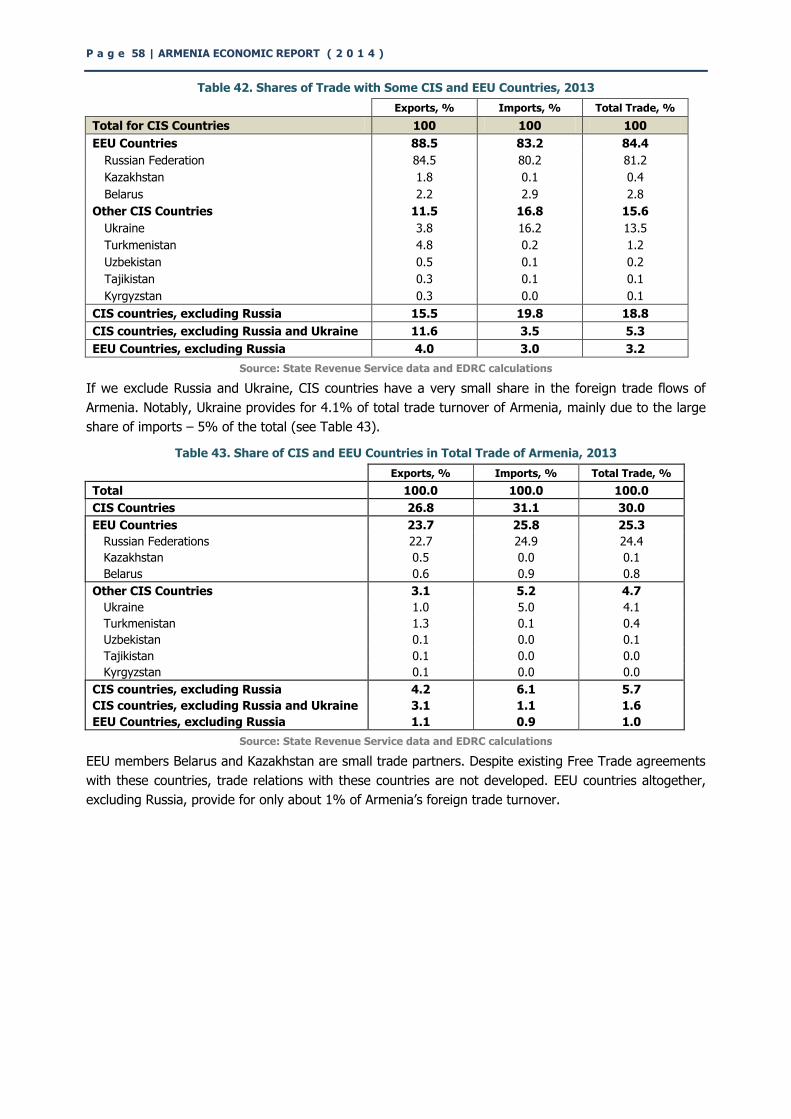
P a g e 58 | ARMENIA ECONOMIC REPORT ( 2 0 1 4 )
Table 42. Shares of Trade with Some CIS and EEU Countries, 2013
Exports, % Imports, % Total Trade, %
Total for CIS Countries 100 100 100
EEU Countries 88.5 83.2 84.4
Russian Federation 84.5 80.2 81.2
Kazakhstan 1.8 0.1 0.4
Belarus 2.2 2.9 2.8
Other CIS Countries 11.5 16.8 15.6
Ukraine 3.8 16.2 13.5
Turkmenistan 4.8 0.2 1.2
Uzbekistan 0.5 0.1 0.2
Tajikistan 0.3 0.1 0.1
Kyrgyzstan 0.3 0.0 0.1
CIS countries, excluding Russia 15.5 19.8 18.8
CIS countries, excluding Russia and Ukraine 11.6 3.5 5.3
EEU Countries, excluding Russia 4.0 3.0 3.2
Source: State Revenue Service data and EDRC calculations
If we exclude Russia and Ukraine, CIS countries have a very small share in the foreign trade flows of
Armenia. Notably, Ukraine provides for 4.1% of total trade turnover of Armenia, mainly due to the large
share of imports – 5% of the total (see Table 43).
Table 43. Share of CIS and EEU Countries in Total Trade of Armenia, 2013
Exports, % Imports, % Total Trade, %
Total 100.0 100.0 100.0
CIS Countries 26.8 31.1 30.0
EEU Countries 23.7 25.8 25.3
Russian Federations 22.7 24.9 24.4
Kazakhstan 0.5 0.0 0.1
Belarus 0.6 0.9 0.8
Other CIS Countries 3.1 5.2 4.7
Ukraine 1.0 5.0 4.1
Turkmenistan 1.3 0.1 0.4
Uzbekistan 0.1 0.0 0.1
Tajikistan 0.1 0.0 0.0
Kyrgyzstan 0.1 0.0 0.0
CIS countries, excluding Russia 4.2 6.1 5.7
CIS countries, excluding Russia and Ukraine 3.1 1.1 1.6
EEU Countries, excluding Russia 1.1 0.9 1.0
Source: State Revenue Service data and EDRC calculations
EEU members Belarus and Kazakhstan are small trade partners. Despite existing Free Trade agreements
with these countries, trade relations with these countries are not developed. EEU countries altogether,
excluding Russia, provide for only about 1% of Armenia’s foreign trade turnover.
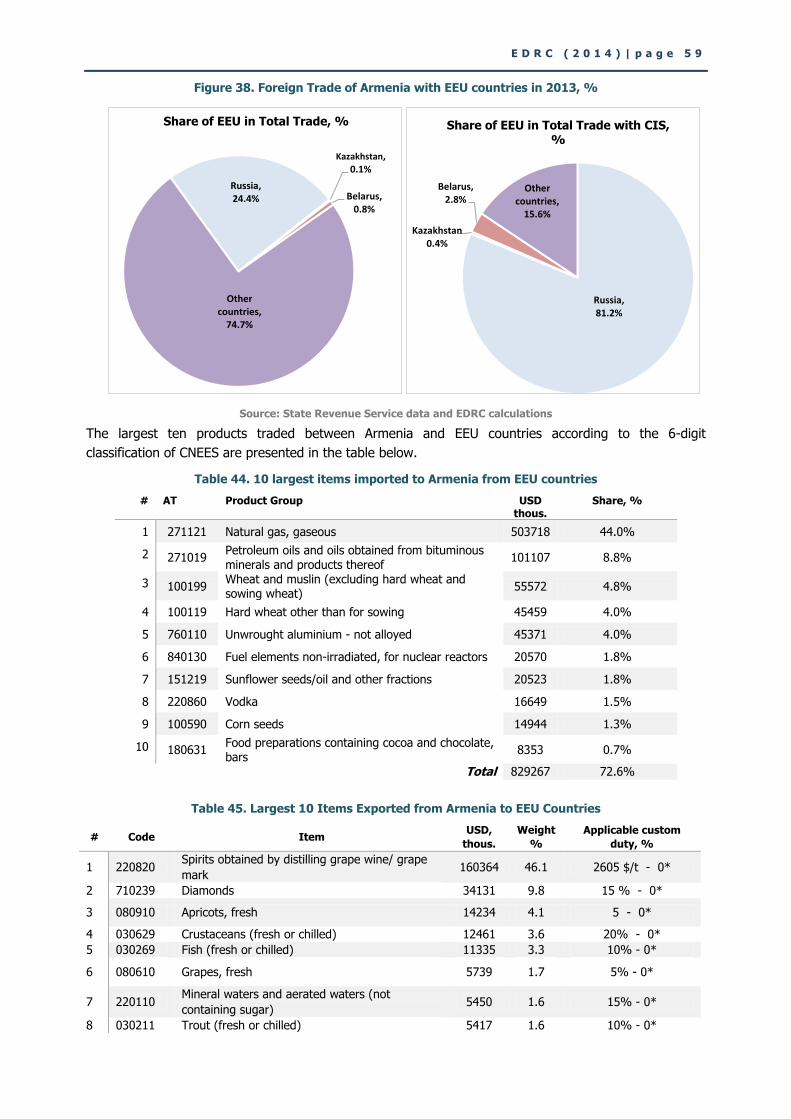
E D R C ( 2 0 1 4 ) | p a g e 5 9
Figure 38. Foreign Trade of Armenia with EEU countries in 2013, %
Source: State Revenue Service data and EDRC calculations
The largest ten products traded between Armenia and EEU countries according to the 6-digit
classification of CNEES are presented in the table below.
Table 44. 10 largest items imported to Armenia from EEU countries
# AT Product Group USD thous.
Share, %
1 271121 Natural gas, gaseous 503718 44.0%
2 271019 Petroleum oils and oils obtained from bituminous minerals and products thereof
101107 8.8%
3 100199 Wheat and muslin (excluding hard wheat and sowing wheat)
55572 4.8%
4 100119 Hard wheat other than for sowing 45459 4.0%
5 760110 Unwrought aluminium - not alloyed 45371 4.0%
6 840130 Fuel elements non-irradiated, for nuclear reactors 20570 1.8%
7 151219 Sunflower seeds/oil and other fractions 20523 1.8%
8 220860 Vodka 16649 1.5%
9 100590 Corn seeds 14944 1.3%
10 180631 Food preparations containing cocoa and chocolate, bars
8353 0.7%
Total 829267 72.6%
Table 45. Largest 10 Items Exported from Armenia to EEU Countries
# Code Item USD,
thous.
Weight
%
Applicable custom
duty, %
1 220820 Spirits obtained by distilling grape wine/ grape
mark 160364 46.1 2605 $/t - 0*
2 710239 Diamonds 34131 9.8 15 % - 0*
3 080910 Apricots, fresh 14234 4.1 5 - 0*
4 030629 Crustaceans (fresh or chilled) 12461 3.6 20% - 0*
5 030269 Fish (fresh or chilled) 11335 3.3 10% - 0*
6 080610 Grapes, fresh 5739 1.7 5% - 0*
7 220110 Mineral waters and aerated waters (not
containing sugar) 5450 1.6 15% - 0*
8 030211 Trout (fresh or chilled) 5417 1.6 10% - 0*
Russia, 24.4%
Kazakhstan, 0.1%
Belarus, 0.8%
Other countries,
74.7%
Share of EEU in Total Trade, %
Russia, 81.2%
Kazakhstan 0.4%
Belarus, 2.8%
Other countries,
15.6%
Share of EEU in Total Trade with CIS, %
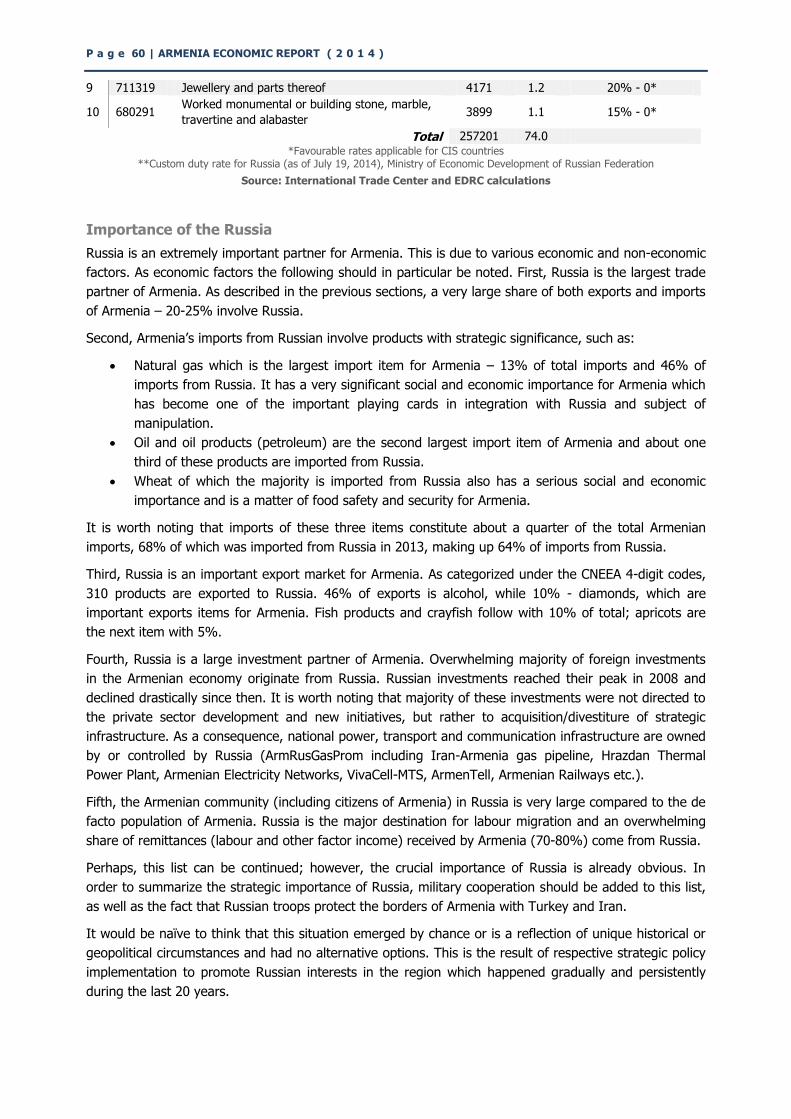
P a g e 60 | ARMENIA ECONOMIC REPORT ( 2 0 1 4 )
9 711319 Jewellery and parts thereof 4171 1.2 20% - 0*
10 680291 Worked monumental or building stone, marble,
travertine and alabaster 3899 1.1 15% - 0*
Total 257201 74.0 *Favourable rates applicable for CIS countries
**Custom duty rate for Russia (as of July 19, 2014), Ministry of Economic Development of Russian Federation
Source: International Trade Center and EDRC calculations
Importance of the Russia
Russia is an extremely important partner for Armenia. This is due to various economic and non-economic
factors. As economic factors the following should in particular be noted. First, Russia is the largest trade
partner of Armenia. As described in the previous sections, a very large share of both exports and imports
of Armenia – 20-25% involve Russia.
Second, Armenia’s imports from Russian involve products with strategic significance, such as:
Natural gas which is the largest import item for Armenia – 13% of total imports and 46% of
imports from Russia. It has a very significant social and economic importance for Armenia which
has become one of the important playing cards in integration with Russia and subject of
manipulation.
Oil and oil products (petroleum) are the second largest import item of Armenia and about one
third of these products are imported from Russia.
Wheat of which the majority is imported from Russia also has a serious social and economic
importance and is a matter of food safety and security for Armenia.
It is worth noting that imports of these three items constitute about a quarter of the total Armenian
imports, 68% of which was imported from Russia in 2013, making up 64% of imports from Russia.
Third, Russia is an important export market for Armenia. As categorized under the CNEEA 4-digit codes,
310 products are exported to Russia. 46% of exports is alcohol, while 10% - diamonds, which are
important exports items for Armenia. Fish products and crayfish follow with 10% of total; apricots are
the next item with 5%.
Fourth, Russia is a large investment partner of Armenia. Overwhelming majority of foreign investments
in the Armenian economy originate from Russia. Russian investments reached their peak in 2008 and
declined drastically since then. It is worth noting that majority of these investments were not directed to
the private sector development and new initiatives, but rather to acquisition/divestiture of strategic
infrastructure. As a consequence, national power, transport and communication infrastructure are owned
by or controlled by Russia (ArmRusGasProm including Iran-Armenia gas pipeline, Hrazdan Thermal
Power Plant, Armenian Electricity Networks, VivaCell-MTS, ArmenTell, Armenian Railways etc.).
Fifth, the Armenian community (including citizens of Armenia) in Russia is very large compared to the de
facto population of Armenia. Russia is the major destination for labour migration and an overwhelming
share of remittances (labour and other factor income) received by Armenia (70-80%) come from Russia.
Perhaps, this list can be continued; however, the crucial importance of Russia is already obvious. In
order to summarize the strategic importance of Russia, military cooperation should be added to this list,
as well as the fact that Russian troops protect the borders of Armenia with Turkey and Iran.
It would be naïve to think that this situation emerged by chance or is a reflection of unique historical or
geopolitical circumstances and had no alternative options. This is the result of respective strategic policy
implementation to promote Russian interests in the region which happened gradually and persistently
during the last 20 years.
E D R C ( 2 0 1 4 ) | p a g e 6 1
In order to draw such a conclusion, it is sufficient to assess the consistent efforts and aspiration
exercised by Russia to achieve full control over power system and its production, imports, distribution
and management aspects of such a small country like Armenia. It cannot be determined by mere
business interest or profit expectations as it is in pursuit of strategic interests.
Construction and operation of Iran-Armenia Gas Pipeline is another example. The pipeline was
constructed during the years of independence; however Armenia did not succeed in having the Iranian
gas as an alternative to the Russian gas neither for itself nor for its neighbours to act as a transit country
(Iran has the largest natural gas resources in the world after Russia). Armenian natural gas market and
infrastructure entirely belong to Russia. Currently, Armenia has no influence over or independence to
increase the imports of cheaper Iranian gas.
Thus, Armenia depends on Russia in economic and energy aspects. In addition, Armenia continues to
rely on Russian support to avoid and regulate a regional military conflict. In such circumstances it is hard
to believe that Armenia may have independence in making serious strategic and economic policy
decisions. Therefore, it is also hard to believe that participation in Eurasian integration processes is an
economic development policy option that originates from domestic economic development needs.
Nonetheless it is important to see that all of the above does not yet mean that Armenia does not have
any potential to protect its interests, achieve an optimal balance in relations with Russia and obtain
economic and social benefits.
P a g e 62 | ARMENIA ECONOMIC REPORT ( 2 0 1 4 )
2.4. Trade Flows Impact Analysis
Trade Creation and Diversion Effects
As a result of EAEU accession, Armenia will put in place a new Customs legislation and will start using
EAEU unified custom duties (starting January 1, 2015). The latter differ considerably from the duties
currently applicable to Armenia’s foreign trade. At the same time, a unified non-tariff regulation system
will be introduced. As a result, Armenia will undergo a significant change in foreign trade regimes which
cannot leave the foreign trade unchanged.
In order to assess the potential social and economic consequences resulting from the shifts in foreign
trade, we analysed the trade relations with the following 3 groups of countries:
1. EAEU countries,
2. Countries that have Free Trade agreements with Armenia,
3. Third countries with which Armenia has neither favoured nor free trade regimes/agreements.
For the purpose of analysing the impact on trade shifts and development, it is first of all necessary to
analyse trade creation and trade diversion effects. Notably, both tariff and non-tariff regulation changes
are assessed, including the potential reduction of transaction cost and administration as a result of EAEU
accession. Trade creation effect can be applicable for Customs Union countries, while trade diversion
effect to the countries in the second and third groups.
Trade with EAEU Countries
Trade creation effects theoretically refer to cases when tariff reduction or elimination decrease prices,
increase demand and expand the trade between the Customs Union member-countries. This is a positive
impact which, in fact is the objective of any Customs Union, ensuring its economic effectiveness.
Under EAEU, trade creation effect will be very limited since member countries have free trade
agreements. Partner countries do not apply customs tariffs for imports from respective countries under
such agreements. Therefore, these countries already enjoy the possible benefits of trade liberalization.
What relates to export tariffs, Armenia has no export tariffs at all. Russia applies export tariffs on fossil
fuel and raw materials (e. g. diamonds). Such export tariffs will no longer exist in the common customs
area under the Customs Union even if they previously were applied. This will induce price reductions.
Nevertheless, it should be considered that the list of goods subject to export tariffs involves a limited
number of products that have a strategic importance for Russia of which the export prices, as a rule, are
determined through bilateral contracts. Consequently potential of trade creation through tariff regulation
or liberalization is very small.
Non-tariff regulation and reduction in various trade barriers, as well as customs administration and
transaction costs are much more important factors in relations among EAEU countries. These factors can
lead to reduction in business costs and prices which may result in trade creation.
Reduction in technical and administrative barriers may create basis for certain dynamic effects, such as
expansion of competitiveness and economic freedom, production cooperation and collaboration etc.
These, in turn, may lead to trade development and growth.
However, there a number of constraints and risks involved. The main constraint is the absence of a
common physical border. Armenia will trade with EAEU countries through a third country – Georgia. This
suggests that the goods will be transported in transit regime and will be subject to special identification.
It is yet to be seen how much and to what extent the administrative costs will change as a result of this.
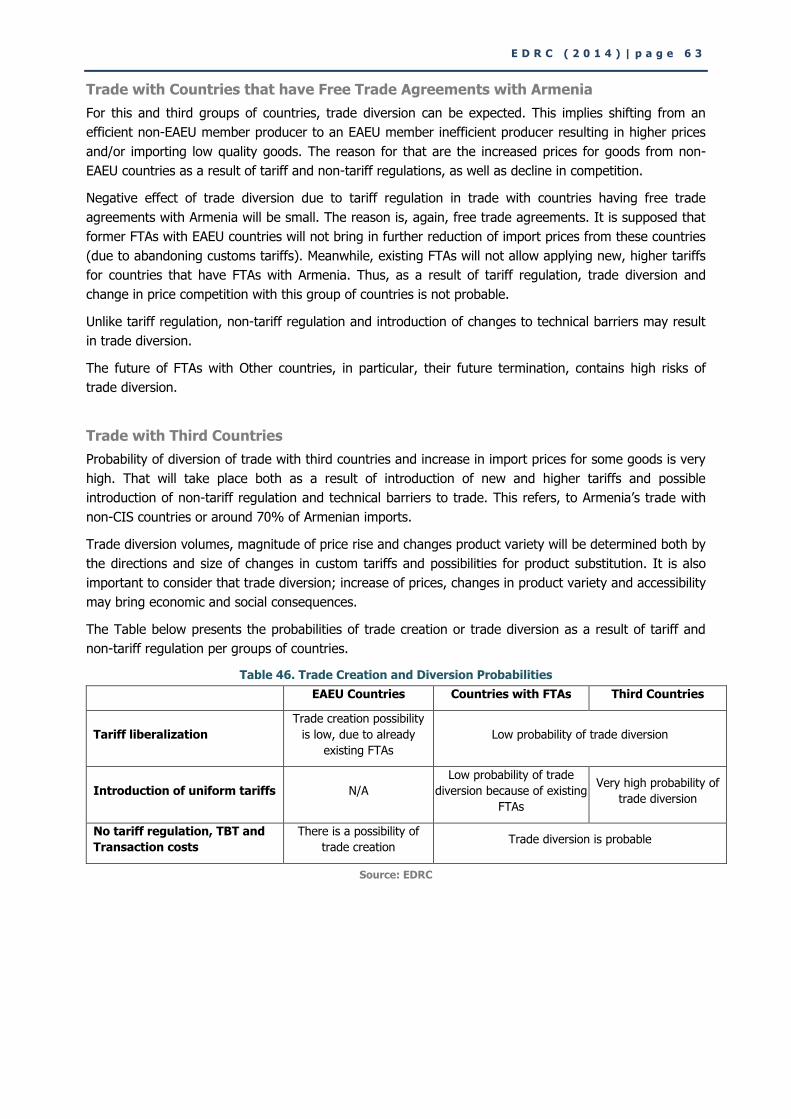
E D R C ( 2 0 1 4 ) | p a g e 6 3
Trade with Countries that have Free Trade Agreements with Armenia
For this and third groups of countries, trade diversion can be expected. This implies shifting from an
efficient non-EAEU member producer to an EAEU member inefficient producer resulting in higher prices
and/or importing low quality goods. The reason for that are the increased prices for goods from non-
EAEU countries as a result of tariff and non-tariff regulations, as well as decline in competition.
Negative effect of trade diversion due to tariff regulation in trade with countries having free trade
agreements with Armenia will be small. The reason is, again, free trade agreements. It is supposed that
former FTAs with EAEU countries will not bring in further reduction of import prices from these countries
(due to abandoning customs tariffs). Meanwhile, existing FTAs will not allow applying new, higher tariffs
for countries that have FTAs with Armenia. Thus, as a result of tariff regulation, trade diversion and
change in price competition with this group of countries is not probable.
Unlike tariff regulation, non-tariff regulation and introduction of changes to technical barriers may result
in trade diversion.
The future of FTAs with Other countries, in particular, their future termination, contains high risks of
trade diversion.
Trade with Third Countries
Probability of diversion of trade with third countries and increase in import prices for some goods is very
high. That will take place both as a result of introduction of new and higher tariffs and possible
introduction of non-tariff regulation and technical barriers to trade. This refers, to Armenia’s trade with
non-CIS countries or around 70% of Armenian imports.
Trade diversion volumes, magnitude of price rise and changes product variety will be determined both by
the directions and size of changes in custom tariffs and possibilities for product substitution. It is also
important to consider that trade diversion; increase of prices, changes in product variety and accessibility
may bring economic and social consequences.
The Table below presents the probabilities of trade creation or trade diversion as a result of tariff and
non-tariff regulation per groups of countries.
Table 46. Trade Creation and Diversion Probabilities
EAEU Countries Countries with FTAs Third Countries
Tariff liberalization
Trade creation possibility
is low, due to already
existing FTAs
Low probability of trade diversion
Introduction of uniform tariffs N/A
Low probability of trade
diversion because of existing
FTAs
Very high probability of
trade diversion
No tariff regulation, TBT and
Transaction costs
There is a possibility of
trade creation Trade diversion is probable
Source: EDRC
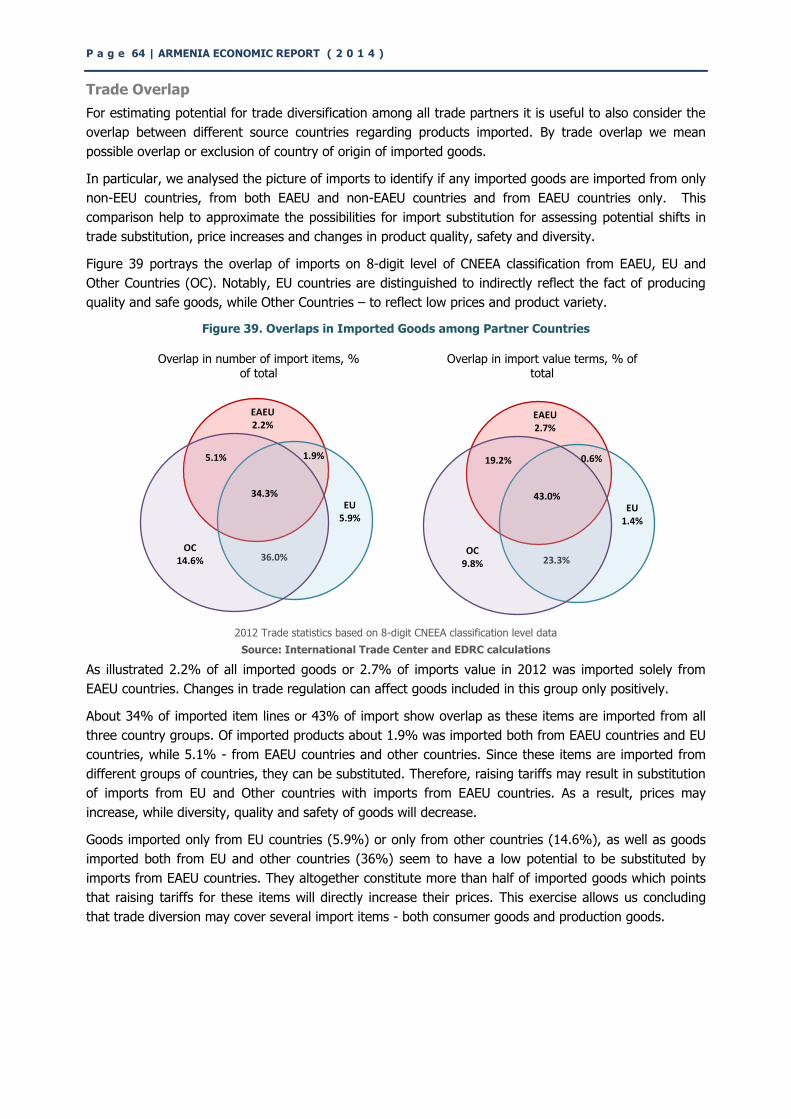
P a g e 64 | ARMENIA ECONOMIC REPORT ( 2 0 1 4 )
Trade Overlap
For estimating potential for trade diversification among all trade partners it is useful to also consider the
overlap between different source countries regarding products imported. By trade overlap we mean
possible overlap or exclusion of country of origin of imported goods.
In particular, we analysed the picture of imports to identify if any imported goods are imported from only
non-EEU countries, from both EAEU and non-EAEU countries and from EAEU countries only. This
comparison help to approximate the possibilities for import substitution for assessing potential shifts in
trade substitution, price increases and changes in product quality, safety and diversity.
Figure 39 portrays the overlap of imports on 8-digit level of CNEEA classification from EAEU, EU and
Other Countries (OC). Notably, EU countries are distinguished to indirectly reflect the fact of producing
quality and safe goods, while Other Countries – to reflect low prices and product variety.
Figure 39. Overlaps in Imported Goods among Partner Countries
2012 Trade statistics based on 8-digit CNEEA classification level data
Source: International Trade Center and EDRC calculations
As illustrated 2.2% of all imported goods or 2.7% of imports value in 2012 was imported solely from
EAEU countries. Changes in trade regulation can affect goods included in this group only positively.
About 34% of imported item lines or 43% of import show overlap as these items are imported from all
three country groups. Of imported products about 1.9% was imported both from EAEU countries and EU
countries, while 5.1% - from EAEU countries and other countries. Since these items are imported from
different groups of countries, they can be substituted. Therefore, raising tariffs may result in substitution
of imports from EU and Other countries with imports from EAEU countries. As a result, prices may
increase, while diversity, quality and safety of goods will decrease.
Goods imported only from EU countries (5.9%) or only from other countries (14.6%), as well as goods
imported both from EU and other countries (36%) seem to have a low potential to be substituted by
imports from EAEU countries. They altogether constitute more than half of imported goods which points
that raising tariffs for these items will directly increase their prices. This exercise allows us concluding
that trade diversion may cover several import items - both consumer goods and production goods.
Overlap in number of import items, % of total
Overlap in import value terms, % of total
36.0%
EU 5.9%
5.1%
EAEU 2.2%
34.3%
1.9%
OC 14.6% 23.3%
EU 1.4%
19.2%
EAEU 2.7%
43.0%
0.6%
OC 9.8%
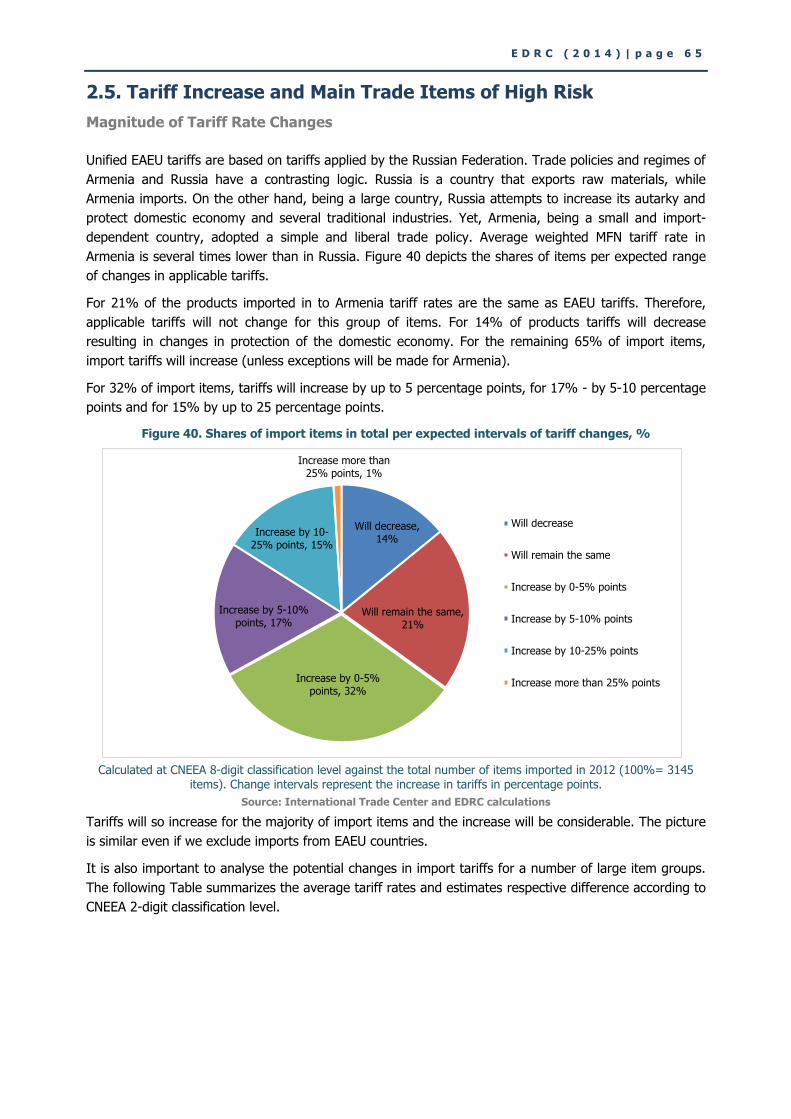
E D R C ( 2 0 1 4 ) | p a g e 6 5
2.5. Tariff Increase and Main Trade Items of High Risk
Magnitude of Tariff Rate Changes
Unified EAEU tariffs are based on tariffs applied by the Russian Federation. Trade policies and regimes of
Armenia and Russia have a contrasting logic. Russia is a country that exports raw materials, while
Armenia imports. On the other hand, being a large country, Russia attempts to increase its autarky and
protect domestic economy and several traditional industries. Yet, Armenia, being a small and import-
dependent country, adopted a simple and liberal trade policy. Average weighted MFN tariff rate in
Armenia is several times lower than in Russia. Figure 40 depicts the shares of items per expected range
of changes in applicable tariffs.
For 21% of the products imported in to Armenia tariff rates are the same as EAEU tariffs. Therefore,
applicable tariffs will not change for this group of items. For 14% of products tariffs will decrease
resulting in changes in protection of the domestic economy. For the remaining 65% of import items,
import tariffs will increase (unless exceptions will be made for Armenia).
For 32% of import items, tariffs will increase by up to 5 percentage points, for 17% - by 5-10 percentage
points and for 15% by up to 25 percentage points.
Figure 40. Shares of import items in total per expected intervals of tariff changes, %
Calculated at CNEEA 8-digit classification level against the total number of items imported in 2012 (100%= 3145 items). Change intervals represent the increase in tariffs in percentage points.
Source: International Trade Center and EDRC calculations
Tariffs will so increase for the majority of import items and the increase will be considerable. The picture
is similar even if we exclude imports from EAEU countries.
It is also important to analyse the potential changes in import tariffs for a number of large item groups.
The following Table summarizes the average tariff rates and estimates respective difference according to
CNEEA 2-digit classification level.
Will decrease, 14%
Will remain the same, 21%
Increase by 0-5% points, 32%
Increase by 5-10% points, 17%
Increase by 10-25% points, 15%
Increase more than 25% points, 1%
Will decrease
Will remain the same
Increase by 0-5% points
Increase by 5-10% points
Increase by 10-25% points
Increase more than 25% points
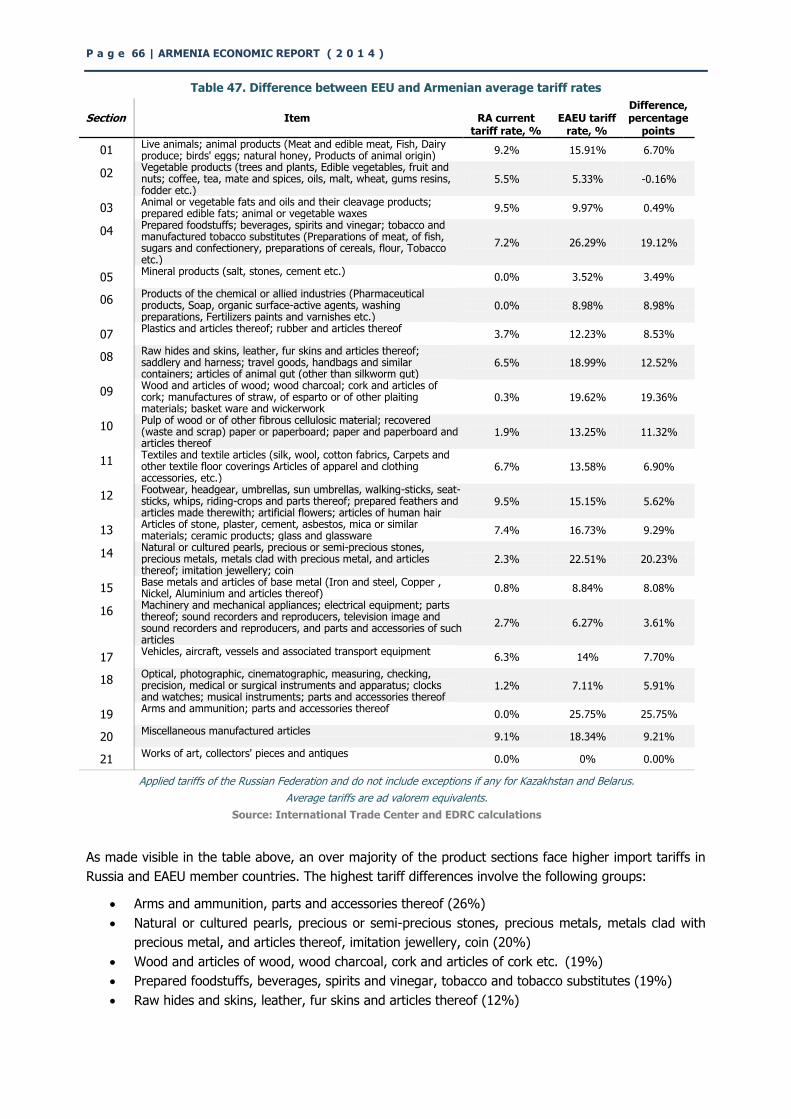
P a g e 66 | ARMENIA ECONOMIC REPORT ( 2 0 1 4 )
Table 47. Difference between EEU and Armenian average tariff rates
Section
Item
RA current
tariff rate, %
EAEU tariff
rate, %
Difference, percentage
points
01 Live animals; animal products (Meat and edible meat, Fish, Dairy produce; birds' eggs; natural honey, Products of animal origin)
9.2% 15.91% 6.70%
02 Vegetable products (trees and plants, Edible vegetables, fruit and nuts; coffee, tea, mate and spices, oils, malt, wheat, gums resins, fodder etc.)
5.5% 5.33% -0.16%
03 Animal or vegetable fats and oils and their cleavage products; prepared edible fats; animal or vegetable waxes
9.5% 9.97% 0.49%
04 Prepared foodstuffs; beverages, spirits and vinegar; tobacco and manufactured tobacco substitutes (Preparations of meat, of fish, sugars and confectionery, preparations of cereals, flour, Tobacco etc.)
7.2% 26.29% 19.12%
05 Mineral products (salt, stones, cement etc.)
0.0% 3.52% 3.49%
06 Products of the chemical or allied industries (Pharmaceutical products, Soap, organic surface-active agents, washing preparations, Fertilizers paints and varnishes etc.)
0.0% 8.98% 8.98%
07 Plastics and articles thereof; rubber and articles thereof
3.7% 12.23% 8.53%
08 Raw hides and skins, leather, fur skins and articles thereof; saddlery and harness; travel goods, handbags and similar containers; articles of animal gut (other than silkworm gut)
6.5% 18.99% 12.52%
09 Wood and articles of wood; wood charcoal; cork and articles of cork; manufactures of straw, of esparto or of other plaiting materials; basket ware and wickerwork
0.3% 19.62% 19.36%
10 Pulp of wood or of other fibrous cellulosic material; recovered (waste and scrap) paper or paperboard; paper and paperboard and articles thereof
1.9% 13.25% 11.32%
11 Textiles and textile articles (silk, wool, cotton fabrics, Carpets and other textile floor coverings Articles of apparel and clothing accessories, etc.)
6.7% 13.58% 6.90%
12 Footwear, headgear, umbrellas, sun umbrellas, walking-sticks, seat-sticks, whips, riding-crops and parts thereof; prepared feathers and articles made therewith; artificial flowers; articles of human hair
9.5% 15.15% 5.62%
13 Articles of stone, plaster, cement, asbestos, mica or similar materials; ceramic products; glass and glassware
7.4% 16.73% 9.29%
14 Natural or cultured pearls, precious or semi-precious stones, precious metals, metals clad with precious metal, and articles thereof; imitation jewellery; coin
2.3% 22.51% 20.23%
15 Base metals and articles of base metal (Iron and steel, Copper , Nickel, Aluminium and articles thereof)
0.8% 8.84% 8.08%
16 Machinery and mechanical appliances; electrical equipment; parts thereof; sound recorders and reproducers, television image and sound recorders and reproducers, and parts and accessories of such articles
2.7% 6.27% 3.61%
17 Vehicles, aircraft, vessels and associated transport equipment
6.3% 14% 7.70%
18 Optical, photographic, cinematographic, measuring, checking, precision, medical or surgical instruments and apparatus; clocks and watches; musical instruments; parts and accessories thereof
1.2% 7.11% 5.91%
19 Arms and ammunition; parts and accessories thereof
0.0% 25.75% 25.75%
20 Miscellaneous manufactured articles
9.1% 18.34% 9.21%
21 Works of art, collectors' pieces and antiques
0.0% 0% 0.00%
Applied tariffs of the Russian Federation and do not include exceptions if any for Kazakhstan and Belarus.
Average tariffs are ad valorem equivalents.
Source: International Trade Center and EDRC calculations
As made visible in the table above, an over majority of the product sections face higher import tariffs in
Russia and EAEU member countries. The highest tariff differences involve the following groups:
Arms and ammunition, parts and accessories thereof (26%)
Natural or cultured pearls, precious or semi-precious stones, precious metals, metals clad with
precious metal, and articles thereof, imitation jewellery, coin (20%)
Wood and articles of wood, wood charcoal, cork and articles of cork etc. (19%)
Prepared foodstuffs, beverages, spirits and vinegar, tobacco and tobacco substitutes (19%)
Raw hides and skins, leather, fur skins and articles thereof (12%)
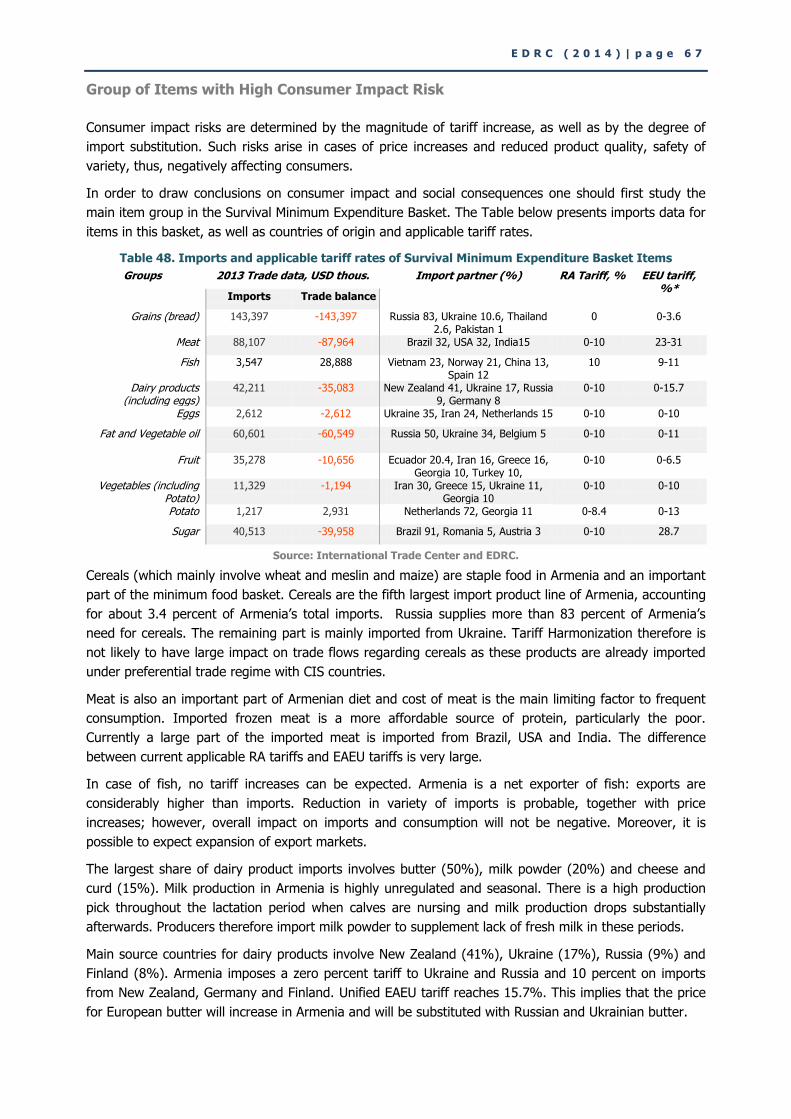
E D R C ( 2 0 1 4 ) | p a g e 6 7
Group of Items with High Consumer Impact Risk
Consumer impact risks are determined by the magnitude of tariff increase, as well as by the degree of
import substitution. Such risks arise in cases of price increases and reduced product quality, safety of
variety, thus, negatively affecting consumers.
In order to draw conclusions on consumer impact and social consequences one should first study the
main item group in the Survival Minimum Expenditure Basket. The Table below presents imports data for
items in this basket, as well as countries of origin and applicable tariff rates.
Table 48. Imports and applicable tariff rates of Survival Minimum Expenditure Basket Items
Groups 2013 Trade data, USD thous. Import partner (%) RA Tariff, % EEU tariff, %*
Imports Trade balance
Grains (bread) 143,397 -143,397 Russia 83, Ukraine 10.6, Thailand 2.6, Pakistan 1
0 0-3.6
Meat 88,107 -87,964 Brazil 32, USA 32, India15 0-10 23-31
Fish 3,547 28,888 Vietnam 23, Norway 21, China 13, Spain 12
10 9-11
Dairy products (including eggs)
42,211 -35,083 New Zealand 41, Ukraine 17, Russia 9, Germany 8
0-10 0-15.7
Eggs 2,612 -2,612 Ukraine 35, Iran 24, Netherlands 15 0-10 0-10
Fat and Vegetable oil 60,601 -60,549 Russia 50, Ukraine 34, Belgium 5 0-10 0-11
Fruit 35,278 -10,656 Ecuador 20.4, Iran 16, Greece 16, Georgia 10, Turkey 10,
0-10 0-6.5
Vegetables (including Potato)
11,329 -1,194 Iran 30, Greece 15, Ukraine 11, Georgia 10
0-10 0-10
Potato 1,217 2,931 Netherlands 72, Georgia 11 0-8.4 0-13
Sugar 40,513 -39,958 Brazil 91, Romania 5, Austria 3 0-10 28.7
Source: International Trade Center and EDRC.
Cereals (which mainly involve wheat and meslin and maize) are staple food in Armenia and an important
part of the minimum food basket. Cereals are the fifth largest import product line of Armenia, accounting
for about 3.4 percent of Armenia’s total imports. Russia supplies more than 83 percent of Armenia’s
need for cereals. The remaining part is mainly imported from Ukraine. Tariff Harmonization therefore is
not likely to have large impact on trade flows regarding cereals as these products are already imported
under preferential trade regime with CIS countries.
Meat is also an important part of Armenian diet and cost of meat is the main limiting factor to frequent
consumption. Imported frozen meat is a more affordable source of protein, particularly the poor.
Currently a large part of the imported meat is imported from Brazil, USA and India. The difference
between current applicable RA tariffs and EAEU tariffs is very large.
In case of fish, no tariff increases can be expected. Armenia is a net exporter of fish: exports are
considerably higher than imports. Reduction in variety of imports is probable, together with price
increases; however, overall impact on imports and consumption will not be negative. Moreover, it is
possible to expect expansion of export markets.
The largest share of dairy product imports involves butter (50%), milk powder (20%) and cheese and
curd (15%). Milk production in Armenia is highly unregulated and seasonal. There is a high production
pick throughout the lactation period when calves are nursing and milk production drops substantially
afterwards. Producers therefore import milk powder to supplement lack of fresh milk in these periods.
Main source countries for dairy products involve New Zealand (41%), Ukraine (17%), Russia (9%) and
Finland (8%). Armenia imposes a zero percent tariff to Ukraine and Russia and 10 percent on imports
from New Zealand, Germany and Finland. Unified EAEU tariff reaches 15.7%. This implies that the price
for European butter will increase in Armenia and will be substituted with Russian and Ukrainian butter.
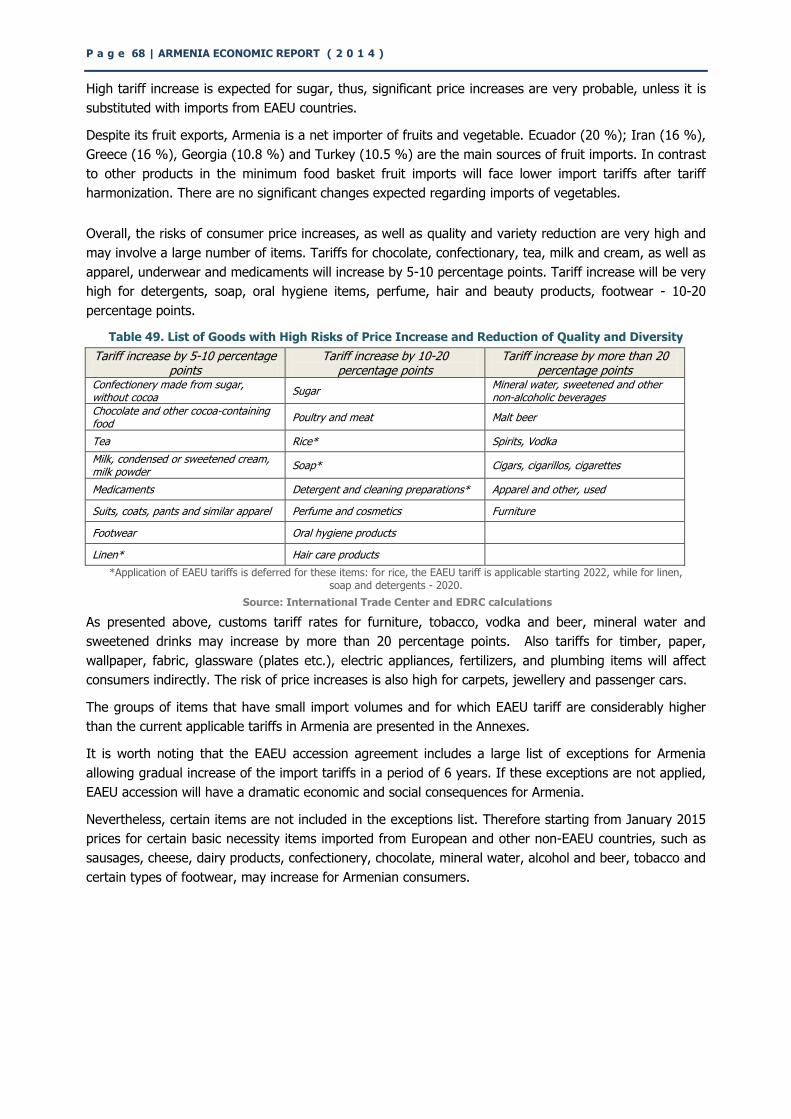
P a g e 68 | ARMENIA ECONOMIC REPORT ( 2 0 1 4 )
High tariff increase is expected for sugar, thus, significant price increases are very probable, unless it is
substituted with imports from EAEU countries.
Despite its fruit exports, Armenia is a net importer of fruits and vegetable. Ecuador (20 %); Iran (16 %),
Greece (16 %), Georgia (10.8 %) and Turkey (10.5 %) are the main sources of fruit imports. In contrast
to other products in the minimum food basket fruit imports will face lower import tariffs after tariff
harmonization. There are no significant changes expected regarding imports of vegetables.
Overall, the risks of consumer price increases, as well as quality and variety reduction are very high and
may involve a large number of items. Tariffs for chocolate, confectionary, tea, milk and cream, as well as
apparel, underwear and medicaments will increase by 5-10 percentage points. Tariff increase will be very
high for detergents, soap, oral hygiene items, perfume, hair and beauty products, footwear - 10-20
percentage points.
Table 49. List of Goods with High Risks of Price Increase and Reduction of Quality and Diversity
Tariff increase by 5-10 percentage points
Tariff increase by 10-20 percentage points
Tariff increase by more than 20 percentage points
Confectionery made from sugar, without cocoa
Sugar Mineral water, sweetened and other non-alcoholic beverages
Chocolate and other cocoa-containing food
Poultry and meat Malt beer
Tea Rice* Spirits, Vodka
Milk, condensed or sweetened cream, milk powder
Soap* Cigars, cigarillos, cigarettes
Medicaments Detergent and cleaning preparations* Apparel and other, used
Suits, coats, pants and similar apparel Perfume and cosmetics Furniture
Footwear Oral hygiene products
Linen* Hair care products
*Application of EAEU tariffs is deferred for these items: for rice, the EAEU tariff is applicable starting 2022, while for linen, soap and detergents - 2020.
Source: International Trade Center and EDRC calculations
As presented above, customs tariff rates for furniture, tobacco, vodka and beer, mineral water and
sweetened drinks may increase by more than 20 percentage points. Also tariffs for timber, paper,
wallpaper, fabric, glassware (plates etc.), electric appliances, fertilizers, and plumbing items will affect
consumers indirectly. The risk of price increases is also high for carpets, jewellery and passenger cars.
The groups of items that have small import volumes and for which EAEU tariff are considerably higher
than the current applicable tariffs in Armenia are presented in the Annexes.
It is worth noting that the EAEU accession agreement includes a large list of exceptions for Armenia
allowing gradual increase of the import tariffs in a period of 6 years. If these exceptions are not applied,
EAEU accession will have a dramatic economic and social consequences for Armenia.
Nevertheless, certain items are not included in the exceptions list. Therefore starting from January 2015
prices for certain basic necessity items imported from European and other non-EAEU countries, such as
sausages, cheese, dairy products, confectionery, chocolate, mineral water, alcohol and beer, tobacco and
certain types of footwear, may increase for Armenian consumers.
E D R C ( 2 0 1 4 ) | p a g e 6 9
2.6. Summary of the Results and Conclusions
The Eurasian integration is a manifestation of great geopolitical processes which opposes
western processes. Armenia as a small country is anyhow forced to be a part of this process.
The Eurasian economic union is a high form of integration between member countries aimed
towards development of a single market space. It involves not just establishment of a customs
union but also agreed upon and common economic policies in certain areas.
Evaluation of the socioeconomic impact of the EAEU is subject to comprehensive analysis. The
theme is first of all multidimensional and does not only involve a customs union but specific
areas of a single market space including analysis of the impact of regulating macroeconomic,
currency, financial market investments, public procurement, competition, energy and other
areas.
The consequences may be put on and carried by private companies, investors, consumers,
labour migrants and the civil society in general. The process can have sector specific impact and
moreover, the impact can be different from short or long term perspectives.
In the framework of this study only establishment of a customs union, which involves a common
customs territory, unified tariff regulation for third countries and general impact of common
regulation of non-tariff barriers on trade flows of Armenia are discussed. Discussions on
occurrence and impact of trade creation and diversion made it possible to develop more clear
insight and come to general conclusions.
Consequences of membership
The consequences of EAEU membership have been evaluated through production and
consumption effects. Budget effects has not been discussed as this will be linked to the general
budget of the customs union and affected by changes in collection policies regarding indirect
taxes from third countries. Also the occurrence of dynamic effects has been discussed as
development impacts which have a relative long term nature. The possible direction and varieties
of impact has been summarized in the table below.
Positive Consequences and Opportunities
Trade creation is generally the main source of positive production effect. Yet, due to tariff
liberalization the possibility of trade creation is small as Armenia already has FTAs with the
Russian Federation and other EAEU member countries and so already enjoys the related
benefits.
Next to liberalization in tariff regulation, reduction of customs administration and transaction
expenses also have the power to contribute to trade creation.
In addition to these, there are also other factors possible which can contribute to trade creation
and result in positive production effect. These in the first place relate to increased competition
and economic effects in the internal market.
Production increase and trade development is among others also possible due to creation of
production cooperatives and increased cooperation. These are considered more dynamic
development effects.
From the perspective of consumption effect, the limitation of energy price rise can be highlighted
as a positive factor, particularly natural gas which plays an important role in this regard.
Consequently on the short term the expected positive effects are not many and the longer term
impact in unclear.
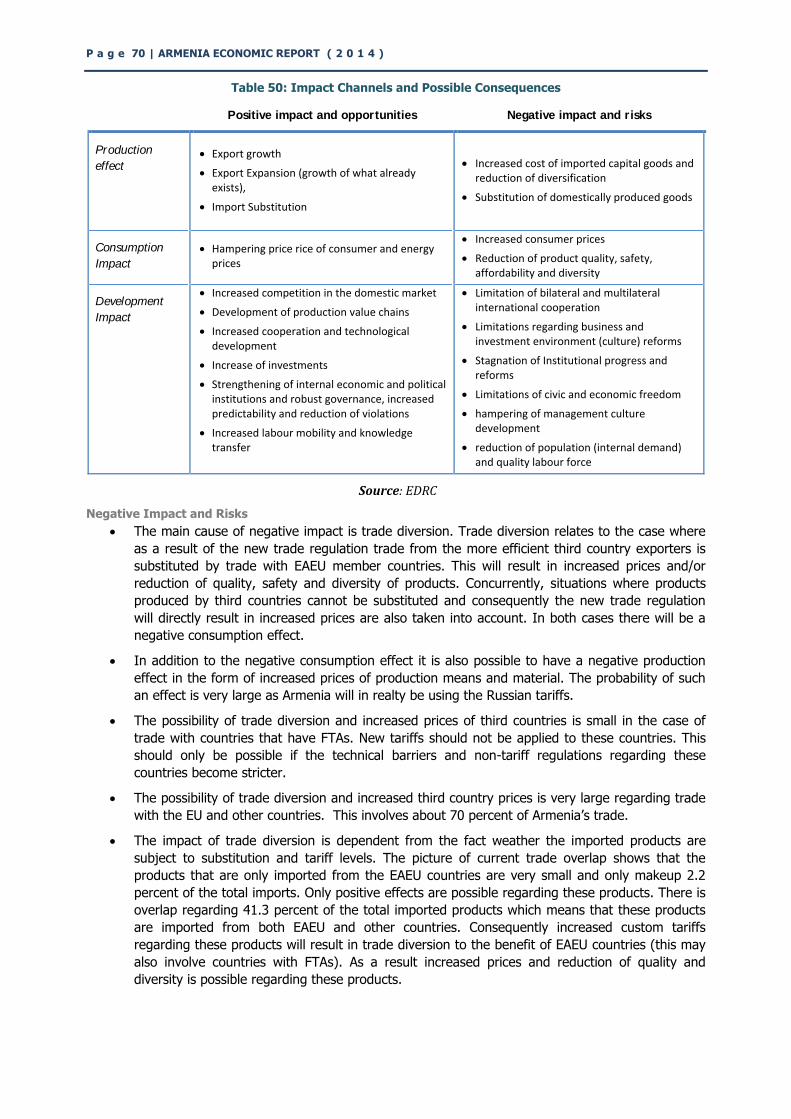
P a g e 70 | ARMENIA ECONOMIC REPORT ( 2 0 1 4 )
Table 50: Impact Channels and Possible Consequences
Positive impact and opportunities Negative impact and risks
Production
effect Export growth
Export Expansion (growth of what already exists),
Import Substitution
Increased cost of imported capital goods and reduction of diversification
Substitution of domestically produced goods
Consumption
Impact
Hampering price rice of consumer and energy prices
Increased consumer prices
Reduction of product quality, safety, affordability and diversity
Development
Impact
Increased competition in the domestic market
Development of production value chains
Increased cooperation and technological development
Increase of investments
Strengthening of internal economic and political institutions and robust governance, increased predictability and reduction of violations
Increased labour mobility and knowledge transfer
Limitation of bilateral and multilateral international cooperation
Limitations regarding business and investment environment (culture) reforms
Stagnation of Institutional progress and reforms
Limitations of civic and economic freedom
hampering of management culture development
reduction of population (internal demand) and quality labour force
Source: EDRC
Negative Impact and Risks
The main cause of negative impact is trade diversion. Trade diversion relates to the case where
as a result of the new trade regulation trade from the more efficient third country exporters is
substituted by trade with EAEU member countries. This will result in increased prices and/or
reduction of quality, safety and diversity of products. Concurrently, situations where products
produced by third countries cannot be substituted and consequently the new trade regulation
will directly result in increased prices are also taken into account. In both cases there will be a
negative consumption effect.
In addition to the negative consumption effect it is also possible to have a negative production
effect in the form of increased prices of production means and material. The probability of such
an effect is very large as Armenia will in realty be using the Russian tariffs.
The possibility of trade diversion and increased prices of third countries is small in the case of
trade with countries that have FTAs. New tariffs should not be applied to these countries. This
should only be possible if the technical barriers and non-tariff regulations regarding these
countries become stricter.
The possibility of trade diversion and increased third country prices is very large regarding trade
with the EU and other countries. This involves about 70 percent of Armenia’s trade.
The impact of trade diversion is dependent from the fact weather the imported products are
subject to substitution and tariff levels. The picture of current trade overlap shows that the
products that are only imported from the EAEU countries are very small and only makeup 2.2
percent of the total imports. Only positive effects are possible regarding these products. There is
overlap regarding 41.3 percent of the total imported products which means that these products
are imported from both EAEU and other countries. Consequently increased custom tariffs
regarding these products will result in trade diversion to the benefit of EAEU countries (this may
also involve countries with FTAs). As a result increased prices and reduction of quality and
diversity is possible regarding these products.
E D R C ( 2 0 1 4 ) | p a g e 7 1
56 percent of the imported product are only imported from non EAEU countries. Consequently,
assuming that the possible substitution levels in this regard are limited, the custom tariffs for
these products will directly increase.
The level of negative impact is also dependent from the degree to which custom tariffs will
increase. Therefore it is important to notice that regarding 32 percent of the products the tariffs
will increase by more than 5 and for 16 percent of products tariff will increases be more than 10
percent.
Tariff increase will happen in almost all of the imported product groups. This indicates that price
increases will relate to both consumption and capital goods.
There is large list of exemptions envisaged for Armenia and a transition period for application of
these tariff modifications. Nevertheless these do not include some important product groups for
which price rises and/or reduction product quality and safety is inevitable.
Conclusions
Gradual increase of Russia’s significance has become predominant in Armenia, realizing control
of the energy sector and development of a general economic dependence. This factor reduces
Armenia’s independence in strategic decision making. With the aim to restore certain balance
and diversification this reality needs to be taken into account during development of future
relations, particularly regarding future Russian investments with strategic importance for the
energy sector.
EAEU membership can result in increased dependence of Armenia from Russia, yet this needs to
be developed into an opportunity for regaining Armenia’s significance. This important regional
integration process needs to serve Armenia’s long term development interests and its effective
positioning in the region and not result in even higher level of isolation.
Future development of the Armenian-Russian relations will need to become a separate topic of
discussion seen from a new light. Armenia needs to develop and realize a partnership strategy
that will service its own interests with an attempt to bring relations in to a more balanced and
mutual beneficial level.
Regardless of the transportation related limitations, the external trade of Armenia has a wide
reach. This is of significance with regard to development of high level relations. From the
perspectives of general trade volumes, products and also number of countries involved, the EU is
a crucial partner for Armenia with a large development potential. 10
It is obvious that the potential of developing relations with the neighbour countries is also not
fully realized. Trade and particularly export to Asian and also other countries of the world is
increasing significantly during the previous years. Development of trade with these countries has
a large importance for Armenia.
With membership in the EAEU, Armenia is forced to significantly change its trade policy with
third countries which is economically not effective for the country. This is made evident by the
large list of exemptions for the 2015-2022 period.
Positive potential economic benefits of membership are limited and this only can be considerable
in case of increased competition, enhanced administration etc. Instead the possible price rise of
raw material and capital goods will have a negative impact on Armenia’s economy.
The main source of economic benefit will be occurrence of long term dynamic effects which also
has limitations and particular analysis on this topic are needed.
The potential for negative impact of trade diversion and increased prices of products imported
from third countries is very high. EAEU membership will bring along negative consumption
effects for Armenia. If exception are not made adequately then socio-economic consequences
10
The number of products imported from the EU to Armenia two times larger compared to the EAEU.
P a g e 72 | ARMENIA ECONOMIC REPORT ( 2 0 1 4 )
will be dramatically large. It is also important to notice that the implemented exception are of a
temporary nature and will last only seven years.
Armenia’s membership of the EAEU is a most crucial event. Its short term economic benefits are not clear whereas negative consumption impact is inevitable. The long term developments, opportunities for realisation of economic benefits and risks are not defined. There is great need for follow-up research and evaluations.
Suggestions for Further Research
The thematic areas of necessary further research is very wide, yet we would like to separate the following crucial questions.
What prospect can the Armenia’s bilateral and multilateral international trade and economic
relations have, how will WTO relations and the already established FTAs and preferential trade
regimes develop?
Does the Eurasian integration place the already initiated European integration processes in a
deadlock?
How can the expected benefits become tangible and effective in absence of a customs border
with EAEU partner countries and particularly in the case where Georgia will not become a
member of this union?
E D R C ( 2 0 1 4 ) | p a g e 7 3
APPENDICES
Appendix 1. The Traditional Theories of Trade Liberalization
Numerous theories and models were developed during the past six decades that attempt assessing the
directions and magnitude of economic impact various regional trade agreements had. First theories on
free trade areas that discussed static impact effects proved that trade liberalization may also have
negative effects. The dominant belief, that mutual removal or reduction of trade tariffs affects countries
development and welfare only positively, broken up11.
The first and central theory among such theories is the Viner’s Partial Equilibrium Model which mostly
discusses trade liberalization effects for small economy (Viner, The Customs Union Issue, 1950). Overall,
abandoning tariff regulation of trade between countries has two major effects: trade creation and trade
diversion (see also Venables 2003).
Trade creation refers to the increase in imports from the partner country due to FTA that takes place
because of domestic production substitution and expansion of domestic demand (as a result of
decreased prices which becomes possible due to decreased or removed tariffs). I. e. impact routes of
increased imports from the partner country are the following two: a) on production which refers to the
reduction of the inefficient domestic production and substitution with imports and b) on consumption
which refers to the decrease in prices.
On the other hand, a second option is also feasible: trade diversion. This refers to those cases when
more efficient imports from third countries are substituted by less efficient imports from the partner
country (due to tariff preferences). It is obvious that trade diversion results in the loss of tariff revenues
set for third countries by the given country due to evaded trade volumes from third countries, thus,
leaving negative economic impact on budget revenues.
In practice, both trade creation and diversion effects take place due to formation of economic union.
Efficiency of economic integration of specific union right now is assessed as a final outcome between
trade creation and diversion effects: it is cost-effective in case of prevailing of the trade creation effects,
and vice versa.
Generally, during the last six decades, in the context of widely applied trade liberalization policies, FTA
impact assessment has become one of the most actual research issues. A lot of researchers widened and
deepened Viner-Meade framework, valuable conclusions has been made based on ex-post evaluations.
For instance, different researchers (Wonnacott and Wonnacott 1981, Johnson 1975, Lipsey 1957) have
come to the conclusion that even FTAs with trade diversion effect can have positive impact if that
particular FTA results in the improvement of trade terms (export and imports price ratio). That mostly
refers to large economies, however, according to some researchers (Wonnacott and Wonnacott, 1981),
this can hold true also for small countries.
It is obvious that if the partner country is more efficient then there will be only the positive effect of
trade creation. However, if there is no domestic production then probability of price reduction decreases.
While for products where the partner is not the most efficient and there is no domestic production, trade
diversion will take place together with price decreases due to crowding out a more efficient third country
from the market.
Some researchers (Bhagwati, Panagariya, 1996) in general believe that establishing an FTA mostly
results in net trade diversion effect; therefore, it is more reasonable to liberalize multi-layer trade
relations instead of FTAs. Their conclusion is mostly true for such goods when there is no domestic 11
Initially, main studies were defined for CUs (Viner, Meade etc), later on it was proved that they hold true also for FTAs (Krueger 1995, Panagariya and Findlay 1996, Krishna and Panagariya 2002)
P a g e 74 | ARMENIA ECONOMIC REPORT ( 2 0 1 4 )
production and partner country cannot fully meet the local demand (in effect, this refers to FTAs signed
by small countries). For example, FTAs in Latin America failed in 1960s exactly because of negative trade
diversion effects (Burfisher, etc. 2003).
Analyses of international experience prove that FTAs don’t have negative effects on the welfare of small
economies. Analyses of trade of countries of six RTAs (APEC, MERCOSUR, NAFTA, EU, ASEAN, CAN)
shows (Crawford and Laird, 2001) that imports under these agreements grew on average by 7%
annually during 1990-1999, while imports from non-member countries – by 6%. Based on this,
researchers came to the conclusion that FTAs overall had net trade creation effect both for member and
non-member countries, thus boosting economic growth of these countries.
As a result of quantitative analyses other researchers also concluded that FTAs mostly have a net trade
creation effect (Baldwin, Venables 1995). According to the CGE model findings, many FTAs, having a net
trade creation effect, have resulted in the welfare growth of many countries (Robinson, Thierfelder
2002).
Anyway, it must be considered that preferential trade liberalization according to the second best theory,
does not have unequivocal impact on the welfare and do not guarantee increase in welfare of countries.
It is explained by the fact that there are numerous restrictions (distortions) in the economic system and
removal of any of those can have both positive and negative impact on the efficiency of the system, or
do not have any impact at all. It is also possible that increasing or making any or those restrictions
stronger or stricter results in increase in welfare (The General Theory of Second Best, Lipsey and
Lancaster, 1956).
At the same time interestingly, it is possible to form in theory such FTAs that have positive impact not
only on all members, but also on the global economy overall (Pareto-improving FTAs, Kemp–Wan
Theorem). This mostly can be realized by developing mechanisms of setting tariffs that prevent trade
diversion, liberalization of all trade between countries and compensation for losses.
If all impacts of trade liberalization discussed so far had static nature, dynamic effects should be viewed
very carefully, the major one among them are:
Competition strengthening: lifting of tariff regulation, by affecting the level of protection for
the domestic production, creates favourable conditions for the development of the efficient
market structure.
Economies of scale effect: small domestic countries receive free access to the partner’s
market, thus getting the possibility to sell larger volumes of goods (in more favourable
conditions).
Investment promotion: creation of free trade areas results in creation of investments and
diversion. I. e. favourable trade terms result in increased investment flows which, if no tariff
preferences granted, would go to other countries.
Technological changes are explained both by technology transfers through foreign
investments and by increased domestic investments in R&D due to comparative expansion of the
market.
Promotion of mutual investments can be viewed as a goal of FTAs, such as ASEAN sometimes states the
real goal of its creation is the increase in investment flows between its members (ADB, 2010).
There is an extensive body of regionalism literature on FTAs and CUs (Freund and Ornelas 2010). CUs
tend to allow member countries to internalize cross border externalities, including externalities that
involve profits from trade or terms of trade regimes. Some of the potential short- and long-term benefits
of increased regional economic integration that the ECU can bring were summarized in six categories by
EBRD in its Transition report of 2012 as:
Lower tariffs and the removal of NTBs should increase trade and enhance consumer choice.
E D R C ( 2 0 1 4 ) | p a g e 7 5
Producers within a regional integration grouping can benefit from increased market size.
Exporting within a regional area may serve as a first step toward the expansion of exports
worldwide.
Countries within a regional integration area can build cross-border production chains by
leveraging each other’s comparative advantages and subsequently exporting the finished product
outside that area.
Deeper regional integration can help member countries strengthen their economic and political
institutions.
Integration can encourage the liberalization of service markets.
Nevertheless possible benefits will need to outweigh the risks that such a union will bring. The first of
these concerns is that a relative change in tariff barriers can divert trade from more efficient external
exporters to less efficient ones and create trade diversion. Therefore to evaluate whether such
agreements are beneficial in practice, it is important to differentiate the possible impact channels
through which the ECU will impact.
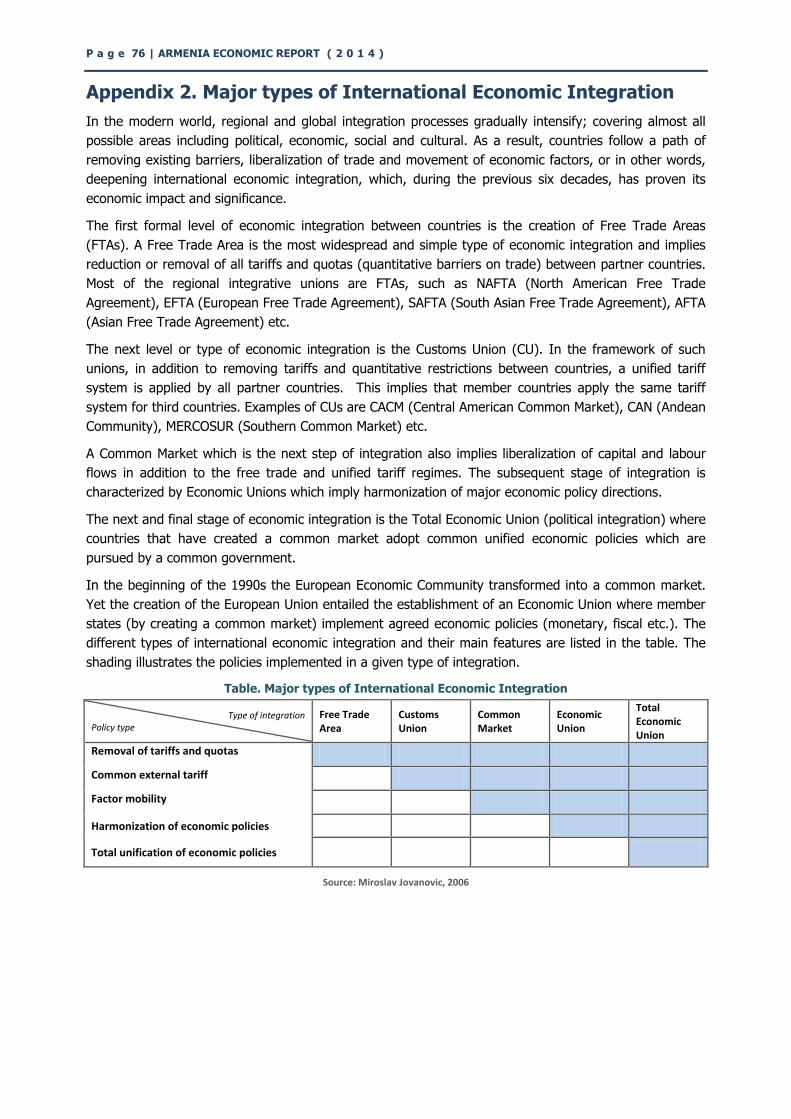
P a g e 76 | ARMENIA ECONOMIC REPORT ( 2 0 1 4 )
Appendix 2. Major types of International Economic Integration
In the modern world, regional and global integration processes gradually intensify; covering almost all
possible areas including political, economic, social and cultural. As a result, countries follow a path of
removing existing barriers, liberalization of trade and movement of economic factors, or in other words,
deepening international economic integration, which, during the previous six decades, has proven its
economic impact and significance.
The first formal level of economic integration between countries is the creation of Free Trade Areas
(FTAs). A Free Trade Area is the most widespread and simple type of economic integration and implies
reduction or removal of all tariffs and quotas (quantitative barriers on trade) between partner countries.
Most of the regional integrative unions are FTAs, such as NAFTA (North American Free Trade
Agreement), EFTA (European Free Trade Agreement), SAFTA (South Asian Free Trade Agreement), AFTA
(Asian Free Trade Agreement) etc.
The next level or type of economic integration is the Customs Union (CU). In the framework of such
unions, in addition to removing tariffs and quantitative restrictions between countries, a unified tariff
system is applied by all partner countries. This implies that member countries apply the same tariff
system for third countries. Examples of CUs are CACM (Central American Common Market), CAN (Andean
Community), MERCOSUR (Southern Common Market) etc.
A Common Market which is the next step of integration also implies liberalization of capital and labour
flows in addition to the free trade and unified tariff regimes. The subsequent stage of integration is
characterized by Economic Unions which imply harmonization of major economic policy directions.
The next and final stage of economic integration is the Total Economic Union (political integration) where
countries that have created a common market adopt common unified economic policies which are
pursued by a common government.
In the beginning of the 1990s the European Economic Community transformed into a common market.
Yet the creation of the European Union entailed the establishment of an Economic Union where member
states (by creating a common market) implement agreed economic policies (monetary, fiscal etc.). The
different types of international economic integration and their main features are listed in the table. The
shading illustrates the policies implemented in a given type of integration.
Table. Major types of International Economic Integration
Type of integration Policy type
Free Trade Area
Customs Union
Common Market
Economic Union
Total Economic Union
Removal of tariffs and quotas
Common external tariff
Factor mobility
Harmonization of economic policies
Total unification of economic policies
Source: Miroslav Jovanovic, 2006
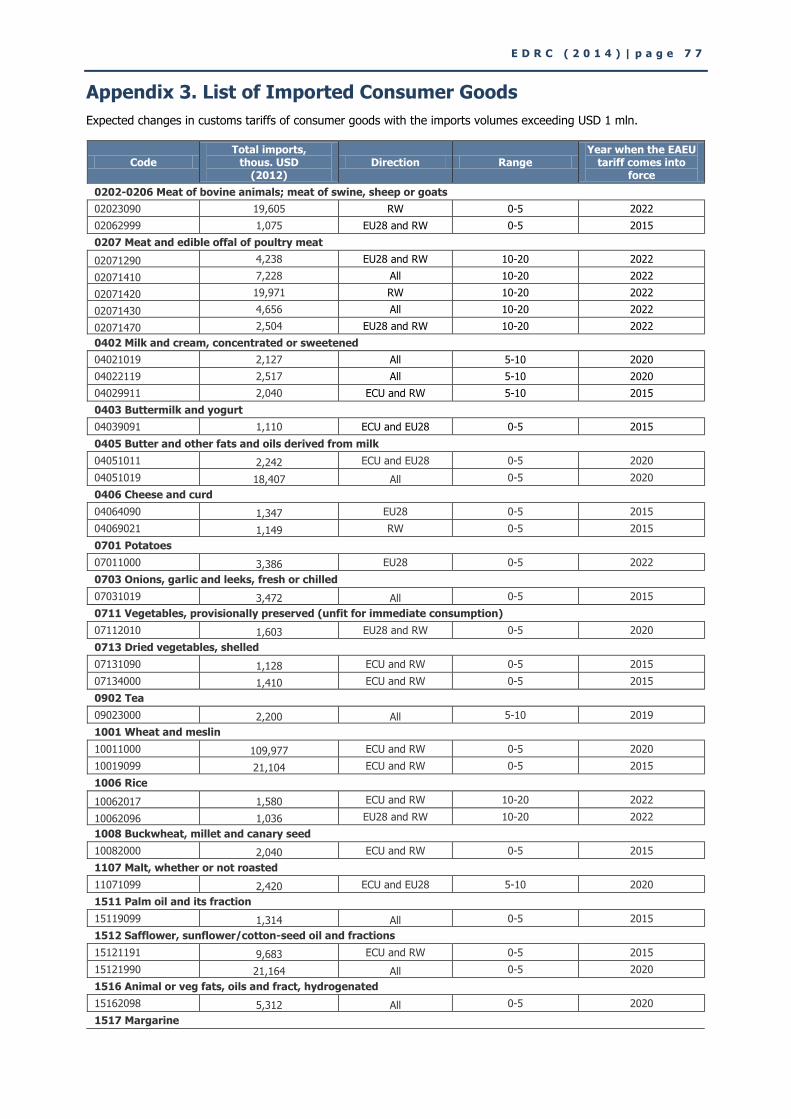
E D R C ( 2 0 1 4 ) | p a g e 7 7
Appendix 3. List of Imported Consumer Goods
Expected changes in customs tariffs of consumer goods with the imports volumes exceeding USD 1 mln.
Code Total imports,
thous. USD (2012)
Direction Range Year when the EAEU
tariff comes into force
0202-0206 Meat of bovine animals; meat of swine, sheep or goats
02023090 19,605 RW 0-5 2022
02062999 1,075 EU28 and RW 0-5 2015
0207 Meat and edible offal of poultry meat
02071290 4,238 EU28 and RW 10-20 2022
02071410 7,228 All 10-20 2022
02071420 19,971 RW 10-20 2022
02071430 4,656 All 10-20 2022
02071470 2,504 EU28 and RW 10-20 2022
0402 Milk and cream, concentrated or sweetened
04021019 2,127 All 5-10 2020
04022119 2,517 All 5-10 2020
04029911 2,040 ECU and RW 5-10 2015
0403 Buttermilk and yogurt
04039091 1,110 ECU and EU28 0-5 2015
0405 Butter and other fats and oils derived from milk
04051011 2,242 ECU and EU28 0-5 2020
04051019 18,407 All 0-5 2020
0406 Cheese and curd
04064090 1,347 EU28 0-5 2015
04069021 1,149 RW 0-5 2015
0701 Potatoes
07011000 3,386 EU28 0-5 2022
0703 Onions, garlic and leeks, fresh or chilled
07031019 3,472 All 0-5 2015
0711 Vegetables, provisionally preserved (unfit for immediate consumption)
07112010 1,603 EU28 and RW 0-5 2020
0713 Dried vegetables, shelled
07131090 1,128 ECU and RW 0-5 2015
07134000 1,410 ECU and RW 0-5 2015
0902 Tea
09023000 2,200 All 5-10 2019
1001 Wheat and meslin
10011000 109,977 ECU and RW 0-5 2020
10019099 21,104 ECU and RW 0-5 2015
1006 Rice
10062017 1,580 ECU and RW 10-20 2022
10062096 1,036 EU28 and RW 10-20 2022
1008 Buckwheat, millet and canary seed
10082000 2,040 ECU and RW 0-5 2015
1107 Malt, whether or not roasted
11071099 2,420 ECU and EU28 5-10 2020
1511 Palm oil and its fraction
15119099 1,314 All 0-5 2015
1512 Safflower, sunflower/cotton-seed oil and fractions
15121191 9,683 ECU and RW 0-5 2015
15121990 21,164 All 0-5 2020
1516 Animal or veg fats, oils and fract, hydrogenated
15162098 5,312 All 0-5 2020
1517 Margarine
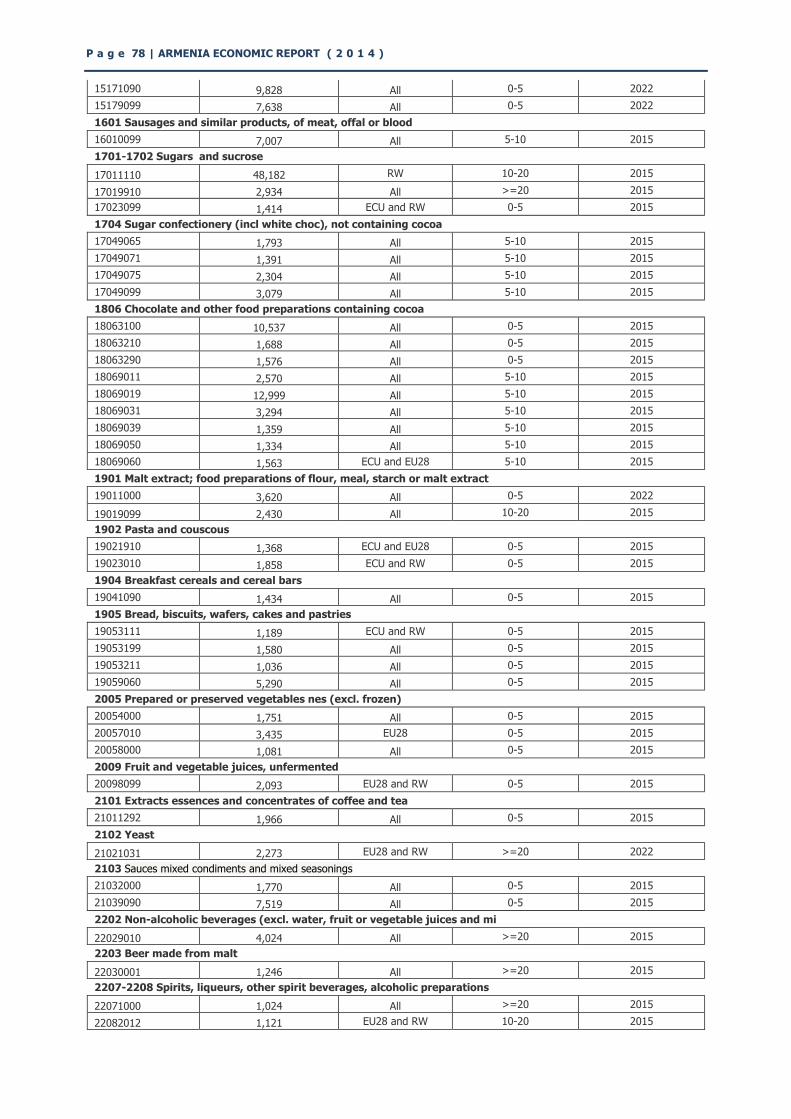
P a g e 78 | ARMENIA ECONOMIC REPORT ( 2 0 1 4 )
15171090 9,828 All 0-5 2022
15179099 7,638 All 0-5 2022
1601 Sausages and similar products, of meat, offal or blood
16010099 7,007 All 5-10 2015
1701-1702 Sugars and sucrose
17011110 48,182 RW 10-20 2015
17019910 2,934 All >=20 2015
17023099 1,414 ECU and RW 0-5 2015
1704 Sugar confectionery (incl white choc), not containing cocoa
17049065 1,793 All 5-10 2015
17049071 1,391 All 5-10 2015
17049075 2,304 All 5-10 2015
17049099 3,079 All 5-10 2015
1806 Chocolate and other food preparations containing cocoa
18063100 10,537 All 0-5 2015
18063210 1,688 All 0-5 2015
18063290 1,576 All 0-5 2015
18069011 2,570 All 5-10 2015
18069019 12,999 All 5-10 2015
18069031 3,294 All 5-10 2015
18069039 1,359 All 5-10 2015
18069050 1,334 All 5-10 2015
18069060 1,563 ECU and EU28 5-10 2015
1901 Malt extract; food preparations of flour, meal, starch or malt extract
19011000 3,620 All 0-5 2022
19019099 2,430 All 10-20 2015
1902 Pasta and couscous
19021910 1,368 ECU and EU28 0-5 2015
19023010 1,858 ECU and RW 0-5 2015
1904 Breakfast cereals and cereal bars
19041090 1,434 All 0-5 2015
1905 Bread, biscuits, wafers, cakes and pastries
19053111 1,189 ECU and RW 0-5 2015
19053199 1,580 All 0-5 2015
19053211 1,036 All 0-5 2015
19059060 5,290 All 0-5 2015
2005 Prepared or preserved vegetables nes (excl. frozen)
20054000 1,751 All 0-5 2015
20057010 3,435 EU28 0-5 2015
20058000 1,081 All 0-5 2015
2009 Fruit and vegetable juices, unfermented
20098099 2,093 EU28 and RW 0-5 2015
2101 Extracts essences and concentrates of coffee and tea
21011292 1,966 All 0-5 2015
2102 Yeast
21021031 2,273 EU28 and RW >=20 2022
2103 Sauces mixed condiments and mixed seasonings
21032000 1,770 All 0-5 2015
21039090 7,519 All 0-5 2015
2202 Non-alcoholic beverages (excl. water, fruit or vegetable juices and mi
22029010 4,024 All >=20 2015
2203 Beer made from malt
22030001 1,246 All >=20 2015
2207-2208 Spirits, liqueurs, other spirit beverages, alcoholic preparations
22071000 1,024 All >=20 2015
22082012 1,121 EU28 and RW 10-20 2015
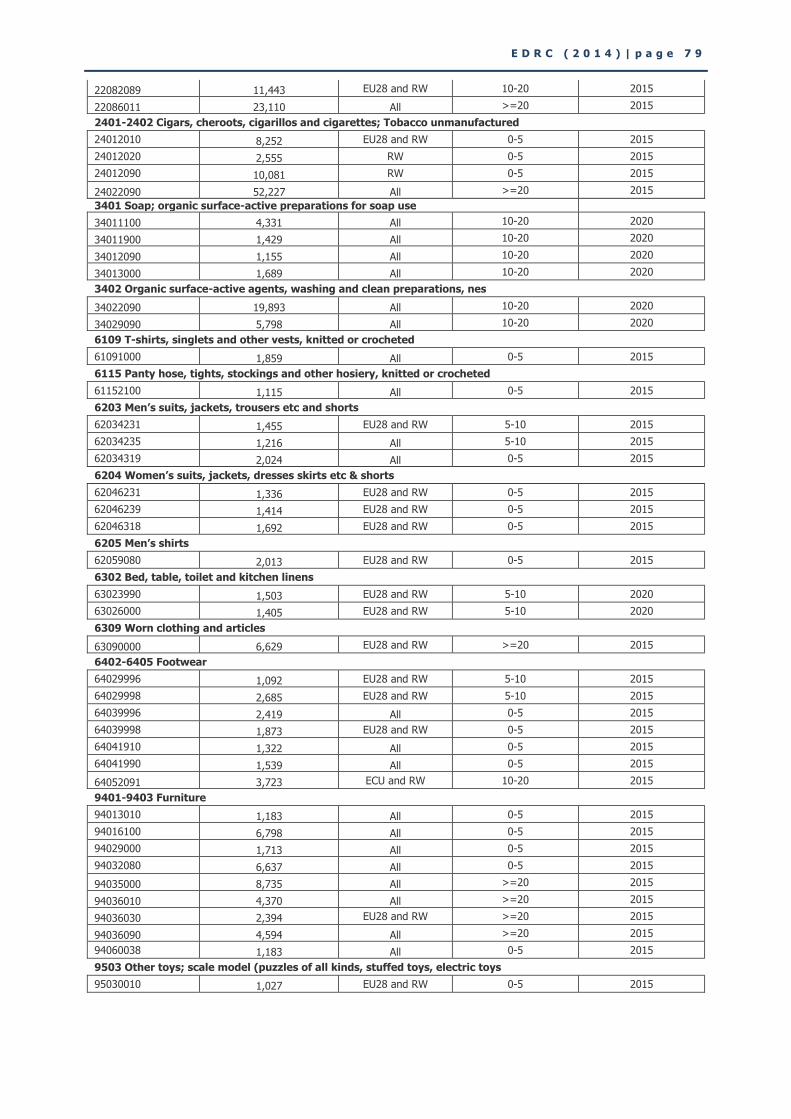
E D R C ( 2 0 1 4 ) | p a g e 7 9
22082089 11,443 EU28 and RW 10-20 2015
22086011 23,110 All >=20 2015
2401-2402 Cigars, cheroots, cigarillos and cigarettes; Tobacco unmanufactured
24012010 8,252 EU28 and RW 0-5 2015
24012020 2,555 RW 0-5 2015
24012090 10,081 RW 0-5 2015
24022090 52,227 All >=20 2015
3401 Soap; organic surface-active preparations for soap use
34011100 4,331 All 10-20 2020
34011900 1,429 All 10-20 2020
34012090 1,155 All 10-20 2020
34013000 1,689 All 10-20 2020
3402 Organic surface-active agents, washing and clean preparations, nes
34022090 19,893 All 10-20 2020
34029090 5,798 All 10-20 2020
6109 T-shirts, singlets and other vests, knitted or crocheted
61091000 1,859 All 0-5 2015
6115 Panty hose, tights, stockings and other hosiery, knitted or crocheted
61152100 1,115 All 0-5 2015
6203 Men’s suits, jackets, trousers etc and shorts
62034231 1,455 EU28 and RW 5-10 2015
62034235 1,216 All 5-10 2015
62034319 2,024 All 0-5 2015
6204 Women’s suits, jackets, dresses skirts etc & shorts
62046231 1,336 EU28 and RW 0-5 2015
62046239 1,414 EU28 and RW 0-5 2015
62046318 1,692 EU28 and RW 0-5 2015
6205 Men’s shirts
62059080 2,013 EU28 and RW 0-5 2015
6302 Bed, table, toilet and kitchen linens
63023990 1,503 EU28 and RW 5-10 2020
63026000 1,405 EU28 and RW 5-10 2020
6309 Worn clothing and articles
63090000 6,629 EU28 and RW >=20 2015
6402-6405 Footwear
64029996 1,092 EU28 and RW 5-10 2015
64029998 2,685 EU28 and RW 5-10 2015
64039996 2,419 All 0-5 2015
64039998 1,873 EU28 and RW 0-5 2015
64041910 1,322 All 0-5 2015
64041990 1,539 All 0-5 2015
64052091 3,723 ECU and RW 10-20 2015
9401-9403 Furniture
94013010 1,183 All 0-5 2015
94016100 6,798 All 0-5 2015
94029000 1,713 All 0-5 2015
94032080 6,637 All 0-5 2015
94035000 8,735 All >=20 2015
94036010 4,370 All >=20 2015
94036030 2,394 EU28 and RW >=20 2015
94036090 4,594 All >=20 2015
94060038 1,183 All 0-5 2015
9503 Other toys; scale model (puzzles of all kinds, stuffed toys, electric toys
95030010 1,027 EU28 and RW 0-5 2015
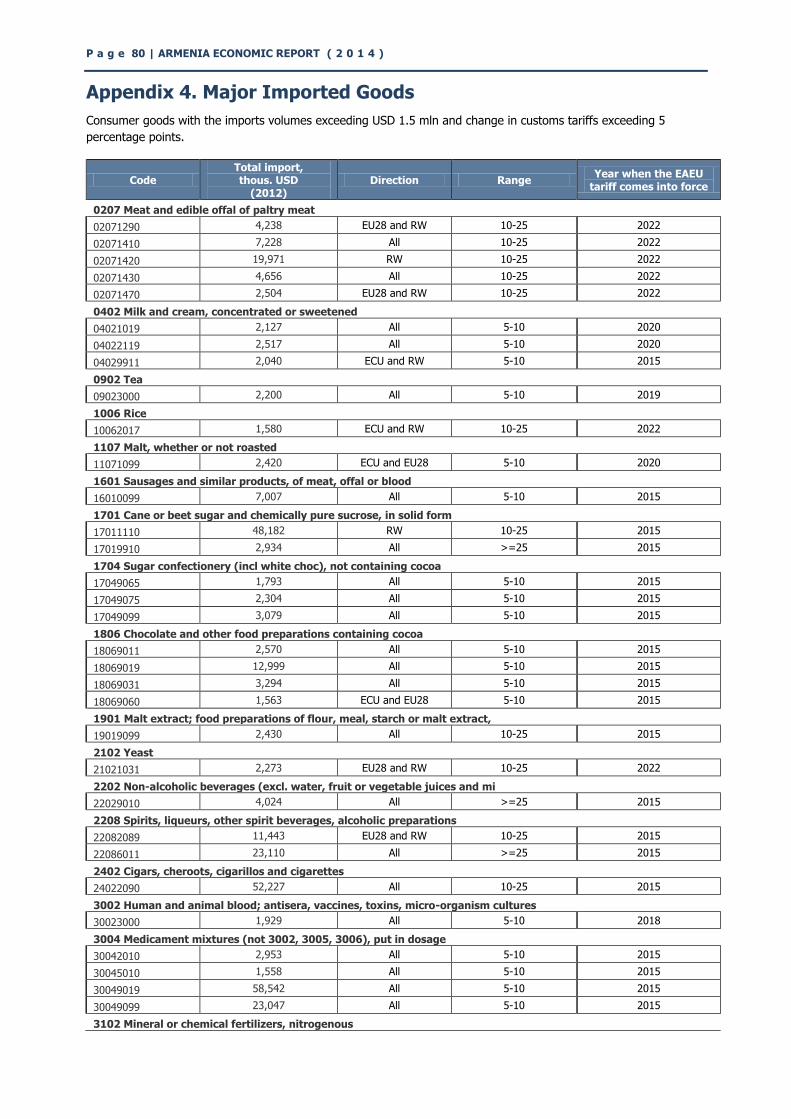
P a g e 80 | ARMENIA ECONOMIC REPORT ( 2 0 1 4 )
Appendix 4. Major Imported Goods
Consumer goods with the imports volumes exceeding USD 1.5 mln and change in customs tariffs exceeding 5
percentage points.
Code Total import, thous. USD
(2012) Direction Range
Year when the EAEU tariff comes into force
0207 Meat and edible offal of paltry meat
02071290 4,238 EU28 and RW 10-25 2022
02071410 7,228 All 10-25 2022
02071420 19,971 RW 10-25 2022
02071430 4,656 All 10-25 2022
02071470 2,504 EU28 and RW 10-25 2022
0402 Milk and cream, concentrated or sweetened
04021019 2,127 All 5-10 2020
04022119 2,517 All 5-10 2020
04029911 2,040 ECU and RW 5-10 2015
0902 Tea
09023000 2,200 All 5-10 2019
1006 Rice
10062017 1,580 ECU and RW 10-25 2022
1107 Malt, whether or not roasted
11071099 2,420 ECU and EU28 5-10 2020
1601 Sausages and similar products, of meat, offal or blood
16010099 7,007 All 5-10 2015
1701 Cane or beet sugar and chemically pure sucrose, in solid form
17011110 48,182 RW 10-25 2015
17019910 2,934 All >=25 2015
1704 Sugar confectionery (incl white choc), not containing cocoa
17049065 1,793 All 5-10 2015
17049075 2,304 All 5-10 2015
17049099 3,079 All 5-10 2015
1806 Chocolate and other food preparations containing cocoa
18069011 2,570 All 5-10 2015
18069019 12,999 All 5-10 2015
18069031 3,294 All 5-10 2015
18069060 1,563 ECU and EU28 5-10 2015
1901 Malt extract; food preparations of flour, meal, starch or malt extract,
19019099 2,430 All 10-25 2015
2102 Yeast
21021031 2,273 EU28 and RW 10-25 2022
2202 Non-alcoholic beverages (excl. water, fruit or vegetable juices and mi
22029010 4,024 All >=25 2015
2208 Spirits, liqueurs, other spirit beverages, alcoholic preparations
22082089 11,443 EU28 and RW 10-25 2015
22086011 23,110 All >=25 2015
2402 Cigars, cheroots, cigarillos and cigarettes
24022090 52,227 All 10-25 2015
3002 Human and animal blood; antisera, vaccines, toxins, micro-organism cultures
30023000 1,929 All 5-10 2018
3004 Medicament mixtures (not 3002, 3005, 3006), put in dosage
30042010 2,953 All 5-10 2015
30045010 1,558 All 5-10 2015
30049019 58,542 All 5-10 2015
30049099 23,047 All 5-10 2015
3102 Mineral or chemical fertilizers, nitrogenous

E D R C ( 2 0 1 4 ) | p a g e 8 1
31022900 5,543 RW 5-10 2020
31023090 16,768 RW 5-10 2020
3209 Aqueous solution of paint and varnish
32099000 2,419 All 10-25 2020
3303 Perfumes and toilet waters
33030090 7,036 All 10-25 2015
3304 Beauty, make-up and skin-care preparations; sunscreens, manicure or pedicure
33043000 1,796 All 10-25 2015
33049900 6,930 All 10-25 2015
3305 Hair preparations
33051000 7,120 All 10-25 2020
33059090 7,851 All 10-25 2015
3306 Oral and dental hygiene preparations
33061000 2,884 All 10-25 2020
3307 Personal toilet preparations shaving preparations, deodorants etc.
33072000 3,695 All 10-25 2015
3401 Soap; organic surface-active preparations for soap use
34011100 4,331 All 10-25 2020
34013000 1,689 All 10-25 2020
3402 Organic surface-active agents, washing and clean preparations, nes
34022090 19,893 All 10-25 2020
34029090 5,798 All 10-25 2020
3901-02 Polymers of ethylene, in primary forms
39011090 2,139 All 5-10 2021
39012090 6,119 EU28 and RW 5-10 2021
39021000 5,712 EU28 and RW 5-10 2021
3916 Monofilament with cross-section exceeding 1mm
39162010 5,908 EU28 and RW 5-10 2015
39162090 2,171 EU28 and RW 5-10 2015
39169090 1,542 EU28 and RW 5-10 2021
3919-3921 Plates, sheets, film, foil and strip, of plastics
39191019 1,527 All 5-10 2021
39201040 1,578 EU28 and RW 5-10 2021
39209990 2,091 EU28 and RW 5-10 2020
39219090 1,846 All 5-10 2020
3922 Baths, shower-baths, wash-basins, bidet etc of plastic
39229000 1,560 All 5-10 2015
3923 Plastic packing goods or closures stoppers, lids, caps, closures
39232990 1,537 All 5-10 2017
3924 Tableware, kitchenware, toiletry articles, of plastic
39241000 2,118 All 5-10 2015
39249090 2,495 All 5-10 2015
3925 Builders ware of plastics, nes
39259080 2,035 All 5-10 2015
4011 New pneumatic tires, of rubber
40111000 14,197 All 5-10 2018
4407-4411 Wood sawn, veneer sheets, particle board, fibreboard and similar board of wood or other ligneous materials
44071091 4,507 RW 10-25 2015
44071093 3,258 ECU and RW 10-25 2015
44071098 2,642 ECU and RW 10-25 2015
44101100 18,064 EU28 and RW 10-25 2015
44111300 3,096 All 10-25 2015
44111400 8,302 All 10-25 2015
44119200 2,145 All 10-25 2015
4418 Builders joinery and carpentry of wood
44182080 5,437 All 10-25 2021
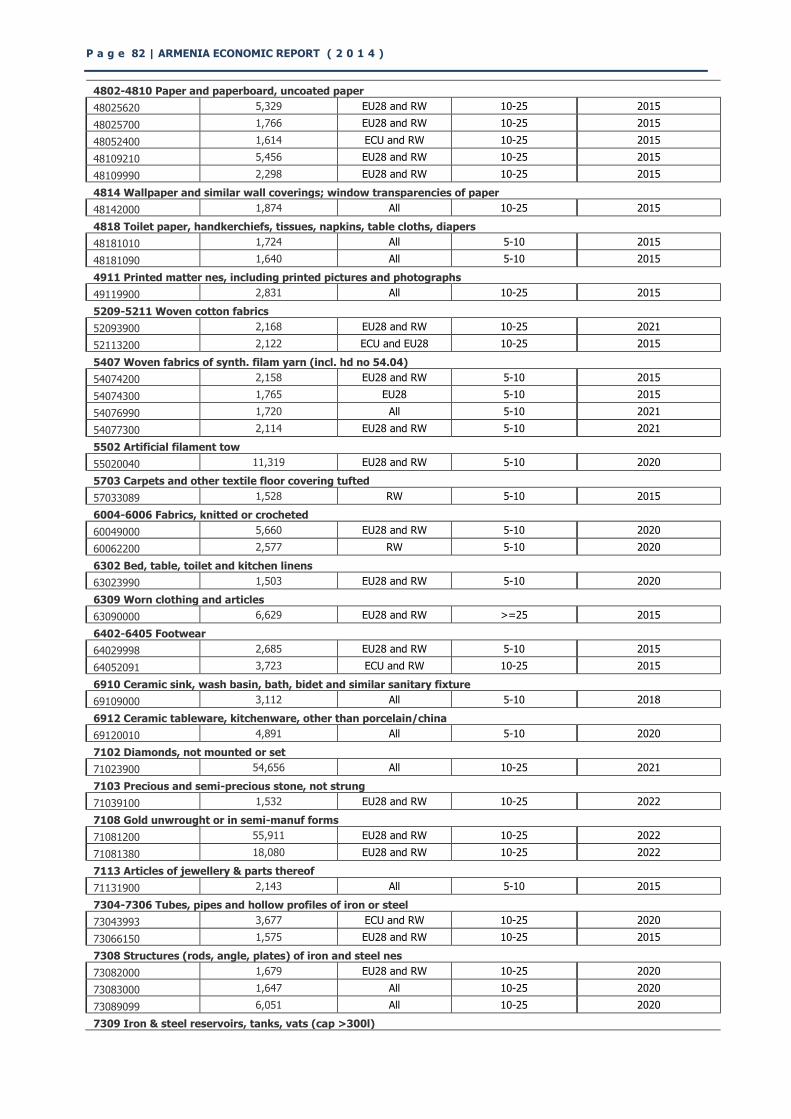
P a g e 82 | ARMENIA ECONOMIC REPORT ( 2 0 1 4 )
4802-4810 Paper and paperboard, uncoated paper
48025620 5,329 EU28 and RW 10-25 2015
48025700 1,766 EU28 and RW 10-25 2015
48052400 1,614 ECU and RW 10-25 2015
48109210 5,456 EU28 and RW 10-25 2015
48109990 2,298 EU28 and RW 10-25 2015
4814 Wallpaper and similar wall coverings; window transparencies of paper
48142000 1,874 All 10-25 2015
4818 Toilet paper, handkerchiefs, tissues, napkins, table cloths, diapers
48181010 1,724 All 5-10 2015
48181090 1,640 All 5-10 2015
4911 Printed matter nes, including printed pictures and photographs
49119900 2,831 All 10-25 2015
5209-5211 Woven cotton fabrics
52093900 2,168 EU28 and RW 10-25 2021
52113200 2,122 ECU and EU28 10-25 2015
5407 Woven fabrics of synth. filam yarn (incl. hd no 54.04)
54074200 2,158 EU28 and RW 5-10 2015
54074300 1,765 EU28 5-10 2015
54076990 1,720 All 5-10 2021
54077300 2,114 EU28 and RW 5-10 2021
5502 Artificial filament tow
55020040 11,319 EU28 and RW 5-10 2020
5703 Carpets and other textile floor covering tufted
57033089 1,528 RW 5-10 2015
6004-6006 Fabrics, knitted or crocheted
60049000 5,660 EU28 and RW 5-10 2020
60062200 2,577 RW 5-10 2020
6302 Bed, table, toilet and kitchen linens
63023990 1,503 EU28 and RW 5-10 2020
6309 Worn clothing and articles
63090000 6,629 EU28 and RW >=25 2015
6402-6405 Footwear
64029998 2,685 EU28 and RW 5-10 2015
64052091 3,723 ECU and RW 10-25 2015
6910 Ceramic sink, wash basin, bath, bidet and similar sanitary fixture
69109000 3,112 All 5-10 2018
6912 Ceramic tableware, kitchenware, other than porcelain/china
69120010 4,891 All 5-10 2020
7102 Diamonds, not mounted or set
71023900 54,656 All 10-25 2021
7103 Precious and semi-precious stone, not strung
71039100 1,532 EU28 and RW 10-25 2022
7108 Gold unwrought or in semi-manuf forms
71081200 55,911 EU28 and RW 10-25 2022
71081380 18,080 EU28 and RW 10-25 2022
7113 Articles of jewellery & parts thereof
71131900 2,143 All 5-10 2015
7304-7306 Tubes, pipes and hollow profiles of iron or steel
73043993 3,677 ECU and RW 10-25 2020
73066150 1,575 EU28 and RW 10-25 2015
7308 Structures (rods, angle, plates) of iron and steel nes
73082000 1,679 EU28 and RW 10-25 2020
73083000 1,647 All 10-25 2020
73089099 6,051 All 10-25 2020
7309 Iron & steel reservoirs, tanks, vats (cap >300l)
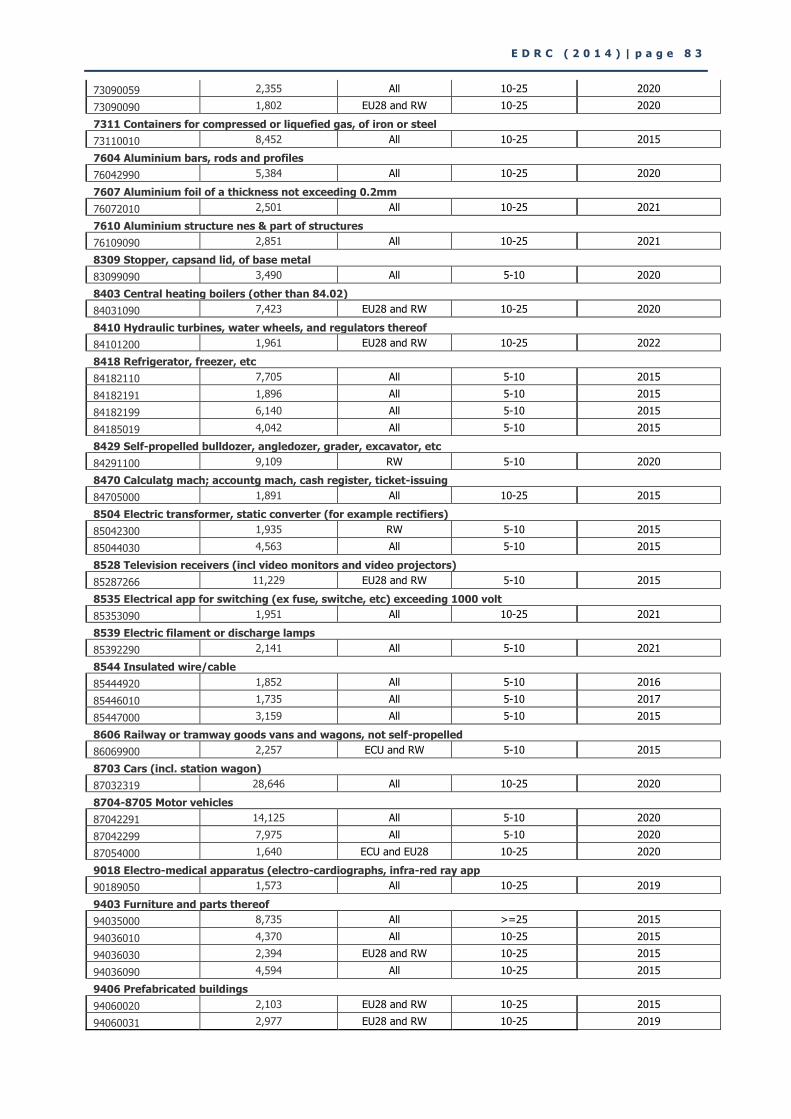
E D R C ( 2 0 1 4 ) | p a g e 8 3
73090059 2,355 All 10-25 2020
73090090 1,802 EU28 and RW 10-25 2020
7311 Containers for compressed or liquefied gas, of iron or steel
73110010 8,452 All 10-25 2015
7604 Aluminium bars, rods and profiles
76042990 5,384 All 10-25 2020
7607 Aluminium foil of a thickness not exceeding 0.2mm
76072010 2,501 All 10-25 2021
7610 Aluminium structure nes & part of structures
76109090 2,851 All 10-25 2021
8309 Stopper, capsand lid, of base metal
83099090 3,490 All 5-10 2020
8403 Central heating boilers (other than 84.02)
84031090 7,423 EU28 and RW 10-25 2020
8410 Hydraulic turbines, water wheels, and regulators thereof
84101200 1,961 EU28 and RW 10-25 2022
8418 Refrigerator, freezer, etc
84182110 7,705 All 5-10 2015
84182191 1,896 All 5-10 2015
84182199 6,140 All 5-10 2015
84185019 4,042 All 5-10 2015
8429 Self-propelled bulldozer, angledozer, grader, excavator, etc
84291100 9,109 RW 5-10 2020
8470 Calculatg mach; accountg mach, cash register, ticket-issuing
84705000 1,891 All 10-25 2015
8504 Electric transformer, static converter (for example rectifiers)
85042300 1,935 RW 5-10 2015
85044030 4,563 All 5-10 2015
8528 Television receivers (incl video monitors and video projectors)
85287266 11,229 EU28 and RW 5-10 2015
8535 Electrical app for switching (ex fuse, switche, etc) exceeding 1000 volt
85353090 1,951 All 10-25 2021
8539 Electric filament or discharge lamps
85392290 2,141 All 5-10 2021
8544 Insulated wire/cable
85444920 1,852 All 5-10 2016
85446010 1,735 All 5-10 2017
85447000 3,159 All 5-10 2015
8606 Railway or tramway goods vans and wagons, not self-propelled
86069900 2,257 ECU and RW 5-10 2015
8703 Cars (incl. station wagon)
87032319 28,646 All 10-25 2020
8704-8705 Motor vehicles
87042291 14,125 All 5-10 2020
87042299 7,975 All 5-10 2020
87054000 1,640 ECU and EU28 10-25 2020
9018 Electro-medical apparatus (electro-cardiographs, infra-red ray app
90189050 1,573 All 10-25 2019
9403 Furniture and parts thereof
94035000 8,735 All >=25 2015
94036010 4,370 All 10-25 2015
94036030 2,394 EU28 and RW 10-25 2015
94036090 4,594 All 10-25 2015
9406 Prefabricated buildings
94060020 2,103 EU28 and RW 10-25 2015
94060031 2,977 EU28 and RW 10-25 2019
P a g e 84 | ARMENIA ECONOMIC REPORT ( 2 0 1 4 )
LIST OF FIGURES Figure 1. Global Economic Growth in 1995-2013 .................................................................................................................... 11 Figure 2. Countries with highest contribution to the global economic growth ................................................................... 12 Figure 3. Shares of largest economies in global GDP and population, % ........................................................................... 12 Figure 4. Per capita GDP for several groups of countries, international dollar ................................................................... 13 Figure 5. Crude oil and Gold prices in international markets, 1980-2013 ........................................................................... 14 Figure 6. Wheat and Copper prices in international markets, 1980-2013 ........................................................................... 14 Figure 7. Price indices for major commodities, % .................................................................................................................. 14 Figure 8. Consumer price indices for several groups of countries, annual average, % .................................................... 15 Figure 9. GDP structure per main sectors in 2001, 2008 and 2013 ..................................................................................... 17 Figure 10. Exports and imports growth rates, 2004-2013, % ............................................................................................... 19 Figure 11. Current account balance, 2004-2013 ..................................................................................................................... 19 Figure 12. Inflows of non-trade remittances, 2008-2013 ...................................................................................................... 20 Figure 13. Gross savings, external public debt and Budget deficit, % of GDP ................................................................... 20 Figure 14. Main Fiscal indicators and GDP growth dynamics in 2008-2013, 2008=100% ................................................ 21 Figure 15. Exchange rate dynamics, 1995-2013 ..................................................................................................................... 23 Figure 16. Total Foreign and Direct Investments in Armenia ................................................................................................ 24 Figure 17. Total Foreign Investments from Russia and other countries .............................................................................. 24 Figure 18. Breakdown of Russian Investments in Armenia per major industries, USD mln ............................................. 24 Figure 19. Total foreign investment excluding investments from Russia ............................................................................ 25 Figure 20. Foreign investments in Armenia per major investing countries, excluding Russia, USD mln ........................ 25 Figure 21. Employment trends in Armenia in 2008-2013 ...................................................................................................... 27 Figure 22. Distribution of employment per salary level in 2012, % ..................................................................................... 29 Figure 23. Unemployment trends for 2008-2013 .................................................................................................................... 30 Figure 24. Unemployment in rural and urban areas in 2008-2013, % ................................................................................ 30 Figure 25. Unemployment in Marzes in 2008-2013, % .......................................................................................................... 31 Figure 26. Unemployment rate by gender in 2008-2013, % ................................................................................................. 31 Figure 27. Structure of unemployment by gender in 2008-2013, % ................................................................................... 32 Figure 28. Poverty and extreme poverty in Armenia, 2008-2012, % .................................................................................. 33 Figure 29. Poverty gap and severity indicators in Armenia, 2008-2012, % ........................................................................ 33 Figure 30. Poverty incidence in 2012 compared to 2008, % ................................................................................................ 35 Figure 31. Poverty trends per gender, % ................................................................................................................................ 36 Figure 32. Global Economic Growth Projections for 2014-2016, % ..................................................................................... 40 Figure 33. Institutional Structure of the EAEU ........................................................................................................................ 47 Figure 34. Foreign Trade of Armenia in 2008-2013, USD mln .............................................................................................. 51 Figure 35. Exports and Imports structure per groups of partner countries in 2013, % .................................................... 51 Figure 36. Armenian exports per groups of countries in 2008-2013 .................................................................................... 52 Figure 37. Imports to Armenia per groups of countries in 2008-2013 ................................................................................ 52 Figure 38. Foreign Trade of Armenia with EEU countries in 2013, % ................................................................................. 59 Figure 39. Overlaps in Imported Goods among Partner Countries ....................................................................................... 64 Figure 40. Shares of import items in total per expected intervals of tariff changes, % .................................................... 65
E D R C ( 2 0 1 4 ) | p a g e 8 5
LIST OF TABLES
Table 1. Economic growth for several groups of countries, % ............................................................................................. 10 Table 2. List of Top 20 Countries with the Highest and Lowest Economic Growth Rates in 2013 .................................. 11 Table 3. International price fluctuations for selected base metals, fuel and wheat, annual average growth rates, % 13 Table 4. Consumer price inflation for several groups of countries, annual average, % .................................................... 15 Table 5. Growth indices in aggregate sectors of the economy, % ....................................................................................... 16 Table 6. Economic growth in main sectors, 2009-2013, % ................................................................................................... 16 Table 7. GDP structure per expenditure components, % ...................................................................................................... 18 Table 8. GDP growth rate, expenditure components, % ....................................................................................................... 18 Table 9. External balance of payments, 2007-2013, % of GDP............................................................................................ 19 Table 10. State budget selected indicators, AMD bln ............................................................................................................. 21 Table 11. External public debt of Armenia, breakdown per donors, 2008-2013 ................................................................ 22 Table 12. Exchange rates of the Armenian dram against major currencies, AMD ............................................................. 22 Table 13. Consumer price trends in 2008-2013, % ................................................................................................................ 23 Table 14. Foreign investments per sectors, 2011-2013 ......................................................................................................... 25 Table 15. Labour force and selected indicators of the labour market, thousand persons ................................................ 26 Table 16. Structure of nominal GDP and employment in 2012 ............................................................................................. 28 Table 17. Average monthly salary per economic sectors and main types of economic activity in 2013 ......................... 28 Table 18. Average monthly salary per economic sectors and Marzes in 2013 ................................................................... 29 Table 19. Dynamics of Gini coefficient in 2008-2012, % ....................................................................................................... 34 Table 20. Breakdown of poverty and extreme poverty incidence in Armenia per community type, % .......................... 34 Table 21. Poverty incidence per Marzes, 2008-2012, % ....................................................................................................... 35 Table 22. Poverty incidence depending on the gender of the HH head, % ........................................................................ 36 Table 23. Child poverty, % ........................................................................................................................................................ 37 Table 24. Poverty depending on the number of children in a HH and their age groups, % ............................................ 37 Table 25. Poverty depending on the number of HH members, % ....................................................................................... 37 Table 26. Poverty incidence depending on the education level of the HH head, % .......................................................... 38 Table 27. Poverty depending on the number of working members in a HH, % ................................................................. 38 Table 28. Impact of social transfers on poverty incidence .................................................................................................... 38 Table 29. Projections of Global Economic Development Indicators in 2014-2016, % ....................................................... 39 Table 30. Economic Growth Projections in 2014-2016, % .................................................................................................... 40 Table 31. Comparisons of projections for the main macroeconomic indicators of Armenia, % ....................................... 41 Table 32. Government of Armenia projections of main macroeconomic indicators ........................................................... 42 Table 33. Distribution of Customs Duties Revenues ............................................................................................................... 49 Table 34. Breakdown of Armenian Imports per Bound Rates under WTO Commitments ................................................ 50 Table 35. Changes in Exports and Imports in 2008-2013, per groups of countries .......................................................... 51 Table 36. Armenian exports to the largest 20 partner countries, 2013 ............................................................................... 53 Table 37. Armenian imports from the largest 20 partner countries, 2013 .......................................................................... 54 Table 38. Armenian trade with Neighbours and countries from Other Regions, 2013 ...................................................... 55 Table 39. Export Items with value of more than USD 30 mln, 2013 ................................................................................... 55 Table 40. Major export items and importing countries in 2013, % ...................................................................................... 56 Table 41. Items with more than USD 30 mln imports in 2013 ............................................................................................. 57 Table 42. Shares of Trade with Some CIS and EEU Countries, 2013 .................................................................................. 58 Table 43. Share of CIS and EEU Countries in Total Trade of Armenia, 2013 ..................................................................... 58 Table 44. 10 largest items imported to Armenia from EEU countries .................................................................................. 59 Table 45. Largest 10 Items Exported from Armenia to EEU Countries ................................................................................ 59 Table 46. Trade Creation and Diversion Probabilities ............................................................................................................. 63 Table 47. Difference between EEU and Armenian average tariff rates ................................................................................ 66 Table 48. Imports and applicable tariff rates of Survival Minimum Expenditure Basket Items ........................................ 67 Table 49. List of Goods with High Risks of Price Increase and Reduction of Quality and Diversity ................................ 68 Table 50. Impact channels and Possible Consequences ........................................................................................................ 71
P a g e 86 | ARMENIA ECONOMIC REPORT ( 2 0 1 4 )
ABBREVIATIONS
AER Armenia economic report
ADB Asian Development Bank
AMD Armenian Dram
bln Billion
BM Budget Message of the GoA
CBA Central Bank of Armenia
CIS Commonwealth of Independent States
CNEEA Goods Nomenclature of the external-economic activity
DCFTA Deep and Comprehensive Free Trade Agreement
EAEC Eurasian Economic Commission
EAEU Eurasian Economic Union
EBRD European Bank for Reconstruction and Development
EDRC Economic Development and Research Center
EU European Union
FDI Foreign Direct Investment
FISIM Financial Intermediation Services Indirectly Measured
FTA Free Trade Agreement
GDP Gross Domestic Product
GIZ Deutsche Gesellschaft für Internationale Zusammenarbeit
GoA Government of Armenia
HH Household
IFAD International Fund of Agricultural Fund
IMF International Monetary Fund
ILCS of HHs Integrated Living Conditions Survey of Households
MFN Most Favoured Nation
mln Million
MoF Ministry of Finance of the RA
MTEF Medium Term Expenditures Framework of the GoA
NSS National Statistical Service of the RA
OECD Organisation for Economic Co-operation and Development
OPEC Organization of the Petroleum Exporting Countries
PDSP Perspective Development Strategic Program
RA Republic of Armenia
RF Russian Federation
RW Rest of the World
TBT Technical Barriers to Trade
UK United Kingdom
UN United Nations
USA United States of America
USD US Dollar
WB World Bank
WEO World Economic Outlook
WTO World Trade Organization