eurasian journal of economics and finance
TRANSCRIPT
Eurasian Journal of Economics and Finance, 5(2), 2017, 141-154
DOI: 10.15604/ejef.2017.05.02.10
EURASIAN JOURNAL OF ECONOMICS AND FINANCE
www.eurasianpublications.com
EVALUATION OF THE TRADE RELATIONSHIP BETWEEN VIETNAM AND
CHINA; VIETNAM AND UNITED STATES: A COMPARISON USING GRAVITY
MODEL
Lien Thi Dinh Banking University of Ho Chi Minh city, Vietnam. Email: [email protected]
Abstract This study aims to evaluate the determinants of trade relationship between two largest trading partners of Vietnam, United States and China. Using gravity model for time series data from 1986 to 2015, the study found that economic growth rate plays a crucial role in stimulating the trade flow. Both trade relationships fit with the practical approach of Heckscher-Ohlin theory, stating that trade flow increases between countries with different income levels. The most important finding of this study lines on the results regarding the impact of trade agreements. While United States-Vietnam bilateral agreement creates trade, the trade agreement between ASEAN and China produced trade diversion. As China expands its markets among ASEAN countries, Vietnam should diversify its export markets to improve its export flow. Key words: Trade Relationship, Gravity Model, Trade Agreement
1. Introduction Vietnam has recently witnessed a significant increase in economic growth rate which peaked about 7% in 2015 as a result of rapid development in the international trade with some large partners including United States (US) and China. The need to understand the determining factors of bilateral trade volumes of Vietnam and two largest trading partners China and the US urges the complementation of this study. Another stimulation is that analyzing the trade performance of Vietnam toward these two trading partners helps to promote further development of bilateral trade. To conduct this type of research, literature often employscross-section data to measure a country’s trade volumes and determining factors with its all trading partners in a specific year. Although those research can cover a range of trading partners, they could not take into account each partner’s unique characteristics, hindering the solutions for each market separately. Therefore, this study will use time series data and focus on two specific trade partners of Vietnam to produce historical relationship background; specific determining factors which make this study more significant.
Vietnam benefits from their geographical characters with long sea coastline, large population and is the entrance gate assessing to Laos, Thailand, and Cambodia through the sea. Its sea coastline is 3,260 km, in the S-lettershape which enhances the international trade through sea transport. Vietnam ranked 14th most populous country in the world with 90.5 million people in the year 2014 (WorldBank, 2016), most of them belong to the working age group. This advantage creates the cheap labor market and a large consuming market which attract many foreign investors. Vietnam borders with China in the north, with Laos in the northwest, Cambodia in the
L. T. Dinh / Eurasian Journal of Economics and Finance, 5(2), 2017, 141-154
142
southwest. Laos, Thailand, and Cambodia are all landlocked countries, so most of their cargos transported through Vietnam’s sea, enforcing both sea and road transport for Vietnam.
Vietnam experiences high economic growth rate due to its successful integration into the world market. Vietnam built adiplomatic relationship with 172 countries by 2007 and became the member of World Trade Organization in 2007. It is also a member of United Nations, Association of South East Asian Nations including ten countries (ASEAN). It soon reformed the economy since 1986 with the Renovation scheme, changing the country from planned economy to socialist-market-oriented economy. Also, the export-oriented strategy has been an engine of economic growth for Vietnam. Among active trading partners, China and United States are two largest ones.
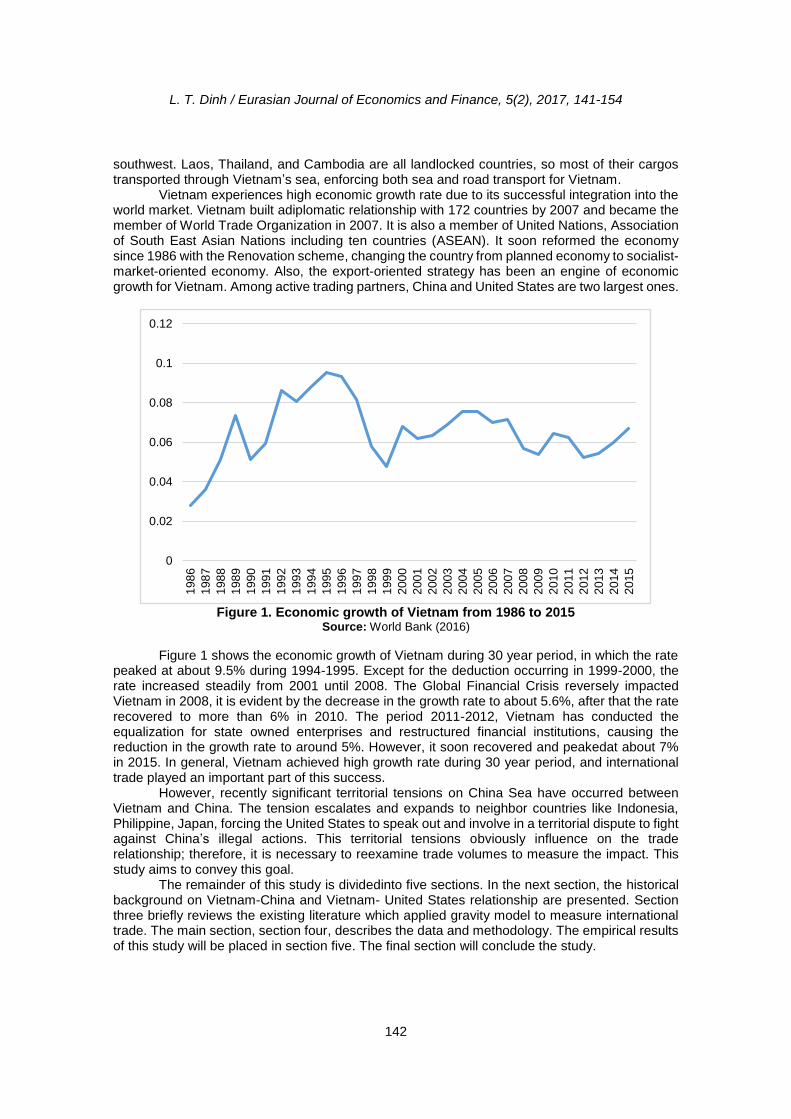
Figure 1. Economic growth of Vietnam from 1986 to 2015
Source: World Bank (2016)
Figure 1 shows the economic growth of Vietnam during 30 year period, in which the rate peaked at about 9.5% during 1994-1995. Except for the deduction occurring in 1999-2000, the rate increased steadily from 2001 until 2008. The Global Financial Crisis reversely impacted Vietnam in 2008, it is evident by the decrease in the growth rate to about 5.6%, after that the rate recovered to more than 6% in 2010. The period 2011-2012, Vietnam has conducted the equalization for state owned enterprises and restructured financial institutions, causing the reduction in the growth rate to around 5%. However, it soon recovered and peakedat about 7% in 2015. In general, Vietnam achieved high growth rate during 30 year period, and international trade played an important part of this success.
However, recently significant territorial tensions on China Sea have occurred between Vietnam and China. The tension escalates and expands to neighbor countries like Indonesia, Philippine, Japan, forcing the United States to speak out and involve in a territorial dispute to fight against China’s illegal actions. This territorial tensions obviously influence on the trade relationship; therefore, it is necessary to reexamine trade volumes to measure the impact. This study aims to convey this goal.
The remainder of this study is dividedinto five sections. In the next section, the historical background on Vietnam-China and Vietnam- United States relationship are presented. Section three briefly reviews the existing literature which applied gravity model to measure international trade. The main section, section four, describes the data and methodology. The empirical results of this study will be placed in section five. The final section will conclude the study.
0
0.02
0.04
0.06
0.08
0.1
0.12
198
6
198
7
198
8
198
9
199
0
199
1
199
2
199
3
199
4
199
5
199
6
199
7
199
8
199
9
200
0
200
1
200
2
200
3
200
4
200
5
200
6
200
7
200
8
200
9
201
0
201
1
201
2
201
3
201
4
201
5
L. T. Dinh / Eurasian Journal of Economics and Finance, 5(2), 2017, 141-154
143
2. Historical Background about Vietnam and China, Vietnam and US Relationship 2.1. Vietnam and China Vietnam shares many common ideologies regarding culture and political policies with China because not only China is a neighbor but also Vietnam had gone through many border fights and went under China rules for one thousand years before the 1670s. Vietnam celebrates similar Lunar New Year, Midterm Autumn Festival and follows similar custom, a religious belief such as remaining an extended family with several generations, respecting senior citizens, Buddhism as main religion, and ancient worship. Like China, Vietnam applies communist and socialist regime, prioritizing state owned enterprises, and planned economy.
Both countries went through different tastes in a diplomatic relationship. Before Vietnam War, China triggered many border fights under Tong, Minh, Nguyen, Thanh dynasties. Nevertheless, during Vietnam War from 1954-1965, China provided significant military support for Vietnam to fight against America who intended to eliminate communist regime in the region. However, when Vietnam War ended, China again implemented some border fights and conducted several occupations such as it occupied Hoang Sa island in 1974, conducted a border war in 1979, occupied some parts of Truong Sa island in 1988 and recently China illegally occupies China Sea area that belongs to Vietnam (Vu, 2013). This action is against the United Nations Convention on the Law of the Sea 1982 and attracted opposition from regional countries like Philippine, Japan, Indonesia, and Vietnam.
It appears that China and Vietnam successfully build the trade relationship; as a result, China shares a significant proportion of foreign investment in Vietnam as well as it becomes one of the important trading partners. Vietnam announced its independence from the American War in 1975 and reunited the north and the south under the communist and socialist regime. Accompanied the economic reform to reinforce its economy, Vietnam issued the Law on Foreign Investment in 1987, paving the way for foreign direct investment. China started their investment from 1991; it went through two stages of investment. From 1991-2001, China explored the opportunities and established limited investments. However, when China joined the WTO in 2001, it expanded its investment network rapidly, so the second stage from 2002-present sees the significant increase in investment in Vietnam. Their main sectors of investments are resource exploration, real estate, agricultural production and labor intensive manufacture which were presented in a research of the Institution of Chinese Studies (ICS) in 2014. For instance, total investment values were 312 million USD in 2013 and rapidly rose to 3.2 billion USD in 2014 (ICS, 2014). With respect to trade relationship, Vietnam always remains deficit with China which appears to be larger over the period. Moreover, the local producers heavily depend on cheap materials imported from China significantly. Although cheap materials improve the competitiveness of export, it is risky for Vietnam to be dependable on one major source regarding the existing territorial tensions.
Conducting greater and increased investment in Vietnam, Chinese investors would like to exploit the benefits from Vietnam trade agreements with other countries. Vietnam is a member of Association of South East Asian Nations (ASEAN), EU Free Trade Agreement (EVFTA) (ICS, 2014). It has recently been negotiating to join the Trans- PacificPartnership among eleven countries. Therefore, Vietnamese producers benefit from preferred tax scheme and other support from members in relation to those trade agreements and associations.
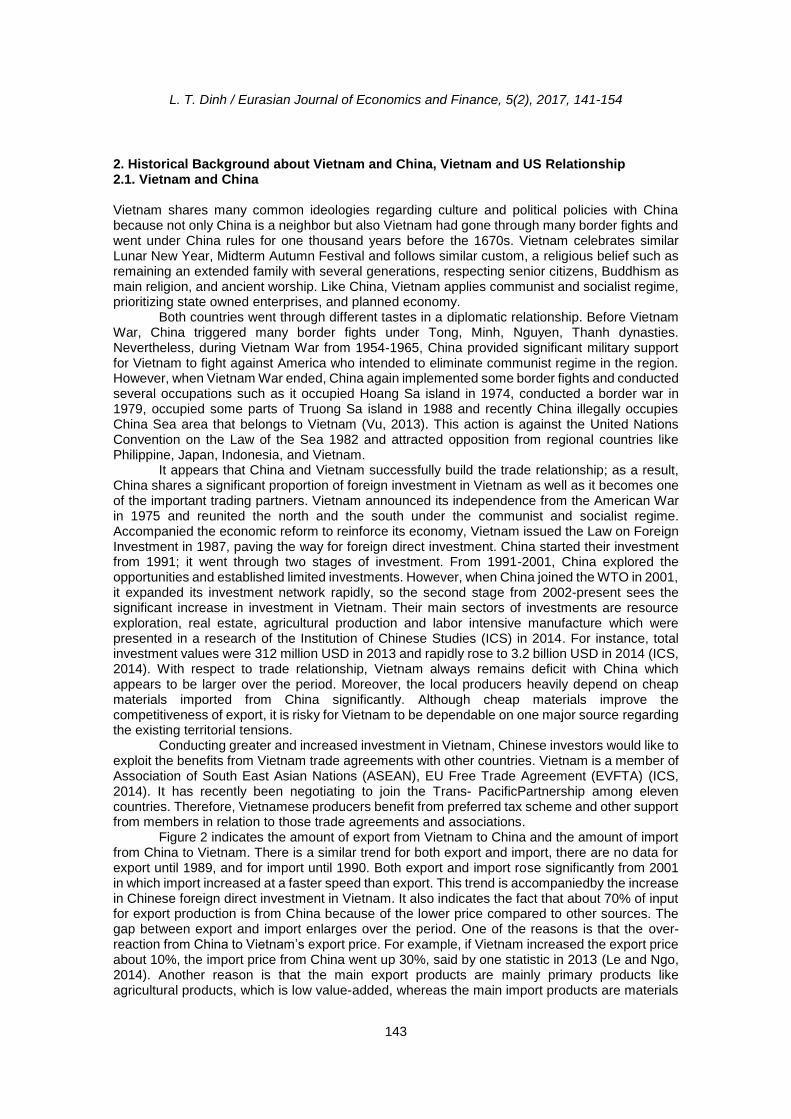
Figure 2 indicates the amount of export from Vietnam to China and the amount of import from China to Vietnam. There is a similar trend for both export and import, there are no data for export until 1989, and for import until 1990. Both export and import rose significantly from 2001 in which import increased at a faster speed than export. This trend is accompaniedby the increase in Chinese foreign direct investment in Vietnam. It also indicates the fact that about 70% of input for export production is from China because of the lower price compared to other sources. The gap between export and import enlarges over the period. One of the reasons is that the over-reaction from China to Vietnam’s export price. For example, if Vietnam increased the export price about 10%, the import price from China went up 30%, said by one statistic in 2013 (Le and Ngo, 2014). Another reason is that the main export products are mainly primary products like agricultural products, which is low value-added, whereas the main import products are materials
L. T. Dinh / Eurasian Journal of Economics and Finance, 5(2), 2017, 141-154
144
for shoe production, and garment production which accounts for higher value-added than exports. Besides, Vietnam imports electronic products, computers, and metals from China. Still, China is one of the largest trading partners, with the peak trade volume reached 19% of the whole country’s trade in 2013 (Le and Ngo, 2014).
Figure 2. Export and Import between Vietnam and China
Source: World Bank (2016)
2.2. Vietnam and US Like China, US had gone through different roles toward Vietnam. America was directly involved in the Vietnam War from 1955-1975to eliminate the communist regime, causing lots of causality for people and destroyed economy. America enacted the economic embargo after the war until 1994;creating severe restrictions in bilateral relationship (Trang, 2015). When America normalized the diplomatic relationship with Vietnam in 1994, this relationship stepped to a new stage. One big success is marked by the Bilateral Trade Agreement in 2001.This Agreement brought huge investment flows into Vietnam, contributing to economic growth.
America plays an active and dominant role in solving the territorial tensions between China with some related Asian countries including Vietnam regarding China Sea. Recently, when China illegally occupied the China Sea area that belonged to Vietnam, and it escalates by placing their oil drilling-platform in 2010 and building army bases, America spoke out to require China to respect the Law of the Sea 1982. Moreover, Vietnam becomes a close center region in the US re-balance strategy because of its geographical characters and continuous high economic growth, a member of ASEAN, on negotiating stage for TPP, according to Danny Russel, Support Foreign Affairs of America about Asia-Pacific issue(Nguyen, 2015).Therefore, it appears that Vietnam gets closer to America due to the existing situation. In general, the tri-relationship among China, Vietnam, and America steps to another milestone.
The trade relationship between US and Vietnam developed well after the embargo ended in 1994 with the establishment of several important agreements. Specifically, foreign affairs between Vietnam and America was established in 1995, the Bilateral Trade Agreement was signed in 2001. The trade agreement on garment and textile was signed in 2003, airport cooperation agreement was successful in 2003, and electronic visa approval for textile and garment products imported into America was achieved (Ministry of Foreign Affairs, 2015). America soon becomes one of the largest import partnersin Vietnam. For example, it ranked the 9th largest import partner in 1994, increased one level to 8th in 1995, and two levels to 6th in 2000 and the total export to America accounted for 20% in 2004 (Ministry of Foreign Affairs, 2015).
L. T. Dinh / Eurasian Journal of Economics and Finance, 5(2), 2017, 141-154
145
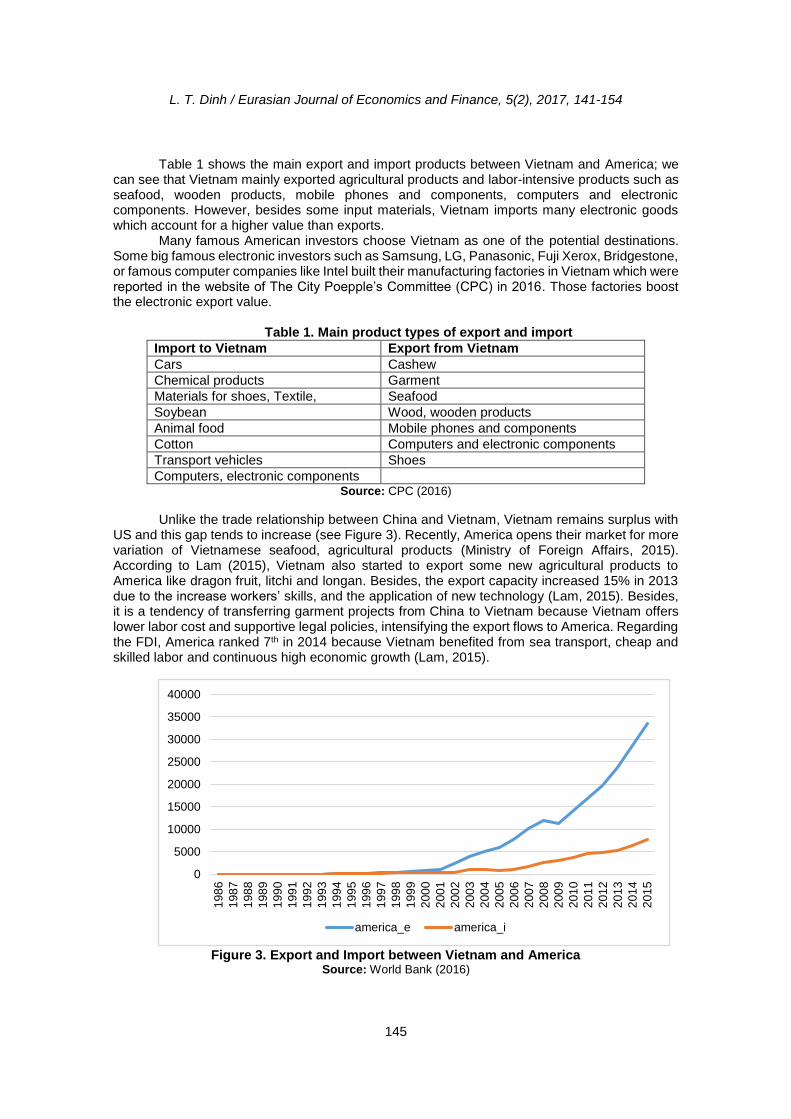
Table 1 shows the main export and import products between Vietnam and America; we can see that Vietnam mainly exported agricultural products and labor-intensive products such as seafood, wooden products, mobile phones and components, computers and electronic components. However, besides some input materials, Vietnam imports many electronic goods which account for a higher value than exports.
Many famous American investors choose Vietnam as one of the potential destinations. Some big famous electronic investors such as Samsung, LG, Panasonic, Fuji Xerox, Bridgestone, or famous computer companies like Intel built their manufacturing factories in Vietnam which were reported in the website of The City Poepple’s Committee (CPC) in 2016. Those factories boost the electronic export value.
Table 1. Main product types of export and import
Import to Vietnam Export from Vietnam
Cars Cashew
Chemical products Garment
Materials for shoes, Textile, Seafood
Soybean Wood, wooden products
Animal food Mobile phones and components
Cotton Computers and electronic components
Transport vehicles Shoes
Computers, electronic components Source: CPC (2016)
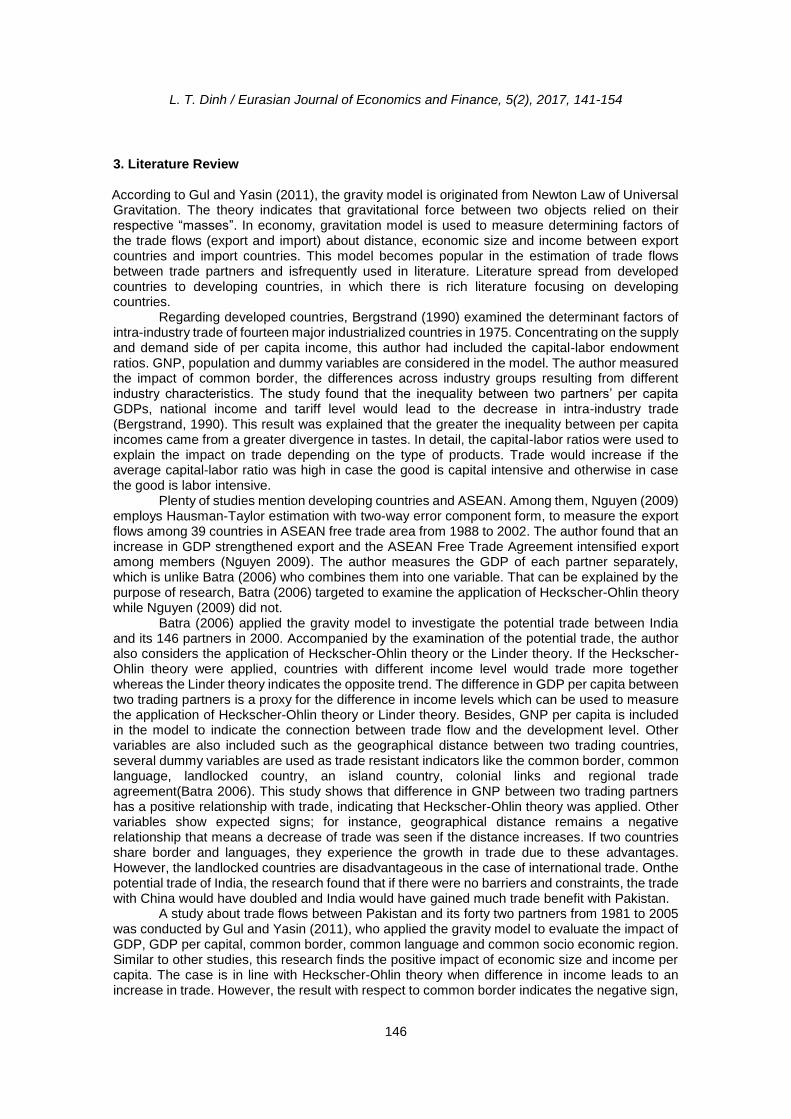
Unlike the trade relationship between China and Vietnam, Vietnam remains surplus with US and this gap tends to increase (see Figure 3). Recently, America opens their market for more variation of Vietnamese seafood, agricultural products (Ministry of Foreign Affairs, 2015). According to Lam (2015), Vietnam also started to export some new agricultural products to America like dragon fruit, litchi and longan. Besides, the export capacity increased 15% in 2013 due to the increase workers’ skills, and the application of new technology (Lam, 2015). Besides, it is a tendency of transferring garment projects from China to Vietnam because Vietnam offers lower labor cost and supportive legal policies, intensifying the export flows to America. Regarding the FDI, America ranked 7th in 2014 because Vietnam benefited from sea transport, cheap and skilled labor and continuous high economic growth (Lam, 2015).
Figure 3. Export and Import between Vietnam and America
Source: World Bank (2016)
0
5000
10000
15000
20000
25000
30000
35000
40000
198
6
198
7
198
8
198
9
199
0
199
1
199
2
199
3
199
4
199
5
199
6
199
7
199
8
199
9
200
0
200
1
200
2
200
3
200
4
200
5
200
6
200
7
200
8
200
9
201
0
201
1
201
2
201
3
201
4
201
5
america_e america_i
L. T. Dinh / Eurasian Journal of Economics and Finance, 5(2), 2017, 141-154
146
3. Literature Review According to Gul and Yasin (2011), the gravity model is originated from Newton Law of Universal Gravitation. The theory indicates that gravitational force between two objects relied on their respective “masses”. In economy, gravitation model is used to measure determining factors of the trade flows (export and import) about distance, economic size and income between export countries and import countries. This model becomes popular in the estimation of trade flows between trade partners and isfrequently used in literature. Literature spread from developed countries to developing countries, in which there is rich literature focusing on developing countries.
Regarding developed countries, Bergstrand (1990) examined the determinant factors of intra-industry trade of fourteen major industrialized countries in 1975. Concentrating on the supply and demand side of per capita income, this author had included the capital-labor endowment ratios. GNP, population and dummy variables are considered in the model. The author measured the impact of common border, the differences across industry groups resulting from different industry characteristics. The study found that the inequality between two partners’ per capita GDPs, national income and tariff level would lead to the decrease in intra-industry trade (Bergstrand, 1990). This result was explained that the greater the inequality between per capita incomes came from a greater divergence in tastes. In detail, the capital-labor ratios were used to explain the impact on trade depending on the type of products. Trade would increase if the average capital-labor ratio was high in case the good is capital intensive and otherwise in case the good is labor intensive.
Plenty of studies mention developing countries and ASEAN. Among them, Nguyen (2009) employs Hausman-Taylor estimation with two-way error component form, to measure the export flows among 39 countries in ASEAN free trade area from 1988 to 2002. The author found that an increase in GDP strengthened export and the ASEAN Free Trade Agreement intensified export among members (Nguyen 2009). The author measures the GDP of each partner separately, which is unlike Batra (2006) who combines them into one variable. That can be explained by the purpose of research, Batra (2006) targeted to examine the application of Heckscher-Ohlin theory while Nguyen (2009) did not.
Batra (2006) applied the gravity model to investigate the potential trade between India and its 146 partners in 2000. Accompanied by the examination of the potential trade, the author also considers the application of Heckscher-Ohlin theory or the Linder theory. If the Heckscher-Ohlin theory were applied, countries with different income level would trade more together whereas the Linder theory indicates the opposite trend. The difference in GDP per capita between two trading partners is a proxy for the difference in income levels which can be used to measure the application of Heckscher-Ohlin theory or Linder theory. Besides, GNP per capita is included in the model to indicate the connection between trade flow and the development level. Other variables are also included such as the geographical distance between two trading countries, several dummy variables are used as trade resistant indicators like the common border, common language, landlocked country, an island country, colonial links and regional trade agreement(Batra 2006). This study shows that difference in GNP between two trading partners has a positive relationship with trade, indicating that Heckscher-Ohlin theory was applied. Other variables show expected signs; for instance, geographical distance remains a negative relationship that means a decrease of trade was seen if the distance increases. If two countries share border and languages, they experience the growth in trade due to these advantages. However, the landlocked countries are disadvantageous in the case of international trade. Onthe potential trade of India, the research found that if there were no barriers and constraints, the trade with China would have doubled and India would have gained much trade benefit with Pakistan.
A study about trade flows between Pakistan and its forty two partners from 1981 to 2005 was conducted by Gul and Yasin (2011), who applied the gravity model to evaluate the impact of GDP, GDP per capital, common border, common language and common socio economic region. Similar to other studies, this research finds the positive impact of economic size and income per capita. The case is in line with Heckscher-Ohlin theory when difference in income leads to an increase in trade. However, the result with respect to common border indicates the negative sign,
L. T. Dinh / Eurasian Journal of Economics and Finance, 5(2), 2017, 141-154
147
which was opposite with other studies. In particular, Pakistan traded with neighbor countries 78% less than expected. This finding results from “the trade restriction policies with India, underground and unrecorded trade with Iran” (Gul and Yasin, 2011, p. 37), two countries have common borders. As a result, trading with the South Asian Association for Regional Cooperation (SAARC) was 17% lower than trading with the rest of the world, due to political tensions and conflicts in the region in which Pakistan, India were two major partners. Trading with countries belong to ECO (Economic Cooperation Organization) is similar, less than expected. From the result, these authors suggested that Pakistan should reduce the trade barriers, improve transport and infrastructure network, improve the quality of export and concentrate more on trading with ASEAN and Middle East where Pakistan can benefit from highly potential trade expansion.
Also study about Pakistan trade relationship by Abbas and Waheed (2015) examined the determining factors of Pakistan’s export flows to 40 trading countries from 1991 to 2011, using the gravity model. They explained the reason for using the log-linear model to solve the problem of heteroscedasticity and serial correlation. Similar to previous research, they found a positive relationship between export and supply capacity and partner countries’ demand whereas distance indicates the negative impact. It is surprising that they found the insignificant impact of dummy variable represented the free trade agreement which was expected to be a positive and significant influence on trade (Abbas and Waheed, 2015). Unlike previous studies, this research took into account the impact of relative price level which was calculated by the nominal exchange rate and the ratio between domestic price index and partner’s price index. The result shows that if domestic currency devalued, export would increase. Instead of using GDP per capita, Abbas and Waheed (2015) applied the variable of the population which represented the market size and the labor supply capacity. The result shows a positive impact of population on export which proved the fact that large population stimulates export due to its readiness of labor supply. As expected, common language contributes to an increase in export flow. However, unlike other studies, they found the surprise result that common border is a resistant factor for export. According to Gul and Yasin (2011), only India and Iran share a border with Pakistan. The negative impact of common border was due to the some trade constraints among those nations. Abbas and Waheed (2015) also calculated the ratio among potential trade using the gravity model and the actual trade to find out the potential partner. Among Pakistan’s partner countries, Europe became the most potential trade partner.
Taguchi (2013) did a research to compare Thailand’s trade integration with Mekong region and advanced ASEAN, China, India, Japan and USA. The author used the gravity model for the panel data from the 1980s to the 2000s. The finding shows that although trading with Mekong region increases significantly during the period, the trading volume was lower than with advanced ASEAN. The reason came from the higher cost of service-links of the remoted production blocks in Mekong region, hindering Thailand’s trade expansion. Still a success of the Greater Mekong Sub-region agreement signed in 1992 boosted the steady increase in trading flow and infrastructure improvement in the region.
Similar to Batra (2006), Xuegang (2008) applied the gravity model to evaluate the determining factors of bilateral trade volumes of Xijang, a northwest region of China with its trade partners. The author used cross section data in 2004 and found the result which is similar to Batra (2006). GDP and GDP per capita indicate the positive relationship with trade, while distance becomes a constraint for international trade(Xuegang, 2008). From the result, the author concluded that Xijanghad cooperated successfully with all its trade partners in which the relationship between Xijang with West Asia is a bit slower compared to other partners.
Working on the whole Chinese situation, Abraham and Hove (2005) did a study to identify which trade agreement China should participate and applied a gravity equation for 23 Asia-Pacific countries between 1992 and 2000. These authors found that GDP growth of import countries and export countries (separately examined) create a positive impact on export flows, whereas both distance (absolute value) variable and the scaled distance (used as weight ratio) variable shows the negative impact on export. Common language and population size contribute to the increase in trade. However, unlike Abbas and Waheed (2015), Abraham and Hove (2005) found insignificant impact of exchange rate variable. Surprisingly, joining ASEAN and APEC did not much contribute to the export flow for the region, whereas the export flow mainly depends on
L. T. Dinh / Eurasian Journal of Economics and Finance, 5(2), 2017, 141-154
148
growth, trade barriers and common languages. China is called a “world’s factory” (Abraham and Hove, 2005, p. 489) because it imports the majority of input components and export final consumption products to the world market. China’s main trading partners are located in the Asia-Pacific region, approximately 80% of export went to neighbor countries in 2000, 71% of imports from the region. China’s main importers of its consumer goods were less-developed Asian countries, and its main exporters of capital goods were from more advanced Asian economies. There was no evidence for the trade creation as the result of joining ASEAN as well as APEC. The export potential from ASEAN countries to China was expected to increase as the ratio between predicted value and actual value is greater than 10 times. As a result, the author found that joining RTA with ASEAN will bring the large mutual benefits for China and the region rather than joining RTA with APEC or Asian APEC.
Huo and Kakinaka (2007) evaluated Cambodia’s bilateral trade flows with its twenty trading partners from 2000 to 2004, this period marks the milestone of Cambodia’s participation into ASEAN Free Trade Area. As usual, these authors applied the gravity model which evaluated the impact of GDP, GDP per capita and distance on bilateral trade. As they used the augmented model, they added the variable for exchange rate, and one new variable not occurred previously is trade conformity index. The reason to consider the trade conformity index is to measure trade complementarities between Cambodia and its partners (Huo and Kakinaka, 2007). All the estimated coefficients indicated the expected signs. The findings show that trade complementarities or factor endowment difference significantly enforces bilateral trade. Both GDP and GDP per capita indicate the positive impact on trade in which GDP presents a stronger influence than GDP per capita. Regarding the geographical distance variable, longer distance will hinder bilateral trade as the transportation cost increases. Cambodia exported the majority of agricultural products, which was believed to cost more for transportation due to the weight, size and damage risk if those products were on the way for a long time. Unlike Abraham and Hove (2005) but similar to Abbas and Waheed (2015), Huo and Kakinaka (2007) find the negative impact of exchange rate volatility on trade. They explained that the exchange rate volatility may create trade discouraging risk and uncertainty of potential profit. From this result, they suggested that a reduction on exchange rate risk may occur if the global transactions of multinational firms increase. The finding about ASEAN participation is opposite with the result of Abraham and Hove (2005). These authors found that being ASEAN members, their bilateral trade would increase. When these authors calculated the potential trade of Cambodia, they found that trade barriers are believed to exist between Cambodia and its four trading partners such as Spain, Japan, Italy, and Malaysia.
Only two researches mention the trade relationship in Vietnamese context. Firstly, according to To and Lee (2015), who did the research about Vietnam economic policies, Vietnam implemented a deeper trade liberalization by reducing administrative and technical barriers to trade, cutting off tariffs, the transport and trade margins, and attracting more foreign direct investment. As a result, it is expected that total trade volume will increase significantly(To and Lee, 2015).
Secondly, Nguyen (2010) applied the gravity model in both static and dynamic form for a panel data to measure the impact factors of Vietnam’s export flows with its fourteen trade partners. Trading countries' income had positively impacted in Vietnam’s export flows (Nguyen 2010).Therefore, due to the few number of researches and the significant economic growth as a result of trade development, the research about determinants of international trade among important trading partners like US and China, in the context of the growth of foreign trade, will be a high interest for us.
Although conducting the research about the impact of economic transition on economic freedom in Poland, Stepniak-Kucharska (2015) finds the positive relationship between trade and economic growth indirectly like some of above studies. This author used the chain-linked Economic Freedom Index by the Fraser Institute and Index of Economic Freedom of the Heritage Foundation and the Wall Street Journal. The author argues that due to the world integration at a higher extent, Poland experienced a higher degree of economic freedom index (Stepniak-Kucharska, 2015). One in three dimensions of economic freedom index is economics.
L. T. Dinh / Eurasian Journal of Economics and Finance, 5(2), 2017, 141-154
149
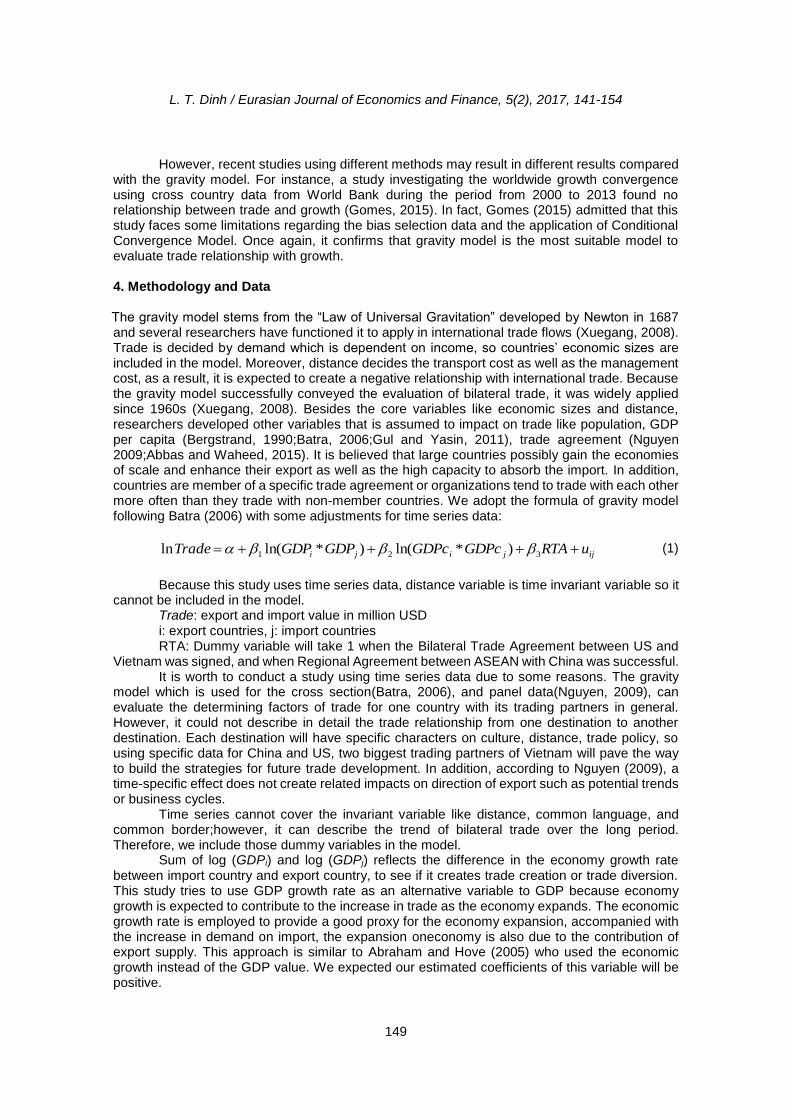
However, recent studies using different methods may result in different results compared with the gravity model. For instance, a study investigating the worldwide growth convergence using cross country data from World Bank during the period from 2000 to 2013 found no relationship between trade and growth (Gomes, 2015). In fact, Gomes (2015) admitted that this study faces some limitations regarding the bias selection data and the application of Conditional Convergence Model. Once again, it confirms that gravity model is the most suitable model to evaluate trade relationship with growth. 4. Methodology and Data The gravity model stems from the “Law of Universal Gravitation” developed by Newton in 1687 and several researchers have functioned it to apply in international trade flows (Xuegang, 2008). Trade is decided by demand which is dependent on income, so countries’ economic sizes are included in the model. Moreover, distance decides the transport cost as well as the management cost, as a result, it is expected to create a negative relationship with international trade. Because the gravity model successfully conveyed the evaluation of bilateral trade, it was widely applied since 1960s (Xuegang, 2008). Besides the core variables like economic sizes and distance, researchers developed other variables that is assumed to impact on trade like population, GDP per capita (Bergstrand, 1990;Batra, 2006;Gul and Yasin, 2011), trade agreement (Nguyen 2009;Abbas and Waheed, 2015). It is believed that large countries possibly gain the economies of scale and enhance their export as well as the high capacity to absorb the import. In addition, countries are member of a specific trade agreement or organizations tend to trade with each other more often than they trade with non-member countries. We adopt the formula of gravity model following Batra (2006) with some adjustments for time series data:
ijjiji uRTAGDPcGDPcGDPGDPTrade 321 )*ln()*ln(ln
(1)
Because this study uses time series data, distance variable is time invariant variable so it
cannot be included in the model. Trade: export and import value in million USD i: export countries, j: import countries RTA: Dummy variable will take 1 when the Bilateral Trade Agreement between US and
Vietnam was signed, and when Regional Agreement between ASEAN with China was successful. It is worth to conduct a study using time series data due to some reasons. The gravity
model which is used for the cross section(Batra, 2006), and panel data(Nguyen, 2009), can evaluate the determining factors of trade for one country with its trading partners in general. However, it could not describe in detail the trade relationship from one destination to another destination. Each destination will have specific characters on culture, distance, trade policy, so using specific data for China and US, two biggest trading partners of Vietnam will pave the way to build the strategies for future trade development. In addition, according to Nguyen (2009), a time-specific effect does not create related impacts on direction of export such as potential trends or business cycles.
Time series cannot cover the invariant variable like distance, common language, and common border;however, it can describe the trend of bilateral trade over the long period. Therefore, we include those dummy variables in the model.
Sum of log (GDPi) and log (GDPj) reflects the difference in the economy growth rate between import country and export country, to see if it creates trade creation or trade diversion. This study tries to use GDP growth rate as an alternative variable to GDP because economy growth is expected to contribute to the increase in trade as the economy expands. The economic growth rate is employed to provide a good proxy for the economy expansion, accompanied with the increase in demand on import, the expansion oneconomy is also due to the contribution of export supply. This approach is similar to Abraham and Hove (2005) who used the economic growth instead of the GDP value. We expected our estimated coefficients of this variable will be positive.
L. T. Dinh / Eurasian Journal of Economics and Finance, 5(2), 2017, 141-154
150
Similar to Batra (2006), this study will examine the trade relationship between Vietnam and China and Vietnam and US to see if it follows Heckscher-Ohlin theory which indicates the differences in income level between two trading partners will lead to an increase in trade. Otherwise the Linder theory will apply. Sum of log of GDP per capita is used as a proxy for the difference in income level. GDP per capita is used as a proxy for the level of economic development, itis expected that the higher the income per capita the higher demand for import.
The dummy variable for Bilateral Trade Agreement with USand for ASEAN agreement with China is applied. It is assumed that this dummy will be positive and statistically significant, which can be argued that members of the trade agreement intensify their trade after the trade agreement came into effect, that means trade creation happens as a result of this agreement.
uij : log-normally distributed error term, including other unexpected errors influencing on trade. The disturbance term log (uij) is assumed to be iid with zero mean E(log(uij))=0 and a constant variance.
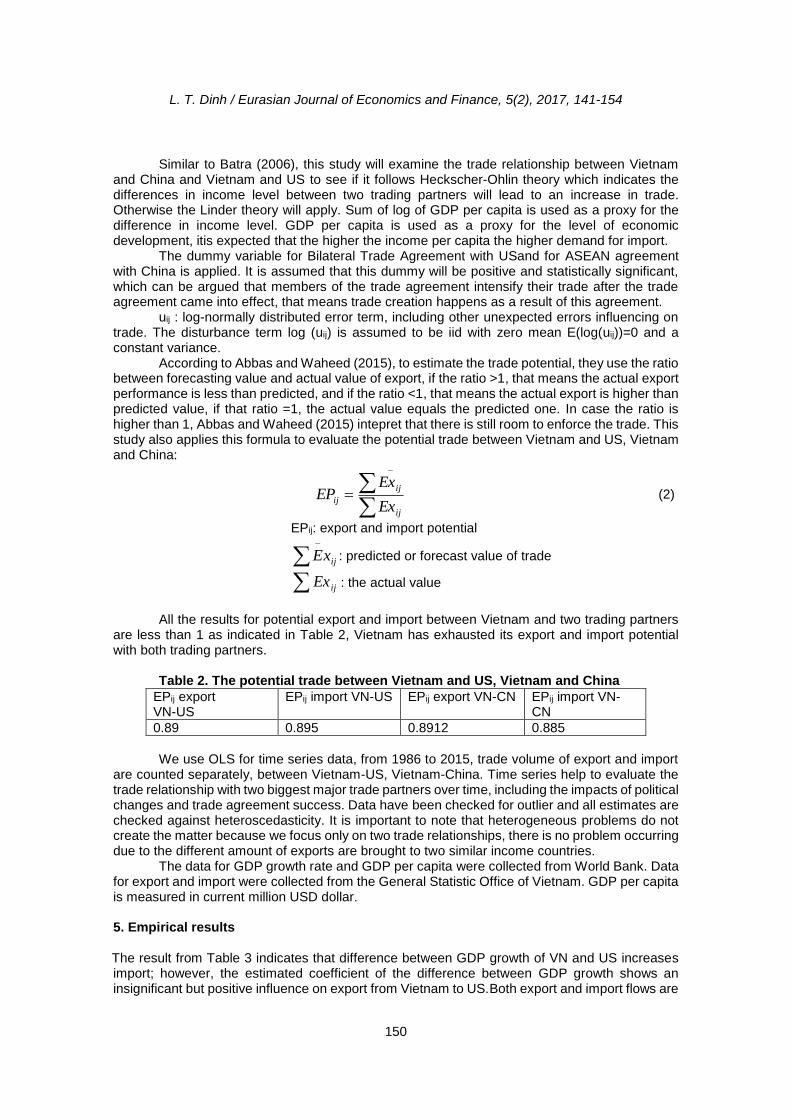
According to Abbas and Waheed (2015), to estimate the trade potential, they use the ratio between forecasting value and actual value of export, if the ratio >1, that means the actual export performance is less than predicted, and if the ratio <1, that means the actual export is higher than predicted value, if that ratio =1, the actual value equals the predicted one. In case the ratio is higher than 1, Abbas and Waheed (2015) intepret that there is still room to enforce the trade. This study also applies this formula to evaluate the potential trade between Vietnam and US, Vietnam and China:
ij
ij
ijEx
ExEP
(2)
EPij: export and import potential
ijxE
: predicted or forecast value of trade
ijEx : the actual value
All the results for potential export and import between Vietnam and two trading partners
are less than 1 as indicated in Table 2, Vietnam has exhausted its export and import potential with both trading partners.
Table 2. The potential trade between Vietnam and US, Vietnam and China
EPij export VN-US
EPij import VN-US EPij export VN-CN EPij import VN-CN
0.89 0.895 0.8912 0.885
We use OLS for time series data, from 1986 to 2015, trade volume of export and import
are counted separately, between Vietnam-US, Vietnam-China. Time series help to evaluate the trade relationship with two biggest major trade partners over time, including the impacts of political changes and trade agreement success. Data have been checked for outlier and all estimates are checked against heteroscedasticity. It is important to note that heterogeneous problems do not create the matter because we focus only on two trade relationships, there is no problem occurring due to the different amount of exports are brought to two similar income countries.
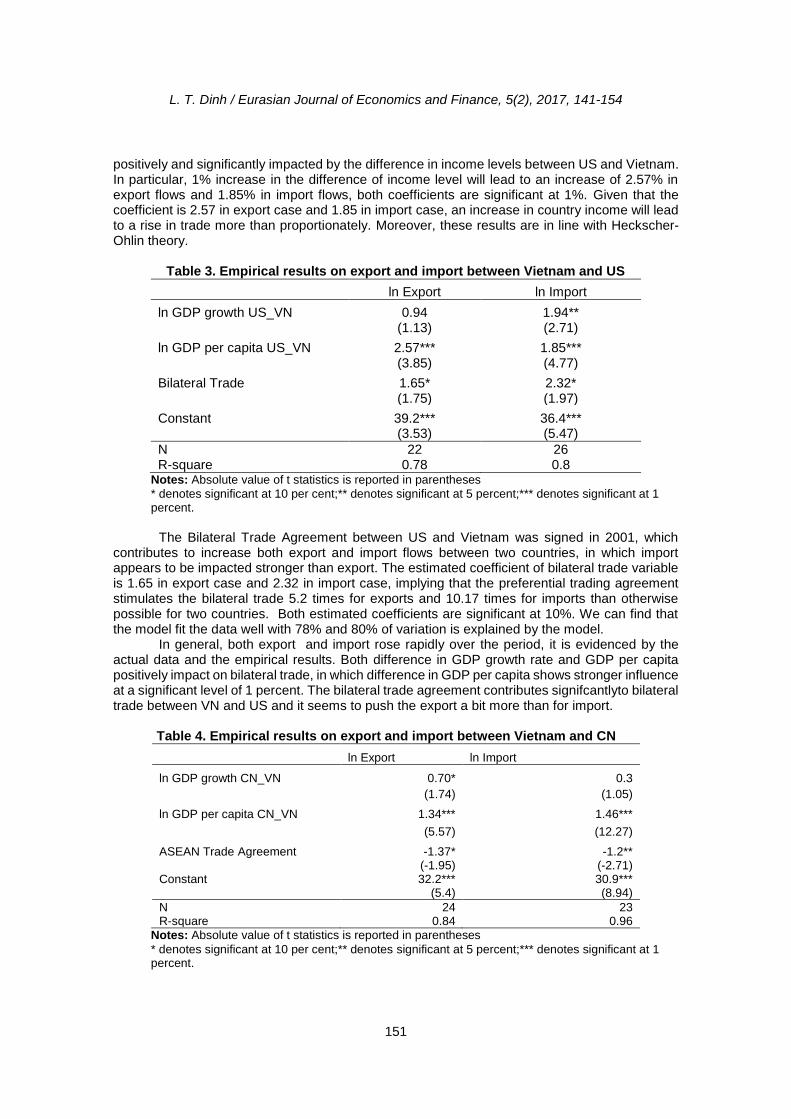
The data for GDP growth rate and GDP per capita were collected from World Bank. Data for export and import were collected from the General Statistic Office of Vietnam. GDP per capita is measured in current million USD dollar. 5. Empirical results The result from Table 3 indicates that difference between GDP growth of VN and US increases import; however, the estimated coefficient of the difference between GDP growth shows an insignificant but positive influence on export from Vietnam to US.Both export and import flows are
L. T. Dinh / Eurasian Journal of Economics and Finance, 5(2), 2017, 141-154
151
positively and significantly impacted by the difference in income levels between US and Vietnam. In particular, 1% increase in the difference of income level will lead to an increase of 2.57% in export flows and 1.85% in import flows, both coefficients are significant at 1%. Given that the coefficient is 2.57 in export case and 1.85 in import case, an increase in country income will lead to a rise in trade more than proportionately. Moreover, these results are in line with Heckscher-Ohlin theory.
Table 3. Empirical results on export and import between Vietnam and US
ln Export ln Import
ln GDP growth US_VN 0.94 1.94** (1.13) (2.71)
ln GDP per capita US_VN 2.57*** 1.85*** (3.85) (4.77)
Bilateral Trade 1.65* 2.32* (1.75) (1.97)
Constant 39.2*** 36.4*** (3.53) (5.47)
N 22 26 R-square 0.78 0.8
Notes: Absolute value of t statistics is reported in parentheses
* denotes significant at 10 per cent;** denotes significant at 5 percent;*** denotes significant at 1 percent.
The Bilateral Trade Agreement between US and Vietnam was signed in 2001, which
contributes to increase both export and import flows between two countries, in which import appears to be impacted stronger than export. The estimated coefficient of bilateral trade variable is 1.65 in export case and 2.32 in import case, implying that the preferential trading agreement stimulates the bilateral trade 5.2 times for exports and 10.17 times for imports than otherwise possible for two countries. Both estimated coefficients are significant at 10%. We can find that the model fit the data well with 78% and 80% of variation is explained by the model.
In general, both export and import rose rapidly over the period, it is evidenced by the actual data and the empirical results. Both difference in GDP growth rate and GDP per capita positively impact on bilateral trade, in which difference in GDP per capita shows stronger influence at a significant level of 1 percent. The bilateral trade agreement contributes signifcantlyto bilateral trade between VN and US and it seems to push the export a bit more than for import.
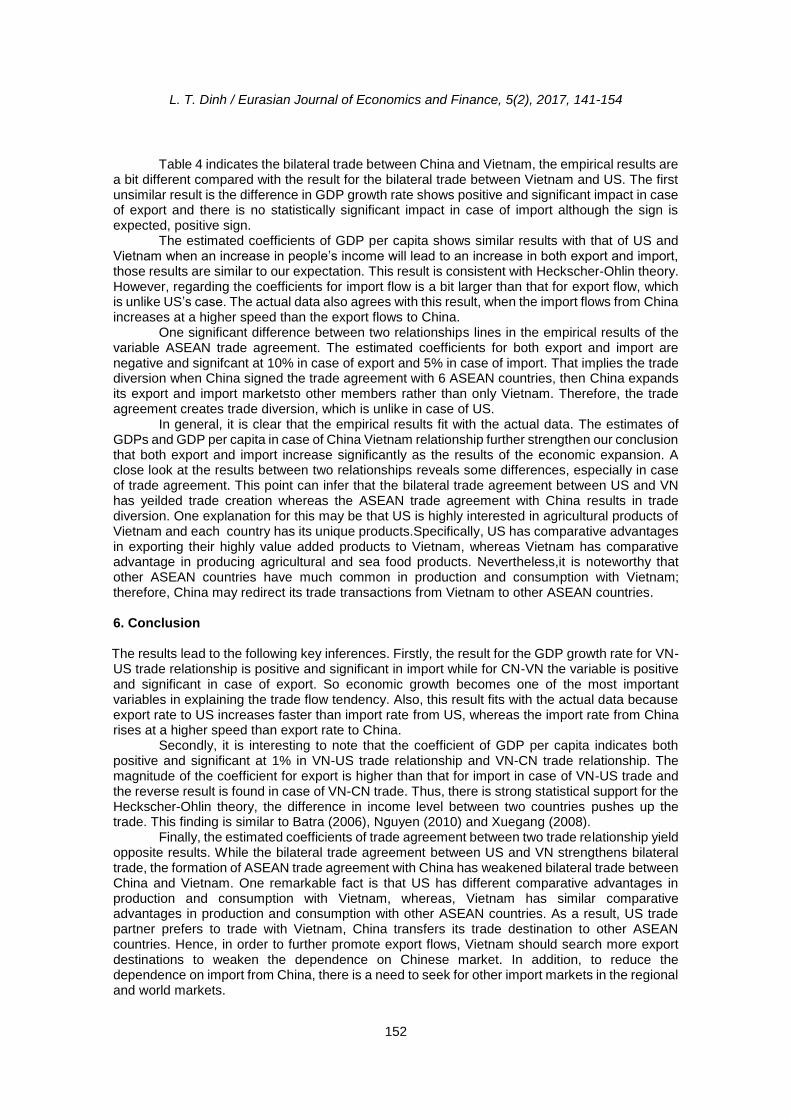
Table 4. Empirical results on export and import between Vietnam and CN
ln Export ln Import
ln GDP growth CN_VN 0.70* 0.3
(1.74) (1.05)
ln GDP per capita CN_VN 1.34*** 1.46***
(5.57) (12.27)
ASEAN Trade Agreement -1.37* -1.2** (-1.95) (-2.71) Constant 32.2*** 30.9*** (5.4) (8.94)
N 24 23 R-square 0.84 0.96
Notes: Absolute value of t statistics is reported in parentheses
* denotes significant at 10 per cent;** denotes significant at 5 percent;*** denotes significant at 1 percent.
L. T. Dinh / Eurasian Journal of Economics and Finance, 5(2), 2017, 141-154
152
Table 4 indicates the bilateral trade between China and Vietnam, the empirical results are a bit different compared with the result for the bilateral trade between Vietnam and US. The first unsimilar result is the difference in GDP growth rate shows positive and significant impact in case of export and there is no statistically significant impact in case of import although the sign is expected, positive sign.
The estimated coefficients of GDP per capita shows similar results with that of US and Vietnam when an increase in people’s income will lead to an increase in both export and import, those results are similar to our expectation. This result is consistent with Heckscher-Ohlin theory. However, regarding the coefficients for import flow is a bit larger than that for export flow, which is unlike US’s case. The actual data also agrees with this result, when the import flows from China increases at a higher speed than the export flows to China.
One significant difference between two relationships lines in the empirical results of the variable ASEAN trade agreement. The estimated coefficients for both export and import are negative and signifcant at 10% in case of export and 5% in case of import. That implies the trade diversion when China signed the trade agreement with 6 ASEAN countries, then China expands its export and import marketsto other members rather than only Vietnam. Therefore, the trade agreement creates trade diversion, which is unlike in case of US.
In general, it is clear that the empirical results fit with the actual data. The estimates of GDPs and GDP per capita in case of China Vietnam relationship further strengthen our conclusion that both export and import increase significantly as the results of the economic expansion. A close look at the results between two relationships reveals some differences, especially in case of trade agreement. This point can infer that the bilateral trade agreement between US and VN has yeilded trade creation whereas the ASEAN trade agreement with China results in trade diversion. One explanation for this may be that US is highly interested in agricultural products of Vietnam and each country has its unique products.Specifically, US has comparative advantages in exporting their highly value added products to Vietnam, whereas Vietnam has comparative advantage in producing agricultural and sea food products. Nevertheless,it is noteworthy that other ASEAN countries have much common in production and consumption with Vietnam; therefore, China may redirect its trade transactions from Vietnam to other ASEAN countries. 6. Conclusion The results lead to the following key inferences. Firstly, the result for the GDP growth rate for VN-US trade relationship is positive and significant in import while for CN-VN the variable is positive and significant in case of export. So economic growth becomes one of the most important variables in explaining the trade flow tendency. Also, this result fits with the actual data because export rate to US increases faster than import rate from US, whereas the import rate from China rises at a higher speed than export rate to China.
Secondly, it is interesting to note that the coefficient of GDP per capita indicates both positive and significant at 1% in VN-US trade relationship and VN-CN trade relationship. The magnitude of the coefficient for export is higher than that for import in case of VN-US trade and the reverse result is found in case of VN-CN trade. Thus, there is strong statistical support for the Heckscher-Ohlin theory, the difference in income level between two countries pushes up the trade. This finding is similar to Batra (2006), Nguyen (2010) and Xuegang (2008).
Finally, the estimated coefficients of trade agreement between two trade relationship yield opposite results. While the bilateral trade agreement between US and VN strengthens bilateral trade, the formation of ASEAN trade agreement with China has weakened bilateral trade between China and Vietnam. One remarkable fact is that US has different comparative advantages in production and consumption with Vietnam, whereas, Vietnam has similar comparative advantages in production and consumption with other ASEAN countries. As a result, US trade partner prefers to trade with Vietnam, China transfers its trade destination to other ASEAN countries. Hence, in order to further promote export flows, Vietnam should search more export destinations to weaken the dependence on Chinese market. In addition, to reduce the dependence on import from China, there is a need to seek for other import markets in the regional and world markets.
L. T. Dinh / Eurasian Journal of Economics and Finance, 5(2), 2017, 141-154
153
This paper has investigated the determinants of trade flows between VN-US and VN-CN to provide the comparison in detail. The export flow and import flow models are derived within the gravity framework. The results fit the actual data and yields highly significant results. The results suggest that GDP growth between two countries fosters the export and import flows. In addition, it seems reasonable to conclude that GDP per capita creates strong impact on trade flow, indicating that income level is very important to explain the trade flows, which proves the practical approach of Heckscher-Ohlin theory on trade. Perhaps the most important finding of the study is that US-VN bilateral trade agreement produced trade creation whereas the ASEAN trade agreement with China produced trade diversion. This finding is inconsistent with some previous studies but strengthens the finding of Nguyen (2010) when he found the trade diversion between AFTA member countries and EU. These results suggest the important trade policies for Vietnam to diversify their export and import destinations. Reference
Abbas, S., and Waheed, A., 2015. Pakistan's potential export flow: The gravity model approach.
The Journal of Developing Areas, 49(4), pp. 367-387. https://doi.org/10.1353/jda.2015.0135
Abraham, F., and van Hove, J., 2005. The rise of China: Prospects of regional trade policy. Review of World Economics, 141(3), pp.486-509. https://doi.org/10.1007/s10290-005-0040-x
Batra, A., 2006. India's global trade potential: The gravity model approach. Global Economic Review, 35(3), pp. 327-361. https://doi.org/10.1080/12265080600888090
Bergstrand, J. H., 1990. The Heckscher-Ohlin-Samuelson model, the Linder hypothesis and the determinants of bilateral intra-industry trade. The Economic Journal, 100(403), pp.1216-1229. https://doi.org/10.2307/2233969
CPC, 2016. Relationship between Vietnam and America, 20 year period. [online] Available at:<https://www.mongcai.gov.vn/vi-vn/tin/quan-he-kinh-te-thuong-mai-viet---m%E1%BB%B9-sau-21-nam-nhin-lai/24021-19424-122877> [Accessed on 10 June 2016].
Gomes, L. J., 2015. Worldwide growth convergence in the new millennium: An empirical investigation. Eurasia Journal of Economics and Finance, 3(3), pp.17-24. https://doi.org/10.15604/ejef.2015.03.03.002
Gul, N. and Yasin, H. M., 2011. The trade potential of Pakistan: An application of gravity model. The Lahore Journal of Economics,16(1), pp. 23-62.
Huo, N. and M. Kakinaka, 2007. Trade structure and trade flows in Cambodia: A gravity model. ASEAN Economic Bulletin, 24(3), pp. 305-319. https://doi.org/10.1355/AE24-3B
Institute of Chinese Studies, 2014. Bilateral trade relationship between Vietnam and China, 20 year period. [online] Available at: <http://vnics.org.vn/Default.aspx?ctl=Article&aID=516>[Accessed on 10 June 2016]. Vietnam: ICS.
Lam, T., 2015.Continuous development of trade relationship between Vietnam and America.Finance Magazine. [online], 27 March Available at: <http://tapchitaichinh.vn/kinh-te-vi-mo/kinh-te-dau-tu/quan-he-thuong-mai-viet-my-khong-ngung-phat-trien-59602.html>[Accessed on 10 June 2016].
Le, K. T. and Ngo, H. D. L., 2014. China Sea Conflict, its impact to bilateral trade relationship between Vietnam and China. Institute of Chinese Studies, [online], 27 August Available at: <http://vnics.org.vn/Default.aspx?ctl=Article&aID=510>[Accessed on 10 June 2016].
Ministry of Foreign Affairs, 2015. Development of Vietnam America relationship. [online] Available
at:<http://www.mofahcm.gov.vn/vi/mofa/tt_baochi/nr041126171753/ns050627154608>[A
ccessed on 10 June 2016]. Vietnam:MFA. Nguyen, B. X., 2010. The determinants of Vietnamese export flows: Static and dynamic panel
gravity approaches. International Journal of Economics and Finance,2(4), pp. 122-129. https://doi.org/10.5539/ijef.v2n4p122
L. T. Dinh / Eurasian Journal of Economics and Finance, 5(2), 2017, 141-154
154
Nguyen, T. K., 2009. Gravity model by panel data approach: An empirical application with implications for the ASEAN free trade area. ASEAN Economic Bulletin,26(3), pp. 266-277. https://doi.org/10.1355/AE26-3C
Nguyen, T. P. H., 2015. The influence of America in the relationship between Vietnam and China. Institute of Chinese Studies, [online], 3 October Available at:<http://vnics.org.vn/Default.aspx?ctl=Article&aID=558>[Accessed on 10 June 2016].
Stepniak-Kucharska, A., 2015. The impact of the economic transition on the development of economic freedom -Case of Poland. Eurasia Journal of Economics and Finance, 3(2), pp. 12-22. https://doi.org/10.15604/ejef.2015.03.02.002
Taguchi, H., 2013. Trade integration of Thailand with Mekong region: An assessment using gravity trade model. International Journal of Development Issues, 12(2), pp. 175-187. https://doi.org/10.1108/IJDI-02-2013-0015
To, M. T. and Lee H., 2015. Assessing the impact of deeper trade reform in Vietnam using a general equilibrium framework.Journal of Southeast Asian Economies,32(1), pp. 140-162. https://doi.org/10.1355/ae32-1h
Trang, L., 2015. Vietnam – US relations: From embargo to comprehensive cooperation. Economics and Forecast,[online] Available at: http://kinhtevadubao.vn/chi-tiet/2-3350-quan-he-viet-namhoa-ky--tu-cam-van-den-hop-tac-toan-dien.html [Accessed on 10 June 2016].
Vu, C. P., 2013. Some issues should be clearly stated. Institute of Chinese Studies,[online] 10 October. Available at: <http://vnics.org.vn/Default.aspx?ctl=Article&aID=359> [Accessed on 10 June 2016].
World Bank, 2016. Vietnam. Country Data, [online]. Available at: http://data.worldbank.org/country/vietnam?view=chart[Accessed on 10 June 2016].
Xuegang, C., 2008. Study on Xinjiang’s bilateral trade using a gravity model. Asia Europe Journal, 6(3), pp. 507-517. https://doi.org/10.1007/s10308-007-0157-8