republic of armenia reducing poverty and improving shared
TRANSCRIPT

Report No.
Republic of Armenia
Reducing Poverty and Improving Shared Prosperity Through
Better Jobs, Skills, and Education
May 24, 2017
Education Global Practice
Europe and Central Asia Region
Document of the World Bank
Pub
lic D
iscl
osur
e A
utho
rized
Pub
lic D
iscl
osur
e A
utho
rized
Pub
lic D
iscl
osur
e A
utho
rized
Pub
lic D
iscl
osur
e A
utho
rized
2
Abbreviations and Acronyms
AMD Armenian Dram LMIC Lower Middle Income Country
ANQA
National Center for Professional
Education Quality Assurance
MoES Ministry of Education and Science
ATC Assessment and Testing Center MoF Ministry of Finance
CBA Central Bank of Armenia NaCET National Center for Educational
Technologies
CIS Commonwealth of Independent States NSS National Statistical Service of Armenia
ECE Early Childhood Education OECD Organization for Economic
Cooperation and Development
EU European Union PER Public Expenditure Review
FBP Family Benefit Program STEM
Science, Technology, Engineering, and
Mathematics
GDP Gross Domestic Product TIMSS Trends in International Mathematics
and Science Study
GoA Government of Armenia STEM
Science, Technology, Engineering, and
Mathematics
HEI Higher Education Institution UEE Unified Entrance Exam
HDI Human Development Index VET Vocational Education and Training
LFS Labour Force Survey
3
Acknowledgements
This report was prepared by a World Bank education ECA team led by Soren Nellemann (Senior
Economist) and Nino Kutateladze (Senior Education Specialist) with analytical work by Micheline
Frias (and lead author) and Anush Shahverdyan (Consultants). The team would like to thank Mercy
Miyang Tembon (Country Director), Laura E. Bailey (Country Manager, Armenia), Lire Ersado
(Program Leader, ECA), and Cristian Aedo (Practice Manager Education, ECA ), for their valuable
input. Special thanks is given to peer reviewers, Dandan Chen (Lead Education Economist) and
members of the SCD core team, Genevieve F. Boyreau (Lead Economist and Program Leader,
South Caucasus), Nistha Sinha (Senior Economist), and Lourdes Rodriguez Chamussy
(Economist). The team is also grateful to officials from Armenia’s National Statistical Service,
National Center for Educational Technologies, and Assessment and Testing Center for generously
providing timely data on school inputs, enrollment, assessments, and labor market participation.
4
FIGURES
FIGURE 1: INCLUSIVE GROWTH AND DEVELOPMENT 2017 ARMENIA NATIONAL KEY
PERFORMANCE INDICATOR RESULTS ................................................................................................. 10
FIGURE 2: AGE PYRAMID OF POPULATION PERCENTAGE, 2016 .............................................................. 11
FIGURE 3: GLOBAL COMPETITIVENESS, 2016-2017 ..................................................................................... 13
FIGURE 4: SOCIAL AND ECONOMIC OUTCOMES AS A RESULT OF INVESTMENT IN ECD ................... 16
FIGURE 5: AVERAGE MONTHLY WAGE BY EDUCATIONAL ATTAINMENT (IN AMD) .......................... 17
FIGURE 6: RETURNS TO UNIT INCREASE OF DIFFERENT SKILLS ON HOURLY EARNINGS ................. 18
FIGURE 7: PERCENTAGE OF EDUCATION LEVEL ....................................................................................... 19
FIGURE 8: NUMBER OF EMPLOYED BY OCCUPATION TYPE AND MARZ, 2014 ...................................... 20
FIGURE 9: CENTRAL GOVERNMENT EXPENDITURES BY ECONOMIC CLASSIFICATION, 2008-2015 .. 22
FIGURE 10: CENTRAL GOVERNMENT EXPENDITURES BY FUNCTION, 2008-2015 ................................. 23
FIGURE 11: GOVERNMENT SPENDING IN THE SOCIAL SECTORS AS PERCENTAGE OF GDP, 2015 ..... 24
FIGURE 12: GOVERNMENT SPENDING IN THE SOCIAL SECTOR AS PERCENTAGE OF GDP, 2015 ....... 24
FIGURE 13: GDP PRODUCTION BY SECTOR, 2011-2014 (IN AMD) .............................................................. 26
FIGURE 14: PERCENTAGE OF FIRMS THAT HAD PROBLEMS HIRING WORKERS .................................. 27
FIGURE 15: GROSS ENROLLMENT AND EDUCATION SPENDING AS PERCENTAGE OF TOTAL
EDUCATION EXPENDITURE BY EDUCATION LEVEL ......................................................................... 30
FIGURE 16: GENERAL COMPARISON OF TESTING RESULTS..................................................................... 32
FIGURE 17: PRESCHOOL GROSS ENROLLMENT RATE, 2011-2015 ............................................................. 33
FIGURE 18: ECE GROSS ENROLLMENT RATIO FOR CHILDREN AGES 0 TO 2, 2014/15 ........................... 34
FIGURE 19: PERCENTAGE OF TEACHERS BY AGE, 2015/16 ........................................................................ 37
FIGURE 20: NATIONAL UEE AVERAGE SCORES, 2015/16 ........................................................................... 38
FIGURE 21: ARMENIA TIMSS PERFORMANCE, 2011 .................................................................................... 39
FIGURE 22: DISTRIBUTION OF TIMSS GRADE 4 MATH ACHIEVEMENT, 2011 ......................................... 39
FIGURE 23: NUMBER OF TERTIARY STUDENTS ENROLLED IN STEM AND NON-STEM BY GENDER,
2014-2015 ................................................................................................................................................... 40 FIGURE 24: INTENSITY OF USE OF READING AND COMPUTER SKILLS AMONG HIGH AND LOW
TECH WORKERS....................................................................................................................................... 44
FIGURE 25: VET GRADUATES BY SUBJECT, 2015 ........................................................................................ 45
FIGURE 26: THE EDUCATION SYSTEM IN ARMENIA .................................................................................. 53 FIGURE 27: DESCRIPTION OF COGNITIVE, SOCIOEMOTIONAL, AND JOB-RELEVANT SKILLS
MEASURED ............................................................................................................................................... 54
5
TABLES
TABLE 1: ARMENIA POVERTY RATE BY EDUCATIONAL LEVEL (FOR POPULATION 16 YEARS AND
OVER), 2008 & 2015 .................................................................................................................................. 12 TABLE 2: ARMENIA AND GEORGIA LABOR FORCE PARTICIPATION RATE (AS PERCENTAGE OF
TOTAL), 2011-2014 .................................................................................ERROR! BOOKMARK NOT DEFINED. TABLE 3: THE DYNAMICS OF THE ACTUAL BUDGET EXPENDITURES ALLOCATED TO THE
EDUCATION SECTOR, 2011-2015 .........................................................ERROR! BOOKMARK NOT DEFINED.
TABLE 4: NUMBER OF GRADUATES OF HEIS WITH EDUCATION DEGREE, 2009-2015 .......................... 37 TABLE 5: ARMENIA POVERTY RATE BY NUMBER OF EMPLOYED HOUSEHOLD MEMBERS, 2008 AND
2015 ............................................................................................................................................................ 52

6
TABLE OF CONTENTS
Executive Summary ............................................................................................................................................ 7
Introduction .......................................................................................................................................................... 9
1. Country Context ........................................................................................................................................ 10
2. Education’s Relationship with the Economy .......................................................................................... 14
A. Returns to investment in education and skills .................................................................................... 14
B. A Spatial analysis of education and employment .............................................................................. 18
C. Fiscal environment: education and social sector expenditures ........................................................ 21
D. Productivity and the labor market ....................................................................................................... 25
3. Challenges in the Education Sector ......................................................................................................... 28
A. Recent education reforms and outcomes ............................................................................................ 28
B. Inefficiencies and learning outcomes in the education system ......................................................... 30
C. Gender aspects and its impact ............................................................................................................. 41
D. Skills characteristics and skills demanded by the economy .............................................................. 43
4. Policy Recommendations ......................................................................................................................... 46
References .......................................................................................................................................................... 50
Annex ................................................................................................................................................................. 52

7
Executive Summary
This report evaluates Armenia’s current education and skills development challenges.
The analysis was based on recent World Bank economic and education studies of Armenia and
data from the National Statistical Service of Armenia’s 2014 Labour Force Survey, the National
Center for Educational Technologies (NaCET), and Assessment and Testing Center (ATC). The
findings are expected to feed into the Systematic Country Diagnostic (SCD) for the Government
of Armenia (GoA) on ways to improve the quality and relevance of the education system to reduce
poverty and improve shared prosperity.
Armenia is in a unique crossroads as a developing middle income country; requiring
education and skills development as vital for its next phase of development. Following the
unprecedented level of economic growth, poverty reduction and social development and a range
of first level reforms until the onset of the global financial crisis in 2008-2009, Armenia has since
struggled to revive and kick-start the economy by introducing a second tier of reforms.
Concurrently, the social and economic outlook is challenged by a dire fiscal situation and negative
impact of an aging population and migration outflow of talent and human resources. Structural
changes in the economy have led to improved productivity in much-needed sectors of the
economy, including industry, agriculture, and service. Nevertheless, Armenia is faced with
multiple challenges centered around low level of social and economic development, worsening
levels of poverty often correlated with the level of education (the lower the level of education, the
higher level of poverty and severity of poverty), a shrinking labor force and increasing dependency
ratio, while the need to boost the innovative capacity of the human capital foundation is greater
than ever through education and skills training.
Education and skills mismatch with emerging labor market needs. While Armenia
stands out in the South Caucasus region for high educational attainment with a tertiary gross
enrollment rate of 52.9 percent in 2015 (as compared to 43 percent in Georgia1), a majority of
employers report that the education system does not produce the high level of cognitive, non-
cognitive, and job-related skills required of workers; is especially true in the growing sectors of
the economy, such as the information technology and high-technology industry, therefore,
adversely affecting productivity and competitiveness. Concurrently, one in four workers remain
engaged in low-productivity employment and despite high educational attainment among females,
female employment rate is close to 50 percent – among the lowest in Europe and Central Asia;
more than 60 percent of youth aged 15 to 24 are unemployed. This implies that a significant amount
of educational resources is wasted. Thus, Armenia is described by numerous mismatches and
challenges that constitute serious impediments to reviving the economy. A comprehensive
education and workforce development system that is gender sensitive and produces skills that are
adequate and relevant to the labor market is key.
11 World Bank database, 2015.
8
Issues with quality persist in education, particularly in STEM education. General
education, has reached significant access, nevertheless, schools are inefficiently used, teaching has
been downgraded to a part-time profession, and Unified Entrance Exam (UEE) and TIMSS
assessments reveal students perform least well in STEM. Additionally, even though Armenia has
a higher tertiary enrollment rate than other CIS countries, there is a high attrition rate and low
enrollment in STEM subjects. Strengthening quality assurance systems and reforming pedagogies,
curricula, and teacher training and support in delivering more innovative, student-centered
approaches would help to improve student motivation and learning outcomes in STEM.
Early childhood development research shows that investment in early childhood
education (ECE) leads to long term educational and economic gains, nevertheless, the
provision of ECE in Armenia is comparatively low, and especially for children under 3 years
and among rural children who stand the greatest chance of long term social exclusion. Lack
of widespread financial support of local community-led initiatives, have led to low coverage of
ECE in Armenia, especially in rural areas and participation of children under 3 years old in ECE
in Armenia is among the lowest in region. Studies have shown that that the brain is almost fully
developed by the age of 3, and failure to stimulate learning during this developmental phase leads
to irreparable neurological underdevelopment later in life that can lead to the social exclusion of
the most vulnerable populations. Therefore, provision of national ECE programs is critical for
breaking inter-generational poverty and improving the skills level of the poorest.
A spatial analysis of Armenia’s population, reveals a statistically significant
association between rural dwelling and incidence of lower educational levels and lower
higher earning job prospects. People who lived in rural areas are less likely than their urban
counterparts to go to university and they are also more likely to work in a low productivity
employment, typically agricultural work, although low productivity is pandemic to secondary
cities as well. Further, in Armenia, higher education is associated with significantly higher
earnings; yet, in Armenia’s 2014 Labour Force household survey, only 11 percent of rural dwellers
reported attending higher education as opposed to 27 percent of urban dwellers. This suggests that
the government must do more to increase access to tertiary education for those located in rural
areas.

9
Introduction
This education report is a compliment to the 2017 World Bank led Armenia
Systematic Country Diagnostic (SCD), which focuses on how to improve shared prosperity
and reduce poverty in Armenia. This report collates information from recent education studies
addressing issues with skills development and gender and spatial differences in educational level
and quality. Concurrently, this study will try to link key macroeconomic and demographic issues
to issues related to the education sector. Thus, this study will provide an overview of the external
and internal issues related to improving education and be central with regards to the direction set
out in the SCD linking these to poverty and shared prosperity.
This study is organized into four main sections intended to provide a comprehensive
analysis of Armenia’s education landscape. It will begin with an overview of Armenia’s current
social and economic context and the factors that have contributed to it. Next, it will dive deeper
into the relationship between education and the economy and unique spatial aspects associated
with income and education inequalities. It will then assess the key challenges within the education
system that are contributing to Armenia’s current state of affairs. Finally, the study will present
policy recommendations based on the information analyzed. In doing so, the aim will be to equip
the Republic of Armenia with a strong set of evidence-based education policies and strategies that
will promote broad-based prosperity and poverty reduction and move Armenia forward in the next
stage of development.

10
1. Country Context
Following the unprecedented level of economic growth, poverty reduction and social
development and a range of first level reforms until the onset of the financial crisis in 2008-
2009, Armenia has since struggled to revive and kick-start the economy by introducing a
second tier of reforms. Concurrently, the social and economic outlook is challenged by a dire
fiscal situation and negative impact of an aging population and migration outflow of talent
and human resources. Overall the country context can be gauged by looking at the World
Economic Forum’s Inclusive Growth and Development Report 2017 (which measured the
accumulated levels and five-year
trends for the inclusive growth
and development of 109
countries). The analysis is based
on seven pillars, consisting of
three “education and skills” (i.e.
access, quality, and equity), two
“basic services and
infrastructure” (i.e. basic and
digital infrastructure and health
services and quality of life), two
“corruption and rents” (i.e.
business and political ethics and
concentration of rents), two
“financial intermediation of real
economy investment” (i.e.
financial system inclusion and
intermediation of business
investment), two “asset building
and entrepreneurship” (i.e. small
business ownership and home and
financial asset ownership), two
“employment and labor
compensation” (i.e. productive
employment and wage and non-
wage compensation), two “fiscal
transfers” (i.e. tax code and social protection). These indicators offer a more comprehensive
analysis of the state of shared economic prosperity of countries than Gross Domestic Product
(GDP) per capita alone. Armenia’s overall inclusive development was ranked 50th out of 70 in the
developing economies category.
Although Armenia has experienced gains in key growth and development indicators,
it has decreased in other critical areas of inclusive development. Figure 1 shows that in the past
five years, Armenia experienced a 10.6 percent increase in growth and development markers,
particularly in GDP per capita (4 percent) and employment (3 percent). At the same time,
Figure 1: Inclusive Growth and Development 2017
Armenia national key performance indicator results

11
according to the World Economic Forum report, wealth inequality has risen 10.2 percent and
marginal gains have been made in median income (0.8 percent) and net income inequality (-0.6
percent). In other words, Armenia’s recent economic progress has been unevenly distributed.
Investment in education and the right skills is key to a more productive, broad-based
and sustainable economy for Armenia. While Armenia stands out in the South Caucasus region
for high educational attainment with a tertiary gross enrollment rate of 52.9 percent in 2015 (as
compared to 43 percent in Georgia), a majority of employers report that the education system does
not produce the high level of cognitive, non-cognitive, and job-related skills required of workers;
is especially true in the growing sectors of the economy, such as the information technology and
high-technology industry, therefore, adversely affecting productivity and competitiveness.
Concurrently, one in four workers remain engaged in low-productivity employment and despite
high educational attainment among females, female employment rate is close to 50 percent –
among the lowest in Europe and Central Asia; more than 60 percent of youth aged 15 to 24 are
unemployed. This implies that a significant amount of educational resources is wasted. Thus,
Armenia is described by numerous mismatches and challenges that constitute serious impediments
to reviving the economy. A comprehensive education and workforce development system that is
gender sensitive and produces skills that are adequate and relevant to the labor market is key.
Concurrently, the above situation as mentioned is and will be further worsened by the
demographic outlook for Armenia as discussed in the following.
Demographic trends forecast a shrinking population and thus urgent need to mobilize
more of Armenia’s working-age population through education and skills training. The
Armenian population has been
rapidly aging since the country’s
independence from the Soviet Union
in 1991, and the total population has
been almost flat since the late 1990s
at around 3.2 million. Given the sharp
drop in the crude birth rate from 22.6
per 1,000 persons in 1990 to 10.6 in
2000, and recent steady decline from
14.2 in 2007 to 13.2 in 2014, the total
population is expected to start
declining. In particular, the working-
Source: World Bank staff calculation based on data from Health,
nutrition, and population statistics.
Figure 2: Age pyramid of population percentage, 2016

12
age population2 is expected to decrease significantly by 8 percent in 2030 and 15 percent in 2050
because the younger generation will not be able to replace the retiring population, as illustrated in
Figure 2. This implies that Armenia needs to maximize the potential of its working-age population
by providing them with the education and skills relevant for the changing economy that is moving
towards greater efficiency and innovation.
Recent findings show that higher levels of educational attainment are associated with
reduced poverty rates (Table 1). According to the National Statistical Service’s Social snapshot
and poverty in Armenia 2016 report, the incidence of poverty in 2015 was highest among persons
with elementary and primary education (54.4 percent). Additional levels of education, even
incomplete secondary was associated with lower poverty rates. Poverty was lowest among those
with tertiary education – around 1.8 times lower than the national average for population over 16
years of age, and 3.5 and 2.8 times lower than among those with elementary and primary or
incomplete secondary education. This trend was consistent in 2008 as well as for incidences of
extreme poverty. Therefore, the findings strongly suggest that higher levels of educational
attainment is a key input in lifting people out of poverty despite the structural problems mentioned
above. We will return to this issue later.
Table 1: Armenia poverty rate by educational level (for population 16 years and over),
2008 & 2015
Educational level
2008 2015
Extremely
poor Poor
Extremely
poor Poor
Percent,
poor
(referenced
population)
Percent,
referenced
population
Elementary and
primary 4.2 36.1 6.9 54.4 3.4 1.8
Incomplete
secondary 3.2 40.1 5.2 43.5 13.9 9.2
General secondary 1.7 30.2 1.8 33.4 51.2 44.1
Specialized
secondary 1.0 21.9 1.7 24.6 19.5 22.9
Tertiary 0.4 14.7 0.3 15.7 12.0 22.0
Total 1.6 26.6 1.8 28.8 100 100 Source: NSS & World Bank. (2016). Social snapshot and poverty in Armenia.
2 Working age in Armenia is 15-63 years for which 63 is the pensionable age, but for data calculation purposes it
includes ages 15-64.
13
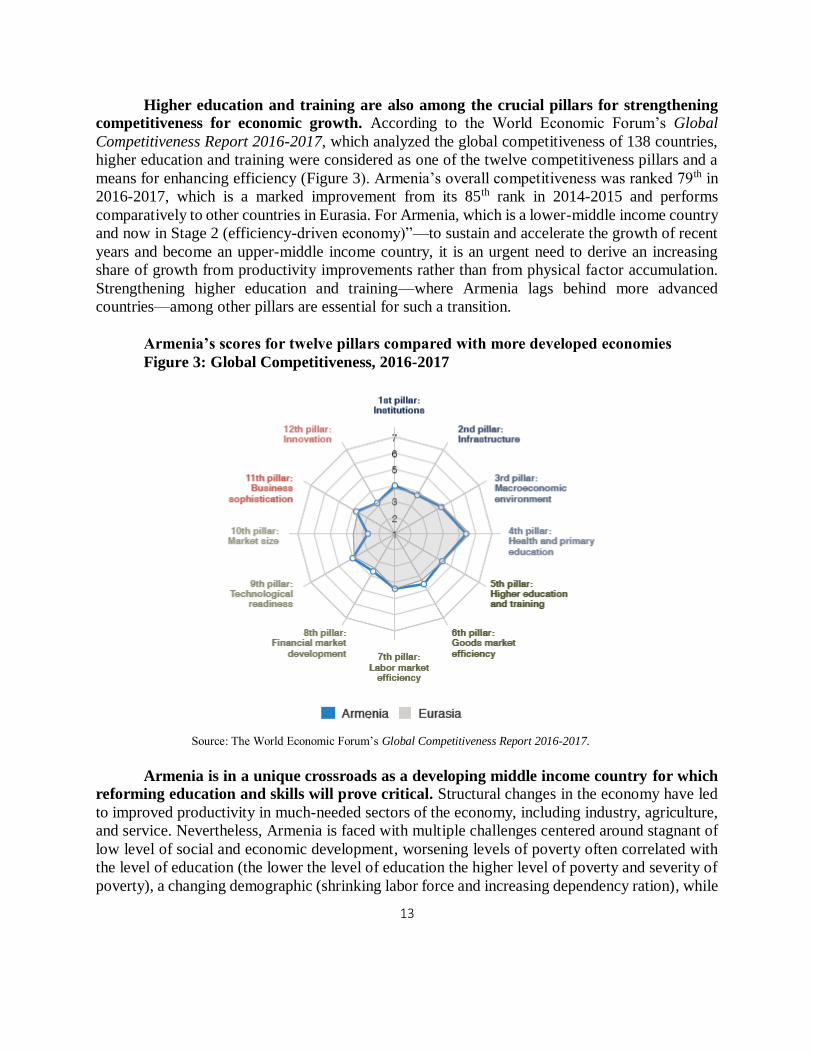
Higher education and training are also among the crucial pillars for strengthening
competitiveness for economic growth. According to the World Economic Forum’s Global
Competitiveness Report 2016-2017, which analyzed the global competitiveness of 138 countries,
higher education and training were considered as one of the twelve competitiveness pillars and a
means for enhancing efficiency (Figure 3). Armenia’s overall competitiveness was ranked 79th in
2016-2017, which is a marked improvement from its 85th rank in 2014-2015 and performs
comparatively to other countries in Eurasia. For Armenia, which is a lower-middle income country
and now in Stage 2 (efficiency-driven economy)”—to sustain and accelerate the growth of recent
years and become an upper-middle income country, it is an urgent need to derive an increasing
share of growth from productivity improvements rather than from physical factor accumulation.
Strengthening higher education and training—where Armenia lags behind more advanced
countries—among other pillars are essential for such a transition.
Armenia’s scores for twelve pillars compared with more developed economies
Figure 3: Global Competitiveness, 2016-2017
Source: The World Economic Forum’s Global Competitiveness Report 2016-2017.
Armenia is in a unique crossroads as a developing middle income country for which
reforming education and skills will prove critical. Structural changes in the economy have led
to improved productivity in much-needed sectors of the economy, including industry, agriculture,
and service. Nevertheless, Armenia is faced with multiple challenges centered around stagnant of
low level of social and economic development, worsening levels of poverty often correlated with
the level of education (the lower the level of education the higher level of poverty and severity of
poverty), a changing demographic (shrinking labor force and increasing dependency ration), while

14
the need to boost the innovative capacity of the human capital foundation is greater than ever. In
sum, Armenia is faced with the following challenges:
1. Despite relatively high attainment level of about half the population, their skills are
incompatible with the demands of the labor market and to compound the problem many
the female higher education graduates drop out of the labor market implying a significant
waste of scare public resources;
2. Only about half of the female population and just over a third of youth ages 15 to 24 are
engaged in the labor market, thus contributing too little in terms of economic activity and
fiscal revenue generation and far from compensating for the declining population;
3. There is a positive correlation between poverty and educational attainment;
4. Investment in human capital with a better alignment of quality, relevance and flexibility is
critical for boosting competitiveness, efficiency and higher value added production.
In the following chapter, we will look at some of the current microeconomic or rate of
return arguments for investing in skills and higher educational attainment before considering the
spatial aspect of poverty and education in Armenia.
2. Education’s Relationship with the Economy
An essential part of economic growth apart from capital is labor and learning (in turn
boosting productivity, technological adaptation and knowledge generation). Labor relates to
the cognitive and non-cognitive skills endowed and applied by workers which in turn is related to
the level of productivity and innovation both as a driver for growth, but also as an essential element
to meet labor markets specific need for skills. Greater productivity levels and higher value added
jobs will be reflected in higher wages. Learning and knowledge in a society in turn can have an
exponential impact on economic growth depending on the overall level of human capital
foundation and the ability to transmit knowledge between institutions, businesses and the markets.
In short, the overall education level and knowledge matter (the more knowledgeable people you
are surrounded with, the more innovation and knowledge exchange is taking place). Concurrently
transmitting knowledge and research and placing these into a commercial and productive use is
also critical and depends on the institutional and technological linkages within a society and with
the global world. While there are benefits to the public and economy in general investing in the
individuals’ education as is well known also carries an economic or financial return as will be
discussed in the following.
A. Returns to investment in education and skills
Education plays an indispensable role in developing skills that are at the core of
improving individuals’ employability and productivity; ultimately, contributing to countries’
economic growth. Recent research has demonstrated that not only cognitive skills—individual's
ability to think such as memory, attention, planning, and language—but also non-cognitive skills
that influence the overall behavior of a person—such as emotional maturity, empathy,
interpersonal skills, and verbal and non-verbal communication—are increasingly shown to have a
15
positive impact on labor market outcomes3 (World Bank, 2015a). Education is the means by which
these skills are developed and refined.
Studies show that education in early childhood (0 to 8 years old) leads to the
development of skills proven to result in more long-term success for the individual and
overall greater productivity. A 2013 survey from the World Bank on Armenia’s skills,
employment, and productivity revealed that adults who participated in early education programs
had a higher probability of using reading and computer skills at work and using them with higher
intensity (i.e. using them daily and reading longer documents) than those who did not participate
in early education (World Bank, 2015a). These adults also scored higher on socioemotional traits,
including extraversion, conscientiousness and grit, which are associated with behavioral traits
shown to matter for a range of outcomes in life, including employability and labor market
outcomes (World Bank, 2015a). The differences were statistically significant after controlling for
gender, educational attainment, mother’s education, father’s education, number of household
shocks experienced by age 12, household socioeconomic status at age 15, and indicator variables
for age groups. The early childhood education (ECE) findings in Armenia are consistent with the
international literature, which show that handicaps developed early in life are difficult if not
impossible to remedy later, but that effective early childhood education programs can have a very
high payoff (World Bank, 2015a).
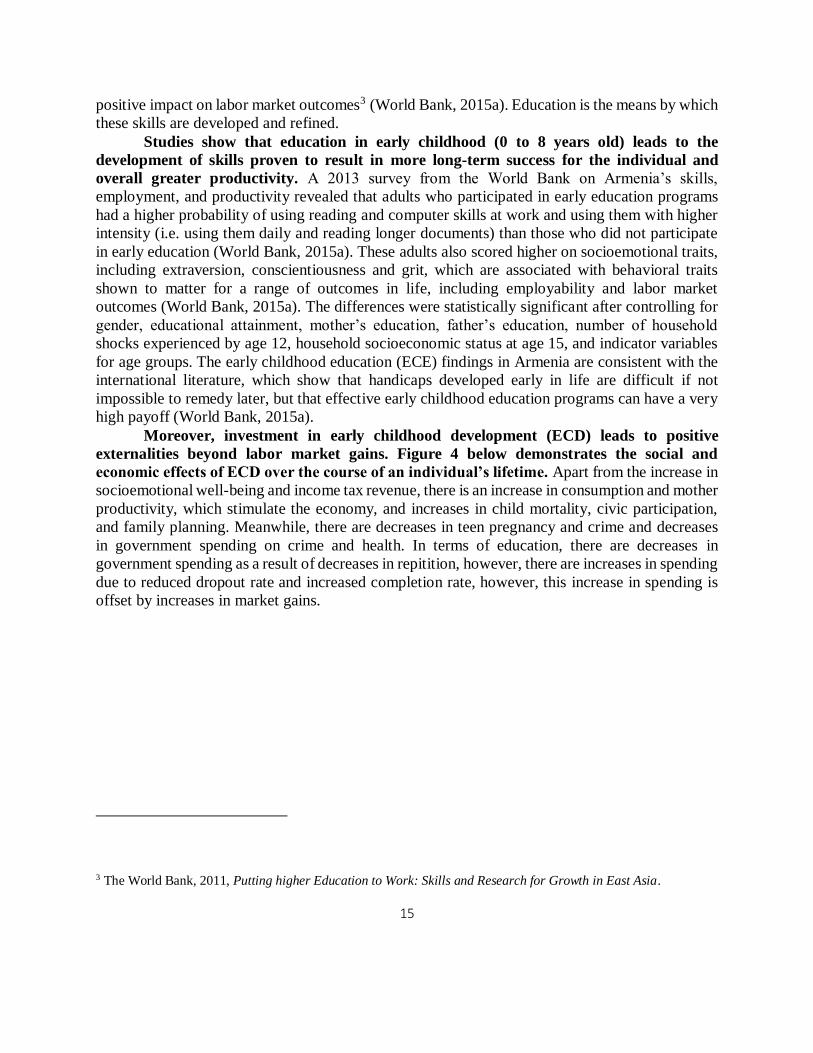
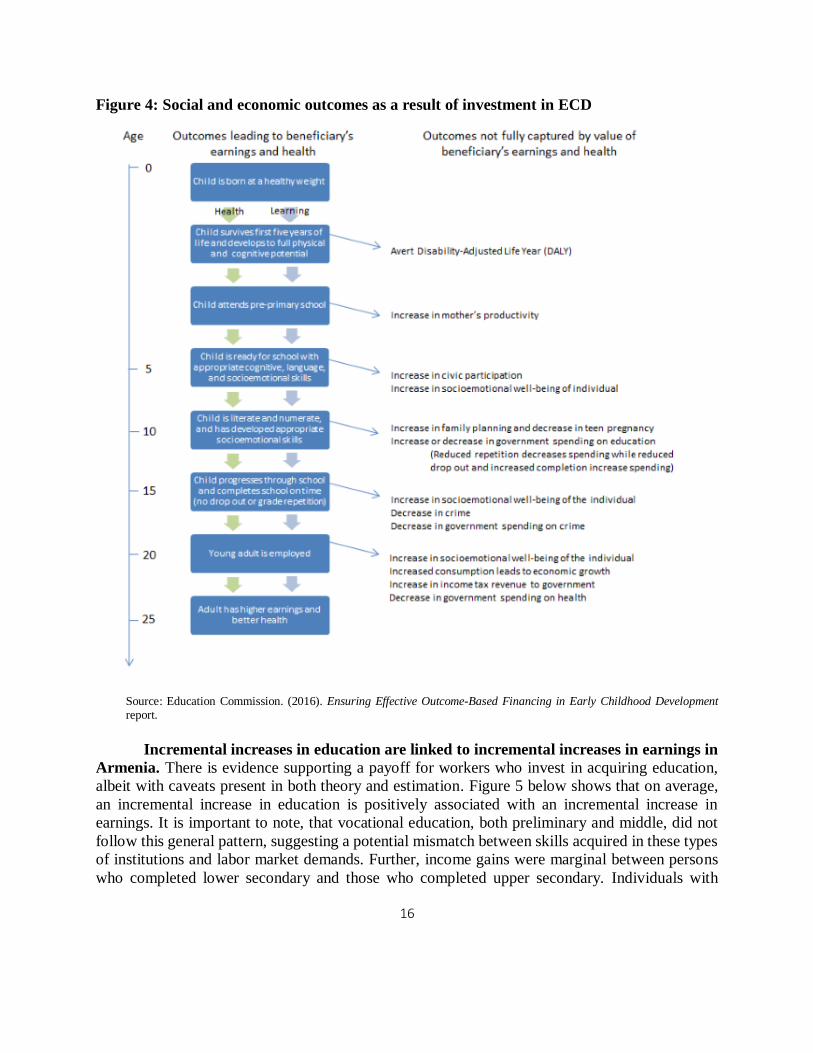
Moreover, investment in early childhood development (ECD) leads to positive
externalities beyond labor market gains. Figure 4 below demonstrates the social and
economic effects of ECD over the course of an individual’s lifetime. Apart from the increase in
socioemotional well-being and income tax revenue, there is an increase in consumption and mother
productivity, which stimulate the economy, and increases in child mortality, civic participation,
and family planning. Meanwhile, there are decreases in teen pregnancy and crime and decreases
in government spending on crime and health. In terms of education, there are decreases in
government spending as a result of decreases in repitition, however, there are increases in spending
due to reduced dropout rate and increased completion rate, however, this increase in spending is
offset by increases in market gains.
3 The World Bank, 2011, Putting higher Education to Work: Skills and Research for Growth in East Asia.
16
Figure 4: Social and economic outcomes as a result of investment in ECD
Source: Education Commission. (2016). Ensuring Effective Outcome-Based Financing in Early Childhood Development report.
Incremental increases in education are linked to incremental increases in earnings in
Armenia. There is evidence supporting a payoff for workers who invest in acquiring education,
albeit with caveats present in both theory and estimation. Figure 5 below shows that on average,
an incremental increase in education is positively associated with an incremental increase in
earnings. It is important to note, that vocational education, both preliminary and middle, did not
follow this general pattern, suggesting a potential mismatch between skills acquired in these types
of institutions and labor market demands. Further, income gains were marginal between persons
who completed lower secondary and those who completed upper secondary. Individuals with

17
higher education reported the greatest monthly earnings and earned over 20,000 AMD more each
month than individuals with any other education level. The findings suggest that higher levels of
education seem to translate to higher levels of skills that are valued by employers in Armenia,
especially in terms of higher education.
Figure 5: Average monthly wage by educational attainment (in AMD)
Source: World Bank staff calculation based on National Statistical Service Labor Force Survey 2014.
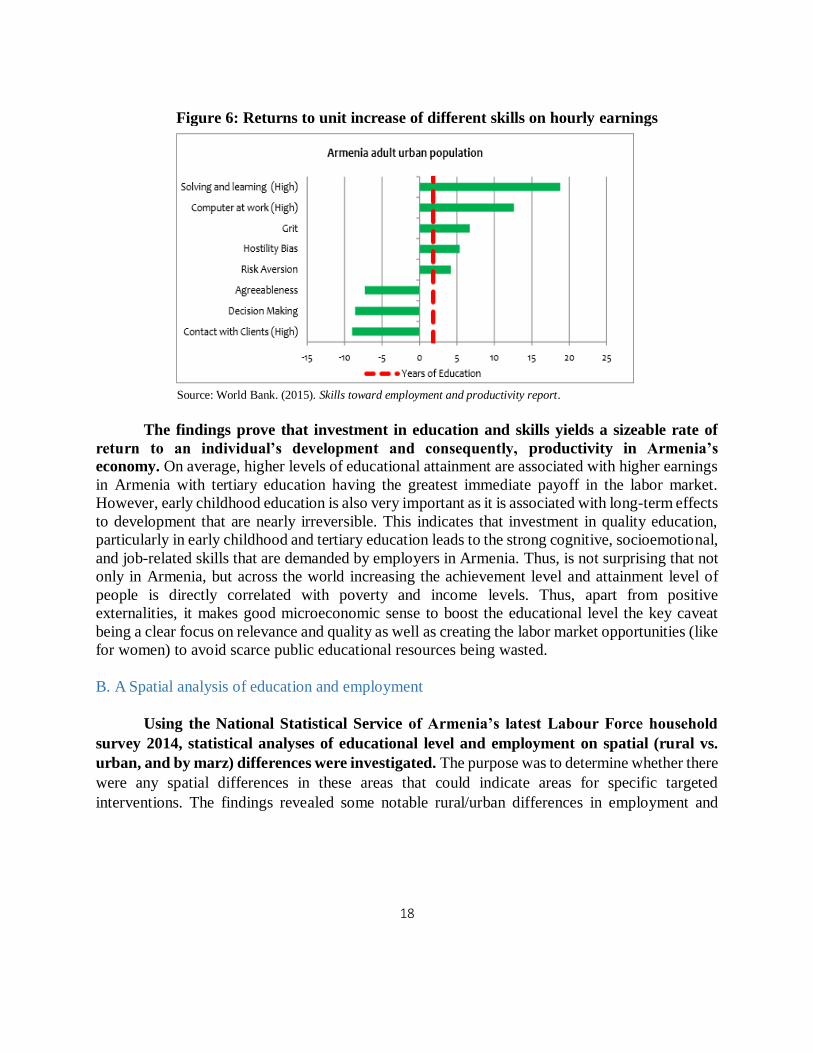
Skills seem to matter as much as education in terms of earnings. The attainment of
certain job-related activities, such as high computer use at work and high solving and learning
activity, and certain socioemotional skills, including grit, risk aversion, and hostility bias seem to
positively correlate with higher hourly earnings (Figure 6). On the other hand, agreeableness, more
careful decision-making and more contact with clients are associated with lower hourly earnings.
This last part aligns with the idea that service-related jobs (those where workers are more prone to
have more contact with clients and use this second group of skills) tend to pay less on average in
the labor market (World Bank, 2015a). These findings reinforce the point that skills complement
education as correlate with earnings.
- 20,000 40,000 60,000 80,000 100,000 120,000
General basic
Upper secondary
Preliminary vocational
Secondary specialized
University
Post-graduate
Average monthly wage by educational attainment (in AMD)
18
Source: World Bank. (2015). Skills toward employment and productivity report.
The findings prove that investment in education and skills yields a sizeable rate of
return to an individual’s development and consequently, productivity in Armenia’s
economy. On average, higher levels of educational attainment are associated with higher earnings
in Armenia with tertiary education having the greatest immediate payoff in the labor market.
However, early childhood education is also very important as it is associated with long-term effects
to development that are nearly irreversible. This indicates that investment in quality education,
particularly in early childhood and tertiary education leads to the strong cognitive, socioemotional,
and job-related skills that are demanded by employers in Armenia. Thus, is not surprising that not
only in Armenia, but across the world increasing the achievement level and attainment level of
people is directly correlated with poverty and income levels. Thus, apart from positive
externalities, it makes good microeconomic sense to boost the educational level the key caveat
being a clear focus on relevance and quality as well as creating the labor market opportunities (like
for women) to avoid scarce public educational resources being wasted.
B. A Spatial analysis of education and employment
Using the National Statistical Service of Armenia’s latest Labour Force household
survey 2014, statistical analyses of educational level and employment on spatial (rural vs.
urban, and by marz) differences were investigated. The purpose was to determine whether there
were any spatial differences in these areas that could indicate areas for specific targeted
interventions. The findings revealed some notable rural/urban differences in employment and
Figure 6: Returns to unit increase of different skills on hourly earnings

19
education outcomes in Armenia. That is to say, where someone resides in Armenia is associated
with marked differences in employment and reported education levels4.
In terms of education, inequitable access to tertiary education is a problem for rural
communities in Armenia. On average, students from urban areas in Armenia achieve higher
levels of education than their rural counterparts (Figure 7). Nearly a third of urban students pursue
higher education, compared to 11 percent of rural students. 25 percent of rural students do not
progress beyond basic education as opposed to 18 percent of urban students. Nearly half (45
percent) of urban students progress in their education beyond upper secondary, while most rural
students only achieve an upper secondary education. Factors likely contributing to the lower
education level for rural students are low participation and achievement in the UEE for rural
students, which impacts their ability to graduate from the 9th grade and pursue higher education
and the cost of tertiary education, as scholarships are primarily merit-based and typically are
awarded to students from wealthier and urban families (World Bank, 2013). These inequities in
access limit the skill level and earning potential of the most vulnerable. Therefore, it is necessary
for the GoA to make sure that rural students receive equal access to quality education and financial
assistance to pursue higher education.
Figure 7: Percentage of education level
Source: World Bank staff calculation using NSS LFS data.
4 Education level in this spatial analysis is defined as the level of education respondents of the LFS 2014 survey
reported (Question #15).
No School5%
Primary8%
Basic12%
Secondary47%
Vocational3%
Secondary Specialized
14%
Higher11%
Rural education level, 2014 No School
5% Primary6%
Basic7%
Secondary35%
Vocational2%
Secondary Specialized
18%
Higher27%
Urban education level, 2014
20
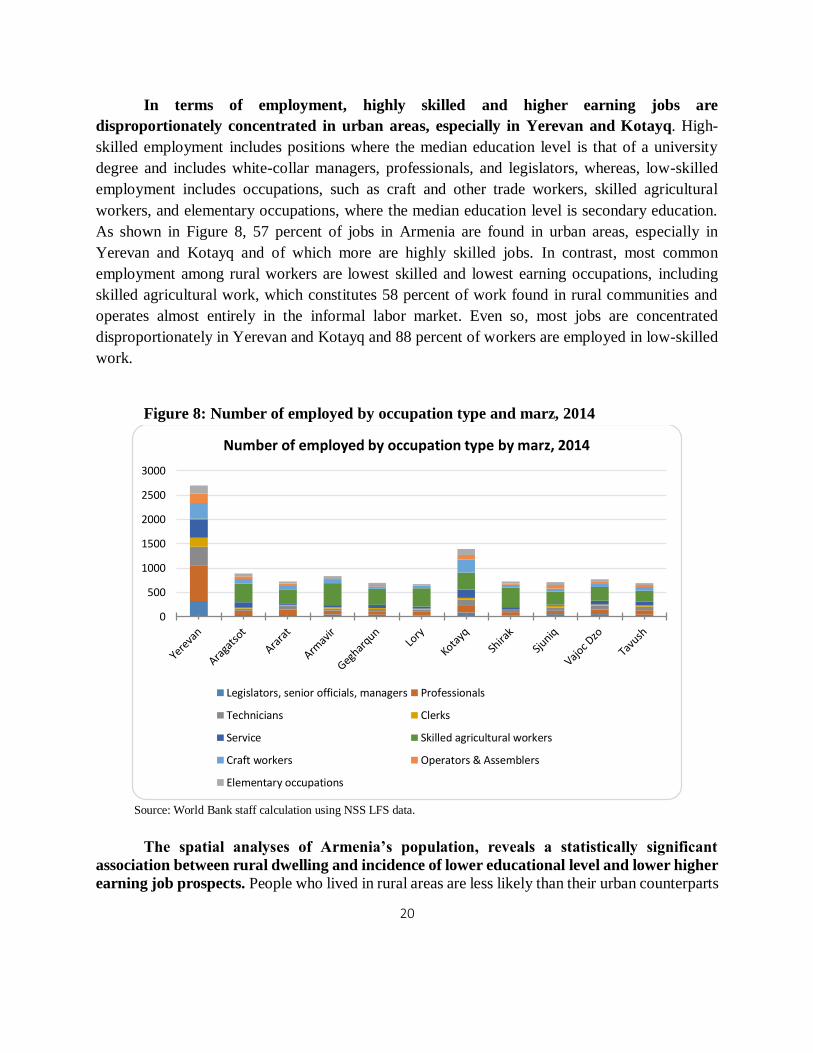
In terms of employment, highly skilled and higher earning jobs are
disproportionately concentrated in urban areas, especially in Yerevan and Kotayq. High-
skilled employment includes positions where the median education level is that of a university
degree and includes white-collar managers, professionals, and legislators, whereas, low-skilled
employment includes occupations, such as craft and other trade workers, skilled agricultural
workers, and elementary occupations, where the median education level is secondary education.
As shown in Figure 8, 57 percent of jobs in Armenia are found in urban areas, especially in
Yerevan and Kotayq and of which more are highly skilled jobs. In contrast, most common
employment among rural workers are lowest skilled and lowest earning occupations, including
skilled agricultural work, which constitutes 58 percent of work found in rural communities and
operates almost entirely in the informal labor market. Even so, most jobs are concentrated
disproportionately in Yerevan and Kotayq and 88 percent of workers are employed in low-skilled
work.
Figure 8: Number of employed by occupation type and marz, 2014
Source: World Bank staff calculation using NSS LFS data.
The spatial analyses of Armenia’s population, reveals a statistically significant
association between rural dwelling and incidence of lower educational level and lower higher
earning job prospects. People who lived in rural areas are less likely than their urban counterparts
0
500
1000
1500
2000
2500
3000
Number of employed by occupation type by marz, 2014
Legislators, senior officials, managers Professionals
Technicians Clerks
Service Skilled agricultural workers
Craft workers Operators & Assemblers
Elementary occupations

21
to go to university. They are also more likely to work in a low productivity employment, typically
agricultural work, although low productivity is pandemic to secondary cities as well. This finding
suggests that the government must do more to increase access to tertiary education and higher
earning jobs for all Armenians with special consideration for those located in rural areas.
Obviously, this will require additional fiscal resources or increased efficiencies and we will now
consider some of the current fiscal and public expenditures on the social sectors in view of
considering options for increasing investments or improving efficiencies in education in Armenia.
C. Fiscal environment: education and social sector expenditures
Strategic fiscal policies are critical to achieving strong economic performance,
especially in times of economic downturn. Supply and demand of goods and services are highly
sensitive to the ways in which governments choose to invest scarce public funds like on education
and social sectors. Consequently, fiscal policies can improve or hinder economic growth. For this
reason, fiscal policies become especially important in times of economic downturn. Strategic fiscal
policies should not only aim to correct economic imbalances and stimulate growth, but it should
also seek to raise the living standards of all members of society in the short and long-term as this
in turn fuels sustained economic development.
Even though public spending has increased significantly, the allocation of public
resources raises concerns over efficiency and its impact on education investment. The general
public expenditure increased by more than 5 percent during the 2012–2015 period and reached
29.4 percent of GDP in 2015. Nevertheless, the upward spending revisions were spread over all
major economic items. Social transfers, the acquisition of goods and services, grants, as well as
labor costs (salary increases for civil servants) absorbed the brunt of the adjustment (Figure 9).
Increasing by 1 percentage point of GDP, social allowances and pensions accounted for the largest
fiscal increases – areas that will likely be further burdened in the future with the aging population.
At the same time, interest payments surged from 1.0 percent of GDP in 2013 to 1.5 percent in
2015, due in part also to the devaluation of the local currency. Subsidies also picked up, reaching
0.7 percent of GDP. In 2015, capital spending increased for the first time since 2009, reaching 2.9
percent of GDP, as authorities made efforts to improve the execution of the capital budget,
however as a reflection of the dire fiscal constraint counterpart funding like for the Education
Sector Improvement Project has been reduced for 2017 (World Bank, 2016b). Armenia’s fiscal
policy appears to be equitable, but the small scope of public programs limit their potential effects
on the population’s welfare and inequality has risen (the Gini index rose from 0.24 in 2008 to 0.28
in 2014) (World Bank, 2016b). Moreover, efficiency scores of social spending reveal that the same
outcomes could be achieved with 50 to 60 percent of the current category spending (World Bank,
2015d). Thus, showing that there is room for more efficiency in the social services spending.

22
Figure 9: Central government expenditures by
economic classification, 2008-2015
Source: World Bank (2016). Programmatic fiscal work: supporting
effective fiscal management.
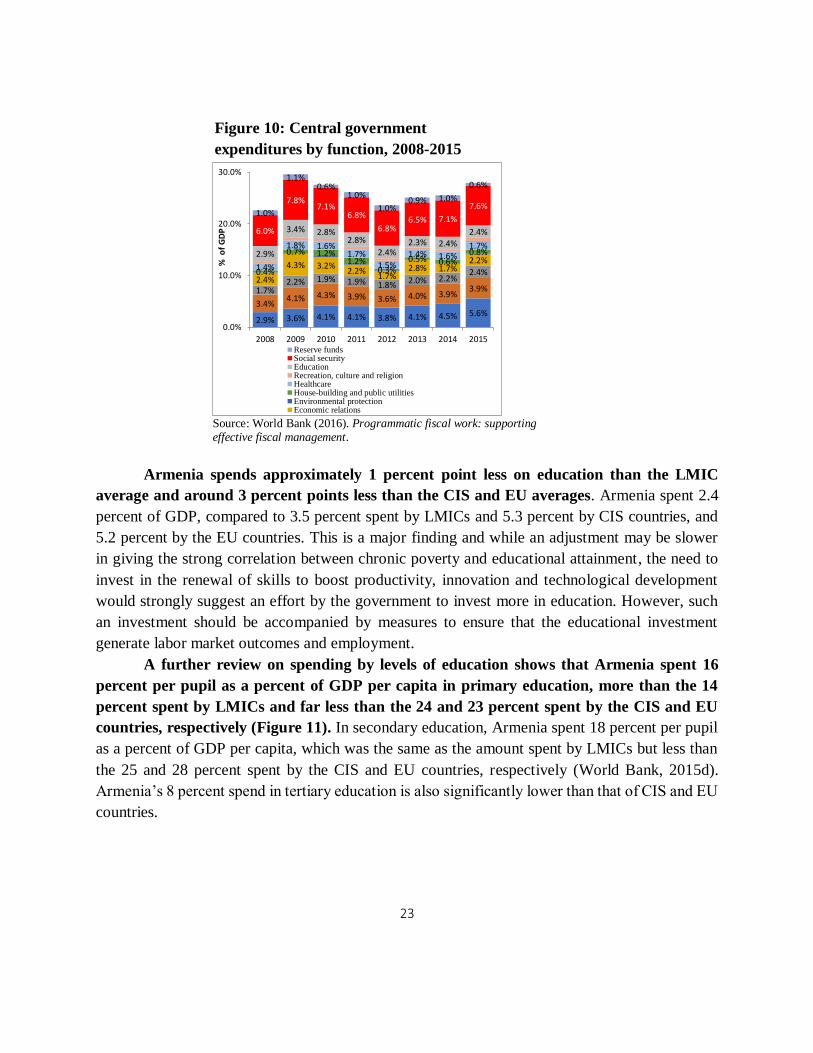
While a strong social protection system is responsible for preventing poverty,
education, a critical area of social expenditures, remains low. Social protection, in particular
the Family Benefit Program (FBP), has played a prominent role in reducing poverty. In 2012,
social protection lifted 14 percent of the population out of poverty5 (World Bank, 2016b). Among
households below the poverty line with or without FBP cash transfers, the former spent more on
education than the latter (US$11.1 for recipients vs. US$6.7 for non-recipients measured in 2005
PPP dollars) and more on miscellaneous items (US$194 vs. US$21) (World Bank, 2016b). If we
extend the comparison to those below the upper poverty line, the results are preserved and
amplified for the education expenses: family benefit recipients spend almost three times more in
education than non-recipients (7 vs. 18.5) (World Bank, 2016b). Nevertheless, spending on
education accounts for only 11 percent of the category spend and 2.4 percent of GDP. Although it
has increased by 0.1 percentage point from 2013, it has not regained its highest level of 3.4 percent
last seen in 2009 (Figure 10). Meanwhile, social security and environmental protection take the
lion’s share of the category spend and in 2015 increased by 0.5 percent and 1.1 percent,
accordingly.
5 The simulations also show that the average percentage shortfall in consumption expenditure for the population,
from the poverty line, would increase by 3.5 percent without the transfer.
2.5% 0.6% 0.5% 0.5% 0.5% 0.5% 0.6% 0.7%
1.8%2.4% 2.3% 2.2% 2.0% 2.2% 2.5% 2.8%
3.8% 4.9% 4.6% 4.5% 4.8% 4.7% 4.9% 5.1%0.3% 0.5% 0.9% 0.9% 1.0% 1.0% 1.3% 1.5%2.3% 2.5% 2.7% 2.6% 2.6% 2.7% 2.9% 3.0%5.8%
7.6% 7.1% 6.8% 6.8% 6.5%7.2%
7.8%3.5%
4.3% 4.0% 3.8% 2.9% 4.6%3.5%
3.7%4.7%
7.0%5.5% 4.7%
3.1%2.8% 2.8%
3.4%
-5.0%
0.0%
5.0%
10.0%
15.0%
20.0%
25.0%
30.0%
2008 2009 2010 2011 2012 2013 2014 2015
% o
f G
DP
Subsidies Payment for labor
Acquisition of services and goods Interest paymentsGrants Social allowances and pensions
Other expenses Fixed assets
Reserves Non-produced assets
Receipts from alienation of NFA
23
Source: World Bank (2016). Programmatic fiscal work: supporting effective fiscal management.
Armenia spends approximately 1 percent point less on education than the LMIC
average and around 3 percent points less than the CIS and EU averages. Armenia spent 2.4
percent of GDP, compared to 3.5 percent spent by LMICs and 5.3 percent by CIS countries, and
5.2 percent by the EU countries. This is a major finding and while an adjustment may be slower
in giving the strong correlation between chronic poverty and educational attainment, the need to
invest in the renewal of skills to boost productivity, innovation and technological development
would strongly suggest an effort by the government to invest more in education. However, such
an investment should be accompanied by measures to ensure that the educational investment
generate labor market outcomes and employment.
A further review on spending by levels of education shows that Armenia spent 16
percent per pupil as a percent of GDP per capita in primary education, more than the 14
percent spent by LMICs and far less than the 24 and 23 percent spent by the CIS and EU
countries, respectively (Figure 11). In secondary education, Armenia spent 18 percent per pupil
as a percent of GDP per capita, which was the same as the amount spent by LMICs but less than
the 25 and 28 percent spent by the CIS and EU countries, respectively (World Bank, 2015d).
Armenia’s 8 percent spend in tertiary education is also significantly lower than that of CIS and EU
countries.
Figure 10: Central government
expenditures by function, 2008-2015
2.9% 3.6% 4.1% 4.1% 3.8% 4.1% 4.5% 5.6%3.4%
4.1% 4.3% 3.9% 3.6% 4.0% 3.9%3.9%1.7%
2.2% 1.9% 1.9% 1.8% 2.0% 2.2%2.4%
2.4%
4.3% 3.2%2.2%
1.7%2.8% 1.7%
2.2%
0.4%
0.7% 1.2%1.2%
0.3%0.5% 0.6%
0.8%
1.4%
1.8% 1.6%1.7%
1.5%1.4% 1.6%
1.7%2.9%
3.4% 2.8%2.8%
2.4%2.3% 2.4%
2.4%6.0%
7.8%7.1%
6.8%
6.8%6.5% 7.1%
7.6%1.0%
1.1%0.6%
1.0%
1.0%0.9% 1.0%
0.6%
0.0%
10.0%
20.0%
30.0%
2008 2009 2010 2011 2012 2013 2014 2015
% o
f G
DP
Reserve fundsSocial securityEducationRecreation, culture and religionHealthcareHouse-building and public utilitiesEnvironmental protectionEconomic relations

24
Figure 11: Government spending in the social sectors as percentage of GDP, 2015
Source: World Bank. (2015). PER.
Despite relatively low social spending, Armenia performs fairly efficiently as
compared to CIS and LMIC group averages, but still has some room for improvement. In
terms of poverty as measure by HDI, on average, Armenia performs better than LMICs and CIS,
but lags behind EU. The adult literacy rate in Armenia outperforms LMICs and is on par with both
CIS and EU countries (World Bank, 2016b). In terms of gross primary enrollment and net
secondary enrollment ratio and completion rate, Armenia outperforms LMICs, is on par with CIS
countries, and is lagging behind the EU countries. When it comes to lower secondary completion
rate and tertiary gross enrollment, Armenia performs better than LMICs, but lags behind both CIS
and EU countries. Figure 12 shows Armenia’s relatively good performance in primary and
secondary education.
Figure 12: Government spending in the social sector as percentage of GDP, 2015
0 6 12 18
Education Spending
Public + Private healthSpending
Health Spending
Social Services Spending
ARM LMIC
CIS EU
Source: World Bank. (2016). Programmatic fiscal work: supporting effective fiscal management.Note: Data coverage and basis are as follows: General govenment cash basis: BGR, BLR, CZE,EGY, GEO, IDN, MDA, LVA,
MDA, SVN, SRB, UKR and UZB. Central government, cash basis: ARM, GTM, HRV, LKA, PHL and SWZ. The rest are
general government on accrual basis. Data on private health spending for most of LMICs is not available.
Co
un
try
GEO
FRA
GB
R
RO
M
NLD
PR
T
IRL
AR
M
CZE
DEU
HU
N
SVK
UK
R
LTU
FIN
ESP
BEL
BG
R
ITA
EST
LVA
LUX
AU
T
PO
L
SWE
DN
K
SVN
CYP
MD
A
Pri
mar
y
edu
cati
on
spen
din
g
10
.7
18
.4
26
.4
11
.8
18
.4
21
.9
19
.7
16
.2
16
.3
18
.3
19
.6
19
.9
28
.1
20
.8
21
.1
21
.8
22
.9
22
.8
22
.8
23
.0
24
.7
24
.8
25
.5
27
.4
27
.6
28
.9
30
.6
34
.1
39
.5
Effi
cien
cy
1.0
0
1.0
0
1.0
0
0.9
0
0.8
5
0.7
6
0.6
6
0.6
6
0.6
6
0.5
8
0.5
4
0.5
3
0.5
3
0.5
1
0.5
1
0.4
9
0.4
9
0.4
7
0.4
7
0.4
6
0.4
3
0.4
3
0.4
2
0.3
9
0.3
9
0.3
7
0.3
5
0.3
1
0.2
7
Most efficient Least efficient
Efficiency Scores Single Input- Output DEA: Input= Primary Education per Pupil Spending; Output= Primary gross enrollment
Color scales: green =high efficiency/low spending; yellow =medium efficiency/medium spending; and red =low efficiency/high spending.

25
Source: World Bank. (2016). Programmatic fiscal work: supporting effective fiscal management.
In sum, Armenia should consider rationalizing its social protection spending to
increase efficiencies within the category spending and potentially allocate additional funds
for education to reach comparable levels of other CIS/EU countries. It will have to align with
social services expenditures of other CIS/EU countries if it is to succeed to kick-starting its social
and economic development once again. Increasing funding for education would also in large part
focus on boosting productivity levels in Armenia one of the only ways to counter the declining
population, workforce as well as staying competitive.
D. Productivity and the labor market
Recent years have been marked by growth in key sectors of the Armenian economy,
fueling the demand for highly educated and skilled and technical workers. Following a recent
burst in the construction bubble, structural transformations have shifted more jobs in other areas
of the economy. The sector that benefited the most from this shift was services, which experienced
a 6.9 percent average annual growth rate in GDP (Figure 13). Agriculture and industry also
experienced some productivity growth, each averaging 3.3 percent annual gains. Services now
employs the greatest percentage of the population at approximately 47.7 percent. Additionally,
since 2006, the information technology and high-technology sector has become one of the fastest
growing sectors in Armenia. The driving factor behind Armenia’s competitiveness was the
availability of relatively cheap and competitive human resources. Due to the growing number of
IT companies in Armenia, demand for IT specialists will continue to increase. Per conservative
estimates, if the market and productivity continue to grow with an average rate of 18 percent and
1 percent respectively, the absorption potential of additional IT specialists will grow at a rate of
17 percent annually and reach 15,000 by 2017 (World Bank, 2014a). This level of growth requires
a higher level of knowledge and skills.
Co
un
try
GEO
IRL
LTU
RO
M
FRA
LUX
ITA
AR
M
ESP
EST
UK
R
BG
R
SVN
SWE
DN
K
FIN
CYP
MD
A
Seco
nd
ary
edu
cati
on
spen
din
g
15
.0
29
.0
20
.0
12
.0
28
.0
20
.0
24
.0
18
.0
27
.0
28
.0
27
.0
24
.0
31
.0
32
.0
33
.0
36
.0
41
.0
38
.0
Effi
cien
cy
1.0
0
1.0
0
1.0
0
1.0
0
0.8
7
0.8
2
0.7
6
0.7
5
0.7
2
0.6
3
0.6
0
0.6
0
0.5
8
0.5
7
0.5
3
0.5
0
0.4
3
0.3
2
Most efficient Least efficient
Efficiency Scores Single Input-multiple Output DEA: Input= Secondary Education per Pupil Spending; Output=Secondary net enrollment and completion rate
Color scales: green =high efficiency/low spending; yellow =medium efficiency/medium spending; and red =low efficiency/high spending.

26
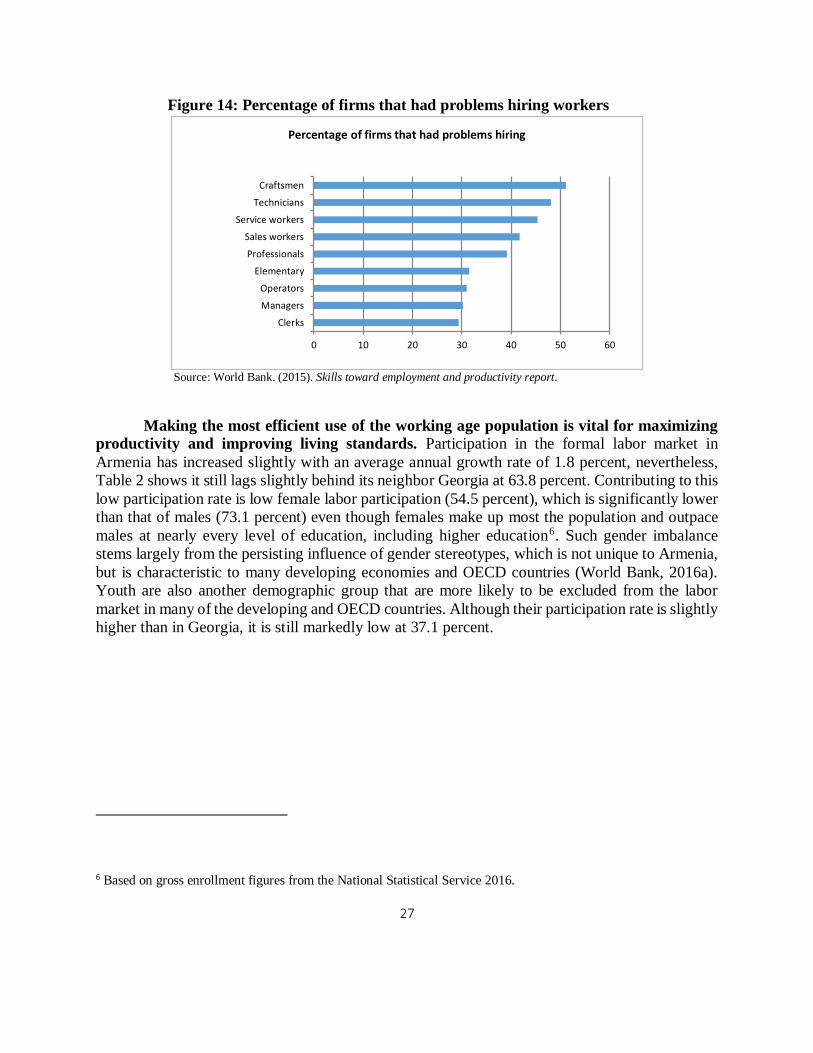
Creating more productive and high-earning jobs can only benefit the economy if these
jobs can be filled quickly by capable Armenian workers. Armenia stands out in the region with
a high tertiary education enrollment of 52.9 percent and even higher 91.6 percent enrollment in
general education in 2015, but as mentioned earlier this high attainment level hides the fact that
the lion’s share of this are female graduates that do not enter the labor market. Further, 90 percent
of employers struggle to find workers with the right skills (World Bank, 2015a). According to
Figure 14, employers have the most difficulty hiring blue-collar workers (i.e. craft and related
workers), followed by low-skilled white-collar (i.e. sales and service workers), and highly skilled
white-collar (i.e. professionals). The most sought after skillsets are cognitive and job-related skills,
followed by socioemotional skills. Yet, employers believe the education system, particularly
vocational and secondary education, are not sufficiently preparing workers with these skills. The
increased GDP growth in the services and industry sector, has only fueled the demand for blue-
collar and low white-collar workers, which is why equipping workers with practical and updated
skills will only help to increase labor market efficiency and overall productivity.
0
500000
1000000
1500000
2000000
2500000
Agriculture Construction Industry Services
GDP production by sector 2011-2014 (in AMD)
2011 2012 2013 2014
Source: World Bank staff calculation based on data from the CBA.
Figure 13: GDP production by sector, 2011-2014 (in AMD)
27
Figure 14: Percentage of firms that had problems hiring workers
Source: World Bank. (2015). Skills toward employment and productivity report.
Making the most efficient use of the working age population is vital for maximizing
productivity and improving living standards. Participation in the formal labor market in
Armenia has increased slightly with an average annual growth rate of 1.8 percent, nevertheless,
Table 2 shows it still lags slightly behind its neighbor Georgia at 63.8 percent. Contributing to this
low participation rate is low female labor participation (54.5 percent), which is significantly lower
than that of males (73.1 percent) even though females make up most the population and outpace
males at nearly every level of education, including higher education6. Such gender imbalance
stems largely from the persisting influence of gender stereotypes, which is not unique to Armenia,
but is characteristic to many developing economies and OECD countries (World Bank, 2016a).
Youth are also another demographic group that are more likely to be excluded from the labor
market in many of the developing and OECD countries. Although their participation rate is slightly
higher than in Georgia, it is still markedly low at 37.1 percent.
6 Based on gross enrollment figures from the National Statistical Service 2016.
0 10 20 30 40 50 60
Clerks
Managers
Operators
Elementary
Professionals
Sales workers
Service workers
Technicians
Craftsmen
Percentage of firms that had problems hiring

28
Table 2: Armenia and Georgia labor force participation rate (as percentage of
total), 2011-2014
2010 2011 2012 2013 2014
Armenia
Male 72.3 72.4 72.0 72.6 73.1
Female 50.9 53.8 53.9 54.2 54.5
Youth 15-24 36.1 37.8 36.5 36.9 37.1
Total 61.6 63.1 63.0 63.4 63.8
Georgia
Male 73.9 74.3 74.7 75.1 75.5
Female 55.6 55.9 56.2 56.5 56.8
Youth 15-24 31.9 32.4 32.9 33.4 33.9
Total 64.0 64.3 64.7 65.0 65.4
Source: World Bank. World Development Indicators, 2010-2014.
Labor market participation not only stimulates greater economic productivity, but it also reduces
poverty. Specifically, the lack of employment increases the risk of being poor or extremely poor.
This is evidenced by the fact that the 2015 poverty rate among households with no employed
members was 35.2 percent, which was 6.5 percentage points higher than the national average (See
Table 5 in Annex) (NSS & World Bank, 2016). Therefore, it is critical to encourage the
participation of more women and youth in the Armenian economy through education and skills
preparation, which we will discuss in the next chapter.
3. Challenges in the Education Sector
A. Recent education reforms and outcomes
Since the late 1990s, education, particularly general secondary education, has been a
priority sector for the government of Armenia; thus, considerable progress has been made
to improve the access to and quality of general education. Armenia has achieved nearly
universal enrollment rates for primary (grades 1-4) and lower secondary (5-9 grades) education.
In addition, implementation of the per capita financing mechanism in which the allocation of a
given amount of budgetary resources between schools depends on the number of students enrolled,
resulted in substantial efficiency gains, increased student-teacher ratios, and enhanced school
autonomy in the mid-2000s (World Bank, 2012c). In terms of quality, an array of reforms have
taken place. The government developed the National Curriculum Framework, standards, and
syllabi, and extended the general education system from 10 to 12 years with an introduction of
high schools that offer specialized streams (see Figure 26 in Annex for education structure). It
29
established the Assessment and Testing Center (ATC), which enhanced the capacity to assess
student performance and introduced a transparent UEE for universities and colleges. Additionally,
nearly all schools in Armenia now have access to the internet and the government is planning to
develop more e-contents to maximize the benefit of internet access (World Bank, 2012c).
Teacher management is another core area of reforms. There has been improvement in
the transparency of the teacher hiring process. While up to 2011 teachers were hired by the school
principals without a competitive selection process, now teacher vacancies are announced publicly,
and a selection committee comprised of the school council, MoES representative and other
members make the selection. Teacher salaries are differentiated by the following factors: teaching
load, geographic area, education level, years of service, as well as by the ranking (1-4) obtained.
Every five years, teachers go through a mandatory pre-attestation training. In 2015, the full cycle
of training was completed, i.e., all teachers in the country went through the pre-attestation training.
Those who took part in 2011 will go through the next cycle of training. Funded by the GoA, the
training focuses on knowledge of education-related laws, but does not examine the use and
effectiveness of teaching skills.
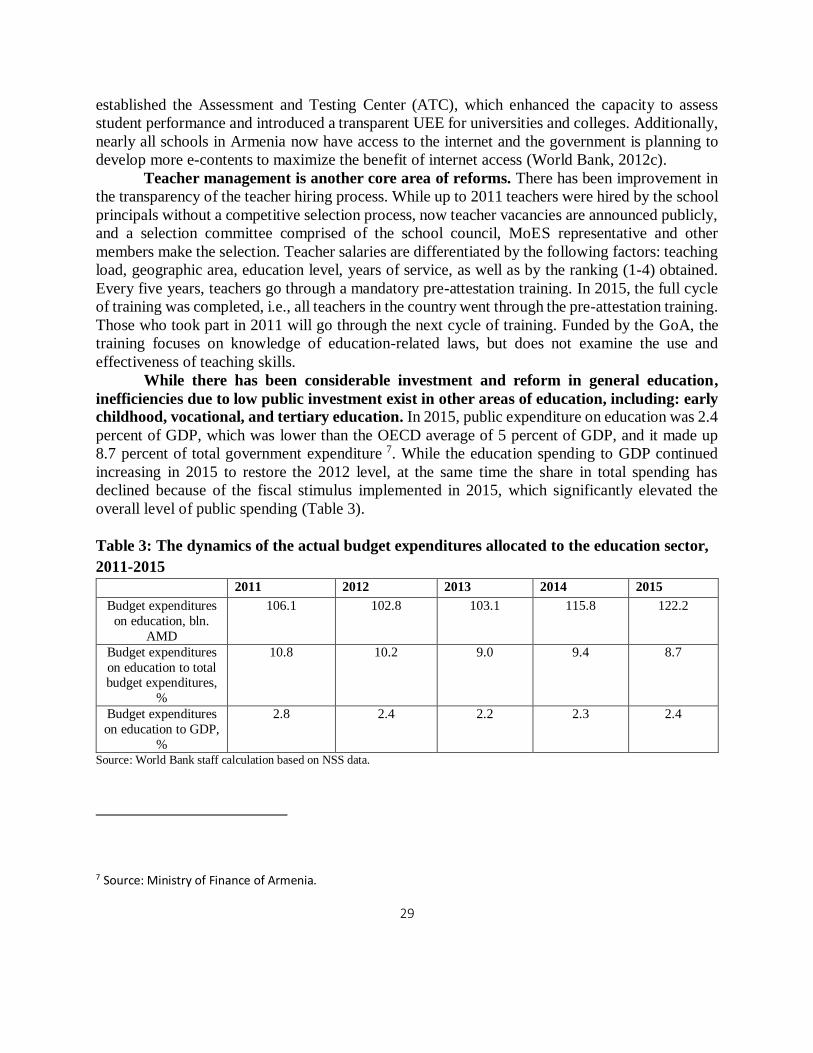
While there has been considerable investment and reform in general education,
inefficiencies due to low public investment exist in other areas of education, including: early
childhood, vocational, and tertiary education. In 2015, public expenditure on education was 2.4
percent of GDP, which was lower than the OECD average of 5 percent of GDP, and it made up
8.7 percent of total government expenditure 7. While the education spending to GDP continued
increasing in 2015 to restore the 2012 level, at the same time the share in total spending has
declined because of the fiscal stimulus implemented in 2015, which significantly elevated the
overall level of public spending (Table 3).
Table 3: The dynamics of the actual budget expenditures allocated to the education sector,
2011-2015
2011 2012 2013 2014 2015
Budget expenditures
on education, bln.
AMD
106.1 102.8 103.1 115.8 122.2
Budget expenditures
on education to total budget expenditures,
%
10.8 10.2 9.0 9.4 8.7
Budget expenditures
on education to GDP,
%
2.8 2.4 2.2 2.3 2.4
Source: World Bank staff calculation based on NSS data.
7 Source: Ministry of Finance of Armenia.

30
Figure 15 shows public spending is lower in pre-primary (0.5 percent), vocational (7.3 percent),
and tertiary (9.1 percent) education. Consequently, early childhood education coverage is very low
with rural areas most disadvantaged; vocational education threatened to become obsolete with
investments barely above 5 percent of education spending, and tertiary spending less than a third
of the 30.2 OECD average spending on tertiary education. Meanwhile, general education, which
is already performing efficiently, constitutes 66 percent of the current education budget.
Figure 15: Gross enrollment and education spending as percentage of total
education expenditure by education level
Source: World Bank staff calculation based on NSS data.
To improve efficiency and sustain progress in the realm of education, Armenia should
continue to apply per-capita financing; it should consider rationalizing some of its general
education budget to allocate more to underserved, critical areas of its education system,
including early childhood, vocational and tertiary education. The following sections will shed
more light on the existing inefficiencies in the Armenian education system and opportunities for
improvement.
B. Inefficiencies and learning outcomes in the education system
Early childhood education
For over a decade the national government, and in partnership with local and
international organizations, has established programs in each of the essential ECD sectors,
including education. In 2009, the government introduced the National Strategy for Child and
Adolescent Health and Development, a multisectoral ECD strategy to collectively tackle
education, health, nutrition, and child and social protection. Some of the government-led
interventions, such as the Expanded Programme on Immunization, Prenatal Health Programme
and Breastfeeding Promotion Programs operate nationally. Alongside the government, many
Pre-primary GeneralPreliminary
VET
SecondaryVET
Tertiary
Gross enrollment rate 28.6 96.3 7.2 10.9 52.9
% of education spending 0.5 66 2.1 5.2 9.1
0
20
40
60
80
100
120
2015 Gross enrollment rate and percentage of public expenditure on
education by level

31
development partners, such as Children of Armenia Fund, Save the Children, UNICEF, the World
Food Programme (WFP), the World Bank, World Vision, the World Health Organization (WHO),
and the Global Alliance for Vaccines and Immunization (GAVI) to list a few, are active in ECD,
implementing complementary capacity building activities in the effort to improve ECD in Armenia
(World Bank, 2012b). In education, the government passed the Law on Preschool Education,
adopted in 2005, which grants children the right to receive preprimary education from a preschool
institution, family or private instruction. It has also implemented a preschool education reform
strategy, the “School Readiness Program,” which aims to improve the school readiness of children
entering primary school. It was first piloted and later enhanced under the first and second World
Bank-funded Education Quality and Relevance Projects (EQRP) in 2004-2009 and 2009-2014;
and continues to be implemented under the Education Improvement Project supporting the
government of Armenia’s efforts to increase preschool enrollment, focusing on vulnerable
populations (including minority ethnic groups and children of disabilities), as a means of
improving school readiness of 5 and 6 year old children entering primary education.
The investments made in preschool education as part of the Bank supported
education improvement project seem to have a positive impact on the school readiness of
children benefiting from the micro-projects. The government has recently commissioned a
School Readiness Study to evaluate the impact of the preschool education micro-projects on child
development implemented in the frames of the Bank supported Education Improvement Project in
Armenia. According to the results of this study, students which have been exposed to preschool
education perform better on multiple dimensions measured by the Early Development Instrument
(EDI) vis-à-vis to the students in the control group, who have not been participated in preschool
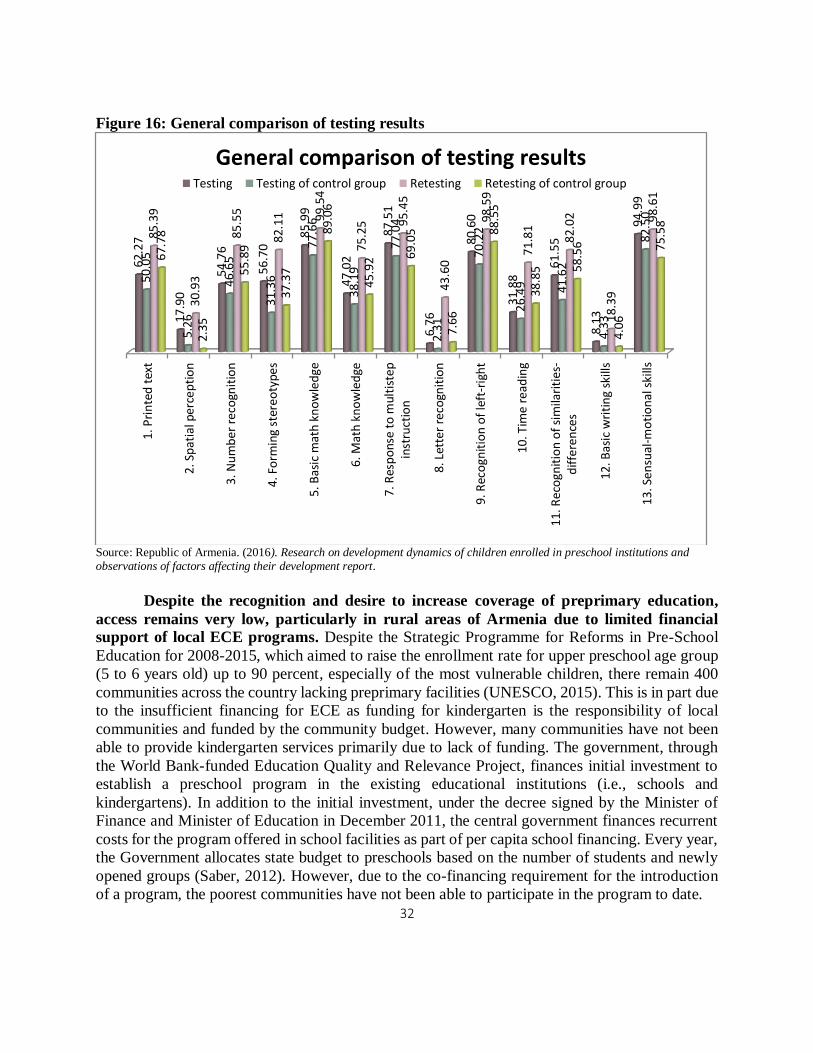
education (RA, 2016). As shown in Figure 16 below, students participating in preschool projects
score 34 percent higher in logic and critical thinking, and 27 percent higher in early reading vis-à-
vis their peers without preschool exposure.
32
Figure 16: General comparison of testing results
Source: Republic of Armenia. (2016). Research on development dynamics of children enrolled in preschool institutions and observations of factors affecting their development report.
Despite the recognition and desire to increase coverage of preprimary education,
access remains very low, particularly in rural areas of Armenia due to limited financial
support of local ECE programs. Despite the Strategic Programme for Reforms in Pre-School
Education for 2008-2015, which aimed to raise the enrollment rate for upper preschool age group
(5 to 6 years old) up to 90 percent, especially of the most vulnerable children, there remain 400
communities across the country lacking preprimary facilities (UNESCO, 2015). This is in part due
to the insufficient financing for ECE as funding for kindergarten is the responsibility of local
communities and funded by the community budget. However, many communities have not been
able to provide kindergarten services primarily due to lack of funding. The government, through
the World Bank-funded Education Quality and Relevance Project, finances initial investment to
establish a preschool program in the existing educational institutions (i.e., schools and
kindergartens). In addition to the initial investment, under the decree signed by the Minister of
Finance and Minister of Education in December 2011, the central government finances recurrent
costs for the program offered in school facilities as part of per capita school financing. Every year,
the Government allocates state budget to preschools based on the number of students and newly
opened groups (Saber, 2012). However, due to the co-financing requirement for the introduction
of a program, the poorest communities have not been able to participate in the program to date.
1. P
rin
ted
tex
t
2. S
pat
ial p
erce
pti
on
3. N
um
ber
rec
ogn
itio
n
4. F
orm
ing
ster
eoty
pes
5. B
asic
mat
h k
no
wle
dge
6. M
ath
kn
ow
led
ge
7. R
esp
ons
e to
mul
tist
epin
stru
ctio
n
8. L
ette
r re
cogn
itio
n
9. R
eco
gnit
ion
of
left
-rig
ht
10. T
ime
read
ing
11. R
eco
gnit
ion
of
sim
ilari
ties
-d
iffe
ren
ces
12. B
asic
wri
tin
g sk
ills
13
. Se
nsu
al-m
oti
on
al s
kills
62.2
7
17.9
0
54.7
6
56.7
0
85.9
9
47.0
2
87.5
1
6.76
80.6
0
31.8
8
61.5
5
8.13
94
.99
50.0
5
5.26
46.6
5
31.3
6
77.6
6
38.1
9
77.0
4
2.31
70.2
2
26.4
9 41.6
2
4.33
82.5
0
85.3
9
30.9
3
85.5
5
82.1
1 99.5
4
75.2
5 95.4
5
43.6
0
98.5
9
71.8
1
82.0
2
18.3
9
98.6
1
67.7
8
2.35
55.8
9
37.3
7
89.0
6
45.9
2 69.0
5
7.66
88.5
5
38.8
5 58.5
6
4.06
75.5
8
General comparison of testing resultsTesting Testing of control group Retesting Retesting of control group
33
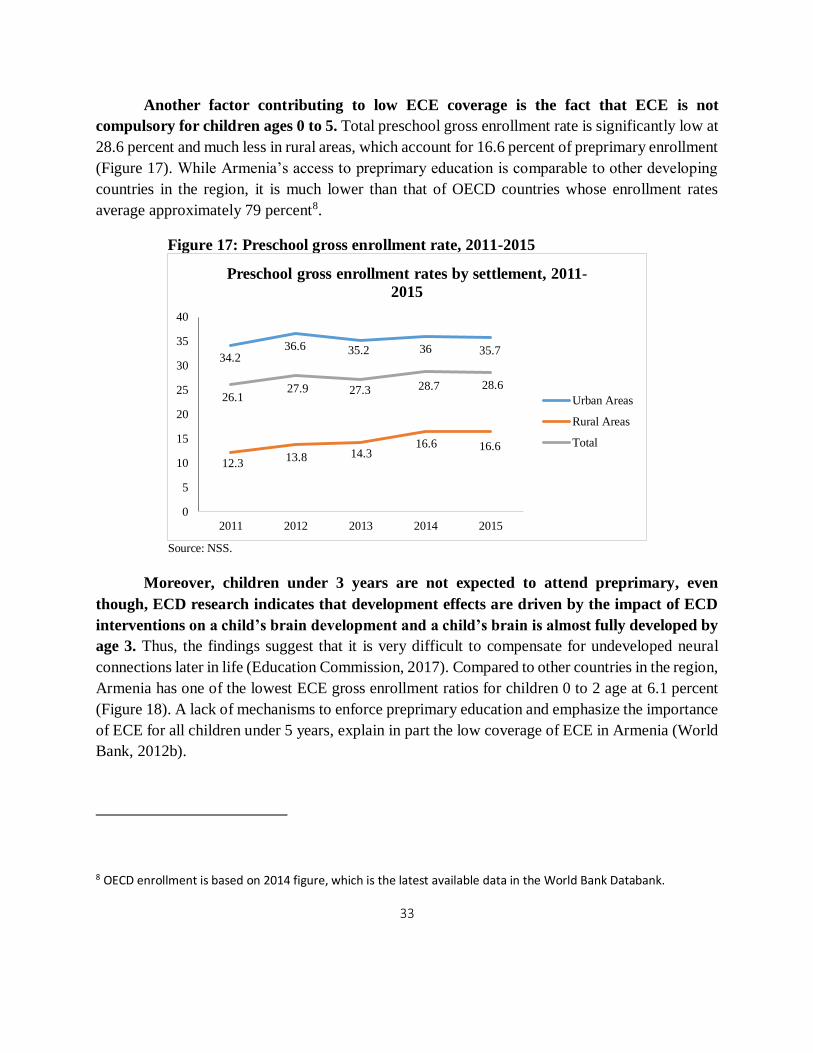
Another factor contributing to low ECE coverage is the fact that ECE is not
compulsory for children ages 0 to 5. Total preschool gross enrollment rate is significantly low at
28.6 percent and much less in rural areas, which account for 16.6 percent of preprimary enrollment
(Figure 17). While Armenia’s access to preprimary education is comparable to other developing
countries in the region, it is much lower than that of OECD countries whose enrollment rates
average approximately 79 percent8.
Figure 17: Preschool gross enrollment rate, 2011-2015
Source: NSS.
Moreover, children under 3 years are not expected to attend preprimary, even
though, ECD research indicates that development effects are driven by the impact of ECD
interventions on a child’s brain development and a child’s brain is almost fully developed by
age 3. Thus, the findings suggest that it is very difficult to compensate for undeveloped neural
connections later in life (Education Commission, 2017). Compared to other countries in the region,
Armenia has one of the lowest ECE gross enrollment ratios for children 0 to 2 age at 6.1 percent
(Figure 18). A lack of mechanisms to enforce preprimary education and emphasize the importance
of ECE for all children under 5 years, explain in part the low coverage of ECE in Armenia (World
Bank, 2012b).
8 OECD enrollment is based on 2014 figure, which is the latest available data in the World Bank Databank.
34.236.6 35.2 36 35.7
12.313.8 14.3
16.6 16.6
26.127.9 27.3 28.7 28.6
0
5
10
15
20
25
30
35
40
2011 2012 2013 2014 2015
Preschool gross enrollment rates by settlement, 2011-
2015
Urban Areas
Rural Areas
Total

34
Figure 18: ECE gross enrollment ratio for children ages 0 to 2, 2014/15
Source: TransMonEE database, 2016.
Two countries that have been able to address similar challenges to ECE financing and
coverage as Armenia are Bulgaria and Mexico. Learnings from their successes and lessons are
worthy of consideration for Armenia. See Box 1.below for more information.
16.2
5.9
37.7
3.4
19.2
33.8
25.8
18.0
3.8
19.0 19.4
14.7 14.1
6.1
0.0
5.0
10.0
15.0
20.0
25.0
30.0
35.0
40.0H
UN
GA
RY
PO
LA
ND
SL
OV
EN
IA
RO
MA
NIA
CR
OA
TIA
ES
TO
NIA
LA
TV
IA
RU
SS
IAN
FE
DE
RA
TIO
N
BO
SN
IA A
ND
HE
RZ
EG
OV
INA
SE
RB
IA
BE
LA
RU
S
MO
LD
OV
A
UK
RA
INE
AR
ME
NIA
C E N T R A L E U R O P E B A L T I C S A N D N O R T H E R N E U R O P E
R U S S I A N F E D .
S O U T H E A S T E R N E U R O P E A N C O U N T R I E S O R W E S T E R N B A L K A N
O T H E R E A S T E R N E U R O P E
S O U T HC A U C A S U S
ECE GROSS ENROLLMENT RATIO FOR CHILDREN AGED 0-2, 2014/15

35
Box 1. International ECE interventions for Armenia
Bulgaria: The Bulgaria Social Inclusion Project (SIP) aims to reach children from poor households and ethnic minorities who
receive fewer years of schooling, including preschool education. While two years of preschool for 5 or 6-year-olds is in principle
compulsory, many children from poor families, rural areas, and minorities, do not attend. In 2007, a $59 million World Bank
loan was provided to the Government of Bulgaria (GoB) to promote social inclusion in ECE through a national school readiness
program. The Social Inclusion Project (SIP) includes integrated social and childcare services with family-focused social services
for children aged 0–3, and their parents, as well as formal kindergarten and childcare services for children aged 3–6. The project
targets low-income and marginalized families, including children with disabilities and other special needs. Two main features
and lessons from this project are worth emphasizing for Armenia:
o Municipalities were supported through finance and capacity building. Based on their needs, municipalities chose
projects that they then managed locally from a menu of community subprojects, including both early childhood care
and education (ECCE) services and infrastructure investments. To determine the eligibility of the municipalities as
well as priority expenditures in each municipality, the project used targeting criteria, including the relative share of
children and families on social assistance, municipal demand, efficiency requirements, and a sufficient number of
potential beneficiaries and community stakeholders. In the design and early implementation phases, the project had
success in working with and addressing the needs of local municipalities. Adapting to municipal demand was crucial.
For example, when municipalities noted that conditionality clauses were unreasonable, the project was redesigned to
better fit municipal demand. The project also promoted local capacity building for improved management and
coordination. As of 2012, 133 municipal staff members had been trained in improved project management areas,
including multisectoral cooperation, subcontracting and cooperation with nongovernmental organizations (NGOs),
and accessing funding.
o The project intends to increase parental demand for services through fee reduction (conditional on participation in
employment programs) and transportation to the centers. The project compensates municipalities for reduced
kindergarten fees so that it will be more affordable for low-income parents to send their children to kindergarten.
Parents can access reduced kindergarten fees only if they also enroll in training and employment programs, which
helped generate demand for those programs. In addition, transport is offered to parents to increase the accessibility to
ECCE services.
Mexico: ECD component of the Compensatory Education Project, the Mexican agency, Consejo Nacional para el Fomento
Educativo (National Council for Education Development; CONAFE) has been serving hard-to-reach populations using
innovative and low-cost service-delivery models. Recognizing the importance of helping children start off right, CONAFE
launched in 1998 Educación Inicial to improve child development and school readiness for 0–4-year-olds and their parents. One
of the largest programs in the Latin America and the Caribbean region, Educación Inicial reaches an estimated 400,000 children
and their parents. The World Bank Compensatory Education Project (CEP) ($100 million) aimed to increase the breadth of the
program to include 172 of the poorest and hardest to reach municipalities in the country. CEP included an ECD component
($30 million) that was designed to strengthen the Educación Inicial program. CONAFE’s approach uses existing assets, such
as preschools and public spaces, for meeting areas and a network of volunteers to teach the parenting education classes. This
community-based approach has been successful and cost effective in improving parenting practices and contributes to children’s
comprehensive development and school readiness. The measures help ensure that high-quality services were provided to
CONAFE’s target population, while keeping costs to a reasonable $112 per child per year, thereby allowing the government to
serve large numbers of beneficiaries in a sustainable manner. Two interesting features and lessons from this project are
emphasized below for Armenia:
o Early stimulation interventions were emphasized. An evaluation conducted in 2009 revealed that while CONAFE’s
approach was demonstrating good results, the model was not fully exploiting the opportunity for providing direct
early stimulation services. The latest generation of Educación Inicial trained volunteers interacting directly with the
children during the sessions, to both maximize the presence of the volunteer and provide more hands-on training to
parents. Special early stimulation sessions for children below four were also incorporated, in an effort to maximize
impact.
o ECD programs were adapted with to better serve marginalized groups, such as Mexico’s indigenous population
through the consultation of indigenous leaders and members of the community.
Source: World Bank. (2015d). Investing in Early Childhood Development.
36
Given the research indicating the importance of early childhood education in an
individual’s neural development and long term success, it is imperative that Armenia seek
to expand the provision of ECE nationally. The ongoing Education Improvement project, which
includes expanding ECE coverage and learnings from international contexts with similar ECE
challenges, set a good precedent for Armenia to systematically implement ECE across the country.
Although general education performs relatively efficiently in Armenia, its
unrelentingly low student-to-teacher ratio reveal opportunities for improved efficiency. In
Armenian general education, total student enrollment of nearly 360,000 in 2010/11 was 100,000
lower than five years earlier (World Bank, 2012c). In 2015/16, the total student enrollment was
364,3989. While enrollment declined by more than 22 percent between 2005/06 and 2010/11, the
size of the teacher workforce and the number of schools remained largely flat. In 2010/11,
Armenia’s 1,365 general education state schools employed 39,021 teaching staff, compared to
1,367 schools employing 40,069 teachers in 2005/06 (World Bank, 2012c). In 2015/16, there were
38,690 teachers employed in general education schools of the country. Therefore, the average
student-to-teacher ratio in Armenia—which was already low at 11.5—further declined to 9.2 by
2010/11 and in 2015/16 it was 9.410. The government has responded by decreasing the teaching
load to part-time, however, this could have implications on teacher quality due to lower average
take home salaries and possibly less motivation to participate in professional development.
Regional strategies could serve as good examples for Armenia to increase efficiency
in general education while ensuring quality remains in-tact. Nearly all countries in Central and
Eastern Europe have seen falling enrollment in primary and secondary education in recent years
because of region-wide demographic changes and have developed cost-cutting polices that
preserve the quality of education. Key strategies include per-capita financing, which uses formula-
based allocations to give schools incentives for finding more efficient ways of providing education
services 11 . By implementing this strategy, countries like Bulgaria, Romania, and Slovakia
successfully reduced the number of teachers and schools in line with declining student enrollments.
Romania has adopted a hub-and-satellite model, which allow younger children to be taught in one
location (e.g., a small village school), while those in older grades attend a nearby hub school that
serves several neighboring villages12. Meanwhile, other countries have adopted the practice of
multi-grade teaching in rural areas that puts students of different ages in the same classroom with
one teacher. Armenia can consider applying some of these strategies to improve the efficiency and
quality of its general education system13.
Teaching is becoming an aging profession in Armenia, which could have
consequences on teacher quality in general education. The number of teachers working that are
past retirement age, match that of the youngest cohort of teachers just graduating from education
9 National Statistical Service: http://www.armstat.am/file/article/soc_15_2.pdf 10 Ibid 11 World Bank. (2015). Armenia: skills toward employment and productivity report. 12 Ibid 13 Ibid
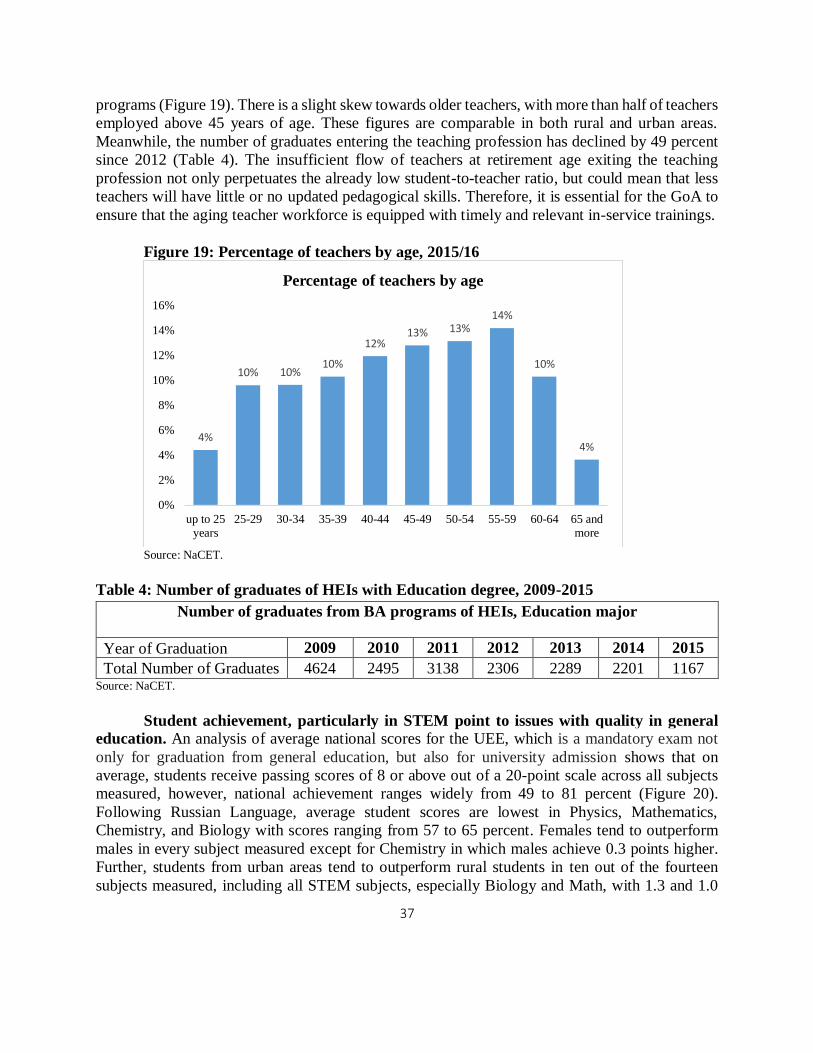
37
programs (Figure 19). There is a slight skew towards older teachers, with more than half of teachers
employed above 45 years of age. These figures are comparable in both rural and urban areas.
Meanwhile, the number of graduates entering the teaching profession has declined by 49 percent
since 2012 (Table 4). The insufficient flow of teachers at retirement age exiting the teaching
profession not only perpetuates the already low student-to-teacher ratio, but could mean that less
teachers will have little or no updated pedagogical skills. Therefore, it is essential for the GoA to
ensure that the aging teacher workforce is equipped with timely and relevant in-service trainings.
Figure 19: Percentage of teachers by age, 2015/16
Source: NaCET.
Table 4: Number of graduates of HEIs with Education degree, 2009-2015
Number of graduates from BA programs of HEIs, Education major
Year of Graduation 2009 2010 2011 2012 2013 2014 2015
Total Number of Graduates 4624 2495 3138 2306 2289 2201 1167 Source: NaCET.
Student achievement, particularly in STEM point to issues with quality in general
education. An analysis of average national scores for the UEE, which is a mandatory exam not
only for graduation from general education, but also for university admission shows that on
average, students receive passing scores of 8 or above out of a 20-point scale across all subjects
measured, however, national achievement ranges widely from 49 to 81 percent (Figure 20).
Following Russian Language, average student scores are lowest in Physics, Mathematics,
Chemistry, and Biology with scores ranging from 57 to 65 percent. Females tend to outperform
males in every subject measured except for Chemistry in which males achieve 0.3 points higher.
Further, students from urban areas tend to outperform rural students in ten out of the fourteen
subjects measured, including all STEM subjects, especially Biology and Math, with 1.3 and 1.0
4%
10% 10%10%
12%13% 13%
14%
10%
4%
0%
2%
4%
6%
8%
10%
12%
14%
16%
up to 25years
25-29 30-34 35-39 40-44 45-49 50-54 55-59 60-64 65 andmore
Percentage of teachers by age

38
points difference. These demographic nuances in UEE performance act as barriers to upper and
tertiary education and enrollment in STEM studies, especially for the socially vulnerable. Regular
monitoring of UEE results will help GoA develop more targeted interventions.
Source: ATC.
By international standards, student achievement in mathematics and science in
Armenia is also lagging. Armenia most recently participated in the Trends in International
Mathematics and Science Study (TIMSS) in 2003, 2007, and 2011. Per TIMSS data, mean scores
of Armenia’s 4th and 8th grade students in Math and Science show a sharp increase from 2003 to
2007, followed by a more pronounced decline from 2007 to 2011 (Figure 21). Given the dramatic
difference in mean scores between 2007 and 2011, which is an unusual trend, comparison for
Armenia has been confined to 2003 and to 2011 only by IEA, which also shows decline from 2003
levels for both subjects and grades. The achievement level for Armenia in TIMSS 2011 lags behind
those of the comparator countries outperforming only Georgia in this group and is slightly below
the international average of 500 (Figure 22). In terms of gender equity in student achievement,
girls outperform boys both in science and math in both grades. These findings indicate that near
14.1
12.0
14
.5
12.4
12.9
13.5
12.8
11
.1
13.9
15.9
16.0
14.5
17.4
15.1
12.5
11.4
13.1
11.1
13
.0
13.0
13.1
8.0
12.8
13.2
15.7
14.1
11
.6
13.711.6
14.111.4 12.9 13.3 12.9
9.813.5 15.3 15.9 14.4 16.2 15.1
0.0
5.0
10.0
15.0
20.0
Arm
enia
n
Lan
guag
e…
Mat
hem
atic
s
Engli
sh
Lan
guag
e
Physi
cs
Bio
logy
Arm
enia
n
His
tory
Chem
istr
y
Russ
ian
Lan
guag
e
Geo
gra
phy
Ger
man
Lan
guag
e
Fre
nch
Lan
guag
e
Worl
d H
isto
ry
Span
ish
Lan
guag
e
Ital
ian
Lan
guag
e
Girls Boys General Average Score
14
.1
12
.0
14
.4
11
.7
14
.2
13
.4
13
.1
10
.2
13
.7
16
.4
14
.2
15
.9
16
.2
14
.3
13
.6
11
.0
13
.0
11
.4
12
.8
12
.1
12
.5
10
.4
13
.8
14
.9
14
.9
15
.0
16
.8
13.711.6
14.111.4
13.3 12.9 12.99.8
13.515.9 14.4 15.3 16.2 15.1
0.0
5.0
10.0
15.0
20.0
Arm
enia
n L
ang
uag
e
and
Lit
erat
ure
Mat
hem
atic
s
En
gli
sh L
angu
age
Ph
ysi
cs
Arm
enia
n H
isto
ry
Bio
logy
Ch
emis
try
Russ
ian
Lan
guag
e
Geo
gra
ph
y
Fre
nch
Lan
gu
age
Wo
rld H
isto
ry
Ger
man
Lan
gu
age
Sp
anis
h L
ang
uag
e
Ital
ian L
ang
uag
e
Urban Rural Total Average Score
Figure 20: National UEE average scores, 2015/16

39
universal access to general education has not necessarily translated into high student achievement
that is widespread. Regular participation in such international student assessments will help
Armenia to benchmark its success and use learnings for better policy-making.
Figure 21: Armenia TIMSS performance, 2011
Source: IEA.
Figure 22: Distribution of TIMSS Grade 4 Math achievement, 2011
Source: IEA.
According to international surveys like TIMMS, traditional teaching styles still
dominate math and science teaching in most countries compared to other subjects, whereas
student-centered learning is relatively rare. Moreover, there is still a clear need for more
contextualization of STEM content in schools, as research shows this to have a positive impact on
student motivation and is especially critical in math. Therefore, it is imperative for Armenia to
reform STEM pedagogies, curricula, and provide teachers with sufficient training and support to

40
deliver more innovative, student-centered learning to improve student motivation and learning
outcomes in STEM.
STEM is also an important focus in higher education as it is essential in supporting
Armenia’s transition into an innovation economy. Armenia lags behind more developed
economies in innovation14. Education, particularly in the science, technology, engineering and
mathematics fields are critical for the advancement of innovation. Nonetheless, enrollment in
STEM in tertiary is very low in comparison to non-STEM subjects (Figure 23). In 2015, only 22
percent of tertiary students enrolled in a STEM program although STEM accounts for
approximately 66 percent of all tertiary programs. In addition, total enrollment in STEM decreased
by 2 percent from 2014 despite overall tertiary enrollment increasing by 3 percent. It is also
important to note that while women make up a higher proportion of students enrolled in tertiary
education, in 2015, only 16 percent of them enrolled in STEM as opposed to 28 percent of males.
This gender difference in STEM also persists in postgraduate programs. More efforts to increase
STEM enrollment and retention is critical to develop the highly skilled workforce Armenia needs
to support the growing high-tech sector. Special consideration should be placed on building
partnerships with the private and social sector to create a pre-university pathway to STEM that is
subsidized and attracts more female students.
Figure 23: Number of tertiary students enrolled in STEM and non-STEM by
gender, 2014-2015
Source: World Bank staff calculation based on ATC data.
14 Source: World Economic Forum’s Global Competitiveness Report, 2016-2017.
2014 2015 2014 2015
Women Men
STEM 18% 16% 30% 28%
Non-STEM 82% 84% 70% 72%
0%
10%
20%
30%
40%
50%
60%
70%
80%
90%
Number of tertiary students admitted in STEM and
non-STEM by gender, 2014-2015

41
Notwithstanding recent reforms, Armenia’s higher education system struggles with
efficiency and quality due to weak governance and financing system. In 2005, the GoA became
a signatory of the Bologna Process, an allegiance currently among 48 European countries that
began in 1999 and aims to improve the quality of higher education. Since then, the GoA has
established several quality assurance programs, including most recently establishing the National
Framework of Education Qualifications and developing the higher education financing strategy in
2011. Nevertheless, financing and governance remain a challenge and include the following
issues: input-based institutional financing with limited incentives for quality improvement, over-
prescription of specializations without responding to the labor market demand, inefficiency in the
entire higher education system comprised of many small institutions with extremely low student-
staff ratios, lack of autonomy and accountability; inequity and slow growth of higher education
enrollment; separation of university and research institutions (World Bank, 2013). Because of
these quality issues, public perception of HEI management is poor and could explain the 30 percent
attrition rate among HEI students15.
To enhance the quality, equity, and efficiency of Armenia’s higher education system,
the government of Armenia recently implemented the Competitive Innovation Fund (CIF),
however, without substantially increasing public funding, it may not result in a marked
impact on quality. To overcome the challenges in the HEI system, the CIF was implemented in
2014 as part of the ongoing Bank supported Education Improvement Project. The Fund aims to
improve the quality and efficiency of higher education, stimulate research and innovations in
higher education, as well as improve managerial capacities in HEIs and establish interactive links
between HEIs and various fields of economy. Six universities were awarded grants for the
implementation of their projects, which launched in December 2015. The project may produce
sufficient experience and platform for introducing a performance-based financing instrument in
Armenia. However, to sustain improvements to quality, competitiveness, and equity, the GoA must
further invest in higher education.
Closer evaluation of Armenia’s education system at every level, reveals several barriers
to the efficient provision of quality education. Beginning from early childhood education, lack of
publicly-funded ECE programs and financial support of community-led initiatives, have led to low
coverage of ECE in Armenia. General education, has reached significant access, nevertheless,
schools are inefficiently used, teaching has been downgraded to a part-time profession, and UEE
and TIMSS assessments reveal students perform least well in STEM. Additionally, even though
Armenia has a higher tertiary enrollment rate than other CIS countries, there is a high attrition rate
and low enrollment in STEM subjects.
C. Gender aspects and its impact
Gender is another area requiring urgent education policy reform in Armenia. Policy
documents have explicitly identified gender equality as an education priority, yet they have not
15 Based on HEI data from NaCET.
42
been realized in practice. The recent adoption of the Gender Policy Concept Paper in 2010 and
the Law on Securing Equal Rights and Equal Opportunities for Women and Men in 2013 identify
priority areas for education reform to promote gender equality. In particular, the Gender Policy
Concept Paper identifies the primary directions of gender policy in the education sphere, which
include forming an egalitarian notion of gender relations, drafting new education curricula and
manuals directed at the creation and implementation of principles of gender equality, as well as at
overcoming traditions that encourage patriarchal gender stereotypes, and integrating gender
education into the curricula as a mandatory component at all levels of the education system (World
Bank, 2016a). While the articulation of gender policy is an impressive step towards promoting
gender equality in the education sector, this commitment has not yet been fully translated into state
education standards and curricula, programs, teacher guides, and textbooks that reflect the
principles of gender equality (World Bank, 2016a).
Data collected from studies show that gender stereotypes exist in the education system
and the broader Armenian culture. Recent surveys on gender found that traditional gender
stereotypes exist among high school teachers and students. Approximately half of the teachers
believed that “women and men should keep traditional professions” and “there are some
professions that women should not have.” Conversely, more than half felt that males could work
in any profession that they wanted. These findings suggest that many teachers subscribe to
stereotypical views about gender, which in turn impacts the opportunities that are presented to
girls. The survey also found that teachers treat male and female students differently. 54 percent of
teachers believe that boys and girls are essentially different and should be treated differently,
Students confirmed that they face different treatment and discrimination by their teachers.
Furthermore, the survey also revealed that teachers lacked an understanding of what constitutes
a gender-equality approach to teaching and learning. These survey findings indicate that teachers
may lack knowledge of and skills in integrating gender perspectives into curriculum and that they
may be victims of traditional gender stereotypes themselves (World Bank, 2016a).
Issues with gender stereotypes also persist in higher education and impacts female
students’ career choices. In higher education, where women constitute the majority of students,
traditional gender roles persist. A 2013 survey of male and female students at Yerevan State
University16, revealed that despite over 90 percent of young people believing “a woman should
have a good education,” only 46 percent of men and 62 percent of women felt that it was important
for women to have a successful career. Moreover, notwithstanding success in school access and
academic achievement, gender patterns exist in the type of study programs Armenian students
pursue at the postsecondary level. Young women tend to dominate the “traditionally female” areas
of study (i.e., education, social sciences, and health), which lead to work in lower-paid public
sector jobs. Meanwhile, young men tend to concentrate in technical fields (i.e., energy, transport,
and construction), which generally correlate with jobs in higher-paying sectors. Furthermore,
16 Source: Center for Gender and Leadership Studies, 2014.

43
many young women who complete higher education do not become employed after graduation
either because their qualifications do not meet labor market demands or because they are expected
to take on family responsibilities after they marry (World Bank, 2016a).
Gender equality is not only a means to economic development, it is also a human right.
In Armenia, women not only attain higher levels of education, but they also outperform males in
national and international examinations. Nevertheless, gender stereotypes in the education system
and broader Armenian context have led to significantly lower female participation in the labor
force (between 14 and 17 percentage points lower than men’s)17 and lower earning potential.
Underutilization of women in the labor force is highly inefficient. Moving beyond the economic
argument, it is important to acknowledge gender equality as key to achieving a broader principle
of improving the quality of life of individuals, families, and communities. Above all, gender
equality is a fundamental human right. Serious efforts are necessary to ensure a more balanced and
fair representation of gender roles in schools and ultimately in the workplace.
D. Skills characteristics and skills demanded by the economy
There is clear indication from the feedback of Armenian employers that the current
education system is not meeting the skills significant for most occupations. According to
results from a World Bank survey on skills and employment in Armenia, skills that are highly
desired by employers for both white-collar and blue-collar occupations include cognitive and job-
related skills, followed by socioemotional skills (see Figure 27 in Annex for description of skills
measured) (World Bank, 2015a). However, 90 percent of employers report difficulty hiring highly
skilled workers, which seems that regardless of Armenia’s highly educated population, graduates
today do not seem to be equipped with the adequate skills. To address this skills mismatch, the
finding suggests that cognitive, socioemotional and relevant job-related skills should be better
integrated into Armenia’s education system.
Among the high-tech sectors, cognitive, socioemotional, and job-related skills are
used with not only more frequency, but also with more intensity. The frequency and intensity
of use of cognitive skills, job-related skills, and socioemotional skills are much higher among
individuals working in high-innovation sectors than among those in low-tech sectors (Figure 24).
High-tech is classified as high-tech manufacturing and knowledge-intensive services, while low-
tech is classified as medium low-tech manufacturing and less knowledge-intensive services. For
instance, based on this classification, the agricultural and construction sectors are considered as
low-tech sectors. A 2013 analysis of Armenia’s high-tech sectors, revealed that 50 percent of
workers in high-tech use reading skills with high frequency, compared with 30 percent of those in
low-tech; 47 percent of individuals working in high-tech reported a high use of computer skills,
compared with 23 percent of low-tech workers (World Bank, 2015a). These workers also reported
using more socioemotional skills, including having contact with people outside work and using
17 World Bank. (2015). Skills toward employment and productivity.
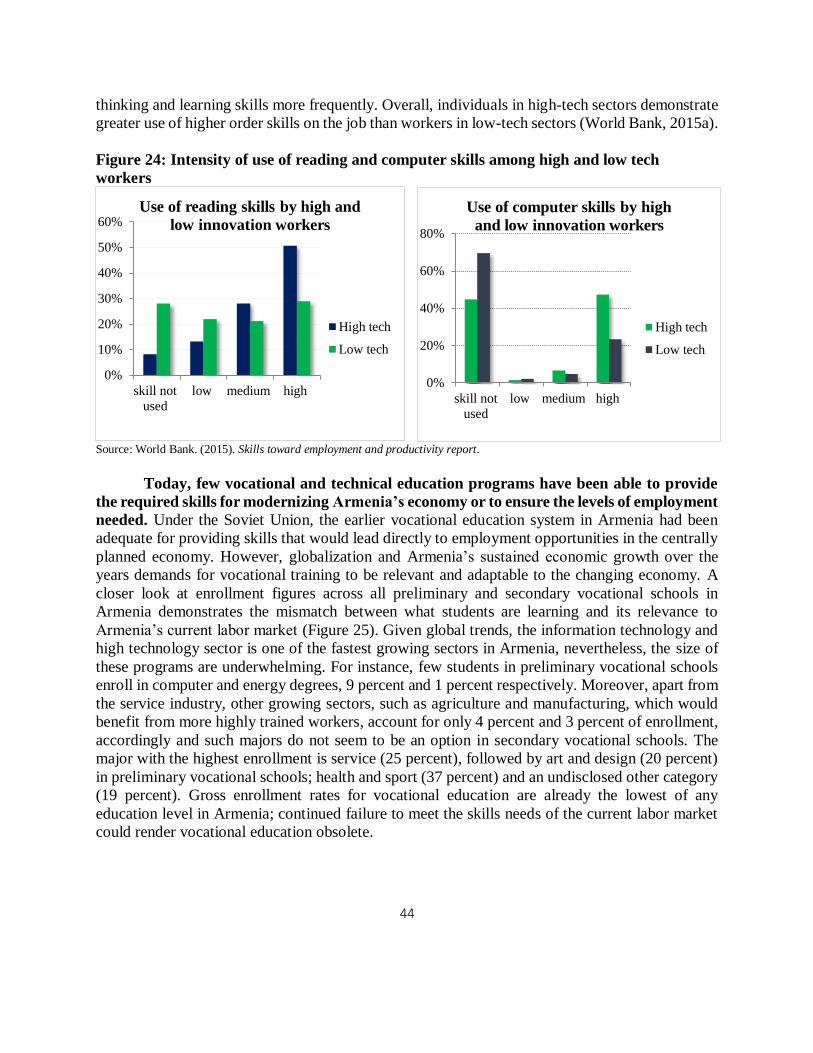
44
thinking and learning skills more frequently. Overall, individuals in high-tech sectors demonstrate
greater use of higher order skills on the job than workers in low-tech sectors (World Bank, 2015a).
Figure 24: Intensity of use of reading and computer skills among high and low tech
workers
Source: World Bank. (2015). Skills toward employment and productivity report.
Today, few vocational and technical education programs have been able to provide
the required skills for modernizing Armenia’s economy or to ensure the levels of employment
needed. Under the Soviet Union, the earlier vocational education system in Armenia had been
adequate for providing skills that would lead directly to employment opportunities in the centrally
planned economy. However, globalization and Armenia’s sustained economic growth over the
years demands for vocational training to be relevant and adaptable to the changing economy. A
closer look at enrollment figures across all preliminary and secondary vocational schools in
Armenia demonstrates the mismatch between what students are learning and its relevance to
Armenia’s current labor market (Figure 25). Given global trends, the information technology and
high technology sector is one of the fastest growing sectors in Armenia, nevertheless, the size of
these programs are underwhelming. For instance, few students in preliminary vocational schools
enroll in computer and energy degrees, 9 percent and 1 percent respectively. Moreover, apart from
the service industry, other growing sectors, such as agriculture and manufacturing, which would
benefit from more highly trained workers, account for only 4 percent and 3 percent of enrollment,
accordingly and such majors do not seem to be an option in secondary vocational schools. The
major with the highest enrollment is service (25 percent), followed by art and design (20 percent)
in preliminary vocational schools; health and sport (37 percent) and an undisclosed other category
(19 percent). Gross enrollment rates for vocational education are already the lowest of any
education level in Armenia; continued failure to meet the skills needs of the current labor market
could render vocational education obsolete.
0%
10%
20%
30%
40%
50%
60%
skill not
used
low medium high
Use of reading skills by high and
low innovation workers
High tech
Low tech
0%
20%
40%
60%
80%
skill not
used
low medium high
Use of computer skills by high
and low innovation workers
High tech
Low tech

45
Source: NaCET.
Armenia’s existing national workforce development system lacks the structure to
effectively produce skills relevant to the current labor market needs. The National Center for
Vocation and Education Training (VET) Development and the National Council for VET
Development were established years ago, as a national initiative to develop Armenia’s workforce.
Nevertheless, issues with management affect the platform’s ability to run effectively. First, the
quality assurance system is not enforced uniformly across the workforce development policies.
For instance, training providers are regulated, but they have limited accountability in meeting
quality standards, since there is almost no monitoring and evaluation (World Bank, 2015a). The
workforce development system relies heavily on government resources and there are no incentives
to use them efficiently or to base them on performance (World Bank, 2015a). Further, even though
the system is being updated and policies are being implemented to diversify the pathway for skill
acquisition, the VET system is still seen as one limited to vertical movement toward tertiary
education and training is almost entirely developed without close collaboration or input from the
industry (World Bank, 2015a). This results in the VET’s inability to meet skills development
needed from the labor market. Regulation of the National Center for VET Development and
National Council for VET Development should be improved to ensure greater accountability and
standardization, and to provide workers with the cognitive, socioemotional, and job-relevant skills
relevant to Armenia’s job market.
Lack of highly qualified workers and youth unemployment is a global issue,
nevertheless, in countries providing an increased level of professional development
alongside educational qualifications seem to fair better employment outcomes. Austria’s
dual VET program stands out in the region. The program, which is similar to the dual VET program
in Germany and Switzerland, harnesses theoretical knowledge with apprenticeship starting in
general education. The program has proven successful as it gives apprentices real-world skills
development. It also serves as beneficial for companies as these apprentices are tasked with
producing valuable work for their employers and the employers are directly helping to shape the
skills of the existing and future labor market. As a result of this program, EU statistics show that
0%5%
10%15%20%25%30%35%40%
Secondary Vocational Graduates by
subject
0%5%
10%15%20%25%
Art
and D
esig
nE
conom
ics…
Min
eral
…E
ner
gy
Met
alw
ork
ing
Mec
han
ical
…M
anufa
cture
…C
om
pute
r…S
ervic
eT
ransp
ort
Fore
stry
Food…
Tex
tile
indust
ryC
onst
ruct
ion…
Agri
cult
ure
Qual
ity…
Rep
roduct
io…
Preliminary Vocational Graduates
by subject
Figure 25: VET graduates by subject, 2015
46
while the average youth unemployment rate within the EU was about 20.3 percent in 2015,
the youth unemployment rate in Austria was 10.6 percent (Eurostat , 2015). However, for this
dual VET program to be successful, coordination of apprenticeships and education plans
between the business community and government is important.
In Asia, Singapore stands out with a robust professional development program
that heavily utilizes information technology. One of the most important drivers of the changes
in the training system was the government’s commitment to increase the creativity and innovative
capacity of its workforce. Part of this has been accomplished by saturating Singapore education
and training institutions with information technology (IT) and mobile e-learning (Tucker, 2012).
In 2002, the country’s Institute for Technical Education launched its eStudent and eTutor systems,
which provides an interconnected personalized, interactive, multimedia, and collaborative learning
environment, as well as an administrative support system that can be accessed from any point at
any time of day or week (Tucker, 2012). 20 percent of the ITE curriculum, mostly the part
consisting of the theory part of the curriculum, is delivered through the internet. This, makes the
learning available not just to those on campus, but also to those located anywhere.
Armenia can leverage these international examples to better integrate their existing
VET program with general education and the private sector to offer apprenticeships like the
dual VET program instituted in Austria and other European countries. Nevertheless, for this
program to be successful, coordination of school curricula and on the job training must be well
planned between the government, private sector and the national VET institutions in Armenia and
strive to meet the skillsets of the emerging labor market needs using the most cutting edge
technological approaches.
4. Policy Recommendations
In the context of the preparation of the SCD for 2017, this report aimed to provide a
comprehensive analysis of the current economic and labor market challenges, including
poverty and the implications for the education system – both internal and external factors
that must be overcome for Armenia to realize holistic growth and development in the future.
Developing effective policies and investing strategically in areas of the economy and human
development through education and skills that promotes inclusive and sustained and accelerated
growth is critical. To this end, the following short and long term policy options and strategies could
be considered by the government:
Short-term recommendations:
1. General education rationalization. o To maintain efficient spending in general education without compromising on
quality, Armenia should continue to provide per-capita financing.
o Any savings from general education can then be applied to other critical and
underserved areas of education, including early childhood, vocational and tertiary
education.
47
o To tackle multiple efficiency challenges in general education, such as low (9.2)
student-to-teacher ratio, expected student population decline, and part-time
teaching profession, Armenia should consider introducing hub-and-satellite
schools, multi-grade teaching, and training teachers to teach multiple disciplines.
These practices have been successfully introduced in the region in countries with
similar contexts as Armenia and learnings from their implementation could prove
valuable for Armenia.
2. Promoting social inclusion through ECE. o The provision of quality preschool education should be expanded, especially for
children under 3 and in rural communities. The ongoing Education Improvement
Project, which includes expansion of ECE coverage as one of its objectives, is a
good precedent and experience for implementing ECE systematically across the
country.
o Lessons learned from countries with similar ECE challenges, such as Bulgaria and
Mexico could offer additional opportunities for Armenia to provide local
municipalities with more financial and capacity-building support and parental
demand through a conditional fee reducation program.
3. Redefining teacher education and training to provide educators with the tools to teach
higher order skills in the classroom.
o To address the skills mismatch of the labor force and ensure that the aging teacher
workforce is equipped with the most timely and relevant pedagogical practices, the
GoA needs to update its teaching program curricula and in-service trainings to
incorporate more pedagogical guidance on strengthening the use of cognitive,
socioemotional, and technical skills in the classroom and at all levels of education
and in rural areas in particular. These core skill groups have been proven to not
only lead to educational achievement, but also long term economic prosperity.
4. Gender mainstreaming in general and higher education
o To tackle gender stereotypes in the education system, which have been shown to
negatively correlate with women’s career path, the GoA should explicitly and more
consistently address gender in the educational standards, curricula, syllabi,
teacher’s guides and trainings, and textbooks so that they are more gender-
balanced.
5. Creating a clearer pathway to STEM education. o To increase student performance in STEM, the GoA should reform the STEM
curricula, pedogies, and materials and train teachers to incorporate more innovative
and student-centered learning, which has been found to motivate student learning. o To increase enrollment in STEM in higher education, partner with HEIs and private
and social sectors to provide secondary students with competitive and subsidized

48
pre-university academic preparation and university scholarships for STEM. Special
emphasis should be placed on attracting more female students to STEM.
6. Strengthening higher education financing reforms. o Learnings from and further investment in the Competitive Innovation Fund can
provide the GoA with the tools and experience to introduce a model for
performance-based funding in higher education systematically.
7. Increasing access to tertiary education in rural areas.
o To close the spatial disparities (urban vs. rural) in education and help more rural
secondary students attain tertiary education, the GoA should provide more financial
assistance to these students in the form of need-based scholarships, which are
currently lacking in Armenia or a combination of merit and need-based.
o
8. Improving the quality of existing the VET institutions.
o For greater accountability, standardization, and integration with the labor market,
reform and improve regulation of the National Center for VET Development and
the National Council for VET Development.
o In addition, more integration of cognitive, socioemotional, and ICT skills in
pedagogy and curriculum will help to meet the needs of Armenia’s emerging IT
and high-tech sector.
Long-term recommendations:
1. Social sector expenditure rationalization.
o Considering Armenia’s constrained fiscal space, increasing and diversifying
investment in education through the rationalization of the social expenditure is key
to improving efficiencies within these sectors. Armenia continues to spend a
significantly smaller amount on education (about 50 percent) of other CIS/EU
countries; while education/human capital formation is not the only catalyst for
changing the country fundamentals and ability to reduce poverty and shift the
economy towards greater productivity levels, innovation and technological
development, it is an essential part.
9. Increasing regular participation in national and international educational
assessments. o To tackle low STEM achievement, the GoA should continue to administer the UEE
and regularly participate in international assessments, such as TIMSS to use
learnings for better policy-making.
2. Modernizing workforce development system.
o A dual VET model that begins in general education and partners with the private
sector to provide students with apprenticeship, similar to what has been

49
implemented in European countries, including Austria, Switzerland, and Germany,
should be explored in Armenia’s context.

50
References
Assessment and Testing Center. (2017a). Gender disaggregated data on average score for
Unified Entrance Exam 2016. Retrieved from http://www.atc.am/index.php
Central Bank of Armenia. (2017). GDP production structure NACE 2 classification [Data file].
Retrieved from https://www.cba.am/en/SitePages/statrealsector.aspxEducation Commission.
(2017). Ensuring effective outcome-based financing in early childhood development. New
York, NY: The International Commission on Financing Global Education Opportunity.
National Center for Educational Technologies (NaCET). (2017). Statistical directory. Retrieved
from http://stat.armedu.am/
National Statistical Service of Armenia (NSS). (2014a). Formal and informal employment data.
Retrieved from http://www.armstat.am/en/?nid=126
NSS. (2014b). Labour force survey micro data database and questionnaire (by household’s
members) [Data file]. Retrieved from http://armstat.am/en/?nid=601
NSS. (2016a). Education enrollment data. Retrieved
from http://www.armstat.am/en/?nid=82&id=1801
NSS. (2016b). Social snapshot and poverty in Armenia. Yerevan, Armenia
NSS. (2017). Data_women in STEM study_Armenia [Data file]. Compiled and provided by NSS
at the World Bank’s request.
Republic of Armenia (RA). (2016). Research on development dynamics of children enrolled in
preschool institutions and observations of factors affecting their development. Yerevan,
Armenia.
Tucker, M.S. (2012). The phoenix: vocational education and training in Singapore. Washington,
DC: National Center on Education and the Economy.
UNESCO. (2015). Armenia: Education for All 2015 national review. Retrieved from
http://unesdoc.unesco.org/images/0022/002299/229906E.pdf
World Bank. (2012a). Armenia education sector policy report: education reforms for economic
growth. Yerevan, Armenia.
World Bank. (2012b). Assessment of the early childhood development policies and programs:
SABER Armenia. Washington, DC: World Bank.
World Bank. (2012c). Quality and equity in Armenian general education: analysis of the student
assessment results and teacher workforce. Yerevan, Armenia.
World Bank. (2012d). Strengthening higher education for the development of the pharmaceutical
industry. Yerevan, Armenia.
World Bank. (2013). Addressing governance at the center of higher education reforms in
Armenia. Yerevan, Armenia.
World Bank. (2014a). IT skills assessment in Armenia. Washington, DC: World Bank.
World Bank. (2014b). Republic of Armenia public expenditure review (PER): expanding the
fiscal envelope. Washington, DC: World Bank.
World Bank. (2015a). Armenia: skills toward employment and productivity (STEP). Washington,
DC: World Bank.
World Bank. (2015b). General assessment of the content of selected school subjects from a
gender perspective. Yerevan, Armenia.

51
World Bank (2015c). Investing in early childhood development. Washington, DC: World Bank.
World Bank. (2015d). Republic of Armenia public expenditure review (PER): supporting
effective fiscal management. Washington, DC: World Bank.
World Bank. (2016a). Gender analysis of Armenian school curriculum and textbooks, policy
brief. Yerevan, Armenia.
World Bank. (2016b). Health, nutrition, and population statistics. [Data file]. Retrieved from
http://databank.worldbank.org/data/reports.aspx?source=health-nutrition-and-population-
statistics&preview=on
World Bank. (2016c). Programmatic fiscal work: supporting effective fiscal management.
Washington, DC: World Bank.
World Bank. (2017). World development indicators. [Data file]. Retrieved from
http://databank.worldbank.org/data/reports.aspx?source=world-development-
indicators&preview=on
World Economic Forum. (2017). The inclusive growth and development report 2017. Geneva,
Switzerland: World Economic Forum.

52
Annex
Table 5: Armenia poverty rate by number of employed household members, 2008 and 2015
NUMBER OF
EMPLOYED
HOUSEHOLD
MEMBERS
2008 2015
Extremel
y poor Poor
Extremely
poor Poor
Percent,
poor
(referenced
population)
Percent,
referenced
population
No employed
members 5.7 46.6 3.2 35.2 14.7 12.0
1 employed
member 2.8 32.5 3.1 30.7 29.5 27.6
2 employed
members 0.7 26.0 1.2 27.4 32.0 33.5
3 and more
employed
members 1.1 24.9 .9 25.4 23.8 26.9
Total 1.9 29.5 1.9 28.7 100 100 Source: NSS RA & World Bank. (2016). Social snapshot and poverty in Armenia.

53
Figure 26: The education system in Armenia
Source: World Bank. (2015). Armenia: skills toward employment and productivity (STEP) report.
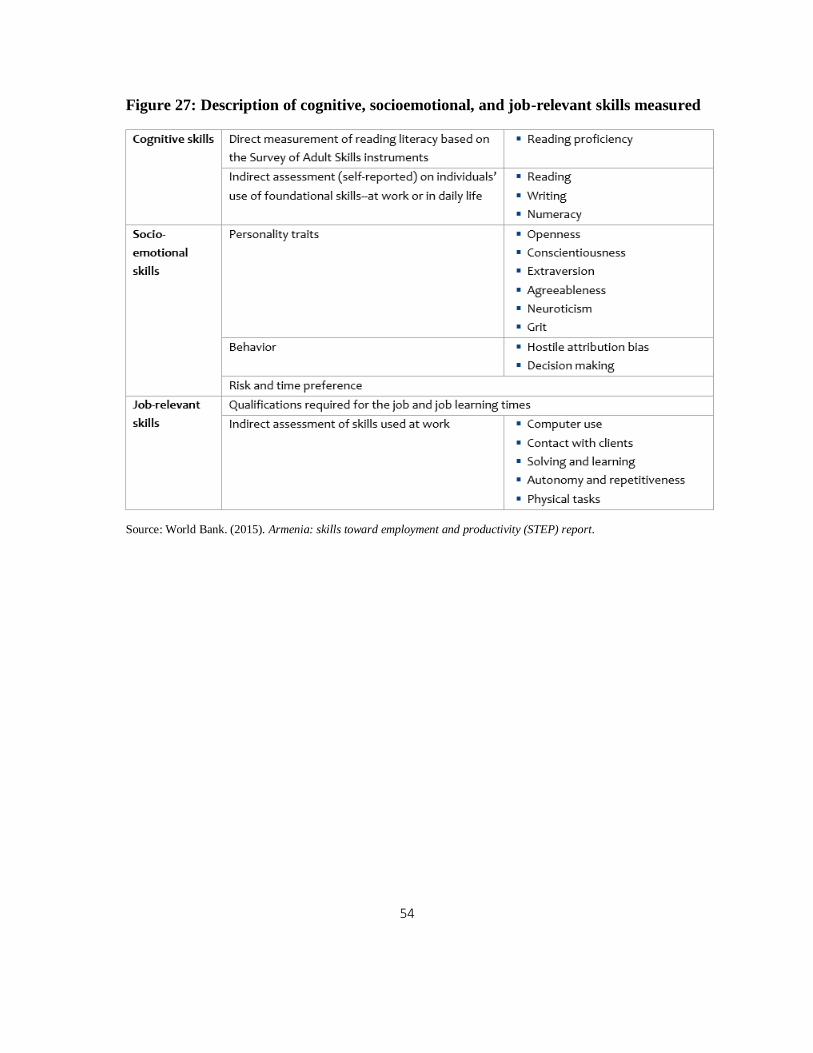
54
Figure 27: Description of cognitive, socioemotional, and job-relevant skills measured
Source: World Bank. (2015). Armenia: skills toward employment and productivity (STEP) report.