men and gender equality in armenia - unfpa
TRANSCRIPT
1
MEN AND GENDER EQUALITY IN ARMENIA
REPORT
ON SOCIOLOGICAL SURVEY FINDINGS
Yerevan 2016
2
The Study was conducted within the framework of the UNFPA program in Armenia in 2015-
2016.
The opinions and conclusions expressed in the Report are those of the authors and do not
necessarily represent views of UNFPA.
REPORT ON FINDINGS OF THE SOCIOLOGICAL SURVEY MEN AND GENDER EQUALITY IN ARMENIA (2016) --------------------------------------- © United Nations Population Fund
Armenia, 2016 UNFPA 14 P. Adamyan St., Yerevan, Armenia Tel.: +374 10 543416 Sampling and field work were done and the database was compiled and finalized by the Institute for Political and Sociological Consulting (IPCS)
Analytical Report was prepared by:
Mr. Vladimir Osipov, PhD, gender expert • Chapters: 1, 2, 3, 7 and 8
Ms. Jina Sargizova, gender expert • Chapters: 4, 5 and 6
3
Table of Contents LIST OF TABLES ........................................................................................................................................ 5
FOREWORD............................................................................................................................................... 13
EXECUTIVE SUMMARY ........................................................................................................................ 14
INTRODUCTION ....................................................................................................................................... 27
SURVEY METHODOLOGY .................................................................................................................... 34
CHAPTER 1. ATTITUDES TOWARD AND KNOWLEDGE ABOUT GENDER EQUALITY ...... 42
Women’s Rights ...................................................................................................................................... 42
Gender equality ....................................................................................................................................... 44
Gender equality laws .............................................................................................................................. 47
Women’s political participation & leadership potential ..................................................................... 49
Quotas for women ................................................................................................................................... 51
CHAPTER 2. VIOLENCE AGAINST WOMEN: PREVALENCE, EXPOSURE AND BEHAVIORS ...................................................................................................................................................................... 54
Prevalence of violence against women .................................................................................................. 55
Intimate Partner Violence: Perpetration of and Exposure to violence .............................................. 56
Reporting physical violence: A comparative analysis .......................................................................... 73
Sexual violence (men) ............................................................................................................................. 79
Violence against women outside the home ............................................................................................ 86
Violence against Men .............................................................................................................................. 90
CHAPTER 3. ATTITUDES TOWARD VIOLENCE ............................................................................. 97
Attitudes toward VAW phenomenon .................................................................................................... 98
Attitudes towards intimate partner physical violence against women ............................................... 99
Attitudes towards rape ......................................................................................................................... 124
Violence against a gay person .............................................................................................................. 135
CHAPTER 4. MAN IN THE FAMILY ................................................................................................. 144
Decision making .................................................................................................................................... 144
Men’s participation as fathers (parenting) ......................................................................................... 159
Men’s participation in household tasks .............................................................................................. 170
CHAPTER 5. SATISFACTION WITH MARRIAGE .......................................................................... 178
CHAPTER 6. HEALTH PRACTICES .................................................................................................. 187
CHAPTER 7. SEXUAL AND REPRODUCTIVE HEALTH ............................................................... 196
Sexual Activity ....................................................................................................................................... 196
Contraception and safe sex................................................................................................................... 201
Termination of pregnancy .................................................................................................................... 203
CHAPTER 8. ATTITUDES TO SEXUALITY, SEXUAL & REPRODUCTIVE HEALTH AND RELATED ISSUES .................................................................................................................................. 207
Sexuality and stereotypes ..................................................................................................................... 207

4
Dating, marriage and children ............................................................................................................. 216
Attitudes toward contraception ........................................................................................................... 222
Table 8. Attitudes toward contraception .............................................................................................. 222
Termination of pregnancy .................................................................................................................... 231
CONCLUSIONS ....................................................................................................................................... 240
RECOMMENDATIONS .......................................................................................................................... 244
5
LIST OF TABLES
SURVEY METHODOLOGY Table 1. Sample distribution in the country’s regions and in Yerevan Table 2. Problems and difficulties identified during fieldwork and
proposed solutions Table 3. Results of Quality Check-Up Table 4. Invalid questionnaires Table 5. Demographic profile of the survey participants CHAPTER 1. ATTITUDES TOWARD AND KNOWLEDGE ABOUT GENDER EQUALITY
Table 2. Attitudes toward women’s rights Percentage of respondents
Table 2. Attitudes toward women’s rights Percentage of male and female respondents
Table 3. Attitudes toward gender equality Percentage of respondents
Table 4. Attitudes toward gender equality Percentage of male and female respondents
Table 5. Knowledge of whether there are national laws on gender equality and on prevention of violence against women (VAW) Percentage of respondents
Table 6. Knowledge of whether there are national laws on gender equality and on VAW prevention Percentage of male and female respondents
Table 7. Attitudes toward women’s political participation & leadership potential Percentage of respondents
Table 8. Attitudes toward political participation & leadership potential Percentage of male and female respondents
Table 9. Attitudes toward quotas for women Percentage of respondents who are for or against quota system that guarantees a fixed proportion of places for women
Table 10. Attitudes toward quotas for women Percentage of male and female respondents who are for or against quota system that guarantees a fixed proportion of places for women
CHAPTER 2. VIOLENCE AGAINST WOMEN: PREVALENCE, EXPOSURE AND BEHAVIORS
6
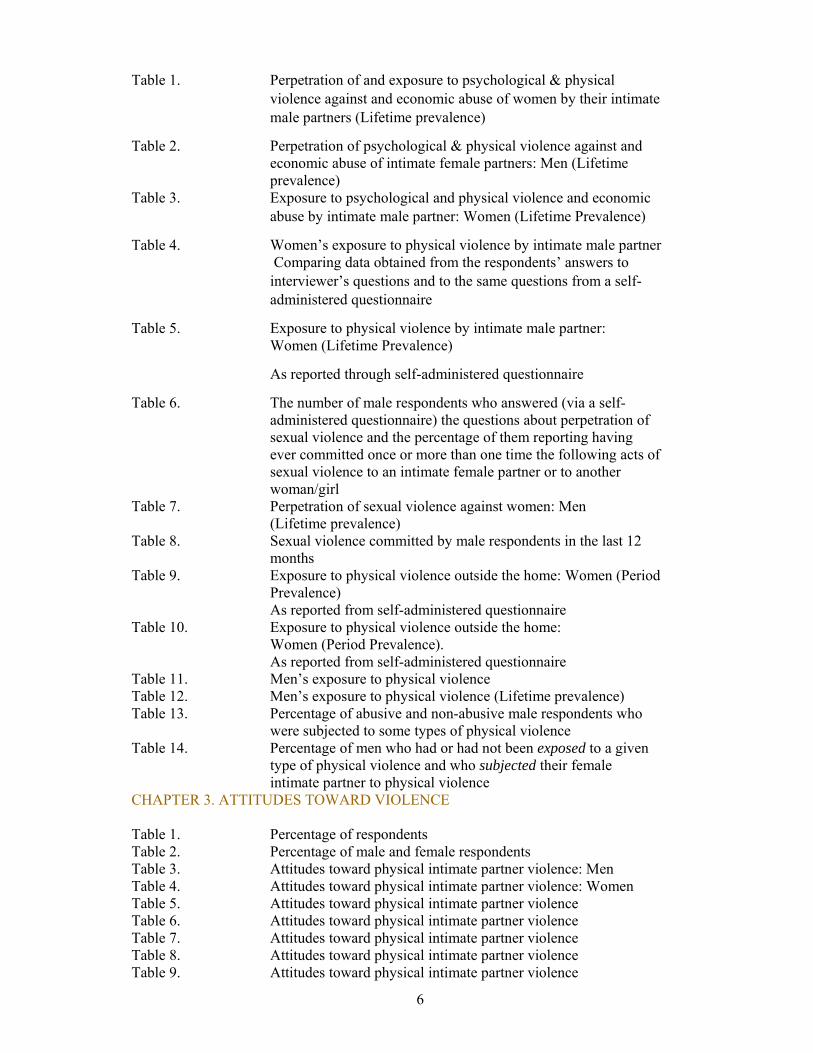
Table 1. Perpetration of and exposure to psychological & physical violence against and economic abuse of women by their intimate male partners (Lifetime prevalence)
Table 2. Perpetration of psychological & physical violence against and economic abuse of intimate female partners: Men (Lifetime prevalence)
Table 3. Exposure to psychological and physical violence and economic abuse by intimate male partner: Women (Lifetime Prevalence)
Table 4. Women’s exposure to physical violence by intimate male partner Comparing data obtained from the respondents’ answers to interviewer’s questions and to the same questions from a self-administered questionnaire
Table 5. Exposure to physical violence by intimate male partner: Women (Lifetime Prevalence)
As reported through self-administered questionnaire
Table 6. The number of male respondents who answered (via a self-administered questionnaire) the questions about perpetration of sexual violence and the percentage of them reporting having ever committed once or more than one time the following acts of sexual violence to an intimate female partner or to another woman/girl
Table 7. Perpetration of sexual violence against women: Men (Lifetime prevalence)
Table 8. Sexual violence committed by male respondents in the last 12 months
Table 9. Exposure to physical violence outside the home: Women (Period Prevalence) As reported from self-administered questionnaire
Table 10. Exposure to physical violence outside the home: Women (Period Prevalence). As reported from self-administered questionnaire
Table 11. Men’s exposure to physical violence Table 12. Men’s exposure to physical violence (Lifetime prevalence) Table 13. Percentage of abusive and non-abusive male respondents who
were subjected to some types of physical violence Table 14. Percentage of men who had or had not been exposed to a given
type of physical violence and who subjected their female intimate partner to physical violence
CHAPTER 3. ATTITUDES TOWARD VIOLENCE Table 1. Percentage of respondents Table 2. Percentage of male and female respondents Table 3. Attitudes toward physical intimate partner violence: Men Table 4. Attitudes toward physical intimate partner violence: Women Table 5. Attitudes toward physical intimate partner violence Table 6. Attitudes toward physical intimate partner violence Table 7. Attitudes toward physical intimate partner violence Table 8. Attitudes toward physical intimate partner violence Table 9. Attitudes toward physical intimate partner violence
7
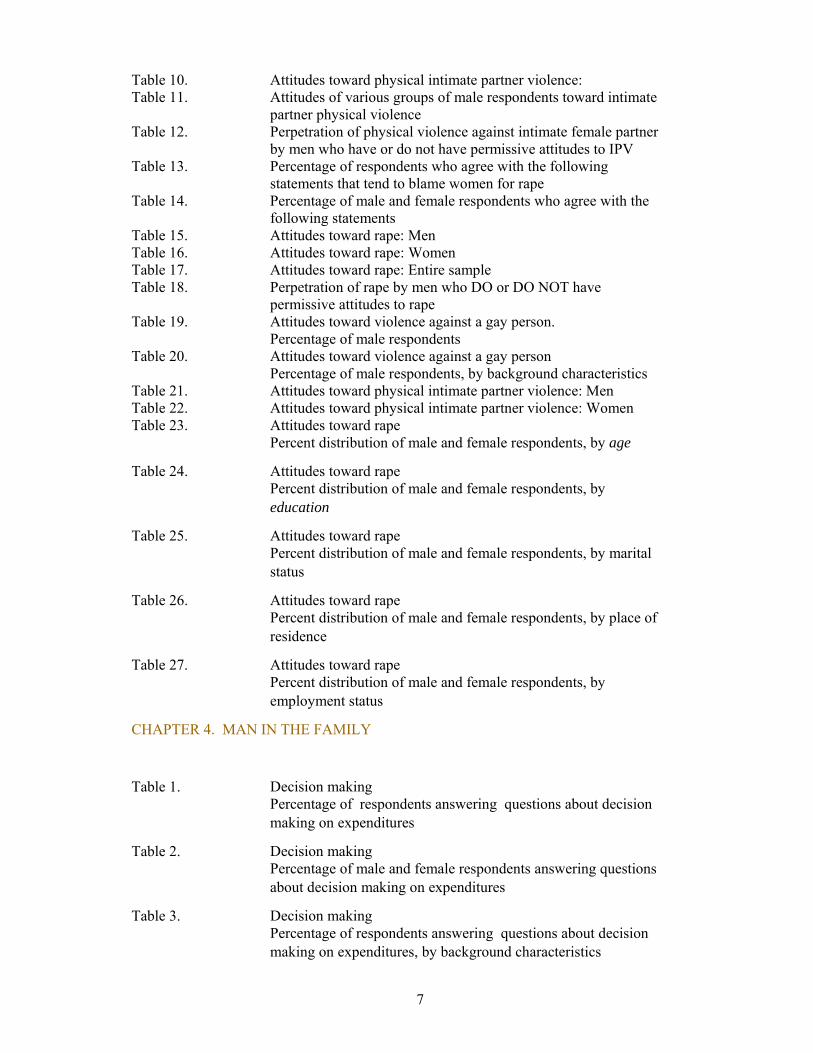
Table 10. Attitudes toward physical intimate partner violence: Table 11. Attitudes of various groups of male respondents toward intimate
partner physical violence Table 12. Perpetration of physical violence against intimate female partner
by men who have or do not have permissive attitudes to IPV Table 13. Percentage of respondents who agree with the following
statements that tend to blame women for rape Table 14. Percentage of male and female respondents who agree with the
following statements Table 15. Attitudes toward rape: Men Table 16. Attitudes toward rape: Women Table 17. Attitudes toward rape: Entire sample Table 18. Perpetration of rape by men who DO or DO NOT have
permissive attitudes to rape Table 19. Attitudes toward violence against a gay person.
Percentage of male respondents Table 20. Attitudes toward violence against a gay person
Percentage of male respondents, by background characteristics Table 21. Attitudes toward physical intimate partner violence: Men Table 22. Attitudes toward physical intimate partner violence: Women Table 23. Attitudes toward rape
Percent distribution of male and female respondents, by age
Table 24. Attitudes toward rape Percent distribution of male and female respondents, by education
Table 25. Attitudes toward rape Percent distribution of male and female respondents, by marital status
Table 26. Attitudes toward rape Percent distribution of male and female respondents, by place of residence
Table 27. Attitudes toward rape Percent distribution of male and female respondents, by employment status
CHAPTER 4. MAN IN THE FAMILY
Table 1. Decision making Percentage of respondents answering questions about decision making on expenditures
Table 2. Decision making Percentage of male and female respondents answering questions about decision making on expenditures
Table 3. Decision making Percentage of respondents answering questions about decision making on expenditures, by background characteristics
8
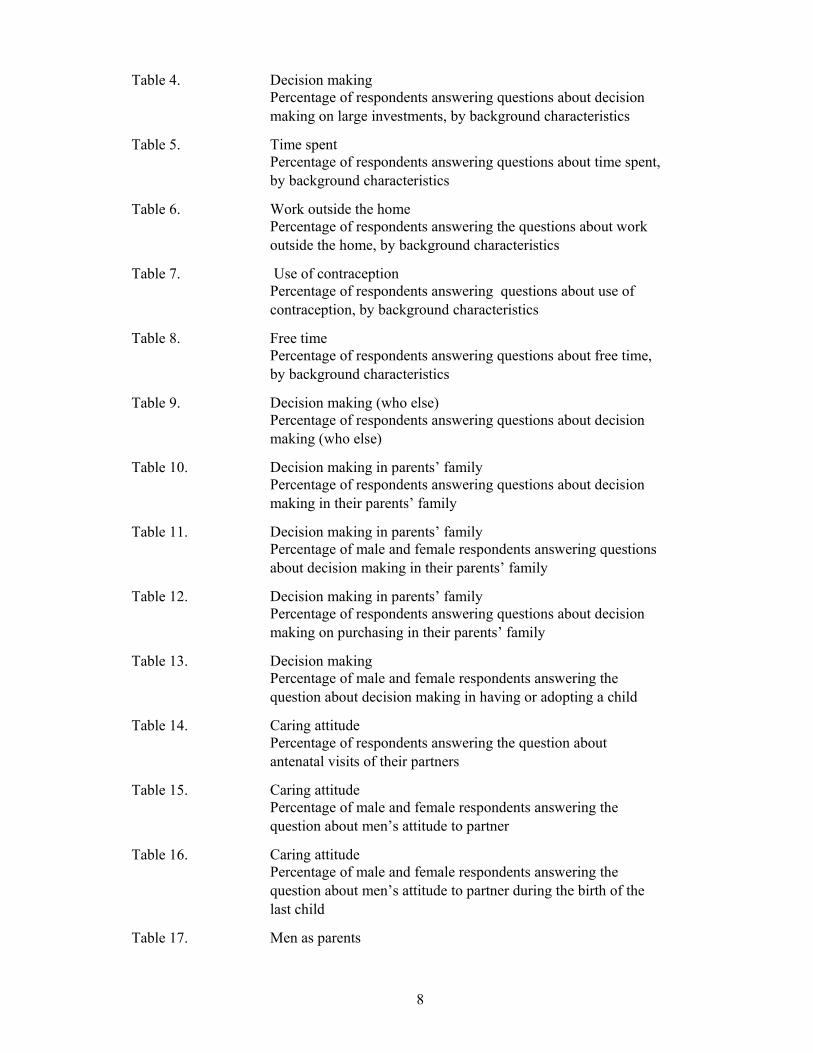
Table 4. Decision making Percentage of respondents answering questions about decision making on large investments, by background characteristics
Table 5. Time spent Percentage of respondents answering questions about time spent, by background characteristics
Table 6. Work outside the home Percentage of respondents answering the questions about work outside the home, by background characteristics
Table 7. Use of contraception Percentage of respondents answering questions about use of contraception, by background characteristics
Table 8. Free time Percentage of respondents answering questions about free time, by background characteristics
Table 9. Decision making (who else) Percentage of respondents answering questions about decision making (who else)
Table 10. Decision making in parents’ family Percentage of respondents answering questions about decision making in their parents’ family
Table 11. Decision making in parents’ family Percentage of male and female respondents answering questions about decision making in their parents’ family
Table 12. Decision making in parents’ family Percentage of respondents answering questions about decision making on purchasing in their parents’ family
Table 13. Decision making Percentage of male and female respondents answering the question about decision making in having or adopting a child
Table 14. Caring attitude Percentage of respondents answering the question about antenatal visits of their partners
Table 15. Caring attitude Percentage of male and female respondents answering the question about men’s attitude to partner
Table 16. Caring attitude Percentage of male and female respondents answering the question about men’s attitude to partner during the birth of the last child
Table 17. Men as parents

9
Percentage of male respondents answering questions about parenting
Table 18. Men as parents Percentage of male respondents choosing the “strongly agree” option, by level of education
Table 19. Men as parents Percentage of respondents answering questions about distribution of parenting tasks
Table 20. Parenting Percentage of male and female respondents answering the question about distribution of parenting tasks
Table 21. Parenting Percentage of respondents answering the question about frequency of performing parenting tasks
Table 22. Parenting Percentage of male and female respondents answering the question about frequency of performing parenting tasks
Table 23. Division of household duties Percentage of male and female respondents answering the question about division of HH duties
Table 24. Division of household duties Percentage of respondents answering the question about division of HH duties
Table 25. Attitude to division of household duties Percentage of respondents answering the question about division of HH duties
Table 26. Attitude to division of household duties Percentage of male and female respondents answering the question about satisfaction with division of HH duties
CHAPTER 5. SATISFACTION WITH MARRIAGE
Table 1. Relationship Percentage of male and female respondents answering the question about their relationships
Table 2. Division of tasks Percentage of male and female respondents answering the question about satisfaction with division of tasks overall
Table 3. Relationship Percentage of male and female respondents answering the question about their relationships
Table 4. Controlling Behavior
10
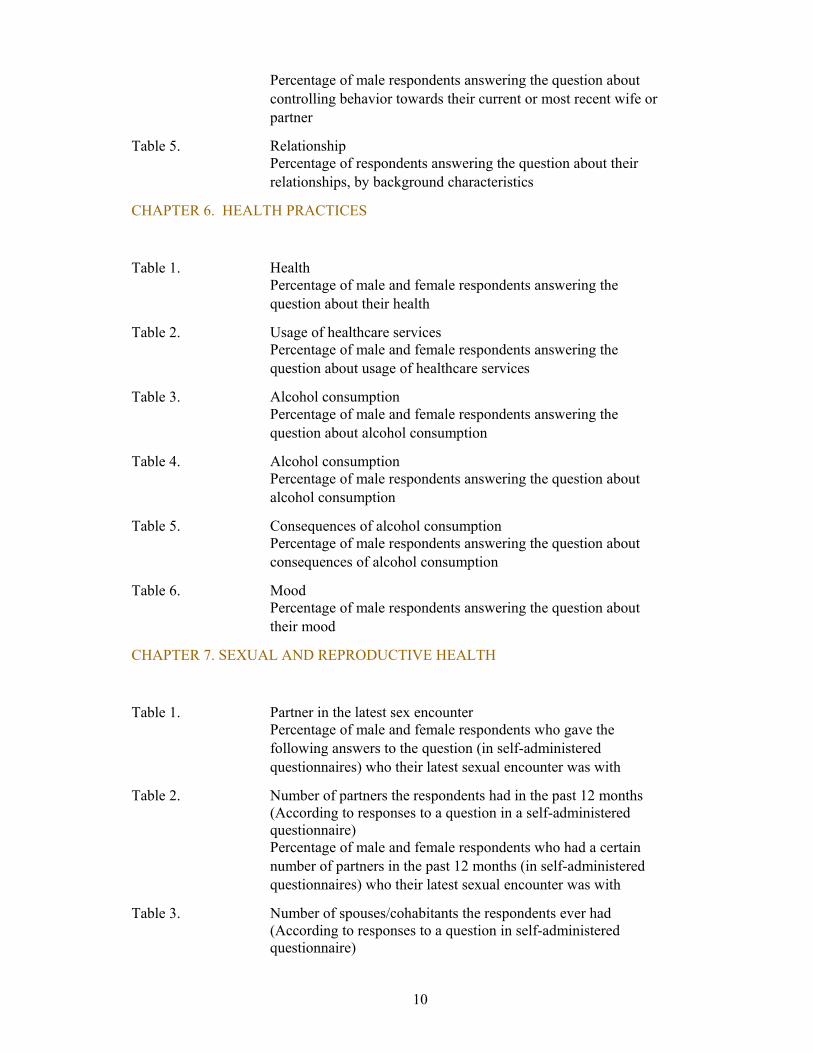
Percentage of male respondents answering the question about controlling behavior towards their current or most recent wife or partner
Table 5. Relationship Percentage of respondents answering the question about their relationships, by background characteristics
CHAPTER 6. HEALTH PRACTICES
Table 1. Health Percentage of male and female respondents answering the question about their health
Table 2. Usage of healthcare services Percentage of male and female respondents answering the question about usage of healthcare services
Table 3. Alcohol consumption Percentage of male and female respondents answering the question about alcohol consumption
Table 4. Alcohol consumption Percentage of male respondents answering the question about alcohol consumption
Table 5. Consequences of alcohol consumption Percentage of male respondents answering the question about consequences of alcohol consumption
Table 6. Mood Percentage of male respondents answering the question about their mood
CHAPTER 7. SEXUAL AND REPRODUCTIVE HEALTH
Table 1. Partner in the latest sex encounter Percentage of male and female respondents who gave the following answers to the question (in self-administered questionnaires) who their latest sexual encounter was with
Table 2. Number of partners the respondents had in the past 12 months (According to responses to a question in a self-administered questionnaire) Percentage of male and female respondents who had a certain number of partners in the past 12 months (in self-administered questionnaires) who their latest sexual encounter was with
Table 3. Number of spouses/cohabitants the respondents ever had (According to responses to a question in self-administered questionnaire)
11
Percentage of male and female respondents who had a certain number of spouses/cohabitants (excluding present relationship)
Table 4. Satisfaction with sexual relations and their frequency (According to responses in self-administered questionnaire)
Percentage of male and female respondents expressing various levels of satisfaction or dissatisfaction with sexual relations and their frequency
Table 5. Refusal to have sex with male partner & its consequences (According to responses to 2 questions in self-administered questionnaire) Percentage of female respondents who did or did not refuse to have sex with their male partner and who reported partner’s response to the refusal
Table 6. Prevalence of transactional sex (According to responses to 3 questions in self-administered questionnaire)
Percentage of female respondents who acknowledged that they had engaged in transactional sex
Table 7. Condom use in the past 12 months (According to responses to 2 questions in self-administered questionnaire) Percentage of male and female respondents who used or did not use condoms in the past 12 months
Table 8. Decision-making on contraception use Percentage of male and female respondents choosing various response options regarding decision-making on contraception use
Table 9. Decision-making on abortion Percentage of male and female respondents choosing various response options regarding decision-making on abortion
Table 10. Male partner’s involvement in women’s abortion case Percentage of male and female respondents answering the question about abortions
CHAPTER 8. ATTITUDES TO SEXUALITY, SEXUAL & REPRODUCTIVE HEALTH AND RELATED ISSUES
Table 1. Attitudes toward sexuality Percentage of respondents who agree with the statements
Table 2. Attitudes toward sexuality Percentage of male and female respondents who agree with the statements
Table 3. Attitudes toward sexuality Percentage of all respondents who agree with the statements, by background characteristics**
Table 4. Attitudes toward sexuality: Men
12
Percentage of all men who agree with the statements, by background characteristics**
Table 5. Attitudes toward sexuality: Women Percentage of all women who agree with the statements, by background characteristics
Table 6. Best age
Respondents
Table 7. Best age
Male and female respondents
Table 8. Attitudes toward contraception Percentage of respondents who agree with the statements
Table 9. Attitudes toward contraceptives Percentage of male and female respondents who agree with the statements
Table 10. Attitudes toward contraception Percentage of all respondents who agree with the statements, by background characteristics
Table 11. Attitudes toward contraception: Men Percentage of all respondents who agree with the statements, by background characteristics
Table 12. Attitudes toward contraception: Women Percentage of all respondents who agree with the statements, by background characteristics
Table 13. Termination of pregnancy Percentage of respondents who agree with the statements
Table 14. Termination of pregnancy Percentage of male and female respondents who agree with the statements
Table 15. Attitudes toward termination of pregnancy Percentage of all respondents who agree with the statements, by background characteristics
Table 16. Attitudes toward termination of pregnancy: Men Percentage of male respondents who agree with the statements, by background characteristics
Table 17. Attitudes toward termination of pregnancy: Women Percentage of female respondents who agree with the following statements, by background characteristics
13
FOREWORD
UNFPA Armenia Country Office is pleased to share a unique report detailing our recent research on men, gender equality and gender relations in Armenia. This report provides a summary of key survey findings using the International Men and Gender Equality Survey (IMAGES) methodology.
IMAGES — created and coordinated by Promundo and the International Center for Research on Women (ICRW) — is one of the most comprehensive studies on men’s practices and attitudes as they relate to gender norms, attitudes toward gender equality policies, household dynamics including caregiving and men’s involvement as fathers, intimate partner violence, health and stress. It has already been successfully used in more than 15 countries of the world, in particular in our region, to lay a factual ground for further policy and advocacy work.
For the past 20 years, UNFPA has been contributing to national development efforts in Armenia in partnership with the government, civil society and other development actors. UNFPA facilitates women's access to sexual and reproductive health services, addresses gender-based violence, tackles gender-biased sex selection in the country through conducting applied research that builds the knowledge base on gender equality, implements gender transformative programs, and advocates for achieving gender equality.
UNFPA's long-term experience has helped build a stronger understanding about gender equality and related societal norms and practices in order to develop an effective approach to working on issues of gender equality. UNFPA believes that the empowerment of women and girls must be accompanied by direct efforts to also support men and boys in challenging inequitable gender-based social norms. UNFPA engages in work that empowers both genders to stand as partners in speaking out against gender based violence (GBV). This research is an effort to increase understanding of masculinity and gender in Armenia. Our hope is that the data and analysis generated will add value to efforts by the Government of Armenia and other development actors aiming to promote the rights and empowerment of women and girls. The research findings provide evidence for attitudes, beliefs and practices that act as barriers to gender equity in Armenia.
Armenia-based IPSC, Institute for Political and Sociological Consulting, conducted the fieldwork. National experts Mrs. Jina Sargizova and Mr. Vladimir Osipov analysed the data and wrote the report. Promundo provided proficient guidance and advice throughout all the stages of the research. We thank all of our partners for their valuable contribution and continuous support.
The survey findings will be widely disseminated to inspire policy debate and promote policy changes to engage men and boys in gender equality. They will also be used for advocacy and awareness raising purposes. UNFPA hopes that this research will positively contribute to the current knowledge base on gender and development at both national and international levels. We also hope that this study will encourage women's organizations in Armenia to support and include men as allies in efforts to eliminate GBV and to reach gender equality.
Rita Columbia Representative for Moldova Country Director for Armenia, Albania, Moldova UNFPA, United Nations Population Fund
14
EXECUTIVE SUMMARY
Background
The principle of equality between sexes is enshrined in the Armenian Constitution and is
reflected in the national legislation. In the amendments made to the Armenian Constitution in 2005
that principle was formulated as a ban on discrimination on a number of grounds, including on the
grounds of sex, while in 2015 a special article on equality between sexes was included. However,
the de jure equality does not necessarily translate into the de facto gender equality. Therefore, the
need for a special gender policy remains acute. Formulation of a gender policy in Armenia goes
back to the late 1990s and is due to a combination of factors, first of all three world conferences1
and prospects of European integration.
The Armenian Government has been taking certain steps to harmonize national policies with
the gender equality principle and with international requirements in that field. Thus, the Beijing
Platform for Action as well as other international documents on gender equality laid the
groundwork for creating a number of national documents to ensure gender equality, primarily the
RoA Gender Policy Concept Paper, which aims to facilitate gender mainstreaming in all spheres
of socio-political and socio-economic life and in policies at all levels of government as a tool for
ensuring sustainable democratic development of the society and for consolidating democratic, open
and just civil society and the rule-of-law State. Of great significance for gender policy
implementation was the Law of the Republic of Armenia on ensuring women and men equal rights
and equal opportunities, which took effect after the RoA President signed it on 11 June 2013.
Among the recent documents adopted by the Armenian Government are the Republic of Armenia
Gender Policy Strategic Action Plan for 2011-2015 and the National Action Plan to Combat Gender-
Based Violence for 2011-2015. At present, the Armenian Government is in the process of preparation
of the Gender Equality Strategy for 2017-2021 and an Action Plan for subsequent years.
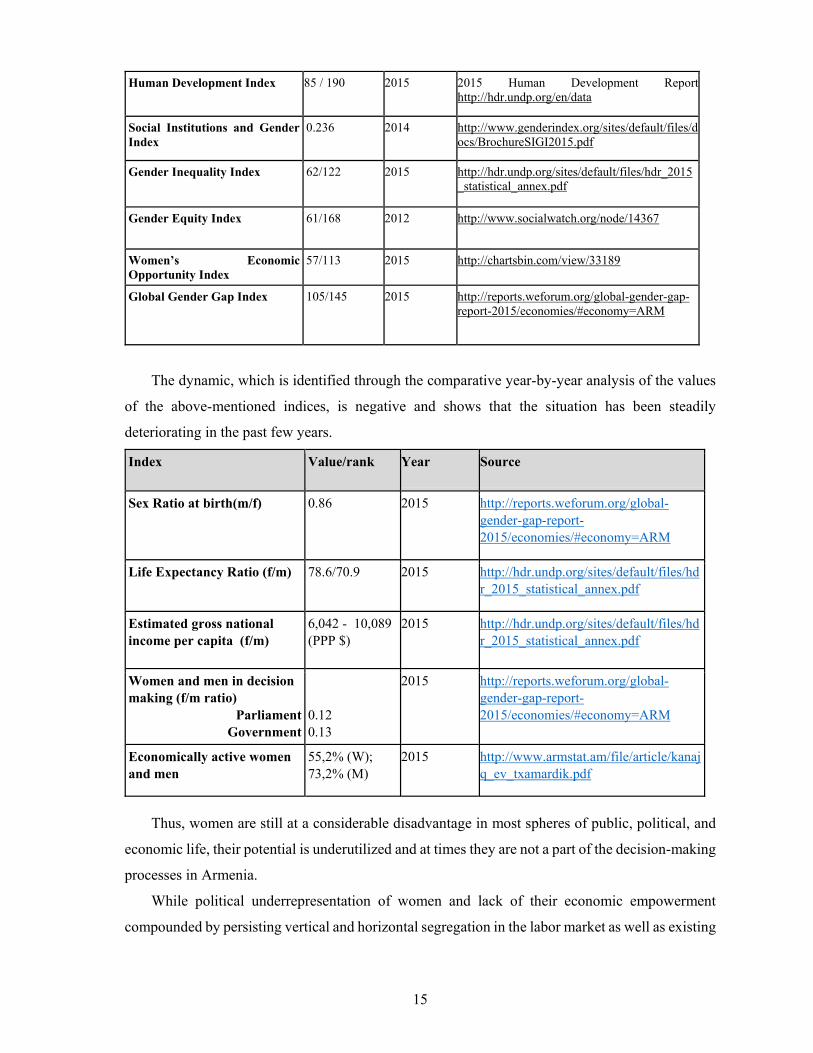
All these efforts notwithstanding, findings of a number of studies as well as values of
relevant indices regarding the gender situation in Armenia have time and again demonstrated that
the advancement and progress of women and the attainment of gender equality are impeded by
widespread negative gender stereotypes and that some traditional practices harmful to women
(primarily gender-based violence (GBV), son preference and sex selective abortions) are still
prevalent in the society:
Index Value/rank Year Source
1 Vienna Conference on Human rights (1993), Cairo Conference on Population and Development (ICPD, 1994) and the Fourth World Conference on Women (Beijing, 1995) particularly stressed the importance of gender equality and relevant policies to achieve it.
15
Human Development Index 85 / 190 2015 2015 Human Development Report http://hdr.undp.org/en/data
Social Institutions and Gender Index
0.236 2014 http://www.genderindex.org/sites/default/files/docs/BrochureSIGI2015.pdf
Gender Inequality Index 62/122 2015 http://hdr.undp.org/sites/default/files/hdr_2015_statistical_annex.pdf
Gender Equity Index 61/168 2012 http://www.socialwatch.org/node/14367
Women’s Economic Opportunity Index
57/113 2015 http://chartsbin.com/view/33189
Global Gender Gap Index
105/145
2015 http://reports.weforum.org/global-gender-gap-report-2015/economies/#economy=ARM
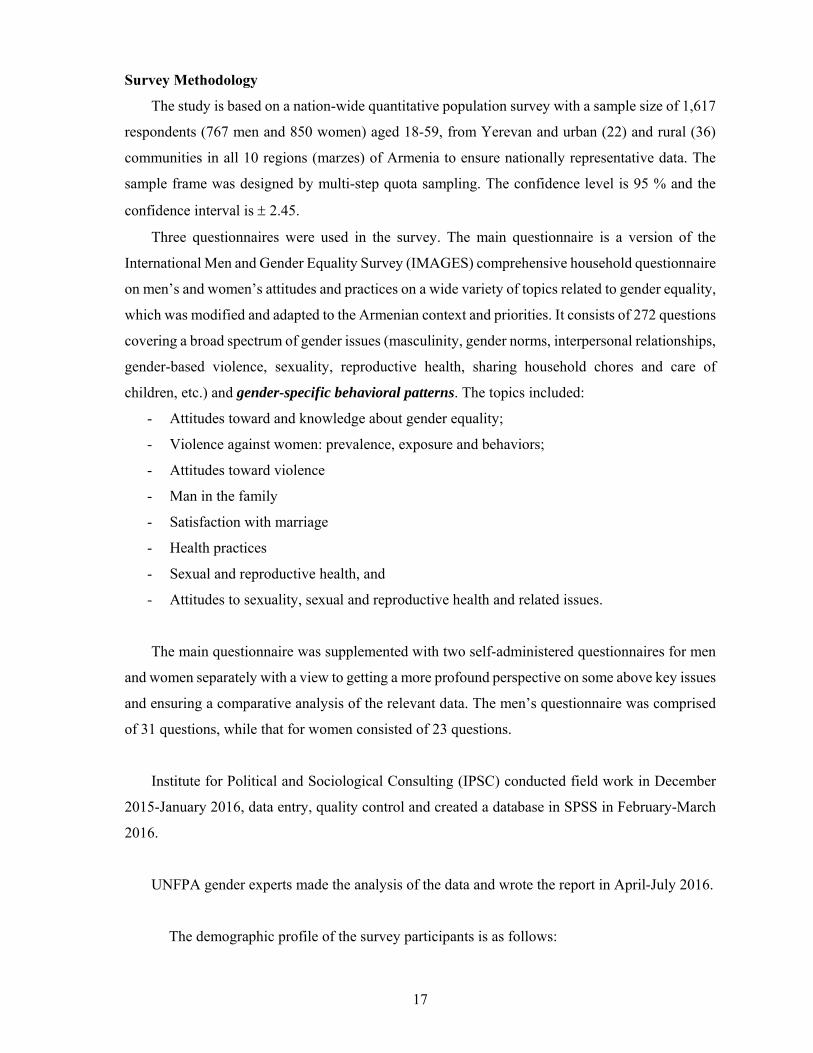
The dynamic, which is identified through the comparative year-by-year analysis of the values
of the above-mentioned indices, is negative and shows that the situation has been steadily
deteriorating in the past few years.
Index Value/rank Year Source
Sex Ratio at birth(m/f) 0.86
2015 http://reports.weforum.org/global-gender-gap-report-2015/economies/#economy=ARM
Life Expectancy Ratio (f/m) 78.6/70.9 2015 http://hdr.undp.org/sites/default/files/hdr_2015_statistical_annex.pdf
Estimated gross national income per capita (f/m)
6,042 - 10,089 (PPP $)
2015 http://hdr.undp.org/sites/default/files/hdr_2015_statistical_annex.pdf
Women and men in decision making (f/m ratio)
Parliament Government
0.12 0.13
2015 http://reports.weforum.org/global-gender-gap-report-2015/economies/#economy=ARM
Economically active women and men
55,2% (W); 73,2% (M)
2015 http://www.armstat.am/file/article/kanajq_ev_txamardik.pdf
Thus, women are still at a considerable disadvantage in most spheres of public, political, and
economic life, their potential is underutilized and at times they are not a part of the decision-making
processes in Armenia.
While political underrepresentation of women and lack of their economic empowerment
compounded by persisting vertical and horizontal segregation in the labor market as well as existing

16
gender imbalance in a number of other spheres are serious problems per se, they reflect at the same
time gender-based discrimination the root causes of which have yet to be eliminated.
Attaining gender equality is impossible without active involvement and participation of men,
which are predicated on their internalizing, holding and maintaining adequate values and norms.
Their commitment to values and norms of gender equality and equity is reflected in their attitudes
and practices concerning masculinity, gender norms, interpersonal relationships, gender-based
violence, sexuality, reproductive health, sharing household chores and care of children, etc. Surveys
are one of the effective tools to find out whether men and women hold gender equitable or
inequitable norms and to what extent. Therefore, the major objectives of the present survey were to
identify the said attitudes and practices in present-day Armenia with a particular focus on
comparing men’s and women’ s opinions on those issues of concern.
This report presents findings of a nation-wide survey-based population study of attitudes,
perceptions and practices of men and women regarding masculinity, gender norms, GBV, intimate
relationships and marriage, sexual practices, health, and household duties in Armenia. The survey
was implemented in line with the general goal of the IMAGES2 research initiative.
While obtaining reliable and solid data concerning the above-mentioned attitudes and practices
is important in and of itself as it gives a realistic picture of the current situation, nevertheless, what
is even more important is the fact that the survey data provide relevant benchmarks for tracking
progress and lay the groundwork for developing better-targeted and more effective gender equality
policies and strategies.
As the focus in this study was inter alia on masculinity, it is important first of all to provide
definition of masculinity that the present study proceeds from. While biological factors and
psychological characteristics are a constituent part of a male identity, masculinity is primarily a
social and cultural construction, the set of societal expectations and beliefs about what men are and
how they should behave that boys and men internalize in the process of socialization and personal
identity formation.
2 IMAGES - International Men and Gender Equality Survey - is a comprehensive household questionnaire on men’s attitudes and practices – along with women’s opinions and reports of men’s practices – on a wide variety of topics related to gender equality. Topics include: gender-based violence; health and health-related practices; household division of labor; men’s participation in caregiving and as fathers; men’s and women’s attitudes about gender and gender-related policies; transactional sex; men’s reports of criminal behavior; and quality of life. http://www.icrw.org/publications/international-men-and-gender-equality-survey-images
17
Survey Methodology
The study is based on a nation-wide quantitative population survey with a sample size of 1,617
respondents (767 men and 850 women) aged 18-59, from Yerevan and urban (22) and rural (36)
communities in all 10 regions (marzes) of Armenia to ensure nationally representative data. The
sample frame was designed by multi-step quota sampling. The confidence level is 95 % and the
confidence interval is 2.45.
Three questionnaires were used in the survey. The main questionnaire is a version of the
International Men and Gender Equality Survey (IMAGES) comprehensive household questionnaire
on men’s and women’s attitudes and practices on a wide variety of topics related to gender equality,
which was modified and adapted to the Armenian context and priorities. It consists of 272 questions
covering a broad spectrum of gender issues (masculinity, gender norms, interpersonal relationships,
gender-based violence, sexuality, reproductive health, sharing household chores and care of
children, etc.) and gender-specific behavioral patterns. The topics included:
- Attitudes toward and knowledge about gender equality;
- Violence against women: prevalence, exposure and behaviors;
- Attitudes toward violence
- Man in the family
- Satisfaction with marriage
- Health practices
- Sexual and reproductive health, and
- Attitudes to sexuality, sexual and reproductive health and related issues.
The main questionnaire was supplemented with two self-administered questionnaires for men
and women separately with a view to getting a more profound perspective on some above key issues
and ensuring a comparative analysis of the relevant data. The men’s questionnaire was comprised
of 31 questions, while that for women consisted of 23 questions.
Institute for Political and Sociological Consulting (IPSC) conducted field work in December
2015-January 2016, data entry, quality control and created a database in SPSS in February-March
2016.
UNFPA gender experts made the analysis of the data and wrote the report in April-July 2016.
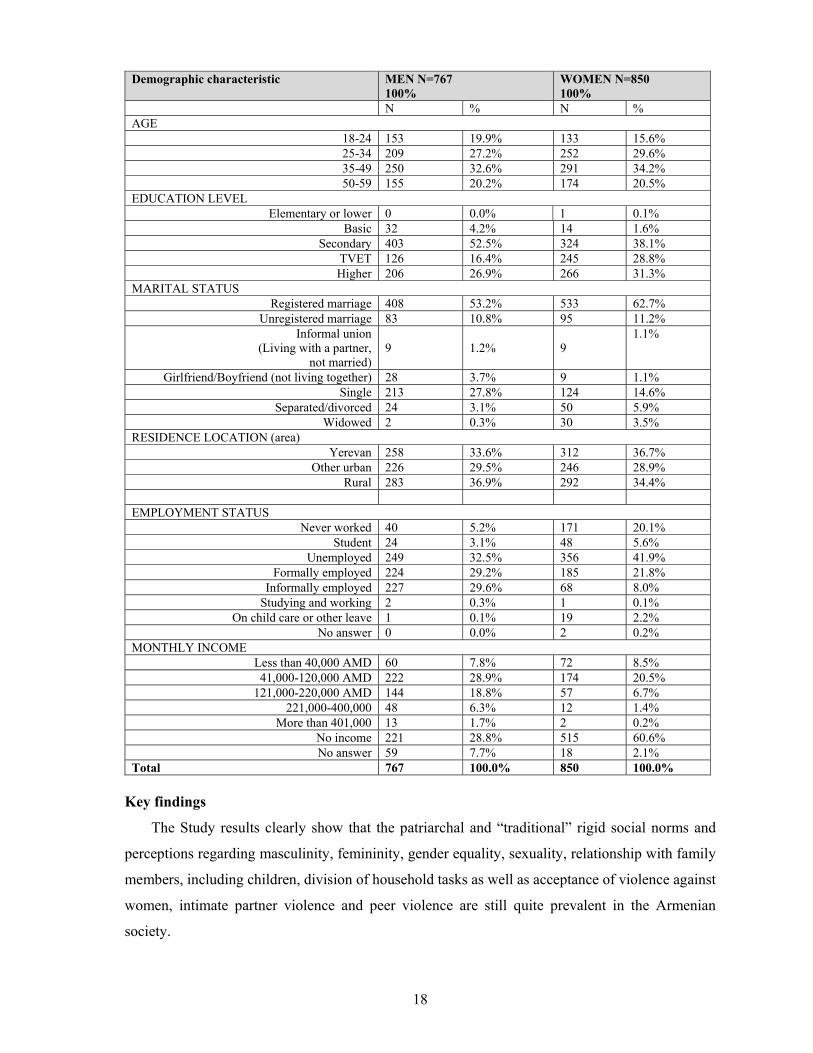
The demographic profile of the survey participants is as follows:
18
Demographic characteristic MEN N=767 100%
WOMEN N=850 100%
N % N % AGE
18-24 153 19.9% 133 15.6% 25-34 209 27.2% 252 29.6% 35-49 250 32.6% 291 34.2% 50-59 155 20.2% 174 20.5%
EDUCATION LEVEL Elementary or lower 0 0.0% 1 0.1%
Basic 32 4.2% 14 1.6% Secondary 403 52.5% 324 38.1%
TVET 126 16.4% 245 28.8% Higher 206 26.9% 266 31.3%
MARITAL STATUS Registered marriage 408 53.2% 533 62.7%
Unregistered marriage 83 10.8% 95 11.2% Informal union
(Living with a partner, not married)
9 1.2% 9 1.1%
Girlfriend/Boyfriend (not living together) 28 3.7% 9 1.1% Single 213 27.8% 124 14.6%
Separated/divorced 24 3.1% 50 5.9% Widowed 2 0.3% 30 3.5%
RESIDENCE LOCATION (area) Yerevan 258 33.6% 312 36.7%
Other urban 226 29.5% 246 28.9% Rural 283 36.9% 292 34.4%
EMPLOYMENT STATUS
Never worked 40 5.2% 171 20.1% Student 24 3.1% 48 5.6%
Unemployed 249 32.5% 356 41.9% Formally employed 224 29.2% 185 21.8%
Informally employed 227 29.6% 68 8.0% Studying and working 2 0.3% 1 0.1%
On child care or other leave 1 0.1% 19 2.2% No answer 0 0.0% 2 0.2%
MONTHLY INCOME Less than 40,000 AMD 60 7.8% 72 8.5% 41,000-120,000 AMD 222 28.9% 174 20.5%
121,000-220,000 AMD 144 18.8% 57 6.7% 221,000-400,000 48 6.3% 12 1.4%
More than 401,000 13 1.7% 2 0.2% No income 221 28.8% 515 60.6% No answer 59 7.7% 18 2.1%
Total 767 100.0% 850 100.0%
Key findings
The Study results clearly show that the patriarchal and “traditional” rigid social norms and
perceptions regarding masculinity, femininity, gender equality, sexuality, relationship with family
members, including children, division of household tasks as well as acceptance of violence against
women, intimate partner violence and peer violence are still quite prevalent in the Armenian
society.
19
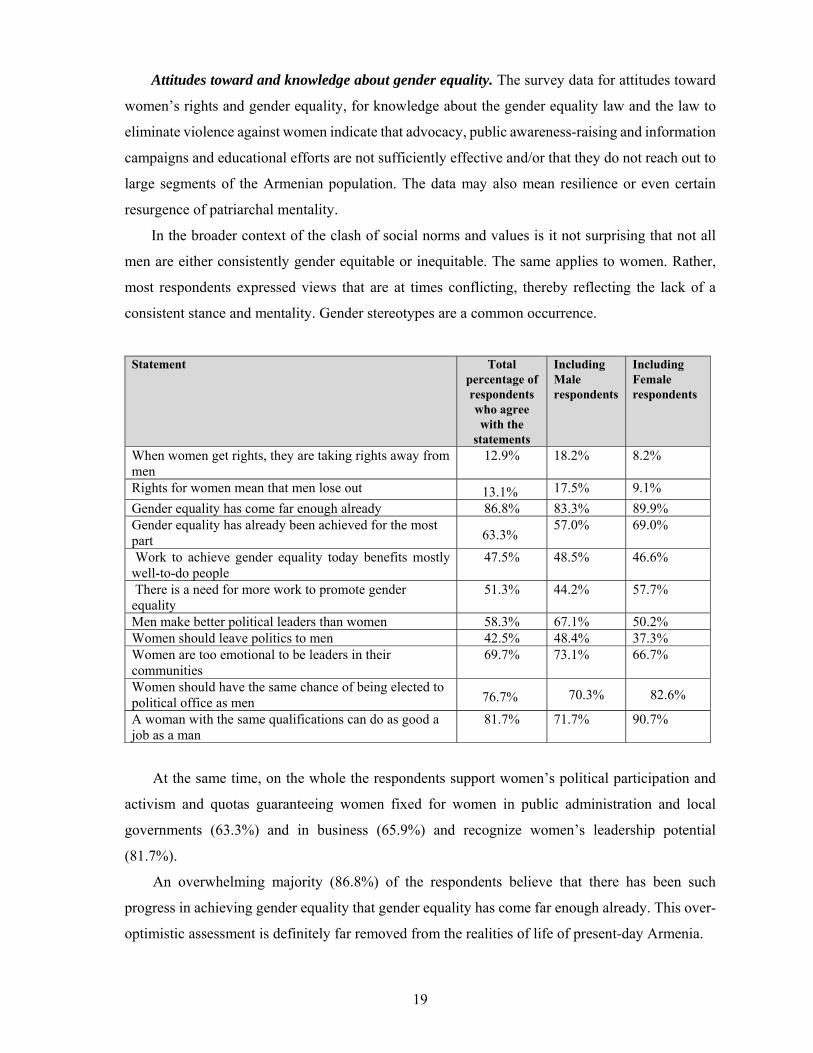
Attitudes toward and knowledge about gender equality. The survey data for attitudes toward
women’s rights and gender equality, for knowledge about the gender equality law and the law to
eliminate violence against women indicate that advocacy, public awareness-raising and information
campaigns and educational efforts are not sufficiently effective and/or that they do not reach out to
large segments of the Armenian population. The data may also mean resilience or even certain
resurgence of patriarchal mentality.
In the broader context of the clash of social norms and values is it not surprising that not all
men are either consistently gender equitable or inequitable. The same applies to women. Rather,
most respondents expressed views that are at times conflicting, thereby reflecting the lack of a
consistent stance and mentality. Gender stereotypes are a common occurrence.
Statement Total
percentage of respondents who agree with the
statements
Including Male respondents
Including Female respondents
When women get rights, they are taking rights away from men
12.9% 18.2% 8.2%
Rights for women mean that men lose out 13.1% 17.5% 9.1% Gender equality has come far enough already 86.8% 83.3% 89.9% Gender equality has already been achieved for the most part 63.3%
57.0% 69.0%
Work to achieve gender equality today benefits mostly well-to-do people
47.5% 48.5% 46.6%
There is a need for more work to promote gender equality
51.3% 44.2% 57.7%
Men make better political leaders than women 58.3% 67.1% 50.2% Women should leave politics to men 42.5% 48.4% 37.3% Women are too emotional to be leaders in their communities
69.7% 73.1% 66.7%
Women should have the same chance of being elected to political office as men 76.7% 70.3% 82.6%
A woman with the same qualifications can do as good a job as a man
81.7% 71.7% 90.7%
At the same time, on the whole the respondents support women’s political participation and
activism and quotas guaranteeing women fixed for women in public administration and local
governments (63.3%) and in business (65.9%) and recognize women’s leadership potential
(81.7%).
An overwhelming majority (86.8%) of the respondents believe that there has been such
progress in achieving gender equality that gender equality has come far enough already. This over-
optimistic assessment is definitely far removed from the realities of life of present-day Armenia.

20
Less than half of the respondents gave the correct answer to the question about the existence
of the Gender Equality Law (43.2%), whereas 36.1% thought that such a law does not exist and
every 5th respondent did not know.
It was even more unexpected to find out that the majority of the respondents gave the wrong
answer to the question about the Law on VAW prevention. While there have been heated public
debates, the draft Law has not so far made it to the country’s National Assembly. As the issue of
the Law would time and again receive wide media coverage, most probably many respondents
among those 62.7% who gave the wrong answer recalled some media reports and thought that the
Law had been adopted. Only a quarter (26.6%) of the respondents gave the right answer and 10.5%
did not know.
The sex-disaggregated data demonstrate that men are better informed about the said laws than
women. While the difference between the proportion of male respondents and that of female
respondents giving the right and wrong answers to the question about a gender equality law is
minimal, in the case of the law to prevent VAW it is considerable.
Violence against women: prevalence, exposure and behaviors. The prevalence data indicate
that violence against women and intimate partners remains an unresolved and contentious issue and
reflects inadequacy of efforts in developing a democratic gender culture with non-violence, non-
discrimination, gender equality and equity as its core principles.
Percentage of men who perpetrated psychological violence against a female intimate partner
53.3% Percentage of women subjected to psychological violence by a male intimate partner
45.9%
Percentage of men who perpetrated economic abuse against a female intimate partner
20.8% Percentage of women subjected to economic abuse by a male intimate partner
21.3%
Percentage of men who perpetrated physical violence against a female intimate partner
17.4% Percentage of women subjected to physical violence by a male intimate partner
12.5%
Percentage of women subjected to physical violence by a male intimate partner – from main questionnaire
12.5% The same – from self-administered 22.4%
Percentage of sexual violence (perpetrated and reported by men) 14.6%
21
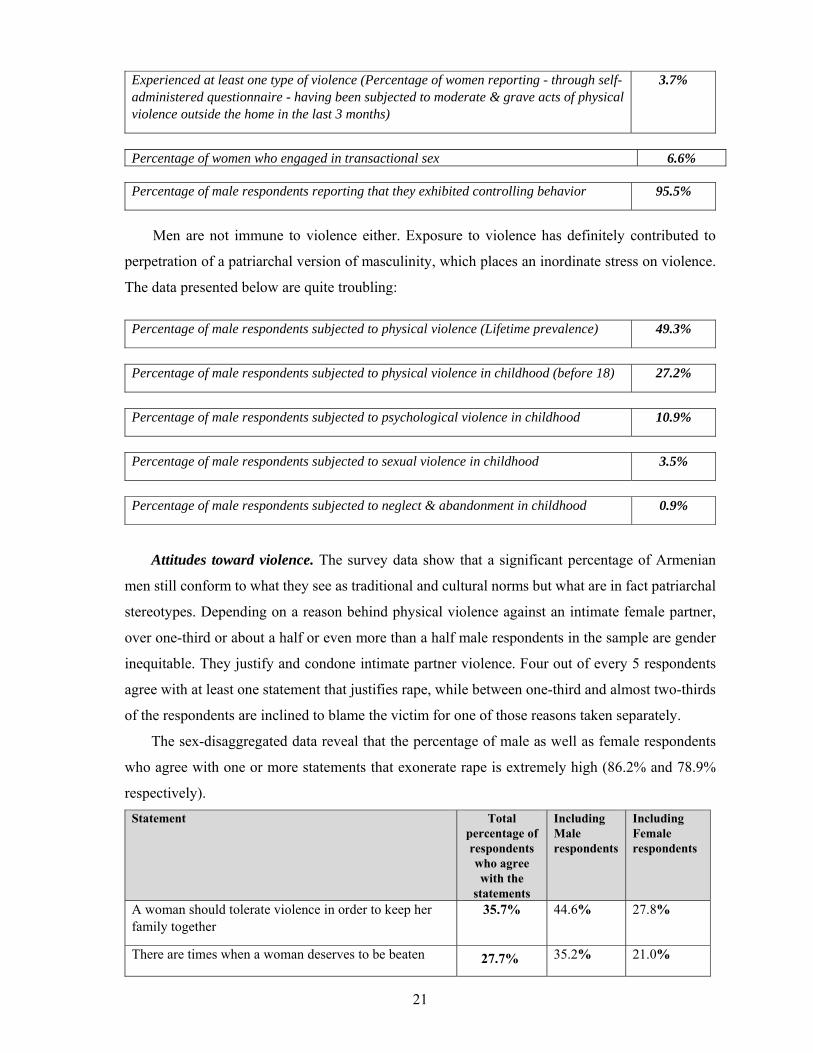
Experienced at least one type of violence (Percentage of women reporting - through self-administered questionnaire - having been subjected to moderate & grave acts of physical violence outside the home in the last 3 months)
3.7%
Percentage of women who engaged in transactional sex 6.6%
Percentage of male respondents reporting that they exhibited controlling behavior 95.5%
Men are not immune to violence either. Exposure to violence has definitely contributed to
perpetration of a patriarchal version of masculinity, which places an inordinate stress on violence.
The data presented below are quite troubling:
Percentage of male respondents subjected to physical violence (Lifetime prevalence) 49.3%
Percentage of male respondents subjected to physical violence in childhood (before 18) 27.2%
Percentage of male respondents subjected to psychological violence in childhood 10.9%
Percentage of male respondents subjected to sexual violence in childhood 3.5%
Percentage of male respondents subjected to neglect & abandonment in childhood 0.9%
Attitudes toward violence. The survey data show that a significant percentage of Armenian
men still conform to what they see as traditional and cultural norms but what are in fact patriarchal
stereotypes. Depending on a reason behind physical violence against an intimate female partner,
over one-third or about a half or even more than a half male respondents in the sample are gender
inequitable. They justify and condone intimate partner violence. Four out of every 5 respondents
agree with at least one statement that justifies rape, while between one-third and almost two-thirds
of the respondents are inclined to blame the victim for one of those reasons taken separately.
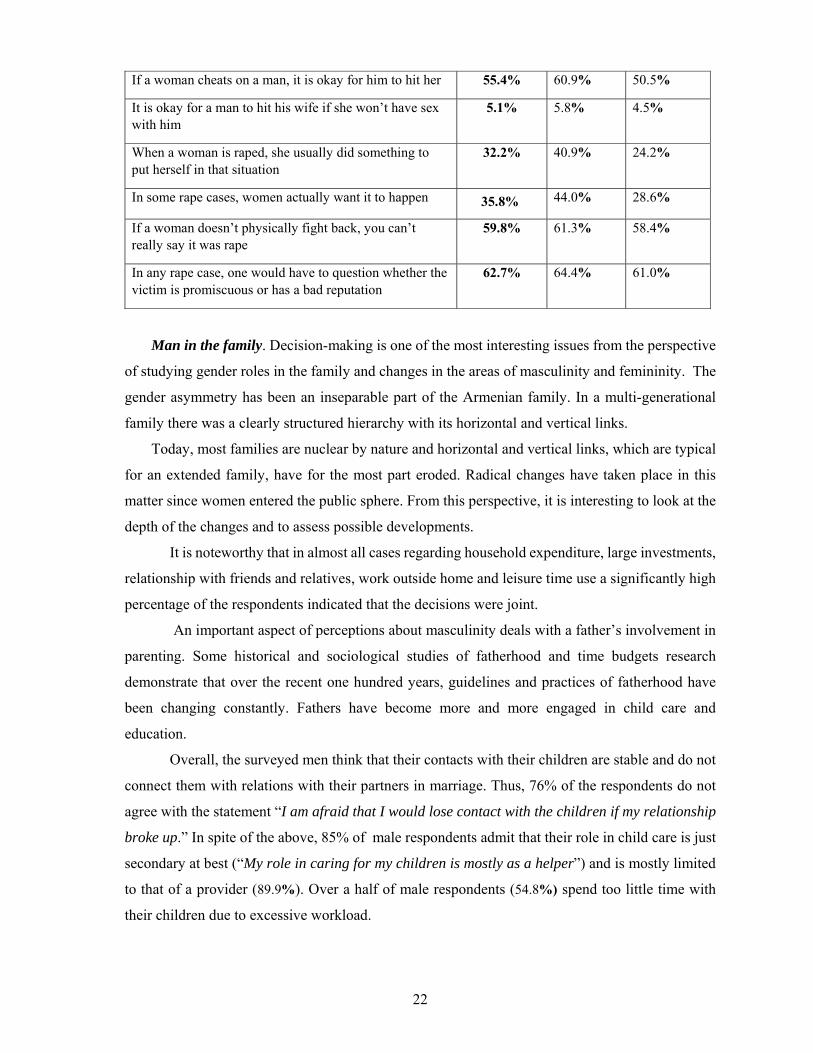
The sex-disaggregated data reveal that the percentage of male as well as female respondents
who agree with one or more statements that exonerate rape is extremely high (86.2% and 78.9%
respectively). Statement Total
percentage of respondents who agree with the
statements
Including Male respondents
Including Female respondents
A woman should tolerate violence in order to keep her family together
35.7% 44.6% 27.8%
There are times when a woman deserves to be beaten 27.7% 35.2% 21.0%
22
If a woman cheats on a man, it is okay for him to hit her 55.4% 60.9% 50.5%
It is okay for a man to hit his wife if she won’t have sex with him
5.1% 5.8% 4.5%
When a woman is raped, she usually did something to put herself in that situation
32.2% 40.9% 24.2%
In some rape cases, women actually want it to happen 35.8% 44.0% 28.6%
If a woman doesn’t physically fight back, you can’t really say it was rape
59.8% 61.3% 58.4%
In any rape case, one would have to question whether the victim is promiscuous or has a bad reputation
62.7% 64.4% 61.0%
Man in the family. Decision-making is one of the most interesting issues from the perspective
of studying gender roles in the family and changes in the areas of masculinity and femininity. The
gender asymmetry has been an inseparable part of the Armenian family. In a multi-generational
family there was a clearly structured hierarchy with its horizontal and vertical links.
Today, most families are nuclear by nature and horizontal and vertical links, which are typical
for an extended family, have for the most part eroded. Radical changes have taken place in this
matter since women entered the public sphere. From this perspective, it is interesting to look at the
depth of the changes and to assess possible developments.
It is noteworthy that in almost all cases regarding household expenditure, large investments,
relationship with friends and relatives, work outside home and leisure time use a significantly high
percentage of the respondents indicated that the decisions were joint.
An important aspect of perceptions about masculinity deals with a father’s involvement in
parenting. Some historical and sociological studies of fatherhood and time budgets research
demonstrate that over the recent one hundred years, guidelines and practices of fatherhood have
been changing constantly. Fathers have become more and more engaged in child care and
education.
Overall, the surveyed men think that their contacts with their children are stable and do not
connect them with relations with their partners in marriage. Thus, 76% of the respondents do not
agree with the statement “I am afraid that I would lose contact with the children if my relationship
broke up.” In spite of the above, 85% of male respondents admit that their role in child care is just
secondary at best (“My role in caring for my children is mostly as a helper”) and is mostly limited
to that of a provider (89.9%). Over a half of male respondents (54.8%) spend too little time with
their children due to excessive workload.
23
According to the gender stereotypes prevalent in the society, the household work is not, as
a rule, considered to be man’s responsibility. Even taking into account the fact that household work
belongs to the private sphere, it is often guided by gender stereotypes existing in the public sphere.
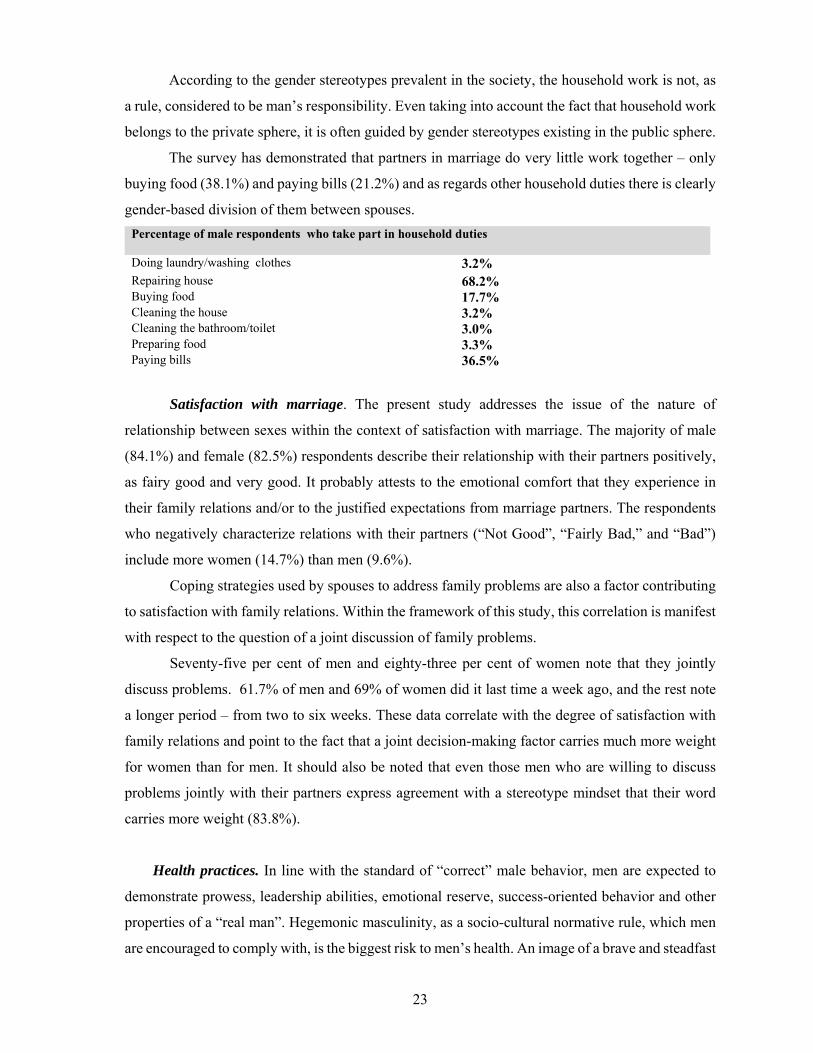
The survey has demonstrated that partners in marriage do very little work together – only
buying food (38.1%) and paying bills (21.2%) and as regards other household duties there is clearly
gender-based division of them between spouses. Percentage of male respondents who take part in household duties Doing laundry/washing clothes 3.2% Repairing house 68.2% Buying food 17.7% Cleaning the house 3.2% Cleaning the bathroom/toilet 3.0% Preparing food 3.3% Paying bills 36.5%
Satisfaction with marriage. The present study addresses the issue of the nature of
relationship between sexes within the context of satisfaction with marriage. The majority of male
(84.1%) and female (82.5%) respondents describe their relationship with their partners positively,
as fairy good and very good. It probably attests to the emotional comfort that they experience in
their family relations and/or to the justified expectations from marriage partners. The respondents
who negatively characterize relations with their partners (“Not Good”, “Fairly Bad,” and “Bad”)
include more women (14.7%) than men (9.6%).
Coping strategies used by spouses to address family problems are also a factor contributing
to satisfaction with family relations. Within the framework of this study, this correlation is manifest
with respect to the question of a joint discussion of family problems.
Seventy-five per cent of men and eighty-three per cent of women note that they jointly
discuss problems. 61.7% of men and 69% of women did it last time a week ago, and the rest note
a longer period – from two to six weeks. These data correlate with the degree of satisfaction with
family relations and point to the fact that a joint decision-making factor carries much more weight
for women than for men. It should also be noted that even those men who are willing to discuss
problems jointly with their partners express agreement with a stereotype mindset that their word
carries more weight (83.8%).
Health practices. In line with the standard of “correct” male behavior, men are expected to
demonstrate prowess, leadership abilities, emotional reserve, success-oriented behavior and other
properties of a “real man”. Hegemonic masculinity, as a socio-cultural normative rule, which men
are encouraged to comply with, is the biggest risk to men’s health. An image of a brave and steadfast
24
man is often connected with the neglect and denial of symptoms of illness or pain. This behavior
can lead to diagnosis of a disease only at a later stage. As a result, not infrequently men overestimate
the quality of their health and are shy about admitting a poor health condition. One of the features
of misconstrued masculinity is unwillingness to seek medical help in contrast to women. It is not
just about different assessment of the state of one’s health and regularity of visits to doctors, but
also about the nature of complaints, ways of describing symptoms and how they are feeling, men’s
desire not to look too worried and many other details. The survey data prove that reality: the total
of 91.3% of men considered their health status as normal or excellent and only 8.6% described it as
poor or very poor, regardless of the fact that 53.70% of male respondents sought health services at
a clinic or hospital during the last year and more than 6% have chronic diseases and problems with
sexual health.
Sexual and reproductive health. Notwithstanding sexual encounters with various women, as
regards long-term relationships and especially marriages, the surveyed men are “monogamous”
since over three-fourths of them have had only one wife or a woman that they cohabit(ed) with. A
relatively small percentage (16.2%) of male respondents has had one wife or a woman they
cohabit(ed) with outside the current relationship.
Another important aspect of a long-term functional intimate relationship (including marriage)
is satisfaction with sexual relations and with their frequency. The survey data demonstrate
unequivocally that an overwhelming majority of male and female respondents find both quality and
frequency of sexual relations with their spouse or main partner as (very) satisfying (men 86.8% and
86.5% respectively; women 89.2% and 89.3% respectively) or more or less satisfying (men 7.7%
and 7.8% respectively; women 6.3% and 6.1% respectively). The proportion of those who find the
“quality” and frequency of sexual relations with their spouse and main partner as unsatisfying is
under 5.0% for men and under 2.5% for women.
A low level and inconsistent use of condoms by men may pose a serious threat for their own
and their intimate partners’ sexual and reproductive health. As evidenced by the data, a half of male
respondents(49.3%) did not use condoms at all, while only a quarter of them (24.2%) always used
a condom and another quarter (25.9%) used condoms mostly or occasionally in the twelve months
preceding the survey. Thus, it is a matter of concern from the perspective not only of contraception
but also of unprotected, hence unsafe sex, especially considering the fact that about 30% of the
male respondents who answered the question about who their partner was in the latest sexual
encounter noted that that was another partner, including casual sex partner and commercial sex
workers.
25
Another way to monitor a sexual and reproductive health status is to be tested for HIV. Out of
396 male respondents who answered the question, only 13.4% were tested for HIV in the last 6
months and another 5.3% in the last 12 months. 7.6% were tested 2-5 years ago and 1.8% more
than 5 years ago. 71.2% were never tested (0.8% gave no answer).
Termination of pregnancy is also an important sexual and reproductive health issue closely
related to prevalent norms of masculinity and femininity. Unless done for medical reasons, abortion
means that pregnancy is or has become unwanted and that social reasons come to the fore, including
lack of knowledge about and access to contraception.
Of those ever-partnered women who answered the question of whether they terminated
pregnancy at some point in their lives, the percentage of the respondents who said “yes” is virtually
the same as that of the respondents who said “no” (45.8% and 46.6% respectively). Of the female
respondents who answered the question about an abortion in the affirmative, only 1.6% had it the
first time when they were younger than 18, whereas 98.4% had it, when they were over 18 years of
age.
Attitudes to sexuality, sexual and reproductive health and related issues. The survey also
focused on a number of statements pertaining to the sphere of sexuality and reflecting patriarchal
stereotypes of masculinity. The views reflected in the statements are held by a considerable, albeit
varying proportion of the respondents. The proportion of those who do not share the view that a
man needs other women even if things with his wife are fine (58.7%) is substantially higher than
that of those who do. Still, one third of the respondents believe that husband’s adulterous behavior
is nothing out of ordinary. The other statement that is supported by a smaller percentage of the
respondents (45.5%) than that of those who disagree with it (49.9%) places responsibility
exclusively on a woman to avoid getting pregnant.
While the statements that men need sex more than women do and that men are always ready
to have sex are definitely misconceptions and patriarchal clichés questioned by recent scientific
research, they are popular. The proportion of the respondents agreeing with those statements (49.1%
and 58.3% respectively) is about 15%-30% higher than that of those who disagree with them (34.5%
and 29.3% respectively).
Another quite widespread stereotype supported by slightly over a half of the respondents is
that women who carry condoms on them are “easy.” Women’s responsible sexual behavior is still
construed by some respondents as promiscuity or lack of “virtue.” At the same time the percentage
of those who disagree with the statement is far from small (37.7%).
A sensitive issue that reflects double standards most visibly is that of woman’s virginity. The
overwhelming majority (85.9%) of the respondents agree (including 75.0% of those who strongly
26
agree) with the statement that a woman should remain a virgin until marriage. Only 12.4% of the
respondents disagreed with that statement and a negligible 1.8% of the respondents were uncertain.
In other words, regardless of how well-meaning they are and of whatever arguments and reasons
they may advance, well over four-fifths of the surveyed respondents effectively deny women the
right of control over their own bodies and sexuality and force them to conform to the norms and
standards imposed by the resurgent patriarchal mentality.
As a first study of its kind conducted in Armenia, the present survey intended to provide a
baseline and a number of benchmarks regarding the issues under consideration. However, it became
clear that further research focusing on individual issues is required, including impact evaluation
studies as a follow-up to targeted policies and programs.
Recommendations
- To strengthen positive aspects of masculinity through educating general public and better
targeted interventions in the education system to promote and consolidate gender equitable
attitudes and behavior,
- To focus on masculinity issues in future National Action Plans and Strategies that seek to
achieve gender equality and equity,
- To strengthen effective cooperation and coordination among major stakeholders, viz.
government agencies, civil society, academic community and international organizations,
- To introduce and to regularly conduct impact evaluation studies in the aftermath of national
programs that address gender (equality) issues, including masculinity issues,
- To support studies on new trends and perceptions of masculinity paying particular attention
to the identification of prevalence of gender equitable attitudes and of the degree to which
they translate into adequate behavior,
- To promote egalitarian type of the family through mainstreaming nonviolent behavior and
GE issues into the national programs on support to families,
- To support improvement of the national legislation and to put forth policy-level efforts to
combat more effectively the identified prevalence of GBV and of the latter’s acceptance
through, inter alia, upgrading the referral mechanism and providing more efficient
assistance to and protection of victims.
- To support introduction of gender quotas into the system of public administration and local
self-government and of a higher gender quota for the National Assembly.
27
INTRODUCTION
The principle of equality between sexes is enshrined in the Armenian Constitution and is
reflected in the national legislation. In the amendments made to the Armenian Constitution in 2005
that principle was formulated as a ban on discrimination on a number of grounds, including on the
grounds of sex3, while in 2015 a special article on equality between sexes4 was included. However,
the de jure equality does not necessarily translate into the de facto gender equality5. Therefore, the
need for a special gender policy remains acute. Formulation of a gender policy in Armenia goes
back to the late 1990s and is due to a combination of factors, first of all three world conferences6
and prospects of European integration7.
The Armenian Government has been taking certain steps to harmonize national policies
with the gender equality principle and with international requirements in that field. Thus, the
Beijing Platform for Action as well as other international documents on gender equality laid the
groundwork for creating a number of national documents to ensure gender equality.
In 1998 the Armenian Government issued Decree No. 242 On the Basics of the Programme
for the Improvement of the Status of Women in the Republic of Armenia and Decree No. 406 On
Approving the National Plan for the Improvement of Women’s Status and Enhancement of Their
Role in the Society for the Period 1998-2000 in the Republic of Armenia. In April 2004 the
Armenian Government adopted the National Action Plan on Improving the Status of Women and
Enhancing Their Role in the Society for the Period 2004-2010. The National Action Plan laid out
the principles, priorities and main directions of the Republic of Armenia’s State policy carried out
to solve problems faced by women. It is unfortunate that during their implementation those two
3 Article 14.1 of the RoA Constitution (2005): “Everyone shall be equal before the law. Any discrimination based on any ground such as sex, race, colour, ethnic or social origin, genetic features, language, religion or belief, political or any other opinion, membership of a national minority, property, birth, disability, age or other personal or social circumstances shall be prohibited.” 4 RoA Constitution (2015), Article 30 “Equality of Rights between Women and Men, which states that “Women and men shall have equal rights.” 5 The national legislation introduced liability for discriminatory acts on a wide range of grounds, including on the grounds of sex. In particular, under Article 143 of the RoA Criminal Code (“Breach of citizens’ legal equality”) in Chapter 19 (“Crimes against constitutional human rights and freedoms of citizens), such acts shall be punishable by fines or imprisonment for up to 2 years or, when committed by officials, by imprisonment for up to 3 years. 6 Vienna Conference on Human rights (1993), Cairo Conference on Population and Development (ICPD, 1994) and the Fourth World Conference on Women (Beijing, 1995) particularly stressed the importance of gender equality and relevant policies to achieve it. 7 For European countries, equality of women and men is not only a principle of human rights but also a sine qua non of democracy, a fundamental criterion of pluralist democracy and an imperative of social justice, as well as a precondition of sustainable development. For instance, numerous Declarations adopted by the Council of Europe state that gender equality is an equal visibility, empowerment, responsibility and participation of both women and men in all spheres of public and private life and requires concerted efforts to combat sexism and gender stereotypes. (Declaration on Equality of Women and Men (Committee of Ministers, 16 November 1988); Declaration on Equality between Women and Men as a Fundamental Criterion of Democracy (4th European Ministerial Conference on equality between women and men, Istanbul, 13-14 November 1997, Gender Equality: A Core Issue in Changing Societies (Declaration and programme of Action adopted by the 5th European Ministerial Conference on Equality between women and men (Skopje, 22-23 January 2003) and Declaration: Making gender equality a reality (119th Session of the Committee of Ministers, Madrid, 12 May 2009)).

28
plans experienced problems related to inadequate Government funding, as a result of which the first
plan was suspended, while the second one was implemented incompletely.
In 2008, in its Action Plan for 2008-20128 the Armenian Government recognized gender
equality as an equal enjoyment of rights and opportunities by men and women in economic, social
and political life and as a first-priority policy direction. The Action Plan recognized also the
necessity of safeguarding equal conditions and equal opportunities for men and women to use their
potential, of ensuring equal participation of men and women in all aspects of public life in order to
foster the socio-economic, political and cultural development of the country, of eliminating
discrimination on the grounds of sex and achieving equality for men and women and ensuring equal
treatment of and equal attitude toward both sexes.
However, the main document that reflects Armenia’s commitment to gender equality policy
and its international obligations in that sphere is the RoA Gender Policy Concept Paper approved
by the Armenian Government in February 20109. This document replaced the National Action Plan
on Improving the Status of Women and Enhancing Their Role in the Society for the Period 2004 -
2010. However, it differs from the National Action Plan both conceptually and ideologically
because it is grounded in the gender equality paradigm regarded as a core democratic value and as
a sine qua non for attaining social justice. The RoA Gender Policy Concept Paper reflects the latest
international approaches to gender equality implementation based on the principle of equal rights
and equal opportunities and lays the groundwork for mainstreaming gender into legislative practices
and into the overall context of public life and State policies.
The Concept Paper aims to create legal, political, social, economic and cultural conditions
to enable women and men to enjoy equal rights and equal opportunities in all spheres. It provides a
foundation for public administration and local self-government bodies and for civil society
institutions to design programmatic activities for ensuring gender equality.
The mission of the Gender Policy Concept Paper is to facilitate gender mainstreaming in
all spheres of socio-political and socio-economic life and in policies at all levels of government as
a tool for ensuring sustainable democratic development of the society and for consolidating
democratic, open, just and civil society and the rule-of-law State.
Of great significance for gender policy implementation and for addressing the issues of
imbalanced rights and opportunities was the Law of the Republic of Armenia on ensuring women
and men equal rights and equal opportunities 10 that was adopted by the RoA National Assembly
on 20 May 2013 and took effect after the RoA President signed it on 11 June 2013. The necessity
8 Republic of Armenia Action Plan for 2008-2012. Annex to the RoA Government Decree N380-A of 28 April 2008 (ՀՀ Կառավարության ծրագիր, Հավելված ՀՀ կառավարության 2008 թվականի ապրիլի 28-ի N 380-Ա որոշման) pp.43-44 9 RoA Gender Policy Concept Paper (2010) http://www.gov.am/u_files/file/kananc-xorh/Gender-hayecakarg.pdf 10 http://www.parliament.am/legislation.php?sel=show&ID=4761
29
of the adoption of that law was stated in the recommendations of the UN Committee on the
Elimination of Discrimination against Women11 and in the European Neighbourhood Programme
Action Plan12.
The Law regulates the issue of ensuring equal rights and equal opportunities to women and
men in the fields of politics, public administration, labor and employment, entrepreneurship, health
care, education, etc. The Law is a document that has incorporated to the maximum extent the
requirements of the Convention on the Elimination of All Forms of Discrimination against Women13
and the CEDAW Committee’s recommendations14. In particular, the Law:
- introduces the concept of “gender-based discrimination” into the legislation,
- prohibits discrimination on the grounds of sex,
- introduces the concepts of direct and indirect discrimination into the legislation,
- provides an opportunity and a procedure for protecting citizens from discrimination on the grounds
of sex,
- introduces legal responsibility of officials and employers for discrimination,
- contributes to the development of culture of gender equality and to the elimination of gender
stereotypes that underlie discriminatory practices,
- outlines the spheres, framework and timeline for the use of temporary special measures aimed to
redress a gender imbalance,
- codifies the necessity to establish national machinery for gender equality, and
- makes provisions for the monitoring and reporting mechanism concerning the implementation of
gender policies.
In 2011, the Armenian Government also adopted the Republic of Armenia Gender Policy
Strategic Action Plan for 2011-201515 and the National Action Plan to Combat Gender-Based Violence
for 2011-2015. The action plans aimed to secure gender equality in power and decision-making,
socioeconomic, education, health, and culture and public information sectors as well as to prevent
gender-based violence and human trafficking. As the monitoring of the implementation of the action
plans demonstrated while certain progress has been made in achieving the goal and objectives set forth
in the action plans, there are still significant problems remaining in the area of gender equality16.
11 Concluding observations of the UN Committee on the Elimination of Discrimination against Women/ Forty-third session / 19 January-6 February 2009/, CEDAW/C/ARM/CO/4/Rev.1 / 12 http://eeas.europa.eu/enp/pdf/pdf/action_plans/armenia_enp_ap_final_en.pdf 13 http://www.un.org/womenwatch/daw/cedaw/cedaw.htm 14 Concluding observations of the UN Committee on the Elimination of Discrimination against Women/ Forty-third session / 19 January-6 February 2009/, CEDAW/C/ARM/CO/4/Rev.1 / 15 http://www.un.am/res/Gender%20TG%20docs/national/2011-2015_Gender%20Policy_NAP-Eng.pdf 16 Assessment of the Implementation of 2011-2015 Gender Policy Strategic Plan and 2011-2015 National Action Plan to Combat Gender-based Violence. Yerevan: UNDP, UNFPA, UNICEF, 2015 (in Armenian). http://un.am/up/library/Assessement_2011-2015_Gender%20Policy_arm.pdf

30
At present the Armenian Government is in the process of preparation of the Gender Equality
Strategy for 2017-2021 and an Action Plan for subsequent years.
***
Findings of a number of studies of the gender situation in Armenia have time and again
demonstrated that the social and State system of Armenia are not yet gender-sensitive17. The
advancement and progress of women and the attainment of gender equality are impeded by
widespread negative gender stereotypes and some traditional practices harmful to women
(primarily gender-based violence, son preference and sex-selective abortions) are still prevalent in
the society.
The gender situation in best characterized by values of relevant indices used by international
organizations:
Index Value/rank Year Source
Human Development Index
85 / 190 2015 2015 Human Development Report http://hdr.undp.org/en/data
Social Institutions and Gender Index
0.236 2014 http://www.genderindex.org/sites/default/files/docs/BrochureSIGI2015.pdf
Gender Inequality Index 62/122 2015 http://hdr.undp.org/sites/default/files/hdr_2015_statistical_annex.pdf
Gender Equity Index 61/168 2012 http://www.socialwatch.org/node/14367
Women’s Economic Opportunity Index
57/113 2015 http://chartsbin.com/view/33189
Global Gender Gap Index
105/145
2015 http://reports.weforum.org/global-gender-gap-report-2015/economies/#economy=ARM
The current situation is most conspicuously reflected through the Gender Gap Index, Gender
Inequality Index and Gender Equity Index. Furthermore, the dynamic which is identified through
17 E.g. Armenia country gender assessment. Mandaluyong City, Philippines: Asian Development Bank, 2015. Assessment of the Implementation of 2011-2015 Gender Policy Strategic Plan and 2011-2015 National Action Plan to Combat Gender-based Violence. Yerevan: UNDP, UNFPA, UNICEF, 2015 (in Armenian).
31
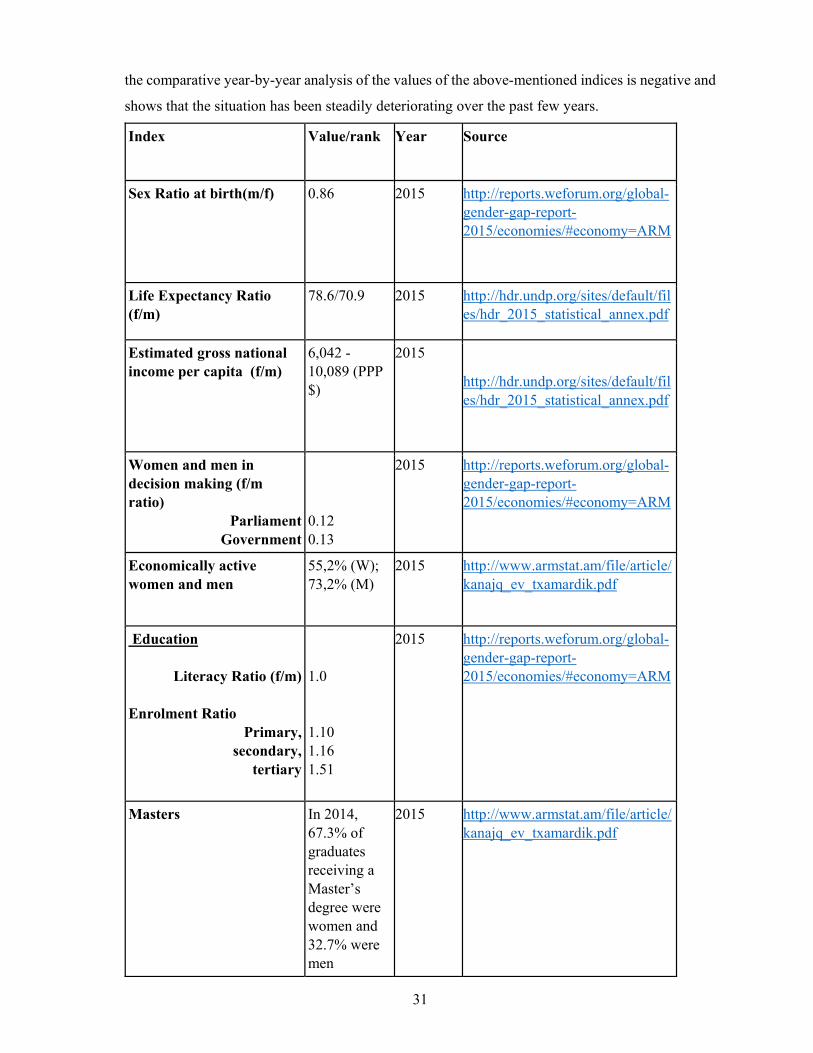
the comparative year-by-year analysis of the values of the above-mentioned indices is negative and
shows that the situation has been steadily deteriorating over the past few years.
Index Value/rank Year Source
Sex Ratio at birth(m/f) 0.86
2015 http://reports.weforum.org/global-gender-gap-report-2015/economies/#economy=ARM
Life Expectancy Ratio (f/m)
78.6/70.9 2015 http://hdr.undp.org/sites/default/files/hdr_2015_statistical_annex.pdf
Estimated gross national income per capita (f/m)
6,042 - 10,089 (PPP $)
2015
http://hdr.undp.org/sites/default/files/hdr_2015_statistical_annex.pdf
Women and men in decision making (f/m ratio)
Parliament Government
0.12 0.13
2015 http://reports.weforum.org/global-gender-gap-report-2015/economies/#economy=ARM
Economically active women and men
55,2% (W); 73,2% (M)
2015 http://www.armstat.am/file/article/kanajq_ev_txamardik.pdf
Education
Literacy Ratio (f/m) Enrolment Ratio
Primary, secondary,
tertiary
1.0 1.10 1.16 1.51
2015 http://reports.weforum.org/global-gender-gap-report-2015/economies/#economy=ARM
Masters
In 2014, 67.3% of graduates receiving a Master’s degree were women and 32.7% were men
2015 http://www.armstat.am/file/article/kanajq_ev_txamardik.pdf
32
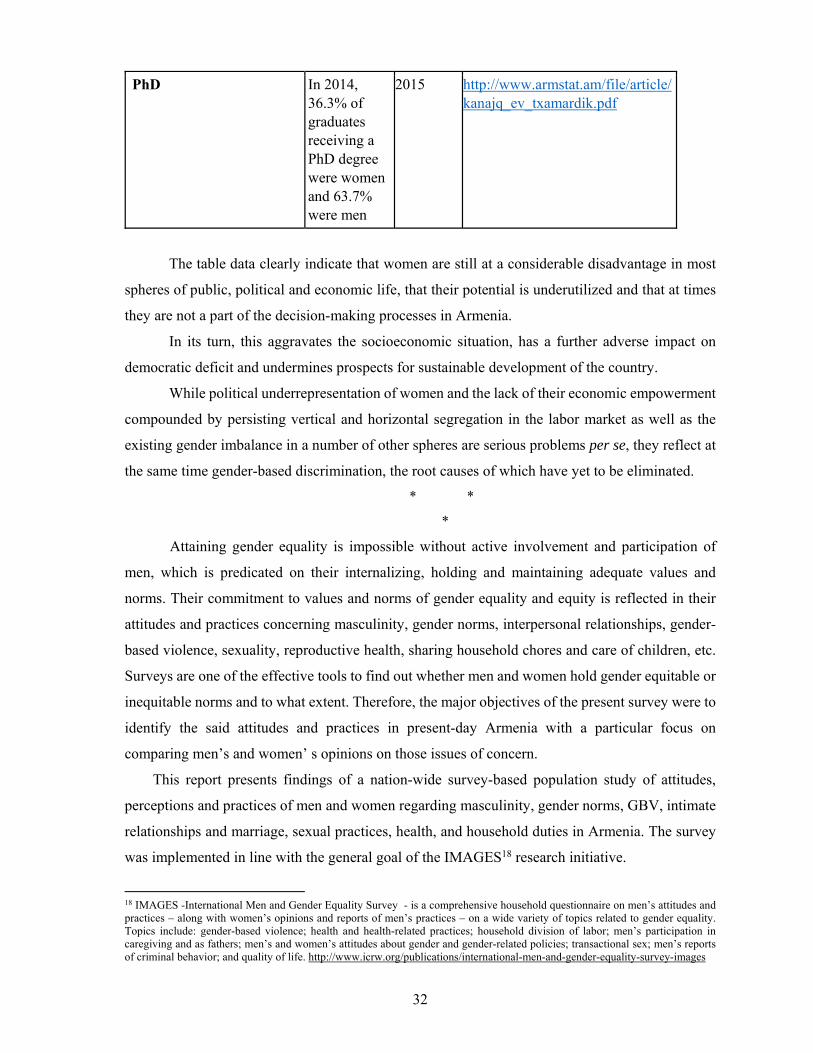
PhD In 2014, 36.3% of graduates receiving a PhD degree were women and 63.7% were men
2015 http://www.armstat.am/file/article/kanajq_ev_txamardik.pdf
The table data clearly indicate that women are still at a considerable disadvantage in most
spheres of public, political and economic life, that their potential is underutilized and that at times
they are not a part of the decision-making processes in Armenia.
In its turn, this aggravates the socioeconomic situation, has a further adverse impact on
democratic deficit and undermines prospects for sustainable development of the country.
While political underrepresentation of women and the lack of their economic empowerment
compounded by persisting vertical and horizontal segregation in the labor market as well as the
existing gender imbalance in a number of other spheres are serious problems per se, they reflect at
the same time gender-based discrimination, the root causes of which have yet to be eliminated. * *
*
Attaining gender equality is impossible without active involvement and participation of
men, which is predicated on their internalizing, holding and maintaining adequate values and
norms. Their commitment to values and norms of gender equality and equity is reflected in their
attitudes and practices concerning masculinity, gender norms, interpersonal relationships, gender-
based violence, sexuality, reproductive health, sharing household chores and care of children, etc.
Surveys are one of the effective tools to find out whether men and women hold gender equitable or
inequitable norms and to what extent. Therefore, the major objectives of the present survey were to
identify the said attitudes and practices in present-day Armenia with a particular focus on
comparing men’s and women’ s opinions on those issues of concern.
This report presents findings of a nation-wide survey-based population study of attitudes,
perceptions and practices of men and women regarding masculinity, gender norms, GBV, intimate
relationships and marriage, sexual practices, health, and household duties in Armenia. The survey
was implemented in line with the general goal of the IMAGES18 research initiative.
18 IMAGES -International Men and Gender Equality Survey - is a comprehensive household questionnaire on men’s attitudes and practices – along with women’s opinions and reports of men’s practices – on a wide variety of topics related to gender equality. Topics include: gender-based violence; health and health-related practices; household division of labor; men’s participation in caregiving and as fathers; men’s and women’s attitudes about gender and gender-related policies; transactional sex; men’s reports of criminal behavior; and quality of life. http://www.icrw.org/publications/international-men-and-gender-equality-survey-images
33
While obtaining reliable and solid data concerning the above-mentioned attitudes and practices
is important in and of itself as it gives a realistic picture of the current situation, nevertheless, what
is even more important is the fact that the data provide relevant benchmarks for tracking progress
and lay the groundwork for developing better-targeted and more effective gender equality policies
and strategies.
As the focus in this study was inter alia on masculinity, it is important first of all to provide
definition of masculinity that the present study proceeds from. While biological factors and
psychological characteristics are a constituent part of male identity, masculinity is primarily a social
and cultural construction, the set of societal expectations and beliefs about what men are and how
they should behave that boys and men internalize in the process of socialization and personal
identity formation.
34
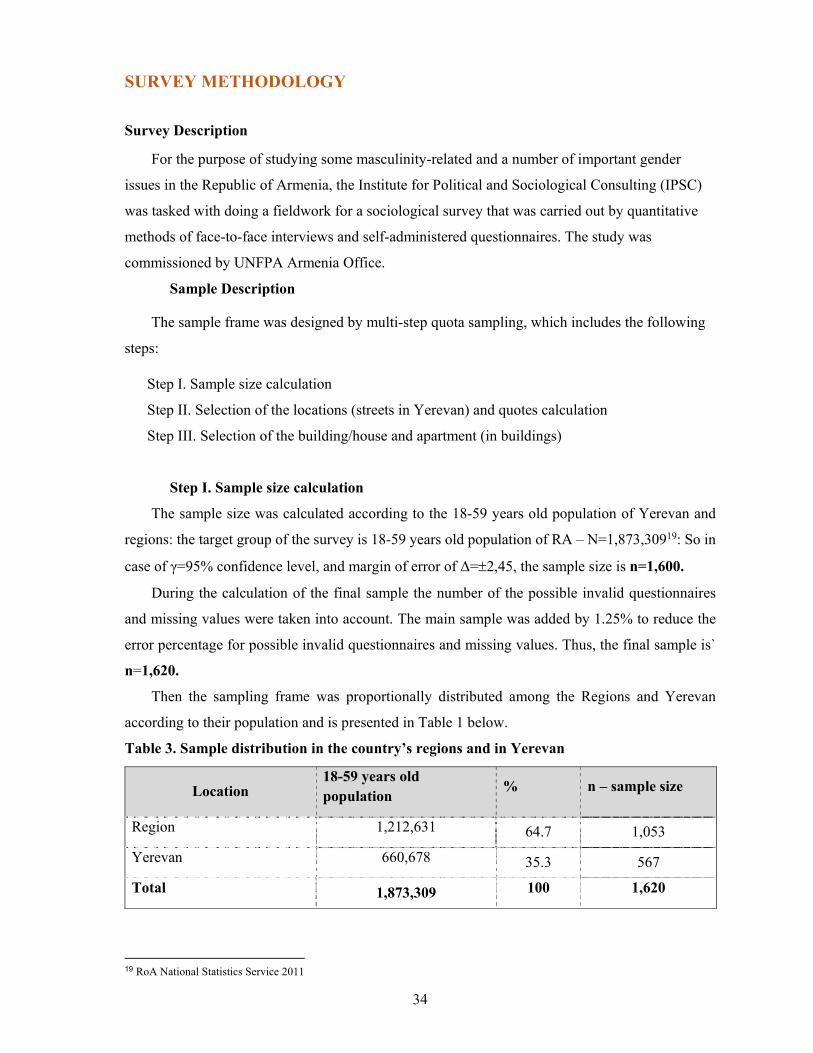
SURVEY METHODOLOGY
Survey Description
For the purpose of studying some masculinity-related and a number of important gender
issues in the Republic of Armenia, the Institute for Political and Sociological Consulting (IPSC)
was tasked with doing a fieldwork for a sociological survey that was carried out by quantitative
methods of face-to-face interviews and self-administered questionnaires. The study was
commissioned by UNFPA Armenia Office.
Sample Description
The sample frame was designed by multi-step quota sampling, which includes the following
steps:
Step I. Sample size calculation
Step II. Selection of the locations (streets in Yerevan) and quotes calculation
Step III. Selection of the building/house and apartment (in buildings)
Step I. Sample size calculation
The sample size was calculated according to the 18-59 years old population of Yerevan and
regions: the target group of the survey is 18-59 years old population of RA – N=1,873,30919: So in
case of γ=95% confidence level, and margin of error of Δ=2,45, the sample size is n=1,600.
During the calculation of the final sample the number of the possible invalid questionnaires
and missing values were taken into account. The main sample was added by 1.25% to reduce the
error percentage for possible invalid questionnaires and missing values. Thus, the final sample is`
n=1,620.
Then the sampling frame was proportionally distributed among the Regions and Yerevan
according to their population and is presented in Table 1 below.
Table 3. Sample distribution in the country’s regions and in Yerevan
Location 18-59 years old population % n – sample size
Region 1,212,631 64.7 1,053
Yerevan 660,678 35.3 567
Total 1,873,309 100 1,620
19 RoA National Statistics Service 2011

35
Problems identified during fieldwork
The problems encountered during the fieldwork are presented in the table below.
Table 2. Problems and difficulties identified during fieldwork and proposed solutions
## Problems Solutions
1
It was difficult to find middle age men during the survey, because of which more time was needed to find respondents by the relevant quota.
The interviewers were instructed to find the quota in any case. However, after searching for 30 min, they were allowed to change the age but not the gender.
2
The number of refusals were much, than expected, because of the topic of the survey, which affected the process of the Fieldwork (time).
The interviewers were instructed to try finding the quotas in any case and to complete the number of the interviews for the day.
3
The number of interrupted interviews was more than expected because of the survey topic, which was affecting to the fieldwork implementation process.
The interviewers were instructed to find respondents according to those quotas again and to conduct the interviews.
Quality Control and Monitoring
The quality check-up of interviewers and the work conducted in the framework of the survey
were been implemented through the following four stages:
Interviewers’ control by the field coordinators
Primary check-up of the received questionnaires quality
o Technical monitoring of the questionnaires
o Content and logical monitoring of the questionnaires
Call check-ups
Return visits
Interviewers’ control via GPS Recorders.
Content and logical monitoring of the questionnaires
All questionnaires (100%) have been monitored by the Quality Control Department of the
Company. The questionnaires passed monitoring with the focus on the following criteria:
Keeping the passages within the questionnaire,
Detection of new, non-recurring information and repetition of information,
Detection of systematic errors,
Detection and counting of missing responses,
Non-adequate and wrong answers,
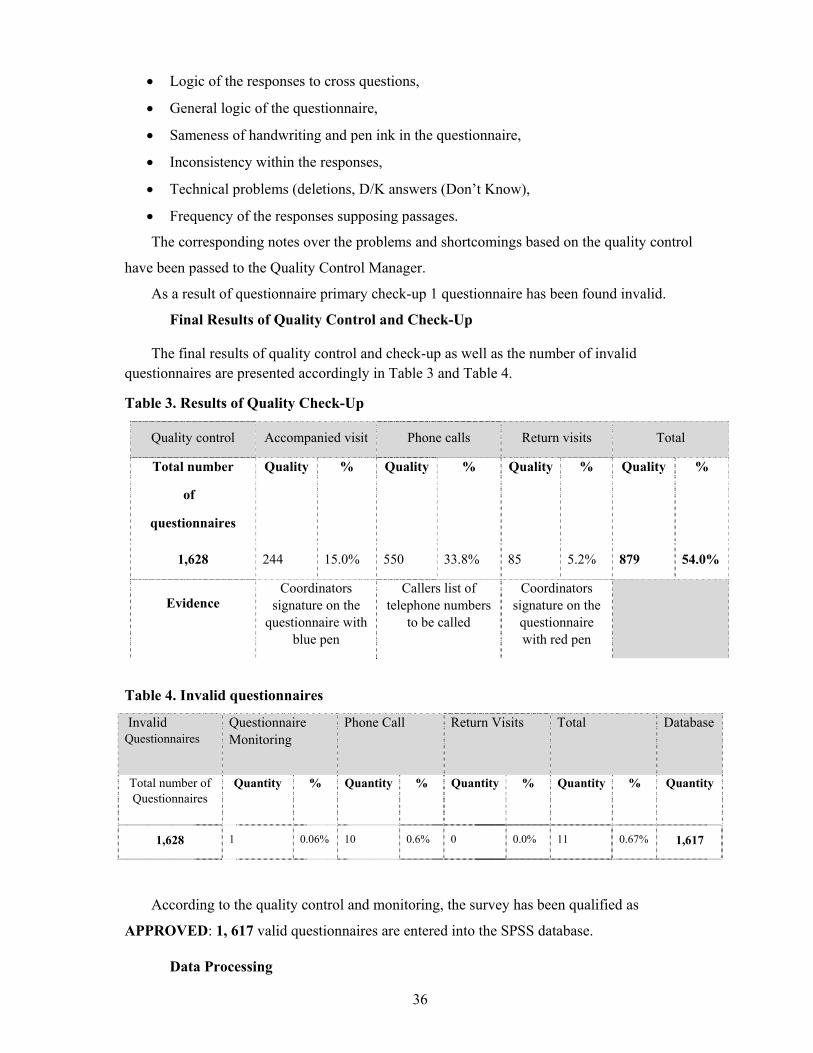
36
Logic of the responses to cross questions,
General logic of the questionnaire,
Sameness of handwriting and pen ink in the questionnaire,
Inconsistency within the responses,
Technical problems (deletions, D/K answers (Don’t Know),
Frequency of the responses supposing passages.
The corresponding notes over the problems and shortcomings based on the quality control
have been passed to the Quality Control Manager.
As a result of questionnaire primary check-up 1 questionnaire has been found invalid.
Final Results of Quality Control and Check-Up
The final results of quality control and check-up as well as the number of invalid questionnaires are presented accordingly in Table 3 and Table 4.
Table 3. Results of Quality Check-Up
Quality control Accompanied visit Phone calls Return visits Total
Total number
of
questionnaires
Quality % Quality % Quality % Quality %
1,628 244 15.0% 550 33.8% 85 5.2% 879 54.0%
Evidence Coordinators
signature on the questionnaire with
blue pen
Callers list of telephone numbers
to be called
Coordinators signature on the questionnaire with red pen
Table 4. Invalid questionnaires
Invalid Questionnaires
Questionnaire Monitoring
Phone Call Return Visits Total Database
Total number of Questionnaires
Quantity % Quantity % Quantity % Quantity % Quantity
1,628 1 0.06% 10 0.6% 0 0.0% 11 0.67% 1,617
According to the quality control and monitoring, the survey has been qualified as
APPROVED: 1, 617 valid questionnaires are entered into the SPSS database.
Data Processing
37
Data processing consists of the following steps:
Questionnaire design,
Training of the interviewers, pilot testing and preparation of the final field version of the
questionnaire,
Preliminary and secondary control of the questionnaires and identification of problems
occurring during fieldwork,
Professional editing and coding,
Preparation of SPSS database,
Data entry into the database,
Final checking and cleaning of the database.
Questionnaire design
The questionnaires for quantitative survey were provided by the Client and were finalized
based on the discussions between IPSC specialists and Client’s experts. The survey included:
One main questionnaire: including 272 questions in total, according to the project tasks
and objectives /is composed of 16 x A4 pages/.
Questionnaire for men: self-administered, which included 31 questions in total, according
to the project tasks and objectives /is composed of 2 x A4 pages /.
Questionnaire for women: self-administered, which included 23 questions in total,
according to the project tasks and objectives /is composed of 1 x A4 pages /.
Questionnaire preparation stage was followed by the interviewers’ instruction stage.
Training of the interviewers, pilot testing and preparation of the final field version of the questionnaire
Being present at the questionnaire instruction is a mandatory condition for all interviewers.
The instruction is organized by the following sections:
Presentation of survey tasks and objectives,
Introduction to the questionnaire,
Role play,
General institutional training.
Preliminary and secondary control of the questionnaires and identification of problems occurring during fieldwork
The main stages of data processing are presented below which follows the field stage:
- Primary check-Up of the questionnaires by the quality controller: the questionnaires from
the field were checked by the corresponding specialists of the company. During the
38
verification process specific attention has been paid to content errors, omissions, to wrong
in-fill of the questionnaire and the deviation from the sample. At the beginning of each field
day the interviewers have been informed about the errors to reduce the possibility of making
the same errors during the following days.
- Secondary check-up of the questionnaire through phone calls. On this stage, the
questionnaires have been checked through phone calls after which all invalid questionnaires
have been removed. Based on the provided information Quality Control Manager has
selected the processed questionnaire to pass them for the next stage of the database
completion.
- After the first two stages the questionnaires are being numbered and based on the numbering
the questionnaires are entered into the database.
Professional Editing and Coding
During the following days of the field the coders extracted responses to the open and semi-
closed questions, which include also the “Other” option for some questions. The responses of the
respondents were professionally treated based on which classified coding categories were created
aimed at categorizing those questions. Furthermore, each questionnaire has been processed
through the coding list and all the open-end and semi-closed questions have been coded. Each
coder was responsible for a given section of the coding (for some open-end questions and for
“Other”). After coding, all the coded questionnaires were entered into the database by the data
entry operators.
Preparation of SPSS database
Based on the final version of the questionnaire an SPSS database were created which consist
of 400 variables. During the database preparation peculiarities of each question were taken into
account and necessary information about variables and their values was inserted. The open-ended
questions codes were entered into the database as well.
Final checking and cleaning of the database
The database quality check is followed by the database clean-up process which is composed
of the two stages:
- Discovery and correction of errors found in the database. The database clean-up is
implemented based on the frequencies analysis, which as a rule is implemented for such
categories as gander, age, location, in order to bring out certain inconsistencies.
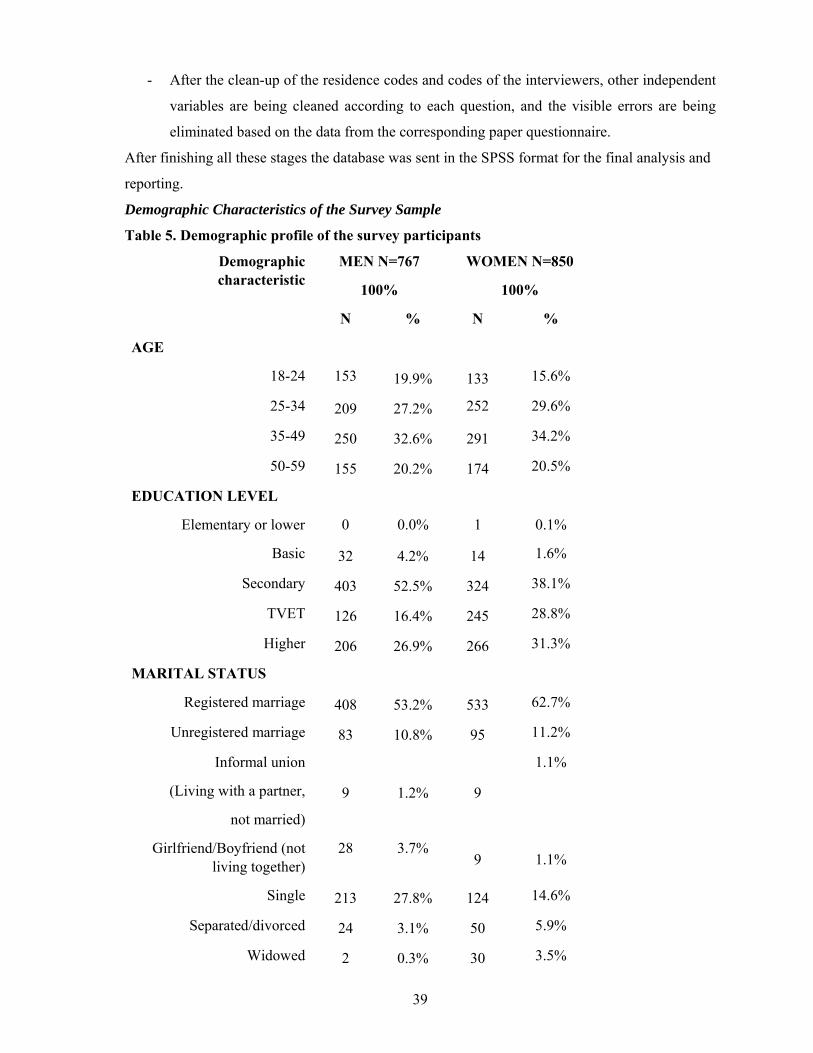
39
- After the clean-up of the residence codes and codes of the interviewers, other independent
variables are being cleaned according to each question, and the visible errors are being
eliminated based on the data from the corresponding paper questionnaire.
After finishing all these stages the database was sent in the SPSS format for the final analysis and
reporting.
Demographic Characteristics of the Survey Sample
Table 5. Demographic profile of the survey participants
Demographic characteristic
MEN N=767
100%
WOMEN N=850
100%
N % N %
AGE
18-24 153 19.9% 133 15.6%
25-34 209 27.2% 252 29.6%
35-49 250 32.6% 291 34.2%
50-59 155 20.2% 174 20.5%
EDUCATION LEVEL
Elementary or lower 0 0.0% 1 0.1%
Basic 32 4.2% 14 1.6%
Secondary 403 52.5% 324 38.1%
TVET 126 16.4% 245 28.8%
Higher 206 26.9% 266 31.3%
MARITAL STATUS
Registered marriage 408 53.2% 533 62.7%
Unregistered marriage 83 10.8% 95 11.2%
Informal union
(Living with a partner,
not married)
9 1.2% 9
1.1%
Girlfriend/Boyfriend (not living together)
28 3.7% 9 1.1%
Single 213 27.8% 124 14.6%
Separated/divorced 24 3.1% 50 5.9%
Widowed 2 0.3% 30 3.5%
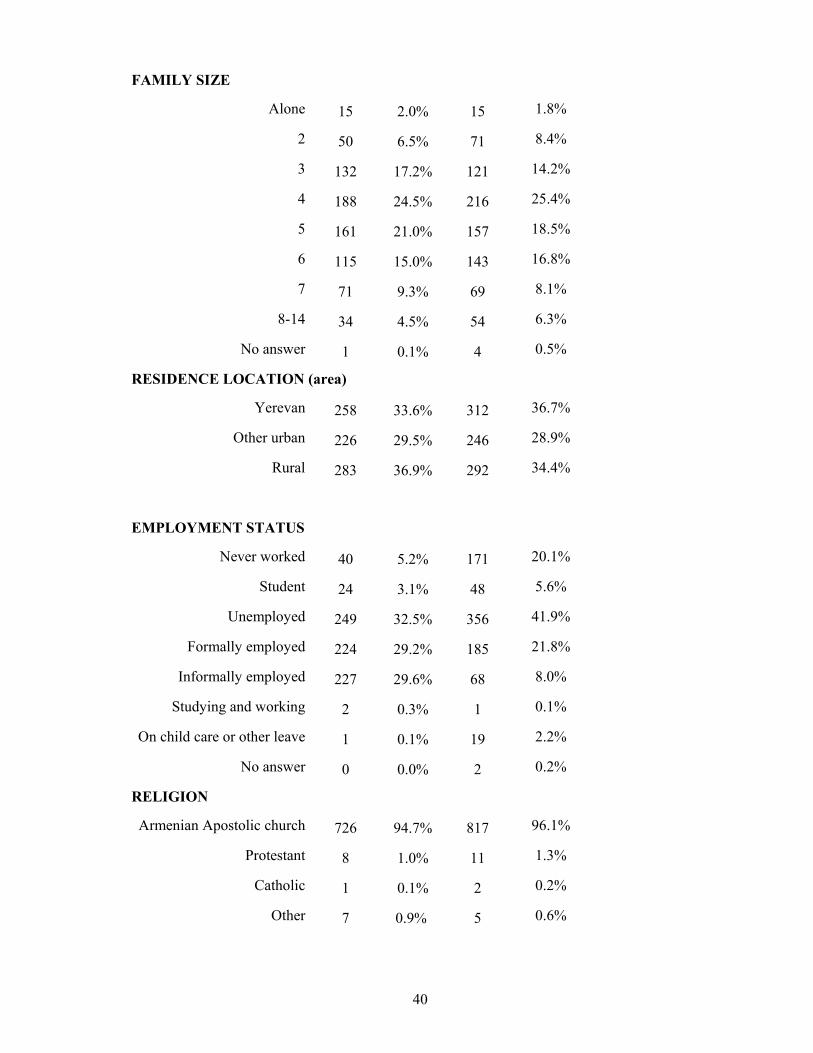
40
FAMILY SIZE
Alone 15 2.0% 15 1.8%
2 50 6.5% 71 8.4%
3 132 17.2% 121 14.2%
4 188 24.5% 216 25.4%
5 161 21.0% 157 18.5%
6 115 15.0% 143 16.8%
7 71 9.3% 69 8.1%
8-14 34 4.5% 54 6.3%
No answer 1 0.1% 4 0.5%
RESIDENCE LOCATION (area)
Yerevan 258 33.6% 312 36.7%
Other urban 226 29.5% 246 28.9%
Rural 283 36.9% 292 34.4%
EMPLOYMENT STATUS
Never worked 40 5.2% 171 20.1%
Student 24 3.1% 48 5.6%
Unemployed 249 32.5% 356 41.9%
Formally employed 224 29.2% 185 21.8%
Informally employed 227 29.6% 68 8.0%
Studying and working 2 0.3% 1 0.1%
On child care or other leave 1 0.1% 19 2.2%
No answer 0 0.0% 2 0.2%
RELIGION
Armenian Apostolic church 726 94.7% 817 96.1%
Protestant 8 1.0% 11 1.3%
Catholic 1 0.1% 2 0.2%
Other 7 0.9% 5 0.6%

41
No religion (atheist/agnostic) 24 3.1% 14
1.6%
No answer 1 0.1% 1 0.1%
MONTHLY INCOME
Less than 40,000 AMD 60 7.8% 72 8.5%
41,000-120,000 AMD 222 28.9% 174 20.5%
121,000-220,000 AMD 144 18.8% 57 6.7%
221,000-400,000 48 6.3% 12 1.4%
More than 401,000 13 1.7% 2 0.2%
No income 221 28.8% 515 60.6%
No answer 59 7.7% 18 2.1%
Total 767 100.0% 850 100.0%
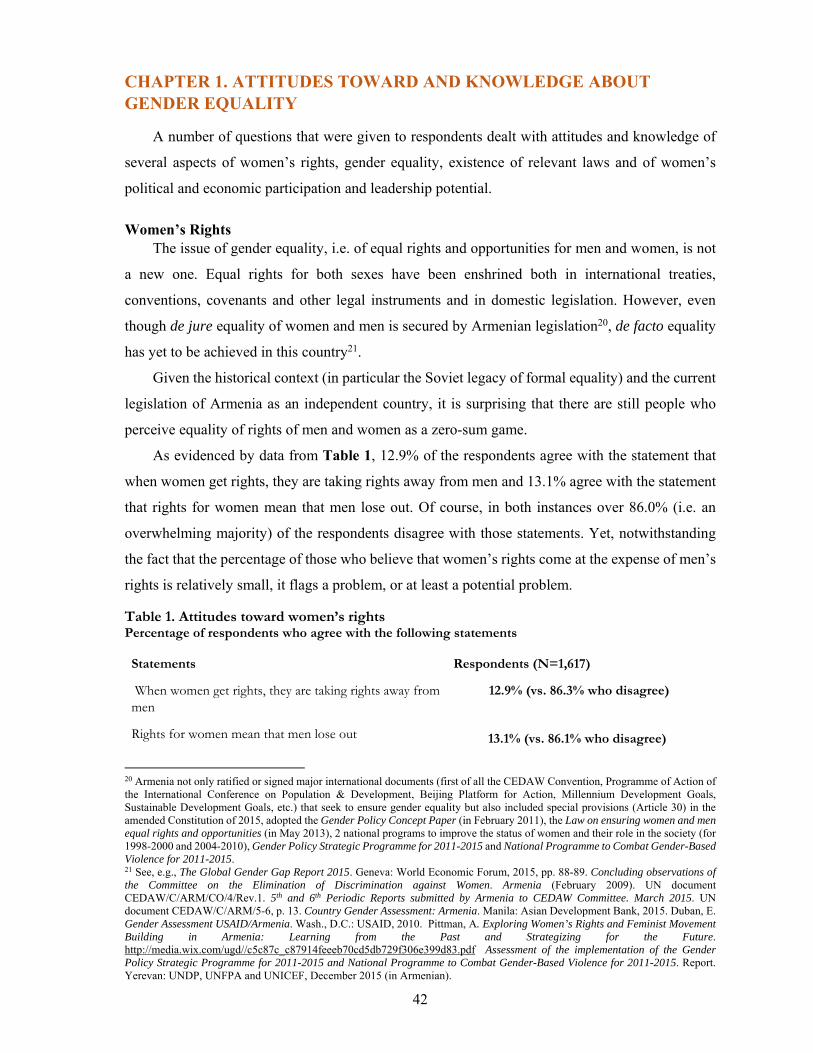
42
CHAPTER 1. ATTITUDES TOWARD AND KNOWLEDGE ABOUT GENDER EQUALITY
A number of questions that were given to respondents dealt with attitudes and knowledge of
several aspects of women’s rights, gender equality, existence of relevant laws and of women’s
political and economic participation and leadership potential.
Women’s Rights The issue of gender equality, i.e. of equal rights and opportunities for men and women, is not
a new one. Equal rights for both sexes have been enshrined both in international treaties,
conventions, covenants and other legal instruments and in domestic legislation. However, even
though de jure equality of women and men is secured by Armenian legislation20, de facto equality
has yet to be achieved in this country21.
Given the historical context (in particular the Soviet legacy of formal equality) and the current
legislation of Armenia as an independent country, it is surprising that there are still people who
perceive equality of rights of men and women as a zero-sum game.
As evidenced by data from Table 1, 12.9% of the respondents agree with the statement that
when women get rights, they are taking rights away from men and 13.1% agree with the statement
that rights for women mean that men lose out. Of course, in both instances over 86.0% (i.e. an
overwhelming majority) of the respondents disagree with those statements. Yet, notwithstanding
the fact that the percentage of those who believe that women’s rights come at the expense of men’s
rights is relatively small, it flags a problem, or at least a potential problem.
Table 1. Attitudes toward women’s rights Percentage of respondents who agree with the following statements Statements Respondents (N=1,617)
When women get rights, they are taking rights away from men
12.9% (vs. 86.3% who disagree)
Rights for women mean that men lose out 13.1% (vs. 86.1% who disagree)
20 Armenia not only ratified or signed major international documents (first of all the CEDAW Convention, Programme of Action of the International Conference on Population & Development, Beijing Platform for Action, Millennium Development Goals, Sustainable Development Goals, etc.) that seek to ensure gender equality but also included special provisions (Article 30) in the amended Constitution of 2015, adopted the Gender Policy Concept Paper (in February 2011), the Law on ensuring women and men equal rights and opportunities (in May 2013), 2 national programs to improve the status of women and their role in the society (for 1998-2000 and 2004-2010), Gender Policy Strategic Programme for 2011-2015 and National Programme to Combat Gender-Based Violence for 2011-2015. 21 See, e.g., The Global Gender Gap Report 2015. Geneva: World Economic Forum, 2015, pp. 88-89. Concluding observations of the Committee on the Elimination of Discrimination against Women. Armenia (February 2009). UN document CEDAW/C/ARM/CO/4/Rev.1. 5th and 6th Periodic Reports submitted by Armenia to CEDAW Committee. March 2015. UN document CEDAW/C/ARM/5-6, p. 13. Country Gender Assessment: Armenia. Manila: Asian Development Bank, 2015. Duban, E. Gender Assessment USAID/Armenia. Wash., D.C.: USAID, 2010. Pittman, A. Exploring Women’s Rights and Feminist Movement Building in Armenia: Learning from the Past and Strategizing for the Future. http://media.wix.com/ugd//c5c87c_c87914feeeb70cd5db729f306e399d83.pdf Assessment of the implementation of the Gender Policy Strategic Programme for 2011-2015 and National Programme to Combat Gender-Based Violence for 2011-2015. Report. Yerevan: UNDP, UNFPA and UNICEF, December 2015 (in Armenian).
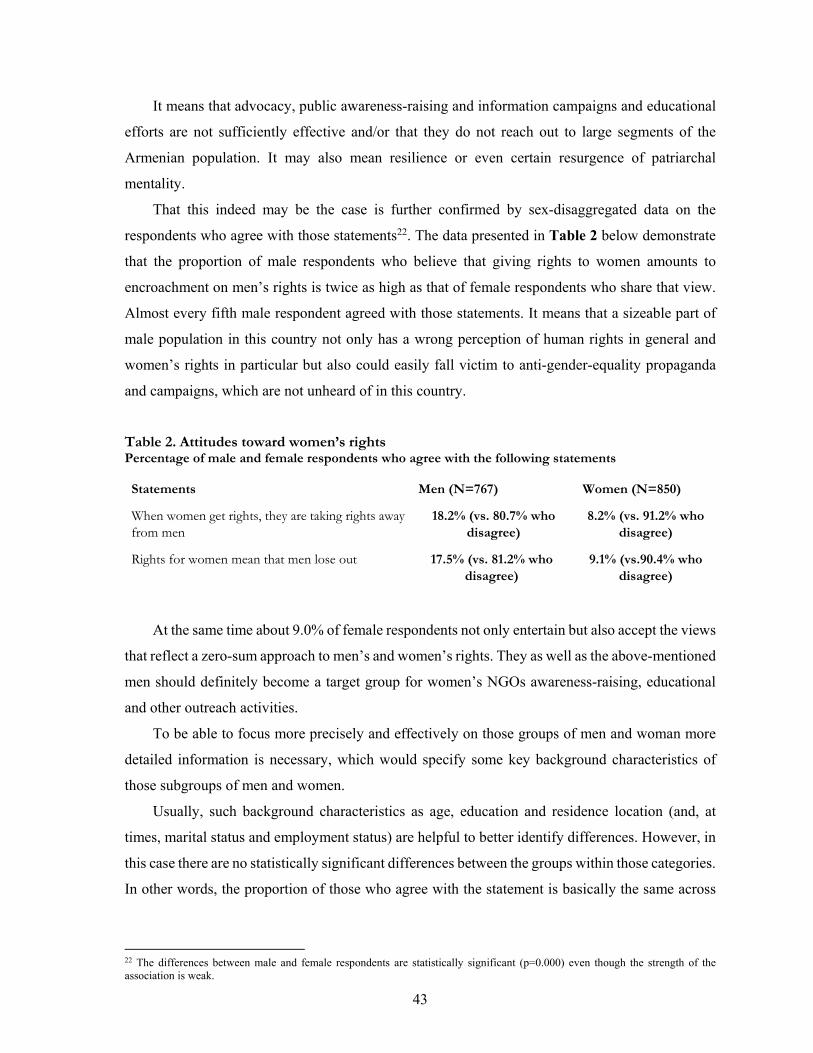
43
It means that advocacy, public awareness-raising and information campaigns and educational
efforts are not sufficiently effective and/or that they do not reach out to large segments of the
Armenian population. It may also mean resilience or even certain resurgence of patriarchal
mentality.
That this indeed may be the case is further confirmed by sex-disaggregated data on the
respondents who agree with those statements22. The data presented in Table 2 below demonstrate
that the proportion of male respondents who believe that giving rights to women amounts to
encroachment on men’s rights is twice as high as that of female respondents who share that view.
Almost every fifth male respondent agreed with those statements. It means that a sizeable part of
male population in this country not only has a wrong perception of human rights in general and
women’s rights in particular but also could easily fall victim to anti-gender-equality propaganda
and campaigns, which are not unheard of in this country.
Table 2. Attitudes toward women’s rights Percentage of male and female respondents who agree with the following statements Statements Men (N=767) Women (N=850)
When women get rights, they are taking rights away from men
18.2% (vs. 80.7% who disagree)
8.2% (vs. 91.2% who disagree)
Rights for women mean that men lose out 17.5% (vs. 81.2% who disagree)
9.1% (vs.90.4% who disagree)
At the same time about 9.0% of female respondents not only entertain but also accept the views
that reflect a zero-sum approach to men’s and women’s rights. They as well as the above-mentioned
men should definitely become a target group for women’s NGOs awareness-raising, educational
and other outreach activities.
To be able to focus more precisely and effectively on those groups of men and woman more
detailed information is necessary, which would specify some key background characteristics of
those subgroups of men and women.
Usually, such background characteristics as age, education and residence location (and, at
times, marital status and employment status) are helpful to better identify differences. However, in
this case there are no statistically significant differences between the groups within those categories.
In other words, the proportion of those who agree with the statement is basically the same across
22 The differences between male and female respondents are statistically significant (p=0.000) even though the strength of the association is weak.

44
all sub-groups and equal to the averages for the entire sample. The same holds true for the
proportion of those who disagree with the statement.
However, when gender enters into the equation the association becomes significant, albeit its
strength varies from weak to moderate. Therefore, data should be drawn from 3-way cross-tabs.
Speaking very relatively and with strong reservations, it is possible to get a profile of the most
gender inequitable groups. Those are 35-49-year-old men with basic education living mostly in
urban areas other than Yerevan and 50-59-year-old women with low level of education and living
mostly in Yerevan.
Gender equality 4 questions were asked about the extent to which gender equality has already been attained and
who has mostly benefitted from it.
As evidenced by data from Table 3, an overwhelming majority (86.8%) of the respondents
believe that there has been such progress in achieving gender equality that gender equality has come
far enough already. This over-optimistic assessment is definitely far removed from the realities of
life of present-day Armenia.
As regards the second statement, the assessment is more realistic. Still, 63.3% of the
respondents agree with the statement that gender equality has already been achieved for the most
part.
Table 3. Attitudes toward gender equality Percentage of respondents who agree with the following statements Statements Respondents (N=1,617)
Gender equality has come far enough already 86.8% (vs. 12.2% who disagree)
Gender equality has already been achieved for the most part 63.3% (vs. 35.7% who disagree)
Work to achieve gender equality today benefits mostly well-to-do people
47.5% (vs. 45.3% who disagree)
There is a need for more work to promote gender equality
51.3% (vs. 46.3% who disagree)
If indeed that is the prevalent opinion, it means that the majority of the population is not
informed and knowledgeable enough. The situation then has a positive and a negative aspect. The
positive aspect is along the lines of the Thomas theorem23 since the position will probably have
positive consequences. The downside, however, is that the idea that gender equality has come far
23 “If men define situations as real, they are real in their consequences,”
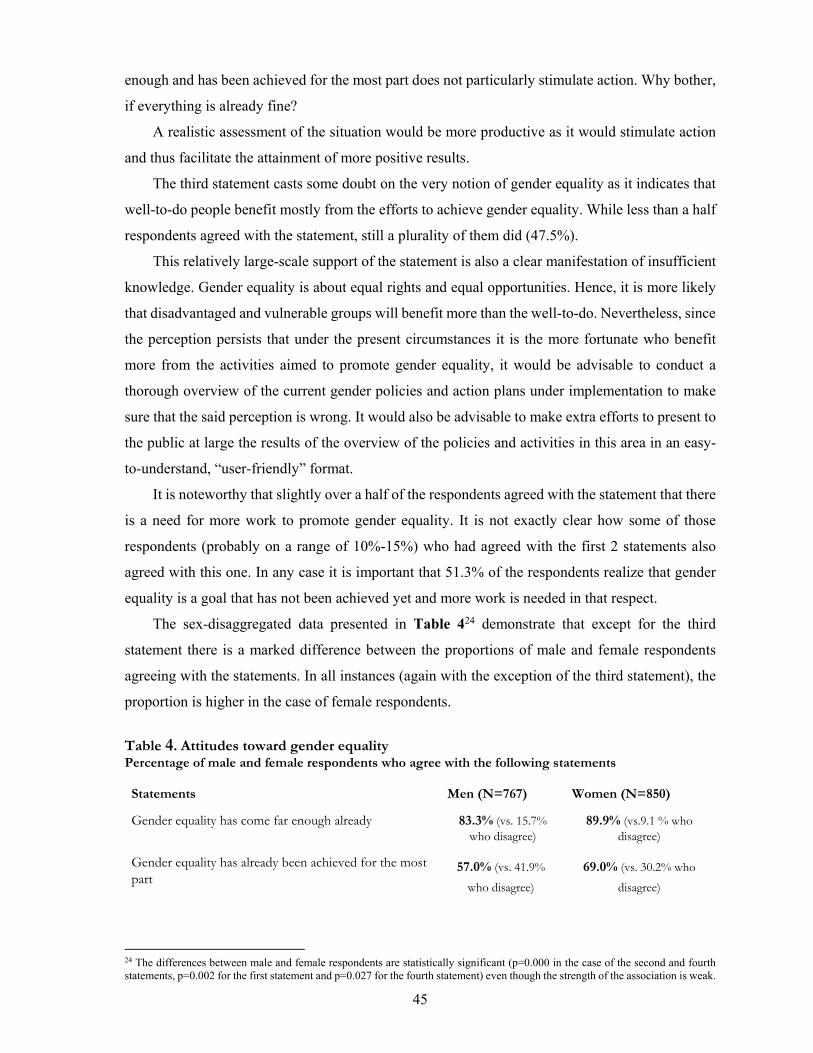
45
enough and has been achieved for the most part does not particularly stimulate action. Why bother,
if everything is already fine?
A realistic assessment of the situation would be more productive as it would stimulate action
and thus facilitate the attainment of more positive results.
The third statement casts some doubt on the very notion of gender equality as it indicates that
well-to-do people benefit mostly from the efforts to achieve gender equality. While less than a half
respondents agreed with the statement, still a plurality of them did (47.5%).
This relatively large-scale support of the statement is also a clear manifestation of insufficient
knowledge. Gender equality is about equal rights and equal opportunities. Hence, it is more likely
that disadvantaged and vulnerable groups will benefit more than the well-to-do. Nevertheless, since
the perception persists that under the present circumstances it is the more fortunate who benefit
more from the activities aimed to promote gender equality, it would be advisable to conduct a
thorough overview of the current gender policies and action plans under implementation to make
sure that the said perception is wrong. It would also be advisable to make extra efforts to present to
the public at large the results of the overview of the policies and activities in this area in an easy-
to-understand, “user-friendly” format.
It is noteworthy that slightly over a half of the respondents agreed with the statement that there
is a need for more work to promote gender equality. It is not exactly clear how some of those
respondents (probably on a range of 10%-15%) who had agreed with the first 2 statements also
agreed with this one. In any case it is important that 51.3% of the respondents realize that gender
equality is a goal that has not been achieved yet and more work is needed in that respect.
The sex-disaggregated data presented in Table 424 demonstrate that except for the third
statement there is a marked difference between the proportions of male and female respondents
agreeing with the statements. In all instances (again with the exception of the third statement), the
proportion is higher in the case of female respondents. Table 4. Attitudes toward gender equality Percentage of male and female respondents who agree with the following statements Statements Men (N=767) Women (N=850)
Gender equality has come far enough already 83.3% (vs. 15.7% who disagree)
89.9% (vs.9.1 % who disagree)
Gender equality has already been achieved for the most part
57.0% (vs. 41.9%
who disagree)
69.0% (vs. 30.2% who
disagree)
24 The differences between male and female respondents are statistically significant (p=0.000 in the case of the second and fourth statements, p=0.002 for the first statement and p=0.027 for the fourth statement) even though the strength of the association is weak.
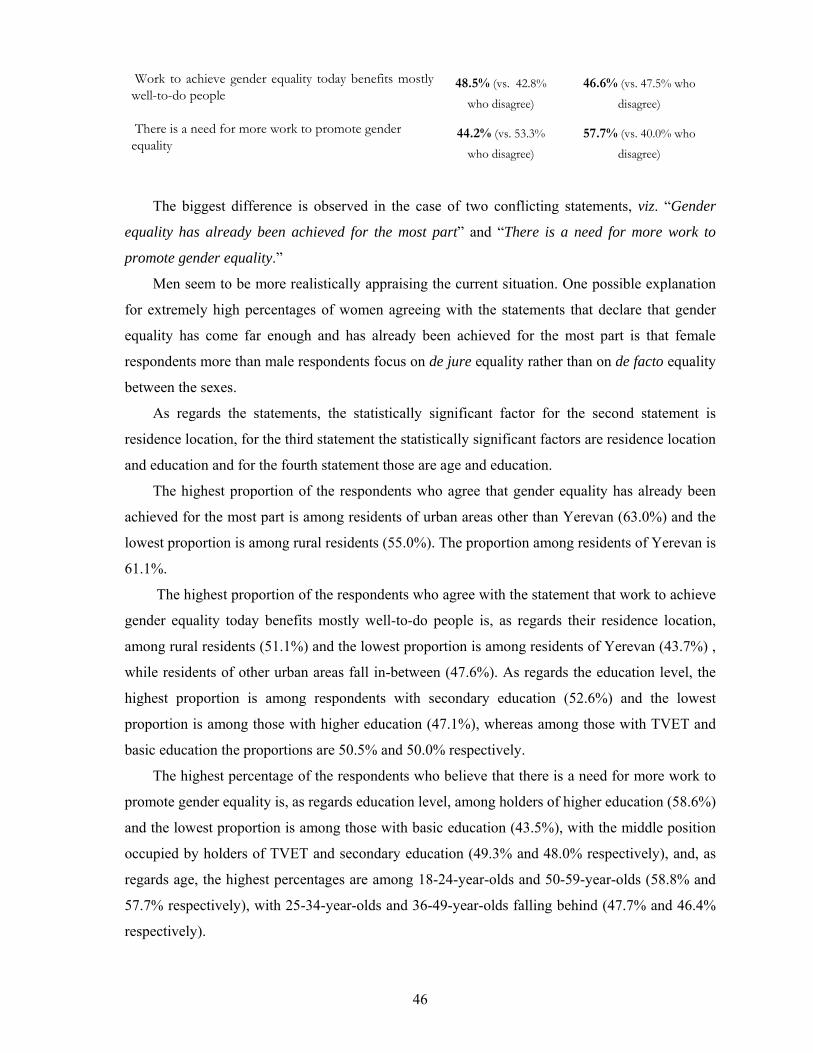
46
Work to achieve gender equality today benefits mostly well-to-do people
48.5% (vs. 42.8%
who disagree)
46.6% (vs. 47.5% who
disagree)
There is a need for more work to promote gender equality
44.2% (vs. 53.3%
who disagree)
57.7% (vs. 40.0% who
disagree)
The biggest difference is observed in the case of two conflicting statements, viz. “Gender
equality has already been achieved for the most part” and “There is a need for more work to
promote gender equality.”
Men seem to be more realistically appraising the current situation. One possible explanation
for extremely high percentages of women agreeing with the statements that declare that gender
equality has come far enough and has already been achieved for the most part is that female
respondents more than male respondents focus on de jure equality rather than on de facto equality
between the sexes.
As regards the statements, the statistically significant factor for the second statement is
residence location, for the third statement the statistically significant factors are residence location
and education and for the fourth statement those are age and education.
The highest proportion of the respondents who agree that gender equality has already been
achieved for the most part is among residents of urban areas other than Yerevan (63.0%) and the
lowest proportion is among rural residents (55.0%). The proportion among residents of Yerevan is
61.1%.
The highest proportion of the respondents who agree with the statement that work to achieve
gender equality today benefits mostly well-to-do people is, as regards their residence location,
among rural residents (51.1%) and the lowest proportion is among residents of Yerevan (43.7%) ,
while residents of other urban areas fall in-between (47.6%). As regards the education level, the
highest proportion is among respondents with secondary education (52.6%) and the lowest
proportion is among those with higher education (47.1%), whereas among those with TVET and
basic education the proportions are 50.5% and 50.0% respectively.
The highest percentage of the respondents who believe that there is a need for more work to
promote gender equality is, as regards education level, among holders of higher education (58.6%)
and the lowest proportion is among those with basic education (43.5%), with the middle position
occupied by holders of TVET and secondary education (49.3% and 48.0% respectively), and, as
regards age, the highest percentages are among 18-24-year-olds and 50-59-year-olds (58.8% and
57.7% respectively), with 25-34-year-olds and 36-49-year-olds falling behind (47.7% and 46.4%
respectively).
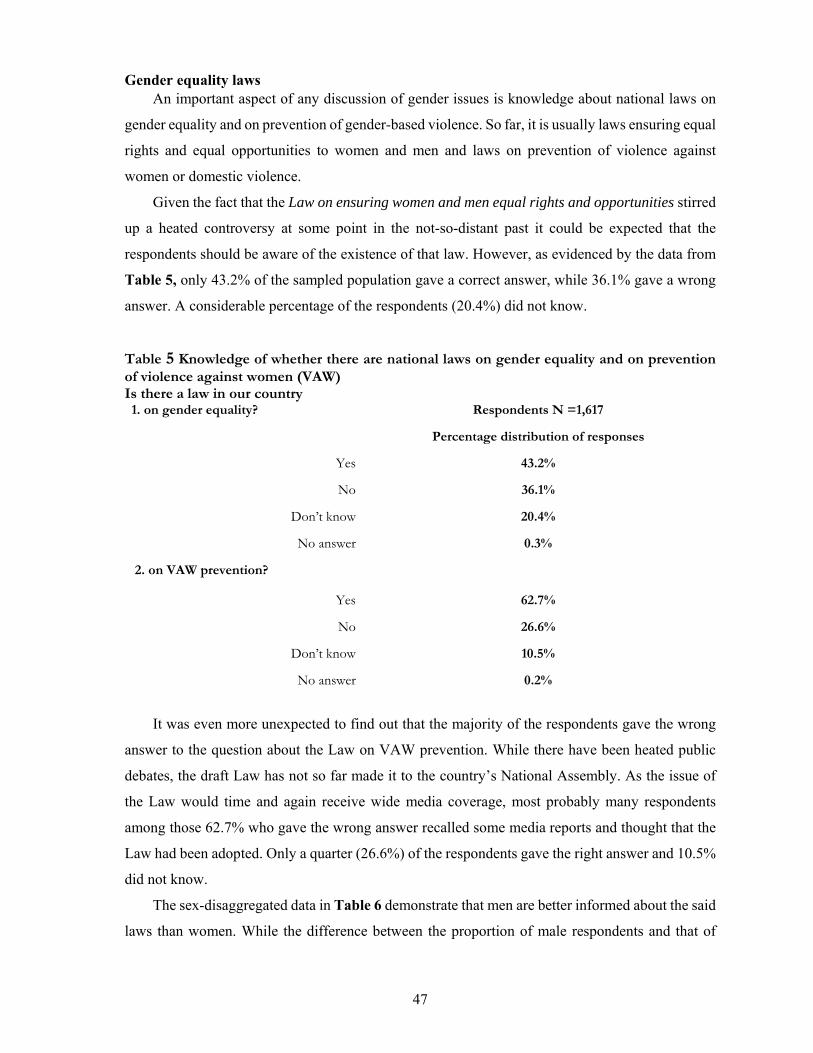
47
Gender equality laws An important aspect of any discussion of gender issues is knowledge about national laws on
gender equality and on prevention of gender-based violence. So far, it is usually laws ensuring equal
rights and equal opportunities to women and men and laws on prevention of violence against
women or domestic violence.
Given the fact that the Law on ensuring women and men equal rights and opportunities stirred
up a heated controversy at some point in the not-so-distant past it could be expected that the
respondents should be aware of the existence of that law. However, as evidenced by the data from
Table 5, only 43.2% of the sampled population gave a correct answer, while 36.1% gave a wrong
answer. A considerable percentage of the respondents (20.4%) did not know.
Table 5 Knowledge of whether there are national laws on gender equality and on prevention of violence against women (VAW) Is there a law in our country 1. on gender equality? Respondents N =1,617
Percentage distribution of responses
Yes 43.2%
No 36.1%
Don’t know 20.4%
No answer 0.3%
2. on VAW prevention?
Yes 62.7%
No 26.6%
Don’t know 10.5%
No answer 0.2%
It was even more unexpected to find out that the majority of the respondents gave the wrong
answer to the question about the Law on VAW prevention. While there have been heated public
debates, the draft Law has not so far made it to the country’s National Assembly. As the issue of
the Law would time and again receive wide media coverage, most probably many respondents
among those 62.7% who gave the wrong answer recalled some media reports and thought that the
Law had been adopted. Only a quarter (26.6%) of the respondents gave the right answer and 10.5%
did not know.
The sex-disaggregated data in Table 6 demonstrate that men are better informed about the said
laws than women. While the difference between the proportion of male respondents and that of
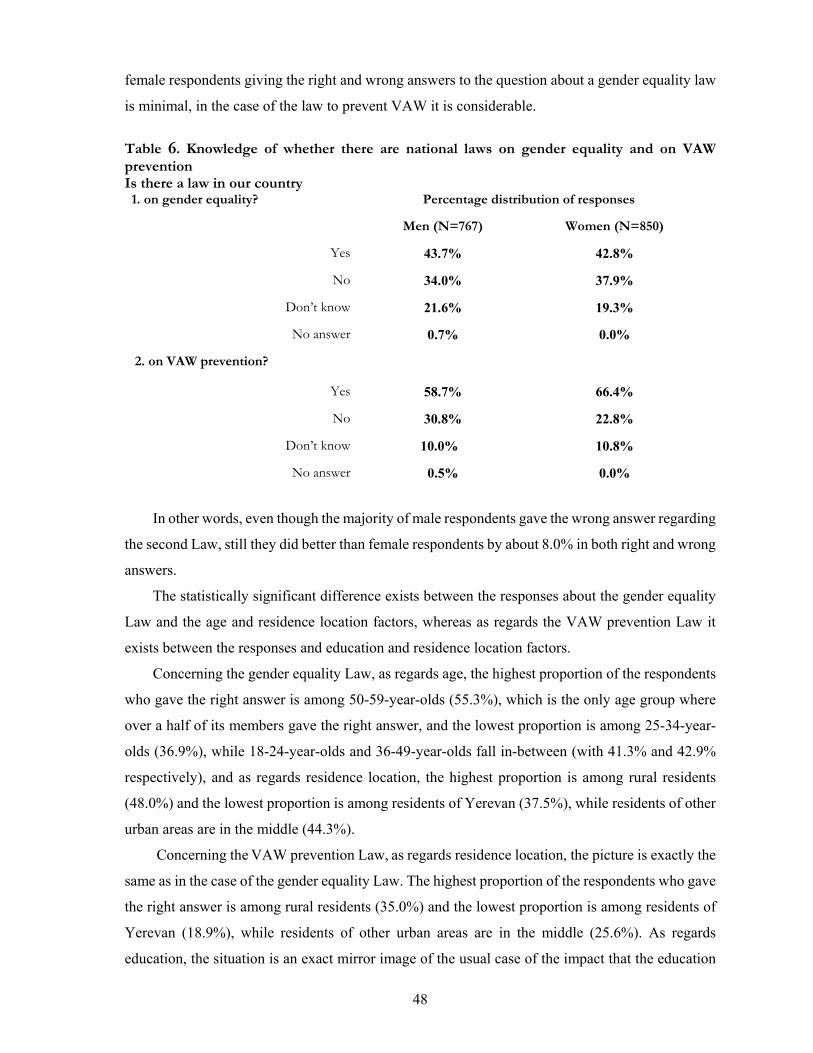
48
female respondents giving the right and wrong answers to the question about a gender equality law
is minimal, in the case of the law to prevent VAW it is considerable.
Table 6. Knowledge of whether there are national laws on gender equality and on VAW prevention Is there a law in our country 1. on gender equality? Percentage distribution of responses
Men (N=767) Women (N=850)
Yes 43.7% 42.8%
No 34.0% 37.9%
Don’t know 21.6% 19.3%
No answer 0.7% 0.0%
2. on VAW prevention?
Yes 58.7% 66.4%
No 30.8% 22.8%
Don’t know 10.0% 10.8%
No answer 0.5% 0.0%
In other words, even though the majority of male respondents gave the wrong answer regarding
the second Law, still they did better than female respondents by about 8.0% in both right and wrong
answers.
The statistically significant difference exists between the responses about the gender equality
Law and the age and residence location factors, whereas as regards the VAW prevention Law it
exists between the responses and education and residence location factors.
Concerning the gender equality Law, as regards age, the highest proportion of the respondents
who gave the right answer is among 50-59-year-olds (55.3%), which is the only age group where
over a half of its members gave the right answer, and the lowest proportion is among 25-34-year-
olds (36.9%), while 18-24-year-olds and 36-49-year-olds fall in-between (with 41.3% and 42.9%
respectively), and as regards residence location, the highest proportion is among rural residents
(48.0%) and the lowest proportion is among residents of Yerevan (37.5%), while residents of other
urban areas are in the middle (44.3%).
Concerning the VAW prevention Law, as regards residence location, the picture is exactly the
same as in the case of the gender equality Law. The highest proportion of the respondents who gave
the right answer is among rural residents (35.0%) and the lowest proportion is among residents of
Yerevan (18.9%), while residents of other urban areas are in the middle (25.6%). As regards
education, the situation is an exact mirror image of the usual case of the impact that the education
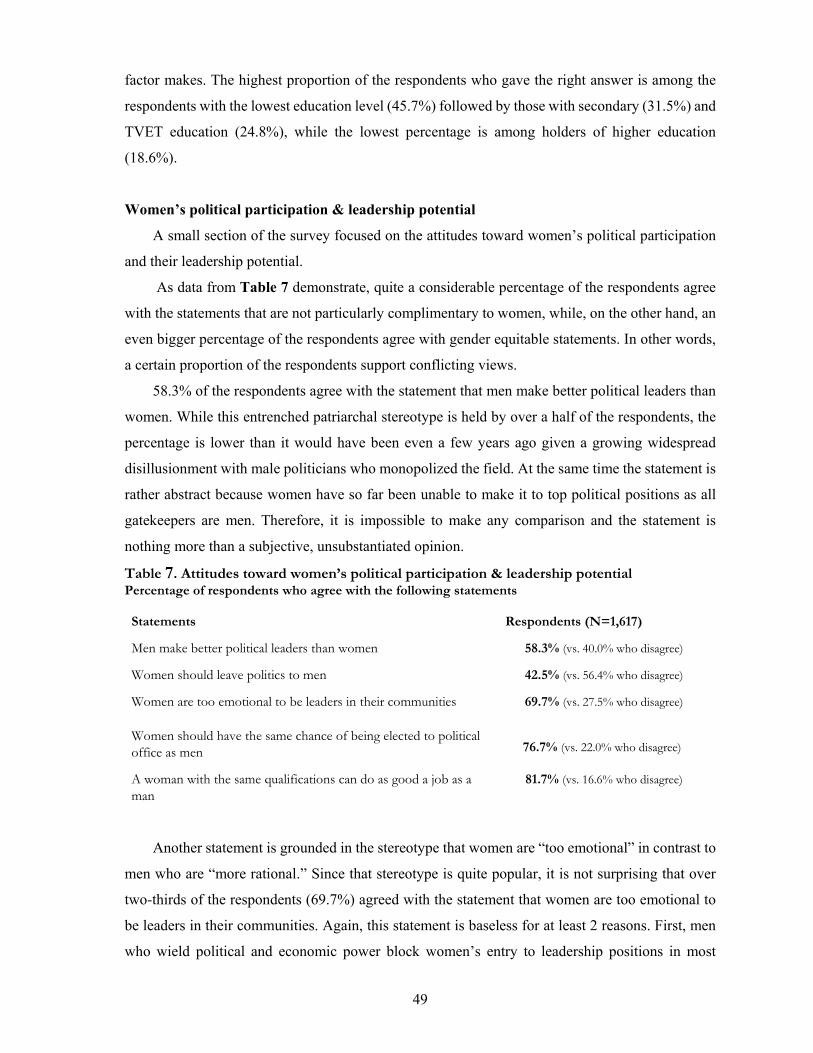
49
factor makes. The highest proportion of the respondents who gave the right answer is among the
respondents with the lowest education level (45.7%) followed by those with secondary (31.5%) and
TVET education (24.8%), while the lowest percentage is among holders of higher education
(18.6%).
Women’s political participation & leadership potential
A small section of the survey focused on the attitudes toward women’s political participation
and their leadership potential.
As data from Table 7 demonstrate, quite a considerable percentage of the respondents agree
with the statements that are not particularly complimentary to women, while, on the other hand, an
even bigger percentage of the respondents agree with gender equitable statements. In other words,
a certain proportion of the respondents support conflicting views.
58.3% of the respondents agree with the statement that men make better political leaders than
women. While this entrenched patriarchal stereotype is held by over a half of the respondents, the
percentage is lower than it would have been even a few years ago given a growing widespread
disillusionment with male politicians who monopolized the field. At the same time the statement is
rather abstract because women have so far been unable to make it to top political positions as all
gatekeepers are men. Therefore, it is impossible to make any comparison and the statement is
nothing more than a subjective, unsubstantiated opinion.
Table 7. Attitudes toward women’s political participation & leadership potential Percentage of respondents who agree with the following statements Statements Respondents (N=1,617)
Men make better political leaders than women 58.3% (vs. 40.0% who disagree)
Women should leave politics to men 42.5% (vs. 56.4% who disagree)
Women are too emotional to be leaders in their communities 69.7% (vs. 27.5% who disagree)
Women should have the same chance of being elected to political office as men 76.7% (vs. 22.0% who disagree)
A woman with the same qualifications can do as good a job as a man
81.7% (vs. 16.6% who disagree)
Another statement is grounded in the stereotype that women are “too emotional” in contrast to
men who are “more rational.” Since that stereotype is quite popular, it is not surprising that over
two-thirds of the respondents (69.7%) agreed with the statement that women are too emotional to
be leaders in their communities. Again, this statement is baseless for at least 2 reasons. First, men
who wield political and economic power block women’s entry to leadership positions in most
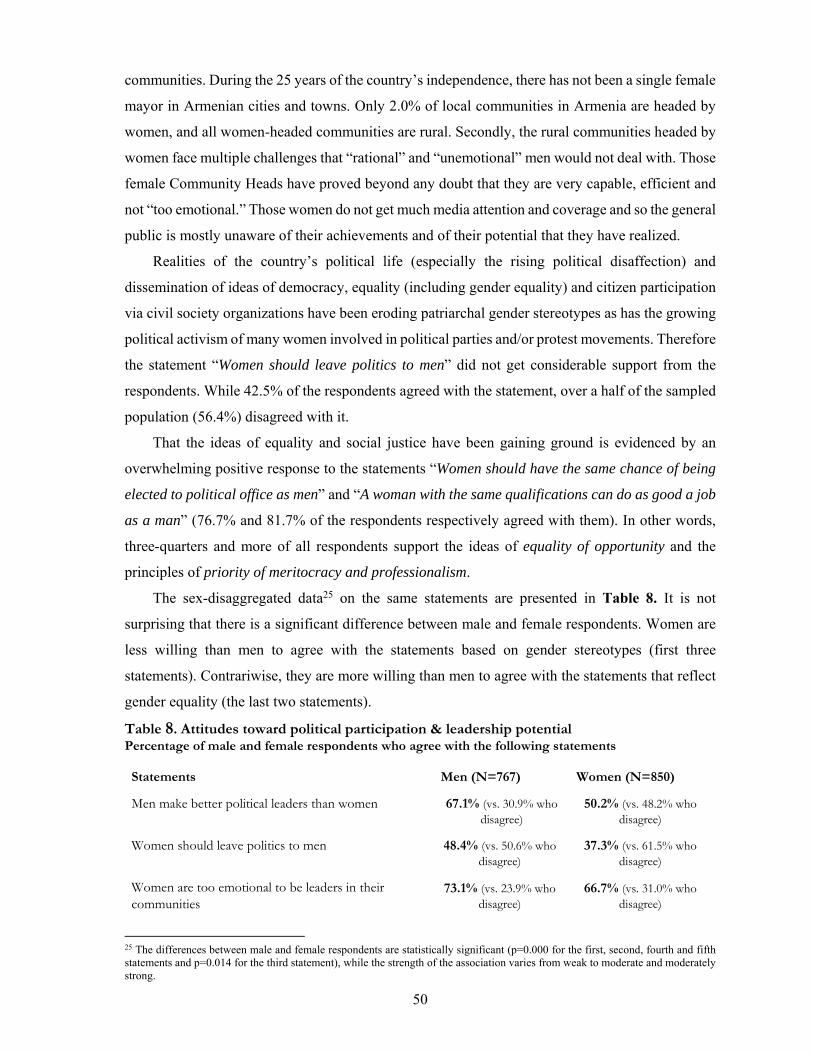
50
communities. During the 25 years of the country’s independence, there has not been a single female
mayor in Armenian cities and towns. Only 2.0% of local communities in Armenia are headed by
women, and all women-headed communities are rural. Secondly, the rural communities headed by
women face multiple challenges that “rational” and “unemotional” men would not deal with. Those
female Community Heads have proved beyond any doubt that they are very capable, efficient and
not “too emotional.” Those women do not get much media attention and coverage and so the general
public is mostly unaware of their achievements and of their potential that they have realized.
Realities of the country’s political life (especially the rising political disaffection) and
dissemination of ideas of democracy, equality (including gender equality) and citizen participation
via civil society organizations have been eroding patriarchal gender stereotypes as has the growing
political activism of many women involved in political parties and/or protest movements. Therefore
the statement “Women should leave politics to men” did not get considerable support from the
respondents. While 42.5% of the respondents agreed with the statement, over a half of the sampled
population (56.4%) disagreed with it.
That the ideas of equality and social justice have been gaining ground is evidenced by an
overwhelming positive response to the statements “Women should have the same chance of being
elected to political office as men” and “A woman with the same qualifications can do as good a job
as a man” (76.7% and 81.7% of the respondents respectively agreed with them). In other words,
three-quarters and more of all respondents support the ideas of equality of opportunity and the
principles of priority of meritocracy and professionalism.
The sex-disaggregated data25 on the same statements are presented in Table 8. It is not
surprising that there is a significant difference between male and female respondents. Women are
less willing than men to agree with the statements based on gender stereotypes (first three
statements). Contrariwise, they are more willing than men to agree with the statements that reflect
gender equality (the last two statements).
Table 8. Attitudes toward political participation & leadership potential Percentage of male and female respondents who agree with the following statements Statements Men (N=767) Women (N=850)
Men make better political leaders than women 67.1% (vs. 30.9% who disagree)
50.2% (vs. 48.2% who disagree)
Women should leave politics to men 48.4% (vs. 50.6% who disagree)
37.3% (vs. 61.5% who disagree)
Women are too emotional to be leaders in their communities
73.1% (vs. 23.9% who disagree)
66.7% (vs. 31.0% who disagree)
25 The differences between male and female respondents are statistically significant (p=0.000 for the first, second, fourth and fifth statements and p=0.014 for the third statement), while the strength of the association varies from weak to moderate and moderately strong.
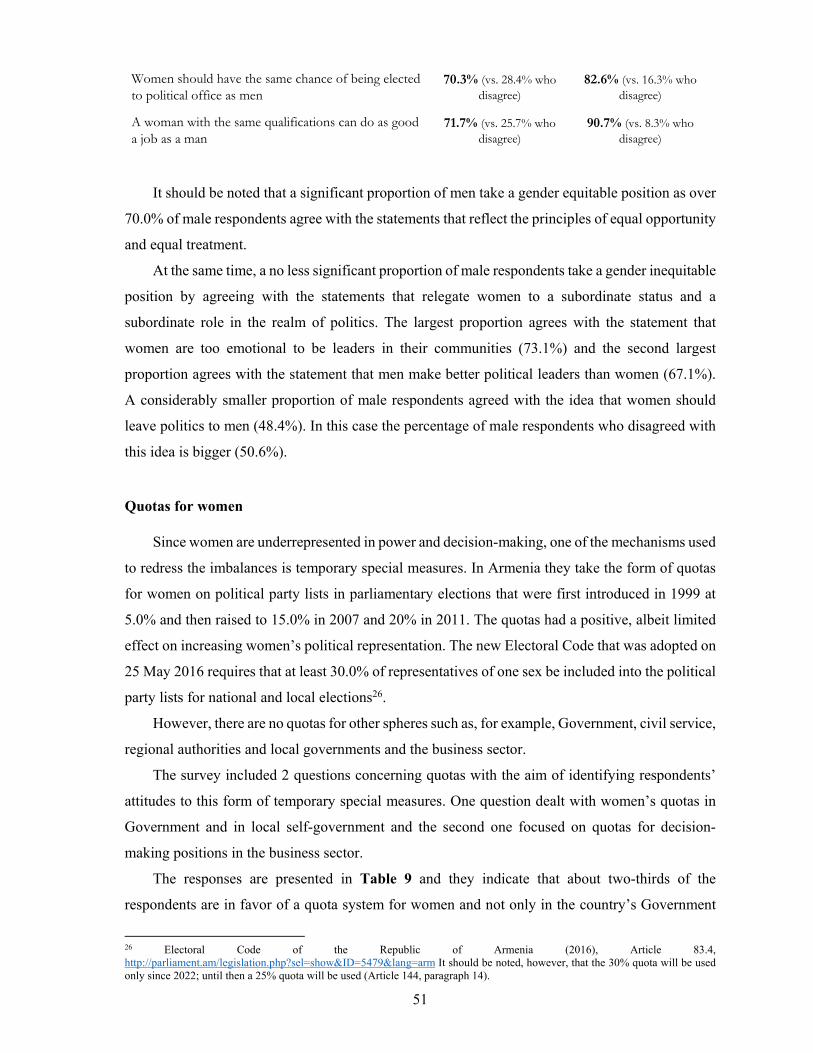
51
Women should have the same chance of being elected to political office as men
70.3% (vs. 28.4% who disagree)
82.6% (vs. 16.3% who disagree)
A woman with the same qualifications can do as good a job as a man
71.7% (vs. 25.7% who disagree)
90.7% (vs. 8.3% who disagree)
It should be noted that a significant proportion of men take a gender equitable position as over
70.0% of male respondents agree with the statements that reflect the principles of equal opportunity
and equal treatment.
At the same time, a no less significant proportion of male respondents take a gender inequitable
position by agreeing with the statements that relegate women to a subordinate status and a
subordinate role in the realm of politics. The largest proportion agrees with the statement that
women are too emotional to be leaders in their communities (73.1%) and the second largest
proportion agrees with the statement that men make better political leaders than women (67.1%).
A considerably smaller proportion of male respondents agreed with the idea that women should
leave politics to men (48.4%). In this case the percentage of male respondents who disagreed with
this idea is bigger (50.6%).
Quotas for women
Since women are underrepresented in power and decision-making, one of the mechanisms used
to redress the imbalances is temporary special measures. In Armenia they take the form of quotas
for women on political party lists in parliamentary elections that were first introduced in 1999 at
5.0% and then raised to 15.0% in 2007 and 20% in 2011. The quotas had a positive, albeit limited
effect on increasing women’s political representation. The new Electoral Code that was adopted on
25 May 2016 requires that at least 30.0% of representatives of one sex be included into the political
party lists for national and local elections26.
However, there are no quotas for other spheres such as, for example, Government, civil service,
regional authorities and local governments and the business sector.
The survey included 2 questions concerning quotas with the aim of identifying respondents’
attitudes to this form of temporary special measures. One question dealt with women’s quotas in
Government and in local self-government and the second one focused on quotas for decision-
making positions in the business sector.
The responses are presented in Table 9 and they indicate that about two-thirds of the
respondents are in favor of a quota system for women and not only in the country’s Government
26 Electoral Code of the Republic of Armenia (2016), Article 83.4, http://parliament.am/legislation.php?sel=show&ID=5479&lang=arm It should be noted, however, that the 30% quota will be used only since 2022; until then a 25% quota will be used (Article 144, paragraph 14).
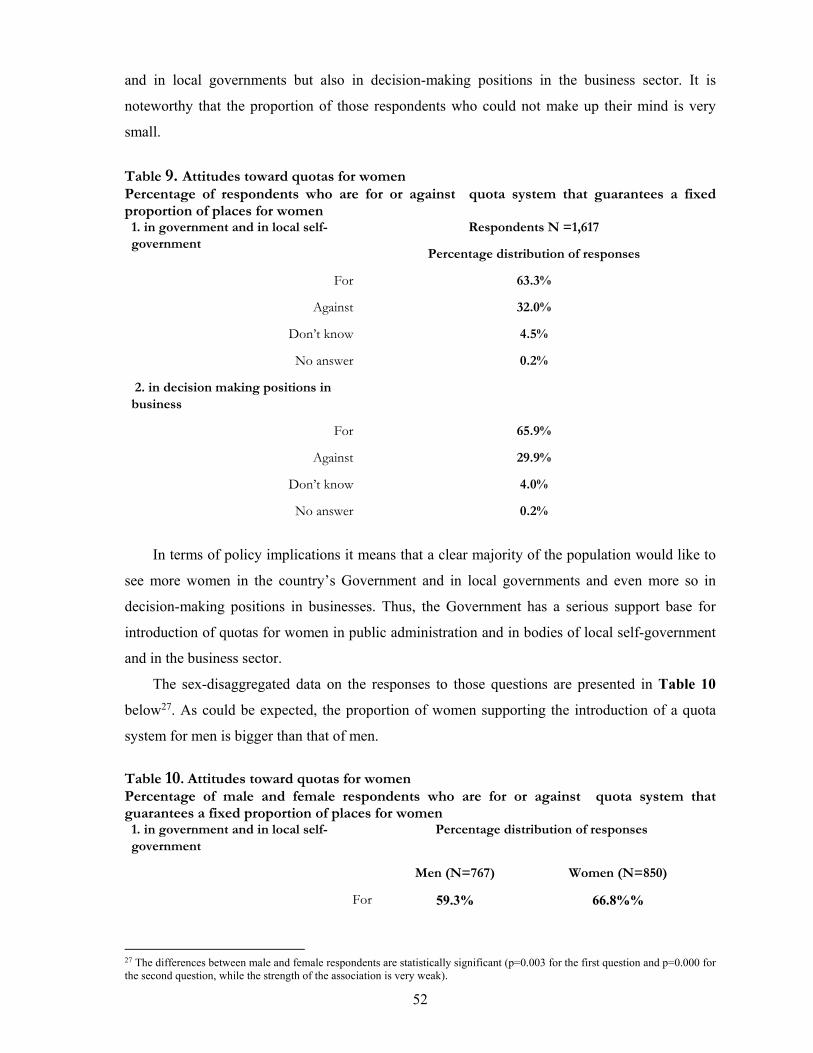
52
and in local governments but also in decision-making positions in the business sector. It is
noteworthy that the proportion of those respondents who could not make up their mind is very
small.
Table 9. Attitudes toward quotas for women Percentage of respondents who are for or against quota system that guarantees a fixed proportion of places for women 1. in government and in local self-government
Respondents N =1,617
Percentage distribution of responses
For 63.3%
Against 32.0%
Don’t know 4.5%
No answer 0.2%
2. in decision making positions in business
For 65.9%
Against 29.9%
Don’t know 4.0%
No answer 0.2%
In terms of policy implications it means that a clear majority of the population would like to
see more women in the country’s Government and in local governments and even more so in
decision-making positions in businesses. Thus, the Government has a serious support base for
introduction of quotas for women in public administration and in bodies of local self-government
and in the business sector.
The sex-disaggregated data on the responses to those questions are presented in Table 10
below27. As could be expected, the proportion of women supporting the introduction of a quota
system for men is bigger than that of men. Table 10. Attitudes toward quotas for women Percentage of male and female respondents who are for or against quota system that guarantees a fixed proportion of places for women 1. in government and in local self-government
Percentage distribution of responses
Men (N=767) Women (N=850)
For 59.3% 66.8%%
27 The differences between male and female respondents are statistically significant (p=0.003 for the first question and p=0.000 for the second question, while the strength of the association is very weak).

53
Against 35.5% 28.8%
Don’t know 4.8% 4.1%
No answer 0.4% 0.2%
2. in decision making positions in business
For 61.4% 69.9%
Against 33.9% 26.2%
Don’t know 4.3% 3.6%
No answer 0.4% 0.2%
The differences between various groups of the respondents by education level and residence
location are statistically significant, whereas by age they are not.
The picture is basically the same for both questions.
In terms of education, the highest proportion of supporters for a quota system for women in
both public administration and local governments and in the business sector is among holders of
higher education (69.6% and 70.5% respectively). They are followed by respondents with basic
education (63.6% and 66.1% respectively).
The lowest proportion is among holders of secondary and TVET education. As regards quotas
for women in public administration and local governments the percentage is basically the same for
both groups (61,0% and 61.2%), while in the case of quotas for women in the business sector the
proportion of those with secondary education is slightly lower than that of holders of TVET
education (63.6% and 64.9%).

54
CHAPTER 2. VIOLENCE AGAINST WOMEN: PREVALENCE, EXPOSURE AND BEHAVIORS
Violence against women28 (VAW) is а grave violation of human rights and a serious social,
health, socioeconomic, development and even a political issue as it affects not only survivors and
perpetrators of violence but also their families, communities and countries. It is one of the worst
forms of discrimination against women and a major obstacle to gender equality.
The Council of Europe Convention on preventing and combating violence against women and
domestic violence emphasizes that the root causes of VAW are historically unequal power relations
between women and men resulting in domination over, and discrimination against, women by men
and recognizes that it is “one of the crucial social mechanisms by which women are forced
into a subordinate position compared with men.”29
In Armenia, recognition of VAW as a serious problem was prompted by the findings of the
first Nationwide Survey on Domestic Violence against Women in Armenia (2008-2009)30 and by
the UN CEDAW Committee’s Concluding Observations regarding the combined third and fourth
periodic reports of Armenia31.
The Armenian Government took certain steps to formulate and implement policies to combat
gender-based violence. In 2010, it adopted the Gender Policy Concept Paper, which contains
Section VII devoted to Gender policy for gender-based violence prevention, and established Inter-
Agency Commission on Combating Gender-Based Violence (affiliated with the RoA Ministry of
Labor & Social Issues). In 2011, the Armenian Government adopted the Gender Policy Strategic
Action Plan for 2011-2015 (which contained Gender Policy Implementation Strategy in Gender-
Based Violence and Human Trafficking Prevention Sector) and the 2011-2015 National Action
Plan to Combat Gender-Based Violence.
Nevertheless, as regards the activities and measures aimed to prevent and combat gender-based
violence, the UN experts, who made an assessment of the implementation of those two Action
Plans, concluded in December 2015 that “notwithstanding the success scored within the framework
of those Action Plans, the full extent of the main goals had not been achieved.”32
28 Article 1 of the Declaration on the Elimination of Violence against Women (adopted by the UN General Assembly on 20 December 1993) defines violence against women as “any act of gender-based violence that results in, or is likely to result in, physical, sexual or psychological harm or suffering to women, including threats of such acts, coercion or arbitrary deprivation of liberty, whether occurring in public or in private life.” UN Document A/RES/48/104. 29 Council of Europe Convention on preventing and combating violence against women and domestic violence (adopted on 11 May 2011 and entered into force on 1 August 2014). Preamble. 30 Report on Nationwide Survey on Domestic Violence against Women in Armenia (2008-2010). Yerevan: UNFPA and RoA NSS, 2011. 31 Concluding Observations of the Committee on the Elimination of Discrimination against Women: Armenia. Geneva, 2009. UN Document CEDAW/C/ARM/CO/4/Rev.1 32 Assessment of the Implementation of 2011-2015 Gender Policy Strategic Plan and 2011-2015 National Action Plan to Combat Gender-based Violence. Yerevan: UNDP, UNFPA, UNHCR, 2015, p. 193 (in Armenian).
55
The lack of adequate legislative and regulatory frameworks makes less effective the efforts to
combat gender-based violence and to ensure prevention and protection, particularly through public
campaigns, advocacy and educational initiatives and law-enforcement agencies’ interventions. A
stand-alone Domestic Violence Law has not been adopted and the Council of Europe Convention
on preventing and combating violence against women and domestic violence has not been signed
yet.
To be better targeted and more efficient the policy-making that aims to combat VAW also
needs to be evidence-based. Thus, it requires a solid knowledge base that goes well beyond mere
statistical data collection, albeit the latter is important too. To be able to make informed decisions
and to effect attitude and behavior changes the policymakers need to have a fairly accurate picture
of the attitudes that the general public and specific target group hold and the behaviors they
demonstrate and to be apprised of new developments. Therefore, studies and surveys in this area
are indispensable. However, in Armenia studies focusing on VAW issues are few and far between
and are usually very limited in their scale and scope. This is particularly true of such aspects of the
issue as sexuality, attitudes and expectations, and perceptions of masculinity and femininity.
The issue of VAW is closely interrelated with some aspects of masculinity as a social construct.
In fact, VAW is among key practices of the “hegemonic masculinity”33 that secure a dominant
social position for men while relegating women to a subordinate social position. Therefore, a VAW
perpetration issue is an important aspect of masculinity studies.
Prevalence of violence against women
Violence against women reflects unequal and asymmetrical power relations, with women
having a de facto lower social status in the hierarchy existing in the society, local communities and
families, and certain interpretations of masculinity. It is a tool to control women, to keep them in a
subordinate position and to limit their opportunities and decision-making power as well as access
to resources and positions of power. It is not incidental therefore that scholars tend to conceptualize
VAW as a ‘relational vulnerability’, i.e. as one of the forms “embedded in highly asymmetrical
social relations and the associated dependencies.”34
A considerable number of questions in the 3 questionnaires used in the survey focused on
prevalence35 and incidence of violence against women. All major forms of VAW, viz.
psychological, physical and sexual violence, controlling behavior and economic abuse, except
33 See Connell, R. W. and James W. Messerschmidt. “Hegemonic Masculinity. Rethinking the Concept.” Gender & Society, Vol. 19, No. 6, December 2005, pp. 829-859. 34 Kabir, N. Violence against Women as ‘Relational’ Vulnerability: Engendering the Sustainable Human Development Agenda. 2014 UNDP Human Development Report Office. Occasional Paper, p. 2. 35 Prevalence is the percentage of the survey population victimized by an act of violence throughout the lifespan (lifetime prevalence) or over a fixed period of time (point prevalence, which in this survey is the past 3 or 12 months).
56
structural violence, have been addressed. While VAW is not framed as exclusively intimate partner
violence (IPV)36, most questions center on IPV because overwhelming evidence from earlier
studies clearly demonstrate that IPV is a predominant type of VAW and therefore the International
Men and Gender Equality Surveys (IMAGES) and the studies modeled on them are structured in
such a way as to pay most attention to IPV. That does not preclude, however, our looking into
prevalence of VAW outside the home.
It is also important to compare VAW prevalence as reported by men and women and, where
possible, to compare relevant data collected through face-to-face interviews and through self-
administered questionnaires.
Intimate Partner Violence: Perpetration of and Exposure to violence
The data presented in 3 Tables below pertain to lifetime prevalence of psychological and
physical violence and economic abuse as reported by women and men through answers to the same
questions from the main questionnaire. The data on sexual violence will be presented separately
because the data were collected from questions given only to men and only in the self-administered
questionnaire.
The Tables present the percentage and the number of ever-partnered male respondents who
ever committed concrete acts of various degree of gravity of psychological and physical violence
and economic abuse and the percentage and number of ever-partnered female respondents who ever
became victims of such acts in heterosexual relationships. 5 questions address psychological
violence, 4 questions economic abuse and 5 questions physical violence.
Table 1 contains data that show an overall extent of victimization of women by their intimate
partners as reported by male and female respondents.
As the ever-partnered male and female respondents are absolutely unrelated, the reported
experience thus pertains to the couples the number of which (2,926) is double to that of the total
number of those men and women combined (1,463) thereby strengthening validity of the data.
Furthermore, even though the male and female respondents are not from the same couples, the
percentages of them reporting violence are strikingly close as regards at least the half of the said
questions, which is yet another indication that the survey data reflect the situation quite accurately.
The survey data clearly demonstrate that psychological violence is a “leader” among various
forms of violence and is followed by economic abuse and physical violence. At the same time there
is considerable variation in prevalence of the types of acts within the same form of violence.
36 The term “intimate partner violence” (IPV) is preferable in this context to the term “domestic violence” (DV) because it is more precise, adequate and, thus, less confusing.
57
Concerning psychological violence, the most prevalent acts, as reported by men, were insulting
a female partner or deliberately making her feel bad about herself (49.4%) and doing things to scare
or intimidate her on purpose (10.1%). For women, the most prevalent acts included those (43.6%
and 9.2% respectively) and humiliation by the partner in front of other people (9.8%).
As regards economic abuse, only one type of act figured prominently in the reports of both
men and women (19.3% and 19.5% respectively), viz. women were prohibited by their intimate
partner from getting a job, going to work, trading or earning money.
2 types of acts are prevalent in physical violence but to a considerably smaller extent than in
other forms of violence. Those are a man slapping his female partner or throwing something at her
that could hurt her (12.9% of men and 10.3% of women reporting that) or pushing or shoving her
(11.4% and 7.5% respectively).
Several other observations of a general nature can be made proceeding from the data presented
in Table 1.
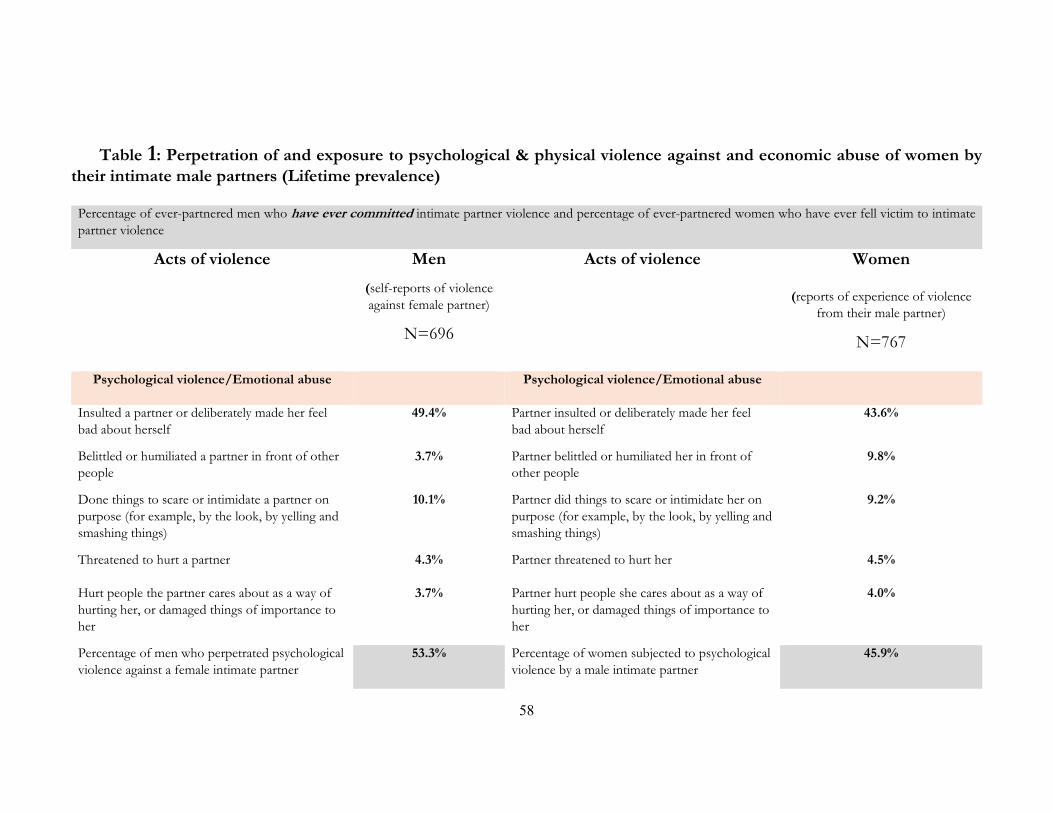
58
Table 1: Perpetration of and exposure to psychological & physical violence against and economic abuse of women by their intimate male partners (Lifetime prevalence)
Percentage of ever-partnered men who have ever committed intimate partner violence and percentage of ever-partnered women who have ever fell victim to intimate partner violence
Acts of violence Men
(self-reports of violence against female partner)
N=696
Acts of violence Women
(reports of experience of violence from their male partner)
N=767
Psychological violence/Emotional abuse Psychological violence/Emotional abuse
Insulted a partner or deliberately made her feel bad about herself
49.4% Partner insulted or deliberately made her feel bad about herself
43.6%
Belittled or humiliated a partner in front of other people
3.7% Partner belittled or humiliated her in front of other people
9.8%
Done things to scare or intimidate a partner on purpose (for example, by the look, by yelling and smashing things)
10.1% Partner did things to scare or intimidate her on purpose (for example, by the look, by yelling and smashing things)
9.2%
Threatened to hurt a partner 4.3% Partner threatened to hurt her 4.5%
Hurt people the partner cares about as a way of hurting her, or damaged things of importance to her
3.7% Partner hurt people she cares about as a way of hurting her, or damaged things of importance to her
4.0%
Percentage of men who perpetrated psychological violence against a female intimate partner
53.3% Percentage of women subjected to psychological violence by a male intimate partner
45.9%
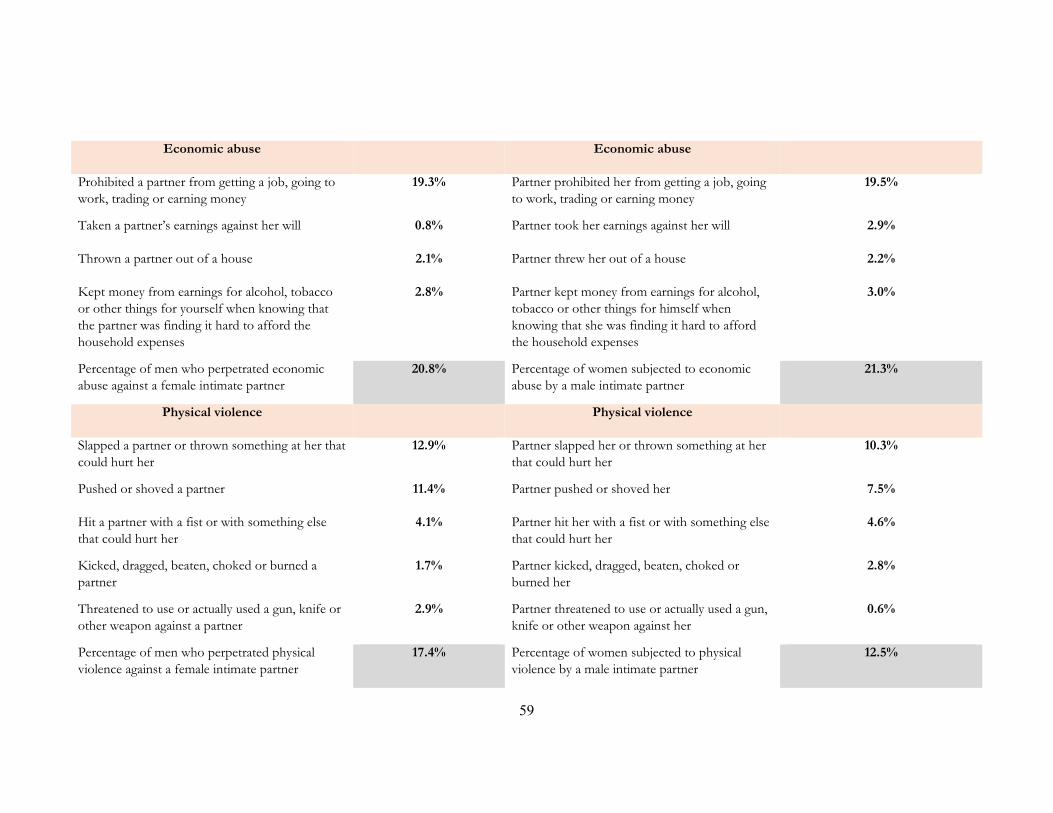
59
Economic abuse Economic abuse
Prohibited a partner from getting a job, going to work, trading or earning money
19.3% Partner prohibited her from getting a job, going to work, trading or earning money
19.5%
Taken a partner’s earnings against her will 0.8% Partner took her earnings against her will 2.9%
Thrown a partner out of a house 2.1% Partner threw her out of a house 2.2%
Kept money from earnings for alcohol, tobacco or other things for yourself when knowing that the partner was finding it hard to afford the household expenses
2.8% Partner kept money from earnings for alcohol, tobacco or other things for himself when knowing that she was finding it hard to afford the household expenses
3.0%
Percentage of men who perpetrated economic abuse against a female intimate partner
20.8% Percentage of women subjected to economic abuse by a male intimate partner
21.3%
Physical violence Physical violence
Slapped a partner or thrown something at her that could hurt her
12.9% Partner slapped her or thrown something at her that could hurt her
10.3%
Pushed or shoved a partner 11.4% Partner pushed or shoved her 7.5%
Hit a partner with a fist or with something else that could hurt her
4.1% Partner hit her with a fist or with something else that could hurt her
4.6%
Kicked, dragged, beaten, choked or burned a partner
1.7% Partner kicked, dragged, beaten, choked or burned her
2.8%
Threatened to use or actually used a gun, knife or other weapon against a partner
2.9% Partner threatened to use or actually used a gun, knife or other weapon against her
0.6%
Percentage of men who perpetrated physical violence against a female intimate partner
17.4% Percentage of women subjected to physical violence by a male intimate partner
12.5%

60
To begin with, the responses of female and male respondents come closest in the case of economic abuse and, to a lesser extent, psychological
violence. The only “mismatch” in the “economic abuse” segment is about the situation when a man takes his female partner’s earnings against her will.
2.9% of female respondents and only 0.8% of male respondents reported such practice. This marked distinction is not incidental, especially against the
background of virtually identical percentages of women and men reporting 3 other types of acts of economic abuse. While other acts are definitely not
seen as particularly honorable, they still fit into the patriarchal version of masculinity in terms of a man’s entitlement to them. Taking money from the
woman who has earned it does not fit into that paradigm.

61
As regards psychological violence, the data reflect the same situation of surprising unanimity,
with a gap registered only with regard to 2 relatively milder manifestations of psychological abuse.
Firstly, the higher percentage of male respondents (49.4%) reported insulting a female partner or
deliberately making her feel bad about herself than the percentage of female respondents (43.6%)
who acknowledged being subjected to such an act. Secondly, the gap is relatively even bigger as
regards belittling or humiliating a female partner in front of other people. This time, however, the
higher percentage of women (9.8%) reported such victimization, whereas only 3.7% of male
respondents confessed to committing an act like that.
The percentage of those reporting physical violence is consistently lower among female victims
than among male perpetrators with the exception of 2 types of acts where, nevertheless, the
difference is negligible.
* *
*
Before getting into a more detailed analysis of the data broken down by key socio-demographic
characteristics other than gender of the respondents, a few general conclusions can be drawn
concerning perpetration of and exposure to those 3 forms of violence against women.
(a) On the whole the difference between the overall percentage of men and women reporting
committing or experiencing violence respectively and the biggest percentage reported for a specific
act within a given form of violence is quite small37. It means that in most cases those men committed
and women were subjected to two or more acts within the same form of violence.
In other words, even when the prevalence of grave and even more so of moderate types of
violence is small, nevertheless, the same men perpetrate also other, relatively “milder” acts and the
same women are subjected to those acts. Besides, it is also a reminder that when violence is
practiced, it is usually not limited to one type of acts.
(b) The prevalence of all those forms of VAW is considerable and the percentage of women
subjected to those forms of violence is significantly higher (at least 1.5-1.8 times) than in earlier
large-scale studies conducted in Armenia, included the above-mentioned nationwide survey. Almost
half of the female respondents (45.9%) reported psychological violence. Every fifth respondent
(21.3%) experienced economic abuse and at least every tenth respondent (12.5%) was subjected to
physical violence.
There are several possible explanations for increased reported prevalence of VAW. It might be
that intimate partner violence is on the rise following the pattern of an increase in violent behavior
and incidents in the society at large and the survey data simply reflect that. Another reason can be
37 E.g. In psychological violence, 45.9% vs. 43.6% (women) and 53.3% vs. 449.4% (men).
62
the fact that due to public awareness-raising campaigns discussing intimate partner violence is no
longer a taboo and does not necessarily entail stigma for its victims. At present, women are more
willing than even a few years ago to come out, especially when they start questioning the “normalcy”
and legitimacy of patriarchal norms associated with VAW, and to report IPV when surveyed, thereby
increasing and improving disclosure rates. Besides, due to those campaigns both women and men
become more knowledgeable and sensitive about VAW, therefore they perceive and recall more
adequately the situations described in the survey questions. There also might be other reasons or a
combination of a number of factors.
(c) While the percentages are higher and thus possibly they reflect the existing situation more
realistically, there is still quite wide a discrepancy overall between men’s and women’s reports. A
consistently greater percentage of men report having ever committed violence (with minor exception
of economic abuse where the percentages are virtually the same) than women report victimization.
Since questions are formulated in no uncertain terms and cannot be misconstrued and misinterpreted,
it seems only natural to conclude that women underreport prevalence of psychological and physical
violence. The data from anonymously filled out self-administered questionnaires (the data will be
discussed and compared later in this Section) supports this conclusion as the percentage of women
reporting exposure to physical violence is significantly bigger than that of women reporting physical
violence via the face-to-face interviews-based questionnaires (22.4% vs. 12.5%).
(d) At the same time it would be fair to say that while the situation, as reflected through the
data, does not give grounds for complacency, those forms of violence are not pervasive or even
widespread in the present-day Armenian society. Of course, there should be zero tolerance of VAW
and more efforts should be made to educate general public and to make men and women recognize
that any act of VAW is ugly and cannot be justified on any grounds and go unpunished. On the other
hand, the data indicate that violence against women is mostly limited to relatively “milder” types,
whereas acts of ‘moderate ‘gravity and severe acts are in single-digit percentages and not
infrequently are smaller than the confidence interval.
* *
*
It is also noteworthy to take a closer look at lifetime prevalence of psychological and physical
violence and economic abuse through data broken down not only by gender but also by other
important background demographic characteristics such as age, education, marital status, location
of residence and employment status. The relevant survey data are presented in Tables 2 and 3 below.
Victimization of women by their male intimate partners is discussed through the use of data first on
63
VAW perpetration as reported by men and then on exposure to VAW as experienced and reported
by women.
As evidenced by the data in Table 2, men’s age is a factor that does not make an impact in a
consistently straightforward and uniform manner with regard to psychological violence, especially
considering the fact that the older the age the greater the likelihood of a longer relationship period
with a female intimate partner. However, even though there is no uniform overall trend, in the case
of specific acts age is positively correlated (“belittling or humiliating the partner in front of others”),
with the youngest age group scoring 0.9% and the oldest group accounting for 7.8%, with two others
falling in-between accordingly. It is noteworthy that younger men seem to refrain from humiliating
their partners in public, while almost half of them report insulting their partner in private. That
reflects changing socio-cultural norms.
Age has a more straightforward, although smaller impact on economic abuse. In line with the
resurging patriarchal version of masculinity, younger men are more inclined to prohibit their female
partner from getting a job (every fifth of them did that). However, when partner is gainfully
employed, they do not take her earnings against her will. While some older men reported taking
money earned by the partner, the percentage is minute.
The strongest correlation of age is with physical violence. While the percentages are small, a
positive correlation is clearly observed in 3 types of violent acts, while in the case of acts of severe
gravity the percentages are extremely small or minuscule for a tendency.
Education does not seem to be a factor that makes a uniform difference. Many studies found
out that higher levels of educational attainment are associated with more liberal and progressive
views and behavior. Sometimes it is even claimed that higher education is an antidote to VAW. That
is definitely not the case in this sample of men. Holders of higher education are not only not immune
to violence but also demonstrate higher percentage of perpetrators of psychological violence. It is
symptomatic that this tendency is mostly limited to words, not actions. As regards verbal abuse, men
with higher education indeed “outperform” men with lower levels of education.
On the other hand, theirs is the lowest percentage in the category of those who hurt people the
partner cares about or damage things of importance to her. In physical violence, their percentage is
highest only in the relatively “mild” type of violent acts, viz. pushing or shoving their partner. It is
lower in the case of punching or slapping a partner or throwing something at her that could hurt her.

64
Table 2. Perpetration of psychological & physical violence against and economic abuse of intimate female partners: Men (Lifetime prevalence)
Percentage of ever-partnered men who reported having ever committed the following acts of violence and abuse against intimate female partners, by background characteristics
Psychological violence Economic abuse Physical violence
Background characteristic
Insulted/made partner feel bad about herself
Belittled/ humiliated partner in front of others
Scared/ intimi-dated partner
Threatened to hurt
Hurt people partner cares about/ damaged things of importance to her
Prohibited partner from getting a job, earning money
Taken partner’s earnings against her will
Thrown partner out of house
Kept earned money for alcohol, etc.
Slapped/ thrown smth at partner
Pushed /shoved partner
Punched partner
Kicked/ dragged choked/burned partner
Threatened with / used weapon
Number of men
N = 696
Age
18-24 48.2 0.9 14.5 0.9 6.4 20.9 0.0 1.8 0.0 6.3 6.3 1.8 0.0 0.0 110
25-34 45.5 1.6 9.0 4.8 3.1 20.6 0.0 1.6 0.5 7.9 9.0 2.1 0.5 0.5 189
35-49 53.1 4.2 9.1 5.4 3.7 19.9 0.8 2.4 2.1 16.5 13.2 5.4 2.9 0.4 243
50-59 49.3 7.8 9.7 4.5 2.6 16.8 2.5 2.5 2.6 18.1 14.9 5.8 2.5 0.0 154
Education
Basic (33.3) (3.3) (3.3) (10.0) (13.4) (20.0) (3.3) (6.7) (3.3) (16.6) (16.7) (10.0) (13.3) (0.0) 30
Secondary 49.2 2.8 10.1 2.2 4.5 21.9 0.9 1.9 2.0 10.7 8.9 4.2 1.7 0.3 356
TVET 47.2 4.1 10.5 4.9 3.2 15.5 0.0 1.6 0.8 17.1 12.2 4.9 0.8 0.0 123
Higher 54.0 5.3 10.7 7.0 1.1 16.6 1.0 2.1 0.5 13.9 14.4 2.1 0.5 0.5 187
Marital status
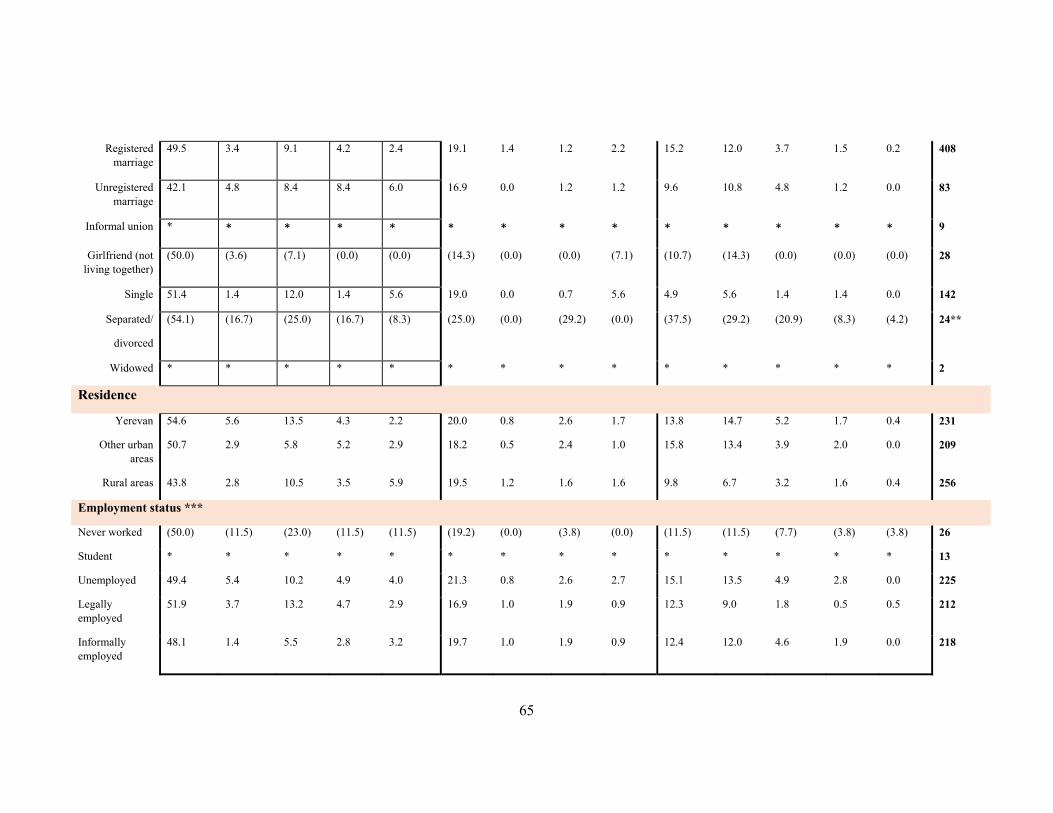
65
Registered marriage
49.5 3.4 9.1 4.2 2.4 19.1 1.4 1.2 2.2 15.2 12.0 3.7 1.5 0.2 408
Unregistered marriage
42.1 4.8 8.4 8.4 6.0 16.9 0.0 1.2 1.2 9.6 10.8 4.8 1.2 0.0 83
Informal union * * * * * * * * * * * * * * 9
Girlfriend (not living together)
(50.0) (3.6) (7.1) (0.0) (0.0) (14.3) (0.0) (0.0) (7.1) (10.7) (14.3) (0.0) (0.0) (0.0) 28
Single 51.4 1.4 12.0 1.4 5.6 19.0 0.0 0.7 5.6 4.9 5.6 1.4 1.4 0.0 142
Separated/
divorced
(54.1) (16.7) (25.0) (16.7) (8.3) (25.0) (0.0) (29.2) (0.0) (37.5) (29.2) (20.9) (8.3) (4.2) 24**
Widowed * * * * * * * * * * * * * * 2
Residence
Yerevan 54.6 5.6 13.5 4.3 2.2 20.0 0.8 2.6 1.7 13.8 14.7 5.2 1.7 0.4 231
Other urban areas
50.7 2.9 5.8 5.2 2.9 18.2 0.5 2.4 1.0 15.8 13.4 3.9 2.0 0.0 209
Rural areas 43.8 2.8 10.5 3.5 5.9 19.5 1.2 1.6 1.6 9.8 6.7 3.2 1.6 0.4 256
Employment status ***
Never worked (50.0) (11.5) (23.0) (11.5) (11.5) (19.2) (0.0) (3.8) (0.0) (11.5) (11.5) (7.7) (3.8) (3.8) 26
Student * * * * * * * * * * * * * * 13
Unemployed 49.4 5.4 10.2 4.9 4.0 21.3 0.8 2.6 2.7 15.1 13.5 4.9 2.8 0.0 225
Legally employed
51.9 3.7 13.2 4.7 2.9 16.9 1.0 1.9 0.9 12.3 9.0 1.8 0.5 0.5 212
Informally employed
48.1 1.4 5.5 2.8 3.2 19.7 1.0 1.9 0.9 12.4 12.0 4.6 1.9 0.0 218
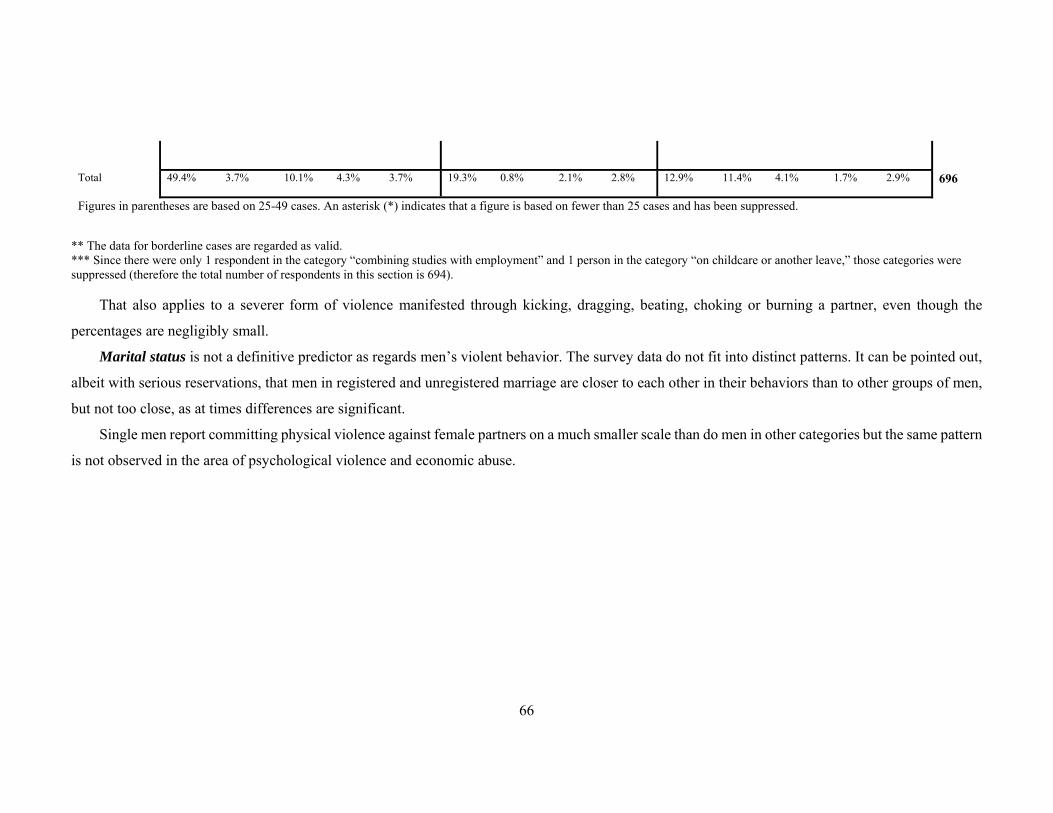
66
Total 49.4% 3.7% 10.1% 4.3% 3.7% 19.3% 0.8% 2.1% 2.8% 12.9% 11.4% 4.1% 1.7% 2.9% 696
Figures in parentheses are based on 25-49 cases. An asterisk (*) indicates that a figure is based on fewer than 25 cases and has been suppressed.
** The data for borderline cases are regarded as valid. *** Since there were only 1 respondent in the category “combining studies with employment” and 1 person in the category “on childcare or another leave,” those categories were suppressed (therefore the total number of respondents in this section is 694).
That also applies to a severer form of violence manifested through kicking, dragging, beating, choking or burning a partner, even though the
percentages are negligibly small.
Marital status is not a definitive predictor as regards men’s violent behavior. The survey data do not fit into distinct patterns. It can be pointed out,
albeit with serious reservations, that men in registered and unregistered marriage are closer to each other in their behaviors than to other groups of men,
but not too close, as at times differences are significant.
Single men report committing physical violence against female partners on a much smaller scale than do men in other categories but the same pattern
is not observed in the area of psychological violence and economic abuse.
67
Another correlation is more straightforward: divorced or separated men have the highest
percentage for committing all acts of violence (with one exception). However, this conclusion is not
without a caveat either. The number of respondents in this group is small. It is in fact a borderline
case with limited, if not questionable, validity. At the same time a tentative conclusion can be drawn
that intimate partner violence was a likely contributing factor to separation or breakdown of intimate
relationship or dissolution of marriage.
The location of respondents’ residence is not a factor of particularly straightforward impact.
While the highest percentage of perpetrators in over two-thirds of types of acts in all forms of VAW
is among residents of Yerevan, the difference is at times minimal or even nominal. Residents of
other urban areas are for the most part in-between, tending to be closer to one or the other group.
The lowest percentage of perpetrators is mostly among rural residents. However, in the case of two
grave violent acts, viz. hurting people the partner cares about or damaging things of importance to
her and taking partner’s earnings against her will, the highest percentage of perpetrators is among
them. Regarding three other types of acts, even though the percentage of perpetrators among them
is not the highest one, it is still higher than among residents of urban areas other than Yerevan.
The situation with an employment factor is even more intricate. While there is not a single
straightforward trend, the only discernible pattern, which can be pointed out (albeit with strong
reservations), is that the unemployed and the respondents who never worked are more likely to be
perpetrators of VAW than legally and informally employed men.
The survey data also indicate that exposure to violence may have some impact on men
increasing, albeit insignificantly, the likelihood of their subsequent violent or non-violent behavior.
Thus, of those men who had never been punched only 2.9% ever punched or hit their female
intimate partner, whereas in the case those men who had been punched the percentage is almost
twice as high as the former. 5.6% of those men punched or hit their female intimate partner.
As regards a more severe and grave act of threatening a female intimate partner with a weapon
the difference is even bigger. It is noteworthy that none of the men who had never been threatened
with a weapon ever threatened his female partner with such a weapon. On the other hand, 4.4% of
the men who had been threatened with a weapon subsequently threatened their female partner with
such a weapon. It should also be pointed out that they made such threats more than once.
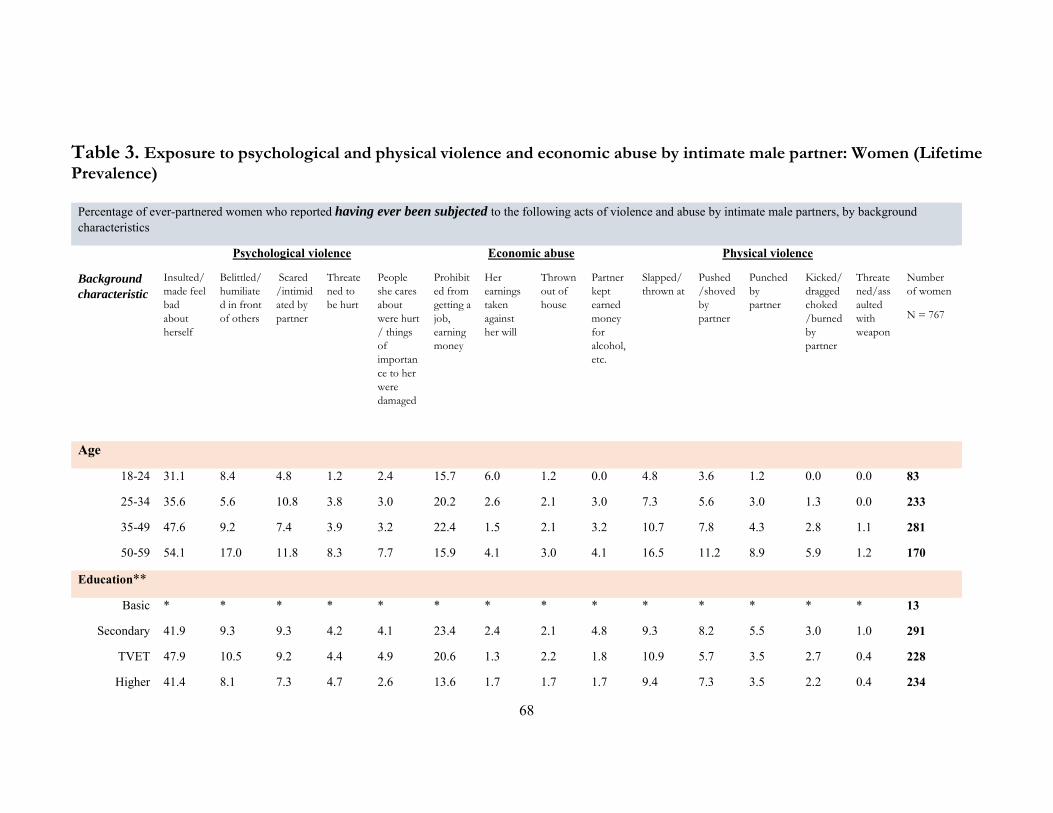
68
Table 3. Exposure to psychological and physical violence and economic abuse by intimate male partner: Women (Lifetime Prevalence)
Percentage of ever-partnered women who reported having ever been subjected to the following acts of violence and abuse by intimate male partners, by background characteristics
Psychological violence Economic abuse Physical violence
Background characteristic
Insulted/ made feel bad about herself
Belittled/humiliated in front of others
Scared /intimidated by partner
Threatened to be hurt
People she cares about were hurt / things of importance to her were damaged
Prohibited from getting a job, earning money
Her earnings taken against her will
Thrown out of house
Partner kept earned money for alcohol, etc.
Slapped/ thrown at
Pushed /shoved by partner
Punched by partner
Kicked/ dragged choked/burned by partner
Threatened/assaulted with weapon
Number of women
N = 767
Age
18-24 31.1 8.4 4.8 1.2 2.4 15.7 6.0 1.2 0.0 4.8 3.6 1.2 0.0 0.0 83
25-34 35.6 5.6 10.8 3.8 3.0 20.2 2.6 2.1 3.0 7.3 5.6 3.0 1.3 0.0 233
35-49 47.6 9.2 7.4 3.9 3.2 22.4 1.5 2.1 3.2 10.7 7.8 4.3 2.8 1.1 281
50-59 54.1 17.0 11.8 8.3 7.7 15.9 4.1 3.0 4.1 16.5 11.2 8.9 5.9 1.2 170
Education**
Basic * * * * * * * * * * * * * * 13
Secondary 41.9 9.3 9.3 4.2 4.1 23.4 2.4 2.1 4.8 9.3 8.2 5.5 3.0 1.0 291
TVET 47.9 10.5 9.2 4.4 4.9 20.6 1.3 2.2 1.8 10.9 5.7 3.5 2.7 0.4 228
Higher 41.4 8.1 7.3 4.7 2.6 13.6 1.7 1.7 1.7 9.4 7.3 3.5 2.2 0.4 234
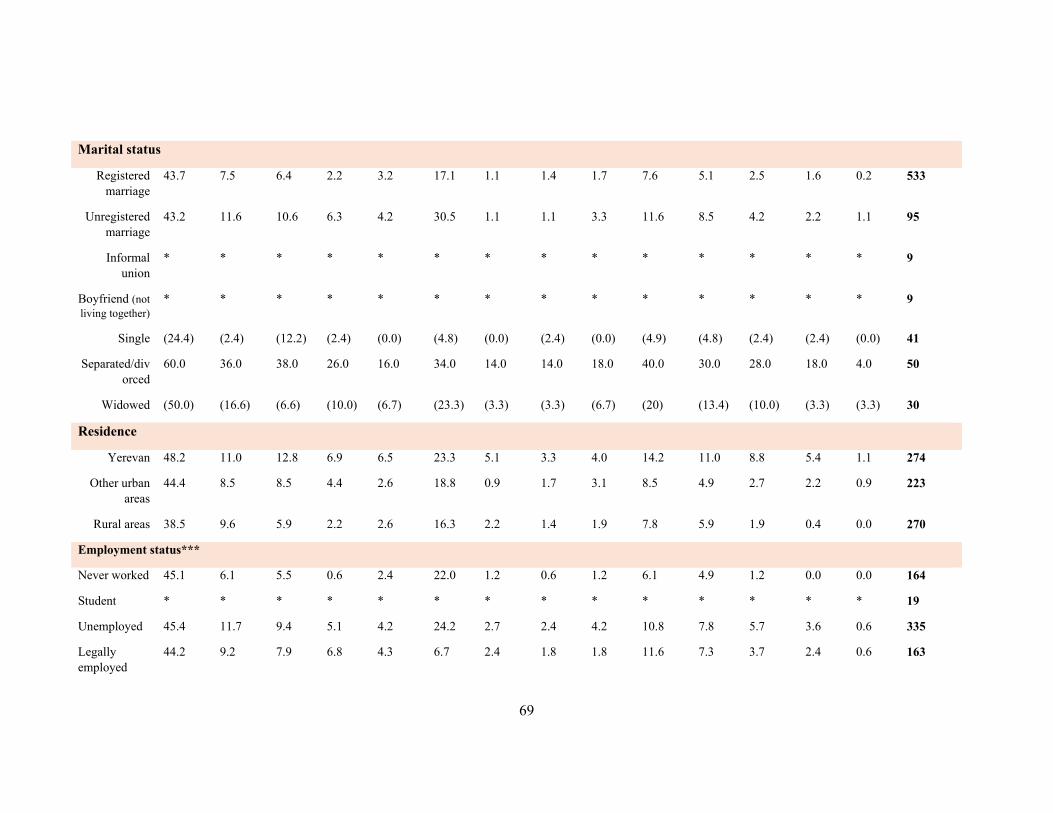
69
Marital status
Registered marriage
43.7 7.5 6.4 2.2 3.2 17.1 1.1 1.4 1.7 7.6 5.1 2.5 1.6 0.2 533
Unregistered marriage
43.2 11.6 10.6 6.3 4.2 30.5 1.1 1.1 3.3 11.6 8.5 4.2 2.2 1.1 95
Informal union
* * * * * * * * * * * * * * 9
Boyfriend (not living together)
* * * * * * * * * * * * * * 9
Single (24.4) (2.4) (12.2) (2.4) (0.0) (4.8) (0.0) (2.4) (0.0) (4.9) (4.8) (2.4) (2.4) (0.0) 41
Separated/divorced
60.0 36.0 38.0 26.0 16.0 34.0 14.0 14.0 18.0 40.0 30.0 28.0 18.0 4.0 50
Widowed (50.0) (16.6) (6.6) (10.0) (6.7) (23.3) (3.3) (3.3) (6.7) (20) (13.4) (10.0) (3.3) (3.3) 30
Residence
Yerevan 48.2 11.0 12.8 6.9 6.5 23.3 5.1 3.3 4.0 14.2 11.0 8.8 5.4 1.1 274
Other urban areas
44.4 8.5 8.5 4.4 2.6 18.8 0.9 1.7 3.1 8.5 4.9 2.7 2.2 0.9 223
Rural areas 38.5 9.6 5.9 2.2 2.6 16.3 2.2 1.4 1.9 7.8 5.9 1.9 0.4 0.0 270
Employment status***
Never worked 45.1 6.1 5.5 0.6 2.4 22.0 1.2 0.6 1.2 6.1 4.9 1.2 0.0 0.0 164
Student * * * * * * * * * * * * * * 19
Unemployed 45.4 11.7 9.4 5.1 4.2 24.2 2.7 2.4 4.2 10.8 7.8 5.7 3.6 0.6 335
Legally employed
44.2 9.2 7.9 6.8 4.3 6.7 2.4 1.8 1.8 11.6 7.3 3.7 2.4 0.6 163

70
Informally employed
39.0 10.9 18.7 9.4 7.8 28.1 6.3 6.3 6.3 18.8 14.0 12.5 7.8 3.2 64
Childcare or other leave
* * * * * * * * * * * * * * 19
Total 43.6% 9.8% 9.2% 4.5% 4.0% 19.5% 2.9% 2.2% 3.0% 10.3% 7.5% 4.6% 2.8% 0.6% 767
Figures in parentheses are based on 25-49 cases. An asterisk (*) indicates that a figure is based on fewer than 25 cases and has been suppressed.
** Since there was only 1 respondent in the category “with elementary or lower education,” the category was suppressed (therefore the total number of respondents in this section is 766). *** Since there was only 1 respondent in the category “combining studies with employment” and 2 respondents gave no answer, those categories were suppressed (therefore the total number of respondents in this section is 764).
71
As evidenced by data in Table 3, the same factors have a different correlation dynamics
in the case of female respondents who have been subjected to the same types of acts within the
same forms of violence.
Not surprisingly, age is positively correlated with exposure to physical and psychological
violence, even though in the case of two types of the latter there are minor deviations from the
pattern. Usually, older women have a longer history of relationship with a male intimate partner
and therefore the likelihood of their exposure to IPV is higher. The same pattern holds true for
2 types of economic abuse. The chances that women have gone through the experience of
being thrown out of house or of their partner keeping money from earnings for alcohol, tobacco
or other things for himself, when he knew that they were finding it hard to afford the household
expenses, increase with the passage of time, although not necessarily proportionally or
dramatically.
As regards 2 other types of economic abuse, there is quite a discrepancy (both in terms of
percentage points and, more importantly in the dynamic) between prevalence as reported by
male perpetrators, on the one hand, and female victims, on the other. The percentage of women
reporting that they were prohibited by their intimate partner from getting a job, going to work,
trading or earning money was lowest in the youngest age group, whereas if the situation were
in line with the men’s reports, the percentage would have been highest. A plausible explanation
can include the following factors: many young women in that age group are still completing
their education or training, relatively few of them are already married or have an intimate
partner, while those who are married may have a child to take care of, and some are unemployed
anyway, so under the circumstances the issue is more hypothetical than a real one. The
percentage is tangibly higher in the next age group of women (25-34-year-olds). Most young
women get married or get an intimate partner at that age, so the issue of getting or not getting
or keeping employment becomes very real. The data indicate that every fifth of ever-partnered
surveyed women in that age bracket not only faced the dilemma but was prohibited by her
intimate partner from getting a gainful employment.
The education factor is a more reliable predictor than in the case of men. The data clearly
indicate that while women’s level of education does not make a significant difference with
regard to violence, nevertheless women with higher education report for the most time the
lowest or at least a lower percentage of prevalence of violence. This can probably be accounted
for by their less willingness and preparedness to tolerate intimate partner violence, especially
more severe acts. In a psychological form of violence, it is when a woman’s partner hurts
people she cares about or damages things of importance to her. In the economic abuse form, it
72
is when a woman is prohibited by her intimate partner from getting a job, going to work, trading
or earning money. This latter case is the only one when difference between women holding
higher education and with women holding education of a lower level (TVET and secondary
education) is considerable (by 7.0-9.8 percentage points respectively).
The role of a marital status is very predictable. The highest percentage of those reporting
IPV is among separated and divorced women. On the average, it exceeds the percentage among
other groups of women by 2 to 3 times (and even more at times) across the board meaning all
3 forms of violence and all other groups of women. This fact does not come as a surprise
because not infrequently IPV is among the women’s reasons, if not the sole one, for separation
and/or divorce. The difference is particularly striking in prevalence of physical violence.
The second highest percentage of IPV victims is among widows. There are two minor
exceptions. Those are related to partner intimidation (in psychological violence) and to
partner’s prohibiting a woman from getting a job and earning money. The latter can be
accounted for by the fact that most widows are of the older age and, as mentioned above, older
men were the least willing to prohibit women from getting a gainful employment.
As could be expected, the consistently lowest percentage of IPV is among single women.
2 minor exceptions are related to intimidation and, to a much lesser extent, being thrown out
of a house. Since they were not in registered or unregistered marriage, it is likely that their
relationship(s) was (were) of limited duration and scope and therefore their experience is
limited too.
Women in registered and unregistered marriages take a middle position. It should be noted
that while these 2 groups are much closer to each other than to other groups, the higher
percentage of women in unregistered marriages than women in registered marriages reported
some acts of psychological and physical violence and economic abuse, including being
humiliated in front of other people, intimidated, pushed or shoved and slapped or thrown
something at by a partner. The most significant difference is related to being prohibited from
getting a job (30.5% vs. 17.1%).
As regards the location of residence factor, the survey data reveal a clear pattern. The
consistently highest percentage of IPV victims is among residents of Yerevan, while the lowest
percentage is for the most part among rural residents (their percentage is negligibly higher than
among residents of urban areas other than Yerevan in the case of being humiliated in front of
other people, intimidated, pushed or shoved and their earnings taken against their will). Victims
from other urban areas take a middle position. Their reported prevalence comes closer to either
group.
73
From an employment status perspective, the most victimized group is informally
employed women. Their percentage is consistently and significantly higher in the case of all
types of violent acts in physical violence and economic abuse and in most types of acts of
psychological violence. The two exceptions are related to relatively milder form of
psychological violence: the percentage in the case of being humiliated in front of others is only
negligibly smaller than that of the highest scoring group, while the difference in the case of
being insulted or made feel bad about themselves by their partner is notable and amounts to
over 5%.
The second most victimized group is unemployed women. Only in one type of acts in
psychological violence (threatened to be hurt) and in physical violence (being slapped or
thrown something at that could hurt a woman) their percentage is negligibly smaller than that
of another group.
The next group is legally employed women. Even though the percentage of their
victimization is in most cases 1.5-2 times lower than that of the most victimized group
(informally employed women), it is still quite close to the second most victimized group
(unemployed women).
It is noteworthy that on the whole (with 2 minor exceptions) the least victimized group is
women who never worked.
***
Reporting physical violence: A comparative analysis
Female respondents were asked twice about their experience of physical violence
perpetrated by their intimate partner.
The first time questions about intimate partner physical violence were read to ever-
partnered women from the main questionnaire by a female interviewer and women were asked
to answer those questions. The pertinent data were presented in a summary and a breakdown
form in a table and as well as a narrative format above.
The second time the same questions were given in a separate self-administered
questionnaire, which the female respondents were asked to fill out by themselves and to drop
it upon completion in a sealed box. That was done to ensure anonymity and better
confidentiality with a view to checking data consistency and reliability. It can be assumed that
most respondents felt comfortable answering the intimate partner physical violence-related
questions in this mode because the completion rate of the relevant section of the self-
administered questionnaire was 82%-83%. It means that at least 4 out of every 5 female
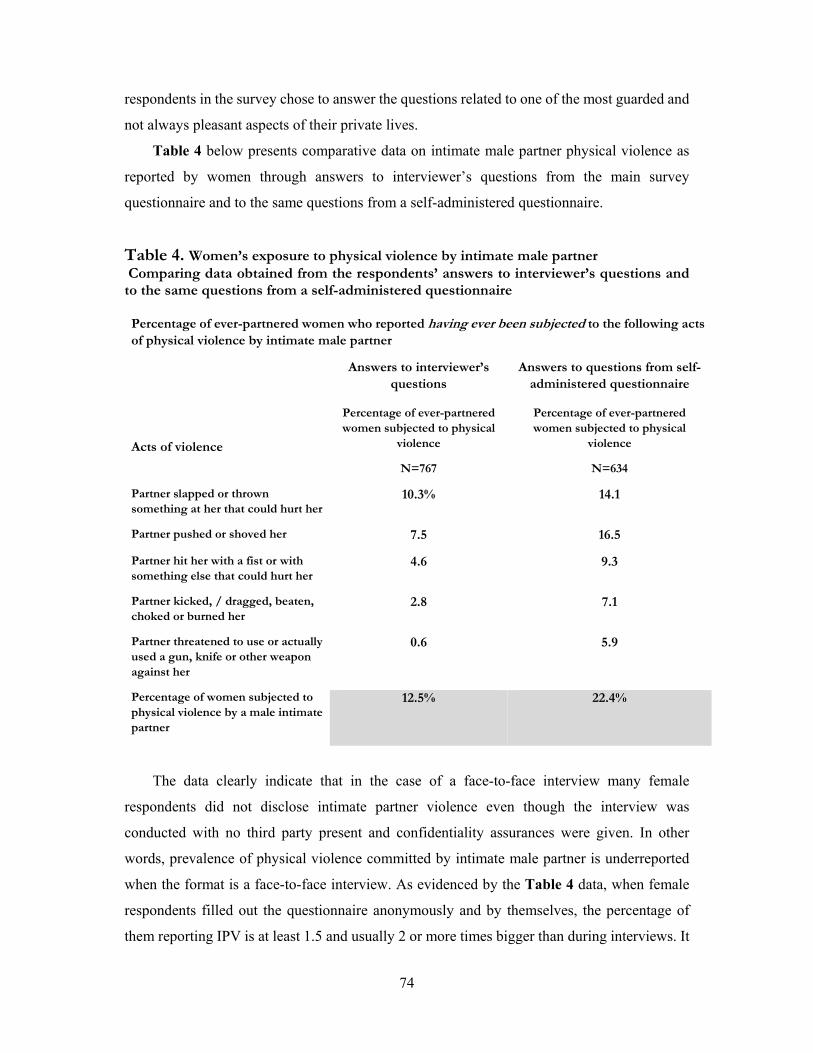
74
respondents in the survey chose to answer the questions related to one of the most guarded and
not always pleasant aspects of their private lives.
Table 4 below presents comparative data on intimate male partner physical violence as
reported by women through answers to interviewer’s questions from the main survey
questionnaire and to the same questions from a self-administered questionnaire.
Table 4. Women’s exposure to physical violence by intimate male partner Comparing data obtained from the respondents’ answers to interviewer’s questions and to the same questions from a self-administered questionnaire Percentage of ever-partnered women who reported having ever been subjected to the following acts of physical violence by intimate male partner
Answers to interviewer’s questions
Answers to questions from self-administered questionnaire
Acts of violence
Percentage of ever-partnered women subjected to physical
violence
N=767
Percentage of ever-partnered women subjected to physical
violence
N=634
Partner slapped or thrown something at her that could hurt her
10.3% 14.1
Partner pushed or shoved her 7.5 16.5
Partner hit her with a fist or with something else that could hurt her
4.6 9.3
Partner kicked, / dragged, beaten, choked or burned her
2.8 7.1
Partner threatened to use or actually used a gun, knife or other weapon against her
0.6 5.9
Percentage of women subjected to physical violence by a male intimate partner
12.5% 22.4%
The data clearly indicate that in the case of a face-to-face interview many female
respondents did not disclose intimate partner violence even though the interview was
conducted with no third party present and confidentiality assurances were given. In other
words, prevalence of physical violence committed by intimate male partner is underreported
when the format is a face-to-face interview. As evidenced by the Table 4 data, when female
respondents filled out the questionnaire anonymously and by themselves, the percentage of
them reporting IPV is at least 1.5 and usually 2 or more times bigger than during interviews. It
75
is noteworthy that the discrepancy between the outcomes of the two modes of reporting by the
same women of the same violent acts is not only significant but also depends on severity of the
act. This discrepancy, which may be called “a (prevalence) underreporting gap,” grows
increasingly bigger the more grave and severe the act becomes.
The Table 5 data demonstrate that the difference between the two modes of women’s
responses is not merely quantitative, however important the latter might be. Not infrequently
the impact of key factors (background characteristics) and the emerging patterns are not
identical. Therefore it is worthwhile to look at how those key factors affect the responses in the
self-administered questionnaire (SAQ) and to compare the dynamic with that in the main
questionnaire (MQ).
As older women have usually been in a longer relationship with a male partner and thus
have potentially been more exposed to the risk of victimization, it is not surprising that age is
on the whole positively correlated with prevalence of physical violence. Both groups of
responses are similar in that respect. However, the growth dynamic in SAQ responses is
noticeably smaller than that in MQ responses (with a minor possible exception of the special
case of a severe violent act of a male partner threatening to use or actually using a gun, knife
or other weapon against the woman), especially considering the relative magnitude of the
percentages in both groups of responses.
The education factor proved unpredictable. While the percentage of women with technical
and vocational education and training (TVET) reporting physical violence is consistently lower
in SAQ responses than that of women with secondary education, the percentage of women with
higher education who were victims of physical violence by their male partners is higher or
virtually equal to that of women with secondary education and is considerably higher than that
of women with TVET education. This pattern contradicts the pattern observed in the MQ
responses and identified also in the studies conducted in many countries.
As a rule, women with higher education are less willing to tolerate violence, especially
physical violence, and usually they choose male partners with higher or at least TVET
education. The men with that level of educational attainment tend to be less violent than men
with lower-level education, especially with regard to physical violence. This trend is also
confirmed by the present study findings. Therefore, the question why the percentage of women
with higher education anonymously reporting intimate partner physical violence is higher or,
at any rate, equal to that of women with lower educational level begs further research.
Table 5. Exposure to physical violence by intimate male partner:
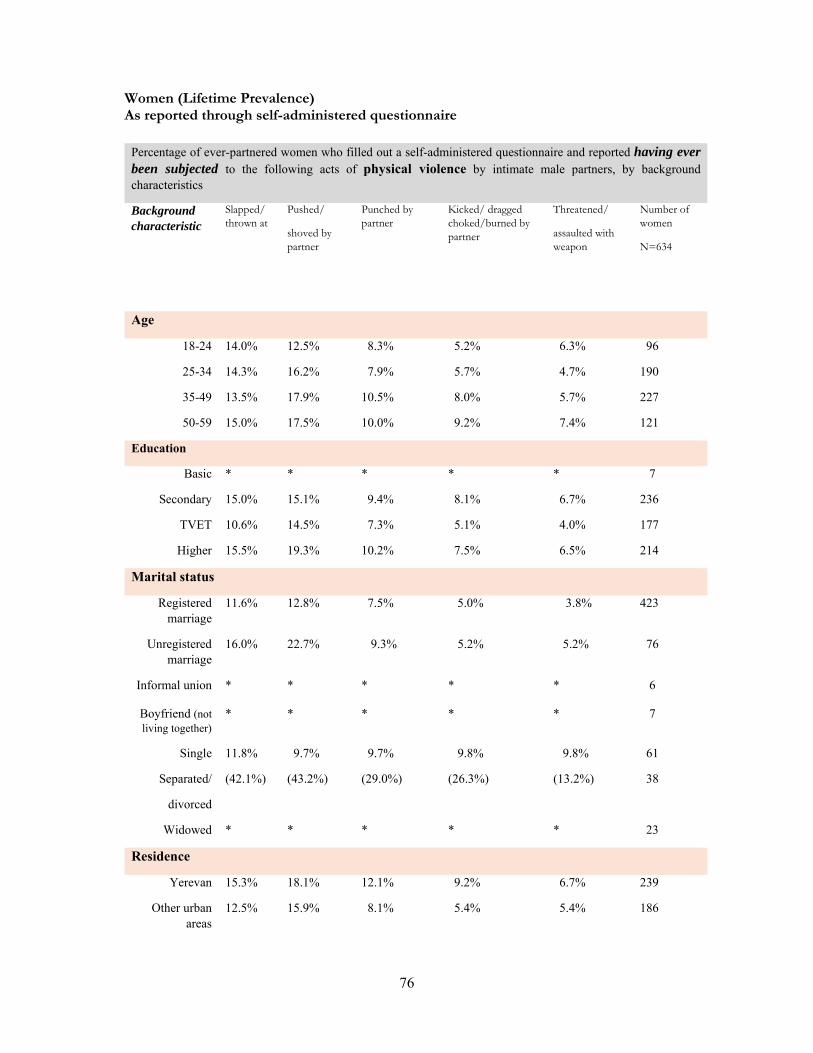
76
Women (Lifetime Prevalence) As reported through self-administered questionnaire
Percentage of ever-partnered women who filled out a self-administered questionnaire and reported having ever been subjected to the following acts of physical violence by intimate male partners, by background characteristics
Background characteristic
Slapped/ thrown at
Pushed/
shoved by partner
Punched by partner
Kicked/ dragged choked/burned by partner
Threatened/
assaulted with weapon
Number of women
N=634
Age
18-24 14.0% 12.5% 8.3% 5.2% 6.3% 96
25-34 14.3% 16.2% 7.9% 5.7% 4.7% 190
35-49 13.5% 17.9% 10.5% 8.0% 5.7% 227
50-59 15.0% 17.5% 10.0% 9.2% 7.4% 121
Education
Basic * * * * * 7
Secondary 15.0% 15.1% 9.4% 8.1% 6.7% 236
TVET 10.6% 14.5% 7.3% 5.1% 4.0% 177
Higher 15.5% 19.3% 10.2% 7.5% 6.5% 214
Marital status
Registered marriage
11.6% 12.8% 7.5% 5.0% 3.8% 423
Unregistered marriage
16.0% 22.7% 9.3% 5.2% 5.2% 76
Informal union * * * * * 6
Boyfriend (not living together)
* * * * * 7
Single 11.8% 9.7% 9.7% 9.8% 9.8% 61
Separated/
divorced
(42.1%) (43.2%) (29.0%) (26.3%) (13.2%) 38
Widowed * * * * * 23
Residence
Yerevan 15.3% 18.1% 12.1% 9.2% 6.7% 239
Other urban areas
12.5% 15.9% 8.1% 5.4% 5.4% 186
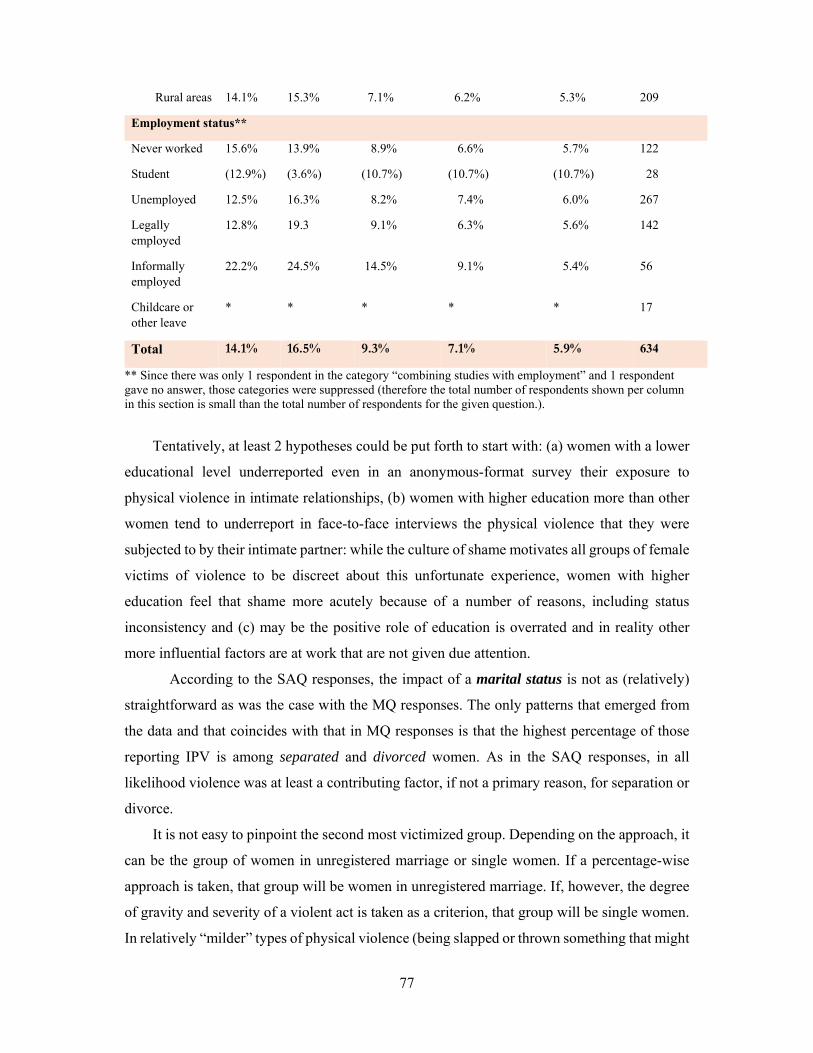
77
Rural areas 14.1% 15.3% 7.1% 6.2% 5.3% 209
Employment status**
Never worked 15.6% 13.9% 8.9% 6.6% 5.7% 122
Student (12.9%) (3.6%) (10.7%) (10.7%) (10.7%) 28
Unemployed 12.5% 16.3% 8.2% 7.4% 6.0% 267
Legally employed
12.8% 19.3 9.1% 6.3% 5.6% 142
Informally employed
22.2% 24.5% 14.5% 9.1% 5.4% 56
Childcare or other leave
* * * * * 17
Total 14.1% 16.5% 9.3% 7.1% 5.9% 634
** Since there was only 1 respondent in the category “combining studies with employment” and 1 respondent gave no answer, those categories were suppressed (therefore the total number of respondents shown per column in this section is small than the total number of respondents for the given question.).
Tentatively, at least 2 hypotheses could be put forth to start with: (a) women with a lower
educational level underreported even in an anonymous-format survey their exposure to
physical violence in intimate relationships, (b) women with higher education more than other
women tend to underreport in face-to-face interviews the physical violence that they were
subjected to by their intimate partner: while the culture of shame motivates all groups of female
victims of violence to be discreet about this unfortunate experience, women with higher
education feel that shame more acutely because of a number of reasons, including status
inconsistency and (c) may be the positive role of education is overrated and in reality other
more influential factors are at work that are not given due attention.
According to the SAQ responses, the impact of a marital status is not as (relatively)
straightforward as was the case with the MQ responses. The only patterns that emerged from
the data and that coincides with that in MQ responses is that the highest percentage of those
reporting IPV is among separated and divorced women. As in the SAQ responses, in all
likelihood violence was at least a contributing factor, if not a primary reason, for separation or
divorce.
It is not easy to pinpoint the second most victimized group. Depending on the approach, it
can be the group of women in unregistered marriage or single women. If a percentage-wise
approach is taken, that group will be women in unregistered marriage. If, however, the degree
of gravity and severity of a violent act is taken as a criterion, that group will be single women.
In relatively “milder” types of physical violence (being slapped or thrown something that might
78
hurt the woman, being pushed or shoved) the percentage of single women reporting them is
significantly lower than that of women in unregistered marriage (11.8% vs. 16.0% and 9.7%
vs. 22.7% respectively). The percentage is equal for a “medium” type of violence (being
punched), whereas in more grave and severe types of physical violence (being kicked, dragged,
beaten, choked or burned by the partner, and partner threatened to use or actually used a gun,
knife or other weapon against the woman) the percentage is tangibly higher for single women.
As they are currently single, it means that they ended a relationship. It is likely that at least in
some cases the relationship was terminated because of violence since those women may not be
willing to tolerate physical violence, which may potentially spill over into a subsequent married
life.
The data for single women in the SAQ responses stand in stark contrast to the data from
the MQ responses, where single women reported the lowest percentage of IPV.
In the SAQ responses, the lowest percentage was reported by women in registered
marriage. However, even they significantly underreported IPV in the face-to-face interviews.
The percentages for their SAQ responses exceed those for the MQ responses for 2-3 times on
the average.
As regards the location of residence factor, the SAQ responses reveal almost the same
pattern as in the case of the MQ responses. Again, the highest percentage of intimate partner
violence victims is among residents of Yerevan. However, in this case there is virtually no
difference between rural residents and residents of urban areas other than Yerevan.
It is noteworthy that the growth in the IPV dynamic between the two reports is not uniform.
The most “modest” growth (about 1.5 times) in the percentage of female respondents reporting
IPV was among residents of Yerevan, the only exception being the most grave and severe act
of a man threatening to use or actually using a gun, knife or other weapon against the female
partner, where the growth is considerable both in terms of percentage points and of a 6-fold
increase (from 1.1% to 6.7%). The percentages of women reporting intimate partner physical
violence have grown more drastically among residents of rural and of urban areas other than
Yerevan. The data indicate that the “prevalence underreporting gap” is much bigger among
them than among residents of Yerevan.
From an employment status perspective, according to the SAQ responses, again the most
victimized group is informally employed women. However, in contrast to the MQ responses,
in the case of the most grave and severe acts of IPV the highest percentage is among female
students.
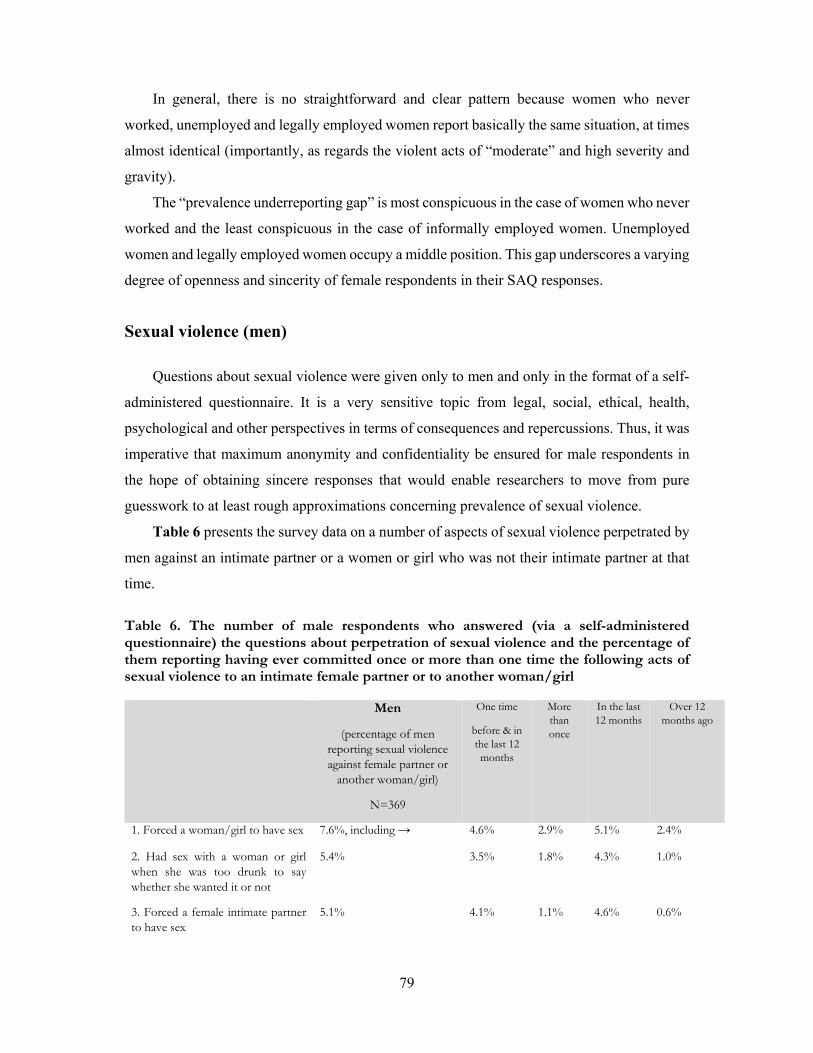
79
In general, there is no straightforward and clear pattern because women who never
worked, unemployed and legally employed women report basically the same situation, at times
almost identical (importantly, as regards the violent acts of “moderate” and high severity and
gravity).
The “prevalence underreporting gap” is most conspicuous in the case of women who never
worked and the least conspicuous in the case of informally employed women. Unemployed
women and legally employed women occupy a middle position. This gap underscores a varying
degree of openness and sincerity of female respondents in their SAQ responses.
Sexual violence (men)
Questions about sexual violence were given only to men and only in the format of a self-
administered questionnaire. It is a very sensitive topic from legal, social, ethical, health,
psychological and other perspectives in terms of consequences and repercussions. Thus, it was
imperative that maximum anonymity and confidentiality be ensured for male respondents in
the hope of obtaining sincere responses that would enable researchers to move from pure
guesswork to at least rough approximations concerning prevalence of sexual violence.
Table 6 presents the survey data on a number of aspects of sexual violence perpetrated by
men against an intimate partner or a women or girl who was not their intimate partner at that
time. Table 6. The number of male respondents who answered (via a self-administered questionnaire) the questions about perpetration of sexual violence and the percentage of them reporting having ever committed once or more than one time the following acts of sexual violence to an intimate female partner or to another woman/girl
Men
(percentage of men reporting sexual violence against female partner or
another woman/girl)
N=369
One time
before & in the last 12 months
More than once
In the last 12 months
Over 12 months ago
1. Forced a woman/girl to have sex 7.6%, including → 4.6% 2.9% 5.1% 2.4%
2. Had sex with a woman or girl when she was too drunk to say whether she wanted it or not
5.4% 3.5% 1.8% 4.3% 1.0%
3. Forced a female intimate partner to have sex
5.1% 4.1% 1.1% 4.6% 0.6%
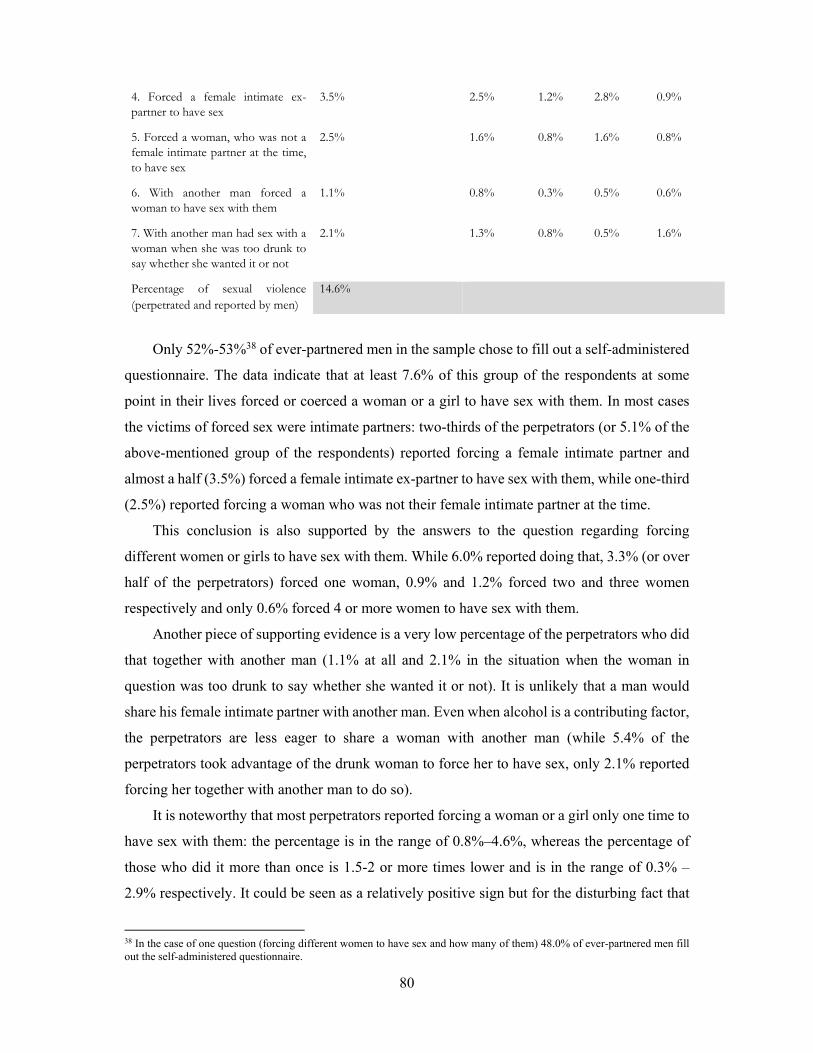
80
4. Forced a female intimate ex-partner to have sex
3.5% 2.5% 1.2% 2.8% 0.9%
5. Forced a woman, who was not a female intimate partner at the time, to have sex
2.5% 1.6% 0.8% 1.6% 0.8%
6. With another man forced a woman to have sex with them
1.1% 0.8% 0.3% 0.5% 0.6%
7. With another man had sex with a woman when she was too drunk to say whether she wanted it or not
2.1% 1.3% 0.8% 0.5% 1.6%
Percentage of sexual violence (perpetrated and reported by men)
14.6%
Only 52%-53%38 of ever-partnered men in the sample chose to fill out a self-administered
questionnaire. The data indicate that at least 7.6% of this group of the respondents at some
point in their lives forced or coerced a woman or a girl to have sex with them. In most cases
the victims of forced sex were intimate partners: two-thirds of the perpetrators (or 5.1% of the
above-mentioned group of the respondents) reported forcing a female intimate partner and
almost a half (3.5%) forced a female intimate ex-partner to have sex with them, while one-third
(2.5%) reported forcing a woman who was not their female intimate partner at the time.
This conclusion is also supported by the answers to the question regarding forcing
different women or girls to have sex with them. While 6.0% reported doing that, 3.3% (or over
half of the perpetrators) forced one woman, 0.9% and 1.2% forced two and three women
respectively and only 0.6% forced 4 or more women to have sex with them.
Another piece of supporting evidence is a very low percentage of the perpetrators who did
that together with another man (1.1% at all and 2.1% in the situation when the woman in
question was too drunk to say whether she wanted it or not). It is unlikely that a man would
share his female intimate partner with another man. Even when alcohol is a contributing factor,
the perpetrators are less eager to share a woman with another man (while 5.4% of the
perpetrators took advantage of the drunk woman to force her to have sex, only 2.1% reported
forcing her together with another man to do so).
It is noteworthy that most perpetrators reported forcing a woman or a girl only one time to
have sex with them: the percentage is in the range of 0.8%–4.6%, whereas the percentage of
those who did it more than once is 1.5-2 or more times lower and is in the range of 0.3% –
2.9% respectively. It could be seen as a relatively positive sign but for the disturbing fact that
38 In the case of one question (forcing different women to have sex and how many of them) 48.0% of ever-partnered men fill out the self-administered questionnaire.

81
most perpetrators report having committed those acts of sexual violence against women in the
last 12 months: they account for 65%-80% of all reports with the exception of the situations
when the perpetrators were joined by another man in forcing a woman to have sex with them
(in which case the percentages are split almost equally between the previous year and earlier
times or, when the woman was drunk, the percentage for the previous year is 3 times lower).
The percentages of sexual violence perpetrators among the male respondents who agreed
to fill out a self-administered questionnaire may seem very low as they are in single digits
ranging from 1.1% to 7.6% and are smaller or slightly bigger than the confidence interval (the
margin of error) and therefore should be treated with caution. In other words, it might seem
that the problem of sexual violence against women is not widespread and since it is a rare
occurrence, it should not raise concerns. In fact, it should and does raise legitimate concerns.
To begin with, while the percentages for individual types of acts within this form of
violence might be relatively small, at least 14.6% of male respondents acknowledged
committing sexual violence. This figure is big enough for the phenomenon to be seriously
reckoned with and to be dealt with through special measures.
Secondly, considering its impact on and repercussions for individuals, communities and
the society at large, sexual violence is among the worst and most traumatic forms of violence
against women. Even if only one woman were subjected to sexual violence, it would be one
too many. It should be borne in mind that any non-consensual sex constitutes rape. The data
confirms that partner/spousal rape exists in the Armenian society, even though it is not
recognized as such and the concept has yet to be incorporated into the national legislation.
Thirdly, the data clearly show that the overwhelming majority of the perpetrators
committed sexual violence within the 12 months prior to the survey. That may indicate that
unless checked, the process may evolve into a tendency.
Fourthly, while the data are the confirmed minimum that the respondents were willing and
confident enough to disclose, they do not reflect the real prevalence of the phenomenon since,
in all likelihood, sexual violence is underreported by the perpetrators for a number of reasons.
The most obvious are inadequate perception of what “forcing” means, especially in the case of
a regular intimate partner, and unwillingness to confess to committing this type of violence
even on condition of anonymity. While having several intimate female partners may be seen
by men (especially young men) and by large segments of the present-day Armenian society as
a manifestation of their masculinity, forcing woman to have sex with him is not seen by the
general public and the man himself as a “manly” thing to do. Therefore, quite a few men would

82
be uncomfortable to admit even to themselves that they are not good enough and that they have
to get sexual favors by force.
More detailed data are presented in Table 7 below via 2-way crosstabs, using the key
standard background characteristics of surveyed male respondents.
As regards the age factor, the percentage of perpetrators among older men is higher than
among younger men with one exception of having sex with a drunk woman without asking her
whether she wants it. This consistently higher percentage can in all likelihood be accounted for
by the fact that their experience with women spans over more years than that of younger men.
It is noteworthy that a higher percentage of older men than younger men committed those
acts of sexual violence (and more often) within the 12 months prior to the survey (and
considerably higher in the case of forcing current or ex-partner to have sex with them) with the
exception of the situations when they forced a drunk woman or forced a woman together with
another man to have sex with them. In the case of those exceptions the difference is negligible
(See Table 8).
Some education level-related tendencies, which were quite visible as regards other forms
of violence against women, are skewed first of all because in most instances the percentages of
perpetrators are too small and, from the confidence interval perspective, too close to one
another for drawing meaningful distinctions. The data for other forms of intimate partner
violence as well as for men’s attitudes towards violence demonstrated that the level of
educational attainment is strongly and inversely correlated with proclivity for violence and with
inclination to exonerate IPV. In the case of sexual violence this tendency is not that
straightforward. While the percentage of the respondents with higher education is indeed for
the most part lower in the case of most acts of sexual violence (with the exception of forcing a
drunk woman to have sex with them), the above tendency does not hold at all for individuals
with secondary and TVET education.
Table 7. Perpetration of sexual violence against women: Men (Lifetime prevalence) The number of male respondents who answered (via a self-administered questionnaire) the questions about perpetration of sexual violence and the percentage of them reporting having ever committed the following acts of sexual violence against women, by background characteristics
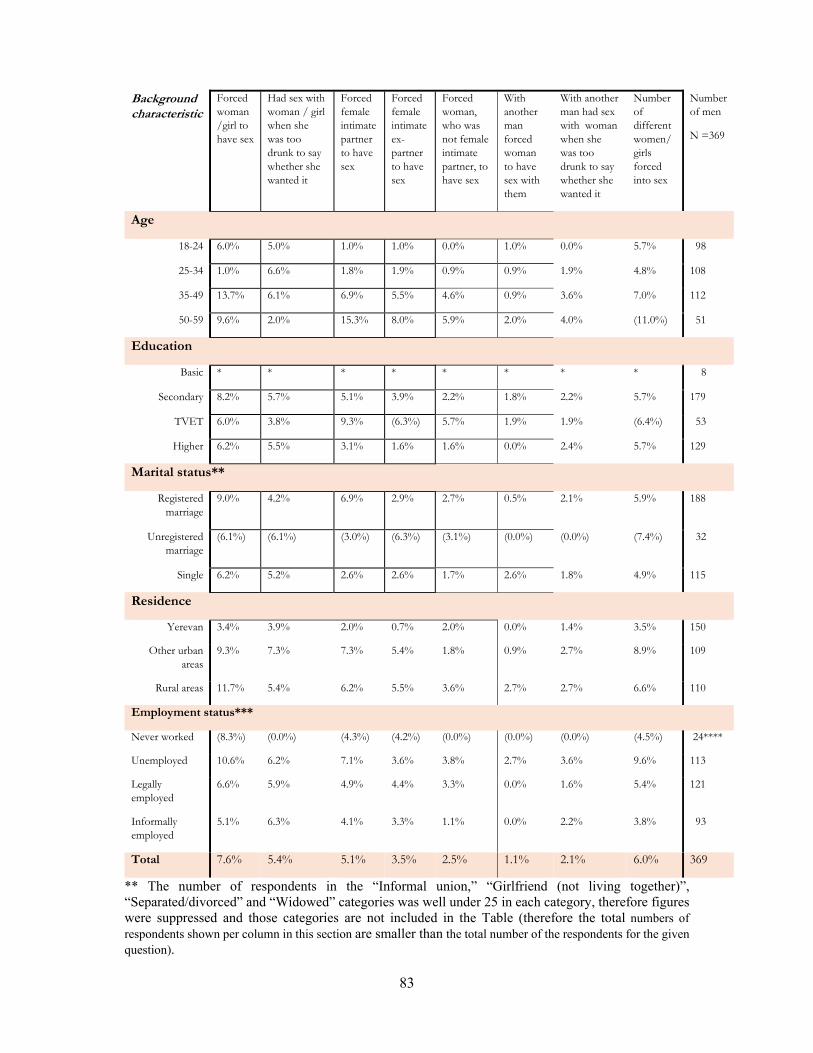
83
Background characteristic
Forced woman/girl to have sex
Had sex with woman / girl when she was too drunk to say whether she wanted it
Forced female intimate partner to have sex
Forced female intimate ex-partner to have sex
Forced woman, who was not female intimate partner, to have sex
With another man forced woman to have sex with them
With another man had sex with woman when she was too drunk to say whether she wanted it
Number of different women/girls forced into sex
Number of men
N =369
Age
18-24 6.0% 5.0% 1.0% 1.0% 0.0% 1.0% 0.0% 5.7% 98
25-34 1.0% 6.6% 1.8% 1.9% 0.9% 0.9% 1.9% 4.8% 108
35-49 13.7% 6.1% 6.9% 5.5% 4.6% 0.9% 3.6% 7.0% 112
50-59 9.6% 2.0% 15.3% 8.0% 5.9% 2.0% 4.0% (11.0%) 51
Education
Basic * * * * * * * * 8
Secondary 8.2% 5.7% 5.1% 3.9% 2.2% 1.8% 2.2% 5.7% 179
TVET 6.0% 3.8% 9.3% (6.3%) 5.7% 1.9% 1.9% (6.4%) 53
Higher 6.2% 5.5% 3.1% 1.6% 1.6% 0.0% 2.4% 5.7% 129
Marital status**
Registered marriage
9.0% 4.2% 6.9% 2.9% 2.7% 0.5% 2.1% 5.9% 188
Unregistered marriage
(6.1%) (6.1%) (3.0%) (6.3%) (3.1%) (0.0%) (0.0%) (7.4%) 32
Single 6.2% 5.2% 2.6% 2.6% 1.7% 2.6% 1.8% 4.9% 115
Residence
Yerevan 3.4% 3.9% 2.0% 0.7% 2.0% 0.0% 1.4% 3.5% 150
Other urban areas
9.3% 7.3% 7.3% 5.4% 1.8% 0.9% 2.7% 8.9% 109
Rural areas 11.7% 5.4% 6.2% 5.5% 3.6% 2.7% 2.7% 6.6% 110
Employment status***
Never worked (8.3%) (0.0%) (4.3%) (4.2%) (0.0%) (0.0%) (0.0%) (4.5%) 24****
Unemployed 10.6% 6.2% 7.1% 3.6% 3.8% 2.7% 3.6% 9.6% 113
Legally employed
6.6% 5.9% 4.9% 4.4% 3.3% 0.0% 1.6% 5.4% 121
Informally employed
5.1% 6.3% 4.1% 3.3% 1.1% 0.0% 2.2% 3.8% 93
Total 7.6% 5.4% 5.1% 3.5% 2.5% 1.1% 2.1% 6.0% 369
** The number of respondents in the “Informal union,” “Girlfriend (not living together)”, “Separated/divorced” and “Widowed” categories was well under 25 in each category, therefore figures were suppressed and those categories are not included in the Table (therefore the total numbers of respondents shown per column in this section are smaller than the total number of the respondents for the given question).
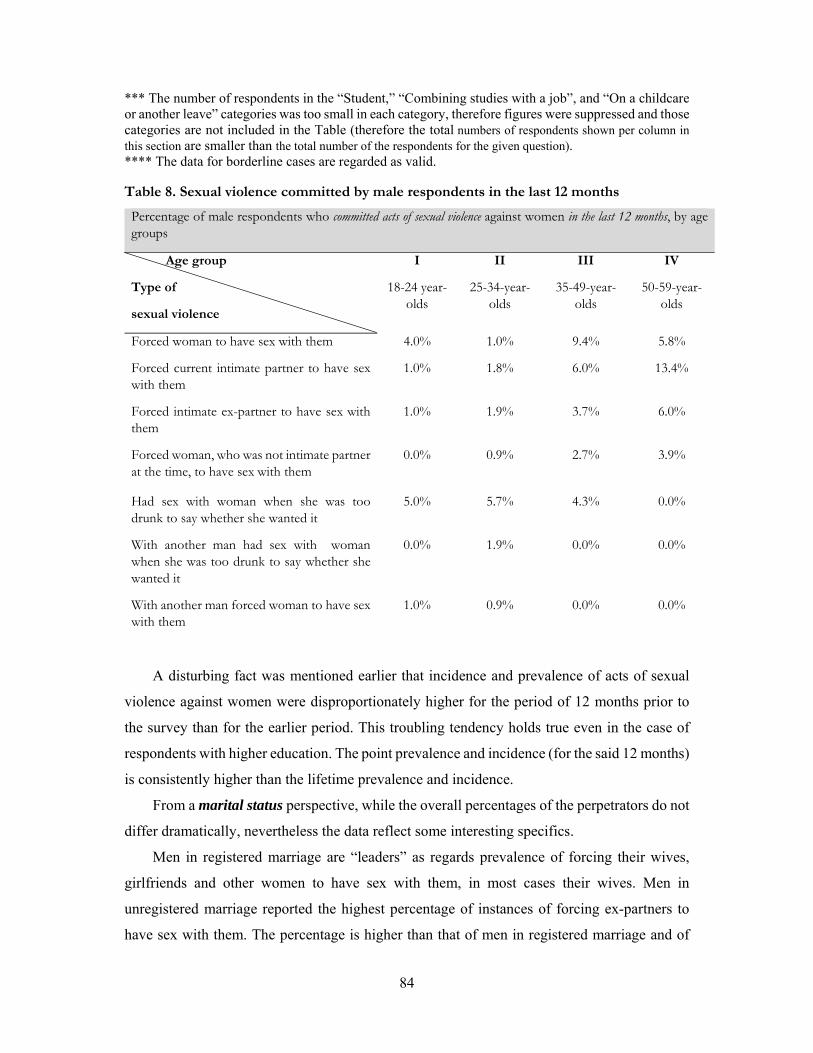
84
*** The number of respondents in the “Student,” “Combining studies with a job”, and “On a childcare or another leave” categories was too small in each category, therefore figures were suppressed and those categories are not included in the Table (therefore the total numbers of respondents shown per column in this section are smaller than the total number of the respondents for the given question). **** The data for borderline cases are regarded as valid. Table 8. Sexual violence committed by male respondents in the last 12 months
Percentage of male respondents who committed acts of sexual violence against women in the last 12 months, by age groups
Age group
Type of
sexual violence
I
18-24 year-olds
II
25-34-year-olds
III
35-49-year-olds
IV
50-59-year-olds
Forced woman to have sex with them 4.0% 1.0% 9.4% 5.8%
Forced current intimate partner to have sex with them
1.0% 1.8% 6.0% 13.4%
Forced intimate ex-partner to have sex with them
1.0% 1.9% 3.7% 6.0%
Forced woman, who was not intimate partner at the time, to have sex with them
0.0% 0.9% 2.7% 3.9%
Had sex with woman when she was too drunk to say whether she wanted it
5.0% 5.7% 4.3% 0.0%
With another man had sex with woman when she was too drunk to say whether she wanted it
0.0% 1.9% 0.0% 0.0%
With another man forced woman to have sex with them
1.0% 0.9% 0.0% 0.0%
A disturbing fact was mentioned earlier that incidence and prevalence of acts of sexual
violence against women were disproportionately higher for the period of 12 months prior to
the survey than for the earlier period. This troubling tendency holds true even in the case of
respondents with higher education. The point prevalence and incidence (for the said 12 months)
is consistently higher than the lifetime prevalence and incidence.
From a marital status perspective, while the overall percentages of the perpetrators do not
differ dramatically, nevertheless the data reflect some interesting specifics.
Men in registered marriage are “leaders” as regards prevalence of forcing their wives,
girlfriends and other women to have sex with them, in most cases their wives. Men in
unregistered marriage reported the highest percentage of instances of forcing ex-partners to
have sex with them. The percentage is higher than that of men in registered marriage and of
85
single men combined. It is also noteworthy that in contrast to men in registered marriage and
to single men, men in unregistered marriage (in a civil union) did not report a single case of
forcing a woman, whether sober or drunk, together with another man. They also reported the
highest prevalence of forcing a woman who was not their intimate partner at that time and of
forcing different women to have sex with them.
The only instance of higher percentage of single men reporting an act of sexual violence
is that of forcing with another man a woman to have sex with them.
Concerning the number of different women forced to have sex by one man, men in
registered marriage reported forcing 2, 3 or even 4 different women, whereas perpetrators in
“unregistered marriage/civil union” category reported forcing 1 woman (even though the
overall prevalence in that group is the highest one) as did two-thirds of the perpetrators from a
“single men” category.
As regards the already mentioned troubling tendency of an increasing “share” of recent
(within the last 12 months) incidents in the overall prevalence of sexual violence, it should be
noted that it has unfolded most conspicuously in the case of single men and those in
unregistered marriage/civil union, whereas in the case of married men the prevalence and
incidence of sexual violence acts show more ‘equal’ distribution over time.
The data broken down by location of perpetrators’ residence show considerable variation
thereby indicating that location is a factor, which is clearly correlated with this form of IPV.
The data also confirm that residents of urban areas other than the capital city of Yerevan are
much more similar to residents of rural areas than to residents of Yerevan. This in all likelihood
is accounted for by the fact that their lifestyles and prevailing mentality are much closer and
that for the most part they demonstrate similar behavior. It is noteworthy that percentage of
perpetrators is noticeably lower among residents of Yerevan, with one small exception in the
case of forcing a woman who was not their intimate partner at the time (while lower than the
percentage among rural residents, the percentage of perpetrators among residents of Yerevan
is almost the same as that of residents of other urban areas). According to their reports, residents
of Yerevan never joined (or were joined by) another man to force a woman to have sex with
them. Besides, the percentage of those who forced a drunk woman in a situation like that is
lower (1.4%) compared to that of rural residents (2.7%) and residents of other urban areas
(2.7%). It is also noteworthy that on the whole residents of rural areas and of urban areas other
than Yerevan “outpace” residents of Yerevan in terms of the dynamic in the point (the past 12-
month) prevalence and incidence of sexual violence acts, whereas in the case of residents of

86
Yerevan the increase, where it happens, is on a much slower scale and point and lifetime
prevalence are distributed more evenly.
It has already been mentioned that because of low percentages of self-reported perpetrators
of sexual violence against women and because not infrequently the percentage points of
differences are smaller or slightly bigger than the confidence interval it is impossible to identify
strong tendencies and that only some specifics can be detected. The situation is similar when
the data are analyzed from the perspective of an employment status of perpetrators. At the
same time it should be noted that employment seems to be a factor that carries some weight.
The analysis of the data does not reveal any uniform and straightforward patterns as numerous
irregularities and deviations emerge in the case of any potential “pattern.”
The highest percentage of male perpetrators of sexual violence is in the category of the
unemployed, the only exception being the incidents of forcing female intimate ex-partner to
have sex with them.
The lowest percentage of male perpetrators of sexual violence is, on the whole, among
men who never worked. This category is a special case. Firstly, it is a borderline case in terms
of absolute numbers. Secondly, men in this category report a zero percentage regarding
incidents of having sex (both alone and with another man) with a woman when she was too
drunk to say whether she wanted it or not, of forcing a woman who was not their intimate
partner at that time and of forcing a woman with another man to have sex with them.
The percentages of reported sexual violence are very close in the case of legally and
informally employed respondents. In fact, as Table 7 data clearly indicate, the differences are
negligible. Those categories of respondents differ from both unemployed respondents and
those men who never worked.
The differences are tangible also between unemployed respondents and those men who
never worked.
Violence against women outside the home
VAW is not limited only to intimate partner violence. The self-administered questionnaire
that female respondents were asked to fill out by themselves contained questions concerning
their exposure to 3 types of moderate and grave physical violence outside the home in a 3-
month period before the survey. The data are presented in Table 9 below.
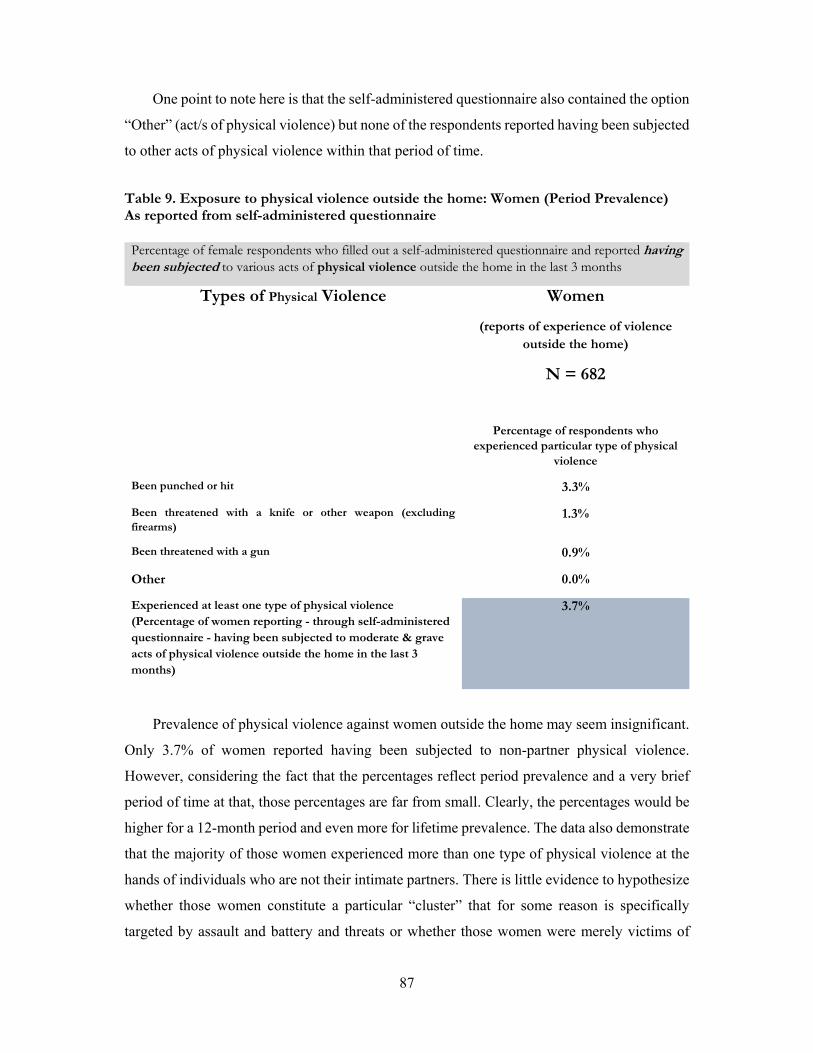
87
One point to note here is that the self-administered questionnaire also contained the option
“Other” (act/s of physical violence) but none of the respondents reported having been subjected
to other acts of physical violence within that period of time.
Table 9. Exposure to physical violence outside the home: Women (Period Prevalence) As reported from self-administered questionnaire Percentage of female respondents who filled out a self-administered questionnaire and reported having been subjected to various acts of physical violence outside the home in the last 3 months
Types of Physical Violence Women
(reports of experience of violence outside the home)
N = 682
Percentage of respondents who experienced particular type of physical
violence
Been punched or hit 3.3%
Been threatened with a knife or other weapon (excluding firearms)
1.3%
Been threatened with a gun 0.9%
Other 0.0%
Experienced at least one type of physical violence (Percentage of women reporting - through self-administered questionnaire - having been subjected to moderate & grave acts of physical violence outside the home in the last 3 months)
3.7%
Prevalence of physical violence against women outside the home may seem insignificant.
Only 3.7% of women reported having been subjected to non-partner physical violence.
However, considering the fact that the percentages reflect period prevalence and a very brief
period of time at that, those percentages are far from small. Clearly, the percentages would be
higher for a 12-month period and even more for lifetime prevalence. The data also demonstrate
that the majority of those women experienced more than one type of physical violence at the
hands of individuals who are not their intimate partners. There is little evidence to hypothesize
whether those women constitute a particular “cluster” that for some reason is specifically
targeted by assault and battery and threats or whether those women were merely victims of

88
street crime and randomly attacked and during the attack were not only punched or hit but also
threatened with some weapon.
***
The data for women’s exposure to non-intimate partner physical violence broken down by
the key background characteristics are presented in Table 10 below.
Table 10. Exposure to physical violence outside the home: Women (Period Prevalence). As reported from self-administered questionnaire Percentage of female respondents who filled out a self-administered questionnaire and reported having been subjected to the following acts of physical violence outside the home in the last 3 months.
N= 682 The respondents who said yes, when asked whether they had been
Background characteristic
punched or hit
threatened with a knife or other weapon (excluding firearms)
threatened with a gun
Number of women N =682
Age 18-24 1.7% 1.7% 1.7% 117 25-34 2.0% 1.0% 0.5% 201 35-49 2.5% 0.8% 0.4% 238 50-59 8.6% 2.4% 1.6% 126
Education Basic * * * 7
Secondary 2.8% 0.8% 1.2% 250 TVET 4.1% 1.6% 0.5% 192 Higher 3.0% 1.7% 0.9% 233
Marital status
Registered marriage 1.6% 0.0% 0.0% 425
Unregistered marriage 5.1% 2.7% 1.4% 77
Informal union * * * 6
Boyfriend (not living together)
* * * 7
Single 3.8% 3.8% 2.9% 104 Separated/
divorced (13.2%) (5.4%) (2.7%) 38
Widowed (12.0%) (4.2%) (4.2%) 25 Residence
Yerevan 3.3% 1.1% 0.4% 264 Other urban areas 4.0% 1.5% 1.0% 202
Rural areas 2.7% 1.4% 1.4% 216 Employment status**
Never worked 0.8% 0.8% 0.8% 129 Student (2.4%) (2.4%) (2.4%) 41 Unemployed 3.9% 1.1% 1.1% 281 Legally employed 4.5% 1.3% 0.7% 154
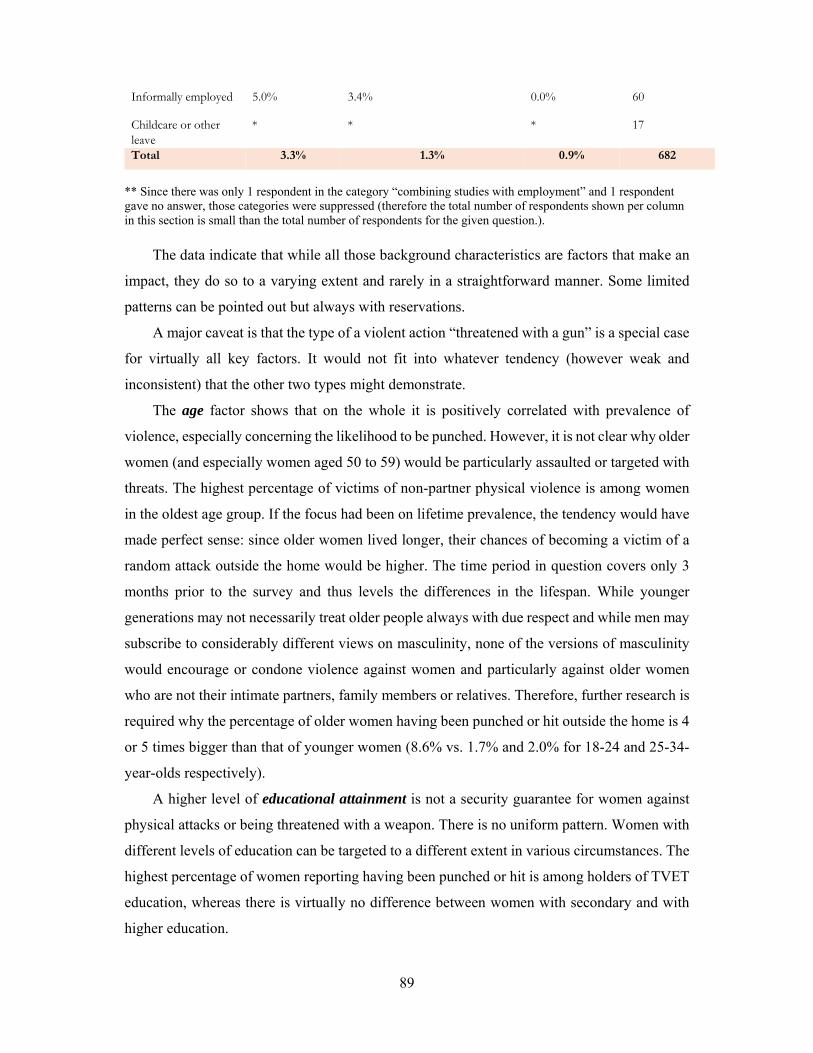
89
Informally employed 5.0% 3.4% 0.0% 60
Childcare or other leave
* * * 17
Total 3.3% 1.3% 0.9% 682
** Since there was only 1 respondent in the category “combining studies with employment” and 1 respondent gave no answer, those categories were suppressed (therefore the total number of respondents shown per column in this section is small than the total number of respondents for the given question.).
The data indicate that while all those background characteristics are factors that make an
impact, they do so to a varying extent and rarely in a straightforward manner. Some limited
patterns can be pointed out but always with reservations.
A major caveat is that the type of a violent action “threatened with a gun” is a special case
for virtually all key factors. It would not fit into whatever tendency (however weak and
inconsistent) that the other two types might demonstrate.
The age factor shows that on the whole it is positively correlated with prevalence of
violence, especially concerning the likelihood to be punched. However, it is not clear why older
women (and especially women aged 50 to 59) would be particularly assaulted or targeted with
threats. The highest percentage of victims of non-partner physical violence is among women
in the oldest age group. If the focus had been on lifetime prevalence, the tendency would have
made perfect sense: since older women lived longer, their chances of becoming a victim of a
random attack outside the home would be higher. The time period in question covers only 3
months prior to the survey and thus levels the differences in the lifespan. While younger
generations may not necessarily treat older people always with due respect and while men may
subscribe to considerably different views on masculinity, none of the versions of masculinity
would encourage or condone violence against women and particularly against older women
who are not their intimate partners, family members or relatives. Therefore, further research is
required why the percentage of older women having been punched or hit outside the home is 4
or 5 times bigger than that of younger women (8.6% vs. 1.7% and 2.0% for 18-24 and 25-34-
year-olds respectively).
A higher level of educational attainment is not a security guarantee for women against
physical attacks or being threatened with a weapon. There is no uniform pattern. Women with
different levels of education can be targeted to a different extent in various circumstances. The
highest percentage of women reporting having been punched or hit is among holders of TVET
education, whereas there is virtually no difference between women with secondary and with
higher education.

90
Marital status is a better predictor. The data show quite a straightforward pattern. Even
the “special case” almost fits into it. A considerably higher percentage of separated/divorced
women (13.2%) and widowed women (12.0%) were punched or hit than among women in
other categories: single women (3.8%), formally (1.6%) and informally (5.1%) married
women. Since the identity of perpetrators is not mentioned, it is impossible to separate street
crime cases from violence committed by persons known to women (colleagues, relatives,
neighbors, etc.). However, the fact that the lowest percentage of victims is among legally
married women is an indicator that potential perpetrators are aware that those women have
husbands and that might be quite an effective deterrent.
As regards the location of victims’ residence, the percentage of women reporting non-
partner physical violence is only marginally higher among residents of urban areas other than
Yerevan. In any case, the differences are negligible and basically regardless of where they
reside women are equally exposed to physical violence.
The data broken down by employment status indicate, albeit indirectly, that workplace
violence may be a factor. Within 3 months prior to the survey 5.0% of informally employed
and 4.5% of legally employed women reported being physically attacked in contrast to only
0.8% of women who never worked.
Violence against Men
Gender-based violence is almost always, particularly in countries like Armenia, directed
against women. Women are subjected to it because they are women and perpetrators use
violence to exercise control over women, especially in intimate partner relations. Gender-based
violence is unidirectional and non-reciprocal. As a rule, women do not subject men to violence
but when they do, it is mostly in self-defense.
At the same time, the proportion and the absolute numbers of men exposed to violence,
especially physical violence, are much higher than among women. However, regardless of
whether victims of violence are women or men, an overwhelming majority of perpetrators are
men. In other words, it is usually men-on-women and men-on-men violence, while women-on-
men violence is still for the most part an exception, even when committed in self-defense.
The data on physical violence against men are presented in Table 11 below. Given the
severe nature of the types of violence (in fact, for the most part amounting to violent crime)
reported by surveyed men, it is clear that, at least in the Armenian context, it is almost
exclusively men-on-men violence. It should also be borne in mind that the survey data are not
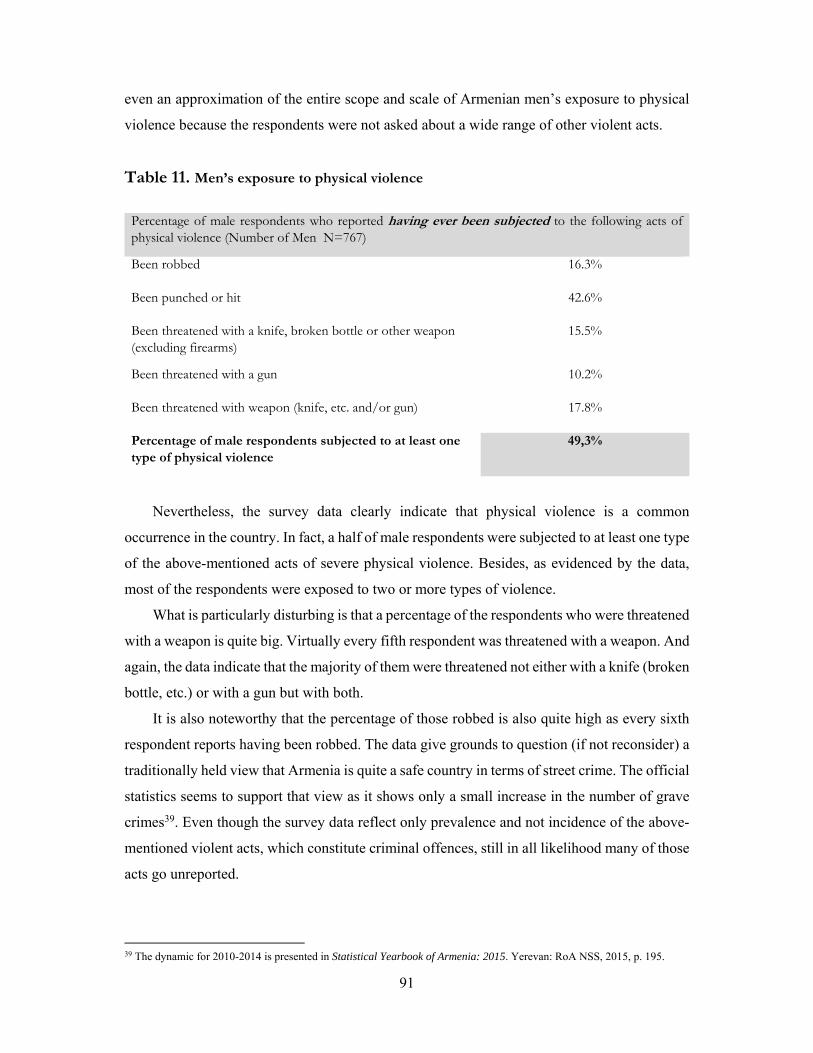
91
even an approximation of the entire scope and scale of Armenian men’s exposure to physical
violence because the respondents were not asked about a wide range of other violent acts.
Table 11. Men’s exposure to physical violence Percentage of male respondents who reported having ever been subjected to the following acts of physical violence (Number of Men N=767)
Been robbed 16.3%
Been punched or hit 42.6%
Been threatened with a knife, broken bottle or other weapon (excluding firearms)
15.5%
Been threatened with a gun 10.2%
Been threatened with weapon (knife, etc. and/or gun) 17.8%
Percentage of male respondents subjected to at least one type of physical violence
49,3%
Nevertheless, the survey data clearly indicate that physical violence is a common
occurrence in the country. In fact, a half of male respondents were subjected to at least one type
of the above-mentioned acts of severe physical violence. Besides, as evidenced by the data,
most of the respondents were exposed to two or more types of violence.
What is particularly disturbing is that a percentage of the respondents who were threatened
with a weapon is quite big. Virtually every fifth respondent was threatened with a weapon. And
again, the data indicate that the majority of them were threatened not either with a knife (broken
bottle, etc.) or with a gun but with both.
It is also noteworthy that the percentage of those robbed is also quite high as every sixth
respondent reports having been robbed. The data give grounds to question (if not reconsider) a
traditionally held view that Armenia is quite a safe country in terms of street crime. The official
statistics seems to support that view as it shows only a small increase in the number of grave
crimes39. Even though the survey data reflect only prevalence and not incidence of the above-
mentioned violent acts, which constitute criminal offences, still in all likelihood many of those
acts go unreported.
39 The dynamic for 2010-2014 is presented in Statistical Yearbook of Armenia: 2015. Yerevan: RoA NSS, 2015, p. 195.
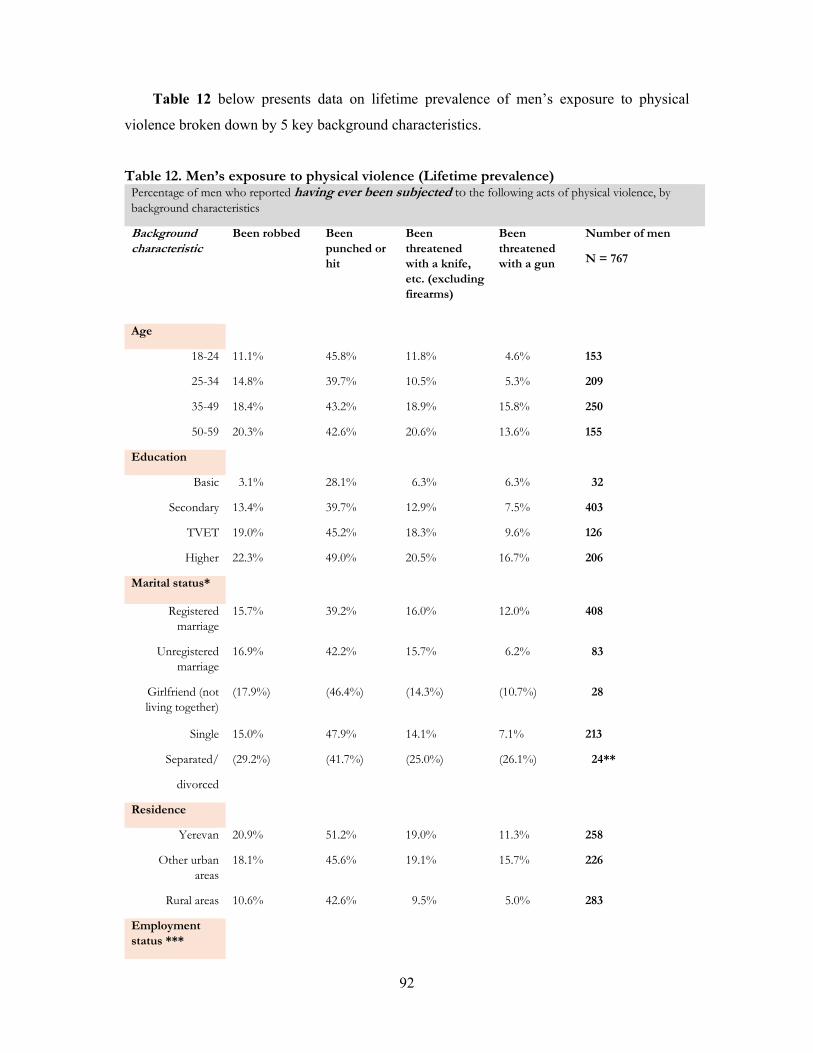
92
Table 12 below presents data on lifetime prevalence of men’s exposure to physical
violence broken down by 5 key background characteristics.
Table 12. Men’s exposure to physical violence (Lifetime prevalence)
Percentage of men who reported having ever been subjected to the following acts of physical violence, by background characteristics
Background characteristic
Been robbed Been punched or hit
Been threatened with a knife, etc. (excluding firearms)
Been threatened with a gun
Number of men
N = 767
Age
18-24 11.1% 45.8% 11.8% 4.6% 153
25-34 14.8% 39.7% 10.5% 5.3% 209
35-49 18.4% 43.2% 18.9% 15.8% 250
50-59 20.3% 42.6% 20.6% 13.6% 155
Education
Basic 3.1% 28.1% 6.3% 6.3% 32
Secondary 13.4% 39.7% 12.9% 7.5% 403
TVET 19.0% 45.2% 18.3% 9.6% 126
Higher 22.3% 49.0% 20.5% 16.7% 206
Marital status*
Registered marriage
15.7% 39.2% 16.0% 12.0% 408
Unregistered marriage
16.9% 42.2% 15.7% 6.2% 83
Girlfriend (not living together)
(17.9%) (46.4%) (14.3%) (10.7%) 28
Single 15.0% 47.9% 14.1% 7.1% 213
Separated/
divorced
(29.2%) (41.7%) (25.0%) (26.1%) 24**
Residence
Yerevan 20.9% 51.2% 19.0% 11.3% 258
Other urban areas
18.1% 45.6% 19.1% 15.7% 226
Rural areas 10.6% 42.6% 9.5% 5.0% 283
Employment status ***
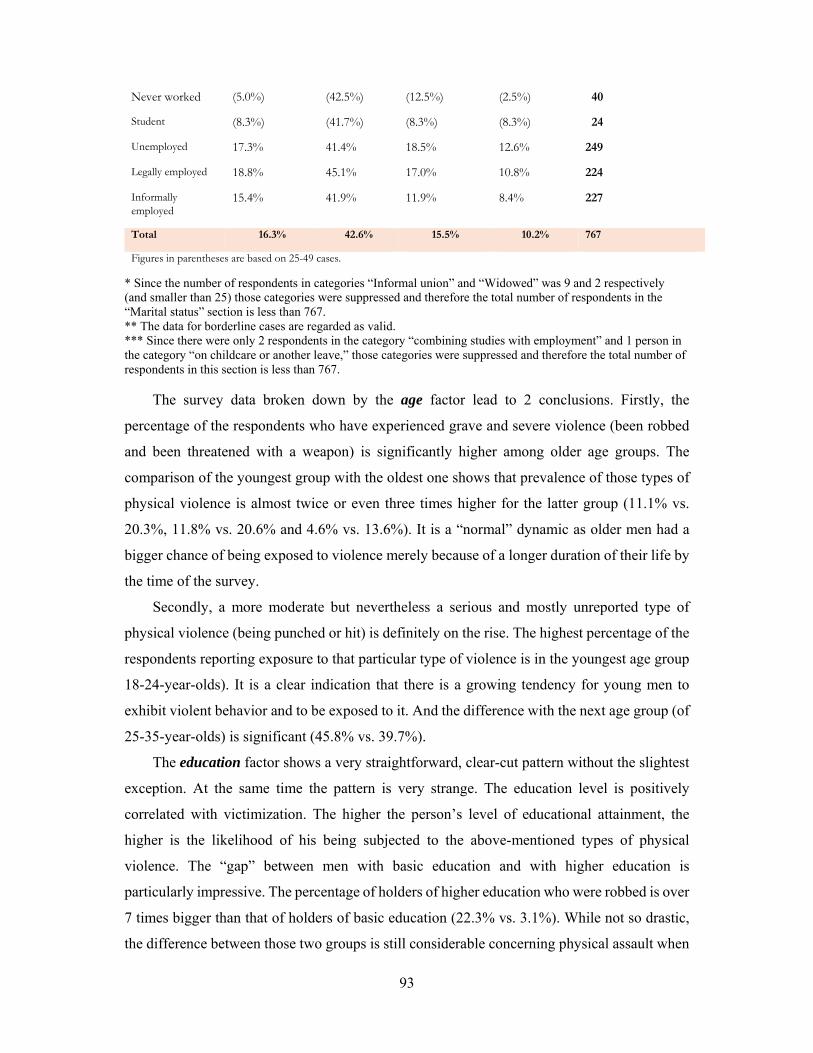
93
Never worked (5.0%) (42.5%) (12.5%) (2.5%) 40
Student (8.3%) (41.7%) (8.3%) (8.3%) 24
Unemployed 17.3% 41.4% 18.5% 12.6% 249
Legally employed 18.8% 45.1% 17.0% 10.8% 224
Informally employed
15.4% 41.9% 11.9% 8.4% 227
Total 16.3% 42.6% 15.5% 10.2% 767
Figures in parentheses are based on 25-49 cases.
* Since the number of respondents in categories “Informal union” and “Widowed” was 9 and 2 respectively (and smaller than 25) those categories were suppressed and therefore the total number of respondents in the “Marital status” section is less than 767. ** The data for borderline cases are regarded as valid. *** Since there were only 2 respondents in the category “combining studies with employment” and 1 person in the category “on childcare or another leave,” those categories were suppressed and therefore the total number of respondents in this section is less than 767.
The survey data broken down by the age factor lead to 2 conclusions. Firstly, the
percentage of the respondents who have experienced grave and severe violence (been robbed
and been threatened with a weapon) is significantly higher among older age groups. The
comparison of the youngest group with the oldest one shows that prevalence of those types of
physical violence is almost twice or even three times higher for the latter group (11.1% vs.
20.3%, 11.8% vs. 20.6% and 4.6% vs. 13.6%). It is a “normal” dynamic as older men had a
bigger chance of being exposed to violence merely because of a longer duration of their life by
the time of the survey.
Secondly, a more moderate but nevertheless a serious and mostly unreported type of
physical violence (being punched or hit) is definitely on the rise. The highest percentage of the
respondents reporting exposure to that particular type of violence is in the youngest age group
18-24-year-olds). It is a clear indication that there is a growing tendency for young men to
exhibit violent behavior and to be exposed to it. And the difference with the next age group (of
25-35-year-olds) is significant (45.8% vs. 39.7%).
The education factor shows a very straightforward, clear-cut pattern without the slightest
exception. At the same time the pattern is very strange. The education level is positively
correlated with victimization. The higher the person’s level of educational attainment, the
higher is the likelihood of his being subjected to the above-mentioned types of physical
violence. The “gap” between men with basic education and with higher education is
particularly impressive. The percentage of holders of higher education who were robbed is over
7 times bigger than that of holders of basic education (22.3% vs. 3.1%). While not so drastic,
the difference between those two groups is still considerable concerning physical assault when
94
they were punched or hit (49.0% and 28.1% respectively). The gap increases for situations of
being threatened with a weapon (while 6.3% of men with basic education were threatened with
a knife or with a gun, the percentage of men with higher education who found themselves in
such situations is 20.5% and 16.7% respectively).
It would seem that a higher level of education provokes, triggers or attracts more physical
violence. The survey data are not sufficient to answer the question why. One possible
explanation could be more willingness of more educated men to report exposure to physical
violence. Less educated men may be more reluctant to admit having been subjected to physical
violence since they are more likely to internalize and to stick to rigid and stereotypical views
of masculinity.
As to marital status, the survey data do not reveal any single and straightforward pattern.
On the whole, separated/divorced men have the highest chance of being physically attacked.
The data for residence of location factor indicate that on the whole there is a considerable
difference between urban and rural residents. The difference is particularly evident in the case
of more grave and severe acts of physical violence, with the percentage of victims among rural
residents being at least twice as low as that among urban residents. While only 10.6% of rural
residents reported having been robbed, in Yerevan the percentage is 20.9% and in other urban
areas 18.1%. 9.5% of rural residents were threatened with a knife or a similar weapon and 5.0%
with a gun, whereas in Yerevan the percentage of the respondents thus threatened was 19.0%
and 11.3% respectively and in other urban areas 19.1% and 15.7% respectively.
As evidenced by the survey data, employment status is most likely not a factor as no
discernible pattern emerge for the unemployed, employed or students or for differences among
them.
***
An important question is whether men’s exposure to physical violence is correlated with
their perpetration of violence against their intimate partners. More specifically, it is worthwhile
to see whether their overall experience of being subjected to physical violence makes any
difference in terms of their perpetration of physical violence against their female intimate
partners. Table 13 presents relevant data for comparing exposure to physical violence of
abusive and non-abusive male intimate partners.
Table 13. Percentage of abusive and non-abusive male respondents who were subjected to some types of physical violence
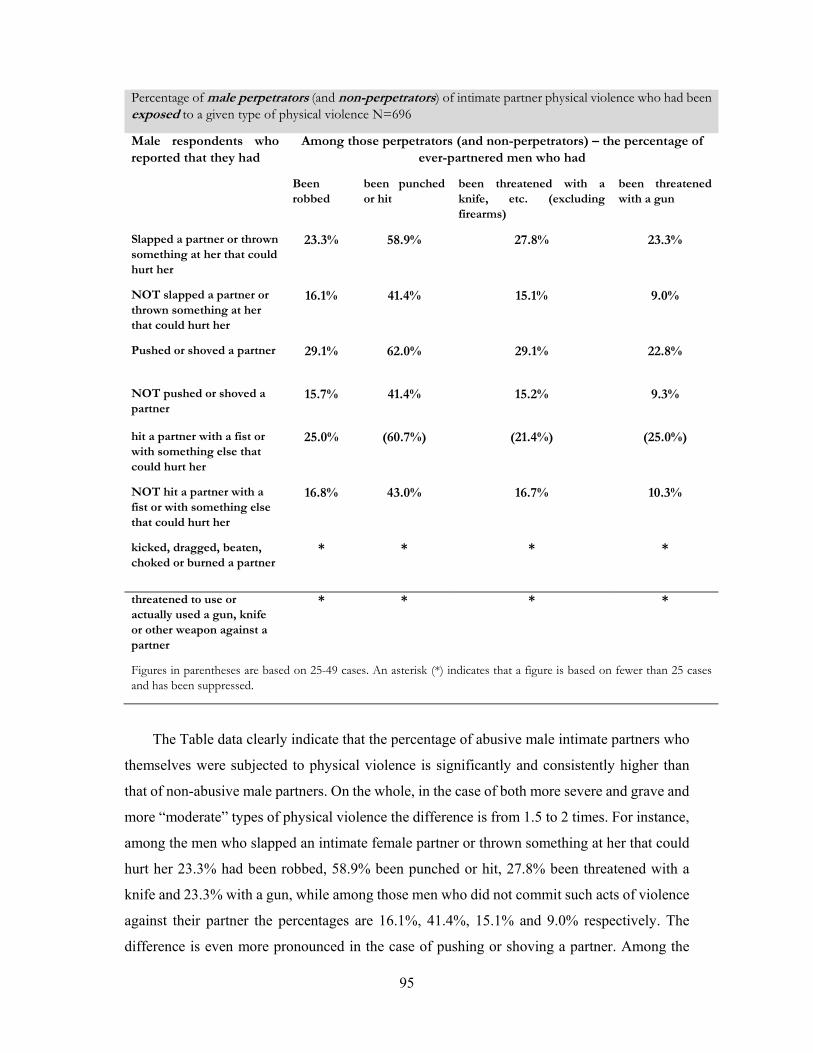
95
Percentage of male perpetrators (and non-perpetrators) of intimate partner physical violence who had been exposed to a given type of physical violence N=696
Male respondents who reported that they had
Among those perpetrators (and non-perpetrators) – the percentage of ever-partnered men who had
Been robbed
been punched or hit
been threatened with a knife, etc. (excluding firearms)
been threatened with a gun
Slapped a partner or thrown something at her that could hurt her
23.3% 58.9% 27.8% 23.3%
NOT slapped a partner or thrown something at her that could hurt her
16.1% 41.4% 15.1% 9.0%
Pushed or shoved a partner 29.1% 62.0% 29.1% 22.8%
NOT pushed or shoved a partner
15.7% 41.4% 15.2% 9.3%
hit a partner with a fist or with something else that could hurt her
25.0% (60.7%) (21.4%) (25.0%)
NOT hit a partner with a fist or with something else that could hurt her
16.8% 43.0% 16.7% 10.3%
kicked, dragged, beaten, choked or burned a partner
* * * *
threatened to use or actually used a gun, knife or other weapon against a partner
* * * *
Figures in parentheses are based on 25-49 cases. An asterisk (*) indicates that a figure is based on fewer than 25 cases and has been suppressed.
The Table data clearly indicate that the percentage of abusive male intimate partners who
themselves were subjected to physical violence is significantly and consistently higher than
that of non-abusive male partners. On the whole, in the case of both more severe and grave and
more “moderate” types of physical violence the difference is from 1.5 to 2 times. For instance,
among the men who slapped an intimate female partner or thrown something at her that could
hurt her 23.3% had been robbed, 58.9% been punched or hit, 27.8% been threatened with a
knife and 23.3% with a gun, while among those men who did not commit such acts of violence
against their partner the percentages are 16.1%, 41.4%, 15.1% and 9.0% respectively. The
difference is even more pronounced in the case of pushing or shoving a partner. Among the
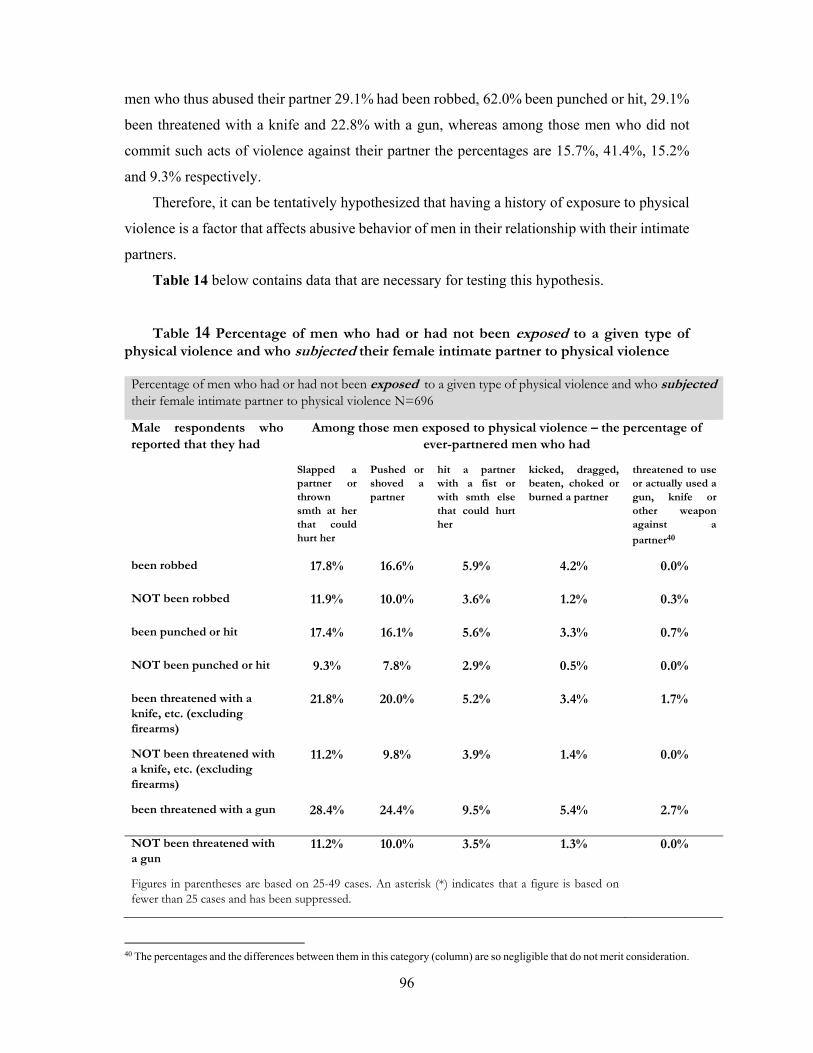
96
men who thus abused their partner 29.1% had been robbed, 62.0% been punched or hit, 29.1%
been threatened with a knife and 22.8% with a gun, whereas among those men who did not
commit such acts of violence against their partner the percentages are 15.7%, 41.4%, 15.2%
and 9.3% respectively.
Therefore, it can be tentatively hypothesized that having a history of exposure to physical
violence is a factor that affects abusive behavior of men in their relationship with their intimate
partners.
Table 14 below contains data that are necessary for testing this hypothesis.
Table 14 Percentage of men who had or had not been exposed to a given type of physical violence and who subjected their female intimate partner to physical violence
Percentage of men who had or had not been exposed to a given type of physical violence and who subjected their female intimate partner to physical violence N=696
Male respondents who reported that they had
Among those men exposed to physical violence – the percentage of ever-partnered men who had
Slapped a partner or thrown smth at her that could hurt her
Pushed or shoved a partner
hit a partner with a fist or with smth else that could hurt her
kicked, dragged, beaten, choked or burned a partner
threatened to use or actually used a gun, knife or other weapon against a
partner40
been robbed 17.8% 16.6% 5.9% 4.2% 0.0%
NOT been robbed 11.9% 10.0% 3.6% 1.2% 0.3%
been punched or hit 17.4% 16.1% 5.6% 3.3% 0.7%
NOT been punched or hit 9.3% 7.8% 2.9% 0.5% 0.0%
been threatened with a knife, etc. (excluding firearms)
21.8% 20.0% 5.2% 3.4% 1.7%
NOT been threatened with a knife, etc. (excluding firearms)
11.2% 9.8% 3.9% 1.4% 0.0%
been threatened with a gun 28.4% 24.4% 9.5% 5.4% 2.7%
NOT been threatened with a gun
11.2% 10.0% 3.5% 1.3% 0.0%
Figures in parentheses are based on 25-49 cases. An asterisk (*) indicates that a figure is based on fewer than 25 cases and has been suppressed.
40 The percentages and the differences between them in this category (column) are so negligible that do not merit consideration.
97
The data clearly show that indeed the history of victimization and exposure to those types
of physical violence encourages men’s violent and abusive behavior, which is directed toward
their female intimate partners. There is a strong association between violence experienced by
men and their use of physical violence against their intimate female partner. In fact, the
percentage of men in this category who physically abused their intimate partner is from 1.5 to
3 and even more times bigger than among men who were not subjected to a given type of
physical violence. Thus, among the men who had been punched or hit 17.4% slapped their
intimate female partner or thrown something at her that could hurt her, 16.1% pushed or shoved
her, 5.6% punched or hit her and 3.3% kicked, dragged, beaten, choked or burned her. On the
other hand, among men who had not been punched or hit, the percentages of those who targeted
their female partner with those violent acts are 21.8%, 20.0%, 5.2% and 3.4% respectively.
Therefore, a conclusion can be drawn that indeed violence begets violence and that one of
the effective ways (albeit not the sole one) to drastically reduce intimate partner physical
violence is to protect men against violence. It means, inter alia, that while combating violence
against women is a legitimate and important goal, it should be broadened to combating gender-
based violence and then to combating violence per se, whatever forms the latter might take.
The best strategy would be to promote the culture and pursue the policy of “zero tolerance” of
violence.
***
As regards violence against women, especially intimate partner violence, the behavior
pattern of men fits into the dominant model of what is construed as “masculine” behavior. A
substantial percentage of men are engaged in non-reciprocal gender-based violence.
The survey data demonstrate that all forms of violence, including sexual violence, against
women are not a rare occurrence.
A special point to note is that non-consensual sex, including partner/spousal rape, does
exist and should be officially recognized as such and addressed by adequate legislation.
A considerable “prevalence underreporting gap” clearly indicates that in future studies and
surveys on gender-based violence a focus should be on the methods that better ensure
anonymity and confidentiality for respondents, thereby placing them in a more psychologically
comfortable situation and thus enhancing reliability of data.
CHAPTER 3. ATTITUDES TOWARD VIOLENCE
98
Attitudes toward VAW phenomenon The present study seeks to address only some facets of cognitive, affective, and behavioral
components of public attitudes towards VAW-related aspects of masculinity. The survey data
provide a large amount of relevant information about respondents’ views, opinions and beliefs,
about their evaluations and emotions and about their behaviors. Of course, since it was beyond
the scope of the survey and actually not feasible to observe the respondents’ behavior in real-
life situations, the conclusions drawn about their feelings and evaluations expressed as well as
behaviors reported and self-reported depend to a much larger extent than their views and beliefs
on their willingness to disclose and share them.
An important component of masculinity studies is finding out how gender equitable or
inequitable men in a given country are. Besides ascertaining prevalence of direct violence, i.e.
of various forms of violence against women perpetrated by men, it is also important to study
attitudes of both men and women to the VAW phenomenon. It is important because, on the one
hand, those attitudes reflect and are shaped by a dominant ideology, norms and value system,
including acceptance of and tolerance towards violence against women and the extent to which
structural and cultural violence exist or do not exist in the society and, on the other hand, the
attitudes affect, sustain or change the society’s culture.
Social environment is an important factor because it can allow, promote or, conversely,
condemn and prohibit violence against women. A central role belongs to the gender-,
masculinity- and femininity-related norms and ideology that are dominant in a given society.
More traditionalistic and patriarchal normative ideas on what constitutes genuine masculinity
usually stress physical strength and demonstration and assertion of power over women,
especially intimate partners, by, inter alia, resorting to coercion and violence.
Researchers emphasize that the normative power dynamics push some men to perpetrate
physical violence against intimate partners to demonstrate their masculinity. In this way, the
researchers contend, “men’s behaviors, including violence perpetration, help them construct an
outward image of power over women that is aligned with a socially constructed ideal of
masculinity.”41
The survey included 8 statements that can help measure the attitudes towards violence
against women (or, more precisely, intimate partner violence against women) and thus find out
how gender equitable or inequitable Armenian men are at present and what position Armenian
41 Fleming, P.J. et al. “Risk Factors for Men’s Lifetime Perpetration of Physical Violence against Intimate Partners: Results from the International Men and Gender Equality Survey (IMAGES) in Eight Countries.” PLoS ONE, 2015, 10(3): e0118639. doi:10.1371/journal.pone.0118639, p. 2.

99
women take on those issues. The first group of 4 statements deals with attitudes towards
primarily intimate partner physical violence. Those statements are:
A woman should tolerate violence to keep her family together.
There are times when a woman deserves to be beaten.
If a woman cheats on a man, it is okay for him to hit her.
It is okay for a man to hit his wife if she won’t have sex with him.
The second group of other 4 statements deals with the issue of rape, an extreme form of
sexual violence (often also compounded by physical violence) against women. Those
statements are:
When a woman is raped, she usually did something to put herself in that situation.
In some rape cases, women actually want it to happen.
If a woman doesn’t physically fight back, you can’t really say it was rape.
In any rape case, one would have to question whether the victim is promiscuous or has a
bad reputation.
Attitudes towards intimate partner physical violence against women
Table 1 contains data on the percentage of the respondents in the entire sample who
agree42 with a number of reasons that justify physical violence against women perpetrated by
their intimate male partner.
Table 1. Percentage of respondents who agree with following statements
Statements Respondents (N=1,617)
A woman should tolerate violence in order to keep her family together
35.7%
There are times when a woman deserves to be beaten 27.7%
If a woman cheats on a man, it is okay for him to hit her 55.4%
It is okay for a man to hit his wife if she won’t have sex with him
5.1%
Percentage of respondents who justify intimate partner physical violence
70.3%
42 For the ease of data presentation, comparison and analysis, the response categories ‘strongly agree’ and ‘agree’ have been merged into a single category ‘agree’ as have been the response categories ‘disagree’ and ‘strongly disagree’ into a single category ‘disagree,’ unless otherwise stated. Whenever necessary, all 4 categories will be used and relevant percentages will be presented.
100
As the survey data indicate, opinions vary significantly depending on the reasons for
justifying intimate partner physical violence. The respondents have different reactions to
different situations. While slightly less than two-thirds of the respondents do not approve of
the idea that a woman should tolerate violence to keep her family together and well over the
two-thirds reject the idea that there are (unspecified) times when a woman deserves to be beaten
and a whopping 92.0% disagree, including 80.3% who strongly disagree, and only 5.1% agree
with the statement that a man can beat a woman for refusing to have sex with him, the response
is totally different, when a woman’s intimate partner hits her because she has cheated on him.
Only 42.0% disagree with the idea, while 55.4% agreed (including 40.7% who strongly
agreed). It is also noteworthy that the respondents not only feel strongly about the matter but
that almost all of them have a well-formed opinion as only about 2.5% had no definitive answer
or chose not to answer the question at all.
Thus, the respondents are the least inclined to exonerate intimate partner violence when
the reason for it is the wife’s refusal to have sex with her husband. The overwhelming majority
in the entire sample reject the idea that a wife’s refusal to have sex with a man is a legitimate
reason for him to hit her and only 5.1% of the respondents agree with that idea.
The highest percentage of the respondents justifies intimate partner violence when a
woman cheats on a man. Overall, it is 55.4% of the entire sample. It does not come as a surprise
because whenever a court case on intimate partner violence because of woman’s (alleged)
unfaithfulness is reported and discussed in social media, in most cases the discussants justify
violence, say that the woman and her lover should have been dealt with even more brutally
(contending, without mixing words, that the “guilty parties” deserve death) and that the
perpetrator is in fact innocent and should not be prosecuted.
The percentage of the respondents justifying on other grounds the physical violence
perpetrated against a woman by a male partner is considerably lower than the percentage of
those who do not justify it. Nevertheless, it is still quite high and those respondents constitute
a sizeable group that cannot be conveniently ignored or dismissed. These relatively high
percentages show that there are no viable national policies to educate people and to raise their
awareness of inadmissibility of violence against women, including domestic violence, or that
the existing policies are not pursued vigorously and that measures that are taken, including
information and advocacy campaigns, are not particularly effective.
Rationalization of violence against women is a disturbing phenomenon, especially when
perpetrators and their sympathizers agree with a statement that does not even specify a concrete
reason for intimate partner violence.
101
Over a quarter of the respondents (27.7%) agreed with the statement that “There are times
when a woman deserves to be beaten.” This attitude is strengthened by growing social
acceptance of violence in the country, by what political scientists would call “brutalization of
a daily life.” In its turn, if violent behavior in public is not resolutely sanctioned by the society
at large or sanctioned selectively and inconsistently, it is bound to be reproduced sooner or later
in private life as well. When acts of interpersonal violence are seen as “legitimate,” especially
as manifestation of machismo, when aggressive behavior and violence, whether unprovoked
or in response to non-violent but presumably offensive behavior are justified, many “excuses”
could easily be found for abusing an intimate female partner.
Another point to note regarding intimate partner violence is its justification through a
concern for a family. Over a third of the respondents (35.7%) believe that woman should
tolerate violence to keep her family together. It is a kind of a paradox, at least a seeming
paradox.
On the one hand, family is seen in this context as an ultimate value. And traditionally it
has been a core value for the Armenian nation.
On the other hand, these same respondents ignore a simple fact that violence against
women is not a family value and that a viable entity, especially such an important social unit
as family, cannot be based on violence. A family where woman is subjected to violence,
especially to physical violence, cannot be a healthy union. At best, it can only project an image
of a seeming unity to outsiders but in reality it is merely a hollowed-out and fragmented family,
a dysfunctional family. Some would even argue that it is not a family at all, at least not a proper,
functional family. Experts point out that every fifth marriage in Armenia ends in divorce and
that physical violence (wife beating) is one of the reasons behind a growing divorce rate43 (the
number of divorces in the country in 2014 was 4,496, registering a 20% increase compared to
2013, when there were 3,756 divorces44).
It is also noteworthy that there is a considerable difference (about 15%) between the
highest percentage of the respondents who agree with an individual statement and the
percentage of the respondents who justify intimate partner violence for at least one reason. The
difference indicates that quite a sizable proportion of the respondents agree only with one
statement and do not agree with 2 or more statements.
***
43 “Every 5th marriage in Armenia ends in divorce: why and what should be done?” Woman and Society. Information & Analytical Portal. WomenNet.am 17.05.2015. 44 Statistical Yearbook of Armenia-2015. Yerevan: RoA NSS, 2015, p. 42.
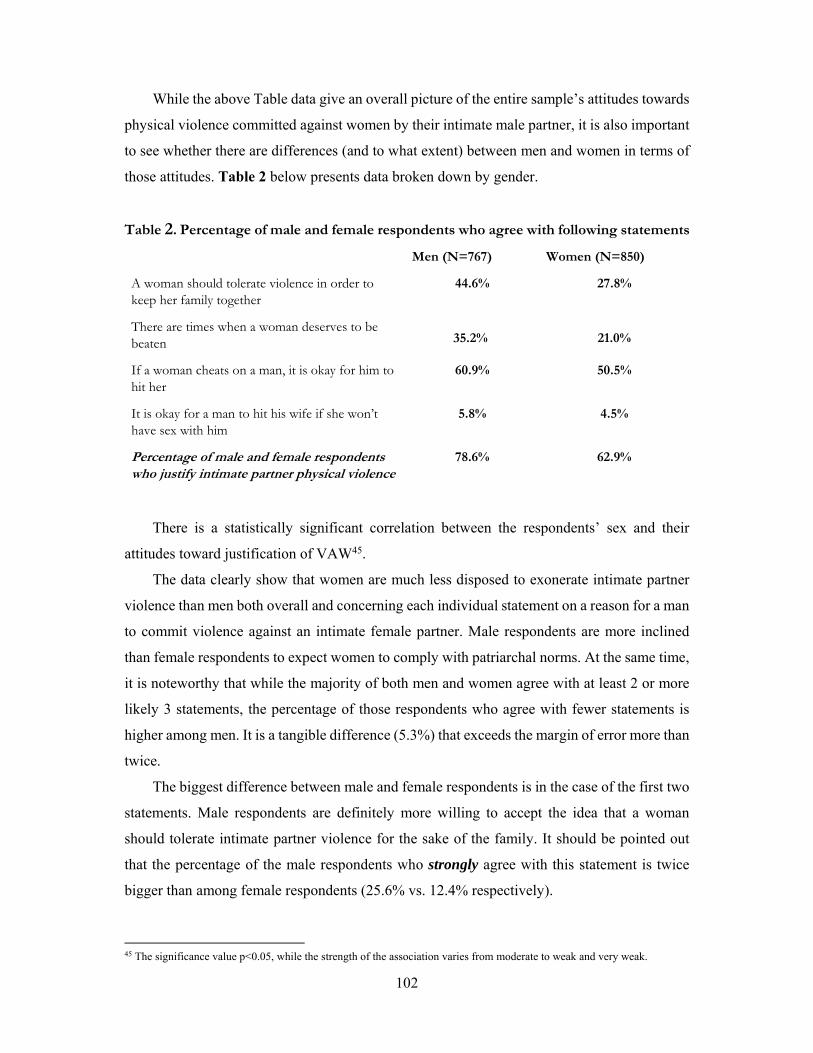
102
While the above Table data give an overall picture of the entire sample’s attitudes towards
physical violence committed against women by their intimate male partner, it is also important
to see whether there are differences (and to what extent) between men and women in terms of
those attitudes. Table 2 below presents data broken down by gender.
Table 2. Percentage of male and female respondents who agree with following statements
Men (N=767) Women (N=850)
A woman should tolerate violence in order to keep her family together
44.6% 27.8%
There are times when a woman deserves to be beaten 35.2% 21.0%
If a woman cheats on a man, it is okay for him to hit her
60.9% 50.5%
It is okay for a man to hit his wife if she won’t have sex with him
5.8% 4.5%
Percentage of male and female respondents who justify intimate partner physical violence
78.6% 62.9%
There is a statistically significant correlation between the respondents’ sex and their
attitudes toward justification of VAW45.
The data clearly show that women are much less disposed to exonerate intimate partner
violence than men both overall and concerning each individual statement on a reason for a man
to commit violence against an intimate female partner. Male respondents are more inclined
than female respondents to expect women to comply with patriarchal norms. At the same time,
it is noteworthy that while the majority of both men and women agree with at least 2 or more
likely 3 statements, the percentage of those respondents who agree with fewer statements is
higher among men. It is a tangible difference (5.3%) that exceeds the margin of error more than
twice.
The biggest difference between male and female respondents is in the case of the first two
statements. Male respondents are definitely more willing to accept the idea that a woman
should tolerate intimate partner violence for the sake of the family. It should be pointed out
that the percentage of the male respondents who strongly agree with this statement is twice
bigger than among female respondents (25.6% vs. 12.4% respectively).
45 The significance value p<0.05, while the strength of the association varies from moderate to weak and very weak.
103
Every third male respondent (35.2%) agrees with the statement that there are times when
a woman deserves to be beaten, whereas only every fifth female respondent does (21.0%).
Again, the percentage of the male respondents who strongly agree with the statement is much
bigger than among female respondents (15.1% vs. 5.9% respectively).
The two other statements constitute a special case each.
As regards infidelity, it is the only case when the majority of men as well as of women
agrees with the statement (60.9% and 50.5% respectively) and, besides, when the percentage
of those in both groups who strongly agree is higher (and considerably higher at that) than
those who simply agree with the statement. Thus, 47.5% of men and 34.6% of women strongly
agree, while 13.4% of men and 15.9% of women simply agree with the statement.
This is also a reflection of the double standards maintained mostly by men but also by a
significant percentage of women in the country such as Armenia where quite a few patriarchal
norms and “values” are maintained in the sphere of sexual relations. Those respondents are
undoubtedly much more lenient regarding man’s infidelity and they would definitely not
support the idea of a woman beating up her intimate partner for cheating on her.
While it could be anticipated that the percentage of male respondents agreeing that
unfaithful woman deserves beating would be quite high, it should be a matter of concern that a
half of female respondents (50.5%) think so too. In fact, technically, it is a majority.
As mentioned earlier, the last statement is also a special case but for a different reason. An
extremely small percentage of male and female respondents agreed with the statement that it is
okay for a man to hit his wife if she will not have sex with him (5.8% and 4.5% respectively)46
and it is regarding this specific question that surveyed men and women demonstrated rare
unanimity. The idea that man can be justified in hitting his wife because she refused him sex is
practically equally unacceptable to men and women.
***
A more detailed picture of men’s and women’s perceptions and opinions regarding
physical violence against an intimate female partner is presented through the survey data
broken down by key background characteristics of the respondents.
46 The data from the most recent DHS nationwide survey, which was conducted in 2010, were 2.8% and 1.2% respectively (Armenia Demographic and Health Survey 2010. Yerevan: NSS and MoH. Calverton (MD): ICF International, 2012, pp. 234-235). A tentative conclusion would indicate that the proportion (and, hence, the number) of women and men who exonerate IPV on that grounds has been on the rise. However, a caveat should be made. It should be noted that the age groups in the samples of the present survey and in the DHS differ. While the present survey targeted the age groups from 18 through 59, the sampled population in the DHS survey was 15-49. That difference definitely skews the results.
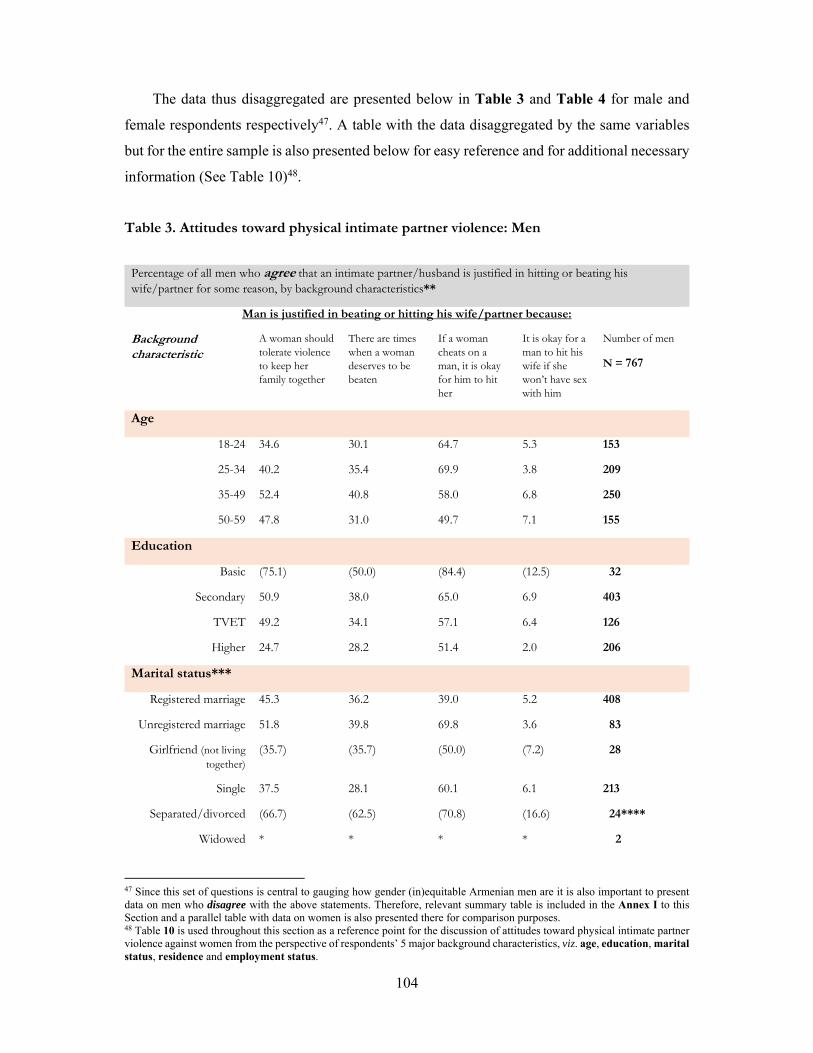
104
The data thus disaggregated are presented below in Table 3 and Table 4 for male and
female respondents respectively47. A table with the data disaggregated by the same variables
but for the entire sample is also presented below for easy reference and for additional necessary
information (See Table 10)48.
Table 3. Attitudes toward physical intimate partner violence: Men
Percentage of all men who agree that an intimate partner/husband is justified in hitting or beating his wife/partner for some reason, by background characteristics**
Man is justified in beating or hitting his wife/partner because:
Background characteristic
A woman should tolerate violence to keep her family together
There are times when a woman deserves to be beaten
If a woman cheats on a man, it is okay for him to hit her
It is okay for a man to hit his wife if she won’t have sex with him
Number of men
N = 767
Age
18-24 34.6 30.1 64.7 5.3 153
25-34 40.2 35.4 69.9 3.8 209
35-49 52.4 40.8 58.0 6.8 250
50-59 47.8 31.0 49.7 7.1 155
Education
Basic (75.1) (50.0) (84.4) (12.5) 32
Secondary 50.9 38.0 65.0 6.9 403
TVET 49.2 34.1 57.1 6.4 126
Higher 24.7 28.2 51.4 2.0 206
Marital status***
Registered marriage 45.3 36.2 39.0 5.2 408
Unregistered marriage 51.8 39.8 69.8 3.6 83
Girlfriend (not living together)
(35.7) (35.7) (50.0) (7.2) 28
Single 37.5 28.1 60.1 6.1 213
Separated/divorced (66.7) (62.5) (70.8) (16.6) 24****
Widowed * * * * 2
47 Since this set of questions is central to gauging how gender (in)equitable Armenian men are it is also important to present data on men who disagree with the above statements. Therefore, relevant summary table is included in the Annex I to this Section and a parallel table with data on women is also presented there for comparison purposes. 48 Table 10 is used throughout this section as a reference point for the discussion of attitudes toward physical intimate partner violence against women from the perspective of respondents’ 5 major background characteristics, viz. age, education, marital status, residence and employment status.
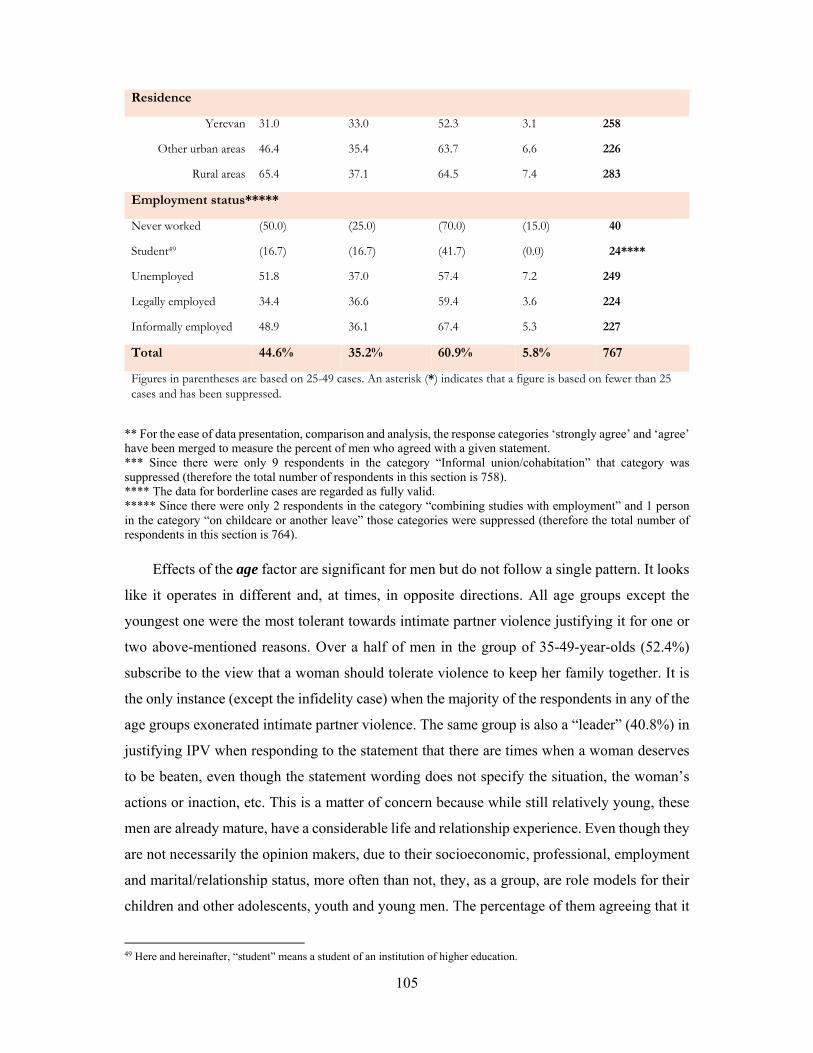
105
Residence
Yerevan 31.0 33.0 52.3 3.1 258
Other urban areas 46.4 35.4 63.7 6.6 226
Rural areas 65.4 37.1 64.5 7.4 283
Employment status*****
Never worked (50.0) (25.0) (70.0) (15.0) 40
Student49 (16.7) (16.7) (41.7) (0.0) 24****
Unemployed 51.8 37.0 57.4 7.2 249
Legally employed 34.4 36.6 59.4 3.6 224
Informally employed 48.9 36.1 67.4 5.3 227
Total 44.6% 35.2% 60.9% 5.8% 767
Figures in parentheses are based on 25-49 cases. An asterisk (*) indicates that a figure is based on fewer than 25 cases and has been suppressed.
** For the ease of data presentation, comparison and analysis, the response categories ‘strongly agree’ and ‘agree’ have been merged to measure the percent of men who agreed with a given statement. *** Since there were only 9 respondents in the category “Informal union/cohabitation” that category was suppressed (therefore the total number of respondents in this section is 758). **** The data for borderline cases are regarded as fully valid. ***** Since there were only 2 respondents in the category “combining studies with employment” and 1 person in the category “on childcare or another leave” those categories were suppressed (therefore the total number of respondents in this section is 764).
Effects of the age factor are significant for men but do not follow a single pattern. It looks
like it operates in different and, at times, in opposite directions. All age groups except the
youngest one were the most tolerant towards intimate partner violence justifying it for one or
two above-mentioned reasons. Over a half of men in the group of 35-49-year-olds (52.4%)
subscribe to the view that a woman should tolerate violence to keep her family together. It is
the only instance (except the infidelity case) when the majority of the respondents in any of the
age groups exonerated intimate partner violence. The same group is also a “leader” (40.8%) in
justifying IPV when responding to the statement that there are times when a woman deserves
to be beaten, even though the statement wording does not specify the situation, the woman’s
actions or inaction, etc. This is a matter of concern because while still relatively young, these
men are already mature, have a considerable life and relationship experience. Even though they
are not necessarily the opinion makers, due to their socioeconomic, professional, employment
and marital/relationship status, more often than not, they, as a group, are role models for their
children and other adolescents, youth and young men. The percentage of them agreeing that it
49 Here and hereinafter, “student” means a student of an institution of higher education.
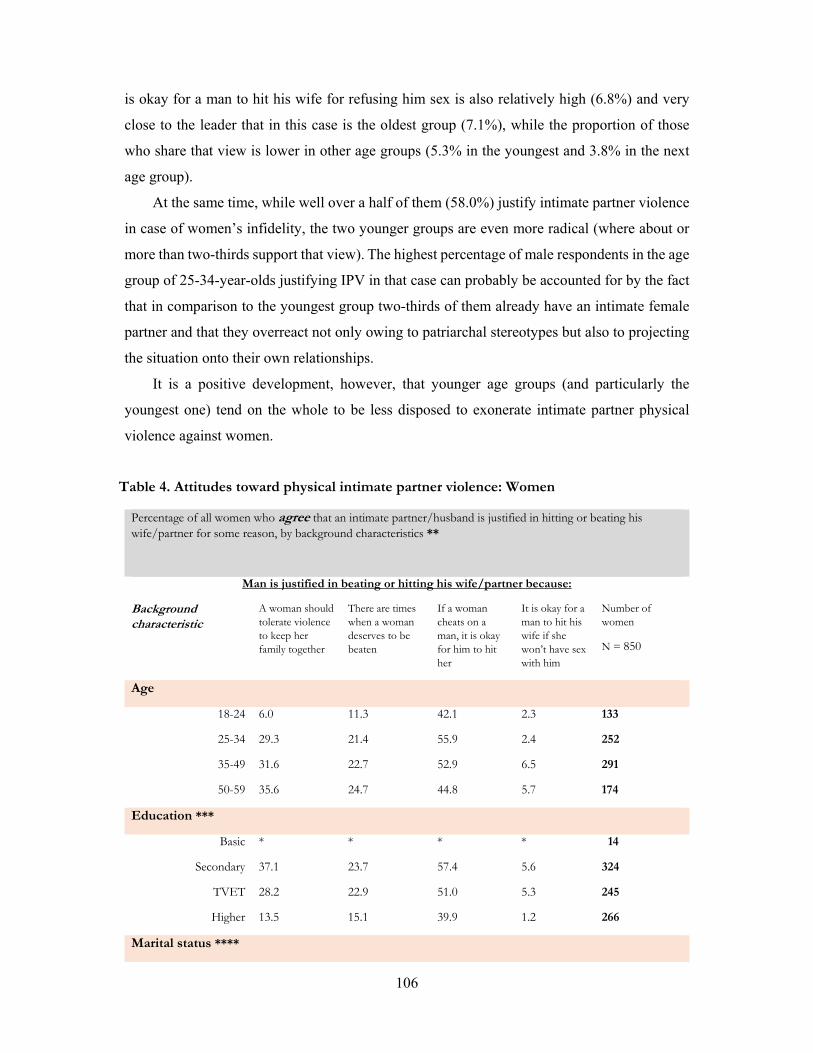
106
is okay for a man to hit his wife for refusing him sex is also relatively high (6.8%) and very
close to the leader that in this case is the oldest group (7.1%), while the proportion of those
who share that view is lower in other age groups (5.3% in the youngest and 3.8% in the next
age group).
At the same time, while well over a half of them (58.0%) justify intimate partner violence
in case of women’s infidelity, the two younger groups are even more radical (where about or
more than two-thirds support that view). The highest percentage of male respondents in the age
group of 25-34-year-olds justifying IPV in that case can probably be accounted for by the fact
that in comparison to the youngest group two-thirds of them already have an intimate female
partner and that they overreact not only owing to patriarchal stereotypes but also to projecting
the situation onto their own relationships.
It is a positive development, however, that younger age groups (and particularly the
youngest one) tend on the whole to be less disposed to exonerate intimate partner physical
violence against women.
Table 4. Attitudes toward physical intimate partner violence: Women
Percentage of all women who agree that an intimate partner/husband is justified in hitting or beating his wife/partner for some reason, by background characteristics **
Man is justified in beating or hitting his wife/partner because:
Background characteristic
A woman should tolerate violence to keep her family together
There are times when a woman deserves to be beaten
If a woman cheats on a man, it is okay for him to hit her
It is okay for a man to hit his wife if she won’t have sex with him
Number of women
N = 850
Age
18-24 6.0 11.3 42.1 2.3 133
25-34 29.3 21.4 55.9 2.4 252
35-49 31.6 22.7 52.9 6.5 291
50-59 35.6 24.7 44.8 5.7 174
Education ***
Basic * * * * 14
Secondary 37.1 23.7 57.4 5.6 324
TVET 28.2 22.9 51.0 5.3 245
Higher 13.5 15.1 39.9 1.2 266
Marital status ****
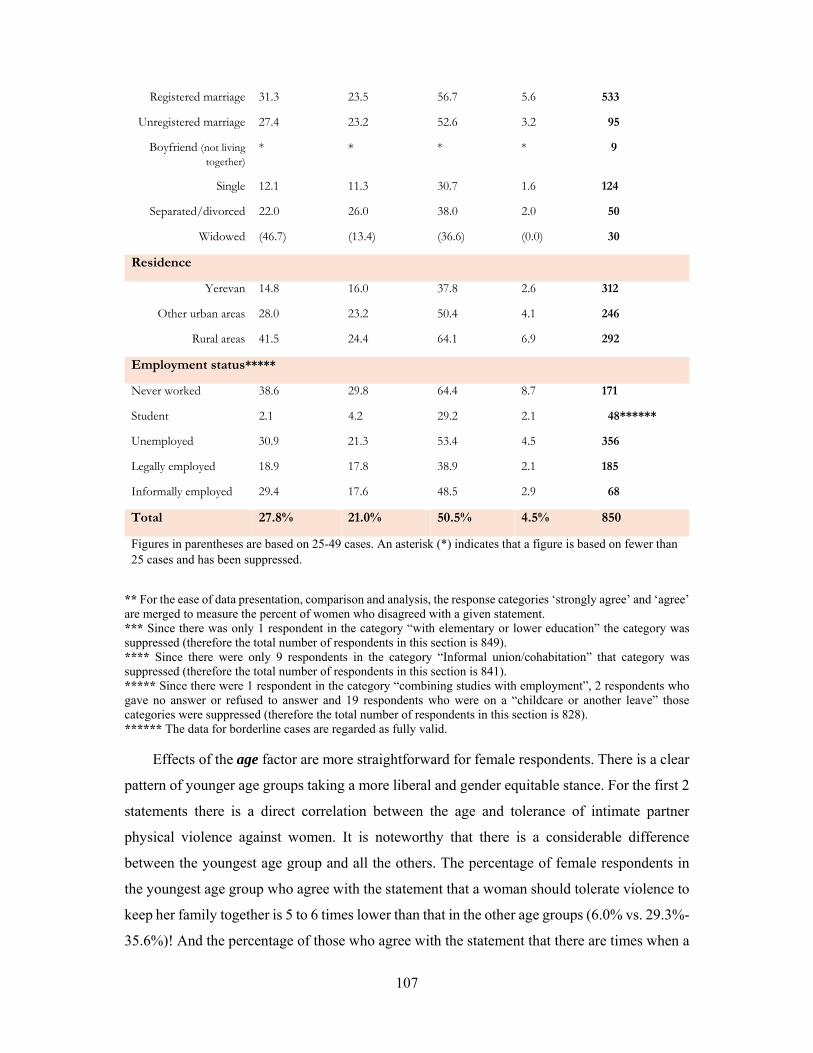
107
Registered marriage 31.3 23.5 56.7 5.6 533
Unregistered marriage 27.4 23.2 52.6 3.2 95
Boyfriend (not living together)
* * * * 9
Single 12.1 11.3 30.7 1.6 124
Separated/divorced 22.0 26.0 38.0 2.0 50
Widowed (46.7) (13.4) (36.6) (0.0) 30
Residence
Yerevan 14.8 16.0 37.8 2.6 312
Other urban areas 28.0 23.2 50.4 4.1 246
Rural areas 41.5 24.4 64.1 6.9 292
Employment status*****
Never worked 38.6 29.8 64.4 8.7 171
Student 2.1 4.2 29.2 2.1 48******
Unemployed 30.9 21.3 53.4 4.5 356
Legally employed 18.9 17.8 38.9 2.1 185
Informally employed 29.4 17.6 48.5 2.9 68
Total 27.8% 21.0% 50.5% 4.5% 850
Figures in parentheses are based on 25-49 cases. An asterisk (*) indicates that a figure is based on fewer than 25 cases and has been suppressed.
** For the ease of data presentation, comparison and analysis, the response categories ‘strongly agree’ and ‘agree’ are merged to measure the percent of women who disagreed with a given statement. *** Since there was only 1 respondent in the category “with elementary or lower education” the category was suppressed (therefore the total number of respondents in this section is 849). **** Since there were only 9 respondents in the category “Informal union/cohabitation” that category was suppressed (therefore the total number of respondents in this section is 841). ***** Since there were 1 respondent in the category “combining studies with employment”, 2 respondents who gave no answer or refused to answer and 19 respondents who were on a “childcare or another leave” those categories were suppressed (therefore the total number of respondents in this section is 828). ****** The data for borderline cases are regarded as fully valid.
Effects of the age factor are more straightforward for female respondents. There is a clear
pattern of younger age groups taking a more liberal and gender equitable stance. For the first 2
statements there is a direct correlation between the age and tolerance of intimate partner
physical violence against women. It is noteworthy that there is a considerable difference
between the youngest age group and all the others. The percentage of female respondents in
the youngest age group who agree with the statement that a woman should tolerate violence to
keep her family together is 5 to 6 times lower than that in the other age groups (6.0% vs. 29.3%-
35.6%)! And the percentage of those who agree with the statement that there are times when a
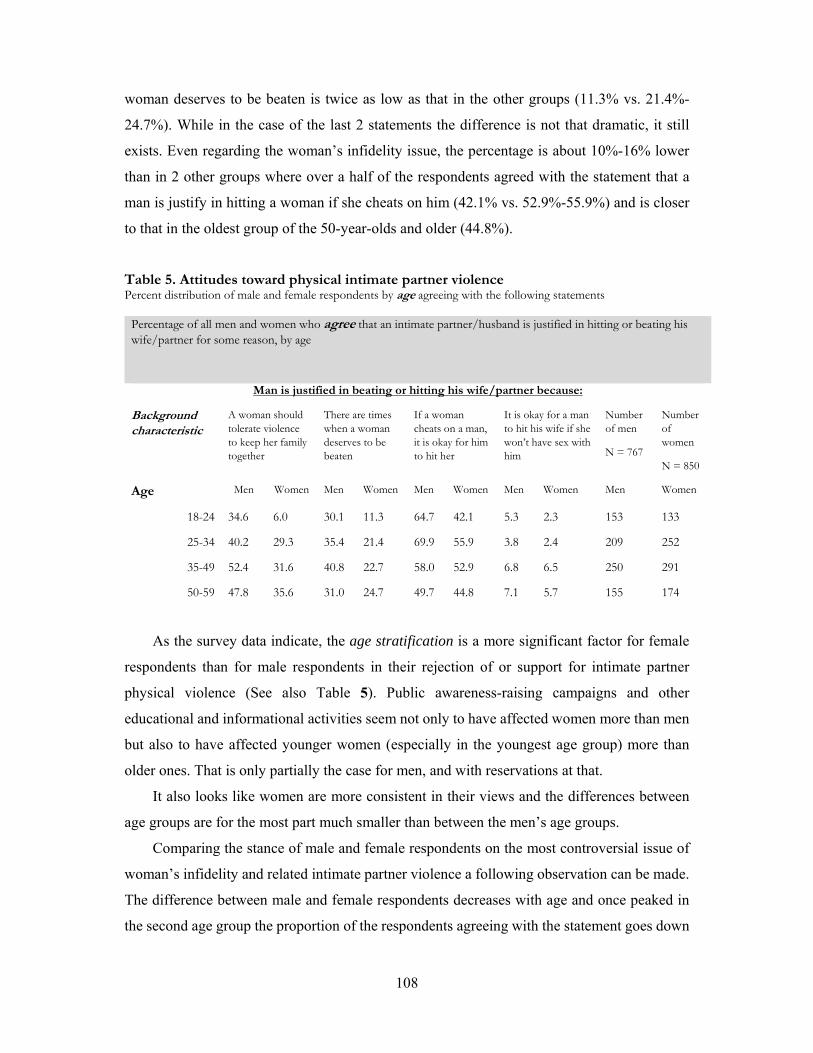
108
woman deserves to be beaten is twice as low as that in the other groups (11.3% vs. 21.4%-
24.7%). While in the case of the last 2 statements the difference is not that dramatic, it still
exists. Even regarding the woman’s infidelity issue, the percentage is about 10%-16% lower
than in 2 other groups where over a half of the respondents agreed with the statement that a
man is justify in hitting a woman if she cheats on him (42.1% vs. 52.9%-55.9%) and is closer
to that in the oldest group of the 50-year-olds and older (44.8%).
Table 5. Attitudes toward physical intimate partner violence Percent distribution of male and female respondents by age agreeing with the following statements
Percentage of all men and women who agree that an intimate partner/husband is justified in hitting or beating his wife/partner for some reason, by age
Man is justified in beating or hitting his wife/partner because:
Background characteristic
A woman should tolerate violence to keep her family together
There are times when a woman deserves to be beaten
If a woman cheats on a man, it is okay for him to hit her
It is okay for a man to hit his wife if she won’t have sex with him
Number of men
N = 767
Number of women
N = 850
Age Men Women Men Women Men Women Men Women Men Women
18-24 34.6 6.0 30.1 11.3 64.7 42.1 5.3 2.3 153 133
25-34 40.2 29.3 35.4 21.4 69.9 55.9 3.8 2.4 209 252
35-49 52.4 31.6 40.8 22.7 58.0 52.9 6.8 6.5 250 291
50-59 47.8 35.6 31.0 24.7 49.7 44.8 7.1 5.7 155 174
As the survey data indicate, the age stratification is a more significant factor for female
respondents than for male respondents in their rejection of or support for intimate partner
physical violence (See also Table 5). Public awareness-raising campaigns and other
educational and informational activities seem not only to have affected women more than men
but also to have affected younger women (especially in the youngest age group) more than
older ones. That is only partially the case for men, and with reservations at that.
It also looks like women are more consistent in their views and the differences between
age groups are for the most part much smaller than between the men’s age groups.
Comparing the stance of male and female respondents on the most controversial issue of
woman’s infidelity and related intimate partner violence a following observation can be made.
The difference between male and female respondents decreases with age and once peaked in
the second age group the proportion of the respondents agreeing with the statement goes down
109
perceptibly. Clearly, it is not that older respondents are more tolerant of woman’s infidelity,
especially marital infidelity. More likely, their level of acceptance of violence becomes lower.
It is in the second age group (25-34-year-olds) overall in the sample (See Table 10) that
the proportion of those who agree with the statement is the highest one (62.3%), almost twice
as high as that of those who disagree. The four-fifths of the respondents (78.3%) in that age
group have or had an intimate partner (including a small percentage of divorced and widowed:
3.5% and 0.4% respectively). It looks like this group feels particularly strongly about intimate
partner fidelity and takes a maximalist perspective that, probably, clouds the vision of the
otherwise quite progressive age group that in other instances does not look favorably on IPV
(on the average, 65%-70% of the respondents in that age group do not agree with the statement
that a man is justified in beating his intimate female partner and as regards the idea that it is
okay for a man to hit his wife if she won’t have sex with him almost 94% of the respondents
in that group disagreed with the statement.)
The men in the youngest group who justify IPV in the case of infidelity speak mostly from
entrenched patriarchal stereotypes or imaginary high moral ground rather than from their life
experience. Only 8.6% of them have an intimate female partner, whereas 40.0% of the female
respondents in that age group are already (albeit for the most part recently) married (and 0.7%
have already separated or divorced). While those female respondents do not exonerate
woman’s infidelity, they are not particularly happy about the idea of violence in an intimate
partnership.
***
Effects of the education factor are not only significant for men but follow a single, well-
articulated pattern. Without exception, the level of educational attainment of men is inversely
correlated with their disposition to justify intimate partner physical violence against women.
Two groups, viz. men with basic education and men with tertiary education, particularly stand
out. The proportion of male respondents with basic education who justify man’s beating his
female intimate partner exceeds that of male respondents with tertiary education 2, 3 or even 6
times (in the latter case the matter concerns the situation when a man hits a wife for refusing
him sex, 12.5% and 2.0% respectively). The respective percentages for agreeing with the first
2 statements (woman should tolerate violence to keep her family together and there are times
when a woman deserves to be beaten) are 75.1% vs. 24.7% and 50.0% vs. 28.2%. The only
exception is the “special case” of woman’s infidelity, mostly because over a half of the
respondents across the board exonerate man hitting a woman in that situation. Nevertheless,
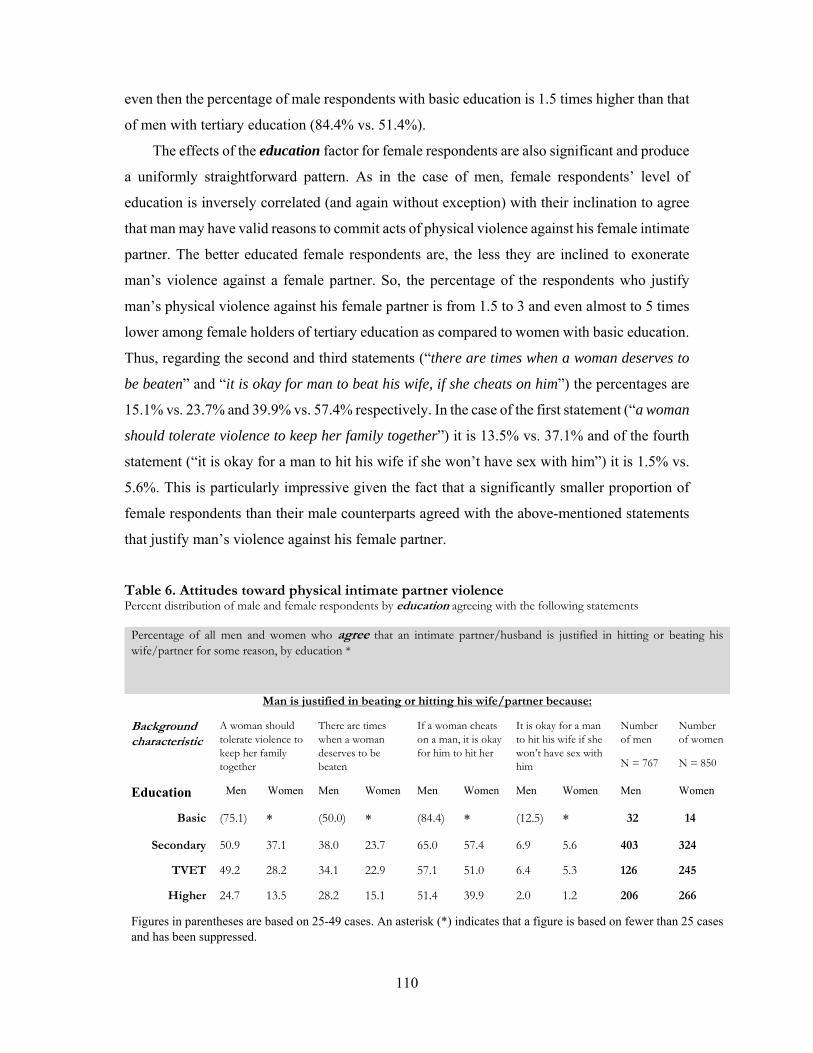
110
even then the percentage of male respondents with basic education is 1.5 times higher than that
of men with tertiary education (84.4% vs. 51.4%).
The effects of the education factor for female respondents are also significant and produce
a uniformly straightforward pattern. As in the case of men, female respondents’ level of
education is inversely correlated (and again without exception) with their inclination to agree
that man may have valid reasons to commit acts of physical violence against his female intimate
partner. The better educated female respondents are, the less they are inclined to exonerate
man’s violence against a female partner. So, the percentage of the respondents who justify
man’s physical violence against his female partner is from 1.5 to 3 and even almost to 5 times
lower among female holders of tertiary education as compared to women with basic education.
Thus, regarding the second and third statements (“there are times when a woman deserves to
be beaten” and “it is okay for man to beat his wife, if she cheats on him”) the percentages are
15.1% vs. 23.7% and 39.9% vs. 57.4% respectively. In the case of the first statement (“a woman
should tolerate violence to keep her family together”) it is 13.5% vs. 37.1% and of the fourth
statement (“it is okay for a man to hit his wife if she won’t have sex with him”) it is 1.5% vs.
5.6%. This is particularly impressive given the fact that a significantly smaller proportion of
female respondents than their male counterparts agreed with the above-mentioned statements
that justify man’s violence against his female partner.
Table 6. Attitudes toward physical intimate partner violence Percent distribution of male and female respondents by education agreeing with the following statements
Percentage of all men and women who agree that an intimate partner/husband is justified in hitting or beating his wife/partner for some reason, by education *
Man is justified in beating or hitting his wife/partner because:
Background characteristic
A woman should tolerate violence to keep her family together
There are times when a woman deserves to be beaten
If a woman cheats on a man, it is okay for him to hit her
It is okay for a man to hit his wife if she won’t have sex with him
Number of men
N = 767
Number of women
N = 850
Education Men Women Men Women Men Women Men Women Men Women
Basic (75.1) * (50.0) * (84.4) * (12.5) * 32 14
Secondary 50.9 37.1 38.0 23.7 65.0 57.4 6.9 5.6 403 324
TVET 49.2 28.2 34.1 22.9 57.1 51.0 6.4 5.3 126 245
Higher 24.7 13.5 28.2 15.1 51.4 39.9 2.0 1.2 206 266
Figures in parentheses are based on 25-49 cases. An asterisk (*) indicates that a figure is based on fewer than 25 cases and has been suppressed.
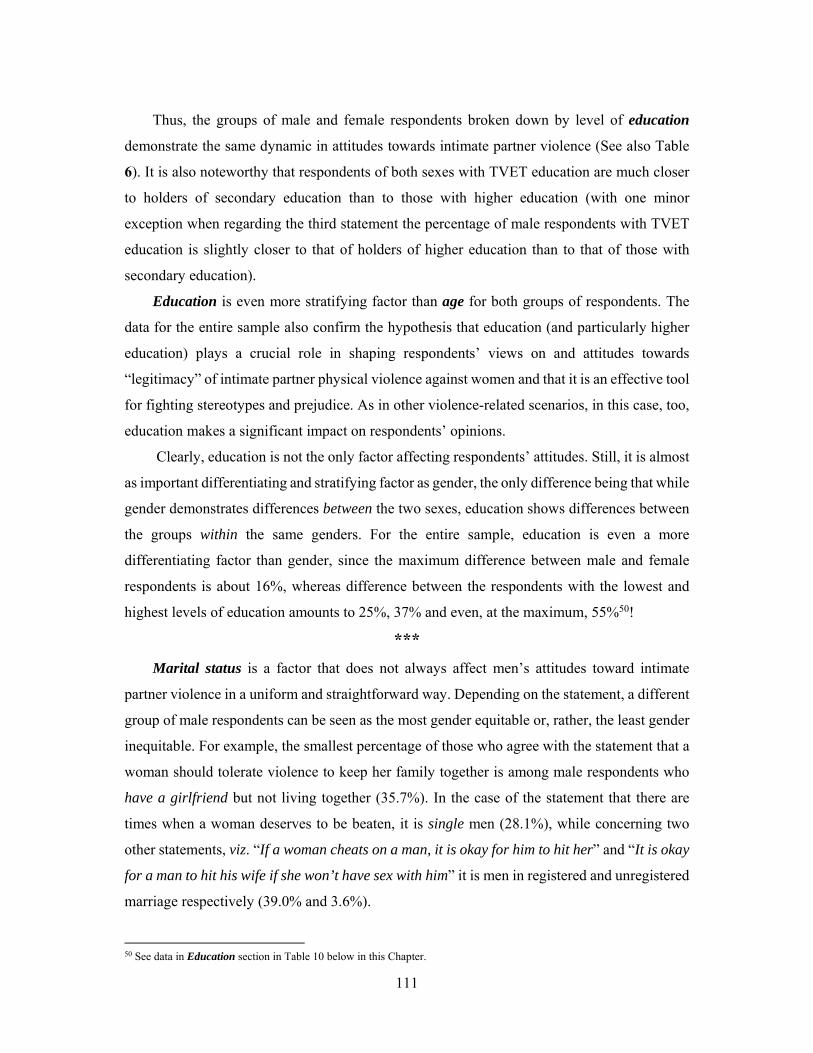
111
Thus, the groups of male and female respondents broken down by level of education
demonstrate the same dynamic in attitudes towards intimate partner violence (See also Table
6). It is also noteworthy that respondents of both sexes with TVET education are much closer
to holders of secondary education than to those with higher education (with one minor
exception when regarding the third statement the percentage of male respondents with TVET
education is slightly closer to that of holders of higher education than to that of those with
secondary education).
Education is even more stratifying factor than age for both groups of respondents. The
data for the entire sample also confirm the hypothesis that education (and particularly higher
education) plays a crucial role in shaping respondents’ views on and attitudes towards
“legitimacy” of intimate partner physical violence against women and that it is an effective tool
for fighting stereotypes and prejudice. As in other violence-related scenarios, in this case, too,
education makes a significant impact on respondents’ opinions.
Clearly, education is not the only factor affecting respondents’ attitudes. Still, it is almost
as important differentiating and stratifying factor as gender, the only difference being that while
gender demonstrates differences between the two sexes, education shows differences between
the groups within the same genders. For the entire sample, education is even a more
differentiating factor than gender, since the maximum difference between male and female
respondents is about 16%, whereas difference between the respondents with the lowest and
highest levels of education amounts to 25%, 37% and even, at the maximum, 55%50!
***
Marital status is a factor that does not always affect men’s attitudes toward intimate
partner violence in a uniform and straightforward way. Depending on the statement, a different
group of male respondents can be seen as the most gender equitable or, rather, the least gender
inequitable. For example, the smallest percentage of those who agree with the statement that a
woman should tolerate violence to keep her family together is among male respondents who
have a girlfriend but not living together (35.7%). In the case of the statement that there are
times when a woman deserves to be beaten, it is single men (28.1%), while concerning two
other statements, viz. “If a woman cheats on a man, it is okay for him to hit her” and “It is okay
for a man to hit his wife if she won’t have sex with him” it is men in registered and unregistered
marriage respectively (39.0% and 3.6%).
50 See data in Education section in Table 10 below in this Chapter.
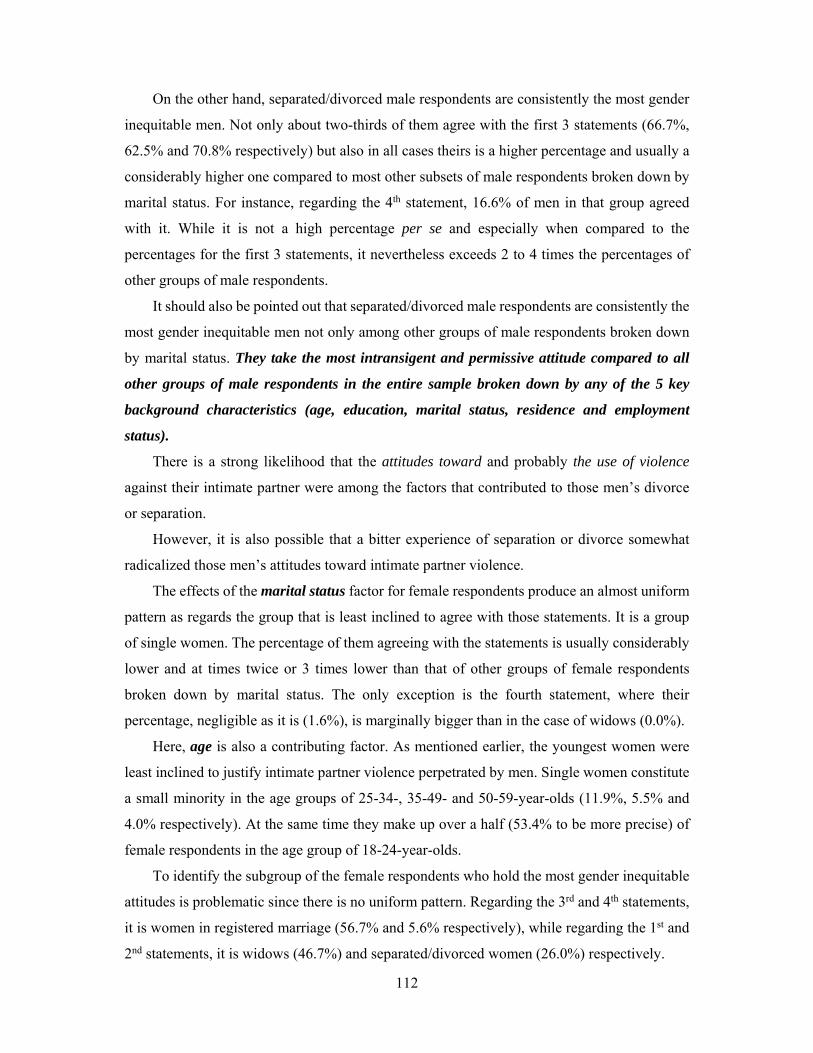
112
On the other hand, separated/divorced male respondents are consistently the most gender
inequitable men. Not only about two-thirds of them agree with the first 3 statements (66.7%,
62.5% and 70.8% respectively) but also in all cases theirs is a higher percentage and usually a
considerably higher one compared to most other subsets of male respondents broken down by
marital status. For instance, regarding the 4th statement, 16.6% of men in that group agreed
with it. While it is not a high percentage per se and especially when compared to the
percentages for the first 3 statements, it nevertheless exceeds 2 to 4 times the percentages of
other groups of male respondents.
It should also be pointed out that separated/divorced male respondents are consistently the
most gender inequitable men not only among other groups of male respondents broken down
by marital status. They take the most intransigent and permissive attitude compared to all
other groups of male respondents in the entire sample broken down by any of the 5 key
background characteristics (age, education, marital status, residence and employment
status).
There is a strong likelihood that the attitudes toward and probably the use of violence
against their intimate partner were among the factors that contributed to those men’s divorce
or separation.
However, it is also possible that a bitter experience of separation or divorce somewhat
radicalized those men’s attitudes toward intimate partner violence.
The effects of the marital status factor for female respondents produce an almost uniform
pattern as regards the group that is least inclined to agree with those statements. It is a group
of single women. The percentage of them agreeing with the statements is usually considerably
lower and at times twice or 3 times lower than that of other groups of female respondents
broken down by marital status. The only exception is the fourth statement, where their
percentage, negligible as it is (1.6%), is marginally bigger than in the case of widows (0.0%).
Here, age is also a contributing factor. As mentioned earlier, the youngest women were
least inclined to justify intimate partner violence perpetrated by men. Single women constitute
a small minority in the age groups of 25-34-, 35-49- and 50-59-year-olds (11.9%, 5.5% and
4.0% respectively). At the same time they make up over a half (53.4% to be more precise) of
female respondents in the age group of 18-24-year-olds.
To identify the subgroup of the female respondents who hold the most gender inequitable
attitudes is problematic since there is no uniform pattern. Regarding the 3rd and 4th statements,
it is women in registered marriage (56.7% and 5.6% respectively), while regarding the 1st and
2nd statements, it is widows (46.7%) and separated/divorced women (26.0%) respectively.
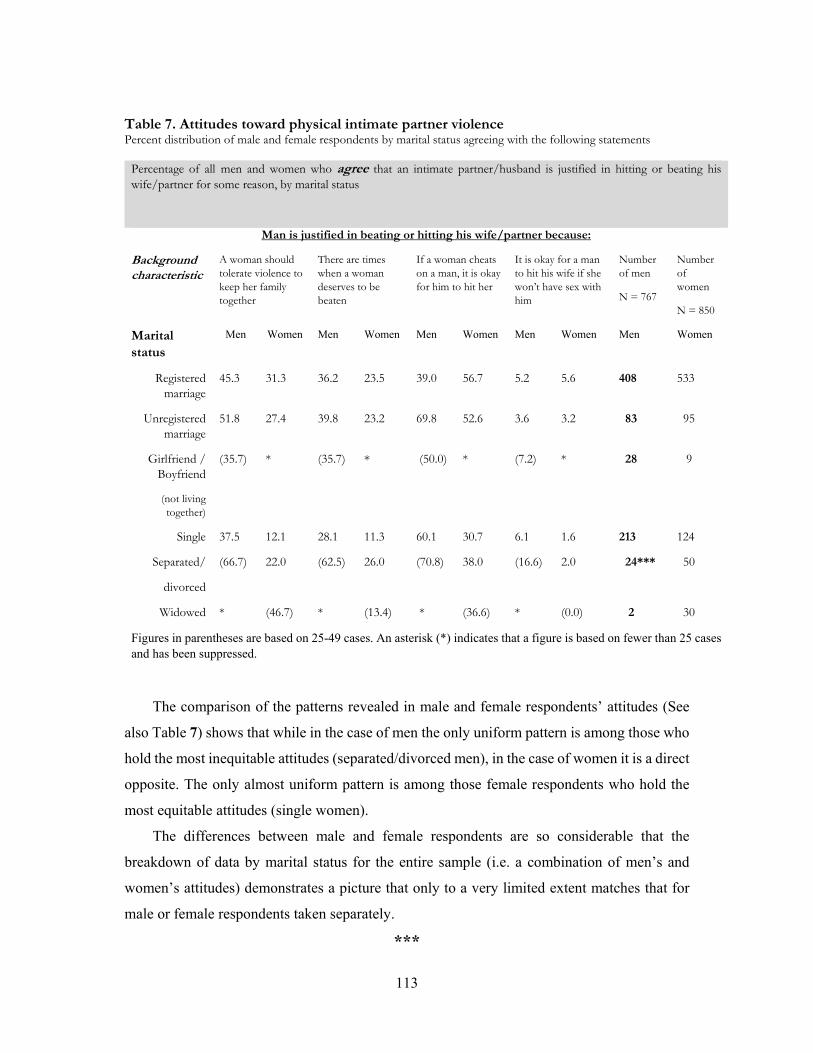
113
Table 7. Attitudes toward physical intimate partner violence Percent distribution of male and female respondents by marital status agreeing with the following statements
Percentage of all men and women who agree that an intimate partner/husband is justified in hitting or beating his wife/partner for some reason, by marital status
Man is justified in beating or hitting his wife/partner because:
Background characteristic
A woman should tolerate violence to keep her family together
There are times when a woman deserves to be beaten
If a woman cheats on a man, it is okay for him to hit her
It is okay for a man to hit his wife if she won’t have sex with him
Number of men
N = 767
Number of women
N = 850
Marital status
Men Women Men Women Men Women Men Women Men Women
Registered marriage
45.3 31.3 36.2 23.5 39.0 56.7 5.2 5.6 408 533
Unregistered marriage
51.8 27.4 39.8 23.2 69.8 52.6 3.6 3.2 83 95
Girlfriend / Boyfriend
(not living together)
(35.7) * (35.7) * (50.0) * (7.2) * 28 9
Single 37.5 12.1 28.1 11.3 60.1 30.7 6.1 1.6 213 124
Separated/
divorced
(66.7) 22.0 (62.5) 26.0 (70.8) 38.0 (16.6) 2.0 24*** 50
Widowed * (46.7) * (13.4) * (36.6) * (0.0) 2 30
Figures in parentheses are based on 25-49 cases. An asterisk (*) indicates that a figure is based on fewer than 25 cases and has been suppressed.
The comparison of the patterns revealed in male and female respondents’ attitudes (See
also Table 7) shows that while in the case of men the only uniform pattern is among those who
hold the most inequitable attitudes (separated/divorced men), in the case of women it is a direct
opposite. The only almost uniform pattern is among those female respondents who hold the
most equitable attitudes (single women).
The differences between male and female respondents are so considerable that the
breakdown of data by marital status for the entire sample (i.e. a combination of men’s and
women’s attitudes) demonstrates a picture that only to a very limited extent matches that for
male or female respondents taken separately.
***
114
Effects of the residence location factor are both significant for men and show a strong
uniform pattern. Male respondents from Yerevan are least and those from rural areas are most
inclined to agree with the statements that justify men’s physical violence against their intimate
female partner. This difference is either considerable (as regards the statement exonerating
man’s violence in the case of woman’s infidelity, where the percentages are 52.3% and 64.5%
respectively) or huge (as regards the statements that a woman should tolerate violence to keep
her family together, 31.0% and 65.4% respectively, and that it is okay for a man to hit his wife
if she won’t have sex with him, 3.1% and 7.4% respectively). Even in the case of the statement
that there are times when a woman deserves to be beaten, where the percentages of all 3 groups
of male respondents come closest, the difference is still almost twice as big as the margin of
error.
Male respondents from urban areas other than Yerevan are closer to their counterparts
from rural areas than to those from Yerevan, except regarding the first statement. In other
words, the proportion of men from urban areas other than Yerevan holding stereotypical views
concerning intimate partner violence for the most part differs less from that of men from rural
areas who constitute the most gender inequitable group. The men from Yerevan are the least
gender inequitable from the perspective of the attitudes toward intimate partner violence.
The residence location factor is very significant and visibly differentiates the 3 groups of
female respondents. Female respondents from Yerevan are clearly the most gender equitable
group in terms of perceptions about intimate partner physical violence against women, whereas
women from rural areas are the most gender inequitable group. As evidenced by the survey
data, the difference between those two groups is considerable, from 1.5 to 2 and more times,
the most significant being as regards the statement that a woman should tolerate violence to
keep her family together (14.8% and 41.5% respectively) and the statement about physical
violence in retribution for woman’s infidelity (37.8% and 64.1% respectively). Female
respondents from urban areas other than Yerevan mostly fall in-between.
Table 8. Attitudes toward physical intimate partner violence Percent distribution of male and female respondents by place of residence agreeing with the following statements
Percentage of all men and women who agree that an intimate partner/husband is justified in hitting or beating his wife/partner for some reason, by place of residence
Man is justified in beating or hitting his wife/partner because:
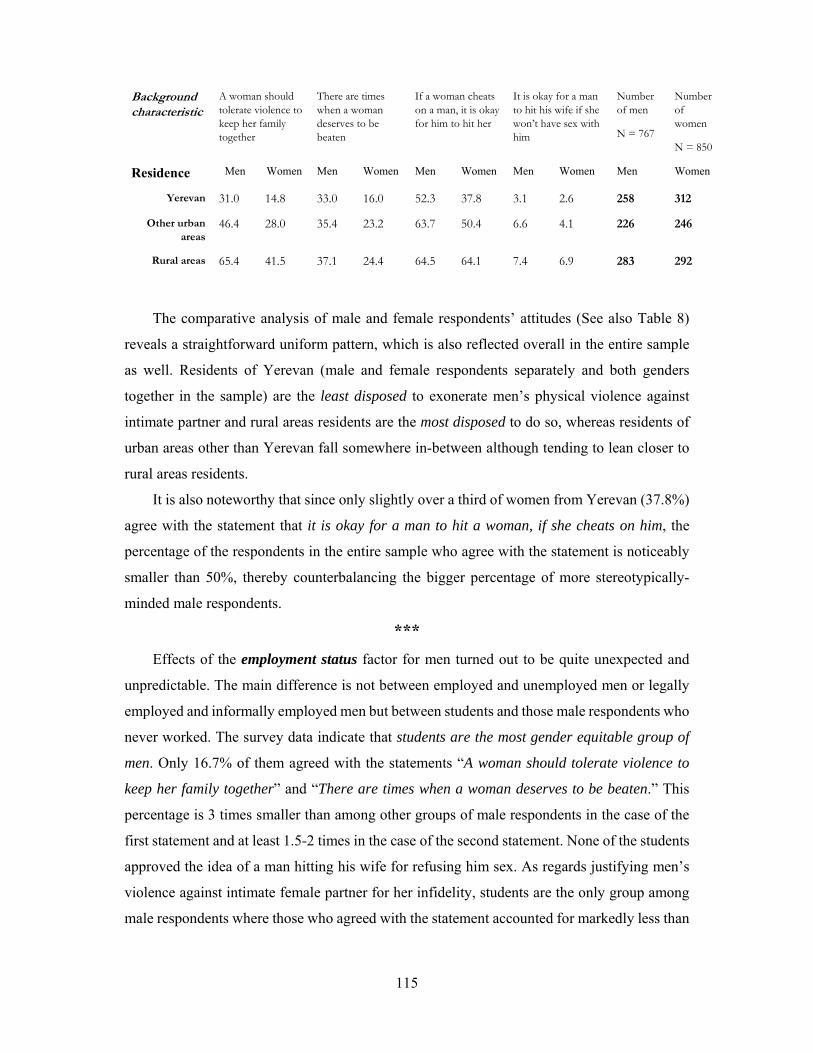
115
Background characteristic
A woman should tolerate violence to keep her family together
There are times when a woman deserves to be beaten
If a woman cheats on a man, it is okay for him to hit her
It is okay for a man to hit his wife if she won’t have sex with him
Number of men
N = 767
Number of women
N = 850
Residence Men Women Men Women Men Women Men Women Men Women
Yerevan 31.0 14.8 33.0 16.0 52.3 37.8 3.1 2.6 258 312
Other urban areas
46.4 28.0 35.4 23.2 63.7 50.4 6.6 4.1 226 246
Rural areas 65.4 41.5 37.1 24.4 64.5 64.1 7.4 6.9 283 292
The comparative analysis of male and female respondents’ attitudes (See also Table 8)
reveals a straightforward uniform pattern, which is also reflected overall in the entire sample
as well. Residents of Yerevan (male and female respondents separately and both genders
together in the sample) are the least disposed to exonerate men’s physical violence against
intimate partner and rural areas residents are the most disposed to do so, whereas residents of
urban areas other than Yerevan fall somewhere in-between although tending to lean closer to
rural areas residents.
It is also noteworthy that since only slightly over a third of women from Yerevan (37.8%)
agree with the statement that it is okay for a man to hit a woman, if she cheats on him, the
percentage of the respondents in the entire sample who agree with the statement is noticeably
smaller than 50%, thereby counterbalancing the bigger percentage of more stereotypically-
minded male respondents.
***
Effects of the employment status factor for men turned out to be quite unexpected and
unpredictable. The main difference is not between employed and unemployed men or legally
employed and informally employed men but between students and those male respondents who
never worked. The survey data indicate that students are the most gender equitable group of
men. Only 16.7% of them agreed with the statements “A woman should tolerate violence to
keep her family together” and “There are times when a woman deserves to be beaten.” This
percentage is 3 times smaller than among other groups of male respondents in the case of the
first statement and at least 1.5-2 times in the case of the second statement. None of the students
approved the idea of a man hitting his wife for refusing him sex. As regards justifying men’s
violence against intimate female partner for her infidelity, students are the only group among
male respondents where those who agreed with the statement accounted for markedly less than

116
a half (41.7%). The proportion of those who agreed with that statement in other groups of male
respondents fluctuated from 57.4% to 70.0%.
The next group, which, on the whole, shows a rather gender equitable attitude is the group
of legally employed men. The proportions of them agreeing with the statements are lower or
virtually equal to the percentages for the entire sample of men in the survey.
Two groups of men “compete” for being the most gender inequitable.
The first one is the group of those male respondents who never worked. The group has the
biggest proportion of those who agreed with 2 statements (the percentage of them agreeing
with the third and the fourth statements is 70.0% and 15.0% respectively).
The second most gender inequitable group is, on the whole, that of currently unemployed
men. The group has the highest proportion of the respondents who agreed with the first (51.8%)
and the second (37.0%) statements.
Thus, it is noteworthy that men who are getting professional education or are legally
employed tend to be the least disposed to justify intimate partner violence.
Effects of the employment status factor for women follow a clearly articulated and
uniform pattern. Without exception, 2 groups are leaders in expressing the most and the least
gender equitable attitudes. Those are students and women who never worked.
Female students showed a minimal tolerance as regards justifying men’s violence against
intimate female partner. As regards 3 statements the proportion of female students agreeing
with them is in single digits (2.1%, 4.2% and 2.1% for the first, second and fourth statements
respectively). The lowest percentage in other groups is 18.9% for the first statement, 17.6% for
the second statement and 2.1% for the fourth statement. Even as regards the third, most
controversial statement concerning physical violence committed against an adulteress, the
percentage of female students agreeing with it is much lower than among other groups (29.2%,
whereas the proportions in other groups fluctuate from 38.9% to 64.4%).
The group of female respondents with the second lowest percentage of support for intimate
partner violence is that of legally employed women. While not a match to students, they
consistently demonstrate a more equitable attitude than other groups of female respondents.
As a group, women who never worked were the most willing to exonerate gender-based
violence. Over or about one-third of them agreed with the statements “A woman should tolerate
violence to keep her family together” and “There are times when a woman deserves to be
beaten” and two-thirds with the statement that a man is justified in hitting his wife, if she cheats
on him. What is also noteworthy is the fact that there is a considerable difference between them
and not only the students but other groups as well. While as regards the fourth statement the
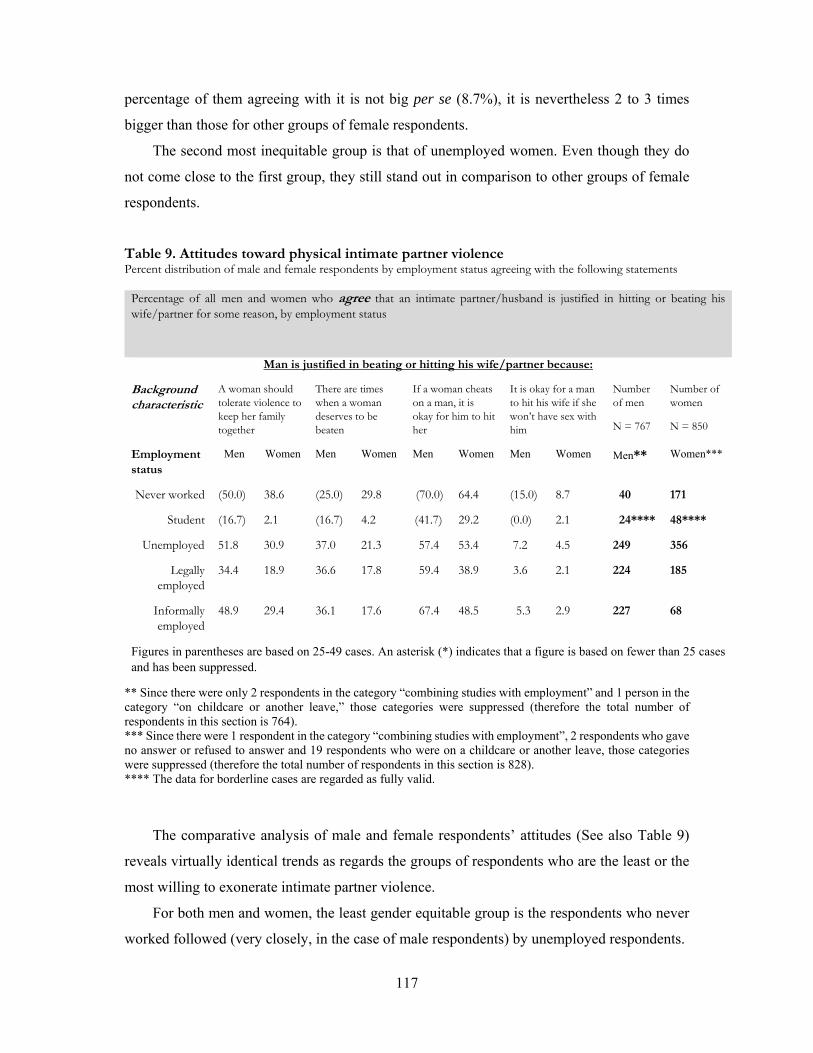
117
percentage of them agreeing with it is not big per se (8.7%), it is nevertheless 2 to 3 times
bigger than those for other groups of female respondents.
The second most inequitable group is that of unemployed women. Even though they do
not come close to the first group, they still stand out in comparison to other groups of female
respondents.
Table 9. Attitudes toward physical intimate partner violence Percent distribution of male and female respondents by employment status agreeing with the following statements
Percentage of all men and women who agree that an intimate partner/husband is justified in hitting or beating his wife/partner for some reason, by employment status
Man is justified in beating or hitting his wife/partner because:
Background characteristic
A woman should tolerate violence to keep her family together
There are times when a woman deserves to be beaten
If a woman cheats on a man, it is okay for him to hit her
It is okay for a man to hit his wife if she won’t have sex with him
Number of men
N = 767
Number of women
N = 850
Employment status
Men Women Men Women Men Women Men Women Men** Women***
Never worked (50.0) 38.6 (25.0) 29.8 (70.0) 64.4 (15.0) 8.7 40 171
Student (16.7) 2.1 (16.7) 4.2 (41.7) 29.2 (0.0) 2.1 24**** 48****
Unemployed 51.8 30.9 37.0 21.3 57.4 53.4 7.2 4.5 249 356
Legally employed
34.4 18.9 36.6 17.8 59.4 38.9 3.6 2.1 224 185
Informally employed
48.9 29.4 36.1 17.6 67.4 48.5 5.3 2.9 227 68
Figures in parentheses are based on 25-49 cases. An asterisk (*) indicates that a figure is based on fewer than 25 cases and has been suppressed.
** Since there were only 2 respondents in the category “combining studies with employment” and 1 person in the category “on childcare or another leave,” those categories were suppressed (therefore the total number of respondents in this section is 764). *** Since there were 1 respondent in the category “combining studies with employment”, 2 respondents who gave no answer or refused to answer and 19 respondents who were on a childcare or another leave, those categories were suppressed (therefore the total number of respondents in this section is 828). **** The data for borderline cases are regarded as fully valid.
The comparative analysis of male and female respondents’ attitudes (See also Table 9)
reveals virtually identical trends as regards the groups of respondents who are the least or the
most willing to exonerate intimate partner violence.
For both men and women, the least gender equitable group is the respondents who never
worked followed (very closely, in the case of male respondents) by unemployed respondents.
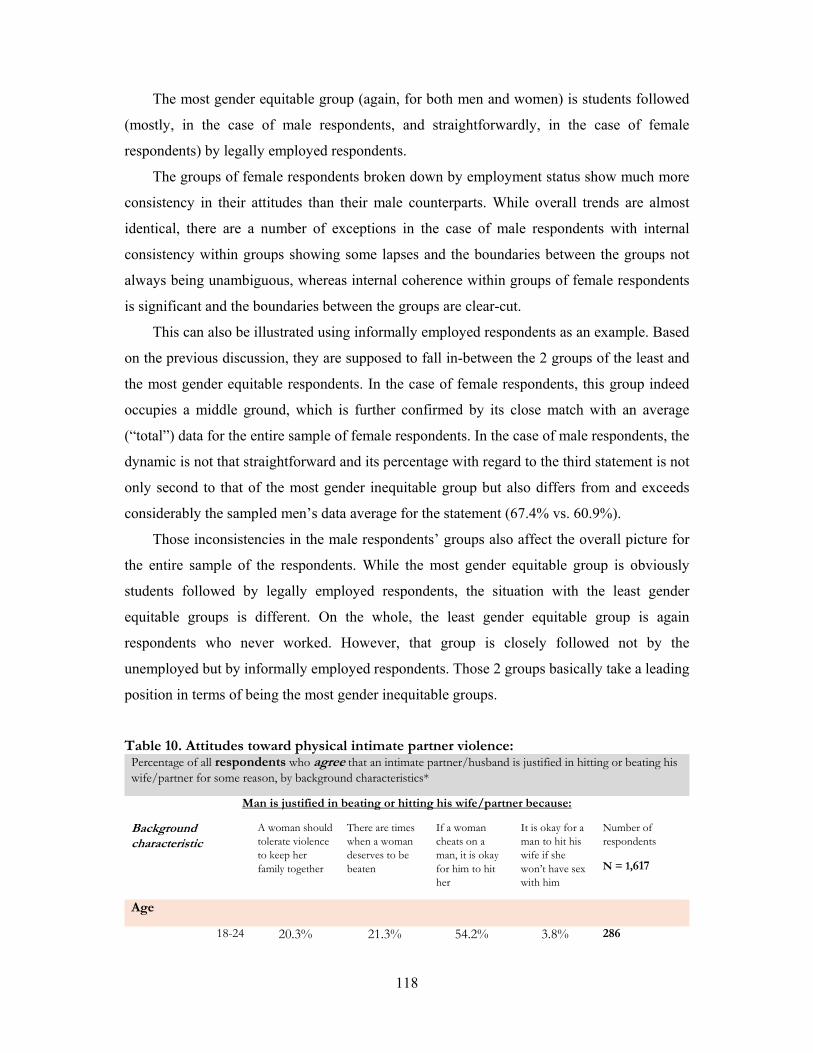
118
The most gender equitable group (again, for both men and women) is students followed
(mostly, in the case of male respondents, and straightforwardly, in the case of female
respondents) by legally employed respondents.
The groups of female respondents broken down by employment status show much more
consistency in their attitudes than their male counterparts. While overall trends are almost
identical, there are a number of exceptions in the case of male respondents with internal
consistency within groups showing some lapses and the boundaries between the groups not
always being unambiguous, whereas internal coherence within groups of female respondents
is significant and the boundaries between the groups are clear-cut.
This can also be illustrated using informally employed respondents as an example. Based
on the previous discussion, they are supposed to fall in-between the 2 groups of the least and
the most gender equitable respondents. In the case of female respondents, this group indeed
occupies a middle ground, which is further confirmed by its close match with an average
(“total”) data for the entire sample of female respondents. In the case of male respondents, the
dynamic is not that straightforward and its percentage with regard to the third statement is not
only second to that of the most gender inequitable group but also differs from and exceeds
considerably the sampled men’s data average for the statement (67.4% vs. 60.9%).
Those inconsistencies in the male respondents’ groups also affect the overall picture for
the entire sample of the respondents. While the most gender equitable group is obviously
students followed by legally employed respondents, the situation with the least gender
equitable groups is different. On the whole, the least gender equitable group is again
respondents who never worked. However, that group is closely followed not by the
unemployed but by informally employed respondents. Those 2 groups basically take a leading
position in terms of being the most gender inequitable groups.
Table 10. Attitudes toward physical intimate partner violence:
Percentage of all respondents who agree that an intimate partner/husband is justified in hitting or beating his wife/partner for some reason, by background characteristics*
Man is justified in beating or hitting his wife/partner because:
Background characteristic
A woman should tolerate violence to keep her family together
There are times when a woman deserves to be beaten
If a woman cheats on a man, it is okay for him to hit her
It is okay for a man to hit his wife if she won’t have sex with him
Number of respondents
N = 1,617
Age
18-24 20.3% 21.3% 54.2% 3.8% 286
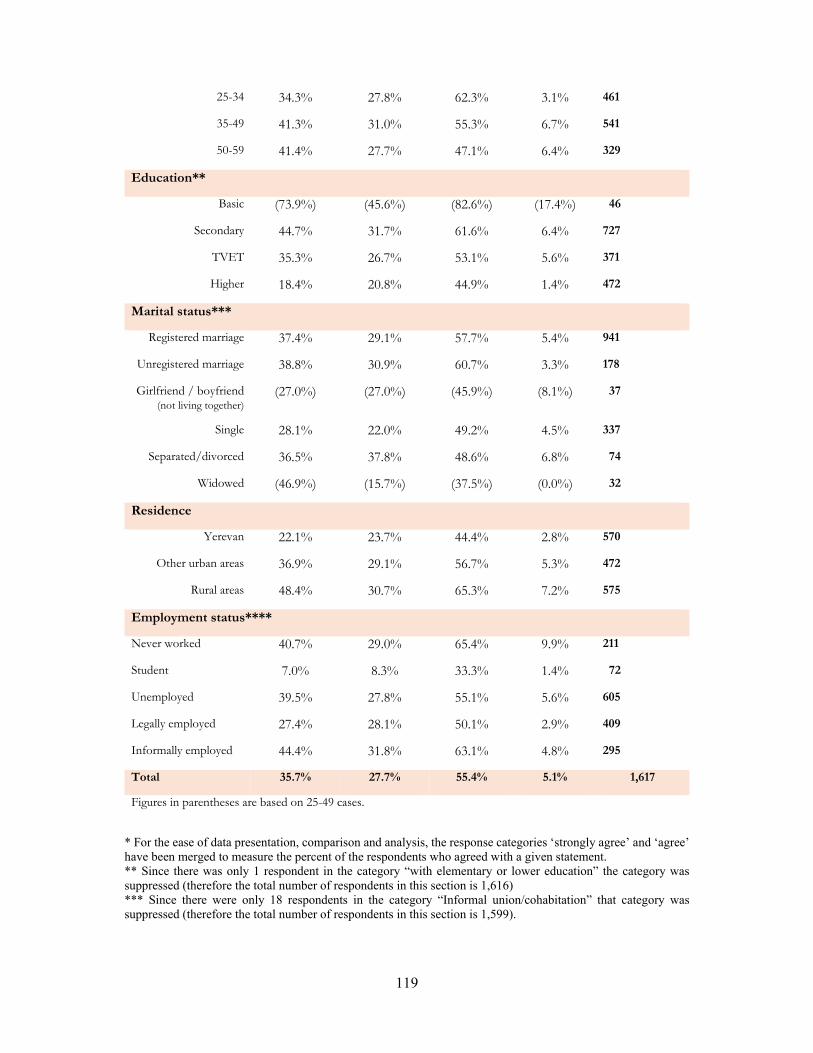
119
25-34 34.3% 27.8% 62.3% 3.1% 461
35-49 41.3% 31.0% 55.3% 6.7% 541
50-59 41.4% 27.7% 47.1% 6.4% 329
Education**
Basic (73.9%) (45.6%) (82.6%) (17.4%) 46
Secondary 44.7% 31.7% 61.6% 6.4% 727
TVET 35.3% 26.7% 53.1% 5.6% 371
Higher 18.4% 20.8% 44.9% 1.4% 472
Marital status***
Registered marriage 37.4% 29.1% 57.7% 5.4% 941
Unregistered marriage 38.8% 30.9% 60.7% 3.3% 178
Girlfriend / boyfriend (not living together)
(27.0%) (27.0%) (45.9%) (8.1%) 37
Single 28.1% 22.0% 49.2% 4.5% 337
Separated/divorced 36.5% 37.8% 48.6% 6.8% 74
Widowed (46.9%) (15.7%) (37.5%) (0.0%) 32
Residence
Yerevan 22.1% 23.7% 44.4% 2.8% 570
Other urban areas 36.9% 29.1% 56.7% 5.3% 472
Rural areas 48.4% 30.7% 65.3% 7.2% 575
Employment status****
Never worked 40.7% 29.0% 65.4% 9.9% 211
Student 7.0% 8.3% 33.3% 1.4% 72
Unemployed 39.5% 27.8% 55.1% 5.6% 605
Legally employed 27.4% 28.1% 50.1% 2.9% 409
Informally employed 44.4% 31.8% 63.1% 4.8% 295
Total 35.7% 27.7% 55.4% 5.1% 1,617
Figures in parentheses are based on 25-49 cases.
* For the ease of data presentation, comparison and analysis, the response categories ‘strongly agree’ and ‘agree’ have been merged to measure the percent of the respondents who agreed with a given statement. ** Since there was only 1 respondent in the category “with elementary or lower education” the category was suppressed (therefore the total number of respondents in this section is 1,616) *** Since there were only 18 respondents in the category “Informal union/cohabitation” that category was suppressed (therefore the total number of respondents in this section is 1,599).

120
**** Since there were only 3 respondents in the category “combining studies with employment,” 20 persons in the category “on childcare or another leave,” and 2 “missing answers” those categories were suppressed (therefore the total number of respondents in this section is 1,592).
Numerous studies on violence against women discovered that not only intimate partner
violence is often the most prevalent form of VAW but also that attitudes towards and practicing
of VAW are closely interrelated. Therefore, that interrelation was hypothesized and
consequently tested in the present study.
First, this correlation can be examined from the perspective of violent behavior, i.e. whether
there is a significant difference in an impact that it makes on perpetrators’ attitudes. The data
on attitudes of men with or without history of intimate partner physical violence towards the
latter are presented in Table 11 below.
Table 11. Attitudes of various groups of male respondents toward intimate partner physical violence Percent distribution of various groups of male respondents agreeing with the following statements
Percentage of various groups of men who agree that an intimate partner/husband is justified in hitting or beating his wife/partner for some reason
Man is justified in beating or hitting his wife/partner because:
A woman should tolerate violence to keep her family together
There are times when a woman deserves to be beaten
If a woman cheats on a man, it is okay for him to hit her
It is okay for a man to hit his wife if she won’t have sex with him
Number
of men
Men in the entire sample
44.6% 35.2% 60.9% 5.8% N = 767
Men who slapped intimate female partner or thrown something at her that could hurt her
65.6% 61.1% 65.6% 10.0% N = 90
Men who NEVER slapped intimate female partner or thrown something at her that could hurt her
42.6% 33.2% 60.7% 4.7% N = 596
Men who pushed or shoved intimate female partner
62.0% 63.3% 64.6% 11.4% N = 49
Men who NEVER pushed or shoved intimate female partner
43.4% 33.3% 61.1% 4.6% N = 606
Men who hit intimate female partner with a fist or
(75.5%) (75.5%) (67.9%) (10.7%) N = 28
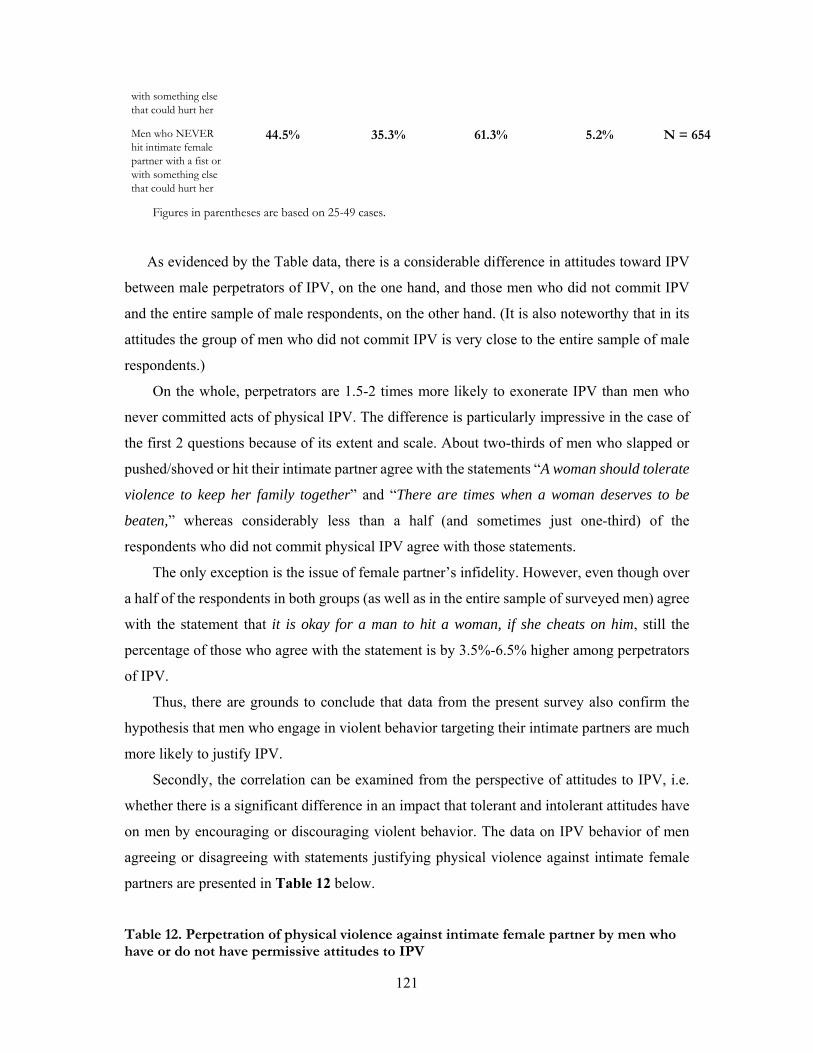
121
with something else that could hurt her
Men who NEVER hit intimate female partner with a fist or with something else that could hurt her
44.5% 35.3% 61.3% 5.2% N = 654
Figures in parentheses are based on 25-49 cases.
As evidenced by the Table data, there is a considerable difference in attitudes toward IPV
between male perpetrators of IPV, on the one hand, and those men who did not commit IPV
and the entire sample of male respondents, on the other hand. (It is also noteworthy that in its
attitudes the group of men who did not commit IPV is very close to the entire sample of male
respondents.)
On the whole, perpetrators are 1.5-2 times more likely to exonerate IPV than men who
never committed acts of physical IPV. The difference is particularly impressive in the case of
the first 2 questions because of its extent and scale. About two-thirds of men who slapped or
pushed/shoved or hit their intimate partner agree with the statements “A woman should tolerate
violence to keep her family together” and “There are times when a woman deserves to be
beaten,” whereas considerably less than a half (and sometimes just one-third) of the
respondents who did not commit physical IPV agree with those statements.
The only exception is the issue of female partner’s infidelity. However, even though over
a half of the respondents in both groups (as well as in the entire sample of surveyed men) agree
with the statement that it is okay for a man to hit a woman, if she cheats on him, still the
percentage of those who agree with the statement is by 3.5%-6.5% higher among perpetrators
of IPV.
Thus, there are grounds to conclude that data from the present survey also confirm the
hypothesis that men who engage in violent behavior targeting their intimate partners are much
more likely to justify IPV.
Secondly, the correlation can be examined from the perspective of attitudes to IPV, i.e.
whether there is a significant difference in an impact that tolerant and intolerant attitudes have
on men by encouraging or discouraging violent behavior. The data on IPV behavior of men
agreeing or disagreeing with statements justifying physical violence against intimate female
partners are presented in Table 12 below.
Table 12. Perpetration of physical violence against intimate female partner by men who have or do not have permissive attitudes to IPV
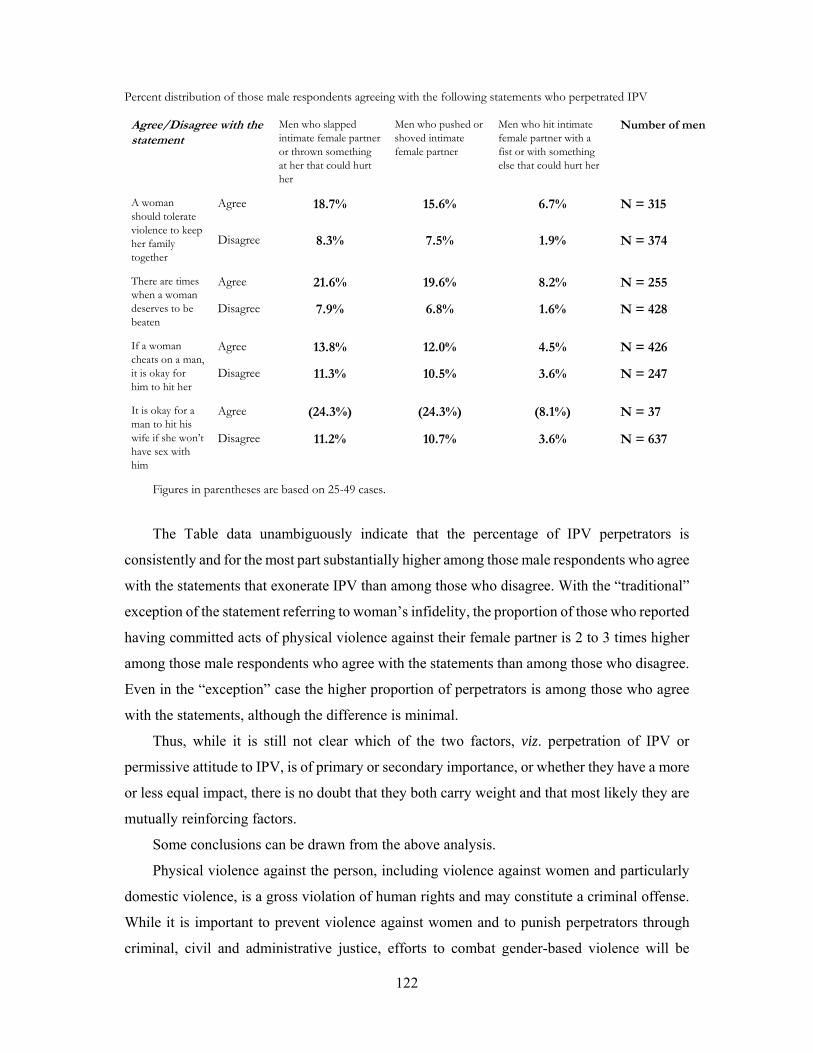
122
Percent distribution of those male respondents agreeing with the following statements who perpetrated IPV
Agree/Disagree with the statement
Men who slapped intimate female partner or thrown something at her that could hurt her
Men who pushed or shoved intimate female partner
Men who hit intimate female partner with a fist or with something else that could hurt her
Number of men
A woman should tolerate violence to keep her family together
Agree 18.7% 15.6% 6.7% N = 315
Disagree 8.3% 7.5% 1.9% N = 374
There are times when a woman deserves to be beaten
Agree 21.6% 19.6% 8.2% N = 255
Disagree 7.9% 6.8% 1.6% N = 428
If a woman cheats on a man, it is okay for him to hit her
Agree 13.8% 12.0% 4.5% N = 426
Disagree 11.3% 10.5% 3.6% N = 247
It is okay for a man to hit his wife if she won’t have sex with him
Agree (24.3%) (24.3%) (8.1%) N = 37
Disagree 11.2% 10.7% 3.6% N = 637
Figures in parentheses are based on 25-49 cases.
The Table data unambiguously indicate that the percentage of IPV perpetrators is
consistently and for the most part substantially higher among those male respondents who agree
with the statements that exonerate IPV than among those who disagree. With the “traditional”
exception of the statement referring to woman’s infidelity, the proportion of those who reported
having committed acts of physical violence against their female partner is 2 to 3 times higher
among those male respondents who agree with the statements than among those who disagree.
Even in the “exception” case the higher proportion of perpetrators is among those who agree
with the statements, although the difference is minimal.
Thus, while it is still not clear which of the two factors, viz. perpetration of IPV or
permissive attitude to IPV, is of primary or secondary importance, or whether they have a more
or less equal impact, there is no doubt that they both carry weight and that most likely they are
mutually reinforcing factors.
Some conclusions can be drawn from the above analysis.
Physical violence against the person, including violence against women and particularly
domestic violence, is a gross violation of human rights and may constitute a criminal offense.
While it is important to prevent violence against women and to punish perpetrators through
criminal, civil and administrative justice, efforts to combat gender-based violence will be
123
effective only when the society at large will have rejected patriarchal stereotypes and norms
and have internalized the principles and norms of the gender equality culture.
The survey data show that a significant percentage of Armenian men still conform to what
they see as traditional and cultural norms but what are in fact patriarchal stereotypes.
Depending on a reason behind physical violence against an intimate female partner, over one-
third or about a half or even more than a half male respondents in the sample are gender
inequitable. They justify and condone intimate partner violence, the only exception being the
situation when a man hits a wife for refusing him sex. This exception is not only noteworthy
but is also virtually unique in terms of consensus between male and female respondents as the
idea that man can be justified in hitting his wife because she refused him sex is in fact equally
unacceptable to respondents of either gender.
Men who accept or conform to masculine norms are much more likely to commit and
justify intimate partner violence.
Women are much less disposed to exonerate intimate partner violence than men both
overall and concerning each individual statement on a reason for a man to commit violence
against an intimate female partner.
Male respondents are more inclined than female respondents to expect women to comply
with patriarchal norms.
The survey data provide grounds to identify the most and the least gender equitable groups
of respondents. It should be borne in mind, however, that much depends on the context and a
comparative perspective. There are no absolutely gender equitable or inequitable groups, they
are rather more or less (in)equitable depending on the extent to which they hold liberal and
egalitarian or traditionalistic and patriarchal views and to which they discarded or subscribe to
lingering patriarchal stereotypes. The designations “the most gender (in)equitable” and “the
least gender (in)equitable” are used here to signify the groups in the context of the present
survey and their rank when compared to one another. This dichotomy cuts across not only
gender but also other 5 key background characteristics. Therefore, an outcome is a generalized
and broad picture of 2 largely imaginable groups, i.e. groups that incorporate individual
characteristics.
Thus, according to the survey data, the most gender equitable group of men would be
constituted of younger, better educated and legally employed51 men who live in Yerevan and
have a girlfriend or are already married.
51 Technically, as regards the employment status, the most gender equitable group is students. However, not only their number is significantly smaller than other groups in that category but, more importantly, the education factor (especially higher
124
The least equitable group of men would be made up of older, less educated men who live
in a rural area, never worked or are currently unemployed and are separated/divorced.
As regards women, the most gender equitable group would comprise younger, better-
educated, legally employed single women living in Yerevan, whereas the least equitable group
would consist of older, less educated women who never worked, live in a rural area and are
married (or widowed).
The study findings also unambiguously indicate that women are much more gender
equitable than men.
Overall, an evidence-based conclusion for the entire sample is that younger, better
educated, legally employed single female residents of Yerevan are much more likely than older,
less educated, separated/divorced male residents of rural areas to reject the patriarchal view
that in certain situations a man is justified in committing physical violence against his intimate
female partner.
***
Attitudes towards rape
Rape is among the gravest and the most extreme forms of sexual violence because of its
severe consequences for victim’s physical and mental health as a result of a gross violation of
bodily integrity and inviolability and of human dignity. As a form of gender-based violence,
which rarely occurs in isolation but is usually a constituent part of a wide scale of various forms
of violent behavior driven, inter alia, by certain views and reinforced by certain stereotypes, it
is about power, domination and subordination. It is one of the ways through which some men
might try to impose and maintain their supremacy, especially if an overall societal climate is
favorable to or at least tolerant of this gross violation of human rights. Therefore it is very
important to find out perceptions of and attitudes toward rape that are prevalent in this society.
To be able to meaningfully do so it is necessary to provide some context because very few
people, if at all, would justify rape per se. However, they may do so when they address a
specific situation. This segment of the survey aimed to thus formulate the questions so as to
see what groups of respondents and to what extent may justify rape by blaming the victim
through peculiar contextualization and social construction of certain situations.
education) is more important (even than gender) and in combination with age and gender it is much more significant than employment and/or marital status. The same holds true for statements below regarding women and the overall sample.
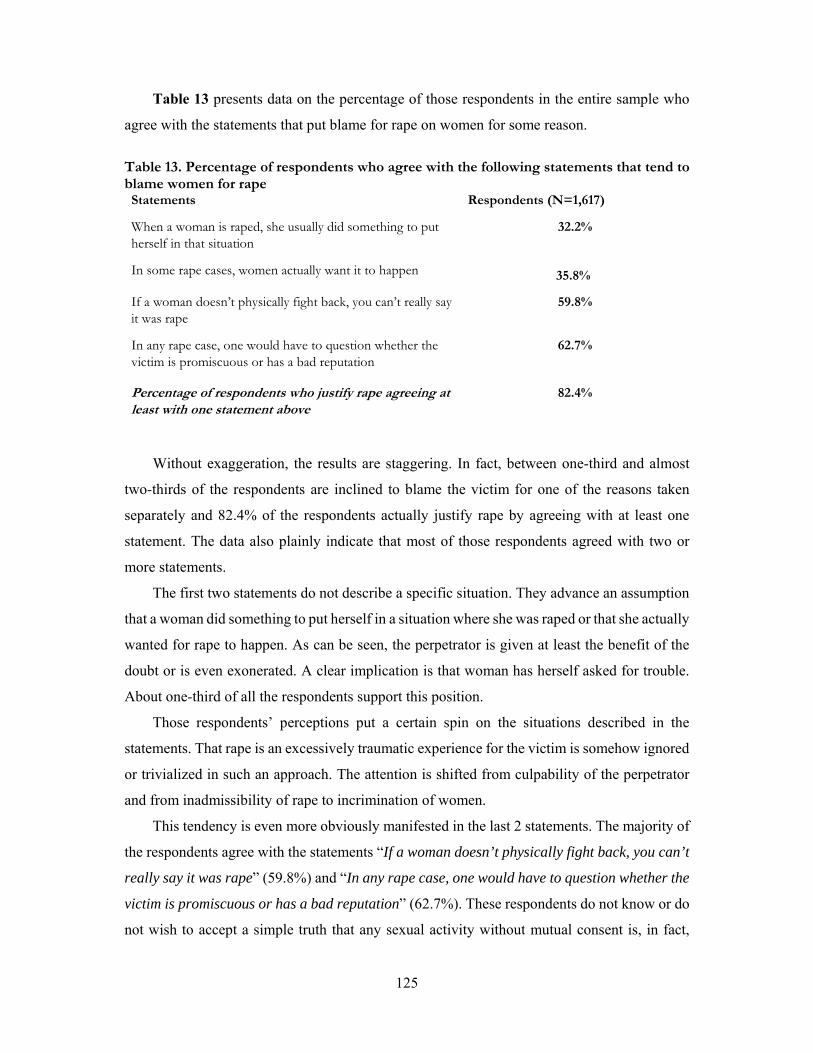
125
Table 13 presents data on the percentage of those respondents in the entire sample who
agree with the statements that put blame for rape on women for some reason. Table 13. Percentage of respondents who agree with the following statements that tend to blame women for rape Statements Respondents (N=1,617)
When a woman is raped, she usually did something to put herself in that situation
32.2%
In some rape cases, women actually want it to happen 35.8%
If a woman doesn’t physically fight back, you can’t really say it was rape
59.8%
In any rape case, one would have to question whether the victim is promiscuous or has a bad reputation
62.7%
Percentage of respondents who justify rape agreeing at least with one statement above
82.4%
Without exaggeration, the results are staggering. In fact, between one-third and almost
two-thirds of the respondents are inclined to blame the victim for one of the reasons taken
separately and 82.4% of the respondents actually justify rape by agreeing with at least one
statement. The data also plainly indicate that most of those respondents agreed with two or
more statements.
The first two statements do not describe a specific situation. They advance an assumption
that a woman did something to put herself in a situation where she was raped or that she actually
wanted for rape to happen. As can be seen, the perpetrator is given at least the benefit of the
doubt or is even exonerated. A clear implication is that woman has herself asked for trouble.
About one-third of all the respondents support this position.
Those respondents’ perceptions put a certain spin on the situations described in the
statements. That rape is an excessively traumatic experience for the victim is somehow ignored
or trivialized in such an approach. The attention is shifted from culpability of the perpetrator
and from inadmissibility of rape to incrimination of women.
This tendency is even more obviously manifested in the last 2 statements. The majority of
the respondents agree with the statements “If a woman doesn’t physically fight back, you can’t
really say it was rape” (59.8%) and “In any rape case, one would have to question whether the
victim is promiscuous or has a bad reputation” (62.7%). These respondents do not know or do
not wish to accept a simple truth that any sexual activity without mutual consent is, in fact,

126
violence and that sexual intercourse under such circumstances is rape. In other words, for those
respondents, unless a woman complies with patriarchal cultural norms by being “virtuous” and
by putting up a fierce fight to defend her “honor” when sexually assaulted, she may be
suspected or even accused of “provoking” men, of being of “easy virtue” or of having herself
invited trouble, especially when she does not have a male “protector.”
It does not matter much for those people that woman is under no obligation to offer any
physical resistance or proof of “impeccable” character or behavior to be considered a victim
but not a “legitimate” target in case of a sexual assault. It does not matter either that those
stereotypes are in contravention of the Armenian legislation. As per Article 138 of the
Armenian Criminal Code, rape is a “sexual intercourse of a man with a woman against her will,
using violence against the latter or some other person, with threat thereof, or taking advantage
of the woman’s helpless situation” and is punishable by imprisonment52. The law does not spell
out any other requirements except the absence of a women’s consent for the assault to be
defined as rape.
Such entrenched patriarchal stereotypes are of course dangerous and send a wrong
message to younger generations. Strange as it might seem, even though rape is an extreme form
of sexual violence against women (and, besides, sex is a sensitive issue for patriarchal norms
and mentality), most respondents take quite a lenient view of it. In any case, they seem to be
more tolerant of it than of physical violence against women disregarding the fact that rape is
usually accompanied by physical violence. Indeed, on the whole the percentage of the
respondents in the entire sample who justify rape (82.4%) for one or more reasons, which are
spelled out in the above statements, is considerably higher than that of the respondents who
justify physical violence against women (70.3%).
Another issue of major public concern should be the fact that over a half of even the
respondents with higher education agree with the stereotypes-based statements that women
who do not physically fight back or who are “promiscuous” or have a bad reputation (54.2%
and 57.2% respectively) and thus are either unaware of a mismatch between their views and
the provision of the law or do not regard the legal approach as adequate and legitimate.
***
As could be expected, there are some differences between male and female respondents in
their attitudes toward rape. Table 14 below presents data broken down by gender.
52 Article 138 (“Rape”), paragraph 1. Criminal Code of the Republic of Armenia. Adopted on 18.04.2003.
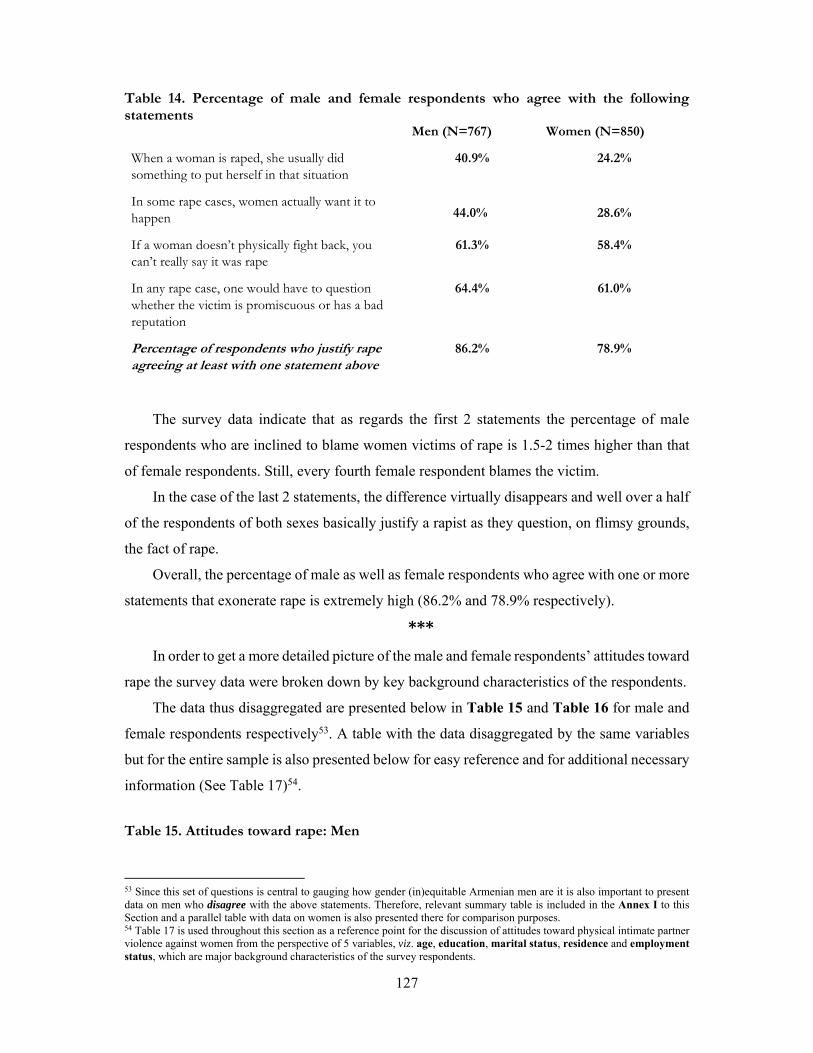
127
Table 14. Percentage of male and female respondents who agree with the following statements Men (N=767) Women (N=850)
When a woman is raped, she usually did something to put herself in that situation
40.9% 24.2%
In some rape cases, women actually want it to happen 44.0% 28.6%
If a woman doesn’t physically fight back, you can’t really say it was rape
61.3% 58.4%
In any rape case, one would have to question whether the victim is promiscuous or has a bad reputation
64.4% 61.0%
Percentage of respondents who justify rape agreeing at least with one statement above
86.2% 78.9%
The survey data indicate that as regards the first 2 statements the percentage of male
respondents who are inclined to blame women victims of rape is 1.5-2 times higher than that
of female respondents. Still, every fourth female respondent blames the victim.
In the case of the last 2 statements, the difference virtually disappears and well over a half
of the respondents of both sexes basically justify a rapist as they question, on flimsy grounds,
the fact of rape.
Overall, the percentage of male as well as female respondents who agree with one or more
statements that exonerate rape is extremely high (86.2% and 78.9% respectively).
***
In order to get a more detailed picture of the male and female respondents’ attitudes toward
rape the survey data were broken down by key background characteristics of the respondents.
The data thus disaggregated are presented below in Table 15 and Table 16 for male and
female respondents respectively53. A table with the data disaggregated by the same variables
but for the entire sample is also presented below for easy reference and for additional necessary
information (See Table 17)54.
Table 15. Attitudes toward rape: Men
53 Since this set of questions is central to gauging how gender (in)equitable Armenian men are it is also important to present data on men who disagree with the above statements. Therefore, relevant summary table is included in the Annex I to this Section and a parallel table with data on women is also presented there for comparison purposes. 54 Table 17 is used throughout this section as a reference point for the discussion of attitudes toward physical intimate partner violence against women from the perspective of 5 variables, viz. age, education, marital status, residence and employment status, which are major background characteristics of the survey respondents.
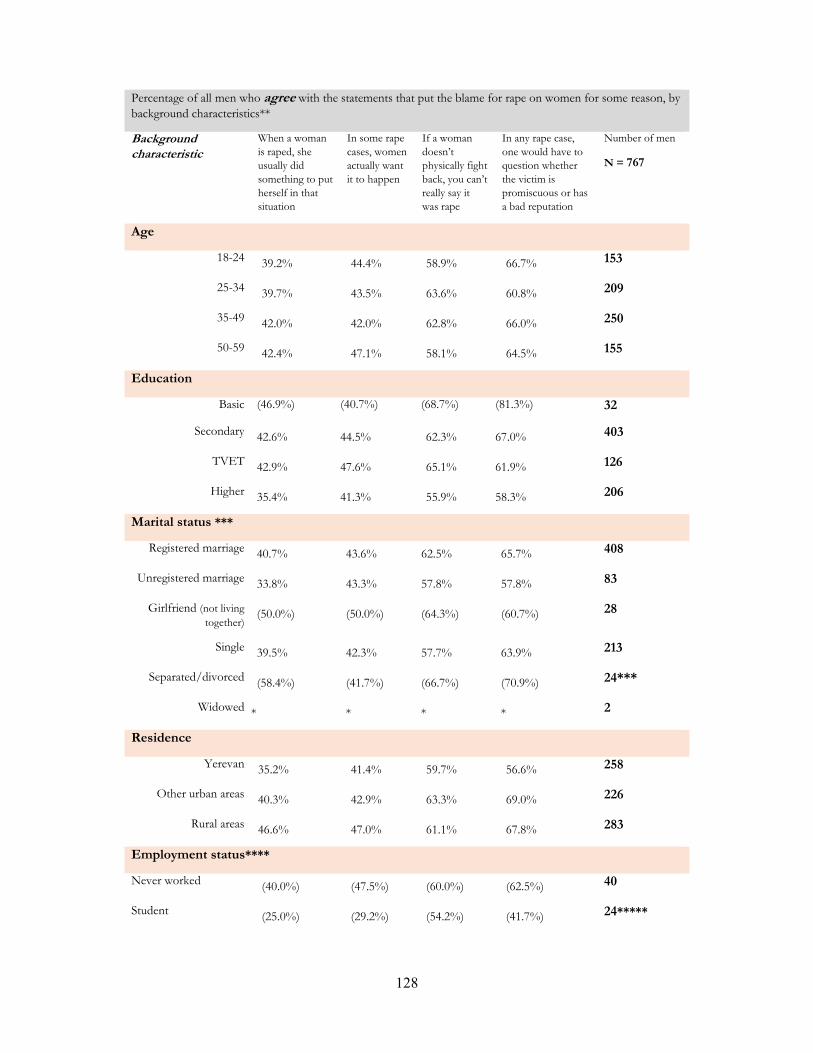
128
Percentage of all men who agree with the statements that put the blame for rape on women for some reason, by background characteristics**
Background characteristic
When a woman is raped, she usually did something to put herself in that situation
In some rape cases, women actually want it to happen
If a woman doesn’t physically fight back, you can’t really say it was rape
In any rape case, one would have to question whether the victim is promiscuous or has a bad reputation
Number of men
N = 767
Age
18-24 39.2% 44.4% 58.9% 66.7% 153
25-34 39.7% 43.5% 63.6% 60.8% 209
35-49 42.0% 42.0% 62.8% 66.0% 250
50-59 42.4% 47.1% 58.1% 64.5% 155
Education
Basic (46.9%) (40.7%) (68.7%) (81.3%) 32
Secondary 42.6% 44.5% 62.3% 67.0% 403
TVET 42.9% 47.6% 65.1% 61.9% 126
Higher 35.4% 41.3% 55.9% 58.3% 206
Marital status ***
Registered marriage 40.7% 43.6% 62.5% 65.7% 408
Unregistered marriage 33.8% 43.3% 57.8% 57.8% 83
Girlfriend (not living together)
(50.0%) (50.0%) (64.3%) (60.7%) 28
Single 39.5% 42.3% 57.7% 63.9% 213
Separated/divorced (58.4%) (41.7%) (66.7%) (70.9%) 24***
Widowed * * * * 2
Residence
Yerevan 35.2% 41.4% 59.7% 56.6% 258
Other urban areas 40.3% 42.9% 63.3% 69.0% 226
Rural areas 46.6% 47.0% 61.1% 67.8% 283
Employment status****
Never worked (40.0%) (47.5%) (60.0%) (62.5%) 40
Student (25.0%) (29.2%) (54.2%) (41.7%) 24*****
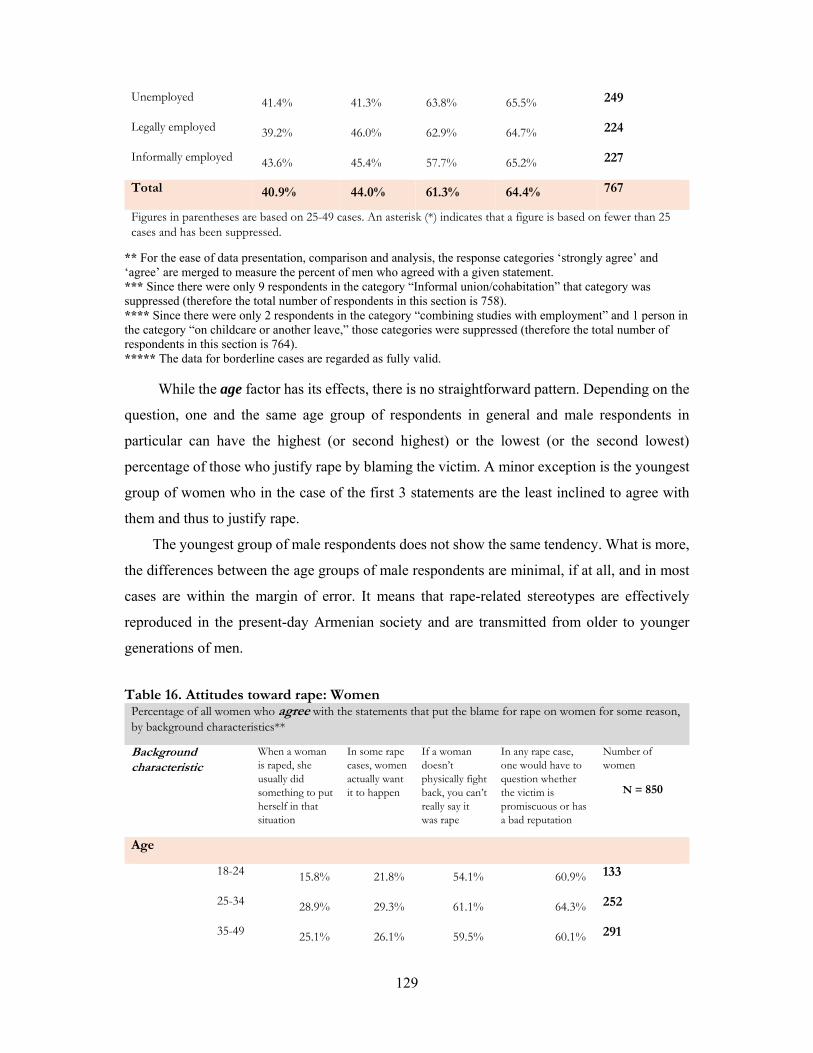
129
Unemployed 41.4% 41.3% 63.8% 65.5% 249
Legally employed 39.2% 46.0% 62.9% 64.7% 224
Informally employed 43.6% 45.4% 57.7% 65.2% 227
Total 40.9% 44.0% 61.3% 64.4% 767
Figures in parentheses are based on 25-49 cases. An asterisk (*) indicates that a figure is based on fewer than 25 cases and has been suppressed.
** For the ease of data presentation, comparison and analysis, the response categories ‘strongly agree’ and ‘agree’ are merged to measure the percent of men who agreed with a given statement. *** Since there were only 9 respondents in the category “Informal union/cohabitation” that category was suppressed (therefore the total number of respondents in this section is 758). **** Since there were only 2 respondents in the category “combining studies with employment” and 1 person in the category “on childcare or another leave,” those categories were suppressed (therefore the total number of respondents in this section is 764). ***** The data for borderline cases are regarded as fully valid.
While the age factor has its effects, there is no straightforward pattern. Depending on the
question, one and the same age group of respondents in general and male respondents in
particular can have the highest (or second highest) or the lowest (or the second lowest)
percentage of those who justify rape by blaming the victim. A minor exception is the youngest
group of women who in the case of the first 3 statements are the least inclined to agree with
them and thus to justify rape.
The youngest group of male respondents does not show the same tendency. What is more,
the differences between the age groups of male respondents are minimal, if at all, and in most
cases are within the margin of error. It means that rape-related stereotypes are effectively
reproduced in the present-day Armenian society and are transmitted from older to younger
generations of men.
Table 16. Attitudes toward rape: Women Percentage of all women who agree with the statements that put the blame for rape on women for some reason, by background characteristics**
Background characteristic
When a woman is raped, she usually did something to put herself in that situation
In some rape cases, women actually want it to happen
If a woman doesn’t physically fight back, you can’t really say it was rape
In any rape case, one would have to question whether the victim is promiscuous or has a bad reputation
Number of women
N = 850
Age
18-24 15.8% 21.8% 54.1% 60.9% 133
25-34 28.9% 29.3% 61.1% 64.3% 252
35-49 25.1% 26.1% 59.5% 60.1% 291
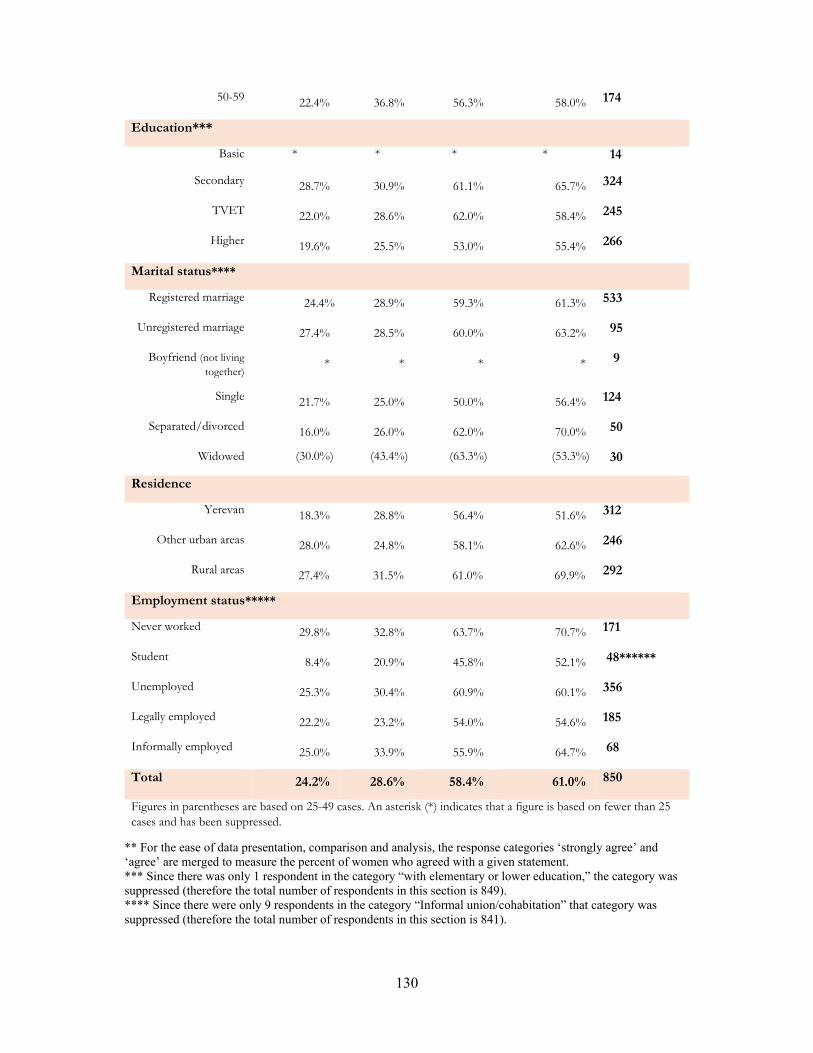
130
50-59 22.4% 36.8% 56.3% 58.0% 174
Education***
Basic * * * * 14
Secondary 28.7% 30.9% 61.1% 65.7% 324
TVET 22.0% 28.6% 62.0% 58.4% 245
Higher 19.6% 25.5% 53.0% 55.4% 266
Marital status****
Registered marriage 24.4% 28.9% 59.3% 61.3% 533
Unregistered marriage 27.4% 28.5% 60.0% 63.2% 95
Boyfriend (not living together)
* * * * 9
Single 21.7% 25.0% 50.0% 56.4% 124
Separated/divorced 16.0% 26.0% 62.0% 70.0% 50
Widowed (30.0%) (43.4%) (63.3%) (53.3%) 30
Residence
Yerevan 18.3% 28.8% 56.4% 51.6% 312
Other urban areas 28.0% 24.8% 58.1% 62.6% 246
Rural areas 27.4% 31.5% 61.0% 69.9% 292
Employment status*****
Never worked 29.8% 32.8% 63.7% 70.7% 171
Student 8.4% 20.9% 45.8% 52.1% 48******
Unemployed 25.3% 30.4% 60.9% 60.1% 356
Legally employed 22.2% 23.2% 54.0% 54.6% 185
Informally employed 25.0% 33.9% 55.9% 64.7% 68
Total 24.2% 28.6% 58.4% 61.0% 850
Figures in parentheses are based on 25-49 cases. An asterisk (*) indicates that a figure is based on fewer than 25 cases and has been suppressed.
** For the ease of data presentation, comparison and analysis, the response categories ‘strongly agree’ and ‘agree’ are merged to measure the percent of women who agreed with a given statement. *** Since there was only 1 respondent in the category “with elementary or lower education,” the category was suppressed (therefore the total number of respondents in this section is 849). **** Since there were only 9 respondents in the category “Informal union/cohabitation” that category was suppressed (therefore the total number of respondents in this section is 841).

131
***** Since there were 1 respondent in the category “combining studies with employment”, 2 respondents who gave no answer or refused to answer and 19 respondents who were on a “childcare or another leave” those categories were suppressed (therefore the total number of respondents in this section is 828). ****** The data for borderline cases are regarded as fully valid.
As could be expected, education, especially higher education, is a very powerful factor.
The proportion of those who agree with the statements is not only the lowest one among holders
of higher education in the entire sample as well as in the subsets of male and female respondents
but is for the most part considerably lower than among holders of a lower-level education. The
difference between holders of higher education and of basic education in their acceptance of
rape ranges from about 7% to 25% for the entire sample and is almost as impressive (with one
notable exception) for male respondents.
As regards the marital status, because of considerable differences between male and
female respondents the picture is far from being straightforward. For the entire sample, the
least inclined group to justify rape is a group of separated/divorced persons in the case of the
first 2 statements, and then of single persons and widowed persons, each for one statement.
The groups that are the most inclined to blame a woman for rape are the respondents who have
a girlfriend or a boyfriend (in the case of the first statement), separated/divorced respondents
(in the case of the 4th statement) and widowed persons (statements 2 and 3).
Among male respondents, the group that is the least inclined to justify rape is primarily
that of men in unregistered marriage and in one case (viz. the statement that in some rape cases
women actually want it to happen) that of separated/divorced men. At the same time, it is
separated/divorced men who, as a group, are the most inclined to justify rape, except for the
above-mentioned case.
Among female respondents, there is not a single group that would demonstrate a consistent
approach in rejecting any justifications for rape. Depending on the statement, it can be single
women, separated/divorced women and (in the case of the 4th statement) even widows. At the
same time, widows are the group where, as regards the first 3 statements, the proportion of
those who blame women for rape is not only the highest one but is also much higher than
among other groups. As regards the 4th statement, the highest proportion is among
separated/divorced women.
Table 17. Attitudes toward rape: Entire sample
Percentage of all respondents who agree with the statements that put the blame for rape on women for some reason, by background characteristics**
Background characteristic
When a woman is raped, she usually did
In some rape cases, women
If a woman doesn’t physically fight
In any rape case, one would have to
Number of respondents
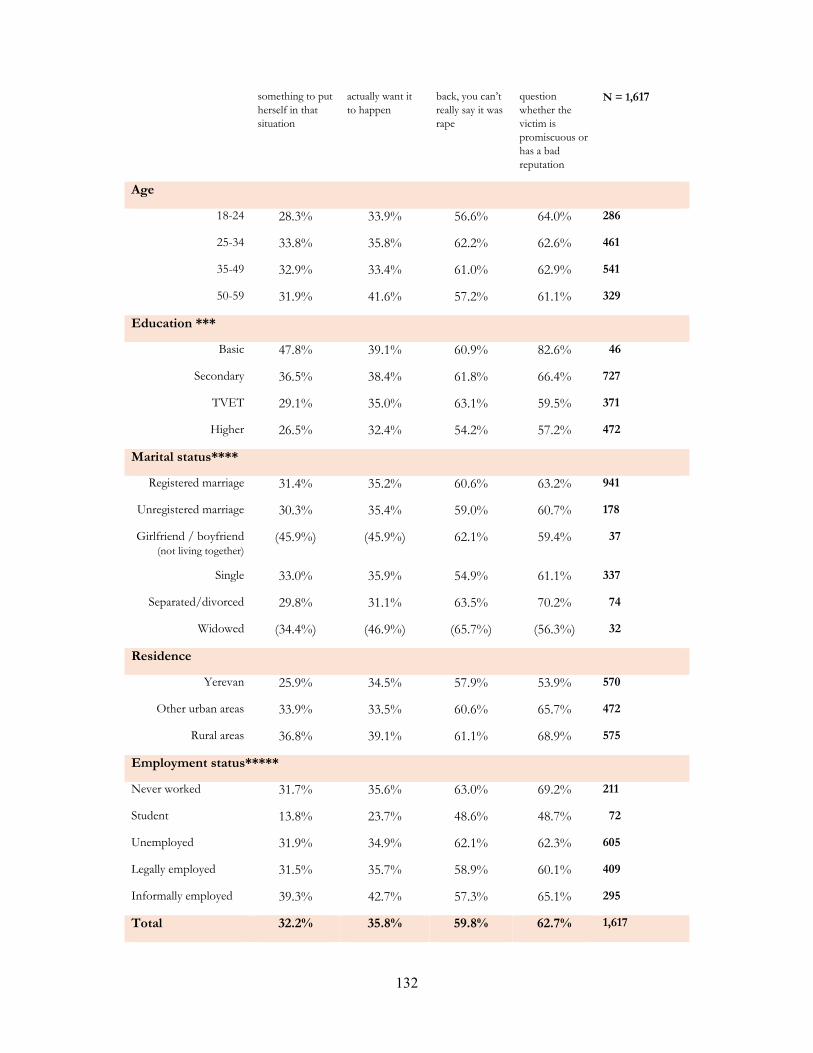
132
something to put herself in that situation
actually want it to happen
back, you can’t really say it was rape
question whether the victim is promiscuous or has a bad reputation
N = 1,617
Age
18-24 28.3% 33.9% 56.6% 64.0% 286
25-34 33.8% 35.8% 62.2% 62.6% 461
35-49 32.9% 33.4% 61.0% 62.9% 541
50-59 31.9% 41.6% 57.2% 61.1% 329
Education ***
Basic 47.8% 39.1% 60.9% 82.6% 46
Secondary 36.5% 38.4% 61.8% 66.4% 727
TVET 29.1% 35.0% 63.1% 59.5% 371
Higher 26.5% 32.4% 54.2% 57.2% 472
Marital status****
Registered marriage 31.4% 35.2% 60.6% 63.2% 941
Unregistered marriage 30.3% 35.4% 59.0% 60.7% 178
Girlfriend / boyfriend (not living together)
(45.9%) (45.9%) 62.1% 59.4% 37
Single 33.0% 35.9% 54.9% 61.1% 337
Separated/divorced 29.8% 31.1% 63.5% 70.2% 74
Widowed (34.4%) (46.9%) (65.7%) (56.3%) 32
Residence
Yerevan 25.9% 34.5% 57.9% 53.9% 570
Other urban areas 33.9% 33.5% 60.6% 65.7% 472
Rural areas 36.8% 39.1% 61.1% 68.9% 575
Employment status*****
Never worked 31.7% 35.6% 63.0% 69.2% 211
Student 13.8% 23.7% 48.6% 48.7% 72
Unemployed 31.9% 34.9% 62.1% 62.3% 605
Legally employed 31.5% 35.7% 58.9% 60.1% 409
Informally employed 39.3% 42.7% 57.3% 65.1% 295
Total 32.2% 35.8% 59.8% 62.7% 1,617

133
Figures in parentheses are based on 25-49 cases. An asterisk (*) indicates that a figure is based on fewer than 25 cases and has been suppressed.
** For the ease of data presentation, comparison and analysis, the response categories ‘strongly agree’ and ‘agree’ have been merged to measure the percent of the respondents who agreed with a given statement. *** Since there was only 1 respondent in the category “with elementary or lower education” the category was suppressed (therefore the total number of respondents in this section is 1,616) **** Since there were only 18 respondents in the category “Informal union/cohabitation” that category was suppressed (therefore the total number of respondents in this section is 1,599). ***** Since there were only 3 respondents in the category “combining studies with employment,” 20 persons in the category “on childcare or another leave,” and 2 “missing answers” those categories were suppressed (therefore the total number of respondents in this section is 1,592).
The effect of the residence factor is not entirely uniform owing primarily to differences in
attitudes among various groups of men and among various groups of women.
It was time and again mentioned above that residents of Yerevan usually demonstrate the
most liberal attitudes and take the least traditionalistic approach, which is grounded in
patriarchal norms. This pattern is for the most part reflected in this case as well, especially what
concerns male respondents. Among the surveyed male respondents, the lowest proportion of
those who agreed with the statements was among residents of Yerevan.
In the case of the entire sample and of female respondents, the main tendency is the same,
with a minor exception observed as regards the second statement, where the lowest proportion
is among residents of urban areas other than Yerevan.
The highest proportion of those who agree with the statements and thus actually blame
women is, in the case of the entire sample, among rural residents. In the sample of men, that is
the case only of the first 2 statements, whereas in the case of the 3rd and 4th statements the
proportion is higher among residents of urban areas other than Yerevan but insignificantly
higher than among rural residents. The situation is virtually the same in the case of the surveyed
women. The highest proportion is basically among rural women and in the case of the first
statement, when the highest proportion is among residents of urban areas other than Yerevan,
the difference is negligible.
As regards the employment status factor, the lowest percentage of those who agree with
the statements is among students. This is true for surveyed men and women and even more so
for the entire sample.
The picture is not so straightforward when an attempt is made to identify a group of
respondents with the highest proportion of those who agree with the statements. Among male
respondents it is primarily the unemployed and those who never worked (and in the case of the
1st statement, informally employed), among female respondents it is mostly those who never
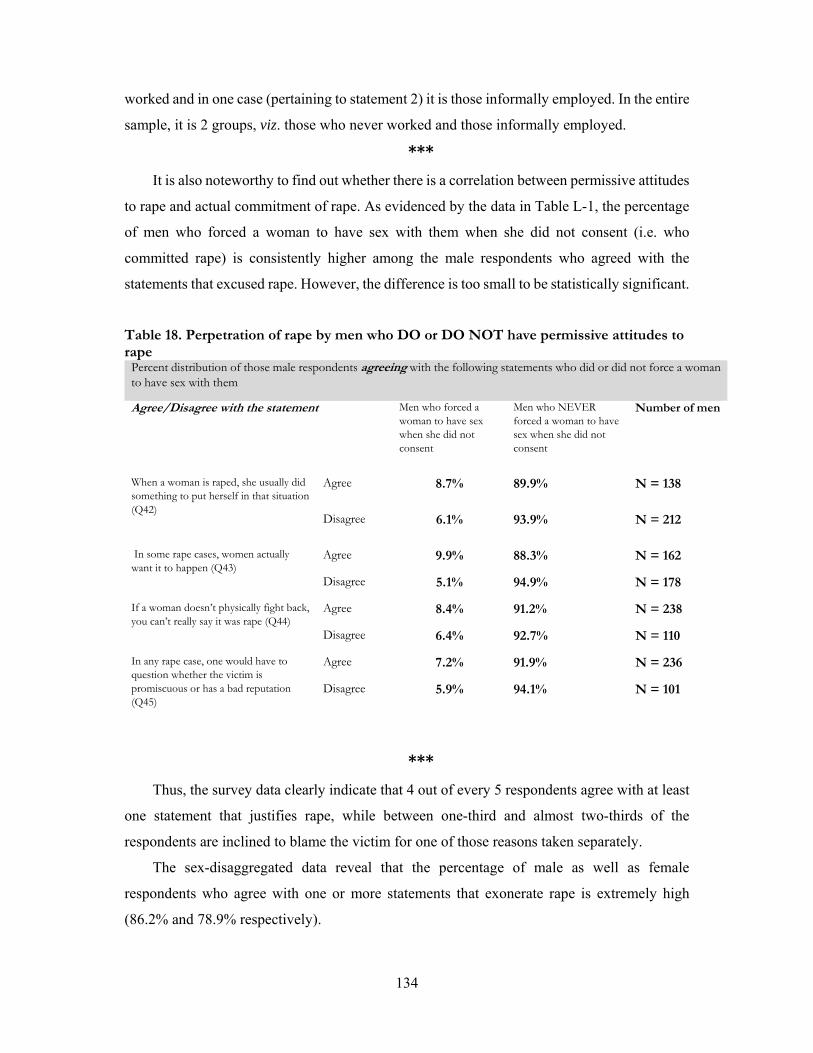
134
worked and in one case (pertaining to statement 2) it is those informally employed. In the entire
sample, it is 2 groups, viz. those who never worked and those informally employed.
***
It is also noteworthy to find out whether there is a correlation between permissive attitudes
to rape and actual commitment of rape. As evidenced by the data in Table L-1, the percentage
of men who forced a woman to have sex with them when she did not consent (i.e. who
committed rape) is consistently higher among the male respondents who agreed with the
statements that excused rape. However, the difference is too small to be statistically significant.
Table 18. Perpetration of rape by men who DO or DO NOT have permissive attitudes to rape
Percent distribution of those male respondents agreeing with the following statements who did or did not force a woman to have sex with them
Agree/Disagree with the statement Men who forced a woman to have sex when she did not consent
Men who NEVER forced a woman to have sex when she did not consent
Number of men
When a woman is raped, she usually did something to put herself in that situation (Q42)
Agree 8.7% 89.9% N = 138
Disagree 6.1% 93.9% N = 212
In some rape cases, women actually want it to happen (Q43)
Agree 9.9% 88.3% N = 162
Disagree 5.1% 94.9% N = 178
If a woman doesn’t physically fight back, you can’t really say it was rape (Q44)
Agree 8.4% 91.2% N = 238
Disagree 6.4% 92.7% N = 110
In any rape case, one would have to question whether the victim is promiscuous or has a bad reputation (Q45)
Agree 7.2% 91.9% N = 236
Disagree 5.9% 94.1% N = 101
***
Thus, the survey data clearly indicate that 4 out of every 5 respondents agree with at least
one statement that justifies rape, while between one-third and almost two-thirds of the
respondents are inclined to blame the victim for one of those reasons taken separately.
The sex-disaggregated data reveal that the percentage of male as well as female
respondents who agree with one or more statements that exonerate rape is extremely high
(86.2% and 78.9% respectively).
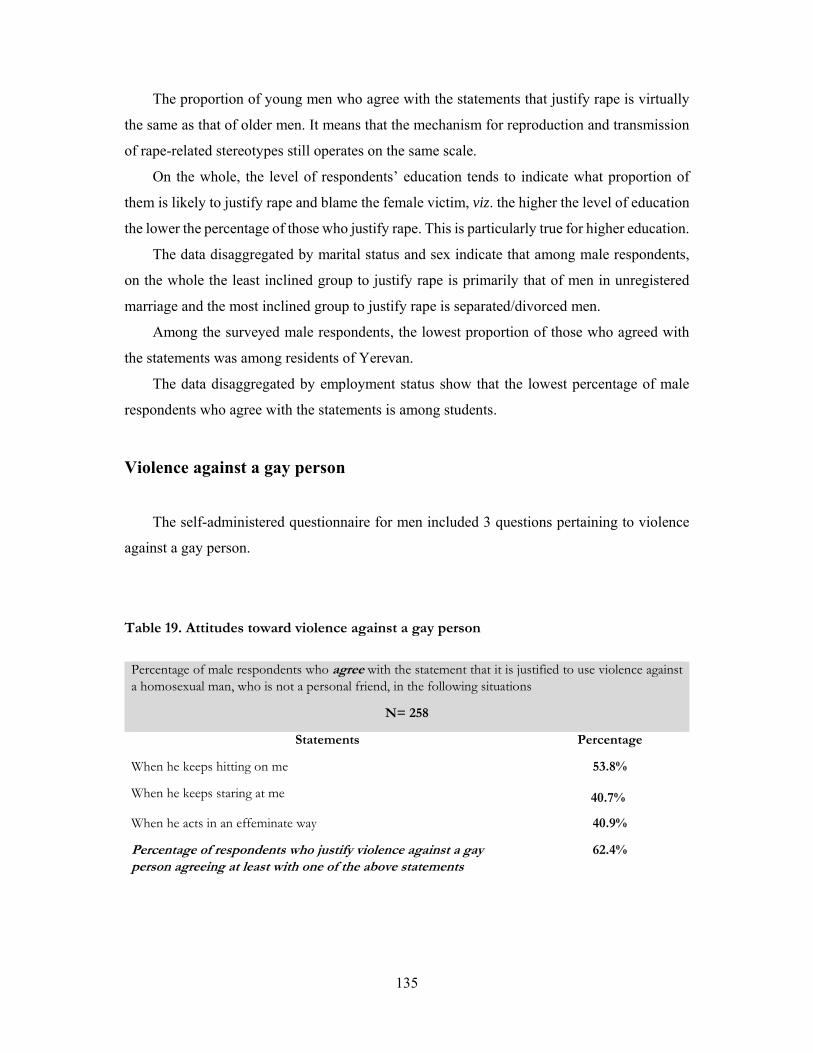
135
The proportion of young men who agree with the statements that justify rape is virtually
the same as that of older men. It means that the mechanism for reproduction and transmission
of rape-related stereotypes still operates on the same scale.
On the whole, the level of respondents’ education tends to indicate what proportion of
them is likely to justify rape and blame the female victim, viz. the higher the level of education
the lower the percentage of those who justify rape. This is particularly true for higher education.
The data disaggregated by marital status and sex indicate that among male respondents,
on the whole the least inclined group to justify rape is primarily that of men in unregistered
marriage and the most inclined group to justify rape is separated/divorced men.
Among the surveyed male respondents, the lowest proportion of those who agreed with
the statements was among residents of Yerevan.
The data disaggregated by employment status show that the lowest percentage of male
respondents who agree with the statements is among students.
Violence against a gay person
The self-administered questionnaire for men included 3 questions pertaining to violence
against a gay person.
Table 19. Attitudes toward violence against a gay person
Percentage of male respondents who agree with the statement that it is justified to use violence against a homosexual man, who is not a personal friend, in the following situations
N= 258
Statements Percentage
When he keeps hitting on me 53.8%
When he keeps staring at me 40.7%
When he acts in an effeminate way 40.9%
Percentage of respondents who justify violence against a gay person agreeing at least with one of the above statements
62.4%
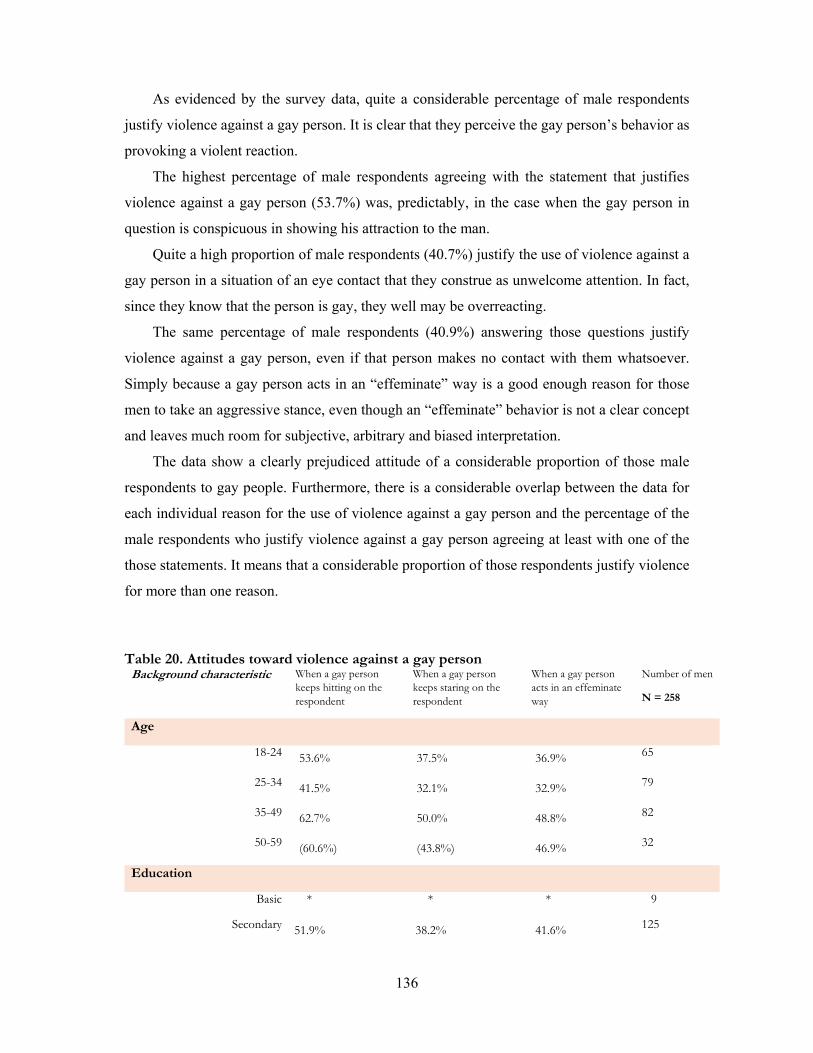
136
As evidenced by the survey data, quite a considerable percentage of male respondents
justify violence against a gay person. It is clear that they perceive the gay person’s behavior as
provoking a violent reaction.
The highest percentage of male respondents agreeing with the statement that justifies
violence against a gay person (53.7%) was, predictably, in the case when the gay person in
question is conspicuous in showing his attraction to the man.
Quite a high proportion of male respondents (40.7%) justify the use of violence against a
gay person in a situation of an eye contact that they construe as unwelcome attention. In fact,
since they know that the person is gay, they well may be overreacting.
The same percentage of male respondents (40.9%) answering those questions justify
violence against a gay person, even if that person makes no contact with them whatsoever.
Simply because a gay person acts in an “effeminate” way is a good enough reason for those
men to take an aggressive stance, even though an “effeminate” behavior is not a clear concept
and leaves much room for subjective, arbitrary and biased interpretation.
The data show a clearly prejudiced attitude of a considerable proportion of those male
respondents to gay people. Furthermore, there is a considerable overlap between the data for
each individual reason for the use of violence against a gay person and the percentage of the
male respondents who justify violence against a gay person agreeing at least with one of the
those statements. It means that a considerable proportion of those respondents justify violence
for more than one reason.
Table 20. Attitudes toward violence against a gay person
Background characteristic When a gay person keeps hitting on the respondent
When a gay person keeps staring on the respondent
When a gay person acts in an effeminate way
Number of men
N = 258
Age
18-24 53.6% 37.5% 36.9% 65
25-34 41.5% 32.1% 32.9% 79
35-49 62.7% 50.0% 48.8% 82
50-59 (60.6%) (43.8%) 46.9% 32
Education
Basic * * * 9
Secondary 51.9% 38.2% 41.6% 125
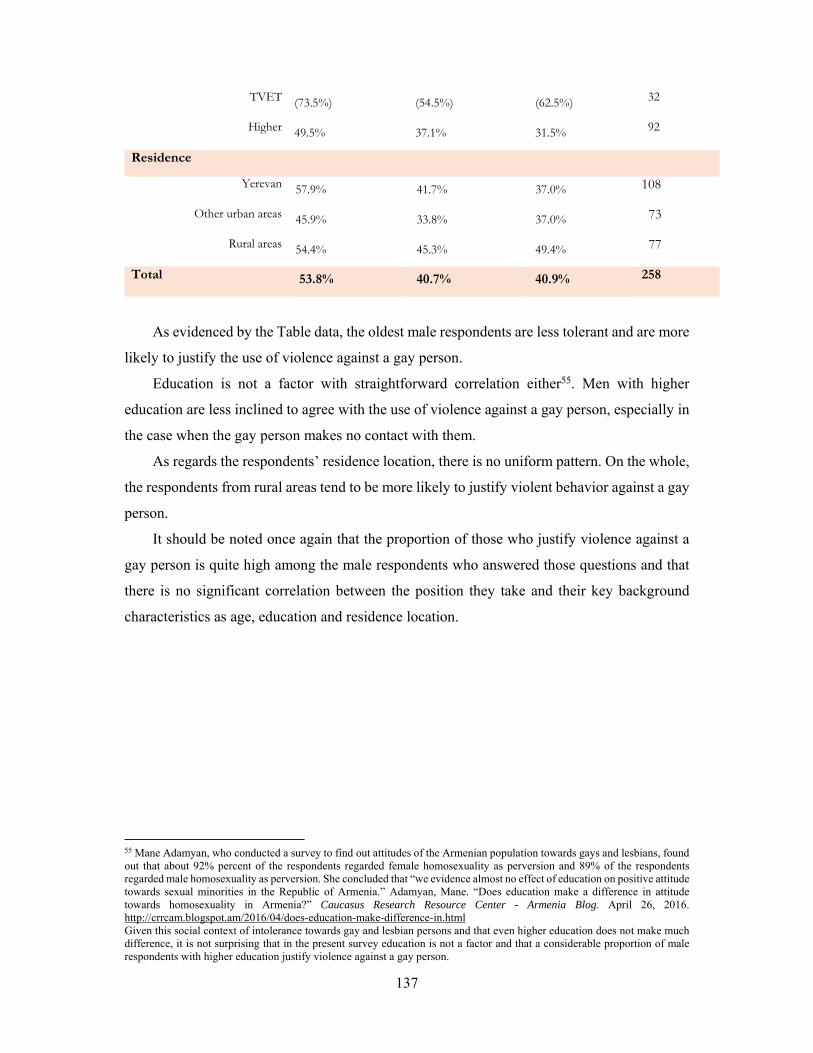
137
TVET (73.5%) (54.5%) (62.5%) 32
Higher 49.5% 37.1% 31.5% 92
Residence
Yerevan 57.9% 41.7% 37.0% 108
Other urban areas 45.9% 33.8% 37.0% 73
Rural areas 54.4% 45.3% 49.4% 77
Total 53.8% 40.7% 40.9% 258
As evidenced by the Table data, the oldest male respondents are less tolerant and are more
likely to justify the use of violence against a gay person.
Education is not a factor with straightforward correlation either55. Men with higher
education are less inclined to agree with the use of violence against a gay person, especially in
the case when the gay person makes no contact with them.
As regards the respondents’ residence location, there is no uniform pattern. On the whole,
the respondents from rural areas tend to be more likely to justify violent behavior against a gay
person.
It should be noted once again that the proportion of those who justify violence against a
gay person is quite high among the male respondents who answered those questions and that
there is no significant correlation between the position they take and their key background
characteristics as age, education and residence location.
55 Mane Adamyan, who conducted a survey to find out attitudes of the Armenian population towards gays and lesbians, found out that about 92% percent of the respondents regarded female homosexuality as perversion and 89% of the respondents regarded male homosexuality as perversion. She concluded that “we evidence almost no effect of education on positive attitude towards sexual minorities in the Republic of Armenia.” Adamyan, Mane. “Does education make a difference in attitude towards homosexuality in Armenia?” Caucasus Research Resource Center - Armenia Blog. April 26, 2016. http://crrcam.blogspot.am/2016/04/does-education-make-difference-in.html Given this social context of intolerance towards gay and lesbian persons and that even higher education does not make much difference, it is not surprising that in the present survey education is not a factor and that a considerable proportion of male respondents with higher education justify violence against a gay person.
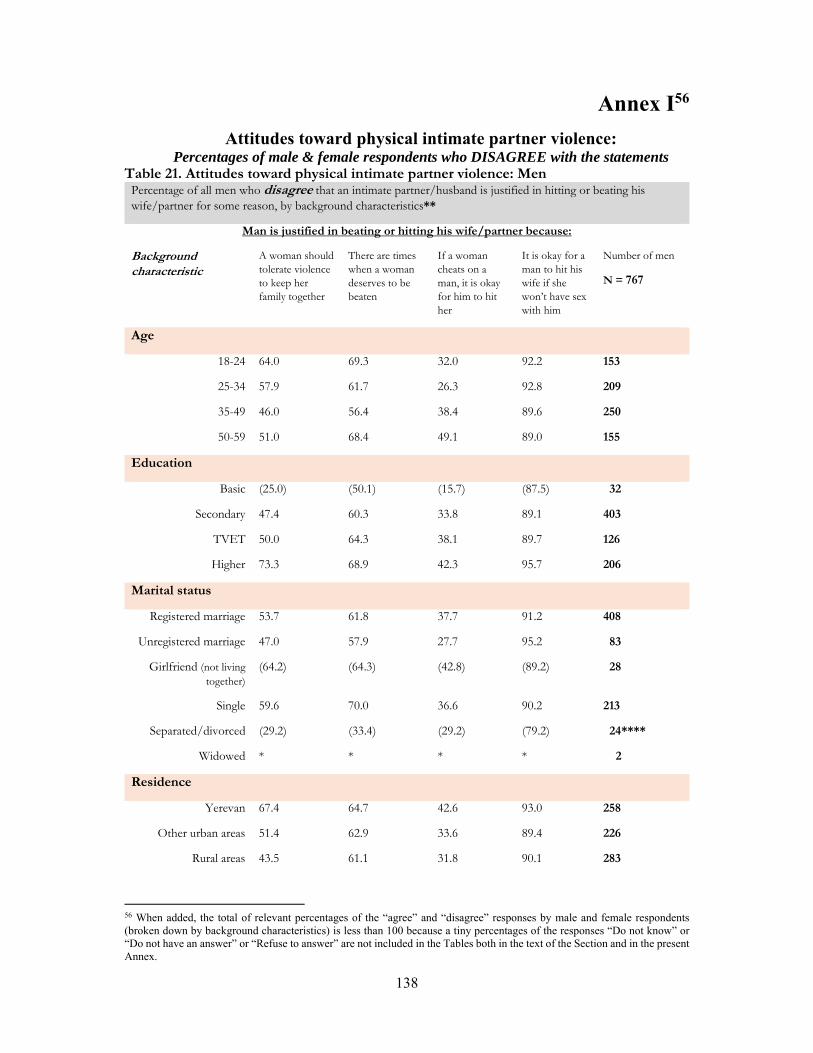
138
Annex I56
Attitudes toward physical intimate partner violence: Percentages of male & female respondents who DISAGREE with the statements
Table 21. Attitudes toward physical intimate partner violence: Men Percentage of all men who disagree that an intimate partner/husband is justified in hitting or beating his wife/partner for some reason, by background characteristics**
Man is justified in beating or hitting his wife/partner because:
Background characteristic
A woman should tolerate violence to keep her family together
There are times when a woman deserves to be beaten
If a woman cheats on a man, it is okay for him to hit her
It is okay for a man to hit his wife if she won’t have sex with him
Number of men
N = 767
Age
18-24 64.0 69.3 32.0 92.2 153
25-34 57.9 61.7 26.3 92.8 209
35-49 46.0 56.4 38.4 89.6 250
50-59 51.0 68.4 49.1 89.0 155
Education
Basic (25.0) (50.1) (15.7) (87.5) 32
Secondary 47.4 60.3 33.8 89.1 403
TVET 50.0 64.3 38.1 89.7 126
Higher 73.3 68.9 42.3 95.7 206
Marital status
Registered marriage 53.7 61.8 37.7 91.2 408
Unregistered marriage 47.0 57.9 27.7 95.2 83
Girlfriend (not living together)
(64.2) (64.3) (42.8) (89.2) 28
Single 59.6 70.0 36.6 90.2 213
Separated/divorced (29.2) (33.4) (29.2) (79.2) 24****
Widowed * * * * 2
Residence
Yerevan 67.4 64.7 42.6 93.0 258
Other urban areas 51.4 62.9 33.6 89.4 226
Rural areas 43.5 61.1 31.8 90.1 283
56 When added, the total of relevant percentages of the “agree” and “disagree” responses by male and female respondents (broken down by background characteristics) is less than 100 because a tiny percentages of the responses “Do not know” or “Do not have an answer” or “Refuse to answer” are not included in the Tables both in the text of the Section and in the present Annex.
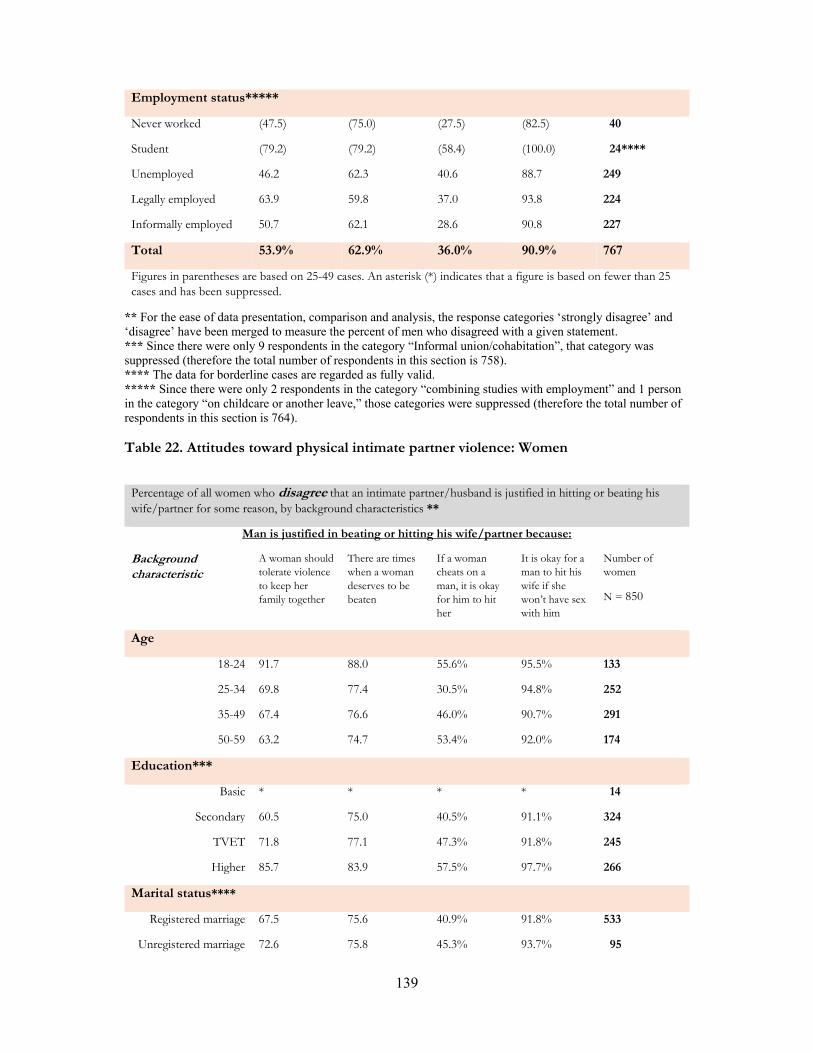
139
Employment status*****
Never worked (47.5) (75.0) (27.5) (82.5) 40
Student (79.2) (79.2) (58.4) (100.0) 24****
Unemployed 46.2 62.3 40.6 88.7 249
Legally employed 63.9 59.8 37.0 93.8 224
Informally employed 50.7 62.1 28.6 90.8 227
Total 53.9% 62.9% 36.0% 90.9% 767
Figures in parentheses are based on 25-49 cases. An asterisk (*) indicates that a figure is based on fewer than 25 cases and has been suppressed.
** For the ease of data presentation, comparison and analysis, the response categories ‘strongly disagree’ and ‘disagree’ have been merged to measure the percent of men who disagreed with a given statement. *** Since there were only 9 respondents in the category “Informal union/cohabitation”, that category was suppressed (therefore the total number of respondents in this section is 758). **** The data for borderline cases are regarded as fully valid. ***** Since there were only 2 respondents in the category “combining studies with employment” and 1 person in the category “on childcare or another leave,” those categories were suppressed (therefore the total number of respondents in this section is 764). Table 22. Attitudes toward physical intimate partner violence: Women
Percentage of all women who disagree that an intimate partner/husband is justified in hitting or beating his wife/partner for some reason, by background characteristics **
Man is justified in beating or hitting his wife/partner because:
Background characteristic
A woman should tolerate violence to keep her family together
There are times when a woman deserves to be beaten
If a woman cheats on a man, it is okay for him to hit her
It is okay for a man to hit his wife if she won’t have sex with him
Number of women
N = 850
Age
18-24 91.7 88.0 55.6% 95.5% 133
25-34 69.8 77.4 30.5% 94.8% 252
35-49 67.4 76.6 46.0% 90.7% 291
50-59 63.2 74.7 53.4% 92.0% 174
Education***
Basic * * * * 14
Secondary 60.5 75.0 40.5% 91.1% 324
TVET 71.8 77.1 47.3% 91.8% 245
Higher 85.7 83.9 57.5% 97.7% 266
Marital status****
Registered marriage 67.5 75.6 40.9% 91.8% 533
Unregistered marriage 72.6 75.8 45.3% 93.7% 95
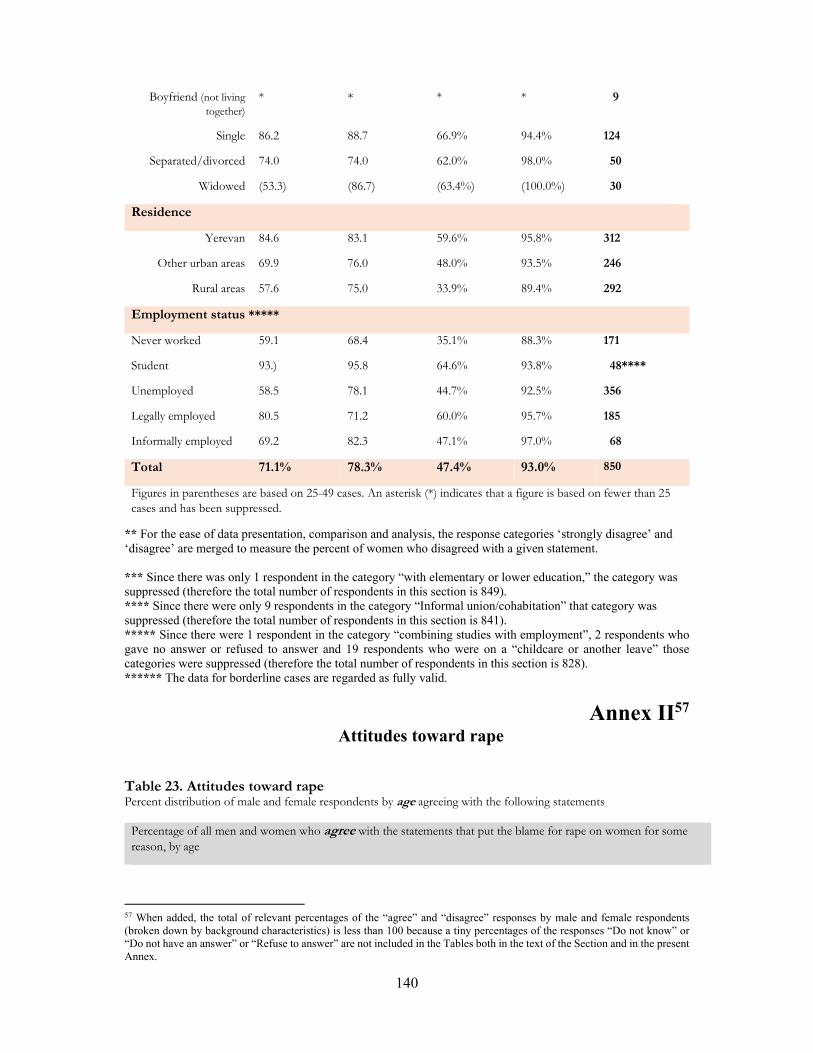
140
Boyfriend (not living together)
* * * * 9
Single 86.2 88.7 66.9% 94.4% 124
Separated/divorced 74.0 74.0 62.0% 98.0% 50
Widowed (53.3) (86.7) (63.4%) (100.0%) 30
Residence
Yerevan 84.6 83.1 59.6% 95.8% 312
Other urban areas 69.9 76.0 48.0% 93.5% 246
Rural areas 57.6 75.0 33.9% 89.4% 292
Employment status *****
Never worked 59.1 68.4 35.1% 88.3% 171
Student 93.) 95.8 64.6% 93.8% 48****
Unemployed 58.5 78.1 44.7% 92.5% 356
Legally employed 80.5 71.2 60.0% 95.7% 185
Informally employed 69.2 82.3 47.1% 97.0% 68
Total 71.1% 78.3% 47.4% 93.0% 850
Figures in parentheses are based on 25-49 cases. An asterisk (*) indicates that a figure is based on fewer than 25 cases and has been suppressed.
** For the ease of data presentation, comparison and analysis, the response categories ‘strongly disagree’ and ‘disagree’ are merged to measure the percent of women who disagreed with a given statement. *** Since there was only 1 respondent in the category “with elementary or lower education,” the category was suppressed (therefore the total number of respondents in this section is 849). **** Since there were only 9 respondents in the category “Informal union/cohabitation” that category was suppressed (therefore the total number of respondents in this section is 841). ***** Since there were 1 respondent in the category “combining studies with employment”, 2 respondents who gave no answer or refused to answer and 19 respondents who were on a “childcare or another leave” those categories were suppressed (therefore the total number of respondents in this section is 828). ****** The data for borderline cases are regarded as fully valid.
Annex II57 Attitudes toward rape
Table 23. Attitudes toward rape Percent distribution of male and female respondents by age agreeing with the following statements
Percentage of all men and women who agree with the statements that put the blame for rape on women for some reason, by age
57 When added, the total of relevant percentages of the “agree” and “disagree” responses by male and female respondents (broken down by background characteristics) is less than 100 because a tiny percentages of the responses “Do not know” or “Do not have an answer” or “Refuse to answer” are not included in the Tables both in the text of the Section and in the present Annex.
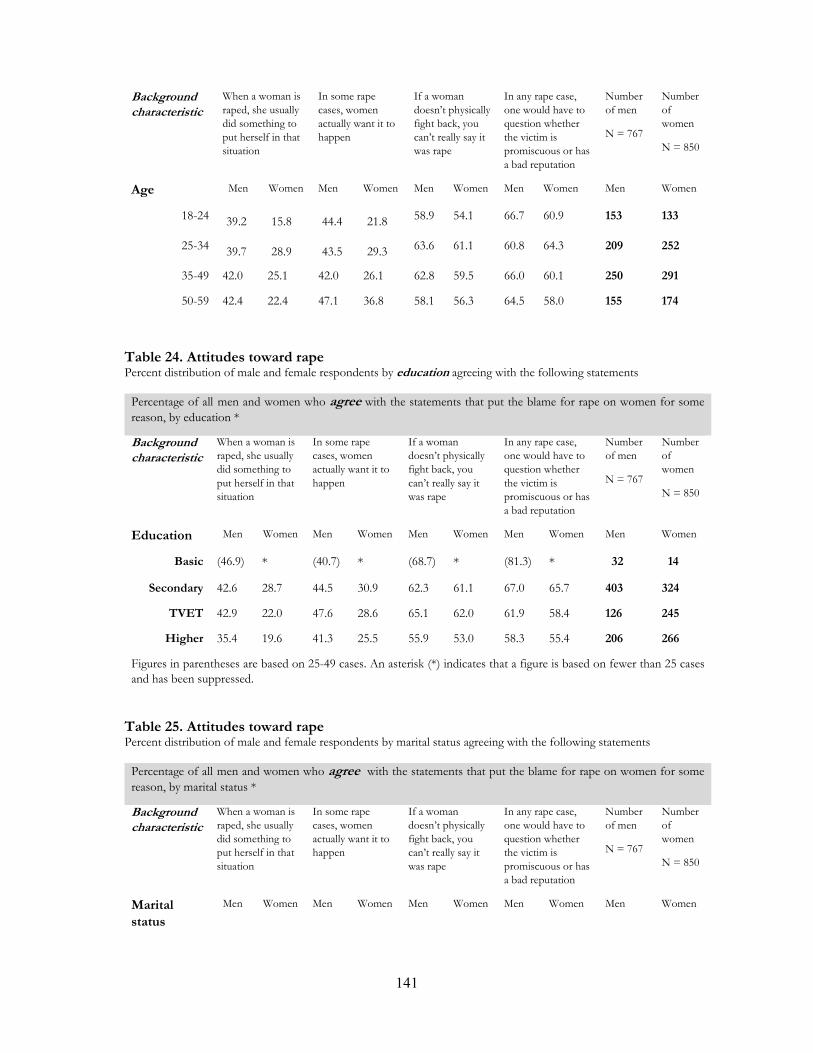
141
Background characteristic
When a woman is raped, she usually did something to put herself in that situation
In some rape cases, women actually want it to happen
If a woman doesn’t physically fight back, you can’t really say it was rape
In any rape case, one would have to question whether the victim is promiscuous or has a bad reputation
Number of men
N = 767
Number of women
N = 850
Age Men Women Men Women Men Women Men Women Men Women
18-24 39.2 15.8 44.4 21.8 58.9 54.1 66.7 60.9 153 133
25-34 39.7 28.9 43.5 29.3 63.6 61.1 60.8 64.3 209 252
35-49 42.0 25.1 42.0 26.1 62.8 59.5 66.0 60.1 250 291
50-59 42.4 22.4 47.1 36.8 58.1 56.3 64.5 58.0 155 174
Table 24. Attitudes toward rape Percent distribution of male and female respondents by education agreeing with the following statements
Percentage of all men and women who agree with the statements that put the blame for rape on women for some reason, by education *
Background characteristic
When a woman is raped, she usually did something to put herself in that situation
In some rape cases, women actually want it to happen
If a woman doesn’t physically fight back, you can’t really say it was rape
In any rape case, one would have to question whether the victim is promiscuous or has a bad reputation
Number of men
N = 767
Number of women
N = 850
Education Men Women Men Women Men Women Men Women Men Women
Basic (46.9) * (40.7) * (68.7) * (81.3) * 32 14
Secondary 42.6 28.7 44.5 30.9 62.3 61.1 67.0 65.7 403 324
TVET 42.9 22.0 47.6 28.6 65.1 62.0 61.9 58.4 126 245
Higher 35.4 19.6 41.3 25.5 55.9 53.0 58.3 55.4 206 266
Figures in parentheses are based on 25-49 cases. An asterisk (*) indicates that a figure is based on fewer than 25 cases and has been suppressed.
Table 25. Attitudes toward rape Percent distribution of male and female respondents by marital status agreeing with the following statements
Percentage of all men and women who agree with the statements that put the blame for rape on women for some reason, by marital status *
Background characteristic
When a woman is raped, she usually did something to put herself in that situation
In some rape cases, women actually want it to happen
If a woman doesn’t physically fight back, you can’t really say it was rape
In any rape case, one would have to question whether the victim is promiscuous or has a bad reputation
Number of men
N = 767
Number of women
N = 850
Marital status
Men Women Men Women Men Women Men Women Men Women

142
Registered marriage
40.7 24.4 43.6 28.9 62.5 59.3 65.7 61.3 408 533
Unregistered marriage
33.8 27.4 43.3 28.5 57.8 60.0 57.8 63.2 83 95
Girlfriend / Boyfriend
(not living together)
(50.0) * (50.0) * (64.3) * (60.7) * 28 9
Single 39.5 21.7 42.3 25.0 57.7 50.0 63.9 56.4 213 124
Separated/
divorced
(58.4) 16.0 (41.7) 26.0 (66.7) 62.0 (70.9) 70.0 24*** 50
Widowed * (30.0) * (43.4) * (63.3) * (53.3) 2 30
Figures in parentheses are based on 25-49 cases. An asterisk (*) indicates that a figure is based on fewer than 25 cases and has been suppressed.
Table 26. Attitudes toward rape Percent distribution of male and female respondents by place of residence agreeing with the following statements
Percentage of all men and women who agree with the statements that put the blame for rape on women for some reason, by place of residence*
Background characteristic
When a woman is raped, she usually did something to put herself in that situation
In some rape cases, women actually want it to happen
If a woman doesn’t physically fight back, you can’t really say it was rape
In any rape case, one would have to question whether the victim is promiscuous or has a bad reputation
Number of men
N = 767
Number of women
N = 850
Residence Men Women Men Women Men Women Men Women Men Women
Yerevan 35.2 18.3 41.4 28.8 59.7 56.4 56.6 51.6 258 312
Other urban areas
40.3 28.0 42.9 24.8 63.3 58.1 69.0 62.6 226 246
Rural areas 46.6 27.4 47.0 31.5 61.1 61.0 67.8 69.9 283 292
Figures in parentheses are based on 25-49 cases. An asterisk (*) indicates that a figure is based on fewer than 25 cases and has been suppressed.
Table 27. Attitudes toward rape Percent distribution of male and female respondents by employment status agreeing with the following statements
Percentage of all men and women who agree with the statements that put the blame for rape on women for some reason, by employment status *
Background characteristic
When a woman is raped, she usually did something to put herself in that situation
In some rape cases, women actually want it to happen
If a woman doesn’t physically fight back, you can’t really say it was rape
In any rape case, one would have to question whether the victim is promiscuous or has a bad reputation
Number of men
N = 767
Number of women
N = 850
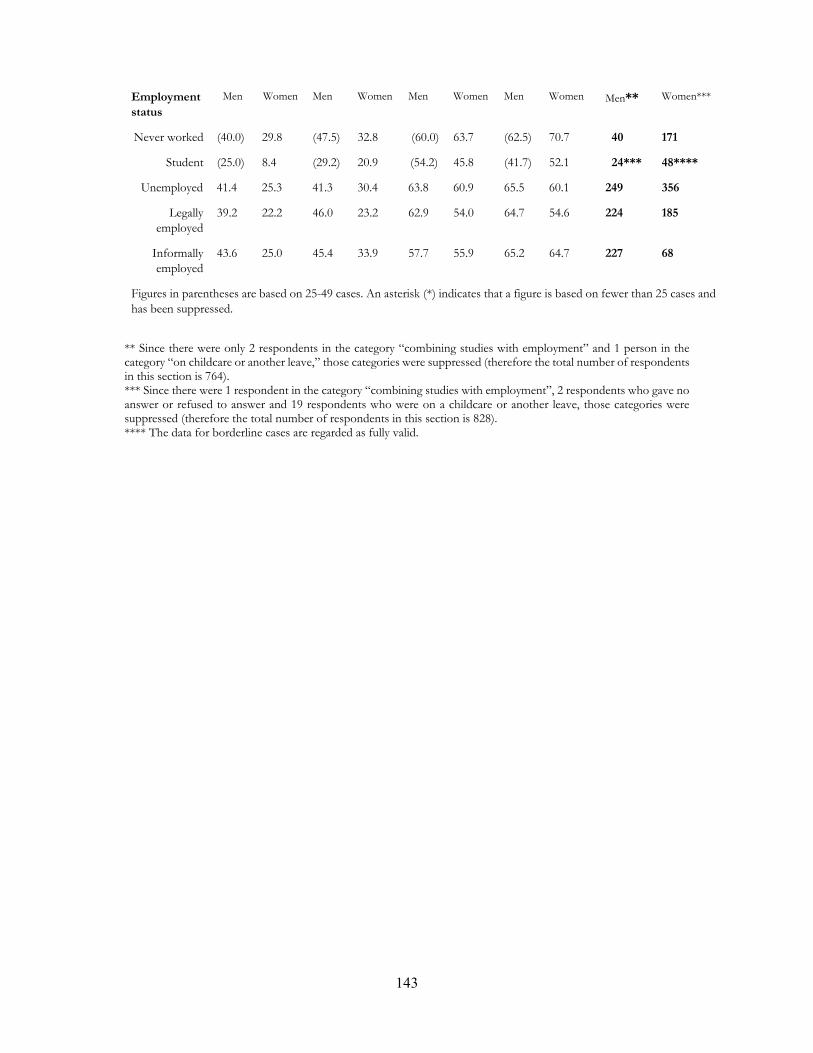
143
Employment status
Men Women Men Women Men Women Men Women Men** Women***
Never worked (40.0) 29.8 (47.5) 32.8 (60.0) 63.7 (62.5) 70.7 40 171
Student (25.0) 8.4 (29.2) 20.9 (54.2) 45.8 (41.7) 52.1 24*** 48****
Unemployed 41.4 25.3 41.3 30.4 63.8 60.9 65.5 60.1 249 356
Legally employed
39.2 22.2 46.0 23.2 62.9 54.0 64.7 54.6 224 185
Informally employed
43.6 25.0 45.4 33.9 57.7 55.9 65.2 64.7 227 68
Figures in parentheses are based on 25-49 cases. An asterisk (*) indicates that a figure is based on fewer than 25 cases and has been suppressed.
** Since there were only 2 respondents in the category “combining studies with employment” and 1 person in the category “on childcare or another leave,” those categories were suppressed (therefore the total number of respondents in this section is 764). *** Since there were 1 respondent in the category “combining studies with employment”, 2 respondents who gave no answer or refused to answer and 19 respondents who were on a childcare or another leave, those categories were suppressed (therefore the total number of respondents in this section is 828). **** The data for borderline cases are regarded as fully valid.
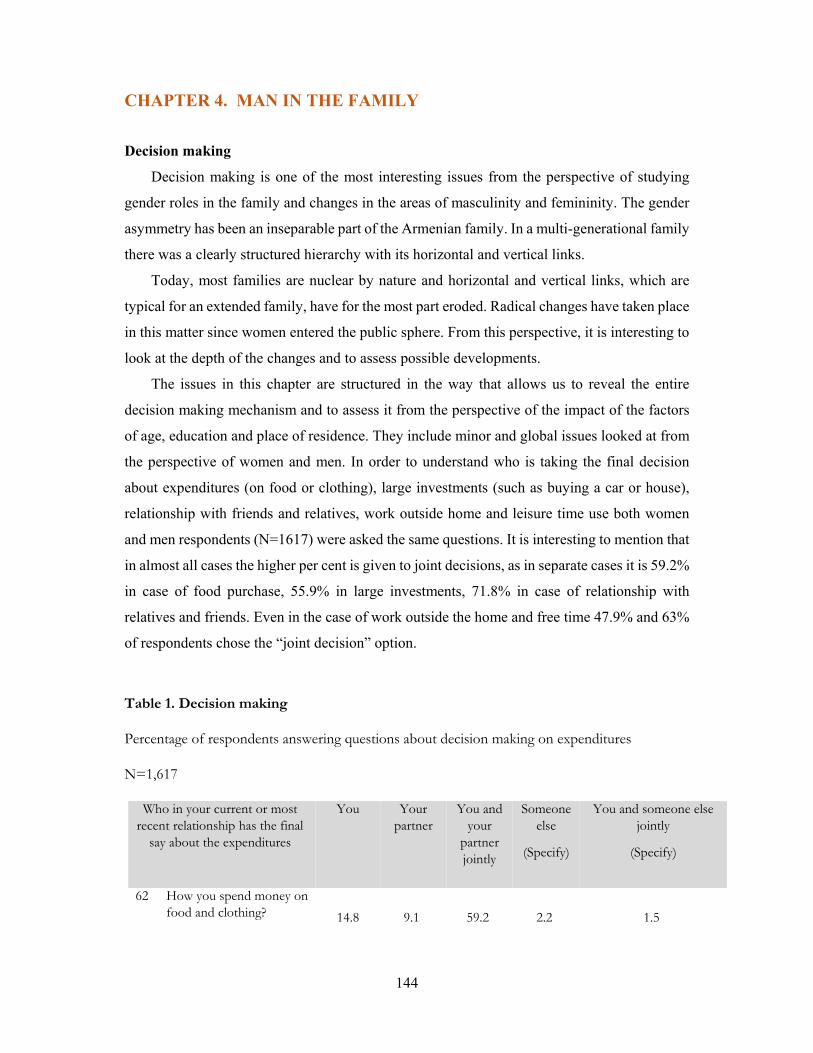
144
CHAPTER 4. MAN IN THE FAMILY Decision making
Decision making is one of the most interesting issues from the perspective of studying
gender roles in the family and changes in the areas of masculinity and femininity. The gender
asymmetry has been an inseparable part of the Armenian family. In a multi-generational family
there was a clearly structured hierarchy with its horizontal and vertical links.
Today, most families are nuclear by nature and horizontal and vertical links, which are
typical for an extended family, have for the most part eroded. Radical changes have taken place
in this matter since women entered the public sphere. From this perspective, it is interesting to
look at the depth of the changes and to assess possible developments.
The issues in this chapter are structured in the way that allows us to reveal the entire
decision making mechanism and to assess it from the perspective of the impact of the factors
of age, education and place of residence. They include minor and global issues looked at from
the perspective of women and men. In order to understand who is taking the final decision
about expenditures (on food or clothing), large investments (such as buying a car or house),
relationship with friends and relatives, work outside home and leisure time use both women
and men respondents (N=1617) were asked the same questions. It is interesting to mention that
in almost all cases the higher per cent is given to joint decisions, as in separate cases it is 59.2%
in case of food purchase, 55.9% in large investments, 71.8% in case of relationship with
relatives and friends. Even in the case of work outside the home and free time 47.9% and 63%
of respondents chose the “joint decision” option.
Table 1. Decision making
Percentage of respondents answering questions about decision making on expenditures
N=1,617
Who in your current or most recent relationship has the final
say about the expenditures
You Your partner
You and your
partner jointly
Someone else
(Specify)
You and someone else jointly
(Specify)
62 How you spend money on food and clothing?
14.8 9.1 59.2 2.2 1.5
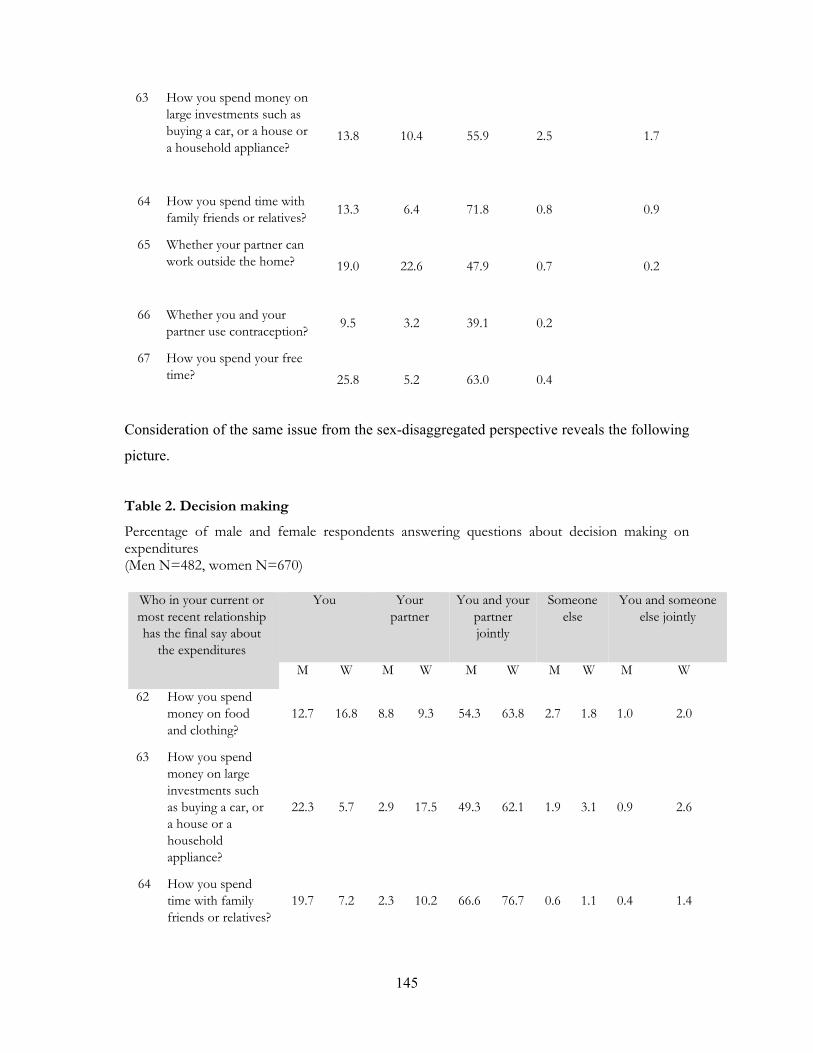
145
63 How you spend money on large investments such as buying a car, or a house or a household appliance?
13.8 10.4 55.9 2.5 1.7
64 How you spend time with family friends or relatives?
13.3 6.4 71.8 0.8 0.9
65 Whether your partner can work outside the home?
19.0 22.6 47.9 0.7 0.2
66 Whether you and your partner use contraception?
9.5 3.2 39.1 0.2
67 How you spend your free time?
25.8 5.2 63.0 0.4
Consideration of the same issue from the sex-disaggregated perspective reveals the following
picture.
Table 2. Decision making
Percentage of male and female respondents answering questions about decision making on expenditures (Men N=482, women N=670)
Who in your current or most recent relationship has the final say about
the expenditures
You Your partner
You and your partner jointly
Someone else
You and someone else jointly
M W M W M W M W M W
62 How you spend money on food and clothing?
12.7 16.8 8.8 9.3 54.3 63.8 2.7 1.8 1.0 2.0
63 How you spend money on large investments such as buying a car, or a house or a household appliance?
22.3 5.7 2.9 17.5 49.3 62.1 1.9 3.1 0.9 2.6
64 How you spend time with family friends or relatives?
19.7 7.2 2.3 10.2 66.6 76.7 0.6 1.1 0.4 1.4
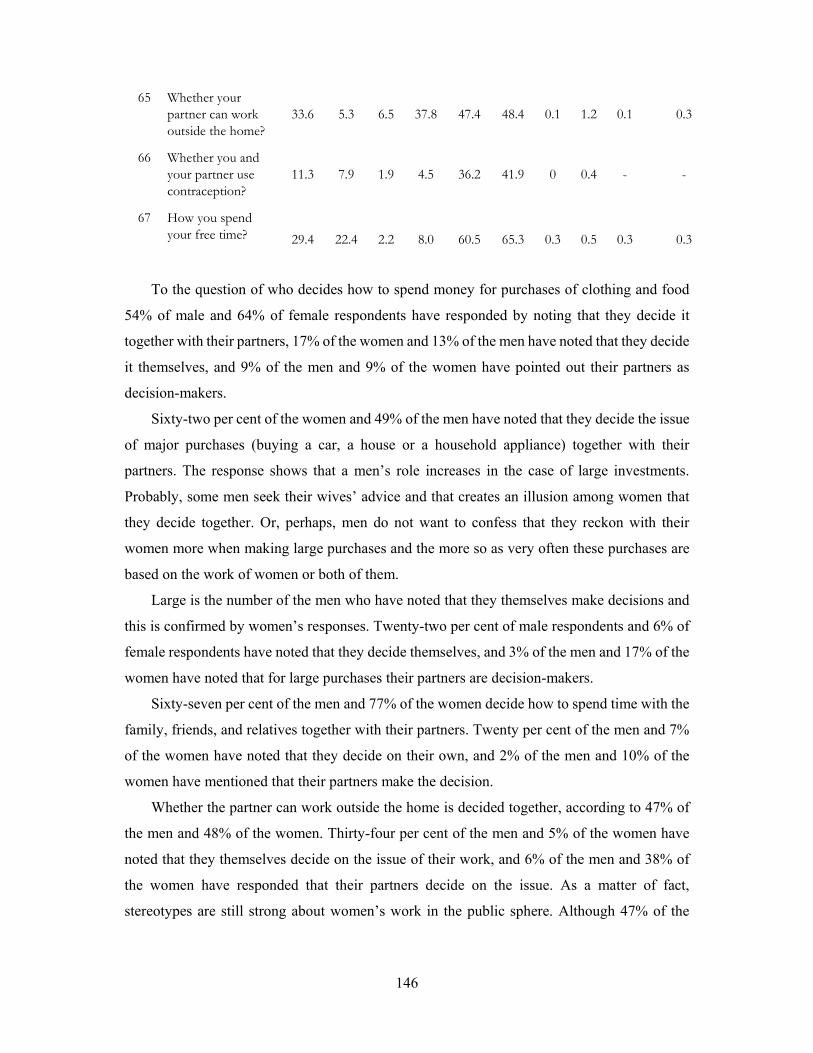
146
65 Whether your partner can work outside the home?
33.6 5.3 6.5 37.8 47.4 48.4 0.1 1.2 0.1 0.3
66 Whether you and your partner use contraception?
11.3 7.9 1.9 4.5 36.2 41.9 0 0.4 - -
67 How you spend your free time?
29.4 22.4 2.2 8.0 60.5 65.3 0.3 0.5 0.3 0.3
To the question of who decides how to spend money for purchases of clothing and food
54% of male and 64% of female respondents have responded by noting that they decide it
together with their partners, 17% of the women and 13% of the men have noted that they decide
it themselves, and 9% of the men and 9% of the women have pointed out their partners as
decision-makers.
Sixty-two per cent of the women and 49% of the men have noted that they decide the issue
of major purchases (buying a car, a house or a household appliance) together with their
partners. The response shows that a men’s role increases in the case of large investments.
Probably, some men seek their wives’ advice and that creates an illusion among women that
they decide together. Or, perhaps, men do not want to confess that they reckon with their
women more when making large purchases and the more so as very often these purchases are
based on the work of women or both of them.
Large is the number of the men who have noted that they themselves make decisions and
this is confirmed by women’s responses. Twenty-two per cent of male respondents and 6% of
female respondents have noted that they decide themselves, and 3% of the men and 17% of the
women have noted that for large purchases their partners are decision-makers.
Sixty-seven per cent of the men and 77% of the women decide how to spend time with the
family, friends, and relatives together with their partners. Twenty per cent of the men and 7%
of the women have noted that they decide on their own, and 2% of the men and 10% of the
women have mentioned that their partners make the decision.
Whether the partner can work outside the home is decided together, according to 47% of
the men and 48% of the women. Thirty-four per cent of the men and 5% of the women have
noted that they themselves decide on the issue of their work, and 6% of the men and 38% of
the women have responded that their partners decide on the issue. As a matter of fact,
stereotypes are still strong about women’s work in the public sphere. Although 47% of the

147
respondents have noted that these issues are decided through joint discussion with their
partners, 38% of the women have noted that their partners’ decision holds.
According to 36% of the men and 42% of the women, the decision to use contraceptives
is made jointly. Eleven per cent of the men and 8% of the women decide themselves, and 2%
of the men and 5% of the women have noted that their partners decide the issue.
The usage of the free time is decided together, according to 60% of the men and 65% of
the women. Twenty-nine per cent of the men and 22% of the women decide themselves, and
2% of the men and 8% of the women have noted that their partners make that decision.
The responses to this question are somewhat in contradiction with the preceding question.
If 22% of women decide themselves how to spend their free time, why then cannot she decide
on the issue of her work too? The reason for this seems to be the fact that men fear to have
economically independent wives and to lose their breadwinner role or are simply being selfish
thinking that working wives will not manage the entire workload of household duties.
Table 3. Decision making
Percentage of respondents answering questions about decision making on expenditures, by background characteristics N=1,617
How you spend money on food and clothing?
You Your partner
You and your
partner jointly
Someone else
You and someone else
jointly
Age 18-24 5.2% 3.6% 29.4% 3.1% 2.1%
25-34 13.6% 9.3% 59.8% 3.1% 1.9%
35-49 18.1% 9.9% 65.2% 1.9% 1.0%
50-59 17.1% 10.9% 67.4% 1.0% 1.6%
Education Basic 26.2% 4.8% 59.5% 0.0% 0.0%
Secondary 13.0% 8.2% 58.2% 3.0% 1.7%
TVET 17.8% 12.1% 60.4% 1.8% 0.9%
Higher 14.0% 8.5% 59.9% 1.7% 1.9%
Residence Yerevan 16.5% 8.7% 56.9% 0.8% 1.2%
Other urban areas 15.9% 9.7% 59.4% 1.2% 1.7%
Rural areas 12.3% 8.9% 61.3% 4.4% 1.7%
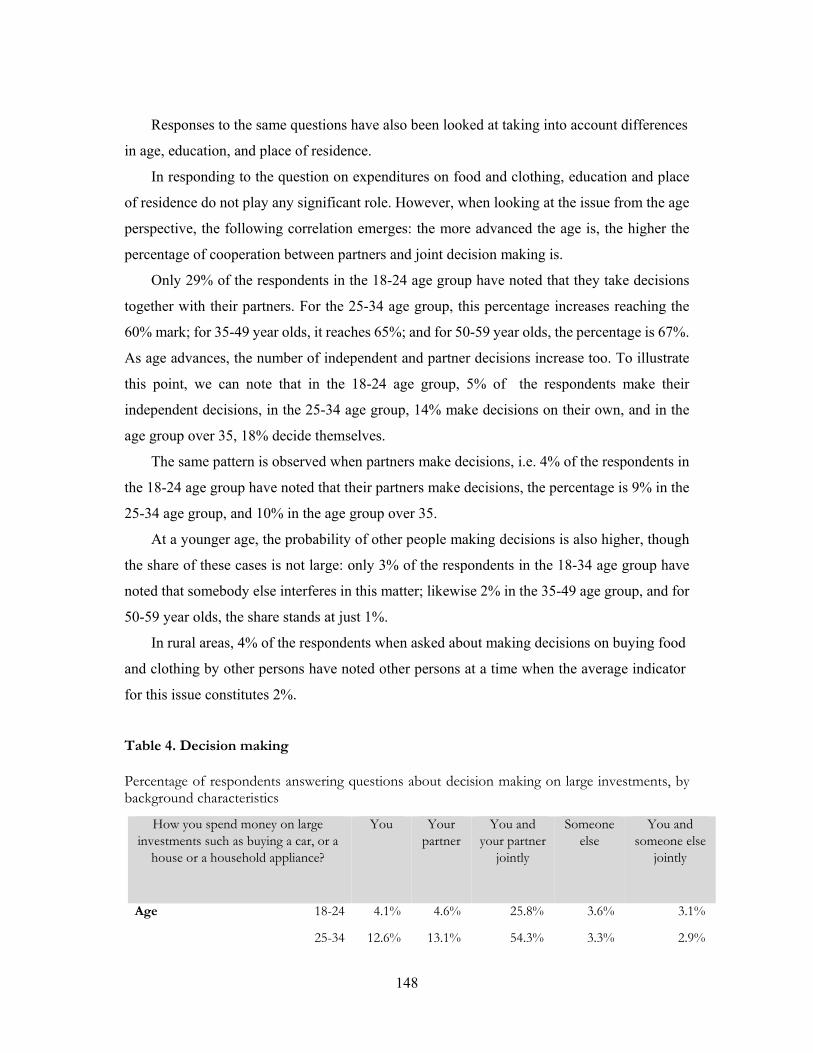
148
Responses to the same questions have also been looked at taking into account differences
in age, education, and place of residence.
In responding to the question on expenditures on food and clothing, education and place
of residence do not play any significant role. However, when looking at the issue from the age
perspective, the following correlation emerges: the more advanced the age is, the higher the
percentage of cooperation between partners and joint decision making is.
Only 29% of the respondents in the 18-24 age group have noted that they take decisions
together with their partners. For the 25-34 age group, this percentage increases reaching the
60% mark; for 35-49 year olds, it reaches 65%; and for 50-59 year olds, the percentage is 67%.
As age advances, the number of independent and partner decisions increase too. To illustrate
this point, we can note that in the 18-24 age group, 5% of the respondents make their
independent decisions, in the 25-34 age group, 14% make decisions on their own, and in the
age group over 35, 18% decide themselves.
The same pattern is observed when partners make decisions, i.e. 4% of the respondents in
the 18-24 age group have noted that their partners make decisions, the percentage is 9% in the
25-34 age group, and 10% in the age group over 35.
At a younger age, the probability of other people making decisions is also higher, though
the share of these cases is not large: only 3% of the respondents in the 18-34 age group have
noted that somebody else interferes in this matter; likewise 2% in the 35-49 age group, and for
50-59 year olds, the share stands at just 1%.
In rural areas, 4% of the respondents when asked about making decisions on buying food
and clothing by other persons have noted other persons at a time when the average indicator
for this issue constitutes 2%.
Table 4. Decision making
Percentage of respondents answering questions about decision making on large investments, by background characteristics
How you spend money on large investments such as buying a car, or a
house or a household appliance?
You Your partner
You and your partner
jointly
Someone else
You and someone else
jointly
Age 18-24 4.1% 4.6% 25.8% 3.6% 3.1%
25-34 12.6% 13.1% 54.3% 3.3% 2.9%
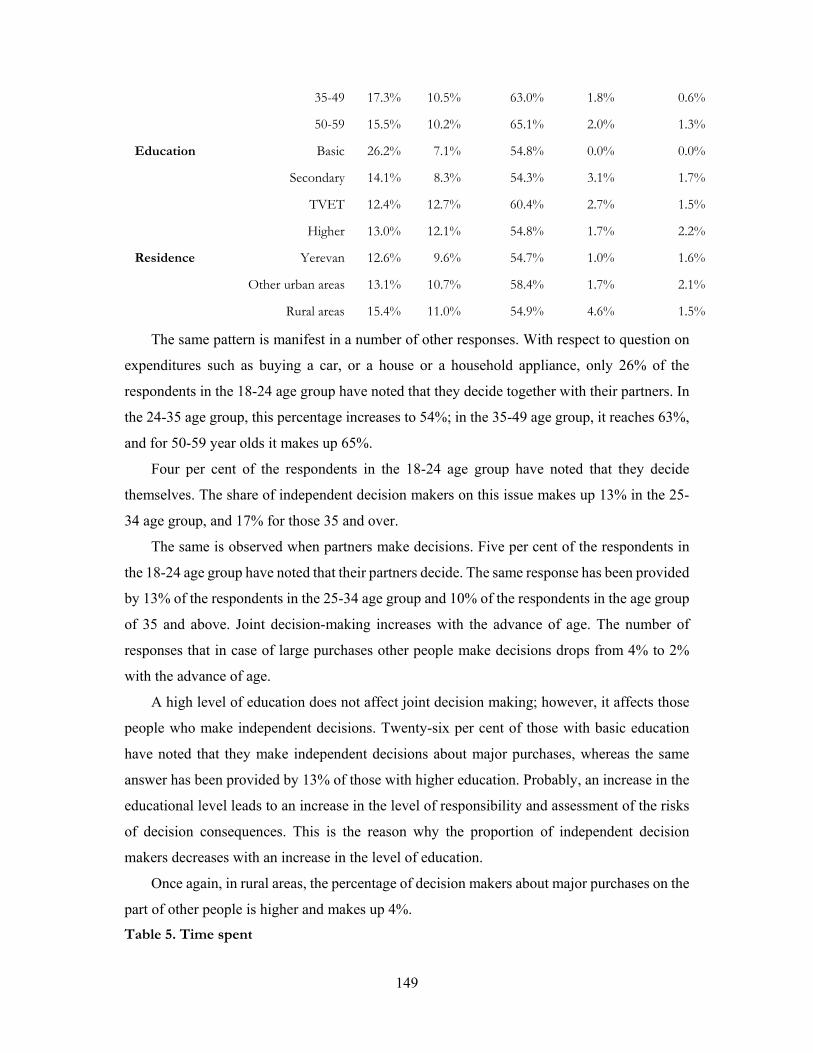
149
35-49 17.3% 10.5% 63.0% 1.8% 0.6%
50-59 15.5% 10.2% 65.1% 2.0% 1.3%
Education Basic 26.2% 7.1% 54.8% 0.0% 0.0%
Secondary 14.1% 8.3% 54.3% 3.1% 1.7%
TVET 12.4% 12.7% 60.4% 2.7% 1.5%
Higher 13.0% 12.1% 54.8% 1.7% 2.2%
Residence Yerevan 12.6% 9.6% 54.7% 1.0% 1.6%
Other urban areas 13.1% 10.7% 58.4% 1.7% 2.1%
Rural areas 15.4% 11.0% 54.9% 4.6% 1.5%
The same pattern is manifest in a number of other responses. With respect to question on
expenditures such as buying a car, or a house or a household appliance, only 26% of the
respondents in the 18-24 age group have noted that they decide together with their partners. In
the 24-35 age group, this percentage increases to 54%; in the 35-49 age group, it reaches 63%,
and for 50-59 year olds it makes up 65%.
Four per cent of the respondents in the 18-24 age group have noted that they decide
themselves. The share of independent decision makers on this issue makes up 13% in the 25-
34 age group, and 17% for those 35 and over.
The same is observed when partners make decisions. Five per cent of the respondents in
the 18-24 age group have noted that their partners decide. The same response has been provided
by 13% of the respondents in the 25-34 age group and 10% of the respondents in the age group
of 35 and above. Joint decision-making increases with the advance of age. The number of
responses that in case of large purchases other people make decisions drops from 4% to 2%
with the advance of age.
A high level of education does not affect joint decision making; however, it affects those
people who make independent decisions. Twenty-six per cent of those with basic education
have noted that they make independent decisions about major purchases, whereas the same
answer has been provided by 13% of those with higher education. Probably, an increase in the
educational level leads to an increase in the level of responsibility and assessment of the risks
of decision consequences. This is the reason why the proportion of independent decision
makers decreases with an increase in the level of education.
Once again, in rural areas, the percentage of decision makers about major purchases on the
part of other people is higher and makes up 4%. Table 5. Time spent
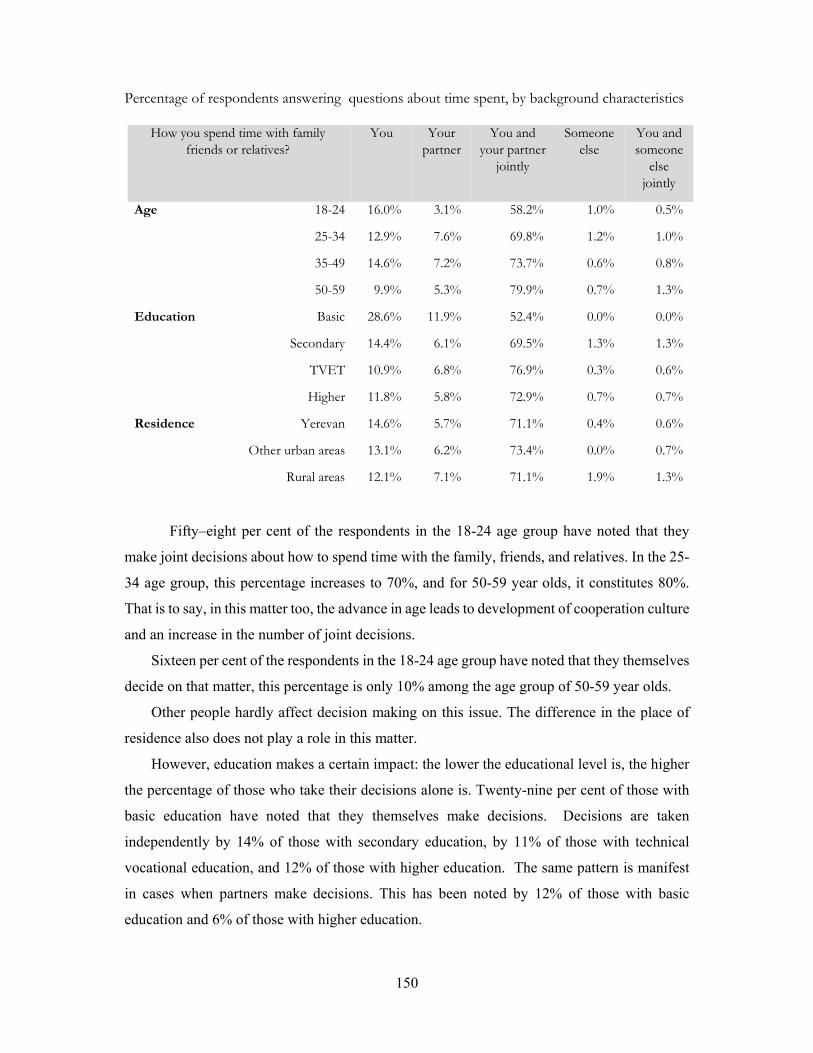
150
Percentage of respondents answering questions about time spent, by background characteristics
How you spend time with family friends or relatives?
You Your partner
You and your partner
jointly
Someone else
You and someone
else jointly
Age 18-24 16.0% 3.1% 58.2% 1.0% 0.5%
25-34 12.9% 7.6% 69.8% 1.2% 1.0%
35-49 14.6% 7.2% 73.7% 0.6% 0.8%
50-59 9.9% 5.3% 79.9% 0.7% 1.3%
Education Basic 28.6% 11.9% 52.4% 0.0% 0.0%
Secondary 14.4% 6.1% 69.5% 1.3% 1.3%
TVET 10.9% 6.8% 76.9% 0.3% 0.6%
Higher 11.8% 5.8% 72.9% 0.7% 0.7%
Residence Yerevan 14.6% 5.7% 71.1% 0.4% 0.6%
Other urban areas 13.1% 6.2% 73.4% 0.0% 0.7%
Rural areas 12.1% 7.1% 71.1% 1.9% 1.3%
Fifty–eight per cent of the respondents in the 18-24 age group have noted that they
make joint decisions about how to spend time with the family, friends, and relatives. In the 25-
34 age group, this percentage increases to 70%, and for 50-59 year olds, it constitutes 80%.
That is to say, in this matter too, the advance in age leads to development of cooperation culture
and an increase in the number of joint decisions.
Sixteen per cent of the respondents in the 18-24 age group have noted that they themselves
decide on that matter, this percentage is only 10% among the age group of 50-59 year olds.
Other people hardly affect decision making on this issue. The difference in the place of
residence also does not play a role in this matter.
However, education makes a certain impact: the lower the educational level is, the higher
the percentage of those who take their decisions alone is. Twenty-nine per cent of those with
basic education have noted that they themselves make decisions. Decisions are taken
independently by 14% of those with secondary education, by 11% of those with technical
vocational education, and 12% of those with higher education. The same pattern is manifest
in cases when partners make decisions. This has been noted by 12% of those with basic
education and 6% of those with higher education.
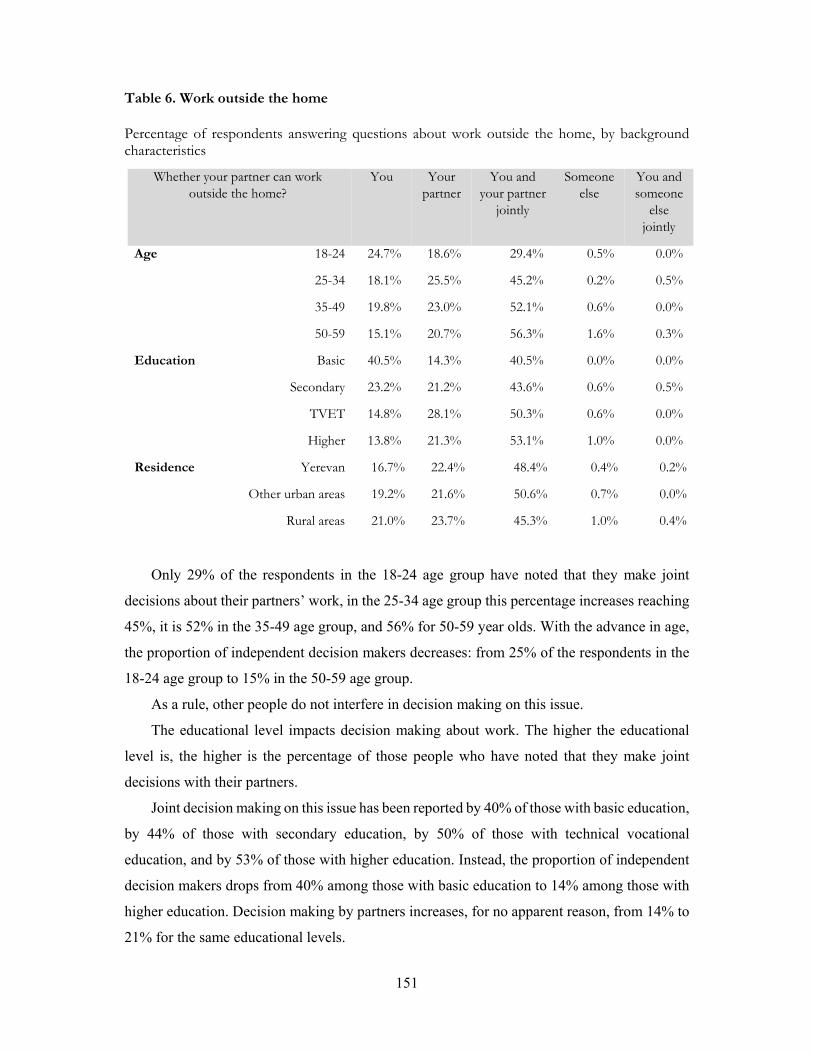
151
Table 6. Work outside the home
Percentage of respondents answering questions about work outside the home, by background characteristics
Whether your partner can work outside the home?
You Your partner
You and your partner
jointly
Someone else
You and someone
else jointly
Age 18-24 24.7% 18.6% 29.4% 0.5% 0.0%
25-34 18.1% 25.5% 45.2% 0.2% 0.5%
35-49 19.8% 23.0% 52.1% 0.6% 0.0%
50-59 15.1% 20.7% 56.3% 1.6% 0.3%
Education Basic 40.5% 14.3% 40.5% 0.0% 0.0%
Secondary 23.2% 21.2% 43.6% 0.6% 0.5%
TVET 14.8% 28.1% 50.3% 0.6% 0.0%
Higher 13.8% 21.3% 53.1% 1.0% 0.0%
Residence Yerevan 16.7% 22.4% 48.4% 0.4% 0.2%
Other urban areas 19.2% 21.6% 50.6% 0.7% 0.0%
Rural areas 21.0% 23.7% 45.3% 1.0% 0.4%
Only 29% of the respondents in the 18-24 age group have noted that they make joint
decisions about their partners’ work, in the 25-34 age group this percentage increases reaching
45%, it is 52% in the 35-49 age group, and 56% for 50-59 year olds. With the advance in age,
the proportion of independent decision makers decreases: from 25% of the respondents in the
18-24 age group to 15% in the 50-59 age group.
As a rule, other people do not interfere in decision making on this issue.
The educational level impacts decision making about work. The higher the educational
level is, the higher is the percentage of those people who have noted that they make joint
decisions with their partners.
Joint decision making on this issue has been reported by 40% of those with basic education,
by 44% of those with secondary education, by 50% of those with technical vocational
education, and by 53% of those with higher education. Instead, the proportion of independent
decision makers drops from 40% among those with basic education to 14% among those with
higher education. Decision making by partners increases, for no apparent reason, from 14% to
21% for the same educational levels.

152
The place of residence does not play any significant role in this matter.
Table 7. Use of contraception
Percentage of respondents answering questions about use of contraception, by background characteristics
Do you and your partner use contraception?
You Your partner
You and your partner
jointly
Someone else
You and someone
else jointly
Age 18-24 7.2% 0.5% 20.6% 0.0%
25-34 12.2% 4.3% 45.6% 0.0%
35-49 11.3% 3.3% 44.0% 0.0%
50-59 4.3% 3.3% 33.9% 1.0%
Education Basic 19.0% 7.1% 35.7% 0.0%
Secondary 10.4% 3.0% 35.3% 0.3%
TVET 7.1% 3.3% 40.5% 0.0%
Higher 9.2% 3.1% 44.3% 0.2%
Residence Yerevan 10.0% 3.7% 38.1% 0.0%
Other urban areas 9.0% 3.3% 39.4% 0.2%
Rural areas 9.4% 2.7% 39.9% 0.4%
As regards the issue of the use of contraceptives (“Do you and your partner use
contraception?”), the proportion of the respondents in all age groups increases with the advance
in age.
Only 21% of the respondents in the 18-24 age group have noted that they make joint
decisions; in the 25-34 age group, this percentage increases to 46%. Further, this percentage
starts to decrease standing at 44% in the 35-49 age group and 34% for 50-59 year olds. The
proportion of independent decision makers fluctuates with age, being 7% for the respondents
in the 18-24 age group, increasing to 12% for those in the 25-34 age group, and decreasing to
4% for 50-59 year olds. That is to say, after the period of active sexual life, this issue simply
loses its topicality and the percentage decrease is determined by that circumstance.
The educational level and place of residence do not make any essential difference in this
matter. Though with increase in the level of education, the degree of cooperative decision
making also increases. Hence, 36% of those with basic education have noted that they make
joint decisions on the issue, and this percentage stands at 44% for those with higher education.
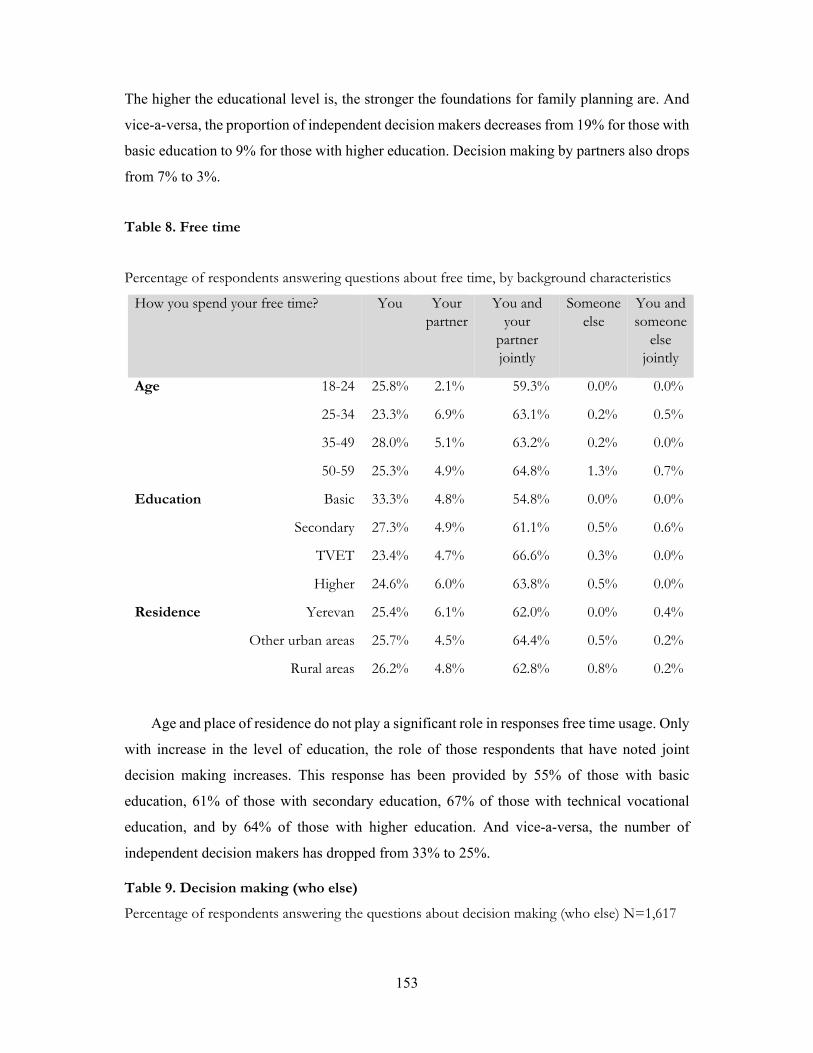
153
The higher the educational level is, the stronger the foundations for family planning are. And
vice-a-versa, the proportion of independent decision makers decreases from 19% for those with
basic education to 9% for those with higher education. Decision making by partners also drops
from 7% to 3%.
Table 8. Free time
Percentage of respondents answering questions about free time, by background characteristics
How you spend your free time? You Your partner
You and your
partner jointly
Someone else
You and someone
else jointly
Age 18-24 25.8% 2.1% 59.3% 0.0% 0.0%
25-34 23.3% 6.9% 63.1% 0.2% 0.5%
35-49 28.0% 5.1% 63.2% 0.2% 0.0%
50-59 25.3% 4.9% 64.8% 1.3% 0.7%
Education Basic 33.3% 4.8% 54.8% 0.0% 0.0%
Secondary 27.3% 4.9% 61.1% 0.5% 0.6%
TVET 23.4% 4.7% 66.6% 0.3% 0.0%
Higher 24.6% 6.0% 63.8% 0.5% 0.0%
Residence Yerevan 25.4% 6.1% 62.0% 0.0% 0.4%
Other urban areas 25.7% 4.5% 64.4% 0.5% 0.2%
Rural areas 26.2% 4.8% 62.8% 0.8% 0.2%
Age and place of residence do not play a significant role in responses free time usage. Only
with increase in the level of education, the role of those respondents that have noted joint
decision making increases. This response has been provided by 55% of those with basic
education, 61% of those with secondary education, 67% of those with technical vocational
education, and by 64% of those with higher education. And vice-a-versa, the number of
independent decision makers has dropped from 33% to 25%.
Table 9. Decision making (who else)
Percentage of respondents answering the questions about decision making (who else) N=1,617

154
Who else How you spend money on food
and clothing?
How you spend money
on large investments
such as buying a car, or a house or a household appliance?
How you spend
time with family
friends or relatives?
Whether your
partner can work outside
the home?
Whether you and
your partner
use contraception?
How you spend your free time?
Parents 31.5 13.1 16.0 - - 9.1
Children 3.7 11.5 16.0 7.7 - 9.1
Parents –in- law 31.5 37.7 24.0 38.5 - 18.2
Children –in- law 1.9 4.9 4.0 15.4 - 9.1
The whole family 1.9 - 9.1
As we have mentioned above, other people do not exert major influence on decision
making. Nevertheless, we have tried to clarify in case of which questions and who exerts
influence. How they spend money on food and clothing is influenced by the parents of both
partners (31%). When making purchases, the respondents take into account the needs of the
children (4%) and the entire family (2%).
As regards the question on how you spend money on large investments such as buying a
car or a house or a household appliance, the partner’s parents have the largest say (38%),
followed by their own parents (13%), and finally by the children (12%).
In decision making on how you spend time with family, friends or relatives, once again
the partner’s parents have the largest say from among other people (24%), followed by the
respondent’s parents (16%) and children (16%):
In decision making on whether your partner can work outside the home again partner’s
parents have the largest say (39%), followed by the children (7%).
As regards the question on how you spend your free time, again the partner’s parents have
the largest say (18.2%), and the rest make up 9% each.
However, since the involvement of other people in the context of the entire survey
constitutes a very small percentage, we believe that this circumstance does not affect the
matter.
Table 10. Decision making in parents’ family
Percentage of respondents answering questions about decision making in their parents’ family
(from the time they were born until the age of 18) N=1,617
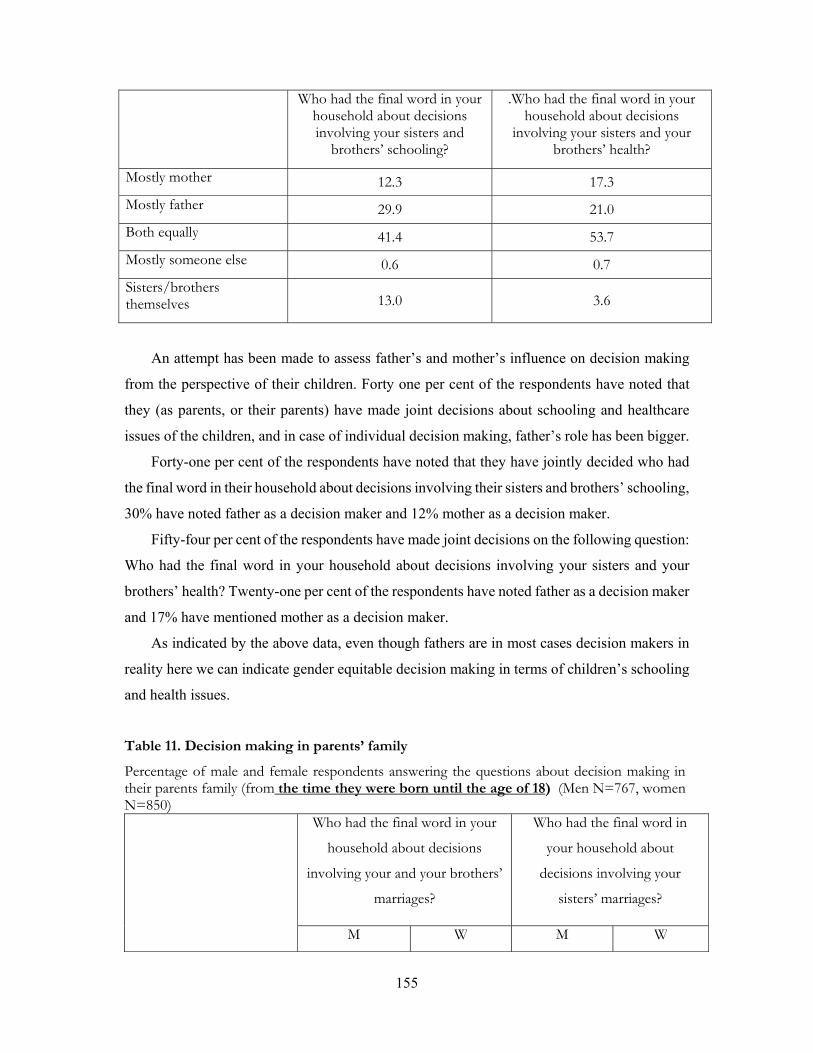
155
Who had the final word in your household about decisions involving your sisters and
brothers’ schooling?
.Who had the final word in your household about decisions
involving your sisters and your brothers’ health?
Mostly mother 12.3 17.3
Mostly father 29.9 21.0
Both equally 41.4 53.7
Mostly someone else 0.6 0.7
Sisters/brothers themselves 13.0 3.6
An attempt has been made to assess father’s and mother’s influence on decision making
from the perspective of their children. Forty one per cent of the respondents have noted that
they (as parents, or their parents) have made joint decisions about schooling and healthcare
issues of the children, and in case of individual decision making, father’s role has been bigger.
Forty-one per cent of the respondents have noted that they have jointly decided who had
the final word in their household about decisions involving their sisters and brothers’ schooling,
30% have noted father as a decision maker and 12% mother as a decision maker.
Fifty-four per cent of the respondents have made joint decisions on the following question:
Who had the final word in your household about decisions involving your sisters and your
brothers’ health? Twenty-one per cent of the respondents have noted father as a decision maker
and 17% have mentioned mother as a decision maker.
As indicated by the above data, even though fathers are in most cases decision makers in
reality here we can indicate gender equitable decision making in terms of children’s schooling
and health issues.
Table 11. Decision making in parents’ family
Percentage of male and female respondents answering the questions about decision making in their parents family (from the time they were born until the age of 18) (Men N=767, women N=850) Who had the final word in your
household about decisions
involving your and your brothers’
marriages?
Who had the final word in
your household about
decisions involving your
sisters’ marriages?
M W M W
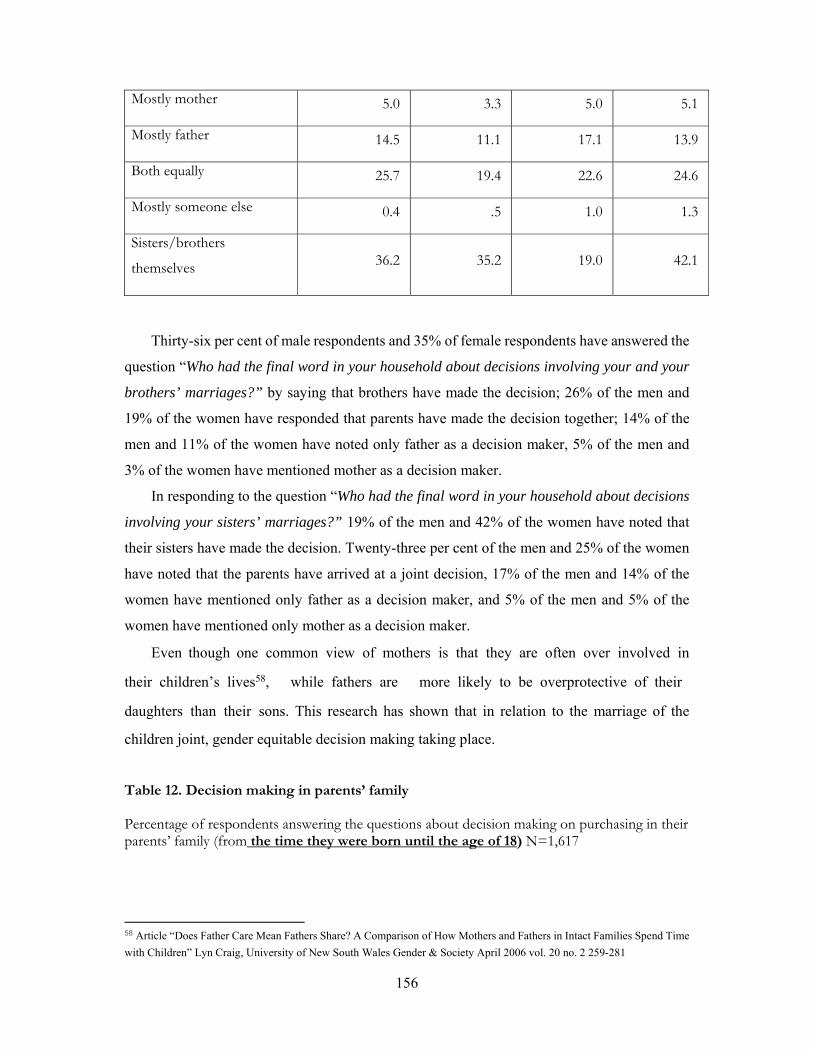
156
Mostly mother 5.0 3.3 5.0 5.1
Mostly father 14.5 11.1 17.1 13.9
Both equally 25.7 19.4 22.6 24.6
Mostly someone else 0.4 .5 1.0 1.3
Sisters/brothers
themselves 36.2 35.2 19.0 42.1
Thirty-six per cent of male respondents and 35% of female respondents have answered the
question “Who had the final word in your household about decisions involving your and your
brothers’ marriages?” by saying that brothers have made the decision; 26% of the men and
19% of the women have responded that parents have made the decision together; 14% of the
men and 11% of the women have noted only father as a decision maker, 5% of the men and
3% of the women have mentioned mother as a decision maker.
In responding to the question “Who had the final word in your household about decisions
involving your sisters’ marriages?” 19% of the men and 42% of the women have noted that
their sisters have made the decision. Twenty-three per cent of the men and 25% of the women
have noted that the parents have arrived at a joint decision, 17% of the men and 14% of the
women have mentioned only father as a decision maker, and 5% of the men and 5% of the
women have mentioned only mother as a decision maker.
Even though one common view of mothers is that they are often over involved in
their children’s lives58, while fathers are more likely to be overprotective of their
daughters than their sons. This research has shown that in relation to the marriage of the
children joint, gender equitable decision making taking place.
Table 12. Decision making in parents’ family Percentage of respondents answering the questions about decision making on purchasing in their parents’ family (from the time they were born until the age of 18) N=1,617
58 Article “Does Father Care Mean Fathers Share? A Comparison of How Mothers and Fathers in Intact Families Spend Time with Children” Lyn Craig, University of New South Wales Gender & Society April 2006 vol. 20 no. 2 259-281
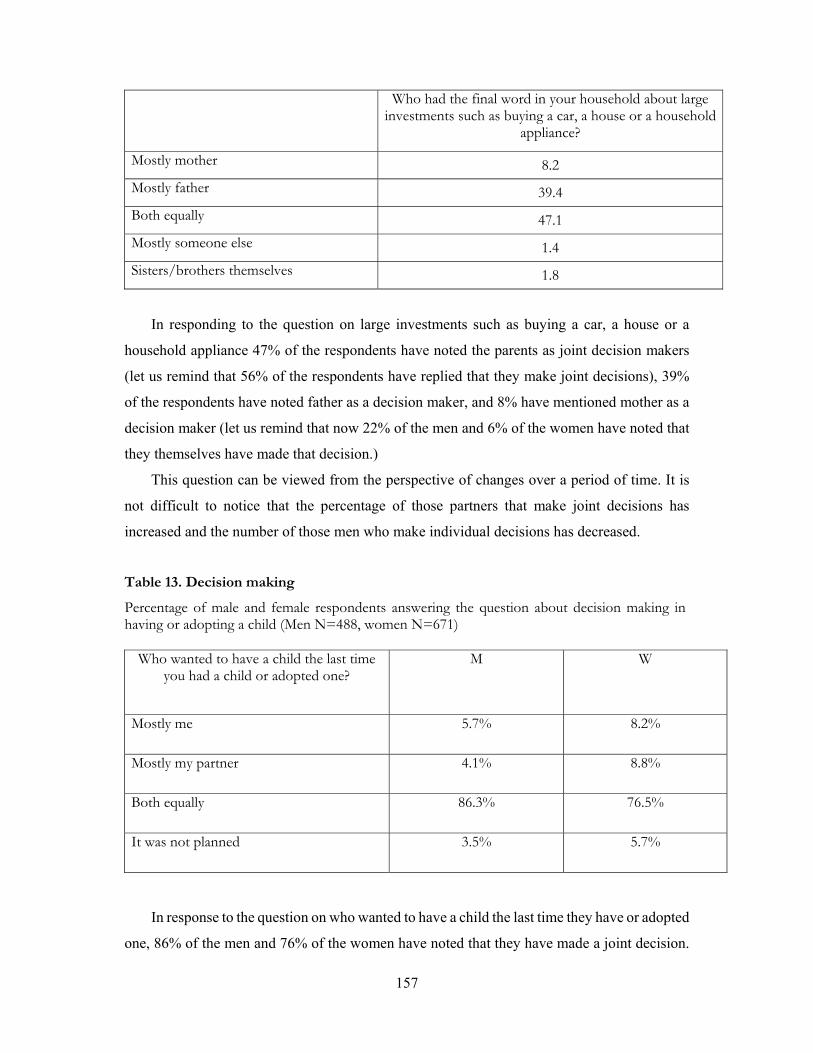
157
Who had the final word in your household about large investments such as buying a car, a house or a household
appliance?
Mostly mother 8.2
Mostly father 39.4
Both equally 47.1
Mostly someone else 1.4
Sisters/brothers themselves 1.8
In responding to the question on large investments such as buying a car, a house or a
household appliance 47% of the respondents have noted the parents as joint decision makers
(let us remind that 56% of the respondents have replied that they make joint decisions), 39%
of the respondents have noted father as a decision maker, and 8% have mentioned mother as a
decision maker (let us remind that now 22% of the men and 6% of the women have noted that
they themselves have made that decision.)
This question can be viewed from the perspective of changes over a period of time. It is
not difficult to notice that the percentage of those partners that make joint decisions has
increased and the number of those men who make individual decisions has decreased.
Table 13. Decision making
Percentage of male and female respondents answering the question about decision making in having or adopting a child (Men N=488, women N=671)
Who wanted to have a child the last time you had a child or adopted one?
M W
Mostly me 5.7% 8.2%
Mostly my partner 4.1% 8.8%
Both equally 86.3% 76.5%
It was not planned 3.5% 5.7%
In response to the question on who wanted to have a child the last time they have or adopted
one, 86% of the men and 76% of the women have noted that they have made a joint decision.
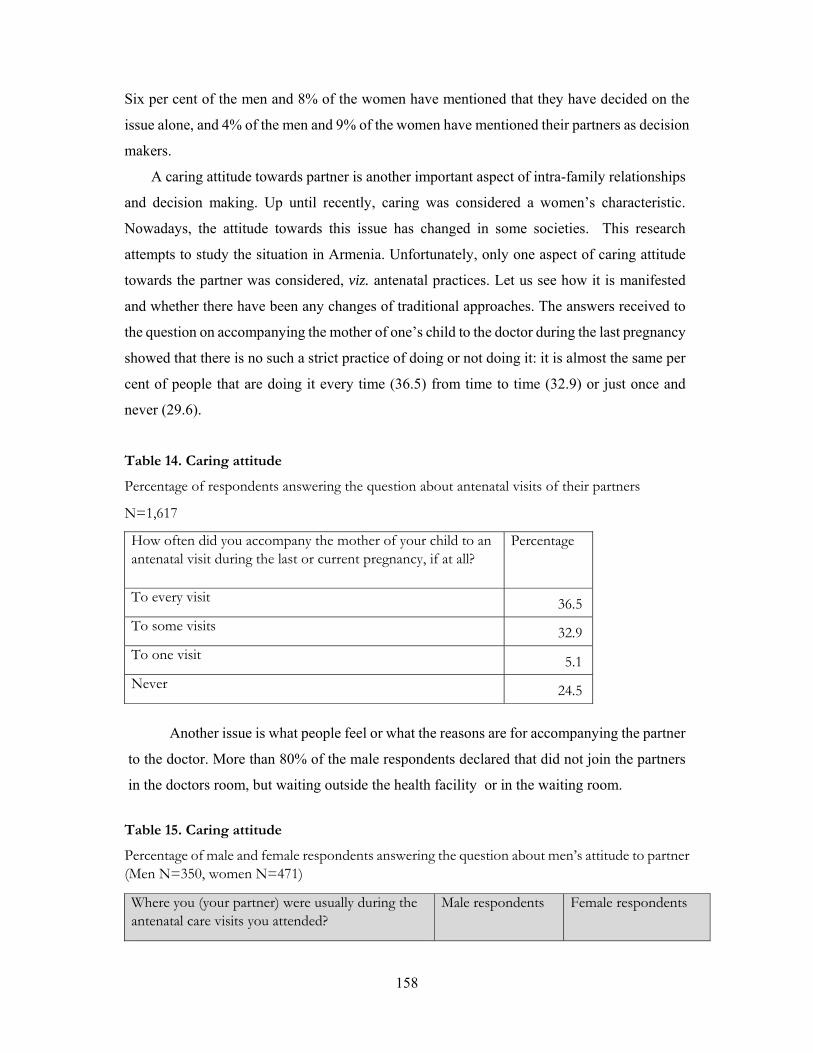
158
Six per cent of the men and 8% of the women have mentioned that they have decided on the
issue alone, and 4% of the men and 9% of the women have mentioned their partners as decision
makers.
A caring attitude towards partner is another important aspect of intra-family relationships
and decision making. Up until recently, caring was considered a women’s characteristic.
Nowadays, the attitude towards this issue has changed in some societies. This research
attempts to study the situation in Armenia. Unfortunately, only one aspect of caring attitude
towards the partner was considered, viz. antenatal practices. Let us see how it is manifested
and whether there have been any changes of traditional approaches. The answers received to
the question on accompanying the mother of one’s child to the doctor during the last pregnancy
showed that there is no such a strict practice of doing or not doing it: it is almost the same per
cent of people that are doing it every time (36.5) from time to time (32.9) or just once and
never (29.6).
Table 14. Caring attitude
Percentage of respondents answering the question about antenatal visits of their partners
N=1,617
How often did you accompany the mother of your child to an antenatal visit during the last or current pregnancy, if at all?
Percentage
To every visit 36.5
To some visits 32.9
To one visit 5.1
Never 24.5
Another issue is what people feel or what the reasons are for accompanying the partner
to the doctor. More than 80% of the male respondents declared that did not join the partners
in the doctors room, but waiting outside the health facility or in the waiting room.
Table 15. Caring attitude
Percentage of male and female respondents answering the question about men’s attitude to partner (Men N=350, women N=471)
Where you (your partner) were usually during the antenatal care visits you attended?
Male respondents Female respondents
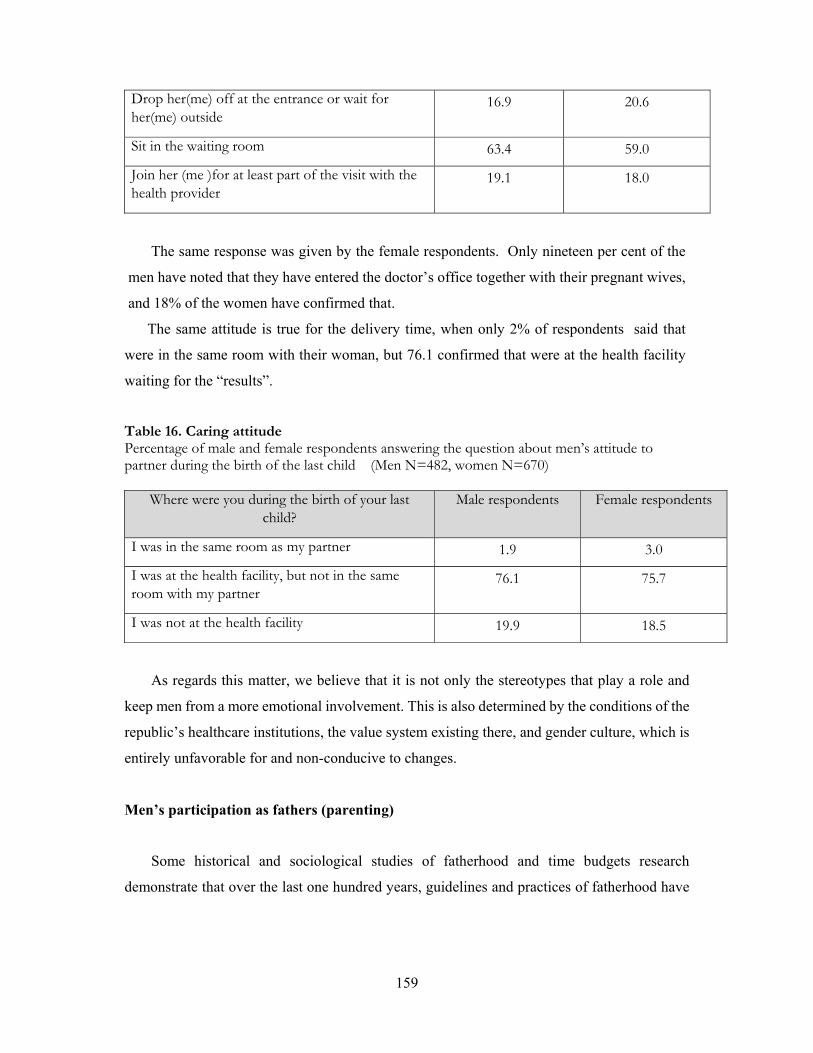
159
Drop her(me) off at the entrance or wait for her(me) outside
16.9 20.6
Sit in the waiting room 63.4 59.0
Join her (me )for at least part of the visit with the health provider
19.1 18.0
The same response was given by the female respondents. Only nineteen per cent of the
men have noted that they have entered the doctor’s office together with their pregnant wives,
and 18% of the women have confirmed that.
The same attitude is true for the delivery time, when only 2% of respondents said that
were in the same room with their woman, but 76.1 confirmed that were at the health facility
waiting for the “results”.
Table 16. Caring attitude Percentage of male and female respondents answering the question about men’s attitude to partner during the birth of the last child (Men N=482, women N=670)
Where were you during the birth of your last child?
Male respondents Female respondents
I was in the same room as my partner 1.9 3.0
I was at the health facility, but not in the same room with my partner
76.1 75.7
I was not at the health facility 19.9 18.5
As regards this matter, we believe that it is not only the stereotypes that play a role and
keep men from a more emotional involvement. This is also determined by the conditions of the
republic’s healthcare institutions, the value system existing there, and gender culture, which is
entirely unfavorable for and non-conducive to changes.
Men’s participation as fathers (parenting)
Some historical and sociological studies of fatherhood and time budgets research
demonstrate that over the last one hundred years, guidelines and practices of fatherhood have

160
been changing constantly. Fathers have become more and more engaged in child care and
education.59
If in the past the man was the provider and, according to Parson, performed an instrumental
function providing for the children and controlling their behavior, since the 60s, researchers
have assigned to the father the role of a nurturer. The father-nurturer not only financially
secures the children and controls their behavior, but also participates in their daily life, attends
sporting events with them, goes for a walk, pursues hobbies, etc.60 He performs not only an
instrumental, but also an expressive role.61
Since the 1990s, changes have been observed in the perception of the idea of parenting.
Traditionally, mother’s role as a parent taking care of the child has been singled out. A devoted,
self-sacrificing, worn out image of mother has found its place in the folklore of many peoples,
and in Armenia, where mother exaltation has become an important cultural value, it has
occupied a special place. The same cannot be said about fatherhood.
The man has been regarded as the family’s protector and breadwinner, emotionally colder,
and his ties with his children have not had much of an emotional touch.
The problem of fatherhood was first voiced within the context of “men studies”, when
inspired by a new feminist wave men too began to remove many problems of masculinity out
of the shadow. Along with empowerment of the feminist movement and prevalence of the idea
of egalitarianism, an attentive, emotional, child-focused image of father began to be advertised.
The changes that have taken place in Armenia in this respect have been attempted to be
clarified through this study.
Table 17. Men as parents
Percentage of male respondents answering questions about parenting (N=488)
Do the following circumstances
apply to your everyday life in your
home
Strongly
disagree
Disagree Agree Strongly
agree
I spend too little time with my children on account of my job.
18.9 10.7 23.2 31.6
59 Tina Miller, Making Sense of Fatherhood: Gender, Caring and Work, Cambridge University Press, 2011; A. V. Avdeyeva, Engaged Fatherhood in Contemporary Russia: Strategies for Participation in Child Care. http://ecsocman.hse.ru/data/2013/03/25/1251441009/Avdeeva.pdf, page 99-100 60 Atkinson, Blackwelder, 1993: 976, 981 -982; La Rossa, 1988: 449 61 Klyotsina, 2009; Finley, Schwartz, 2004: 143 - 144
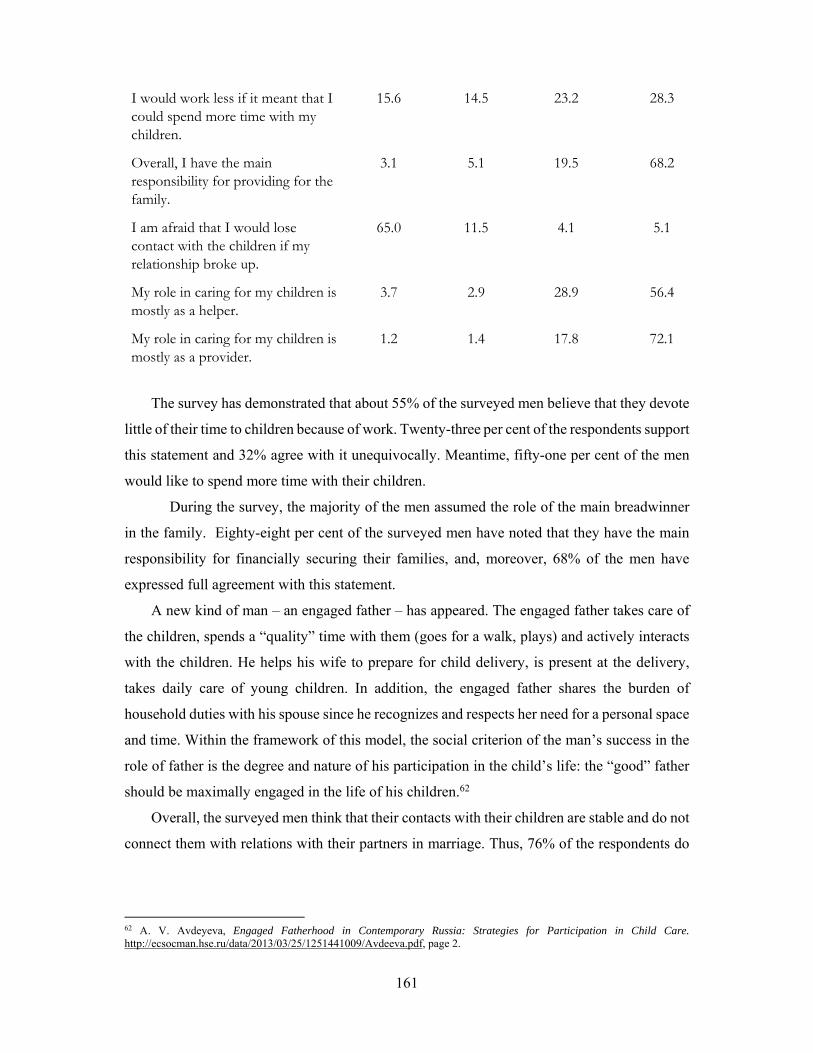
161
I would work less if it meant that I could spend more time with my children.
15.6 14.5 23.2 28.3
Overall, I have the main responsibility for providing for the family.
3.1 5.1 19.5 68.2
I am afraid that I would lose contact with the children if my relationship broke up.
65.0 11.5 4.1 5.1
My role in caring for my children is mostly as a helper.
3.7 2.9 28.9 56.4
My role in caring for my children is mostly as a provider.
1.2 1.4 17.8 72.1
The survey has demonstrated that about 55% of the surveyed men believe that they devote
little of their time to children because of work. Twenty-three per cent of the respondents support
this statement and 32% agree with it unequivocally. Meantime, fifty-one per cent of the men
would like to spend more time with their children.
During the survey, the majority of the men assumed the role of the main breadwinner
in the family. Eighty-eight per cent of the surveyed men have noted that they have the main
responsibility for financially securing their families, and, moreover, 68% of the men have
expressed full agreement with this statement.
A new kind of man – an engaged father – has appeared. The engaged father takes care of
the children, spends a “quality” time with them (goes for a walk, plays) and actively interacts
with the children. He helps his wife to prepare for child delivery, is present at the delivery,
takes daily care of young children. In addition, the engaged father shares the burden of
household duties with his spouse since he recognizes and respects her need for a personal space
and time. Within the framework of this model, the social criterion of the man’s success in the
role of father is the degree and nature of his participation in the child’s life: the “good” father
should be maximally engaged in the life of his children.62
Overall, the surveyed men think that their contacts with their children are stable and do not
connect them with relations with their partners in marriage. Thus, 76% of the respondents do
62 A. V. Avdeyeva, Engaged Fatherhood in Contemporary Russia: Strategies for Participation in Child Care. http://ecsocman.hse.ru/data/2013/03/25/1251441009/Avdeeva.pdf, page 2.

162
not agree with the statement “I am afraid that I would lose contact with the children if my
relationship broke up.”
In spite of the above, 85% of the respondents admit that their role in child care is just
secondary at best (“My role in caring for my children is mostly as a helper)”.
In fact, it is possible to conclude that the perception of the role of the man as the main
breadwinner is still quite stable. The majority of men consider themselves responsible for this
matter, although nowadays the role of women in this matter has largely increased. Relying on
this stereotype, men justify spending little of their time on caring for children, arguing that on
account of work they cannot do that and that their role is limited to that of a provider.
Indirectly, this also confirms the gender segregation existing in the labor market and more
limited opportunities for women to financially provide for their families. At the same time,
only half of the surveyed men would spend more time with their children if the work permitted.
Hence, work is not the only cause of spending comparatively less time on child care.
Responses to the same questions have also been studied taking into account the men’s
educational level.
Table 18. Men as parents
Percentage of male respondents choosing the “strongly agree” option, by level of education (N=488) level of education
I spend too little time with my
children on account of
my job.
I would work less if
it meant that I could spend more time with
my children.
Overall, I have the main responsibility for providing
for the family.
I am afraid that I
would lose contact with the
children if my
relationship broke up.
My role in caring for my
children is mostly as a
helper.
My role in caring for
my children is mostly as
a provider.
Incomplete secondary
45.8% 45.8% 91.7% 16.7% 87.5% 95.8%
Complete secondary
28.6% 26.5% 66.0% 6.3% 54.6% 71.8%
Vocational specialized (vocational training,
30.4% 26.5% 74.5% 2.9% 57.8% 75.5%

163
technical college
Higher (university degree, bachelor’s degree
35.5% 29.8% 62.9% 2.4% 52.4% 65.3%
We have looked at the statement “I spend too little time with my children on account of my
job” from the perspective of the level of education and have revealed the following picture:
this proposition is supported by 46% of those with incomplete secondary education, by 29% of
those with secondary education, by 30% of those with vocational technical college education,
and by 35% of the university-educated. So, it is possible to state that education does not play
an essential role in this matter and one third of the men have noted that they spend less time
with their children on account of their jobs (this percentage was higher among those with
incomplete secondary education -46%).
More time would be spent on children if the work permitted by about 46% of those with
incomplete secondary education, by 26% of those with secondary and technical vocational
education, and by 30% of those with higher education. Thus, those men that have noted that
due to their workload at the workplace they spend less time with their children are ready to
spend more time in the absence of work.
The lower the educational level is, the more manifest the providing responsibility for the
family. This approach has been supported by about 92% of the men with incomplete education,
by 66% of those with complete secondary education, by 74% of those with technical vocational
education, and by 63% of those with higher education. In terms of the numbers of men with
incomplete education and those with higher education, the difference in the approach to this
statement is quite large and stands at 30% and it is higher among men with lower level of
education who display stronger gender stereotypes and traditional perceptions of masculinity.
The same pattern of responses is manifest in replying to the statement “My role in caring
is providing for the family.” It has been supported by about 96% of the men with incomplete
education, by 72% of those with complete secondary education, by 75% of those with technical
vocational education, and by 65% of those with higher education. Again, the amplitude of
fluctuation in this matter between men with incomplete education and those with higher

164
education is quite wide and constitutes 30%, which is probably conditioned by the same above
noted reasons.
The majority of the men do not tie up their relations with their children with those with
their partners. But, nevertheless, the following correlation is displayed through positive
responses to this question: the lower the man’s educational level is, the higher his suspicion
that break-up of relations with his partner will influence his relations with his children. This is
the response of 17% of the men with incomplete secondary education, of 6% of those with
secondary education, of 3% of those with technical vocational education, and of 2% of those
with higher education.
The lower the educational level of the men is, the higher the percentage of those men who
agree with the proposition that “My role in caring for my children is mostly as a helper.”
Eighty-eight per cent of the men who have positively responded to this question have
incomplete secondary education, 54.6% secondary education, 57.8% technical vocational
education, and 52.4% have higher education.
Table 19. Men as parents Percentage of respondents answering questions about distribution of parenting tasks (N=1,617) How do you and your partner distribute the following tasks (youngest child)
Usually me Shared equally or done together
Usually partner
Daily care of the child 34.0 10.6 22.8
Staying at home with the child when he/she is sick
35.8 15.9 19.7
Taking or collecting the child to/from school/daycare center
18.6 12.7 11.0
Playing with the child or doing various leisure-time activities together
18.7 38.1 7.8
Scolding the child (verbal discipline) 26.4 28.8 9.8
Spanking or beating the child 16.0 6.0 4.1
Changing the child’s diapers or clothes 26.6 4.6 19.1
Giving the child a bath 30.1 5.1 21.0
Talking about personal matters with the child 20.4 28.6 8.4
Helping with the child’s homework 22.5 13.4 10.4
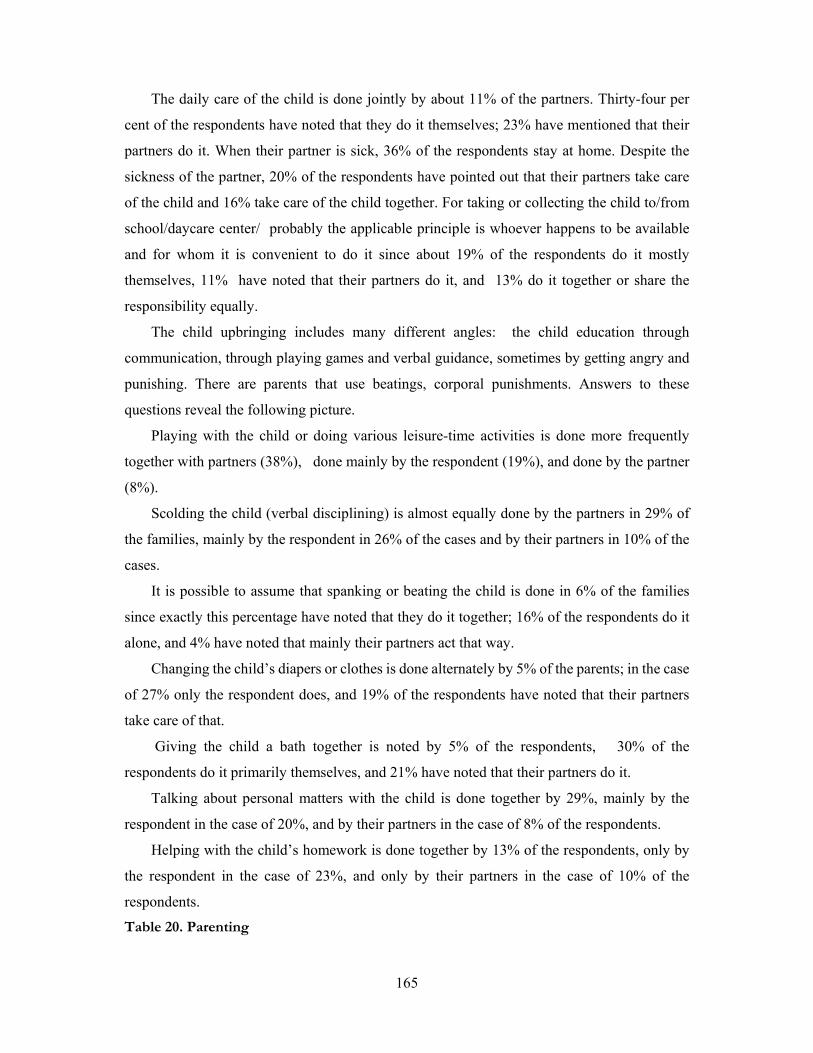
165
The daily care of the child is done jointly by about 11% of the partners. Thirty-four per
cent of the respondents have noted that they do it themselves; 23% have mentioned that their
partners do it. When their partner is sick, 36% of the respondents stay at home. Despite the
sickness of the partner, 20% of the respondents have pointed out that their partners take care
of the child and 16% take care of the child together. For taking or collecting the child to/from
school/daycare center/ probably the applicable principle is whoever happens to be available
and for whom it is convenient to do it since about 19% of the respondents do it mostly
themselves, 11% have noted that their partners do it, and 13% do it together or share the
responsibility equally.
The child upbringing includes many different angles: the child education through
communication, through playing games and verbal guidance, sometimes by getting angry and
punishing. There are parents that use beatings, corporal punishments. Answers to these
questions reveal the following picture.
Playing with the child or doing various leisure-time activities is done more frequently
together with partners (38%), done mainly by the respondent (19%), and done by the partner
(8%).
Scolding the child (verbal disciplining) is almost equally done by the partners in 29% of
the families, mainly by the respondent in 26% of the cases and by their partners in 10% of the
cases.
It is possible to assume that spanking or beating the child is done in 6% of the families
since exactly this percentage have noted that they do it together; 16% of the respondents do it
alone, and 4% have noted that mainly their partners act that way.
Changing the child’s diapers or clothes is done alternately by 5% of the parents; in the case
of 27% only the respondent does, and 19% of the respondents have noted that their partners
take care of that.
Giving the child a bath together is noted by 5% of the respondents, 30% of the
respondents do it primarily themselves, and 21% have noted that their partners do it.
Talking about personal matters with the child is done together by 29%, mainly by the
respondent in the case of 20%, and by their partners in the case of 8% of the respondents.
Helping with the child’s homework is done together by 13% of the respondents, only by
the respondent in the case of 23%, and only by their partners in the case of 10% of the
respondents. Table 20. Parenting
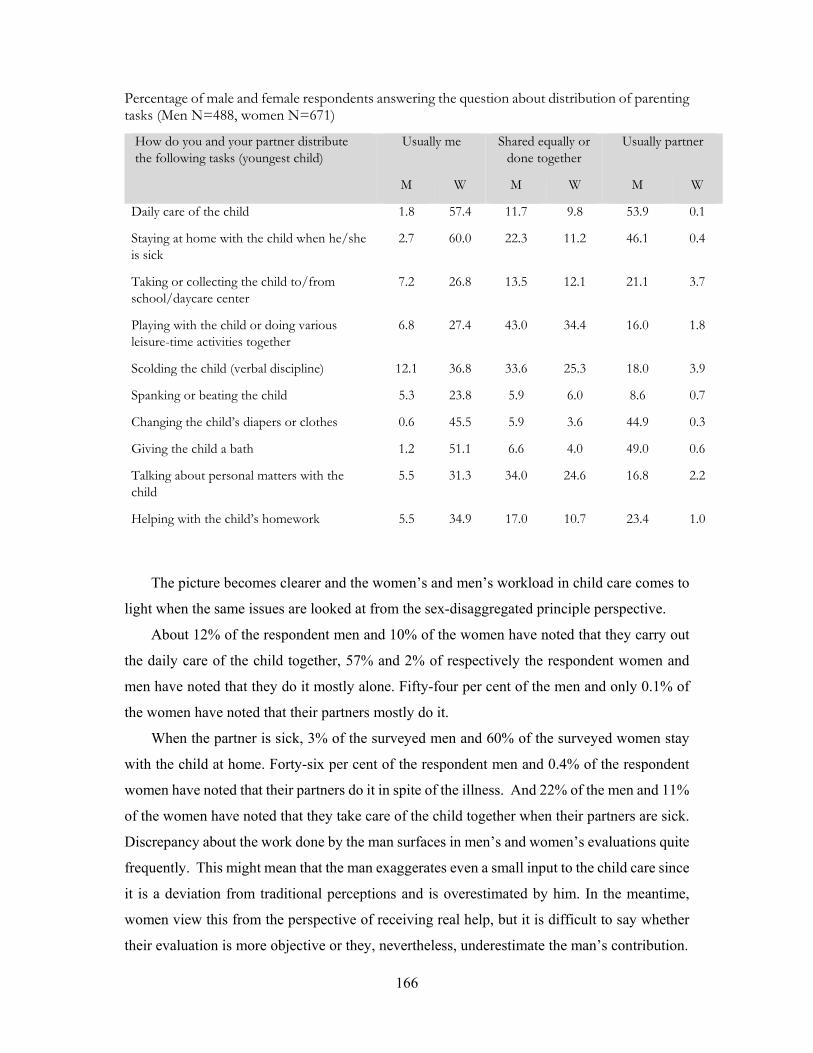
166
Percentage of male and female respondents answering the question about distribution of parenting tasks (Men N=488, women N=671)
How do you and your partner distribute the following tasks (youngest child)
Usually me Shared equally or done together
Usually partner
M W M W M W
Daily care of the child 1.8 57.4 11.7 9.8 53.9 0.1
Staying at home with the child when he/she is sick
2.7 60.0 22.3 11.2 46.1 0.4
Taking or collecting the child to/from school/daycare center
7.2 26.8 13.5 12.1 21.1 3.7
Playing with the child or doing various leisure-time activities together
6.8 27.4 43.0 34.4 16.0 1.8
Scolding the child (verbal discipline) 12.1 36.8 33.6 25.3 18.0 3.9
Spanking or beating the child 5.3 23.8 5.9 6.0 8.6 0.7
Changing the child’s diapers or clothes 0.6 45.5 5.9 3.6 44.9 0.3
Giving the child a bath 1.2 51.1 6.6 4.0 49.0 0.6
Talking about personal matters with the child
5.5 31.3 34.0 24.6 16.8 2.2
Helping with the child’s homework 5.5 34.9 17.0 10.7 23.4 1.0
The picture becomes clearer and the women’s and men’s workload in child care comes to
light when the same issues are looked at from the sex-disaggregated principle perspective.
About 12% of the respondent men and 10% of the women have noted that they carry out
the daily care of the child together, 57% and 2% of respectively the respondent women and
men have noted that they do it mostly alone. Fifty-four per cent of the men and only 0.1% of
the women have noted that their partners mostly do it.
When the partner is sick, 3% of the surveyed men and 60% of the surveyed women stay
with the child at home. Forty-six per cent of the respondent men and 0.4% of the respondent
women have noted that their partners do it in spite of the illness. And 22% of the men and 11%
of the women have noted that they take care of the child together when their partners are sick.
Discrepancy about the work done by the man surfaces in men’s and women’s evaluations quite
frequently. This might mean that the man exaggerates even a small input to the child care since
it is a deviation from traditional perceptions and is overestimated by him. In the meantime,
women view this from the perspective of receiving real help, but it is difficult to say whether
their evaluation is more objective or they, nevertheless, underestimate the man’s contribution.
167
Taking or collecting the child to/from school/daycare center/ is done by either one of the
partners in the opinion of 13% of the men and 12% of the women. Seven per cent of the men
and 27% of the women have noted that they do it mostly themselves, and 21% of the men and
4% of the women have mentioned that their partners mostly do it.
The picture of leisure-time activities with the child seems to be comparably more
egalitarian. Playing with the child or doing various leisure-time activities is done together,
according to 43% of the men and 34% of the women. Only 7% of the respondent men and 27%
of the respondent women have noted that they do it mostly themselves, and 16% of the men
and 2% of the women have mentioned that their partners mostly do it.
According to 34% of the surveyed men and 25% of the surveyed women they both scold
the child and subject to verbal discipline. Twelve per cent of the men and 37% of the women
have noted that they do it mostly themselves, and 18% of the men and 1% of the women have
pointed out that their partners do it.
Spanking or beating the child is done in 6% of the families. Five per cent of the men and
24% of the women have noted that they spank or beat the child mostly themselves, and 9% of
the men and 0.7% of the women have mentioned that that their partners mostly act that way.
In fact, since women spend more time with the child and the public perceives women as
the child’s main educator, women are the ones who mostly apply punishment. In this case,
fathers act according to the principle of “not being the bad guy.” This also becomes an
additional moral burden for women. By engaging less in the child’s everyday goings-on, the
man appears in an advantageous situation, his words carry bigger weight since they are not
voiced every day.
Changing the child’s diapers or clothes are alternately done in the assessment of 6% of the
men and 4% of the women. According to 0.6% of the respondent men and 45% of the women,
only they do it, and 45% of the men and 0.3% of the women have noted that their partners do
it.
Giving the child a bath is done together, according to 7% of the men and 4% of the women.
One per cent of the respondent men and 51% of the respondent women have noted that they do
it primarily themselves. According to 49% of the men and 0.6% of the women, it is done by
their partners.
Talking about personal matters with the child is done together, according to 34% of the
surveyed men and 25% of the surveyed women. Five per cent of the men and 31% of the
women have noted that it is mostly done by the respondent, and 17% of the men and 2% of the
women have mentioned that their partners do it.
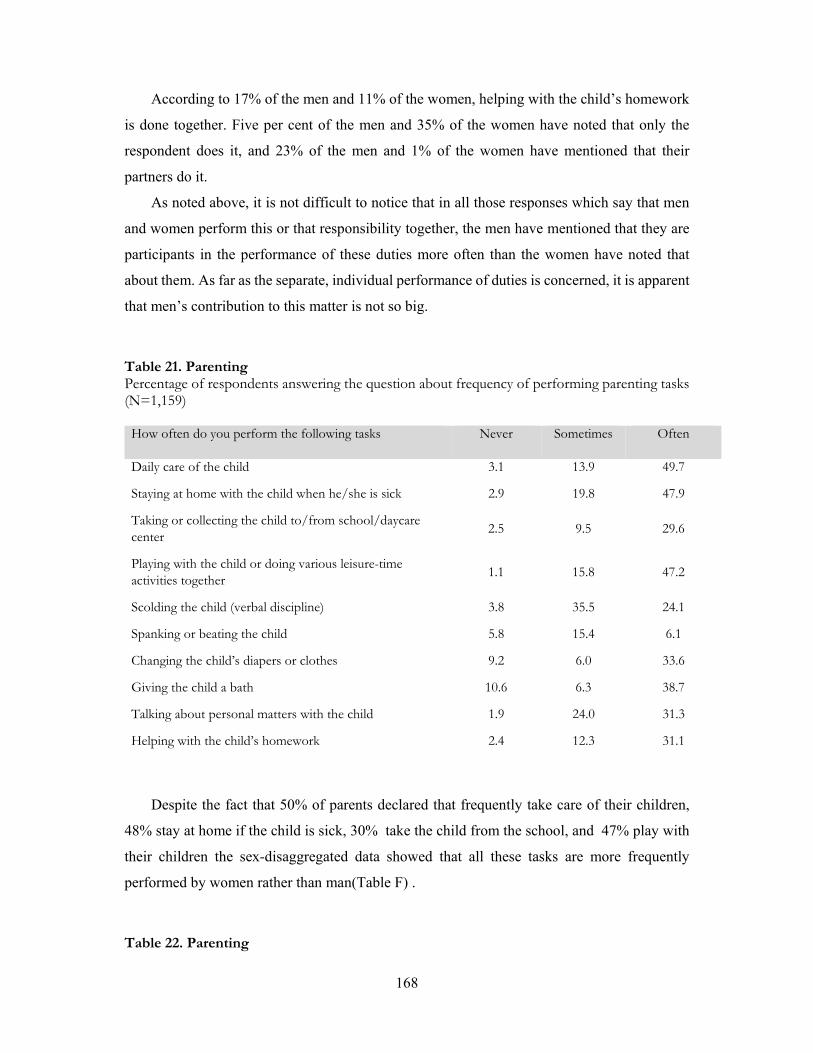
168
According to 17% of the men and 11% of the women, helping with the child’s homework
is done together. Five per cent of the men and 35% of the women have noted that only the
respondent does it, and 23% of the men and 1% of the women have mentioned that their
partners do it.
As noted above, it is not difficult to notice that in all those responses which say that men
and women perform this or that responsibility together, the men have mentioned that they are
participants in the performance of these duties more often than the women have noted that
about them. As far as the separate, individual performance of duties is concerned, it is apparent
that men’s contribution to this matter is not so big.
Table 21. Parenting Percentage of respondents answering the question about frequency of performing parenting tasks (N=1,159) How often do you perform the following tasks Never Sometimes Often
Daily care of the child 3.1 13.9 49.7
Staying at home with the child when he/she is sick 2.9 19.8 47.9
Taking or collecting the child to/from school/daycare center
2.5 9.5 29.6
Playing with the child or doing various leisure-time activities together
1.1 15.8 47.2
Scolding the child (verbal discipline) 3.8 35.5 24.1
Spanking or beating the child 5.8 15.4 6.1
Changing the child’s diapers or clothes 9.2 6.0 33.6
Giving the child a bath 10.6 6.3 38.7
Talking about personal matters with the child 1.9 24.0 31.3
Helping with the child’s homework 2.4 12.3 31.1
Despite the fact that 50% of parents declared that frequently take care of their children,
48% stay at home if the child is sick, 30% take the child from the school, and 47% play with
their children the sex-disaggregated data showed that all these tasks are more frequently
performed by women rather than man(Table F) .
Table 22. Parenting
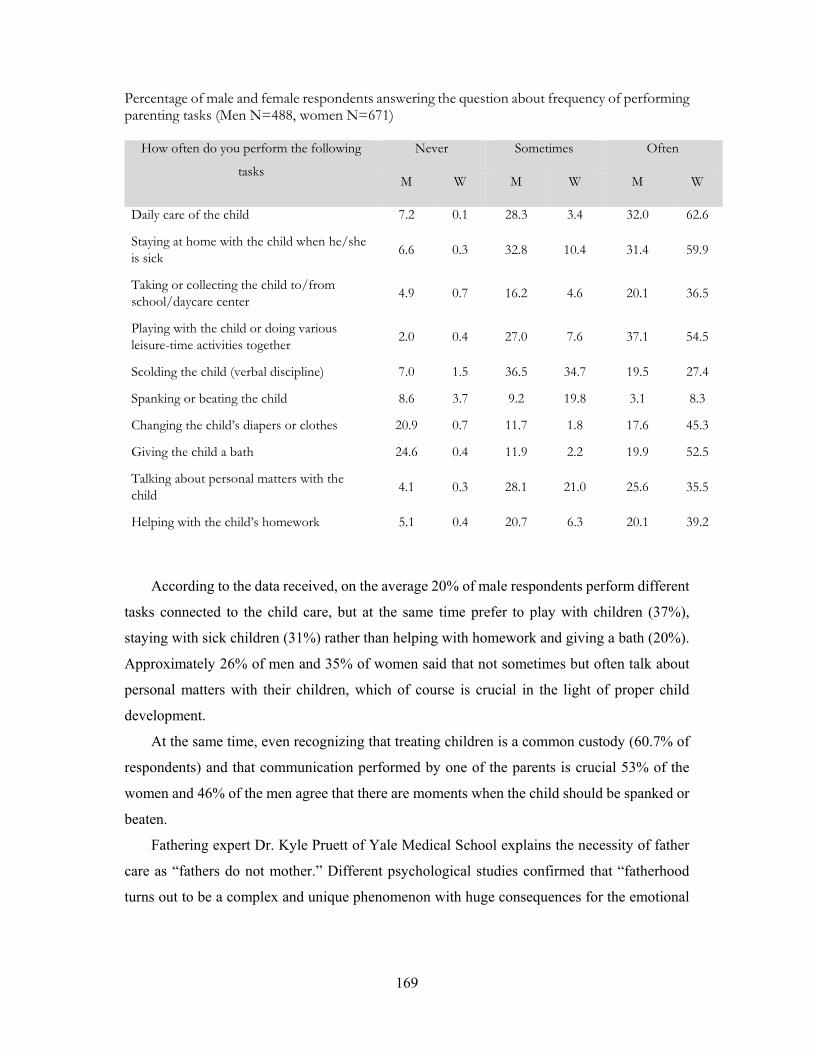
169
Percentage of male and female respondents answering the question about frequency of performing parenting tasks (Men N=488, women N=671)
How often do you perform the following
tasks
Never Sometimes Often
M W M W M W
Daily care of the child 7.2 0.1 28.3 3.4 32.0 62.6
Staying at home with the child when he/she is sick
6.6 0.3 32.8 10.4 31.4 59.9
Taking or collecting the child to/from school/daycare center
4.9 0.7 16.2 4.6 20.1 36.5
Playing with the child or doing various leisure-time activities together
2.0 0.4 27.0 7.6 37.1 54.5
Scolding the child (verbal discipline) 7.0 1.5 36.5 34.7 19.5 27.4
Spanking or beating the child 8.6 3.7 9.2 19.8 3.1 8.3
Changing the child’s diapers or clothes 20.9 0.7 11.7 1.8 17.6 45.3
Giving the child a bath 24.6 0.4 11.9 2.2 19.9 52.5
Talking about personal matters with the child
4.1 0.3 28.1 21.0 25.6 35.5
Helping with the child’s homework 5.1 0.4 20.7 6.3 20.1 39.2
According to the data received, on the average 20% of male respondents perform different
tasks connected to the child care, but at the same time prefer to play with children (37%),
staying with sick children (31%) rather than helping with homework and giving a bath (20%).
Approximately 26% of men and 35% of women said that not sometimes but often talk about
personal matters with their children, which of course is crucial in the light of proper child
development.
At the same time, even recognizing that treating children is a common custody (60.7% of
respondents) and that communication performed by one of the parents is crucial 53% of the
women and 46% of the men agree that there are moments when the child should be spanked or
beaten.
Fathering expert Dr. Kyle Pruett of Yale Medical School explains the necessity of father
care as “fathers do not mother.” Different psychological studies confirmed that “fatherhood
turns out to be a complex and unique phenomenon with huge consequences for the emotional

170
and intellectual growth of children.”63 A father, as a male parent, brings a unique contribution
to the parenting project; likewise, a mother, as a female, uniquely impacts the life and
development of her child. This diversity, in itself, provides children with a broader, richer
experience of contrasting relational interactions—more so than for children who are raised by
only one parent. Children are learning at earliest age by experience, that men and women are
different and have different ways of dealing with life, other adults and children. Fathers tend
to play with (37%), and mothers tend to care for (62%), children. Fathers encourage
competition; mothers encourage equity. One style encourages independence while the other
encourages security…. Both provide security and confidence in their own ways by
communicating love and physical intimacy.64
Data on frequency of communication with their children collected within the framework
of this very research provide as with an understanding that parents do not avoid communication
even living separately from their children: 52% of respondents declared that communicating
with their children almost every day. The American Journal of Sociology finds that, “Societies
with father-present patterns of child socialization produce men who are less inclined to exclude
women from public activities than their counterparts in father-absent societies.”65 When we
disregard the gender distinctions of parental influence as unimportant or unnecessary, we
seriously diminish the proper development of children. Kids need the active participation of a
mother and a father, and both parents need to be true to their gender designs. Both bring
different and equally important things to the parenting project.
Although during the preceding inquiry it became clear that men accept their role of the
breadwinner of the family and their responsibility for providing for the family as it is fixed in
the public consciousness, 26% of the men do not provide financial support and 10% of the
fathers provide assistance from time to time if the child does not live with them. At the same
time, 42% have noted that they provide permanent assistance, and 16% have mentioned that
they cover the greater part of the expenses.
Men’s participation in household tasks
The household is characterized as a production area where a non-marketable production
(self-sufficiency) is carried out, as well as an activity that targets the maintenance of
63 Erik Erikson, New York: Warner Books, 1987 64 Barbara Dafoe Whitehead, Atlantic Monthly, April 1993 65 Scott Coltrane, “Father-Child Relationships and the Status of Women: A Cross-Cultural Study,” American Journal of Sociology, 93 (1988)
171
utilitarian/usual state of family-administered goods (renovation, apartment clean-up, etc.).
Domestic servicing of family members is carried out in the household. The scope of and nature
of work at the household vary in different countries and even with different layers of the same
country. Under the conditions of patriarchy and in accordance with the traditions of the
majority of societies, public and private (household) areas are divided between men and
women. And the more traditional and undemocratic the society is, the bigger this difference.66
As a matter of fact, home production includes unpaid types of activities, which are carried
out by household members to meet their needs. These types of activities can be replaced by
market commodities or paid services if the circumstances (income amount, market conditions,
and individual preferences) provide that opportunity. For example, in Armenia women can
foods at home because this way it is more reasonable for the family, but with an increase in the
family income this canned food can be bought. At the same time, it is possible that even in
cases when the family can afford to buy it, they might all the same be prepared at home due to
preferences of family members ( “home-made food is always more delicious” and “safe”).
Household work requires energy and time. It has mainly been done and is done by women
and they are compelled to either refrain from working in public spheres or choose part-time
employment.
Up until recently, the household work has not been assessed quantitatively: it has not been
reflected in national statistical data. However, the study of the structure of time spent on work
is very important for equal distribution of employment, for evaluation of women’s and men’s
contribution to the country’s economic and social life, and for equal division of household
duties and responsibilities associated with child care.
Since 2005, the National Statistical Service has been responsible for preparing Women
and Men in Armenia statistical booklet, comprised with a data on different aspects of life
including time usage by both: women and men. The data contains information on the time spent
by men and women on paid and unpaid (household) work and shows that women usually spent
five times more time on household duties than men67. The problem researchers have always
paid most of their attention to women as principal actors in household.
According to the gender stereotypes prevalent in the society, the household work is, as a
rule, not considered to be a man’s job. A real man, according to a wide-spread stereotype,
should have a “respectable job” and “earn money”. This determines not only the family welfare,
66 L. Zakaryan, A. Harutiunyan, Gender and Journalism, Learning manual, AAWUE Yerevan 2010, page 175. 67Women and Men in Armenia, Statistical booklet, RA NSS, 2015 http://www.armstat.am/file/article/kanajq_ev_txamardik.pdf
172
but also its social status, reputation, and lifestyle. According to these perceptions, men should
assume only some household functions, and as a rule, it is apartment renovation and, partially,
major purchases, etc.
These perceptions depend on the cultural and value system of society, state gender policies
and can change parallel to society’s political and socio-economic development. Men’s roles
are changing slowly, men retain primarily the roles of a provider: of money, security, a
matrimonial and parenting status. An overlay of new and old models of a gender order68 is
taking place. Social perceptions of women’s role and place in public sphere change more
quickly than perceptions about the enhancement of the role of men in household work. One of
the main reasons for this situation is the circumstance that household work does not create a
market value and, hence, has not been highly valued.
In Armenia, field studies of the issue under consideration have never been conducted. So,
the present study is quite informative from that perspective.
Under current conditions, traditional social contracts do not match the roles of women and
men in the labor market. The equality of positions in the areas of education and work has
removed the foundation of inequality in the social status; the man stopped being a protector
and the only provider in the family, which should have led to the equality of their household
positions. However, changes in this direction are proceeding slowly and are contradictory by
nature.
At the same time, this is an important issue since if one of them deals with household work
and it is the woman that has been the one for a very long time, she has little time to manage her
leisure and to develop her human capital.
Even taking into account the fact that household work belongs to the private sphere, it is
often guided by gender stereotypes existing in the public sphere.
To understand the perception of masculinity in Armenia, some issues on the man
involvement in household work and duties, such as doing laundry/washing clothes, cleaning
the house, bathroom or toilet, preparing food, buying food, paying bills and repairing house
have been highlighted.
The survey has demonstrated that partners in marriage do very little work together – only
buying food (38.1%) and paying bills (21.2%) and, the rest of the household duties, such as
laundry, house renovation, apartment and rest-room clean-up, meal preparation, seem, as a rule,
68 Edited by E. Zdravomislova, A. Rotkirkh, A. Tyemkina, A New Way of Life in Contemporary Russia: Gender Research of Daily Routine. Saint Petersburg: The publishing house of the European University of Saint Petersburg, 2009, page 8, http://socioline.ru/files/5/348/s-091_pages.pdf

173
to be divided between the spouses. For example, 46% of the respondents have noted that they
themselves do the laundry and 36% have mentioned their partners. Or other examples: house
renovation is done either by the respondents (37%) or their partners (38%); the apartment and
rest-room clean-up are respectively 47% and 36%; and meal preparation 46% and 35%.
Table 23. Division of household duties
Percentage of male and female respondents answering the question about division of HH duties (Men N=694, women N=738)
If you disregard the outside help you receive from others, how do you and your partner divide the following tasks:
Usually you Shared equally or done together
Usually partner
M W M W M W
Doing laundry/
washing clothes 3.2% 87.3% 0.3% 0.5% 71.9% 2.0%
Repairing house 68.2% 8.1% 3.2% 9.5% 4.3% 70.7%
Buying food 17.7% 35.6% 35.4% 40.7% 23.6% 15.4%
Cleaning the house 3.2% 89.1% 2.3% 1.1% 71.5% 1.9%
Cleaning the bathroom/toilet 3.0% 89.3% 1.0% 0.8% 72.6% 1.9%
Preparing food 3.3% 86.6% 4.2% 3.5% 69.5% 2.2%
Paying bills 36.5% 28.5% 20.7% 21.5% 18.4% 40.9%
The division of household tasks between women and men is better clarified when the
responses to the same questions are viewed through sex-disaggregated data. According to the
survey results, men pay the least attention to the clean-up tasks in the household. For example,
only 3.0% of the surveyed men have noted that most of the time they themselves clean the
bathrooms and toilets, 3.2% deal with cleaning the apartment and 3.2% do the laundry. Only
3.3% of the men have mentioned that they prepare food at home. However, 68.2% of the men
do house renovations and 36.5% pay the utility bills. Perhaps, the laundry is nowadays done
with a washing-machine and for this reason a lower percentage of the men have pointed that
out. We have the same situation with clean-up tasks and food preparation. A higher
percentage of women note that they themselves perform these tasks as compared to a lower
percentage of men that point out that these tasks are done by their partners. Approximately
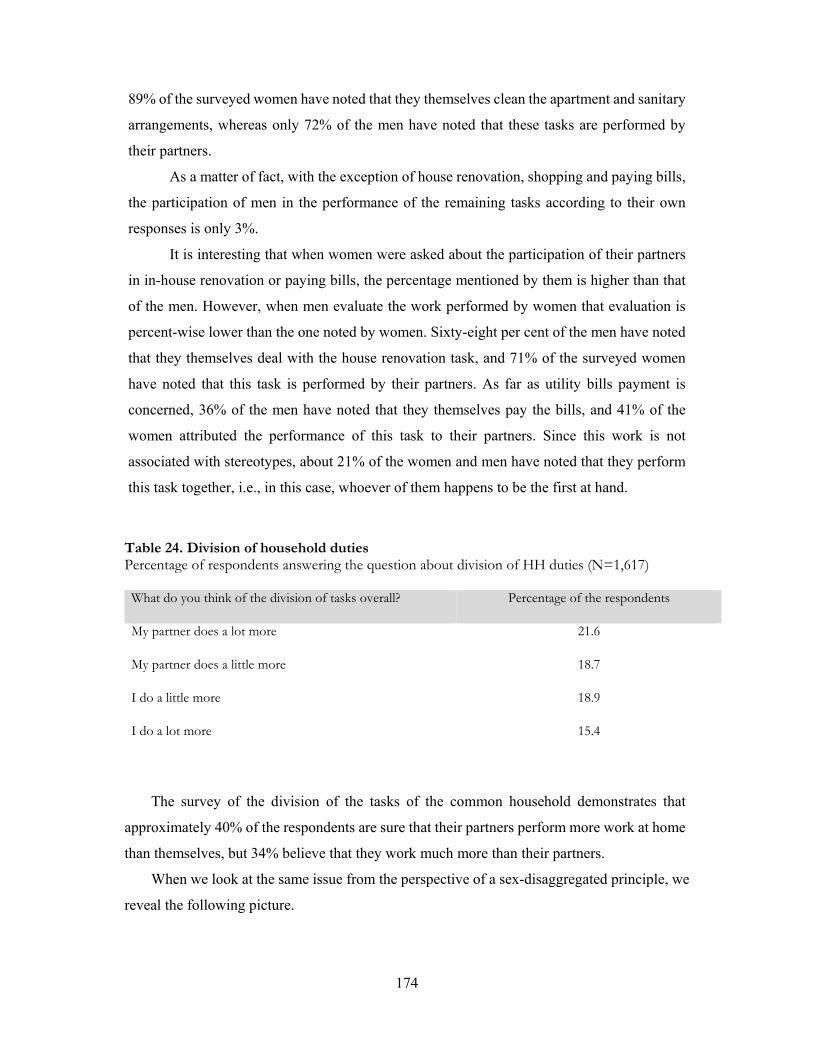
174
89% of the surveyed women have noted that they themselves clean the apartment and sanitary
arrangements, whereas only 72% of the men have noted that these tasks are performed by
their partners.
As a matter of fact, with the exception of house renovation, shopping and paying bills,
the participation of men in the performance of the remaining tasks according to their own
responses is only 3%.
It is interesting that when women were asked about the participation of their partners
in in-house renovation or paying bills, the percentage mentioned by them is higher than that
of the men. However, when men evaluate the work performed by women that evaluation is
percent-wise lower than the one noted by women. Sixty-eight per cent of the men have noted
that they themselves deal with the house renovation task, and 71% of the surveyed women
have noted that this task is performed by their partners. As far as utility bills payment is
concerned, 36% of the men have noted that they themselves pay the bills, and 41% of the
women attributed the performance of this task to their partners. Since this work is not
associated with stereotypes, about 21% of the women and men have noted that they perform
this task together, i.e., in this case, whoever of them happens to be the first at hand.
Table 24. Division of household duties Percentage of respondents answering the question about division of HH duties (N=1,617) What do you think of the division of tasks overall? Percentage of the respondents
My partner does a lot more 21.6
My partner does a little more 18.7
I do a little more 18.9
I do a lot more 15.4
The survey of the division of the tasks of the common household demonstrates that
approximately 40% of the respondents are sure that their partners perform more work at home
than themselves, but 34% believe that they work much more than their partners.
When we look at the same issue from the perspective of a sex-disaggregated principle, we
reveal the following picture.
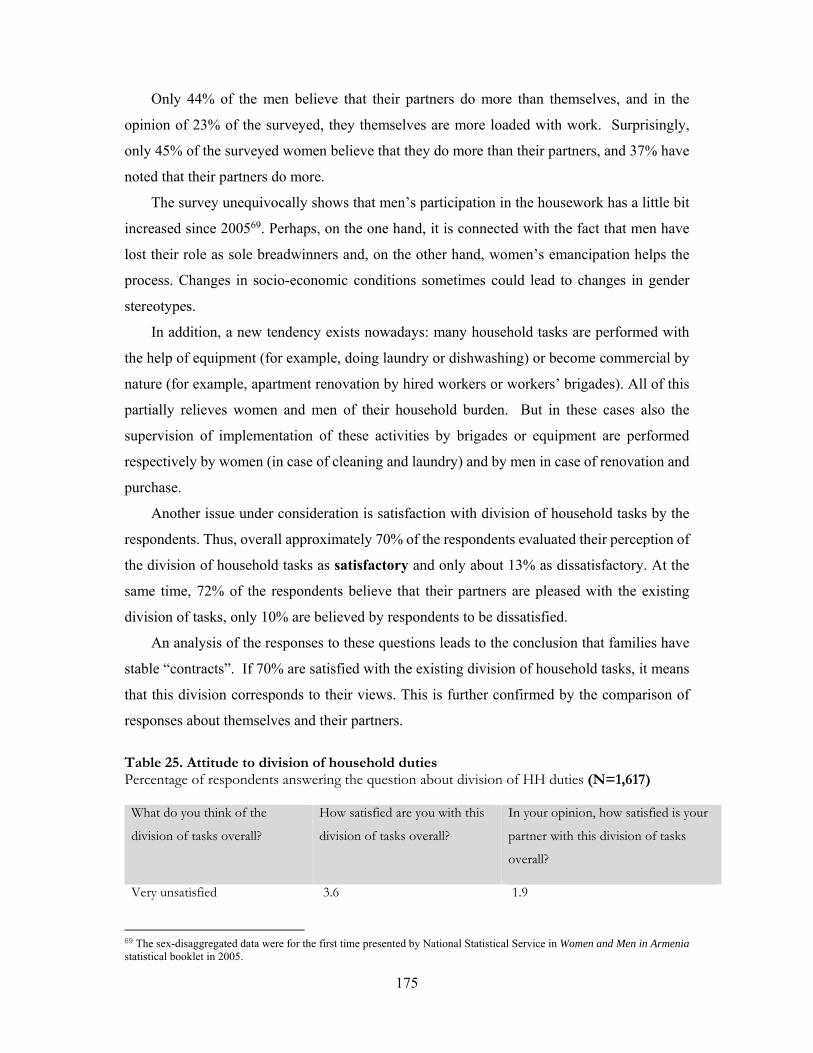
175
Only 44% of the men believe that their partners do more than themselves, and in the
opinion of 23% of the surveyed, they themselves are more loaded with work. Surprisingly,
only 45% of the surveyed women believe that they do more than their partners, and 37% have
noted that their partners do more.
The survey unequivocally shows that men’s participation in the housework has a little bit
increased since 200569. Perhaps, on the one hand, it is connected with the fact that men have
lost their role as sole breadwinners and, on the other hand, women’s emancipation helps the
process. Changes in socio-economic conditions sometimes could lead to changes in gender
stereotypes.
In addition, a new tendency exists nowadays: many household tasks are performed with
the help of equipment (for example, doing laundry or dishwashing) or become commercial by
nature (for example, apartment renovation by hired workers or workers’ brigades). All of this
partially relieves women and men of their household burden. But in these cases also the
supervision of implementation of these activities by brigades or equipment are performed
respectively by women (in case of cleaning and laundry) and by men in case of renovation and
purchase.
Another issue under consideration is satisfaction with division of household tasks by the
respondents. Thus, overall approximately 70% of the respondents evaluated their perception of
the division of household tasks as satisfactory and only about 13% as dissatisfactory. At the
same time, 72% of the respondents believe that their partners are pleased with the existing
division of tasks, only 10% are believed by respondents to be dissatisfied.
An analysis of the responses to these questions leads to the conclusion that families have
stable “contracts”. If 70% are satisfied with the existing division of household tasks, it means
that this division corresponds to their views. This is further confirmed by the comparison of
responses about themselves and their partners. Table 25. Attitude to division of household duties Percentage of respondents answering the question about division of HH duties (N=1,617) What do you think of the
division of tasks overall?
How satisfied are you with this
division of tasks overall?
In your opinion, how satisfied is your
partner with this division of tasks
overall?
Very unsatisfied 3.6 1.9
69 The sex-disaggregated data were for the first time presented by National Statistical Service in Women and Men in Armenia statistical booklet in 2005.
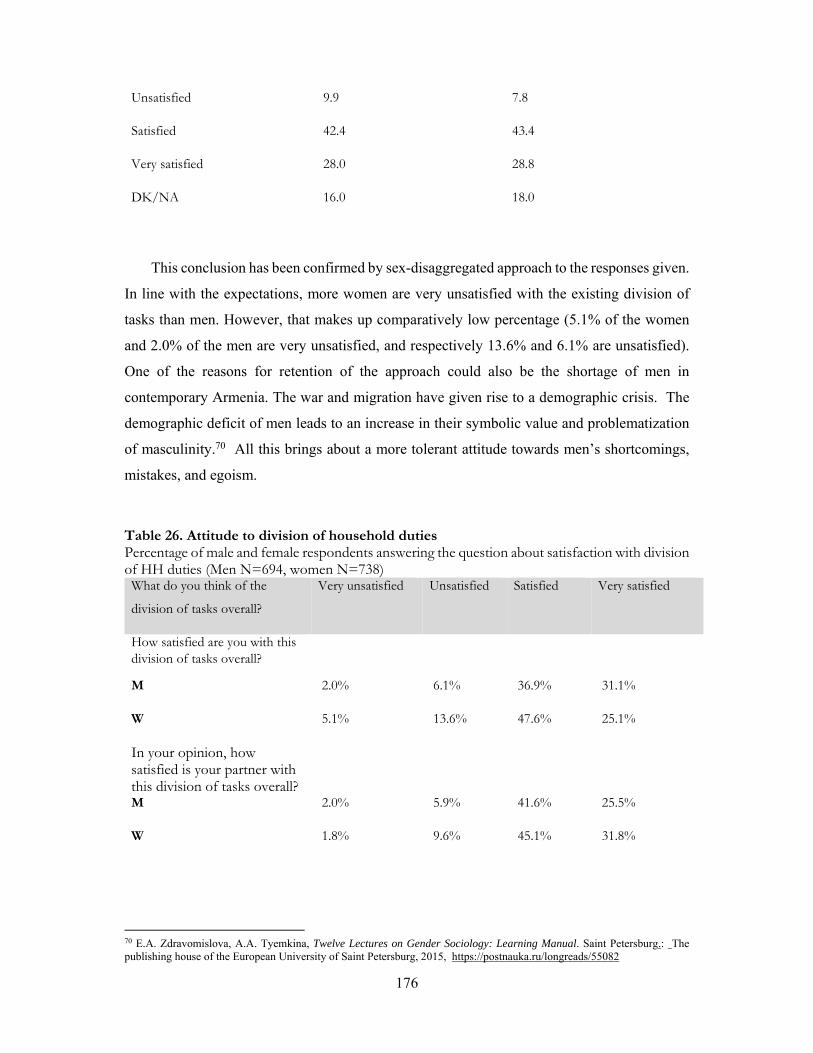
176
Unsatisfied 9.9 7.8
Satisfied 42.4 43.4
Very satisfied 28.0 28.8
DK/NA 16.0 18.0
This conclusion has been confirmed by sex-disaggregated approach to the responses given.
In line with the expectations, more women are very unsatisfied with the existing division of
tasks than men. However, that makes up comparatively low percentage (5.1% of the women
and 2.0% of the men are very unsatisfied, and respectively 13.6% and 6.1% are unsatisfied).
One of the reasons for retention of the approach could also be the shortage of men in
contemporary Armenia. The war and migration have given rise to a demographic crisis. The
demographic deficit of men leads to an increase in their symbolic value and problematization
of masculinity.70 All this brings about a more tolerant attitude towards men’s shortcomings,
mistakes, and egoism.
Table 26. Attitude to division of household duties Percentage of male and female respondents answering the question about satisfaction with division of HH duties (Men N=694, women N=738) What do you think of the
division of tasks overall?
Very unsatisfied Unsatisfied Satisfied Very satisfied
How satisfied are you with this division of tasks overall?
M 2.0% 6.1% 36.9% 31.1%
W 5.1% 13.6% 47.6% 25.1%
In your opinion, how satisfied is your partner with this division of tasks overall?
M 2.0% 5.9% 41.6% 25.5%
W 1.8% 9.6% 45.1% 31.8%
70 E.A. Zdravomislova, A.A. Tyemkina, Twelve Lectures on Gender Sociology: Learning Manual. Saint Petersburg.: The publishing house of the European University of Saint Petersburg, 2015, https://postnauka.ru/longreads/55082
177
The study of the opinions of women and men about the partner’s satisfaction seems to also
reinforce the understanding of the matched expectations. Thus, about 77% of women believe
that their partners are satisfied with similar division of tasks (let us remind that 68% of men
have expressed satisfaction, i.e. the deviation is 9%), and in that, they believe that 45.1% are
satisfied and 31.8% are very satisfied.
About 67% of men believe that their partners are satisfied with similar division of tasks
(let us remind that 73% of women have expressed satisfaction, i.e. the deviation is 6%), and in
that, they believe that 41.6% are satisfied and 25.5% are very satisfied.
Thus, the survey has demonstrated that an unequal and unfair division of household tasks
persists, however, this division, by at large, corresponds to the existing gender stereotypes and
does not give rise to gender conflicts.

178
CHAPTER 5. SATISFACTION WITH MARRIAGE
The present study views the nature of relationships between sexes within the context of
satisfaction with marriage. The satisfaction with marriage is defined either as “a subjective
evaluation of the nature of their relationship by each of the spouses71,” or as “a subjective
perception, through the prism of socio-cultural norms, by the spouses of the functioning of the
family in terms of its satisfying their individual needs,” which include the need for
communication, cognition, defense of I-concept, mutual understanding, etc.72 Some sources
characterize “satisfaction with marriage” as result of adequate realization of the perception
(image) of the family that has formed in man’s consciousness under the influence of encounters
with diverse events that make up their experience (actual or symbolic) in a given realm of
activity.73
There are many conceptions and approaches which describe the role and factors that
influence satisfaction with family life. Factors influencing the degree of subjective satisfaction
with marriage include: the stage of the life cycle of the family and length of marriage,
motivation to get married, similarity of values of spouses, existence of children in the family,
sexual satisfaction of the spouses, division of household duties, housing conditions (the size
and the level of comfort of the accommodation), the family budget (the amount and means of
distribution), and employment. For example, working women manifest higher level of
subjective satisfaction with marriage than non-working housewives. Researchers attribute the
reasons for this to satisfaction of the self-realization motivation in the sphere of professional
activities which increases the self-respect and self-acceptance level of women and to the
possibility of receiving an emotional support from their colleagues at work. There is also a
correlation between satisfaction with marriage and satisfaction with work. In particular, men
demonstrate quite complex interdependence between success at work and family relations: the
instability of the latter arises both when men have professional (and consequently financial)
failures and drastic improvement of the financial state. When the man has firm determination
to financially secure his wife and children, he not only negatively assesses relations in the
71 A.V. Hankevych, Factors that Influence Satisfaction with Family Life. http://seanewdim.com/uploads/3/2/1/3/3213611/hankevych_a._v._factors_that_influence_on_satisfaction_of_family_life.pdf 72 V.P. Levkovych, O.E. Zuscova, A Socio-Psychological Approach to the Study of Spousal Conflicts. Samara, 2007; D.Y. Raygorodski, Editor, The Family Psychology: Reader, Samara: Bakhrakh-M, 2007. 73 S. E.Golod, A Socio-Demographic Analysis of the State and Evolution of the Family. Социс.., 2008, #1.
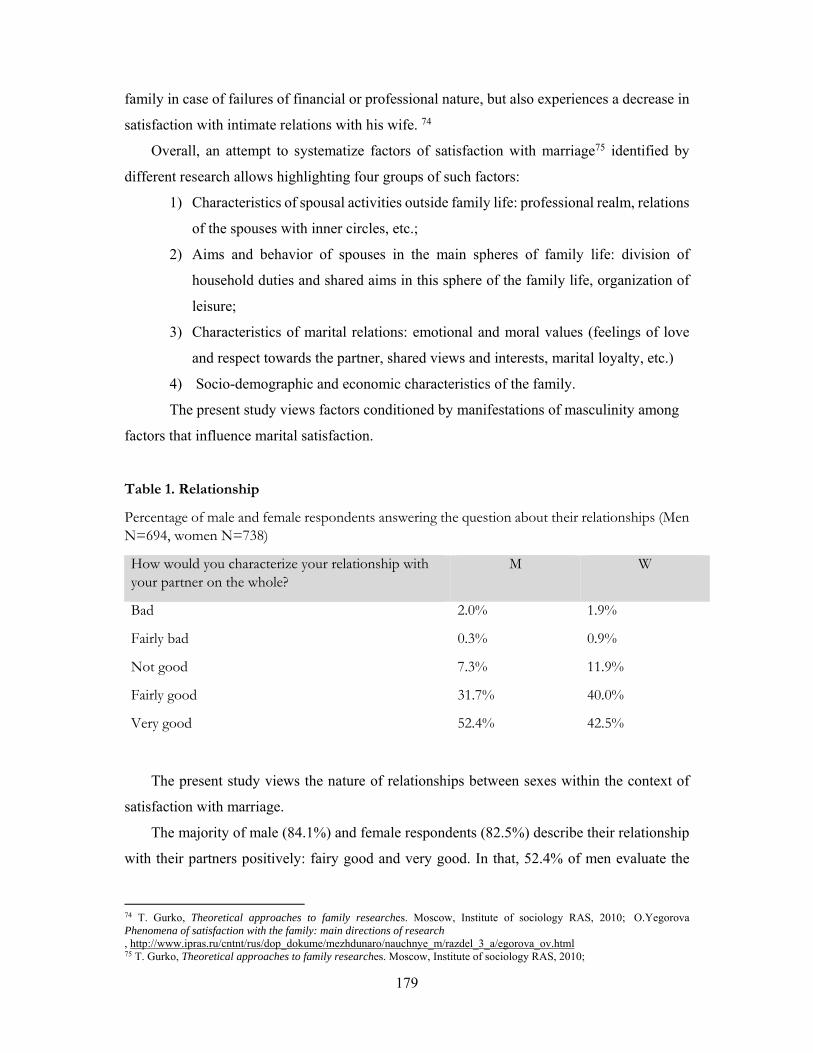
179
family in case of failures of financial or professional nature, but also experiences a decrease in
satisfaction with intimate relations with his wife. 74
Overall, an attempt to systematize factors of satisfaction with marriage75 identified by
different research allows highlighting four groups of such factors:
1) Characteristics of spousal activities outside family life: professional realm, relations
of the spouses with inner circles, etc.;
2) Aims and behavior of spouses in the main spheres of family life: division of
household duties and shared aims in this sphere of the family life, organization of
leisure;
3) Characteristics of marital relations: emotional and moral values (feelings of love
and respect towards the partner, shared views and interests, marital loyalty, etc.)
4) Socio-demographic and economic characteristics of the family.
The present study views factors conditioned by manifestations of masculinity among
factors that influence marital satisfaction.
Table 1. Relationship
Percentage of male and female respondents answering the question about their relationships (Men N=694, women N=738)
How would you characterize your relationship with your partner on the whole?
M W
Bad 2.0% 1.9%
Fairly bad 0.3% 0.9%
Not good 7.3% 11.9%
Fairly good 31.7% 40.0%
Very good 52.4% 42.5%
The present study views the nature of relationships between sexes within the context of
satisfaction with marriage.
The majority of male (84.1%) and female respondents (82.5%) describe their relationship
with their partners positively: fairy good and very good. In that, 52.4% of men evaluate the
74 T. Gurko, Theoretical approaches to family researches. Moscow, Institute of sociology RAS, 2010; O.Yegorova Phenomena of satisfaction with the family: main directions of research , http://www.ipras.ru/cntnt/rus/dop_dokume/mezhdunaro/nauchnye_m/razdel_3_a/egorova_ov.html 75 T. Gurko, Theoretical approaches to family researches. Moscow, Institute of sociology RAS, 2010;
180
relations in the superlative degree as “Very Good”, which may attest to the emotional comfort
that they experience in their family relations or to the justified expectations of the marriage in
terms of their partners. In comparison with men, women are more cautious about positive
evaluations. Only 42.5% of women characterize relations with their partners as “Very Good”
and 40.0% as “Fairly Good”. The respondents that negatively characterize relations with their
partners (“Not Good”, “Fairly Bad”, and “Bad”) include more women (14.7%) than men
(9.6%). Overall, one may conclude that men are more satisfied with family relations than
women, which coincides with the data of the research on the psychology of marital
relationships, which demonstrate that the degree of satisfaction with marriage is also influenced
by the sex of the spouse76 and the differences lie, as a rule, in a higher satisfaction with marriage
of men than of women.
At the same time, psychologists relate marital satisfaction to the degree of internality of
the person. The partners who fully take up the responsibility for their lives are more satisfied
with their marriage, irrespective of the gender, i.e. in general, the maturity of the personality
plays a first-rate role in successful formation of the marriage. It should be noted that marital
satisfaction of women is interconnected with the degree of internality of their husbands: the
higher are the indicators of the internality of the husband, the higher is the level of martial
satisfaction of his wife.77 Hence, a conclusion can be drawn that marriage with responsible,
mature men is subjectively more favorable for women. This is also confirmed by a significant
correlation of women’s satisfaction with the fact that their husbands have jobs.
Based on the above, a number of sources draw a conclusion that gender stereotypical
behavior of spouses determines the correlation of their expectations and behavior.78 In other
words, the spouses, each of whom feels comfortable within the framework of stereotypical
perceptions about masculinity and femininity, as well as about their family and professional
roles, are more satisfied with their marriage and are less conflicting. This study confirms this
conclusion by the example of dependence between marital satisfaction and division of house
work.
The observed correlation is demonstrated by the answers to the question How satisfied are
you with this division of tasks overall? With its sub questions, see below:
76 A.N. Vasilyeva, G.R. Shaghivaleyeva, Study of Gender Relations of Marital Satisfaction among Couples. International Journal of Applied and Fundamental Research, 2010, #3, pp.38-39. 77 Y.E. Aleshina, edited by D.Y. Raygorodski, The Family Psychology. Samara: Bakhrakh-M, 2002, pp. 92-100. 78 Correlation of Family Values and Role Play of Spouses (Gender Aspect). Connections of personality’s social position in the membership groups with sociometric status http://cyberleninka.ru/article/n/soglasovannost-semeynyh-tsennostey-i-rolevyh-ustanovok-suprugov-gendernyy-aspekt#ixzz4DyrppjuH
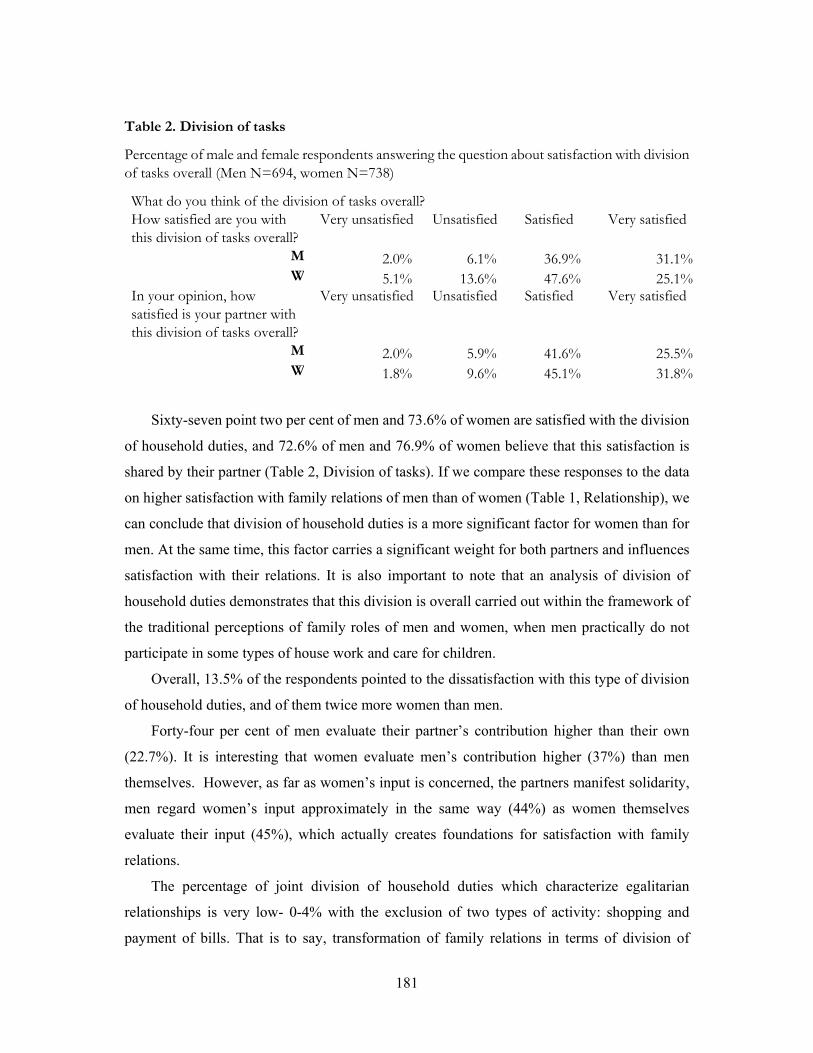
181
Table 2. Division of tasks
Percentage of male and female respondents answering the question about satisfaction with division of tasks overall (Men N=694, women N=738)
What do you think of the division of tasks overall? How satisfied are you with this division of tasks overall?
Very unsatisfied Unsatisfied Satisfied Very satisfied
M 2.0% 6.1% 36.9% 31.1% W 5.1% 13.6% 47.6% 25.1%
In your opinion, how satisfied is your partner with this division of tasks overall?
Very unsatisfied Unsatisfied Satisfied Very satisfied
M 2.0% 5.9% 41.6% 25.5% W 1.8% 9.6% 45.1% 31.8%
Sixty-seven point two per cent of men and 73.6% of women are satisfied with the division
of household duties, and 72.6% of men and 76.9% of women believe that this satisfaction is
shared by their partner (Table 2, Division of tasks). If we compare these responses to the data
on higher satisfaction with family relations of men than of women (Table 1, Relationship), we
can conclude that division of household duties is a more significant factor for women than for
men. At the same time, this factor carries a significant weight for both partners and influences
satisfaction with their relations. It is also important to note that an analysis of division of
household duties demonstrates that this division is overall carried out within the framework of
the traditional perceptions of family roles of men and women, when men practically do not
participate in some types of house work and care for children.
Overall, 13.5% of the respondents pointed to the dissatisfaction with this type of division
of household duties, and of them twice more women than men.
Forty-four per cent of men evaluate their partner’s contribution higher than their own
(22.7%). It is interesting that women evaluate men’s contribution higher (37%) than men
themselves. However, as far as women’s input is concerned, the partners manifest solidarity,
men regard women’s input approximately in the same way (44%) as women themselves
evaluate their input (45%), which actually creates foundations for satisfaction with family
relations.
The percentage of joint division of household duties which characterize egalitarian
relationships is very low- 0-4% with the exclusion of two types of activity: shopping and
payment of bills. That is to say, transformation of family relations in terms of division of
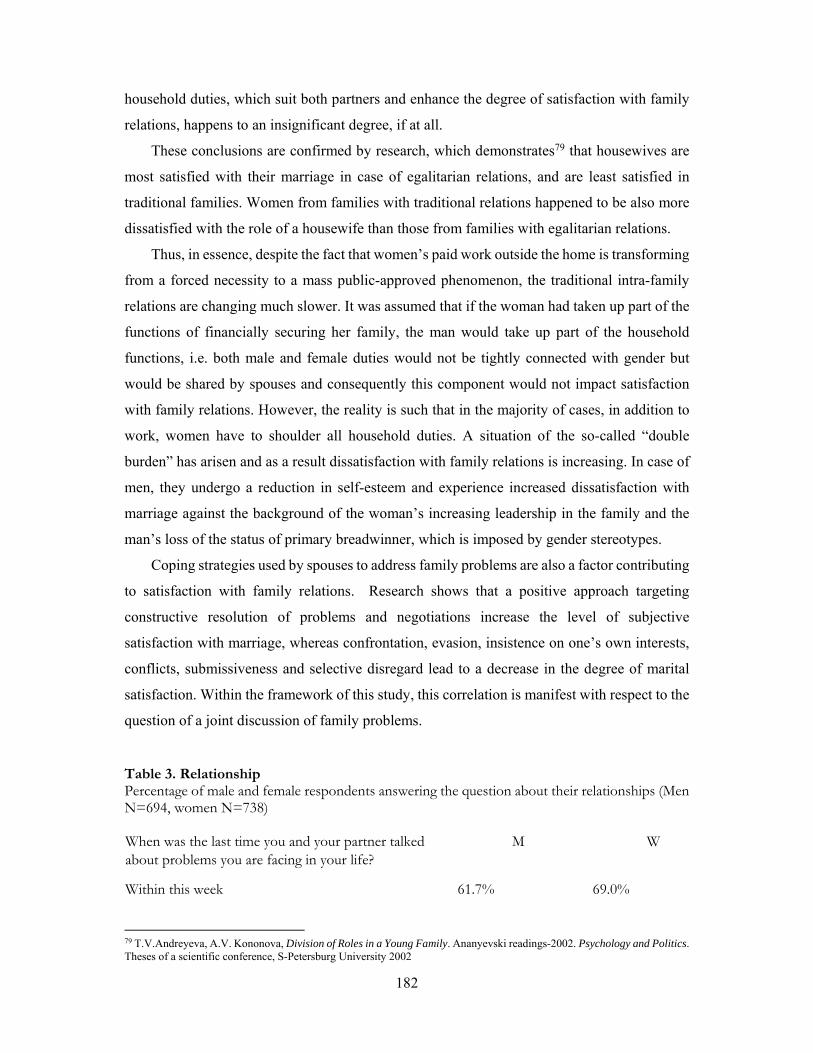
182
household duties, which suit both partners and enhance the degree of satisfaction with family
relations, happens to an insignificant degree, if at all.
These conclusions are confirmed by research, which demonstrates79 that housewives are
most satisfied with their marriage in case of egalitarian relations, and are least satisfied in
traditional families. Women from families with traditional relations happened to be also more
dissatisfied with the role of a housewife than those from families with egalitarian relations.
Thus, in essence, despite the fact that women’s paid work outside the home is transforming
from a forced necessity to a mass public-approved phenomenon, the traditional intra-family
relations are changing much slower. It was assumed that if the woman had taken up part of the
functions of financially securing her family, the man would take up part of the household
functions, i.e. both male and female duties would not be tightly connected with gender but
would be shared by spouses and consequently this component would not impact satisfaction
with family relations. However, the reality is such that in the majority of cases, in addition to
work, women have to shoulder all household duties. A situation of the so-called “double
burden” has arisen and as a result dissatisfaction with family relations is increasing. In case of
men, they undergo a reduction in self-esteem and experience increased dissatisfaction with
marriage against the background of the woman’s increasing leadership in the family and the
man’s loss of the status of primary breadwinner, which is imposed by gender stereotypes.
Coping strategies used by spouses to address family problems are also a factor contributing
to satisfaction with family relations. Research shows that a positive approach targeting
constructive resolution of problems and negotiations increase the level of subjective
satisfaction with marriage, whereas confrontation, evasion, insistence on one’s own interests,
conflicts, submissiveness and selective disregard lead to a decrease in the degree of marital
satisfaction. Within the framework of this study, this correlation is manifest with respect to the
question of a joint discussion of family problems.
Table 3. Relationship Percentage of male and female respondents answering the question about their relationships (Men N=694, women N=738) When was the last time you and your partner talked about problems you are facing in your life?
M W
Within this week 61.7% 69.0%
79 T.V.Andreyeva, A.V. Kononova, Division of Roles in a Young Family. Ananyevski readings-2002. Psychology and Politics. Theses of a scientific conference, S-Petersburg University 2002
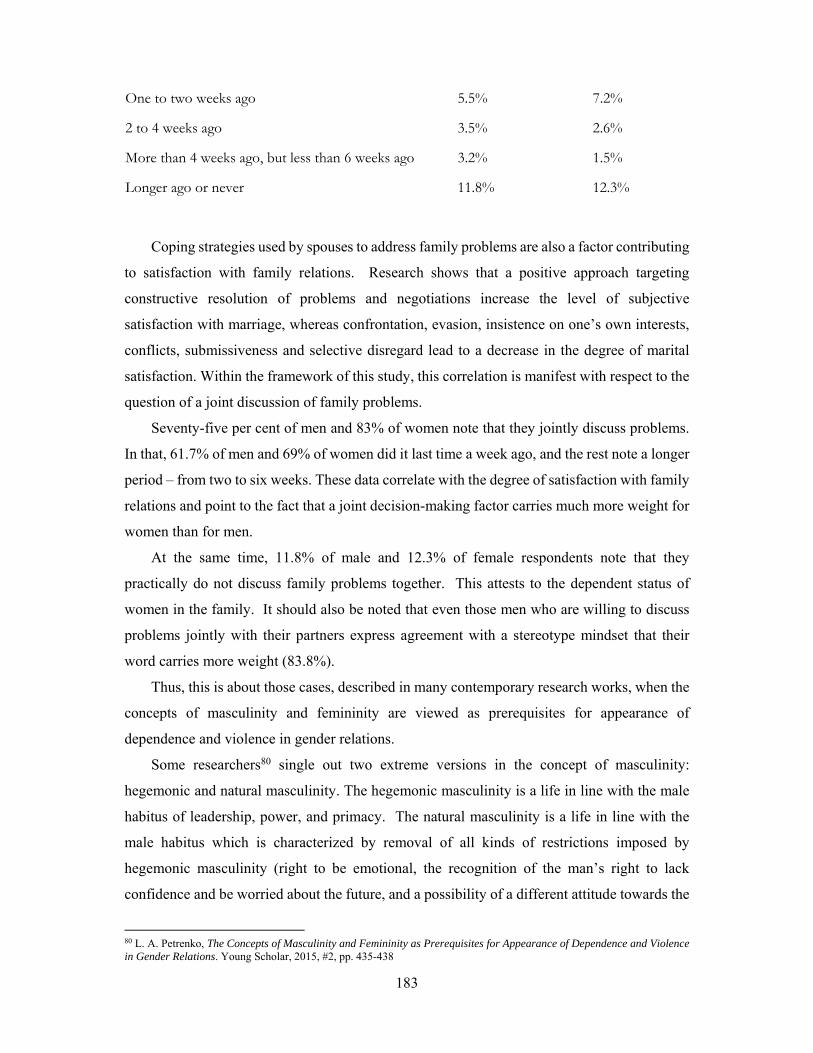
183
One to two weeks ago 5.5% 7.2%
2 to 4 weeks ago 3.5% 2.6%
More than 4 weeks ago, but less than 6 weeks ago 3.2% 1.5%
Longer ago or never 11.8% 12.3%
Coping strategies used by spouses to address family problems are also a factor contributing
to satisfaction with family relations. Research shows that a positive approach targeting
constructive resolution of problems and negotiations increase the level of subjective
satisfaction with marriage, whereas confrontation, evasion, insistence on one’s own interests,
conflicts, submissiveness and selective disregard lead to a decrease in the degree of marital
satisfaction. Within the framework of this study, this correlation is manifest with respect to the
question of a joint discussion of family problems.
Seventy-five per cent of men and 83% of women note that they jointly discuss problems.
In that, 61.7% of men and 69% of women did it last time a week ago, and the rest note a longer
period – from two to six weeks. These data correlate with the degree of satisfaction with family
relations and point to the fact that a joint decision-making factor carries much more weight for
women than for men.
At the same time, 11.8% of male and 12.3% of female respondents note that they
practically do not discuss family problems together. This attests to the dependent status of
women in the family. It should also be noted that even those men who are willing to discuss
problems jointly with their partners express agreement with a stereotype mindset that their
word carries more weight (83.8%).
Thus, this is about those cases, described in many contemporary research works, when the
concepts of masculinity and femininity are viewed as prerequisites for appearance of
dependence and violence in gender relations.
Some researchers80 single out two extreme versions in the concept of masculinity:
hegemonic and natural masculinity. The hegemonic masculinity is a life in line with the male
habitus of leadership, power, and primacy. The natural masculinity is a life in line with the
male habitus which is characterized by removal of all kinds of restrictions imposed by
hegemonic masculinity (right to be emotional, the recognition of the man’s right to lack
confidence and be worried about the future, and a possibility of a different attitude towards the
80 L. A. Petrenko, The Concepts of Masculinity and Femininity as Prerequisites for Appearance of Dependence and Violence in Gender Relations. Young Scholar, 2015, #2, pp. 435-438
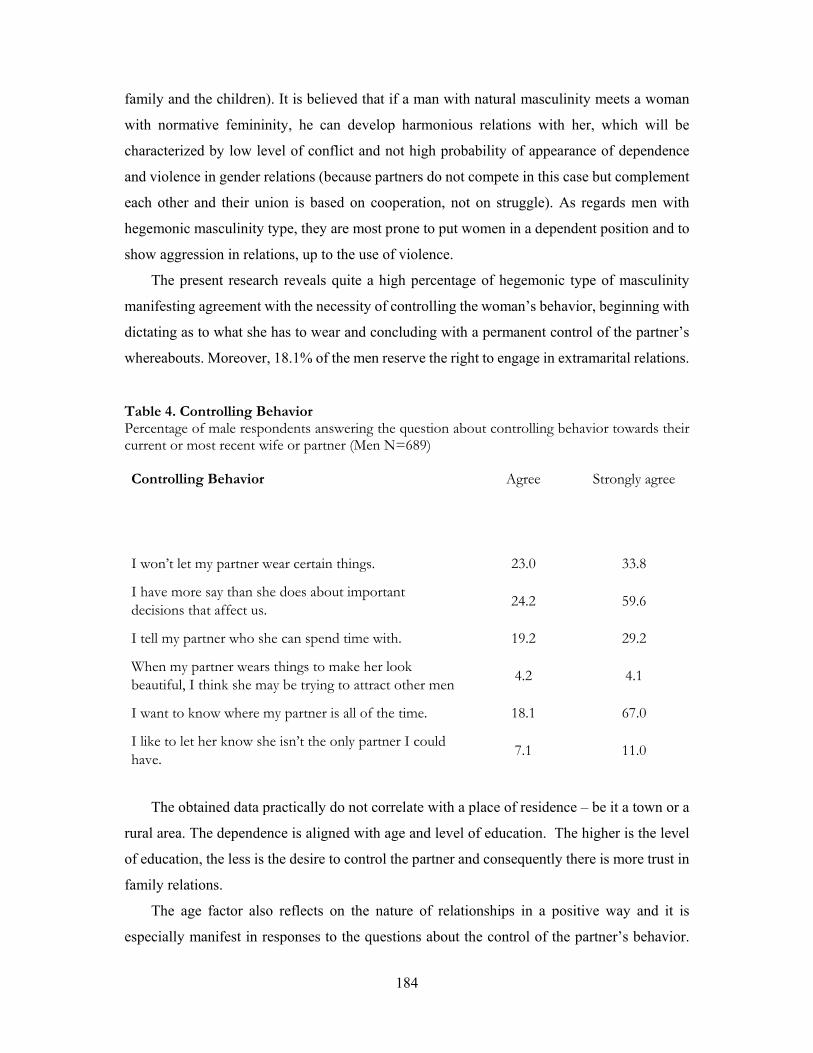
184
family and the children). It is believed that if a man with natural masculinity meets a woman
with normative femininity, he can develop harmonious relations with her, which will be
characterized by low level of conflict and not high probability of appearance of dependence
and violence in gender relations (because partners do not compete in this case but complement
each other and their union is based on cooperation, not on struggle). As regards men with
hegemonic masculinity type, they are most prone to put women in a dependent position and to
show aggression in relations, up to the use of violence.
The present research reveals quite a high percentage of hegemonic type of masculinity
manifesting agreement with the necessity of controlling the woman’s behavior, beginning with
dictating as to what she has to wear and concluding with a permanent control of the partner’s
whereabouts. Moreover, 18.1% of the men reserve the right to engage in extramarital relations.
Table 4. Controlling Behavior Percentage of male respondents answering the question about controlling behavior towards their current or most recent wife or partner (Men N=689) Controlling Behavior
Agree Strongly agree
I won’t let my partner wear certain things. 23.0 33.8
I have more say than she does about important decisions that affect us.
24.2 59.6
I tell my partner who she can spend time with. 19.2 29.2
When my partner wears things to make her look beautiful, I think she may be trying to attract other men
4.2 4.1
I want to know where my partner is all of the time. 18.1 67.0
I like to let her know she isn’t the only partner I could have.
7.1 11.0
The obtained data practically do not correlate with a place of residence – be it a town or a
rural area. The dependence is aligned with age and level of education. The higher is the level
of education, the less is the desire to control the partner and consequently there is more trust in
family relations.
The age factor also reflects on the nature of relationships in a positive way and it is
especially manifest in responses to the questions about the control of the partner’s behavior.

185
With age, not only a deeper trust in partner is recorded, but also a higher degree of respect
towards the partner’s opinion. However, yet another factor should be taken into account: with
the increase in age disharmonious families break up and the percentage of harmonious families
increases in the selection. Of significance are also psychological peculiarities of elderly people
related to age, such as social comfort, the burden of the years lived together, the difficulties
experienced together, the existence of children and grandchildren, denial of the possibility of
divorce at an advanced age. In addition, fear of loneliness at an advanced age compels to show
more attention and tolerance towards the partner, to be considerate of the partner, which
explains closer relations and ability to more effectively resolve arising problems than before.
All this feeds the tendency of elderly people to perceive their marriage as successful, which is
manifest in responses to the question about the satisfaction with family relations in the age
group above 50: 81.6% of respondents from this group positively evaluate their relationships
with their partners (Table B, Relationship).
Table 5. Relationship Percentage of respondents answering the question about their relationships, by background characteristics (N=1,617)
Bad Fairly bad Not good
Fairly good
Very good
Age
18-24 2.1% 1.0% 11.9% 30.9% 42.3%
25-34 2.6% 0.0% 6.4% 31.9% 54.5%
35-49 1.2% 0.8% 9.9% 36.8% 48.8%
50-59 2.3% 1.0% 12.5% 43.4% 38.2%
Ed
uca
tion
Basic 0.0% 0.0% 0.0% 100.0% 0.0%
Secondary 1.9% 0.6% 11.0% 33.3% 49.0%
TVET 2.1% 0.9% 12.1% 40.2% 42.0%
Higher 1.7% 0.5% 6.0% 36.7% 49.3%
Res
iden
ce Yerevan 1.8% 0.6% 10.6% 33.5% 46.7%
Other urban areas 1.7% 0.7% 11.4% 35.9% 46.6%
Rural areas 2.3% 0.6% 7.5% 38.3% 48.6%
The study of dependence of subjective satisfaction with marriage on length of marital life
demonstrates that possible reasons for an increase in satisfaction with marriage at later stages

186
of matrimony are psychological peculiarities of spouses related to their age, the expansion of
spheres of self-expression of parents after completing the performance of the function of
upbringing their children which is manifest in realization of careers outside family life –
through professional, social activities, pursuit of different hobbies - for which the spouses
simply had no time in the past. As regards the impact of grown up children’s leaving the family
on martial satisfaction, “the syndrome of empty nests”, which expresses itself in negative
emotional pattern of “the lost meaning of life,” is observed in those cases when completion of
the function of rearing children creates emptiness in life (parents do not work, absence of
meaningful interests, low level of education), when spouses have long before distanced
themselves from each other and do not have common “points of contact” and interests, and
relations between matured children and parents are distant and full of conflict. It is also known
that when mothers take up the roles of grandmothers in the families of their grown up children,
they experience a significant increase in the level of their subjective satisfaction with marriage.
We should also mention that the conducted research reveals that the degree of satisfaction
with family relations is especially high in families in the age group of 25-34. This can be
explained by birth of children in the family, which is an important factor conditioning
satisfaction with marital life. There is a connection between the stages of the life cycle of the
family and the degree of subjective satisfaction with marriage: minimum satisfaction with
marriage is observed in families with infant children, and maximum satisfaction before the
birth of children. The subjective satisfaction with marriage decreases during transitional
periods in the life cycle of the family and in families with young children.
The other parameters, such as level of education and place of residence, have not shown
significant impact on the degree of satisfaction with marriage.
187
CHAPTER 6. HEALTH PRACTICES
In the 1970s, researchers started claiming that man’s health, morbidity, and mortality
depend not only on biological but also on social factors. Before that, peculiarities of male
diseases and the difference between the length of life of men and women had been looked at
exclusively through the prism of biology of sexes, ignoring social reasons for the specifics.
Feminist and gender studies81 became a prerequisite for transition from study of separate
factors of the men’s ill health to a systemic analysis of the men’s health as a serious social
problem.
The peak of studies proving interdependence between masculine stereotypes of behavior
and the men’s health falls on the 2000s.82 Without denying the biological factors of men’s high
mortality, modern science ascribes an important theoretical and practical significance to social
factors – the man’s role and masculinity. Men’s aspiration to maintain a high standard of their
traditional role leads to negative consequences in the form of problems with health.83 The thing
is that men’s sexual role models imply heightened inclination towards risks (including in
unnecessary cases), avoidance of expressing emotions, rare appeals for medical assistance, a
high risk of realization of destructive behavioral practices by men (drug use, alcoholism) and
major (as compared to women) involvement in physically dangerous activities, in extreme
sports, etc.84
Studies demonstrate that men more rarely realize their exposure to the risk of getting ill,
infliction of traumas and emergence of different problems with health than women. In spite of
the fact, that men’s risk of developing drug addiction or alcoholism is much higher, men of all
ages underestimate, to a large degree, the risks associated with smoking and use of alcohol and
narcotic substances. Almost three of four men state that they are not worried about the
81 Donald F. Sabo, David Frederick Gordon, Men's Studies Association (U.S.)Men's health and illness: gender, power, and the body ,1995 82 The men’s health is dealt with by a number of international professional societies and a number of popular science Internet sites is devoted to the issue (for example, www.menshealthnetwork.org). These problems are elucidated from different angles in interdisciplinary scholarly journals: «Journal of Men's Studies» (published since 1992); «Men and Masculinities» (published since 1999); «Psychology of Men and Masculinity» (published since 2000), «International Journal of Men's Health» (published since 2002), «American Journal of Men's Health» (published since 2007), «The Aging Male» (published since 1998), «Journal of Adolescent Health», etc. 83 O'Neil J. M., Good G.E., Holmes S. (1995). Fifteen years of theory and research on men's gender role conflict: New paradigms for empirical research. In R. Levant and W. Pollack (Eds.), Foundations for anew psychology of men. New York: Basic Books 84 Addis & Cohane, 2005; Mansfield et al.2005, Burmikina2006, Korkhova 2000
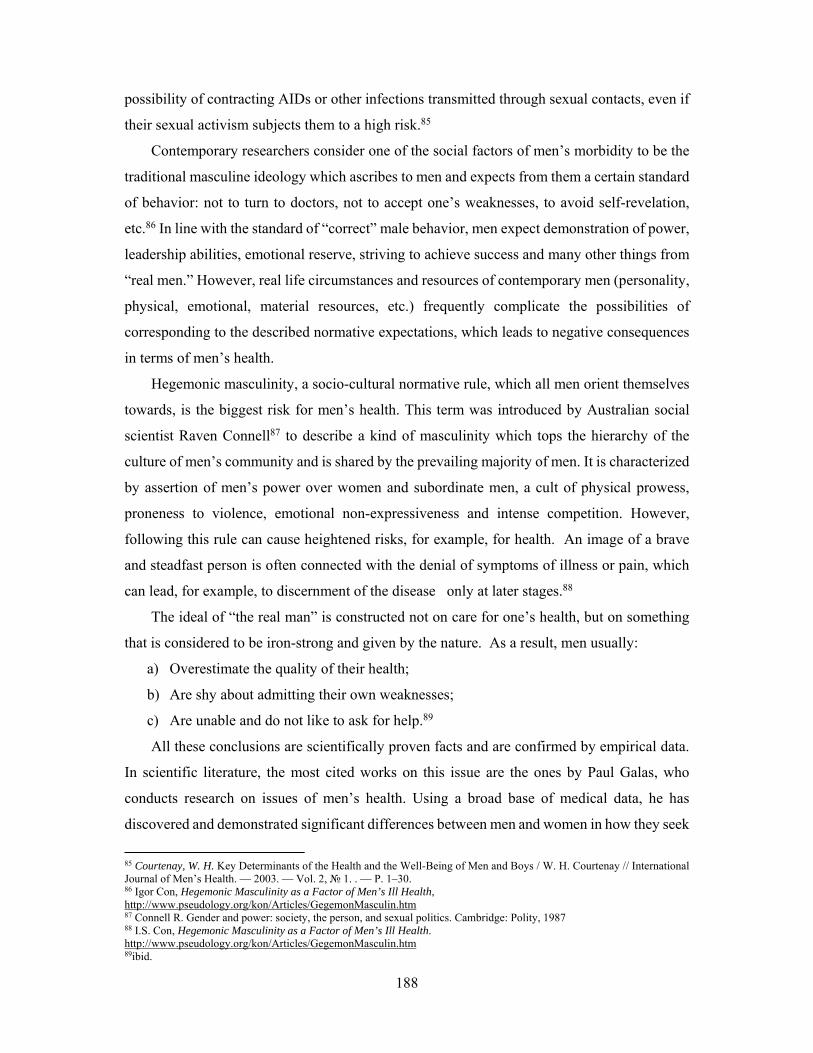
188
possibility of contracting AIDs or other infections transmitted through sexual contacts, even if
their sexual activism subjects them to a high risk.85
Contemporary researchers consider one of the social factors of men’s morbidity to be the
traditional masculine ideology which ascribes to men and expects from them a certain standard
of behavior: not to turn to doctors, not to accept one’s weaknesses, to avoid self-revelation,
etc.86 In line with the standard of “correct” male behavior, men expect demonstration of power,
leadership abilities, emotional reserve, striving to achieve success and many other things from
“real men.” However, real life circumstances and resources of contemporary men (personality,
physical, emotional, material resources, etc.) frequently complicate the possibilities of
corresponding to the described normative expectations, which leads to negative consequences
in terms of men’s health.
Hegemonic masculinity, a socio-cultural normative rule, which all men orient themselves
towards, is the biggest risk for men’s health. This term was introduced by Australian social
scientist Raven Connell87 to describe a kind of masculinity which tops the hierarchy of the
culture of men’s community and is shared by the prevailing majority of men. It is characterized
by assertion of men’s power over women and subordinate men, a cult of physical prowess,
proneness to violence, emotional non-expressiveness and intense competition. However,
following this rule can cause heightened risks, for example, for health. An image of a brave
and steadfast person is often connected with the denial of symptoms of illness or pain, which
can lead, for example, to discernment of the disease only at later stages.88
The ideal of “the real man” is constructed not on care for one’s health, but on something
that is considered to be iron-strong and given by the nature. As a result, men usually:
a) Overestimate the quality of their health;
b) Are shy about admitting their own weaknesses;
c) Are unable and do not like to ask for help.89
All these conclusions are scientifically proven facts and are confirmed by empirical data.
In scientific literature, the most cited works on this issue are the ones by Paul Galas, who
conducts research on issues of men’s health. Using a broad base of medical data, he has
discovered and demonstrated significant differences between men and women in how they seek
85 Courtenay, W. H. Key Determinants of the Health and the Well-Being of Men and Boys / W. H. Courtenay // International Journal of Men’s Health. — 2003. — Vol. 2, № 1. . — P. 1–30. 86 Igor Con, Hegemonic Masculinity as a Factor of Men’s Ill Health, http://www.pseudology.org/kon/Articles/GegemonMasculin.htm 87 Connell R. Gender and power: society, the person, and sexual politics. Cambridge: Polity, 1987 88 I.S. Con, Hegemonic Masculinity as a Factor of Men’s Ill Health. http://www.pseudology.org/kon/Articles/GegemonMasculin.htm 89ibid.
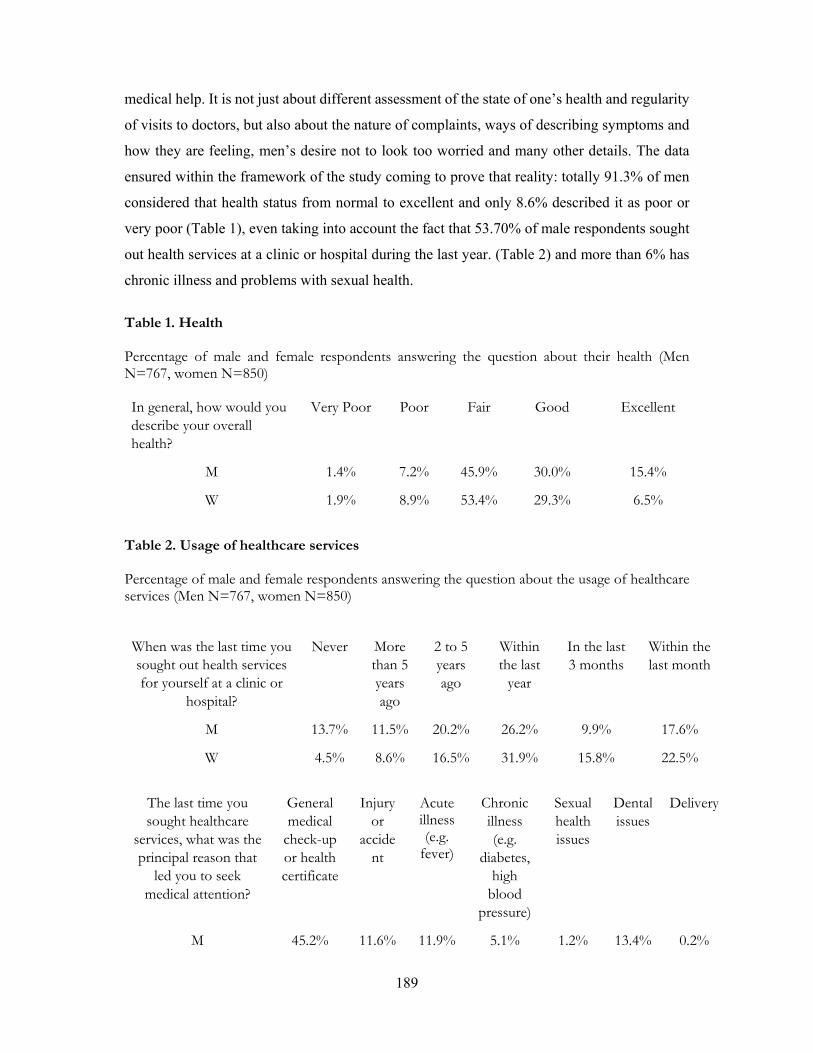
189
medical help. It is not just about different assessment of the state of one’s health and regularity
of visits to doctors, but also about the nature of complaints, ways of describing symptoms and
how they are feeling, men’s desire not to look too worried and many other details. The data
ensured within the framework of the study coming to prove that reality: totally 91.3% of men
considered that health status from normal to excellent and only 8.6% described it as poor or
very poor (Table 1), even taking into account the fact that 53.70% of male respondents sought
out health services at a clinic or hospital during the last year. (Table 2) and more than 6% has
chronic illness and problems with sexual health.
Table 1. Health Percentage of male and female respondents answering the question about their health (Men N=767, women N=850) In general, how would you describe your overall health?
Very Poor Poor Fair Good Excellent
M 1.4% 7.2% 45.9% 30.0% 15.4%
W 1.9% 8.9% 53.4% 29.3% 6.5%
Table 2. Usage of healthcare services Percentage of male and female respondents answering the question about the usage of healthcare services (Men N=767, women N=850)
When was the last time you sought out health services for yourself at a clinic or
hospital?
Never More than 5 years ago
2 to 5 years ago
Within the last
year
In the last 3 months
Within the last month
M 13.7% 11.5% 20.2% 26.2% 9.9% 17.6%
W 4.5% 8.6% 16.5% 31.9% 15.8% 22.5%
The last time you sought healthcare
services, what was the principal reason that
led you to seek medical attention?
General medical
check-up or health certificate
Injury or
accident
Acute illness (e.g.
fever)
Chronic illness (e.g.
diabetes, high
blood pressure)
Sexual health issues
Dental issues
Delivery
M 45.2% 11.6% 11.9% 5.1% 1.2% 13.4% 0.2%

190
W 38.9% 3.7% 10.1% 7.0% 8.3% 10.2% 11.2%
A survey on self-evaluation of health has shown that men are more satisfied with their
health than women. At the same time, responses to the questions could be connected with
gender views and stereotypes, according to which, complaining does not befit men, they should
be strong and tough. This type of attitude leads to many problems: men more rarely seek
diagnostics, thus missing the possibility of starting to treat illnesses at their earlier stages, rarely
admit depression and tell about stressful life.90
According to researchers, the understanding of what it means to be a “real man” that exists
in society leads to a situation when men view seeking medical assistance as admission of their
own weakness91.
Researchers highlight the following male stereotypes about health:
- Men should perform the role of a breadwinner and pursue a career, so there is no time
to take care of health;
- Men easier get depressed when they remain unemployed;
- Men are more scared of losing their jobs and wages and, for this reason, go to work
even if they are sick;
- Men seek specialist help when they have more serious problems with health than
women.92
According to researchers, gender role conflicts negatively correlate with self-respect,
intimacy, and satisfaction with marriage and positively correlate with anxiety. Men experience
a stress not only when they consider themselves unable to meet the requirements of their male
role (for example, to make a successful career or to provide for the family), but also when the
situation requires that they show a “non-male” behavior (for example, to stay at home and take
medical procedures).93 Moreover, some studies94 emphasize the fact that men prefer to receive
“social support” (i.e. approval, consent, encouragement of their opinions and actions) from
women rather than from men.
90 Paul M. Galdas, Francine Cheater, Paul Marshall (2005). Men and health help‐seeking behaviour: literature review. 91 T.V. Rogacheva, Male and Female Stereotypes of Attitude towards Health in Contemporary Russia. http://www.medpsy.com/mprj/archiv_global/2010_4_5/nomer/nomer14.php 92 I.B. Nazarova, Health of the Employed Population. Moscow, 2007 93 I.S. Con, Hegemonic Masculinity as a Factor of Men’s Ill Health. http://www.pseudology.org/kon/Articles/GegemonMasculin.htm 94 Meyer R.E., Murray R.F. Prevention and treatment of alcohol problems. – Washington, 1989.
191
The studies demonstrate that so called “social isolation” when men prefer to receive “social
support” (i.e. approval, consent, encouragement of their opinions and actions) from women
rather than from men, decreases their chances of survival after heart attacks, cancer, and stroke.
Men with a higher level of social support frequently take better care of their health, they easier
adopt a healthy lifestyle and are more inclined towards treatment.95 The same is revealed through
studies among men with pathologies of the cardio-vascular system: men who have traditional or
stereotypic views of masculinity did not follow doctors’ recommendations well and more rarely
adopted a healthy lifestyle after release from an in-patient clinic than their peers with less radical
views of masculinity.96
Overall, men and male teenagers who have traditional or stereotypic views of masculinity
have bigger health risks than their peers with less radical views. Such traditional views are directly
connected with harmful habits (including smoking, alcohol abuse, and use of drugs), as well as
are inversely correlated with safe behavior, following a diet, sleep and rest regime and sexual
behavior. Men who have traditional views of masculinity manifestations more rarely seek
somebody else’s help when they need it and more rarely make use of health services97 than other
men.
There are very interesting data about interdependence between alcoholism and traditional
gender male role. As it appears, drinking in the male company facilitates the provision of this
support by men to men, removing the restrictions of appearing to act in a traditionally female way
(complaints about life, admission of a weakness, hugs, tears), something, which is necessary to all
people irrespective of sex, and something which men can hardly allow themselves to do in a
traditional society.98 The data received is coming to prove it, as 42.7% of male respondents
declared periodic usage of alcohol (from every day to 1-3 times a month) in contrast to women
taking alcohol less than once a month or never (92.4%). Table 3. Alcohol consumption Percentage of male and female respondents answering the question about alcohol consumption (Men N=767, women N=850)
95 Courtenay, W. H. Behavioral factors associated with disease, injury, and death among men: evidence and implications for prevention / W. H. Courtenay // The Journal of Men’s Studies. — 2000 Vol. 9, № 1 ; Courtenay, W. H. Gender and ethnic differences in health beliefs and behaviors / W. H. Courtenay, D. R. McCreary, J. R. Merighi // Journal of Health Psychology. — 2002. — Vol. 7, № 3 96 American Psychiatric Association. Diagnostic and statistical manual of mental disorders (4th ed). — 2000. — Washington, DC: Gomez, 2007. 97 Ibid. 98 Meyer R.E., Murray R.F. Prevention and treatment of alcohol problems. – Washington, 1989.
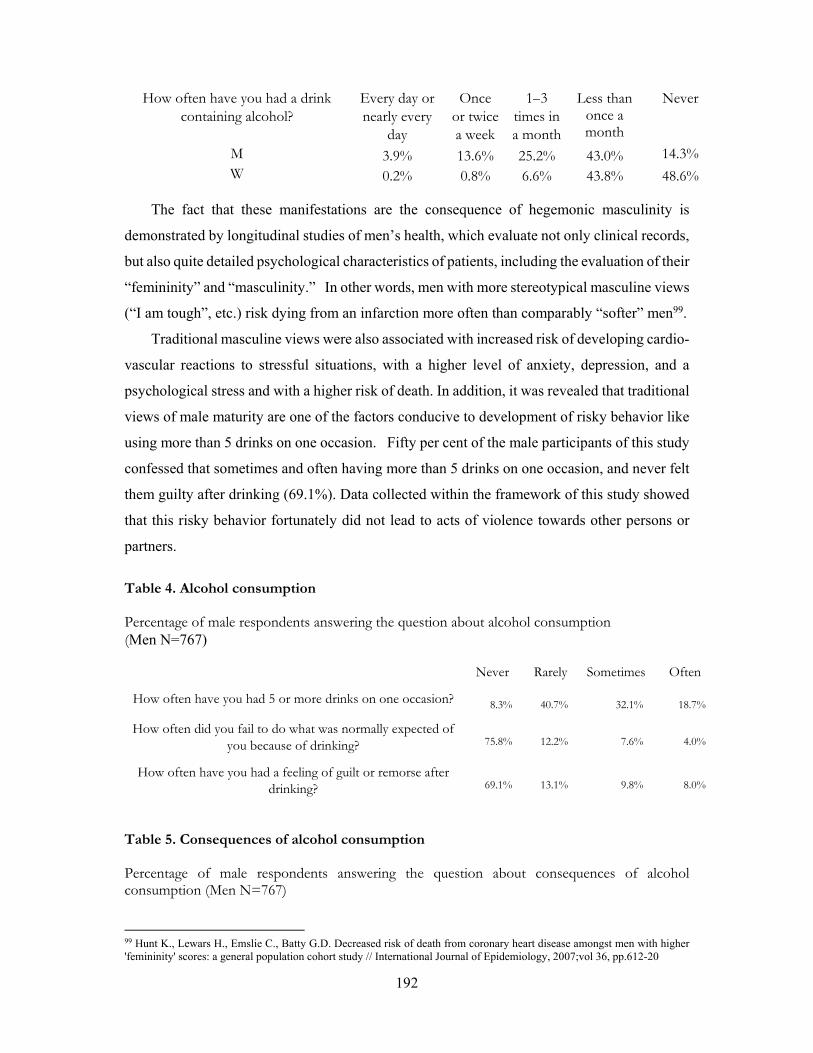
192
How often have you had a drink containing alcohol?
Every day or nearly every
day
Once or twice a week
1–3 times in a month
Less than once a month
Never
M 3.9% 13.6% 25.2% 43.0% 14.3% W 0.2% 0.8% 6.6% 43.8% 48.6%
The fact that these manifestations are the consequence of hegemonic masculinity is
demonstrated by longitudinal studies of men’s health, which evaluate not only clinical records,
but also quite detailed psychological characteristics of patients, including the evaluation of their
“femininity” and “masculinity.” In other words, men with more stereotypical masculine views
(“I am tough”, etc.) risk dying from an infarction more often than comparably “softer” men99.
Traditional masculine views were also associated with increased risk of developing cardio-
vascular reactions to stressful situations, with a higher level of anxiety, depression, and a
psychological stress and with a higher risk of death. In addition, it was revealed that traditional
views of male maturity are one of the factors conducive to development of risky behavior like
using more than 5 drinks on one occasion. Fifty per cent of the male participants of this study
confessed that sometimes and often having more than 5 drinks on one occasion, and never felt
them guilty after drinking (69.1%). Data collected within the framework of this study showed
that this risky behavior fortunately did not lead to acts of violence towards other persons or
partners. Table 4. Alcohol consumption Percentage of male respondents answering the question about alcohol consumption (Men N=767)
Never Rarely Sometimes Often
How often have you had 5 or more drinks on one occasion? 8.3% 40.7% 32.1% 18.7%
How often did you fail to do what was normally expected of you because of drinking? 75.8% 12.2% 7.6% 4.0%
How often have you had a feeling of guilt or remorse after drinking? 69.1% 13.1% 9.8% 8.0%
Table 5. Consequences of alcohol consumption Percentage of male respondents answering the question about consequences of alcohol consumption (Men N=767)
99 Hunt K., Lewars H., Emslie C., Batty G.D. Decreased risk of death from coronary heart disease amongst men with higher 'femininity' scores: a general population cohort study // International Journal of Epidemiology, 2007;vol 36, pp.612-20
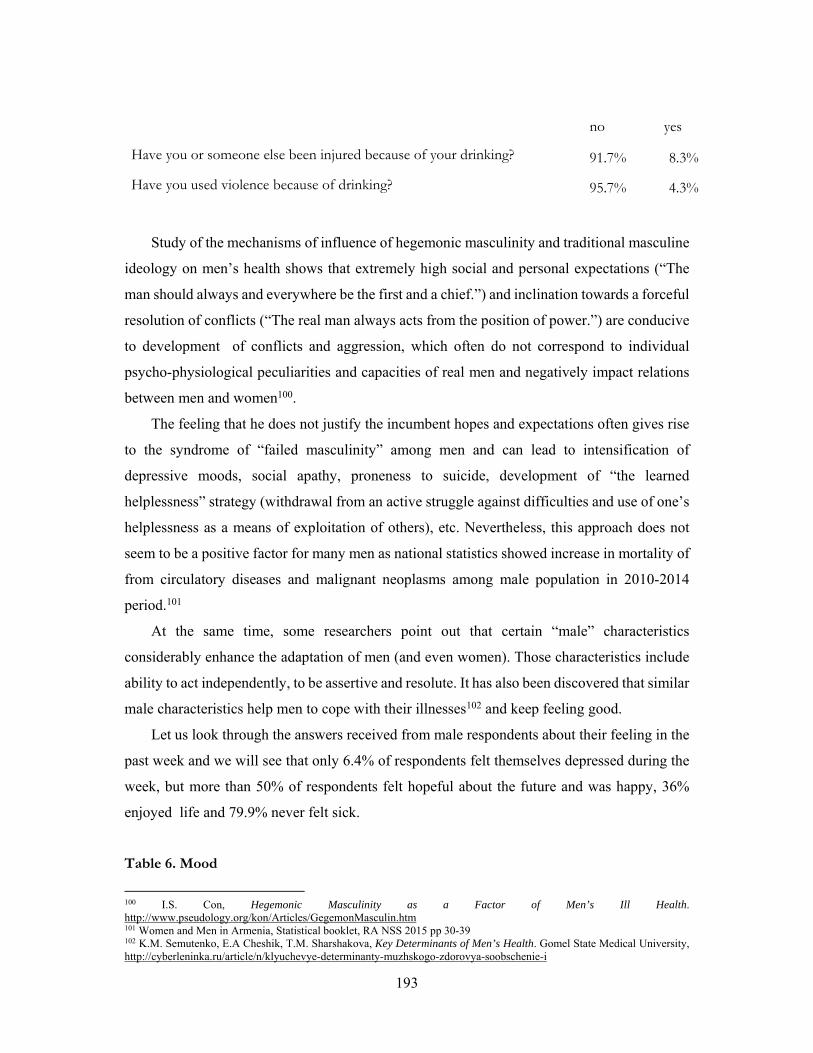
193
no yes
Have you or someone else been injured because of your drinking? 91.7% 8.3%
Have you used violence because of drinking? 95.7% 4.3%
Study of the mechanisms of influence of hegemonic masculinity and traditional masculine
ideology on men’s health shows that extremely high social and personal expectations (“The
man should always and everywhere be the first and a chief.”) and inclination towards a forceful
resolution of conflicts (“The real man always acts from the position of power.”) are conducive
to development of conflicts and aggression, which often do not correspond to individual
psycho-physiological peculiarities and capacities of real men and negatively impact relations
between men and women100.
The feeling that he does not justify the incumbent hopes and expectations often gives rise
to the syndrome of “failed masculinity” among men and can lead to intensification of
depressive moods, social apathy, proneness to suicide, development of “the learned
helplessness” strategy (withdrawal from an active struggle against difficulties and use of one’s
helplessness as a means of exploitation of others), etc. Nevertheless, this approach does not
seem to be a positive factor for many men as national statistics showed increase in mortality of
from circulatory diseases and malignant neoplasms among male population in 2010-2014
period.101
At the same time, some researchers point out that certain “male” characteristics
considerably enhance the adaptation of men (and even women). Those characteristics include
ability to act independently, to be assertive and resolute. It has also been discovered that similar
male characteristics help men to cope with their illnesses102 and keep feeling good.
Let us look through the answers received from male respondents about their feeling in the
past week and we will see that only 6.4% of respondents felt themselves depressed during the
week, but more than 50% of respondents felt hopeful about the future and was happy, 36%
enjoyed life and 79.9% never felt sick.
Table 6. Mood
100 I.S. Con, Hegemonic Masculinity as a Factor of Men’s Ill Health. http://www.pseudology.org/kon/Articles/GegemonMasculin.htm 101 Women and Men in Armenia, Statistical booklet, RA NSS 2015 pp 30-39 102 K.M. Semutenko, E.A Cheshik, T.M. Sharshakova, Key Determinants of Men’s Health. Gomel State Medical University, http://cyberleninka.ru/article/n/klyuchevye-determinanty-muzhskogo-zdorovya-soobschenie-i
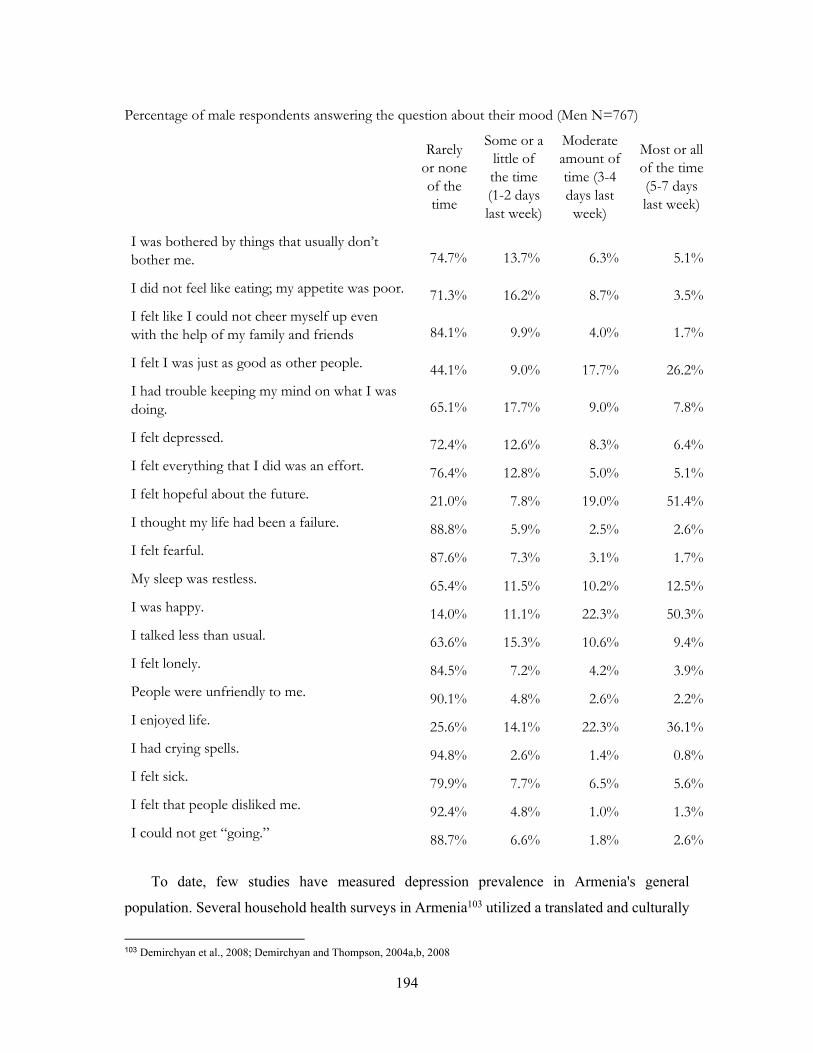
194
Percentage of male respondents answering the question about their mood (Men N=767)
Rarely
or none of the time
Some or a little of the time (1-2 days last week)
Moderate amount of time (3-4 days last week)
Most or all of the time (5-7 days last week)
I was bothered by things that usually don’t bother me. 74.7% 13.7% 6.3% 5.1%
I did not feel like eating; my appetite was poor. 71.3% 16.2% 8.7% 3.5% I felt like I could not cheer myself up even with the help of my family and friends 84.1% 9.9% 4.0% 1.7%
I felt I was just as good as other people. 44.1% 9.0% 17.7% 26.2% I had trouble keeping my mind on what I was doing. 65.1% 17.7% 9.0% 7.8%
I felt depressed. 72.4% 12.6% 8.3% 6.4% I felt everything that I did was an effort. 76.4% 12.8% 5.0% 5.1% I felt hopeful about the future. 21.0% 7.8% 19.0% 51.4%
I thought my life had been a failure. 88.8% 5.9% 2.5% 2.6% I felt fearful. 87.6% 7.3% 3.1% 1.7% My sleep was restless. 65.4% 11.5% 10.2% 12.5% I was happy. 14.0% 11.1% 22.3% 50.3% I talked less than usual. 63.6% 15.3% 10.6% 9.4% I felt lonely. 84.5% 7.2% 4.2% 3.9% People were unfriendly to me. 90.1% 4.8% 2.6% 2.2% I enjoyed life. 25.6% 14.1% 22.3% 36.1%
I had crying spells. 94.8% 2.6% 1.4% 0.8% I felt sick. 79.9% 7.7% 6.5% 5.6% I felt that people disliked me. 92.4% 4.8% 1.0% 1.3% I could not get “going.” 88.7% 6.6% 1.8% 2.6%
To date, few studies have measured depression prevalence in Armenia's general
population. Several household health surveys in Armenia103 utilized a translated and culturally
103 Demirchyan et al., 2008; Demirchyan and Thompson, 2004a,b, 2008
195
adapted Armenian version of the Center for Epidemiologic Studies Depression Scale (CES-D)
to measure the prevalence of depressive symptoms among the general population aged 18 and
over and, using the traditional cut-off point of 16, found high rates ranging between 80.7% and
53.0% in the female population, while the rate for males was 44.9%104. Nowadays, Armenia’s
reported morbidity of mental disorders (the diagnosis for the first time) per 100,000 population
has increased from 82.9 in 2009 to 89.3 in 2013105.
When discussing gender peculiarities of attitude to health issues, it is important to
underline that in recent years the Armenian Government has undertaken targeted measures for
improvement of accessibility to health services and for ensuring the equal right of men and
women to receive medical assistance guaranteed by the RA Law on Medical Assistance and
Population Servicing adopted in 1996. The priority policy on healthcare development is
reflected in the Concept Paper on Quality Improvement and Management of Medical
Assistance Provided to the Population of the Republic of Armenia (2002) and Strategic
program for Healthy Lifestyle endorsed by the RA Government in 2014.
104 Demirchyan, Anahit, Tsovinar, Harutyunyan, Petrosyan Varduhi TM. Household Health Survey. Yerevan, Armenia; 2006 105 National Statistical Service. Statistical Yearbook of Armenia. Yerevan, Armenia; 2014:31
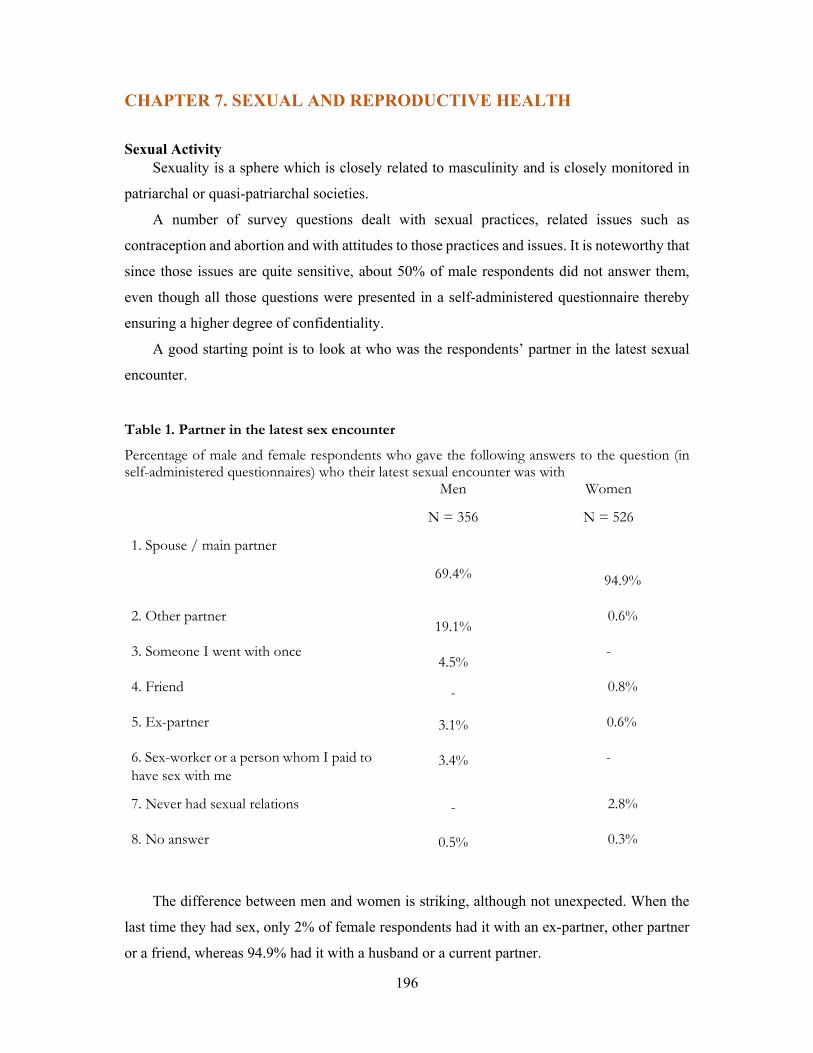
196
CHAPTER 7. SEXUAL AND REPRODUCTIVE HEALTH
Sexual Activity Sexuality is a sphere which is closely related to masculinity and is closely monitored in
patriarchal or quasi-patriarchal societies.
A number of survey questions dealt with sexual practices, related issues such as
contraception and abortion and with attitudes to those practices and issues. It is noteworthy that
since those issues are quite sensitive, about 50% of male respondents did not answer them,
even though all those questions were presented in a self-administered questionnaire thereby
ensuring a higher degree of confidentiality.
A good starting point is to look at who was the respondents’ partner in the latest sexual
encounter.
Table 1. Partner in the latest sex encounter
Percentage of male and female respondents who gave the following answers to the question (in self-administered questionnaires) who their latest sexual encounter was with Men
N = 356
Women
N = 526
1. Spouse / main partner
69.4%
94.9%
2. Other partner 19.1%
0.6%
3. Someone I went with once 4.5%
-
4. Friend - 0.8%
5. Ex-partner 3.1% 0.6%
6. Sex-worker or a person whom I paid to have sex with me
3.4% -
7. Never had sexual relations - 2.8%
8. No answer 0.5% 0.3%
The difference between men and women is striking, although not unexpected. When the
last time they had sex, only 2% of female respondents had it with an ex-partner, other partner
or a friend, whereas 94.9% had it with a husband or a current partner.

197
On the other hand, almost one-third of male respondents emphasize their sexual prowess
by indicating that they had sex with a woman who is not their wife or current partner. Almost
every fifth male respondent noted having sex with another partner and 3.4% paid a woman for
sexual favors.
This tendency is further confirmed by the answers to the question about the number of
partners the respondents had in the past 12 months (See Table 2 below). While a considerable
proportion of male respondents (30.8%) did not have sex within the previous 12 months and
even a higher percentage among others had only one partner (40.9%), a quarter of male
respondents had 2 or more partners. Given the current Armenian realities and norms of dating,
relationship and sexual behavior, it would be a rare occurrence for a man to have even two
stable, functional intimate relationships within 12 months. Therefore, it is obvious that in most
cases the respondents who had 2 or more partners were not in a long-term relationship or had
a lasting intimacy. In fact, 19.6% of male respondents had one-night stand with one woman
and 16.6% with 2 or more women.
Table 2. Number of partners the respondents had in the past 12 months (According to responses to a question in a self-administered questionnaire) Percentage of male and female respondents who had a certain number of partners in the past 12 months (in self-administered questionnaires) who their latest sexual encounter was with
MEN
N = 396
WOMEN
N = 394
Number of partners Percent of respondents Number of partners Percent of respondents
0 30.8% 0 25.9%
1 40.9% 1 70.1%
2 7.6% 2 0.8%
3 4.3% - -
4 4.5% - -
5 2.8% - -
6 or more 5.6% 6 or more 0.3%
No answer 3.5% No answer 3.1%
Total 100.0% 100.0%
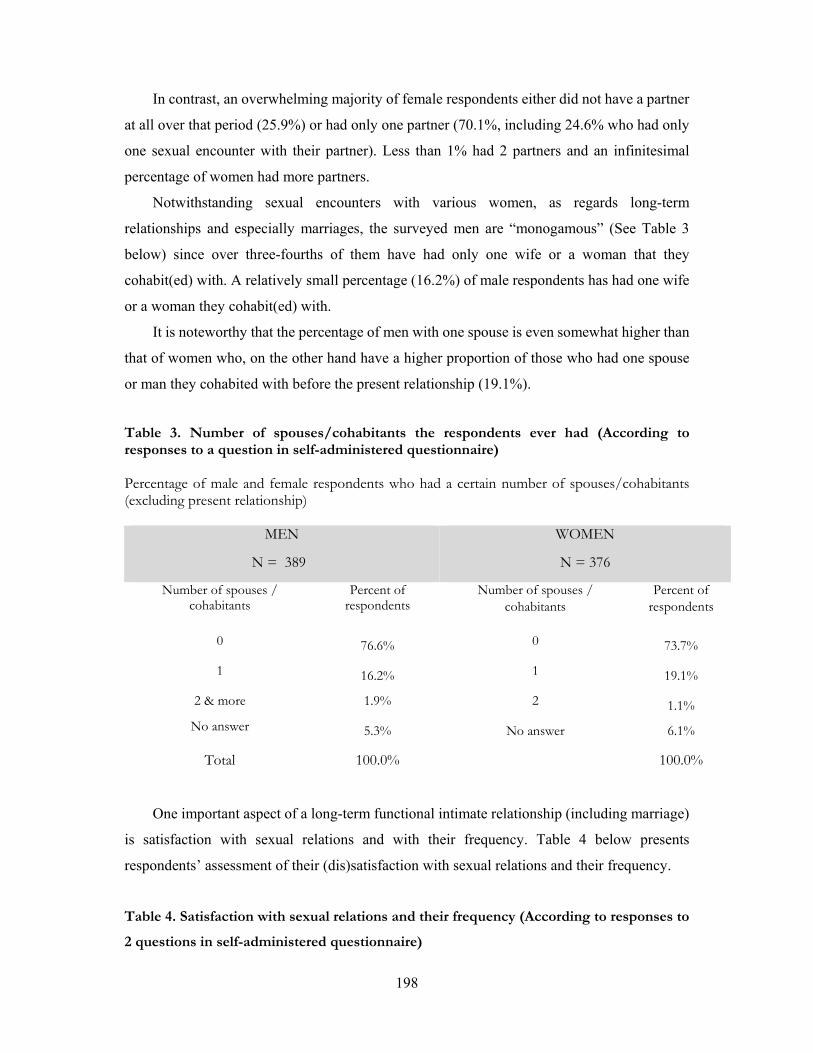
198
In contrast, an overwhelming majority of female respondents either did not have a partner
at all over that period (25.9%) or had only one partner (70.1%, including 24.6% who had only
one sexual encounter with their partner). Less than 1% had 2 partners and an infinitesimal
percentage of women had more partners.
Notwithstanding sexual encounters with various women, as regards long-term
relationships and especially marriages, the surveyed men are “monogamous” (See Table 3
below) since over three-fourths of them have had only one wife or a woman that they
cohabit(ed) with. A relatively small percentage (16.2%) of male respondents has had one wife
or a woman they cohabit(ed) with.
It is noteworthy that the percentage of men with one spouse is even somewhat higher than
that of women who, on the other hand have a higher proportion of those who had one spouse
or man they cohabited with before the present relationship (19.1%).
Table 3. Number of spouses/cohabitants the respondents ever had (According to responses to a question in self-administered questionnaire) Percentage of male and female respondents who had a certain number of spouses/cohabitants (excluding present relationship)
MEN
N = 389
WOMEN
N = 376
Number of spouses / cohabitants
Percent of respondents
Number of spouses / cohabitants
Percent of respondents
0 76.6% 0 73.7%
1 16.2% 1 19.1%
2 & more 1.9% 2 1.1%
No answer 5.3% No answer 6.1%
Total 100.0% 100.0%
One important aspect of a long-term functional intimate relationship (including marriage)
is satisfaction with sexual relations and with their frequency. Table 4 below presents
respondents’ assessment of their (dis)satisfaction with sexual relations and their frequency.
Table 4. Satisfaction with sexual relations and their frequency (According to responses to
2 questions in self-administered questionnaire)
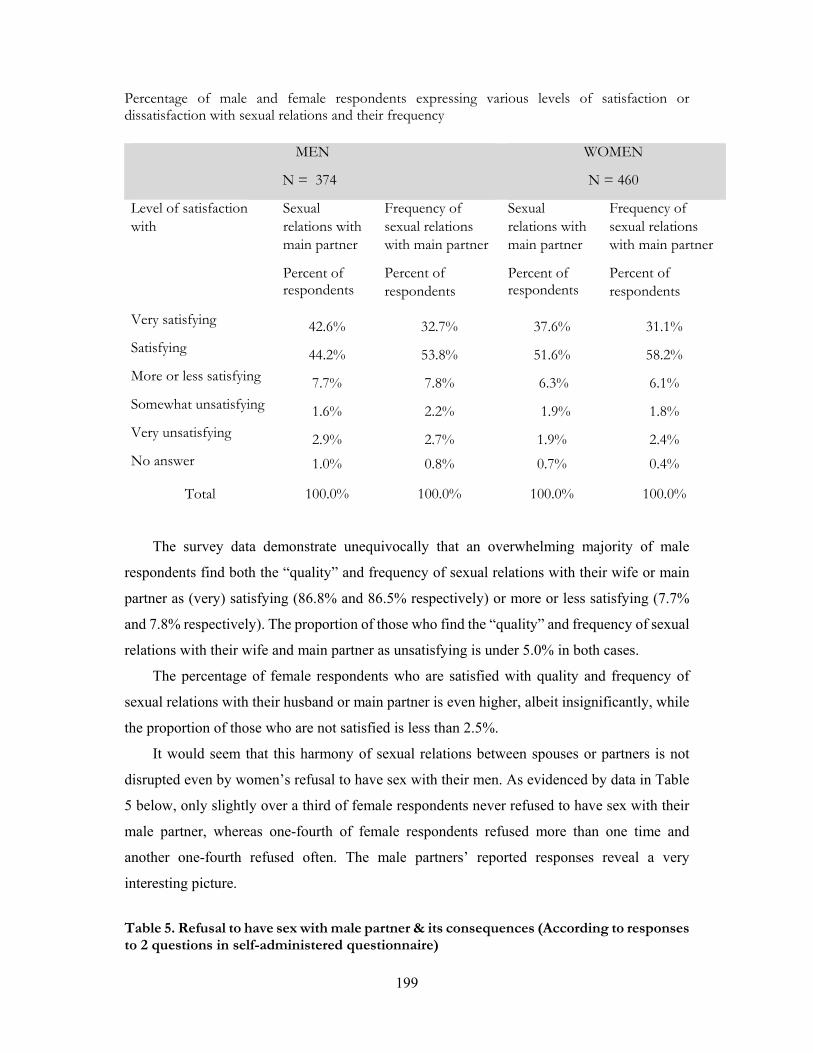
199
Percentage of male and female respondents expressing various levels of satisfaction or dissatisfaction with sexual relations and their frequency
MEN
N = 374
WOMEN
N = 460
Level of satisfaction with
Sexual relations with main partner
Frequency of sexual relations with main partner
Sexual relations with main partner
Frequency of sexual relations with main partner
Percent of respondents
Percent of respondents
Percent of respondents
Percent of respondents
Very satisfying 42.6% 32.7% 37.6% 31.1% Satisfying 44.2% 53.8% 51.6% 58.2% More or less satisfying 7.7% 7.8% 6.3% 6.1%
Somewhat unsatisfying 1.6% 2.2% 1.9% 1.8% Very unsatisfying 2.9% 2.7% 1.9% 2.4% No answer 1.0% 0.8% 0.7% 0.4%
Total 100.0% 100.0% 100.0% 100.0%
The survey data demonstrate unequivocally that an overwhelming majority of male
respondents find both the “quality” and frequency of sexual relations with their wife or main
partner as (very) satisfying (86.8% and 86.5% respectively) or more or less satisfying (7.7%
and 7.8% respectively). The proportion of those who find the “quality” and frequency of sexual
relations with their wife and main partner as unsatisfying is under 5.0% in both cases.
The percentage of female respondents who are satisfied with quality and frequency of
sexual relations with their husband or main partner is even higher, albeit insignificantly, while
the proportion of those who are not satisfied is less than 2.5%.
It would seem that this harmony of sexual relations between spouses or partners is not
disrupted even by women’s refusal to have sex with their men. As evidenced by data in Table
5 below, only slightly over a third of female respondents never refused to have sex with their
male partner, whereas one-fourth of female respondents refused more than one time and
another one-fourth refused often. The male partners’ reported responses reveal a very
interesting picture.
Table 5. Refusal to have sex with male partner & its consequences (According to responses to 2 questions in self-administered questionnaire)
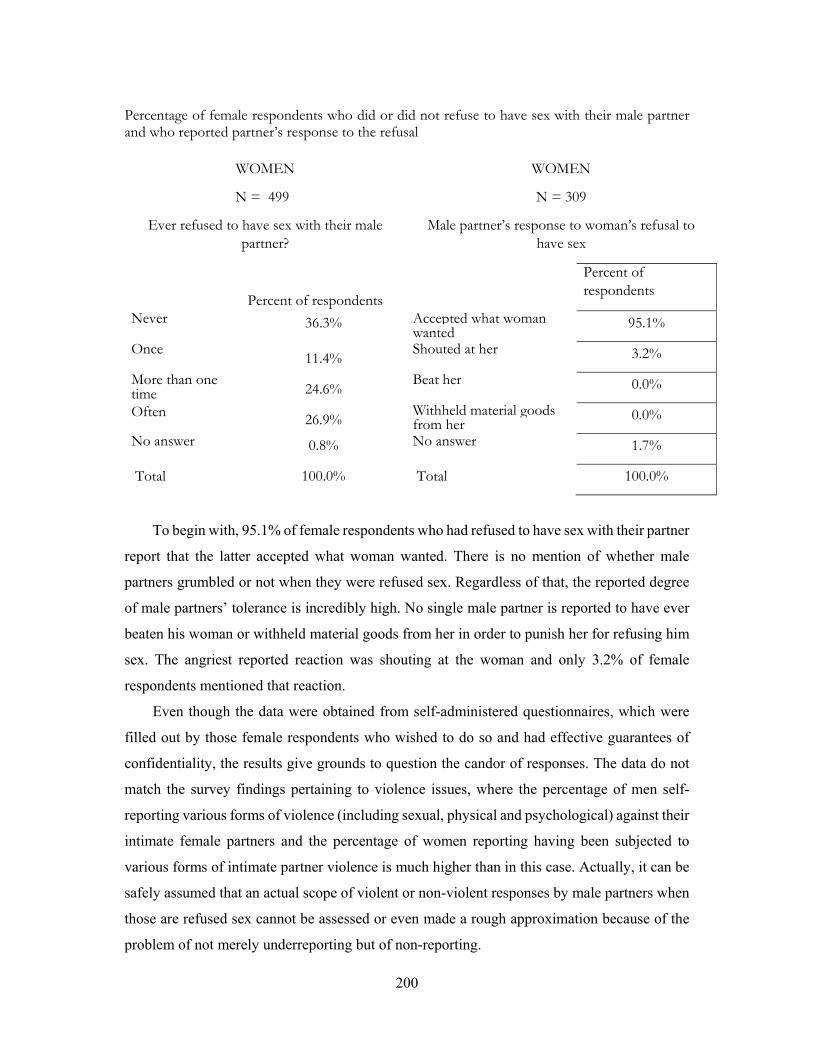
200
Percentage of female respondents who did or did not refuse to have sex with their male partner and who reported partner’s response to the refusal
WOMEN
N = 499
WOMEN
N = 309
Ever refused to have sex with their male partner?
Male partner’s response to woman’s refusal to have sex
Percent of respondents
Percent of respondents
Never 36.3% Accepted what woman wanted
95.1%
Once 11.4%
Shouted at her 3.2%
More than one time 24.6%
Beat her 0.0%
Often 26.9% Withheld material goods from her
0.0%
No answer 0.8% No answer 1.7%
Total 100.0% Total 100.0%
To begin with, 95.1% of female respondents who had refused to have sex with their partner
report that the latter accepted what woman wanted. There is no mention of whether male
partners grumbled or not when they were refused sex. Regardless of that, the reported degree
of male partners’ tolerance is incredibly high. No single male partner is reported to have ever
beaten his woman or withheld material goods from her in order to punish her for refusing him
sex. The angriest reported reaction was shouting at the woman and only 3.2% of female
respondents mentioned that reaction.
Even though the data were obtained from self-administered questionnaires, which were
filled out by those female respondents who wished to do so and had effective guarantees of
confidentiality, the results give grounds to question the candor of responses. The data do not
match the survey findings pertaining to violence issues, where the percentage of men self-
reporting various forms of violence (including sexual, physical and psychological) against their
intimate female partners and the percentage of women reporting having been subjected to
various forms of intimate partner violence is much higher than in this case. Actually, it can be
safely assumed that an actual scope of violent or non-violent responses by male partners when
those are refused sex cannot be assessed or even made a rough approximation because of the
problem of not merely underreporting but of non-reporting.
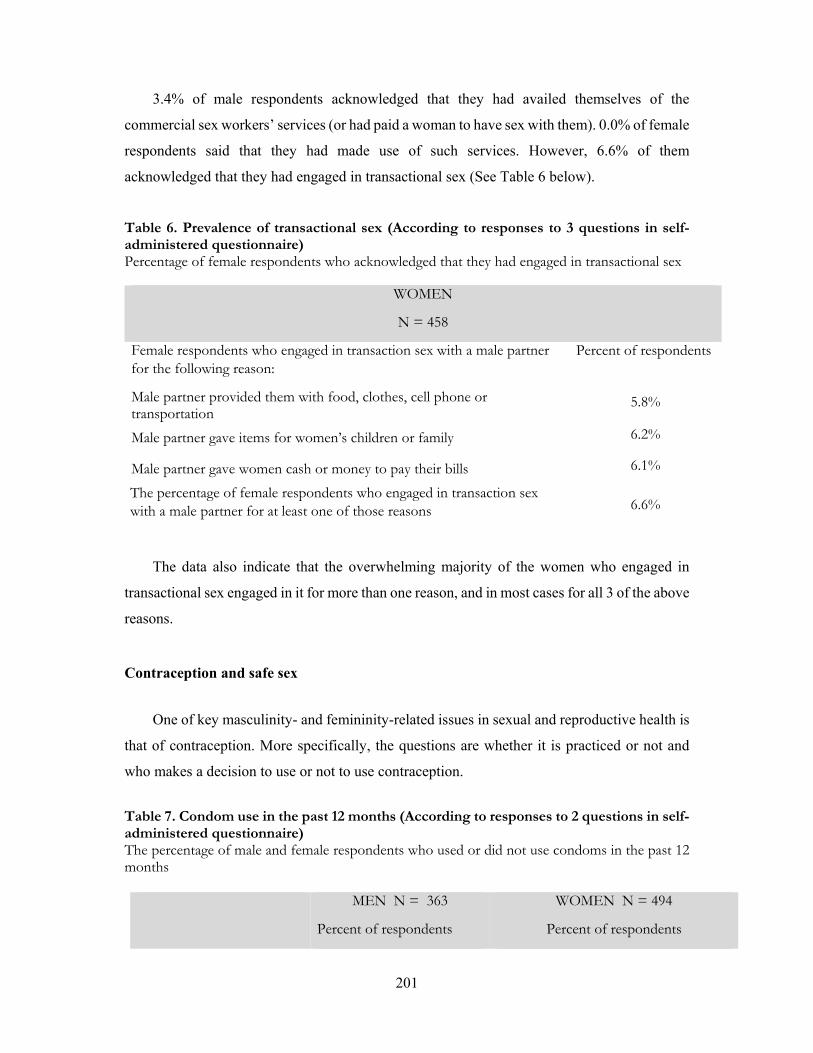
201
3.4% of male respondents acknowledged that they had availed themselves of the
commercial sex workers’ services (or had paid a woman to have sex with them). 0.0% of female
respondents said that they had made use of such services. However, 6.6% of them
acknowledged that they had engaged in transactional sex (See Table 6 below).
Table 6. Prevalence of transactional sex (According to responses to 3 questions in self-administered questionnaire) Percentage of female respondents who acknowledged that they had engaged in transactional sex
WOMEN
N = 458
Female respondents who engaged in transaction sex with a male partner for the following reason:
Percent of respondents
Male partner provided them with food, clothes, cell phone or transportation
5.8%
Male partner gave items for women’s children or family 6.2%
Male partner gave women cash or money to pay their bills 6.1%
The percentage of female respondents who engaged in transaction sex with a male partner for at least one of those reasons 6.6%
The data also indicate that the overwhelming majority of the women who engaged in
transactional sex engaged in it for more than one reason, and in most cases for all 3 of the above
reasons.
Contraception and safe sex
One of key masculinity- and femininity-related issues in sexual and reproductive health is
that of contraception. More specifically, the questions are whether it is practiced or not and
who makes a decision to use or not to use contraception.
Table 7. Condom use in the past 12 months (According to responses to 2 questions in self-administered questionnaire) The percentage of male and female respondents who used or did not use condoms in the past 12 months
MEN N = 363
Percent of respondents
WOMEN N = 494
Percent of respondents
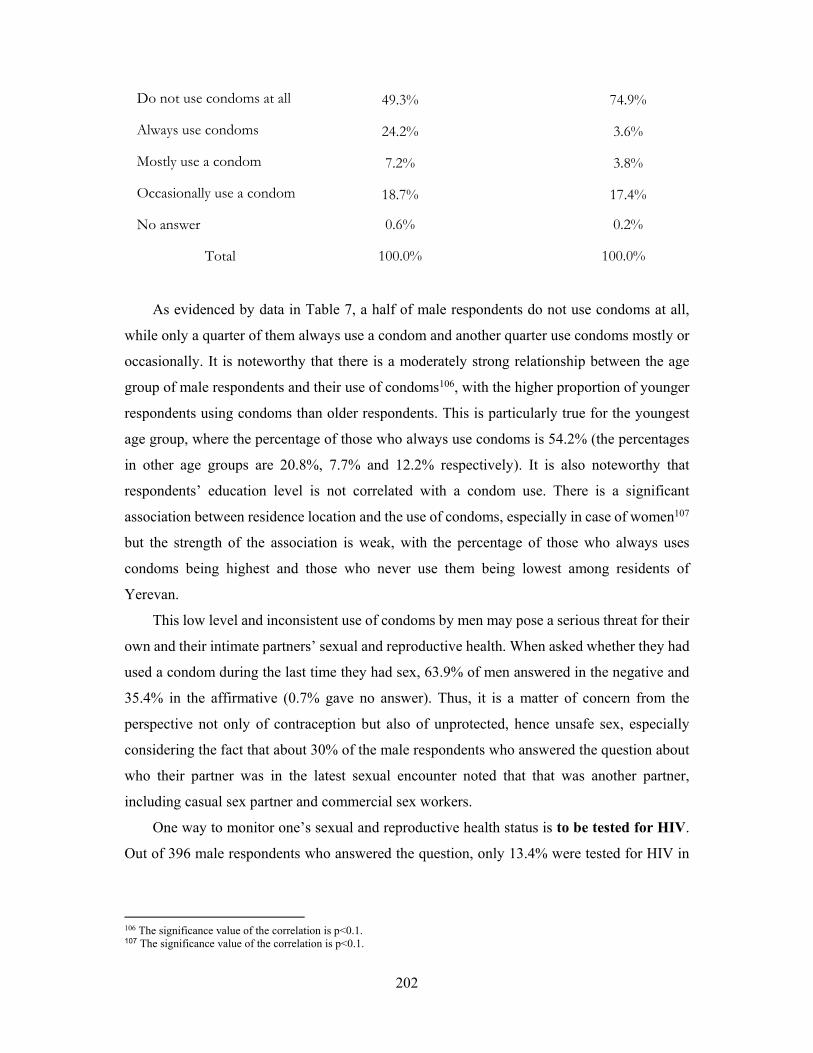
202
Do not use condoms at all 49.3% 74.9%
Always use condoms 24.2% 3.6%
Mostly use a condom 7.2% 3.8%
Occasionally use a condom 18.7% 17.4%
No answer 0.6% 0.2%
Total 100.0% 100.0%
As evidenced by data in Table 7, a half of male respondents do not use condoms at all,
while only a quarter of them always use a condom and another quarter use condoms mostly or
occasionally. It is noteworthy that there is a moderately strong relationship between the age
group of male respondents and their use of condoms106, with the higher proportion of younger
respondents using condoms than older respondents. This is particularly true for the youngest
age group, where the percentage of those who always use condoms is 54.2% (the percentages
in other age groups are 20.8%, 7.7% and 12.2% respectively). It is also noteworthy that
respondents’ education level is not correlated with a condom use. There is a significant
association between residence location and the use of condoms, especially in case of women107
but the strength of the association is weak, with the percentage of those who always uses
condoms being highest and those who never use them being lowest among residents of
Yerevan.
This low level and inconsistent use of condoms by men may pose a serious threat for their
own and their intimate partners’ sexual and reproductive health. When asked whether they had
used a condom during the last time they had sex, 63.9% of men answered in the negative and
35.4% in the affirmative (0.7% gave no answer). Thus, it is a matter of concern from the
perspective not only of contraception but also of unprotected, hence unsafe sex, especially
considering the fact that about 30% of the male respondents who answered the question about
who their partner was in the latest sexual encounter noted that that was another partner,
including casual sex partner and commercial sex workers.
One way to monitor one’s sexual and reproductive health status is to be tested for HIV.
Out of 396 male respondents who answered the question, only 13.4% were tested for HIV in
106 The significance value of the correlation is p<0.1. 107 The significance value of the correlation is p<0.1.

203
the last 6 months and another 5.3% in the last 12 months. 7.6% were tested 2-5 years ago and
1.8% more than 5 years ago. 71.2% were never tested (0.8% gave no answer).
An important question is who in the relationship wields decision-making power regarding
the use of contraception (See Table 8). It is noteworthy and quite unexpected that in the
relationships where contraception is used about two-thirds of the respondents pointed out that
the decision is made jointly. Even 61.7% of male respondents reported that the decision is made
jointly. When that decision is made only by one party, the percentage is higher for “by oneself”
option than for “by partner” option for both men and women and the percentage is higher for
men than for women as sole decision-makers.
Table 8. Decision-making on contraception use Percentage of male and female respondents choosing various response options regarding decision-making on contraception use
MEN
N = 407
WOMEN
N = 448
BOTH MEN
AND WOMEN
N = 855
Decision made Percent of respondents
Percent of respondents
Percent of respondents
By oneself 19.2% 12.9% 15.9%
By partner 3.2% 7.4% 5.4%
Jointly 61.7% 69.0% 65.5%
By someone else 0.0% 0.7% 0.4%
No answer 15.9% 10.0% 12.8%
Total 100.0% 100.0% 100.0%
Termination of pregnancy
Termination of pregnancy is another important sexual and reproductive health issue
closely related to prevalent norms of masculinity and femininity. Unless done for medical
reasons, abortion means that pregnancy is or has become unwanted and that social reasons
come to the fore, including lack of knowledge about and access to contraception. It is important
to find out what percentage of women ever terminated pregnancy, what their age was at first
abortion, who made a decision about abortion and whether male partner was involved (and if

204
yes, to what extent) in decision-making and in supporting the woman financially and
psychologically.
Not all ever-partnered women answered the question of whether they terminated
pregnancy at some point in their lives. Of those who did answer the question, the percentage
of the respondents who said “yes” is virtually the same as that of the respondents who said “no”
(45.8% and 46.6% respectively). 7.4% chose the option of “Not applicable.” If an adjustment
is made and the latter group is disregarded, exactly a half of the respondents to this question
experienced an abortion at least once in their lives.
Of the female respondents who answered the question about an abortion in the affirmative,
only 1.6% had it the first time when they were younger than 18, whereas 98.4% had it, when
they were over 18 years of age.
As regards decision-making about abortion, there is a considerable mismatch between
men’s and women’s reports concerning male partner’s participation in it. According to male
respondents’ reports, when an abortion decision was made, only 23.6% of the men involved
took part in the decision-making. On the other hand, according to female respondents’ reports,
86.6% of their male partners took part in making that decision. One possible explanation of
this discrepancy is that men and women have drastically different perceptions of what taking
part in decision-making is. Most probably, female respondents take a broader view of
participation, including discussion, advice or even mere presence at the time of decision-
making, etc., whereas male respondents probably meant more than that, including having a
final say in the matter and/or a real involvement that entails commitment.
Another question, viz. who made the decision about abortion, is more straightforward and
differences between male and female respondents are considerably less. It should be noted that
the question was answered only by those male respondents who had participated in decision-
making about abortion and by those female respondents who had ever had an abortion. The
highest proportion of both men and women mentioned that the decision was made jointly by
partners (See Table 9 below). If the decision was not made jointly but was made by one party
only, in men’s accounts it was made in equal proportion by a male partner or a woman, whereas
in female reporters’ accounts the decision was made first and foremost by a woman, with men
making that decision only in 1.3% of cases.
Table 9. Decision-making on abortion Percentage of male and female respondents choosing various response options regarding decision-making on abortion

205
MEN
N = 84
WOMEN
N = 320
Decision made Percent of respondents Percent of respondents
by woman 9.5% 26.9%
by male partner 9.5% 1.3%
jointly 77.4% 64.7%
by someone else 1.2% 4.1%
by woman & someone else 0.0% 0.3%
by doctor 1.2% 2.5%
no answer 1.2% 0.3%
Total 100.0% 100.0%
Thus, as evidenced by the survey data, this very important decision, was made at least
formally, for the most part jointly. It is impossible, however, to say how equitably that decision
was made because jointly does not necessarily mean equitably and since it is not known how
much bargaining power each party had.
Men’s participation is not limited to decision-making only. They can also provide financial
and psychological support to their female partners in case of abortion.
Table 10. Male partner’s involvement in women’s abortion case Percentage of male and female respondents answering the question about abortions
MEN N = 85
Percent of respondents
WOMEN N = 321 Percent of
respondents
Male partner provided financial support to the woman for the abortion
92.9% 92.8%
Male partner accompanied the woman for the abortion
82.1% 73.5%
Male partner involved in at least one of the above aspects
96.5% 94.4%
The data in Table 10 demonstrate a high level of support, especially financial support,
provided by male partners. The same proportion of male and female respondents indicated that

206
male partners provided financial support for the abortion. The proportion of the respondents
saying that male partners accompanied their women when those went to have an abortion is
lower, especially in case of female respondents.

207
CHAPTER 8. ATTITUDES TO SEXUALITY, SEXUAL & REPRODUCTIVE HEALTH AND RELATED ISSUES
Sexuality and stereotypes
The main questionnaire of the survey contained a number of statements pertaining to the
sphere of sexuality and reflecting patriarchal stereotypes of masculinity. The answers to those
questions show the extent to which the sampled population in general and men and women
taken separately in particular are gender (in)equitable.
Table 1. Attitudes toward sexuality Percentage of respondents who agree with the following statements Statements Respondents (N=1,617)
Men need sex more than women do 49.1%
Men are always ready to have sex 58.3%
A man needs other women even if things with his wife are fine
34.8%
It is a woman’s responsibility to avoid getting pregnant 45.5%
A woman should remain a virgin until marriage 85.9%
Women who carry condoms on them are “easy” 51.0%
Percentage of respondents who agree with at least one of those statements
97.3%
The views reflected in the statements are held by a considerable, albeit varying proportion
of the respondents (See Table 1). The least supported are only 2 statements. The proportion of
those who do not share the view that a man needs other women even if things with his wife are
fine (58.7%) is substantially higher than that of those who do. Still, one third of the respondents
believe that husband’s adulterous behavior is nothing out of ordinary. The other statement that
is supported by a smaller percentage of the respondents (45.5%) than that of those who disagree
with it (49.9%) places responsibility exclusively on a woman to avoid getting pregnant.
However, the difference is not as big as concerning the first statement and, besides, the
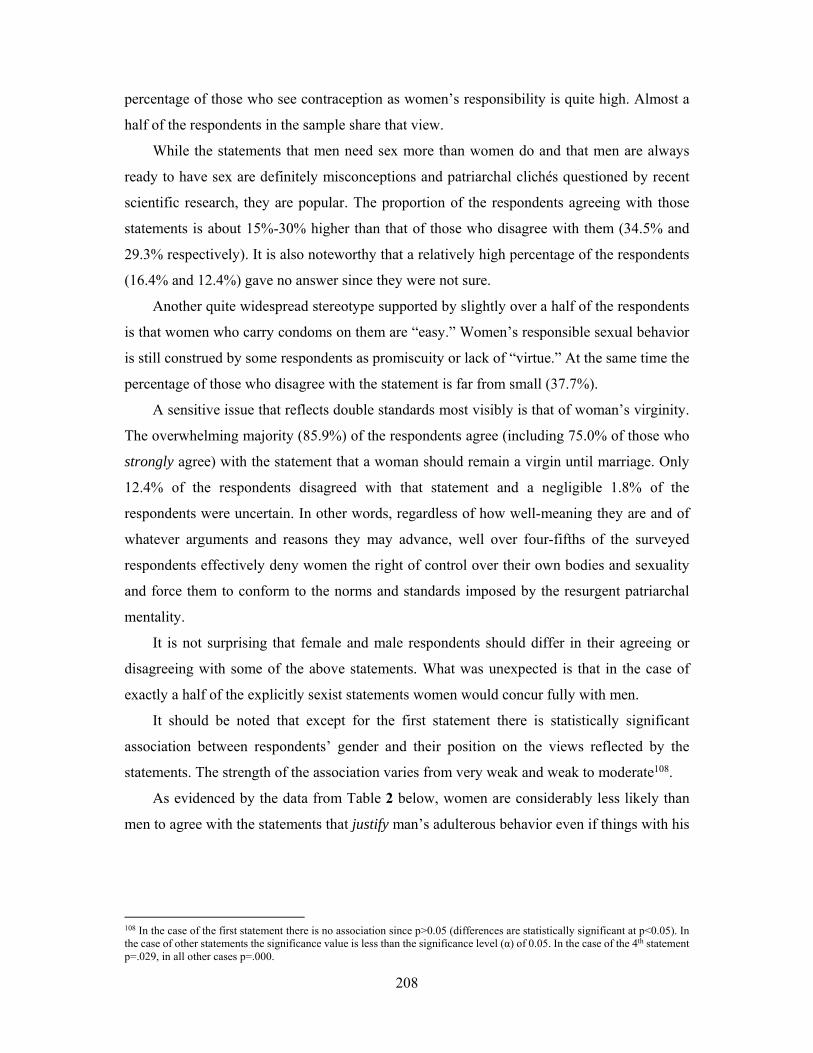
208
percentage of those who see contraception as women’s responsibility is quite high. Almost a
half of the respondents in the sample share that view.
While the statements that men need sex more than women do and that men are always
ready to have sex are definitely misconceptions and patriarchal clichés questioned by recent
scientific research, they are popular. The proportion of the respondents agreeing with those
statements is about 15%-30% higher than that of those who disagree with them (34.5% and
29.3% respectively). It is also noteworthy that a relatively high percentage of the respondents
(16.4% and 12.4%) gave no answer since they were not sure.
Another quite widespread stereotype supported by slightly over a half of the respondents
is that women who carry condoms on them are “easy.” Women’s responsible sexual behavior
is still construed by some respondents as promiscuity or lack of “virtue.” At the same time the
percentage of those who disagree with the statement is far from small (37.7%).
A sensitive issue that reflects double standards most visibly is that of woman’s virginity.
The overwhelming majority (85.9%) of the respondents agree (including 75.0% of those who
strongly agree) with the statement that a woman should remain a virgin until marriage. Only
12.4% of the respondents disagreed with that statement and a negligible 1.8% of the
respondents were uncertain. In other words, regardless of how well-meaning they are and of
whatever arguments and reasons they may advance, well over four-fifths of the surveyed
respondents effectively deny women the right of control over their own bodies and sexuality
and force them to conform to the norms and standards imposed by the resurgent patriarchal
mentality.
It is not surprising that female and male respondents should differ in their agreeing or
disagreeing with some of the above statements. What was unexpected is that in the case of
exactly a half of the explicitly sexist statements women would concur fully with men.
It should be noted that except for the first statement there is statistically significant
association between respondents’ gender and their position on the views reflected by the
statements. The strength of the association varies from very weak and weak to moderate108.
As evidenced by the data from Table 2 below, women are considerably less likely than
men to agree with the statements that justify man’s adulterous behavior even if things with his
108 In the case of the first statement there is no association since p>0.05 (differences are statistically significant at p<0.05). In the case of other statements the significance value is less than the significance level (α) of 0.05. In the case of the 4th statement p=.029, in all other cases p=.000.
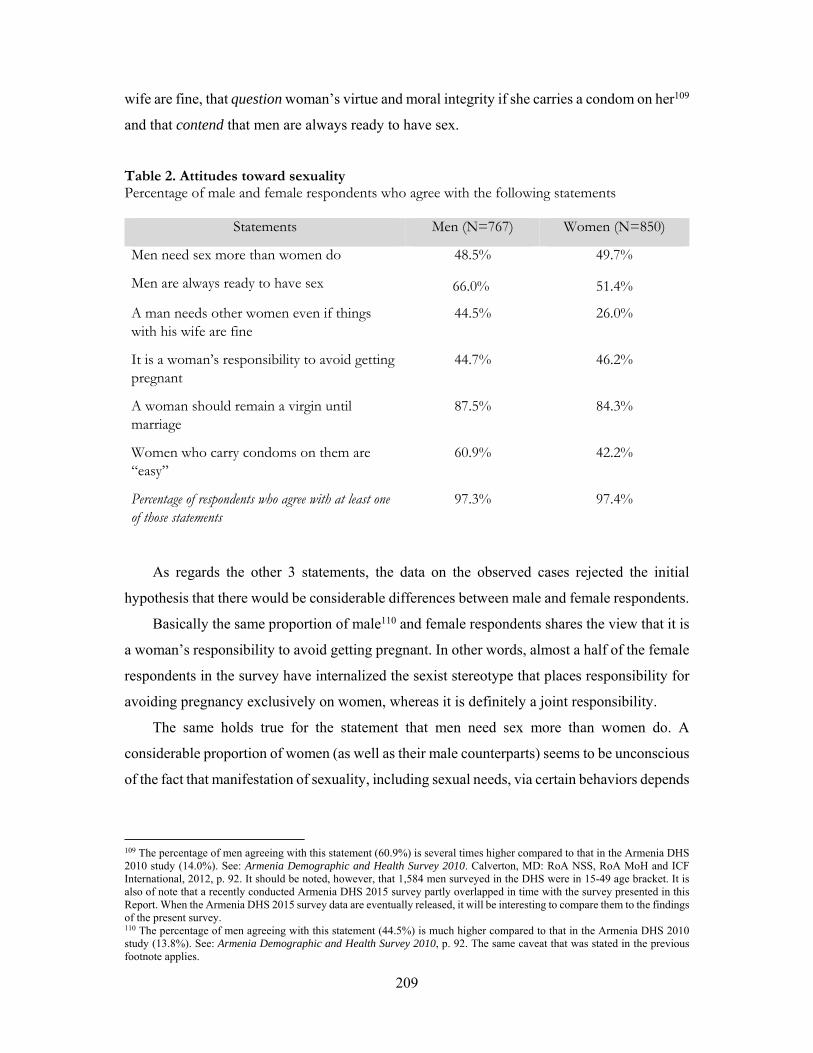
209
wife are fine, that question woman’s virtue and moral integrity if she carries a condom on her109
and that contend that men are always ready to have sex.
Table 2. Attitudes toward sexuality Percentage of male and female respondents who agree with the following statements
Statements Men (N=767) Women (N=850)
Men need sex more than women do 48.5% 49.7%
Men are always ready to have sex 66.0% 51.4%
A man needs other women even if things with his wife are fine
44.5% 26.0%
It is a woman’s responsibility to avoid getting pregnant
44.7% 46.2%
A woman should remain a virgin until marriage
87.5% 84.3%
Women who carry condoms on them are “easy”
60.9% 42.2%
Percentage of respondents who agree with at least one of those statements
97.3% 97.4%
As regards the other 3 statements, the data on the observed cases rejected the initial
hypothesis that there would be considerable differences between male and female respondents.
Basically the same proportion of male110 and female respondents shares the view that it is
a woman’s responsibility to avoid getting pregnant. In other words, almost a half of the female
respondents in the survey have internalized the sexist stereotype that places responsibility for
avoiding pregnancy exclusively on women, whereas it is definitely a joint responsibility.
The same holds true for the statement that men need sex more than women do. A
considerable proportion of women (as well as their male counterparts) seems to be unconscious
of the fact that manifestation of sexuality, including sexual needs, via certain behaviors depends
109 The percentage of men agreeing with this statement (60.9%) is several times higher compared to that in the Armenia DHS 2010 study (14.0%). See: Armenia Demographic and Health Survey 2010. Calverton, MD: RoA NSS, RoA MoH and ICF International, 2012, p. 92. It should be noted, however, that 1,584 men surveyed in the DHS were in 15-49 age bracket. It is also of note that a recently conducted Armenia DHS 2015 survey partly overlapped in time with the survey presented in this Report. When the Armenia DHS 2015 survey data are eventually released, it will be interesting to compare them to the findings of the present survey. 110 The percentage of men agreeing with this statement (44.5%) is much higher compared to that in the Armenia DHS 2010 study (13.8%). See: Armenia Demographic and Health Survey 2010, p. 92. The same caveat that was stated in the previous footnote applies.
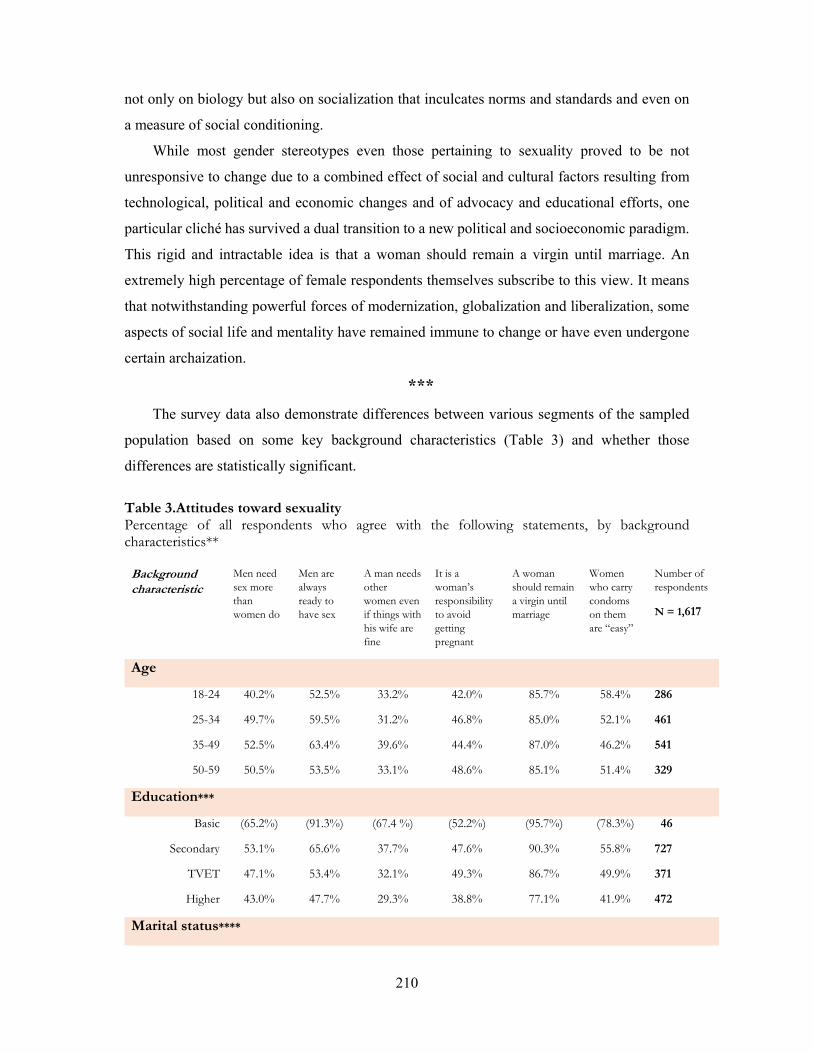
210
not only on biology but also on socialization that inculcates norms and standards and even on
a measure of social conditioning.
While most gender stereotypes even those pertaining to sexuality proved to be not
unresponsive to change due to a combined effect of social and cultural factors resulting from
technological, political and economic changes and of advocacy and educational efforts, one
particular cliché has survived a dual transition to a new political and socioeconomic paradigm.
This rigid and intractable idea is that a woman should remain a virgin until marriage. An
extremely high percentage of female respondents themselves subscribe to this view. It means
that notwithstanding powerful forces of modernization, globalization and liberalization, some
aspects of social life and mentality have remained immune to change or have even undergone
certain archaization.
***
The survey data also demonstrate differences between various segments of the sampled
population based on some key background characteristics (Table 3) and whether those
differences are statistically significant. Table 3.Attitudes toward sexuality Percentage of all respondents who agree with the following statements, by background characteristics**
Background characteristic
Men need sex more than women do
Men are always ready to have sex
A man needs other women even if things with his wife are fine
It is a woman’s responsibility to avoid getting pregnant
A woman should remain a virgin until marriage
Women who carry condoms on them are “easy”
Number of respondents
N = 1,617
Age
18-24 40.2% 52.5% 33.2% 42.0% 85.7% 58.4% 286
25-34 49.7% 59.5% 31.2% 46.8% 85.0% 52.1% 461
35-49 52.5% 63.4% 39.6% 44.4% 87.0% 46.2% 541
50-59 50.5% 53.5% 33.1% 48.6% 85.1% 51.4% 329
Education***
Basic (65.2%) (91.3%) (67.4 %) (52.2%) (95.7%) (78.3%) 46
Secondary 53.1% 65.6% 37.7% 47.6% 90.3% 55.8% 727
TVET 47.1% 53.4% 32.1% 49.3% 86.7% 49.9% 371
Higher 43.0% 47.7% 29.3% 38.8% 77.1% 41.9% 472
Marital status****
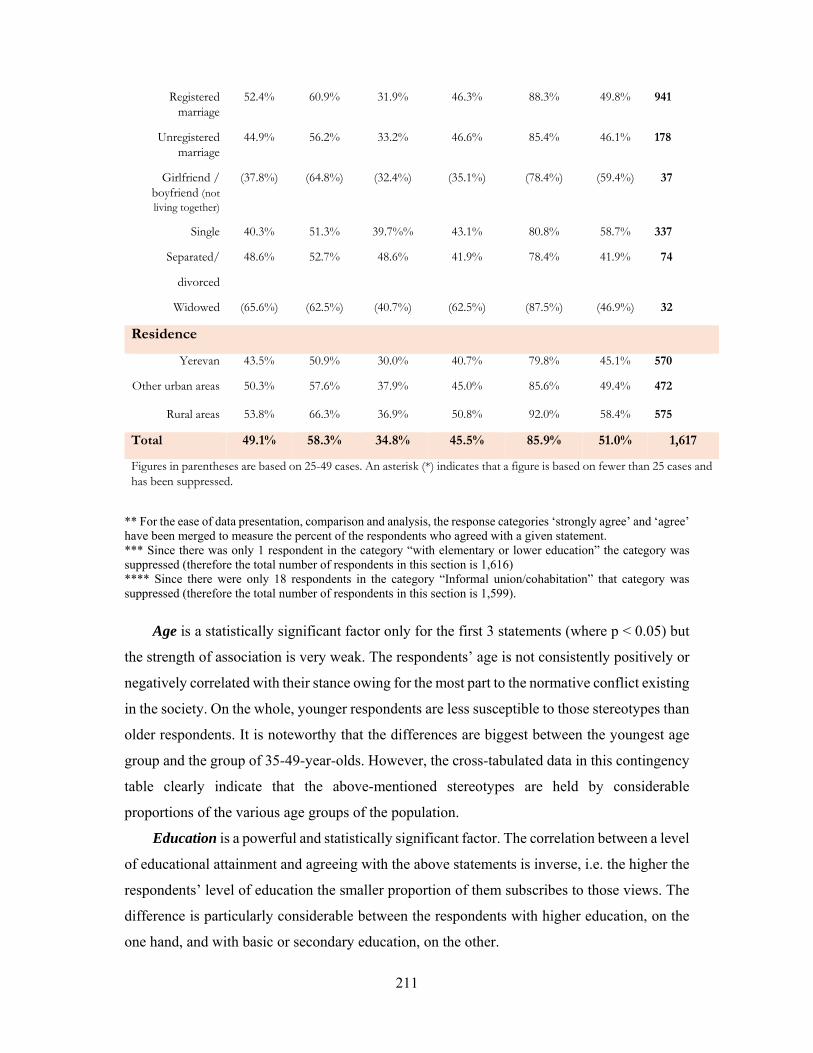
211
Registered marriage
52.4% 60.9% 31.9% 46.3% 88.3% 49.8% 941
Unregistered marriage
44.9% 56.2% 33.2% 46.6% 85.4% 46.1% 178
Girlfriend / boyfriend (not living together)
(37.8%) (64.8%) (32.4%) (35.1%) (78.4%) (59.4%) 37
Single 40.3% 51.3% 39.7%% 43.1% 80.8% 58.7% 337
Separated/
divorced
48.6% 52.7% 48.6% 41.9% 78.4% 41.9% 74
Widowed (65.6%) (62.5%) (40.7%) (62.5%) (87.5%) (46.9%) 32
Residence
Yerevan 43.5% 50.9% 30.0% 40.7% 79.8% 45.1% 570
Other urban areas 50.3% 57.6% 37.9% 45.0% 85.6% 49.4% 472
Rural areas 53.8% 66.3% 36.9% 50.8% 92.0% 58.4% 575
Total 49.1% 58.3% 34.8% 45.5% 85.9% 51.0% 1,617
Figures in parentheses are based on 25-49 cases. An asterisk (*) indicates that a figure is based on fewer than 25 cases and has been suppressed.
** For the ease of data presentation, comparison and analysis, the response categories ‘strongly agree’ and ‘agree’ have been merged to measure the percent of the respondents who agreed with a given statement. *** Since there was only 1 respondent in the category “with elementary or lower education” the category was suppressed (therefore the total number of respondents in this section is 1,616) **** Since there were only 18 respondents in the category “Informal union/cohabitation” that category was suppressed (therefore the total number of respondents in this section is 1,599).
Age is a statistically significant factor only for the first 3 statements (where p < 0.05) but
the strength of association is very weak. The respondents’ age is not consistently positively or
negatively correlated with their stance owing for the most part to the normative conflict existing
in the society. On the whole, younger respondents are less susceptible to those stereotypes than
older respondents. It is noteworthy that the differences are biggest between the youngest age
group and the group of 35-49-year-olds. However, the cross-tabulated data in this contingency
table clearly indicate that the above-mentioned stereotypes are held by considerable
proportions of the various age groups of the population.
Education is a powerful and statistically significant factor. The correlation between a level
of educational attainment and agreeing with the above statements is inverse, i.e. the higher the
respondents’ level of education the smaller proportion of them subscribes to those views. The
difference is particularly considerable between the respondents with higher education, on the
one hand, and with basic or secondary education, on the other.
212
Marital status is not an effective factor in terms of its impact on the position that a
respondent takes as regards the above statements. Even when the differences (between the
results shown in the contingency table) are statistically significant (statements 1, 3 and 5), the
strength of association is very weak. The data indicate that not a single category in this segment
of the sample is consistent in its views. Depending on the statement, the same group of
respondents may be more inclined to hold traditionalistic and conservative views or more
liberal and progressive.
Residence location proved to be a very important factor in terms of shaping respondents’
attitudes toward sexuality-related statements. The differences between the proportions of the
respondents agreeing with the above statements depending on the place where they live are
consistently significant statistically111. Its impact is much more straightforward than of the
other factors.
The surveyed residents of Yerevan tend to be much less likely to agree with the above
statements than the residents of rural areas, i.e. the respondents who live in the capital city are
more likely to subscribe to more modern and liberal views than the respondents who live in
villages. Only as regards the statement about virginity well over a half of the respondents from
Yerevan agreed and as regards the statement that men are always ready to have sex exactly a
half the respondents from Yerevan agreed and as regards 4 other statements less than 50.0% of
the surveyed Yerevan residents agreed with them, while a half or over a half of the respondents
from rural areas agreed with all the statements but one. As regards the statement that a man
needs other women even if things with his wife are fine, only 36.9% of the respondents from
rural areas agreed with it.
The respondents who live in urban areas other than Yerevan fall in-between, at times
gravitating more to one or the other group.
It was shown above that the attitudes that the respondents have toward the statements are
affected by their gender. The gender impact further complicates the effect that the respondents’
key background characteristics have on the respondent’s attitude toward the said statement (See
Table 4 and 5 below).
Table 4. Attitudes toward sexuality: Men Percentage of all men who agree with the following statements, by background characteristics**
111 The significance value is less (p=0.041) or much less (p=0.000, p=0.001 and p=0.005) than the significance level (α) of 0.05.

213
Background characteristic
Men need sex more than women do (Q19)
Men are always ready to have sex (Q25)
A man needs other women even if things with his wife are fine (Q27)
It is a woman’s responsibility to avoid getting pregnant (Q33)
A woman should remain a virgin until marriage (Q40)
Women who carry condoms on them are “easy” (Q41)
Number of men
N = 767
Age
18-24 43.8% 63.4% 48.4% 45.8% 87.6% 73.9% 153
25-34 49.2% 62.7% 42.1% 44.5% 86.6% 66.0% 209
35-49 52.0% 72.8% 47.6% 39.6% 89.2% 52.4% 250
50-59 46.4% 61.9% 38.7% 52.3% 85.8% 54.8% 155
Education
Basic (65.7%) (93.8%) (78.2%) (46.9%) (93.7%) (78.2%) 32
Secondary 51.8% 71.0% 46.2% 45.6% 89.8% 65.5% 403
TVET 46.8% 65.9% 40.5% 53.2% 89.6% 56.4% 126
Higher 40.3% 51.9% 38.4% 37.4% 80.6% 52.0% 206
Marital status***
Registered marriage 53.0% 68.6% 43.4% 42.2% 89.7% 57.6% 408
Unregistered marriage
43.3% 66.3% 42.2% 50.6% 86.7% 59.0% 83
Girlfriend (not living together)
(39.3%) (71.5%) (42.9%) (42.9%) 85.7% 67.9% 28
Single 43.2% 58.2% 45.6% 45.5% 83.1% 69.0% 213
Separated/
divorced
(50.0%) (75.0%) (45.9%) (62.5%) (91.7%) (45.8%) 24****
Widowed * * * * * * 2
Residence
Yerevan 41.1% 55.8% 39.5% 41.8% 81.8% 57.4% 258
Other urban areas 50.0% 64.6% 43.4% 43.8% 87.6% 60.2% 226
Rural areas 54.0% 76.3% 49.9% 48.1% 92.6% 64.6% 283
Total 48.5% 66.0% 44.5% 44.7% 87.5% 60.9% 767
Figures in parentheses are based on 25-49 cases. An asterisk (*) indicates that a figure is based on fewer than 25 cases and has been suppressed.
** For the ease of data presentation, comparison and analysis, the response categories ‘strongly agree’ and ‘agree’ have been merged to measure the percent of men who agreed with a given statement. *** Since there were only 9 respondents in the category “Informal union/cohabitation” that category was suppressed (therefore the total number of respondents in this section is 758). **** The data for borderline cases are regarded as fully valid.
214
With the exception of the last statement (Women who carry condoms on them are “easy”),
there is no statistically significant correlation between male respondents’ age and their
(dis)agreement with the statements. Nevertheless, some observations could be made.
While in the entire sample the proportion of younger respondents who do not agree with
the gender inequitable statements was smaller than that of the respondents in other age groups,
in the case of young male respondents that is not so. In the latter case the proportions are, with
one exception, either higher than in other age groups or the highest. Besides, they are
consistently higher than the respective proportions in the entire sample.
There is a statistically significant correlation between female respondents’ age and their
agreement with the first 3 statements. For the other 3 statements there is no such correlation.
The proportion of the youngest female respondents agreeing with the statements is the smallest
and thus reflects the overall tendency displayed by the entire sample. In contrast to male
respondents, in most cases the proportions of the female respondents (who agree with the
statements) in other age groups are smaller than in the entire sample.
There is a statistically significant correlation between male respondents’ level of
educational attainment and their attitudes toward all but two statements. Those two statements
place on a woman the responsibility to avoid getting pregnant and contend that a woman should
remain a virgin until marriage. Those are probably the most sensitive statements and they are
least affected by a level of formal education because those issues are not, as a rule, addressed
and discussed in educational institutions within the framework of a core curriculum. In all other
cases the same tendency that was observed for the entire sample, viz. the inverse correlation
between the level of the respondents’ education and the proportion of the respondents agreeing
with the statements, is manifested here as well.
In the case of the surveyed women the correlation between the level of their education
and their attitudes toward the statement is statistically significant without exceptions. It is
noteworthy that while the above-mentioned overall inverse correlation tendency is also
observed in this case, the differences between the proportions of the respondents holding
secondary and higher education are noticeably greater for male than female respondents
(excluding the 2 exceptions mentioned earlier).
Thus, a conclusion can be drawn that while a greater proportion of male respondents are
on the whole more likely to agree with the statements than that of female respondents with the
same level of education, the effect of the educational factor is stronger for men than women.
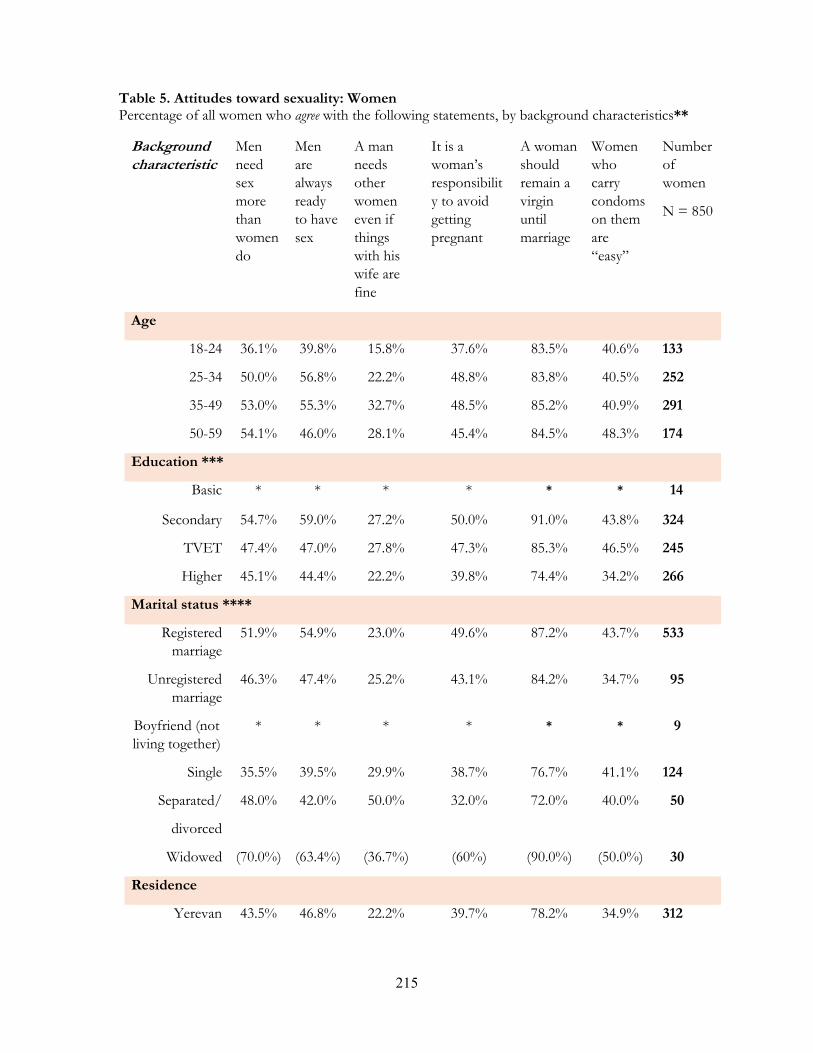
215
Table 5. Attitudes toward sexuality: Women Percentage of all women who agree with the following statements, by background characteristics** Background characteristic
Men need sex more than women do
Men are always ready to have sex
A man needs other women even if things with his wife are fine
It is a woman’s responsibility to avoid getting pregnant
A woman should remain a virgin until marriage
Women who carry condoms on them are “easy”
Number of women
N = 850
Age
18-24 36.1% 39.8% 15.8% 37.6% 83.5% 40.6% 133
25-34 50.0% 56.8% 22.2% 48.8% 83.8% 40.5% 252
35-49 53.0% 55.3% 32.7% 48.5% 85.2% 40.9% 291
50-59 54.1% 46.0% 28.1% 45.4% 84.5% 48.3% 174
Education ***
Basic * * * * * * 14
Secondary 54.7% 59.0% 27.2% 50.0% 91.0% 43.8% 324
TVET 47.4% 47.0% 27.8% 47.3% 85.3% 46.5% 245
Higher 45.1% 44.4% 22.2% 39.8% 74.4% 34.2% 266
Marital status ****
Registered marriage
51.9% 54.9% 23.0% 49.6% 87.2% 43.7% 533
Unregistered marriage
46.3% 47.4% 25.2% 43.1% 84.2% 34.7% 95
Boyfriend (not living together)
* * * * * * 9
Single 35.5% 39.5% 29.9% 38.7% 76.7% 41.1% 124
Separated/
divorced
48.0% 42.0% 50.0% 32.0% 72.0% 40.0% 50
Widowed (70.0%) (63.4%) (36.7%) (60%) (90.0%) (50.0%) 30
Residence
Yerevan 43.5% 46.8% 22.2% 39.7% 78.2% 34.9% 312

216
Other urban areas
50.4% 51.2% 32.9% 45.9% 83.7% 39.4% 246
Rural areas 53.5% 56.5% 24.3% 53.5% 91.4% 52.4% 292
Total 49.7% 51.4% 26.0% 46.2% 84.3% 42.2% 850
Figures in parentheses are based on 25-49 cases. An asterisk (*) indicates that a figure is based on fewer than 25 cases and has been suppressed.
** For the ease of data presentation, comparison and analysis, the response categories ‘strongly agree’ and ‘agree’ are merged to measure the percent of women who disagreed with a given statement. *** Since there was only 1 respondent in the category “with elementary or lower education” the category was suppressed (therefore the total number of respondents in this section is 849). **** Since there were only 9 respondents in the category “Informal union/cohabitation” that category was suppressed (therefore the total number of respondents in this section is 841).
Marital status makes almost no statistically significant impact on male respondents.
However, the Table data, show considerable variation of the proportions of male respondents
who agree with the statements that were offered to them.
Even though the differences between the results shown in the contingency table for female
respondents are statistically significant, the strength of the association is very weak and would
not usually be regarded as acceptable. In any event, no straightforward and uniform patterns
can be observed.
While in general reflecting the trends observed in the entire sample, the data from Tables
4 and 5 indicate that residence location, nevertheless, affects men and women differently.
Unlike the entire sample, the residence location and attitudes do not always have a statistically
significant association when gender is the third factor. As regards male respondents, this
association exists except in the case of the fourth statement (“It is a woman’s responsibility to
avoid getting pregnant”) and as regards female respondents, the first two statements are
exceptions.
The proportions of male respondents agreeing with the statements are higher than those
for female respondents and the averages reflected for the entire sample. That was predictable
given the earlier discovered differences between male and female responses. What was not so
obvious is the fact that differences are for the most part more pronounced between male
respondents than between female respondents from the 3 groups of residence locations covered
by the survey.
Dating, marriage and children
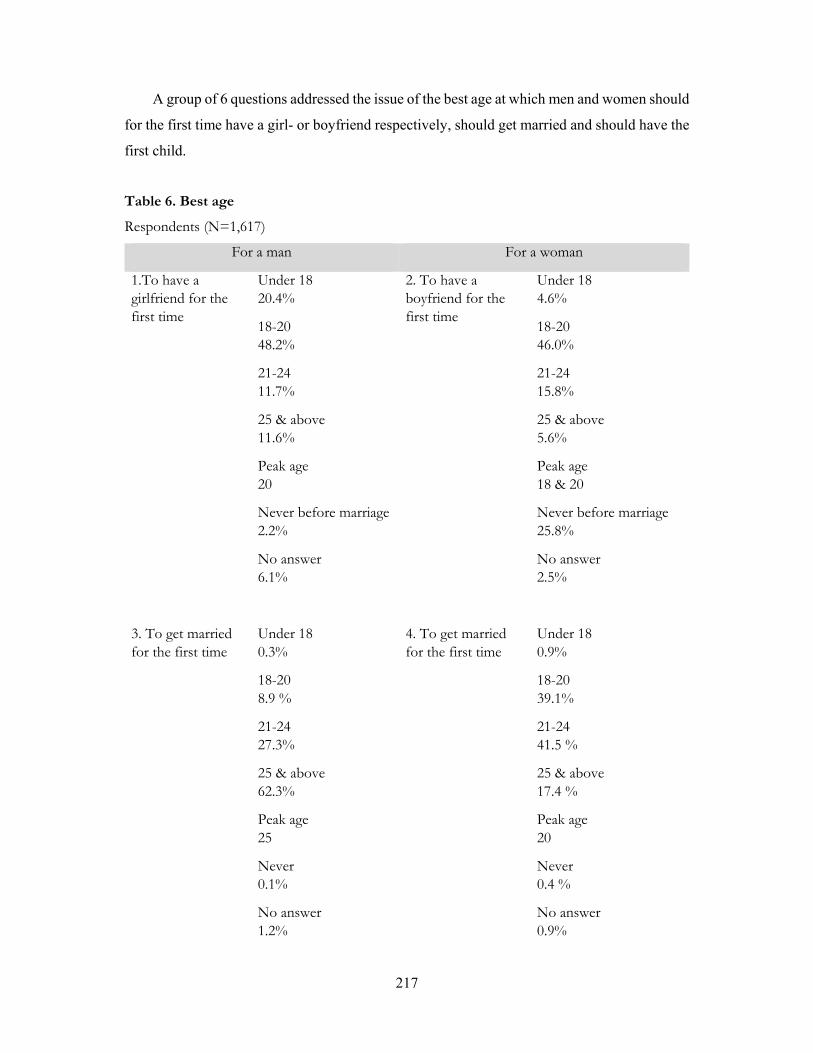
217
A group of 6 questions addressed the issue of the best age at which men and women should
for the first time have a girl- or boyfriend respectively, should get married and should have the
first child.
Table 6. Best age
Respondents (N=1,617)
For a man For a woman
1.To have a girlfriend for the first time
Under 18 20.4%
2. To have a boyfriend for the first time
Under 18 4.6%
18-20 48.2%
18-20 46.0%
21-24 11.7%
21-24 15.8%
25 & above 11.6%
25 & above 5.6%
Peak age 20
Peak age 18 & 20
Never before marriage 2.2%
Never before marriage 25.8%
No answer 6.1%
No answer 2.5%
3. To get married for the first time
Under 18 0.3%
4. To get married for the first time
Under 18 0.9%
18-20 8.9 %
18-20 39.1%
21-24 27.3%
21-24 41.5 %
25 & above 62.3%
25 & above 17.4 %
Peak age 25
Peak age 20
Never 0.1%
Never 0.4 %
No answer 1.2%
No answer 0.9%
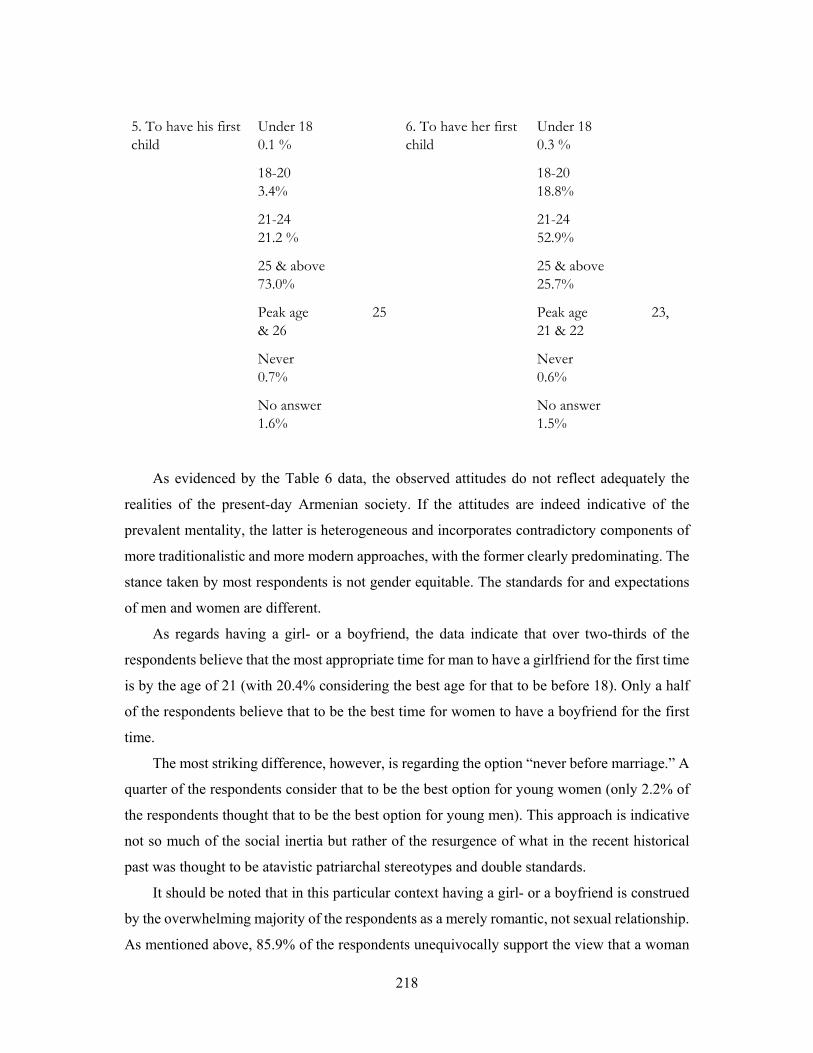
218
5. To have his first child
Under 18 0.1 %
6. To have her first child
Under 18 0.3 %
18-20 3.4%
18-20 18.8%
21-24 21.2 %
21-24 52.9%
25 & above 73.0%
25 & above 25.7%
Peak age 25 & 26
Peak age 23, 21 & 22
Never 0.7%
Never 0.6%
No answer 1.6%
No answer 1.5%
As evidenced by the Table 6 data, the observed attitudes do not reflect adequately the
realities of the present-day Armenian society. If the attitudes are indeed indicative of the
prevalent mentality, the latter is heterogeneous and incorporates contradictory components of
more traditionalistic and more modern approaches, with the former clearly predominating. The
stance taken by most respondents is not gender equitable. The standards for and expectations
of men and women are different.
As regards having a girl- or a boyfriend, the data indicate that over two-thirds of the
respondents believe that the most appropriate time for man to have a girlfriend for the first time
is by the age of 21 (with 20.4% considering the best age for that to be before 18). Only a half
of the respondents believe that to be the best time for women to have a boyfriend for the first
time.
The most striking difference, however, is regarding the option “never before marriage.” A
quarter of the respondents consider that to be the best option for young women (only 2.2% of
the respondents thought that to be the best option for young men). This approach is indicative
not so much of the social inertia but rather of the resurgence of what in the recent historical
past was thought to be atavistic patriarchal stereotypes and double standards.
It should be noted that in this particular context having a girl- or a boyfriend is construed
by the overwhelming majority of the respondents as a merely romantic, not sexual relationship.
As mentioned above, 85.9% of the respondents unequivocally support the view that a woman

219
should remain a virgin until marriage. Still, the awareness of the possibility or a prospect of a
romantic relationship turning into a sexual one is definitely behind the reasoning of the 25.8%
of those respondents who claim that women should not have a boyfriend before marriage. In
fact, this approach is for the most part wishful thinking and it obviously clashes with today’s
dating and relationship realities.
The differences in the approach to men and women are no less vividly manifested in case
of the best age for the first marriage. But before looking at those differences, 2 important
findings should be noted. First of all, less than a half percent of the respondents think that men
or women should not get married at all. Family is still regarded highly and is an important
social institution. Secondly, less than 1.0% of the respondents mentioned the age under 18.
Whatever the rationale behind the views that the best age for men or women to get married for
the first time is at some point in their lives after the age of 18, it is very positive that virtually
all respondents do not hold views that would contradict both the national legislation of Armenia
and the accepted international standards.
According to the plurality of the respondents (40.8%), the best age for men is 25. 36.5%
of the respondents see the age of primarily 21-24 and also 18-20 as the most appropriate age
for men to marry and 21.5% of the respondents pointed at the age over 25.
For women, 20 is seen as the best age for the first marriage (according to the 26.8% of the
respondents), with the proportion of those who regard the best age being 18-20 and 21-24 being
practically the same (around 40.0%). 25 is seen as the absolute ceiling (and only by 13.4%),
whereas only 4.0% of the respondents indicated the age above 25.
According to the Republic of Armenia National Statistical Service, the average age at first
marriage has been steadily growing since independence and as at 2014, it was 26.8 for urban
and 25.5 for rural women and 29.7 for urban and 28.9 for rural men112.
Thus, the gap between the official statistical data and what the survey respondents see as
the most desirable age for men and women to get married is 5-6 years. However, in reality the
gap is smaller because there is (at times considerable) difference between the date of a de facto
marriage and that of its official registration. According to an age-old Armenian tradition, which
even the Soviet reglamentation of the societal and family life failed to eliminate, a wedding
and/or religious ceremony makes a union socially recognized, regardless of its official
registration. Therefore, many couples register their marriage officially only when a need arises,
most often when a child is or is to be born or even after the birth of the child. According to the
112 Women and Men in Armenia 2015. Statistical Booklet. Yerevan: RoA NSS, 2015, p. 23.
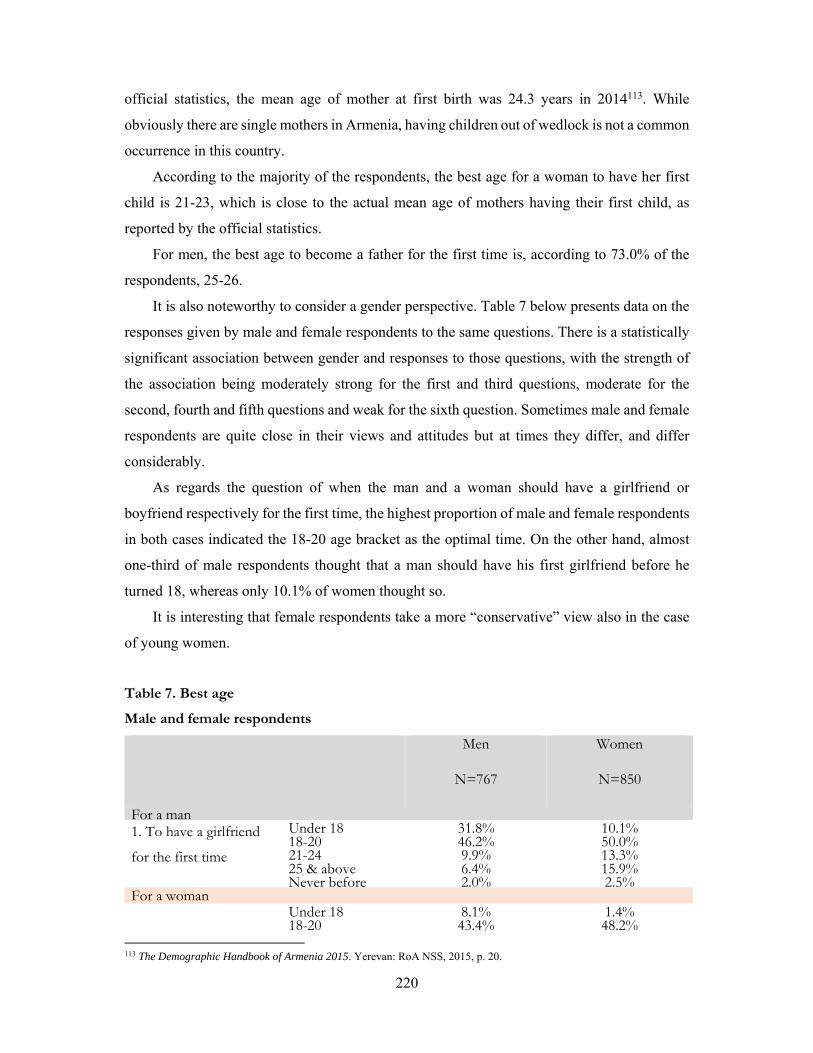
220
official statistics, the mean age of mother at first birth was 24.3 years in 2014113. While
obviously there are single mothers in Armenia, having children out of wedlock is not a common
occurrence in this country.
According to the majority of the respondents, the best age for a woman to have her first
child is 21-23, which is close to the actual mean age of mothers having their first child, as
reported by the official statistics.
For men, the best age to become a father for the first time is, according to 73.0% of the
respondents, 25-26.
It is also noteworthy to consider a gender perspective. Table 7 below presents data on the
responses given by male and female respondents to the same questions. There is a statistically
significant association between gender and responses to those questions, with the strength of
the association being moderately strong for the first and third questions, moderate for the
second, fourth and fifth questions and weak for the sixth question. Sometimes male and female
respondents are quite close in their views and attitudes but at times they differ, and differ
considerably.
As regards the question of when the man and a woman should have a girlfriend or
boyfriend respectively for the first time, the highest proportion of male and female respondents
in both cases indicated the 18-20 age bracket as the optimal time. On the other hand, almost
one-third of male respondents thought that a man should have his first girlfriend before he
turned 18, whereas only 10.1% of women thought so.
It is interesting that female respondents take a more “conservative” view also in the case
of young women.
Table 7. Best age
Male and female respondents
Men
N=767
Women
N=850
For a man 1. To have a girlfriend
for the first time
Under 18 31.8% 10.1% 18-20 46.2% 50.0% 21-24 9.9% 13.3% 25 & above 6.4% 15.9% Never before 2.0% 2.5%
For a woman Under 18 8.1% 1.4% 18-20 43.4% 48.2%
113 The Demographic Handbook of Armenia 2015. Yerevan: RoA NSS, 2015, p. 20.
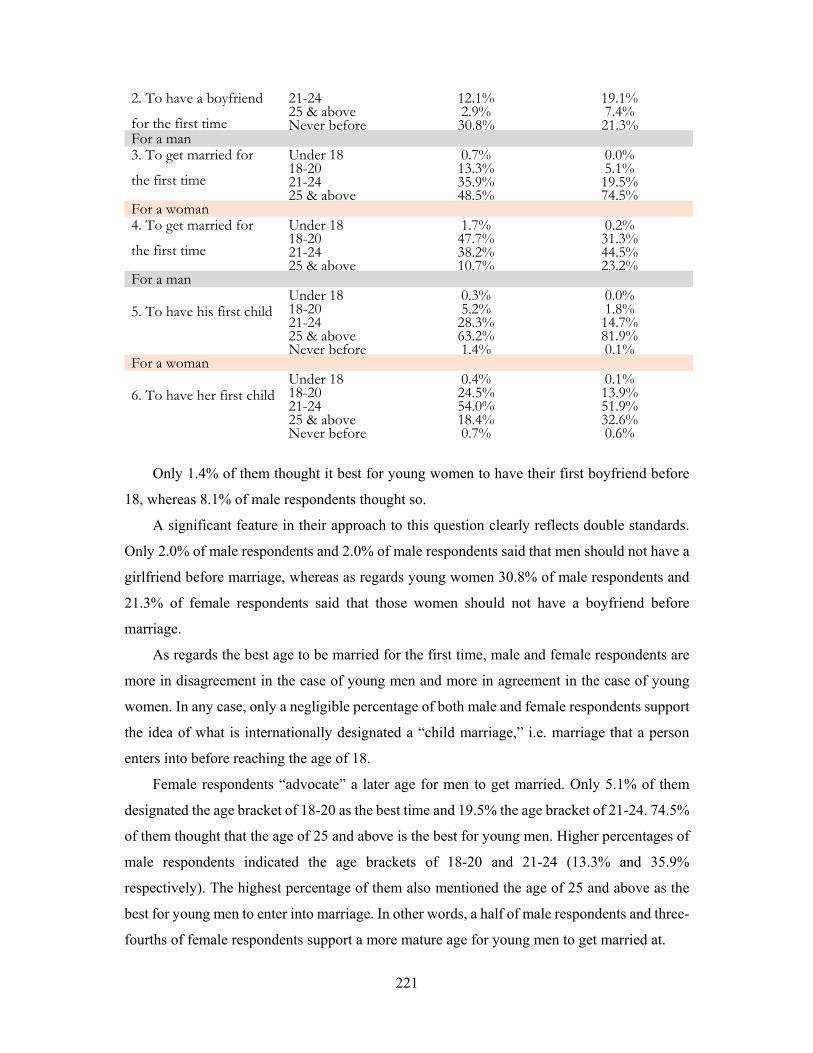
221
2. To have a boyfriend
for the first time
21-24 12.1% 19.1% 25 & above 2.9% 7.4% Never before 30.8% 21.3%
For a man 3. To get married for
the first time
Under 18 0.7% 0.0% 18-20 13.3% 5.1% 21-24 35.9% 19.5% 25 & above 48.5% 74.5%
For a woman 4. To get married for
the first time
Under 18 1.7% 0.2% 18-20 47.7% 31.3% 21-24 38.2% 44.5% 25 & above 10.7% 23.2%
For a man
5. To have his first child Under 18 0.3% 0.0% 18-20 5.2% 1.8% 21-24 28.3% 14.7% 25 & above 63.2% 81.9% Never before 1.4% 0.1%
For a woman
6. To have her first child Under 18 0.4% 0.1% 18-20 24.5% 13.9% 21-24 54.0% 51.9% 25 & above 18.4% 32.6% Never before 0.7% 0.6%
Only 1.4% of them thought it best for young women to have their first boyfriend before
18, whereas 8.1% of male respondents thought so.
A significant feature in their approach to this question clearly reflects double standards.
Only 2.0% of male respondents and 2.0% of male respondents said that men should not have a
girlfriend before marriage, whereas as regards young women 30.8% of male respondents and
21.3% of female respondents said that those women should not have a boyfriend before
marriage.
As regards the best age to be married for the first time, male and female respondents are
more in disagreement in the case of young men and more in agreement in the case of young
women. In any case, only a negligible percentage of both male and female respondents support
the idea of what is internationally designated a “child marriage,” i.e. marriage that a person
enters into before reaching the age of 18.
Female respondents “advocate” a later age for men to get married. Only 5.1% of them
designated the age bracket of 18-20 as the best time and 19.5% the age bracket of 21-24. 74.5%
of them thought that the age of 25 and above is the best for young men. Higher percentages of
male respondents indicated the age brackets of 18-20 and 21-24 (13.3% and 35.9%
respectively). The highest percentage of them also mentioned the age of 25 and above as the
best for young men to enter into marriage. In other words, a half of male respondents and three-
fourths of female respondents support a more mature age for young men to get married at.
222
They have a different view on the best age for young women to get married for the first
time. For male respondents, the best time is the age of 18-20 followed by the age of 21-24
(47.7% and 28.2% respectively). Only 10.7% of them mentioned the age of 25 and above as
the best for young women to marry.
The best time for young women to get married, as indicated by female respondents is more
evenly “spread” over those age brackets. Only 31.1% of them support early marriages (the age
of 18-20). The highest percentage of female respondents (44.5%) believes that the best age is
21-24. It is interesting that almost a quarter of female respondents indicated the age of 25 and
above as the best time for young women to tie the knot.
Thus, judging by their opinions, a considerable percentage of male and female respondents
would prefer young persons and especially young men to marry at an age when they have
become socially mature adults and have got education and/or professional training and a job.
It is not surprising that a similar or the same line of reasoning can be seen in their responses
to the question of the best time for men and women to have their first child. The highest
proportion of male and female respondents mentioned the age of 25 and above as the best time
for men to have their first child. A considerable proportion of male respondents (28.3%)
indicated the age of 21-24, whereas only 14.7% of female respondents “opted” for that age.
There is a certain consensus among male and female respondents that the best age for
women to have their first child is that of 21-24, as over a half of them mentioned that age
bracket. At the same time a quarter of male respondents indicate the age of 18-28 and 18.4%
the age of 25 and above. Other female respondents gave preference to the age of 25 and above
(32.6%) rather than to the age of 18-20 (13.9%).
Attitudes toward contraception
The statements about contraception that were included in the main survey questionnaire
are heterogeneous and need to be broken down into several sub-groups. The major division is
between statements that reflect attitudes toward contraception and statements that focus on
accessibility and affordability of contraceptives. The survey participants’ responses to
questions containing the statements are presented in Table 8.
Table 8. Attitudes toward contraception Percentage of respondents who agree with the following statements

223
Statements on attitudes toward contraceptives Respondents (N=1,617)
Contraceptives have bad side effects for women 67.8%
I believe it is morally wrong to use contraceptives 40.4%
Percentage of respondents who agree with at least one of those statements 73.5%
Intimate partners should use some form of contraception if they are not ready to have a child
78.8%
Statements on accessibility & affordability of contraceptives
Contraceptives are difficult to obtain in our region or village 20.5%
Contraceptives are embarrassing to obtain in our region or village
26.4%
Contraceptives are not affordable 21.9%
Percentage of respondents who agree with at least one of those statements
45.2%
Two-thirds of the respondents believe that contraceptives have bad side effects for women,
16.0% say there are no bad side effects and another 16.2% gave no opinion. Some modern
methods of birth control may indeed have temporary side effects for women. It should be noted
that not all contraceptives have side effects, that not all side effects are bad and that even “bad”
side effects considerably outweigh the risk of unwanted pregnancy and the need for abortion.
The empowering effect of contraceptives should not be disregarded as they enable couples and
especially women to be in control of their fertility and secure their right and opportunity to
determine the number and spacing of children.
An unexpectedly high percentage of the respondents believe that it is morally wrong to
use contraceptives (40.4%). 51.1% do not agree with the statement and 8.5% gave no opinion.
It was beyond the scope of this survey to identify the exact reasons why those respondents
found the use of contraceptives objectionable on moral grounds.
In any event there are grounds to contend that a considerable proportion of those
respondents are not absolutely sure or that they hold this idea as an abstract principle, which
can be overlooked when dealing with realities of life. Only 13.9% of the respondents disagreed
with the statement that intimate partners should use some form of contraception if they are not
ready to have a child, whereas 78.8% agreed with it (and 7.0% could not make up their mind).
It means that well over a half of those who believe that it is morally wrong to use contraceptives
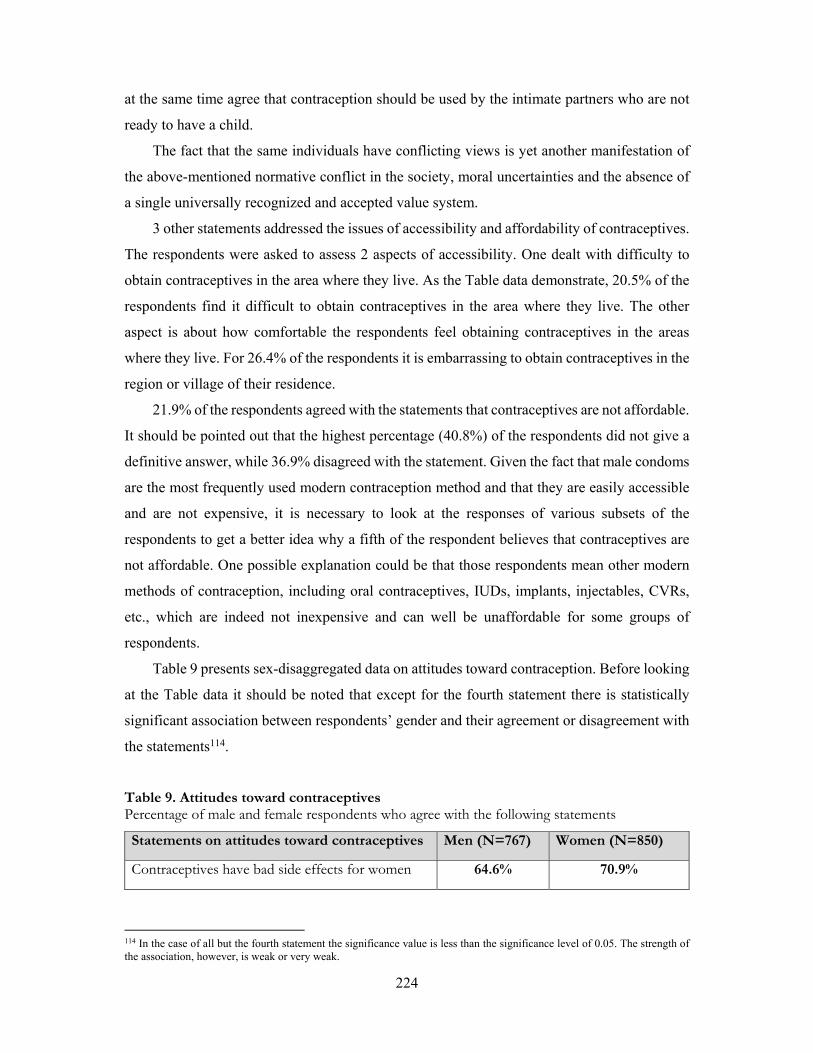
224
at the same time agree that contraception should be used by the intimate partners who are not
ready to have a child.
The fact that the same individuals have conflicting views is yet another manifestation of
the above-mentioned normative conflict in the society, moral uncertainties and the absence of
a single universally recognized and accepted value system.
3 other statements addressed the issues of accessibility and affordability of contraceptives.
The respondents were asked to assess 2 aspects of accessibility. One dealt with difficulty to
obtain contraceptives in the area where they live. As the Table data demonstrate, 20.5% of the
respondents find it difficult to obtain contraceptives in the area where they live. The other
aspect is about how comfortable the respondents feel obtaining contraceptives in the areas
where they live. For 26.4% of the respondents it is embarrassing to obtain contraceptives in the
region or village of their residence.
21.9% of the respondents agreed with the statements that contraceptives are not affordable.
It should be pointed out that the highest percentage (40.8%) of the respondents did not give a
definitive answer, while 36.9% disagreed with the statement. Given the fact that male condoms
are the most frequently used modern contraception method and that they are easily accessible
and are not expensive, it is necessary to look at the responses of various subsets of the
respondents to get a better idea why a fifth of the respondent believes that contraceptives are
not affordable. One possible explanation could be that those respondents mean other modern
methods of contraception, including oral contraceptives, IUDs, implants, injectables, CVRs,
etc., which are indeed not inexpensive and can well be unaffordable for some groups of
respondents.
Table 9 presents sex-disaggregated data on attitudes toward contraception. Before looking
at the Table data it should be noted that except for the fourth statement there is statistically
significant association between respondents’ gender and their agreement or disagreement with
the statements114.
Table 9. Attitudes toward contraceptives Percentage of male and female respondents who agree with the following statements
Statements on attitudes toward contraceptives Men (N=767) Women (N=850)
Contraceptives have bad side effects for women 64.6% 70.9%
114 In the case of all but the fourth statement the significance value is less than the significance level of 0.05. The strength of the association, however, is weak or very weak.
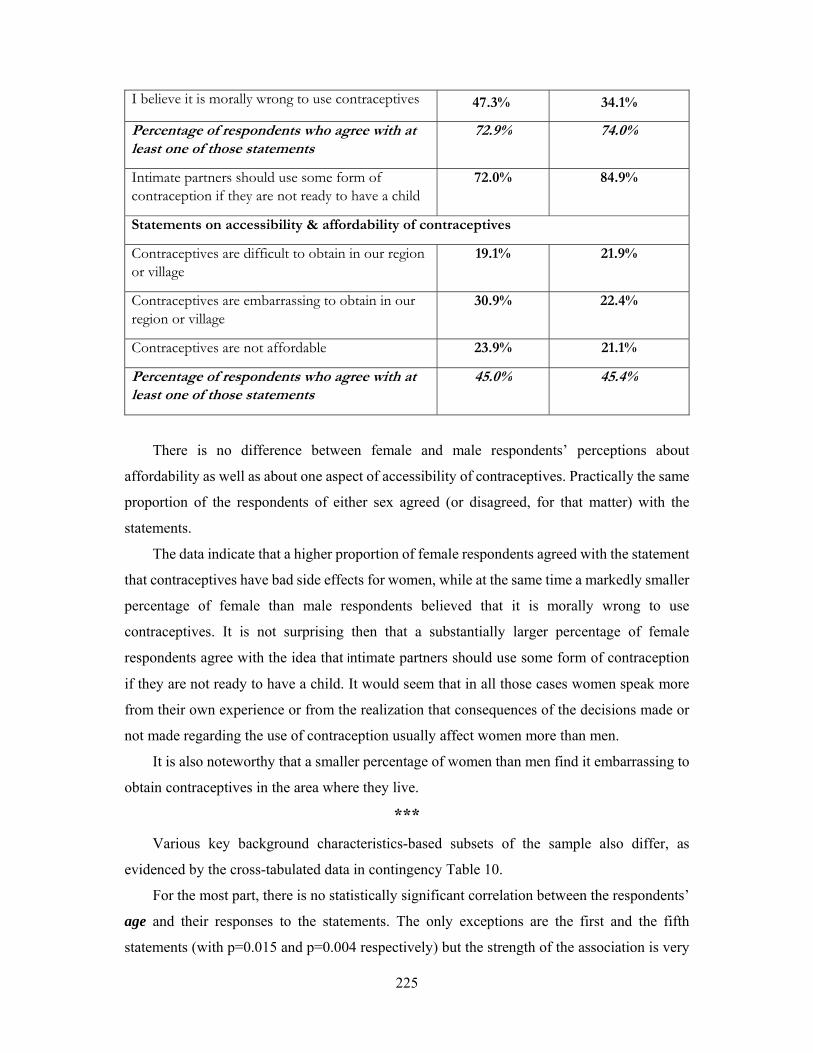
225
I believe it is morally wrong to use contraceptives 47.3% 34.1%
Percentage of respondents who agree with at least one of those statements
72.9% 74.0%
Intimate partners should use some form of contraception if they are not ready to have a child
72.0% 84.9%
Statements on accessibility & affordability of contraceptives
Contraceptives are difficult to obtain in our region or village
19.1% 21.9%
Contraceptives are embarrassing to obtain in our region or village
30.9% 22.4%
Contraceptives are not affordable 23.9% 21.1%
Percentage of respondents who agree with at least one of those statements
45.0% 45.4%
There is no difference between female and male respondents’ perceptions about
affordability as well as about one aspect of accessibility of contraceptives. Practically the same
proportion of the respondents of either sex agreed (or disagreed, for that matter) with the
statements.
The data indicate that a higher proportion of female respondents agreed with the statement
that contraceptives have bad side effects for women, while at the same time a markedly smaller
percentage of female than male respondents believed that it is morally wrong to use
contraceptives. It is not surprising then that a substantially larger percentage of female
respondents agree with the idea that intimate partners should use some form of contraception
if they are not ready to have a child. It would seem that in all those cases women speak more
from their own experience or from the realization that consequences of the decisions made or
not made regarding the use of contraception usually affect women more than men.
It is also noteworthy that a smaller percentage of women than men find it embarrassing to
obtain contraceptives in the area where they live.
***
Various key background characteristics-based subsets of the sample also differ, as
evidenced by the cross-tabulated data in contingency Table 10.
For the most part, there is no statistically significant correlation between the respondents’
age and their responses to the statements. The only exceptions are the first and the fifth
statements (with p=0.015 and p=0.004 respectively) but the strength of the association is very
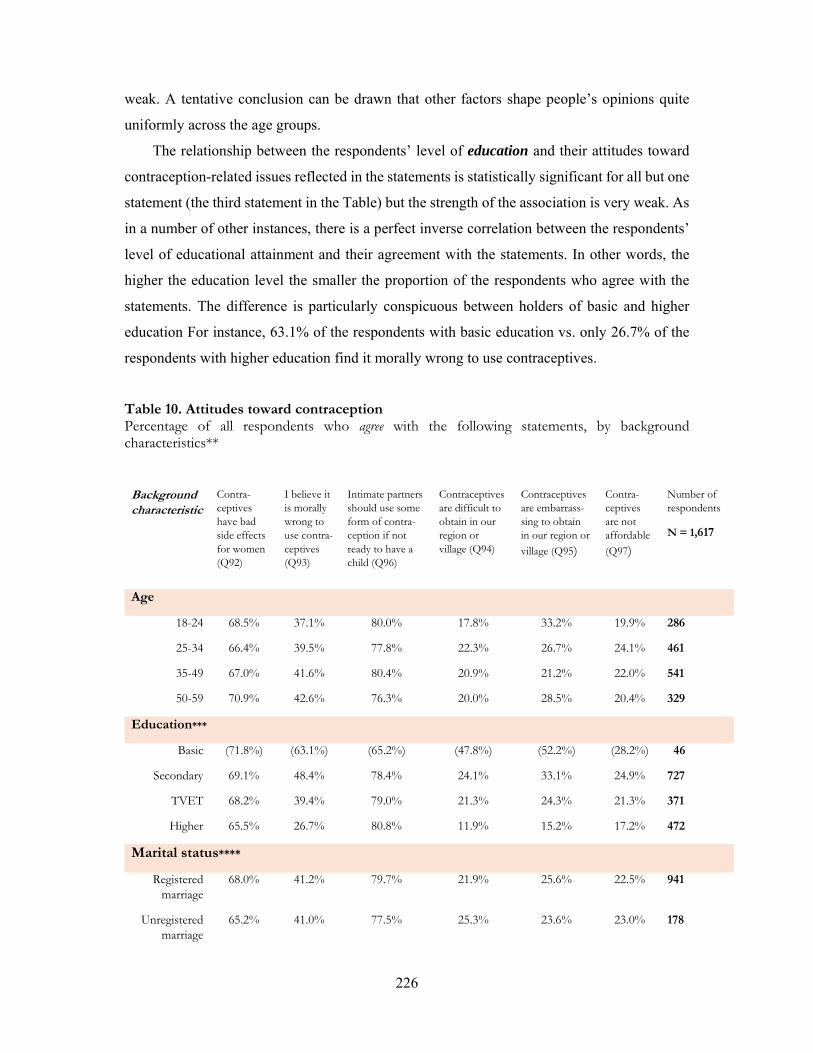
226
weak. A tentative conclusion can be drawn that other factors shape people’s opinions quite
uniformly across the age groups.
The relationship between the respondents’ level of education and their attitudes toward
contraception-related issues reflected in the statements is statistically significant for all but one
statement (the third statement in the Table) but the strength of the association is very weak. As
in a number of other instances, there is a perfect inverse correlation between the respondents’
level of educational attainment and their agreement with the statements. In other words, the
higher the education level the smaller the proportion of the respondents who agree with the
statements. The difference is particularly conspicuous between holders of basic and higher
education For instance, 63.1% of the respondents with basic education vs. only 26.7% of the
respondents with higher education find it morally wrong to use contraceptives.
Table 10. Attitudes toward contraception Percentage of all respondents who agree with the following statements, by background characteristics**
Background characteristic
Contra-ceptives have bad side effects for women (Q92)
I believe it is morally wrong to use contra-ceptives (Q93)
Intimate partners should use some form of contra-ception if not ready to have a child (Q96)
Contraceptives are difficult to obtain in our region or village (Q94)
Contraceptives are embarrass-sing to obtain in our region or
village (Q95)
Contra-ceptives are not affordable
(Q97)
Number of respondents
N = 1,617
Age
18-24 68.5% 37.1% 80.0% 17.8% 33.2% 19.9% 286
25-34 66.4% 39.5% 77.8% 22.3% 26.7% 24.1% 461
35-49 67.0% 41.6% 80.4% 20.9% 21.2% 22.0% 541
50-59 70.9% 42.6% 76.3% 20.0% 28.5% 20.4% 329
Education***
Basic (71.8%) (63.1%) (65.2%) (47.8%) (52.2%) (28.2%) 46
Secondary 69.1% 48.4% 78.4% 24.1% 33.1% 24.9% 727
TVET 68.2% 39.4% 79.0% 21.3% 24.3% 21.3% 371
Higher 65.5% 26.7% 80.8% 11.9% 15.2% 17.2% 472
Marital status****
Registered marriage
68.0% 41.2% 79.7% 21.9% 25.6% 22.5% 941
Unregistered marriage
65.2% 41.0% 77.5% 25.3% 23.6% 23.0% 178
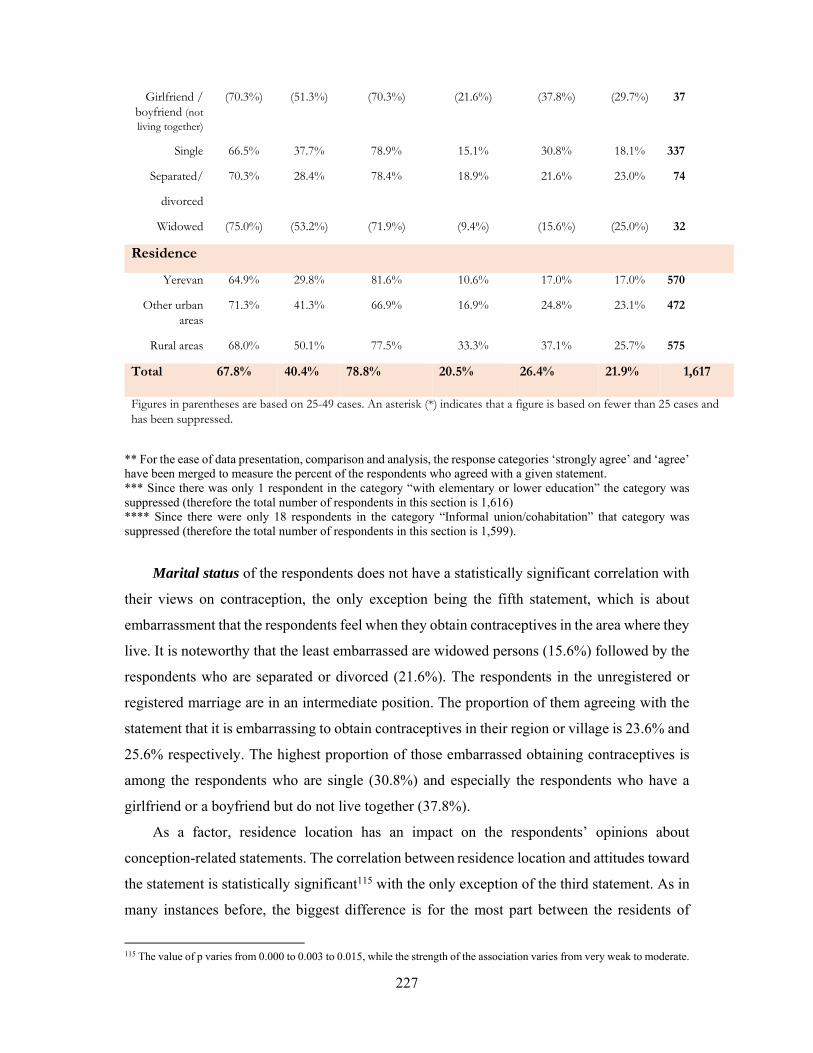
227
Girlfriend / boyfriend (not living together)
(70.3%) (51.3%) (70.3%) (21.6%) (37.8%) (29.7%) 37
Single 66.5% 37.7% 78.9% 15.1% 30.8% 18.1% 337
Separated/
divorced
70.3% 28.4% 78.4% 18.9% 21.6% 23.0% 74
Widowed (75.0%) (53.2%) (71.9%) (9.4%) (15.6%) (25.0%) 32
Residence
Yerevan 64.9% 29.8% 81.6% 10.6% 17.0% 17.0% 570
Other urban areas
71.3% 41.3% 66.9% 16.9% 24.8% 23.1% 472
Rural areas 68.0% 50.1% 77.5% 33.3% 37.1% 25.7% 575
Total 67.8% 40.4% 78.8% 20.5% 26.4% 21.9% 1,617
Figures in parentheses are based on 25-49 cases. An asterisk (*) indicates that a figure is based on fewer than 25 cases and has been suppressed.
** For the ease of data presentation, comparison and analysis, the response categories ‘strongly agree’ and ‘agree’ have been merged to measure the percent of the respondents who agreed with a given statement. *** Since there was only 1 respondent in the category “with elementary or lower education” the category was suppressed (therefore the total number of respondents in this section is 1,616) **** Since there were only 18 respondents in the category “Informal union/cohabitation” that category was suppressed (therefore the total number of respondents in this section is 1,599).
Marital status of the respondents does not have a statistically significant correlation with
their views on contraception, the only exception being the fifth statement, which is about
embarrassment that the respondents feel when they obtain contraceptives in the area where they
live. It is noteworthy that the least embarrassed are widowed persons (15.6%) followed by the
respondents who are separated or divorced (21.6%). The respondents in the unregistered or
registered marriage are in an intermediate position. The proportion of them agreeing with the
statement that it is embarrassing to obtain contraceptives in their region or village is 23.6% and
25.6% respectively. The highest proportion of those embarrassed obtaining contraceptives is
among the respondents who are single (30.8%) and especially the respondents who have a
girlfriend or a boyfriend but do not live together (37.8%).
As a factor, residence location has an impact on the respondents’ opinions about
conception-related statements. The correlation between residence location and attitudes toward
the statement is statistically significant115 with the only exception of the third statement. As in
many instances before, the biggest difference is for the most part between the residents of
115 The value of p varies from 0.000 to 0.003 to 0.015, while the strength of the association varies from very weak to moderate.
228
Yerevan and rural residents, while residents of urban areas other than Yerevan are in the
middle. For example, only 29.8% of residents of Yerevan in contrast to 50.1% of the
respondents from rural areas believe it is morally wrong to use contraceptives (the proportion
of the respondents from other urban areas who believe so is 41.3%). No less dramatic difference
is observed as regards difficulties in obtaining contraceptives in the area where they live (10.6%
and 33.3% respectively) and as regards the embarrassment in obtaining contraceptives there
(17.0% and 37.1% respectively).
It should be noted that the respondents’ views on the third statement are the only variable
which does not have a statistically significant association with either of the 4 key other
variables (background characteristics).
The survey data on the contraception issue can be further reviewed from a gender
perspective. The data from Tables 11 and 12 indicate that age is not a factor of strong impact.
In the case of male respondents, the association of age with their attitudes toward the
contraception-related statements is not significant, whereas for female respondents the
association is significant only for the second, fourth and fifth statements but the strength of the
association is very weak. As regards the statements that it is morally wrong to use contraception
and contraceptives are difficult to obtain in their region or village, the correlation is positive,
i.e. the proportion of those female respondents who agree with the statements is growing with
age. The difference is particularly noticeable between the youngest and the oldest women in
the sample. The proportions for the second statement are 27.8% and 39.6% respectively and
for the fourth statement are 18.0% and 23.0% respectively. In the case of the fifth statement
the correlation is not straightforward. While younger groups of women tend to be more
embarrassed obtaining contraceptives (30.1% in the youngest group and 22.2% in the next age
group), the oldest group of women comes second in terms of proportion of those who feel
embarrassed (25.9%).
Table 11. Attitudes toward contraception: Men Percentage of all respondents who agree with the following statements, by background characteristics** Background characteristic
Contraceptives have bad side effects for women
I believe it is morally wrong to use
Intimate partners should use some form of contra ception if
Contraceptives are difficult to obtain in our
Contraceptives are embarrass ing to obtain in our
Contra ceptives are not affordable
Number of men
N = 767
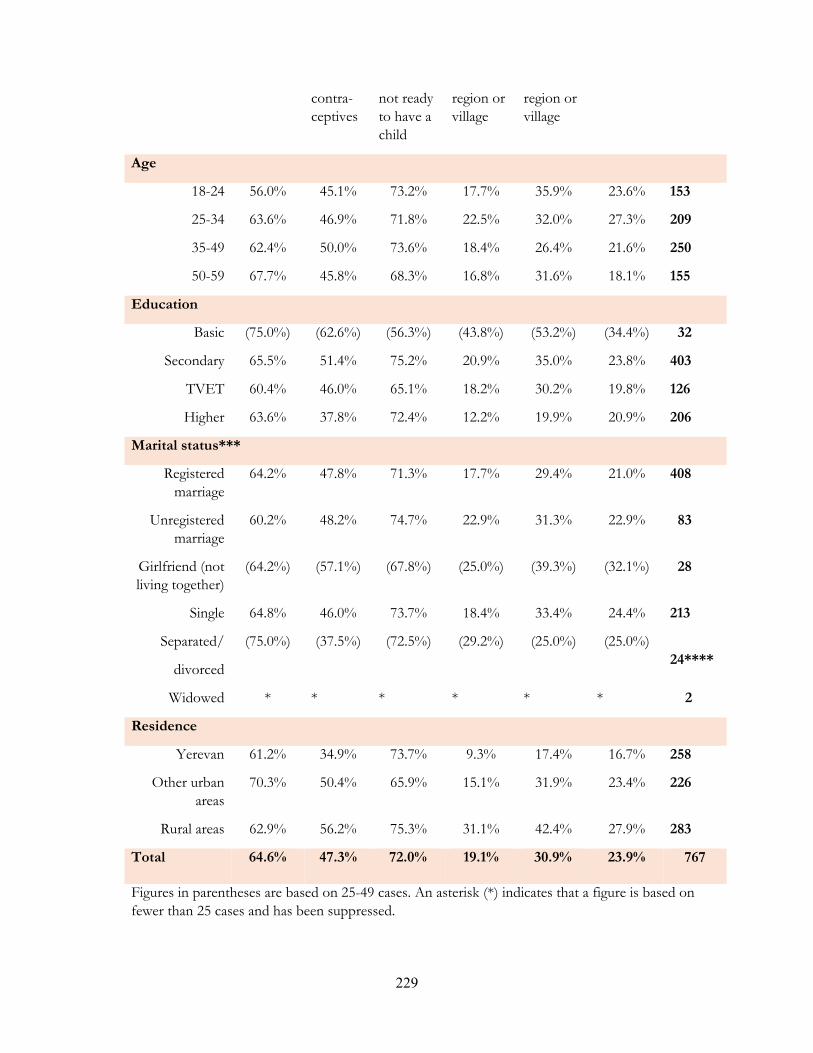
229
contra-ceptives
not ready to have a child
region or village
region or village
Age
18-24 56.0% 45.1% 73.2% 17.7% 35.9% 23.6% 153
25-34 63.6% 46.9% 71.8% 22.5% 32.0% 27.3% 209
35-49 62.4% 50.0% 73.6% 18.4% 26.4% 21.6% 250
50-59 67.7% 45.8% 68.3% 16.8% 31.6% 18.1% 155
Education
Basic (75.0%) (62.6%) (56.3%) (43.8%) (53.2%) (34.4%) 32
Secondary 65.5% 51.4% 75.2% 20.9% 35.0% 23.8% 403
TVET 60.4% 46.0% 65.1% 18.2% 30.2% 19.8% 126
Higher 63.6% 37.8% 72.4% 12.2% 19.9% 20.9% 206
Marital status***
Registered marriage
64.2% 47.8% 71.3% 17.7% 29.4% 21.0% 408
Unregistered marriage
60.2% 48.2% 74.7% 22.9% 31.3% 22.9% 83
Girlfriend (not living together)
(64.2%) (57.1%) (67.8%) (25.0%) (39.3%) (32.1%) 28
Single 64.8% 46.0% 73.7% 18.4% 33.4% 24.4% 213
Separated/
divorced
(75.0%) (37.5%) (72.5%) (29.2%) (25.0%) (25.0%) 24****
Widowed * * * * * * 2
Residence
Yerevan 61.2% 34.9% 73.7% 9.3% 17.4% 16.7% 258
Other urban areas
70.3% 50.4% 65.9% 15.1% 31.9% 23.4% 226
Rural areas 62.9% 56.2% 75.3% 31.1% 42.4% 27.9% 283
Total 64.6% 47.3% 72.0% 19.1% 30.9% 23.9% 767
Figures in parentheses are based on 25-49 cases. An asterisk (*) indicates that a figure is based on fewer than 25 cases and has been suppressed.
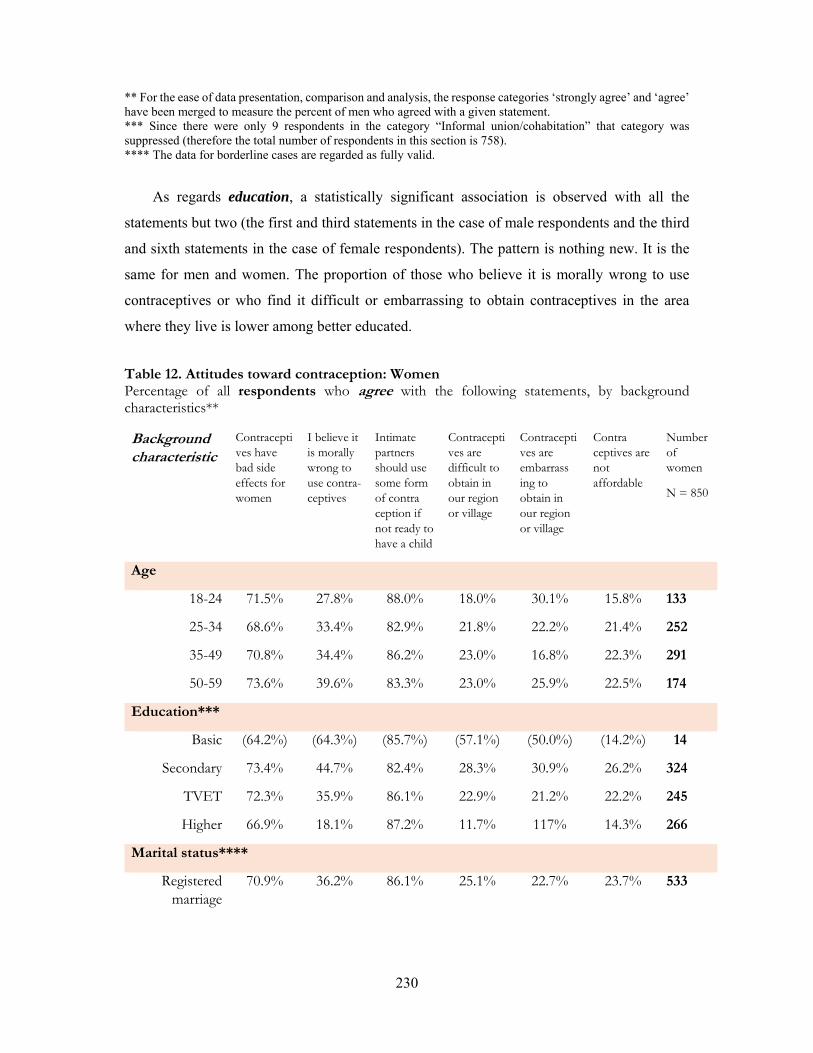
230
** For the ease of data presentation, comparison and analysis, the response categories ‘strongly agree’ and ‘agree’ have been merged to measure the percent of men who agreed with a given statement. *** Since there were only 9 respondents in the category “Informal union/cohabitation” that category was suppressed (therefore the total number of respondents in this section is 758). **** The data for borderline cases are regarded as fully valid.
As regards education, a statistically significant association is observed with all the
statements but two (the first and third statements in the case of male respondents and the third
and sixth statements in the case of female respondents). The pattern is nothing new. It is the
same for men and women. The proportion of those who believe it is morally wrong to use
contraceptives or who find it difficult or embarrassing to obtain contraceptives in the area
where they live is lower among better educated.
Table 12. Attitudes toward contraception: Women Percentage of all respondents who agree with the following statements, by background characteristics** Background characteristic
Contraceptives have bad side effects for women
I believe it is morally wrong to use contra-ceptives
Intimate partners should use some form of contra ception if not ready to have a child
Contraceptives are difficult to obtain in our region or village
Contraceptives are embarrass ing to obtain in our region or village
Contra ceptives are not affordable
Number of women
N = 850
Age
18-24 71.5% 27.8% 88.0% 18.0% 30.1% 15.8% 133
25-34 68.6% 33.4% 82.9% 21.8% 22.2% 21.4% 252
35-49 70.8% 34.4% 86.2% 23.0% 16.8% 22.3% 291
50-59 73.6% 39.6% 83.3% 23.0% 25.9% 22.5% 174
Education***
Basic (64.2%) (64.3%) (85.7%) (57.1%) (50.0%) (14.2%) 14
Secondary 73.4% 44.7% 82.4% 28.3% 30.9% 26.2% 324
TVET 72.3% 35.9% 86.1% 22.9% 21.2% 22.2% 245
Higher 66.9% 18.1% 87.2% 11.7% 117% 14.3% 266
Marital status****
Registered marriage
70.9% 36.2% 86.1% 25.1% 22.7% 23.7% 533
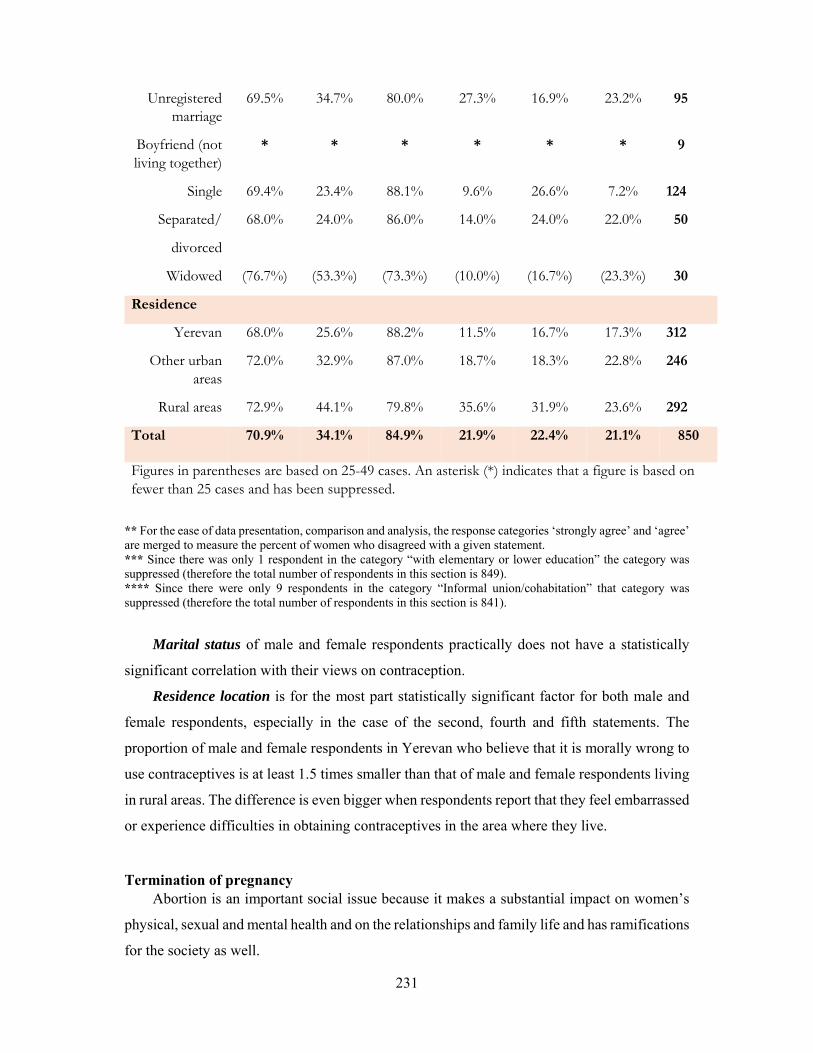
231
Unregistered marriage
69.5% 34.7% 80.0% 27.3% 16.9% 23.2% 95
Boyfriend (not living together)
* * * * * * 9
Single 69.4% 23.4% 88.1% 9.6% 26.6% 7.2% 124
Separated/
divorced
68.0% 24.0% 86.0% 14.0% 24.0% 22.0% 50
Widowed (76.7%) (53.3%) (73.3%) (10.0%) (16.7%) (23.3%) 30
Residence
Yerevan 68.0% 25.6% 88.2% 11.5% 16.7% 17.3% 312
Other urban areas
72.0% 32.9% 87.0% 18.7% 18.3% 22.8% 246
Rural areas 72.9% 44.1% 79.8% 35.6% 31.9% 23.6% 292
Total 70.9% 34.1% 84.9% 21.9% 22.4% 21.1% 850
Figures in parentheses are based on 25-49 cases. An asterisk (*) indicates that a figure is based on fewer than 25 cases and has been suppressed.
** For the ease of data presentation, comparison and analysis, the response categories ‘strongly agree’ and ‘agree’ are merged to measure the percent of women who disagreed with a given statement. *** Since there was only 1 respondent in the category “with elementary or lower education” the category was suppressed (therefore the total number of respondents in this section is 849). **** Since there were only 9 respondents in the category “Informal union/cohabitation” that category was suppressed (therefore the total number of respondents in this section is 841).
Marital status of male and female respondents practically does not have a statistically
significant correlation with their views on contraception.
Residence location is for the most part statistically significant factor for both male and
female respondents, especially in the case of the second, fourth and fifth statements. The
proportion of male and female respondents in Yerevan who believe that it is morally wrong to
use contraceptives is at least 1.5 times smaller than that of male and female respondents living
in rural areas. The difference is even bigger when respondents report that they feel embarrassed
or experience difficulties in obtaining contraceptives in the area where they live.
Termination of pregnancy Abortion is an important social issue because it makes a substantial impact on women’s
physical, sexual and mental health and on the relationships and family life and has ramifications
for the society as well.
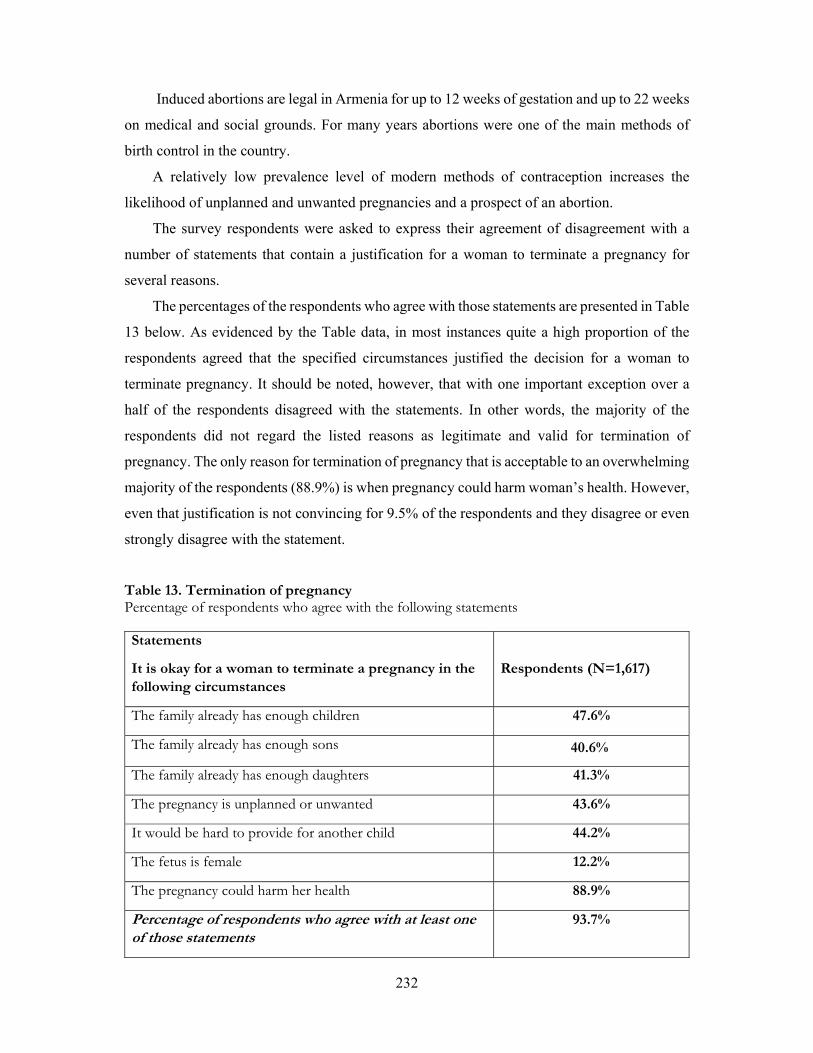
232
Induced abortions are legal in Armenia for up to 12 weeks of gestation and up to 22 weeks
on medical and social grounds. For many years abortions were one of the main methods of
birth control in the country.
A relatively low prevalence level of modern methods of contraception increases the
likelihood of unplanned and unwanted pregnancies and a prospect of an abortion.
The survey respondents were asked to express their agreement of disagreement with a
number of statements that contain a justification for a woman to terminate a pregnancy for
several reasons.
The percentages of the respondents who agree with those statements are presented in Table
13 below. As evidenced by the Table data, in most instances quite a high proportion of the
respondents agreed that the specified circumstances justified the decision for a woman to
terminate pregnancy. It should be noted, however, that with one important exception over a
half of the respondents disagreed with the statements. In other words, the majority of the
respondents did not regard the listed reasons as legitimate and valid for termination of
pregnancy. The only reason for termination of pregnancy that is acceptable to an overwhelming
majority of the respondents (88.9%) is when pregnancy could harm woman’s health. However,
even that justification is not convincing for 9.5% of the respondents and they disagree or even
strongly disagree with the statement.
Table 13. Termination of pregnancy Percentage of respondents who agree with the following statements Statements
It is okay for a woman to terminate a pregnancy in the following circumstances
Respondents (N=1,617)
The family already has enough children 47.6%
The family already has enough sons 40.6%
The family already has enough daughters 41.3%
The pregnancy is unplanned or unwanted 43.6%
It would be hard to provide for another child 44.2%
The fetus is female 12.2%
The pregnancy could harm her health 88.9%
Percentage of respondents who agree with at least one of those statements
93.7%

233
The highest-ranking valid reason for ending a pregnancy is that the family already has
enough children (47.6%). It is important to note that while the percentage of the respondents
who agree with a modified version of that statement (when the sex of the children that the
family already has is specified) is lower, there is no gender bias. Practically the same
percentage of respondents finds that as a good reason for a woman to terminate pregnancy
whether the family has enough sons or daughters.
What is even more important is the fact that only 12.2% of the sampled population
approved sex-selective abortions (vs. 86.3% that did not).
The differences in men’s and women’s responses concerning the abortion issue could be
expected. However, it is not the magnitude but the “direction” of the differences that at times
proved unpredictable. It is not surprising that the percentage of women justifying abortion is
higher than that of men, what is surprising is that that is the case regardless of the justification.
The relevant survey data are presented in table 14 below. It should be noted that there is a
statistically significant association (with one exception) between the respondents’ gender and
their attitudes toward various justifications of termination of pregnancy116.
Table 14. Termination of pregnancy Percentage of male and female respondents who agree with the following statements Statements
It is okay for a woman to terminate a pregnancy in the following circumstances
Men (N=767)
Women (N=850)
The family already has enough children 36.1% 58.0%
The family already has enough sons 32.4% 48.1%
The family already has enough daughters 33.1% 48.6%
The pregnancy is unplanned or unwanted 33.0% 53.1%
It would be hard to provide for another child 35.3% 52.2%
The fetus is female 11.4% 13.0%
The pregnancy could harm her health 88.2% 89.7%
Percentage of respondents who agree with at least one of those statements
92.7% 94.6%
116 The only exception is the sixth statement, which justifies abortion because the fetus is female. In all other cases the significance value p=0.000, with the strength of the association being weak or moderate, except in the case of the final statement, where p=0.27 and the strength of the association is very weak.
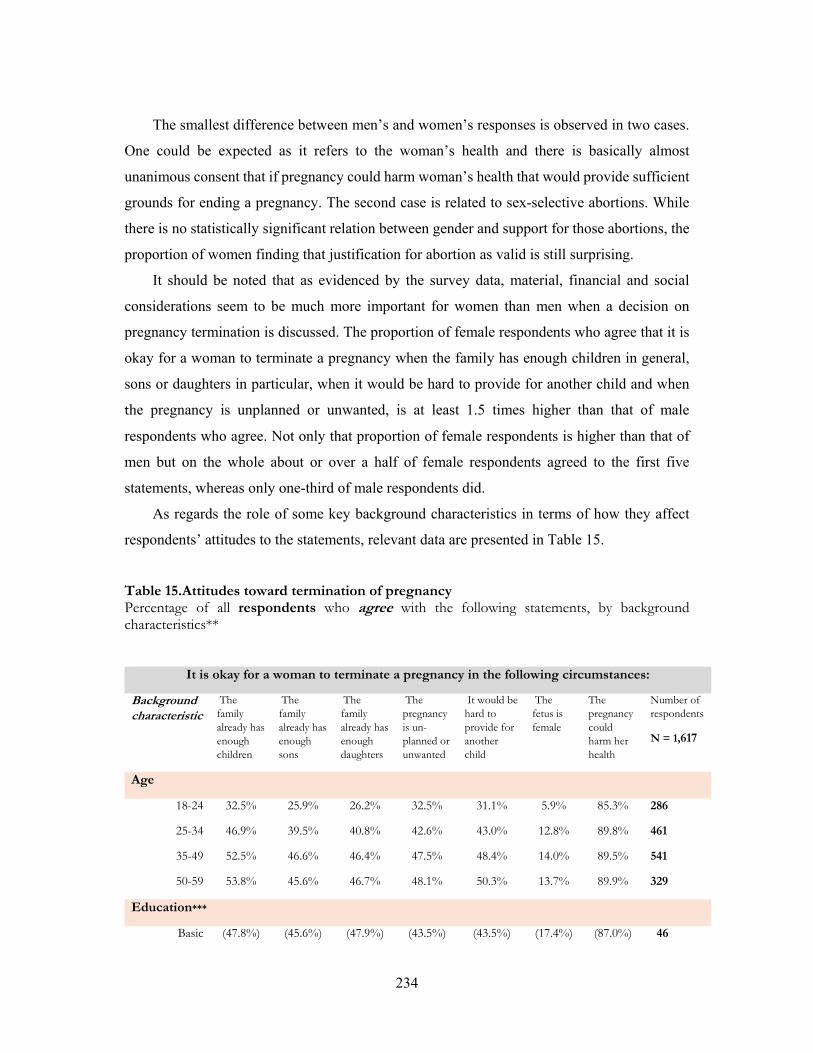
234
The smallest difference between men’s and women’s responses is observed in two cases.
One could be expected as it refers to the woman’s health and there is basically almost
unanimous consent that if pregnancy could harm woman’s health that would provide sufficient
grounds for ending a pregnancy. The second case is related to sex-selective abortions. While
there is no statistically significant relation between gender and support for those abortions, the
proportion of women finding that justification for abortion as valid is still surprising.
It should be noted that as evidenced by the survey data, material, financial and social
considerations seem to be much more important for women than men when a decision on
pregnancy termination is discussed. The proportion of female respondents who agree that it is
okay for a woman to terminate a pregnancy when the family has enough children in general,
sons or daughters in particular, when it would be hard to provide for another child and when
the pregnancy is unplanned or unwanted, is at least 1.5 times higher than that of male
respondents who agree. Not only that proportion of female respondents is higher than that of
men but on the whole about or over a half of female respondents agreed to the first five
statements, whereas only one-third of male respondents did.
As regards the role of some key background characteristics in terms of how they affect
respondents’ attitudes to the statements, relevant data are presented in Table 15.
Table 15.Attitudes toward termination of pregnancy Percentage of all respondents who agree with the following statements, by background characteristics**
It is okay for a woman to terminate a pregnancy in the following circumstances:
Background characteristic
The family already has enough children
The family already has enough sons
The family already has enough daughters
The pregnancy is un-planned or unwanted
It would be hard to provide for another child
The fetus is female
The pregnancy could harm her health
Number of respondents
N = 1,617
Age
18-24 32.5% 25.9% 26.2% 32.5% 31.1% 5.9% 85.3% 286
25-34 46.9% 39.5% 40.8% 42.6% 43.0% 12.8% 89.8% 461
35-49 52.5% 46.6% 46.4% 47.5% 48.4% 14.0% 89.5% 541
50-59 53.8% 45.6% 46.7% 48.1% 50.3% 13.7% 89.9% 329
Education***
Basic (47.8%) (45.6%) (47.9%) (43.5%) (43.5%) (17.4%) (87.0%) 46

235
Secondary 48.5% 42.9% 43.0% 44.2% 44.5% 16.5% 87.5% 727
TVET 53.6% 46.4% 46.6% 45.0% 50.7% 11.6% 88.9% 371
Higher 41.5% 32.4% 33.9% 41.5% 38.8% 5.5% 81.3% 472
Marital status****
Registered marriage
52.7% 45.6% 46.4% 47.8% 49.2% 13.0% 90.7% 941
Unregistered marriage
52.3% 42.1% 42.1% 45.5% 48.9% 11.8% 90.4% 178
Girlfriend / boyfriend (not living together)
(27.0%) (18.9%) (18.9%) (27.0%) (27.0%) (8.1%) (78.4%) 37
Single 31.2% 25.8% 27.0% 30.6% 28.8% 7.7% 84.0% 337
Separated/
divorced
50.0% 46.0% 43.2% 46.0% 44.6% 16.2% 89.2% 74
Widowed (56.2%) (46.9%) (46.9%) (56.3%) (56.3%) (15.7%) (90.7%) 32
Residence
Yerevan 40.0% 30.5% 31.1% 34.3% 39.0% 6.1% 88.2% 570
Other urban areas
46.4% 40.9% 42.5% 44.3% 42.6% 12.7% 89.6% 472
Rural areas 56.2% 50.6% 50.3% 52.1% 50.6% 17.7% 89.1% 575
Total 47.6% 40.6% 41.3% 43.6% 44.2% 12.2% 88.9% 1,617
Figures in parentheses are based on 25-49 cases. An asterisk (*) indicates that a figure is based on fewer than 25 cases and has been suppressed.
** For the ease of data presentation, comparison and analysis, the response categories ‘strongly agree’ and ‘agree’ have been merged to measure the percent of the respondents who agreed with a given statement. *** Since there was only 1 respondent in the category “with elementary or lower education” the category was suppressed (therefore the total number of respondents in this section is 1,616) **** Since there were only 18 respondents in the category “Informal union/cohabitation” that category was suppressed (therefore the total number of respondents in this section is 1,599).
The relation between the respondents’ age and their attitudes is statistically significant,
even though the strength of the association is very weak, especially regarding the last 2
statements. (The last statement is in general a special case because harm to woman’s health is
cited as a reason for abortion.)
The correlation is positive, i.e. the higher the age the higher the proportion of the
respondents who agree with the statements. In other words, younger respondents are less
inclined to agree with any justification for abortion. The difference is particularly noticeable
between the youngest age group and the rest of the respondents.

236
It is noteworthy that education is not an influential factor in this case. Even when there is
a statistically significant association, it is extremely weak. The table data also show the absence
of a consistent, let alone uniform pattern.
As education, marital status has very limited significant association and only for the first
5 statements at that. The respondents who are single or who have a girlfriend or a boyfriend
but not living together are the least inclined to justify abortion for any reason. It is not surprising
because these 2 socio-demographic groups are made up primarily of younger people who, as
mentioned earlier tend to be the least disposed to agree with the statements that justify
termination of pregnancy.
On the other hand, the proportion of those who agree with the statements is much higher
among 4 other groups (respondents in registered and unregistered marriage, separated or
divorced or widowed) and are practically the same for those 4 groups.
As usual, residence location is a variable that consistently has a statistically significant
association with the respondents’ attitudes toward justification of abortion, except for the last
statement. This exception is not surprising because in this case the matter concerns harm that
pregnancy can cause to woman’s health. Almost 90.0% in the entire sample believed that to be
a valid reason for ending an abortion and the opinions of male and female respondents virtually
coincided.
As regards other statements, it is noteworthy that the residents of Yerevan are least and
residents of rural areas are most inclined to agree with the statements that spell out reasons for
abortion. As always, the residents of other urban areas fall in-between.
While there are no sufficient grounds to draw the conclusions why the dynamic is such as
it is, it is quite possible that residents of Yerevan and, to a lesser extent, residents of other urban
areas are less supportive of abortion in principle because they are more aware of and they more
likely have a greater experience of modern methods of contraception. As the table data
demonstrate, a half or more of rural residents agree with the first five statements that justify
abortion for one reason or another.
The most striking difference is manifested as regards the sixth statement that says that it
is okay for a woman to terminate a pregnancy when the fetus is female. While only 6.1% of
the respondents from Yerevan agree with that statement, in other urban areas and among rural
residents the proportion is 12.7% and 17.7% respectively. In other words, almost every fifth
respondent in rural areas supports sex-selective abortions which are a form of gendercide.

237
Annexes to Chapter on Contraception Table 16. Attitudes toward termination of pregnancy: Men Percentage of male respondents who agree with the following statements, by background characteristics**
It is okay for a woman to terminate a pregnancy in the following circumstances:
Background characteristic
The family already has enough children
The family already has enough sons
The family already has enough daughters
The pregnancy is un-planned or unwanted
It would be hard to provide for another child
The fetus is female
The pregnancy could harm her health
Number of men
N = 767
Age
18-24 21.6% 20.3% 19.0% 23.5% 21.6% 6.6% 81.7% 153
25-34 34.0% 29.7% 32.6% 28.7% 30.1% 10.6% 89.0% 209
35-49 40.4% 36.4% 35.6% 37.2% 42.4% 14.0% 89.2% 250
50-59 46.4% 42.0% 43.9% 41.3% 44.5% 12.9% 91.6% 155
Education
Basic (37.5%)
(37.5%)
(43.7%)
(37.5%) (34.4%) (15.7%)
(87.6%) 32
Secondary 40.4% 37.5% 37.2% 34.9% 38.5% 16.4% 86.1% 403
TVET 41.2% 36.6% 34.9% 32.5% 39.7% 6.4% 89.7% 126
Higher 24.3% 19.5% 22.4% 28.7% 26.7% 3.9% 91.2% 206
Marital status***
Registered marriage
39.7% 36.1% 37.5% 35.1% 38.4% 10.7% 92.1% 408
Unregistered marriage
41.0% 35.0% 35.0% 35.0% 43.4% 12.0% 89.2% 83
Girlfriend (not living together)
(25.0%)
(21.5%)
(21.5%) (21.4%) (25.0%) (10.7%)
(75.0%) 28
Single 25.8% 23.0% 23.0% 28.2% 26.7% 7.9% 82.6% 213
Separated/
divorced
50.0% 45.8% 41.7% 45.8% 45.8% 33.3% 79.1% 24****
Widowed * * * * * * * 2
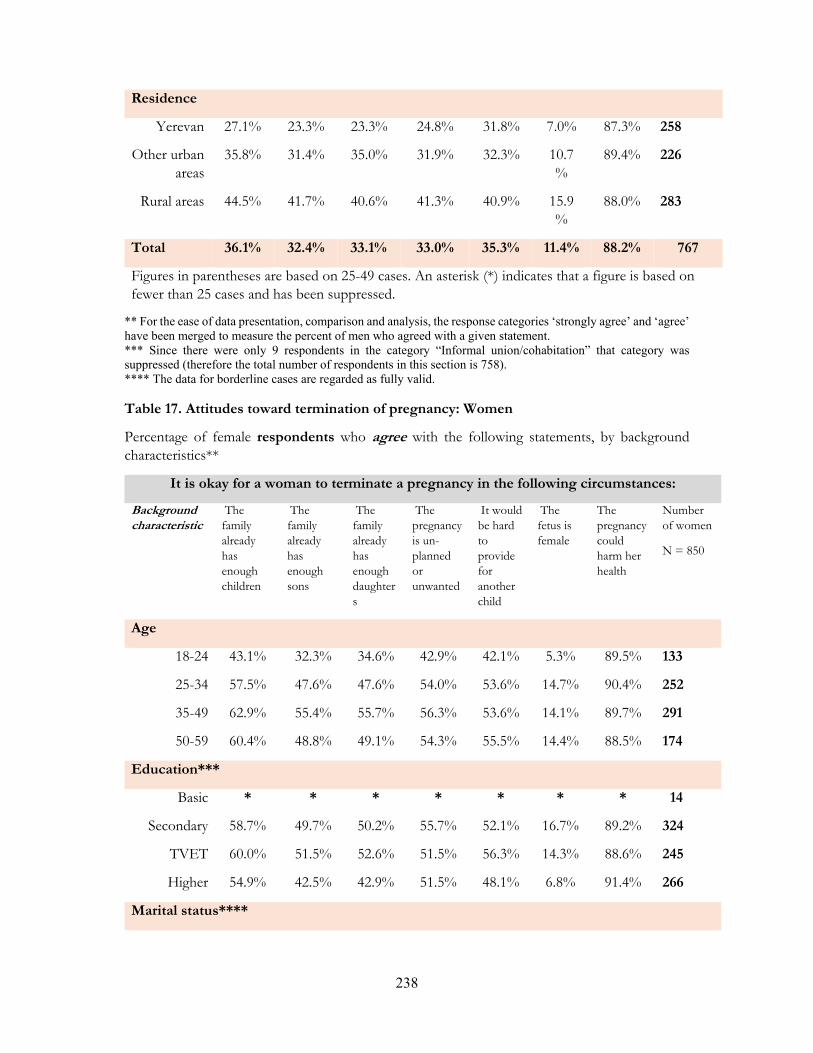
238
Residence
Yerevan 27.1% 23.3% 23.3% 24.8% 31.8% 7.0% 87.3% 258
Other urban areas
35.8% 31.4% 35.0% 31.9% 32.3% 10.7%
89.4% 226
Rural areas 44.5% 41.7% 40.6% 41.3% 40.9% 15.9%
88.0% 283
Total 36.1% 32.4% 33.1% 33.0% 35.3% 11.4% 88.2% 767
Figures in parentheses are based on 25-49 cases. An asterisk (*) indicates that a figure is based on fewer than 25 cases and has been suppressed.
** For the ease of data presentation, comparison and analysis, the response categories ‘strongly agree’ and ‘agree’ have been merged to measure the percent of men who agreed with a given statement. *** Since there were only 9 respondents in the category “Informal union/cohabitation” that category was suppressed (therefore the total number of respondents in this section is 758). **** The data for borderline cases are regarded as fully valid. Table 17. Attitudes toward termination of pregnancy: Women
Percentage of female respondents who agree with the following statements, by background characteristics**
It is okay for a woman to terminate a pregnancy in the following circumstances:
Background characteristic
The family already has enough children
The family already has enough sons
The family already has enough daughters
The pregnancy is un-planned or unwanted
It would be hard to provide for another child
The fetus is female
The pregnancy could harm her health
Number of women
N = 850
Age
18-24 43.1% 32.3% 34.6% 42.9% 42.1% 5.3% 89.5% 133
25-34 57.5% 47.6% 47.6% 54.0% 53.6% 14.7% 90.4% 252
35-49 62.9% 55.4% 55.7% 56.3% 53.6% 14.1% 89.7% 291
50-59 60.4% 48.8% 49.1% 54.3% 55.5% 14.4% 88.5% 174
Education***
Basic * * * * * * * 14
Secondary 58.7% 49.7% 50.2% 55.7% 52.1% 16.7% 89.2% 324
TVET 60.0% 51.5% 52.6% 51.5% 56.3% 14.3% 88.6% 245
Higher 54.9% 42.5% 42.9% 51.5% 48.1% 6.8% 91.4% 266
Marital status****
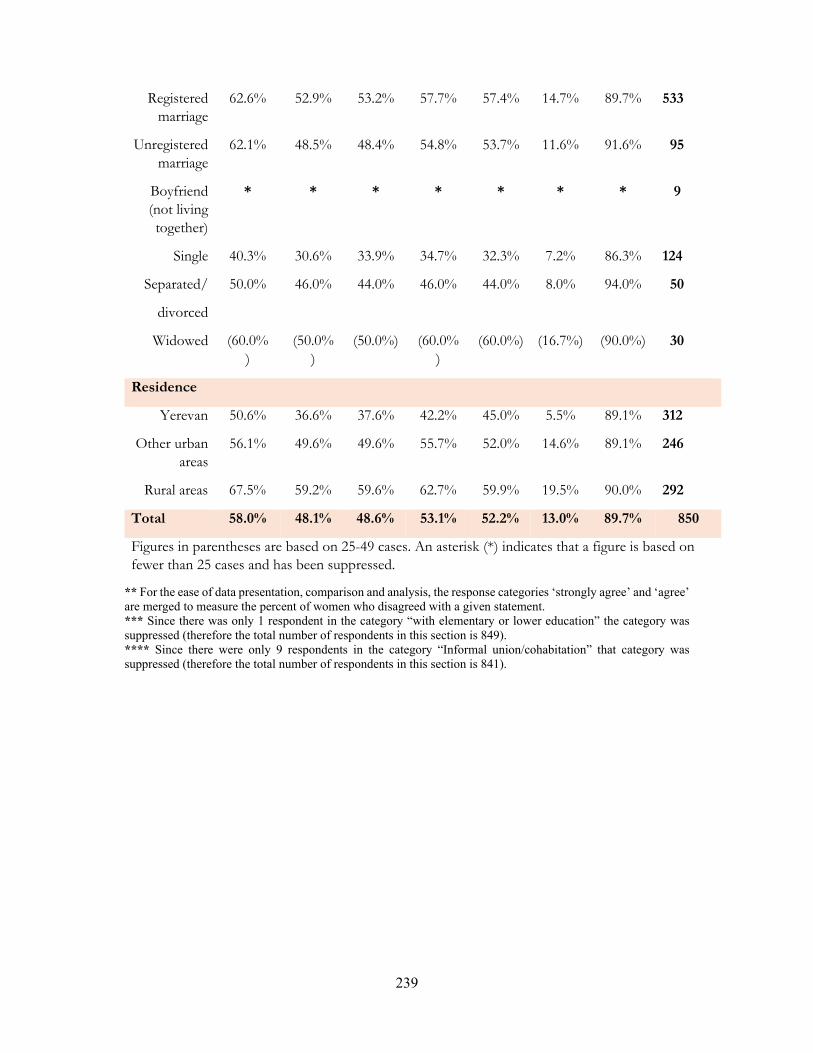
239
Registered marriage
62.6% 52.9% 53.2% 57.7% 57.4% 14.7% 89.7% 533
Unregistered marriage
62.1% 48.5% 48.4% 54.8% 53.7% 11.6% 91.6% 95
Boyfriend (not living together)
* * * * * * * 9
Single 40.3% 30.6% 33.9% 34.7% 32.3% 7.2% 86.3% 124
Separated/
divorced
50.0% 46.0% 44.0% 46.0% 44.0% 8.0% 94.0% 50
Widowed (60.0%)
(50.0%)
(50.0%) (60.0%)
(60.0%) (16.7%) (90.0%) 30
Residence
Yerevan 50.6% 36.6% 37.6% 42.2% 45.0% 5.5% 89.1% 312
Other urban areas
56.1% 49.6% 49.6% 55.7% 52.0% 14.6% 89.1% 246
Rural areas 67.5% 59.2% 59.6% 62.7% 59.9% 19.5% 90.0% 292
Total 58.0% 48.1% 48.6% 53.1% 52.2% 13.0% 89.7% 850
Figures in parentheses are based on 25-49 cases. An asterisk (*) indicates that a figure is based on fewer than 25 cases and has been suppressed.
** For the ease of data presentation, comparison and analysis, the response categories ‘strongly agree’ and ‘agree’ are merged to measure the percent of women who disagreed with a given statement. *** Since there was only 1 respondent in the category “with elementary or lower education” the category was suppressed (therefore the total number of respondents in this section is 849). **** Since there were only 9 respondents in the category “Informal union/cohabitation” that category was suppressed (therefore the total number of respondents in this section is 841).
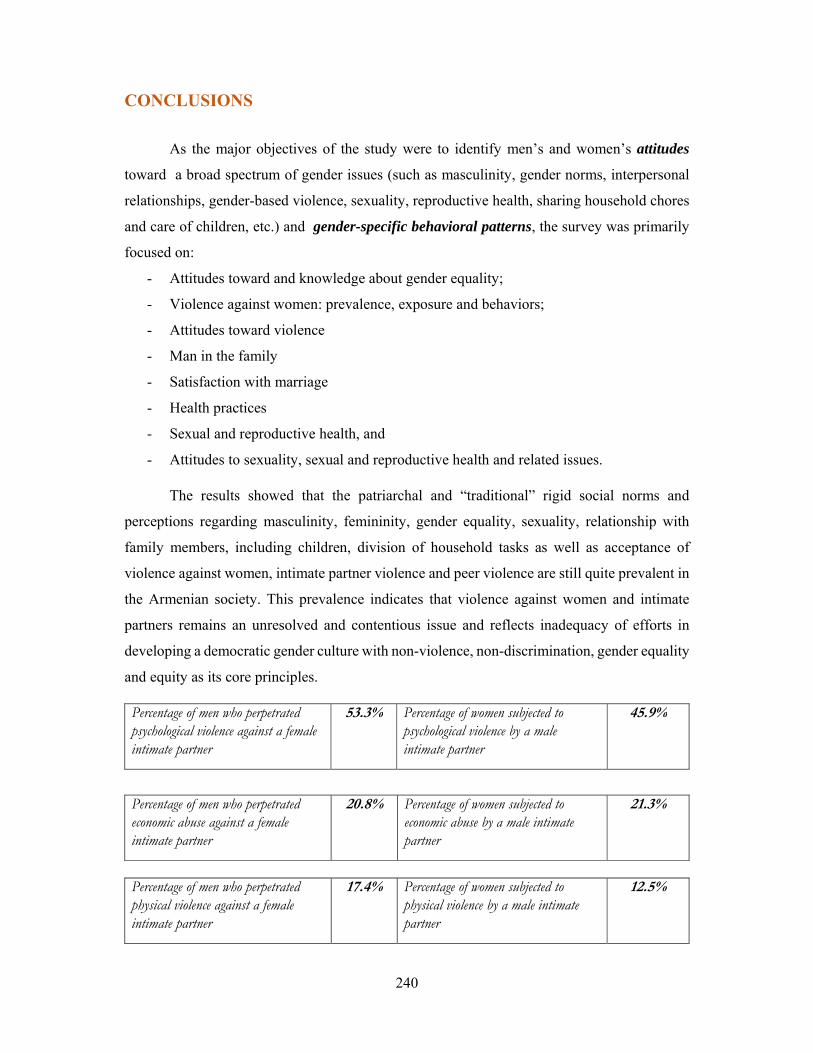
240
CONCLUSIONS
As the major objectives of the study were to identify men’s and women’s attitudes
toward a broad spectrum of gender issues (such as masculinity, gender norms, interpersonal
relationships, gender-based violence, sexuality, reproductive health, sharing household chores
and care of children, etc.) and gender-specific behavioral patterns, the survey was primarily
focused on:
- Attitudes toward and knowledge about gender equality;
- Violence against women: prevalence, exposure and behaviors;
- Attitudes toward violence
- Man in the family
- Satisfaction with marriage
- Health practices
- Sexual and reproductive health, and
- Attitudes to sexuality, sexual and reproductive health and related issues.
The results showed that the patriarchal and “traditional” rigid social norms and
perceptions regarding masculinity, femininity, gender equality, sexuality, relationship with
family members, including children, division of household tasks as well as acceptance of
violence against women, intimate partner violence and peer violence are still quite prevalent in
the Armenian society. This prevalence indicates that violence against women and intimate
partners remains an unresolved and contentious issue and reflects inadequacy of efforts in
developing a democratic gender culture with non-violence, non-discrimination, gender equality
and equity as its core principles.
Percentage of men who perpetrated psychological violence against a female intimate partner
53.3% Percentage of women subjected to psychological violence by a male intimate partner
45.9%
Percentage of men who perpetrated economic abuse against a female intimate partner
20.8% Percentage of women subjected to economic abuse by a male intimate partner
21.3%
Percentage of men who perpetrated physical violence against a female intimate partner
17.4% Percentage of women subjected to physical violence by a male intimate partner
12.5%

241
Percentage of women subjected to physical violence by a male intimate partner – from main questionnaire
12.5% The same – from self-administered 22.4%
Percentage of sexual violence (perpetrated and reported by men) 14.6%
Experienced at least one type of violence (Percentage of women reporting - through self-administered questionnaire - having been subjected to moderate & grave acts of physical violence outside the home in the last 3 months)
3.7%
Percentage of women who engaged in transactional sex 6.6%
Percentage of male respondents reporting that they exhibited controlling behavior 95.5%
Percentage of male respondents subjected to physical violence (Lifetime prevalence) 49.3%
Percentage of male respondents subjected to physical violence in childhood (before 18) 27.2%
Percentage of male respondents subjected to psychological violence in childhood 10.9%
Percentage of male respondents subjected to sexual violence in childhood 3.5%
Percentage of male respondents subjected to neglect & abandonment in childhood 0.9%
In the broader context of the clash of social norms and values is it not surprising that not
all men are either consistently gender equitable or inequitable. The same applies to women.
Rather, most respondents expressed views that are at times conflicting, thereby reflecting the
lack of a consistent stance and mentality. Gender stereotypes are a common occurrence.
Statement Total percentage of respondents who agree with the
statements
Including Male respondents
Including Female
respondents
When women get rights, they are taking rights away from men
12.9% 18.2% 8.2%
Rights for women mean that men lose out 13.1% 17.5% 9.1%

242
Gender equality has come far enough already 86.8% 83.3% 89.9%
Gender equality has already been achieved for the most part 63.3%
57.0% 69.0%
Work to achieve gender equality today benefits mostly well-to-do people
47.5% 48.5% 46.6%
There is a need for more work to promote gender equality
51.3% 44.2% 57.7%
Men make better political leaders than women 58.3% 67.1% 50.2%
Women should leave politics to men 42.5% 48.4% 37.3%
Women are too emotional to be leaders in their communities
69.7% 73.1% 66.7%
Women should have the same chance of being elected to political office as men 76.7%
70.3% 82.6%
A woman with the same qualifications can do as good a job as a man
81.7% 71.7% 90.7%
A woman should tolerate violence in order to keep her family together
35.7% 44.6% 27.8%
There are times when a woman deserves to be beaten 27.7%
35.2% 21.0%
If a woman cheats on a man, it is okay for him to hit her
55.4% 60.9% 50.5%
It is okay for a man to hit his wife if she won’t have sex with him
5.1% 5.8% 4.5%
When a woman is raped, she usually did something to put herself in that situation
32.2% 40.9% 24.2%
In some rape cases, women actually want it to happen 35.8%
44.0% 28.6%
If a woman doesn’t physically fight back, you can’t really say it was rape
59.8% 61.3% 58.4%
In any rape case, one would have to question whether the victim is promiscuous or has a bad reputation
62.7% 64.4% 61.0%
Violence against a gay person is justified for a number of reasons
N/A 62.4% N/A
I spend too little time with my children on account of my job.
N/A 54.8% N/A

243
My role in caring for my children is mostly as a provider.
N/A 89.9% N/A
I am satisfied with relationship/marriage 83.3% 84.1% 82.5%
Percentage of male respondents who taking part in household duties Doing laundry/washing clothes 3.2%
Repairing house 68.2%
Buying food 17.7%
Cleaning the house 3.2%
Cleaning the bathroom/toilet 3.0%
Preparing food 3.3%
Paying bills 36.5%
The gender gap is particularly conspicuous in power imbalances in the family and intimate
relationships.
The data clearly indicate the lack of positive, gender equitable male role models and
prevalence of negative masculinity patterns, and the necessity to promote alternative, non-
violent versions of masculinity.
Notwithstanding the Government policies aimed to eliminate gender discrimination and
gender imbalances in various areas of public life, and to promote gender equity and equality,
including temporary special measures, the progress, as evidenced by the survey findings, so far
has been modest at best.
The factors that tend to make a positive impact on gender equitable attitudes are younger
age groups, advanced level of education (particularly higher education), and being a capital
city resident. The policies should capitalize on these and similar positive factors to help the
Armenian society to overcome stereotypical notions of masculinity and femininity and the
negative impact that they entail.
As a first study of its kind conducted in Armenia, the present survey intended to provide a
baseline and a number of benchmarks regarding the issues under consideration. However, it
became clear that further research focusing on individual issues is required, including impact
evaluation studies as a follow up to targeted policies and programs.
244
RECOMMENDATIONS
- To strengthen positive aspects of masculinity through educating general
public and better targeted interventions in the education system to promote
and consolidate gender equitable attitudes and behavior,
- To focus on masculinity issues in future National Action Plans and
Strategies that seek to achieve gender equality and equity,
- To strengthen effective cooperation and coordination among major
stakeholders, viz. government agencies, civil society, academic community
and international organizations,
- To introduce and to regularly conduct impact evaluation studies in the
aftermath of national programs that address gender (equality) issues,
including masculinity issues,
- To support studies on new trends and perceptions of masculinity paying
particular attention to the identification of prevalence of gender equitable
attitudes and of the degree to which they translate into adequate behavior,
- To promote egalitarian type of the family through mainstreaming
nonviolent behavior and GE issues into the national programs on support
to families,
- To support improvement of the national legislation and to put forth policy-
level efforts to combat more effectively the identified prevalence of GBV
and of the latter’s acceptance through, inter alia, upgrading the referral
mechanism and providing more efficient assistance to and protection of
victims.
- To support introduction of gender quotas in the system of public
administration and local self-government and of a higher gender quota for
the National Assembly.