appraisal of biochemical and genetic diversity of mango cultivars using molecular markers
TRANSCRIPT

Vol. 13(28), pp. 2796-2806, 9 July, 2014 DOI: 10.5897/AJB2014.13685 Article Number: 7D1670845878 ISSN 1684-5315 Copyright © 2014 Author(s) retain the copyright of this article http://www.academicjournals.org/AJB
African Journal of Biotechnology
Full Length Research Paper
Appraisal of biochemical and genetic diversity of mango cultivars using molecular markers
Abou-Ellail M1., Hattem M. El-Shabrawi2, Mohamed A. Matter2, Usama I. Aly2*, Hassan A.
Ghareeb2 and E. A. Eissa3
1Genetics Department, Faculty of Agriculture and Natural Resources, Aswan University, Aswan, Egypt. 2Plant biotechnology Department., National Research Center, 12622 Dokki, Giza, Egypt. 3Genetics Department, Faculty of Agriculture, Fayoum University, 63514 Fayoum, Egypt.
Received 2 February, 2014; Accepted 9 June, 2014
Mango (Mangifera indica L.) is one of the oldest fruit crops and is broadly cultivated worldwide. To determine the level of genetic diversity, a total of 13 mango genotypes have been collected from different farms of Fayoum oasis in Egypt and were analyzed using molecular (DNA) and biochemical (SDS-PAGE) markers along with the quantification of soluble carbohydrates, chlorophyll and carotenoids. These profiles were evaluated as characters to identify the taxonomic relationships of these genotypes. A total of 433 protein bands (ranged from 8 to 180 KDa) from all genotypes, were detected in SDS-PAGE. A total of 306 RAPD fragments were produced by 19 primers and among them 123 (40.2%) were polymorphic. The similarities between different taxa were estimated by Jaccard’s similarity index and clustered in neighbour joining clustering tree. Among the 13 tested mango samples, the total carbohydrate contents ranged between 31.9 and 40.8 µg/100 mg fresh weights, which represents Taymour cultivar and accession No. 7, respectively. Of the 13 mango cultivars and accessions studied, the highest chlorophyll content (386.9 µg/g) was found in accession No. 10; whereas, the lowest value was observed with accession No. 12 (202.5 µg/g). The amounts of carotenoids were wide-ranging and reached a maximum value of 106.2 µg/g with accession No. 9, however, accession No. 8 recorded the lowest concentration (19.9 µg/g). In conclusion, RAPD-PCR and SDS-PAGE were proved to be an efficient tool in assessing the genetic diversity of mango genotypes. It will also provide an important input to breeders for mango improvement program. Key words: Mango, genetic diversity, chlorophyll, SDS-PAGE, RAPD.
INTRODUCTION Mango (Mangifera indica L.) is commonly known as the ‘king of fruits’. A native of Southeast Asia is one of the
important fruit crops in the tropical and subtropical regions thought to have been introduced to Africa in the
*Corresponding author. E-mail: [email protected]. Abbreviations: SDS-PAGE, Sodium dodecyl sulfate polyacrylamide gel electrophoresis; RAPD, random amplified polymorphic DNA. Author(s) agree that this article remain permanently open access under the terms of the Creative Commons Attribution License 4.0 International License

14th century (Singh, 1960; Duval et al., 2005). Most cultivated mangoes belong to the species Mangifera indica; one of 600 species in the family Anacardiaceae. The genus Mangifera contains around 70 species, which can be divided into two subgenera, Limus and Mangifera (Kostermans and Bompard, 1993) with at least 26 spe-cies producing edible fruits (Mukherjee, 1997; Tanaka, 1976). Mango plays a major role in the global trade as it constitutes approximately 50% of all tropical fruits pro-duced worldwide, equivalent to 5.5% of all fruit produced globally (Jedele et al., 2003; Vasanthaiah et al., 2007). In Egypt, mango is an important fruit crop and according to the latest statistics provided by the Ministry of Agriculture and Land Reclamation of Egypt (2007), a total of 184204 Feddan are cultivated with mango.
Mango has economic as well as therapeutic value due to its high vitamin, mineral and fiber content (Lakshminarayana, 1980). Ripe fruits are freshly eaten or prepared as juice, jams, jellies, and squash or canned, while unripe fruits are used in pickles, chutneys and other culinary arrangements. The various parts of mango are used as antihelmintic, diaphoretic, and refrigerant agents and in bleeding piles, manorrhagia, scabies and cuta-neous infections, leucorrhoea, diarrhea and dysentery (Lakshminarayana, 1980; Mukherjee, 1997).
Genetic diversity is one of the key factors for the impro-vement of many crop plants including mango. Plant bree-ders rely on the availability of genetic diversity during selection in cultivar development.
It has been proposed that traditional agro-ecosystems maintain a high diversity of cultivated plants, both in terms of crop species and genotypes within each species (Alcorn, 1981; Altieri et al., 1987; Bellon, 1996; Brush, 1989, 1992, 2000). Human action, as well as ecological and evolutionary processes, promotes the maintenance of genetic variation of crops within traditional agro eco-systems (Lambert, 1996).
Varieties developed with wider genetic base may be helpful in enhancing the yield under various agro-climatic conditions (Asif et al., 2005). Diverse genetic base may also resist the spread of diseases (Zhu et al., 2000) in approved varieties. The study of genetic diversity is also important for varietal identification, proper purity mainte-nance, for the implementation of plant variety protection rights and export under WTO regulations. Mango has been reported to have extensive diversity due to conti-nuous grafting and phenotypic differences arising from varied agro climatic conditions in different areas (Young and Ledin, 1954; Ravishankar et al., 2000).
Genetic diversity can be accessed from pedigree ana-lysis, morphological traits or using molecular markers (Pejic et al., 1998).
A number of reports are available on the use for DNA markers to assess genetic diversity among species of several horticultural crops, as well as validation of genetic relatedness among them (Bhat et al., 2010).
Molecular markers have diverse applications in crop
Abou-Ellail et al. 2797 improvement, particularly in the areas of genetic diversity and varietal identification studies, gene tagging, disease diagnostics, pedigree analysis, hybrid detection, sex dif-ferentiation and marker assisted selection. DNA markers can be used to diagnose the presence of the gene with-out having to wait for gene effect to be seen (Bhat et al., 2010; Botez et al., 2009; Sisko et al., 2009; Thimmappaiah et al., 2009).
Molecular markers are useful tools for estimating gene-tic diversity as these are not influenced by environment, are abundant and do not require previous pedigree infor-mation (Bohn et al., 1999). Among the biochemical mar-kers, SDS-PAGE has been widely used due to its simpli-city and effectiveness for estimating genetic diversity.
Among the different DNA marker types, random ampli-fied polymorphic DNA (RAPD) markers have frequently been used for genetic analyses (Langridge et al., 2001) due to simplicity, efficiency and non requirement of sequence information. RAPDs assay detects nucleotides sequence of polymorphisms in DNA using only a single primer pair of arbitrary nucleotide sequence (Welsh and McClelland, 1990; Williams et al., 1990). RAPDs have been widely used for identification of genotypes in crop plants, for investigating the genetic variability within spe-cies and to show relationships among populations (Freitas et al., 2000).
Like all living organisms, plants require energy in che-mical form so they can grow and carry out basic life functions. Plants produce, store and burn carbohydrates in the form of sugar to provide them energy (Bieleski, 1962; Bieleski et al., 1992). Carbohydrates are the most abundant single class of organic substances found in nature and initially synthesized in plants from a complex series of reactions involving photosynthesis (Giaquinta, 1979; Gayler and Glasziou, 1972).
There are many pigments in the higher plants, such as chlorophyll, carotenoids, phtochrome, flavonoid, anthocya-nin, tannin, and many others (Yang et al., 1998). Chloro-phyll is an extremely important bio-molecule that absorbs sunlight and uses its energy to synthesize carbohydrates from CO2 and water. This process is known as photosyn-thesis and is the basis for sustaining the life processes of all plants (Blachburn, 1998). Plants contain both chloro-phyll a and chlorophyll b, which have slightly different structures (Carter and Spiering, 2002). Carotenoids are composed of two small six-carbon rings connected by a "chain" of carbon atoms. Carotenoids act as accessory pigments, harvesting light for photosynthesis and as photo protective agents limiting the damaging effects of high irradiance (Johnson et al., 1993; Feruse and Arkosiova, 2001). Carotenoids protect cells and tissues from free radicals and also function as light collectors (Blachburn, 1998). During recent years there has been remarkable progress in chlorophyll and carotenoids quan-tification as an intriguing tool that can reveal information on plant performance and cultivars relationship (Kulshreshtha et al., 1987).
2798 Afr. J. Biotechnol.
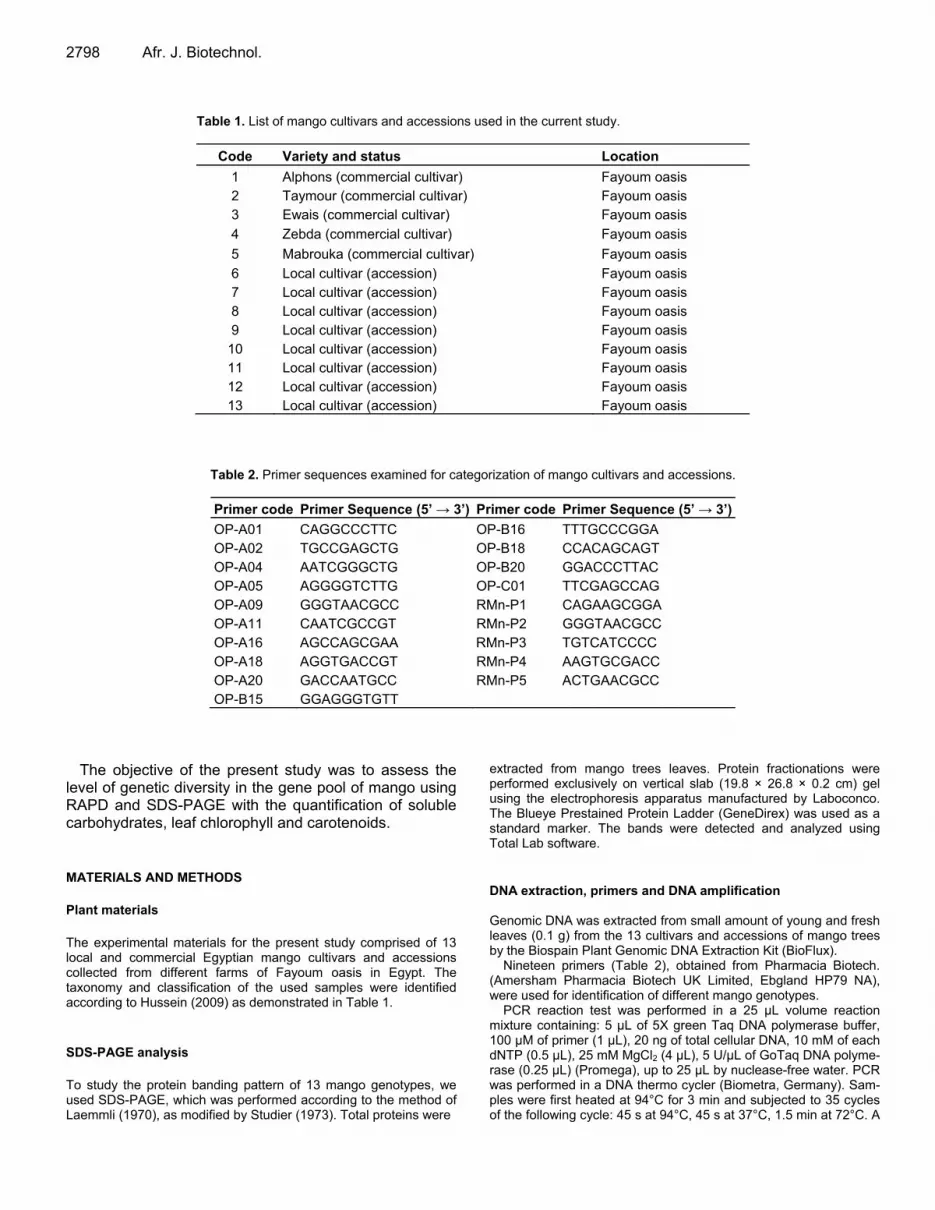
Table 1. List of mango cultivars and accessions used in the current study.
Code Variety and status Location
1 Alphons (commercial cultivar) Fayoum oasis 2 Taymour (commercial cultivar) Fayoum oasis 3 Ewais (commercial cultivar) Fayoum oasis
4 Zebda (commercial cultivar) Fayoum oasis
5 Mabrouka (commercial cultivar) Fayoum oasis
6 Local cultivar (accession) Fayoum oasis 7 Local cultivar (accession) Fayoum oasis 8 Local cultivar (accession) Fayoum oasis 9 Local cultivar (accession) Fayoum oasis
10 Local cultivar (accession) Fayoum oasis 11 Local cultivar (accession) Fayoum oasis 12 Local cultivar (accession) Fayoum oasis 13 Local cultivar (accession) Fayoum oasis
Table 2. Primer sequences examined for categorization of mango cultivars and accessions.
Primer code Primer Sequence (5’ → 3’) Primer code Primer Sequence (5’ → 3’)
OP-A01 CAGGCCCTTC OP-B16 TTTGCCCGGA OP-A02 TGCCGAGCTG OP-B18 CCACAGCAGT OP-A04 AATCGGGCTG OP-B20 GGACCCTTAC OP-A05 AGGGGTCTTG OP-C01 TTCGAGCCAG OP-A09 GGGTAACGCC RMn-P1 CAGAAGCGGA OP-A11 CAATCGCCGT RMn-P2 GGGTAACGCC OP-A16 AGCCAGCGAA RMn-P3 TGTCATCCCC OP-A18 AGGTGACCGT RMn-P4 AAGTGCGACC OP-A20 GACCAATGCC RMn-P5 ACTGAACGCC OP-B15 GGAGGGTGTT
The objective of the present study was to assess the level of genetic diversity in the gene pool of mango using RAPD and SDS-PAGE with the quantification of soluble carbohydrates, leaf chlorophyll and carotenoids. MATERIALS AND METHODS Plant materials The experimental materials for the present study comprised of 13 local and commercial Egyptian mango cultivars and accessions collected from different farms of Fayoum oasis in Egypt. The taxonomy and classification of the used samples were identified according to Hussein (2009) as demonstrated in Table 1. SDS-PAGE analysis To study the protein banding pattern of 13 mango genotypes, we used SDS-PAGE, which was performed according to the method of Laemmli (1970), as modified by Studier (1973). Total proteins were
extracted from mango trees leaves. Protein fractionations were performed exclusively on vertical slab (19.8 × 26.8 × 0.2 cm) gel using the electrophoresis apparatus manufactured by Laboconco. The Blueye Prestained Protein Ladder (GeneDirex) was used as a standard marker. The bands were detected and analyzed using Total Lab software. DNA extraction, primers and DNA amplification Genomic DNA was extracted from small amount of young and fresh leaves (0.1 g) from the 13 cultivars and accessions of mango trees by the Biospain Plant Genomic DNA Extraction Kit (BioFlux).
Nineteen primers (Table 2), obtained from Pharmacia Biotech. (Amersham Pharmacia Biotech UK Limited, Ebgland HP79 NA), were used for identification of different mango genotypes.
PCR reaction test was performed in a 25 µL volume reaction mixture containing: 5 µL of 5X green Taq DNA polymerase buffer, 100 µM of primer (1 µL), 20 ng of total cellular DNA, 10 mM of each dNTP (0.5 µL), 25 mM MgCl2 (4 µL), 5 U/µL of GoTaq DNA polyme-rase (0.25 µL) (Promega), up to 25 µL by nuclease-free water. PCR was performed in a DNA thermo cycler (Biometra, Germany). Sam-ples were first heated at 94°C for 3 min and subjected to 35 cycles of the following cycle: 45 s at 94°C, 45 s at 37°C, 1.5 min at 72°C. A

Abou-Ellail et al. 2799
Table 3. Total soluble carbohydrates μg/100mg), total chlorophyll (µg/g), and carotenoids content (µg/g) in different genotypes of mango trees (mean ± SE).
Code Total soluble carbohydrates µg/100mg) Total chlorophyll (µg/g) Carotenoids (µg/g)
1 35.5 ±3.79 210.9 ± 14.5 28.0 ± 2.43 2 31.9 ±4.04 205.2 ±11.78 29.4 ±2.56 3 38.5 ±2.45 273.2 ±21.2 40.9 ±3.5 4 37.2 ±3.39 272.9 ±18.7 30.9 ±1.51 5 34.6 ±2. 9 323.3 ±24.8 99.9 ±4.81 6 32.6 ±3.97 366.9 ±22.91 54.8 ±2.47 7 40.8 ±3.54 378 ± 21.1 66.8 ±4.69 8 32.4 ±4.13 276.3 ±15.9 19.9 ±1.23 9 39.8 ±3.93 331.9 ±20.5 106.2 ±7.17
10 35.4 ±3.28 386.9 ±23.8 37.3 ± 2.61 11 38.4 ± 4.1 318.4 ±27.58 48.8 ±2.48 12 36.3 ±3.97 202.5 ±13.52 28.3 ±1.92 13 32.2 ±3.58 322 ±20.31 47.0 ±2.57
A final step of 5 min at 72°C was always run. PCR reaction was tested on 1.6% agarose (Genetics) gels and 100 bp DNA ladder H3 RTU (Genetics) was used as the standard marker. Total soluble carbohydrates estimation Total soluble sugars content were assayed at 625 nm using anthrone reagent (Cao et al., 2007). Total chlorophyll and carotenoids analysis Total chlorophyll (The sum of chlorophyll a and b) and total carotenoids (Car) concentrations were determined following the methods of Porra et al. (1989) and Lichtenthaler (1987), respec-tively on the basis of µg /g fresh weight according to the following formula: Total chlorophyll (TC) = 17.76A646.6 + 7.34A663.6 (µg/ml) Total carotenoids = 4.69A440.5 – 0.267 x TC (µg/ml) Data handling and cluster analysis The size of DNA fragments and protein band molecular weights were calculated using Total Lab software. Data were scored for computer analysis on the basis of the presence (1) or absence (0) of the amplified products for each primer. Pair wise comparisons of genotypes, based on the presence or absence of unique and shared polymorphic products, were used to determine similarity index, according to Jaccard (1980). The similarity coefficients were, then, used to construct dendrogram, using Neighbour joining cluster algorithm employing the Paleontological Statistics (PAST) software Version 2.17b (Hammer et al., 2001). RESULTS AND DISCUSSION Total carbohydrate Data in Table 3 shows the total carbohydrates did not
differ much within the tested 13 mango genotypes. Taymor cultivar showed the lowest level of total carbo-hydrates (31.9 µg/100 mg) while, the highest (40.8 µg/100 mg) was found in accessions No. 7.
Reid et al. (1989) have reported that decapitation and girdling of Protea plant flowers slow down the leaf blackening and he proposed that reduced carbohydrate content was the cause of that phenomena. Bieleski et al. (1992) reported that the changes in carbohydrate content of P. eximia leaves are consistent with our hypothesis that the leaf-blackening disorder arises out of a depletion of leaf carbohydrate. Leaf blackening was visible shortly after the starch and sugar content of the leaves had fallen to their minimum level. Moreover, Boldingh et al. (2000) reported that glucose peak in early development of A. deliciosa coincides with a peaks of water content. Tran-sient accumulation of sugars at the early stage of growth may lead to an increase in osmotic pressure followed by an increase in cell turgor at the expansion phase. Total chlorophyll and carotenoids determination Data presented in Table 3 illustrate the total chlorophyll content (Chl a+b), in leaves of 13 different mango genotypes which ranged between 202.5 to 386.9 µg/g fresh weight. It is clear that, the highest chlorophyll con-tent (386.9 µg/g) was found in accession No. 10, whereas the lowest value was observed with accession No. 12 (202.5 µg/g). Carotenoids had significantly varied results, the concentrations were in a wide scale and ranged from 19.9 to 106.2 µg/g, the accessions No. 9 shows the hig-hest concentration (106.2 µg/g), however, accessions No. 8 recorded the lowest concentration (19.9 µg/g). These results are in agreement with Kershaw and Webber (1986) who examined seasonal changes in chlorophyll concentrations and photosynthetic rates in Brachythecium

2800 Afr. J. Biotechnol. rutabulum from an apple orchard in Canada. Samples collected from a low-light environment, exhibited higher chlorophyll concentrations and higher rates of photosyn-thesis at low light, relative to samples collected when understory irradiance was greater. So, it was clear that the variation in pigments concentrations among different genotypes maybe a reason of genetical or environmental variance. Molecular and biochemical identification of some genotypes of mango Genome profiling is a strategy that identifies genomic DNA fragments common to closely related species with-out performing DNA sequencing. Random RAPD-PCR is one of the key technologies of genome profiling (Naimuddin et al., 2002). PCR based methods including RAPD can be effectively used for cultivars identification and the study of phylogeny and genetic diversity (Saengprajak and Saensouk, 2012).
Initial evaluating of 19 RAPD primers against 13 culti-vars and accessions of mango trees gave 123 polymor-phic bands and 183 fragments were monomorphic bet-ween the plant genotypes (Figure 1 and Table 4). The total 306 bands were amplified using 19 RAPD primers; produced an average of 7 (OP-B16) to 24 (Mnp3) bands per primer. The number of RAPD fragments that were amplified ranged from 1 (OP-A01) to 19 (Mnp5) with an average of 16.1 bands per primer and the sizes ranged from about 65 to 2100 bp. However, the highest number of DNA amplified fragments, using the 19 primers, was present in cultivar Taymour (Table 5) (255 fragments), while the accession No. 13 revealed the lowest number (227 fragments).
For the polymorphism percentage presented by the 19 primers which used to identify the genotypes as shown in Table 4, the primer OP-B18 gave the highest number of polymorphic fragments in all genotypes (18 fragments) with 79.3% polymorphism percentage while the primers OP-B15 and OP-B20 gave the lowest number of polymor-phic fragments (1 fragment) with 7.1 and 9.1%, respec-tively of polymorphism percentage.
As showed in Table 6, the band data were utilized to calculate the similarity matrix. Jaccard’s similarity coeffi-cient ranged from 0.755 (between the accessions 6 and 13) to 0.893 (accessions 6 and 7). The RAPD results revealed a large set of markers, which can be used for the evaluation of both between- and within-species gene-tic variation (Guadagnuolo et al., 2001).
Figure 2 illustrate the neighbour joining clustering tree which was constructed on the basis of Jaccard’s coeffi-cient based on RAPD-PCR. The tree clustered the culti-vars and accessions into two clusters (I and II). The clusters I divided to two groups (A and B). The group A contained most of the accessions (7, 6, 8, 9, 13, 11 and 10) while the group B included the cultivars Taymour and
alphons and only one accession No. 12. However, the cluster II consisted of three cultivars which are Mabrouka, Ewais and Zebda.
On the other hand, to identify the 13 genotypes of mango, we used another method which is SDS-PAGE technique. The banding patterns were analyzed on 12% SDS-PAGE. Two bands corresponding to 18.5, 17 and 16 KDa were observed in 12% SDSPAGE (Figure 3).
The 18.5 KDa band was reported in all cultivar geno-types Alphons, Taymour, Ewais, Zebda and Mabrouka but it disappeared in all the accession genotypes. 17 KDa band was detected in cultivars alphons, Taymour, Ewais and Zebda and in the accessions 6, 10, 11, 12 and 13. Moreover, the 16 KDa band appeared in Mabrouka and in the accessions 7 and 8. That is in agreement with the results of Zaied et al. (2007) who found variation between different genotypes of mango at SDS-PAGE level. The similarity between the cultivars and the accession was high which ranged from 91.4 to 100% (Table 7).
Mabrouka cultivar and the accessions 6, 10, 11, 12 and 13 showed 91.4% of similarity. Also, the similarity bet-ween the accessions 7 and 8 and four cultivars Alphons, Taymour, Ewais and Zebda was 91.4%. However, the similarity rose up to 100% between 13, 6, 10, 11 and 12 and among 7 and 8. Moreover, the cultivars Alphons, Taymour, Ewais and Zebda revealed the highest simi-larity (100%). Neighbour joining clustering based on SDS-PAGE results showed that the cultivars and the accessions under study were set in two clusters (I and II). The cluster I contained two groups (A and B). Group A include accessions 8, 7, Mabrouka and accession 9, while group B contain Zebda, Taymour, Ewais and Alphons cultivars (Figure 2). Furthermore, the cluster II consisted of the accessions 6, 13, 12, 11 and 10. Some of the accessions grouped together either from RAPD-PCR results or from SDS-PAGE, and that could refer to their common ancestor which may be one of the cultivars under study or another cultivar was not used in our study. Our results show that RAPD-PCR and SDS-PAGE are useful for taxonomy and evaluation study between different cultivars and accessions of mango. That is in agreement with the study of Ghafoor and Arshad, (2008) that reported that the electrophoretic patterns of total proteins (SDS-PAGE) have been successfully employed to resolve the taxonomic and evolutionary problems of some plant species. The use of RAPD technique for the study of genetic variation has been demonstrated as sui-table in many species (Abbas et al. 2009). Moreover, we can report that the RAPD-PCR and SDS-PAGE results indicated existence variations between these genotypes. The molecular and/or biochemical methods are more powerful than morphological traits to study the genetic diversity. Ungerer et al. (2003) and Alan (2007) showed that the estimation of genetic diversity based on the mor-phological traits alone showed the true level of genetic diversity between genotypes because morphological traits are determined by the interaction between genetic

Abou-Ellail et al. 2801
Figure 1. DNA amplified fragments using random primers (OP- Mnp1, B18, B15, B20, Co1, Mnp2, Mnp3, Mnp4, Mnp5, A20, A18, B16, A04, A02, A16, A01 and A05). Commercial cultivars: (1) Alphons, (2) Taymour, (3) Ewais, (4) Zebda and (5) Mabrouka. Accessions (6, 7, 8, 9, 10, 11, 12 and 13) uses as a stock. M: 1Kb markers.

2802 Afr. J. Biotechnol. Table 4. Genetic polymorphism between five cultivars (1) Alphons, (2) Taymour, (3) Ewais, (4) Zebda and (5) Mabrouka and eight accessions 6, 7, 8, 9, 10, 11, 12 and 13 of mango detected by RAPD-PCR.
Primer Size of fragments
(bp) Total
bands Number of monomorphic
bands Number of polymorphic
bands Polymorphism percentage (%)
OP-A01 240-1390 19 8 11 57.9 OP-A02 144-1240 15 8 7 46.7 OP-A04 65-2100 14 12 2 14.3 OP-A05 125-1120 18 16 2 11.1 OP-A09 130-1240 12 8 4 33.3 OP-A11 120-1370 16 9 7 43.8 OP-A16 110-1490 20 13 7 35.0 OP-A18 110-1520 23 5 18 78.3 OP-A20 240-1520 11 10 1 9.1 OP-B15 150-1065 14 13 1 7.1 OP-B16 440-1170 7 1 6 85.7 OP-B18 180-1120 16 14 2 12.5 OP-B20 210-1450 24 11 13 54.2 OP-C01 125-725 13 10 3 23.1 Mnp1 150-1240 12 9 3 25.0 Mnp2 110-1240 20 11 9 45,0 Mnp3 140-1270 24 7 17 70.8 Mnp4 190-1250 15 7 8 53.3 Mnp5 125-975 13 11 2 15.4 Total - 306 183 123 40.2
Table 5. Total bands produced from each primer for the five cultivars (1) Alphons, (2) Taymour, (3) Ewais, (4) Zebda and (5) Mabrouka (1) Alphons, (2) Taymour, (3) Ewais, (4) Zebda and (5) Mabrouka and eight accessions 6, 7, 8, 9, 10, 11, 12 and 13 of mango.
Primers 13 12 11 10 9 8 7 6 5 4 3 2 1
OP-A01 11 17 12 13 14 13 12 14 14 15 14 14 14
OP-A02 7 11 10 10 11 12 12 12 11 10 9 12 11
OP-A04 13 14 14 13 14 12 12 12 13 14 13 13 13
OP-A05 17 17 17 17 17 17 17 17 17 17 17 17 17
OP-A09 10 9 10 9 8 9 10 10 9 9 9 10 9
OP-A11 11 12 12 12 14 14 12 12 14 12 12 12 12
OP-A16 15 16 15 14 13 15 16 15 15 16 16 17 15
OP-A18 14 14 18 20 17 19 15 19 18 14 13 17 13
OP-A20 11 11 11 10 11 11 10 10 10 11 10 11 11
OP-B15 14 14 14 14 14 14 14 14 14 14 14 14 13
OP-B16 1 3 3 2 2 3 2 4 3 5 3 3 3
OP-B18 14 16 16 16 15 16 16 15 14 14 15 15 15
OP-B20 16 19 18 20 19 18 19 21 18 18 19 19 19
OP-C01 11 11 11 12 12 13 12 12 12 12 12 11 11
Mnp1 9 11 10 10 10 9 10 10 10 11 10 9 10
Mnp2 14 14 15 14 15 17 16 17 14 16 14 15 15
Mnp3 15 18 17 16 15 15 15 16 17 17 13 20 18
Mnp4 11 11 11 11 10 10 10 13 9 12 11 13 12
Mnp5 13 13 13 13 12 13 11 11 13 12 13 13 13
Total 227 251 247 246 243 250 241 254 245 249 237 255 244

Abou-Ellail et al. 2803 Table 6. Genetic similarity matrix detected between five cultivars (1) Alphons, (2) Taymour, (3) Ewais, (4) Zebda and (5) Mabrouka and eight accessions 6, 7, 8, 9, 10, 11, 12 and 13 of mango with RAPD markers based on Jaccard’s coefficients.
Genotype 13 12 11 10 9 8 7 6 5 4 3 2 1
13 1 12 0.781 1.000 11 0.823 0.855 1.000 10 0.775 0.862 0.871 1.000 9 0.787 0.854 0.856 0.849 1.000 8 0.800 0.832 0.875 0.848 0.867 1.000 7 0.789 0.816 0.817 0.831 0.851 0.877 1.000 6 0.755 0.820 0.822 0.856 0.827 0.860 0.893 1.000 5 0.785 0.865 0.860 0.867 0.866 0.865 0.848 0.845 1.000 4 0.770 0.828 0.797 0.830 0.822 0.808 0.804 0.822 0.833 1.000 3 0.761 0.842 0.837 0.851 0.802 0.821 0.817 0.809 0.883 0.824 1.000 2 0.779 0.850 0.846 0.839 0.798 0.870 0.820 0.831 0.815 0.806 0.826 1.000 1 0.772 0.879 0.860 0.896 0.818 0.844 0.813 0.832 0.864 0.840 0.876 0.876 1.000
Figure 2. (A) RAPD based dendogram of the thirteen cultivars and accessions constructed using Neighbour joining method based on Jaccard's coefficient. (B) Dendogram showing the similarity among the electrophoretic protein patterns (SDS-PAGE) of 13 of cultivars and accessions based on Jaccard's similarity coefficient values which were grouped by the Neighbour joining method.
and environmental factors. Gene expression is influenced by the environment therefore; the selection based merely on morphological traits has been often misleading (Kumar et al., 1998; Astarini et al., 2004 and Asif et al., 2005). In fact RAPD-PCR is a useful technique for pro-viding information on the degree of polymorphism and genetic diversity of our cultivars and accessions. So this analysis could be profitable for breeders for rapid and
early identification of most diverse genotypes to improve crop productivity. The knowledge of the genetic diversity of the genotypes is important for parental selection that to maximize the genetic improvement. But we found that RAPD-PCR technique was much higher and an efficient method than that of the SDS-PAGE for genotypes iden-tification because the RAPD-PCR markers are stable but the markers appearing in SDS-PAGE could be affected by

2804 Afr. J. Biotechnol.
Figure 3. SDS-PAGE banding patterns of 13 cultivars and accessions of mango. Cultivars: (1) Alphons, (2) Taymour, (3) Ewais, (4) Zebda and (5) Mabrouka. Accessions: 6, 7, 8, 9, 10, 11, 12 and 13. Wild type varieties used as a stock M: Protein marker.
Table 7. Genetic similarity matrix appeared between five cultivars (1) Alphons, (2) Taymour, (3) Ewais, (4) Zebda and (5) Mabrouka and eight accessions 6, 7, 8, 9, 10, 11, 12 and 13 of mango with SDS-PAGE based on Jaccard’s coefficients.
Genotype 13 12 11 10 9 8 7 6 5 4 3 2 1
13 1.000 12 1.000 1.000 11 1.000 1.000 1.000 10 1.000 1.000 1.000 1.000 9 0.970 0.970 0.970 0.970 1.000 8 0.941 0.941 0.941 0.941 0.970 1.000 7 0.941 0.941 0.941 0.941 0.970 1.000 1.000 6 1.000 1.000 1.000 1.000 0.970 0.941 0.941 1.000 5 0.914 0.914 0.914 0.914 0.941 0.971 0.971 0.914 1.000 4 0.971 0.971 0.971 0.971 0.941 0.914 0.914 0.971 0.943 1.000 3 0.971 0.971 0.971 0.971 0.941 0.914 0.914 0.971 0.943 1.000 1.000 2 0.971 0.971 0.971 0.971 0.941 0.914 0.914 0.971 0.943 1.000 1.000 1.000 1 0.971 0.971 0.971 0.971 0.941 0.914 0.914 0.971 0.943 1.000 1.000 1.000 1.000
the environment.
Conflict of Interests The author(s) have not declared any conflict of interests.
REFERENCES Abbas SJ, Farhatullah KB, Marwat IA, Munir I (2009). Molecular
analysis of genetic diversity in Brassica species. Pak. J. Bot. 41(1): 167-176.
Alcorn JB (1981). Huastec non crop resource management: Impli-cations for prehistoric rain forest management. Hum. Ecol. 9:395-417.
Altieri M, Merrick LC, Anderson MK (1987). Peasant agriculture and the conservation of crop and wild plant resources. Conserv. Biol. 1:49-58.
Alan HS (2007). Molecular markers to assess genetic diversity. Euphytica 158: 313-321.
Asif M, Rahman M, Zafar Y (2005). DNA fingerprinting studies of some wheat (Triticum aestivum L.) genotypes using random amplified polymorphic DNA (RAPD) analysis. Pak. J. Bot. 37(2): 271-277.
Astarini AI, Plummer AJ, Lancaster AR, Yan G (2004). Fingerprinting of cauliflower cultivars using RAPD markers. Aust. J. Agric. Res. 55: 112-124.

Bellon M (1996). The dynamics of crop infra-specific diversity: A
conceptual framework at the farmer level. Econ. Bot. 50: 26-39. Bhat ZA, Dhillon WS, Rashid R, Bhat JA, Alidar W, Ganaie MY (2010).
The role of molecular markers in improvement of fruit crops. Not. Sci. Biol. 2:22–30.
Bieleski RL (1962). The physiology of sugarcane. V. Kinetics of sugar accumulation. Aust. J. Biol. Sci. 15: 429-444.
Bieleski RL, Ripperda J, Newman JP, Reid MS (1992). Carbohydrate changes and leaf blackening in cut flower stems of Protea eximia. J. Am. Soc. Hortic. Sci. 117(1): 124-127.
Blachburn GA (1998). Quantifying chlorophylls and carotenoids at leaf and canopy scales. Remote Sens. Environ. 66: 273-285.
Bohn M, Utz HF, Melchinger AE (1999). Genetic similarities among winter wheat cultivars determined on the basis of RFLPs and SSRs and their use for predicting progeny variance. Crop Sci. 39(1): 228-237.
Boldingh H, Smith GS, Klages K (2000). Seasonal concentrations of non-structural carbohydrates of five Actinidia species in fruit, leaf and fine root tissue. Ann. Bot. 85: 469-476.
Botez CR, Sestras M, Ardelean D, Pamfil B, Patrascu SA (2009). Phe-notypic Selection Assisted by Molecular Markers for Scab Resistance in Apple. Acta Hortic. 814:771-776.
Brush SB (1989). Rethinking crop genetic resource conservation. Conserv. Biol. 3: 19-29.
Brush SB (1992). Reconsidering the green revolution: Diversity and sta-bility in cradle areas of crop domestication. Hum. Ecol. 20: 145-167.
Brush SB (2000). Genes in the field: On farm conservation of crop diversity. International Development Centre and International Plant Genetic Resources Institute, Lewis Publishers.
Cao JK, Jiang WB, Zhao YM (2007). Experiment guidance of postharvest physiology and biochemistry of fruits and vegetables. China Light Industry Press, 9.
Carter AG, Spiering BA (2002). Optical properties of intact leaves for estimating chlorophyll concentration. J. Environ. Qual. 31: 1424-1432.
Duval MF, Bunel J, Sitbon C, Risterucci AM (2005). Development of microsatellite markers for mango (Mangifera indica L.). Mol. Ecol. Notes 4: 824-826.
Feruse P, Arkosiova M (2001). Variability of chlorophyll content under fluctuating environment. Acta Fytotechnica et Zootechnica 4: Special Number Proceedings of the International Scientific Conference on the Occasion of the 55th Anniversary of the Slovak Agricultural University in Nitra.
Freitas LB, Jerusalinsky L, Bonatto SL, Salzano FM (2000). Extreme homogeneity among Brazilian wheat genotypes determined by RAPD markers. Pesqui. Agropecu. Bras. 35(11): 2255-2260.
Gayler KR, Glasziou KT (1972). Physiological functions of acid and neutral invertases in growth and sugar storage in sugarcane. Physiol. Plant. 27: 25-31.
Ghafoor A, Arshad M (2008). Seed protein profiling of Pisum sativum L., germplasm using sodium dodecyl sulphate polyacrylamide gel electrophoresis (SDS-PAGE) for investigation of biodiversity. Pak. J. Bot. 40(6): 2315-2321.
Giaquinta RT (1979). Sucrose translocation and storage in the sugar beet. Plant Physiol. 63: 828–832.
Hammer O, Harper DAT, Ryan PD (2001). PAST: Paleontological statistics software package for education and data analysis. Palaeonto. Electro. 4(1): 9.
Hussein M (2009). Identification and estimation of genetic relationships among some mango cultivars grown in Egypt using DNA techniques. Ph.D. Thesis, Suez Canal University, Faculty of Agriculture, Department of Agriculture and Botany (Genetics).
Jaccard P (1980). Nouvelles recherches sur la distribution florale. Bull. Soc. Vaud. Sci. Nat. 44: 223–270.
Jedele S, Hau AM, Oppen MV (2003). An analysis of the world market for mangos and its importance for developing countries. Paper was presented in the Conference on International Agricultural Research for Development on 8-10 October in Gottingen.
Johnson GN, Scholes JD, Horton P, Young AJ (1993). Relationships between carotenoid composition and growth habit in British plant species. Plant Cell Environ. 16: 681-686.
Kershaw KA, Webber MR (1986). Seasonal changes in the chlorophyll
Abou-Ellail et al. 2805
content and quantum efficiency of the mos Brachythecium rutabulum. J. Bryol. 14(1): 151-158.
Kostermans AJGH, Bompard JM (1993). The Mangoes, Their Botany, Nomencla-ture, Horticulture and Utilisation. Academic Press, London.
Kulshreshtha S, Mishra DP, Gupta RK (1987). Changes in content of chlorophyll, proteins and lipids in whole chloroplast and chloroplast membrane fractions at different leaf water potentials in drought resistant and sensitive genotypes of wheat. Photosynthesis 21(1): 65-70.
Kumar PP, Yau JCK, Goh CJ (1998). Genetic analysis of Heliconia species and cultivars with randomly amplified polymorphic DNA (RAPD) markers. J. Amer. Soc. Hortic. Sci. 123: 91-97.
Laemmli UK (1970). Cleavage of structural prteins during the assembly of the head of bacteriophage T4. Nature 227: 680-685.
Lakshminarayana S (1980). Tropical and subtropical fruits; composition, properties and uses. In: Mango. (Eds. Nagy S and Shaw PE) AVI publishing, Westport, Connecticut, pp: 184-257.
Lambert DP (1996). Crop diversity and fallow management in a tropical deciduous forest shifting cultivation system. Hum. Ecol. 24: 427-453.
Langridge P, Lagudah ES, Holton TA, Appels R, Sharp PJ, Chalmers KJ (2001). Trends in genetic and genome analyses in wheat: A review. Aust. J. Agric. Res. 52(12): 1043-1077.
Lichtenthaler HK (1987).Chlorophylls and carotenoids: pigments of photosynthetic biomembranes. Methods Enzymol. 148:350–382.
Mukherjee SK (1997). Introduction: botany and importance. In: Litz, RE (Ed). The Mango; Botany, Production and Uses. CAB International, New York. pp. 118.
Naimuddin M, Kurazono T, Nishigaki K (2002). Commonly conserved genetic fragments revealed by genome profiling can serve as tracers of evolution. Nucl. Acids Res. 30(10): 42.
Pejic I, Ajmone-marsan P, Morgante M, Kozumplick V, Castiglioni P, Taramino G, Motto M (1998). Comparative analysis of genetic similarity among maize inbred lines detected by RFLPs, RAPDs, SSRs and AFLPs. Theor. Appl. Genet. 97(8): 1248-1255.
Porra RJ, Thompson WA, Kriedelman PA (1989). Determination of accurate extraction and simultaneously equation for assaying chlorophyll a and b extracted with different solvents: Verification of the concentration of chlorophyll standards by atomic absorption spectroscopy. Biochim. Biophys. Acta. 975: 384-394.
Saengprajak J, Saensouk P (2012). Genetic diversity and species identification of cultivar species in subtribe cucumerinae (Cucurbitaceae) Using RAPD and SCAR Markers. Amer. J. Plant Sci. 3: 1092-1097.
Singh LB (1960). In: The Mango, Botany, Cultivation and Utilization. Leonard Hill, London.
Sisko M, Javornik B, Siftar A, Ivancic A (2009). Genetic relationships among Slovenian pears assessed by molecular markers. J. Amer. Soc. Hortic. Sci. 134:97-108.
Studier FW (1973). Analysis of bacteriophage T1 early RNAs and proteins of slab gels. J. Mol. Biol. 79: 237-248.
Tanaka T (1976). Tanaka’s Encyclopedia of Edible Plants of the World. Keigaku Publishing Co., Tokyo.
Thimmappaiah WG, Santhosh SD, Melwyn GS (2009). Assessment of genetic diversity in cashew germplasm using RAPD and ISSR markers. Sci. Hortic. 120:411-417.
Ungerer MC, Halldorsdottir SS, Purugganan MA, Mackay TFC (2003). Genotype environment interactions at quantitative trait loci affecting inflorescence development in Arabidopsis thaliana. Genetics 165: 353–365.
Vasanthaiah HKN, Ravishankar KV, Mukunda GK (2007). Mango in Kole C (ed.) Genome mapping and molecular breeding in plants fruits and nuts Springer-Verlag Berlin Heidelberg. pp. 303-323.
Welsh J, McClelland M (1990). Fingerprinting genomes using PCR with arbitrary primers. Nucleic Acids Res. 18: 7213-7218.
Williams JGK, Kubelik AR, Livak KJ, Rafalski JA, Tingey SV (1990). DNA polymorphisms amplified by arbitrary primers are useful as genetic markers. Nucleic Acids Res. 18: 6531-6535.
Yang CM, Chang KW, Yin MH, Huang HM (1998). Methods for the determination of the chlorophyll and their derivatives. Taiwania 43(2): 116-122.
Young TW, Ledin RB (1954). Mango breeding. Proc. Fla. State Hortic. Soc. 67: 241-244.

2806 Afr. J. Biotechnol. Zaied NS, Khafagy SAA, Saleh MA (2007). Evaluation of some mango
species by fruit characters and fingerprint. Res. J. Agric. Biol. Sci. 3(4): 316-320.
Zhu Y, Chen H, Fan J, Wang Y, Li Y, Chen J, Fan JX, Yang S, Hu L,
Leung H, Mew TW, Teng PS, Wang Z, Mundt CC (2000). Genetic diversity and disease control in rice. Nature 406(6797): 718-722.