applying lean six sigma in an improvement project - theseus
TRANSCRIPT
Juha Laine
Applying Lean Six Sigma in an Improvement Project - Raising the customer self-service rate at an IT Service Company
Helsinki Metropolia University of Applied Sciences
Master of Business Administration
Business Informatics
Thesis
10th November, 2015
Abstract
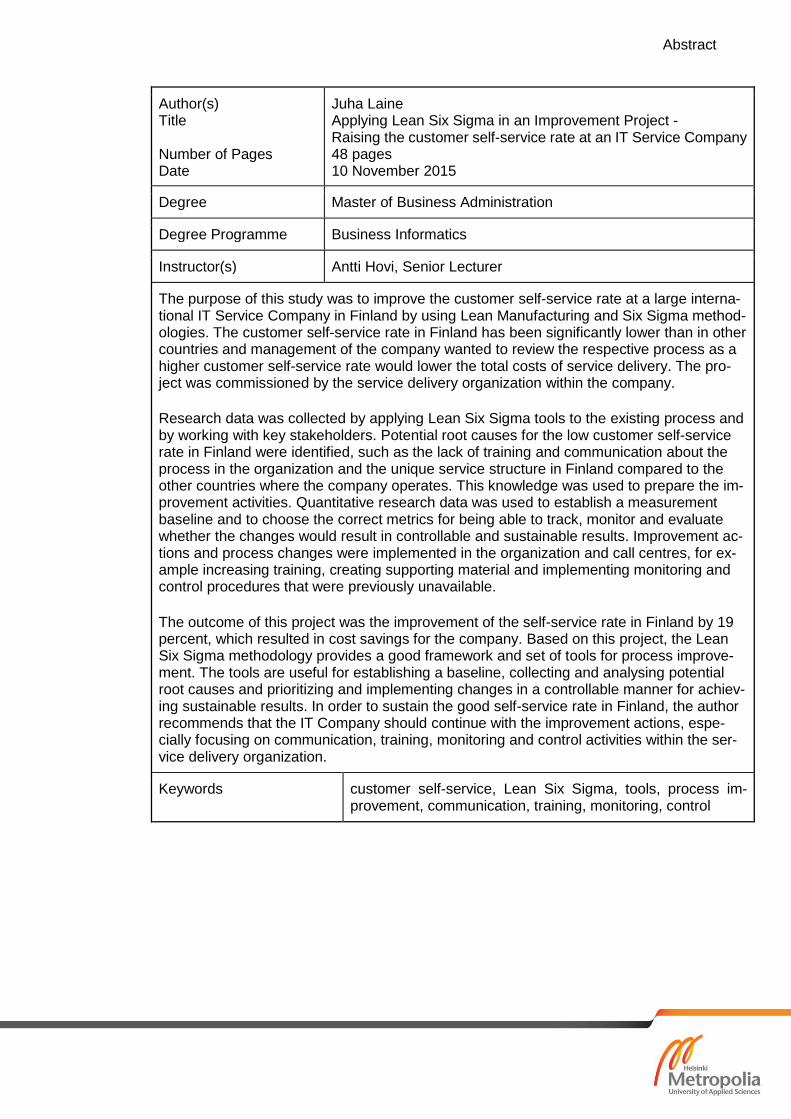
Author(s) Title Number of Pages Date
Juha Laine Applying Lean Six Sigma in an Improvement Project - Raising the customer self-service rate at an IT Service Company 48 pages 10 November 2015
Degree Master of Business Administration
Degree Programme Business Informatics
Instructor(s) Antti Hovi, Senior Lecturer
The purpose of this study was to improve the customer self-service rate at a large interna-tional IT Service Company in Finland by using Lean Manufacturing and Six Sigma method-ologies. The customer self-service rate in Finland has been significantly lower than in other countries and management of the company wanted to review the respective process as a higher customer self-service rate would lower the total costs of service delivery. The pro-ject was commissioned by the service delivery organization within the company.
Research data was collected by applying Lean Six Sigma tools to the existing process and by working with key stakeholders. Potential root causes for the low customer self-service rate in Finland were identified, such as the lack of training and communication about the process in the organization and the unique service structure in Finland compared to the other countries where the company operates. This knowledge was used to prepare the im-provement activities. Quantitative research data was used to establish a measurement baseline and to choose the correct metrics for being able to track, monitor and evaluate whether the changes would result in controllable and sustainable results. Improvement ac-tions and process changes were implemented in the organization and call centres, for ex-ample increasing training, creating supporting material and implementing monitoring and control procedures that were previously unavailable.
The outcome of this project was the improvement of the self-service rate in Finland by 19 percent, which resulted in cost savings for the company. Based on this project, the Lean Six Sigma methodology provides a good framework and set of tools for process improve-ment. The tools are useful for establishing a baseline, collecting and analysing potential root causes and prioritizing and implementing changes in a controllable manner for achiev-ing sustainable results. In order to sustain the good self-service rate in Finland, the author recommends that the IT Company should continue with the improvement actions, espe-cially focusing on communication, training, monitoring and control activities within the ser-vice delivery organization.
Keywords customer self-service, Lean Six Sigma, tools, process im-provement, communication, training, monitoring, control
Contents
LIST OF FIGURES 1
1 Introduction 2
1.1 Case Company 2
1.2 Business Problem, Objective and Outcome 2
1.3 Scope, Approach and Structure 3
2 Research Process and Methods 4
2.1 Research process 4
2.2 Literature Review 5
3 Lean Six Sigma & Best Practices in IT Process Development 5
3.1 Origins of Lean 6
3.2 Core Lean principles 8
3.3 Origins of Six Sigma 12
3.4 Core Six Sigma principles 13
3.5 Fusion of Lean and Six Sigma 14
3.6 Lean and Six Sigma in a service organization 15
4 Lean Six Sigma Improvement Process and Project Tools 17
4.1 Framing the Business Problem 17
4.2 PDSA Cycles 19
4.3 The DMAIC Model 20
4.4 DMAIC - Define 21
4.4.1 Project Charter 22
4.4.2 SIPOC 22
4.4.3 Team Building 23
4.4.4 The RACI Chart 24
4.4.5 Stakeholder Analysis & Commitment Map 24
4.5 DMAIC - Measure 25
4.5.1 Process Mapping 26
4.5.2 Data Collection 26
4.6 DMAIC - Analyse 26
4.6.1 Pareto Chart 27
4.6.2 Brainstorming 27
4.6.3 The 5 Why’s 27
4.6.4 The Affinity Diagram 28
4.6.5 Cause and Effect Diagrams 28
4.6.6 Value Analysis Prioritization 29
4.7 DMAIC - Improve 29
4.8 DMAIC - Control 30
4.8.1 Control Charts 30
5 Improving Customer Self-Service rate in Finland 31
5.1 Current State Analysis 31
5.1.1 Case Organization 32
5.1.2 Problem Statement & Target 32
5.1.3 Measurement & Data Collection 32
5.2 Project charter 32
5.3 Team Building 34
5.4 Establishing Baseline 36
5.5 Preparing the improvement plan 39
5.6 Executing Improvements 41
5.7 Control 42
6 Results and Further Development 43
6.1 Results 43
6.2 Discussion and further development opportunities 45
6.3 Reliability and validity 46
References 47
1 (48)
LIST OF FIGURES
Figure 1. PDSA Cycle
Figure 2. DMAIC Model
Figure 3. DMAIC model and PDSA Cycles
Figure 4. SIPOC Model
Figure 5. The 5 Why's
Figure 6. VAP Chart Example
Figure 7. Accelerated Model of Improvement (AMI)
Figure 8. Summary of PDSA cycles
Figure 9. The RACI Chart
Figure 10. Stakeholder Analysis
Figure 11. SIPOC
Figure 12. Baseline Data Collection
Figure 13. Pareto Chart
Figure 14. Self-Service Control Chart Baseline
Figure 15. Affinity Diagram
Figure 16. Cause & Effect Diagram
Figure 17. VAP Chart
Figure 18. Control charts
Figure 19. Volume and Trend Chart
2 (48)
1 Introduction
1.1 Case Company
This research was done as part of an improvement project for a large international Infor-
mation Technology (IT) company operating in Finland that provides products, technolo-
gies, solutions and services to consumers and businesses.
The improvement project and case research was done for the service delivery organiza-
tion within the company that provides technology services such as call handling, direct
support and services to the customers. The majority of the people involved in project
were from the service delivery organization and working directly in service, account de-
livery or project management functions. The actual support delivery is being mostly han-
dled by business partners or external subcontractors together with the customer call cen-
tres being located in Europe or offshore in another region. The project and research were
done anonymously. Some of the data elements or details about actions taken have been
omitted from this research or discussed only in general terms by the request of the com-
pany.
1.2 Business Problem, Objective and Outcome
The purpose of this research and improvement project was to find ways to improve the
customer self-service rate in Finland and to lower the total costs of service delivery. Cus-
tomer self-service is a process where a specific spare part is delivered to the end cus-
tomer who performs the needed repair and exchanges the part himself. It is an alternative
service delivery method to phone service, where no spare part is replaced or onsite ser-
vice by the company or a partner engineer, where an engineer comes to perform the
repair or exchanges the parts needed. Customer self-service is a fast, flexible and a cost
effective method of service delivery for the company, which is why self-service and
phone service are the preferred delivery alternatives over direct onsite services.
The customer self-service rate in Finland has been historically lower than in the other
Nordic countries where the company operates. The management in the service delivery
organization commissioned the improvement project to review the respective process
3 (48)
and to identify improvement opportunities. A higher customer self-service rate would de-
crease the need for onsite services, which in turn would also lower the total costs of
overall service delivery.
The objective for the project was to improve the customer self-service rate by 20% and
in turn lower the overall number of onsite service requests by a respective amount within
the calendar year in 2015. The objectives for the research were to define the project
objectives and goals; select key metrics to use; identify potential root causes to prepare
an improvement plan and to execute the required changes by using Lean Production
and Six Sigma methodologies and tools.
The outcome of this project and research was the improvement of the self-service rate
in Finland, cost savings and improvement actions that facilitated the change that could
potentially be applied more widely in the organization. This would help the company im-
prove processes and to drive continuous improvement by the application of the research
findings as well as documenting Lean Six Sigma best practices.
1.3 Scope, Approach and Structure
Within the service delivery organization one of the goals is to drive continuous process
improvement, innovation and development activities to improve the customer satisfaction
and quality of service. Lean Six Sigma is one approach and set of tools chosen in the
organization for optimizing work and capacity. A way for improving cycle times and re-
ducing process variability by providing a structured framework for process improvement
activities. This project was chosen to be done using Lean Production and Six Sigma
principles as a part of Lean Six Sigma Green Belt training.
The scope of this research and project work was limited to individuals working within the
company. No external service delivery partners outside the company were involved in
this project. The majority of the research and project work performed was done within
the company service delivery organization and the call centres abroad. Although the
context is based on one particular IT company; the findings, approach, tools and con-
cepts researched can be used more widely within the industry. Lean Production and Six
Sigma are well known and established theories and methodologies that are widely ap-
plied in manufacturing and a range of other industries, from services to health care.
4 (48)
This study focused on a particular process improvement project and the application of
Lean Six Sigma tools and concepts in practice. The research was not aimed to serve as
an in-depth analysis of Lean Production, Six Sigma or Lean Six Sigma theories but rather
an introduction to the key concepts, tools used and general application of Lean principles
in practice. Not all Lean Six Sigma tools were used during the project and only the ones
relevant to the improvement project are described in this research. General project man-
agement concepts and methods are touched upon but they are not the primary focus of
this research.
The outcome of this research is therefore limited to findings within one company and one
improvement project. The practical application of Lean Six Sigma and the tools used
during the improvement project that can serve as a guideline or set of best practices
within the company or more widely in the industry.
2 Research Process and Methods
2.1 Research process
The thesis will have six main chapters.
1. The first chapter is the introduction providing the company and research context
as well as objectives and goals.
2. The second chapter will detail the research process and methods used.
3. The third chapter will provide a general overview of key Lean Production and Six
Sigma concepts as well as Lean Six Sigma approach used in the research.
4. The fourth chapter will provide some details in regards to the project framework
and the particular Lean Six Sigma tools used during the project.
5. The fifth chapter will present the project documenting each step taken during the
improvement project.
6. The sixth chapter will present the results and ideas for further development.
The research was mainly performed by utilizing qualitative as well as quantitative data.
This helped to form a valid baseline and gain enough understanding about the current
state. This information was then used to identify and analyse potential root causes for
the low customer self-service rate. The author interviewed key stakeholders involved in
the process as well as the call centre team leads and individual agents who are working
5 (48)
directly with the customers. The information gathered formed the basis for the proposed
improvement plan and required actions to be taken.
Measurement baseline data was acquired from the internal reporting tools so that the
project team was able to evaluate past performance and choose the correct metrics to
utilise during the project. A six month period was chosen before the project start to act
as the baseline for past performance. The average six month utilization rate for customer
self-service (or share of total service) acted as the main baseline for the improvement
project. A six month period was deemed sufficient for the project purposes as it was long
enough to reliably assess the current state as well as account for any monthly or sea-
sonal variation.
2.2 Literature Review
Most of the literature used during the research comes from the training material provided
by the company as a part of the Lean Six Sigma training. This training material is a
compilation of known Lean Six Sigma theories, concepts and tools used. It was a re-
quirement to use the provided Lean Six Sigma training material and tools during the
project to be certified by the organization. Specific project and process related infor-
mation was sourced internally through the delivery organization. Most of the information
about Lean Six Sigma tools and methods utilized were provided by the Lean Six Sigma
project management office (PMO) as part of the training. This served as the main source
of information in regards to the research, concepts and tools used. Additional business
literature in regards to Lean Production and Six Sigma were used to compliment the
research as well as other articles and websites.
3 Lean Six Sigma & Best Practices in IT Process Development
It can be said that companies nowadays are driven by fulfilling the needs of their cus-
tomers while trying to gain competitive advantage over their competitors. Customers
everywhere demand better quality, shorter waiting times and lower prices – essentially
getting more with less. This can be achieved by providing additional value to customers
be it with improving quality, reducing costs or shortening lead times. Keeping these cus-
tomers satisfied, loyal and content is critical to any businesses continued success in the

6 (48)
marketplace. In general, poor or inconsistent quality in products manufactured or ser-
vices offered will affect customer satisfaction and loyalty negatively, while potentially in-
creasing lead times and product returns, which eventually will lead to reduced revenues.
Lean Production and Six Sigma are concepts and methodologies that aim to provide
businesses with a framework and set of tools to better drive cycle time reduction, opti-
mizing capacity while reducing variability and improving overall quality, in manufacturing
as well as services. This in turn can lead to increased revenues and more satisfied cus-
tomers.
3.1 Origins of Lean
In the “Brief History of Lean” the Lean Enterprise Institute (2000) states that Henry Ford
was one of the first people in manufacturing to create something what he called as “flow
production” or integrating an entire production process in sequence with the birth of the
assembly line during the 1920s. This was a breakthrough in manufacturing where indi-
vidual parts were earlier produced by different general-purpose machines and then as-
sembled into a finished product after quite a bit of tinkering and subassembly needed at
possibly different locations and workshops. The inherent problem with this new produc-
tion process was the inability to provide variety as the famous Model T car was limited
to just one colour as well as one essentially identical model. Later when other automak-
ers started to provide more models with different options this resulted in more complex
production systems that had more process steps. Larger, faster and more complex ma-
chines were eventually able to somewhat lower the costs per these process steps, but
at the expense of growing inventories and throughput times which again increased costs
for the companies.
Modig and Åhlström (2013) describe how the concept of efficiency is traditionally under-
stood only to mean resource efficiency. Resource efficiency being in this context, the
most efficient use of any value-adding resources that can be gained through, for in-
stance, with economies of scale. How much can a machine produce or how many calls
can a call agent process within a certain time period? Flow efficiency on the other hand
focuses on the process output or the individual unit being processed and the efficiency
of the process flow of this unit within the organization. In services, this unit usually means
the customer and the process flow starts from the time a customer need is identified and
only stops when the need is finally fulfilled. An example in this case, would be how fast
7 (48)
(or how well) can the company resolve a customer problem when a problem occurs or
when a call is placed to the call centre?
Basic Lean principles can be said to derive from the Japanese automotive manufacturing
industry, specifically Toyota with their invention of the Toyota Production System (TPS).
Lean being short for “Lean Manufacturing or “Lean Production”, which basically could be
described as a systematic method for the elimination of unwanted elements in the man-
ufacturing process or removing the unnecessary steps, the “waste” in the process. After
World War II Japan had scarce resources and was technologically behind the western
countries which forced local companies to look elsewhere for efficiency. The mass pro-
duction methods used by the US automobile companies were not adaptable to the Jap-
anese market situation, where Japan at the time relied heavily on importing; there was
not a lot of free space or skilled workforce readily available. The engineers at Toyota
focused on a few key things, the needs of its customers and optimizing manufacturing to
meet those needs. They found out that with a series of simple innovations, they were
able to improve continuity in their process flow and offer a wider variety in their product
offering. (Lean Enterprise Institute, 2000)
The Toyota Production System in essence shifted focus from individual machines and
their level of utilization to the flow of the individual product itself throughout the total pro-
cess. This is also in line with the just-in-time philosophy, which at Toyota resulted in
reduced inventories and production that better matched customer demand. (Lean Enter-
prise Institute 2000) (Modig and Åhlström, 2013)
Toyota concluded that by right-sizing machines for the actual volume needed, introduc-ing self-monitoring machines to ensure quality, lining the machines up in process se-quence, pioneering quick setups so each machine could make small volumes of many part numbers, and having each process step notify the previous step of its current needs for materials, it would be possible to obtain low cost, high variety, high quality, and very rapid throughput times to respond to changing customer desires. (Lean Enterprise Insti-tute, 2000)
Western observers took interest in what Toyota was doing and this concept of lean man-
ufacturing or Lean production was first described in the book “The Machine That
Changed the World” (1990) by James P. Womack, Daniel Roos and Daniel T. Jones. It
was further explored in their follow-up book “Lean Thinking” (1996) by James P. Womack
and Daniel T. Jones and these books have served as the main sources for Lean
knowledge and research to the modern day.

8 (48)
3.2 Core Lean principles
Womack (2007) described three fundamental business issues that should guide the en-
tire organization on Lean transformation:
- Purpose: What customer problems will be solved?
- Process: How will value streams be assessed to make sure each step is valuable,
capable, available, adequate, flexible and linked by flow, pull and levelling?
- People: How can the organization ensure that value streams are continually eval-
uated in terms of purpose and Lean process and actively improved?
Lean Enterprise Institute (2000) defines that the core idea of Lean is to create more value
for customers with fewer resources. In different terms, maximize customer value while
minimizing waste. Tuominen (2010) says that Lean is not an end state that you aim for
but rather a process for continuous learning and development. It is all encompassing and
travels through all the levels in the organization and its processes. It is based on two
main principles:
- Firstly, the creation of an uninterrupted flow of material, information and re-
sources in all business processes. This is achieved by the use of Lean tools.
- Secondly, the management needs to be committed to invest in the employees
and continuous improvement in the company. It is not about copying or mimicking
the use of certain well-known lean tools or principles but rather developing such
principles that fit the business requirements of the organization applying Lean.
To attain high performance and providing better value to the customers.
According to Kouri (2000) and the Lean Six Sigma training material (2014), an activity
adds value when it transforms or shapes raw material or information to meet the custom-
ers’ needs or requirements. Some activities, such as moving materials or information
during production are necessary, but do not add real value in the eyes of the customer.
In a production environment, such as with Toyota; the categories of waste identified
were:
- Overproduction
- Waiting time (idle time)
- Conveyance (unnecessary transport of parts/products)
9 (48)
- Processing (unnecessary work/overwork)
- Excess Inventory (more stock then needed)
- Motion/Transport (time spent looking for parts or information, people/resources)
- Correction (rework/overlap/error correction)
George (2003) describes lead time as how long it takes you to deliver a service or a
product once an order has been initiated. Any activity that adds value in the eyes of the
customer is called “value-added” work and any activity that is of “no-value” or the cus-
tomer would prefer a supplier without these costs can be deemed a “non-value added”
activity (or categorized simply as waste). Waste being any activity that takes up time,
resources, or space but does not add real value to the product or service being provided.
In a non-production environment different types of waste are comparable to the produc-
tion environment with a few differences; Overproduction (performing work before re-
quired), waiting time (for information/approval), motion (non-value add movement of peo-
ple/paper), transport (non-value add movement of work), inventory (obsolete stock, sup-
plies), defects (time spent correcting defect) or under-utilization (people/skills under-uti-
lized) are all forms of waste in a service organization.
Basic lean principles are customer centricity, where the customers are the ones that
define value. Flow are waste-free processes that provide material and information with-
out interruption. Pull, where products are created as the customer needs them and Takt,
where cycle time and production is aligned to the customer demands (similar to just-in-
time). Defect-free products, services and driving customer satisfaction with continuous
improvement. (Lean Six Sigma training material, 2014)
As per Lean Six Sigma training material (2014) the core of Lean focuses on ways to
maximize process velocity, the speed and efficiency in any process by finding ways to
eliminate the non-value added work or waste; anything that is slowing the process down.
It provides the tools for cost and lead time reduction, analysing the process flow and
measuring the delay times at each individual activity step within the process. Tools on
how to map a process and collect data for each individual cycle time for better calculating
process efficiency. How to measure delay times per each activity that contributes to the
overall process length and eventually being able to create a truly Lean process by re-
moving all the non-value adding elements.
10 (48)
Most processes are said to be “un-Lean” or with a Process Cycle Time (PCT) or Process
Cycle Efficiency (PCE) below 10%, where PCE equals Value-Add Time divided by Total
Lead Time, time from entry into a process until exit. Process steps that are thought to be
essential can be found unnecessary and the time and costs associated with these steps
can be removed after the application of Lean tools and Lean thinking. Traditionally, com-
panies are trying to find ways to perform actions more efficiently with, for example, train-
ing or improving processes to better handle the overall increase in complexity, while Lean
approaches the same problem with questioning “is everything done currently even nec-
essary?” (Lean Six Sigma training material, 2014) (George, 2003).
Matti Torkkeli, the vice president of Lean5 Europe states that “Traditionally efficiency is
sought by trying to do things faster. You lose sight of the real problem. The idea is not
that a doctor has to perform a diagnosis faster. The purpose is not to run faster, but to
walk a shorter distance”. (Semkina, 2015)
So Lean focuses on quantifying and eliminating the cost of complexity, the separation of
what can be called as “value-added” activities from the “non-value added” activities and
the elimination of these root causes for any non-value added work and the related costs.
It is said that only 20% of the activities can cause 80% of the delay so it is very important
to focus particularly on these non-value added activities. Key goals being reducing or
controlling work in progress, increasing throughput and process efficiency, eliminating
variation in lead time based on data. (Lean Six Sigma training material, 2014)
As per George (2003) Work-In-Progress or Work-In-Process (WIP) is material or inven-
tory that has begun the manufacturing process and is no longer considered as part of
the inventory, but is not yet a complete or finished product. In Lean Manufacturing, ex-
cessive or large amounts of WIP are considered waste or a by-product of bottlenecks in
the process. It ties up resources that would generate higher returns elsewhere. This is
especially important in services. Exit Rate (throughput) is the output of manufacturing or
a process over a period of time. WIP divided by exit rate equals cycle time. Process
efficiency is the performance indicator of how efficiently the process is converting work
in process into exit rate. It represents the percentage of value add time along the critical
process path equalling value add time divided by cycle time.
11 (48)
A lean process is categorised by George (2003).
- Operates at a Process Cycle Efficiency (PCE) of >20%
- Has a maximum cap on WIP to control velocity
- Uses a Pull system where new work is released into the process only when
work has exited to the next process.
- Uses visual controls to manage and monitor the process (e.g. by showing the
status of various items or service in-process, and a list of additional lead-time
reduction ideas)”
At its core, Lean is really about continuous improvement and driving customer satisfac-
tion. As stated, it is the end customers that define value and not the company. The pro-
cess flow should be as much waste- and defect-free as possible, the products and ser-
vices aligned with customer demands and created as the customer’s need them (just-in-
time). Error proofing is one structured approach to ensuring quality all the way through
the work process by taking pre-emptive steps to prevent errors from occurring. Total
Productive Maintenance (TPM) is a series of methods that ensures every piece of equip-
ment is always able to perform its required tasks so that production is never interrupted,
the main idea being to have processes and methods to keep the tools always working
and minimize any process down time. (Lean Six Sigma training material, 2014)
Lean is leading “customer-first”, about valuing people, developing and performing to-
gether. It is about continuous learning and improvement. (Semkina, 2015)
As a final note, Modig and Åhlström (2013) state that the understanding about Lean
production or the concepts of Lean can really differ from person to person. Some see it
directly tied with Toyota manufacturing, some view it as a philosophy or as a set of quality
tools and some view it as an all-encompassing source for everything that is good or done
correctly in the organization. It is understandable for people to reduce Lean to a set of
tools or concrete step of actions that makes it easier to comprehend and apply in prac-
tice. This results in a very narrow focus for its application or potential, although it can be
said that just striving for flow efficiency can be generally more useful than just focusing
on the efficient use of resources. Another danger is to tie Lean too closely with Toyota
Production Systems or their application of the tools and potentially seeing it as irrelevant
for any another operating environment. Focusing on how the tools are used instead of
asking why these tools are used as Lean is very relevant and applicable to a wide range
of industries.
12 (48)
It is a problem when Lean is seen as a method but not as a goal or strategy. Modig and
Åhlström (2013) see Lean as an operational strategy that is tied to the business environ-
ment, as a high-level concept that can be applied more widely if it is tied to an overall
business strategy, goal or purpose. Not trying to emulate what Toyota did or focusing on
just the tools or increases in flow efficiency but understanding on a deeper level why
Lean is applied. By definition, Lean should not be seen as something where its benefits
can be considered as self-evident. It is not a static goal or end state but a dynamic
roadmap for continuous improvement within the organization.
3.3 Origins of Six Sigma
Six Sigma or 6 Σ can be described as a technique or set of quality management tools
that is aimed at process improvement and reducing variability with the goal of reaching
near perfection in terms of quality. It is associated with manufacturing or the manufac-
turing process where the goal is to achieve “six sigma” level of operations (striving to-
wards six standard deviations between the process mean and the nearest specification
limit where practically no item will fail to meet specifications). It comes from the relation-
ship between the variation in a process and the customer requirements in relation to that
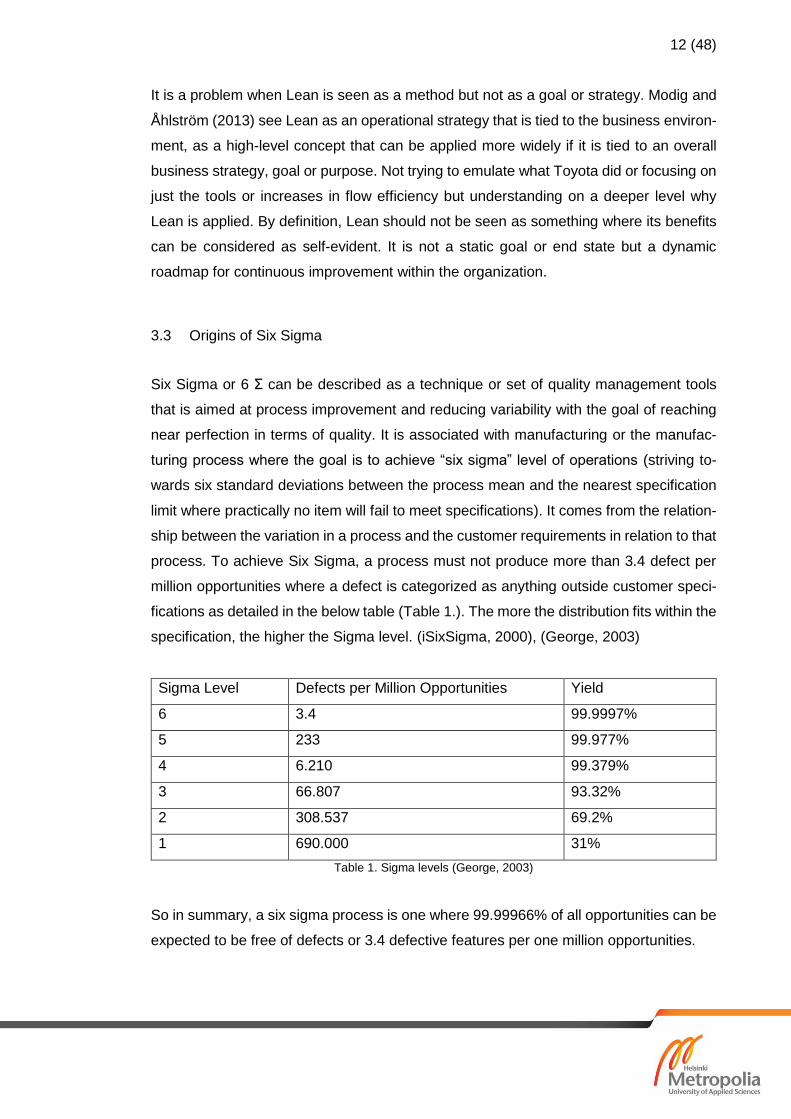
process. To achieve Six Sigma, a process must not produce more than 3.4 defect per
million opportunities where a defect is categorized as anything outside customer speci-
fications as detailed in the below table (Table 1.). The more the distribution fits within the
specification, the higher the Sigma level. (iSixSigma, 2000), (George, 2003)
Sigma Level Defects per Million Opportunities Yield
6 3.4 99.9997%
5 233 99.977%
4 6.210 99.379%
3 66.807 93.32%
2 308.537 69.2%
1 690.000 31%
Table 1. Sigma levels (George, 2003)
So in summary, a six sigma process is one where 99.99966% of all opportunities can be
expected to be free of defects or 3.4 defective features per one million opportunities.
13 (48)
Six Sigma is a measurement-based, data-driven discipline or methodology that is aimed
at identifying and eliminating defects and minimizing the variability in manufacturing or
business processes. Part of its quality management methods is to create a hierarchy or
an infrastructure of people in quality management functions within the company who are
experts in the use of these tools and methods such as “Yellow Belts”, “Green Belts” and
“Black Belts” as per level of experience and proficiency. Each Six Sigma improvement
project carried out will follow a certain sequence of steps with a clearly defined and
measurable value target. Examples can be reducing process cycle times, reducing costs
or increasing customer satisfaction. (iSixSigma, 2000)
3.4 Core Six Sigma principles
Six Sigma emphasizes the need to recognize opportunities and eliminate defects as de-
fined by the customers. It is a customer focused philosophy of data-based decision mak-
ing and process excellence. It provides a structured framework for achieving sustainable
process improvement. It renews focus on statistical tools to drive decision making and
for making significant reductions in variation and the number of defects. Delivering high
quality services is hindered by variation and Six Sigma employs this data-driven decision
making into a comprehensive set of quality tools set and building a cultural infrastructure
that is aimed at reducing variation. (George, 2003)
To put it simply, the outcomes of any processes are the results of everything what goes
into that process, “Y is the function of X” that relates an output (Y) to inputs of different
process variables (Xs):
Y = f(X1, X2, X3,…)
Any output, like growth or profits will be dependent on the different process variables
(Xs) that can be quality, lead time, non-value added costs etc. that go into the process.
In order to improve this or to get a better output (Y), one needs to identify and focus on
the individual variables, the critical Xs that affect the final outcome. (George, 2003)
The core elements of Six Sigma adoption are according to Lean Six Sigma for Service:
How to Use Lean Speed and Six Sigma Quality to Improve Services and Transactions
by Michael George, 2003:
14 (48)
1) CEO & Managerial Engagement
2) Appropriate resources (staff & time) to high-priority projects.
3) Everyone involved in Six Sigma should receive some level of training
4) Variation has to be eliminated
GE (2015) states that Six Sigma in their company revolves around a few key concepts:
- Critical to Quality – the attributes most valuable to the customer
- Defects – Failing to delivery what is valuable to the customer or what the cus-
tomer wants.
- Process Capability – What your process can deliver
- Variation – What the customer sees and feels
- Stable Operations – Ensuring consistent and predictable process performance
- Design for Six Sigma: Designing to meet customer needs and process capability.
In summary, Six Sigma is a customer-focused philosophy and a statistical standard of
data-based decision making aimed at process excellence. It provides a structured frame-
work for achieving sustainable results with focus on statistical tools to drive decisions on
reducing variation and the number of defects.
3.5 Fusion of Lean and Six Sigma
As stated earlier, the roots of both Lean Manufacturing and Six Sigma reach as far back
as the 1980s and beyond, when the needs for quality and speed were mainly present in
a manufacturing environment. Lean Manufacturing or Lean Production arose as a meth-
odology for optimizing automotive manufacturing while Six Sigma evolved as a quality
initiative aimed at eliminating defects by reducing variation in the processes for the sem-
iconductor industry. (George, 2003)
Lean Manufacturing and Six Sigma can be utilized independently but there are benefits
in integrating the two principles. Better focus, synergy and utilization of limited resources
under one improvement strategy in the organization. It is true that Lean and Six Sigma
principles can be viewed as more contradicting rather than complimentary disciplines,
although both enable the reduction of the cost of complexity.
15 (48)
- Six Sigma is said to focus on quality and elimination of variation, while paying
little attention to identifying waste and non-value add steps or improving process
speed and flow.
- Lean being focused on speed does not really address critical customer needs or
the effects of variation like the inherent benefits of bringing a process under sta-
tistical control with a culture and infrastructure needed to be able to sustain it.
Reducing defects or lead times alone will bring some gains but to achieve the absolutely
lowest cost one needs to simultaneously improve both quality and speed at the same
time. By combining the strengths of these two disciplines, one can achieve the best of
both worlds with Lean Six Sigma rather than relying on its individual components. Lean
Six Sigma incorporates Lean’s principles of speed and action into the Six Sigma im-
provement process, which in turn reduces cycle times and variation, uniquely battling the
hidden costs of complexity while increasing velocity of improvement projects as well as
the results. (George, 2003)
In summary, Lean Production tools drive cycle time reduction while optimizing capacity
while Six Sigma aims at improving quality and reducing variability. Lean’s focus on speed
does not generally hurt quality because Lean practices try to eliminate the non-value add
activities that make up most of the overall processing time, any waiting time or queues
and the overall time spent between the value-add activities. Six Sigma tools help reduce
the amount of defects which in turn can also help speed up the overall process.
3.6 Lean and Six Sigma in a service organization
George (2003) describes a service organization so that it can encompass everything
except, the direct manufacturing process i.e. the physical making of goods or articles by
hand or machinery. Lean Manufacturing, Six Sigma or Lean Six Sigma can be applied in
a service organization just as efficiently as in any manufacturing organization. Even in
manufacturing, it can be said that only 20% of product prices can be attributed directly
to manufacturing with 80% coming from service or support functions like design, finance,
human resources, product development, engineering etc.
Lean Enterprise Institute (2000) tries to correct the popular misconception that Lean is
suited only for manufacturing. Lean can be applied to every business and every process
16 (48)
as it is not a tactic or a short-term cost reduction program, but more of a way of thinking
and performing actions in the entire organization.
In transactional environments, for people working in customer facing service functions,
people find that most of the steps they follow in their processes do not add real value to
the final service in the eyes of their customers. It can be said that service processes are
usually slow or lengthy processes, which tend to mean that they are also expensive pro-
cesses. Lean tools are not designed just for manufacturing environment but as a set of
principles that can accelerate the speed of all processes across the whole enterprise in
which they are applied. Wasted time or costs can be just as efficiently cut by reducing
lead times and streamlining processes in the aim for produce better quality or better
service as in any standard manufacturing environment. Lean tools help by reducing com-
plexity while increasing quality, speed and customer satisfaction. (George, 2003) ”Em-
pirical data have shown that the cost of services are inflated by 30-80% waste – that is,
the processes are riddled with activities that add no value from the perspective of the
customer... Work that adds no value in your customers’ eyes typically comprises 50% of
total service costs” (George, 2003, pp. 12-13, 3)
One might ask that if there are so large cost and lead time opportunities in service or-
ganizations, why Lean Six Sigma is not applied more widely in the industry or in every
service organization. This is mostly due to the fact that rather than in a production line or
a manufacturing organization, the work being performed in services is largely invisible or
very hard to quantify properly. This does not just concern simple work flow processes
but especially the amount of work-in-process, which is why detailed value stream- or
process flow maps need to employed and this is harder to do in service organizations
than in purely manufacturing facilities.
It is not however impossible as the examples by the City of Espoo and the Finnish central
hospital in Northern-Karelia demonstrate. By applying lean principles, social welfare ap-
plications that took earlier over 7 days to process, are now finalised in under 2 days by
the City of Espoo (Nurmi, 2015). With a one-time investment of 5 500 euros into ware-
housing practices and applying Lean and Kanban (just-in-time) methods a central hos-
pital in Northern-Karelia was able to release 5 000 hours of yearly working time for nurses
that were earlier spent on organizing and storing hospital supplies. (Puolakka, 2015)
17 (48)
4 Lean Six Sigma Improvement Process and Project Tools
PMI (2008) describes a project as a temporary endeavour to create a unique product,
service or result that has a definite beginning and an end. The end is reached when the
project objectives have been achieved or when the project is terminated prior to it being
finished. Project management is the application of knowledge, skills, tools and various
techniques to activities to meet the project requirements. A project lifecycle usually com-
prises of five process groups or stages: Initiating, Planning, Executing, Monitoring and
Controlling and Closing.
As per previous chapter, Lean Six Sigma is a structured, streamlined and focused ap-
proach to process improvement. Improvement is about making changes that lead to a
new direction or to reach performance levels not previously attained. All improvement
will require change, but not all change will result in improvement. (Lean Six Sigma train-
ing material, 2014). This chapter will detail what kind of structure or framework a Lean
Six Sigma project can follow from start to finish and what tools can be utilised during the
different stages of the improvement project.
4.1 Framing the Business Problem
One can begin with three questions to frame the business problem and to start drafting
the improvement plan. These questions can provide an initial structure for the overall
process of making quality improvements and these questions will also eventually tie into
the final improvement plan. This can also be used to formulate an Accelerated model of
Improvement (AMI) chart which can help define the key areas and metrics. (Lean Six
Sigma training material, 2014)
What are we trying to accomplish?
The initial goal should be short, clear and concise and able to guide the improvement
effort. You can identify expected results but the goal does not have to be defined explic-
itly at this stage. You can address the problem or opportunity, the aim for the project and
why is it important to the business by aligning it with the organization’s overall strategic
plans. You capture the scope, aim and estimated business or customer impact.
18 (48)
How will we know that a change is an improvement?
What is known of the project at this stage, past performance or baseline to start from?
How has past performance been and what is the desired outcome? If changes are made
and results get better over time one can most likely conclude that the change has led to
an improvement. How can one determine this, record and assess the changes made?
Here you determine project measurements, baseline and a data collection plan.
What changes can we make that will result in an improvement?
Is there variation in the process due to material or human error? Can one address any
of the factors that lead to these errors or influence the process with the improvement
efforts? Identifying and prioritizing top causes and success factors. Drafting an improve-
ment plan and making the required changes.
As per Lean Six Sigma training material (2014) there are three categories of improve-
ment.
1) Eliminating quality problems such as failing to meet customer expectations or
requirements. Removing errors or long waiting times.
2) Optimizing systems or getting lean by reducing costs and increasing speed while
maintaining quality. This can be reducing non-value adding work in the process
or streamlining the overall workflow, i.e. doing more with less.
3) The third is expanding on customer expectations by providing higher value to
customers. This can be new and better products or services, innovations or new
solutions to already existing problems.
The DMAIC framework (Define-Measure-Analyse-Improve-Control) can be used as the
baseline guideline for the overall project management life cycle. Within each of these
phases, one can apply structured PDSA (Plan-Do-Study-Act) cycles to perform quick
actions that will result in better sustainable improvements. During each of these individ-
ual PDSA cycles one can utilise a variety of process improvement tools to try and achieve
the desired results. The DMAIC model and PDSA cycles will be looked at in more detail
during the next sections. (Lean Six Sigma training material, 2014)
19 (48)
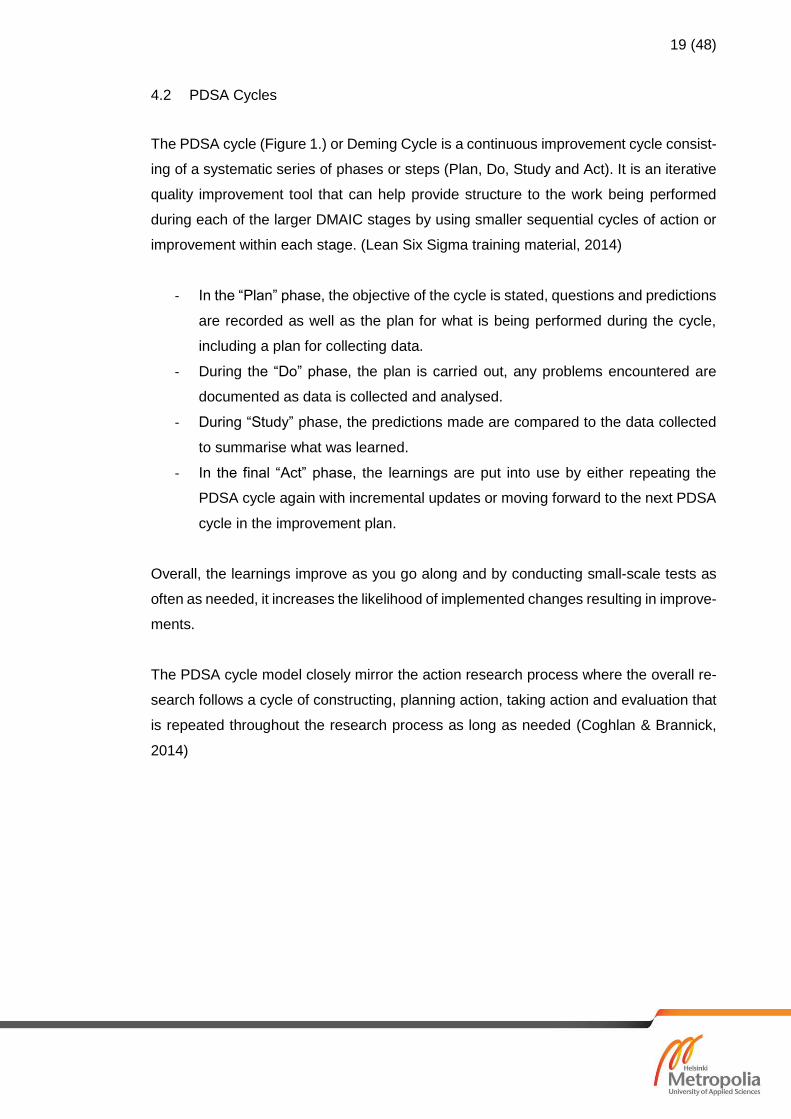
4.2 PDSA Cycles
The PDSA cycle (Figure 1.) or Deming Cycle is a continuous improvement cycle consist-
ing of a systematic series of phases or steps (Plan, Do, Study and Act). It is an iterative
quality improvement tool that can help provide structure to the work being performed
during each of the larger DMAIC stages by using smaller sequential cycles of action or
improvement within each stage. (Lean Six Sigma training material, 2014)
- In the “Plan” phase, the objective of the cycle is stated, questions and predictions
are recorded as well as the plan for what is being performed during the cycle,
including a plan for collecting data.
- During the “Do” phase, the plan is carried out, any problems encountered are
documented as data is collected and analysed.
- During “Study” phase, the predictions made are compared to the data collected
to summarise what was learned.
- In the final “Act” phase, the learnings are put into use by either repeating the
PDSA cycle again with incremental updates or moving forward to the next PDSA
cycle in the improvement plan.
Overall, the learnings improve as you go along and by conducting small-scale tests as
often as needed, it increases the likelihood of implemented changes resulting in improve-
ments.
The PDSA cycle model closely mirror the action research process where the overall re-
search follows a cycle of constructing, planning action, taking action and evaluation that
is repeated throughout the research process as long as needed (Coghlan & Brannick,
2014)
20 (48)
Figure 1. PDSA Cycle
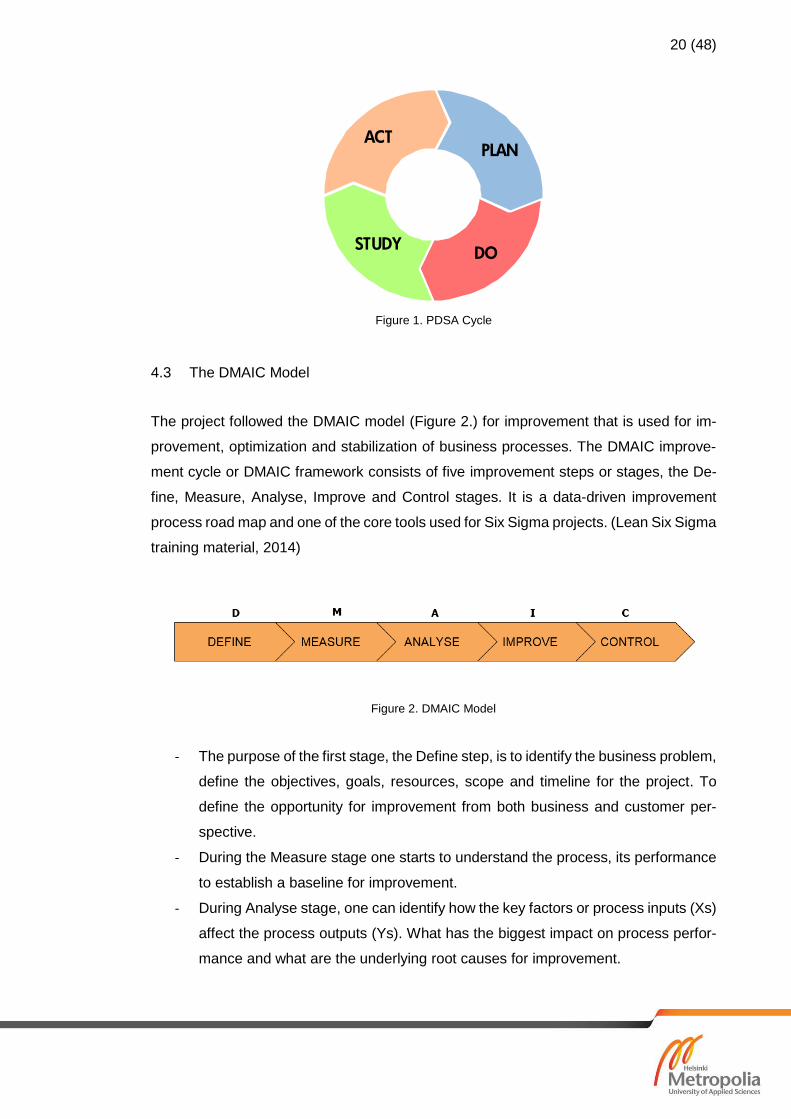
4.3 The DMAIC Model
The project followed the DMAIC model (Figure 2.) for improvement that is used for im-
provement, optimization and stabilization of business processes. The DMAIC improve-
ment cycle or DMAIC framework consists of five improvement steps or stages, the De-
fine, Measure, Analyse, Improve and Control stages. It is a data-driven improvement
process road map and one of the core tools used for Six Sigma projects. (Lean Six Sigma
training material, 2014)
Figure 2. DMAIC Model
- The purpose of the first stage, the Define step, is to identify the business problem,
define the objectives, goals, resources, scope and timeline for the project. To
define the opportunity for improvement from both business and customer per-
spective.
- During the Measure stage one starts to understand the process, its performance
to establish a baseline for improvement.
- During Analyse stage, one can identify how the key factors or process inputs (Xs)
affect the process outputs (Ys). What has the biggest impact on process perfor-
mance and what are the underlying root causes for improvement.
PLAN
DOSTUDY
ACT
21 (48)
- The Improve stage is to develop potential improvement solutions, to test and im-
plement these solutions to the original business problem or the critical factors or
inputs (X’s) in the process.
- The final Control stage is reached after implementing the solution, to institution-
alize any process changes and for establishing control procedures.
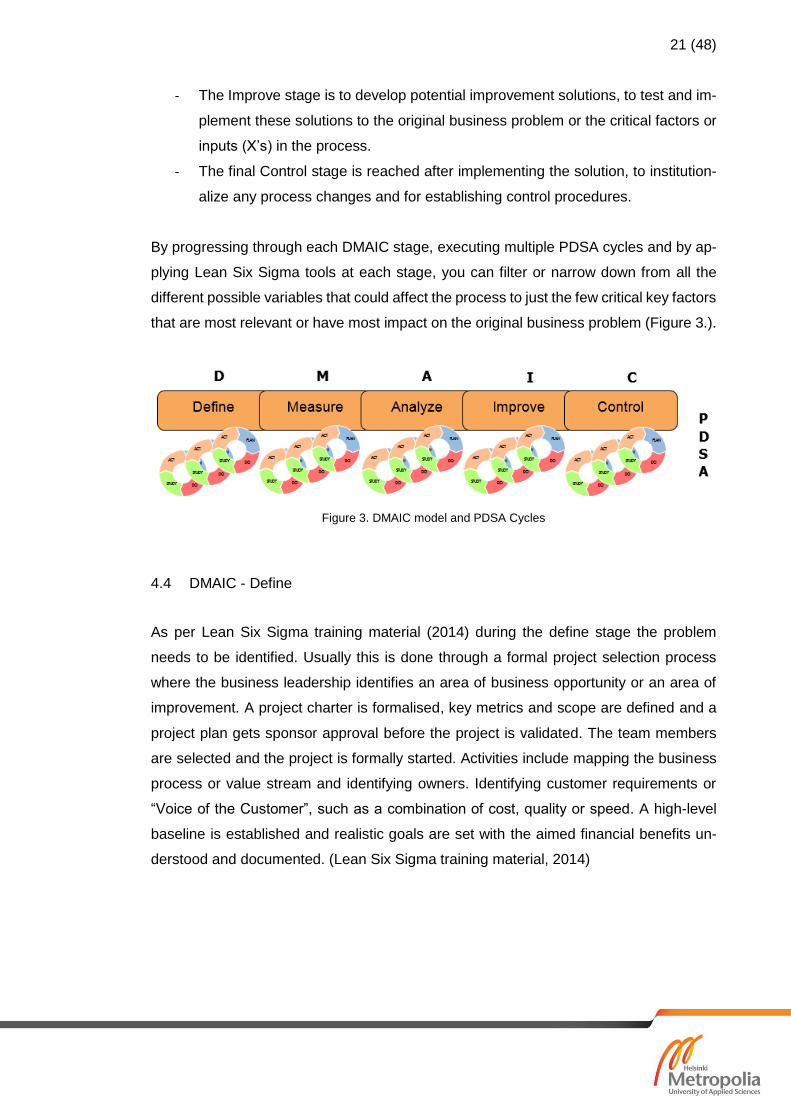
By progressing through each DMAIC stage, executing multiple PDSA cycles and by ap-
plying Lean Six Sigma tools at each stage, you can filter or narrow down from all the
different possible variables that could affect the process to just the few critical key factors
that are most relevant or have most impact on the original business problem (Figure 3.).
Figure 3. DMAIC model and PDSA Cycles
4.4 DMAIC - Define
As per Lean Six Sigma training material (2014) during the define stage the problem
needs to be identified. Usually this is done through a formal project selection process
where the business leadership identifies an area of business opportunity or an area of
improvement. A project charter is formalised, key metrics and scope are defined and a
project plan gets sponsor approval before the project is validated. The team members
are selected and the project is formally started. Activities include mapping the business
process or value stream and identifying owners. Identifying customer requirements or
“Voice of the Customer”, such as a combination of cost, quality or speed. A high-level
baseline is established and realistic goals are set with the aimed financial benefits un-
derstood and documented. (Lean Six Sigma training material, 2014)
22 (48)
4.4.1 Project Charter
Martin (2014) states that the project charter is used to determine the scope, problem
statement, objective, financial justification and the required resources or members of the
project team. It forms the basis of the project; the purpose and objective for everyone
involved in the project that strive for a shared goal. A goal can be an answer to a cus-
tomer need or a general one, to improve “quality” for instance. A customer is any person
or organization that receives a product or service (output) from the work activities (pro-
cess) and they are the ones that define what “quality” is as per previous chapter. One
key action is to translate these customer needs into measurable requirements that are
specific and relate directly to an attribute of the product or service provided. Once these
requirements are understood and agreed upon, you can validate the learnings into a
project charter or an initial improvement plan.
Importantly, a project charter should contain a clear, quantifiable problem statement and
how it is aligned with strategic goals. It contains start- and end dates, project team mem-
bers and sponsors, scope, key risks and dependencies. Key objectives, context and
business impact are defined. The expected project benefits are also valued against the
time it will take to complete the actions to see if the project is worth the effort or the
resources that will be tied to it for the duration of the project. (Lean Six Sigma training
material, 2014)
4.4.2 SIPOC
The SIPOC (Supplier-Input-Process-Output-Customer) Chart (Figure 4.) is one of the
tools in process improvement that helps summarize these process inputs and outputs in
a visual form in their own separate columns. This helps identify clearly the actual process
outputs and the end customers for these outputs. It can give people who might be unfa-
miliar with a certain process a high-level view or help reinforce and define key process
areas for the people who are already familiar with the process. (Lean Six Sigma training
material, 2014)
Suppliers – Internal or external suppliers to the process
Inputs – Inputs to the process i.e. work, material or information.
Process – One process flow representing the entire process from end to end
Outputs – Outputs to the internal or external customers, for instance, communication

23 (48)
Customers – Internal or external customers of the process receiving the output
Figure 4. SIPOC Model
4.4.3 Team Building
One model for group or team development identified in the Lean Six Sigma training ma-
terial (2014) is forming, storming, norming and performing. This model for group devel-
opment or teaming was introduced by Bruce Tuckman in 1965 who outlined that these
four stages or phases are all necessary for any team to go through on their way to im-
proved performance; to be able to solve challenges and problems; to be able to come
up with solutions and implement work and finally, to deliver results. Understanding this
model can help a new team become more effective faster, when the different stages are
taken into account while the project is progressing.
Forming
The independent team members meet and learn about the project, challenges and goals.
Each person acts according to their own behaviour and their motivation varies, some are
positive and excited, others anxious to start or do not know what is yet expected from
them during the project. Initial views are formed and team members start slowly working
together as a team rather than individuals when progressing through the next stages.
Storming
Team members start forming opinions about each other. They start voicing opinions and
questions. Disagreements can arise and personalities can clash that should be resolved
before teams can move out from this stage, sometimes it can be that teams never leave
this stage. Tolerance and patience are required to minimize any disruptiveness to the

24 (48)
project as a whole. Supervision and direction is needed for everyone to be able to con-
tinue working effectively.
Norming
People start co-operating and resolving their differences. They start working towards a
shared common goal and tolerating other team members better.
Performing
During the final stage, the team should be motivated and efficiently working together.
They can revisit earlier stages should there be any changes in team dynamics but gen-
erally, the team members can now work more effectively without the need for close su-
pervision.
4.4.4 The RACI Chart
As per Lean Six Sigma training material (2014) the responsibility assignment matrix or
RACI chart is used to describe the roles or participation by people in the organization for
completing tasks or deliverables for a given project or business process. It is used for
clarifying roles and responsibilities within a team or process, especially in cross-func-
tional projects and processes that involve people from different business areas and/or
departments.
Responsible – Responsible for work/task to be performed.
Accountable – One accountable/approver for work/task/deliverable to be performed
Consulted – Asked/consulted for opinion, a subject matter expert.
Informed – Those who are kept up-to-date on progress/task completion
4.4.5 Stakeholder Analysis & Commitment Map
A stakeholder is any person or organization that is affected or impacted by a proposed
change or is involved in the process. Stakeholder analysis is the process for identifying
and sorting groups or individuals that are affected by project actions or proposed
changes. It is used in preparation to assess attitudes or commitment to potential
25 (48)
changes, identify potential risks or key stakeholders who are crucial to the project or
could have adverse effects to the project progress. (Lean Six Sigma training material,
2014)
4.5 DMAIC - Measure
As per Lean Six Sigma training material (2014) the ability to assess the performance of
anything one wishes to improve is only as good as the ability to measure it. Sometimes
just improving the ability to measure a process results in improvements. In general, the
measurement system must be in control or variability of the measurement system must
be very small in relation to process variation as well as compared to the specification
limits.
During this phase, it is determined what needs to be measured during the project. A
measure being a quantified evaluation or actual performance based on observable data
such as time, number of defects, sales or attributes such as gender or customer type if
applicable. Key inputs, process and output metrics are identified. What data is needed
and how to measure it. A data collection plan is developed and a measurement system
validated. Baseline data is collected for being able to measure baseline process perfor-
mance. Baseline data is also used to determine whether any improvement has been
made at the end of the improvement project. (Lean Six Sigma training material, 2014)
“Quick Win” opportunities are identified where a solution idea is already developed and
can be quickly actioned upon based on careful risk assessment and impact. These low
risk “quick wins” can be immediately implemented, saving time and effort and attaining
cost savings earlier in the project, bypassing the Analysis Phase altogether. Examples
can be process step elimination, procedure change, a delivery simplification or a simple
communication improvement. This can provide important momentum in the project and
drive value and confidence during the early stages of the project.
There are two types of measurement variation that usually needs to be taken into con-
sideration. Reproducibility (or operator variability) where different individuals can get dif-
ferent measurements for an identical activity. Repeatability (or equipment variability),
where an individual gets different measurements for an identical activity between suc-
cessive or repeated measurements (Lean Six Sigma training material, 2014).
26 (48)
4.5.1 Process Mapping
Process mapping is one of the most effective improvement tools in Six Sigma, Lean
production and business process management. Mapping the process or making a graph-
ical representation of the process flow identifying each step in the process helps select-
ing what to measure, and where (and how) to find the gaps between strategic focus and
actual process. You can identify suppliers, process inputs, customers and process out-
puts to help with the decision making. Process mapping also helps to visualize the pro-
cess and help with value analysis, eventually helping pinpoint potential defects and lags
in cycle time when supplemented with baseline data. (Lean Six Sigma training material,
2014)
4.5.2 Data Collection
Data collection can be done in many ways. There can be an official data collection plan
consisting of many different metrics or then there are just only a few key metrics that are
followed during the project. In a Lean Six Sigma project, the key is to be able to determine
process performance or capability. Comparing the existing data to the requirements or
goals, to assess the improvement opportunities. Data collections starts with key metrics
and developing the operational definitions for each metric. Ensuring metrics are aligned
with the process and to understand the dependencies between them. (Lean Six Sigma
training material, 2014)
4.6 DMAIC - Analyse
Root cause analysis is an iterative process going from observations to hypotheses to
tests and back to observations again. Hypotheses for current-state performance are
made. This list is sorted and filtered down by determining that some hypotheses are
unrealistic or impossible to validate. Determining if there can be established a measura-
ble relationship between potential critical factors or root causes. Validating these hypoth-
eses by any statistical methods possible and estimating their impact on a performance
metric. Quantifying and prioritizing root causes for improvement, be it financially or by
business impact. (Lean Six Sigma training material, 2014)
27 (48)
4.6.1 Pareto Chart
The Pareto principle states that for many events, roughly 80% of the effects come from
20% of the causes. This helps with separating relevant issues from trivial ones and pro-
vide focus on where efforts or resources should be allocated. To identify one or two
situations or categories where most problems occur and what should be worked on first.
(Lean Six Sigma training material, 2014)
4.6.2 Brainstorming
Usually coming up with ideas and solutions takes time and effort. Existing assumptions,
boundaries or paradigms must be challenged and evaluated. Process steps can be re-
organized and “outside the box” thinking applied. Brainstorming can also be a structured
method for generating ideas or solutions. You can produce many ideas in a short time
frame and this can help facilitate the creative thinking process within the team or organ-
ization. (Lean Six Sigma training material, 2014)
4.6.3 The 5 Why’s
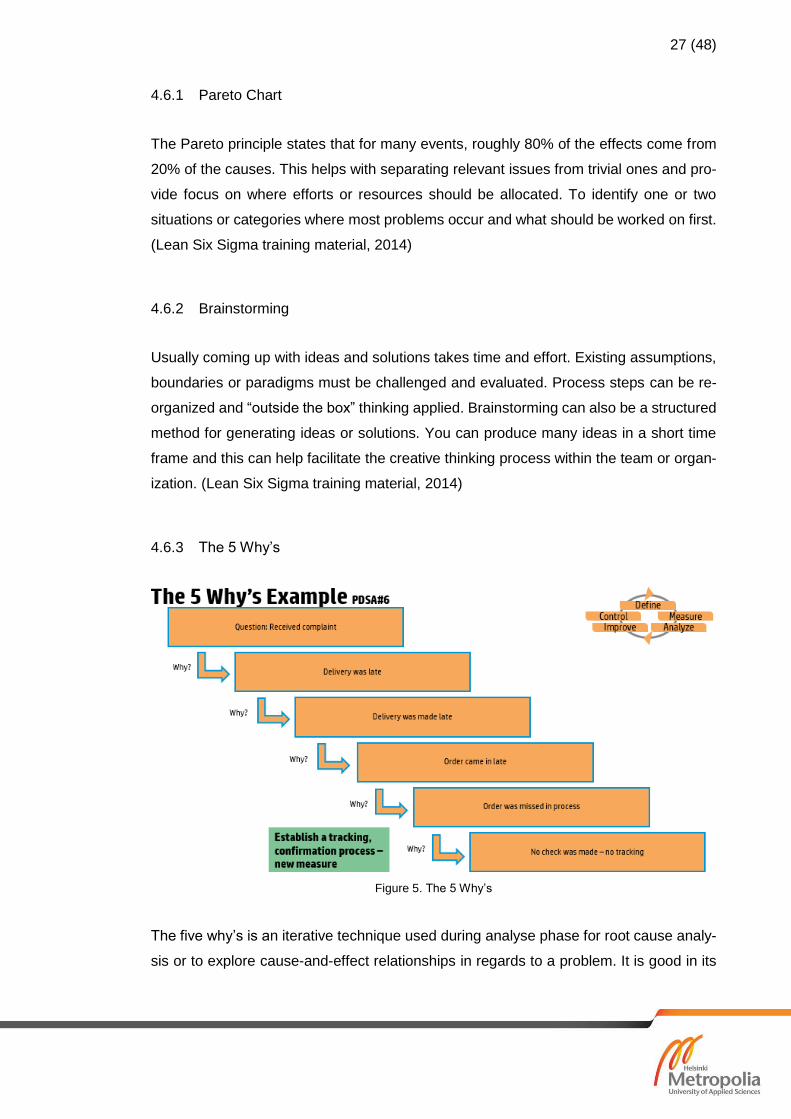
Figure 5. The 5 Why’s
The five why’s is an iterative technique used during analyse phase for root cause analy-
sis or to explore cause-and-effect relationships in regards to a problem. It is good in its
28 (48)
simplicity, as it can be completed without a heavy data collection plan or statistical anal-
ysis. An example of this exercise can be seen above (Figure 5.). At its core, it is just
repeatedly asking the question “Why” or “Why did the process fail?” five or more times,
where you can peel away the layers of symptoms which in turn can lead to the root cause
of a particular problem. Sometimes this can leady to another new series of questions
related to another root cause. One important thing to remember is that the uncovered
“real” root cause should point towards a process that is either not working or non-existent
rather than a broad general answer that is out of the respondent’s control, such as lack
of time, investment, resources or just “human error”. (Lean Six Sigma training material,
2014)
4.6.4 The Affinity Diagram
Brainstorming exercises and root-cause analysis can lead to a large number of potential
root causes. Affinity diagrams allows sorting a larger number of ideas into smaller groups
that only contain related ideas. It can help to identify main categories for potential root
causes to help with later review and analysis exercises. (Lean Six Sigma training mate-
rial, 2014)
4.6.5 Cause and Effect Diagrams
Cause and effect diagrams are used in quality management to identify root causes likely
to be causing or having an impact on a problem. It allows to see linkages between groups
and detailed potential root causes that come up in brainstorming sessions. (Lean Six
Sigma training material, 2014)
Causal diagrams, also known as Ishikawa or fishbone diagrams, are tree-diagrams that
show the causes of a specific event. Each cause can be an imperfection or source of
variation and these are typically categorized into people, methods, machines, systems,
measurements or environmental factors depending on the process.
29 (48)
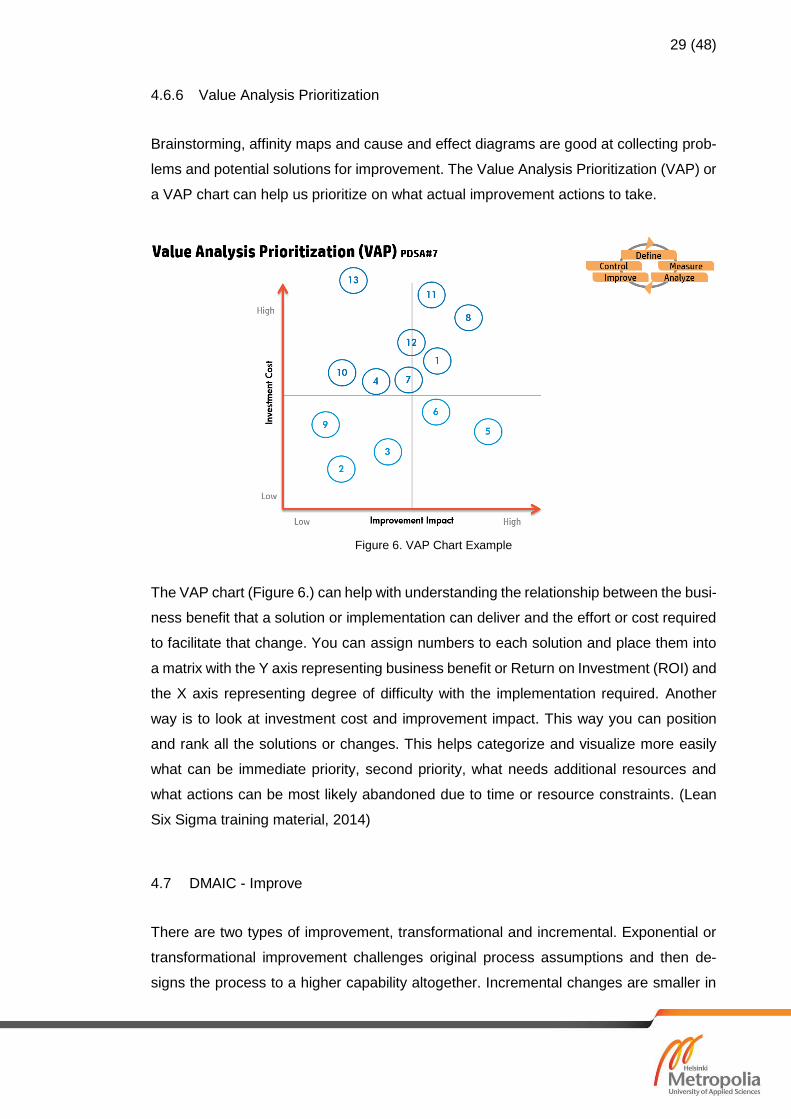
4.6.6 Value Analysis Prioritization
Brainstorming, affinity maps and cause and effect diagrams are good at collecting prob-
lems and potential solutions for improvement. The Value Analysis Prioritization (VAP) or
a VAP chart can help us prioritize on what actual improvement actions to take.
Figure 6. VAP Chart Example
The VAP chart (Figure 6.) can help with understanding the relationship between the busi-
ness benefit that a solution or implementation can deliver and the effort or cost required
to facilitate that change. You can assign numbers to each solution and place them into
a matrix with the Y axis representing business benefit or Return on Investment (ROI) and
the X axis representing degree of difficulty with the implementation required. Another
way is to look at investment cost and improvement impact. This way you can position
and rank all the solutions or changes. This helps categorize and visualize more easily
what can be immediate priority, second priority, what needs additional resources and
what actions can be most likely abandoned due to time or resource constraints. (Lean
Six Sigma training material, 2014)
4.7 DMAIC - Improve
There are two types of improvement, transformational and incremental. Exponential or
transformational improvement challenges original process assumptions and then de-
signs the process to a higher capability altogether. Incremental changes are smaller in
30 (48)
nature and progress step-by-steps via smaller changes that eventually lead to a higher
capability. There is an inherent benefit in generating as many potential solutions as pos-
sible for each of the root causes identified that can be later in the process narrowed down
or combined into one overall solution or a combination of different solutions that address
the original business problem. (Lean Six Sigma training material, 2014)
To-be process maps and high-level implementation plans are usually drafted and piloted.
Usually picking the most obvious, simple and easiest solutions to implement first. Testing
solutions via performing quick Plan-Do-Study-Act cycles and finally implementing and
verifying the final solutions and changes.
4.8 DMAIC - Control
The final control stage is for establishing control measures and monitoring the improve-
ments in an effort to ensure sustainable results, to being able to “sustain the gain”. A
control plan is usually created and any documentation, process or training material is
updated. Financial and other benefits are calculated for review. (Lean Six Sigma training
material, 2014)
4.8.1 Control Charts
As per Lean Six Sigma training material (2014) volume and trend charts are an easy way
to measure project success. With the correct measures put in place it will be easy to say
if the changes have resulted in an improvement and whether the project goals were met.
A stable, predictable process is a requirement for achieving and maintaining quality.
The definition of variation is the measurable difference in values or characteristics that
vary over time or location. Understanding of variation is necessary for troubleshooting
and problem resolution. Causes for variation can be inherent in the process affecting
everyone working in the process and affecting the outcome of the process. This is called
common cause variation. Variation can also arise from specific circumstances that are
called special cause variation. A stable process that meets requirements can have some
variation, if only emerging from common or system caused causes, and the variation is
31 (48)
predictable, remains essentially stable over time or within statistically established speci-
fication limits. A process where both common and special causes are rampant can be
described as an unstable process and is detrimental to the overall quality of the process.
Control charts are statistical tools used to help assess process performance or examine
variation in a process. To be used as a guide to improving a process and whether po-
tential variation is caused by either common or special causes. They can be used to
demonstrate process stability and predictability over time or to show process instability
and level of variation present. Control charts can help answer questions like how does a
process measure vary over time, is the process stable or unstable, is it within control
limits and did the changes match predictions or potentially cause a process to become
more unstable? (Lean Six Sigma training material, 2014)
The construction of a control chart, for example like an individuals and moving range
chart (I-MR) starts with
1) Selecting a process characteristic to measure or control
2) Collecting data
3) Establishing control by finding and eliminating any special causes
4) Constructing the control chart
5) Using them as part of control purposes and activities moving forward.
5 Improving Customer Self-Service rate in Finland
This chapter focuses on the practical application of the Lean Six Sigma improvement
process and the project framework as well as the tools described in the previous chapter.
How these tools were used in the Customer Self-Service improvement project.
5.1 Current State Analysis
This section focuses on the case organization and evaluating the current state and the
business problem.
32 (48)
5.1.1 Case Organization
This improvement project was done for a large international Information Technology (IT)
company operating in Finland that provides products, technologies, solutions and ser-
vices to consumers and businesses.
5.1.2 Problem Statement & Target
The purpose of this project was to improve the customer self-service rate in Finland and
lower the total costs of service delivery. This was aligned with the overall organizational
goals and targets.
5.1.3 Measurement & Data Collection
Case reports were used to assess the baseline performance. A period of six months prior
to project start was chosen to be used as a baseline. This measurement period was
assessed to be long enough to account for any variation and long enough to determine
the baseline performance reliably. A six month period one month after project start was
decided to be the start of the measurement period to see if improvements were made.
This also provided us with a comparison to the earlier baseline that could be used in the
final report.
The six month average for onsite- and customer self-service rates were measured. The
overall number of cases were needed to be able to calculate actual business impact in
euros. During the project it was also introduced that customer satisfaction should be
measured although not a metric that the project success was measured on. By perform-
ing any changes during the project, it was important to make sure that it did not inadvert-
ently impact customer satisfaction negatively.
5.2 Project charter
As stated, improving the self-service rate in Finland was aligned with the overall strategic
goals in the service delivery organization for increasing automation, providing remote
33 (48)
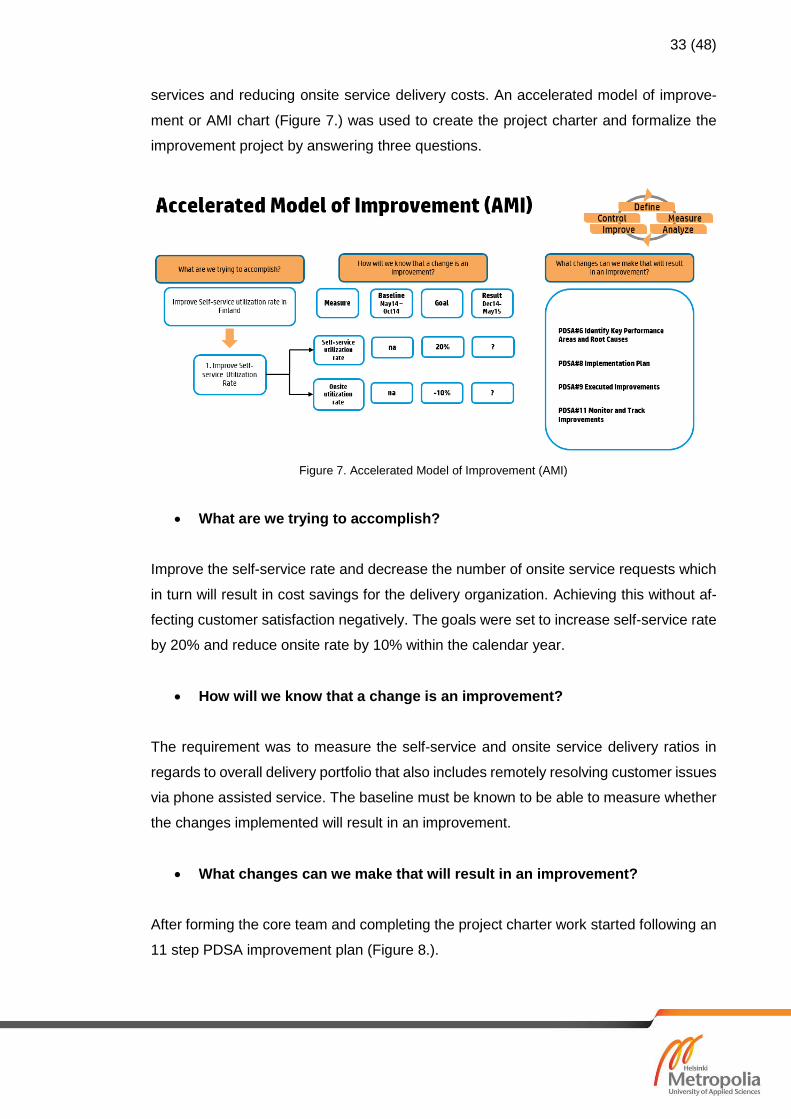
services and reducing onsite service delivery costs. An accelerated model of improve-
ment or AMI chart (Figure 7.) was used to create the project charter and formalize the
improvement project by answering three questions.
Figure 7. Accelerated Model of Improvement (AMI)
What are we trying to accomplish?
Improve the self-service rate and decrease the number of onsite service requests which
in turn will result in cost savings for the delivery organization. Achieving this without af-
fecting customer satisfaction negatively. The goals were set to increase self-service rate
by 20% and reduce onsite rate by 10% within the calendar year.
How will we know that a change is an improvement?
The requirement was to measure the self-service and onsite service delivery ratios in
regards to overall delivery portfolio that also includes remotely resolving customer issues
via phone assisted service. The baseline must be known to be able to measure whether
the changes implemented will result in an improvement.
What changes can we make that will result in an improvement?
After forming the core team and completing the project charter work started following an
11 step PDSA improvement plan (Figure 8.).
34 (48)
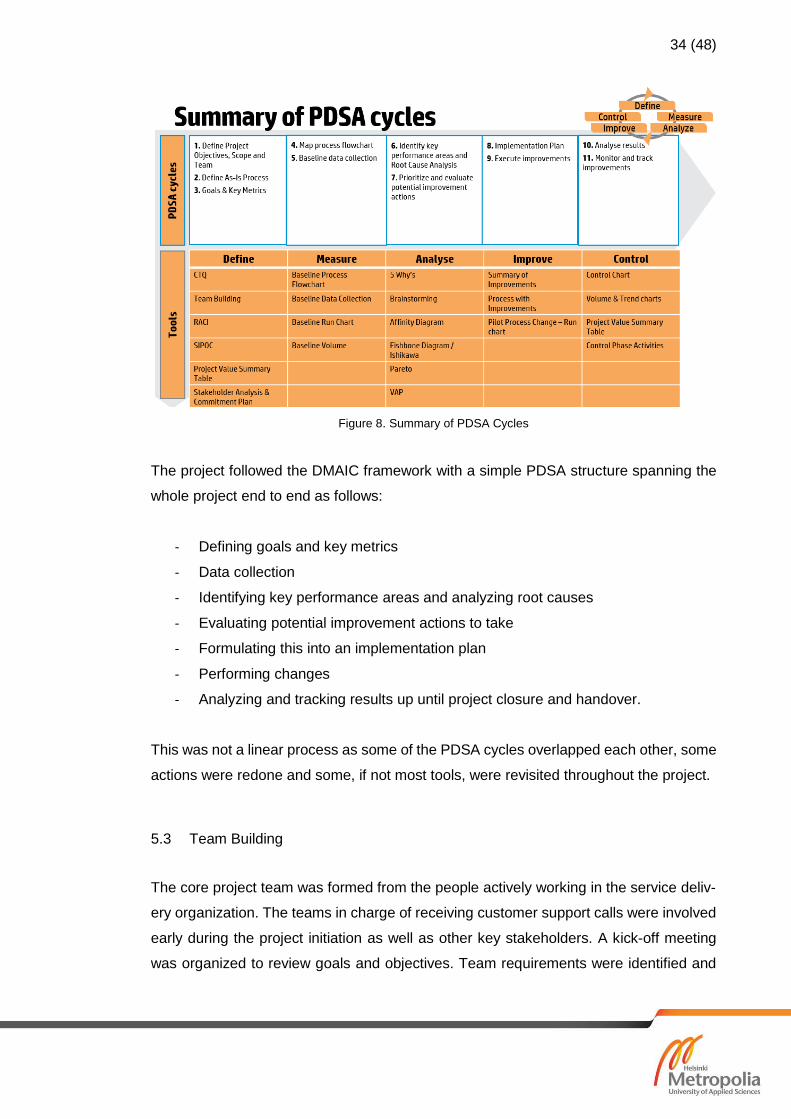
Figure 8. Summary of PDSA Cycles
The project followed the DMAIC framework with a simple PDSA structure spanning the
whole project end to end as follows:
- Defining goals and key metrics
- Data collection
- Identifying key performance areas and analyzing root causes
- Evaluating potential improvement actions to take
- Formulating this into an implementation plan
- Performing changes
- Analyzing and tracking results up until project closure and handover.
This was not a linear process as some of the PDSA cycles overlapped each other, some
actions were redone and some, if not most tools, were revisited throughout the project.
5.3 Team Building
The core project team was formed from the people actively working in the service deliv-
ery organization. The teams in charge of receiving customer support calls were involved
early during the project initiation as well as other key stakeholders. A kick-off meeting
was organized to review goals and objectives. Team requirements were identified and
35 (48)
the key stakeholders who would need to be involved. Workshops for brainstorming ac-
tivities together with the local business leads were organized and call centre agents con-
tacted directly for feedback and further improvement ideas.
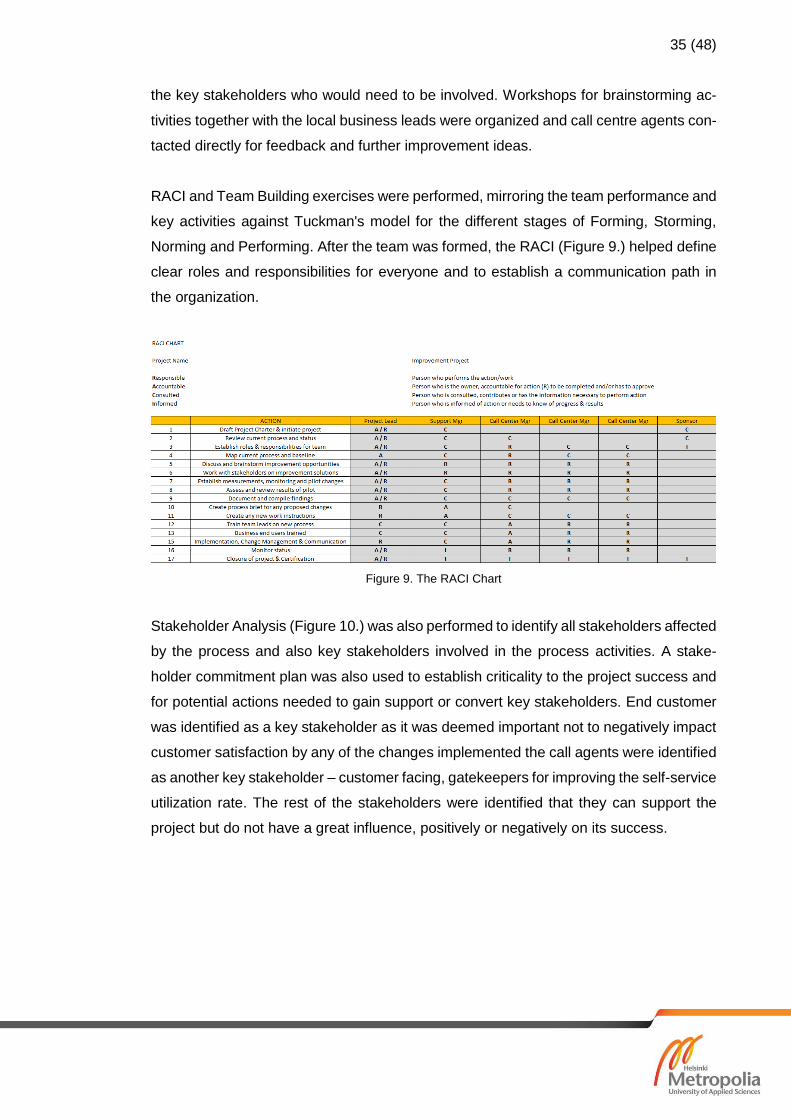
RACI and Team Building exercises were performed, mirroring the team performance and
key activities against Tuckman's model for the different stages of Forming, Storming,
Norming and Performing. After the team was formed, the RACI (Figure 9.) helped define
clear roles and responsibilities for everyone and to establish a communication path in
the organization.
Figure 9. The RACI Chart
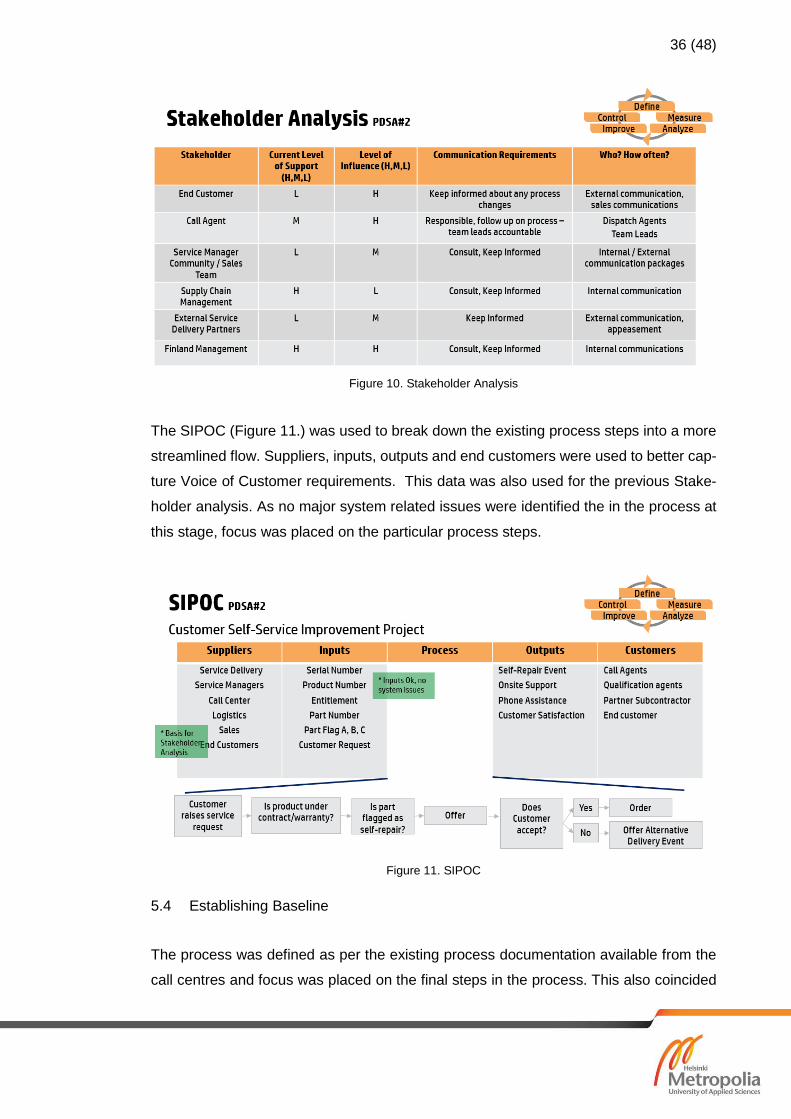
Stakeholder Analysis (Figure 10.) was also performed to identify all stakeholders affected
by the process and also key stakeholders involved in the process activities. A stake-
holder commitment plan was also used to establish criticality to the project success and
for potential actions needed to gain support or convert key stakeholders. End customer
was identified as a key stakeholder as it was deemed important not to negatively impact
customer satisfaction by any of the changes implemented the call agents were identified
as another key stakeholder – customer facing, gatekeepers for improving the self-service
utilization rate. The rest of the stakeholders were identified that they can support the
project but do not have a great influence, positively or negatively on its success.
36 (48)
Figure 10. Stakeholder Analysis
The SIPOC (Figure 11.) was used to break down the existing process steps into a more
streamlined flow. Suppliers, inputs, outputs and end customers were used to better cap-
ture Voice of Customer requirements. This data was also used for the previous Stake-
holder analysis. As no major system related issues were identified the in the process at
this stage, focus was placed on the particular process steps.
Figure 11. SIPOC
5.4 Establishing Baseline
The process was defined as per the existing process documentation available from the
call centres and focus was placed on the final steps in the process. This also coincided
37 (48)
with the SIPOC findings from earlier. Focusing on the steps when the call agent or qual-
ifier offers self-service to the customer and whether the customer accepts or declines
this offer. As the self-service process is globally followed, there was no reason such a
large difference in performance between the other countries and Finland has been ex-
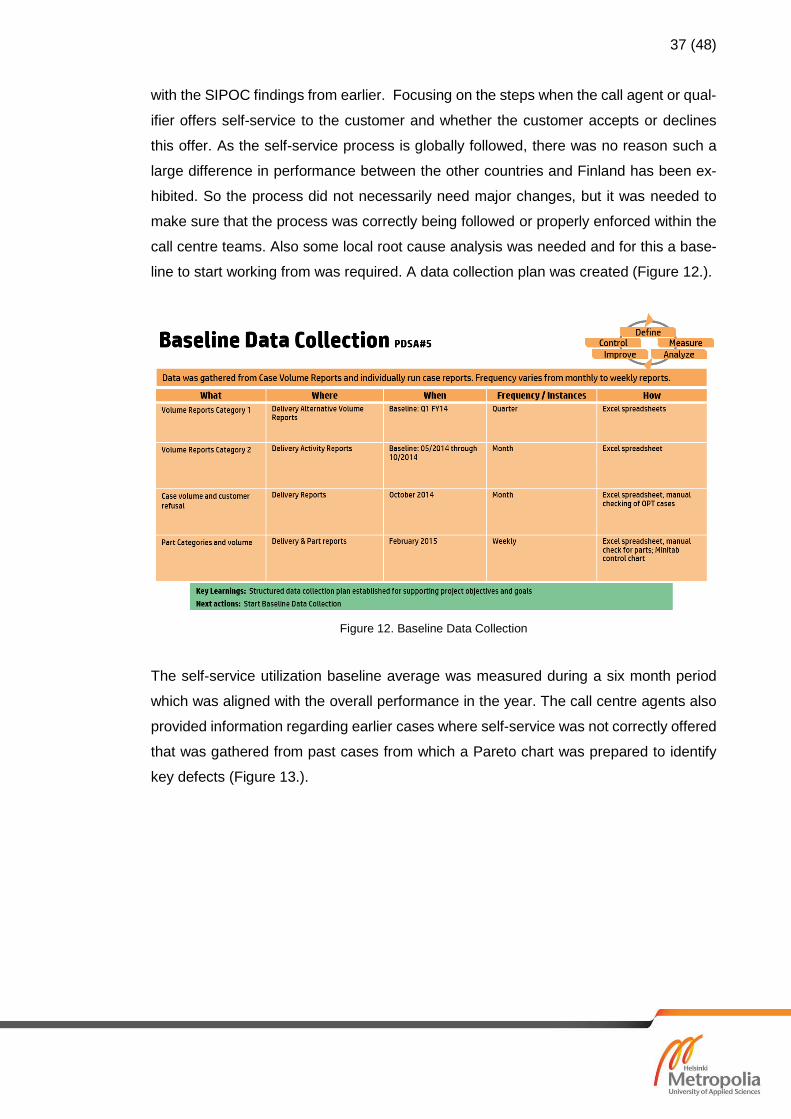
hibited. So the process did not necessarily need major changes, but it was needed to
make sure that the process was correctly being followed or properly enforced within the
call centre teams. Also some local root cause analysis was needed and for this a base-
line to start working from was required. A data collection plan was created (Figure 12.).
Figure 12. Baseline Data Collection
The self-service utilization baseline average was measured during a six month period
which was aligned with the overall performance in the year. The call centre agents also
provided information regarding earlier cases where self-service was not correctly offered
that was gathered from past cases from which a Pareto chart was prepared to identify
key defects (Figure 13.).
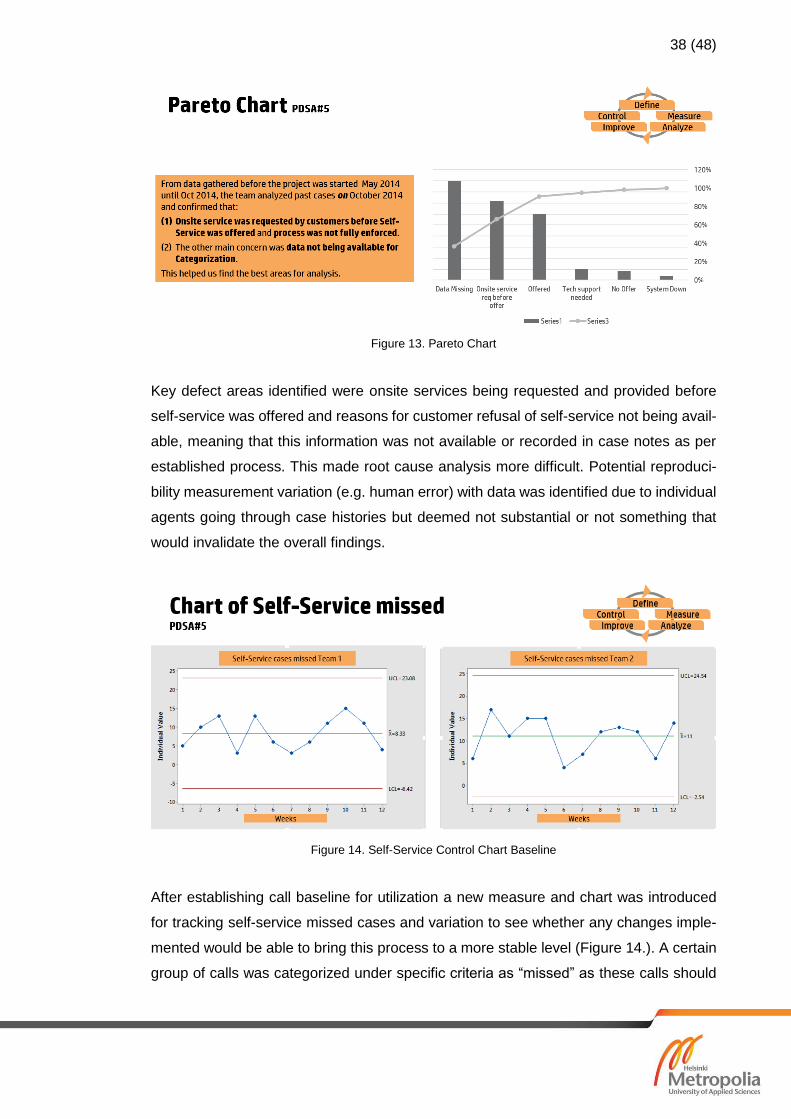
38 (48)
Figure 13. Pareto Chart
Key defect areas identified were onsite services being requested and provided before
self-service was offered and reasons for customer refusal of self-service not being avail-
able, meaning that this information was not available or recorded in case notes as per
established process. This made root cause analysis more difficult. Potential reproduci-
bility measurement variation (e.g. human error) with data was identified due to individual
agents going through case histories but deemed not substantial or not something that
would invalidate the overall findings.
Figure 14. Self-Service Control Chart Baseline
After establishing call baseline for utilization a new measure and chart was introduced
for tracking self-service missed cases and variation to see whether any changes imple-
mented would be able to bring this process to a more stable level (Figure 14.). A certain
group of calls was categorized under specific criteria as “missed” as these calls should
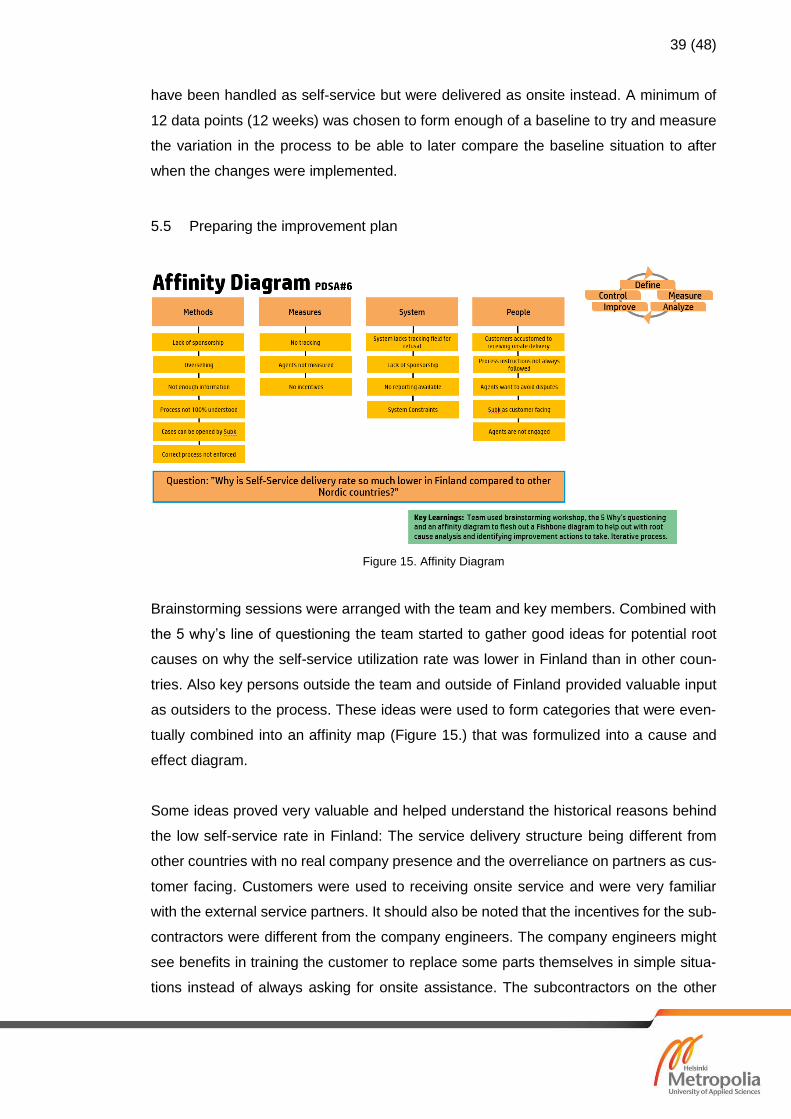
39 (48)
have been handled as self-service but were delivered as onsite instead. A minimum of
12 data points (12 weeks) was chosen to form enough of a baseline to try and measure
the variation in the process to be able to later compare the baseline situation to after
when the changes were implemented.
5.5 Preparing the improvement plan
Figure 15. Affinity Diagram
Brainstorming sessions were arranged with the team and key members. Combined with
the 5 why’s line of questioning the team started to gather good ideas for potential root
causes on why the self-service utilization rate was lower in Finland than in other coun-
tries. Also key persons outside the team and outside of Finland provided valuable input
as outsiders to the process. These ideas were used to form categories that were even-
tually combined into an affinity map (Figure 15.) that was formulized into a cause and
effect diagram.
Some ideas proved very valuable and helped understand the historical reasons behind
the low self-service rate in Finland: The service delivery structure being different from
other countries with no real company presence and the overreliance on partners as cus-
tomer facing. Customers were used to receiving onsite service and were very familiar
with the external service partners. It should also be noted that the incentives for the sub-
contractors were different from the company engineers. The company engineers might
see benefits in training the customer to replace some parts themselves in simple situa-
tions instead of always asking for onsite assistance. The subcontractors on the other
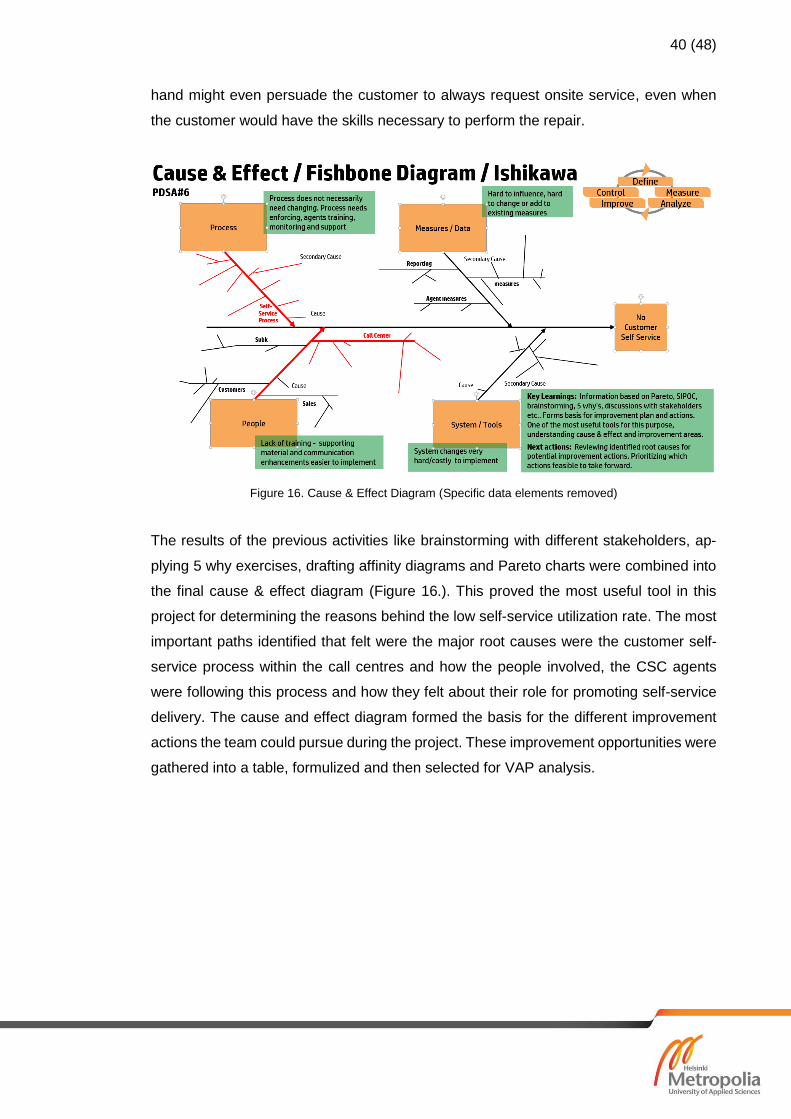
40 (48)
hand might even persuade the customer to always request onsite service, even when
the customer would have the skills necessary to perform the repair.
Figure 16. Cause & Effect Diagram (Specific data elements removed)
The results of the previous activities like brainstorming with different stakeholders, ap-
plying 5 why exercises, drafting affinity diagrams and Pareto charts were combined into
the final cause & effect diagram (Figure 16.). This proved the most useful tool in this
project for determining the reasons behind the low self-service utilization rate. The most
important paths identified that felt were the major root causes were the customer self-
service process within the call centres and how the people involved, the CSC agents
were following this process and how they felt about their role for promoting self-service
delivery. The cause and effect diagram formed the basis for the different improvement
actions the team could pursue during the project. These improvement opportunities were
gathered into a table, formulized and then selected for VAP analysis.
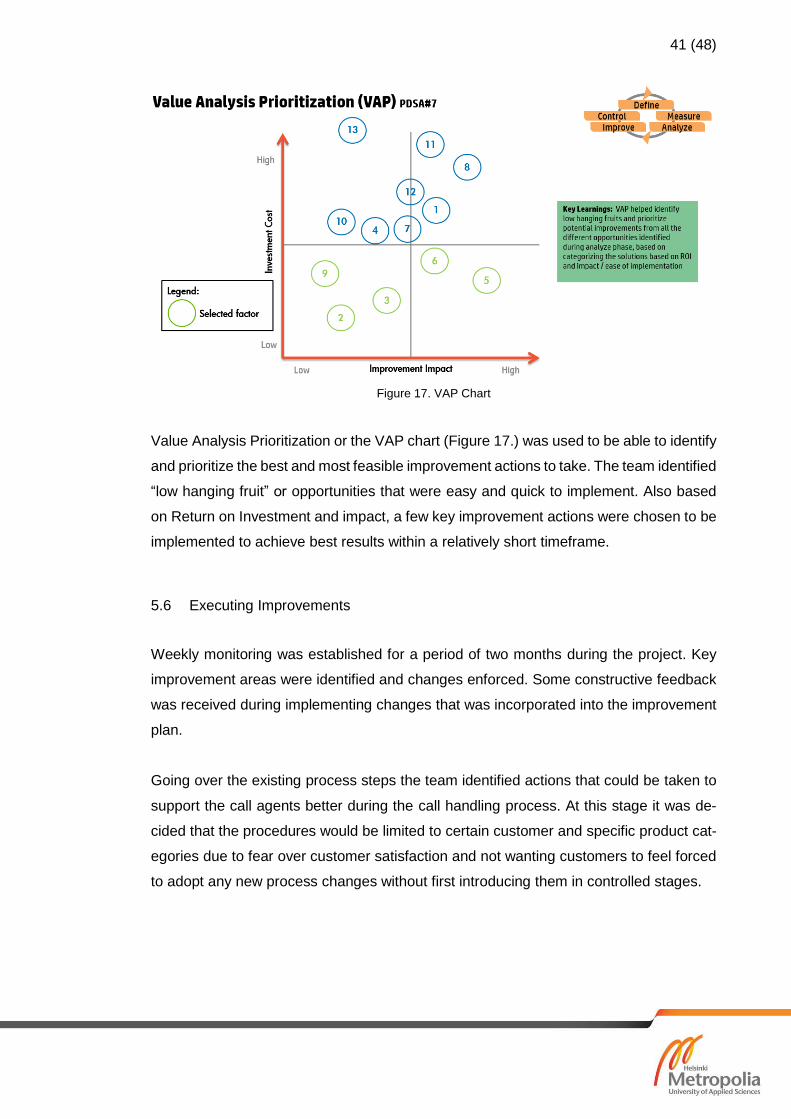
41 (48)
Figure 17. VAP Chart
Value Analysis Prioritization or the VAP chart (Figure 17.) was used to be able to identify
and prioritize the best and most feasible improvement actions to take. The team identified
“low hanging fruit” or opportunities that were easy and quick to implement. Also based
on Return on Investment and impact, a few key improvement actions were chosen to be
implemented to achieve best results within a relatively short timeframe.
5.6 Executing Improvements
Weekly monitoring was established for a period of two months during the project. Key
improvement areas were identified and changes enforced. Some constructive feedback
was received during implementing changes that was incorporated into the improvement
plan.
Going over the existing process steps the team identified actions that could be taken to
support the call agents better during the call handling process. At this stage it was de-
cided that the procedures would be limited to certain customer and specific product cat-
egories due to fear over customer satisfaction and not wanting customers to feel forced
to adopt any new process changes without first introducing them in controlled stages.
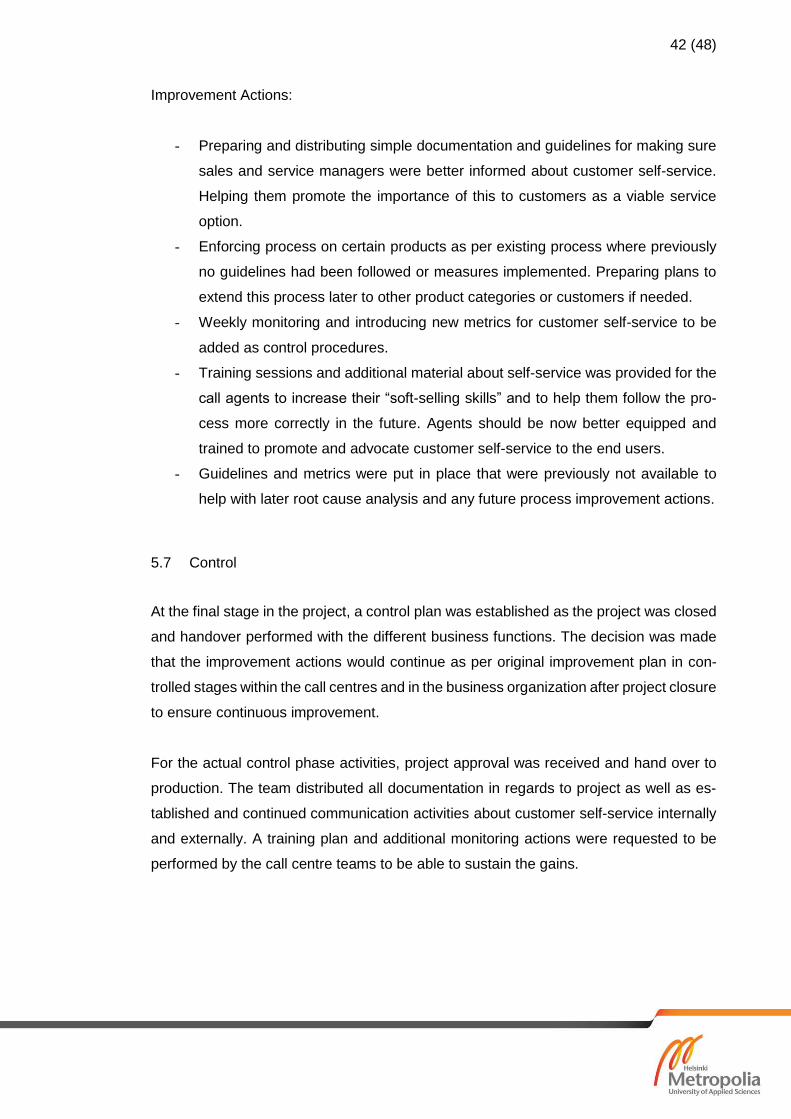
42 (48)
Improvement Actions:
- Preparing and distributing simple documentation and guidelines for making sure
sales and service managers were better informed about customer self-service.
Helping them promote the importance of this to customers as a viable service
option.
- Enforcing process on certain products as per existing process where previously
no guidelines had been followed or measures implemented. Preparing plans to
extend this process later to other product categories or customers if needed.
- Weekly monitoring and introducing new metrics for customer self-service to be
added as control procedures.
- Training sessions and additional material about self-service was provided for the
call agents to increase their “soft-selling skills” and to help them follow the pro-
cess more correctly in the future. Agents should be now better equipped and
trained to promote and advocate customer self-service to the end users.
- Guidelines and metrics were put in place that were previously not available to
help with later root cause analysis and any future process improvement actions.
5.7 Control
At the final stage in the project, a control plan was established as the project was closed
and handover performed with the different business functions. The decision was made
that the improvement actions would continue as per original improvement plan in con-
trolled stages within the call centres and in the business organization after project closure
to ensure continuous improvement.
For the actual control phase activities, project approval was received and hand over to
production. The team distributed all documentation in regards to project as well as es-
tablished and continued communication activities about customer self-service internally
and externally. A training plan and additional monitoring actions were requested to be
performed by the call centre teams to be able to sustain the gains.

43 (48)
Figure 18. Control charts
A control chart (Figure 18.) with stages was utilized to measure the improvements made
after initial measurement period of January until March for the missed opportunities in
self-service. After March a slight drop in the number of missed cases was observed after
the improvement and tracking measures were put in place. The Upper Case and Lower
Case levels narrowed which meant that the process had less variation and was more
stable. There was a small detectable shift in the mean for the missed opportunities in
both team categories meaning that there were less missed opportunities than before so
the process was improved.
6 Results and Further Development
This chapter presents the project results, research findings and ideas for further devel-
opment.
6.1 Results
The purpose of this project was to improve the customer self-service rate in Finland by
20% and lower the overall number of onsite service requests by 10% within the calendar
year. Although the project goal was optimistic and it was known that changes might take
a long time to take effect due to effectively trying to change operating culture, the cus-
tomer self-service rate improved by 19% within a 6 month period in comparison to the
44 (48)
earlier baseline utilization rate. The number of onsite service requests in comparison fell
9% during the same period. Below is a four month trend chart from showing the small
increase in the number of self-service cases and the larger decrease of onsite cases
during this period (Figure 19.).
Overall, the customer self-service rate in certain product categories increased by over
30% during a period of 12 months. Customer satisfaction was not negatively impacted
due to any process changes. Major cost savings were achieved in the organization in
comparison to the old utilization rate if no changes would have been implemented.
Figure 19. Volume and Trend Chart
As a summary, the process changes made were:
- Reinforced customer self-service process, guidelines and metrics within the call
centres and internally in the organization – Improved customer self-service rate
while maintaining customer satisfaction.
- Streamlined and clarified communication about customer self-service – Provided
clear and consistent information, documentation and communication about cus-
tomer self-service, process changes and control plans internally within the organ-
ization and externally to customers.
- Established process improvements, monitoring and measurements not previ-
ously available for customer self-service – Process measurements established
for increasing quality and reducing variation in the process.
45 (48)
6.2 Discussion and further development opportunities
Lean Six Sigma approach and methodology provided a very good framework and set of
tools for process improvement projects and could also be applied to other projects or
business areas. Lean is about facilitating continuous improvement and driving customer
satisfaction. It is about making the process flow as waste- and defect-free as possible.
Six Sigma provided the tools for measurement- and data-based decision making. This
helped to bring the process under control and reduce variation, which in turn helped with
improving quality.
The DMAIC and PDSA models provided a good project framework that was scalable,
easy to follow and structured in a way that guided the work naturally from one stage to
the next, with multiple iteration and improvement cycles in between. There is much po-
tential in applying these tools to improve productivity and efficiency more widely in the
organization, be it in service delivery, manufacturing, logistics or process improvement.
The Lean Six Sigma approach is universal in the sense that it can be utilized in many
different areas and business aspects. If more widely adopted in the organization and
day-to-day work, its applications are numerous.
To be able to improve anything, you first need to be able to measure it as without the
data you cannot really start improving. You need to be able to get a process under control
to be able to standardize and eventually improve. You need to bring people together and
align the team under one common goal. Lean Six Sigma concepts and tools for process
improvement are very useful for establishing a clear baseline, collecting and analyzing
data for identifying the underlying root causes, prioritizing improvements and implement-
ing changes in a controllable and sustainable manner. It also provided the control mech-
anisms to ensure that the improvements are sustainable and that these are not lost once
the project ends. This was a danger that was identified during the project after handover
was done to the business and call centres. Also, some of the tools utilized might not have
been needed to achieve the results. Lean Six Sigma should be approached as a meth-
odology or strategic goal guiding the process, not necessarily just as a toolkit to be ap-
plied without assessing the actual need or requirements for the use of these tools.
The proposal to the company was summarized in an improvement and action plan pre-
pared based on the results of this research. In order to sustain and improve the self-
46 (48)
service rate in Finland, the identified improvement actions should continue in the organ-
ization and be extended more widely in the teams. Further development opportunities lie
with more research into the different aspects of Lean Six Sigma to find the most relevant
applications for everyday business use. In order to sustain the good self-service rate in
Finland, the author recommends that the IT Company should continue with the improve-
ment actions, especially focusing on communication, training, monitoring and control ac-
tivities within the service delivery organization and call centres. In summary, this project
attained its business and research goals but will only serve as a first step on the road for
future improvements within the organization and company.
6.3 Reliability and validity
The Lean Six Sigma approach and methodology during this project proved very useful
during the research process. In general, the research findings can also be applied in
other departments and business areas, be it in manufacturing or services. The presented
approach, tools and concepts should be valuable in any business environment and es-
pecially useful in projects that deal with process or quality improvement due to its nature.
More time will need to pass before it can be fully assessed whether the improvements
made resulted in sustainable and controlled results. Although much emphasis was put
into enabling continuous improvement within the organization it is too early to tell whether
the changes implemented can actually facilitate a permanent procedural or cultural
change within the teams. A gap identified was with the control mechanisms put in place
and whether these were enough to facilitate a long standing change within the organiza-
tion or customers. Also during the research the team found out that it needed to also
include additional metrics for tracking customer satisfaction, although this was not origi-
nally a metric the project success was measured on.
Overall, the results should be reliable enough to be reproducible, although a lot of metrics
are dependable on single variables and some data findings might have reproducibility
issues due to the human factor present during the gathering of the results. None of this
was deemed substantial to warrant questioning the reliability of the results for the project
or the actions taken. The project and research design, statistical and data-driven ap-
proach facilitated that the results should be as valid and reliable as possible.
47 (48)
References
Coghlan, D. & Brannick, T., Doing action research in your own organization. 2014, Sage
GE, What is Six Sigma? [ONLINE] Available at: http://www.ge.com/en/company/compa-
nyinfo/quality/whatis.htm, [Accessed 1 September 2015]
iSixSigma, What is Six Sigma?, http://www.isixsigma.com/new-to-six-sigma/getting-
started/what-six-sigma/, [Accessed 1 September 2015]
Kouri, Ilkka. 2010. Lean-taskukirja. Teknologiateollisuus ry
Lean Enterprise Institute. 2000. A BRIEF HISTORY OF LEAN. [ONLINE] Available at:
http://www.lean.org/WhatsLean/History.cfm. [Accessed 31 August 15].
Lean Enterprise Institute. 2000. What is Lean? [ONLINE] Available at:
http://www.lean.org/whatslean/. [Accessed 31 August 15].
Lean Six Sigma training Material 2014, the company PMO (internal), various authors
Nurmi, Klaus 2015, “Toimeentulotuen jonot lyhenivät autotehtaan opeilla”. Länsiväylä,
16.09.2015
Martin, James William, 2014, 2nd edition 2007, Lean Six Sigma for Supply Chain Man-
agement: A 10-step solution process, McGraw-Hill Education
Michael, George, 2003. Lean Six Sigma for Service: How to Use Lean Speed and Six
Sigma Quality to Improve Services and Transactions. 1 Edition. McGraw-Hill Education.
Modig N & Åhlström P, 2013. Tätä on Lean: Ratkaisu tehokkuusparadoksiin. Rheologica
Publishing
PMI, 2008. A guide to the project management body of knowledge (PMBOK Guide),
Fourth Edition. Project Management Institute, inc
48 (48)
Puolakka, Marjukka, 2015, ”Sairaala järkevöitti logistiikkaansa Toyotan malliin – 5 500
euroa varastointitarpeisiin, 5 000 lisätuntia hoitotyöhön”, Tekniikka & Talous, 27.10.2015
Semkina, Soili, 2015, ”Tehot irti fiksusti”, Kauppalehti, 17.06.2015
Tuominen, Kari, 2010. Lean käytännössä: yritysesimerkkejä tehokkaista lean-
periaatteista ja –käytännöistä. Readme.fi
Womack, James P, 2007. The Machine That Changed the World: The Story of Lean
Production-- Toyota's Secret Weapon in the Global Car Wars That Is Now Revolutioniz-
ing World Industry. Reprint Edition. Free Press.