etunimi sukunimi - theseus
TRANSCRIPT
How to Find Potential Customers
in Southeast United States
Skidder Markets?
Nokian Heavy Tyres Ltd
Marika Holvitie
Master’s Thesis
December 2015
Degree Programme in
International Project
Management
ABSTRACT
Tampereen Ammattikorkeakoulu
Tampere University of Applied Sciences
Degree Program in International Project Management
MARIKA HOLVITIE
How to Find Potential Customers in Southeast United States Skidder Markets?
Nokian Heavy Tyres Ltd
Master’s Thesis, 67 pages plus appendices 9 pages
December 2015
This study was created in order to provide Nokian Heavy Tyres Ltd a better understand-
ing of the overall markets in the United States, the skidder markets in Southeast states
and to find different channels that lead to the end-users.
This work aims to determine whether the different data collection methods and channels
possess the minimum requirements or even potential opportunities that would allow
Nokian Heavy Tyres Ltd, a Finnish special tyre manufacturer, to successfully use them
in a purpose of definition the sales channels.
The methodology used was qualitative research due to the exploratory nature of this
thesis as it intended to provide fundamental insights and uncover trends. The data were
gathered from official organizations, articles, professional magazines and governmental
websites as well as with direct contact by email and phone.
The element of strategic management is analysing strategic position and that is why
theoretical structure for this research lies in PESTEL analysis. The macro-level section
of external market environment includes economic, political and legal, technological,
environmental and socio-cultural aspects. The empirical part of this research consists of
micro-level analysis which investigates skidder tyre markets in the United States and its
main players.
The findings indicate that there are skidder markets in the United States. The overall
market conditions are stable and forest industry has signs of improvements. Harvesting
methods and markets are predicted to remain much the same in future. However differ-
ent trade agreements and duties can have critical outcomes for logging business. Situa-
tion in the Southern states looks promising with rising demand for lumber and logs and
markets are seen as worth investing.
With qualitative research, the information about the markets, channels, customers and
competitors was gathered. Potential customer were found and based on the results, the
best channels were easy to determine according to content and usage.
Keywords: United States, forest industry, skidder markets, logging.
3
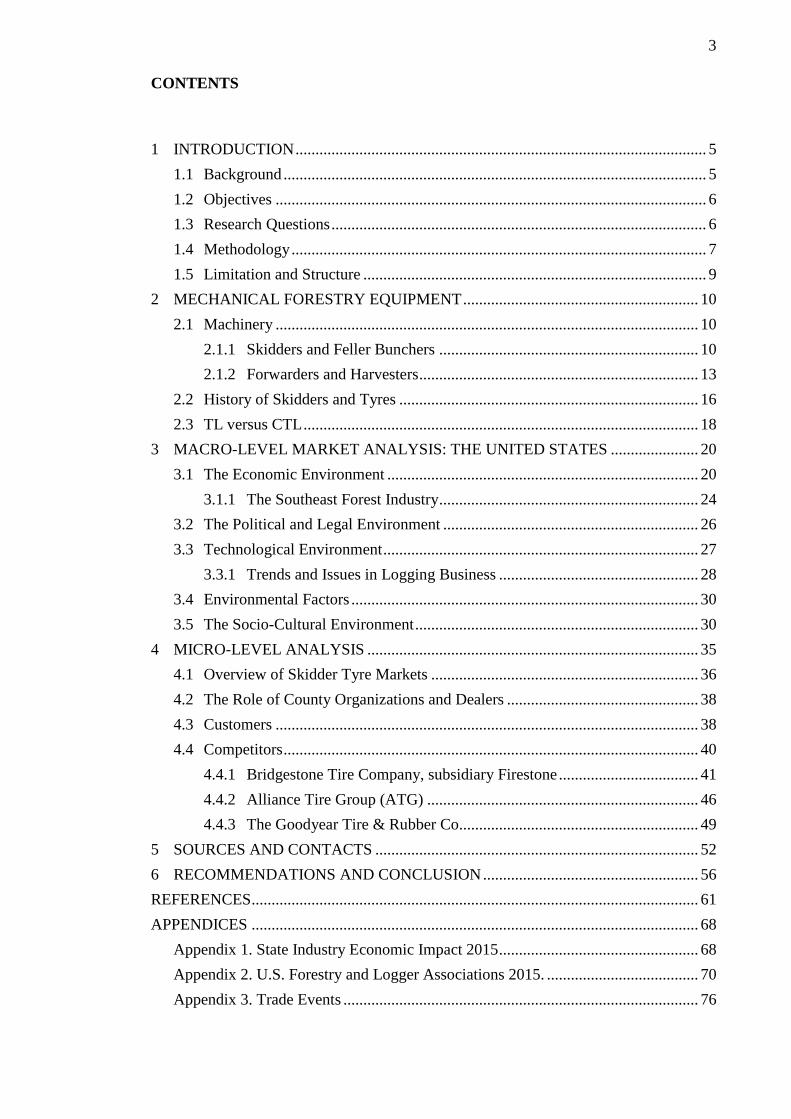
CONTENTS
1 INTRODUCTION ....................................................................................................... 5
1.1 Background .......................................................................................................... 5
1.2 Objectives ............................................................................................................ 6
1.3 Research Questions .............................................................................................. 6
1.4 Methodology ........................................................................................................ 7
1.5 Limitation and Structure ...................................................................................... 9
2 MECHANICAL FORESTRY EQUIPMENT ........................................................... 10
2.1 Machinery .......................................................................................................... 10
2.1.1 Skidders and Feller Bunchers ................................................................. 10
2.1.2 Forwarders and Harvesters ...................................................................... 13
2.2 History of Skidders and Tyres ........................................................................... 16
2.3 TL versus CTL ................................................................................................... 18
3 MACRO-LEVEL MARKET ANALYSIS: THE UNITED STATES ...................... 20
3.1 The Economic Environment .............................................................................. 20
3.1.1 The Southeast Forest Industry ................................................................. 24
3.2 The Political and Legal Environment ................................................................ 26
3.3 Technological Environment ............................................................................... 27
3.3.1 Trends and Issues in Logging Business .................................................. 28
3.4 Environmental Factors ....................................................................................... 30
3.5 The Socio-Cultural Environment ....................................................................... 30
4 MICRO-LEVEL ANALYSIS ................................................................................... 35
4.1 Overview of Skidder Tyre Markets ................................................................... 36
4.2 The Role of County Organizations and Dealers ................................................ 38
4.3 Customers .......................................................................................................... 38
4.4 Competitors ........................................................................................................ 40
4.4.1 Bridgestone Tire Company, subsidiary Firestone ................................... 41
4.4.2 Alliance Tire Group (ATG) .................................................................... 46
4.4.3 The Goodyear Tire & Rubber Co............................................................ 49
5 SOURCES AND CONTACTS ................................................................................. 52
6 RECOMMENDATIONS AND CONCLUSION ...................................................... 56
REFERENCES ................................................................................................................ 61
APPENDICES ................................................................................................................ 68
Appendix 1. State Industry Economic Impact 2015 .................................................. 68
Appendix 2. U.S. Forestry and Logger Associations 2015. ...................................... 70
Appendix 3. Trade Events ......................................................................................... 76
4
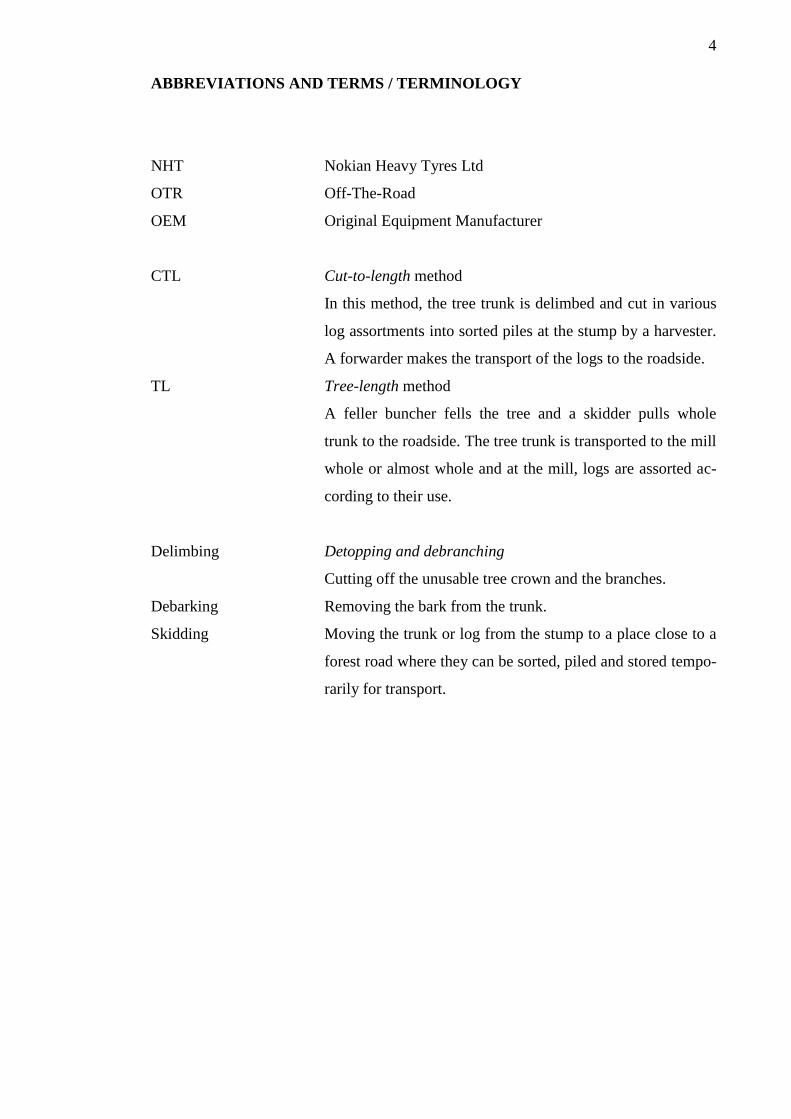
ABBREVIATIONS AND TERMS / TERMINOLOGY
NHT Nokian Heavy Tyres Ltd
OTR Off-The-Road
OEM Original Equipment Manufacturer
CTL Cut-to-length method
In this method, the tree trunk is delimbed and cut in various
log assortments into sorted piles at the stump by a harvester.
A forwarder makes the transport of the logs to the roadside.
TL Tree-length method
A feller buncher fells the tree and a skidder pulls whole
trunk to the roadside. The tree trunk is transported to the mill
whole or almost whole and at the mill, logs are assorted ac-
cording to their use.
Delimbing Detopping and debranching
Cutting off the unusable tree crown and the branches.
Debarking Removing the bark from the trunk.
Skidding Moving the trunk or log from the stump to a place close to a
forest road where they can be sorted, piled and stored tempo-
rarily for transport.
5
1 INTRODUCTION
1.1 Background
The forest industry is now recovering in North America and the future looks promising.
In 2011 a half of the global wood harvesting was done by mechanized methods and it
has been growing all the time (Timber West 2013; Ponsse 2015).
Nokian Heavy Tyres Ltd has manufactured forestry tyres for decades and their products
are known for their extremely high quality. Nokian Heavy Tyres is a clear global market
leader in cut-to-length (CTL) machine forestry tyres. For a couple of years, their prod-
uct range includes tyres to full-tree (FT) / Tree-length (TL) machines, such as skidders.
In the end of 2013, Nokian Heavy Tyres introduced new Nokian Forest King TRS LS-2
tyre for Skidders (Heavy Tyre eNews 2013). Tyre 35.5L-32 is a common size in skid-
ders in North America. Tyre weights almost 600 kg and has 2010 mm diameter. Project
Manager Teemu Vainionpää from Nokian Heavy Tyres Product Development designed
this tyre to meet today’s standards with wide tread and high traction lugs with special
cut and crack resistant compound and steel fortification against punctures.
The bachelor’s thesis by Lahtinen (2011) focused on the global challenges that harvest-
ing is facing now and in the future. In his thesis Lahtinen claims that the CTL method is
the most competitive method to harvest. However, especially in North America the long
history with TL method grows deep in people and that’s why it is seen as a difficult
market area for CTL machines. According to the International Journal of Forest Engi-
neering (2001), rubber tyre skidders and feller bunchers are the most popular timber
harvesting systems especially in the Southern United States.
Harvesting methods in the United States has remained mostly unchanged but are be-
coming more efficient. The skidder markets are dominated by John Deere, Tigercat and
Caterpillar. These manufacturers are investing forestry equipment innovations to in-
crease productivity and are constantly looking for opportunities to reduce owning and
operating costs of their equipment with new features and advanced technology.
6
With these arguments it is only natural that Nokian Heavy Tyres has designed new tyre
family and is searching new markets in North America which is one of the largest coun-
tries using skidders.
1.2 Objectives
This study was created in order to provide Nokian Heavy Tyres a better understanding
of the overall markets in the United States, the skidder markets in Southeast states and
to find different channels that lead to the end-users. This market research is intended to
bring clarification to existing knowledge, provide fundamental insights and uncover
trends.
There have not been previous researches on markets and the information in the com-
pany was based quite much on assumptions and approved methods. The goal was to
solve some open questions about the target market and to provide Nokian Heavy Tyres
reliable and accurate information which would aid them in their decision-making proc-
ess.
1.3 Research Questions
Focus of the thesis was to find different channels that lead to the end-users. Require-
ments for the end-users were that they would own a skidder machine and would be lo-
cated in the Southeast part of the North America. The main research question is:
How to find potential customers in the Southeast United States skidder markets?
In this study end-users are considered as customers, loggers that make the buying deci-
sion. Even though they are not direct customers to Nokian Heavy Tyres as the company
do not sell tyres directly to the end-users but uses different distribution channels such as
tyre shops and dealers.
The emphasis on finding end-users is highly important and especially stresses the fact
that end-users can have various channels to purchase tyres, not only through tyre shops
and dealers.
7
Sub-questions:
- What are the different approaches, channels and data collection methods that can
be used?
- What are the markets alike?
- What are the trends in this competitive environment?
1.4 Methodology
This work aims to determine whether the different data collection methods and channels
possess minimum requirements or even potential opportunities that would allow Nokian
Heavy Tyres to successfully use them in a purpose to define the sales channels.
In order to get the answer to the sub-questions, study will investigate what is the current
opinion of the United States markets and what kind of image market gives itself through
the different indicators and reports. Methodology to be used is qualitative research due
to the exploratory nature of this thesis as it intends to provide fundamental insights and
uncover trends. According to Alasuutari (2011, 24) the qualitative research process is
always unique to some extent and consists of observations and clues. In the research,
observations are reviewed mostly as clues because they are studied through explicitly
defined point of view (ibid. 79).
Analysing and interpreting the possibilities of qualitative data is not limited to one or
two perspectives on what data reflects or evidence (ibid. 88). Research data was gath-
ered from official organizations, articles, professional magazines, governmental web-
sites and a variety of internet sites, online publications as well as with direct contacts by
email and phone. According to Alasuutari (2011, 24) qualitative analysis always deals
with the cultural concepts.
The sources and data that already exist regardless of the research will perform as indica-
tors. When collecting naturally occurring data the term unobtrusive measures is used.
This refers to the observation and data collection in a way that the target group is not
disturbed by the execution of the study (Webb et al. 1966, according to Alasuutari 2011,
84).
8
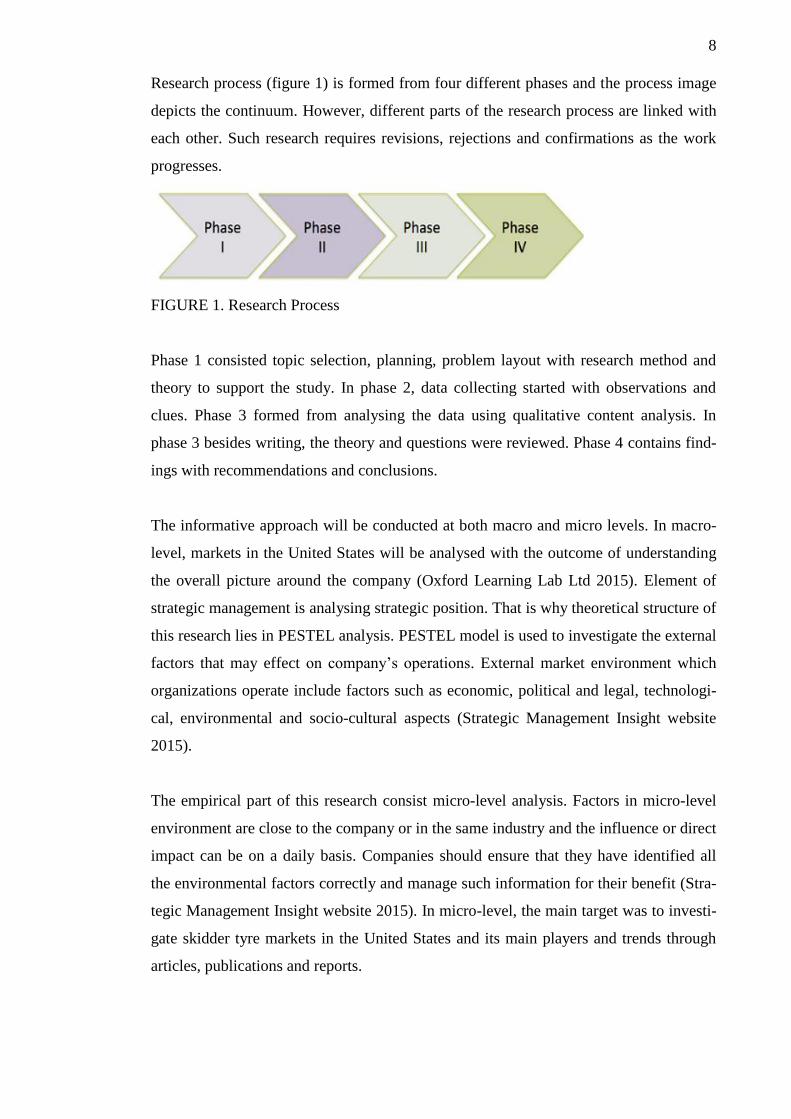
Research process (figure 1) is formed from four different phases and the process image
depicts the continuum. However, different parts of the research process are linked with
each other. Such research requires revisions, rejections and confirmations as the work
progresses.
FIGURE 1. Research Process
Phase 1 consisted topic selection, planning, problem layout with research method and
theory to support the study. In phase 2, data collecting started with observations and
clues. Phase 3 formed from analysing the data using qualitative content analysis. In
phase 3 besides writing, the theory and questions were reviewed. Phase 4 contains find-
ings with recommendations and conclusions.
The informative approach will be conducted at both macro and micro levels. In macro-
level, markets in the United States will be analysed with the outcome of understanding
the overall picture around the company (Oxford Learning Lab Ltd 2015). Element of
strategic management is analysing strategic position. That is why theoretical structure of
this research lies in PESTEL analysis. PESTEL model is used to investigate the external
factors that may effect on company’s operations. External market environment which
organizations operate include factors such as economic, political and legal, technologi-
cal, environmental and socio-cultural aspects (Strategic Management Insight website
2015).
The empirical part of this research consist micro-level analysis. Factors in micro-level
environment are close to the company or in the same industry and the influence or direct
impact can be on a daily basis. Companies should ensure that they have identified all
the environmental factors correctly and manage such information for their benefit (Stra-
tegic Management Insight website 2015). In micro-level, the main target was to investi-
gate skidder tyre markets in the United States and its main players and trends through
articles, publications and reports.
9
1.5 Limitation and Structure
The theory and findings will be given to the company as recommendations to reach tyre
end-users. Information found as a result about the loggers and their businesses, such as
contact and company information, machinery, tyres, purchase channels, experiences and
future prospects, will be given only to the Nokian Heavy Tyres and will not be pub-
lished here. Nokian Heavy Tyres as a company will not be presented in this thesis nor
their actions in a target country.
In chapter one, the introduction of the research with information about the thesis, its
objectives, research questions and methodology is given. The mechanical forestry
equipment is introduced in chapter two in more detail and different harvesting chains
are compared. History of skidders and rubber tyres takes us 50 years back from where
we return to the present day and future technology.
In chapter three, markets in the United States will be analysed in macro-level. In addi-
tion to PESTEL analysis, the Southern forest industry will be examined including the
trends and issues in logging business. After macro-level analysis it is natural to go to
chapter four, where micro-level analysis is done for the tyre markets and its main play-
ers. Customers and competitors will be investigated as well as the impact of dealers and
country organizations.
The different channels, sources and findings are presented in chapter five and in ap-
pendix 2. Information that has been considered sensitive has been edited from the thesis.
Field research has been started with the data received from this research. Field research
is not part of the thesis and results are not published.
Finally, recommendations and conclusions are presented in chapter six. Key issues are
pointed out about the data collection methods and problems, from the overall market
situation with forest industry and Southern states, followed by competitors’ strategic
focus.
10
2 MECHANICAL FORESTRY EQUIPMENT
Ponsse Plc, a Finnish forest machine manufacturer, claims that still around 50% of the
world’s wood harvest is harvested manually, for example using a chainsaw. The re-
maining half is harvested mechanically and those markets are predominated by the tree-
length method TL (60 %) and by the cut-to-length method CTL (40%) (Ponsse 2015).
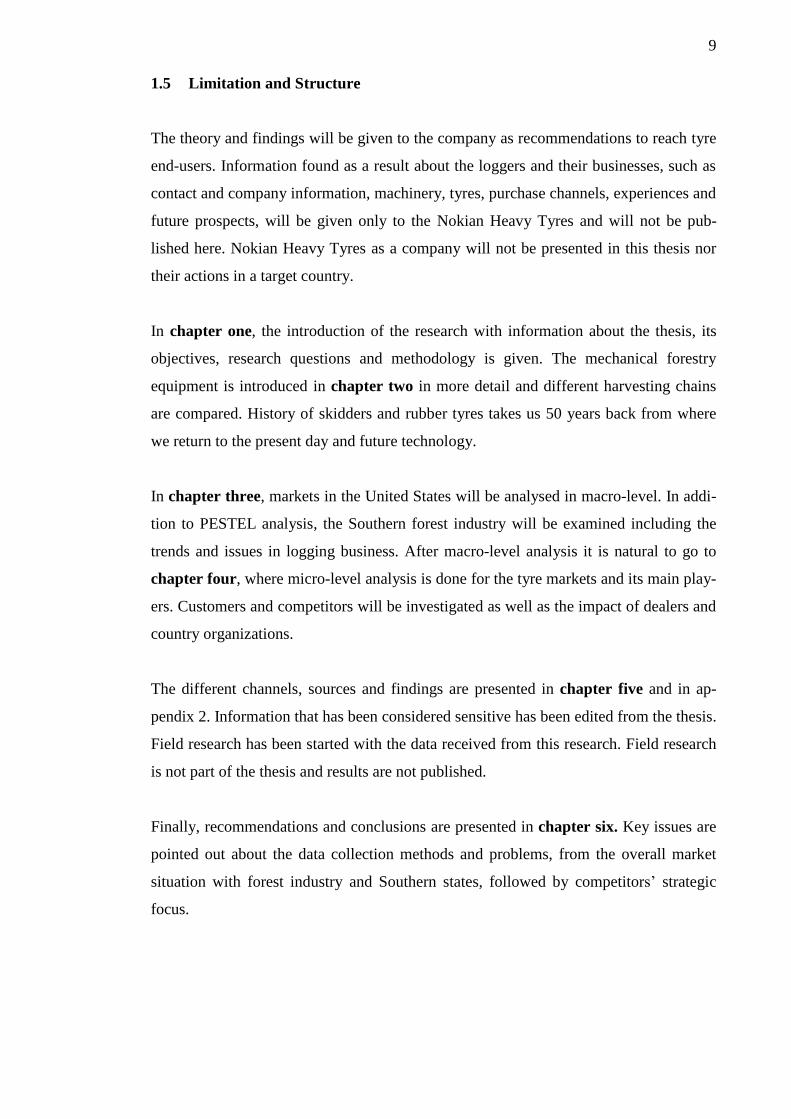
In this thesis, the focus will be on heavy forest machinery used in logging operations
that runs with rubber tyres, such as skidders, feller bunchers, forwarders and harvesters.
Below are descriptions in more detail of these harvesting machines.
PICTURE 1. Skidders and Feller Bunchers (John Deere)
2.1 Machinery
2.1.1 Skidders and Feller Bunchers
In Tree-Length (TL) method, trunks are delimbed and transported to the mill whole or
almost whole. At the mill, trunks are separated according to usage, for example sawlogs
and pulpwood (Ponsse 2015). For this performance, feller bunchers and skidders are
required.
A felling machine such as feller buncher fells the tree and a skidder pulls whole trunk to
the side of the road. A delimber delimbs and tops the trunks. If trunks must be cut for
11
long-distance transport, a slasher will be needed at the roadside. With a crane or sepa-
rate loading machine the trunks or logs are loaded to a timber truck (Ponsse 2015).
The first skidder was introduced in 1951 in the United States (Šušnjar, Horvat, Pandur
& Zorić 2015). Today the market is dominated by John Deere, Tigercat and Caterpillar.
John Deere introduced their 440 Cable Skidder in 1965 and now, in 2015 they celebrate
their 50 years of skidders by launching a whole new L-Series wheeled feller bunchers
and L-series skidders (John Deere 2015).
Cable Skidder
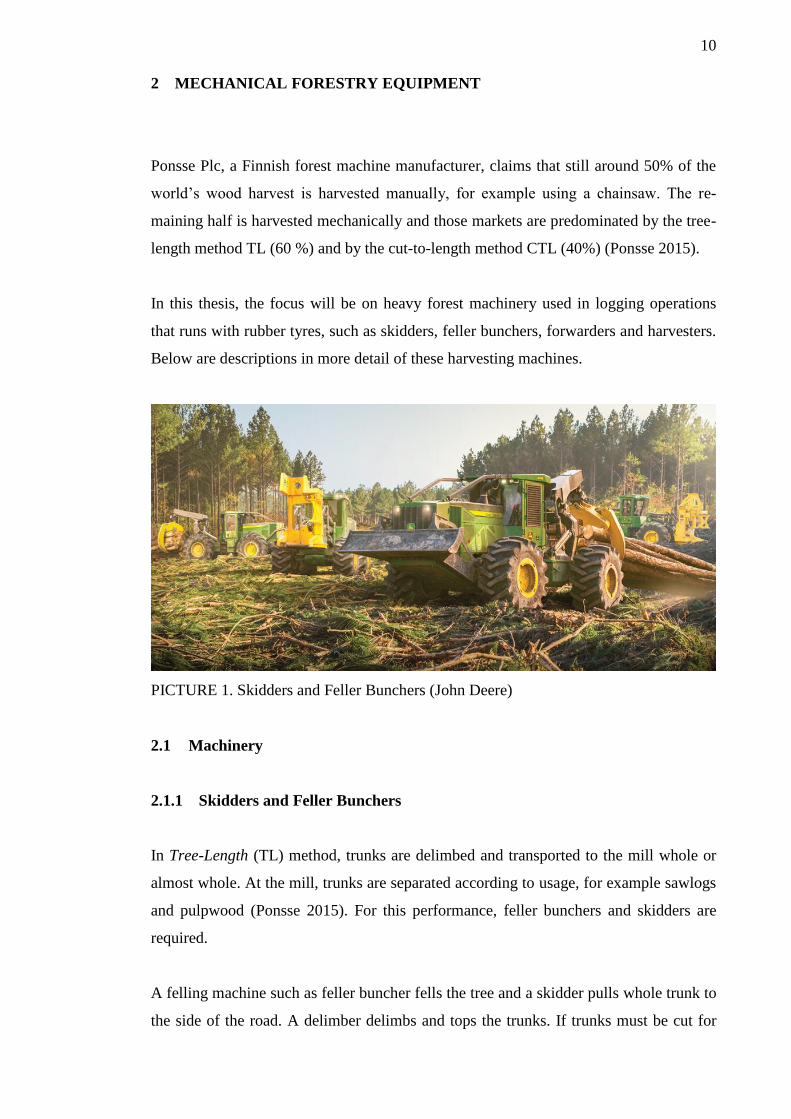
The cable skidder (picture 2) uses a winch. The cable is reeled out and attached to the
timber (by the operator or a second person), then the winch pulls the load to the skidder
and the winch holds the trees while the skidder drags them to a landing area (VanNatta
Logging and Forestry site).
One cause that cable skidders are less popular nowadays might be the reason that it re-
quires tremendous amount of manpower with dragging the cable and hooking it up. Ca-
ble skidders are used especially in steep hills and places where it is not possible to drive
the machine close to the log (Creighton 1997, according to RitchieWiki 2003).
PICTURE 2. Cable Skidder (Global Machinery Network Inc.)
12
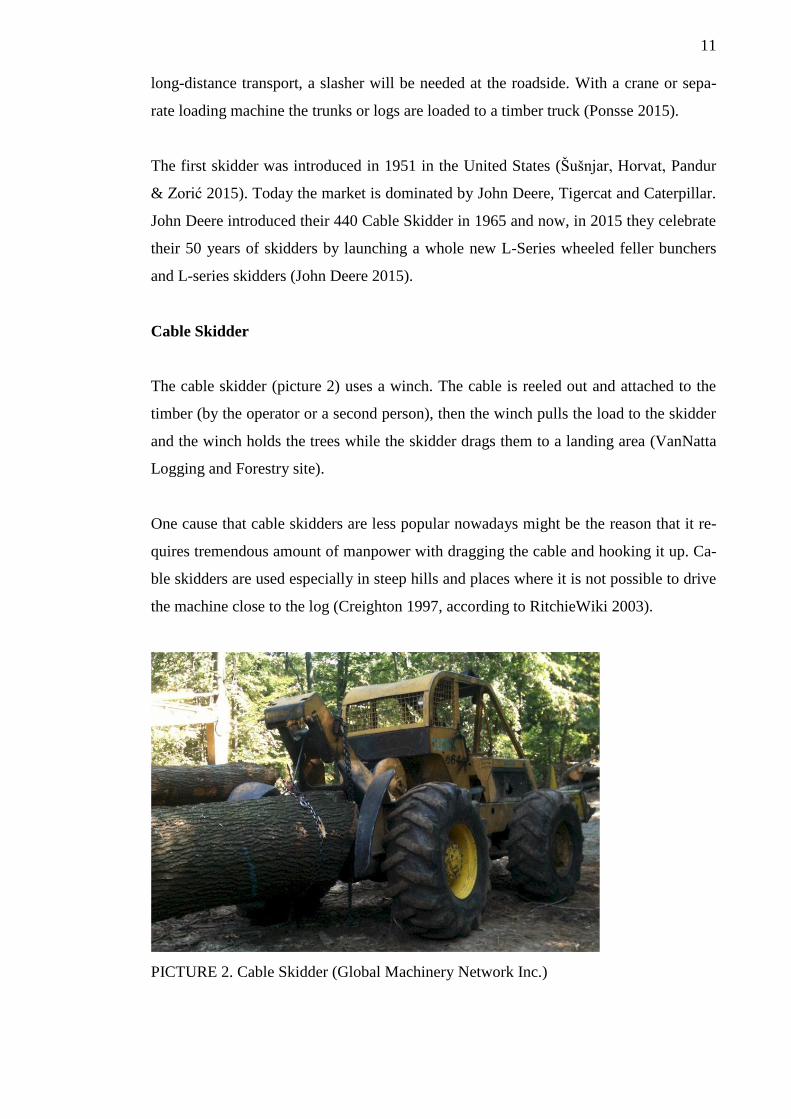
Grapple Skidder
As the name implies, grapple skidder use a hydraulic claw-like attachment to grasp logs.
Grapple skidders are usually used when distances are longer. This is more popular and
faster way of working as hydraulic grapple bucket grabs and lifts the timber. However,
with grapple skidder the operator must be able to back up to a log to pinch up the log/s
(VanNatta Logging and Forestry site).
PICTURE 3. Grapple Skidder (Loggin On)
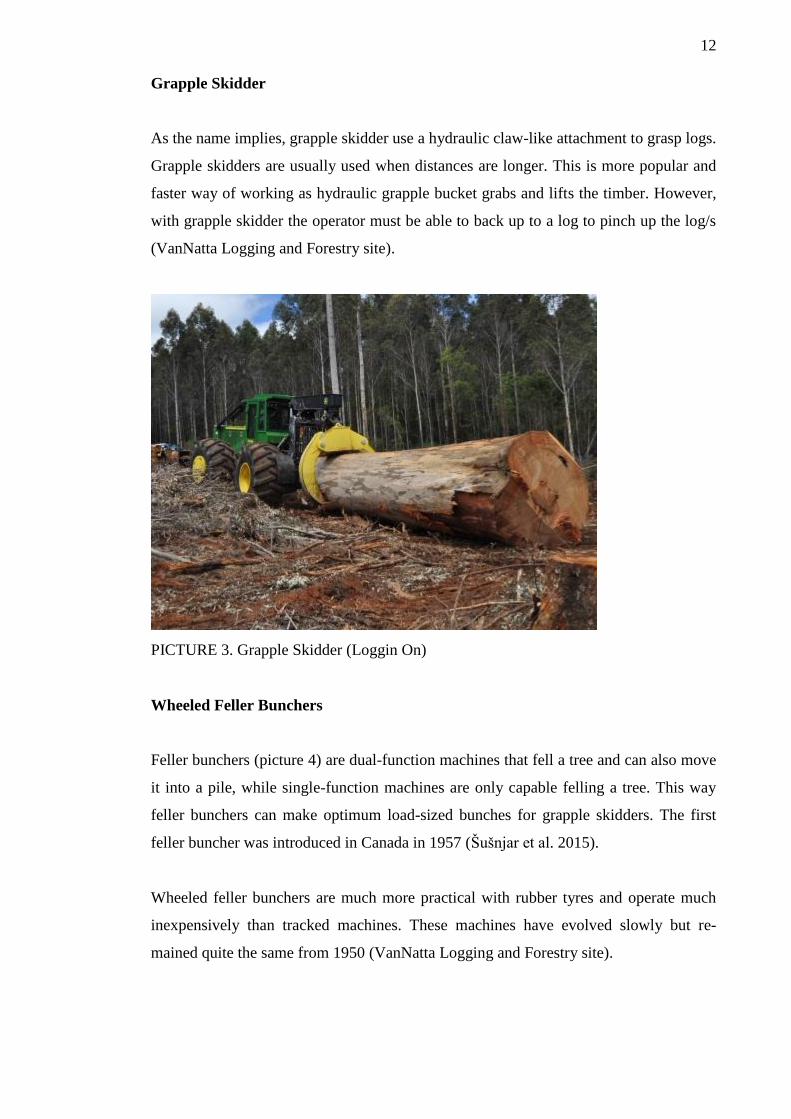
Wheeled Feller Bunchers
Feller bunchers (picture 4) are dual-function machines that fell a tree and can also move
it into a pile, while single-function machines are only capable felling a tree. This way
feller bunchers can make optimum load-sized bunches for grapple skidders. The first
feller buncher was introduced in Canada in 1957 (Šušnjar et al. 2015).
Wheeled feller bunchers are much more practical with rubber tyres and operate much
inexpensively than tracked machines. These machines have evolved slowly but re-
mained quite the same from 1950 (VanNatta Logging and Forestry site).
13
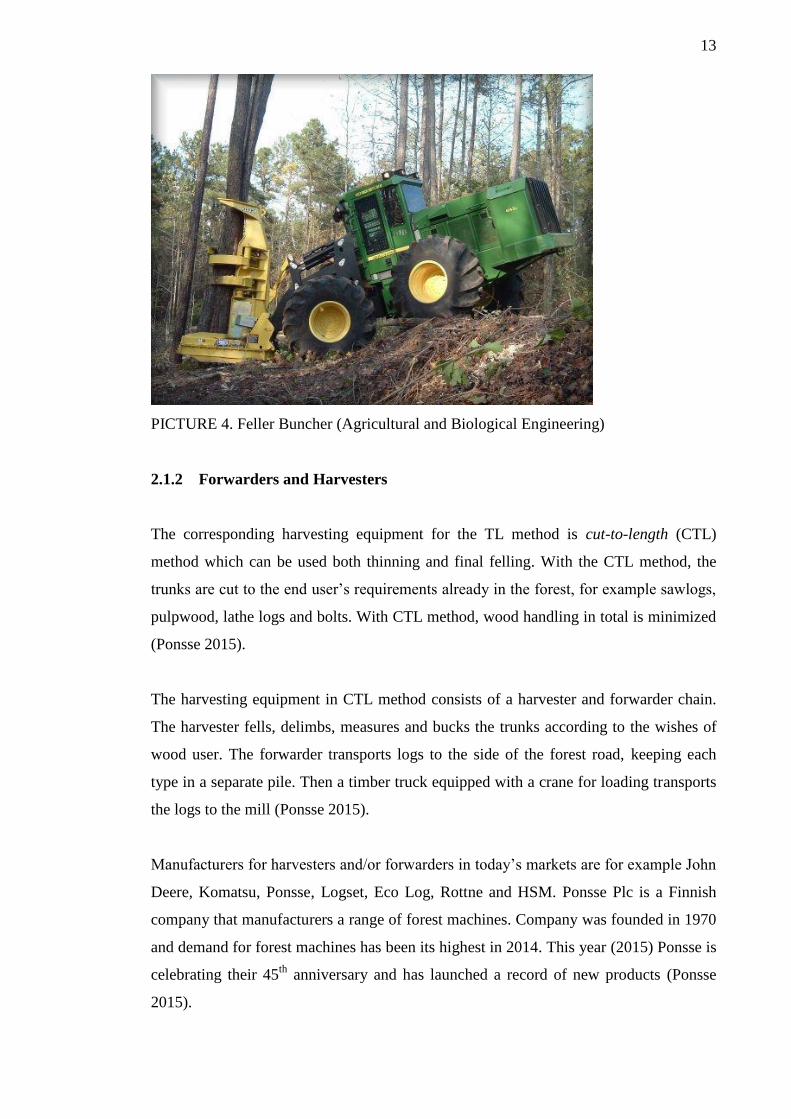
PICTURE 4. Feller Buncher (Agricultural and Biological Engineering)
2.1.2 Forwarders and Harvesters
The corresponding harvesting equipment for the TL method is cut-to-length (CTL)
method which can be used both thinning and final felling. With the CTL method, the
trunks are cut to the end user’s requirements already in the forest, for example sawlogs,
pulpwood, lathe logs and bolts. With CTL method, wood handling in total is minimized
(Ponsse 2015).
The harvesting equipment in CTL method consists of a harvester and forwarder chain.
The harvester fells, delimbs, measures and bucks the trunks according to the wishes of
wood user. The forwarder transports logs to the side of the forest road, keeping each
type in a separate pile. Then a timber truck equipped with a crane for loading transports
the logs to the mill (Ponsse 2015).
Manufacturers for harvesters and/or forwarders in today’s markets are for example John
Deere, Komatsu, Ponsse, Logset, Eco Log, Rottne and HSM. Ponsse Plc is a Finnish
company that manufacturers a range of forest machines. Company was founded in 1970
and demand for forest machines has been its highest in 2014. This year (2015) Ponsse is
celebrating their 45th
anniversary and has launched a record of new products (Ponsse
2015).
14
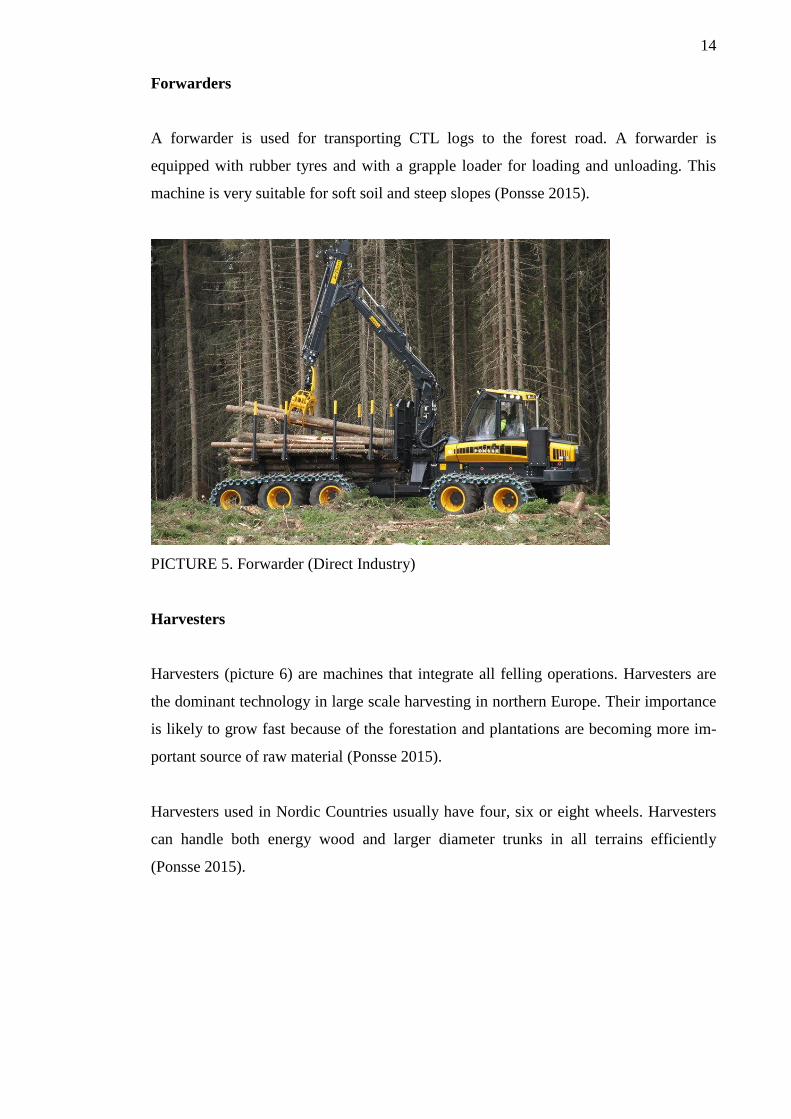
Forwarders
A forwarder is used for transporting CTL logs to the forest road. A forwarder is
equipped with rubber tyres and with a grapple loader for loading and unloading. This
machine is very suitable for soft soil and steep slopes (Ponsse 2015).
PICTURE 5. Forwarder (Direct Industry)
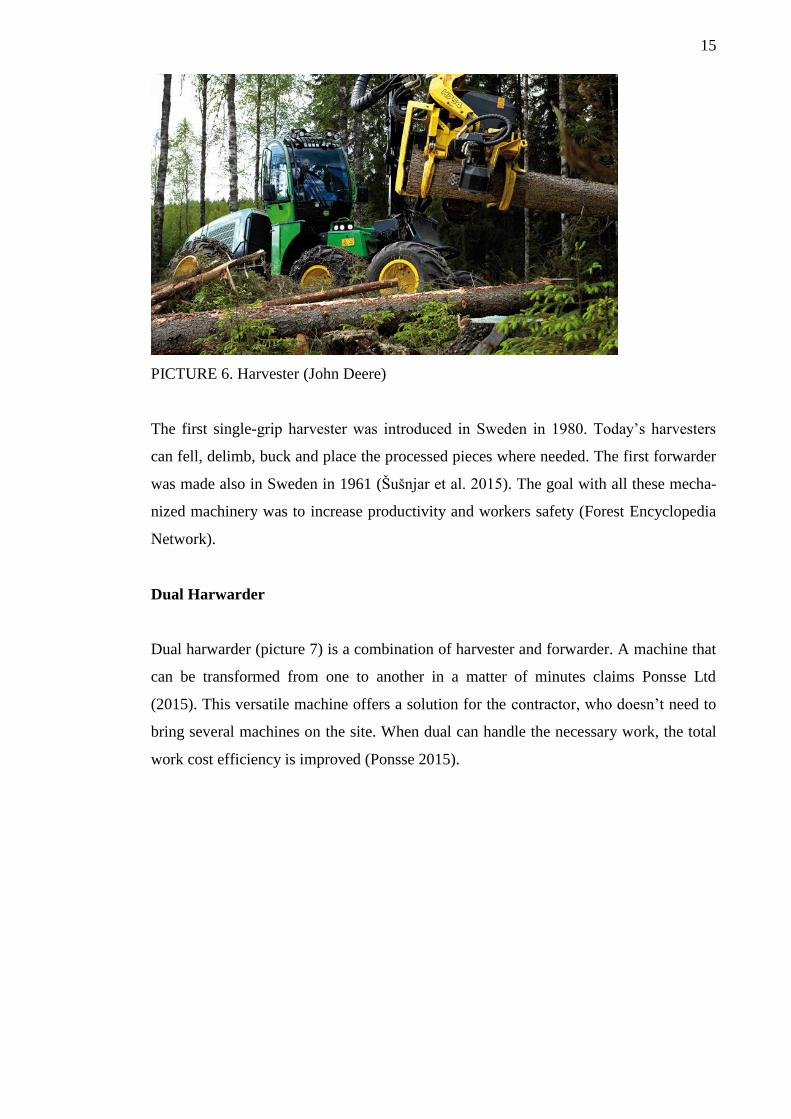
Harvesters
Harvesters (picture 6) are machines that integrate all felling operations. Harvesters are
the dominant technology in large scale harvesting in northern Europe. Their importance
is likely to grow fast because of the forestation and plantations are becoming more im-
portant source of raw material (Ponsse 2015).
Harvesters used in Nordic Countries usually have four, six or eight wheels. Harvesters
can handle both energy wood and larger diameter trunks in all terrains efficiently
(Ponsse 2015).
15
PICTURE 6. Harvester (John Deere)
The first single-grip harvester was introduced in Sweden in 1980. Today’s harvesters
can fell, delimb, buck and place the processed pieces where needed. The first forwarder
was made also in Sweden in 1961 (Šušnjar et al. 2015). The goal with all these mecha-
nized machinery was to increase productivity and workers safety (Forest Encyclopedia
Network).
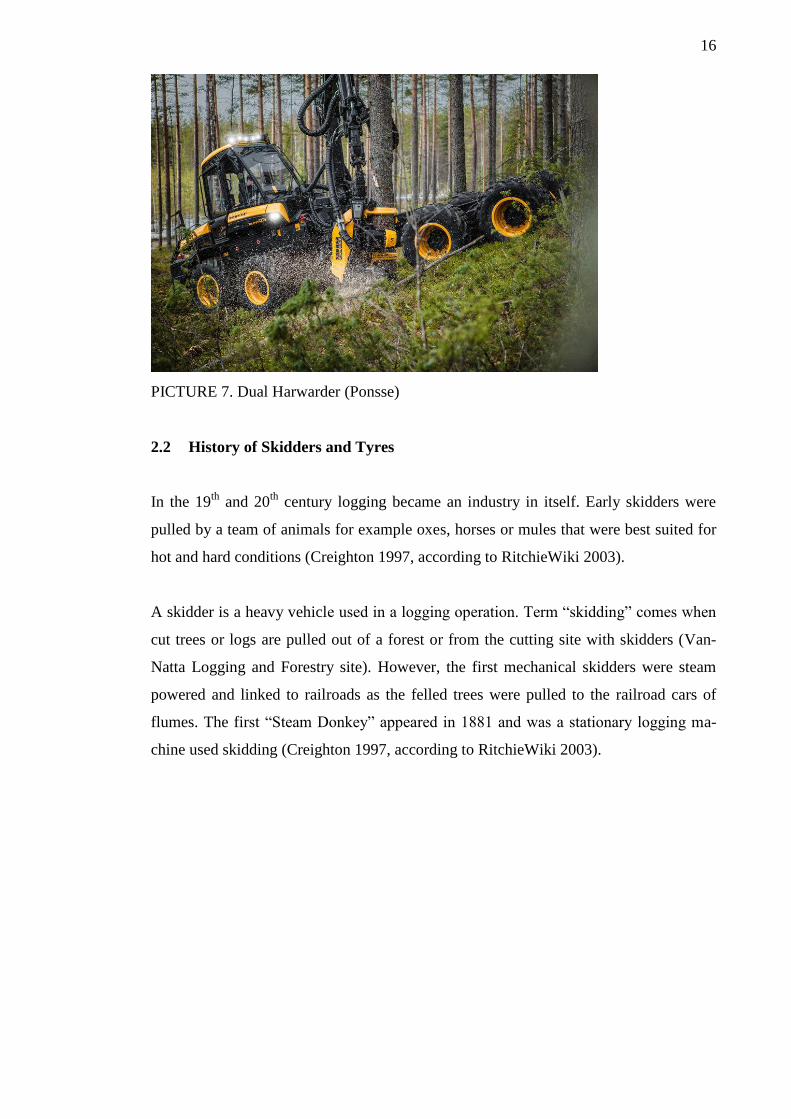
Dual Harwarder
Dual harwarder (picture 7) is a combination of harvester and forwarder. A machine that
can be transformed from one to another in a matter of minutes claims Ponsse Ltd
(2015). This versatile machine offers a solution for the contractor, who doesn’t need to
bring several machines on the site. When dual can handle the necessary work, the total
work cost efficiency is improved (Ponsse 2015).
16
PICTURE 7. Dual Harwarder (Ponsse)
2.2 History of Skidders and Tyres
In the 19th
and 20th
century logging became an industry in itself. Early skidders were
pulled by a team of animals for example oxes, horses or mules that were best suited for
hot and hard conditions (Creighton 1997, according to RitchieWiki 2003).
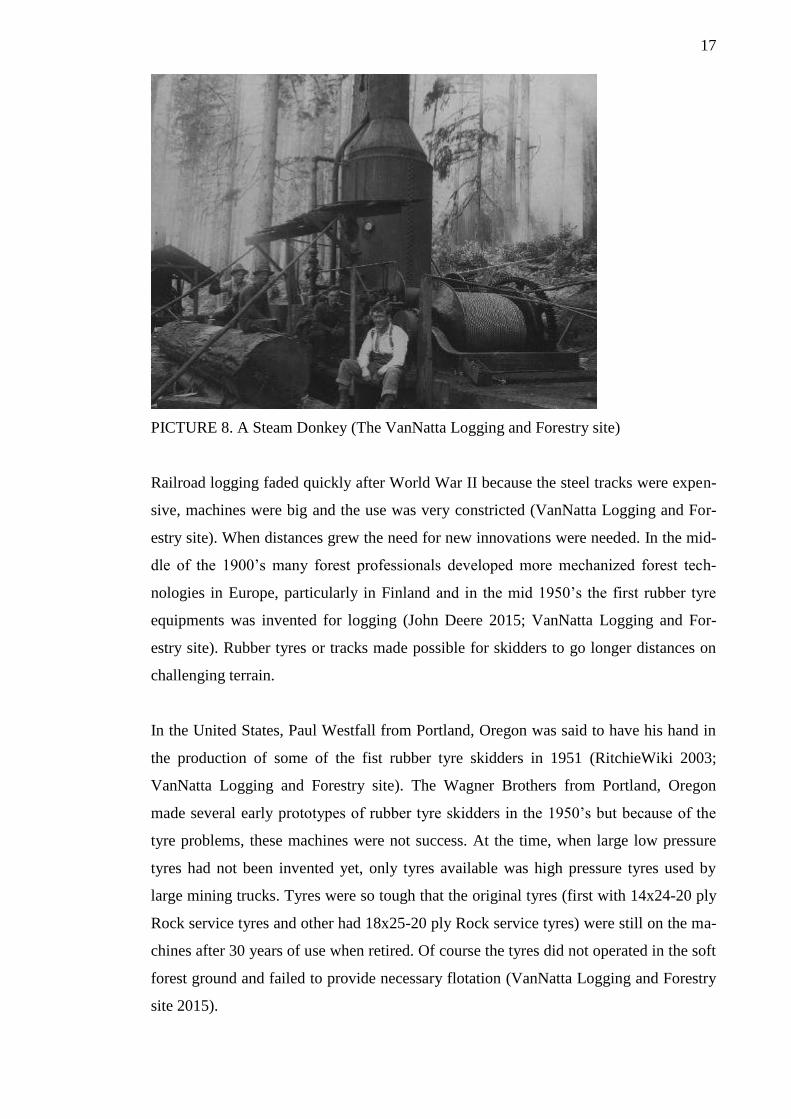
A skidder is a heavy vehicle used in a logging operation. Term “skidding” comes when
cut trees or logs are pulled out of a forest or from the cutting site with skidders (Van-
Natta Logging and Forestry site). However, the first mechanical skidders were steam
powered and linked to railroads as the felled trees were pulled to the railroad cars of
flumes. The first “Steam Donkey” appeared in 1881 and was a stationary logging ma-
chine used skidding (Creighton 1997, according to RitchieWiki 2003).
17
PICTURE 8. A Steam Donkey (The VanNatta Logging and Forestry site)
Railroad logging faded quickly after World War II because the steel tracks were expen-
sive, machines were big and the use was very constricted (VanNatta Logging and For-
estry site). When distances grew the need for new innovations were needed. In the mid-
dle of the 1900’s many forest professionals developed more mechanized forest tech-
nologies in Europe, particularly in Finland and in the mid 1950’s the first rubber tyre
equipments was invented for logging (John Deere 2015; VanNatta Logging and For-
estry site). Rubber tyres or tracks made possible for skidders to go longer distances on
challenging terrain.
In the United States, Paul Westfall from Portland, Oregon was said to have his hand in
the production of some of the fist rubber tyre skidders in 1951 (RitchieWiki 2003;
VanNatta Logging and Forestry site). The Wagner Brothers from Portland, Oregon
made several early prototypes of rubber tyre skidders in the 1950’s but because of the
tyre problems, these machines were not success. At the time, when large low pressure
tyres had not been invented yet, only tyres available was high pressure tyres used by
large mining trucks. Tyres were so tough that the original tyres (first with 14x24-20 ply
Rock service tyres and other had 18x25-20 ply Rock service tyres) were still on the ma-
chines after 30 years of use when retired. Of course the tyres did not operated in the soft
forest ground and failed to provide necessary flotation (VanNatta Logging and Forestry
site 2015).
18
Like it is said in John Deere Timeline (2015): “From the horse to the skidder, the skid-
der to the Full Tree team, to the advent of Cut-to-Length – logging equipment has come
a long way”. Current skidders are tracked or four wheels drive tractors and are used also
for pulling tree stumps, pushing over small trees and for making a preliminary logging
paths; ‘skid roads’.
2.3 TL versus CTL
There have been CTL machines in the markets for a long time but adopting them in the
North America has been slow. It is understandable when it comes to logging equipment,
many prefer to see the machine approve itself before making expensive purchase. With
CTL equipment, harvesting and processing functions can be done in one place at the
same time and this eliminates the need to change the equipment (or have more person-
nel) and creates more efficient process.
Fuel consumption per harvested cubic metre can be seen lower with the CTL method
than with the TL method because fewer machines are needed (Ponsse 2015). The cost of
harvesting and delivery to the roadside can be compared in some parts but depends so
much on the logging conditions and the country. On the other hand, the need for TL
machines in North America has been always higher since the mills and their equipment
have been designed to use tree-length trunks.
In the International Journal of Forest Engineering: ‘Productivity of harvesters and for-
warders in CTL operation’, Eriksson & Lindroos (2014) are saying that the productivity
of harvesters have been increasing quite rapidly over recent decades. The study based
on the samples of harvesters and forwarders working in thinning and final felling.
Usually cut-to-length are technically more advanced than tree-length forest machines
and therefore they also cost more argues Ponsse (2015). Nowadays, more follow-up
data can be gathered from the operations. However, some factors such as changes in
operators’ skills can effect on the accuracy of operational planning, costs and work per-
formance. It seems that lack of the talented operators for both forest machines chains (in
TL or CTL method) is a global phenomenon and several countries are suffering from it.
To get well-trained operator for CTL machine will take time. Nowadays, there are more
19
forestry schools specialised teaching operators for harvesters and forwarders. Education
costs and time used for training are high compared to TL method.
Salary costs are hard to compare since in some cases CTL harvesting costs can be seen
slightly lower because fewer operators are needed but in some countries the labour is
cheap. In the cost model for calculation of forest operations costs, the International
Journal of Forest Engineering (2014) pointed out that the operational costs includes op-
erator salaries, social charges, other benefits and overtime work, which may vary from
country to country. The number of religious holidays and vacations makes it difficult to
compare globally the maximum number of work days per year.
Tree-length method is a traditional way of harvesting in the United States since the
mills and their equipment are suited for TL trees. Other factors that have slowed down
the arrival of the CTL method in the United States can be the amount of financial in-
vestment that CTL machines requires and training CTL operators takes longer time.
20
3 MACRO-LEVEL MARKET ANALYSIS: THE UNITED STATES
This chapter of the exploration of international market will focus on the United States
overall conditions. The external environmental factors which can affect company’s per-
formance and activities will be analysed on macro-level using PESTEL analysis. This
includes target country’s economic, political and legal, technological, environmental
and socio-cultural environmental factors (Strategic Management Insight website 2015).
In addition to PESTEL analysis, the Southern forest industry will be examined with
trends and issues in logging business.
When identifying external factors in macro environment, the aim is to find out the cur-
rent factors affecting the company, identify the factors that may change in the future and
to exploit the opportunities and threats. The evaluation of a foreign market environment
will start with economic variables related to the size and nature of the markets.
3.1 The Economic Environment
The last recession in the United States ended in 2009. The country has the largest econ-
omy in the world, with GDP of 17,419 trillion U.S. dollars (2014). GDP has been grow-
ing at 3,9% rate during 2015. While GDP growing, the unemployment rate has been
dropping 10,0% from October 2009 to 5,1% in September 2015. According to Bureau
of Labour Statistics job gains were on the health care and information fields, while em-
ployment in mining sector has declined by 102,000 since its peak at December 2014
(Bureau of Labor Statistics 2015).
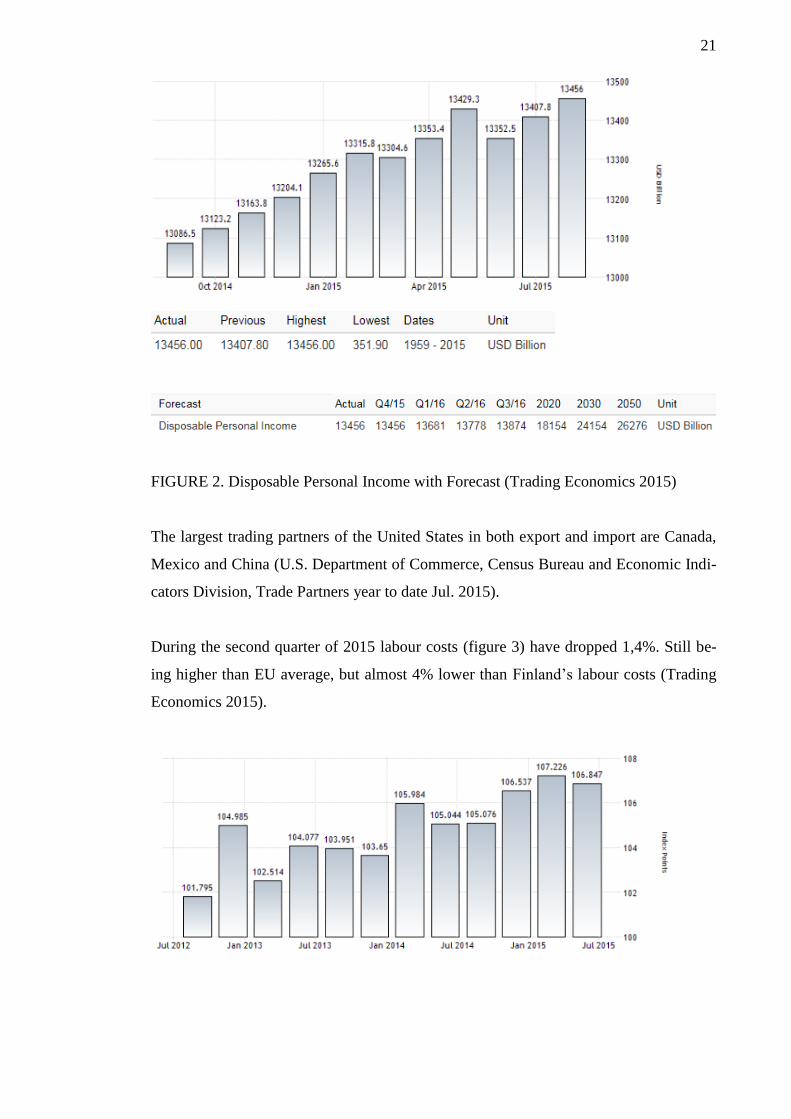
Disposable personal income (figure 2) has also reached all time high on August 2015:
13,456 billion U.S. dollars (Trading Economics 2015).
21
FIGURE 2. Disposable Personal Income with Forecast (Trading Economics 2015)
The largest trading partners of the United States in both export and import are Canada,
Mexico and China (U.S. Department of Commerce, Census Bureau and Economic Indi-
cators Division, Trade Partners year to date Jul. 2015).
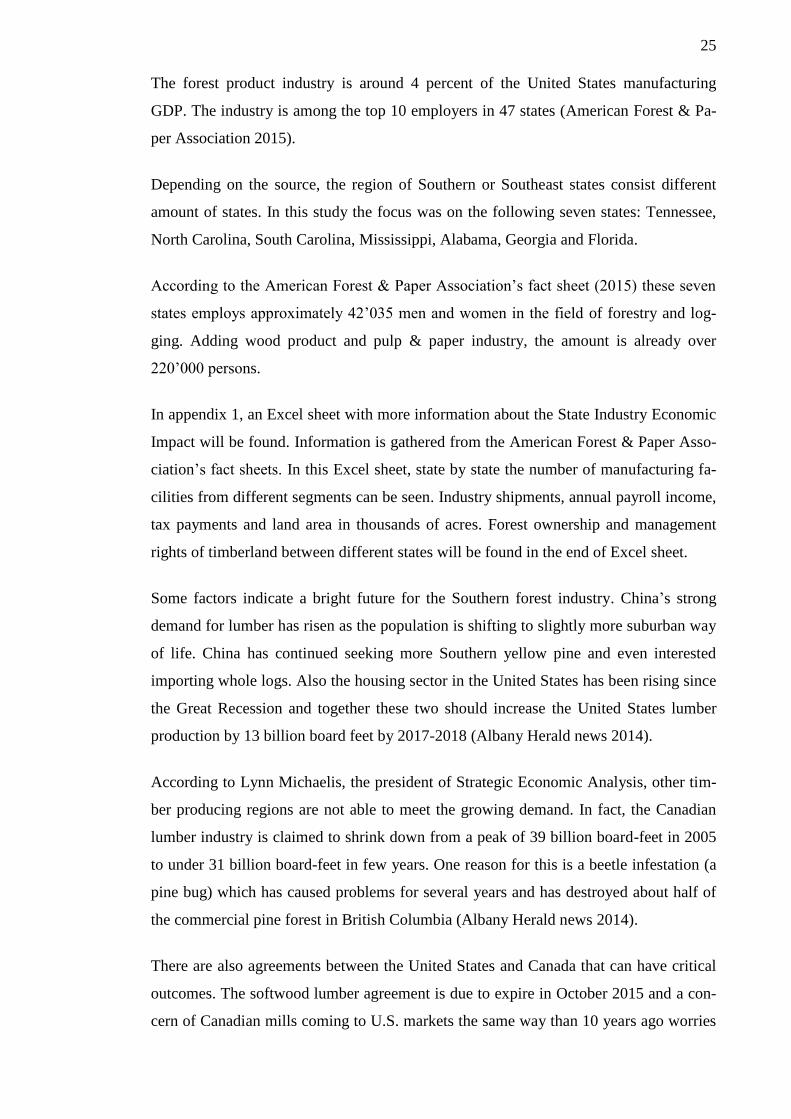
During the second quarter of 2015 labour costs (figure 3) have dropped 1,4%. Still be-
ing higher than EU average, but almost 4% lower than Finland’s labour costs (Trading
Economics 2015).

22
FIGURE 3. Labour Costs with Forecast (Trading Economics 2015)
In the United States the national corporate tax is 35% which is very high compared to
the European average of 18,7% or to Finland’s 20% (Deloitte 2015).
On the 5th of October 2015 signed Trans-Pacific Partnership (TPP) reduces trade tariffs
between the United States, Canada, Australia, Vietnam, Japan, Chile, Brunei, Malaysia,
Mexico, Singapore, Peru and New Zealand (The Trans-Pacific Partnership 2015).
According to the authors of ‘The Trans-Pacific Partnership and Asia-Pacific Integration:
A Quantitative Assessment 2012’, the TPP would benefit the United States by estimated
income raise of 0.4% by 2025, which would be equivalent of 77 billion U.S. dollars in
2007. EU has given estimates of a similar gain for the U.S. from possible Transatlantic
Trade and investment Partnership (TTIP). Agreement between EU and U.S. has not yet
been agreed on (Furman 2015). Next negotiations are held 19th of October 2015 (Euro-
pean Commission, TTIP).
The forestry sector is global, capital-intensive market sector which is influenced by
fluctuations of the housing market, ideals of the paperless society, machine develop-
ments, as well as the availability of labour. After the recession, the current market situa-
tion in the construction industry and in the housing markets has signs of improvement.
The paper industry however continues to decline in the United States. Different regula-
tions and limitations affect the industry in many countries but in countries such as
China, Brazil and Russia, the paper production is more beneficial with lower level regu-
lations. It has been estimated that the competition from wood products will intensify in
the future when even fewer people derive their livelihood from the forest industry
(Ponsse 2014).
23
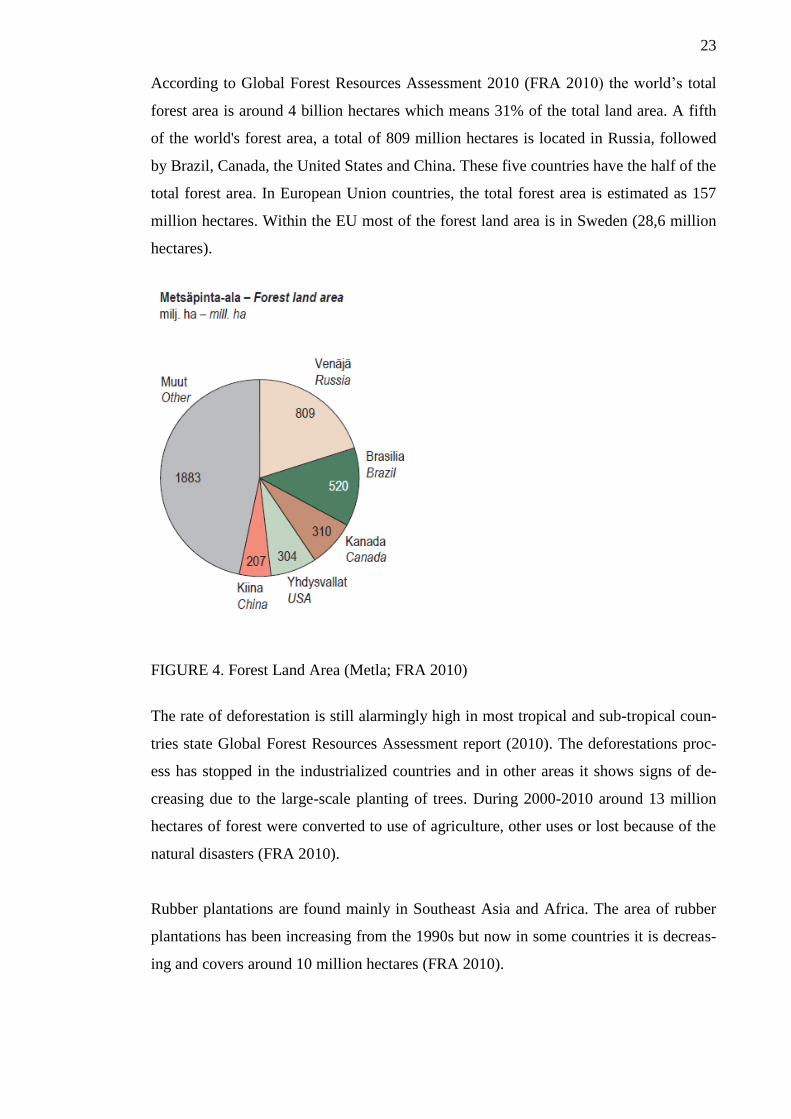
According to Global Forest Resources Assessment 2010 (FRA 2010) the world’s total
forest area is around 4 billion hectares which means 31% of the total land area. A fifth
of the world's forest area, a total of 809 million hectares is located in Russia, followed
by Brazil, Canada, the United States and China. These five countries have the half of the
total forest area. In European Union countries, the total forest area is estimated as 157
million hectares. Within the EU most of the forest land area is in Sweden (28,6 million
hectares).
FIGURE 4. Forest Land Area (Metla; FRA 2010)
The rate of deforestation is still alarmingly high in most tropical and sub-tropical coun-
tries state Global Forest Resources Assessment report (2010). The deforestations proc-
ess has stopped in the industrialized countries and in other areas it shows signs of de-
creasing due to the large-scale planting of trees. During 2000-2010 around 13 million
hectares of forest were converted to use of agriculture, other uses or lost because of the
natural disasters (FRA 2010).
Rubber plantations are found mainly in Southeast Asia and Africa. The area of rubber
plantations has been increasing from the 1990s but now in some countries it is decreas-
ing and covers around 10 million hectares (FRA 2010).
24
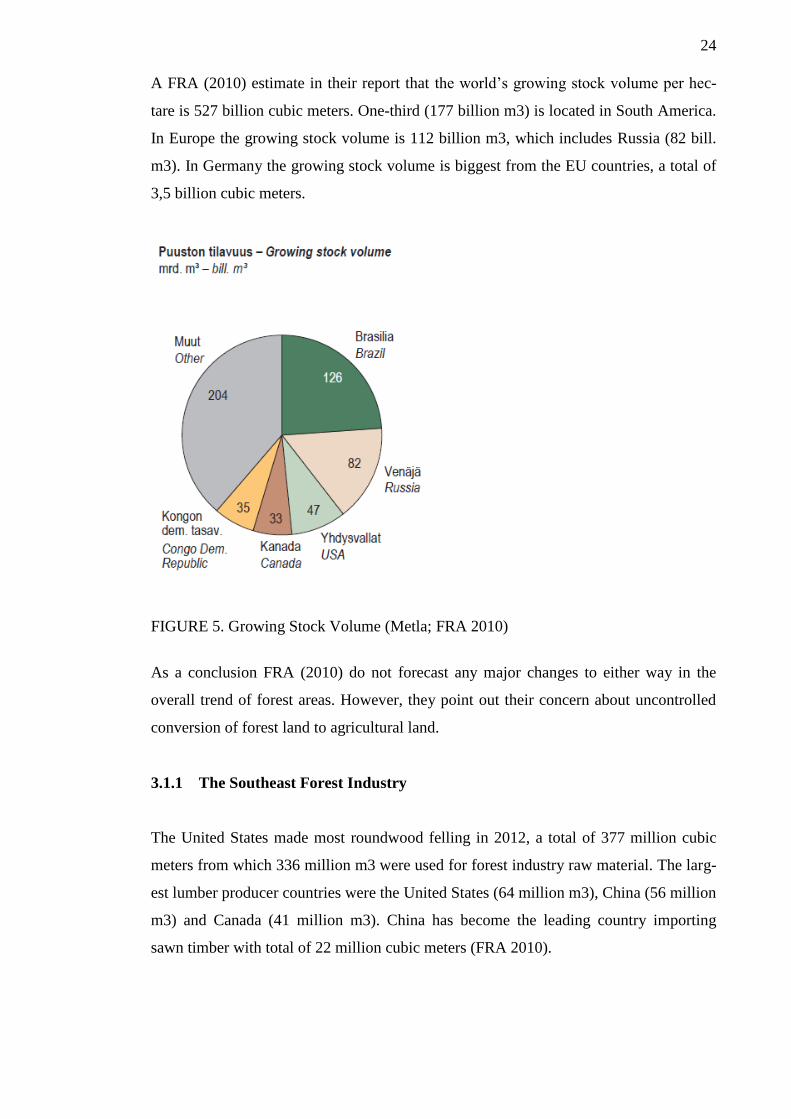
A FRA (2010) estimate in their report that the world’s growing stock volume per hec-
tare is 527 billion cubic meters. One-third (177 billion m3) is located in South America.
In Europe the growing stock volume is 112 billion m3, which includes Russia (82 bill.
m3). In Germany the growing stock volume is biggest from the EU countries, a total of
3,5 billion cubic meters.
FIGURE 5. Growing Stock Volume (Metla; FRA 2010)
As a conclusion FRA (2010) do not forecast any major changes to either way in the
overall trend of forest areas. However, they point out their concern about uncontrolled
conversion of forest land to agricultural land.
3.1.1 The Southeast Forest Industry
The United States made most roundwood felling in 2012, a total of 377 million cubic
meters from which 336 million m3 were used for forest industry raw material. The larg-
est lumber producer countries were the United States (64 million m3), China (56 million
m3) and Canada (41 million m3). China has become the leading country importing
sawn timber with total of 22 million cubic meters (FRA 2010).
25
The forest product industry is around 4 percent of the United States manufacturing
GDP. The industry is among the top 10 employers in 47 states (American Forest & Pa-
per Association 2015).
Depending on the source, the region of Southern or Southeast states consist different
amount of states. In this study the focus was on the following seven states: Tennessee,
North Carolina, South Carolina, Mississippi, Alabama, Georgia and Florida.
According to the American Forest & Paper Association’s fact sheet (2015) these seven
states employs approximately 42’035 men and women in the field of forestry and log-
ging. Adding wood product and pulp & paper industry, the amount is already over
220’000 persons.
In appendix 1, an Excel sheet with more information about the State Industry Economic
Impact will be found. Information is gathered from the American Forest & Paper Asso-
ciation’s fact sheets. In this Excel sheet, state by state the number of manufacturing fa-
cilities from different segments can be seen. Industry shipments, annual payroll income,
tax payments and land area in thousands of acres. Forest ownership and management
rights of timberland between different states will be found in the end of Excel sheet.
Some factors indicate a bright future for the Southern forest industry. China’s strong
demand for lumber has risen as the population is shifting to slightly more suburban way
of life. China has continued seeking more Southern yellow pine and even interested
importing whole logs. Also the housing sector in the United States has been rising since
the Great Recession and together these two should increase the United States lumber
production by 13 billion board feet by 2017-2018 (Albany Herald news 2014).
According to Lynn Michaelis, the president of Strategic Economic Analysis, other tim-
ber producing regions are not able to meet the growing demand. In fact, the Canadian
lumber industry is claimed to shrink down from a peak of 39 billion board-feet in 2005
to under 31 billion board-feet in few years. One reason for this is a beetle infestation (a
pine bug) which has caused problems for several years and has destroyed about half of
the commercial pine forest in British Columbia (Albany Herald news 2014).
There are also agreements between the United States and Canada that can have critical
outcomes. The softwood lumber agreement is due to expire in October 2015 and a con-
cern of Canadian mills coming to U.S. markets the same way than 10 years ago worries
26
the mills. Factors such as trade agreements and duties on U.S. timber at the border by
the Canadian government may change the markets considerably (Albany Herald news
2014).
The growth of the wood pellet industry in Georgia has grown from zero to 9 mills in the
last 5 years. By 2017, the estimation for production is 11 million tons. Biggest custom-
ers are the European electrical generating plants. Georgia has 24,3 million acres of tim-
berland and room to grow with strong infrastructure. These will create opportunities to
50’000 forest industry employees and experienced foresters (Albany Herald news
2014).
The forest industry and situation in Southern states looks bright with rising demand for
lumber and logs. Existing sawmills have announced about expansions and companies
such as Interfor from Canada and Klausner from Europe have been investing in South-
ern sawmills (Albany Herald news 2014).
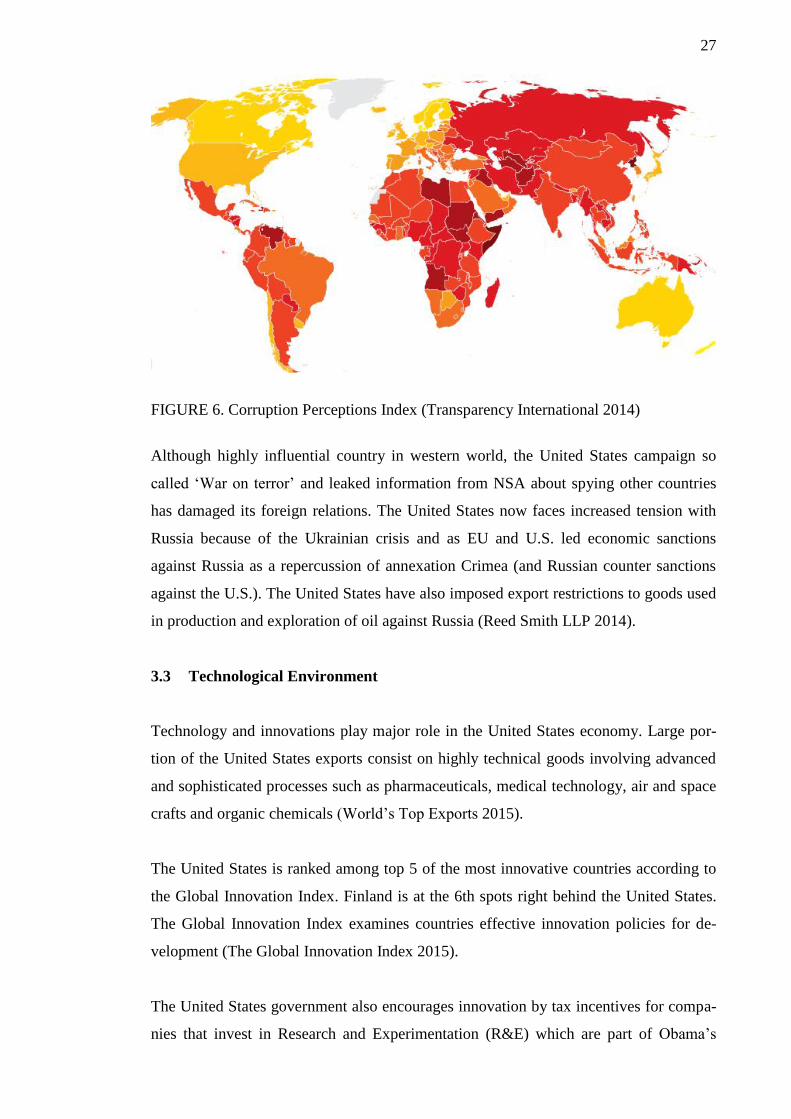
3.2 The Political and Legal Environment
The United States is a democratic country with effective rule of law and high political
stability. The country is considered to have rather low corruption rate and with Trans-
parency International ranking it is on a place 17th (with three other countries/territories)
on the list of countries with least perceived corruption (Transparency International,
2014).
27
FIGURE 6. Corruption Perceptions Index (Transparency International 2014)
Although highly influential country in western world, the United States campaign so
called ‘War on terror’ and leaked information from NSA about spying other countries
has damaged its foreign relations. The United States now faces increased tension with
Russia because of the Ukrainian crisis and as EU and U.S. led economic sanctions
against Russia as a repercussion of annexation Crimea (and Russian counter sanctions
against the U.S.). The United States have also imposed export restrictions to goods used
in production and exploration of oil against Russia (Reed Smith LLP 2014).
3.3 Technological Environment
Technology and innovations play major role in the United States economy. Large por-
tion of the United States exports consist on highly technical goods involving advanced
and sophisticated processes such as pharmaceuticals, medical technology, air and space
crafts and organic chemicals (World’s Top Exports 2015).
The United States is ranked among top 5 of the most innovative countries according to
the Global Innovation Index. Finland is at the 6th spots right behind the United States.
The Global Innovation Index examines countries effective innovation policies for de-
velopment (The Global Innovation Index 2015).
The United States government also encourages innovation by tax incentives for compa-
nies that invest in Research and Experimentation (R&E) which are part of Obama’s
28
three step strategy for American innovation (United States Department of the Treasury
report 2011):
1) Investing in Building Blocks of American Innovation by investing in education, re-
search and infrastructure.
2) Promoting Market-Based Innovation by aforementioned R&E tax credits, strengthen-
ing intellect property policies, encouraging high-growth and innovation based entrepre-
neurship and promoting open innovative and competitive markets.
3) Catalyze Breakthroughs for National Priorities focusing on clean energy with the
goal of delivering 80% of the nations electricity from clean sources by the year 2035
and driving breakthroughs in biotech, nanotech, advanced manufacturing, education and
healthcare technologies and in space applications (The White House, Executive Sum-
mary).
3.3.1 Trends and Issues in Logging Business
Timber West, the Journal of Logging & Sawmills interviewed the heads of the three
main logging equipment companies in the summer 2013; Tony Larocci from Tigercat,
Kevin Thieneman from Caterpillar, and Martin Wilkinson from John Deere. Topics for
discussion were related to the recovery of the forest industry in North America and how
to deal with current and future issues.
Key concerns among the loggers and the issues that clearly emerged from all three log-
ging equipment manufacturers were increase diesel fuel costs and insurance rates and a
shortage of skilled operators. Equipment companies focuses on finding solutions for the
matters by better cost management and having new features and advanced technology in
their machines. Especially during the difficult economic times, maintaining profitability
is the most important thing. Innovations that will improve durability by keeping their
equipment running longer, reduce fuel consumption by having skidders working more
efficiently and increase production, are the key issues to meet customer’s needs (Timber
West 2013).
New innovations are telematics solution, new technology for engines to meet FT4 (Final
Tier 4) emission requirements, remote control capability, up-to-date after-sales solutions
and smooth operations with support and service to increase productivity and by lower-
ing owning and operating costs (Timber West 2013).
29
In the future on a global basis, the remote control capability can help with operator
shortage suggests Tony Larocci from Tigercat. Kevin Thieneman from Caterpillar esti-
mates that autonomous machines operating in forestry applications can be seen over ten
years. However, Thieneman points out that “manufacturers and distributors must con-
tinue developing ways to increase the ease of operation, as well as the machine diagnos-
tics and repair.” (Timber West 2013).
Logging equipment is evolving and in the future even more efficient equipment is
needed. Martin Wilkinson from John Deere state:
“We predict that harvesting methods will remain mostly unchanged but
will become more efficient by the use of telematics and advanced operator
training. In terms of trends, mainstream forestry equipment will follow
government regulatory requirements and efficiency and cost needs. Most
forestry equipment form changes will be driven by niche markets such as
first thinning and biomass recovery” (Timber West 2013).
Nowadays, ergonomics and ease of use are more important than ever. Special attention
is taken in the design of cabin structures and in the drivers working comfort. The com-
fort of the operator can be seen as a key factor in terms of productivity and quality
(Ponsse Product News 2015, 5, 8). However, the development of technology can reduce
small contractors from the forest sector who cannot afford more expensive equipment.
Also the competition in the labour market is tough and skilled labour is harder to find
because nowadays operators need to manage information technology (Ponsse 2014).
Customer-oriented product development is crucial when designing forestry equipment
and harvesting technology. Users’ contributions to a product development are needed in
order to respond to the customers’ needs. The PONSSE Scorpion harvester has won a
several awards in automation, design and the novel structure. For example, The Long
Live the Automation! award was granted for its new innovations concerning new level-
ling and stabilising system and digital features. This award is granted every second year
of remarkable and innovative automation industry solutions. The Fennia Prize Grand
Prix award for industrial design representing a new generation of harvesters. Scorpion
harvester has 80% new technology (Ponsse 2014). The Quality Innovation of the year
2013 award was granted for improved operator ergonomics and the machine’s working
efficiency with visibility in all directions (Laatukeskus, Excellence Finland & Design
Forum).
30
3.4 Environmental Factors
In the United States the forestry activities are regulated by the Environmental Protection
Agency and by the Department of Environmental Quality. Felling areas are defined in
the legislation and they are adjusted and controlled by Sustainable Forest Initiative
(SFI) (Ponsse 2014).
There has been a lot of discussion on a global basis about reducing the terrain damages.
When trees are being pulled, tree particles and seeds are cultivated into the soil and
cause in a way a positive impact. However, this can have disadvantage when damaging
remaining trees as branches are dragged against them and breaking the bark of living
trees. Another concern in the topsoil is when skidders use tyres with chains and cause
damages by increasing the costs of forest rehabilitation and reforestation (VanNatta
Logging and Forestry site).
In Europe there are new regulations for engines to meet the EU emission requirements.
Logging equipment manufacturers has to target for low emission, a cleaner environment
and a better response for power usage and fuel economy (Ponsse 2015). Requirements
for environmental issues usually begin in Europe and Americas will adopt them at a
later time.
3.5 The Socio-Cultural Environment
The United States has low birth rate of 1,87 children per woman, which is not enough to
keep the population stable (2,1 children per woman). In the future, the United States is
facing problems with aging workforce which might lead to labour shortage and requires
tax increases to compensate the needs of growing elder population (The Wall Street
Journal 2015).

31
FIGURE 7. Population Pyramid (Central Intelligence Agency, People and Society
2015)
Estimated population in July 2015 was 321,368,864. Although because of immigration
the population is still increasing by the rate of 0,78% (Central Intelligence Agency,
People and Society 2015).
While public education is available to everyone in the United States and people in gen-
eral are educated, according to PISA study done in 2012 the average of 15 years old
U.S. citizens are ranked below average in mathematical skills. Same target group is
ranked around average in reading and science compared to other OECD countries (PISA
2012).
Educational merits are strongly tied to the student’s socio-economical status. Although
the American Dream is a national ethos of the Americans, the social mobility in the
country is low. People born in lower social class are more likely to stay there than to
ascend (Economic Policy Institute 2012).
The patriotism in the U.S. started to rise after 9/11 terrorist attacks. According to Gallup
Inc. 2005, such occurrences reflect on people’s consuming habits. Patriotism seems to
be unwavering among the whites but changes by race, age or gender (Gallup Inc. 2005).
According to a survey by Field Agent (The City Wire 2015), consumers favour Ameri-
can made goods but not as a top priority. American made products ranks in the fourth
32
place among quality, price, customer service experience and sustainability. If the price
and quality are competitive, Field Agent CEO Rick West says that the consumer will
likely chose the product that creates or supports jobs in America (The City Wire 2015).
Considering the influence in the automotive industry such factor can reflect in the tyre
markets as well.
Social factors such as population growth, health consciousness, buying habits and an
emphasis on safety are cultural aspects and influence the demand for products and ser-
vices. Companies should respond to this demand by employing local to gain cultural
knowledge and adapt processes and products to local markets and build strong relation-
ships (Czinkota & Ronkainen 2010, 121).
Learned behaviour patterns are constantly shaped for example by technology and educa-
tion and that way the culture is one of the most challenging elements of the international
markets. Hofstede’s Cultural Dimension will provide insight of how these values will
relate to behaviour.
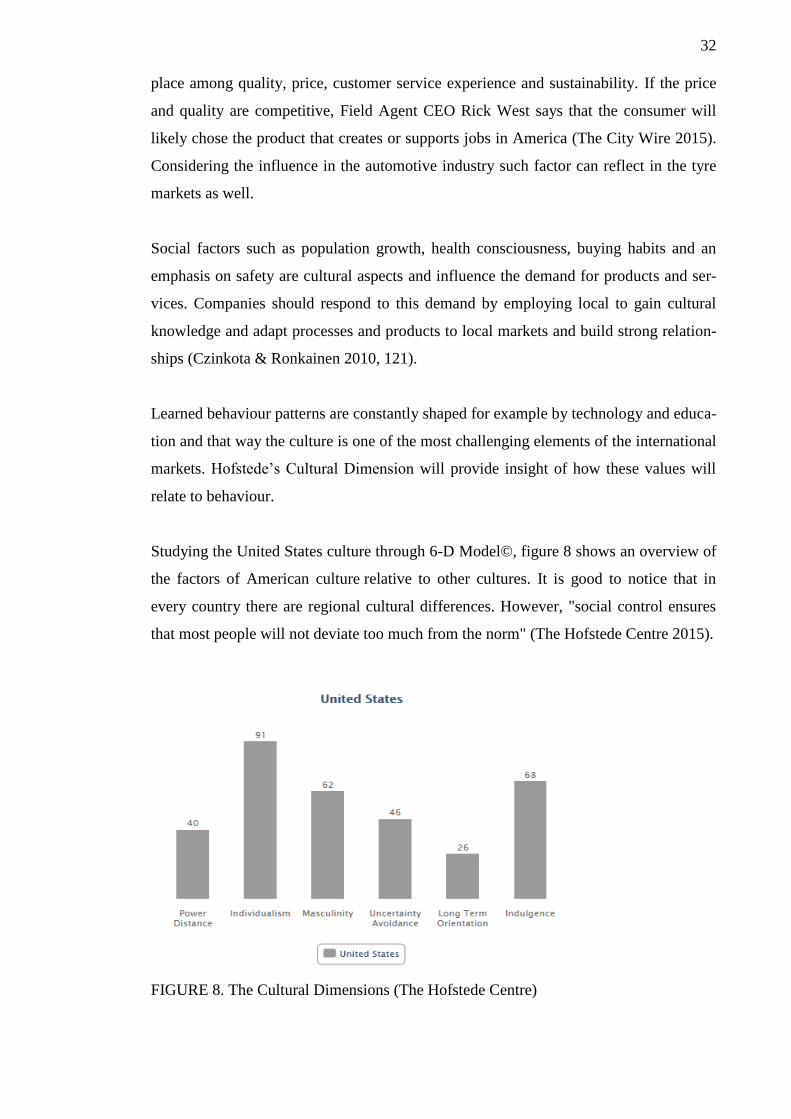
Studying the United States culture through 6-D Model©, figure 8 shows an overview of
the factors of American culture relative to other cultures. It is good to notice that in
every country there are regional cultural differences. However, "social control ensures
that most people will not deviate too much from the norm" (The Hofstede Centre 2015).
FIGURE 8. The Cultural Dimensions (The Hofstede Centre)
33
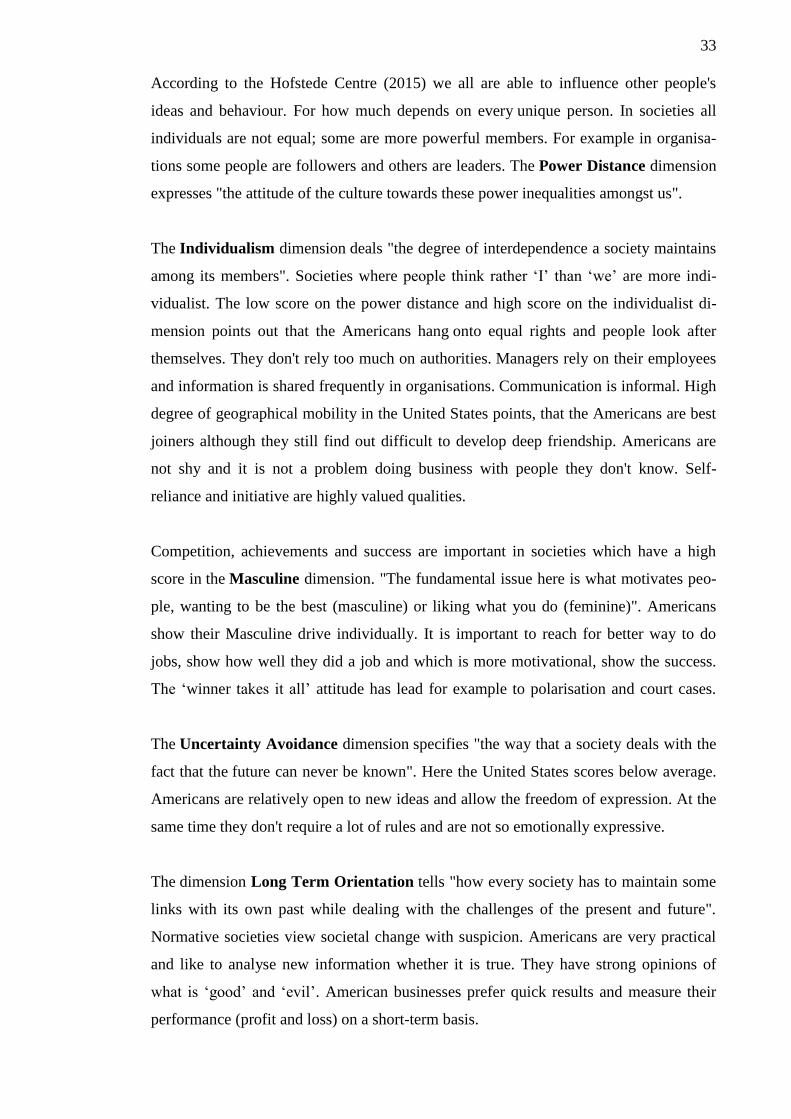
According to the Hofstede Centre (2015) we all are able to influence other people's
ideas and behaviour. For how much depends on every unique person. In societies all
individuals are not equal; some are more powerful members. For example in organisa-
tions some people are followers and others are leaders. The Power Distance dimension
expresses "the attitude of the culture towards these power inequalities amongst us".
The Individualism dimension deals "the degree of interdependence a society maintains
among its members". Societies where people think rather ‘I’ than ‘we’ are more indi-
vidualist. The low score on the power distance and high score on the individualist di-
mension points out that the Americans hang onto equal rights and people look after
themselves. They don't rely too much on authorities. Managers rely on their employees
and information is shared frequently in organisations. Communication is informal. High
degree of geographical mobility in the United States points, that the Americans are best
joiners although they still find out difficult to develop deep friendship. Americans are
not shy and it is not a problem doing business with people they don't know. Self-
reliance and initiative are highly valued qualities.
Competition, achievements and success are important in societies which have a high
score in the Masculine dimension. "The fundamental issue here is what motivates peo-
ple, wanting to be the best (masculine) or liking what you do (feminine)". Americans
show their Masculine drive individually. It is important to reach for better way to do
jobs, show how well they did a job and which is more motivational, show the success.
The ‘winner takes it all’ attitude has lead for example to polarisation and court cases.
The Uncertainty Avoidance dimension specifies "the way that a society deals with the
fact that the future can never be known". Here the United States scores below average.
Americans are relatively open to new ideas and allow the freedom of expression. At the
same time they don't require a lot of rules and are not so emotionally expressive.
The dimension Long Term Orientation tells "how every society has to maintain some
links with its own past while dealing with the challenges of the present and future".
Normative societies view societal change with suspicion. Americans are very practical
and like to analyse new information whether it is true. They have strong opinions of
what is ‘good’ and ‘evil’. American businesses prefer quick results and measure their
performance (profit and loss) on a short-term basis.

34
The Indulgence dimension is defined as "the extent to which people try to control their
desires and impulses based on the way they were raised." It is related to socialization.
The American society culture can be called indulged not restrained. The praise ‘Work
hard and play hard’ with a normative score describes this indulgent society (The
Hofstede Centre 2015).
35
4 MICRO-LEVEL ANALYSIS
Micro environmental factors such as customer markets, employees, competitors, media,
shareholders, suppliers and marketing intermediaries are factors close to business and
which have a direct impact on a company’s business operation and success. Businesses
cannot always control micro-level factors but company should endeavour to manage
them and to ensure that they have correctly identified all of the factors in this competi-
tive environment (Strategic Management Insight website 2015).
When a company moves into new markets or segments, it can create major potential for
business growth. As Kotler & Keller (2012, 213) tells: “a company needs to identify
which market segments it can serve effectively”. It is vital to understand the market
dynamics, consumer behaviour and the competitive environment of the specific mar-
kets.
Having a good information base of the market and building it to the knowledge is a very
important for every company. Data gathering through research will usually provide an
adequate understanding of the business environment to help managers in their decision
making. In primary research, the company collects the data for the specific purpose and
in secondary research, previously collected data are used. With secondary research, a
company can quite easily and quickly have an access to information with limited man-
power or resources (Czinkota & Ronkainen 2010, 240).
In global strategic planning processes, the underlying forces that determine business
success are common regardless the country. Those tools will help allocate a company’s
resources, balance risks, to gain competitive advantage and stronger long-term position
(ibis. 191). In this study, the markets and competitive analysis is done to understand the
structure of the global industry in order to identify the most valuable opportunities and
the most effective approaches to them as well as to determine profitability and what
drives competition.
36
4.1 Overview of Skidder Tyre Markets
A global strategy does not imply that a company should serve the entire globe. Com-
pany must allocate their resources between different countries and segments (Czinkota
& Ronkainen 2010, 194).
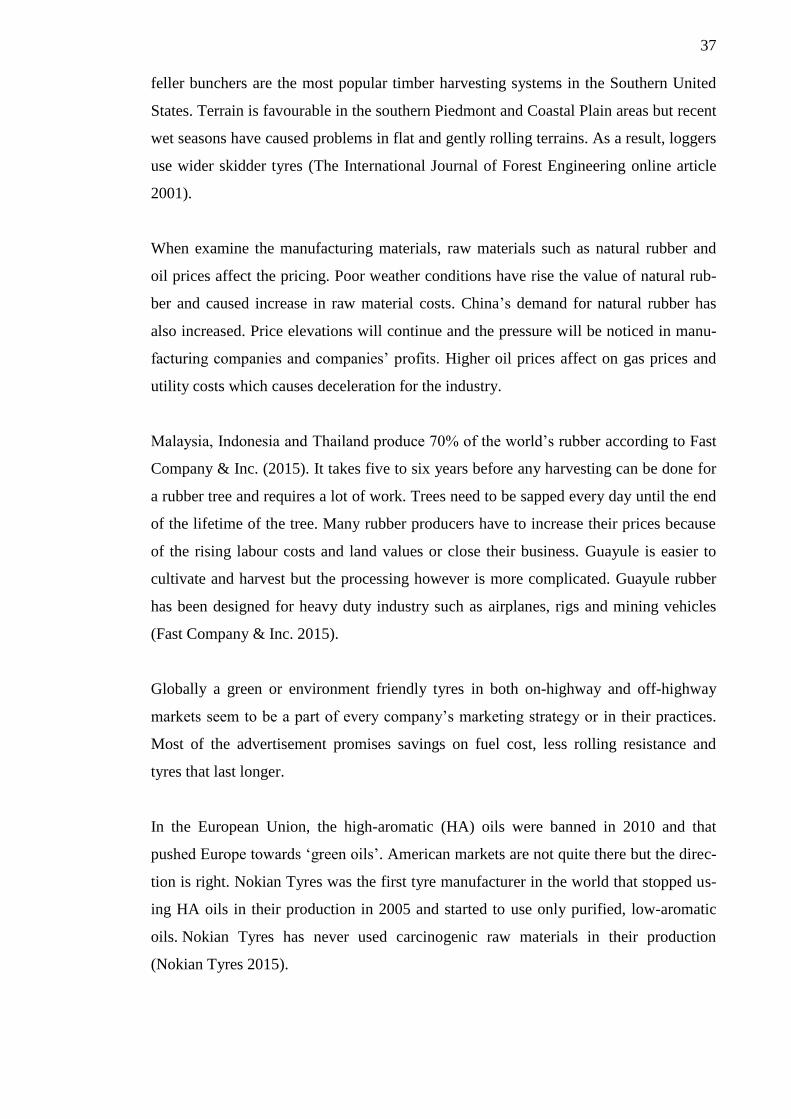
The Heavy-Duty off-the-road (OTR) tyre manufacturing industry manufactures tyres for
industrial, construction, agricultural, mining vehicles and forestry machines such as
skidders, feller bunchers, harvesters, forwarders.
Compared to year 2013, the replacement OTR tyre market in the United States has
raised little but did suffer at the Original Equipment (OE) level. Coal mining segment
has impacted mostly on these figures and the slowdown in global mining operations has
affected North American mining tyre markets as well. Decline in oil prices can be a
threat for the United States if taking place for a longer period. In the future the need for
OTR tyres will increase due to the stronger construction activity, demand for agricul-
tural machinery and tyre replacements (SteamFeed 2015).
FIGURE 9. 2014 U.S. Replacement Tire Sales (Modern Tire Dealer, Rubber Manufac-
turers Association)
Skidder markets in the United States are broad and diverse and the key is to understand
consumer behaviour with distinct needs and wants for the strategic thinking. Effective
target marketing focuses on the consumers they can satisfy the most (Kotler & Keller
2012, 213).
The International Journal of Forest Engineering online article: ‘Effect of Tire Size on
Skidder Productivity Under Wet Conditions’ (2001), states that rubber tyre skidders and
37
feller bunchers are the most popular timber harvesting systems in the Southern United
States. Terrain is favourable in the southern Piedmont and Coastal Plain areas but recent
wet seasons have caused problems in flat and gently rolling terrains. As a result, loggers
use wider skidder tyres (The International Journal of Forest Engineering online article
2001).
When examine the manufacturing materials, raw materials such as natural rubber and
oil prices affect the pricing. Poor weather conditions have rise the value of natural rub-
ber and caused increase in raw material costs. China’s demand for natural rubber has
also increased. Price elevations will continue and the pressure will be noticed in manu-
facturing companies and companies’ profits. Higher oil prices affect on gas prices and
utility costs which causes deceleration for the industry.
Malaysia, Indonesia and Thailand produce 70% of the world’s rubber according to Fast
Company & Inc. (2015). It takes five to six years before any harvesting can be done for
a rubber tree and requires a lot of work. Trees need to be sapped every day until the end
of the lifetime of the tree. Many rubber producers have to increase their prices because
of the rising labour costs and land values or close their business. Guayule is easier to
cultivate and harvest but the processing however is more complicated. Guayule rubber
has been designed for heavy duty industry such as airplanes, rigs and mining vehicles
(Fast Company & Inc. 2015).
Globally a green or environment friendly tyres in both on-highway and off-highway
markets seem to be a part of every company’s marketing strategy or in their practices.
Most of the advertisement promises savings on fuel cost, less rolling resistance and
tyres that last longer.
In the European Union, the high-aromatic (HA) oils were banned in 2010 and that
pushed Europe towards ‘green oils’. American markets are not quite there but the direc-
tion is right. Nokian Tyres was the first tyre manufacturer in the world that stopped us-
ing HA oils in their production in 2005 and started to use only purified, low-aromatic
oils. Nokian Tyres has never used carcinogenic raw materials in their production
(Nokian Tyres 2015).
38
4.2 The Role of County Organizations and Dealers
Czinkota & Ronkainen said that: “country organizations should be treated as a source of
supply as much as they are considered a source of demand.” Understanding the core
strategy in every level is vital for the successful business. Passing on the information
between headquarter, global managers and country managers in a balance will improve
a company’s possibilities to develop and implement global strategy (2010, 201, 226).
Czinkota & Ronkainen (ibid. 207) recommend to include local marketers into different
actions related organization structure, overall corporate culture, management processes
and to develop strategic planning to gain mutual interaction.
Most of the tyre manufacturers do not sell tyres directly to end-users but they use distri-
bution channels such as tyre shops and dealers which are essential linkages between the
manufacturer and the customer. These distribution channels must be designed in a way
that they cover a certain area and take into account requirements of the manufacturer
and the customers.
4.3 Customers
To attract new customers and take market share from competitors is a challenge where
company must understand consumer behaviour. In a book ‘Marketing Strategy & Com-
petitive Positioning’, Graham Hooley et al. (2012, 88) point out: “information is the raw
material of decision making”. A company has to have precise understanding for what
the buying decisions is based on; what are the prime motivators for purchase and are
there any de-motivators.
In this study end-users are considered as customers, loggers who make the buying deci-
sion. The question is who have the influence on this decision. To know how to market
tyres, marketers need to consider loggers, operators and other initiators and influencers
into consideration (ibid. 90). An operator may look for comfort, ease of operating and
factors that can have promotive influence for work. A machine buyer may look for eco-
nomical performances such as fuel consumption, rolling resistance, durability and price.
How the typical buying process in this segment will take place? Will there be a problem
recognition, information search with evaluating the alternatives, dealer search and fi-
39
nally the purchase decision with other post purchase agreements (Kotler & Keller 2012,
167). The demand can come whenever and tyres are a critical part that the work gets
done. The marketer has to realize how the buyer acts but also to be aware of unantici-
pated situational factors and services included.
With qualitative research the information about the markets, channels and customers are
received. With the data available, the company can determine customer requirements,
expectations and behaviour. Already this level of information provides data of market
segmentation and determines customers’ opinions and perceptions (Hooley et al. 2012,
100).
Typically qualitative research is followed by a quantitative research where the company
can gather primary data from customers’ direct feedback and can provide insights into
problems (ibid. 100). Also primary data will help the company understand the secon-
dary findings and evaluate the reliability and validity of the data.
In current tyre segment, in niche markets and with this target group marketers must cre-
ate a strong relationship with their customers and it is crucial to point out what is the
value they will provide (Kotler & Keller 2012, 207). Customers are trying to cope with
higher fuel prices, tougher government regulations, increased environmental conscious-
ness and with other economic realities. It is important to create mutually beneficial alli-
ances where both parties’ needs and values are brought closer together (Hooley et al.
2012, 90). Will customers’ future needs and expectations change when factors such as
social and economical changes affect their living standards?
In the United States there are approximately 29’000 - 30’000 independent tyre dealers.
The primary decision makers on the tyre buying process are men with 61% share. The
growth of buying online has increased among the 18 to 34 years old consumers in the
United States. If women do the purchasing, it is most likely done online (Modern Tire
Dealer 2015).
Modern Tire Dealer released ‘Facts Issues 2015’ in January and claims that consumers
do not really care where the tyre is produced and 70% of consumers don’t have brand
preference. In most purchasing events, a tyre dealer is the person that consumers rely
on. Dealer’s recommendation about the brand is valued (2015).
40
4.4 Competitors
As Sun Tzu has said; “If you know your enemy as you know yourself, you need not fear
the results of a hundred battles” (Clavell 1981, according to Hooley et al. 2012, 106).
The same principle can be applied for today’s business. A company has to identify their
relevant competitors and have the knowledge of competitors’ strengths and weaknesses.
To know competitors future actions is important for every company’s marketing strat-
egy (Hooley et al. 2012, 106).
To understand markets and competitive environment: company, competitors, customers,
every company must have a clear definition of the industry’s structure they are operat-
ing in, know their competitors as well as to understand customers’ requirements and
choices (ibid. 55).
An ongoing challenge between the competitors is to understand the trends in demand,
the sources of profit and the structure of the industry regarding tyre manufacturers with
their intermediaries (Czinkota & Ronkainen, 2010). If company wants to improve its
position within the market or maintain it, the competitor analysis and monitoring is cru-
cial.
There are several companies in the markets which manufacture tyres for a variety of
heavy vehicles such as Goodyear, Bridgestone, Alliance, Michelin, Continental AG,
Pirelli and Hankook. Based on the results received from the secondary interviews; Fire-
stone, Primex and Goodyear are the most used tyre brands in the Southern U.S. skidder
markets. Competitor analysis will be made by comparing these three skidder tyre manu-
facturers from which Firestone was clearly the most used tyre brand. Information for the
analysis is presented here, in the chapter four, but the conclusions will be part of the
chapter six.
A company must identify what aspects of business to benchmark in order to have rele-
vant data which enables processes and operations to be compared (Hooley et al. 2012,
107). The focus on competitor analysis was not in a price or issues that can be old in-
formation in a couple of weeks. The goal was to investigate competitors’ actions and
what they want to achieve.
41
First thing was to assess competitors’ direction with current resources and future objec-
tives: whether the company is expanding its operations in certain countries or building
additional production facilities, hiring staff to a specific department or investing for
Research and Development (R&D). These factors can be seen as a forecast of how
competitors’ see the future and also give other companies signals of competitors’
strengths and weaknesses (ibid. 2012, 109, 117).
Second factors searched for competitor analysis are competitors’ current and future
strategies. The aim is to identify their goals, selection of a target market and strategic
focus in a way which can be recognized as possible opportunities or threats for Nokian
Tyres (ibid. 2012, 113, 119).
4.4.1 Bridgestone Tire Company, subsidiary Firestone
‘Your Journey, Our Passion’ (Bridgestone 2015).
The Bridgestone Tire Company Ltd was founded by Shojiro Ishibashi in Japan in 1931.
Bridgestone Americas (BSAM) has its roots in two companies. In 1988 Bridgestone
purchased Firestone Tire and Rubber Company, founded by Harvey Firestone in Akron,
Ohio in August 1900. Their tyres are sold under the Bridgestone, Firestone, Dayton and
other brand names. Bridgestone Corporation has it’s headquarter in Tokyo (Bridgestone
2015).
Firestones history with first rubber-tyre skidders and harvesters began in the late 1960s
and the company continues working with the top equipment manufacturers in order to
meet increasing demand of heavy tyres. According to Firestone, they were the first to
adapt farm tyres for logging service (Bridgestone Americas Tire Operations LLC,
2011).
42
Firestone offers the wide range of tyres for the forest segment in North America and has
one of the industry’s best service networks to back this up. Company’s rule for today’s
logging business is: “You can only make money when you keep the machines moving”
(Bridgestone Americas Tire Operations LLC, 2011).
Brand Strategy
Bridgestone and Firestone have always had separate brands and slogans and they have
been able to combine effectively marketing mix with product range. The corporation
has announced (Bridgestone 2015) their wishes to clarify their brand strategy and to
create awareness by global advertisement and by official worldwide Olympic partner-
ing.
Bridgestone has sponsorship strategy to build brand awareness. Especially in the U.S.
market Bridgestone has found the connection which settle well in American culture as
they developed promotion and sponsorship strategy with professional sports leagues. In
September 2015 the company started partnering with the National Football League
(Bridgestone Americas, Inc). Advertisements during the big games has gained them
brand recognition, consumer trust and growth in sales (Creative Guerrilla Marketing,
2015).
Nielsen is an American information and measurement company which measures and
monitors what consumers watch and buy on a global and local basis. They have discov-
ered that consumers can be reach through advertising showed during sport events for
example in Super Bowl and Sunday Night Football (The Nielsen Company).
Bridgestone continues building brand power and global expansion with integrated brand
strategy by partnering with sport properties such as: golf, skiing, football, hockey, soc-
cer and motor sport. Firestone however has been more regional brand and the focus is to
grow globally with brand management. The company assesses their strengths as a long
history with forestry tyres and strong regional brand (Bridgestone 2015).
Locations in the United States
In the U.S. the company advertise their ‘world-class customer service’ and their dedica-
tion to ‘serve society with superior quality’ (Bridgestone 2015). Their new plant in
Aiken, South Carolina was part of the company’s global strategy which had influence
43
from the earthquake and tsunami in Japan 2011. Then the company realized how vul-
nerable their two off-the-road plants were. With the plant in the U.S., Bridgestone has
been able to be closer to their customers who make a large percentage from their global
revenue and have more dependable and cost effective deliveries (Strategic Insights,
Bridgestone 2015).
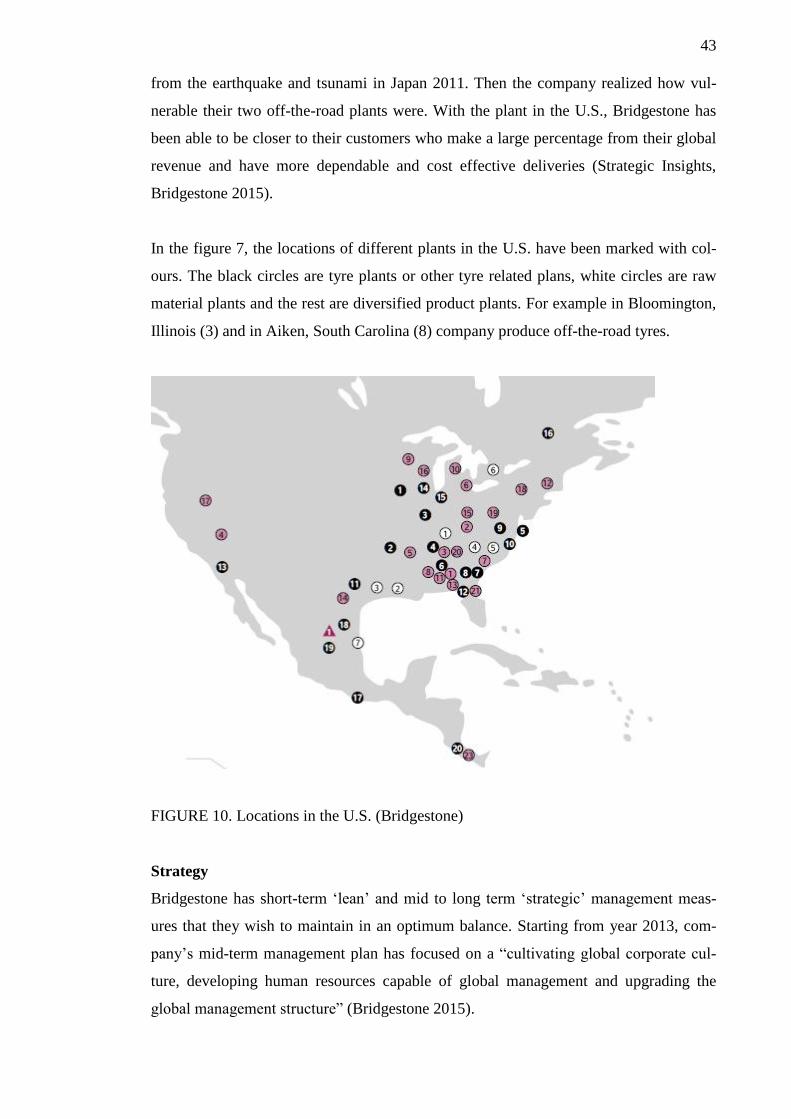
In the figure 7, the locations of different plants in the U.S. have been marked with col-
ours. The black circles are tyre plants or other tyre related plans, white circles are raw
material plants and the rest are diversified product plants. For example in Bloomington,
Illinois (3) and in Aiken, South Carolina (8) company produce off-the-road tyres.
FIGURE 10. Locations in the U.S. (Bridgestone)
Strategy
Bridgestone has short-term ‘lean’ and mid to long term ‘strategic’ management meas-
ures that they wish to maintain in an optimum balance. Starting from year 2013, com-
pany’s mid-term management plan has focused on a “cultivating global corporate cul-
ture, developing human resources capable of global management and upgrading the
global management structure” (Bridgestone 2015).
44
The highest priority in Bridgestone’s strategy seems to be optimization of management
reforms on a group and global basis. Midterm management plan for HR is to develop
human resources capable of global management and for company’s structure, upgrading
the global management (Bridgestone 2015).
In Bridgestone’s Annual Report (2014), their strategy was based on a highly competi-
tive technological edge with the new and advanced technology. The company has set a
growth strategy for years 2005-2015, where they plan to launch minimum of 10 new
products successfully to the markets during the next ten years. Their goals include also
improvements for the production, effectiveness to the existing products and services and
increase their position gradually into developing and emerging markets. Bridgestone
claims to create the need for tyres and brand loyalty in new areas while capitalizing the
established ones (Creative Guerrilla Marketing 2015).
Bridgestone has announced in October 2015 that they will adopt new corporate govern-
ance structure to meet their goals of “becoming a truly global company” and becoming
“Dan-Totsu in all aspects” (the Japanese term for ‘the absolute and clear leader’) of
their business. With these values, the company wishes to have quality of its manage-
ment and transparency of its decision making processes. The company seeks to further
strengthen its internal control systems and have more effective strategic planning and
decision making. These amendments will be presented to the shareholders in March
2016 for approval (Bridgestone 2015).
R&D
Bridgestone Corporation informed in October 2015 that their emphasis will be on accel-
erated “technology and business model innovations”. The company’s focus is on a qual-
ity and they announced to make continuous improvement in each and every area of
business. Bridgestone Corporation wishes to create customer value by “infusing a cul-
ture of innovation throughout the enterprise, evolving the R&D structure, move from
‘product’ to ‘solution’” by following trends and customer needs (Bridgestone 2015).
In Kodaira City, Tokyo the R&D and manufacturing will be reorganized and business
design, research, manufacturing and testing will be strengthen. According to Bridge-
45
stone’s latest news, they are expected to invest about 230 million Euros for this project
and have opening of facilities in 2018 (Bridgestone 2015).
Environmental Mission
The Bridgestone group’s environmental mission includes objectives such as; “be in
harmony with nature, value natural resources, reducing CO2 and other significant emis-
sions”. The Group has also long-term environmental vision of using 100% sustainable
material in tyres by 2050 (Bridgestone 2015).
Bridgestone has been able to test a prototype tyre made entirely from alternative natural
rubber called guayule. However, invention isn’t new. During the World War II, gua-
yule’s barks and roots were turned into rubber and used as replacements when the Japa-
nese cut supplying Asian rubber (Fast Company & Inc 2015).
In the future we should see more of guayule and understand its role in the tyre industry.
Bridgestone’s estimation is that guayule will be used in the 2020s tyres and solely by
2050 (Tire Review 1015).
According to Bridgestone (2015), the demand for tyres is expected to increase with the
global population growth. That is why the company is investing highly to R&D. Natural
rubber is the primary raw material in tyre production and estimation is that 90% of all
natural rubber (Hevea brasiliensis rubber tree) is harvested from the Southeast Asia.
However, guayule does not need the tropical environment. It grows in the Southwest
U.S. and Northern Mexico in more dry regions. Bridgestone opened a research farm
2013 in Arizona which has all the needed equipment for R&D, experimental production
and manufacturing to achieve their environmental vision (Bridgestone Americas Inc,
2015).
46
4.4.2 Alliance Tire Group (ATG)
”Application Specific - Purpose Built” (ATG 2015).
The Alliance Tire Company Ltd. has its roots in Israel from year 1950. The Group was
founded in 2007 when a father and a son, Ashok Mahansaria and Yogesh Mahansaria
bought an Israeli tyre company called Alliance Tire. Previously, Ashok and Yogesh had
worked in a family business called Balkrishna Tyres (ATG 2015).
Alliance Tire Group (ATG) has three brands in the market: Alliance, Galaxy and
Primex. Alliance was the first brand joint in 2007 and Galaxy and Primex were merged
in year 2009. ATG is specialized in the sales of forestry, agricultural, industrial and
OTR tyres worldwide. ATG’s corporate office is in India and has regional headquarters
in the United States, Netherlands, Israel and South Africa (ATG 2015).
Strategy
In the off-highway tyre segment, the vision set for the group is to be among the top
three global leaders in agriculture, forestry and construction tyre segments. Company’s
intention is to ‘deliver superior value’ to their customers with lowest Total Cost of
Ownership (TCO) which is their concept for the off-highway tyres decision-making
process.
The group’s focus is on the “innovations, technology and cost efficient manufacturing
and distribution practices”. ATG has invested in product mix availability and re-aligned
their production capacities. Company puts a lot of effort on understanding customers’
(end-users, contractors and farmers) unique needs and claims that it has strengthen their
position in the markets and helped improve brand image among OEM customers (ATG
2015).
47
ATG’s sales globally are expected to double in less than 5 years to more than 940 mil-
lion Euros and on the OE-side, Alliance has consolidated its position among global and
regional farm equipment makers. The group has a new control for the farm and OTR
tyre making with an increased product supply (ATG 2015).
Brand Strategy
Alliance and Primex are known from their history in the forestry markets serving Origi-
nal Equipment Manufacturers (OEM) and aftermarkets with ‘application-specific and
purpose-built’ tyres (ATG 2015). Their focus is on the work-tyre segment industry and
they will continue investing in technology and in technical know-how. Both brands are
considered as flagship brands in the same segment.
After the acquisition in 2010, the ‘GAP brand strategy’ (Galaxy-Alliance-Primex) has
been focusing highly on modifying company’s strengths in forestry, agriculture and
construction tyre sectors. Alliance has hired a former Michelin North America Inc. Ex-
ecutive as their reinforcement (Tire Business 2014) and started to push flotation tyres to
North American markets more aggressively since year 2014 (ATG 2015).
Plant Locations
The Group has three manufacturing facilities: two plants in India (one in Tirunelveli,
Tamil Nadu made in 2009 and is now being expanded, and the new plant in Dahej, Gu-
jarat) and the third plant in Hadera, Israel. Alliance is planning to increase manufactur-
ing capacity in India and Israel. In Tirunelveli they manufacture 84’000 tons annually,
producing radial tyres for the AG and construction segment as well as bias tires for AG,
construction, OTR and forestry. Plant in Gujarat produces mix of radial agricultural and
construction tires, including some all-steel designs (ATG 2015).
Apart from Alliance Tire Groups own manufacturing, they receive tyres from China and
Taiwan from their contract manufacturers. The group invest heavily on strategic loca-
tions of their centres and warehouses which they say, have helped them with innovative
service solutions they offer (ATG 2015).
The company claims to have a thorough network of dealers and distributors. Alliance
has three warehouse distribution centres (figure 11) in the Southeast United States.
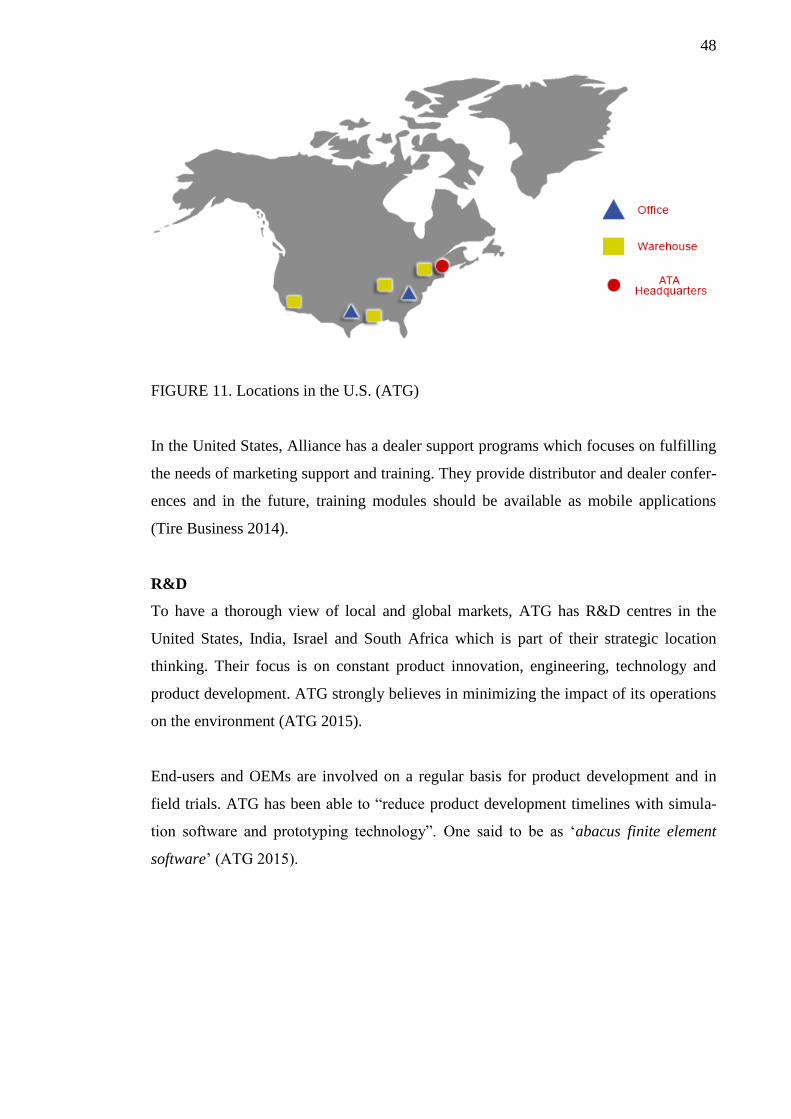
48
FIGURE 11. Locations in the U.S. (ATG)
In the United States, Alliance has a dealer support programs which focuses on fulfilling
the needs of marketing support and training. They provide distributor and dealer confer-
ences and in the future, training modules should be available as mobile applications
(Tire Business 2014).
R&D
To have a thorough view of local and global markets, ATG has R&D centres in the
United States, India, Israel and South Africa which is part of their strategic location
thinking. Their focus is on constant product innovation, engineering, technology and
product development. ATG strongly believes in minimizing the impact of its operations
on the environment (ATG 2015).
End-users and OEMs are involved on a regular basis for product development and in
field trials. ATG has been able to “reduce product development timelines with simula-
tion software and prototyping technology”. One said to be as ‘abacus finite element
software’ (ATG 2015).
49
4.4.3 The Goodyear Tire & Rubber Co
“Made to feel good” (Goodyear 2015).
The Goodyear Tire & Rubber Company was founded in 1898 by Frank Seiberling but
was named after the inventor of vulcanized rubber, Charles Goodyear. In 1921 Good-
year made their first off-the-road tyre called ‘the Rut-Proof tire’ (Goodyear 2015).
In 2013 was the grand opening of company’s new headquarters in Akron, Ohio (global,
North America, Dunlop Tires North America and innovation centre) (Goodyear 2015).
Plant Locations
Goodyear started manufacturing commercial tyres and OTR tyres in Topeka, Kansas in
late 2010. OTR tyres are also produced in Brazil, Columbia, Luxemburg, South Africa,
India, Japan, Indonesia and Malaysia (Goodyear 2015).
In October 2015, The Goodyear announced about the disbandment of its global alliance
with Sumitomo Rubber Industries (SRI) Ltd. (Shareholder 2015). Another new is that
Goodyear will start building a new factory in Mexico in the middle of 2017 with their
focus on high-value added consumer tyres (Goodyear 2015). This has no effect on the
OTR sector but indicates company’s strategic focus towards passenger car sector.
In a dealer meeting 2015, Goodyear announced that they will introduce low-cost radial
tyres which have been manufactured in the United States. Goodyear points out that the
timing is perfect because of the tariffs in consumer tyres which are from 30% to 109%
when imported from China (Goodyear 2015; MTD Modern Tire Dealer 2015).
Brand Strategy
With Goodyear’s Blimp, the company has quite impressive way to advertise in Amer-
ica. Blimp is a non-rigid airship shaped as a vessel and the first blimp flew in 1925
(Goodyear 2015).
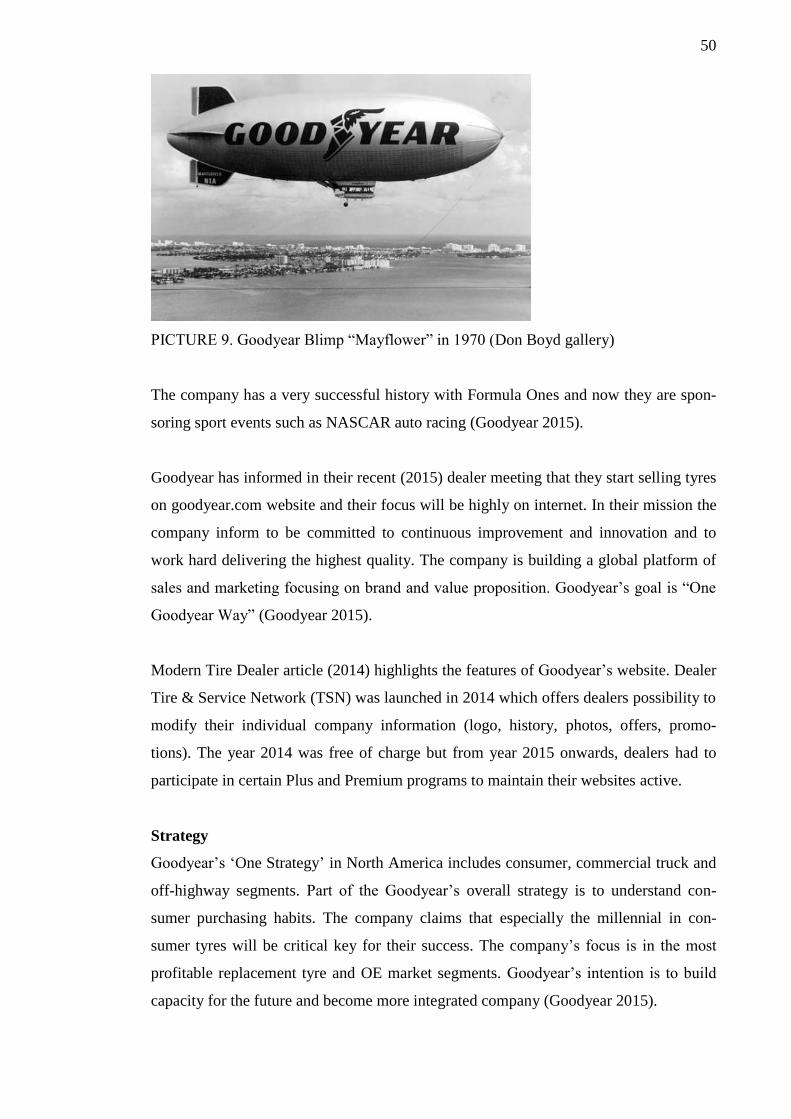
50
PICTURE 9. Goodyear Blimp “Mayflower” in 1970 (Don Boyd gallery)
The company has a very successful history with Formula Ones and now they are spon-
soring sport events such as NASCAR auto racing (Goodyear 2015).
Goodyear has informed in their recent (2015) dealer meeting that they start selling tyres
on goodyear.com website and their focus will be highly on internet. In their mission the
company inform to be committed to continuous improvement and innovation and to
work hard delivering the highest quality. The company is building a global platform of
sales and marketing focusing on brand and value proposition. Goodyear’s goal is “One
Goodyear Way” (Goodyear 2015).
Modern Tire Dealer article (2014) highlights the features of Goodyear’s website. Dealer
Tire & Service Network (TSN) was launched in 2014 which offers dealers possibility to
modify their individual company information (logo, history, photos, offers, promo-
tions). The year 2014 was free of charge but from year 2015 onwards, dealers had to
participate in certain Plus and Premium programs to maintain their websites active.
Strategy
Goodyear’s ‘One Strategy’ in North America includes consumer, commercial truck and
off-highway segments. Part of the Goodyear’s overall strategy is to understand con-
sumer purchasing habits. The company claims that especially the millennial in con-
sumer tyres will be critical key for their success. The company’s focus is in the most
profitable replacement tyre and OE market segments. Goodyear’s intention is to build
capacity for the future and become more integrated company (Goodyear 2015).
51
Company’s ‘Strategy Roadmap’ has a purpose of spotting “MegaTrends that are shap-
ing the direction of the global tyre industry”. Attention has been in increased consumer
demand towards high value added tyres. These tyres have features such as saving fuel,
driving comfort and wet traction (Annual Report 2014, 4).
Goodyear’s key strategies have been concerning market-back product development,
targeting profitable segments with more selective approach to gain competitive advan-
tages and developing company’s personnel. In manufacturing their focus has been im-
proving efficiency and supply chain (Annual Report 2014, 7).
R&D
During 2014 Goodyear launched 21 new commercial tyres and 17 consumer tyres. The
company will keep targeting on price and product mix to have lower cost materials
where possible as well as finding other compensatory opportunities to reduce costs of
raw materials (Annual Report 2014, 8).
Goodyear’s concern is also in world resources and in responsible production. They in-
vest in R&D, innovation and environmental friendly products. The company has manu-
factured tyres from renewable biomass (Goodyear 2015).
Goodyear manufactures and markets tyres and rubber-related chemicals. Goodyear dis-
tributes their tyres for most applications. In North America their business has been prof-
itable and they forecast for sustainable growth (Goodyear 2015).
52
5 SOURCES AND CONTACTS
Search for the potential end-users started from different Forestry and Logging Asso-
ciations in Southeast United States. A list of all forestry and logger associations in the
U.S. from year 2015 will be found from appendix 2. Information for the appendix 2 was
received from the Southern Loggin’ Times Magazine, January-February release in 2015.
Most of the associations have functioning websites with contact information. Forestry
and logger associations publish different kind of information and articles on their news-
letters and magazines but also on their website, on LinkedIn and on Facebook. As an
example, through the Tennessee Forestry Association (TFA), products and services can
be advertised to their members (loggers, professional foresters, equipment dealers,
landowners, sawmills, paper mills and trucking companies) in TFA’s annual or quar-
terly publications (magazine, hardcopy, CD, email, online from their website) that
reaches over 2200 members (TFA website 2015).
LinkedIn is one of the channels to find information from different associations. As an
example, Georgia Forestry Association has 981 members on LinkedIn. There are lot of
happenings, publications, public announcements and annual meetings informed on their
site.
Source: LinkedIn www.linkedin.com
LinkedIn offers data and contact information from private people to companies. Per-
sonal profiles can be accessed though the title or job description (master logger, opera-
tor), companies and associations by their name, area or field. As an example couple of
organizations: Southern Loggers Cooperative, Truck Loggers Association and Ameri-
can Forest & Paper Association.
Facebook has more forest and loggers associations than LinkedIn. Facebook also has a
lot of information about different events with pictures. Some examples from associa-
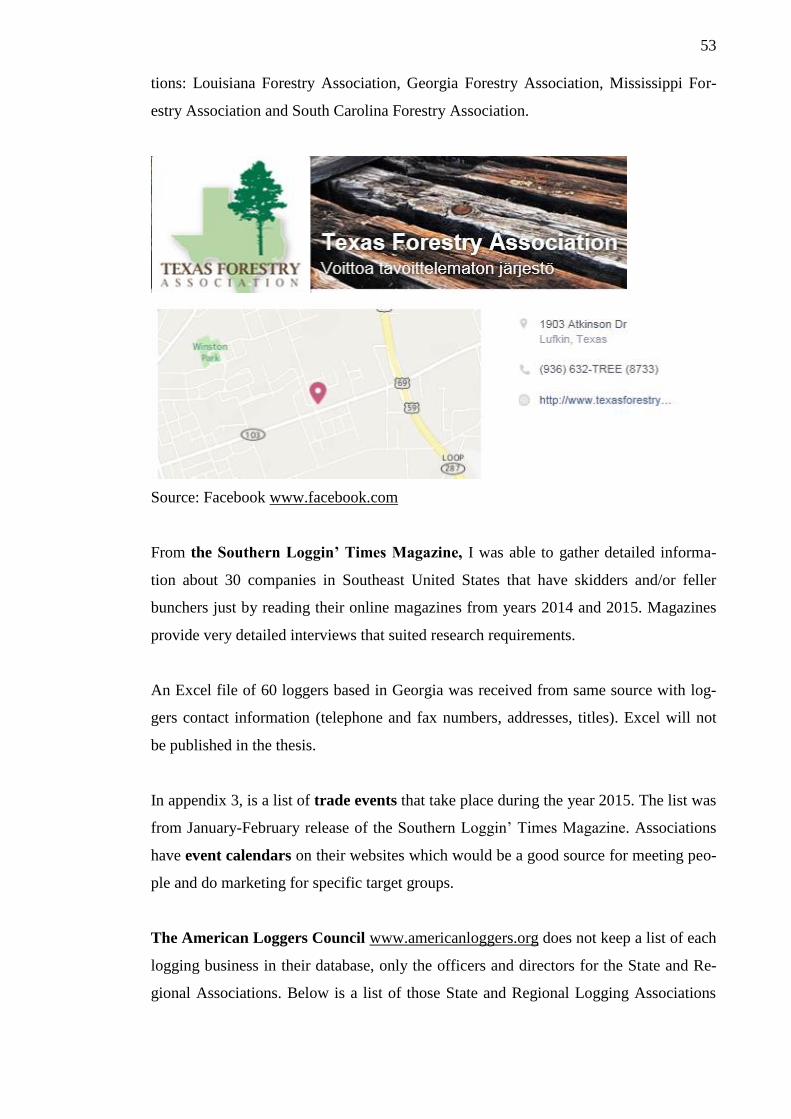
53
tions: Louisiana Forestry Association, Georgia Forestry Association, Mississippi For-
estry Association and South Carolina Forestry Association.
Source: Facebook www.facebook.com
From the Southern Loggin’ Times Magazine, I was able to gather detailed informa-
tion about 30 companies in Southeast United States that have skidders and/or feller
bunchers just by reading their online magazines from years 2014 and 2015. Magazines
provide very detailed interviews that suited research requirements.
An Excel file of 60 loggers based in Georgia was received from same source with log-
gers contact information (telephone and fax numbers, addresses, titles). Excel will not
be published in the thesis.
In appendix 3, is a list of trade events that take place during the year 2015. The list was
from January-February release of the Southern Loggin’ Times Magazine. Associations
have event calendars on their websites which would be a good source for meeting peo-
ple and do marketing for specific target groups.
The American Loggers Council www.americanloggers.org does not keep a list of each
logging business in their database, only the officers and directors for the State and Re-
gional Associations. Below is a list of those State and Regional Logging Associations
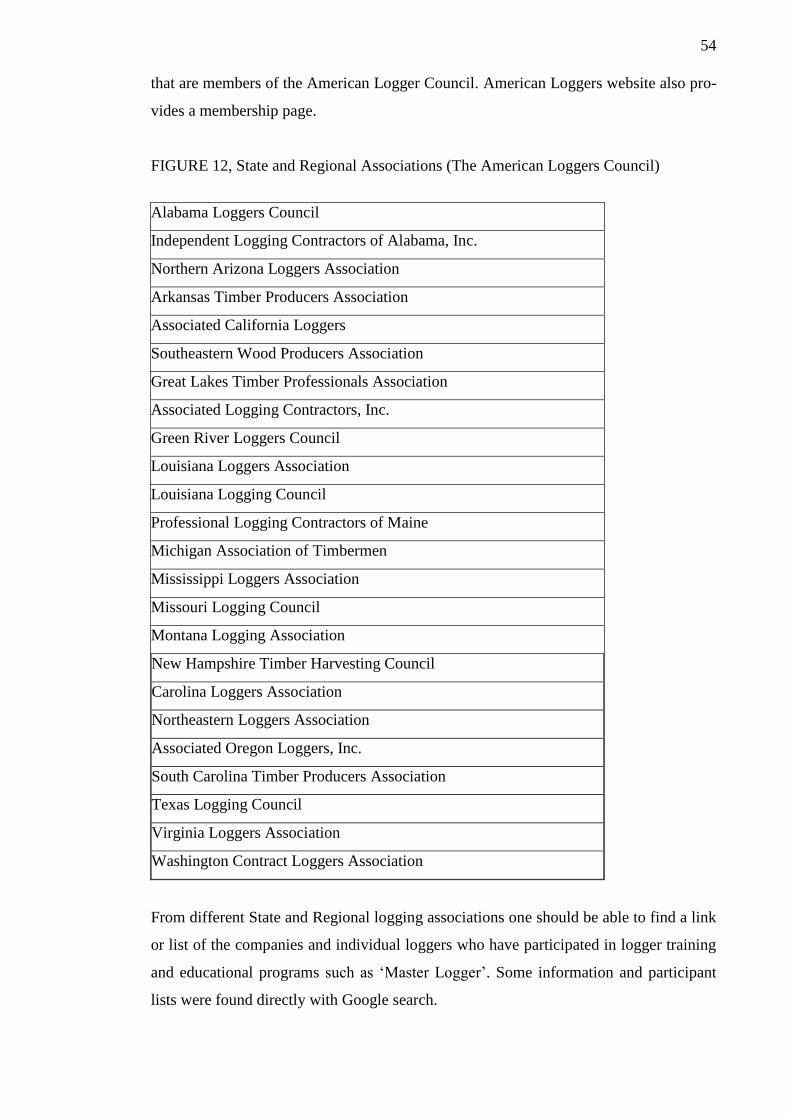
54
that are members of the American Logger Council. American Loggers website also pro-
vides a membership page.
FIGURE 12, State and Regional Associations (The American Loggers Council)
Alabama Loggers Council
Independent Logging Contractors of Alabama, Inc.
Northern Arizona Loggers Association
Arkansas Timber Producers Association
Associated California Loggers
Southeastern Wood Producers Association
Great Lakes Timber Professionals Association
Associated Logging Contractors, Inc.
Green River Loggers Council
Louisiana Loggers Association
Louisiana Logging Council
Professional Logging Contractors of Maine
Michigan Association of Timbermen
Mississippi Loggers Association
Missouri Logging Council
Montana Logging Association
New Hampshire Timber Harvesting Council
Carolina Loggers Association
Northeastern Loggers Association
Associated Oregon Loggers, Inc.
South Carolina Timber Producers Association
Texas Logging Council
Virginia Loggers Association
Washington Contract Loggers Association
From different State and Regional logging associations one should be able to find a link
or list of the companies and individual loggers who have participated in logger training
and educational programs such as ‘Master Logger’. Some information and participant
lists were found directly with Google search.

55
Some of the sources and contacts did not produce any results. In some cases, the reason
was that the timing was very busy for example for the loggers. Schools and official or-
ganizations had the summer holiday. In most places the problem was that there were no
systems build for this kind of data gathering and such information simply was not avail-
able.
56
6 RECOMMENDATIONS AND CONCLUSION
The objective of this study was to find different channels that lead to the potential cus-
tomers. Based on the results, the best channel finding end-users was easy to determine:
the Southern Loggin’ Times Magazine. Naturally the results can be considered in many
ways. If the need is purely quantitative, one channel over the others was clearly the best.
In situations where more detailed content is requested this could be laborious, but one
surprising source was found for that as well. Thus the results can be viewed from many
different perspectives.
For the company, the researcher’s personal suggestion is to create good relationships for
the associations. To advertise tyres in associations’ magazine, publish an article of a
satisfied customer or about a successful tyre testing. This is based on the fact that the
loggers exchange important information with each other and trust each other's word.
This way the end-users can demand tyres they want from tyre shops and dealers. The
effect of demand radiates to the definition of sales channels in that area.
Findings from LinkedIn and Facebook may not be accurate or might be even misleading
information. Obviously this applies to all websites. However, the researcher’s proposi-
tion is that these channels should be used for information search and detect the trends,
events, topicalities and for example for drastic changes in user numbers. Social media is
important source for feedback from products, services and customer satisfaction. It is an
easy way to pass on the information when received good or bad experience and for
companies to pick up hints.
In the future new channels parallel to Facebook will appear to the market for changing
information. People usually are social by nature; it would be good to know what kind of
forums or applications loggers use. In this way the companies could also connect easier
with the end-users and to market their products through these channels. Trade events are
good places to meet the end-users and others related to the business. This channel could
be utilized much more.
Data collection problems appeared when certain websites were not specific enough
and the information was left inadequate. These organizations may be lacking the skills,
57
personnel or functioning system. Some of the websites looked quite old and without the
dates, the outdated data could be more misleading than helpful.
Every company must find their own sources and methods which approved best from the
variety of possible contact groups and different channels. The researcher’s recommen-
dation for the company is to continue with international market researches since new
information was found relatively easy and in some cases, an outside view of the markets
can open up new channels that locals do not necessarily even think about. However,
most of these activities and recommendations will work locally as well.
Based on the key findings a comprehensive picture of the end-users were obtained;
owner information, logging operations, list of equipment, equipment dealers, tyres, cur-
rent challenges, future prospects, as well other numbers and figures about their business.
The practical benefit of the results is important for the company and for the sales man-
ager of this region.
The research data has been given to the company to identify and compare alternatives.
To gain benefits in decision-making process, follow-up or in further research, the find-
ings must be evaluated in company level as well. Since the data was collected from the
secondary sources, findings are given forward for testing.
In some areas of the Southern United States, Nokian Tyres Inc has a working network
of tyre and equipment dealers. Company must determine if these distribution channels
can serve the skidder customers. With the information received from this study a search
for potential dealers in areas with large potential of users has started. Results from the
study have provided contacts to the dealer network and Nokian Tyres representatives.
Results will also help store managers targeting new potential customers.
Tyre shops and dealers must decide which channels to use in order to reach their cus-
tomers. It is recommended that they use multiple channels and try new ones as well. In
addition, would be interesting to find out how equipment dealers fit in the picture of
finding new customers. Maintaining close relationships to the customers seems to be an
effective way to remain competitive in the United States.
58
The overall market conditions in the United States are stable and the country has the
largest economy in the world. Canada, Mexico and China are the largest trading part-
ners with the United States in both export and import. The current market situation in
the construction industry and in the housing market has signs of improvement. Mining
sector has declined but that is also a global phenomenon. The paper industry in the
United States continues to decline.
In the United States, the forest land area covers 304 million hectares and growing stock
volume is 47 billion cubic meters. The country makes most roundwood felling and is
among the largest lumber producers in the world. The forest product industry is impres-
sive employer in most of the states.
The forest industry and situation in Southern states looks promising with rising de-
mand for lumber and logs (especially from China), the huge appearance of wood pellet
industry in Georgia and because of the expansions and investments made in Southern
sawmills. Canadian lumber industry is claimed to shrink down and the effects of ‘pine
bug’ has been increasing. This indicates heavy positive pressure towards Southern
states. However, the different trade agreements and duties between the United States
and Canada can have critical outcomes for the future which can be seen as huge threat
for the industry.
Logging equipment manufacturers predict more efficient equipment into the markets but
mostly the harvesting methods and markets are predicted to remain fairly the same. Key
concerns among the loggers are increased diesel fuel costs and insurance rates, shortage
of skilled operators and wet conditions in the logging areas which creates different kind
of challenges.
Tyres are necessity, not an industry with much of excitement. Tyres are used on a daily
basis but still it is a challenge to make tyres interesting and relevant. Mostly the vehicle
owners will buy the same brand they have or buy ones recommended by the dealer, tyre
shop or they rely on the recommendations of other operators, loggers.
In a competitive environment, the competitor analysis and monitoring is crucial. When
searching different types of advantages companies try to achieve and their likely ac-
tions, evaluating the credibility of the information can be difficult. Some information is
59
obviously confidential and some leaves too much room for interpretation. However,
researcher’s conclusions about competitors are following.
Each brand; Firestone, Primex and Goodyear have been in forestry markets for a long
time. Based on the findings, Firestone and Primex stands out quite clearly in off-the-
road (OTR) sector with their investments, while Goodyear seem to be targeting more
towards consumer markets.
Globally new manufacturing facilities and expansions are reported from all three
brands. In the United States, Firestone and Primex have heavily invested in the South-
east area where their plants, centres or warehouses can be found. Their strengths are
clearly in the dealer and distribution networks and offered services networks.
Primex seems to have a desire to conquer the United States markets and the effort is
significant. The group has invested on strategic locations, product mix availability,
hired key players into their company, re-aligned their production capacities and are
pushing for sale expansion. Group’s vision for OTR segment is to be among the top
three in global leaders and their focus is to deliver superior value with lowest total cost
of ownership.
Firestone is a strong regional brand and their focus is to grow globally. The company
has invested in a new plant in South Carolina to be closer to their customers highlight-
ing customer service and quality in their actions. Company centralize on competitive
technological edge and innovations by investing highly on R&D.
Based on the findings, Goodyear manufactures OTR tyres globally in many places but
the silence in the news or articles raises questions about their future. Company’s focus
towards internet sales, targeting only profitable segments and having more selective
approach for the markets indicates about their orientation.
According to the competitors’ actions, Firestone and Primex have similar trends and
Nokian Heavy Tyres will be a challenger for them. Competitors do see the future in the
United States markets good and worth investing.

60
Possible upcoming research could analyse the results and new business connections
from the study. With qualitative research, the company could gather primary data from
customers’ direct feedback. Also primary data would help the company understand the
secondary findings and will provide more accurate indications for decision making.
61
REFERENCES
Alasuutari, P. 2011. Laadullinen Tutkimus 2.0. 4th
ed. Tampere: Vastapaino.
Albany Herald news. 2014. Forest business gives Georgia solid lead. Read 2.8.2015.
http://www.albanyherald.com/news/2014/jul/30/lynn-michaelis-forest-business-gives-
georgia/
Alliance Tire Group (ATG). 2015. ATG website. Read 13.9.2015.
http://www.atgtire.com/Default.aspx
ATG. 2015. Advantage. Read 13.9.2015. http://www.atgtire.com/AtgAdvantage.aspx
ATG. 2015. Brochure. Read 13.9.2015.
http://www.atgtire.com/images/brochures/GALAXY-PRIMEX-AGRI-FORESTRY-
RANGE-2011.pdf
ATG. 2015. Products. Read 13.9.2015. http://www.atgtire.com/products-forestry.aspx
ATG. 2015. Profile. Read 13.9.2015. http://www.atgtire.com/ProfileWW.aspx
ATG. 2015. Quality Policy. Read 13.9.2015. http://www.atgtire.com/QualityPolicy.aspx
ATG. 2015. Vision, Mission. Read 13.9.2015.
http://www.atgtire.com/VisionMission.aspx
Bridgestone Americas Inc. 2015. Press release. Read 10.10.2015.
http://www.bridgestoneamericas.com/en/newsroom/press-releases/2015/-from-seed-to-
tread--bridgestone-reveals-first-tires-made-entire#sthash.xdsGsh2h.dpuf
Bridgestone Americas Inc. 2015. Press release. Read 26.9.2015.
http://www.bridgestoneamericas.com/en/newsroom/press-releases/2015/bridgestone-
supports-schools-with-contest-to-fund-athletic-and-w#sthash.pY3P2Q5o.dpuf
Bridgestone. 2015. Annual report 2014. Read 26.9.2015.
http://www.bridgestone.eu/~/media/Files/Corporate/Central/Downloads/2014%20Annu
al%20Report%20Operational.ashx
Bridgestone. 2011. Brochure. Read 12.9.2015.
http://dealersupport.firestoneag.com/pdfs/brochures/Full-
Line%20Forestry%20Brochure.pdf
Bridgestone. 2015. Mid-term Management Plan. Read 26.9.2015.
http://www.bridgestone.com/corporate/library/mid_term/pdf/mid-term15.pdf
Bridgestone. 2015. News. Read 12.9.2015.
http://www.bridgestone.com/corporate/news/2015101601.html
Bridgestone. 2015. Strategic Insights. Read 12.9.2015.
http://www.strategicdev.com/wp-content/uploads/2015/07/BridgestoneJune2015.pdf
Bridgestone. 2015. Strategy. Read 26.9.2015.
http://www.bridgestone.com/corporate/strategy/
Bridgestone. 2015. Technology and Innovation. Read 10.10.2015.
http://www.bridgestone.eu/corporate/corp/technology-and-innovation/
Bridgestone. 2015. Who we are. Read 12.9.2015.
http://www.bridgestonetire.com/about/who-we-are
Bureau of Labor Statistics. 2015. United States Department of Labor. Read 25.7.2015.
http://www.bls.gov/news.release/empsit.nr0.htm
62
Creative Guerrilla Marketing. 2015. The Marketing & Branding Strategy Behind
Bridgestone Tires. Read 12.9.2015.
http://www.creativeguerrillamarketing.com/advertising/the-marketing-branding-
strategy-behind-bridgestone-tires/
Czinkota, M., Ronkainen, I. 2010. Principles of International Marketing. 9th
ed. Austra-
lia: South-Western Cengage Learning.
Deloitte. Corporate Tax Rates 2015. Read 26.7.2015.
http://www2.deloitte.com/content/dam/Deloitte/global/Documents/Tax/dttl-tax-
corporate-tax-rates-2015.pdf
Design Forum. 2014. Fennia Prize. Read 15.8.2015.
http://www.designforum.fi/prizes/fenniaprize/2014_en
Economic Policy Institute. 2012. U.S. lags behind peer countries in mobility. Read
22.8.2015. http://www.epi.org/publication/United States-lags-peer-countries-mobility/
Eriksson, M. & Lindroos, O. 2014. Productivity of harvesters and forwarders in CTL
operations in northern Sweden based on large follow-up datasets. The International
Journal of Forest Engineering (Volume 25, Issue 3, 2014). Read 18.7.2015.
http://www.tandfonline.com/doi/full/10.1080/14942119.2014.974309
European Commission. 2015. The Transatlantic Trade Investment Partnership (TTIP).
Read 1.8.2015. http://ec.europa.eu/trade/policy/in-focus/ttip/
Fast Company & Inc. 2014. How tire company Bridgestone is solving a tricky natural
resource issue. Read 12.9.2015. http://www.fastcompany.com/3033390/innovation-
agents/how-tire-company-firestone-is-solving-a-tricky-natural-resource-issue
Forest Resources Assessment (FRA). 2010. Main report. Read 1.8.2015
http://www.fao.org/docrep/013/i1757e/i1757e.pdf
Furman, J. 2015. Trade, Innovation, and Economic Growth. Read 1.8.2015.
https://www.whitehouse.gov/sites/default/files/docs/20150408_trade_innovation_growt
h_brookings.pdf
Gallup Inc. 2005. Post-9/11 Patriotism Remains Steadfast. Read 22.8.2015.
http://www.gallup.com/poll/17401/post911-patriotism-remains-steadfast.aspx
Goodyear. 2015. Annual report 2014. Read 27.9.2015.
https://corporate.goodyear.com/content/dam/goodyear-
corp/documents/annualreports/GT2014_AR.pdf
Goodyear. 2015. Corporate history. Read 27.9.2015.
https://corporate.goodyear.com/content/goodyear-corp/en-US/about/history.html
Goodyear. 2015. History. Read 27.9.2015. http://www.goodyear.eu/home_en/about-
us/our-history/
Goodyear. 2015. Mission. Read 27.9.2015.
https://corporate.goodyear.com/content/goodyear-corp/en-US/about/mission.html
Goodyear. 2015. Quality, Innovation. Read 27.9.2015.
http://www.goodyear.eu/home_en/goodyear-quality/innovation/
63
Goodyear. 2015. Shareholder report. Read 11.10.2015.
http://apps.shareholder.com/sec/viewerContent.aspx?companyid=AMDA-
1IFBEB&docid=10938016
Hooley, G., Piercy, N.F., Nicoulaud, B. 2012. Marketing Strategy & Competitive Posi-
tioning, 5th
ed. Harlow: Pearson.
International Mining (IM). 2012. Mining Tyres. Read 27.9.2015. http://im-
mining.com/2012/09/01/mining-tyres/
John Deere. 2015. Company’s website, 50 years. Read 5.7.2015.
https://www.deere.com/en_US/campaigns/skidders50.page?cid=VURL_Skidder50
John Deere. 2015. Forestry Timeline. Read 5.7.2015.
https://www.deere.com/en_US/industry/forestry/learn_more/about_construction_and_fo
restry/history/history.page
Journal of Forest Engineering. 2001. Effect of Tire Size on Skidder Productivity Under
Wet Conditions. Klepac, J., Stokes, B., Roberson, J. Read 5.9.2015.
https://journals.lib.unb.ca/index.php/ijfe/article/view/9926/10123
Kotler, P., Keller, K.L. 2012. Marketing management. 14th
ed. Harlow: Pearson.
Laatukeskus. 2013, Excellence Finland. Read 15.8.2015.
http://www.laatukeskus.fi/palvelut-vuoden-laatuinnovaatio-kilpailu-2013/international-
quality-award-year-prizes-have-been-awarded
Lahtinen, M. 2011. The global challenges of harvesting and how the CTL method can
respond to them. Metsätalouden koulutusohjelma. Mikkelin ammattikorkeakoulu.
Bachelor’s thesis.
Modern Tire Dealer (MTD). Facts Issues 2015. Research by BrightLine Marketing
LLC. Read 5.9.2015. http://www.moderntiredealer.com/uploads/stats/mtd-facts-issue-
2015.pdf
Modern Tire Dealer (MTD). 2015. Articles. Read 27.9.2015.
http://www.moderntiredealer.com/article/312486/goodyear-tells-dealers-it-will-sell-
tires-online, http://www.moderntiredealer.com/article/312302/get-ready-for-the-
millennials
Nielsen. 2015. Company website. Read 10.10.2015.
http://www.nielsen.com/us/en/about-us.html.
Nokian Heavy Tyres. 2015. Company’s website. Read 27.6.2015.
http://www.nokianheavytyres.us/area-of-se?kayttoalue=12607912.
Nokian Heavy Tyres. 2015. Technical manual, Forestry tyres. Read 27.6.2015.
http://www.nokianheavytyres.us/files/nht/technical_manual/NokianHeavyTyres_Techni
cal_manual_03_Forestry_20140609.pdf
Nokian Heavy Tyres. Heavy Tyre eNews 11/2013. Read 27.6.2015.
http://newsletter.nokiantyres.com/heavy-tyres?issue=33780582
Oxford Learning Lab Ltd 2015. Read 6.6.2015.
http://www.oxlearn.com/arg_Marketing-Resources-PESTLE--Macro-Environmental-
Analysis_11_31
64
PISA. 2012. Report. Read 22.8.2015.
http://www.oecd.org/pisa/keyfindings/PISA2012_US%20report_ebook(eng).pdf
Ponsse. 2015. Annual Report 2014. Read 4.7.2015. http://www.ponsse.com/media-
archive/other-publications/annual-reports/2014
Ponsse. 2015. Business sector. Read 28.6.2015.
http://www.ponsse.com/ponsse/business-sector
Ponsse. 2015. Equipment and harvesting costs. Read 28.6.2015.
http://www.ponsse.com/ponsse/business-sector/cut-to-length-method/equipment-and-
harvesting-costs
Ponsse. 2014. News, Design Forum. Read 15.8.2015.
http://www.designforum.fi/prizes/fenniaprize/2014_en.
Ponsse. 2015. Product News 2015. Read 4.7.2015.
file:///C:/Users/Marika/Documents/Downloads/PONSSE_Product_News_2015_ENG.p
df
PR Newswire Association LLC. 2015. Article. Read 27.9.2015.
http://www.prnewswire.com/news-releases/goodyear-to-build-tire-factory-in-san-luis-
potosi-mexico-300071798.html
Reed Smith LLP. 2014. Sanctions. Read 6.8.2015.
http://www.reedsmith.com/files/Publication/9221cf81-e4f7-4907-ab2c-
f7dc249eac58/Presentation/PublicationAttachment/441e0ec9-dbd8-4c3a-b1fa-
0bf7ed4d5872/alert_14-
255.pdf?utm_source=Mondaq&utm_medium=syndication&utm_campaign=View-
Original
RitchieWiki 2013. Ritchie Bros. Auctioneers. Everything about Equipment. Read
11.7.2015. http://www.ritchiewiki.com/wiki/index.php/Skidder
State Industry Economic Impact. 2015. American Forest & Paper Association. Read
1.8.2015 http://www.afandpa.org/
SteamFeed. 2015. Heavy-duty OTR tire manufacturing in the UNITED STATES. Read
5.9.2015. http://www.steamfeed.com/heavy-duty-otr-tire-manufacturing-in-the-us-
industry-market-research-report-now-available-from-ibisworld/
Strategic Management Insight. 2013. PEST & PESTEL Analysis. Read 6.6.2015.
http://www.strategicmanagementinsight.com/tools/pest-pestel-analysis.html
Šušnjar, M., Horvat, D., Pandur Z., Zorić, M. 2015. Development of forest machines –
new trends. Institute of Forest Engineering Faculty of Foresty, University of Zagred.
Read 5.7.2015.
http://www.crojfe2015.com/r/i/5.%20CROJFE_2015_Presentation_Susnjar.pdf
The City Wire Staff, Talk Business and Politics. 2015. Study: Consumers favor ‘Made
in UNITED STATES’ products over sustainability. Read 22.8.2015.
http://www.thecitywire.com/node/38039#.VhZqvPntlBc
65
The Global Innovation Index. 2015. Global Innovation Index 2015: Switzerland, UK,
Sweden, Netherlands, UNITED STATES are Leaders. Read 8.8.2015.
https://www.globalinnovationindex.org/content/page/press-release/
The Hofstede Centre. 2015. The UNITED STATES’s Cultural Dimensions. Read
29.8.2015. http://geert-hofstede.com/united-states.html
The International Journal of Forest Engineering. 2014. The cost model for calculation of
forest operations costs. Ackerman, P., Belbo, H., Eliasson, L., de Jong, A., Lazdins, A.,
Lyons, J. Read 18.7.2015.
http://www.tandfonline.com/doi/full/10.1080/14942119.2014.903711
The Tennessee Forestry Association (TFA). 2015. Read 13.6.2015. www.tnforestry.com
The Trans-Pacific Partnership. 2015. The Office of the United States Trade Representa-
tive. Read 1.8.2015. https://ustr.gov/tpp/#overall-us-benefits
The United States Department of the Treasury. 2011. Report. Read 8.8.2015.
http://www.treasury.gov/resource-center/tax-
policy/Documents/Research%20and%20Experimentation%20report%20FINAL.PDF
The Wall Street Journal. 2015. U.S. Birthrate Hits Turning Point. Read 22.8.2015
http://www.wsj.com/articles/u-s-birthrate-hits-turning-point-1434513662
The White House. 2010. Executive Summary. Read 8.8.2015.
https://www.whitehouse.gov/innovation/strategy/executive-summary
Timber West, Journal of Logging & Sawmills. 2013. Looking to the future in logging
equipment. Read 15.8.2015.
http://forestnet.com/TWissues/2013_july_august/looking_to_the_future.php
Tire Business. 2014. News. Read 13.9.2015.
http://www.tirebusiness.com/article/20140205/NEWS/140209966
Tire Review. 2015. Bridgestone turns out first guayule prototype tires. Read
10.10.2015. http://www.tirereview.com/bridgestone-turns-out-first-guayule-prototype-
tires/
Trading Economics. 2015. Disposable Personal Income. Read 25.7.2015.
http://www.tradingeconomics.com/united-states/disposable-personal-income
Trading Economics. 2015. Labour-costs. Read 25.7.2015.
http://www.tradingeconomics.com/united-states/labour-costs
Transparency International. 2014. Corruption Perceptions Index. Read 6.8.2015.
http://www.transparency.org/cpi2014/results
U.S. Department of Commerce. 2015. Census Bureau and Economic Indicators Divi-
sion, Trade Partners year to date Jul. 2015. Read 26.7.2015.
http://www.trade.gov/mas/ian/build/groups/public/@tg_ian/documents/webcontent/tg_i
an_003364.pdf
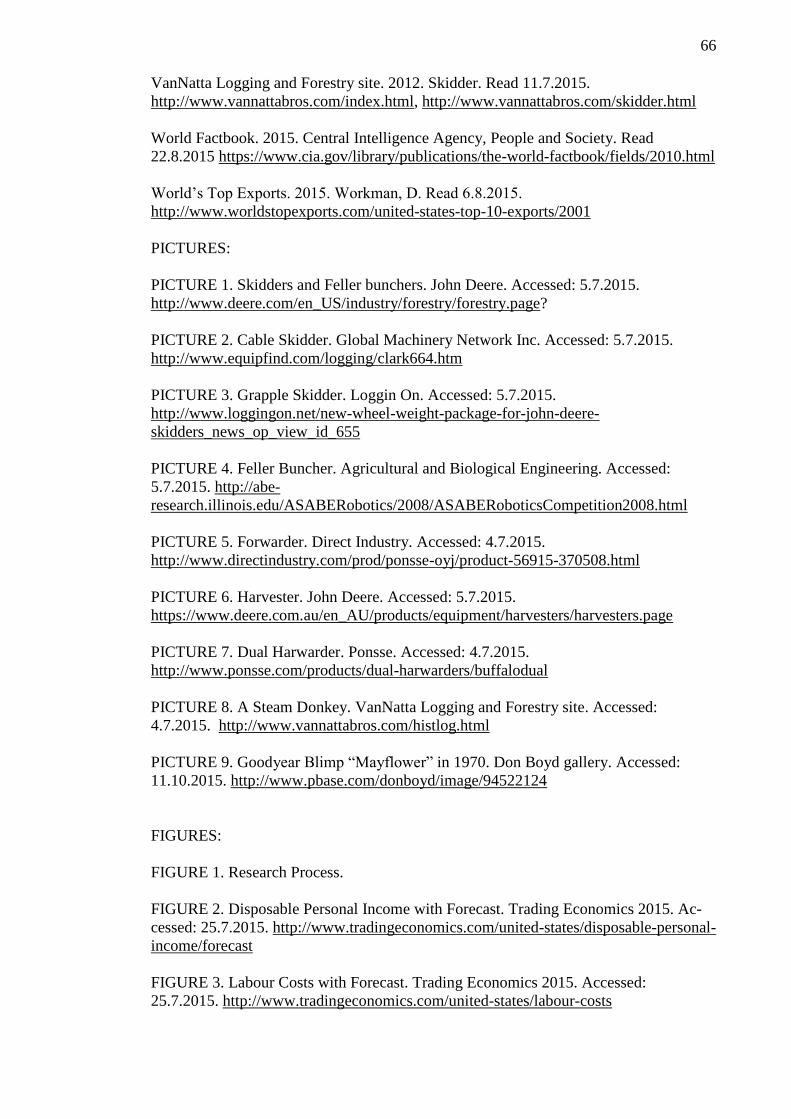
66
VanNatta Logging and Forestry site. 2012. Skidder. Read 11.7.2015.
http://www.vannattabros.com/index.html, http://www.vannattabros.com/skidder.html
World Factbook. 2015. Central Intelligence Agency, People and Society. Read
22.8.2015 https://www.cia.gov/library/publications/the-world-factbook/fields/2010.html
World’s Top Exports. 2015. Workman, D. Read 6.8.2015.
http://www.worldstopexports.com/united-states-top-10-exports/2001
PICTURES:
PICTURE 1. Skidders and Feller bunchers. John Deere. Accessed: 5.7.2015.
http://www.deere.com/en_US/industry/forestry/forestry.page?
PICTURE 2. Cable Skidder. Global Machinery Network Inc. Accessed: 5.7.2015.
http://www.equipfind.com/logging/clark664.htm
PICTURE 3. Grapple Skidder. Loggin On. Accessed: 5.7.2015.
http://www.loggingon.net/new-wheel-weight-package-for-john-deere-
skidders_news_op_view_id_655
PICTURE 4. Feller Buncher. Agricultural and Biological Engineering. Accessed:
5.7.2015. http://abe-
research.illinois.edu/ASABERobotics/2008/ASABERoboticsCompetition2008.html
PICTURE 5. Forwarder. Direct Industry. Accessed: 4.7.2015.
http://www.directindustry.com/prod/ponsse-oyj/product-56915-370508.html
PICTURE 6. Harvester. John Deere. Accessed: 5.7.2015.
https://www.deere.com.au/en_AU/products/equipment/harvesters/harvesters.page
PICTURE 7. Dual Harwarder. Ponsse. Accessed: 4.7.2015.
http://www.ponsse.com/products/dual-harwarders/buffalodual
PICTURE 8. A Steam Donkey. VanNatta Logging and Forestry site. Accessed:
4.7.2015. http://www.vannattabros.com/histlog.html
PICTURE 9. Goodyear Blimp “Mayflower” in 1970. Don Boyd gallery. Accessed:
11.10.2015. http://www.pbase.com/donboyd/image/94522124
FIGURES:
FIGURE 1. Research Process.
FIGURE 2. Disposable Personal Income with Forecast. Trading Economics 2015. Ac-
cessed: 25.7.2015. http://www.tradingeconomics.com/united-states/disposable-personal-
income/forecast
FIGURE 3. Labour Costs with Forecast. Trading Economics 2015. Accessed:
25.7.2015. http://www.tradingeconomics.com/united-states/labour-costs

67
FIGURE 4. Forest Land Area. Metla; FRA 2010. Accessed: 1.8.2015.
http://www.metla.fi/metinfo/tilasto/julkaisut/vsk/2013/vsk13_13.pdf
FIGURE 5. Growing Stock Volume. Metla; FRA 2010. Accessed: 1.8.2015.
http://www.metla.fi/metinfo/tilasto/julkaisut/vsk/2013/vsk13_13.pdf
FIGURE 6. Corruption Perceptions Index. Transparency International 2014. Accessed:
6.8.2015. http://www.transparency.org/cpi2014/results
FIGURE 7. Population Pyramid. Central Intelligence Agency, People and Society 2015.
Accessed: 22.8.2015.
https://www.cia.gov/library/publications/the-world-factbook/geos/us.html
FIGURE 8. Cultural Dimensions. The Hofstede Centre. Accessed: 29.8.2015.
http://geert-hofstede.com/united-states.html
FIGURE 9. U.S. Replacement Tire Sales. Modern Tire Dealer figures, Rubber Manu-
facturers Association. Accessed: 5.9.2015.
http://www.moderntiredealer.com/uploads/stats/mtd-facts-issue-2015.pdf
FIGURE 10. Locations in the U.S. Bridgestone 2015. Accessed: 12.9.2015.
http://www.bridgestone.com/corporate/library/data_book/pdf/BSDATA2015.pdf
FIGURE 11. Locations in the U.S. ATG 2015. Accessed: 13.9.2015.
http://www.atgtire.com/map-United States.aspx
FIGURE 12, State and Regional Associations (The American Loggers Council)
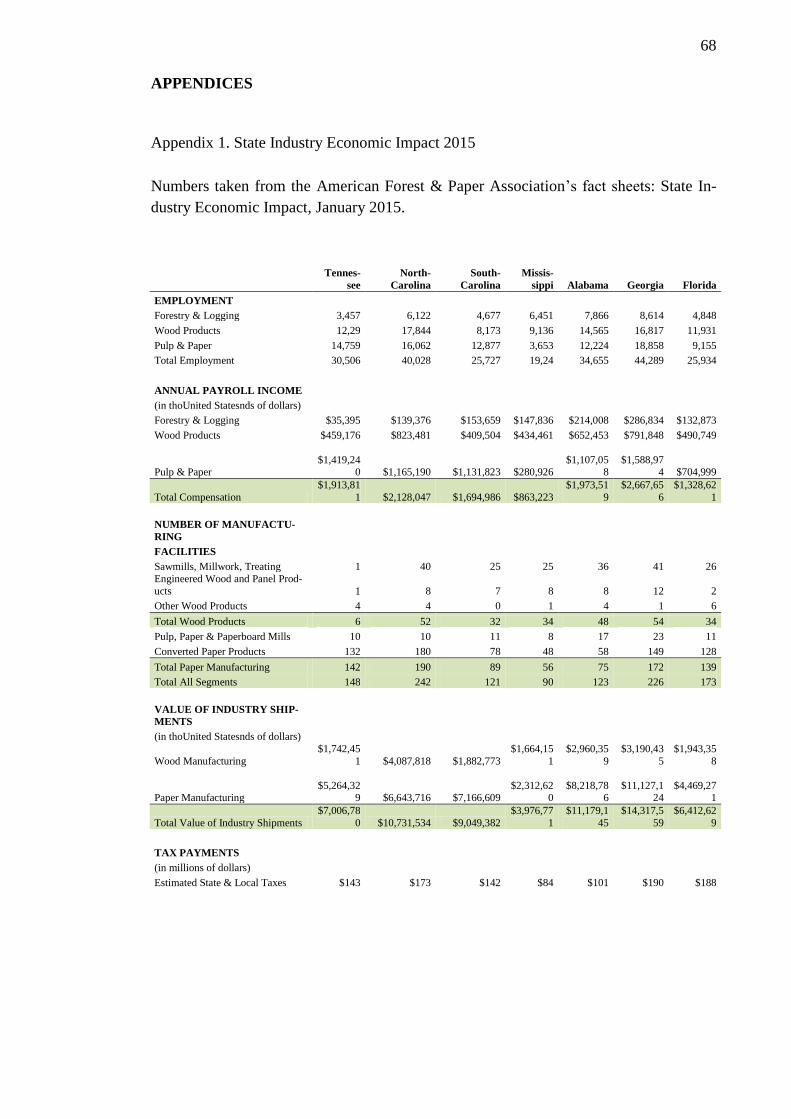
68
APPENDICES
Appendix 1. State Industry Economic Impact 2015
Numbers taken from the American Forest & Paper Association’s fact sheets: State In-
dustry Economic Impact, January 2015.
Tennes-
see
North-
Carolina
South-
Carolina
Missis-
sippi Alabama Georgia Florida
EMPLOYMENT
Forestry & Logging 3,457 6,122 4,677 6,451 7,866 8,614 4,848
Wood Products 12,29 17,844 8,173 9,136 14,565 16,817 11,931
Pulp & Paper 14,759 16,062 12,877 3,653 12,224 18,858 9,155
Total Employment 30,506 40,028 25,727 19,24 34,655 44,289 25,934
ANNUAL PAYROLL INCOME
(in thoUnited Statesnds of dollars) Forestry & Logging $35,395 $139,376 $153,659 $147,836 $214,008 $286,834 $132,873
Wood Products $459,176 $823,481 $409,504 $434,461 $652,453 $791,848 $490,749
Pulp & Paper
$1,419,240 $1,165,190 $1,131,823 $280,926
$1,107,058
$1,588,974 $704,999
Total Compensation
$1,913,81
1 $2,128,047 $1,694,986 $863,223
$1,973,51
9
$2,667,65
6
$1,328,62
1
NUMBER OF MANUFACTU-
RING
FACILITIES
Sawmills, Millwork, Treating 1 40 25 25 36 41 26
Engineered Wood and Panel Prod-
ucts 1 8 7 8 8 12 2
Other Wood Products 4 4 0 1 4 1 6
Total Wood Products 6 52 32 34 48 54 34
Pulp, Paper & Paperboard Mills 10 10 11 8 17 23 11
Converted Paper Products 132 180 78 48 58 149 128
Total Paper Manufacturing 142 190 89 56 75 172 139
Total All Segments 148 242 121 90 123 226 173
VALUE OF INDUSTRY SHIP-
MENTS
(in thoUnited Statesnds of dollars)
Wood Manufacturing
$1,742,45
1 $4,087,818 $1,882,773
$1,664,15
1
$2,960,35
9
$3,190,43
5
$1,943,35
8
Paper Manufacturing
$5,264,329 $6,643,716 $7,166,609
$2,312,620
$8,218,786
$11,127,124
$4,469,271
Total Value of Industry Shipments
$7,006,78
0 $10,731,534 $9,049,382
$3,976,77
1
$11,179,1
45
$14,317,5
59
$6,412,62
9
TAX PAYMENTS
(in millions of dollars)
Estimated State & Local Taxes $143 $173 $142 $84 $101 $190 $188
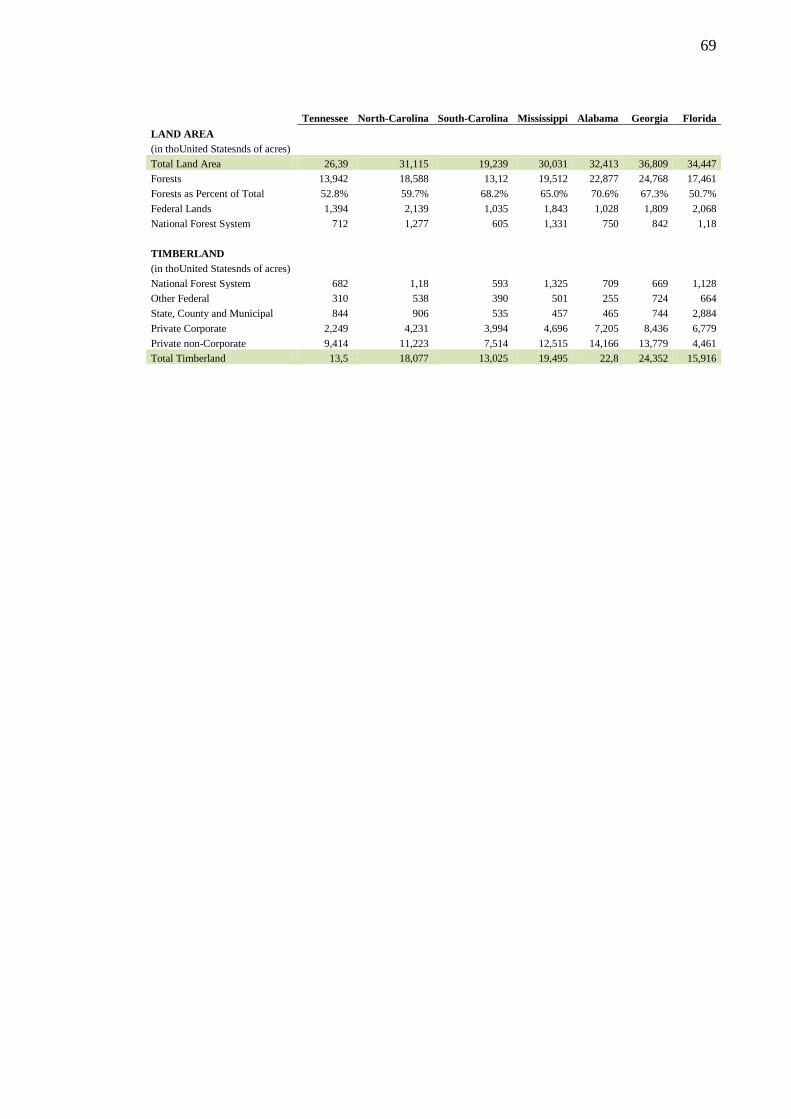
69
Tennessee North-Carolina South-Carolina Mississippi Alabama Georgia Florida
LAND AREA
(in thoUnited Statesnds of acres)
Total Land Area 26,39 31,115 19,239 30,031 32,413 36,809 34,447
Forests 13,942 18,588 13,12 19,512 22,877 24,768 17,461
Forests as Percent of Total 52.8% 59.7% 68.2% 65.0% 70.6% 67.3% 50.7%
Federal Lands 1,394 2,139 1,035 1,843 1,028 1,809 2,068
National Forest System 712 1,277 605 1,331 750 842 1,18
TIMBERLAND
(in thoUnited Statesnds of acres)
National Forest System 682 1,18 593 1,325 709 669 1,128
Other Federal 310 538 390 501 255 724 664
State, County and Municipal 844 906 535 457 465 744 2,884
Private Corporate 2,249 4,231 3,994 4,696 7,205 8,436 6,779
Private non-Corporate 9,414 11,223 7,514 12,515 14,166 13,779 4,461
Total Timberland 13,5 18,077 13,025 19,495 22,8 24,352 15,916
70
Appendix 2. U.S. Forestry and Logger Associations 2015.
Source: Southern Loggin’ Times Magazine, January/February 2015.
Alabama Forestry Assn.
555 Alabama St., Montgomery, AL 36104-4395; 334-265-8733, Fax: 334-262-1258;
Email: [email protected]; www.alaforestry.org; C. Isaacson, exec. vp.
Annual Meeting: September 13-15 2015, Perdido Beach Resort, Orange Beach, AL
Alabama Loggers Council
555 Alabama St., Montgomery, AL 36104-4309; 334-265-8733, Fax: 334-262-1258;
Annual Meeting: TBD, Prattville, AL
Alaska Forest Assn.
111 Stedman St., Ste. 200, Ketchikan, AK 99901; 907-225-6114, Fax: 907-225-5920;
Email: [email protected]; www.akforest.org
Annual Meeting: October 21-23 2015, Best Western Landing, Ketchikan, AK
American Loggers Council
PO Box 966, Hemphill, TX 75948-0966; 409-625-0206, Fax: 409-625-0207; Email:
[email protected]; www.americanloggers.org; M. Anderson, pres; R. Schwab,
1st vp; K. Martin, 2nd vp.
Annual Meeting: September 24-26 2015, Red Lion Hotel, Eureka, CA
Arkansas Forestry Assn.
1213 W. 4th St., Little Rock, AR 72201-1905; 501-374-2441, Fax: 501-374-6413;
Email: [email protected]; www.arkforests.org; P. Prutzman, pres.; M. Braswell, exec.
vp.
Annual Meeting: October 6-8 2015, Arlington Hotel, Hot Springs, AR
Arkansas Timber Producers Assn.
2311 Biscayne Dr., Ste. 206, Little Rock, AR 72227-3393; 501-224-2232, 888-403-
2232, Fax: 501-224-9625; Email: [email protected]; www.arkloggers.com; D.
Crouse, pres.; S. Word, vp.
Annual Meeting: June 18-20 2015, in conjunction with In-Woods- Expo, Hot Springs,
AR
Associated California Loggers
555 Capitol Mall, Ste. 745, Sacramento, CA 95814-4581; 916-441-7940, Fax: 916-441-
7942; www.calog.com; E. Carleson, exec. dir.
Annual Meeting: January 13-15 2015, Peppermill Resort, Spa & Casino, Reno, NV
Associated Contract Loggers & Truckers Of Minnesota
3961 S. Barker Rd., Gilbert, MN 55741-8145; 218-780-5927, Fax: 888-317-7591;
Email: [email protected]; www.acltmn.com; S. Dane, exec. dir.
Associated Logging Contractors Inc.
PO Box 671, Coeur D' Alene, ID 83816-0671; 208-667-6473, 800-632-8743 (ID), Fax:
208-667-2144; Email: [email protected]; S. Sherich, pres.; M. Mahon, vp.;
S. Keough, exec. dir.
Annual Meeting: April 24-25 2015, Best Western Lodge at River's Edge, Orofino, ID
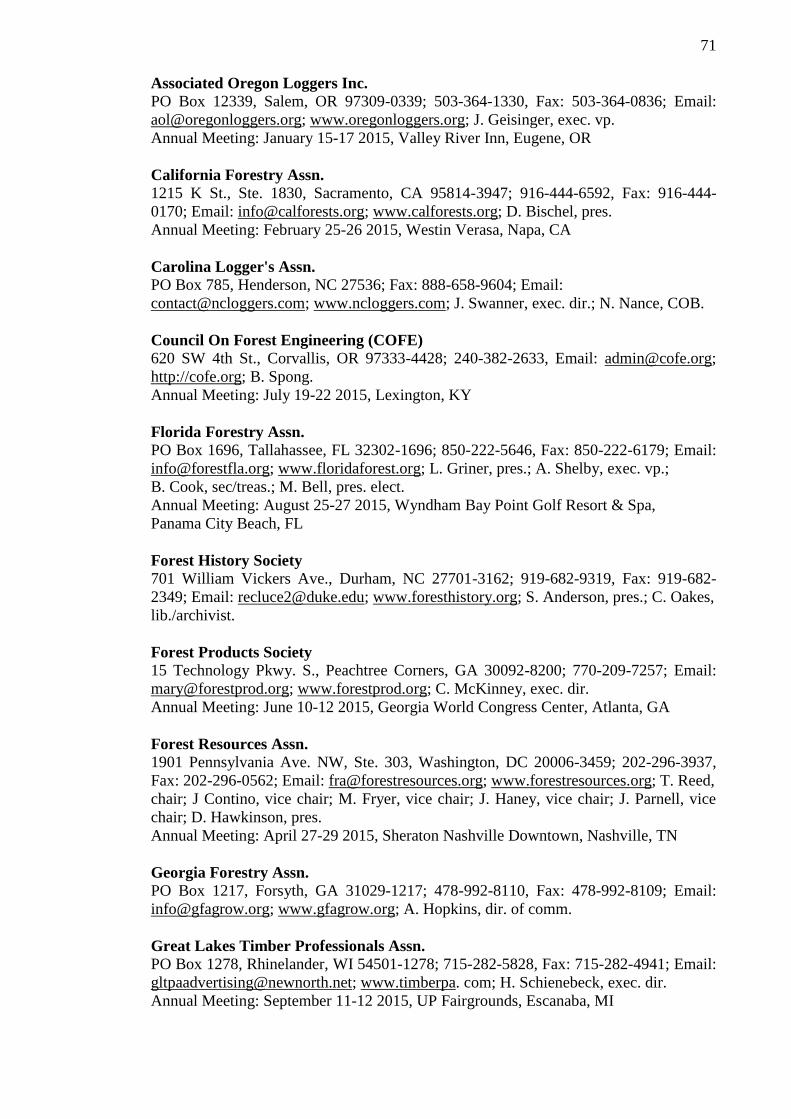
71
Associated Oregon Loggers Inc.
PO Box 12339, Salem, OR 97309-0339; 503-364-1330, Fax: 503-364-0836; Email:
[email protected]; www.oregonloggers.org; J. Geisinger, exec. vp.
Annual Meeting: January 15-17 2015, Valley River Inn, Eugene, OR
California Forestry Assn.
1215 K St., Ste. 1830, Sacramento, CA 95814-3947; 916-444-6592, Fax: 916-444-
0170; Email: [email protected]; www.calforests.org; D. Bischel, pres.
Annual Meeting: February 25-26 2015, Westin Verasa, Napa, CA
Carolina Logger's Assn.
PO Box 785, Henderson, NC 27536; Fax: 888-658-9604; Email:
[email protected]; www.ncloggers.com; J. Swanner, exec. dir.; N. Nance, COB.
Council On Forest Engineering (COFE)
620 SW 4th St., Corvallis, OR 97333-4428; 240-382-2633, Email: [email protected];
http://cofe.org; B. Spong.
Annual Meeting: July 19-22 2015, Lexington, KY
Florida Forestry Assn.
PO Box 1696, Tallahassee, FL 32302-1696; 850-222-5646, Fax: 850-222-6179; Email:
[email protected]; www.floridaforest.org; L. Griner, pres.; A. Shelby, exec. vp.;
B. Cook, sec/treas.; M. Bell, pres. elect.
Annual Meeting: August 25-27 2015, Wyndham Bay Point Golf Resort & Spa,
Panama City Beach, FL
Forest History Society
701 William Vickers Ave., Durham, NC 27701-3162; 919-682-9319, Fax: 919-682-
2349; Email: [email protected]; www.foresthistory.org; S. Anderson, pres.; C. Oakes,
lib./archivist.
Forest Products Society
15 Technology Pkwy. S., Peachtree Corners, GA 30092-8200; 770-209-7257; Email:
[email protected]; www.forestprod.org; C. McKinney, exec. dir.
Annual Meeting: June 10-12 2015, Georgia World Congress Center, Atlanta, GA
Forest Resources Assn.
1901 Pennsylvania Ave. NW, Ste. 303, Washington, DC 20006-3459; 202-296-3937,
Fax: 202-296-0562; Email: [email protected]; www.forestresources.org; T. Reed,
chair; J Contino, vice chair; M. Fryer, vice chair; J. Haney, vice chair; J. Parnell, vice
chair; D. Hawkinson, pres.
Annual Meeting: April 27-29 2015, Sheraton Nashville Downtown, Nashville, TN
Georgia Forestry Assn.
PO Box 1217, Forsyth, GA 31029-1217; 478-992-8110, Fax: 478-992-8109; Email:
[email protected]; www.gfagrow.org; A. Hopkins, dir. of comm.
Great Lakes Timber Professionals Assn.
PO Box 1278, Rhinelander, WI 54501-1278; 715-282-5828, Fax: 715-282-4941; Email:
[email protected]; www.timberpa. com; H. Schienebeck, exec. dir.
Annual Meeting: September 11-12 2015, UP Fairgrounds, Escanaba, MI
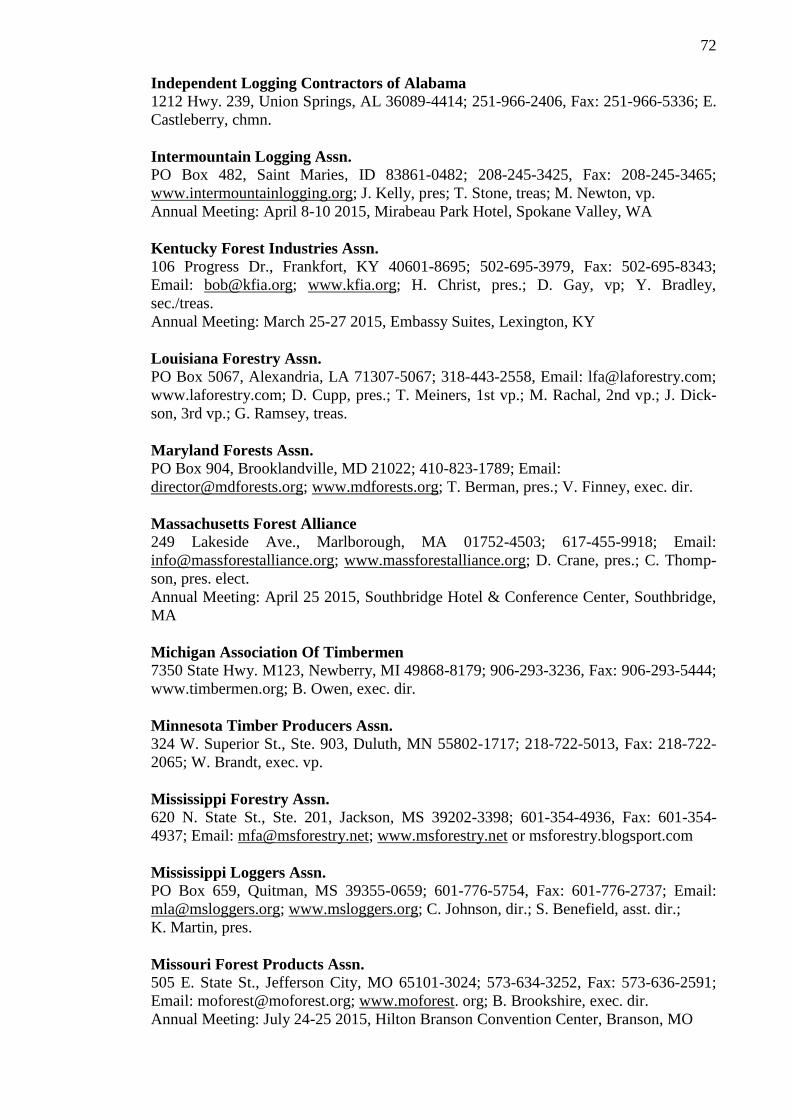
72
Independent Logging Contractors of Alabama
1212 Hwy. 239, Union Springs, AL 36089-4414; 251-966-2406, Fax: 251-966-5336; E.
Castleberry, chmn.
Intermountain Logging Assn.
PO Box 482, Saint Maries, ID 83861-0482; 208-245-3425, Fax: 208-245-3465;
www.intermountainlogging.org; J. Kelly, pres; T. Stone, treas; M. Newton, vp.
Annual Meeting: April 8-10 2015, Mirabeau Park Hotel, Spokane Valley, WA
Kentucky Forest Industries Assn.
106 Progress Dr., Frankfort, KY 40601-8695; 502-695-3979, Fax: 502-695-8343;
Email: [email protected]; www.kfia.org; H. Christ, pres.; D. Gay, vp; Y. Bradley,
sec./treas.
Annual Meeting: March 25-27 2015, Embassy Suites, Lexington, KY
Louisiana Forestry Assn.
PO Box 5067, Alexandria, LA 71307-5067; 318-443-2558, Email: [email protected];
www.laforestry.com; D. Cupp, pres.; T. Meiners, 1st vp.; M. Rachal, 2nd vp.; J. Dick-
son, 3rd vp.; G. Ramsey, treas.
Maryland Forests Assn.
PO Box 904, Brooklandville, MD 21022; 410-823-1789; Email:
[email protected]; www.mdforests.org; T. Berman, pres.; V. Finney, exec. dir.
Massachusetts Forest Alliance
249 Lakeside Ave., Marlborough, MA 01752-4503; 617-455-9918; Email:
[email protected]; www.massforestalliance.org; D. Crane, pres.; C. Thomp-
son, pres. elect.
Annual Meeting: April 25 2015, Southbridge Hotel & Conference Center, Southbridge,
MA
Michigan Association Of Timbermen
7350 State Hwy. M123, Newberry, MI 49868-8179; 906-293-3236, Fax: 906-293-5444;
www.timbermen.org; B. Owen, exec. dir.
Minnesota Timber Producers Assn.
324 W. Superior St., Ste. 903, Duluth, MN 55802-1717; 218-722-5013, Fax: 218-722-
2065; W. Brandt, exec. vp.
Mississippi Forestry Assn.
620 N. State St., Ste. 201, Jackson, MS 39202-3398; 601-354-4936, Fax: 601-354-
4937; Email: [email protected]; www.msforestry.net or msforestry.blogsport.com
Mississippi Loggers Assn.
PO Box 659, Quitman, MS 39355-0659; 601-776-5754, Fax: 601-776-2737; Email:
[email protected]; www.msloggers.org; C. Johnson, dir.; S. Benefield, asst. dir.;
K. Martin, pres.
Missouri Forest Products Assn.
505 E. State St., Jefferson City, MO 65101-3024; 573-634-3252, Fax: 573-636-2591;
Email: [email protected]; www.moforest. org; B. Brookshire, exec. dir.
Annual Meeting: July 24-25 2015, Hilton Branson Convention Center, Branson, MO
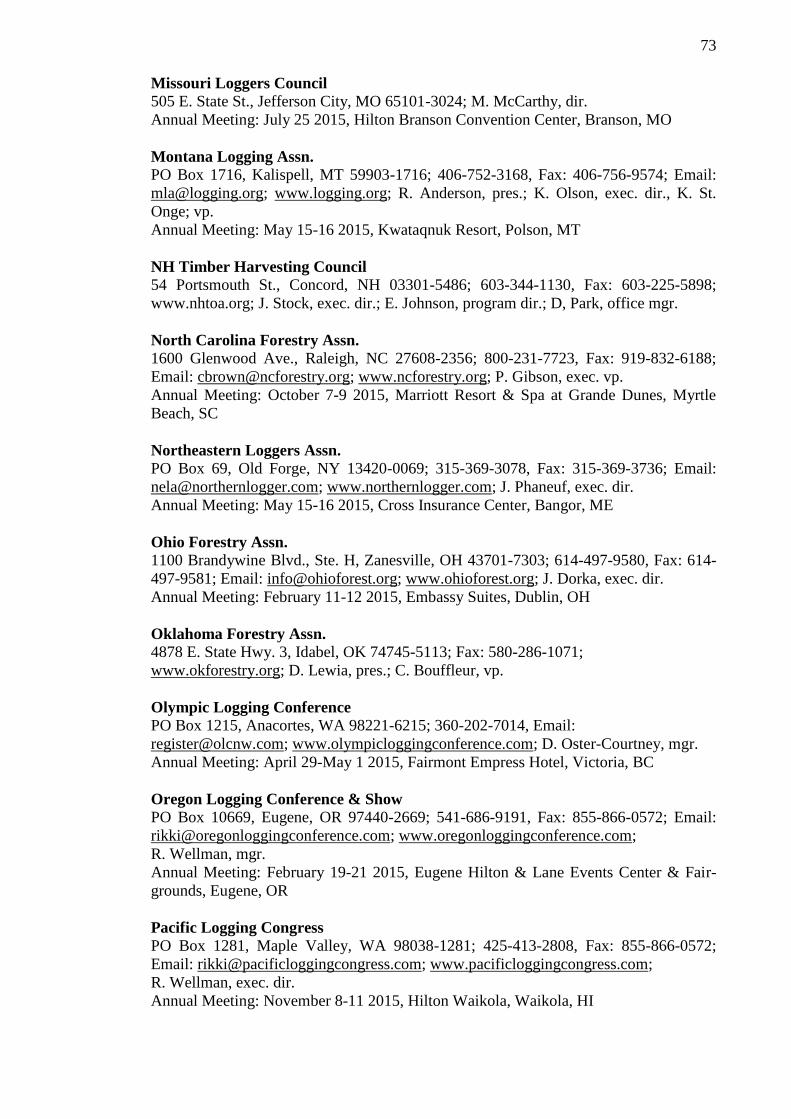
73
Missouri Loggers Council
505 E. State St., Jefferson City, MO 65101-3024; M. McCarthy, dir.
Annual Meeting: July 25 2015, Hilton Branson Convention Center, Branson, MO
Montana Logging Assn.
PO Box 1716, Kalispell, MT 59903-1716; 406-752-3168, Fax: 406-756-9574; Email:
[email protected]; www.logging.org; R. Anderson, pres.; K. Olson, exec. dir., K. St.
Onge; vp.
Annual Meeting: May 15-16 2015, Kwataqnuk Resort, Polson, MT
NH Timber Harvesting Council
54 Portsmouth St., Concord, NH 03301-5486; 603-344-1130, Fax: 603-225-5898;
www.nhtoa.org; J. Stock, exec. dir.; E. Johnson, program dir.; D, Park, office mgr.
North Carolina Forestry Assn.
1600 Glenwood Ave., Raleigh, NC 27608-2356; 800-231-7723, Fax: 919-832-6188;
Email: [email protected]; www.ncforestry.org; P. Gibson, exec. vp.
Annual Meeting: October 7-9 2015, Marriott Resort & Spa at Grande Dunes, Myrtle
Beach, SC
Northeastern Loggers Assn.
PO Box 69, Old Forge, NY 13420-0069; 315-369-3078, Fax: 315-369-3736; Email:
[email protected]; www.northernlogger.com; J. Phaneuf, exec. dir.
Annual Meeting: May 15-16 2015, Cross Insurance Center, Bangor, ME
Ohio Forestry Assn.
1100 Brandywine Blvd., Ste. H, Zanesville, OH 43701-7303; 614-497-9580, Fax: 614-
497-9581; Email: [email protected]; www.ohioforest.org; J. Dorka, exec. dir.
Annual Meeting: February 11-12 2015, Embassy Suites, Dublin, OH
Oklahoma Forestry Assn.
4878 E. State Hwy. 3, Idabel, OK 74745-5113; Fax: 580-286-1071;
www.okforestry.org; D. Lewia, pres.; C. Bouffleur, vp.
Olympic Logging Conference
PO Box 1215, Anacortes, WA 98221-6215; 360-202-7014, Email:
[email protected]; www.olympicloggingconference.com; D. Oster-Courtney, mgr.
Annual Meeting: April 29-May 1 2015, Fairmont Empress Hotel, Victoria, BC
Oregon Logging Conference & Show
PO Box 10669, Eugene, OR 97440-2669; 541-686-9191, Fax: 855-866-0572; Email:
[email protected]; www.oregonloggingconference.com;
R. Wellman, mgr.
Annual Meeting: February 19-21 2015, Eugene Hilton & Lane Events Center & Fair-
grounds, Eugene, OR
Pacific Logging Congress
PO Box 1281, Maple Valley, WA 98038-1281; 425-413-2808, Fax: 855-866-0572;
Email: [email protected]; www.pacificloggingcongress.com;
R. Wellman, exec. dir.
Annual Meeting: November 8-11 2015, Hilton Waikola, Waikola, HI
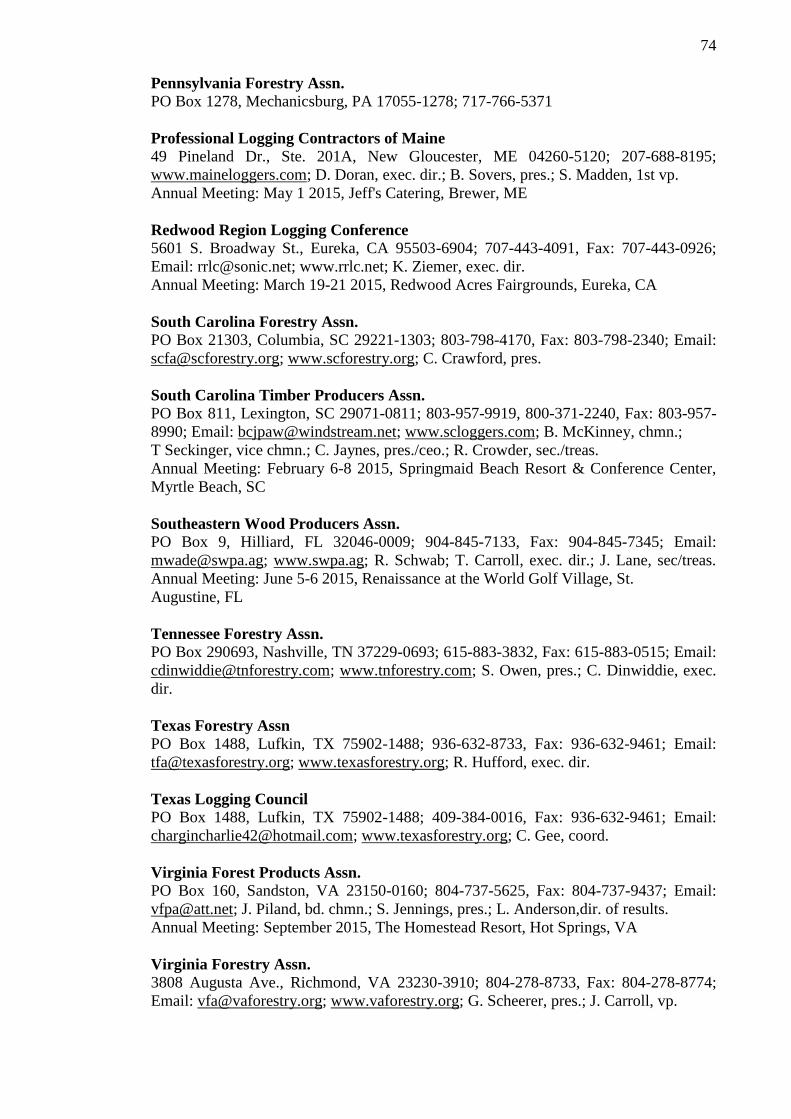
74
Pennsylvania Forestry Assn.
PO Box 1278, Mechanicsburg, PA 17055-1278; 717-766-5371
Professional Logging Contractors of Maine
49 Pineland Dr., Ste. 201A, New Gloucester, ME 04260-5120; 207-688-8195;
www.maineloggers.com; D. Doran, exec. dir.; B. Sovers, pres.; S. Madden, 1st vp.
Annual Meeting: May 1 2015, Jeff's Catering, Brewer, ME
Redwood Region Logging Conference
5601 S. Broadway St., Eureka, CA 95503-6904; 707-443-4091, Fax: 707-443-0926;
Email: [email protected]; www.rrlc.net; K. Ziemer, exec. dir.
Annual Meeting: March 19-21 2015, Redwood Acres Fairgrounds, Eureka, CA
South Carolina Forestry Assn.
PO Box 21303, Columbia, SC 29221-1303; 803-798-4170, Fax: 803-798-2340; Email:
[email protected]; www.scforestry.org; C. Crawford, pres.
South Carolina Timber Producers Assn.
PO Box 811, Lexington, SC 29071-0811; 803-957-9919, 800-371-2240, Fax: 803-957-
8990; Email: [email protected]; www.scloggers.com; B. McKinney, chmn.;
T Seckinger, vice chmn.; C. Jaynes, pres./ceo.; R. Crowder, sec./treas.
Annual Meeting: February 6-8 2015, Springmaid Beach Resort & Conference Center,
Myrtle Beach, SC
Southeastern Wood Producers Assn.
PO Box 9, Hilliard, FL 32046-0009; 904-845-7133, Fax: 904-845-7345; Email:
[email protected]; www.swpa.ag; R. Schwab; T. Carroll, exec. dir.; J. Lane, sec/treas.
Annual Meeting: June 5-6 2015, Renaissance at the World Golf Village, St.
Augustine, FL
Tennessee Forestry Assn.
PO Box 290693, Nashville, TN 37229-0693; 615-883-3832, Fax: 615-883-0515; Email:
[email protected]; www.tnforestry.com; S. Owen, pres.; C. Dinwiddie, exec.
dir.
Texas Forestry Assn
PO Box 1488, Lufkin, TX 75902-1488; 936-632-8733, Fax: 936-632-9461; Email:
[email protected]; www.texasforestry.org; R. Hufford, exec. dir.
Texas Logging Council
PO Box 1488, Lufkin, TX 75902-1488; 409-384-0016, Fax: 936-632-9461; Email:
[email protected]; www.texasforestry.org; C. Gee, coord.
Virginia Forest Products Assn.
PO Box 160, Sandston, VA 23150-0160; 804-737-5625, Fax: 804-737-9437; Email:
[email protected]; J. Piland, bd. chmn.; S. Jennings, pres.; L. Anderson,dir. of results.
Annual Meeting: September 2015, The Homestead Resort, Hot Springs, VA
Virginia Forestry Assn.
3808 Augusta Ave., Richmond, VA 23230-3910; 804-278-8733, Fax: 804-278-8774;
Email: [email protected]; www.vaforestry.org; G. Scheerer, pres.; J. Carroll, vp.

75
Virginia Loggers Assn.
33 Morewood Pl., Palmyra, VA 22963-2750; 434-589-1942, Email: valoggersas-
[email protected]; www.valoggers.org; V. Wright, pres.
Annual Meeting: August 23-25 2015, TBD
Washington Contract Loggers Assn.
PO Box 2168, Olympia, WA 98507-2168; 800-422-0074, Fax: 360-943-8544; Email:
[email protected]; www.loggers.com; E. Bryant, chmn. of board; J. Bonagofsky,
pres/ceo.
Annual Meeting: March 27-28 2015, Tulalip Casino, Marysville, WA
West Virginia Forestry Assn.
PO Box 718, Ripley, WV 25271-0718; 304-372-1955, Email: [email protected];
www.wvfa.org; F. Stewart, exec. dir.
76
Appendix 3. Trade Events
The list of the 2015 Trade Shows was from the Southern Loggin’ Times Magazine,
January/February 2015.
February 5-7: Sierra-Cascade Forest Products & Construction Equipment Exposition,
Shasta District Fairgrounds, Anderson, CA: 530-222-1290; sierracascadeexpo.com
February 19-21: Oregon Logging Conference & Show, Hilton Hotel/Lane County
Convention Center and Fairgrounds, Eugene, OR: 541-686-9191; oregonloggingconfer-
ence.com
March 19-21: Redwood Region Logging Conference, Redwood Empire Fairgrounds,
Eureka, CA: 707-443-4091; rrlc.net
April 8-10: Intermountain Logging Assn. Equipment Show & Conference, Mirabeau
Park Hotel and Convention Center, Spokane Valley, WA: 208-245-3425; intermoun-
tainlogging.org
May 15-16: Northeastern Forest Products Equipment Expo, Bangor, ME: 315-369-
3078; nefpexpo.net
June 18-20: InWoodsExpo (live equipment demo), Hot Springs, AR; Larry Boccarossa
at 501-224-2232; [email protected]; arkloggers.com/expo
September 10-12: Lake States Logging & Heavy Equipment Expo, EAA Event
Grounds, Escanaba, MI: 715-282-5828; timberpa.com
September 18-19: Mid-Atlantic Logging & Biomass Expo, Selma-Smithfield, NC: DK
Knight at 334-834-1170; [email protected]; malbexpo.com