nokia go - theseus
TRANSCRIPT
NOKIA GO Future Success Strategy
Dr. Sebastian Schwarz
MASTER’S THESIS October 2019 International Business Management
ABSTRACT
Tampereen ammattikorkeakoulu Tampere University of Applied Sciences International Business Management SEBASTIAN SCHWARZ: NOKIA GO Future Success Strategy Master's thesis 77 pages, appendices 21 pages October 2019
Abstract Nokia has fundamentally changed its business model in the recent decades, and they are not yet done. This thesis explores Nokia’s current corporate strategy, puts it to the test and recommend improvements to the current strategic planning. Starting point for this work is to provide a broad understanding of Nokia's current business environment, covering its influencing factors, stakeholders, environ-mental factors, etc. as well as Nokia’s current position & strategy. Based on this information, a set of strategic options is derived and analysed, from which a single strategic plan, nick named “Nokia Go”, is formed. Nokia Go relies on three main objectives, namely increased emphasis on the software sector, new business op-portunities in the OTT sector, and future-proofing in the wireless data transfer technology sector. This strategic plan is developed in detail, including a strategic planning calendar, critical success factors, and balanced scorecards, to provide a feasible future success strategy for Nokia. Furthermore, adjustments to Nokia’s current vision and mission statements are proposed to reflect the findings of this constructive research project. The strategy development work concludes with the implementation plan for the developed strategy, covering schedule, dissemination, and measures for contin-ued monitoring and evaluation of its success.
Key words: business strategy, strategy development, telecommunications, in-ternational business administration
3
TABLE OF CONTENTS
ABSTRACT ......................................................................................................... 2
LIST OF FIGURES ............................................................................................. 5
LIST OF TABLES ................................................................................................ 7
GLOSSARY ........................................................................................................ 8
1 INTRODUCTION ........................................................................................... 9
1.1. Motivation ................................................................................................ 9
1.2. Scope ...................................................................................................... 9
1.3. Background on strategy development ................................................... 11
1.4. Objectives ............................................................................................. 13
1.5. Research methodology ......................................................................... 14
1.6. Outline ................................................................................................... 17
2 UNDERSTANDING NOKIA’S BUSINESS ENVIRONMENT ........................ 18
2.1. Factors influencing Nokia’s business environment ................................ 18
2.2. Analysing Nokia’s stakeholders ............................................................ 19
2.3. Major environmental challenges affecting Nokia ................................... 20
3 NOKIA’S CURRENT POSITION AND STRATEGY ..................................... 22
3.1. Nokia’s resources to deliver on its current strategy ............................... 22
3.2. Nokia’s current market position ............................................................. 27
3.3. Evaluating Nokia’s current competitive advantage ................................ 31
4 DEVELOPING STRATEGIC OPTIONS FOR NOKIA .................................. 33
4.1. Nokia’s strategic options ....................................................................... 33
4.2. Nokia’s main competitors ...................................................................... 37
4.3. Outlining the basis of Nokia’s future strategy ........................................ 38
5 GO’s STRATEGY PLAN .............................................................................. 46
5.1. Go’s strategic planning calendar (SPC) ................................................ 46
5.2. Nokia’s critical success factors with Go strategy ................................... 47
5.3. The developed Go strategy ................................................................... 49
6 NOKIA’S KEY STRATEGIC FACTORS ....................................................... 55
6.1. Testing Go strategy for strategic fit with Nokia values ........................... 55
6.2. Nokia’s revised vision and mission statement ....................................... 56
6.3. Go’s strategy statement and management objectives ........................... 59
6.4. Go’s balanced scorecard ...................................................................... 61
7 GO STRATEGY IMPLEMENTATION PLANNING ....................................... 63
4
7.1. Schedule for implementing the Go strategy .......................................... 63
7.2. Planning the dissemination process for the Go strategy ....................... 64
7.3. Monitoring and evaluation systems ....................................................... 66
8 CONCLUSION & DISCUSSION .................................................................. 67
8.1. Delivery against objectives .................................................................... 67
8.2. Outlook .................................................................................................. 68
REFERENCES ................................................................................................. 70
APPENDICES ................................................................................................... 78
Appendix 1. Stakeholders analysis .............................................................. 78
Appendix 2. Shareholder overview .............................................................. 87
Appendix 3. PESTLE ................................................................................... 89
Appendix 4. Porter’s five forces on Nokia .................................................... 92
Appendix 5. Nokia Networks market share .................................................. 93
Appendix 6. Nokia Segmentation by Industries ........................................... 93
Appendix 7. VRIO Analysis .......................................................................... 96
Appendix 8. Nokia Go Balanced Scorecard ................................................. 97
Appendix 9. Nokia Go Force Field Analysis ................................................. 98
5
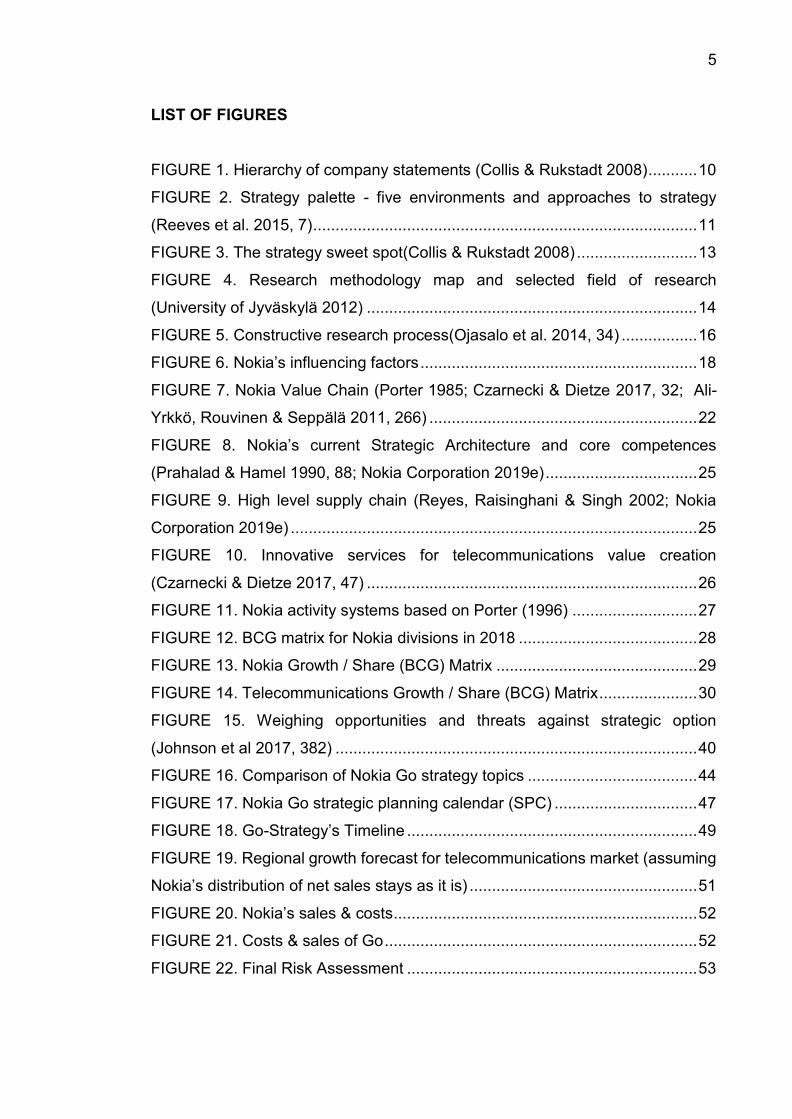
LIST OF FIGURES
FIGURE 1. Hierarchy of company statements (Collis & Rukstadt 2008) ........... 10
FIGURE 2. Strategy palette - five environments and approaches to strategy
(Reeves et al. 2015, 7) ...................................................................................... 11
FIGURE 3. The strategy sweet spot(Collis & Rukstadt 2008) ........................... 13
FIGURE 4. Research methodology map and selected field of research
(University of Jyväskylä 2012) .......................................................................... 14
FIGURE 5. Constructive research process(Ojasalo et al. 2014, 34) ................. 16
FIGURE 6. Nokia’s influencing factors .............................................................. 18
FIGURE 7. Nokia Value Chain (Porter 1985; Czarnecki & Dietze 2017, 32; Ali-
Yrkkö, Rouvinen & Seppälä 2011, 266) ............................................................ 22
FIGURE 8. Nokia’s current Strategic Architecture and core competences
(Prahalad & Hamel 1990, 88; Nokia Corporation 2019e) .................................. 25
FIGURE 9. High level supply chain (Reyes, Raisinghani & Singh 2002; Nokia
Corporation 2019e) ........................................................................................... 25
FIGURE 10. Innovative services for telecommunications value creation
(Czarnecki & Dietze 2017, 47) .......................................................................... 26
FIGURE 11. Nokia activity systems based on Porter (1996) ............................ 27
FIGURE 12. BCG matrix for Nokia divisions in 2018 ........................................ 28
FIGURE 13. Nokia Growth / Share (BCG) Matrix ............................................. 29
FIGURE 14. Telecommunications Growth / Share (BCG) Matrix ...................... 30
FIGURE 15. Weighing opportunities and threats against strategic option
(Johnson et al 2017, 382) ................................................................................. 40
FIGURE 16. Comparison of Nokia Go strategy topics ...................................... 44
FIGURE 17. Nokia Go strategic planning calendar (SPC) ................................ 47
FIGURE 18. Go-Strategy’s Timeline ................................................................. 49
FIGURE 19. Regional growth forecast for telecommunications market (assuming
Nokia’s distribution of net sales stays as it is) ................................................... 51
FIGURE 20. Nokia’s sales & costs .................................................................... 52
FIGURE 21. Costs & sales of Go ...................................................................... 52
FIGURE 22. Final Risk Assessment ................................................................. 53
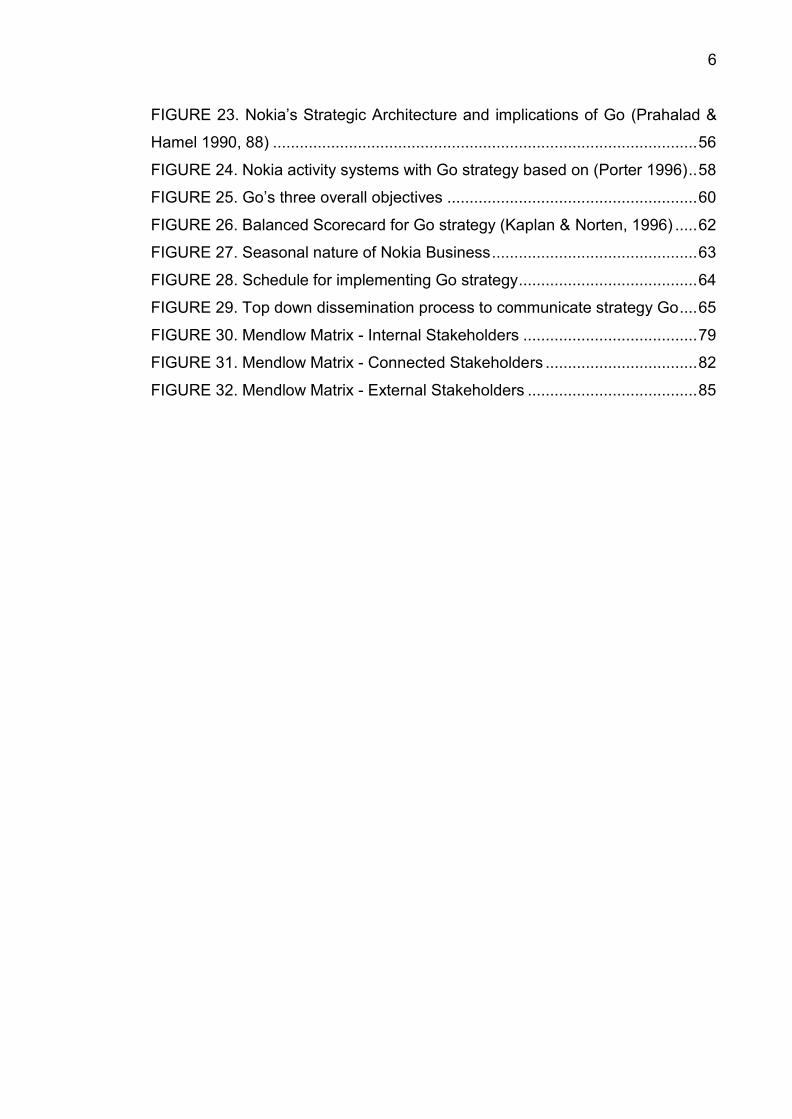
6
FIGURE 23. Nokia’s Strategic Architecture and implications of Go (Prahalad &
Hamel 1990, 88) ............................................................................................... 56
FIGURE 24. Nokia activity systems with Go strategy based on (Porter 1996) .. 58
FIGURE 25. Go’s three overall objectives ........................................................ 60
FIGURE 26. Balanced Scorecard for Go strategy (Kaplan & Norten, 1996) ..... 62
FIGURE 27. Seasonal nature of Nokia Business .............................................. 63
FIGURE 28. Schedule for implementing Go strategy ........................................ 64
FIGURE 29. Top down dissemination process to communicate strategy Go .... 65
FIGURE 30. Mendlow Matrix - Internal Stakeholders ....................................... 79
FIGURE 31. Mendlow Matrix - Connected Stakeholders .................................. 82
FIGURE 32. Mendlow Matrix - External Stakeholders ...................................... 85
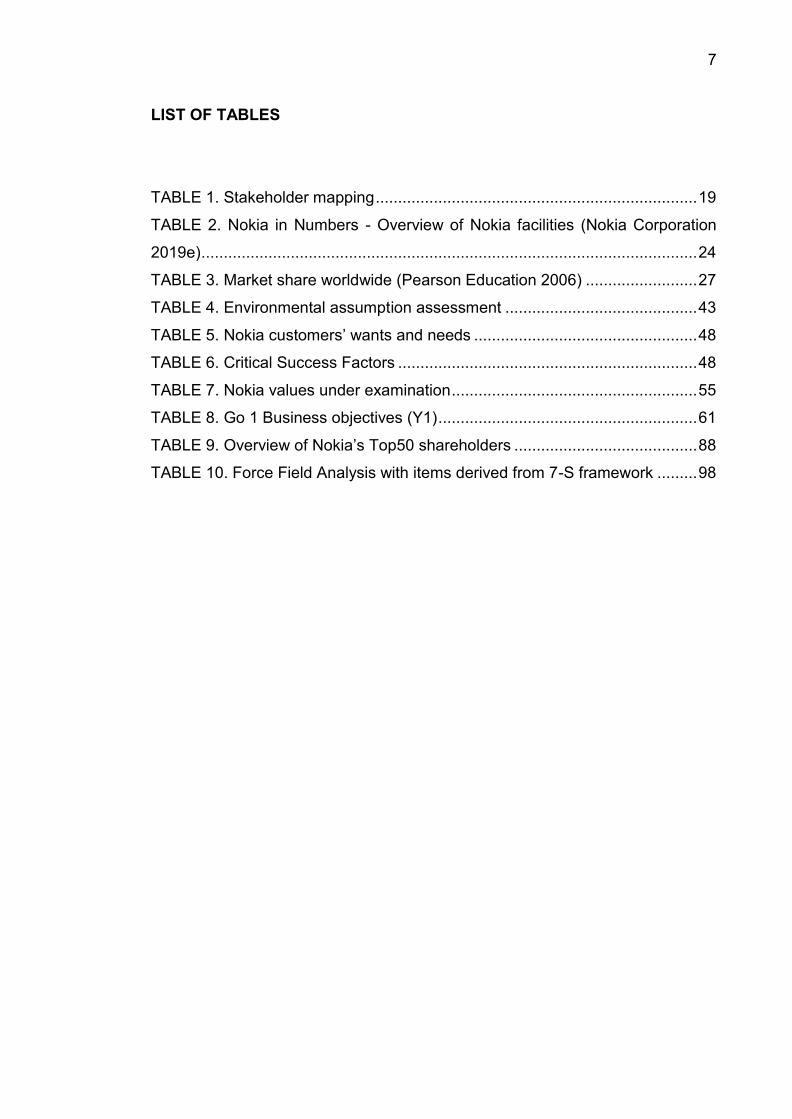
7
LIST OF TABLES
TABLE 1. Stakeholder mapping ........................................................................ 19
TABLE 2. Nokia in Numbers - Overview of Nokia facilities (Nokia Corporation
2019e) ............................................................................................................... 24
TABLE 3. Market share worldwide (Pearson Education 2006) ......................... 27
TABLE 4. Environmental assumption assessment ........................................... 43
TABLE 5. Nokia customers’ wants and needs .................................................. 48
TABLE 6. Critical Success Factors ................................................................... 48
TABLE 7. Nokia values under examination ....................................................... 55
TABLE 8. Go 1 Business objectives (Y1) .......................................................... 61
TABLE 9. Overview of Nokia’s Top50 shareholders ......................................... 88
TABLE 10. Force Field Analysis with items derived from 7-S framework ......... 98
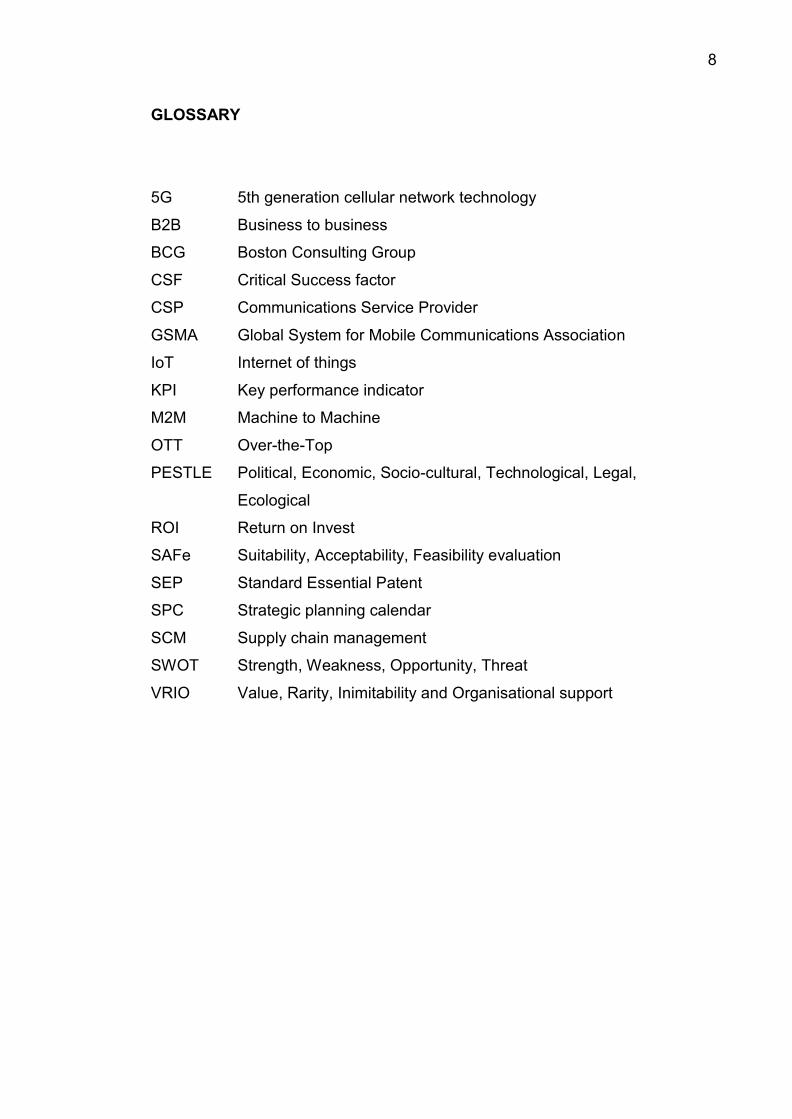
8
GLOSSARY
5G 5th generation cellular network technology
B2B Business to business
BCG Boston Consulting Group
CSF Critical Success factor
CSP Communications Service Provider
GSMA Global System for Mobile Communications Association
IoT Internet of things
KPI Key performance indicator
M2M Machine to Machine
OTT Over-the-Top
PESTLE Political, Economic, Socio-cultural, Technological, Legal,
Ecological
ROI Return on Invest
SAFe Suitability, Acceptability, Feasibility evaluation
SEP Standard Essential Patent
SPC Strategic planning calendar
SCM Supply chain management
SWOT Strength, Weakness, Opportunity, Threat
VRIO Value, Rarity, Inimitability and Organisational support
9
1 INTRODUCTION
“It wasn’t that Nokia didn’t do the right thing;
it was doing the right thing for too long.”
Risto Siilasmaa, Chairman of the Nokia board (Siilasmaa 2018, 30)
Nokia has fundamentally changed its business model many times over the years.
Starting as a paper and pulp mill in 1865, the company moved to rubber products
in the early 1900s and entered the networking and radio industry in the early
1960s. Here it stayed and became a world leader for mobile phones until a rapid
decline resulted in the sale of the mobile phone business to Microsoft in 2013.
Since then, Nokia is establishing itself new as a networking infrastructure busi-
ness (Jaako, Lamberg, Laukia & Tikkanen 2011). This study explores Nokia’s
current corporate strategy, puts it to the test and recommends improvements to
the current strategic planning for future success.
1.1. Motivation
The motivation for this thesis is very personal. In July 2016 the author joined
Nokia Technologies in Finland as Senior Researcher, not aware of most of the
long history of Nokia and its current business approach. In 2018 he became re-
search leader and relocated to Nokia Solutions and Networks GmbH in Germany
in 2019 to take on a more strategic role. With this work, the author wants to
strengthen his personal knowledge of Nokia’s wider business environment and
its core competencies to fulfil his role in the best possible way.
1.2. Scope
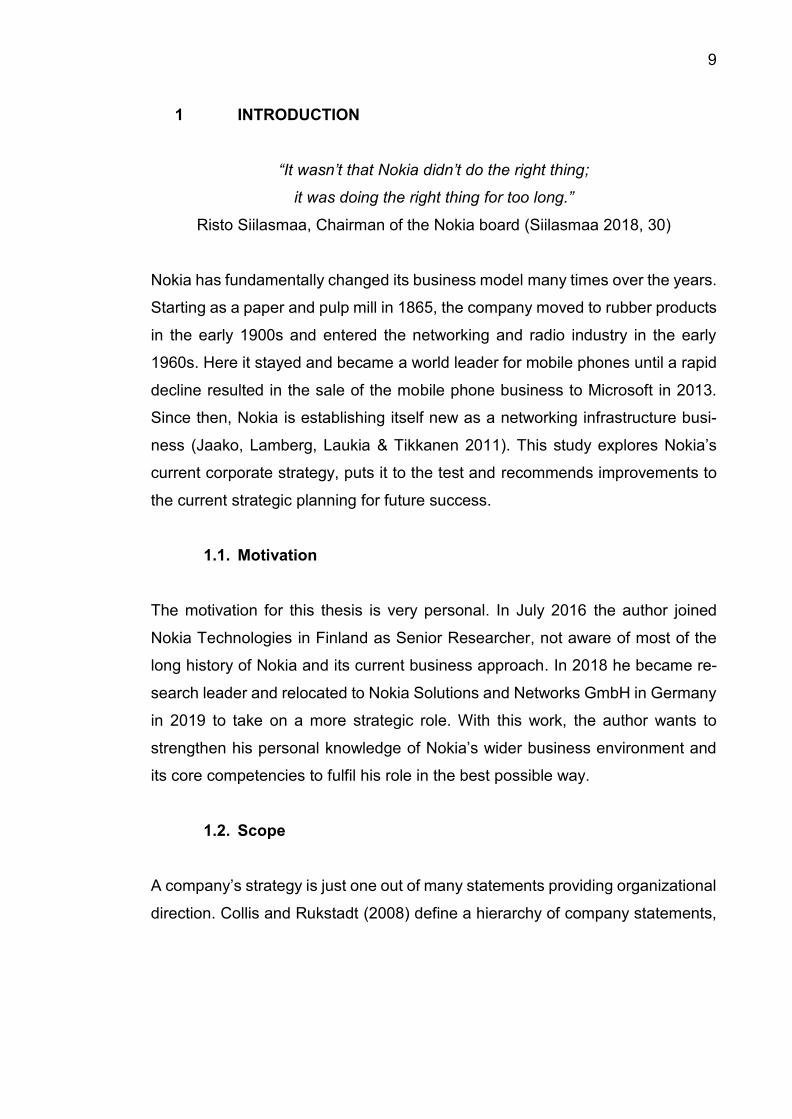
A company’s strategy is just one out of many statements providing organizational
direction. Collis and Rukstadt (2008) define a hierarchy of company statements,
10
starting from the mission statement, describing why the company exists, to com-
pany values and its vision, to the strategy and means of implementation and mon-
itoring, as shown in Figure 1.
FIGURE 1. Hierarchy of company statements (Collis & Rukstadt 2008)
Typically, a strategy comes together with a strategy statement including three key
elements, an objective, a clear scope, and the means to execute the strategy.
The scope of this thesis is the strategy for Nokia, starting from a first business
understanding, over strategy ideation, assessment and prototyping to a final im-
plementation planning. The actual implementation will not be part of this work.
Nokia’s Values shall remain unaltered, but there will be some proposed adjust-
ment to its mission and vision and balanced scorecard.
Finally, all information and material shall be taken from public sources, thus this
thesis does not violate company confidentiality.
11
1.3. Background on strategy development
Strategy development is at heart problem solving, and the best strategy is the
one that solves the problem at hand. One needs to understand the environment
to establish the appropriate strategy. To characterize the business environment,
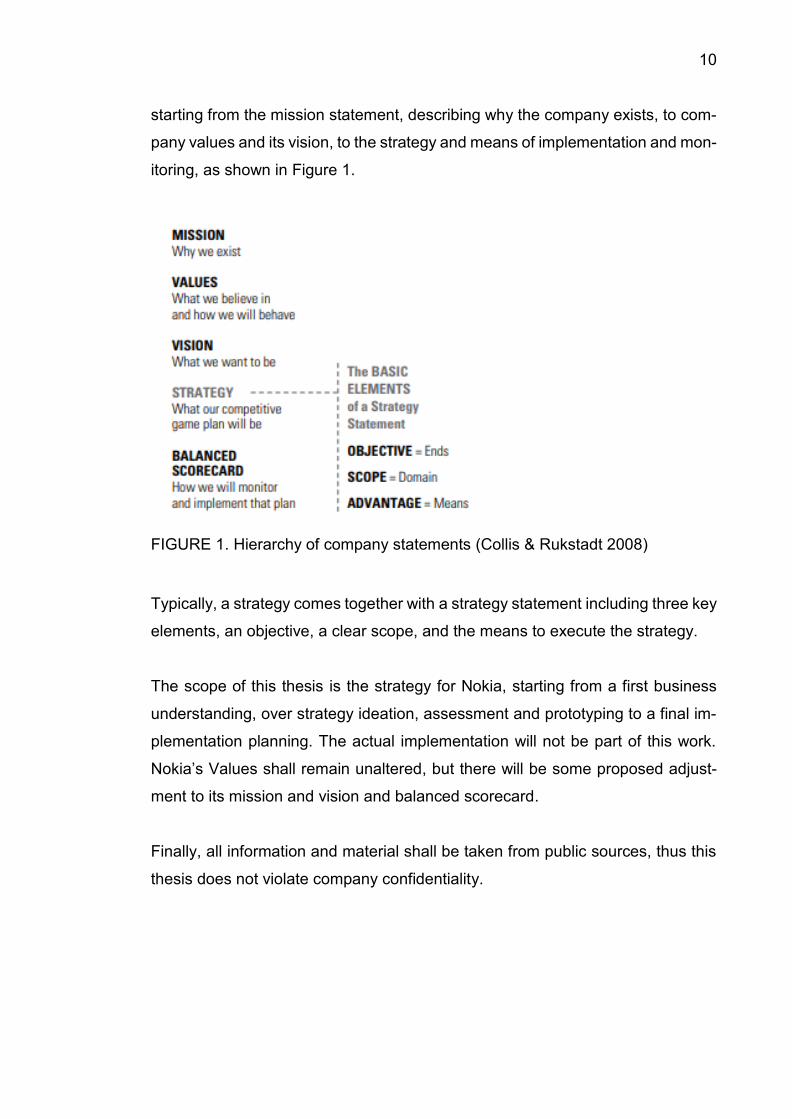
and chose a winning strategy, this thesis follows the strategy palette introduced
by Reeves (Reeves, Haanaes & Sinha 2015): Business environments can be
categorised along three dimensions: Predictability (can you forecast it?), mallea-
bility (can you shape it?), and harshness (can you survive it?). Combining these
dimensions yields five distinct environments, as shown in Figure 2, each of which
requires a distinct approach to strategy and execution (Reeves et al. 2015).
FIGURE 2. Strategy palette - five environments and approaches to strategy (Reeves et al. 2015, 7)
Reeves defines the business environments as follows (Reeves et al. 2015):
• Classical: I can predict it, but I can’t change it.
• Adaptive: I can’t predict it, and I can’t change it.
• Visionary: I can predict it, and I can change it.
• Shaping: I can’t predict it, but I can change it.
• Renewal: My resources are severely constrained.
12
Based on each environment, a different strategy approach should be chosen. For
example, classical environments would favour to strategies based on scale,
adaptive environments do not allow for much planning and the respective strategy
should rely on speed. In a visionary environment, companies win by being the
first to the market, and in a shaping environment, they can collaboratively shape
their industry to their advantage. Finally, in a renewal environment, one needs to
first conserve resources to ensure viability before choosing one of the other four
approaches later on.
Starting from this analysis, viable strategy options can be developed following the
process laid out by Lafley and Martin’s (2013) five-step strategy cascade model:
1. What is our winning aspiration?
2. Where will we play?
3. How will we win?
4. What capabilities do we need to win?
5. What management systems are needed?
Lafley correctly sees a strategy as a means to “win”, and to win it is necessary to
move from addressing issues to making a consent choice. So, any strategy plan-
ning based on the above strategy cascade model should follow the following
“Seven Steps to Strategy Making” (Lafley, Martin & Rivkin 2012):
Step 1: Move from Issues to Choice
Step 2: Generate Strategic Possibilities
Step 3: Specify the Conditions for Success
Step 4: Identify the Barriers to Choice
Step 5: Design Tests for the Barrier Conditions
Step 6: Conduct the Tests
Step 7: Make the choice
13
Together, the works by Reeves et al. and Lafley et al. form the methodology basis
of this thesis. Following Reeves strategy palette, Nokia can be seen at the tran-
sition between renewal and visionary, as will be shown in chapters 2 and 3. The
strategy development following Lafley’s “Seven Steps to Strategy Making” will
then be the topic of chapters 4 to 7.
1.4. Objectives
Put into a 33-word strategy statement of its own, this thesis aims to
"develop a new business strategy for Nokia, guaranteeing future success
and aligned with company core values, by gaining a deep understanding
of Nokia’s current environment, position, and strategy and evaluating
available strategic options."
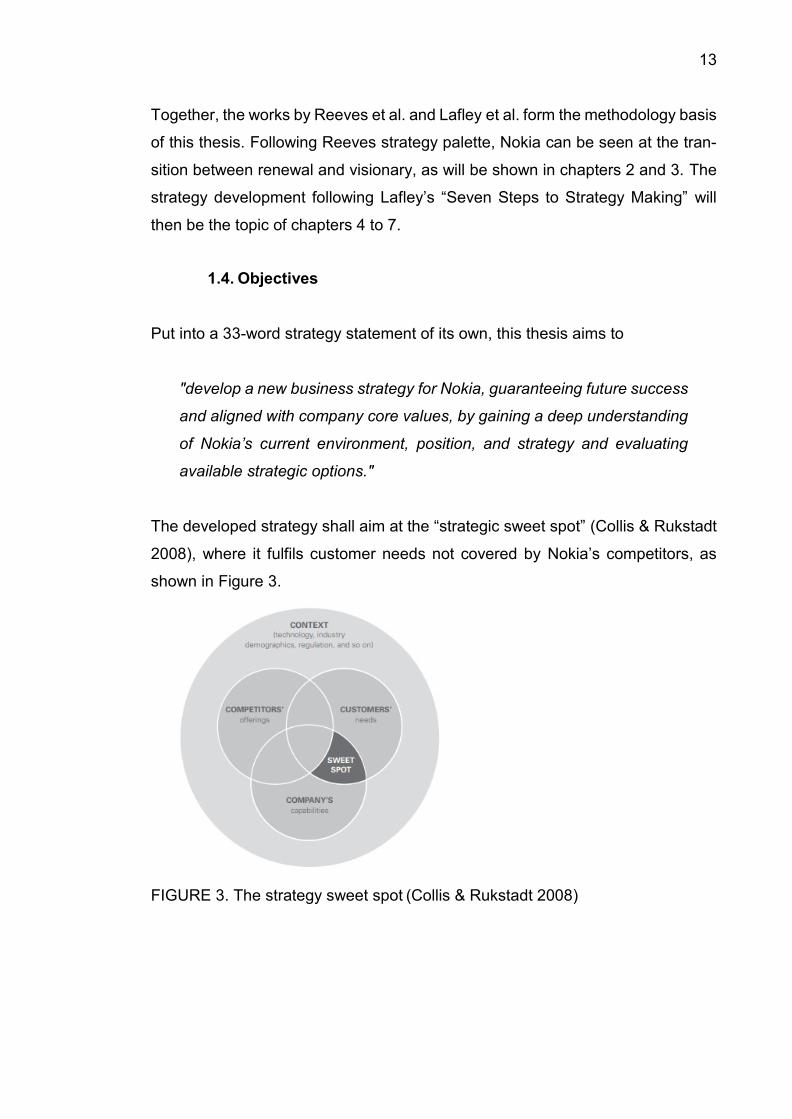
The developed strategy shall aim at the “strategic sweet spot” (Collis & Rukstadt
2008), where it fulfils customer needs not covered by Nokia’s competitors, as
shown in Figure 3.
FIGURE 3. The strategy sweet spot (Collis & Rukstadt 2008)
14
1.5. Research methodology
The preceding chapters addressed the motivation for this work, as well as its
scope, background and objectives. This chapter will lay out the research meth-
odology to accomplish the chosen objectives in the given setting.
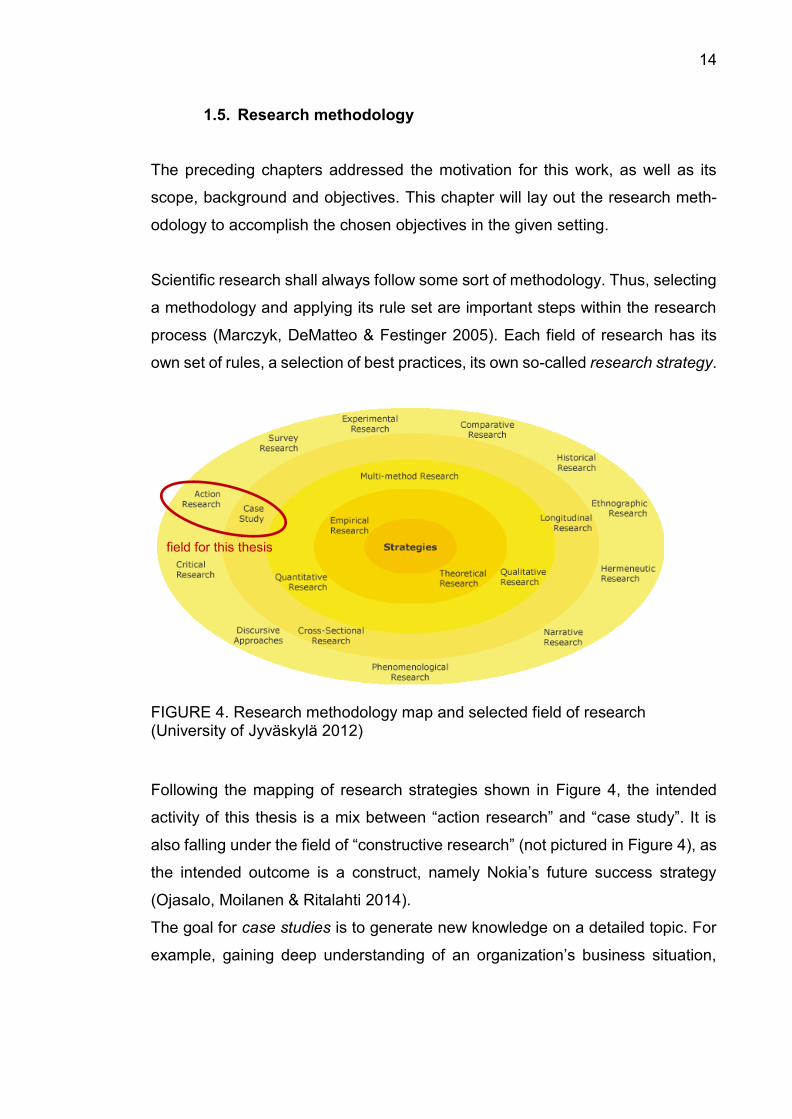
Scientific research shall always follow some sort of methodology. Thus, selecting
a methodology and applying its rule set are important steps within the research
process (Marczyk, DeMatteo & Festinger 2005). Each field of research has its
own set of rules, a selection of best practices, its own so-called research strategy.
FIGURE 4. Research methodology map and selected field of research (University of Jyväskylä 2012)
Following the mapping of research strategies shown in Figure 4, the intended
activity of this thesis is a mix between “action research” and “case study”. It is
also falling under the field of “constructive research” (not pictured in Figure 4), as
the intended outcome is a construct, namely Nokia’s future success strategy
(Ojasalo, Moilanen & Ritalahti 2014).
The goal for case studies is to generate new knowledge on a detailed topic. For
example, gaining deep understanding of an organization’s business situation,
field for this thesis

15
and develop solutions for a specific problem based on this exercise. The purpose
is to create ideas to solve perceived problems, not necessarily how to drive and
implement the change as it would be for action research (Ojasalo et al. 2014, 18).
Action research aims at producing new knowledge and achieving a change in
practice based on this new knowledge. An essential part is that the change is
implemented in practice and its impact evaluated. Therefore, the research pro-
cess is often quite long, and participation of the affected workforce is a key ele-
ment (Ojasalo et al. 2014, 17).
Constructive research solves of a problem in practice by creating a new construct,
a concrete output, such as a new product, method, or business model. Or in the
case of this thesis, a new strategy for Nokia’s future success. Constructive re-
search is very similar to action research, although targeting a specific construct,
rather than specific actions. And again, implementation and evaluation of the de-
veloped construct are essential parts of this research strategy (Ojasalo et al.
2014, 18). Constructive research is often applied to advance an existing construct
and can be characterized as applied studies which produce new knowledge in
the form of normative outputs (Kasanen, Lukkav & Siitonen 1993). Unlike other
research strategies, constructive research has an explicit defined normative pur-
pose following clear practical adequacy (Lassenius, Soininen, Vanhanen, 2001).
Combining these three research strategies onto the thesis strategy from chapter
1.4 yields the following mapping,
"develop a new business strategy for Nokia, guaranteeing future success
and aligned with company core values, by gaining a deep understanding
of Nokia’s current environment, position, and strategy and evaluating
available strategic options,"
where green denotes constructive research, case studies, turquoise denotes ac-
tion research, and purple denotes case studies.
The intended outcome of this thesis falls clearly in the constructive research cat-
egory, while to reach this outcome methodology from the other two strategies
16
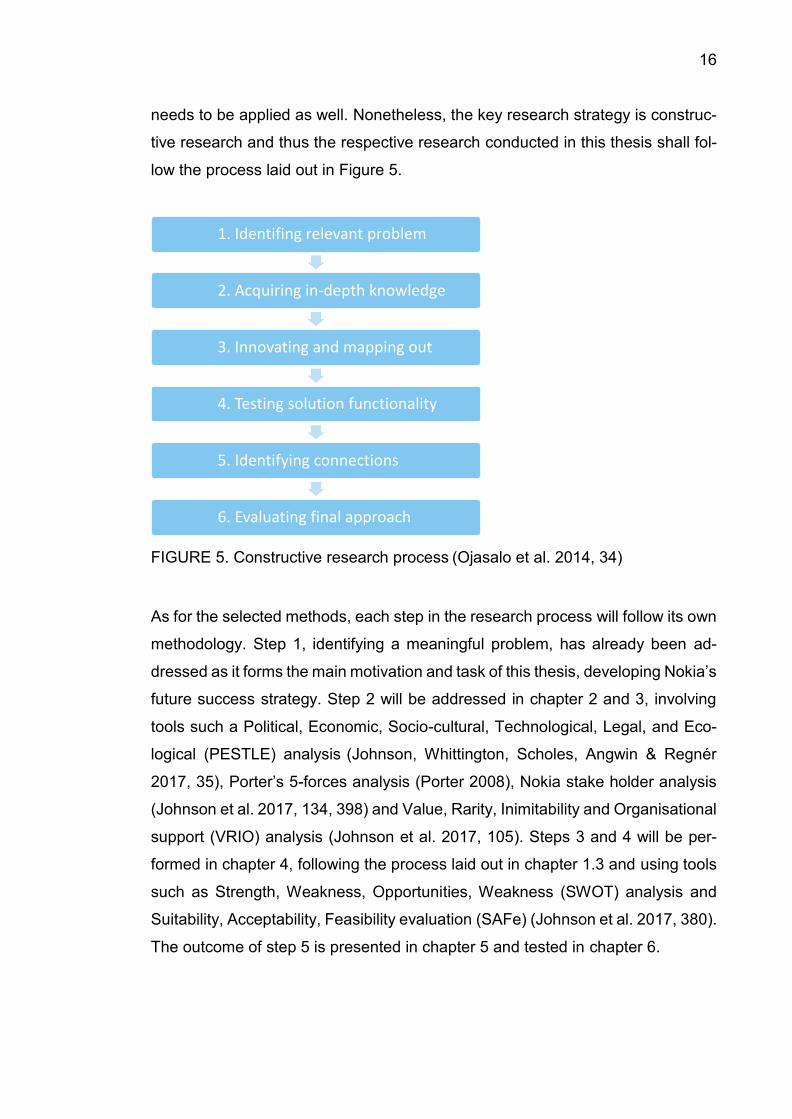
needs to be applied as well. Nonetheless, the key research strategy is construc-
tive research and thus the respective research conducted in this thesis shall fol-
low the process laid out in Figure 5.
FIGURE 5. Constructive research process (Ojasalo et al. 2014, 34)
As for the selected methods, each step in the research process will follow its own
methodology. Step 1, identifying a meaningful problem, has already been ad-
dressed as it forms the main motivation and task of this thesis, developing Nokia’s
future success strategy. Step 2 will be addressed in chapter 2 and 3, involving
tools such a Political, Economic, Socio-cultural, Technological, Legal, and Eco-
logical (PESTLE) analysis (Johnson, Whittington, Scholes, Angwin & Regnér
2017, 35), Porter’s 5-forces analysis (Porter 2008), Nokia stake holder analysis
(Johnson et al. 2017, 134, 398) and Value, Rarity, Inimitability and Organisational
support (VRIO) analysis (Johnson et al. 2017, 105). Steps 3 and 4 will be per-
formed in chapter 4, following the process laid out in chapter 1.3 and using tools
such as Strength, Weakness, Opportunities, Weakness (SWOT) analysis and
Suitability, Acceptability, Feasibility evaluation (SAFe) (Johnson et al. 2017, 380).
The outcome of step 5 is presented in chapter 5 and tested in chapter 6.
1. Identifing relevant problem
2. Acquiring in-depth knowledge
3. Innovating and mapping out
4. Testing solution functionality
5. Identifying connections
6. Evaluating final approach
17
Although implementation and implementation evaluation are essential parts of
constructive research, these topics will not be an essential part of this thesis.
Some guidance towards implementation and evaluation will be given in chapter
7, but to keep the public knowledge character of this work and keep it within a
reasonable workload, no detailed studies will be performed.
All information to perform analyses and evaluations is generated from publicly
available sources, such as financial reports and company or competitor commu-
nication. If any conclusion or decision is synthesised from some source other than
the author’s personal work or judgement, it is clearly referenced.
1.6. Outline
The remainder of this thesis is structured as follows. First, the background of
Nokia’s business environment and Nokia’s market position and strategy are ana-
lysed in chapters 2 and 3 respectively. Based on this information, different stra-
tegic business options for Nokia are developed and presented in chapter 4. Out
of these options, one specific strategy, titled “Nokia Go”, is distilled and further
developed in chapter 5. Respective key strategic factors and are presented in
chapter 6. In chapter 7, the implementation proposal for the Nokia Go strategy is
sketched out. The thesis is concluded in chapter 8.
18
2 UNDERSTANDING NOKIA’S BUSINESS ENVIRONMENT
Our previous slogan was about connecting people, but the current one has
been changed to ‘connect the world’”
Oli Linamma, head of 5G Telecommunication (McCaskill 2018).
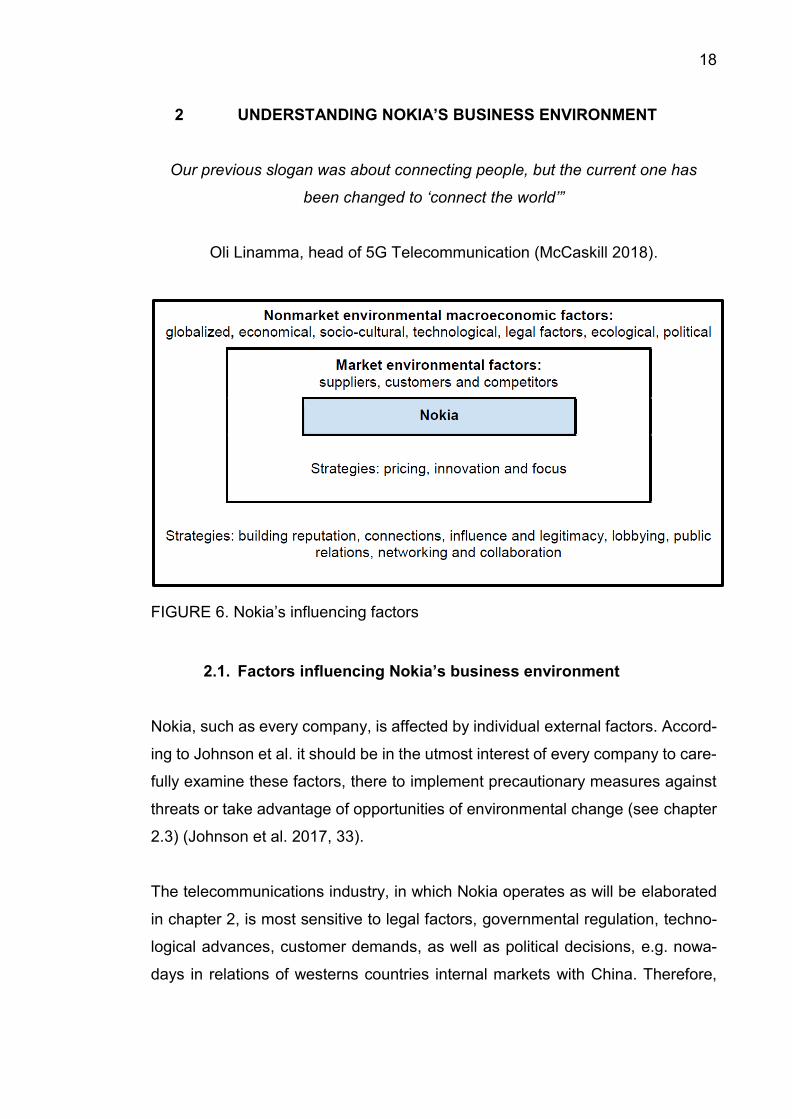
FIGURE 6. Nokia’s influencing factors
2.1. Factors influencing Nokia’s business environment
Nokia, such as every company, is affected by individual external factors. Accord-
ing to Johnson et al. it should be in the utmost interest of every company to care-
fully examine these factors, there to implement precautionary measures against
threats or take advantage of opportunities of environmental change (see chapter
2.3) (Johnson et al. 2017, 33).
The telecommunications industry, in which Nokia operates as will be elaborated
in chapter 2, is most sensitive to legal factors, governmental regulation, techno-
logical advances, customer demands, as well as political decisions, e.g. nowa-
days in relations of westerns countries internal markets with China. Therefore,
19
relevant nonmarket environmental macroeconomic factors will be closely ana-
lysed in the PESTLE framework (see chapter 2.3) (Johnson et al. 2017, 35).
The interactions of the market environment between “suppliers, customers and
competitors” are - in contrast - mainly of economical nature (Johnson et al. 2017,
35). To analyse Nokia’s market environment Porter’s 5-forces analysis will be
used (see chapter 2.3).
Since neither Johnson et al. (2017) nor Porter (2008) is stating that one factor is
considered more important than another the following analysis will consider all
previously mentioned factors.
Finally, strategic moves of every company are influenced by the expectations of
their stakeholders (Johnson et al. 2017, 134, 398). In order to comprehend the
wholesome context a stakeholder analysis will be conducted in chapter 2.2.
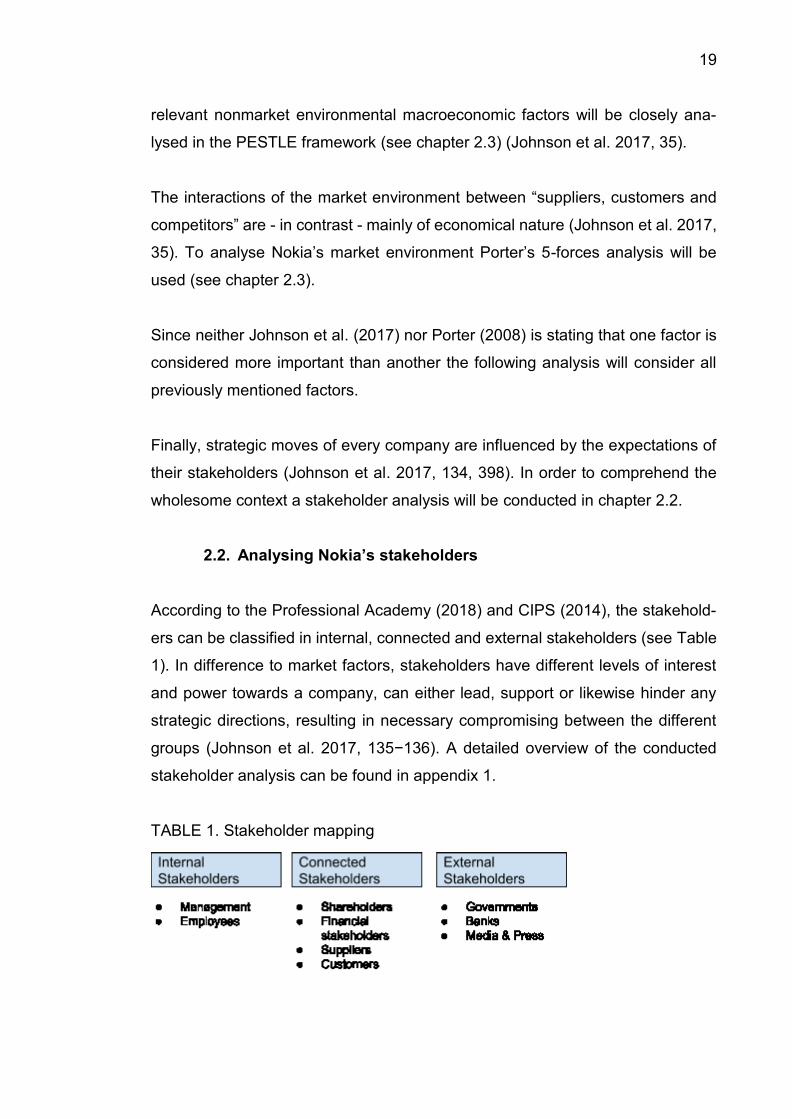
2.2. Analysing Nokia’s stakeholders
According to the Professional Academy (2018) and CIPS (2014), the stakehold-
ers can be classified in internal, connected and external stakeholders (see Table
1). In difference to market factors, stakeholders have different levels of interest
and power towards a company, can either lead, support or likewise hinder any
strategic directions, resulting in necessary compromising between the different
groups (Johnson et al. 2017, 135−136). A detailed overview of the conducted
stakeholder analysis can be found in appendix 1.
TABLE 1. Stakeholder mapping
20
Key internal stakeholders identified are first of all the CEO, his management cir-
cle, as well as the Nokia board and their members, in particular Risto Siilasmaa,
chairman of the Nokia board (Siilasmaa 2018, 123, 141). They are the captains
of the boat, giving direction and guidance.
Among the connected stakeholders, undoubtedly, the customers are the key fig-
ures, source of demand and decision maker about win or lose. Considering the
shareholders would unify or one majority shareholder arise, bargaining power and
influence would increase tremendously (Johnson et al. 2017, 137). In the group
of external stakeholders, local governments can be considered extraordinarily
powerful in regard of laws that might influence Nokia’s business (e.g. information
security aspects).
Stakeholders’ expectations considerably influence how Nokia ought to operate in
its business environment (Johnson et al. 2017, 398). Meeting these expectations
constitutes a big challenge for all tech companies, especially where short product
life cycles are driven by constant technological innovation (Staisch, Peters,
Stueckl & Sergua 2012). Furthermore, as Nokia operates with highly complex
technologies, external stakeholders expect Nokia to be a trustful company that
complies with applicable laws. Finally, Nokia has the responsibility to take care
for its over 100.000 employees worldwide, by establishing a sustainable business
(Nokia Corporation 2019a).
2.3. Major environmental challenges affecting Nokia
Based on a weighted PESTLE (see appendix 3) and Porter’s 5-forces analysis
(see appendix 4) (Porter 2008), the following most significant environmental fac-
tors are summarized.
Starting with opportunities in the political arena, Nokia has gained an advantage
over its competitors Huawei & ZTE in the telecommunications market who have
been partially banned or are under investigation in several countries (Rolander,
21
Kim 2018). Leapfrogging of these policy decisions might give Nokia an even
greater competitive edge over its rivals (Preker 2019).
The 5G networks growth forecast over the next years will be exponential (Pav-
lovic 2018) with the main cause arguably being the cultural change towards mo-
bile data availability (Bean 2016) and video-on-demand, to point out one specific
that by 2021 shall represent 82 % of data traffic worldwide (Cisco 2018).
The need for industrial automation is another driver for connectivity (Czarnecki &
Ditze 2017, 20), likewise new technologies require supporting software solutions,
resulting in higher demand for Nokia infrastructure. (Tornatore, Chang & Ellinas
2017)
Environmental threats conversely result from social factors, since staff and re-
cruitment cost are higher due to globally growing competition (Modis 2018).
Based on the results of the Porter 5-forces analysis, Nokia is well situated for its
current business model, facing relative low power of suppliers and only a decent
threat of new entrants (Statistica 2018; Arrow 2019). Although competition is
harsh and buyers exhibit relative high power (Porter 2008, 80; Statistica 2018),
Nokia is controlling the supply side of the value chain and tries to further integrate
vertically (Nokia Corporation 2019a).
Possibly one of the greatest threats for Nokia is the impact of potential substitu-
tions which could favour for example satellite internet connections over current
broadband technology over the next decades (Bowler 2018).
22
3 NOKIA’S CURRENT POSITION AND STRATEGY
3.1. Nokia’s resources to deliver on its current strategy
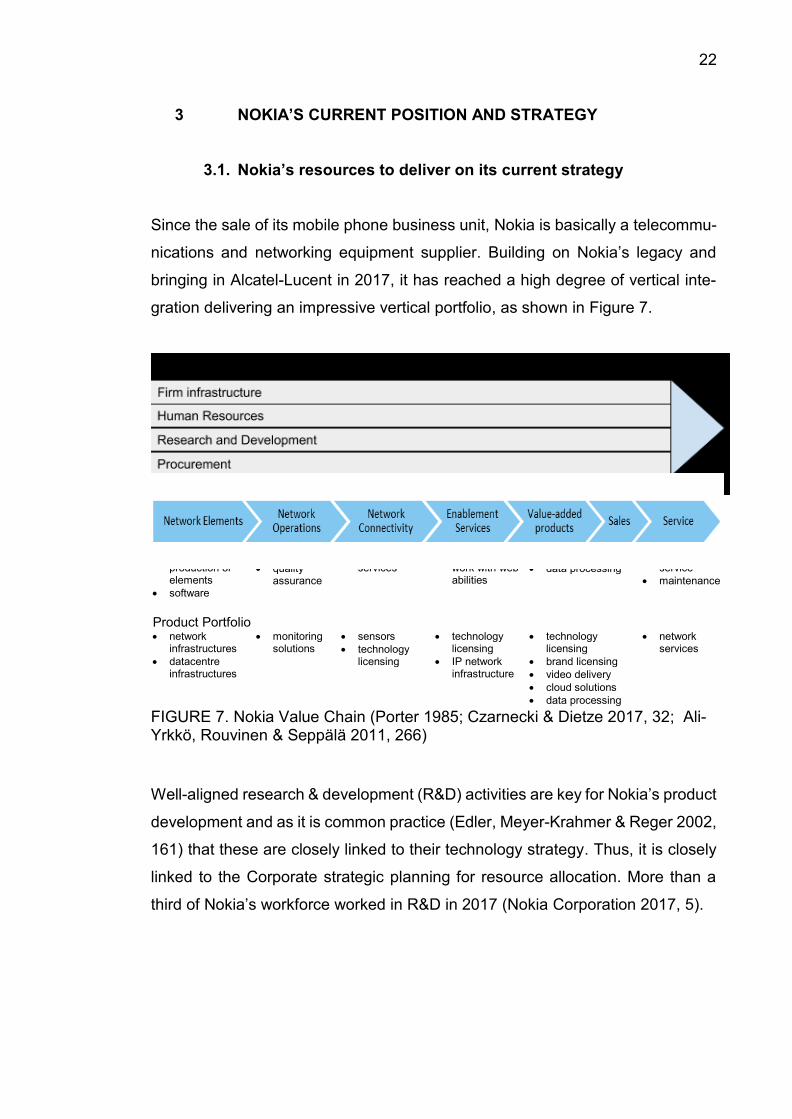
Since the sale of its mobile phone business unit, Nokia is basically a telecommu-
nications and networking equipment supplier. Building on Nokia’s legacy and
bringing in Alcatel-Lucent in 2017, it has reached a high degree of vertical inte-
gration delivering an impressive vertical portfolio, as shown in Figure 7.
FIGURE 7. Nokia Value Chain (Porter 1985; Czarnecki & Dietze 2017, 32; Ali-Yrkkö, Rouvinen & Seppälä 2011, 266)
Well-aligned research & development (R&D) activities are key for Nokia’s product
development and as it is common practice (Edler, Meyer-Krahmer & Reger 2002,
161) that these are closely linked to their technology strategy. Thus, it is closely
linked to the Corporate strategic planning for resource allocation. More than a
third of Nokia’s workforce worked in R&D in 2017 (Nokia Corporation 2017, 5).
• construction & production of elements
• software
• monitoring
• quality assurance
• connectivity services
• enhancing net-work with web abilities
• applications
• data processing
• customer service
• maintenance
Product Portfolio • network
infrastructures
• datacentre infrastructures
• monitoring solutions
• sensors
• technology licensing
• technology licensing
• IP network infrastructure
• technology licensing
• brand licensing
• video delivery
• cloud solutions
• data processing
• network services
23
The strategic reason for the Alcatel-Lucent purchase was to add important tech-
nologies to the Nokia portfolio (e.g. fixed line Network business), to increase R&D
resources decisively, and to obtain patents to complement the Nokia patent port-
folio in strategically important technological fields such as IP routing (Siilasmaa
2018, 277).
In addition to this, Nokia is cooperating heavily with externals, e.g. by teaming up
for strategic partnerships, such as with Orange on Telco Cloud (Orange Press
Releases 2017), by entering diverse alliances, such as the Global System for
Mobile Communications Association (GSMA), or by collaborating with universi-
ties, such as Aalto University in Finland (Aalto University Press Releases 2018),
herewith acknowledging the fact that networking in the field of innovation is an
indispensable asset for all tech companies to form a sustainable basis for all of
their activities (Edler et al. 2002, 161).
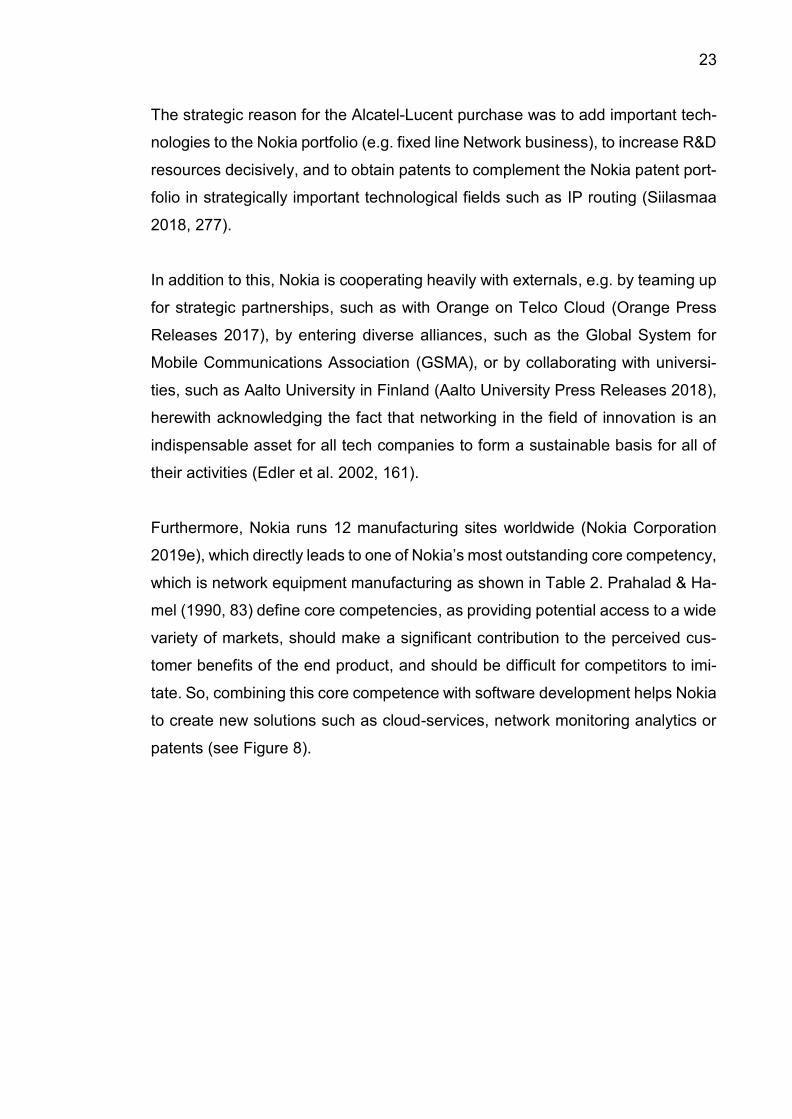
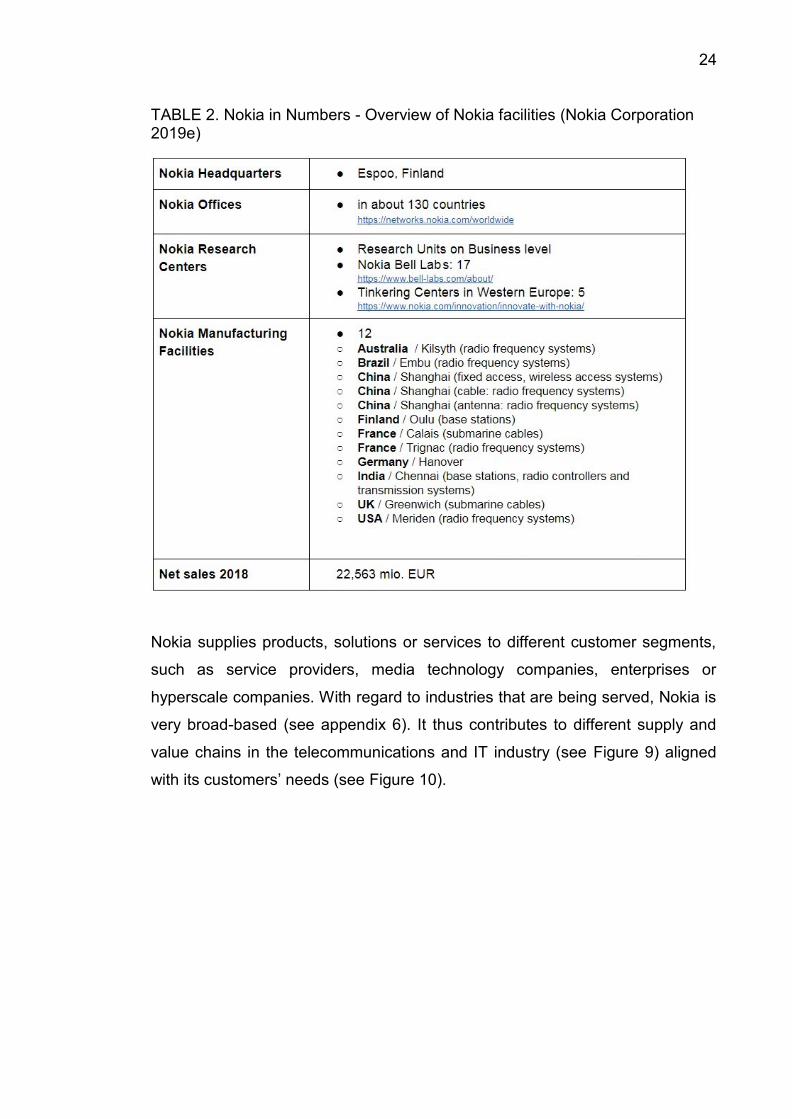
Furthermore, Nokia runs 12 manufacturing sites worldwide (Nokia Corporation
2019e), which directly leads to one of Nokia’s most outstanding core competency,
which is network equipment manufacturing as shown in Table 2. Prahalad & Ha-
mel (1990, 83) define core competencies, as providing potential access to a wide
variety of markets, should make a significant contribution to the perceived cus-
tomer benefits of the end product, and should be difficult for competitors to imi-
tate. So, combining this core competence with software development helps Nokia
to create new solutions such as cloud-services, network monitoring analytics or
patents (see Figure 8).
24
TABLE 2. Nokia in Numbers - Overview of Nokia facilities (Nokia Corporation 2019e)
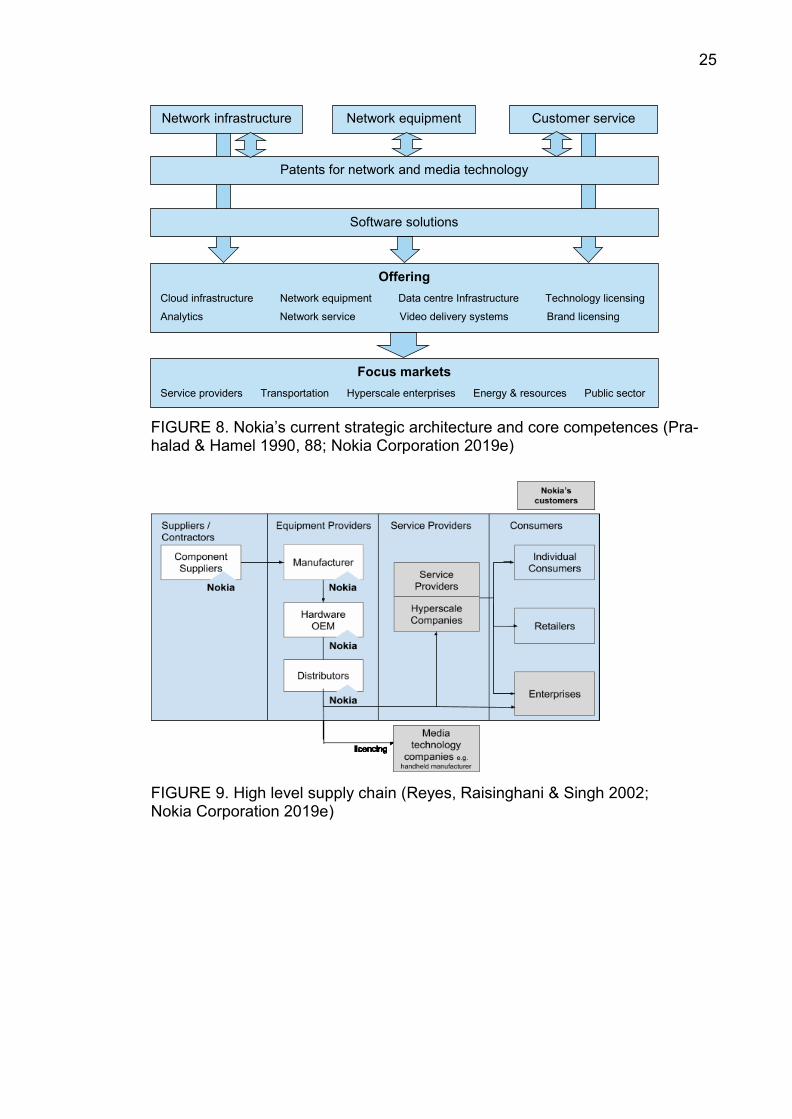
Nokia supplies products, solutions or services to different customer segments,
such as service providers, media technology companies, enterprises or
hyperscale companies. With regard to industries that are being served, Nokia is
very broad-based (see appendix 6). It thus contributes to different supply and
value chains in the telecommunications and IT industry (see Figure 9) aligned
with its customers’ needs (see Figure 10).
25
FIGURE 8. Nokia’s current strategic architecture and core competences (Pra-halad & Hamel 1990, 88; Nokia Corporation 2019e)
FIGURE 9. High level supply chain (Reyes, Raisinghani & Singh 2002; Nokia Corporation 2019e)
Network infrastructure Network equipment
manufacturing
Customer service
Patents for network and media technology
Software solutions
Offering
Cloud infrastructure Network equipment Data centre Infrastructure Technology licensing
Analytics Network service Video delivery systems Brand licensing
Focus markets
Service providers Transportation Hyperscale enterprises Energy & resources Public sector
26
1
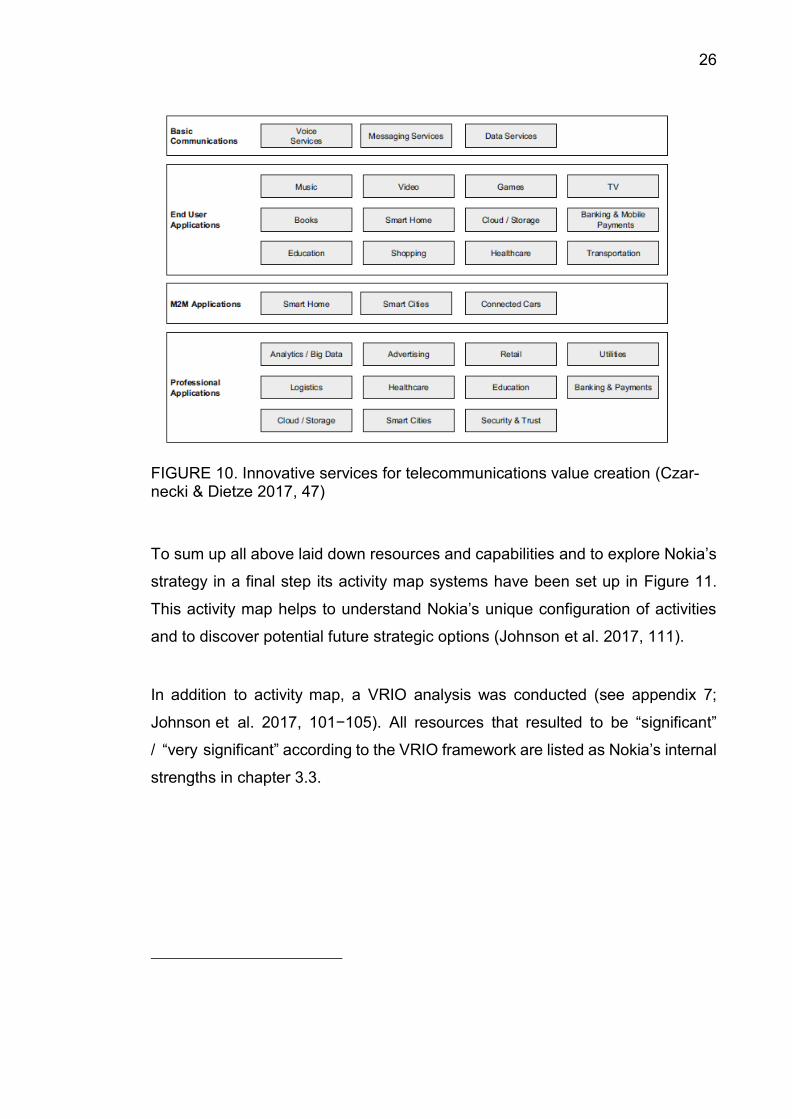
FIGURE 10. Innovative services for telecommunications value creation (Czar-necki & Dietze 2017, 47)
To sum up all above laid down resources and capabilities and to explore Nokia’s
strategy in a final step its activity map systems have been set up in Figure 11.
This activity map helps to understand Nokia’s unique configuration of activities
and to discover potential future strategic options (Johnson et al. 2017, 111).
In addition to activity map, a VRIO analysis was conducted (see appendix 7;
Johnson et al. 2017, 101−105). All resources that resulted to be “significant”
/ “very significant” according to the VRIO framework are listed as Nokia’s internal
strengths in chapter 3.3.
27
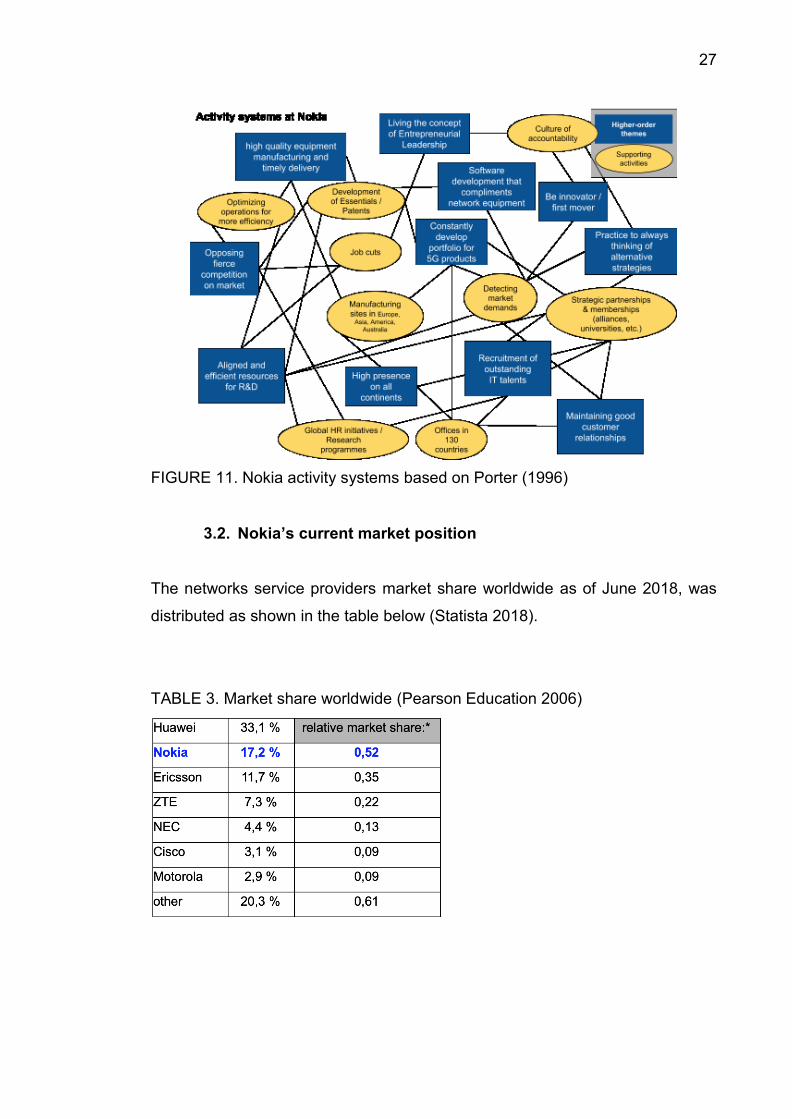
FIGURE 11. Nokia activity systems based on Porter (1996)
3.2. Nokia’s current market position
The networks service providers market share worldwide as of June 2018, was
distributed as shown in the table below (Statista 2018).
TABLE 3. Market share worldwide (Pearson Education 2006)
28
Although the greatest focus lies on the biggest competitors Huawei and Ericsson,
the smaller ones as well as the ‘others’ must not be neglected, as they represent
a significant potential for growth.
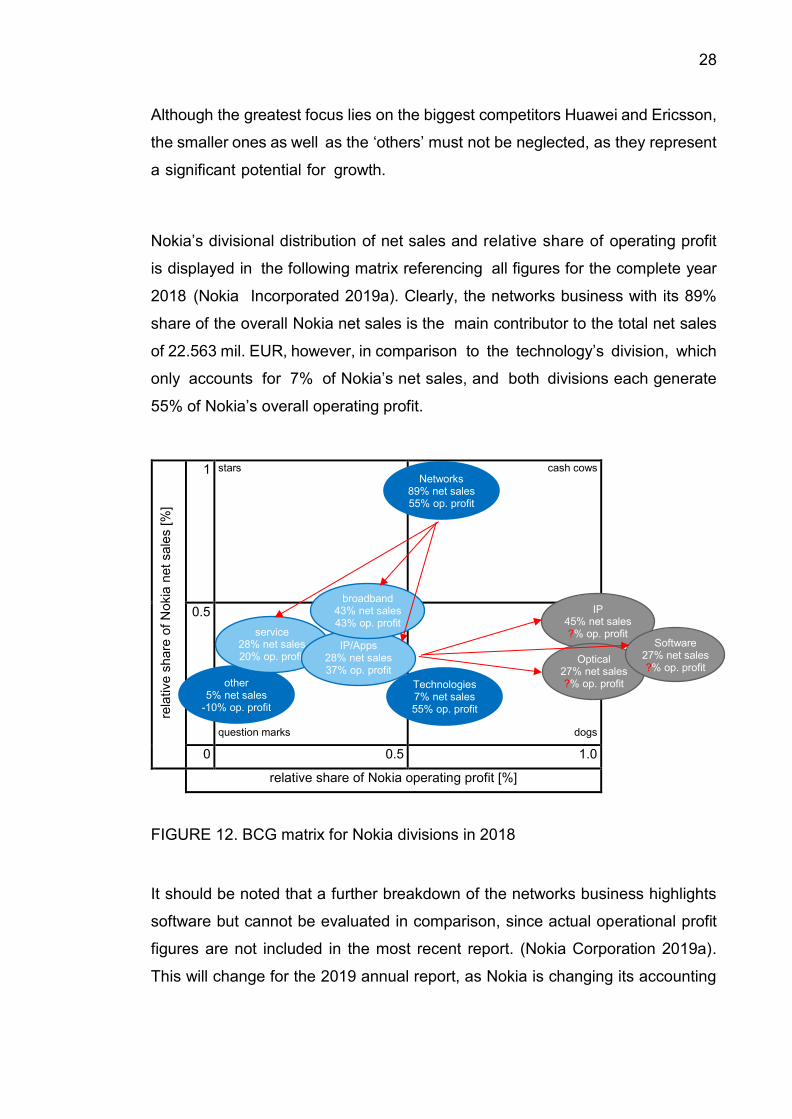
Nokia’s divisional distribution of net sales and relative share of operating profit
is displayed in the following matrix referencing all figures for the complete year
2018 (Nokia Incorporated 2019a). Clearly, the networks business with its 89%
share of the overall Nokia net sales is the main contributor to the total net sales
of 22.563 mil. EUR, however, in comparison to the technology’s division, which
only accounts for 7% of Nokia’s net sales, and both divisions each generate
55% of Nokia’s overall operating profit.
rela
tive s
hare
of
Nokia
net
sale
s [%
]
1 stars cash cows
0.5
question marks dogs
0 0.5 1.0
relative share of Nokia operating profit [%]
FIGURE 12. BCG matrix for Nokia divisions in 2018
It should be noted that a further breakdown of the networks business highlights
software but cannot be evaluated in comparison, since actual operational profit
figures are not included in the most recent report. (Nokia Corporation 2019a).
This will change for the 2019 annual report, as Nokia is changing its accounting
Networks 89% net sales 55% op. profit
Technologies 7% net sales 55% op. profit
other 5% net sales
-10% op. profit
service 28% net sales 20% op. profit
IP/Apps 28% net sales 37% op. profit
broadband 43% net sales 43% op. profit
IP 45% net sales ?% op. profit
Optical 27% net sales ?% op. profit
Software 27% net sales ?% op. profit
29
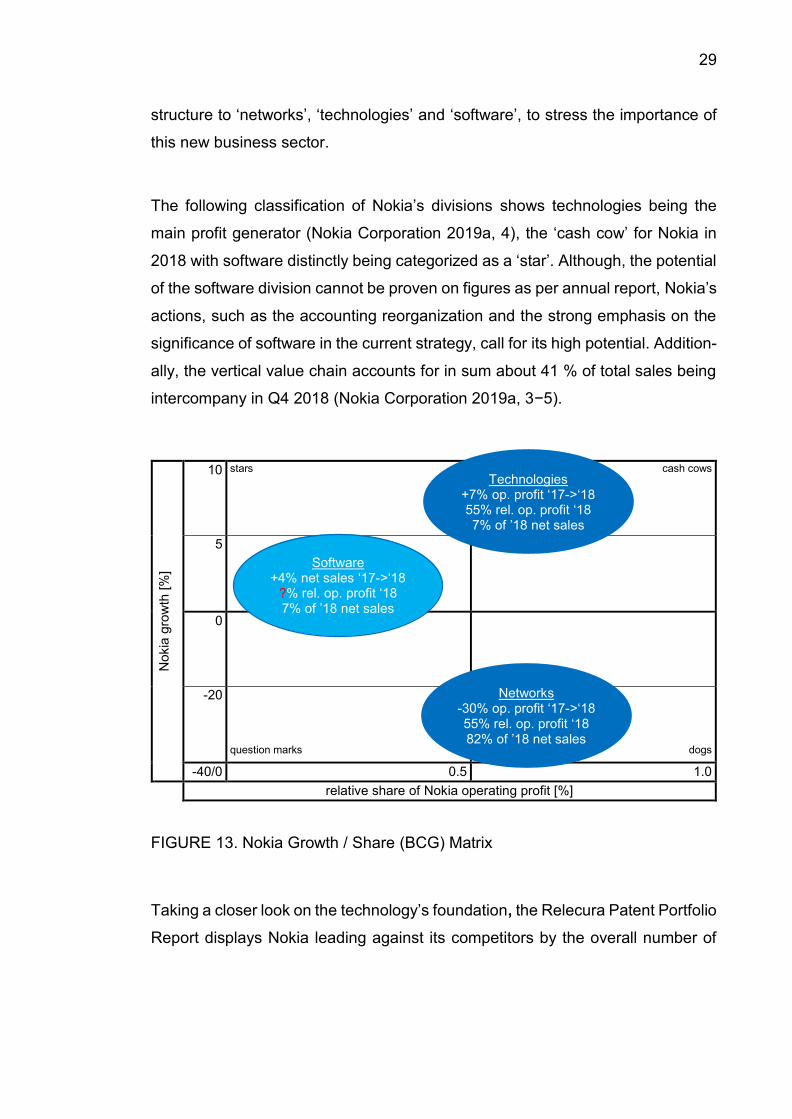
structure to ‘networks’, ‘technologies’ and ‘software’, to stress the importance of
this new business sector.
The following classification of Nokia’s divisions shows technologies being the
main profit generator (Nokia Corporation 2019a, 4), the ‘cash cow’ for Nokia in
2018 with software distinctly being categorized as a ‘star’. Although, the potential
of the software division cannot be proven on figures as per annual report, Nokia’s
actions, such as the accounting reorganization and the strong emphasis on the
significance of software in the current strategy, call for its high potential. Addition-
ally, the vertical value chain accounts for in sum about 41 % of total sales being
intercompany in Q4 2018 (Nokia Corporation 2019a, 3−5).
Nokia
gro
wth
[%
]
10 stars
cash cows
5
0
-20
question marks dogs
-40/0 0.5 1.0
relative share of Nokia operating profit [%]
FIGURE 13. Nokia Growth / Share (BCG) Matrix
Taking a closer look on the technology’s foundation, the Relecura Patent Portfolio
Report displays Nokia leading against its competitors by the overall number of
Technologies +7% op. profit ‘17->‘18 55% rel. op. profit ‘18 7% of ’18 net sales
Networks -30% op. profit ‘17->‘18 55% rel. op. profit ‘18 82% of ’18 net sales
Software +4% net sales ‘17->‘18
?% rel. op. profit ‘18 7% of ’18 net sales
30
18
patents in nearly all the heading categories, such as data processing, transmis-
sion, signal transmission, substation equipment, switches & relays, TV & broad-
cast, telephonic communications, and wireless networks (Relecura 2018, 13−14).
In fact, some competitors are partially relying on those patents which gives Nokia
an edge and bargaining power over these (Relecura 2018, 5−6).
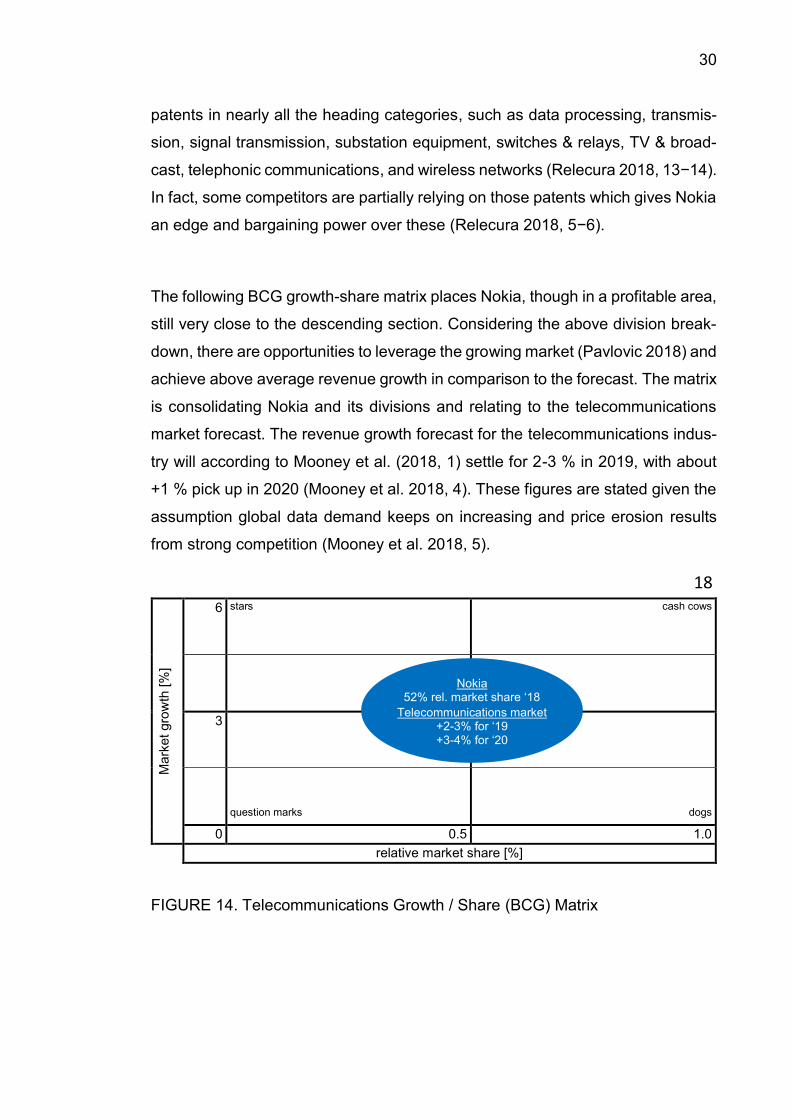
The following BCG growth-share matrix places Nokia, though in a profitable area,
still very close to the descending section. Considering the above division break-
down, there are opportunities to leverage the growing market (Pavlovic 2018) and
achieve above average revenue growth in comparison to the forecast. The matrix
is consolidating Nokia and its divisions and relating to the telecommunications
market forecast. The revenue growth forecast for the telecommunications indus-
try will according to Mooney et al. (2018, 1) settle for 2-3 % in 2019, with about
+1 % pick up in 2020 (Mooney et al. 2018, 4). These figures are stated given the
assumption global data demand keeps on increasing and price erosion results
from strong competition (Mooney et al. 2018, 5).
Mark
et gro
wth
[%
]
6 stars cash cows
3
question marks dogs
0 0.5 1.0
relative market share [%]
FIGURE 14. Telecommunications Growth / Share (BCG) Matrix
Nokia 52% rel. market share ‘18
Telecommunications market +2-3% for ‘19 +3-4% for ‘20
31
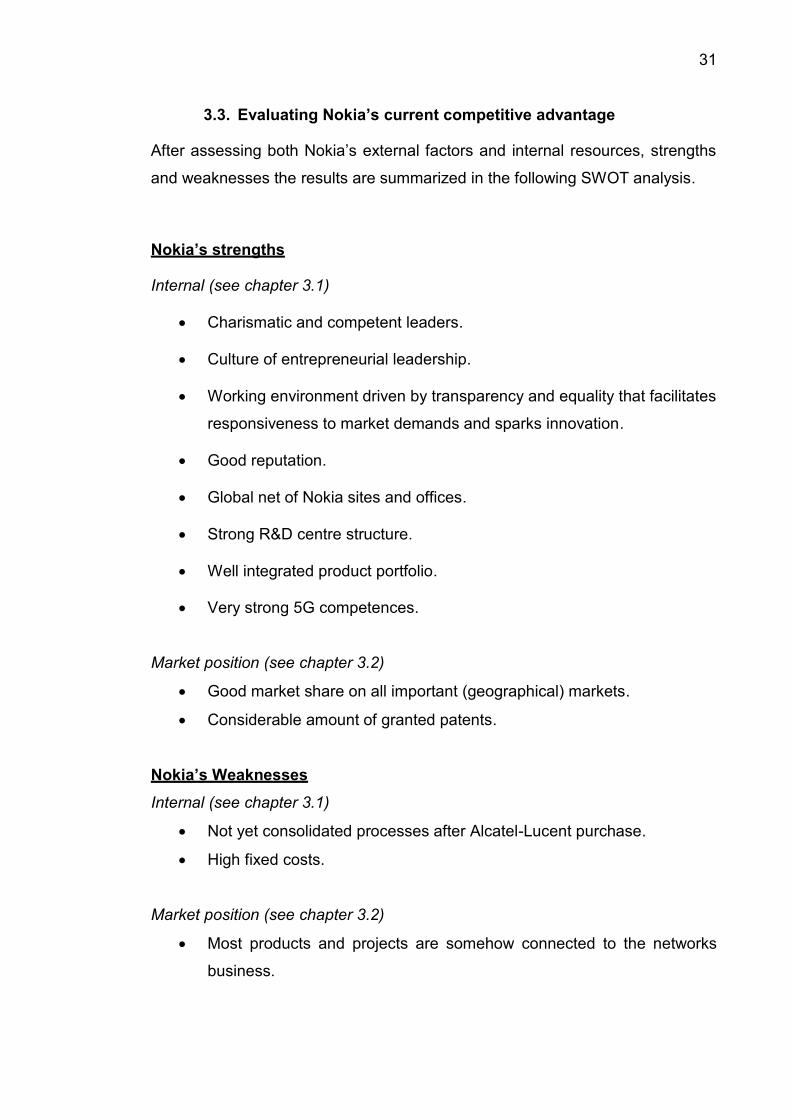
3.3. Evaluating Nokia’s current competitive advantage
After assessing both Nokia’s external factors and internal resources, strengths
and weaknesses the results are summarized in the following SWOT analysis.
Nokia’s strengths
Internal (see chapter 3.1)
• Charismatic and competent leaders.
• Culture of entrepreneurial leadership.
• Working environment driven by transparency and equality that facilitates
responsiveness to market demands and sparks innovation.
• Good reputation.
• Global net of Nokia sites and offices.
• Strong R&D centre structure.
• Well integrated product portfolio.
• Very strong 5G competences.
Market position (see chapter 3.2)
• Good market share on all important (geographical) markets.
• Considerable amount of granted patents.
Nokia’s Weaknesses
Internal (see chapter 3.1)
• Not yet consolidated processes after Alcatel-Lucent purchase.
• High fixed costs.
Market position (see chapter 3.2)
• Most products and projects are somehow connected to the networks
business.
32
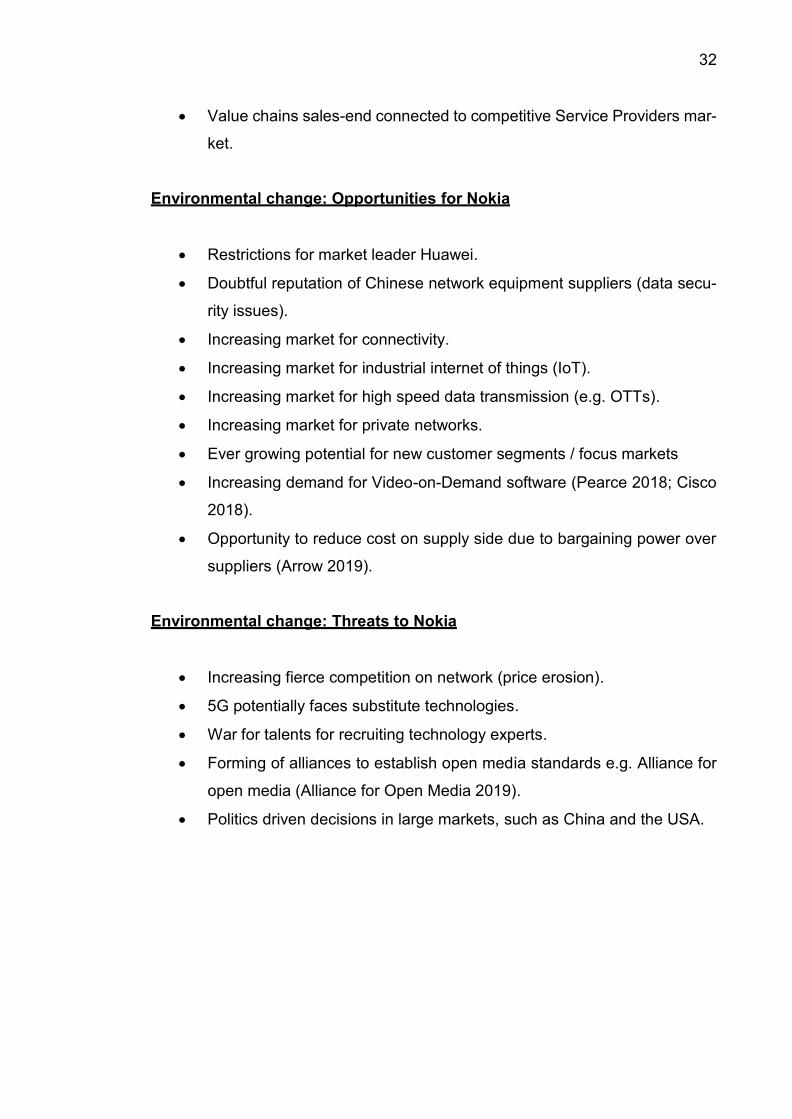
• Value chains sales-end connected to competitive Service Providers mar-
ket.
Environmental change: Opportunities for Nokia
• Restrictions for market leader Huawei.
• Doubtful reputation of Chinese network equipment suppliers (data secu-
rity issues).
• Increasing market for connectivity.
• Increasing market for industrial internet of things (IoT).
• Increasing market for high speed data transmission (e.g. OTTs).
• Increasing market for private networks.
• Ever growing potential for new customer segments / focus markets
• Increasing demand for Video-on-Demand software (Pearce 2018; Cisco
2018).
• Opportunity to reduce cost on supply side due to bargaining power over
suppliers (Arrow 2019).
Environmental change: Threats to Nokia
• Increasing fierce competition on network (price erosion).
• 5G potentially faces substitute technologies.
• War for talents for recruiting technology experts.
• Forming of alliances to establish open media standards e.g. Alliance for
open media (Alliance for Open Media 2019).
• Politics driven decisions in large markets, such as China and the USA.
33
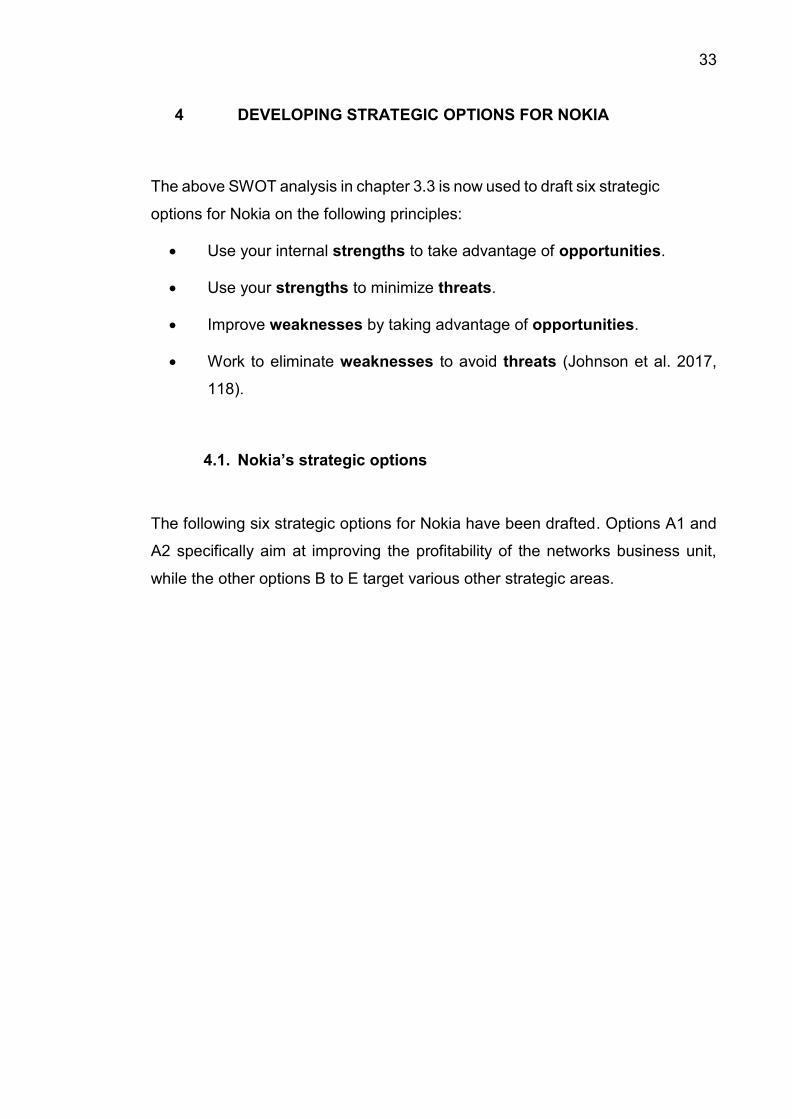
4 DEVELOPING STRATEGIC OPTIONS FOR NOKIA
The above SWOT analysis in chapter 3.3 is now used to draft six strategic
options for Nokia on the following principles:
• Use your internal strengths to take advantage of opportunities.
• Use your strengths to minimize threats.
• Improve weaknesses by taking advantage of opportunities.
• Work to eliminate weaknesses to avoid threats (Johnson et al. 2017,
118).
4.1. Nokia’s strategic options
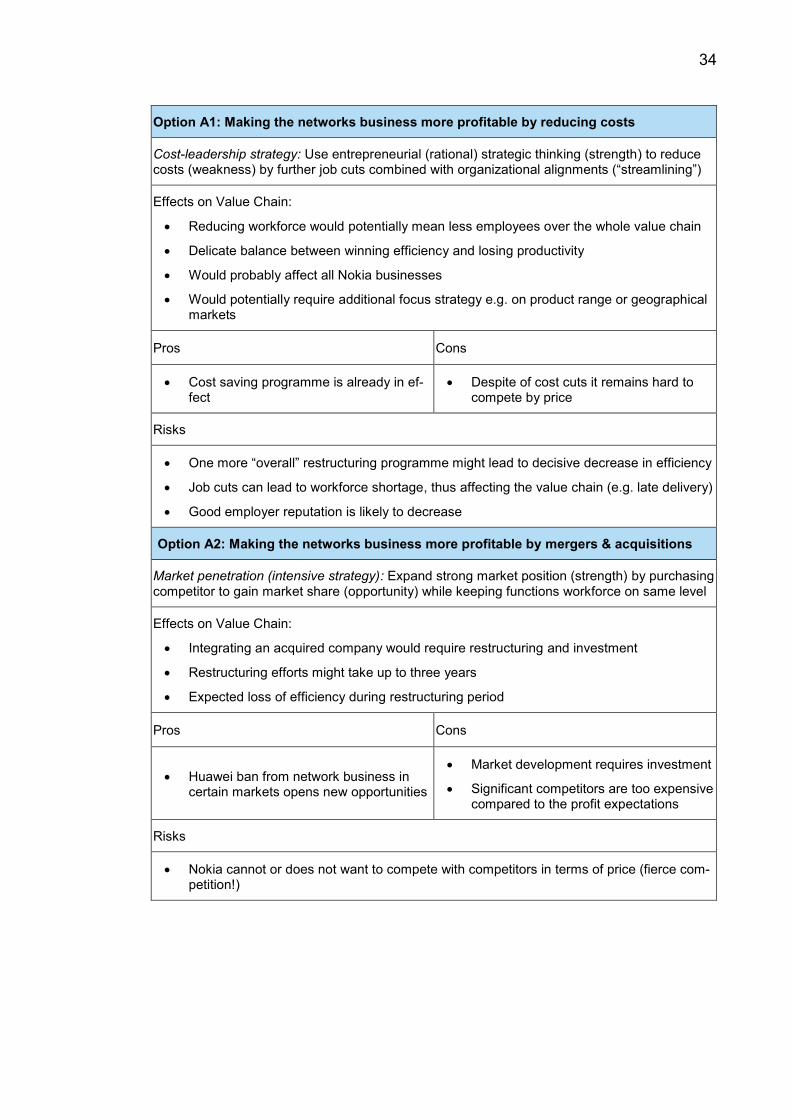
The following six strategic options for Nokia have been drafted. Options A1 and
A2 specifically aim at improving the profitability of the networks business unit,
while the other options B to E target various other strategic areas.
34
Option A1: Making the networks business more profitable by reducing costs
Cost-leadership strategy: Use entrepreneurial (rational) strategic thinking (strength) to reduce costs (weakness) by further job cuts combined with organizational alignments (“streamlining”)
Effects on Value Chain:
• Reducing workforce would potentially mean less employees over the whole value chain
• Delicate balance between winning efficiency and losing productivity
• Would probably affect all Nokia businesses
• Would potentially require additional focus strategy e.g. on product range or geographical markets
Pros Cons
• Cost saving programme is already in ef-fect
• Despite of cost cuts it remains hard to compete by price
Risks
• One more “overall” restructuring programme might lead to decisive decrease in efficiency
• Job cuts can lead to workforce shortage, thus affecting the value chain (e.g. late delivery)
• Good employer reputation is likely to decrease
Option A2: Making the networks business more profitable by mergers & acquisitions
Market penetration (intensive strategy): Expand strong market position (strength) by purchasing competitor to gain market share (opportunity) while keeping functions workforce on same level
Effects on Value Chain:
• Integrating an acquired company would require restructuring and investment
• Restructuring efforts might take up to three years
• Expected loss of efficiency during restructuring period
Pros Cons
• Huawei ban from network business in certain markets opens new opportunities
• Market development requires investment
• Significant competitors are too expensive compared to the profit expectations
Risks
• Nokia cannot or does not want to compete with competitors in terms of price (fierce com-petition!)
35
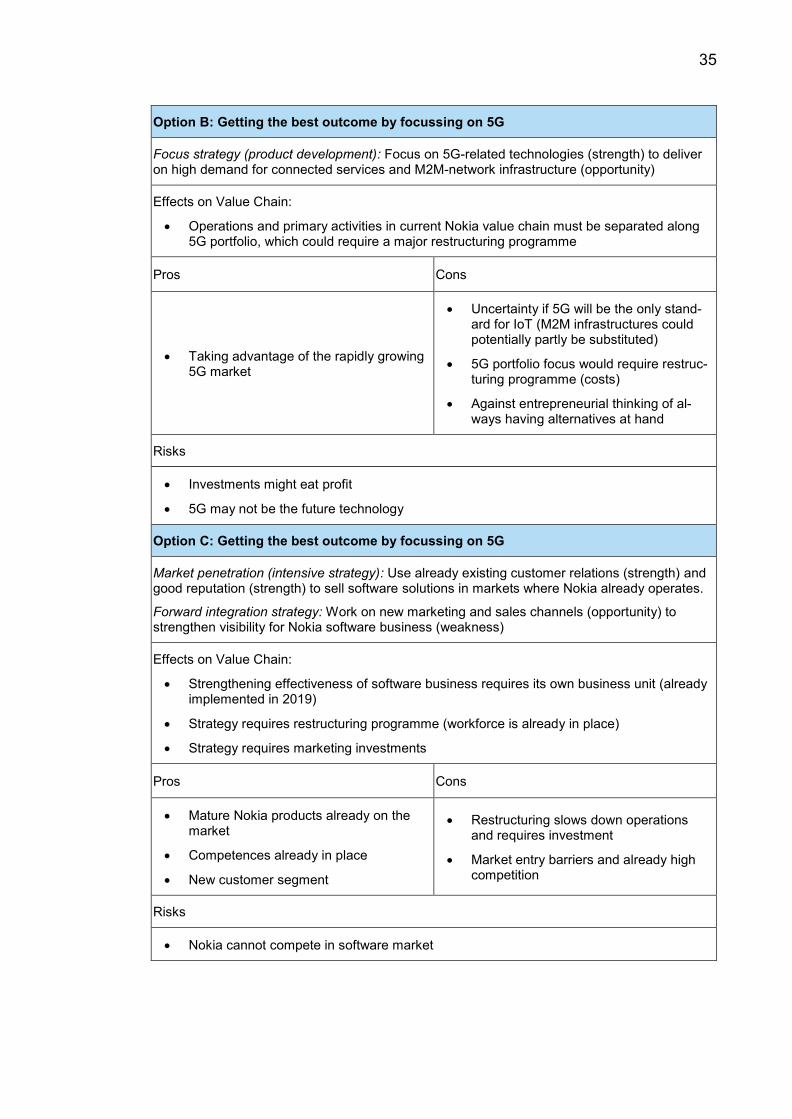
Option B: Getting the best outcome by focussing on 5G
Focus strategy (product development): Focus on 5G-related technologies (strength) to deliver on high demand for connected services and M2M-network infrastructure (opportunity)
Effects on Value Chain:
• Operations and primary activities in current Nokia value chain must be separated along 5G portfolio, which could require a major restructuring programme
Pros Cons
• Taking advantage of the rapidly growing 5G market
• Uncertainty if 5G will be the only stand-ard for IoT (M2M infrastructures could potentially partly be substituted)
• 5G portfolio focus would require restruc-turing programme (costs)
• Against entrepreneurial thinking of al-ways having alternatives at hand
Risks
• Investments might eat profit
• 5G may not be the future technology
Option C: Getting the best outcome by focussing on 5G
Market penetration (intensive strategy): Use already existing customer relations (strength) and good reputation (strength) to sell software solutions in markets where Nokia already operates.
Forward integration strategy: Work on new marketing and sales channels (opportunity) to strengthen visibility for Nokia software business (weakness)
Effects on Value Chain:
• Strengthening effectiveness of software business requires its own business unit (already implemented in 2019)
• Strategy requires restructuring programme (workforce is already in place)
• Strategy requires marketing investments
Pros Cons
• Mature Nokia products already on the market
• Competences already in place
• New customer segment
• Restructuring slows down operations and requires investment
• Market entry barriers and already high competition
Risks
• Nokia cannot compete in software market
36
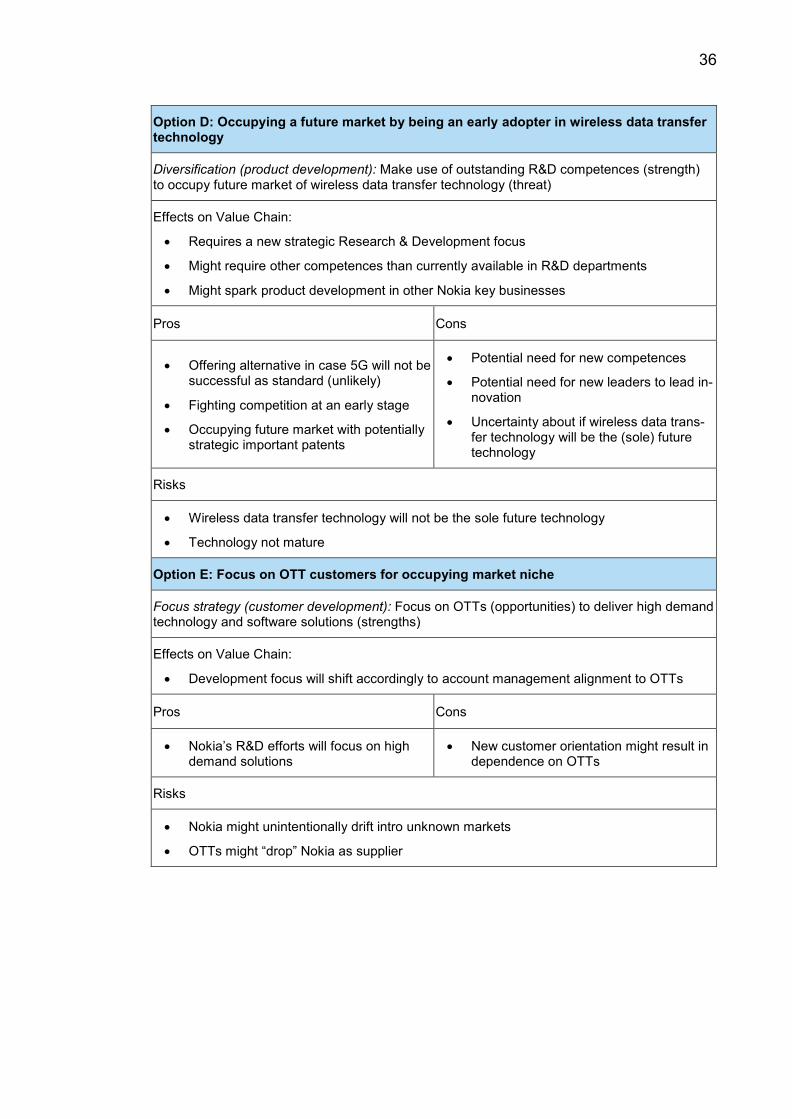
Option D: Occupying a future market by being an early adopter in wireless data transfer technology
Diversification (product development): Make use of outstanding R&D competences (strength) to occupy future market of wireless data transfer technology (threat)
Effects on Value Chain:
• Requires a new strategic Research & Development focus
• Might require other competences than currently available in R&D departments
• Might spark product development in other Nokia key businesses
Pros Cons
• Offering alternative in case 5G will not be successful as standard (unlikely)
• Fighting competition at an early stage
• Occupying future market with potentially strategic important patents
• Potential need for new competences
• Potential need for new leaders to lead in-novation
• Uncertainty about if wireless data trans-fer technology will be the (sole) future technology
Risks
• Wireless data transfer technology will not be the sole future technology
• Technology not mature
Option E: Focus on OTT customers for occupying market niche
Focus strategy (customer development): Focus on OTTs (opportunities) to deliver high demand technology and software solutions (strengths)
Effects on Value Chain:
• Development focus will shift accordingly to account management alignment to OTTs
Pros Cons
• Nokia’s R&D efforts will focus on high demand solutions
• New customer orientation might result in dependence on OTTs
Risks
• Nokia might unintentionally drift intro unknown markets
• OTTs might “drop” Nokia as supplier
37
4.2. Nokia’s main competitors
Looking into the market activities of Nokia and its competitors in the global tele-
communications business, the focus will be on its big competitors, namely
Huawei and Ericsson, as these offer a comparable end to end portfolio like Nokia.
As mentioned in chapter 3.2, smaller competitors must not be neglected, there-
fore ZTE, a smaller competitor in the networks business, shall also be included.
At a first glance, it seems that Huawei is the biggest competitor of Nokia, as the
Chinese company dominates the networks market with its end-to-end portfolio.
The numbers mentioned in chapter 3.2, as well as the annual report of Huawei
(Huawei 2017) support this assumption. Looking on the latest news related to the
5G business, Huawei has big issues regarding cyber security and is banned from
doing business in the USA, Australia, New Zealand, Japan and Taiwan. The pres-
sure on Germany is growing as well since the German security agencies unani-
mously voted in January for a ban (Asian Nikkei Review 2019). Similar security
concerns in the UK lead to an official statement from Huawei that changing these
security issues will take at least three up to five years and will cost Huawei around
$2bn for the solving process (BBC News 2019). Even if Huawei’s founder Mr.
Ren Zhengfei is forecasting a growth of turnover around $ 25 billion in 2019 and
furthermore Huawei’s Cyber Security Officer and Privacy Officer Jaap Meijer is
confirming that there is no slowdown in networks sales currently, Mr. Jaap Meijer
is noting that there will be an impact to business progress if this situation will hold
on for longer times (Bloomberg 2019).
It can be assumed that the current security concerns will have a big impact on
the market position of Huawei in the 5G networks business, since the official time-
line for solving these issues of three to five years will be very long in this fast-
paced business.
Looking at the other “big” competitor from China, ZTE is facing comparable issues
in the western world. The USA, Japan and Australia have already banned ZTE
from their networks market. ZTE mentions a list of 5 collaborations with global
operators on its official homepage. This information seems not quite accurate
38
since three of this five (Germany, Japan and Spain) have officially banned ZTE
or are checking the security concerns under the pressure of the US (CNBC 2018;
ZTE 2019).
Beside the Chinese networks companies Huawei and ZTE with their current is-
sues, it seems that the Swedish tech company Ericsson, which again has a sim-
ilar end- to-end portfolio as Nokia, is the only other big competitor for Nokia in the
networks (5G) business. By comparing net sales by region (Q4/2018) between
Ericsson and Nokia it becomes evident that both have a strategic focus on the
same regions. For instance, in Asia-Pacific/North East Asia and North America
both companies have reported the biggest growth in 2018. Nokia is the bigger
company with a much higher turnover compared to Ericsson, but the competitor
from Sweden seems to be more efficient and more profitable with a gross margin
of 41% and an operating margin of 17,5% compared to Nokia’s 39,7% and 13,5%
(Ericsson 2019; Nokia Corporation 2019a).
Nokia’s position in this turbulent time is quite stable and the Finnish company
could profit from the political situation, the trade war between the USA and China,
and the security concerns regarding Huawei and ZTE. Canada has banned
Huawei from its networks market and therefor Nokia has secured a $40 million
investment from Canada’s federal government for stepping up its 5G R&D busi-
ness. If the situation for Huawei will stay as mentioned above, it could result in a
chance for Nokia to catch the lead in the global networks market (Globalnews
2019).
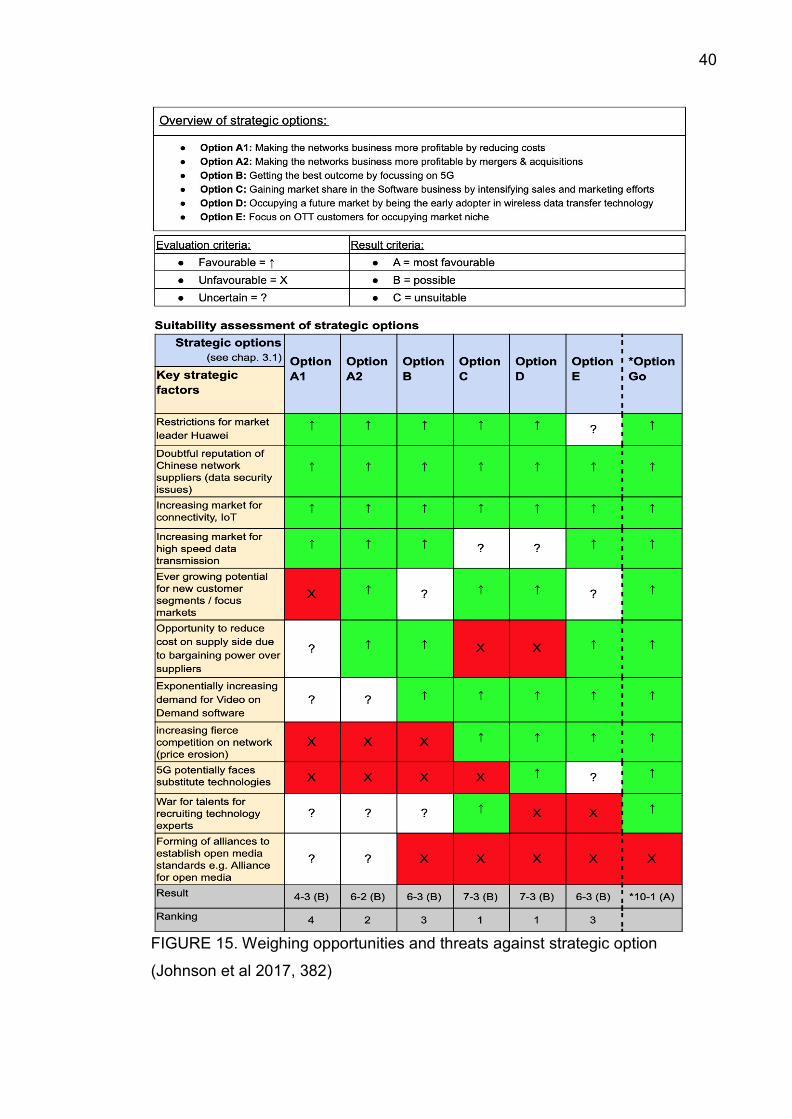
4.3. Outlining the basis of Nokia’s future strategy
Based on the strategic options in chapter 4.1 and the careful consideration of
competitors’ strategy in chapter 4.2, a feasible strategy to move forward with can
be distilled. The SAFe is utilized in the following, starting with addressing the
‘suitability’ first (Johnson et al. 2017, 380).
39
It is furthermore important to highlight that the evaluation is based on the assump-
tions of an overall growing telecommunications market due the drive towards con-
nectivity and technologies enabling such, to only name the major factors out of
the previously conducted environmental analysis.
40
FIGURE 15. Weighing opportunities and threats against strategic option
(Johnson et al 2017, 382)
41
The result of the assessment is not entirely conclusive. Consequently, a ranking
was introduced to evaluate the tendencies.
Based on the final ranking one of the most preferable options is option C, focusing
on strengthening the salesforce of the profitable software division. The other win-
ner of the evaluation is option D, which is aiming to leverage the most out of the
growing wireless technology demand.
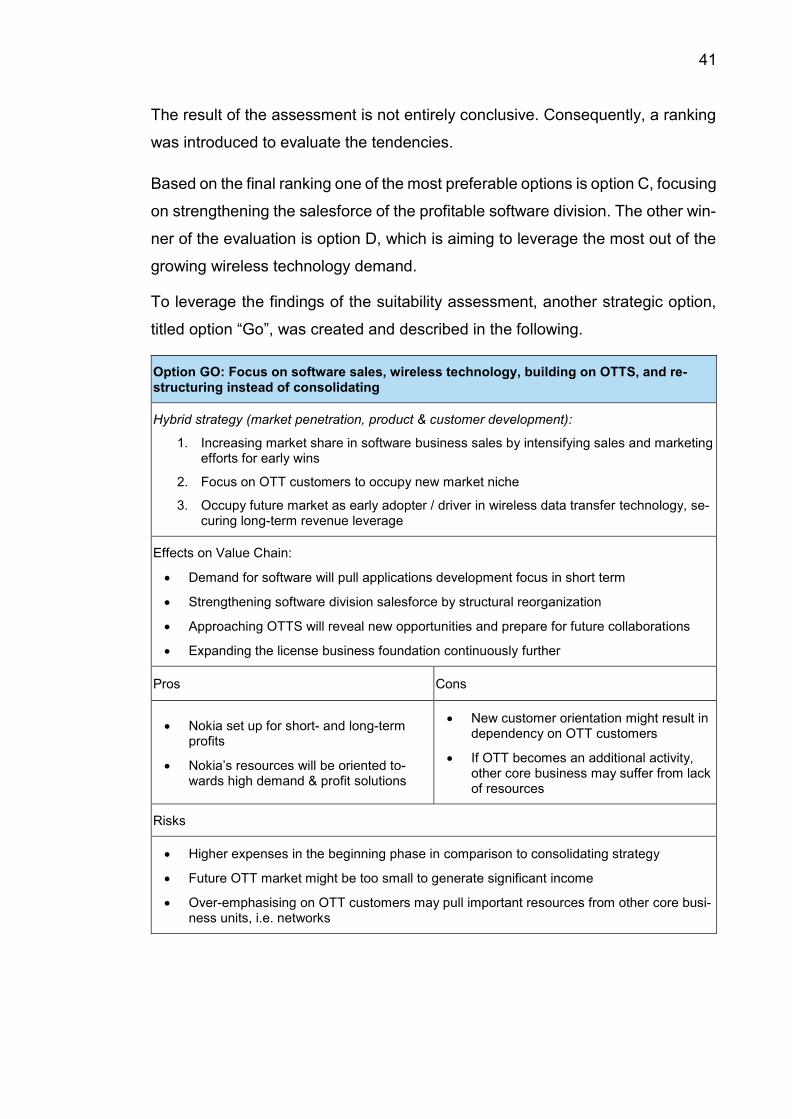
To leverage the findings of the suitability assessment, another strategic option,
titled option “Go”, was created and described in the following.
Option GO: Focus on software sales, wireless technology, building on OTTS, and re-structuring instead of consolidating
Hybrid strategy (market penetration, product & customer development):
1. Increasing market share in software business sales by intensifying sales and marketing efforts for early wins
2. Focus on OTT customers to occupy new market niche
3. Occupy future market as early adopter / driver in wireless data transfer technology, se-curing long-term revenue leverage
Effects on Value Chain:
• Demand for software will pull applications development focus in short term
• Strengthening software division salesforce by structural reorganization
• Approaching OTTS will reveal new opportunities and prepare for future collaborations
• Expanding the license business foundation continuously further
Pros Cons
• Nokia set up for short- and long-term profits
• Nokia’s resources will be oriented to-wards high demand & profit solutions
• New customer orientation might result in dependency on OTT customers
• If OTT becomes an additional activity, other core business may suffer from lack of resources
Risks
• Higher expenses in the beginning phase in comparison to consolidating strategy
• Future OTT market might be too small to generate significant income
• Over-emphasising on OTT customers may pull important resources from other core busi-ness units, i.e. networks
42
After repetition of the suitability analysis, Option Go was evaluated as the most
suitable strategy in addressing the environmental factors.
Following on in accordance with Johnson et al., in the next step it must be as-
sessed whether option Go will answer stakeholder expectations, i.e. whether it
will be acceptable, next to being suitable as it was evaluated above (Johnson et
al. 2017, 387−398).
Based on the previous findings presented in chapter 2.2, the following prior ex-
pectations can be stated:
• sustainable business prepared to cope with challenges of the future
• trustful company that complies with applicable laws
• profit growth
These expectations can be summarized in referring to risk reduction and profit
growth, both directed at a foresighted and sustainable business model.
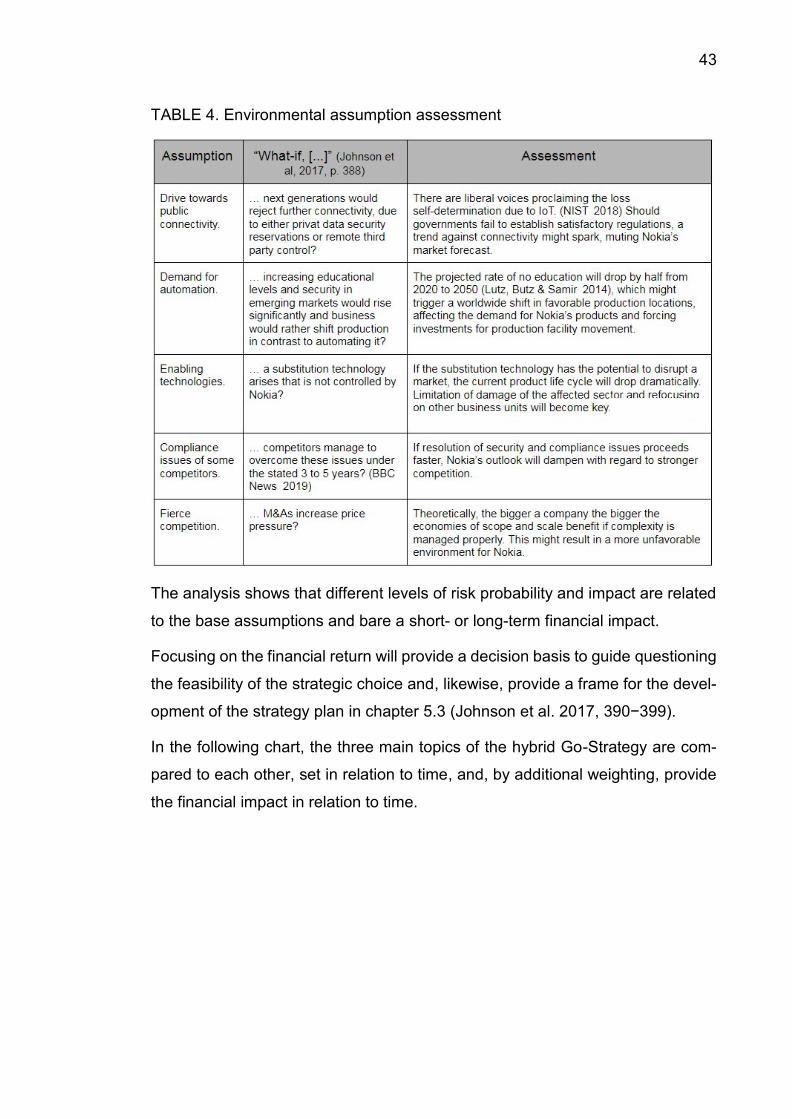
To address the risks that are involved with this strategic choice, the major under-
lying environmental assumptions based on the findings in chapter 2.3 are ques-
tioned in Table 4 (Johnson et al. 2017, 388).
43
TABLE 4. Environmental assumption assessment
The analysis shows that different levels of risk probability and impact are related
to the base assumptions and bare a short- or long-term financial impact.
Focusing on the financial return will provide a decision basis to guide questioning
the feasibility of the strategic choice and, likewise, provide a frame for the devel-
opment of the strategy plan in chapter 5.3 (Johnson et al. 2017, 390−399).
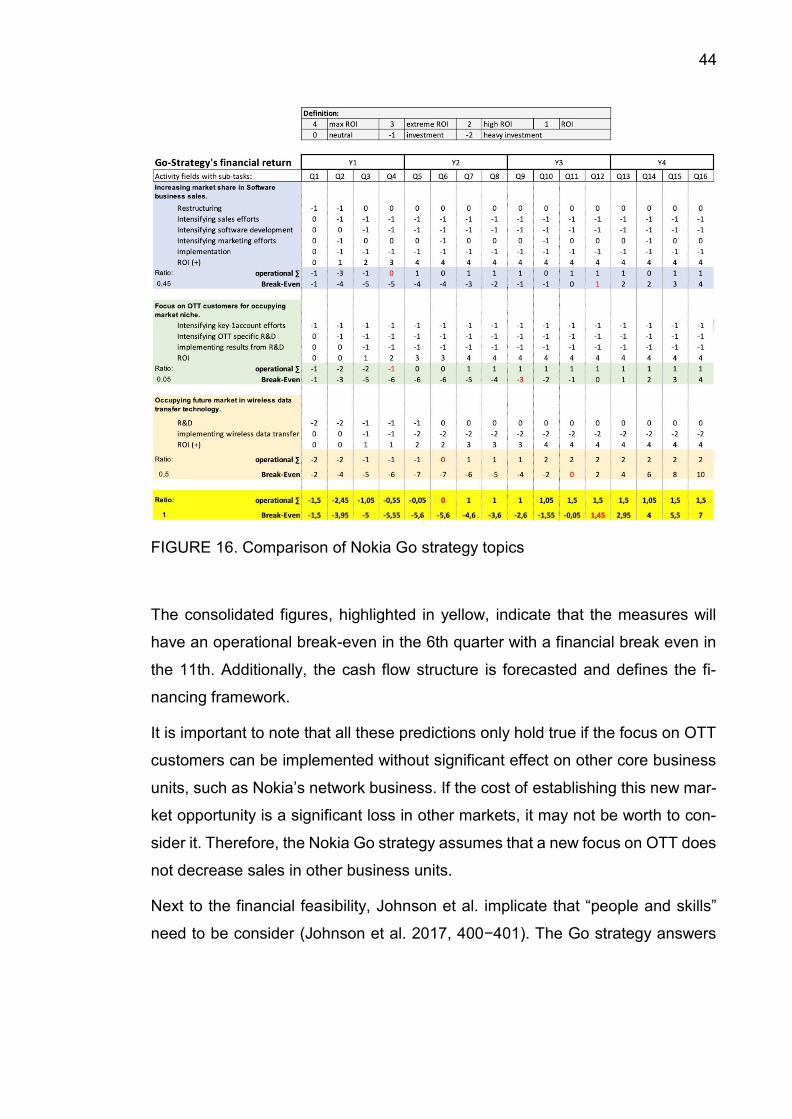
In the following chart, the three main topics of the hybrid Go-Strategy are com-
pared to each other, set in relation to time, and, by additional weighting, provide
the financial impact in relation to time.
44
FIGURE 16. Comparison of Nokia Go strategy topics
The consolidated figures, highlighted in yellow, indicate that the measures will
have an operational break-even in the 6th quarter with a financial break even in
the 11th. Additionally, the cash flow structure is forecasted and defines the fi-
nancing framework.
It is important to note that all these predictions only hold true if the focus on OTT
customers can be implemented without significant effect on other core business
units, such as Nokia’s network business. If the cost of establishing this new mar-
ket opportunity is a significant loss in other markets, it may not be worth to con-
sider it. Therefore, the Nokia Go strategy assumes that a new focus on OTT does
not decrease sales in other business units.
Next to the financial feasibility, Johnson et al. implicate that “people and skills”
need to be consider (Johnson et al. 2017, 400−401). The Go strategy answers
45
this aspect from an ethical standpoint, since consolidation is shifted to reorgani-
zation. This direction leverages the current resources in two ways. Firstly, faster
availability of staff, and secondly, deep operations and business know-how of
such, which both adds value to the Go strategies orientation towards software,
OTT and wireless data transfer.
Concluding, it is fair to assume that the Go strategy answers the stakeholders’
expectations of secured, sustainable profit generation through focus on different
individually self-supporting sub-strategies.
In the next chapter, the strategy plan for Nokia Go will be developed in more
detail.
46
5 GO’s STRATEGY PLAN
5.1. Go’s strategic planning calendar (SPC)
To position Nokia competitively for the future, to consider environmental circum-
stances and the ever faster change of such, to prepare against threats and like-
wise enable Nokia to take advantage of opportunities a suitable strategy plan
must be established.
Considering the above and reflecting on Nokia’s future Go strategy the initial stra-
tegic analysis was conducted in accordance with the rational approach (Porter
1980) that provided a broad understanding of all factors at this time and resulted
in the definition of the Go strategy. From here on it is important to stress that the
environment is in constant movement and the past findings might become obso-
lete sooner than later which is why repeated, periodical re-evaluation is key in
staying focused on upfront challenges and opportunities. This course is vital to
the non-rational (Moore 2011) approach and answers stakeholder expectations
with regard to foresighted management as stated in chapters 2.2 and 4.3.
Since the dynamic approach asks for a reduced time horizon with regard to goals
and thus flexibility is ranked higher priority, (Moore 2011) the described Go strat-
egy is a strong supporter of this direction.
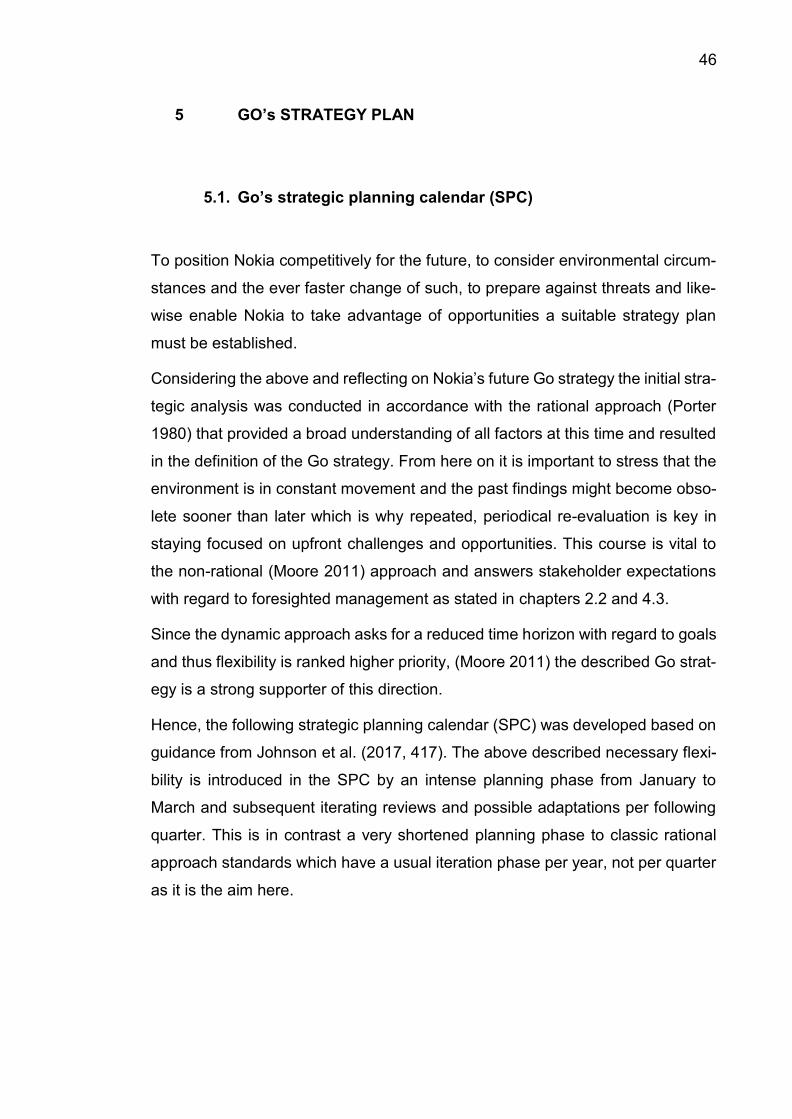
Hence, the following strategic planning calendar (SPC) was developed based on
guidance from Johnson et al. (2017, 417). The above described necessary flexi-
bility is introduced in the SPC by an intense planning phase from January to
March and subsequent iterating reviews and possible adaptations per following
quarter. This is in contrast a very shortened planning phase to classic rational
approach standards which have a usual iteration phase per year, not per quarter
as it is the aim here.
47
FIGURE 17. Nokia Go strategic planning calendar (SPC)
Taking a closer look, the SPC provides answers to the short lived environment
nowadays as it enables the management to receive information regularly and act
within a reasonable timeframe. Finally, it does answer the stakeholder expecta-
tions profoundly, since it places a focus on management rather than strategy.
This is in so far clever, as a strategy is a product of management and stressing
such enables management to adopt the strategy on the fly.
5.2. Nokia’s critical success factors with Go strategy
Before constructing the strategy plan in detail, the critical success factors (CSF)
for sustaining Nokia’s business success must be defined. CSFs are factors that
are “either particularly valued by customers or which provide a significant ad-
vantage in terms of costs” (Johnson et al. 2017, 773) CSFs are those outstanding
factors that constitute a business’ competitive advantage. CSFs can be measured
by Key Performance Indicators (KPIs) to quantify objectives and measure how
good an organisation delivers on any CSF compared to its competitors. (Sims &
Adrian 2013, 47) To define the CSFs it is important to understand, what Nokia’s
48
customers want/need. As there was no data available, the following customer
requirements are based on rational assumption.
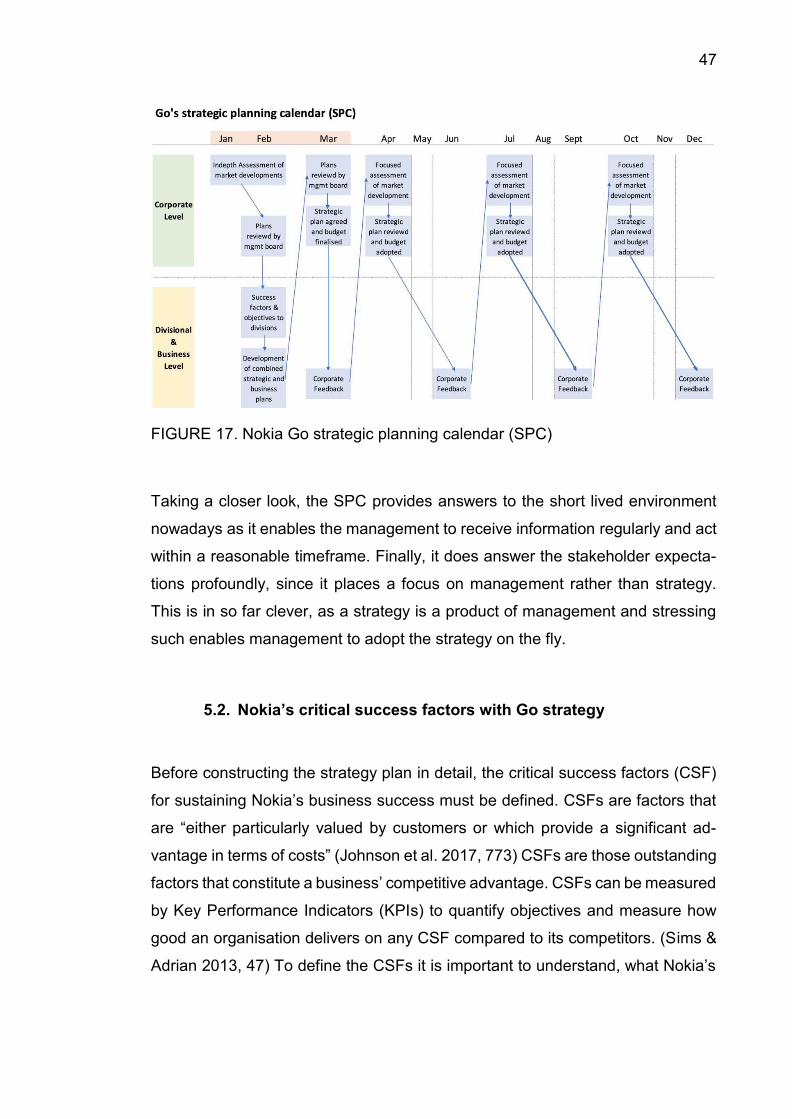
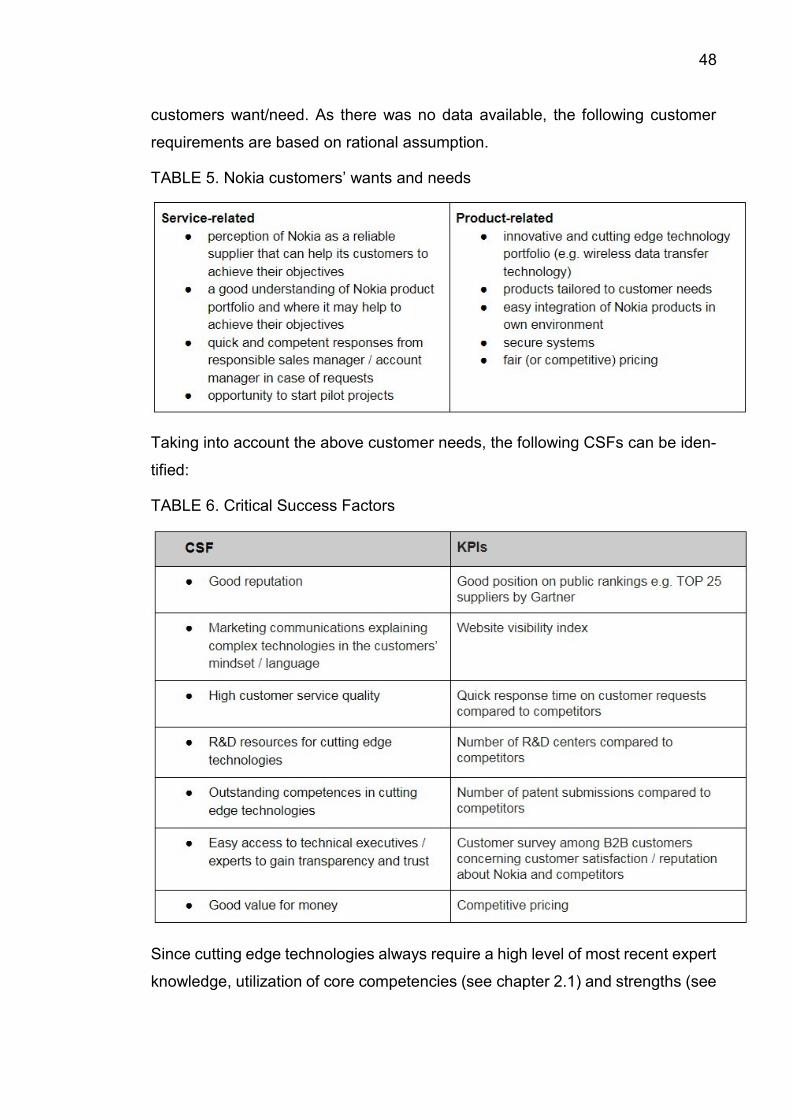
TABLE 5. Nokia customers’ wants and needs
Taking into account the above customer needs, the following CSFs can be iden-
tified:
TABLE 6. Critical Success Factors
Since cutting edge technologies always require a high level of most recent expert
knowledge, utilization of core competencies (see chapter 2.1) and strengths (see
49
chapter 2.3) is mandatory. The Go strategy is intended to leverage these factors
through reorganization and therefore counter knowledge loss through consolida-
tion. Precisely because of the reorganization, continuous qualification measures
will be indispensable to align in accordance with the CSFs.
5.3. The developed Go strategy
Based on the conducted analysis, the strategic plan will be developed in the fol-
lowing. The earlier findings will thus be consolidated to fall into timeline, regional
focus and a reasonable cost framework.
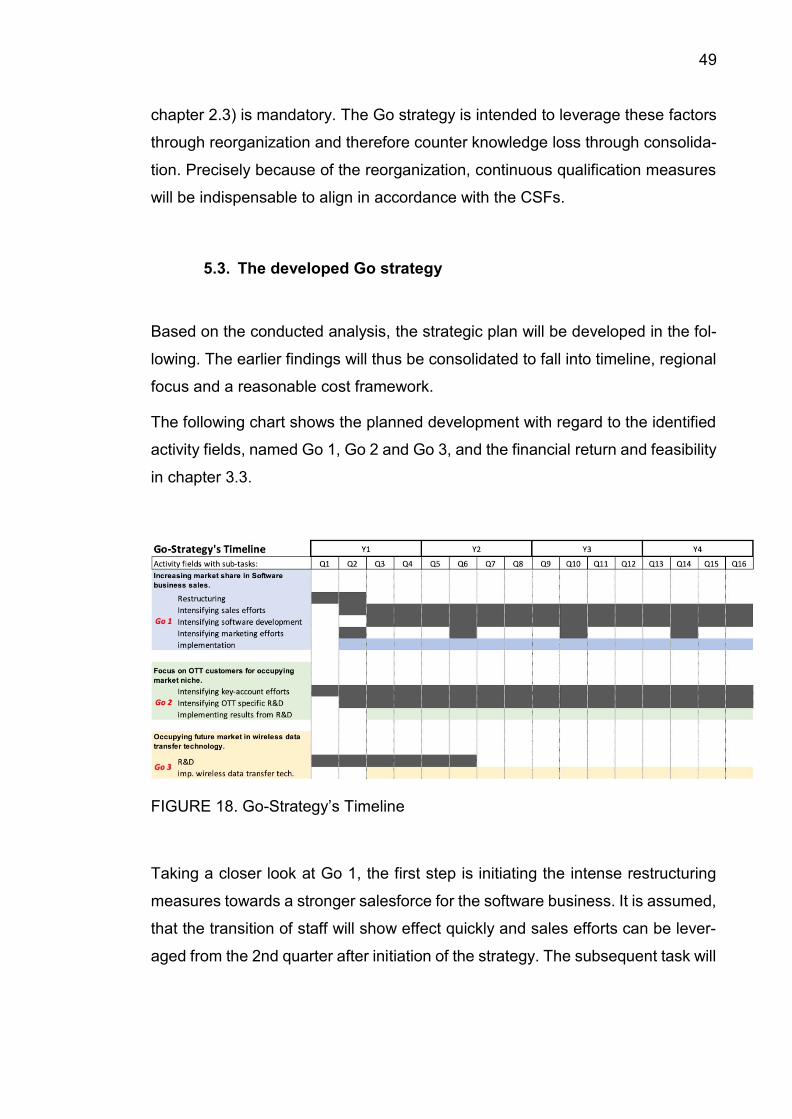
The following chart shows the planned development with regard to the identified
activity fields, named Go 1, Go 2 and Go 3, and the financial return and feasibility
in chapter 3.3.
FIGURE 18. Go-Strategy’s Timeline
Taking a closer look at Go 1, the first step is initiating the intense restructuring
measures towards a stronger salesforce for the software business. It is assumed,
that the transition of staff will show effect quickly and sales efforts can be lever-
aged from the 2nd quarter after initiation of the strategy. The subsequent task will
50
fall to software development and simultaneous implementation that will start to
generate ROI. Additionally, marketing efforts will be timed in the second quarter
to counteract Nokia’s business seasonality (Nokia Corporation 2018a) and con-
clude the individual business case of Go1.
Go 2 is aiming on winning new customers through focusing on OTTs. The first
sub-task here is intensifying key-account efforts with OTTs which will result in
better understanding of their demands and pave the way for areas of cooperation.
Though this area is considered relatively small with a ratio of only 0,05 in chapter
3.3, it is nonetheless important to be initiated. Since customer understanding is
key in directing future strategic decisions and the impact of OTTs is considered
to increase in the future, this aspect of the Go strategy will leverage new oppor-
tunities in the next years.
Finally, the third activity field, Go 3, will need to further focus on R&D. It was
evaluated in chapter 3.2., that Nokia’s patent basis is already top tear among its
competitors when it comes to wireless data transfer and 5G technologies in par-
ticular. Nonetheless, Nokia should aim to remain on the leading edge of R&D and
therefore secure the associated benefits for the long run. Cutting cost now would
likely result in lost revenue in the years to come.
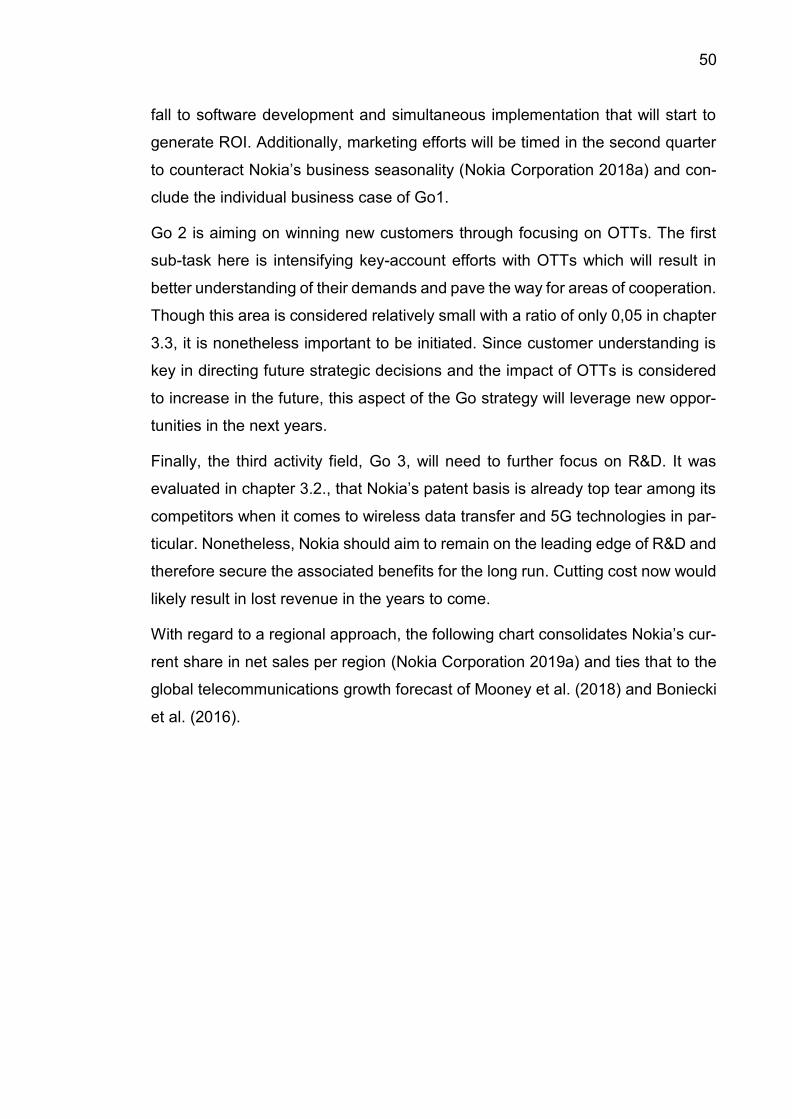
With regard to a regional approach, the following chart consolidates Nokia’s cur-
rent share in net sales per region (Nokia Corporation 2019a) and ties that to the
global telecommunications growth forecast of Mooney et al. (2018) and Boniecki
et al. (2016).
51
FIGURE 19. Regional growth forecast for telecommunications market (assum-ing Nokia’s distribution of net sales stays as it is)
Focusing on the forecast, Nokia should intensify targeting Latin America, the Mid-
dle-East and Africa over the other regions, since these yield bigger growth in the
long run.
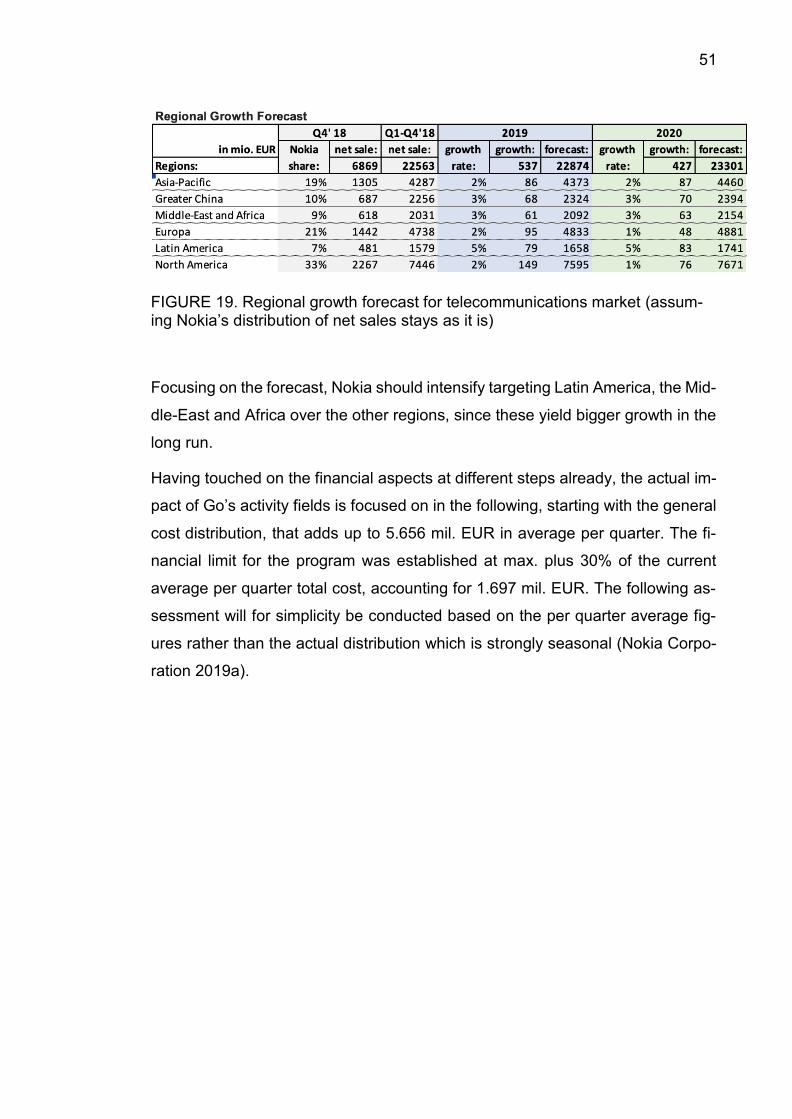
Having touched on the financial aspects at different steps already, the actual im-
pact of Go’s activity fields is focused on in the following, starting with the general
cost distribution, that adds up to 5.656 mil. EUR in average per quarter. The fi-
nancial limit for the program was established at max. plus 30% of the current
average per quarter total cost, accounting for 1.697 mil. EUR. The following as-
sessment will for simplicity be conducted based on the per quarter average fig-
ures rather than the actual distribution which is strongly seasonal (Nokia Corpo-
ration 2019a).
52
FIGURE 20. Nokia’s sales & costs
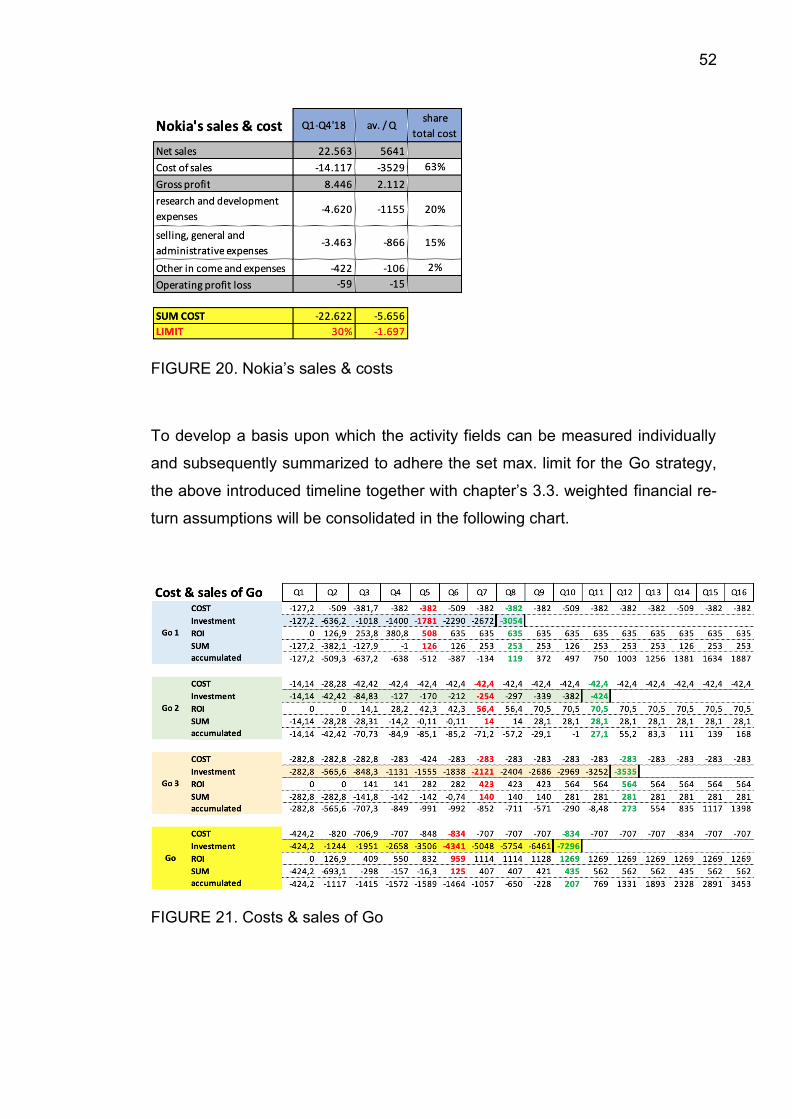
To develop a basis upon which the activity fields can be measured individually
and subsequently summarized to adhere the set max. limit for the Go strategy,
the above introduced timeline together with chapter’s 3.3. weighted financial re-
turn assumptions will be consolidated in the following chart.
FIGURE 21. Costs & sales of Go
53
The whole program’s investment cost stretches over 10 quarters and accounts
for 7.296 mil. EUR, with max. 1.589 mil. EUR per quarter cost, accounting for
plus 28,1% of total per quarter cost and therefore well within the 30% set limit.
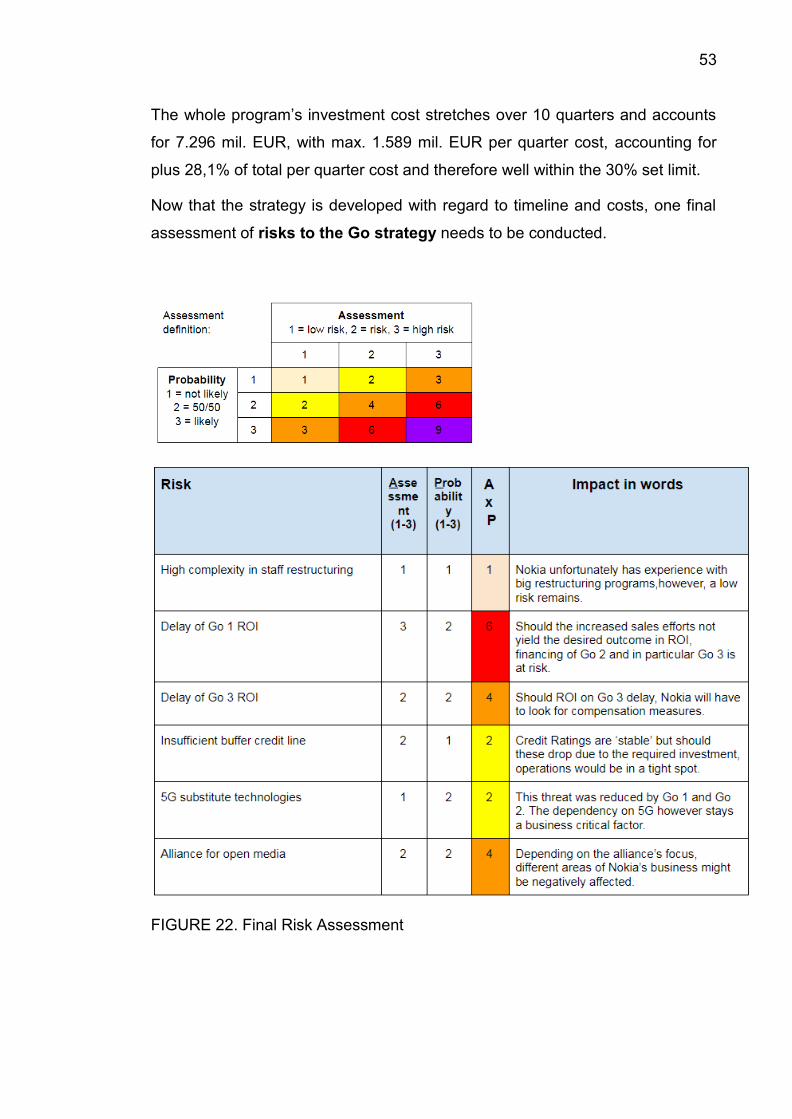
Now that the strategy is developed with regard to timeline and costs, one final
assessment of risks to the Go strategy needs to be conducted.
FIGURE 22. Final Risk Assessment
54
Considering the emphasised risks and threats in chapters 2.3 and 3.3, the current
overview looks less negative due to the synergies of the hybrid Go strategy, that
manages to reduce risks and environmental threats by strategic reorientation and
leverage of internal resources.
Concluding, the developed Go Strategy answers to opportunities in the market,
reduces the impact of threads to Nokia and leverages internal strengths and re-
sources. Since the assessment of the strategy is positive, the remaining risks
reasonable and the risk-return trade-off favourable, the Go strategy is considered
viable.
55
6 NOKIA’S KEY STRATEGIC FACTORS
6.1. Testing Go strategy for strategic fit with Nokia values
When assessing the strategic fit of the recommended strategy, Nokia’s corporate
culture should definitely be taken into account: The organisational culture is a set
of values and assumptions that all employees share and that shape the way em-
ployees work in their daily routines. Should the recommended strategy not com-
ply with the organisational values, there is the substantial risk that costly
measures have to be taken to possibly change the culture and thus to make the
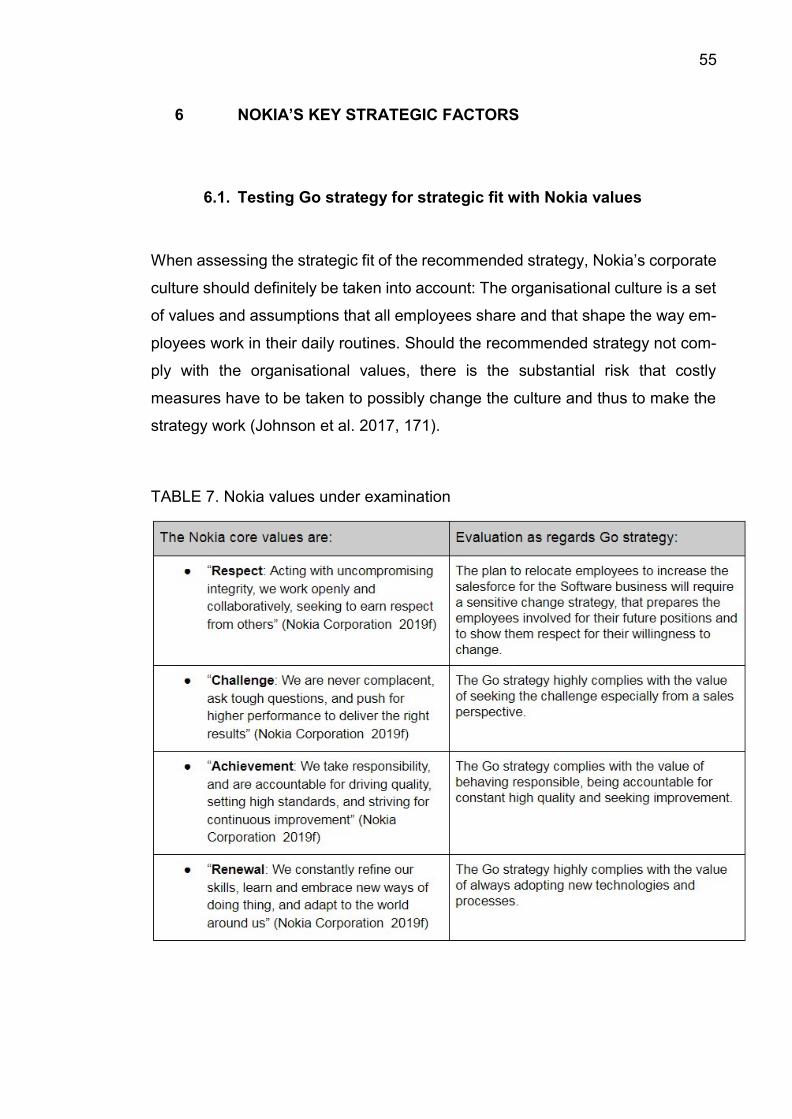
strategy work (Johnson et al. 2017, 171).
TABLE 7. Nokia values under examination
56
This brief evaluation reveals a need for action for the value of “Respect” that
should definitely be taken into account during the strategy implementation. If this
is observed, there should be no major obstacle to be expected, based on the
above evaluation.
6.2. Nokia’s revised vision and mission statement
In the following the strategic fit of the Go strategy with the current Nokia vision
and mission shall be verified. To do so, the current Nokia‘s strategic architecture
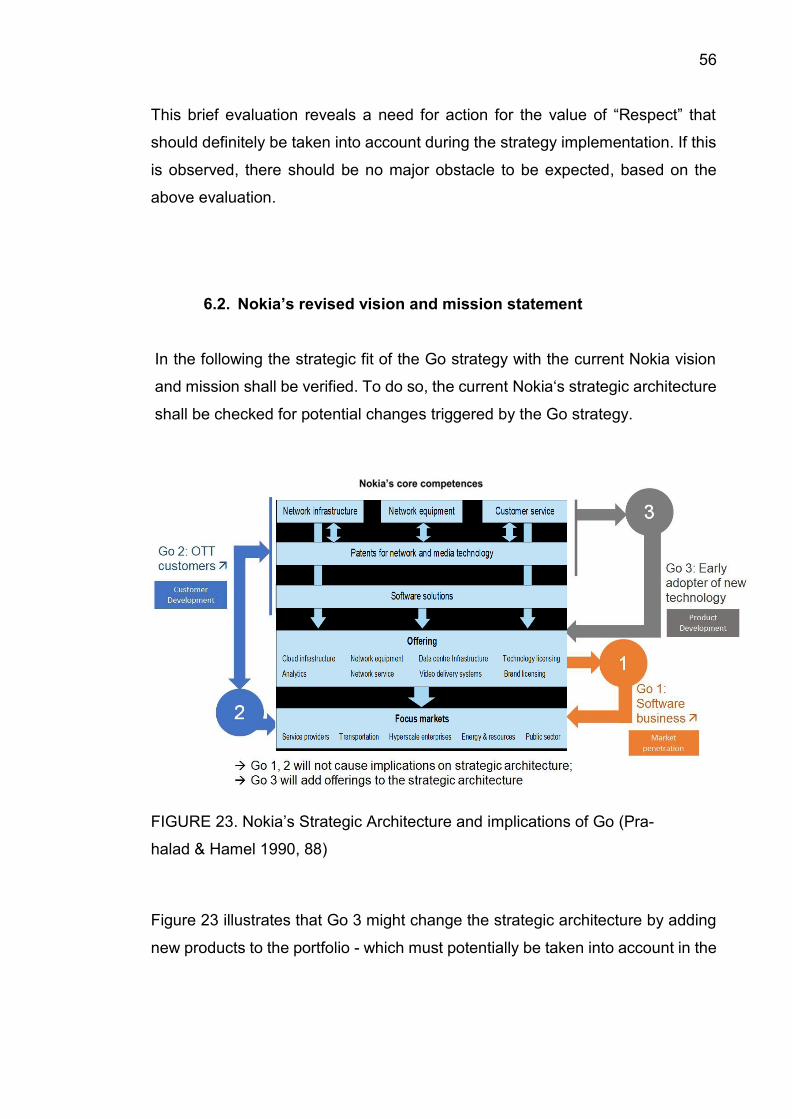
shall be checked for potential changes triggered by the Go strategy.
FIGURE 23. Nokia’s Strategic Architecture and implications of Go (Pra-
halad & Hamel 1990, 88)
Figure 23 illustrates that Go 3 might change the strategic architecture by adding
new products to the portfolio - which must potentially be taken into account in the
57
mission and vision statements. Go 1 and 2 completely integrate in Nokia’s current
strategic Architecture.
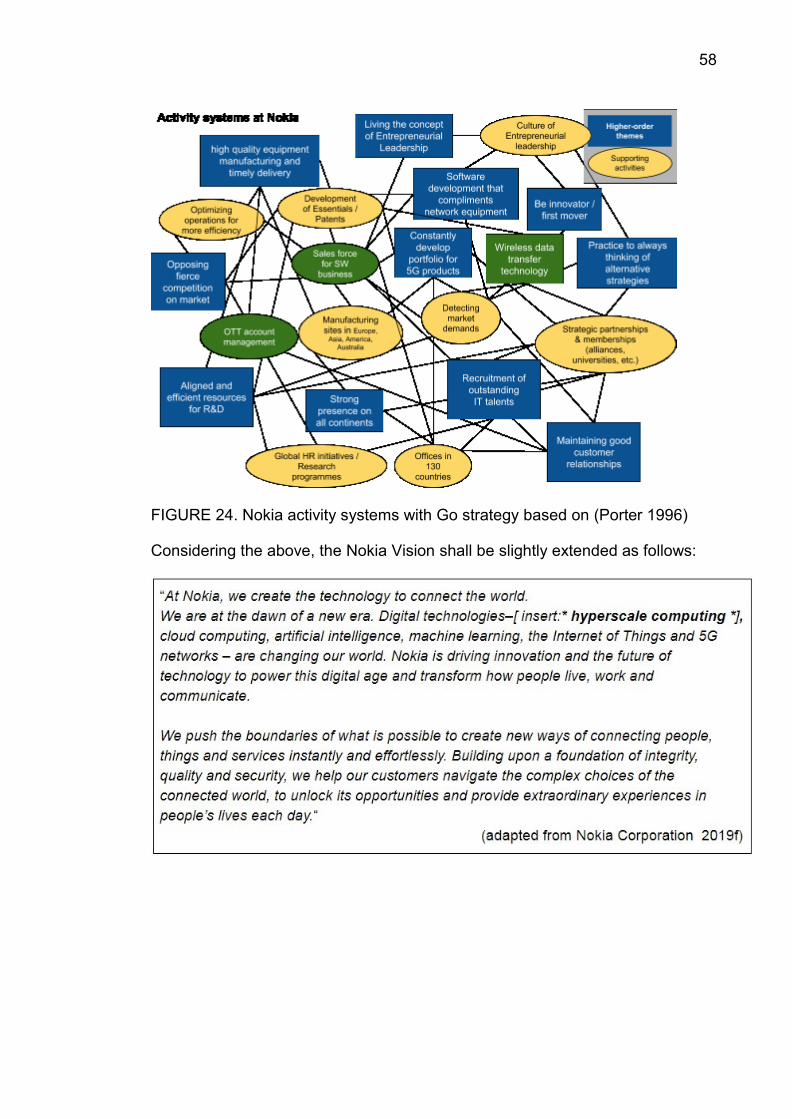
Furthermore, we can use the Nokia activity systems to learn, where the Go strat-
egy causes changes to the current strategy, which must potentially be considered
in the mission and vision statements.
Go 3 adds an additional higher-order theme to the current Nokia activity systems.
(see Figure 24 – Go elements highlighted in green). To situate Go 2 and Go 3 on
the below map, two supporting activities have been added. It becomes evident
that the new elements integrate almost seamlessly into the activity systems,
which might potentially require only slight amendments to the mission and vision
of Nokia.
After thoughtful evaluation of Nokia’s current mission and vision, it is also valid
for the Go strategy, as both statements leave enough room to incorporate the
strategic focus of Go1, Go2 and Go3. However, to clearly stress the strategic
importance of the OTT customer segment in the future Go strategy, two slight
amendments to the mission and vision are recommended.
Considering the above, the current Nokia Mission statement shall be slightly
amended as follows:
58
FIGURE 24. Nokia activity systems with Go strategy based on (Porter 1996)
Considering the above, the Nokia Vision shall be slightly extended as follows:
59
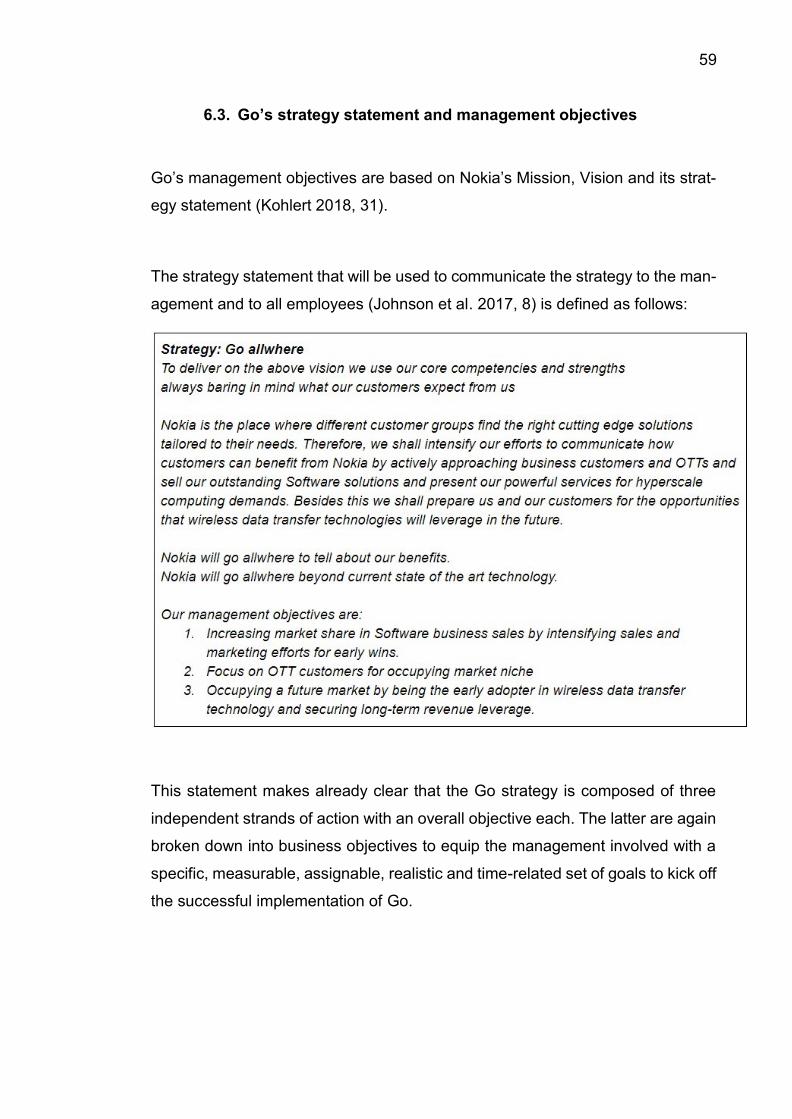
6.3. Go’s strategy statement and management objectives
Go’s management objectives are based on Nokia’s Mission, Vision and its strat-
egy statement (Kohlert 2018, 31).
The strategy statement that will be used to communicate the strategy to the man-
agement and to all employees (Johnson et al. 2017, 8) is defined as follows:
This statement makes already clear that the Go strategy is composed of three
independent strands of action with an overall objective each. The latter are again
broken down into business objectives to equip the management involved with a
specific, measurable, assignable, realistic and time-related set of goals to kick off
the successful implementation of Go.
60
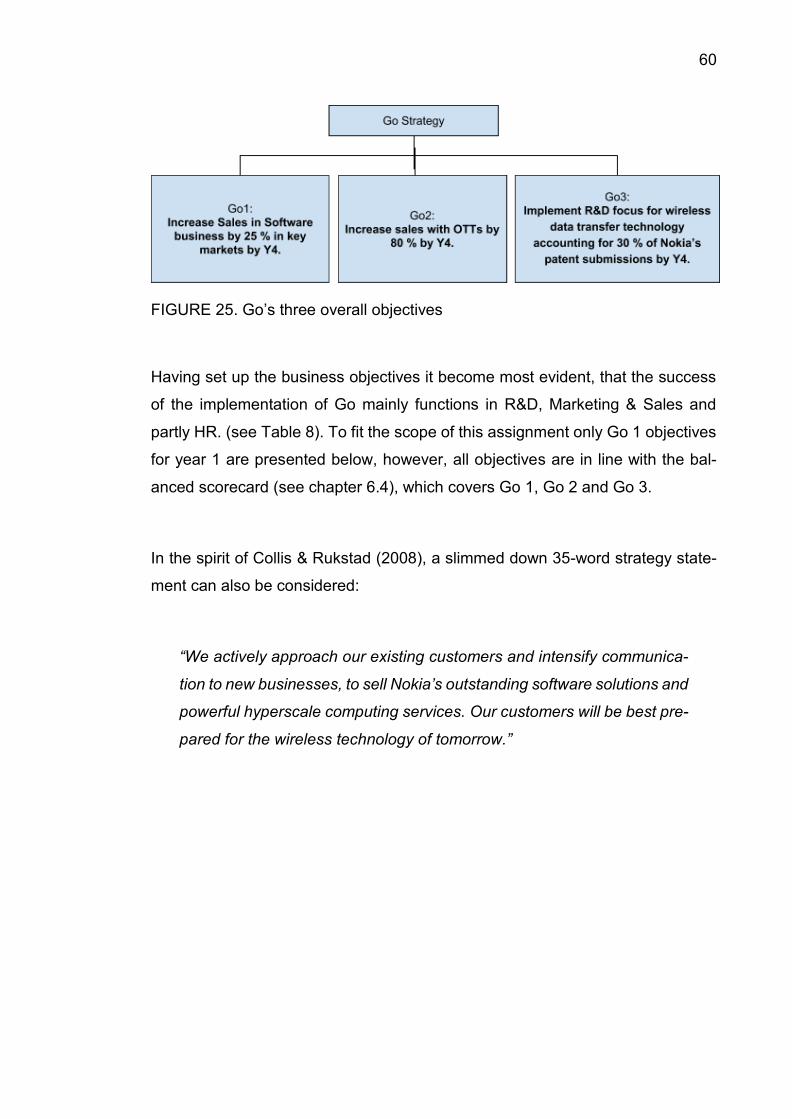
FIGURE 25. Go’s three overall objectives
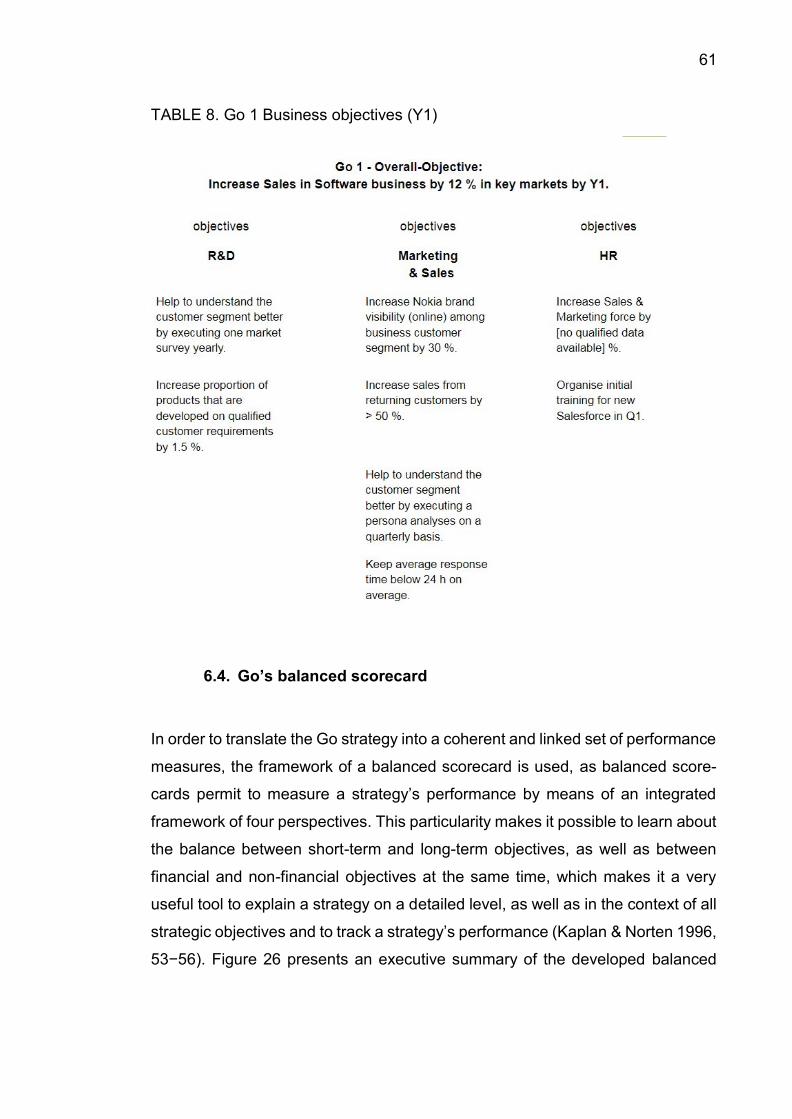
Having set up the business objectives it become most evident, that the success
of the implementation of Go mainly functions in R&D, Marketing & Sales and
partly HR. (see Table 8). To fit the scope of this assignment only Go 1 objectives
for year 1 are presented below, however, all objectives are in line with the bal-
anced scorecard (see chapter 6.4), which covers Go 1, Go 2 and Go 3.
In the spirit of Collis & Rukstad (2008), a slimmed down 35-word strategy state-
ment can also be considered:
“We actively approach our existing customers and intensify communica-
tion to new businesses, to sell Nokia’s outstanding software solutions and
powerful hyperscale computing services. Our customers will be best pre-
pared for the wireless technology of tomorrow.”
61
TABLE 8. Go 1 Business objectives (Y1)
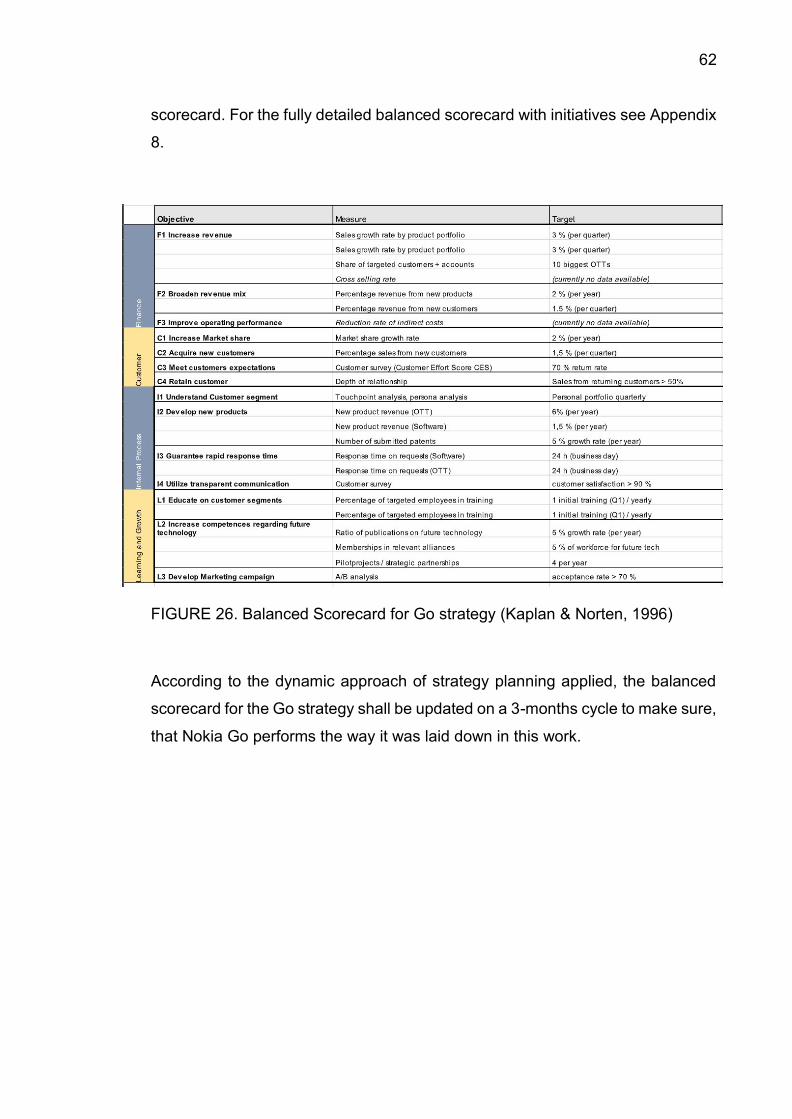
6.4. Go’s balanced scorecard
In order to translate the Go strategy into a coherent and linked set of performance
measures, the framework of a balanced scorecard is used, as balanced score-
cards permit to measure a strategy’s performance by means of an integrated
framework of four perspectives. This particularity makes it possible to learn about
the balance between short-term and long-term objectives, as well as between
financial and non-financial objectives at the same time, which makes it a very
useful tool to explain a strategy on a detailed level, as well as in the context of all
strategic objectives and to track a strategy’s performance (Kaplan & Norten 1996,
53−56). Figure 26 presents an executive summary of the developed balanced
62
47
scorecard. For the fully detailed balanced scorecard with initiatives see Appendix
8.
FIGURE 26. Balanced Scorecard for Go strategy (Kaplan & Norten, 1996)
According to the dynamic approach of strategy planning applied, the balanced
scorecard for the Go strategy shall be updated on a 3-months cycle to make sure,
that Nokia Go performs the way it was laid down in this work.
63
7 GO STRATEGY IMPLEMENTATION PLANNING
7.1. Schedule for implementing the Go strategy
Nokia is operating in a most dynamic and highly competitive environment (see
chapters 2.3, 3.1, and 3.2), so the time advantage shall be exploited whenever
possible to make use of current opportunities and to fight threats (see chapter
3.3). The only impediment to take quick action is that a stand-alone Business Unit
„Software“ is not yet fully in place, which means capacity-wise, a responsible
manager to help to implement the Go strategy is missing at this moment in time,
however, Nokia is already about to establish an adequate structure for Nokia
Software by the end of 2019 at the latest (Nokia Corporation 2019a, 3). Adding
an OTT customer focus would further require some restructuring and training.
Despite of this, there is no evident obstacle to start implementing the Go strategy.
In terms of capability to change, Nokia has proved in the past, that it can change,
plus Nokia is still guided by „crisis-proven“ and competent leaders such as Rajeev
Suri (CEO) and Risto Siilasmaa (chairman of the Nokia board).
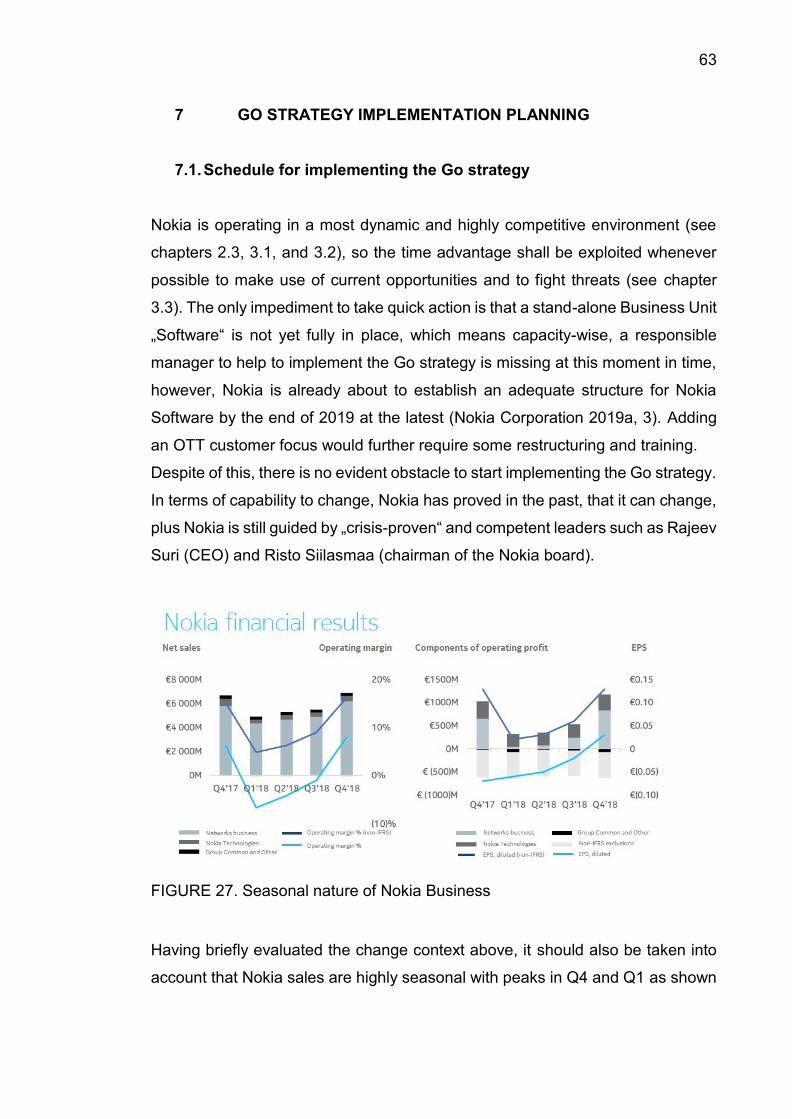
FIGURE 27. Seasonal nature of Nokia Business
Having briefly evaluated the change context above, it should also be taken into
account that Nokia sales are highly seasonal with peaks in Q4 and Q1 as shown
64
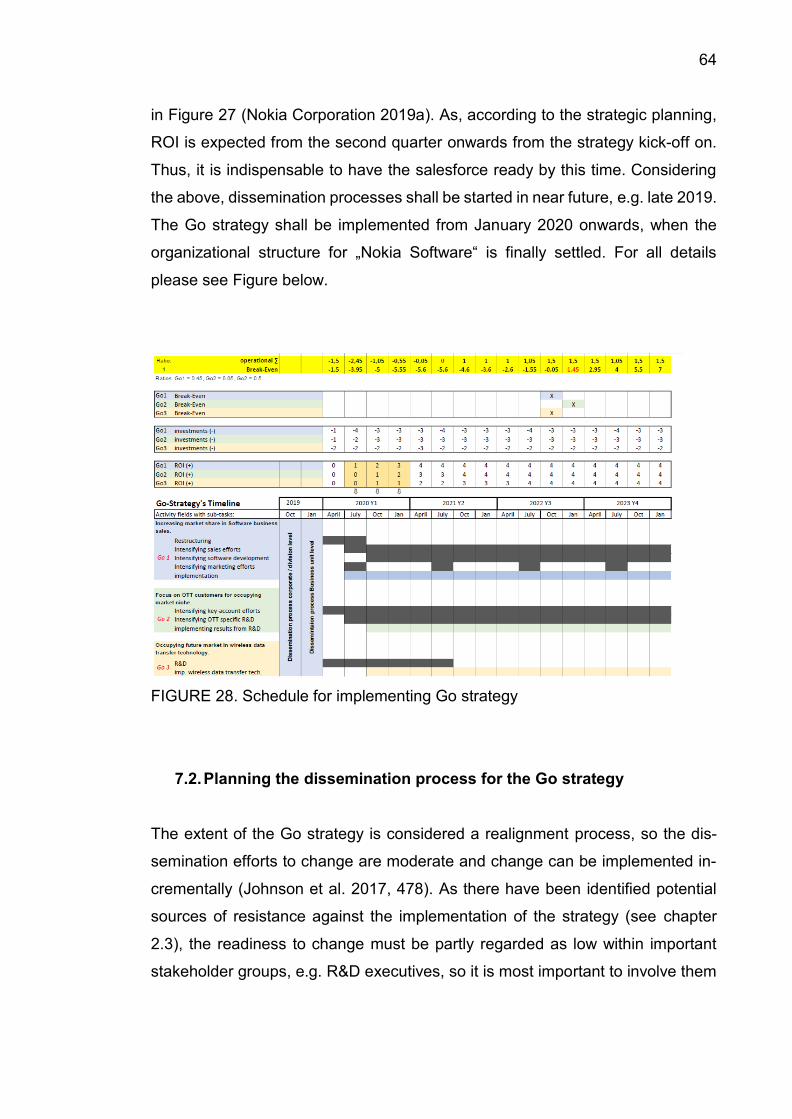
in Figure 27 (Nokia Corporation 2019a). As, according to the strategic planning,
ROI is expected from the second quarter onwards from the strategy kick-off on.
Thus, it is indispensable to have the salesforce ready by this time. Considering
the above, dissemination processes shall be started in near future, e.g. late 2019.
The Go strategy shall be implemented from January 2020 onwards, when the
organizational structure for „Nokia Software“ is finally settled. For all details
please see Figure below.
FIGURE 28. Schedule for implementing Go strategy
7.2. Planning the dissemination process for the Go strategy
The extent of the Go strategy is considered a realignment process, so the dis-
semination efforts to change are moderate and change can be implemented in-
crementally (Johnson et al. 2017, 478). As there have been identified potential
sources of resistance against the implementation of the strategy (see chapter
2.3), the readiness to change must be partly regarded as low within important
stakeholder groups, e.g. R&D executives, so it is most important to involve them
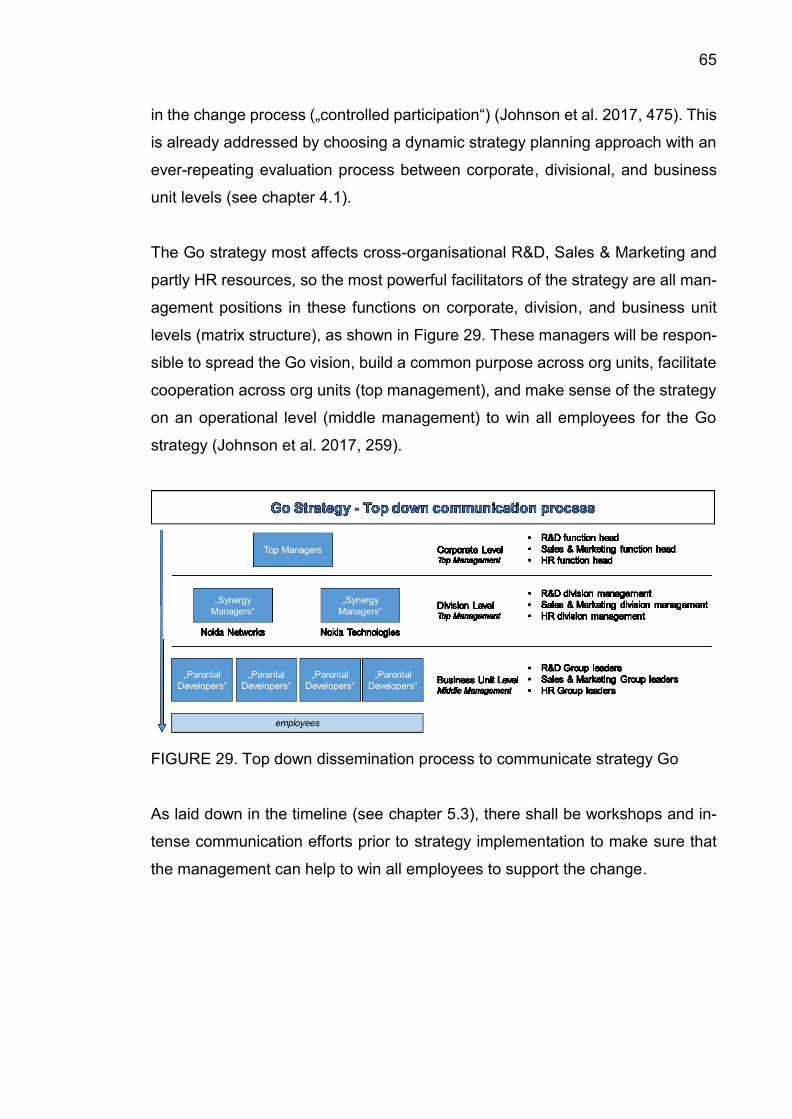
65
in the change process („controlled participation“) (Johnson et al. 2017, 475). This
is already addressed by choosing a dynamic strategy planning approach with an
ever-repeating evaluation process between corporate, divisional, and business
unit levels (see chapter 4.1).
The Go strategy most affects cross-organisational R&D, Sales & Marketing and
partly HR resources, so the most powerful facilitators of the strategy are all man-
agement positions in these functions on corporate, division, and business unit
levels (matrix structure), as shown in Figure 29. These managers will be respon-
sible to spread the Go vision, build a common purpose across org units, facilitate
cooperation across org units (top management), and make sense of the strategy
on an operational level (middle management) to win all employees for the Go
strategy (Johnson et al. 2017, 259).
FIGURE 29. Top down dissemination process to communicate strategy Go
As laid down in the timeline (see chapter 5.3), there shall be workshops and in-
tense communication efforts prior to strategy implementation to make sure that
the management can help to win all employees to support the change.
66
7.3. Monitoring and evaluation systems
After thoughtful consideration, allocation of direct inputs (all resources consumed,
e.g. financial, human commitment) shall be planned and monitored by the Stra-
tegic control system, whereas direct outputs (all satisfactory results, e.g. meeting
of targets) shall be monitored by Balanced Scorecards / Strategy maps (Johnson
et al. 2017, 454, 456). It is a matter of fact that the Go strategy will challenge
Nokia’s structure, as intense collaboration across business units, functions of
business units and even divisions will be required to make this strategy work.
Therefore, the monitoring and evaluation systems used shall help immediately to
foster cross-organisational exchange by nature, e.g. by consensual development
of the strategic plan (as it is the case with the Strategic control style) and improve
the understanding for cause-effect relationships of inputs and outputs throughout
org unit barriers (as is the case with Balanced Scorecards / Strategy maps) (John-
son et al. 2017, 454, 456).
The culture of entrepreneurial leadership at Nokia will definitely encourage the
management to master the monitoring systems recommended above.
67
8 CONCLUSION & DISCUSSION
This thesis focused on business research strategy development at the example
of Nokia, a once proud mobile communications giant, now fighting its way back
to the top of the telecommunication industry. The conducted activities were clas-
sified as constructive research and the respective methodology was followed to
obtain the best possible outcome given the scope and available time and re-
sources for this work. The resulting construct, Nokia’s future success strategy
nicknamed Nokia Go, was synthesised from a range of possible business strate-
gies. These strategies themselves were based on an in-depth analysis of Nokia’s
business environment and its current position and strengths. Nokia Go’s strategic
fit was evaluated, and updated vision and mission statements were established.
Finally, some guidelines and schedules for implementing and monitoring Nokia
Go have been provided.
8.1. Delivery against objectives
The objective of this thesis was to:
"develop a new business strategy for Nokia, guaranteeing future success
and aligned with company core values, by gaining a deep understanding
of Nokia’s current environment, position, and strategy and evaluating
available strategic options." (see chapter 1.4)
With respect to this aim, all objectives have been fulfilled. Certainly, future suc-
cess is hard to guarantee, but the developed strategy is built on a solid analysis
of the current telecommunications (see chapter 2) market and Nokia’s own posi-
tion within (see chapter 3) and following well established practices for strategy
development (see chapters 1.3, 4 and 5).
68
Alignment with Nokia’s core company values has been a guiding principle
throughout the strategy development and was explicitly tested in chapter 6. The
required deep understanding was gained through in-depth analyses of Nokia’s
current environment (see chapter 2), position, and strategy (see chapter 3).
Another objective was to settle the new strategy in the strategic sweet spot” (Col-
lis & Rukstadt 2008), not occupied by any competitors (see Figure 3). This re-
quirement was an essential part of the strategy development in chapter 4.
Besides, the author’s personal motivation for this work was to strengthen his
knowledge of Nokia and its business environment, as well as develop new core
competencies in strategy development.
Concluding, all set goals, personal and scientific, have been achieved within the
defined scope.
8.2. Outlook
With regards of things left undone, the proposed new customer focus on OTT
would definitely require careful analysis of market size and expected sales. Es-
pecially if it is expected that this new customer focus may negatively affect other
business units, e.g. sales in the network sector. It would be self-defeating if Nokia
sacrifices market share in a big market, e.g. 5G cellular, in order to become leader
in a much smaller market such as OTT. Within the scope of this thesis it was
assumed that the new OTT focus has no negative impact.
Furthermore, the work presented in this thesis mainly concentrated on new topics
to add to Nokia’s business strategy. Another highly interesting topic would be
what parts of the current business strategy are less profitable and could be
ramped down in favour of other more promising ventures.
69
For the future it remains to see how successful the new Nokia software business
unit will fare. Another big question is the success of 5G technology and its mon-
etisation. Current developments look good for Nokia (Reuters 2019), but it re-
mains to see if the company can keep its profitability high enough in the tough
telecommunications market.
With respect to the strategy developed in this thesis, Nokia is already following
some parts, such as establishing a new Nokia Software business unit, but it is
doubtful that the presented Nokia Go strategy will be adopted. After all, Nokia
much bigger than a simple Master thesis. Nonetheless, the knowledge and skills
gained by the author will hopefully help him form his own Nokia future success
story, just in a smaller scale.
70
REFERENCES
Aalto University Press Releases. 2018. Aalto University and Nokia expand their cooperation. Read on 14.06.2019. https://www.aalto.fi/news/aalto-university-and-nokia-expand-their-cooperation-0 Abhishek, G. 2013. International Business Environment: Challenges and Changes Research. Journal of Management Sciences 2 (11), 34 – 38. Ansoff, I. 1965. Corporate Strategy. New York: McGraw Hill. Ali-Yrkkö, J., Rouvinen, P., Seppälä, T., and Ylä-Anttila, P. 2011. Who Captures Value in Global Supply Chains? Journal of Industry, Competition and Trade 11(3), 263 – 278 Alliance for open media. 2019. The Big Picture. Read on 12.06.2019. https://ao-media.org/about/ Arrow Electronics Incorporated. 2019. Manufacturers. Read on 16.06.2019. https://www.arrow.com/en/manufacturers BBC. 2019. BBC News - Huawei: Tackling security concerns may take five years. Read on 21.06.2019. https://www.bbc.com/news/business47145685 Bea, F. and Haas J. Strategisches Management. 6th edition Konstanz: UVK Veragsgesellschaft mbH. Blatchford. 2019. Global News. Read on 25.06.2019. http://global-news.ca/news/4884541/ottawa-nokia-deal-5g-technology/ Boniecki, D., Marcati, C., Abou-Zahr, W., Alatovic, T., El Hamamsy, T. 2016. Mid-dle East and Africa, Telecommunications industry at cliff’s edge. Time for bold decisions. Read on 24.06.2019. https://www.mckinsey.com/~/media/mckin-sey/industries/telecommunications/our%20insights/win-ning%20the%20rush%20for%20data%20services%20in%20the%20mid-dle%20east%20and%20africa/telecommunications%20indus-try%20at%20cliffs%20edge%20time%20for%20bold%20deci-sions_june2016.ashx Bowler, T. 2018. The low-cost mini satellites bringing mobile to the world. Read on 16.06.2019. https://www.bbc.com/news/business-43090226 Bund.de. 2019. The State of IT Security in Germany 2017. Read on 17.06.2019. https://www.bsi.bund.de/SharedDocs/Downloads/EN/BSI/Publications/Secu-ritysituation/IT-Security-Situation-in-Germany-2017.pdf?blob=publicationFile
71
Brand Finance. 2018. Finland 10 2018 - The most valuable Finnish brands of 2018. Read on 20.06.2019. https://brandirectory.com/league_tables/table/fin-land-10-2018 Choubey N. and Yazdan A. 2016. Introducing Facebook’s new terrestrial connec-tivity systems — Terragraph and Project ARIES. Read on 14.06.2019. https://code.fb.com/connectivity/introducing-facebook-s-new-terrestrial-connec-tivity-systems-terragraph-and-projectaries/ CIPS - Chartered Institute of Procurement and Supply. 2014. Internal, connected and external Stakeholders. Read on 10.06.2019. https://www.cips.org/Docu-ments/Knowledge/Procurement-Topics-and-Skills/2-Procurement-Organisa-tion/Stakeholders/Stakeholders.pdf Cisco. 2018. Cisco Visual Networking Index: Forecast and Trends, 2017–2022 . Read on 12.06.2019. https://www.cisco.com/c/en/us/solutions/collateral/service-provider/visual-networking-index-vni/white-paper-c11-741490.html Collis D. and Rukstad M. G. 2008. Can You Say What Your Strategy Is? Har-vard Business Review, April 2008. Czarnecki C. and Dietze C. 2017. Reference Architecture for the Telecommuni-cations Industry, Springer. Edler, J., Meyer-Krahmer, F. and Reger, G. 2002. Changes in the strategic man-agement of technology: results of a global benchmarking study. R&D Manage-ment, 32 (2), 149. El-Darwiche, B., Rupp, C., Peladeau, P., and Groene, F. 2017. 2017 Telecom-munications Trends. Read on 17.06.2019. https://www.strategyand.pwc.com/me-dia/file/2017-Telecommunications-Trends.pdf European Commission. 2018. Cybersecurity. Read on 12.06.2019. https://ec.eu-ropa.eu/digital-single-market/en/cyber-security Europa.eu. 2019. Digital Single Market - European Commission. Read on 17.06.2019. https://ec.europa.eu/digital-single-market/en Freeman, R. E. 1984. Strategic Management: A Stakeholder Approach. Boston: Pitman. Gartner Press Release. 2017. Gartner Announces Rankings of the 2017 Supply Chain Top 25. Read on 20.06.2019. https://www.gartner.com/en/news-room/press-releases/2017-05-25-gartner-announces-rankings-of-the-2017-sup-ply-chain-top-https://www.gartner.com/en/newsroom/press-releases/2017-05-25-gartner-announces-rankings-of-the-2017-supply-chain-top-25
72
George S. 1989. Global Strategy in a World of Nations. Sloan Management Re-view 31 (1), 29 – 40. Google. 2019. High Speed Internet Service & TV. Read on 14.06.2019. https://fi-ber.google.com/about/ Haberberg, A. and Rieple, A. 2008. Strategic management: Theory and Applica-tion. Oxford: Oxford University Press. Investor’s Business Daily. 2015. Fiber Optic Firms Challenged. Investor’s Busi-ness Daily, 28. Read on 12.06.2019. http://search.ebscohost.com/login.aspx?di-rect=true&db=bsh&AN=109978737&site=ehost-live Aspara, J., Lamberg, J.A., Laukia, A., Tikkanen; H. 2011. Strategic management of business model transformation: Lessons from Nokia. Management Decision 49 (4), 622 − 647. Jamil, R., Shah, S., Hussain, T., Shah, A., and Kazmi, A. 2015. Critical Explora-tion of Prescriptive and Emergent approaches to Strategic management: A review paper. Business and Management, 7, 91 − 100. Johnson, G., Whittington, R., Scholes, K., Angwin, D., and Regnér, P. 2017. Ex-ploring strategy: Text and Cases. 11th edition. Harlow: Pearson Education Lim-ited. Kasanen, E., Lukka, K. and Siitonen, A. 1993. The constructive approach in man-agement accounting research. Journal of Management Accounting Research 5, 241 − 264. Kastner, J. 2019. Nikkei Asian Review. Read on 21.06.2019. https://asia.nik-kei.com/Politics/International-relations/Germany-caught-in-dilemma-over-Huawei-5G-rollout Kharas H. and Gertz G. 2010. The New Global Middle Class: A Cross-Over from West to East. Read on 10.06.2019. https://www.brookings.edu/wp-content/up-loads/2016/06/03_china_middle_class_kharas.pdf Kharpal. 2018. Read on 25.06.2019. https://www.cnbc.com/2018/08/23/huawei-and-zte-banned-from-selling-5g-equipment-to-australia.html Kohlert, H. 2018. Strategische Ausrichtung als Wettbewerbsvorteil. Kohlhammer. University of Jyväskylä. 2018. Mapping Research Methods. Read on 12.08.2019. https://koppa.jyu.fi/avoimet/hum/menetelmapolkuja/en Krasuski, M. 2019. Read on 25.06.2019. https://www.bloomberg.com/news/arti-cles/2019-02-13/huawei-says-security-concerns-aren-t-slowing-sales-for-now [
73
Lafley A.G., Martin R. L., Rivkin J. W. 2012. Bringing science to the art of strat-egy. Harvard Business Review 90(9), 56 − 66 Lafley A.G., Martin R. L. 2013. Playing to Win: How Strategy Really Works. Har-vard Business Review Press. Lobbyfacts. 2019. LobbyFacts-Nokia. Read on 12.06.2019. https://lobby-facts.eu/representative/03fddfe885f74d5f89abbbfd77c97b3a/nokia Lutz, W., Butz, W. and Samir. 2014. World population and human capital in the twenty-first century. Oxford: Oxford University Press. Marczyk, G., DeMatteo, D. and Festinger, F. 2005. Essentials of Research De-sign and Methodology. John Wiley & Sons. McCaskill, S. 2018. Inside the 5G factory: How Nokia's research aids its own pro-duction. Read on 10.06.2019. https://www.techradar.com/news/inside-the-5g- factory-how-nokias-research-aids-its-own-production Martin, K. 2018. Nokia to cut jobs in focus on 5G. Read on 14.06.2019. https://www.foxbusiness.com/markets/nokia-to-cut-jobs-in-focus-on-5g Mendelow, A. 1991. Stakeholder mapping. Proceedings of the 2nd International Conference on Information Systems, Cambridge. Mintzberg, H., Waters J. 1985. Of Strategies, Deliberate and Emergent. Strategic Management Journal 6 (3), 257−272. Mintzberg, H. 1971. Patterns in strategy formation. Management Science 24 (9). Modis. 2018. A Look Ahead at Tech Jobs. Read on 10.06.2019. https://www.modis.com/en-us/resources/employers/top-jobs-2019/ Mooney, C., Hari, M., Arden, A., Habib, M., Park, J. and Martinez, L. 2018. Indus-try Top Trends 2019 - Telecommunications. Read on 17.06.2019. http://www.maalot.co.il/Publications/SCT20181118141642.pdf Moore, K. 2011. Porter or Mintzberg: Whose View of Strategy Is the Most Rele-vant Today? Read on 17.06.2019. https://www.forbes.com/sites/karlmoore/2011 /03/28/porter-or-mintzberg-whose-view-of-strategy-is-the-most-relevant-today/ National Institute of Standards and Technology (NIST). 2018. Privacy Engineer-ing & Cybersecurity for IoT Programs. Read on 23.06.2019. https://www.nist.gov/ sites/default/files/documents/2018/03/29/iot_roundtable_3.29.pdf Nokia. 2013. Nokia Networks. Read on 17.06.2019. https://networks.nokia.com/ solutions/motive-serviceview-for-home/infographic
74
Nokia Corporation. 2018a, Nokia Annual Report 2017. Read on 30.05.2019. https://www.nokia.com/about-us/investors/ Nokia Corporation. 2018b. Nokia People & Planet Report 2017. Read on 04.06.2019.https://www.nokia.com/sites/default/files/nokia_peple_and_planet_ report_2017.pdf Nokia Corporation. 2019a. Report for Q4 and Full Year 2018. Read on 30.05.2019. https://www.nokia.com/about-us/investors/ Nokia Corporation. 2019b. Biggest Shareholders registered in Finland on Decem-ber 31, 2018. Read on 30.05.2019. https://www.nokia.com/about-us/inves-tors/stock-information/biggest-shareholders/ Nokia Corporation. 2019c. Debt information. Read on 30.05.2019. https://www.nokia.com/about-us/investors/debt-information/ Nokia Corporation. 2019d. Governance Guidelines. Read on 30.05.2019. https://www.nokia.com/sites/default/files/cg_guidelines_2019_.pdf Nokia Corporation. 2019e. Industries. Read on 30.05.2019. https://net-works.nokia.com/industries/ Nokia Corporation. 2019f. Vision & Values. Read on 30.05.2019. https://www.nokia.com/about-us/who-we-are/our-vision/ Nokia Corporation. 2019g. Who we are. Read on 30.05.2019. https://www.nokia.com/about-us/who-we-are/ Nokiamob. 2017. Nokia’s 2016 annual report shows interesting things about the company. Read on 08.06.2019. https://nokiamob.net/2017/03/24/nokias-2016-annual-report-shows-interesting-things-about-the-company/ Ojasalo K., Moilanen T., and Ritalahti J. 2014. Methods for Development Work - New kind of competence for business. SanomaPro. Orange Press Releases. 2017. Orange and Nokia Networks team up on Telco Cloud. Read on 16.05.2019. https://www.orange.com/en/Press-Room/press-re-leases/press-releases-2015/Orange-and-Nokia-Networks-team-up-on-Telco-Cloud Pearce, F. 2018. Energy Hogs: Can World’s Huge Data Centers Be Made More Efficient? Read on 12.06.2019. https://e360.yale.edu/features/energy-hogs-can- huge-data-centers-be-made-more-efficient
75
Reyes, P., Raisinghani, M.S., Singh, M. 2002. Global supply chain management in the telecommunications industry: The role of Information Technology in Inte-gration of Supply Chain Entities. Journal of Global Information Technology Man-agement 5(2), 48. Preker, A. 2019. Merkel nennt Bedingung für Huawei-Beteiligung am 5G-Ausbau. Read on 10.06.2019. http://www.spiegel.de/netzwelt/netzpolitik/huawei-be-teiligung-am-5g-ausbau-angela-merkel-nennt-in-japan-bedingung-a- 1251592.html Pavlovic, C. 2018. Mobile data growth and 5G - Are we getting the numbers right? Read on 10.06.2019. https://www.nokia.com/blog/mobile-data-growth-and-5g-are-we-getting-numbers-right/ Pearson Education. 2006. Marketing Metrics: Understanding Market Share and Related Metrics. Read on 17.06.2019. http://www.informit.com/articles/arti-cle.aspx?p=463943&seqNum=3 Porter, M. E. 1980. Competitive Strategy. New York: Free Press. Porter, M. E. 1984. Competitive Advantage. New York: Free Press. Porter, M. E. 1996. What is strategy? Harvard Business Review 74 (6), 61 – 78. Porter, M. E. 2008. The Five Competitive Forces That Shape Strategy. Harvard Business Review 86 (1), 78 – 93. Prahalad, C. K. and Hamel, G. 1990. The Core Competence of the Corporation. Harvard Business Review 68 (3), 79 – 91. Professional Academy. 2018. Stakeholder Mapping. Read on 12.06.2019. https://www.professionalacademy.com/blogs-and-advice/stakeholder-mapping-marketing-theories Randy, B. 2016. Why Cultural Change Is Necessary For Big Data Adoption. Read on 11.06.2019. https://www.forbes.com/sites/ciocentral/2016/11/08/another-side-of-big-data-big-data-for-social-good-2/#2bcba23c6628 Reeves M., Haanaes K., and Sinha J. 2015. Your Strategy needs a Strategy: How to Choose and Execute the Right Approach. Harvard: Harvard Business Review Press. Relecura. 2018. Nokia Patent Portfolio Report. Read on 16.06.2019. https://relecura.com/wp-content/uploads/2018/03/Nokia_Portfolio_Re-port_Mar2018.pdf Reputation Institute Press Release. 2018. Top 100 Reputable Companies Around the Globe According to Reputation Institute’s Global RepTrak® 100.
76
Read on 20.06.2019. https://globenewswire.com/news-release/2018/03/16/ 1441572/0/en/Top-100-Reputable-Companies-Around-the-Globe-According-to-Reputation-Institute-s-Global-RepTrak-100.html Reuters. 2019. Nokia says it has moved ahead of Huawei in 5G orders. Read on 17.08.2019. https://www.reuters.com/article/us-nokia-5g/nokia-says-it-has-moved-ahead-of-huawei-in-5g-orders-idUSKCN1T428W Rolander, N. and Kim, S. 2018. Samsung's 5G Network Grab Gets Boost With Huawei, ZTE Under Fire. Read on 10.06.2019. https://www.bloom-berg.com/news/articles/2018-12-19/samsung-s-5g-network-grab-gets-boost-with-huawei-zte-under-fire Siilasmaa, R. 2018. Transforming NOKIA: The Power of Paranoid Optimism to Lead Through Colossal Change. McGraw-Hill. Sims, A. 2013. Enterprise Strategy: Clear Definitions Exist for the Terms "Key Performance Indicators" and "Critical Success Factors", Yet Many Students Still Confuse the Former with Targets and Seem Unable to Provide Correct Examples of the Latter. Financial Management (UK), June 2013, 45 – 48. Staisch A., Peters, G., Stueckl, T., and Sergua, J. 2012. Current Trends in Prod-uct Lifecycle Management. Read on 12.06.2019. https://pdfs.seman-ticscholar.org/ec6e/a1216a54b62d0a07156b89c0456238d4f95c.pdf Statista inc. 2018. Networks service providers' market share worldwide from 2015 to 2018. Read on 14.06.2019. https://www.statista.com/statistics/540788/service- provider-network-market-share-by-vendor/ SyncForce. 2019. Nokia Brand. Read on 20.06.2019. https://www.rank-ingthebrands.com/Brand-detail.aspx?brandID=11 The European Patent Convention (EPC). 2007. Patentable inventions. Article 52. Read on 12.06.2019. https://www.epo.org/law-practice/legal-texts/html/epc/2016 /e/ar52.html Times Now News. 2019. Nokia to cut jobs, says slow 5G progress not cause for layoffs. Read on 14.06.2019. https://www.timesnownews.com/technology-sci-ence/article/nokia-to-cut-jobs-says-slow-5g-progress-not-cause-for-layoffs/ Tornatore, M., Chang, G. and Ellinas, G. 2017. Fiber-Wireless Convergence in Next-Generation Communication Networks. Heidelberg: Springer. The World Bank, The International Bank for Reconstruction and Development, InfoDev, and The International Telecommunication Union. 2011. Telecommuni-cations Regulation Handbook. Read on 12.06.2019. http://www.infodev.org/info-dev-files/resource/InfodevDocuments_1057.pdf

77
United Nations. 2018. World Urbanization Prospects - The 2018 Revision. Read on 11.06.2019. http://www.un.org/en/development/desa/population/theme/ur-banization/index.shtml Wethe, D. 2017. Drilling Is Back. What About the Workers? Bloomberg Busi-nessweek 4509, 14 – 15. WIPO - World Intellectual Property Organization. 2015. Intellectual Property Indi-cators. Read on 16.06.2019. https://www.wipo.int/edocs/pubdocs/en/ wipo_pub_941_2015.pdf
78
APPENDICES
Appendix 1. Stakeholders analysis
To understand which roles have influenced the direction of the current strategy
so far and which of these are in the position to influence any future strategic plans,
all stakeholders will be mapped in the following order: Internal stakeholders, con-
nected stakeholders and external stakeholders (Professional Academy 2018)
Internal stakeholders
The Nokia corporation is a public limited-liability company and is compelled to
comply with Finnish laws (such as the Finnish Corporate Governance Code) and
certain corporate governance standards to trade stocks, e.g. at Nasdaq Helsinki
(Nokia Corporation 2019d). Nokia’s governance thus disposes of a variety of gov-
ernance bodies that affect the way Nokia operates and strategically manages the
organization on several levels.
Risto Siilasmaa, chairman of the Nokia board, must be considered as Nokia’s
most influential strategic leader, who paved the way to Nokia’s present position.
He took office in 2012, when Nokia underwent its most severe crisis. Since then
he has changed the composition of the board bringing in more technological ex-
pertise, he diligently choses the management and most important, he has trans-
formed the corporate culture by introducing concepts of entrepreneurial leader-
ship on all levels and by promoting values such as transparency and equality
among management and employees as indispensable prerequisites for open and
data-driven discourse on strategic matters (Siilasmaa 2018, 123, 144). This new
corporate culture, that is accompanied by internal measures (Nokia Corporation
2018, 109), certainly makes Nokia a potentially productive and motivating work-
ing environment with a high level of interest on part of all employees. One must
not forget to consider the strong position of Nokia’s employees, in particular the
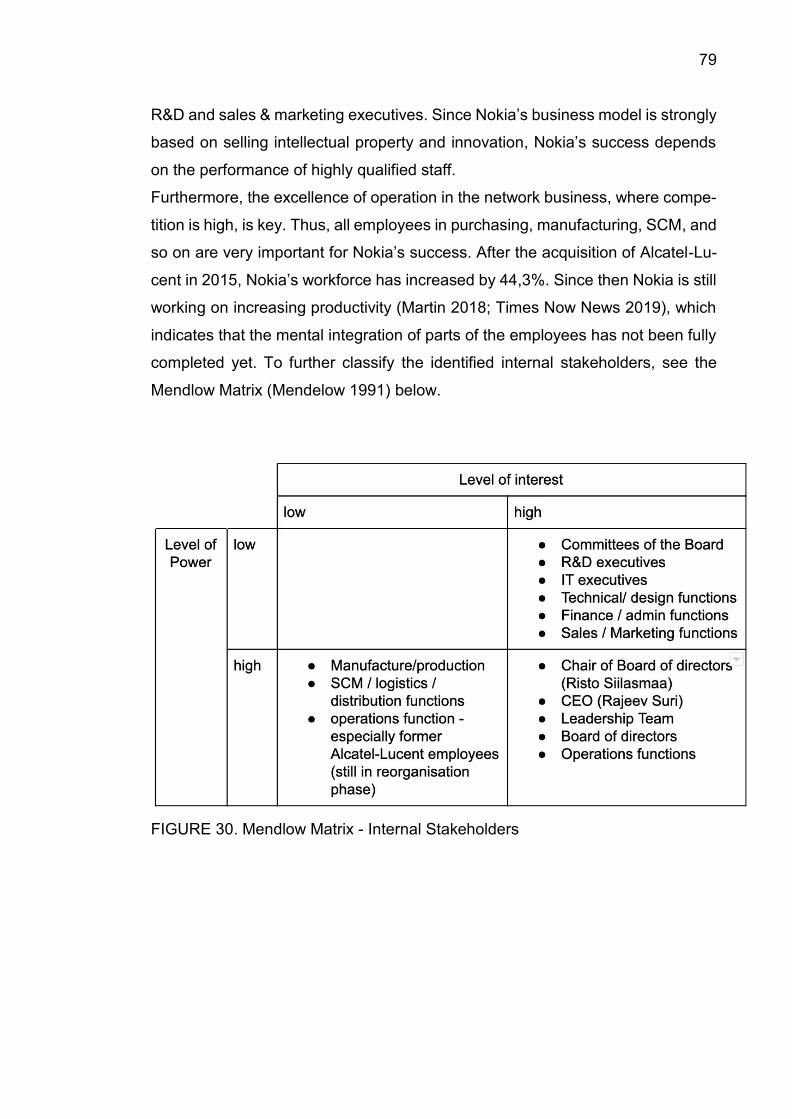
79
50
R&D and sales & marketing executives. Since Nokia’s business model is strongly
based on selling intellectual property and innovation, Nokia’s success depends
on the performance of highly qualified staff.
Furthermore, the excellence of operation in the network business, where compe-
tition is high, is key. Thus, all employees in purchasing, manufacturing, SCM, and
so on are very important for Nokia’s success. After the acquisition of Alcatel-Lu-
cent in 2015, Nokia’s workforce has increased by 44,3%. Since then Nokia is still
working on increasing productivity (Martin 2018; Times Now News 2019), which
indicates that the mental integration of parts of the employees has not been fully
completed yet. To further classify the identified internal stakeholders, see the
Mendlow Matrix (Mendelow 1991) below.
FIGURE 30. Mendlow Matrix - Internal Stakeholders
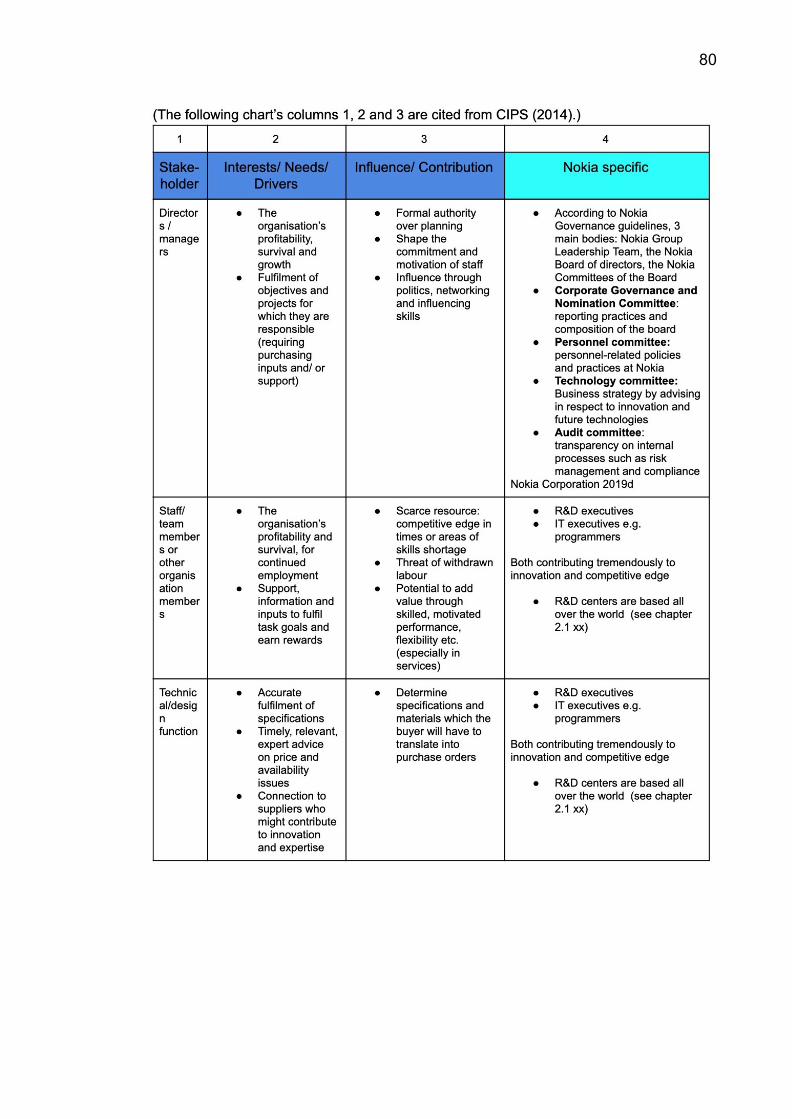
80
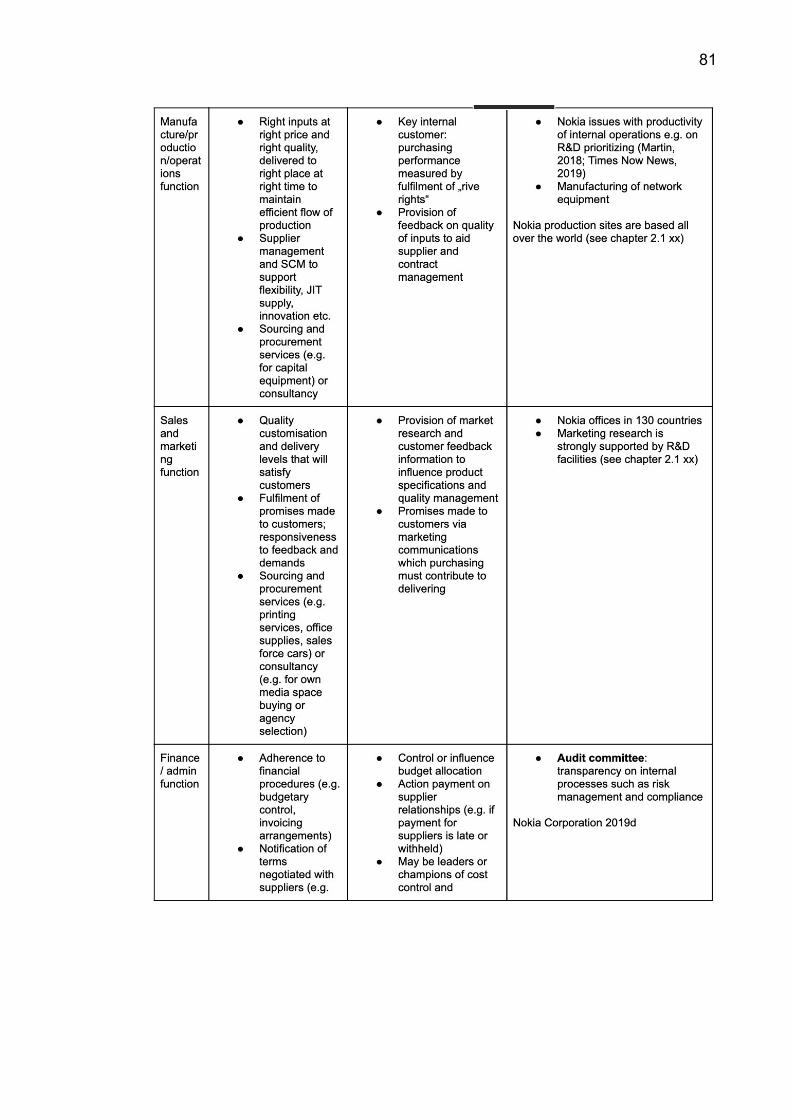
81
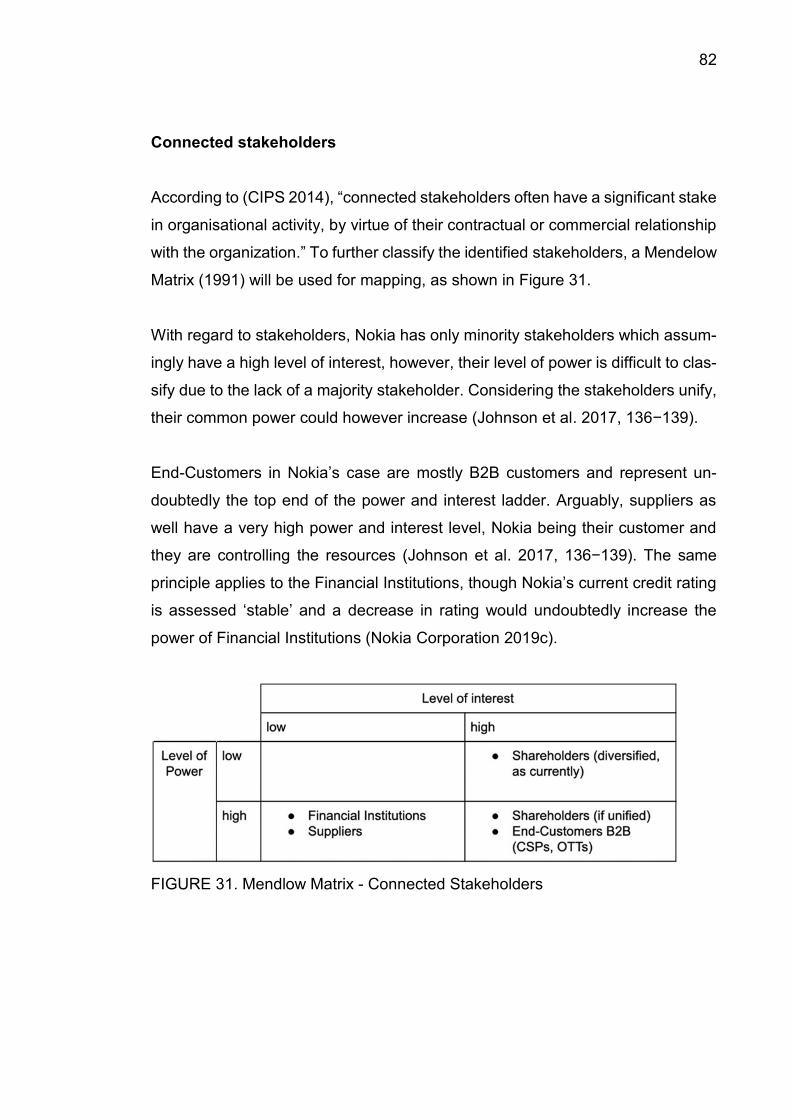
82
Connected stakeholders
According to (CIPS 2014), “connected stakeholders often have a significant stake
in organisational activity, by virtue of their contractual or commercial relationship
with the organization.” To further classify the identified stakeholders, a Mendelow
Matrix (1991) will be used for mapping, as shown in Figure 31.
With regard to stakeholders, Nokia has only minority stakeholders which assum-
ingly have a high level of interest, however, their level of power is difficult to clas-
sify due to the lack of a majority stakeholder. Considering the stakeholders unify,
their common power could however increase (Johnson et al. 2017, 136−139).
End-Customers in Nokia’s case are mostly B2B customers and represent un-
doubtedly the top end of the power and interest ladder. Arguably, suppliers as
well have a very high power and interest level, Nokia being their customer and
they are controlling the resources (Johnson et al. 2017, 136−139). The same
principle applies to the Financial Institutions, though Nokia’s current credit rating
is assessed ‘stable’ and a decrease in rating would undoubtedly increase the
power of Financial Institutions (Nokia Corporation 2019c).
FIGURE 31. Mendlow Matrix - Connected Stakeholders
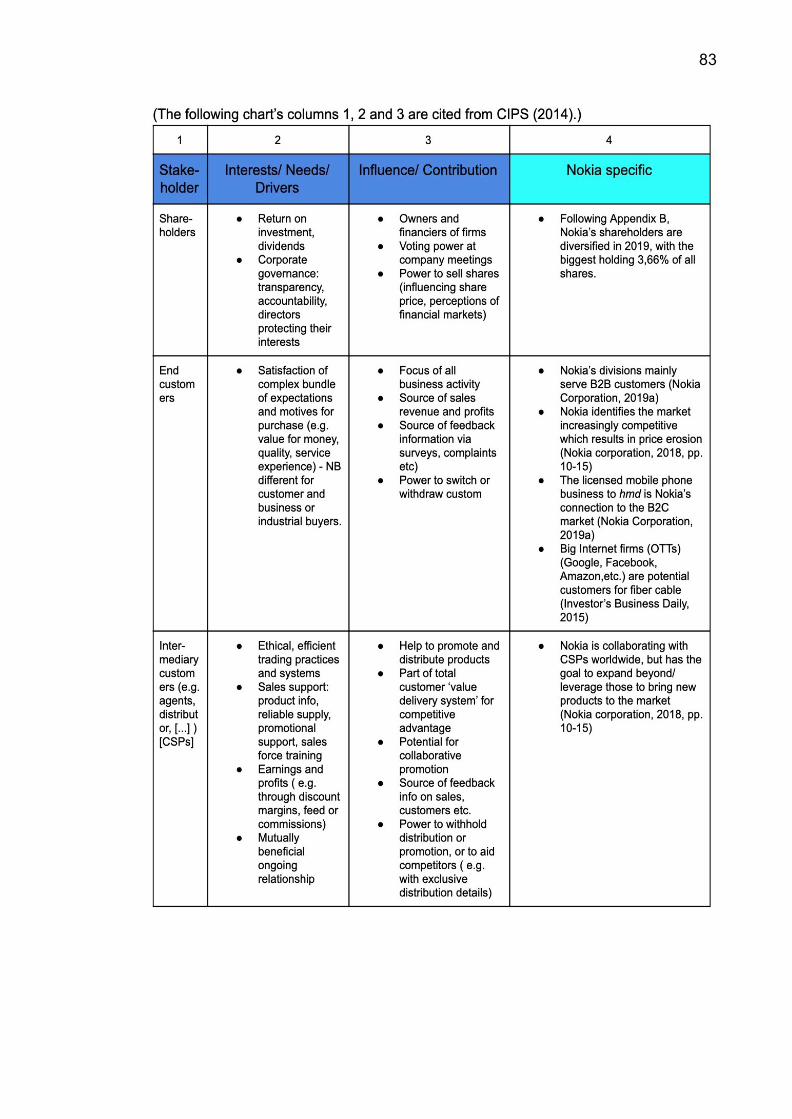
83
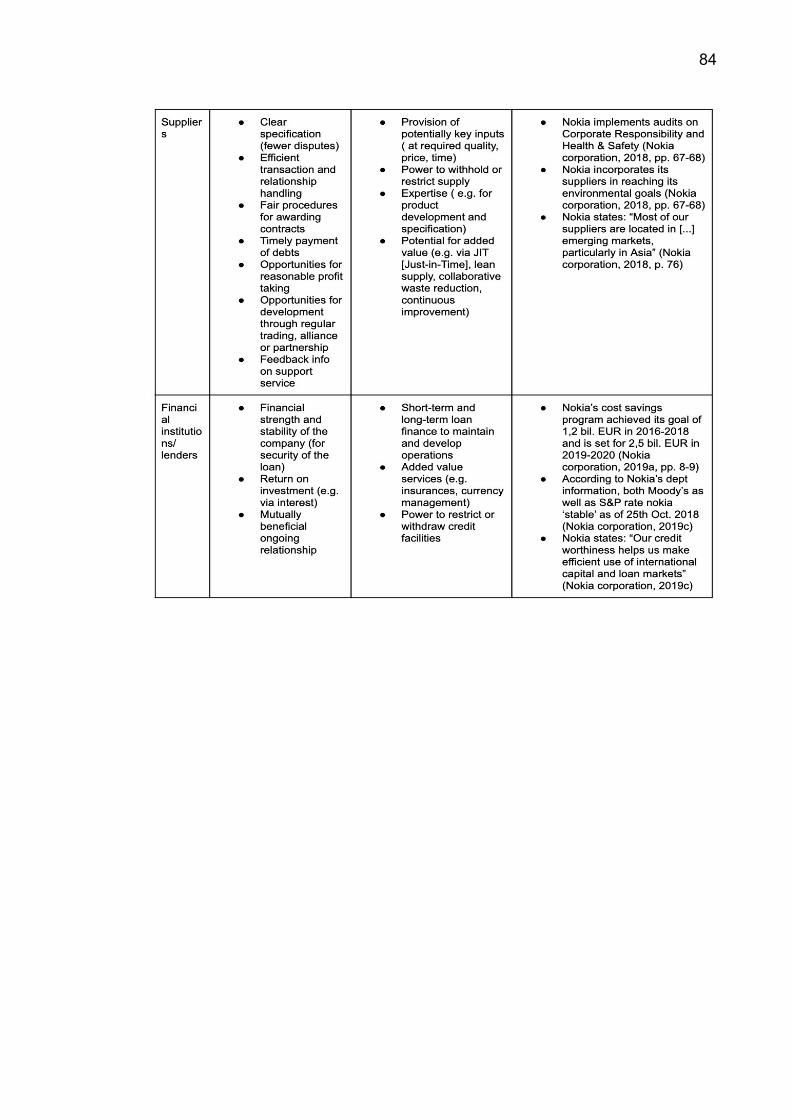
84
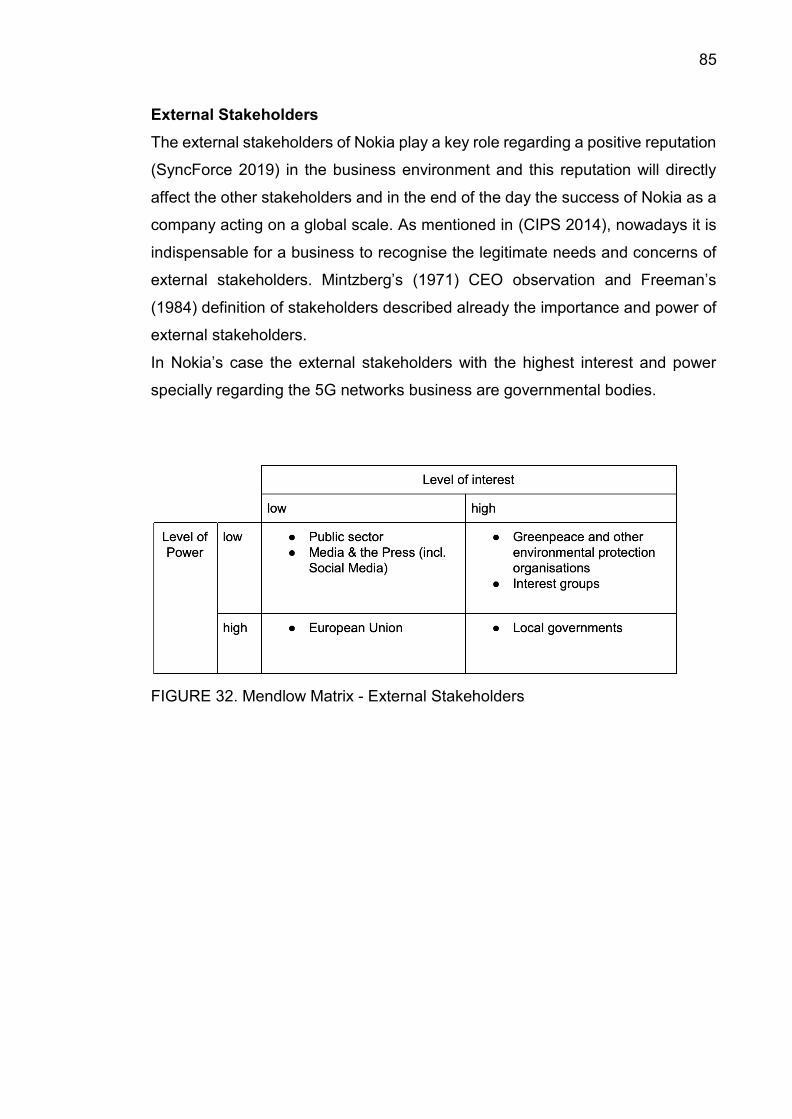
85
External Stakeholders
The external stakeholders of Nokia play a key role regarding a positive reputation
(SyncForce 2019) in the business environment and this reputation will directly
affect the other stakeholders and in the end of the day the success of Nokia as a
company acting on a global scale. As mentioned in (CIPS 2014), nowadays it is
indispensable for a business to recognise the legitimate needs and concerns of
external stakeholders. Mintzberg’s (1971) CEO observation and Freeman’s
(1984) definition of stakeholders described already the importance and power of
external stakeholders.
In Nokia’s case the external stakeholders with the highest interest and power
specially regarding the 5G networks business are governmental bodies.
FIGURE 32. Mendlow Matrix - External Stakeholders
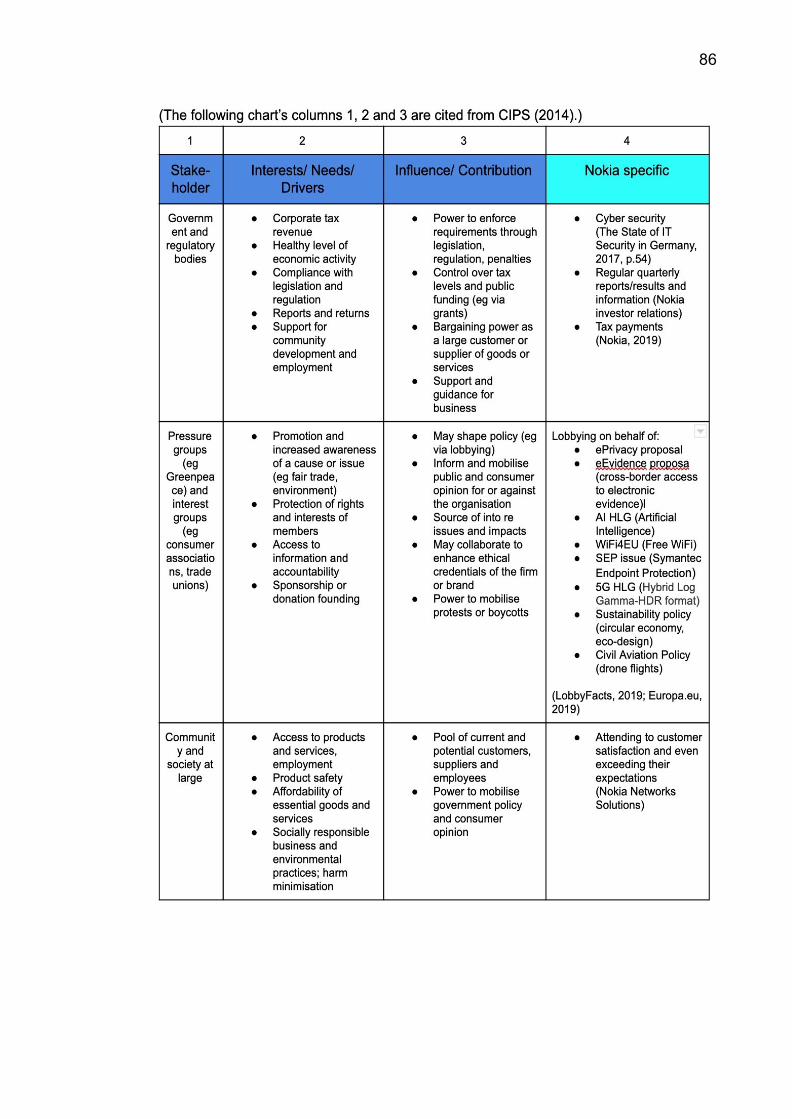
86
87
Appendix 2. Shareholder overview
The below chart is citing Nokia Corporation’s (2019b) 50 biggest shareholders,
which in total hold 11,10 % of all shares, with Solidium Oy being the biggest
shareholder with 3,66 % of all shares as of 31. December 2018. Since no flagging
notifications have been issued since the 30. November 2015, no shareholder is
holding more than 5 % of total shares (Nokia Corporation 2019b).
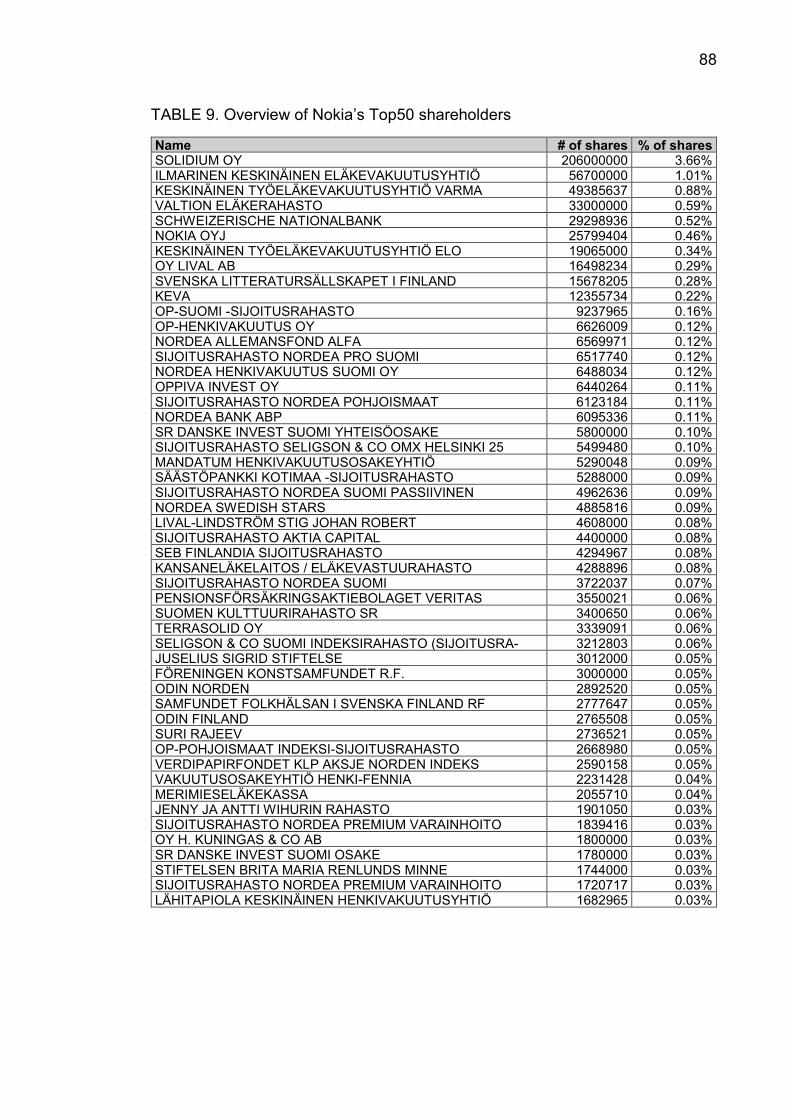
88
TABLE 9. Overview of Nokia’s Top50 shareholders
Name # of shares % of shares SOLIDIUM OY 206000000 3.66% ILMARINEN KESKINÄINEN ELÄKEVAKUUTUSYHTIÖ 56700000 1.01% KESKINÄINEN TYÖELÄKEVAKUUTUSYHTIÖ VARMA 49385637 0.88% VALTION ELÄKERAHASTO 33000000 0.59% SCHWEIZERISCHE NATIONALBANK 29298936 0.52% NOKIA OYJ 25799404 0.46% KESKINÄINEN TYÖELÄKEVAKUUTUSYHTIÖ ELO 19065000 0.34% OY LIVAL AB 16498234 0.29% SVENSKA LITTERATURSÄLLSKAPET I FINLAND 15678205 0.28% KEVA 12355734 0.22% OP-SUOMI -SIJOITUSRAHASTO 9237965 0.16% OP-HENKIVAKUUTUS OY 6626009 0.12% NORDEA ALLEMANSFOND ALFA 6569971 0.12% SIJOITUSRAHASTO NORDEA PRO SUOMI 6517740 0.12% NORDEA HENKIVAKUUTUS SUOMI OY 6488034 0.12% OPPIVA INVEST OY 6440264 0.11% SIJOITUSRAHASTO NORDEA POHJOISMAAT 6123184 0.11% NORDEA BANK ABP 6095336 0.11% SR DANSKE INVEST SUOMI YHTEISÖOSAKE 5800000 0.10% SIJOITUSRAHASTO SELIGSON & CO OMX HELSINKI 25 PÖRSSINOTEERAT
5499480 0.10% MANDATUM HENKIVAKUUTUSOSAKEYHTIÖ 5290048 0.09% SÄÄSTÖPANKKI KOTIMAA -SIJOITUSRAHASTO 5288000 0.09% SIJOITUSRAHASTO NORDEA SUOMI PASSIIVINEN 4962636 0.09% NORDEA SWEDISH STARS 4885816 0.09% LIVAL-LINDSTRÖM STIG JOHAN ROBERT 4608000 0.08% SIJOITUSRAHASTO AKTIA CAPITAL 4400000 0.08% SEB FINLANDIA SIJOITUSRAHASTO 4294967 0.08% KANSANELÄKELAITOS / ELÄKEVASTUURAHASTO 4288896 0.08% SIJOITUSRAHASTO NORDEA SUOMI 3722037 0.07% PENSIONSFÖRSÄKRINGSAKTIEBOLAGET VERITAS 3550021 0.06% SUOMEN KULTTUURIRAHASTO SR 3400650 0.06% TERRASOLID OY 3339091 0.06% SELIGSON & CO SUOMI INDEKSIRAHASTO (SIJOITUSRA-HASTO)
3212803 0.06% JUSELIUS SIGRID STIFTELSE 3012000 0.05% FÖRENINGEN KONSTSAMFUNDET R.F. 3000000 0.05% ODIN NORDEN 2892520 0.05% SAMFUNDET FOLKHÄLSAN I SVENSKA FINLAND RF 2777647 0.05% ODIN FINLAND 2765508 0.05% SURI RAJEEV 2736521 0.05% OP-POHJOISMAAT INDEKSI-SIJOITUSRAHASTO 2668980 0.05% VERDIPAPIRFONDET KLP AKSJE NORDEN INDEKS 2590158 0.05% VAKUUTUSOSAKEYHTIÖ HENKI-FENNIA 2231428 0.04% MERIMIESELÄKEKASSA 2055710 0.04% JENNY JA ANTTI WIHURIN RAHASTO 1901050 0.03% SIJOITUSRAHASTO NORDEA PREMIUM VARAINHOITO TASAPAINO
1839416 0.03% OY H. KUNINGAS & CO AB 1800000 0.03% SR DANSKE INVEST SUOMI OSAKE 1780000 0.03% STIFTELSEN BRITA MARIA RENLUNDS MINNE 1744000 0.03% SIJOITUSRAHASTO NORDEA PREMIUM VARAINHOITO MALTTI
1720717 0.03% LÄHITAPIOLA KESKINÄINEN HENKIVAKUUTUSYHTIÖ 1682965 0.03%
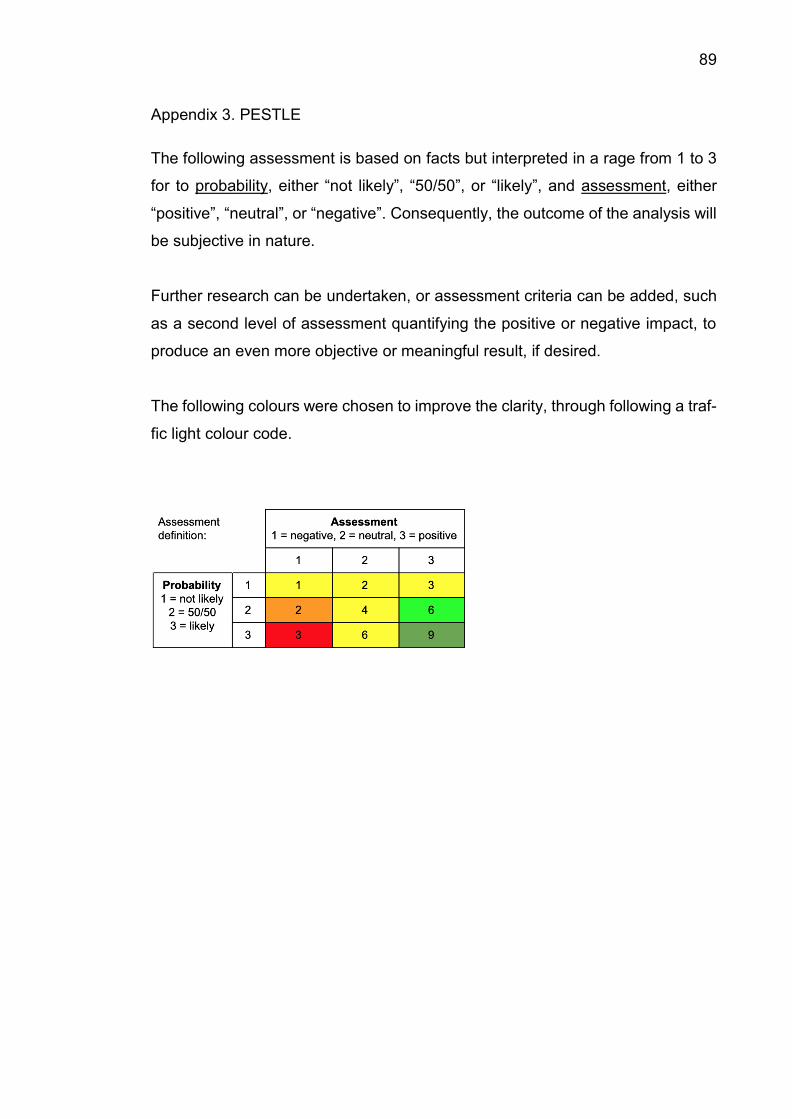
89
Appendix 3. PESTLE
The following assessment is based on facts but interpreted in a rage from 1 to 3
for to probability, either “not likely”, “50/50”, or “likely”, and assessment, either
“positive”, “neutral”, or “negative”. Consequently, the outcome of the analysis will
be subjective in nature.
Further research can be undertaken, or assessment criteria can be added, such
as a second level of assessment quantifying the positive or negative impact, to
produce an even more objective or meaningful result, if desired.
The following colours were chosen to improve the clarity, through following a traf-
fic light colour code.
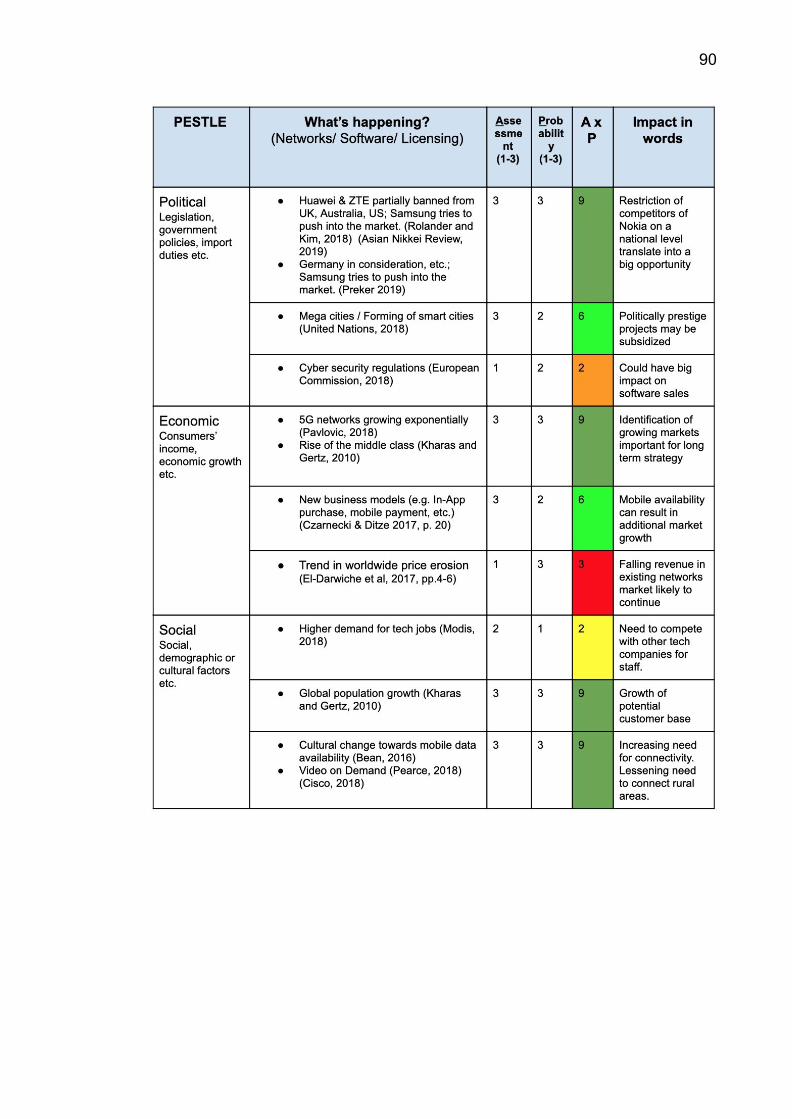
90
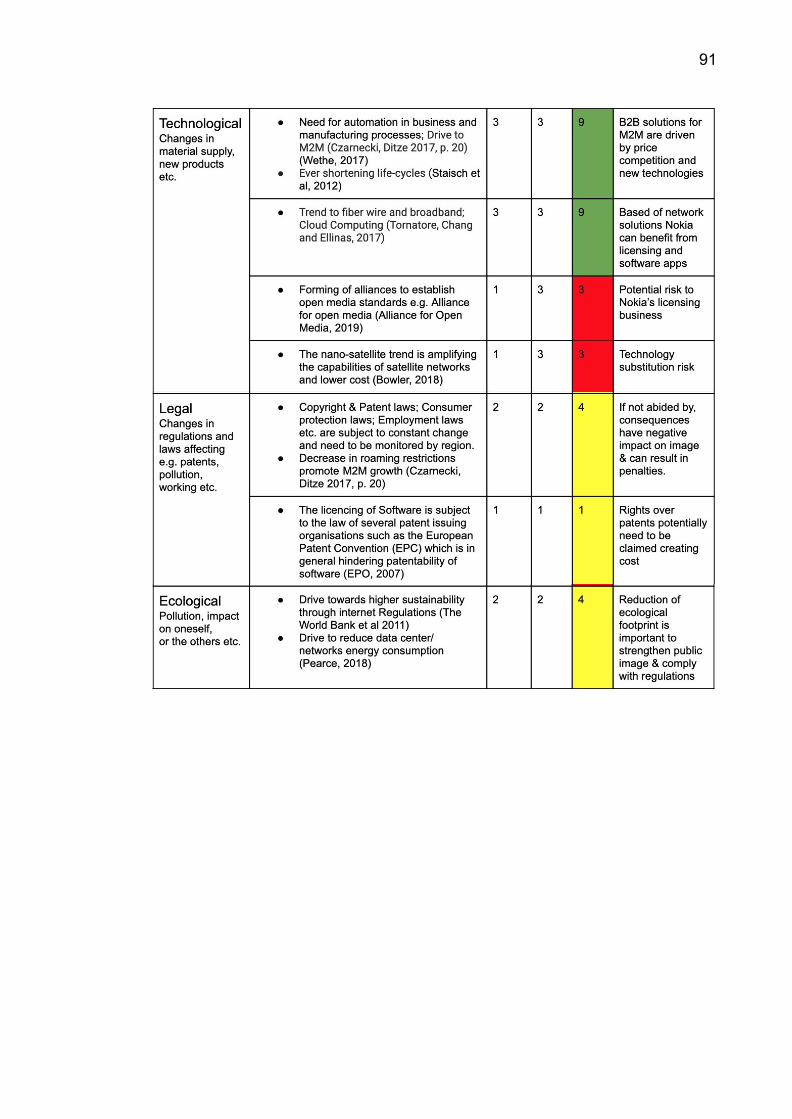
91
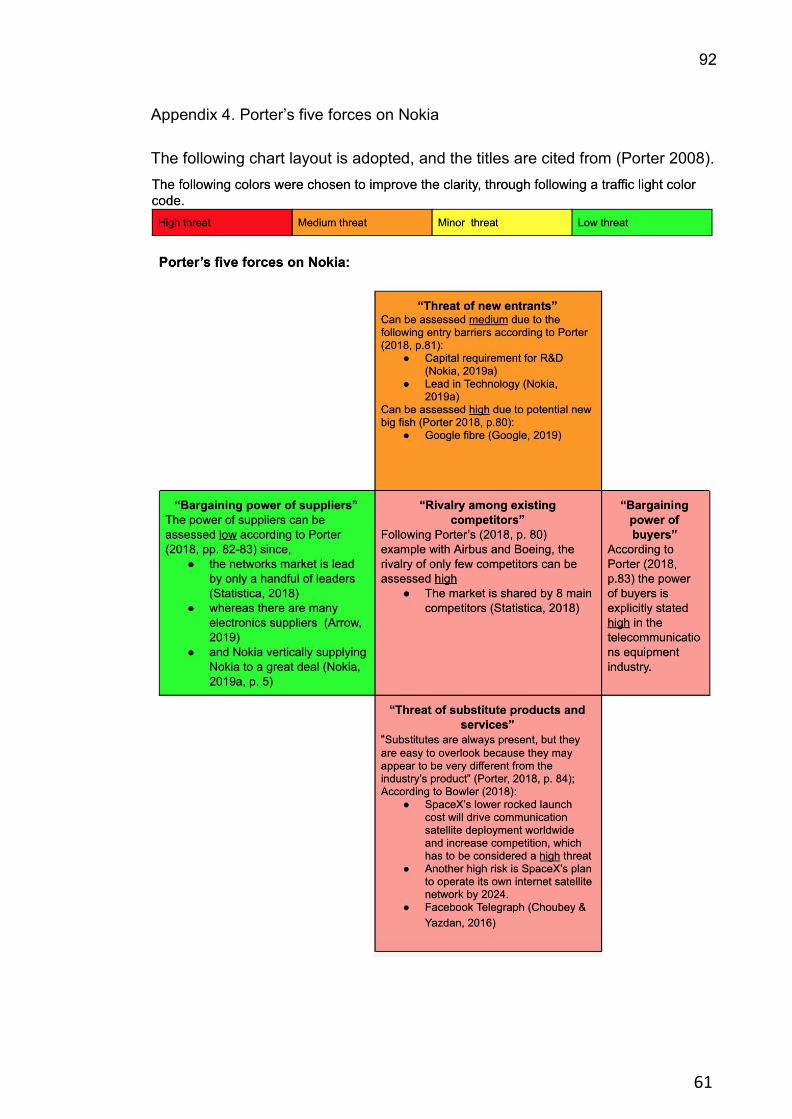
92
60
61
Appendix 4. Porter’s five forces on Nokia
The following chart layout is adopted, and the titles are cited from (Porter 2008).
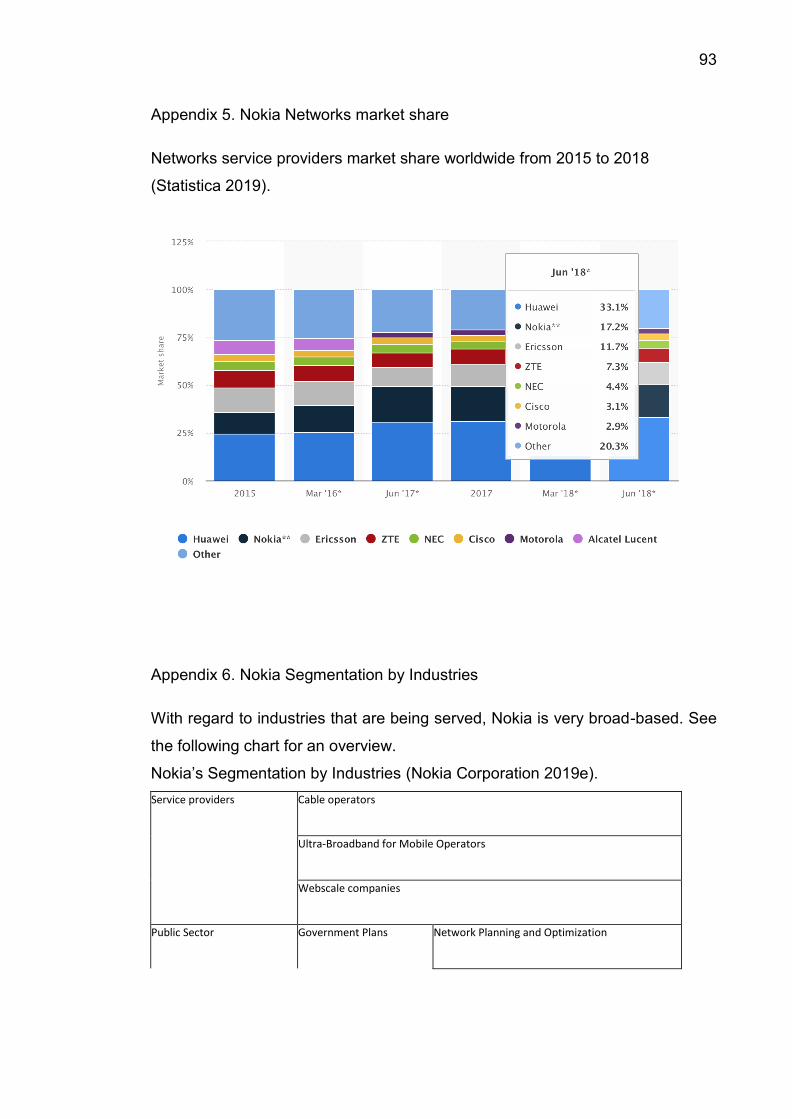
93
Appendix 5. Nokia Networks market share
Networks service providers market share worldwide from 2015 to 2018
(Statistica 2019).
Appendix 6. Nokia Segmentation by Industries
With regard to industries that are being served, Nokia is very broad-based. See
the following chart for an overview.
Nokia’s Segmentation by Industries (Nokia Corporation 2019e).
Service providers Cable operators
Ultra-Broadband for Mobile Operators
Webscale companies
Public Sector Government Plans Network Planning and Optimization
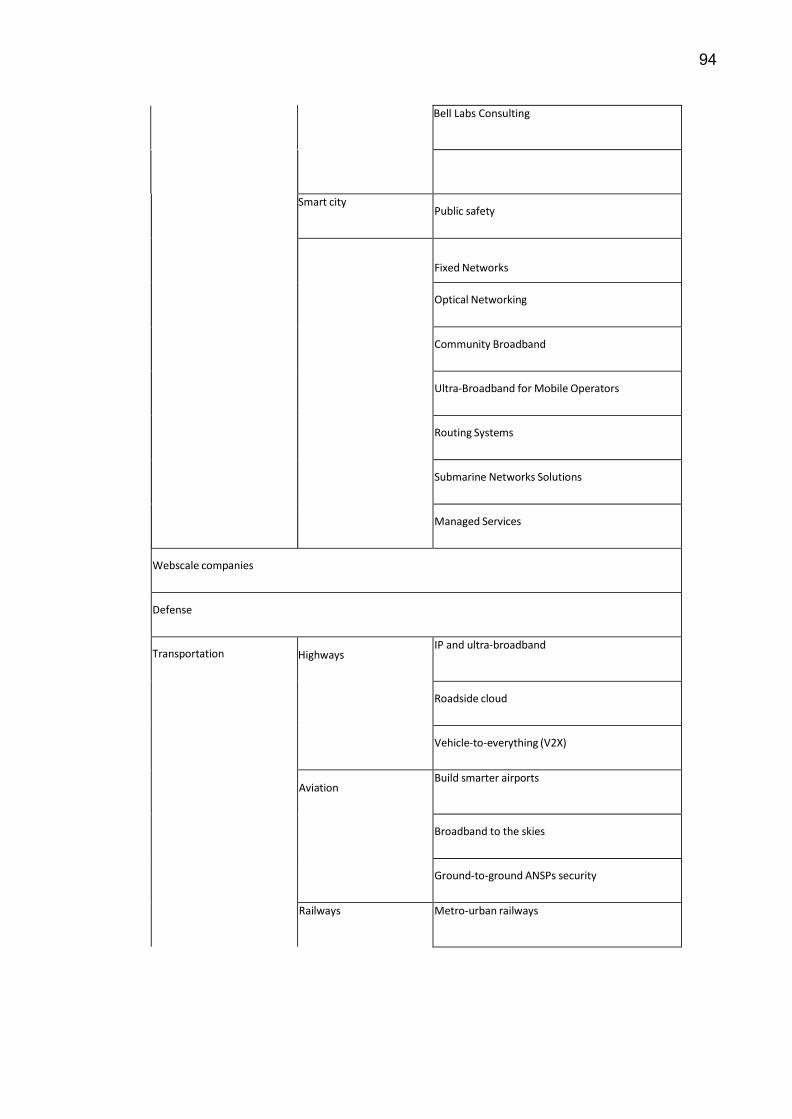
94
Bell Labs Consulting
Smart city Public safety
Fixed Networks
Optical Networking
Community Broadband
Ultra-Broadband for Mobile Operators
Routing Systems
Submarine Networks Solutions
Managed Services
Webscale companies
Defense
Transportation Highways IP and ultra-broadband
Roadside cloud
Vehicle-to-everything (V2X)
Aviation Build smarter airports
Broadband to the skies
Ground-to-ground ANSPs security
Railways Metro-urban railways
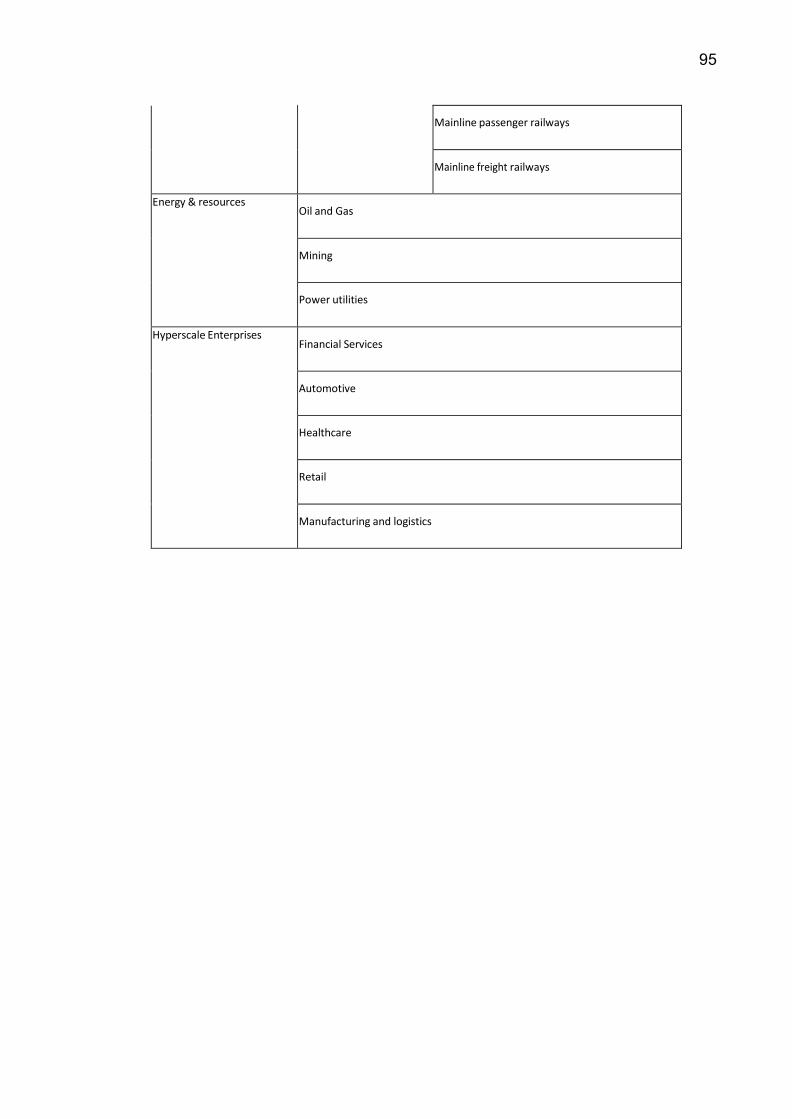
95
Mainline passenger railways
Mainline freight railways
Energy & resources Oil and Gas
Mining
Power utilities
Hyperscale Enterprises Financial Services
Automotive
Healthcare
Retail
Manufacturing and logistics
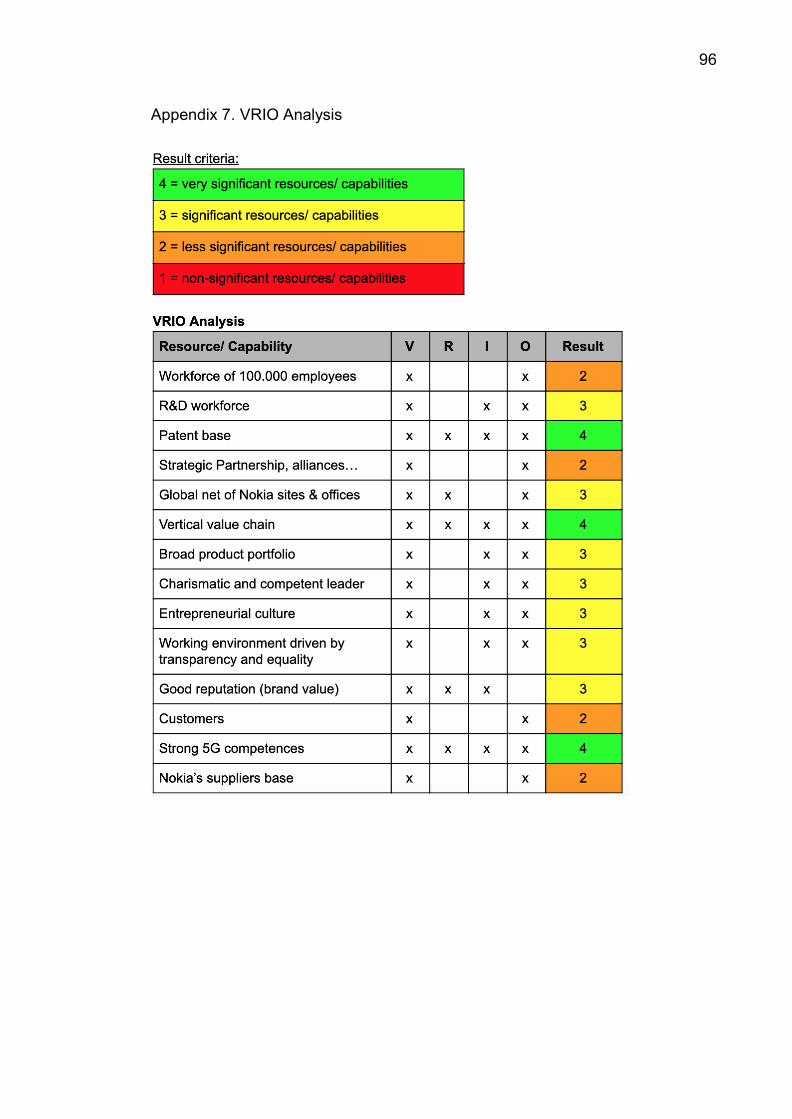
96
Appendix 7. VRIO Analysis
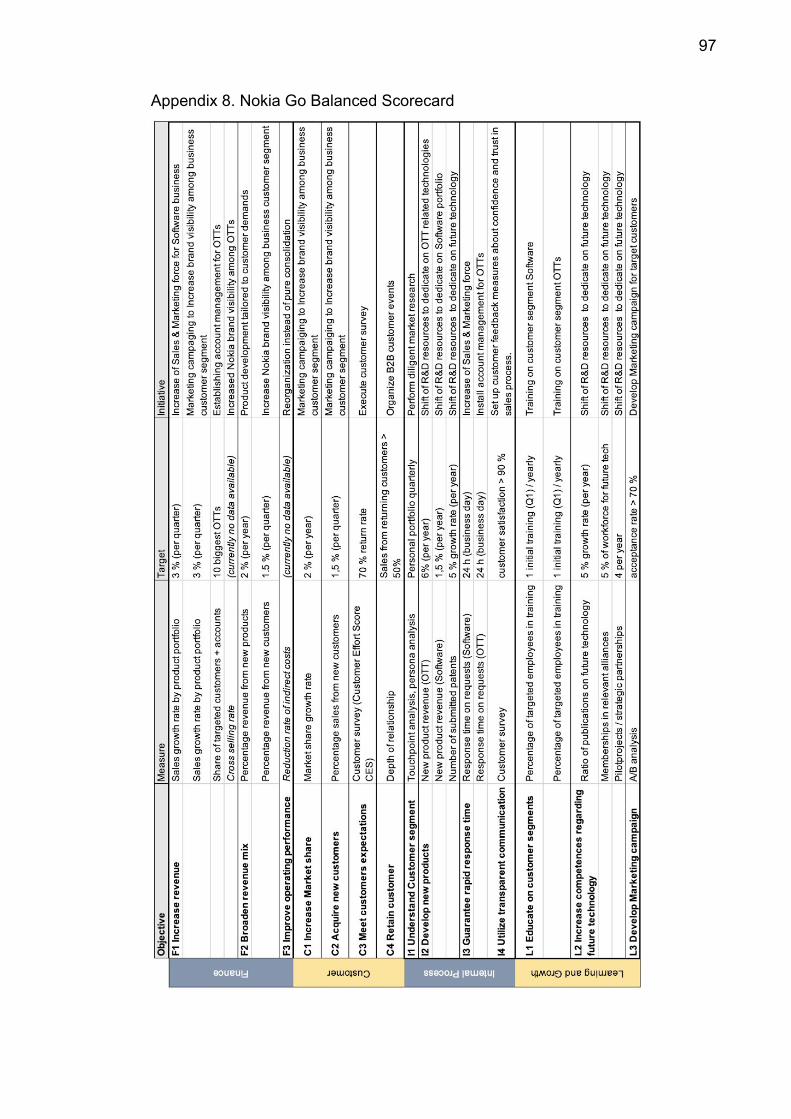
97
Appendix 8. Nokia Go Balanced Scorecard
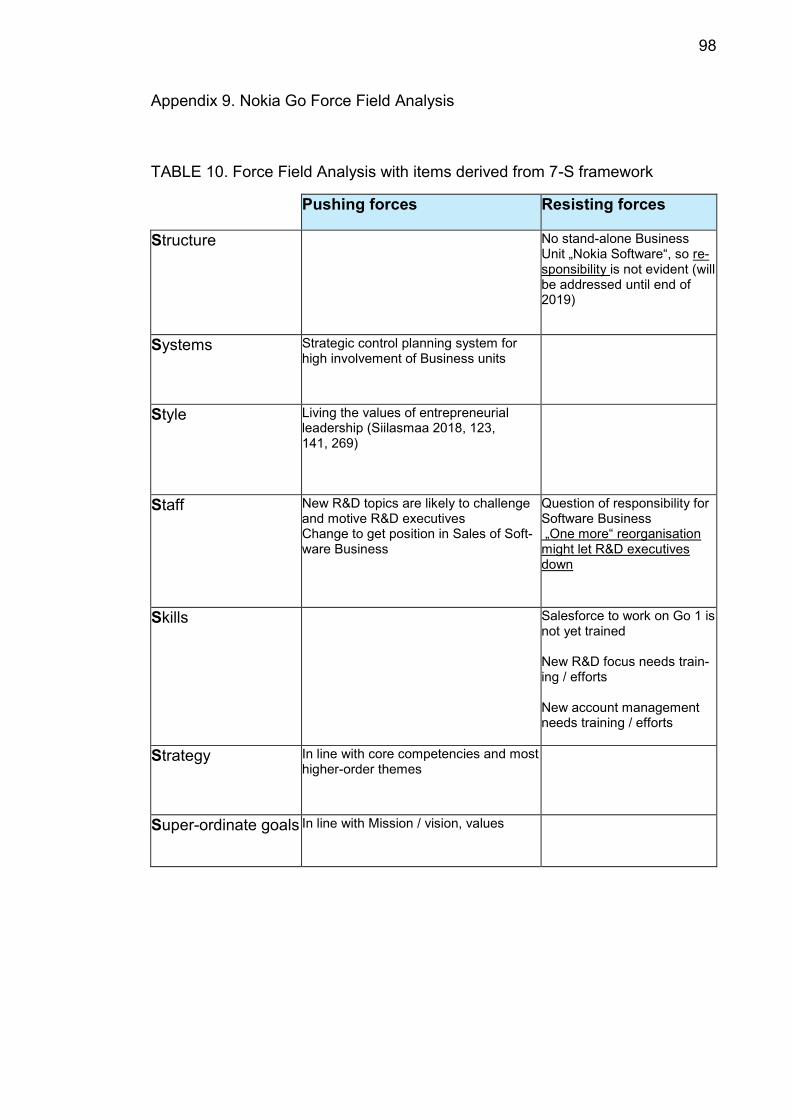
98
Appendix 9. Nokia Go Force Field Analysis
TABLE 10. Force Field Analysis with items derived from 7-S framework
Pushing forces Resisting forces
Structure No stand-alone Business Unit „Nokia Software“, so re-sponsibility is not evident (will be addressed until end of 2019)
Systems Strategic control planning system for high involvement of Business units
Style Living the values of entrepreneurial leadership (Siilasmaa 2018, 123, 141, 269)
Staff New R&D topics are likely to challenge and motive R&D executives Change to get position in Sales of Soft-ware Business
Question of responsibility for Software Business „One more“ reorganisation might let R&D executives down
Skills Salesforce to work on Go 1 is not yet trained New R&D focus needs train-ing / efforts New account management needs training / efforts
Strategy In line with core competencies and most higher-order themes
Super-ordinate goals In line with Mission / vision, values