design of lean six sigma simulation games for online learning
TRANSCRIPT
DESIGN OF LEAN SIX SIGMA SIMULATION GAMES FOR ONLINE LEARNING
by
Arun Kottayil
A thesis submitted to the faculty of The University of North Carolina at Charlotte
in partial fulfillment of the requirements for the degree of Master of Science in
Engineering Management
Charlotte
2014
Approved by:
______________________________ Dr. Ertunga C. Ozelkan
______________________________ Dr. Tiffany Barnes
______________________________ Dr. Agnes Galambosi Ozelkan

ii
©2014 Arun Kottayil
ALL RIGHTS RESERVED
iii
ABSTRACT
ARUN KOTTAYIL. Design of Lean Six Sigma simulation games for online learning. (Under the direction of Dr. ERTUNGA C. OZELKAN)
While simulation games are widely applied in a face-to-face classroom setting,
there is a lack of adequate collection of simulation games for online learning. Hence, the
purpose of this research is two-fold: 1) to identify the gap for Lean Six Sigma simulation
games for online learning and 2) to identify a framework to develop online simulation
games. For these purposes, existing face-to-face classroom and online simulations related
to Lean Six Sigma are surveyed and survey results are analyzed. The gaps between face-
to-face and online simulation games are identified and the main challenges for closing
those gaps are discussed. Analytic Hierarchy Process (AHP) methodology has been
applied to develop a new framework for designing educational online simulation games
based on the response of game sessions participants. The most important criteria are
identified based on user responses, and their respective weights are calculated. To
illustrate the proposed framework a new version of the Dice Game has been developed
and evaluated against existing games in a multi-criteria decision making setting. The
results are promising and indicate that there is an opportunity to build a well-designed
collection of online simulation games to enhance online learning.

iv
ACKNOWLEDGMENTS
I wish to express my sincere gratitude to my advisor Dr. Ertunga Ozelkan for the
guidance, support and kind advices, to my thesis committee members Dr. Tiffany Barnes
and Dr. Agnes Galambosi Ozelkan for their support and feedback, and to all my fellow
classmates and friends for their support.
v
TABLE OF CONTENTS
LIST OF TABLES viii
LIST OF FIGURES x
CHAPTER 1: INTRODUCTION 1
CHAPTER 2: PROBLEM STATEMENT AND OBJECTIVES 6
Problem Statement 6
Objectives 7
CHAPTER 3: LITERATURE REVIEW 9
CHAPTER 4: ANALYSIS OF EXISTING SIMULATION GAMES 21
Survey of Available Operations Management Simulations 21
Gaps Between Offline and Online Educational Simulations 24
Challenges for Implementing an Online Educational Simulation 26
CHAPTER 5: METHODOLOGY 29
Multi-Criteria Decision Making: Analytic Hierarchy Process (AHP) 29
Voice of the Customer: Kano Model 32
Hypothesis Testing: Analysis of Variance (ANOVA) and T-test 33
CHAPTER 6: IDENTIFY PROBLEM STRUCTURE: CRITERIA, GOALS, AND 34 ALTERNATIVES FOR SIMULATION GAMES
Identifying Criteria 34
Kano Model for Educational Simulations 36
Defining Goals 39
Identifying Alternatives 41
CHAPTER 7: ANALYSIS OF CRITERIA FOR SIMULATION GAMES 42
Statistical Analysis of the Responses on Criteria Evaluation 51
vi
CHAPTER 8: A NEW FRAMEWORK FOR ONLINE EDUCATIONAL 55 SIMULATIONS DESIGN
Learning Objectives 57
Interactive Game Play 58
Real-World Mimic Elements 60
Flow 62
Fun Elements 64
Multi-Media Guidance 65
Real Time Connectivity 66
Thought Stimulating Interactive Quizzes 66
Real-Time Communication Platform & Post-Game Play Discussion Platform 67
Pre- and Post-Session Quizzes 68
Configurable Settings 69
Revise / Review Result Storage 72
Compliance 72
CHAPTER 9: ANALYSIS OF ALTERNATIVES FOR SIMULATION GAMES 73
Dice Game Prototype Design 78
Comparison of Alternatives 85
CHAPTER 10: SELECTION OF BEST SIMULATION GAME ALTERNATIVE 89
Analysis of Scoring for Various Game Sessions 90
Statistical Analysis of Simulation Scoring Responses 91
Other Feedback on the Prototype 95
CHAPTER 11: SUMMARY, RESULTS, AND CONCLUSIONS 97
CHAPTER 12: RECOMMENDATIONS AND FUTURE RESEARCH 102
vii
REFERENCES 108
APPENDIX A: RESULT OF AVAILABLE SIMULATIONS SURVEY 113
APPENDIX B: RESPONSE DATA FOR AHP EVALUATION AND SCORING 121
Survey Question to Identify the Primary List of Criteria 121
Individual Response Data for AHP Evaluation of Criteria 122
Individual Expert Response Data for AHP Evaluation of Criteria 123
Score Ratings for Various Game Sessions 124
Consolidated Data for Scoring Responses 125
AHP Evaluation of Alternatives: Individual Responses 126
viii
LIST OF TABLES
TABLE 1: Definitions of key terms 4
TABLE 2: Summary of criteria selection 36
TABLE 3: Classification of attributes 38
TABLE 4: Modeling means and fundamental objectives 40
TABLE 5: AHP evaluation of criteria group decision 47
TABLE 6: Criteria evaluation by Dice Game participants 47
TABLE 7: Criteria evaluation by Lampshade Game participants 48
TABLE 8: Group judgment of experts for criteria 48
TABLE 9: Descriptive statistics of criteria evaluation 51
TABLE 10: Results of ANOVA test 52
TABLE 11: Correlation analysis 54
TABLE 12: Pros and cons of face-to-face version 74
TABLE 13: Pros and cons of existing online version 76
TABLE 14: Pros and cons of iPad application version 77
TABLE 15: Pros and cons of new prototype 78
TABLE16: Template for pairwise comparison of alternatives 85
TABLE 17: Sample calculation of priority vector 85
TABLE 18: Group judgment for evaluation of alternatives 87
TABLE 19: Calculation of final scores for alternatives 88
TABLE 20: Final scores for alternatives 89
TABLE 21: Average scoring for alternatives 91
TABLE 22: Correlation analysis of scoring data 91

ix
TABLE 23: ANOVA results for mean scores 92
TABLE 24: Results of paired t-test 94
TABLE 25: Survey results of Operation Management Simulations 113
TABLE 26: Template for scoring 124
TABLE 27: Consolidated scoring data 125
x
LIST OF FIGURES
FIGURE 1: Disposition of thesis 5
FIGURE 2: Major steps of Analytic Hierarchy Process 30
FIGURE 3: Kano model (Kano et al., 1984) 32
FIGURE 4: Kano model for educational simulations 39
FIGURE 5: Fundamental and means objective model of the goal 41
FIGURE 6: Basic Setup of Dice Game (Rajamani & Ozelkan, 2004) 44
FIGURE 7: Different settings of Lampshade Game (Ozelkan & Galambosi, 2009) 44
FIGURE 8: Sample AHP template (Ozelkan, 2014) 45
FIGURE 9: Interval plot 53
FIGURE 10: Residual Plots 53
FIGURE 11: An illustration of the proposed framework 56
FIGURE 12: Relationship of the proposed framework with the fundamental objectives 56
FIGURE 13: Comparison of different player mode 71
FIGURE 14: Dice Game class setup 74
FIGURE 15: Dice Game scoreboard 75
FIGURE 16: Screenshot of existing online Dice Game (Ganesha.org, 2014) 76
FIGURE 17: Screenshot of Dice Game iPad App (Goldratt Research Labs, 2014) 77
FIGURE 18: A screenshot of new Dice Game prototype 81
FIGURE 19: A screenshot of new Dice Game prototype 82
FIGURE 20: A screenshot of new Dice Game prototype 82
FIGURE 21: A screenshot of new Dice Game prototype 83
FIGURE 22: A screenshot of new Dice Game prototype 83

xi
FIGURE 23: A screenshot of new Dice Game prototype 84
FIGURE 24: A screenshot of new Dice Game prototype 84
FIGURE 25: Boxplot of final scores 92
FIGURE 26: Boxplot of differences 94
FIGURE 27: Box plot of New Prototype vs. existing online 95
CHAPTER 1: INTRODUCTION
Lean manufacturing is an all-encompassing term for a manufacturing philosophy,
set of tools, processes and best practices that focus on eliminating waste with respect to
value that is defined by the customer, or in short, a way to ‘achieve more with less’
(Womack, Jones, & Roos, 1990). Lean manufacturing has its roots in Toyota Production
System (TPS) that was developed by Taiichi Ōno during his service at Toyota motor
company in the third quarter of the twentieth century (Ōno, 1988). The success of Toyota
during tough economic times and the oil crisis of the 1970’s made United States
automobile manufactures to adopt these methodologies to their facilities. Many of these
efforts became successful and thus the elimination of waste and other TPS concepts such
as Just-In-time (JIT) became a popular drive among numerous manufacturing firms
across United States.
John Krafcik coined the term ‘Lean Manufacturing’ in 1988 (Krafcik, 1988) to
encompass the waste elimination principles that are derived from the Japanese
manufacturing industry. Lean has been ever evolving since then, and numerous
individuals and organizations around the world have made tremendous contributions to
improve and develop many sophisticated tools and standard processes based on this idea.
As the Lean philosophy became a success story in manufacturing sector, other industries
also started looking for answers from Lean practices to thrive in the tough global
competitive economy (Staats, Brunner, & Upton, 2011). Health care is one of the major
2
industries in service sector that started adopting Lean practices in last decade and there
have been many successful implementations around the world (Poksinska, 2010), which
proved that focusing on value and elimination of waste is not only applicable to
manufacturing but also to any industry that serves an internal or external customer need.
Lean manufacturing has also interested many academic scholars and has become a
subject of interest for many students. Most of the major universities across globe now
offer courses related to Lean manufacturing from introductory levels to advanced topics.
Major universities have developed advanced degree and certificate programs that include
Lean and a bundle of peer subjects such as Six-Sigma and other statistical quality
controls, Supply chain management, Operations management, and Analytics that are
offered both on-campus and online.
With the advent of Internet bandwidth and reliability, and proliferation of portable
devices, there is a rapid growth in online education sector. This includes learning from
dedicated websites and programs offered by traditional universities using Internet as a
medium. Fifty percent or more of higher education institutions in USA use some sort of
online knowledge delivery mechanisms (Blackboard Inc., 1998).
Education simulations can be used as a method of active learning to engage the
learner in problem solving and motivating them for critical thinking that mostly result in
efficient learning of the underlying concepts than via a traditional one way lecture
(Lunce, 2006). These events can be short, as a single exercise or a long role-play that
brings in a controlled real world setting to the classroom, which may be conducted using
simple stationery materials, specially designed kits or a computer based multimedia
simulation program. Multiple researches have confirmed the benefits of using
3
simulations in the classrooms along with lectures and discussions (Gibbons, Fairweather,
Anderson, & Merill, 1998; Granlund, Berglund, & Eriksson, 2000; Heinich, 2002).
There are many exercises and simulations that are developed and implemented by
scholars, institutions, and consulting companies that can be used in classes on Lean
related topics. Many companies produce off-the-shelf kits that can be used in classrooms
or training sessions that simulate a real life work situation or a business problem. Most of
such simulations are designed for using in a physical classroom with direct participation
of the students, leaving the increasing number of online students with no opportunity to
use these simulations for active learning. The increase in number of Lean Six Sigma
online learners thus raises the need for online simulations related to these topics. The
challenges that need to be tackled for developing an online simulation or translating an
existing offline simulation to an online version are further detailed in later sections.
It is debatable whether education should be seen as a mentoring relationship,
sometimes even at a spiritual level in East and South Asian cultures, or as a service
provided by institutions and teachers to students in return for the fee paid. In latter, it is
important to identify the voice of the participants (majorly students) while designing any
component that is used for knowledge transfer and learning. In this project, an analytical
process will be followed to capture the voice of the users, evaluate the existing
simulations, identifying problems, and finding solutions based on objective decision-
making processes.
4
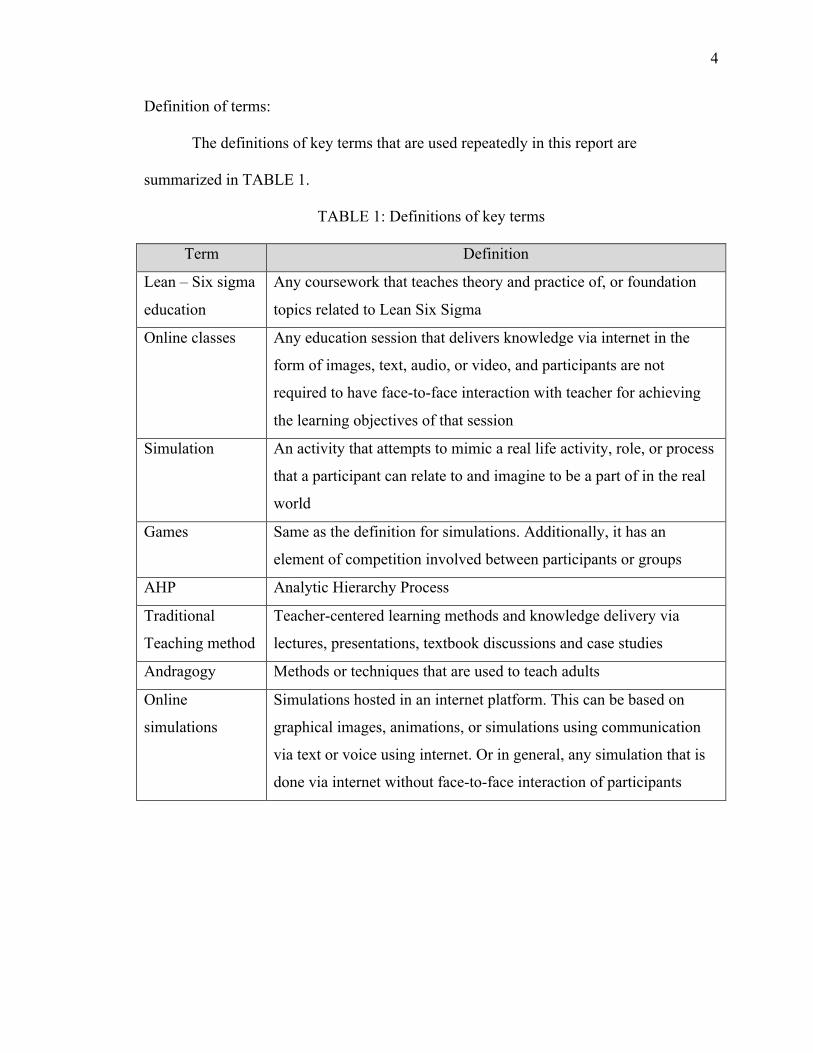
Definition of terms:
The definitions of key terms that are used repeatedly in this report are
summarized in TABLE 1.
TABLE 1: Definitions of key terms
Term Definition
Lean – Six sigma
education
Any coursework that teaches theory and practice of, or foundation
topics related to Lean Six Sigma
Online classes Any education session that delivers knowledge via internet in the
form of images, text, audio, or video, and participants are not
required to have face-to-face interaction with teacher for achieving
the learning objectives of that session
Simulation An activity that attempts to mimic a real life activity, role, or process
that a participant can relate to and imagine to be a part of in the real
world
Games Same as the definition for simulations. Additionally, it has an
element of competition involved between participants or groups
AHP Analytic Hierarchy Process
Traditional
Teaching method
Teacher-centered learning methods and knowledge delivery via
lectures, presentations, textbook discussions and case studies
Andragogy Methods or techniques that are used to teach adults
Online
simulations
Simulations hosted in an internet platform. This can be based on
graphical images, animations, or simulations using communication
via text or voice using internet. Or in general, any simulation that is
done via internet without face-to-face interaction of participants

5
Disposition of thesis:
FIGURE 1: Disposition of thesis

CHAPTER 2: PROBLEM STATEMENT AND OBJECTIVES
Problem Statement
There is little collection of effective online simulation games available for
students who attend online Lean Six Sigma or Operations Management courses that
deliver at least similar level of educational value when compared to a face-to-face
classroom simulations on the same topics.
The problem can be further broken down to the following questions: How can an
online educational simulation game on advanced topics such as Lean Six Sigma that
benefit students of but not limited to systems engineering online courses be designed and
implemented with similar or better effectiveness as that of a regular face-to-face
classroom simulation activity? What is the current status of online or offline simulations
available related to Lean Six Sigma or operations management in general? What are the
gaps between a face-to-face classroom educational simulation and an online educational
simulation? What are the main challenges for translating a face-to-face classroom
simulation to an online simulation? What are the different criteria and their respective
weights for evaluating an education simulation or game? What is a good method to
capture the voice of users of such simulation? Finally, what could be a good framework
for designing an advanced topic online simulation that closes the identified gaps by
surpassing the challenges?
7
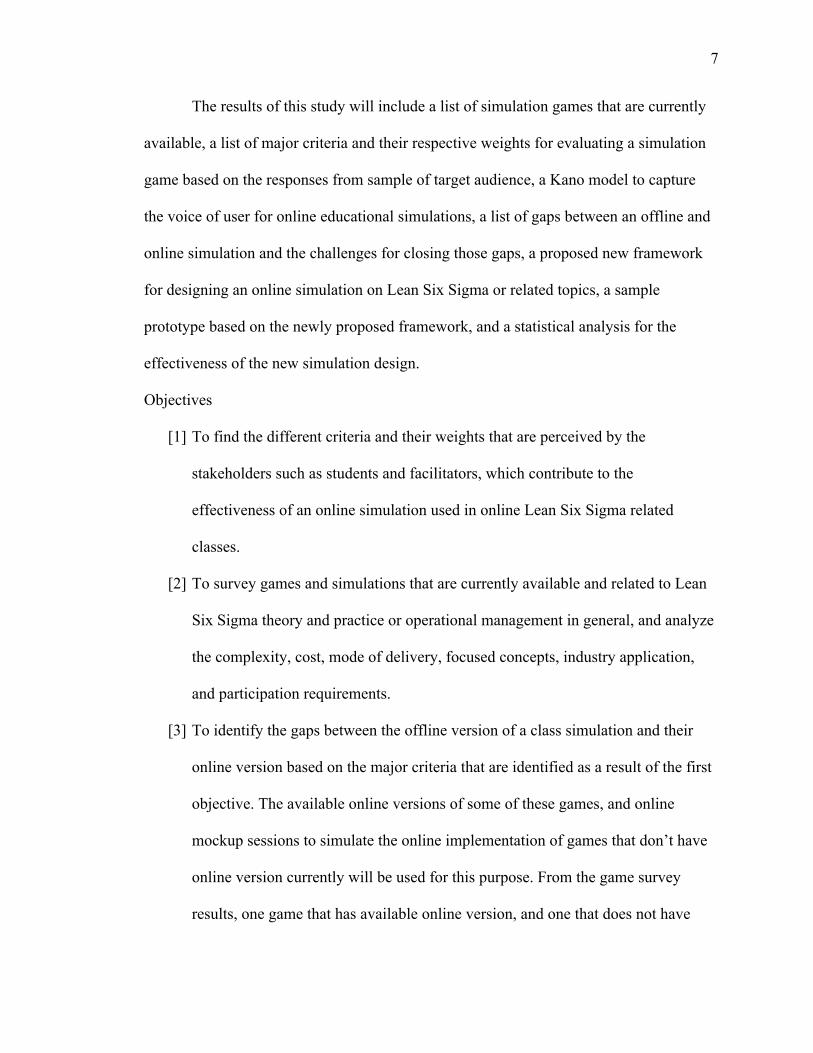
The results of this study will include a list of simulation games that are currently
available, a list of major criteria and their respective weights for evaluating a simulation
game based on the responses from sample of target audience, a Kano model to capture
the voice of user for online educational simulations, a list of gaps between an offline and
online simulation and the challenges for closing those gaps, a proposed new framework
for designing an online simulation on Lean Six Sigma or related topics, a sample
prototype based on the newly proposed framework, and a statistical analysis for the
effectiveness of the new simulation design.
Objectives
[1] To find the different criteria and their weights that are perceived by the
stakeholders such as students and facilitators, which contribute to the
effectiveness of an online simulation used in online Lean Six Sigma related
classes.
[2] To survey games and simulations that are currently available and related to Lean
Six Sigma theory and practice or operational management in general, and analyze
the complexity, cost, mode of delivery, focused concepts, industry application,
and participation requirements.
[3] To identify the gaps between the offline version of a class simulation and their
online version based on the major criteria that are identified as a result of the first
objective. The available online versions of some of these games, and online
mockup sessions to simulate the online implementation of games that don’t have
online version currently will be used for this purpose. From the game survey
results, one game that has available online version, and one that does not have
8
online version currently will be used in offline and online test class sessions of
stakeholder focus groups to identify these gaps.
[4] To identify the challenges for closing those gaps for online class simulations.
These challenges could be related to online game play itself or related to effective
translation of an offline version of class simulation to its online version. If there
are no gaps identified as the result of the third objective, then to identify the
factors that contribute to their effectiveness, which can be incorporated into a
framework for designing more online simulations for the class.
[5] To propose a framework or template that can be used to design the online
translation of available class simulations or new online simulations, which closes
the identified gaps by addressing the identified challenges.
[6] To design the translation of an offline simulation or a new online simulation as an
example based on the proposed framework. This design can be used for the
implementation and evaluation of the particular online game in the future, which
is not in scope of this thesis.
[7] To capture the voice of the customer (participants) for an online educational
simulation.
CHAPTER 3: LITERATURE REVIEW
There are multiple domains involved in the development of an effective online
simulation for students. The available literature, research findings and data related to
online education, adult education, benefits of simulations, effectiveness of simulations,
design of educational content, computer simulations, design of computer-based
educational simulations, challenges in online education and simulations, criteria for
evaluating a simulation, Lean manufacturing and Lean Six Sigma education, and tools for
capturing voice of customers have been reviewed and major findings are detailed below.
Online Education and Andragogy:
Student enrollments for online courses show a minimum 9.3% growth every year,
and more than 32.0% of students take at least one course online (Allen & Seaman, 2013,
pp. 4-5). Online education enables adults to pursue higher education or specialized
training without having to be away from work, at their convenient time and pace (Moore
& Kearsley, 2012).
dos Santos Matai and Matai (2009) have summarized the works of (Knowles,
1970), and (Cavalcanti & Gayo, 2006) on the premises of andragogical educational
approaches. According to that, adults know their needs and pursue knowledge in a
pragmatic way. Adults are more self-motivated from their inner wish to grow, increased
self-esteem and fulfillment, and thus act independently with higher self-efficacy to gain
knowledge they need with minimum direct dependency on teachers. In adult learning, the
10
active role of the learner is critical since the learner’s experience is of preeminent
importance. The teachers’ and other scholars’ experiences serve as a reference source,
which may or may not be valued by the adult learner. Adult learners also aim their
learning towards what is meaningful to them and has an immediate or near future usage
rather than learning something that may or may not be useful in the future. This factor
has more weight for adults who are pursuing higher education with the aim of advancing
in their current professional career path.
Adults benefit more from a problem-centered orientation while learning than a
didactic theoretical orientation (Knowles, 1996). Since the targeted audiences for Lean
and related management education are mostly adults, it is important to align the
classrooms towards both theoretical and problem centered approaches for effective
learning. The simulations and classroom exercises implement this approach and hence
they are effective for adult students (Ota, DiCarlo, Burts, Laird, & Gioe, 2006).
Additionally, senior students and young adults also benefit from these approaches as they
develop interest in exploring the professional identity by identifying the skill sets and
discovering prospective vocations and career paths. Thus it gives an opportunity to know
and try different work areas, which helps the students to get in to the context easily and
delve into inner interests and abilities. Students also learn what are expected from them in
a professional setting, people with whom they have to socialize, and the level of
competition in those professional settings (Cole, 1941).

11
Benefits of Simulations and Games:
The terms simulations and games will be used interchangeably in this report.
Though there are nuances in the dictionary definition of these terms, for simplicity and
avoiding confusion, they both mean an activity that attempt to mimic a real life activity,
role, or process that a participant can relate to and imagine to be a part of in real world.
Additionally, a game also has an element of competition between the participants or
participating teams. In most cases, this game element can be included or removed based
on the preference of facilitator and participants. There are many benefits for using
classroom simulations as a vehicle for problem-centered learning. They have higher
motivation factor for active participation of students, the learning in real world setting
improves the performance of real world application, students and teachers have more
control over variables since simulations are mostly very flexible, and in some cases it
allows students to learn the core concepts and what to expect in real-world problems
without the risk of dangerous environment or in situations where real world scenario is
expensive or even impossible to create (Lunce, 2006, p. 38).
Classroom simulations in which students participate as groups also provide a
platform for collaborative and cooperative learning, which has benefits of increased
motivation, higher interactivity, fostering of social skills and improvement of
metacognitive skills (Trollip & Alessi, 2001, p. 34). The simulation exercises generally
provide a quick feedback to the participants, which is an essential element in any learning
experience (Gagné, Briggs, & Wager, 1992).
12
Design of an Educational Content:
There are many detailed studies conducted related to the development of
instructional methods and educational content. Arinto (n.d) has created a handbook for
instructional designs based on different proven effective instructional design principles
for developing an educational activity. It can be effective if a blended approach is taken
to develop educational content that take appropriate practices from different educational
theories based on the target audience and the learning objectives (Arinto, n.d). Bloom’s
taxonomy of cognitive skills is useful for identifying and defining learning outcomes or
objectives (Arinto, n.d; Bloom, College, & Examiners, 1956). There have been many
versions of processes developed by different individuals and organizations to define and
develop effective accomplishment of learning objectives. An analytical approach to
design an instructional process for complex experiential learning environments that are
applicable both to face-to-face and virtual environments such as computer-based
simulations and games is the iterative four step experiential instructional design process,
4xEID (Appelman, 2011). This method proposes an iterative 4-step process of defining
the goals of learning environment, operationalize the content and creating a content
hierarchy, defining specific methodologies that establish overall treatments of contents,
and defining learning vectors that couple to an experiential mode framework. Individual
designer or a group of designers together can utilize this process.
Effectiveness of Simulations:
Gentry (1980) studied the effect of group size on attitude towards the simulations
and performance in simulation games. He studied different groups of student from same
class with group size ranging from two and more. He found that there is no significant
13
effect of group size on the performance. However, the size of the groups significantly
affected the level of engagement in the activity and the amount of discussions, since more
interactions were observed in groups with smaller number of participants.
Computer Simulations:
A computer simulated model is a real-life system or process represented in an
abstracted or scaled-down form (Heinich, 2002). Computer simulations are used in a
wide variety of practical contexts including design of complex systems, weather
forecasting, forecasting of prices, etc. It allows running a real life scenario virtually by
embracing all the factors and noises involved. Furthermore, it enables the user to analyze
the process and results acquired without the expenditure of the money or risk typically
involved in a real life process.
Learning supported by simulations, as mentioned earlier, provides an experiential
learning procedure where information is shared by transformation of experience. Students
can see the impact of their decisions on the problem situation and future events, and can
react to these effects and make new decisions (Merkuryeva, 2001). It also enables the
audience to expand their academic domain beyond the walls of a typical classroom and
enable them to have a realistic perspective on actual industrial scenarios. Since
“computer simulations are flexible and dynamic”, they can guide the learner in the
achievement of specific learning goals (Gibbons et al., 1998). Through the use of “Java
applets”, computer simulations can now be delivered over the Web making them a viable
component in the distance learning experience (Granlund et al., 2000; Osciak & Milheim,
2001). However, many security issues and vulnerabilities for Java applets have been
14
reported, and latest technology such as Dart (Špiláková, Jašek, & Schauer, 2014) or
HTML5 could be an alternative to Java applets.
Design of Computer Based Educational Simulations:
Adams et al. (2008b) have conducted and published a very detailed study on their
work related to design of computer-based simulations for students as part of the Physics
Education Technology (PhET) interactive simulations project at the University of
Colorado Boulder. These simulations were initially developed for undergraduate students
and have currently become extensively used in higher-grade classes also. They have
found that engaging students in thoughtful exploration improves the understanding of the
concept. A variety of factors influence the learning from these simulations such as
interactivity of the program, presence of small puzzles, and features that make the
simulation fun to play with. Placement of small quizzes in the simulation is an effective
way of stimulating thoughts and more engagement. These small puzzles need to be with
an acceptable difficulty, since very tough puzzles might demotivate the user and user may
give up further exploration.
Adams et al. (2008b) have also given a higher emphasis on the ‘fun’ aspect of a
simulation and have concluded that when the simulations are fun, the students enjoy
playing with them. This fun factor contributes to higher engagement that in turn results in
higher learning. The simulations that appear ‘boring’ do not get students drawn into it
and are found to be less effective than the fun-to-play simulations. However, addition of
more fun elements was often found to distract students and in effect reduce the learning
achieved by the simulation session. As demonstrated in their study and following
common logic, fun is an important factor for the effectiveness of simulation in a
15
pedagogical viewpoint. However, such detailed studies about fun criteria of educational
simulations in an andragogical aspect are very limited and is an open question for future
research. It can be safely assumed that a little fun will also be appealing to adults
participating in an educational simulation and will help to increase the engagement level
in the activity. The higher threshold level for fun factor to become a distraction or even a
nuisance might be different for adults and children.
Adams et al. (2008b) have also categorized simulation designs to three different
categories based on usability as Non-Intuitive, Semi-Intuitive and Intuitive. Non-Intuitive
simulations are difficult to use even with instructions, Semi-Intuitive simulations are easy
to use after first demonstration or explanation, and Intuitive simulations are very easy to
use with no instruction.
It appears that while it is possible to create intuitive simulations for low-level
topics in any subjects, for advanced topics it may not be possible to deliver simulations in
such simple intuitive format in which the user plays around with the simulation and
learns through engaged-exploration. Educational simulations for advanced topics might
be more efficient with some guidance and instructions that build up learning step–by-step
during the course of play. An instructor in parallel may do this guidance while students
play simulation on the computers. However, this approach has a limitation that the
instructor needs to be available real time either physically or online with the students,
which may require all participants to attend a fixed scheduled meeting. This might be a
major drawback since one of the major advantages of online education is that they are
flexible in schedule. One solution for this problem is to have the guidance incorporated
into the simulation that students can play at a convenient time, which also reduces the
16
load on the instructors. However, a right limit needs to be applied for the guidance since
it should not hinder the crucial ‘engaged exploration’, which is a major factor
contributing to learning through the simulation activity.
Lean Six Sigma Education:
Since the popularization of Lean manufacturing ideas in western countries and the
successful implementation of Lean automobile production systems, a general interest on
these topics grew among many academic scholars that were also reflected in mainstream
literature in the fourth quarter of twentieth century. Many people, including employees of
traditional organizations that are planning to implement a Lean system, and new students
are interested in formally learning this philosophy and its tools. One of the major
challenges while teaching Lean concepts to people who do not have any prior experience
with Lean is to create a context for the students so that they can visualize and grasp the
core concepts effectively (Dukovska-Popovska, Hove-Madsen, & Nielsen, 2008). One of
the major benefits of contextualized learning is that learners easily repeat it as long as
they apply it in the same context (Trollip & Alessi, 2001, p. 33).
The learning from classroom simulations that are set in manufacturing context can
also be useful for applications in service industry setting. By using TimeWise®
simulation sessions in classroom, Pariseau (2011) found that majority of the students that
participated in classroom simulation in manufacturing context was able to transfer their
knowledge to a service environment, though no additional class time was spent on
discussing the application of Lean in services. She observed that eighty one percent of the
students in the course were able to identify wastes and describe a service process, and
eighty-two percent of students had high perceptions of their ability to apply Lean in other
17
type of organizations. She has concluded that “The understanding and knowledge gained
is not limited to manufacturing but can be transferred to a service environment”.
Challenges in Online Education and Simulations:
Though online education is getting increasingly popular every year, it is not free
from shortcomings. There are many challenges to overcome for the efficient
communication between participants in the program and setting up an effective
environment for meaningful learning. As class sizes increases, the synergy level of active
dialog among the participants, which is the most promising potential in online education,
tends to decrease and eventually becomes to the level of independent study (Ion-
University of Illinois, n.d). Simulation and learning games sessions, in which participants
actively participate as group, can help to retain this synergy.
There are some notable disadvantages associated with learning using face-to-face
classroom simulations. It can be argued that these simulations over-simplify a real world
problem by eliminating the distractions and some complexities of real life situation that
might result in an ‘imprecise’ learning, which might turn useless in a real life event
(Lunce, 2006, p. 38). So it is important that the simulations that are aimed for the students
to learn advanced concepts should be designed with adequate level of complexity that
closely matches a real world setting. Additionally, a standalone simulation activity might
not provide any real learning for the participant, except for the pleasure of play or
participation, without proper debriefing and discussions to reflect what was learned
during the session (Heinich, 2002).
In addition to the general disadvantages of simulations, online simulations pose
some additional issues. Since these activities are done on computers using keystrokes and
18
mouse clicks, it lacks a realism of activities that are performed in real world. Some
simulations such as those related to office process work would be able to deliver a good
sense of real world setting since these processes are majorly done via computers in reality
anyways. However, this issue is notably important in simulations in a manufacturing
setting. Without the sense of physical labor and motion, the participants might fail to
capture the key points from the simulations as reflected in the dialogue “Unlike armchair
generals, we will share the pain of our soldiers, in the form of electric shocks” (McClory,
1983).
Additionally, the real-time communication between the participants while playing
the game is a vital element of group simulations. So it is critically important to account
the usage of real-time multimedia communication while designing a simulation for online
classes. These communication platforms can either be incorporated within the game or
additional audio/video conferencing tools such as Skype or Centra can be provided to the
participants.
Criteria for Evaluating a Simulation:
Regardless of online or offline implementation, the net effectiveness of an
educational simulation is evaluated based on multiple criteria. The criteria and weights of
each criterion are different for students and facilitators, and may vary with different
individuals. There are multiple literatures published on different aspects of evaluation of
an educational simulation and multimedia educational activities. There is little literature
available on specific evaluation criteria pertaining to online education simulations.
Geissinger (1997) has summarized the work of Barker and King (1993) and explained
that quality of end user interface design, engagement, interactivity, and ‘tailorability’ are
19
the major evaluation criteria for an educational simulation. Kennedy, Petrovic, and
Keppell (1998) maintain that introductory learning objectives, navigation and orientation,
and interactivity are the major criteria for evaluating a multimedia educational activity.
Adams et al. (2008b) has mentioned required pre-requisite knowledge could be a
criterion for evaluating an educational simulation. They even went further and suggested
that prior understanding could be a negative influence as the students who do not believe
they already know the relevant ideas are more likely to learn more by detailed
exploration.
Tools for analyzing the evaluation criteria and their weights:
It is a challenging task to design a simulation that satisfies all participants. This
problem with multiple criteria and multiple decision makers needs to be solved to find the
set of criteria and their weights that effects the reasonable satisfaction of the population
of prospective participants. Analytic Hierarchy Process (AHP) is a technique developed
by Thomas L. Saaty in 1970s to organize and analyze complex problems to arrive at the
‘best available’ decision by an individual. This method employs pairwise comparisons
that reflect individual preferences to relatively weigh different options and
mathematically arrive at the best decision (T. L. Saaty, 1990). When multiple decision-
makers are involved or preferences of multiple individuals need to be incorporated in to
the decision, AHP can be used to capture the individual preferences, and then those
results can be combined to reflect the net group preferences. Aczél and Saaty (1983)
proved that geometric mean is the best way to synthesize group judgment matrices from
the judgments given by the individuals in the form of reciprocal matrices. When multiple
people are involved in decision-making, a consensus may not be arrived at, and analytical

20
methods need to be used to synthesize the final judgment. The deterministic approach of
using geometric mean to synthesize judgment matrices, or a weighted synthesizing
method if participating individuals have unequal importance, can be effectively used in
most cases except for large number of geographically dispersed people (Basak & Saaty,
1993, pp. 106-106).
CHAPTER 4: ANALYSIS OF EXISTING SIMULATION GAMES
In this section, details of a survey of simulations that are focused on topics related
to Lean Six Sigma education and operations management in general are discussed. The
gaps between online and offline simulations are analyzed, and the challenges for closing
those gaps and other challenges for implementing an effective online educational
simulations are discussed in detail.
Survey of Available Operations Management Simulations
The number of Lean simulations kits and training programs have increased
dramatically in the last decade and a plethora of consulting firms have come up with their
own versions of Lean training programs that range from two hours sessions to multi-day
sessions. In 2003, there were about seventeen simulations used for Lean training purposes
by the major organizations (Verma, 2003). In 2010 that number shot up to more than
forty (Badurdeen, Marksberry, Hall, & Gregory, 2010). Right now, a quick Internet
search will pop up dozens of consulting companies that provide off-the-shelf kits and
training packages. A survey of games, simulations and exercises that can be used for
Lean classrooms has been conducted and results are given in Appendix A. This list of
games are gathered majorly from various online websites that sell simulation kits,
academic papers that propose or discuss usage of a simulation to demonstrate related
learning objectives, and online blogs and discussion forums related to the topic. The
details and references to the sources of games are provided in Appendix A TABLE 25.
22
The survey found at least 53 distinct simulations. There are multiple variations for
many of these 53 simulations that are adjusted to match different audiences and
industries. Most of the popular simulations are in a manufacturing setting. However,
consulting companies are coming up with kits that are designed for service industry
settings as well, with major focus on healthcare industry. Many of the training programs
and kits that are sold online are not very different from each other. One company might
be selling kits with Lego® airplanes and the other one might be selling Lego® cars.
Nevertheless, they aim to teach the same principles.
There are tons of games online (predominantly Adobe Flash games) that could
relate to operations management principles. For example Coffee Shop game (McNeely &
Wofford, 2014) shows how to optimize a coffee shop operations. However these games
are not coherent enough to be used as an educational activity. The qualifier for including
a particular game in the survey list is whether that game can be used as part of an
educational activity to effectively deliver the learning objectives, which can be applied by
the participants not only to the setting that the game is on but also to any real-world
setting related to the learning objectives.
Most of the simulations that are available now, are designed for a face-to-face
classroom or offline learning. Out of the 53 simulations, only four have effective online
deployments that can be used by online learners. Additionally, most of the online
versions are single-player setup. Different from a multi-player team setup, at one point,
the focus of the individual changes to ‘winning the game’ than ‘learning’ the underlying
principles. Four games have standalone computer applications that can be downloaded
and played individually. Dice Game has an iOs app version, which costs $2.99
23
The cost of available simulations shows a wide variation. Most of the simulations
that are developed in academia use everyday stationary objects and cost less than ten
dollars. Some companies produce kits based on Lego blocks that could range from $10 to
$400. The Lego materials for these games will not cost much but together with
instructions and licensing cost, these get expensive. There are special kits, which use
objects such as LED flashlights, electric plugs, mini CAT toy trucks etc. that will cost
anywhere between $500 to $2000 with license and training materials. Very expensive
simulations such as TimeWise (no advertised prices for kits currently online) have special
objects such as timepieces in the kit. These kits are part of training sessions that could
even be multi-day sessions and costs include training, instruction material and licensing
fees.
The number of participants and the time required for play would be an important
factor for facilitators, as some games cannot be played without a minimum number of
people and cannot be finished before certain duration. This could limit their application in
classes that have small number of students and does not have enough meeting time to
complete the activity. The number of participants varies from a single person to multiple
groups of dozens of people. The time required for completing different simulations
varies from few minutes (for e.g. Name Game) to multiple days (for e.g. TimeWise).
24
Gaps Between Offline and Online Educational Simulations
Few identified gaps between online and offline simulations have been discussed
earlier in the literature review section. Additionally, there were a few more gaps
identified from the sample participants’ responses and feedback to the face-to-face
classroom and online simulation sessions. These are analyzed, summarized, and
discussed below.
Limitations to Realism:
As discussed in the literature review section, most of the face-to-face classroom
simulations themselves have a substantial gap from the real world setting since most of
them tend to over-simplify a real-world problem. Thus a complex operation in the real
world setting will be mostly mimicked by simple actions during the simulation. For
example, manufacturing a lampshade structure is simplified to cutting the top of a cup
and putting holes on the sides in the Lampshade Game. This gap increases further if these
simulations are implemented online as-is. The actions drifts further away from the reality
since they are now simulated by keystrokes and mouse clicks. One of the other
limitations that is also reflected in the students’ feedback for games involving repeated
steps is, in physical face-to-face classroom simulations students have more tolerance to
repeated activity since they enjoy developing the sense of mastery over the action as in
the case of a real-world application. However, in online simulations these activities
become ‘boring’ after few repetitions, and thus results in lower engagement.
25
Direct Communication Gaps:
The existing online simulations provide very limited communication between the
participants. Most of the educational games that are available online do not have a
multiplayer mode. Even if they have a multiplayer mode, the communication is very
limited between the individuals. For example, online beer (Appendix A, TABLE 25 No.
20) game has a multiplayer setup but it does not provide any communication platform
(Although it needs to be noted that beer game is a specific example where the key focus
of the game is how communication gap in the supply chain creates the bullwhip effect).
In general, one of the key elements of collaborative learning is the discussion between
individuals (Trollip & Alessi, 2001), so the limitation of communication for existing
online simulations limits the overall effectiveness of the sessions.
Tacit Communications:
During a face-to-face classroom simulation session, like any direct person-to-
person communication, a part of commination happens tacitly via body language, subtle
facial expressions, hand gestures etc. These help the facilitator to intervene if students
appear to be confused, lost, or in doubt. These factors also contribute to the total
engagement in the activity. There is a substantial gap between offline and online
simulations based on this factor since it is very hard to capture these tacit
communications between participants remotely.
26
Ad-Hoc Configurability:
Face-to-face classroom simulations have some degree of ad-hoc configurability
for the play settings, since the facilitator has more control over the simulation session.
For example, in the case of the Dice Game, the setting for the game can be changed from
manufacturing to services easily if the facilitator names the work stations as task stations
and movement of chips as flow of work from one process to another. This degree of ad-
hoc configurability is unavailable in online simulations since the implementation will be
hosted in one particular setting and changing the settings requires more time and
recourses if the simulation does not provide those configurable settings option by default.
However, if planned and implemented ahead online simulations can have more flexibility
than a face-to-face simulation.
Challenges for Implementing an Online Educational Simulation
Following the analysis of the aforementioned gaps, a set of challenges for closing
those gaps can be identified. Some of them are inherent to online simulations and cannot
be overcome completely. These challenges are identified, listed, and discussed below.
Implementing a Good Real-World Mimic:
The main challenge to close the gap of lacking realism is to find a mimic for the
real-world object or process that can be implemented on a computer simulation. This
becomes harder in the case of educational simulations that are played in a manufacturing
setting. For example, finding a mimic that connects back to the real-real world setting
like physically cutting and punching a paper cup, in a computer simulation will be a
challenging task. There could be multiple alternative solutions to this problem but none
27
of them can guarantee the same level of effectiveness of the sense of physical motion,
transformation, and actions.
Administration Challenges for Multiplayer Games:
One of the main factors that contribute to higher level of engagement in a
classroom simulation session is participants being together face-to-face within a single
room. This is not highly challenging in the case of a classroom simulation since
participants are pre-committed to meet or participate at a scheduled time. However, since
many of the online courses advocate the benefits of students being able to learn through a
very flexible schedule that fits each individual, administering to get online students to
join a fixed time meeting could be very challenging for games that require multiple
players.
Communication Challenges:
As detailed in the analysis of gaps, there is an inherent challenge in accomplishing
the same level of implicit and explicit communication remotely using any currently
available technology, at the same level as a face-to-face communication. However, by
implementing real-time audiovisual communication between participants, this gap can be
minimized, though a complete closure is impossible.
Technical Challenges and Additional Resources:
Developing and implementing an online simulation involves more technical
challenges than developing a face-to-face classroom simulation. This will require
additional resources and can be more costly to implement than a face-to-face classroom
version of the simulation. It requires the student to possess Internet accessible devices
such as computers or tablets that meet performance standards for the technology used to
28
implement the simulations. For example, a simulation that employs graphics and
audiovisual communication will require a device with graphical processing capabilities
and a reliable Internet connection. Additionally, there will be additional costs involved to
host and store these simulations and information online, and to make them accessible to
all.
Complex Learning Objectives
In particular to advanced topics such as Lean Six Sigma, learning from an
intuitive simulation is challenging since the topic itself will require some pre-requisite
background knowledge, and at least a high level explanation to kick start the learning
from the simulations. In these cases, letting the user to figure out the learning objectives
by trial and error might not be an effective approach. This challenge may be addressed by
breaking down learning objectives to specific sections and divide simulation activity to
different sections or create different simulations for each specific set of learning
objectives.
CHAPTER 5: METHODOLOGY
In this chapter, methodology and process followed in this thesis is detailed. This
chapter includes description of steps of Analytic Hierarchy Process such as synthesizing
weights of simulation, evaluation criteria and comparison of alternatives. Additionally,
the process of developing a Kano model, a method for capturing voice of the customer,
and the details of statistical tests used in the project are also detailed.
Definition of Target Population and Sample:
Immediate target population for the final implementation of the designed
simulation is, but not limited to, the graduate level students of the Systems Engineering
and Engineering Management (SEEM) Department at University of North Carolina at
Charlotte. The sample population for evaluation of criteria and hypothesis testing is
selected randomly from volunteers including graduate level students and teachers in the
SEEM department.
Multi-Criteria Decision Making: Analytic Hierarchy Process (AHP)
The problem in focus for this study is a multiple criteria, multiple decision-maker
problem. Analytic Hierarchy Process (AHP) is an analysis tool that is generally used to
compare multiple alternatives based on multiple criteria for complex decision problems.
The core idea of AHP is using multiple pairwise comparisons to compare multiple
decision elements and deduce the best option available.
30
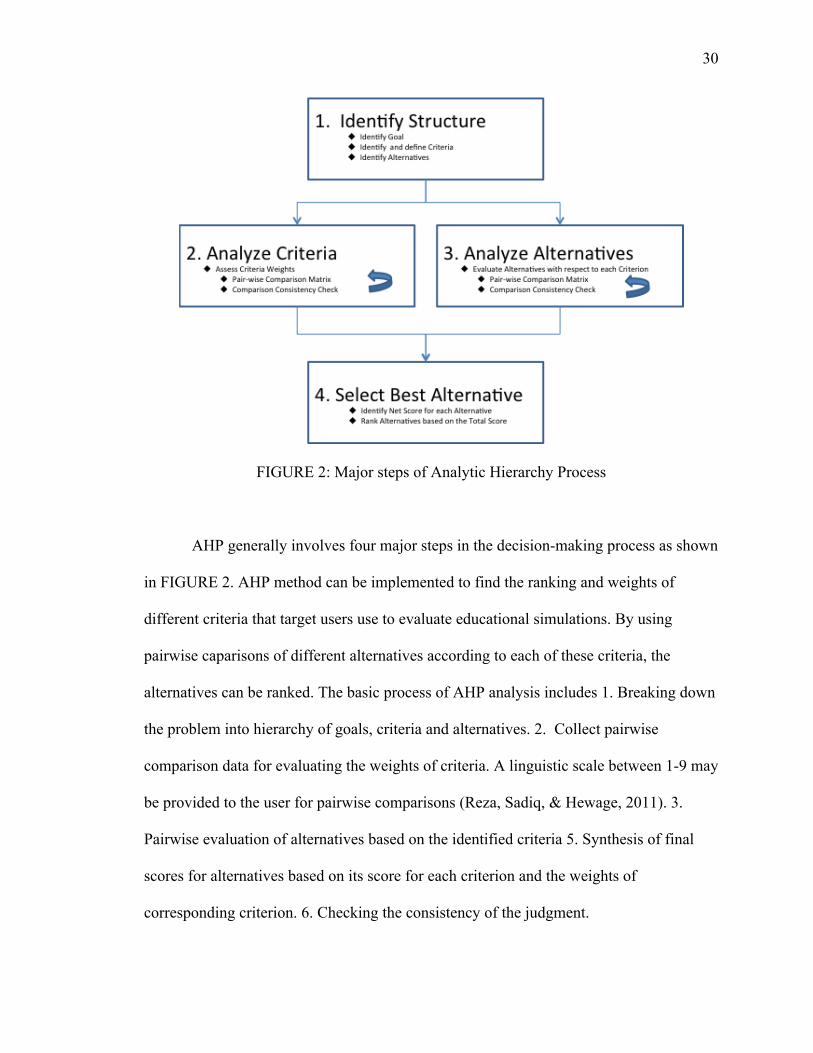
FIGURE 2: Major steps of Analytic Hierarchy Process
AHP generally involves four major steps in the decision-making process as shown
in FIGURE 2. AHP method can be implemented to find the ranking and weights of
different criteria that target users use to evaluate educational simulations. By using
pairwise caparisons of different alternatives according to each of these criteria, the
alternatives can be ranked. The basic process of AHP analysis includes 1. Breaking down
the problem into hierarchy of goals, criteria and alternatives. 2. Collect pairwise
comparison data for evaluating the weights of criteria. A linguistic scale between 1-9 may
be provided to the user for pairwise comparisons (Reza, Sadiq, & Hewage, 2011). 3.
Pairwise evaluation of alternatives based on the identified criteria 5. Synthesis of final
scores for alternatives based on its score for each criterion and the weights of
corresponding criterion. 6. Checking the consistency of the judgment.
31
Original AHP method proposed by Saaty involves using dominant right
eigenvector to find the underlying scale of ranking from a reciprocal symmetric judgment
matrix (T. L. Saaty, 1990). However, a normalized geometric mean can also be an
estimator for this underlying scale (Crawford, 1987; Wind & Saaty, 1980). For this
project a geometric mean approach is used to synthesize the ranking and weights of
different criteria. In this project, in addition to the complexity of multiple criteria, the
problem is more complex since there are multiple decision makers are involved. The
consolidated criteria weights are derived from the judgments of different people, who are
the random sample from the population of target audience, each individual responders act
as different decision makers. T. Saaty (1989) has outlined a process for group decision
making using AHP. He proposed two different approaches for synthesizing group
judgment from individual judgments. In the first method, a consensus is reached between
the individual members for each pairwise comparison. In the second method, the group
judgment is calculated from the individual judgments. As detailed in the literature review
section, Aczél and Saaty (1983) has found that group judgment can be synthesized for
each pairwise comparison by calculating the geometric mean of individual judgments for
that particular pairwise comparison. In this project the second method is used since there
is an expected substantial difference between individual judgments and to bring all group
members together to reach consensus is a difficult task. Following the process outlined by
T. Saaty (1989), the process for finding the evaluation criteria and their respective
weights is detailed in later chapters.
32
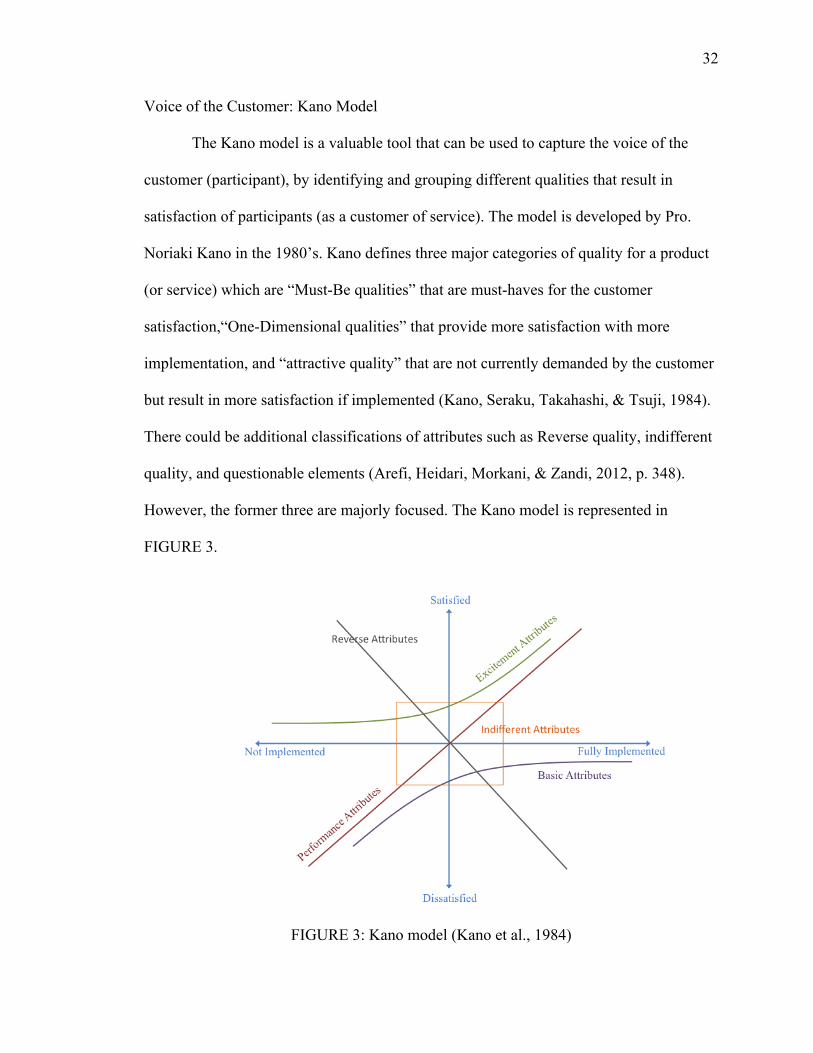
Voice of the Customer: Kano Model
The Kano model is a valuable tool that can be used to capture the voice of the
customer (participant), by identifying and grouping different qualities that result in
satisfaction of participants (as a customer of service). The model is developed by Pro.
Noriaki Kano in the 1980’s. Kano defines three major categories of quality for a product
(or service) which are “Must-Be qualities” that are must-haves for the customer
satisfaction,“One-Dimensional qualities” that provide more satisfaction with more
implementation, and “attractive quality” that are not currently demanded by the customer
but result in more satisfaction if implemented (Kano, Seraku, Takahashi, & Tsuji, 1984).
There could be additional classifications of attributes such as Reverse quality, indifferent
quality, and questionable elements (Arefi, Heidari, Morkani, & Zandi, 2012, p. 348).
However, the former three are majorly focused. The Kano model is represented in
FIGURE 3.
FIGURE 3: Kano model (Kano et al., 1984)
33
Hypothesis Testing: Analysis of Variance (ANOVA) and T-test
At different stages of this project, simple comparative statistical tests or ANOVA
tests will be utilized to test different hypothesis about collected data. A simple T-test or
paired T-test can be used to compare means of different populations based on the sample
data (Montgomery, 2008). The null and alternate hypothesis for each testing will be
explained in the corresponding sections of this report. A significance level of 0.05 is
selected for each hypothesis testing and the null hypothesis will be rejected if the p-value
corresponding to the test statistic is less than the significance level. Minitab software will
be used for any statistical analysis of data.
Analysis of Variance (ANOVA) test can be used to compare the means for more
than two populations. The null hypothesis for ANOVA test is all means are equal, and the
alternate hypothesis is at least one mean is different. There are three major assumptions
for an ANOVA test 1. Data is normally distributed 2. Observations are independent 3.
Variance is equal for all populations (Montgomery, 2008). After the test, a model
adequacy check is done for verifying these assumptions using the Minitab software.
CHAPTER 6: IDENTIFY PROBLEM STRUCTURE: CRITERIA, GOALS, AND ALTERNATIVES FOR SIMULATION GAMES
In this chapter, the first step of AHP as mentioned in previous chapter will be
detailed along with additional analysis based on the findings.
Identifying Criteria
A survey has been conducted to identify multiple criteria for evaluating
simulation games. Initially the major criteria that appear commonly in literature were
listed out and given to sample audience for feedback. Participants were also asked to add
any criteria that they deemed are important to the list. Before classroom sessions were
conducted for this project, participants provided their own list of criteria. A total of 11
participants provided inputs. This set of criteria included substantive learning,
complexity, duration, customizability, timing flexibility, fun, learning objectives,
discussions, engagement level, interaction, cost, pre-requisite knowledge, key topics
covered, configurability, industry settings, real-world connection, graphics, interesting
topic, intuitive game play, “non-boring” duration, and different player modes.
Few criteria that were repeated in most of the responses were substantive
learning, engagement, fun, interactivity, duration, complexity, configurability, level of
prerequisite knowledge required, presence of competition, visual appeal, platform for
discussion, setup time required, accessibility, number of people required for the
simulation and costs. It is no surprise that different stakeholders will have different
criteria for evaluation simulations. For example, the teachers or facilitators will be mostly
35
concerned with the learning objective, setup time and number of people required for
running an effective simulation session. The department may consider the cost of
simulation as one of the major criteria. Students may give more emphasis to having fun,
interacting and the look and feel of the simulation.
TABLE 2 summarizes the selection of major criteria from the initial list of
criteria. As shown in this table, the major criteria are Substantive learning, Engagement,
Complexity, Duration, and Customizability. These categories are described as following:
1. Substantive Learning: Includes number of learning objectives, subject matter,
subject topics that are covered during the game, etc.
2. Engagement Level: Related to how much fun participants have playing the game.
How much interaction participants have with other players. How good the
platform for discussion and collaborative learning is. Presence of competition or
race. How interactive the game design is.
3. Complexity: Importance of how complex or simple is the activity. How long does
it take to understand the rules? Is the gameplay confusing?
4. Duration: The duration of game play or simulation activity. Does it take long time
to achieve the learning objectives?
5. Configurability: How far the game or simulation is customizable? Are there
options to configure it to specifically match manufacturing, services, healthcare
etc. Can the number of people required for the session be changed? Does the user
have the option to play in a single player or multi-player setting? Can the
difficulty level be varied for different users?

36
TABLE 2: Summary of criteria selection
Initial Criteria List Final Major Criteria List • Substantive learning • Complexity • Duration • Customizability • Relevance to subject • Timing flexibility • Fun • Learning objectives • Discussions • Engagement Level • Interaction • Cost • Pre-requisite knowledge • Key topics covered • Configurability • Industry setting • Real-world connection • Graphics • High definition visualization • Interesting topic • Intuitive Game play • Non-boring duration • Mobile compatibility • Different player modes • Accessible to participants
• Substantive learning • Interesting topic • Learning objectives • Pre requisite knowledge • Key topics covered
• Complexity • Intuitive Game play
• Duration • Non boring duration
• Engagement Level • Discussions • Interaction • Real-world connection • Graphics • Fun
• Configurability • Customizability
• Player mode customizability
• Industry setting • Timing flexibility
Kano Model for Educational Simulations
Following the identification and evaluation of weights of criteria, attributes of
online educational simulations that are perceived by the participants are classified to
must-be, one dimensional, and attractive qualities. Some of the attributes are expected to
be present at least at a minimum level, which might lead to classify them as a basic
quality. However, for simplicity, the following qualifiers are used to classify different
attributes: if the best implementation results in the best positive customer satisfaction and
the worst implementation results in the worst negative customer satisfaction (hate), it is a

37
performance attribute. If the best implementation results in the best positive customer
satisfaction and the worst implementation results in zero customer satisfaction, it is an
excitement attribute. If the best implementation results in zero customer satisfaction and
the worst implementation results in the worst negative customer satisfaction (hate) then it
is a basic attribute.
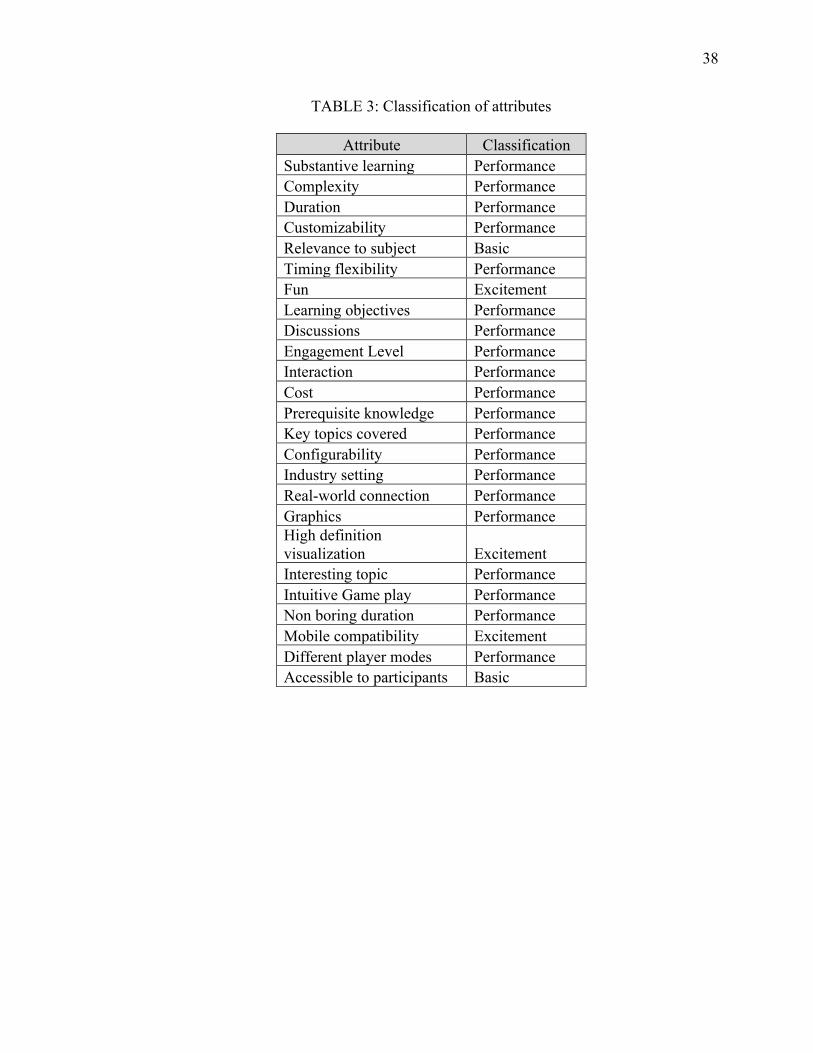
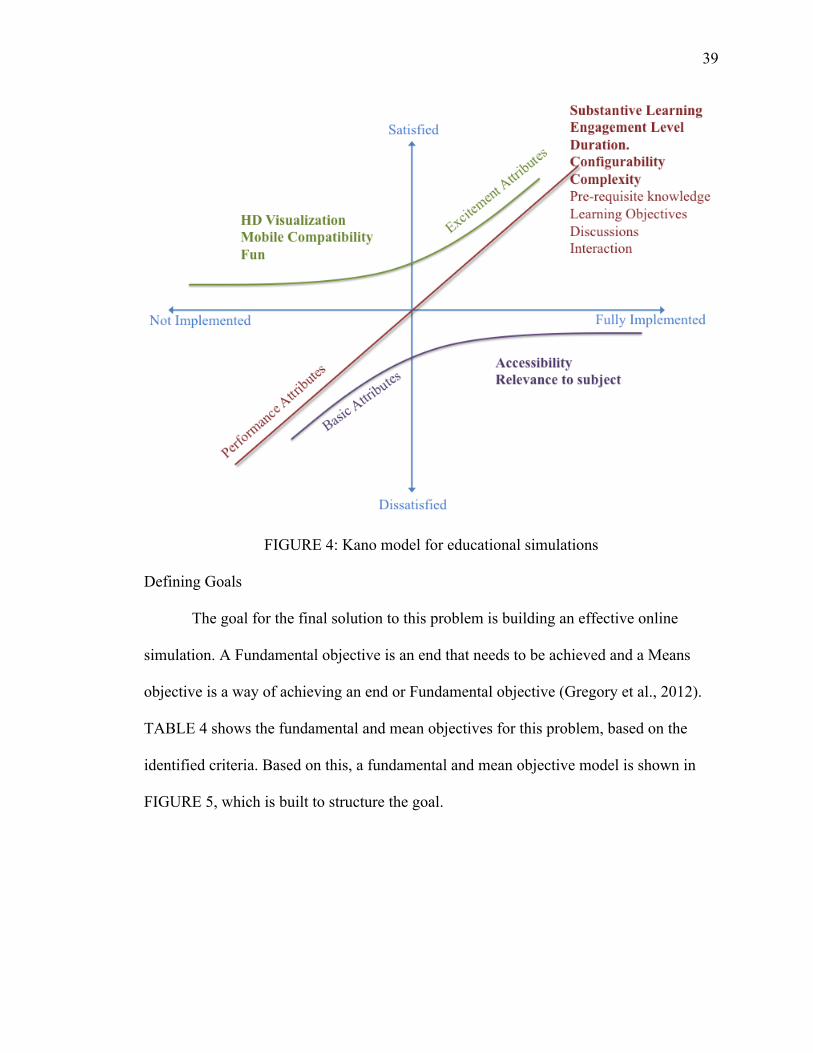
The list of criteria from TABLE 2 is classified based on the above logic and the
results are shown in TABLE 3. It can be seen that most of the commonly referred criteria
are performance criteria. For simplicity, only major criteria from the list of final major
criteria in TABLE 2 are included in the illustration of the corresponding Kano model in
FIGURE 4.
38
TABLE 3: Classification of attributes
Attribute Classification Substantive learning Performance Complexity Performance Duration Performance Customizability Performance Relevance to subject Basic Timing flexibility Performance Fun Excitement Learning objectives Performance Discussions Performance Engagement Level Performance Interaction Performance Cost Performance Prerequisite knowledge Performance Key topics covered Performance Configurability Performance Industry setting Performance Real-world connection Performance Graphics Performance High definition visualization Excitement Interesting topic Performance Intuitive Game play Performance Non boring duration Performance Mobile compatibility Excitement Different player modes Performance Accessible to participants Basic
39
FIGURE 4: Kano model for educational simulations
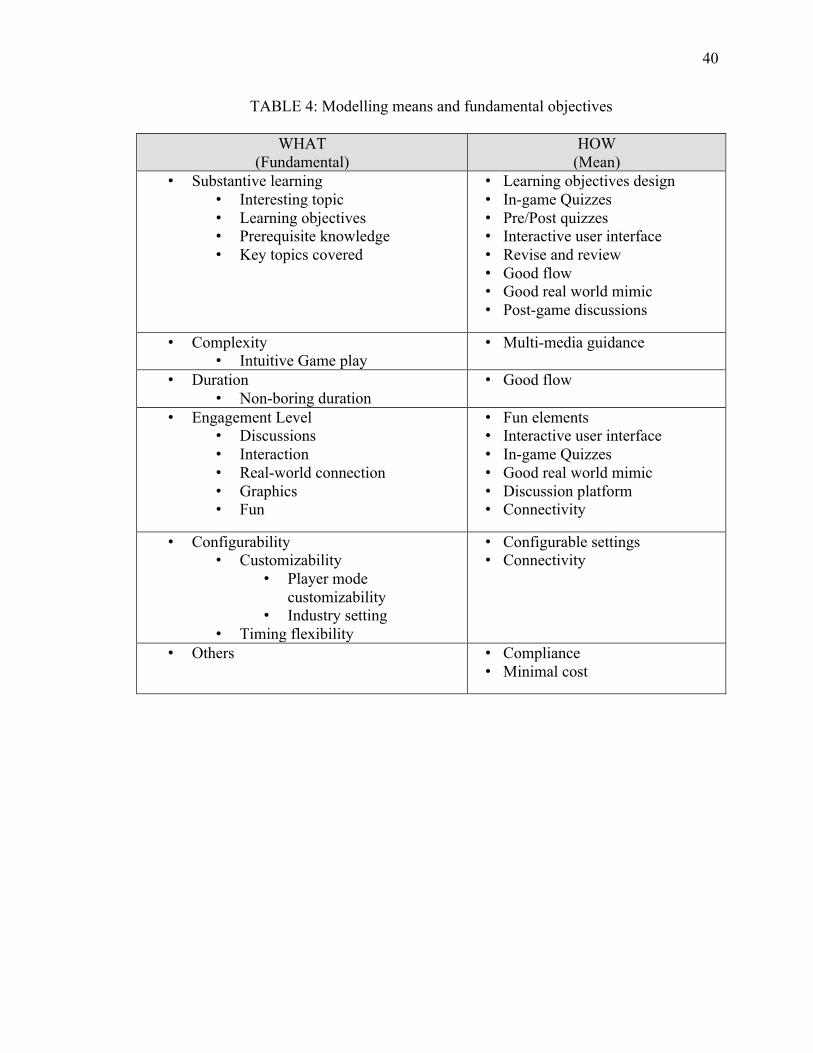
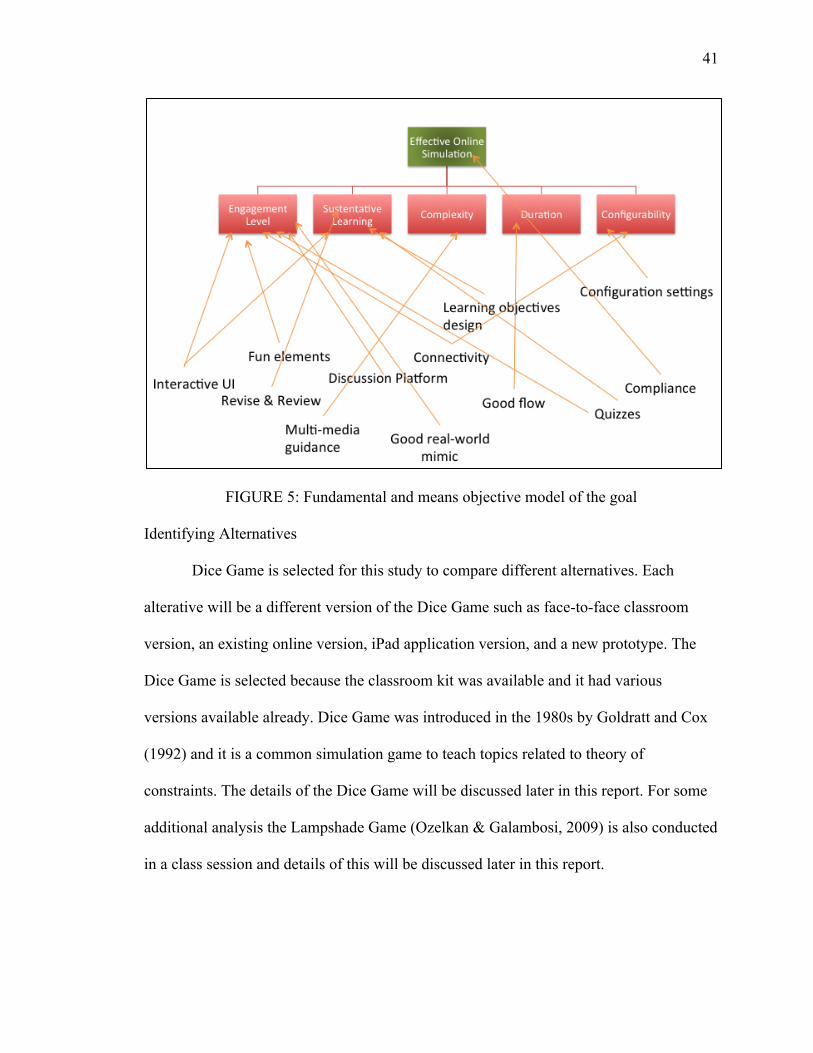
Defining Goals
The goal for the final solution to this problem is building an effective online
simulation. A Fundamental objective is an end that needs to be achieved and a Means
objective is a way of achieving an end or Fundamental objective (Gregory et al., 2012).
TABLE 4 shows the fundamental and mean objectives for this problem, based on the
identified criteria. Based on this, a fundamental and mean objective model is shown in
FIGURE 5, which is built to structure the goal.
40
TABLE 4: Modelling means and fundamental objectives
WHAT (Fundamental)
HOW (Mean)
• Substantive learning • Interesting topic • Learning objectives • Prerequisite knowledge • Key topics covered
• Learning objectives design • In-game Quizzes • Pre/Post quizzes • Interactive user interface • Revise and review • Good flow • Good real world mimic • Post-game discussions
• Complexity • Intuitive Game play
• Multi-media guidance
• Duration • Non-boring duration
• Good flow
• Engagement Level • Discussions • Interaction • Real-world connection • Graphics • Fun
• Fun elements • Interactive user interface • In-game Quizzes • Good real world mimic • Discussion platform • Connectivity
• Configurability • Customizability
• Player mode customizability
• Industry setting • Timing flexibility
• Configurable settings • Connectivity
• Others • Compliance • Minimal cost
41
FIGURE 5: Fundamental and means objective model of the goal
Identifying Alternatives
Dice Game is selected for this study to compare different alternatives. Each
alterative will be a different version of the Dice Game such as face-to-face classroom
version, an existing online version, iPad application version, and a new prototype. The
Dice Game is selected because the classroom kit was available and it had various
versions available already. Dice Game was introduced in the 1980s by Goldratt and Cox
(1992) and it is a common simulation game to teach topics related to theory of
constraints. The details of the Dice Game will be discussed later in this report. For some
additional analysis the Lampshade Game (Ozelkan & Galambosi, 2009) is also conducted
in a class session and details of this will be discussed later in this report.

CHAPTER 7: ANALYSIS OF CRITERIA FOR SIMULATION GAMES
In this chapter, the second step of AHP, analyzing criteria will be detailed along
with additional analysis based on the findings. It includes a collection of individual
judgments and synthesis of group judgments for the evaluation of criteria. Additionally,
statistical analysis of the collected data is performed.
The respective weights for each criterion are found in this step using AHP group
decision-making. Before starting the process, two different sample face-to-face classroom
simulation sessions were conducted. The first session used Dice Game and second
session used the Lampshade Game. Details of these games are provided in the
simulations and game list in Appendix A. Though it is technically possible to gather user
perception about simulation evolutions without having them to play any particular
simulation, these simulations sessions helped to set the context for the participants since
many of them have never attended any simulation sessions in graduate level classes.
Additionally, these sessions were scored by students in a Likert scale for collecting data
for further analysis.
Dice Game:
The Dice Game was introduced by Eliyahu Moshe Goldratt to show the effects of
process variability and bottlenecks on the system performance. The basic idea of Dice
Game is simulating a variance in a production setup using a die roll to determine the
capacity of each workstation. The effects of process variability builds up downstream and

43
the production results in less than the statistically expected average if high process
variability is present in the system (Goldratt & Cox, 1992). Participants will be allocated
to different workstations in the production line and each participant rolls a die to simulate
a day’s capacity. The actual production will be the minimum of the day’s capacity or
available inventory. The indicators of the production performance will be the number of
products coming out of the final workstation or shipped to the customer.
The Dice Game has been further developed by many to demonstrate the effects of
production variability in different settings. The face-to-face version of the Dice Game
played in a classroom as part of this project is developed by Rajamani and Ozelkan
(2004) and involves three iterations of a Dice Game session based on traditional push
production system, a reduced variability system , and ConWIP production system (a
constant work in progress system). The main objective of this game is to help the
participants to understand the root causes of some major issues in a production or supply
chain such as high level of inventory, production delays, unplanned overtime, difficulty
in meeting schedules, etc. This game version helps the users to understand two common
phenomena, uncertainty due to process variability and dependency to previous
operations, which affect the performance of manufacturing system or a supply chain. This
version illustrates the difference between a push and pull production system as well. An
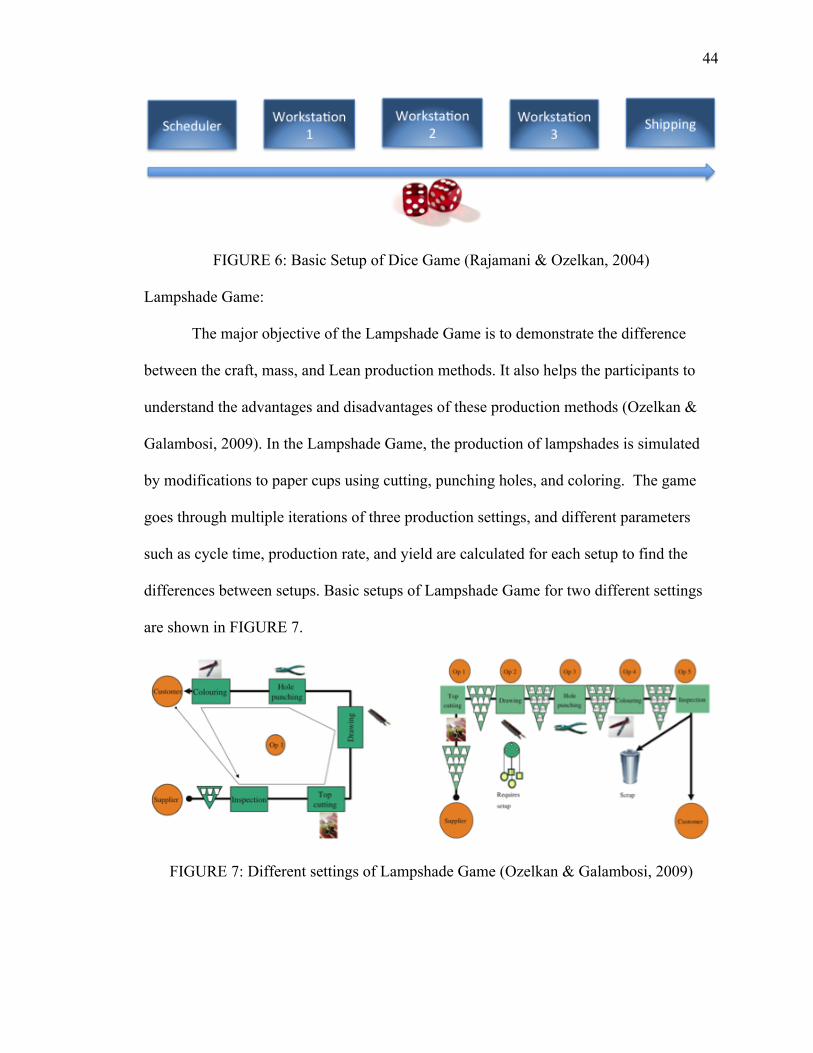
illustration of basic Dice Game setup is shown in FIGURE 6
44
FIGURE 6: Basic Setup of Dice Game (Rajamani & Ozelkan, 2004)
Lampshade Game:
The major objective of the Lampshade Game is to demonstrate the difference
between the craft, mass, and Lean production methods. It also helps the participants to
understand the advantages and disadvantages of these production methods (Ozelkan &
Galambosi, 2009). In the Lampshade Game, the production of lampshades is simulated
by modifications to paper cups using cutting, punching holes, and coloring. The game
goes through multiple iterations of three production settings, and different parameters
such as cycle time, production rate, and yield are calculated for each setup to find the
differences between setups. Basic setups of Lampshade Game for two different settings
are shown in FIGURE 7.
FIGURE 7: Different settings of Lampshade Game (Ozelkan & Galambosi, 2009)
45
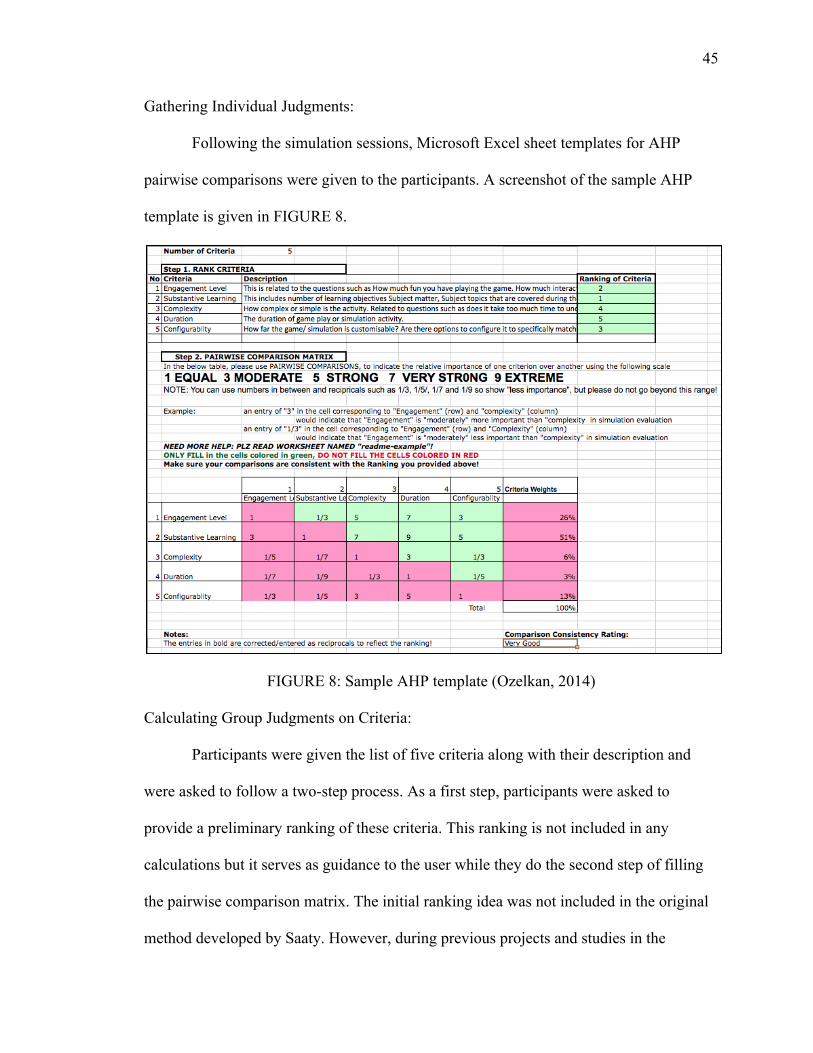
Gathering Individual Judgments:
Following the simulation sessions, Microsoft Excel sheet templates for AHP
pairwise comparisons were given to the participants. A screenshot of the sample AHP
template is given in FIGURE 8.
FIGURE 8: Sample AHP template (Ozelkan, 2014)
Calculating Group Judgments on Criteria:
Participants were given the list of five criteria along with their description and
were asked to follow a two-step process. As a first step, participants were asked to
provide a preliminary ranking of these criteria. This ranking is not included in any
calculations but it serves as guidance to the user while they do the second step of filling
the pairwise comparison matrix. The initial ranking idea was not included in the original
method developed by Saaty. However, during previous projects and studies in the
46
systems engineering department that involved AHP, this preliminary ranking method
seemed to improve the consistency of user pairwise comparison as it acts as a guide while
users do the evaluation. Participants were asked to fill only the top right diagonal half of
the matrix (green cells) as the other half is the reciprocal of it. A Likert scale was
provided for pairwise comparison to force each individual pairwise ratio to comparable
numbers for group pairwise ratio synthesis. The individual responses are provided in
Appendix B for reference. To calculate the criteria weights for each individual response
the following mathematical process was exercised:
1. For each cell in the top right diagonal half of the matrix in individual responses,
the users enter their subjective scoring as ratio of row / column.
2. For each row corresponding to a particular criterion, the geometric mean of the
cells is calculated.
3. Each geometric mean is divided by the sum of the geometric means to normalize
them. This value corresponds to weights for each individual criterion and it is also
called as the Priority Vector.
For synthesizing group criteria weights from the individual responses, the following
process is exercised:
4. Gather all individual response matrices. Calculate geometric mean of
corresponding cells in every individual response and fill that geometric mean in
the corresponding cells in the group response matrix, which has exactly the same
structure as individual responses.
47
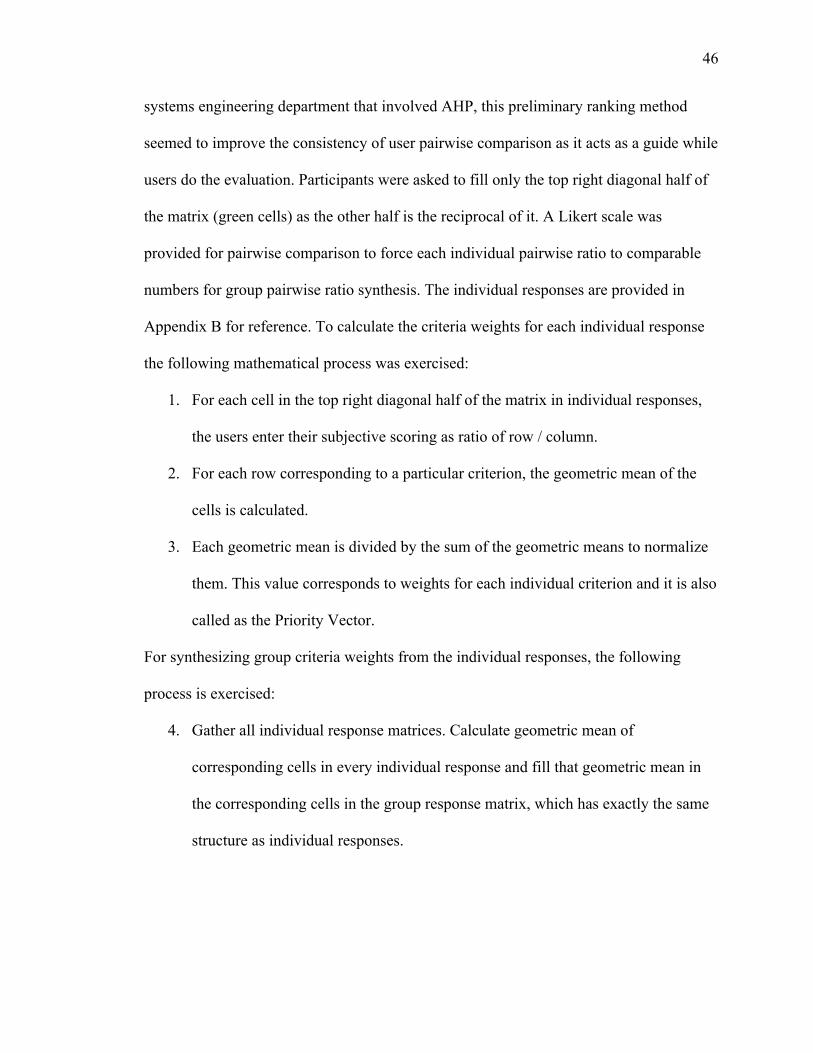
5. Repeat steps 2 and 3 on the group decision matrix and the computed results will
be the corresponding weights for each criterion based on the group judgment.
TABLE 5 shows the result from the AHP evaluation template.
TABLE 5: AHP evaluation of criteria group decision
1 2 3 4 5
Criteria Engagement Level
Substantive Learning Complexity Duration Configurability Geometric
Mean Criteria Weights
1 Engagement Level 1.00 1.04 2.40 3.76 2.16 1.83 29%
2 Substantive Learning 0.96 1.00 2.37 3.93 3.11 2.33 37%
3 Complexity 0.42 0.42 1.00 2.71 1.09 0.88 14% 4 Duration 0.27 0.25 0.37 1.00 0.48 0.41 7% 5 Configurability 0.46 0.32 0.92 2.09 1.00 0.78 13%
Total 6.23 100%
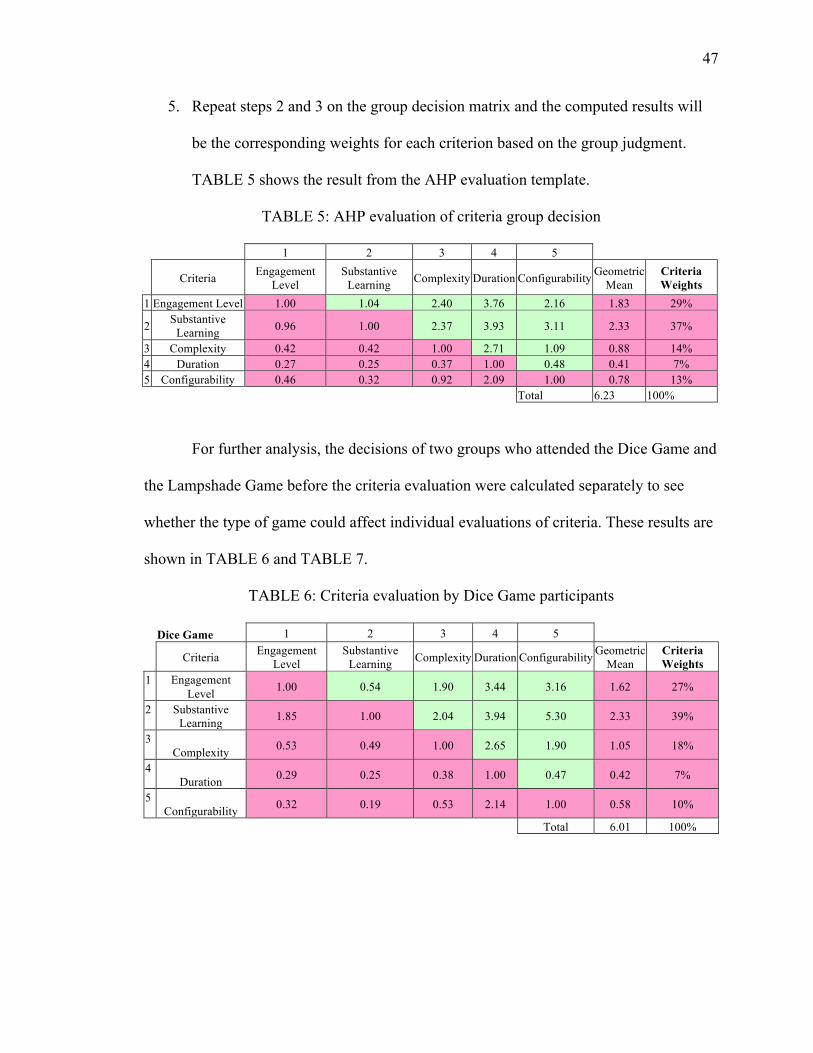
For further analysis, the decisions of two groups who attended the Dice Game and
the Lampshade Game before the criteria evaluation were calculated separately to see
whether the type of game could affect individual evaluations of criteria. These results are
shown in TABLE 6 and TABLE 7.
TABLE 6: Criteria evaluation by Dice Game participants
Dice Game 1 2 3 4 5
Criteria Engagement Level
Substantive Learning Complexity Duration Configurability Geometric
Mean Criteria Weights
1 Engagement Level 1.00 0.54 1.90 3.44 3.16 1.62 27%
2 Substantive Learning 1.85 1.00 2.04 3.94 5.30 2.33 39%
3 Complexity 0.53 0.49 1.00 2.65 1.90 1.05 18%
4 Duration 0.29 0.25 0.38 1.00 0.47 0.42 7%
5 Configurability 0.32 0.19 0.53 2.14 1.00 0.58 10%
Total 6.01 100%
48
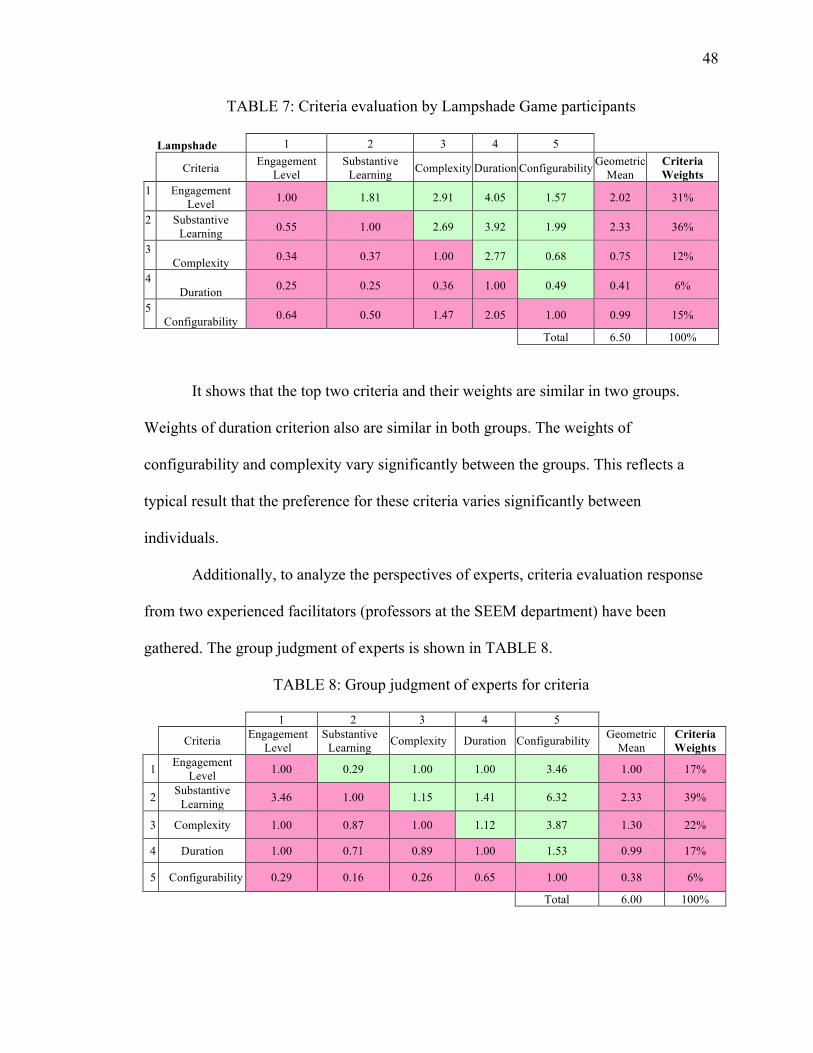
TABLE 7: Criteria evaluation by Lampshade Game participants
Lampshade 1 2 3 4 5
Criteria Engagement Level
Substantive Learning Complexity Duration Configurability Geometric
Mean Criteria Weights
1 Engagement Level 1.00 1.81 2.91 4.05 1.57 2.02 31%
2 Substantive Learning 0.55 1.00 2.69 3.92 1.99 2.33 36%
3 Complexity 0.34 0.37 1.00 2.77 0.68 0.75 12%
4 Duration 0.25 0.25 0.36 1.00 0.49 0.41 6%
5 Configurability 0.64 0.50 1.47 2.05 1.00 0.99 15%
Total 6.50 100%
It shows that the top two criteria and their weights are similar in two groups.
Weights of duration criterion also are similar in both groups. The weights of
configurability and complexity vary significantly between the groups. This reflects a
typical result that the preference for these criteria varies significantly between
individuals.
Additionally, to analyze the perspectives of experts, criteria evaluation response
from two experienced facilitators (professors at the SEEM department) have been
gathered. The group judgment of experts is shown in TABLE 8.
TABLE 8: Group judgment of experts for criteria
1 2 3 4 5
Criteria Engagement Level
Substantive Learning Complexity Duration Configurability Geometric
Mean Criteria Weights
1 Engagement Level 1.00 0.29 1.00 1.00 3.46 1.00 17%
2 Substantive Learning 3.46 1.00 1.15 1.41 6.32 2.33 39%
3 Complexity 1.00 0.87 1.00 1.12 3.87 1.30 22%
4 Duration 1.00 0.71 0.89 1.00 1.53 0.99 17%
5 Configurability 0.29 0.16 0.26 0.65 1.00 0.38 6%
Total 6.00 100%
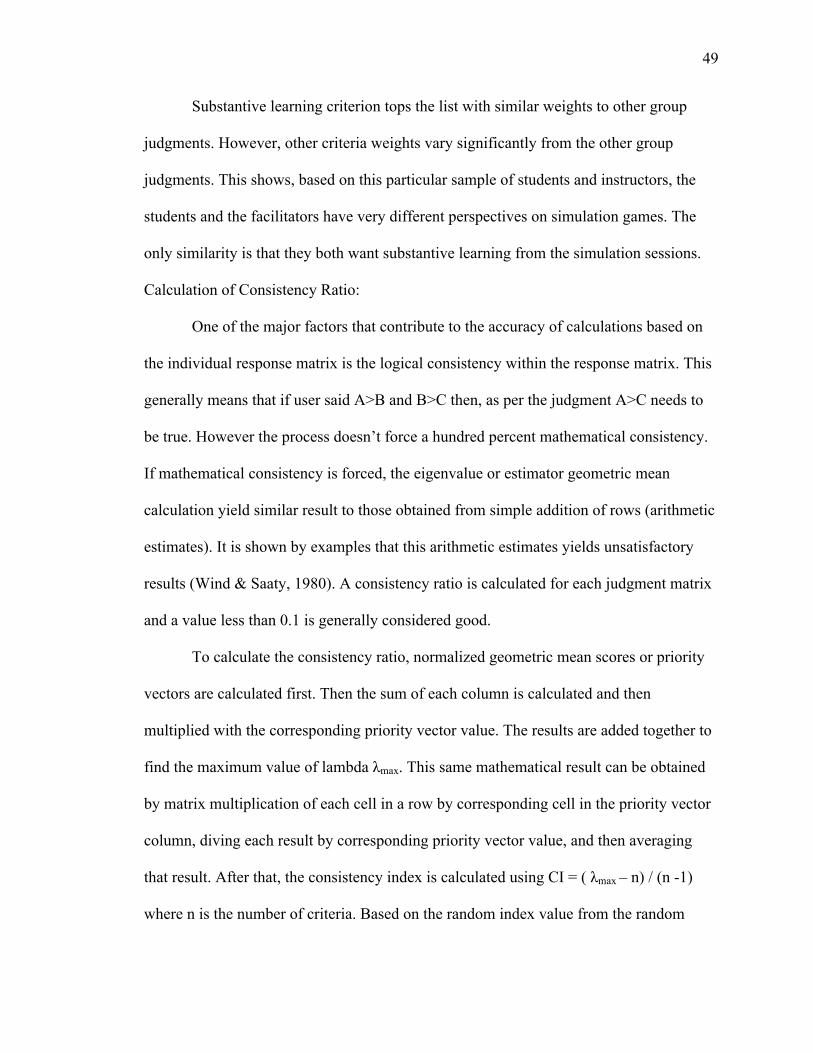
49
Substantive learning criterion tops the list with similar weights to other group
judgments. However, other criteria weights vary significantly from the other group
judgments. This shows, based on this particular sample of students and instructors, the
students and the facilitators have very different perspectives on simulation games. The
only similarity is that they both want substantive learning from the simulation sessions.
Calculation of Consistency Ratio:
One of the major factors that contribute to the accuracy of calculations based on
the individual response matrix is the logical consistency within the response matrix. This
generally means that if user said A>B and B>C then, as per the judgment A>C needs to
be true. However the process doesn’t force a hundred percent mathematical consistency.
If mathematical consistency is forced, the eigenvalue or estimator geometric mean
calculation yield similar result to those obtained from simple addition of rows (arithmetic
estimates). It is shown by examples that this arithmetic estimates yields unsatisfactory
results (Wind & Saaty, 1980). A consistency ratio is calculated for each judgment matrix
and a value less than 0.1 is generally considered good.
To calculate the consistency ratio, normalized geometric mean scores or priority
vectors are calculated first. Then the sum of each column is calculated and then
multiplied with the corresponding priority vector value. The results are added together to
find the maximum value of lambda λmax. This same mathematical result can be obtained
by matrix multiplication of each cell in a row by corresponding cell in the priority vector
column, diving each result by corresponding priority vector value, and then averaging
that result. After that, the consistency index is calculated using CI = ( λmax – n) / (n -1)
where n is the number of criteria. Based on the random index value from the random
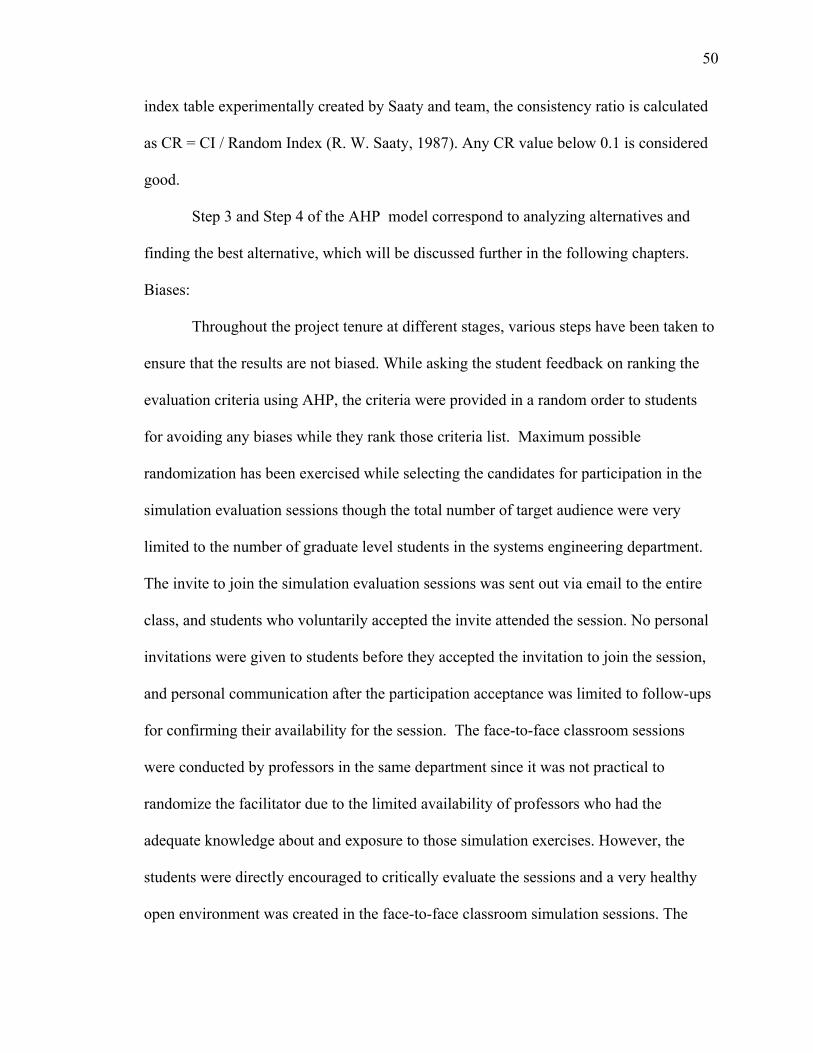
50
index table experimentally created by Saaty and team, the consistency ratio is calculated
as CR = CI / Random Index (R. W. Saaty, 1987). Any CR value below 0.1 is considered
good.
Step 3 and Step 4 of the AHP model correspond to analyzing alternatives and
finding the best alternative, which will be discussed further in the following chapters.
Biases:
Throughout the project tenure at different stages, various steps have been taken to
ensure that the results are not biased. While asking the student feedback on ranking the
evaluation criteria using AHP, the criteria were provided in a random order to students
for avoiding any biases while they rank those criteria list. Maximum possible
randomization has been exercised while selecting the candidates for participation in the
simulation evaluation sessions though the total number of target audience were very
limited to the number of graduate level students in the systems engineering department.
The invite to join the simulation evaluation sessions was sent out via email to the entire
class, and students who voluntarily accepted the invite attended the session. No personal
invitations were given to students before they accepted the invitation to join the session,
and personal communication after the participation acceptance was limited to follow-ups
for confirming their availability for the session. The face-to-face classroom sessions
were conducted by professors in the same department since it was not practical to
randomize the facilitator due to the limited availability of professors who had the
adequate knowledge about and exposure to those simulation exercises. However, the
students were directly encouraged to critically evaluate the sessions and a very healthy
open environment was created in the face-to-face classroom simulation sessions. The
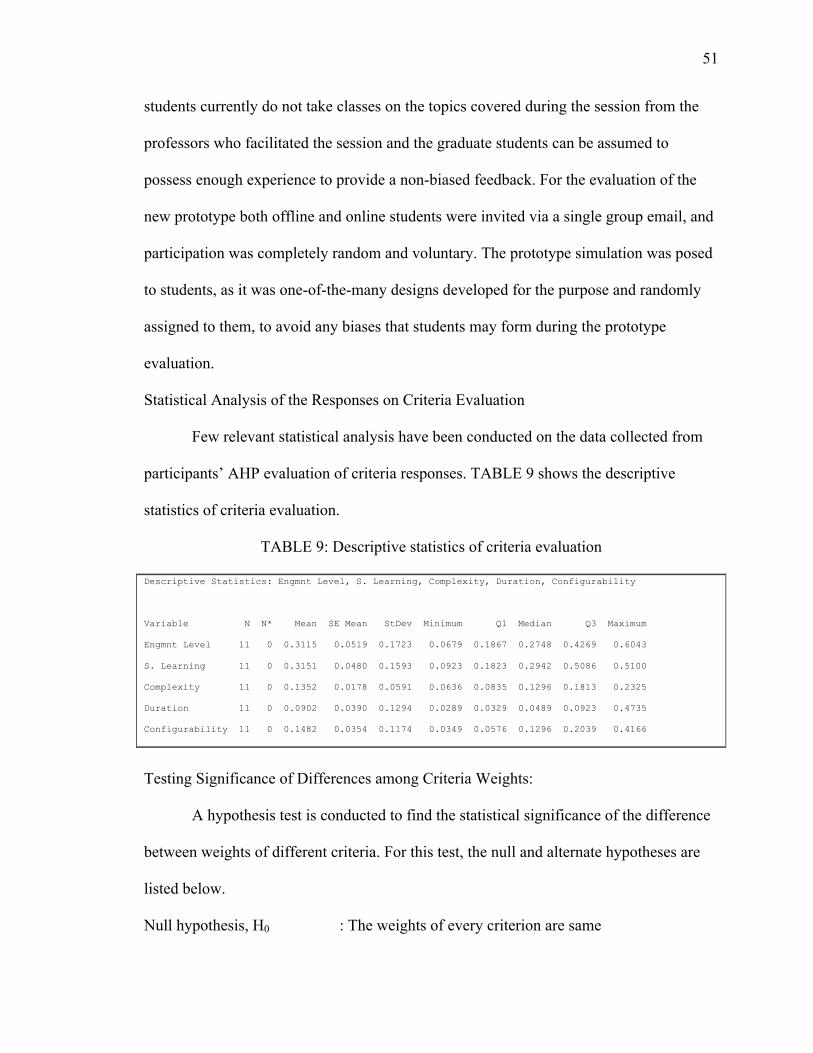
51
students currently do not take classes on the topics covered during the session from the
professors who facilitated the session and the graduate students can be assumed to
possess enough experience to provide a non-biased feedback. For the evaluation of the
new prototype both offline and online students were invited via a single group email, and
participation was completely random and voluntary. The prototype simulation was posed
to students, as it was one-of-the-many designs developed for the purpose and randomly
assigned to them, to avoid any biases that students may form during the prototype
evaluation.
Statistical Analysis of the Responses on Criteria Evaluation
Few relevant statistical analysis have been conducted on the data collected from
participants’ AHP evaluation of criteria responses. TABLE 9 shows the descriptive
statistics of criteria evaluation.
TABLE 9: Descriptive statistics of criteria evaluation
Descriptive Statistics: Engmnt Level, S. Learning, Complexity, Duration, Configurability
Variable N N* Mean SE Mean StDev Minimum Q1 Median Q3 Maximum
Engmnt Level 11 0 0.3115 0.0519 0.1723 0.0679 0.1867 0.2748 0.4269 0.6043
S. Learning 11 0 0.3151 0.0480 0.1593 0.0923 0.1823 0.2942 0.5086 0.5100
Complexity 11 0 0.1352 0.0178 0.0591 0.0636 0.0835 0.1296 0.1813 0.2325
Duration 11 0 0.0902 0.0390 0.1294 0.0289 0.0329 0.0489 0.0923 0.4735
Configurability 11 0 0.1482 0.0354 0.1174 0.0349 0.0576 0.1296 0.2039 0.4166
Testing Significance of Differences among Criteria Weights:
A hypothesis test is conducted to find the statistical significance of the difference
between weights of different criteria. For this test, the null and alternate hypotheses are
listed below.
Null hypothesis, H0 : The weights of every criterion are same
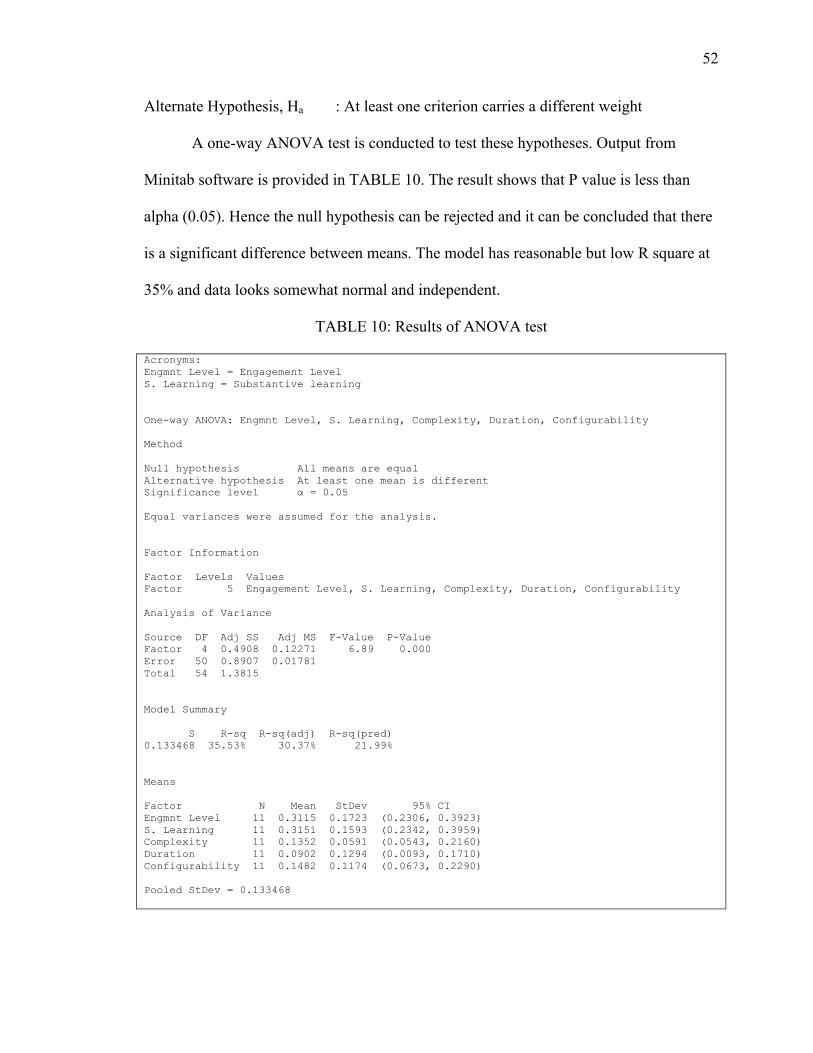
52
Alternate Hypothesis, Ha : At least one criterion carries a different weight
A one-way ANOVA test is conducted to test these hypotheses. Output from
Minitab software is provided in TABLE 10. The result shows that P value is less than
alpha (0.05). Hence the null hypothesis can be rejected and it can be concluded that there
is a significant difference between means. The model has reasonable but low R square at
35% and data looks somewhat normal and independent.
TABLE 10: Results of ANOVA test
Acronyms: Engmnt Level = Engagement Level S. Learning = Substantive learning One-way ANOVA: Engmnt Level, S. Learning, Complexity, Duration, Configurability Method Null hypothesis All means are equal Alternative hypothesis At least one mean is different Significance level α = 0.05 Equal variances were assumed for the analysis. Factor Information Factor Levels Values Factor 5 Engagement Level, S. Learning, Complexity, Duration, Configurability Analysis of Variance Source DF Adj SS Adj MS F-Value P-Value Factor 4 0.4908 0.12271 6.89 0.000 Error 50 0.8907 0.01781 Total 54 1.3815 Model Summary S R-sq R-sq(adj) R-sq(pred) 0.133468 35.53% 30.37% 21.99% Means Factor N Mean StDev 95% CI Engmnt Level 11 0.3115 0.1723 (0.2306, 0.3923) S. Learning 11 0.3151 0.1593 (0.2342, 0.3959) Complexity 11 0.1352 0.0591 (0.0543, 0.2160) Duration 11 0.0902 0.1294 (0.0093, 0.1710) Configurability 11 0.1482 0.1174 (0.0673, 0.2290) Pooled StDev = 0.133468
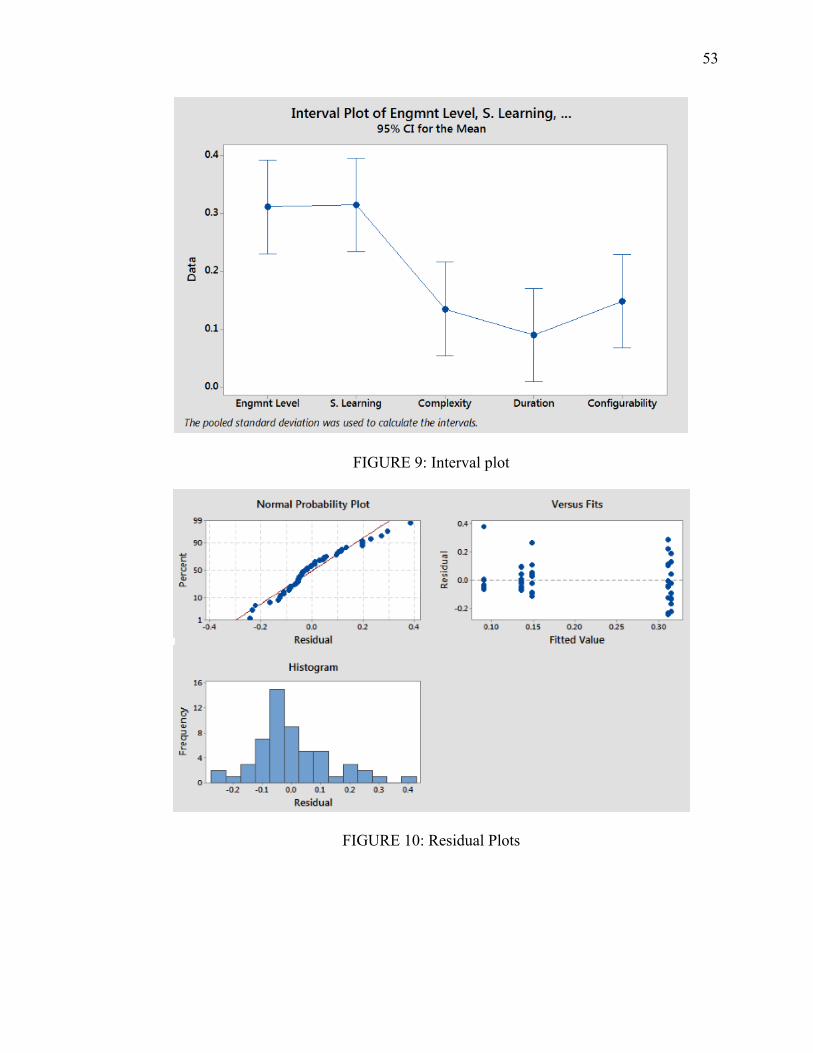
53
FIGURE 9: Interval plot
FIGURE 10: Residual Plots
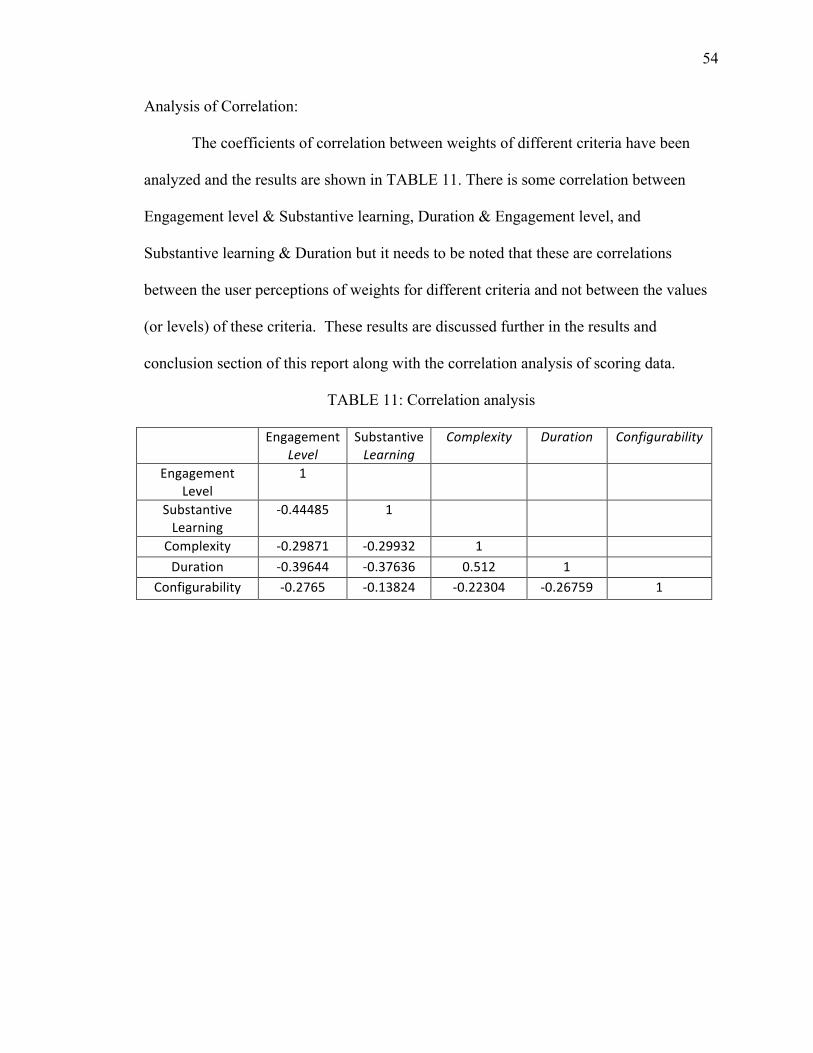
54
Analysis of Correlation:
The coefficients of correlation between weights of different criteria have been
analyzed and the results are shown in TABLE 11. There is some correlation between
Engagement level & Substantive learning, Duration & Engagement level, and
Substantive learning & Duration but it needs to be noted that these are correlations
between the user perceptions of weights for different criteria and not between the values
(or levels) of these criteria. These results are discussed further in the results and
conclusion section of this report along with the correlation analysis of scoring data.
TABLE 11: Correlation analysis
Engagement Level
Substantive Learning
Complexity Duration Configurability
Engagement Level
1
Substantive Learning
-‐0.44485 1
Complexity -‐0.29871 -‐0.29932 1 Duration -‐0.39644 -‐0.37636 0.512 1
Configurability -‐0.2765 -‐0.13824 -‐0.22304 -‐0.26759 1
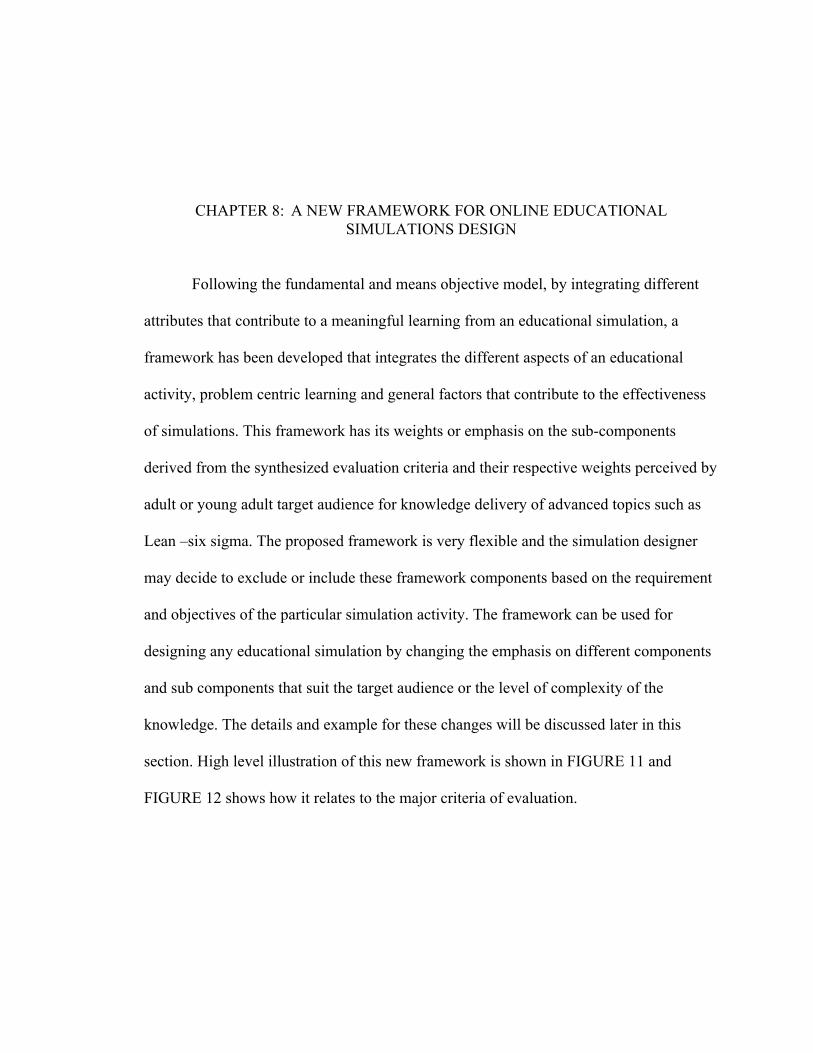
CHAPTER 8: A NEW FRAMEWORK FOR ONLINE EDUCATIONAL SIMULATIONS DESIGN
Following the fundamental and means objective model, by integrating different
attributes that contribute to a meaningful learning from an educational simulation, a
framework has been developed that integrates the different aspects of an educational
activity, problem centric learning and general factors that contribute to the effectiveness
of simulations. This framework has its weights or emphasis on the sub-components
derived from the synthesized evaluation criteria and their respective weights perceived by
adult or young adult target audience for knowledge delivery of advanced topics such as
Lean –six sigma. The proposed framework is very flexible and the simulation designer
may decide to exclude or include these framework components based on the requirement
and objectives of the particular simulation activity. The framework can be used for
designing any educational simulation by changing the emphasis on different components
and sub components that suit the target audience or the level of complexity of the
knowledge. The details and example for these changes will be discussed later in this
section. High level illustration of this new framework is shown in FIGURE 11 and
FIGURE 12 shows how it relates to the major criteria of evaluation.
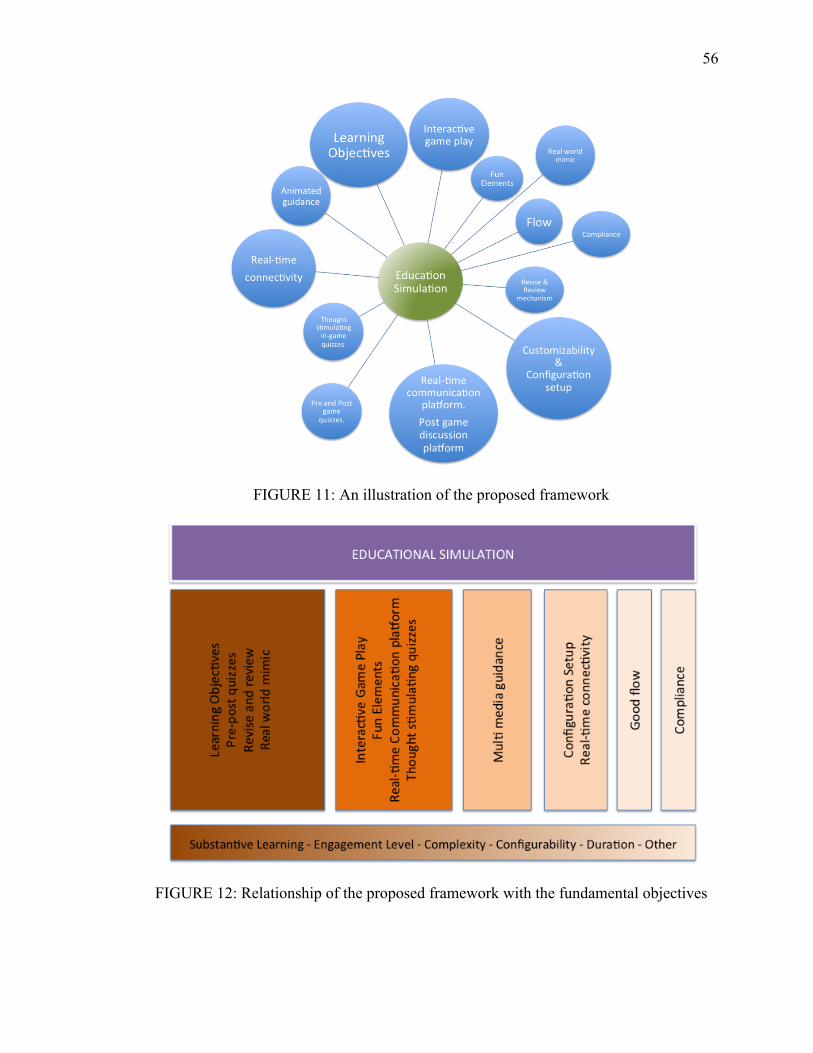
56
FIGURE 11: An illustration of the proposed framework
FIGURE 12: Relationship of the proposed framework with the fundamental objectives
57
Learning Objectives
Identifying and defining the learning objectives is the most important part of
designing any educational activity. Kennedy et al. (1998) mentioned that consistency
between learning objectives and content of instruction is a key element for effectiveness
of an education simulation. The designer needs to define what the key ideas or
knowledge are that the students should gain after going through the activity. These ideas
or key points need to be incorporated in the simulation in a logical order that builds on
top of the existing knowledge or connects together as the user goes through the different
stages of the educational simulation. For many simulations or games that the designers
are attempting to develop an online version for, a face-to-face classroom version may
already exist. There are many games that have been played in face-to-face classrooms for
a long time such as the Dice Game or the plug assembly game. These games already have
their objectives defined and incorporated to the activity, and the job of the online version
designer is easy in these cases. For example, the Dice Game learning objectives are
identifying some of the root causes that affect the performance of workstations and how
the process variability and the dependency on the previous operations affect the
performance of each work stations. Each of these objectives can further be broken down
to sub-objectives. The designer determines the level of details and the scope of these
objectives depending on the prerequisite knowledge of the user and expected mastery
from the simulation session.
In some cases where the offline version of the proposed game doesn’t exist, it is a
great challenge for the designer to identity, define and organize these learning objectives.
There are many analytical methods under the instructional systems technology domain
58
that might be helpful or can assist the designer to achieve clearly defined and weighted
learning objectives. One such interesting method that has a great focus on the problem-
centric learning is the iterative four step experiential ID process by Dr. Robert Appelman,
which was discussed in the literature review section (Appelman, 2011). By going through
these methodologies, the designer can capture and organize the key learning elements.
This clear definition will also help to evaluate the effectiveness of the activity by
checking how students performed against those objectives at the end of the simulation
activity or whether the goals of activity has been reached successfully.
Interactive Game Play
One of the crucial elements that contribute to the effectiveness of the simulation is
its interactivity. Higher level of interactivity results in higher level of engagement, which
in turn results in higher level of learning. An interactive game design lets the participant
to get into engaged exploration, which is an effective way of learning and retaining
knowledge (Adams et al., 2008b). Implementing an effective interactive game play is a
challenging task, and there is no ‘one size fits all’ solution. The type of interactivity
depends on the type of simulation, the complexity of learning objective, and the type of
target audience.
Adams et al. (2008a) has detailed the interactive design details for the PhET
interactive simulations project at University of Colorado Boulder. These simulations
were aimed at grade school and undergraduate level students. They found that good
interactive designs could be created by utilization of intuitive controls, click and drag
interface, ‘grabable’ objects, sliders, radio buttons and checkboxes, realistic visual
representations, and animations. It is clear that these designs are created based on a
59
pedagogical approach. However, most of these concepts can be assumed to work with
adults, too. The designer may also refer to general formal computer game designs
principles and frameworks such as MDA framework (standing for Mechanics, Dynamics,
and Aesthetics) (Hunicke, LeBlanc, & Zubek, 2004).
The following could be some options the designer may consider to make the
simulation more interactive: animations and movements on the screen, audio effects and
feedbacks, contrasting hues, background music, etc. Using voice recognition and audio
commands to game control will be a good way to improve interaction if properly
implemented. The designer also may wish to force frequent alternate user inputs, in case
the game play involves multiple repetitive steps. For example, for the Dice Game,
repeated mouse clicks to roll the die may bore the user but forcing some intermittent
keyboard inputs may help to break this repetition boredom. A quick feedback loop for the
game play could contribute to higher level of interaction. In this case, the user will see the
effects of their action immediately, and they can engage in the exploration following the
best results they observe. It might not be possible to achieve the level of interactivity that
can deliver all defined learning objectives in one attempt of the design. The designer may
consider an iterative design improvement process based on the feedback from the sample
group of targeted population.
60
Real-World Mimic Elements
By basic definition, the simulation is an activity that attempts to mimic a real life
activity, role, or process that a participant can relate to and imagine to be a part of in the
real world. It can be safely assumed that the final application of the learning that users
gained from the education simulation will be in a real world setting. So the simulation
needs to mimic the elements of the real world setting where the user will potentially
apply the learned ideas. There is no one-stop solution for this attribute. Depending on the
learning objectives and the real world application, the designer will need different
approaches to incorporate these real-world attributes into the simulations.
Existing face-to-face classroom simulations mimic real-world settings majorly in
two different approaches. One way to simulate a real-world task, especially in
manufacturing context, is to mimic it using physical objects and physical movements. For
example, the games such as Lego airplanes and Lego cups mimic a production line by
using Lego blocks, and physical movements and transformation of these objects. This
approach assumes that the participants will connect to the real world setup by extending
their imagination from the play object or play process to a real world object or process.
Another popular approach is to extend the imagination of the participants to connect to a
real-world object or process using game play stimuli that force the user to imagine that
particular scenario. For example, in the Dice Game, the roll of a die simulates a day’s
production capacity. The physical roll of die has no connection with an actual activity
happening during a production scenario. However, this enables the user to completely
imagine a production setting and a day’s production that is recorded and is later used to
compare the results of different scenarios and approaches applied during the game play.
61
On translating face-to-face classroom simulations to online versions,
implementing the real-world mimic of a simulation that implements the second approach
described above, is relatively easy. For example, the roll of a die can be simulated with a
random number generator that produces numbers between 1 and 6. The users will connect
to the real world setting based on the output in the same way it was with the roll of a die.
However, it is quite challenging to implement the online version of the mimic that uses
the first approach. Mimicking a physical mimic (a simulation game play object), which
mimics a real-world object or process on a computer screen without disturbing the
imaginary connection between the mimic object and real-world object is very
challenging. The designer may take different approaches to implement this translation
depending on the type of activity performed in a face-to-face classroom simulation. For
example, in the case of the Lampshade Game, the user may color the cup objects by
multiple mouse movements similar to the hand painting of the cups, or the change of
production die template in mass production simulated by a series of mouse clicks in a
challenging particular order. In another example of an airplane factory, the user may click
and drag to align different corners of a paper object on the screen to simulate folding a
paper. The key idea of this method is to let the user go through activities that take similar
duration of the face-to-face classroom simulation activity and let the user feel the strain
or even the ‘frustration’ of the process.
Computer simulations enable a wide variety of additional possibilities of
mimicking real-world that are not possible in a face-to-face classroom simulation.
Computer graphics can be used to visually simulate a real-world setting that helps the
user to connect immediately and imagine being in the particular setting. In this way it
62
enables the designer to explore beyond the limits of a typical face-to-face classroom
simulation by bypassing the dangers, setup time, work, required resources or expense of
an extensive face-to-face classroom simulation. The usage and effectiveness of computer
simulations for educational activities has already been discussed in detail in the literature
review section, and it can be noted that computer simulations have already been found as
an effective medium of knowledge delivery. The type of graphical simulation for a game
depends on the objective and design of that particular game. The graphical representation
can be varied and a few, for example a first person perspective visual representation can
be changed into top view map of a production layout or animated objects moving on the
screen. Various existing and possible options for graphics implementation will be
discussed later in this report.
Flow
Almost all educational simulations make the user to go through different steps
where the learning objectives are tacitly or explicitly delivered to the user. This builds on
top of the existing knowledge during progression from one step to another, or it may
connect together at the end of the simulation process. In the case of simulations related to
advanced topics, the flow of the game from one stage to another is critically important.
Without a properly defined flow, the user may sometimes get lost during the simulation
or reach at the end of simulation without being able to assimilate the learning objectives
in a logical order. In pedagogical simulations where the content is simple and virtually
confined to the same ‘scene’, the focus on flow is not critical as the learning is supposed
to happen by trial and error of actions and effects. This method might not be effective for
63
advanced topics as it may lead to frustration of the user when they get lost or fail to
connect the dots of information.
The designer needs to define the flow of events, stages or information delivery
while designing the simulations and this can be implemented in many ways depending on
the nature of simulation activity. The designer may decide to move the user’s thought
iterations of game play with different settings where the user takes the information from
one iteration and applies the knowledge in the next iteration. For example, in the Dice
Game, the user goes through a push version, a reduced variability version and a pull
version to learn the impact of reduced variability and dependency on previous work
stages on the final production of a system. These are the same game process iterations but
with different settings parameters. In general sense, the existing simulations tend to
follow a pattern of demonstration on what does not work (worse scenario) and then what
works (a better scenario). This flow of going from bad to good is beneficial for the users
as most of the real world setting problems require the participant to take it from a bad
state to a good state. However, this flow is not mandated, and the designer may decide a
different flow based on the objectives of the game.
The design of the flow also deals with incorporating changes in the scenario based
on the actions of the user during the game play. Moreno-Ger, Burgos, Martínez-Ortiz,
Sierra, and Fernández-Manjón (2008) has explained in detail about incorporating
scenario changes based on the pre-defined logic to add assessment and adaption to the
design. This principle can also be applied to design the game flow in general. Based on
the pre-defined logic, the designer may set a different flow for users, based on their
behavior at different levels. For example, in the case of the Dice Game, the designer may
64
decide to take the user to the second increased inventory iteration or skip that iteration,
based on user’s answer to a question that is posed after the first iteration.
Fun Elements
It is undoubtedly clear that the participants benefit from having fun during an
educational activity. The details of the importance of including fun elements in an
education simulations were discussed earlier in the literature review section based on the
work of Adams et al. (2008b). In general, fun results in more engagement and thus to
better learning. A designer could implicitly or explicitly add fun elements to a simulation.
Some simulations can be inherently fun by selecting a fun real world mimic setting. For
example, in a Design of Experiments class Catapult data collection simulation, using
gummy bears, or soft toy puppies are funnier than using a regular marble or a plastic ball.
In pedagogical viewpoint, colors and shapes are fun to play with but further research is
required for evaluating the effectiveness of this approach in andragogical perspective.
The designer may explore the possibilities of cartoons and fun animations during the
game play to make it more interesting.
In multiplayer game play, a little competition between different teams could crank
up the fun during the game play and result in more engagement. This competition could
be based on the time to finish the game or it can be based on the higher score. The
success of this approach depends on the real-time connectivity implemented for the
simulation. The race against time, and completion to beat high scores or a preset level can
also be implemented in single player simulations. However, the designer needs to
exercise caution with the amount of fun elements included in the simulation. If the fun
level is more than a particular level, it can potentially distract the user and hinder the
65
active learning process, which is the main goal of the educational activity. Extensive
emphasis on competition or race is also not beneficial since the user might completely
shift focus from learning to winning the competition.
Multi-Media Guidance
Unlike grade school level science simulations, in which students may benefit
more from an engaged exploration and trial and error learning, andragogical advanced
topics simulations need a play guidance within the game. This guidance is not focused on
explaining the controls and game play ‘how-to’s, since the typical audience for these
advanced simulations will generally be able to figure those details themselves. This
guidance is more focused on taking the user through different objectives of the game and
making a streamlined information flow. Without this guidance the user may get lost
during the game play unable to figure out what information is important and what is not.
There could be multiple ways to implement this active guidance during the game play.
For example, an animated character can be used to explain the objectives of the
simulation and hint what are the key points to look for during the game play.
This guidance can be provided via text, audio, prerecorded video, audio-visual
animations, or even by the facilitator using a real-time connection platform. Sometimes,
this guidance can be excluded for real-time multiplayer game play to force individual
team players to discuss during the game play and find their way through the simulation
and assimilate the expected learning objectives by the end of the session. However, single
players mostly benefit from the active guidance. The designer may include guidance
elements by default to the activity or may include options to turn on and turn off control
to the user. Additionally, the implementation of this factor also depends on the
66
technology implemented for the simulation. Video guidance may require large memory
capacity, and real-time connectivity by facilitator might require large bandwidth
connection. Though technically challenging to implement, an animated guidance seems
to be an efficient solution for providing theses guidance elements. This guidance is also
important to set the flow of the game as discussed in detail under the Flow component for
the proposed framework.
Real Time Connectivity
Real-time connectivity is imperative for an online simulation implementation. The
technology for connectivity can be decided based on the type of data transfer during the
game play. There could be multiple options for maintaining the central connectivity for
the simulation. For example, the system can be designed to download the content to the
user’s web browser and run the program at the client’s side or the designer may decide to
run the program at the server side and emulate the results on the client’s browser or
dedicated application. Synchronizing data in the multiplayer mode could be implemented
via real-time secure connection to the centralized server. Since the technology evolves at
a very fast rate every day, it is advisable to consult an IT expert for finding the technical
options for these implementations and understand the capabilities and limitations of using
such technologies. The game play elements might require slight modifications to
accommodate the limitations of chosen technology if there are any.
Thought Stimulating Interactive Quizzes
As Adams et al. (2008b) concluded, placement of small quizzes during the game
play will stimulate user’s critical thoughts and helps to achieve higher levels of
engagement towards better substantial learning. These simple quizzes must be of a
67
particular difficulty level based on the proficiency of the user in such a way that it is hard
enough to force the user to think and reflect about the covered topic, but should not be
hard enough to demotivate or frustrate the user. The quizzes can be built on top of the
defined learning objectives and tied to the key takeaways that the designer has defined for
the simulation. These quizzes needs to be strategically placed during the game play. The
placement of quizzes in the middle of engaged exploration might distract the user. It is
advisable to place these quizzes between sections or iterations of the game play.
Strategically placed right questions can also logically connect the user from the previous
section to the next section.
Real-Time Communication Platform & Post-Game Play Discussion Platform
One of the crucial elements that contribute to an effective learning is the level of
engagement that the user experiences during the simulation activity. For a team
simulation game play, in addition to the real-time connectivity between the simulation
content for different participants, a real-time discussion platform needs to be
implemented that can enable interaction between the team members, similar to that
during a face-to-face classroom simulation session. This platform may support
multimedia discussion in the form of texts, audio, or video. Development of a new
multimedia discussion platform will be challenging and will require tremendous
recourses to implement successfully. There are higher chances that the education system
already has a communication platform provided for online content delivery and
discussions for the online students. These can be leveraged for the in-game discussions. If
technically possible, the simulation program may be integrated with existing discussion
platforms that enable the seamless engagement of participants during the game play.
68
Additionally, facilitators also can use these platforms to provide in-game instructions or
guidance during the game play.
Pre- and Post-Session Quizzes
In most cases of educational simulations with clearly defined learning objectives,
a final quiz can be implemented after the simulation session. This will be beneficial in
many ways, such as forcing the user to critically think and reflect on the learning
obtained from the simulation activity, enabling the facilitator to grade the user
performance and evaluate the effectiveness of the simulation activity, and setting a
context for the follow-up discussion that happens in the integrated discussion platform or
in the following class session after the simulation activity.
A pre-game quiz will be helpful in many cases to set the context. It can also help
to evaluate the initial level of the participants, which can be used to calculate the
effectiveness of the activity in comparison with the post-activity quiz. The designer may
also set pre-defined scenario paths for different levels of proficiency of the user, which is
evaluated from the pre-simulation quiz. However, there is a counterargument against
inclusion of pre-session quizzes that the user may tend to focus only on finding answers
for these questions during the session and doesn’t participate in the session with an open
mind. The designer may decide to include or exclude the pre-session quizzes based on the
type of simulation, learning objective and the level of the target audience.
A post-simulation discussion session may be implemented to reflect on the
learning from the simulation and for additional discussion on the context set by the
simulation session. This will be applicable only to a multiplayer game setup. The
discussion platform may be implemented as a real-time connectivity platform using
69
video, audio, or text chat. Alternatively, an asynchronous version of discussion platforms
may be implemented using message boards and forum thread discussions. These
platforms need not be included within the simulation setup, since in most cases there will
be existing platforms available for online content delivery of distance education
programs. These platforms generally feature ability to host discussions and can be
utilized for the post simulation discussions. Integration between the simulation program
and the available discussion platform will be a value added feature in which the game
result data is automatically imported to the design platform for further discussions.
Configurable Settings
One of the key attributes of an online simulation is its configurability and
customizability. Configurability and Customizability have a subtle difference in meaning.
In general, configuring a software application means making slight changes in the
prebuilt application to suit a specific application and customization refers to larger
changes that are built only for that specific application. However, these terms are used
interchangeably often. A ‘design for changes approach’ will be beneficial for this case
since individualization is one of the key elements in an education simulation.
Configurability can be achieved in different levels. The design for configurability has to
start from designing the learning objectives, since a rigid set of learning objectives that
are focused only on a particular setting might make the entire online simulation non-
configurable by default. Following are some customizations that the designer may want
to include in the design of an online simulation.
70
Changes in Keywords and Visuals:
The keywords or the representations appearing in the simulations can be selected
from a set of predefined group to match the industry or the background of the user. By
using the setting that the users can quickly connect to such as the keywords for their
industry domain or images representing their work place, will result in more engagement
and result in better learning. These features enable the facilitator to use the same
simulation for different target audience effectively.
Changes in Instructions:
The multi-media instructional element can be designed to be customizable
according to the target user. For example, the instruction can be configured to deliver in
different languages. The user may be given an option to turn off or on the additional
guidance instructions. The designer may decide to pop up instructions when the user
appears to be stuck during the game play. The level of details in the instruction can be
made configurable so that the facilitator can decide the amount of instructions that needs
to be given to the user depending on the prerequisite knowledge of the target users.
Changes in difficulty levels:
The user or the facilitator may be given an option to select the difficulty level of
the game play. This difficulty may be related to the difficulty in achieving tasks during
the game play or a difficulty set by limiting the information or guidance provided to the
user to force critical thinking. The design may accommodate configuration for changing
the pace of the game play so that the facilitator may decide to crank up or slow down the
game play elements such as iterations based on the level of the target players.
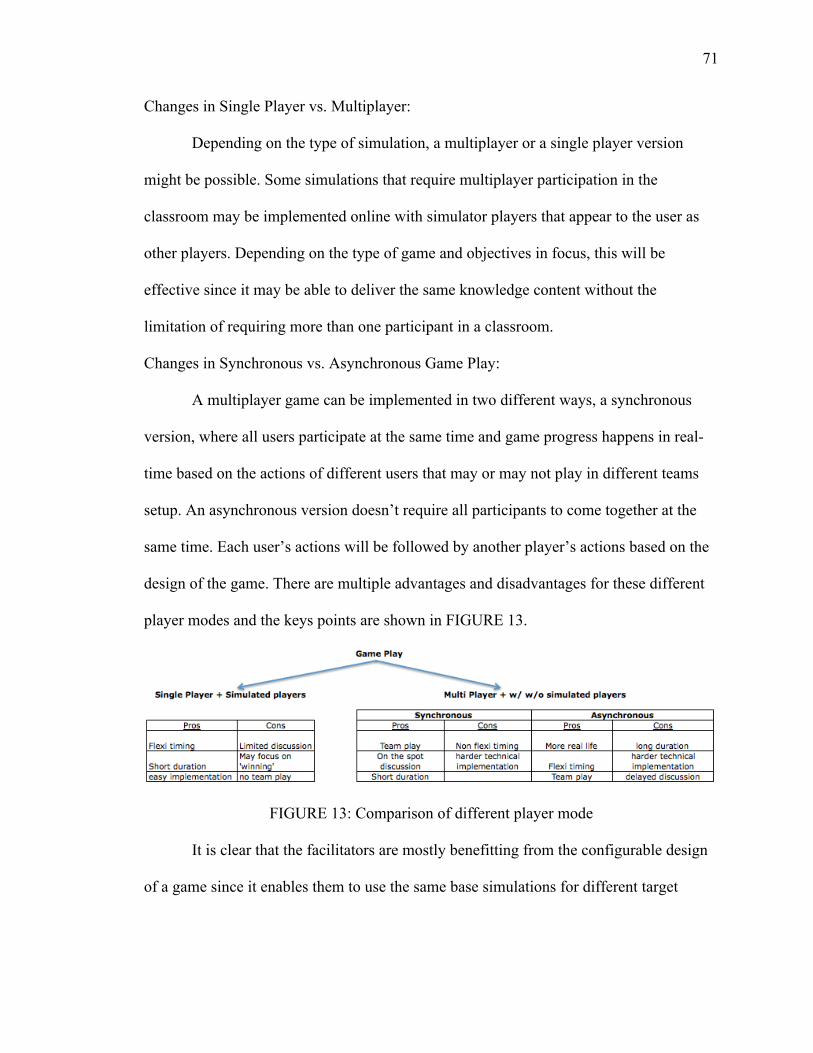
71
Changes in Single Player vs. Multiplayer:
Depending on the type of simulation, a multiplayer or a single player version
might be possible. Some simulations that require multiplayer participation in the
classroom may be implemented online with simulator players that appear to the user as
other players. Depending on the type of game and objectives in focus, this will be
effective since it may be able to deliver the same knowledge content without the
limitation of requiring more than one participant in a classroom.
Changes in Synchronous vs. Asynchronous Game Play:
A multiplayer game can be implemented in two different ways, a synchronous
version, where all users participate at the same time and game progress happens in real-
time based on the actions of different users that may or may not play in different teams
setup. An asynchronous version doesn’t require all participants to come together at the
same time. Each user’s actions will be followed by another player’s actions based on the
design of the game. There are multiple advantages and disadvantages for these different
player modes and the keys points are shown in FIGURE 13.
FIGURE 13: Comparison of different player mode
It is clear that the facilitators are mostly benefitting from the configurable design
of a game since it enables them to use the same base simulations for different target
72
audience, which helps to reduce setup time and expenditure on resources associated with
running different simulations.
Revise / Review Result Storage
The results of a simulation session can be stored on a centralized location where
the user may go back and refer the results and related data for the game simulation.
Depending on the discussion platform, the discussions may also be recorded for
references. This feature will be helpful for users to review the learning objectives or
simply refresh the topic. It may also interest students to go back and do additional
analysis on the game data, which might not be possible immediately after the game play
due to time restrictions.
Compliance
As any other educational activity, the simulation needs to be compliant to the
standards, regulations, and policies set for educational activities. Additionally, using
multi-media within the simulation and including accessibility features, the simulations
can be made ADA compliant. Some very quick facts related to ADA compliant online
material are available on The Ohio State University ADA Coordinator's Office (2014)
website.
CHAPTER 9: ANALYSIS OF ALTERNATIVES FOR SIMULATION GAMES
This chapter details the third step of AHP, analysis of alternatives. The criteria for
evaluating an educational simulation and their respective weights have already been
synthesized using AHP group decision-making process as detailed in Chapter 7. Since
the Dice Game was selected for evaluating different versions (alternatives), four
alternatives are compared with each other. As discussed in the identification of
alternatives section these alternatives are face-to-face classroom version, existing online
version, iPad application version, and the new prototype. The details of these four
alternatives are discussed further.
Face-to-face Classroom Version:
The version played in the classroom as part of this study typically sets up five to
seven workstations starting from scheduler to shipping, and it is played using regular dice
and plastic chips. Five to ten participants can effectively be accommodated in one
session. The participants need to assemble in the room at a scheduled time, which brings
down the flexibility of the game session, and it takes about 2 hours to complete. On the
other hand, it allows real-time discussions between the participants, fun to play in a
group, and it provides a great amount of control of the game flow to the facilitator.
TABLE 12 summarizes the major pros and cons of this version.
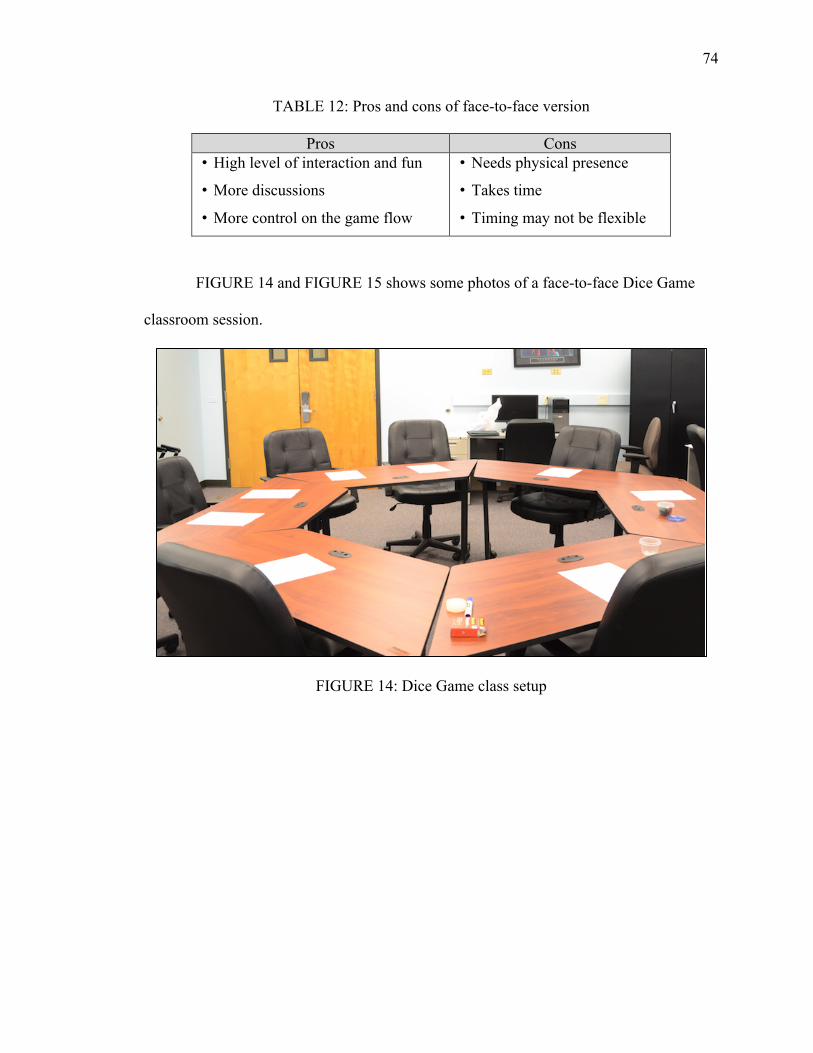
74
TABLE 12: Pros and cons of face-to-face version
Pros Cons • High level of interaction and fun
• More discussions
• More control on the game flow
• Needs physical presence
• Takes time
• Timing may not be flexible
FIGURE 14 and FIGURE 15 shows some photos of a face-to-face Dice Game
classroom session.
FIGURE 14: Dice Game class setup
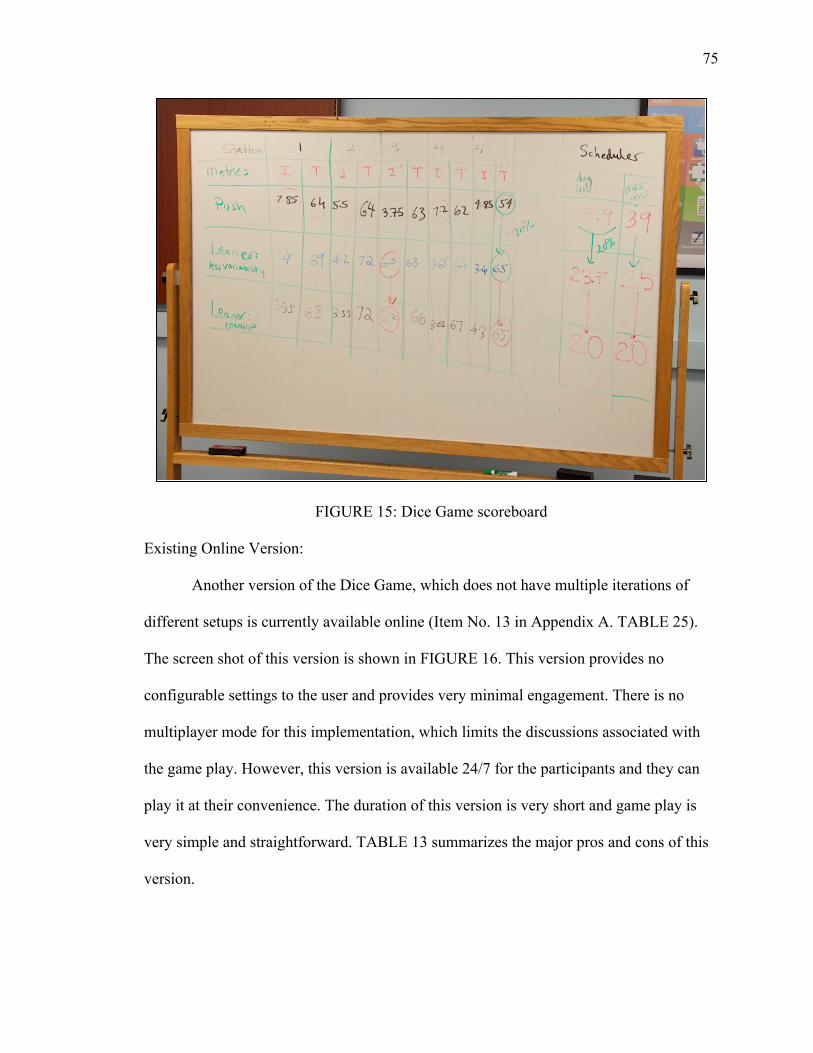
75
FIGURE 15: Dice Game scoreboard
Existing Online Version:
Another version of the Dice Game, which does not have multiple iterations of
different setups is currently available online (Item No. 13 in Appendix A. TABLE 25).
The screen shot of this version is shown in FIGURE 16. This version provides no
configurable settings to the user and provides very minimal engagement. There is no
multiplayer mode for this implementation, which limits the discussions associated with
the game play. However, this version is available 24/7 for the participants and they can
play it at their convenience. The duration of this version is very short and game play is
very simple and straightforward. TABLE 13 summarizes the major pros and cons of this
version.
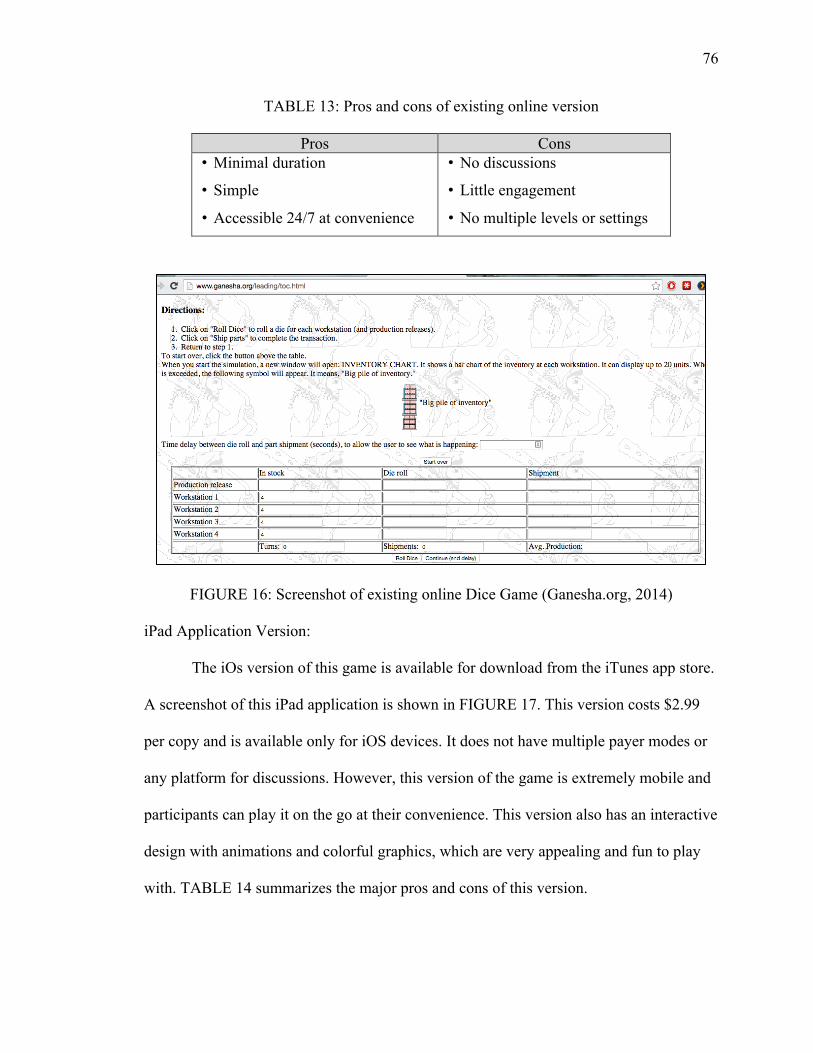
76
TABLE 13: Pros and cons of existing online version
Pros Cons • Minimal duration
• Simple
• Accessible 24/7 at convenience
• No discussions
• Little engagement
• No multiple levels or settings
FIGURE 16: Screenshot of existing online Dice Game (Ganesha.org, 2014)
iPad Application Version:
The iOs version of this game is available for download from the iTunes app store.
A screenshot of this iPad application is shown in FIGURE 17. This version costs $2.99
per copy and is available only for iOS devices. It does not have multiple payer modes or
any platform for discussions. However, this version of the game is extremely mobile and
participants can play it on the go at their convenience. This version also has an interactive
design with animations and colorful graphics, which are very appealing and fun to play
with. TABLE 14 summarizes the major pros and cons of this version.
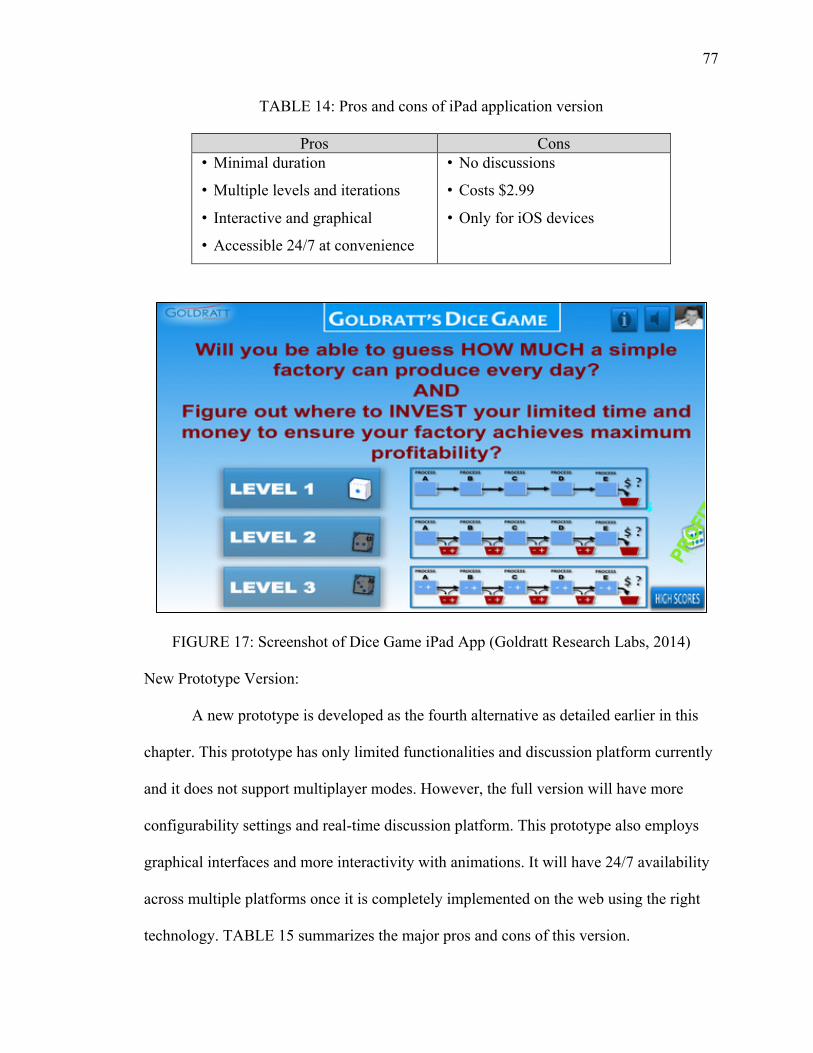
77
TABLE 14: Pros and cons of iPad application version
Pros Cons • Minimal duration
• Multiple levels and iterations
• Interactive and graphical
• Accessible 24/7 at convenience
• No discussions
• Costs $2.99
• Only for iOS devices
FIGURE 17: Screenshot of Dice Game iPad App (Goldratt Research Labs, 2014)
New Prototype Version:
A new prototype is developed as the fourth alternative as detailed earlier in this
chapter. This prototype has only limited functionalities and discussion platform currently
and it does not support multiplayer modes. However, the full version will have more
configurability settings and real-time discussion platform. This prototype also employs
graphical interfaces and more interactivity with animations. It will have 24/7 availability
across multiple platforms once it is completely implemented on the web using the right
technology. TABLE 15 summarizes the major pros and cons of this version.
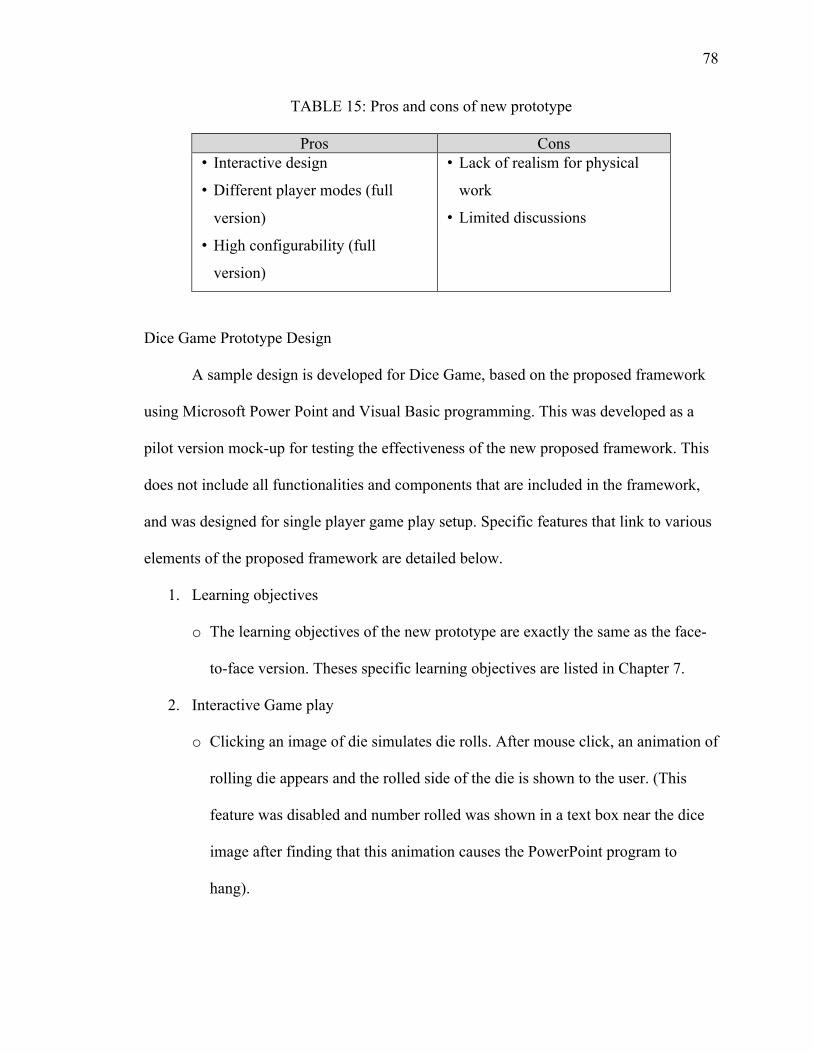
78
TABLE 15: Pros and cons of new prototype
Pros Cons • Interactive design
• Different player modes (full
version)
• High configurability (full
version)
• Lack of realism for physical
work
• Limited discussions
Dice Game Prototype Design
A sample design is developed for Dice Game, based on the proposed framework
using Microsoft Power Point and Visual Basic programming. This was developed as a
pilot version mock-up for testing the effectiveness of the new proposed framework. This
does not include all functionalities and components that are included in the framework,
and was designed for single player game play setup. Specific features that link to various
elements of the proposed framework are detailed below.
1. Learning objectives
o The learning objectives of the new prototype are exactly the same as the face-
to-face version. Theses specific learning objectives are listed in Chapter 7.
2. Interactive Game play
o Clicking an image of die simulates die rolls. After mouse click, an animation of
rolling die appears and the rolled side of the die is shown to the user. (This
feature was disabled and number rolled was shown in a text box near the dice
image after finding that this animation causes the PowerPoint program to
hang).
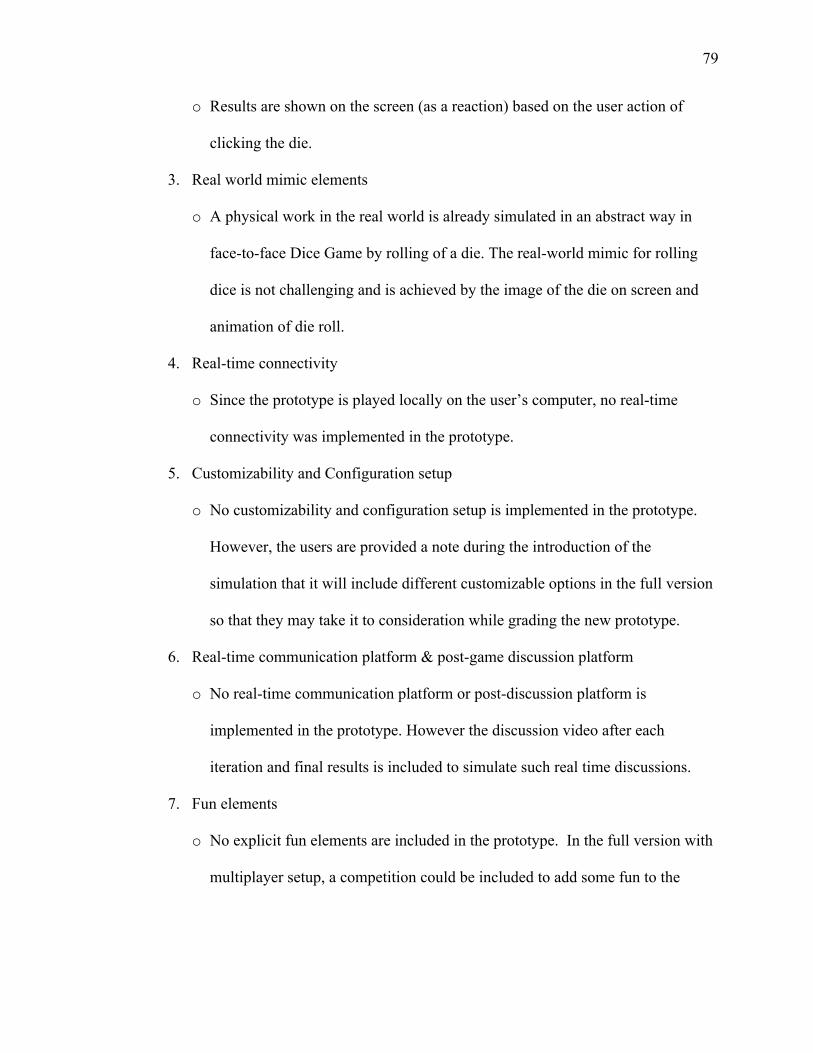
79
o Results are shown on the screen (as a reaction) based on the user action of
clicking the die.
3. Real world mimic elements
o A physical work in the real world is already simulated in an abstract way in
face-to-face Dice Game by rolling of a die. The real-world mimic for rolling
dice is not challenging and is achieved by the image of the die on screen and
animation of die roll.
4. Real-time connectivity
o Since the prototype is played locally on the user’s computer, no real-time
connectivity was implemented in the prototype.
5. Customizability and Configuration setup
o No customizability and configuration setup is implemented in the prototype.
However, the users are provided a note during the introduction of the
simulation that it will include different customizable options in the full version
so that they may take it to consideration while grading the new prototype.
6. Real-time communication platform & post-game discussion platform
o No real-time communication platform or post-discussion platform is
implemented in the prototype. However the discussion video after each
iteration and final results is included to simulate such real time discussions.
7. Fun elements
o No explicit fun elements are included in the prototype. In the full version with
multiplayer setup, a competition could be included to add some fun to the
80
simulation game. Animations or behavior of objects on the screen responding
to user action could also be done in a fun way.
8. Flow
o The flow of game play (systematic progress from a worse off situation to a
better off situation) is identified from the face-to-face version and is explicitly
embedded in the game flow for the new prototype. In the prototype, the game
flow is set by animated guidance, discussion video after each iteration, and
simple in-game quizzes to stage the next iteration and set the flow of the game
(and information delivery) so that the user builds knowledge systematically on
top of existing knowledge and learns all the designed learning objectives by the
end of the simulation activity.
9. Multi-media guidance
o Guidance is implemented by video instructions (full version may implement an
animated character) and text instructions (fixed on the window and pop-up
messages)
10. Thought-stimulating interactive quizzes
o Simple ‘yes or no’ quizzes are included between different iterations of the
game for making the user stop and reflect what was learned in the previous
iteration and setting the stage for the next iteration.
11. Pre- and Post-game quizzes
o No pre-game quiz is implemented in the prototype. A post-game quiz with
three questions is included in the prototype. The right answer and a brief
81
description is shown to the users once they answer the multiple-choice
question.
12. Revise and review mechanism
o The PowerPoint file retains the results of the game until the user explicitly
resets it by the using the reset buttons provided. Students will also be able to go
back and replay the discussion videos to revise the discussion points.
13. Compliance
o No explicit compliance components are included in the prototype.
Few screenshots from the mock-up design prototype are shown in FIGURE 18,
FIGURE 19, FIGURE 20, FIGURE 21, FIGURE 22, FIGURE 23, and FIGURE 24. A
few of the design elements that were discussed earlier that correspond to the proposed
framework components are explicitly marked in these screenshots.
FIGURE 18: A screenshot of new Dice Game prototype
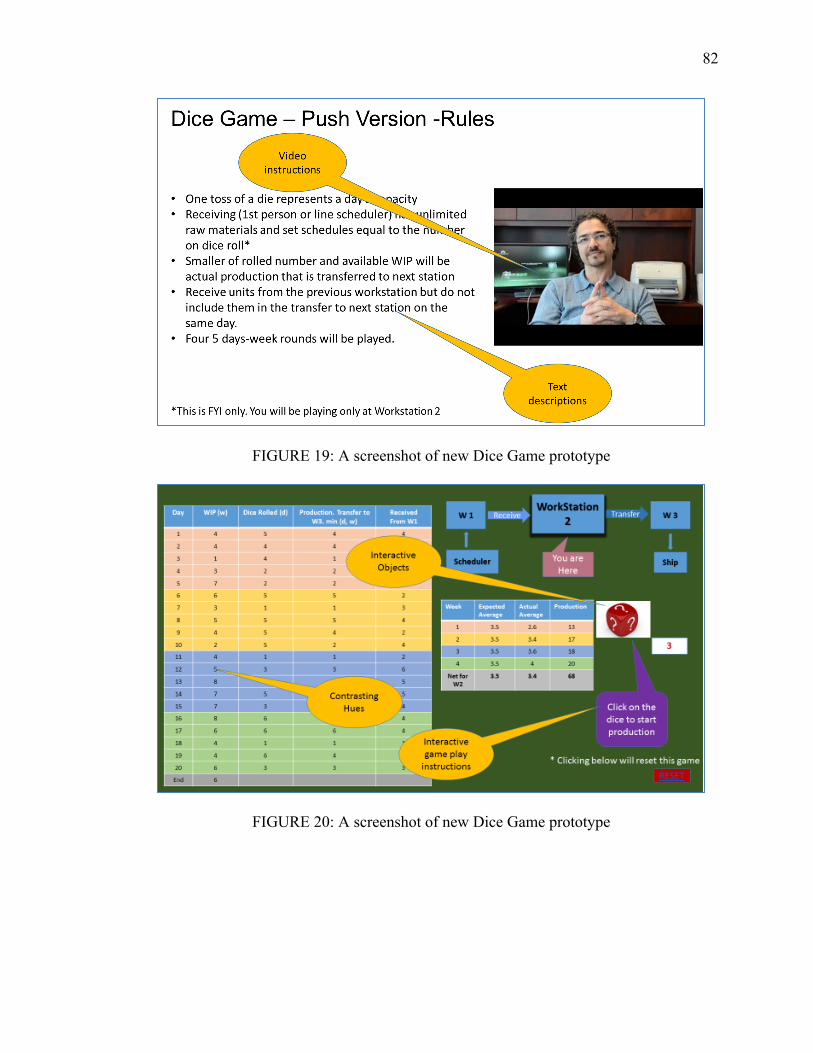
82
FIGURE 19: A screenshot of new Dice Game prototype
FIGURE 20: A screenshot of new Dice Game prototype
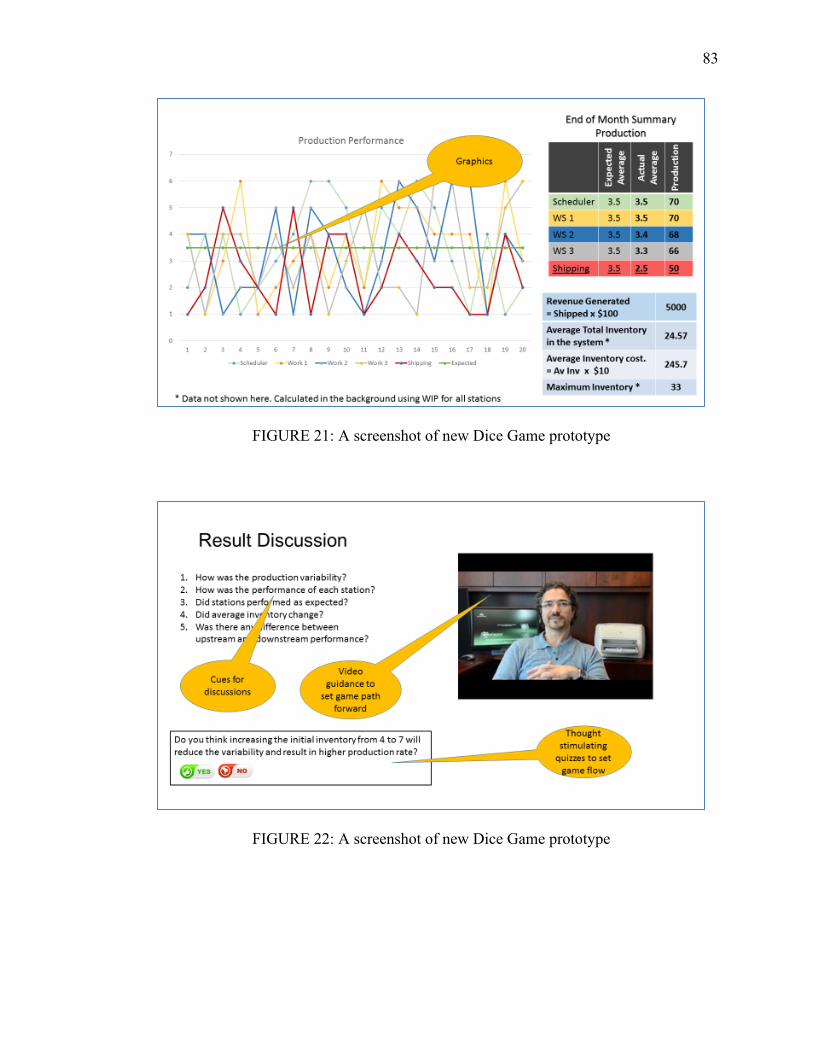
83
FIGURE 21: A screenshot of new Dice Game prototype
FIGURE 22: A screenshot of new Dice Game prototype
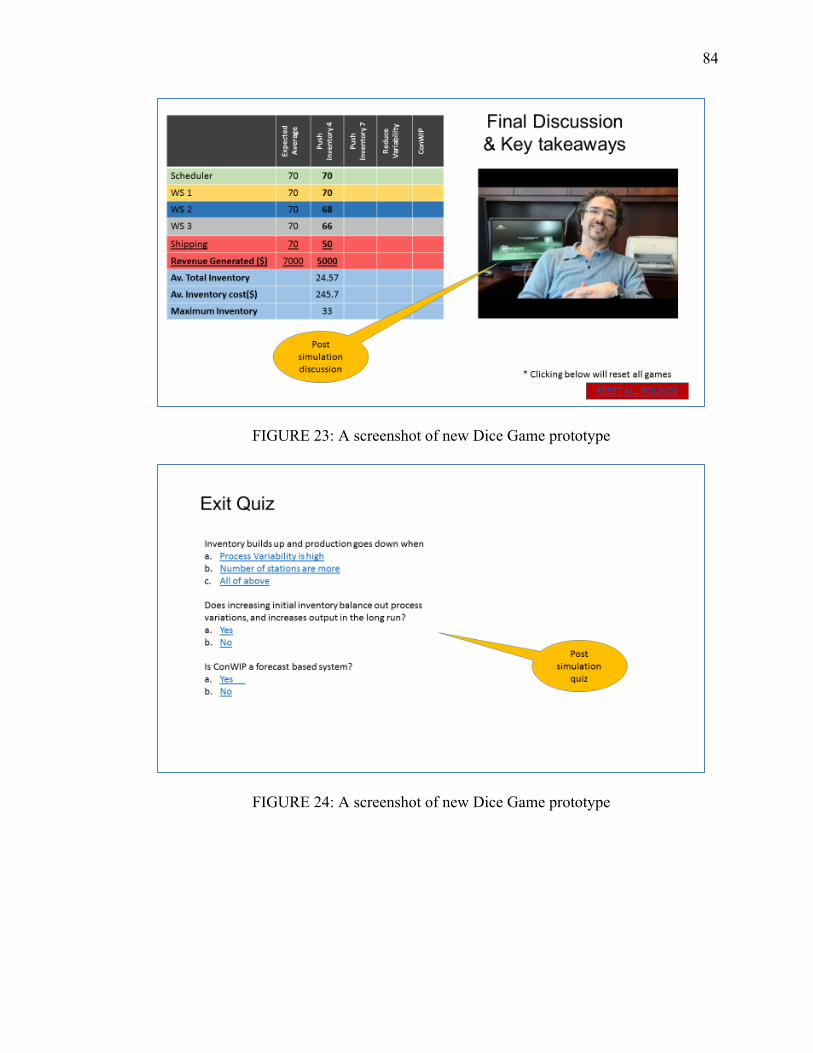
84
FIGURE 23: A screenshot of new Dice Game prototype
FIGURE 24: A screenshot of new Dice Game prototype
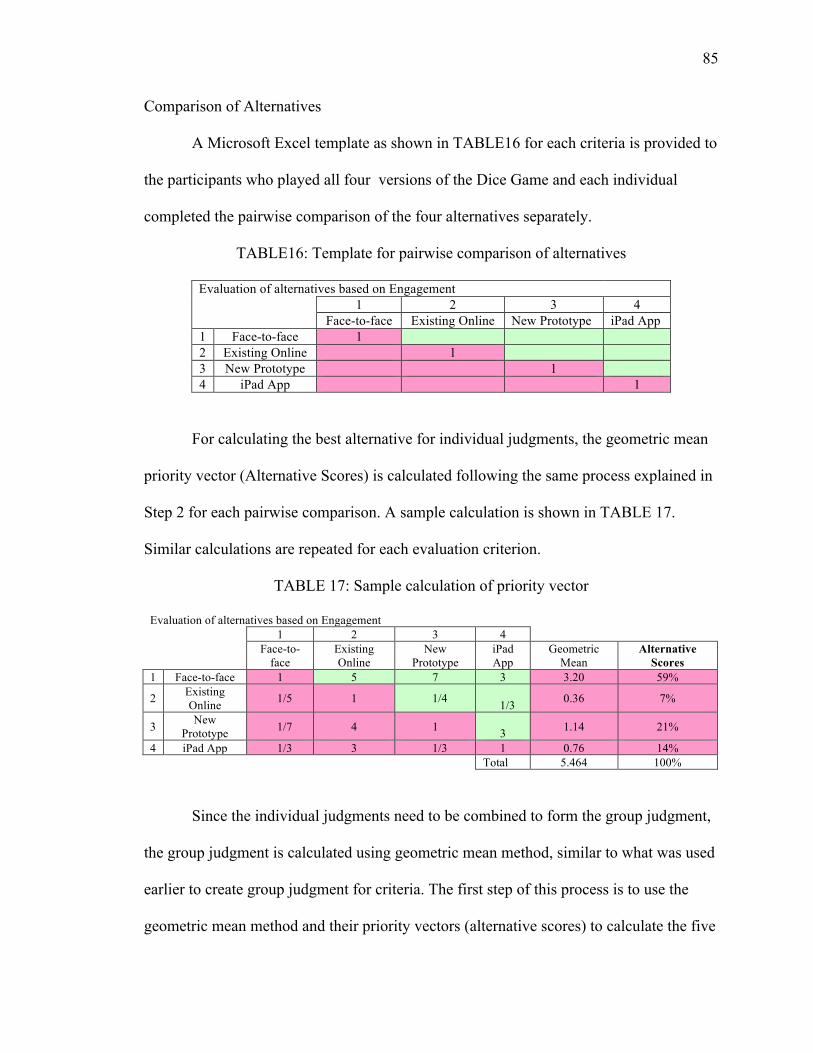
85
Comparison of Alternatives
A Microsoft Excel template as shown in TABLE16 for each criteria is provided to
the participants who played all four versions of the Dice Game and each individual
completed the pairwise comparison of the four alternatives separately.
TABLE16: Template for pairwise comparison of alternatives
Evaluation of alternatives based on Engagement 1 2 3 4
Face-to-face Existing Online New Prototype iPad App 1 Face-to-face 1 2 Existing Online 1 3 New Prototype 1 4 iPad App 1
For calculating the best alternative for individual judgments, the geometric mean
priority vector (Alternative Scores) is calculated following the same process explained in
Step 2 for each pairwise comparison. A sample calculation is shown in TABLE 17.
Similar calculations are repeated for each evaluation criterion.
TABLE 17: Sample calculation of priority vector
Evaluation of alternatives based on Engagement 1 2 3 4
Face-to-
face Existing Online
New Prototype
iPad App
Geometric Mean
Alternative Scores
1 Face-to-face 1 5 7 3 3.20 59%
2 Existing Online 1/5 1 1/4 1/3 0.36 7%
3 New Prototype 1/7 4 1 3 1.14 21%
4 iPad App 1/3 3 1/3 1 0.76 14%
Total 5.464 100%
Since the individual judgments need to be combined to form the group judgment,
the group judgment is calculated using geometric mean method, similar to what was used
earlier to create group judgment for criteria. The first step of this process is to use the
geometric mean method and their priority vectors (alternative scores) to calculate the five

86
sets of group judgments for alternative comparison for five different criteria. . Then all
priority vectors are put together in a 4x5 matrix. The weights of the criteria are put
together to a corresponding 5x1 matrix. The dot product of priority vector matrix and
criteria matrix will give the final score for each alternative. This dataset for pairwise
comparisons of alternatives for individual judgments is provided in Appendix B. TABLE
18 shows the group judgment for the evaluation of alternatives and TABLE 19 shows the
calculation of final scores for alternatives.
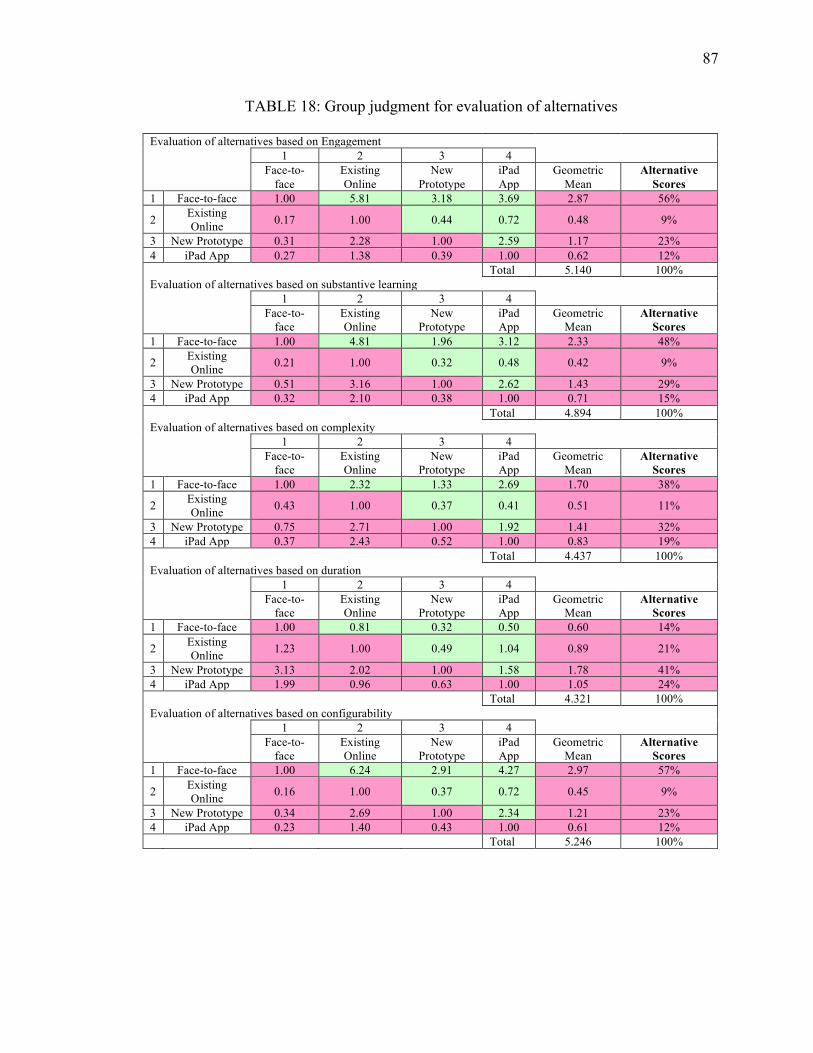
87
TABLE 18: Group judgment for evaluation of alternatives
Evaluation of alternatives based on Engagement 1 2 3 4
Face-to-
face Existing Online
New Prototype
iPad App
Geometric Mean
Alternative Scores
1 Face-to-face 1.00 5.81 3.18 3.69 2.87 56%
2 Existing Online 0.17 1.00 0.44 0.72 0.48 9%
3 New Prototype 0.31 2.28 1.00 2.59 1.17 23% 4 iPad App 0.27 1.38 0.39 1.00 0.62 12%
Total 5.140 100%
Evaluation of alternatives based on substantive learning 1 2 3 4
Face-to-
face Existing Online
New Prototype
iPad App
Geometric Mean
Alternative Scores
1 Face-to-face 1.00 4.81 1.96 3.12 2.33 48%
2 Existing Online 0.21 1.00 0.32 0.48 0.42 9%
3 New Prototype 0.51 3.16 1.00 2.62 1.43 29% 4 iPad App 0.32 2.10 0.38 1.00 0.71 15%
Total 4.894 100%
Evaluation of alternatives based on complexity 1 2 3 4
Face-to-
face Existing Online
New Prototype
iPad App
Geometric Mean
Alternative Scores
1 Face-to-face 1.00 2.32 1.33 2.69 1.70 38%
2 Existing Online 0.43 1.00 0.37 0.41 0.51 11%
3 New Prototype 0.75 2.71 1.00 1.92 1.41 32% 4 iPad App 0.37 2.43 0.52 1.00 0.83 19%
Total 4.437 100%
Evaluation of alternatives based on duration 1 2 3 4
Face-to-
face Existing Online
New Prototype
iPad App
Geometric Mean
Alternative Scores
1 Face-to-face 1.00 0.81 0.32 0.50 0.60 14%
2 Existing Online 1.23 1.00 0.49 1.04 0.89 21%
3 New Prototype 3.13 2.02 1.00 1.58 1.78 41% 4 iPad App 1.99 0.96 0.63 1.00 1.05 24%
Total 4.321 100%
Evaluation of alternatives based on configurability 1 2 3 4
Face-to-
face Existing Online
New Prototype
iPad App
Geometric Mean
Alternative Scores
1 Face-to-face 1.00 6.24 2.91 4.27 2.97 57%
2 Existing Online 0.16 1.00 0.37 0.72 0.45 9%
3 New Prototype 0.34 2.69 1.00 2.34 1.21 23% 4 iPad App 0.23 1.40 0.43 1.00 0.61 12%
Total 5.246 100%
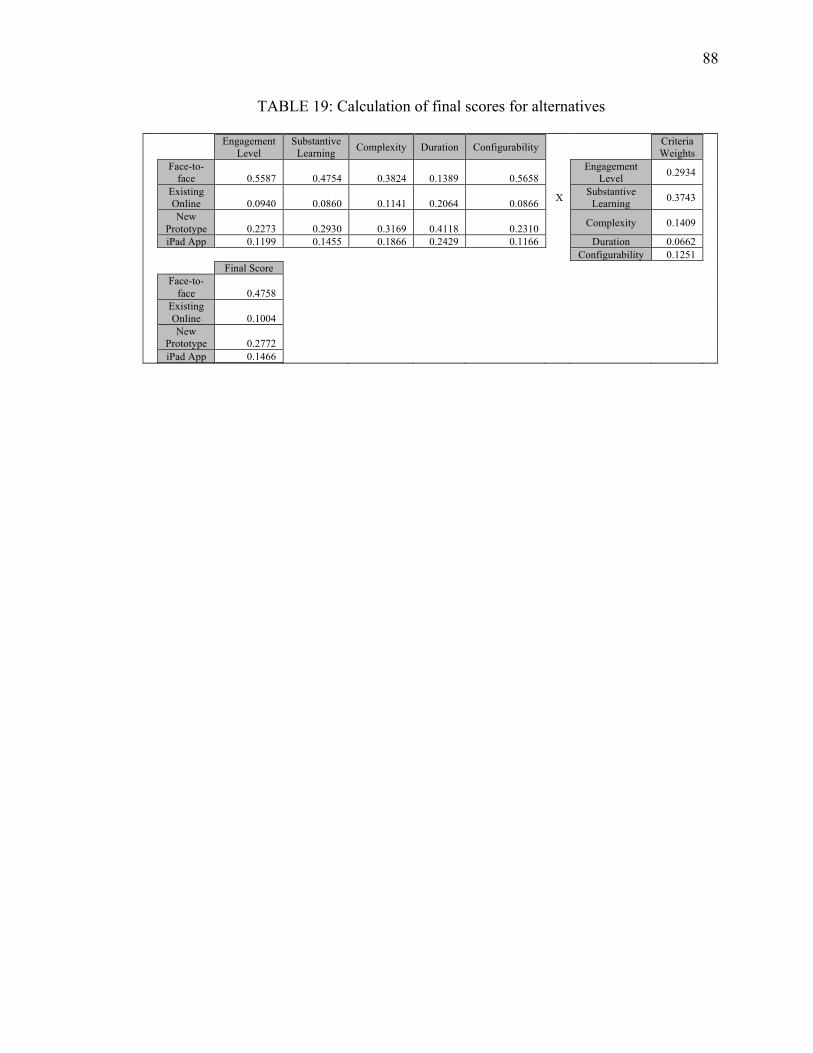
88
TABLE 19: Calculation of final scores for alternatives
Engagement Level
Substantive Learning Complexity Duration Configurability
Criteria Weights
Face-to-face 0.5587 0.4754 0.3824 0.1389 0.5658
Engagement Level 0.2934
Existing Online 0.0940 0.0860 0.1141 0.2064 0.0866 X Substantive
Learning 0.3743
New Prototype 0.2273 0.2930 0.3169 0.4118 0.2310
Complexity 0.1409
iPad App 0.1199 0.1455 0.1866 0.2429 0.1166
Duration 0.0662
Configurability 0.1251
Final Score
Face-to-face 0.4758
Existing Online 0.1004
New Prototype 0.2772
iPad App 0.1466
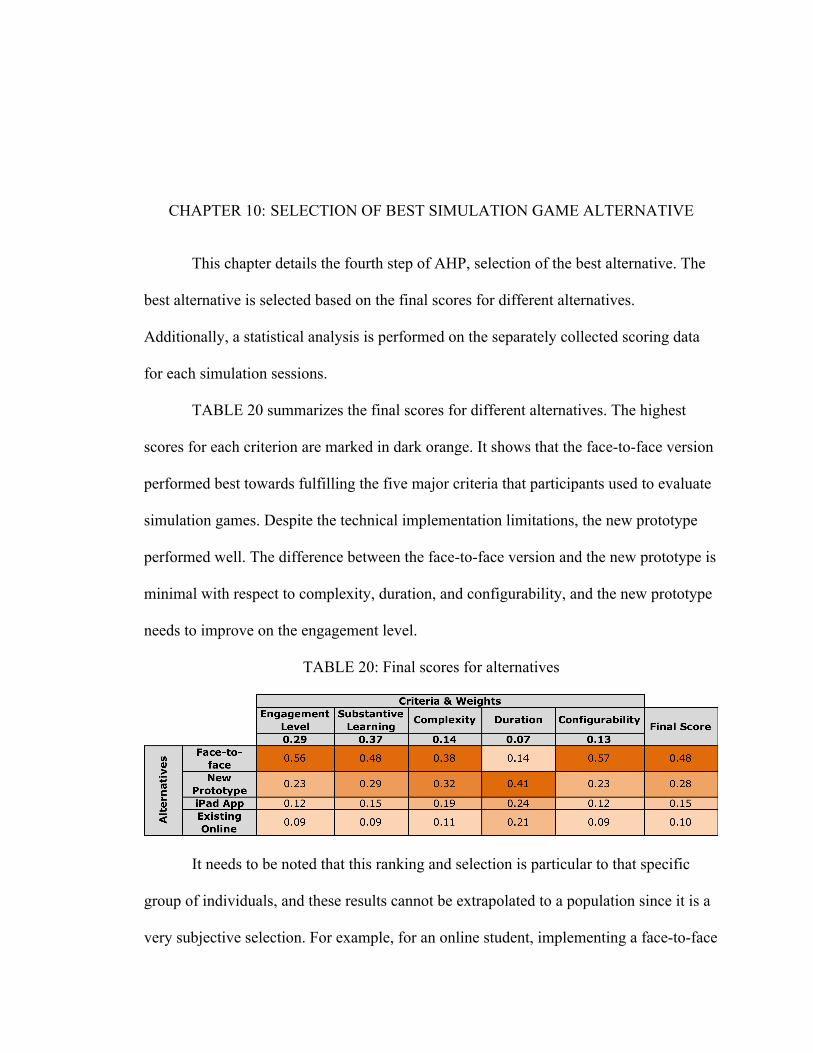
CHAPTER 10: SELECTION OF BEST SIMULATION GAME ALTERNATIVE
This chapter details the fourth step of AHP, selection of the best alternative. The
best alternative is selected based on the final scores for different alternatives.
Additionally, a statistical analysis is performed on the separately collected scoring data
for each simulation sessions.
TABLE 20 summarizes the final scores for different alternatives. The highest
scores for each criterion are marked in dark orange. It shows that the face-to-face version
performed best towards fulfilling the five major criteria that participants used to evaluate
simulation games. Despite the technical implementation limitations, the new prototype
performed well. The difference between the face-to-face version and the new prototype is
minimal with respect to complexity, duration, and configurability, and the new prototype
needs to improve on the engagement level.
TABLE 20: Final scores for alternatives
It needs to be noted that this ranking and selection is particular to that specific
group of individuals, and these results cannot be extrapolated to a population since it is a
very subjective selection. For example, for an online student, implementing a face-to-face
90
simulation is almost impossible, even though the result of the AHP evaluation by a
specific group of students show that face-to-face is the best option.
Analysis of Scoring for Various Game Sessions
Only individuals who attended all four versions of the Dice Game were asked to
do the AHP evaluation of the alternatives. Individuals who played only some versions of
the game including the face-to-face classroom Lampshade Game were asked to provide
scoring for each session based on the five established criteria on a one to nine scale. They
were not asked to do AHP evaluation, since consistency of the size of comparison matrix
cannot be maintained if the number of rows and columns for alternatives are different for
each individual. Most of the participants were able to evaluate the new prototype and the
existing online version of the Dice Game. Mobile version of the Dice Game is only
available in iOS platform and many participants who did not own an Apple device were
unable to evaluate the iOS version.
The template for data collection and consolidated response data is given in
Appendix B, TABLE 26 and TABLE 27. The final score is calculated by adding the
result of multiplying the individual criteria rating with weights of criteria This dataset
includes the scoring done for face-to-face classroom Dice Game simulation, face-to-face
classroom Lampshade Game simulation, one currently available online Dice Game
simulation (Item No. 13 in Appendix A TABLE 25), the currently available iPad App for
the Dice Game, and the newly developed Dice Game mock-up simulation.
The number of participants who played the face-to-face, iPad app, existing online,
and new Prototype versions are five, five, nine, & nine respectively. Based on the data for
the Dice Game, average scores for different alternatives are calculated as shown in
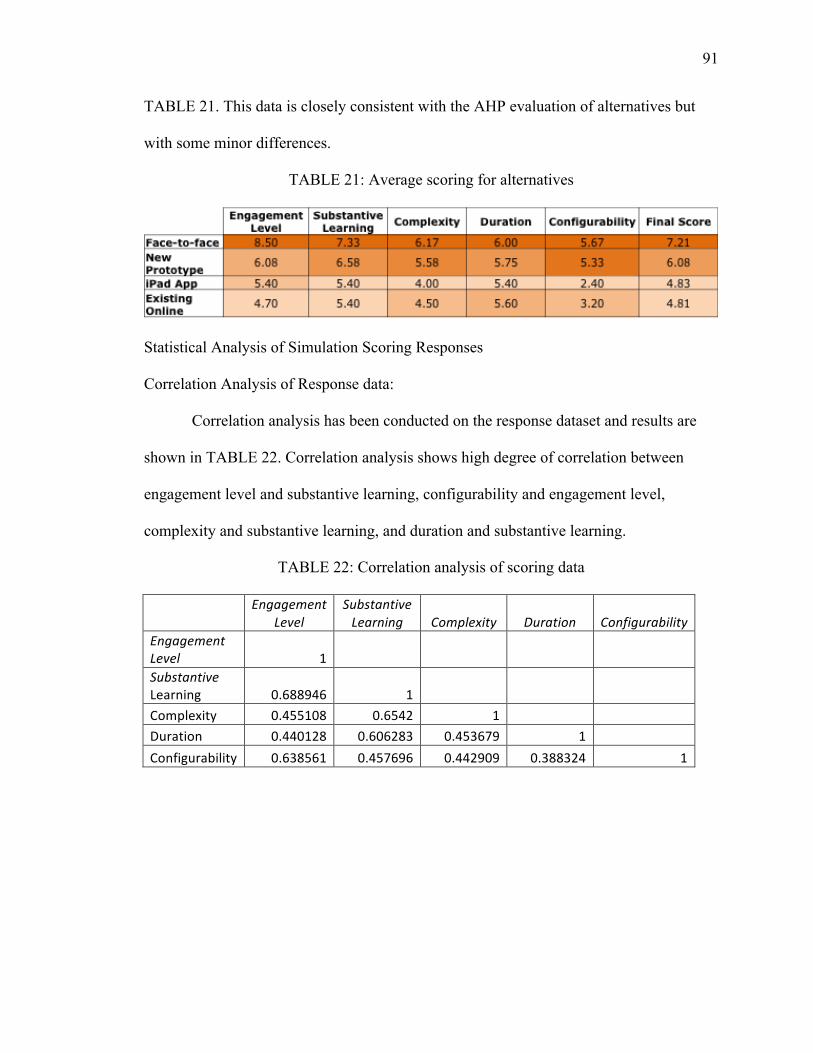
91
TABLE 21. This data is closely consistent with the AHP evaluation of alternatives but
with some minor differences.
TABLE 21: Average scoring for alternatives
Statistical Analysis of Simulation Scoring Responses
Correlation Analysis of Response data:
Correlation analysis has been conducted on the response dataset and results are
shown in TABLE 22. Correlation analysis shows high degree of correlation between
engagement level and substantive learning, configurability and engagement level,
complexity and substantive learning, and duration and substantive learning.
TABLE 22: Correlation analysis of scoring data
Engagement
Level Substantive Learning Complexity Duration Configurability
Engagement Level 1
Substantive Learning 0.688946 1
Complexity 0.455108 0.6542 1 Duration 0.440128 0.606283 0.453679 1
Configurability 0.638561 0.457696 0.442909 0.388324 1
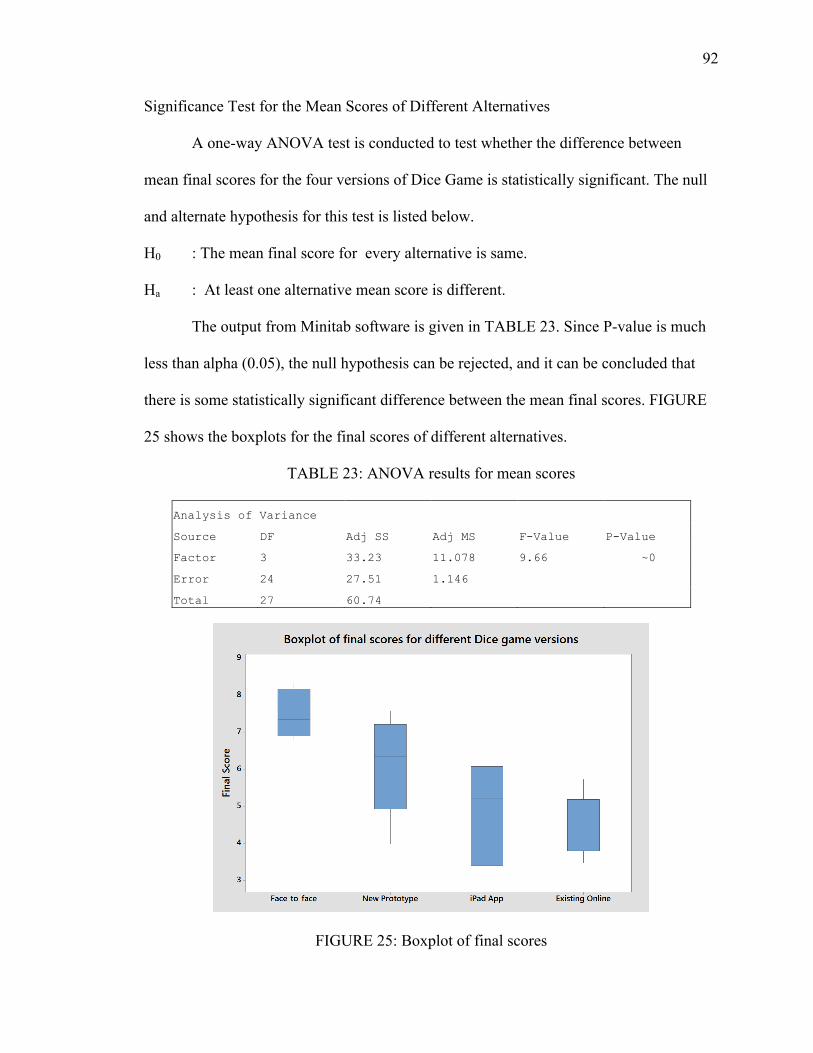
92
Significance Test for the Mean Scores of Different Alternatives
A one-way ANOVA test is conducted to test whether the difference between
mean final scores for the four versions of Dice Game is statistically significant. The null
and alternate hypothesis for this test is listed below.
H0 : The mean final score for every alternative is same.
Ha : At least one alternative mean score is different.
The output from Minitab software is given in TABLE 23. Since P-value is much
less than alpha (0.05), the null hypothesis can be rejected, and it can be concluded that
there is some statistically significant difference between the mean final scores. FIGURE
25 shows the boxplots for the final scores of different alternatives.
TABLE 23: ANOVA results for mean scores
Analysis of Variance Source DF Adj SS Adj MS F-Value P-Value
Factor 3 33.23 11.078 9.66 ~0
Error 24 27.51 1.146 Total 27 60.74
FIGURE 25: Boxplot of final scores
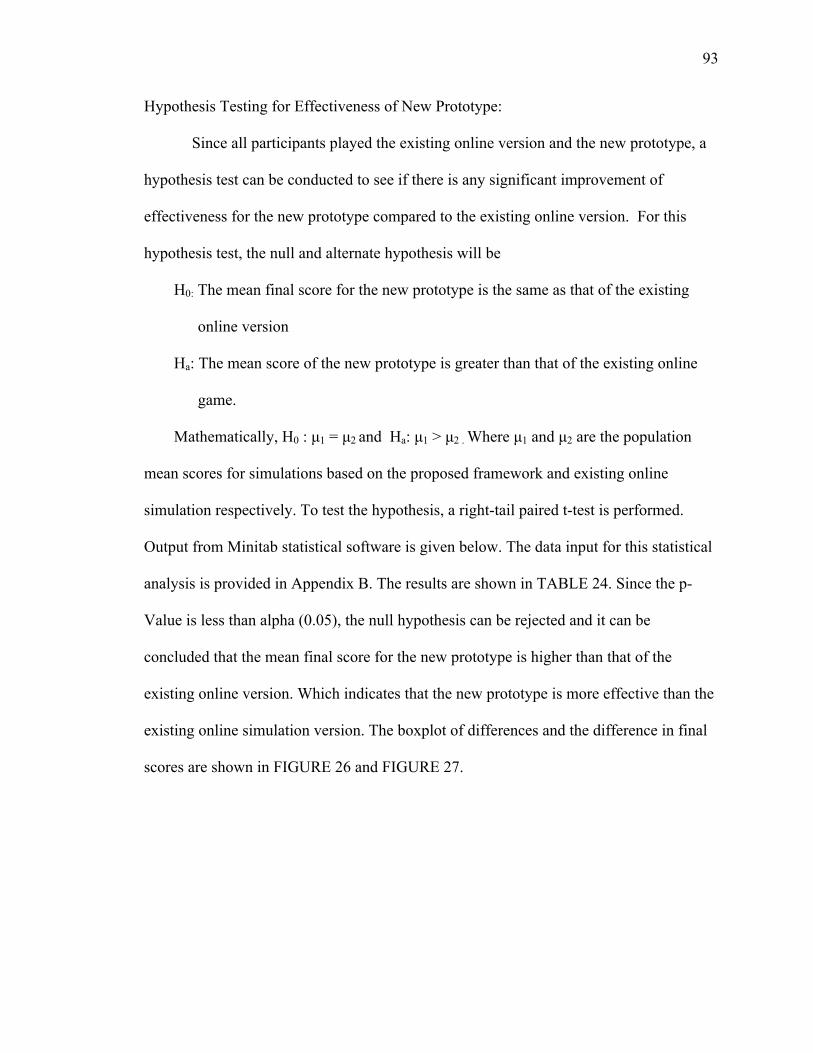
93
Hypothesis Testing for Effectiveness of New Prototype:
Since all participants played the existing online version and the new prototype, a
hypothesis test can be conducted to see if there is any significant improvement of
effectiveness for the new prototype compared to the existing online version. For this
hypothesis test, the null and alternate hypothesis will be
H0: The mean final score for the new prototype is the same as that of the existing
online version
Ha: The mean score of the new prototype is greater than that of the existing online
game.
Mathematically, H0 : µ1 = µ2 and Ha: µ1 > µ2 . Where µ1 and µ2 are the population
mean scores for simulations based on the proposed framework and existing online
simulation respectively. To test the hypothesis, a right-tail paired t-test is performed.
Output from Minitab statistical software is given below. The data input for this statistical
analysis is provided in Appendix B. The results are shown in TABLE 24. Since the p-
Value is less than alpha (0.05), the null hypothesis can be rejected and it can be
concluded that the mean final score for the new prototype is higher than that of the
existing online version. Which indicates that the new prototype is more effective than the
existing online simulation version. The boxplot of differences and the difference in final
scores are shown in FIGURE 26 and FIGURE 27.
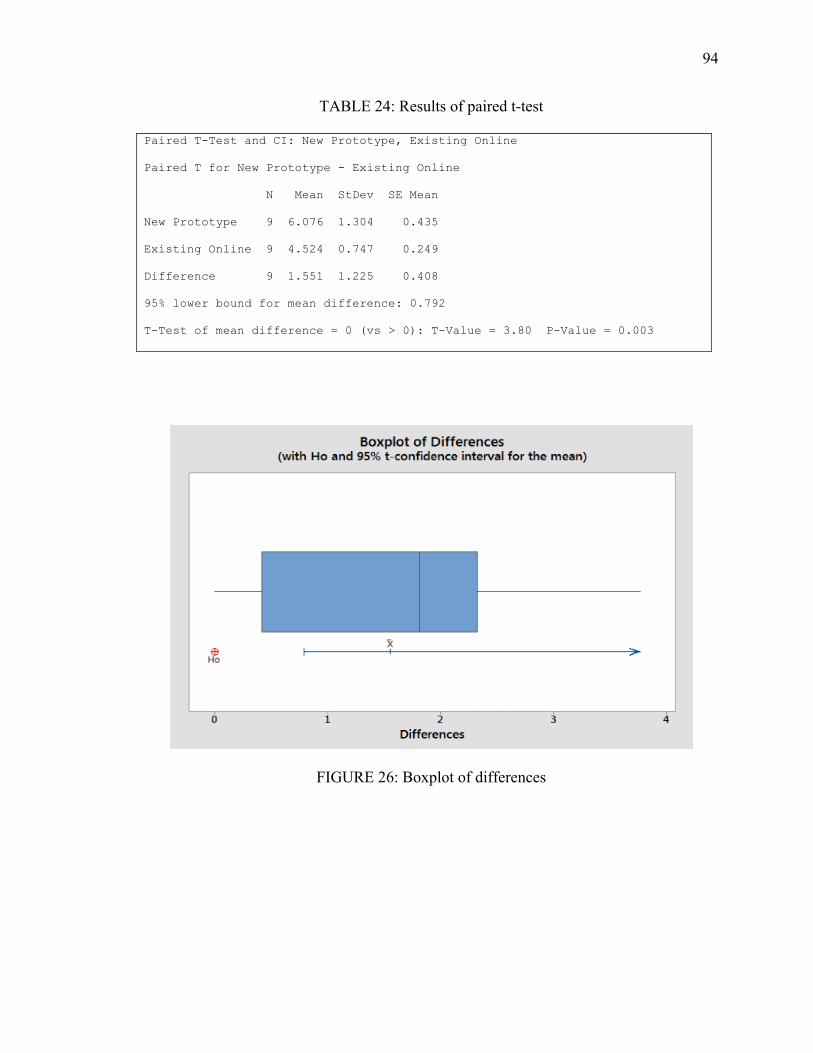
94
TABLE 24: Results of paired t-test
Paired T-Test and CI: New Prototype, Existing Online
Paired T for New Prototype - Existing Online
N Mean StDev SE Mean
New Prototype 9 6.076 1.304 0.435
Existing Online 9 4.524 0.747 0.249
Difference 9 1.551 1.225 0.408
95% lower bound for mean difference: 0.792
T-Test of mean difference = 0 (vs > 0): T-Value = 3.80 P-Value = 0.003
FIGURE 26: Boxplot of differences
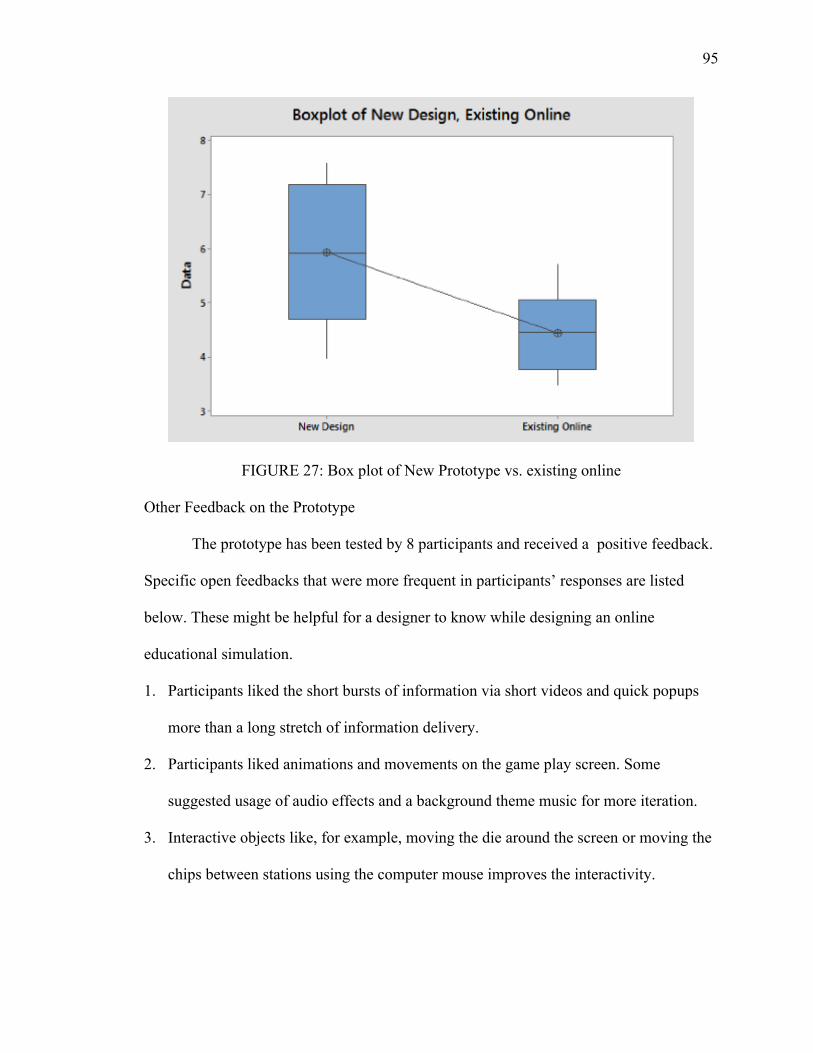
95
FIGURE 27: Box plot of New Prototype vs. existing online
Other Feedback on the Prototype
The prototype has been tested by 8 participants and received a positive feedback.
Specific open feedbacks that were more frequent in participants’ responses are listed
below. These might be helpful for a designer to know while designing an online
educational simulation.
1. Participants liked the short bursts of information via short videos and quick popups
more than a long stretch of information delivery.
2. Participants liked animations and movements on the game play screen. Some
suggested usage of audio effects and a background theme music for more iteration.
3. Interactive objects like, for example, moving the die around the screen or moving the
chips between stations using the computer mouse improves the interactivity.

96
4. For post-game discussion, consolidated results of the game in the form of graphs,
tables etc. can be put together with specific video/animated discussion about the final
results and key takeaway reiteration.
5. In the case of games with repetitive actions such as die roll in the Dice Game,
different approaches such as moving dice around the screen, forcing a keyboard input,
or a voice command input may be helpful to break the boredom of repetitive mouse
clicks.
6. Highlighting the main focus elements on the screen in response to a user action can
draw user attention to those key points. For example, in the Dice Game, highlighting
the initial level of inventory at the beginning of each round by animated text will be
helpful for the user to notice the initial level change and it suggests internally to
follow what changes are happening due to that action.
7. Discussion during the session and after the session has significant effects on higher
substantive learning from the simulation.
CHAPTER 11: SUMMARY, RESULTS, AND CONCLUSIONS
Survey of Available Operations Management Simulations:
A survey has been conducted to find the existing simulations that can be used for
delivering learning objectives related to Lean Six Sigma and operations management in
general. Fifty three distinct simulations with multiple versions have been surveyed. Key
learning objectives, online and electronic versions availability, approximate cost,
minimum number of participants, time required for setup and play, and the industry
settings have been analyzed and the resulting data is tabulated in Appendix A TABLE 25.
Gaps between Offline and Online Simulations:
Gaps between online and offline simulations have been identified based on
existing literature and sample participants’ responses. These gaps have been analyzed in
detail and the major gaps are listed below:
1. Limitation to realism
2. Direct communication gaps
3. Tacit communications
4. Ad-hoc configurability
Challenges for Implementing an Online Educational Simulation:
The challenges to close the aforementioned gaps, and additional challenges for
implementing an online simulation have been analyzed in detail. The major challenges
are listed below:
98
1. Implementing a good real-world mimic
2. Administrative challenges for multiplayer games
3. Communication limitations
4. Technical challenges and additional resources
5. Complex learning objectives
Simulation Evaluation Criteria:
Analytic Hierarchy Process is used to find the criteria and their corresponding
weights to evaluate an educational simulation. These major criteria and their weights are:
1. Substantive Learning : 0.37
2. Engagement : 0.29
3. Complexity : 0.14
4. Configurability : 0.13
5. Duration : 0.07
Statistical Analysis of Criteria Evaluation Data:
The response data for evaluation of criteria has been analyzed and descriptive
statistical parameters of the sample are calculated. A one-way ANOVA test to compare
the mean weights of different criteria confirms a statistically significant difference
between them with a 95% confidence level.
Kano Model for online educational simulations
The Kano model for online educational simulations was developed based on the
major attributes appearing in the existing literature and criteria evaluation by the sample
99
respondents. These Attributes has been categorized to basic, performance and excitement
attributes.
A New Framework for Online Educational Simulation Designs:
A new framework has been proposed to reduce the major gaps between online
and offline simulations to lower limits by addressing the major challenges. It also
incorporates the feedback from sample participants’ responses to different game sessions
and common educational activities design practices. The major components for this
framework are listed below:
1. Learning objectives
2. Interactive Game play
3. Real world mimic elements
4. Real-time connectivity
5. Customizability and Configuration setup
6. Real-time communication platform & Post-game discussion platform
7. Fun elements
8. Flow
9. Multi-media guidance
10. Thought stimulating interactive quizzes
11. Pre and Post game quizzes
12. Revise and review mechanism
13. Compliance
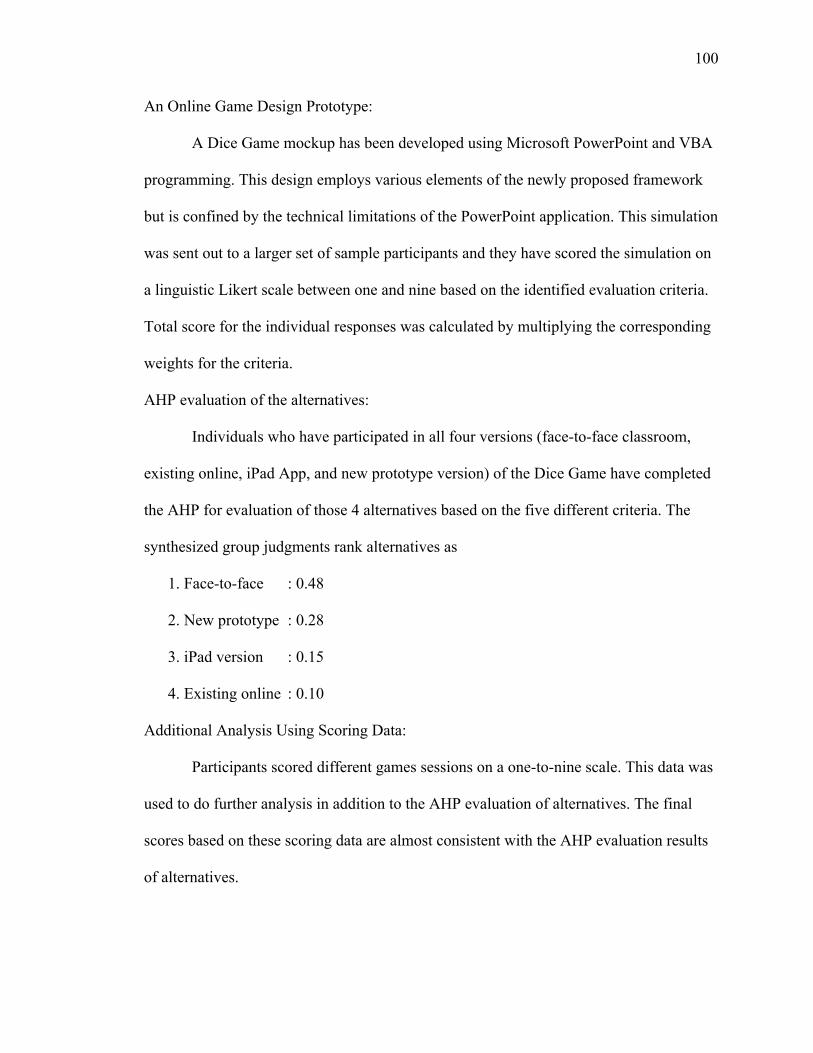
100
An Online Game Design Prototype:
A Dice Game mockup has been developed using Microsoft PowerPoint and VBA
programming. This design employs various elements of the newly proposed framework
but is confined by the technical limitations of the PowerPoint application. This simulation
was sent out to a larger set of sample participants and they have scored the simulation on
a linguistic Likert scale between one and nine based on the identified evaluation criteria.
Total score for the individual responses was calculated by multiplying the corresponding
weights for the criteria.
AHP evaluation of the alternatives:
Individuals who have participated in all four versions (face-to-face classroom,
existing online, iPad App, and new prototype version) of the Dice Game have completed
the AHP for evaluation of those 4 alternatives based on the five different criteria. The
synthesized group judgments rank alternatives as
1. Face-to-face : 0.48
2. New prototype : 0.28
3. iPad version : 0.15
4. Existing online : 0.10
Additional Analysis Using Scoring Data:
Participants scored different games sessions on a one-to-nine scale. This data was
used to do further analysis in addition to the AHP evaluation of alternatives. The final
scores based on these scoring data are almost consistent with the AHP evaluation results
of alternatives.

101
A Hypothesis test has been conducted to find whether there is statistically
significant difference for the mean final scores between different versions of the ice
game. A one-way ANOVA was used to test this hypothesis and results show a
statistically significant difference in these mean scores. Additionally another hypothesis
test was conducted to test whether the mean scores for the new prototype was higher than
that of the existing online version. A right tailed, paired t-test was used, and the results
show that the mean final score for the new prototype is significantly higher than that of
the existing online version.
Limitations of the study
Available sample size is the largest limitation of the study. The immediate target
audience of the study of the Lean Six Sigma simulations games is the graduate-level
students at Systems Engineering department. Currently the total number of students is
limited to less than 100. Getting a large sample size from this small population has many
practical difficulties. Since the major focus of the study involved comparison of the face-
to-face simulations with other alternatives, the number of sample participants was
reduced further to volunteers from on-campus students (who mostly take on campus
courses during Fall and Spring, and online courses during Summer).
A total of 12 participants have contributed data to this study. It needs to be noted
that out of 12 only two participants were teachers (facilitators). So the results of this
study predominantly reflect a student perspective. The ideal sample would be a random
mixture of on-campus students, online students, facilitators and other stakeholders.
CHAPTER 12: RECOMMENDATIONS AND FUTURE RESEARCH
The new prototype scored very close to the face-to-face simulations on duration,
configurability, and complexity criteria. Hence more emphasis needs to be given on the
engagement level and substantive learning enhancement in the new prototype.
Correlation analysis has shown a high degree of correlation between scores for these
criteria, and improving one can most likely improve the other criteria.
Improving configurability wouldn't be a great challenge with the full
implementation of the design based on the new prototype using the latest technology.
This increased configurability shall be a great advantage for these simulations over the
face-to-face versions.
The designer may also implement an iterative design process to develop new
games or translate existing face-to-face versions into online versions. The design may be
improved in iterative cycles based on the feedback from the test group of participants.
Existing platforms such as eAdventure (www.e-adventure.e-ucm.es) could be explored to
implement simulation games.
Further development of prototype:
Developing an enhanced version of the Dice Game would also be the next step of this
research. This will require addition of multiple features to the game based on the defined
framework. However, the first step towards this goal will be identifying the right
technology to implement this simulation game on the web. Consulting an IT systems
103
expert or a team will be helpful to identify the best technology for this purpose and to
understand its advantages and limitations. Few possibilities for the enhanced version are
detailed below:
1. Learning objectives
o The basic learning objectives of the face-to-face version are already
implemented in the new prototype. If the designer needs to include more
learning objectives, it may be added to the full version.
2. Interactive Game play
o More animations and improved interactivity; Movement could be achieved by
movement animations of chips, die, etc. Interactive objects on the screen such
as movable dice, chips by click and drag may be added as well.
o Highlighting the reaction to any particular user action by animations or color
changes.
o The user may be asked to fill in the table data by using keyboard after each die
roll instead of populating the table automatically. This could force the user to
think more and help to eliminate the boredom of repeated clicks.
3. Real world mimic elements
o The movement of chips can be done by clicking and dragging them into place.
Instead of clicking the die image, users may drag and throw the die using the
mouse.
4. Real-time connectivity
o Since the simulation will be hosted on the web and accessed via a web browser
(depending on the chosen technology), real-time connectivity is inherent. In
104
case of multiplayer games, each user actions are communicated to the server
and will reflect on the game screens of other users. The facilitator (if present)
may be provided with an option to view all the participants’ actions on a single
screen.
5. Customizability and Configuration setup
o Keywords, images, instructions and illustrations of the Dice Game that are
tailored to different industry settings need to be defined and built into the
simulation. The facilitator or user may choose the setting based on the target
participants’ background.
o A setting for the level of difficulty may be provided. In low difficulty setting,
the explanations and guidance appear frequently and in higher difficulty
settings these appear less frequently. The level of quizzes can also be changed
based on the difficulty setting.
o The user may be provided with an option to play with simulated players or real
multiplayers depending on the availability of other players.
6. Real-time communication platform & Post-game discussion platform
o A fully integrated audio-video communication platform will be challenging to
develop and may require unjustifiably high resources to build for this purpose.
However, the designer may explore how existing platforms such as Skype,
Google Hangout, or Centra meeting can be used in parallel to the game session
or integrated with the simulation game.
105
7. Fun elements
o In the full version with multiplayer setup, a competition could be included to
add some fun to the simulation game. Animations or behavior of objects on the
screen responding to user action could also be done in a fun way.
8. Flow
o The full version may use the same flow as the prototype unless the designer
includes additional learning objectives.
9. Multi-media guidance
o The full version may implement an animated character or avatar to replace the
video in the prototype. It will also require making multiple versions of these if
the game provides multiple industry settings.
10. Thought-stimulating interactive quizzes
o The quizzes may be modified if the designer includes additional iterations or
change learning objectives.
11. Pre- and Post-game quizzes
o A pre-game quiz may be included in the final version. The post-game quiz in
the prototype can be modified to match the pre-game quiz or improved if more
learning objectives are added.
12. Revise and review mechanism
o The results of the game session or the user actions can be logged and stored on
the server. Users may later access the saved sessions and review the results. It
may not be possible to store the real-time discussion or post game discussions.
106
A cheat sheet or document summary of the learning from the game may be
stored for revision after the discussions.
13. Compliance
o All elements of the game may be checked against ADA guidelines and
configurable settings may be provided to the user for enabling accessibility
features such as magnifier, inverted contrast, or audio aids based on the user
preferences.
o All aspects of the game and its implementation need to be checked and made
aligning with policies of the institution or governing bodies.
Additional future work
• Further testing of the full version of the Dice Game and iterative improvements to
the design
• Updates to framework based on feedback from larger sample size
• Develop additional online games to test the proposed framework
Addressing the Limitations of this study:
The limitation of this study due to limited number of available test participants
and experts is detailed in Chapter 11. To overcome this limitation, a larger sample testing
needs to be conducted and more expert reviews needs to be gathered. The ideal sample
will include adequate number (statistically determined) of random participants that fall
into different categories such as on-campus students, online students, graduate students,
under-graduate students, teachers (facilitators), and other stakeholders. Additionally,
experts’ opinion, evaluation and feedbacks also need to be collected and analyzed. These
experts may be experienced teachers, facilitators, or senior students who have extensive

107
experience in facilitating or participating in simulation activities. AHP methodology and
statistical analysis explained in this thesis shall be used to structure and analyze the data
collected from the larger sample. This may change the top criteria and their respective
weights. Selection from different alternatives needs to be based on the evaluation of
alternatives by the sample of particular set of end users whom the simulation is aimed at.
108
REFERENCES
Aczél, J., & Saaty, T. L. (1983). Procedures for synthesizing ratio judgements. Journal of
mathematical Psychology, 27(1), 93-102.
Adams, W. K., Reid, S., LeMaster, R., McKagan, S., Perkins, K., Dubson, M., & Wieman, C. E. (2008a). A study of educational simulations Part II–Interface Design. Journal of Interactive Learning Research, 19(4), 551-577.
Adams, W. K., Reid, S., LeMaster, R., McKagan, S. B., Perkins, K. K., Dubson, M., & Wieman, C. E. (2008b). A Study of Educational Simulations Part I-Engagement and Learning. Journal of Interactive Learning Research, 19(3), 397-419.
Allen, I. E., & Seaman, J. (2013). Changing Course: Ten Years of Tracking Online Education in the United States: ERIC.
Appelman, R. L. (2011). An Iterative 4 Step Experiential ID Process (4xEID). Paper presented at the AECT International convention, Jacksonville, FL.
Arefi, M., Heidari, M., Morkani, G. S., & Zandi, K. (2012). Application of Kano Model in Higher Education Quality Improvement: Study Master’s Degree Program of Educational Psychology in State Universities of Tehran. World Applied Sciences Journal, 17(3), 347-353.
Arinto, P. (n.d). Handbook on Instructional Design for the Academy of ICT Essentials for Government Leaders.
Badurdeen, F., Marksberry, P., Hall, A., & Gregory, B. (2010). Teaching Lean Manufacturing With Simulations and Games: A Survey and Future Directions. Simulation & Gaming.
Barker, P., & King, T. (1993). Evaluating interactive multimedia courseware—A methodology. Computers & Education, 21(4), 307-319. doi: http://dx.doi.org/10.1016/0360-1315(93)90034-G
Basak, I., & Saaty, T. (1993). Group decision making using the analytic hierarchy process. Mathematical and computer modelling, 17(4), 101-109.
Blackboard Inc. (1998). Educational Benefits of Online Learning. http://blackboardsupport.calpoly.edu/content/faculty/handouts/Ben_Online.pdf
Bloom, B. S., College, C. o., & Examiners, U. (1956). Taxonomy of educational objectives (Vol. 1): David McKay New York.
Cavalcanti, R. d. A., & Gayo, M. (2006). Andragogia na educação universitária. Conceitos. Disponível em:< www. adufpb. org. br/publica/conceitos/11/art05. pdf>. Acesso em, 11.
109
Cole, R. C. (1941). Vocational guidance for boys: a program for schools and social agencies. New York, London: Harper & Brothers.
Crawford, G. B. (1987). The geometric mean procedure for estimating the scale of a judgement matrix. Mathematical Modelling, 9(3–5), 327-334. doi: http://dx.doi.org/10.1016/0270-0255(87)90489-1
dos Santos Matai, P. H. L., & Matai, S. (2009). Cooperative Education: Andragogy. Retrieved from International Social Science Council,ISSC, 1, rue Miollis, Paris Cedex 15, 75732, France website: http://www.iiis.org/CDs2009/CD2009SCI/ag2009/PapersPdf/A064IQ.pdf
Dukovska-Popovska, I., Hove-Madsen, V., & Nielsen, K. B. (2008). Teaching lean thinking through game: Some challenges. 36th European Society for Engineering Education (SEFI) on Quality Assessment, Employability & Innovation.
Gagné, R. M., Briggs, L. J., & Wager, W. W. (1992). Principles of instructional design (4th ed.). Fort Worth: Harcourt Brace Jovanovich College Publishers.
Ganesha.org. (2014). Goldratt's Theory of Constraints: Online Simulation. from http://www.ganesha.org/leading/toc.html
Geissinger, H. (1997). Educational software: Criteria for evaluation. Paper presented at the Proceedings of ASCILITE.
Gentry, G. W. (1980). Group size and attitudes toward the simulation experience. Simulation & Games.
Gibbons, A. S., Fairweather, P. G., Anderson, T. A., & Merill, M. D. (1998). Simulation and computer-based instruction. In C. R. Dills & A. J. Romiszowski (Eds.), Instructional development paradigms (pp. 772-783). Englewood Cliffs, NJ: Instructional Technology Publications.
Goldratt, E. M., & Cox, J. (1992). The goal : a process of ongoing improvement (2nd rev. ed.). Great Barrington, MA: North River Press.
Goldratt Research Labs. (2014). Goldratt's Dice Game. Retrieved from https://itunes.apple.com/us/app/goldratts-dice-game-phone/id654456406?mt=8
Granlund, R., Berglund, E., & Eriksson, H. (2000). Designing web-based simulation for learning. Future Generation Computer Systems, 17(2), 171-185.
Gregory, R., Failing, L., Harstone, M., Long, G., McDaniels, T., & Ohlson, D. (2012). Structured decision making: a practical guide to environmental management choices: John Wiley & Sons.
Heinich, R. (2002). Instructional media and technologies for learning (7th ed.). Upper Saddle River, N.J.: Merrill.
110
Hunicke, R., LeBlanc, M., & Zubek, R. (2004). MDA: A formal approach to game design and game research. Paper presented at the Proceedings of the AAAI Workshop on Challenges in Game AI.
Ion-University of Illinois. (n.d). Weaknesses of Online Learning. Retrieved from Ion-University of Illinois website: http://www.ion.uillinois.edu/resources/tutorials/overview/weaknesses.asp
Kano, N., Seraku, N., Takahashi, F., & Tsuji, S. (1984). Attractive quality and must-be quality. Journal of the Japanese Society for Quality Control, 14(2), 147-156.
Kennedy, G., Petrovic, T., & Keppell, M. (1998). The development of multimedia evaluation criteria and a program of evaluation for computer aided learning. Paper presented at the ASCILITE.
Knowles, M. S. (1970). The modern practice of adult education (Vol. 41): New York Association Press New York.
Knowles, M. S. (1996). Adult Learning. In R. L. Craig (Ed.), The ASTD training and development handbook : a guide to human resource development (4 ed.). New York: McGraw-Hill.
Krafcik, J. F. (1988). Triumph of the lean production system. Sloan management review, 30(1), 41-51.
Lunce, L. M. (2006). Simulations: Bringing the benefits of situated learning to the traditional classroom. Journal of Applied Educational Technology, 3(1), 37-45.
McClory, K. (Writer). (1983). Never Say Never Again [Motion Picture]. USA: MGM.
McNeely, D., & Wofford, J. (2014). Coffe Shop - Play it Now. from http://coolmath-games.com/0-coffee-shop/
Merkuryeva, G. (2001). Computer simulation in industrial management games. Paper presented at the Conference on Manufacturing, Modelling, Management and Control (MIM 2000), 12-14 July 2000, Kidlington, UK.
Montgomery, D. C. (2008). Design and analysis of experiments: John Wiley & Sons.
Moore, M. G., & Kearsley, G. (2012). Distance education : a systems view of online learning (3rd ed.). Belmont, CA: Wadsworth Cengage Learning.
Moreno-Ger, P., Burgos, D., Martínez-Ortiz, I., Sierra, J. L., & Fernández-Manjón, B. (2008). Educational game design for online education. Computers in Human Behavior, 24(6), 2530-2540. doi: http://dx.doi.org/10.1016/j.chb.2008.03.012
Ōno, T. (1988). Toyota production system: beyond large-scale production: Productivity press.
111
Osciak, S. Y., & Milheim, W. D. (2001). Multiple Intelligence and the Design of Webbased Instruction. Paper presented at the International Journal of Instructional Media.
Ota, C., DiCarlo, C. F., Burts, D. C., Laird, R., & Gioe, C. (2006). Training and the needs of adult learners. Journal of Extension, 44(6).
Ozelkan, E. C. (2014). Lecture notes on AnalyticalAhierarchy Process (AHP). Systems Engineering and Engineering Management. UNC Charlotte.
Ozelkan, E. C., & Galambosi, A. (2009). Lampshade game for lean manufacturing. Production Planning & Control: The Management of Operations, 20(5), 385-402.
Pariseau, S. E. (2011). Can Lean Service Applications Be Learned Through the Use of a Manufacturing Simulation? Paper presented at the Northeast Decision Sciences Institute Annual Meeting.
Poksinska, B. (2010). The current state of lean implementation in health care: literature review. Quality Management in Healthcare, 19(4), 319-329.
Rajamani, D., & Ozelkan, E. C. (2004). Dice game simulation. Class instructions. CLLES. UNC Charlotte Charlotte, NC.
Reza, B., Sadiq, R., & Hewage, K. (2011). Sustainability assessment of flooring systems in the city of Tehran: An AHP-based life cycle analysis. Construction and Building Materials, 25(4), 2053-2066. doi: http://dx.doi.org/10.1016/j.conbuildmat.2010.11.041
Saaty, R. W. (1987). The analytic hierarchy process—what it is and how it is used. Mathematical Modelling, 9(3), 161-176.
Saaty, T. (1989). Group Decision Making and the AHP. In B. Golden, E. Wasil & P. Harker (Eds.), The Analytic Hierarchy Process (pp. 59-67): Springer Berlin Heidelberg.
Saaty, T. L. (1990). How to make a decision: the analytic hierarchy process. European journal of operational research, 48(1), 9-26.
Špiláková, P., Jašek, R., & Schauer, F. (2014). Security Risks of Java Applets in Remote Experimentation and Available Alternatives. Paper presented at the Applied Mathematics, Computational Science & Engineering, Varna, Bulgaria. http://www.europment.org/library/2014/varna/bypaper/AMCSE/AMCSE-23.pdf
Staats, B. R., Brunner, D. J., & Upton, D. M. (2011). Lean principles, learning, and knowledge work: Evidence from a software services provider. Journal of Operations Management, 29(5), 376-390.

112
The Ohio State University ADA Coordinator's Office. (2014). ADA: Fast Facts for Faculty - Accessible Web Content. from http://ada.osu.edu/resources/fastfacts/Web_Content_Accessible_to_All.htm
Trollip, S. R., & Alessi, S. M. (2001). Multimedia for learning: methods and development: Allyn & Bacon, Massachusetts.
Verma, A. K. (2003). Simulation tools and training programs in lean manufacturing–current status. Report submitted to the National Shipbuilding Research, Advanced Shipbuilding Enterprise Program.
Wind, Y., & Saaty, T. L. (1980). Marketing applications of the analytic hierarchy process. Management Science, 26(7), 641-658.
Womack, J. P., Jones, D. T., & Roos, D. (1990). The machine that changed the world: Scribner.
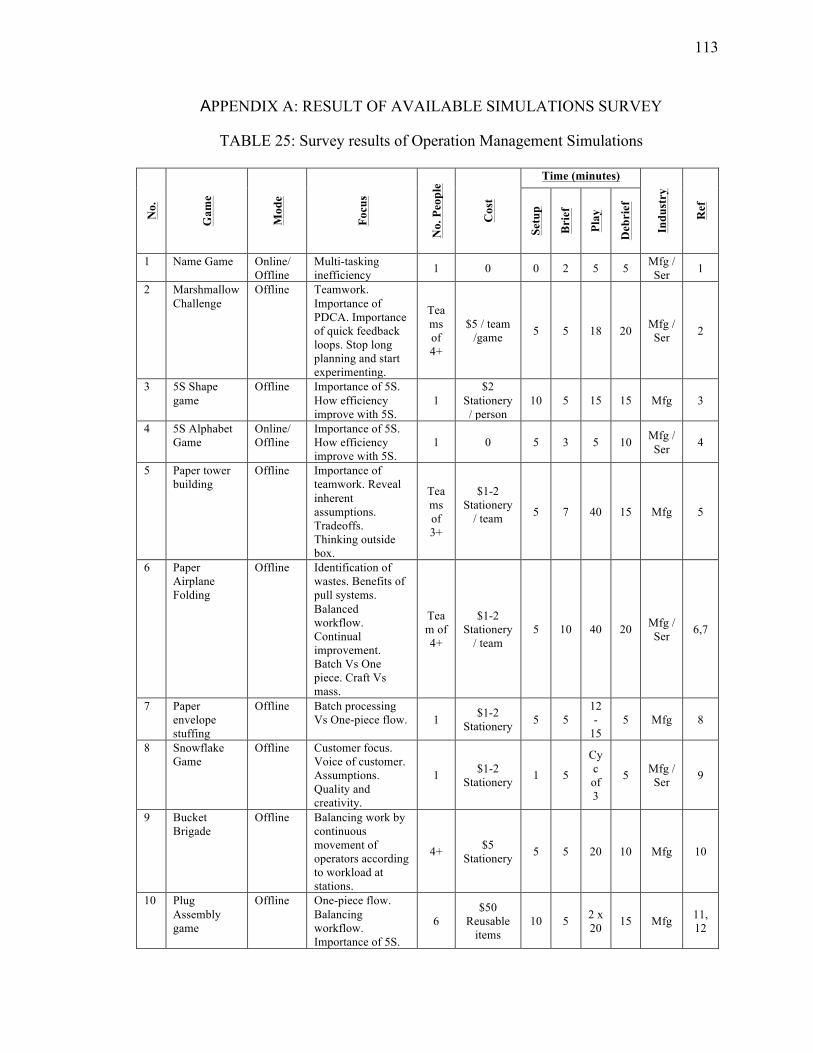
113
APPENDIX A: RESULT OF AVAILABLE SIMULATIONS SURVEY
TABLE 25: Survey results of Operation Management Simulations N
o.
Gam
e
Mod
e
Focu
s
No.
Peo
ple
Cos
t
Time (minutes)
Indu
stry
Ref
Setu
p
Bri
ef
Play
Deb
rief
1 Name Game Online/ Offline
Multi-tasking inefficiency 1 0 0 2 5 5 Mfg /
Ser 1
2 Marshmallow Challenge
Offline Teamwork. Importance of PDCA. Importance of quick feedback loops. Stop long planning and start experimenting.
Teams of 4+
$5 / team /game 5 5 18 20 Mfg /
Ser 2
3 5S Shape game
Offline Importance of 5S. How efficiency improve with 5S.
1 $2
Stationery/ person
10 5 15 15 Mfg 3
4 5S Alphabet Game
Online/ Offline
Importance of 5S. How efficiency improve with 5S.
1 0 5 3 5 10 Mfg / Ser 4
5 Paper tower building
Offline Importance of teamwork. Reveal inherent assumptions. Tradeoffs. Thinking outside box.
Teams of 3+
$1-2 Stationery
/ team
5 7 40 15 Mfg 5
6 Paper Airplane Folding
Offline Identification of wastes. Benefits of pull systems. Balanced workflow. Continual improvement. Batch Vs One piece. Craft Vs mass.
Team of 4+
$1-2 Stationery
/ team 5 10 40 20 Mfg /
Ser 6,7
7 Paper envelope stuffing
Offline Batch processing Vs One-piece flow. 1 $1-2
Stationery 5 5 12-
15 5 Mfg 8
8 Snowflake Game
Offline Customer focus. Voice of customer. Assumptions. Quality and creativity.
1 $1-2 Stationery 1 5
Cyc of 3
5 Mfg / Ser 9
9 Bucket Brigade
Offline Balancing work by continuous movement of operators according to workload at stations.
4+ $5 Stationery 5 5 20 10 Mfg 10
10 Plug Assembly game
Offline One-piece flow. Balancing workflow. Importance of 5S.
6 $50
Reusable items
10 5 2 x 20 15 Mfg 11,
12
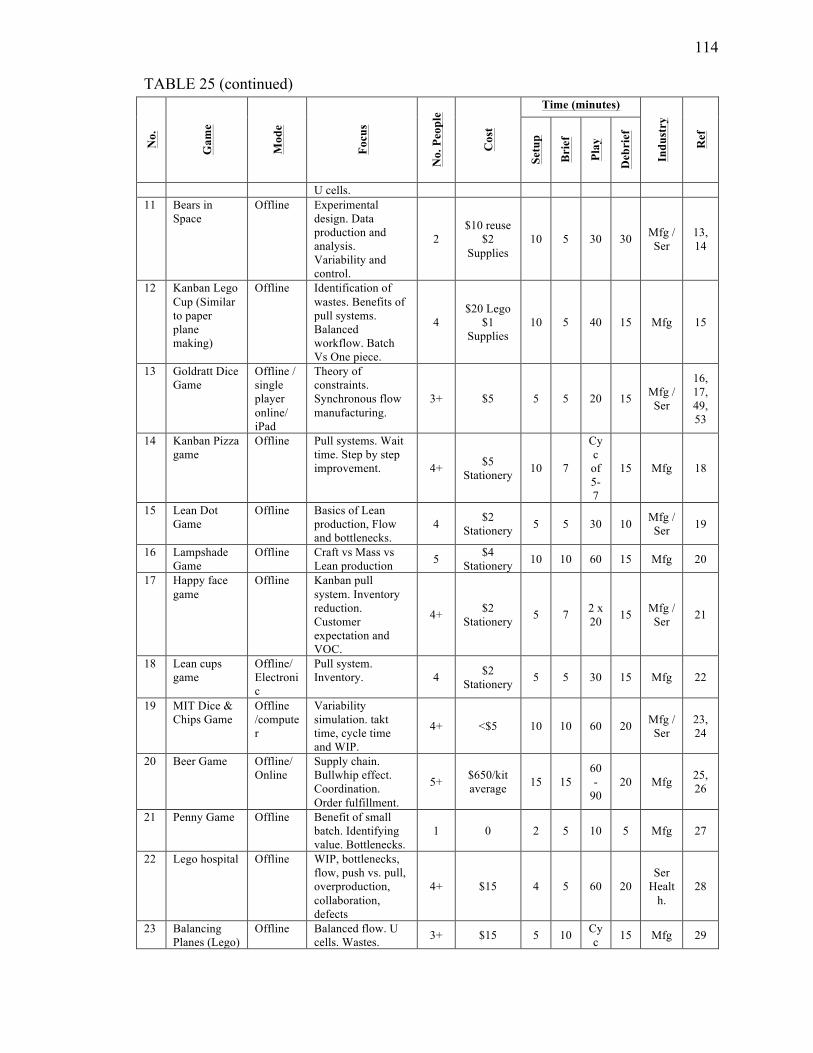
114
TABLE 25 (continued)
No.
Gam
e
Mod
e
Focu
s
No.
Peo
ple
Cos
t
Time (minutes)
Indu
stry
Ref
Setu
p
Bri
ef
Play
Deb
rief
U cells. 11 Bears in
Space Offline Experimental
design. Data production and analysis. Variability and control.
2 $10 reuse
$2 Supplies
10 5 30 30 Mfg / Ser
13, 14
12 Kanban Lego Cup (Similar to paper plane making)
Offline Identification of wastes. Benefits of pull systems. Balanced workflow. Batch Vs One piece.
4 $20 Lego
$1 Supplies
10 5 40 15 Mfg 15
13 Goldratt Dice Game
Offline / single player online/ iPad
Theory of constraints. Synchronous flow manufacturing.
3+ $5 5 5 20 15 Mfg / Ser
16, 17, 49, 53
14 Kanban Pizza game
Offline Pull systems. Wait time. Step by step improvement. 4+ $5
Stationery 10 7
Cyc of 5-7
15 Mfg 18
15 Lean Dot Game
Offline Basics of Lean production, Flow and bottlenecks.
4 $2 Stationery 5 5 30 10 Mfg /
Ser 19
16 Lampshade Game
Offline Craft vs Mass vs Lean production 5 $4
Stationery 10 10 60 15 Mfg 20
17 Happy face game
Offline Kanban pull system. Inventory reduction. Customer expectation and VOC.
4+ $2 Stationery 5 7 2 x
20 15 Mfg / Ser 21
18 Lean cups game
Offline/ Electronic
Pull system. Inventory. 4 $2
Stationery 5 5 30 15 Mfg 22
19 MIT Dice & Chips Game
Offline /computer
Variability simulation. takt time, cycle time and WIP.
4+ <$5 10 10 60 20 Mfg / Ser
23, 24
20 Beer Game Offline/ Online
Supply chain. Bullwhip effect. Coordination. Order fulfillment.
5+ $650/kit average 15 15
60-
90 20 Mfg 25,
26
21 Penny Game Offline Benefit of small batch. Identifying value. Bottlenecks.
1 0 2 5 10 5 Mfg 27
22 Lego hospital Offline WIP, bottlenecks, flow, push vs. pull, overproduction, collaboration, defects
4+ $15 4 5 60 20 Ser
Health.
28
23 Balancing Planes (Lego)
Offline Balanced flow. U cells. Wastes. 3+ $15 5 10 Cy
c 15 Mfg 29
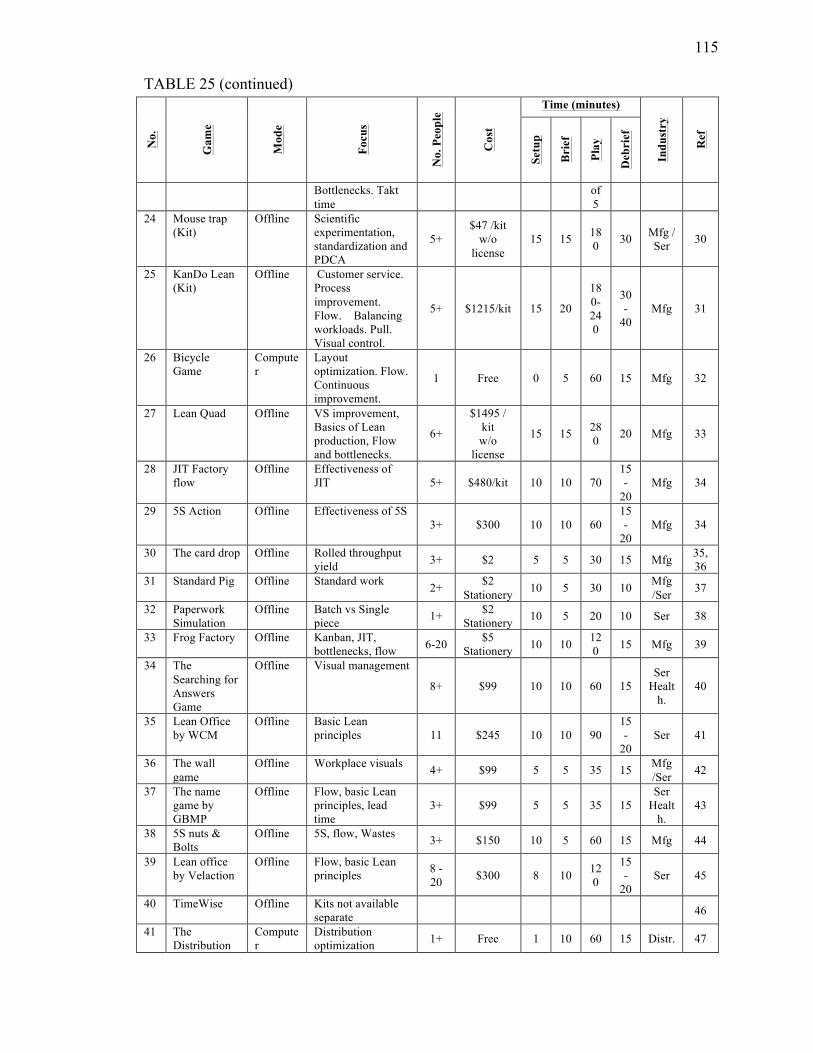
115
TABLE 25 (continued)
No.
Gam
e
Mod
e
Focu
s
No.
Peo
ple
Cos
t
Time (minutes)
Indu
stry
Ref
Setu
p
Bri
ef
Play
Deb
rief
Bottlenecks. Takt time
of 5
24 Mouse trap (Kit)
Offline Scientific experimentation, standardization and PDCA
5+ $47 /kit
w/o license
15 15 180 30 Mfg /
Ser 30
25 KanDo Lean (Kit)
Offline Customer service. Process improvement. Flow. Balancing workloads. Pull. Visual control.
5+ $1215/kit 15 20
180-240
30-
40 Mfg 31
26 Bicycle Game
Computer
Layout optimization. Flow. Continuous improvement.
1 Free 0 5 60 15 Mfg 32
27 Lean Quad Offline VS improvement, Basics of Lean production, Flow and bottlenecks.
6+
$1495 / kit w/o
license
15 15 280 20 Mfg 33
28 JIT Factory flow
Offline Effectiveness of JIT 5+ $480/kit 10 10 70
15-
20 Mfg 34
29 5S Action Offline Effectiveness of 5S 3+ $300 10 10 60
15-
20 Mfg 34
30 The card drop Offline Rolled throughput yield 3+ $2 5 5 30 15 Mfg 35,
36 31 Standard Pig Offline Standard work 2+ $2
Stationery 10 5 30 10 Mfg /Ser 37
32 Paperwork Simulation
Offline Batch vs Single piece 1+ $2
Stationery 10 5 20 10 Ser 38
33 Frog Factory Offline Kanban, JIT, bottlenecks, flow 6-20 $5
Stationery 10 10 120 15 Mfg 39
34 The Searching for Answers Game
Offline Visual management
8+ $99 10 10 60 15 Ser
Health.
40
35 Lean Office by WCM
Offline Basic Lean principles 11 $245 10 10 90
15-
20 Ser 41
36 The wall game
Offline Workplace visuals 4+ $99 5 5 35 15 Mfg /Ser 42
37 The name game by GBMP
Offline Flow, basic Lean principles, lead time
3+ $99 5 5 35 15 Ser
Health.
43
38 5S nuts & Bolts
Offline 5S, flow, Wastes 3+ $150 10 5 60 15 Mfg 44
39 Lean office by Velaction
Offline Flow, basic Lean principles 8 -
20 $300 8 10 120
15-
20 Ser 45
40 TimeWise Offline Kits not available separate 46
41 The Distribution
Computer
Distribution optimization 1+ Free 1 10 60 15 Distr. 47
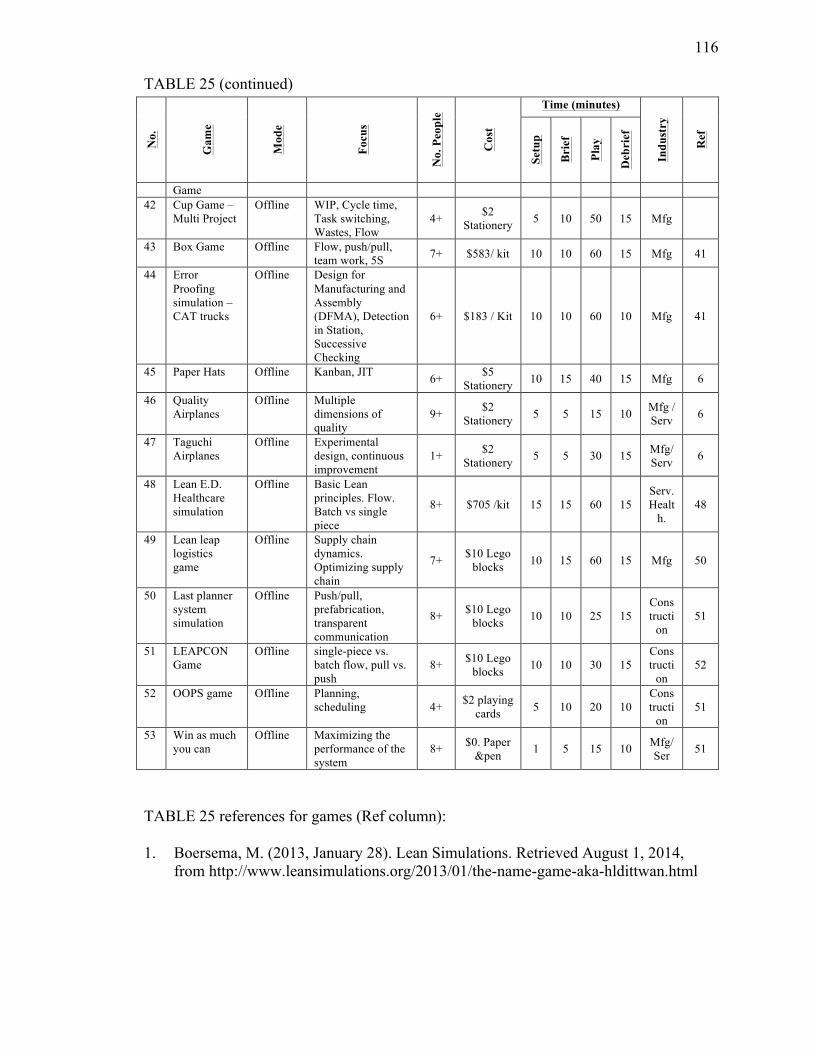
116
TABLE 25 (continued)
No.
Gam
e
Mod
e
Focu
s
No.
Peo
ple
Cos
t
Time (minutes)
Indu
stry
Ref
Setu
p
Bri
ef
Play
Deb
rief
Game 42 Cup Game –
Multi Project Offline WIP, Cycle time,
Task switching, Wastes, Flow
4+ $2 Stationery 5 10 50 15 Mfg
43 Box Game Offline Flow, push/pull, team work, 5S 7+ $583/ kit 10 10 60 15 Mfg 41
44 Error Proofing simulation – CAT trucks
Offline Design for Manufacturing and Assembly (DFMA), Detection in Station, Successive Checking
6+ $183 / Kit 10 10 60 10 Mfg 41
45 Paper Hats Offline Kanban, JIT 6+ $5 Stationery 10 15 40 15 Mfg 6
46 Quality Airplanes
Offline Multiple dimensions of quality
9+ $2 Stationery 5 5 15 10 Mfg /
Serv 6
47 Taguchi Airplanes
Offline Experimental design, continuous improvement
1+ $2 Stationery 5 5 30 15 Mfg/
Serv 6
48 Lean E.D. Healthcare simulation
Offline Basic Lean principles. Flow. Batch vs single piece
8+ $705 /kit 15 15 60 15 Serv. Healt
h. 48
49 Lean leap logistics game
Offline Supply chain dynamics. Optimizing supply chain
7+ $10 Lego blocks 10 15 60 15 Mfg 50
50 Last planner system simulation
Offline Push/pull, prefabrication, transparent communication
8+ $10 Lego blocks 10 10 25 15
Constructi
on 51
51 LEAPCON Game
Offline single-piece vs. batch flow, pull vs. push
8+ $10 Lego blocks 10 10 30 15
Constructi
on 52
52 OOPS game Offline Planning, scheduling 4+ $2 playing
cards 5 10 20 10 Constructi
on 51
53 Win as much you can
Offline Maximizing the performance of the system
8+ $0. Paper &pen 1 5 15 10 Mfg/
Ser 51
TABLE 25 references for games (Ref column):
1. Boersema, M. (2013, January 28). Lean Simulations. Retrieved August 1, 2014, from http://www.leansimulations.org/2013/01/the-name-game-aka-hldittwan.html
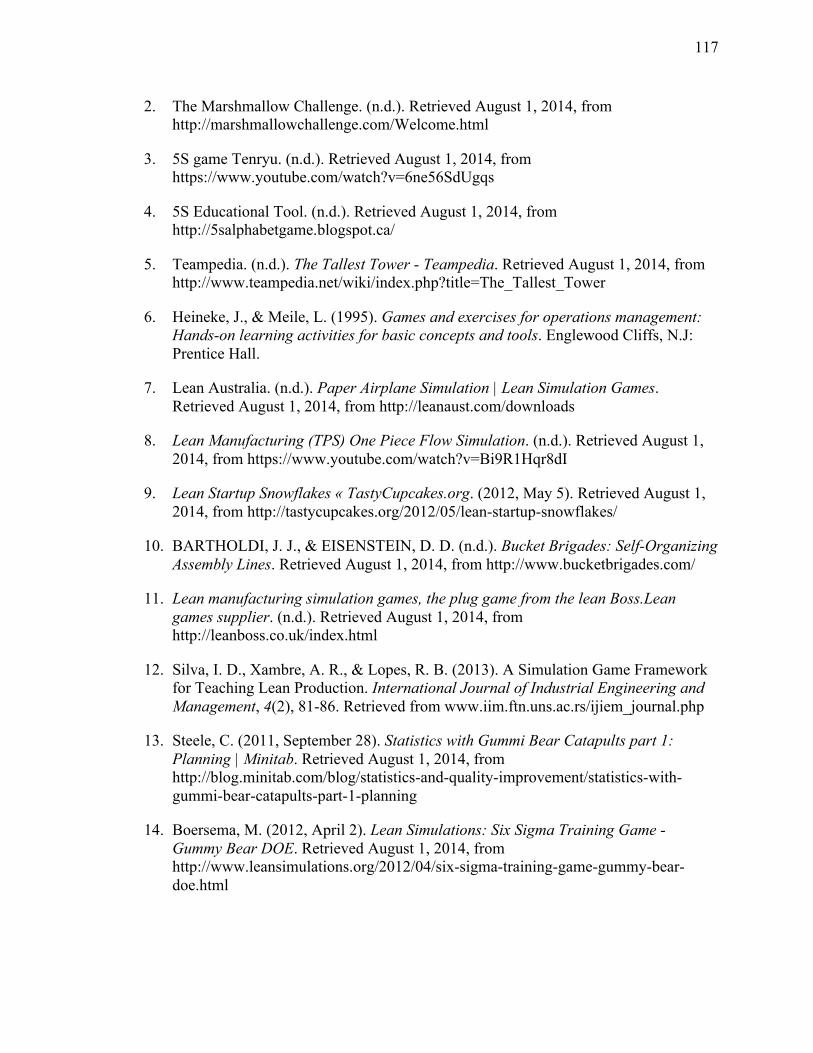
117
2. The Marshmallow Challenge. (n.d.). Retrieved August 1, 2014, from http://marshmallowchallenge.com/Welcome.html
3. 5S game Tenryu. (n.d.). Retrieved August 1, 2014, from https://www.youtube.com/watch?v=6ne56SdUgqs
4. 5S Educational Tool. (n.d.). Retrieved August 1, 2014, from http://5salphabetgame.blogspot.ca/
5. Teampedia. (n.d.). The Tallest Tower - Teampedia. Retrieved August 1, 2014, from http://www.teampedia.net/wiki/index.php?title=The_Tallest_Tower
6. Heineke, J., & Meile, L. (1995). Games and exercises for operations management: Hands-on learning activities for basic concepts and tools. Englewood Cliffs, N.J: Prentice Hall.
7. Lean Australia. (n.d.). Paper Airplane Simulation | Lean Simulation Games. Retrieved August 1, 2014, from http://leanaust.com/downloads
8. Lean Manufacturing (TPS) One Piece Flow Simulation. (n.d.). Retrieved August 1, 2014, from https://www.youtube.com/watch?v=Bi9R1Hqr8dI
9. Lean Startup Snowflakes « TastyCupcakes.org. (2012, May 5). Retrieved August 1, 2014, from http://tastycupcakes.org/2012/05/lean-startup-snowflakes/
10. BARTHOLDI, J. J., & EISENSTEIN, D. D. (n.d.). Bucket Brigades: Self-Organizing Assembly Lines. Retrieved August 1, 2014, from http://www.bucketbrigades.com/
11. Lean manufacturing simulation games, the plug game from the lean Boss.Lean games supplier. (n.d.). Retrieved August 1, 2014, from http://leanboss.co.uk/index.html
12. Silva, I. D., Xambre, A. R., & Lopes, R. B. (2013). A Simulation Game Framework for Teaching Lean Production. International Journal of Industrial Engineering and Management, 4(2), 81-86. Retrieved from www.iim.ftn.uns.ac.rs/ijiem_journal.php
13. Steele, C. (2011, September 28). Statistics with Gummi Bear Catapults part 1: Planning | Minitab. Retrieved August 1, 2014, from http://blog.minitab.com/blog/statistics-and-quality-improvement/statistics-with-gummi-bear-catapults-part-1-planning
14. Boersema, M. (2012, April 2). Lean Simulations: Six Sigma Training Game - Gummy Bear DOE. Retrieved August 1, 2014, from http://www.leansimulations.org/2012/04/six-sigma-training-game-gummy-bear-doe.html
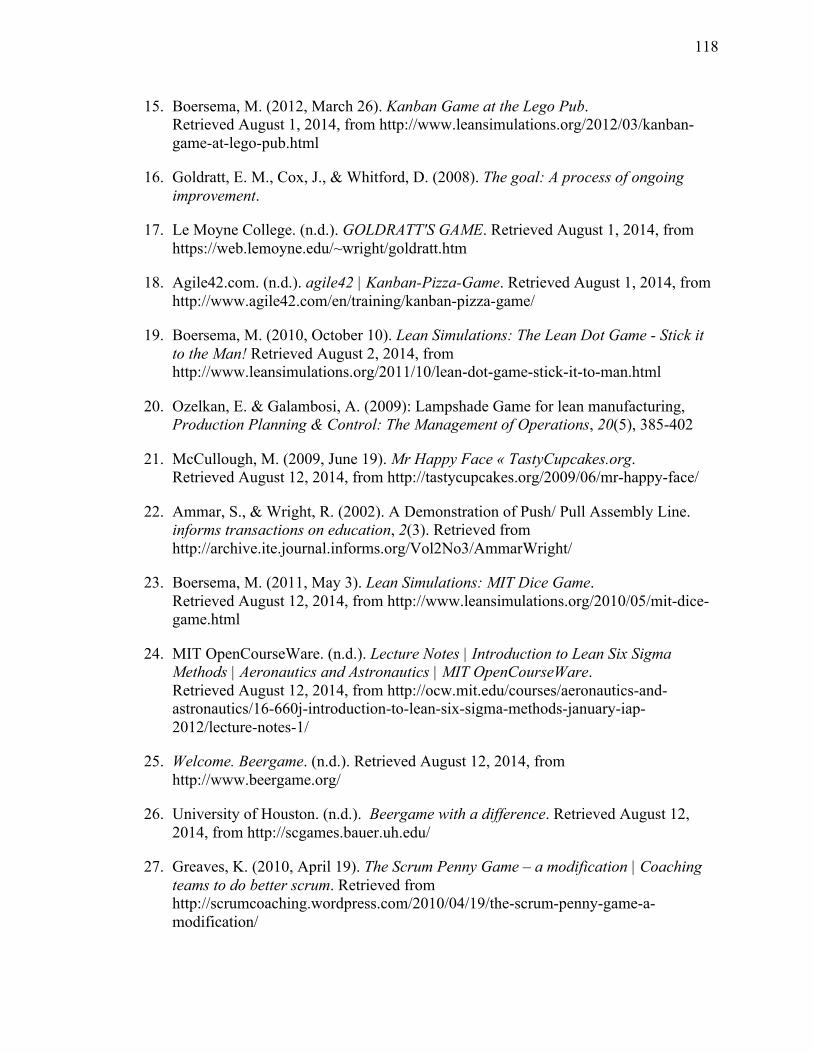
118
15. Boersema, M. (2012, March 26). Kanban Game at the Lego Pub. Retrieved August 1, 2014, from http://www.leansimulations.org/2012/03/kanban-game-at-lego-pub.html
16. Goldratt, E. M., Cox, J., & Whitford, D. (2008). The goal: A process of ongoing improvement.
17. Le Moyne College. (n.d.). GOLDRATT'S GAME. Retrieved August 1, 2014, from https://web.lemoyne.edu/~wright/goldratt.htm
18. Agile42.com. (n.d.). agile42 | Kanban-Pizza-Game. Retrieved August 1, 2014, from http://www.agile42.com/en/training/kanban-pizza-game/
19. Boersema, M. (2010, October 10). Lean Simulations: The Lean Dot Game - Stick it to the Man! Retrieved August 2, 2014, from http://www.leansimulations.org/2011/10/lean-dot-game-stick-it-to-man.html
20. Ozelkan, E. & Galambosi, A. (2009): Lampshade Game for lean manufacturing, Production Planning & Control: The Management of Operations, 20(5), 385-402
21. McCullough, M. (2009, June 19). Mr Happy Face « TastyCupcakes.org. Retrieved August 12, 2014, from http://tastycupcakes.org/2009/06/mr-happy-face/
22. Ammar, S., & Wright, R. (2002). A Demonstration of Push/ Pull Assembly Line. informs transactions on education, 2(3). Retrieved from http://archive.ite.journal.informs.org/Vol2No3/AmmarWright/
23. Boersema, M. (2011, May 3). Lean Simulations: MIT Dice Game. Retrieved August 12, 2014, from http://www.leansimulations.org/2010/05/mit-dice-game.html
24. MIT OpenCourseWare. (n.d.). Lecture Notes | Introduction to Lean Six Sigma Methods | Aeronautics and Astronautics | MIT OpenCourseWare. Retrieved August 12, 2014, from http://ocw.mit.edu/courses/aeronautics-and-astronautics/16-660j-introduction-to-lean-six-sigma-methods-january-iap-2012/lecture-notes-1/
25. Welcome. Beergame. (n.d.). Retrieved August 12, 2014, from http://www.beergame.org/
26. University of Houston. (n.d.). Beergame with a difference. Retrieved August 12, 2014, from http://scgames.bauer.uh.edu/
27. Greaves, K. (2010, April 19). The Scrum Penny Game – a modification | Coaching teams to do better scrum. Retrieved from http://scrumcoaching.wordpress.com/2010/04/19/the-scrum-penny-game-a-modification/
119
28. Dukovska-Popovska, I., Hove-Madsen, V., & Nielsen, K. B. (n.d.). Teaching lean thinking through game: some challenges. Retrieved from http://www.sefi.be/wp-content/abstracts/1092.pdf
29. Ammar, S., & Wright, R. (n.d.). BALANCING PLANES. Retrieved August 12, 2014, from http://web.lemoyne.edu/~wright/planes.htm
30. Lean Learning Center. (n.d.). The Mouse Trap Experience « Lean Learning CenterLean Learning Center. Retrieved August 12, 2014, from http://www.leanlearningcenter.com/products/mousetrap/
31. MTa Learning. (n.d.). MTa KanDo Lean | Lean Game | Supply Chain Game. Retrieved August 12, 2014, from http://www.leangame.com/
32. Ludocity. (n.d.). Ludosity » Lean Game. Retrieved August 12, 2014, from http://ludosity.com/library/lean-game/
33. Lean Learning Center. (n.d.). Lean Quad Simulation: Guiding Value Stream Improvement « Lean Learning CenterLean Learning Center. Retrieved August 12, 2014, from http://www.leanlearningcenter.com/products/leanquad/
34. AnythingLean.com. (n.d.). Lean Games | Lean Training | Lean Products. Retrieved August 12, 2014, from http://www.5sleanmanufacturing.com/Lean_games_s/6.htm
35. Boersema, M. (2010, April 21). Lean Simulations: The Card Drop Exercise. Retrieved from http://www.leansimulations.org/2010/04/card-drop-exercise.html
36. Pereira, R. (2007, September 12). Calculating Rolled Throughput Yield (RTY). Retrieved August 12, 2014, from http://blog.gembaacademy.com/2007/09/12/calculating-rolled-throughput-yield-rty/
37. Minnesota office of continuous improvement. (n.d.). Continuous Improvement Tools and Resources. Retrieved August 12, 2014, from http://mn.gov/admin/lean/resources/ci-tools/index.jsp
38. Boersema, M. (2010, June 15). Lean Simulations: Paperwork Simulation - Lean Office. Retrieved August 12, 2014, from http://www.leansimulations.org/2010/06/paperwork-simulation-lean-office.html
39. Peter. (2012, April 12). AbOrigineMundi | The Frog Factory: a Kanban experience game. Retrieved August 12, 2014, from http://www.aboriginemundi.com/index.php/2010/04/the-frog-factory-a-kanban-experience-game/
40. The Searching for Answers Game. (n.d.). Retrieved August 12, 2014, from http://www.shopgbmp.org/neseforanga.html
120
41. Lean Kits and Simulations : WCM Associates LLC. (n.d.). Retrieved August 12, 2014, from http://www.wcmfg.com/KitsandSimulations.htm
42. GBMP. (n.d.). The Wall Game: Experience the Power of Workplace Visuals. Retrieved August 12, 2014, from http://www.shopgbmp.org/newagaexpoof.html
43. GBMP. (n.d.). The Name Game: Seeing the Benefits of Flow. Retrieved August 12, 2014, from http://www.shopgbmp.org/nenagasebeof.html
44. GBMP. (n.d.). The Nuts & Bolts Exercise. Retrieved August 12, 2014, from http://www.shopgbmp.org/nenuboex.html
45. Velaction. (n.d.). Components of the Lean Training System. Retrieved August 12, 2014, from http://www.velaction.com/training-system-components/
46. Time Wise Management Systems. (n.d.). Retrieved August 12, 2014, from http://www.timewisems.com/lean_manufacturing_le101.html
47. Jackson, P. L., & Muckstadt, J. A. (n.d.). The Distribution Game. Retrieved August 12, 2014, from http://people.orie.cornell.edu/jackson/distgame.html#Contents
48. More Effective Consulting LLC. (n.d.). Lean Healthcare and Lean Hospital Simulation Kit and Training Programs. Retrieved August 12, 2014, from http://www.moreeffective.com/products/LeanED.html
49. Goldratt's Theory of Constraints: Online Simulation. (n.d.). Retrieved August 30, 2014, from http://www.ganesha.org/leading/toc.html
50. Holweg, M., & Bicheno, J. (2002). Supply chain simulation – a tool for education, enhancement and endeavour. International Journal of Production Economics, 78(2), 163-175. Retrieved October 1, 2014.
51. Senior, B., & Gonzalez, V. (2014). Using Games to Teach Lean Construction in Higher Education. Retrieved from http://www.xcdsystem.com/lss/proceedings/prof60.html
52. Technion Israel Institute of Technology. (n.d.). Technion LEAPCON Game. Retrieved from http://tx.technion.ac.il/~cvsacks/tech-leap.htm
53. Goldratt Research Labs. (2014, July 26). Goldratt's Dice Game phone version on the App Store on iTunes. Retrieved from https://itunes.apple.com/us/app/goldratts-dice-game-phone/id654456406?mt=8
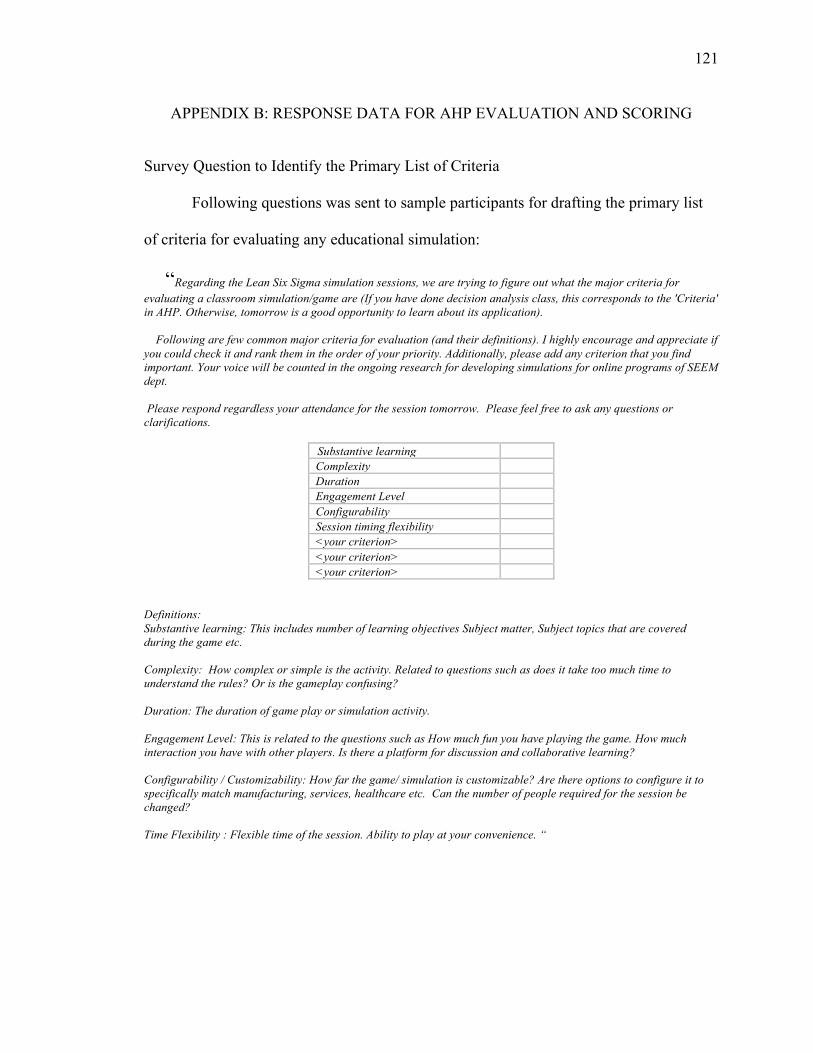
121
APPENDIX B: RESPONSE DATA FOR AHP EVALUATION AND SCORING
Survey Question to Identify the Primary List of Criteria
Following questions was sent to sample participants for drafting the primary list
of criteria for evaluating any educational simulation:
“Regarding the Lean Six Sigma simulation sessions, we are trying to figure out what the major criteria for evaluating a classroom simulation/game are (If you have done decision analysis class, this corresponds to the 'Criteria' in AHP. Otherwise, tomorrow is a good opportunity to learn about its application). Following are few common major criteria for evaluation (and their definitions). I highly encourage and appreciate if you could check it and rank them in the order of your priority. Additionally, please add any criterion that you find important. Your voice will be counted in the ongoing research for developing simulations for online programs of SEEM dept. Please respond regardless your attendance for the session tomorrow. Please feel free to ask any questions or clarifications.
Substantive learning Complexity Duration Engagement Level Configurability Session timing flexibility <your criterion> <your criterion> <your criterion>
Definitions: Substantive learning: This includes number of learning objectives Subject matter, Subject topics that are covered during the game etc. Complexity: How complex or simple is the activity. Related to questions such as does it take too much time to understand the rules? Or is the gameplay confusing? Duration: The duration of game play or simulation activity. Engagement Level: This is related to the questions such as How much fun you have playing the game. How much interaction you have with other players. Is there a platform for discussion and collaborative learning? Configurability / Customizability: How far the game/ simulation is customizable? Are there options to configure it to specifically match manufacturing, services, healthcare etc. Can the number of people required for the session be changed? Time Flexibility : Flexible time of the session. Ability to play at your convenience. “
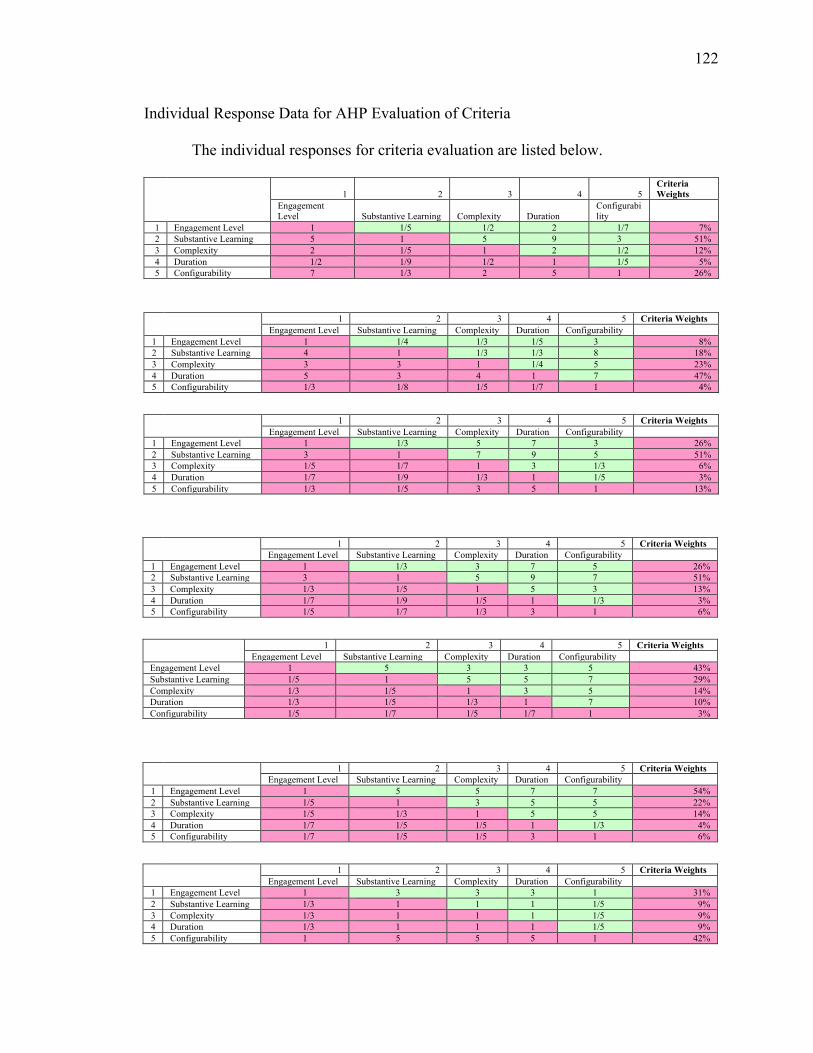
122
Individual Response Data for AHP Evaluation of Criteria
The individual responses for criteria evaluation are listed below.
1 2 3 4 5
Criteria Weights
Engagement Level Substantive Learning Complexity Duration
Configurability
1 Engagement Level 1 1/5 1/2 2 1/7 7% 2 Substantive Learning 5 1 5 9 3 51% 3 Complexity 2 1/5 1 2 1/2 12% 4 Duration 1/2 1/9 1/2 1 1/5 5% 5 Configurability 7 1/3 2 5 1 26%
1 2 3 4 5 Criteria Weights
Engagement Level Substantive Learning Complexity Duration Configurability
1 Engagement Level 1 1/4 1/3 1/5 3 8% 2 Substantive Learning 4 1 1/3 1/3 8 18% 3 Complexity 3 3 1 1/4 5 23% 4 Duration 5 3 4 1 7 47% 5 Configurability 1/3 1/8 1/5 1/7 1 4%
1 2 3 4 5 Criteria Weights
Engagement Level Substantive Learning Complexity Duration Configurability
1 Engagement Level 1 1/3 5 7 3 26% 2 Substantive Learning 3 1 7 9 5 51% 3 Complexity 1/5 1/7 1 3 1/3 6% 4 Duration 1/7 1/9 1/3 1 1/5 3% 5 Configurability 1/3 1/5 3 5 1 13%
1 2 3 4 5 Criteria Weights
Engagement Level Substantive Learning Complexity Duration Configurability
1 Engagement Level 1 1/3 3 7 5 26% 2 Substantive Learning 3 1 5 9 7 51% 3 Complexity 1/3 1/5 1 5 3 13% 4 Duration 1/7 1/9 1/5 1 1/3 3% 5 Configurability 1/5 1/7 1/3 3 1 6%
1 2 3 4 5 Criteria Weights
Engagement Level Substantive Learning Complexity Duration Configurability
Engagement Level 1 5 3 3 5 43% Substantive Learning 1/5 1 5 5 7 29% Complexity 1/3 1/5 1 3 5 14% Duration 1/3 1/5 1/3 1 7 10% Configurability 1/5 1/7 1/5 1/7 1 3%
1 2 3 4 5 Criteria Weights
Engagement Level Substantive Learning Complexity Duration Configurability
1 Engagement Level 1 5 5 7 7 54% 2 Substantive Learning 1/5 1 3 5 5 22% 3 Complexity 1/5 1/3 1 5 5 14% 4 Duration 1/7 1/5 1/5 1 1/3 4% 5 Configurability 1/7 1/5 1/5 3 1 6%
1 2 3 4 5 Criteria Weights
Engagement Level Substantive Learning Complexity Duration Configurability
1 Engagement Level 1 3 3 3 1 31% 2 Substantive Learning 1/3 1 1 1 1/5 9% 3 Complexity 1/3 1 1 1 1/5 9% 4 Duration 1/3 1 1 1 1/5 9% 5 Configurability 1 5 5 5 1 42%
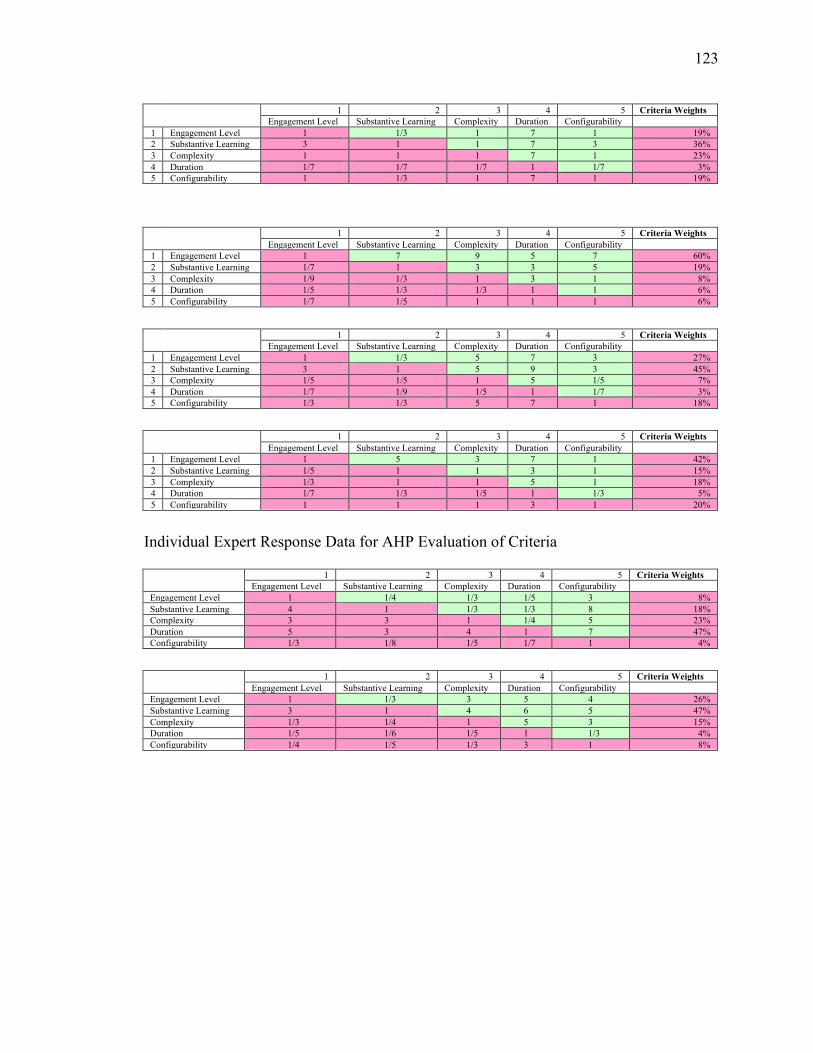
123
1 2 3 4 5 Criteria Weights
Engagement Level Substantive Learning Complexity Duration Configurability
1 Engagement Level 1 1/3 1 7 1 19% 2 Substantive Learning 3 1 1 7 3 36% 3 Complexity 1 1 1 7 1 23% 4 Duration 1/7 1/7 1/7 1 1/7 3% 5 Configurability 1 1/3 1 7 1 19%
1 2 3 4 5 Criteria Weights
Engagement Level Substantive Learning Complexity Duration Configurability
1 Engagement Level 1 7 9 5 7 60% 2 Substantive Learning 1/7 1 3 3 5 19% 3 Complexity 1/9 1/3 1 3 1 8% 4 Duration 1/5 1/3 1/3 1 1 6% 5 Configurability 1/7 1/5 1 1 1 6%
1 2 3 4 5 Criteria Weights
Engagement Level Substantive Learning Complexity Duration Configurability
1 Engagement Level 1 1/3 5 7 3 27% 2 Substantive Learning 3 1 5 9 3 45% 3 Complexity 1/5 1/5 1 5 1/5 7% 4 Duration 1/7 1/9 1/5 1 1/7 3% 5 Configurability 1/3 1/3 5 7 1 18%
1 2 3 4 5 Criteria Weights
Engagement Level Substantive Learning Complexity Duration Configurability
1 Engagement Level 1 5 3 7 1 42% 2 Substantive Learning 1/5 1 1 3 1 15% 3 Complexity 1/3 1 1 5 1 18% 4 Duration 1/7 1/3 1/5 1 1/3 5% 5 Configurability 1 1 1 3 1 20%
Individual Expert Response Data for AHP Evaluation of Criteria
1 2 3 4 5 Criteria Weights
Engagement Level Substantive Learning Complexity Duration Configurability
Engagement Level 1 1/4 1/3 1/5 3 8% Substantive Learning 4 1 1/3 1/3 8 18% Complexity 3 3 1 1/4 5 23% Duration 5 3 4 1 7 47% Configurability 1/3 1/8 1/5 1/7 1 4%
1 2 3 4 5 Criteria Weights
Engagement Level Substantive Learning Complexity Duration Configurability
Engagement Level 1 1/3 3 5 4 26% Substantive Learning 3 1 4 6 5 47% Complexity 1/3 1/4 1 5 3 15% Duration 1/5 1/6 1/5 1 1/3 4% Configurability 1/4 1/5 1/3 3 1 8%
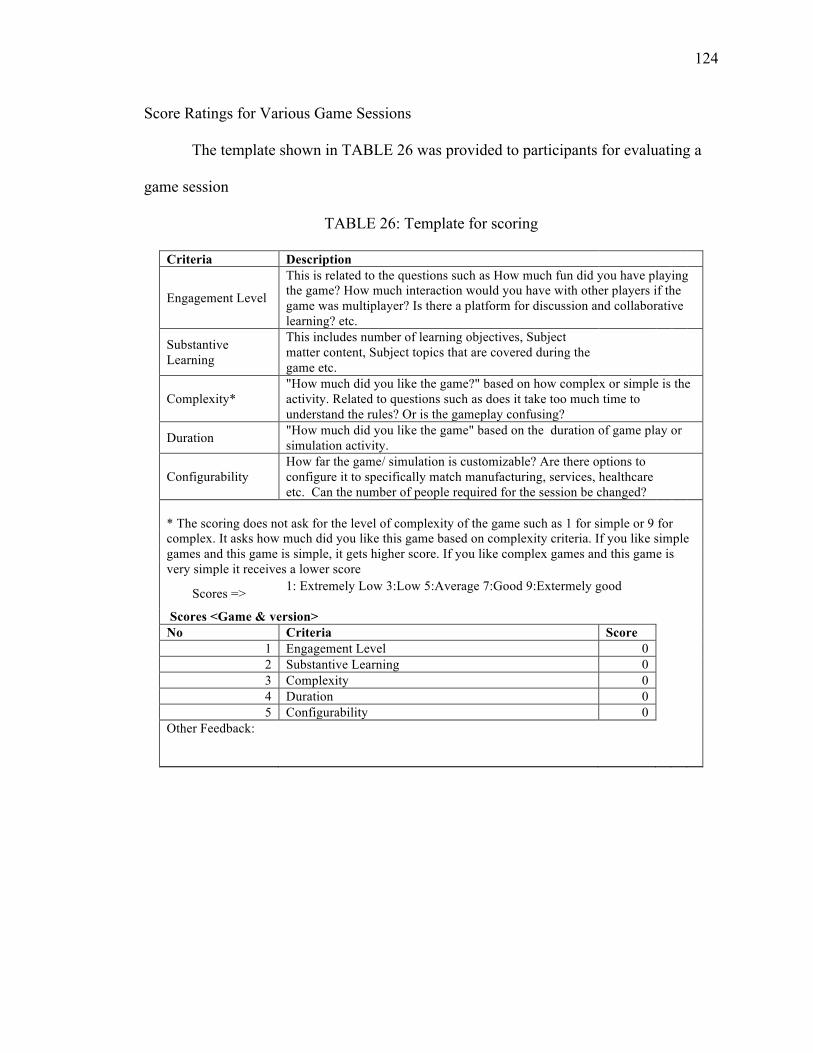
124
Score Ratings for Various Game Sessions
The template shown in TABLE 26 was provided to participants for evaluating a
game session
TABLE 26: Template for scoring
Criteria Description
Engagement Level
This is related to the questions such as How much fun did you have playing the game? How much interaction would you have with other players if the game was multiplayer? Is there a platform for discussion and collaborative learning? etc.
Substantive Learning
This includes number of learning objectives, Subject matter content, Subject topics that are covered during the game etc.
Complexity*
"How much did you like the game?" based on how complex or simple is the activity. Related to questions such as does it take too much time to understand the rules? Or is the gameplay confusing?
Duration "How much did you like the game" based on the duration of game play or simulation activity.
Configurability How far the game/ simulation is customizable? Are there options to configure it to specifically match manufacturing, services, healthcare etc. Can the number of people required for the session be changed?
* The scoring does not ask for the level of complexity of the game such as 1 for simple or 9 for complex. It asks how much did you like this game based on complexity criteria. If you like simple games and this game is simple, it gets higher score. If you like complex games and this game is very simple it receives a lower score Scores => 1: Extremely Low 3:Low 5:Average 7:Good 9:Extermely good
Scores <Game & version> No Criteria Score
1 Engagement Level 0 2 Substantive Learning 0 3 Complexity 0 4 Duration 0 5 Configurability 0 Other Feedback:
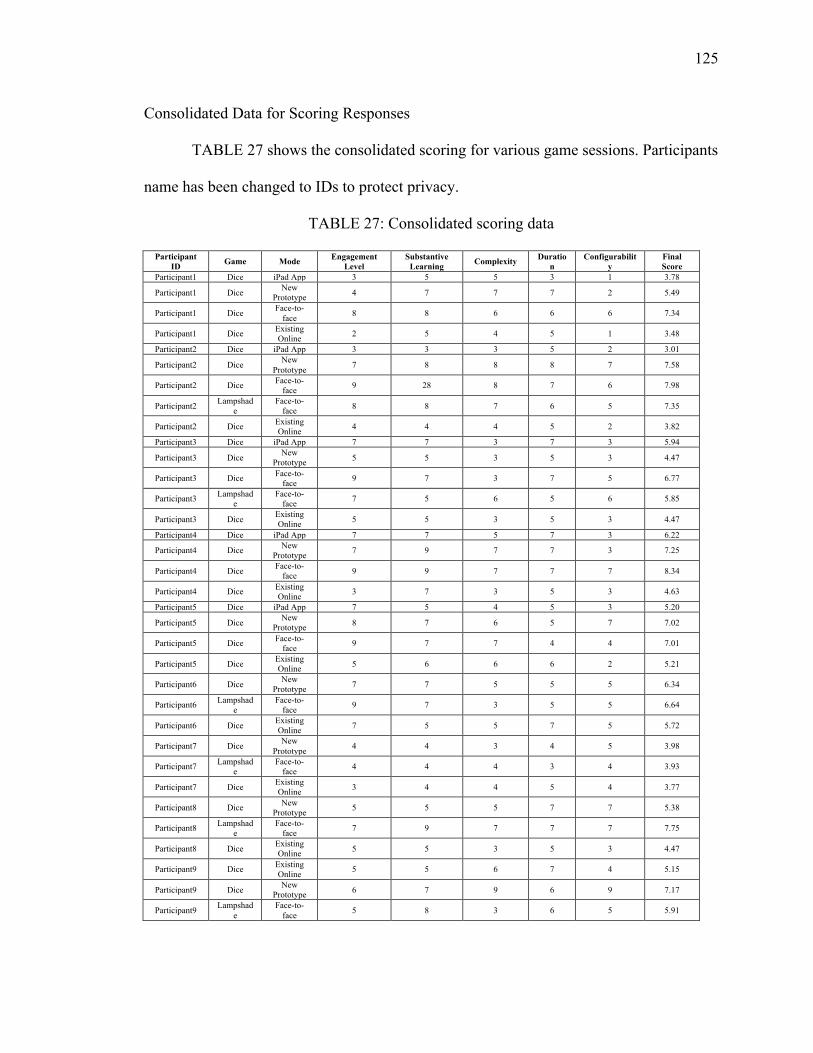
125
Consolidated Data for Scoring Responses
TABLE 27 shows the consolidated scoring for various game sessions. Participants
name has been changed to IDs to protect privacy.
TABLE 27: Consolidated scoring data
Participant ID Game Mode Engagement
Level Substantive
Learning Complexity Duration
Configurability
Final Score
Participant1 Dice iPad App 3 5 5 3 1 3.78
Participant1 Dice New Prototype 4 7 7 7 2 5.49
Participant1 Dice Face-to-face 8 8 6 6 6 7.34
Participant1 Dice Existing Online 2 5 4 5 1 3.48
Participant2 Dice iPad App 3 3 3 5 2 3.01
Participant2 Dice New Prototype 7 8 8 8 7 7.58
Participant2 Dice Face-to-face 9 28 8 7 6 7.98
Participant2 Lampshade
Face-to-face 8 8 7 6 5 7.35
Participant2 Dice Existing Online 4 4 4 5 2 3.82
Participant3 Dice iPad App 7 7 3 7 3 5.94
Participant3 Dice New Prototype 5 5 3 5 3 4.47
Participant3 Dice Face-to-face 9 7 3 7 5 6.77
Participant3 Lampshade
Face-to-face 7 5 6 5 6 5.85
Participant3 Dice Existing Online 5 5 3 5 3 4.47
Participant4 Dice iPad App 7 7 5 7 3 6.22
Participant4 Dice New Prototype 7 9 7 7 3 7.25
Participant4 Dice Face-to-face 9 9 7 7 7 8.34
Participant4 Dice Existing Online 3 7 3 5 3 4.63
Participant5 Dice iPad App 7 5 4 5 3 5.20
Participant5 Dice New Prototype 8 7 6 5 7 7.02
Participant5 Dice Face-to-face 9 7 7 4 4 7.01
Participant5 Dice Existing Online 5 6 6 6 2 5.21
Participant6 Dice New Prototype 7 7 5 5 5 6.34
Participant6 Lampshade
Face-to-face 9 7 3 5 5 6.64
Participant6 Dice Existing Online 7 5 5 7 5 5.72
Participant7 Dice New Prototype 4 4 3 4 5 3.98
Participant7 Lampshade
Face-to-face 4 4 4 3 4 3.93
Participant7 Dice Existing Online 3 4 4 5 4 3.77
Participant8 Dice New Prototype 5 5 5 7 7 5.38
Participant8 Lampshade
Face-to-face 7 9 7 7 7 7.75
Participant8 Dice Existing Online 5 5 3 5 3 4.47
Participant9 Dice Existing Online 5 5 6 7 4 5.15
Participant9 Dice New Prototype 6 7 9 6 9 7.17
Participant9 Lampshade
Face-to-face 5 8 3 6 5 5.91
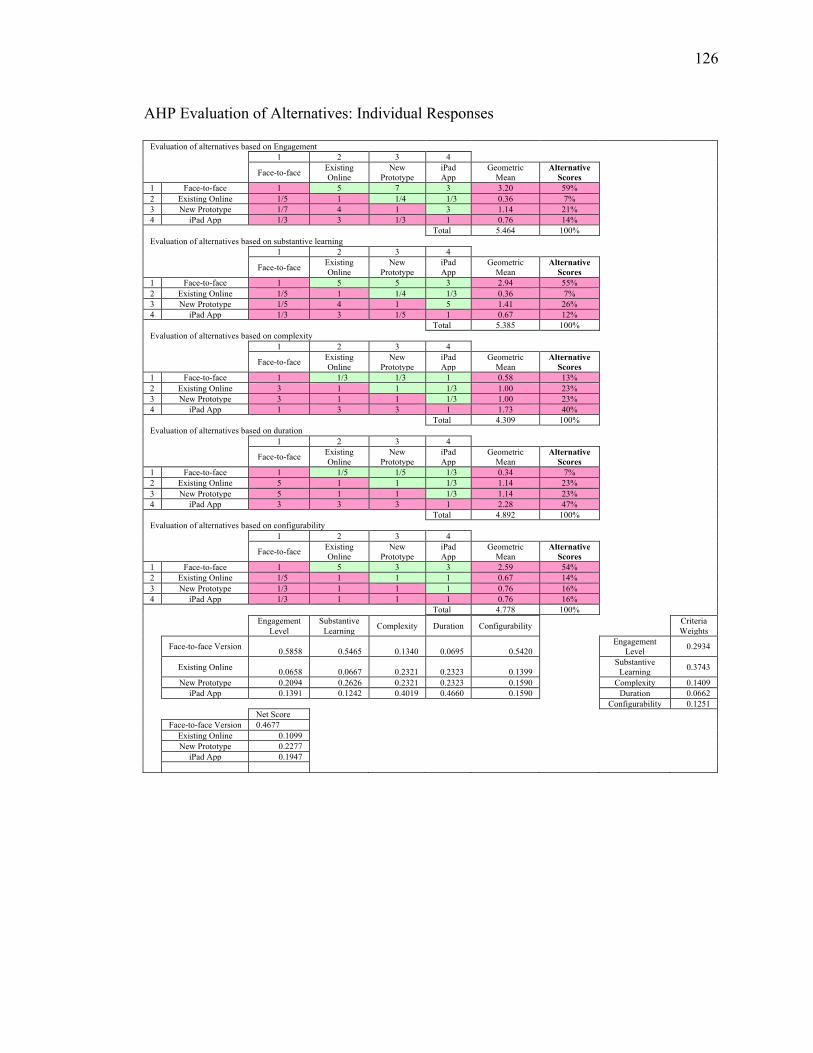
126
AHP Evaluation of Alternatives: Individual Responses
Evaluation of alternatives based on Engagement 1 2 3 4
Face-to-face Existing
Online New
Prototype iPad App
Geometric Mean
Alternative Scores
1 Face-to-face 1 5 7 3 3.20 59% 2 Existing Online 1/5 1 1/4 1/3 0.36 7% 3 New Prototype 1/7 4 1 3 1.14 21% 4 iPad App 1/3 3 1/3 1 0.76 14%
Total 5.464 100%
Evaluation of alternatives based on substantive learning 1 2 3 4
Face-to-face Existing
Online New
Prototype iPad App
Geometric Mean
Alternative Scores
1 Face-to-face 1 5 5 3 2.94 55% 2 Existing Online 1/5 1 1/4 1/3 0.36 7% 3 New Prototype 1/5 4 1 5 1.41 26% 4 iPad App 1/3 3 1/5 1 0.67 12%
Total 5.385 100%
Evaluation of alternatives based on complexity 1 2 3 4
Face-to-face Existing
Online New
Prototype iPad App
Geometric Mean
Alternative Scores
1 Face-to-face 1 1/3 1/3 1 0.58 13% 2 Existing Online 3 1 1 1/3 1.00 23% 3 New Prototype 3 1 1 1/3 1.00 23% 4 iPad App 1 3 3 1 1.73 40%
Total 4.309 100%
Evaluation of alternatives based on duration 1 2 3 4
Face-to-face Existing
Online New
Prototype iPad App
Geometric Mean
Alternative Scores
1 Face-to-face 1 1/5 1/5 1/3 0.34 7% 2 Existing Online 5 1 1 1/3 1.14 23% 3 New Prototype 5 1 1 1/3 1.14 23% 4 iPad App 3 3 3 1 2.28 47%
Total 4.892 100%
Evaluation of alternatives based on configurability 1 2 3 4
Face-to-face Existing
Online New
Prototype iPad App
Geometric Mean
Alternative Scores
1 Face-to-face 1 5 3 3 2.59 54% 2 Existing Online 1/5 1 1 1 0.67 14% 3 New Prototype 1/3 1 1 1 0.76 16% 4 iPad App 1/3 1 1 1 0.76 16%
Total 4.778 100%
Engagement Level
Substantive Learning Complexity Duration Configurability
Criteria Weights
Face-to-face Version 0.5858 0.5465 0.1340 0.0695 0.5420
Engagement Level 0.2934
Existing Online 0.0658 0.0667 0.2321 0.2323 0.1399
Substantive Learning 0.3743
New Prototype 0.2094 0.2626 0.2321 0.2323 0.1590
Complexity 0.1409
iPad App 0.1391 0.1242 0.4019 0.4660 0.1590
Duration 0.0662
Configurability 0.1251
Net Score
Face-to-face Version 0.4677
Existing Online 0.1099
New Prototype 0.2277
iPad App 0.1947

127
AHP Evaluation of Alternatives Individual Responses (continued)
Evaluation of alternatives based on Engagement 1 2 3 4
Face-to-face Version
Existing Online
New Prototype
iPad App
Geometric Mean
Alternative Scores
1 Face-to-face Version 1 7 3 3 2.82 56% 2 Existing Online 1/7 1 3 3 1.06 21% 3 New Prototype 1/3 1/3 1 1 0.58 11% 4 iPad App 1/3 1/3 1 1 0.58 11%
5.037 100%
Evaluation of alternatives based on substantive learning 1 2 3 4
Face-to-face Version
Existing Online
New Prototype
iPad App
Geometric Mean
Alternative Scores
1 Face-to-face Version 1 3 1 1 1.32 30% 2 Existing Online 1/3 1 1/3 1/3 0.44 10% 3 New Prototype 1 3 1 1 1.32 30% 4 iPad App 1 3 1 1 1.32 30%
4.387 100%
Evaluation of alternatives based on complexity 1 2 3 4
Face-to-face Version
Existing Online
New Prototype
iPad App
Geometric Mean
Alternative Scores
1 Face-to-face Version 1 7 3 3 2.82 52% 2 Existing Online 1/7 1 1/5 1/3 0.31 6% 3 New Prototype 1/3 5 1 3 1.50 28% 4 iPad App 1/3 3 1/3 1 0.76 14%
5.385 100%
Evaluation of alternatives based on duration 1 2 3 4
Face-to-face Version
Existing Online
New Prototype
iPad App
Geometric Mean
Alternative Scores
1 Face-to-face Version 1 3 1/3 1/3 0.76 15% 2 Existing Online 1/3 1 1/5 1/5 0.34 7% 3 New Prototype 3 5 1 1 1.97 39% 4 iPad App 3 5 1 1 1.97 39%
5.036 100%
Evaluation of alternatives based on configurability 1 2 3 4
Face-to-face Version
Existing Online
New Prototype
iPad App
Geometric Mean
Alternative Scores
1 Face-to-face Version 1 5 5 5 3.34 63% 2 Existing Online 1/5 1 1 1 0.67 13% 3 New Prototype 1/5 1 1 1 0.67 13% 4 iPad App 1/5 1 1 1 0.67 13%
5.350 100%
Engagement Level
Substantive Learning Complexity Duration Configurability
Criteria Weights
Face-to-face Version 0.5593 0.3000 0.5232 0.1509 0.6250
Engagement Level 0.2934
Existing Online 0.2114 0.1000 0.0580 0.0675 0.1250
Substantive Learning 0.3743
New Prototype 0.1146 0.3000 0.2777 0.3908 0.1250
Complexity 0.1409
iPad App 0.1146 0.3000 0.1411 0.3908 0.1250
Duration 0.0662
Configurability 0.1251
Net Score
Face-to-face Version 0.4383
Existing Online 0.1277
New Prototype 0.2266
iPad App 0.2073
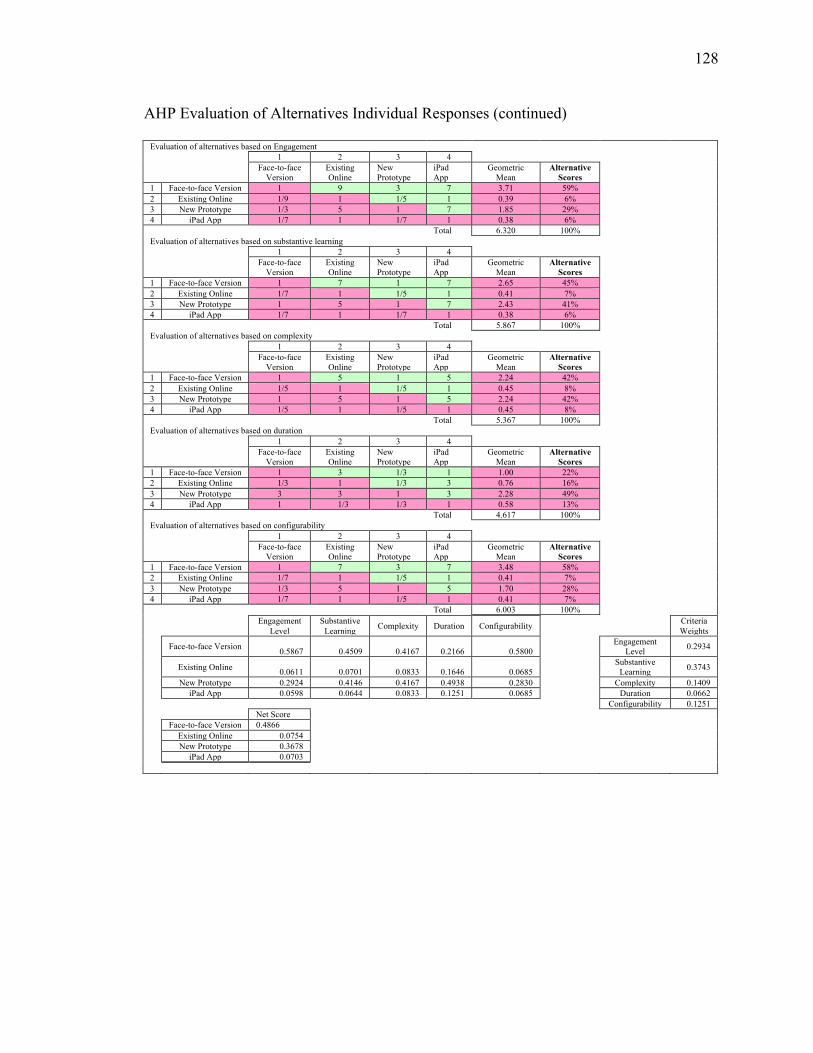
128
AHP Evaluation of Alternatives Individual Responses (continued)
Evaluation of alternatives based on Engagement 1 2 3 4
Face-to-face Version
Existing Online
New Prototype
iPad App
Geometric Mean
Alternative Scores
1 Face-to-face Version 1 9 3 7 3.71 59% 2 Existing Online 1/9 1 1/5 1 0.39 6% 3 New Prototype 1/3 5 1 7 1.85 29% 4 iPad App 1/7 1 1/7 1 0.38 6%
Total 6.320 100%
Evaluation of alternatives based on substantive learning 1 2 3 4
Face-to-face Version
Existing Online
New Prototype
iPad App
Geometric Mean
Alternative Scores
1 Face-to-face Version 1 7 1 7 2.65 45% 2 Existing Online 1/7 1 1/5 1 0.41 7% 3 New Prototype 1 5 1 7 2.43 41% 4 iPad App 1/7 1 1/7 1 0.38 6%
Total 5.867 100%
Evaluation of alternatives based on complexity 1 2 3 4
Face-to-face Version
Existing Online
New Prototype
iPad App
Geometric Mean
Alternative Scores
1 Face-to-face Version 1 5 1 5 2.24 42% 2 Existing Online 1/5 1 1/5 1 0.45 8% 3 New Prototype 1 5 1 5 2.24 42% 4 iPad App 1/5 1 1/5 1 0.45 8%
Total 5.367 100%
Evaluation of alternatives based on duration 1 2 3 4
Face-to-face Version
Existing Online
New Prototype
iPad App
Geometric Mean
Alternative Scores
1 Face-to-face Version 1 3 1/3 1 1.00 22% 2 Existing Online 1/3 1 1/3 3 0.76 16% 3 New Prototype 3 3 1 3 2.28 49% 4 iPad App 1 1/3 1/3 1 0.58 13%
Total 4.617 100%
Evaluation of alternatives based on configurability 1 2 3 4
Face-to-face Version
Existing Online
New Prototype
iPad App
Geometric Mean
Alternative Scores
1 Face-to-face Version 1 7 3 7 3.48 58% 2 Existing Online 1/7 1 1/5 1 0.41 7% 3 New Prototype 1/3 5 1 5 1.70 28% 4 iPad App 1/7 1 1/5 1 0.41 7%
Total 6.003 100%
Engagement Level
Substantive Learning Complexity Duration Configurability
Criteria Weights
Face-to-face Version 0.5867 0.4509 0.4167 0.2166 0.5800
Engagement Level 0.2934
Existing Online 0.0611 0.0701 0.0833 0.1646 0.0685
Substantive Learning 0.3743
New Prototype 0.2924 0.4146 0.4167 0.4938 0.2830
Complexity 0.1409
iPad App 0.0598 0.0644 0.0833 0.1251 0.0685
Duration 0.0662
Configurability 0.1251
Net Score
Face-to-face Version 0.4866
Existing Online 0.0754
New Prototype 0.3678
iPad App 0.0703
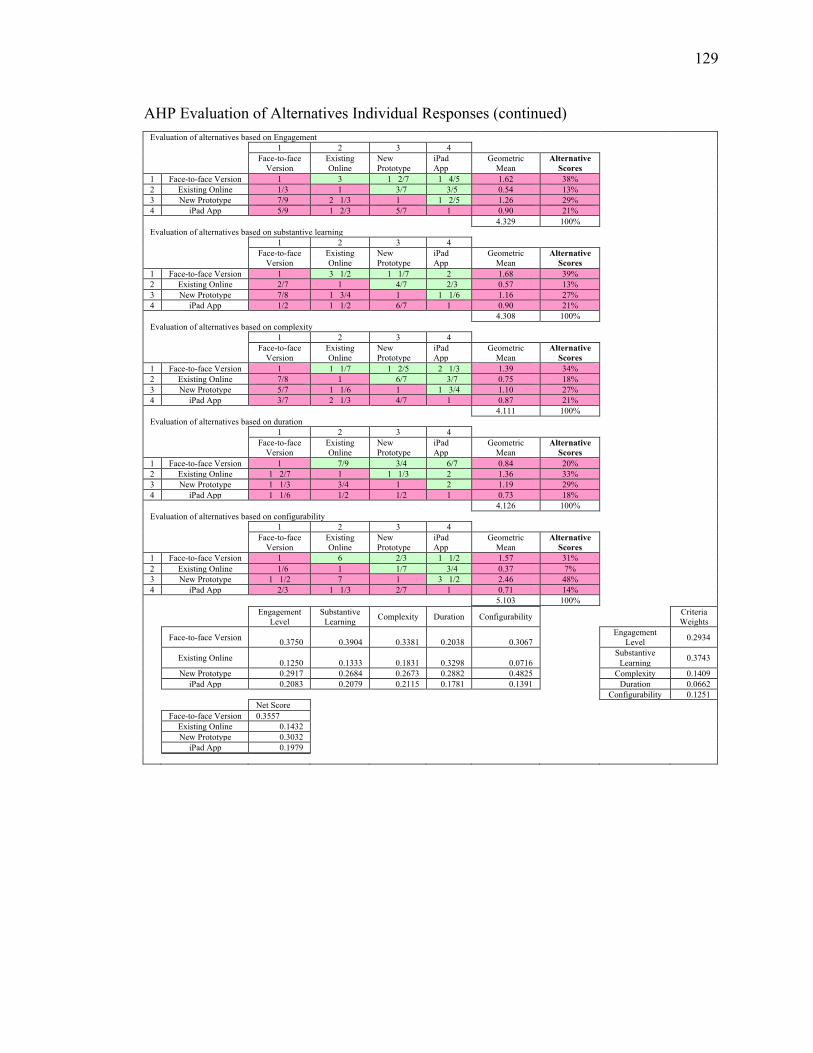
129
AHP Evaluation of Alternatives Individual Responses (continued)
Evaluation of alternatives based on Engagement
1 2 3 4
Face-to-face
Version Existing Online
New Prototype
iPad App
Geometric Mean
Alternative Scores
1 Face-to-face Version 1 3 1 2/7 1 4/5 1.62 38% 2 Existing Online 1/3 1 3/7 3/5 0.54 13% 3 New Prototype 7/9 2 1/3 1 1 2/5 1.26 29% 4 iPad App 5/9 1 2/3 5/7 1 0.90 21%
4.329 100%
Evaluation of alternatives based on substantive learning
1 2 3 4
Face-to-face
Version Existing Online
New Prototype
iPad App
Geometric Mean
Alternative Scores
1 Face-to-face Version 1 3 1/2 1 1/7 2 1.68 39% 2 Existing Online 2/7 1 4/7 2/3 0.57 13% 3 New Prototype 7/8 1 3/4 1 1 1/6 1.16 27% 4 iPad App 1/2 1 1/2 6/7 1 0.90 21%
4.308 100%
Evaluation of alternatives based on complexity
1 2 3 4
Face-to-face
Version Existing Online
New Prototype
iPad App
Geometric Mean
Alternative Scores
1 Face-to-face Version 1 1 1/7 1 2/5 2 1/3 1.39 34% 2 Existing Online 7/8 1 6/7 3/7 0.75 18% 3 New Prototype 5/7 1 1/6 1 1 3/4 1.10 27% 4 iPad App 3/7 2 1/3 4/7 1 0.87 21%
4.111 100%
Evaluation of alternatives based on duration 1 2 3 4
Face-to-face Version
Existing Online
New Prototype
iPad App
Geometric Mean
Alternative Scores
1 Face-to-face Version 1 7/9 3/4 6/7 0.84 20% 2 Existing Online 1 2/7 1 1 1/3 2 1.36 33% 3 New Prototype 1 1/3 3/4 1 2 1.19 29% 4 iPad App 1 1/6 1/2 1/2 1 0.73 18%
4.126 100%
Evaluation of alternatives based on configurability 1 2 3 4
Face-to-face Version
Existing Online
New Prototype
iPad App
Geometric Mean
Alternative Scores
1 Face-to-face Version 1 6 2/3 1 1/2 1.57 31% 2 Existing Online 1/6 1 1/7 3/4 0.37 7% 3 New Prototype 1 1/2 7 1 3 1/2 2.46 48% 4 iPad App 2/3 1 1/3 2/7 1 0.71 14%
5.103 100%
Engagement Level
Substantive Learning Complexity Duration Configurability
Criteria Weights
Face-to-face Version 0.3750 0.3904 0.3381 0.2038 0.3067
Engagement Level 0.2934
Existing Online 0.1250 0.1333 0.1831 0.3298 0.0716
Substantive Learning 0.3743
New Prototype 0.2917 0.2684 0.2673 0.2882 0.4825
Complexity 0.1409
iPad App 0.2083 0.2079 0.2115 0.1781 0.1391
Duration 0.0662
Configurability 0.1251
Net Score
Face-to-face Version 0.3557
Existing Online 0.1432
New Prototype 0.3032
iPad App 0.1979

130
AHP Evaluation of Alternatives Individual Responses (continued)
Evaluation of alternatives based on Engagement
1 2 3 4
Face-to-face
Version Existing Online
New Prototype
iPad App
Geometric Mean
Alternative Scores
1 Face-to-face Version 1 7 4 6 3.60 61% 2 Existing Online 1/7 1 1/4 1/3 0.33 6% 3 New Prototype 1/4 4 1 4 1.41 24% 4 iPad App 1/6 3 1/4 1 0.59 10%
5.939 100%
Evaluation of alternatives based on substantive learning
1 2 3 4
Face-to-face
Version Existing Online
New Prototype
iPad App
Geometric Mean
Alternative Scores
1 Face-to-face Version 1 7 5 7 3.96 65% 2 Existing Online 1/7 1 1/3 1/3 0.35 6% 3 New Prototype 1/5 3 1 3 1.16 19% 4 iPad App 1/7 3 1/3 1 0.61 10%
6.084 100%
Evaluation of alternatives based on complexity
1 2 3 4
Face-to-face
Version Existing Online
New Prototype
iPad App
Geometric Mean
Alternative Scores
1 Face-to-face Version 1 5 3 4 2.78 52% 2 Existing Online 1/5 1 1/5 1/4 0.32 6% 3 New Prototype 1/3 5 1 3 1.50 28% 4 iPad App 1/4 4 1/3 1 0.76 14%
5.355 100%
Evaluation of alternatives based on duration 1 2 3 4
Face-to-face Version
Existing Online
New Prototype
iPad App
Geometric Mean
Alternative Scores
1 Face-to-face Version 1 1/4 1/5 1/3 0.36 7% 2 Existing Online 4 1 1/3 3 1.41 26% 3 New Prototype 5 3 1 5 2.94 55% 4 iPad App 3 1/3 1/5 1 0.67 12%
5.385 100%
Evaluation of alternatives based on configurability 1 2 3 4
Face-to-face Version
Existing Online
New Prototype
iPad App
Geometric Mean
Alternative Scores
1 Face-to-face Version 1 9 7 9 4.88 70% 2 Existing Online 1/9 1 1/4 1/4 0.29 4% 3 New Prototype 1/7 4 1 4 1.23 18% 4 iPad App 1/9 4 1/4 1 0.58 8%
6.975 100%
Engagement Level
Substantive Learning Complexity Duration Configurability
Criteria Weights
Face-to-face Version 0.6062 0.6502 0.5198 0.0667 0.6996
Engagement Level 0.2934
Existing Online 0.0556 0.0583 0.0591 0.2626 0.0414
Substantive Learning 0.3743
New Prototype 0.2381 0.1904 0.2793 0.5465 0.1763
Complexity 0.1409
iPad App 0.1001 0.1010 0.1419 0.1242 0.0828
Duration 0.0662
Configurability 0.1251
Net Score
Face-to-face Version 0.5865
Existing Online 0.0690
New Prototype 0.2387
iPad App 0.1058