lean six sigma yellow belt certification general audience
TRANSCRIPT
Lean Six Sigma Yellow Belt Certification General Audience
Rev: 2014-02-20
Course Overview
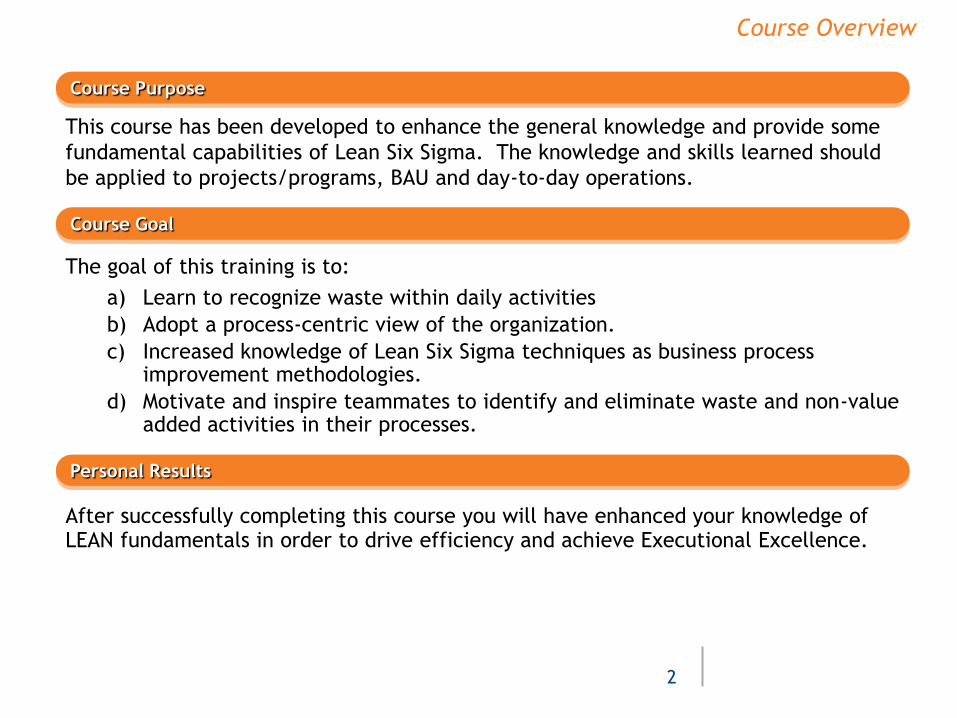
This course has been developed to enhance the general knowledge and provide some
fundamental capabilities of Lean Six Sigma. The knowledge and skills learned should
be applied to projects/programs, BAU and day-to-day operations.
Course Purpose
After successfully completing this course you will have enhanced your knowledge of LEAN fundamentals in order to drive efficiency and achieve Executional Excellence.
The goal of this training is to:
a) Learn to recognize waste within daily activities
b) Adopt a process-centric view of the organization.
c) Increased knowledge of Lean Six Sigma techniques as business process improvement methodologies.
d) Motivate and inspire teammates to identify and eliminate waste and non-value added activities in their processes.
Course Goal
Personal Results
2
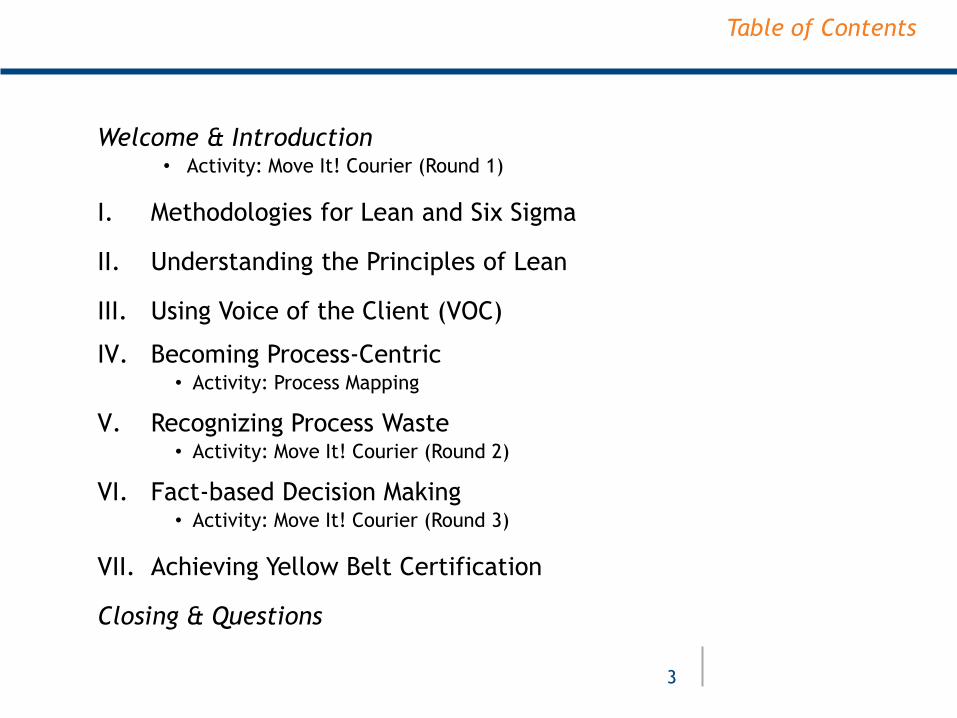
Welcome & Introduction • Activity: Move It! Courier (Round 1)
I. Methodologies for Lean and Six Sigma
II. Understanding the Principles of Lean
III. Using Voice of the Client (VOC)
IV. Becoming Process-Centric • Activity: Process Mapping
V. Recognizing Process Waste • Activity: Move It! Courier (Round 2)
VI. Fact-based Decision Making • Activity: Move It! Courier (Round 3)
VII. Achieving Yellow Belt Certification
Closing & Questions
3
Table of Contents
Business Process Improvement
4
“Often, problems are knots with many
strands, and looking at those strands can
make a problem seem different.”
~ Fred McFeely Rogers ~ “Mr. Rogers Neighborhood”
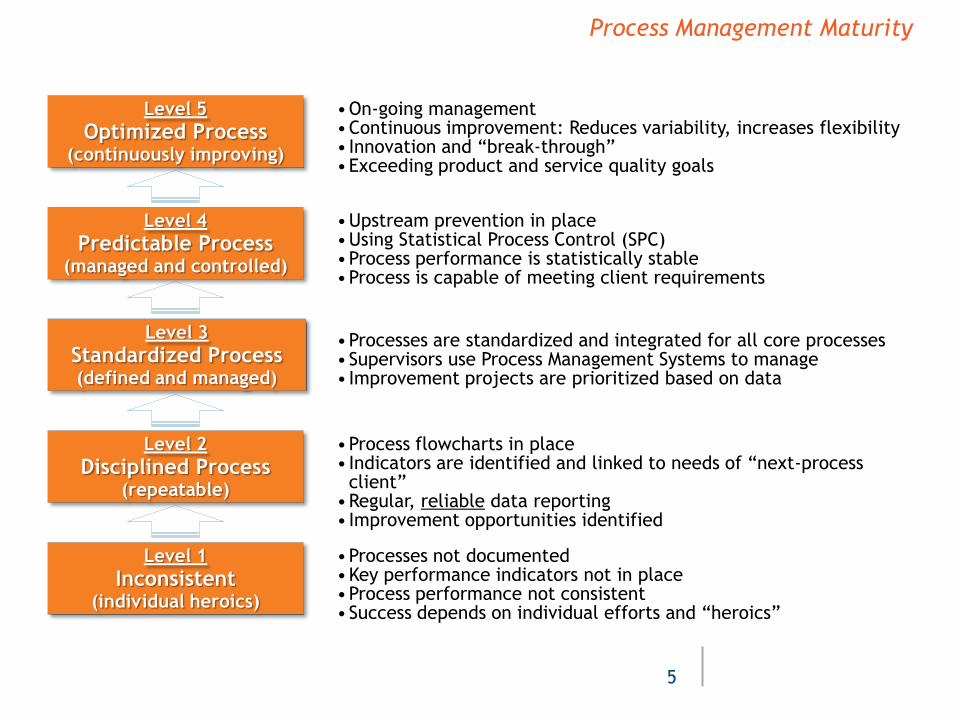
Process Management Maturity
Level 2
Disciplined Process (repeatable)
Level 3
Standardized Process (defined and managed)
Level 4
Predictable Process (managed and controlled)
Level 5
Optimized Process (continuously improving)
•Processes not documented •Key performance indicators not in place •Process performance not consistent •Success depends on individual efforts and “heroics”
•Process flowcharts in place • Indicators are identified and linked to needs of “next-process
client” •Regular, reliable data reporting • Improvement opportunities identified
•Processes are standardized and integrated for all core processes •Supervisors use Process Management Systems to manage • Improvement projects are prioritized based on data
•Upstream prevention in place •Using Statistical Process Control (SPC) •Process performance is statistically stable •Process is capable of meeting client requirements
•On-going management •Continuous improvement: Reduces variability, increases flexibility • Innovation and “break-through” •Exceeding product and service quality goals
Level 1
Inconsistent (individual heroics)
5
Methodologies for Lean & Six Sigma
“Everything can be improved”
~ Clarence W. Barron ~
One of the most influential figures in the history of Dow Jones and Co.
Considered the founder of modern financial journalism.
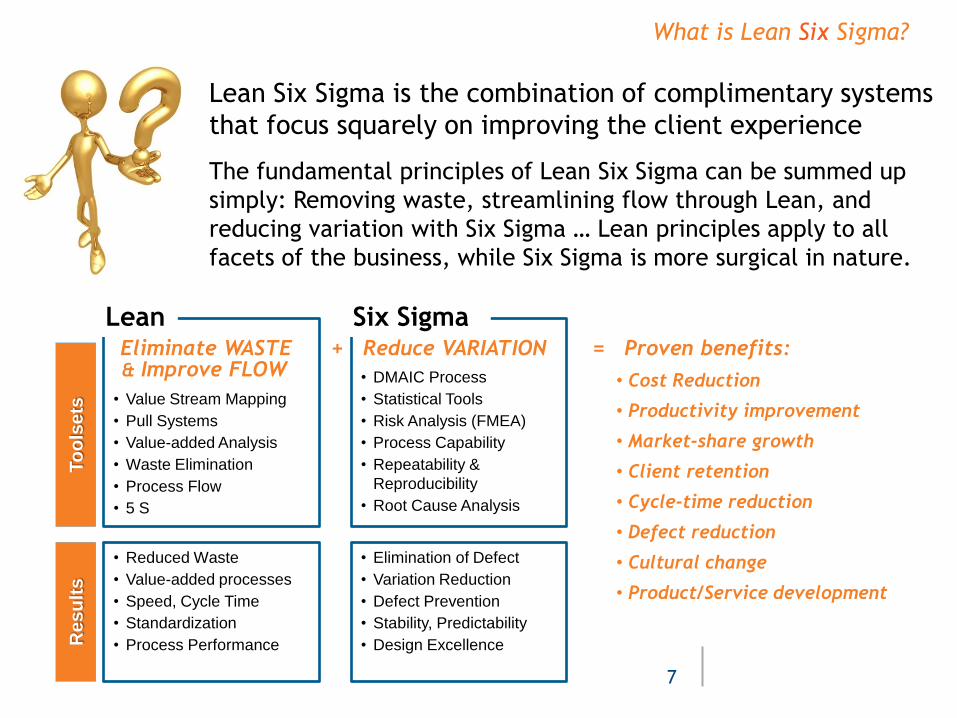
What is Lean Six Sigma?
Eliminate WASTE + Reduce VARIATION = Proven benefits:
• Cost Reduction
• Productivity improvement
• Market-share growth
• Client retention
• Cycle-time reduction
• Defect reduction
• Cultural change
• Product/Service development
Re
su
lts
• Value Stream Mapping
• Pull Systems
• Value-added Analysis
• Waste Elimination
• Process Flow
• 5 S
Lean
• Reduced Waste
• Value-added processes
• Speed, Cycle Time
• Standardization
• Process Performance
• DMAIC Process
• Statistical Tools
• Risk Analysis (FMEA)
• Process Capability
• Repeatability &
Reproducibility
• Root Cause Analysis
Six Sigma
• Elimination of Defect
• Variation Reduction
• Defect Prevention
• Stability, Predictability
• Design Excellence
To
ols
ets
& Improve FLOW
Lean Six Sigma is the combination of complimentary systems
that focus squarely on improving the client experience
The fundamental principles of Lean Six Sigma can be summed up
simply: Removing waste, streamlining flow through Lean, and
reducing variation with Six Sigma … Lean principles apply to all
facets of the business, while Six Sigma is more surgical in nature.
7
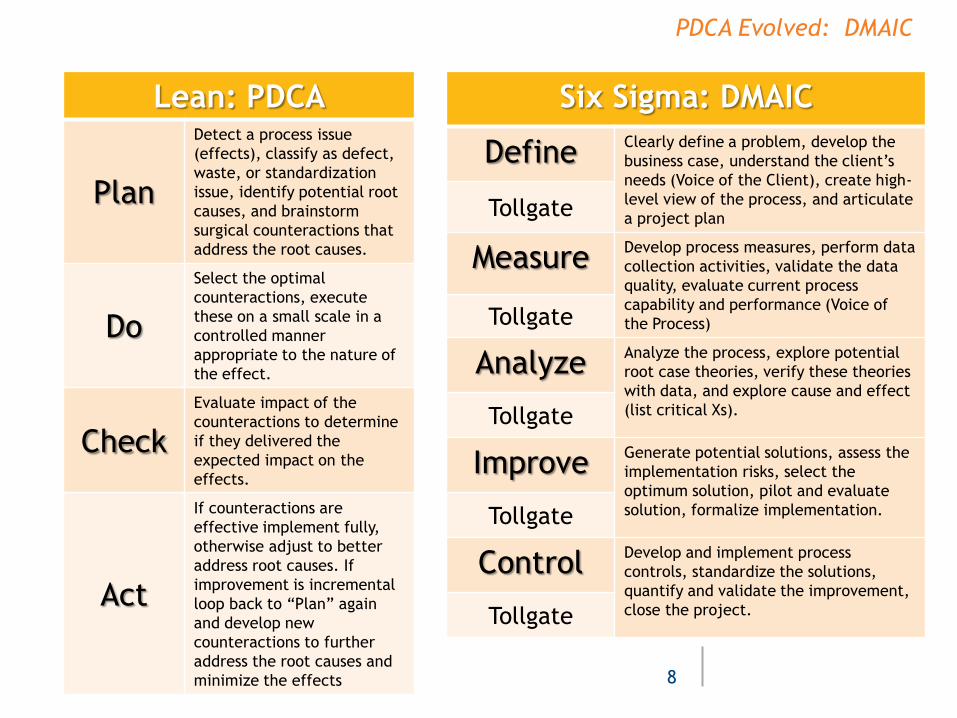
PDCA Evolved: DMAIC
Lean: PDCA
Plan
Detect a process issue
(effects), classify as defect,
waste, or standardization
issue, identify potential root
causes, and brainstorm
surgical counteractions that
address the root causes.
Do
Select the optimal
counteractions, execute
these on a small scale in a
controlled manner
appropriate to the nature of
the effect.
Check
Evaluate impact of the
counteractions to determine
if they delivered the
expected impact on the
effects.
Act
If counteractions are
effective implement fully,
otherwise adjust to better
address root causes. If
improvement is incremental
loop back to “Plan” again
and develop new
counteractions to further
address the root causes and
minimize the effects
Six Sigma: DMAIC
Define Clearly define a problem, develop the
business case, understand the client’s
needs (Voice of the Client), create high-
level view of the process, and articulate
a project plan Tollgate
Measure Develop process measures, perform data
collection activities, validate the data
quality, evaluate current process
capability and performance (Voice of
the Process) Tollgate
Analyze Analyze the process, explore potential
root case theories, verify these theories
with data, and explore cause and effect
(list critical Xs). Tollgate
Improve Generate potential solutions, assess the
implementation risks, select the
optimum solution, pilot and evaluate
solution, formalize implementation. Tollgate
Control Develop and implement process
controls, standardize the solutions,
quantify and validate the improvement,
close the project. Tollgate
8
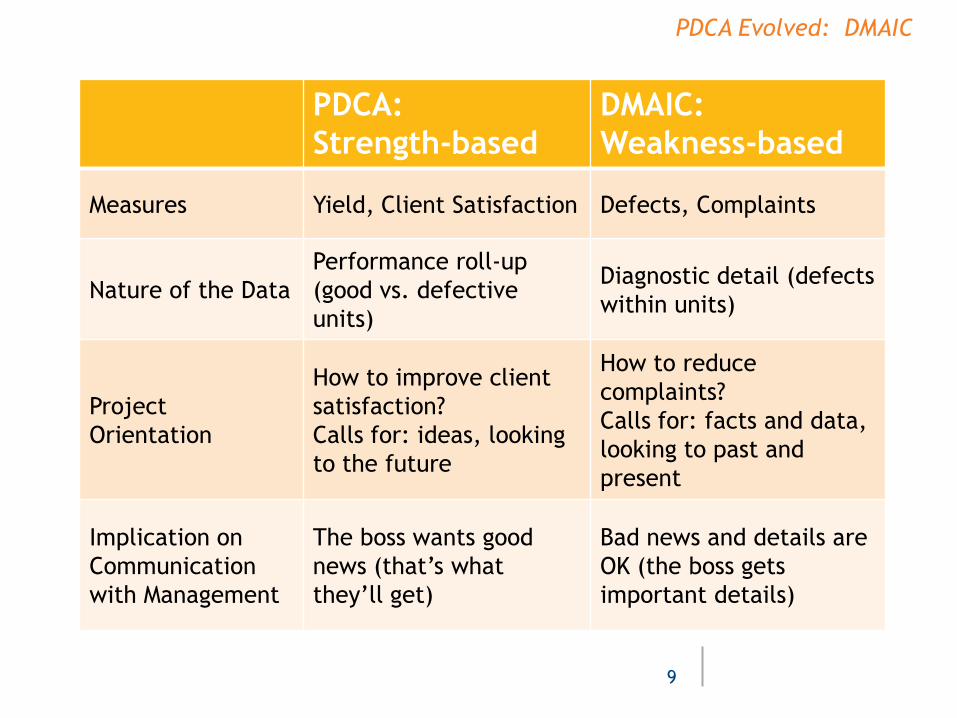
PDCA Evolved: DMAIC
PDCA:
Strength-based
DMAIC:
Weakness-based
Measures Yield, Client Satisfaction Defects, Complaints
Nature of the Data
Performance roll-up
(good vs. defective
units)
Diagnostic detail (defects
within units)
Project
Orientation
How to improve client
satisfaction?
Calls for: ideas, looking
to the future
How to reduce
complaints?
Calls for: facts and data,
looking to past and
present
Implication on
Communication
with Management
The boss wants good
news (that’s what
they’ll get)
Bad news and details are
OK (the boss gets
important details)
9

Understanding the Principles of Lean
“Learn to see… Realize that everything
connects to everything else”
~ Leonardo da Vinci ~
Widely considered to be one of the greatest geniuses of all time and perhaps the
most diversely talented person ever to have lived.
Lean is a systematic approach to process optimization based on the premise that anywhere work is done, some amount of waste (non-value added effort) is generated
Lean Principles Definition
Lean removes many forms of waste so that Six Sigma can focus on reducing
variability. Variation leads to defects, which is a major source of waste. Six
Sigma is a method to make processes more capable through the reduction of
variation. Thus the symbiotic relationship between the two methodologies.
The goal of Lean is total elimination of waste through:
• Identifying the sources
• Planning for waste elimination
• Use of Lean, Process Management, and Six Sigma
• Establishing “permanent” controls that prevent reoccurrence
11
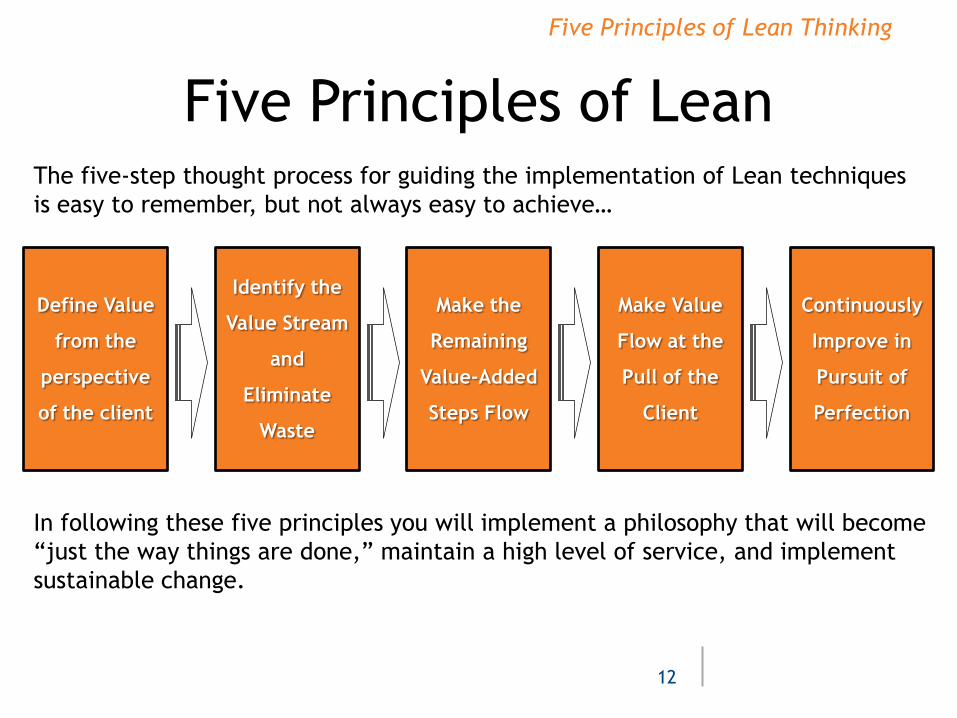
Five Principles of Lean Thinking
The five-step thought process for guiding the implementation of Lean techniques
is easy to remember, but not always easy to achieve…
In following these five principles you will implement a philosophy that will become
“just the way things are done,” maintain a high level of service, and implement
sustainable change.
Five Principles of Lean
Define Value
from the
perspective
of the client
Identify the
Value Stream
and
Eliminate
Waste
Make the
Remaining
Value-Added
Steps Flow
Make Value
Flow at the
Pull of the
Client
Continuously
Improve in
Pursuit of
Perfection
12
Value-Added Analysis
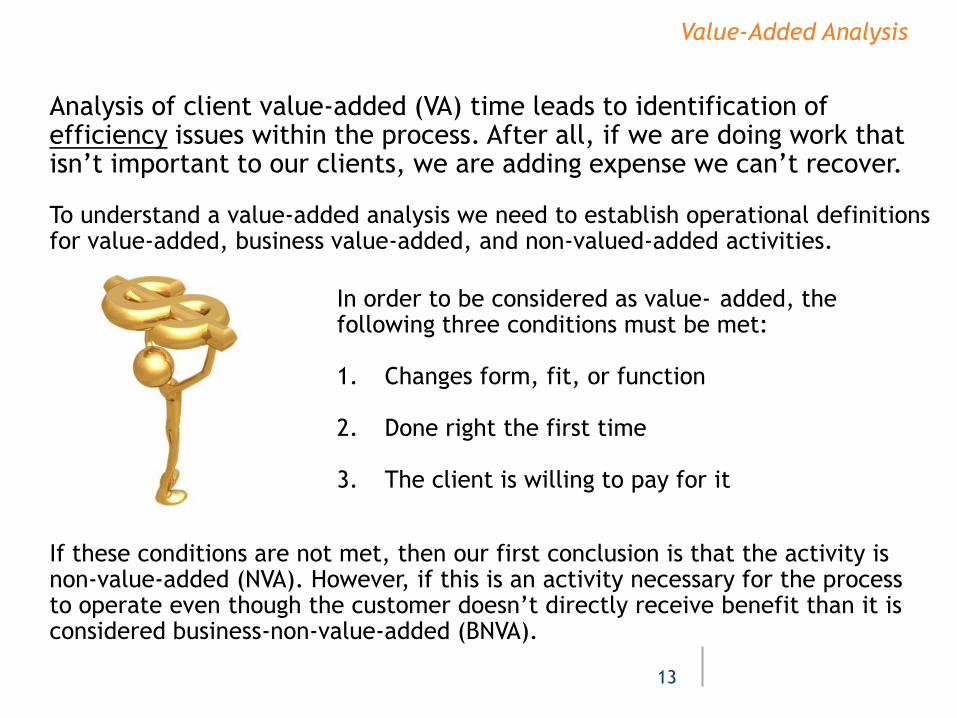
Analysis of client value-added (VA) time leads to identification of efficiency issues within the process. After all, if we are doing work that isn’t important to our clients, we are adding expense we can’t recover.
To understand a value-added analysis we need to establish operational definitions for value-added, business value-added, and non-valued-added activities.
In order to be considered as value- added, the following three conditions must be met:
1. Changes form, fit, or function
2. Done right the first time
3. The client is willing to pay for it
If these conditions are not met, then our first conclusion is that the activity is non-value-added (NVA). However, if this is an activity necessary for the process to operate even though the customer doesn’t directly receive benefit than it is considered business-non-value-added (BNVA).
13
Hidden Factories
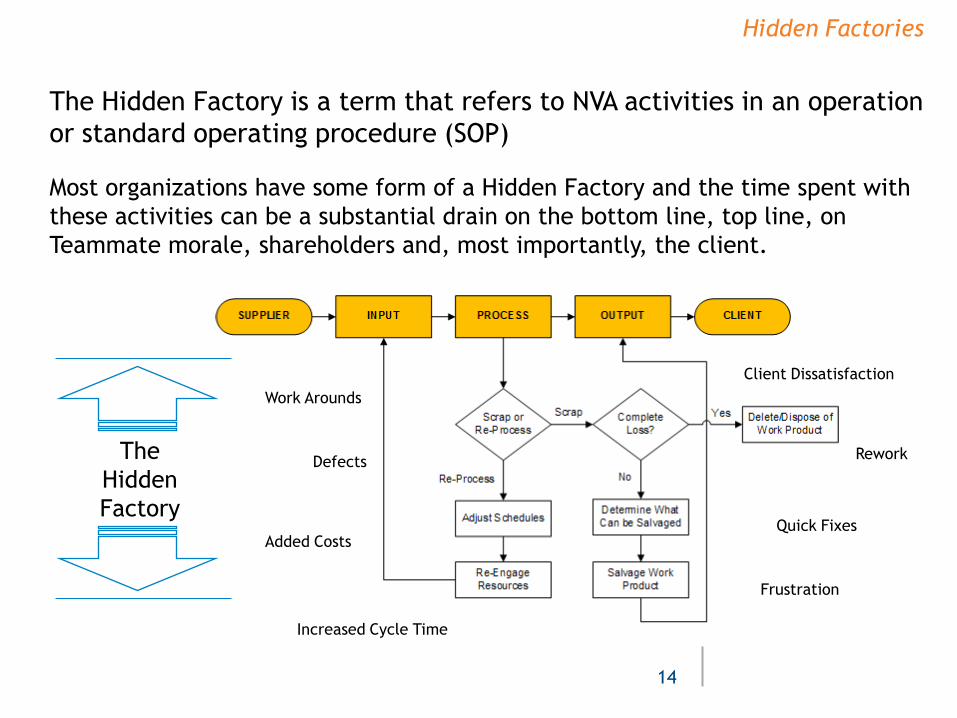
The Hidden Factory is a term that refers to NVA activities in an operation
or standard operating procedure (SOP)
Most organizations have some form of a Hidden Factory and the time spent with
these activities can be a substantial drain on the bottom line, top line, on
Teammate morale, shareholders and, most importantly, the client.
14
Quick Fixes
Rework
Frustration
Client Dissatisfaction
Work Arounds
Increased Cycle Time
Defects
Added Costs
The
Hidden
Factory
Using Voice of the Client (VOC)
“A car for every purse and purpose”
~ Alfred P. Sloane ~
President, chairman, and CEO of General Motors Corporation from the
1920s - 1950s. Led GM to become the largest corporation on earth.
Defining Critical To Quality (CTQ)
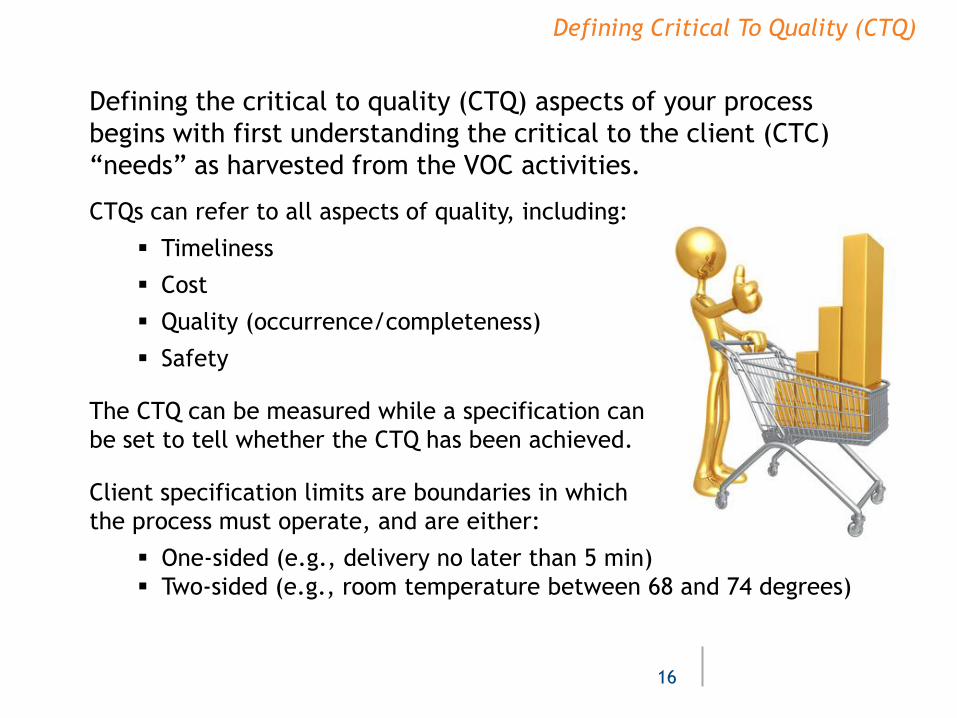
Defining the critical to quality (CTQ) aspects of your process
begins with first understanding the critical to the client (CTC)
“needs” as harvested from the VOC activities.
CTQs can refer to all aspects of quality, including:
Timeliness
Cost
Quality (occurrence/completeness)
Safety
The CTQ can be measured while a specification can
be set to tell whether the CTQ has been achieved.
Client specification limits are boundaries in which
the process must operate, and are either:
One-sided (e.g., delivery no later than 5 min)
Two-sided (e.g., room temperature between 68 and 74 degrees)
16
Defects, Opportunities, and DPO
Name__________Name__________
SSN__________SSN__________
Address_________Address_________
Age__________Age__________
InsuranInsuran. #_________. #_________
Provider__________Provider__________
Hospital_________Hospital_________
Charge $_________Charge $_________
Name__________Name__________
SSN__________SSN__________
Address_________Address_________
Age__________Age__________
InsuranInsuran. #_________. #_________
Provider__________Provider__________
Hospital_________Hospital_________
Charge $_________Charge $_________
Name__________Name__________
SSN__________SSN__________
Address_________Address_________
Age__________Age__________
InsuranInsuran. #_________. #_________
Provider__________Provider__________
Hospital_________Hospital_________
Charge $_________Charge $_________
Name__________Name__________
SSN__________SSN__________
Address_________Address_________
Age__________Age__________
InsuranInsuran. #_________. #_________
Provider__________Provider__________
Hospital_________Hospital_________
Charge $_________Charge $_________
Name__________Name__________
SSN__________SSN__________
Address_________Address_________
Age__________Age__________
InsuranInsuran. #_________. #_________
Provider__________Provider__________
Hospital_________Hospital_________
Charge $_________Charge $_________
Name__________Name__________
SSN__________SSN__________
Address_________Address_________
Age__________Age__________
InsuranInsuran. #_________. #_________
Provider__________Provider__________
Hospital_________Hospital_________
Charge $_________Charge $_________
Name__________Name__________
SSN__________SSN__________
Address_________Address_________
Age__________Age__________
InsuranInsuran. #_________. #_________
Provider__________Provider__________
Hospital_________Hospital_________
Charge $_________Charge $_________
Name__________Name__________
SSN__________SSN__________
Address_________Address_________
Age__________Age__________
InsuranInsuran. #_________. #_________
Provider__________Provider__________
Hospital_________Hospital_________
Charge $_________Charge $_________
Name__________Name__________
SSN__________SSN__________
Address_________Address_________
Age__________Age__________
InsuranInsuran. #_________. #_________
Provider__________Provider__________
Hospital_________Hospital_________
Charge $_________Charge $_________
Name__________Name__________
SSN__________SSN__________
Address_________Address_________
Age__________Age__________
InsuranInsuran. #_________. #_________
Provider__________Provider__________
Hospital_________Hospital_________
Charge $_________Charge $_________
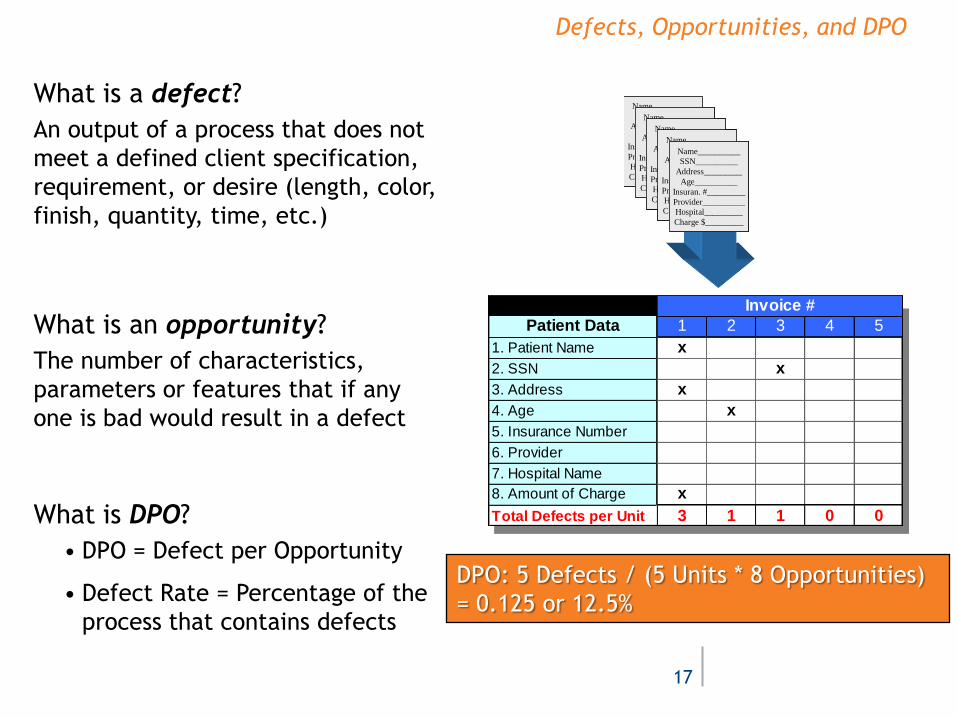
DPO: 5 Defects / (5 Units * 8 Opportunities)
= 0.125 or 12.5%
Hospital_________Hospital_________
Charge Charge
Patient Data 1 2 3 4 5
1. Patient Name x
2. SSN x
3. Address x
4. Age x
5. Insurance Number
6. Provider
7. Hospital Name
8. Amount of Charge x
Total Defects per Unit 3 1 1 0 0
Invoice #
What is a defect?
An output of a process that does not
meet a defined client specification,
requirement, or desire (length, color,
finish, quantity, time, etc.)
What is an opportunity?
The number of characteristics,
parameters or features that if any
one is bad would result in a defect
What is DPO?
• DPO = Defect per Opportunity
• Defect Rate = Percentage of the
process that contains defects
17
Calculating Yield
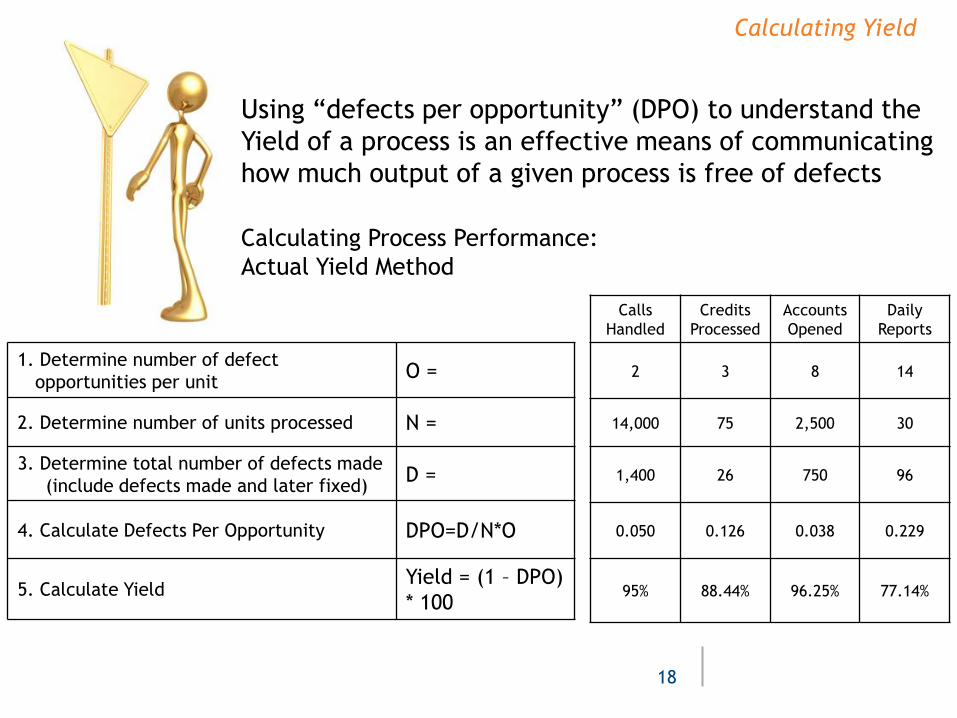
Using “defects per opportunity” (DPO) to understand the
Yield of a process is an effective means of communicating
how much output of a given process is free of defects
Calculating Process Performance:
Actual Yield Method
1. Determine number of defect
opportunities per unit O =
2. Determine number of units processed N =
3. Determine total number of defects made
(include defects made and later fixed) D =
4. Calculate Defects Per Opportunity DPO=D/N*O
5. Calculate Yield Yield = (1 – DPO)
* 100
Calls
Handled
Credits
Processed
Accounts
Opened
Daily
Reports
2 3 8 14
14,000 75 2,500 30
1,400 26 750 96
0.050 0.126 0.038 0.229
95% 88.44% 96.25% 77.14%
18
Becoming Process-Centric
“If you can't describe what you are
doing as a process, you don't know
what you're doing”
~ W. Edwards Deming ~
Pioneered philosophy and methods allowing organizations to plan and
continually improve processes, products and services
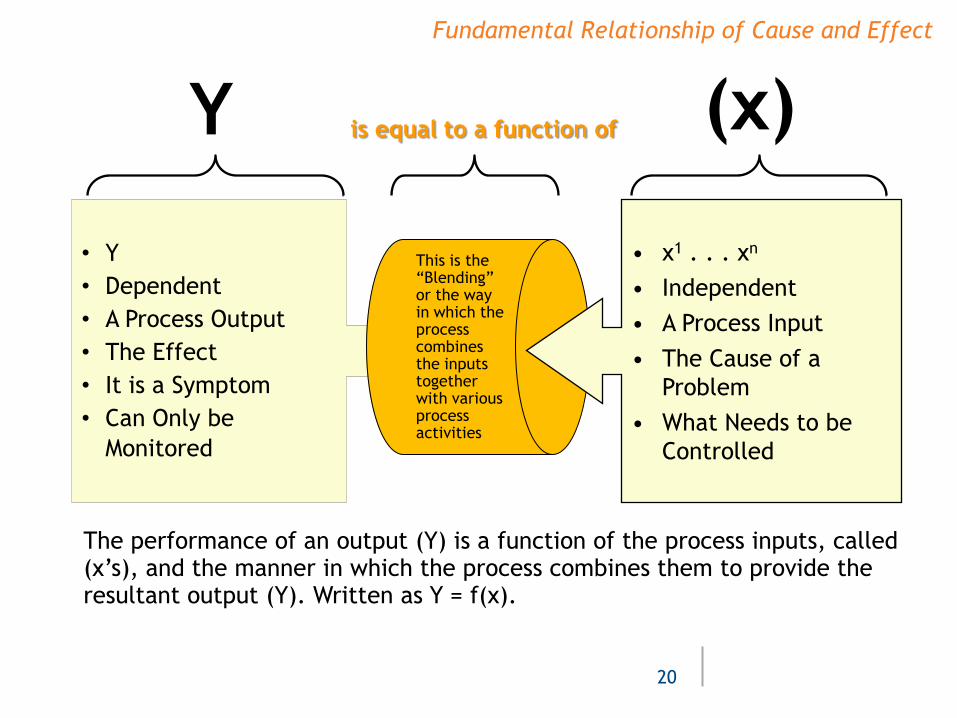
• Y
• Dependent
• A Process Output
• The Effect
• It is a Symptom
• Can Only be
Monitored
(x) Y
Fundamental Relationship of Cause and Effect
is equal to a function of
The performance of an output (Y) is a function of the process inputs, called (x’s), and the manner in which the process combines them to provide the resultant output (Y). Written as Y = f(x).
20
This is the “Blending” or the way in which the process combines the inputs together with various process activities
• x1 . . . xn
• Independent
• A Process Input
• The Cause of a
Problem
• What Needs to be
Controlled
• Presents a pictorial representation of the
sequence of actions that comprise a specific
business process
• Provides an opportunity to understand work that
is being performed… both actual and ideal paths
• Reveal problem areas, defects, and potential
improvement opportunities.
• Identify the areas of complexity and re-work
Process Mapping
21
Business Process Maps graphically depicts the logical sequence of activities of a selected business unit, who is responsible, and how the success of a business process can be determined
The primary purpose of business process mapping is
to assist organizations in becoming more efficient:
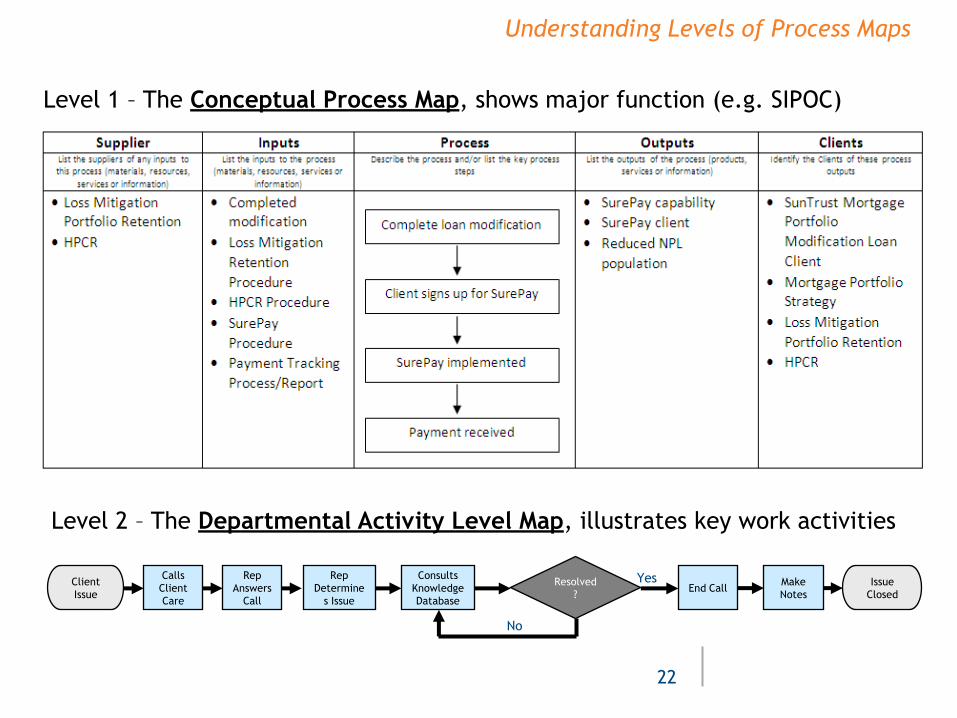
Understanding Levels of Process Maps
Level 2 – The Departmental Activity Level Map, illustrates key work activities
22
Calls
Client
Care
Resolved
?
Client
Issue
Rep
Answers
Call
Rep
Determine
s Issue
Consults
Knowledge
Database
End Call Make
Notes
Issue
Closed
No
Yes
Level 1 – The Conceptual Process Map, shows major function (e.g. SIPOC)
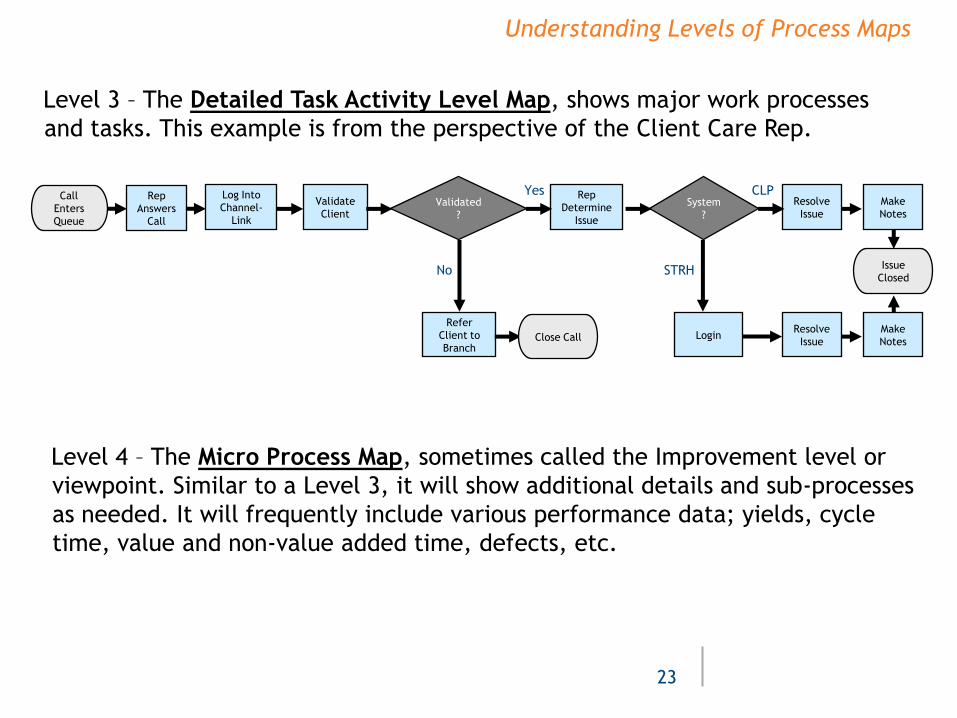
Level 4 – The Micro Process Map, sometimes called the Improvement level or
viewpoint. Similar to a Level 3, it will show additional details and sub-processes
as needed. It will frequently include various performance data; yields, cycle
time, value and non-value added time, defects, etc.
Level 3 – The Detailed Task Activity Level Map, shows major work processes
and tasks. This example is from the perspective of the Client Care Rep.
23
Rep
Answers
Call
Validated
?
Call
Enters
Queue
Log Into
Channel-
Link
Rep
Determine
Issue
Validate
Client
Resolve
Issue
Make
Notes
Issue
Closed No
Yes System
?
STRH
CLP
Login Resolve
Issue
Make
Notes
Refer
Client to
Branch Close Call
Understanding Levels of Process Maps
Four Perspectives
1. What you think the process is
2. What the process really is
3. What the process should be
4. What the process could be
Ensuring which of these perspectives has been
applied (and that it is the correct one) is
essential to evaluating the process
24
Applying appropriate analytical methodology to study current processes and identify opportunities for improvement is the key to the success of any process improvement effort
Process Maps provides a structured analytical
approach but can be highly subjective, depicting
one of four different perspectives of a process:
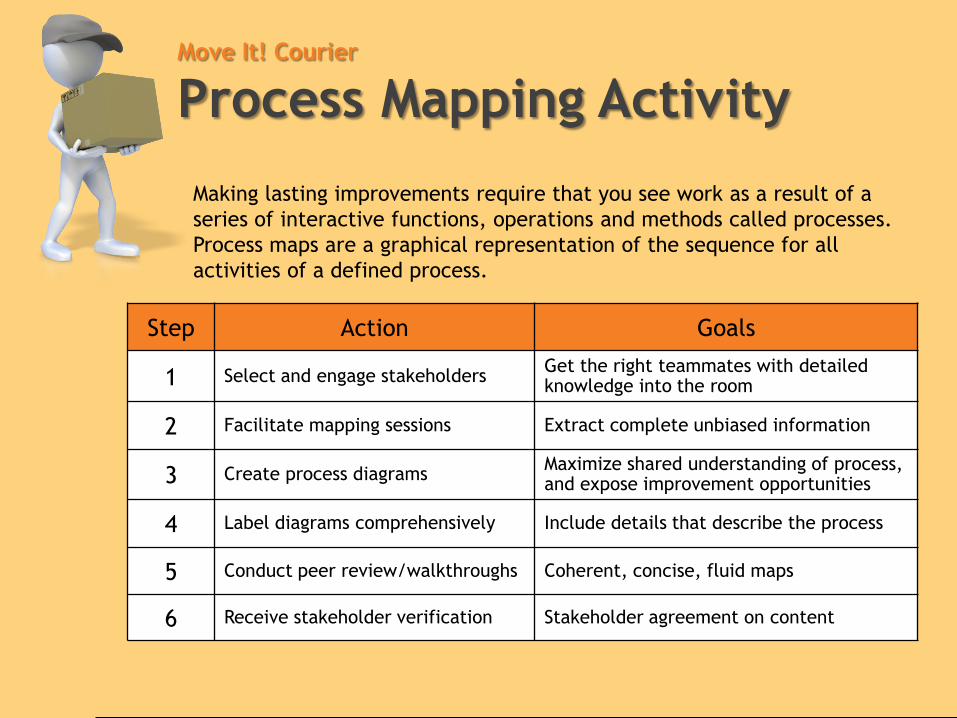
Making lasting improvements require that you see work as a result of a
series of interactive functions, operations and methods called processes.
Process maps are a graphical representation of the sequence for all
activities of a defined process.
The steps for creating a process map are straightforward:
Move It! Courier
Process Mapping Activity
Step Action Goals
1 Select and engage stakeholders Get the right teammates with detailed knowledge into the room
2 Facilitate mapping sessions Extract complete unbiased information
3 Create process diagrams Maximize shared understanding of process, and expose improvement opportunities
4 Label diagrams comprehensively Include details that describe the process
5 Conduct peer review/walkthroughs Coherent, concise, fluid maps
6 Receive stakeholder verification Stakeholder agreement on content
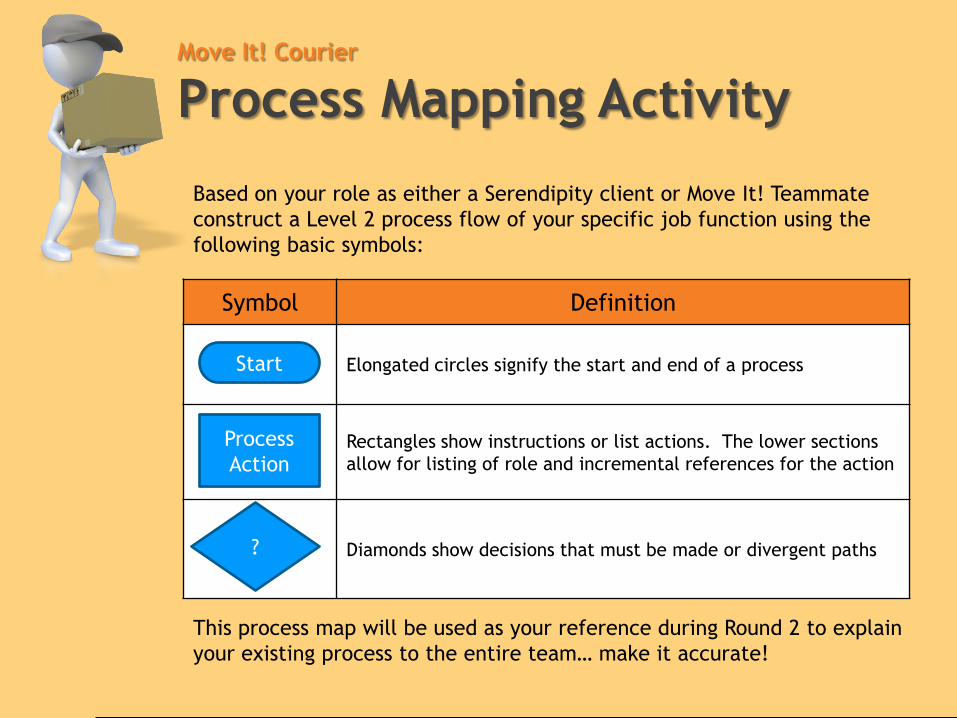
Based on your role as either a Serendipity client or Move It! Teammate
construct a Level 2 process flow of your specific job function using the
following basic symbols:
This process map will be used as your reference during Round 2 to explain
your existing process to the entire team… make it accurate!
Move It! Courier
Process Mapping Activity
Symbol Definition
Elongated circles signify the start and end of a process
Rectangles show instructions or list actions. The lower sections
allow for listing of role and incremental references for the action
Diamonds show decisions that must be made or divergent paths
Process
Action
?
Start
Recognizing Process Waste
“Perfection is not when there is no more
to add, but no more to take away”
~ Antoine de Saint-Exupery ~
French aristocrat, writer, poet laureate and pioneering aviator.
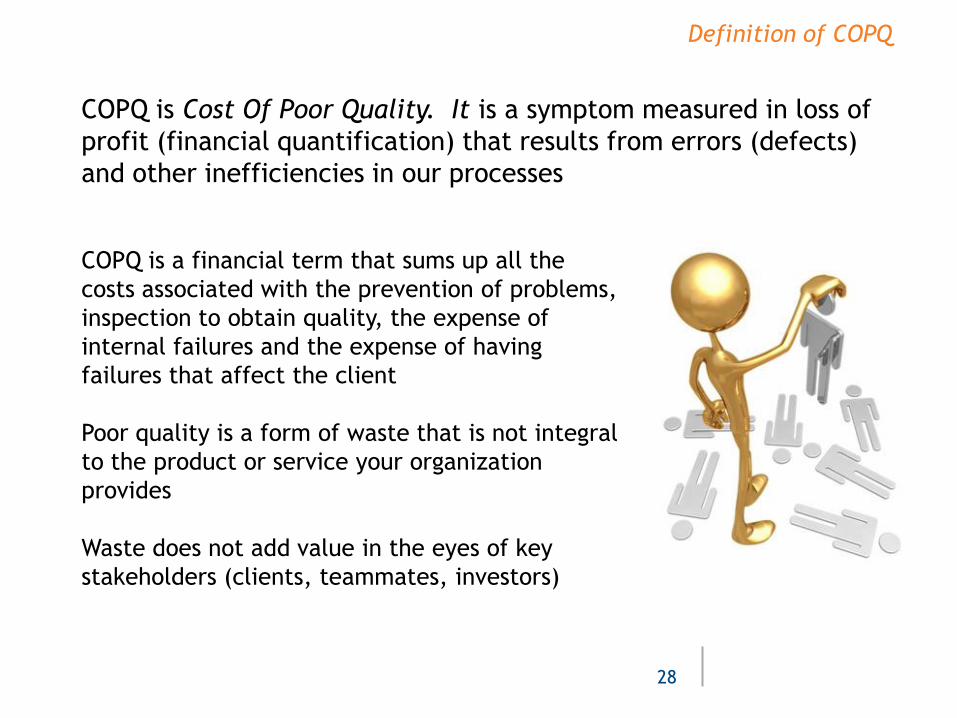
Definition of COPQ
COPQ is Cost Of Poor Quality. It is a symptom measured in loss of
profit (financial quantification) that results from errors (defects)
and other inefficiencies in our processes
28
COPQ is a financial term that sums up all the
costs associated with the prevention of problems,
inspection to obtain quality, the expense of
internal failures and the expense of having
failures that affect the client
Poor quality is a form of waste that is not integral
to the product or service your organization
provides
Waste does not add value in the eyes of key
stakeholders (clients, teammates, investors)
Areas of Waste
“Seven Plus One” Areas of WASTE
1. Over-processing
2. Transportation
3. Motion
4. Inventory
5. Waiting Time
6. Defects
7. Overproduction
7+1. Unexploited Knowledge
29
Area: Consumer/PWIM
Sponsor: Willem Hattink
Problem Statement: The creation of an Investment Policy Statement involved many
redundant and other non-value added steps that added to the total cycle time.
Resolution:
• Created a new Investment Policy Statement that reduced process steps from 18 to 8
• Retained the ability to create custom Allocations for clients
• Reduced the cycle time from 10 minutes per request to 3 minutes
Areas of Waste: 1
1. Over-processing
(Adding more value to a service or product than
what a client wants or is willing to pay for)
The basic concept of over-processing is doing more
work than is really necessary to satisfy the client
30
Areas of Waste: 2
2 .Transportation
(Unnecessary movement of materials,
products, information, or people)
Every move from one activity to another takes
time, which is something Lean thinkers are
always trying to minimize
31
Area: MTG/Default
Sponsor: Mike Zarro
Problem Statement: Thirty five processors spent ~30 minutes a day to upload the
SCRA military checks from the DoD website by printing these documents and walking
them to a coordinator two floors down.
Resolution:
• Processors now copy the image from the website and upload it directly
•Time savings benefit equating to ~ 4,165 hours per year
Areas of Waste: 3
3. Motion
(Excessive bending, reaching, or
stretching motions)
While “transportation” refers to the
movement of the work, “motion” involves
the unnecessary movement of Teammates
32
Area: MTG/Fullfillment
Sponsor: Leo O’Donnell
Problem Statement: Teammates working the fulfillment process were getting in and
out of systems 13 times just to get through their checklist.
Resolution:
• Rearranged checklist to complete everything in the first system before moving on to
the second, etc
• Reduced motion waste by 13 in and outs (26 touchpoints)
4. Inventory
(Any unfinished work that exceeds
what is required to produce for the
client at a given demand interval)
Excess inventory causes waiting, long
lead times, and the failure to meet
client expectations
Areas of Waste: 4
33
Area: Supply Chain/Strategic Sourcing
Sponsor: David Dierker
Problem Statement: Over $500K of items had become obsolete, and 40% of all items
had very low yearly demand yet we were continuing to incur warehousing costs.
Resolution:
• Start ordering direct and eliminate inventory
• Outsourced warehouse to reduce overhead costs equating to over $300K and reduced
ongoing inventory from ~$2MM down to ~$1MM
Areas of Waste: 5
5. Waiting Time
(The delay experienced between the end of one
process step and the beginning of the next step)
So much work in the service industry is not readily
visible to the naked eye, its necessary to highlight
where work is sitting around waiting for someone to do
something with it
34
Area: MTG/Default
Sponsor: Mike Zarro
Problem Statement: In the Non Agency Investor review process, roles and responsibilities
were not laid out, resulting in long cycle times.
Resolution:
• Clearly defined roles and responsibilities by mapping out the process
• Implemented a Triage Team Meeting to cut down on the number of touch points and
identify Subject Matter Expert responders up front
• Resulting in reduction of ~ 2-3 days to respond to requests
Areas of Waste: 6
6. Defects
(Any aspect of service delivery that
does not meet client needs)
Probably the first thing that comes to mind
when someone says waste. The costs of
defects is usually a factor of ten greater
than just the material costs involved.
35
Area: EIS/ETI
Sponsor: Rob Scarmuzzi
Problem Statement: The current SLA for requesting ‘blacking out’ monitoring is met only
35% of the time. When monitoring is not ‘blacked out’ properly due to no request or a late
request erroneous incident tickets are generated, which takes approx. 1 hour to resolve.
Resolution:
• Made HPSC Request the only way to request Monitoring Blackouts
• Implemented review and feedback on Incidents Open In Error
as part of Daily Incident Quality Review
• Saved approximately 65 hours/week
7. Overproduction
(The production of service outputs or
products above and beyond what is
immediately needed)
Overproduction ties up resources and
financial capital, causes long lead times,
downstream shortages, and is a fertile
breeding ground for many forms of waste
Areas of Waste: 7
36
Area: Supply Chain/Strategic Sourcing
Sponsor: Marianne Rhea
Problem Statement: SunTrust branches have reported excess amounts of brochures
being ordered and sent to them. Constant revisions result in older versions being
disposed of. Also when branches close the brochures have to be disposed of as well.
Resolution:
• Optimize the ordering process to better match actual branch demand so that excess
brochures are not produced and wasted.
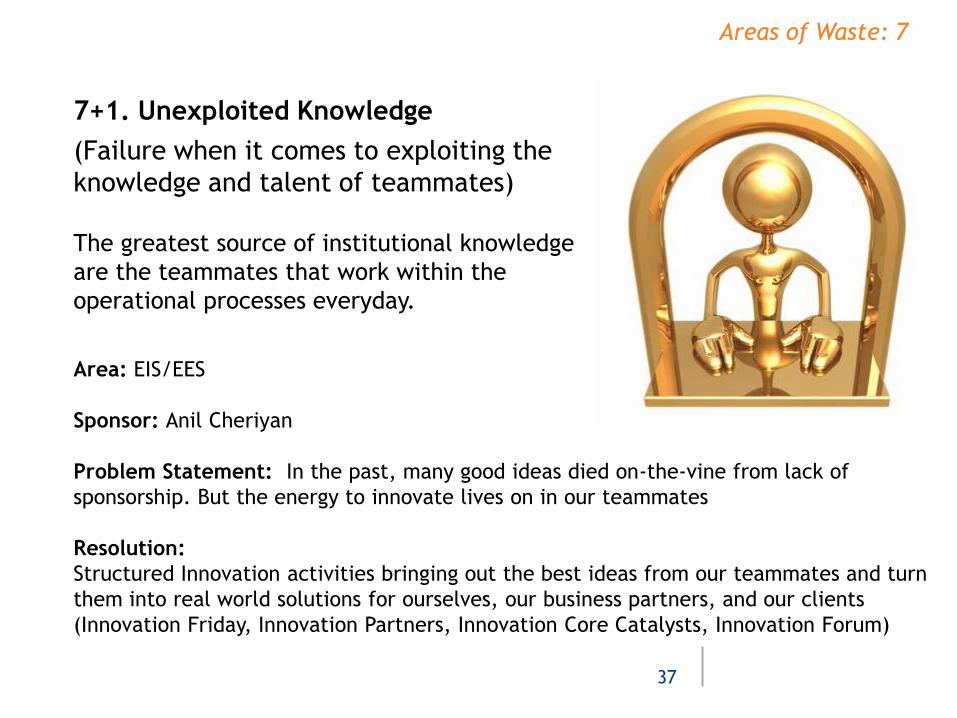
7+1. Unexploited Knowledge
(Failure when it comes to exploiting the
knowledge and talent of teammates)
The greatest source of institutional knowledge
are the teammates that work within the
operational processes everyday.
Areas of Waste: 7
37
Area: EIS/EES
Sponsor: Anil Cheriyan
Problem Statement: In the past, many good ideas died on-the-vine from lack of
sponsorship. But the energy to innovate lives on in our teammates
Resolution:
Structured Innovation activities bringing out the best ideas from our teammates and turn
them into real world solutions for ourselves, our business partners, and our clients
(Innovation Friday, Innovation Partners, Innovation Core Catalysts, Innovation Forum)
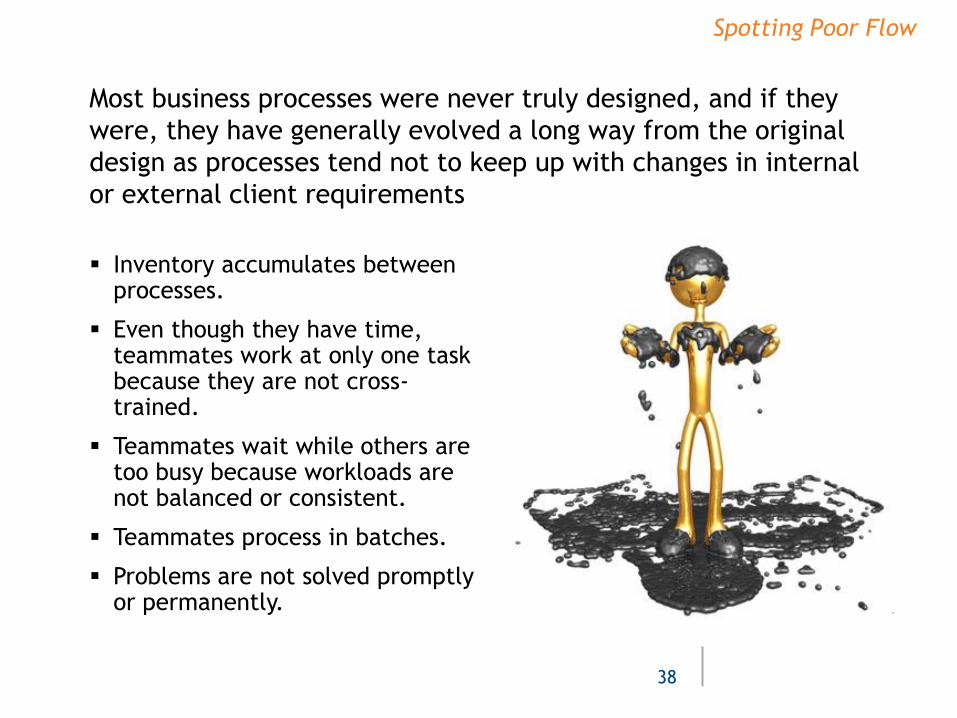
Inventory accumulates between processes.
Even though they have time, teammates work at only one task because they are not cross-trained.
Teammates wait while others are too busy because workloads are not balanced or consistent.
Teammates process in batches.
Problems are not solved promptly or permanently.
Spotting Poor Flow
38
Most business processes were never truly designed, and if they
were, they have generally evolved a long way from the original
design as processes tend not to keep up with changes in internal
or external client requirements
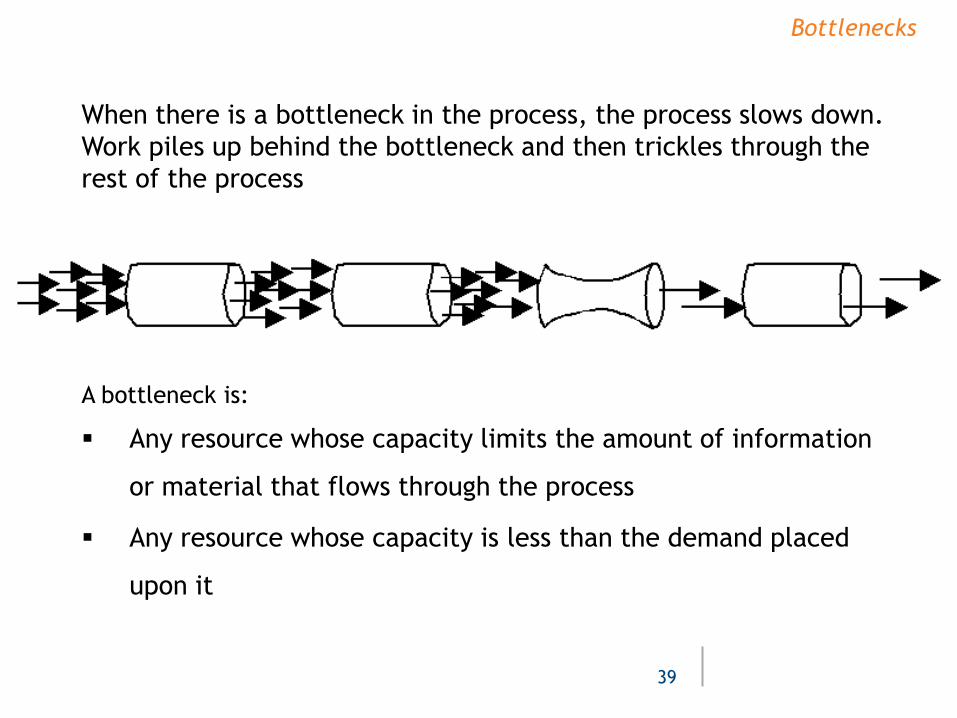
Bottlenecks
When there is a bottleneck in the process, the process slows down.
Work piles up behind the bottleneck and then trickles through the
rest of the process
A bottleneck is:
Any resource whose capacity limits the amount of information
or material that flows through the process
Any resource whose capacity is less than the demand placed
upon it
39
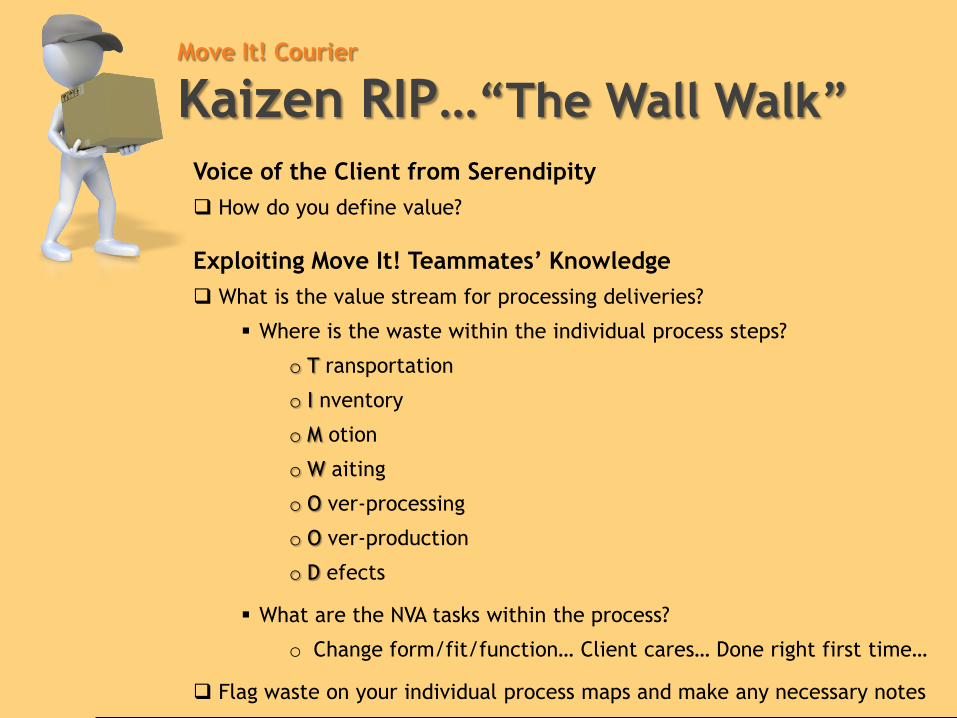
Move It! Courier
Kaizen RIP…“The Wall Walk”
Voice of the Client from Serendipity
How do you define value?
Exploiting Move It! Teammates’ Knowledge
What is the value stream for processing deliveries?
Where is the waste within the individual process steps?
o T ransportation
o I nventory
o M otion
o W aiting
o O ver-processing
o O ver-production
o D efects
What are the NVA tasks within the process?
o Change form/fit/function… Client cares… Done right first time…
Flag waste on your individual process maps and make any necessary notes
Fact-based Decision Making
“In God we trust; all others must
bring data”
~ W. Edwards Deming ~
Pioneered philosophy and methods allowing organizations to plan and
continually improve processes, products and services
Measuring Cycle Time
42
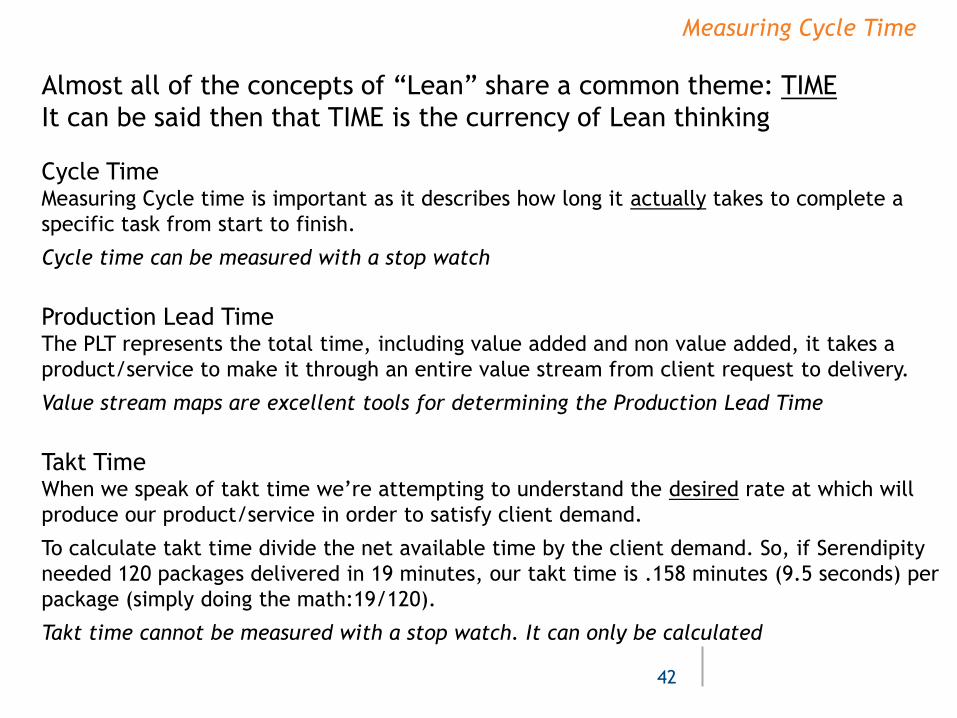
Almost all of the concepts of “Lean” share a common theme: TIME
It can be said then that TIME is the currency of Lean thinking
Cycle Time Measuring Cycle time is important as it describes how long it actually takes to complete a
specific task from start to finish.
Cycle time can be measured with a stop watch
Production Lead Time The PLT represents the total time, including value added and non value added, it takes a
product/service to make it through an entire value stream from client request to delivery.
Value stream maps are excellent tools for determining the Production Lead Time
Takt Time When we speak of takt time we’re attempting to understand the desired rate at which will
produce our product/service in order to satisfy client demand.
To calculate takt time divide the net available time by the client demand. So, if Serendipity
needed 120 packages delivered in 19 minutes, our takt time is .158 minutes (9.5 seconds) per
package (simply doing the math:19/120).
Takt time cannot be measured with a stop watch. It can only be calculated
Measuring Variation
43
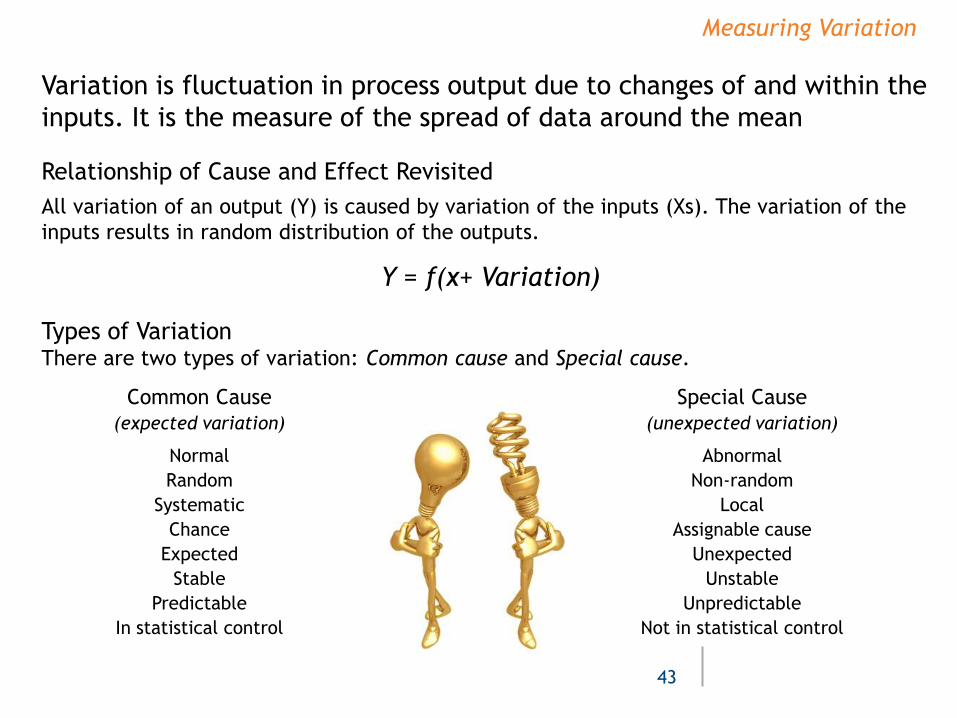
Variation is fluctuation in process output due to changes of and within the
inputs. It is the measure of the spread of data around the mean
Relationship of Cause and Effect Revisited
All variation of an output (Y) is caused by variation of the inputs (Xs). The variation of the
inputs results in random distribution of the outputs.
Y = f(x+ Variation)
Types of Variation There are two types of variation: Common cause and Special cause.
Common Cause
(expected variation)
Normal
Random
Systematic
Chance
Expected
Stable
Predictable
In statistical control
Special Cause
(unexpected variation)
Abnormal
Non-random
Local
Assignable cause
Unexpected
Unstable
Unpredictable
Not in statistical control
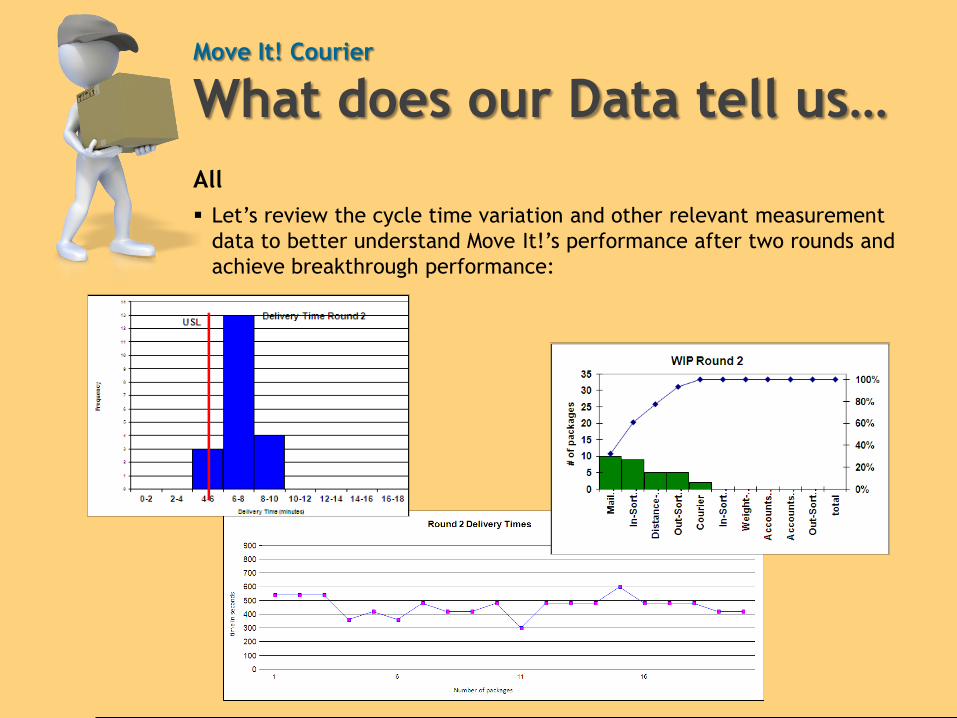
Move It! Courier
What does our Data tell us…
All
Let’s review the cycle time variation and other relevant measurement
data to better understand Move It!’s performance after two rounds and
achieve breakthrough performance:
5 Whys and Mile Deep Thinking
45
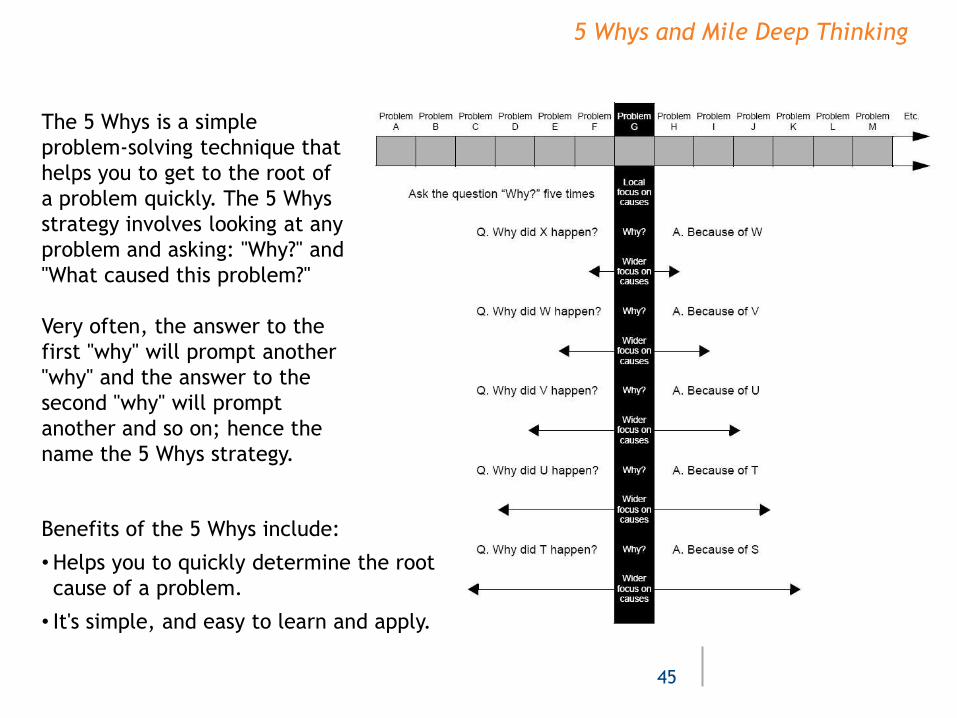
The 5 Whys is a simple
problem-solving technique that
helps you to get to the root of
a problem quickly. The 5 Whys
strategy involves looking at any
problem and asking: "Why?" and
"What caused this problem?"
Very often, the answer to the
first "why" will prompt another
"why" and the answer to the
second "why" will prompt
another and so on; hence the
name the 5 Whys strategy.
Benefits of the 5 Whys include:
• Helps you to quickly determine the root
cause of a problem.
• It's simple, and easy to learn and apply.
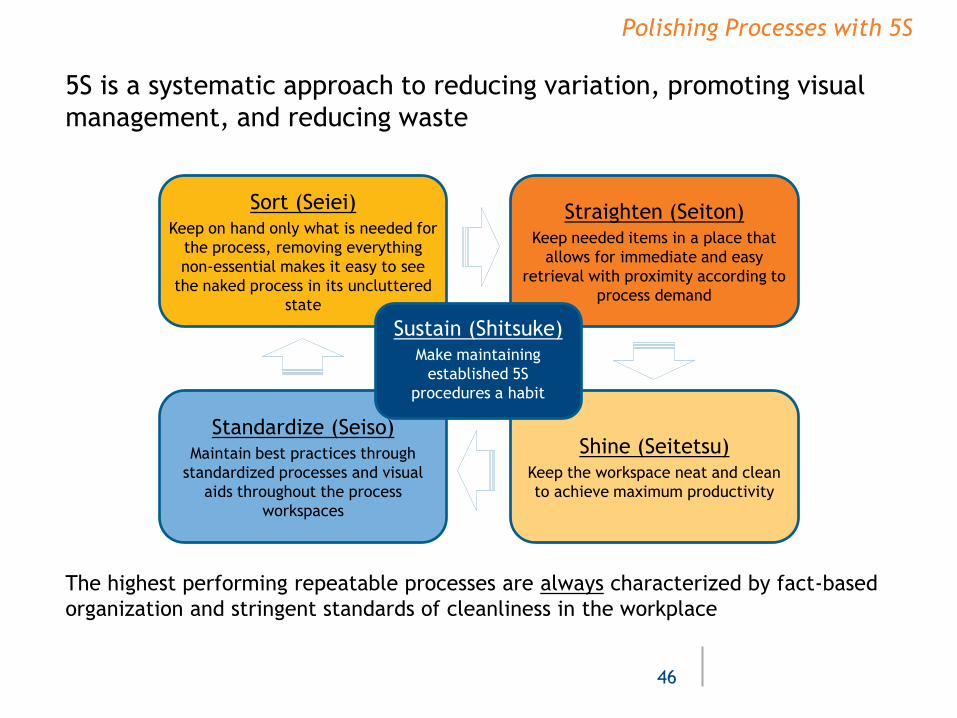
5S is a systematic approach to reducing variation, promoting visual
management, and reducing waste
The highest performing repeatable processes are always characterized by fact-based
organization and stringent standards of cleanliness in the workplace
Polishing Processes with 5S
46
Straighten (Seiton) Keep needed items in a place that
allows for immediate and easy
retrieval with proximity according to
process demand
Shine (Seitetsu) Keep the workspace neat and clean
to achieve maximum productivity
Standardize (Seiso) Maintain best practices through
standardized processes and visual
aids throughout the process
workspaces
Sort (Seiei) Keep on hand only what is needed for
the process, removing everything
non-essential makes it easy to see
the naked process in its uncluttered
state
Sustain (Shitsuke) Make maintaining
established 5S
procedures a habit
Achieving Yellow Belt Certification
“The best approach is to dig out and
eliminate problems where they are
assumed not to exist”
~ Shigeo Shingo~
Japanese industrial engineer who distinguished himself as one of the world’s
thought leaders in building operational excellence. The Shingo Prize for
Operational Excellence is awarded annually in his memory
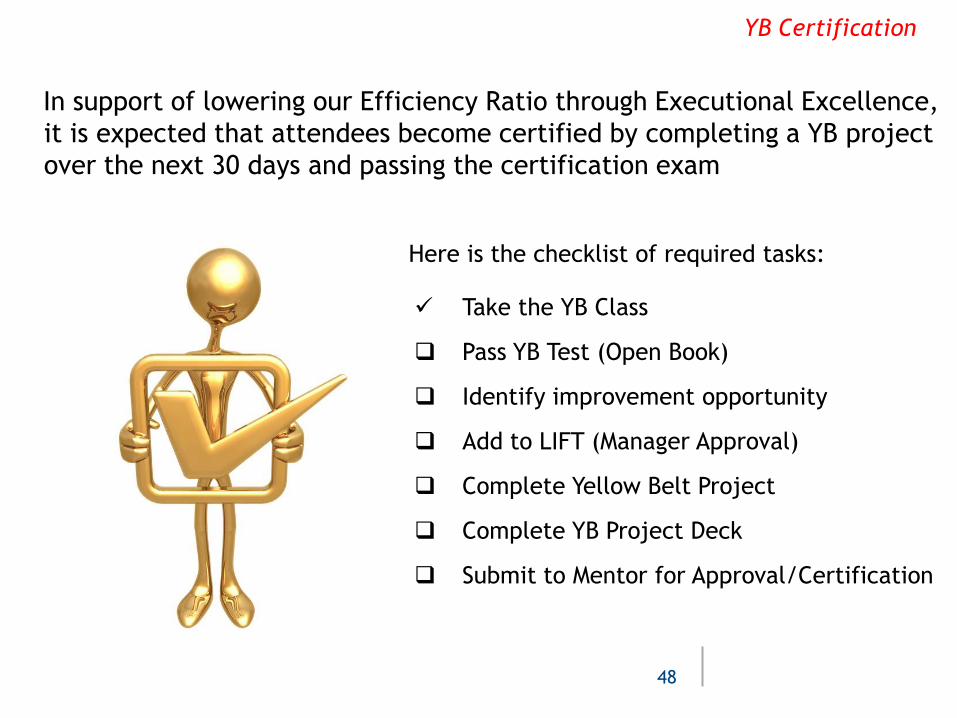
In support of lowering our Efficiency Ratio through Executional Excellence,
it is expected that attendees become certified by completing a YB project
over the next 30 days and passing the certification exam
Here is the checklist of required tasks:
Take the YB Class
Pass YB Test (Open Book)
Identify improvement opportunity
Add to LIFT (Manager Approval)
Complete Yellow Belt Project
Complete YB Project Deck
Submit to Mentor for Approval/Certification
YB Certification
48
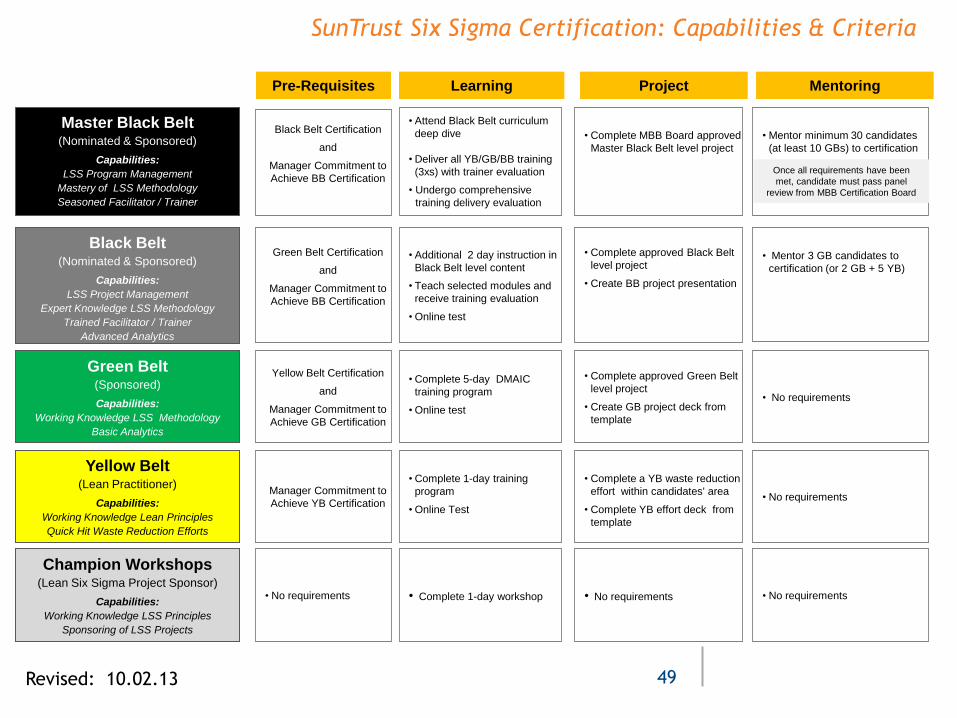
SunTrust Six Sigma Certification: Capabilities & Criteria
49
• Attend Black Belt curriculum
deep dive
• Deliver all YB/GB/BB training
(3xs) with trainer evaluation
• Undergo comprehensive
training delivery evaluation
Master Black Belt (Nominated & Sponsored)
Capabilities:
LSS Program Management
Mastery of LSS Methodology
Seasoned Facilitator / Trainer
• Mentor minimum 30 candidates
(at least 10 GBs) to certification
• Complete MBB Board approved
Master Black Belt level project
Black Belt (Nominated & Sponsored)
Capabilities:
LSS Project Management
Expert Knowledge LSS Methodology
Trained Facilitator / Trainer
Advanced Analytics
• Mentor 3 GB candidates to
certification (or 2 GB + 5 YB)
• Complete approved Black Belt
level project
• Create BB project presentation
• Complete 5-day DMAIC
training program
• Online test
Green Belt (Sponsored)
Capabilities:
Working Knowledge LSS Methodology
Basic Analytics
• No requirements
• Complete approved Green Belt
level project
• Create GB project deck from
template
• Complete 1-day training
program
• Online Test
Yellow Belt (Lean Practitioner)
Capabilities:
Working Knowledge Lean Principles
Quick Hit Waste Reduction Efforts
• No requirements
• Complete a YB waste reduction
effort within candidates' area
• Complete YB effort deck from
template
• Complete 1-day workshop
Champion Workshops (Lean Six Sigma Project Sponsor)
Capabilities:
Working Knowledge LSS Principles
Sponsoring of LSS Projects
• No requirements • No requirements
Learning Project Mentoring
Once all requirements have been
met, candidate must pass panel
review from MBB Certification Board
Pre-Requisites
• Additional 2 day instruction in
Black Belt level content
• Teach selected modules and
receive training evaluation
• Online test
Black Belt Certification
and
Manager Commitment to
Achieve BB Certification
Yellow Belt Certification
and
Manager Commitment to
Achieve GB Certification
Manager Commitment to
Achieve YB Certification
• No requirements
Green Belt Certification
and
Manager Commitment to
Achieve BB Certification
Revised: 10.02.13
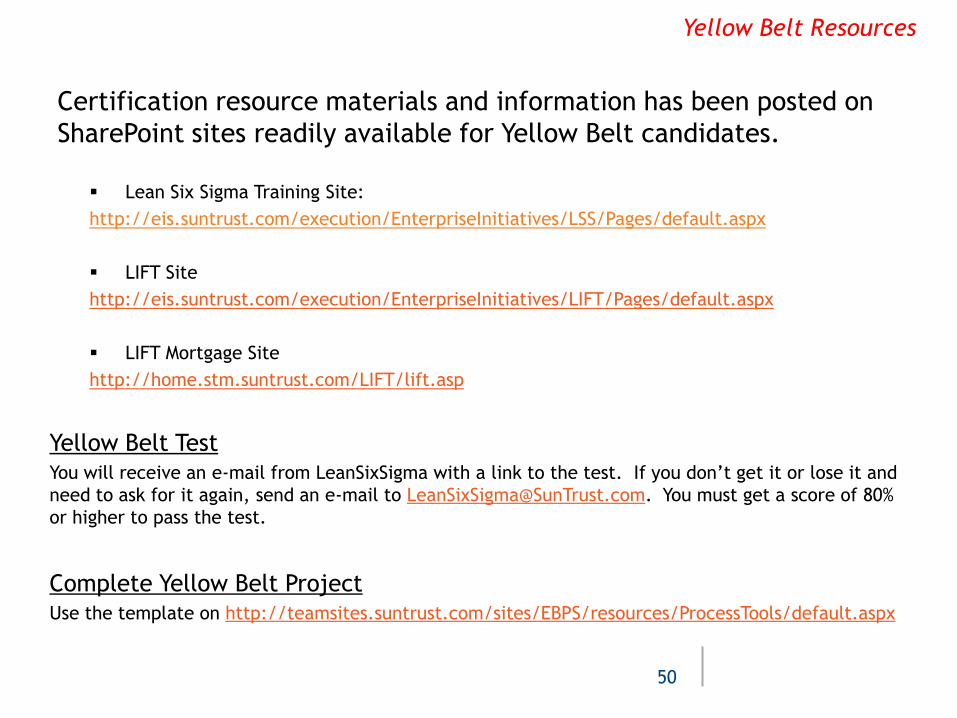
Lean Six Sigma Training Site:
http://eis.suntrust.com/execution/EnterpriseInitiatives/LSS/Pages/default.aspx
LIFT Site
http://eis.suntrust.com/execution/EnterpriseInitiatives/LIFT/Pages/default.aspx
LIFT Mortgage Site
http://home.stm.suntrust.com/LIFT/lift.asp
Yellow Belt Resources
50
Yellow Belt Test You will receive an e-mail from LeanSixSigma with a link to the test. If you don’t get it or lose it and
need to ask for it again, send an e-mail to [email protected]. You must get a score of 80%
or higher to pass the test.
Complete Yellow Belt Project Use the template on http://teamsites.suntrust.com/sites/EBPS/resources/ProcessTools/default.aspx
Certification resource materials and information has been posted on
SharePoint sites readily available for Yellow Belt candidates.