annual report - parliament of western australia
TRANSCRIPT
ANNUAL REPORT2016-2017YEAR 1 OF OUR STRATEGIC PLAN 2016-2021
Bigger than our buildings, further than the finish line

VenuesWest Corporate Office Phone: (08) 9441 8222 Fax: (08) 9441 8288 Stephenson Ave Mount Claremont WA 6010 PO Box 581 Floreat WA 6014 Email: [email protected]
Date of publication 9 October 2017
Table of Contents MESSAGE TO THE MINISTER 1
OVERVIEW 2
Executive Summary 2
Operational Structure 7
Performance Management Framework 20
AGENCY PERFORMANCE 26
Performance Measures 26
Key Service Areas 27
Financial Summary 33
Strategic Asset Management 34
SIGNIFICANT ISSUES AND TRENDS 35
DISCLOSURES AND LEGAL COMPLIANCE 36
Independent Auditor’s Report 37
Financial Statements 40
Key Performance Indicators 69
Ministerial Directives 75
Other Financial Disclosures 75
Governance Disclosures 78
Other Legal Requirements 79
Government Policy Requirements 81
CONTACT US 83
VENUESWEST ANNUAL REPORT 2016-2017
CONTENTS
ii
Message to the Minister To the Honourable Mick Murray
Minister for Sport and Recreation
In accordance with the requirements of Section 64 of the Financial Management Act 2006, it is our pleasure to submit for your information and presentation to Parliament, the Annual Report of the Western Australian Sports Centre Trust trading as VenuesWest for the year ended 30 June 2017.
The annual report has been prepared in accordance with the provisions of the Financial Management Act 2006.
Richard Muirhead
CHAIRMAN VENUESWEST BOARD 9 OCTOBER 2017
David Etherton
CHIEF EXECUTIVE OFFICER VENUESWEST BOARD 9 OCTOBER 2017
VENUESWEST ANNUAL REPORT 2016-2017
CONTENTS
1
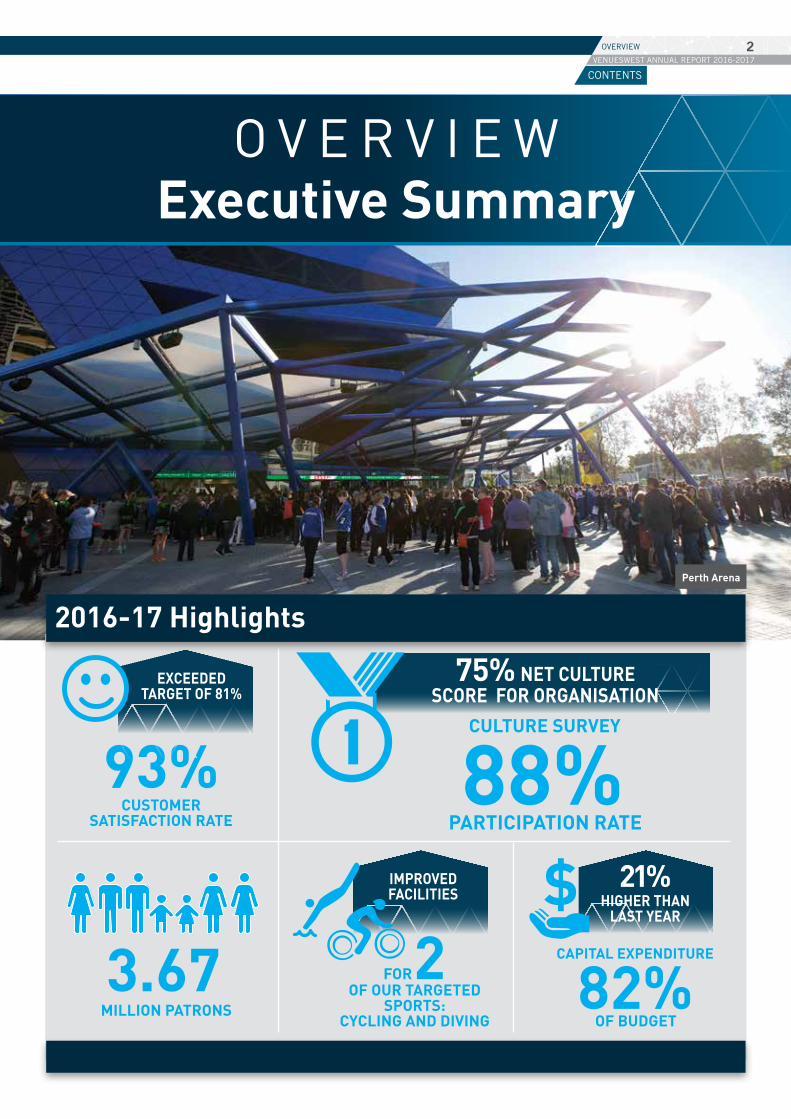
3.67 MILLION PATRONS
CUSTOMER SATISFACTION RATE
93%
O V E R V I E WExecutive Summary
88% CULTURE SURVEY
PARTICIPATION RATE
75% NET CULTURE SCORE FOR ORGANISATION
OF BUDGET82%
IMPROVED FACILITIES
21%HIGHER THAN
LAST YEAR
EXCEEDED TARGET OF 81%
2016-17 Highlights
OF OUR TARGETED SPORTS:
CYCLING AND DIVING
FOR2 CAPITAL EXPENDITURE
Perth Arena
CONTENTS
VENUESWEST ANNUAL REPORT 2016-20172OVERVIEW
Chairman’s Review I am pleased to present the 2016-17 Annual Report for VenuesWest. In its 30th year, the organisation has never played a more significant role in the community, from providing grass roots sporting opportunities to fabulous entertainment events for the whole family. In 2016-17 over 3.67 million people were provided with world class sport and entertainment experiences and with the opening of Perth Stadium next year this is expected to grow to five million very quickly.
This year there were some remarkable achievements, including the delivery of outstanding customer experiences across all our venues. Customer satisfaction moved from an all-time high of 91% to an extraordinary 93%, reflecting the exceptional commitment and skills of our teams, our dedicated service providers and the high standard of our venues.
The organisation’s capital expenditure program saw delivery of substantially improved training facilities for two targeted high performance sports - cycling and diving. A new track and roof were installed at the SpeedDome, replacing the original track which had been installed some 28 years ago. At HBF Stadium refurbishment of the dive tower and new training facilities meant that more WA-based athletes were able to train to international standards at home.
The first year of the new Strategic Plan commenced with considerable time dedicated to examination of the assets within the portfolio – not only in terms of strategic fit but also in regard to best service delivery models and long term sustainability for the people of Western Australia. Whilst the organisation was left with little choice but to take over management of the operations at Perth Motorplex following departure of the previous operator, the State Government also supported the Board’s position in relation to this asset being progressed for either sale or lease to a private sector operator. We look forward to the outcome of this process being realised next year.
VenuesWest has not been immune to the downturn in the Western Australian economy. Entertainment events and tickets sales were lower than in previous years, primarily driven by the local economy but also resulting from a downturn in the international touring cycle. One area that exceeded expectations despite this downturn in the economy was health and fitness revenue which was driven by a new sales strategy that generated over 4,100 gym members for the first time ever.
After forecasting an internal budget deficit for the 2016-17 year it was pleasing to see that a proactive response targeting financial efficiencies across the organisation contributed to a positive net financial result.
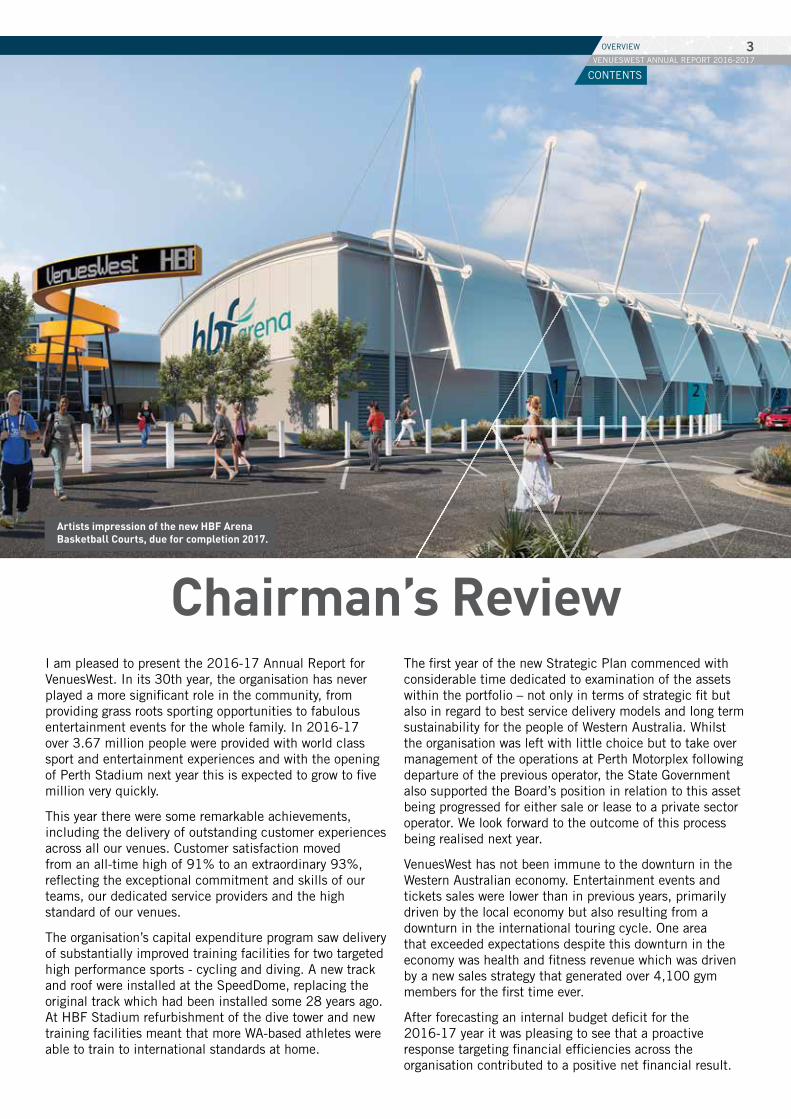
Artists impression of the new HBF Arena Basketball Courts, due for completion 2017.
CONTENTS
VENUESWEST ANNUAL REPORT 2016-20173OVERVIEW
This was an incredible result which will enable continued reinvestment into the portfolio.
In our ever changing world, VenuesWest understands only too well, the range of security challenges that must be considered. A growing proportion of the ongoing capital reinvestment in our assets is committed to increasing security for all our patrons and staff in the face of increased threat of terrorism events. A more obvious example to members of the public would be the precautionary installation of anti-vehicle bollards at Perth Arena in April this year.
It is essential that we continuously respond to this evolving security environment, and the incident that occurred at Manchester Arena in May further highlighted this. A full security management review of the organisation’s existing operational security processes was initiated by the Board this year. This will help to ensure we have the organisational capacity and capability to prepare, react and recover from any security incident. The review guided many process improvement decisions throughout the year; and this focus together with ongoing investment will see improvements continue into the future.
A further assessment of the portfolio’s current building infrastructure and comparison with what other large venues are doing (nationally and globally) to address increased terror levels, is also underway. It is the Board’s intention to use the findings of this review to understand how the capital infrastructure can be ‘hardened’ further to mitigate the risk of terrorist activity and the extent of investment that is required to improve security at our venues.
As would be expected, the Board’s energies have also been directed toward planning for the opening and a successful first year in terms of a calendar of events for Perth Stadium. Perth Stadium is the State’s most significant investment in a piece of sporting infrastructure to date and it will be incredibly exciting to commission the venue and see it become operational next year.
Board members visited the majority of the venues over the year and I can say they have been impressed with the passion and calibre of front line staff who truly deliver exceptional sport and entertainment experiences. I thank them for their efforts and would like to acknowledge the entire VenuesWest team for its absolute focus on customer service and making it all happen, every time at every venue.
I would like to extend the Board’s congratulations to our CEO, David Etherton whose leadership skills were recognised by the Institute of Public Administration Australia (IPAA) being awarded the Murdoch University Leader of the Year in State or Federal Government Award for 2016-17.
On behalf of the Board I would also like to acknowledge the amazing efforts and outcomes delivered by the dedicated VenuesWest Team, as well as the efforts of David and his Executive Team. Without their dedication, commitment and dynamic leadership VenuesWest would not be where it is today.
I am grateful as Chairman for the commitment and diligence of my fellow Board members, and acknowledge in particular the outgoing Board members – Stephanie McManus, Dean Farmer and Alex McKenzie. As a collective, the Board has ensured a continued responsiveness by the organisation to a changing global environment and shifting local conditions.
On behalf of the Board, I also take this opportunity to thank our previous Minister, the Hon Mia Davies and her office for their support, and warmly welcome new Minister for Sport and Recreation the Hon Mick Murray MLA. We look forward to working with the Government to ensure VenuesWest continues to provide world class sport and entertainment experiences for the benefit of all Western Australians now and into the future.
Richard Muirhead Chairman
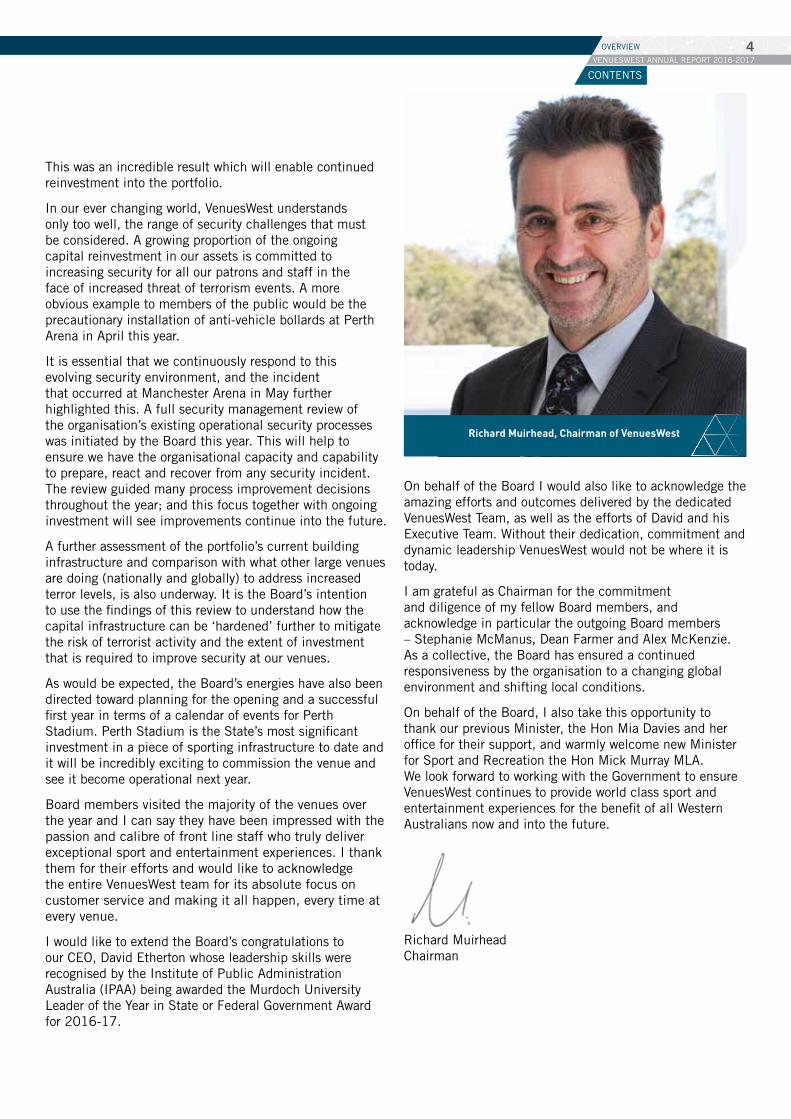
Richard Muirhead, Chairman of VenuesWest
CONTENTS
VENUESWEST ANNUAL REPORT 2016-20174OVERVIEW
Chief Executive Officer: Year in Review 2016-17
This year marked the first year of VenuesWest’s Strategic Plan 2016-2021, ‘Bigger Than Our Buildings, Further Than The Finish Line’ in which we outlined our vision to deliver world class sport and entertainment experiences to the people of Western Australia. This achievement is only possible with the right people and it is with great pride that I report VenuesWest delivered an exceptional result on its key objective to deliver outstanding customer service. I did not think it was possible but customer satisfaction levels this year again increased to 93%, reflecting the enormous commitment of our people and service providers in delivering a consistently high standard of customer service.
In excess of 3.67 million customers attended events or used VenuesWest facilities over the past year. A fabulous result in uncertain economic times, and one which highlights VenuesWest’s ability to ensure our sport and entertainment venues benefit all Western Australians from elite athletes training and competing, to young children acquiring life skills, and families and friends enjoying world class sport and entertainment experiences.
A diverse range of assets requires capital investment to maintain national and international training and competition standards and commercial capacity. To ensure our venues remain fit for purpose, the organisation delivers a diverse capital works program. Two targeted sports, cycling and diving were significant beneficiaries of the asset investment to meet world class standards, with $2.52 million spent on installing a new 250 metre timber velodrome cycle track and replacement roof at SpeedDome. At HBF Stadium the Dive Tower and training facilities were upgraded, enabling more Western Australian elite athletes to train in their home state.
The Perth 2016 World Masters Athletics Championships was hosted at the WA Athletics Stadium from 26 October to 6 November. The event was a huge success and attracted over 4,000 international athletes. In recognition of the professional support provided during the event, VenuesWest was presented with an appreciation plaque by the Masters Organising Committee.
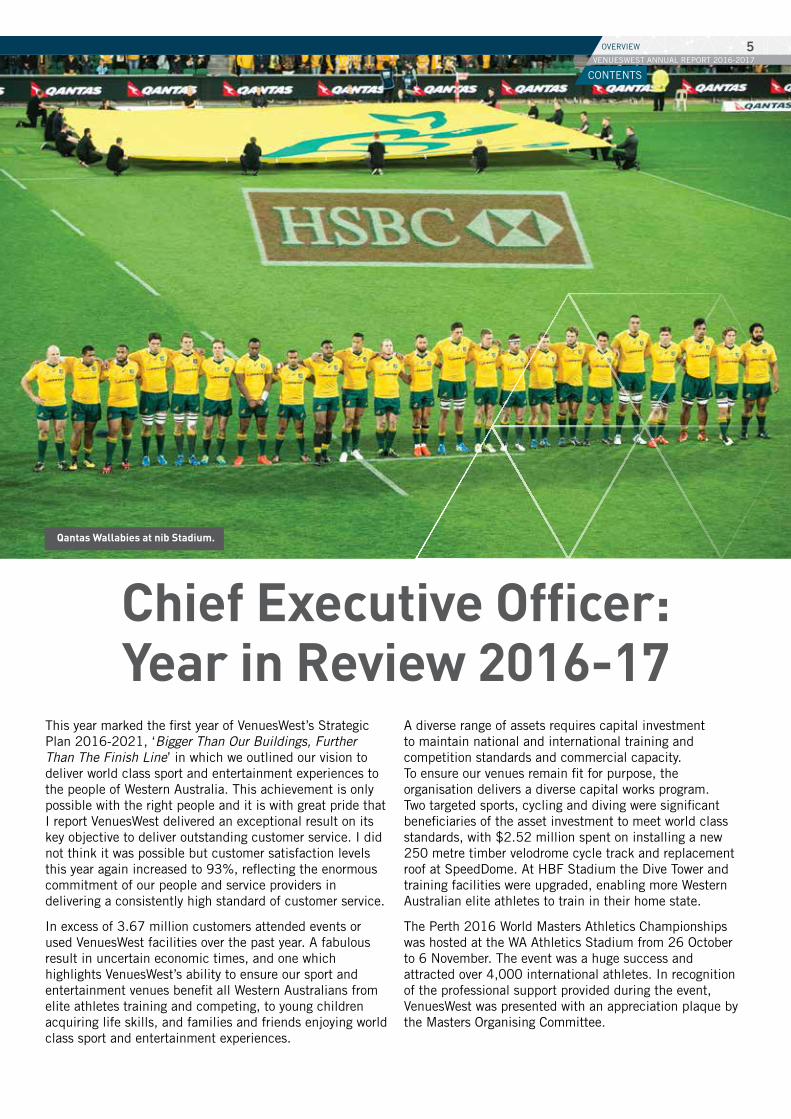
Qantas Wallabies at nib Stadium.
CONTENTS
VENUESWEST ANNUAL REPORT 2016-20175OVERVIEW
It was a tough year economically in Western Australia. Cognisant of that, the organisation focused on implementing financial efficiencies and conducted a review and redesign of the organisational structure to enable the streamlining of operations. As mentioned in the Chairman’s report, the positive financial outcome was a great result given the economic conditions. These results led to a big improvement in the percentage of operating costs covered by our customers, an incredible achievement which enables continued reinvestment into our venues.
Our management structures were tested this year with the responsibility of the interim management of Perth Motorplex falling to the organisation. A number of safety improvements to the facilities and its operations were made and customer satisfaction with the venue increased to an all-time high of 90%. Simultaneously, the long term management solution has also progressed with the venue being offered for sale or lease.
We successfully completed year one of our Community Partners program where deserving families and volunteers were able to attend over 40 sport and entertainment events held in our venues, giving them an opportunity that otherwise may not have been possible.
Commercially it was a challenging year in the entertainment sector with the softest market of events and sales for Perth Arena since it opened in 2012. AEG Ogden performed exceptionally well and it is pleasing to see the schedule for next year looks promising with a number of key acts confirmed. Sporting events at Perth Arena bumped up ticket sales with a highly successful, championship winning, Wildcats season as well as record crowds at the Hopman Cup where Roger Federer made an emotional winning return to tennis.
It will be an exciting year ahead with the opening of Perth Stadium in early 2018. The 60,000 seat venue has been designed with a ‘fans first’ approach to planning and design including exceptional event atmosphere and cutting edge stadium technology. This $1.3 billion investment into sporting infrastructure represents a once in a life time opportunity and transition plans are progressing as VenuesLive takes on the operation of the Stadium. A vibrant calendar of events is coming together, including two sold out Ed Sheeran concerts, a double header Rugby league match and the EPL Premiers Chelsea will also play against Perth Glory. We will continue to work with our partners such as Tourism Western Australia to attract major events to WA. We look forward to welcoming football and cricket to the magnificent new stadium.
This year’s achievements have only been possible with the right culture and the right people on board. I would like to thank staff across all of our locations for their dedication and accomplishments.
Thank you to the Leadership Team for their dedication and willingness to work hard with me, to learn, reflect and transform. The ongoing leadership and significant contribution of the Board and particularly the Chair in the successful development and implementation of our new strategic direction is sincerely appreciated. I would also like to acknowledge our Minister, the Hon Mick Murray for his support in our vision to deliver world class sport and entertainment experiences.
David Etherton Chief Executive Officer
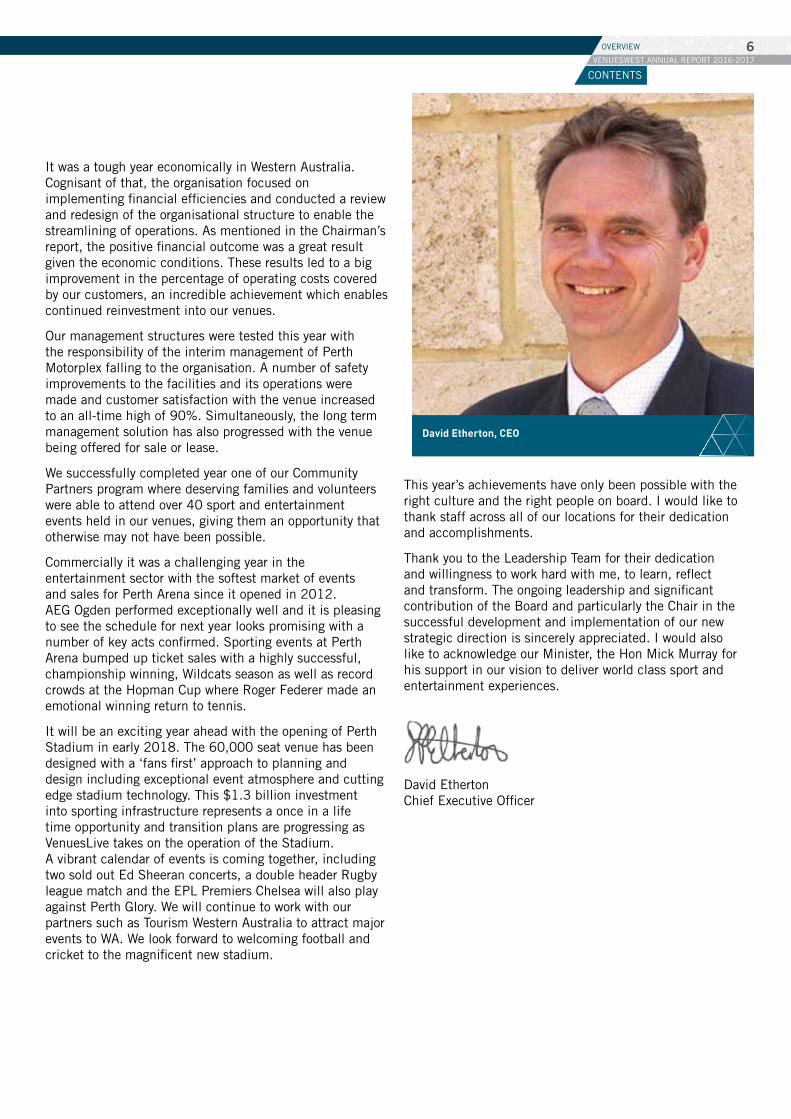
David Etherton, CEO
CONTENTS
VENUESWEST ANNUAL REPORT 2016-20176OVERVIEW
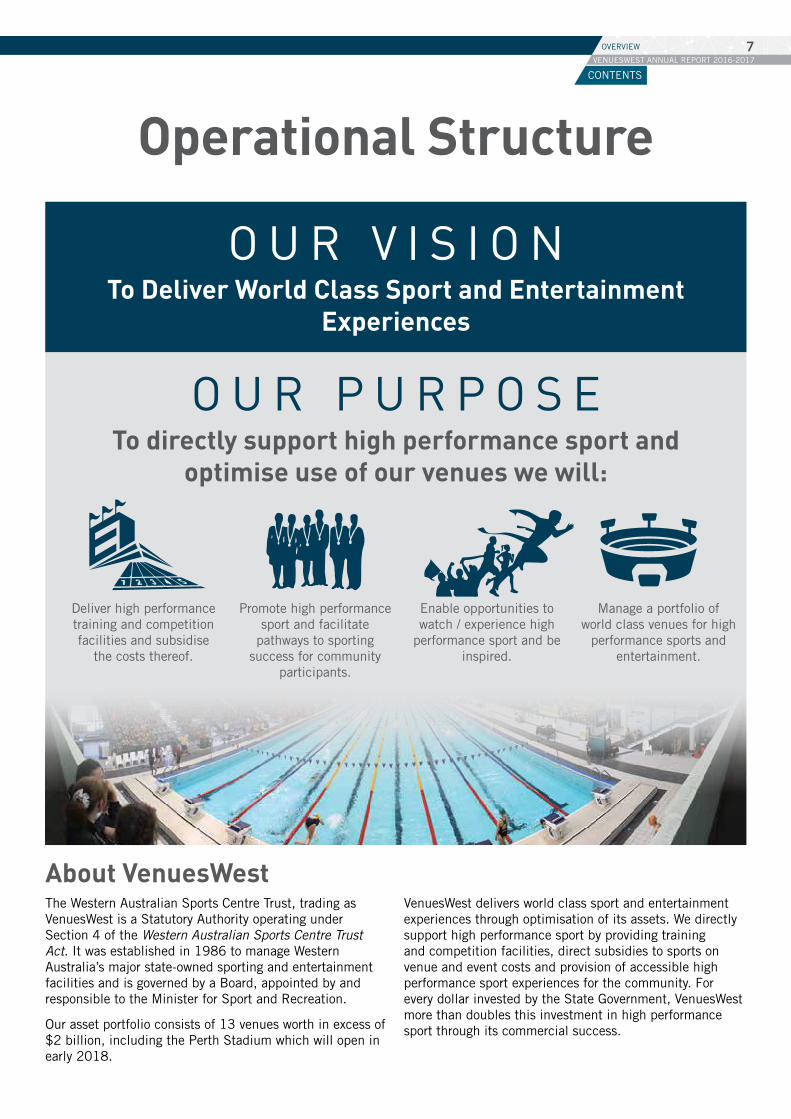
Operational Structure
About VenuesWest The Western Australian Sports Centre Trust, trading as VenuesWest is a Statutory Authority operating under Section 4 of the Western Australian Sports Centre Trust Act. It was established in 1986 to manage Western Australia’s major state-owned sporting and entertainment facilities and is governed by a Board, appointed by and responsible to the Minister for Sport and Recreation.
Our asset portfolio consists of 13 venues worth in excess of $2 billion, including the Perth Stadium which will open in early 2018.
VenuesWest delivers world class sport and entertainment experiences through optimisation of its assets. We directly support high performance sport by providing training and competition facilities, direct subsidies to sports on venue and event costs and provision of accessible high performance sport experiences for the community. For every dollar invested by the State Government, VenuesWest more than doubles this investment in high performance sport through its commercial success.
O U R V I S I O NTo Deliver World Class Sport and Entertainment
Experiences
O U R P U R P O S ETo directly support high performance sport and
optimise use of our venues we will:
Deliver high performance training and competition facilities and subsidise
the costs thereof.
Promote high performance sport and facilitate
pathways to sporting success for community
participants.
Enable opportunities to watch / experience high
performance sport and be inspired.
Manage a portfolio of world class venues for high
performance sports and entertainment.
CONTENTS
VENUESWEST ANNUAL REPORT 2016-20177OVERVIEW
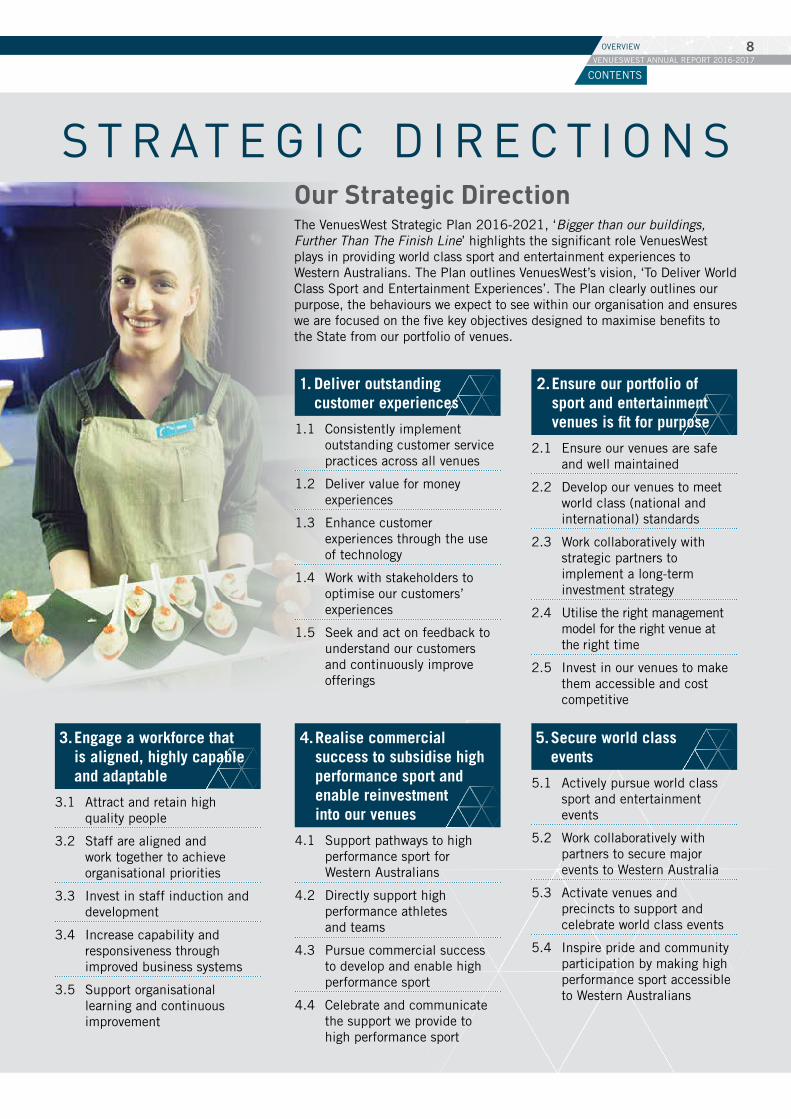
S T R AT E G I C D I R E C T I O N S
1. Deliver outstanding customer experiences
1.1 Consistently implement outstanding customer service practices across all venues
1.2 Deliver value for money experiences
1.3 Enhance customer experiences through the use of technology
1.4 Work with stakeholders to optimise our customers’ experiences
1.5 Seek and act on feedback to understand our customers and continuously improve offerings
2. Ensure our portfolio of sport and entertainment venues is fit for purpose
2.1 Ensure our venues are safe and well maintained
2.2 Develop our venues to meet world class (national and international) standards
2.3 Work collaboratively with strategic partners to implement a long-term investment strategy
2.4 Utilise the right management model for the right venue at the right time
2.5 Invest in our venues to make them accessible and cost competitive
5. Secure world class events
5.1 Actively pursue world class sport and entertainment events
5.2 Work collaboratively with partners to secure major events to Western Australia
5.3 Activate venues and precincts to support and celebrate world class events
5.4 Inspire pride and community participation by making high performance sport accessible to Western Australians
4. Realise commercial success to subsidise high performance sport and enable reinvestment into our venues
4.1 Support pathways to high performance sport for Western Australians
4.2 Directly support high performance athletes and teams
4.3 Pursue commercial success to develop and enable high performance sport
4.4 Celebrate and communicate the support we provide to high performance sport
3. Engage a workforce that is aligned, highly capable and adaptable
3.1 Attract and retain high quality people
3.2 Staff are aligned and work together to achieve organisational priorities
3.3 Invest in staff induction and development
3.4 Increase capability and responsiveness through improved business systems
3.5 Support organisational learning and continuous improvement
Our Strategic Direction The VenuesWest Strategic Plan 2016-2021, ‘Bigger than our buildings, Further Than The Finish Line’ highlights the significant role VenuesWest plays in providing world class sport and entertainment experiences to Western Australians. The Plan outlines VenuesWest’s vision, ‘To Deliver World Class Sport and Entertainment Experiences’. The Plan clearly outlines our purpose, the behaviours we expect to see within our organisation and ensures we are focused on the five key objectives designed to maximise benefits to the State from our portfolio of venues.
CONTENTS
VENUESWEST ANNUAL REPORT 2016-20178OVERVIEW
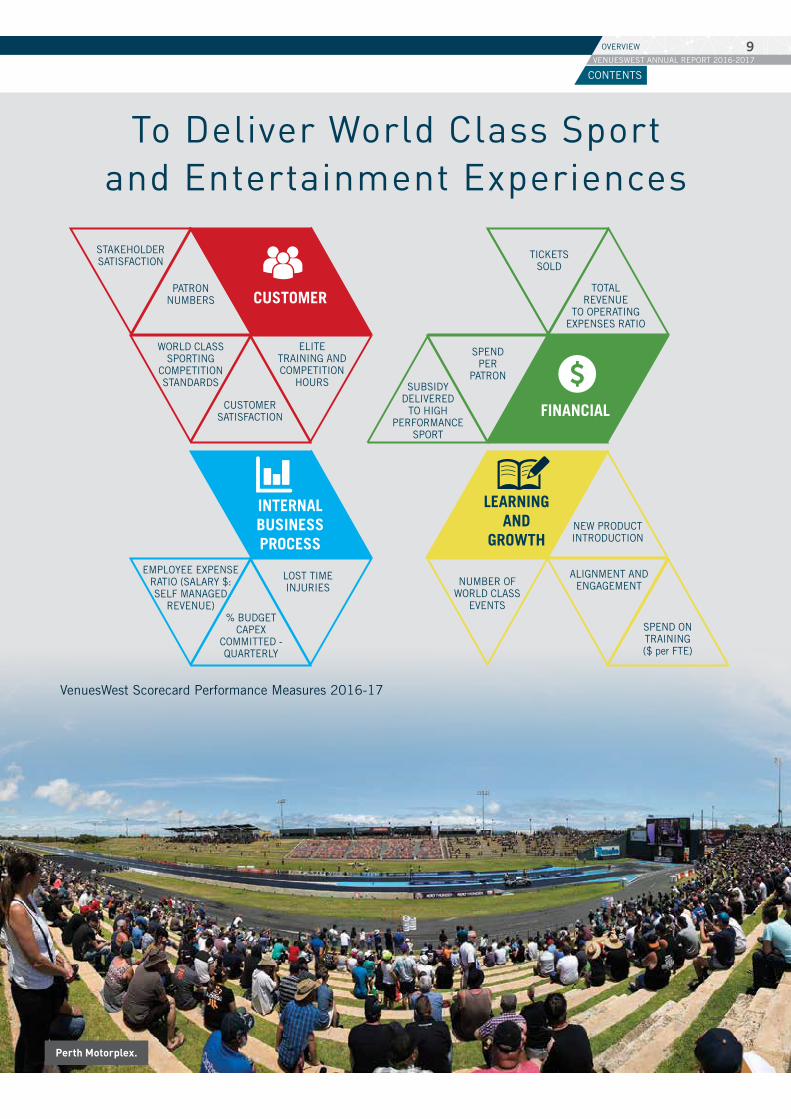
To Deliver World Class Sport and Entertainment Experiences
SPEND ON TRAINING ($ per FTE)
NEW PRODUCT INTRODUCTION
NUMBER OF WORLD CLASS
EVENTS
ALIGNMENT AND ENGAGEMENT
LEARNING AND
GROWTH
INTERNAL BUSINESS PROCESS
EMPLOYEE EXPENSE RATIO (SALARY $: SELF MANAGED
REVENUE)% BUDGET
CAPEX COMMITTED - QUARTERLY
PATRON NUMBERS
WORLD CLASS SPORTING
COMPETITION STANDARDS
ELITE TRAINING AND COMPETITION
HOURS
STAKEHOLDER SATISFACTION
CUSTOMER SATISFACTION
CUSTOMERTOTAL
REVENUE TO OPERATING
EXPENSES RATIO
SPEND PER
PATRONSUBSIDY
DELIVERED TO HIGH
PERFORMANCE SPORT
TICKETS SOLD
FINANCIAL
LOST TIME INJURIES
Perth Motorplex.
VenuesWest Scorecard Performance Measures 2016-17
CONTENTS
VENUESWEST ANNUAL REPORT 2016-20179OVERVIEW
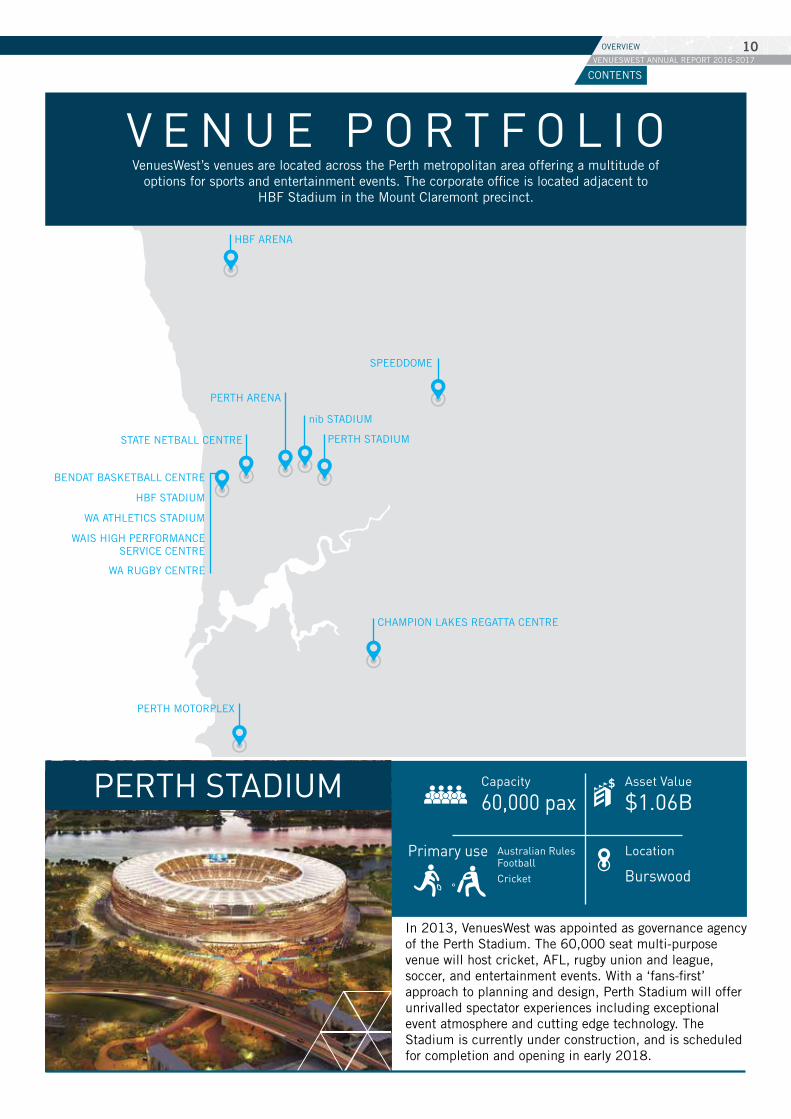
V E N U E P O R T F O L I OVenuesWest’s venues are located across the Perth metropolitan area offering a multitude of
options for sports and entertainment events. The corporate office is located adjacent to HBF Stadium in the Mount Claremont precinct.
PERTH STADIUM Asset Value
$1.06BCapacity
60,000 pax
Location
Burswood
Primary use Australian Rules Football Cricket
In 2013, VenuesWest was appointed as governance agency of the Perth Stadium. The 60,000 seat multi-purpose venue will host cricket, AFL, rugby union and league, soccer, and entertainment events. With a ‘fans-first’ approach to planning and design, Perth Stadium will offer unrivalled spectator experiences including exceptional event atmosphere and cutting edge technology. The Stadium is currently under construction, and is scheduled for completion and opening in early 2018.
CHAMPION LAKES REGATTA CENTRE
PERTH MOTORPLEX
SPEEDDOME
nib STADIUM
PERTH STADIUM
HBF STADIUM
BENDAT BASKETBALL CENTRE
WA ATHLETICS STADIUM
WAIS HIGH PERFORMANCE SERVICE CENTRE
WA RUGBY CENTRE
PERTH ARENA
STATE NETBALL CENTRE
HBF ARENA
CONTENTS
VENUESWEST ANNUAL REPORT 2016-201710OVERVIEW
Asset Value
$62M
Asset Value
$6.5M
Capacity
42,000 pax
Capacity
3,000 pax
Location
Joondalup
Location
Midvale
Primary use Sporting ActivitiesHealth & FitnessAquaticsOutdoor Festivals
Primary use Indoor Cycle
The SpeedDome provides training and competition facilities for cycling and rollersports in Western Australia. The SpeedDome opened in 1989 and is Perth’s only combined indoor velodrome and rollersports complex.
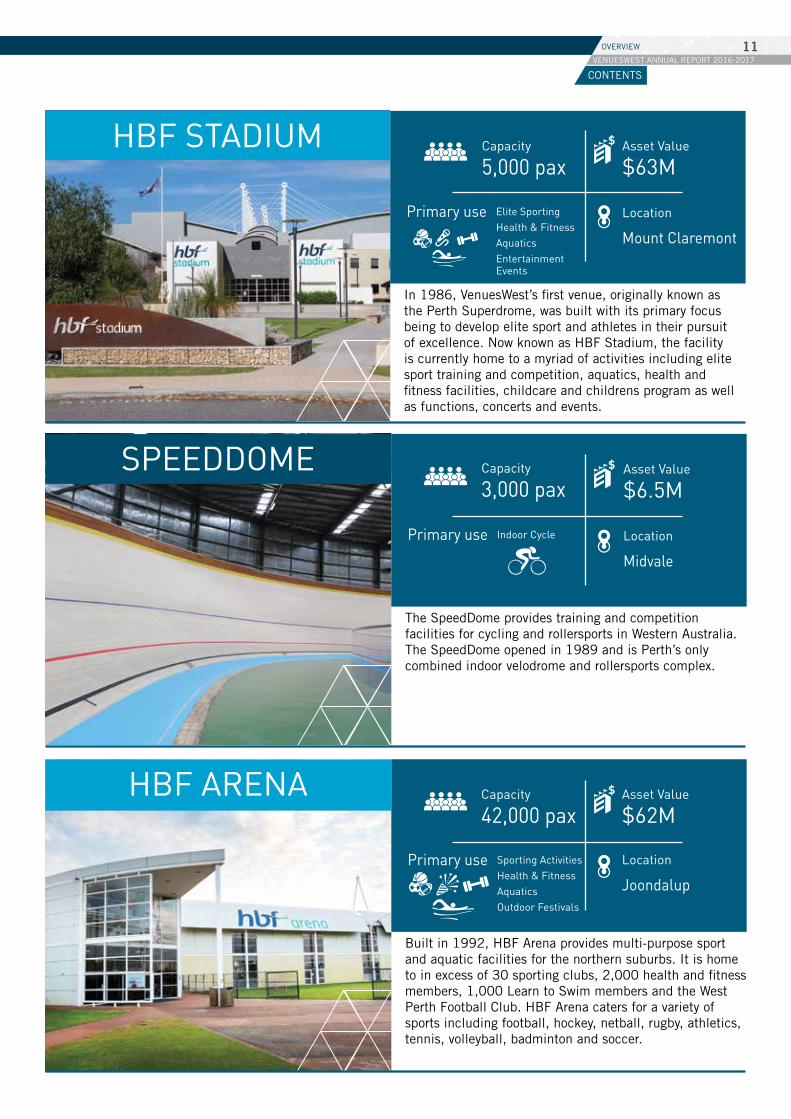
Built in 1992, HBF Arena provides multi-purpose sport and aquatic facilities for the northern suburbs. It is home to in excess of 30 sporting clubs, 2,000 health and fitness members, 1,000 Learn to Swim members and the West Perth Football Club. HBF Arena caters for a variety of sports including football, hockey, netball, rugby, athletics, tennis, volleyball, badminton and soccer.
HBF ARENA
SPEEDDOME
Asset Value
$63MCapacity
5,000 pax
Location
Mount Claremont
Primary use Elite SportingHealth & FitnessAquaticsEntertainment Events
In 1986, VenuesWest’s first venue, originally known as the Perth Superdrome, was built with its primary focus being to develop elite sport and athletes in their pursuit of excellence. Now known as HBF Stadium, the facility is currently home to a myriad of activities including elite sport training and competition, aquatics, health and fitness facilities, childcare and childrens program as well as functions, concerts and events.
HBF STADIUM
CONTENTS
VENUESWEST ANNUAL REPORT 2016-201711OVERVIEW
Asset Value
$43.6M
Asset Value
$21.8M
Capacity
2,500 pax
Capacity
12,000 pax
Location
Mount Claremont
Location
Mount Claremont
Primary use Basketball
Primary use Athletics
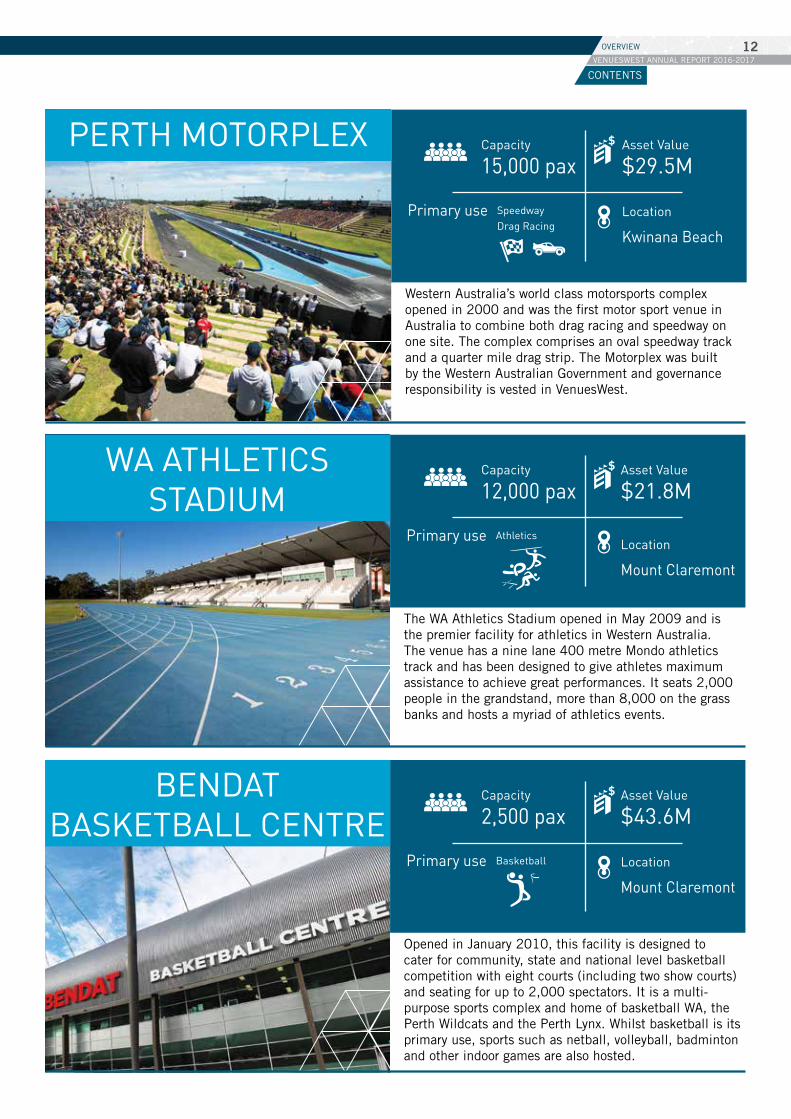
The WA Athletics Stadium opened in May 2009 and is the premier facility for athletics in Western Australia. The venue has a nine lane 400 metre Mondo athletics track and has been designed to give athletes maximum assistance to achieve great performances. It seats 2,000 people in the grandstand, more than 8,000 on the grass banks and hosts a myriad of athletics events.
Opened in January 2010, this facility is designed to cater for community, state and national level basketball competition with eight courts (including two show courts) and seating for up to 2,000 spectators. It is a multi-purpose sports complex and home of basketball WA, the Perth Wildcats and the Perth Lynx. Whilst basketball is its primary use, sports such as netball, volleyball, badminton and other indoor games are also hosted.
BENDAT BASKETBALL CENTRE
WA ATHLETICS STADIUM
Asset Value
$29.5MCapacity
15,000 pax
Location
Kwinana Beach
Primary use SpeedwayDrag Racing
Western Australia’s world class motorsports complex opened in 2000 and was the first motor sport venue in Australia to combine both drag racing and speedway on one site. The complex comprises an oval speedway track and a quarter mile drag strip. The Motorplex was built by the Western Australian Government and governance responsibility is vested in VenuesWest.
PERTH MOTORPLEX
CONTENTS
VENUESWEST ANNUAL REPORT 2016-201712OVERVIEW
Asset Value
$83M
Asset Value
$23.2M
Capacity
35,000 pax
Capacity
10,000 pax
Location
Perth
Location
Armadale
Primary use Rugby UnionRugby LeagueSoccer
Primary use RowingCanoeingTriathlon
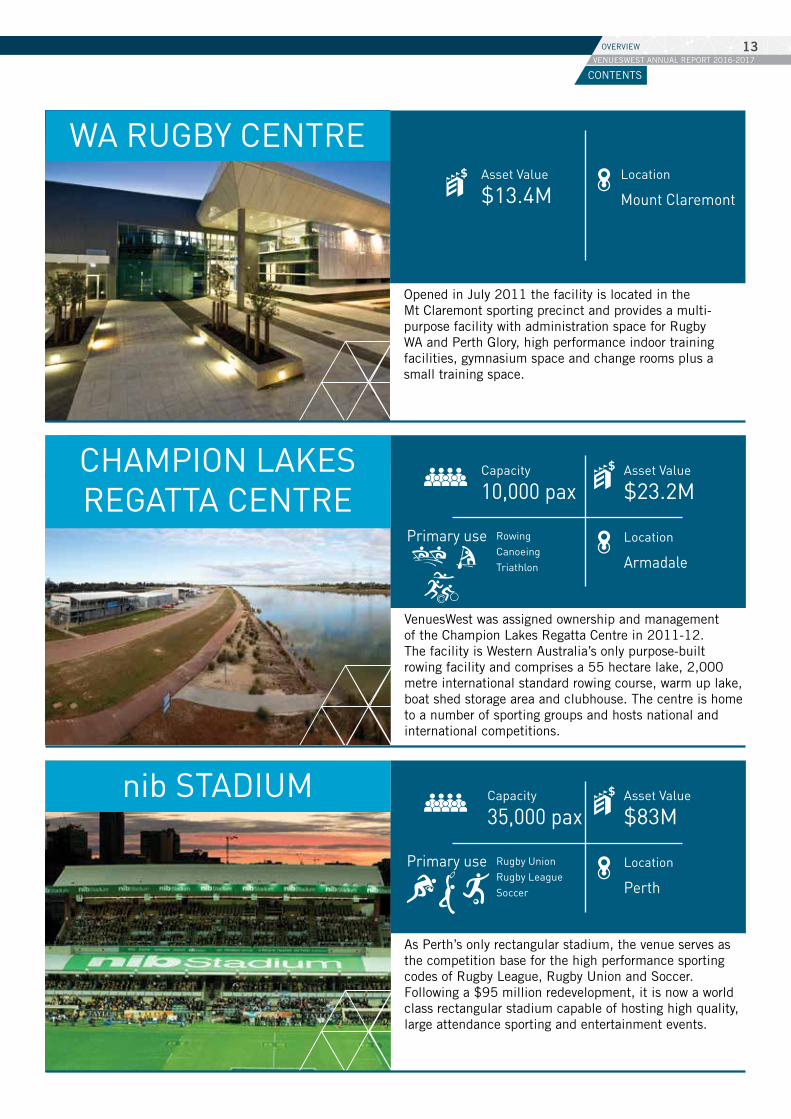
VenuesWest was assigned ownership and management of the Champion Lakes Regatta Centre in 2011-12. The facility is Western Australia’s only purpose-built rowing facility and comprises a 55 hectare lake, 2,000 metre international standard rowing course, warm up lake, boat shed storage area and clubhouse. The centre is home to a number of sporting groups and hosts national and international competitions.
As Perth’s only rectangular stadium, the venue serves as the competition base for the high performance sporting codes of Rugby League, Rugby Union and Soccer. Following a $95 million redevelopment, it is now a world class rectangular stadium capable of hosting high quality, large attendance sporting and entertainment events.
nib STADIUM
CHAMPION LAKES REGATTA CENTRE
Asset Value
$13.4MLocation
Mount Claremont
Opened in July 2011 the facility is located in the Mt Claremont sporting precinct and provides a multi-purpose facility with administration space for Rugby WA and Perth Glory, high performance indoor training facilities, gymnasium space and change rooms plus a small training space.
WA RUGBY CENTRE
CONTENTS
VENUESWEST ANNUAL REPORT 2016-201713OVERVIEW
STATE NETBALL CENTRE
Asset Value
$29M
Asset Value
$24MCapacity
1,050 pax
Location
Mount Claremont
Location
Jolimont
Primary use Netball
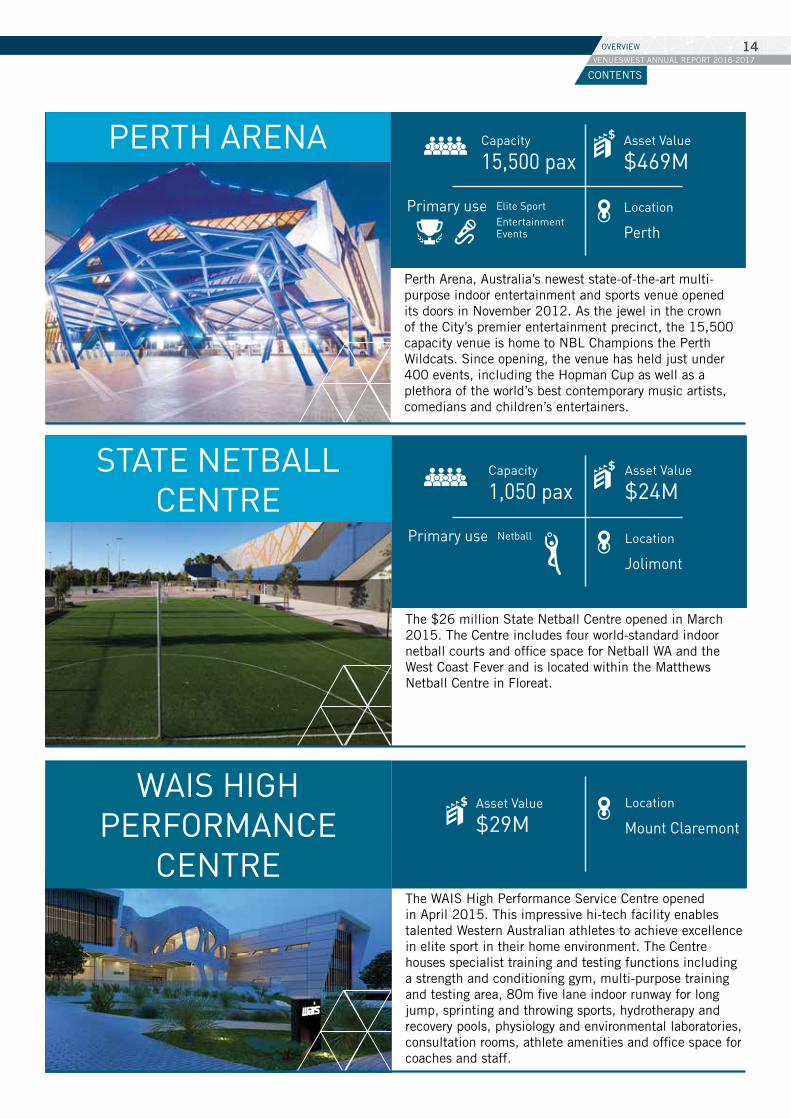
The $26 million State Netball Centre opened in March 2015. The Centre includes four world-standard indoor netball courts and office space for Netball WA and the West Coast Fever and is located within the Matthews Netball Centre in Floreat.
The WAIS High Performance Service Centre opened in April 2015. This impressive hi-tech facility enables talented Western Australian athletes to achieve excellence in elite sport in their home environment. The Centre houses specialist training and testing functions including a strength and conditioning gym, multi-purpose training and testing area, 80m five lane indoor runway for long jump, sprinting and throwing sports, hydrotherapy and recovery pools, physiology and environmental laboratories, consultation rooms, athlete amenities and office space for coaches and staff.
Asset Value
$469MCapacity
15,500 pax
Location
Perth
Primary use Elite SportEntertainment Events
Perth Arena, Australia’s newest state-of-the-art multi-purpose indoor entertainment and sports venue opened its doors in November 2012. As the jewel in the crown of the City’s premier entertainment precinct, the 15,500 capacity venue is home to NBL Champions the Perth Wildcats. Since opening, the venue has held just under 400 events, including the Hopman Cup as well as a plethora of the world’s best contemporary music artists, comedians and children’s entertainers.
PERTH ARENA
WAIS HIGH PERFORMANCE
CENTRE
CONTENTS
VENUESWEST ANNUAL REPORT 2016-201714OVERVIEW
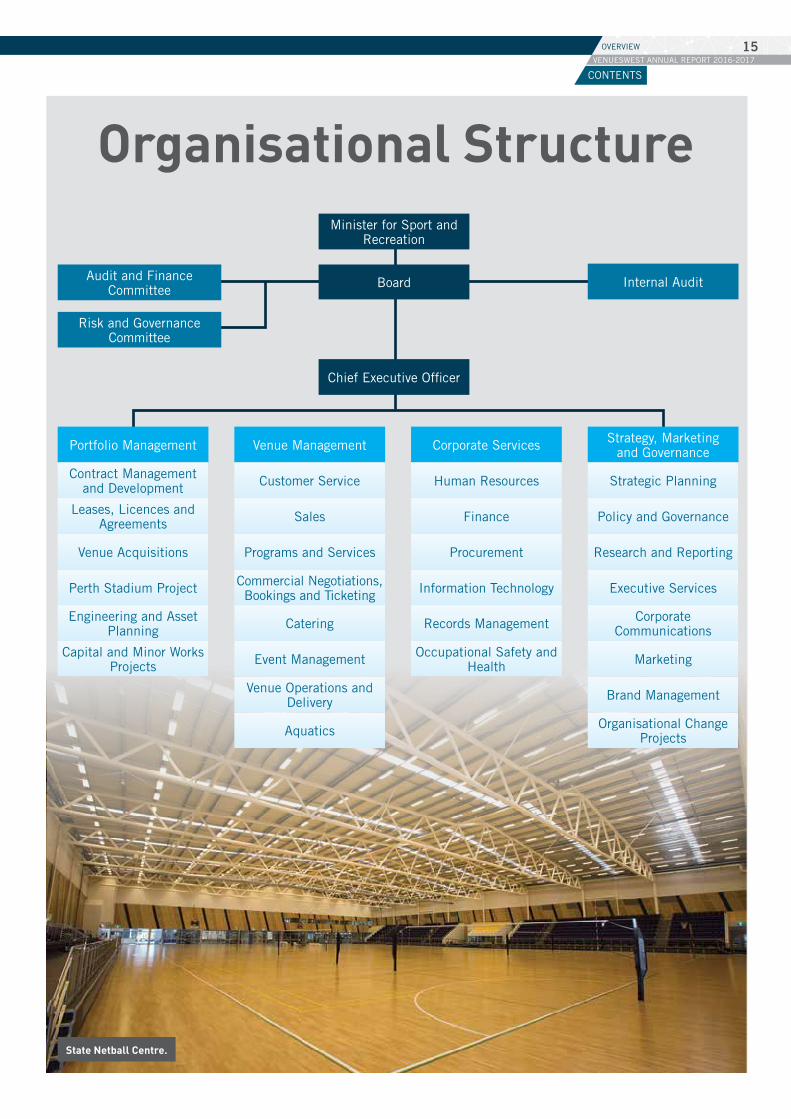
Organisational Structure
Internal AuditAudit and Finance Committee
Risk and Governance Committee
Minister for Sport and Recreation
Board
Chief Executive Officer
Corporate Services Strategy, Marketing and GovernancePortfolio Management Venue Management
Strategic Planning
Policy and Governance
Research and Reporting
Executive Services
Corporate Communications
Marketing
Brand Management
Organisational Change Projects
Human Resources
Finance
Procurement
Information Technology
Records Management
Occupational Safety and Health
Customer Service
Sales
Programs and Services
Commercial Negotiations, Bookings and Ticketing
Catering
Event Management
Venue Operations and Delivery
Aquatics
Contract Management and Development
Leases, Licences and Agreements
Venue Acquisitions
Perth Stadium Project
Engineering and Asset Planning
Capital and Minor Works Projects
State Netball Centre.
CONTENTS
VENUESWEST ANNUAL REPORT 2016-201715OVERVIEW
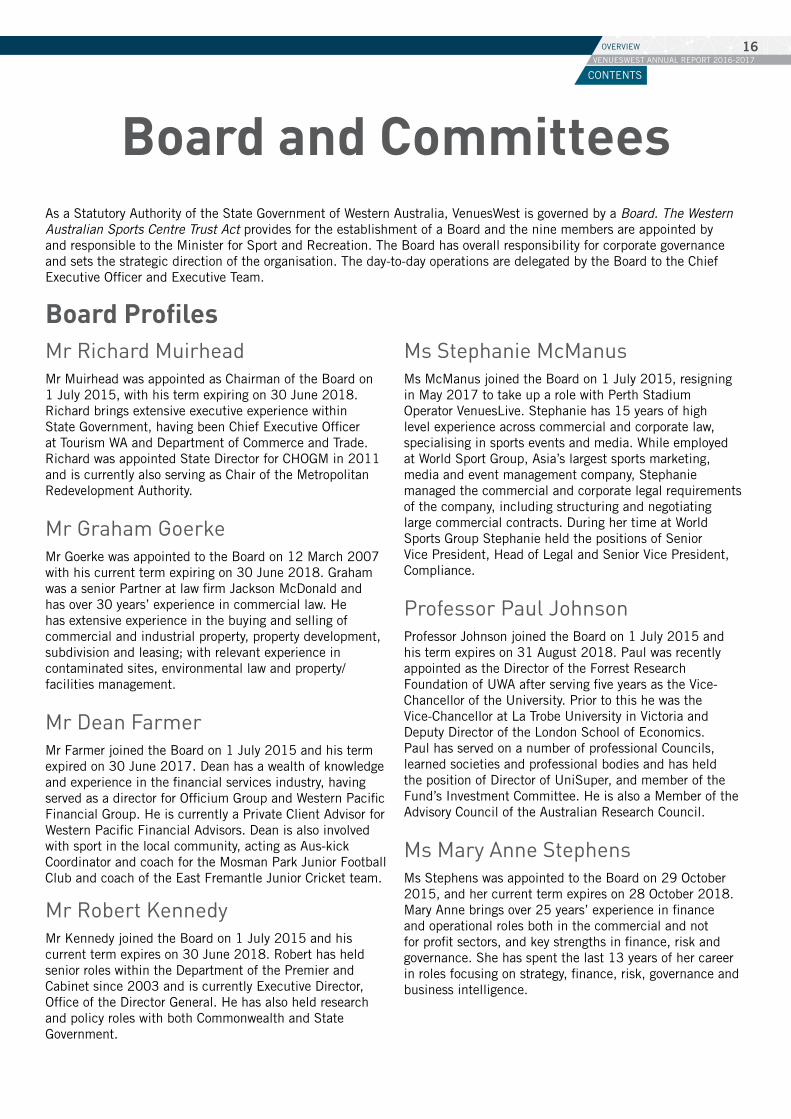
Board and CommitteesAs a Statutory Authority of the State Government of Western Australia, VenuesWest is governed by a Board. The Western Australian Sports Centre Trust Act provides for the establishment of a Board and the nine members are appointed by and responsible to the Minister for Sport and Recreation. The Board has overall responsibility for corporate governance and sets the strategic direction of the organisation. The day-to-day operations are delegated by the Board to the Chief Executive Officer and Executive Team.
Board ProfilesMr Richard Muirhead Mr Muirhead was appointed as Chairman of the Board on 1 July 2015, with his term expiring on 30 June 2018. Richard brings extensive executive experience within State Government, having been Chief Executive Officer at Tourism WA and Department of Commerce and Trade. Richard was appointed State Director for CHOGM in 2011 and is currently also serving as Chair of the Metropolitan Redevelopment Authority.
Mr Graham GoerkeMr Goerke was appointed to the Board on 12 March 2007 with his current term expiring on 30 June 2018. Graham was a senior Partner at law firm Jackson McDonald and has over 30 years’ experience in commercial law. He has extensive experience in the buying and selling of commercial and industrial property, property development, subdivision and leasing; with relevant experience in contaminated sites, environmental law and property/facilities management.
Mr Dean FarmerMr Farmer joined the Board on 1 July 2015 and his term expired on 30 June 2017. Dean has a wealth of knowledge and experience in the financial services industry, having served as a director for Officium Group and Western Pacific Financial Group. He is currently a Private Client Advisor for Western Pacific Financial Advisors. Dean is also involved with sport in the local community, acting as Aus-kick Coordinator and coach for the Mosman Park Junior Football Club and coach of the East Fremantle Junior Cricket team.
Mr Robert KennedyMr Kennedy joined the Board on 1 July 2015 and his current term expires on 30 June 2018. Robert has held senior roles within the Department of the Premier and Cabinet since 2003 and is currently Executive Director, Office of the Director General. He has also held research and policy roles with both Commonwealth and State Government.
Ms Stephanie McManusMs McManus joined the Board on 1 July 2015, resigning in May 2017 to take up a role with Perth Stadium Operator VenuesLive. Stephanie has 15 years of high level experience across commercial and corporate law, specialising in sports events and media. While employed at World Sport Group, Asia’s largest sports marketing, media and event management company, Stephanie managed the commercial and corporate legal requirements of the company, including structuring and negotiating large commercial contracts. During her time at World Sports Group Stephanie held the positions of Senior Vice President, Head of Legal and Senior Vice President, Compliance.
Professor Paul JohnsonProfessor Johnson joined the Board on 1 July 2015 and his term expires on 31 August 2018. Paul was recently appointed as the Director of the Forrest Research Foundation of UWA after serving five years as the Vice-Chancellor of the University. Prior to this he was the Vice-Chancellor at La Trobe University in Victoria and Deputy Director of the London School of Economics. Paul has served on a number of professional Councils, learned societies and professional bodies and has held the position of Director of UniSuper, and member of the Fund’s Investment Committee. He is also a Member of the Advisory Council of the Australian Research Council.
Ms Mary Anne StephensMs Stephens was appointed to the Board on 29 October 2015, and her current term expires on 28 October 2018. Mary Anne brings over 25 years’ experience in finance and operational roles both in the commercial and not for profit sectors, and key strengths in finance, risk and governance. She has spent the last 13 years of her career in roles focusing on strategy, finance, risk, governance and business intelligence.
CONTENTS
VENUESWEST ANNUAL REPORT 2016-201716OVERVIEW
Ms Susan HuntMs Hunt joined the Board on 1 September 2016 with her term expiring on 31 August 2018. Susan was recently appointed the Chief Executive Officer of Lotterywest. She has a wealth of commercial and facilities management expertise garnered through her role as CEO and Director of Business Operations at Perth Zoo. Susan has also been President of the World Association of Zoos and Aquaria since 2015 and was awarded a Public Service Medal in 2010 and the 2017 IPAA WA Patron’s Award for her outstanding contribution to conservation, public service and the State.
Mr Alex McKenzieMr McKenzie was appointed to the Board on 1 September 2016 and his term expires on 31 August 2017. Until his recent retirement, Alex spent over 25 years as Chief Executive Officer of the Royal Life Saving Society of WA. His extensive involvement in lifesaving and long standing commitment to aquatic safety are very relevant to our organisation and he also brings a strong background in compliance, auditing and strategic planning.
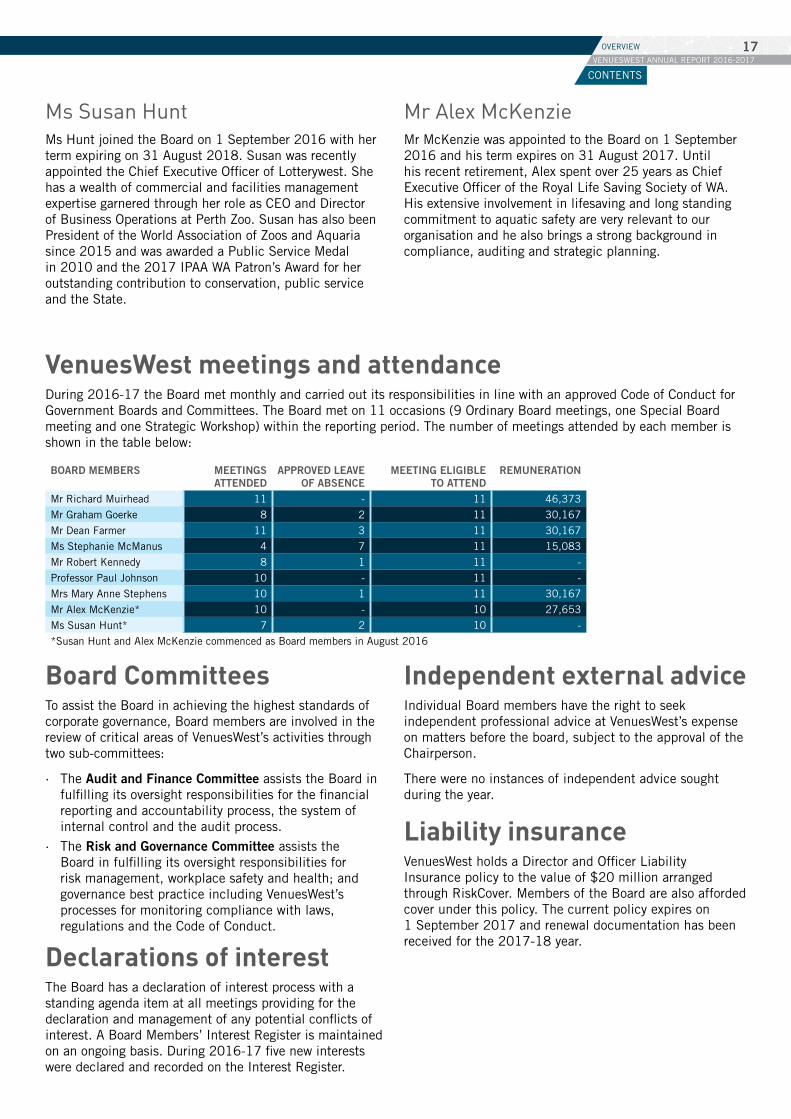
VenuesWest meetings and attendanceDuring 2016-17 the Board met monthly and carried out its responsibilities in line with an approved Code of Conduct for Government Boards and Committees. The Board met on 11 occasions (9 Ordinary Board meetings, one Special Board meeting and one Strategic Workshop) within the reporting period. The number of meetings attended by each member is shown in the table below:
BOARD MEMBERS MEETINGS ATTENDED
APPROVED LEAVE OF ABSENCE
MEETING ELIGIBLE TO ATTEND
REMUNERATION
Mr Richard Muirhead 11 - 11 46,373
Mr Graham Goerke 8 2 11 30,167
Mr Dean Farmer 11 3 11 30,167
Ms Stephanie McManus 4 7 11 15,083
Mr Robert Kennedy 8 1 11 -
Professor Paul Johnson 10 - 11 -
Mrs Mary Anne Stephens 10 1 11 30,167
Mr Alex McKenzie* 10 - 10 27,653
Ms Susan Hunt* 7 2 10 -
*Susan Hunt and Alex McKenzie commenced as Board members in August 2016
Board Committees To assist the Board in achieving the highest standards of corporate governance, Board members are involved in the review of critical areas of VenuesWest’s activities through two sub-committees:
· The Audit and Finance Committee assists the Board in fulfilling its oversight responsibilities for the financial reporting and accountability process, the system of internal control and the audit process.
· The Risk and Governance Committee assists the Board in fulfilling its oversight responsibilities for risk management, workplace safety and health; and governance best practice including VenuesWest’s processes for monitoring compliance with laws, regulations and the Code of Conduct.
Declarations of interestThe Board has a declaration of interest process with a standing agenda item at all meetings providing for the declaration and management of any potential conflicts of interest. A Board Members’ Interest Register is maintained on an ongoing basis. During 2016-17 five new interests were declared and recorded on the Interest Register.
Independent external advice Individual Board members have the right to seek independent professional advice at VenuesWest’s expense on matters before the board, subject to the approval of the Chairperson.
There were no instances of independent advice sought during the year.
Liability insuranceVenuesWest holds a Director and Officer Liability Insurance policy to the value of $20 million arranged through RiskCover. Members of the Board are also afforded cover under this policy. The current policy expires on 1 September 2017 and renewal documentation has been received for the 2017-18 year.
CONTENTS
VENUESWEST ANNUAL REPORT 2016-201717OVERVIEW
Executive Team During 2016-17, there were a number of changes to the Executive Team. Steve Paul joined the organisation as Director Corporate Services in January 2017. Prior to this appointment the Corporate Services functions of Human Resources and ICT were managed by Janis Carren and Glenn Nordsvan, Chief Financial Officer sat on the Executive Team.
David Etherton Chief Executive Officer
David commenced as Chief Executive Officer of VenuesWest in February 2008. After graduating with an Economics Degree from the University of WA, David has had more than 20 years’ experience in the tourism, events and venue management industries, with much of that time spent in senior leadership roles. David has a strong strategic focus, well developed commercial acumen and extensive experience in managing high volume customer interaction organisations to deliver exceptionally high customer service.
Since commencing as CEO of the then WA Sports Centre Trust, David has overseen the significant growth and changes to the organisation. This has included expansion from four to 13 venues (including the successful opening of six brand new venues), the upgrading, transition and integration of two existing venues and the Perth Stadium which is currently under construction and due to open in 2018.
Colin Brandis Director, Portfolio Management
Colin joined the Executive team as Director Strategic Projects and Contracts in 2012 and was subsequently appointed Director Portfolio Management in 2014. Colin brings a wealth of management experience, having led various commercial, services and construction contracting, strategic procurement and facility management functions over the last 25 years of a 40 year career in the public sector.
Colin has a breadth of experience in developing and implementing major contracts with the Forest Products Commission and the Department of Corrective Services, developing whole of government services contracts with the Department of Finance and reviewing the Public Works Act for the Government. Prior to joining VenuesWest Colin was a Director of the Rottnest Island Authority where he led major capital redevelopment and investment on the Island.
Colin has an extensive sporting background, particularly in hockey as a player, umpire and coach. He has been head coach of the WA Institute of Sport hockey unit, a satellite coach with the Australian Institute of Sport, and a successful State coach of Western Australian hockey teams with 12 gold medals from National Championships and the Australian Hockey League.
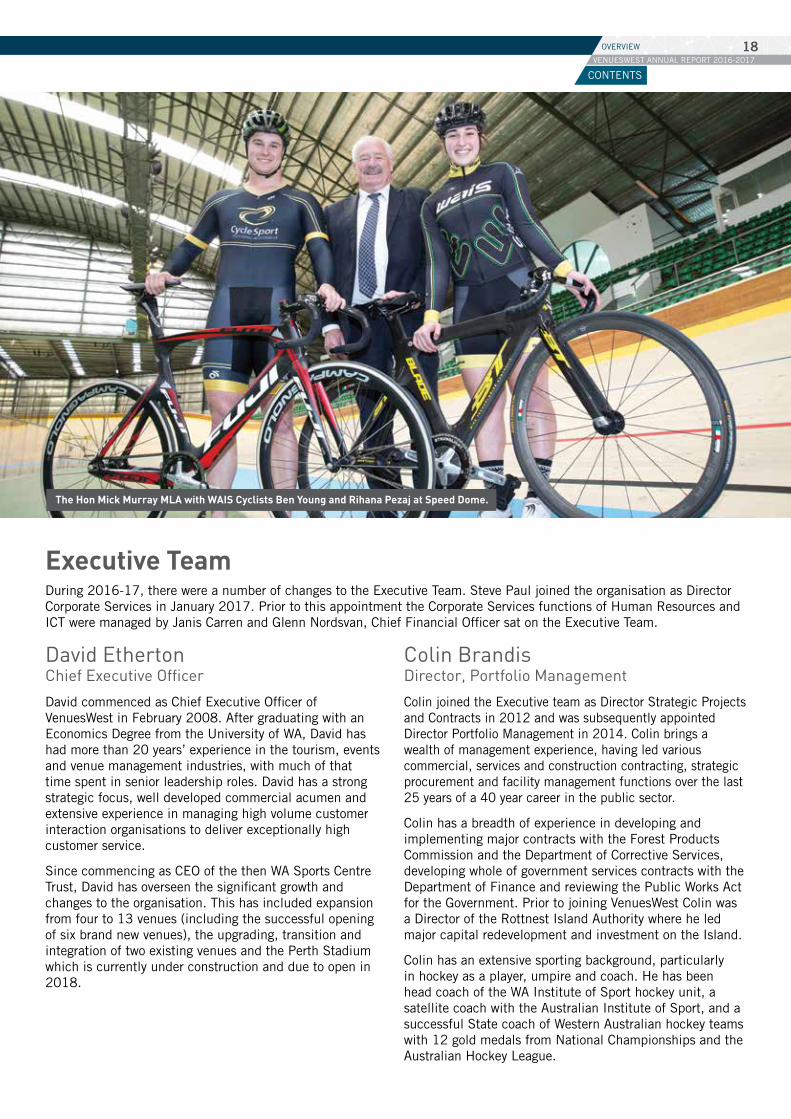
The Hon Mick Murray MLA with WAIS Cyclists Ben Young and Rihana Pezaj at Speed Dome.
CONTENTS
VENUESWEST ANNUAL REPORT 2016-201718OVERVIEW
Peter Bauchop Chief Executive Officer
Peter joined VenuesWest in September 2014 as General Manager, nib Stadium and is now the Chief Operating Officer. Peter has 20 plus years senior management experience in public venue and event management across 23 facilities and over 400 major events. This includes General Manager for Hilton LivingWell and nine years as Chief Executive Officer at Allia Venue Management.
Peter has a proven track record of delivering record financial performance for facilities that he manages, with consistent achievement of customer satisfaction levels in excess of 90%. He has procured and delivered some of the most iconic world class events, including the Socceroos, Wallabies, Rabbitohs, Perth Glory, Western Force, Ed Sheeran, Elton John, Billy Joel, Rod Stewart, The Police, Fleetwood Mac, Foo Fighters, The Who, Kings of Leon, Eric Clapton, Pearl Jam, Taylor Swift, Eagles, Meatloaf, Neil Diamond and Luciano Pavarotti.
Peter holds an Accredited Venue Manager qualification from the Venue Management Association (Asia and Pacific). He also chairs the Australian Rectangular Stadium Group, and was instrumental in establishing national benchmarking of stadia management efficiency, event yields and costs in association with the Centre for Tourism and Leisure Management at the University of South Australia.
Janis Carren Director, Strategy Marketing and Governance
Janis joined VenuesWest in June 2008 and has been a member of the Executive Team since that time, bringing with her extensive public sector experience gained from working in various Western Australian statutory authorities over a 20 plus year career.
As Director Strategy Marketing and Governance, Janis is able to draw on her strengths as a strategic thinker and influencer and her experience in terms of advising and supporting Boards in the delivery of planning, communications, marketing, policy, research and organisational change projects that have been part of the organisation’s considerable growth and success.
Prior to VenuesWest, Janis was a member of the Executive Team at Tourism WA as its Strategic and Corporate Planner and the Manager of Business Planning and Improvement at Central TAFE. Janis accredits her early professional success to the opportunities made available to her at the Water Authority in various Corporate Development and Financial Administrative roles, enabling a thorough understanding of the public sector and commercial operating environment.
Helen Hill Manager, Executive Services
Helen joined VenuesWest in October 2012, and holds the role of Manager Executive Services.
With an Advanced Diploma in Business Management, Helen has over 25 years’ experience in Executive support roles, holding similar roles in the banking and property industries both here and overseas. Prior to joining VenuesWest, she spent 14 years in an executive role in one of WA’s largest local governments, providing research, advisory and support services.
Glenn Nordsvan Chief Financial Officer
Glenn joined VenuesWest in January 2014. Prior to working at VenuesWest, Glenn held a number of senior financial and management positions in different industry sectors, including state and local government, industry and member associations and the private sector.
Glenn is a Certified Practicing Accountant with qualifications in both accounting and marketing.
Steve Paul Director, Corporate Services
Steve joined the Executive team in January 2017. Steve has experience at both State and National level roles in Human Resources and Organisational Development in both private and public sector environments including KPMG, ASX listed mining contracting services and government agencies, the most recent being LandCorp. Steve has a tertiary degree in Arts and Management and several industry accreditations and post-tertiary qualifications.
CONTENTS
VENUESWEST ANNUAL REPORT 2016-201719OVERVIEW
Performance Management Framework
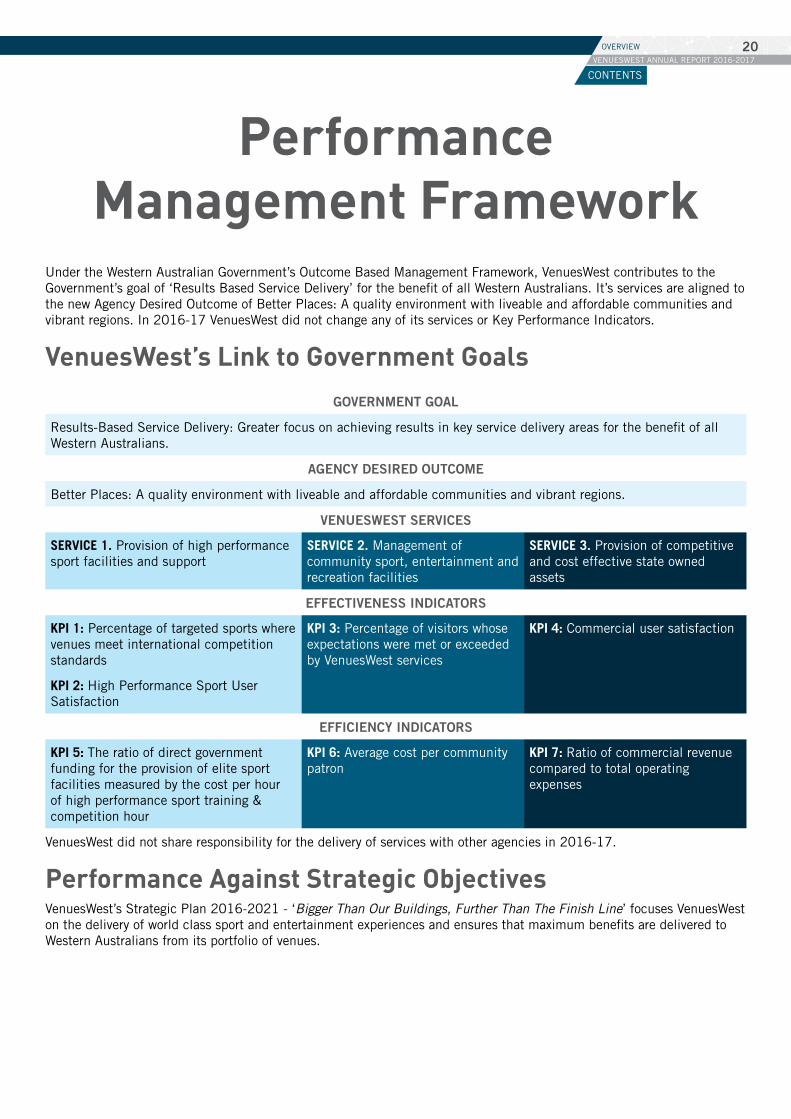
Under the Western Australian Government’s Outcome Based Management Framework, VenuesWest contributes to the Government’s goal of ‘Results Based Service Delivery’ for the benefit of all Western Australians. It’s services are aligned to the new Agency Desired Outcome of Better Places: A quality environment with liveable and affordable communities and vibrant regions. In 2016-17 VenuesWest did not change any of its services or Key Performance Indicators.
VenuesWest’s Link to Government Goals
GOVERNMENT GOAL
Results-Based Service Delivery: Greater focus on achieving results in key service delivery areas for the benefit of all Western Australians.
AGENCY DESIRED OUTCOME
Better Places: A quality environment with liveable and affordable communities and vibrant regions.
VENUESWEST SERVICES
SERVICE 1. Provision of high performance sport facilities and support
SERVICE 2. Management of community sport, entertainment and recreation facilities
SERVICE 3. Provision of competitive and cost effective state owned assets
EFFECTIVENESS INDICATORS
KPI 1: Percentage of targeted sports where venues meet international competition standards
KPI 2: High Performance Sport User Satisfaction
KPI 3: Percentage of visitors whose expectations were met or exceeded by VenuesWest services
KPI 4: Commercial user satisfaction
EFFICIENCY INDICATORS
KPI 5: The ratio of direct government funding for the provision of elite sport facilities measured by the cost per hour of high performance sport training & competition hour
KPI 6: Average cost per community patron
KPI 7: Ratio of commercial revenue compared to total operating expenses
VenuesWest did not share responsibility for the delivery of services with other agencies in 2016-17.
Performance Against Strategic ObjectivesVenuesWest’s Strategic Plan 2016-2021 - ‘Bigger Than Our Buildings, Further Than The Finish Line’ focuses VenuesWest on the delivery of world class sport and entertainment experiences and ensures that maximum benefits are delivered to Western Australians from its portfolio of venues.
CONTENTS
VENUESWEST ANNUAL REPORT 2016-201720OVERVIEW
STRATEGIC OBJECTIVE 1: Deliver Outstanding Customer Experiences
VenuesWest’s diverse portfolio of venues presents challenges in delivering consistency of customer service. Combine that with the use of third party providers and the need for consistency and reliability of customer service practices is critical. This year VenuesWest rolled out a new Customer Service framework to staff and suppliers which was positively received by our customers with an amazing 93% satisfaction level being achieved this year.
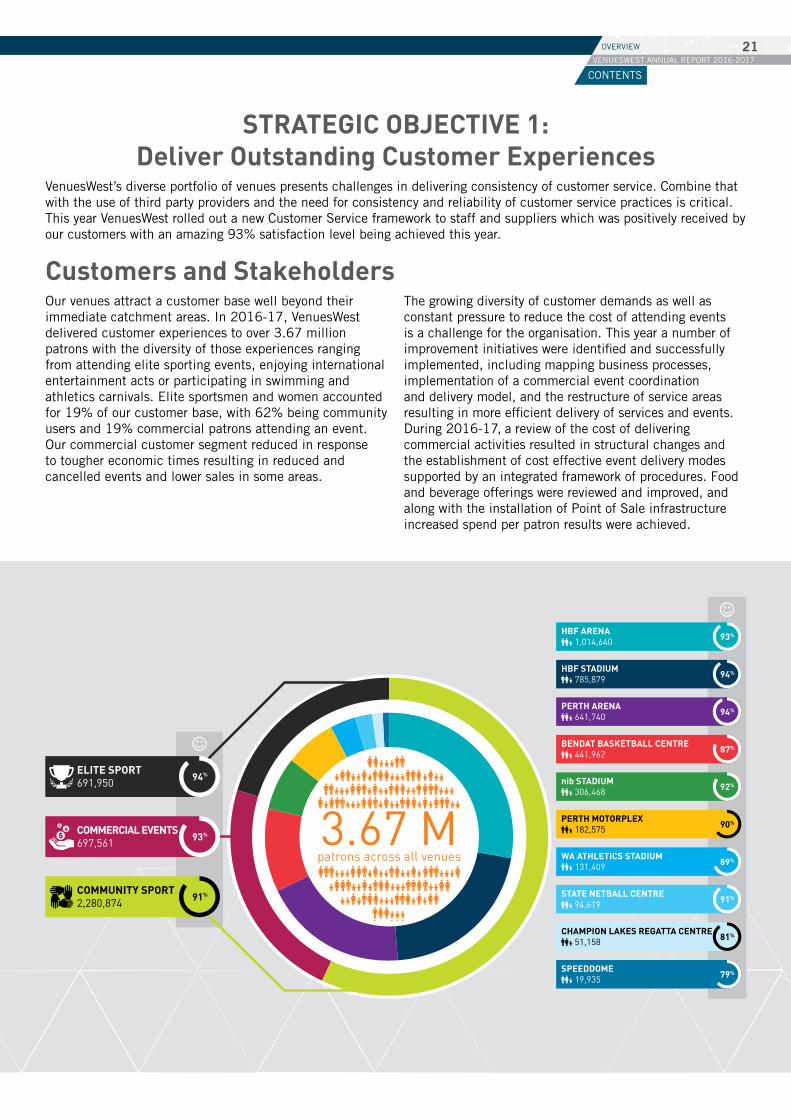
Customers and Stakeholders Our venues attract a customer base well beyond their immediate catchment areas. In 2016-17, VenuesWest delivered customer experiences to over 3.67 million patrons with the diversity of those experiences ranging from attending elite sporting events, enjoying international entertainment acts or participating in swimming and athletics carnivals. Elite sportsmen and women accounted for 19% of our customer base, with 62% being community users and 19% commercial patrons attending an event. Our commercial customer segment reduced in response to tougher economic times resulting in reduced and cancelled events and lower sales in some areas.
The growing diversity of customer demands as well as constant pressure to reduce the cost of attending events is a challenge for the organisation. This year a number of improvement initiatives were identified and successfully implemented, including mapping business processes, implementation of a commercial event coordination and delivery model, and the restructure of service areas resulting in more efficient delivery of services and events. During 2016-17, a review of the cost of delivering commercial activities resulted in structural changes and the establishment of cost effective event delivery modes supported by an integrated framework of procedures. Food and beverage offerings were reviewed and improved, and along with the installation of Point of Sale infrastructure increased spend per patron results were achieved.
3.67 Mpatrons across all venues
ELITE SPORT691,950
COMMERCIAL EVENTS697,561
COMMUNITY SPORT2,280,874
91%
93%
94%
WA ATHLETICS STADIUM 131,409
STATE NETBALL CENTRE 94,619
CHAMPION LAKES REGATTA CENTRE 51,158
HBF ARENA 1,014,640
HBF STADIUM 785,879
PERTH ARENA 641,740
BENDAT BASKETBALL CENTRE 441,962
nib STADIUM 306,468
PERTH MOTORPLEX 182,575
89%
81%
91%
94%
92%
93%
87%
94%
90%
SPEEDDOME 19,935
79%
CONTENTS
VENUESWEST ANNUAL REPORT 2016-201721OVERVIEW
A new sales process also saw VenuesWest reaching 4,100 health and fitness members for the first time ever. Despite increased competition in the industry, the gyms at HBF Stadium and HBF Arena both increased sales and attendance figures, including in Personal Training sessions.
New websites for VenuesWest, HBF Stadium, HBF Arena and nib Stadium were launched in September 2016 and are the main vehicle for all marketing activities and information sources for customers. Social media channels including Facebook, Instagram and Twitter were used to engage with customers in real time.
Key stakeholders include our high performance, community and commercial customers, as well as sporting associations, user groups, service providers, partners, promoters and relevant State and local government agencies. The support and advocacy from these stakeholders and the broader community is critical to our success. Stakeholders are proactively engaged in planning and their feedback is regularly sought on asset planning and opportunities for improvement. Two major stakeholder forums were held this year and the second at nib Stadium was attended by the incoming Minister for Sport and Recreation. Regular newsletters were sent out to stakeholders to keep them up to date with developments across the portfolio.
STRATEGIC OBJECTIVE 2: Ensure our Portfolio of Sport and Entertainment Venues is Fit for Purpose
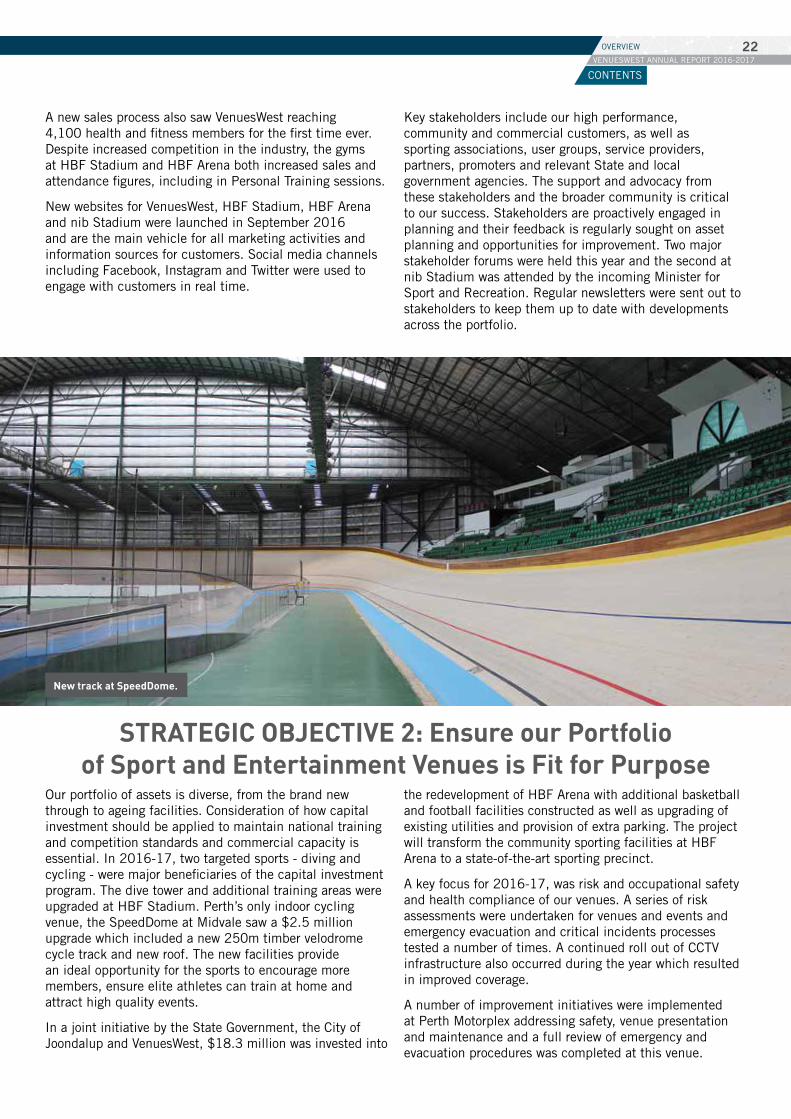
Our portfolio of assets is diverse, from the brand new through to ageing facilities. Consideration of how capital investment should be applied to maintain national training and competition standards and commercial capacity is essential. In 2016-17, two targeted sports - diving and cycling - were major beneficiaries of the capital investment program. The dive tower and additional training areas were upgraded at HBF Stadium. Perth’s only indoor cycling venue, the SpeedDome at Midvale saw a $2.5 million upgrade which included a new 250m timber velodrome cycle track and new roof. The new facilities provide an ideal opportunity for the sports to encourage more members, ensure elite athletes can train at home and attract high quality events.
In a joint initiative by the State Government, the City of Joondalup and VenuesWest, $18.3 million was invested into
the redevelopment of HBF Arena with additional basketball and football facilities constructed as well as upgrading of existing utilities and provision of extra parking. The project will transform the community sporting facilities at HBF Arena to a state-of-the-art sporting precinct.
A key focus for 2016-17, was risk and occupational safety and health compliance of our venues. A series of risk assessments were undertaken for venues and events and emergency evacuation and critical incidents processes tested a number of times. A continued roll out of CCTV infrastructure also occurred during the year which resulted in improved coverage.
A number of improvement initiatives were implemented at Perth Motorplex addressing safety, venue presentation and maintenance and a full review of emergency and evacuation procedures was completed at this venue.
New track at SpeedDome.
CONTENTS
VENUESWEST ANNUAL REPORT 2016-201722OVERVIEW
STRATEGIC OBJECTIVE 3: Engage a Workforce that is Aligned, Highly Capable and Adaptable
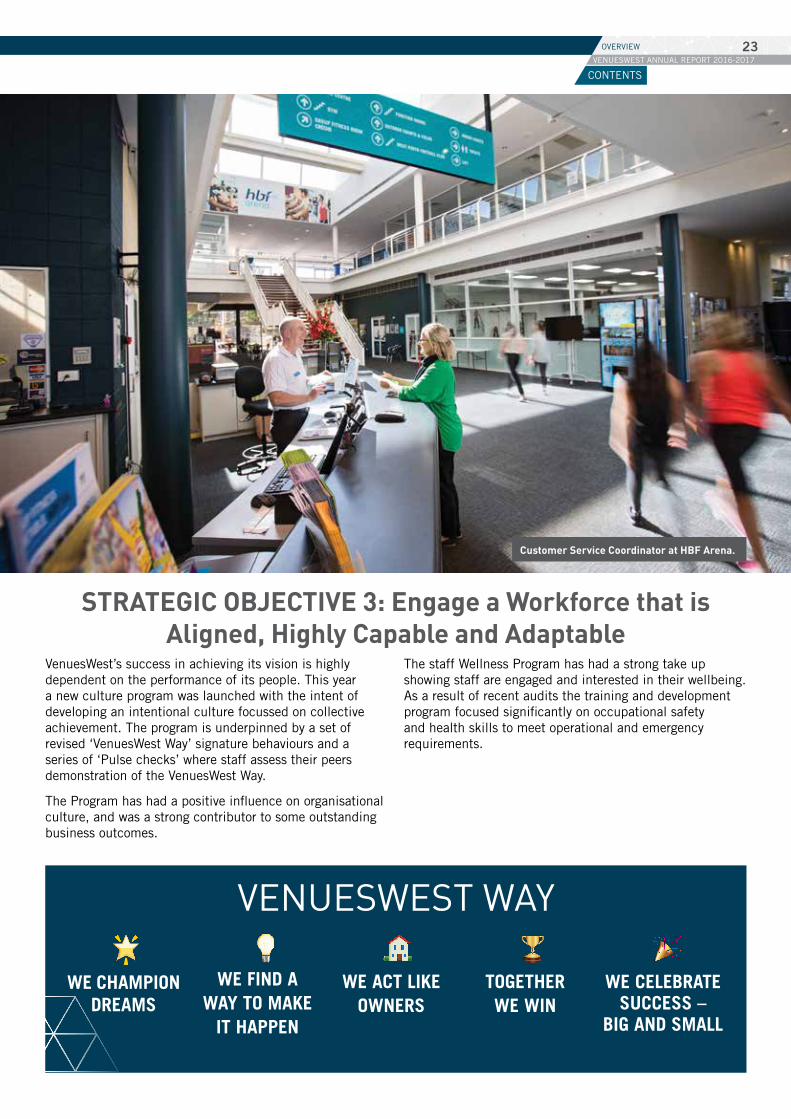
VenuesWest’s success in achieving its vision is highly dependent on the performance of its people. This year a new culture program was launched with the intent of developing an intentional culture focussed on collective achievement. The program is underpinned by a set of revised ‘VenuesWest Way’ signature behaviours and a series of ‘Pulse checks’ where staff assess their peers demonstration of the VenuesWest Way.
The Program has had a positive influence on organisational culture, and was a strong contributor to some outstanding business outcomes.
The staff Wellness Program has had a strong take up showing staff are engaged and interested in their wellbeing. As a result of recent audits the training and development program focused significantly on occupational safety and health skills to meet operational and emergency requirements.
VENUESWEST WAY
WE CHAMPION DREAMS
WE FIND A WAY TO MAKE
IT HAPPEN
WE ACT LIKE OWNERS
TOGETHER WE WIN
WE CELEBRATESUCCESS –
BIG AND SMALL
Customer Service Coordinator at HBF Arena.
CONTENTS
VENUESWEST ANNUAL REPORT 2016-201723OVERVIEW
COMMUNITY PROGRAMS
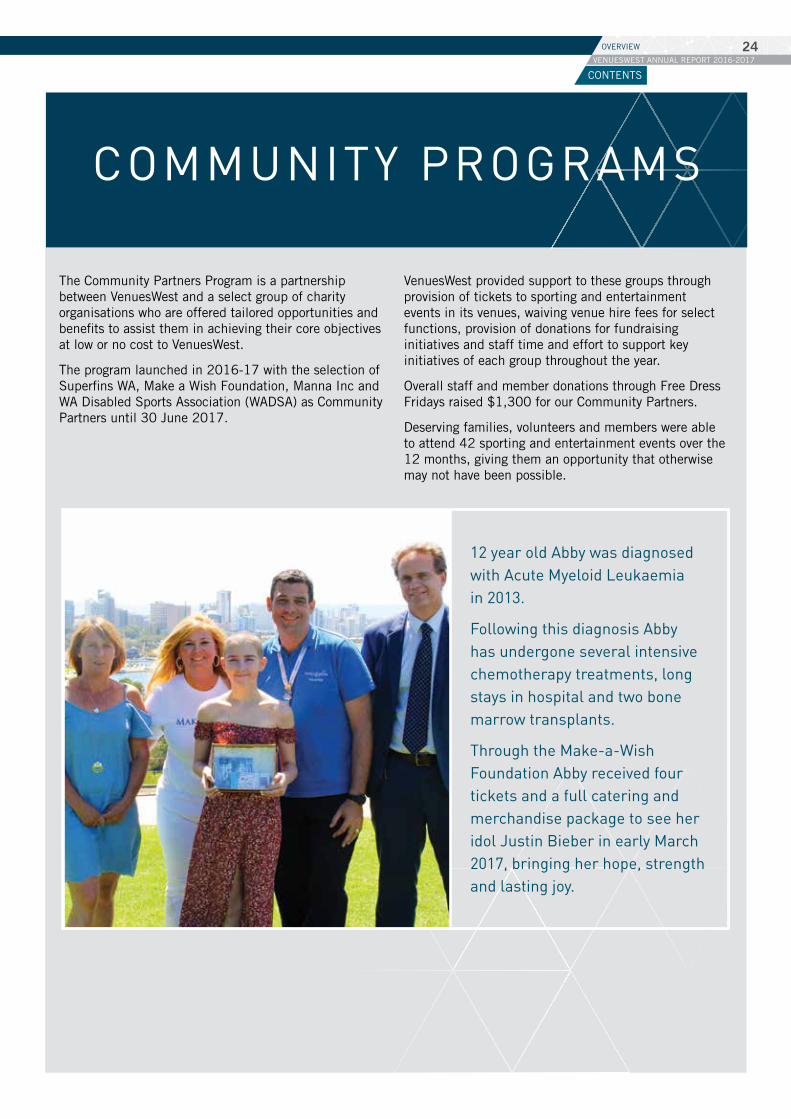
The Community Partners Program is a partnership between VenuesWest and a select group of charity organisations who are offered tailored opportunities and benefits to assist them in achieving their core objectives at low or no cost to VenuesWest.
The program launched in 2016-17 with the selection of Superfins WA, Make a Wish Foundation, Manna Inc and WA Disabled Sports Association (WADSA) as Community Partners until 30 June 2017.
VenuesWest provided support to these groups through provision of tickets to sporting and entertainment events in its venues, waiving venue hire fees for select functions, provision of donations for fundraising initiatives and staff time and effort to support key initiatives of each group throughout the year.
Overall staff and member donations through Free Dress Fridays raised $1,300 for our Community Partners.
Deserving families, volunteers and members were able to attend 42 sporting and entertainment events over the 12 months, giving them an opportunity that otherwise may not have been possible.
12 year old Abby was diagnosed with Acute Myeloid Leukaemia in 2013.
Following this diagnosis Abby has undergone several intensive chemotherapy treatments, long stays in hospital and two bone marrow transplants.
Through the Make-a-Wish Foundation Abby received four tickets and a full catering and merchandise package to see her idol Justin Bieber in early March 2017, bringing her hope, strength and lasting joy.
CONTENTS
VENUESWEST ANNUAL REPORT 2016-201724OVERVIEW
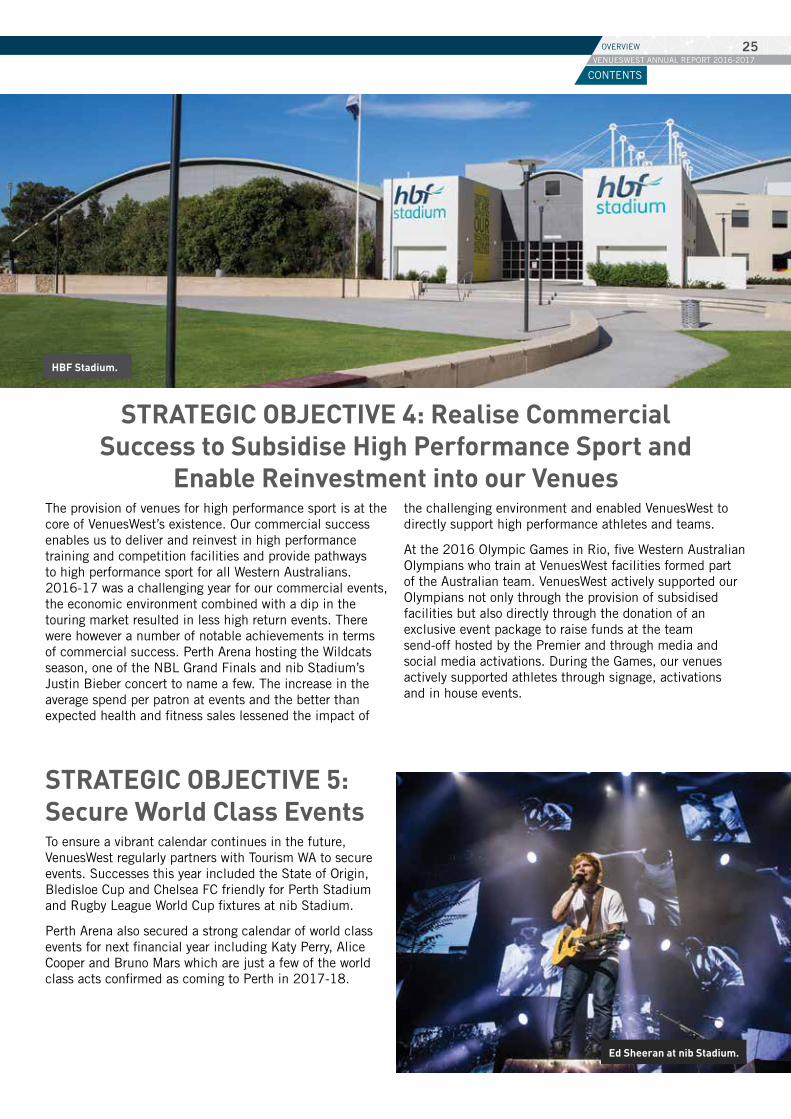
STRATEGIC OBJECTIVE 4: Realise Commercial Success to Subsidise High Performance Sport and
Enable Reinvestment into our Venues The provision of venues for high performance sport is at the core of VenuesWest’s existence. Our commercial success enables us to deliver and reinvest in high performance training and competition facilities and provide pathways to high performance sport for all Western Australians. 2016-17 was a challenging year for our commercial events, the economic environment combined with a dip in the touring market resulted in less high return events. There were however a number of notable achievements in terms of commercial success. Perth Arena hosting the Wildcats season, one of the NBL Grand Finals and nib Stadium’s Justin Bieber concert to name a few. The increase in the average spend per patron at events and the better than expected health and fitness sales lessened the impact of
the challenging environment and enabled VenuesWest to directly support high performance athletes and teams.
At the 2016 Olympic Games in Rio, five Western Australian Olympians who train at VenuesWest facilities formed part of the Australian team. VenuesWest actively supported our Olympians not only through the provision of subsidised facilities but also directly through the donation of an exclusive event package to raise funds at the team send-off hosted by the Premier and through media and social media activations. During the Games, our venues actively supported athletes through signage, activations and in house events.
STRATEGIC OBJECTIVE 5: Secure World Class Events
To ensure a vibrant calendar continues in the future, VenuesWest regularly partners with Tourism WA to secure events. Successes this year included the State of Origin, Bledisloe Cup and Chelsea FC friendly for Perth Stadium and Rugby League World Cup fixtures at nib Stadium.
Perth Arena also secured a strong calendar of world class events for next financial year including Katy Perry, Alice Cooper and Bruno Mars which are just a few of the world class acts confirmed as coming to Perth in 2017-18.
HBF Stadium.
Ed Sheeran at nib Stadium.
CONTENTS
VENUESWEST ANNUAL REPORT 2016-201725OVERVIEW
AGENCY PERFORMANCE
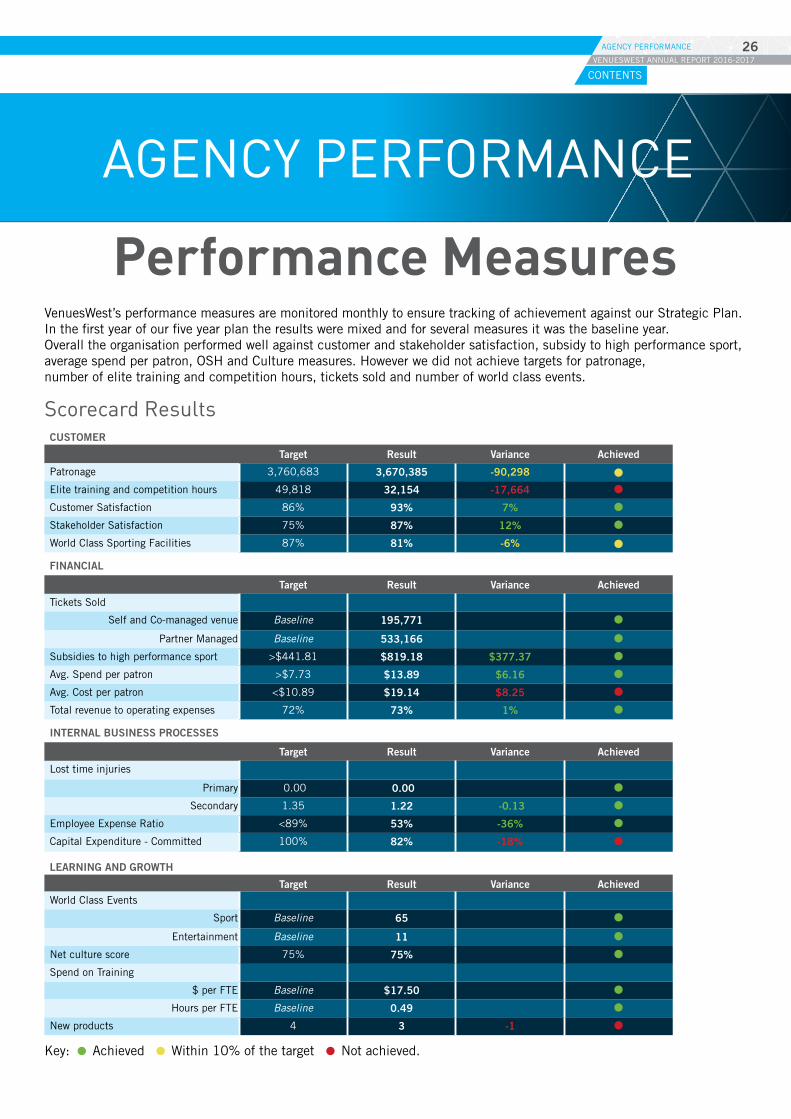
Performance MeasuresVenuesWest’s performance measures are monitored monthly to ensure tracking of achievement against our Strategic Plan. In the first year of our five year plan the results were mixed and for several measures it was the baseline year. Overall the organisation performed well against customer and stakeholder satisfaction, subsidy to high performance sport, average spend per patron, OSH and Culture measures. However we did not achieve targets for patronage, number of elite training and competition hours, tickets sold and number of world class events.
Scorecard ResultsCUSTOMER
Target Result Variance Achieved
Patronage 3,760,683 3,670,385 -90,298
Elite training and competition hours 49,818 32,154 -17,664
Customer Satisfaction 86% 93% 7%
Stakeholder Satisfaction 75% 87% 12%
World Class Sporting Facilities 87% 81% -6%
FINANCIAL
Target Result Variance Achieved
Tickets Sold
Self and Co-managed venue Baseline 195,771
Partner Managed Baseline 533,166
Subsidies to high performance sport >$441.81 $819.18 $377.37
Avg. Spend per patron >$7.73 $13.89 $6.16
Avg. Cost per patron <$10.89 $19.14 $8.25
Total revenue to operating expenses 72% 73% 1%
INTERNAL BUSINESS PROCESSES
Target Result Variance Achieved
Lost time injuries
Primary 0.00 0.00
Secondary 1.35 1.22 -0.13
Employee Expense Ratio <89% 53% -36%
Capital Expenditure - Committed 100% 82% -18%
LEARNING AND GROWTH Target Result Variance Achieved
World Class Events
Sport Baseline 65
Entertainment Baseline 11
Net culture score 75% 75%
Spend on Training
$ per FTE Baseline $17.50
Hours per FTE Baseline 0.49
New products 4 3 -1
Key: Achieved Within 10% of the target Not achieved.
CONTENTS
VENUESWEST ANNUAL REPORT 2016-201726AGENCY PERFORMANCE
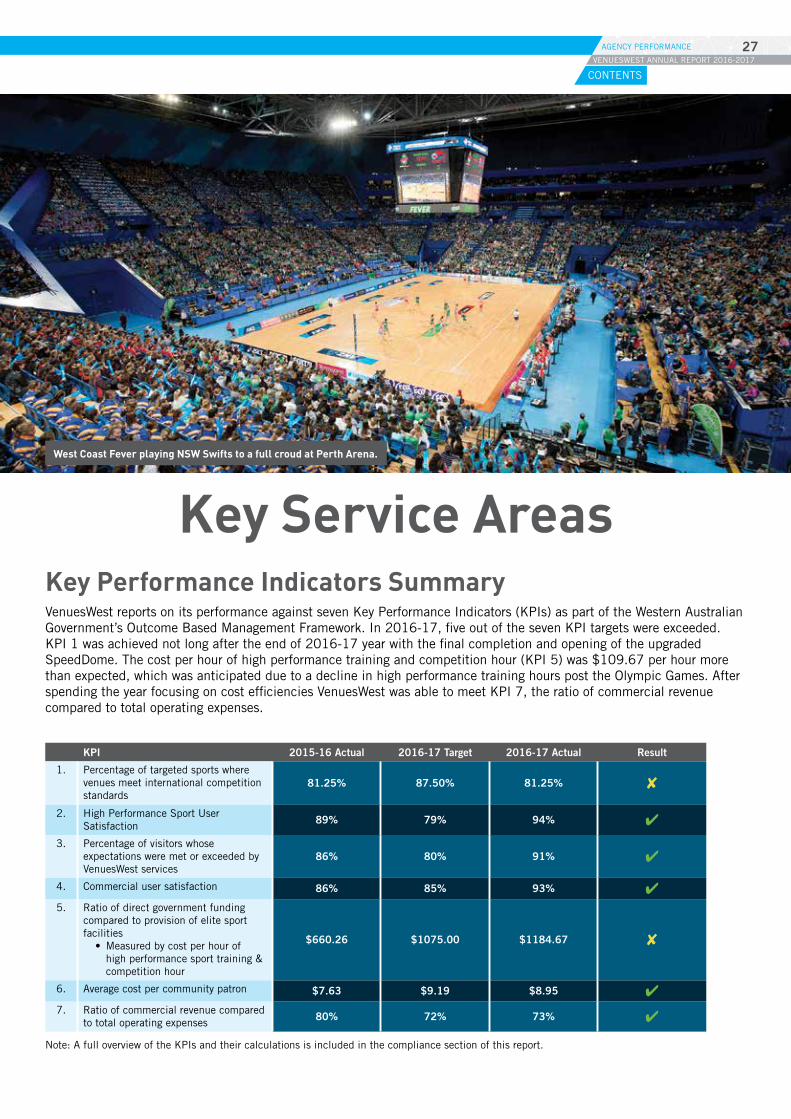
Key Service AreasKey Performance Indicators Summary VenuesWest reports on its performance against seven Key Performance Indicators (KPIs) as part of the Western Australian Government’s Outcome Based Management Framework. In 2016-17, five out of the seven KPI targets were exceeded. KPI 1 was achieved not long after the end of 2016-17 year with the final completion and opening of the upgraded SpeedDome. The cost per hour of high performance training and competition hour (KPI 5) was $109.67 per hour more than expected, which was anticipated due to a decline in high performance training hours post the Olympic Games. After spending the year focusing on cost efficiencies VenuesWest was able to meet KPI 7, the ratio of commercial revenue compared to total operating expenses.
KPI 2015-16 Actual 2016-17 Target 2016-17 Actual Result
1. Percentage of targeted sports where venues meet international competition standards
81.25% 87.50% 81.25% ✘
2. High Performance Sport User Satisfaction 89% 79% 94% ✔
3. Percentage of visitors whose expectations were met or exceeded by VenuesWest services
86% 80% 91% ✔
4. Commercial user satisfaction 86% 85% 93% ✔5. Ratio of direct government funding
compared to provision of elite sport facilities
• Measured by cost per hour of high performance sport training & competition hour
$660.26 $1075.00 $1184.67 ✘
6. Average cost per community patron $7.63 $9.19 $8.95 ✔7. Ratio of commercial revenue compared
to total operating expenses 80% 72% 73% ✔
Note: A full overview of the KPIs and their calculations is included in the compliance section of this report.
West Coast Fever playing NSW Swifts to a full croud at Perth Arena.
CONTENTS
VENUESWEST ANNUAL REPORT 2016-201727AGENCY PERFORMANCE
SERVICE 1: Provision of Elite Sport Facilities and Support
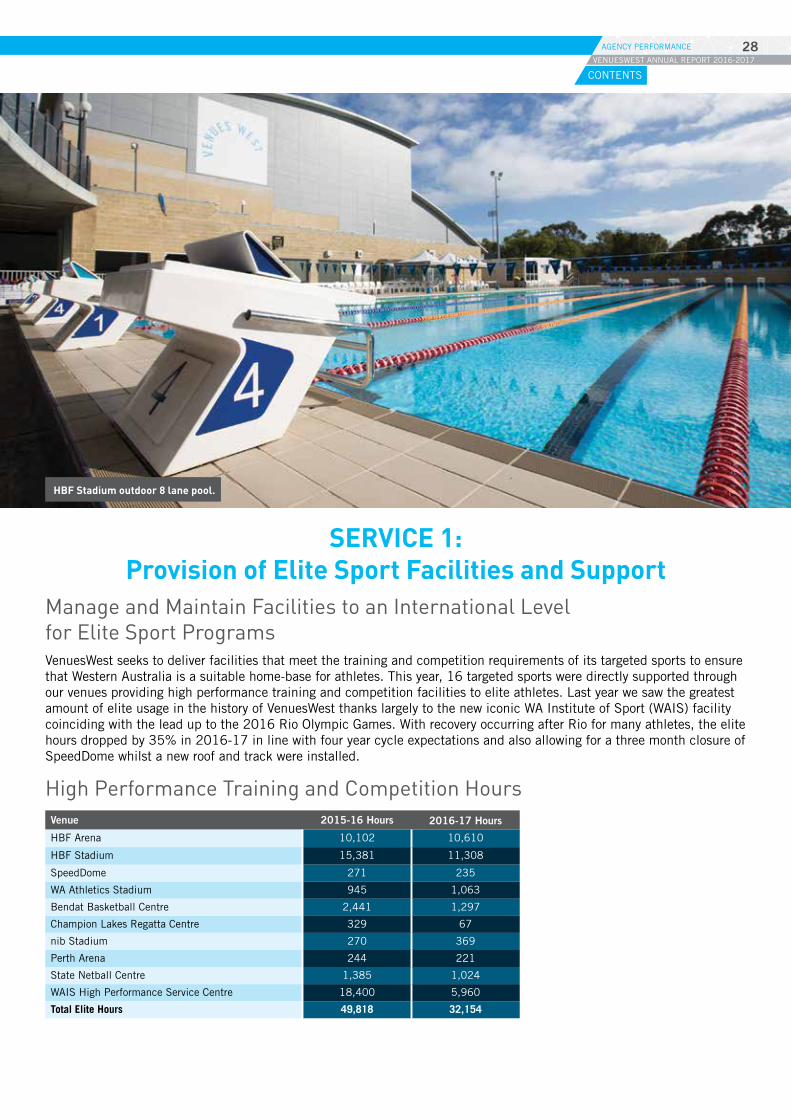
Manage and Maintain Facilities to an International Level for Elite Sport Programs VenuesWest seeks to deliver facilities that meet the training and competition requirements of its targeted sports to ensure that Western Australia is a suitable home-base for athletes. This year, 16 targeted sports were directly supported through our venues providing high performance training and competition facilities to elite athletes. Last year we saw the greatest amount of elite usage in the history of VenuesWest thanks largely to the new iconic WA Institute of Sport (WAIS) facility coinciding with the lead up to the 2016 Rio Olympic Games. With recovery occurring after Rio for many athletes, the elite hours dropped by 35% in 2016-17 in line with four year cycle expectations and also allowing for a three month closure of SpeedDome whilst a new roof and track were installed.
High Performance Training and Competition HoursVenue 2015-16 Hours 2016-17 Hours
HBF Arena 10,102 10,610
HBF Stadium 15,381 11,308
SpeedDome 271 235
WA Athletics Stadium 945 1,063
Bendat Basketball Centre 2,441 1,297
Champion Lakes Regatta Centre 329 67
nib Stadium 270 369
Perth Arena 244 221
State Netball Centre 1,385 1,024
WAIS High Performance Service Centre 18,400 5,960
Total Elite Hours 49,818 32,154
HBF Stadium outdoor 8 lane pool.
CONTENTS
VENUESWEST ANNUAL REPORT 2016-201728AGENCY PERFORMANCE
Aquatics Water Polo Basketball Netball
Cycling Indoor
Diving
Australian Rules Football
Athletics
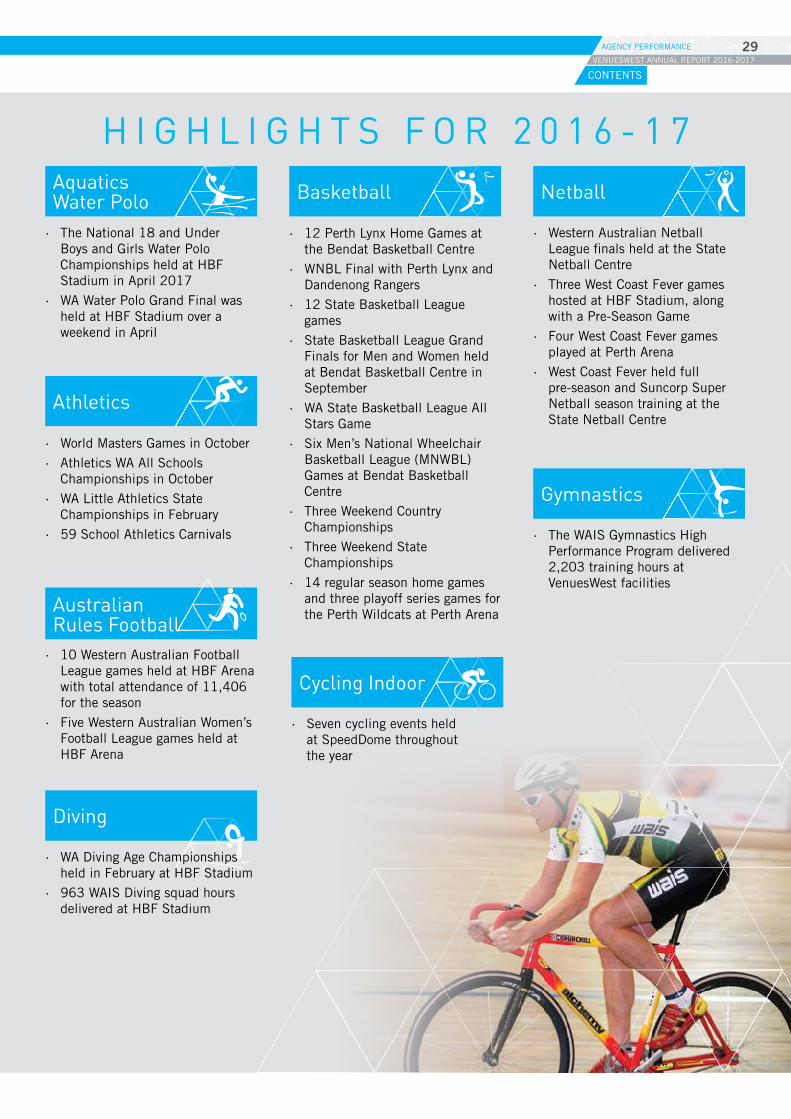
H I G H L I G H T S F O R 2 0 1 6 - 1 7
· The National 18 and Under Boys and Girls Water Polo Championships held at HBF Stadium in April 2017
· WA Water Polo Grand Final was held at HBF Stadium over a weekend in April
· 12 Perth Lynx Home Games at the Bendat Basketball Centre
· WNBL Final with Perth Lynx and Dandenong Rangers
· 12 State Basketball League games
· State Basketball League Grand Finals for Men and Women held at Bendat Basketball Centre in September
· WA State Basketball League All Stars Game
· Six Men’s National Wheelchair Basketball League (MNWBL) Games at Bendat Basketball Centre
· Three Weekend Country Championships
· Three Weekend State Championships
· 14 regular season home games and three playoff series games for the Perth Wildcats at Perth Arena
· Western Australian Netball League finals held at the State Netball Centre
· Three West Coast Fever games hosted at HBF Stadium, along with a Pre-Season Game
· Four West Coast Fever games played at Perth Arena
· West Coast Fever held full pre-season and Suncorp Super Netball season training at the State Netball Centre
· Seven cycling events held at SpeedDome throughout the year
· WA Diving Age Championships held in February at HBF Stadium
· 963 WAIS Diving squad hours delivered at HBF Stadium
· 10 Western Australian Football League games held at HBF Arena with total attendance of 11,406 for the season
· Five Western Australian Women’s Football League games held at HBF Arena
· The WAIS Gymnastics High Performance Program delivered 2,203 training hours at VenuesWest facilities
Gymnastics
· World Masters Games in October
· Athletics WA All Schools Championships in October
· WA Little Athletics State Championships in February
· 59 School Athletics Carnivals
CONTENTS
VENUESWEST ANNUAL REPORT 2016-201729AGENCY PERFORMANCE
Swimming Rugby League Rugby Union
Rowing, Canoeing, Triathlon
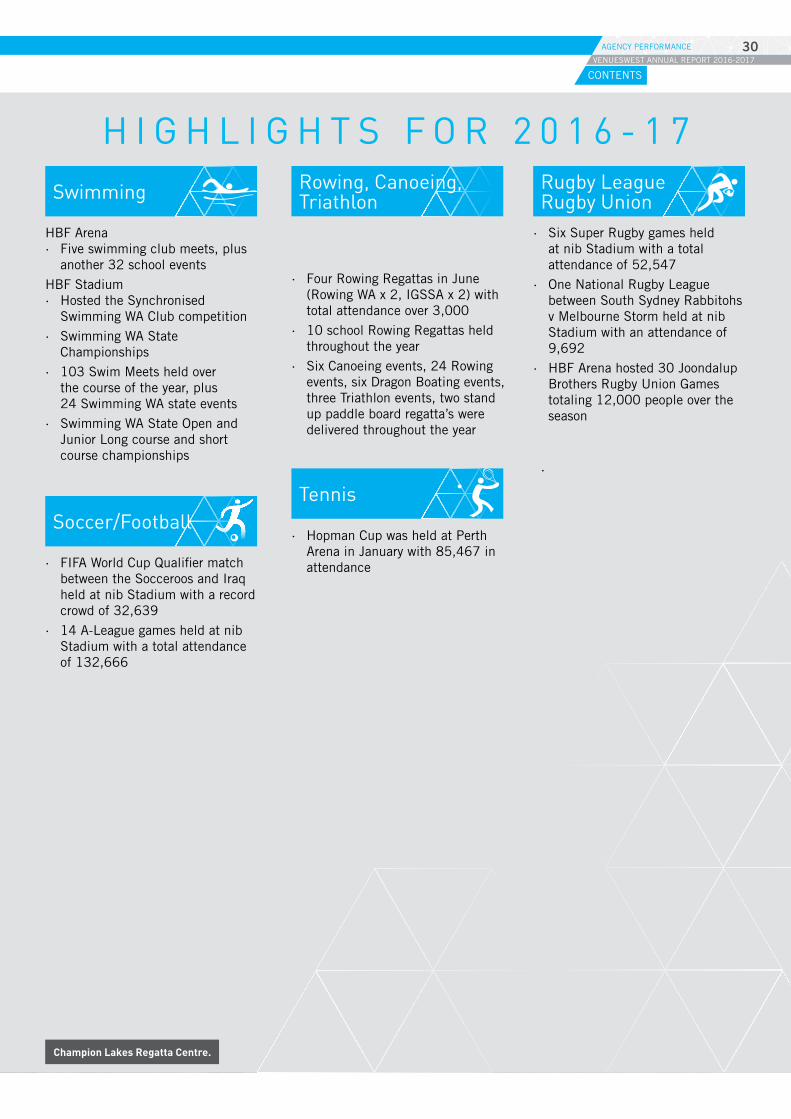
H I G H L I G H T S F O R 2 0 1 6 - 1 7
HBF Arena · Five swimming club meets, plus
another 32 school events
HBF Stadium · Hosted the Synchronised
Swimming WA Club competition
· Swimming WA State Championships
· 103 Swim Meets held over the course of the year, plus 24 Swimming WA state events
· Swimming WA State Open and Junior Long course and short course championships
· Six Super Rugby games held at nib Stadium with a total attendance of 52,547
· One National Rugby League between South Sydney Rabbitohs v Melbourne Storm held at nib Stadium with an attendance of 9,692
· HBF Arena hosted 30 Joondalup Brothers Rugby Union Games totaling 12,000 people over the season
Soccer/Football
· FIFA World Cup Qualifier match between the Socceroos and Iraq held at nib Stadium with a record crowd of 32,639
· 14 A-League games held at nib Stadium with a total attendance of 132,666
· Hopman Cup was held at Perth Arena in January with 85,467 in attendance
Tennis
Champion Lakes Regatta Centre.
·
· Four Rowing Regattas in June (Rowing WA x 2, IGSSA x 2) with total attendance over 3,000
· 10 school Rowing Regattas held throughout the year
· Six Canoeing events, 24 Rowing events, six Dragon Boating events, three Triathlon events, two stand up paddle board regatta’s were delivered throughout the year
CONTENTS
VENUESWEST ANNUAL REPORT 2016-201730AGENCY PERFORMANCE
SERVICE 2: Management of Community Facilities and Services
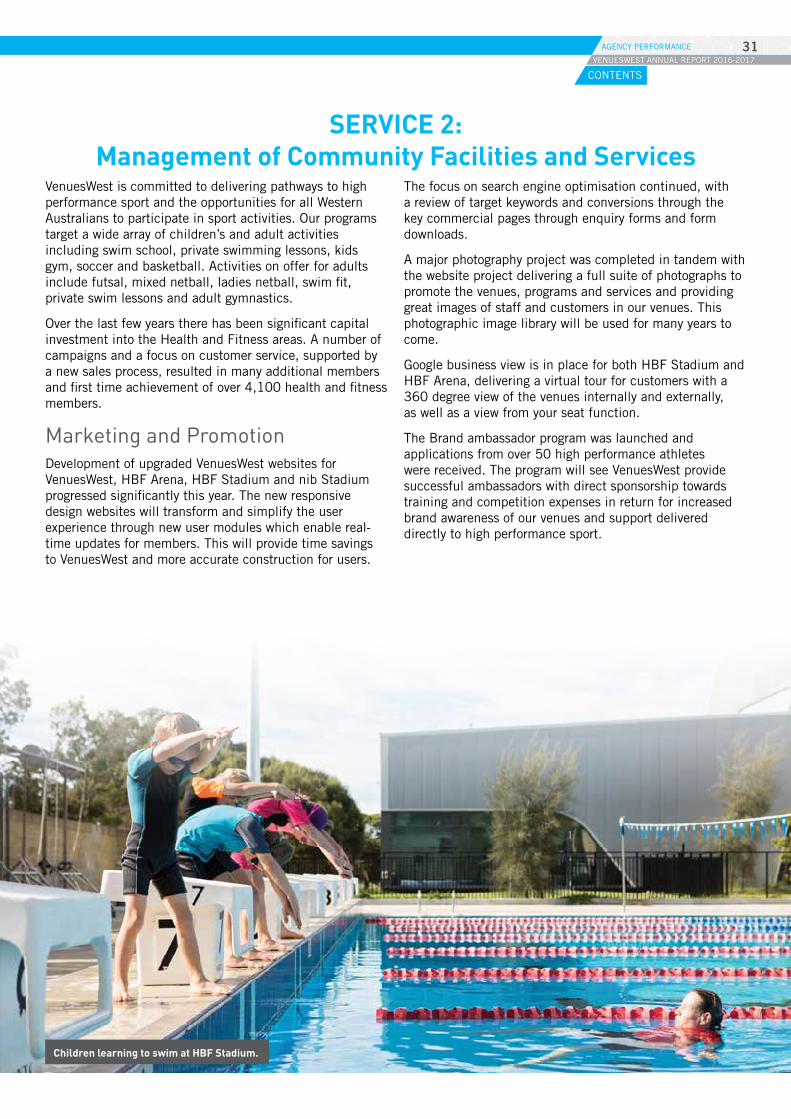
VenuesWest is committed to delivering pathways to high performance sport and the opportunities for all Western Australians to participate in sport activities. Our programs target a wide array of children’s and adult activities including swim school, private swimming lessons, kids gym, soccer and basketball. Activities on offer for adults include futsal, mixed netball, ladies netball, swim fit, private swim lessons and adult gymnastics.
Over the last few years there has been significant capital investment into the Health and Fitness areas. A number of campaigns and a focus on customer service, supported by a new sales process, resulted in many additional members and first time achievement of over 4,100 health and fitness members.
Marketing and Promotion Development of upgraded VenuesWest websites for VenuesWest, HBF Arena, HBF Stadium and nib Stadium progressed significantly this year. The new responsive design websites will transform and simplify the user experience through new user modules which enable real-time updates for members. This will provide time savings to VenuesWest and more accurate construction for users.
The focus on search engine optimisation continued, with a review of target keywords and conversions through the key commercial pages through enquiry forms and form downloads.
A major photography project was completed in tandem with the website project delivering a full suite of photographs to promote the venues, programs and services and providing great images of staff and customers in our venues. This photographic image library will be used for many years to come.
Google business view is in place for both HBF Stadium and HBF Arena, delivering a virtual tour for customers with a 360 degree view of the venues internally and externally, as well as a view from your seat function.
The Brand ambassador program was launched and applications from over 50 high performance athletes were received. The program will see VenuesWest provide successful ambassadors with direct sponsorship towards training and competition expenses in return for increased brand awareness of our venues and support delivered directly to high performance sport.
Children learning to swim at HBF Stadium.
CONTENTS
VENUESWEST ANNUAL REPORT 2016-201731AGENCY PERFORMANCE
SERVICE 3: Provision of Competitive and
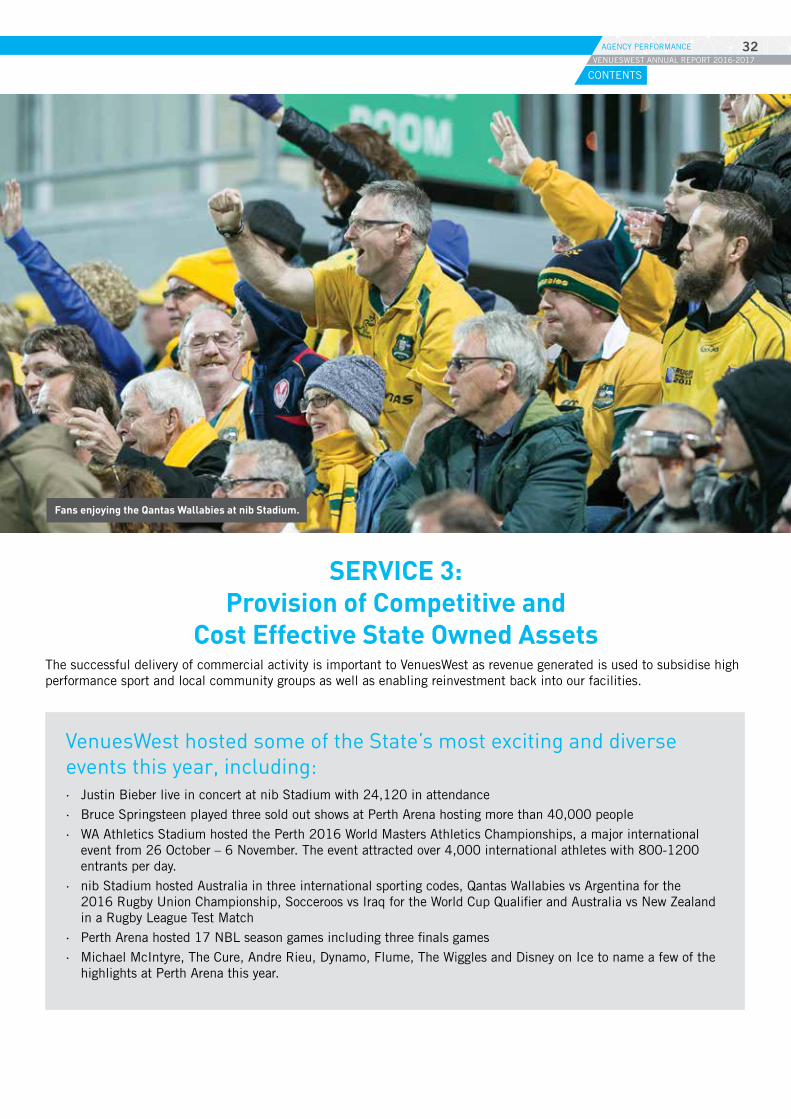
Cost Effective State Owned AssetsThe successful delivery of commercial activity is important to VenuesWest as revenue generated is used to subsidise high performance sport and local community groups as well as enabling reinvestment back into our facilities.
VenuesWest hosted some of the State’s most exciting and diverse events this year, including: · Justin Bieber live in concert at nib Stadium with 24,120 in attendance
· Bruce Springsteen played three sold out shows at Perth Arena hosting more than 40,000 people
· WA Athletics Stadium hosted the Perth 2016 World Masters Athletics Championships, a major international event from 26 October – 6 November. The event attracted over 4,000 international athletes with 800-1200 entrants per day.
· nib Stadium hosted Australia in three international sporting codes, Qantas Wallabies vs Argentina for the 2016 Rugby Union Championship, Socceroos vs Iraq for the World Cup Qualifier and Australia vs New Zealand in a Rugby League Test Match
· Perth Arena hosted 17 NBL season games including three finals games
· Michael McIntyre, The Cure, Andre Rieu, Dynamo, Flume, The Wiggles and Disney on Ice to name a few of the highlights at Perth Arena this year.
Fans enjoying the Qantas Wallabies at nib Stadium.
CONTENTS
VENUESWEST ANNUAL REPORT 2016-201732AGENCY PERFORMANCE
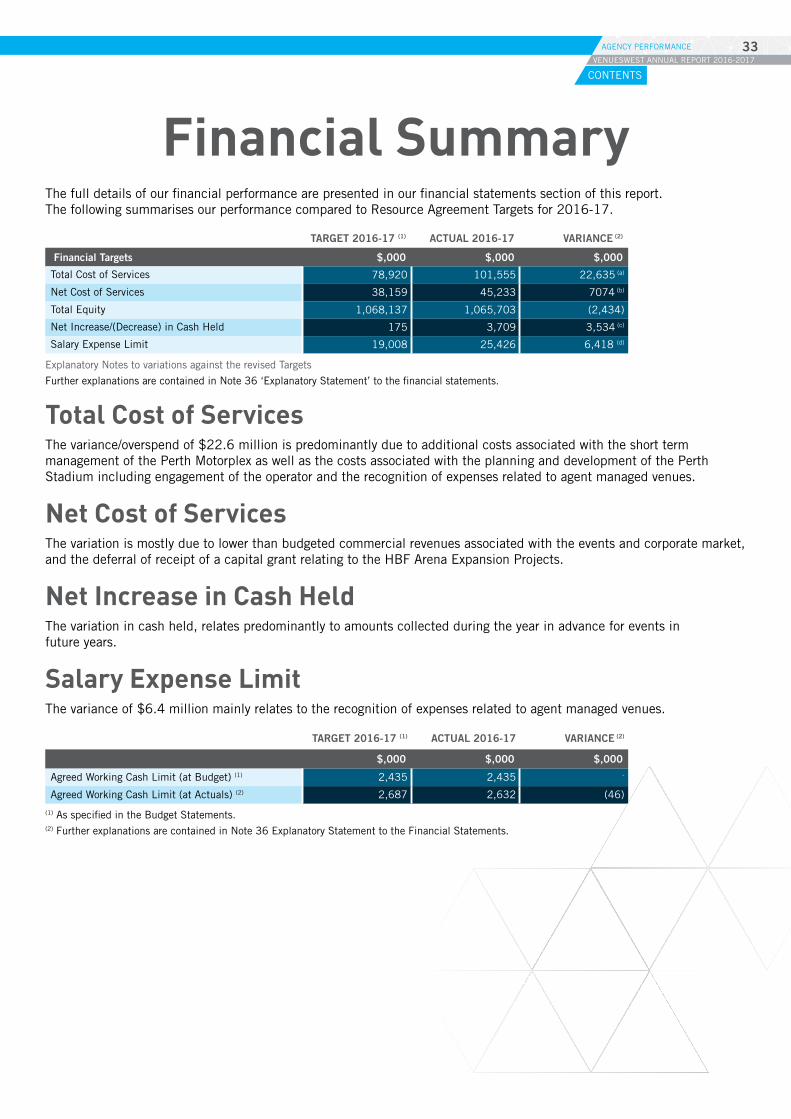
Financial SummaryThe full details of our financial performance are presented in our financial statements section of this report. The following summarises our performance compared to Resource Agreement Targets for 2016-17.
TARGET 2016-17 (1) ACTUAL 2016-17 VARIANCE (2)
Financial Targets $,000 $,000 $,000
Total Cost of Services 78,920 101,555 22,635 (a)
Net Cost of Services 38,159 45,233 7074 (b)
Total Equity 1,068,137 1,065,703 (2,434)
Net Increase/(Decrease) in Cash Held 175 3,709 3,534 (c)
Salary Expense Limit 19,008 25,426 6,418 (d)
Explanatory Notes to variations against the revised Targets
Further explanations are contained in Note 36 ‘Explanatory Statement’ to the financial statements.
Total Cost of Services The variance/overspend of $22.6 million is predominantly due to additional costs associated with the short term management of the Perth Motorplex as well as the costs associated with the planning and development of the Perth Stadium including engagement of the operator and the recognition of expenses related to agent managed venues.
Net Cost of Services The variation is mostly due to lower than budgeted commercial revenues associated with the events and corporate market, and the deferral of receipt of a capital grant relating to the HBF Arena Expansion Projects.
Net Increase in Cash Held The variation in cash held, relates predominantly to amounts collected during the year in advance for events in future years.
Salary Expense Limit The variance of $6.4 million mainly relates to the recognition of expenses related to agent managed venues.
TARGET 2016-17 (1) ACTUAL 2016-17 VARIANCE (2)
$,000 $,000 $,000
Agreed Working Cash Limit (at Budget) (1) 2,435 2,435 -
Agreed Working Cash Limit (at Actuals) (2) 2,687 2,632 (46)
(1) As specified in the Budget Statements. (2) Further explanations are contained in Note 36 Explanatory Statement to the Financial Statements.
CONTENTS
VENUESWEST ANNUAL REPORT 2016-201733AGENCY PERFORMANCE
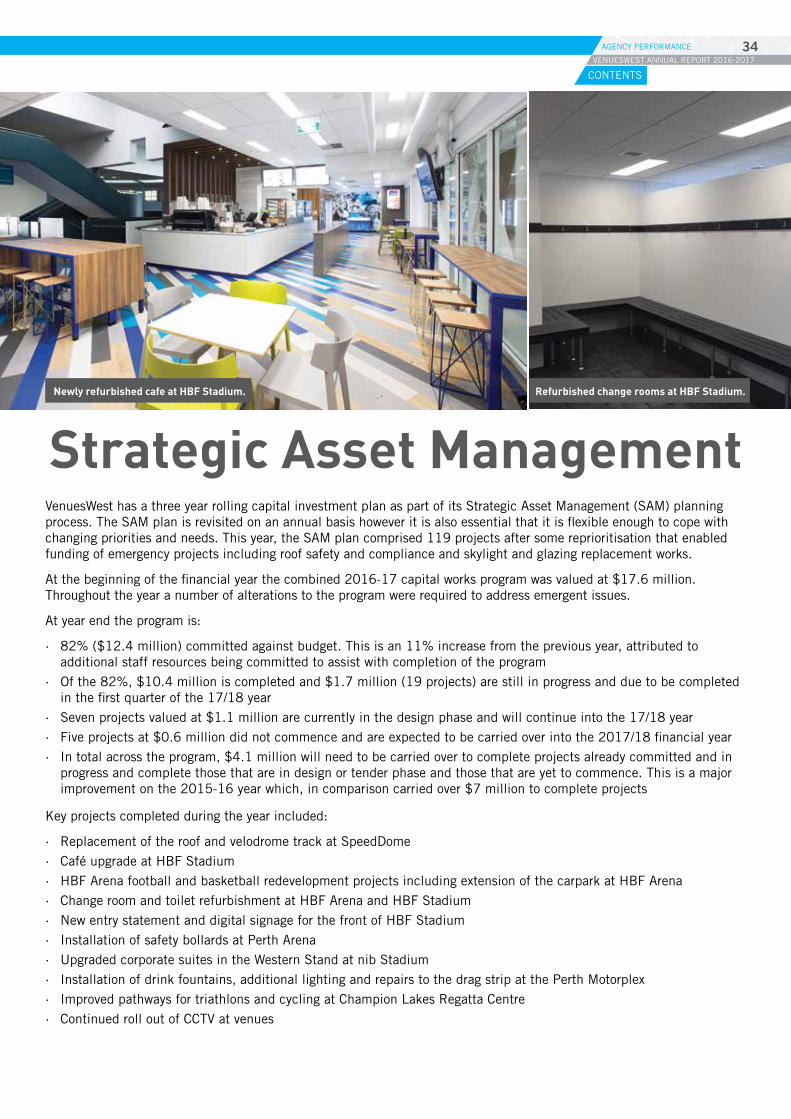
Strategic Asset Management VenuesWest has a three year rolling capital investment plan as part of its Strategic Asset Management (SAM) planning process. The SAM plan is revisited on an annual basis however it is also essential that it is flexible enough to cope with changing priorities and needs. This year, the SAM plan comprised 119 projects after some reprioritisation that enabled funding of emergency projects including roof safety and compliance and skylight and glazing replacement works.
At the beginning of the financial year the combined 2016-17 capital works program was valued at $17.6 million. Throughout the year a number of alterations to the program were required to address emergent issues.
At year end the program is:
· 82% ($12.4 million) committed against budget. This is an 11% increase from the previous year, attributed to additional staff resources being committed to assist with completion of the program
· Of the 82%, $10.4 million is completed and $1.7 million (19 projects) are still in progress and due to be completed in the first quarter of the 17/18 year
· Seven projects valued at $1.1 million are currently in the design phase and will continue into the 17/18 year
· Five projects at $0.6 million did not commence and are expected to be carried over into the 2017/18 financial year
· In total across the program, $4.1 million will need to be carried over to complete projects already committed and in progress and complete those that are in design or tender phase and those that are yet to commence. This is a major improvement on the 2015-16 year which, in comparison carried over $7 million to complete projects
Key projects completed during the year included:
· Replacement of the roof and velodrome track at SpeedDome
· Café upgrade at HBF Stadium
· HBF Arena football and basketball redevelopment projects including extension of the carpark at HBF Arena
· Change room and toilet refurbishment at HBF Arena and HBF Stadium
· New entry statement and digital signage for the front of HBF Stadium
· Installation of safety bollards at Perth Arena
· Upgraded corporate suites in the Western Stand at nib Stadium
· Installation of drink fountains, additional lighting and repairs to the drag strip at the Perth Motorplex
· Improved pathways for triathlons and cycling at Champion Lakes Regatta Centre
· Continued roll out of CCTV at venues
Newly refurbished cafe at HBF Stadium. Refurbished change rooms at HBF Stadium.
CONTENTS
VENUESWEST ANNUAL REPORT 2016-201734AGENCY PERFORMANCE
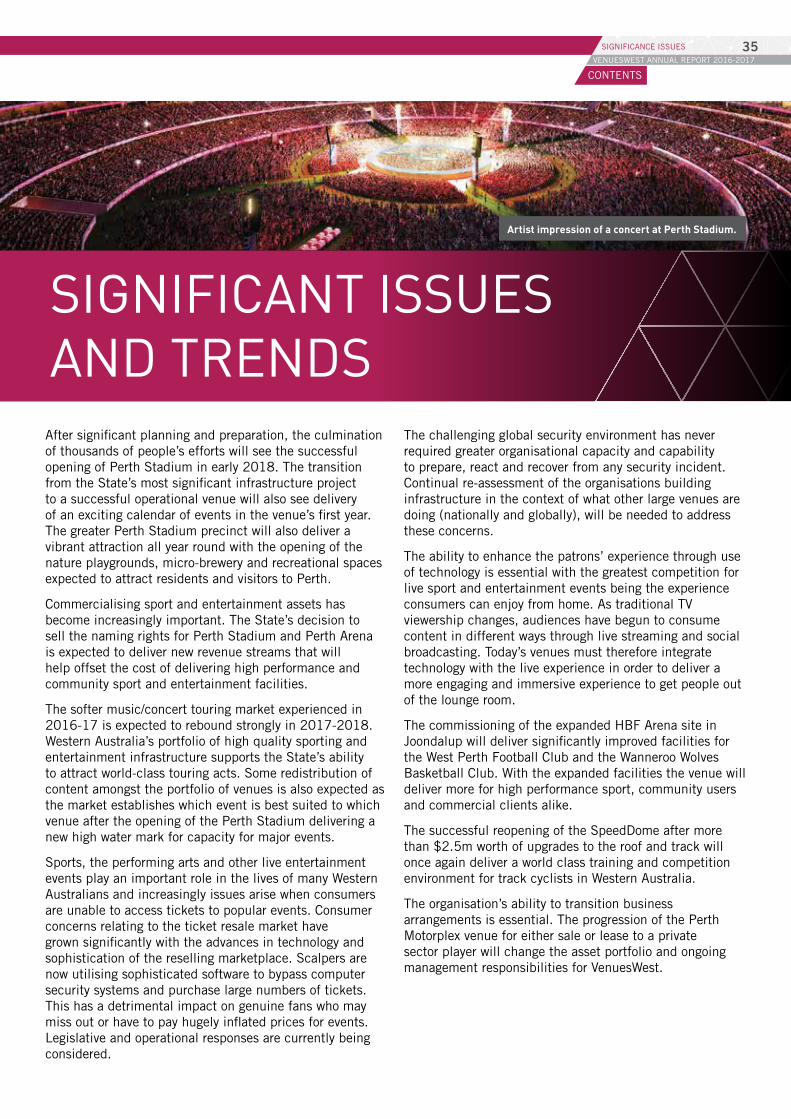
After significant planning and preparation, the culmination of thousands of people’s efforts will see the successful opening of Perth Stadium in early 2018. The transition from the State’s most significant infrastructure project to a successful operational venue will also see delivery of an exciting calendar of events in the venue’s first year. The greater Perth Stadium precinct will also deliver a vibrant attraction all year round with the opening of the nature playgrounds, micro-brewery and recreational spaces expected to attract residents and visitors to Perth.
Commercialising sport and entertainment assets has become increasingly important. The State’s decision to sell the naming rights for Perth Stadium and Perth Arena is expected to deliver new revenue streams that will help offset the cost of delivering high performance and community sport and entertainment facilities.
The softer music/concert touring market experienced in 2016-17 is expected to rebound strongly in 2017-2018. Western Australia’s portfolio of high quality sporting and entertainment infrastructure supports the State’s ability to attract world-class touring acts. Some redistribution of content amongst the portfolio of venues is also expected as the market establishes which event is best suited to which venue after the opening of the Perth Stadium delivering a new high water mark for capacity for major events.
Sports, the performing arts and other live entertainment events play an important role in the lives of many Western Australians and increasingly issues arise when consumers are unable to access tickets to popular events. Consumer concerns relating to the ticket resale market have grown significantly with the advances in technology and sophistication of the reselling marketplace. Scalpers are now utilising sophisticated software to bypass computer security systems and purchase large numbers of tickets. This has a detrimental impact on genuine fans who may miss out or have to pay hugely inflated prices for events. Legislative and operational responses are currently being considered.
The challenging global security environment has never required greater organisational capacity and capability to prepare, react and recover from any security incident. Continual re-assessment of the organisations building infrastructure in the context of what other large venues are doing (nationally and globally), will be needed to address these concerns.
The ability to enhance the patrons’ experience through use of technology is essential with the greatest competition for live sport and entertainment events being the experience consumers can enjoy from home. As traditional TV viewership changes, audiences have begun to consume content in different ways through live streaming and social broadcasting. Today’s venues must therefore integrate technology with the live experience in order to deliver a more engaging and immersive experience to get people out of the lounge room.
The commissioning of the expanded HBF Arena site in Joondalup will deliver significantly improved facilities for the West Perth Football Club and the Wanneroo Wolves Basketball Club. With the expanded facilities the venue will deliver more for high performance sport, community users and commercial clients alike.
The successful reopening of the SpeedDome after more than $2.5m worth of upgrades to the roof and track will once again deliver a world class training and competition environment for track cyclists in Western Australia.
The organisation’s ability to transition business arrangements is essential. The progression of the Perth Motorplex venue for either sale or lease to a private sector player will change the asset portfolio and ongoing management responsibilities for VenuesWest.
SIGNIFICANT ISSUES AND TRENDS
Artist impression of a concert at Perth Stadium.
CONTENTS
VENUESWEST ANNUAL REPORT 2016-201735SIGNIFICANCE ISSUES
DISCLOSURES AND LEGAL COMPLIANCE
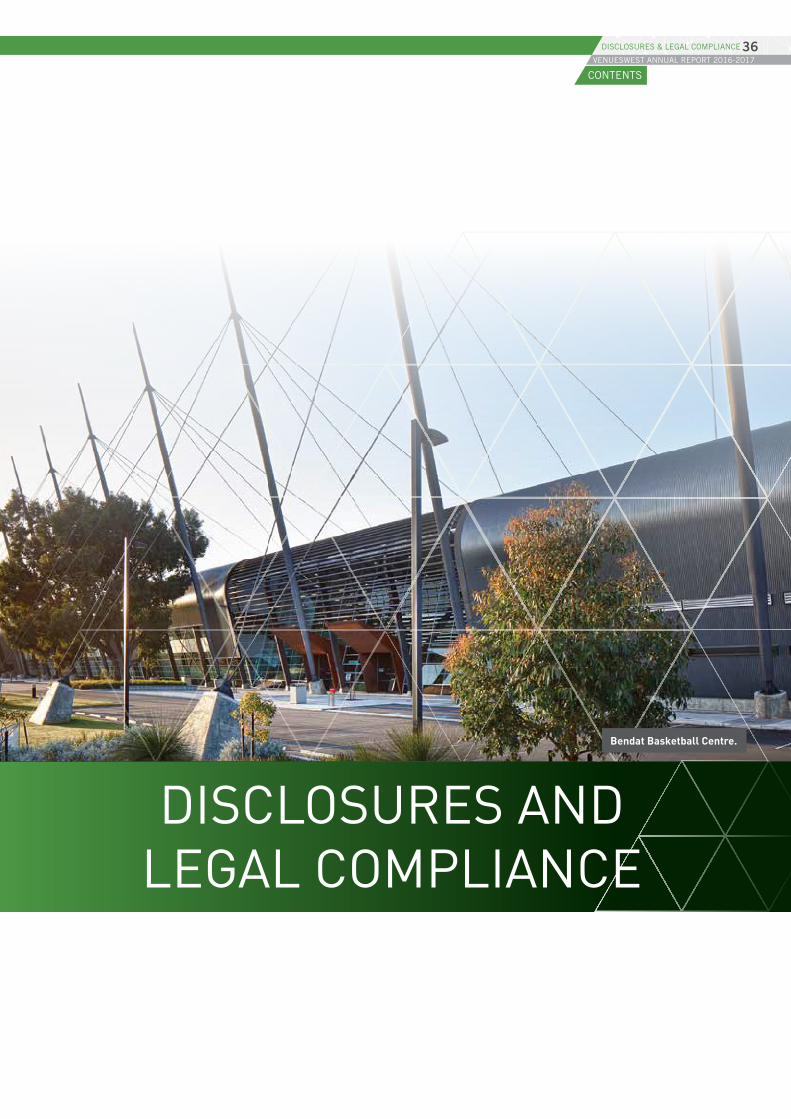
Bendat Basketball Centre.
CONTENTS
VENUESWEST ANNUAL REPORT 2016-201736DISCLOSURES & LEGAL COMPLIANCE
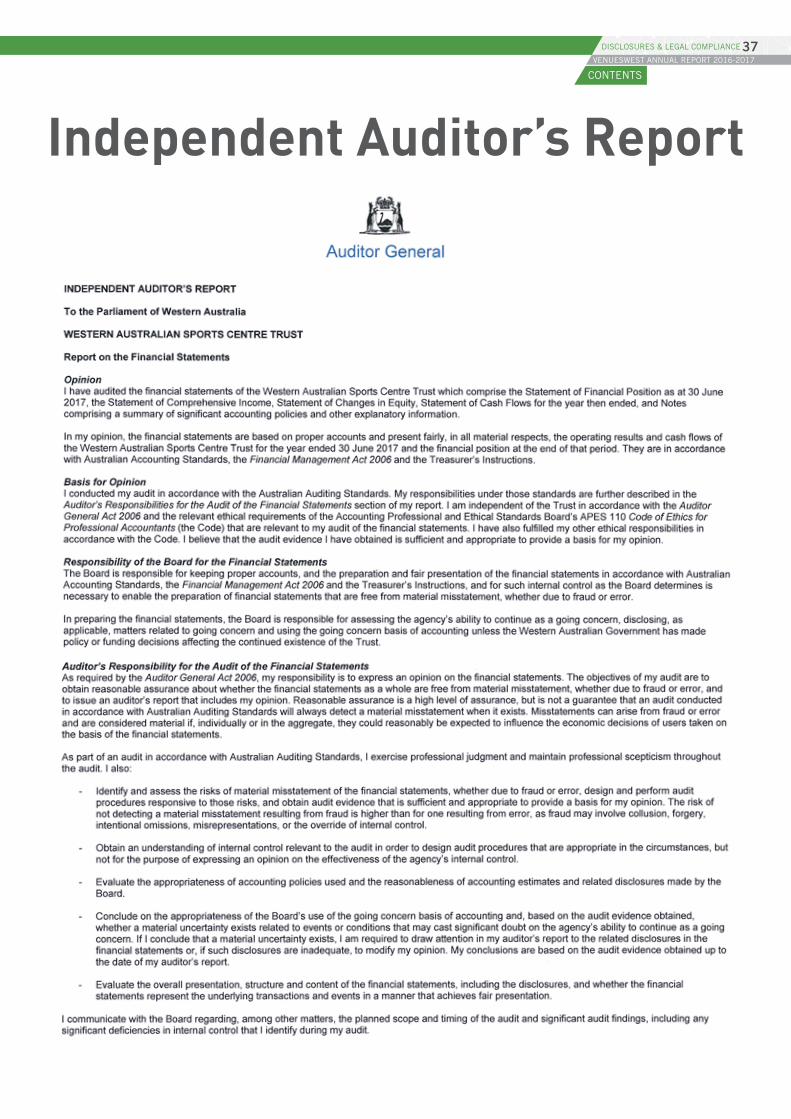
Independent Auditor’s ReportCONTENTS
VENUESWEST ANNUAL REPORT 2016-201737DISCLOSURES & LEGAL COMPLIANCE
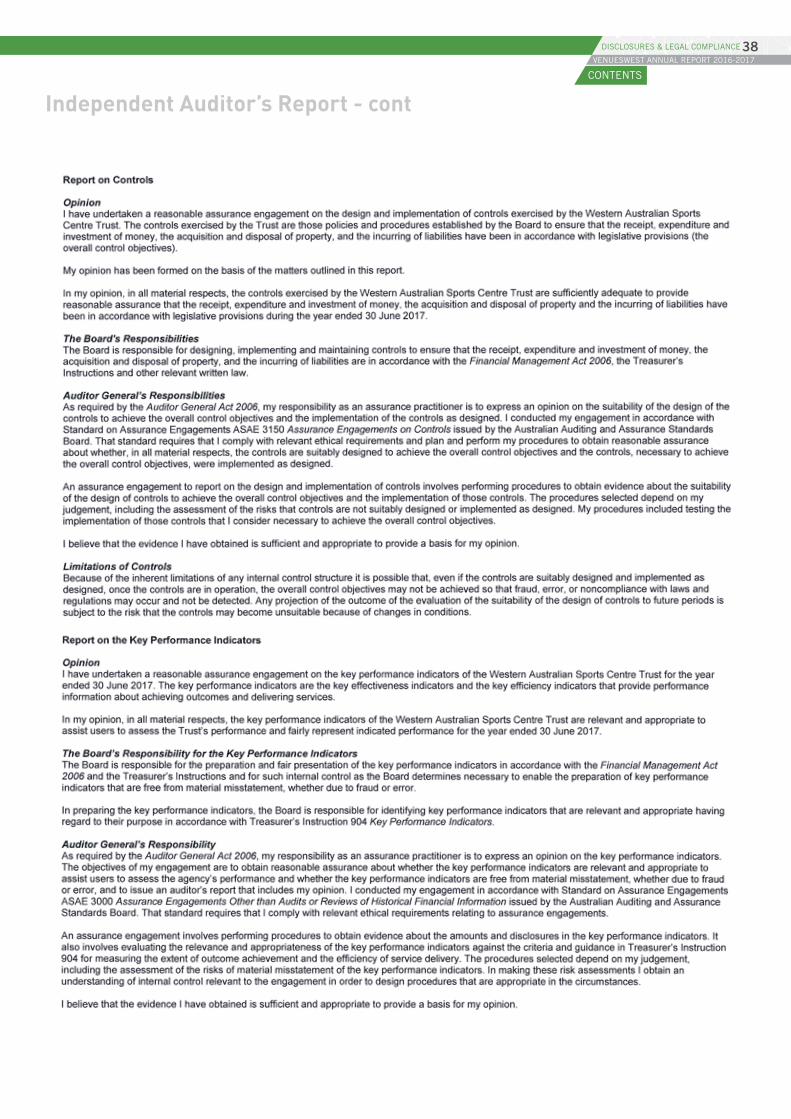
Independent Auditor’s Report - contCONTENTS
VENUESWEST ANNUAL REPORT 2016-201738DISCLOSURES & LEGAL COMPLIANCE
Independent Auditor’s Report - contCONTENTS
VENUESWEST ANNUAL REPORT 2016-201739DISCLOSURES & LEGAL COMPLIANCE
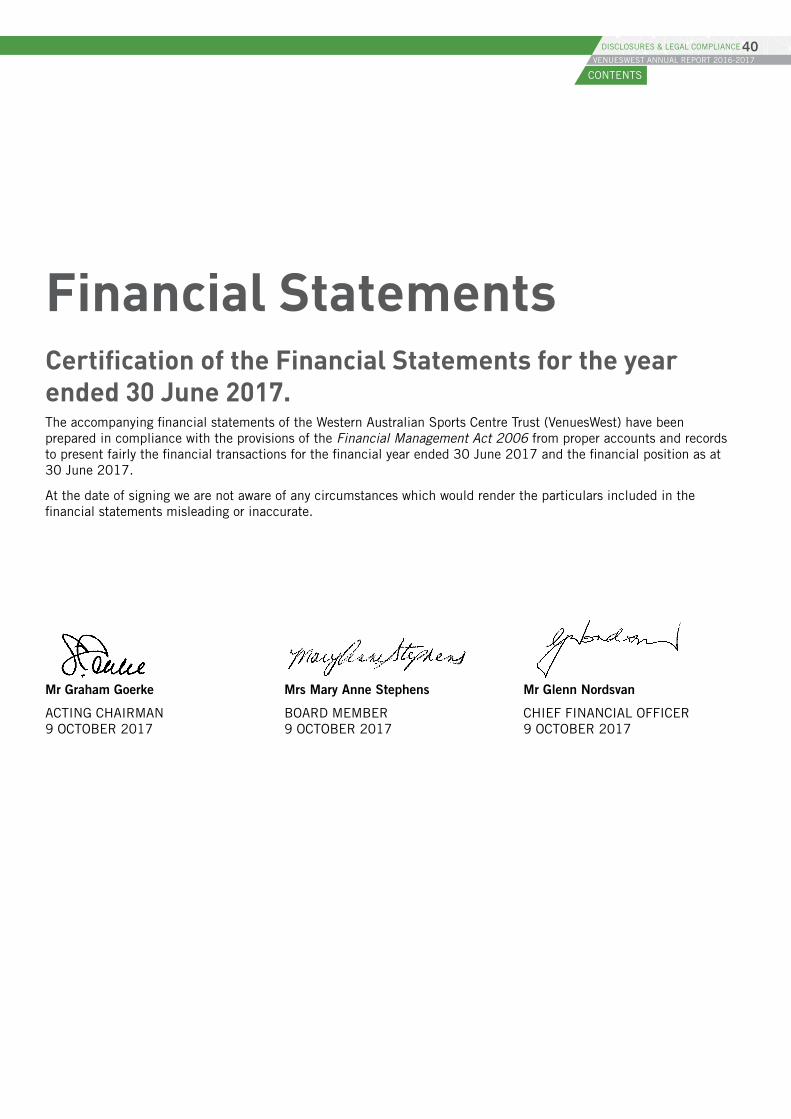
Financial StatementsCertification of the Financial Statements for the year ended 30 June 2017.The accompanying financial statements of the Western Australian Sports Centre Trust (VenuesWest) have been prepared in compliance with the provisions of the Financial Management Act 2006 from proper accounts and records to present fairly the financial transactions for the financial year ended 30 June 2017 and the financial position as at 30 June 2017.
At the date of signing we are not aware of any circumstances which would render the particulars included in the financial statements misleading or inaccurate.
Mr Graham Goerke
ACTING CHAIRMAN 9 OCTOBER 2017
Mrs Mary Anne Stephens
BOARD MEMBER 9 OCTOBER 2017
Mr Glenn Nordsvan
CHIEF FINANCIAL OFFICER 9 OCTOBER 2017
CONTENTS
VENUESWEST ANNUAL REPORT 2016-201740DISCLOSURES & LEGAL COMPLIANCE
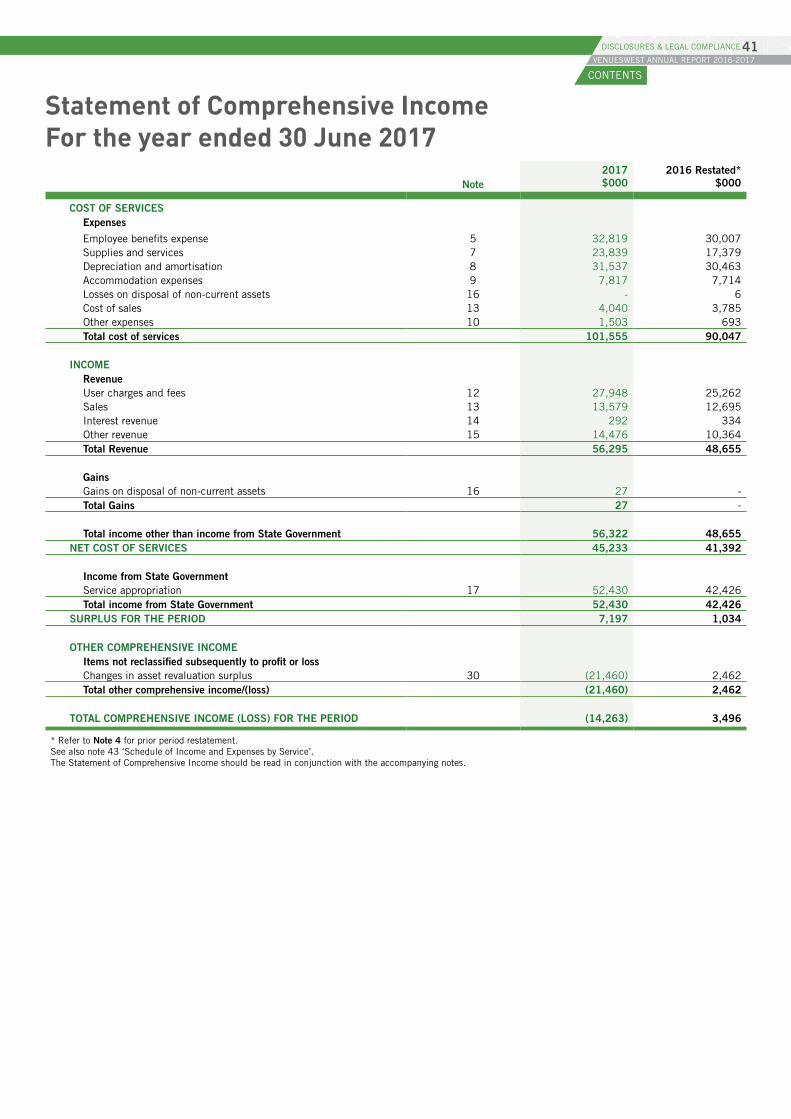
Statement of Comprehensive Income For the year ended 30 June 2017
Note2017 $000
2016 Restated* $000
COST OF SERVICESExpenses
Employee benefits expense 5 32,819 30,007Supplies and services 7 23,839 17,379Depreciation and amortisation 8 31,537 30,463Accommodation expenses 9 7,817 7,714Losses on disposal of non-current assets 16 - 6Cost of sales 13 4,040 3,785Other expenses 10 1,503 693Total cost of services 101,555 90,047
INCOMERevenueUser charges and fees 12 27,948 25,262Sales 13 13,579 12,695Interest revenue 14 292 334Other revenue 15 14,476 10,364Total Revenue 56,295 48,655
GainsGains on disposal of non-current assets 16 27 -Total Gains 27 - Total income other than income from State Government 56,322 48,655
NET COST OF SERVICES 45,233 41,392
Income from State GovernmentService appropriation 17 52,430 42,426Total income from State Government 52,430 42,426
SURPLUS FOR THE PERIOD 7,197 1,034
OTHER COMPREHENSIVE INCOMEItems not reclassified subsequently to profit or lossChanges in asset revaluation surplus 30 (21,460) 2,462Total other comprehensive income/(loss) (21,460) 2,462
TOTAL COMPREHENSIVE INCOME (LOSS) FOR THE PERIOD (14,263) 3,496
* Refer to Note 4 for prior period restatement. See also note 43 ‘Schedule of Income and Expenses by Service’. The Statement of Comprehensive Income should be read in conjunction with the accompanying notes.
CONTENTS
VENUESWEST ANNUAL REPORT 2016-201741DISCLOSURES & LEGAL COMPLIANCE
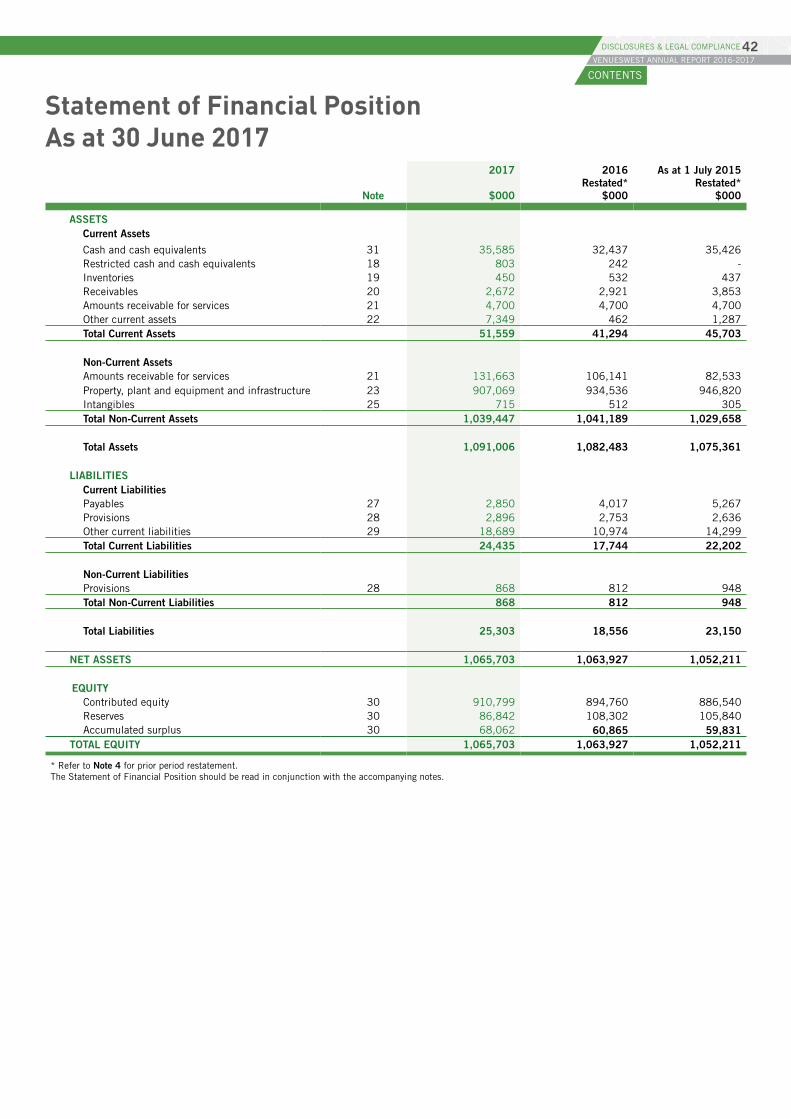
Statement of Financial Position As at 30 June 2017
Note
2017
$000
2016 Restated*
$000
As at 1 July 2015 Restated*
$000
ASSETSCurrent Assets
Cash and cash equivalents 31 35,585 32,437 35,426Restricted cash and cash equivalents 18 803 242 -Inventories 19 450 532 437Receivables 20 2,672 2,921 3,853Amounts receivable for services 21 4,700 4,700 4,700Other current assets 22 7,349 462 1,287Total Current Assets 51,559 41,294 45,703
Non-Current AssetsAmounts receivable for services 21 131,663 106,141 82,533Property, plant and equipment and infrastructure 23 907,069 934,536 946,820Intangibles 25 715 512 305Total Non-Current Assets 1,039,447 1,041,189 1,029,658
Total Assets 1,091,006 1,082,483 1,075,361
LIABILITIESCurrent LiabilitiesPayables 27 2,850 4,017 5,267Provisions 28 2,896 2,753 2,636Other current liabilities 29 18,689 10,974 14,299Total Current Liabilities 24,435 17,744 22,202
Non-Current LiabilitiesProvisions 28 868 812 948Total Non-Current Liabilities 868 812 948
Total Liabilities 25,303 18,556 23,150
NET ASSETS 1,065,703 1,063,927 1,052,211
EQUITYContributed equity 30 910,799 894,760 886,540Reserves 30 86,842 108,302 105,840Accumulated surplus 30 68,062 60,865 59,831
TOTAL EQUITY 1,065,703 1,063,927 1,052,211
* Refer to Note 4 for prior period restatement. The Statement of Financial Position should be read in conjunction with the accompanying notes.
CONTENTS
VENUESWEST ANNUAL REPORT 2016-201742DISCLOSURES & LEGAL COMPLIANCE
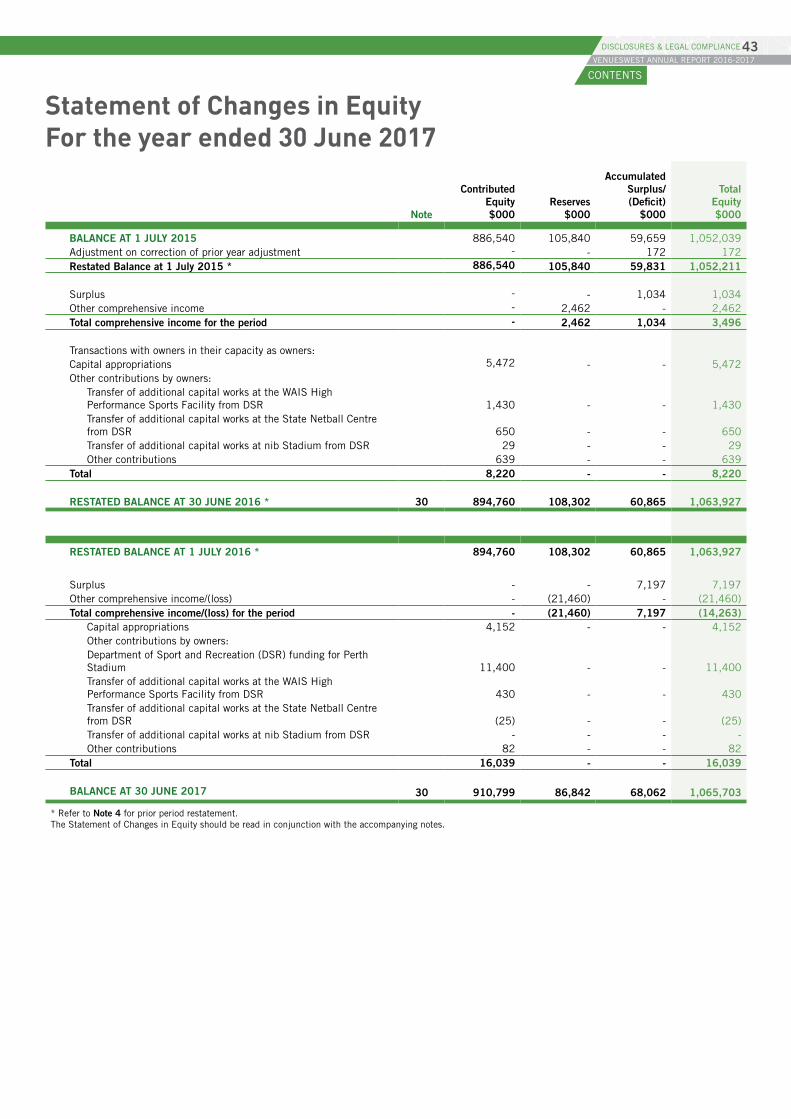
Statement of Changes in Equity For the year ended 30 June 2017
Note
Contributed Equity $000
Reserves $000
Accumulated Surplus/ (Deficit)
$000
Total Equity $000
BALANCE AT 1 JULY 2015 886,540 105,840 59,659 1,052,039Adjustment on correction of prior year adjustment - - 172 172Restated Balance at 1 July 2015 * 886,540 105,840 59,831 1,052,211
Surplus - - 1,034 1,034Other comprehensive income - 2,462 - 2,462Total comprehensive income for the period - 2,462 1,034 3,496
Transactions with owners in their capacity as owners:Capital appropriations 5,472 - - 5,472Other contributions by owners:
Transfer of additional capital works at the WAIS High Performance Sports Facility from DSR 1,430 - - 1,430Transfer of additional capital works at the State Netball Centre from DSR 650 - - 650Transfer of additional capital works at nib Stadium from DSR 29 - - 29Other contributions 639 - - 639
Total 8,220 - - 8,220
RESTATED BALANCE AT 30 JUNE 2016 * 30 894,760 108,302 60,865 1,063,927
RESTATED BALANCE AT 1 JULY 2016 * 894,760 108,302 60,865 1,063,927
Surplus - - 7,197 7,197Other comprehensive income/(loss) - (21,460) - (21,460)Total comprehensive income/(loss) for the period - (21,460) 7,197 (14,263)
Capital appropriations 4,152 - - 4,152Other contributions by owners:Department of Sport and Recreation (DSR) funding for Perth Stadium 11,400 - - 11,400Transfer of additional capital works at the WAIS High Performance Sports Facility from DSR 430 - - 430Transfer of additional capital works at the State Netball Centre from DSR (25) - - (25)Transfer of additional capital works at nib Stadium from DSR - - - -Other contributions 82 - - 82
Total 16,039 - - 16,039
BALANCE AT 30 JUNE 2017 30 910,799 86,842 68,062 1,065,703
* Refer to Note 4 for prior period restatement. The Statement of Changes in Equity should be read in conjunction with the accompanying notes.
CONTENTS
VENUESWEST ANNUAL REPORT 2016-201743DISCLOSURES & LEGAL COMPLIANCE
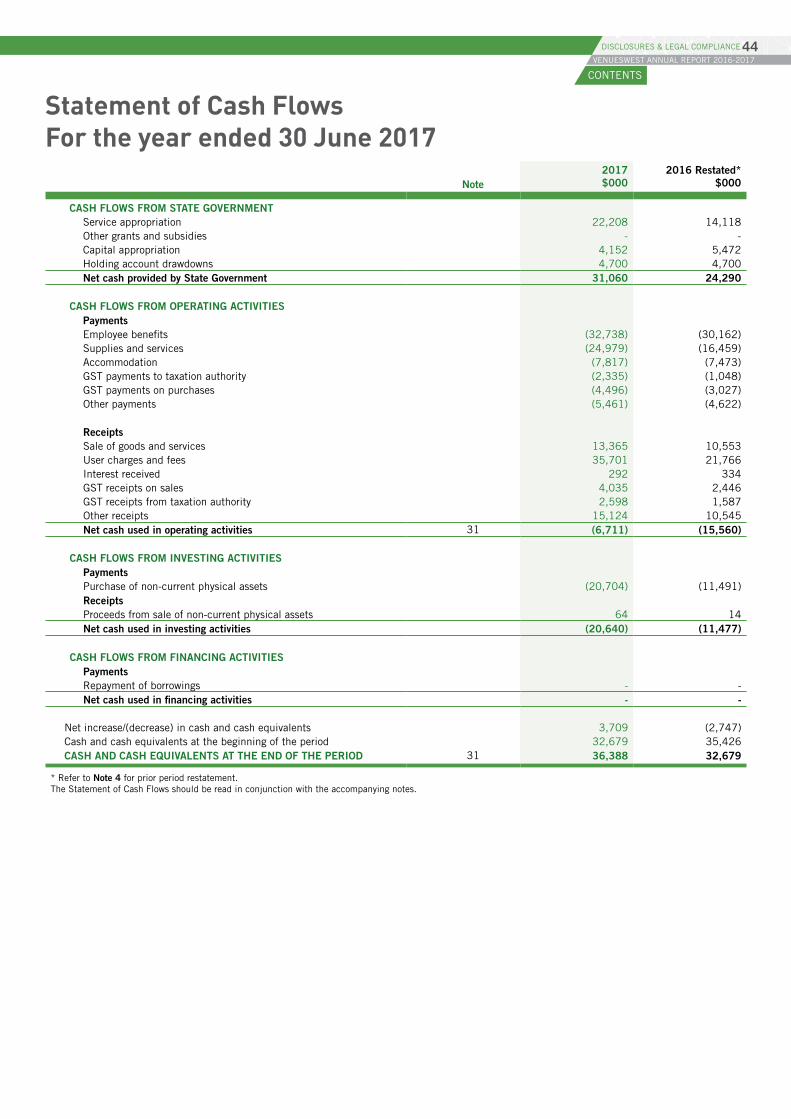
Statement of Cash Flows For the year ended 30 June 2017
Note2017 $000
2016 Restated* $000
CASH FLOWS FROM STATE GOVERNMENTService appropriation 22,208 14,118Other grants and subsidies - -Capital appropriation 4,152 5,472Holding account drawdowns 4,700 4,700Net cash provided by State Government 31,060 24,290
CASH FLOWS FROM OPERATING ACTIVITIES
PaymentsEmployee benefits (32,738) (30,162)Supplies and services (24,979) (16,459)Accommodation (7,817) (7,473)GST payments to taxation authority (2,335) (1,048)GST payments on purchases (4,496) (3,027)Other payments (5,461) (4,622)
ReceiptsSale of goods and services 13,365 10,553User charges and fees 35,701 21,766Interest received 292 334GST receipts on sales 4,035 2,446GST receipts from taxation authority 2,598 1,587Other receipts 15,124 10,545Net cash used in operating activities 31 (6,711) (15,560)
CASH FLOWS FROM INVESTING ACTIVITIESPaymentsPurchase of non-current physical assets (20,704) (11,491)ReceiptsProceeds from sale of non-current physical assets 64 14Net cash used in investing activities (20,640) (11,477)
CASH FLOWS FROM FINANCING ACTIVITIESPaymentsRepayment of borrowings - -Net cash used in financing activities - -
Net increase/(decrease) in cash and cash equivalents 3,709 (2,747)Cash and cash equivalents at the beginning of the period 32,679 35,426CASH AND CASH EQUIVALENTS AT THE END OF THE PERIOD 31 36,388 32,679
* Refer to Note 4 for prior period restatement. The Statement of Cash Flows should be read in conjunction with the accompanying notes.
CONTENTS
VENUESWEST ANNUAL REPORT 2016-201744DISCLOSURES & LEGAL COMPLIANCE
Notes to the Financial Statements for the year ended 30 June 2017
1. Australian Accounting StandardsGeneralThe Western Australian Sports Centre Trust’s (the Trust’s) financial statements for the year ended 30 June 2017 have been prepared in accordance with Australian Accounting Standards. The term ‘Australian Accounting Standards’ includes Standards and Interpretations issued by the Australian Accounting Standard Board (AASB).
The Trust has adopted any applicable, new and revised Australian Accounting Standards from their operative dates.
Early adoption of standardsThe Trust cannot early adopt an Australian Accounting Standard unless specifically permitted by TI1101 Application of Australian Accounting Standards and Other Pronouncements. There has been no early adoption of Australian Accounting Standards that have been issued or amended (but not operative) by the Trust for the annual reporting period ended 30 June 2017.
2. Summary of significant accounting policies(a) General statementThe Trust is a not-for-profit reporting entity that prepares general purpose financial statements in accordance with Australian Accounting Standards, the Framework, Statements of Accounting Concepts and other authoritative pronouncements of the AASB as applied by the Treasurer’s instructions. Several of these are modified by the Treasurer’s instructions to vary application, disclosure, format and wording.
The Financial Management Act 2006 and the Treasurer’s instructions impose legislative provisions that govern the preparation of financial statements and take precedence over Australian Accounting Standards, the Framework, Statements of Accounting Concepts and other authoritative pronouncements of the AASB.
Where modification is required and has had a material or significant financial effect upon the reported results, details of that modification and the resulting financial effect are disclosed in the notes to the financial statements.
(b) Basis of preparationThe financial statements have been prepared on the accrual basis of accounting using the historical cost convention, except for land, buildings and infrastructure which have been measured at fair value.
The accounting policies adopted in the preparation of the financial statements have been consistently applied throughout all periods presented unless otherwise stated.
The financial statements provide comparative information in respect of the previous period. An additional statement of financial position at the beginning of the preceding period is included because of a retrospective restatement. An additional statement of financial position as at 1 July 2015 is presented to apply the restatement retrospectively relating to the recognition of transactions of one of its venues. See Note 4.
The financial statements are presented in Australian dollars and all values are rounded to the nearest thousand dollars ($’000).
Note 3 ‘Key sources of estimation uncertainty’ discloses key assumptions made concerning the future, and other key sources of estimation uncertainty at the end of the reporting period that have a significant risk of causing a material adjustment to the carrying amounts of assets and liabilities within the next financial year.
(c) Reporting entityThe reporting entity comprises the Western Australian Sports Centre Trust, trading as VenuesWest.
(d) Contributed equityAASB Interpretation 1038 Contributions by Owners Made to Wholly-Owned Public Sector Entities requires transfers in the nature of equity contributions, other than as a result of a restructure of administrative arrangements, to be designated by the Government (the owner) as contributions by owners (at the time of, or prior to transfer) before such transfers can be recognised as equity contributions. Capital appropriations have been designated as contributions by owners by TI 955 Contributions by Owners made to Wholly Owned Public Sector Entities and have been credited directly to Contributed equity.
The transfer of net assets to/from other agencies, other than as a result of a restructure of administrative arrangements, are designated as contributions by owners where the transfers are non-discretionary and non-reciprocal.
(e) IncomeRevenue recognitionRevenue is measured at the fair value of consideration received or receivable. Revenue is recognised for the major business activities as follows:
Sale of goodsRevenue is recognised from the sale of goods and disposal of other assets when the significant risks and rewards of ownership transfer to the purchaser and can be measured reliably.
Provision of servicesRevenue is recognised by reference to the stage of completion of the transaction.
InterestRevenue is recognised as the interest accrues.
Service appropriationsService Appropriations are recognised as revenues at fair value in the period in which the Trust gains control of the appropriated funds. The Trust gains control of appropriated funds at the time those funds are deposited to the bank account or credited to the ‘Amounts receivable for services’ (holding account) held at Treasury.
Grants, donations, gifts and other non-reciprocal contributionsRevenue is recognised at fair value when the Trust obtains control over the assets comprising the contributions, usually when cash is received.
Other non-reciprocal contributions that are not contributions by owners are recognised at their fair value. Contributions of services are only recognised when a fair value can be reliably determined and the services would be purchased if not donated.
GainsRealised and unrealised gains are usually recognised on a net basis. These include gains arising on the disposal of non-current assets and some revaluations of non-current assets.
CONTENTS
VENUESWEST ANNUAL REPORT 2016-201745DISCLOSURES & LEGAL COMPLIANCE
Notes to the Financial Statements for the year ended 30 June 2017(f) Property, plant and equipment and infrastructureCapitalisation/expensing of assetsItems of property, plant and equipment and infrastructure costing $5,000 or more are recognised as assets and the cost of utilising assets is expensed (depreciated) over their useful lives. Items of property, plant and equipment and infrastructure costing less than $5,000 are immediately expensed direct to the Statement of Comprehensive Income (other than where they form part of a group of similar items which are significant in total).
Initial recognition and measurement Property, plant and equipment and infrastructure are initially recognised at cost.
For items of property, plant and equipment and infrastructure acquired at no cost or for nominal cost, cost is their fair value at the date of acquisition.
Subsequent measurement Subsequent to initial recognition as an asset, the revaluation model is used for the measurement of land, buildings and infrastructure and historical cost for all other property, plant and equipment. Land, buildings and infrastructure are carried at fair value less accumulated depreciation (buildings and infrastructure only) and accumulated impairment losses. All other items of property, plant and equipment are stated at historical cost less accumulated depreciation and accumulated impairment losses.
Where market-based evidence is available, the fair value of land and buildings is determined on the basis of current market buying values determined by reference to recent market transactions. When buildings are revalued by reference to recent market transactions, the accumulated depreciation is eliminated against the gross carrying amount of the asset and the net amount restated to the revalued amount.
Land and buildings are independently valued annually by the Western Australian Land Information Authority (Valuation Services) and recognised annually to ensure that the carrying amount does not differ materially from the asset’s fair value at the end of the reporting period.
In the absence of market-based evidence, fair value of land and buildings is determined on the basis of existing use. This normally applies where buildings are specialised or where land use is restricted. Fair value for existing use assets is determined by reference to the cost of replacing the remaining future economic benefits embodied in the asset, i.e. the depreciated replacement cost. Where the fair value of buildings is determined on the depreciated replacement cost basis, the gross carrying amount and the accumulated depreciation are restated proportionately.
Fair value of infrastructure has been determined by reference to the depreciated replacement cost (existing use basis) as the assets are specialized and no market-based evidence of value is available.
When infrastructure is revalued, the accumulated depreciation is restated proportionately with the change in the gross carrying amount of the asset so that the carrying amount of the asset after revaluation equals its revalued amount.
The most significant assumptions and judgements in estimating fair value are made in assessing whether to apply the existing use basis to assets and in determining estimated economic life. Professional judgment by the valuer is required where the evidence does not provide a clear distinction between market type assets and existing use assets.
DerecognitionUpon disposal or derecognition of an item of property, plant and equipment and infrastructure, any revaluation surplus relating to that asset is retained in the asset revaluation surplus.
Asset revaluation surplusThe asset revaluation surplus is used to record increments and decrements on the revaluation of non-current assets as described in note 23 ‘Property, plant and equipment and infrastructure’.
DepreciationAll non-current assets having a limited useful life are systematically depreciated over their estimated useful lives in a manner that reflects the consumption of their future economic benefits.
Depreciation is calculated using the straight line method, using rates which are reviewed annually. Estimated useful lives for each class of depreciable asset are:
Buildings 20 to 50 yearsLeased buildings 40 to 50 yearsPlant and equipment 3 to 15 yearsOffice equipment 3 to 10 yearsLeased office equipment 4 yearsBoating 5 yearsInfrastructure
· Bridges
· Roads, Pathways and Pavements
100 years
40 to 50 years
Works of art controlled by the Trust are classified as property, plant and equipment and infrastructure. These are anticipated to have indefinite useful lives. Their service potential has not, in any material sense, been consumed during the reporting period and consequently no depreciation has been recognised.
Land is not depreciated.
Land and buildings are held for the provision of elite, community and commercial sporting and entertainment activities. The future economic benefit of land and buildings is dependant on the Trust’s ability to generate cash inflows to provide the facilities for these activities.
(g) IntangiblesCapitalisation/expensing of assetsAcquisitions of intangible assets costing $5,000 or more are recognised as assets and the cost of utilising assets is expensed (depreciated) over their useful lives. Intangible assets costing less than $5,000 are immediately expensed direct to the Statement of Comprehensive Income (other than where they form part of a group of similar items which are significant in total).
Intangible assets are initially recognised at cost. For assets acquired at no cost or for nominal cost, the cost is their fair value at the date of acquisition.
The cost model is applied for subsequent measurement requiring the asset to be carried at cost less any accumulated amortisation and accumulated impairment losses.
Amortisation for intangible assets with finite useful lives is calculated for the period of the expected benefit (estimated useful life which is reviewed annually) on a straight line basis. All intangible assets controlled by the Trust have a useful life with zero residual value.
The expected useful lives for each class of intangible assets are:
Licences 3 to 10 yearsSoftware (a) 3 to 10 years(a) Software that is not integral to the operation of any hardware
LicencesLicences have a finite useful life and are carried at cost less accumulated amortisation and accumulated impairment losses.
Computer SoftwareSoftware that is an integral part of the related hardware is recognised as property, plant and equipment. Software that is not an integral part of the related hardware is recognised as an intangible asset. Software costing less than $5,000 is expensed in the year of acquisition.
CONTENTS
VENUESWEST ANNUAL REPORT 2016-201746DISCLOSURES & LEGAL COMPLIANCE
Notes to the Financial Statements for the year ended 30 June 2017(h) Impairment of assetsProperty, plant and equipment, infrastructure and intangible assets are tested for any indication of impairment at the end of each reporting period. Where there is an indication of impairment, the recoverable amount is estimated. Where an asset measured at cost is written down to recoverable amount, an impairment loss is recognised in profit or loss. Where a previously revalued asset is written down to recoverable amount, the loss is recognised as a revaluation decrement in other comprehensive income. As the Trust is a not-for-profit entity, unless an asset has been identified as a surplus asset, the recoverable amount is the higher of an asset’s fair value less costs to sell and depreciated replacement cost.
The risk of impairment is generally limited to circumstances where an asset’s depreciation is materially understated, where the replacement cost is falling or where there is a significant change in useful life. Each relevant class of assets is reviewed annually to verify that the accumulated depreciation/amortisation reflects the level of consumption or expiration of asset’s future economic benefits and to evaluate any impairment risk from falling replacement costs.
Intangible assets with an indefinite useful life and intangible assets not yet available for use are tested for impairment at the end of each reporting period irrespective of whether there is any indication of impairment.
The recoverable amount of assets identified as surplus assets is the higher of fair value less costs to sell and the present value of future cash flows expected to be derived from the asset. Surplus assets carried at fair value have no risk of material impairment where fair value is determined by reference to market-based evidence. Where fair value is determined by reference to depreciated replacement cost, surplus assets are at risk of impairment and the recoverable amount is measured. Surplus assets at cost are tested for indications of impairment at the end of each reporting period.
(i) LeasesThe Trust holds operating leases for its motor vehicles and three properties. Lease payments are expensed on a straight line basis over the lease term as this represents the pattern of benefits derived from the lease.
(j) Financial instrumentsIn addition to cash, the Trust has one category of financial instruments:
· Loans and receivables
Financial Instruments have been disaggregated into the following classes:
Financial Assets · Cash and cash equivalents
· Restricted cash and cash equivalents
· Receivables
· Amounts receivable for services
Financial Liabilities · Payables
Initial recognition and measurement of financial instruments is at fair value which normally equates to the transaction cost or the face value. Subsequent measurement is at amortised cost using the effective interest method.
The fair value of short-term receivables and payables is the transaction cost or the face value because there is no interest rate applicable and subsequent measurement is not required as the effect of discounting is not material.
(k) Cash and cash equivalentsFor the purpose of the Statement of Cash Flows, cash and cash equivalent (and restricted cash and cash equivalents) assets comprise cash on hand.
(l) Accrued salariesAccrued salaries (see note 27 ‘Payables’) represent the amount due to staff but unpaid at the end of the financial year. Accrued salaries are settled within a fortnight of the financial year end. The Trust considers the carrying amount of accrued salaries to be equivalent to its fair value.
(m) Amounts receivable for services (holding account)The Trust receives income from the State Government partly in cash and partly as an asset (holding account receivable). The holding account receivable balance, resulting from service appropriation funding, is accessible on the emergence of the cash funding requirement to cover leave entitlements and asset replacement.
(n) InventoriesInventories are measured at the lower of cost and net realisable value. Costs are assigned by the method most appropriate to each particular class of inventory, with the majority being valued on a first in first out basis. Inventories not held for resale are valued at cost unless they are no longer required, in which case they are valued at net realisable value.
(o) ReceivablesReceivables are recognised and carried at original invoice amount less an allowance for any uncollectible amounts (i.e. impairment). The collectability of receivables is reviewed on an ongoing basis and any receivables identified as uncollectible are written-off against the allowance account. The allowance for uncollectible amounts (doubtful debts) is raised when there is objective evidence that the Trust will not be able to collect its debts. The carrying amount is equivalent to fair value as it is due for settlement within 30 days.
(p) PayablesPayables are recognised at the amounts payable when the Trust becomes obliged to make future payments as a result of a purchase of assets or services. The carrying amount is equivalent to fair value, as they are generally settled within 30 days.
(q) ProvisionsProvisions are liabilities of uncertain timing and amount and are recognised where there is a present legal or constructive obligation as a result of a past event and when the outflow of resources embodying economic benefits is probable and a reliable estimate can be made of the amount of the obligation. Provisions are reviewed at the end of each reporting period.
Provisions - employee benefitsAll annual leave and long service leave provisions are in respect of employees’ services up to the end of the reporting period.
Annual leaveAnnual leave is not expected to be settled wholly within 12 months after the end of the reporting period and is therefore considered to be ‘other long term employee benefits’. The annual leave liability is recognised and measured at the present value of amounts expected to be paid when the liabilities are settled using the remuneration rate expected to apply at the time of settlement.
When assessing expected future payments consideration is given to expected future wage and salary levels including non salary components such as employer superannuation contributions, as well as the experience of employee departures and periods of service. The expected future payments are discounted using market yields at the end of the reporting period on national government bonds with terms to maturity that match, as closely as possible, the estimated future cash outflows.
The provision for annual leave is classified as a current liability as the Trust does not have an unconditional right to defer settlement of the liability for at least 12 months after the end of the reporting period.
CONTENTS
VENUESWEST ANNUAL REPORT 2016-201747DISCLOSURES & LEGAL COMPLIANCE
Notes to the Financial Statements for the year ended 30 June 2017(q) Provisions - cont
Long service leaveA liability for long service leave is recognised after an employee has completed two years of service based on remuneration rates current as at the end of the reporting period.
An actuarial assessment of long service leave undertaken by PriceWaterhouseCoopers at30 June 2016 determined that the liability measured using the short-hand measurement technique above was not materially different from the liability determined using the present value of expected future payments. This calculation is consistent with the Trust’s experience of employee retention and leave taken.
Unconditional long service leave provisions are classified as current liabilities as the Trust does not have an unconditional right to defer settlement of the liability for at least 12 months after the end of the reporting period. Pre-conditional and conditional long service leave provisions are classified as non-current liabilities because the Trust has an unconditional right to defer the settlement of the liability until the employee has completed the requisite years of service.
SuperannuationThe Government Employees Superannuation Board (GESB) and other funds administer public sector superannuation arrangements in Western Australia in accordance with legislative requirements. Eligibility criteria for membership in particular schemes for public sector employees varies according to commencement and implementation dates.
Eligible employees contribute to the Pension Scheme, a defined benefit pension scheme closed to new members since 1987, or the Gold State Superannuation Scheme (GSS), a defined benefit lump sum scheme closed to new members since 1995.
Employees commencing employment prior to 16 April 2007 who were not members of either the Pension or the GSS Schemes became non-contributory members of the West State Superannuation Scheme (WSS). Employees commencing employment on or after 16 April 2007 became members of the GESB Super Scheme (GESBS). From 30 March 2012, existing members of the WSS or GESBS and new employees became able to choose their preferred superannuation fund. The Trust makes concurrent contributions to GESB or other funds on behalf of employees in compliance with the Commonwealth Government’s Superannuation Guarantee (Administration) Act 1992. Contributions to these accumulation schemes extinguish the Trust’s liability for superannuation charges in respect of employees who are not members of the Pension Scheme or GSS.
The GSS is a defined benefit scheme for the purposes of employees and whole-of-government reporting. However, it is a defined contribution plan for Trust purposes because the concurrent contributions (defined contributions) made by the Trust to GESB extinguishes the Trust’s obligations to the related superannuation liability.
The Trust has no liabilities under the Pension or the GSS Schemes. The liabilities for the unfunded Pension Scheme and the unfunded GSS Scheme transfer benefits attributable to members who transferred from the Pension Scheme, are assumed by the Treasurer. All other GSS Scheme obligations are funded by concurrent contributions made by the Trust to the GESB.
The GESB makes all benefit payments in respect of the Pension and GSS Schemes, and is recouped from the Treasurer for the employer’s share.
Provisions - otherEmployment on-costsEmployment on-costs, including workers’ compensation insurance, are not employee benefits and are recognised separately as liabilities and expenses when the employment to which they relate has occurred. Employment on-costs are included as part of ‘Other Expenses’ and are not included as part of the Trust’s ‘Employee benefits expense’. The related liability is included in ‘Employment on-costs provision’.
(r) Superannuation expenseThe superannuation expense in the Statement of Comprehensive Income comprises employer contributions paid to the GSS (concurrent contributions), WSS, the GESBS, and other superannuation funds.
(s) Assets and services received free of charge or for nominal costAssets or services received free of charge or for nominal cost, that the Trust would otherwise purchase if not donated, are recognised as income at the fair value of the assets or services where they can be reliably measured. A corresponding expense is recognised for services received. Receipts of assets are recognised in the Statement of Financial Position.
Services received from other State Government agencies are separately disclosed under Income from State Government in the Statement of Comprehensive Income.
Non-reciprocal transfers of assets from other government agencies are recognised as Contributions from owners .
3. Key sources of estimation uncertainty and judgementKey estimates and assumptions concerning the future are based on historical experience and various other factors that have a risk of causing a material adjustment to the carrying amount of assets and liabilities within the next financial year.
Depreciated replacement cost In the absence of market-based evidence, fair value of land and buildings is determined on the basis of existing use. Fair value for existing use assets is determined by reference to the cost of replacing the remaining future economic benefits embodied in the asset, i.e. the depreciated replacement cost. In determining the depreciated replacement cost, estimation uncertainty relates to the determination of a suitable inflationary index.
Agent managed venuesWhen VenuesWest enters into an agreement with an external operator to manage a venue, management undertakes judgement in relation to the assessment of whether the arrangement between VenuesWest and the operator will result in a principal/agent relationship, where the operator acts as an agent on behalf of VenuesWest.
Long service leaveSeveral estimations and assumptions used in calculating the Trust’s long service leave provision include expected future salary rates, discount rates, employee retention rates and expected future payments. Changes in these estimations and assumptions may impact on the carrying amount of the long service leave provision.
CONTENTS
VENUESWEST ANNUAL REPORT 2016-201748DISCLOSURES & LEGAL COMPLIANCE
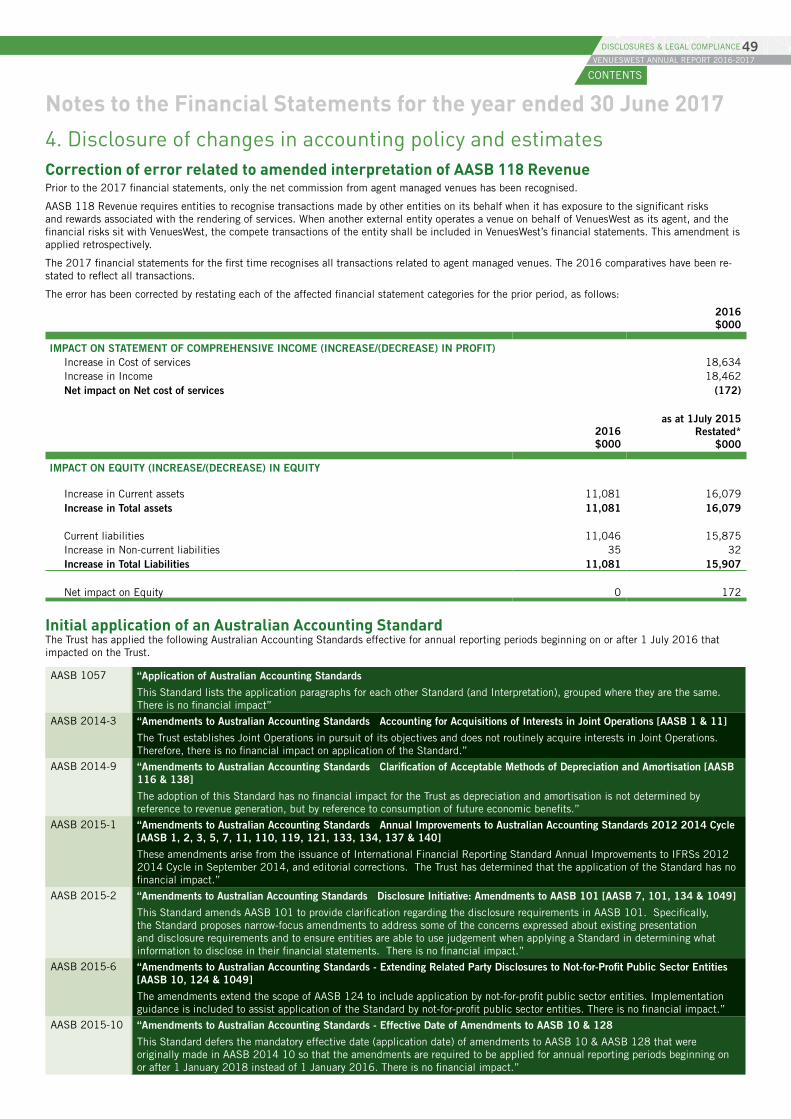
Notes to the Financial Statements for the year ended 30 June 2017
4. Disclosure of changes in accounting policy and estimatesCorrection of error related to amended interpretation of AASB 118 RevenuePrior to the 2017 financial statements, only the net commission from agent managed venues has been recognised.
AASB 118 Revenue requires entities to recognise transactions made by other entities on its behalf when it has exposure to the significant risks and rewards associated with the rendering of services. When another external entity operates a venue on behalf of VenuesWest as its agent, and the financial risks sit with VenuesWest, the compete transactions of the entity shall be included in VenuesWest’s financial statements. This amendment is applied retrospectively.
The 2017 financial statements for the first time recognises all transactions related to agent managed venues. The 2016 comparatives have been re-stated to reflect all transactions.
The error has been corrected by restating each of the affected financial statement categories for the prior period, as follows:
2016 $000
IMPACT ON STATEMENT OF COMPREHENSIVE INCOME (INCREASE/(DECREASE) IN PROFIT)Increase in Cost of services 18,634Increase in Income 18,462Net impact on Net cost of services (172)
2016 $000
as at 1July 2015 Restated*
$000
IMPACT ON EQUITY (INCREASE/(DECREASE) IN EQUITY
Increase in Current assets 11,081 16,079Increase in Total assets 11,081 16,079
Current liabilities 11,046 15,875Increase in Non-current liabilities 35 32Increase in Total Liabilities 11,081 15,907
Net impact on Equity 0 172
Initial application of an Australian Accounting StandardThe Trust has applied the following Australian Accounting Standards effective for annual reporting periods beginning on or after 1 July 2016 that impacted on the Trust.
AASB 1057 “Application of Australian Accounting Standards
This Standard lists the application paragraphs for each other Standard (and Interpretation), grouped where they are the same. There is no financial impact”
AASB 2014-3 “Amendments to Australian Accounting Standards Accounting for Acquisitions of Interests in Joint Operations [AASB 1 & 11]
The Trust establishes Joint Operations in pursuit of its objectives and does not routinely acquire interests in Joint Operations. Therefore, there is no financial impact on application of the Standard.”
AASB 2014-9 “Amendments to Australian Accounting Standards Clarification of Acceptable Methods of Depreciation and Amortisation [AASB 116 & 138]
The adoption of this Standard has no financial impact for the Trust as depreciation and amortisation is not determined by reference to revenue generation, but by reference to consumption of future economic benefits.”
AASB 2015-1 “Amendments to Australian Accounting Standards Annual Improvements to Australian Accounting Standards 2012 2014 Cycle [AASB 1, 2, 3, 5, 7, 11, 110, 119, 121, 133, 134, 137 & 140]
These amendments arise from the issuance of International Financial Reporting Standard Annual Improvements to IFRSs 2012 2014 Cycle in September 2014, and editorial corrections. The Trust has determined that the application of the Standard has no financial impact.”
AASB 2015-2 “Amendments to Australian Accounting Standards Disclosure Initiative: Amendments to AASB 101 [AASB 7, 101, 134 & 1049]
This Standard amends AASB 101 to provide clarification regarding the disclosure requirements in AASB 101. Specifically, the Standard proposes narrow-focus amendments to address some of the concerns expressed about existing presentation and disclosure requirements and to ensure entities are able to use judgement when applying a Standard in determining what information to disclose in their financial statements. There is no financial impact.”
AASB 2015-6 “Amendments to Australian Accounting Standards - Extending Related Party Disclosures to Not-for-Profit Public Sector Entities [AASB 10, 124 & 1049]
The amendments extend the scope of AASB 124 to include application by not-for-profit public sector entities. Implementation guidance is included to assist application of the Standard by not-for-profit public sector entities. There is no financial impact.”
AASB 2015-10 “Amendments to Australian Accounting Standards - Effective Date of Amendments to AASB 10 & 128
This Standard defers the mandatory effective date (application date) of amendments to AASB 10 & AASB 128 that were originally made in AASB 2014 10 so that the amendments are required to be applied for annual reporting periods beginning on or after 1 January 2018 instead of 1 January 2016. There is no financial impact.”
CONTENTS
VENUESWEST ANNUAL REPORT 2016-201749DISCLOSURES & LEGAL COMPLIANCE
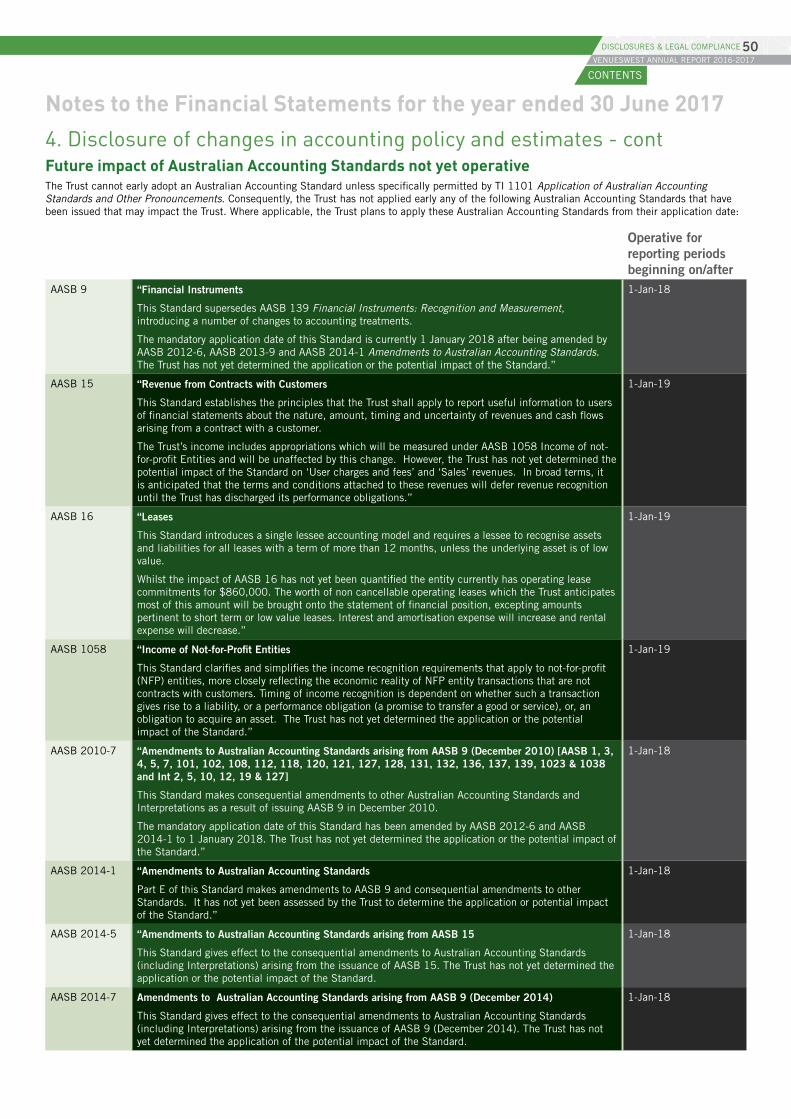
Notes to the Financial Statements for the year ended 30 June 2017
4. Disclosure of changes in accounting policy and estimates - contFuture impact of Australian Accounting Standards not yet operativeThe Trust cannot early adopt an Australian Accounting Standard unless specifically permitted by TI 1101 Application of Australian Accounting Standards and Other Pronouncements. Consequently, the Trust has not applied early any of the following Australian Accounting Standards that have been issued that may impact the Trust. Where applicable, the Trust plans to apply these Australian Accounting Standards from their application date:
Operative for reporting periods beginning on/after
AASB 9 “Financial Instruments
This Standard supersedes AASB 139 Financial Instruments: Recognition and Measurement, introducing a number of changes to accounting treatments.
The mandatory application date of this Standard is currently 1 January 2018 after being amended by AASB 2012-6, AASB 2013-9 and AASB 2014-1 Amendments to Australian Accounting Standards. The Trust has not yet determined the application or the potential impact of the Standard.”
1-Jan-18
AASB 15 “Revenue from Contracts with Customers
This Standard establishes the principles that the Trust shall apply to report useful information to users of financial statements about the nature, amount, timing and uncertainty of revenues and cash flows arising from a contract with a customer.
The Trust’s income includes appropriations which will be measured under AASB 1058 Income of not-for-profit Entities and will be unaffected by this change. However, the Trust has not yet determined the potential impact of the Standard on ‘User charges and fees’ and ‘Sales’ revenues. In broad terms, it is anticipated that the terms and conditions attached to these revenues will defer revenue recognition until the Trust has discharged its performance obligations.”
1-Jan-19
AASB 16 “Leases
This Standard introduces a single lessee accounting model and requires a lessee to recognise assets and liabilities for all leases with a term of more than 12 months, unless the underlying asset is of low value.
Whilst the impact of AASB 16 has not yet been quantified the entity currently has operating lease commitments for $860,000. The worth of non cancellable operating leases which the Trust anticipates most of this amount will be brought onto the statement of financial position, excepting amounts pertinent to short term or low value leases. Interest and amortisation expense will increase and rental expense will decrease.”
1-Jan-19
AASB 1058 “Income of Not-for-Profit Entities
This Standard clarifies and simplifies the income recognition requirements that apply to not-for-profit (NFP) entities, more closely reflecting the economic reality of NFP entity transactions that are not contracts with customers. Timing of income recognition is dependent on whether such a transaction gives rise to a liability, or a performance obligation (a promise to transfer a good or service), or, an obligation to acquire an asset. The Trust has not yet determined the application or the potential impact of the Standard.”
1-Jan-19
AASB 2010-7 “Amendments to Australian Accounting Standards arising from AASB 9 (December 2010) [AASB 1, 3, 4, 5, 7, 101, 102, 108, 112, 118, 120, 121, 127, 128, 131, 132, 136, 137, 139, 1023 & 1038 and Int 2, 5, 10, 12, 19 & 127]
This Standard makes consequential amendments to other Australian Accounting Standards and Interpretations as a result of issuing AASB 9 in December 2010.
The mandatory application date of this Standard has been amended by AASB 2012-6 and AASB 2014-1 to 1 January 2018. The Trust has not yet determined the application or the potential impact of the Standard.”
1-Jan-18
AASB 2014-1 “Amendments to Australian Accounting Standards
Part E of this Standard makes amendments to AASB 9 and consequential amendments to other Standards. It has not yet been assessed by the Trust to determine the application or potential impact of the Standard.”
1-Jan-18
AASB 2014-5 “Amendments to Australian Accounting Standards arising from AASB 15
This Standard gives effect to the consequential amendments to Australian Accounting Standards (including Interpretations) arising from the issuance of AASB 15. The Trust has not yet determined the application or the potential impact of the Standard.
1-Jan-18
AASB 2014-7 Amendments to Australian Accounting Standards arising from AASB 9 (December 2014)
This Standard gives effect to the consequential amendments to Australian Accounting Standards (including Interpretations) arising from the issuance of AASB 9 (December 2014). The Trust has not yet determined the application of the potential impact of the Standard.
1-Jan-18
CONTENTS
VENUESWEST ANNUAL REPORT 2016-201750DISCLOSURES & LEGAL COMPLIANCE
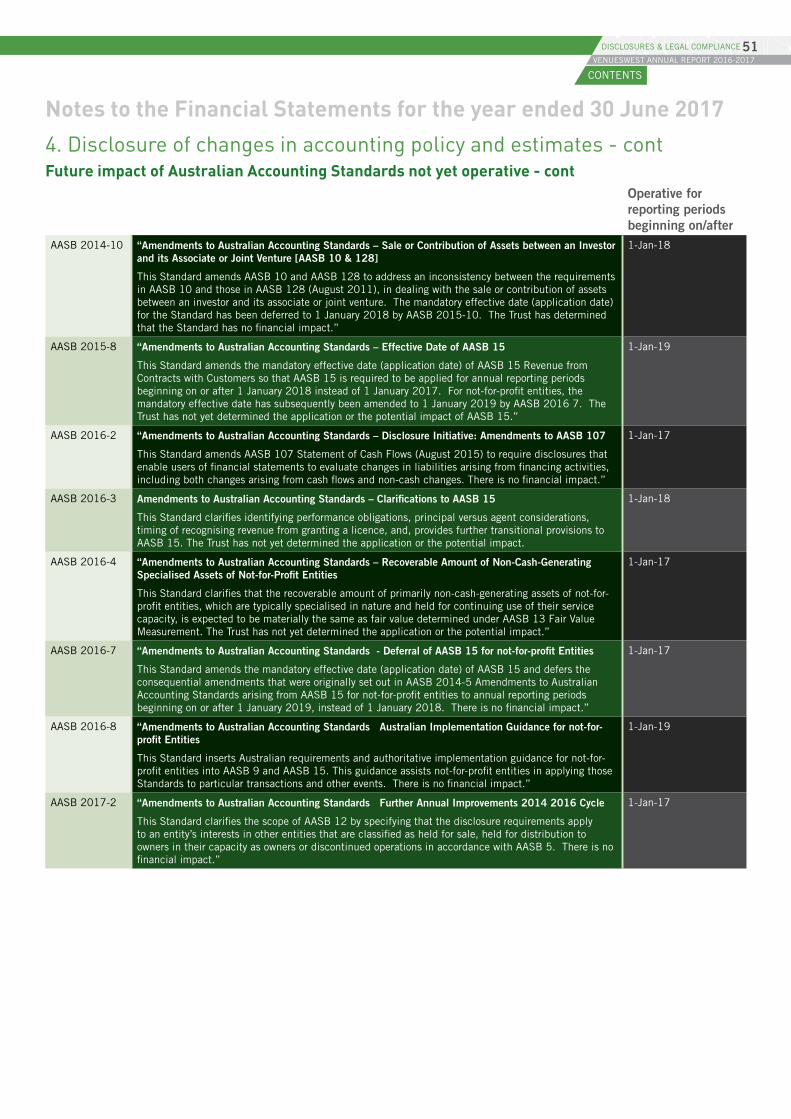
Notes to the Financial Statements for the year ended 30 June 2017
4. Disclosure of changes in accounting policy and estimates - contFuture impact of Australian Accounting Standards not yet operative - cont
Operative for reporting periods beginning on/after
AASB 2014-10 “Amendments to Australian Accounting Standards – Sale or Contribution of Assets between an Investor and its Associate or Joint Venture [AASB 10 & 128]
This Standard amends AASB 10 and AASB 128 to address an inconsistency between the requirements in AASB 10 and those in AASB 128 (August 2011), in dealing with the sale or contribution of assets between an investor and its associate or joint venture. The mandatory effective date (application date) for the Standard has been deferred to 1 January 2018 by AASB 2015-10. The Trust has determined that the Standard has no financial impact.”
1-Jan-18
AASB 2015-8 “Amendments to Australian Accounting Standards – Effective Date of AASB 15
This Standard amends the mandatory effective date (application date) of AASB 15 Revenue from Contracts with Customers so that AASB 15 is required to be applied for annual reporting periods beginning on or after 1 January 2018 instead of 1 January 2017. For not-for-profit entities, the mandatory effective date has subsequently been amended to 1 January 2019 by AASB 2016 7. The Trust has not yet determined the application or the potential impact of AASB 15.”
1-Jan-19
AASB 2016-2 “Amendments to Australian Accounting Standards – Disclosure Initiative: Amendments to AASB 107
This Standard amends AASB 107 Statement of Cash Flows (August 2015) to require disclosures that enable users of financial statements to evaluate changes in liabilities arising from financing activities, including both changes arising from cash flows and non-cash changes. There is no financial impact.”
1-Jan-17
AASB 2016-3 Amendments to Australian Accounting Standards – Clarifications to AASB 15
This Standard clarifies identifying performance obligations, principal versus agent considerations, timing of recognising revenue from granting a licence, and, provides further transitional provisions to AASB 15. The Trust has not yet determined the application or the potential impact.
1-Jan-18
AASB 2016-4 “Amendments to Australian Accounting Standards – Recoverable Amount of Non-Cash-Generating Specialised Assets of Not-for-Profit Entities
This Standard clarifies that the recoverable amount of primarily non-cash-generating assets of not-for-profit entities, which are typically specialised in nature and held for continuing use of their service capacity, is expected to be materially the same as fair value determined under AASB 13 Fair Value Measurement. The Trust has not yet determined the application or the potential impact.”
1-Jan-17
AASB 2016-7 “Amendments to Australian Accounting Standards - Deferral of AASB 15 for not-for-profit Entities
This Standard amends the mandatory effective date (application date) of AASB 15 and defers the consequential amendments that were originally set out in AASB 2014-5 Amendments to Australian Accounting Standards arising from AASB 15 for not-for-profit entities to annual reporting periods beginning on or after 1 January 2019, instead of 1 January 2018. There is no financial impact.”
1-Jan-17
AASB 2016-8 “Amendments to Australian Accounting Standards Australian Implementation Guidance for not-for-profit Entities
This Standard inserts Australian requirements and authoritative implementation guidance for not-for-profit entities into AASB 9 and AASB 15. This guidance assists not-for-profit entities in applying those Standards to particular transactions and other events. There is no financial impact.”
1-Jan-19
AASB 2017-2 “Amendments to Australian Accounting Standards Further Annual Improvements 2014 2016 Cycle
This Standard clarifies the scope of AASB 12 by specifying that the disclosure requirements apply to an entity’s interests in other entities that are classified as held for sale, held for distribution to owners in their capacity as owners or discontinued operations in accordance with AASB 5. There is no financial impact.”
1-Jan-17
CONTENTS
VENUESWEST ANNUAL REPORT 2016-201751DISCLOSURES & LEGAL COMPLIANCE
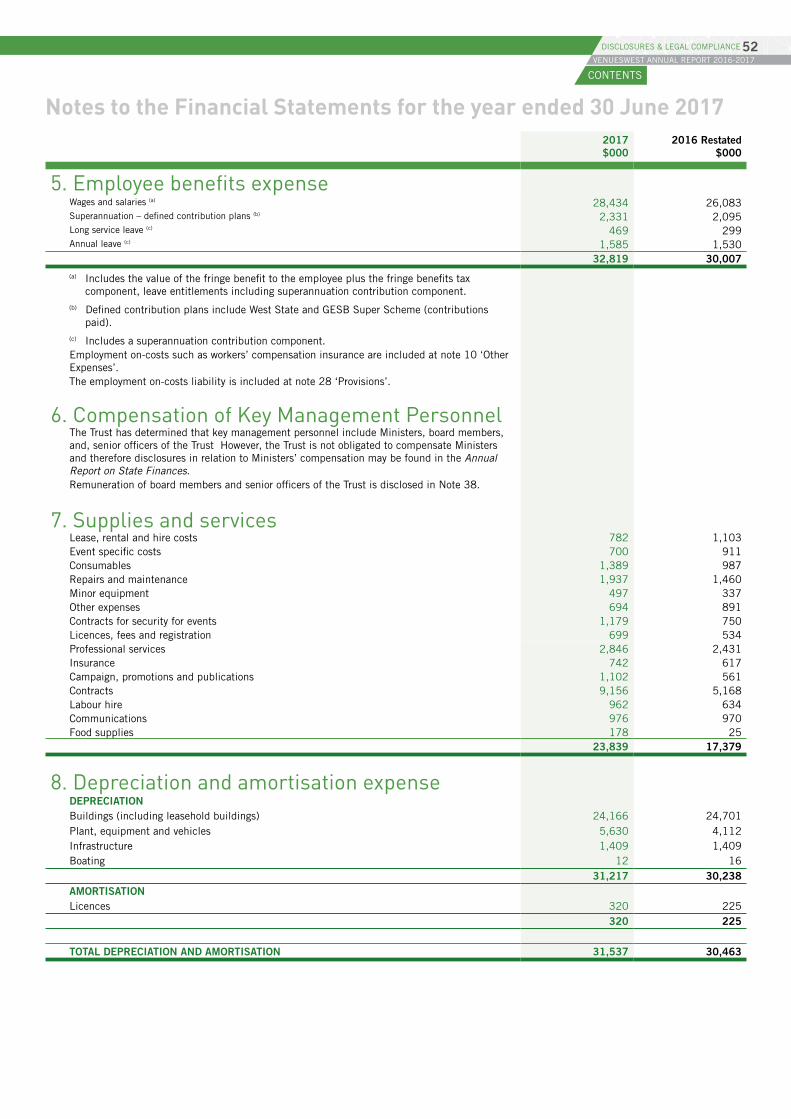
Notes to the Financial Statements for the year ended 30 June 20172017 $000
2016 Restated $000
5. Employee benefits expenseWages and salaries (a) 28,434 26,083Superannuation – defined contribution plans (b) 2,331 2,095Long service leave (c) 469 299Annual leave (c) 1,585 1,530
32,819 30,007(a) Includes the value of the fringe benefit to the employee plus the fringe benefits tax
component, leave entitlements including superannuation contribution component.(b) Defined contribution plans include West State and GESB Super Scheme (contributions
paid).(c) Includes a superannuation contribution component.Employment on-costs such as workers’ compensation insurance are included at note 10 ‘Other Expenses’.The employment on-costs liability is included at note 28 ‘Provisions’.
6. Compensation of Key Management PersonnelThe Trust has determined that key management personnel include Ministers, board members, and, senior officers of the Trust However, the Trust is not obligated to compensate Ministers and therefore disclosures in relation to Ministers’ compensation may be found in the Annual Report on State Finances.Remuneration of board members and senior officers of the Trust is disclosed in Note 38.
7. Supplies and servicesLease, rental and hire costs 782 1,103Event specific costs 700 911Consumables 1,389 987Repairs and maintenance 1,937 1,460Minor equipment 497 337Other expenses 694 891Contracts for security for events 1,179 750Licences, fees and registration 699 534Professional services 2,846 2,431Insurance 742 617Campaign, promotions and publications 1,102 561Contracts 9,156 5,168Labour hire 962 634Communications 976 970Food supplies 178 25
23,839 17,379
8. Depreciation and amortisation expenseDEPRECIATIONBuildings (including leasehold buildings) 24,166 24,701Plant, equipment and vehicles 5,630 4,112Infrastructure 1,409 1,409Boating 12 16
31,217 30,238AMORTISATIONLicences 320 225
320 225
TOTAL DEPRECIATION AND AMORTISATION 31,537 30,463
CONTENTS
VENUESWEST ANNUAL REPORT 2016-201752DISCLOSURES & LEGAL COMPLIANCE
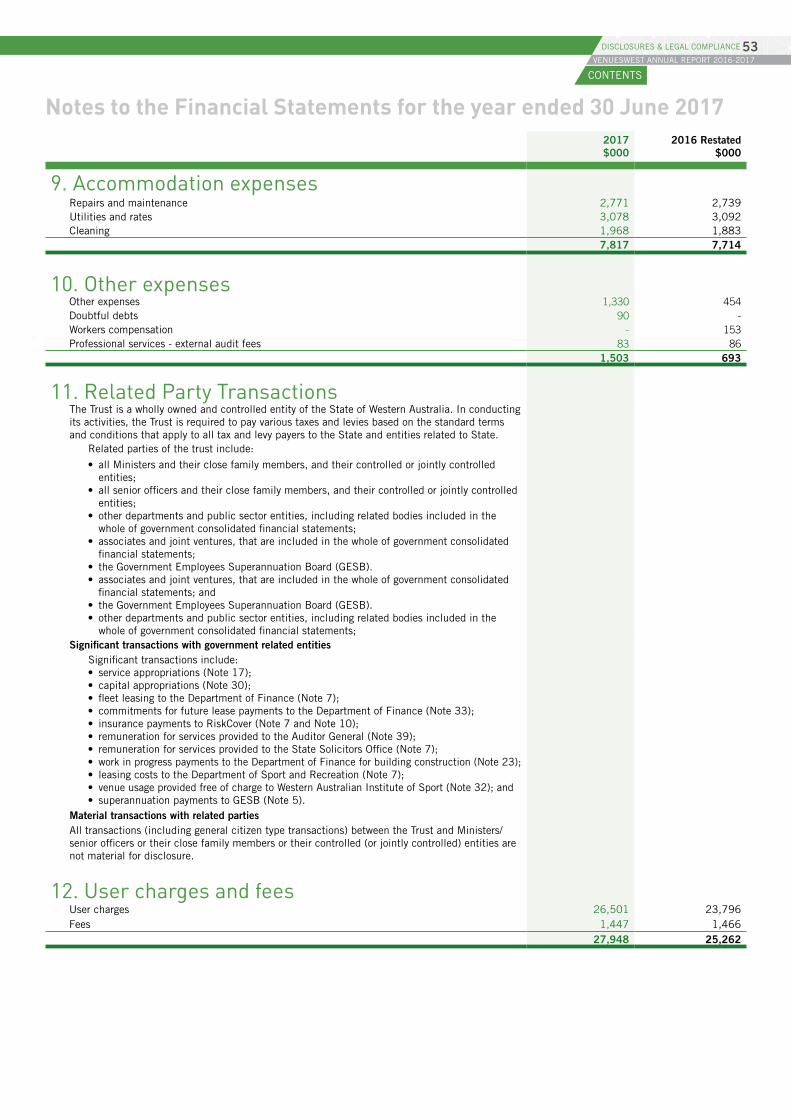
Notes to the Financial Statements for the year ended 30 June 20172017 $000
2016 Restated $000
9. Accommodation expensesRepairs and maintenance 2,771 2,739Utilities and rates 3,078 3,092Cleaning 1,968 1,883
7,817 7,714
10. Other expensesOther expenses 1,330 454Doubtful debts 90 -Workers compensation - 153Professional services - external audit fees 83 86
1,503 693
11. Related Party TransactionsThe Trust is a wholly owned and controlled entity of the State of Western Australia. In conducting its activities, the Trust is required to pay various taxes and levies based on the standard terms and conditions that apply to all tax and levy payers to the State and entities related to State.
Related parties of the trust include:
• all Ministers and their close family members, and their controlled or jointly controlled entities;
• all senior officers and their close family members, and their controlled or jointly controlled entities;
• other departments and public sector entities, including related bodies included in the whole of government consolidated financial statements;
• associates and joint ventures, that are included in the whole of government consolidated financial statements;
• the Government Employees Superannuation Board (GESB).• associates and joint ventures, that are included in the whole of government consolidated
financial statements; and• the Government Employees Superannuation Board (GESB).• other departments and public sector entities, including related bodies included in the
whole of government consolidated financial statements;Significant transactions with government related entities
Significant transactions include:• service appropriations (Note 17);• capital appropriations (Note 30);• fleet leasing to the Department of Finance (Note 7);• commitments for future lease payments to the Department of Finance (Note 33);• insurance payments to RiskCover (Note 7 and Note 10);• remuneration for services provided to the Auditor General (Note 39);• remuneration for services provided to the State Solicitors Office (Note 7);• work in progress payments to the Department of Finance for building construction (Note 23);• leasing costs to the Department of Sport and Recreation (Note 7);• venue usage provided free of charge to Western Australian Institute of Sport (Note 32); and• superannuation payments to GESB (Note 5).
Material transactions with related partiesAll transactions (including general citizen type transactions) between the Trust and Ministers/senior officers or their close family members or their controlled (or jointly controlled) entities are not material for disclosure.
12. User charges and feesUser charges 26,501 23,796Fees 1,447 1,466
27,948 25,262
CONTENTS
VENUESWEST ANNUAL REPORT 2016-201753DISCLOSURES & LEGAL COMPLIANCE
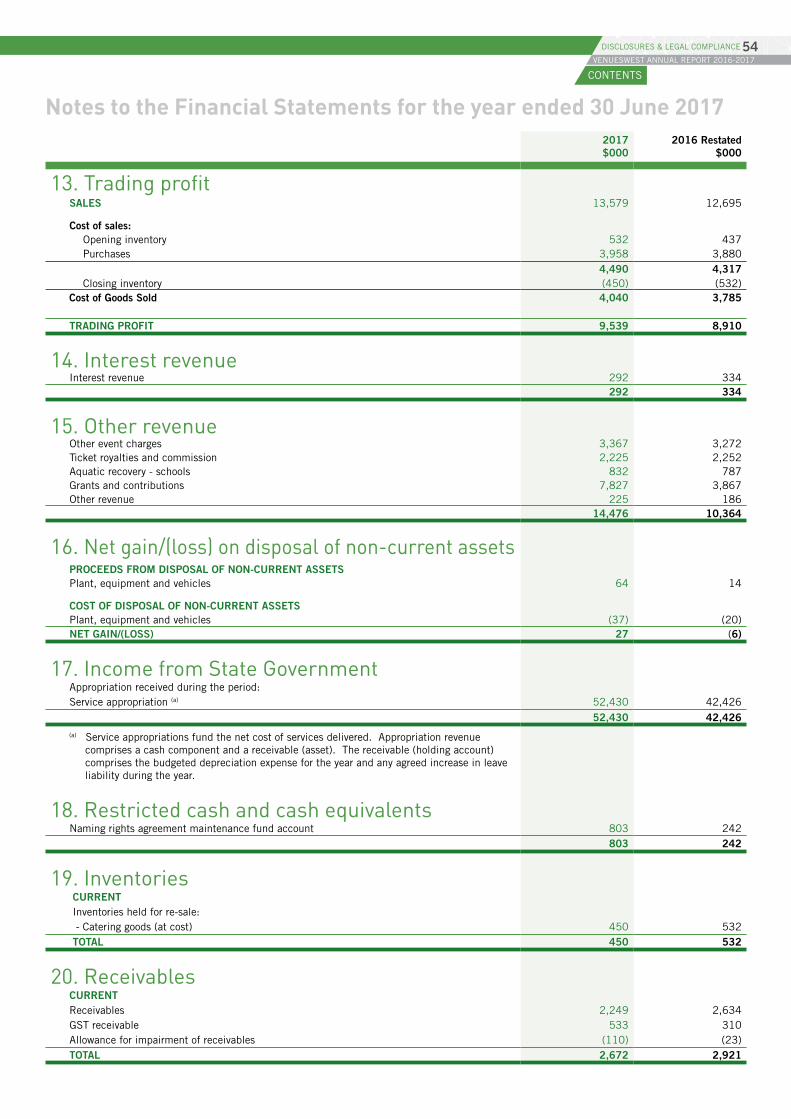
Notes to the Financial Statements for the year ended 30 June 20172017 $000
2016 Restated $000
13. Trading profitSALES 13,579 12,695
Cost of sales:Opening inventory 532 437Purchases 3,958 3,880
4,490 4,317Closing inventory (450) (532)
Cost of Goods Sold 4,040 3,785
TRADING PROFIT 9,539 8,910
14. Interest revenueInterest revenue 292 334
292 334
15. Other revenueOther event charges 3,367 3,272Ticket royalties and commission 2,225 2,252Aquatic recovery - schools 832 787Grants and contributions 7,827 3,867Other revenue 225 186
14,476 10,364
16. Net gain/(loss) on disposal of non-current assetsPROCEEDS FROM DISPOSAL OF NON-CURRENT ASSETSPlant, equipment and vehicles 64 14
COST OF DISPOSAL OF NON-CURRENT ASSETSPlant, equipment and vehicles (37) (20)NET GAIN/(LOSS) 27 (6)
17. Income from State GovernmentAppropriation received during the period:Service appropriation (a) 52,430 42,426
52,430 42,426(a) Service appropriations fund the net cost of services delivered. Appropriation revenue
comprises a cash component and a receivable (asset). The receivable (holding account) comprises the budgeted depreciation expense for the year and any agreed increase in leave liability during the year.
18. Restricted cash and cash equivalentsNaming rights agreement maintenance fund account 803 242
803 242
19. Inventories CURRENT Inventories held for re-sale: - Catering goods (at cost) 450 532 TOTAL 450 532
20. ReceivablesCURRENTReceivables 2,249 2,634GST receivable 533 310Allowance for impairment of receivables (110) (23)TOTAL 2,672 2,921
CONTENTS
VENUESWEST ANNUAL REPORT 2016-201754DISCLOSURES & LEGAL COMPLIANCE
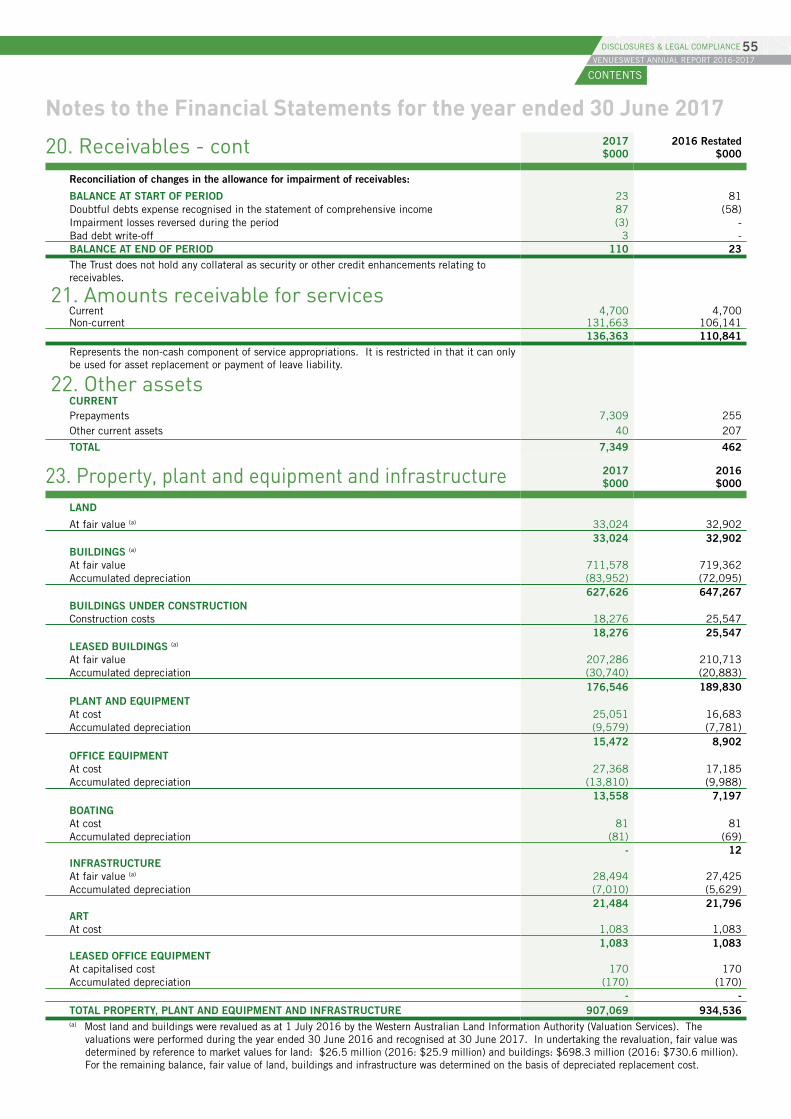
Notes to the Financial Statements for the year ended 30 June 2017
20. Receivables - cont 2017 $000
2016 Restated $000
Reconciliation of changes in the allowance for impairment of receivables:
BALANCE AT START OF PERIOD 23 81Doubtful debts expense recognised in the statement of comprehensive income 87 (58)Impairment losses reversed during the period (3) -Bad debt write-off 3 -BALANCE AT END OF PERIOD 110 23The Trust does not hold any collateral as security or other credit enhancements relating to receivables.
21. Amounts receivable for servicesCurrent 4,700 4,700Non-current 131,663 106,141
136,363 110,841Represents the non-cash component of service appropriations. It is restricted in that it can only be used for asset replacement or payment of leave liability.
22. Other assetsCURRENTPrepayments 7,309 255Other current assets 40 207
TOTAL 7,349 462
23. Property, plant and equipment and infrastructure 2017 $000
2016 $000
LAND
At fair value (a) 33,024 32,90233,024 32,902
BUILDINGS (a)
At fair value 711,578 719,362Accumulated depreciation (83,952) (72,095)
627,626 647,267BUILDINGS UNDER CONSTRUCTION Construction costs 18,276 25,547
18,276 25,547LEASED BUILDINGS (a)
At fair value 207,286 210,713Accumulated depreciation (30,740) (20,883)
176,546 189,830PLANT AND EQUIPMENTAt cost 25,051 16,683Accumulated depreciation (9,579) (7,781)
15,472 8,902OFFICE EQUIPMENTAt cost 27,368 17,185Accumulated depreciation (13,810) (9,988)
13,558 7,197BOATINGAt cost 81 81Accumulated depreciation (81) (69)
- 12INFRASTRUCTUREAt fair value (a) 28,494 27,425Accumulated depreciation (7,010) (5,629)
21,484 21,796ARTAt cost 1,083 1,083
1,083 1,083LEASED OFFICE EQUIPMENTAt capitalised cost 170 170Accumulated depreciation (170) (170)
- -TOTAL PROPERTY, PLANT AND EQUIPMENT AND INFRASTRUCTURE 907,069 934,536(a) Most land and buildings were revalued as at 1 July 2016 by the Western Australian Land Information Authority (Valuation Services). The
valuations were performed during the year ended 30 June 2016 and recognised at 30 June 2017. In undertaking the revaluation, fair value was determined by reference to market values for land: $26.5 million (2016: $25.9 million) and buildings: $698.3 million (2016: $730.6 million). For the remaining balance, fair value of land, buildings and infrastructure was determined on the basis of depreciated replacement cost.
CONTENTS
VENUESWEST ANNUAL REPORT 2016-201755DISCLOSURES & LEGAL COMPLIANCE
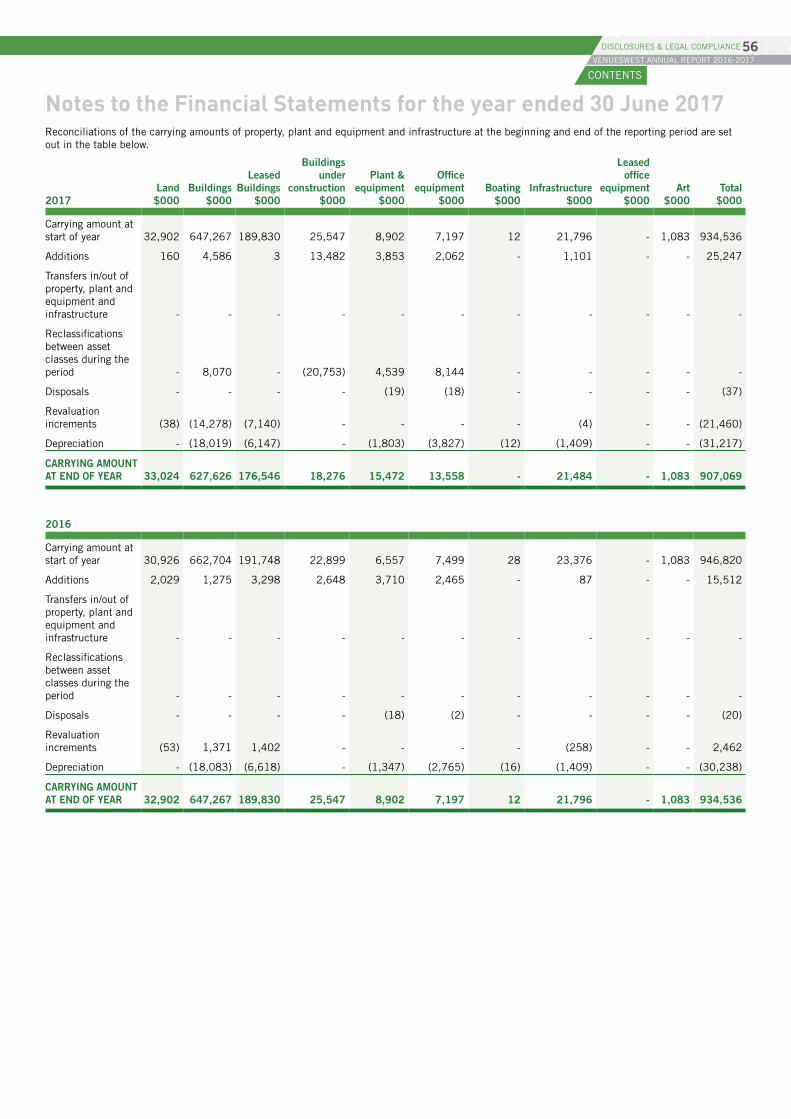
Notes to the Financial Statements for the year ended 30 June 2017Reconciliations of the carrying amounts of property, plant and equipment and infrastructure at the beginning and end of the reporting period are set out in the table below.
2017Land $000
Buildings $000
Leased Buildings
$000
Buildings under
construction $000
Plant & equipment
$000
Office equipment
$000Boating
$000Infrastructure
$000
Leased office
equipment $000
Art $000
Total $000
Carrying amount at start of year 32,902 647,267 189,830 25,547 8,902 7,197 12 21,796 - 1,083 934,536
Additions 160 4,586 3 13,482 3,853 2,062 - 1,101 - - 25,247
Transfers in/out of property, plant and equipment and infrastructure - - - - - - - - - - -
Reclassifications between asset classes during the period - 8,070 - (20,753) 4,539 8,144 - - - - -
Disposals - - - - (19) (18) - - - - (37)
Revaluation increments (38) (14,278) (7,140) - - - - (4) - - (21,460)
Depreciation - (18,019) (6,147) - (1,803) (3,827) (12) (1,409) - - (31,217)
CARRYING AMOUNT AT END OF YEAR 33,024 627,626 176,546 18,276 15,472 13,558 - 21,484 - 1,083 907,069
2016
Carrying amount at start of year 30,926 662,704 191,748 22,899 6,557 7,499 28 23,376 - 1,083 946,820
Additions 2,029 1,275 3,298 2,648 3,710 2,465 - 87 - - 15,512
Transfers in/out of property, plant and equipment and infrastructure - - - - - - - - - - -
Reclassifications between asset classes during the period - - - - - - - - - - -
Disposals - - - - (18) (2) - - - - (20)
Revaluation increments (53) 1,371 1,402 - - - - (258) - - 2,462
Depreciation - (18,083) (6,618) - (1,347) (2,765) (16) (1,409) - - (30,238)
CARRYING AMOUNT AT END OF YEAR 32,902 647,267 189,830 25,547 8,902 7,197 12 21,796 - 1,083 934,536
CONTENTS
VENUESWEST ANNUAL REPORT 2016-201756DISCLOSURES & LEGAL COMPLIANCE
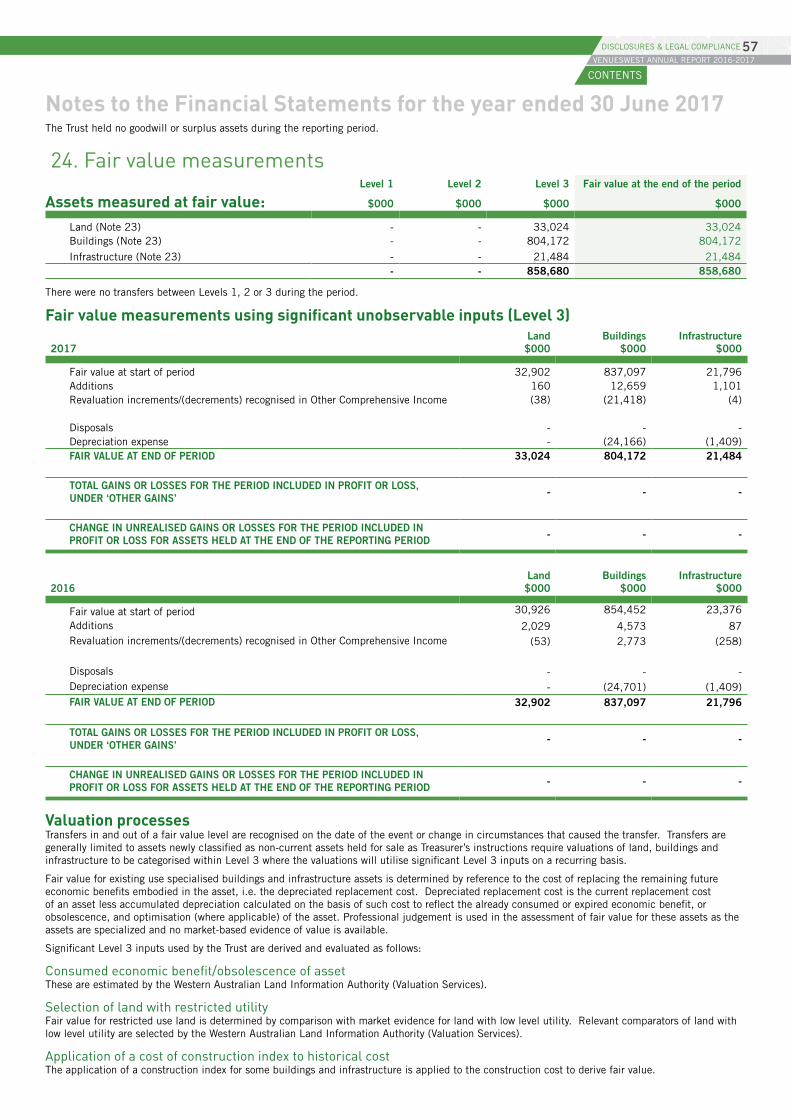
Notes to the Financial Statements for the year ended 30 June 2017The Trust held no goodwill or surplus assets during the reporting period.
24. Fair value measurements
Assets measured at fair value: Level 1 Level 2 Level 3 Fair value at the end of the period
$000 $000 $000 $000
Land (Note 23) - - 33,024 33,024Buildings (Note 23) - - 804,172 804,172
Infrastructure (Note 23) - - 21,484 21,484- - 858,680 858,680
There were no transfers between Levels 1, 2 or 3 during the period.
Fair value measurements using significant unobservable inputs (Level 3) 2017
Land $000
Buildings $000
Infrastructure $000
Fair value at start of period 32,902 837,097 21,796Additions 160 12,659 1,101Revaluation increments/(decrements) recognised in Other Comprehensive Income (38) (21,418) (4)
Disposals - - -Depreciation expense - (24,166) (1,409)FAIR VALUE AT END OF PERIOD 33,024 804,172 21,484 TOTAL GAINS OR LOSSES FOR THE PERIOD INCLUDED IN PROFIT OR LOSS, UNDER ‘OTHER GAINS’ - - -
CHANGE IN UNREALISED GAINS OR LOSSES FOR THE PERIOD INCLUDED IN PROFIT OR LOSS FOR ASSETS HELD AT THE END OF THE REPORTING PERIOD - - -
2016Land $000
Buildings $000
Infrastructure $000
Fair value at start of period 30,926 854,452 23,376
Additions 2,029 4,573 87Revaluation increments/(decrements) recognised in Other Comprehensive Income (53) 2,773 (258)
Disposals - - -Depreciation expense - (24,701) (1,409)FAIR VALUE AT END OF PERIOD 32,902 837,097 21,796
TOTAL GAINS OR LOSSES FOR THE PERIOD INCLUDED IN PROFIT OR LOSS, UNDER ‘OTHER GAINS’ - - -
CHANGE IN UNREALISED GAINS OR LOSSES FOR THE PERIOD INCLUDED IN PROFIT OR LOSS FOR ASSETS HELD AT THE END OF THE REPORTING PERIOD - - -
Valuation processesTransfers in and out of a fair value level are recognised on the date of the event or change in circumstances that caused the transfer. Transfers are generally limited to assets newly classified as non-current assets held for sale as Treasurer’s instructions require valuations of land, buildings and infrastructure to be categorised within Level 3 where the valuations will utilise significant Level 3 inputs on a recurring basis.
Fair value for existing use specialised buildings and infrastructure assets is determined by reference to the cost of replacing the remaining future economic benefits embodied in the asset, i.e. the depreciated replacement cost. Depreciated replacement cost is the current replacement cost of an asset less accumulated depreciation calculated on the basis of such cost to reflect the already consumed or expired economic benefit, or obsolescence, and optimisation (where applicable) of the asset. Professional judgement is used in the assessment of fair value for these assets as the assets are specialized and no market-based evidence of value is available.
Significant Level 3 inputs used by the Trust are derived and evaluated as follows:
Consumed economic benefit/obsolescence of asset These are estimated by the Western Australian Land Information Authority (Valuation Services).
Selection of land with restricted utilityFair value for restricted use land is determined by comparison with market evidence for land with low level utility. Relevant comparators of land with low level utility are selected by the Western Australian Land Information Authority (Valuation Services).
Application of a cost of construction index to historical costThe application of a construction index for some buildings and infrastructure is applied to the construction cost to derive fair value.
CONTENTS
VENUESWEST ANNUAL REPORT 2016-201757DISCLOSURES & LEGAL COMPLIANCE
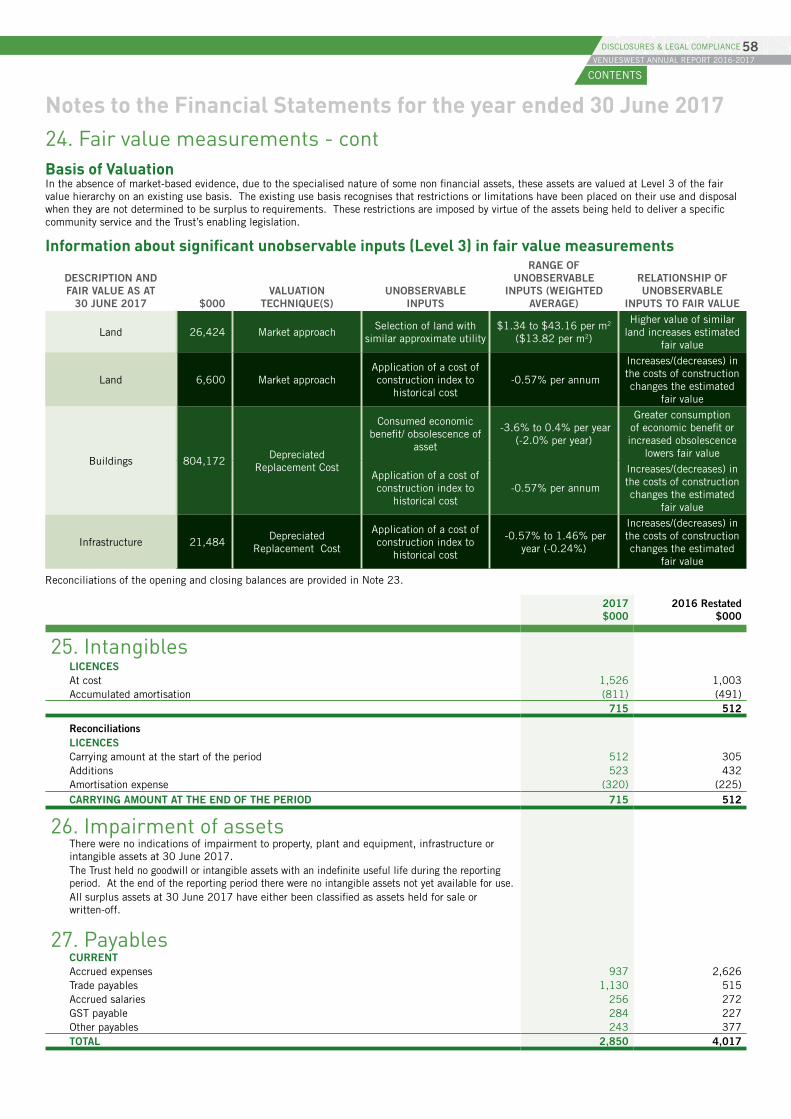
Notes to the Financial Statements for the year ended 30 June 201724. Fair value measurements - contBasis of ValuationIn the absence of market-based evidence, due to the specialised nature of some non financial assets, these assets are valued at Level 3 of the fair value hierarchy on an existing use basis. The existing use basis recognises that restrictions or limitations have been placed on their use and disposal when they are not determined to be surplus to requirements. These restrictions are imposed by virtue of the assets being held to deliver a specific community service and the Trust’s enabling legislation.
Information about significant unobservable inputs (Level 3) in fair value measurements
DESCRIPTION AND FAIR VALUE AS AT
30 JUNE 2017 $000VALUATION
TECHNIQUE(S)UNOBSERVABLE
INPUTS
RANGE OF UNOBSERVABLE
INPUTS (WEIGHTED AVERAGE)
RELATIONSHIP OF UNOBSERVABLE
INPUTS TO FAIR VALUE
Land 26,424 Market approachSelection of land with
similar approximate utility$1.34 to $43.16 per m2
($13.82 per m2)
Higher value of similar land increases estimated
fair value
Land 6,600 Market approachApplication of a cost of construction index to
historical cost -0.57% per annum
Increases/(decreases) in the costs of construction changes the estimated
fair value
Buildings 804,172 Depreciated
Replacement Cost
Consumed economic benefit/ obsolescence of
asset
-3.6% to 0.4% per year (-2.0% per year)
Greater consumption of economic benefit or increased obsolescence
lowers fair value
Application of a cost of construction index to
historical cost -0.57% per annum
Increases/(decreases) in the costs of construction changes the estimated
fair value
Infrastructure 21,484Depreciated
Replacement Cost
Application of a cost of construction index to
historical cost
-0.57% to 1.46% per year (-0.24%)
Increases/(decreases) in the costs of construction changes the estimated
fair value
Reconciliations of the opening and closing balances are provided in Note 23.
2017 $000
2016 Restated $000
25. IntangiblesLICENCESAt cost 1,526 1,003Accumulated amortisation (811) (491)
715 512
ReconciliationsLICENCESCarrying amount at the start of the period 512 305Additions 523 432Amortisation expense (320) (225)CARRYING AMOUNT AT THE END OF THE PERIOD 715 512
26. Impairment of assetsThere were no indications of impairment to property, plant and equipment, infrastructure or intangible assets at 30 June 2017.The Trust held no goodwill or intangible assets with an indefinite useful life during the reporting period. At the end of the reporting period there were no intangible assets not yet available for use.All surplus assets at 30 June 2017 have either been classified as assets held for sale or written-off.
27. PayablesCURRENTAccrued expenses 937 2,626Trade payables 1,130 515Accrued salaries 256 272GST payable 284 227Other payables 243 377TOTAL 2,850 4,017
CONTENTS
VENUESWEST ANNUAL REPORT 2016-201758DISCLOSURES & LEGAL COMPLIANCE
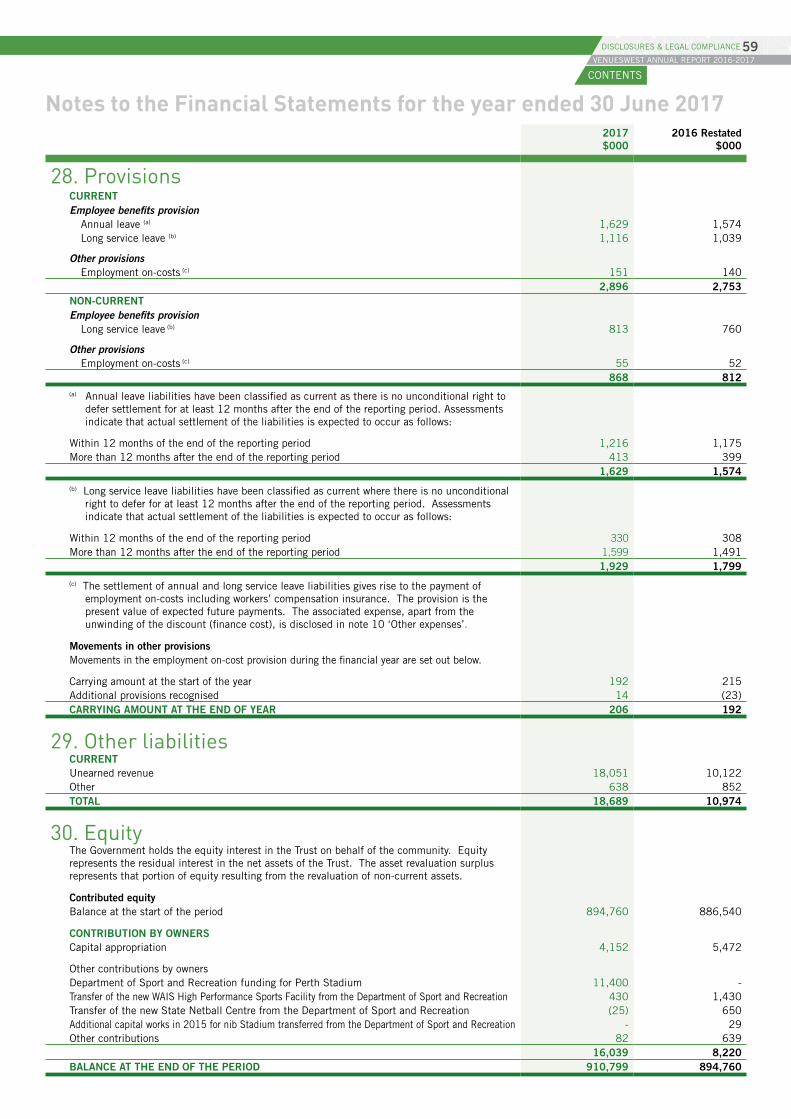
Notes to the Financial Statements for the year ended 30 June 20172017 $000
2016 Restated $000
28. ProvisionsCURRENTEmployee benefits provision
Annual leave (a) 1,629 1,574Long service leave (b) 1,116 1,039
Other provisionsEmployment on-costs (c) 151 140
2,896 2,753NON-CURRENTEmployee benefits provision
Long service leave (b) 813 760
Other provisionsEmployment on-costs (c) 55 52
868 812(a) Annual leave liabilities have been classified as current as there is no unconditional right to
defer settlement for at least 12 months after the end of the reporting period. Assessments indicate that actual settlement of the liabilities is expected to occur as follows:
Within 12 months of the end of the reporting period 1,216 1,175More than 12 months after the end of the reporting period 413 399
1,629 1,574(b) Long service leave liabilities have been classified as current where there is no unconditional
right to defer for at least 12 months after the end of the reporting period. Assessments indicate that actual settlement of the liabilities is expected to occur as follows:
Within 12 months of the end of the reporting period 330 308More than 12 months after the end of the reporting period 1,599 1,491
1,929 1,799(c) The settlement of annual and long service leave liabilities gives rise to the payment of
employment on-costs including workers’ compensation insurance. The provision is the present value of expected future payments. The associated expense, apart from the unwinding of the discount (finance cost), is disclosed in note 10 ‘Other expenses’.
Movements in other provisionsMovements in the employment on-cost provision during the financial year are set out below.
Carrying amount at the start of the year 192 215Additional provisions recognised 14 (23)CARRYING AMOUNT AT THE END OF YEAR 206 192
29. Other liabilitiesCURRENTUnearned revenue 18,051 10,122Other 638 852TOTAL 18,689 10,974
30. EquityThe Government holds the equity interest in the Trust on behalf of the community. Equity represents the residual interest in the net assets of the Trust. The asset revaluation surplus represents that portion of equity resulting from the revaluation of non-current assets.
Contributed equityBalance at the start of the period 894,760 886,540
CONTRIBUTION BY OWNERSCapital appropriation 4,152 5,472
Other contributions by ownersDepartment of Sport and Recreation funding for Perth Stadium 11,400 -Transfer of the new WAIS High Performance Sports Facility from the Department of Sport and Recreation 430 1,430Transfer of the new State Netball Centre from the Department of Sport and Recreation (25) 650Additional capital works in 2015 for nib Stadium transferred from the Department of Sport and Recreation - 29Other contributions 82 639
16,039 8,220BALANCE AT THE END OF THE PERIOD 910,799 894,760
CONTENTS
VENUESWEST ANNUAL REPORT 2016-201759DISCLOSURES & LEGAL COMPLIANCE
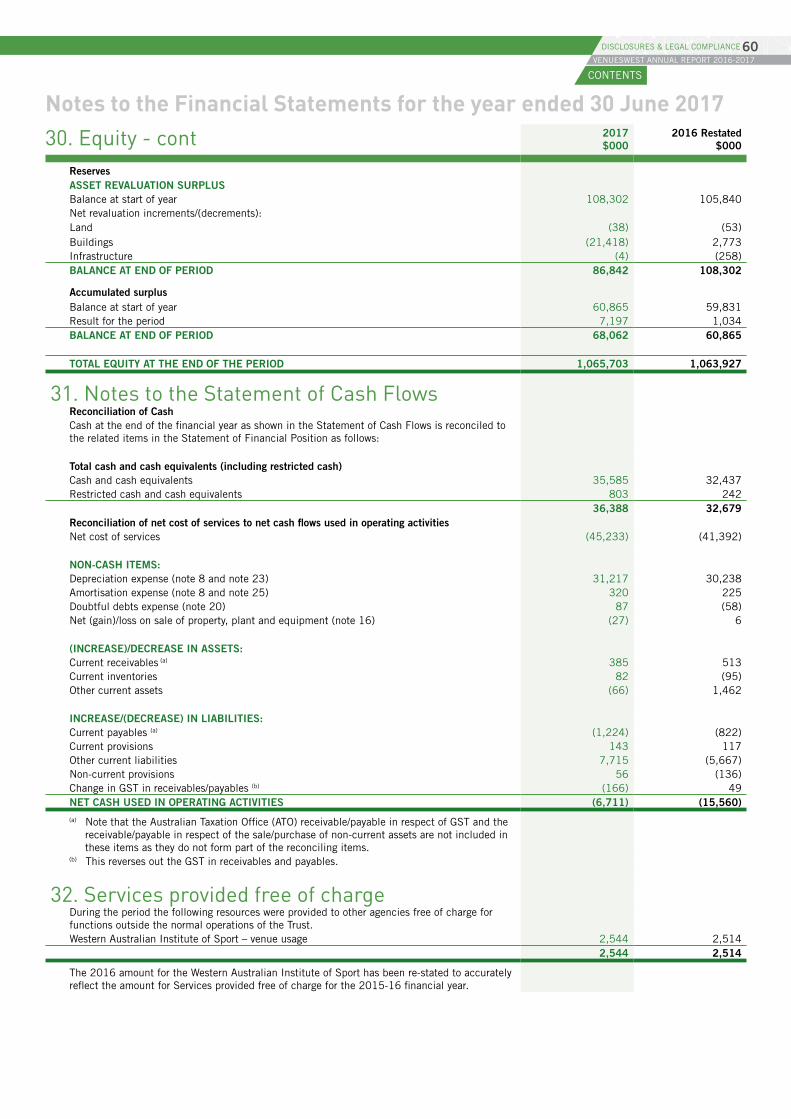
Notes to the Financial Statements for the year ended 30 June 201730. Equity - cont 2017
$0002016 Restated
$000
ReservesASSET REVALUATION SURPLUSBalance at start of year 108,302 105,840Net revaluation increments/(decrements):Land (38) (53)Buildings (21,418) 2,773Infrastructure (4) (258)BALANCE AT END OF PERIOD 86,842 108,302
Accumulated surplusBalance at start of year 60,865 59,831Result for the period 7,197 1,034BALANCE AT END OF PERIOD 68,062 60,865
TOTAL EQUITY AT THE END OF THE PERIOD 1,065,703 1,063,927
31. Notes to the Statement of Cash FlowsReconciliation of CashCash at the end of the financial year as shown in the Statement of Cash Flows is reconciled to the related items in the Statement of Financial Position as follows:
Total cash and cash equivalents (including restricted cash)Cash and cash equivalents 35,585 32,437Restricted cash and cash equivalents 803 242
36,388 32,679Reconciliation of net cost of services to net cash flows used in operating activitiesNet cost of services (45,233) (41,392)
NON-CASH ITEMS:Depreciation expense (note 8 and note 23) 31,217 30,238Amortisation expense (note 8 and note 25) 320 225Doubtful debts expense (note 20) 87 (58)Net (gain)/loss on sale of property, plant and equipment (note 16) (27) 6
(INCREASE)/DECREASE IN ASSETS:Current receivables (a) 385 513Current inventories 82 (95)Other current assets (66) 1,462
INCREASE/(DECREASE) IN LIABILITIES:Current payables (a) (1,224) (822)Current provisions 143 117Other current liabilities 7,715 (5,667)Non-current provisions 56 (136)Change in GST in receivables/payables (b) (166) 49NET CASH USED IN OPERATING ACTIVITIES (6,711) (15,560)(a) Note that the Australian Taxation Office (ATO) receivable/payable in respect of GST and the
receivable/payable in respect of the sale/purchase of non-current assets are not included in these items as they do not form part of the reconciling items.
(b) This reverses out the GST in receivables and payables.
32. Services provided free of chargeDuring the period the following resources were provided to other agencies free of charge for functions outside the normal operations of the Trust.Western Australian Institute of Sport – venue usage 2,544 2,514
2,544 2,514
The 2016 amount for the Western Australian Institute of Sport has been re-stated to accurately reflect the amount for Services provided free of charge for the 2015-16 financial year.
CONTENTS
VENUESWEST ANNUAL REPORT 2016-201760DISCLOSURES & LEGAL COMPLIANCE
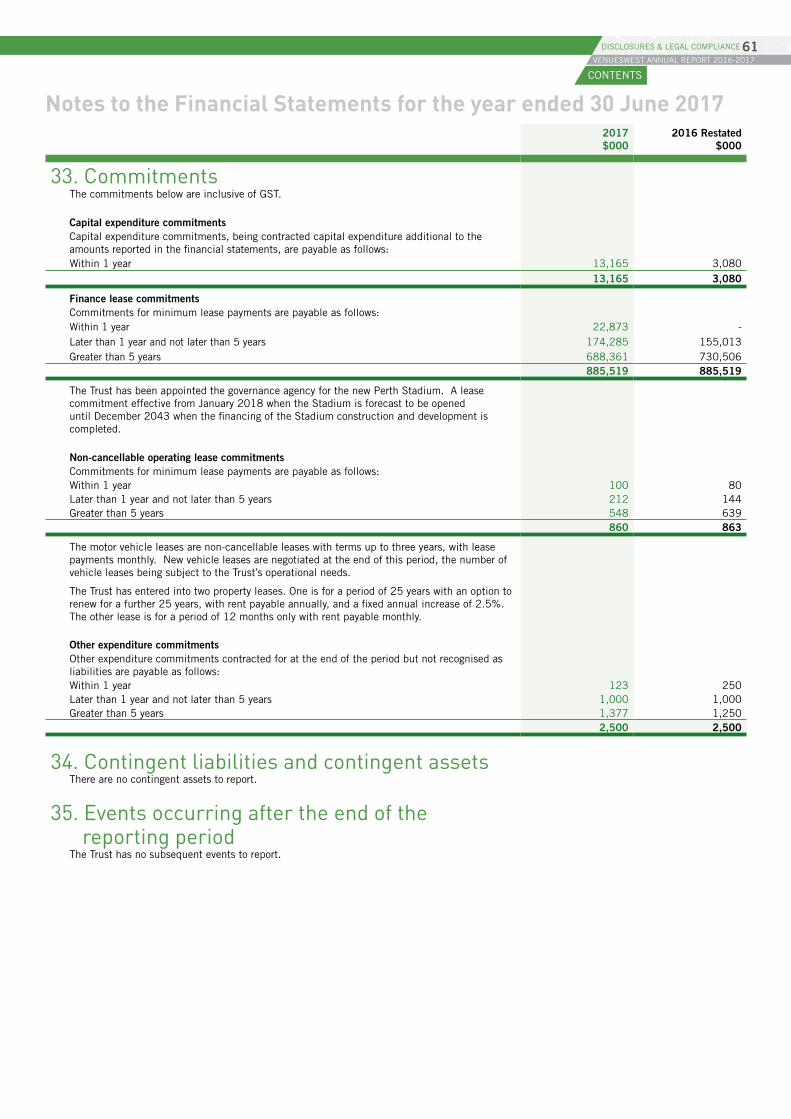
Notes to the Financial Statements for the year ended 30 June 20172017 $000
2016 Restated $000
33. CommitmentsThe commitments below are inclusive of GST.
Capital expenditure commitmentsCapital expenditure commitments, being contracted capital expenditure additional to the amounts reported in the financial statements, are payable as follows:Within 1 year 13,165 3,080
13,165 3,080
Finance lease commitmentsCommitments for minimum lease payments are payable as follows:Within 1 year 22,873 -Later than 1 year and not later than 5 years 174,285 155,013Greater than 5 years 688,361 730,506
885,519 885,519
The Trust has been appointed the governance agency for the new Perth Stadium. A lease commitment effective from January 2018 when the Stadium is forecast to be opened until December 2043 when the financing of the Stadium construction and development is completed.
Non-cancellable operating lease commitmentsCommitments for minimum lease payments are payable as follows:Within 1 year 100 80Later than 1 year and not later than 5 years 212 144Greater than 5 years 548 639
860 863
The motor vehicle leases are non-cancellable leases with terms up to three years, with lease payments monthly. New vehicle leases are negotiated at the end of this period, the number of vehicle leases being subject to the Trust’s operational needs.
The Trust has entered into two property leases. One is for a period of 25 years with an option to renew for a further 25 years, with rent payable annually, and a fixed annual increase of 2.5%. The other lease is for a period of 12 months only with rent payable monthly.
Other expenditure commitmentsOther expenditure commitments contracted for at the end of the period but not recognised as liabilities are payable as follows:Within 1 year 123 250Later than 1 year and not later than 5 years 1,000 1,000Greater than 5 years 1,377 1,250
2,500 2,500
34. Contingent liabilities and contingent assetsThere are no contingent assets to report.
35. Events occurring after the end of the reporting period
The Trust has no subsequent events to report.
CONTENTS
VENUESWEST ANNUAL REPORT 2016-201761DISCLOSURES & LEGAL COMPLIANCE
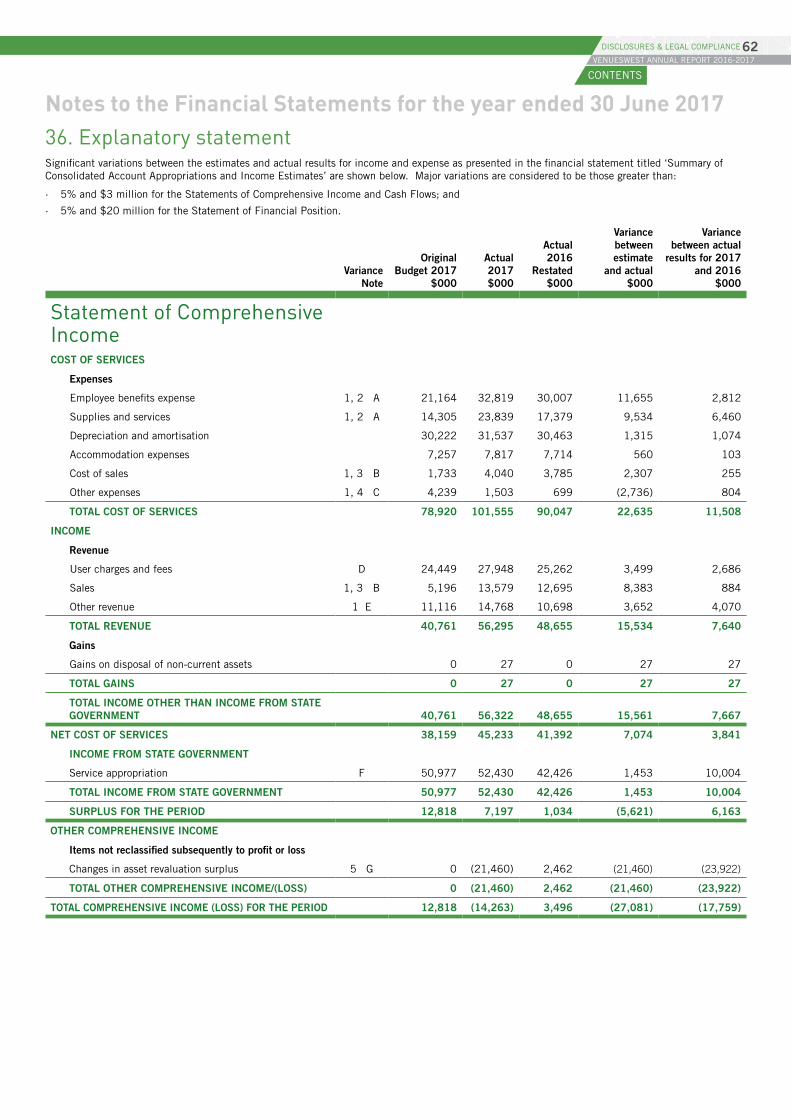
Notes to the Financial Statements for the year ended 30 June 201736. Explanatory statementSignificant variations between the estimates and actual results for income and expense as presented in the financial statement titled ‘Summary of Consolidated Account Appropriations and Income Estimates’ are shown below. Major variations are considered to be those greater than:
· 5% and $3 million for the Statements of Comprehensive Income and Cash Flows; and
· 5% and $20 million for the Statement of Financial Position.
Variance Note
Original Budget 2017
$000
Actual 2017 $000
Actual 2016
Restated $000
Variance between estimate
and actual $000
Variance between actual
results for 2017 and 2016
$000
Statement of Comprehensive IncomeCOST OF SERVICES
Expenses
Employee benefits expense 1, 2 A 21,164 32,819 30,007 11,655 2,812
Supplies and services 1, 2 A 14,305 23,839 17,379 9,534 6,460
Depreciation and amortisation 30,222 31,537 30,463 1,315 1,074
Accommodation expenses 7,257 7,817 7,714 560 103
Cost of sales 1, 3 B 1,733 4,040 3,785 2,307 255
Other expenses 1, 4 C 4,239 1,503 699 (2,736) 804
TOTAL COST OF SERVICES 78,920 101,555 90,047 22,635 11,508
INCOME
Revenue
User charges and fees D 24,449 27,948 25,262 3,499 2,686
Sales 1, 3 B 5,196 13,579 12,695 8,383 884
Other revenue 1 E 11,116 14,768 10,698 3,652 4,070
TOTAL REVENUE 40,761 56,295 48,655 15,534 7,640
Gains
Gains on disposal of non-current assets 0 27 0 27 27
TOTAL GAINS 0 27 0 27 27
TOTAL INCOME OTHER THAN INCOME FROM STATE GOVERNMENT 40,761 56,322 48,655 15,561 7,667
NET COST OF SERVICES 38,159 45,233 41,392 7,074 3,841
INCOME FROM STATE GOVERNMENT
Service appropriation F 50,977 52,430 42,426 1,453 10,004
TOTAL INCOME FROM STATE GOVERNMENT 50,977 52,430 42,426 1,453 10,004
SURPLUS FOR THE PERIOD 12,818 7,197 1,034 (5,621) 6,163
OTHER COMPREHENSIVE INCOME
Items not reclassified subsequently to profit or loss
Changes in asset revaluation surplus 5 G 0 (21,460) 2,462 (21,460) (23,922)
TOTAL OTHER COMPREHENSIVE INCOME/(LOSS) 0 (21,460) 2,462 (21,460) (23,922)
TOTAL COMPREHENSIVE INCOME (LOSS) FOR THE PERIOD 12,818 (14,263) 3,496 (27,081) (17,759)
CONTENTS
VENUESWEST ANNUAL REPORT 2016-201762DISCLOSURES & LEGAL COMPLIANCE
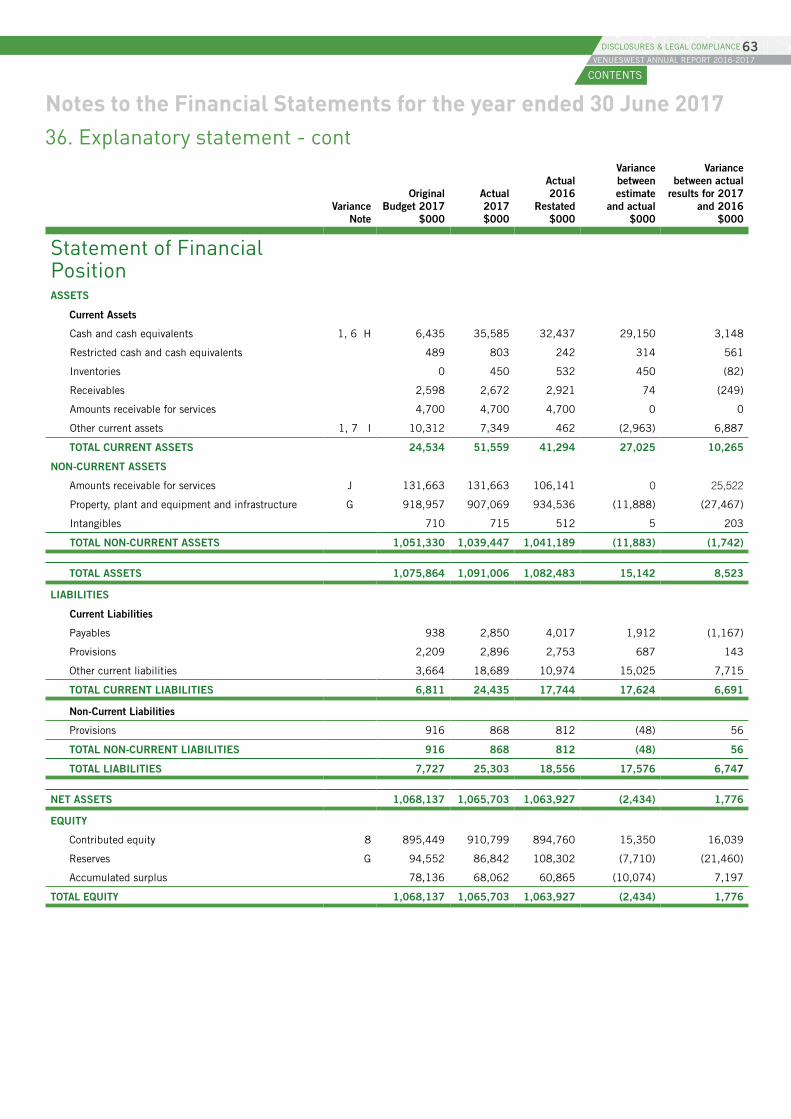
Notes to the Financial Statements for the year ended 30 June 201736. Explanatory statement - cont
Variance Note
Original Budget 2017
$000
Actual 2017 $000
Actual 2016
Restated $000
Variance between estimate
and actual $000
Variance between actual
results for 2017 and 2016
$000
Statement of Financial PositionASSETS
Current Assets
Cash and cash equivalents 1, 6 H 6,435 35,585 32,437 29,150 3,148
Restricted cash and cash equivalents 489 803 242 314 561
Inventories 0 450 532 450 (82)
Receivables 2,598 2,672 2,921 74 (249)
Amounts receivable for services 4,700 4,700 4,700 0 0
Other current assets 1, 7 I 10,312 7,349 462 (2,963) 6,887
TOTAL CURRENT ASSETS 24,534 51,559 41,294 27,025 10,265
NON-CURRENT ASSETS
Amounts receivable for services J 131,663 131,663 106,141 0 25,522
Property, plant and equipment and infrastructure G 918,957 907,069 934,536 (11,888) (27,467)
Intangibles 710 715 512 5 203
TOTAL NON-CURRENT ASSETS 1,051,330 1,039,447 1,041,189 (11,883) (1,742)
TOTAL ASSETS 1,075,864 1,091,006 1,082,483 15,142 8,523
LIABILITIES
Current Liabilities
Payables 938 2,850 4,017 1,912 (1,167)
Provisions 2,209 2,896 2,753 687 143
Other current liabilities 3,664 18,689 10,974 15,025 7,715
TOTAL CURRENT LIABILITIES 6,811 24,435 17,744 17,624 6,691
Non-Current Liabilities
Provisions 916 868 812 (48) 56
TOTAL NON-CURRENT LIABILITIES 916 868 812 (48) 56
TOTAL LIABILITIES 7,727 25,303 18,556 17,576 6,747
NET ASSETS 1,068,137 1,065,703 1,063,927 (2,434) 1,776
EQUITY
Contributed equity 8 895,449 910,799 894,760 15,350 16,039
Reserves G 94,552 86,842 108,302 (7,710) (21,460)
Accumulated surplus 78,136 68,062 60,865 (10,074) 7,197
TOTAL EQUITY 1,068,137 1,065,703 1,063,927 (2,434) 1,776
CONTENTS
VENUESWEST ANNUAL REPORT 2016-201763DISCLOSURES & LEGAL COMPLIANCE
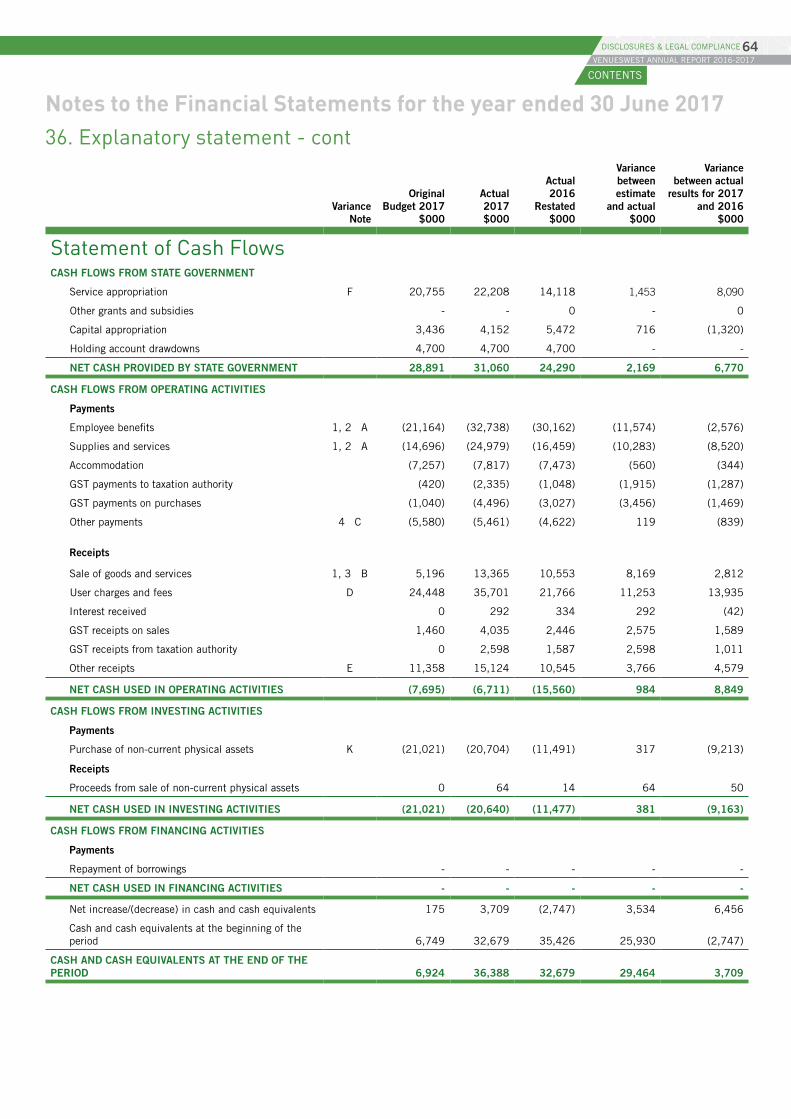
Notes to the Financial Statements for the year ended 30 June 201736. Explanatory statement - cont
Variance Note
Original Budget 2017
$000
Actual 2017 $000
Actual 2016
Restated $000
Variance between estimate
and actual $000
Variance between actual
results for 2017 and 2016
$000
Statement of Cash FlowsCASH FLOWS FROM STATE GOVERNMENT
Service appropriation F 20,755 22,208 14,118 1,453 8,090
Other grants and subsidies - - 0 - 0
Capital appropriation 3,436 4,152 5,472 716 (1,320)
Holding account drawdowns 4,700 4,700 4,700 - -
NET CASH PROVIDED BY STATE GOVERNMENT 28,891 31,060 24,290 2,169 6,770
CASH FLOWS FROM OPERATING ACTIVITIES
Payments
Employee benefits 1, 2 A (21,164) (32,738) (30,162) (11,574) (2,576)
Supplies and services 1, 2 A (14,696) (24,979) (16,459) (10,283) (8,520)
Accommodation (7,257) (7,817) (7,473) (560) (344)
GST payments to taxation authority (420) (2,335) (1,048) (1,915) (1,287)
GST payments on purchases (1,040) (4,496) (3,027) (3,456) (1,469)
Other payments 4 C (5,580) (5,461) (4,622) 119 (839)
Receipts
Sale of goods and services 1, 3 B 5,196 13,365 10,553 8,169 2,812
User charges and fees D 24,448 35,701 21,766 11,253 13,935
Interest received 0 292 334 292 (42)
GST receipts on sales 1,460 4,035 2,446 2,575 1,589
GST receipts from taxation authority 0 2,598 1,587 2,598 1,011
Other receipts E 11,358 15,124 10,545 3,766 4,579
NET CASH USED IN OPERATING ACTIVITIES (7,695) (6,711) (15,560) 984 8,849
CASH FLOWS FROM INVESTING ACTIVITIES
Payments
Purchase of non-current physical assets K (21,021) (20,704) (11,491) 317 (9,213)
Receipts
Proceeds from sale of non-current physical assets 0 64 14 64 50
NET CASH USED IN INVESTING ACTIVITIES (21,021) (20,640) (11,477) 381 (9,163)
CASH FLOWS FROM FINANCING ACTIVITIES
Payments
Repayment of borrowings - - - - -
NET CASH USED IN FINANCING ACTIVITIES - - - - -
Net increase/(decrease) in cash and cash equivalents 175 3,709 (2,747) 3,534 6,456
Cash and cash equivalents at the beginning of the period 6,749 32,679 35,426 25,930 (2,747)
CASH AND CASH EQUIVALENTS AT THE END OF THE PERIOD 6,924 36,388 32,679 29,464 3,709
CONTENTS
VENUESWEST ANNUAL REPORT 2016-201764DISCLOSURES & LEGAL COMPLIANCE
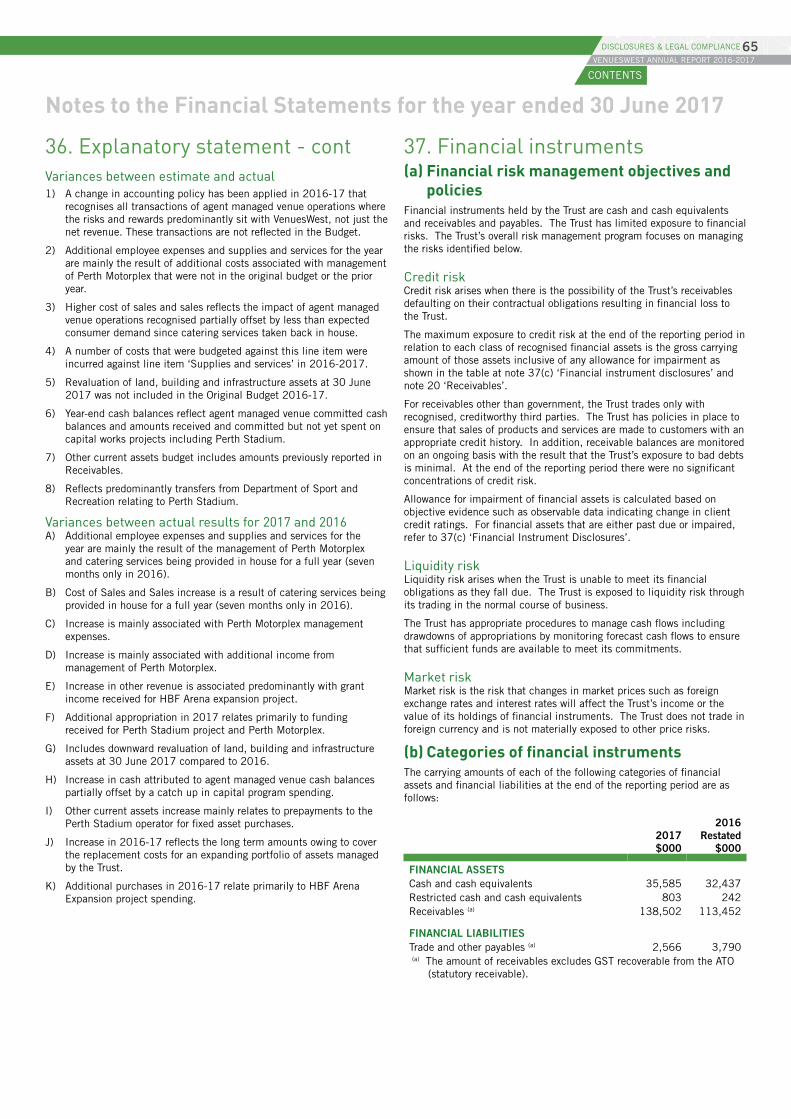
Notes to the Financial Statements for the year ended 30 June 2017
36. Explanatory statement - contVariances between estimate and actual1) A change in accounting policy has been applied in 2016-17 that
recognises all transactions of agent managed venue operations where the risks and rewards predominantly sit with VenuesWest, not just the net revenue. These transactions are not reflected in the Budget.
2) Additional employee expenses and supplies and services for the year are mainly the result of additional costs associated with management of Perth Motorplex that were not in the original budget or the prior year.
3) Higher cost of sales and sales reflects the impact of agent managed venue operations recognised partially offset by less than expected consumer demand since catering services taken back in house.
4) A number of costs that were budgeted against this line item were incurred against line item ‘Supplies and services’ in 2016-2017.
5) Revaluation of land, building and infrastructure assets at 30 June 2017 was not included in the Original Budget 2016-17.
6) Year-end cash balances reflect agent managed venue committed cash balances and amounts received and committed but not yet spent on capital works projects including Perth Stadium.
7) Other current assets budget includes amounts previously reported in Receivables.
8) Reflects predominantly transfers from Department of Sport and Recreation relating to Perth Stadium.
Variances between actual results for 2017 and 2016A) Additional employee expenses and supplies and services for the
year are mainly the result of the management of Perth Motorplex and catering services being provided in house for a full year (seven months only in 2016).
B) Cost of Sales and Sales increase is a result of catering services being provided in house for a full year (seven months only in 2016).
C) Increase is mainly associated with Perth Motorplex management expenses.
D) Increase is mainly associated with additional income from management of Perth Motorplex.
E) Increase in other revenue is associated predominantly with grant income received for HBF Arena expansion project.
F) Additional appropriation in 2017 relates primarily to funding received for Perth Stadium project and Perth Motorplex.
G) Includes downward revaluation of land, building and infrastructure assets at 30 June 2017 compared to 2016.
H) Increase in cash attributed to agent managed venue cash balances partially offset by a catch up in capital program spending.
I) Other current assets increase mainly relates to prepayments to the Perth Stadium operator for fixed asset purchases.
J) Increase in 2016-17 reflects the long term amounts owing to cover the replacement costs for an expanding portfolio of assets managed by the Trust.
K) Additional purchases in 2016-17 relate primarily to HBF Arena Expansion project spending.
37. Financial instruments(a) Financial risk management objectives and
policiesFinancial instruments held by the Trust are cash and cash equivalents and receivables and payables. The Trust has limited exposure to financial risks. The Trust’s overall risk management program focuses on managing the risks identified below.
Credit riskCredit risk arises when there is the possibility of the Trust’s receivables defaulting on their contractual obligations resulting in financial loss to the Trust.
The maximum exposure to credit risk at the end of the reporting period in relation to each class of recognised financial assets is the gross carrying amount of those assets inclusive of any allowance for impairment as shown in the table at note 37(c) ‘Financial instrument disclosures’ and note 20 ‘Receivables’.
For receivables other than government, the Trust trades only with recognised, creditworthy third parties. The Trust has policies in place to ensure that sales of products and services are made to customers with an appropriate credit history. In addition, receivable balances are monitored on an ongoing basis with the result that the Trust’s exposure to bad debts is minimal. At the end of the reporting period there were no significant concentrations of credit risk.
Allowance for impairment of financial assets is calculated based on objective evidence such as observable data indicating change in client credit ratings. For financial assets that are either past due or impaired, refer to 37(c) ‘Financial Instrument Disclosures’.
Liquidity riskLiquidity risk arises when the Trust is unable to meet its financial obligations as they fall due. The Trust is exposed to liquidity risk through its trading in the normal course of business.
The Trust has appropriate procedures to manage cash flows including drawdowns of appropriations by monitoring forecast cash flows to ensure that sufficient funds are available to meet its commitments.
Market riskMarket risk is the risk that changes in market prices such as foreign exchange rates and interest rates will affect the Trust’s income or the value of its holdings of financial instruments. The Trust does not trade in foreign currency and is not materially exposed to other price risks.
(b) Categories of financial instrumentsThe carrying amounts of each of the following categories of financial assets and financial liabilities at the end of the reporting period are as follows:
2017 $000
2016 Restated
$000
FINANCIAL ASSETSCash and cash equivalents 35,585 32,437Restricted cash and cash equivalents 803 242Receivables (a) 138,502 113,452
FINANCIAL LIABILITIESTrade and other payables (a) 2,566 3,790(a) The amount of receivables excludes GST recoverable from the ATO
(statutory receivable).
CONTENTS
VENUESWEST ANNUAL REPORT 2016-201765DISCLOSURES & LEGAL COMPLIANCE
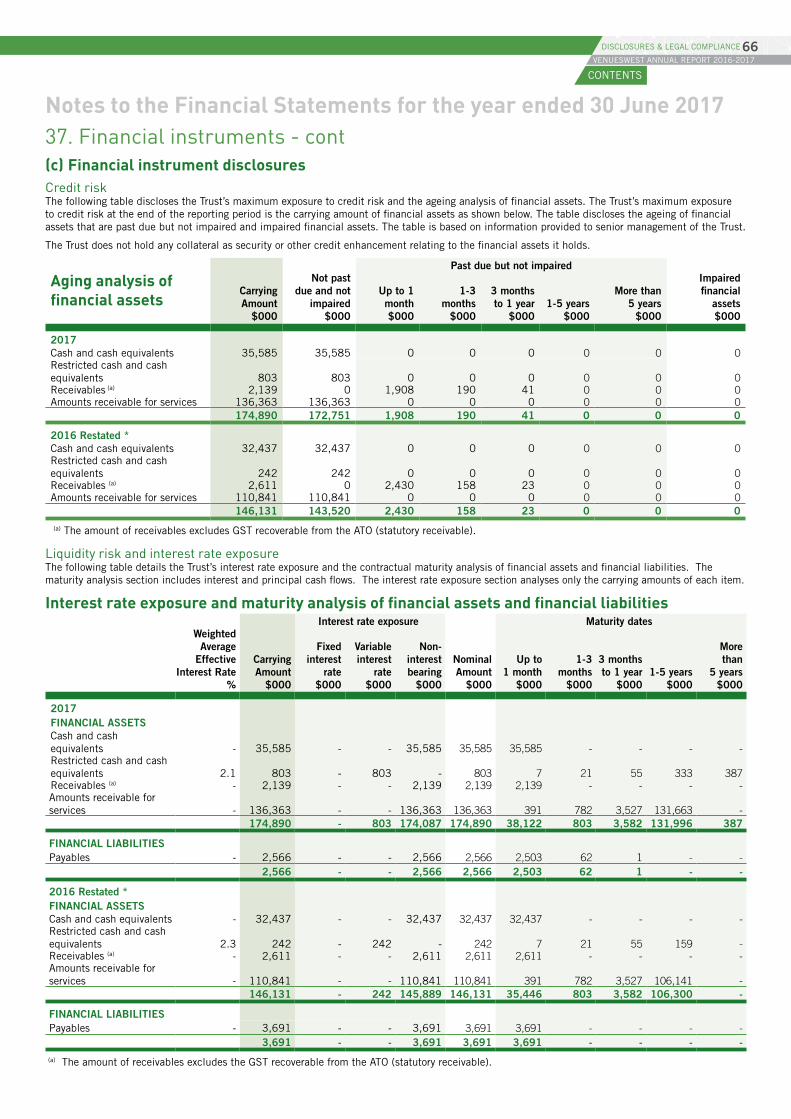
Notes to the Financial Statements for the year ended 30 June 201737. Financial instruments - cont(c) Financial instrument disclosuresCredit riskThe following table discloses the Trust’s maximum exposure to credit risk and the ageing analysis of financial assets. The Trust’s maximum exposure to credit risk at the end of the reporting period is the carrying amount of financial assets as shown below. The table discloses the ageing of financial assets that are past due but not impaired and impaired financial assets. The table is based on information provided to senior management of the Trust.
The Trust does not hold any collateral as security or other credit enhancement relating to the financial assets it holds.
Past due but not impaired
Aging analysis of financial assets
Carrying Amount
$000
Not past due and not
impaired $000
Up to 1 month $000
1-3 months
$000
3 months to 1 year
$0001-5 years
$000
More than 5 years
$000
Impaired financial
assets $000
2017Cash and cash equivalents 35,585 35,585 0 0 0 0 0 0Restricted cash and cash equivalents 803 803 0 0 0 0 0 0Receivables (a) 2,139 0 1,908 190 41 0 0 0Amounts receivable for services 136,363 136,363 0 0 0 0 0 0
174,890 172,751 1,908 190 41 0 0 0
2016 Restated *Cash and cash equivalents 32,437 32,437 0 0 0 0 0 0Restricted cash and cash equivalents 242 242 0 0 0 0 0 0Receivables (a) 2,611 0 2,430 158 23 0 0 0Amounts receivable for services 110,841 110,841 0 0 0 0 0 0
146,131 143,520 2,430 158 23 0 0 0(a) The amount of receivables excludes GST recoverable from the ATO (statutory receivable).
Liquidity risk and interest rate exposureThe following table details the Trust’s interest rate exposure and the contractual maturity analysis of financial assets and financial liabilities. The maturity analysis section includes interest and principal cash flows. The interest rate exposure section analyses only the carrying amounts of each item.
Interest rate exposure and maturity analysis of financial assets and financial liabilitiesInterest rate exposure Maturity dates
Weighted Average
Effective Interest Rate
%
Carrying Amount
$000
Fixed interest
rate $000
Variable interest
rate $000
Non-interest bearing
$000
Nominal Amount
$000
Up to 1 month
$000
1-3 months
$000
3 months to 1 year
$0001-5 years
$000
More than
5 years $000
2017FINANCIAL ASSETSCash and cash equivalents - 35,585 - - 35,585 35,585 35,585 - - - -Restricted cash and cash equivalents 2.1 803 - 803 - 803 7 21 55 333 387Receivables (a) - 2,139 - - 2,139 2,139 2,139 - - - -Amounts receivable for services - 136,363 - - 136,363 136,363 391 782 3,527 131,663 -
174,890 - 803 174,087 174,890 38,122 803 3,582 131,996 387
FINANCIAL LIABILITIESPayables - 2,566 - - 2,566 2,566 2,503 62 1 - -
2,566 - - 2,566 2,566 2,503 62 1 - -
2016 Restated *FINANCIAL ASSETSCash and cash equivalents - 32,437 - - 32,437 32,437 32,437 - - - -Restricted cash and cash equivalents 2.3 242 - 242 - 242 7 21 55 159 -Receivables (a) - 2,611 - - 2,611 2,611 2,611 - - - -Amounts receivable for services - 110,841 - - 110,841 110,841 391 782 3,527 106,141 -
146,131 - 242 145,889 146,131 35,446 803 3,582 106,300 -
FINANCIAL LIABILITIESPayables - 3,691 - - 3,691 3,691 3,691 - - - -
3,691 - - 3,691 3,691 3,691 - - - -(a) The amount of receivables excludes the GST recoverable from the ATO (statutory receivable).
CONTENTS
VENUESWEST ANNUAL REPORT 2016-201766DISCLOSURES & LEGAL COMPLIANCE
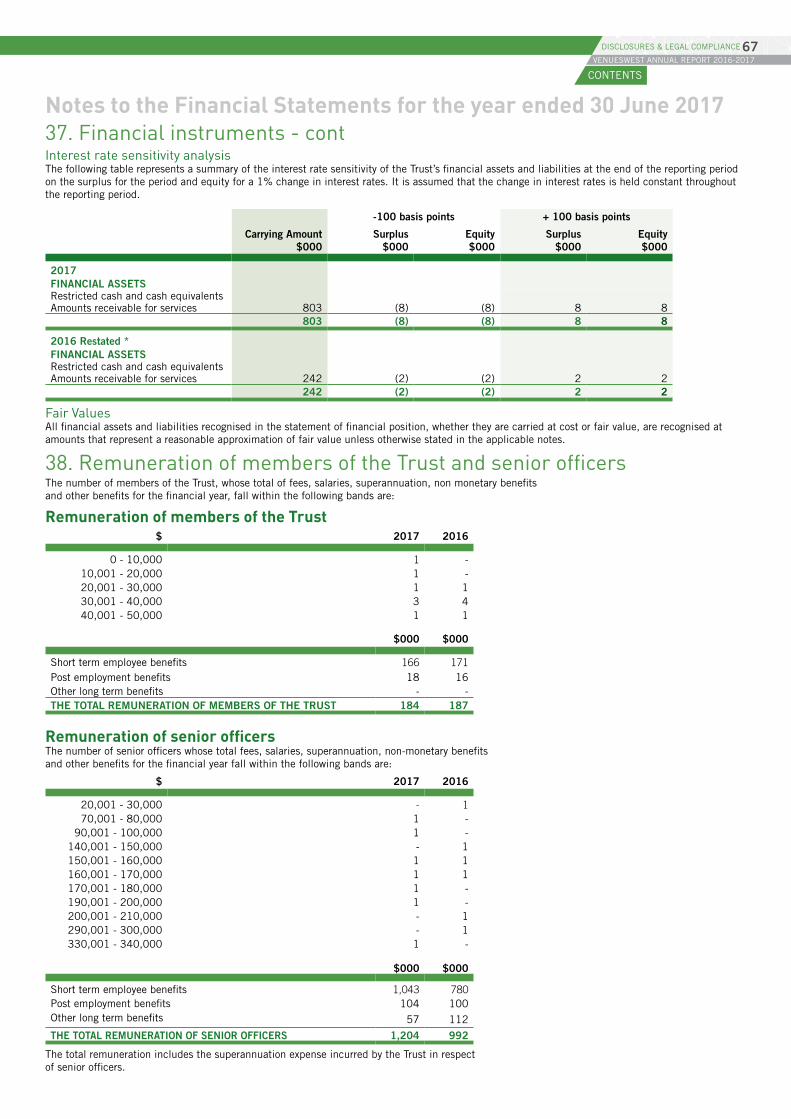
Notes to the Financial Statements for the year ended 30 June 201737. Financial instruments - contInterest rate sensitivity analysisThe following table represents a summary of the interest rate sensitivity of the Trust’s financial assets and liabilities at the end of the reporting period on the surplus for the period and equity for a 1% change in interest rates. It is assumed that the change in interest rates is held constant throughout the reporting period.
-100 basis points + 100 basis points
Carrying Amount $000
Surplus $000
Equity $000
Surplus $000
Equity $000
2017FINANCIAL ASSETSRestricted cash and cash equivalentsAmounts receivable for services 803 (8) (8) 8 8
803 (8) (8) 8 8
2016 Restated *FINANCIAL ASSETSRestricted cash and cash equivalentsAmounts receivable for services 242 (2) (2) 2 2
242 (2) (2) 2 2
Fair ValuesAll financial assets and liabilities recognised in the statement of financial position, whether they are carried at cost or fair value, are recognised at amounts that represent a reasonable approximation of fair value unless otherwise stated in the applicable notes.
38. Remuneration of members of the Trust and senior officersThe number of members of the Trust, whose total of fees, salaries, superannuation, non monetary benefits and other benefits for the financial year, fall within the following bands are:
Remuneration of members of the Trust$ 2017 2016
0 - 10,000 1 -10,001 - 20,000 1 -20,001 - 30,000 1 130,001 - 40,000 3 440,001 - 50,000 1 1
$000 $000
Short term employee benefits 166 171Post employment benefits 18 16Other long term benefits - -THE TOTAL REMUNERATION OF MEMBERS OF THE TRUST 184 187
Remuneration of senior officersThe number of senior officers whose total fees, salaries, superannuation, non-monetary benefits and other benefits for the financial year fall within the following bands are:
$ 2017 2016
20,001 - 30,000 - 1 70,001 - 80,000 1 -
90,001 - 100,000 1 -140,001 - 150,000 - 1150,001 - 160,000 1 1160,001 - 170,000 1 1170,001 - 180,000 1 -190,001 - 200,000 1 -200,001 - 210,000 - 1290,001 - 300,000 - 1330,001 - 340,000 1 -
$000 $000
Short term employee benefits 1,043 780Post employment benefits 104 100Other long term benefits 57 112
THE TOTAL REMUNERATION OF SENIOR OFFICERS 1,204 992
The total remuneration includes the superannuation expense incurred by the Trust in respect of senior officers.
CONTENTS
VENUESWEST ANNUAL REPORT 2016-201767DISCLOSURES & LEGAL COMPLIANCE
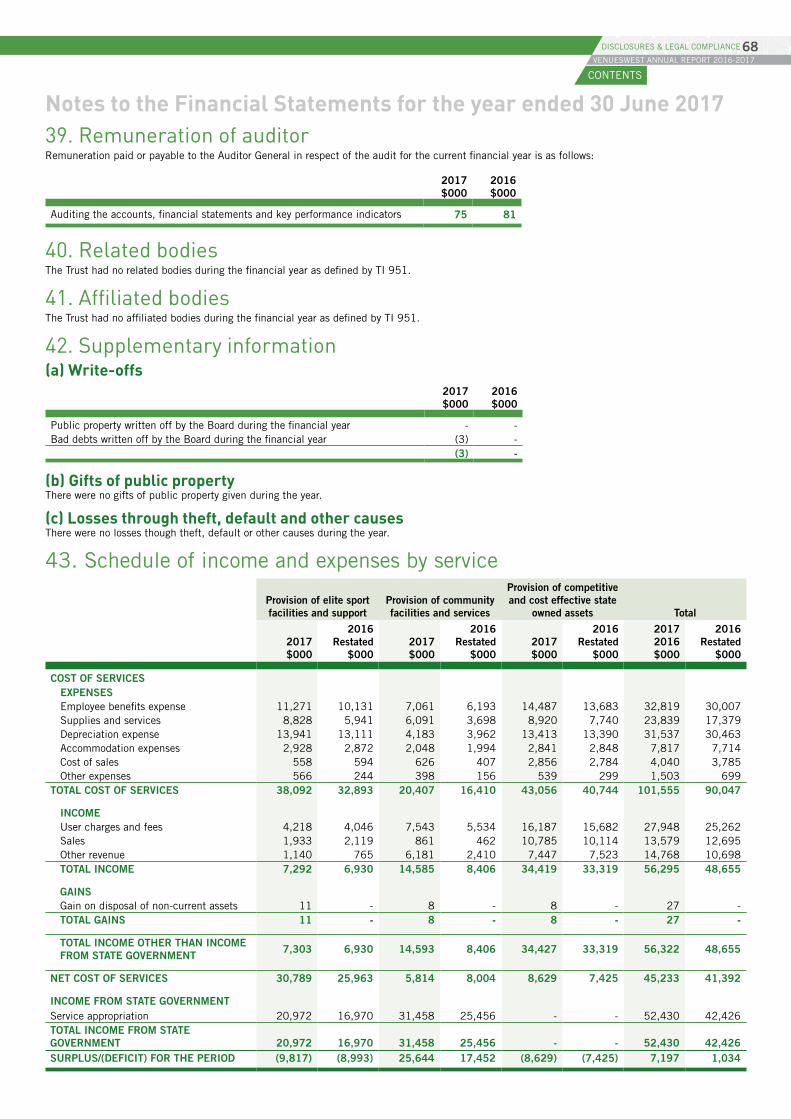
Notes to the Financial Statements for the year ended 30 June 201739. Remuneration of auditorRemuneration paid or payable to the Auditor General in respect of the audit for the current financial year is as follows:
2017 $000
2016 $000
Auditing the accounts, financial statements and key performance indicators 75 81
40. Related bodiesThe Trust had no related bodies during the financial year as defined by TI 951.
41. Affiliated bodiesThe Trust had no affiliated bodies during the financial year as defined by TI 951.
42. Supplementary information(a) Write-offs
2017 $000
2016 $000
Public property written off by the Board during the financial year - -Bad debts written off by the Board during the financial year (3) -
(3) -
(b) Gifts of public propertyThere were no gifts of public property given during the year.
(c) Losses through theft, default and other causesThere were no losses though theft, default or other causes during the year.
43. Schedule of income and expenses by service
Provision of elite sport facilities and support
Provision of community facilities and services
Provision of competitive and cost effective state
owned assets Total
2017 $000
2016 Restated
$0002017 $000
2016 Restated
$0002017 $000
2016 Restated
$000
2017 2016 $000
2016 Restated
$000
COST OF SERVICESEXPENSESEmployee benefits expense 11,271 10,131 7,061 6,193 14,487 13,683 32,819 30,007Supplies and services 8,828 5,941 6,091 3,698 8,920 7,740 23,839 17,379Depreciation expense 13,941 13,111 4,183 3,962 13,413 13,390 31,537 30,463Accommodation expenses 2,928 2,872 2,048 1,994 2,841 2,848 7,817 7,714Cost of sales 558 594 626 407 2,856 2,784 4,040 3,785Other expenses 566 244 398 156 539 299 1,503 699
TOTAL COST OF SERVICES 38,092 32,893 20,407 16,410 43,056 40,744 101,555 90,047
INCOMEUser charges and fees 4,218 4,046 7,543 5,534 16,187 15,682 27,948 25,262Sales 1,933 2,119 861 462 10,785 10,114 13,579 12,695Other revenue 1,140 765 6,181 2,410 7,447 7,523 14,768 10,698TOTAL INCOME 7,292 6,930 14,585 8,406 34,419 33,319 56,295 48,655
GAINSGain on disposal of non-current assets 11 - 8 - 8 - 27 -TOTAL GAINS 11 - 8 - 8 - 27 -
TOTAL INCOME OTHER THAN INCOME FROM STATE GOVERNMENT 7,303 6,930 14,593 8,406 34,427 33,319 56,322 48,655
NET COST OF SERVICES 30,789 25,963 5,814 8,004 8,629 7,425 45,233 41,392
INCOME FROM STATE GOVERNMENTService appropriation 20,972 16,970 31,458 25,456 - - 52,430 42,426TOTAL INCOME FROM STATE GOVERNMENT 20,972 16,970 31,458 25,456 - - 52,430 42,426SURPLUS/(DEFICIT) FOR THE PERIOD (9,817) (8,993) 25,644 17,452 (8,629) (7,425) 7,197 1,034
CONTENTS
VENUESWEST ANNUAL REPORT 2016-201768DISCLOSURES & LEGAL COMPLIANCE
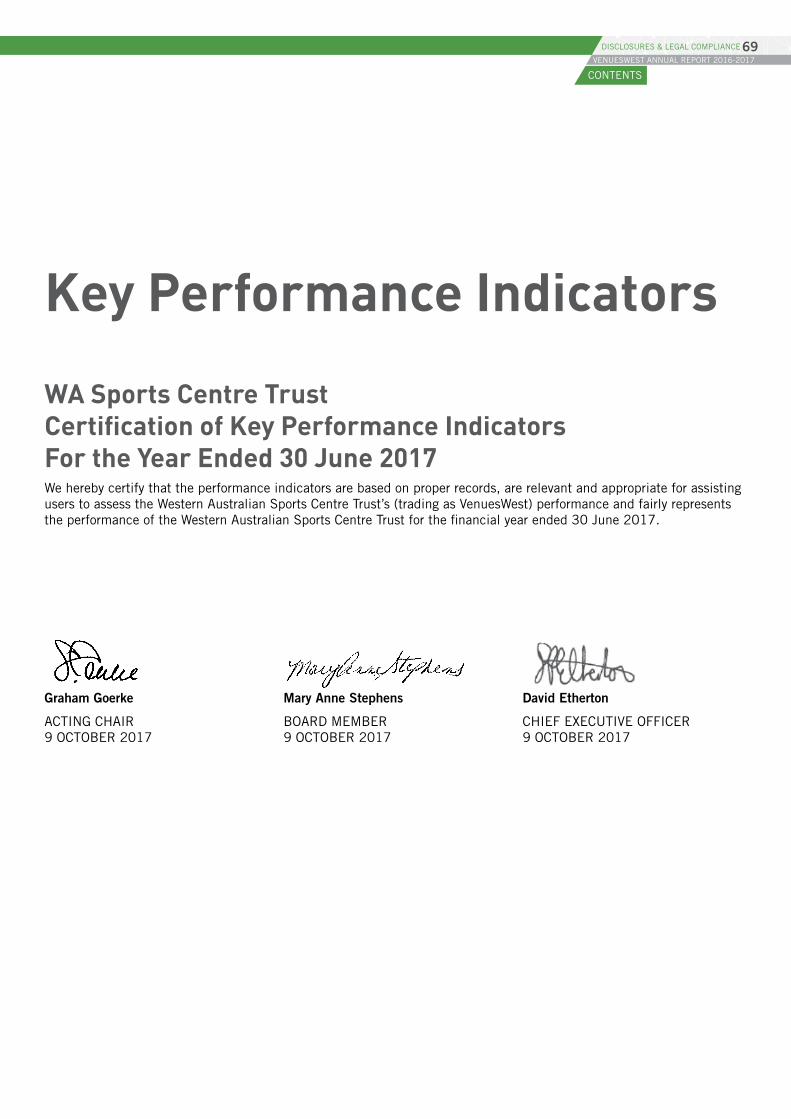
Key Performance Indicators
WA Sports Centre Trust Certification of Key Performance Indicators For the Year Ended 30 June 2017 We hereby certify that the performance indicators are based on proper records, are relevant and appropriate for assisting users to assess the Western Australian Sports Centre Trust’s (trading as VenuesWest) performance and fairly represents the performance of the Western Australian Sports Centre Trust for the financial year ended 30 June 2017.
Graham Goerke
ACTING CHAIR 9 OCTOBER 2017
Mary Anne Stephens
BOARD MEMBER 9 OCTOBER 2017
David Etherton
CHIEF EXECUTIVE OFFICER 9 OCTOBER 2017
CONTENTS
VENUESWEST ANNUAL REPORT 2016-201769DISCLOSURES & LEGAL COMPLIANCE
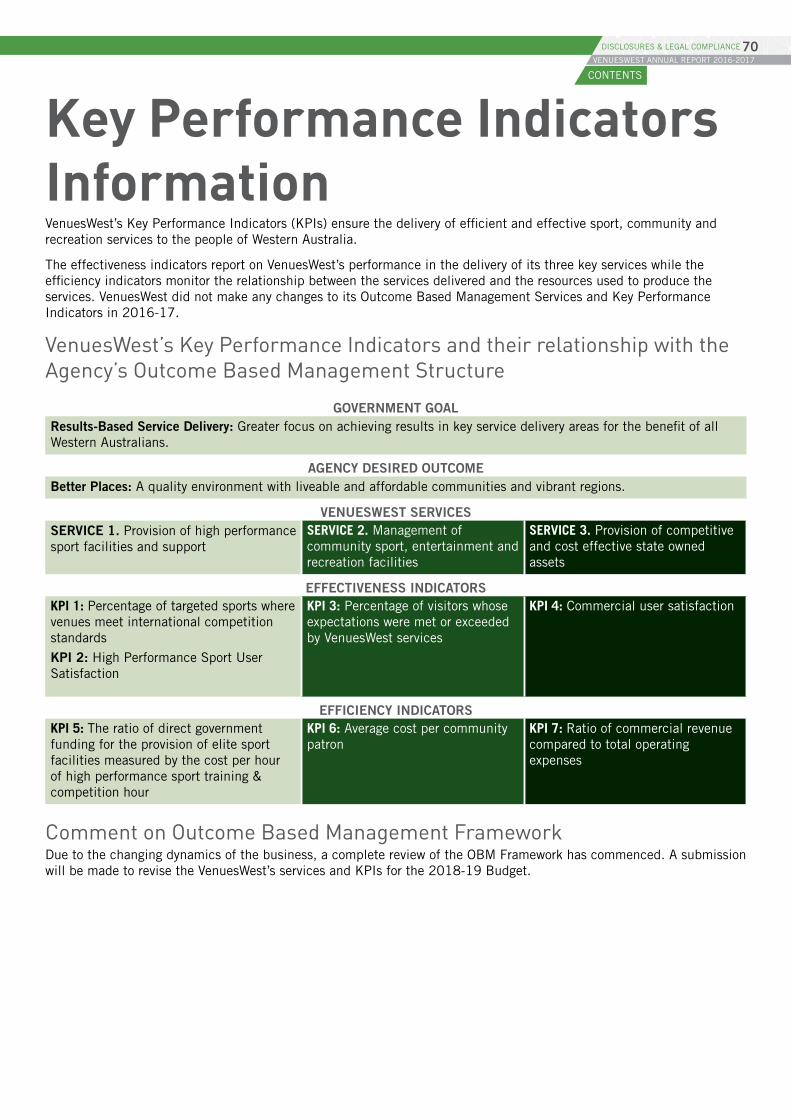
Key Performance Indicators Information VenuesWest’s Key Performance Indicators (KPIs) ensure the delivery of efficient and effective sport, community and recreation services to the people of Western Australia.
The effectiveness indicators report on VenuesWest’s performance in the delivery of its three key services while the efficiency indicators monitor the relationship between the services delivered and the resources used to produce the services. VenuesWest did not make any changes to its Outcome Based Management Services and Key Performance Indicators in 2016-17.
VenuesWest’s Key Performance Indicators and their relationship with the Agency’s Outcome Based Management Structure
GOVERNMENT GOALResults-Based Service Delivery: Greater focus on achieving results in key service delivery areas for the benefit of all Western Australians.
AGENCY DESIRED OUTCOMEBetter Places: A quality environment with liveable and affordable communities and vibrant regions.
VENUESWEST SERVICESSERVICE 1. Provision of high performance sport facilities and support
SERVICE 2. Management of community sport, entertainment and recreation facilities
SERVICE 3. Provision of competitive and cost effective state owned assets
EFFECTIVENESS INDICATORSKPI 1: Percentage of targeted sports where venues meet international competition standards
KPI 2: High Performance Sport User Satisfaction
KPI 3: Percentage of visitors whose expectations were met or exceeded by VenuesWest services
KPI 4: Commercial user satisfaction
EFFICIENCY INDICATORSKPI 5: The ratio of direct government funding for the provision of elite sport facilities measured by the cost per hour of high performance sport training & competition hour
KPI 6: Average cost per community patron
KPI 7: Ratio of commercial revenue compared to total operating expenses
Comment on Outcome Based Management FrameworkDue to the changing dynamics of the business, a complete review of the OBM Framework has commenced. A submission will be made to revise the VenuesWest’s services and KPIs for the 2018-19 Budget.
CONTENTS
VENUESWEST ANNUAL REPORT 2016-201770DISCLOSURES & LEGAL COMPLIANCE
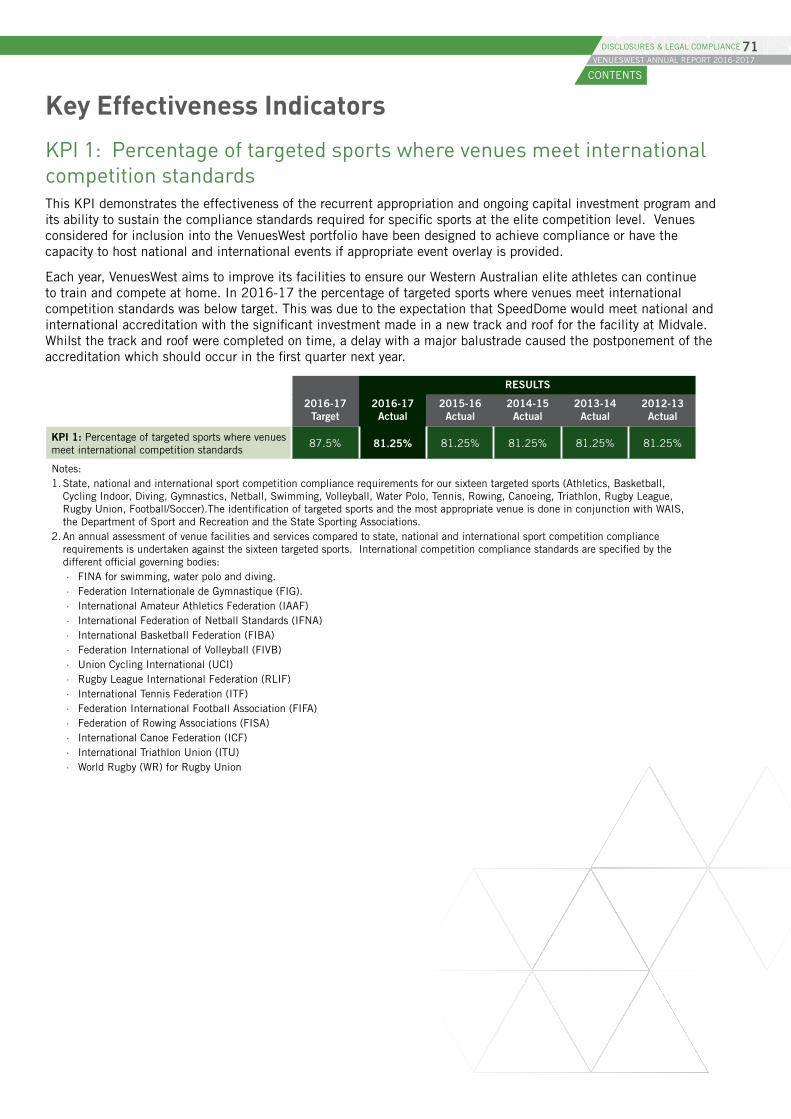
Key Effectiveness Indicators
KPI 1: Percentage of targeted sports where venues meet international competition standardsThis KPI demonstrates the effectiveness of the recurrent appropriation and ongoing capital investment program and its ability to sustain the compliance standards required for specific sports at the elite competition level. Venues considered for inclusion into the VenuesWest portfolio have been designed to achieve compliance or have the capacity to host national and international events if appropriate event overlay is provided.
Each year, VenuesWest aims to improve its facilities to ensure our Western Australian elite athletes can continue to train and compete at home. In 2016-17 the percentage of targeted sports where venues meet international competition standards was below target. This was due to the expectation that SpeedDome would meet national and international accreditation with the significant investment made in a new track and roof for the facility at Midvale. Whilst the track and roof were completed on time, a delay with a major balustrade caused the postponement of the accreditation which should occur in the first quarter next year.
RESULTS
2016-17 Target
2016-17 Actual
2015-16 Actual
2014-15 Actual
2013-14 Actual
2012-13 Actual
KPI 1: Percentage of targeted sports where venues meet international competition standards
87.5% 81.25% 81.25% 81.25% 81.25% 81.25%
Notes: 1. State, national and international sport competition compliance requirements for our sixteen targeted sports (Athletics, Basketball,
Cycling Indoor, Diving, Gymnastics, Netball, Swimming, Volleyball, Water Polo, Tennis, Rowing, Canoeing, Triathlon, Rugby League, Rugby Union, Football/Soccer).The identification of targeted sports and the most appropriate venue is done in conjunction with WAIS, the Department of Sport and Recreation and the State Sporting Associations.
2. An annual assessment of venue facilities and services compared to state, national and international sport competition compliance requirements is undertaken against the sixteen targeted sports. International competition compliance standards are specified by the different official governing bodies: · FINA for swimming, water polo and diving. · Federation Internationale de Gymnastique (FIG). · International Amateur Athletics Federation (IAAF) · International Federation of Netball Standards (IFNA) · International Basketball Federation (FIBA) · Federation International of Volleyball (FIVB) · Union Cycling International (UCI) · Rugby League International Federation (RLIF) · International Tennis Federation (ITF) · Federation International Football Association (FIFA) · Federation of Rowing Associations (FISA) · International Canoe Federation (ICF) · International Triathlon Union (ITU) · World Rugby (WR) for Rugby Union
CONTENTS
VENUESWEST ANNUAL REPORT 2016-201771DISCLOSURES & LEGAL COMPLIANCE
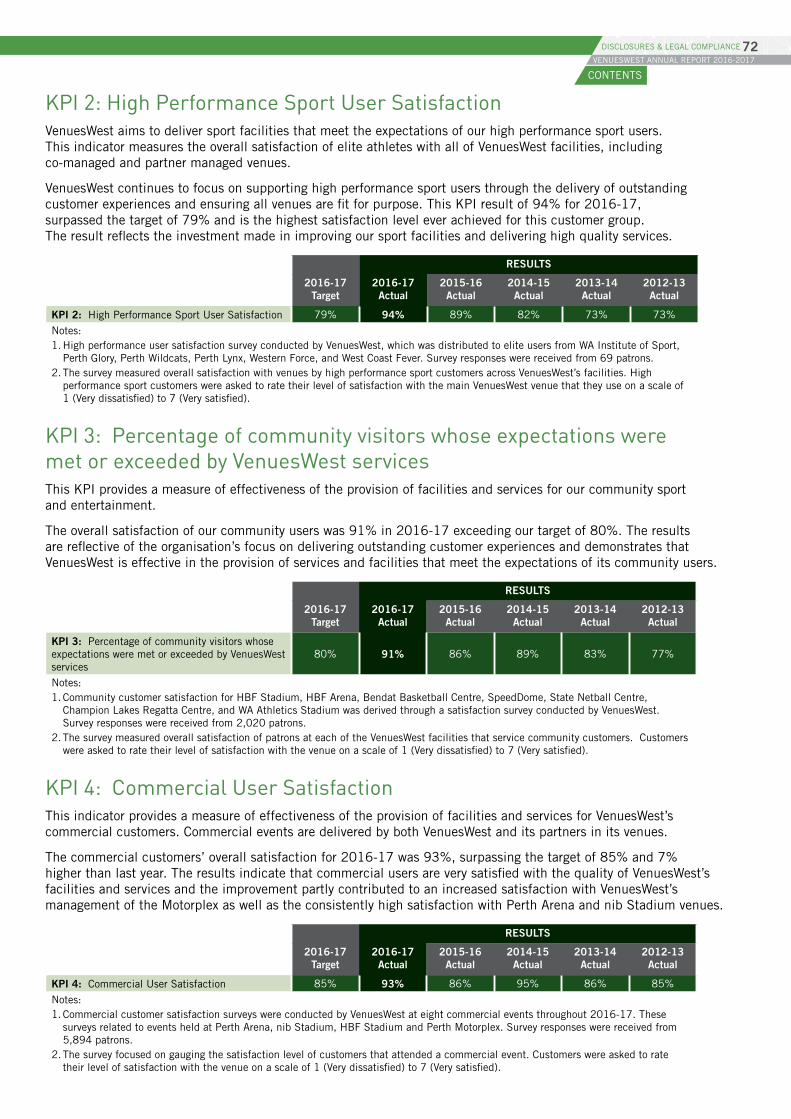
KPI 2: High Performance Sport User Satisfaction VenuesWest aims to deliver sport facilities that meet the expectations of our high performance sport users. This indicator measures the overall satisfaction of elite athletes with all of VenuesWest facilities, including co-managed and partner managed venues.
VenuesWest continues to focus on supporting high performance sport users through the delivery of outstanding customer experiences and ensuring all venues are fit for purpose. This KPI result of 94% for 2016-17, surpassed the target of 79% and is the highest satisfaction level ever achieved for this customer group. The result reflects the investment made in improving our sport facilities and delivering high quality services.
RESULTS
2016-17 Target
2016-17 Actual
2015-16 Actual
2014-15 Actual
2013-14 Actual
2012-13 Actual
KPI 2: High Performance Sport User Satisfaction 79% 94% 89% 82% 73% 73%
Notes: 1. High performance user satisfaction survey conducted by VenuesWest, which was distributed to elite users from WA Institute of Sport,
Perth Glory, Perth Wildcats, Perth Lynx, Western Force, and West Coast Fever. Survey responses were received from 69 patrons. 2. The survey measured overall satisfaction with venues by high performance sport customers across VenuesWest’s facilities. High
performance sport customers were asked to rate their level of satisfaction with the main VenuesWest venue that they use on a scale of 1 (Very dissatisfied) to 7 (Very satisfied).
KPI 3: Percentage of community visitors whose expectations were met or exceeded by VenuesWest servicesThis KPI provides a measure of effectiveness of the provision of facilities and services for our community sport and entertainment.
The overall satisfaction of our community users was 91% in 2016-17 exceeding our target of 80%. The results are reflective of the organisation’s focus on delivering outstanding customer experiences and demonstrates that VenuesWest is effective in the provision of services and facilities that meet the expectations of its community users.
RESULTS
2016-17 Target
2016-17 Actual
2015-16 Actual
2014-15 Actual
2013-14 Actual
2012-13 Actual
KPI 3: Percentage of community visitors whose expectations were met or exceeded by VenuesWest services
80% 91% 86% 89% 83% 77%
Notes: 1. Community customer satisfaction for HBF Stadium, HBF Arena, Bendat Basketball Centre, SpeedDome, State Netball Centre,
Champion Lakes Regatta Centre, and WA Athletics Stadium was derived through a satisfaction survey conducted by VenuesWest. Survey responses were received from 2,020 patrons.
2. The survey measured overall satisfaction of patrons at each of the VenuesWest facilities that service community customers. Customers were asked to rate their level of satisfaction with the venue on a scale of 1 (Very dissatisfied) to 7 (Very satisfied).
KPI 4: Commercial User Satisfaction This indicator provides a measure of effectiveness of the provision of facilities and services for VenuesWest’s commercial customers. Commercial events are delivered by both VenuesWest and its partners in its venues.
The commercial customers’ overall satisfaction for 2016-17 was 93%, surpassing the target of 85% and 7% higher than last year. The results indicate that commercial users are very satisfied with the quality of VenuesWest’s facilities and services and the improvement partly contributed to an increased satisfaction with VenuesWest’s management of the Motorplex as well as the consistently high satisfaction with Perth Arena and nib Stadium venues.
RESULTS
2016-17 Target
2016-17 Actual
2015-16 Actual
2014-15 Actual
2013-14 Actual
2012-13 Actual
KPI 4: Commercial User Satisfaction 85% 93% 86% 95% 86% 85%
Notes: 1. Commercial customer satisfaction surveys were conducted by VenuesWest at eight commercial events throughout 2016-17. These
surveys related to events held at Perth Arena, nib Stadium, HBF Stadium and Perth Motorplex. Survey responses were received from 5,894 patrons.
2. The survey focused on gauging the satisfaction level of customers that attended a commercial event. Customers were asked to rate their level of satisfaction with the venue on a scale of 1 (Very dissatisfied) to 7 (Very satisfied).
CONTENTS
VENUESWEST ANNUAL REPORT 2016-201772DISCLOSURES & LEGAL COMPLIANCE
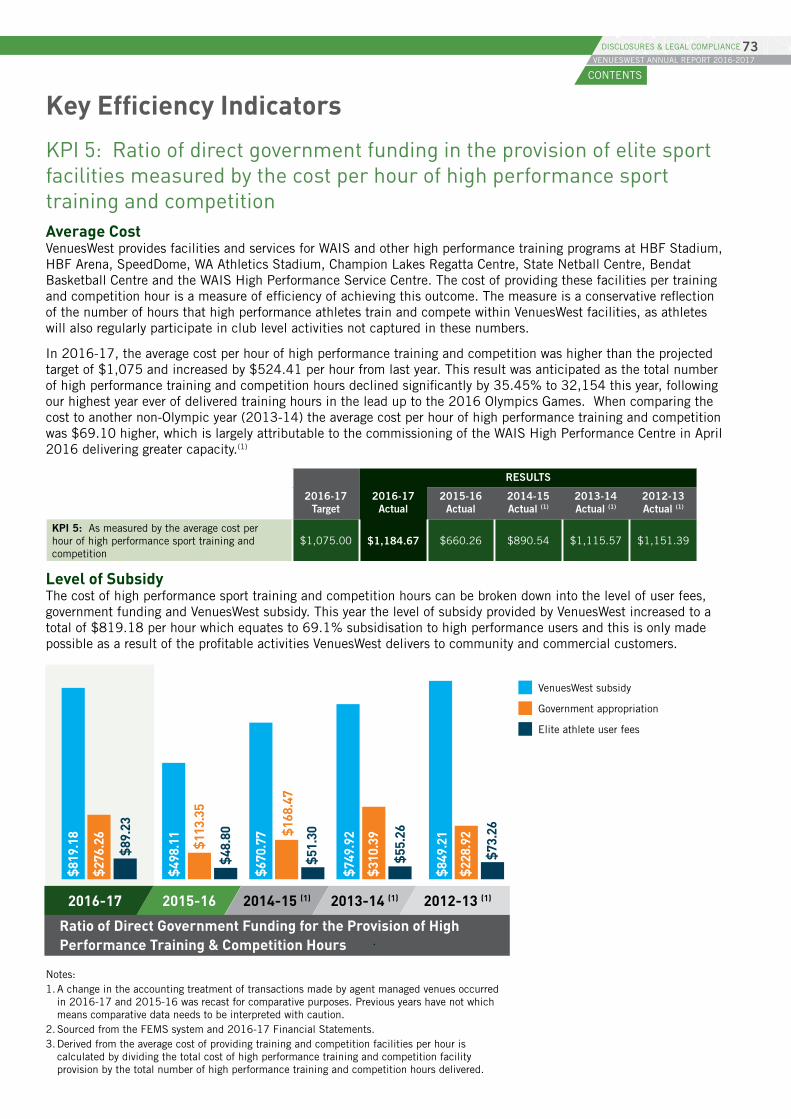
Key Efficiency Indicators
KPI 5: Ratio of direct government funding in the provision of elite sport facilities measured by the cost per hour of high performance sport training and competition Average CostVenuesWest provides facilities and services for WAIS and other high performance training programs at HBF Stadium, HBF Arena, SpeedDome, WA Athletics Stadium, Champion Lakes Regatta Centre, State Netball Centre, Bendat Basketball Centre and the WAIS High Performance Service Centre. The cost of providing these facilities per training and competition hour is a measure of efficiency of achieving this outcome. The measure is a conservative reflection of the number of hours that high performance athletes train and compete within VenuesWest facilities, as athletes will also regularly participate in club level activities not captured in these numbers.
In 2016-17, the average cost per hour of high performance training and competition was higher than the projected target of $1,075 and increased by $524.41 per hour from last year. This result was anticipated as the total number of high performance training and competition hours declined significantly by 35.45% to 32,154 this year, following our highest year ever of delivered training hours in the lead up to the 2016 Olympics Games. When comparing the cost to another non-Olympic year (2013-14) the average cost per hour of high performance training and competition was $69.10 higher, which is largely attributable to the commissioning of the WAIS High Performance Centre in April 2016 delivering greater capacity.(1)
RESULTS
2016-17 Target
2016-17 Actual
2015-16 Actual
2014-15 Actual (1)
2013-14 Actual (1)
2012-13 Actual (1)
KPI 5: As measured by the average cost per hour of high performance sport training and competition
$1,075.00 $1,184.67 $660.26 $890.54 $1,115.57 $1,151.39
Level of Subsidy The cost of high performance sport training and competition hours can be broken down into the level of user fees, government funding and VenuesWest subsidy. This year the level of subsidy provided by VenuesWest increased to a total of $819.18 per hour which equates to 69.1% subsidisation to high performance users and this is only made possible as a result of the profitable activities VenuesWest delivers to community and commercial customers.
Notes: 1. A change in the accounting treatment of transactions made by agent managed venues occurred
in 2016-17 and 2015-16 was recast for comparative purposes. Previous years have not which means comparative data needs to be interpreted with caution.
2. Sourced from the FEMS system and 2016-17 Financial Statements. 3. Derived from the average cost of providing training and competition facilities per hour is
calculated by dividing the total cost of high performance training and competition facility provision by the total number of high performance training and competition hours delivered.
VenuesWest subsidy
Government appropriation
Elite athlete user fees
2012-13 (1)2013-14 (1)2014-15 (1)2015-162016-17
Ratio of Direct Government Funding for the Provision of High Performance Training & Competition Hours
$89.
23
$48.
80
$51.
30
$55.
26
$73.
26
$228
.92
$310
.39
$113
.35
$168
.47
$276
.26
$819
.18
$498
.11
$670
.77
$749
.92
$849
.21
CONTENTS
VENUESWEST ANNUAL REPORT 2016-201773DISCLOSURES & LEGAL COMPLIANCE
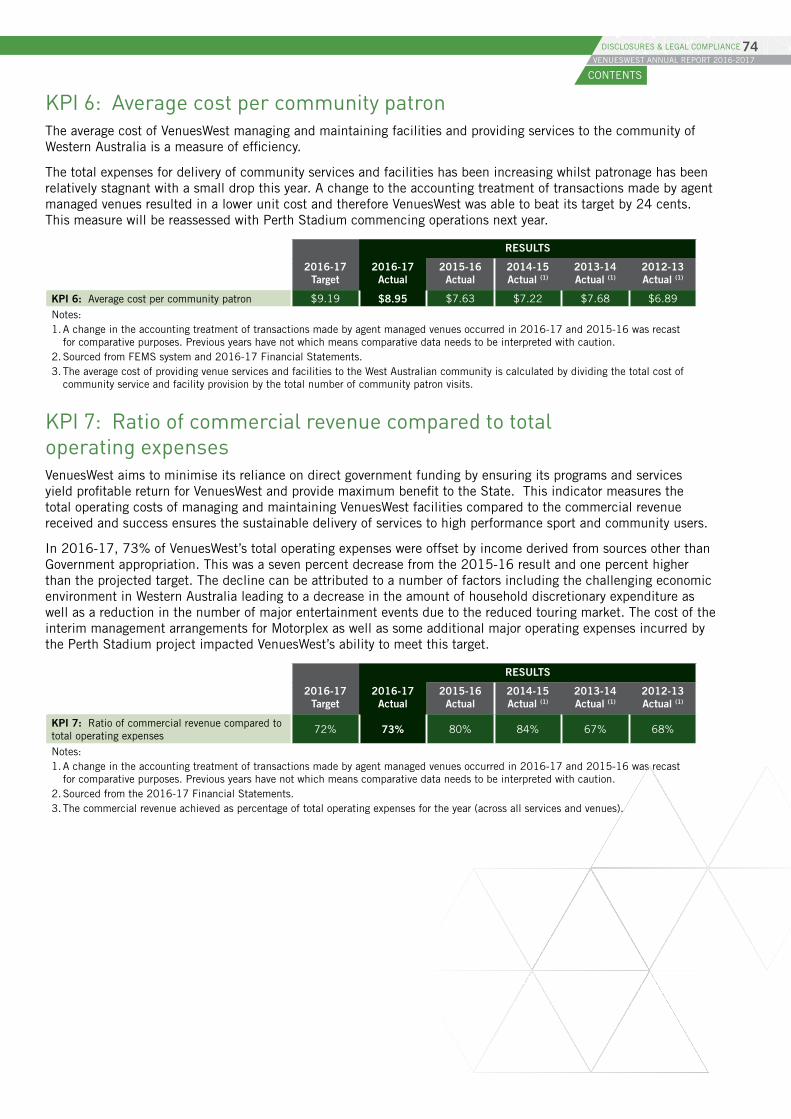
KPI 6: Average cost per community patron The average cost of VenuesWest managing and maintaining facilities and providing services to the community of Western Australia is a measure of efficiency.
The total expenses for delivery of community services and facilities has been increasing whilst patronage has been relatively stagnant with a small drop this year. A change to the accounting treatment of transactions made by agent managed venues resulted in a lower unit cost and therefore VenuesWest was able to beat its target by 24 cents. This measure will be reassessed with Perth Stadium commencing operations next year.
RESULTS
2016-17 Target
2016-17 Actual
2015-16 Actual
2014-15 Actual (1)
2013-14 Actual (1)
2012-13 Actual (1)
KPI 6: Average cost per community patron $9.19 $8.95 $7.63 $7.22 $7.68 $6.89
Notes: 1. A change in the accounting treatment of transactions made by agent managed venues occurred in 2016-17 and 2015-16 was recast
for comparative purposes. Previous years have not which means comparative data needs to be interpreted with caution. 2. Sourced from FEMS system and 2016-17 Financial Statements.3. The average cost of providing venue services and facilities to the West Australian community is calculated by dividing the total cost of
community service and facility provision by the total number of community patron visits.
KPI 7: Ratio of commercial revenue compared to total operating expensesVenuesWest aims to minimise its reliance on direct government funding by ensuring its programs and services yield profitable return for VenuesWest and provide maximum benefit to the State. This indicator measures the total operating costs of managing and maintaining VenuesWest facilities compared to the commercial revenue received and success ensures the sustainable delivery of services to high performance sport and community users.
In 2016-17, 73% of VenuesWest’s total operating expenses were offset by income derived from sources other than Government appropriation. This was a seven percent decrease from the 2015-16 result and one percent higher than the projected target. The decline can be attributed to a number of factors including the challenging economic environment in Western Australia leading to a decrease in the amount of household discretionary expenditure as well as a reduction in the number of major entertainment events due to the reduced touring market. The cost of the interim management arrangements for Motorplex as well as some additional major operating expenses incurred by the Perth Stadium project impacted VenuesWest’s ability to meet this target.
RESULTS
2016-17 Target
2016-17 Actual
2015-16 Actual
2014-15 Actual (1)
2013-14 Actual (1)
2012-13 Actual (1)
KPI 7: Ratio of commercial revenue compared to total operating expenses
72% 73% 80% 84% 67% 68%
Notes: 1. A change in the accounting treatment of transactions made by agent managed venues occurred in 2016-17 and 2015-16 was recast
for comparative purposes. Previous years have not which means comparative data needs to be interpreted with caution. 2. Sourced from the 2016-17 Financial Statements.3. The commercial revenue achieved as percentage of total operating expenses for the year (across all services and venues).
CONTENTS
VENUESWEST ANNUAL REPORT 2016-201774DISCLOSURES & LEGAL COMPLIANCE
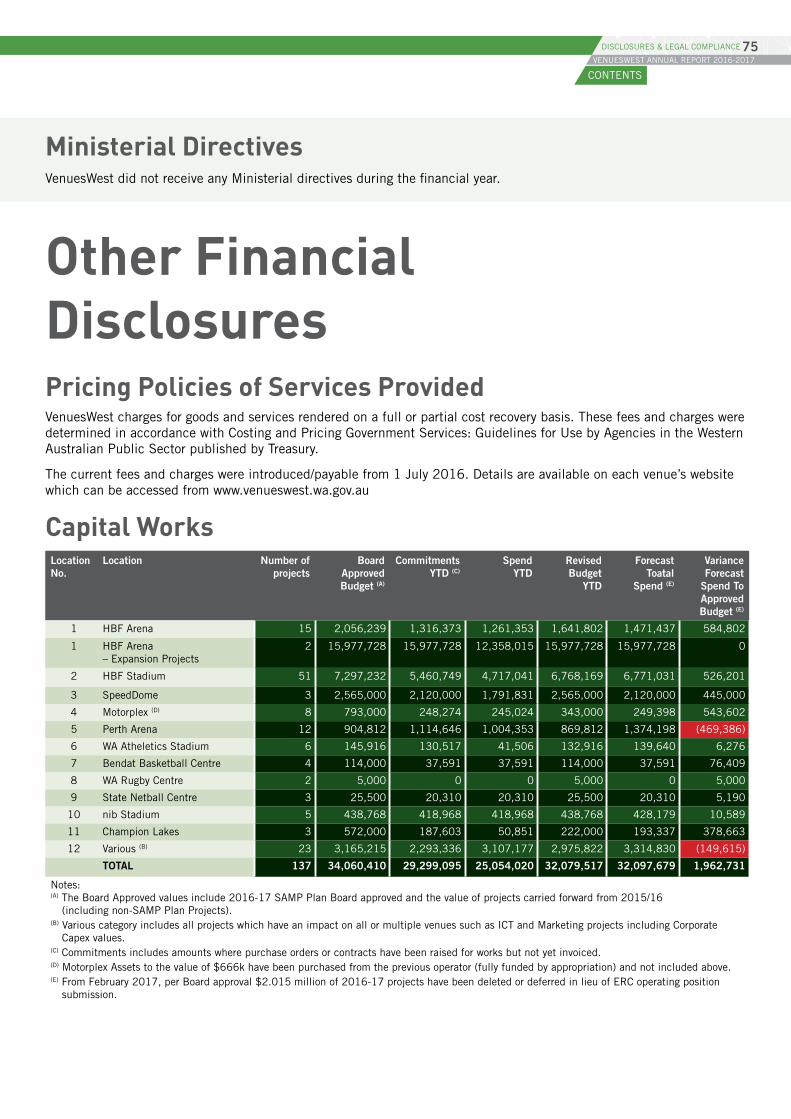
Ministerial DirectivesVenuesWest did not receive any Ministerial directives during the financial year.
Other Financial DisclosuresPricing Policies of Services Provided VenuesWest charges for goods and services rendered on a full or partial cost recovery basis. These fees and charges were determined in accordance with Costing and Pricing Government Services: Guidelines for Use by Agencies in the Western Australian Public Sector published by Treasury.
The current fees and charges were introduced/payable from 1 July 2016. Details are available on each venue’s website which can be accessed from www.venueswest.wa.gov.au
Capital Works Location No.
Location Number of projects
Board Approved Budget (A)
Commitments YTD (C)
Spend YTD
Revised Budget
YTD
Forecast Toatal
Spend (E)
Variance Forecast
Spend To Approved Budget (E)
1 HBF Arena 15 2,056,239 1,316,373 1,261,353 1,641,802 1,471,437 584,802
1 HBF Arena – Expansion Projects
2 15,977,728 15,977,728 12,358,015 15,977,728 15,977,728 0
2 HBF Stadium 51 7,297,232 5,460,749 4,717,041 6,768,169 6,771,031 526,201
3 SpeedDome 3 2,565,000 2,120,000 1,791,831 2,565,000 2,120,000 445,000
4 Motorplex (D) 8 793,000 248,274 245,024 343,000 249,398 543,602
5 Perth Arena 12 904,812 1,114,646 1,004,353 869,812 1,374,198 (469,386)
6 WA Atheletics Stadium 6 145,916 130,517 41,506 132,916 139,640 6,276
7 Bendat Basketball Centre 4 114,000 37,591 37,591 114,000 37,591 76,409
8 WA Rugby Centre 2 5,000 0 0 5,000 0 5,000
9 State Netball Centre 3 25,500 20,310 20,310 25,500 20,310 5,190
10 nib Stadium 5 438,768 418,968 418,968 438,768 428,179 10,589
11 Champion Lakes 3 572,000 187,603 50,851 222,000 193,337 378,663
12 Various (B) 23 3,165,215 2,293,336 3,107,177 2,975,822 3,314,830 (149,615)
TOTAL 137 34,060,410 29,299,095 25,054,020 32,079,517 32,097,679 1,962,731
Notes: (A) The Board Approved values include 2016-17 SAMP Plan Board approved and the value of projects carried forward from 2015/16
(including non-SAMP Plan Projects).(B) Various category includes all projects which have an impact on all or multiple venues such as ICT and Marketing projects including Corporate
Capex values.(C) Commitments includes amounts where purchase orders or contracts have been raised for works but not yet invoiced.(D) Motorplex Assets to the value of $666k have been purchased from the previous operator (fully funded by appropriation) and not included above.(E) From February 2017, per Board approval $2.015 million of 2016-17 projects have been deleted or deferred in lieu of ERC operating position
submission.
CONTENTS
VENUESWEST ANNUAL REPORT 2016-201775DISCLOSURES & LEGAL COMPLIANCE
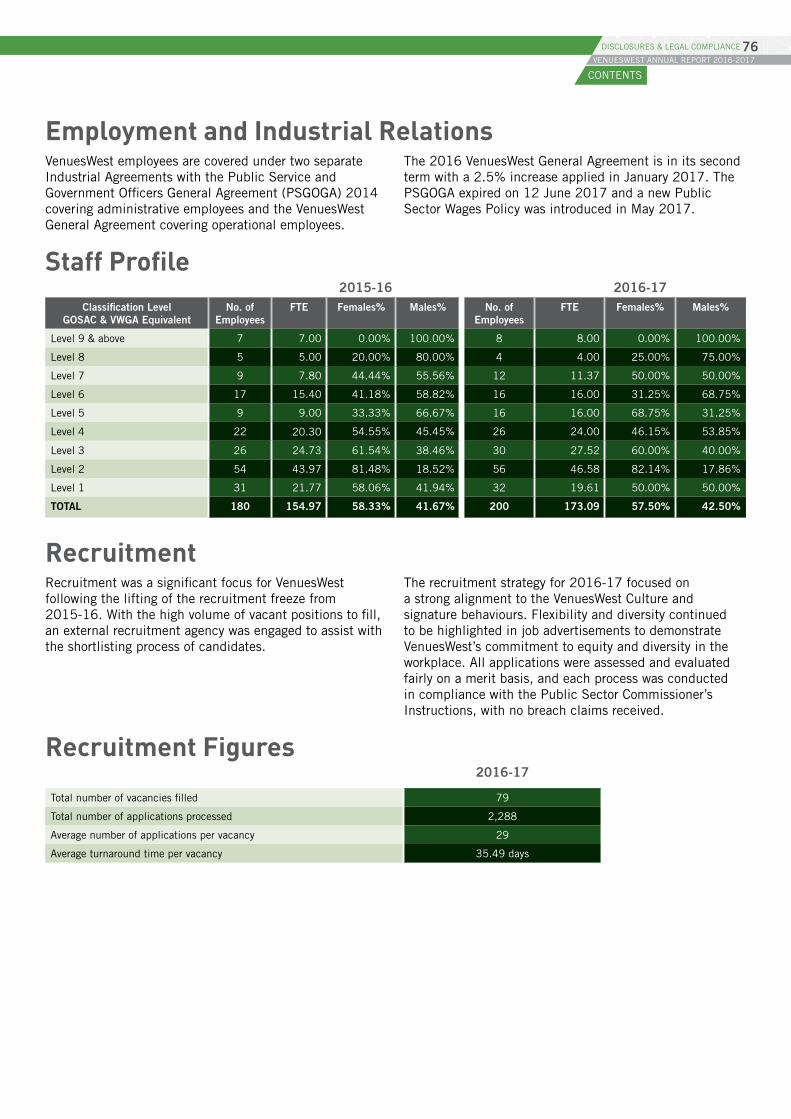
Employment and Industrial Relations VenuesWest employees are covered under two separate Industrial Agreements with the Public Service and Government Officers General Agreement (PSGOGA) 2014 covering administrative employees and the VenuesWest General Agreement covering operational employees.
The 2016 VenuesWest General Agreement is in its second term with a 2.5% increase applied in January 2017. The PSGOGA expired on 12 June 2017 and a new Public Sector Wages Policy was introduced in May 2017.
Staff Profile2015-16 2016-17
Classification Level GOSAC & VWGA Equivalent
No. of Employees
FTE Females% Males% No. of Employees
FTE Females% Males%
Level 9 & above 7 7.00 0.00% 100.00% 8 8.00 0.00% 100.00%
Level 8 5 5.00 20.00% 80.00% 4 4.00 25.00% 75.00%
Level 7 9 7.80 44.44% 55.56% 12 11.37 50.00% 50.00%
Level 6 17 15.40 41.18% 58.82% 16 16.00 31.25% 68.75%
Level 5 9 9.00 33.33% 66.67% 16 16.00 68.75% 31.25%
Level 4 22 20.30 54.55% 45.45% 26 24.00 46.15% 53.85%
Level 3 26 24.73 61.54% 38.46% 30 27.52 60.00% 40.00%
Level 2 54 43.97 81.48% 18.52% 56 46.58 82.14% 17.86%
Level 1 31 21.77 58.06% 41.94% 32 19.61 50.00% 50.00%
TOTAL 180 154.97 58.33% 41.67% 200 173.09 57.50% 42.50%
Recruitment Recruitment was a significant focus for VenuesWest following the lifting of the recruitment freeze from 2015-16. With the high volume of vacant positions to fill, an external recruitment agency was engaged to assist with the shortlisting process of candidates.
The recruitment strategy for 2016-17 focused on a strong alignment to the VenuesWest Culture and signature behaviours. Flexibility and diversity continued to be highlighted in job advertisements to demonstrate VenuesWest’s commitment to equity and diversity in the workplace. All applications were assessed and evaluated fairly on a merit basis, and each process was conducted in compliance with the Public Sector Commissioner’s Instructions, with no breach claims received.
Recruitment Figures 2016-17
Total number of vacancies filled 79
Total number of applications processed 2,288
Average number of applications per vacancy 29
Average turnaround time per vacancy 35.49 days
CONTENTS
VENUESWEST ANNUAL REPORT 2016-201776DISCLOSURES & LEGAL COMPLIANCE
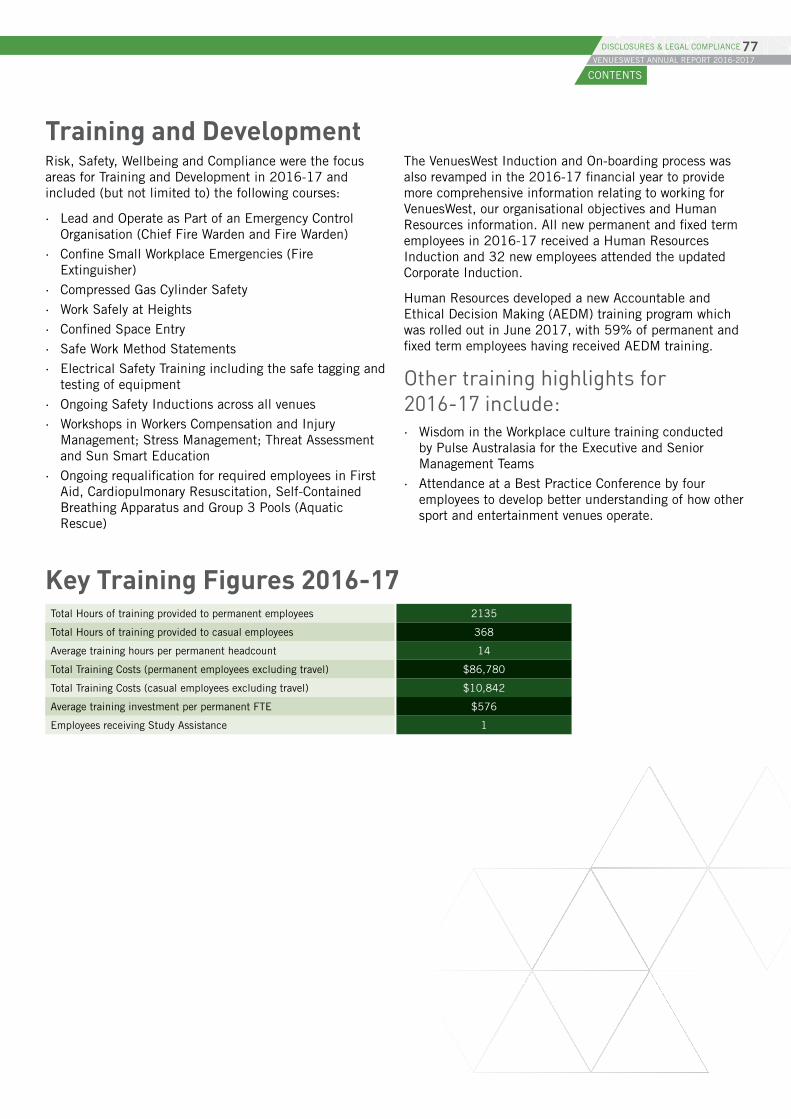
Training and DevelopmentRisk, Safety, Wellbeing and Compliance were the focus areas for Training and Development in 2016-17 and included (but not limited to) the following courses:
· Lead and Operate as Part of an Emergency Control Organisation (Chief Fire Warden and Fire Warden)
· Confine Small Workplace Emergencies (Fire Extinguisher)
· Compressed Gas Cylinder Safety
· Work Safely at Heights
· Confined Space Entry
· Safe Work Method Statements
· Electrical Safety Training including the safe tagging and testing of equipment
· Ongoing Safety Inductions across all venues
· Workshops in Workers Compensation and Injury Management; Stress Management; Threat Assessment and Sun Smart Education
· Ongoing requalification for required employees in First Aid, Cardiopulmonary Resuscitation, Self-Contained Breathing Apparatus and Group 3 Pools (Aquatic Rescue)
The VenuesWest Induction and On-boarding process was also revamped in the 2016-17 financial year to provide more comprehensive information relating to working for VenuesWest, our organisational objectives and Human Resources information. All new permanent and fixed term employees in 2016-17 received a Human Resources Induction and 32 new employees attended the updated Corporate Induction.
Human Resources developed a new Accountable and Ethical Decision Making (AEDM) training program which was rolled out in June 2017, with 59% of permanent and fixed term employees having received AEDM training.
Other training highlights for 2016-17 include: · Wisdom in the Workplace culture training conducted
by Pulse Australasia for the Executive and Senior Management Teams
· Attendance at a Best Practice Conference by four employees to develop better understanding of how other sport and entertainment venues operate.
Key Training Figures 2016-17Total Hours of training provided to permanent employees 2135
Total Hours of training provided to casual employees 368
Average training hours per permanent headcount 14
Total Training Costs (permanent employees excluding travel) $86,780
Total Training Costs (casual employees excluding travel) $10,842
Average training investment per permanent FTE $576
Employees receiving Study Assistance 1
CONTENTS
VENUESWEST ANNUAL REPORT 2016-201777DISCLOSURES & LEGAL COMPLIANCE
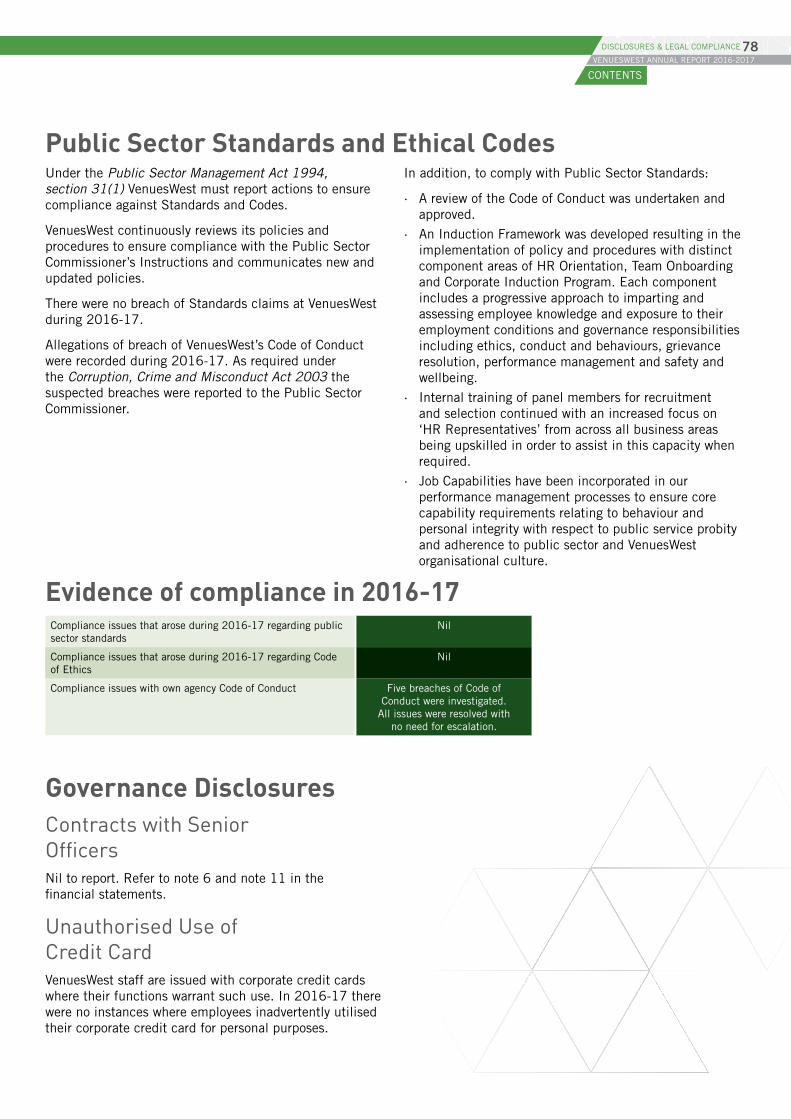
Public Sector Standards and Ethical Codes
Under the Public Sector Management Act 1994, section 31(1) VenuesWest must report actions to ensure compliance against Standards and Codes.
VenuesWest continuously reviews its policies and procedures to ensure compliance with the Public Sector Commissioner’s Instructions and communicates new and updated policies.
There were no breach of Standards claims at VenuesWest during 2016-17.
Allegations of breach of VenuesWest’s Code of Conduct were recorded during 2016-17. As required under the Corruption, Crime and Misconduct Act 2003 the suspected breaches were reported to the Public Sector Commissioner.
In addition, to comply with Public Sector Standards:
· A review of the Code of Conduct was undertaken and approved.
· An Induction Framework was developed resulting in the implementation of policy and procedures with distinct component areas of HR Orientation, Team Onboarding and Corporate Induction Program. Each component includes a progressive approach to imparting and assessing employee knowledge and exposure to their employment conditions and governance responsibilities including ethics, conduct and behaviours, grievance resolution, performance management and safety and wellbeing.
· Internal training of panel members for recruitment and selection continued with an increased focus on ‘HR Representatives’ from across all business areas being upskilled in order to assist in this capacity when required.
· Job Capabilities have been incorporated in our performance management processes to ensure core capability requirements relating to behaviour and personal integrity with respect to public service probity and adherence to public sector and VenuesWest organisational culture.
Evidence of compliance in 2016-17
Compliance issues that arose during 2016-17 regarding public sector standards
Nil
Compliance issues that arose during 2016-17 regarding Code of Ethics
Nil
Compliance issues with own agency Code of Conduct Five breaches of Code of Conduct were investigated.
All issues were resolved with no need for escalation.
Governance DisclosuresContracts with Senior Officers Nil to report. Refer to note 6 and note 11 in the financial statements.
Unauthorised Use of Credit Card VenuesWest staff are issued with corporate credit cards where their functions warrant such use. In 2016-17 there were no instances where employees inadvertently utilised their corporate credit card for personal purposes.
CONTENTS
VENUESWEST ANNUAL REPORT 2016-201778DISCLOSURES & LEGAL COMPLIANCE
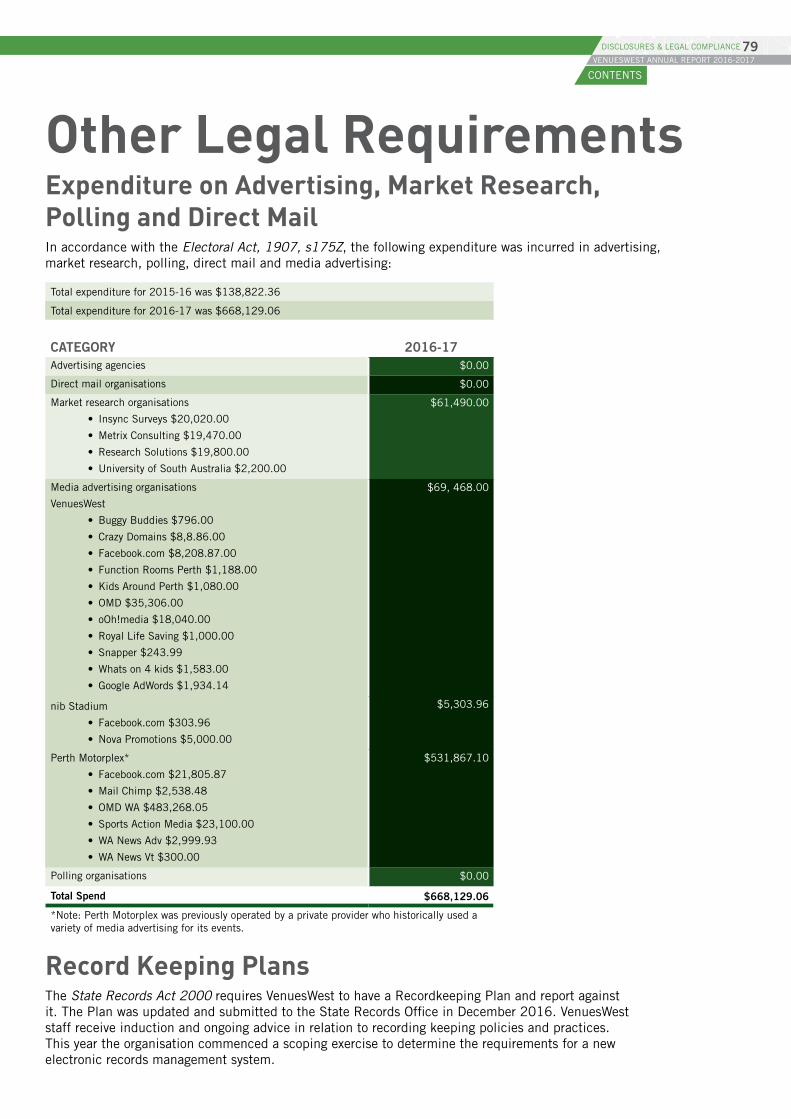
Other Legal Requirements Expenditure on Advertising, Market Research, Polling and Direct Mail In accordance with the Electoral Act, 1907, s175Z, the following expenditure was incurred in advertising, market research, polling, direct mail and media advertising:
Total expenditure for 2015-16 was $138,822.36
Total expenditure for 2016-17 was $668,129.06
CATEGORY 2016-17Advertising agencies $0.00
Direct mail organisations $0.00
Market research organisations
• Insync Surveys $20,020.00
• Metrix Consulting $19,470.00
• Research Solutions $19,800.00
• University of South Australia $2,200.00
$61,490.00
Media advertising organisations
VenuesWest
• Buggy Buddies $796.00
• Crazy Domains $8,8.86.00
• Facebook.com $8,208.87.00
• Function Rooms Perth $1,188.00
• Kids Around Perth $1,080.00
• OMD $35,306.00
• oOh!media $18,040.00
• Royal Life Saving $1,000.00
• Snapper $243.99
• Whats on 4 kids $1,583.00
• Google AdWords $1,934.14
$69, 468.00
nib Stadium
• Facebook.com $303.96
• Nova Promotions $5,000.00
$5,303.96
Perth Motorplex*
• Facebook.com $21,805.87
• Mail Chimp $2,538.48
• OMD WA $483,268.05
• Sports Action Media $23,100.00
• WA News Adv $2,999.93
• WA News Vt $300.00
$531,867.10
Polling organisations $0.00
Total Spend $668,129.06
*Note: Perth Motorplex was previously operated by a private provider who historically used a variety of media advertising for its events.
Record Keeping Plans The State Records Act 2000 requires VenuesWest to have a Recordkeeping Plan and report against it. The Plan was updated and submitted to the State Records Office in December 2016. VenuesWest staff receive induction and ongoing advice in relation to recording keeping policies and practices. This year the organisation commenced a scoping exercise to determine the requirements for a new electronic records management system.
CONTENTS
VENUESWEST ANNUAL REPORT 2016-201779DISCLOSURES & LEGAL COMPLIANCE
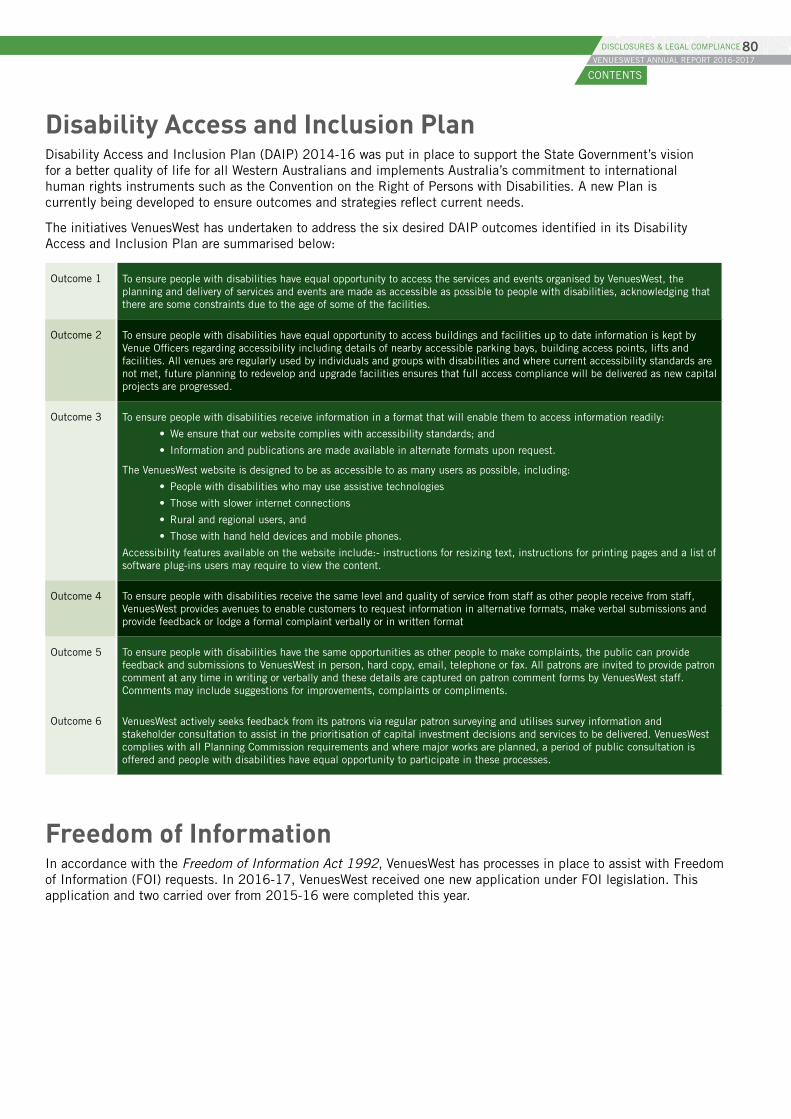
Disability Access and Inclusion Plan Disability Access and Inclusion Plan (DAIP) 2014-16 was put in place to support the State Government’s vision for a better quality of life for all Western Australians and implements Australia’s commitment to international human rights instruments such as the Convention on the Right of Persons with Disabilities. A new Plan is currently being developed to ensure outcomes and strategies reflect current needs.
The initiatives VenuesWest has undertaken to address the six desired DAIP outcomes identified in its Disability Access and Inclusion Plan are summarised below:
Outcome 1 To ensure people with disabilities have equal opportunity to access the services and events organised by VenuesWest, the planning and delivery of services and events are made as accessible as possible to people with disabilities, acknowledging that there are some constraints due to the age of some of the facilities.
Outcome 2 To ensure people with disabilities have equal opportunity to access buildings and facilities up to date information is kept by Venue Officers regarding accessibility including details of nearby accessible parking bays, building access points, lifts and facilities. All venues are regularly used by individuals and groups with disabilities and where current accessibility standards are not met, future planning to redevelop and upgrade facilities ensures that full access compliance will be delivered as new capital projects are progressed.
Outcome 3 To ensure people with disabilities receive information in a format that will enable them to access information readily:
• We ensure that our website complies with accessibility standards; and
• Information and publications are made available in alternate formats upon request.
The VenuesWest website is designed to be as accessible to as many users as possible, including:
• People with disabilities who may use assistive technologies
• Those with slower internet connections
• Rural and regional users, and
• Those with hand held devices and mobile phones.
Accessibility features available on the website include:- instructions for resizing text, instructions for printing pages and a list of software plug-ins users may require to view the content.
Outcome 4 To ensure people with disabilities receive the same level and quality of service from staff as other people receive from staff, VenuesWest provides avenues to enable customers to request information in alternative formats, make verbal submissions and provide feedback or lodge a formal complaint verbally or in written format
Outcome 5 To ensure people with disabilities have the same opportunities as other people to make complaints, the public can provide feedback and submissions to VenuesWest in person, hard copy, email, telephone or fax. All patrons are invited to provide patron comment at any time in writing or verbally and these details are captured on patron comment forms by VenuesWest staff. Comments may include suggestions for improvements, complaints or compliments.
Outcome 6 VenuesWest actively seeks feedback from its patrons via regular patron surveying and utilises survey information and stakeholder consultation to assist in the prioritisation of capital investment decisions and services to be delivered. VenuesWest complies with all Planning Commission requirements and where major works are planned, a period of public consultation is offered and people with disabilities have equal opportunity to participate in these processes.
Freedom of Information In accordance with the Freedom of Information Act 1992, VenuesWest has processes in place to assist with Freedom of Information (FOI) requests. In 2016-17, VenuesWest received one new application under FOI legislation. This application and two carried over from 2015-16 were completed this year.
CONTENTS
VENUESWEST ANNUAL REPORT 2016-201780DISCLOSURES & LEGAL COMPLIANCE
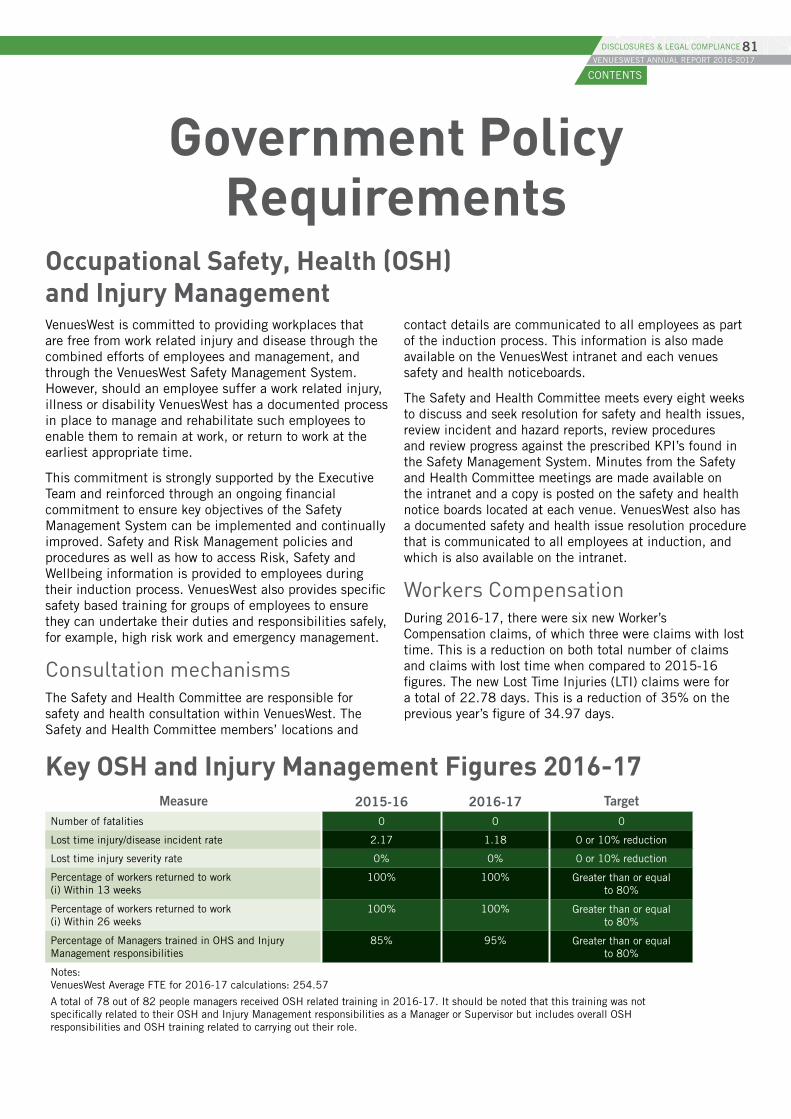
Government Policy Requirements
Occupational Safety, Health (OSH) and Injury Management VenuesWest is committed to providing workplaces that are free from work related injury and disease through the combined efforts of employees and management, and through the VenuesWest Safety Management System. However, should an employee suffer a work related injury, illness or disability VenuesWest has a documented process in place to manage and rehabilitate such employees to enable them to remain at work, or return to work at the earliest appropriate time.
This commitment is strongly supported by the Executive Team and reinforced through an ongoing financial commitment to ensure key objectives of the Safety Management System can be implemented and continually improved. Safety and Risk Management policies and procedures as well as how to access Risk, Safety and Wellbeing information is provided to employees during their induction process. VenuesWest also provides specific safety based training for groups of employees to ensure they can undertake their duties and responsibilities safely, for example, high risk work and emergency management.
Consultation mechanismsThe Safety and Health Committee are responsible for safety and health consultation within VenuesWest. The Safety and Health Committee members’ locations and
contact details are communicated to all employees as part of the induction process. This information is also made available on the VenuesWest intranet and each venues safety and health noticeboards.
The Safety and Health Committee meets every eight weeks to discuss and seek resolution for safety and health issues, review incident and hazard reports, review procedures and review progress against the prescribed KPI’s found in the Safety Management System. Minutes from the Safety and Health Committee meetings are made available on the intranet and a copy is posted on the safety and health notice boards located at each venue. VenuesWest also has a documented safety and health issue resolution procedure that is communicated to all employees at induction, and which is also available on the intranet.
Workers CompensationDuring 2016-17, there were six new Worker’s Compensation claims, of which three were claims with lost time. This is a reduction on both total number of claims and claims with lost time when compared to 2015-16 figures. The new Lost Time Injuries (LTI) claims were for a total of 22.78 days. This is a reduction of 35% on the previous year’s figure of 34.97 days.
Key OSH and Injury Management Figures 2016-17 Measure 2015-16 2016-17 Target
Number of fatalities 0 0 0
Lost time injury/disease incident rate 2.17 1.18 0 or 10% reduction
Lost time injury severity rate 0% 0% 0 or 10% reduction
Percentage of workers returned to work (i) Within 13 weeks
100% 100% Greater than or equal to 80%
Percentage of workers returned to work (i) Within 26 weeks
100% 100% Greater than or equal to 80%
Percentage of Managers trained in OHS and Injury Management responsibilities
85% 95% Greater than or equal to 80%
Notes: VenuesWest Average FTE for 2016-17 calculations: 254.57
A total of 78 out of 82 people managers received OSH related training in 2016-17. It should be noted that this training was not specifically related to their OSH and Injury Management responsibilities as a Manager or Supervisor but includes overall OSH responsibilities and OSH training related to carrying out their role.
CONTENTS
VENUESWEST ANNUAL REPORT 2016-201781DISCLOSURES & LEGAL COMPLIANCE
LTI Incidence Rate The LTI rate for 2016-17 was 1.18% which is almost a 50% decrease on the previous year’s LTI rate. The significant decrease in LTIs can be attributed to several safety initiatives including the introduction of safe and high risk work procedures, a greater focus on hazard inspection processes, and the introduction of newsletters to increase awareness of each employees safety responsibilities. These initiatives were implemented by the Risk, Safety and Wellbeing team following a significant increase in the 2015-16 LTI rate. Continued focus by the Executive has allowed specific safety related workplace training including hazard identification and safe work methods to take place across all levels of the organisation at all venues. A greater onus of responsibility has also been placed on managers and supervisors to ensure that safe work practices are adhered to by all staff.
LTI Severity RateThe number of severe injuries for 2016-17 was 0. The capture of information logged through the new electronic incident and hazard report database will continue to assist the Risk, Safety and Wellbeing team in the gathering and analysing safety data to develop corrective actions in response to hazardous workplace activities.
Percentage of Managers/Supervisors Trained in OSH Responsibilities (past three years) The 2016-17 target for training was 80%, which includes any employee who supervises staff as defined by the RiskCover Annual Reporting Requirements. The 2016-17 training figure is 95% which is an increase of 13.04% compared to 2015-16. The total three year average still exceeds the required target by 7.45% i.e. 87.45%. The increase in attendances can be attributed to an ongoing commitment by the Executive to continue funding safety related training courses for employees at VenuesWest venues.
Safety Training for supervisors in 2016-17 included:
· RiskCover Injury Management
· Emergency Management
· OSH Representative course
· Permit to Work
· Safe Work Method Statements/Risk assessments
· Working at Heights
· Confined Space Entry
· Rescue from height
· Safety Inductions
Safety Initiatives completed in 2016-17:
· In April 2017, flu vaccinations were again offered for employees, including options to attend at HBF Arena, HBF Stadium and nib Stadium corporate offices.
· Ongoing formalised safety induction process with a current attendance rate of over 90%.
· Purchase and rollout of a new electronic audit, incident, hazard and risk management system. This system has significantly improved the organisation’s ability to identify, assess and remove hazards from the workplace and has assisted in improving the organisations overall safety culture.
· 85% of OSH representatives were trained
· Creation of a Public Safety and Security Manger role to manage the organisations security and emergency management frameworks.
· Creation of a Contractor Safety Coordinator role to coordinate the organisation’s contractor and licensee management frameworks.
OSH system assessment and resultsFollowing completion of an internal audit in 2015 VenuesWest currently holds a B+ rating for OSH management. As part of the ongoing internal audit process an OSH audit is scheduled to take place in 2017. A Worksafe Plan audit was scheduled in August 2016 however due to a sub-contractor fatality at one of the venues this audit process has been put on hold until the completion of the Worksafe investigation.
CONTENTS
VENUESWEST ANNUAL REPORT 2016-201782DISCLOSURES & LEGAL COMPLIANCE
Contact us
VenuesWest 100 Stephenson Avenue Mt Claremont WA 6010
PO Box 581 Floreat WA 6014
(+61 8) 9441 8222 [email protected] facebook.com/venueswest twitter: @venueswest youtube: venueswest
HBF Stadium100 Stephenson Avenue Mt Claremont WA 6010
PO Box 581 Floreat WA 6014
(+61 8) 9441 8211 [email protected] facebook.com/hbfstadium twitter: @HBFStadiumPools
HBF ArenaKennedya Drive Joondalup WA 6027
PO Box 33 Joondalup WA 6919
(+61 8) 9300 3355 [email protected] facebook.com/hbfarena
Perth Arena 700 Wellington Street Perth WA 6000
PO Box 624 West Perth WA 6872
(+61 8) 6365 0700 [email protected]
WA Athletics StadiumStephenson Avenue Mt Claremont WA 6010
PO Box 581 Floreat WA 6014
(+61 8) 6272 0400 [email protected]
Bendat Basketball Centre201 Underwood Avenue Floreat WA 6014
PO Box 581 Floreat WA 6014
(+61 8) 6272 0741 [email protected] facebook.com/bendatbasketballcentre
SpeedDomeEddie Barron Drive Midvale WA 6056
PO Box 1816 Midland WA 6936
(+61 8) 9250 6701 [email protected]
Rugby WA203 Underwood Ave Floreat WA 6014
PO Box 146, Floreat WA 6014
(+61 8) 9387 0700 [email protected]
Perth MotorplexCnr Anketell and Rockingham Roads Kwinana Beach WA 6167
PO Box 241 Kwinana WA 6966
(+61 8) 9419 6622 (+61 8) 9439 4488 [email protected]
Champion Lakes Regatta CentreSports Island, Henley Drive Champion Lakes, Western Australia
PO Box 187 Kelmscott WA 6991
(+61 8) 9390 7051 [email protected]
nib Stadium 310 Pier Street Perth WA 6000
PO Box 8256 Perth Business Centre Perth WA
(+61 8) 9422 1500 [email protected] facebook.com/nibstadium twitter: @nibStadium
State Netball Centre200 Selby Street Jolimont WA 6014
PO Box 930 Subiaco WA 6904
(+61 8) 9380 3700 [email protected]
CONTENTS