annual report for 2002 - idrc digital library
TRANSCRIPT
1
ANNUAL REPORT FOR 2002
OCTOBER 2003
THE INTERNATIONAL CENTER FOR AGRICULTURAL RESEARCH IN THE DRY AREAS (ICARDA)
P.O. BOX 5466, ALEPPO, SYRIA
BARLEY IMPROVEMENT PROJECT
2
TABLE OF CONTENT II. EXECUTIVE SUMMARY .............................................................................................5
1. Cultivar Development .................................................................................................8 1.1. The Crossing Program .....................................................................................8 1.2. Selection and Testing..................................................................................... 10 1.3. Distribution of Germplasm........................................................................... 10 1.4. Cultivar Development for the Near East ....................................................11
1.4.1. Syria...........................................................................................................11 1.4.2. Lebanon................................................................................................... 15 1.4.3. Jordan....................................................................................................... 18 1.4.4. Turkey...................................................................................................... 18 1.4.5. Iran ........................................................................................................... 21 1.4.6. Iraq ...........................................................................................................30
1.4.6.1. Climatic conditions .................................................................................30 1.4.6.2. On Farm Feed Production of Barley Varieties ................................30 1.4.6.3. On-farm Crop Rotation for Feed Production...................................32
1.5. Cultivar Development for North Africa and Horn of Africa.................34 1.5.1. Selections in the special nurseries for Maghreb.......................................34 1.5.2. Special nursery for North Africa and for Libya........................................35
1.5.2.1. Identification of Promising Lines in Libya.......................................36 1.5.3. Tolerance and resistance to barley stem gall midge (Mayetiola hordei Keiffer). .........................................................................................................................37
1.6. Cultivar Development for Central Asia and Caucasus ...........................37 1.6.1. Introduction ...........................................................................................37 1.6.2. Kazakhstan .............................................................................................38 1.6.3. Kyrgyzstan ..............................................................................................40 1.6.4. Turkmenistan.........................................................................................42 1.6.5. Azerbaijan ...............................................................................................43 1.6.6. Armenia...................................................................................................43 1.6.7. Uzbekistan ..............................................................................................43
1.7. Cultivar Development for Latin America ..................................................46 1.7.1. Yield Experiments................................................................................46 1.7.2. Drought Resistance ..............................................................................47 1.7.3. Argentina.................................................................................................47 1.7.4. Brazil ........................................................................................................47 1.7.5. Bolivia......................................................................................................48 1.7.6. Chile .........................................................................................................48 1.7.7. Colombia.................................................................................................48 1.7.8. Ecuador ...................................................................................................48 1.7.9. Mexico ....................................................................................................49 1.7.10. Peru .........................................................................................................49 1.7.11. Uruguay..................................................................................................49
1.8. Cultivar Development for South East Asia ........................................................50 1.8.1. North and South Korea ......................................................................50 1.8.2. China ........................................................................................................50
1.9. Food Barley ....................................................................................................... 51
3
1.9.1. Food barley status ............................................................................................ 51 1.10. Biotic Stresses: Insects and Viruses............................................................53
1.10.1. Insects ......................................................................................................53 1.10.1.1. Breeding for Resistance to Russian Wheat Aphid (RWA) ..........53
1.10.1.1.1. Ethiopia............................................................................................53 1.10.1.1.2. North Africa ....................................................................................54 1.10.1.1.3. New Screenings .............................................................................54 1.10.1.1.4. The Barley Stem Gall Midge Tolerance Nursery..................55
1.10.2. Viruses ..............................................................................................................55 1.10.2.1. PCR Markers to Select for resistance to Barley Yellow Dwarf Virus (BYDV).........................................................................................................................55 1.10.2.2. Selection for resistance to BYDV in segregating populations ........56 1.10.2.3. Screening for resistance to BYDV ..........................................................57
1.10.2.3.1. Evaluation in Short Rows............................................................57 1.10.2.3.2. Evaluation in Small Plots............................................................57
2. Participatory Plant Breeding ........................................................................................60 2.1. Introduction ...............................................................................................................60 2.2. Participatory Barley Breeding in Syria ...............................................................60
2.2.1. The Methodology..................................................................................60 2.2.2. The Farmer Initial Trials (FIT) ........................................................64 2.2.3. The Farmer Advanced Trials (FAT) ................................................65 2.2.4. The Farmer Elite Trials (FET) .........................................................66 2.2.5. Farmer Preferences...............................................................................66 2.2.6. Specific Adaptation: How Specific?.................................................68
2.3. Participatory Barley Breeding in Yemen ...........................................................70 2.3.1. Introduction ...........................................................................................70 2.3.2. Seed Multiplication............................................................................... 71 2.3.3. Socio-Economic and Gender Analysis ............................................ 71
2.3.3.1. Methodology of Data Collection.................................................. 71 2.3.3.2. Preliminary Results .........................................................................72
2.4. Participatory Barley Breeding in Egypt.....................................................79 2.5. Participatory Barley Breeding in Jordan....................................................82
2.5.1. Livelihood Analysis ..............................................................................83 2.5.1.1. Community Characterization .......................................................84 2.5.1.2. Livelihood characterization of rural communities. .................89 2.5.1.3. Problems, Solutions and Aspirations of the Communities ... 91
2.5.2. Participatory Field Trials and Selection..........................................93 2.5.2.1. Farmer Initial Yield Trials.............................................................93 2.5.2.2. Farmer Advanced Yield Trials .....................................................98 2.5.2.3. Differences between Selection Criteria Used by Men and Women Farmers and by Breeders. ..................................................................101 2.5.2.4. Women’s Selection ........................................................................ 105
3. Molecular Breeding........................................................................................................ 109 3.1. DNA Markers Linked to Quantitative Resistance to scald in the Tadmor/WI2291 cross.................................................................................................. 109 3.2. Dehydrin Genes in Barley ............................................................................110
3.2.1. Sequence Variability of Dehydrin Genes within Barley........................110
4
3.2.2. Data Analysis...................................................................................................111 3.3. RNA Analysis of Dhn Gene Extraction.............................................................112
3.3.1. Accumulation of RNA ...................................................................................112 3.4. Phenotyping of the mapping population Tadmor//ER/Apm. .........113
4. Training, Conferences, visitors and Publications.............................................115 4.1. Training ............................................................................................................115 4.2. Conferences, Workshops, Meetings ..........................................................116 4.3. Visitors...............................................................................................................117 4.4. Publications .....................................................................................................119
V. ACKNOWLEDGEMENTS........................................................................................ 120 5.1. Donors.............................................................................................................. 120 5.2. Collaborators................................................................................................... 120
5
II. EXECUTIVE SUMMARY The annual report is presented in the same layout of 2001, which follows four main topics, namely (1) Cultivar development; (2) Participatory Plant Breeding, (3) Molecular Breeding, and (4) Training, Conferences, Visitors and Publications. The lines selected for drought tolerance in 2000, proved to be cold tolerant during the winter 2002, and were the best performing lines during a long dry spell in February-March 2002. A new barley variety, ALCARA, has been released in Spain in a project supported by INIA with the collaboration of IRTA (Lerida) CSIC (Zaragoza) and INIA-Valladolid. The variety derives from an F2 sent with the ICARDA’s international nurseries in 1990. A spring barley line selected from a nursery distributed in 1998 has been proposed for release in Kazakhstan with the name of BIRLIK-1. It is expected that the variety will be grown on around 400,000 ha in northern region of Akmolinskaya Kustanaiskaya. A new winter barley variety selected by Krasny-Vodopad Breeding station was submitted in 2002 for the official state yield trials. Eventually, in Lebanon new lines with a higher yield potential than Rihane-03 were identified. Despite the difficult situation, the collaboration with Iraq continued, and produced evidence of the adaptation of Tadmor and Zanbaka to the dry areas of the country. Several promising lines adapted to the various agro ecological conditions of the country were identified in Iran. A new emphasis is given to food barley, and the first action in this direction was the organization of an International Workshop, jointly organized by ICARDA, FAO, and IRESA, which was attended by more than 30 participants from 13 countries, representing most of the area where barley is largely used as food, including Ecuador, Nepal, and Peru.
Screening for resistance to BYDV was made more efficient with allele-specific PCR markers.
Participatory plant breeding has fully replaced the on-station yield testing of breeding material; the new methodology has been fully implemented in Syria, and applied in Jordan, Egypt, Eritrea and Yemen. The biological component is sustained by socio-economic studies and gender analysis.
Molecular breeding is expanding both at the head quarters and as collaborations with advanced institutions in Australia, Germany and Denmark. Particular attention is given to produce good quality phenotypic data.
The work of the project has been disseminated though 4 new publications, visits to National Programs and participation in conferences, workshops and meetings.
Several scientists attended individual non-degree training or training courses in barley improvement, while six students continued their degree training and one obtained a PhD degree. More than 30 scientists, both from developed and developing countries visited the project.
6
The assistance and the contributions of scientists from the National Programs, of the research and secretarial support staff at the Headquarters and in Mexico, and the financial support of several donors, namely the OPEC Fund for International Development, the Government of Italy, the Government of Denmark, the Grain Research and Development Corporation (GRDC), Australia, Der Bundesminister für Wirtschaftliche Zusammenarbeit (BMZ, Germany), the International Development Research Centre (IDRC, Canada), the United States Agency for International Development (USAID), the System Wide Program on Participatory Research and Gender Analysis (SWP PRGA), and the European Union, are gratefully acknowledged.
7
III. INTRODUCTION Barley is grown on more than 70 million hectares, about 42 of which in the developing countries including those of Central Asia and the Caucasus. Barley is grown for animal feed, human food, and malt, and in many different types of environments. However, in developing countries, most barley is grown in marginal environments, often on the fringes of deserts and steppes, or at high elevations in the tropics, receiving modest or no inputs.
Because most barley is grown in unfavorable environments and by resource-poor farmers, comparatively little progress has been made through conventional breeding approaches. Therefore, the barley project at ICARDA has developed an approach to germplasm enhancement based on direct selection in the target environment and with farmers' participation. This approach provides varieties with specific adaptation to both biotic and abiotic stresses and the specific uses. The aim is to achieve sustainable increases in barley productivity by adapting the crop to the different farming systems of developing countries, with special emphasis to those areas where resource-poor farmers grow the crop.
The apparent contradiction between ICARDA's global mandate for barley improvement and the emphasis on specific adaptation is resolved by a process of decentralized breeding through selection in the target environment. This involves NARS scientists being partners in the entire breeding scheme, from the selection of parents, to the design of crosses, to the choice of selection and breeding methods, to the selection between and within segregating populations in each individual country. Therefore, there has been a gradual reduction of conventional breeding work at headquarters, with a reallocation of resources and support to NARS in the decentralized selection and testing. A major new direction in the last five years has been the participation of farmers, both men and women, in the early selection of segregating populations to better exploit specific adaptation.
The goal of the project, which has a global perspective, is typical of a crop improvement project, namely to increase the productivity of barley in marginal areas, and the purpose is the adoption of improved varieties by farmers in marginal areas. By breeding for specific adaptation to both physical environments and users, the goal is pursued by deploying a large number of diverse varieties in the target areas, and by leaving the flexibility to national programs and to farmers to release and to adopt populations, pure lines, or mixtures of pure lines.
The project deals with a wide range of germplasm, from spring to winter, and from the wild progenitor, Hordeum spontaneum to landraces and modern cultivars. The major role of ICARDA’s barley breeders is to generate useful genetic variability through targeted crosses, to distribute segregating populations, and to coordinate the analysis of data and the utilization of the information. The role of the national barley breeders, and eventually of farmers, is to identify parental material (for example sources of resistance), to design suitable crosses, and to perform the selection in the target environments.
8
1. CULTIVAR DEVELOPMENT The main activities described here are related to the development of germplasm with higher yields in specific environments, with resistance to biotic and abiotic stress, and with improved quality (food, feed, malting) characteristics. The activities involving farmer participation and molecular approaches will be described in other sections. 1.1. The Crossing Program
The implementation of the breeding philosophy is based on a large crossing program that is the main source of new genetic variation. Parental lines used in the crossing program include lines selected for their performance in various target environments, selected by farmers in their own fields, sources of resistance to diseases, pests and viruses identified either by ICARDA scientists or by national program scientists, lines selected for special characteristics (earliness, yield potential, resistance to drought, heat, cold or salinity, seed quality attributes, lodging resistance, etc), and cultivars produced by other breeding programs in the world. In terms of diversity, the parental lines include landraces from several countries, modern varieties, six- and two-row, early and late maturing types, spring, facultative, and winter types, hulless and hulled. Recently, malting barleys were added to the crossing block in response to an increased demand by NARS.
The overall crossing program is the sum of several small crossing programs, each targeted to a specific country, or to a group of countries, or to a specific objective, and with each group comprising between 50 and 300 crosses. While at the headquarters crosses are only made in the spring, in Mexico crosses are made during the winter at the CIANO Station at Ciudad Obregon, and in the summer at the El Batan and Toluca Stations. The crosses made by the project in 2002 are given in Table 1.
Crosses with landraces and with H. spontaneum are not listed separately as most of the crosses for Syria, Jordan and northern Iraq (Mashreq) have a landrace and/or H. spontaneum as one of the parents. Most of the crosses done in 2001 to transfer, incorporate or combine resistance to diseases, pests and BYDV and to incorporate the hull-less gene were included among those targeted for specific countries. Also, crosses made to develop mapping populations are not listed separately.
9
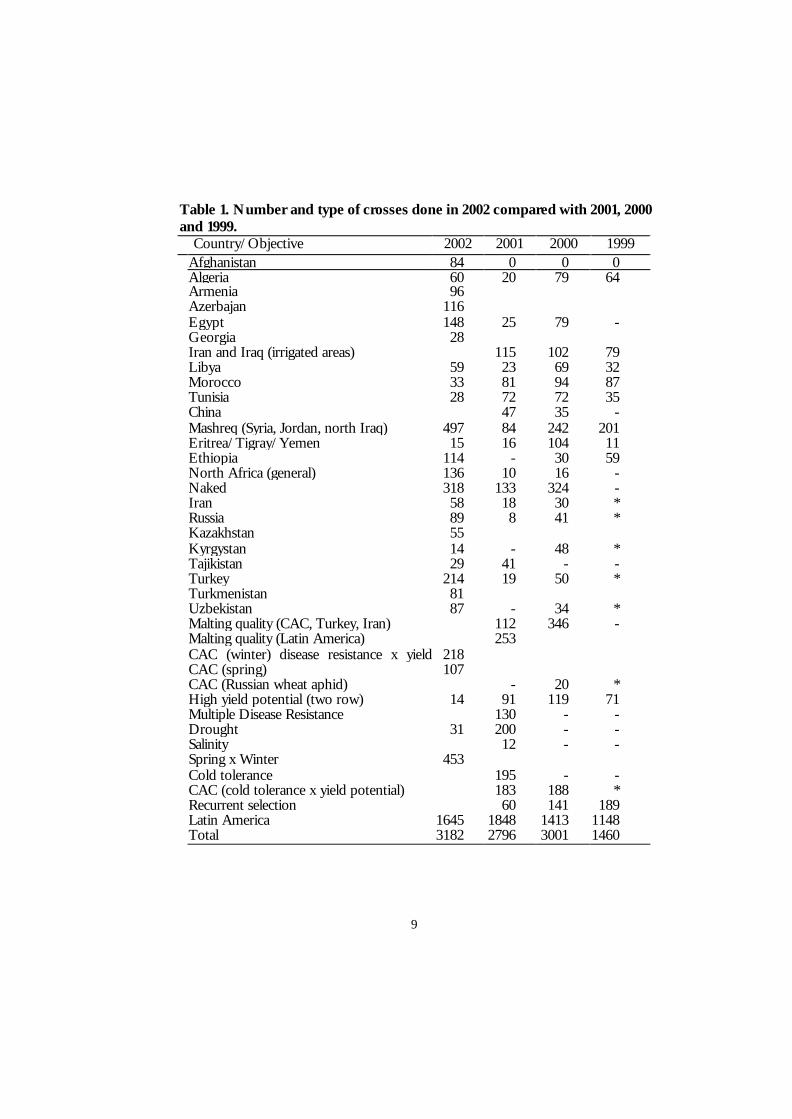
Table 1. Number and type of crosses done in 2002 compared with 2001, 2000 and 1999.
Country/Objective 2002 2001 2000 1999 Afghanistan 84 0 0 0 Algeria 60 20 79 64 Armenia 96 Azerbajan 116 Egypt 148 25 79 - Georgia 28 Iran and Iraq (irrigated areas) 115 102 79 Libya 59 23 69 32 Morocco 33 81 94 87 Tunisia 28 72 72 35 China 47 35 - Mashreq (Syria, Jordan, north Iraq) 497 84 242 201 Eritrea/Tigray/Yemen 15 16 104 11 Ethiopia 114 - 30 59 North Africa (general) 136 10 16 - Naked 318 133 324 - Iran 58 18 30 * Russia 89 8 41 * Kazakhstan 55 Kyrgystan 14 - 48 * Tajikistan 29 41 - - Turkey 214 19 50 * Turkmenistan 81 Uzbekistan 87 - 34 * Malting quality (CAC, Turkey, Iran) 112 346 - Malting quality (Latin America) 253 CAC (winter) disease resistance x yield 218 CAC (spring) 107 CAC (Russian wheat aphid) - 20 * High yield potential (two row) 14 91 119 71 Multiple Disease Resistance 130 - - Drought 31 200 - - Salinity 12 - - Spring x Winter 453 Cold tolerance 195 - - CAC (cold tolerance x yield potential) 183 188 * Recurrent selection 60 141 189 Latin America 1645 1848 1413 1148 Total 3182 2796 3001 1460
10
1.2. Selection and Testing
The development of new germplasm is largely done in collaboration with NARS of developing countries, in collaboration with the farmers of a number of countries, and in some cases in collaboration with advanced institutions in developed countries. The process is based on decentralized selection, defined as selection in the target environment, starting from the generation of new variability based on the crossing program described above.
The segregating populations derived from the crossing program are distributed in two different ways. In the first, the F2, or more often the F3 bulks are sent as targeted nurseries to the respective country or countries. Based on the selections made by the national programs in the targeted locations, we then send nurseries that include the selected populations, and eventually country-specific yield trials. In the second, which is used in the case of countries for which we do not have sufficient information to develop targeted crosses and targeted segregating populations, we send the traditional international nurseries and yield trials that are targeted to four types of environments, namely:
Low-rainfall areas with mild winters Low rainfall areas with cool winters Moderate rainfall areas Cold areas with severe winters (predominantly with winter types)
We are also making available internationally two crossing blocks, two sets of segregating populations, trait-specific nurseries comprising lines characterized by earliness, hulless caryopsis, cold tolerance, heat tolerance, resistance to specific diseases, insects or viruses, etc.
The decentralization of both selection and testing has caused a progressive reduction of the number of lines that are yield-tested on ICARDA’s research stations. With exception of the mapping populations, which are still yield-tested on station, all the routine yield testing is conducted in farmers’ fields with the participation of farmers, while seed multiplication is done on station. 1.3. Distribution of Germplasm One of the institutional obligations of the program id the distribution of germplasm described in the previous section. During 2002 more than one thousand sets of nurseries were dispatched to more than 50 countries (Fig. 1) from both the headquarters and the ICARDA/CIMMYT program in Mexico.

11
( from Syria, from Mexico, from both)53 countries53 countries
Fig. 1. During 2002 the program distributed germplasm in 55 countries 1.4. Cultivar Development for the Near East
1.4.1. Syria Syria, with about 1.6 million hectares of barley, most of which in dry areas, represents a typical Mediterranean-continental environment with low and erratic rainfall, low winter temperatures that limit plant growth when water is not limiting. This environment represents areas where the crop is grown in Jordan, Palestine, Iraq, Turkey, Iran, Pakistan and Afghanistan.
Cultivar development for this type of environment follows a conventional approach, through the on farm verification trials (OFVT) conducted in collaboration with the Syrian national program, and a participatory approach (described later).
The OFVT with barley are conducted in several locations in each of the two stability zones, namely zone B receiving between 350 mm and 250 mm of annual rainfall, and zone C receiving about 250 mm of annual rainfall, respectively.
Lines tested in the OFVT are selected by ICARDA, GCSAR (General Commission for Scientific and Agricultural Research) and ACSAD (Arab Center
12
for Studies of the Arid Zones and Dry Lands) and are tested for a maximum of three years when they perform well. If they do not perform well they can be discarded already after the first year.
The trials are conducted as RCB designs with three replications in zone B and four in zone C.
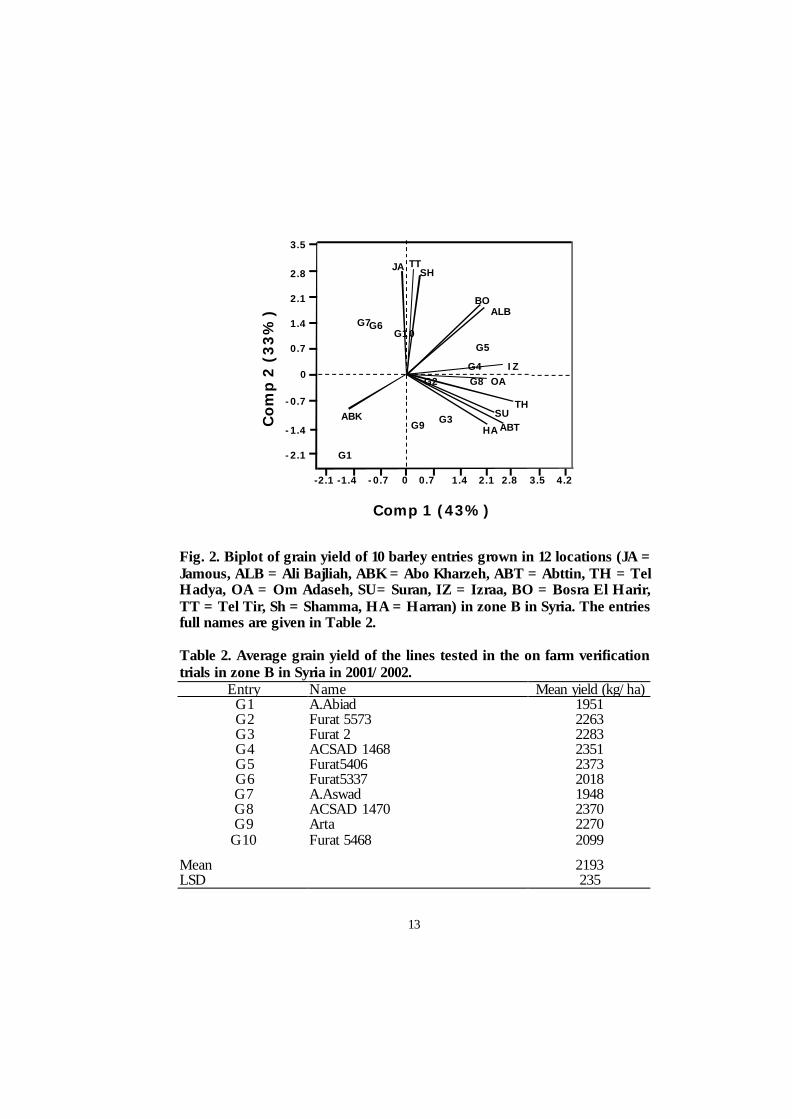
The OVFT for zone B in 2001/2002 (Table 2) included six promising lines and four checks. They were conducted in the 12 locations shown in Fig 2. The overall average grain yield was 2193 kg/ha. The lowest yielding locations were Tel Tir (190 kg/ha), Jamous (627 kg/ha) and Shamma (689 kg/ha), while the highest yielding were Izraa (3371 kg/ha)), Tel Hadya (3620 kg/ha), and Abtin (4252 kg/ha). The broad sense heritability ranged from 0.35 to 0.95.
Genotype x environment interactions explained 71% of the variation of the environmentally standardized data and was mostly associated with Abo Kharzeh (Fig. 2). In this location the white-seeded landrace A. Abiad performed well while in all other locations was amongst the worst performers. There were three groups of locations: the first group included the three lowest yielding locations with A. Aswad, Furat 5406 and Furat 5468 as best performers, the second group included Ali Bajliah and Bosra El Harir, with average yields around 2 t/ha, and the third group which included all the other locations (except Abo Kharzeh). In this group, which included the highest yielding locations (with the exception of Om Adaseh where the average yield was 1.5 t/ha), the best performers were Furat 5406 (which performed well also in the second group), Furat 2, Arta, ACSAD 1468 and ACSAD 1470.
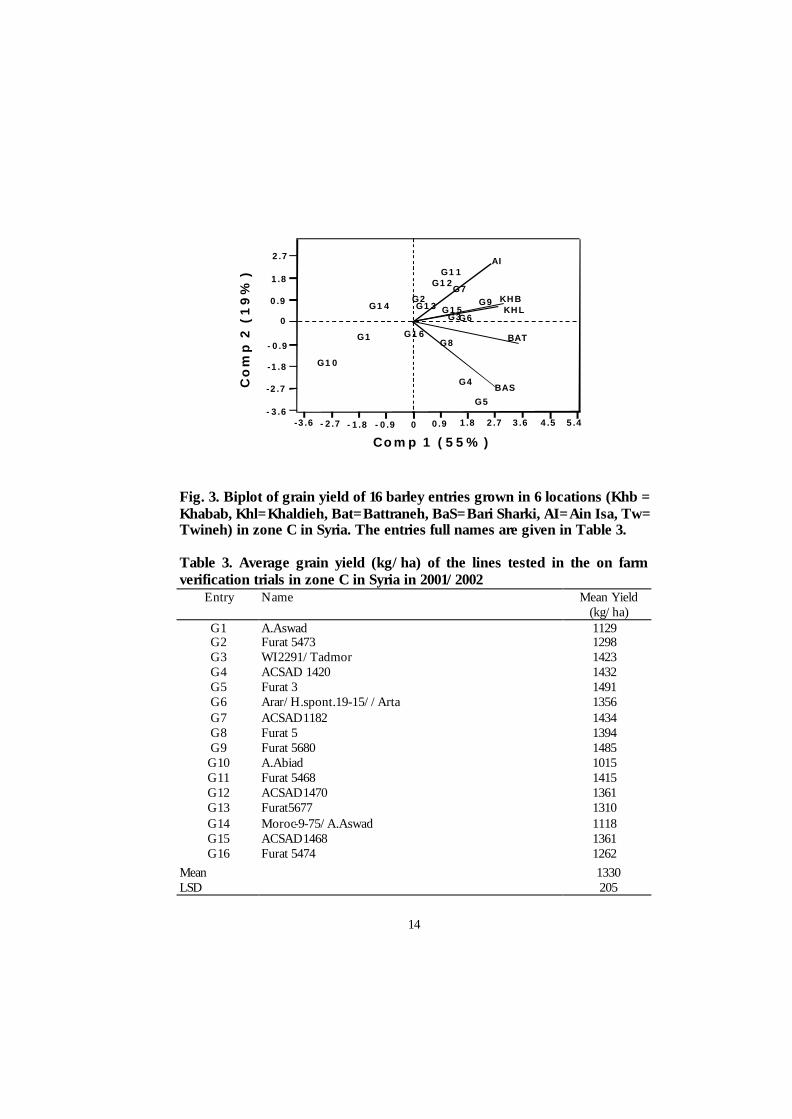
The OVFT for zone C (Table 3) included 13 promising lines and three checks (the two local landraces and the recently released variety Furat 3). They were conducted in 6 locations with an overall average grain yield of 1330 kg/ha, well below the average on the on farm trials in Zone B. The mean yields ranged from less than 50 kg/ha in Twineh, (characterized by the highest CV and zero heritability), to more than 3000 kg/ha in Battraneh. Heritability ranged from 0 in Twineh to as high as 0.8 in Ain Isa. Genotypes x Environment Interactions explained nearly 55% of the variation of the environmentally standardized data. Twineh was poorly represented, due to the 0 heritability, (Fig. 3). The other locations were evenly distributed with Khabab and Khaldieh closely correlated. Most of the entries out yielded the two local landraces, A. Abiad and A. Aswad in most of the locations; ACSAD 1468, Arar/H.spont.19-15//Arta and Furat 5680 were the best performing lines in most of the locations, while the recently released Furat 3 and Furat 5 performed well in Bari Sharki, which was the second most stressed location with only 160 kg/ha.
13
Comp 1 (43%)
Co
mp
2 (
33
%)
JA
ALB
IZ
TH
TT
G1
G10
G2 G8
G9
G6
G5
G4
G3
BO
SH
G7
-2.1 0-0.7-1.4
-2.1
0.7 1.4 2.1 2.8 3.5 4.2
-1.4
OA
SUABTHA
ABK-0.7
0
0.7
1.4
2.1
2.8
3.5
Fig. 2. Biplot of grain yield of 10 barley entries grown in 12 locations (JA = Jamous, ALB = Ali Bajliah, ABK = Abo Kharzeh, ABT = Abttin, TH = Tel Hadya, OA = Om Adaseh, SU= Suran, IZ = Izraa, BO = Bosra El Harir, TT = Tel Tir, Sh = Shamma, HA = Harran) in zone B in Syria. The entries full names are given in Table 2. Table 2. Average grain yield of the lines tested in the on farm verification trials in zone B in Syria in 2001/2002.
Entry Name Mean yield (kg/ha) G1 A.Abiad 1951 G2 Furat 5573 2263 G3 Furat 2 2283 G4 ACSAD 1468 2351 G5 Furat5406 2373 G6 Furat5337 2018 G7 A.Aswad 1948 G8 ACSAD 1470 2370 G9 Arta 2270
G10 Furat 5468 2099 Mean 2193 LSD 235
14
C o m p 1 ( 5 5 % )
Co
mp
2 (
19
%)
BAT
G11
G10
G2
G6
G1G8
G5
G4
G3
AI
G7
-3.6 0-1.8-2.7
-2.7
1.8 2.7 3.6 4.5 5.4
-1.8
BAS
KHB
-0.9
0
0.9
1.8
2.7
0.9-0.9-3.6
KHLG13G14
G12
G16
G9G15
Fig. 3. Biplot of grain yield of 16 barley entries grown in 6 locations (Khb = Khabab, Khl=Khaldieh, Bat=Battraneh, BaS=Bari Sharki, AI=Ain Isa, Tw= Twineh) in zone C in Syria. The entries full names are given in Table 3. Table 3. Average grain yield (kg/ha) of the lines tested in the on farm verification trials in zone C in Syria in 2001/2002
Entry Name Mean Yield (kg/ha)
G1 A.Aswad 1129 G2 Furat 5473 1298 G3 WI2291/Tadmor 1423 G4 ACSAD 1420 1432 G5 Furat 3 1491 G6 Arar/H.spont.19-15//Arta 1356 G7 ACSAD1182 1434 G8 Furat 5 1394 G9 Furat 5680 1485 G10 A.Abiad 1015 G11 Furat 5468 1415 G12 ACSAD1470 1361 G13 Furat5677 1310 G14 Moroc-9-75/A.Aswad 1118 G15 ACSAD1468 1361 G16 Furat 5474 1262
Mean 1330 LSD 205
15
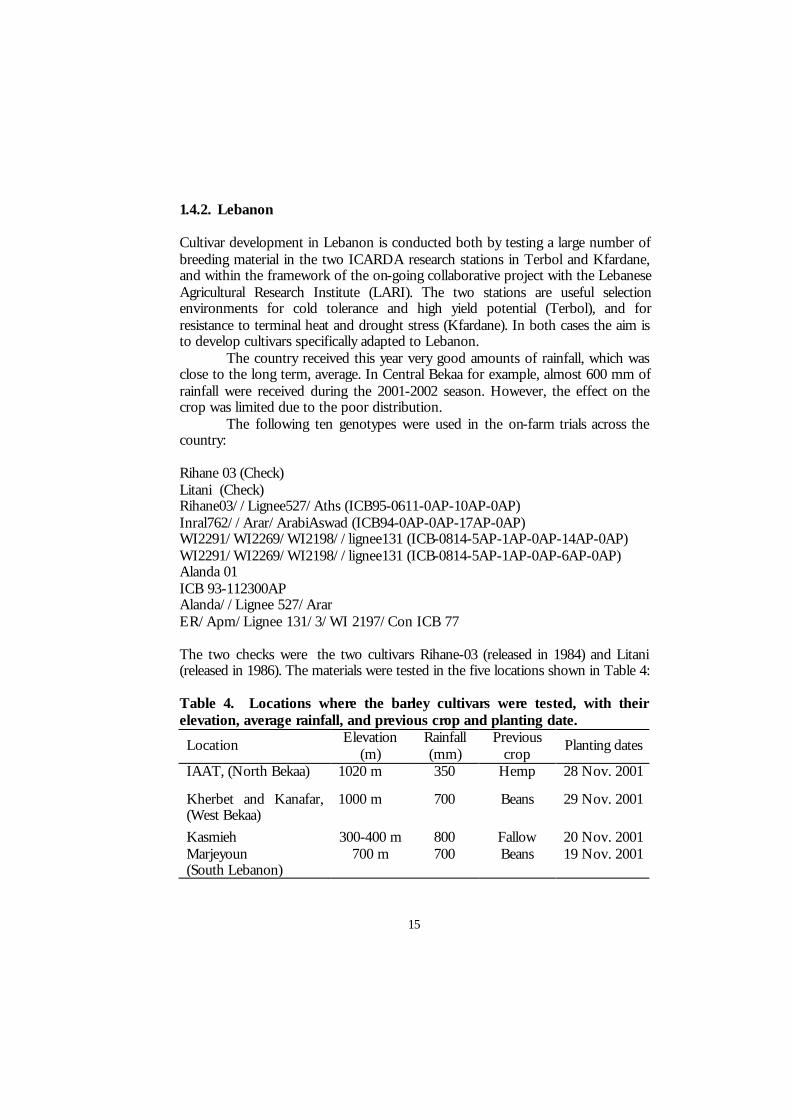
1.4.2. Lebanon
Cultivar development in Lebanon is conducted both by testing a large number of breeding material in the two ICARDA research stations in Terbol and Kfardane, and within the framework of the on-going collaborative project with the Lebanese Agricultural Research Institute (LARI). The two stations are useful selection environments for cold tolerance and high yield potential (Terbol), and for resistance to terminal heat and drought stress (Kfardane). In both cases the aim is to develop cultivars specifically adapted to Lebanon.
The country received this year very good amounts of rainfall, which was close to the long term, average. In Central Bekaa for example, almost 600 mm of rainfall were received during the 2001-2002 season. However, the effect on the crop was limited due to the poor distribution.
The following ten genotypes were used in the on-farm trials across the country:
Rihane 03 (Check) Litani (Check) Rihane03//Lignee527/Aths (ICB95-0611-0AP-10AP-0AP) Inral762//Arar/ArabiAswad (ICB94-0AP-0AP-17AP-0AP) WI2291/WI2269/WI2198//lignee131 (ICB-0814-5AP-1AP-0AP-14AP-0AP) WI2291/WI2269/WI2198//lignee131 (ICB-0814-5AP-1AP-0AP-6AP-0AP) Alanda 01 ICB 93-112300AP Alanda//Lignee 527/Arar ER/Apm/Lignee 131/3/WI 2197/Con ICB 77 The two checks were the two cultivars Rihane-03 (released in 1984) and Litani (released in 1986). The materials were tested in the five locations shown in Table 4: Table 4. Locations where the barley cultivars were tested, with their elevation, average rainfall, and previous crop and planting date.
Location Elevation (m)
Rainfall (mm)
Previous crop
Planting dates
IAAT, (North Bekaa) 1020 m 350 Hemp 28 Nov. 2001
Kherbet and Kanafar, (West Bekaa)
1000 m
700 Beans 29 Nov. 2001
Kasmieh Marjeyoun (South Lebanon)
300-400 m 700 m
800 700
Fallow Beans
20 Nov. 2001 19 Nov. 2001
16
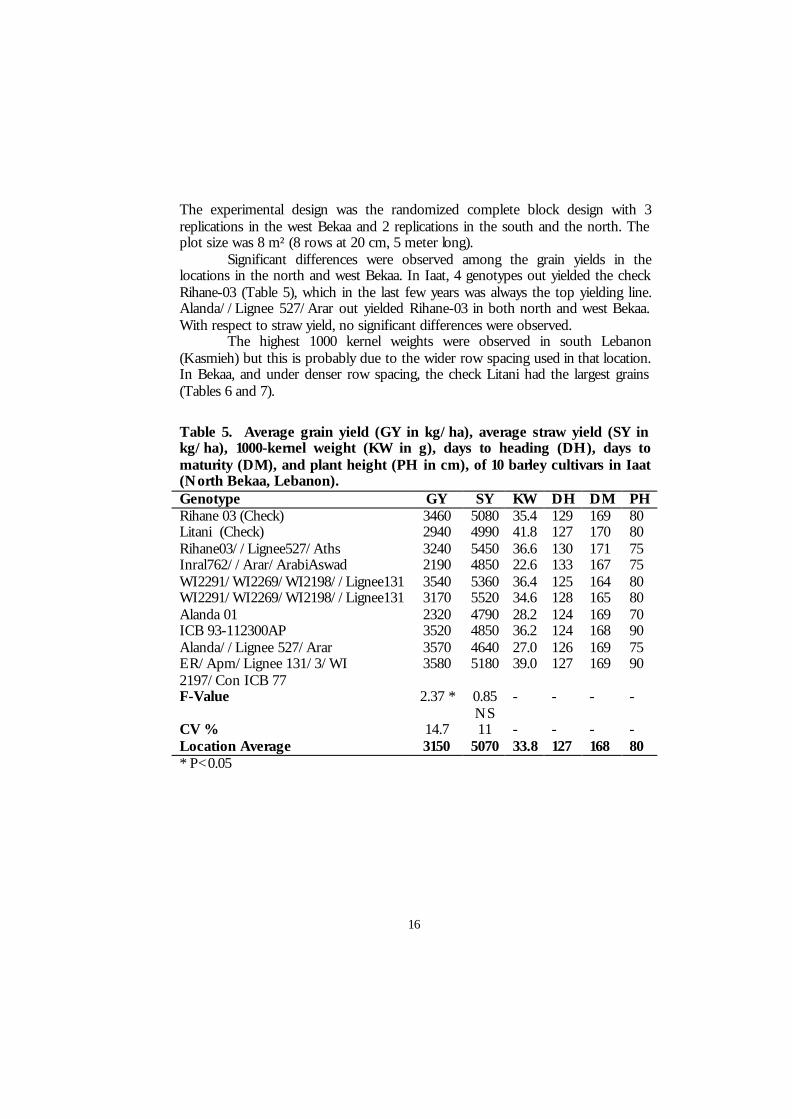
The experimental design was the randomized complete block design with 3 replications in the west Bekaa and 2 replications in the south and the north. The plot size was 8 m² (8 rows at 20 cm, 5 meter long).
Significant differences were observed among the grain yields in the locations in the north and west Bekaa. In Iaat, 4 genotypes out yielded the check Rihane-03 (Table 5), which in the last few years was always the top yielding line. Alanda//Lignee 527/Arar out yielded Rihane-03 in both north and west Bekaa. With respect to straw yield, no significant differences were observed.
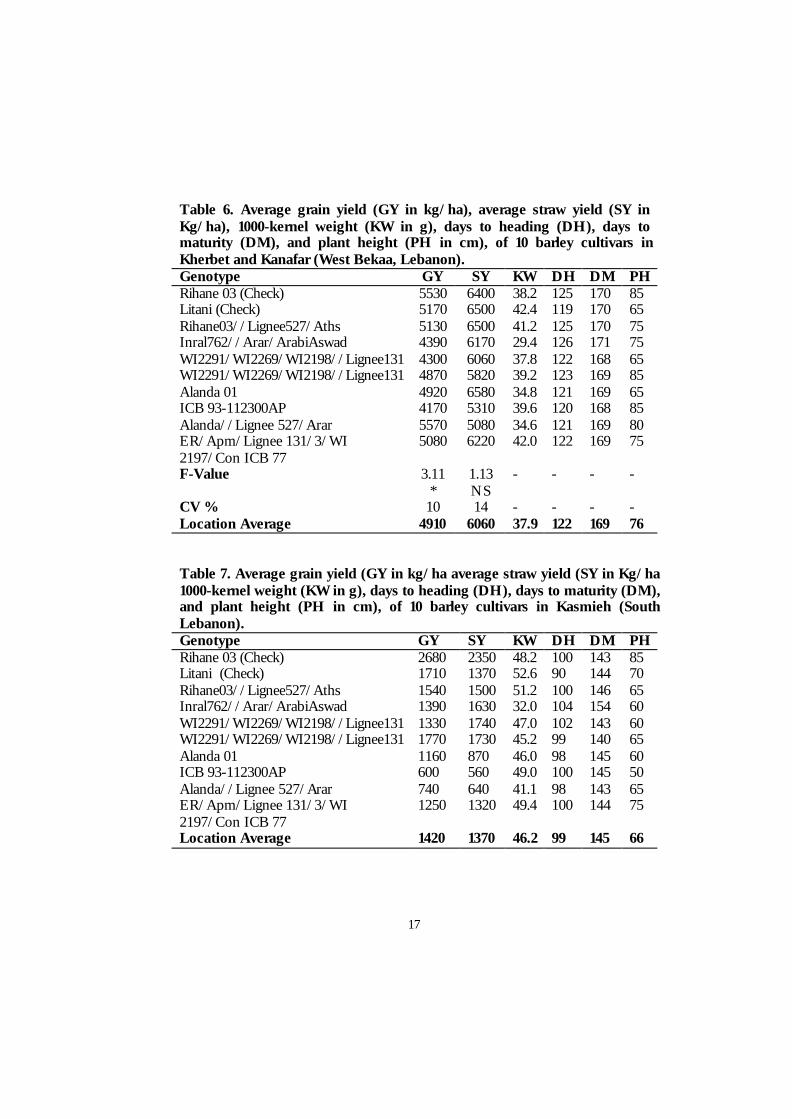
The highest 1000 kernel weights were observed in south Lebanon (Kasmieh) but this is probably due to the wider row spacing used in that location. In Bekaa, and under denser row spacing, the check Litani had the largest grains (Tables 6 and 7).
Table 5. Average grain yield (GY in kg/ha), average straw yield (SY in kg/ha), 1000-kernel weight (KW in g), days to heading (DH), days to maturity (DM), and plant height (PH in cm), of 10 barley cultivars in Iaat (North Bekaa, Lebanon). Genotype GY SY KW DH DM PH Rihane 03 (Check) 3460 5080 35.4 129 169 80 Litani (Check) 2940 4990 41.8 127 170 80 Rihane03//Lignee527/Aths 3240 5450 36.6 130 171 75 Inral762//Arar/ArabiAswad 2190 4850 22.6 133 167 75 WI2291/WI2269/WI2198//Lignee131 3540 5360 36.4 125 164 80 WI2291/WI2269/WI2198//Lignee131 3170 5520 34.6 128 165 80 Alanda 01 2320 4790 28.2 124 169 70 ICB 93-112300AP 3520 4850 36.2 124 168 90 Alanda//Lignee 527/Arar 3570 4640 27.0 126 169 75 ER/Apm/Lignee 131/3/WI 2197/Con ICB 77
3580 5180 39.0 127 169 90
F-Value 2.37 * 0.85 NS
- - - -
CV % 14.7 11 - - - - Location Average 3150 5070 33.8 127 168 80 * P<0.05
17
Table 6. Average grain yield (GY in kg/ha), average straw yield (SY in Kg/ha), 1000-kernel weight (KW in g), days to heading (DH), days to maturity (DM), and plant height (PH in cm), of 10 barley cultivars in Kherbet and Kanafar (West Bekaa, Lebanon). Genotype GY SY KW DH DM PH Rihane 03 (Check) 5530 6400 38.2 125 170 85 Litani (Check) 5170 6500 42.4 119 170 65 Rihane03//Lignee527/Aths 5130 6500 41.2 125 170 75 Inral762//Arar/ArabiAswad 4390 6170 29.4 126 171 75 WI2291/WI2269/WI2198//Lignee131 4300 6060 37.8 122 168 65 WI2291/WI2269/WI2198//Lignee131 4870 5820 39.2 123 169 85 Alanda 01 4920 6580 34.8 121 169 65 ICB 93-112300AP 4170 5310 39.6 120 168 85 Alanda//Lignee 527/Arar 5570 5080 34.6 121 169 80 ER/Apm/Lignee 131/3/WI 2197/Con ICB 77
5080 6220 42.0 122 169 75
F-Value 3.11 *
1.13 NS
- - - -
CV % 10 14 - - - - Location Average 4910 6060 37.9 122 169 76 Table 7. Average grain yield (GY in kg/ha average straw yield (SY in Kg/ha 1000-kernel weight (KW in g), days to heading (DH), days to maturity (DM), and plant height (PH in cm), of 10 barley cultivars in Kasmieh (South Lebanon). Genotype GY SY KW DH DM PH Rihane 03 (Check) 2680 2350 48.2 100 143 85 Litani (Check) 1710 1370 52.6 90 144 70 Rihane03//Lignee527/Aths 1540 1500 51.2 100 146 65 Inral762//Arar/ArabiAswad 1390 1630 32.0 104 154 60 WI2291/WI2269/WI2198//Lignee131 1330 1740 47.0 102 143 60 WI2291/WI2269/WI2198//Lignee131 1770 1730 45.2 99 140 65 Alanda 01 1160 870 46.0 98 145 60 ICB 93-112300AP 600 560 49.0 100 145 50 Alanda//Lignee 527/Arar 740 640 41.1 98 143 65 ER/Apm/Lignee 131/3/WI 2197/Con ICB 77
1250 1320 49.4 100 144 75
Location Average 1420 1370 46.2 99 145 66
18
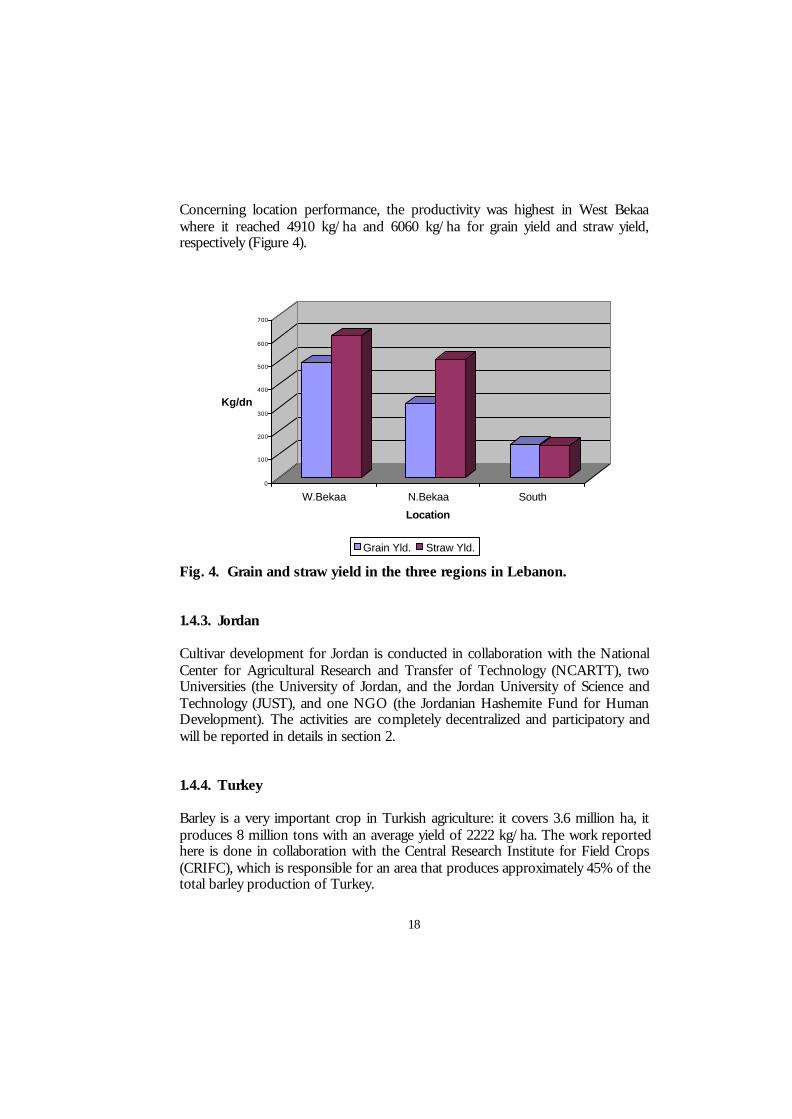
Concerning location performance, the productivity was highest in West Bekaa where it reached 4910 kg/ha and 6060 kg/ha for grain yield and straw yield, respectively (Figure 4).
0
100
200
300
400
500
600
700
Kg/dn
W.Bekaa N.Bekaa South
Location
Grain Yld. Straw Yld.
Fig. 4. Grain and straw yield in the three regions in Lebanon. 1.4.3. Jordan Cultivar development for Jordan is conducted in collaboration with the National Center for Agricultural Research and Transfer of Technology (NCARTT), two Universities (the University of Jordan, and the Jordan University of Science and Technology (JUST), and one NGO (the Jordanian Hashemite Fund for Human Development). The activities are completely decentralized and participatory and will be reported in details in section 2. 1.4.4. Turkey Barley is a very important crop in Turkish agriculture: it covers 3.6 million ha, it produces 8 million tons with an average yield of 2222 kg/ha. The work reported here is done in collaboration with the Central Research Institute for Field Crops (CRIFC), which is responsible for an area that produces approximately 45% of the total barley production of Turkey.
19
Climatic variations in the area are large and fluctuations in crop performance occur frequently, and due to a number of constraints crop reductions or failures are frequent. The most important abiotic stresses in the Central Anatolian Plateau include, cold, terminal drought and heat stresses at grain filling. Diseases, particularly scald and barley stripe, are also important in this zone.
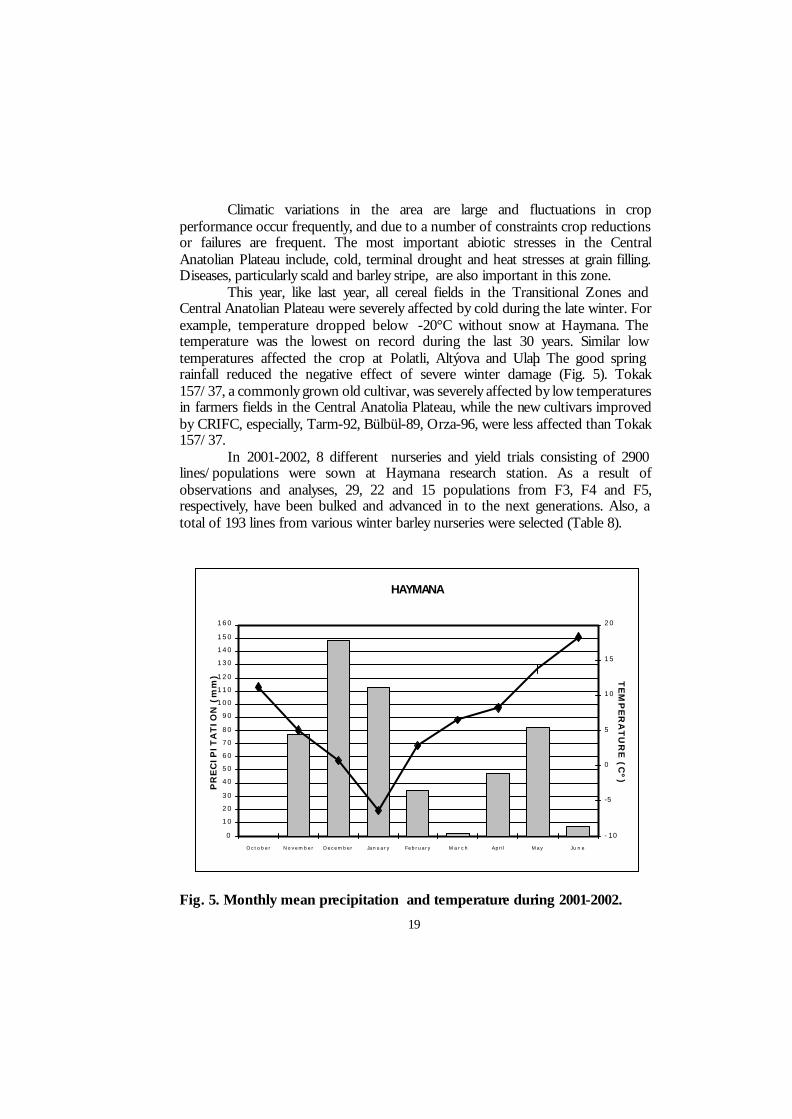
This year, like last year, all cereal fields in the Transitional Zones and Central Anatolian Plateau were severely affected by cold during the late winter. For example, temperature dropped below -20°C without snow at Haymana. The temperature was the lowest on record during the last 30 years. Similar low temperatures affected the crop at Polatli, Altýova and Ulaþ. The good spring rainfall reduced the negative effect of severe winter damage (Fig. 5). Tokak 157/37, a commonly grown old cultivar, was severely affected by low temperatures in farmers fields in the Central Anatolia Plateau, while the new cultivars improved by CRIFC, especially, Tarm-92, Bülbül-89, Orza-96, were less affected than Tokak 157/37.
In 2001-2002, 8 different nurseries and yield trials consisting of 2900 lines/populations were sown at Haymana research station. As a result of observations and analyses, 29, 22 and 15 populations from F3, F4 and F5, respectively, have been bulked and advanced in to the next generations. Also, a total of 193 lines from various winter barley nurseries were selected (Table 8).
Fig. 5. Monthly mean precipitation and temperature during 2001-2002.
HAYMANA
0
102030
4050607080
90100110120
130140150
160
O c t o b e r Novembe r December January February M a r c h April May J u n e
PR
EC
IPIT
AT
ION
(m
m)
-10
-5
0
5
10
15
20
TE
MP
ER
AT
UR
E (C
º)
20
Like the last two successive seasons, because of a severe dry period during the entire autumn, germination and emergence were completed only by the end of the December. The nurseries were severely affected by frost damage during the winter period.
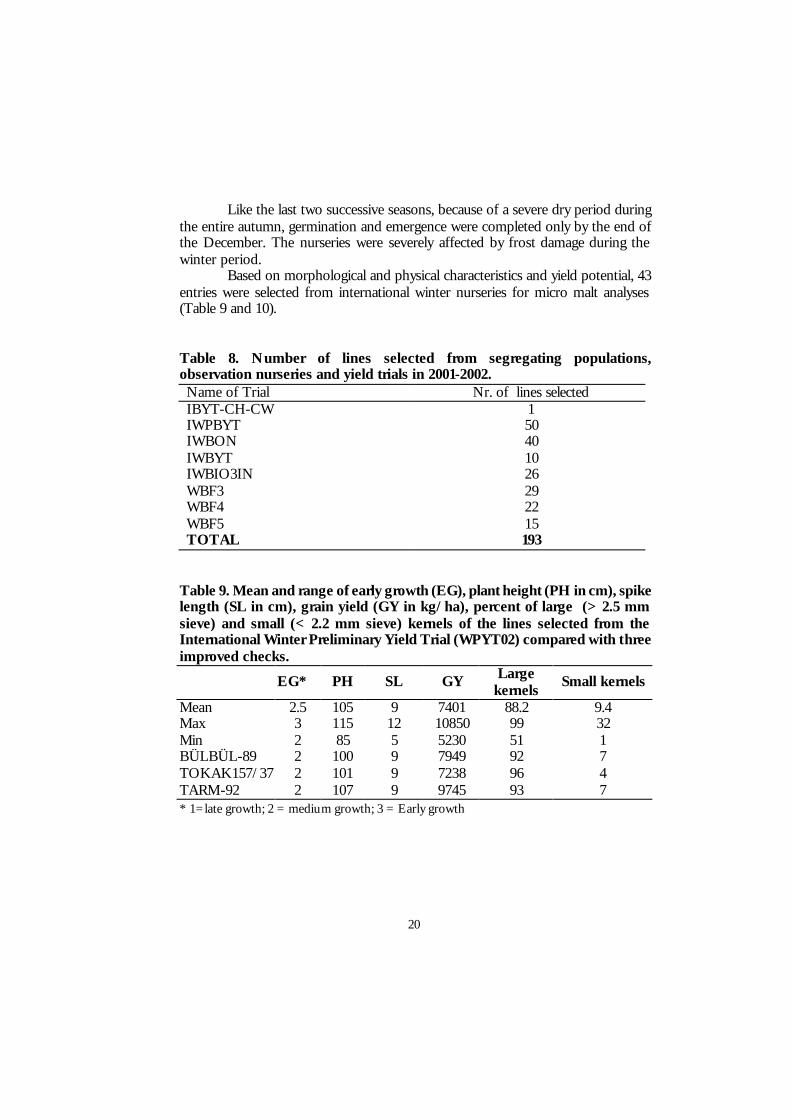
Based on morphological and physical characteristics and yield potential, 43 entries were selected from international winter nurseries for micro malt analyses (Table 9 and 10). Table 8. Number of lines selected from segregating populations, observation nurseries and yield trials in 2001-2002. Name of Trial Nr. of lines selected IBYT-CH-CW 1 IWPBYT 50 IWBON 40 IWBYT 10 IWBIO3IN 26 WBF3 29 WBF4 22 WBF5 15 TOTAL 193
Table 9. Mean and range of early growth (EG), plant height (PH in cm), spike length (SL in cm), grain yield (GY in kg/ha), percent of large (> 2.5 mm sieve) and small (< 2.2 mm sieve) kernels of the lines selected from the International Winter Preliminary Yield Trial (WPYT02) compared with three improved checks.
EG* PH SL GY Large kernels
Small kernels
Mean 2.5 105 9 7401 88.2 9.4 Max 3 115 12 10850 99 32 Min 2 85 5 5230 51 1 BÜLBÜL-89 2 100 9 7949 92 7 TOKAK157/37 2 101 9 7238 96 4 TARM-92 2 107 9 9745 93 7 ∗ 1=late growth; 2 = medium growth; 3 = Early growth
21
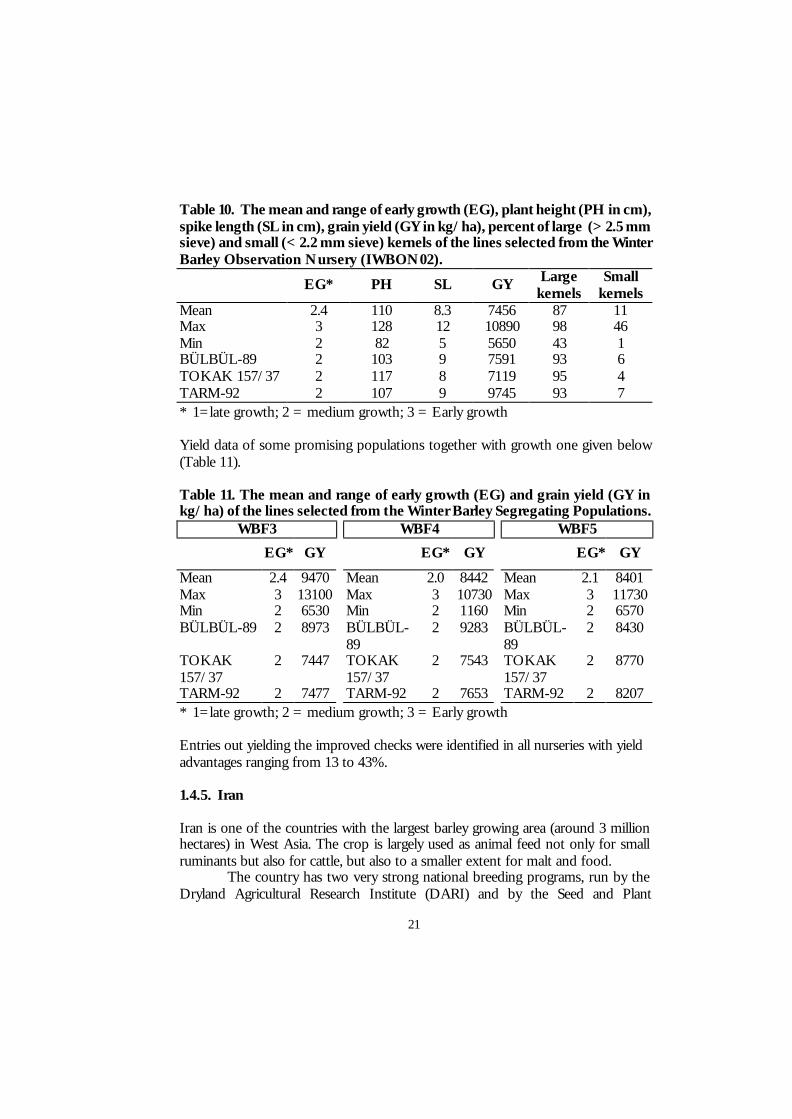
Table 10. The mean and range of early growth (EG), plant height (PH in cm), spike length (SL in cm), grain yield (GY in kg/ha), percent of large (> 2.5 mm sieve) and small (< 2.2 mm sieve) kernels of the lines selected from the Winter Barley Observation Nursery (IWBON02).
EG* PH SL GY Large kernels
Small kernels
Mean 2.4 110 8.3 7456 87 11 Max 3 128 12 10890 98 46 Min 2 82 5 5650 43 1 BÜLBÜL-89 2 103 9 7591 93 6 TOKAK 157/37 2 117 8 7119 95 4 TARM-92 2 107 9 9745 93 7 ∗ 1=late growth; 2 = medium growth; 3 = Early growth Yield data of some promising populations together with growth one given below (Table 11).
Table 11. The mean and range of early growth (EG) and grain yield (GY in kg/ha) of the lines selected from the Winter Barley Segregating Populations.
WBF3 WBF4 WBF5
EG* GY EG* GY EG* GY
Mean 2.4 9470 Mean 2.0 8442 Mean 2.1 8401 Max 3 13100 Max 3 10730 Max 3 11730 Min 2 6530 Min 2 1160 Min 2 6570 BÜLBÜL-89 2 8973 BÜLBÜL-
89 2 9283 BÜLBÜL-
89 2 8430
TOKAK 157/37
2 7447 TOKAK 157/37
2 7543 TOKAK 157/37
2 8770
TARM-92 2 7477
TARM-92 2 7653
TARM-92 2 8207 ∗ 1=late growth; 2 = medium growth; 3 = Early growth Entries out yielding the improved checks were identified in all nurseries with yield advantages ranging from 13 to 43%. 1.4.5. Iran Iran is one of the countries with the largest barley growing area (around 3 million hectares) in West Asia. The crop is largely used as animal feed not only for small ruminants but also for cattle, but also to a smaller extent for malt and food.
The country has two very strong national breeding programs, run by the Dryland Agricultural Research Institute (DARI) and by the Seed and Plant
22
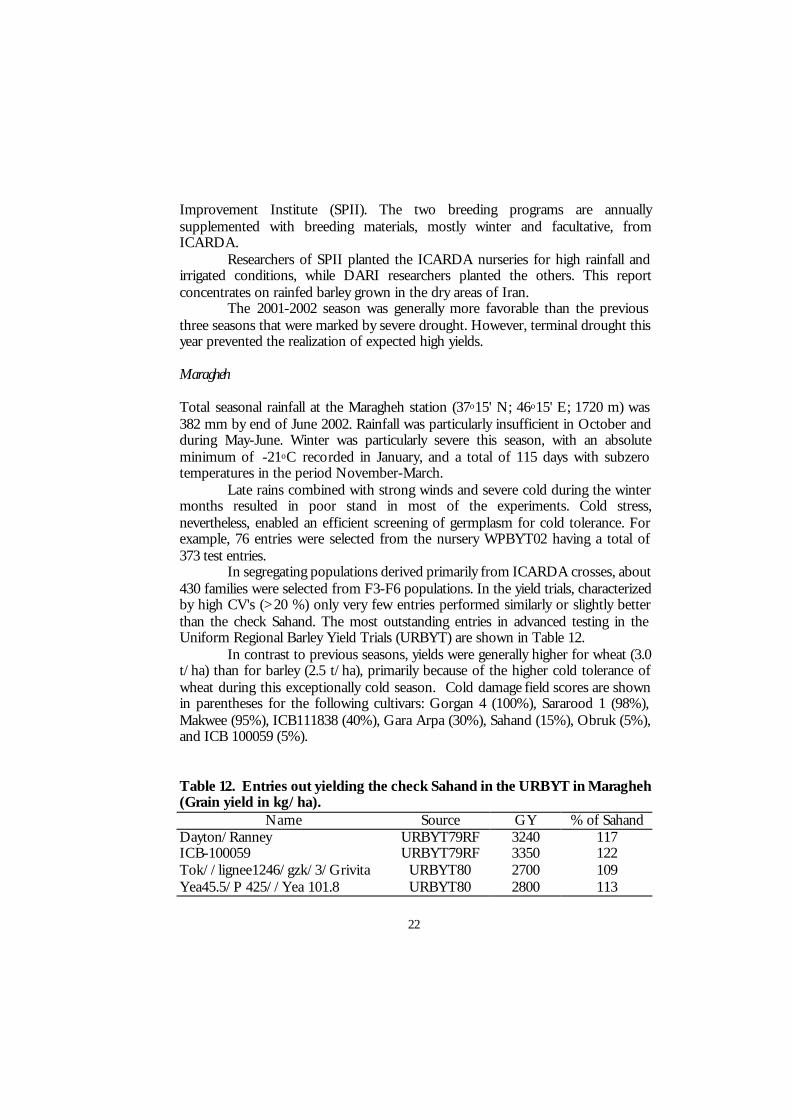
Improvement Institute (SPII). The two breeding programs are annually supplemented with breeding materials, mostly winter and facultative, from ICARDA. Researchers of SPII planted the ICARDA nurseries for high rainfall and irrigated conditions, while DARI researchers planted the others. This report concentrates on rainfed barley grown in the dry areas of Iran.
The 2001-2002 season was generally more favorable than the previous three seasons that were marked by severe drought. However, terminal drought this year prevented the realization of expected high yields. Maragheh Total seasonal rainfall at the Maragheh station (37o15' N; 46o15' E; 1720 m) was 382 mm by end of June 2002. Rainfall was particularly insufficient in October and during May-June. Winter was particularly severe this season, with an absolute minimum of -21oC recorded in January, and a total of 115 days with subzero temperatures in the period November-March.
Late rains combined with strong winds and severe cold during the winter months resulted in poor stand in most of the experiments. Cold stress, nevertheless, enabled an efficient screening of germplasm for cold tolerance. For example, 76 entries were selected from the nursery WPBYT02 having a total of 373 test entries. In segregating populations derived primarily from ICARDA crosses, about 430 families were selected from F3-F6 populations. In the yield trials, characterized by high CV's (>20 %) only very few entries performed similarly or slightly better than the check Sahand. The most outstanding entries in advanced testing in the Uniform Regional Barley Yield Trials (URBYT) are shown in Table 12.
In contrast to previous seasons, yields were generally higher for wheat (3.0 t/ha) than for barley (2.5 t/ha), primarily because of the higher cold tolerance of wheat during this exceptionally cold season. Cold damage field scores are shown in parentheses for the following cultivars: Gorgan 4 (100%), Sararood 1 (98%), Makwee (95%), ICB111838 (40%), Gara Arpa (30%), Sahand (15%), Obruk (5%), and ICB 100059 (5%). Table 12. Entries out yielding the check Sahand in the URBYT in Maragheh (Grain yield in kg/ha).
Name Source GY % of Sahand Dayton/Ranney URBYT79RF 3240 117 ICB-100059 URBYT79RF 3350 122 Tok//lignee1246/gzk/3/Grivita URBYT80 2700 109 Yea45.5/P 425//Yea 101.8 URBYT80 2800 113
23
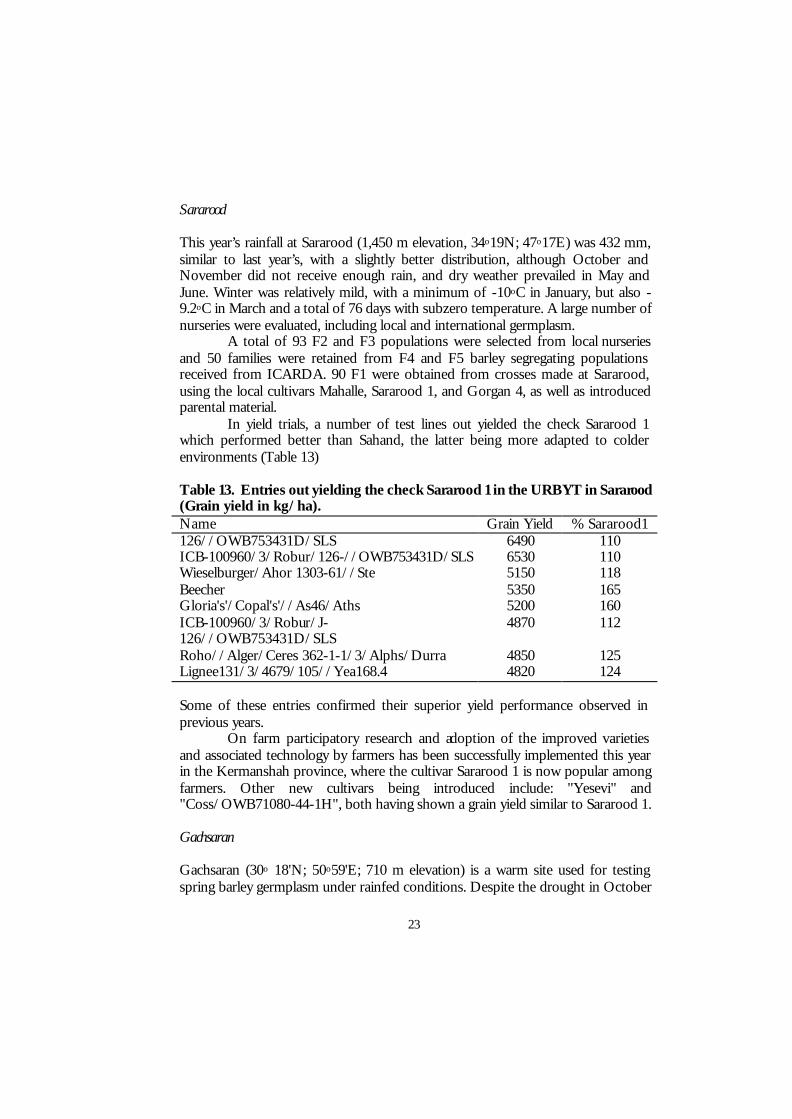
Sararood This year’s rainfall at Sararood (1,450 m elevation, 34o19N; 47o17E) was 432 mm, similar to last year’s, with a slightly better distribution, although October and November did not receive enough rain, and dry weather prevailed in May and June. Winter was relatively mild, with a minimum of -10oC in January, but also -9.2oC in March and a total of 76 days with subzero temperature. A large number of nurseries were evaluated, including local and international germplasm. A total of 93 F2 and F3 populations were selected from local nurseries and 50 families were retained from F4 and F5 barley segregating populations received from ICARDA. 90 F1 were obtained from crosses made at Sararood, using the local cultivars Mahalle, Sararood 1, and Gorgan 4, as well as introduced parental material. In yield trials, a number of test lines out yielded the check Sararood 1 which performed better than Sahand, the latter being more adapted to colder environments (Table 13) Table 13. Entries out yielding the check Sararood 1 in the URBYT in Sararood (Grain yield in kg/ha). Name Grain Yield % Sararood1 126//OWB753431D/SLS 6490 110 ICB-100960/3/Robur/126-//OWB753431D/SLS 6530 110 Wieselburger/Ahor 1303-61//Ste 5150 118 Beecher 5350 165 Gloria's'/Copal's'//As46/Aths 5200 160 ICB-100960/3/Robur/J-126//OWB753431D/SLS
4870 112
Roho//Alger/Ceres 362-1-1/3/Alphs/Durra 4850 125 Lignee131/3/4679/105//Yea168.4 4820 124 Some of these entries confirmed their superior yield performance observed in previous years. On farm participatory research and adoption of the improved varieties and associated technology by farmers has been successfully implemented this year in the Kermanshah province, where the cultivar Sararood 1 is now popular among farmers. Other new cultivars being introduced include: "Yesevi" and "Coss/OWB71080-44-1H", both having shown a grain yield similar to Sararood 1. Gachsaran Gachsaran (30o 18'N; 50o59'E; 710 m elevation) is a warm site used for testing spring barley germplasm under rainfed conditions. Despite the drought in October
24
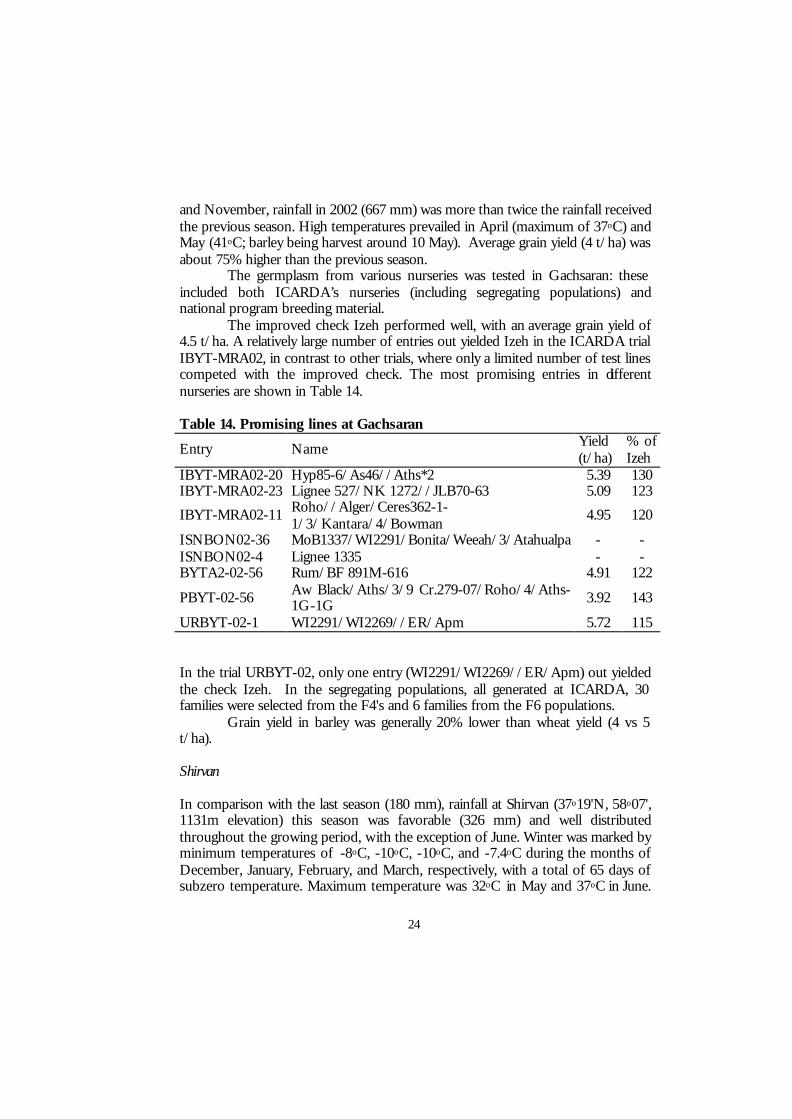
and November, rainfall in 2002 (667 mm) was more than twice the rainfall received the previous season. High temperatures prevailed in April (maximum of 37oC) and May (41oC; barley being harvest around 10 May). Average grain yield (4 t/ha) was about 75% higher than the previous season.
The germplasm from various nurseries was tested in Gachsaran: these included both ICARDA’s nurseries (including segregating populations) and national program breeding material. The improved check Izeh performed well, with an average grain yield of 4.5 t/ha. A relatively large number of entries out yielded Izeh in the ICARDA trial IBYT-MRA02, in contrast to other trials, where only a limited number of test lines competed with the improved check. The most promising entries in different nurseries are shown in Table 14. Table 14. Promising lines at Gachsaran
Entry Name Yield (t/ha)
% of Izeh
IBYT-MRA02-20 Hyp85-6/As46//Aths*2 5.39 130 IBYT-MRA02-23 Lignee 527/NK 1272//JLB70-63 5.09 123
IBYT-MRA02-11 Roho//Alger/Ceres362-1-1/3/Kantara/4/Bowman
4.95 120
ISNBON02-36 MoB1337/WI2291/Bonita/Weeah/3/Atahualpa - - ISNBON02-4 Lignee 1335 - - BYTA2-02-56 Rum/BF 891M-616 4.91 122
PBYT-02-56 Aw Black/Aths/3/9 Cr.279-07/Roho/4/Aths-1G-1G 3.92 143
URBYT-02-1 WI2291/WI2269//ER/Apm 5.72 115 In the trial URBYT-02, only one entry (WI2291/WI2269//ER/Apm) out yielded the check Izeh. In the segregating populations, all generated at ICARDA, 30 families were selected from the F4's and 6 families from the F6 populations. Grain yield in barley was generally 20% lower than wheat yield (4 vs 5 t/ha). Shirvan
In comparison with the last season (180 mm), rainfall at Shirvan (37o19'N, 58o07', 1131m elevation) this season was favorable (326 mm) and well distributed throughout the growing period, with the exception of June. Winter was marked by minimum temperatures of -8oC, -10oC, -10oC, and -7.4oC during the months of December, January, February, and March, respectively, with a total of 65 days of subzero temperature. Maximum temperature was 32oC in May and 37oC in June.

25
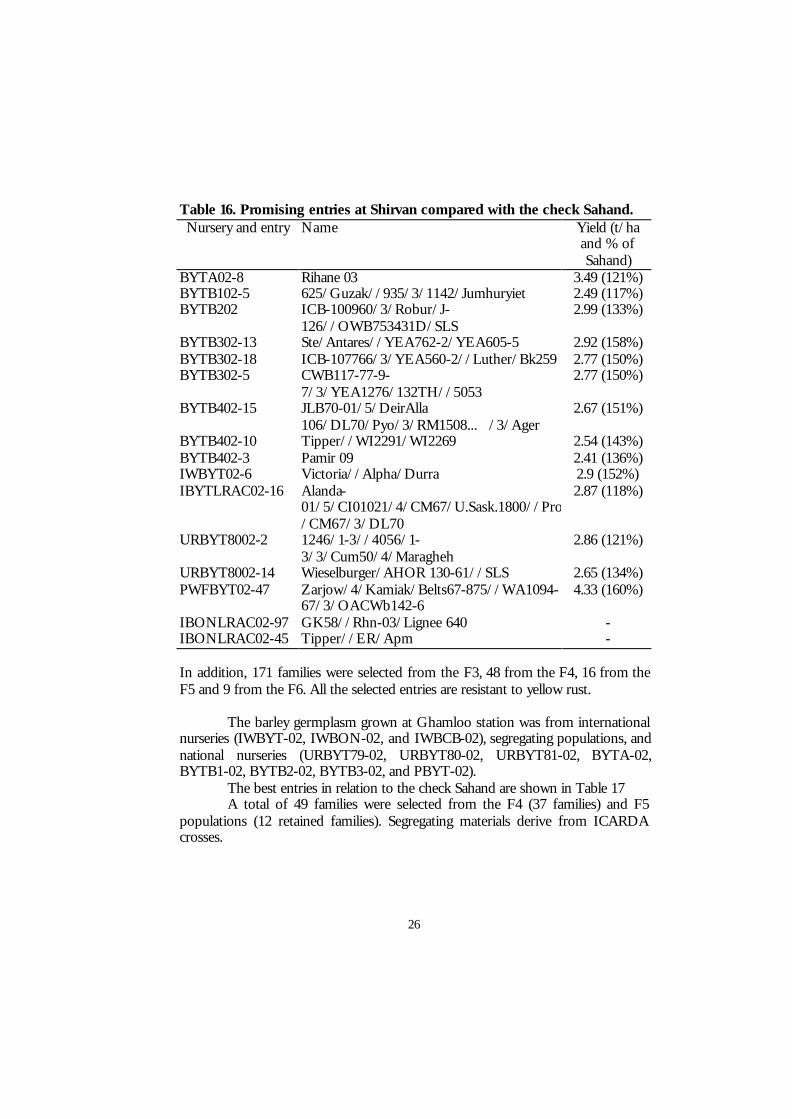
The cool weather that prevailed in most of the spring favored the development of yellow rust to an epidemic level both in wheat and barley, both on-station and in farmers’ fields. Although yellow rust does not occur frequently in barley at such an epidemic level, the screening of barley germplasm for this disease is very useful, contributing to the elimination of highly susceptible entries. The most susceptible entries are shown in Table 15. Table 15. Entries highly susceptible to yellow rust at Shirvan. Nursery and entry Name IWBYT02-12 Alpha/Durra//Tipper IWBCB02-26 Wysor (USA) IWBCB02-35 MI62-420-32/4*A//Sussex IWBCB02-36 Alpha/Durra//ICB-102854 IWBCB02-58 Batal 01 IWBCB02-83 H-2 IWBCB02-89 Dictoo IWBCB02-92 Radical/Pervenets IWBCB02-93 Nebelia/Kozir IWBCB02-97 Kozir M URBYT81-2 Roho//Alger/Ceres 362-1-1/3/Alpha/Durra
A large number of nurseries were evaluated at this station. This includes: segregating populations (F3, F4, F5, and F6, totaling 752 entries), IWBYT02, IBYT-LRA-C02, PWFBYT02, URBYT78-02, URBYT80-02, URBYT81-02, BYTA-02, BYTB1-02, BYTB3-02, BYTB4-02, IBON-LRA02, and IWBON02. The most promising entries selected for further testing are shown in Table 16. Ghamloo The growing conditions at Ghamloo research station (35o10'N, 47o30'E, 1500m elevation) were primarily marked by severe cold that prevailed throughout the winter and part of spring. The damaging effect of cold was not only due to very low minimum temperatures (-24oC in January), but also to the early onset of cold weather (15 days of subzero temperatures in November, with a minimum of -15oC during that month). The absolute minimum temperature in December, February and March was -9oC, -17oC, and -11oC, respectively. In total, there were 100 days with below-freezing temperature, with 2 days in April, and one day in May. Precipitation was higher than last season (350 mm versus 298 mm), but terminal drought (13 mm of rain in May, and none in June) decreased yield of those entries that withstood cold. Despite the higher precipitation, grain yield was lower than in the previous season. For example, Sahand averaged 2.6 t/ha in 2000-01 and 2.0 t/ha in 2001-02. Yet, barley yields were slightly higher than those of wheat.
26
Table 16. Promising entries at Shirvan compared with the check Sahand. Nursery and entry Name Yield (t/ha
and % of Sahand)
BYTA02-8 Rihane 03 3.49 (121%) BYTB102-5 625/Guzak//935/3/1142/Jumhuryiet 2.49 (117%) BYTB202 ICB-100960/3/Robur/J-
126//OWB753431D/SLS 2.99 (133%)
BYTB302-13 Ste/Antares//YEA762-2/YEA605-5 2.92 (158%) BYTB302-18 ICB-107766/3/YEA560-2//Luther/Bk259 2.77 (150%) BYTB302-5 CWB117-77-9-
7/3/YEA1276/132TH//5053 2.77 (150%)
BYTB402-15 JLB70-01/5/DeirAlla 106/DL70/Pyo/3/RM1508... /3/Ager
2.67 (151%)
BYTB402-10 Tipper//WI2291/WI2269 2.54 (143%) BYTB402-3 Pamir 09 2.41 (136%) IWBYT02-6 Victoria//Alpha/Durra 2.9 (152%) IBYTLRAC02-16 Alanda-
01/5/CI01021/4/CM67/U.Sask.1800//Pro/CM67/3/DL70
2.87 (118%)
URBYT8002-2 1246/1-3//4056/1-3/3/Cum50/4/Maragheh
2.86 (121%)
URBYT8002-14 Wieselburger/AHOR 130-61//SLS 2.65 (134%) PWFBYT02-47 Zarjow/4/Kamiak/Belts67-875//WA1094-
67/3/OACWb142-6 4.33 (160%)
IBONLRAC02-97 GK58//Rhn-03/Lignee 640 - IBONLRAC02-45 Tipper//ER/Apm - In addition, 171 families were selected from the F3, 48 from the F4, 16 from the F5 and 9 from the F6. All the selected entries are resistant to yellow rust. The barley germplasm grown at Ghamloo station was from international nurseries (IWBYT-02, IWBON-02, and IWBCB-02), segregating populations, and national nurseries (URBYT79-02, URBYT80-02, URBYT81-02, BYTA-02, BYTB1-02, BYTB2-02, BYTB3-02, and PBYT-02). The best entries in relation to the check Sahand are shown in Table 17
A total of 49 families were selected from the F4 (37 families) and F5 populations (12 retained families). Segregating materials derive from ICARDA crosses.
27
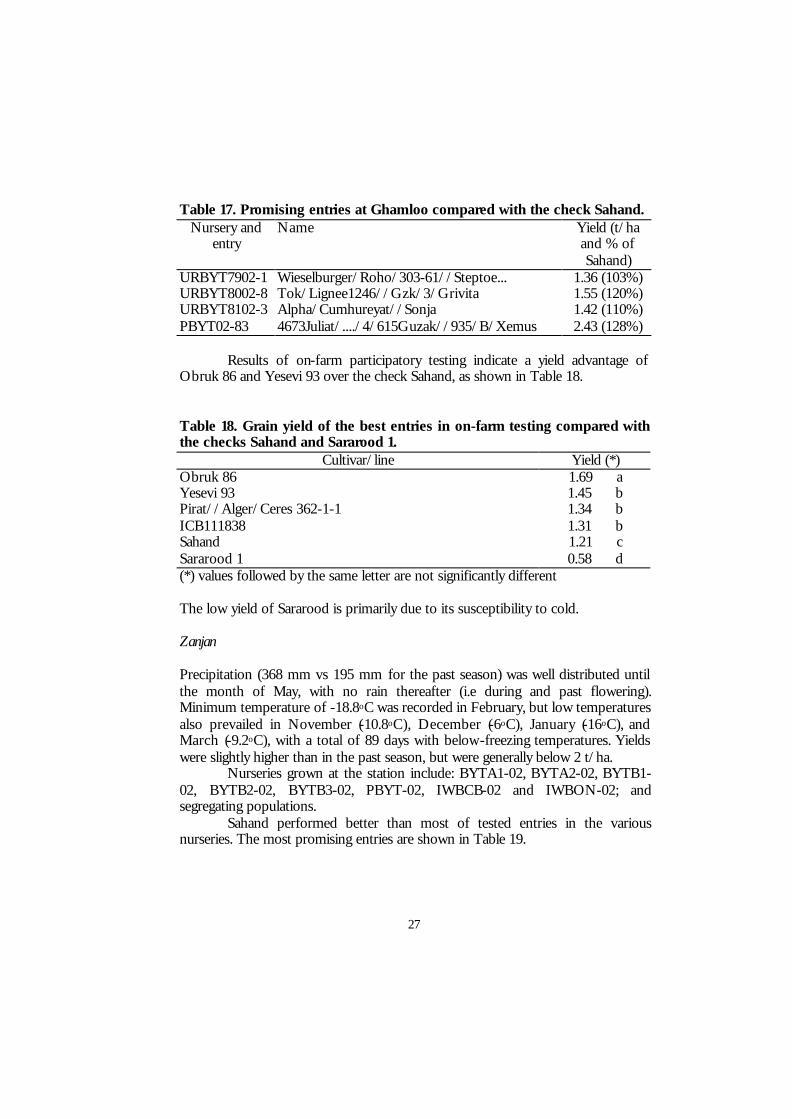
Table 17. Promising entries at Ghamloo compared with the check Sahand. Nursery and
entry Name Yield (t/ha
and % of Sahand)
URBYT7902-1 Wieselburger/Roho/303-61//Steptoe... 1.36 (103%) URBYT8002-8 Tok/Lignee1246//Gzk/3/Grivita 1.55 (120%) URBYT8102-3 Alpha/Cumhureyat//Sonja 1.42 (110%) PBYT02-83 4673Juliat/..../4/615Guzak//935/B/Xemus 2.43 (128%)
Results of on-farm participatory testing indicate a yield advantage of Obruk 86 and Yesevi 93 over the check Sahand, as shown in Table 18. Table 18. Grain yield of the best entries in on-farm testing compared with the checks Sahand and Sararood 1.
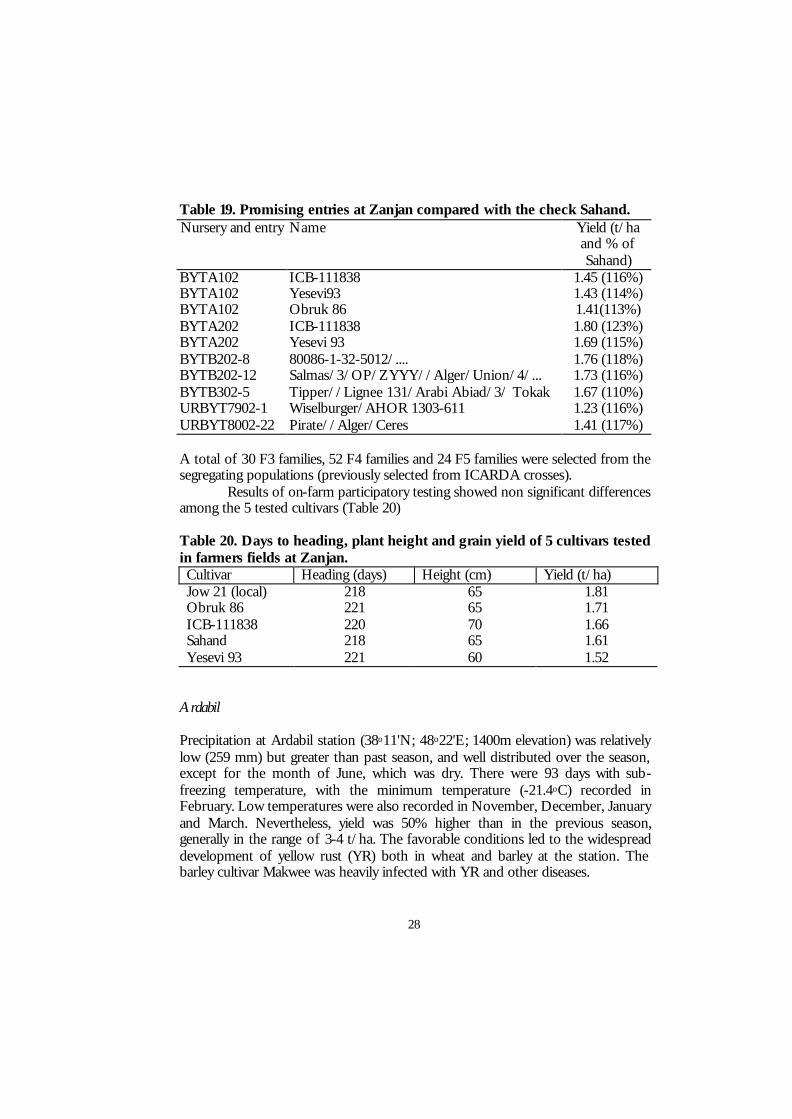
Cultivar/line Yield (*) Obruk 86 1.69 a Yesevi 93 1.45 b Pirat//Alger/Ceres 362-1-1 1.34 b ICB111838 1.31 b Sahand 1.21 c Sararood 1 0.58 d (*) values followed by the same letter are not significantly different The low yield of Sararood is primarily due to its susceptibility to cold. Zanjan Precipitation (368 mm vs 195 mm for the past season) was well distributed until the month of May, with no rain thereafter (i.e during and past flowering). Minimum temperature of -18.8oC was recorded in February, but low temperatures also prevailed in November (-10.8oC), December (-6oC), January (-16oC), and March (-9.2oC), with a total of 89 days with below-freezing temperatures. Yields were slightly higher than in the past season, but were generally below 2 t/ha. Nurseries grown at the station include: BYTA1-02, BYTA2-02, BYTB1-02, BYTB2-02, BYTB3-02, PBYT-02, IWBCB-02 and IWBON-02; and segregating populations. Sahand performed better than most of tested entries in the various nurseries. The most promising entries are shown in Table 19.
28
Table 19. Promising entries at Zanjan compared with the check Sahand. Nursery and entry Name Yield (t/ha
and % of Sahand)
BYTA102 ICB-111838 1.45 (116%) BYTA102 Yesevi93 1.43 (114%) BYTA102 Obruk 86 1.41(113%) BYTA202 ICB-111838 1.80 (123%) BYTA202 Yesevi 93 1.69 (115%) BYTB202-8 80086-1-32-5012/.... 1.76 (118%) BYTB202-12 Salmas/3/OP/ZYYY//Alger/Union/4/... 1.73 (116%) BYTB302-5 Tipper//Lignee 131/Arabi Abiad/3/ Tokak 1.67 (110%) URBYT7902-1 Wiselburger/AHOR 1303-611 1.23 (116%) URBYT8002-22 Pirate//Alger/Ceres 1.41 (117%) A total of 30 F3 families, 52 F4 families and 24 F5 families were selected from the segregating populations (previously selected from ICARDA crosses). Results of on-farm participatory testing showed non significant differences among the 5 tested cultivars (Table 20) Table 20. Days to heading, plant height and grain yield of 5 cultivars tested in farmers fields at Zanjan. Cultivar Heading (days) Height (cm) Yield (t/ha) Jow 21 (local) 218 65 1.81 Obruk 86 221 65 1.71 ICB-111838 220 70 1.66 Sahand 218 65 1.61 Yesevi 93 221 60 1.52
Ardabil Precipitation at Ardabil station (38o11'N; 48o22'E; 1400m elevation) was relatively low (259 mm) but greater than past season, and well distributed over the season, except for the month of June, which was dry. There were 93 days with sub-freezing temperature, with the minimum temperature (-21.4oC) recorded in February. Low temperatures were also recorded in November, December, January and March. Nevertheless, yield was 50% higher than in the previous season, generally in the range of 3-4 t/ha. The favorable conditions led to the widespread development of yellow rust (YR) both in wheat and barley at the station. The barley cultivar Makwee was heavily infected with YR and other diseases.
29
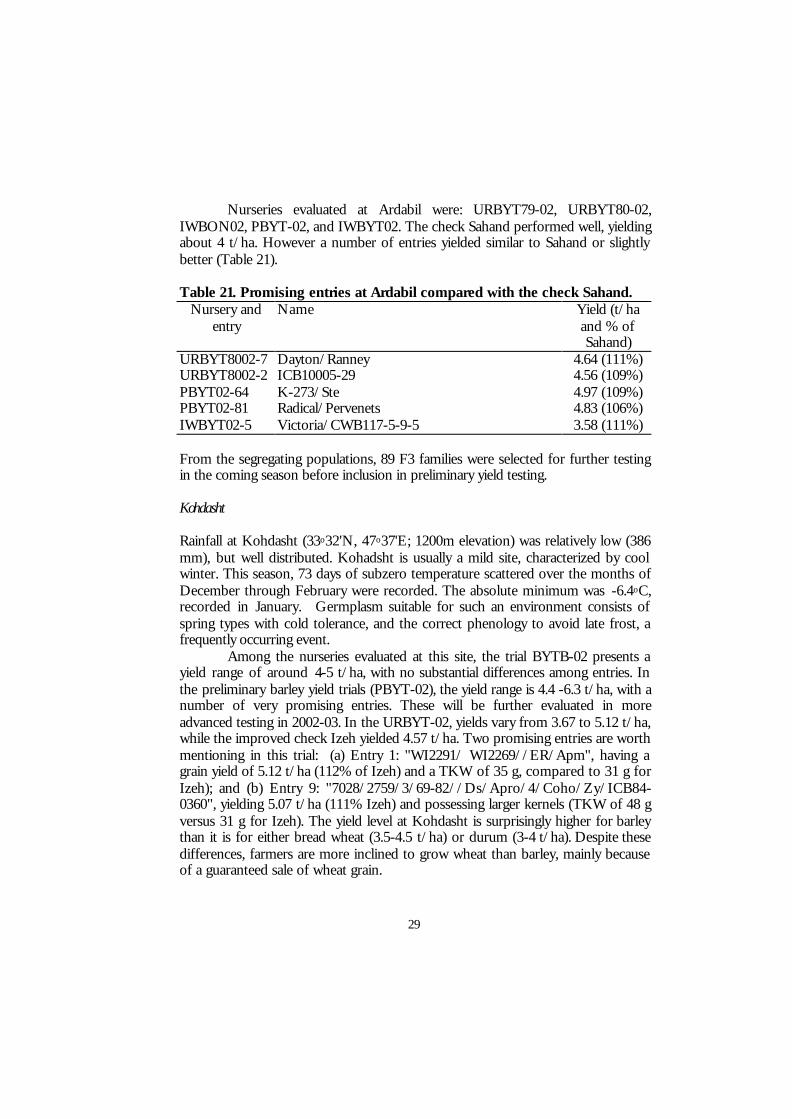
Nurseries evaluated at Ardabil were: URBYT79-02, URBYT80-02, IWBON02, PBYT-02, and IWBYT02. The check Sahand performed well, yielding about 4 t/ha. However a number of entries yielded similar to Sahand or slightly better (Table 21). Table 21. Promising entries at Ardabil compared with the check Sahand.
Nursery and entry
Name Yield (t/ha and % of Sahand)
URBYT8002-7 Dayton/Ranney 4.64 (111%) URBYT8002-2 ICB10005-29 4.56 (109%) PBYT02-64 K-273/Ste 4.97 (109%) PBYT02-81 Radical/Pervenets 4.83 (106%) IWBYT02-5 Victoria/CWB117-5-9-5 3.58 (111%) From the segregating populations, 89 F3 families were selected for further testing in the coming season before inclusion in preliminary yield testing. Kohdasht Rainfall at Kohdasht (33o32'N, 47o37'E; 1200m elevation) was relatively low (386 mm), but well distributed. Kohadsht is usually a mild site, characterized by cool winter. This season, 73 days of subzero temperature scattered over the months of December through February were recorded. The absolute minimum was -6.4oC, recorded in January. Germplasm suitable for such an environment consists of spring types with cold tolerance, and the correct phenology to avoid late frost, a frequently occurring event. Among the nurseries evaluated at this site, the trial BYTB-02 presents a yield range of around 4-5 t/ha, with no substantial differences among entries. In the preliminary barley yield trials (PBYT-02), the yield range is 4.4 -6.3 t/ha, with a number of very promising entries. These will be further evaluated in more advanced testing in 2002-03. In the URBYT-02, yields vary from 3.67 to 5.12 t/ha, while the improved check Izeh yielded 4.57 t/ha. Two promising entries are worth mentioning in this trial: (a) Entry 1: "WI2291/ WI2269//ER/Apm", having a grain yield of 5.12 t/ha (112% of Izeh) and a TKW of 35 g, compared to 31 g for Izeh); and (b) Entry 9: "7028/2759/3/69-82//Ds/Apro/4/Coho/Zy/ICB84-0360", yielding 5.07 t/ha (111% Izeh) and possessing larger kernels (TKW of 48 g versus 31 g for Izeh). The yield level at Kohdasht is surprisingly higher for barley than it is for either bread wheat (3.5-4.5 t/ha) or durum (3-4 t/ha). Despite these differences, farmers are more inclined to grow wheat than barley, mainly because of a guaranteed sale of wheat grain.
30
Participatory Partnership A total of 335 ha of farmers fields were planted to barley using the improved technology (including varieties) developed by researchers, extensionists, farmers, and local communities working closely together. This included 270 ha of Sararood 1 in the Kermanshah Province, 15 ha of Izeh in "Kohgiloieh-va-Boir Ahmed" Province, and 50 ha of Sararood 1 in Kordestan Province. The yield advantage of the new technology was greater than 50%. The area covered by the new technology is expected to increase by several-fold in 2002-03, as more seed becomes available. 1.4.6. Iraq 1.4.6.1. Climatic Conditions The 1999-2000 season was the driest season at five sites commonly used by the breeding program. The lowest rainfall was recorded at Hatra (69 mm) and the highest at Mosul (202 mm) (Table 22). The last two seasons were much wetter and both total rainfall and rainfall distribution at the stations of Mosul, Telafer and Rabiah were good, where the rainfall quantity during March, April and, May exceeded the critical level (>100 mm) for the drought in the region. However, a mid season drought occurred in the 2001-2002 season and the month of May was dry at all locations. The variation in rainfall caused a large fluctuation in barley production and a negative impact on farmers. Breeders face a major challenge in trying to cope with such instability of climatic conditions and in finding drought resistant varieties. Thus more lines or finished varieties are needed for testing under farmers’ field conditions. 1.4.6.2. On Farm Feed Production of Barley Varieties To facilitate the spreading and the adoption of new varieties in the dry areas of Al Jazeera in northern Iraq (200 – 350 mm rainfall), the newly developed lines, Tadmor, LR402, LR156, Rihane-03 and Zanbaka were planted in large plots (25 x 100 m) in Hatra, Ragrag, Tel Abta and Mahalabya using a seed rate of 120 kg/ha and 40 kg/ha of N and 40 kg /ha of P2O5 at planting time. The following traits were recorded: date of plants emergence, heading and maturity time, disease development (powdery mildew, rust etc.), biological yield, grain yield, straw yield, protein content and straw quality (evaluated at ICARDA headquarters), and farmers opinion and preference during a field day organized at maturity time.

31
Table 22. Monthly rainfall recorded in five stations in Iraq during 1999/2000, 2000/2001, and 2001/2002. Station Year Oct. Nov. Dec. Jan. Feb. Mar. Apr. May Total Mosul 2000 10 19 35 62 23 23 30 0 202 2001 12.4 47.7 83.6 25.9 37.3 82.5 35.8 35.8 361 2002 2 4 65 70 20 152 60 0 373 Telafer 2000 14 13.5 21 44 17 38 17 0 165 2001 2.8 53.6 94.2 29.2 39.5 69.4 25.5 26.5 337.6 2002 3 13 44 32 14 110 20 0 236 Rabiah 2000 4.4 2.9 28 51 8 18 7 0 119 2001 11.5 41.4 135 41.1 51.6 74.2 31.1 18.6 411.6 2002 0 3 32 30 10 140 57 0 272 Mahal. 2000 14 2 22 28 11 32 19 0 128 2001 7 23 85 27 33 50 51 10 276 2002 4 3 60 69 22 107 75 0 340 Hatra 2000 2 2 33 24 8 0 0 0 69 2001 0 25 68 20 28 65 20 0 226 2002 0 0 49 62 26 92 30 1 260 Source: Directorate of Agriculture, Ninevah Governorate.
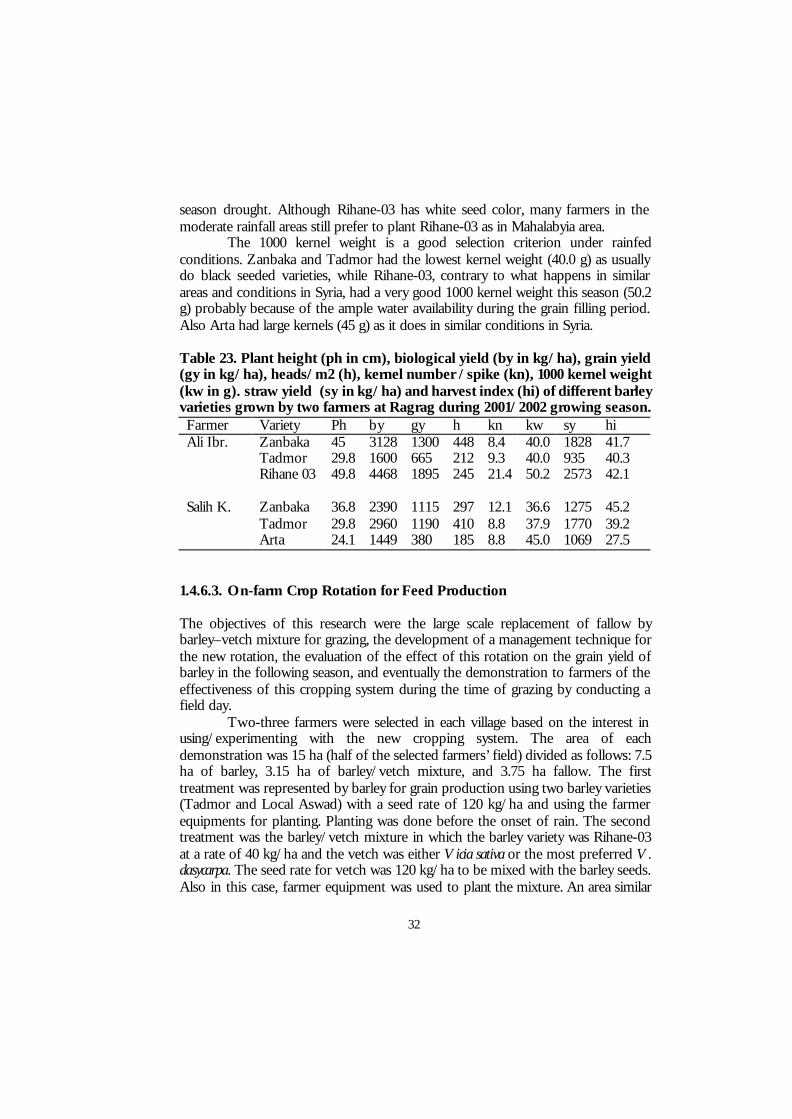
Table 23 presents the results of the evaluation of three barley varieties grown by two farmers at Ragrag. Although this site received 340 mm rainfall, the distribution was irregular. The crop was exposed to moisture stress during tillering and stems elongation till mid of March. Plant height, tillering and kernel number per spike were negatively affected. However, more than 50% of the total rain fell after mid March and during grain filling period. This resulted in good kernel weight for all barley cultivars, especially for Rihane-03. Rihane-03 gave the highest biological yield (4468 kg/ha) compared to both Zanbaka and Tadmor. This is expected because of a good rainfall in this season. However, this increase led to the increase in straw yield rather than to increase in grain yield especially for Rihane 03 and Arta. In one farmer field (Ali Ibrahim), Rihane-03 gave the highest grain yield (1895 kg/ha), followed by Zanbaka (1300 kg/ha) and by Tadmor (665 kg/ha). In the other farmer field (Salih Khalil), both Zanbaka and Tadmor gave relatively good yield (1115 and 1190 kg/ha, respectively) compared to Arta (380 kg/ha).
Mid season drought caused a drastic decrease in plant height for all varieties, but, as also observed in Syria, Arta was affected more than the black seeded varieties and had the shortest plant height but also the lowest harvest index. These results support the choice of Zanbaka and Tadmor (both black seeded) for diffusion in the region, and the exclusion of Arta because of its lower yielding ability, the white seed color, and the short plant height. Rihane-03 is a good yielding variety for both grain and straw under good rainfall, and survived the mid
32
season drought. Although Rihane-03 has white seed color, many farmers in the moderate rainfall areas still prefer to plant Rihane-03 as in Mahalabyia area.
The 1000 kernel weight is a good selection criterion under rainfed conditions. Zanbaka and Tadmor had the lowest kernel weight (40.0 g) as usually do black seeded varieties, while Rihane-03, contrary to what happens in similar areas and conditions in Syria, had a very good 1000 kernel weight this season (50.2 g) probably because of the ample water availability during the grain filling period. Also Arta had large kernels (45 g) as it does in similar conditions in Syria. Table 23. Plant height (ph in cm), biological yield (by in kg/ha), grain yield (gy in kg/ha), heads/m2 (h), kernel number /spike (kn), 1000 kernel weight (kw in g). straw yield (sy in kg/ha) and harvest index (hi) of different barley varieties grown by two farmers at Ragrag during 2001/2002 growing season. Farmer Variety Ph by gy h kn kw sy hi Ali Ibr. Zanbaka 45 3128 1300 448 8.4 40.0 1828 41.7 Tadmor 29.8 1600 665 212 9.3 40.0 935 40.3 Rihane 03 49.8 4468 1895 245 21.4 50.2 2573 42.1 Salih K. Zanbaka 36.8 2390 1115 297 12.1 36.6 1275 45.2 Tadmor 29.8 2960 1190 410 8.8 37.9 1770 39.2 Arta 24.1 1449 380 185 8.8 45.0 1069 27.5
1.4.6.3. On-farm Crop Rotation for Feed Production The objectives of this research were the large scale replacement of fallow by barley–vetch mixture for grazing, the development of a management technique for the new rotation, the evaluation of the effect of this rotation on the grain yield of barley in the following season, and eventually the demonstration to farmers of the effectiveness of this cropping system during the time of grazing by conducting a field day. Two-three farmers were selected in each village based on the interest in using/experimenting with the new cropping system. The area of each demonstration was 15 ha (half of the selected farmers’ field) divided as follows: 7.5 ha of barley, 3.15 ha of barley/vetch mixture, and 3.75 ha fallow. The first treatment was represented by barley for grain production using two barley varieties (Tadmor and Local Aswad) with a seed rate of 120 kg/ha and using the farmer equipments for planting. Planting was done before the onset of rain. The second treatment was the barley/vetch mixture in which the barley variety was Rihane-03 at a rate of 40 kg/ha and the vetch was either Vicia sativa or the most preferred V. dasycarpa. The seed rate for vetch was 120 kg/ha to be mixed with the barley seeds. Also in this case, farmer equipment was used to plant the mixture. An area similar
33
to the one planted with the mixture was left fallow and was treated according to farmer practices. The barley-vetch mixture was to be totally grazed by a suitable number of sheep during March and April. Permission for the farmer should be guaranteed from the local authorities to graze the area within the specified time.
The following observations/measurements were collected: date of seedling emergence for barley and vetch, duration of the grazing period, dates of heading and maturity for barley, biological yield, straw yield and grain yield estimated on an area of 6 m2. Eventually soil studies were conducted for the different uses and the initial and final body weight of the sheep grazing the barley/vetch mixture were recorded.
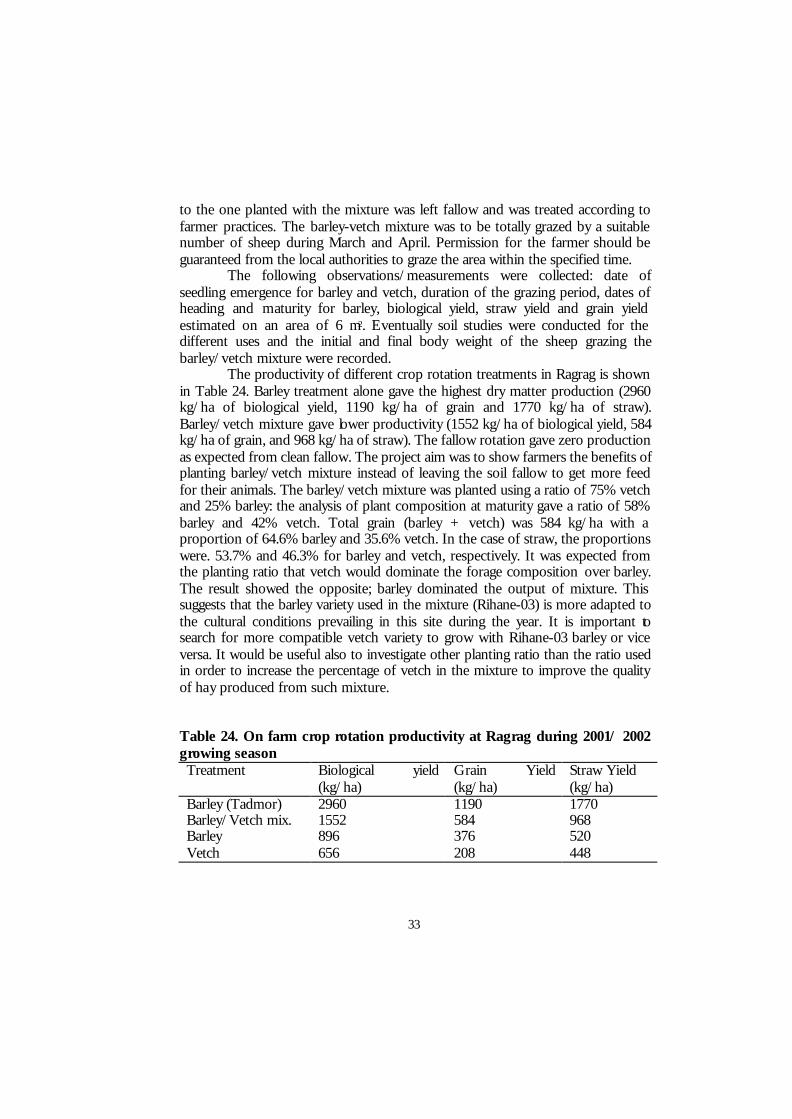
The productivity of different crop rotation treatments in Ragrag is shown in Table 24. Barley treatment alone gave the highest dry matter production (2960 kg/ha of biological yield, 1190 kg/ha of grain and 1770 kg/ha of straw). Barley/vetch mixture gave lower productivity (1552 kg/ha of biological yield, 584 kg/ha of grain, and 968 kg/ha of straw). The fallow rotation gave zero production as expected from clean fallow. The project aim was to show farmers the benefits of planting barley/vetch mixture instead of leaving the soil fallow to get more feed for their animals. The barley/vetch mixture was planted using a ratio of 75% vetch and 25% barley: the analysis of plant composition at maturity gave a ratio of 58% barley and 42% vetch. Total grain (barley + vetch) was 584 kg/ha with a proportion of 64.6% barley and 35.6% vetch. In the case of straw, the proportions were. 53.7% and 46.3% for barley and vetch, respectively. It was expected from the planting ratio that vetch would dominate the forage composition over barley. The result showed the opposite; barley dominated the output of mixture. This suggests that the barley variety used in the mixture (Rihane-03) is more adapted to the cultural conditions prevailing in this site during the year. It is important to search for more compatible vetch variety to grow with Rihane-03 barley or vice versa. It would be useful also to investigate other planting ratio than the ratio used in order to increase the percentage of vetch in the mixture to improve the quality of hay produced from such mixture. Table 24. On farm crop rotation productivity at Ragrag during 2001/ 2002 growing season Treatment Biological yield
(kg/ha) Grain Yield (kg/ha)
Straw Yield (kg/ha)
Barley (Tadmor) 2960 1190 1770 Barley/Vetch mix. 1552 584 968 Barley 896 376 520 Vetch 656 208 448
34
1.5. Cultivar Development for North Africa and Horn of Africa 1.5.1. Selections in the special nurseries for Maghreb During 2001-2002 the nurseries specifically targeted for North Africa were: 1. Segregating populations for North Africa, divided in two groups:
SEGEL02, containing mostly early germplasm, planted in Libya, SEGMAG02 planted in Algeria, Tunisia, and Morocco (Table 25).
2. Special nursery for North Africa: NUREL00, containing mostly early germplasm, planted in Libya, and NURMAG00, planted in Algeria, Tunisia, and Morocco (Table 25).
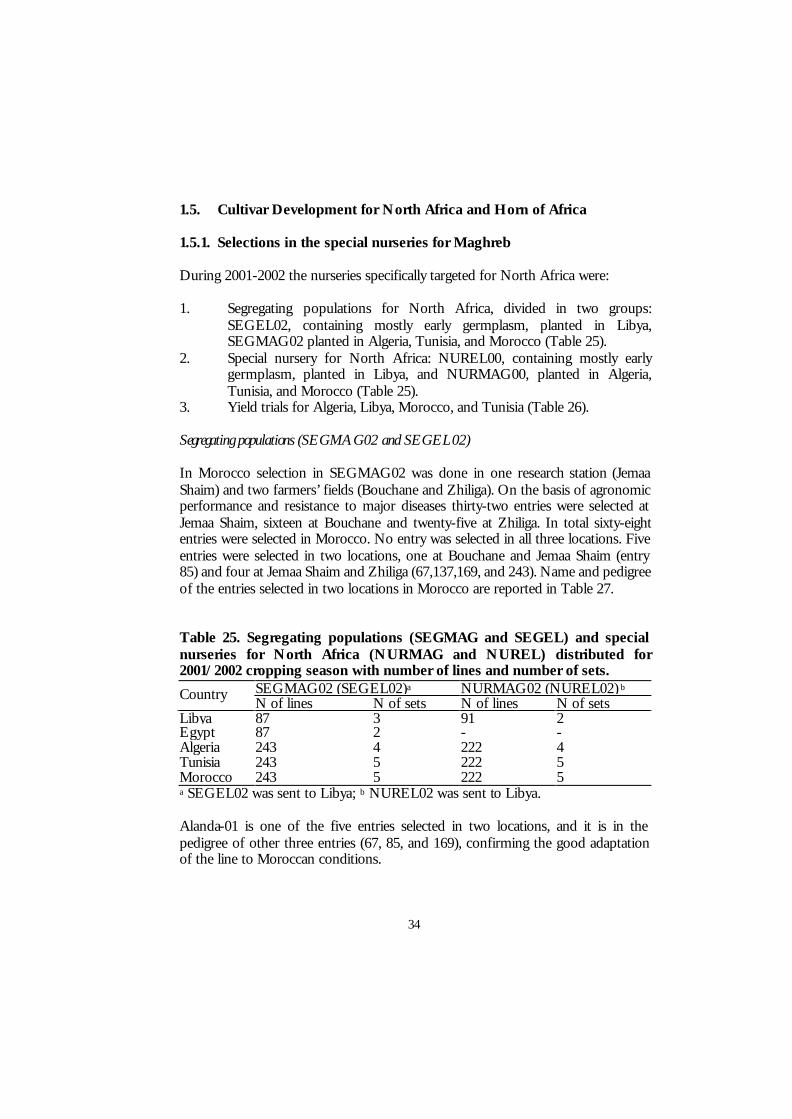
3. Yield trials for Algeria, Libya, Morocco, and Tunisia (Table 26). Segregating populations (SEGMAG02 and SEGEL02) In Morocco selection in SEGMAG02 was done in one research station (Jemaa Shaim) and two farmers’ fields (Bouchane and Zhiliga). On the basis of agronomic performance and resistance to major diseases thirty-two entries were selected at Jemaa Shaim, sixteen at Bouchane and twenty-five at Zhiliga. In total sixty-eight entries were selected in Morocco. No entry was selected in all three locations. Five entries were selected in two locations, one at Bouchane and Jemaa Shaim (entry 85) and four at Jemaa Shaim and Zhiliga (67,137,169, and 243). Name and pedigree of the entries selected in two locations in Morocco are reported in Table 27. Table 25. Segregating populations (SEGMAG and SEGEL) and special nurseries for North Africa (NURMAG and NUREL) distributed for 2001/2002 cropping season with number of lines and number of sets.
SEGMAG02 (SEGEL02)a NURMAG02 (NUREL02) b Country N of lines N of sets N of lines N of sets
Libya 87 3 91 2 Egypt 87 2 - - Algeria 243 4 222 4 Tunisia 243 5 222 5 Morocco 243 5 222 5 a SEGEL02 was sent to Libya; b NUREL02 was sent to Libya. Alanda-01 is one of the five entries selected in two locations, and it is in the pedigree of other three entries (67, 85, and 169), confirming the good adaptation of the line to Moroccan conditions.

35
Table 26. Barley yield trials distributed to North Africa in 2001/02 cropping season with number of lines, number of replications and number of locations. Country N of lines N of replications N of sets Libya 49 2 3 Algeria 72 2 4 Tunisia 80 2 4 Morocco 80 2 4
Table 27. Entries selected in two locations in Morocco from SEGMAG02. Entry Cross Pedigree 67 Aths/Lignee686//Arimar/Aths/3/Eldorado//Ala
nda/Zafraa ICB99-0340-0AP
85 Alanda/Zafraa//Gloria'S'/Copal'S'/4/NK1272//Manker/Arig8/3/ Alanda/Hamra-01
ICB99-0359-0AP
137 Bda/3/Sutter//Sutter*2/Numar/9/Morex/8/U.Sask.1766/Api//Cel/3/Weeah/7/Api/CM67//Hma-03/4/Cq/Cm//Apm/3/RM1508/5/ Attiki/6/Mari/Aths*2
ICB99-0422-0AP
169 Alanda/Hamra/4/CompCr229//As46/Pro/3/Srs/9/Lignee527/ Asse//NK1272/3/Arig8/8/Api/CM67//Hma-03/4/Cq/Cm//Apm/3/ RM1508/5/Attiki/6/Mari/Aths*2/7/Alanda
ICB99-0454-0AP
243 Alanda-01 -
In Tunisia selection was done at El Kef only, and forty-five entries were selected.
Fourteen entries were selected both in Morocco (at least one location) and Tunisia. Eight out of the fourteen were commonly selected in El Kef and Jemaa Shaim. Entries 67, 85, and 169, selected in two locations in Morocco were also selected at El Kef.
A total of 95 entries were promoted to further testing in NURMAG03. Selection in SEGEL02 was done at Sofit in Libya, and at Gemmiza in Egypt. Thirty-nine entries were selected in Libya, and fifty-six in Egypt. Twenty-six entries were selected in both countries; of these twenty-two were hulless.
Thirty-nine entries were promoted to next year testing in NUREL03. 1.5.2. Special Nursery for North Africa and for Libya Due to the severe drought that affected all countries across North Africa during the past cropping season, selection in NURMAG02 was done only in four
36
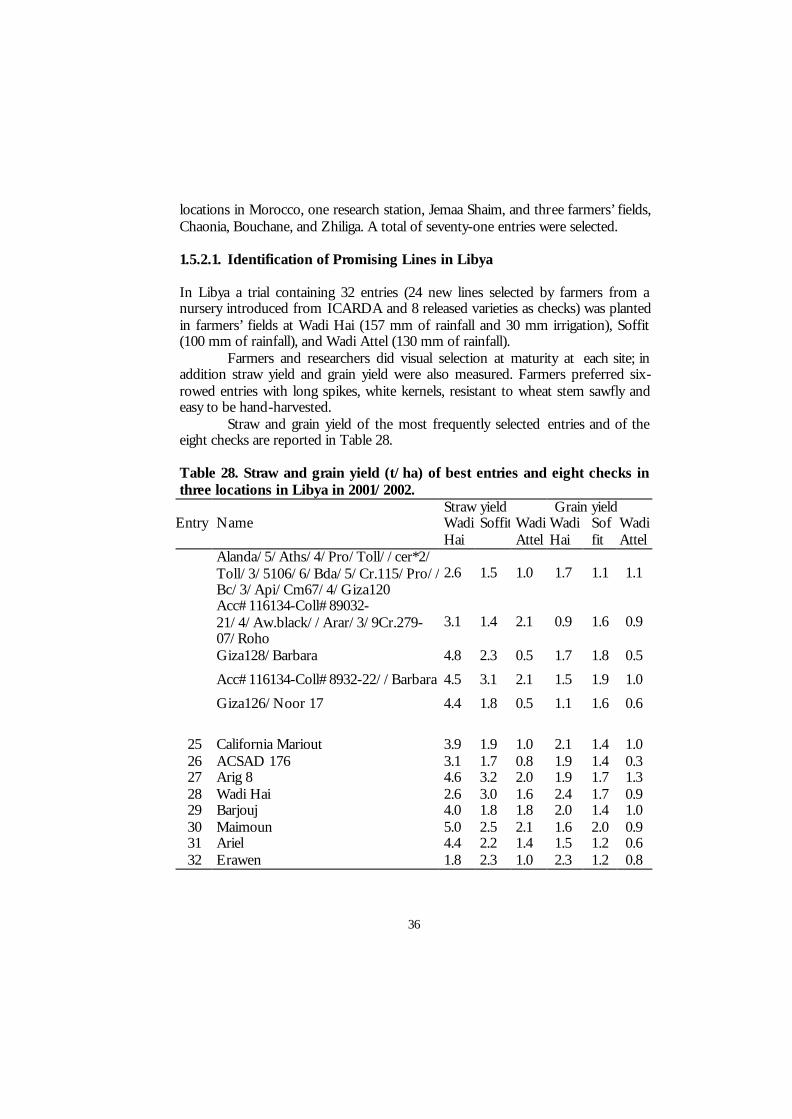
locations in Morocco, one research station, Jemaa Shaim, and three farmers’ fields, Chaonia, Bouchane, and Zhiliga. A total of seventy-one entries were selected. 1.5.2.1. Identification of Promising Lines in Libya In Libya a trial containing 32 entries (24 new lines selected by farmers from a nursery introduced from ICARDA and 8 released varieties as checks) was planted in farmers’ fields at Wadi Hai (157 mm of rainfall and 30 mm irrigation), Soffit (100 mm of rainfall), and Wadi Attel (130 mm of rainfall).
Farmers and researchers did visual selection at maturity at each site; in addition straw yield and grain yield were also measured. Farmers preferred six-rowed entries with long spikes, white kernels, resistant to wheat stem sawfly and easy to be hand-harvested.
Straw and grain yield of the most frequently selected entries and of the eight checks are reported in Table 28. Table 28. Straw and grain yield (t/ha) of best entries and eight checks in three locations in Libya in 2001/2002.
Straw yield Grain yield Entry Name Wadi
Hai Soffit Wadi
Attel Wadi Hai
Soffit
Wadi Attel
Alanda/5/Aths/4/Pro/Toll//cer*2/Toll/3/5106/6/Bda/5/Cr.115/Pro//Bc/3/Api/Cm67/4/Giza120
2.6 1.5 1.0 1.7 1.1 1.1
Acc#116134-Coll#89032-21/4/Aw.black//Arar/3/9Cr.279-07/Roho
3.1 1.4 2.1 0.9 1.6 0.9
Giza128/Barbara 4.8 2.3 0.5 1.7 1.8 0.5
Acc#116134-Coll#8932-22//Barbara 4.5 3.1 2.1 1.5 1.9 1.0
Giza126/Noor 17 4.4 1.8 0.5 1.1 1.6 0.6
25 California Mariout 3.9 1.9 1.0 2.1 1.4 1.0 26 ACSAD 176 3.1 1.7 0.8 1.9 1.4 0.3 27 Arig 8 4.6 3.2 2.0 1.9 1.7 1.3 28 Wadi Hai 2.6 3.0 1.6 2.4 1.7 0.9 29 Barjouj 4.0 1.8 1.8 2.0 1.4 1.0 30 Maimoun 5.0 2.5 2.1 1.6 2.0 0.9 31 Ariel 4.4 2.2 1.4 1.5 1.2 0.6 32 Erawen 1.8 2.3 1.0 2.3 1.2 0.8
37
1.5.3. Tolerance and Resistance to Barley Stem Gall Midge (Mayetiola hordei Keiffer).
Dr. S. Lhaloui in Morocco conducts the screening for barley stem gall midge. The barley stem gall midge (BSGM), Mayetiola hordei Keiffer, is a destructive pest of barley in the Mediterranean countries. In Morocco, both Hessian fly and barley stem gall midge may infest barley fields; however, the latter is the most important. This insect causes severe grain yield losses averaging 35% yearly, which is equivalent to losses caused by the Hessian fly on wheat. Therefore, there is an urgent need to identify sources of resistance to this pest, and incorporate this resistance into adapted barley cultivars.
In 1999 a total of 5274 entries were screened both in the field and the greenhouse for resistance to BSGM and 174 lines were selected. The selected entries were screened for a second year and only 164 confirmed their resistance.
The 164 entries were planted both at Jemaa Shaim and Sidi El Aidi during the 2000-01 and 2001-02 seasons to test the field tolerance to the barley stem gall midge. Both seasons were characterized by a high population level of the barley stem gall midge population and by severe drought. Most of the selected entries were able to perform very well under drought stress and a high population level of the insect pest.
The lines are being multiplied at ICARDA and will be distributed next season in a BSGM nursery. 1.6. Cultivar Development for Central Asia and Caucasus 1.6.1. Introduction Central Asia and the Caucasus (CAC) include five countries in Central Asia (Kazakhstan, Kyrgyzstan, Tajikistan, Turkmenistan, and Uzbekistan), and three countries in the Caucasus (Armenia, Azerbaijan and Georgia). The region covers an enormous area - 418 million ha of which about 275 million ha are classified as rangelands. The environment in the region is characterized by low and variable rainfall and extremes of temperature. The landscape is a mixture of mountain, desert and steppe. In the Soviet era, the region covered by the eight republics was essentially a commodity-producing component of a larger system, importing inputs from elsewhere and exporting its products back. Each country now faces the challenge of developing a “stand-alone’ economy, a process that will require enormous diversification of agricultural production. This will have a positive environmental as well as economic impact. The region now faces levels of yields and production that are well below those of other countries. Also, annual productivity and production show large fluctuation, partly due to the harsh and variable climate and short growing season.
38
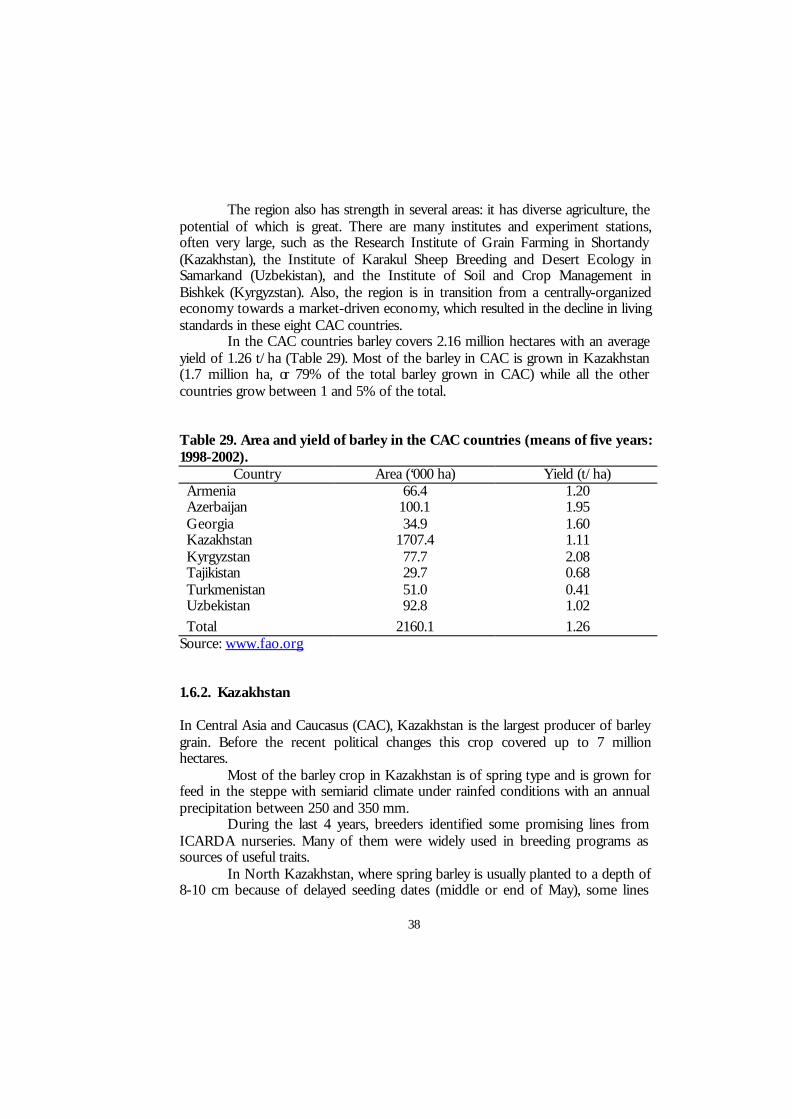
The region also has strength in several areas: it has diverse agriculture, the potential of which is great. There are many institutes and experiment stations, often very large, such as the Research Institute of Grain Farming in Shortandy (Kazakhstan), the Institute of Karakul Sheep Breeding and Desert Ecology in Samarkand (Uzbekistan), and the Institute of Soil and Crop Management in Bishkek (Kyrgyzstan). Also, the region is in transition from a centrally-organized economy towards a market-driven economy, which resulted in the decline in living standards in these eight CAC countries. In the CAC countries barley covers 2.16 million hectares with an average yield of 1.26 t/ha (Table 29). Most of the barley in CAC is grown in Kazakhstan (1.7 million ha, or 79% of the total barley grown in CAC) while all the other countries grow between 1 and 5% of the total. Table 29. Area and yield of barley in the CAC countries (means of five years: 1998-2002).
Country Area (‘000 ha) Yield (t/ha) Armenia 66.4 1.20 Azerbaijan 100.1 1.95 Georgia 34.9 1.60 Kazakhstan 1707.4 1.11 Kyrgyzstan 77.7 2.08 Tajikistan 29.7 0.68 Turkmenistan 51.0 0.41 Uzbekistan 92.8 1.02 Total 2160.1 1.26
Source: www.fao.org 1.6.2. Kazakhstan In Central Asia and Caucasus (CAC), Kazakhstan is the largest producer of barley grain. Before the recent political changes this crop covered up to 7 million hectares.
Most of the barley crop in Kazakhstan is of spring type and is grown for feed in the steppe with semiarid climate under rainfed conditions with an annual precipitation between 250 and 350 mm. During the last 4 years, breeders identified some promising lines from ICARDA nurseries. Many of them were widely used in breeding programs as sources of useful traits.
In North Kazakhstan, where spring barley is usually planted to a depth of 8-10 cm because of delayed seeding dates (middle or end of May), some lines
39
proved to be suitable for direct use by farmers. The best ones, Batyr-1 and Batyr-2, performed well during 3 years testing and showed yield increase of 20-30%. Based on the result of previous years these varieties will be submitted to the Official State Variety Testing Commission in 2003.
One spring barley variety (Birlik-1) has been selected from ICARDA nurseries, and out yielded the control varieties by 90-95% during the last 2 years. 400 kg of seed are available for on-farm testing and seed multiplication.
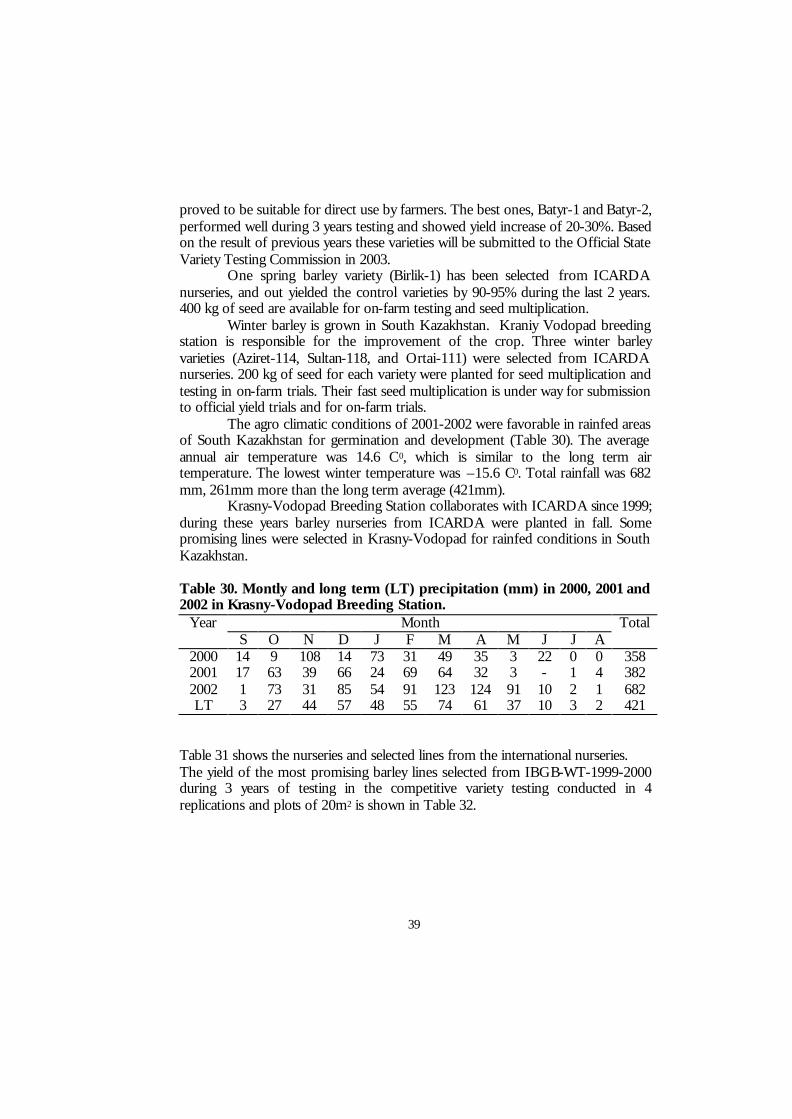
Winter barley is grown in South Kazakhstan. Kraniy Vodopad breeding station is responsible for the improvement of the crop. Three winter barley varieties (Aziret-114, Sultan-118, and Ortai-111) were selected from ICARDA nurseries. 200 kg of seed for each variety were planted for seed multiplication and testing in on-farm trials. Their fast seed multiplication is under way for submission to official yield trials and for on-farm trials.
The agro climatic conditions of 2001-2002 were favorable in rainfed areas of South Kazakhstan for germination and development (Table 30). The average annual air temperature was 14.6 C0, which is similar to the long term air temperature. The lowest winter temperature was –15.6 C0. Total rainfall was 682 mm, 261mm more than the long term average (421mm).
Krasny-Vodopad Breeding Station collaborates with ICARDA since 1999; during these years barley nurseries from ICARDA were planted in fall. Some promising lines were selected in Krasny-Vodopad for rainfed conditions in South Kazakhstan.
Table 30. Montly and long term (LT) precipitation (mm) in 2000, 2001 and 2002 in Krasny-Vodopad Breeding Station.
Month Year S O N D J F M A M J J A
Total
2000 14 9 108 14 73 31 49 35 3 22 0 0 358 2001 17 63 39 66 24 69 64 32 3 - 1 4 382 2002 1 73 31 85 54 91 123 124 91 10 2 1 682 LT 3 27 44 57 48 55 74 61 37 10 3 2 421
Table 31 shows the nurseries and selected lines from the international nurseries. The yield of the most promising barley lines selected from IBGB-WT-1999-2000 during 3 years of testing in the competitive variety testing conducted in 4 replications and plots of 20m2 is shown in Table 32.
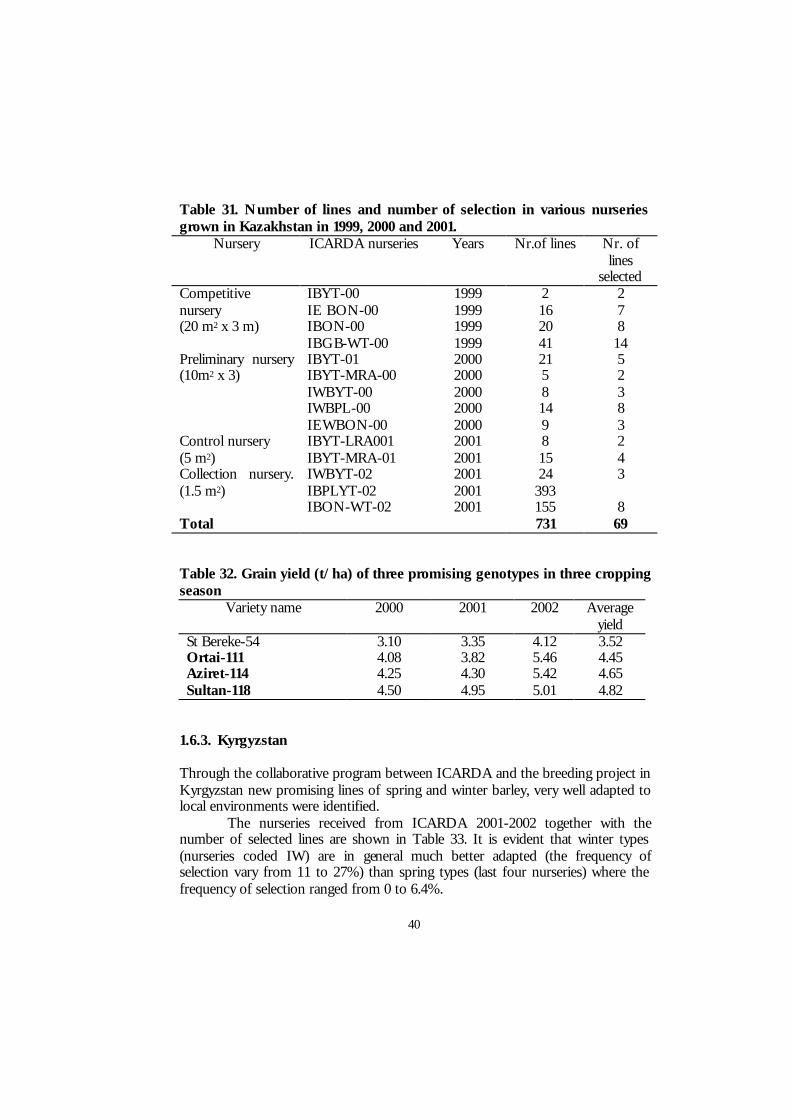
40
Table 31. Number of lines and number of selection in various nurseries grown in Kazakhstan in 1999, 2000 and 2001.
Nursery ICARDA nurseries Years Nr.of lines Nr. of lines
selected Competitive nursery (20 m2 x 3 m)
IBYT-00 IE BON-00 IBON-00 IBGB-WT-00
1999 1999 1999 1999
2 16 20 41
2 7 8
14 Preliminary nursery (10m2 x 3)
IBYT-01 IBYT-MRA-00 IWBYT-00 IWBPL-00 IEWBON-00
2000 2000 2000 2000 2000
21 5 8 14 9
5 2 3 8 3
Control nursery (5 m2)
IBYT-LRA001 IBYT-MRA-01
2001 2001
8 15
2 4
Collection nursery. (1.5 m2)
IWBYT-02 IBPLYT-02 IBON-WT-02
2001 2001 2001
24 393 155
3 8
Total 731 69 Table 32. Grain yield (t/ha) of three promising genotypes in three cropping season
Variety name 2000 2001 2002 Average yield
St Bereke-54 3.10 3.35 4.12 3.52 Ortai-111 4.08 3.82 5.46 4.45 Aziret-114 4.25 4.30 5.42 4.65 Sultan-118 4.50 4.95 5.01 4.82
1.6.3. Kyrgyzstan Through the collaborative program between ICARDA and the breeding project in Kyrgyzstan new promising lines of spring and winter barley, very well adapted to local environments were identified.
The nurseries received from ICARDA 2001-2002 together with the number of selected lines are shown in Table 33. It is evident that winter types (nurseries coded IW) are in general much better adapted (the frequency of selection vary from 11 to 27%) than spring types (last four nurseries) where the frequency of selection ranged from 0 to 6.4%.
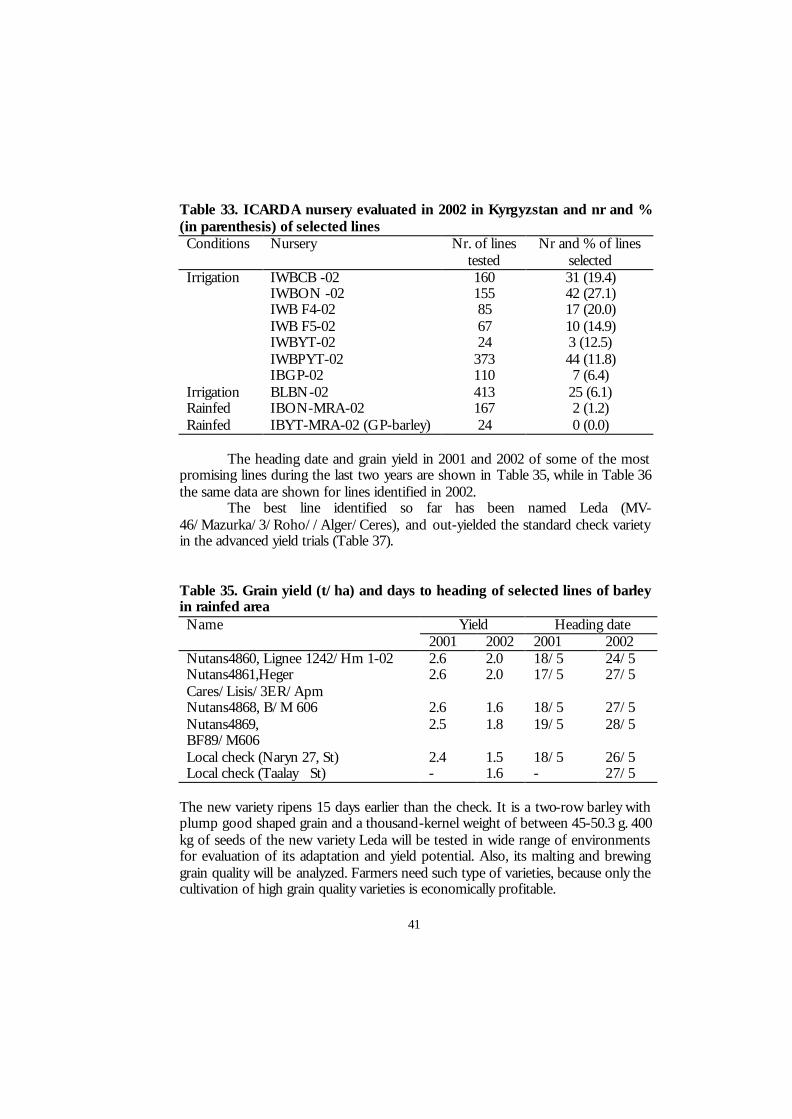
41
Table 33. ICARDA nursery evaluated in 2002 in Kyrgyzstan and nr and % (in parenthesis) of selected lines Conditions Nursery Nr. of lines
tested Nr and % of lines
selected Irrigation IWBCB -02 160 31 (19.4) IWBON -02 155 42 (27.1) IWB F4-02 85 17 (20.0) IWB F5-02 67 10 (14.9) IWBYT-02 24 3 (12.5) IWBPYT-02 373 44 (11.8) IBGP-02 110 7 (6.4) Irrigation BLBN-02 413 25 (6.1) Rainfed IBON-MRA-02 167 2 (1.2) Rainfed IBYT-MRA-02 (GP-barley) 24 0 (0.0)
The heading date and grain yield in 2001 and 2002 of some of the most
promising lines during the last two years are shown in Table 35, while in Table 36 the same data are shown for lines identified in 2002.
The best line identified so far has been named Leda (MV-46/Mazurka/3/Roho//Alger/Ceres), and out-yielded the standard check variety in the advanced yield trials (Table 37). Table 35. Grain yield (t/ha) and days to heading of selected lines of barley in rainfed area Name Yield Heading date 2001 2002 2001 2002 Nutans4860, Lignee 1242/Hm 1-02 2.6 2.0 18/5 24/5 Nutans4861,Heger Cares/Lisis/3ER/Apm
2.6 2.0 17/5 27/5
Nutans4868, B/M 606 2.6 1.6 18/5 27/5 Nutans4869, BF89/M606
2.5 1.8 19/5 28/5
Local check (Naryn 27, St) 2.4 1.5 18/5 26/5 Local check (Taalay St) - 1.6 - 27/5
The new variety ripens 15 days earlier than the check. It is a two-row barley with plump good shaped grain and a thousand-kernel weight of between 45-50.3 g. 400 kg of seeds of the new variety Leda will be tested in wide range of environments for evaluation of its adaptation and yield potential. Also, its malting and brewing grain quality will be analyzed. Farmers need such type of varieties, because only the cultivation of high grain quality varieties is economically profitable.
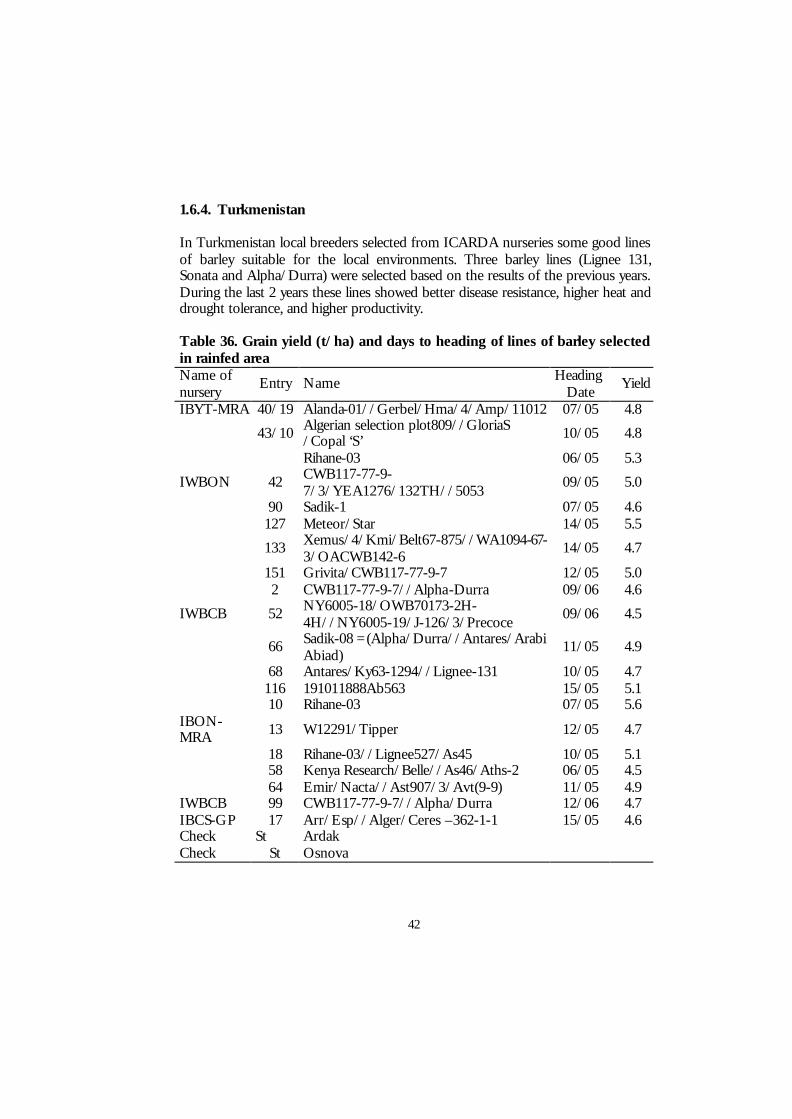
42
1.6.4. Turkmenistan
In Turkmenistan local breeders selected from ICARDA nurseries some good lines of barley suitable for the local environments. Three barley lines (Lignee 131, Sonata and Alpha/Durra) were selected based on the results of the previous years. During the last 2 years these lines showed better disease resistance, higher heat and drought tolerance, and higher productivity. Table 36. Grain yield (t/ha) and days to heading of lines of barley selected in rainfed area Name of nursery
Entry Name Heading Date
Yield
IBYT-MRA 40/19 Alanda-01//Gerbel/Hma/4/Amp/11012 07/05 4.8
43/10 Algerian selection plot809//GloriaS /Copal ‘S’ 10/05 4.8
Rihane-03 06/05 5.3
IWBON 42 CWB117-77-9-7/3/YEA1276/132TH//5053
09/05 5.0
90 Sadik-1 07/05 4.6 127 Meteor/Star 14/05 5.5
133 Xemus/4/Kmi/Belt67-875//WA1094-67-3/OACWB142-6
14/05 4.7
151 Grivita/CWB117-77-9-7 12/05 5.0 2 CWB117-77-9-7//Alpha-Durra 09/06 4.6
IWBCB 52 NY6005-18/OWB70173-2H-4H//NY6005-19/J-126/3/Precoce
09/06 4.5
66 Sadik-08 =(Alpha/Durra//Antares/Arabi Abiad)
11/05 4.9
68 Antares/Ky63-1294//Lignee-131 10/05 4.7 116 191011888Ab563 15/05 5.1 10 Rihane-03 07/05 5.6 IBON-MRA 13 W12291/Tipper 12/05 4.7
18 Rihane-03//Lignee527/As45 10/05 5.1 58 Kenya Research/Belle//As46/Aths-2 06/05 4.5 64 Emir/Nacta//Ast907/3/Avt(9-9) 11/05 4.9 IWBCB 99 CWB117-77-9-7//Alpha/Durra 12/06 4.7 IBCS-GP 17 Arr/Esp//Alger/Ceres –362-1-1 15/05 4.6 Check St Ardak Check St Osnova
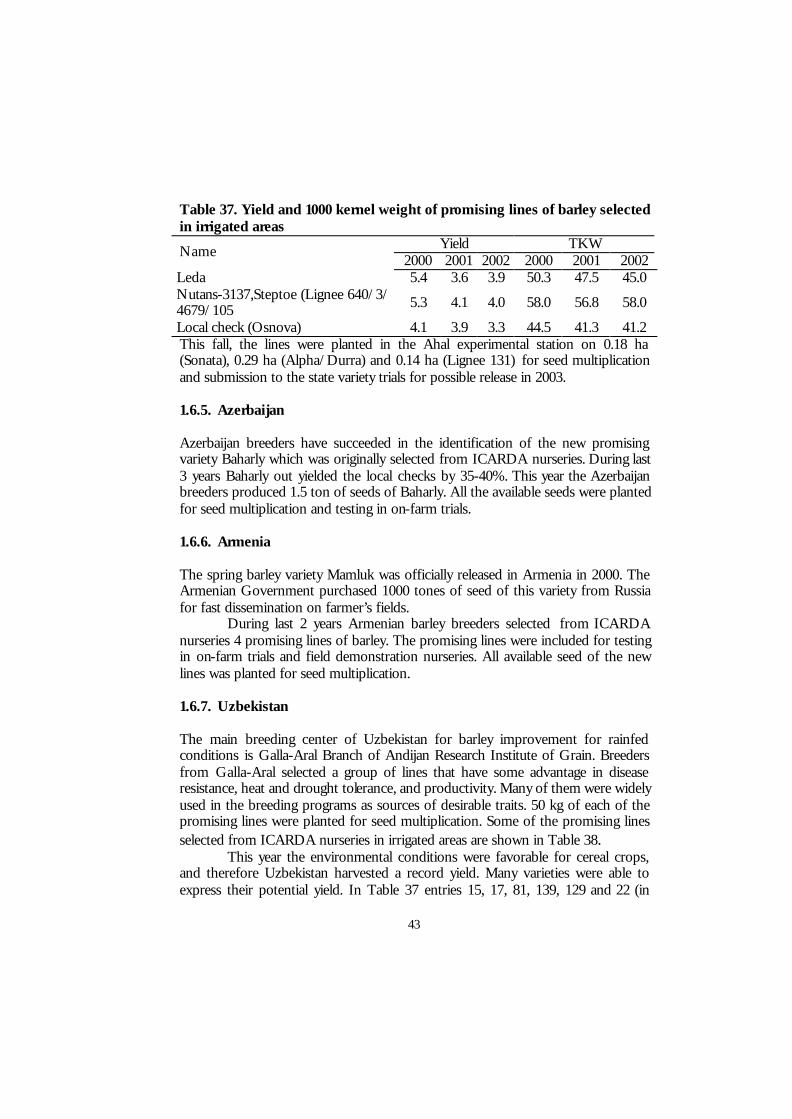
43
Table 37. Yield and 1000 kernel weight of promising lines of barley selected in irrigated areas
Yield TKW Name 2000 2001 2002 2000 2001 2002
Leda 5.4 3.6 3.9 50.3 47.5 45.0 Nutans-3137,Steptoe (Lignee 640/3/ 4679/105 5.3 4.1 4.0 58.0 56.8 58.0
Local check (Osnova) 4.1 3.9 3.3 44.5 41.3 41.2 This fall, the lines were planted in the Ahal experimental station on 0.18 ha (Sonata), 0.29 ha (Alpha/Durra) and 0.14 ha (Lignee 131) for seed multiplication and submission to the state variety trials for possible release in 2003. 1.6.5. Azerbaijan Azerbaijan breeders have succeeded in the identification of the new promising variety Baharly which was originally selected from ICARDA nurseries. During last 3 years Baharly out yielded the local checks by 35-40%. This year the Azerbaijan breeders produced 1.5 ton of seeds of Baharly. All the available seeds were planted for seed multiplication and testing in on-farm trials. 1.6.6. Armenia The spring barley variety Mamluk was officially released in Armenia in 2000. The Armenian Government purchased 1000 tones of seed of this variety from Russia for fast dissemination on farmer’s fields.
During last 2 years Armenian barley breeders selected from ICARDA nurseries 4 promising lines of barley. The promising lines were included for testing in on-farm trials and field demonstration nurseries. All available seed of the new lines was planted for seed multiplication. 1.6.7. Uzbekistan The main breeding center of Uzbekistan for barley improvement for rainfed conditions is Galla-Aral Branch of Andijan Research Institute of Grain. Breeders from Galla-Aral selected a group of lines that have some advantage in disease resistance, heat and drought tolerance, and productivity. Many of them were widely used in the breeding programs as sources of desirable traits. 50 kg of each of the promising lines were planted for seed multiplication. Some of the promising lines selected from ICARDA nurseries in irrigated areas are shown in Table 38.
This year the environmental conditions were favorable for cereal crops, and therefore Uzbekistan harvested a record yield. Many varieties were able to express their potential yield. In Table 37 entries 15, 17, 81, 139, 129 and 22 (in
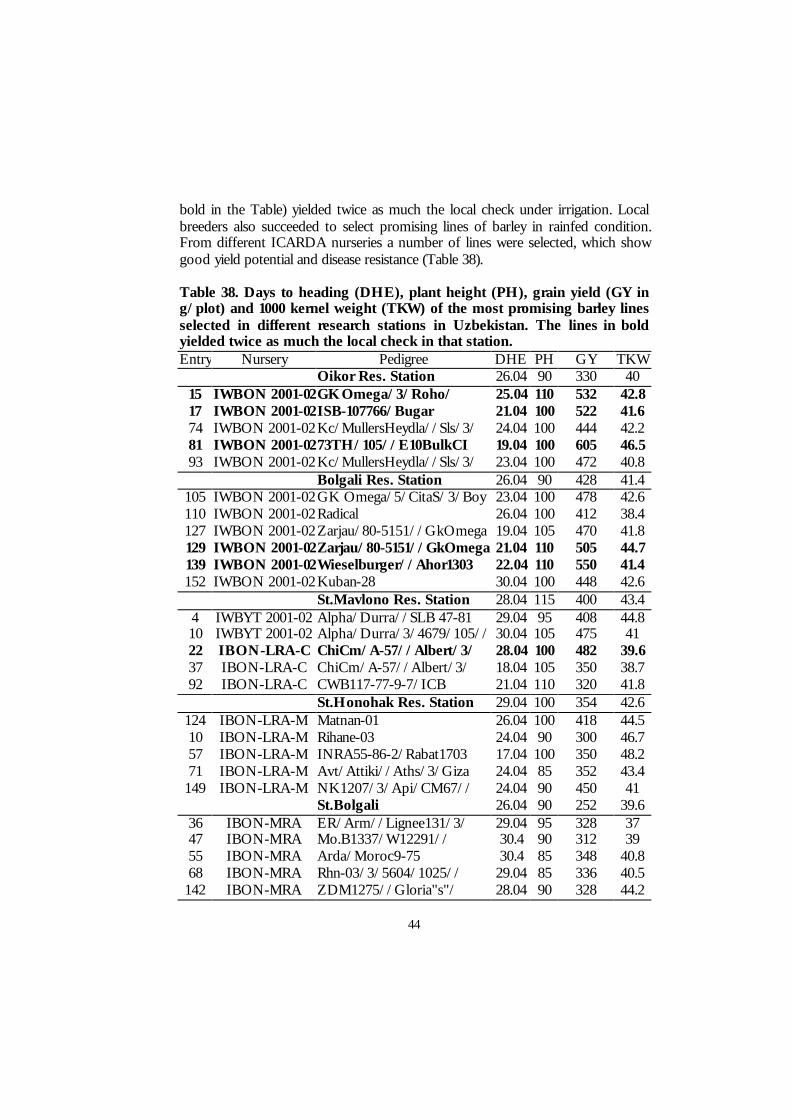
44
bold in the Table) yielded twice as much the local check under irrigation. Local breeders also succeeded to select promising lines of barley in rainfed condition. From different ICARDA nurseries a number of lines were selected, which show good yield potential and disease resistance (Table 38). Table 38. Days to heading (DHE), plant height (PH), grain yield (GY in g/plot) and 1000 kernel weight (TKW) of the most promising barley lines selected in different research stations in Uzbekistan. The lines in bold yielded twice as much the local check in that station. Entry Nursery Pedigree DHE PH GY TKW
Oikor Res. Station 26.04 90 330 40 15 IWBON 2001-02GK Omega/3/Roho/ 25.04 110 532 42.8 17 IWBON 2001-02ISB-107766/Bugar 21.04 100 522 41.6 74 IWBON 2001-02 Kc/MullersHeydla//Sls/3/ 24.04 100 444 42.2 81 IWBON 2001-0273TH/105//E10BulkCI 19.04 100 605 46.5 93 IWBON 2001-02 Kc/MullersHeydla//Sls/3/ 23.04 100 472 40.8 Bolgali Res. Station 26.04 90 428 41.4
105 IWBON 2001-02 GK Omega/5/CitaS/3/Boy 23.04 100 478 42.6 110 IWBON 2001-02 Radical 26.04 100 412 38.4 127 IWBON 2001-02 Zarjau/80-5151//GkOmega 19.04 105 470 41.8 129 IWBON 2001-02Zarjau/80-5151//GkOmega 21.04 110 505 44.7 139 IWBON 2001-02Wieselburger//Ahor1303 22.04 110 550 41.4 152 IWBON 2001-02 Kuban-28 30.04 100 448 42.6
St.Mavlono Res. Station 28.04 115 400 43.4 4 IWBYT 2001-02 Alpha/Durra//SLB 47-81 29.04 95 408 44.8 10 IWBYT 2001-02 Alpha/Durra/3/4679/105// 30.04 105 475 41 22 IBON-LRA-C ChiCm/A-57//Albert/3/ 28.04 100 482 39.6 37 IBON-LRA-C ChiCm/A-57//Albert/3/ 18.04 105 350 38.7 92 IBON-LRA-C CWB117-77-9-7/ICB 21.04 110 320 41.8 St.Honohak Res. Station 29.04 100 354 42.6
124 IBON-LRA-M Matnan-01 26.04 100 418 44.5 10 IBON-LRA-M Rihane-03 24.04 90 300 46.7 57 IBON-LRA-M INRA55-86-2/Rabat1703 17.04 100 350 48.2 71 IBON-LRA-M Avt/Attiki//Aths/3/Giza 24.04 85 352 43.4
149 IBON-LRA-M NK1207/3/Api/CM67// 24.04 90 450 41 St.Bolgali 26.04 90 252 39.6
36 IBON-MRA ER/Arm//Lignee131/3/ 29.04 95 328 37 47 IBON-MRA Mo.B1337/W12291// 30.4 90 312 39 55 IBON-MRA Arda/Moroc9-75 30.4 85 348 40.8 68 IBON-MRA Rhn-03/3/5604/1025// 29.04 85 336 40.5
142 IBON-MRA ZDM1275//Gloria"s"/ 28.04 90 328 44.2
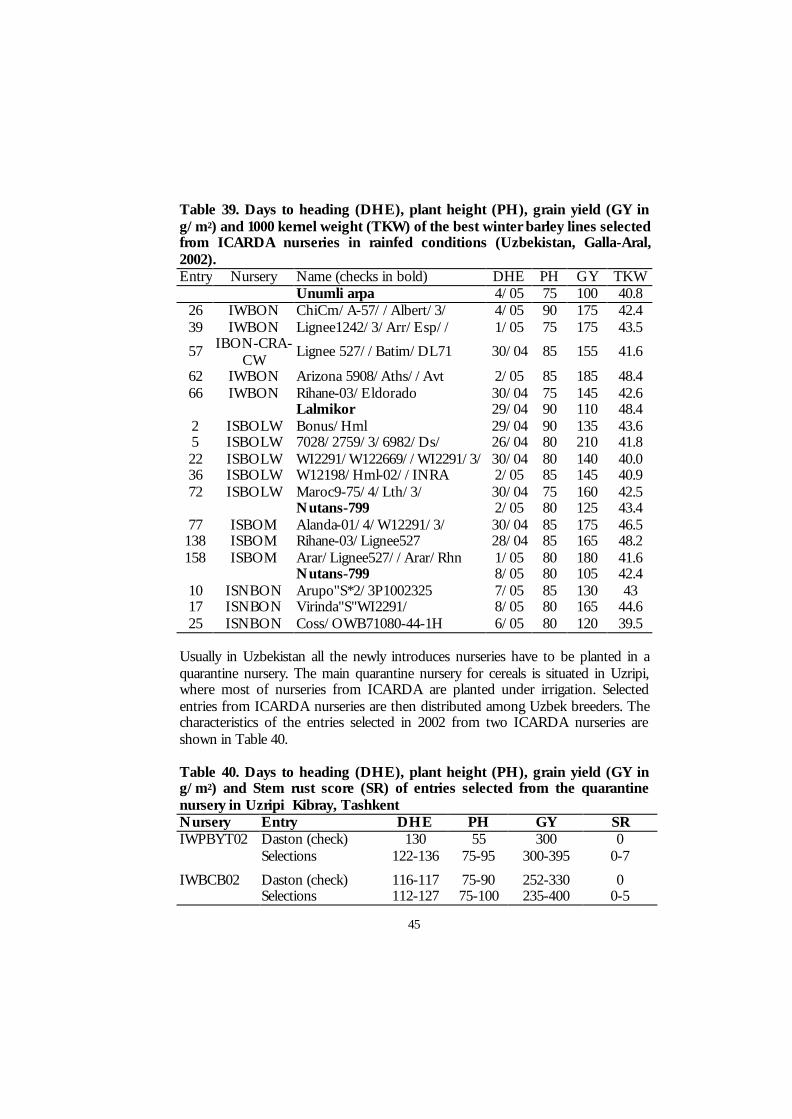
45
Table 39. Days to heading (DHE), plant height (PH), grain yield (GY in g/m2) and 1000 kernel weight (TKW) of the best winter barley lines selected from ICARDA nurseries in rainfed conditions (Uzbekistan, Galla-Aral, 2002). Entry Nursery Name (checks in bold) DHE PH GY TKW
Unumli arpa 4/05 75 100 40.8 26 IWBON ChiCm/A-57//Albert/3/ 4/05 90 175 42.4 39 IWBON Lignee1242/3/Arr/Esp// 1/05 75 175 43.5
57 IBON-CRA-CW
Lignee 527//Batim/DL71 30/04 85 155 41.6
62 IWBON Arizona 5908/Aths//Avt 2/05 85 185 48.4 66 IWBON Rihane-03/Eldorado 30/04 75 145 42.6 Lalmikor 29/04 90 110 48.4
2 ISBOLW Bonus/Hml 29/04 90 135 43.6 5 ISBOLW 7028/2759/3/6982/Ds/ 26/04 80 210 41.8 22 ISBOLW WI2291/W122669//WI2291/3/ 30/04 80 140 40.0 36 ISBOLW W12198/Hml-02//INRA 2/05 85 145 40.9 72 ISBOLW Maroc9-75/4/Lth/3/ 30/04 75 160 42.5 Nutans-799 2/05 80 125 43.4
77 ISBOM Alanda-01/4/W12291/3/ 30/04 85 175 46.5 138 ISBOM Rihane-03/Lignee527 28/04 85 165 48.2 158 ISBOM Arar/Lignee527//Arar/Rhn 1/05 80 180 41.6
Nutans-799 8/05 80 105 42.4 10 ISNBON Arupo"S*2/3P1002325 7/05 85 130 43 17 ISNBON Virinda"S"WI2291/ 8/05 80 165 44.6 25 ISNBON Coss/OWB71080-44-1H 6/05 80 120 39.5
Usually in Uzbekistan all the newly introduces nurseries have to be planted in a quarantine nursery. The main quarantine nursery for cereals is situated in Uzripi, where most of nurseries from ICARDA are planted under irrigation. Selected entries from ICARDA nurseries are then distributed among Uzbek breeders. The characteristics of the entries selected in 2002 from two ICARDA nurseries are shown in Table 40. Table 40. Days to heading (DHE), plant height (PH), grain yield (GY in g/m2) and Stem rust score (SR) of entries selected from the quarantine nursery in Uzripi Kibray, Tashkent Nursery Entry DHE PH GY SR IWPBYT02 Daston (check) 130 55 300 0 Selections 122-136 75-95 300-395 0-7 IWBCB02 Daston (check) 116-117 75-90 252-330 0 Selections 112-127 75-100 235-400 0-5
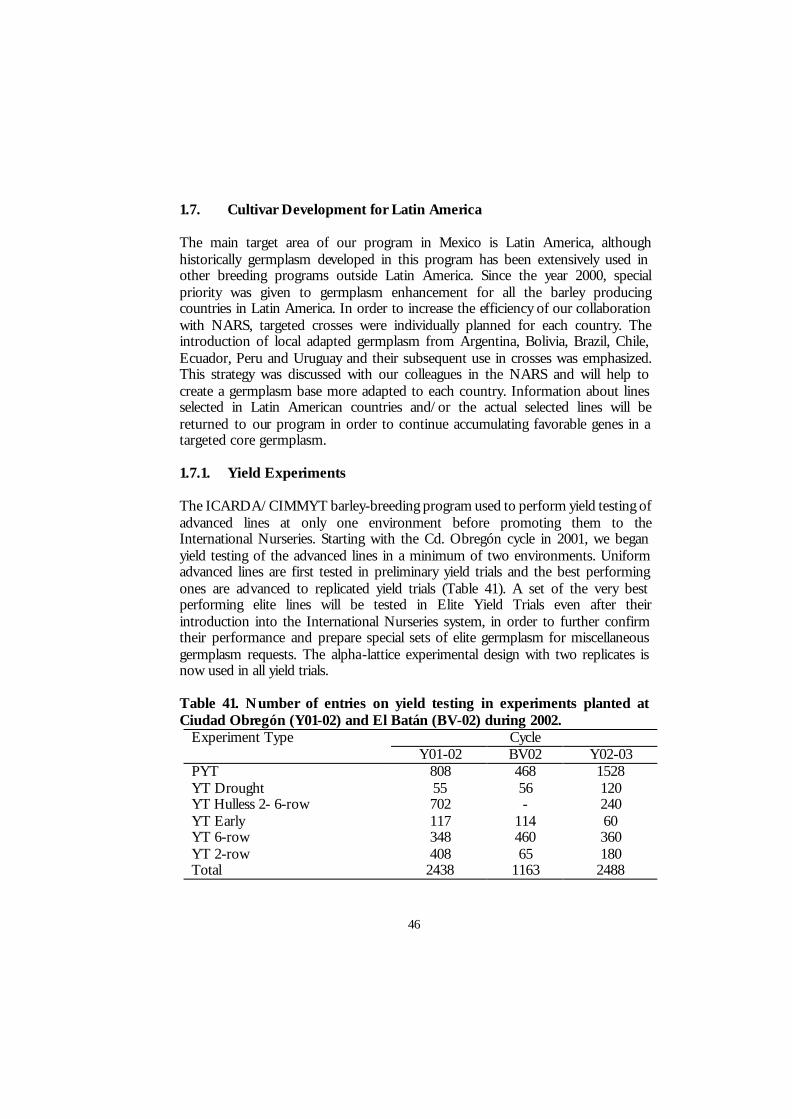
46
1.7. Cultivar Development for Latin America The main target area of our program in Mexico is Latin America, although historically germplasm developed in this program has been extensively used in other breeding programs outside Latin America. Since the year 2000, special priority was given to germplasm enhancement for all the barley producing countries in Latin America. In order to increase the efficiency of our collaboration with NARS, targeted crosses were individually planned for each country. The introduction of local adapted germplasm from Argentina, Bolivia, Brazil, Chile, Ecuador, Peru and Uruguay and their subsequent use in crosses was emphasized. This strategy was discussed with our colleagues in the NARS and will help to create a germplasm base more adapted to each country. Information about lines selected in Latin American countries and/or the actual selected lines will be returned to our program in order to continue accumulating favorable genes in a targeted core germplasm. 1.7.1. Yield Experiments The ICARDA/CIMMYT barley-breeding program used to perform yield testing of advanced lines at only one environment before promoting them to the International Nurseries. Starting with the Cd. Obregón cycle in 2001, we began yield testing of the advanced lines in a minimum of two environments. Uniform advanced lines are first tested in preliminary yield trials and the best performing ones are advanced to replicated yield trials (Table 41). A set of the very best performing elite lines will be tested in Elite Yield Trials even after their introduction into the International Nurseries system, in order to further confirm their performance and prepare special sets of elite germplasm for miscellaneous germplasm requests. The alpha-lattice experimental design with two replicates is now used in all yield trials. Table 41. Number of entries on yield testing in experiments planted at Ciudad Obregón (Y01-02) and El Batán (BV-02) during 2002.
Experiment Type Cycle Y01-02 BV02 Y02-03 PYT 808 468 1528 YT Drought 55 56 120 YT Hulless 2- 6-row 702 - 240 YT Early 117 114 60 YT 6-row 348 460 360 YT 2-row 408 65 180 Total 2438 1163 2488

47
1.7.2. Drought Resistance A total of 55 lines derived from crosses between a drought resistant genotype and the highest yielding genotypes from the program were tested in a yield experiment at Ciudad Obregón last winter. Only one pre-planting irrigation (about 120 mm) was applied to it. The top yielding lines with improved agronomic traits were tested again in a yield trial in El Batán during last summer, together with several additional advanced lines selected under drought conditions. A 60-line experiment was planted at Y02-03 in a drought testing area. Lines from this trial will already have 3-4 cycles of advanced testing under drought and will create a genetic base of drought resistant lines adapted to Mexico and suitable for testing at dry environments worldwide.
During 2001 the program started receiving ICARDA’s international nurseries from Syria, which were planted in the drought stress area at Obregón and El Batán. Lines with good tolerance to yellow rust, leaf rust, spot blotch and resistant to water stress later in the season, were selected. The objective is to broaden the genetic base of drought resistance in the program here at Mexico, which would be suitable for the dry areas of Latin America. 1.7.3 Argentina Dr. Alberto Prina, director of the Instituto de Genética "E. A. Fravret" from the National Institute of Agricultural Technology – INTA, contacted our program to request sources of drought resistance. At the moment the drought resistant germplasm present in the ICARDA/CIMMYT program is six-row, so his request was also directed to the international nurseries deployed from ICARDA in Syria, to cover their main interest in the two-row types.
Locally adapted cultivars from Argentina were introduced into the program in order to generate populations with drought tolerance, including two-row parents with malting quality. Advanced lines selected under drought will be available for testing under their conditions soon. 1.7.4. Brazil Ing. Agr. M.Sc. Renato Amabile, from the Brazilian Agricultural Research Corporation, Cerrado Region, CPAC – EMBRAPA, completed a one-month barley breeding training at Cd. Obregón at our program last March. During his stay he selected segregating populations and advanced lines that were delivered to Brazil. During August, a 21-day consultancy was requested to evaluate the feasibility of promoting the barley crop in the Cerrado region. The National Barley Breeding Program and commercial production fields were visited at Passo Fundo and Brasilia. New opportunities of collaboration were discussed with Dr. Euclydes Minella, National Barley Research Coordinator and with Ing. Amabile. The need of
48
special support for breeding new cultivars for the Cerrado and for Fusarium head blight resistance for the Southern area was determined. All varieties released in the country, because of industry requirements, are malting two-row, except one released for the Central region, which is malting six-row. Our six-row program can give important support to the Cerrado Region, especially because the environmental conditions in that region might be highly correlated with the conditions at Cd. Obregón: high temperatures with no rainfall and irrigation during the growing season. A special project is under preparation.
During the MV02 cycle a collection of local adapted germplasm was introduced and being used to develop targeted populations for this country and to introgress malting quality and disease resistance to our program. Advanced lines will be available next year for special nurseries.
Early this year Dr. Gerardo Arias, a barley breeder from EMBRAPA, requested a set of the best and most diverse sources of FHB resistant lines to be molecularly analyzed during his sabbatical at Washington State University, USA. The objective was to determine the diversity of the genes conferring FHB resistance in the different sources used in the program. The study is under execution at the moment. 1.7.5. Bolivia The country was visited in February 2000 and collaborators were contacted. Targeted crosses with Bolivian cultivars are being carried out since MV00. Advanced lines for a special shipment will be available next year. 1.7.6. Chile Ing. Agr. MSc. Eduardo Beratto, barley breeder at the National Agricultural Research Institute – INIA, visited the program on March of 2000 and selected germplasm that was delivered to his program. Targeted crosses with local cultivars have been made since MV00 and advanced lines for a special shipment will be available next year. 1.7.7. Colombia Although the country is having difficulties in receiving shipments, we were able to send international nurseries to one collaborator. Barley breeding has been very limited since the closing of the national program some years ago.
1.7.8. Ecuador The National program was visited in 2001, taking advantage of the participation to an international meeting at Quito.

49
A complete set of elite cultivars and advanced lines selected in the country was received and already used in targeted crosses at MV02. Special shipments with advanced lines and segregating populations from crosses with adapted material were sent to Ecuador during the year. These included a set of drought resistant hulless and cold resistant barleys.
Ms. Elena Villacrés from the INIAP was invited by ICARDA to participate in the Food Barley Workshop held in Hammamet, Tunisia in January 2002. 1.7.9. Mexico Several special projects are covering the barley research needs of this country. Several targeted crosses are being made to develop germplasm especially adapted and with the industry quality requirements.
A joint article was presented with Ing. Jorge Correa, at the 17th North American Barley Researchers Workshop held at Fargo, USA in September. 1.7.10. Peru The program was visited twice during 2001 and new areas of collaboration were discussed, including the development of barley with malting quality and resistance to the possible new race of yellow rust. The program has been collaborating with testing of our lines and the North American Barley Stripe Rust Nursery under the possible new race epidemics. A set of elite lines was received and already used in targeted crosses in MV02. This will add to the crosses already made since MV00.
Ing. Agr. M.Sc. Luz Gómez was sponsored by ICARDA to participate in the Food Barley Workshop held in Hammamet, Tunisia in January 2002. Following this event she was also invited to visit the ICARDA headquarters in Syria. The barley-breeding program at the University of La Molina has been working for more than 34 years. They have had an important impact in the region, releasing superior cultivars, several of them with significant collaboration from our program. 1.7.11. Uruguay Colleagues from the National Agricultural Research Institute – INIA, the University of the Republic, and the Technological Laboratory of Uruguay – LATU, have been visited every year since 2000. Closer collaboration was discussed and a special collaborative project is planned to be written. The need of support for FHB breeding was identified, and a special set with all the resistant germplasm available at our program was delivered. A set of adapted elite lines and cultivars from Uruguay was introduced to the program in 2000 and is being extensively used to make targeted crosses and to introgress malting quality. A special BYDV resistant
50
nursery was delivered in 2000 and advanced lines from the targeted crosses selected under our conditions will be available next year.
Ing. Agr. M.Sc. Fernanda Gamba, barley plant pathologist at the University of the Republic, was invited by ICARDA to participate in the International Leaf Blight Workshop carried out in Syria last April. This was the first time a colleague from Uruguay visited the ICARDA program in Syria. 1.8. Cultivar Development for South East Asia Barley area in South East Asia is not as large as in other areas of the world and it represents only about 3% of the total area in the world as average of the last 5 years. The countries with the largest area are the Republic of China (1.4 million ha), India (755,000 ha), the Republic of Korea (80,000 ha, the People Democratic Republic of Korea (39,000 ha), and Nepal (30,000 ha). Small areas of barley are grown in Bangladesh (nearly 7,000 ha), Bhutan (4,300 ha), Thailand (3,600 ha) and Mongolia (2,800 ha). Yield range from less than 1 t/ha in Bangladesh and Thailand, to nearly 4 t/ha in the republic of Korea. 1.8.1. North and South Korea Dr. Jiankang Wang, an adjunct post-doctoral fellow from S. Korea at the Wheat Program at CIMMYT, selected during the last winter cycle a barley collection that was delivered to Mr. Gyel Chun Sik, barley breeder at the Academy of Agricultural Sciences. In March, Dr. Lucy Gilchrist visited S. Korea for a consultancy about FHB in wheat and barley, since that disease is one of the most quality and yield limiting factors in that country. A collection of FHB resistant germplasm was also sent to S. Korea.
Mr. Choe Sun Song from N. Korea participated in the Wheat Training Program this year. He also selected germplasm that was added to an elite special set that was delivered to his country. Both colleagues from S. and N. Korea committed to send elite local germplasm to be used in targeted crosses for their environments. 1.8.2. China Two special shipments of barley were delivered to China besides the regular international nurseries, through Mr. He Zhonghu, Liaison Officer at the CIMMYT China Beijing Office. Within the collaboration in FHB research being carried out within the US Wheat and Barley Scab Initiative, a collaborative nursery was sent to be planted in China next season. The plans are to join the group that visit China to evaluate the nurseries next March, and also visit local barley breeding programs, enhancing the collaboration with the region.
51
1.9. Food Barley Although barley is best known as a feed crop and the principal ingredient of beer, it is also an important food crop, especially for people living in remote highlands. ICARDA and its research and development partners have joined forces to correct the relative neglect of this ancient dietary stalwart.
Barley grain is used as feed for animals, malt, and human food. It was a staple food as far back as 18,000 years ago. It was the energy food of the masses, and it had a reputation for building strength. Barley was awarded to the champions of the Eleusian games. According to Plinius, the gladiators of the Roman Empire were called hordearii, barley-men, because barley was the main component of their training diet.
Early barley remnants from Mesopotamia and Egypt are much more abundant than those of wheat, and the earliest literature suggests that barley was a more important human food than wheat. The Sumerians had a god for barley but none for wheat. In the Near East and Mediterranean, the shift to wheat as human food came in classical times, and by the first century A.D. barley was already mostly fed to animals. In northern Europe barley remained the main food cereal until the 16th century.
Barley is still an important staple food in several regions, generally in places where other cereals grow poorly due to altitude, low rainfall, or soil salinity. It remains the most viable option in dry areas (< 300 mm of rainfall) and in production systems where alternatives for food crops are very limited or absent, such as the highlands and mountains of Central Asia and the Horn of Africa, the Andes, the Atlas mountains of Morocco, and several other areas. These regions are characterized by harsh living conditions and are home to some of the poorest farmers in the world. Sustainable production of barley could play a significant role in improving food security at the household and community levels.
1.9.1. Food Barley Status Morocco is the largest consumer of barley as food. There the crop has played a significant role in food security of households throughout history. Since the beginning of the second millennium succeeding dynasties have relied on large barley grain storage facilities as bulwarks against hunger. About 20% of barley grain in Morocco is used as food, mainly in the mountainous and southern parts of the country. Consumption is higher in dry years. Rural dwellers consume annually an average of 54 kg per person, compared to 5.5 kg per person in the cities. A large variety of dishes, including soups, bread, potages, and couscous, are made from barley grain products.
Barley grain accounts for over 60% of the food of the people in the highlands of Ethiopia. It is used in diverse recipes that have deep roots in culture and tradition. Some recipes, such as Besso, Zurbegonie, and Chiko, which have
52
long shelf life, can only be prepared from barley grain. Other recipes, such as Genfo, Kolo and Kinche, are most popular when made from barley grain, but can be prepared from other cereals. Barley is the preferred grain, after tef, for making the traditional bread called Injera. Barley can be used on its own or in combination with tef or some other cereal. Other recipes, such as Dabbo (bread), Kitta (Torosho), Atmit (Muk), and Wot, can be prepared from pure barley flour or from blends. Among local beverages, Tella and Borde are prominent, and best made from barley grain.
Barley spikes at milk or dough stage are also roasted over flame and the grain is eaten as a snack called Eshete/Wotelo, or Enkuto if the roasted barley spikes are dry.
In Yemen, barley is grown at 1800-3000 meters above sea level, and the grain is used in various dishes and local drinks. Maloog and Matany are two breads made from a blend of barley flour and bread wheat flour the earlier, and barley flour and lentil flour the latter. Nakia is a local drink made from boiled barley grain.
In the Andes of Colombia, Ecuador, Peru and Bolivia, barley is the staple food of farmers at altitudes between 2200 and 4000 meters above sea level. It is the crop best adapted to high altitudes, drought, salinity, and aluminum toxicity. Its earliness and cold tolerance make it suited to the short frost-free growing seasons in the high altitudes. In this area barley is finely ground and roasted into Machica or Pito; barley ‘rice,’ coarsely broken grain, is used for soups; and barley flakes, a relatively recent product, are eaten for breakfast. Hulless barley is preferred, and earns a higher price than regular barley. For example, in Ecuador, the variety Atahualpa, with its larger and lighter hull-free kernels fetches 10% more than other varieties.
In Nepal, barley occupies only 1% of the cultivated area, but makes a significant contribution to the food security of the poor living in the inaccessible mountainous areas. And barley is indispensable in virtually every Hindu ritual. Early maturing naked barley is more common in the higher altitude range of east and west Nepal (Solukhumbu and Mustang districts). But in the mid-west (Karnali) regular barley is preferred over naked barley, which is also due to the food habit of different ethnic groups in these areas. Most barley product is used for food.
Most efforts in barley breeding have focused on feed and malting cultivars. International agricultural research has almost completely neglected the improvement (quantity and quality) of food barley. In response to requests from a number of NARS, the barley project at ICARDA initiated a program to improve the adaptation and quality of food barley.
An international workshop on food barley improvement, jointly organized by ICARDA, the Food and Agriculture Organization of the United Nations, and Institution de Recherche et Enseignement Supérieur Agricole, Tunisia, and supported by the OPEC Fund for International Development, was held in Hammamet, Tunisia, 14-17 January.
53
The workshop brought together more than 30 participants from 13 countries, representing most of the area where barley is largely used as food, from as far away as Ecuador, Peru, and Nepal.
The workshop was organized to review food-barley-based systems and identify bottlenecks in production; review present and past research efforts addressing food barley improvement; identify and describe major cultivated food barley varieties, including uses and growing environments; identify quality characteristics desired by consumers; identify constraints and research needs; and discuss and define a regional and global plan of action for research and collaboration.
Participants presented the status of food barley in their respective countries. Their talks included descriptions of traditional and new uses of barley, varieties, research activities, and the importance of food barley as compared to feed and malting barley.
All participants agreed strongly on the need to establish domestic and international networks of researchers with a common interest in food barley. They also contributed to the preparation of a global project on food barley improvement with the following components: · Collection of baseline information and filling of gaps · Breeding local food barley for quality and sustainable productivity · Establishment of optimum crop management for sustainable production · Improvement of storage and food-barley-based diets · Development of small-scale food barley industry, and · Seed production and multiplication. It was also agreed that barley recipes would be collected from diverse regions and compiled in a book to promote food barley and to document local knowledge.
There is a scope for the development of food barley varieties with higher and stable yield, better grain quality, and high nutritive barley varieties. Eventually food barley research will have a direct impact on the livelihood of the rural population in the regions where barley is a staple food not only by increasing sustainable crop productivity but also by improving nutritional quality, and developing barley-based local industry. 1.10. Biotic Stresses: Insects and Viruses 1.10.1. Insects 1.10.1.1. Breeding for Resistance to Russian Wheat Aphid (RWA) 1.10.1.1.1. Ethiopia Russian wheat aphid, Diuraphis noxia (Mordvilko) is an important pest of barley in Ethiopia where yield losses between 40-70% have been observed. Host plant
54
resistance is the most economical and practical means of controlling this insect. Field and greenhouse screening of barley germplasm at ICARDA resulted in the identification of 27 sources of resistance, which were tested for resistance to RWA in hot spots in Ethiopia. The six sources of resistance that conferred resistance to the Syrian RWA and the Ethiopian RWA were crossed to nine Ethiopian land races in 2000. The 20 F2 populations derived from these crosses were planted in Tel Hadya in 2001 and artificially infested with RWA at the seedling stage. 430 single F2 plants were selected as resistant. F3 seeds from each of the 430 F2 selected plants were planted in progeny rows at Tel Hadya and artificially infested with RWA. The harvested F4 seeds from the 269 selected lines in 2002 have been sent to Ethiopia for agronomic evaluation in different RWA prone areas. 1.10.1.1.2. North Africa Seeds from 58 F3 single plants selected in 2001 from 22 crosses were planted in 2-m long rows at Tel Hadya, with systematically repeated susceptible checks (1 row) every 10-test rows. This material was artificially infested with RWA. Nine lines were selected for resistance to RWA, and 10 single spikes were separately harvested from each line for testing as head rows in 2003. 1.10.1.1.3. New Screenings 2067 winter breeding lines, 160 lines from the winter crossing block, 1958 spring breeding lines, and 168 from the spring crossing block were screened in the field at Tel Hadya for resistance to RWA. The entries were planted in hill plots, 10 seeds/ hill using an alpha lattice design with 2 reps. One susceptible check was used every 10 entries. When plants were at tillering stage, they were infested with about 10 aphids per plant. The evaluation was done when symptoms were clearly seen on susceptible checks using a 1-3 scale for leaf rolling and a 1-6 scale for leaf chlorosis.
The promising lines selected from the field screening were evaluated in the initial test (one rep) in the greenhouse. The method of infestation and evaluation in the greenhouse was similar to that of the field, except that seeds were planted in regular greenhouse flats and individual plants were infested at one leaf stage with 10 aphids. The selected lines from the initial greenhouse screening were evaluated in the advanced test (4 reps) in the plastic house for confirmation.
One line (BIW03IN-850) was confirmed resistant to RWA throughout the different tests. This line will be sent for testing against RWA biotypes in North Africa (Morocco) and Ethiopia before being used in the breeding program.
55
1.10.1.1.4. The Barley Stem Gall Midge Tolerance Nursery A total of 99 entries, which are the result of the screening conducted in the past years, were screened in 2001-2002 in Jemaa Shaim and Sidi El Aidi experiment stations in Morocco for further selection of tolerant entries. This season was also characterized by very severe weather conditions, marked mainly by a very long period of mid-season drought. Again, the selection was based on Jemaa Shaim station where no supplemental irrigation was used. This screening cut the nursery down to 60 entries, which constitute now the first barley stem gall midge tolerance nursery which will be selected for other agronomic characters. 1.10.2. Viruses 1.10.2.1. PCR Markers to Select for resistance to Barley Yellow Dwarf Virus (BYDV) When resistant (symptomless) and susceptible (with typical BYDV symptoms) plants in the F2 populations as well as selected resistant plants in the F3-5 families were tested for the presence of the Yd2 gene with the allele-specific PCR primers: Ylp-MF (AAT ACA GGA ATC TGT TGA AAG AA), Ylp-RAS (CTA GTA TCT CTG GCT CAG), it was possible in most cases to amplify the Yd2 gene in the resistant plants but not in the susceptible plants (Figure 6). There was a strong association between resistant plants (no symptoms) and the amplified Yd2 fragment (88%); this association was stronger in the advanced lines (F3-5) (93%) than in the F2 segregating population (83%). The usefulness of these PCR markers is not only to identify the present of the Yd2 gene in barley breeding materials, but also to confirm the absence of Yd2 in BYDV-resistant barley germplasm. Nevertheless, the PCR screening method with allele-specific PCR markers provides a quick, efficient method that of optimized could be used to screen thousands of barley lines for BYDV resistance based on Yd2 and possibly to identify resistance based on genes other than Yd2.
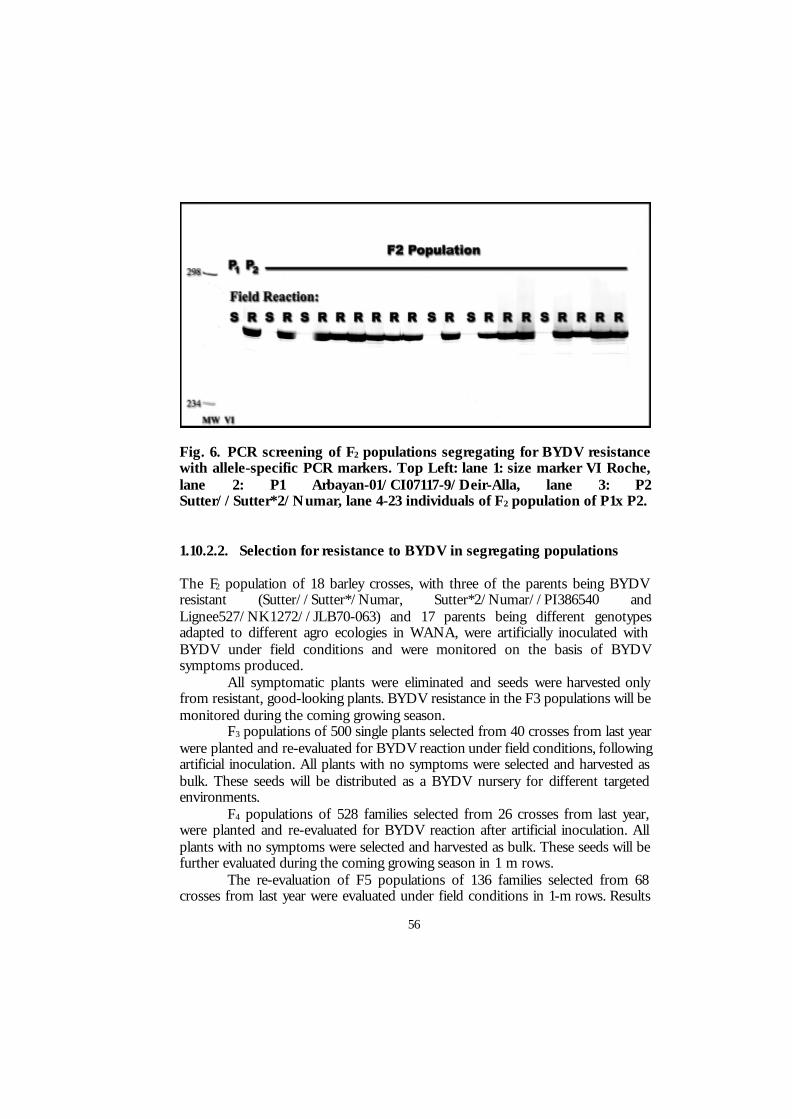
56
Fig. 6. PCR screening of F2 populations segregating for BYDV resistance with allele-specific PCR markers. Top Left: lane 1: size marker VI Roche, lane 2: P1 Arbayan-01/CI07117-9/Deir-Alla, lane 3: P2 Sutter//Sutter*2/Numar, lane 4-23 individuals of F2 population of P1x P2. 1.10.2.2. Selection for resistance to BYDV in segregating populations The F2 population of 18 barley crosses, with three of the parents being BYDV resistant (Sutter//Sutter*/Numar, Sutter*2/Numar//PI386540 and Lignee527/NK1272//JLB70-063) and 17 parents being different genotypes adapted to different agro ecologies in WANA, were artificially inoculated with BYDV under field conditions and were monitored on the basis of BYDV symptoms produced.
All symptomatic plants were eliminated and seeds were harvested only from resistant, good-looking plants. BYDV resistance in the F3 populations will be monitored during the coming growing season. F3 populations of 500 single plants selected from 40 crosses from last year were planted and re-evaluated for BYDV reaction under field conditions, following artificial inoculation. All plants with no symptoms were selected and harvested as bulk. These seeds will be distributed as a BYDV nursery for different targeted environments.
F4 populations of 528 families selected from 26 crosses from last year, were planted and re-evaluated for BYDV reaction after artificial inoculation. All plants with no symptoms were selected and harvested as bulk. These seeds will be further evaluated during the coming growing season in 1 m rows.
The re-evaluation of F5 populations of 136 families selected from 68 crosses from last year were evaluated under field conditions in 1-m rows. Results
57
showed that most of the lines such as 02F5-34-2, 02F5-45-1 and 02F5-65-2 exhibited high resistance to BYDV infection, and higher yield than the resistant parent QB813-2 (Table 42).
1.10.2.3. Screening for Resistance to BYDV Barley breeding lines were evaluated for their reaction to BYDV at three stages. During the first year, the breeding lines are evaluated in 30-cm short rows, which permit the evaluation of large number of entries. During the second year, the entries that showed BYDV tolerance during the 1st year, based on symptoms produced, were planted in 1 m rows and evaluated on the basis of diseases score, biomass and grain weight and height. During the third year, only the best performing lines form the second year are planted in 4x1m plots, which permit the evaluation of grain yield loss due to BYDV infection by comparing infected plots to the healthy ones. From previous experience in cereal crops, yield loss evaluation was found to be the most reliable factor in determining resistance to BYDV infection. 1.10.2.3.1. Evaluation in Short Rows The preliminary evaluation of 179 barley lines from different nurseries indicated that some of these lines, based on the severity of BYDV symptoms produced, were highly tolerant. The best lines identified are summarized in Table 43. These lines will be further evaluated during the next growing season. 1.10.2.3.2.Evaluation in Small Plots The re-evaluation of best performing lines of different nurseries from previous season for BYDV tolerance/resistance in small plots, which permits yield loss determination in response to infection, showed that some lines such as 0F2-14-P1, 99F2-6-P2 and IBSCGP2000-18 were highly resistant/tolerant to BYDV infection (Table 44). The grain yield of these lines when infected with BYDV was almost equal to that of the healthy control.
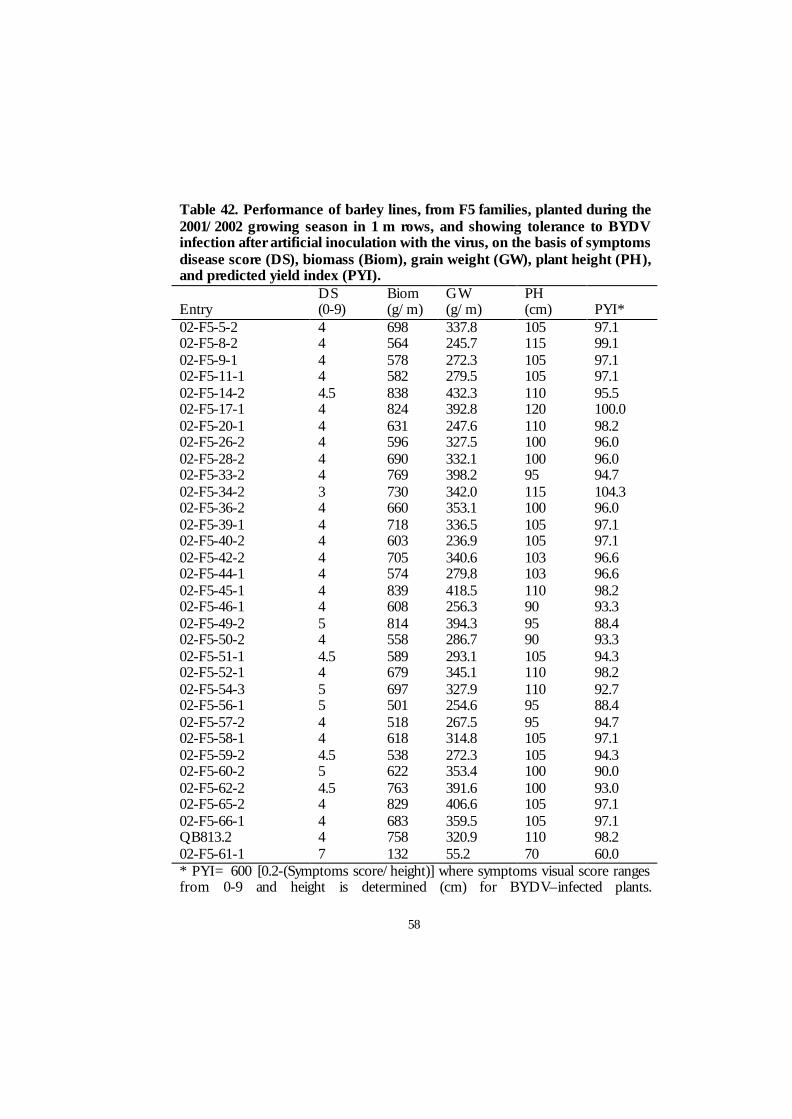
58
Table 42. Performance of barley lines, from F5 families, planted during the 2001/2002 growing season in 1 m rows, and showing tolerance to BYDV infection after artificial inoculation with the virus, on the basis of symptoms disease score (DS), biomass (Biom), grain weight (GW), plant height (PH), and predicted yield index (PYI). Entry
DS (0-9)
Biom (g/m)
GW (g/m)
PH (cm)
PYI*
02-F5-5-2 4 698 337.8 105 97.1 02-F5-8-2 4 564 245.7 115 99.1 02-F5-9-1 4 578 272.3 105 97.1 02-F5-11-1 4 582 279.5 105 97.1 02-F5-14-2 4.5 838 432.3 110 95.5 02-F5-17-1 4 824 392.8 120 100.0 02-F5-20-1 4 631 247.6 110 98.2 02-F5-26-2 4 596 327.5 100 96.0 02-F5-28-2 4 690 332.1 100 96.0 02-F5-33-2 4 769 398.2 95 94.7 02-F5-34-2 3 730 342.0 115 104.3 02-F5-36-2 4 660 353.1 100 96.0 02-F5-39-1 4 718 336.5 105 97.1 02-F5-40-2 4 603 236.9 105 97.1 02-F5-42-2 4 705 340.6 103 96.6 02-F5-44-1 4 574 279.8 103 96.6 02-F5-45-1 4 839 418.5 110 98.2 02-F5-46-1 4 608 256.3 90 93.3 02-F5-49-2 5 814 394.3 95 88.4 02-F5-50-2 4 558 286.7 90 93.3 02-F5-51-1 4.5 589 293.1 105 94.3 02-F5-52-1 4 679 345.1 110 98.2 02-F5-54-3 5 697 327.9 110 92.7 02-F5-56-1 5 501 254.6 95 88.4 02-F5-57-2 4 518 267.5 95 94.7 02-F5-58-1 4 618 314.8 105 97.1 02-F5-59-2 4.5 538 272.3 105 94.3 02-F5-60-2 5 622 353.4 100 90.0 02-F5-62-2 4.5 763 391.6 100 93.0 02-F5-65-2 4 829 406.6 105 97.1 02-F5-66-1 4 683 359.5 105 97.1 QB813.2 4 758 320.9 110 98.2 02-F5-61-1 7 132 55.2 70 60.0 * PYI= 600 [0.2-(Symptoms score/height)] where symptoms visual score ranges from 0-9 and height is determined (cm) for BYDV–infected plants.
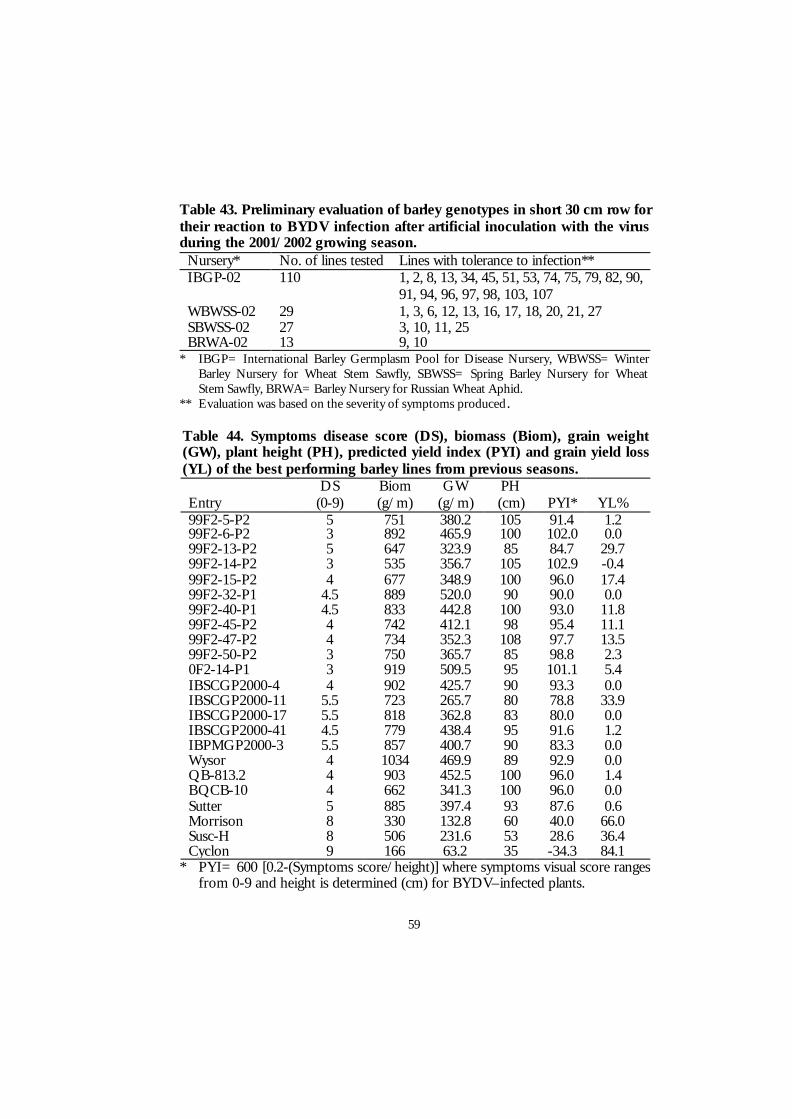
59
Table 43. Preliminary evaluation of barley genotypes in short 30 cm row for their reaction to BYDV infection after artificial inoculation with the virus during the 2001/2002 growing season.
Nursery* No. of lines tested Lines with tolerance to infection** IBGP-02 110 1, 2, 8, 13, 34, 45, 51, 53, 74, 75, 79, 82, 90,
91, 94, 96, 97, 98, 103, 107 WBWSS-02 29 1, 3, 6, 12, 13, 16, 17, 18, 20, 21, 27 SBWSS-02 27 3, 10, 11, 25 BRWA-02 13 9, 10
* IBGP= International Barley Germplasm Pool for Disease Nursery, WBWSS= Winter Barley Nursery for Wheat Stem Sawfly, SBWSS= Spring Barley Nursery for Wheat Stem Sawfly, BRWA= Barley Nursery for Russian Wheat Aphid.
** Evaluation was based on the severity of symptoms produced . Table 44. Symptoms disease score (DS), biomass (Biom), grain weight (GW), plant height (PH), predicted yield index (PYI) and grain yield loss (YL) of the best performing barley lines from previous seasons. Entry
DS (0-9)
Biom (g/m)
GW (g/m)
PH (cm)
PYI*
YL%
99F2-5-P2 5 751 380.2 105 91.4 1.2 99F2-6-P2 3 892 465.9 100 102.0 0.0 99F2-13-P2 5 647 323.9 85 84.7 29.7 99F2-14-P2 3 535 356.7 105 102.9 -0.4 99F2-15-P2 4 677 348.9 100 96.0 17.4 99F2-32-P1 4.5 889 520.0 90 90.0 0.0 99F2-40-P1 4.5 833 442.8 100 93.0 11.8 99F2-45-P2 4 742 412.1 98 95.4 11.1 99F2-47-P2 4 734 352.3 108 97.7 13.5 99F2-50-P2 3 750 365.7 85 98.8 2.3 0F2-14-P1 3 919 509.5 95 101.1 5.4 IBSCGP2000-4 4 902 425.7 90 93.3 0.0 IBSCGP2000-11 5.5 723 265.7 80 78.8 33.9 IBSCGP2000-17 5.5 818 362.8 83 80.0 0.0 IBSCGP2000-41 4.5 779 438.4 95 91.6 1.2 IBPMGP2000-3 5.5 857 400.7 90 83.3 0.0 Wysor 4 1034 469.9 89 92.9 0.0 QB-813.2 4 903 452.5 100 96.0 1.4 BQCB-10 4 662 341.3 100 96.0 0.0 Sutter 5 885 397.4 93 87.6 0.6 Morrison 8 330 132.8 60 40.0 66.0 Susc-H 8 506 231.6 53 28.6 36.4 Cyclon 9 166 63.2 35 -34.3 84.1
* PYI= 600 [0.2-(Symptoms score/height)] where symptoms visual score ranges from 0-9 and height is determined (cm) for BYDV–infected plants.
60
2. PARTICIPATORY PLANT BREEDING 2.1. Introduction In recent years there has been an increasing interest towards participatory research in general, and towards participatory plant breeding in particular. Following the early work of Rhoades and Booth (Farmer-Back-To-Farmer: a model for generating acceptable agricultural technology. Agricultural administration, 1982, 11: 127-137), scientists have become increasingly aware that users’ participation in technology development may be the key to increase the probability of success for the technology. Social scientists have been the first to experiment with various methodologies of participatory research, while in general biological scientists lagged behind in accepting this innovative way of conducting research. Even now, despite the increasing popularity of participatory research, the majority of scientists involved in this type of research are not (primarily) biological scientists. In the specific case of participatory plant breeding (PPB), and to the best of our knowledge, there are few formal plant breeding programs which either experiment it or practice it. This has had four consequences. Firstly, the collaboration between biological and social scientists, considered to be a key to the success of participatory research (Voss, 1996) has been less than satisfactory. Secondly, the social and anthropological aspects of PPB have been studied, discussed and examined much more extensively and much more professionally than the biological aspects. Thirdly, there are difficulties in institutionalizing PPB because the institutions promoting farmer participation are usually different from those responsible for formal plant breeding. Fourthly, the fact that the practitioners of PPB are prevalently non-breeders, has generated the belief that there are two types of plant breeding, the participatory and the non-participatory plant breeding, which are often seen as equivalent to non-formal and formal breeding, respectively. During 2002 we concluded the first cycle of selection on farmers fields following the methodology introduced in 2000.
In this report we will report the results obtained with the participatory programs in Syria, Yemen, Jordan and Egypt. 2.2. Participatory Barley Breeding in Syria 2.2.1. The Methodology During 2002 we concluded the first cycle of selection on farmers fields following the methodology introduced in 2000.
The major features of this first cycle of selection were the following: 1) of the two main ICARDA’s research stations only Tel Hadya was used, and only for seed multiplication and therefore the process was fully decentralized; 2) the
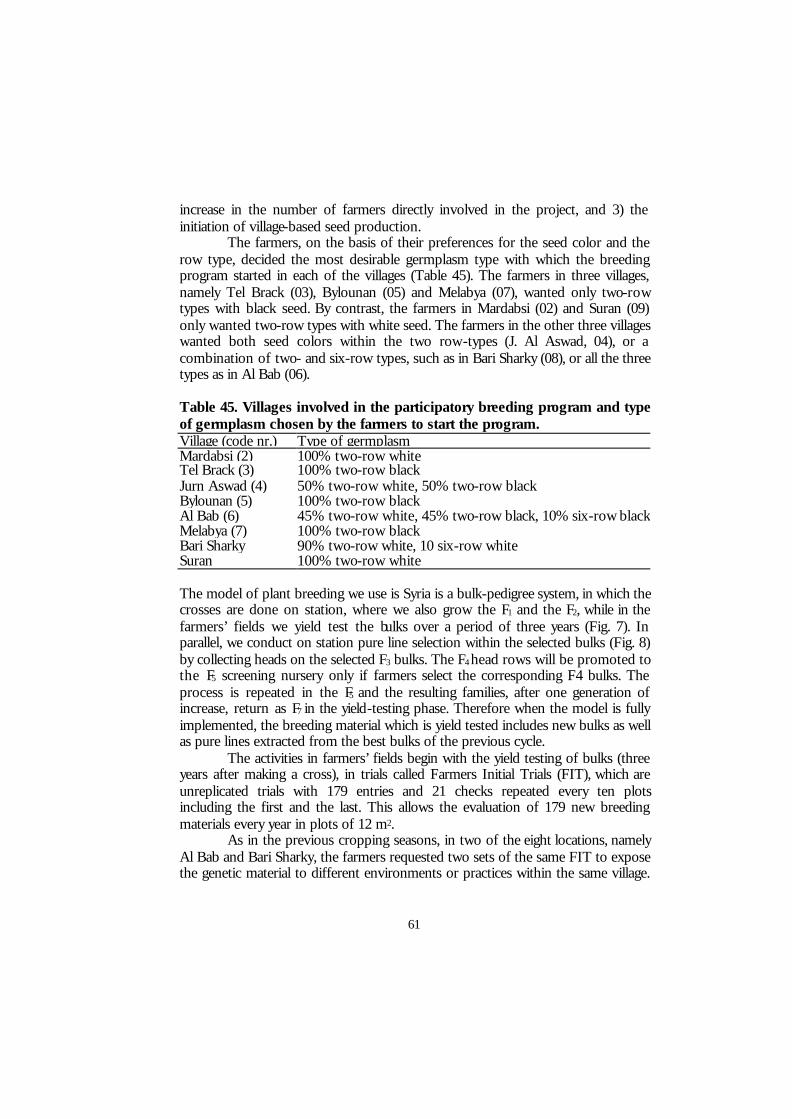
61
increase in the number of farmers directly involved in the project, and 3) the initiation of village-based seed production.
The farmers, on the basis of their preferences for the seed color and the row type, decided the most desirable germplasm type with which the breeding program started in each of the villages (Table 45). The farmers in three villages, namely Tel Brack (03), Bylounan (05) and Melabya (07), wanted only two-row types with black seed. By contrast, the farmers in Mardabsi (02) and Suran (09) only wanted two-row types with white seed. The farmers in the other three villages wanted both seed colors within the two row-types (J. Al Aswad, 04), or a combination of two- and six-row types, such as in Bari Sharky (08), or all the three types as in Al Bab (06). Table 45. Villages involved in the participatory breeding program and type of germplasm chosen by the farmers to start the program.
The model of plant breeding we use is Syria is a bulk-pedigree system, in which the crosses are done on station, where we also grow the F1 and the F2, while in the farmers’ fields we yield test the bulks over a period of three years (Fig. 7). In parallel, we conduct on station pure line selection within the selected bulks (Fig. 8) by collecting heads on the selected F3 bulks. The F4 head rows will be promoted to the F5 screening nursery only if farmers select the corresponding F4 bulks. The process is repeated in the F5 and the resulting families, after one generation of increase, return as F7 in the yield-testing phase. Therefore when the model is fully implemented, the breeding material which is yield tested includes new bulks as well as pure lines extracted from the best bulks of the previous cycle.
The activities in farmers’ fields begin with the yield testing of bulks (three years after making a cross), in trials called Farmers Initial Trials (FIT), which are unreplicated trials with 179 entries and 21 checks repeated every ten plots including the first and the last. This allows the evaluation of 179 new breeding materials every year in plots of 12 m2.
As in the previous cropping seasons, in two of the eight locations, namely Al Bab and Bari Sharky, the farmers requested two sets of the same FIT to expose the genetic material to different environments or practices within the same village.
Village (code nr.) Type of germplasm Mardabsi (2) 100% two-row white Tel Brack (3) 100% two-row black Jurn Aswad (4) 50% two-row white, 50% two-row black Bylounan (5) 100% two-row black Al Bab (6) 45% two-row white, 45% two-row black, 10% six-row blackMelabya (7) 100% two-row black Bari Sharky 90% two-row white, 10 six-row white Suran 100% two-row white
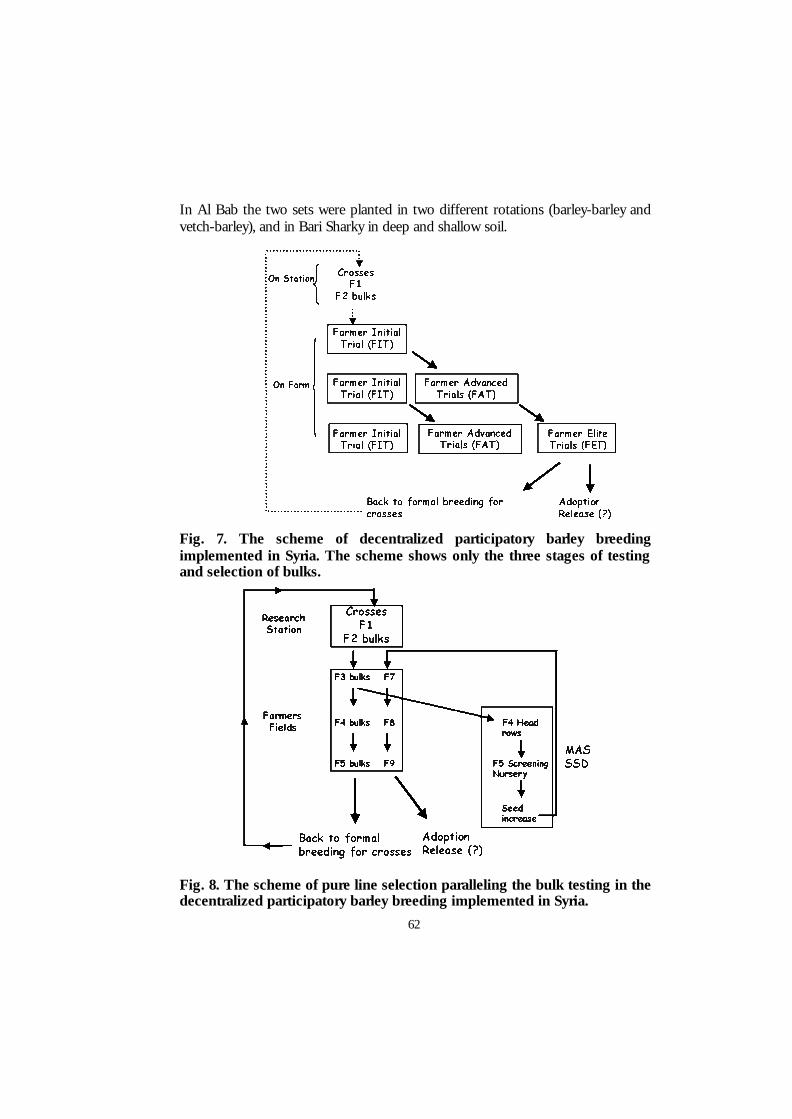
62
In Al Bab the two sets were planted in two different rotations (barley-barley and vetch-barley), and in Bari Sharky in deep and shallow soil. Fig. 7. The scheme of decentralized participatory barley breeding implemented in Syria. The scheme shows only the three stages of testing and selection of bulks. Fig. 8. The scheme of pure line selection paralleling the bulk testing in the decentralized participatory barley breeding implemented in Syria.
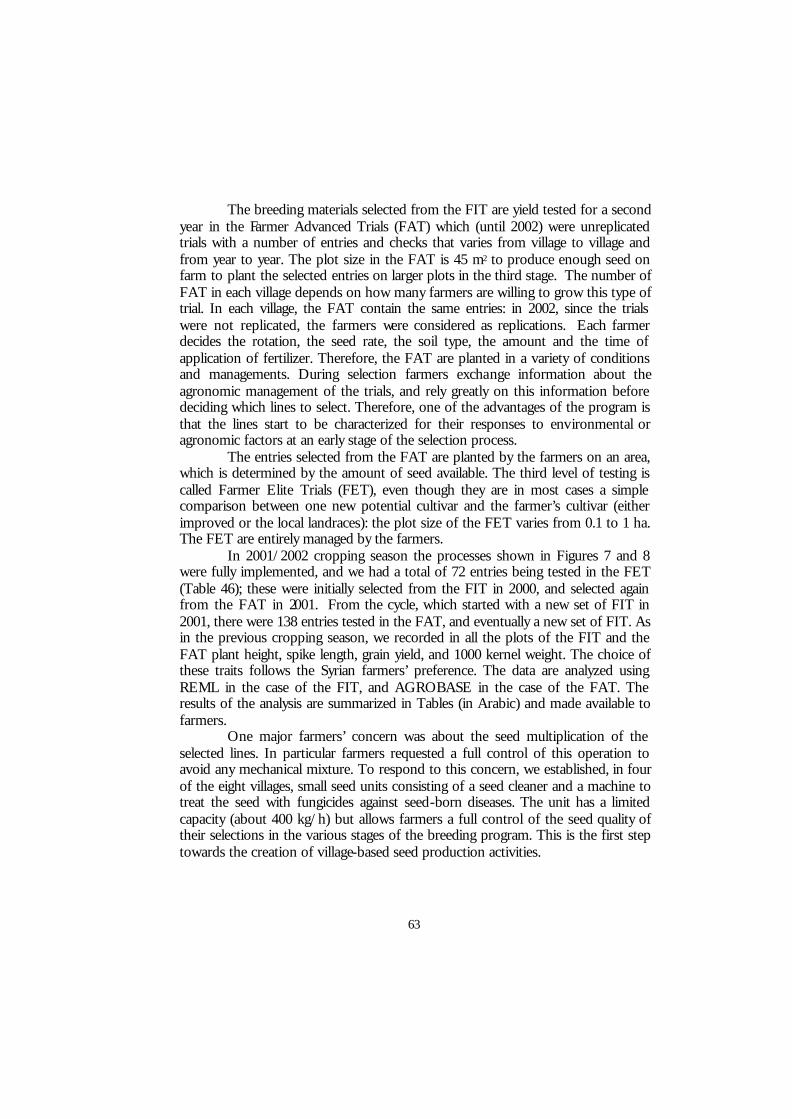
63
The breeding materials selected from the FIT are yield tested for a second year in the Farmer Advanced Trials (FAT) which (until 2002) were unreplicated trials with a number of entries and checks that varies from village to village and from year to year. The plot size in the FAT is 45 m2 to produce enough seed on farm to plant the selected entries on larger plots in the third stage. The number of FAT in each village depends on how many farmers are willing to grow this type of trial. In each village, the FAT contain the same entries: in 2002, since the trials were not replicated, the farmers were considered as replications. Each farmer decides the rotation, the seed rate, the soil type, the amount and the time of application of fertilizer. Therefore, the FAT are planted in a variety of conditions and managements. During selection farmers exchange information about the agronomic management of the trials, and rely greatly on this information before deciding which lines to select. Therefore, one of the advantages of the program is that the lines start to be characterized for their responses to environmental or agronomic factors at an early stage of the selection process.
The entries selected from the FAT are planted by the farmers on an area, which is determined by the amount of seed available. The third level of testing is called Farmer Elite Trials (FET), even though they are in most cases a simple comparison between one new potential cultivar and the farmer’s cultivar (either improved or the local landraces): the plot size of the FET varies from 0.1 to 1 ha. The FET are entirely managed by the farmers.
In 2001/2002 cropping season the processes shown in Figures 7 and 8 were fully implemented, and we had a total of 72 entries being tested in the FET (Table 46); these were initially selected from the FIT in 2000, and selected again from the FAT in 2001. From the cycle, which started with a new set of FIT in 2001, there were 138 entries tested in the FAT, and eventually a new set of FIT. As in the previous cropping season, we recorded in all the plots of the FIT and the FAT plant height, spike length, grain yield, and 1000 kernel weight. The choice of these traits follows the Syrian farmers’ preference. The data are analyzed using REML in the case of the FIT, and AGROBASE in the case of the FAT. The results of the analysis are summarized in Tables (in Arabic) and made available to farmers.
One major farmers’ concern was about the seed multiplication of the selected lines. In particular farmers requested a full control of this operation to avoid any mechanical mixture. To respond to this concern, we established, in four of the eight villages, small seed units consisting of a seed cleaner and a machine to treat the seed with fungicides against seed-born diseases. The unit has a limited capacity (about 400 kg/h) but allows farmers a full control of the seed quality of their selections in the various stages of the breeding program. This is the first step towards the creation of village-based seed production activities.
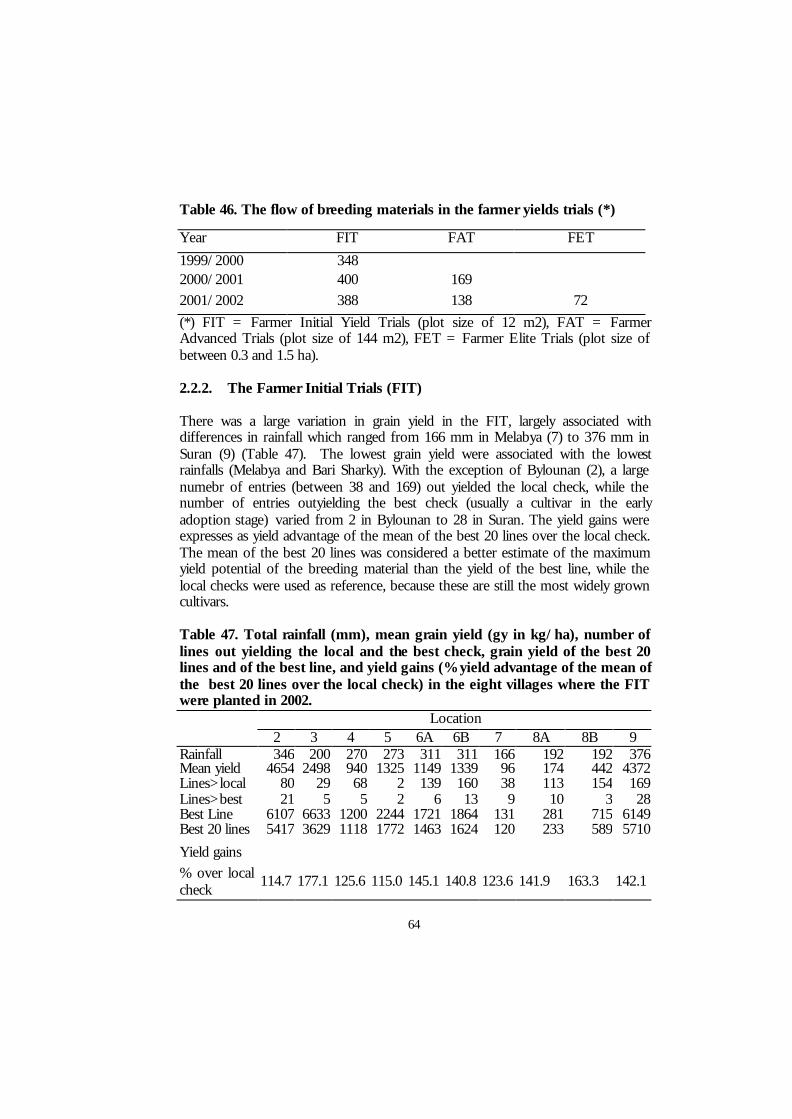
64
Table 46. The flow of breeding materials in the farmer yields trials (*)
(*) FIT = Farmer Initial Yield Trials (plot size of 12 m2), FAT = Farmer Advanced Trials (plot size of 144 m2), FET = Farmer Elite Trials (plot size of between 0.3 and 1.5 ha). 2.2.2. The Farmer Initial Trials (FIT) There was a large variation in grain yield in the FIT, largely associated with differences in rainfall which ranged from 166 mm in Melabya (7) to 376 mm in Suran (9) (Table 47). The lowest grain yield were associated with the lowest rainfalls (Melabya and Bari Sharky). With the exception of Bylounan (2), a large numebr of entries (between 38 and 169) out yielded the local check, while the number of entries outyielding the best check (usually a cultivar in the early adoption stage) varied from 2 in Bylounan to 28 in Suran. The yield gains were expresses as yield advantage of the mean of the best 20 lines over the local check. The mean of the best 20 lines was considered a better estimate of the maximum yield potential of the breeding material than the yield of the best line, while the local checks were used as reference, because these are still the most widely grown cultivars. Table 47. Total rainfall (mm), mean grain yield (gy in kg/ha), number of lines out yielding the local and the best check, grain yield of the best 20 lines and of the best line, and yield gains (% yield advantage of the mean of the best 20 lines over the local check) in the eight villages where the FIT were planted in 2002. Location 2 3 4 5 6A 6B 7 8A 8B 9 Rainfall 346 200 270 273 311 311 166 192 192 376 Mean yield 4654 2498 940 1325 1149 1339 96 174 442 4372 Lines>local 80 29 68 2 139 160 38 113 154 169 Lines>best 21 5 5 2 6 13 9 10 3 28 Best Line 6107 6633 1200 2244 1721 1864 131 281 715 6149 Best 20 lines 5417 3629 1118 1772 1463 1624 120 233 589 5710 Yield gains % over local check
114.7 177.1 125.6 115.0 145.1 140.8 123.6 141.9 163.3 142.1
Year FIT FAT FET
1999/2000 348 2000/2001 400 169 2001/2002 388 138 72
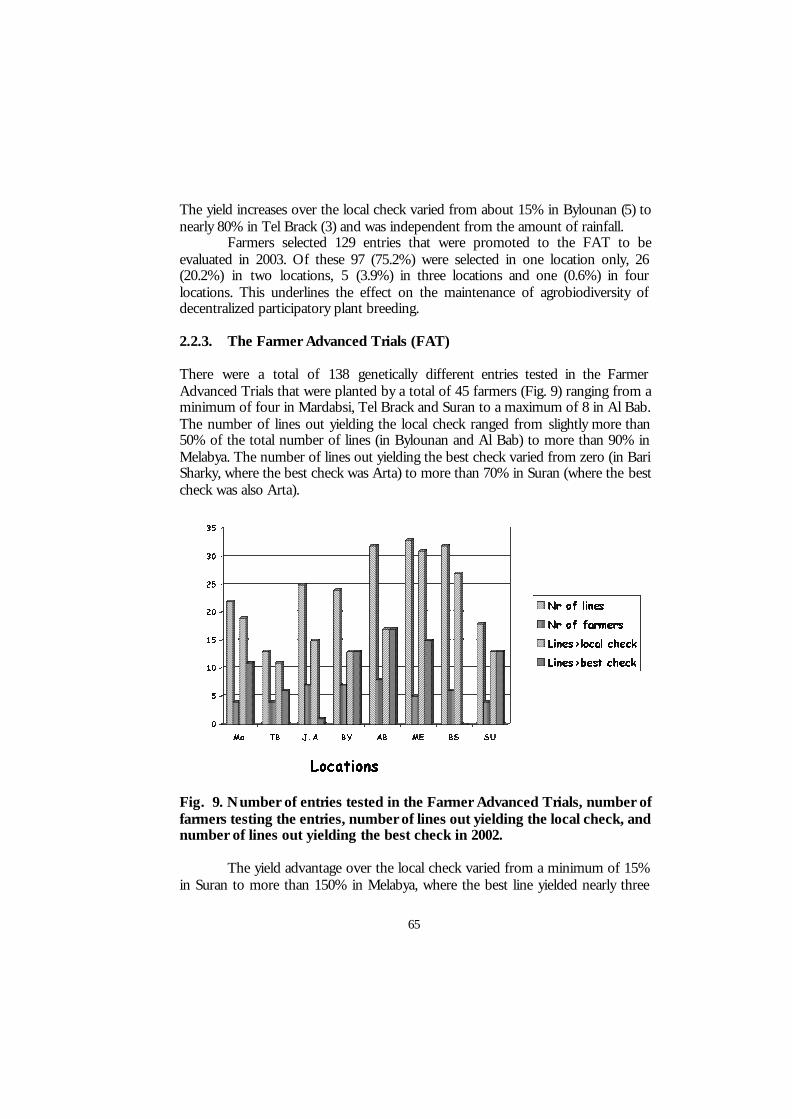
65
The yield increases over the local check varied from about 15% in Bylounan (5) to nearly 80% in Tel Brack (3) and was independent from the amount of rainfall.
Farmers selected 129 entries that were promoted to the FAT to be evaluated in 2003. Of these 97 (75.2%) were selected in one location only, 26 (20.2%) in two locations, 5 (3.9%) in three locations and one (0.6%) in four locations. This underlines the effect on the maintenance of agrobiodiversity of decentralized participatory plant breeding. 2.2.3. The Farmer Advanced Trials (FAT) There were a total of 138 genetically different entries tested in the Farmer Advanced Trials that were planted by a total of 45 farmers (Fig. 9) ranging from a minimum of four in Mardabsi, Tel Brack and Suran to a maximum of 8 in Al Bab. The number of lines out yielding the local check ranged from slightly more than 50% of the total number of lines (in Bylounan and Al Bab) to more than 90% in Melabya. The number of lines out yielding the best check varied from zero (in Bari Sharky, where the best check was Arta) to more than 70% in Suran (where the best check was also Arta). Fig. 9. Number of entries tested in the Farmer Advanced Trials, number of farmers testing the entries, number of lines out yielding the local check, and number of lines out yielding the best check in 2002.
The yield advantage over the local check varied from a minimum of 15% in Suran to more than 150% in Melabya, where the best line yielded nearly three
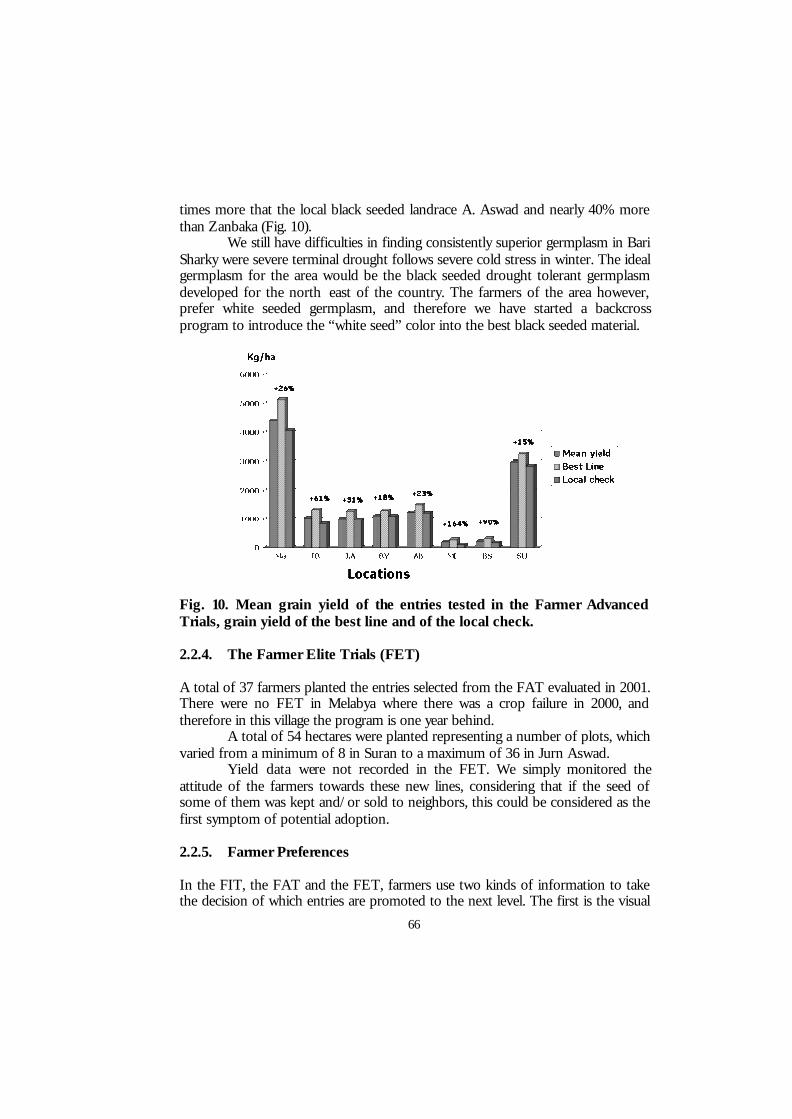
66
times more that the local black seeded landrace A. Aswad and nearly 40% more than Zanbaka (Fig. 10).
We still have difficulties in finding consistently superior germplasm in Bari Sharky were severe terminal drought follows severe cold stress in winter. The ideal germplasm for the area would be the black seeded drought tolerant germplasm developed for the north east of the country. The farmers of the area however, prefer white seeded germplasm, and therefore we have started a backcross program to introduce the “white seed” color into the best black seeded material. Fig. 10. Mean grain yield of the entries tested in the Farmer Advanced Trials, grain yield of the best line and of the local check. 2.2.4. The Farmer Elite Trials (FET) A total of 37 farmers planted the entries selected from the FAT evaluated in 2001. There were no FET in Melabya where there was a crop failure in 2000, and therefore in this village the program is one year behind.
A total of 54 hectares were planted representing a number of plots, which varied from a minimum of 8 in Suran to a maximum of 36 in Jurn Aswad. Yield data were not recorded in the FET. We simply monitored the attitude of the farmers towards these new lines, considering that if the seed of some of them was kept and/or sold to neighbors, this could be considered as the first symptom of potential adoption. 2.2.5. Farmer Preferences In the FIT, the FAT and the FET, farmers use two kinds of information to take the decision of which entries are promoted to the next level. The first is the visual
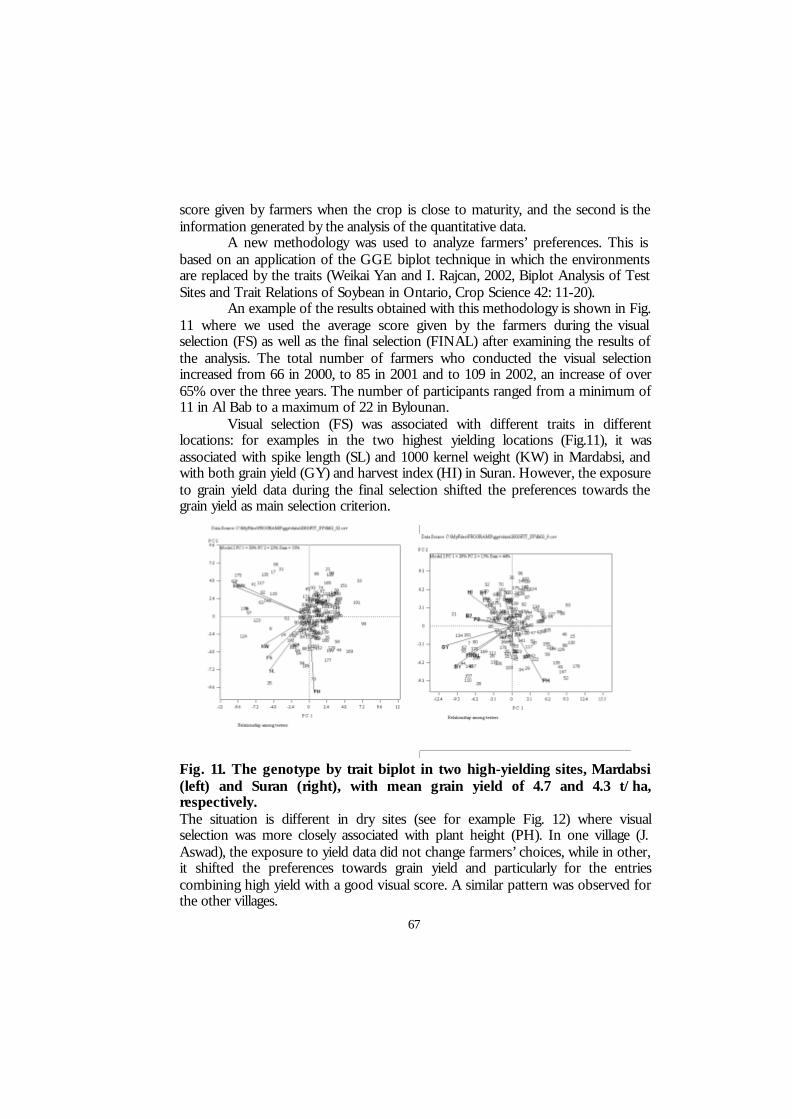
67
score given by farmers when the crop is close to maturity, and the second is the information generated by the analysis of the quantitative data.
A new methodology was used to analyze farmers’ preferences. This is based on an application of the GGE biplot technique in which the environments are replaced by the traits (Weikai Yan and I. Rajcan, 2002, Biplot Analysis of Test Sites and Trait Relations of Soybean in Ontario, Crop Science 42: 11-20).
An example of the results obtained with this methodology is shown in Fig. 11 where we used the average score given by the farmers during the visual selection (FS) as well as the final selection (FINAL) after examining the results of the analysis. The total number of farmers who conducted the visual selection increased from 66 in 2000, to 85 in 2001 and to 109 in 2002, an increase of over 65% over the three years. The number of participants ranged from a minimum of 11 in Al Bab to a maximum of 22 in Bylounan.
Visual selection (FS) was associated with different traits in different locations: for examples in the two highest yielding locations (Fig.11), it was associated with spike length (SL) and 1000 kernel weight (KW) in Mardabsi, and with both grain yield (GY) and harvest index (HI) in Suran. However, the exposure to grain yield data during the final selection shifted the preferences towards the grain yield as main selection criterion. Fig. 11. The genotype by trait biplot in two high-yielding sites, Mardabsi (left) and Suran (right), with mean grain yield of 4.7 and 4.3 t/ha, respectively. The situation is different in dry sites (see for example Fig. 12) where visual selection was more closely associated with plant height (PH). In one village (J. Aswad), the exposure to yield data did not change farmers’ choices, while in other, it shifted the preferences towards grain yield and particularly for the entries combining high yield with a good visual score. A similar pattern was observed for the other villages.
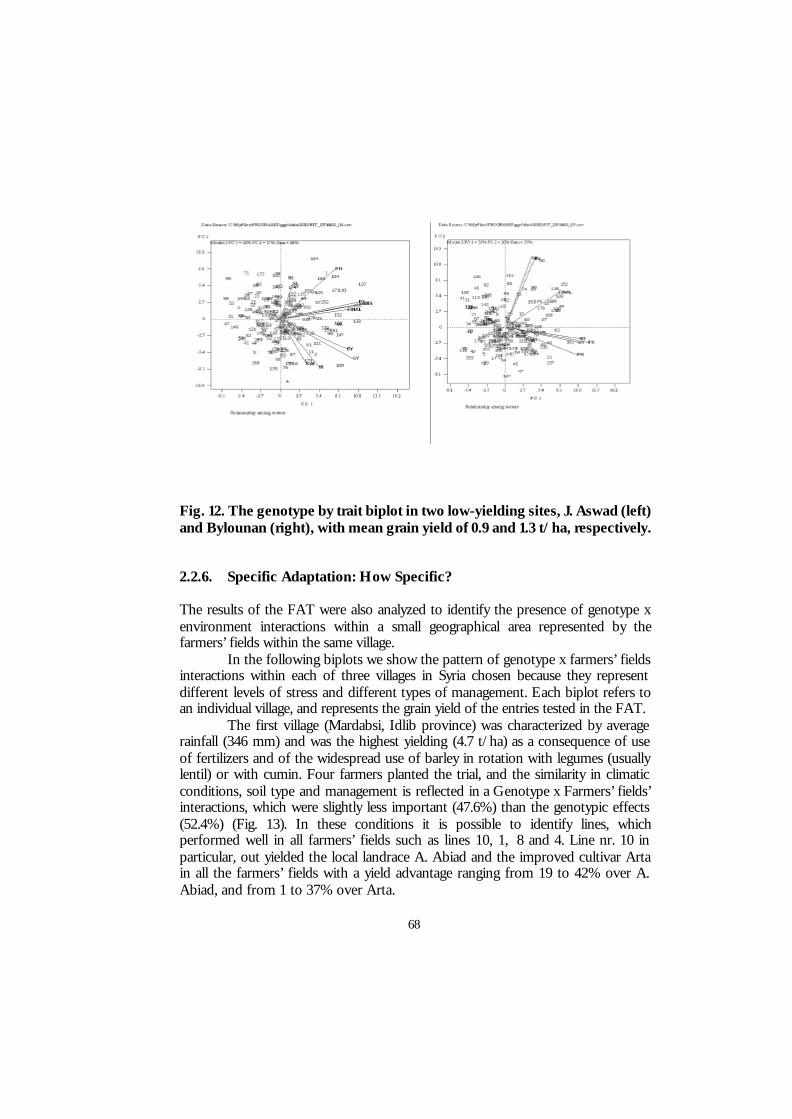
68
Fig. 12. The genotype by trait biplot in two low-yielding sites, J. Aswad (left) and Bylounan (right), with mean grain yield of 0.9 and 1.3 t/ha, respectively. 2.2.6. Specific Adaptation: How Specific? The results of the FAT were also analyzed to identify the presence of genotype x environment interactions within a small geographical area represented by the farmers’ fields within the same village.
In the following biplots we show the pattern of genotype x farmers’ fields interactions within each of three villages in Syria chosen because they represent different levels of stress and different types of management. Each biplot refers to an individual village, and represents the grain yield of the entries tested in the FAT.
The first village (Mardabsi, Idlib province) was characterized by average rainfall (346 mm) and was the highest yielding (4.7 t/ha) as a consequence of use of fertilizers and of the widespread use of barley in rotation with legumes (usually lentil) or with cumin. Four farmers planted the trial, and the similarity in climatic conditions, soil type and management is reflected in a Genotype x Farmers’ fields’ interactions, which were slightly less important (47.6%) than the genotypic effects (52.4%) (Fig. 13). In these conditions it is possible to identify lines, which performed well in all farmers’ fields such as lines 10, 1, 8 and 4. Line nr. 10 in particular, out yielded the local landrace A. Abiad and the improved cultivar Arta in all the farmers’ fields with a yield advantage ranging from 19 to 42% over A. Abiad, and from 1 to 37% over Arta.

69
Data obtained during 2002, indicate that decentralized-participatory plant breeding can be very powerful in adapting the crop to a wide range of specific environments (environment here is defined as the complex of climate, soil type, soil depth, soil fertility, agronomic management, etc), even within a limited geographical area. Fig. 13. Genotype by farmer field interactions in the Farmer Advanced Trials planted in two locations in Syria representing favorable and stress conditions for barley. The breeding lines in the two locations are different. A. Abiad, Arta, A. Aswad, Zanbaka and Tadmor are the checks.
By contrast, in Bylounan, (Raqqa province) where the rainfall was only 273 mm, the average grain yield in the fields of the seven farmers who grew the trial, was only 1.3 t/ha. Furthermore, in this village soils are shallow, there is little use of fertilizers or other inputs, and it is common to grow continuous barley. As a result, we observed a large Genotype x Farmers’ fields’ interactions, which was seven times larger (87.9%) than the genotypic effects (12.1%). As a consequence, the top yielding breeding lines were not the same in every farmers’ field: for example, line 11 had a yield advantage of between 31% and 60% over A. Aswad, of 32% to 119% over Tadmor, and of 27% to 97% over Zanbaka in the fields of Hamed, Awad and Mohamed, but performed poorly in the field of Ibrahim, Ahmed, Majid and Ali. On the other hand, line 12 out yielded the three checks in the field of Ahmed, line 19 in the field of Majid and to a less extent in the field of Ibrahim.
Eventually, in Al Bab the trial was grown by eight farmers with an average grain yield of 1.2 t/ha despite a total rainfall of 311 mm (Fig. 14). This location is usually characterized by yields lower than one would expect on the basis of rainfall, probably because of low temperatures during the wet season. The importance of Genotype x Farmers’ fields’ interactions was as large as observed in Bylounan, but in the case of this village it was possible to attribute some of the interaction effects to the effect of rotation; in fact one of the farmers, Mr. Abdo, grew the same trial
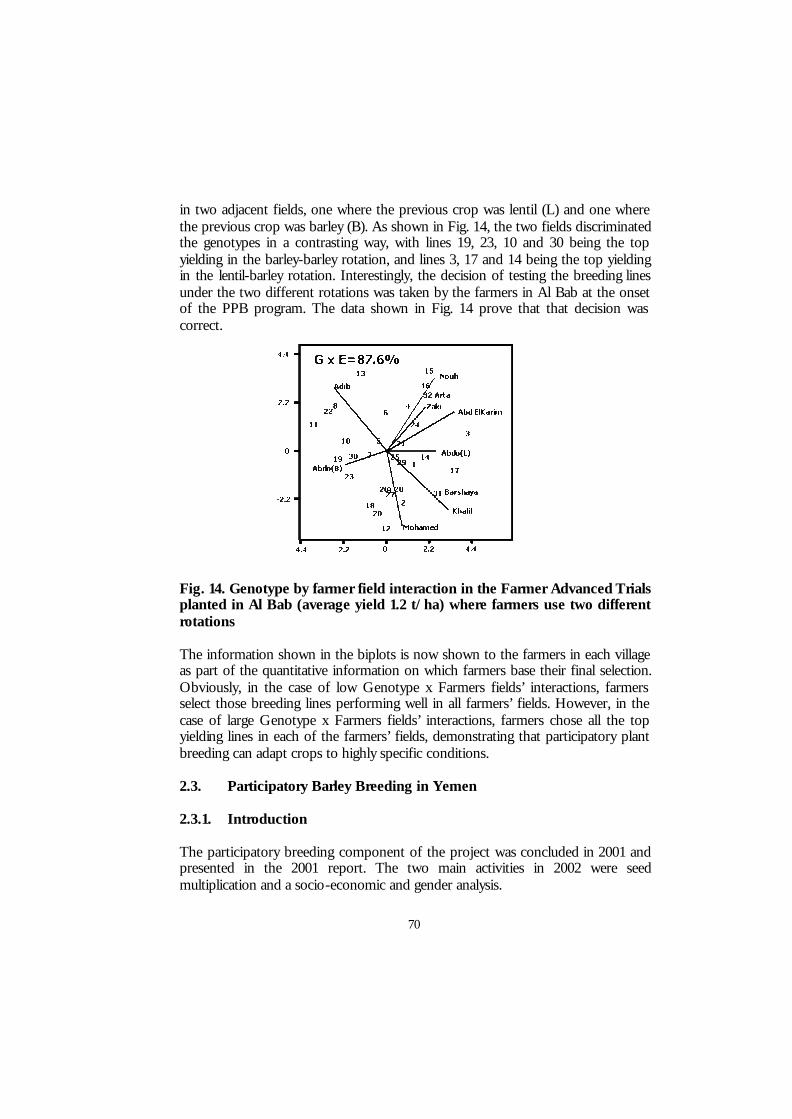
70
in two adjacent fields, one where the previous crop was lentil (L) and one where the previous crop was barley (B). As shown in Fig. 14, the two fields discriminated the genotypes in a contrasting way, with lines 19, 23, 10 and 30 being the top yielding in the barley-barley rotation, and lines 3, 17 and 14 being the top yielding in the lentil-barley rotation. Interestingly, the decision of testing the breeding lines under the two different rotations was taken by the farmers in Al Bab at the onset of the PPB program. The data shown in Fig. 14 prove that that decision was correct.
Fig. 14. Genotype by farmer field interaction in the Farmer Advanced Trials planted in Al Bab (average yield 1.2 t/ha) where farmers use two different rotations The information shown in the biplots is now shown to the farmers in each village as part of the quantitative information on which farmers base their final selection. Obviously, in the case of low Genotype x Farmers fields’ interactions, farmers select those breeding lines performing well in all farmers’ fields. However, in the case of large Genotype x Farmers fields’ interactions, farmers chose all the top yielding lines in each of the farmers’ fields, demonstrating that participatory plant breeding can adapt crops to highly specific conditions. 2.3. Participatory Barley Breeding in Yemen 2.3.1. Introduction The participatory breeding component of the project was concluded in 2001 and presented in the 2001 report. The two main activities in 2002 were seed multiplication and a socio-economic and gender analysis.
71
2.3.2. Seed Multiplication Two barley lines, El-Irra 58 and El-Irra 60, and three lentil lines (YG 35007, YG 35008, FLIP96-53L) were multiplied at El-Irra station and the seed distributed to five villages in the Kuhlan Affar area. At Beit El Wali the participating farmer multiplied the same lines. In Dhamar area the second year trials were planted both for lentil and barley in two locations. The trials comprised 5 barley entries (4 selected lines and the local variety) and six lentil entries (5 selected lines and the local variety). 2.3.3. Socio-Economic and Gender Analysis The main partnership to complement this component was with the Agricultural Research and Extension Authority (AREA) including both research and extension staff.
In a first stage a rapid appraisal was conducted in the project area of Kuhlan Affar, and the two villages selected in the project area of Dhamar with an objective to prepare a socio-economic assessment and gender analysis of the characteristics of the agricultural households participating in the selection processes of both barley and lentil varieties. The appraisal included the villages of Beit al-Wali and Al-Ashmor in Kuhlan Affar area and Balasan and Yarim in Dhamar area. The socio-economic survey covered these four villages.
Focus group meetings were conducted. The meetings included both men and women both jointly and separately. The selection of varieties in relation to the decision-making processes within the households was discussed. As the selections were conducted separately with men and women, an understanding of the decision-making process was necessary to help in the preparation of a socio-economic survey of the participating households in the project.
We used the output of the appraisal to prepare a formal survey aiming at characterizing the participating households by income levels, labor and other resources; the data of the survey are currently being analyzed. 2.3.3.1. Methodology of Data Collection Qualitative and quantitative methods of investigation were used in collecting information including informal group discussion survey with women and men in the selected households, and formal survey using questionnaires.
During the period of March 14-22, 2001 an exploratory visit in preparation of a social science study including a gender analysis was conducted in Beit al-Wali and Al-Ashmor villages in the Kuhlan Affar area and in Balasan and Yarim villages in the Dhamar area with the objective of understanding the socio-economic and gender aspects of the farming households involved in the participatory barley breeding project. Based on the information gathered from

72
these households, a questionnaire was prepared in order to collect additional information on these communities.
During the period September 2001-March 2002, a formal questionnaire interview was completed on the selected households. The sample included 20 households from a total of 6 villages in Kuhlan Affar area (Al-Ashmor, Beit Al-Wali and Hisn El-Naqi villages) and 17 households from Dhamar area (As-Sawad and Yafa’ villages) and Ibb (Al-Dharw).
The qualitative data was analyzed using gender analysis tools. The quantitative information was analyzed using SPSS. The chi-square test was used to test the significance of the relationships between variables. 2.3.3.2. Preliminary Results All farmers in the area plant the same crop at the same time to avoid that young children eat the crop at its green stage on their way to and from school. In Yemen most crops can be eaten before maturity such as faba bean, chickpeas and others. Also, farmers prefer early varieties. They make sure that they all plant and harvest at the same time to avoid having their field “invaded” by children in case their production ought to be harvested later on.
Land tenure also plays a role in the management of the trials, as farmers take care of their own land more than the shared or rented land, which also affect the management of crops including barley.
On the plains of Dhamar, land holdings are much larger and mechanization has been introduced mainly for land preparation. Thus decisions of farmers are more independent in relation to rotation and to the selection of varieties within the PPB project. Cropping Patterns in Kuhlan Affar and Dhamar and Rotation Farmers have a multiple and quite complex farming system. Barley and lentils are the main crops grown in this area in addition to sorghum, wheat, peas, maize, and alfalfa.
In Kuhlan Affar, all farmers consult each other in order to set a period where they graze their land at the same time.
In Dhamar, farmers grow mainly potatoes (for those who have a source of irrigation), sorghum, wheat, barley, peas, lentil, maize, alfalfa, vegetables, and some fruit trees. The main crops are wheat and barley and are grown under rainfed conditions.
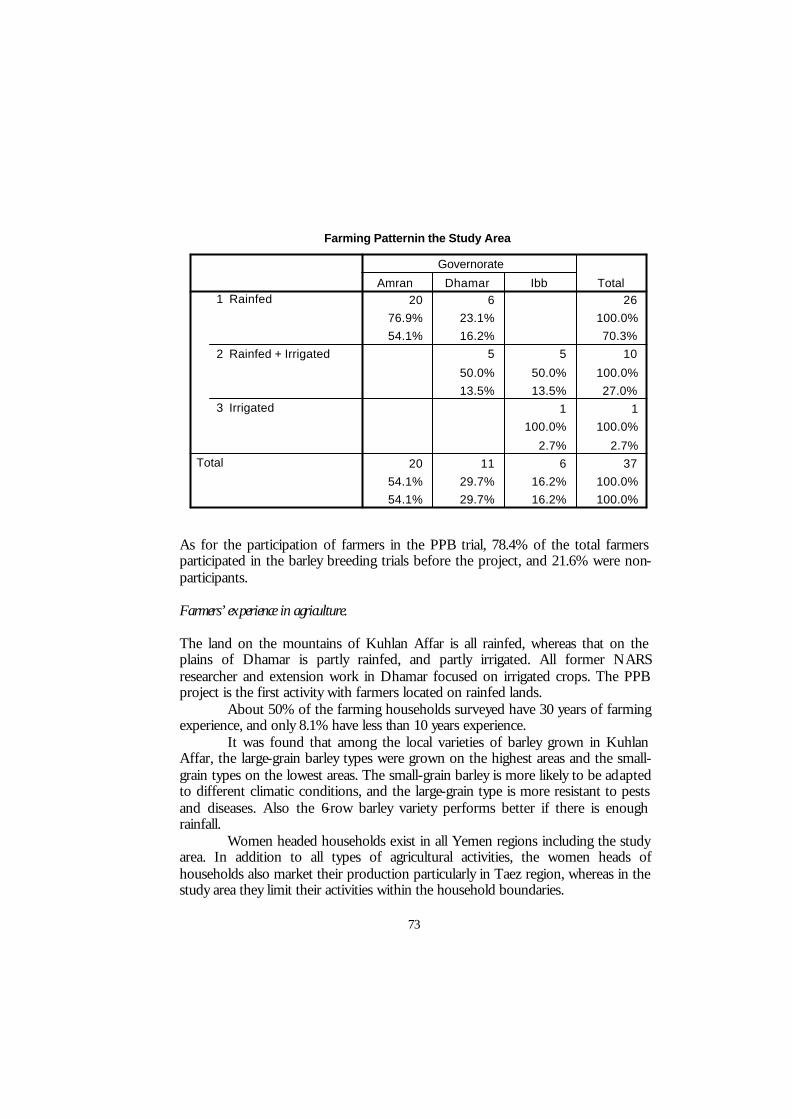
73
As for the participation of farmers in the PPB trial, 78.4% of the total farmers participated in the barley breeding trials before the project, and 21.6% were non-participants. Farmers’ experience in agriculture. The land on the mountains of Kuhlan Affar is all rainfed, whereas that on the plains of Dhamar is partly rainfed, and partly irrigated. All former NARS researcher and extension work in Dhamar focused on irrigated crops. The PPB project is the first activity with farmers located on rainfed lands.
About 50% of the farming households surveyed have 30 years of farming experience, and only 8.1% have less than 10 years experience.
It was found that among the local varieties of barley grown in Kuhlan Affar, the large-grain barley types were grown on the highest areas and the small-grain types on the lowest areas. The small-grain barley is more likely to be adapted to different climatic conditions, and the large-grain type is more resistant to pests and diseases. Also the 6-row barley variety performs better if there is enough rainfall.
Women headed households exist in all Yemen regions including the study area. In addition to all types of agricultural activities, the women heads of households also market their production particularly in Taez region, whereas in the study area they limit their activities within the household boundaries.
Farming Patternin the Study Area
20 6 26
76.9% 23.1% 100.0%
54.1% 16.2% 70.3%
5 5 10
50.0% 50.0% 100.0%
13.5% 13.5% 27.0%
1 1
100.0% 100.0%
2.7% 2.7%
20 11 6 37
54.1% 29.7% 16.2% 100.0%
54.1% 29.7% 16.2% 100.0%
1 Rainfed
2 Rainfed + Irrigated
3 Irrigated
Total
Amran Dhamar Ibb
Governorate
Total
74
Selection of Barley and Lentil in Kuhlan Affar by Women and Men Farmers One of the most important selection criteria of women and men’s selection is earliness. Discussions at the meetings held with both men and women, revealed that men farmers mainly base their selection on market prices. Thus grain size is another important selection criteria. Women think more about food and animals’ feed characteristics that make both grain and straw important in their selection. Also, on small terraced fields of Kuhlan Affar smallholdings lead farmers to take group decisions concerning rotation, and they practically select the same varieties of barley in the PPB project, although the reasons behind their choices are different. Criteria of Barley and Lentil Variety Selection by women and men in Dhamar In order to better understand the choices of farmers for particular varieties and plant characteristics, it is important to mention that the PPB trials were planted only in rainfed areas. In this area, the collaborating women and men farmers selected early varieties with a short growing period. The main reason behind this choice is because the rainy season lasts only two months and precipitation does not exceed 200 mm. Farmers dislike late varieties because they need a period of four months to reach maturity. Another reason for farmers’ reluctance to plant long-duration varieties is that frosts occur during the last two months of growth with negative effects to crop yields.
Both women and men base their selection on the length of the growing period. They prefer the varieties of short growing period even if late varieties produce bigger grains. Also late varieties need a source of irrigation that is available only to few farmers.
Three local barley varieties were grown in the area before the introduction of the new varieties by the PPB project. The preliminary results of the formal survey show that most women have selected the same varieties as their male relatives. Thus their actual selection is based on agronomic characteristics of the plant and on the agro-ecological conditions of their area in relation to the varieties. Furthermore, they are still very much influenced by their male relatives. Women explained this congruency of selection by the fact that they perceived that this would increase the chances of acceptability of new variety for their area. Considering this and the subsequent explanation of the process to women participants, it is expected that women will have a more independent selection of the varieties and may select different varieties than men in the coming years when they will have the chance to use these new varieties in a larger scale as food and feed.
The color of the grain is not of a great importance to farmers despite the fact that bread is actually made of a dark grain. Women did not express any desire to have a lighter color of the grain provided that the taste is good. All new varieties
75
of barley are called “Masri” (meaning Egyptian) in the area because the few varieties that were introduced in the past in the area originated from Egypt, and “Masri” is still used for any new variety of grain introduced in the area regardless of its origin.
Contrary to Kuhlan Affar area, in Dhamar, grazing crop residue is an independent initiative which takes place regardless of whether the neighbors are grazing their land or not. It is not a problem if a land is grazed next to a field that is not harvested yet. Apparently herders prevent animals from damaging neighboring fields. Future participation of women to the selection process in neighboring areas Farmers agreed that the women of their households (wives, daughters, daughters-in-law) participate in future in the selection conducted in other areas. Although women are not used to express their opinion openly, men have ensured that women are the decision-makers on selection of different varieties, and that they have already refused to use bags of grains that their husbands had bought from the market, which they did not like for making bread or feeding their animals. The Yemeni customs prevent women to state openly that they have some decision-making on the varieties, but in fact as indicated earlier, they do decide especially when they have tested the varieties for different domestic purposes. Skills of Farmers The women and men farmers acquired additional knowledge from their participation in the PPB project. First of all, they learned about the existence of other varieties that can perform well in their environment. Before the project’s activities, they knew about the existence of only three local varieties (Sagla, Shiha and Aswad), which they grew on their lands. They have also learned about different management practices of barley and lentil. The future seems promising as these farmers (women and men) are very cooperative with the project. Linking barley and lentil to the livelihoods of rural people Barley and lentil are both important crops for the livelihoods of rural communities in the study areas. They are used both for human and animal nutrition.
For human nutrition, barley is either used alone after grinding or as mixture with lentils. It is widely used for making bread (called “Malug” or “Gahin”). Barley grains are used to prepare a drink called “coffee from barley”. It is also used to make “khamir”, bread made of maize flour mixed with barley. It is also used to make soups and cakes. Barley grains are used as medicine to relieve kidney problems. Milk and barley are cooked together to prepare a meal called
76
“Zawm” that can be served anytime of the day. Other types of bread and food called “Chiza” and “Mathani” are made of barley.
100% of the surveyed farms use barley for human nutrition, mainly for bread making. 43% of the sample use barley grain as a drink (barley coffee), and 29.7% use barley grain for soup and as a medicinal plant for kidney problems.
Barley straw is mainly used as fodder for animals, and is widely used as chicken bed. Barley grains are fed to ewes after lambing and to sheep in general. Straw is also fed to animals. Barley straw is used for building after being mixed with soil. It is also used as bed for chicken.
About 84% of the sample use straw for animal feeding, and 11% use straw for building purposes. Characteristics of the Participating Women The characteristics of the participating women help understand the selection that has taken place in the two research sites. The selection process undertaken had a significant impact in terms of participation of women in this project. They usually perform all types of activities without discussing their work with anybody. The project has given them the opportunity to interact and discuss their concerns with others. However many characteristics of the participating women ought to be highlighted. 1. Illiteracy: all women who participated in the selection process are illiterate.
They have never got a chance to go to school because there is no school in their village and, due to social reasons, they were not allowed to study in schools located in other villages. This would have made the communication with these women very difficult if it wasn’t for the presence of women from extension services during the discussion. The women never had access to the PPB farmers’ record books. Some farmers are able to register their financial accountings, but nothing else. Illiteracy includes also women’s ignorance of family planning; some women were married five years ago and have already four children. This implies a very high demand on women’s labor in the house and in the farm activities. It also implies high population growth rates, which requires additional needs for sustaining the livelihoods of larger rural population in these very marginal environments.
2. Social status of women in Yemen: women in the study area have been raised by
their families in such a way that men are favored in all aspects of life, and should have the last word whenever differences in opinion arose between women and men. Women are not allowed to argue, even though few of them do, particularly when they have the entire responsibility of the farm.
3. Decision-Making: as the selection process is a new initiative in those villages, it
was perceived both by women and men more like an exam than as an

77
individual assessment and selection of new varieties to be planted in their areas. Therefore, they visit the experimental field together before the official selection day, and decide about the best varieties they want to select for their area. They had enough time to discuss all the characteristics together. Then at the time of the formal selection in presence of scientists and extension agents, although women and men do the selection separately, they still select the varieties that they have agreed upon earlier on. This does not mean that the selection was done in an improper way; in fact the pre-selection discussion which was the farmers’ initiative may have helped to use the pool of knowledge and may have led to a more meaningful selection. But it shows on one hand that there is a discussion going on between women and men about the selection of barley and lentil varieties on field trials, and on the other, that they understood the message given to them as to select one variety for their area. This may be the reason for women and men selecting the same variety. Women do complain that their husbands are the main decision-makers concerning agriculture, but implicitly they do agree that they do make decision in their domain of activities such as the type of flour used to make bread. They also have strong decision-making in animal feeding using all types of plants and plant residues. Women have expressed that in case they disagree with their husbands about a variety, it is always the opinion of the husbands that predominate, otherwise, they will be blamed for a bad choice they may have done. Finally women who manage the farm in absence of their husbands who come back home only at harvest time decide about the crops to plant.
4. Division of labor on farm: women do most of the agricultural work (planting,
thinning, harvesting etc) including livestock management (milking, feeding, feeding cows by gavages, veterinary activities), post-harvest activities and food processing. At planting time men plow the land using draught animals such as donkey, bull or even camels, and are followed by women broadcasting the seeds. They also take over the responsibility of irrigating the land. They may be working off-farm all year long, but do come back to work on farm with their families during peak periods of planting and harvesting. They ensure the marketing of the farm products. Women perform all the other agricultural activities consisting mainly of planting, weeding and harvesting. They also do the post-harvest activities and insure water supply to their households in addition of food preparation and caring of children. Women were found to work everywhere during all daytime.
5. Women’s understanding of the participatory plant-breeding project: the purpose of the
project is understood by women as “a means to select the best varieties of barley and lentil”. Although women have participated in the PPB in Yemen, they have never heard about the performance of the different varieties in the
78
different locations because they know only the two or three local varieties grown in Yemen. Men of these households have expressed their willingness to let their wives and daughters participate in field trips organized by the scientists and extension agents involved in the PPB project in order to allow them learn more about the performance of different varieties in different agro-ecological conditions.
During the early stages of women’s participation in the PPB project they have learned about the existence of many varieties, and discuss many aspects of agriculture production with their husbands and children. They may acquire more knowledge and experience during the later stages of their participation in the PPB project. Men do not influence much the knowledge of women in agriculture because women are busy all day long performing all types of activities. They sometimes do discuss their work with their husbands. However, men’s opinion about women’s knowledge in agriculture is negative. This can be true to some extent for women whose husbands work on-farm but is not true for those whose husbands work off-farm and whose wives and daughters do the farming.
6. Discussions of the PPB between men and women: men do inform women in general
about their activities related to agricultural production. Discussions take place between them, and when women are consistent in their discussion and present strong arguments to support their ideas, men may take their opinion into consideration, but the last word is always for the men.
7. Preferences of women for barley and lentil varieties: women prefer the large grains of
both barley and lentil because of their high market prices. The size of the grain is favored even if the quantity of grains on the spike is small. Women favor all types of straw (millet, fenugreek, lentil, faba bean, barley) for their value as animal feed except wheat. They perceive that wheat straw makes animals very weak. There is a consensus on which varieties women and men select. Women base their selection on their own knowledge but their choices are very much affected by their husbands’ opinion. Women were asked individually about the characteristics of the selected varieties, and later on they were asked within groups in order to reach the best choice of varieties for the area.
8. Opinions of women on the selection process: it is premature for women to have an
independent opinion on the selection process. However their independence in expressing opinion is well developed as long as their husbands’ opinion is not involved. More time is needed until women are more acquainted to the selection process in order to assess and develop the methodology further.
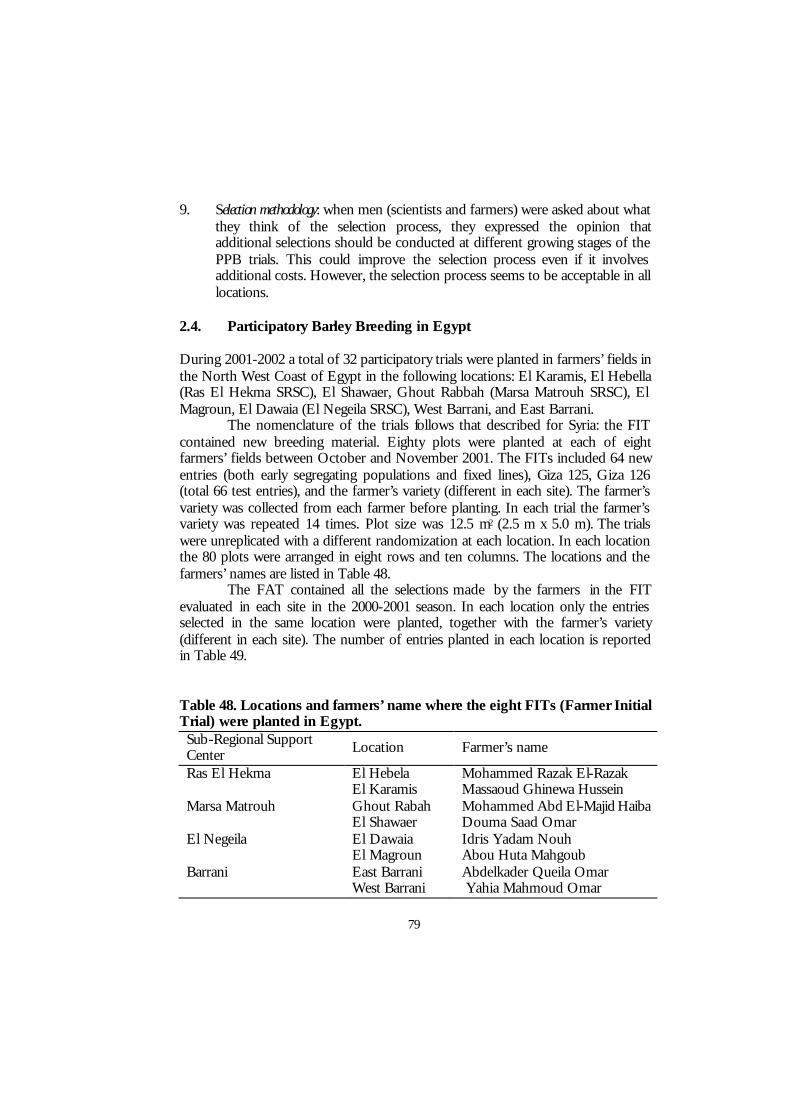
79
9. Selection methodology: when men (scientists and farmers) were asked about what they think of the selection process, they expressed the opinion that additional selections should be conducted at different growing stages of the PPB trials. This could improve the selection process even if it involves additional costs. However, the selection process seems to be acceptable in all locations.
2.4. Participatory Barley Breeding in Egypt During 2001-2002 a total of 32 participatory trials were planted in farmers’ fields in the North West Coast of Egypt in the following locations: El Karamis, El Hebella (Ras El Hekma SRSC), El Shawaer, Ghout Rabbah (Marsa Matrouh SRSC), El Magroun, El Dawaia (El Negeila SRSC), West Barrani, and East Barrani. The nomenclature of the trials follows that described for Syria: the FIT contained new breeding material. Eighty plots were planted at each of eight farmers’ fields between October and November 2001. The FITs included 64 new entries (both early segregating populations and fixed lines), Giza 125, Giza 126 (total 66 test entries), and the farmer’s variety (different in each site). The farmer’s variety was collected from each farmer before planting. In each trial the farmer’s variety was repeated 14 times. Plot size was 12.5 m2 (2.5 m x 5.0 m). The trials were unreplicated with a different randomization at each location. In each location the 80 plots were arranged in eight rows and ten columns. The locations and the farmers’ names are listed in Table 48. The FAT contained all the selections made by the farmers in the FIT evaluated in each site in the 2000-2001 season. In each location only the entries selected in the same location were planted, together with the farmer’s variety (different in each site). The number of entries planted in each location is reported in Table 49.
Table 48. Locations and farmers’ name where the eight FITs (Farmer Initial Trial) were planted in Egypt. Sub-Regional Support Center Location Farmer’s name
El Hebela Mohammed Razak El-Razak Ras El Hekma El Karamis Massaoud Ghinewa Hussein Ghout Rabah Mohammed Abd El-Majid Haiba Marsa Matrouh El Shawaer Douma Saad Omar El Dawaia Idris Yadam Nouh El Negeila El Magroun Abou Huta Mahgoub East Barrani Abdelkader Queila Omar Barrani West Barrani Yahia Mahmoud Omar

80
Table 49. Number of entries selected by farmers in 2000-2001 and included in FAT02 in each location.
SubRegional Support Center Location Number of entries (excluding the check)
El Hebela - Ras El Hekma El Karamis 10 Ghout Rabah - Marsa Matrouh El Shawaer 8 El Dawaia 11 El Negeila El Magroun 8 Barrani 1 4 Barrani Barrani 2 18
In El Hebela and Ghout Rabah, because of the limited rainfall in the previous season, the trial failed and therefore there were no entries selected for the FAT02. In each location the selected entries were planted in two farmers’ fields (the same farmer as the previous year and another farmer in the same area).
In each field of the same location, the FAT had the same entries and farmers were considered as replications.
The FET contained the selections made by the farmers from the FAT evaluated in 2000-2001.
The trials were visited several times during the cropping growing season by the farmers and by MRMP research staff. At maturity, in each farmer's field, a group of five to seven expert farmers, including the host farmer, gave an agronomic score to each plot. A score from 0 (worst) to 5 (best) was used in all locations. In each region the same farmers scored the trials planted in the two locations in that area. Selection was conducted in such a way as to reveal the criteria being used by the farmers in making their choices. At the end of the selection we sat with farmers to discuss about the trial, to have their impression about the germplasm, and to decide which entries to select for the next year. One barley breeder scored the trials at the same time.
In each trial the following data were recorded: plant height (PH) in cm; spike length (SL) in cm; number of spikes per m2 (SSM); biomass (BY) in kg/ha; grain yield (GY) in kg/ha. The data were subjected to the different types of analysis described earlier
Plant height, spike length, number of spikes per m2, grain yield, and biomass of the 66 entries included in the FIT02 are shown in Table 50 together with the values of the local check.
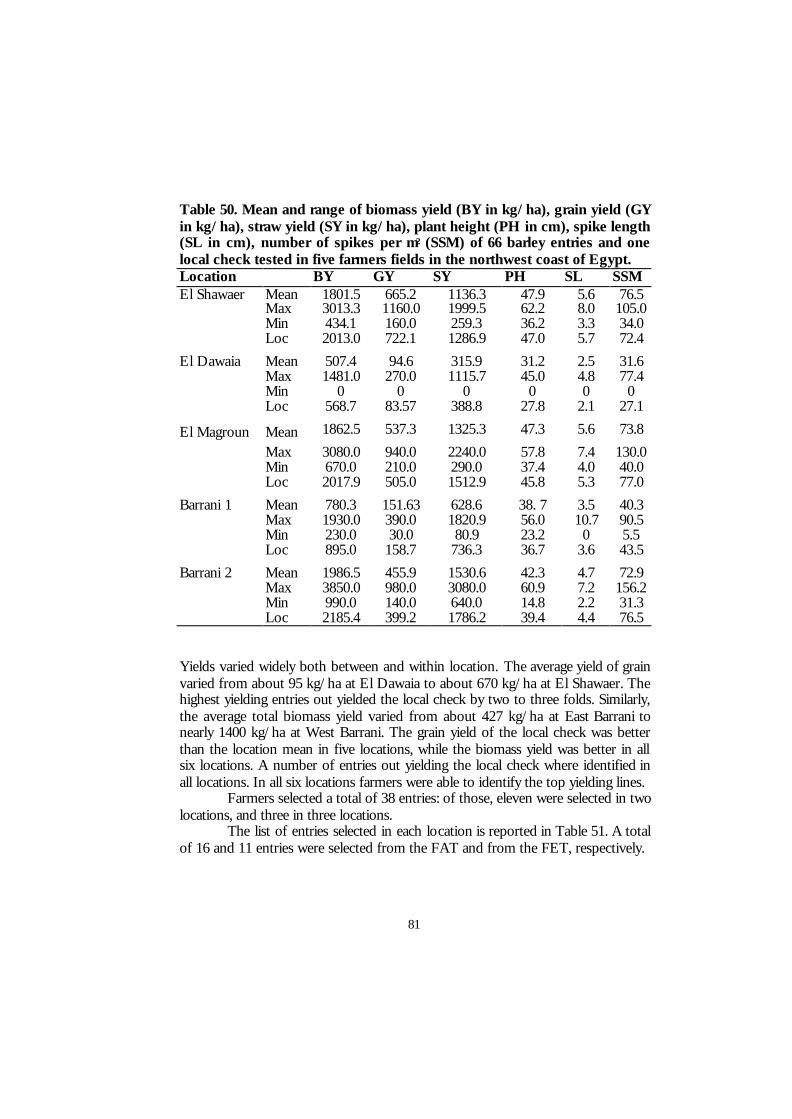
81
Table 50. Mean and range of biomass yield (BY in kg/ha), grain yield (GY in kg/ha), straw yield (SY in kg/ha), plant height (PH in cm), spike length (SL in cm), number of spikes per m2 (SSM) of 66 barley entries and one local check tested in five farmers fields in the northwest coast of Egypt. Location BY GY SY PH SL SSM El Shawaer Mean 1801.5 665.2 1136.3 47.9 5.6 76.5 Max 3013.3 1160.0 1999.5 62.2 8.0 105.0 Min 434.1 160.0 259.3 36.2 3.3 34.0 Loc 2013.0 722.1 1286.9 47.0 5.7 72.4 El Dawaia Mean 507.4 94.6 315.9 31.2 2.5 31.6 Max 1481.0 270.0 1115.7 45.0 4.8 77.4 Min 0 0 0 0 0 0 Loc 568.7 83.57 388.8 27.8 2.1 27.1 El Magroun Mean 1862.5 537.3 1325.3 47.3 5.6 73.8
Max 3080.0 940.0 2240.0 57.8 7.4 130.0 Min 670.0 210.0 290.0 37.4 4.0 40.0 Loc 2017.9 505.0 1512.9 45.8 5.3 77.0 Barrani 1 Mean 780.3 151.63 628.6 38. 7 3.5 40.3 Max 1930.0 390.0 1820.9 56.0 10.7 90.5 Min 230.0 30.0 80.9 23.2 0 5.5 Loc 895.0 158.7 736.3 36.7 3.6 43.5 Barrani 2 Mean 1986.5 455.9 1530.6 42.3 4.7 72.9 Max 3850.0 980.0 3080.0 60.9 7.2 156.2 Min 990.0 140.0 640.0 14.8 2.2 31.3 Loc 2185.4 399.2 1786.2 39.4 4.4 76.5 Yields varied widely both between and within location. The average yield of grain varied from about 95 kg/ha at El Dawaia to about 670 kg/ha at El Shawaer. The highest yielding entries out yielded the local check by two to three folds. Similarly, the average total biomass yield varied from about 427 kg/ha at East Barrani to nearly 1400 kg/ha at West Barrani. The grain yield of the local check was better than the location mean in five locations, while the biomass yield was better in all six locations. A number of entries out yielding the local check where identified in all locations. In all six locations farmers were able to identify the top yielding lines.
Farmers selected a total of 38 entries: of those, eleven were selected in two locations, and three in three locations.
The list of entries selected in each location is reported in Table 51. A total of 16 and 11 entries were selected from the FAT and from the FET, respectively.
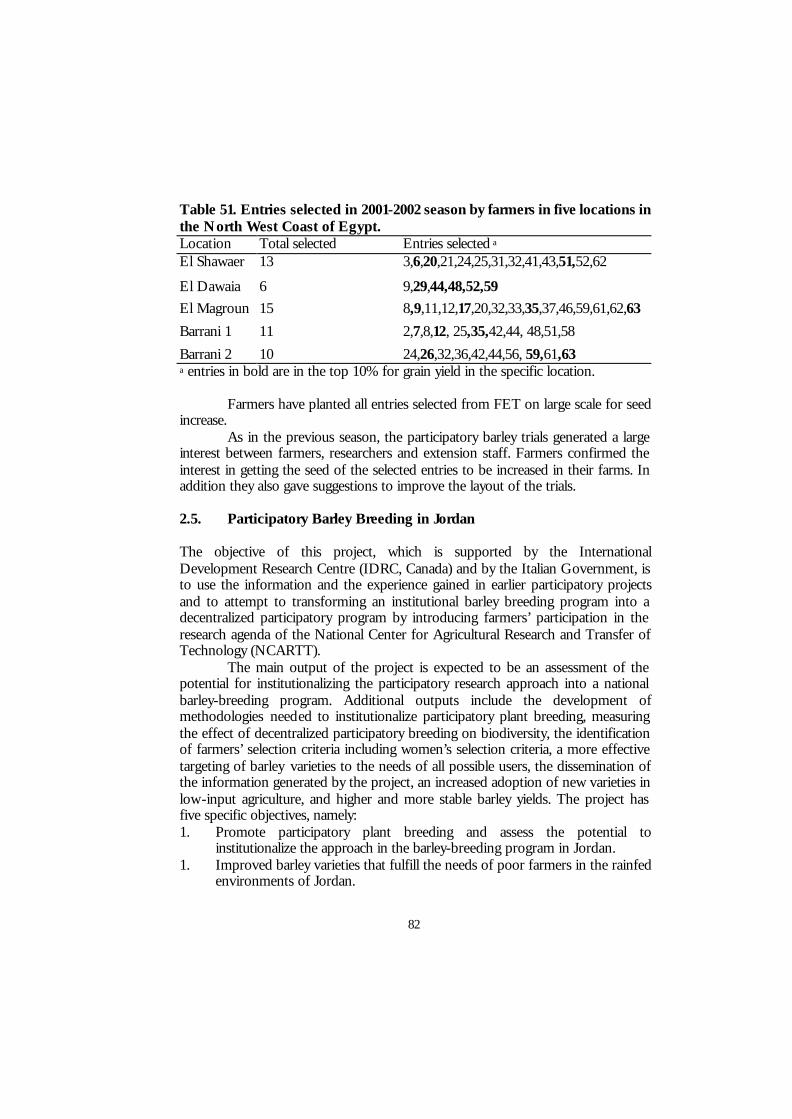
82
Table 51. Entries selected in 2001-2002 season by farmers in five locations in the North West Coast of Egypt. Location Total selected Entries selected a El Shawaer 13 3,6,20,21,24,25,31,32,41,43,51,52,62 El Dawaia 6 9,29,44,48,52,59 El Magroun 15 8,9,11,12,17,20,32,33,35,37,46,59,61,62,63 Barrani 1 11 2,7,8,12, 25,35,42,44, 48,51,58 Barrani 2 10 24,26,32,36,42,44,56, 59,61,63 a entries in bold are in the top 10% for grain yield in the specific location.
Farmers have planted all entries selected from FET on large scale for seed increase.
As in the previous season, the participatory barley trials generated a large interest between farmers, researchers and extension staff. Farmers confirmed the interest in getting the seed of the selected entries to be increased in their farms. In addition they also gave suggestions to improve the layout of the trials. 2.5. Participatory Barley Breeding in Jordan The objective of this project, which is supported by the International Development Research Centre (IDRC, Canada) and by the Italian Government, is to use the information and the experience gained in earlier participatory projects and to attempt to transforming an institutional barley breeding program into a decentralized participatory program by introducing farmers’ participation in the research agenda of the National Center for Agricultural Research and Transfer of Technology (NCARTT).
The main output of the project is expected to be an assessment of the potential for institutionalizing the participatory research approach into a national barley-breeding program. Additional outputs include the development of methodologies needed to institutionalize participatory plant breeding, measuring the effect of decentralized participatory breeding on biodiversity, the identification of farmers’ selection criteria including women’s selection criteria, a more effective targeting of barley varieties to the needs of all possible users, the dissemination of the information generated by the project, an increased adoption of new varieties in low-input agriculture, and higher and more stable barley yields. The project has five specific objectives, namely: 1. Promote participatory plant breeding and assess the potential to
institutionalize the approach in the barley-breeding program in Jordan. 1. Improved barley varieties that fulfill the needs of poor farmers in the rainfed
environments of Jordan.
83
2. Enhanced rate of adoption of new varieties through farmers’ participation in selection and testing.
3. Identification of differences between selection criteria used by men and women farmers and by breeders.
2.5.1. Livelihood Analysis In four of the six locations where participatory barley breeding program was conducted, namely Mohay, Ghweer, Rabba and Ramtha, a study was conducted to gather an understanding of the communities, identify their constraints, their livelihood challenges and strategies, as well as the degree of importance of barley production in their and their children ‘s lives.
The livelihood of people in these areas depends on different types of farming and a range of other activities. They succeed in some of their initiatives and fail in others, according to their access to resources, work opportunities and other life related items. The daily struggle of rural communities needs to be well understood in order for researchers and development practitioners to intervene according to the real obstacles these people face.
Farming is considered as key to rural economy and an important source of employment, but other sources of income are also of great importance because many rural people are unable to gain adequate and secure livelihoods from farming only due to different reasons.
Understanding the livelihoods is a critical element of the Institutionalization of Participatory Research (PR). Without having a "livelihoods approach" as the mean to understand more about rural communities' constraints and opportunities, PR cannot be fully institutionalized. Furthermore, PR is currently used predominantly in biophysical research and less so in social science research, and such capacity is lacking at NCARTT. The aim of this investigation was, therefore, partly to have a more complete picture of the livelihoods aspects of the villages where PBB is being conducted and partly to train and build the awareness of NCARTT staff on this aspect of the research. To achieve the last objective, national researchers from JOHUD, NCARTT and UOJ participated actively in the investigation.
In order to combat poverty through technology or other development interventions, there is a need to understand the overall livelihood system of the communities we deal with. In this respect, and as part of a larger study in the region, information was collected from four research sites (Mohay, Ghweer, Rabba and Ramtha) with both women and men using participatory tools. The research objectives of this study were to assess the livelihoods of the rural people and to understand their constraints and to understand the importance of barley production in their daily lives.
Several participatory tools, such as the seasonal calendar, the historical calendar, the problem analysis diagram, the livelihood matrix, the benefits analysis

84
matrix (for barley products only), mapping of the social organization, village resources mapping, were used to collect information. Some of these tools have been used with men alone, some of them with women alone and some with both women and men.
Eventually, the method used for problem diagnosis was the constraints analysis tool. This tool is useful in helping the researcher in discussing with farmers the problems they face, the causes and consequences of these problems, and identify the possible entry points for eventual solutions. This tool was used with women and men separately in Ghweer, with men in Mohay, and with women in Rabba and Ramtha. 2.5.1.1. Community Characterization A number of tribes have important representatives in governmental institutions and decision-making positions. This affects considerably the members of these tribes in the rural areas, such as the Majali tribe, which has a Minister in the Jordanian government. This aspect is important in Jordan as the social organization of tribes helps understand farmers’ strategies for their livelihoods and the possible interventions.
The structure of the tribes in Mohay shows the different tribes living in the area. They have many important roles in terms of their relationships, their relations with the governmental institutions and their impact on the rural people. They have a strong capacity to affect in one way or the other the opinions of their members.
Participatory tools were used either with women and men or with men alone and women alone according to the circumstances in each location. This information of gender specificity is reported in the title for each section of information.
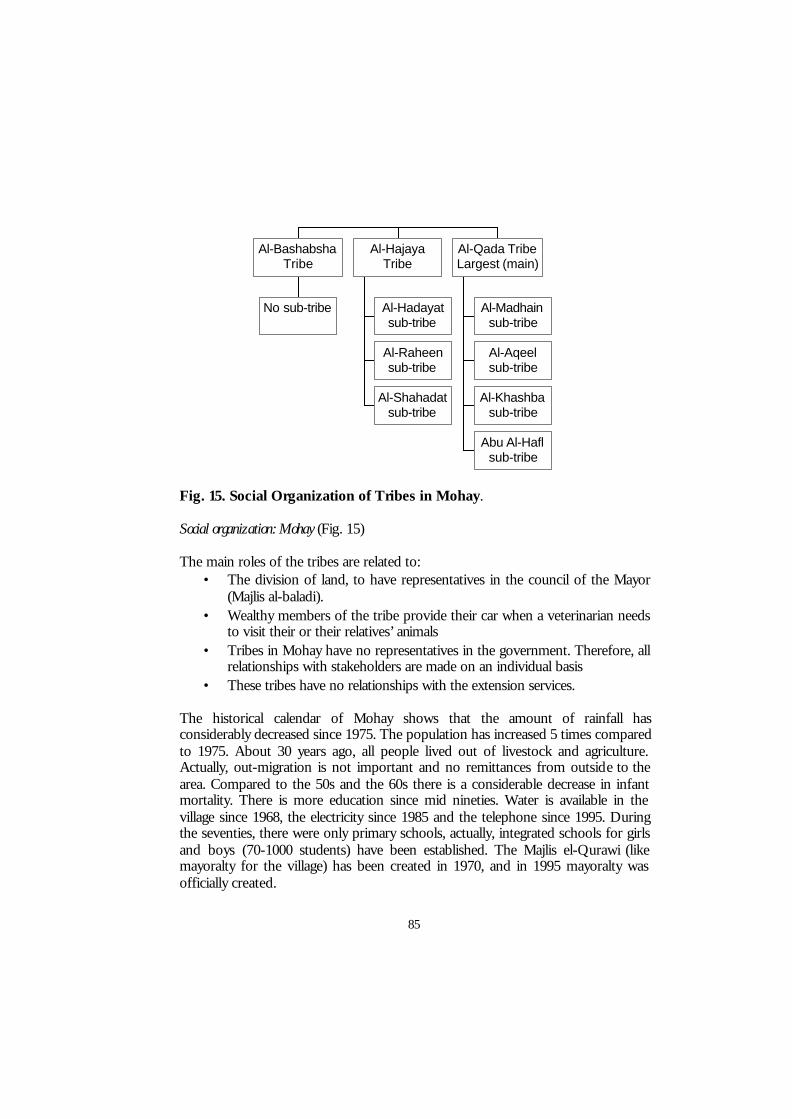
85
Fig. 15. Social Organization of Tribes in Mohay. Social organization: Mohay (Fig. 15) The main roles of the tribes are related to:
• The division of land, to have representatives in the council of the Mayor (Majlis al-baladi).
• Wealthy members of the tribe provide their car when a veterinarian needs to visit their or their relatives’ animals
• Tribes in Mohay have no representatives in the government. Therefore, all relationships with stakeholders are made on an individual basis
• These tribes have no relationships with the extension services. The historical calendar of Mohay shows that the amount of rainfall has considerably decreased since 1975. The population has increased 5 times compared to 1975. About 30 years ago, all people lived out of livestock and agriculture. Actually, out-migration is not important and no remittances from outside to the area. Compared to the 50s and the 60s there is a considerable decrease in infant mortality. There is more education since mid nineties. Water is available in the village since 1968, the electricity since 1985 and the telephone since 1995. During the seventies, there were only primary schools, actually, integrated schools for girls and boys (70-1000 students) have been established. The Majlis el-Qurawi (like mayoralty for the village) has been created in 1970, and in 1995 mayoralty was officially created.
No sub-tribe
Al-BashabshaTribe
Al-Hadayatsub-tribe
Al-Raheensub-tribe
Al-Shahadatsub-tribe
Al-HajayaTribe
Al-Madhainsub-tribe
Al-Aqeelsub-tribe
Al-Khashbasub-tribe
Abu Al-Haflsub-tribe
Al-Qada TribeLargest (main)
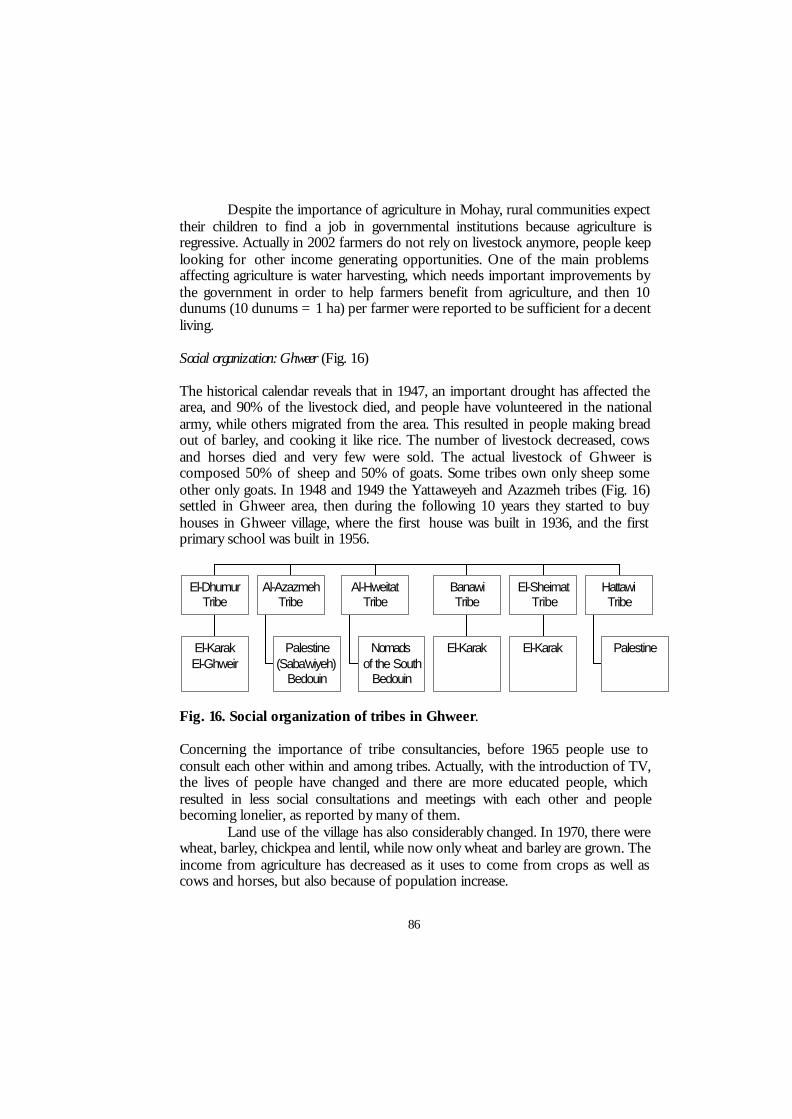
86
Despite the importance of agriculture in Mohay, rural communities expect their children to find a job in governmental institutions because agriculture is regressive. Actually in 2002 farmers do not rely on livestock anymore, people keep looking for other income generating opportunities. One of the main problems affecting agriculture is water harvesting, which needs important improvements by the government in order to help farmers benefit from agriculture, and then 10 dunums (10 dunums = 1 ha) per farmer were reported to be sufficient for a decent living. Social organization: Ghweer (Fig. 16) The historical calendar reveals that in 1947, an important drought has affected the area, and 90% of the livestock died, and people have volunteered in the national army, while others migrated from the area. This resulted in people making bread out of barley, and cooking it like rice. The number of livestock decreased, cows and horses died and very few were sold. The actual livestock of Ghweer is composed 50% of sheep and 50% of goats. Some tribes own only sheep some other only goats. In 1948 and 1949 the Yattaweyeh and Azazmeh tribes (Fig. 16) settled in Ghweer area, then during the following 10 years they started to buy houses in Ghweer village, where the first house was built in 1936, and the first primary school was built in 1956.
Fig. 16. Social organization of tribes in Ghweer. Concerning the importance of tribe consultancies, before 1965 people use to consult each other within and among tribes. Actually, with the introduction of TV, the lives of people have changed and there are more educated people, which resulted in less social consultations and meetings with each other and people becoming lonelier, as reported by many of them.
Land use of the village has also considerably changed. In 1970, there were wheat, barley, chickpea and lentil, while now only wheat and barley are grown. The income from agriculture has decreased as it uses to come from crops as well as cows and horses, but also because of population increase.
El-KarakEl-Ghweir
El-DhumurTribe
Palestine(Saba'wiyeh)
Bedouin
Al-AzazmehTribe
Nomadsof the South
Bedouin
Al-HweitatTribe
El-Karak
BanawiTribe
El-Karak
El-SheimatTribe
Palestine
HattawiTribe
87
Nowadays, migration from rural to urban areas affects mainly students who go to cities for studying, and then they usually come back to their original village. They surprisingly prefer to come back to their villages and find decent income sources for their livelihoods, but their education prevent them from looking for employment opportunities because of what they call thaqafat el-‘eib which means that it is a shame for educated people to work in agriculture.
Women were asked to draw a map of their village with the different resources existent in their village. Local people mapped many types of resources such as social, financial, human physical and natural resources. The local people were asked to classify these resources by degree of importance. The main resources reported on the map by women were: 1. The mosque: prayers, Islam, home of God (social and physical) 2. The school: education (social and physical) 3. Health center: good integrated health center: (social and physical) 4. Social club: for social events such as weddings, condolences, visits of
guests, votes, conferences, leisure of youth etc… (social and physical) 5. Kindergarten for educating young children and helping the working
mothers (social, financial and physical) 6. Post office for telephone calls, mail, payment of telephone bills, and
opening saving accounts (social and physical) Women were asked to describe the natural resources of their village, and the results were: 1. Lands: all lands are owned by the Dhumur tribe; the Azazmeh tribe rent
land from the Dhumur for farming, then the Hweitat tribe rent also land at a smaller scale than the Azazmeh.
2. Livestock: considering livestock ownership, the Azazmeh owns goats, and the Hweitat owns both goats and sheep.
3. Water: about 7 home wells were drilled to overcome the problems of water in summer.
4. Vegetative cover: many local plants, such as Shih, chamomile, thym, ji’deh, rijl al-hamameh all are used as hot drinks to cure some ailments.
Financial resources identified and discussed with women 1. Agricultural credits are used for: a. Buying livestock (are given mainly to men) 2. Other credits obtained from the bank are used for: a. Buying lands to be constructed b. Education c. Construction of homes. Social organization: Rabba (Fig. 17)
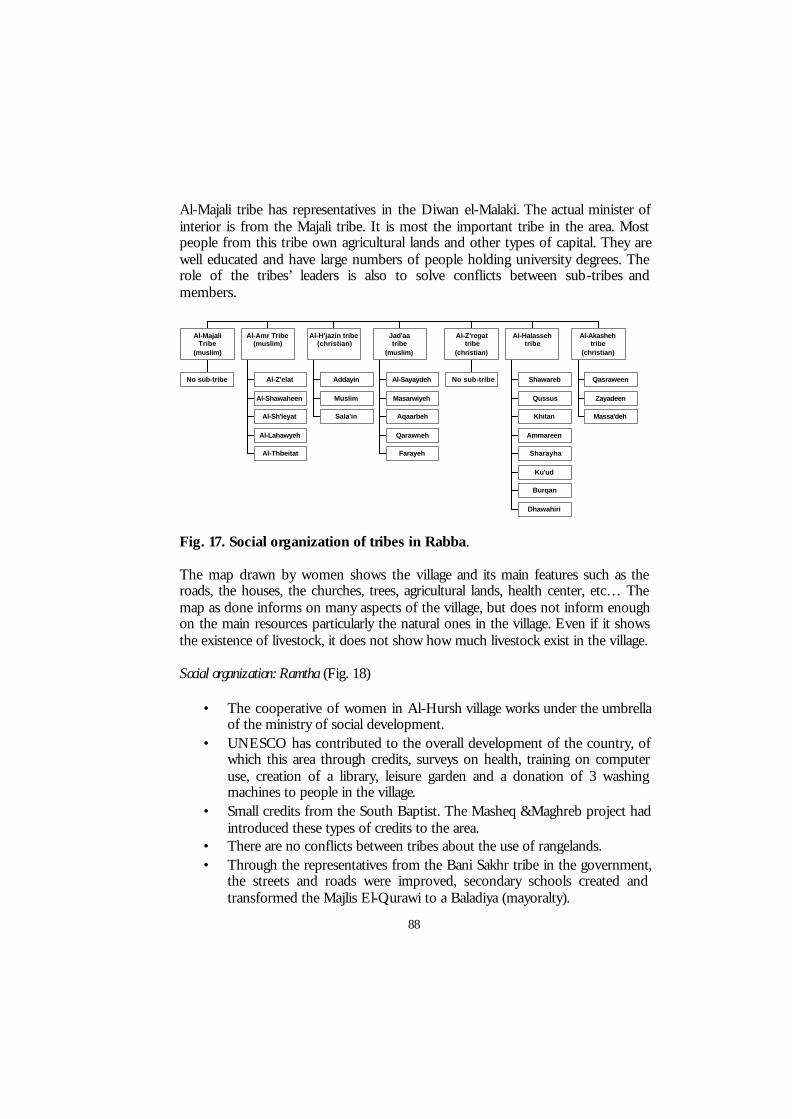
88
Al-Majali tribe has representatives in the Diwan el-Malaki. The actual minister of interior is from the Majali tribe. It is most the important tribe in the area. Most people from this tribe own agricultural lands and other types of capital. They are well educated and have large numbers of people holding university degrees. The role of the tribes’ leaders is also to solve conflicts between sub-tribes and members.
Fig. 17. Social organization of tribes in Rabba. The map drawn by women shows the village and its main features such as the roads, the houses, the churches, trees, agricultural lands, health center, etc… The map as done informs on many aspects of the village, but does not inform enough on the main resources particularly the natural ones in the village. Even if it shows the existence of livestock, it does not show how much livestock exist in the village. Social organization: Ramtha (Fig. 18)
• The cooperative of women in Al-Hursh village works under the umbrella of the ministry of social development.
• UNESCO has contributed to the overall development of the country, of which this area through credits, surveys on health, training on computer use, creation of a library, leisure garden and a donation of 3 washing machines to people in the village.
• Small credits from the South Baptist. The Masheq &Maghreb project had introduced these types of credits to the area.
• There are no conflicts between tribes about the use of rangelands. • Through the representatives from the Bani Sakhr tribe in the government,
the streets and roads were improved, secondary schools created and transformed the Majlis El-Qurawi to a Baladiya (mayoralty).
No sub-tribe
Al-MajaliTribe
(muslim)
Al-Z'elat
Al-Shawaheen
Al-Sh'leyat
Al-Lahawyeh
Al-Thbeitat
Al-Amr Tribe(muslim)
Addayin
Muslim
Sala'in
Al-H'jazin tribe(christian)
Al-Sayaydeh
Masarwiyeh
Aqaarbeh
Qarawneh
Farayeh
Jad'aatribe
(muslim)
No sub-tribe
Al-Z'regattribe
(christian)
Shawareb
Qussus
Khitan
Ammareen
Sharayha
Ku'ud
Burqan
Dhawahiri
Al-Halassehtribe
Qasraween
Zayadeen
Massa'deh
Al-Akashehtribe
(christian)
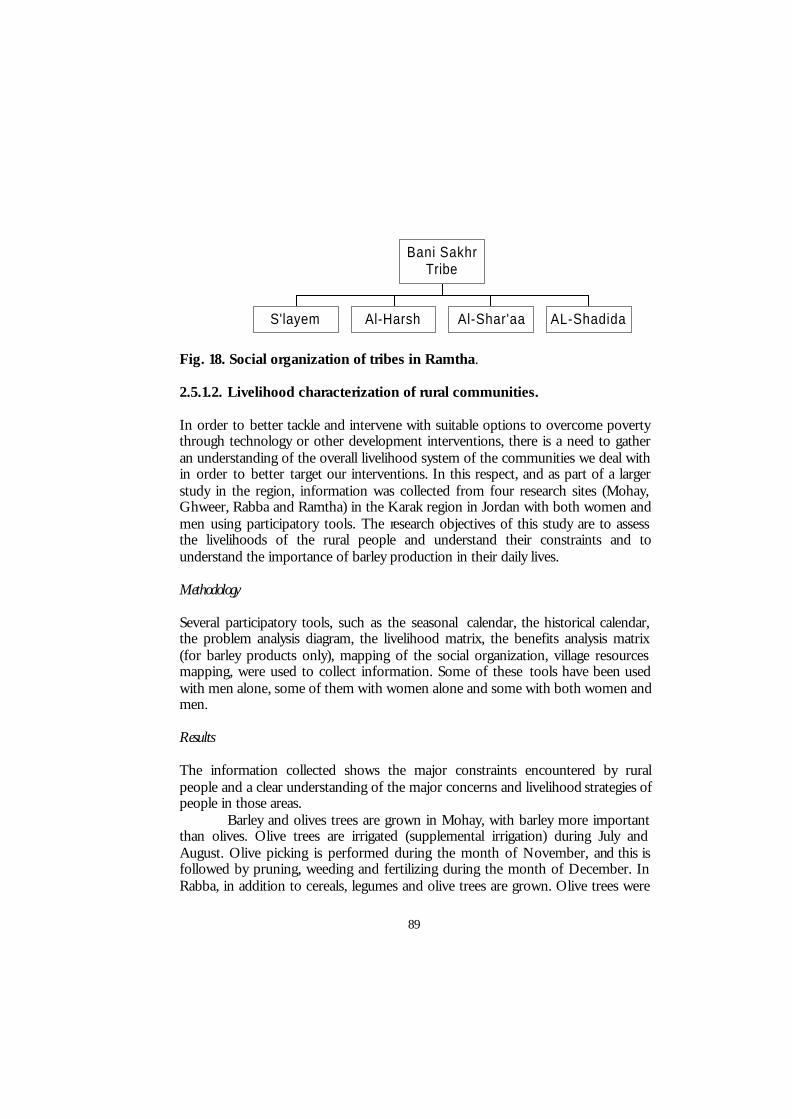
89
Fig. 18. Social organization of tribes in Ramtha. 2.5.1.2. Livelihood characterization of rural communities. In order to better tackle and intervene with suitable options to overcome poverty through technology or other development interventions, there is a need to gather an understanding of the overall livelihood system of the communities we deal with in order to better target our interventions. In this respect, and as part of a larger study in the region, information was collected from four research sites (Mohay, Ghweer, Rabba and Ramtha) in the Karak region in Jordan with both women and men using participatory tools. The research objectives of this study are to assess the livelihoods of the rural people and understand their constraints and to understand the importance of barley production in their daily lives. Methodology Several participatory tools, such as the seasonal calendar, the historical calendar, the problem analysis diagram, the livelihood matrix, the benefits analysis matrix (for barley products only), mapping of the social organization, village resources mapping, were used to collect information. Some of these tools have been used with men alone, some of them with women alone and some with both women and men. Results The information collected shows the major constraints encountered by rural people and a clear understanding of the major concerns and livelihood strategies of people in those areas.
Barley and olives trees are grown in Mohay, with barley more important than olives. Olive trees are irrigated (supplemental irrigation) during July and August. Olive picking is performed during the month of November, and this is followed by pruning, weeding and fertilizing during the month of December. In Rabba, in addition to cereals, legumes and olive trees are grown. Olive trees were
S'layem Al-Harsh Al-Shar'aa AL-Shadida
Bani SakhrTribe
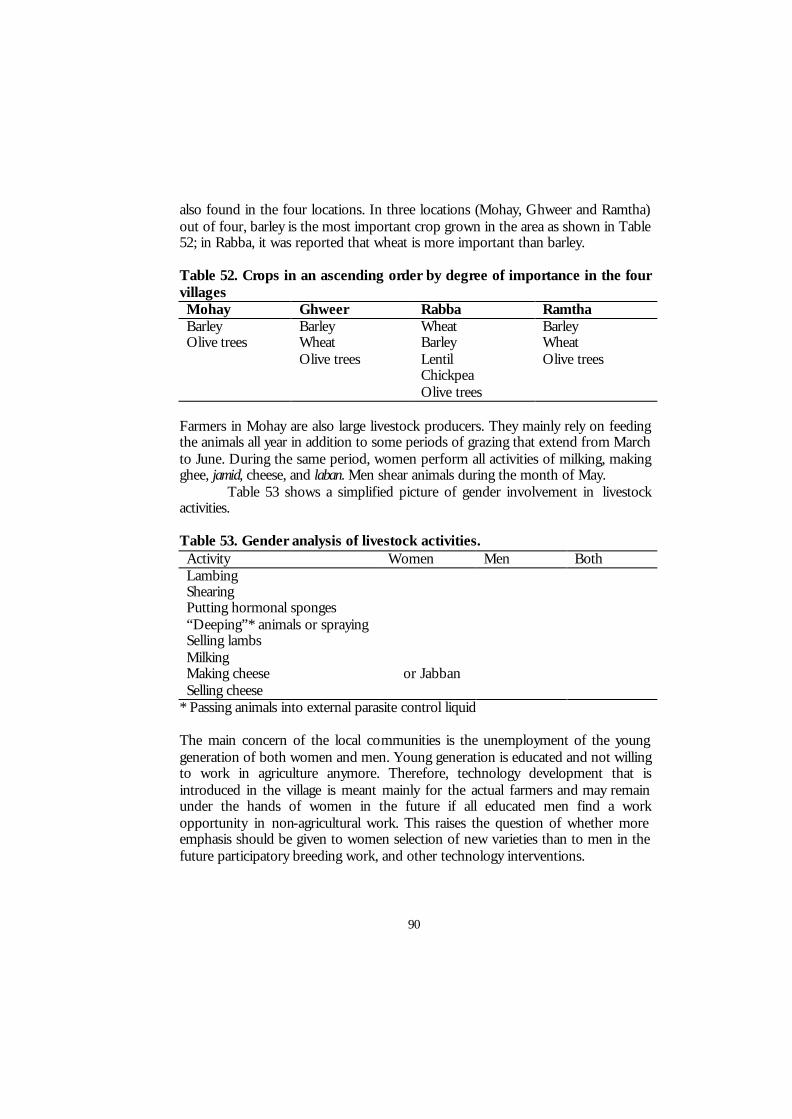
90
also found in the four locations. In three locations (Mohay, Ghweer and Ramtha) out of four, barley is the most important crop grown in the area as shown in Table 52; in Rabba, it was reported that wheat is more important than barley. Table 52. Crops in an ascending order by degree of importance in the four villages Mohay Ghweer Rabba Ramtha Barley� Barley Wheat Barley Olive trees � Wheat Barley Wheat Olive trees Lentil Olive trees Chickpea Olive trees
Farmers in Mohay are also large livestock producers. They mainly rely on feeding the animals all year in addition to some periods of grazing that extend from March to June. During the same period, women perform all activities of milking, making ghee, jamid, cheese, and laban. Men shear animals during the month of May.
Table 53 shows a simplified picture of gender involvement in livestock activities. Table 53. Gender analysis of livestock activities. Activity Women Men Both Lambing � Shearing �� Putting hormonal sponges �� “Deeping”* animals or spraying � Selling lambs � Milking � Making cheese � or Jabban Selling cheese �
* Passing animals into external parasite control liquid The main concern of the local communities is the unemployment of the young generation of both women and men. Young generation is educated and not willing to work in agriculture anymore. Therefore, technology development that is introduced in the village is meant mainly for the actual farmers and may remain under the hands of women in the future if all educated men find a work opportunity in non-agricultural work. This raises the question of whether more emphasis should be given to women selection of new varieties than to men in the future participatory breeding work, and other technology interventions.
91
2.5.1.3. Problems, Solutions and Aspirations of the Communities Problem diagnosis The method used for problem diagnosis was the constraints analysis tool. This tool is useful in helping the researcher discuss with farmers the problems they face, the causes and consequences of these problems, and identify the possible entry points for eventual solutions. This tool was used with women and men separately in Ghweer, with men in Mohay, and with women in Rabba and Ramtha.
In Ghweer, the problem diagnosis (by women) indicated that the main problem of rural people in Ghweer is associated with unemployment. The causes of unemployment in Ghweer are the scarcity of projects held by the Government, the scarcity of employment opportunities in the whole area, the scarcity of institutions that provide credits, “thaqafat el-‘aib” which means that young people especially when educated refuse to work in some professions such as carpenter or ironsmith or agriculture. As a consequence young people suffer from psychological problems, they look older than their real age, the age of marriage is delayed for both women and men because they cannot establish their independent household without a reliable income, the family cannot respond to some household needs such as education, the level of the standard of living of the family decreases because the dependency ratio increases as a result of more consumers than producers.
The solutions suggested by the local people are to provide essential needs at reasonable prices such as gas, kerosene and fuel oil, as well as sugar and other essential goods, and t provide work opportunities and health insurance to people in rural areas.
The mapping the village resource by men in Ghweer shows that people rely mainly on governmental employment. Only one farmer living in the village has livestock, the others are Bedouins living outside the village.
The main problem stated by men in Ghweer is the lack of water for livestock producers, the lack of a secondary school for boys, in addition to the lack of an Imam for the mosque. The causes of these problems according to men are the decline in rainfall during the last few years, the only well that provides water for animal producers is far from the areas of their flocks, the boys secondary school is located in Thania which is 5 km away from Ghweer. The effects of these problems are that the production costs are very high due to the high prices of water which reduces the income from production, the high costs of education which leads to students sneaking away (out) of school, and selling part of the livestock due to the lack of sufficient water. The solutions suggested by the local people are building pipelines from the main well of the village to the area where most livestock producers are grouped, decrease the water prices from 0.5 JD to 30 cents, and consider upgrading the existing primary school in Ghweer to a secondary school.
92
In Mohay, the problem diagnosis conducted with men revealed that the main constraints farmers suffer from are unemployment, lack of health center and drought. Local people associated the lack of employment opportunities with the fact that their area is not well represented in governmental institutions. The lack of health center was also strongly stressed. In those case in which some work opportunities were created, the distance to the job was far and the income was only 70 JD, of which 30 JD are spent for transportation. The effects of the lack of health center are that there are more health problems in the area; reaching the closest health center (about 40 km away) requires additional time and money.
The solutions to these problems suggested by the local community are to allocate an investor in the area to create work opportunities, to improve the small health center that already exists in the village, and to improve the water harvesting techniques through more investments.
In Rabba the problem diagnosis (by women) indicated that unemployment followed by drought and the weaknesses of agricultural extension services are the main problems. The causes of these problems according to women are the lack of factories in the area, lack of vacancies for employment, lack of good connections at the governmental level and the absenteeism of the extension agents.
The unemployment causes difficulties for young people, both women and men, in getting married even when their have high education degrees because they have no job, migration of men outside the area - one PhD holder is employed in a Veterinarian cabinet and is paid 100 JD), psychological problems to men and women – a university degree holders works in the village as hairdresser to get additional income, but still Thaqafat el-Aib is important in the area.
The solutions suggested by the local people are to provide credits for small income generating activities, to open projects to create work opportunities, and to make credits available to people.
In Ramtha, the problem diagnosis conducted with women revealed that the main constraints farmers suffer from are unemployment of both women and men. This is the result of lack of projects in the area, and of drought (mahl in local language), and therefore most people rely on the salaries of their children in the Jordanian army. The irrigation of olive trees was also stated as one of the main problems in the area. Other problems include low productivity caused by drought (land produces every 10 years and is called ‘ashrawiyeh’); farmers are about to leave trees without irrigation because of water prices (from 400-600 JD every 3 months) 50 trees cost 1000 JD/year; lack of projects in the area because the government wants to protect the environment (there was a factory producing soap that has been closed).
In conclusion, the information shows the major constraints and a clear understanding of the major concerns and livelihood strategies of people in those areas. Scientists should have a more clear understanding of the approach particularly for natural resource management. This investigation will be complemented later by additional visits and compared with other sites in the
93
region, and more exercises for scientists about the participatory tools used to work with local communities are needed. The collected information is showing the major constraints and a clear understanding of the major concerns and livelihood strategies of people in those areas. 2.5.2. Participatory Field Trials and Selection. 2.5.2.1. Farmer Initial Yield Trials The PPB trials in Jordan are structured like in Syria and Egypt and the same acronyms are used in the three countries. In 2002/02, a new set of FIT, each with two hundred plot (179 entries and two systematic checks, one repeated 10 times and one repeated 11 times) were planted at each of the same seven farmers’ fields as in the previous season, and in the research station at Ghweer. The entries, the same in all locations, include both segregating populations and fixed lines, while as checks we used the improved six-row officially released variety Rum, and the local check. The local check was a landraces and the host farmer supplied its seed. In each trial Rum was repeated 11 times and the local check 10. However, while Rum was repeated in all locations, the local check varied with the locations. Plot size is 10 m2 (2m x 5m). The trials were unreplicated with a different randomization at each location. In each location the 200 plots were arranged in incomplete blocks of ten plots each, and in ten rows and twenty columns. This allowed both an incomplete block analysis as well as a bi-dimensional spatial analysis.
Seed increase was planted at the JUST’s campus in 100 m2 plots under supplementary irrigation.
The total amount of rainfall varied from 345 in Rabba to 139 in Mohay (Table 54). In Ramtha, we used the rainfall recorded at the research station that is situated in between the two locations used for the trials. Actually, Ramtha East is drier, and Ramtha West is wetter than the station. Even though total rainfall was high, its distribution was poor with no rainfall after anthesis.
In each trial, we recorded plant height (ph) in cm, spike length (sp) in cm, grain yield (gy) and total biomass (by) in kg/ha, harvest index (hi), and 1000 kernel weight (kw) in g.
Grain yield ranged from 189 and 353 kg/ha in Mohay and Khanasri, to 1222 kg/ha in Ramtha East and 1654 kg/ha in Ramtha West (Table 55). In all locations there was a very low harvest index, possibly a consequence of the severe terminal stress. In the two driest locations, also plant height, spike length and 1000-kernel weight, the latter particularly in Khanasri, were negatively affected by terminal drought.
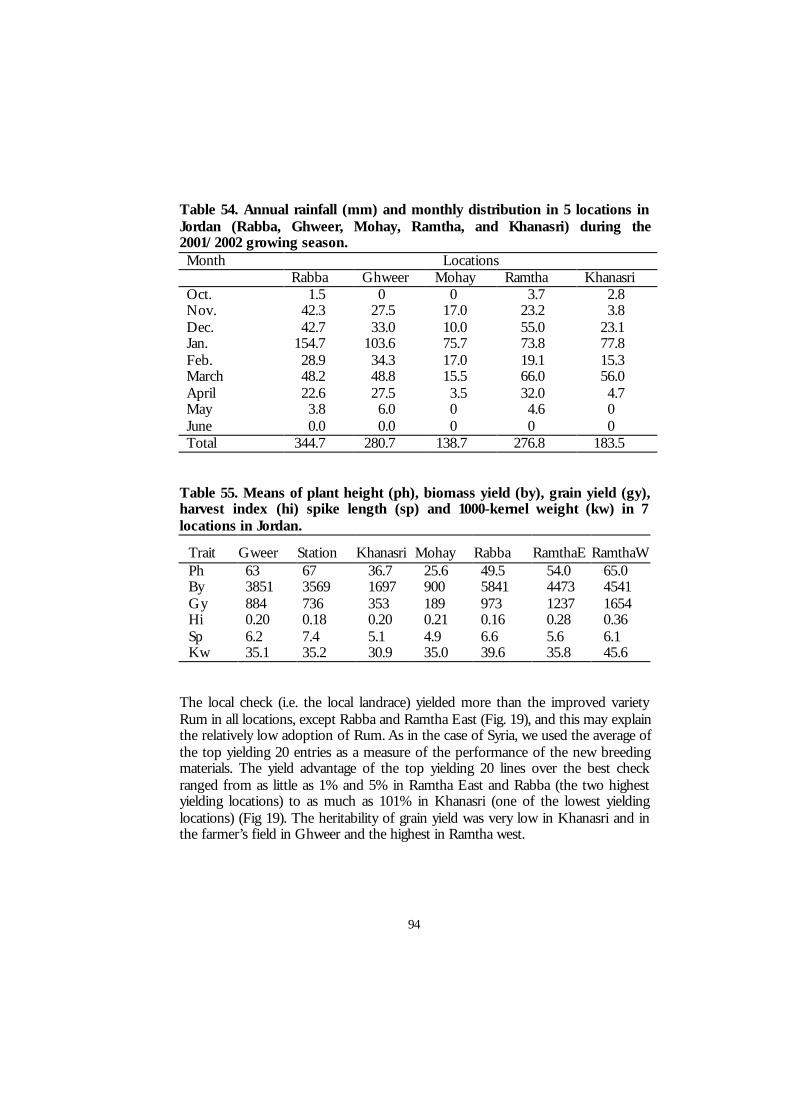
94
Table 54. Annual rainfall (mm) and monthly distribution in 5 locations in Jordan (Rabba, Ghweer, Mohay, Ramtha, and Khanasri) during the 2001/2002 growing season. Month Locations Rabba Ghweer Mohay Ramtha Khanasri Oct. 1.5 0 0 3.7 2.8 Nov. 42.3 27.5 17.0 23.2 3.8 Dec. 42.7 33.0 10.0 55.0 23.1 Jan. 154.7 103.6 75.7 73.8 77.8 Feb. 28.9 34.3 17.0 19.1 15.3 March 48.2 48.8 15.5 66.0 56.0 April 22.6 27.5 3.5 32.0 4.7 May 3.8 6.0 0 4.6 0 June 0.0 0.0 0 0 0 Total 344.7 280.7 138.7 276.8 183.5
Table 55. Means of plant height (ph), biomass yield (by), grain yield (gy), harvest index (hi) spike length (sp) and 1000-kernel weight (kw) in 7 locations in Jordan.
Trait Gweer Station Khanasri Mohay Rabba RamthaE RamthaW Ph 63 67 36.7 25.6 49.5 54.0 65.0 By 3851 3569 1697 900 5841 4473 4541 Gy 884 736 353 189 973 1237 1654 Hi 0.20 0.18 0.20 0.21 0.16 0.28 0.36 Sp 6.2 7.4 5.1 4.9 6.6 5.6 6.1 Kw 35.1 35.2 30.9 35.0 39.6 35.8 45.6
The local check (i.e. the local landrace) yielded more than the improved variety Rum in all locations, except Rabba and Ramtha East (Fig. 19), and this may explain the relatively low adoption of Rum. As in the case of Syria, we used the average of the top yielding 20 entries as a measure of the performance of the new breeding materials. The yield advantage of the top yielding 20 lines over the best check ranged from as little as 1% and 5% in Ramtha East and Rabba (the two highest yielding locations) to as much as 101% in Khanasri (one of the lowest yielding locations) (Fig 19). The heritability of grain yield was very low in Khanasri and in the farmer’s field in Ghweer and the highest in Ramtha west.
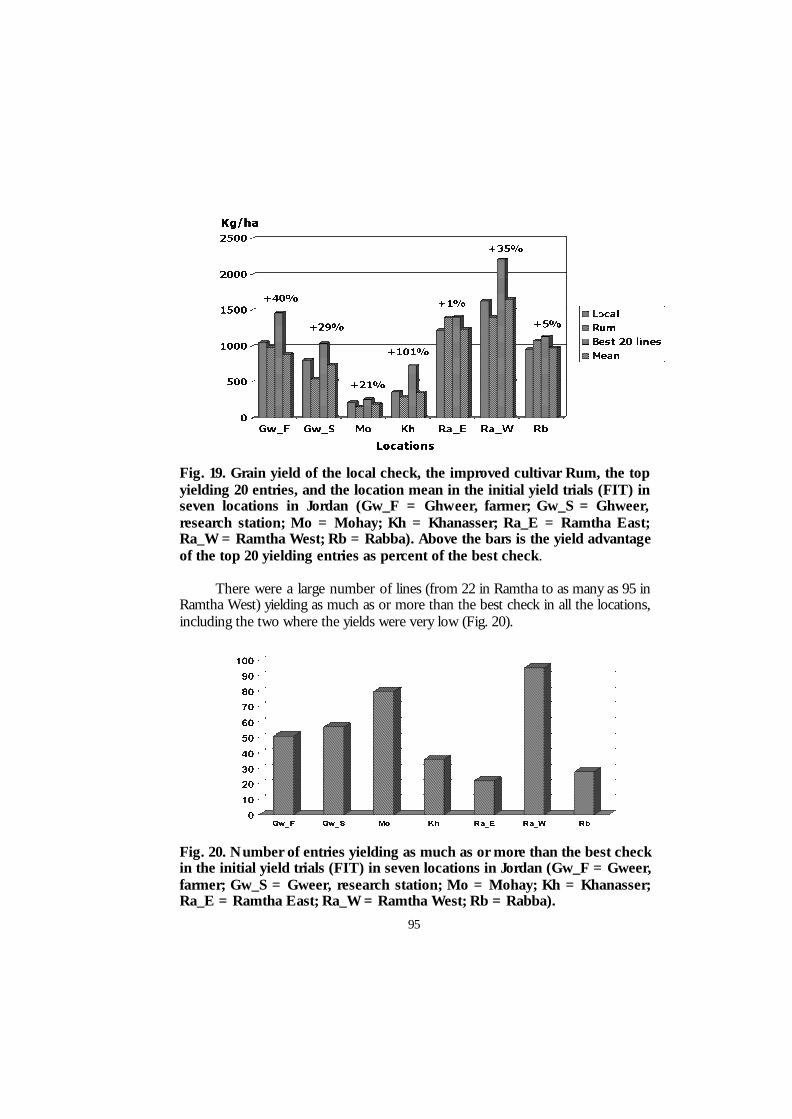
95
Fig. 19. Grain yield of the local check, the improved cultivar Rum, the top yielding 20 entries, and the location mean in the initial yield trials (FIT) in seven locations in Jordan (Gw_F = Ghweer, farmer; Gw_S = Ghweer, research station; Mo = Mohay; Kh = Khanasser; Ra_E = Ramtha East; Ra_W = Ramtha West; Rb = Rabba). Above the bars is the yield advantage of the top 20 yielding entries as percent of the best check. There were a large number of lines (from 22 in Ramtha to as many as 95 in Ramtha West) yielding as much as or more than the best check in all the locations, including the two where the yields were very low (Fig. 20). Fig. 20. Number of entries yielding as much as or more than the best check in the initial yield trials (FIT) in seven locations in Jordan (Gw_F = Gweer, farmer; Gw_S = Gweer, research station; Mo = Mohay; Kh = Khanasser; Ra_E = Ramtha East; Ra_W = Ramtha West; Rb = Rabba).
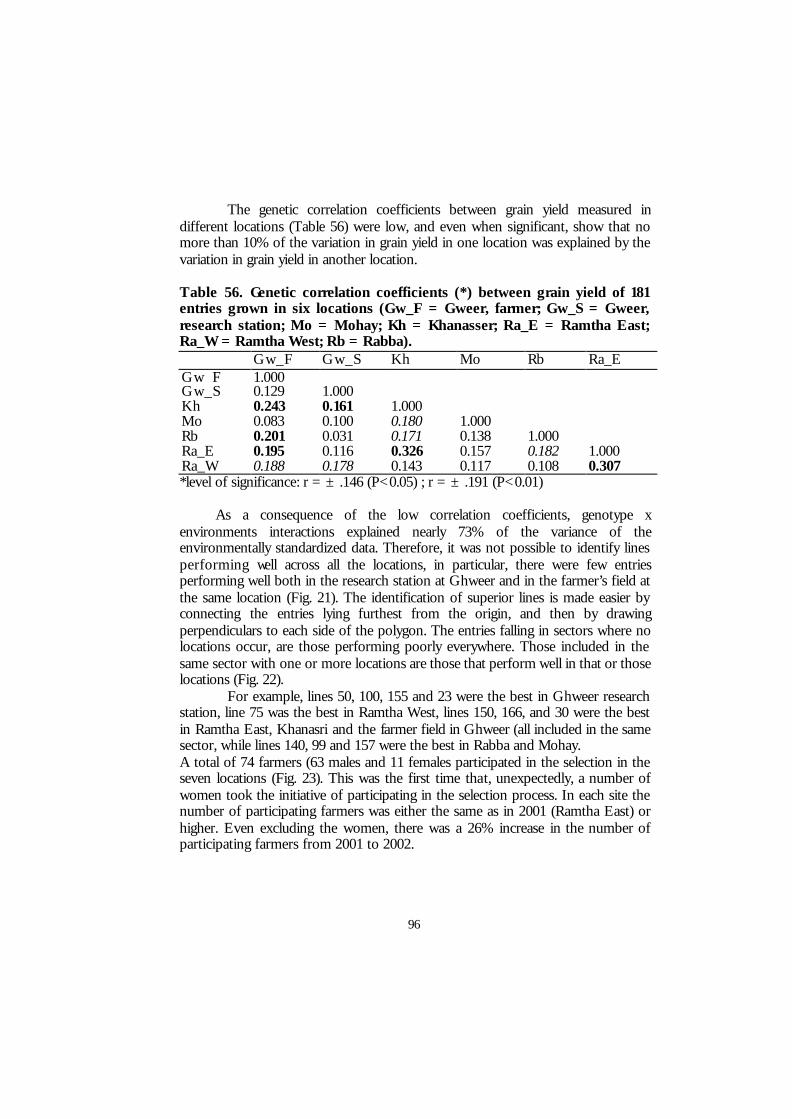
96
The genetic correlation coefficients between grain yield measured in different locations (Table 56) were low, and even when significant, show that no more than 10% of the variation in grain yield in one location was explained by the variation in grain yield in another location. Table 56. Genetic correlation coefficients (*) between grain yield of 181 entries grown in six locations (Gw_F = Gweer, farmer; Gw_S = Gweer, research station; Mo = Mohay; Kh = Khanasser; Ra_E = Ramtha East; Ra_W = Ramtha West; Rb = Rabba). Gw_F Gw_S Kh Mo Rb Ra_E Gw_F 1.000 Gw_S 0.129 1.000 Kh 0.243 0.161 1.000 Mo 0.083 0.100 0.180 1.000 Rb 0.201 0.031 0.171 0.138 1.000 Ra_E 0.195 0.116 0.326 0.157 0.182 1.000 Ra_W 0.188 0.178 0.143 0.117 0.108 0.307 *level of significance: r = ± .146 (P<0.05) ; r = ± .191 (P<0.01) As a consequence of the low correlation coefficients, genotype x environments interactions explained nearly 73% of the variance of the environmentally standardized data. Therefore, it was not possible to identify lines performing well across all the locations, in particular, there were few entries performing well both in the research station at Ghweer and in the farmer’s field at the same location (Fig. 21). The identification of superior lines is made easier by connecting the entries lying furthest from the origin, and then by drawing perpendiculars to each side of the polygon. The entries falling in sectors where no locations occur, are those performing poorly everywhere. Those included in the same sector with one or more locations are those that perform well in that or those locations (Fig. 22).
For example, lines 50, 100, 155 and 23 were the best in Ghweer research station, line 75 was the best in Ramtha West, lines 150, 166, and 30 were the best in Ramtha East, Khanasri and the farmer field in Ghweer (all included in the same sector, while lines 140, 99 and 157 were the best in Rabba and Mohay. A total of 74 farmers (63 males and 11 females participated in the selection in the seven locations (Fig. 23). This was the first time that, unexpectedly, a number of women took the initiative of participating in the selection process. In each site the number of participating farmers was either the same as in 2001 (Ramtha East) or higher. Even excluding the women, there was a 26% increase in the number of participating farmers from 2001 to 2002.
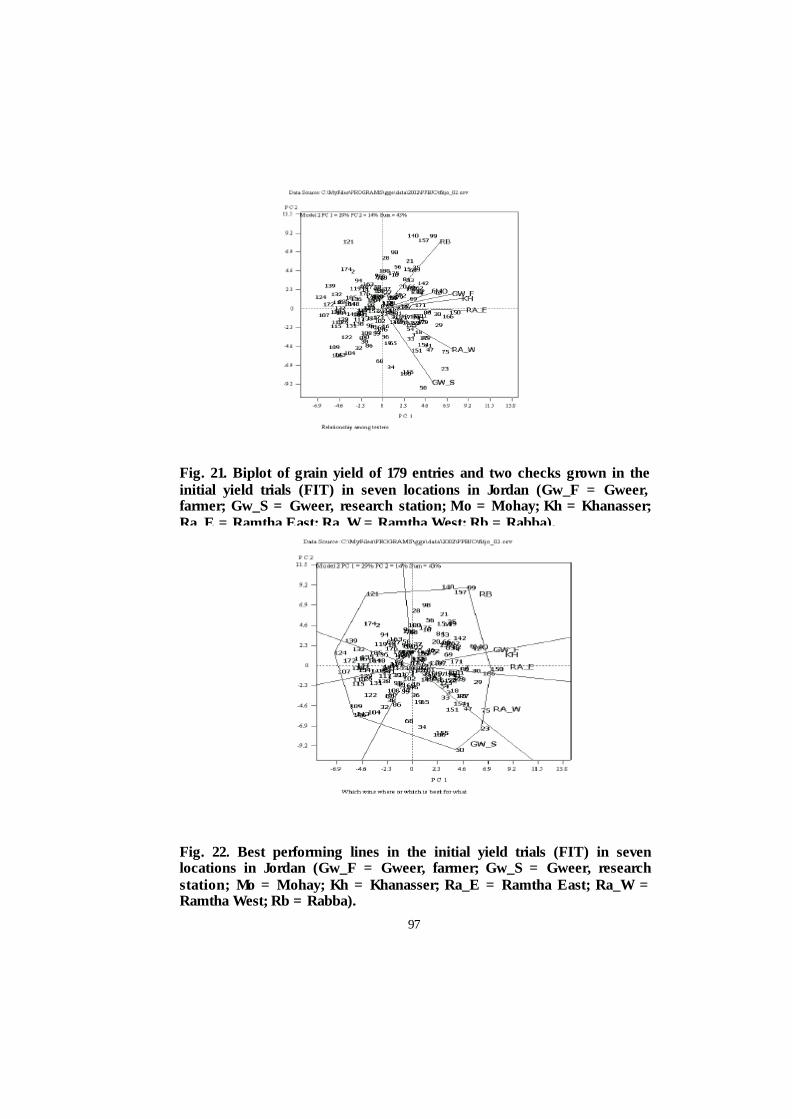
97
Fig. 21. Biplot of grain yield of 179 entries and two checks grown in the initial yield trials (FIT) in seven locations in Jordan (Gw_F = Gweer, farmer; Gw_S = Gweer, research station; Mo = Mohay; Kh = Khanasser; Ra_E = Ramtha East; Ra_W = Ramtha West; Rb = Rabba).
Fig. 22. Best performing lines in the initial yield trials (FIT) in seven locations in Jordan (Gw_F = Gweer, farmer; Gw_S = Gweer, research station; Mo = Mohay; Kh = Khanasser; Ra_E = Ramtha East; Ra_W = Ramtha West; Rb = Rabba).
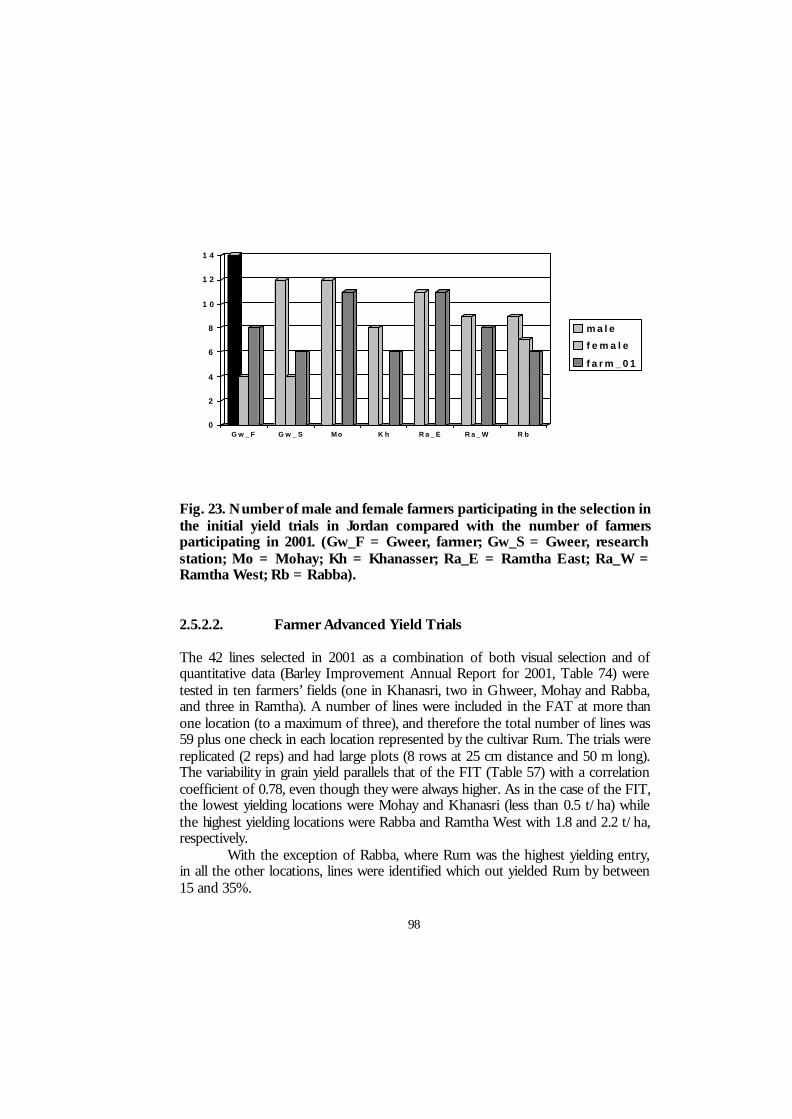
98
0
2
4
6
8
1 0
1 2
1 4
G w _ F G w _ S Mo K h R a _ E R a _ W R b
m a l e
f e m a l e
f a r m _ 0 1
Fig. 23. Number of male and female farmers participating in the selection in the initial yield trials in Jordan compared with the number of farmers participating in 2001. (Gw_F = Gweer, farmer; Gw_S = Gweer, research station; Mo = Mohay; Kh = Khanasser; Ra_E = Ramtha East; Ra_W = Ramtha West; Rb = Rabba). 2.5.2.2. Farmer Advanced Yield Trials The 42 lines selected in 2001 as a combination of both visual selection and of quantitative data (Barley Improvement Annual Report for 2001, Table 74) were tested in ten farmers’ fields (one in Khanasri, two in Ghweer, Mohay and Rabba, and three in Ramtha). A number of lines were included in the FAT at more than one location (to a maximum of three), and therefore the total number of lines was 59 plus one check in each location represented by the cultivar Rum. The trials were replicated (2 reps) and had large plots (8 rows at 25 cm distance and 50 m long). The variability in grain yield parallels that of the FIT (Table 57) with a correlation coefficient of 0.78, even though they were always higher. As in the case of the FIT, the lowest yielding locations were Mohay and Khanasri (less than 0.5 t/ha) while the highest yielding locations were Rabba and Ramtha West with 1.8 and 2.2 t/ha, respectively.
With the exception of Rabba, where Rum was the highest yielding entry, in all the other locations, lines were identified which out yielded Rum by between 15 and 35%.
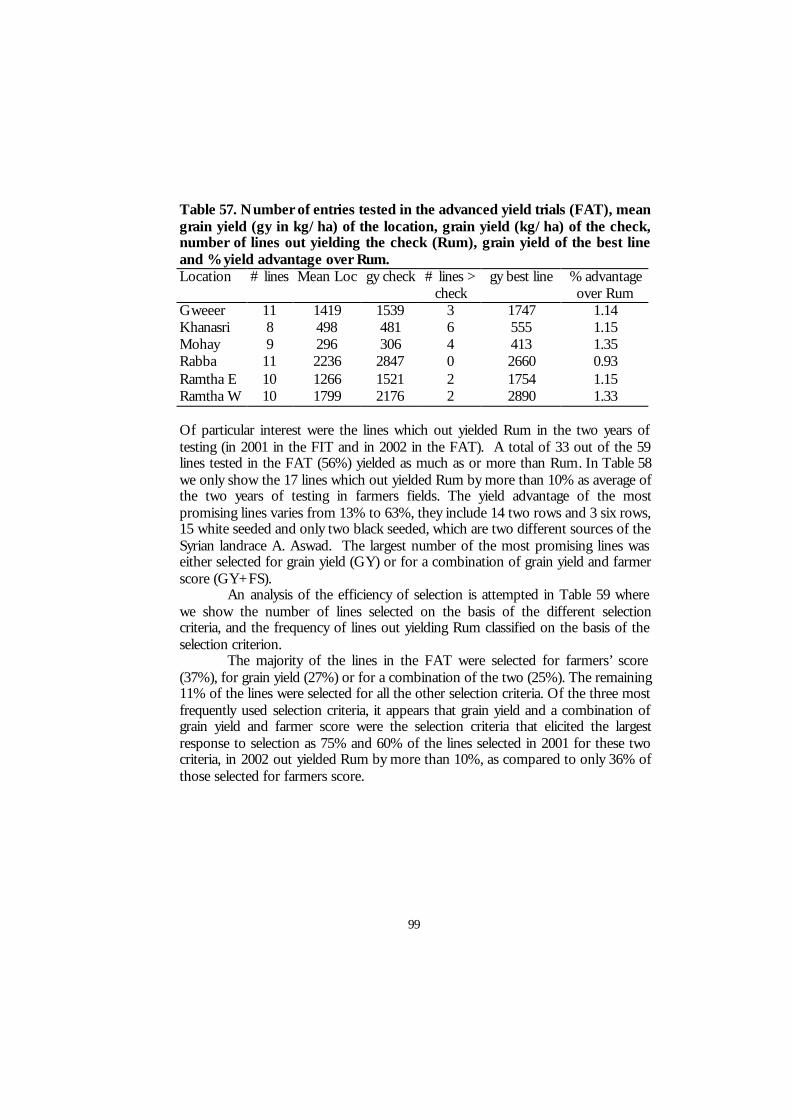
99
Table 57. Number of entries tested in the advanced yield trials (FAT), mean grain yield (gy in kg/ha) of the location, grain yield (kg/ha) of the check, number of lines out yielding the check (Rum), grain yield of the best line and % yield advantage over Rum. Location # lines Mean Loc gy check # lines >
check gy best line % advantage
over Rum Gweeer 11 1419 1539 3 1747 1.14 Khanasri 8 498 481 6 555 1.15 Mohay 9 296 306 4 413 1.35 Rabba 11 2236 2847 0 2660 0.93 Ramtha E 10 1266 1521 2 1754 1.15 Ramtha W 10 1799 2176 2 2890 1.33 Of particular interest were the lines which out yielded Rum in the two years of testing (in 2001 in the FIT and in 2002 in the FAT). A total of 33 out of the 59 lines tested in the FAT (56%) yielded as much as or more than Rum. In Table 58 we only show the 17 lines which out yielded Rum by more than 10% as average of the two years of testing in farmers fields. The yield advantage of the most promising lines varies from 13% to 63%, they include 14 two rows and 3 six rows, 15 white seeded and only two black seeded, which are two different sources of the Syrian landrace A. Aswad. The largest number of the most promising lines was either selected for grain yield (GY) or for a combination of grain yield and farmer score (GY+FS).
An analysis of the efficiency of selection is attempted in Table 59 where we show the number of lines selected on the basis of the different selection criteria, and the frequency of lines out yielding Rum classified on the basis of the selection criterion.
The majority of the lines in the FAT were selected for farmers’ score (37%), for grain yield (27%) or for a combination of the two (25%). The remaining 11% of the lines were selected for all the other selection criteria. Of the three most frequently used selection criteria, it appears that grain yield and a combination of grain yield and farmer score were the selection criteria that elicited the largest response to selection as 75% and 60% of the lines selected in 2001 for these two criteria, in 2002 out yielded Rum by more than 10%, as compared to only 36% of those selected for farmers score.
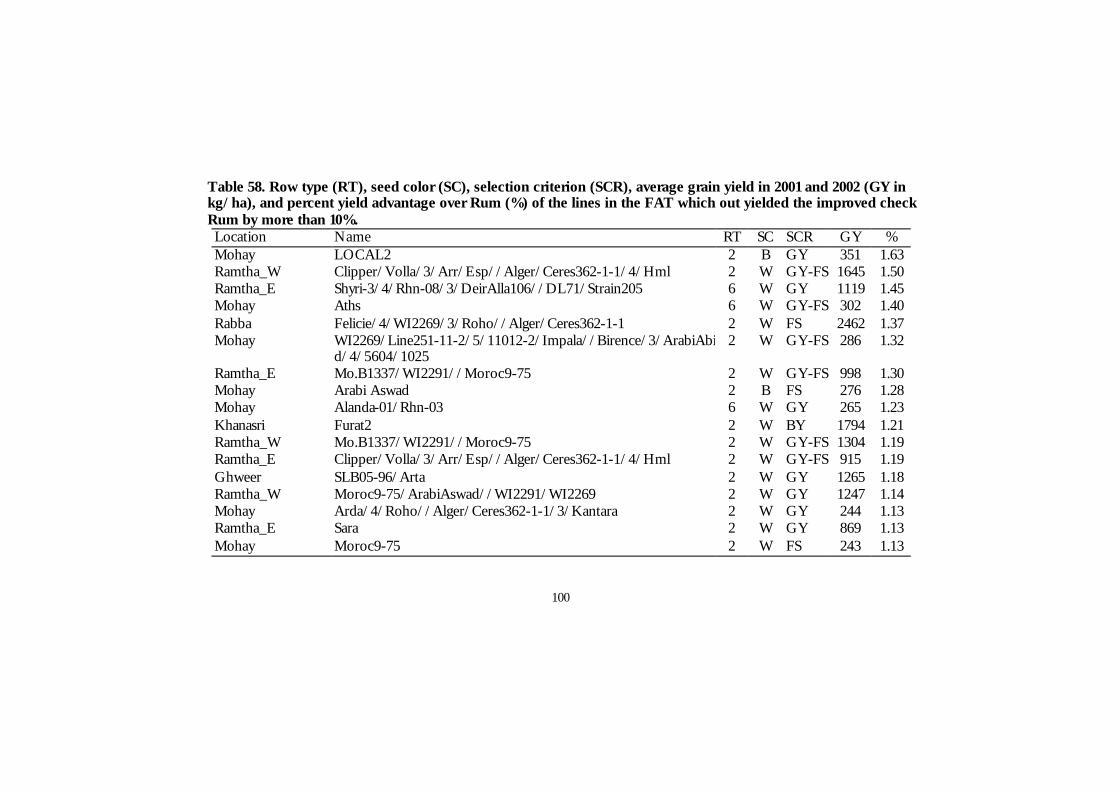
100
Table 58. Row type (RT), seed color (SC), selection criterion (SCR), average grain yield in 2001 and 2002 (GY in kg/ha), and percent yield advantage over Rum (%) of the lines in the FAT which out yielded the improved check Rum by more than 10%. Location Name RT SC SCR GY % Mohay LOCAL2 2 B GY 351 1.63 Ramtha_W Clipper/Volla/3/Arr/Esp//Alger/Ceres362-1-1/4/Hml 2 W GY-FS 1645 1.50 Ramtha_E Shyri-3/4/Rhn-08/3/DeirAlla106//DL71/Strain205 6 W GY 1119 1.45 Mohay Aths 6 W GY-FS 302 1.40 Rabba Felicie/4/WI2269/3/Roho//Alger/Ceres362-1-1 2 W FS 2462 1.37 Mohay WI2269/Line251-11-2/5/11012-2/Impala//Birence/3/ArabiAbia
d/4/5604/1025 2 W GY-FS 286 1.32
Ramtha_E Mo.B1337/WI2291//Moroc9-75 2 W GY-FS 998 1.30 Mohay Arabi Aswad 2 B FS 276 1.28 Mohay Alanda-01/Rhn-03 6 W GY 265 1.23 Khanasri Furat2 2 W BY 1794 1.21 Ramtha_W Mo.B1337/WI2291//Moroc9-75 2 W GY-FS 1304 1.19 Ramtha_E Clipper/Volla/3/Arr/Esp//Alger/Ceres362-1-1/4/Hml 2 W GY-FS 915 1.19 Ghweer SLB05-96/Arta 2 W GY 1265 1.18 Ramtha_W Moroc9-75/ArabiAswad//WI2291/WI2269 2 W GY 1247 1.14 Mohay Arda/4/Roho//Alger/Ceres362-1-1/3/Kantara 2 W GY 244 1.13 Ramtha_E Sara 2 W GY 869 1.13 Mohay Moroc9-75 2 W FS 243 1.13
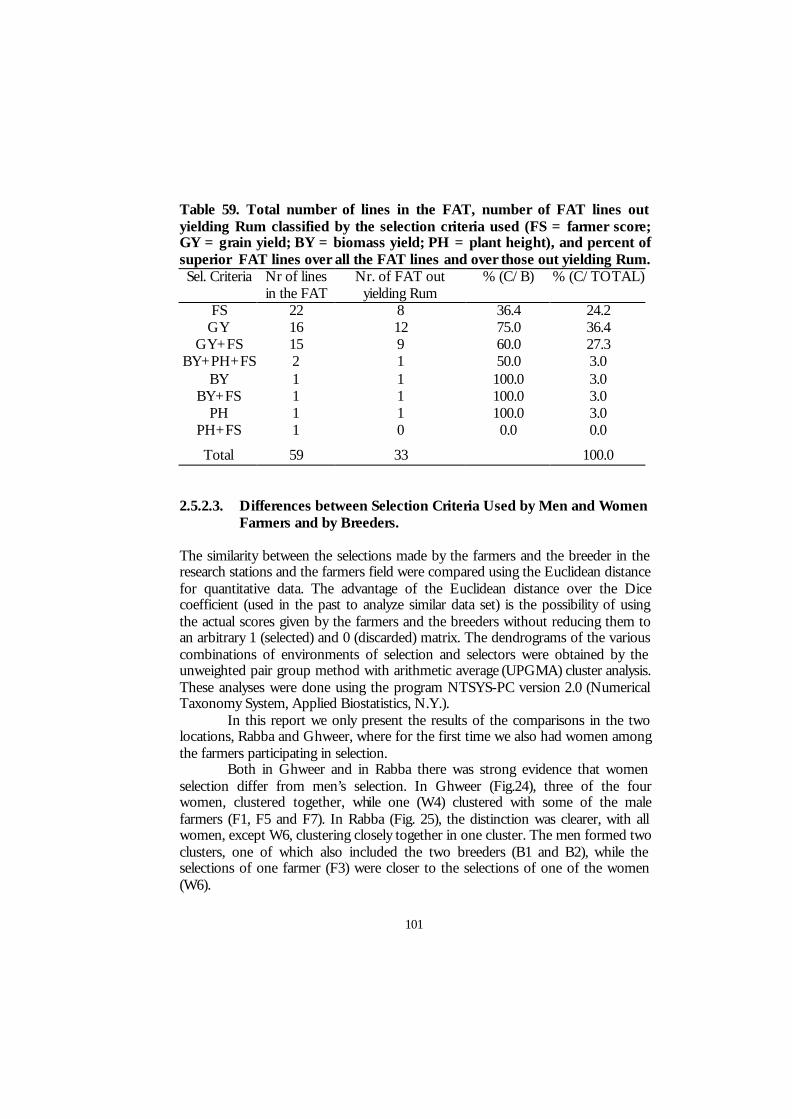
101
Table 59. Total number of lines in the FAT, number of FAT lines out yielding Rum classified by the selection criteria used (FS = farmer score; GY = grain yield; BY = biomass yield; PH = plant height), and percent of superior FAT lines over all the FAT lines and over those out yielding Rum. Sel. Criteria Nr of lines
in the FAT Nr. of FAT out
yielding Rum % (C/B) % (C/TOTAL)
FS 22 8 36.4 24.2 GY 16 12 75.0 36.4
GY+FS 15 9 60.0 27.3 BY+PH+FS 2 1 50.0 3.0
BY 1 1 100.0 3.0 BY+FS 1 1 100.0 3.0
PH 1 1 100.0 3.0 PH+FS 1 0 0.0 0.0
Total 59 33 100.0 2.5.2.3. Differences between Selection Criteria Used by Men and Women
Farmers and by Breeders. The similarity between the selections made by the farmers and the breeder in the research stations and the farmers field were compared using the Euclidean distance for quantitative data. The advantage of the Euclidean distance over the Dice coefficient (used in the past to analyze similar data set) is the possibility of using the actual scores given by the farmers and the breeders without reducing them to an arbitrary 1 (selected) and 0 (discarded) matrix. The dendrograms of the various combinations of environments of selection and selectors were obtained by the unweighted pair group method with arithmetic average (UPGMA) cluster analysis. These analyses were done using the program NTSYS-PC version 2.0 (Numerical Taxonomy System, Applied Biostatistics, N.Y.).
In this report we only present the results of the comparisons in the two locations, Rabba and Ghweer, where for the first time we also had women among the farmers participating in selection.
Both in Ghweer and in Rabba there was strong evidence that women selection differ from men’s selection. In Ghweer (Fig.24), three of the four women, clustered together, while one (W4) clustered with some of the male farmers (F1, F5 and F7). In Rabba (Fig. 25), the distinction was clearer, with all women, except W6, clustering closely together in one cluster. The men formed two clusters, one of which also included the two breeders (B1 and B2), while the selections of one farmer (F3) were closer to the selections of one of the women (W6).
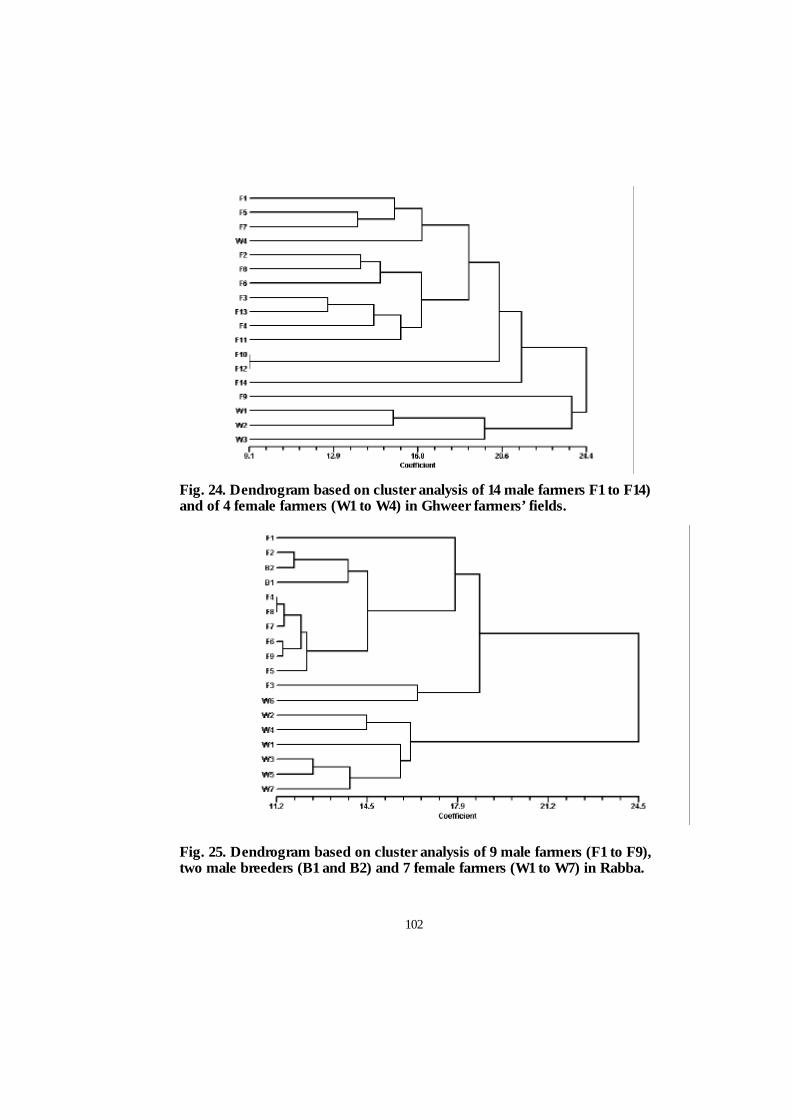
102
Fig. 24. Dendrogram based on cluster analysis of 14 male farmers F1 to F14) and of 4 female farmers (W1 to W4) in Ghweer farmers’ fields. Fig. 25. Dendrogram based on cluster analysis of 9 male farmers (F1 to F9), two male breeders (B1 and B2) and 7 female farmers (W1 to W7) in Rabba.
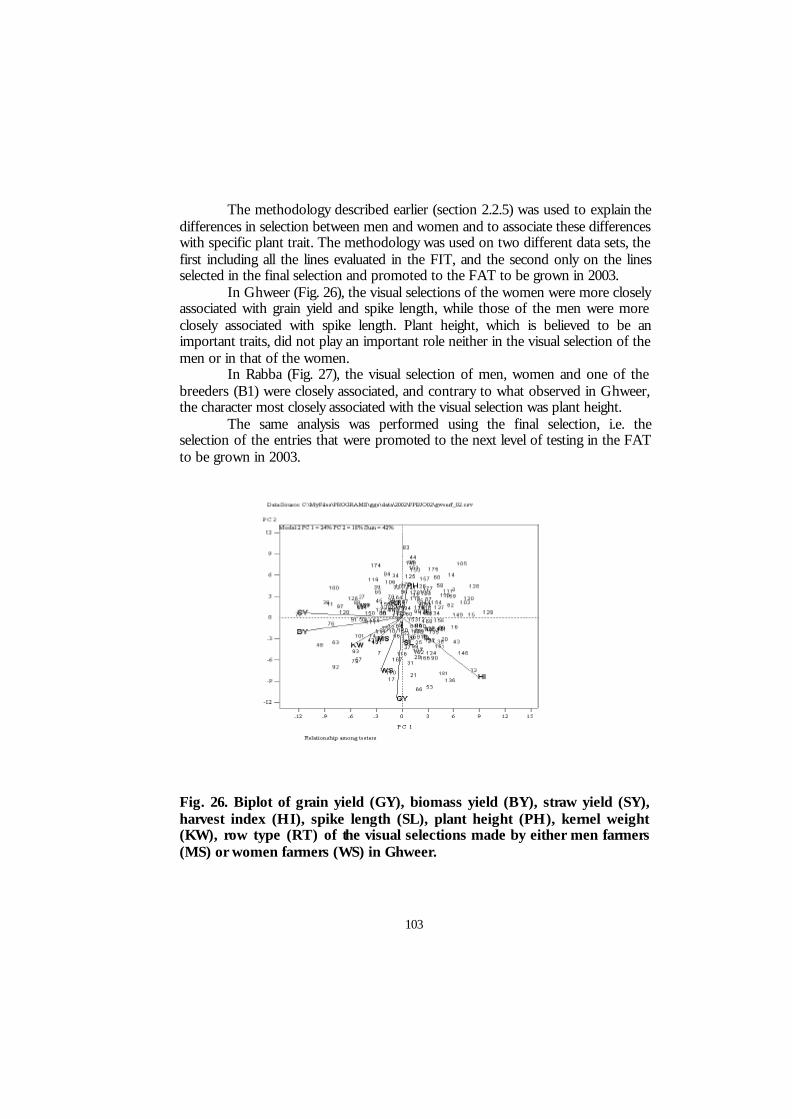
103
The methodology described earlier (section 2.2.5) was used to explain the differences in selection between men and women and to associate these differences with specific plant trait. The methodology was used on two different data sets, the first including all the lines evaluated in the FIT, and the second only on the lines selected in the final selection and promoted to the FAT to be grown in 2003.
In Ghweer (Fig. 26), the visual selections of the women were more closely associated with grain yield and spike length, while those of the men were more closely associated with spike length. Plant height, which is believed to be an important traits, did not play an important role neither in the visual selection of the men or in that of the women.
In Rabba (Fig. 27), the visual selection of men, women and one of the breeders (B1) were closely associated, and contrary to what observed in Ghweer, the character most closely associated with the visual selection was plant height.
The same analysis was performed using the final selection, i.e. the selection of the entries that were promoted to the next level of testing in the FAT to be grown in 2003. Fig. 26. Biplot of grain yield (GY), biomass yield (BY), straw yield (SY), harvest index (HI), spike length (SL), plant height (PH), kernel weight (KW), row type (RT) of the visual selections made by either men farmers (MS) or women farmers (WS) in Ghweer.
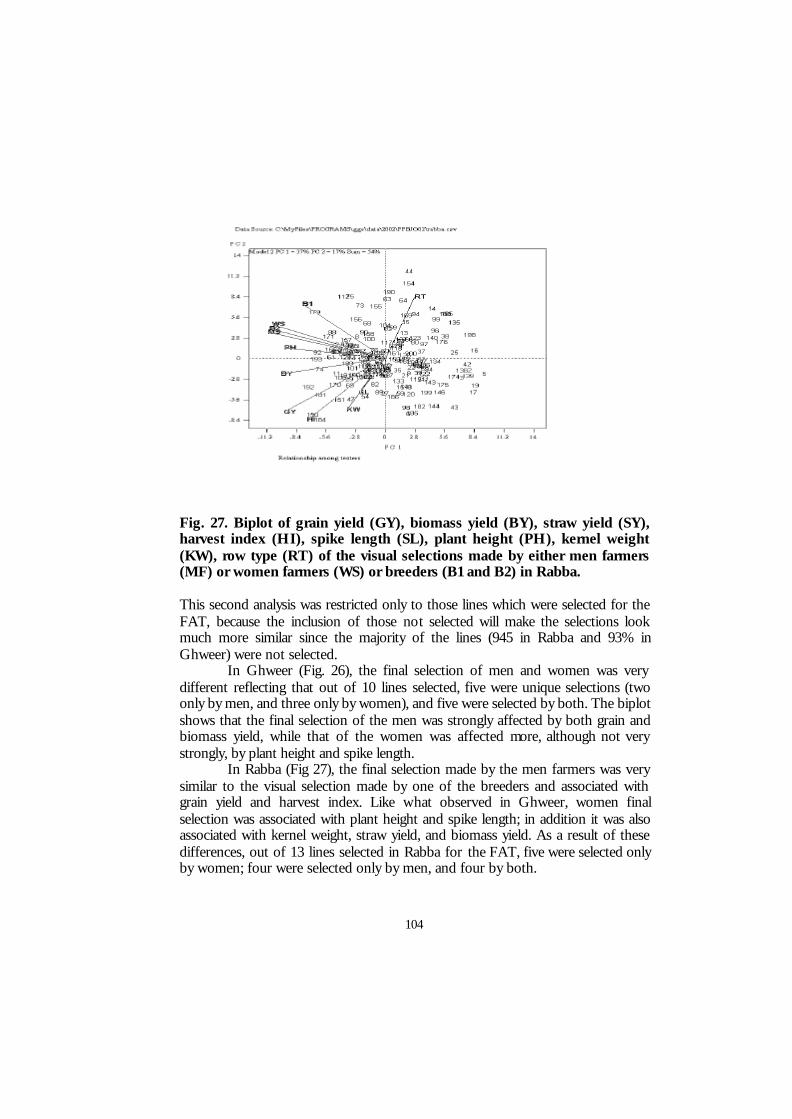
104
Fig. 27. Biplot of grain yield (GY), biomass yield (BY), straw yield (SY), harvest index (HI), spike length (SL), plant height (PH), kernel weight (KW), row type (RT) of the visual selections made by either men farmers (MF) or women farmers (WS) or breeders (B1 and B2) in Rabba. This second analysis was restricted only to those lines which were selected for the FAT, because the inclusion of those not selected will make the selections look much more similar since the majority of the lines (945 in Rabba and 93% in Ghweer) were not selected.
In Ghweer (Fig. 26), the final selection of men and women was very different reflecting that out of 10 lines selected, five were unique selections (two only by men, and three only by women), and five were selected by both. The biplot shows that the final selection of the men was strongly affected by both grain and biomass yield, while that of the women was affected more, although not very strongly, by plant height and spike length.
In Rabba (Fig 27), the final selection made by the men farmers was very similar to the visual selection made by one of the breeders and associated with grain yield and harvest index. Like what observed in Ghweer, women final selection was associated with plant height and spike length; in addition it was also associated with kernel weight, straw yield, and biomass yield. As a result of these differences, out of 13 lines selected in Rabba for the FAT, five were selected only by women; four were selected only by men, and four by both.
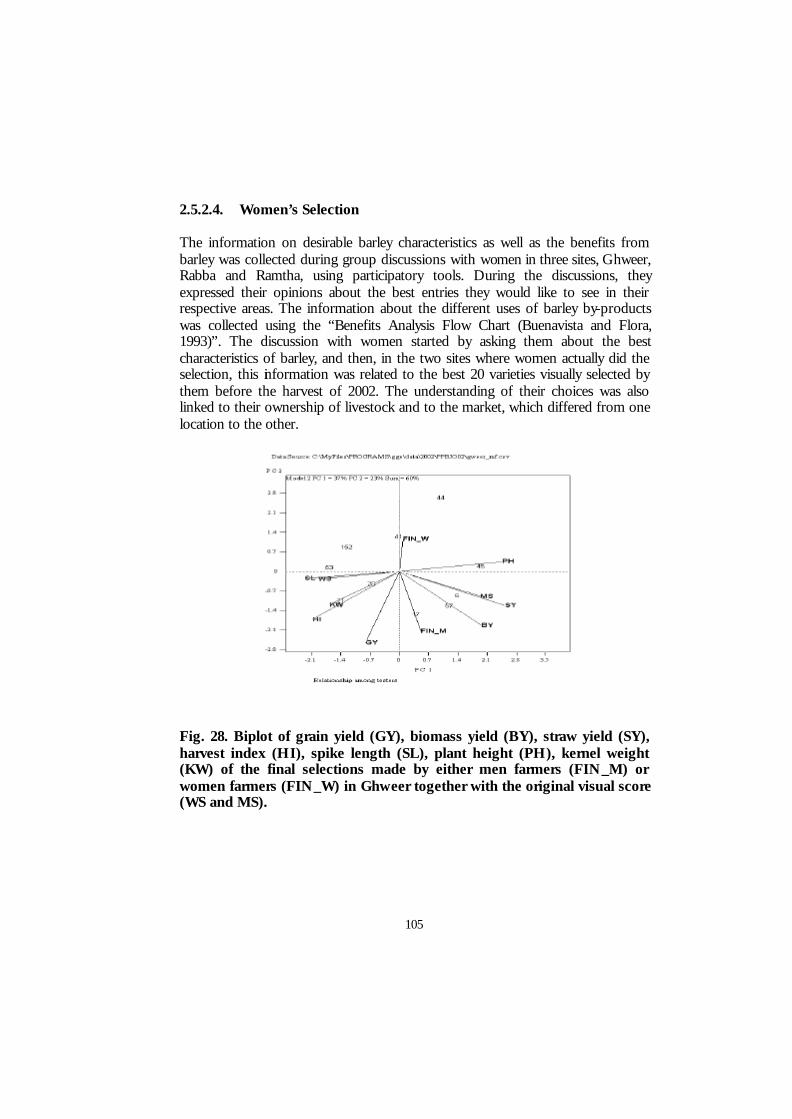
105
2.5.2.4. Women’s Selection The information on desirable barley characteristics as well as the benefits from barley was collected during group discussions with women in three sites, Ghweer, Rabba and Ramtha, using participatory tools. During the discussions, they expressed their opinions about the best entries they would like to see in their respective areas. The information about the different uses of barley by-products was collected using the “Benefits Analysis Flow Chart (Buenavista and Flora, 1993)”. The discussion with women started by asking them about the best characteristics of barley, and then, in the two sites where women actually did the selection, this information was related to the best 20 varieties visually selected by them before the harvest of 2002. The understanding of their choices was also linked to their ownership of livestock and to the market, which differed from one location to the other. Fig. 28. Biplot of grain yield (GY), biomass yield (BY), straw yield (SY), harvest index (HI), spike length (SL), plant height (PH), kernel weight (KW) of the final selections made by either men farmers (FIN_M) or women farmers (FIN_W) in Ghweer together with the original visual score (WS and MS).
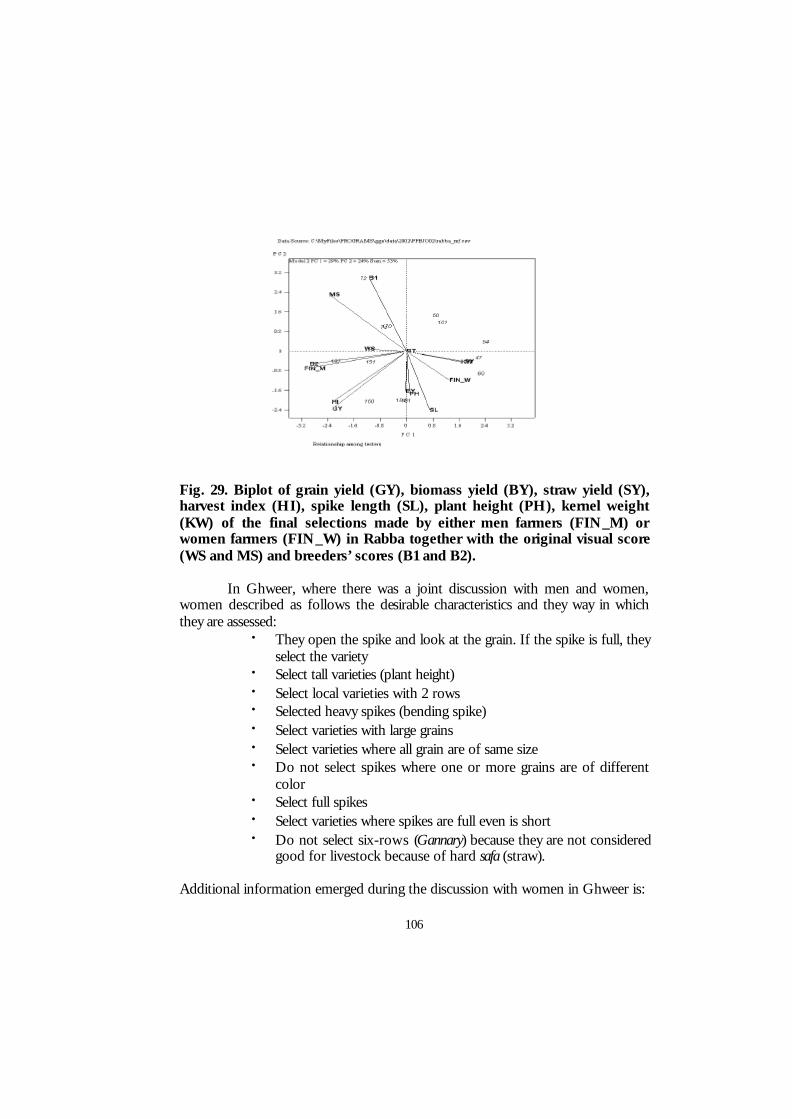
106
Fig. 29. Biplot of grain yield (GY), biomass yield (BY), straw yield (SY), harvest index (HI), spike length (SL), plant height (PH), kernel weight (KW) of the final selections made by either men farmers (FIN_M) or women farmers (FIN_W) in Rabba together with the original visual score (WS and MS) and breeders’ scores (B1 and B2).
In Ghweer, where there was a joint discussion with men and women,
women described as follows the desirable characteristics and they way in which they are assessed:
• They open the spike and look at the grain. If the spike is full, they select the variety
• Select tall varieties (plant height) • Select local varieties with 2 rows • Selected heavy spikes (bending spike) • Select varieties with large grains • Select varieties where all grain are of same size • Do not select spikes where one or more grains are of different
color • Select full spikes • Select varieties where spikes are full even is short • Do not select six-rows (Gannary) because they are not considered
good for livestock because of hard safa (straw). Additional information emerged during the discussion with women in Ghweer is:
107
• Straw is not important; • Local varieties are better for animal feeding in terms of health and
milk production; • When livestock is fed with “Gannary” (6 rows) variety, animals are
reported to remain continuously hungry; • White-seeded varieties are more desirable because they are more
expensive, and this is especially important for women farmers who do not own livestock and sell their barley on the market;
• Laban and all other milk products are better when animals are fed with white barley varieties;
• For 95% of men grain yield is more important than straw yield because there is no market for straw, since the number of livestock is very low in Ghweer. They prefer an increase of 70 kg of grain rather than 1 ton of straw.
In Rabba a separate meeting was held with women in Rabba, and the
desirable characteristics, and the way in which they are assessed were as follows: • Select varieties with about 40-50 grains per spike; • Prefer big grain size; • Select medium grain size for animal feeding; • Straw was also an important selection criteria for animal feeding; • Preference to 2 rows varieties because of their good grain yield,
good straw yield and white color; • Prefer varieties with white seed; • Six row varieties (Gannary) are selected for marketing; • Women often discuss the varieties with their husbands and sons; • Plant height is very important; • Grain yield is more important than straw yield because of the
large price difference: grain = 10 JD/ton, straw = 25 JD/ton. One interesting aspect of the women’s preferences in Rabba was the distinction between selection criteria for animal feeding and others for marketing.
In Ramtha there was no women selection, and the desirable characteristics mentioned by women farmers in that site are as follows:
• Prefer Arabi Abiad; • Prefer 2 rows varieties; • Prefer long spikes; • The local variety is good for marketing (big grain, easier to
harvest, livestock like it, if needed it is suitable for human nutrition as it was used 40 years ago);
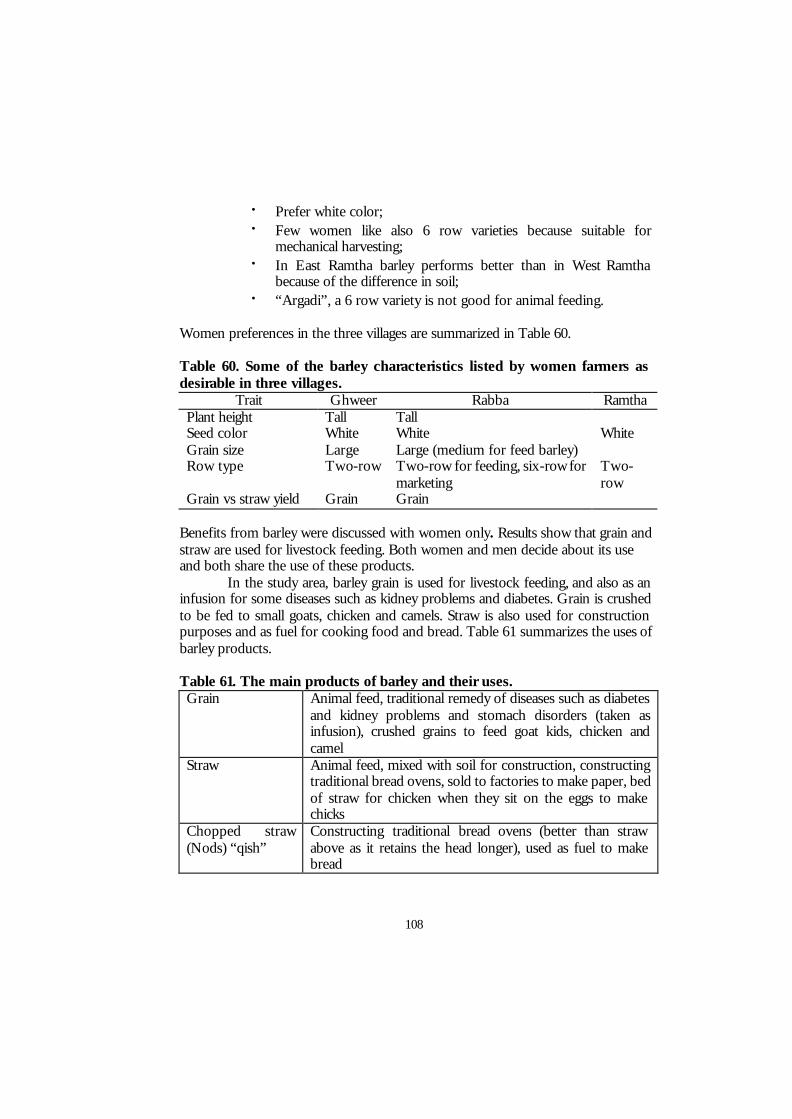
108
• Prefer white color; • Few women like also 6 row varieties because suitable for
mechanical harvesting; • In East Ramtha barley performs better than in West Ramtha
because of the difference in soil; • “Argadi”, a 6 row variety is not good for animal feeding.
Women preferences in the three villages are summarized in Table 60. Table 60. Some of the barley characteristics listed by women farmers as desirable in three villages.
Trait Ghweer Rabba Ramtha Plant height Tall Tall Seed color White White White Grain size Large Large (medium for feed barley) Row type Two-row Two-row for feeding, six-row for
marketing Two-row
Grain vs straw yield Grain Grain Benefits from barley were discussed with women only. Results show that grain and straw are used for livestock feeding. Both women and men decide about its use and both share the use of these products.
In the study area, barley grain is used for livestock feeding, and also as an infusion for some diseases such as kidney problems and diabetes. Grain is crushed to be fed to small goats, chicken and camels. Straw is also used for construction purposes and as fuel for cooking food and bread. Table 61 summarizes the uses of barley products. Table 61. The main products of barley and their uses. Grain Animal feed, traditional remedy of diseases such as diabetes
and kidney problems and stomach disorders (taken as infusion), crushed grains to feed goat kids, chicken and camel
Straw Animal feed, mixed with soil for construction, constructing traditional bread ovens, sold to factories to make paper, bed of straw for chicken when they sit on the eggs to make chicks
Chopped straw (Nods) “qish”
Constructing traditional bread ovens (better than straw above as it retains the head longer), used as fuel to make bread
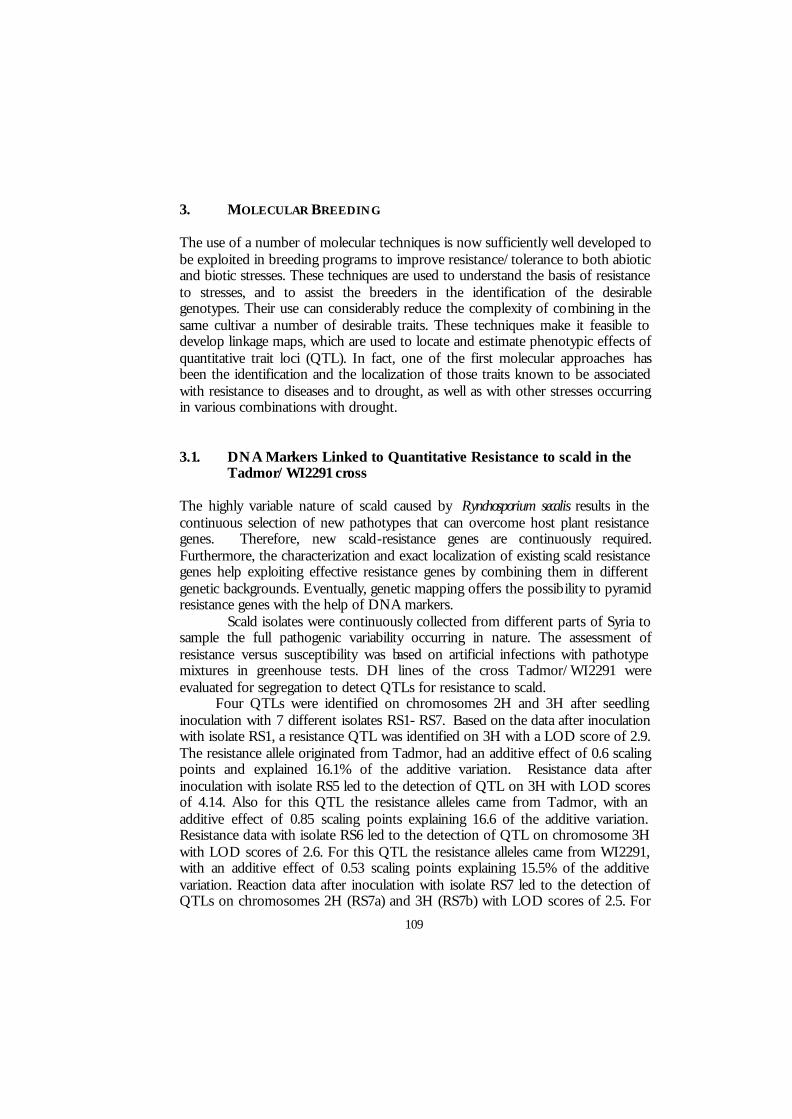
109
3. MOLECULAR BREEDING The use of a number of molecular techniques is now sufficiently well developed to be exploited in breeding programs to improve resistance/tolerance to both abiotic and biotic stresses. These techniques are used to understand the basis of resistance to stresses, and to assist the breeders in the identification of the desirable genotypes. Their use can considerably reduce the complexity of combining in the same cultivar a number of desirable traits. These techniques make it feasible to develop linkage maps, which are used to locate and estimate phenotypic effects of quantitative trait loci (QTL). In fact, one of the first molecular approaches has been the identification and the localization of those traits known to be associated with resistance to diseases and to drought, as well as with other stresses occurring in various combinations with drought. 3.1. DNA Markers Linked to Quantitative Resistance to scald in the
Tadmor/WI2291 cross The highly variable nature of scald caused by Rynchosporium secalis results in the continuous selection of new pathotypes that can overcome host plant resistance genes. Therefore, new scald-resistance genes are continuously required. Furthermore, the characterization and exact localization of existing scald resistance genes help exploiting effective resistance genes by combining them in different genetic backgrounds. Eventually, genetic mapping offers the possibility to pyramid resistance genes with the help of DNA markers.
Scald isolates were continuously collected from different parts of Syria to sample the full pathogenic variability occurring in nature. The assessment of resistance versus susceptibility was based on artificial infections with pathotype mixtures in greenhouse tests. DH lines of the cross Tadmor/WI2291 were evaluated for segregation to detect QTLs for resistance to scald.
Four QTLs were identified on chromosomes 2H and 3H after seedling inoculation with 7 different isolates RS1- RS7. Based on the data after inoculation with isolate RS1, a resistance QTL was identified on 3H with a LOD score of 2.9. The resistance allele originated from Tadmor, had an additive effect of 0.6 scaling points and explained 16.1% of the additive variation. Resistance data after inoculation with isolate RS5 led to the detection of QTL on 3H with LOD scores of 4.14. Also for this QTL the resistance alleles came from Tadmor, with an additive effect of 0.85 scaling points explaining 16.6 of the additive variation. Resistance data with isolate RS6 led to the detection of QTL on chromosome 3H with LOD scores of 2.6. For this QTL the resistance alleles came from WI2291, with an additive effect of 0.53 scaling points explaining 15.5% of the additive variation. Reaction data after inoculation with isolate RS7 led to the detection of QTLs on chromosomes 2H (RS7a) and 3H (RS7b) with LOD scores of 2.5. For

110
these two QTLs the resistance alleles came from WI2291, with an additive effect of 0.66 and 0.62 scaling points explaining 12.2% and 11.9% of the additive variation, respectively. Inoculation with isolate RS1, RS2 and RS3 did not result in identification of any QTL. Together, the four QTL for scald explained 72.3 % of the additive variation. 3.2. Dehydrin Genes in Barley Dehydrins are proteins produced during the late stage of plant embryo development and inducible through environmental stimulus such as dehydration. When barley plants are subjected to a reduction in water availability, the typical molecular response leads to the accumulation of dehydration-related dehydrins. These polypeptides are characterized by a consensus 15 amino acids domain rich in lysine (EKKGIMDKIKEKLPG) that may be present several times in the sequence. In many dehydrins an additional characteristic domain rich in serine is present adjacent to the lysine rich domain. In barley about 13 dehydrin genes have been cloned; they are spread all over the barley genome. 3.2.1. Sequence Variability of Dehydrin Genes within Barley Four barley genotypes (Arta, Sara, Tadmor, Zanbaka) and one accession of wild barley (Hordeum spontaneum 41-1) were used in this study. DNA was isolated from leaf material with the CTAB extraction method. Genomic DNA was amplified by PCR using Taq polymerase. Four Dehydrin gene-specific primers were used to amplify the Dehydrin genes as shown in Table 62. Table 62. Sequence of dehydrin gene-specific primers used in PCR amplification of genomic DNA for sequencing analysis. Dhn gene 5’ primers 3’ primers
Dhn1 GACGAGGGATGGCCACAAGACTGA
AGTAACGCATGGCTGCGGATGCTA
Dhn3 AGGCAACCAAGATCAACACCACCTG
GCGGAAGTTTTACTGCATCTCCATC
Dhn9 ATGGAGTTCCAAGGGCAGCACGAC
AGGCTTCGACGCGTAGCTATGCAA
Dhn12 GATGATCCAGCAGCAAACTCA
TCAGCTCGAGCTTGACGACT
The forward and reverse Dhn primers are located within the coding region. PCR reactions were electrophoresed on 1.8% agarose gel to check the amplified fragment. The appropriate PCR reactions were cleaned using the Quiagen PCR Product purification Kit. Dhn fragments were sequenced on both strands using
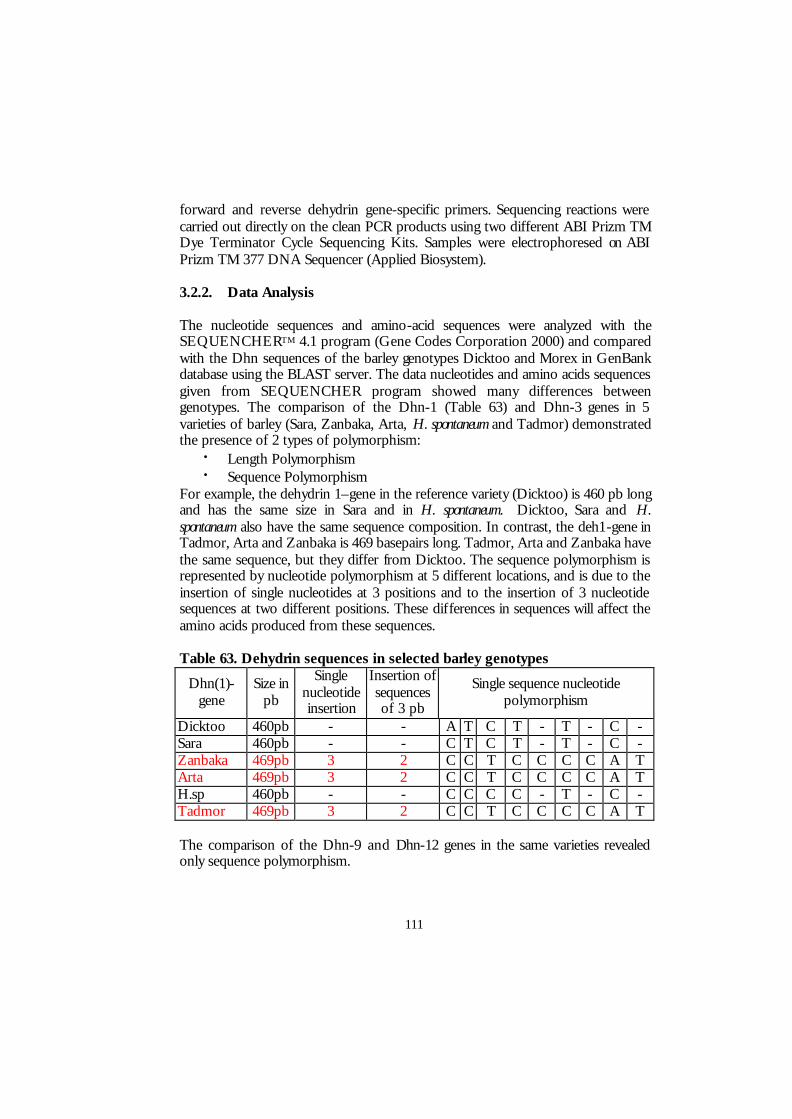
111
forward and reverse dehydrin gene-specific primers. Sequencing reactions were carried out directly on the clean PCR products using two different ABI Prizm TM Dye Terminator Cycle Sequencing Kits. Samples were electrophoresed on ABI Prizm TM 377 DNA Sequencer (Applied Biosystem). 3.2.2. Data Analysis The nucleotide sequences and amino-acid sequences were analyzed with the SEQUENCHERTM 4.1 program (Gene Codes Corporation 2000) and compared with the Dhn sequences of the barley genotypes Dicktoo and Morex in GenBank database using the BLAST server. The data nucleotides and amino acids sequences given from SEQUENCHER program showed many differences between genotypes. The comparison of the Dhn-1 (Table 63) and Dhn-3 genes in 5 varieties of barley (Sara, Zanbaka, Arta, H. spontaneum and Tadmor) demonstrated the presence of 2 types of polymorphism:
• Length Polymorphism • Sequence Polymorphism
For example, the dehydrin 1–gene in the reference variety (Dicktoo) is 460 pb long and has the same size in Sara and in H. spontaneum. Dicktoo, Sara and H. spontaneum also have the same sequence composition. In contrast, the deh1-gene in Tadmor, Arta and Zanbaka is 469 basepairs long. Tadmor, Arta and Zanbaka have the same sequence, but they differ from Dicktoo. The sequence polymorphism is represented by nucleotide polymorphism at 5 different locations, and is due to the insertion of single nucleotides at 3 positions and to the insertion of 3 nucleotide sequences at two different positions. These differences in sequences will affect the amino acids produced from these sequences. Table 63. Dehydrin sequences in selected barley genotypes
Dhn(1)-gene
Size in pb
Single nucleotide insertion
Insertion of sequences of 3 pb
Single sequence nucleotide polymorphism
Dicktoo 460pb - - A T C T - T - C - Sara 460pb - - C T C T - T - C - Zanbaka 469pb 3 2 C C T C C C C A T Arta 469pb 3 2 C C T C C C C A T H.sp 460pb - - C C C C - T - C - Tadmor 469pb 3 2 C C T C C C C A T The comparison of the Dhn-9 and Dhn-12 genes in the same varieties revealed only sequence polymorphism.
112
3.3. RNA Analysis of Dhn Gene Extraction To study the variation of expressed dehydrin genes induced by drought conditions seed of the following 14 genotypes were geminated in Petri dishes and then seedlings were transferred to pots in the plastic house:
1. WI2269/Line251-11-2 2. Leb71/CBB37//Leb71/CBB29 3. Gustoe 4. M64-76/Bon//Jo/york/3/M5/Galt//As46/4/Hj34-80/Astrix/5
/NK1272 5. Arta 6. Harmal-02//Esp/1808-4L 7. Zanbaka 8. Pitayo/Cam//Avt/RM1508/3/Pon/4/Mona/Ben//Cam 9. H. spontaneum 41-1 10. Aths 11. Tadmor 12. Rihane-03 13. Sara 14. Harmal
Three plants per pot and three pots of each genotype were used. Two pots of each genotype were subjected to the dehydration treatment (no watering of plants from ten days after their transfer to pots onwards) and the last one was watered regularly up to the end of the experiment and used as control. Leaf samples were collected after the initiation of water stress; one sampling each for five weeks. Seven days interval separated each two collections for the first three samples, while only three days separated the last two collections of samples.
Total RNA was extracted from leaf tissues and total RNAs were denatured and fractionated on 1.2 % agarose containing formaldehyde. After electrophoresis, RNA was transferred to nylon membranes, and analyzed for Dhn gene extraction according to standard DNA:RNA hybridization procedure. The 32 P-labeled DNA probe were synthesized from genomic DNA fragments of Dhns directly (carried out at Risoe National Laboratories). RNA blots were exposed to phosphor films at room temperature. 3.3.1. Accumulation of RNA Drought acclimatization of barley genotypes resulted in detectable accumulation of Dhn-mRNA. The results with two Dhn probes showed that DHns accumulate in late stage of plant drought stress and mostly in the last collection and before the plant died. (Fig. 28). Dhn1 accumulation occurred in the last collection (H.
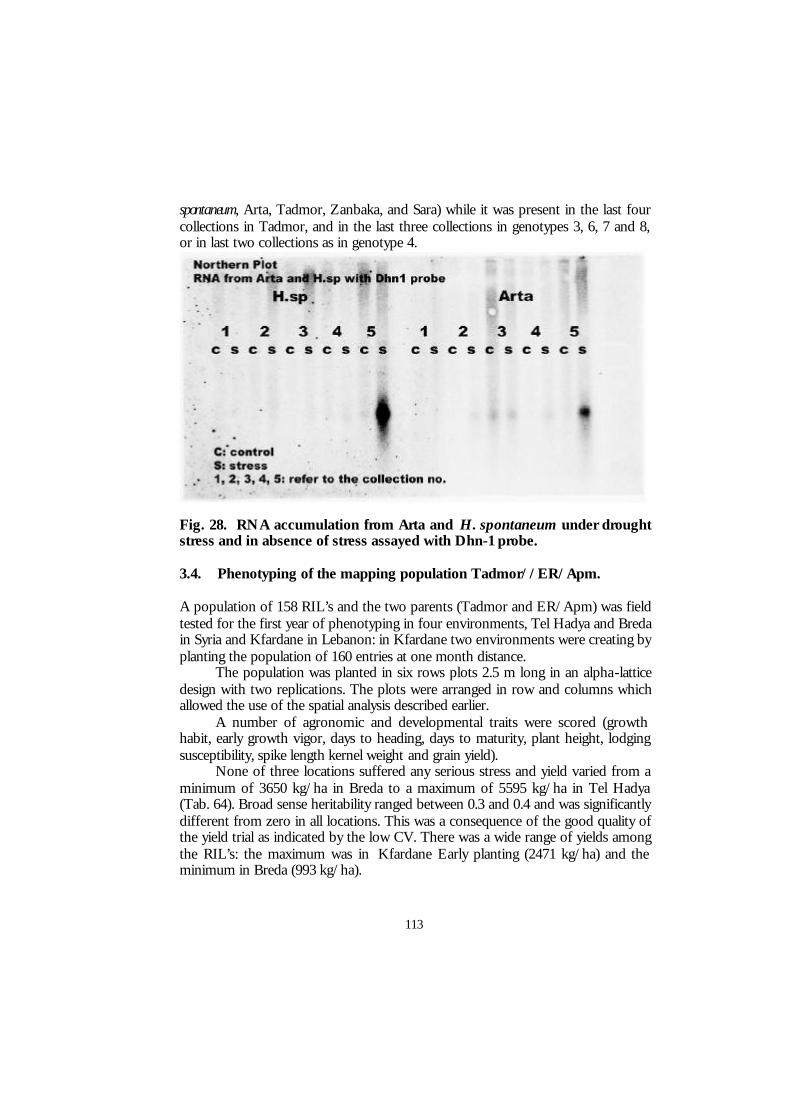
113
spontaneum, Arta, Tadmor, Zanbaka, and Sara) while it was present in the last four collections in Tadmor, and in the last three collections in genotypes 3, 6, 7 and 8, or in last two collections as in genotype 4.
Fig. 28. RNA accumulation from Arta and H. spontaneum under drought stress and in absence of stress assayed with Dhn-1 probe. 3.4. Phenotyping of the mapping population Tadmor//ER/Apm. A population of 158 RIL’s and the two parents (Tadmor and ER/Apm) was field tested for the first year of phenotyping in four environments, Tel Hadya and Breda in Syria and Kfardane in Lebanon: in Kfardane two environments were creating by planting the population of 160 entries at one month distance. The population was planted in six rows plots 2.5 m long in an alpha-lattice design with two replications. The plots were arranged in row and columns which allowed the use of the spatial analysis described earlier. A number of agronomic and developmental traits were scored (growth habit, early growth vigor, days to heading, days to maturity, plant height, lodging susceptibility, spike length kernel weight and grain yield). None of three locations suffered any serious stress and yield varied from a minimum of 3650 kg/ha in Breda to a maximum of 5595 kg/ha in Tel Hadya (Tab. 64). Broad sense heritability ranged between 0.3 and 0.4 and was significantly different from zero in all locations. This was a consequence of the good quality of the yield trial as indicated by the low CV. There was a wide range of yields among the RIL’s: the maximum was in Kfardane Early planting (2471 kg/ha) and the minimum in Breda (993 kg/ha).
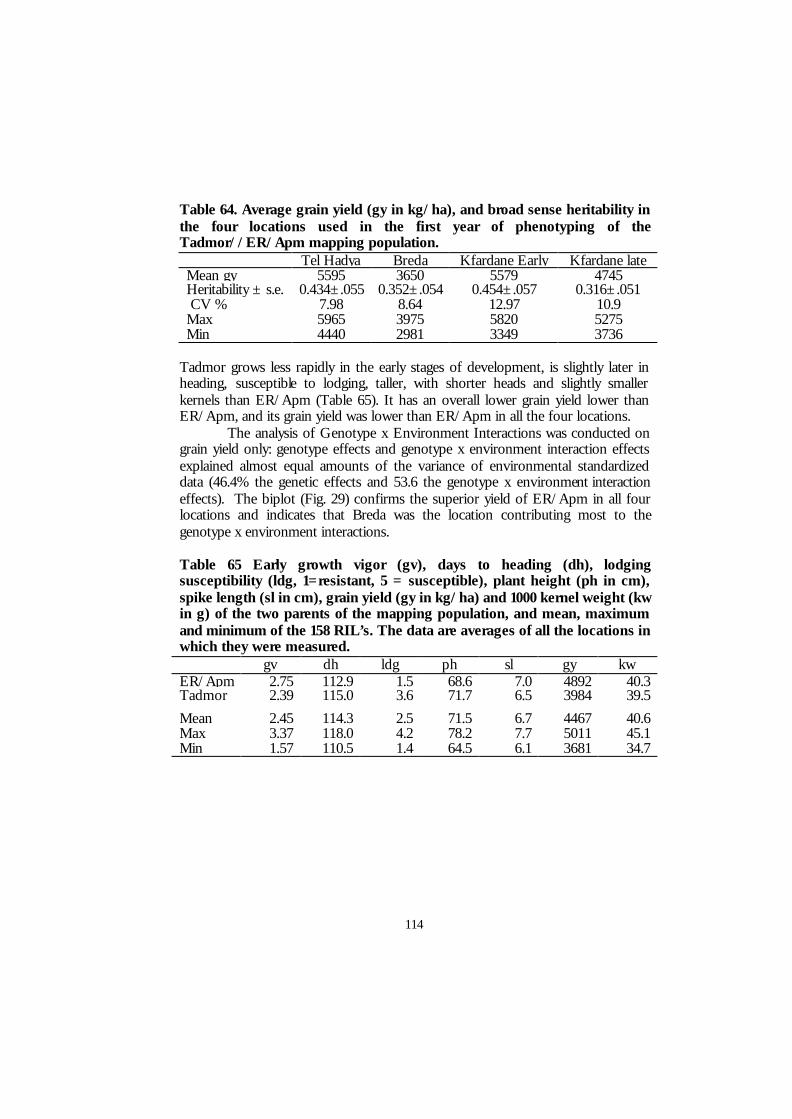
114
Table 64. Average grain yield (gy in kg/ha), and broad sense heritability in the four locations used in the first year of phenotyping of the Tadmor//ER/Apm mapping population.
Tel Hadya Breda Kfardane Early Kfardane late Mean gy 5595 3650 5579 4745 Heritability ± s.e. 0.434±.055 0.352±.054 0.454±.057 0.316±.051 CV % 7.98 8.64 12.97 10.9 Max 5965 3975 5820 5275 Min 4440 2981 3349 3736
Tadmor grows less rapidly in the early stages of development, is slightly later in heading, susceptible to lodging, taller, with shorter heads and slightly smaller kernels than ER/Apm (Table 65). It has an overall lower grain yield lower than ER/Apm, and its grain yield was lower than ER/Apm in all the four locations. The analysis of Genotype x Environment Interactions was conducted on grain yield only: genotype effects and genotype x environment interaction effects explained almost equal amounts of the variance of environmental standardized data (46.4% the genetic effects and 53.6 the genotype x environment interaction effects). The biplot (Fig. 29) confirms the superior yield of ER/Apm in all four locations and indicates that Breda was the location contributing most to the genotype x environment interactions. Table 65 Early growth vigor (gv), days to heading (dh), lodging susceptibility (ldg, 1=resistant, 5 = susceptible), plant height (ph in cm), spike length (sl in cm), grain yield (gy in kg/ha) and 1000 kernel weight (kw in g) of the two parents of the mapping population, and mean, maximum and minimum of the 158 RIL’s. The data are averages of all the locations in which they were measured.
gv dh ldg ph sl gy kw ER/Apm 2.75 112.9 1.5 68.6 7.0 4892 40.3 Tadmor 2.39 115.0 3.6 71.7 6.5 3984 39.5 Mean 2.45 114.3 2.5 71.5 6.7 4467 40.6 Max 3.37 118.0 4.2 78.2 7.7 5011 45.1 Min 1.57 110.5 1.4 64.5 6.1 3681 34.7
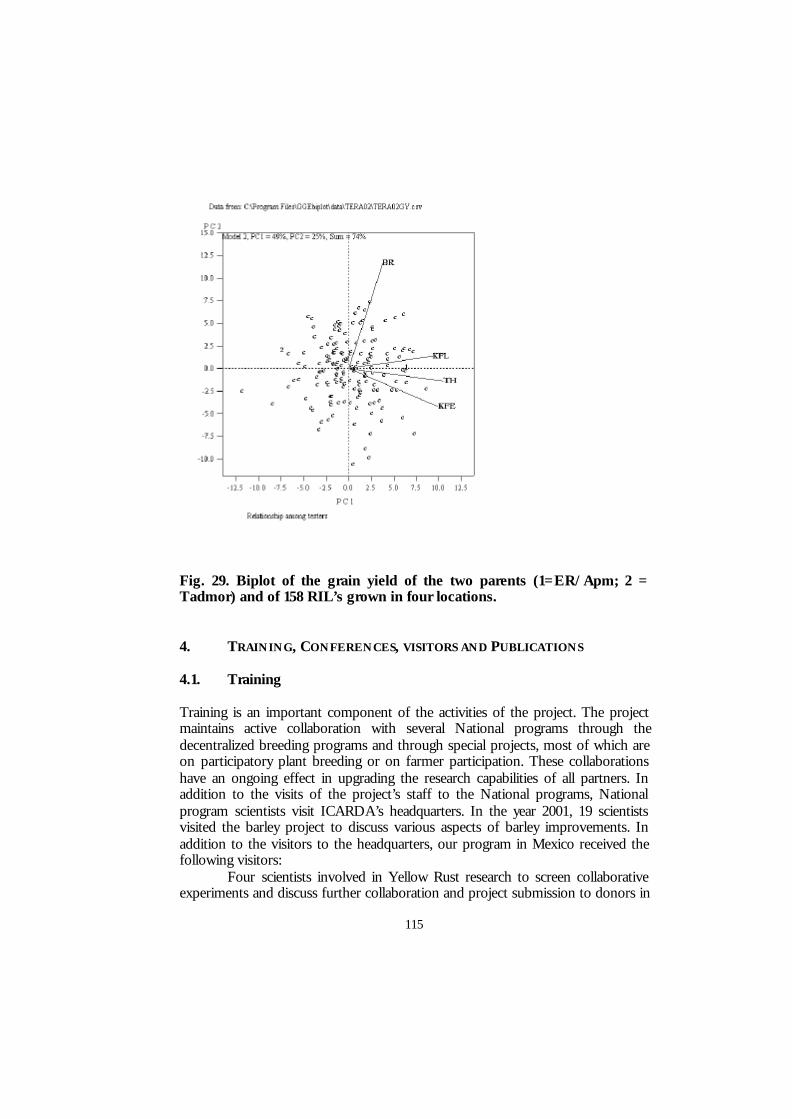
115
Fig. 29. Biplot of the grain yield of the two parents (1=ER/Apm; 2 = Tadmor) and of 158 RIL’s grown in four locations. 4. TRAINING, CONFERENCES, VISITORS AND PUBLICATIONS 4.1. Training Training is an important component of the activities of the project. The project maintains active collaboration with several National programs through the decentralized breeding programs and through special projects, most of which are on participatory plant breeding or on farmer participation. These collaborations have an ongoing effect in upgrading the research capabilities of all partners. In addition to the visits of the project’s staff to the National programs, National program scientists visit ICARDA’s headquarters. In the year 2001, 19 scientists visited the barley project to discuss various aspects of barley improvements. In addition to the visitors to the headquarters, our program in Mexico received the following visitors: Four scientists involved in Yellow Rust research to screen collaborative experiments and discuss further collaboration and project submission to donors in
116
this area (Drs. Pat Hayes, Isabel Vales and Chris Mundt from Oregon State University, USA, and Dr. Chris-Carolin Schön from Hohenheim University, Germany). Dr. Cornelia Glass, from KWS seeds, Germany joined the group. Researchers from Busch Agricultural Resources Inc. spent three days in the barley program working in the breeding material of their collaborative research (Drs. Leslie Wright and Linnea Skoglund). Dr. Colin Wellings from the Plant Breeding Institute of the University of Sydney (Australia) to screen the lines sent for yellow rust testing at Toluca. The CRC molecular genetics board also visited the barley program.
Mr. Adnan Al-Yassin, barley breeder at the National Center for Agricultural Research and Technology Transfer (NCARTT), defended his PhD thesis “Molecular and Field Assessment of Genetic Variation in Barley Grain Yield under Low and High Yielding Environments” at the University of Jordan in front of a committee composed by Prof. A.M. Tell (the supervisor), Dr. S. Ceccarelli (the co-supervisor), Prof. O. Kafawin, Prof. A. Masod, and H.E. the Minister of Agriculture Dr. M. Duwayri.
Dr. S. Ceccarelli lectured at a Training Course “Participatory Plant Breeding and Agrobiodiversity Conservation” held in Amman (March 17-20) and attended by 14 participants (nine from Jordan, two from Lebanon, two from Palestine and one from Syria).
Dr. Ceccarelli gave a lecture on participatory plant breeding at a Training Course on Production of Cereals and Legume Crops (March 25-April 4, 2002).
Dr. S. Ceccarelli lectured at a Training Course organized by SMAAR (Syrian Ministry of Agriculture and Agrarian Reform, held in Aleppo (March 17-20) and attended by 14 participants (nine from Jordan, two from Lebanon, two from Palestine and one from Syria).
Dr. S. Ceccarelli gave a seminar at FAO on “Recent Developments in Participatory Plant Breeding at ICARDA (June 3). 4.2. Conferences, Workshops, Meetings An International Workshop on “Food barley improvement”, jointly organized by ICARDA, FAO, and IRESA, and with the financial support of OPEC, was held in Hammamet, Tunisia, 14-17 January. Stakeholder Meeting of the PRGA Program in BMZ/Bonn, April 22-23, with a presentation on “The quality of participation and the quality of science in PPB” Technical Meeting held in Houston, Texas, U.S.A, April 15-17, 2002, to discuss the proposal ‘Harnessing agricultural technology to improve the health of the poor: “Biofortified” crops to combat micronutrient malnutrition’, to be submitted as a CGIAR Challenge Program.
117
Jordan-ICARDA National Coordination Meeting in Jordan with a presentation on “Breeding for Drought Resistance in Barley”. International Symposium on Barley yellow dwarf diseases: Recent Advances and Future Strategies” (El Batan, Texcoco, Mexico) on 1-5 September, 2002, with two presentations. “Quality of Science in Participatory Plant Breeding” Workshop at Rome, Italy (at IPGRI headquarters) (September 30-October 4). 9th NARP Regional Coordination Meeting held in Tripoli (Libya) on October 20-24. NVRSRP Regional Coordination Meeting in Cairo (Egypt) on October 14-17. Visit the barley trials in South Australia, discussed collaborative research with South Australian scientists, and discuss ICIS and GEBEI with Dr. Ian DeLacy, at the University of Queensland. Annual Meeting of the America Society of Agronomy with two presentations: “Localization of quantitative trait loci (QTL) for dryland characters in barley by linkage mapping” and “Breeding for Drought Resistance in a Changing Climate”. EUCARPIA-Cereal Section Meeting with a presentation on Barley Improvement at ICARDA” Swedish University of Agricultural Sciences (SLU) to participate in a seminar on “Breeding cassava for subsistence economies” and to be the opponent in the defense of the PhD thesis by Mr. Jonathan Mkumbira, a cassava breeder from Malawi (November 26-December 1). 1st Wheat and barley end users’ Workshop (Tel Amara, Lebanon) on December 15-16. 4.3. Visitors Mr. Mathew Abang/Cameroon to collect, analyze and interpret RFLP data
from Syrian isolates of R. secalis to determine genetic structure, (9-16 March 2002).
Dr. C. Linde/South Africa to collect, analyze and interpret RFLP data from Syrian isolates of R. secalis to

118
determine genetic structure, (12-17 March 2002).
Dr. Bruce Mc Donald/USA to collect, analyze and interpret RFLP data from Syrian isolates of R. secalis to determine genetic structure, (12-17 March 2002).
Dr. Lamia El Fattal/Egypt IDRC-MERO to discuss projects currently supported by IDRC, (13-15 April 2002).
Mr. Ahmad Qassem Khazaleh/Jordan to become familiar with the handling of large-scale trials that will be implemented in Jordan during the cropping season 2002/2003, (27 April-6 May 2002).
Dr. Jurgen Hagmann/Germany Consultant for the participatory Barley Breeding Project in Syria, (28 April-4 May 2002).
Mr. Abdalla Khabbaz/Syria/DSAR to participate in the barley selection group in Syria, (29 April-10 May 2002).
Mr. Bahaeldin Jamal/Syria/DSAR to participate in the barley selection group in Syria, (29 April-10 May 2002).
Mr. Hasan Al Rashi/Syria/DSAR to participate in the barley selection group in Syria, (29 April-10 May 2002).
Mr. Yaser Al-Mousa/Syria/DSAR to participate in the barley selection group in Syria, (30 April-2 May & 6-10 May 2002)
Mr. Abdulatif Al-Shami/Syria/DSAR to participate in the barley selection group in Syria, (30 April-2 May & 6-10 May 2002).
Mr. Ahmed Hayyan/Syria/DSAR to participate in the barley selection group in Syria, (30 April-2 May & 6-10 May 2002).
Mr. Jumaa Ta'alab/Syria/DSAR to participate in the barley selection group in Syria, (30 April-2 May & 6-10 May 2002).
Mr. A. Hakim Al-Omar/Syria/DSAR to participate in the barley selection group in Syria, (30 April-2 May & 6-10 May 2002).
Ms. Daniela Mangione/Italy to complete data collection, (19-29 July 2002).
Mr. Fekadu Fufa/Ethiopia to characterize the breeding material tested in the participatory breeding program-30/11/2002).
Dr. Luz Gomez Pando/Peru to get acquainted with ICARDA activities, (19-30 January 2002).
Mr. Ahmed Lutf/Yemen to finalize the on-going PPB project in

119
Yemen, (21-31 January 2002). Mr. Idris Yadem Nouh to visit the Participatory Barley Project, (3-
10 May 2002). Mr. Abdelkader Keweila to visit the Participatory Barley Project, (3-
10 May 2002). Dr. Naiim Moselhy/Egypt to visit the Participatory Barley Project, (3-
10 May 2002). Mr. Ali Istar/Morocco to get acquainted with the program
activities in Syria, (3-11 May, 2002). Dr. John Hamblin/Australia to discuss possible collaboration with
ICARDA scientists (22-25 June 2002). 4.4. Publications Sayed, H., H. Kayyal, L. Ramsey, S., Ceccarelli and M. Baum, 2002. Segregation
distortion in doubled haploid lines of barley (Hordeum vulgare L.) detected by simple sequence repeat (SSR) markers. Euphytica 125: 265-272.
Ceccarelli, S. and S. Grando, 2002. Plant breeding with farmers requires testing the
assumptions of conventional plant breeding: Lessons from the ICARDA barley program. In: Cleveland, David A. and Daniela. Soleri, (eds.). Farmers, scientists and plant breeding: Integrating Knowledge and Practice. Wallingford, Oxon, UK: CAB I Publishing International. pp. 297-332.
Soleri, D., Cleveland, D.A., Smith, S.E., Ceccarelli, S., S. Grando, Rana, R.B., Rijal,
D. and Labrada, H.R., 2002. Understanding farmers' knowledge as the basis for collaboration with plant breeders: methodological development and examples from ongoing research in Mexico, Syria, Cuba and Nepal. In: Cleveland, David A. and Daniela. Soleri, (eds.). Farmers, scientists and plant breeding: Integrating Knowledge and Practice. Wallingford, Oxon, UK: CAB I Publishing International. pp. 19-60.
K.M. Makkouk, W. Ghulam, M. Baum, S. Ceccarelli and S, Grando, 2002. Use of
PCR Markers to Select Barley Yellow Dfarf Virus Resistant Plants. In Henry, M. and McNab, A. (eds.) Barley Yellow Dwarf Disease: Recent Advances and Future Strategies, 123-126. Mexico, D.F.: CIMMYT.
120
V. ACKNOWLEDGEMENTS 5.1. Donors The financial support of the following donors is gratefully acknowledged: 1. The OPEC Fund for International Development 2. The Government of Italy 3. The Government of Denmark 4. The Grain Research and Development Corporation (GRDC, Australia) 5. Der Bundesminister für Wirtschaftliche Zusammenarbeit (BMZ, Germany) 6. The International Development Research Centre (IDRC, Canada) 7. The United States Agency for International Development (USAID) 8. The System Wide Program on Participatory Research and Gender Analysis
(SWP PRGA) 9. The European Union 5.2. Collaborators Several research support staff and scientists have contributed to this report. Their assistance, help and contribution is gratefully acknowledged.