fish nutrition research in asia - idrc digital library
TRANSCRIPT


COMMUNICATIONS DIVISION
3-N-91-3001 - 11 $3,045
2201 - 00031
300 copies

Fish Nutrition Research in Asia
Proceedings of the Fourth Asian Fish Nutrition Workshop

Fish Nutrition Research in Asia
Proceedings of the Fourth Asian Fish Nutrition Workshop
Edited by
S.S. De Silva
1991
Published by the Asian Fisheries Society in association with the
International Development Research Centre of Canada

Fish Nutrition Research in Asia
Proceedings of the Fourth Asian Fish Nutrition Workshop
Edited by
S.S. DESILVA
1991
Printed in Manila, Philippines
De Silva, S.S., editor. 1991. Fish nutrition research in Asia. Proceedings of the Founh Asian Fish Nutrition Workshop. Asian Fish Soc. Spec. Puhl. 5, 205 p. Asian Fisheries Society, Manila, Philippines.
Copyright, 1991. Asian Fisheries Society, and International Development Research Centre of Canada
ISBN 971-8709-03-7

Contents
Foreword• Brian Davy ancl T.E. Chua. . . . . . . . . . . . . . . . . . . . . . . . . . . . . . ix
Introduction • S.S. De Silva ..................... .
Concepts in the Formulation and Preparation of a Complete Fish Diet • S.P. Lall ....................... .
Use of Non-Conventional Feedstuff of Plant Origin as Fish Feeds - Is It Practical and Economically Feasible? • K.L. Wee .. ............................. .
Nutritional Studies on Seabass (Lates calcarifer) • M. Boonyaratpalin ................... .
An Artificial Diet for Larval Rabbitfish, Siganus guttatus Bloch• M.M. Parazo . ..................... .
Effect of Feeding Levels on Food Utilization and Growth of Catla Fry• D. Seenappa and K.V. Devaraj . .......... .
Growth Response and Carcass Composition of Red Tilapia Fry Fed Diets with Varying Protein Levels and Protein to Energy Ratios• C.B. Santiago and M.A. Laron . .... .
A Preliminary Study on Protein Requirement of Juvenile Black Sea Bream (Sparus macrocephalus) • X. Xu, W. Ji, Y. Li and C. Gao . . . . . . . . . . . . . . . . . . . . . . . ..
Optimum Dietary Protein to Energy Ratio for Labeo rohita Fingerlings • K.M. Das, SN. Mohanty and S. Sarkar . .
Protein and Fat Digestibility of Five Feed Ingredients by an Indian Major Carp, Cat/a cat/a (Ham.)• M.C. Nandeesha, G .K. Srikanth, P. Keshavanath and S.K. Das ...
v
x
1
13
33
43
49
55
63
69
75

Digestibility of Lipid in Different Feeds by Mrigal, Cirrhinus mrigala (Ham.) and Grass Carp, Ctenopharyngodon idella (Val.) • B .N. Singh ............................ .
Growth and Changes in Carcass Composition in Young of Labeo rohita and Cirrhina mrigala During Feeding and Starvation• P.K. Mukhopadhyay, S.N. Mohanty, K.M. Das,
83
S. Sarkar andB.C. Patra. . . . . . . . . . . . . . . . . .. . . . . . . . . . . . . . . . . . . 87
Utilization of Carbohydrate and Lipid as Dietary Energy Sources by Stinging Catfish, Heteropneustesfossilis (Bloch)• A.M. Akand, MR. Hasan and M.A.B. Habib . ..
The Nutritional Value of Commercial Feed Ingredients for Nile Tilapia (Oreochromis niloticus L.) in China•
93
Z. Li, W. Lei, J. Li andX. He. . . . . . . . . . . . . . . . . . . . . . . . . . . . . . . . . . 101
Evaluation of Some Oilseed Cakes as Dietary Protein Sources for the Fry of Indian Major Carp, Labeo rohita (Hamilton)• MR. Hasan, A.K. Azad, A.M. Omar Farooque, AM. Akand and P.M. Das. . . . . . . . . . . . . . . . . . . . . . . . . . . . . . . . . . . . 107
Evaluation of Partial Replacement of Fish Meal and Soybean Meal Cake by Alfalfa, Trifolium sp., in Practical Diets for Chinese Blunt Snout Bream, Megalobrama amblycephala, Fingerlings • L. Jia, X. He and Y. Yang . ............. .
Effects of Different Levels of Dietary Protein and a Legume Vigna catiang on Gonadal Development in Oreochromis niloticus (L.) • P R.T. Cumaranatunga and KL.G.P. Mallika . ...
Culture of the Cladoceran Moina micrura Kurz Using Agroindustrial Wastes• S.H. Tay, V.K. Rajbanshi, W.H. Ho, J. Chew and E.A. Yap . ..................... .
Supplementary Feeding of Fish in a Duck-Fish Integrated System. I. The Effect of Rice-Bran• A. Yakupitiyage, P. Edwards and KL. Wee ....................... .
Modular Method of Rearing Milkfish with Artificial Feed • F.P. Pascual, N.S. Sumagaysay and /.G. Borlongan . ....... .
Production of Nile Tilapia (Oreochromis niloticus) in Different Culture and Harvesting Systems• C. Nitithamyong, J. Chiayvareesajja, S. Chiayvareesajja, C. Wongwit andR. Tansakul . .
vi
119
125
135
143
159
169

Growth and Production of Nile Tilapia (Oreochromis niloticus) in Monoculture and Polyculture with Snakehead (Channa striata), and in Integrated Culture with Pig and Snakehead • C. Nitithamyong, J. Chiayvareesajja, S. Chiayvareesajja, R. Tansakul and C. Wongwit . ................... .
Comparison of Feeding Strategies for Common Carp Based on Biomass and Biomass-Pond Interactions • H.S. Sehgal and H.S. Toor . .......................... .
Influence of Virginiarnycin on Growth and Body Composition of Rohu (Labeo rohita) and Common Carp (Cyprinus carpio) •
175
181
P. Keshavanath, S. Shyama, M.C. Nandeesha and T J. Varghese. . . . . . . . . 193
Workshop Recommendations. . . . . . . . . . . . . . . . . . . . . . . . . . . . . . . . . . . 201
List of Participants . . . . . . . . . . . . . . . . . . . . . . . . . . . . . . . . . . . . . . . . . . 203
vii


Foreword
These proceedings summarize discussions of the Asian Fish Nutrition Network held in September 1990 in Vijayawada, Andhra Pradesh, India, at a workshop, the fourth in a series funded by the International Development Research Centre (IDRC) to develop a coordinated regional fish nutrition research program in Asia. This series of workshops and proceedings, produced under the continuing guidance of Dr. Sena S. De Silva, is one of many collaborative efforts between IDRC and the Asian Fisheries Society.
We are delighted to see the sustained interest and development of new nutrition approaches by this growing group of scientists. We expect that this sector will have an expanding role to play in the development of Asian aquaculture for the future.
The workshop has made important and useful recommendations. We hope that our respective organizations and, hopefully others in the region, will seriously consider ways and means to support the implementation of these recommendations.
We thank Dr. Sena De Silva for his able assistance in making this workshop a success and encourage members of the Asian Fisheries Society to obtain their free copies of this publication by writing to the Secretariat.
F. BRIAN DAVY Associate Director (Fisheries) International Development Research Centre Singapore
ix
CHUA TIIlA-ENG President
Asian Fisheries Society Manila

Introduction
Asia continues to lead in aquaculture production in the world. Most of Asia is also experiencing a gradual transition from extensive to semi-intensive culture practices for finfish and intensive practices for shellfish. Undoubtedly, such changes make the role of supplementary feeding more and more important, and development of low-cost diets a necessity. The latter is still in its early stages of development, particularly with respect to finfish culture.
Also, in the Asian context, laboratory developed diets are not adopted easily by the farmers for many reasons. As such, the Asian fish nutrition researcher can not work in isolation, and if his research is to be effective he has to work hand-in-hand with the rural farmer. To face this challenge, the researchers need to realign their research and develop a fresh approach. Workshops of this nature permit researchers to discuss and develop such new strategies, as often dictated by the needs of the society.
This is the fourth volume of proceedings of workshops on fish nutrition research in Asia. It contains the papers presented at the workshop in September 1990 at Vijayawada, Andhra Pradesh, India, an area which has experienced an explosive growth in fish culture in less than a decade. The volume is divided into sections for convenience and clarity, and includes reviews and original research findings. It is hoped that the contents reflect the type of ongoing fish nutrition research in the region, and the resumf of discussions and recommendations would help to direct fish nutrition research in Asia to provide with a much needed animal protein source to the poorer sectors of the population at a reasonable cost.
I am thankful to all session chairmen, rapporteurs and referees, and in particular to Dr. Santosh P. Lall, Dr. K. Devaraj and Dr. Kok Leong Wee for their help in editing.
SENA S. DE SILVA
x

Concepts in the Formulation and Preparation of a Complete Fish Diet
SANTOSH P. LALL Biological Sciences Branch
Department ofFisheries and Oceans P.0.Box550
Halifax, Nova Scotia Canada B3J 2S7
LALL, S.P. 1991. Concepts in the formulation and preparation of a complete fish diet, p. 1-12. In S.S. De Silva (ed.) Fish nutrition research in Asia. Proceedings of the Fourth Asian Fish Nutrition Workshop. Asian Fish. Soc. Spec. Publ. 5, 205 p. Asian Fisheries Society, Manila, Philippines.
Abstract
In order to develop efficient and economical feed formulas for aquaculture, basic information is required on the nutrient requirements of the species cultivated, the chemical composition and organoleptic properties of feed ingredients in relation to their acceptability and the ability of fish to digest and utilize nutrients from various sources. Although the knowledge of nutrient requirements has been expanding steadily in recent years, often a prudent analogy is necessary to predict the specific requirements of many warm water fish. Nutrients can be obtained from a large number of natural feed ingredients; however, no single feedstuff has all the nutrients in the correct amounts that are needed by fish. Feedstuffs may also show wide fluctuations in their composition due to seasonal and geographic variations, and formulations should be modified accordingly.
Linear programming offers considerable potential in the development of "least cost formulation" of fish feeds. Several types of feeds, including wet, semi-moist, dry steam pellets and dry extruded (expanded) pellets are now utilized in ffsh production. Such processing techniques offer certain advantages and their effects on nutrient stability may be quite varied. Practical suggestions are given for the use of grain and other by-products in the formulation and manufacture of feeds for small fish farms.
Introduction
The science of fish nutrition has advanced rapidly over the past fifteen years largely as a result of the development of commercial fish farming. Early researchers into fish biology and fish culture relied on natural foods such as fresh animal meat and fishery by-products for feeding fish. Biologists approached the problems of fish nutrition by investigating the effect of natural foods on fish. In 1924, Embody and Gordon studied the chemical composition of the natural food of wild trout and found that the proximate composition of various insects consumed by trout was 49% protein, 15-16% lipid, 8% fiber and 10% ash. It is not surprising to note that these values resemble the composition of existing trout diets. Later, nutritionists attempted to substitute on a nutrient basis other materials in feed formulations. It is on this foundation that our knowledge of the nutritional requirements of fishes has evolved.
1

2
Although several species of coldwater and warm water fish are cultured, nutrient requirements of rainbow trout (Oncorhynchus mykiss) and catfish (Ictalurus punctatus) have been most extensively studied. In recent years, research on the nutrition of tilapia, carp, red sea bream, milkfish and many other freshwater and marine fish has been undertaken by several research institutions in Europe, Asia and North America. Unfortunately, most of the information on the nutrient requirements of these fish is confined to young, rapidly growing fish. Recent publications (NRC 1981, 1983; Cowey et al. 1985; Halver 1989; Lovell 1989) may be referred for more specific details.
lt is well known that proper nutrition is one of the most important factors influencing the ability of fish to attain genetic potential for growth, reproduction and longevity. Successful feeding depends on the production goal which in turn is determined by the genetic potential of farmed fish, feed resources and environmental factors. Feed represents the largest single cost item in intensive fish production. The main objective of ration formulation is to utilize knowledge of nutrient requirements, locally available feed ingredients and digestive capacity of fish in the development of a nutritionally balanced mixture of feedstuffs which will be eaten in sufficient amounts to provide optimum production at an acceptable cost. The farmer must produce quality product at the lowest possible costs.
The dilemma facing this author is that of determining what constitutes the most efficient and economic ration. Obviously, there is a lack of information on nutrient and energy requirements of fish species cultured in Asia and the digestible energy value of feed ingredients commonly available there. Some prudent analogies to predict the nutrient requirements of these fish and the energy content of those feeds are necessary until more information becomes available. This paper describes some basic concepts of feed formulations for fish feed production and shows how formulations may be developed even in the absence of specific information.
General guidelines for feed formulation
Diet formulation is a process in which feed ingredients and various vitamin and mineral supplements are blended to produce a diet with the required quantities of essential nutrients. All fish have a definite qualitative as well as quantitative need for various nutrients, some of them highly interrelated. These can be supplied by a large number of natural feedstuffs in a compounded ration, however no single feed ingredient contains all nutrients that are needed in the correct proportion. By selecting the various feedstuffs of plant and animal origin in proper amounts, a well balanced compounded ration may be formulated. It is impractical to formulate rations which will exactly meet the requirements of all species. There are not only minor excesses of a few nutrients in any ration but also fluctuations in the nutrient intake of fish depending upon the level of feed intake.
Generally four types of feeds are produced and marketed: Complete, supplemental (variable mixture of ingredients for extensive culture), concentrate (supplemental with main protein source), and premix (vitamins, minerals and drugs with a carrier). This paper considers only the formulation of a complete diet. The basic information required for feed formulation includes: nutrient requirements of the species cultivated and feeding habits; local availability, cost and nutrient composition of feed ingredients; ability of fish to utilize nutrients from various sources; type of ration desired (larval, starter, grower, broodstock, etc.); expected feed consumption; feed additives required and the type of feed processing desired. These topics will be discussed in more detail.

3
Points to consider infeedformulation
In order to increase the efficiency of fish production, one must take into account both nutrition and feed cost. Supplying adequate nutrition for various species of fish involves the formulation of diets containing approximately 40 essential nutrients and the proper management of numerous factors relating to diet quality and intake. The bioavailability of nutrients, diet palatability or acceptability, feed manufacture, storage methods, and chemical contamination may have profound effects on fish performance.
It is important that feed formulas developed for fish culture are nutritionally and economically sound. An economical diet must produce a kg of healthy fish at the "least cost" during a normal growing season. However, the feed at the lowest price per kg of fish is not necessarily synonymous with least cost production. Linear programming has been widely used to achieve least cost feed formulas for the feeding of fish and shrimps but a computer is only as good as the person entering data into it. Nutritionists must have good fundamental and practical knowledge in order to provide proper data and evaluate computer-derived formulas. In many cases, feeds formulated strictly by computer have not met with success because they have not been evaluated closely by nutritionists. It is necessary to make sure that the many things a nutritionist has learned from experience, that cannot be programmed into a computer, have also been considered.
In the development of economical diets, one cannot ignore the fact that some differences in feed composition will be introduced by seasonal changes in the ingredients. Feed manufacturers must take advantage of the availability of different feed ingredients at economical prices at various times of the year, rather than rely solely on one particular type. Physical characteristics, milling and composition of the feed ingredients may have significant effects on the processing and quality of finished feed. Cereal grains provide starch, which gelatinizes to give a water stable pellet while ingredients high in fiber or fat may affect pellet durability.
When protein levels are stated, it is assumed that protein will be of good quality, highly digestible and containing the proper balance of amino acids. However, in many cases the daily requirements of some essential amino acids and protein nitrogen are not met, resulting in poor growth performance of fish. Since energy intake is the main factor controlling feeding, the absolute amounts of protein, vitamins and minerals ingested depend to a large extent on energy intake. Therefore, the dietary balance is more critical than the absolute levels of specific nutrients.
Good quality feeds are produced from good quality ingredients. Fresh feed is also more palatable than rancid or stale feed. Furthermore, many vitamins are unstable under ordinary storage conditions. Vitamin stability in premix or finished feed is affected when stored over an extended period. Nutritional deficiencies are encountered where feed is not properly mixed and fed in a stressful environment. Even a well-balanced ration may not prevent a deficiency of certain vitamins if fish are suffering from disease or stress conditions.
Sometimes excellent quality feeds do not perform satisfactorily unless correct feeding practices and proper feeding rates are used. In addition to proper feeding and nutrition, the fish producer must give careful consideration to management, disease control and selection of stock to optimize production efficiency.

4
Nutrient requirement
Although nutrient requirements of fish have been investigated for over fifty years, only in the past decade comprehensive research has been directed towards species other than rainbow trout and channel catfish. The nutrient requirements of fish should be considered at all stages of development including larval, fry, grower and broodstock stages. Differences in the nutrient requirement of fish in these different stages is widely recognized but remain to be studied in detail.
Nutrient requirements for any animal species can be defined using several criteria, and the requirement for a given nutrient may vary with the criterion used. Growth, reproduction, behavior patterns, nutrient storage, enzyme activity, and gross and histological appearance of tissues and their content of nucleic acids and proteins are the major criteria used to assess the nutritional adequacy of diets. Ideal performance is not known in all cases. It has been assumed in this paper, and in most other studies of nutrient requirements, that maximum performance is ideal, although this is not true by every criterion. Greatest consumption of nutrients and most rapid growth often do not correlate with longest life span or freedom from disease.
Fish require amino acids, fatty acids, vitamins, minerals and energy sources (protein, lipid and carbohydrate). The nutrient requirements of selected fish species do not vary much and are summarized in Tables 1 to 5. The obvious differences are in the essential fatty acid requirements and the ability of different species to utilize carbohydrates.
Table l. Estimated protein requirements of some species of juvenile wannwater fish.
Estimated requirement
Species Protein source (%)
auumel catfish (lctalurws punctatws) Whole-egg protein 32-36
Common carp (Cyprinws carpio) Casein 31-38
Estuary grouper (Epinephelws salmoil.ks) Tuna muscle meal 40-50
Gilthead bream (Chrysophrys aurata) Casein, FPC and amino acids 40
Grass carp (Ctenopharyngodon ii.kl/a) Casein 41-43
Japanese eel (Anguilla japonica) Casein and amino acids 44-45
Milkfish (Chanos chanos) Casein 40 Red sea bream
(Chrysophrys major) Casein 55 Snakehead
(Channa micropeltes) Fish meal 52 Striped bass
(Marone samtilis) Fish meal and soy proteinate 47 Tilapia
T.aurea Casein and egg albumin 34 T. mossambica White fish meal 40 T. nilotica Casein 30 T. zillii Casein 35
Yellowtail (Serio/a quitr.qwradjQla) Sand eel and fish meal 55
Based on Wilson and Halver (1986).

Table 2. Amino acid requirements of some species of warmwater fish. I
Channel Common Japanese Tilapia Amino acid catfish carp eel nilotica
Arginine 4.3 (1.0) 4.3 (1.6) 4.5 (1.7) 4.2 (1.18) Histidine 1.5 (0.4) 2.1 (0.8) 2.1 (0.8) 1.72(0.48) Isoleucine 2.6 (0.6) 2.5 (0.9) 4.0 (1.5) 3.11 (0.87) Leu cine 3.5 (0.8) 3.3 (1.3) 5.3 (2.0) 3.39 (0.95) Valine 3.0 (0.7~ 3.6 (1.4) 4.0 (1.5) 5.12 (0.78) Lysine 5.1 (1.2 5.7 (22) 5.3 (2.0) 5.12 (l.43) Phenylalanine 5.0 (1.2)3 6.5 (2.5)5 5.8 (2.2)6 3.75 (1.05)8 Methionine 2.3 (0.6)4 3.1 (l.2)4 3.2 (1.2)4 2.68 (0.75)9 Threonine 2.0 (0.5) 3.9 (1.5) 4.0 (1.5) 3.75 (1.05) Trypatophan 0.5 (0.12) 0.8 (0.3) 1.1 (0.4)7 1.00 (0.28)
Crude protein in diet(%) 24 38.5 38 28
)Based on Wilson and Halver (1986). Values for tilapia from Santiago and Lovell (1988). Requirements expressed as percentage of dietary protein. Values in parentheses indicate requiremenn as % dry diet
20ther values reported: 5.0 (1.5), total protein in the diet 30%. 3Diet contained 0.3% tyrosine, with 0.6% tyrosine in the diet, phenylalanine requirement was
2.0% of the protein. 41n the absence of cystine. 51n the absence of tyrosine, with 1 % tyrosine in the diet, phenylalanine requirement was 3.4% of
the protein. °In the absence of tyrosine, with 2% tyrosine in the diet, phenylalanine requirement was 3.2% of
the f.rotein. Other values reported: 0.3 (0.1), total protein in the diet 42%.
8Tyrosine 1.79% of dietary protein. 9cystine 0.54% of dietary protein.
Table 3. Essential fatty acid requirements of certain warmwater fish species.
Species
Ayu
Channel catfish
Common carp
Japanese eel
Red sea bream
Seaba98
Tilapia nilotica
Tilapia zillii
Yellowtail
Based on Watanabe (1988).
Requirement
1 % 18:3 (n-3) or 1 % 20:5 (n-3)
1 % 18:3 (n-3) or 0.5% - 0.75% 20:5 (n-3) and 22:6 (n-3)
1 % 18:2 (n-6) and 1 % 18:3 (n-3)
0.5% 18:2 (n-6) and 0.5% 18:3 (n-3)
0.5% 20:5 (n-3) and 22:6 (n-3) or 0.5% 20:5 (n-3)
1 % 20:5 (n-3) and 22:6 (n-3)
0.5% 18:2 (n-6)
1 % 18:2 (n-6) or 1 % 20:4 (n-6)
2% 20:5 (n-3) and 22:6 (n-3)
5

6
Table 4. A summary of published v.itamin requirements for growth of channel catfish, common carp and rainbow trouL 1,2
Vitamin Channel catfish Common carp Rainbow trout
Vitamin A (IU) 5,500 1,000-20,000 2,000-15,000 Vitamin D (IU) 500-4,000 N.R. 2,400 Vitamin E 50-100 80-300 30-50 VitaminK IO N.R. IO Thiamin 1-20 N.R. 1-12 Riboflavin 9-20 4-IO 3-30 Pyridoxine 3-20 4 1-15 Pantothenic acid I0-50 25 I0-50 Niacin 14 29 1-150 Folic acid N.R. or5 N.R. 5-10 Vitamin B12 0.02 N.R. 0.02 Choline 400 500-4,000 50-3,000 Inositol N.R.3 200-440 200-500 VitaminC N.R. or 100 R 100-500
lmg/kg of diet unless specified. 2 Values summarized from the published literature. 3N.R. = not required, R = required.
Table 5. Mineral requirements of certain finfish. l
Rainbow Channel Common Japanese Mineral trout catfish carp eel
Calcium(%) <0.1 <0.1 <0.1 0.27 Phosphorus (%)2 0.7 0.4 0.7 0.3 Magnesium(%) 0.05 0.04 0.05 0.04 Iron (mg/kg) R3 30 170 Copper (mg/kg) 3 5 3 Manganese (mg/kg) 13 2.4 13 Zinc (mg/kg) 15-30 20 15-30 Iodine (µg/kg) R Selenium (mg/kg) 0.15-0.38 0.25 R R
l Based on Lall (1989). 2rnorganic phosphorus. 3Required.
The requirements as stated do not include any surpluses. In practice, extra nutrients are added commonly so that fish are provided diets with a margin of safety. In determining the level of nutrients for final formulation the following factors must be considered: species, strain and stage of development; health of fish; nutrient availability and variable ingredient composition; water temperature and environmental conditions; molds, toxins or inhibitors in the ingredients; mixing and processing of either ingredients or diets; duration and type of storage; method of feeding; projected time to market.
Composition of feedstuffs
Feed ingredients are selected on the basis of the nutrient composmon as determined by chemical analysis and available energy content (digestible and metabolizable). The major source of information on nutrient composition is the United States-Canadian tables of feed composition (NRC 1982). Other comprehensive tables of feed composition, including feeds from different geographical areas, have been published. They include: Tropical feeds (Gohl 1981); Nutrition

7
compos1uon of some Philippine feedstuffs (Castillo and Gerpacio 1976); Middle East feed composition tables (Kearl et al. 1979); Nutrient requirements of warmwater fishes and shellfishes (NRC 1983) and Fish feed and feeding in developing countries (ACDP 1983). The NRC bulletin (1983) entitled "Composition of selected underutilized resources as animal feedstuffs" also lists the composition of selected food processing wastes, forest residues, animals, crops and aquatic plants.
Feedstuffs are of varied composition. Generally, the values given in composition tables are averages reflecting the concentration of nutrients most likely to be present. If nutrient concentrations found in these tables are high, obviously the diet formulated on the basis of these values will be deficient even though the dietary concentrations are calculated to satisfy the requirements. It is desirable to have each batch of feed ingredient analyzed for actual content prior to feed formulation. However, this is not always practical and feed manufacturers may have to rely on published tables, recognizing that feedstuffs available in particular areas may differ from those described. Ultimately, it is important for each country to compile its own feed composition tables.
The protein content of grains (dry matter basis) may vary from batch to batch due to differences in soil fertility, time of harvest, genetic constitution and several other factors. The amino acid composition of specific grains may also show wide variation. It is well known that there is a marked inverse relationship between the protein content of wheat or grain sorghum and lysine concentration of the protein. As the protein content increases, the proportion of lysine in the protein decreases significantly. An inverse relationship between the protein content and concentration of certain essential amino acids (lysine, arginine,.methionine and cystine) in the protein occurs also in barley, com, oats and rice.
Animal protein sources are also subject to variation as a result of manufacturing conditions and the nature of the raw material from which they are processed. Severe heating during drying will lower digestibility and cause some loss of essential amino acids. Proteins from hide, scales, feathers, and hair have low digestibility and high concentrations of collagenous protein. The latter will result in relatively low concentrations of tryptophan in the product.
Feed analysis tables do not show the utilization of amino acids, sugars, vitamins and minerals. For example, the utilization of amino acids in a feed ingredient is influenced by digestive enzyme inhibitors (trypsin and chemotrypsin inhibitors, etc.), natural bound resistant proteins and undigestible compounds formed during processing (Maillard reaction). Aflatoxin, or other mycotoxins are of great concern as contaminants of feedstuffs. A number of these compounds may be present in moldy grains. Because of the high toxicity of these compounds, the use of moldy grains, even in small amounts, involves considerable risk.
Digestibility and nutrient availability
The formulation of a diet requires a knowledge of the digestibility of individual nutrients in feed ingredients. The difference between the nutrient content of the feed consumed and the feces voided being the amount absorbed or digested. Similarly, digestible energy (DE) is relatively simple to measure, being the gross energy of feed minus the energy in the feces. The undigested portion excreted in the feces is by far the major energy loss from the diet. Metabolizable energy (ME) is more difficult to measure since energy losses through the gills and in the urine must be measured and subtracted from DE. Although measurements of DE and ME have many shortcomings (Cho and Kaushik 1990), they are valuable in determining the percentage of a

8
feedstuff which may be utilized by the fish. Attempts should be made to measure DE values of locally available ingredients suitable for the formulation of fish diets. If diets formulated on the basis of DE values do not show optimum performance, other measurements of post-absorptive losses and recovered energy may be necessary to develop the optimum ration.
There is a major problem in both DE and ME measurements in that starch digestibility varies widely depending upon the source, concentration, feed intake and whether the starch is raw or cooked. Gelatinization of the starch occurs during extrusion processing but not in regular steam pelleting. Thus the DE value of otherwise similar feed may differ according to the processing method employed.
It is generally recognized that digestibility data are useful only when ingredients do not contain gossypol-like substances, tannins, complex polysaccharides, antitrypsin and other interfering substances which may influence the digestibility of various nutrients in the diet and give erroneous results.
The DE or ME values of feed ingredients are used strictly as guidelines and not considered biological constants. The DE and ME values of a mixed diet are not necessarily equal to the sum of the energy values of its constituents. Our recent work (unpublished) shows that the energy component of the diet varies with the nature of feed ingredients, particularly with the level and type of lipid supplement.
The rate of protein hydrolysis is the limiting factor in determining the efficacy of plant protein utilization. Several factors including enzyme-resistant peptides, tightly folded protein conformations, and trypsin inhibitors affect protein hydrolysis and consequently its digestibility. The digestibility of most refined vegetable and fish oils is relatively high.
Other dietary components
Certain feed components are added to diets for physiological or economic reasons. They include pellet binders, synthetic antioxidants, mold inhibitors, feeding stimulants, hormones and antibiotics, etc. Binders may be necessary to improve the firmness of pellets and also reduce the loss of fine particles during feed manufacture. Widely used binders are sodium and calcium bentonites, lignosulfonates, hemicellulose, carboxymethyl cellulose, alginates and guar gum. Cereal grains provide starch, which gelatinizes to give a water stable pellet. Other ingredients such as whey, wheat gluten, gelatinized starches and molasses, alone or in combination, will permit the production of good pellets. Common synthetic antioxidants used in fish feeds are BHT (3,5-di-tert-butyl-4 hydroxytoluene), BHA (2(3)-tert-butyl-4-hydroxyanisole) and ethoxyquin (1,2-dihydro-6-ethoxy-2,2,4-trimethyl-quinoline). The significance of other feed components is discussed elsewhere (NRC 1983).
Mechanics of diet formulation
The first nutritional consideration in diet formulation is the energy content of the diet, followed by the DE and ME ratios of various nutrients particularly the protein and energy ratio. The protein content of the diet and the amino acid balance are first calculated. Then, the level and type of lipids are selected to satisfy essential fatty acid and energy requirements. Concentrates of vitamins and minerals are often used to augment those occurring naturally in other ingredients. Because the vitamin content of natural products is variable and depends on factors such as origin, length and conditions of storage, time of year, length of storage, oxidation

9
or heating of the product, synthetic vitamins are added to assure adequate amounts. With the exception of iron, the mineral contents of feedstuffs is relatively consistent; however, phosphorus bioavailability from plant protein supplements must be estimated. Mineral interactions must also be taken into account.
The mathematical techniques used for feed formulation are simple unless least cost diets are required. With the proliferation of microcomputers in all segments of the feed industry and the availability of many software programs, the formulation of complex rations is becoming easier. However, a proper background in nutrition is necessary for the application of these programs. Diets that contain few feedstuffs, or where levels of, say protein, energy and minerals are fixed, may be formulated using simple algebra or simultaneous equations.
Linear programming is a mathematical technique that allows nutritionists to choose the best combination of feed ingredients at the least possible cost from a variety of available feedstuffs, having different nutrient composition and prices. The following information is necessary: nutrient requirements of fish; list of acceptable feed ingredients; nutrient content and DE or ME values of feed ingredients; unit price of feed ingredients including vitamins and mineral mixtures, and additives; minimum and maximum restrictions on the levels of each ingredient. Other constraints such as milling and handling characteristics of feed ingredients may be imposed by a feed manufacturer.
Nutrient and ingredient restrictions that have been used for least cost formulation of fish feeds have been summarized in Table 6. The restriction placed on minimum and maximum levels of certain ingredients depend on several factors. such as the unidentified growth factors in fish meal, palatability, presence of feed toxicants (gossypol in cottonseed meal) and undesirable pigments, etc. Further details regarding mathematical programs may be found elsewhere (Cooper and Steinberg 1974; Cho et al. 1985). It should be emphasized that least cost feed formulation is not always practical for a small feed manufacturer or farm, where the choice of feed ingredients is limited.
In animal nutrition research, several maximum profit formulations have also been developed. These use all known nutrition inputs and animal production outputs. Feeds are formulated from ingredients of known cost and composition, and are designed to optimize animal performance (daily weight gain) for maximum profit. Such formulations require
Table 6. Nutrient and ingredient restrictions in least cost feed formulation for channel catfish.
Qualifier Restriction Amount Units
Protein MiDimum 32 %
Fiber Maximum 7 %
Lipid Maximum 6 % Phosphorus (available) Minimum 0.5 % Phosphorus (available) Maximum 0.7 % Digestible energy Minimum 2.8 kcal/g Digestible energy Maximum 3.0 kcal/g Lysine Minimum 1.63 % Methionine Minimum 0.30 % Methionine + cystine Minimum 0.74 %
Grain or grain by-products Minimum 25 % Cottonseed meal Maximum IO % Fish meal, menhaden Minimum 4 % Fish meal, menhaden Maximum 12 % Pigments (xanthophylls) Maximum 11 mg/kg
Vitamin premix Equality 0.5 %
Mineral premix Equality 0.5 %
Based on Robinson (1990).

10
information on the daily dry matter intake of the animal, production response and daily nutrient requirements for maintenance. This technique has not been yet used with fish, but has many practical applications for intensive fish culture. Further studies on the energy requirement of fish are required before such feed formulation can be applied.
Dietary components and water quality
The composition, digestibility and physical characteristics of fish feeds may have a significant effect on water quality. The excretion of undigestible matter can be reduced by the manipulation of diet composition. Since ingredients containing high· concentrations of ash, fiber, chitin and undigestible carbohydrate result in an increase in the excretion of suspended solids, ammonia and phosphorus. These substances cause eutrophication consequently leading to oxygen deficits in ponds or receiving waters.
Diets containing_ a high level of protein, or a poor quality protein with a low level of energy supplied from lipid result in increased oxidation of protein causing· high rate of ammonia excretion from the gills and high fecal nitrogen content. The phosphorus output from fish farms can be controlled by reducing the phosphorus level in the diet, increasing feed efficiency and limiting the use of feed ingredients supplying excessive levels of phosphorus (Ketola 1985; Sumari 1986). Excessive carbohydrate particularly starch stimulates the growth of fungi. Furthermore, containing lipids which are not properly retained in the pellet may leach out thus producing a thin film on the water surface and possibly affecting the fishes gills.
Feed processing
Several forms of dry and moist fish feeds are produced either commercially or locally for small-scale farm use. Generally, dry feeds contain 8-10% moisture while the water content of moist feed ranges from 17 to 40% or more. Processing involves grinding, mixing, agglomerating, heating, drying, screening, crumbling, etc. which cause changes in the chemical properties of the starch, protein and other constituents. In recent years significant progress has been made in the production of dry feeds particularly by extrusion process. Generally, diets manufactured for warm water fishes utilize either steam pelleting or extrusion processing to produce dry pellets. During the steam pelleting process, steam is added to the feed in a conditioning chamber, where it is mixed with fe~d to raise moisture to approximately 15-18% and temperature to 70-80°C. The hot mixture is then forced through dies of various size openings and cut to varying lengths. The total moisture in pellets may be reduced by forcing air over the heated pellets which in turn may further crumble into smaller granules.
Extrusion processing requires more sophisticated equipment and production costs are high. Much higher temperature, pressure and moisture are applied to the feed mash than in the steam pelleting process. The finely ground feed in the conditioning chamber is heated to 104-148°C with dry steam under pressure to raise moisture content to approximately 20-25%. The sudden reduction in pressure as the material squeezes through the die holes at the end of the barrel allows the expansion of water vapor and entrapment of air. The carbohydrate fraction of the diet becomes gelatinized and the. air is trapped inside of pellets. These extruded particles contain more water than do steam pellets and also require external drying. Certain changes in diet composition and processing conditions can produce either floating or slow sinking pellets. Special ingredients or binders may be incorporated to prevent pellet disintegration.

11
Dry pellets have several advantages because they ensure continuous availability and uniformity of feed, ease of transport, storage and feeding. Furthermore, nutrient loss by leaching is minimal, water quality is not seriously affected and the risk of feeding improperly processed trash feed is greatly reduced.
The processing and prcxluction of moist feeds show wide variations. Moist pellets contain variable amounts of ground whole fish, fish and crustacean waste, liver, slaughterhouse byprcxlucts, etc. and/or fish silage, dry ingredients such as fish meal, whey, rice and wheat byprcxlucts, vitamin and mineral supplements, and hydrocolloidal binding agents, e.g., guar gum, alginates, carboxy methyl cellulose and gelatinized starch, etc. The diet is either ·cold pelleted, extruded through meat grinders or through more elaborate types of grinders and extruders. Raw fish and fishery by-prcxlucts must be pasteurized to destroy pathogens and the enzyme thiaminase found in fish tissues. Improper and long-term storage of moist diets can adversely affect the stability of vitamins, cause oxidation of lipid and bacterial and fungal contamination.
Often, the addition of humectants (propylene glycol and sodium chloride) which lower water activity and prevent bacterial growth, and fungistats (propionic and sorbic acid) which retard mold growth is required in these diets. The high moisture content enhances the loss of vitamin C. In areas where significant amounts of fishery and local by-products are available at relatively low cost, these diets have definite advantages. However, improperly processed moist pellets may cause feed waste and water pollution.
Effect of processing on the nutritional value of feeds
Most processing conditions have an overall beneficial effect on the physical characteristic and nutritional value of feeds. However, in a number of cases processing may lower the nutritional value of certain constituents particularly vitamins, proteins and unsaturated fatty acids. During processing, the reaction between reducing sugars such as glucose, fructose, lactose or maltose, and the free amino group of an amino acid, particularly the epsilon amino group of lysine, reduces the nutritional value of proteins. Depending on the severity of heat treatment, significant losses of sulfur amino acids, arginine, tryptophan, and histidine may also occur. These carbohydrate-amino acid reactions, often termed "Maillard" or "non-enzymatic browning", result in linkages that are not hydrolyzed by digestive enzymes. These amino acids are readily recovered from protein by acid hydrolysis in vitro, but are biologically unavailable.
Lipids used in fish feeds contain large proportions of highly unsaturated fatty acids which are especially susceptible to autoxidation. Hydroperoxides are formed when oxygen adds to the carbon-carbon double bond, but these compounds break down rapidly to several other compounds. During oxidative rancidity, the major breakdown products consist of ketones and aldehydes which give rancid fats their characteristic odors and flavors. Ascorbic acid is also readily oxidized and lost from the diet particularly when in aqueous solution. Stable forms of ascorbic acid, i.e., sulfate and phosphate esters, have been widely tested and are used in many commercial diets. The stability of the vitamins under various conditions is summarized in Table 7. The content of certain minerals in processed feed may also vary as a result of metallic contaminants.
The availability of vitamins may increase during processing. Approximately 90% of the niacin in cereal grains is bound to polysaccharide complexes and is therefore unavailable. Heat treatment increases the bioavailability -of both niacin and folic acid. The thermal process breaks

12
Table 7. Factors affecting the stability of vitamins.
Humid-Vitamins Heat Light Airl ity Acid Alkali pH7
Vitamin A u2 u u u u s s VitaminD u u u s u s VitaminE u u u s s3 s Vitamin K s u s u u s Thiamin u s u u s u u Riboflavin s u s s u s VitaminB6 u u s3 s3 s Vitamin B12 s u u s s s Niacin s s s u s s s Pantothenic acid u s s u u u s Biotin u s s s3 s3 s Folic acid u u u u s u Ascorbic acid u u u s u u
1 Air or oxygen. 2s = stable or stability slightly affected; U = unstable. 3Jndicates "stable" Wlder moderate acidic or alkaline conditions.
down the polyglutamate side chain of folic acid thus increasing the intestinal absorption of this vitamin. Processing also influences the nutritional availability of some minerals. The extrusion process in particular may destroy some microorganisms, inactivate trypsin inhibitors, reduce free gossypol and increase starch digestibility (Camire et al. 1990).
References
ADCP. 1983. Fish feeds and feeding in developing cowitries. Aquaculture Development Coordination Programme. ADCP/REP/83/18. FAO, Rome.
Camire, M.E., A. Camire and K. Knunhar. Oiemical and nutritional changes in foods during extrusion. Crit. Rev. Food Sci. Nutr. 29: 35-57. Castillo, L.S. and A.L. Gcrpacio. 1976. Nutrient composition of some Philippine feedstuffs. Tech. Bull. 21, 3rd., DepL Animal Science,
University of Philippines, Los Baiios, Philippines. Cho, C. Y. and S.J. Kaushik. 1990. Nutrition energetics in fish: energy and protein utilization in rainbow trout (Salmo gairdneri). World Rev.
Nutr. DieL 61: 132-172. Cho, C. Y., C.B. Cowey and T. Watanabe. 1985. Fish nutrition in Asia. Methodological approaches to research and development. International
Development Research Centre, Ottawa. Cooper, L. and D. Steinberg. 1974. Methods and applications of linear programming. W.B. Saunders Co., Philadelphia. Cowey, C.B., A.M. Mackie and J.G. Bell. 1985. Nutrition and feeding in fish. Academic Press, London. Embody, G.C. and M. Gordon. 1924. A comparative study of natural an.! artificial foods of brook trouL Trans. Amer. Fish. Soc. 54: 185-200. Gobi, B. 1981. Tropical feeds, animal production and health series. No. 12. Food and Agriculture Organization of the United Nations, Rome.
529p. Halver, J.E. 1989. Fish nutrition. 2nd edition. Academic Press, New York. Ketola, H.G. 1985. Mineral nutrition: cffecu of phosphoruA in trout and salmon feeds on water pollution, p. 465-473. In C.B. Cowey, A.M.
Mackie and J.G. Bell (eds.) Nutrition and feeding in fish. Academic Press, London. Lall, S.P. 1989. The minerals, p. 219-257. In J.E. Halver (ed.) Fish nutrition. 2nd edition. Academic Press, New York. Lovell, R.T. 1989. Nutrition and feeding of fish. A VI, Van Nostrand Reinhold, New York. Kearl, L.C., M Farid, LE. Harris, M. Wardeh and H. Lloyd. 1978. Middle East feed composition tables. International Feedstuffs Institute, Utah
University, Logan. NRC. 1981. Nutrient requirements of coldwau:r fishes. National R.search Council. National Academy Press, Washington, DC. NRC. 1982. United States-Canada tables of feed composition. National Research Council. National Academy Press, Washington, DC. NRC. 1983. Nutrient requirements of wannwater fishes and shellfishes. National Research Council. National Academy Press, Washington, DC. NRC. 1983. Underutilized resources as animal feedstuffs. National Research Council. National Academy Press, Washington, DC. Robinson, E.H. 1990. Channel catfish nutrition. Rev. AquaL Sci. 1: 365-391. Santiago, C.B. and R.T. Lovell. 1988. Amino acid requirements for growth of Nile tilapia. J. Nutr. 118: 1540-1546. Sumari, 0. 1986. Feed and waste water in aquaculture, p. 230-254. In A. Grimaldi and J. Rosenthal (eds.) Trends and problems aquaatlture
developmenL Proc. of the 2nd Intl. Conference on Aquafanning, Fiere di Verona, Italy. Watanabe, T. 1988. Nutritional value of animal and plant lipid sources for fish, p. 339-341. In Congress Proceedings, Aquaculture International
Congress and Exposition, British Columbia Pavilion Corp., Vancouver. Wilson, R.P. and J.E. Halver. 1986. Protein and amino acid requirements of fishes. Annu. Rev. Nutr. 6: 225-244.

Use of Non-Conventional Feedstuff of Plant Origin as Fish Feeds - Is It Practical and Economically Feasible?
KOK LEONG W&~ National Key Centre/or Teaching and Research in Aquaculture
University o/Tasmania - Launceston P.O. Box 1214
Launceston, Tasmania 7250 Australia
WEE, K.L. 1991. Use of non-conventional feedstuff of plant origin as fish feeds - is it practical and economically feasible?, p. 13-32. In S.S. De Silva (ed.) Fish nutrition research in Asia. Proceedings of the Fourth Asian Fish Nutrition Workshop. Asian Fish. Soc. Spec. Pub!. 5, 205 p. Asian Fisheries Society, Manila, Philippines.
Abstract
A review of selected literature on investigations into the use of non-conventional plant feedstuffs (NCPF) in fish feed indicaled that it is not possible to utilize them at high levels without compromising growth. Poor nutritive value in terms of poor digestibility, low availability of nutrients and presence of anti-nutritional factors were suggested as probable causes why NCPF was not suitable. Methods to enhance the nutritive value ofNCPF were suggested and discussed.
Fishmeal is an essential component in artificial diets. In view of the increasing cost and relative scarcity of fishmeal, a considerable research effort has been expended on evaluating the suitability of plant ingredients as complete or partial replacement of the fishmeal component in diets.
This paper addresses the question how effective is the replacement of fishmeal by plant ingredients, commonly classified as non-<:enventional feedstuffs in fish diets. The available experimental data are updated and methods of enhancing the nutritive value of non-<:enventional feedstuffs are also presented.
Introduction
Fish species generally require higher levels of dietary protein for optimum growth than poultry or cattle (Tacon and Cowey 1985). To supply this quantity of dietary protein, fish meal of marine origin, with amino acid profile that closely matched the fish's requirement pattern is commonly used at high levels of between 25 and 65% (average 35%) in fish feeds (Tacon and Jackson 1985). The increasingly scarce supply of fishmeal with its concomitant rise in price and the increased competition from other livestock feed manufacture has made it necessary to seek a cost-effective replacement to supply dietary protein in aquaculture feeds. This aspect of fish feed development research is centered on the search for inexpensive, readily available and nutritious protein sources which can supply all the nutritional needs of the fish. One obvious approach involves the greater utilization of ingredients of plant origin. Over the years, plant products such as oilseed cakes, for example, soybean meal and cottonseed meal have been evaluated as fish
13

14
feed ingredients. With advanced processing techniques, their nutritive value has been enhanced to such an extent that they are now considered conventional ingredients in aquaculture as in agriculture.
There are other similar by-products with potential which are at present the subject of research to determine its usefulness in fish feeds. These include the category of materials classified as non-conventional feedstuffs, i.e., those that have not been traditionally used in animal feeding and/or are not normally used in commercially produced rations for livestock (including aquatic organisms such as finfish and shellfish) (Devendra 1985). It is the objective of this paper to review the current status of the utilization of non-conventional feedstuff of plant origin as dietary protein resources in formulated fish feeds and/or as whole supplementary practical feeds.
The idea for this review originated from the paper presented by Dr. C. Young Cho at the Third Asian Finfish Nutrition Network Meeting in Bangkok in 1988 (Cho and Smith 1988). They suggested that in view of the generally poor nutritive value of non-conventional feedstuffs, in terms of high fiber and low protein and fat content, and the inability of the fish to digest the products efficiently, it is perhaps necessary to reconsider the whole concept of utilizing such products in fish feeds.
Utilillltion of Non-Conventional Plant Feedstuff (NCPF) as Dietary Protein Source in Formulated Fish Feeds
Several reviews have been written about non-conventional feedstuff resources. Devendra ( 1985) provided a comprehensive account on non-conventional feed resources available in Asia and the Pacific and its utilization in livestock feeds. Other authors outline the potential of these products and the current utilization trend in aquaculture feeds (Tacon and Jackson 1985; Wee 1988; Pantastico 1988; Shetty and Nandeesha 1988). It is not the intention of this paper to conduct another review of a similar nature. This paper will present 11pdated information on the possible utilization of NCPF currently available. Only selected literature relating to the utilization of cheap, readily available ingredients in tropical fish species will be considered.
The growth performance of certain fish species fed selected non-conventional plant feedstuffs is shown in Table 1. From the summary provided in Table 1 and the other previous reviews, it is quite clear that plant proteins cannot be employed as the sole source of dietary protein. It appears that for most of the NCPF, the maximum recommended level of inclusion appears to be between 20 and 30% of the diet
Several factors which limit higher incorporation of NCPF in fish feeds have been suggested: a) Low protein content - plant products generally contain lower protein levels (on average
containing 20-40% protein) than animal protein such as fish meal (60-80%) (Devendra 1985; Gohl 1981).
b) Amino acid imbalance - plant protein generally contains low levels of one or more essential amino acids, and cannot meet the fish requirement (Tacon 1987).
c) Presence of anti-nutritional factors. The anti-nutritional factors commonly found in plant proteins are presented in Table 2. The NCPF inevitably contains one or more of these factors (Tacon and Jackson 1985).

Table 1. Summary of results from selected experiments utilizing non-conventional plant feedstuffs (NCPF) in fish feeds for tropical fish species.
Level of Control Digestibility Growth Culture Ingredient Species of fish NCPFused diet coefficients response systems References
Homwon Nile tilapia 40, 30and Chicken Not available Specific growth rates (SGR) Clear water Klinavee et al. ( 1990) Ceratophyllum Oreochromis 20% of diet feed (NA) obtained were ff), 99 and 106% Fiberglass tanks demersum niloticus replacing fish of the control diet for 40, 30
meal and 20% inclusion levels, respectively. SGR of control 7.58%/fish/day
Hom won Nile tilapia 50% of diet Commercial NA Percentage weight gain (PWG) Cages in lake Chiayvareesajja et al. ( 1990) C.demersum 0. niloticus with 12.5 and pellets obtained were 52 and 92% of
25% fish meal the control diet for diets containing 50% test ingredient with 12.5% and 25% fish meal, respectively. Percentage weight gain for control diet was 114%
Eleacharis Nile tilapia 40, 30and Chicken NA SGR obtained were 65, 93 Oearwater, Klinavee et al. ( 1990) ochrostachys 0. niloticus 20% of diet feed and 122% of control diet at fiberglass (~teud.) replacing fish 40, 30 and 20o/o inclusion level, tanks
respectively. SGR of control was 1.58%/day
Duckweed Common carp 40o/o of di et 60% of rice NA Total weight gain obtained Static water Devaraj et al. (1981) Lemna1'Unor Cyprinus carpio bran and was 83% of control (5.3 kg cement cistern
40o/o groundnut in 140 days) oil cake
Cabbage leaver Common carp 40% of diet 60% rice NA Total weight gain obtained Static water, Devaraj et al. (1981) C. carpio bran, 40% is 83% of control (5.3 kg cement cistern
groundnut after 140 days) oil cake
Water hyacinth 0. niloticus 40, 30and Chicken NA SGR obtained were 64, 93 Oear water, Klinavee et al. ( 1990) Eichhornia 20% of diet feed and 110% of control diet fiberglass crassipes replacing fish for 40, 30 and 20% inclusion tanks (dried) meal level, respectively. SGR of
control diet was 1.5%/ fish/day
Water hyacinth Brycon sp. 9.5 and 18.9% Fish meal NA SGR obtained were 25 and Ooth cages Saint-Paul et al. (1981)
E. crassipes of diet remained 12.5% better than control suspended in (dried) constant at diet for the 9.5 and 18.9% ponds with -27.3%, com inclusion level, respectively. recirculating UI
meal varied SGR for control was 0.8%/day water system

Level of Control Digestibility Growth Culture Ingredient Species of fish NCPFused diet coefficients response systems References
Water hyacinth Catfish 50% of diet Minced meat NA PWG obtained was 150% Glass Niamat and Jafri (1984)
E. crassipes HeteropnewJes (87% of diet) better than control (at 20% aquarium (dried) fossil is compared with 8% weight
gain for control over 20 days)
Water hyacinth Labeo 20and 40%. Fish meal Apparent SGR obtained were 79 and Static water, Hasan et al. (1990)
E. crassipes rohita of total dietary as 100% of protein 68 % of control diet for 20 indoor glass
(dried) protein dietary digestibility and 40% inclusion level, aquarium protein coefficient respectively. SGR for control
(APD) were 71 was 3.13%/day and 63% for 20 and 40% inclu-sion level, respectively, and 79% for control
Water hyacinth Trichogaster sp. 2.5 and 10% Fish meal NA SGR obtained were 1.36 and Cages in lakes Hutabarat et al. (1986)
E. crassipes of diet remained 0.93%/day for the 2.5 and (dried) constant at 10% inclusion rate,
35% of diet respectively
C. carpio 2.5 and 10% Fish meal NA 1.61 and 1.51 %/day, Cages in lakes Hutabarat et al. (1 Q86)
of diet remained respectively constant at 35% of diet
Water hyacinth Oreochromis 2.5 and 10% Fish meal NA 1.34 and L30%/day, Cages in lakes Hutabarat et al. (1986)
E. crassipes mossambicus of diet remained respectively (dried) constant at
35% of diet
Puntius 2.5 and 10% Fish meal NA 0.96 and 1.44%/day, Cages in lakes Hutabarat et al. (1986)
javanicus of diet remained respectively constant at 35% of diet
Water hyacinth 0. ni/oticus lOOand 75% commercial NA SGR obtained were 85 and Static water Edwards et al. (1985)
E. crassipes of control diet 95% of control diet. outdoor
(dried) diet SGR for control diet concrete tanks
was 1.99%/day

Level of Control Digestibility Growth Culture Ingredient Species of fish NCPFused diet coefficients response systems References
Water hyacinth 0. niloticus 50% of dietary Dietary protein APD was SGR obtained was 79 and Outdoor concrete Pongsri (1986) E. crassipes protein by fish meal 49-65% 81 % control in recirculating tanks in static (dritd) (37.5% of diet) groundnut meal and static water experimental or recirculating
and rice bran system, respectively. The water systems SGR for control diet was 1.64%/day and 1.58%/day, respectively
Water hyacinth Trichogasler sp. 2.5 and Fish meal NA SGR obtained were 2.84 and Cages in Hutabarat et al. (1986) E. crassipes 10% of diet remained 1.8%/day inclusion rate, lakes (Composted) constant at respectively
35% of diet
Water hyacinth C. carpio 2.5 and Fish meal NA 1.38 and 1.34%/day, Cages in Hutabarat et al. (1986) E. crassipes 10% of diet remained res pecti vel y lakes (Composted) constant at
35% of diet
Water hyacinth 0. nwssambicus 2.5 and Fish meal NA 1.38 and 1.20%/day, Cages in Hutabarat et al. (1986) E. crassipes 10% of diet remained respectively lakes (Composted) constant at
35% of diet
Water hyacinth P. javanicus 2.5 and Fish meal NA 1.27 and 1.26%/day, Cages in Hutabarat et al. (1986) E. crassipes 10% of diet remained respectively lakes (Composted) constant at
35% of diet
Water hyacinth 0. ni/oticus 100, 75 Commercial NA SGR obtained were 42, 98, 108 Outdoor static Edwards et al. (1985)
E. crassipes 50 and 25% diet and 98% of the control diet. water, concrete (Composted) of control SGR control diet was 1.99%/day tanks
diet
Water hyacinth 0 ni/oticus 50% of dietary Dietary protein APD were SGR obtained were 76 and 81 % Outdoor concrete Pongsri ( 1986) E. crassipes protein (37.5% supplied by 46 and65% of control diet in static water tanks in static water (5 weeks of the diet) fish meal, in static and and recirculating water system, or recirculating composting) ground nut recirculating respectively. The SGR for water systems
and rice bran water systems, control diet was 1.64%/day respectively

Level of Control Digestibility Growth Culture Ingredient Species of fish NCPFused diet coefficients response systems References
Water hyacinth 0. niloticus 50% of dietary Dietary protein APO were SGR obtained were 77 and 94% of Outdoor concrete Pongsri (1986) E. crossil"s protein (37.5% supplied by 33 and 36% control diet in static water and tanks in stAtic water (l-112 ycan) of the diet fish meal, for static and recirculating water system,
ground nut recirculating respectively. The SGR for control and rice bran water systems, diet was l.64%/day
respectively
UllCQl!M 0. niloticus 20,40, Fish meal NA PWG obtained were 61.37; 37% and Outdoor static water Santiago et al. (1988) Lcucocepltala 80% of diet as 100% 80, 87 and 8% of the control diet system panial water Leaf meal protein dietary for female and male fish, change weekly
protein respectively at levels of 20, 40 and 8%, respectively. The % weight gain for the control diet were 27 and 72% for females and males, respectively
Lcuctu!na L. rohila 20,40% Fishmeal APO was SGR obtained were 79 and 70% Indoor static water Hasan et al (1990) Lcucocepltala of total supplying 68 and63% of control diet for 20 and 40% glass aquaria Leaf meal protein 100%of for inclusion level, respectively.
the dietary The protein level of 20% SGR for protein control was 2.34%/day and 40%,
respectively
~"" 0. niloticus 25,50 Fishmeal APOwas72, SGR obtained were 66, 66 and 18% Indoor recirculating Wee and Wang (1987) Lcucocepltala 100%of supplying 66and40, of control diet for 25, 50 and system and Leaf meal dietary protein 100%ofthe respectively 100% water inclusion level, concrete tanks
dietary with increasing respectively. The SGR for the protein amount of control diet was 3.03%/day
leafmeal
Lcuctu!na 0. niloticus 25,50 Fishmeal APO was75, SGR obtained were 89, 73 and 2.3% Indoor recircuiating Wee and Wang (1987) Lcucocepltala 100%of supplying 65 and41%, of control diet at 25, 50 and system and Leaf meal dietary protein 100%ofthe respectively l 00% inclusion level, respectively. concrete tanks (soaked in dietary The SGR for the control diet was water for protein 3.03%/day 48 hours)
Lcuctu!na L. rohiJa 20and40% Fishmeal APOwas7l, SGR obtained were 86 and 75% of Indoor static Hasan et al (1990) Lcucocepltala of total supplying and63%, the control at 20 and 40% inclusion water system, Leaf meal protein 100%of respectively level, respectively. SGR for glass aquaria (soaked in the dietary control diet was 2.34%/day water for protein 24 houn)

Level of Control Digestibility Growth Culture Ingredient Species of fish NCPFused diet coefficients response systems References
Cassava 0. niloticll8 20,40 Fish meal APD was64, SGR obtained were 79, 71, 44 Indoor, recirculating Ng and Wee (1989) leafmeal 60, 100% supplying SO, 3S% and and 6% of control diet with water system. (ManiJwt of dietary 100% of the 18%, with increasing substitution level, Concrete tanks esculenJa) protein dietary increasing respectively. The SGR for (soaked in protein amount of the control was 2.62%/day water for leaf meal, 48 houn) respectively
Cassava 0. niloticll8 20,40 Fishmeal APDwas67, SGR obtained were 82, 6S, 7 Indoor, recirculating Ng and Wee (1989) leafmeal 60, 100% supplying SO and 3S%, and 8% of control diet with water system. (/tlanilwt of dietary 100% of the respectively increasing substitution level, Concrete tanks esculenJa) protein dietary respectively. The SGR for (S1Dldried) protein control diet was 2.62%/day
Rapeseed 0. mossambicll8 lS, 30, Fistuneal NA SGR obtained were 96, 90, 81, Indoor, recirculating Davies et al. (1990) Brassica nap118 40,SO Hyprosoy 87 and 78% of control diet systems
and60% meat and bone for the increasing levd of of dietary meal to supply plant meal, respectively. protein 1 ()()% protein SGR for control diet was
S.38%/day
Green gram 0. niloticll8 13, 25, Fishmeal NA The percent average daily Indoor, recirculating De Silva and Gunuekera (1989) meal 37,SO% soybean weight gain (ADG) obtained systems Phaseol118 meal meal were Sl, SS, 48 and S3% of
supplying control with incorporation dietary of plant meal, respectively. protein The ADG for the control diet (2S% was 7.79%/day content)
Mustard C. carpio 2S and Fishmeal APDwere SGR obtained were 8S 111d 67% Indoor, recirculating Hossain and Jauncey (1989) oil cake SO%of supplying 84and 81%, of control diet for 2S and water system Brassica dietary 100% of respectively SO% inclusion level, respectively. jwncea protein protein dietary The SGR for the control diet
protein was 3.S8%/day
Linseed meal C. carpio 2Sand Fishmeal APD were8S SGR obtained were 86 and 66% of Indoor, recirculating Hossain and J auncey (1989) Linum SO%of supplying and 78%, control diet at 25 111d S0'1o water system 113itatissimum dietary 100% of respectively inclusion level, respectively.
protein protein SGR for the control diet was 3.S8%/day
Sesame meal C. carpio 25,SO Fishmeal APD were 81, SGR obtained were 74, S4111d Indoor, recirculating Hossain and Jauneey (1989) Sesamum and 70% supplying 18 and 78%, 36% of control at 2S, SO and water system indicum of dietary 100% of respectively 70% inclusion level, respectively.
protein protein SGR for control diet was 3.S8%/day

20
Table 2. Anti-nutritional factors in plant foods.
Stress factor
Phytate Oxalate Tannin
Goiuin Gossypol
Limarin Trypsin inhibitor Solanine
Nawre
Organic acid Organic acid Polyphenol
Glucosinolate Polyphenol
Cyanogenetic glucoside Protein Glycoside
Source: Teotino and Knorr (1985).
Food
Cereals, legumes Spinach, amaranth Beans
Sorghum Rapeseed Cottonseed
Cassava Legumes, cereals Potato
Action
Chelates metals Chelates cations Binds proteins
Goitrogenic Chelates metals Reactive Releases HCN Inhibits proteolysis Inhibits cholinesterase
Dietary effect
Decreases mineral availability Makes calcitim, iron unavailable Makes proteins insoluble, inactivates
enzymes Decreases iron, B-12 availability Decreases iodine uptake Causes anemia May cause poisoning May cause poisoning Decreases protein digestibility Causes gastrointestinal or neurologic
disorders, may cause poisoning
Surprisingly, in those experiments evaluating NCPF in fish feeds where digestibility coefficients were measured, the apparent total or dry matter digestibilities were low whilst comparatively high values for apparent protein digestibility coefficients were observed. As fish species do not possess the mechanisms to break down plant tissues, it is interesting to observe such high apparent protein digestibility values. This suggests that the processing procedures adopted, prior to incorporation, had rendered the plant protein available to the fish for digestion.
However caution must be exercised when comparing the results from these studies. It is possible that results could be misinterpreted from these sources:
1) Experimental rearing systems Experiments conducted in static water systems allow the production of natural food
organisms such as phytoplankton and zooplankton which may be beneficial to some species of fish. This occurrence may mask the nutritional contribution of the experimental diets to the experimental fish leading to erroneous conclusions. A distinction must be made regarding results obtained in a clear water system from that generated in a static water system. However, it is necessary to generate concise and clarifiable data, under controlled laboratory conditions, and those under the real commercial farming environment where several factors can and often act simultaneously. 2) Experimental feed formulation
Poorly conceived formulation of experimental diets could lead to misleading results. It is expected that at low levels of test plant protein, the growth response should be comparable to the control as there are adequate nutrients contained in the rest of the ingredients to satisfy the fish needs. At such low levels, it is possible that the impact of the inclusion of test plant protein mostly increased the overall fiber content and that the plant protein may not supply any nutrient at all. The inadequacy of the plant protein only became obvious when present at such level that the experimental diet as a whole becomes deficient in some nutrients. Based on such results, it would be misleading to recommend that a plant protein could be included at a certain level without compromising fish growth, when in fact it merely acted as a filler and did not contribute to the nutrition of the fish at all. Fish meal with its excellent amino acid profile will support reasonable growth even when included at low levels. Nandeesha et al. (1989) however, have produced fish meal free diets capable of supporting substantial growth in Cat/a cat/a, an Indian major carp.

21
From these forementioned observations it is concluded that most of the NCPF, processed in its current form, cannot be utilized to replace fish meal at any high level without compromising growth and production.
Enhancement of its nutritive value by some processing means to increase the bioavailability of nutrients, reduction or removal of anti-nutritional factors and the inclusion of appropriate additives to correct known deficiencies could result in NCPF being incorporated at a higher level in fish feeds. The successful transformation of soybean meal from being a by-product of the soy oil extraction industry into a conventional fish feed ingredient is an example of the potential value of plant proteins as animal feed and the critical importance of a systematic approach in evaluating and upgrading a product. An examination of the investigative steps into the development of soybean meal into a major fish feed ingredient can serve as a model which can be similarly applied to other NCPF. The research into the use of soybean meal in aquaculture feed probably began when it was realized that firstly, it contains a high level of protein (averaging 40-45%) and secondly, the amino acid profile within the protein, with the exception of methionine, is very good and consistent with the requirements of most fish species (Lovell 1990). However, it is also known to contain anti-nutritional factors such as the trypsin inhibitor, haemagglutinins and others which fortunately, could be eliminated through processing techniques involving heat treatment. Advances in food processing techniques, such as micronisation, extrusion and expansion have produced higher quality products which are more digestible with increased bioavailability of nutrients and reduced anti-nutritional factors (Tacon and Jackson 1985). The present trend in the utilization of soybean involves the use of full fat soybean to benefit from the higher fat content (20%) which also contains useful components such as lecithin. As a result, soybean meal is now one of the key dietary protein sources in catfish and other fish diet (Lovell 1990).
Therefore, the role of food processing engineers to enhance the nutritive value of products, biotechnologists and agronomists to produce plants which contain low or no anti-nutritional factors, and feed formulators and manufacturers to present the nutrients in such a manner that will benefit the user, i.e., the fish, in fish feed development cannot be overemphasized. It is essential that fish 'nutritionists' work in conjunction with these engineers, biotechnologists, and agronomists to produce cost-effective, well balanced and nutritious fish diets.
Utilization of Macrophytes in Fish Culture
Aquatic and terrestrial macrophytes have been used as supplementary feeds in fish farming since the early days of freshwater fish culture industry (Bardach et al. 1972) and still play an important role as fish feeds in extensive culture systems today (Edwards 1987). Leaves from terrestrial plants such as Cassava manihot, Leucaena leucocephala, grasses and vegetables and aquatic plants - floating and submerged such as Lemna sp., Azolla sp., Ceratophyllum demersum and Hydrilla verticillata have been reported as feeds in fish culture. The availability of such feeds is the key to the success of many of the extensive and semi-intensive culture systems utilizing herbivorous fish species. Excellent reviews on the use of macrophytes in fish culture have been carried out (Edwards 1980; Edwards 1987; Okeyo 1989).
Fish do not possess the enzyme cellulase or significant symbiotic gut flora capable of hydrolyzing cellulose. However, herbivorous fish species have evolved anatomical and physiological adaptations to aid them in ingestion, mastication, digestion and absorption of plant materials. Thus fish are able to extract nutrients from apparently "indigestible" plant food

22
substapces. The bicuspid and tricuspid teeth on the jaws of Tilapia rendalli cut and macerate macrophytes (Pullin 1983). Grass carp, Ctenopharyngodon idella and T. rendalli possess strong and specialized pharyngeal teeth with flattened, serrated and rasping surface to cut, shred and grind macrophytes (Hickling 1966). Herbivorous and omnivorous fish normally have very long, coiled intestine, for example, it is 14 times the total length in Oreochromis niloticus (Trewavas 1982). This effectively allows this species of fish to retain the feed for a longer period of time in the gut to effect digestion and absorption. In addition, in certain species of tilapia, the stomach pH is low enough to enable lysing of cell walls in plant tissues, further aiding in the digestion (Caulton 1982).
In summary, in herbivorous fish species, especially those consuming macrophytes, the first stage of digestion, the breakdown of plant tissues is through mechanical non-enzymatic means. It is to be expected therefore that their digestion efficiency will not be optimum and yet plantbased diets have been observed to support the high biomass of herbivorous fish species in the wild. Therefore, an examination of how wild herbivorous fish populations derive their nutrition from a predominantly plant-based diet could provide clues as how best to do the same for fish stocks in fish farms. In productive waters where there is greater quantity and diversity of food organisms, food supply is not limiting and fish species selectively choose the food items required. Stenophagous herbivorous species, however, tend to feed a lot on one type of material to extract a desired quantity of essential nutrients. For example, the grass carp feeds almost exclusively on macrophytes and is completely dependent on the utilization of its pharyngeal teeth to mechanically break down the plants, which although functional, is not efficient; therefore only a small proportion of the feed consumed is digested and absorbed. Therefore, to meet its nutritional requirement the grass carp consumes huge quantities at each meal. A feeding rate of 174% of its body weight per day is typical (Edwards 1987). This is in part due to the high moisture content of the feed but also as an adaptation to secure enough essential nutrients from a poorly digestible source.
In experiments with controlled feeding regimes wherein experimental fish are fed on plant only diets in clear water systems, weight losses are recorded (Oreochromis mossambicus fed on Spirogyra maxima (Mathavan et al. 1976); Tilapia zillii fed on Hydrilla verticulata, Potamogeton pectinatus and Myriophyllum spicatum (Legner and Murray 1981); Oreochromis aureus fed on Elodea trifoliata, Myriophyllum sp. and Potamogeton gramineous (Okeyo 1987); and Oreochromis niloticus fed on Azolla pinnata (Almazan et al. 1986). These growth responses are to be expected given the fish's limited capacity to digest plant materials.
However, in experiments wherein experimental fish are fed combinations of plant and animal matter, positive growth of varying degree was observed. The general trend is towards one of better growth with increased level of dietary animal material (Fischer 1973; Legner and Murray 1981 ). This observation is confirmed in studies on the feeds and feeding habits of wild herbivorous fish populations which indicated that apart from plant materials, a significant amount of non-plant matter is also consumed. The non-plant component of the diet could have been inadvertently ingested with the plant materials - e.g., microbial films, protozoan, or insect larvae, etc., resident on submerged macrophytes or it could have been taken in selectivety through active foraging for organisms such as insect larvae, chironomid larvae, tubifex worms. Adult Tilapia zillii reared in ideal conditions in the Imperial Valley, California, increased its total length by 165 mm in the first year and 86 mm in the second year. These growth rates are faster than those observed in their natural habitat in Africa (Legner et al. 1975). The diet consisted of aquatic macrophytes, algae and significantly also included mosquito and chironomid

23
larvae and aquatic snails. The nutritional contribution from these different types of feed was not quantified. Presumably, a significant proportion of the nutritional requirements comes from both the plant and non-plant components of the diet.
Pandian and Vivekanandan ( 1985) in a review on the energetics of feeding and digestion in fish indicated that a herbivore like Oreochromis mossambicus, when offered animal, plant or detrital feed, exhibited an absorption efficiency of 95, 79 or 42%, respectively. The high absorption efficiency when fed on an exclusive animal diet and its high protein requirement suggest that animal matter is essential for herbivores and detritivores. They concluded that herbivores/detritivores neither will nor can consume and absorb a sufficient quantity of plant/detrital material to meet their metabolic energy demands. This hypothesis thus explains the negative or poor growth of fish fed an exclusively plant diet and the success of wild population of herbivorous fish species with access to both plant and animal origin feeds.
The feeding efficiency of herbivorous fish fed macrophytes could be measured in terms of the feed conversion ratios (FCR) obtained in feeding trials, i.e., dry weight of food required per unit live weight gain. In general, poor feed conversion ratios from 5 to 11 are obtained compared to values between 1 and 2 for commercially available artificial pelleted feeds (Edwards 1980; Shireman and Smith 1983; Venkatesh and Shetty 1978a). However, some macrophytes such as duckweeds (Lemna minor) although supporting poor growth gave an FCR of less than 2 (Edwards 1980) and 1 (Gaigher et al. i984) indicating that duckweeds are readily ingested and efficiently utilized by the Tilapia hybrid (0. niloticus x 0. aureus).
Another indicator of feeding efficiency is the digestibility efficiencies. This is commonly measured as apparent digestibility coefficients - the fraction of the ingested amount that is not recovered in the feces, expressed as the percentage of the ingested amount. The apparent digestibility coefficients of some macrophytes by different species of herbivorous fish are presented in Table 3. With the exception of the napier grass which gave an apparent total digestibility coefficient of less than 20%, the rest of the macrophytes tested showed relatively acceptable coefficients (50-80%) albeit low when compared to feedstuffs of animal origin such as fish meal. The general trend suggested that aquatic macrophytes are more digestible than terrestrial macrophytes.
Therefore, on average, 50% or more of the protein contained within the macrophytes could be digested and absorbed. However, macrophytes normally contain low levels of protein (20-40%) and fish species cultured on a plant only diet either lose weight or grew very slowly. This protein inadequacy is compounded by the fact that plant proteins are normally deficient in one or more essential amino acids such as methionine leading to essential amino acid deficiency problems. This may help explain the role of animal protein when fed in combination with plant proteins, i.e., in supplying the essential amino acids and other micronutrients. The apparent success of utilizing macrophytes as fish feeds in Asia and Africa in extensive fish farms with static water ponds could be attributed to the presence of other food organisms such as phytoplankton, zooplankton, copepods and benthic organisms. These other sources of nutrition were stimulated to gr9w through deliberately designed fertilization programs or from the fertilizing effects of uneaten food and undigested food in fish feces.
A perusal of available literature on digestion and digestive enzymes in fish revealed some interesting conclusions of interest to fish nutritionists. One of the most controversial dealt with the question of whether fish are capable of producing the enzyme cellulase to hydrolyze cellulose in breaking plant cell walls. Initial studies by Fish (1960), Hickling (1966), Stickney and Shumway (1974) and Buddington (1980) detected some cellulase activity in the intestinal

24
Table 3. Appareol nutrient digestibility coefficients of cenain macropbytes for selected herbivorous fish species.
Digestibility coefficient (%) Macropbytes Fish species Dry matter Protein References
Napier grass (Pennisetwn p11Tpurewn) Ctenopltary111odon idel/a 19.7 Edwards (1987) (Pennisetwn p11Tpurewn) c. idel/a 16.45 63.96 Law et al. (1985)
Napier hybrids c. idel/a 85.70 V enkatesh and Shetty (1978b) Napier hybrids C. idel/a 79.51 Halinge (1981) Napier hybrids C. idel/a 78.3 Gowrishankar (1979) Napier hybrids c. idel/a 87.17 Ramakrishna (1980) Paragrass (Brachiara phaseoloides) C. idella 88.70 Gowrishankar (1979) Kudzu (Piararia phaseoloides) C. idel/a 75.90 Gowrishankar (1979) Cowpea (Vigna siliensis) C. idella 83.0 Ramakrishna(l980) Ku Kabul (Leucaena leucocepha/a) C. id.ella 85.65 Ramakrishna (1980) Green panic (Panicwn mazinwm) C. idel/a 80.13 Halinge (1981) Rhodes grass (Chloris gaymta) C. idella 81.87 Halinge (1981) Carpet grass (Axonopws compressus) c. idel/a 20.92 62.98 Law et al. (1985) Yam leaves (Colocasi111r1 antiqworwn) C. id.ella 55.29 72.04 Law et al. (1985) Sourpaspalum (Paspal111r1 conjwgatwn) C. idel/a 35.13 Lin and Chen (1983) Lettuce C. idel/a 12 Fischer (1970) Duckweeds Lemnaminor C. idel/a 53 80 Edwards (1987) Lemnaminor C. idel/a 60 Van Dyke and Sutton (1977) Lemnaminor c. idel/a 81.8 Lin and Chen (1983)
Lemnagibba 0. niloticws x 0. awreus 86 Edwards (1980)
Spirode/a polyrhiza C. id.ella 75.05 Lin and Chen (1983) Spirode/a polyrhiza Tilap"ia rendalli 47-57 Edwards (1987) Spirode/a polyrhiza Tilapia me/anoplewra 42-57 Mann (1966) W olffia a"hiza C. idel/a 66.67 Lin and Oien (1983)
Elodea canadensis T. melanoplewra 43-57 Mann (1966) Elodea canadensis T. rendalli 47-57 Edwards (1987)
Hom wort Ceratophyllwn demerswn C. idel/a 49.43 Lin and Oien ( 1983)
T. rendalli 47.8-58.7 Edwards (1980) C. idel/a 85.70 Venkatesh and Shetty (l 978a)
Hydril/a verticil/ata C. idel/a 67.91 Lin and Chen (1983) Hydril/a verticil/ata C. idel/a 80.98 V enkatesh and She tty ( 1978a) Hydril/a verticil/ata Elroplws swratnensis 34.6-51.9 59.2-70.9 De Silva and Perera (1983) Najas qwadelwpensis Tilapia zillii 29.3 75.1 Buddington (1979)
18 species of higher C. id.ella 58 (average) Chiang et al. (1966) aquatic plants
Water hyacinth C. id.ella 58.94 Lin and Oien (1983) Eichhornia crassipe.s

25
extracts. It was later suggested that the source of the cellulolytic activity measored was extraneous. They found that there is a positive correlation between the amount of processed plant detritus in the fish gut and cellulase activity and that the activity is presumably attributable to the bacteria and fungi colonizing the feed (Prejs and Blaszczyk 1977; Buddington 1980). It was also observed that there is a similar positive correlation between cellulolytic activity and the amount of zooplankton or aquatic insects consumed (Mair 1977; Monk 1976; Lindsay and Harris 1980).
Only fish with the appropriate accessory masticatory apparatus can break down plant cell wall. Perhaps then to improve the utilization efficiency the macrophytes should be pretreated in some W3:YS to break down the cellulose and release the more nutritious cellular contents before feeding to the fish, for example, fermenting or ensiling grasses, leave clippings prior to feeding to the fish. The action not only provides a more digestible product but it may also increase the protein content from the microbial biomass. One other suggestion which I would like to put forward is the use of wood-eating insects for their cellulase production capacity. One could mass produce these insects, process and incorporate them into macrophytes or other plant products.
The intestinal tract of fish larvae is much more simply organized and shorter than that of the adults (Stroband and Dabrowski 1979), correlating with a low production of enzymes (Dabrowski 1979). This phenomenon perhaps explains why nutritionally complete artificial larval food which are readily ingested by the fish larvae sometimes do not support growth, i.e., the larvae at this stage simply do not have the necessary enzymes or the amount to digest the feed at the optimal level. In view of this information, it may not be advisable to include plant proteins in larval feeds, unless properly treated to render them digestible, until such time that the fish are capable of utilizing them efficiently. Jancarik (1964) suggested that the fish larvae could utilize live food well because of the exogenous enzymes present within the food organisms taken in. Perhaps exogenous enzymes such as proteases or cellulase extracted from bacteria or fungi could be incorporated into larval feeds to aid in digestion. This concept will be expanded later in the paper.
It is known that herbivorous macrophyte feeding fish have distinct preferences and select only certain types of plant materials to ingest (Edwards 1987). Grass carp, C. idella, for instance, favored soft plants such as filamentous algae, submerged aquatic macrophytes, duckweeds and soft leaves of terrestrial plants such as herbaceous plants and vegetables and grasses (Lin 1954; Anon. 1980). Among the least desired are fibrous and woody plants such as rushes and sedges and also large floating aquatic macrophytes such as water lettuce (Pistia statiotes) and water hyacinth (Eichhornia crassipes) (Singh et al. 1967; Alabaster and Stott 1967). Even amongst those plants favored by the grass carp, gustatory preferences play an important role in the selection because in a list of 16 plants eaten, in approximate order of preference, the fairly succulent water cress (Rorippa nasturtium - aquaticum) was the 14th species listed (Cross 1969). Recently, Chifamba (1990) showed that T. rendalli, preferentially selected Valisneria aethiopica over Ceratophyllum demersum, Najas pectinata and Lagaroshiphon sp. Proximate analyses of the macrophytes showed that V. aethiopica contained significantly higher protein and ash content. The feeding behavior of T. rendalli is consistent with the diet selectfon strategy, whereby food item selection by a general herbivore is geared to maximizing intake of nutrients, particularly nitrogen and energy (Mattson 1980). Other factors such as palatibility, particularly with respect to fiber content, have been shown to affect selection (Prejs 1984). Tan (1970) indicated that the superiority of Hydrilla verticilliata over other plants tested as fish food was due to its soft nature (low fiber content) and high ash content. Plants with high structural materials and polyphenolic compounds are selected against (Hom et al. 1982). Gustatory

26
sensitivity studies in fish species, wherein the behavioral responses to varying amino acids were monitored, indicated that effective neutral amino acids seem to be common stimulatory chemicals across the different species of fish examined but the effectiveness of the basic and acidic amino acids is strongly dependent on fish species (Marui et al. 1983). The common carp, Cyprinus carpio, is generally insensitive to the basic amino acids (Marui et al. 1983) whilst the Japanese eel, Anguilla japonica, does not respond to acidic compounds (Yoshii et al. 1979). The herbivorous Tilapia zillii, however, are responsive to both acidic and basic compounds as well as neutral amino acids (Johnsen et al. 1990). There is a strong correlation between the composition of pref erred food and effective feeding stimuli. The herbivorous marine rabbitfish, Sig anus fuscescens, and the carp, C. carpio, are particularly sensitive to glutamic acid, whilst most carnivorous species do not respond well to glutamic acid. Examination of the composition of the preferred food of these species showed that glutamic acid is the most common amino acid in lettuce (Uhazy et al. 1978); freshwater vascular plant, Typha latifoliata (Boyd 1970) and marine alga. By contrast, the glutamic acid in clams and squids is relatively low. On the other hand, proline, the most potent gustatory stimuli for marine teleosts is most abundantly found in clams and squids and only moderately abundant in lettuce and T. latifoliata.
It is therefore worthwhile noting the chemical content, in particular, the amino acid profile, of the plant feedstuff being considered as a fish feed ingredient as it may affect the palatability of the product.
Methods to Enhance Nutritive Value of Non-Conventional Plant Feedstuffs
From the observations presented, it is apparent that with the low nutritive value of the NCPF and the fish's inability to breakdown plant cell walls, it is not possible to include NCPF at high levels without affecting growth. It is further suggested that with improved nutritive value, the level of inclusion could be increased. The following processing techniques are highlighted as possible methods that could be useful in fish feed development.
Germination
Germination can affect the nutritional value of seeds and grains in several ways, it has been shown to:
a) increase lysine availability in wheat, barley, oats and rice (Hamad and Fields 1979); b) increase vitamin content in seedlings. A tenfold increase in vitamin C content of peas
and beans (Fordham et al. 1975) and higher level of vitamins B-1, B-2 and C, niacin, folic acid and biotin in soybean (Liener 1980) upon germination;
c) reduce or eliminate anti-nutritional factors in legumes, such as tannins in p1geon pea, chick pea and gram (by 50%) (Reddy et al. 1985); phytate in soybeans (Sutardi and Buckle 1985). The effects of germination on protease (trypsin) inhibitor activities varied. The activity was found to increase in kidney beans (Palmer et al. 1973), and decrease in field peas (Hobday et al. 1973) and soybean (Wassef et al. 1988).
From the summary, it would appear beneficial to germinate the seeds and use the sprouts either as whole fresh feed or to convert into meals for inclusion in formulated feeds.

27
Fermentation
The effects of fermentation on some plant products are presented in Tables 4 and 5 (taken from Teutino and Knorr 1985).
During fermentation, nutrient losses may occur as a result of leaching, destruction by light, heat or oxygen, or microbial utilization (Jones 1975). Nevertheless, loss of nutrients during fermentation is commonly small and there maybe an increase in the nutrient level through microbial synthesis.
Table 4. Effects of fermentation on proteins and lipids.
Effect on quality factoi:ll
Free Protein (available)
efficiency amino acid Free fany Nutrient/product ratio Digestibility content acid content
Proteins Grains
Wheat tempeh + Wheat ++lysine Maize, oats, rice, millet +lysine Rice meal + isoleucine
+ leucine Oilseeds
Miso (rice and soy) + + Wheat soybean. tempeh + Soybean tempeh nd nd
nd nd + ++
nd + nd +
+ +
Natto (soybean) + Oncom (peanut) nd nd
+ nd +
Sunflower meal +lysine
Lipids Oilseeds
Miso + Soybean tempeh + On com +
8 ++ = 5-fold increase; + = increase; nd =not different from unfermented product Source: Teutino and Knorr (1985).
Reference
Wang et al. (1968) Hamad and Fields (1979) Hamad and Fields (1979) Tongnual and Fields (1979)
Beuchat (1983) Wang et al. (1968) Wang et al. (1968) Hackler et al. (1964) Murata et al. (1967) Zamora and Veum (1979) van Veen and Steinkraus (1970) Jones (1975) Liener (1980) Liener (1980) Wang and Hesseltine (1981) Beuchat (1983) van Veen and Steinkraus (1970) Canella et al. (1984)
Beuchat (1983) Murata et al. (1967) Beuchat (1983)
Most of the information presented in Tables 4 and 5 are derived from studies on the effect of food processing on nutritional quality of food for human consumption. In any case, all of the effects observed are also relevant to the need to enhance nutritive value of NCPF for animal feeds. The obstacle to recommending such techniques to farmers would be possession of skills to ensure successful fermentation, availability and access to fermentation microorganisms and whether fish would take to such feed products.

28
Table 5. Effects of fermentation on nutritional stress factors.
Product
Grains Wheat flour Whole-wheat bread
Oilseeds Soybean tempeh
On corn Sunflower meal Cononseed meal
Vegetables Sauerkraut Gari (cassava)
Fermentation microorganisma
Yeast Yeast
R
R L D
L L
Effect on stress
fact oil>
- phytate + zinc solubility
(- phytate)
- phytate - phytate - trypsin inhibitorC - trypsin inhibitorC - phytate - chlorogenic acid - free gossypol
- goitrogens - cyanogenetic glucosides
a= Rhizopus o/igosporus; L =lactic acid bacteria; D = Diploida. b+ = significant increase; - = significant decrease. cProbably destroyed by heat treaunent before fermentation (Liener and Kakade 1980).
Source: Teutino and Knorr (1985).
Reference
Kiiic. (1979) Reinhold (1975)
Sudarmadji and Markakis (1977) Sutardi and Buckle (1985) van Veen and Schaeffer (1950) Smith et al. (I %4) Fardiaz and Markakis (1981) Canella et al. (1984) Baugher and Campbell (1969)
Pederson (1 %0) Collard and Levi (1959)
Addition of Exogenous Enzymes
The objective of adding enzymes is to increase digestibility of the feed. In the case of fish feeds, two classes of enzymes are relevant:
a) proteases to aid in dietary protein digestion; b) enzymes to break down plant cell wall to liberate the nutritious cellular contents.
Addition of Protease in Fish Feed
The idea of introducing exogenous enzymes into fish feeds is not new. Addition of proteolytic enzymes with their food resulted in only small positive effects in common carp (Dabrowska et al. 1979; Dabrowski and Glogowski 1977a, 1977b). However, these studies were conducted with enzyme extracts from fish intestinal tissues and not with purified, and well defined activity proteases. Proteases, manufactured by synthetic means or derived from plants, animals or microbial sources, are increasingly being used as additives in pig feeds. The addition of these enzymes have led to a decrease in the incidence of diarrhea and an improvement in feed utilization when used in cereal-based pig diets (Anon. 1988).
The efficacy of using exogenous enzymes in fish feeds needs to be reinvestigated using commercially available, well proven proteases. Production of such enzymes using microbial means is cheap and easy to scale up. In addition, microorganisms exhibit a wider variety of specific proteases than plants or animals, broadening the spectrum of substrates it can act on (Loffler 1986). However, using exogenous enzymes in fish feeds could potentially have these problems:
1) As the exogenous proteases are proteins, it is likely that the endogenous proteases will digest them like any other dietary proteins;

29
2) Being proteases of different origin, their molecular weight and amino acid sequence will differ. As a consequence, such enzymes also differ in terms of their environmental requirements for maximal activity (pH and temperature optimi, activating agents, inhibitors and other factors affecting chemical reactions in the gut (Inborr 1989).
Notwithstanding these obstacles to successful utilization of enzyme additives in fish feeds, the area with greatest potential for use is in larval feeds. In particular, during those few weeks (posthatching) wherein the types and quantity of enzymes produced are inadequate. A practical way to use exogenous enzymes would be the incorporation of enzymes found in plants such as papain, bromelaine and ficin from papaya, pineapple, and fig unprocessed and directly into the feeds. The wastes from processing these fruits such as papaya peelings, pineapple tops and skins could then be beneficially utilized.
Addition o/Cellulase and Other Enzymes in Fish Feeds
Along the lines of adding proteases to aid in protein digestion, it may be beneficial to add enzyme preparations that can degrade plant materials and render the product more susceptible to digestion. It has been reported that certain microorganisms such as fungi, Trichoderma reesei, could produce cellulase, hemi-cellulase and beta glucanase which attacks cellulose, hemicellulose and beta-glucans, respectively, which are the main components of the plant cell walls. Commercial preparations of such enzymes are available and are now being utilized in chicken and pig feeds which have high incorporation levels of plant materials (Alko Ltd. Biotechnology, SF 05200 Rajamaki, Finland). It is now possible to obtain products that remain stable and viable even after processing through feed manufacture and within animal's gut.
From a practical feed point of view, perhaps it would not be absolutely necessary to process and isolate the enzymes, rather the whole preparation . could be incorporated into the feed directly.
If fish species could successfully utilize these enzymes, then the potential of using high levels of plant-based ingredients in fish feeds could then be realized.
In conclusion, crudely processed NCPF currently being tested as an ingredient for aquaculture feeds cannot be utilized at a level of more than 20-30% of diet without compromising growth. It is believed however that the inclusion rate could be increased with proper processing to enhance its nutritive value. However, NCPF are normally utilized in practical feeds as inexpensive supplementary feeds. The increased costs involved in further postharvest treatment of NCPF have to be justified. In this context, more research needs to be carried out to evaluate the efficacy of varying pre-incorporation treatments and the economic benefits of utilizing these enhanced products.
Acknowledgements
I would like to thank my fellow scientists who responded to my request for papers especially Drs. Corazon Santiago, Felicitas Pascual and Mr. M.C. Nandeesha; and to Dr. Sena S. De Silva who invited me to the workshop. The financial assistance, provided by the International Development Research Centre, Canada, to attend the workshop is also gratefully acknowledged.

30
References
Alabaster, J.S. and B. Stott. 1967. Grass carp (Ctenopharyngodon ilk/la Val.) for aquatic weed control, p. 123-126. In Proc. Eur. Weed Res. Coun. 2nd Int. Symp. Aquatic Weeds, Oldenburg, Germany.
Almazan, G.J., R.S.V. Pullin, A.F. Angeles, T.A. Manalo, R.A. Agbayani and M.T.B. Trono. 1986. Azolla pinnata as a dietary component for Nile tilapia, Oreochromis niloticus, p. 523-528. In J.L Maclean, L.B. Dizon and L V. Hosillos (eds.) The First Asian Fisheries Forum. Asian Fisheries Society, Manila, Philippines.
Anon. 1980. Pond fish culture in China. Lecture notes for FAO training coune. Network of Aquaculture Centres in Asia Regional Aquaculture Lead Centre, Wuxi, China.
Anon. 1988. Enzymes in pig diets. Feed Int. March, p. 11. Bardach, J.E., J.H. Ryther and W.O. McLamey. 1972. Aquaculture: the farming and husbandry of freshwater and marine organisms. John Wiley
and Sons, New York. Baugher, W.L. and T.C. Campbell. 1969. Gossypol detoxication by fungi. Science 164: 1526. Beuchat, L.R. 1983. Indigenous fermentation foods, p. 477. ln G. Reed (ed.) Biotechnology, Vol. 5, Verlag Chemie, Weinheim. Boyd, C.E. 1970. Chemical analyses of some vascular aquatic plants. Arch. Hydrobiol. 67: 78-85. Buddington, R.K. 1979. Digestion of an aquatic macrophyte by Tilapia zillii (Gervais). J. Fish Biol. 15: 449-455. Buddington, R.K. 1980. Hydrolysis-resistant organic matter as a reference for measurement of fish digestive efficiency. Trans. Am. Fish Soc.
109: 653-656. Canella, M., A. Bernardi and D. Marghinou. 1984. Improvement of germinated sunflower meal by fermentation. J. Food Sci. Technol. 17: 314. Caulton, M.S. 1982. Feeding metabolism and growth of Tilapia: some quantitative considerations. In R.S.V. Pullin and R.H. Lowe-McConnell
(eds.) The biology and culture of tilapia. ICLARM Conf. Proc. 7, 360 p. Chiang, L'Kuei, et al. 1966. Collected articles on the 7th Conference of the Committee of Fishery Research of the West Pacific, Hydrobiology
Institute, p. 84-94. Chinese Academy of Sciences, Peking. Chiayvareesaija, S.C. Wongwit and R. Tansakul. 1990. Cage culture of tilapia (Oreochromis niloticus) using aquatic weed-based pellets, p. 287-
290. ln R. Hirano and I. Hanyu (eds.) The Second Asian Fisheries Forum. 991 p. Asian Fisheries Society, Manila, Philippines. Chiiamba, P.C. 1990. Preference of Tilapia rendalli (Boulenger) for some species of aquatic plants. J. Fish Biol. 36: 701-705. Cho, C.Y. and T.K. Smith. 1988. Relevance of different experimental approaches in fish nutrition to progress in aquaculture. Paper presented at
the Third Asian Fish Nutrition Network Workshop held 6-10 June 1988 at the Asian Institute of Technology, Bangkok, Thailand. Collard, P. and S. Levi. 1959. A two-page fermentation of cassava. Nature 183: 620. Cross, D.G. 1969. Aquatic weed control using grass carp. J. Fish Biol. 1: 27-30. Dabrowski, K. 1979. The role of proteolytic enzymes in fish digestion. In E. Styczynska-Jurewicz, T. Jaspers and G. Persone (eds.) Cultivation of
fish fry and its live food. Eur. Mar. Soc., Bredene. Belgium, Special Publ. 4: 1U7-126. Dabrowski, K. and J. Glogowski. 1977a. Studies on the role of exogenous proteolytic enzymes in digestion in processes in fish. Hydrobiologia
54: 129-134. Dabrowski, K. and J. Glogowski. l 977b. A study of the application of proteotytic enzymes to fish food. Aquaculture 12: 349-360. Dabrowska, H., H. Grudniewski and K. Dabrowski. 1979. Artificial diets for common carp: effect of the addition of enzyme extracts. Prog. Fish
Cult. 41(4): 196-200. Davies, S.J., S. McConnell and R. Bateson. 1990. Potential of rapeseed meal as an alternative protein source in complete diets for tilapia
(Oreochromis mossambicus, Peters). Aquaculture 87: 145-154. De Silva, S.S. and M.K. Perera. 1983. Digestibility of an aquatic macrophyte by the cichlid Etroplus suralensis (Bloch) with observations on the
relative merits of three indigenous components as markers and daily changes in digestibility. J. Fish Biol. 23: 675-684. De Silva, S.S. and R.M. Gunasekera. 1989. Effect of protein level and amount of plant ingredient (Phaseolus aureus) incorporated into the diets
on consumption, growth perlormance and carcass composition in Oreochromis niloticus fry. Aquaculture 80: 121-133. Devaraj, K.V., D.S. Krishna Rao and G.Y. Keshavappa. 1981. Utilization of duck weed and waste cabbage leaves in the formulation of fish feed.
MysoreJ. Agric. S.U. 15: 132-135. Devendra, C. 1985. Non-<:onventional feed resources in Asia and the Pacific. 2nd edition. FAO/APHCA Publication No. 6, FAO, Bangkok. Edwards, P. 1980. Food potential of aquatic macrophytes. ICLARM Stud. Rev. 5, 51 p. Edwards, P. 1987. Use of terrestrial and aquatic macrophytes in aquaculture, p. 311-385. In D. Moriarty and R.S.V. Pullin (eds.) Detritus anc
microbial ecology in aquaculture. ICLARM Conf. Proc. 14, 420 p. Edwards, P., M. Kamal and K.L Wee. 1985. Incorporation of composted and dried water hyacinth in pelleted feed for the tilapia Oreochromi.s
niloticus (Peters). Aquacult. Fish. Manage. 16: 233-248. Fardiaz, D. and P. Markakis. 1981. Degradation ofphytic acid in oncom (fermented peanut press ~e). J. Food Sci. 46: 523. Fischer, Z. 1970. The elements of energy balance in grass carp (Ctenopharyngodon ilk/la), Part 1. Pol. Arch. Hydrobiol. 17: 421-434. Fischer, Z. 1973. Physiology and bioenergetics of grass carp. Pol. Arch. Hydrobiol. 20: 529-557. Fish, G.R. 1960. Comparative activity of some digestive enzymes in the alimentary canal oftilapia and perch. Hydrobiologia 15: 161-178. Fordham, J.R., C.E. Wells and LM. Chen. 1975. Sprouting of seeds and nutritional composition of seeds and sprouts. J. Food Sci. 40: 552. Gaigher, LG., D. Porath and G. Granoth. 1984. Evaluation of duckweed (Lemna gibba) as feed for tilapia (Oreochromis niloticus x 0. aweus) in
a recirculating unit. Aquaculture 41: 235-244. Gohl, B. 1981. Tropical feeds. FAO Animal Prod. Health Ser. 12, 529 p. Gowrishankar, K.A. 1979. Relative growth rate of grass carp, Ctenopharyngodon ilk/la (Val.) when fed three different terrestrial fodder plants.
University of Agricultural Science. Bangalore, India. M.F. Sci. thesis. Hackler, L.R., J.P. Van Buren, K.H. Steinkraus, L. El Rawi and D.B. Hand. 1964. Effects of heat treatment on nutritive value of soy milk fed to
weaning rats. J. Food Sci. 30: 723. Halinge, N.V. 1981. Evaluation of three terrestrial fodder grasses as feed for the grass carp, Ctenopharyngodon idella (Val.). University of
Agricultural Sciences, Bangalore, India. M.F. Sci. thesis. Hamad, A.M. and M.L. Fields. 1979. Evaluation of the protein quality and available lysine of germinated and fermented cereals. J. Food Sci.
44(2): 456. Hasan, M.R., M. Moniruzzaman and A.M. Farooque. 1990. Evaluation of leucaena and water hyacinth leaf meal as dietary protein sources of the
fry of Indian major carp, Labeo rohila (Hamilton), p. VS-'1:18. In R. Hirano and I. Hanyu (eds.) The Second Asian Fisheries Forum. 991 p. Asian Fisheries Society, Martila, Philippines.
'

31
Hickling, C.F. 1966. On the feeding process in the white amur, Ctenopharyngodon idella. J. Zool. 148: 408-419. Hobday, S.M., D.A. Thurman and DJ. Barber. 1973. Proteolytic and uypsin inhibitory activities in extracts of germinating Pisum sativum seeds.
Phytochemistry 12: 1041. Hom, M.H., S.N. Murray and T.W. Edwards. 1982. Dietary selectivity in the field and food preferences in the laboratory for two herviborous
fishes (Cebidichthys violaceus and Xiphister mucosus) from a temperate intertidal zone. Mar. Biol. 67(3): 237-246. Hossain, M.A. and K. Jauncey. 1989. Nutritional evaluation of some Bangladeshi oilseed meals as substitutes for fish meal in the diet of common
carp (Cyprinus carpio L.). Aquacult. Fish. Manage. 20: 255-269. Hutabarat, J., L. Syarani and A.K.M. Smith. 1986. The use of freshwater hyacinth Eichornia crassipes in cage culture in Lake Rawa Pening,
Central Java, p. 570-580. In J.L. Maclean, L.B. Dizon and L.V. Hosillos (eds.) The First Asian Fisheries ·Forum. 727 p. Asian Fisheries Society, Manila, Philippines.
Inborr, J. 1989. Pig diets: enzymes in combination. Feed Int. October: 16-27. Jancarik, A. 1964. Die Verdanung der Hamptnahrstoffe beim Karkfen. St. Fisch, deren Hilfswiss 12: 601-684. Johnsen, P.B., H. Thou and M.A. Adams. 1990. Gustatory sensitivity of the herbivore Tilapia zillii to amino acids. J. Fish Biol. 36: 587-593. Jones, I.D. 1975. Effect of processing by fermentation on nutrients, p. 324. In R.S. Harris and E. Karmas (eds.) Nutritional evaluation of food
processing. Avi Publ. Co., Inc. Westport, Connecticut. Kirk, J.R. 1979. Nutritional changes upon processing, p. 62. In F. Oydesdale (ed.) Food science and nutrition: current issues and answers.
Prentice-Hall, Inc., Englewood Oiffs, New Jersey. Klinavee, S., R. Tansakul and W. Promkunthong. 1990. Growth of Nile tilapia (Oreochromis niloticus) fed with aquatic plant mixtures, p. 283-
286. ln R. Hirano and I. Hanyu (eds.) Tne Second Asian Fisheries Forum. 991 p. Asian Fisheries Society, Manila, Philippines. Law, A,T., S.H. Cheah and K.J. Ang. 1985. An evaluation of the apparent digestibility of some locally available plants and a pelleted feed in
three finfish in Malaysia. In Finfish nutrition in Asia: methodological approaches to research and development. IDRC 233e, Ottawa, Canada.
Legner, E.F., W.J. Hausner, T.W. Fisher and P.A. Medved. 1975. Biological aquatic weed control by fish in the lower Sonoran Desert of California. Calif. Agricult. 29(22): 8-10.
Legner, E.F. and C.A. Murray. 1981. Feeding rates and growth of the fish Tilapia zillii (Cichlidae) on Hydrilla verticillata, Potamogeton pectinatus and Myriophyllum spicatum var. exalbescens and interactions in irrigation canals of south-eastern California. Mosq. News 41(2): 241-250.
Liener, I.E. 1980. Miscellaneous toxic factors, p. 429. In I.E. Llener (ed.) Toxic constituents in plant foodstuffs. 2nd ed. Academic Press, New York.
Liener, I.E. and M.L. Kakade. 1980. Protease inhibitors, p. 429. In I.E. Llener (ed.) Toxic constituents in plant foodstuffs. 2nd ed. Academic Press, New York.
Lin, S.Y. 1954. Chinese systems of pond stocking. Proc. !PFC 5(2 and 3): 113-125. Lin, H.R. and S.H. Chen. 1983. Radioactive tracer studies on the digestion of aquatic plants by the grass carp (Ctenopharyngodon idella). Paper
presented at the International Conference on Development and Management of Tropical Living Aquatic Resources, 2-5 August 1983, Universiti Pertanian Malaysia, Malaysia.
Lindsay, G.J.H. and J.E. Harris. 1980. Carboxymethylcellulase activity in the digestive tracts of fish. J. Fish Biol. (16): 219-233. Loffler, A. 1986. Proteolytic enzymes: sources and applications. Food Tech January: 63-70. Lovell, R.T. 1990. Use of soybean products for aquaculture species: revised. ASA Technical Bulletin AQ 21-90 6[1. American Soybean
Association, Singapore. Mann, H. 1966. The utilization of food by Tilapia melanopleura (Dum). FAO Fish. Rep. 44(3): 408-410. Mair, G. 1977. Z.Clluloseverdauung bei Omnivoren Cypriniden. Haesarbeit, Univ. Innsbruck, p. 60. Mathavan, S., E. Vivekanandan and T.J. Pandian. 1976. Food utilization in the fish Tilapia mossambica fed on plant and animal foods. Helgol.
Wiss. Meeresunters 28: 66-70. Mattson, W.J., Jr. 1980. Herbivory in relation to plant nitrogen content. Annu. Rev. Ecol. Syst. 11: 119-161. Marui, T., S. Harada and Y. Kasahara. 1983. Gustatory specificity for amino acids in the facial taste system of the carp, Cyprinus carpio L. J.
Comp. Physiol. 153, 299-30-8. Monk, D.C. 1976. The distribution of cellulase in freshwater invertebrates of different feeding habits. Freshwat. Biol. 6: 471-475. Murata, K., H. Ikehata and T. Miyamoto. 1967. Studies on the nutritional vali·• of tempeh. J. Food Sci. 32: 580. Nandeesha, M.C., G.K. Srikanth, T.J. Varghese, P. Keshavanath and H.P.C. Sheny. 1989. Growth performance of an Indian major carp, Cat/a
cat/a (Ham.), on fish meal-free diet, p. 137-142. ln S.S. De Silva (ed.) Fish nutrition research in Asia. Proceedings of the Third Asian Fish Nutrition Network Meeting. Asian Fish Soc. Spec. Publ. 4, 166 p. Asian Fisheries Society, Manila, Philippines.
Ng, W.K. and K.L. Wee. 1989. The nutritive value of cassava leaf meal in pelleted feed for Nile tilapia. Aquaculture 83: 45-58. Niamat, R. and A.K. Jafri. 1984. Preliminary observations on the use of water hyacinth (Eichhornia crassipes) leaf meal as protein source in fish
feeds. Cur. Sci. 53(6): 338-340. Okeyo, D.O. 1987. Growth by Oreochromis aureus (Teleostei: Cichlidae) on diets of three aquatic macrophytes. Northern Arizona University,
Flagstaff, Arizona. Ph.D. dissertation. Okeyo, D.0. 1989. Herbivory in freshwater fishes: a review. Isr. J. Aquacult. Bamidgeh 41(3): 79-97. Palmer, R., A. Mcintosh and A. Pusztai. 1973. The nutritional evaluation of kidney beans (Phaseolus vulgaris). The effect on nutritional value of
seed germination and changes in trypsin inhibitor content. J. Sci. Food Agric. 24: 937-944. Pandian, T.J. and E. Vivekanandan. 1985. Energetics of feeding and digestion, p. 99-124. In P. Tytler and P. Calow (eds.) Fish energetics: new
perspective. Croom Helm, Beckenham, UK. Pantastico, J.B. 1988. Non-conventional feed resources in aquaculture: an overview of work done in the Philippines, p. 71-87. In S.S. De Silva
(ed.) Finfish nutrition research in Asia. Proceedings of the Second Asian Fish Nutrition Network Meeting. Heinemann Publishers Asia Pte. Ltd., Singapore.
Pederson, C.S. 1960. Sauerkraut. Adv. Food. Res. 10: 233. Pongsri, C. 1986. Utilization of water hyacinth in Nile tilapia pelleted feed. Asian Institute of Technology, Bangkok, Thailand. M.Sc. thesis. Prejs, A. 1984. Herbivory by temperate freshwater fishes and its consequences. Environ. Biol. Fish. 10(4): 281-296. Prejs, A. and Blaszczyk. 1977. Relationships between food and cellulase activity in freshwater fishes. J. Fish Biol. 11: 447-452. Pullin, R.S.V. 1983. Choice of tilapia species for aquaculture, p. 64-76. In L. Fishelson and Z. Yaron (compilers). International symposium on
tilapia in aquaculture. Tel Aviv University, Tel Aviv, Israel.

32
Ramakrishna, N.R. 1980. Studies on the relative growth rate of grass carp, Ctenopharyngodon idella, when fed on a terrestrial grass and two leguminous fodder plants. University of Agricultural Science, Bangalore, India. M.F. Sc. thesis.
Reddy, N.R., M.D. Pierson, S.K. Sathe and D.K. Salunkhe. 1985. Dry bean tannings: a review of nutritional implications. J. Am. Oil Chem. Soc. 62: 541.
Reinhold, J.G. 1975. Phytate destruction by yeast fermentation in whole wheat meals. J. Am. Dietel Assoc. 66: 38. Saint-Paul, U., U. Werder and S.A. Teixeira. 1981. Use of water hyacinth in feeding trial with Matrincha (Brycon sp.). J. Aquat. Plant Manage.
19: 18-22. Santiago, C.B., M.B. Aldaba, M.A. Laron and O.S. Reyes. 1988. Reproductive performance and growth of Nile tilapia (Oreochromis niloticus)
broodstock fed diets containing uucaena leucocephola leaf meal. Aquarulture 70: 53-61. Shetty, H.P.C. and M.C. Nandeesha. 1988. An overview of carp nutrition research in India, p. 71-87. In S.S. De Silva (ed.) Finfish nutrition
research in Asia. Proceedings of the Second Asian Fish Nutrition Network Meeting. Heinemann Publishers Asia Pte. Ltd., Singapore. Shireman, J.V. and C.R. Smith. 1983. Synopsis of biological data on the grass carp Ctenopharyngodon ilk/la (Cuvier and Valenciennes 1844).
FAO Fisheries Synopsis No. 135, 86 p. FAO, Rome. Singh, S.B., K.K. Sukumaran, K.K. Pillai and P.C. Chakraborti. 1967. Observation on the efficacy of grass carp in controlling and utilizing
aquatic weeds in ponds in India. Proc. !PFC 12(2): 220--235. Singleton, V.L ·and F.H. Kratz.er. 1973. Plant phenolics, p. 309. In Naturally occurring toxicants in plant foods. Nat Acad. of Sci. Nat Res.
Council, Washington, DC. Smith, A.K., J.J. Rackis, C.W. Hesseltine, M. Smith, D.J. Dobbins and A.N. Booth. 1964. Tempeh: nutritive value in relation to processing.
Cereal Chem. 41: 173. Stickney, R.R. and S.E. Shumway. 1974. Occurrence of cellulase activity in the stomachs of fishes. J. Fish Biol. 6: 779-790. Stroband, H. and K. Dabrowski. 1979. Morphological and physiological aspects of the digestive system and feeding in freshwater fish larvae, p.
355-374. In M. Fontaine (ed.) Nutrition des poissons. Actes du Colluque CNERNA, Paris. Sudarmadji and P. Markakis. 1977. The phytate and phytase of soybean tempeh. J. Sci. Food Agric. 28: 381. Sutardi and K.A. Buckle. 1985. Reduction in phytic and acid levels in soybeans during tempeh production, storage and frying. Food Sci. 50: 260. Tacon, A.G.J. 1987. The nutrition and feeding of farmed fish and shrimp - training manual. 2. Nutrient sources and composition. FAO publica-
tion: GCP!RLAm5/IT A. Field document 5/E. Food and Agriculture Organization of the United Nations, Rome, Italy. Tacon, A.GJ. and C.B. Cowey. 1985. Protein and amino acid requirements, p. 155-183. In P. Tytler and P. Calow (eds.) Fish energetics: new
perspectives. Croom Hehn, Beckenham, UK. Tacon, A.GJ. and A. Jackson. 1985. Utilization of conventional and 1mconventional protein sources in practical feeds, p. 119-145. In C.B.
Cowey, A.M. Mackie and J.G. Bell (eds.) Nutrition and feeding in fish. Academic Press, London. Tan, X.T. 1970. Consumption and nutritive value of some grasses, plants and aquatic weeds tested as diets. J. Fish Biol. 2: 253-257. Teutino, R.A. and D. Knorr. 1985. Impact of biotechnology on nutritional quality offood plants. Food Technol. 39(10): 127-134. Tongnual, P. and M.L Fields. 1979. Fermentation and relative nutritive value of rice meal and chips. J. Food Sci. 44: 1784. Trewavas, E. 1982. Tilapia: taxonomy and speciation, p. 3-13. In R.S.V. Pullin and R.H. Lowe-McConnell (eds.) The biology and culture of
tilapias. ICLARM Conf. Proc. 7, 360 p. Chazy, LS., R.D. Tanaka and AJ. Macinnis. 1978. Scltistosoma mansoni: identification of chemicals that anract or trap its snail vector,
Biompholaria glabrata. Science 201: 924-926. Van Dyke, J.M. and D.L Sutton. 1977. Digestion of duckweed (umNJ spp.) by the grass carp (Ctenopharyngodon idella). J. Fish Biol. 11: '1:73-
278. Van Veen, A.G. and G. Schaeffer. 1950. Cited in Llener and Kakade 1980. Van Veen, A.G. and K.H. Steinkraus. 1970. Nutritive value and wholesomeness of fermented foods. J. Agric. Food. Chem. 18(4): 675. Venkatesh, B. and H.P.C. Shetty. 1978a. Nutritive value of two aquatic weeds and a terrestrial grass as feed for grass carp, Ctenopharyngodon
idella. Mysore. J. Agric. Sci. 12: 597-604. Venkatesh, B. and H.P.C. Shetty. !978b. Studies on the growth rate of grass carp, Ctenopharyngodon idella (Val), fed on aquatic weeds and a
terrestrial grass. Aquaculture 13(1 ): 45-53. Wang, H.L and C.W. Hesseltine. 1981. Use of microbial cultures: legumes and cereal products. Food Tech. 35(1): 79. Wang, H.L., D.K. Ruttle and C.W. Hesseltine. 1968. Protein quality of wheat and soybean after Rltizopus oligosporus fermentation. J. Nutr. 96:
109. Wassef, E.A., G.H. Pahner and M.G. Poxton. 1988. Protease digestion of the meals of ungerminated and germinated soya beans. J. Sci. Food
Agric. 44: 201-214. Wee, K.L. and S.S. Wang. 1987. Nutritive value of UllCllena leafmeal in pelleted feed for Nile tilapia. Aquarulture 62: 97-108. Wee, K.L. 1988. Alternate feed sources for finfish in Asia, p. 25-41. In S.S. De Silva (ed.) Finfish nutrition research in Asia. Proceedings of the
Second Asian Fish Nutrition Network Meeting. Heinemann Publishers Asia Pte. l...ld., Singapore. Yoshii, K., H. Karno, K. Kurihara and Y. Kobatake. 1979. Gustatory responses of eel palatine receptors to amino acids and carboxylic acids. J.
Gen. Physiol. 74: 310-317. Zamora, R.G. and T.L Veum. 1979. The nutritive value of dehulled soybeans fermented with Arpergillus orryae or Rhizopus oligosporus as
evaluated by rats. J. Nutr. I 09: 1333.

Nutritional Studies on Seabass (Lates calcarifer)
MALI BOONY ARATPALIN National Institute of Coastal Aquaculture
Kao-san Soi 1 Kaoseng, Songkhla
Thailand 90000
BOONYARATPALIN, M. 1991. Nutritional studies on seabass (I.Ales calcarifer), p. 33-41. In S.S. De Silva (ed.) Fish nutrition research in Asia. Proceedings of the Fourth Asian Fish Nutrition Workshop. Asian Fish. Soc. Spec. Publ. 5, 205 p. Asian Fisheries Society, Manila, Philippines.
Abstract
Seabass is an important carnivorous species cultured in some Asian countries. In this paper studies on nutrient requirements of seabass, in particular protein, fany acid and vitamins are reviewed, and the areas which need further investigations are highlighted. Based on information available, broad guidelines on vitamin requirements are deduced and vitamin deficiency syrnptons enumerated.
Introduction
Seabass, Lates calcarifer, also called giant sea perch, is an economically important food fish and sport fish in the tropical and subtropical areas of the western Pacific and Indian Ocean countries including India, Burma, Sri Lanka, Bangladesh, Malay Peninsula, Java, Borneo, Celebes, Philippines, Papua New Guinea, Northern Australia, Southern China and Taiwan.
Seabass had been cultured in Hong Kong, Indonesia, Malays:a, Philippines, Singapore, Taiwan and Thailand for a long time. Data published by SEAFDEC (1987) showed that the seabass production was 34, 1,384, 1,067, 219 and 1,158 tonnes in Hong Kong, lndonesia, Malaysia, Singapore and Thailand, respectively, for the year 1987.
In this paper nutritional studies carried out on seabass are presented.
Feeds
The traditional feed used in most of the commercial seabass growout culture operations in Southeast Asia is raw minced or chopped trash fish. This traditional feed often does not completely satisfy the nutritional requirements of seabass, resulting in many malnutrition problems and low survival. Furthermore, the supply of trash fish is becoming limited due to increased demand from other aquaculture activities. Market price, quality and quantity of trash fish is often uncertain due to changes in the climate, season or conditions of handling and
33

34
storage. For these reasons, efforts have been made by researchers in Indonesia (Tacon and Rausin 1989), Singapore (Chou 1984, 1988; Chou et al. 1987), Tahiti (Cuzon et al., in press) and Thailand (Boonyaratpalin 1988a, 1988b, 1989; Buranapanidgit et al. 1988; Wanakowat et al. 1989; Boonyaratpalin et al. 1989a; Sakaras et al. 1988, 1989) to study the nutrient requirements and to develop complete artificial feeds which will supply seabass with essential nutrients and improve profits for culturists.
The nutritional requirements of seabass are similar to other marine carnivorous fish in respect of quality of protein, amino acids, lipids, fatty acids, carbohydrates, vitamins and minerals. The quantitative demand for these nutrients varies depending on species, growth stage and environmental conditions.
Protein and Amino Acids
Protein is the main essential nutrient for maintaining life and promoting growth. Not only is protein the substance for fish body and organ-building. It is essential for good growth and health, and also important for enzyme and hormone production essential for normal metabolism. Therefore, a liberal and continuous supply of protein is needed. Inadequate protein results in reduction or cessation of growth, or a loss of weight due to the withdrawal of protein from tissues to maintain vital functions and to replace dead cells. When protein is supplied in excess in the diet, proportionately less will be deposited in tissues, and the excess dietary protein will be used as a source of energy. Protein is an expensive energy source and requires energy for deamination. It also causes excessive nitrogenous waste to be released in to the pond or cage culture environment. Therefore, an optimum energy to protein ratio has to be considered. AQUACOP (Cuzon and Fuchs 1988) examined four practical diets with 35 to 55% protein content containing Norwegian fish meal, and a control diet with 52% protein containing fish meal plus fish protein concentrate. Protein:energy ratio was fixed at approximately 140 mg protein/kcal. The results revealed an optimum level of protein ranging from 45 to 55%, the highest growth rate resulting from the 52% protein control diet. Sakaras et al. (1988) tested seabass of 7 .47 g on a range of six practical diets with three dietary protein levels of 45, 50 and 55%, and two lipid levels of 10 and 15% at each protein level. Fish were fed to satiation twice daily for 8 weeks. The results showed that the diet with 50% protein, 15% lipid and 7.33 kcal/g of protein was optimal for growth; feed conversion (1.11:1), protein retention (33.81 %) and protein efficiency ratio (1.81). Sakaras et al. (1989) reported that diets with 45% protein and 18% lipid gave the highest growth. Dietary protein demand was higher during the larval and fry stages and lower in growout. Wong and Chou (1989) reported that the optimal dietary protein level of growout seabass was 40-45 with 12% dietary lipid.
Animal proteins such as fish meal and squid meal are the best protein sources and the most easily accepted by seabass. Chungyampin and Boonyaratpalin (1988) showed that adding squid meal at 5% of a seabass fingerling diet at the expense of fish meal improved growth and feed efficiency by 11.4% and 13.3%, respectively. No information is yet available on essential amino acid requirements of seabass. However, it has been shown that excessive dietary tyrosine may result in kidney disease problems (Boonyaratpalin et al. 1990). A mixture of proteins adjusted to reproduce the amino acid pattern of seabass might be the most efficient source of protein at this moment. Greater knowledge of this topic is required, so that protein content, feed conversion and cost of feeds for seabass can be reduced.

35
Lipids and Essential Fatty Acids
Lipids are a concentrated and highly digestible source of energy, a carrier of fat-soluble vitamins, a component of cell membranes which strengthen the tenacity of membranes and promote absorption of nutrients. Lipids are essential for normal growth and metabolic function of seabass. Lipids also influence flavor and texture of feed and fish. AQUACOP (Cuzon and Fuchs 1988) found that there was no significant difference in growth and survival among seabass fed three diets at 6, 10 and 14% lipid with 52% protein. Sakaras et al. (1988, 1989) reported that the optimum dietary lipid level for seabass fingerling was 10 and 15% at protein levels of 55 and 45%, respectively. The protein sparing effect of the dietary lipids was demonstrated in this study.
Dietary essential fatty acid requirements of seabass fingerlings were studied at the National Institute of Coastal Aquaculture, Songkhla, Thailand. In the first experiment (Buranapanidgit et al. 1989), four fish meal and casein diets containing 0.46 to 0.88, 1.72 and 2.70% W3HUFA (dry weight basis) were fed to seabass for 12 weeks. The first essential fatty acid deficiency sign was a reddening of fins and skin observed after 2 weeks in the group fed the diet with 0.46% W3HUF A. This was followed by other deficiency symptoms such as abnormal eyes, shock syndrome, loss of appetite, poor growth and swollen, pale liver. The fish fed a diet containing 0.88% W3HUFA also showed slight EFA deficiency such as reddening of the fins and skin. The fish fed the diet containing 1.72% W3HUFA, approximately 13% of dietary total lipid, provided the best growth rate and showed no deficiency signs. The results indicated that W3HUFA has an essential role in seabass as in other marine fish and the quantitative requirements are approximately 1. 72% on dry weight basis.
In a second experiment (Buranapanidgit et al. 1989), six fish meal and casein diets containing 1.0, 1.2, 1.4, 1.6, 1.8 and 2.0% (dry weight basis) W3HUFA were tested for 10 weeks. Dietary W3HUFA levels were adjusted using squid liver oil. No significant differences in growth, feed efficiency and mortality were recorded, and none of the treatments showed deficiency symptoms. The results from both experiments indicated that the dietary W3HUF A requirement for seabass fingerlings is 1.0-1.7% for good growth and no EFA deficiency.
Vitamins
Vitamins are now generally recognized as being organic compounds that are required in trace amounts and essential for maintenance, normal growth, reproduction and health of all animals. However, not all vitamins appear essential in a practical seabass feed even though they are required for normal metabolic functions. Some vitamins may be synthesized by seabass in almost sufficient quantities to meet the requirements, or may be present in adequate amounts in the practical feed ingredients. Vitamin requirements depend upon size, stage of sexual maturity, growth rate, environmental conditions and dietary nutrient interrelations. The vitamin requirements of seabass seem to decrease as fish size increases (Boonyaratpalin et al. 1989b ).
Phrornkhuntong et al. ( 1987) observed that adding a vitamin mix to trash fish fed to seabass fingerling increased growth rate from 9.36 g to 23.48 g and reduced the feed conversion ratio from 7.44:1 to 3.82: 1 over a 9-week rearing period. The vitamin requirements for seabass have been established for young fish by both supplementing practical diets and semipurified diets with various levels of a specific vitamin. The requirements are generally based on the minimum dietary vitamin level that will support maximum growth or maximum tissue storage and prevent deficiency symptoms. Boonyaratpalin et al. ( 1988) observed that there was no significant

36
difference in weight gain, feed efficiency and total mortality attributable to the deletion of choline, niacin, inositol or vitamin E from practical diets. Pimoljinda and Boonyaratpalin (1989) reported that no differences in growth, feed efficiency and survival were seen in seabass fingerling fed practical diets from which vitamin B6 and pantothenic acid were deleted. Lower weight gain and feed efficiency were observed in fish fed on diets lacking B 1 and B2 after a 60-day feeding trial. Seabass fed a diet lacking vitamin C had normal growth up to 15 days only, after which growth ceased and deficiency signs such as poor appetite, loss of equilibrium, gill hemorrhage and scoliosis were observed. In addition, severe mortality occurred after 45 days and all fish died within 60 days. Two experiments were conducted by Boonyaratpalin et al. (1989b, 1989c) to determine the quantitative vitamin C requirements of seabass fingerling. In experiment 1, to broadly define vitamin C requirement levels and deficiency signs, practical diets supplemented with different levels of vitamin C at 0, 500, 1,000, 1,500, 2,000 and 2,500 mg/kg of feed were fed to seabass for 10 weeks in freshwater. Fish fed with 0 mg/kg level of vitamin C showed deficiency signs of dark coloration, cessation of growth and loss of equilibrium. Best growth results were obtained with vitamin C levels of 1,000 mg/kg or greater. Tr.. order to determine the minimum dietary vitamin C requirement more precisely, practical diets containing smaller incremental level of vitamin Cat 0, 500, 700, 900, 1,100, 2,500 and 5,000 mg/kg, were fed to seabass for 8 weeks in seawater. Fish fed diets without supplementary vitamin C ceased growing after 4 weeks. Deficiency signs of caudal fin erosion, dark coloration, bleeding of gills, short operculum, short snout, exopthalmia, short body, fragile gill filaments and loss of equilibrium gradually developed after 3 weeks (Plate 1). Fish fed diets with supplementary vitamin C levels of 500 mg/kg or greater, demonstrated satisfactory growth, with only slight vitamin C deficiency signs in fish fed diets with 500 mg vitamin C/kg. The vitamin C content of liver and kidney increased with the in~ase in dietary vitamin C levels. In conclusion, the minimum level of supplementary vitamin C required for normal growth of seabass fingerlings in seawater was 500 mg/kg, and the supplementary level of 1,100 mg/kg was required for normal tissue storage.
Wanakowat et al. (1989) found that seabass fed a semi-purified diet (Table 1) without vitamin B6 developed the following symptoms after 2 to 6 weeks of feeding: anorexia, retarded growth, surf ace swimming, avoidance of schooling, erratic spiral swimming, lesions of the lower lip, high mortality and convulsions (Plate 2). Feed efficiency, percent weight gain and survival rate of fish fed the vitamin B6 free diet were significantly lower than fish fed diet with 5 mg/kg of vitamin B6 (dry weight basis). There was no significant difference in growth, feed efficiency and survival among fish fed diets containing vitamin B6 at levels of 5, 10 and 20 mg/kg dry diet. However, lymphocyte levels were lower in fish fed the 5 mg/kg diet than in fish fed with 10 and 20 mg/kg diets. These data indicate that the dietary vitamin B6 required for normal growth is 5 mg/kg and for normallymphocyte level is 10 mg/kg diet.
Wanakowat and Boonyaratpalin (in press) fed seabass with semi-purified diets which were deficient in several vitamins for 10 weeks. Thiamin deficiency induced substantial post-handling shock and high mortality. Fish fed diets lacking riboflavin demonstrated deficiency symptoms including anorexia, erratic swimming and cataracts after 3 weeks. Pantothenic acid deficiency symptoms included ventral fin hemorrhage and erosion, hemorrhage around the operculum and isthmus, clubbed gill and high mortality. Inositol deficiency led to poor growth; abnormal mouth and head bone formation was observed in a low percentage of individuals. Vitamin E deficiency resulted in dark coloration and muscular atrophy and fish were susceptible to bacterial skin disease infection. From the limited amount of work done on the quantitative vitamin requirements of seabass, Table 2 has been prepared to summarize their vitamin requirements and deficiency signs.

Table 1. Composition of the experimental semi-purified moot pelleted diets(%).
Dietmnnber
Ingredient 2 3 4
Casein (vitamin-free) 50 50 50 50 Gelatin 10 10 10 10 Cod liver oil 6 6 6 6 Soybean oil 3 3 3 3 alpha-Starch 5 5 5 5 Cellulose 8 8 8 8 NaC.M.C. 5 5 5 5 Vitamin mixturel 2 2 2 2 McCollum's salt mixture2 4 4 4 4 Amino acid mixture3 7 7 7 7 Vitamin B6 HCl (mg/kg dry diet) 0 5 10 20 Water (ml) 80 80 80 80
l Vitamin mixture (mg/100 g dry diet): - thiamin HCl, 5; riboflavin, 20; choline chloride, 500; nicotinic acid, 75; Ca-pantothenate, 50; inositol, 200; biotin, 0.5; folic acid, 1.5; vitamin Bl2• 0.1; menadione, 4.0; alpha-tocopherol acetate, 40; vitamin A (IU), 1,000; Vitamin DJ (IU), 200; B.H.T., l; ascorbic acid, 100; cellulose, 999.85. TOTAL 2,000.00.
2McCollum's salt-mixture No. 185 plOs trace elements (units/100 g mineral mixture): calcium lactate, 32.70 g; K2 HP04, 23.98 g; CAHP04 2H20. 13.58 g; MgS04 7H20. 13.20 g; Na2HP04 2H20. 8.72 g; NaCl 4.35 g; ferric citrate, 2.97 g; 1nS04 7H20. 0.3 g; CoC12 6H20, 100 mg; MnS01H20,80 mg; Kl, 15 mg; A1Cl3 6H20. 15 mg; CuC12, 10 mg; TOTAL 100 g.
Amino acid mixture (g/100 g dry diet): L-Phenylalanine, 0.6; L-Arginine HCl, 1.3; LCystine, 0.7; L-Tryptophan, 0.2; L-Histidine HCl H20, 0.2; DL-Alanine, 1.3; L-Aspartic acid Na, 1.0; L-Valine, 0.7; L-Lysine HCl, 0.6; Glycine, 0.4 (Yone 1976).
Table 2. The vitamin requirements and deficiency signs for seabass.
Vitamin
Thiamin
Riboflavin Pyridoxine
Pantothenic acid
Nicotinic acid Biotin Inositol Choline Folic acid Ascorbic acid
Vitamin A Vitamin D Vitamin E Vitamin K
Requirement (mg/kg)
R 5
R
NA2 NA R NA NA 700
NA NA R NA
R l required but quantitative level not known. NA2 no information available.
Deficiency signs
Poor growth, substantial posthandling shock, high mortality Erratic swimming, cataracts Avoidance of schooling, erratic spiral swimming, surfacing, lesion of lower lip, high mortality and convulsions Ventral fin hemorrhage and erosion, clubbed gill and high mortality
Poor growth, abnormal bone formation
Bleeding gill, short operculum, short snout, exopthalmia, short body, equilibrium loss
Muscular atrophy, susceptible to diseases
37

38
Panially darkened body or fin Susceptibility to fin rot
Bleeding from the gills Cutvature of the body
Short snout and popped eyes Cessation of growth and detached isthmus
Plate I. Signs of ascorbic acid deficiency in seabass.

39
Lesions at lhe lower lip Convulsions
Plate 2. Signs of Vitamin 86 deficiency in seabass.
Carbohydrates
The natural food of seabass are high in protein so it can be assumed that they do not utilize carbohydrates well. In fact, fish are able to synthesize carbohydrates from dietary lipids and protein. Therefore, even though they are the cheapest source of energy when measured on a unit scale, carbohydrates are not essential nutrients in seabass feeds. Adding small amounts of starch (10%) to diets lacking carbohydrates improved the growth rate of seabass but higher levels (27%) were shown to hinder growth (Boonyaratpalin, unpublished data).
Carbohydrates are useful not only as a source of energy but also as a binder because of their viscosity. Carbohydrates will hold together feed ingredients and reduce the rate at which a feed will dissolve in water. A good binder will minimize wastage of feed and pollution of the culture environment.
More research on the relationships between protein, lipid and carbohydrate levels in seabass feeds is needed. The results of such work could allow a further increase in carbohydrate levels at the expense of protein or lipids, thus reducing the cost of the feed. Until further research has been conducted on this subject, it seems inadvisable to exceed the total carbohydrate content of a seabass fingerling feed above 20%.
Minerals
There are approximately twelve inorganic elements that have been shown to be required to maintain structural osmoregulation, muscle contraction, oxygen transportation and metabolic functions of fish. It is extremely difficult to conduct experiments on mineral requirements of aquatic animals because of the probfom of limiting their concentration in the diet and especially because there is almost always a water-borne contribution to the uptake of any mineral. This is particularly true of the trace elements.
Mineral requirements for seabass have not been adequately evaluated because seabass do not readily accept purified diets. Experiments on the optimum level of supplementary mineral mix USPXII and the effect of micromineral and calcium lactate on the growth of seabass

40
fingerlings were done by feeding five fish meal and casein-based diets each containing 0, 2 or 4% USPXII mineral mix, 4% macromineral and 4% calcium lactate deficient macromineral (Porn-ngam et al. 1989). R~sults showed that the diet containing 2% mineral mix gave optimum growth, and the diet devoid of calcium lactate reduced the growth rate only slightly. Seabass seem to be able to satisfy their micromineral requirement with elements present from their water supply and practiaal feed stuffs.
An experiment on the effects of 0, 0.5, 1.0 and 2.0% monosodium phosphate supplemented in fish meal-based diets showed that the growth of seabass fed a diet with 0.5% monosodium phosphate supplementation was superior to the growth of fish fed diets with other phosphate levels. However, 1.0% monosodium phosphate supplementation gave the best feed efficiency and protein efficiency ratio. Considering also the phosphorus available in the fish meal, the total available phosphorus requirement of seabass was 0.55-0.65% (Boonyaratpalin and Phongmaneeratana 1990).
References
Boonyaratpalin, M. 1988a. Annual Report of Fish Nutrition Project in Thailand. National Inland Fisheries Institute, Department of Fisheries, Bangkok, Thailand. 17 p.
Boonyaratpalin, M. ! 988b. Seabass feed. Manual for training provincial fisheries officer. Prajuabkhirikhan Coastal Aquaculture Research and Development Center. 21 p. (In Thai).
Boonyaratpalin, M. 1989. Annual Report of Fish Nutrition Project in Thailand. National Institute of Coastal Aquaculture, Department of Fisheries, Songkhla, Thailand. 23 p.
Boonyaratpalin, M., N. Unprasert, P. Kosutharak, S. Chumsungnem and W. Sothana. 1988. Effect of choline, niacin, inositol and vitamin Eon the growth, feed efficiency and survival of seabass fingerling in freshwater. Technical Paper No. 7 /1988. National Institute of Coastal Aquaculture, Department of Fisheries, Thailand. 22 p. (In Thai).
Boonyaratpalin, M., T. Pechamanee, S. Chungyampin and J. Buranapanidgit. 1989a. Seabass feed, feeding and nutrition deficiency signs. Extension paper No. I, National Institute of Coastal Aquaculture, Department of Fisheries, Songkhla, Thailand. 12 p. (In Thai).
Boonyaratpalin, M., K Unprasert and J. Buranapanidgit. !989b. Optimal supplementary vitamin C level in seabass fingerling diet, p. 149-157. /n M. Takeda and T. Watanabe (eds.) The current status of fish nutrition in aquaailture. The Proc. Third Int. Symp. on Feeding and Nutr. in Fish, 28 August-I September, Toba, Japan.
Boonyaratpalin, M., N. Unprasert, P. Kosutharak, W. Sothana and S. Chums1D1gnem. 1989c. Effect of different levels of vitamin C added in diet on growth, feed efficiency and survival rate of seabass. Technical Paper No. 6/1989. National Institute of Coastal Aquaculture, Department of Fisheries, Thailand. 21 p. (In Thai).
Boonyaratpalin, M. and J. Phongmareetana. 1990. Requirement of seabass for dietary phosphorus. Technical Paper No. 4/1990. National Institute of Coastal Aquaailture. Thailand 20 p. (In Thai).
Boonyaratpalin, S., J.L. Fryer, R.P. Hedrick, K. Supamattaya, S. Direkbusarakom and U. Jadesadakraisom. 1990. Development of kidney disease and occurrence of pathogens in seabass (lales ca/carifer) fed two different diets. Technical Paper No. 8/1990. National Institute of Coastal Aquaailture. Department of Fisheries, Thailand. 13 p. (In Thai).
Buranapanidgit, J., M. Boonyaratpalin, T. Watanabe, T. Pechmanee and R. Yashiro. 1988. Essential fatty acid requirement of juvenile seabass Lq1es ca/carifer. Technical Paper No. 3. National Institute of Coastal Aquaculture, Department of Fisheries. 21 p. (In Thai).
Buranapanidgit, J., M. Boonyaratpalin and S. Kaewninglard 1989. Optimum level 0f W3HUFA on juvenile seabass, l..a/es calcarifer, p. 7. In IDRC Fish Nutrition Project Annual Report. Department of Fisheries, Thailand
Chou, R. 1984. The effect of dietary water content on the feed intake, food conversion efficiency and growth of yo1D1g seabass (l..ales ca/carifer). Singapore J. Primary Ind. 12(2): 120-127.
Chou. R. 1988. Progress of seafarming activities, research and development in Singapore. Appendix XIII, p. 81-89. In Report of the Second National Coordinators Meeting on Regional Seafarming Development and Demonstration Project RAS/8Ml24. 20-23 September 1988 Singapore, Regional Seafarming Development and Demonstration Project, Network of Aquacualture Centres in Asia, Bangkok, Thailand.
Chou, R.F., J. Wong and H.B. Lee. 1987. Observations on the weaning of frngerlings of some cultured marine food fish in Singapore. Singapore J. Primary Ind. 15(2): 64-72.
Chungyampin, S. and M. Boonyaratpalin. 1988. Effect of type of feeds and squid meal on growth of seabass fingerling. National Institute of Coastal Aquaailture. (Unpublished data).
Cuzon, G. and J. Fuchs. 1988. Preliminary nutritional studies of seabass lales calcarifer (Bloch) protein and lipid requirements, p. 15-16. /n 19th Annual Conference and Exposition World Aquaculture Society, Hawaii'88 Program and Abstracts.
Cuzon, G., R. Chou and J. Fuchs. Nutrition of seabass. In advances in Tropical Aquaculture, 20 February4 March 1989, Tahiti, 11 p. (In press). Phromkhuntong, W., K. Supamauaya and W. Jiuione. 1987. Effect of water-soluble vitamins on growth, body composition and histology of
seabass. Report of the Aquatic Science Division, Fawlty of Natural Resources, Prince of Songkhla University. 37 p. Pimoljinda, T. and M. Boonyaratpalin. 1989. Study on vitamin requirements of seabass l..ates ca/carifer Bloch in sea water. Tech. Paper No. 3/32
Phuket Brackishwater Fisheries Station, Department of Fisheries, Thailand. 26 p. (In Thai). Pom-ngam, N., Chonchuencob and U. Boonchum. 1989. Dietary mineral requirements in seabass. /n IDRC Fish Nutrition Project Annual Report,
Department of Fisheries, Thailand 3 p.

41
Sakaras, W., M. Boonyaratpalin, N. Unprasert and P. Kumpang. 1988. Optimum density protein energy ratio in seabass feed I. Teclmical Paper No. 7, Rayong Brackishwater Fuheries Station. 'fl\ailand. 20 p. (In Thai).
Sakaras, W., M. Boonyaratpalin, N. Unprasert. 1989. Optimum dietary proiein energy ratio in seabass feed II. Technical Paper No. 8. Rayong Brackishwater Fisheries Station. Thailand 22 p. (In Thai).
SEAFDEC. 1987. Fisheries Statistical Bulletin for South China Seas Asia. Southeast Asian Fisheries Development Centre, Bangkok, Thailand p. 100-103.
Tacon, A.GJ. and N; Rausin. 19.89. Seabass cage culture trial, p. 34-69. /n The food and feeding of seabass Lates calcarifer, grouper Epinephelus tauvina and rabbitfuh Siganus canalicw/atus in floating net cages. INS/81/008 Technical Paper 13. The National Seafanning Development Centre, Lampung, Indonesia.
Wanakowat, J., M. Boonyaratpalin, T. Pimoljinda and M. Assavaaree. 1989. Vitamin B6 requirement of juvenile seabass Lates ca/carifer, p. 141-149. /n M. Takeda and T. Watanabe (eds.) The current status of fish nu&rition in aquarulture. The Proc. Third Int. Symp. on Feeding and Nutr. in Fish, 28 August-I September, Toba, Japan.
Wanakowat, J. and M. Boonyaratpalin. Vitamin requirements and deficiency signs of juvenile seabass-li. Teclmical Paper. National Institute of Coastal Aquawalture, Songkhla, Thailand. (In press).
Wong, F.J. and R. Chou. 1989. Dietary protein requirement of early grow-out seabass (Lates calcarifer Bloch) and some observations on the performance of two practical formulated feeds. Singapore Journal of Primary lndus&ries. The Primary Production DepartmenL Vol. 17, No. 2. 134p.
Yone, Y. 1976. Nutrition studies of red sea bream, p. 39-63. In Proceedings of the First International Conference on Aquaculture Nutrition. 14-15 October 1975. Lewes/Rehoboth, Delaware.


An Artificial Diet for Larval Rabbitfish, Siganus guttatus Bloch
MONINA M. PARAZO Aquaculture Department
Southeast Asian Fisheries Development Center P.O.Box 256, Iloilo City, Philippines
PARAZO, M.M. 1991. An artificial diet for larval rabbitfish, Siganus gUl/a/us Bloch, p. 43-48. /n S.S. De Silva (ed.) Fish nutrition research in Asia. Proceedings of the Fourth Asian Fish Nutrition Work.shop. Asian Fish. Soc. Spec. Pub!. 5, 205 p. Asian Fisheries Society, Manila, Philippines.
Abstract
A 21-day feeding trial was conducted to determine growth, survival and metamorphosis oflarval rabbitfish (Siganus guttatus Bloch) fed artificial diets containing approximately 40, 45, 50 and 55% crude protein. Arlemia nauplii served as the control feed. Larvae performed equally well on all artificial diets with specific growth rate, % metamorphosis and % survival of 7.80-8.35, 95.2-97.9% and 59.9-70.3%, respectively (P >0.01). In contrast, Artemia-fed larvae exhibited poor growth (5.03) and low survival (51 %) possibly due to inadequate feeding level or poor nutritional quality of Artemia. Hence, a diet with 40% protein and estimated energy content of 3,971 kcal kg-I may be used with satisfactory results during hatchery production of rabbitfish.
Introduction
Present hatchery systems for marine fish species rely heavily on Artemia as food for larvae and fry. However, the prohibitive cost of Anemia is a constraint to the development of marine finfish hatcheries. A viable alternative is to replace Artemia with cheap but efficient artificial diets.
The use of artificial diets for rearing marine finfish larvae is not widespread (Vereth 1987) particularly during the first feeding stage. This is mainly due to technical difficulties associated with particle size requirements, acceptability and digestibility of artificial diets, food distribution and water quality problems (Girin 1979). Nevertheless, the successful use of artificial diets for larvae and fry of several marine fish species, e.g., mil.kfish (Ouray and Bagarinao 1984), sea bass (Barahona-Fernandes and Girin 1976), turbot and sole (Bromley 1979) have been reported. For rabbitfish (Siganus guttatus Bloch) larvae, a species of commercial importance in the tropics, the possibility of using artificial diets with 53-59% (Hara et al. 1986) or 40% crude protein (Juario et al. 1985) during hatchery production have been suggested. However, in these studies comparison of survival and growth performance of rabbitfish larvae fed artificial versus live diets was not made. Moreover, no studies have been conducted to compare growth and development of rabbitfish larvae fed diets with different crude protein levels.
43

44
This report assessed survival and growth of rabbitfish larvae and fry fed artificial diets with approximately 40, 45, 50 and 55% crude protein levels and compared to fish fed Artemia.
Materials and Methods
Diets and feeding scheme
Four diets containing graded levels of protein were formulated (Table 1). The.major dietary protein sources were locally available shrimp meal, squid meal and fish meal, mixed at 1: 1: 1 protein ratio. Bread.flour was used as a carbohydrate source and cod liver oil served as a lipid source. Mineral and vitamin mixes were added to the diets. Kappa-carageenan (Datingbayan Agro-Industrial Corporation, Cebu, Philippines) was used as a binder (Table 1).
Table 1. Composition of experimental diets.
Ingredients (g 100 g-1 dry diet)
Shrimp meal (Acetes sp.)
Fish meal Squid meal Breadflour Cod liver oil Vitamin mix I Mineril mix 1 Kappa-carageenan BHT (Antioxidant) Cellulose
14.SO 14.SO 13.40 37.(J()
7.10 3.00 2.00 5.00 0.05 285
Proximate analysis (% of dry matter)
Crude protein 39.2 Crude fat 9.9 Crude fiber 5.5 Ash 7.6 Nitrogen-free
extract 37.8
Estimated ene~y (kcal kg-1 3,971
2
18.00 18.00 17.00 28.(J()
6.40 3.00 2.00 5.00 0.05 l.95
44.7 10.5 5.8 8.4
30.6
3!)51
Diet no. 3
21.90 21.90 20.50 19.00 5.65 3.00 2.00 5.00 0.05 1.00
51.3 10.6 5.5 9.9
227
3,914
4
25.20 25.20 23.55 11.00 5.00 3.00 2:00 5.00 0.05 0
56.2 10.2 4.8
10.7
18.1
3,890
lComposition was n:ported in Paruo (1990). 2computed based on lllandard physiological fuel values of 9 kcal g-1 lipid and 4 kcal g-1 protein
and carbohydrale.
Experimental diets were prepared by initially mixing preweighed, finely ground (<125 µ) ingredients, including vitamins and minerals, in a commercial food mixer. Cod liver oil (with BHT added), cooked breadflour, and warm water (80°C) were sequentially added to the diet while mixing. Kappa-carageenan, dissolved and gelatinized in boiling water (at 5 g carageenan/100 ml water), was then quickly poured while mixing at high speed. After one minute, mixing was stopped and the resultant dough of even consistency was spread thinly on an aluminum tray for drying in an air draft oven (50 to 60°C) until moisture was reduced to less than 10%. Each diet was crushed and passed through a graded series of sieves to obtain particles of 150-250, 250-425 and 425-500 µsizes. Prepared diets were kept at -10°C and a 3-4 day ration was transferred to the refrigerator as needed.

45
Diets prepared in this manner tended to float. However, nutrient leaching did not seem to be a problem as larvae fed on the diet particles immediately upon administration. Increasingly larger particles were given as larvae grew.
Each diet was analyzed in duplicate for moisture, crude protein, crude fat, crude fiber and ash by standard methods of AOAC (1975). Nitrogen-free extract was determined by subtraction. The proximate composition of each diet is shown in Table 1. Estimated energy contents were similar among the test diets.
Rearing and feeding scheme
Twenty-five-day-old hatchery-bred rabbitfish larvae (mean wet body weight, 26 mg and mean total length, 1.3 cm)) were used. Prior to the experiment, larvae were reared in 5-t concrete tanks and fed rotifers and Artemia.
Larvae were stocked (750 fish) in 250-1 round fiberglass tanks with conical bottom. All tanks, provided with aeration and filtered flow-through seawater, were located outdoors under ambient light and temperature (25-28°C, daytime) conditions. Tank bottoms were cleaned daily.
Before the start of the feeding trial, larvae were weaned to the test diets over a 3-day period. During the weaning period, Artemia was provided in decreasing amounts while test diets were given in increasing amounts and frequency until fish were trained to accept the experimental diets. Weaning of fish to artificial diets was facilitated by acoustic conditioning, i.e., tapping the tank sides, before every feeding time. Mortalities during the weaning period were replaced.
Larvae were fed 4.5 g artificial diet/tank/day or approximately 23% of initial wet biomass, dispensed 6 times per day around 0900, 1030, 1200, 1300, 1500 and 1700 hours. Control fish were fed Artemia nauplii twice daily at 1-2 Artemia ml-1 day-1 feeding level based on Juario et al. (1985).
The 21-day feeding trial followed a completely randomized block design with 3 replicates per treatment. At the end of the experiment final body weight, weight gain, specific growth rate, determined as 100 x {lnWrmai - lnWiniwu/days}, survival rate and number of metamorphosed fish were recorded and the data analyzed by one-way analysis of variance and Duncan's multiple range test (P = 0.01) using the SPSS/PC statistical computer package. Metamorphosed fish were assessed visually as having brownish coloration with light colored spots, while nonmetamorphosed larvae were highly transparent with silvery abdomens (May et al. 1974).
Carcass composition of initial fish samples and those from each diet treatment (60 fish/treatment) were also determined at the end of the experiment using the same procedure earlier described for the experimental diets.
Results
No significant differences were observed in specific growth rate (7 .80-8.35), survival (60-70%) and metamorphosis (95-98%) among fish fed artificial diets (Table 2). In contrast, control fish fed Artemia exhibited poorest growth rate (5.03) among the diet treatments.
Survival rates, although statistically insignificant, tended to be lower (51 %) in Artemia fed fish. One replicate in the Artemia treatment was discarded after mass mortality occurred on the 15th day. Affected fish were analyzed and found to be heavily infested by a parasite (Amyloodinium ocel/atum) on fins, skin and gills (Baticados, pers. comm.). Microscopic examination of gills of diseased fish showed fused or destroyed lamellae. Larvae manifested

46
Table 2. Mean values of final body weight (mg), weight gain (%), specific growth rate. metammphosis (%) and survival (%) of SiganuS gul/a/us after 21 days of feeding the test diets.
Crude Final Specific Diet protein body Weight growth Meta-
no. (%) weightl gain rate2 morphosis Survival
l 40 l34.8a 418a 7.83a 97.2a 6l.3a
2 45 144.7a 456a 8.o8a 95.5a 63.oa
3 50 150.5a 479a 8.35a 97.9a 70.3a
4 55 136.l a 423a 7,8oa 95.2a 59.9a
Control 74.8b 188b 5.03b 99.03 51.03
Values with the same superscript are not significantly different (P>().01). lsixty fish from each treatment (20 fish/replicate) were weighed to determine mean final wet
bodt weight. Specific growth rate: 100 x [lnWfinal-lnWinitial/days].
weak and erratic swimming, surfacing and eventual mortality due to asphyxiation. Bacteria were also isolated from the kidney and stomach of affected fish. In comparison, no such infection and mass mortality were observed in those fed artificial diets.
At the end of the experiment, metamorphosed fish fed Artemia had orange coloration while those fed artificial diets exhibited a normal pale brown color.
Fish in the artificial diet treatments showed higher carcass protein and lower ash levels than initial and Artemia fed fish (Table 3). Carcass ether extract was lowest in Artemia and Diet 4 treatment groups.
Table 3. Carcass composition of Siganus gut/a/us before and after the 21-day feeding trial.
Diet no. Body composition (% of dry matter) Protein Crude fat
Initial fish 56.35c 8.75a l 60.15ab 8.72a
2 62.203 6.89b 3 59.28b 7.07b
4 6l.25a 5.94c Control 55.47C 5.84c
Values with same superscript are not significantly different (P>().0 l). ND=Not determined
Discussion
Ash
27.54a 19-.86c 19.21 c 2l.46b 2l.36b
ND
Rabbitfish larvae survived and grew well on all artificial diets tested indicating that the formulations were sufficient and that around 40% dietary protein level may be nutritionally adequate. Otherwise, nutrient deficiency syndromes would have become apparent owing to small size and accelerated manner of growth during the larval stage (Dabrowski 1984). Inclusion of high carbohydrate content (37%) in Diet 1 did not seem detrimental to larval growth nor did it drastically alter fish carcass protein content implying efficient use of dietary carbohydrate to spare protein for growth. In a previous experiment, Parazo (1990) also observed that rabbitfish fry effectively utilize non-protein energy sources. This protein-sparing characteristic presents rabbitfish with an advantage over other cultivable fish species such as sea bass and grouper. As availability and cost of fish meal, a major source of dietary protein, becomes prohibitive (McCoy 1990), fish species which effectively utilize carbohydrate and grow well even on low dietary protein levels may become the preferred species for culture.

47
Swvival rates obtained in this study compare well with previous reports on hatchery production of rabbitfish using combined diets of live zooplankton and artificial diets (Hara et al. 1986; Juario et al. 1985). In this study, fish mortality was partly a result of aggressive behavior of bigger individuals. This aggressive behavior has been previously observed in S. guttatus (Juario et al. 1985) and S. canaliculatus (May et al. 1974).
Low survival and growth of larvae in the control group was surprising since Artemia has long been considered an excellent larval food (Vereth 1987). Low growth and swvival of Artemia-fed fish may be explained by suboptimal feeding level and/or by Artemia quality being nutritionally deficient. Based on Artemia dry weight of 2.42 µg/nauplii (Sorgeloos et al. 1986), control fish were fed less (0.9 g tank day-1) than those in the artificial diet treatment (4.5 g tank day-I). This was also confirmed by low carcass protein and fat content of Artemia fed fish suggesting inadequate nutrient intake for deposition as fish flesh or tissue fat reserve. In this study, it is difficult to establish whether larval mortality among Artemia-fed fish was due to poor nutritional status which increased their susceptibility to parasitic and bacterial infections. Clearly, optimal feeding levels for larval rabbitfish still need to be investigated. For larval S. guttatus, exclusive feeding with Artemia resulted in inferior growth, abnormal coloration, parasitic and bacterial infestations. The reason for abnormal coloration of larvae is unclear. Hdwever, the presence of bacteria in the stomach of rabbitfish larvae indicates that infection occurred through the feed pathway. Intestinal infection associated with Artemia feeding have also been recorded in larvae of rockfish, Sebastes schlegeli, puffer, Takifugu rubripes, grouper, Epinephelus akaara (Tanasomwang and Muroga 1989) and coregonid, Coregonus fera (Burkhardt-Holm et al. 1989). Horvath (1979) stated that in many cases, bacterial or parasitic diseases in larval fish are only secondary symptoms of deficiencies in the feed or in the environment.
An artificial diet with approximately 40% protein and estimated energy content 3,971 kcal kg-I may be used to feed rabbitfish during their larval and early fry stages. Preparation of the artificial diet is easy, does not require complicated equipments, and may easily be adapted for use in private hatcheries.
Acknowledgements
I am grateful to Ma. C. L. Baticados for examination of diseased fish; G. Minoso for proximate analysis of fish and feeds; and Dr. S. de Silva, Dr. F. P. Pascual and L. Ma. B. Garcia for reviewing the manuscript.
References
AOAC. 1975. Official methods of analysis. 121h edition. Association of Official Analytical Chemists, Washington, DC. Barahona-Fernandes, M. and M. Girin. 1976. Preliminary tests on the optimal pellet-adaptation age for sea bass larvae (Pisces, Dicentrarchus
/abrax L 1758). Aquarulture, 8: 283-290. Bromley, P.J. 1979. The weaning of turbot (ScophlhalmMS maximus L.) and sole (So/ea solea L.) on dry diets, p. 449-455. /n J.E. Halver and K.
Tiews (eds.) Finfish nutrition and fishfeed technology. Vol. I. Hecnemann Verlagsgesellschaft, Berlin. Burkhardt-Holm, V.P., R. Eckmann and V. Storch. 1989. SchadiglDlg des dannepithels von coregonenlarven (Coregonusfera) durch Artemia-
futterung: Eine bakterielle uifektion. J. Appl. lchthyol. 1: 2-11. Dabrowski, K. 1984. The feeding of fish larvae: present "state of the art" and perspectives. Reprod. Nutr. Develop. 24(6): 807-833. Ouray, M. and T. U. Bagarinao. 1984. Weaning of hatchery-bred milkfish larvae from live food to artificial diets. Aquaculture 41: 325-332. Girin, M. 1979. Feeding problems and the technology of rearing marine fish larvae, p. 359-366. In J.E. Halver and K. Tiews (eds.) Finfish
nutrition and fishfeed technology. Vol. I. Heenemann Verlagsgesellschaft, Berlin. Hara, S., M.N. Ouray, M.M. Parazo and Y. Taki. 1986. Year-round spawning and seed production of the rabbitfish, Siganus g1.ittatus.
Aquaculture 59: 259-272.

48
Hoivath, L. 1979. The rearin~ of warmwater fish laivae, p. 349-357. /n J.E. Halver and K. Tiews (eds.) Finfish nutrition and fishfeed technology. Vol. 1. Heenemann Verlagsgesellschaft, Berlin.
Juario, J.V., M.N. Ouray, V.M. Duray, J.F. Nacario and J.M. E. Almendras. 1985. Breeding and laival rearing of the rabbitfish, Siganus guttatus (Bloch). Aquaculture 44: 91-101.
May, R.C., D. Popper and J.P. Mcvey. 1974. Rearing and laival development of Siganus canaliculatus (Parle) (Pisces:Siganidae). Micronesica 10: 285-298.
McCoy, H. II. 1990. Fishmeal-the critical ingredient in aquaculture feeds. Aquacult. Mag. Mar./ Apr.: 43-50. Parazo, M.M. 1990. Effect of dietary protein and energy level on growth, protein utilization and carcass composition of rabbitfish, Siganus
guttatus. Aquaculture 86: 41-49. Sorgeloos, P., P. Lavens, P. Leger. W. Tackaert and D. Versichele. 1986. Manual for the culture and use of brine shrimp artemia in aquaculture.
1be Belgian Administration for Development Cooperation and The Food and Agricultural Organization of the United Nations. State University of Ghent, Belgium, Faculty of Agriculture. 319 p.
Tanamsomwang, V. and K. Muroga. 1989. Intestinal microflora of rockfish Sebastes schlegeli, tiger puffer Talcifugu rubripes and red grouper Epinephelus akaara at their laival and juvenile stages. Nippon Suisan Gakkaishi 55: 1371-1377.
Vereth, J.A.J. 1987. The production and nutrition of fish fry and its role and constraints in aquacultural production, p. 107-118. /n J.A.J. Vereth, M. Carillo, S. Zanuy and E.A. Huismann (eds.) Proceedings of the Latin American Seminar on Aquaculture, Pudoc, W agenigen.

Effect of Feeding Levels on Food Utilization and Growth of Catla Fry
D. SEENAPPA K.V. DEVARAJ
Inland Fisheries Division University of Agricultural Sciences
Hebba/, Bangalore 560 024 India
SEENAPPA, D. and K.V. DEV ARAJ. 1991. Effects of feeding levels on food utilization and growth of calla fry, p. 49-54. In S.S. De Silva (ed.) Fish nutrition research in Asia. Proceedings of the Fourth Asian Fish Nutrition Workshop. Asian Fish. Soc. Spec. Pub!. 5, 205 p. Asian Fisheries Society, Manila, Philippines.
Abstract
A purified diet was fed to calla Calla calla (Harn.) fry thrice a day for a period of 40 days at six feeding levels (4, 6, 8, 10, 12 and 14% of the body weight) to assess their effect on growth and food utilization.
The growth (weight gain %) increased as feeding level increased. However, growth of fish fed 8% of body weight was not significantly higher than that fed a lower ration, but was significantly lower than fish fed higher rations. Growth of fish fed at 10% or above were not significantly differenL
Food consumption(%) was similar in ftsh fed diets up to 10% ration. Growth rate (mgJl.ive fish/day) was found to be significantly dependent on feeding level. Food conversion ratio (FCR) and protein efficiency (PER) were better at lower rations. Survival of calla fry was low at 8% ration followed by 4%. However, no significant difference was observed between different rations (P > 0.01).
The results of the study suggest that feeding a purified diet to catla fry at 10% body weight would be optimal.
Introduction
Supplemental feeding has become an integral part of fish culture. The major constraint for developing a complete low cost diet is the paucity of knowledge on the nutritional requirements specific to cultivable carps. Dietary nutritional requirements are more precisely determined through feeding purified diets under in vitro conditions. Growth response, feed utilization and su~ival when fed purified diets depend upon several factors of which feeding level is one of the most important. The effect of varying feeding rates on growth, feed consumption, efficiency and body composition of a number of species have been studied (Brett et al. 1969; Pandian and Raghuraman 1972; Andrews and Stickney 1972; Cho et al. 1976; Reddy and Katre 1979; De Silva et al. 1986; Kiran and Paulraj 1988; Das and Ray 1989; Aditya and Patra 1990). It is evident from the earlier studies that the rate of feeding alters nutrient intake and feed efficiency
49

50
as excess feeding may lead to leaching of nutrients and limited feeding may suppress growth due to starvation. The present study was therefore, carried out to determine the optimum feeding level for Cat/a cat/a fry fed purified diets.
Materials and Methods
Eighteen plastic tubs (50 x 33 x 18 cm) located indoor in the wet laboratory of the Fisheries Research Station, University of Agricultural Sciences, Bangalore, were used for the study. Each tub was filled with 30 1 of tube well water. The water was well aerated for a period of 24 hours prior to stocking.
Forty-day old catla fry reared in cement tanks containing natural food and also fed with supplemental diet mixture of rice bran and groundnut cake were collected in one lot from the Research Station, and were used in this experiment. Each experimental tub randomly numbered, was stocked at a rate of fifteen fry (average total weight 3.58 g ± 0.26 g) keeping the average weight nearly constant in replicated treatments (in triplicate). Prior to the start of each experiment, catla fry were acclimatized for ten days to the standardized experimental conditions of 16 hours of aeration and artificial lighting and to the purified experimental diet.
The experimental diet containing 45.8% crude protein (Devaraj and Se~nappa 1989) on a dry weight basis was prepared. The details of the feed ingredient composition of the test diet are given in Tables 1 to 3. The dry ingredients except oil were weighed separately. Mineral premix and vitamin powder were mixed with cellulose and blended using an electrical grinder, and the required quantity of cod liver oil was added to the ingredient mixture. Later, water (80 mVlOO g feed ingredients) was added and hand mixed until it formed a stiff dough. This was extruded without added heat through a 2-mm die in a hand mincer. The spaghetti-like strings were air dried, powdered and handseived to size ( < 1 mm). The feed was stored in high gauge plastic bags under room temperature until further use.
The feeding trial was carried out for 40 days. Fish were fed at different levels (4, 6, 8, 10, 12 and 14% on wet weight basis) based on body weight of fish, thrice a day at 0900, 1100 and 1300 hours. Left-over feed was collected at 1500 hours daily. The tubs were cleaned the next morning
Table l. Composition of diet (IOO g).,
Ingredient Weight(%)
Casein (a) 42.89 Gelatin (b) 8. 54 Dextrin (a) 16.73 Cod liver oil (c) 8.00 Cellulose (a) 7.(:f) Corboxymethyl cellulose (a) I0.00 Mineral premix (d) 4.50 Vitamin mix (e) l.50 Oxytetracycline 0.15
Total 100.00
Romali chemical for laboratory use (American preparate) (a). S.D. Fine-<:hemicals Pvt Lld, Boisor, 401501 (b). Universal Generics Pvt Lld., Bombay, India (each !Oml contains Vit A. 7,000 IU, Vit D. 800 IU and polyunsaturated dietary supplement (c). Formulated at the Research Station (d). Roche Private Ltd., Bombay, India (e).
Table 2. Composition of Roche multivitamin tablets.
Vitamin A, I.P. (as acetate) Thiamine mononitrate I.P. (Vit B1) Riboflavin I.P. (Vit B2) Nicotinamide I.P. Pyridoxine hydrochloride I.P. (Vit B6) Calcium pantothenate USP. Cyanocobalamine I.P. (Vit B12) Ascorbic acid I.P. (Vit C) Cholecalciferol (Vit. D3) USP. Vitamin-E ENF (As di-Alpha-Tocopherol acetate) Biotin (Vit H) Calcium phosphate I.P. Dried phosphate I.P. Magnesium phosphate dibasic Manganese hypophosphate Total phosphorous in the preparation
2,500 IU 2.0 mg 3.0 mg
25.0 mg l.5 mg 5.0 mg 1.0 mg
50.0 mg 200 IU
10.0 mg 0.05 mg 0.208 g
10.62 mg 48.00 mg 0.60 mg
44.60 mg

51
before first feeding, by siphoning and replacing with an equal volume. Total weight of fish in each tub was measured once every week using an AND electronic balance-FX 3000 model under animal weighing mode and the amount to be fed was adjusted accordingly. Based on the weight gain, food consumption and feed utilization, the efficiency of different feeding levels were evaluated. The results of the study were analyzed through a microcomputer using ANOV AV AXNMS version, V 4.
Proximate composition of feed (Table 4) and. also of fish was determined using the Tecator Kjeltec-1026 model for crude protein and Tecator Soxtec-HT2 model equipments for crude fat. Moisture and ash content were analyzed using AOAC methods (1984). The caloric value of the feed was calculated on the basis of 5.65 kcal/g casein, 3.9 kcal/g gelatin, 4.11 kcaVg dextrin and 9.45 kcal/g fat based on standard physiological fuel values (Mazid et al. 1979).
Table 3. Details of mineral mixture formulated (100 g).
Calcium orthophosphate Potassium dihydrogen phosphate Sodium dihydrogen phosphate Sodium chloride Magnesium sulphate Potassium chloride Ferrous sulphate Zinc sulphate Manganese sulphate Copper sulphate Cobalt chloride Potassium iodide Aluminium chloride
40.16 23.98
8.72 6.00
12.75 5.00 2.50 0.55 0.25 0.0785 0.0105 0.0017 0.0018
Table 4. Proximate composition of purified dieL
Composition
Moisture(%) Dry matter (%) Crude protein Crude fat Ash
Calculated gross energy (kcal/I 00 g)
PIE ratio (mg/kcal) FJP ratio Kcal/g protein % protein
energy in the diet
9.9 90.1 45.8
8.4 13.6
420 109
9.2
.t3.6
Results and Discu~ion
The pH, dissolved oxygen, free carbon dioxide, total alkalinity and ammonia nitrogen of water during the study period were 7.12, 6.8 ppm, 3.2 ppm, 193 ppm and 1.8 mg at N/L, respectively (average values). The overall atmospheric and water temperatures ranged from 22.8-30.1°C (mean 26.8 ± 1.3°C) to 25.0-29.5°C (mean 27.3°C ± 1.1°C), respectively, during morning and 25.0-32.2°C (28.0 ± l.6°C) to 25.0-30.3°C (27.6 ± 1.2°C), respectively, during evening.
Survival varied from 82.2 to 93.3% (Table 5). The variations in survival noticed between treatments were not different (P > 0.01) indicating that there were no significant effects of feeding levels on the survival of catla fry. Karmakar and Ghosh (1984) observed greater variation m the survival of Liza parsia fry ranging from 31 to 88% and attributed to the high stocking density (3/1). The better survival noticed in the present study can be due to the optimum stocking of fish fry which was predetermined through a preliminary pilot study.
Chiu et al. (1987) observed significant increases in growth of fingerlings of Chanos chanos with increased feeding rates. Das and Ray (1989) have also noticed a significant increase in weight gain and protein efficiency ratio in fingerlings of Cirrhinus mrigala at feeding levels ranging from 3 to 30% body weight and significantly lesser growth at 45% feeding level when fed the diet containing 35% crude protein. On the contrary, Kiran and Paulraj (1988) reported a linear increase in growth of the mullet Liza parsia fry up to a feeding level of 8% and a disproportionately lower growth with further increase in feeding level. Allen and Wooton (1982)

52
and Singh and Srivastava (1985) have also reported similar observations in the three-spined stickle back, Gasterosteus aculeatus and catfish, Heteropneustes fossilis, respectively. In the present study, growth was found to be nonlinear although dependent on the amount of food offered. The total weight gain (%),daily rate of growth mg/g live fish/day, specific growth rates (%/day) were least in fry fed at 4% body weight and were maximum in fry fed at 14% body weight (Table 5). The weight gains noticed for rations 4, 6 and 8% were significantly lower than that for others. However, the difference in the weight gain between 10, 12 and 14% rations were not significant (P > 0.01). Das and Ray (1989) noticed a maximum growth of advance fingerlings of mrigal at 15% ration and suggested rations of 9 to 24% as adequate for mrigal. The specific growth rate and daily rate of growth of catla fry fed different rations were greater than those of catfish, Heteropneustes fossilis (Reddy and Katre 1979) and fry of mullet, Liza parsia (Kiran and Paulraj 1988) and lesser than those of channel catfish, Ictalurus punctatus (Andrews 1979). These variations can be attributed to the inherent capacity of catla fry to grow, differences in feed quality and water temperature. The present result on growth confirms the importance of feeding rate on weight gain in fish and a feeding level at 10% body weight of fish would be optimal for catla fry.
Kiran and Paulraj (1988) noticed no significant increase in feed consumption in Liza parsia beyond a ration of 8%, while in the present study the percentage of feed consumption was highest at lower levels of feeding and was least in fish fed 14% body weight (68.6%). Feed
Table 5. The effect offeeding levels on growth and food utilization in calla fry.
Total weight (g) Weight
Ration Survival gain (%body wt) (%) Initial Final (%)
4 86.7a 3.6a 5.6 55.9a
(±13.34) (±0.19) (±0.62) (±11.77)
6 91.1a 35a 6.1 72.8a
(±3.85) (±0.50) (±0.39) (±16.29)
8 82.2a 3.6a 6.4 77.9a
(±3.85) (±0.26) (±0.29) (±15.11)
IO 93.3a 3.6a 8.2 127.9b (±0.19) (±0.59) (±22.78)
12 91.la 3.6a 8.3 137.8b
(±7.69) (±0.36) (±1.53) (±23.06)
14 93.3a 3.6a 8.9 148.6b
(±6.66) (±0.18) (±0.7) (±7.18)
Values of the same column bearing common superscripts are not different P > 0.01. Values in parentheses are the standard deviations.
Food conswnption
(%)
87.3a (±0.70)
87.5a (±0.86)
84.lab
(±2.58)
82.2b (±1.62)
73.9c (±3.29)
68.6d (±1.37)
Mean final total fish weight - Mean initial total weight Weight gain (%)
Mean initial total fish weight
g dry food fed FCR
g live weight gain
Total weight gain PER
Protein intake
Feeding Food Protein rate conversion efficiency
(mg/live ratio ratio fish/day (FCR) (PER)
255a 2.47a 0.893
(±5.03) (±0.27) (±0.1)
32.lb 3.!0ab o.nb
(±1.66) (±0.61) (±0.13)
42.3c 3.90bc o.s1bc (±1.07) (±0.48) (±0.07)
46.ld 3_32b 0.67bc
(±1.57) (±0.39) (±0.08)
50.1d 3.63bc 0.61 be
(±4.31) (±0.63) (±0.1)
62.9e 4.22c o.52c (±4.38) (±0.37) (±0.05)

53
wastage was 31.4% at a higher level (14% body weight) of feeding and was minimum (12.5-12.7%) at lower feeding levels. Significant difference was not observed between 4, 6 and 8% rations (P > 0.01).
An inverse relation was noticed between consumption and feeding level. Except at 10 and 12% rations, in all other treatments significant variations in feed consumption were noticed (P < 0.01). Food consumption at 10% ration level was significantly higher than 4, 6 and 8% rations and more or less similar to that of 12%. However, at 10% ration growth was significantly higher than 4, 6 and 8% and was statistically similar to that at 12% and 14%, indicating that 10% ration would be optimal for catla fry. Based on food consumption it is calculated that catla fry consume a maximum of about 63 mg/g live fish/day. This is comparable to those reported for Oreochromis mossambicus (65 mg/g/day) by Pandian and Raghuraman (1972), Ophicephalus striatus (Pandian 1967) and Cyprinus carpio. Feed consumption of 157.6 mg/g live fish/day for H. fossi/is (Reddy and Katre 1979), 80 mg/g/day for Liza parsia (Kiran and Paulraj 1988) and 139.9 mg/g live fish/day for fry of Cirrhinus mrigala (Sampath and Ravindran 1988) have been reported. The overall lower consumption in catla fry noticed in the present study can be attributed to the better feed composition as fish consume feed to meet its dietary nutritional requirements (Lovell 1978).
The quantity fed has a significant role on the food conversion ratio (FCR). The FCR value was least in fish fed at lower level (4%). The value increased with increasing ration size except at 8% and was high (4.2) for fish fed at 14% body weight. Feed efficiency decreased with increased feeding levels. FCR values did not differ significantly between fish fed for 6, 8, 10 and 12% rations. Though consumption was more when fed at 14% body weight, no significant difference in conversion efficiency between 10, 12 and 14% rations were noticed. Reddy and Katre (1979), Andrews and Stickney (1972) and Das and Ray (1989) have also observed similar trends of better conversion ratio and conversion efficiency at lower ration levels. The significant decrease in conversion efficiency in H. fossilis at higher feeding levels was attributed to the possible increase in Specific Dynamic Action (SDA) and/or probable evacuation of undigested food and/or excess swimming activity due to surfacing (Reddy and Katre 1979). The decrease in the efficiency of assimilation and digestion can also be the reason for the poor conversion efficiency of the diet noticed in the present study for higher rations.
Protein efficiency values were high in fish on lower rations and the value decreased with increasing ration size.
Body composition of catla fry was also affected by different feeding rates. Dry matter and per cent protein increased with increasing feeding levels (Table 6). Gatlin et al. (1986) also reported an increase in dry matter content of fingerlings of channel catfish with increased feeding rate but observed a decrease in protein and ash content.
Table 6. Effect of feeding levels on body dry matter and protein content (by dry weight) in catla fry.
Feeding level Moisture Dry matter Crude protein (%) (%) (%) (%)
0 (Initial) 83.1 16.8 63.5 4 81.9 18.0 64.8 6 82.0 17.9 65.4 8 80.4 19.6 66.6
10 80.7 19.2 65.6 12 80.5 19.4 65.3 14 80.8 19.l 65.5

54
The present study suggests that a ration level of 10% body weight would be optimal for catla fry in vitro with purified diet containing 45.8% crude protein and gross energy of 420 kcal/100 g diet.
References
Aditya, S. and B.C. Patra. 1990. Feed intake and protein requirement of an air-breathing fish Anabas testudineus {Bloch). Paper presented in the Second Indian Fisheries Forum organized by the Asian Fisheries Society (Indian Branch), College of Fisheries, 27-31 May. Mangalore, India. (Abstract).
Allen, J.R.M. and RJ. Wooton. 1982. Effect of ration and temperature on the growth of three spined stickle back Gasterosteus aculeatus. J. Fish Biol. 20(4): 400-422.
Andrews, J.W. 1979. Some effects of feeding rate on growth, feed conversion and nutrient absorption of channel catfish. Aquaculture 14: 243-246.
Andrews, J.W. and R.R. Stickney. 1972. Interactions of feeding rates and environmental temperature on growth, food conversion and body composition of channel catfish. Trans. Am. Fi.sh. Soc. 101: 94-99.
AOAC. 1984. Official methods of analysis. 14th edition. Association of Official Analytical Chemists. Arlington, Virginia. 1141 p. Bren, JR, J.E. Shelboum and C.T. Shoop. 1969. Growth rate and body composition of fingerlings sockeye salmon, Oncorhyncus nerka in
relation to ~e temperature and ration siz.e. J. Fish. Res.-Board Canada 26: 2363-2394. Chiu, Y.N., N.S. Sumagaysay and M.A.S. Sastrillo. 1987. Effect of feeding frequency and feeding rate on the growth and fr~d efficiency of
milkfish, Chanos chanos Forsskal,juveniles. Asian Fish. Sci. 1: 27-31. Cho, C. Y., S.J. Slinger and H.S. Bayley. 1976. Influence of level and type of dietary protein and level of feeding on feed utilization of rainbow
trout J. Nutr. 106: 1547-1556. Das, I. and A.K. Ray. 1989. Effect of different feeding levels on the growth performance of Cirrhinus mrigala (Ham.) fingerlings. Paper
presented in the National Seminar on Forty Years of Freshwater Aquaculture in India. Organized by Association of Aquaculturists and Central Institute of Freshwater Aquaculture, 7-9 November. Bhubaneswar, India. (Abstract).
De Silva, S.S., R.M. Gunasekara and C. Keembiyahetty. 1986. Optimum ration and feeding frequency in Oreochromis niloticus young, p. 559-564. In J.L Maclean, LB. Diron and L V. Hosillos (eds.) The First Asian Fisheries Forum. 727 p. Asian Fisheries Society, Manila, Philippines.
Devaraj, K.V. and D. Seenappa. 1989. Studies on the nutritional requirements and feed formulation of cultivable fishes. Annual Research Report of the PL-480 Fish Nutrition Project for the year 1989-1990.
Gatlin, D.M., W.E. Poe and R.P. Wilson. 1986. Protein and energy requirements of fingerlings channel catfish for maintenance and maximum growth. J. Nutr. 116: 2121-2131.
Karmakar, H.C. and A.N. Ghosh. 1984. Experiment for optimiz.ation of feeding rate and feeding intensity during nursery rearing of Liza parsia (Hamilton). Proc. Symp. Coastal Aquaculture 3: 803-806.
Kiran, V. and P.R. Paulraj. 1988. Food ration for rearing the fry of the mullet Liza parsia, p. 91-94. /n M. Mohan Joseph (ed.) The First Indian Fisheries Forum. Asian Fisheries Society, Indian Branch, Mangalore.
Lovell, R.T. 1978. Factors affecting voluntary food consumption by channel catfish. Proc. World Symp. on Finfish Nutrition and Fish Feed Technology, Hamburg, 20-23 June 1979. 1: 555-564.
Mazid, M.A., Y. Tanaka, Teruhisa Katayama, M.F. Asadur Rahmon, K.L Simpson and C.C. Chischester. 1979. Growth response of Tilapia zillii fingerlings fed isocaloric diets with variable protein levels. Aquaatlture 18: 115-122.
Pandian, T.J. 1967. Intake, digestion, absorption and conversion of food in the fish Mega/ops cyprinoides and Ophiocephalus striatus. Mar. Biol. 1: 16-32.
Pandian, T.J. and R. Raghuraman. 1972. Effects of feeding rate on conversion efficiency and chemical composition of the fish Tilapia mossambica. Mar. Biol. 12: 129-136.
Reddy, S.R. and S. Katre. 1979. Growth rate and conversion efficiency of the air-breathing catfish Heteropneustes fossilis in relation to ration siz.e. Aquaculture 18(1): 35-50.
Sampath, K. and J. Ravindran. 1988. Optimum meal frequency in the fry of Ci"hinus mrigala (Hamilton), p. 65-67. In M. Mohan Joseph (ed.) The First Indian Fisheries Forum. Asian Fisheries ~ociety, Indian Branch, Mangalore.
Singh, R.P. and A.K. Srivastava. 1985. Effect of different ration levels on the growth and the gross conversion efficiency in a siluroid catfish Heteropneustesfossilis (Bloch). Inst Zool. Academia Sinica 24(1): 69-74.

Growth Response and Carcass Composition of Red Tilapia Fry Fed Diets with Varying
Protein Levels and Protein to Energy Ratios
CORAZON B. SANTIAGO MANUEL A. LARON
Binangonan Freshwater Station SEAFDEC Aquaculture Department
Binangonan, Rizal, Philippines
SA'\IIAGO, C.B. and M.A. LARON. 1991. Growth response and carcass composition of red tilapia fry fed diets with varying protein levels and protein to energy ratios, p. 55-62. In S.5. De Silva (ed.) Fish nutrition research in Asia. Proceedings of the Fourth Asian Fish Nutrition Workshop. Asian Fish. Soc. Spec. Pub!. 5, 205 p. Asian Fisheries Society, Manila, Philippines.
Abstract
An 8-week feeding experiment was conducted with red tilapia fry of 0.160 ± 0.035 g initial weight. Twelve diets of four protein levels (25, 30, 35 and 40%) and three protein to energy (PIE) ratios (111, I 00 and 80 mg proteinti{cal) at each protein level were used. The highest growth was attained by fry fed a 40% protein diet with a PIE ratio of 111 mg/kcal. A lower but not a significantly different (P > 0.05) growth response was auained by fry on a 35% protein diet with a PIE ratio of 111 mg/kcal and a 30% protein diet with a PIE ratio of I 00. Protein efficiency ratio was affected by the dietary protein level. Feed conversion ratio was not significantly influenced by the dietary protein level nor the PIE ratio.
Carcass moisture content (%) was affected only by the PIE ratio. Carcass moisture content was directly related to the PIE ratio of the diets and was inversely related to the digestible energy (DE) level. Both protein level and PIE ratio significantly influenced carcass lipid content(%) on a dry matter basis but not the ash content. Carcass lipid(%) increased with increasing dietary protein and increasing DE levels of the diet, but decreased with increasing PIE ratio. Carcass protein content decreased significantly with the decrease of PIE ratio and increase of DE level of the diet.
Introduction
Red tilapia is one of the most important and desirable species for culture in Taiwan (Kuo 1984; Liao and Chang 1983), Malaysia (Siraj et al. 1988) and the Philippines. It is a hybrid of at least two species of tilapia belonging to the genus Oreochromis which includes 0. niloticus and 0. mossambicus (Pullin 1988). Protein and energy requirements of the two tilapia species and 0. aureus are known (NRC 1983), but information on the nutrition of red tilapia is meager.
A preliminary study showed that red tilapia fingerlings require about 34% crude protein in the diet (Cismeros-Moreno 1981). At 24°C, a high-protein practical diet (44% crude protein) was found more efficient in promoting growth of red tilapia fingerlings (15-18 g average weight) than the medium (28% protein) and low-protein (13%) diets (Hepher et al. 1983). Using practical
55

56
diets with three protein levels (25, 30 and 35%) and energy levels (270, 310 and 350 kcaVlOO g), Chen and Lee (1985) found that the diet with 35% protein and 350 kcaVlOOg (protein to energy ratio = 100 mg protein/kcal) yielded the best growth of young red tilapia (3.8 g mean initial weight). However, higher levels of protein and energy have not been tested.
The present study was conducted to evaluate the response of red tilapia fry to diets containing varying protein levels and protein to energy (PIE) ratios.
Materials and Methods
Experimental diets
Diets with protein levels ranging from 25 to 40% at 5% intervals and PIE ratios of 111, 100 and 88 mg/kcal at each protein level were formulated (Table 1). To maintain the desired PIE ratios, dietary energy levels increased with the increase of protein level. Protein levels or PIE ratios used in the present study were within the range of values favorable for other tilapia species closely related to red tilapia (Cruz and Laudencia 1977; Davis and Stickney 1978; Kubaryk 1980; Winfree and Stickney 1981; Jauncey 1982; Santiago et al. 1982; De Silva and Perera 1985; Wang et al. 1985; Siddiqui et al. 1988).
The ratio of oil to dextrin was maintained equal in all diets except for the 40% protein diet with a PIE ratio of 80 mg/kcal (Diet 12). Also, except for diet 12, the oil content of all other diets was within the range of dietary lipid that gave comparable feed conversion ratios and protein efficiency ratios in red tilapia (Kamarudin et al. 1988).
Table I. Composition of experimental diets (the digestible energy has been calculated based on the values used by Wang et al. 1985).
Diet number 2 3 4 5 6 7 8 9 10 11
Ingredient
Casein 22.47 22.47 22.47 26.97 26.97 26.97 31.47 31.47 31.47 35.95 35.95 Gelatin 4.78 4.78 4.78 5.73 5.73 5.73 6.68 6.68 6.68 7.64 7.64 Oil* 6.25 7.64 11.11 7.50 9.17 13.33 8.75 10.69 15.56 10.00 12.22 Dcxtrin 14.06 17.19 25.00 16.88 20.62 30.00 19.69 24.06 35.00 22.50 27.50 Celufil** 45.94 41.42 30.14 36.42 31.01 17.47 26.91 20.60 4.79 17.41 10.19 Others*** 6.50 6.50 6.50 6.50 6.50 6.50 6.50 6.50 6.50 6.50 6.50
Nutrient
Estimated % protein 25 25 25 30 30 30 35 35 35 40 40
12
35.95 7.64
24.44 25.00 0.47 6.50
40 DE**** 225 250 312 270 300 375 315 350 437 360 400 500 PIE**** 111 100 80 111 100 80 111 100 80 111 100 80 DE/P**** 9.0 10.0 12.0 9.0 10.0 12.0 9.0 10.0 12.0 9.0 10.0 12.0
Analyzed (% dry matter)
Protein 24.8 24.5 24.3 28.1 28.0 28.7 33.3 33.1 34.3 38.8 38.8 42.l Crude fat 4.8 7.7 10.9 5.9 9.0 14.8 8.1 11.7 16.3 9.1 13.0 23.8 Ash 3.8 3.8 3.8 4.2 3.9 3.8 3.9 3.8 3.8 3.9 3.9 4.2
*Consists of 50% com oil and 50% soybean oil. **A non-nutritive filler (USA Biochemical Corp.). ***Vitamin mix, 1.5%; mineral mix, 4.0%; and carboxymethyl cellulose (CMC), 1.0%. Vitamin mix was as reported by Santiago and Lovell (1988). Mineral
mix provided the following (amount/kg diet): Ca(H2P04)i.H20, 32.55 g; CaCOJ, 1.577 g; MnS04.H20, 40 mg; MgS04, 2.48 g; KIOJ, 3 mg; Cu~04.5H20, 12 mg; ZnS04.7H20, 88 mg; Naa, 2.5 g; Co02, 4 mg; FeS04.7H20, 0.746 g; Na2SeOJ, 0.2 mg.
****DE, PIE and DE/P were expressed as kca1/100g, mg/kcal, and kca1/g, respectively.

57
Diets were prepared by first mixing the dry ingredients and then blending in the oils. Water was added and the moist mixture was pelleted in an electric food grinder. The pellets were ovendried at 60°C. The dry pellets were crumbled to appropriate sizes before feeding to the fish.
Experimental fish and treatments
Mature red tilapia were obtained from a private commercial farm and maintained in the laboratory with feeding. Young red tilapia produced by the broodstock were fed a practical diet until the desired size of fish was attained. One week before stocking, the fish were fed one of the experimental diets (Diet 1) containing the lowest protein and energy levels.
A 4 x 3 factorial experiment was conducted. The main factors were protein level and PIE ratio. The twelve treatment combinations were replicated three times.
Fish were stocked randomly at a density of 20 fry/aquarium filled with 40 1 of aerated well water. Mean initial body weight was 0.160 ± 0.035 g and total length was 22.5 ± 1.4 mm. The fry were fed the test diets slightly over satiation level three times a day for 8 weeks. The amount of feed given was assumed to be the amount of feed consumed due to difficulty in recovering small feed particles from the water column and separating fecal material from the feed. Daily feed consumption was calculated on a weekly basis for 8 weeks.
Fish were counted and weighed in bulk weekly. Daily mortalities were recorded. During final sampling, equal numbers of fish samples per aquarium were obtained after about 20 hours of fasting, and then frozen, chopped and homogenized for proximate analysis (Lovell 197 5). Fish samples for each treatment were pooled.
Water management
Glass aquaria were provided with adequate aeration and cleaned once or twice daily by siphoning wastes/excess feed with the use of a 2-mm diameter plastic tubing. Water was partially replaced everytime the aquaria were cleaned and completely replaced after each weekly sampling. During the experimental period, dissolved oxygen ranged from 6.3 to 10.5 mg/I and pH, 6.8 to 8.8. Water temperature ranged from 26.5 to 29°C at 0700 hours and 27 to 32°C at 1500 hours. Mean daily temperature fluctuation was 3 ± 1°C.
Statistical analysis
Data were analyzed by analysis of variance for factorial experiments. Duncan's new multiple range test was used to determine differences in treatment means. Correlation analyses were also performed when applicable.
Results
Growth
Weight gain was significantly affected (P <0.01) by the protein level but not by the PIE ratio nor by the interaction of both factors. Duncan's multiple range test revealed that the significance was brought about mainly by differences between fish fed the 25% protein diets and those fed

58
the 40% protein diet with a PIE ratio of 111 mg/kcal and between fish fed the 25% protein diets with PIE ratios of 111 and 100 mg/kcal and those fed the 35% protein diet with a PIE ratio of 111 mg/kcal (Table 2). Significant differences likewise existed between the weight gain of fish fed a 30% protein diet and that of fish fed a 40% protein diet, both diets with 111 mg/kcal PIE ratio. Weight gains of fish fed the 30% protein diet with a PIE ratio of 100 mg/kcal and fish fed the 25% protein diet with a PIE ratio of 111 mg/kcal were significantly different (P <0.05). Results indicate that the 25% dietary protein level with PIE ratios ranging from 111 to 80 mg/kcal was deficient for growth.
Weight gain of fish fed the 25% protein level increased, although not significantly, as the PIE ratio decreased from 111 to 80 mg/kcal (or digestible dietary energy increased from 225 to 312 kcal/100 g) while the weight gain of fish fed the 30% protein diet increased as the PIE ratio decreased from 111 to 100 mg/kcal (digestible energy increased from 270 to 300 kcaVlOO g) (Table 2). At the 35 and 40% protein levels, weight gain decreased with decreasing PIE ratio. Among the 35 and 40% protein diets, those with a PIE ratio of 111 mg protein/kcal gave the best growth performance (Table 2). Regardless of PIE ratio, there was a significant increase in weight gain as the dietary protein increased from 25 to 35 or 40% (Table 3).
Table 2. Mean weight gain, protein efficiency ratio (PER), feed conversioo. ratio (FCR), feed consumption and survival of red tilapia fry fed diets with varying protein levels and protein to energy (PIE) ratios for 8 weeks.•
Feed Protein PIE DE Weight consumption level ratio (kcal/ gain (g/100 g Survival (%) (mg/kcal) 100 g) (g) PER•• FCR••• fish/day) (%)
25 Ill 225 3.8oid 1.35ab 3_03N.S. !95N.S. 73N.S.
25 100 250 4.25lcd 1.39ab 2.90 20.2 68 25 80 312 4.897bcd l.508 2.69 19.9 78 30 Ill 270 5.Iwbcd 1.24ab 2.87 20.2 55 30 100 300 6.l8labc 1.31ab 2.72 19.9 74 30 80 375 5.924abcd 1.45ab 2.32 20.5 63 35 l ll 315 6.642ab 1.15ab 2.50 20.2 70 35 100 350 5.954abcd 1.33ab 2.21 20.l 12 35 80 437 5.512abcd 1.03ab 2.71 20.4 65 40 l ll 3(J() 7.457a 1.03ab 2.50 20.7 58 40 100 400 5.78labcd 1.02b 2.50 20.l 78 40 80 500 5.264abcd 1.13ab 2.25 20.4 68
*Mean initial body weight was O. l(J() ± 0.035 g. Column means with a common superscript are not significanty different (P >0.05); N.S. means not significanL
weight gain (g) feed consumed (g) ••PER = •••FCR
protein consumed (g) weight gain (g)
Protein efficiency ratio (PER) was significantly influenced by the dietary protein level (P <0.03) but not by the PIE ratio nor the interaction of both. However, at each protein level, PER generally increased as rhe PIE ratio decreased. Regardless of PIE ratio, PER was significantly high at the 25% protein level, decreasing as the dietary protein increased (Table 3).
The food conversion ratios (FCRs) were not significantly different (P >0.05) among treatments but were consistently poor for fish fed the 25% protein diets (Table 2 ). This further suggests that, within the PIE ratios tested, diets for red tilapia fry should contain a protein level higher than 25%. Survival rates did not differ significantly (P >0.05) among the dietary treatments.

Table 3. A sununary of the mean weight gain, feed conswnption, suivival rate, PER and FCR of red tilapia fry fed varying protein levels.•
Feed Protein Weight consumption level gain (g/100 g SU1Vival (%) (g) fish/day) (%) PER FCR
25 4.32b 19,9a 73a l.42a 2.s1a 30 5.74ab 20.2a 65a 1.33ab 2.64a 35 6.048 20.2a 69a J.J70C 2.47a 40 6.17a 20.4a 688 J.()6C 2.4la
•Column means with a common superscript are not significantly different (P >0.0 I for weight gain and PER; P >0.05 for all others).
59
The estimated daily feed consumption did not differ significantly (P >0.05) among fish fed the different protein levels and PIE ratios (Tables 2 and 3). This is rather unexpected because fish given the low-energy diets were supposed to voluntarily consume more feed than those given the high-energy diets.
Body composition
Results of the proximate analysis of fish carcass are presented in Table 4. Carcass moisture content (%) was significantly affected (P <0.003) only by the PIE ratio. On the other hand, carcass lipid content (%) on a dry matter basis was significantly affected (P <0.001) by both dietary protein level and PIE ratio. Neither factor significantly affected (P >0.05) carcass ash content(%) which tended to decrease with increasing dietary protein at each PIE ratio and with decreasing PIE ratio at each protein level. Body protein content was significantly influenced (P <0.0001) by the PIE ratio of the diet.
Table 4. Body composition of the red ti.lapia fry after 8 weeks of feeding diets with varying protein levels and protein to
energy ratios.•
Protein PIE DE Dry matter basis(%) level ratio (kcal/ Moisture (%) (mg/kcal) 100 g) (%) Lipid Ash Protein
25 Ill 225 73.3a 21.1f 13.2N.S. 4g,5ab
25 100 250 72.5abc 29,9def 12.5 4g,9ab
25 80 312 69.9abc 33.6cd 11.6 43.sd 30 Ill 270 72.8ab 29.lef 11.9 49.48
30 100 300 71.7abc 31.1dcf 11.5 46.oc 30 80 375 10.2abc 36.4bc 10.6 40.6e 35 Ill 315 11.9abc 30.6def 11.6 49.4a 35 100 350 71.1 abc 31.3def 11.4 48.4b 35 80 437 69.JC 33.4Cd 10.6 44.7d
40 III 360 71.1abc 33.ocde 11.9 45.9c 40 100 400 69.8abc 37.sb 11.2 44.4d 40 80 500 69.oc 42.8a 11.2 46.oc
•Column means with a common superscript arc not significantly different (P >-0.05); N.S. means not significantly different. Initial body composition at stocking: moisture content, 83.2%; crude protein, lipid (ether extract), and ash contents on dry matter basis were 62.2, 9.1. and 12.6 %, respectively.
Moisture content of red tilapia was inversely related to the the lipid content (r = -0.66), but was directly related to the body ash and protein contents (r = 0.53 and 0.58, respectively). Body lipid was inversely related to body moisture (r = -0.66), ash (r = -0.46), and protein (r = -0.54) contents. Ash and protein contents were directly related (r = 0.48).

60
Discu~ion
The importance of protein level in relation to the energy level of the diets for red tilapia fry is evident in the present study as was found earlier for several other fish species (Garling and Wilson 1976; Murai et al. 1985; Lovell 1989). The red tilapia fry grew best on a 40% protein diet with a PIE ratio of 111 mg/kcal. However, a lower but not significantly different growth was attained with diets containing 35% protein with a PIE ratio of 111 mg/kcal and 30% protein with a PIE ratio of 100 mg/kcal. It appears that within a certain range of dietary protein concentrations favorable to red tilapia fry, the best PIE ratio remains the same but it becomes lower at a marginal protein level. PIE ratios lower than the optimum led to slower growth in young T. aurea (= 0. aureus), but growth reduction on the diets was not as marked as that on diets with excessive PIE ratios (Winfree and Stickney 1981). Such a trend is true for red tilapia fry fed the 30% protein diets.
Chen and Lee ( 1985) earlier found that practical diets with 270 kcal/I 00 g regardless of protein level and 25% protein diets with PIE ratios ranging from 94 to 72 mg/kcal gave low growth in young red tilapia (about 4 g initial weight). Similar results were obtained for red tilapia fry fed the three 25% protein diets and the 30% protein diet with a PIE ratio of 111 mg/kcal (DE= 270 kcal/100 g). The increasing mean body weight of red tilapia fry as a response to decreasing PIE ratio (or increasing level of DE) at the 25% protein level and, to a lesser extent, at the 30% protein level is similar to that reported for 0. aureus fed isonitrogenous diets (32% protein) with increasing energy levels (260-342 kcal/100 g) (Lee and Chen 1984). However, extremely high dietary energy (i.e., low PIE ratio) caused growth depression, particularly in fish fed the high protein diets (35 and 40% ), as was reported for other fish species (Fineman-Kalio and Camacho 1987; Daniels and Robinson 1986; Prather and Lovell 1973). In the 35 and 40% protein diets that produced high growth response, 50% of the total DE was in the form of protein. This is close to the values estimated by Tacon and Cowey (1985) for 0. mossambicus (55%), 0. niloticus (48%) and Tilapia zillii (51 %) (Jauncey 1982; Santiago et al. 1982; Mazid et al. 1979).
Similar to the results on red tilapia fry, a trend of decreasing PER with increasing dietary protein was observed in red tilapia fingerlings (Chen and Lee 1985) and several other tilapia species (Teshima et al. 1978, 1985; Mazid et al. 1979; Jauncey 1982; Wang et al. 1985; Siddiqui et al. 1988; De Silva et al. 1989; Shiau and Huang 1989). The same trend was also reported for various other fish species (Ogino and Saito 1970; Kanazawa et al. 1980; Millikin 1982; Henken et al. 1986; Paparaskeva-Papoutsoglou and Alexis 1986; Wee and Ngamsnae 1987). Such a response has not been fully explained but it may indicate some compensatory mechanism to increase efficiency at insufficient protein levels (Berger and Halver 1987).
Dietary protein did not affect the body moisture and ash contents of red tilapia fry and several other fish species (Berger and Halver 1987; Daniels and Robinson 1986; Millikin 1982; Page and Andrews 1973). Moreover, dietary protein level did not affect the body protein, expressed as % of dl)' matter, as was reported for the Yamato carp fingerlings (Murai et al. 1985). Body protein content of carp was almost constant regardless of dietary protein levels (22-41 %), dietary lipid (5 and 15%), carbohydrate (5-50%) and DE (Takeuchi et al. 1979). Carcass lipid content (%) of red tilapia fry increased with the increase of dietary protein level because dietary lipid and, consequently, dietary energy increased with protein level to maintain the desired PIE ratios. In carp, carcass lipid level increased with the increase of dietary lipid and decrease of dietary protein (Murai et al. 1985). The gross body composition of a hybrid tilapia

61
(0. niloticus x 0. aureus) was not greatly affected by dietary protein levels greater than 24% (Shiau and Huang 1989).
Carcass protein content of T. aurea was not clearly affected by the dietary PIE ratios (Winfree and Stickney 1981). In contrast, carcass protein content (%)of red tilapia fry decreased significantly (P <0.0001) with decreasing PIE ratio. However, in both red tilapia and T. aurea, carcass lipid and PIE ratio were inversely related.
An inverse relation between carcass moistun and lipid contents was observed in red tilapia fry as was reported for other fish species (Garling and Wilson 1976; Winfree and Stickney 1981; Jauncey 1982; Lee and Chen 1984; Z.eitler et al. 1984; Murai et al. 1985; Wee and Ngamsnae 1987; Siddiqui et at. 1988). The trends of changes in body composition as a response to dietary treatments were not always the same among various fish species. The differences may be due to differences in diet composition and objective(s) of the studies.
Acknowledgements
We thank the International Development Research Centre (IDRC) of Canada for partially funding the study. We also thank Dr. Sena S. De Silva, IDRC coordinator for the Asian Fish Nutrition Network, for his encouragement and support.
References
Berger, A. J.E. Halver. 1987. Effect of dietary protein, lipid and caibohydrate content on the growth, feed efficiency and carcass composition of striped bass, Morone sax.atilis (Walbaum) fingerlings. AquaculL Fish. Manage. 18: 345-356.
Chen, J.C. and K.-K. Lee. 1985. Effects of dietary protein and energy levels on growth and body composition of red tilapia (Oreochromis sp.), p. 337-380. In R. Day and T.L Richards (eds.) The Proceedings of the International Warm Water Aquaculture Conference 1985 (Finfish).
Cismeros-Moreno, I.A. 1981. Informe preliminar sobre los requerimientos de proteina cruda en alevines de tilapia roja. Rev. Latinoam. Acuicult. 7: 18-21. (English abstract).
Cruz, E . .M. and l.L. Laudencia. 1977. Protein requirements of Tilapia mossambica fingerlings. Kalikasan, Philipp. J. Biol. 6: 177-182. Daniels, W.H. and E.H. Robinson. 1986. Protein and energy requirements of juvenile red drum (Sciaenops ocellatus). Aquaculture 53: 243-252. Davis, A.T. and R.R. Stickney. 1978. Growth responses of Tilapia aurea to dietary protein quality and quantity. Trans. Am. Fish. Soc., 107: 479-
483. De SHva, S.S. and M.K. Perera. 1985. Effects of dietary protein level on growth, food conversion, and protein use in young Tilapia nilotica at
four salinities. Trans. Am. Fish. Soc., 114: 584-589. De Silva, S.S., Gunasekera, R.M. and D. Atapanu. 1989. The dietary protein requirements of young tilapia and an evaluation of the least cost
dietary protein levels. Aquaculture 80: 271-284. Fineman-Kalio, A.S. and A.S. Camacho. 1987. The effects of supplemental feeds containing different protein:energy ratios on the growth and
survival of Oreochromis niloticus (L.) in brackish water ponds. Aquacult. Fish. Manage. 18: 139-149. Ga~ling, D.L Jr. and R.P. Wilson. 1976. Optimum dietary protein to energy ratio for channel catfish fingerlings, lctalurus p1111ctatus. J. Nutr. 106:
1368-137'5. Henken, A.M., M.A.M. Machiels, W. Decker and H. Hogendoom. 1986. The effect of dietary protein and energy content on growth rate and feed
utilization of the African catfish Clarias gariepinus (Burchell 1822). Aquaculture 58: 55-74. Hepher, B., J.C. Liao, S.H. Cheng and C.S. Hsieh. 1983. Food utilization by red tilapia - effects of diet composition, feeding level and
temperature on utilization efficiencies for maintenance and growth. Aquaculture 32: 255-275. Jauncey, K. 1982. The effects of varying dietary protein level on the growth, foosl conversion, protein utilization and body composition of
juvenile tilapias (Sarotherodon mossambicus). Aquaculture 27: 43-54. Kamarudin, M.S., Z.A. Aizam and M.N. Muhamad. 1988. Effects of varying dietary lipid levels on growth, survi"val and feed conversion
efficiency of red tilapia fry, p. 251-255. In Proc. 12th Ann. Conf. Malaysian Soc. Anim. Production. Kanazawa, A., S. Teshirna, M. Sakamoto and A. Shinomiya. 1980. Nutritional requirements of the puffer fish: purified test diet and the optimum
protein level. Bull. Japan. Soc. Sci. Fish. 46(11): 1357-1361. Kubaryk, J.M. 1980. Effects of diet, feeding schedule and sex on food cormnnption, growth and retention of protein and energy by tilapia.
Auburn University, Alabama. Ph.D. Dissertation. Kuo, C.-M. 1984. lbe development oftilapia culture in Taiwan. ICLARM Newsletter. 7(1): 12-14. Lee, K.-K. and J.-C. Oien. 1984. Effects of dietary energy with iso--protein level on growth and body composition of tilapia. J. Fish. Soc. Taiwan
I !(I): 27-36. Liao, 1.-C. and S.-L Chang. 1983. Studies on the feasibility of red tilapia culture in saline water, p. 524-533. In L. Fishelson and Z. Yaron
(compilers) International Symposium on Tilapia in Aquaculture (!st Proq:edings, Nazareth, Israel) Tel Aviv University, Israel.

62
Lovell, R.T. 1975. Laboratory manual for fish feed analysis and fish nutrition studies. International Center for Aquaculture, Auburn University, Alabama. 62 p.
Lovell, T. 1989. Nutrition and feeding of fish. Van Nostrand Reinhold, New York. 260 p. Mazid, M.A., Y. Tanaka, T. Katayama, M.A. Rahman, K.L Simpson and C.O. Chichester. 1979. Growth response of Tilapia zillii fingerlings fed
isocaloric diets wilh variable protein levels. Aquaculture 18: 115-122. Millikin, M.R. 1982. Effects of dietary protein concentration on growth, feed efficiency and body composition of age-0 striped bass. Trans. Am.
Fish. Soc. 111: 373-378. Murai, T., T. Akiyama, T. Takeuchi, T. Watanabe and T. Nose. 1985. Effects of dietary protein and lipid levels on performance and carcass
composition of fingerling carp. Bull. Japan. Soc. Sci. Fish. 51: 605-608. NRC. 1983. Nutrient requirements of warmwater fishes and shellfishes. National Research Council. National Academy Press, Washington, DC.
10'2 p. Ogino, C. and K. Saito. 1970. Protein nutrition. I. The utilization of dietary protein by young carp. Bull. Japan. Soc. Sci. Fish. 36: 250-254.
(English translation by Lydia A. Hutchison. Universities' Translation Service, San Diego, California). Page, J.W. and J.W. Andrews. 1973. Interactions of dietary levels of protein and energy on channel catfish (lctalurus punctatus). J. Nutr. 103:
1339-1346. Paparaskeva-Papoutsoglou, E. and Alexis, M.N. 1986. Protein requirements of young grey mullet, Mug ii capilo. Aquaculture 52: l 05-115. Prather, E.E. and R.T. Lovell. 1973. Response of intensively-fed catfish to diets containing various protein-to-energy ratios. Proc. 27th Ann.
Conf. Soulheast Assoc. Game Fish. Comm. 27: 455-459. Pullin, R.S.V., editor. 1988. Tilapia genetic resources for aquaculture. ICLARM Conf. Proc. 16, 108 p. International Center for Living Aquatic
Resources Management, Manila. Philippines. Santiago, C.B. and R.T. Lovell. 1988. Amino acid requirements for growth of Nile tilapia. J. Nutr. 118: 1540-1546. Santiago, C.B., M.B. Aldaba and M.A. Laron 1982. Dietary crude protein requirement of Tilapia nilotica fry. Kalikasan, Philipp. J. Biol. 11(2 &
3): 61-71. s:,;au, S.-Y. and S.-L. Huang. 1989. Optimal dietary protein for hybrid tilapia (Oreochromis niloticus x 0. aureus) reared in seawater.
Aquaculture 81: 119-127. Siddiqui, A.Q., M.S. Howlander and A.A. Adam. 1988. Effects of dietary protein levels on growth, feed conversion and protein utilization in fry
and young Nile tilapia, Oreochromis niloticus. Aquaculture 70: 63-73. Siraj, S.S., Z. Kamaruddin, M.K.A. Sater and M.S. Kamarudin. 1988. Effects of feeding frequency on growth, food conversion and survival of
red tilapia (Oreochromis mossambicus/0. niloticus) hybrid fry, p. 383-386. In R.S.V. Pullin, T. Bhukaswan, K. Tongulhai and J.L. Maclean (eds.) The Second International Symposium on Tilapia in Aquaculture. ICLARM Conf. Proc. 15, 623 p. Deparunent of Fisheries, Bangkok, Thailand, and International Center for Living Aquatic Resources Management, Manila, Philippines.
Tacon, A.G.J. and C.B. Cowey. 1985. Protein and amino acid requirements, p. 155-183. In P .. Tytler and P. Calow (eds.) Fish energetics: new perspectives. Croom Helm Ltd., London.
Takeuchi, T., T. Watanabe and C. Ogino. 1979. Optimum ratio of dietary energy to protein for carp. Bull. Japan. Soc. Sci. Fish. 45: 983-987. Teshima, S.-I., A. Kanazawa and Y. Uchiyama. 1985. Optimum protein levels in casein-gelatin diets for Tilapia nilotica fingerlings. Mem. Fae.
Fish., Kagoshima Univ. 34(1): 45-52. Teshima, S., G.M. Ojeda Gonzalez and A. Kanazawa. 1978. Nutritional requirements of tilapia: utilization of dietary protein by Tilapia zillii.
Mem. Fae. Fish., Kagoshima Univ. 27(1): 49-57. Wang, K.-W., T. Takeuchi and T. Watanabe. 1985a. Effect of dietary protein levels on growth of Ti/apia nilotica. Bull. Japan. Soc. Sci. Fish. 51:
133-140. Wee, K.L. and P. Ngamsnae. 1987. Dietary protein requirement of fingerlings of !he herbivorous carp tawes, Puntius gonionotus (Bleeker).
Aquacult. Fish. Manage. 18: 121-129. Winfree, R.A. and R.R. Stickney. 1981. Effects of dietary protein and energy on growlh, feed conversion efficiency and body composition of T.
aurea. J. Nutr. 111: 1001-1012. Zeitler, M.H., M. Kirchgessner and F.J. Schwarz. 1984. Effect of different protein and energy supplies on carcass composition of carp (Cyprinus
carpio L.). Aquaculture 36: 37-48.

A Preliminary Study on Protein Requirement of Juvenile Black Sea Bream (Sparus macrocephalus)
XUXUELIANG JIWENJUAN
LI YAN GAO CHUNREN
Yellow Sea Fisheries Research Institute Qingdao
China
XU, X., W. TI, Y. LI and C. GAO. 1991. A preliminary study on protein requirement of juvenile black sea bream (Sparus macrocephalus), p. 63-67. In S.S. De Silva (ed.) Fish nutrition research in Asia. Proceedings of the Fourth Asian Fish Nutrition Workshop. Asian Fish. Soc. Spec. Pub!. 5, 205 p. Asian Fisheries Society, Manila, Philippines.
Abstract
Juvenile black sea bream were fed semi-purified diets containing five levels of dietary protein, 25, 30, 40, 45 and 50% for 8 weeks. Juveniles fed diets containing 40-50% dietary protein showed beuer growth and feed conversion than thosto fed diets containing 25-30% dietary protein (P <0.05). Fish fed diets with 40-50% dietary protein also had higher body protein content.
The results showed that the dietary protein level of 45% gives maximum growth, and the cost effective protein level was 40%.
Introduction
Protein requirement study is one of the most important aspects in fish nutrition. Protein as a major fish feed component not only provides fish with essential amino acids, but is also used for tissue repair and growth.
In recent years, a number of studies have been performed (Halver et al. 1964; Cowey 1975; Garling and Wilson 1976; Mazid et al. 1979; De Silva et al. 1986; De Silva et al. 1989) to determine the optimal dietary protein level in fish. It is, however, important not to assume that findings for one species are directly applicable for feed formulations for others. Though some work has been done on the protein requirement of red sea bream (Yone 1976), there is a paucity of information on protein requirement of black sea bream juvenile, Sparus macrocephalus.
Black sea bream is becoming increasingly important as a cultured marine species due to its high economic value, particularly in East China Sea and the Yellow Sea coast.
The purpose of the present study was to define the dietary protein requirement of black sea bream juvenile and provide basic information for formulating practical diets for culture of this species around the China coast.
63

64
Materials and Methods
Black sea bream juveniles were obtained from Jiao Nan fish hatchery station at Jiao Nan county. Upon arrival in the wet laboratory, they were acclimated for two weeks in 600-1 cylindrical fiberglass tanks with flow through water. Following acclimation, 10 groups of 30 fish per group (mean weight 4.3-4.4 g) were randomly selected and placed in 60-1 cylindrical fiberglass tanks. The rate of flow was about 0.8 l/min. There were two replicates for each dietary treatment. Each of the five experimental diets was fed 4 times daily, 7 days per week, for 8 weeks. Each group received an equivalent to 4% of total body weight per day. T1le total weight of each experimental group was determined at 2-week intervals. Growth rate and feed conversion rate were calculated and corrected for mortality.
Five experimental diets were formulated and prepared identically to contain 25, 30, 40, 45 and 50% protein (Tables 1 and 2). All diets were maintained approximately isocaloric by adjusting the dextrin component in relation to the protein component and by keeping the amount of fat fractions identical. The diets were prepared by mixing thoroughly the dry ingredients with oil, water and passing through a laboratory grinder with a die. The diets were dried at room temperature (26-27°C) for 4 hours and then broken into smaller particles by hand, and stored at -20°C.
At the end of the experiment the remaining fish from each tank were pooled for body protein analyses. The protein content of fish was determined by using a Kjeltec 1026 analyzer according to AOAC (1970) methods and the data were expressed on a dry weight basis. Statistical significance of the experimental data for growth and feed conversion was based on Duncan's new multiple range test (Steel and Torrie 1960).
Table I. Ingredient composition of diets.
Ingredient 2 3 4 5 (%)
Fishmeal 30 40 54 60 67 Dextrin 55 47 36 32 26 Fish oil 9 7 5 4 3.5 Vitamin mixture• 2 2 2 2 2 Mineral mixture•• 4.0 3.5 2.5 l.6 l.O Cellulose and binder 3 3 3 3 3
*Vitamins in mg/kg of diet (except as noted): tocopherol, 2,160 IU; menadione 60; Dcalcium pantothenate 240; pyridoxine HO 60; D-biotin 6; folic acid 60; inositol 600; riboflavin 120; (choline chloride 6 g and L-ascorbic acid 4 g were added separately.
••Minerals in mg/lg of diet (except as noted): MnSO, 7H20; ZnSO, 81.6; CuS04·5H20 7.5; FeS04, 7H20 60; Na2SeO, 0.03; CoCI 6H20 0.06; NaMo04·2H20 0.9.
Table 2. Proximate composition of diets.
Proximate composition 2 3 4 5 (%dry weight)
Protein 24.2 30.9 39.3 45.1 51.3 Fat 10 10 10 10 10 Ash 7.9 8.3 8.7 8.6 8.7 Caloric content• 3.7 3.7 3.7 3.7 3.7
*Caloric content determined as the maximum metabolizable energy assuming full digestibility (kcal/g).

65
Results
Growth
Growth rate of black sea bream juveniles increased as dietary protein increased up to 40% of the diet (Table 3, Fig. 1). Results showed that the requirement for protein appeared to be 40-50% of the diet. Body weight gains were significantly higher in fish on diets containing 40-50% protein (P <0.05). There were no significant differences in weight gain between the diets containing 25% and 30% of dietary protein. Similarly, differences in growth response occurred very early in the experiment (Fig. 2). A linear increase in growth rate was observed with increasing dietary protein intake up to a breakpoint corresponding to the requirement of dietary protein, where growth rate leveled off.
Table 3. Effect of dietary protein levels on weight gain (g), food coovenion rate (FCR) and body protein cootent of black sea bream juveniles.
Average Average % Carcass Diet initial weight (g) final weight (g) increase FCR protein%
1 4.3±0.51 11.38±0.85 164.658::!:5.22 2888±0.18a 50.8 2 4.4±0.14 1297±0.33 l 94.778±4.82a 2.268±0.03a 53.8 3 4.4±0.10 14.90±0.71 246.5lht4.82b 1.4ShiQ.01 b 56.9 4 4.4±0.14 15.75±0.14 257.95ht4.88b 1.39b±0.1 ob 55.9 5 4.4±0.10 15.57±1.08 253.86hts.92b 1.59hiQ_ 13b 55.4
Each value in the body of table is the mean of two replicates, values with the same supencript in a colunm are not significantly different (P>0.05).
15
Ci 12 --c ·a; a -.c 9 Cl ·a; :i:: >-
"O 0
6 .c CD
Protein(%)
• 50% Cl CD ... D 45% CD > A 40%
<C 3 0 30%
• 25%
I I I I I .. 0 1.____,~___._~_._~_.__~.._~.__~~---'----
0 2 3 4 5 6 7 8
Weeks
Fig. 1. Growth curve of black sea bream juveniles fed diets containing various levels of protein.

66
Feed conversion rate
The most efficient feed per gain ratios of 1.45-1.39 were obtained with diets containing 40-45% dietary protein (Table 3). Feed conversion data tended to show similar effects as dietary protein concentration did on growth.
The body protein content was altered by the dietary protein level. There was a general increase in the percentage of protein in the fish carcass in relation to the amount of protein in the diet (Table 3), and was apparently higher for diet 3 and decreased with other diets.
Discussion
The dietary protein requirement of cultured fish species have been investigated (Takeuchi et al. 1979; Garling and Wilson 1976; Dabrowski et al. 1977; Lim et al. 1979; Yone 1976; Jauncey 1982; De Silva et al. 1985, 1989) and these studies have shown that dietary protein requirement for fish varied from species to species due to feeding habit, size, water temperature and so on. The present study showed that the best growth performance of black sea bream juvenile was obtained at dietary protein levels of 40-50%, which correspond closely to those results from a similar study done by Xu Xenling et al. (unpublished data).
It is evident that all diets used in the present study were approximately isocaloric, and contained the same basic ingredients. Furthermore, since the amount fed in each treatment was the same, differences in the rate of growth would largely result from differences in dietary protein intake.
In Fig. 2, a linear increase in growth rate was observed with increasing protein intake up to a breakpoint. This result was consistent with the findings of De Silva et al. (1989) on tilapia. They pointed out that beyond a particular dietary protein level, the increase in growth rate is lesser relative to a unit increase in dietary protein level until the point of maximum growth is achieved.
- 12 C) -c (U I I C) -.c 10 C)
·o:; == 9 >-
'tJ 0
8 .c G> C) (U 7 ... G> > ct 6 I I I I I ..
25 30 40 45 50
Dietary protein
Fig. 2. Effects of various levels of protein m growth of black sea bream.

67
Food utilization, expressed as FCR, is known to be affected by a number of factors. In the present study, FCR was negatively, linearly, correlated to the dietary protein content (fable 3) since FCR at 40-45% of dietary protein was comparable to or even superior to that obtained with the 50% dietary protein.
Phillips (1969) showed that N-retention is influenced by the sparing action of carbohydrate and lipid on the utilization of protein as an energy source. Table 3 showed that N-retention at the 40-45% of dietary protein was comparable to or oven superior to that obtained with 50% dietary protein. This result might indicate that protein-energy ratio at these protein levels was well balanced.
Based on results of this study, it can be suggested that the optimum dietary protein level for black sea bream juvenile is 45% whereas the most cost effective protein level is 40%.
References
AOAC. 1970. Official methods of analysis of the Association of Official Analytical Otemists. AOAC, Washmgton, OC. 1015 p. Cowey, C.B. 1975. Aspects of protein utilization by fish. Proc. Nutri. Soc. 34: 57-63. Dabrowski, K. 1977. Protein requirements of grass carp fry (Ctenopharyngodon idella). Aquaatlture 10: 63-73. De Silva, S.S. and W.M.K. Perera. 1985. Effects of dietary protein level on growth, feed conversion and protein use in young Tilapia nilotica at
four salinities. Trans. Am. Fish. Soc. 114: 584-589. De Silva, S., S. Rasanthi, M. G1D1asekera and D. Atapattu. 1989. The dietary protein requirements of young tilapia and an evaluation of the least
cost dietary protein levels. Aquaculture 80: 271-284. Garling, D.L, Jr. and R.P. Wilson. 1976. Optimum dietary protein to energy ratio for ch8JU1el catfish fmgerlings, lctalurus punctalus. J. Nutr.
106: 1368-1375. Halver, J.E., LS. Bates and E.T. Menz. 1964. Protein requirements for sockeye salmon and rainbow trout. American Societies for Experimental
Biology. Federation Proceedings, Vol. 23, p. 1778. Ja1D1cey, K. 1982. The effects of varying dietary procein level on the growth, food conversion, protein utilization and body composition of
juvC'llile tilapia (Sarotherodo11 mouambU:ws). Aquaculture 1:1: 42-54. Llrn, C., S. Sukhawonga and F.P. Pascual. 1979. A preliminary study on the protein requirements of Challos cha1t0s. (Forsskal) fry in a controlled
environrnenL Aquaculture 17: 195-201. Mazid, M.A., Y. Tanaka, T. Katayama, M.A. Rahman, K.L Simposon and C.0. Chichester. 1979. Growth response of tilapia fmgerlings fed
isocaloric diets with variable protein levels. Aquaculture 18: 115-122. Phillips, A.M., Jr. 1969. Nutrition digestion and energy utilization, p. 391-432. In W.S. Hoar and DJ. Randall (eds.) Fish physiology, Vol. I.
Academic Press Inc., New York. Steel, R.G.D. and J.H. Torrie. 1960. Principles and procedures of statistics. McGraw-Hill, New York. Takeuchi, T., T. Watanabe and C. Ogino. 1979. Availability of carbohydrate and lipid as dietary energy sources for carp. Bull. Japan. Soc. Sci.
Fish. 45: 977-982. Yone, Y. 1976. Nutritional studies of red sea bream, p. 29-64. In K.S. Price, W.N. Shaw and K.S. Danberg (eds.) Proceedings of the First
International Conference on Aquaculture Nutrition. Lewes/Rehoboth, University of Delaware.


Optimum Dietary Protein to Energy Ratio for Labeo rohita Finger lings
K.M. DAS S.N. MOHANTY
S.SARKAR Central Institute of Freshwater Aquaculture
Kausalyaganga, Bhubaneswar 751 002 India
DAS, KM., S.N. MOHANTY and S. SARKAR. 1991. Optimum dietary protein to energy ratio for Labeo rohita fingerlings, p. 69-73. /n S.S. De Silva (ed.) Fish nutrition research in Asia. Proceedings of the Fourth Asian Fish Nutrition Workshop. Asian Fish. Soc. Spec. Puhl. 5, 205 p. Asian Fisheries Society, Manila, Philippines.
Abstract
Twelve purified diets were formulated and fed to Labeo rohila fingerlings for a period of 56 days. Four crude protein levels, 34, 38, 42 and 46% and three different energy levels, 250, 325 and 400 kcal/100 g at each protein level were utilized. The protein, lipid and digestible carbohydrate sources were casein-gelatin, cod liver-sunflower oil and dextrin, respectively.
Based on growth performance and nutrient retention efficiencies (food conversion ratio, protein efficiency ratio and protein retention effo:iency), the diet containing 38% protein and 400 kcal/100 g energy with a protein to energy ratio of 95 mg protein/kcal appeared to be the best utilized at a water temperature of 22.8 to 30.6°C.
Introduction
Indian major carps are efficient converters of food to flesh, with food conversion ratio varying in the range of 2.0-2.5 depending on the type and composition of food. But the cost of fish production becomes high due to their higher dietary protein requirements in the diet. Under conditions where energy intake is inadequate, dietary proteins are used as an energy source and the production cost increases. Cowey (1978) observed that unless sufficient dietary energy is provided, the quality and quantity of dietary protein cannot reflect protein synthesis. Excess dietary protein is wasteful and stresses the animal while excess energy means more fatty fish. Thus optimum protein to energy (PIE) ratio in diet is very important to maintain fish quality and to reduce the dietary cost.
Information on protein-energy relationship in Indian major carp is not known. The purpose of the present investigation was to determine the optimum PIE ratio for fingerlings of Labeo rohita, an Indian major carp.
69

70
Materials and Methods
Twelve purified diets (diet nos. 1 to 12) containing four crude protein levels, 34, 38, 42 and 46 and three different energy levels, 250, 325 and 400 kcaVl 00 g at each protein level were compounded (Table 1 ). Just before use the feed was weighed and mixed with a few drops of lukewarm water to make a dough and then placed in a petridish at the bottom of the experimental containers. Proximate analyses of ingredients and formulated diets were done using standard methods.(AOAC 1975). Energy values of diets were determined by Parr 1341 plain oxygen bomb calorimeter.
Table l.
PIE Ingredients (%) Crude F.nergy ratio
Diet protein (kcal/ (mg Cod liver Sunflower no. (%) lOOg) (PJ'kcal E) Casein Gelatin oil oil Dextrin Cellulose CMC Vitamin Mineral
1 34.1 242 140.9 40 10 3 2 12.25 24.75 2 3 3 2 34.0 310 109.7 40 10 3 7 20.0 12.0 2 3 3 3 33.8 388 87.l 40 10 3 12 27.0 2 3 3 4 38.2 246 155.3 44 11 3 2 8.5 23.5 2 3 3 5 37.9 320 118.4 44 11 3 7 16.0 11.0 2 3 3 6 38.1 402 94.8 44 11 3 12 22.0 2 3 3 7 42.3 255 165.9 48 12 3 2 4.5 22.5 2 3 3 8 42.8 328 130.5 48 12 3 7 12.0 10.0 2 3 3 9 42.5 395 107.6 48 12 3 12 17.0 2 3 3
10 45.5 240 189.6 52 13 3 2 6.75 15.25 2 3 3 11 45.6 316 144.3 52 13 3 7 8.0 9.0 2 3 3 12 45.6 394 115.7 52 13 3 12 12.0 2 3 3
Induced-bred stock of La.beo rohita fingerlings of average weight 4.12 g was used for the experiment.
The experiment was conducted at room temperature under natural photoperiod for 56 days in June-July 1989. Ten acclimated fingerlings were randomly distributed in 36 10-1 capacity plastic containers containing 8 1 of stored tube well water. Each treatment had three replicates. The ambient water temperature varied from 22.8 to 30.8°C (average 28.2°C) and oxygen level from 6.5 to 7 .5 ppm. The fish were fed twice a day at 1000 and 1630 hours at 2% of body weight per day. Supplementary aeration was provided through airstones using a compressor. The unconsumed food was collected twice daily 3 hours after feeding so as to determine the feed intake. The containers were cleaned and water changed with fresh water daily. The quantum of feed was adjusted following weekly sampling.
The specific growth rate (SGR), food conversion ratio (FCR), protein efficiency ratio (PER), protein retention efficiency (PRE) and energy retention efficiency (ERE) were worked out by using the following formulae:
SGR FCR PER PRE
ERE
100 [(loge final body weight - loge initial body weight)/day]. Total feed intake (dry matter)/total live weight gain. Total live weight gain/total protein intake. [(fotal final body weight x final carcass protein - total initial body weight x initial carcass protein)/total protein intake] 100. [(Total final body weight x final carcass energy - total initial body weight x initial carcass energy)/total energy intake] 100.
Analysis of variance and critical difference were employed for statistical significance.

71
Results
The composition of diets is presented in Table 1. Dietary PIE ratio (mg protein/kcal) was lowest (87.1) at 33.8% protein and 388 kcal energy and it was highest (189.6) at 45.6% protein and 240 kcal energy.
Table 2 indicates growth and nutrient utilization. Out of the twelve experimental diets, diet nos. 5 and 6 showed better growth performance (17.0 g and 18.2 g, respectively) compared to others (P < 0.01). The specific growth rate of fish fed diet nos. 5 and 6 was 0.63 which was significantly higher than that on the other ten diets. However, no significant correlation (r = -0.23 P > 0.05) between PIE ratio and specific growth rate could be established in the present study. It was observed that with the increasing level of dietary energy up to 34% protein level, growth increased and was significantly different at PIE ratios 140.9, 109.7 and 87.1, while diets containing 38, 42 and 46% protein did not demonstrate any significant growth difference of fish at all three energy levels.
Table 2. Performance of L. rohi.Ja fingerlings to the experimental diets.
PIE ratio Weight (g) Diet (mg no. PJkcal E) Initial Final Gain %gain SGR* FCR* PER* PRE* ERE*
1 140.9 48.0 56.4 8.4 17.5 o.21c 6.15C 0.47C 17.45ab l 1.13be 2 109.7 45.4 57.0 11.6 25.55 0.4b 4.8-1.b 0.61 be 14.60b 12.92b 3 87.l 39.8 50.7 10.9 27.39 0.43b 4.4ob o.10b 17.38ab 9.71c 4 155.3 42.9 55.4 12.5 29.14 0.46b 3,39ab 0.77b 17.37ab 13.58b 5 118.4 39.9 56.9 17.0 42.61 0.63a 3.31 ab 0.78b 17.538b 12.ob 6 94.8 43.6 61.8 18.2 41.74 0.63a 2.77a 0.958 20.08 12.34b 7 165.9 43.8 58.9 15.1 34.47 0.53a 3.66ab 0.65be 15.66b 11.04be 8 130.5 38.3 51.3 13.0 33.94 0.52a 3,59ab 0.65be l 1.39c 10.29be 9 107.6 42.5 56.3 13.8 32.47 0.51 8 2.91a o.82b 18.558 16.158
10 189.6 39.1 49.8 10.7 27.37 0.43b 3,97ab 0.56be 10.69c 11.41 be 11 144.3 37.4 48.4 11.0 29.41 0.46b 3.72ab 0.60be l 1.64c 11.lObe 12 115.7 43.l 55.1 12.0 27.84 0.44b 2.96a 0.74b 14.33b 15.87a
•Any two means with a common letter are not significantly different at the 5% level of significance.
The best FCR was observed (2.8) with diet no. 6. From Tables 2 and 3 it appears that high energy diets (400 kcaVlOO g) at 38, 42 and 46% protein levels had always significantly (P < 0.001) better food conversion than with the low energy feeds at same protein levels (Table 2). No correlation (r = 0.20, P > 0.05) between PIE ratio and food conversion ratio could be established.
A negative correlation (r = -0.54, P > 0.05) though non-significant between PIE ratio and PER was observed. Fish fed diet no. 6 demonstrated the highest PER (0.95) which is significantly (P < 0.001) different from the rest.
A negative relationship (r = -0.56, P > 0.05) was observed with between PIE ratio and PRE values. High PRE values were observed with high energy diets at 38, 42 and 46% protein levels. Maximum PRE (20) was observed with diet no. 6.
No significant correlation (r = -0.20, P > 0.05) between PIE ratio and ERE values could be noted. High ERE values (16.15 and 15.87) were recorded with diet nos. 9 and 12, respectively, both being high energy diets at 42 and 46% protein levels.
Discussion
The results of the study indicate better food conversion at protein levels tested up to an energy content of 400 kcaVl 00 g diet while specific growth rate increased with increasing

72
Table3.
Source of Degree of Sumof Mean Probability Parameters variation freedooi squares square Fvalue value
SGR Block 2 0.004 0.002 0.25 P>0.05 Treatment 11 0.310 0.028 3.95 P<0.01 Error 22 0.157 0.007
FCR Block 2 0.181 0.090 0.31 P>0.05 Treatment 11 29.887 2717 9.22 P<0.001 Error 22 6.483 0.295
PER Block 2 0.011 o.oos 0.91 P>0.05 Treatment 11 0.556 O.OSI 8.45 P<O.CXH Error 22 0.132 0.006
PRE Block 2 4.564 2.282 1.06 P>0.05 Treatment 11 305.584 27.780 1290 P<O.CXH Error 22 47.379 2.154
ERE Block 2 1.056 0.528 0.34 P>0.05 Treatment 11 136. 781 12435 8.08 P<O.CXH Error 22 33.853 1.539
energy level at 34 and 38% dietary protein. PER and PRE demonstrated a negative relationship with PIE ratio between protein levels 34 to 46%. [Thus it may be stated that protein in diet is not the only vital factor for fish growth.] Mukhopadhyay et al. (1986) observed a significant increase in weight gain, feed efficiency and protein utilization in C/arias batrachus fed diets containing a PIE ratio of 87.6. Garling and Wilson (1976) demonstrated the optimum PIE ratio for channel catfish to be 88 between protein levels of 24 to 36%. The observations of the present study inferred that a PIE ratio of 95 at 38% protein level is optimum for rohu fingerlings. Diet no. 5 having 38% protein and 320 kcal energy, however, registered the same specific growth rate as that of diet no. 6. Thus it appears that a diet having 38% protein and 320 to 400 kcal energy/100 g may be ideal for rohu fingerlings. Earlier, Sen et al. (1978) and Mohanty et al. (1990) observed that protein requirements of Indian major carp lie between 40 and 45%. As evident from Fig. 1, it is possible to lower the protein level to 38% by increasing the dietary energy to 400 kcal/100 g in carp feed (diet no. 6) without affecting the growth performance. Protein and energy requirements of fish should not be considered in isolation but as dietary PIE ratio only. However, the concept of PIE ratios must be restricted to diets containing adequate levels of protein and energy (Garling and Wilson 1976).
The absence of positive relationship between growth and dietary energy at higher levels of protein ( 42 and 46%) indicates that Labeo rohita cannot efficiently utilize feeds having a higher protein level(> 40%) and at an energy level of 400 kcal/100 g diet. Prather and Lovell (1973) postulated that high levels of protein without sufficient energy in the diet may be harmful to fish. Page and Andrews (1973) observed in channel catfish that bigger fish require more energy and less protein compared to smaller fish. Since in the present study experimental fish had an initial average weight of only 4.12 g, it is expected that it may be possible to further reduce the dietary PIE ratio for growers. In view of cost-effective feed formulation, a balance of protein and energy in the diet is of vital importance in order to reduce the cost of feed since protein is the costliest item in the diet.

73
Fig. 1. Aowshect diagram showing comparative efficiency of different diets (Di -D12) in robu.
SGR
FCR
PER
PRE
ERE
Acknowledgements
The authors are grateful to Dr. S.D. Tripathi, Director, Central Institute of Freshwater Aquaculture, Kausalyaganga for kindly providing the necessary facilities and for his keen interest in this study. The authors are also thankful to Dr. P.K. Mukhopadhyay, Senior Scientist, for critically going through the manuscript and Mr. M. Rout, Scientist (SG) for helping in the statistical analyses of the data.
References
AOAC. 1975. Official methods of analysis. Association of Official Analytical Chemists. 12th ed. Washington, DC. 1094 p. Cowey, C.B. 1978. Protein and amino acid requirements of fmfish. In EIFAC Symp. Finfish Nutr. and Feed Technol., Hamburg, June 1978.
EIFAC{78/Symp. R/6. Garling, D.L. Jr. and R.P. Wilson. 1976. Optimum dietary protein to energy ratio for channel catfish lc1alurus punclalus. J. Nutr. 106: 1368-1375. Mohanty, S.N., D.N. Swamy and S.D. Tripathi. 1990. Growth, nutritional indices and carcass composition of the Indian major carp fry C. calla,
L. rohila and C. mrigala fed four different dietary protein levels. Aquaculture Hungarica 6: 211-217. Mukhopadhyay, P.K., A. Hazra and M.Y. Kamal. 1986. Growth response of Clarias balrachus fed with isonitrogenous diets with variable energy
levels. Proc. Nat. Acad. Sci. India. 56(8), IV: 329-334. Page, J.W. and J.W. Andrews. 1973. Interactions of dietary levels of protein and energy on channel catfish (/cla/urus punclalus). J. Nutr. 103:
1339-1346. Prather, E.E. and R.T. Lovell. 1973. Response of intensively fed channel catfish to diets containing various protein-energy ratios. Proc. Annu.
Conf. Southeastern Assoc. Game Fish. Comm. 27: 455-459. Sen, P.R., N.G.S. Rao, S.R. Ghosh and M. Rout. 1978. Observation on the protein and carbohydrate requirements of carps. Aquaculture 13: 245-
255.


Protein and Fat Digestibility of Five Feed Ingredients by an Indian Major Carp,
Catla catla (Ham.)
M.C. NANDEESHA G.K. SRIKANTH
P. KESHA V ANATH S.K. DAS
University of Agricultural Sciences College of Fisheries Mangalore 575 002
India
NANDEESHA, M.C., G.K. SRIKANTH, P. KESHAVANATH and S.K. DAS. 1991. Protein and fat digestibility of five feed ingredients by an Indian major caip, Cat/a calla {Ham.), p. 75-81. In S.S. De Silva (ed.) Fish nutrition research in Asia. Proceedings of the Fourth Asian Fish Nutrition Workshop. Asian Fish. Soc. Spec. Puhl. 5, 205 p. Asian Fisheries Society, Manila, Philippines.
Abstract
The digestibility of locally available diewy protein wurcie1, namely, Gliricidia maclllata, Colocasia esclllenta, Eichhonaia crassipu, Leuctuna leucocepllala and Ora/osquilla Mpa by the Indian major caip, Cat/a calla was evaluated at 15, 30 and 45% incorporation, using a fish meal-based feed as the referencie dieL Better digestibility of protein and fat was noticed at 15% inclusion, while a declining trend in digestibility wu observed with the higher levels of incorporation. The digestibility of protein from Eichhonaia and Glirici<lia was found to be lower at all levels of inclusion compared fo others.
Introduction
Carp culture in India is expanding rapidly. However, one of the major constraints experienced by farmers is the nonavailability of suitable supplementary diets. Although a number of feed industries have been established recently, they are confronted with the problem of selecting suitable ingredients, mainly due to lack of information on their digestibility.
This investigation was undertaken to assess the usefulness of a fow locally available ingredients through digestibility studies, employing the Indian major carp, Cat/a cat/a (Ham.).
Materials and Methods
The experiment was conducted in duplicate, in glass aquaria (77 x 38 x 38 cm) at 28°C ± 1°C. Three catla with weight ranging from 23.2 to 32.4 g were stocked per aquarium. Fish were
75

76
acclimated to the respective diets in the experimental aquaria over a period of 10 days. During the experiment they were fed 5% of their body weight daily for six hours from 1000 to 1600 hours for 30 days. During this period, fecal samples were collected everyday, 1700 hours after feeding. After collecting fecal matter and feeding, water in the aquaria was changed completely and the fish were not disturbed until the next morning. Daily samples of fecal matter were dried at 60°C for 2400 hours, pooled treatment-wise and analyzed separately for nutrients.
Formulation of diets
The reference diet was prepared according to Varghese et al. (1976) (fable 1). One percent chromic oxide was used as a marker.
Five test diets were formulated using four plant sources, namely, G/iricidia maculata (diet GA), Colocasia esculenta (diet CE), Eichhornia crassipes (diet EC) and Leucaena leucocephala (diet LL) and an animal source, Oratosquil/a nepa (diet ON). The finely powdered test ingredients ( 400 µ) obtained by sundrying, powdering and sieving were incorporated at three different levels, namely, 15, 30 and 45% by replacing equal proportions of all the ingredients from the reference diet (Table 1).
Table l. Percentage composition of reference and test diets.
Reference Set I Set II Set ill Ingredients diet (85:15) (70:30) (55:45)
Fish meal 25 21.18 17.36 13.26 Groundnut calce 24 20.33 16.6S 13.21 Rice bran 39 33.02 27.05 2L23 Tapioca flour 10 8.47 6.94 5.30 Vitamin mineral mix l LOO LOO LOO Chromic oxide l LOO LOO LOO
Test ingredients•
Squilla meal 15.00 30.00 45.00 Gliricidia powder 15.00 30.00 45.00 Colocasia powder 15.00 30.00 45.00 Eichhornia powder 15.00 30.00 45.00 Leucaena powder 15.00 30.00 45.00
*Different diets were formulated at each level of incorporation, namely, 15, 30 and 45% using test ingredients.
Analysis of samples
The ingredients, diets and fecal matter were analyzed for dry matter, protein and fat following AOAC (1975) procedures. The chromic oxide content of fecal matter was estimated by the wet digestion method of Furukawa and Tsukahara (1966). Apparent digestibility values were calculated as follows:

Apparent nutrient digestibility of reference diet
(
% marker in diet % nutrient in fece~ = 100 - 100 x
% marker in feces % nutrient in feed
Apparent digestibility coefficient (ADC) of test ingredient
100 % reference diet = x ADC of test diet -
% test ingredient 100
ADC of x reference
diet
77
Statistical analysis of data was carried out using Duncan's Multiple Range Test (Duncan 1955).
Results
The proximate composition of the test ingredients and diets is presented in Table 2. Squilla meal contained a relatively higher level of protein, but its fat content was lower than the rest of the test ingredients. Among the four plant ingredients, Colocasia and Leucaena were richer in terms of protein and fat, while Gliricidia and Eichhornia had these nutrients at nearly equal but lower levels. The latter two ingredients also had higher levels of fiber compared to others. 'The ash content was highest in squilla meal. There was a considerable decline in the protein level of test diets having plant ingredients at 30 and 45%. This trend was similar for fat in squilla meal diets at 30 and 45%.
The digestibility data presented in Table 3 indicate varied digestibility of protein and fat from test diets, a progressive decline being noticed with increasing levels of incorporation. The inclusion of squilla at 15% resulted in digestibility comparable to the reference diet, while 30 and 45% levels significantly lowered the digestibility of both protein and fat. Among the plant ingredients, Gliricidia and Eichhornia showed poor digestibility at all levels of incorporation as compared to Colocasia and Leucaena. Interestingly, the digestibility of the two nutrients from Colocasia was better than that of the reference diet at 15% inclusion, but at higher levels, digestibility declined. In the case of Leucaena, relatively better digestibility was recorded at 15 and 30%, while at 45% there was a sharp decline.
Discussion
Studies involving various fish species have clearly shown the superiority of fish meal in inducing good growth due to its well balanced amino acid profile, perhaps coupled with unknown growth promoting factors (Andrews and Page 1974; Tacon and Jackson 1985). However, its escalating cost, uncertain availability and the demand for fish previously used in fish meal manufacture for human consumption have necessitated investigations for finding alternate sources of protein. Such replacements have met with varied degrees of success depending on the nature and composition of ingredients, inclusion level and method of processing (Tacon and Jackson 1985; Matty 1986; Nandeesha et al. 1988a, 1988b; De Silva and Gunasekara 1989).

-.J 00
Table 2. Dry matter, protein and fat contents (%)of ingredients and of the formulated diets.
Ingredients Dry matter Protein Fat Fiber Ash
Oratosquil/a 93.33 44.09 1.97 16.67 22.27 (0.19) (0.11) (0.21) (0.71) (0.55)
Gliricidia 89.25 17.01 2.41 17.72 7.91 (0.62) (0.26) (0.09) (0.27) (0.43)
Colocasia 86.81 18.77 3.42 14.38 15.87 (1.20) (0.20) (0.17) (0.66) (0.27)
Eichhornia 90.79 17.87 2.06 18.17 9.27 (0.55) (0.06) (0.09) (0.37) (0.32)
Leucaena 92.40 24.06 4.12 15.38 10.00 (0.38) (0.31) (0.17) (0.44) (0.59)
Fish meal 91.80 59.84 8.87 1.62· 20.22 (0.08) (0.01) (0.21) (0.11) (0.22)
Dry matter Protein Fat
Diet Set! Set II Set III Set I Set II Set III Set! Set II Set ill (85: 15) (70:30) (55:45) (85:15) (70:30) (55:45) (85:15) (70:30) (55:45)
ON 94.30 92.96 91.47 33.08 30.70 29.01 5.38 4.41 4.07 (0.04) (0.42) (0.65) (0.11) (0.24) (0.12) (0.11) (0.19) (0.18)
GM 96.36 97.49 91.03 32.58 27.04 23.11 5.45 5.21 4.97 (0.92) (0.51) (0.62) (0.27) (0.33) (0.21) (0.17) (0.21) (0.06)
CE 97.27 92.27 91.05 31.48 26.36 23.89 5.77 5.52 5.29 (0.20) (0.52) (0.66) (0.23) (0.04) (0.17) (0.21) (0.09) (0.11)
EC 96.85 96.63 92.51 32.18 25.96 22.18 5.53 5.41 5.02 (0.16) (0.29) (0.52) (0.15) (0.24) (0.15) (0.06) (0.16) (0.26)
LL 93.45 94.29 93.48 32.64 26.09 23.25 5.94 5.77 5.13 (0.49) (0.18) (0.34) (0.07) (0.14) (0.11) (0.12) (0.1-4) (0.04)
FM 92.36 30.49 6.74 (reference (0.18) (0.09) (0.06) diet)
Figures in parentheses indicate standard deviation.

79
Table 3. Digestibility coefficient(%) of protein 111d fat of the test ingredients.
Protein Fat
Seti Setll Setm Seti Setll Set ill Diet (85:1S) (70:30) (55:45) (85:15) (70:30) (55:4S)
ON 90.4d so.sd 57.7d 89.7C 72.3b 35.28
(0.27) (l.44) (l.25) (l.97) (l.08) (0.26)
GM 61.8• s2.s• 37.18 84.88 75.4b 50.lb (0.73) (l.02) (0.17) (l.65) (l.01) (l.58)
CE 92.8e 76.4cd 10.sc 94.lc 86.4d 54.2c (0.37) (0.40) (l.16) (l.48) (0.20) (0.64)
EC 73.8b 59.9b 47_9b 83.98 n.9c 63.ld (l.43) (0.26) (0.88) (0.66) (0.74) (l.10)
LL 8l.7c 7l.7c 49_9b 92.6c 69.68 45.3e (l.34) (0.58) (0.13) (l.59) (l.17) (0.35)
FM 89.sd 90.4e 86.4e 88.9b ·89.3d 92.sf (0.16) (0.33) (0.31) (0.25) (0.46) (0.6S)
Figures in parentheses indicate stllldard deviation. Figures with same superscripu in the same column are not significantly different (P < O.OS).
The present results are a clear evidence for the varied degree of digestibility depending on the nature, source and composition of ingredients and their level of inclusion. Although the decline in protein and fat digestibility at 15 and 30% levels of incorporation of squilla meal was relatively less, it declined drastically at 45%. Squilla meal is rich in protein as well as chitin (Muzzareli 1977). Fishes appear not to possess chitinase enzyme responsible for chitin digestion. In prawns, this enzyme helps in breaking down chitin (Kitabhayashi et al. 1971).
The decline in digestibility could also be ascribed to increased fiber and ash contents in the diet at higher levels of squilla incorporation (Table 2). De Silva et al. (1990) reported reduction in dry matter and protein digestibility with decreasing dietary protein content and increasing ash and fiber contents. Although the ash and fiber contents of compounded diets were not estimated, the available data on these parameters in the ingredients show that 45% inclusion of squilla meal contributed for the significant increase of ash and fiber in the diet. Field studies on carp growth have also shown that squilla at 35% retards growth (Bhat et al. 1986) and at 10% promotes growth (Nandeesha et al. 1989).
The incorporation of plant proteins led to lower digestibility of both protein and fat from all the test ingredients, except Colocasia which was digested better when included at 15%. The digestibility of protein from Colocasia was satisfactory even at 35 and 45%. Good digestibility of Colocasia at all levels of incorporation appears to be due to its lower fiber content (14.38%) and absence of antinutritional factors as compared to other plant ingredients. It may be appropriate to mention here that Colocasia is also being used for human consumption. Further, a growth trial conducted by Venugopal (1980) indicated good growth of carps with 36% Colocasia combined with 18% fish meal.
Among all the plant ingredients tested, Gliricidia was found to be poorly digested, followed by Eichhornia. The high fiber content of these two ingredients (17.72 and 18.17%, respectively), could be responsible for their poor digestibility as reported by De Silva et al. (1990) in Oreochromis aureus with leaf meal, apart from the possible presence of some antinutritional factors (Hastings 1969; Atack et al. 1979; Jackson et al. 1982). High levels of fiber in the diet are

80
known to retard catfish growth (NRC-NAS 1977). The optimum level of fiber in carp diets is not clearly known.
The digestibility of Leucaena was relatively better at 15% inclusion, while there was a drastic decline at 45% inclusion. Leucaena is reported to contain many antinutritional factors, the major one being mimosine. Wee and Wang (1987) suggested 25% to be its optimum for incorporation in Nile tilapia diet, following soaking.
The decline in fat digestibility was relatively less when the test ingredient was increased from 15 to 30% as compared to 30 to 45%. It is likely that protein and fat digestibilities are affected independently, depending on the level of fiber in the test ingredient and its inclusion level.
De Silva et al. (1990) suggested that it is better to use ingredients like leaf meal at 15-20% level rather than at the commonly suggested 30% level (Cho et al. 1982). The present study also indicates that it is advisable to test the ingredients at lower levels of incorporation. Digestibility of various nutrients is known to be influenced by different parameters like feeding level and meal size (HeBken et al. 1985), size and age (Windell et al. 1978), dietary components (Spyridakis et al. 1989; De Silva et al. 1990) and type of nutrient (Nose and Toyama 1966). The present findings show that the digestibility is largely dependent on the nature and level of ingredients incorporated. The digestibility values obtained in the present study show that all the five ingredients evaluated are suitable for inclusion in the diet of catla at lower levels. Further experiments are in progress to assess the effect of these ingredients on tissue chemistry and growth of carps.
Acknowledgements
Financial assistance provided by the International Foundation for Science, Sweden (N1003-1) to the senior author to carry out this work is gratefully acknowledged. Encouragement received from Prof. H.P.C. Shetty, Director and Professor T.J. Varghese of this Institute induced initiation of this study.
References
Andrews, J.W. and J.W. Page. 1974. Growth factors in the fish meal component of catfish diets. J. Nutr. 104: 1091-1096. AOAC. 1975. Official methods of analysis. Association cl Official Analytical Chemists. Washington, DC. 1094 p. Atack, T.H., K. Jauncey and AJ. Matty. 1979. The utilization of single cell protein by fingerling minor carp. Aquaculture 18: 337-348. Bhat, G.K., H.P.C. Shetty and M.C. NandeeshL 1986. Formulation and evaluation cl pelleted fish feed based on soyabean meal and squilla meal,
p. 539-542. In J.L Maclean, LB. Diron and L V. Hosillos (eds.) First Asian Fisheries Forum. 771 p. Asian Fisheries Society, Manila, Philippines.
Cho, C.Y., S.J. Slinger and H.S. Bayley. 1982. Bioenergetics cl salmonid fishes, energy intake, expenditure and productivity. Comp. Biochem. Physiol. 73B: 25-41.
De Silva, S.S. and R.M. Gunasekara. 1989. Effect cl dietary protein level and amount of plant ingredient (Phaseolus awreus) incorporated into the diets on consumption, growth performance and carcass composition in Oreoclaromis niloticus fry. Aquaculture 80: 121-133.
De Silva, S.S., K.F. Shim and A.K. Ong. 1990. An evaluation of the method used in digestibility estimations of a dietary ingredient and comparisons en external and internal markers, and time cl faeces collection in digestibility studies in the fish Oreochromis aureus (Steindachner). Reprod.Nutr. Dev. 30: 215··226.
Duncan, D.B. 1955. Multiple range and multiple F tests. Biometrics 11: 1-42. Furukawa, A. and H. Taukahara. 1966. On the acid digestion method for the determination of chromic oxide as an index substance in the study of
digestibility cl fish feeds. Bull. Japan. Soc. ScL Fish. 32: 502-506. Hastings, W.H. 1969. Nutritional scores, p. 263-293. /n O.W.. Neuhaus 1111d J.E. Halver (eds.) Ftsh in research. Academic Press, New York. Henken, A.M., D.W. Kleingeld and P.A.T. Tjissen. 1985. The effects cl feeding level on apparent digestibility of dietary dry matter, crude protein
and gross energy in the African catfish Clarias gariepitUU (Burchell 1822). Aquaculture 51: 1-11. Jackson, A.J., B.S. Capper and A.J. Matty. 1982. Evaluation cl some pl.mt proteins in complete diets for the tilapia. Aquaculture 27: 97-109. Kitabhayashi, K., H. Kurata, H. Shudo, K. Nakamura and S. lshiwak:a. 1971. Studies on formula feed for Kuruma prawn - I. On the relationship
among glucosamine, phosphorus and calcimn. Bull. Tokai Reg. Fish. Res. Lab. 65: 91-107.

81
Matty, AJ. 1986. By-product and wastes as feed, p. 81-89 . ./n R. Billard and J. Marcel (eds.) Aquawlture of cyprinids. Instiwt Nationale de la Recherche Agronomiquc, Paris.
Muzzareli, R.A.A. 19TI. Oiitin. Pergamon Press, Oxford. 309 p. Nandeesha, M.C., P. Keshavanath, T.J. Varghese, G.K. Srikanth, N. Basavaraja and H.P.C. Shcuy. 1988a. Agricultural waste based carp diets.
Punjab Fish. Bull. 12: 33-37. Nandecsha, M.C., G.K. Srikanth, N. Basavaraja, P. Keshavanath, TJ. Varghese, K. Bano, A.K. Ray and R.D. Kale. 1988b. Influence of
earthworm meal on the growth and flesh quality of common carp. Biol. Wastes 26: 189-198. Nandeesha, M.C., N. Basavaraja, P. Keshavanath, T J. Varghese, H.P.C. Shetty and G.K. Srikanth. 1989. Influence of soyabcan and squilla meal
based diets enriched with sardine oil on the growth and organolcptic quality of common carp, Cyprinus carpio (Linn.) .. Biol. Wastes 30: 61-69.
Nose, T. and K. Toyama. 1966. Protein digestibility of brown fish meal in raiflbow trout. Bull. Freshwat. Fish. Res. Lab. 15: 213-224. NRC-NAS. 19TI. Nutrient requirements of warmwater fishes. National Research Council - National Academy of Sciences. Washington, DC. 78
p. Spyridakis, P., R. Metailler, I. Gabaudan and A. Riaza. 1989. SWdies on nutrient digestibility in European sea bass (Dicenlrarchus labrax). l.
Methodological aspects concerning faeces collection. Aquaculwre 77: 61-70. Tacon, A.G.J. and A.I. Jackson. 1985. Utilization of conventional and unconventional protein sources in practical fish feeds, p. 119-145. ln C.B.
Cowey, A.M. Mackie and J.G. Bell (eds.) Nutrition and feeding in fish. Academic Press, London. Varghese, T J., K.V. Dcvaraj, B. Shantharam and H.P.C. Shetty. 1976. Growth response of the common carp, Cyprinus carpio var. communis to
protein-rich pelleted feed, p. 1-19. ln The Symposium on the Development and Utilization of Inland Fishery Resources, 27-29 October, Colombo, Sri Lanka.
Venugopal, M.N. 1980. Studies on the growth response of Calla calla (Harn.). Cirrhina mrigala (Harn.) and Cyprinus carpio (Linn.) to proteins of different sources in the pelleted feeds. University of Agriculwral Scienes, Bangalore, India. 145 p. M.F.Sc. thesis.
Wee, K.L. and S.S. Wang. 1987. Nutritive value of uucaena leaf meal in pelleted feed for Nile tilapia. Aquaculwre 62: 97-108. Windell, J.T., J. W. Foltz and I.A. Sarokon. 1978. Effect of fish siz.e, temperature and amount fed on nutrient digestibility of a pelleted diet by
rainbow trout, Sa/mo gairdneri. Trans. Am. Fish. Soc. 107: 613-618.


Digestibility of Lipid in Different Feeds by Mrigal, Cirrhinus mrigala (Ham.) and Grass Carp,
Ctenopharyngodon idella (Val.)*
B.N. SINGH Central Institute of Freshwater Aquaculture P.O. Kausalyaganga, Bhubaneswar 751 002
Orissa, India
SINGH, B.N. 1991. Digestibility of lipid in different feeds by mrigal, Cirrhinus mrigala (Ham.) and grass carp, Ctenopharyngodon idella (Val.), p. 83-86. /n S.S. De Silva (ed.) Fish nutrition research in Asia. Proceedings of the Fourth Asian Fish Nutrition Workshop. Asian Fish. Soc. Spec. Publ. 5, 205 p. Asian Fisheries Society, Manila, Philippines.
Abstract
The digestibility of crude lipid in mrigal yearlings ranged from 92.1 to 98.1 % for feedstuffs and pelleted feeds of plant origin. The mean lipid digestibility coefficient of conventional feedstuffs such as groundnut oilcake, rice bran and wheat bran was 96.4, 96.4 and 94.9%, respectively. The mean lipid digestibility coefficient of unconventional feedstuffs such as sesame oilcake, sal seed cake and com gluten meal was high, 98.1, 97.4 and 96.5%, respectively.
The lipid digestibility coefficient in grass carp fingerlings ranged from 87.1 to 96.7% for the conventional and unconventional feedstuffs of plant origin. Grass carp fingerlings gave a lower lipid digestibility coefficient (87 .1 % ) than mrigal for sal seed cake.
Introduction
Lipid is an important source of energy for fish. The optimum lipid requirements of Indian major carp and common carp were determined to be 4-6% (Sin 1973; Singh 1984, 1988, 1990; Singh et al. 1987). However, the knowledge of the actual amount of lipid digested and absorbed is more important than the level supplied in the diet. Some studies have been conducted on the digestibility of lipid by common carp (Bondi et al. 1957; Kirchgessner et al. 1986). Studies on Indian major carp, however, are lacking. Therefore, this investigation was undertaken to determine the digestibility of lipid of conventional and nonconventional feedstuffs, and formulated feeds by yearling mrigal and finger lings of grass carp.
*Editor's note: The Asian Fish Nutrition Network does not recommend digestibility determinations based on total fecal collections, unless suitable devices are used to trap all feces voided. Complete collection of feces is almost impossible to be achieved in a tank by siphoning out, etc. Nor does it recommend digestibility estimations of dietary ingredients based on experiments feeding the test ingredient by itself.
83

84
Materials and Methods
Twenty mrigal, Cirrhinus mrigala yearlings with an average weight of 99 .4 g (range 7 5-110 g) and thirty grass carp, Ctenopharyngodon idella fingerlings with an average weight of 11.1 g (range 10.1-12.4 g) were acclimatized to laboratory conditions for 2 weeks in ten plastic pools (90 cm diameter and 80 cm height each having 100 1 water). The fish were fed on formulated balanced feed during acclimatization. The test feed was fed for one week before fecal collections for analysis were started. Mrigal yearlings were fed daily at the rate of 1-1.5% of their live body weight and the unconsumed food was removed prior to collection af fecal matter. The voided fecal pellets were collected within half an hour to minimize leaching of nutrients for about 3 hours daily. The fecal samples were pooled together, dried and stored in dessicators until analysis. The remaining fecal matter voided was collected next morning, dried, weighed and stored separately to determine total fecal output daily. The feeding trial for each test feed was conducted for about 20 days and then fish was adapted for one week for the next feed. The same feeding and collection methodology was followed for grass carp fingerlings also. However, grass carp fingerlings were fed daily at the rate of 1.8 to 5% of body weight depending on the level of consumption of the test diet since each test diet was consumed at different rates by the same group of fish. The water in the plastic pools was aerated using air pump and changed periodically to maintain good qualify. The temperature was recorded daily. The water temperature during the experiment ranged 24.8 to 29.5°C.
The composition of feeds is given in Table 1. The feed and fecal matter were analyzed for lipid and also for protein contents. The crude lipid content of food and fecal matter was determined by repeated extraction in a mixture of chloroform and methanol. The calculations for digestibility of lipid by direct method were done in the same way as described earlier by Singh (1989) using the following equation:
nutrient intake-nutrient in feces Percent digestibility = ------------- x 100
nutrient intake
Table 1. Composition of test diets.
Feed ingredimts/ Test diet no. pelleted diets (with
% composition) 2 3 4 s 6 7 8 9
Growidnut oilcake 98 49 24.S Sesame oilcake 98 24.S Rice bran 98 49 49 Wheat bran 98 Salseed cake 98 Wheat flour 98 Com gluten meal 98 CaHP04 1.S 1.S 1.S 1.S 1.S 1.S 1.S 1.S 1.S Salt 0.3 0.3 0.3 0.3 0.3 0.3 0.3 0.3 0.3 Trace mineral mix 1 0.1 0.1 0.1 0.1 0.1 0.1 0.1 0.1 0.1 Vitamin mix2 0.1 0.1 0.1 0.1 0.1 0.1 0.1 0.1 0.1
I Trace mineral mixture provided the following concentration (ppm): Cu, 10; Fe, 100; Mn, SO; Zn, SO; Co, O.OS; and I, 0.1. 2Vitamin mixture provided the following concenlnllion per kg diet: vitamin A, S,000 IU; vitamin D, 400 IU; vitamin E 20 mg:
thiamin mononitrate CB1>. 4 mg; riboflavin (Bz), 6 mg; nicotinamide, SO mg; pyridoxine hydrochloride, 3 mg; calcium pantothenate, 10 mg; cyanocobalmin CB12>. 2 mg; ascorbic acid (vitamin q, 100 mg; bioten, 0.1 mg.

85
Results and Discussion
The lipid content of feedstuffs and formulated feeds tested in this study ranged between 1.6 and 17 .5% (Table 2). The lipid digestibility coefficients for individual feedstuffs as well as formulated feeds were high (92.1-98.1 % ) in mrigal yearlings. The lipid digestibility for the feed composed of groundnut oilcake and rice bran fortified with vitamins and minerals was 92.1 % in mrigal. The lipid digestibility coefficient was highest (98.1 % ) for feedstuffs such as sesame oilcake as well as for the formulated feed having sesame oilcake as one of the ingredients (Table 2).
Table 2. Lipi.d digestibility coefficients from feed ingredients and pelleted feeds in mrigal yearlings and grass carp fingerlings.
Mean lipi.d digestibility Mean crude Mean crude coefficients (%)
procein content lipid content Diet in diet in diet Mrigal Grass carp no. (%) (%) yearlings fin}'erlings
l 35.3 9.1 96.4±0.2 91.3 ±2.8 2 24.2 11.2 98.l ± l.6 96.3±1.6 3 10.5 5.1 96.4±0.9 96.7±1.4 4 14.2 4.2 94.9 ± l.4 90.4 ± l.9 5 11.5 l.6 97.4 ± l.l 87.l ± 1.4 6 22.3 15.2 92.l ±0.4 7 21.3 17.2 98.l ±0.7 95.6± l.5 8 11.S 4.3 97.3 ±0.8 9 43.l 3.5 96.5±0.2
The lipid digestibility coefficient in grass carp fingerlings ranged between 87 .1 and 96.7%. In gr.ass carp, lowest lipid digestibility (87 .1 % ) was reported for rice bran and sesame oilcake (Table 2). The feed composed of sesame oilcake +groundnut oilcake +rice bran (diet no. 7) also gave a high lipid digestibility coefficient (95.6%) in spite of the fact that the digestibility coefficient of groundnut oilcake was lower (91.3% ).
The mean lipid digestibility for single ingredients such as rice bran and sesame oilcake was similar and high (96.3-98.1 % ) in both species (Table 2). However, mean lipid digestibility coefficients for groundnut oilcake, salseed cake and wheat bran were high (94.9-97.4%) in mrigal yearlings but lower (87 .1-90.4%) in grass carp fingerlings (Table 2).
Mrigal yearlings and grass carp finger lings have high digestibility coefficients (87 .1-98.1 % ) of crude lipid from single ingredients as well as formulated feeds of plant origin which is higher than the mean crude lipid digestibility (83%) observed in common carp (Kirchgessner et al. 1986). However, high digestibility coefficients (81-97%) of fats for single ingredients of animal and plant origin have been reported in other warmwater fishes such as channel catfish, Ictalurus punctatus (Lovell 1977). The digestibility coefficients of lipid in fish meal is high (97-98%) in channel catfish (Lovell 1977) and tilapia, Tilapia aurea (Popma 1982), but they observed that lipid digestibility from plant ingredients was lower than in fish meal. However, digestibility of pure fats supplied in the form of coconut oil, soyoil and fish oil has been found to be over 90% in common carp (Takeuchi et al. 1979). The present study shows that mrigal and grass carp have good lipid digestibility from feeds of plant origin. Moreover, it further reveals that for ingredients like groundnut oilcake and salseed cake mrigal has high lipid digestibility than grass carp.

86
Acknowledgements
I am thankful to the Director, Central Institute of Freshwater Aquaculture, for the facilities. I also thank Mr. S. Sarkar for his technical assistance during this study.
References
Bondi, A., A. Spandorf and R. Cahni. 1957. The nutritive value of various feed for carp. Bamidgeh 9(1): 13-22. Kirchgessner, M., H. Kirzinger and F J. Schwarz. 1986. Digestibility of crude nutrients in different feeds and estimation of their energy content
for carp (Cyprinus carpio L). Aquaculture 58: 185-194. Lovell, R.T. 1977. Digestibility of nutrients in feedstuffs for catfish, p. 33-37. /n R.R. Stickney and R.T. Lovell (eds.) Nutrition and feeding of
channel catfish. Southern Cooperative Series Bull. 218. Auburn University, Alabama. Popma, T.J. 1982. Digestibility of selected feedstuffs and naturally occurring algae by Tilapia. Auburn University, Alabama. 78 p. Ph.D.
dissertation. Sin, A.W. 1973. The dietary protein requirements for growth of young carp (Cyprinus carpio). Hong Kong Fish. Bull. 3: 77-87. Singh, B.N. 1984. Nutrition and feed formulation for carps, p. 55-67. /n Founh Advisory Committee Meeting of NACA, FAO/UNDP Project, 3-6
December 1984, Bhubaneswar, Orissa, India. Singh, B.N. 1988. Fish nutrition, p. 1-42. In International Symposium on Aquaculture Research Needs for the Year 2000, 15-18 November 1988.
Cosponsored by FERRO, OICD, USDA and !CAR, New Delhi. Singh, B.N. 1989. The digestibility of protein and energy from feedstuffs and pelleted diets in mrigal, Cirrhinus mrigala (Ham.) and grass carp,
Cte11opharyngodon idella (Val.). I. Freshwat. Biol. 1(1): 7-13. Singh, B.N. 1990. Fish nutrition-nutritional requirements, digestibility and feed formulations. Abstract, p. 8. /n Symposium on Modem Trends in
Fish Biology Research, 17-20 January 1990 at Bhagalpur. Singh, B.N., V.R.P. Sinha and K. Kumar. 1987. Protein requirements of an Indian major carp, Cirrhi11us mrigala (Ham.) Intl. J. Acad. lchthyol.
8(1): 71-75. Takeuchi, M., T. Watanabe and C. Ogino. 1979. Availability of carbohydrate and lipid as dietary energy sources of carp. Bull. Japan. Soc. Sci.
Fish. 45: 977-982.

Growth and Changes in Carcass Composition in Young of Labeo rohita and Ci"hina mrigala
During Feeding and Starvation
P.K. MUKHOPADHYAY S.N. MOHANTY
K.M.DAS S. SARKAR B.C. PATRA
Central Institute of Freshwater Aquaculture Kausal'yaganga, Bhubaneswar 751 002
India
MUKHOPADHYAY, P.K., S.N. MOHANTY, K.M. DAS, S. SARKAR and B.C. PA1RA. 1991. Growth and changes in carcass composition in young of Labeo rohita and Cirrhi111J mrigala during feeding and starvation, p. 87-91. ln S.S. De Silva (ed.) Fish nutrition research in Asia. Proceedings of the Fourth Asian Fish Nutrition Workshop. Asian Fish. Soc. Spec. Pub!. 5, 205 p. Asian Fisheries Society, Manila, Philippines.
Abstract
Fry and fingerlings of CirrhiluJ mrigala and fry of Labeo rohita were maintained in glass jan in the laboratory without food for 4 weeks. Throughout the starvation period there were no marlc.ed behavioral changes compared to fed fish. There was no mortality during the experimental period. It was noted that the rate of weight loss was slow in starved fish compared to rate of weight gain in fed fish. In swved fish, the rate of oxygen consmnption/utilization showed a decreasing trend as the experiment progressed although there was an insignificant increase initially. The rate of release of ammonia gradually increased in starved fish, and body protein was reduced by approximately 3%. There was no significant change in the level of total lipids in swved fish. The depletion of endogenous protein prior to lipid reserves indicated greater liability of protein for energy purposes during periods of starvation.
Introduction
Under conditions of food scarcity in ponds, fish meet their maintenance requirement on nutrient reserves in the organs from depositions during feeding phases. Thus when food is not readily available due to overstocking, natural breeding and continuous unfavorable weather conditions, fish face starvation.
The present investigation reports the growth and general biochemical changes in two Indian carp species: rohu, Labeo rohita and mrigal, Ci"hina mrigala under starved and fed conditions to assess utilization of nutrients - protein and lipid for routine metabolism.
87

88
Materials and Methods
Healthy fry of rohu and mrigal (initial weight 1.7 g) and fingerlings of mrigal (initial weight 11.4 g) were taken at random from the stock raised from fish spawned and reared in the Central Institute of Freshwater Aquaculture (CIFA) culture ponds. They were acclimated to the laboratory conditions and fed on mixed plankton available at the CIFA farm ponds for a week prior to the start of the experiment. The fish were randomly divided into three replicates each for starved and fed groups in fiberglass jars (30 1 capacity) containing 15 fish in 15 1 of stored tap water at an average water temperature of 30°C ± 2°C. A separate set of experiments was carried out, side by side, for fry and fingerlings. Supplementary aeration was provided through airstones using a compressor. The experiment was run for 28 days.
Water quality characteristics such as temperature, pH, dissolved oxygen, ammonia, total dissolved solids and specific conductivity were monitored weekly (APHN A WW A/WPCF 1976). The groups that were fed were maintained on an artificial diet, given twice a day at 0800 hours and 1600 hours at 5% of total biomass for fingerlings and 10% for fry. The composition of the artificial diet is shown in Table 1. In the case of fry, feed was given in fine granular form and for fingerlings it was in the form of broken pellets. The fiberglass jars were cleaned and water replenished daily early in the morning.
Sampling to record changes in body weight was done at weekly intervals. At the end of the experimental period, the final weight of fishes was recorded (Tables 2 and 3) and the proximate composition of fish muscle fillet determined (Table 4). Crude protein was analyzed in a Kjeltec system and crude lipid extracted in a Soxtech system. Ash content was estimated as described in AOAC (1975). Moisture content was analyzed using the routine procedure.
Table 1. Composition of anificial diet.
Ingredients used
Grmmdnut cake Cooked soybean meal Rice polish Fishmeal Vitamins + trace minerals + CaHP04 + salt (NaO)
49 20 24 5
2
Proximate composition (%dry weight)
Crude protein Crude fat Crude fiber Ash Carbohydrate (NFE) Energy
31.1 10.2 11.6 9.1
38.0 4.75 kcallg
Table 2. Performance of mrigal fingerlings under starved and fed conditions (28 days).
Per cent weight Treatment Average initial Average final gain (+)/loss(-)
conditions weight (g) weight (g) in 28 days
Starved 13.7 10.6 (-) 22.3 Anificial diet 10.5 12.9 (+)23.0

89
Table 3. Performance of rohu and mrigal fry 1D1der starved and fed conditions (28 days).
Per cent weight Treatment Initial weight (g) Final weight (g) gain (+)/loss (-) conditions (Mean± S.E.) (Mean± S.E.) in 28 days
Starved rohu 1.4 ± 0.02 1.06±0.Dl (-) 25.8 Starved mrigal l.7±0.005 l.4±0.003 (-) 19.5 Artificial diet fed
rohu l.9± 0.03 2.7 ± 0.006 (+) 40.2 mrigal l.7±0.003 2.5 ±0.032 (+) 48.2
Table 4. Proximate composition(%) in muscle fillet of starved and fed rohu and mrigal fry.
Crude protein Crude lipid
Initial Final Initial Final
Rohu fry - fed 49.18 ± 0.098 53.42 ± 0.242 18.09 ± 0.Q28 23.20 ± 0.459 Rohu fry - starved 49.18 ± 0.098 47.61±0.121 18.09 ± 0.028 19.39 ± 0.066 Mrigal fry - fed 52.45 ± 0.028 55.07 ± 0.040 18.40 ± 0.345 24,14 ± 0.876 Mrigal fry - starved 52.45 ± 0.028 49.85 ± 0.087 18.40 ± 0.345 19.73 ± 0.237
Results and Discussion
There was no mortality during the experiment. The starved fish did not show any marked behavioral change except that they became emaciated. The rates of weight loss in both rohu and mrigal are shown in Tables 2 and 3 and Fig. 1. The loss in bcx:ly weight in rohu was 25.8% in 28 days and 19.5% in mrigal. On the other hand, the weight gain in fed rohu was 40.2%, and 48.2% in mrigal. These indicate that weight loss was less rapid in starved fish in relation to weight gain
00.0 50.0 00.0 50.0
/ I
I I
10.0 40.0 10.0 I 40.0 / I
I
I I
I I
~ I ~ !!; 2.. Ill
20.0 30.0 20.0 I 30.0 c Ill I c ~ I "OI
I I
+- I I +-.c .c 30.0 I 20.0 30.0 I 20.0 Cl
Cl I I
~ I I CD
I I ~ /
, , / /
40.0 / 10.0 40.0 10.0 /
/ , , ;
-- -- ... 0 7 14 21 28 0 7 14 21 28
days days
ROHU MR I GAL
Fig. I. Percent weight gain (---)and loss (-) of fed and starved rohu and mrigal over the 28-day experimental period.

Table 5. Water quality characteristics.
Temperature ("C) pH DO(mg/l) NH3 (mg/l) TDS (mg/l) Conductivity (µmhos/cm) Date (days) R M R M R M R M R M R M
19.3.90 Initial 30.8 30.8 8.8 8.4 4.0 4.0 0.40 0.40 140.0 140.0 0.211 0.216
Con 30.7 30.7 8.5 8.3 3.0 3.0 0.45 0.60 165.0 150.0 0.320 0.336
26.3.90 7 days Fast 30.7 30.7 8.0 8.0 2.5 2.5 0.50 1.00 174.0 167.0 0.340 0.583
3.4.90Con 30.0 30.2 8.0 8.0 2.0 2.2 1.25 0.72 180.0 192.0 0.327 0.340 14 days
Fast 30.0 30.0 7.9 7.8 2.1 2.4 3.00 1.20 147.0 142.5 0.345 0.447
9.4.90Con 31.5 31.5 8.0 8.0 2.5 2.6 0.89 0.87 189.0 193.7 0.317 0.342 21 days
Fast 31.0 31.0 7.8 7.7 2.7 2.8 1.05 1.14 142.0 140.2 0.379 0.395
16.4.90 Con 32.0 32.0 7.8 7.3 3.6 4.0 0.95 0.87 189.0 195.2 0.361 0.175 28 days
Fast 32.1 32.2 7.8 8.1 4.4 4.6 2.10 2.09 137.0 142.1 0.377 0.378
Mrigal Fing Initial Final Initial Final Initial Final Initial Final
Starved 28.63 29.00 7.4 7.30 6.12 6.02 0.08 0.27
Mrigal Fing (Fed/control) 28.63 29.17 7.2 7.10 7.20 5.37 0.08 0.10

91
in fed fish. It seems probable that during nonfeeding phases nitrogenous compounds may get partially converted to collagen to strengthen the skin envelope so as to prevent the rapid removal of lipid as was suggested by Hughes (1963). Love (1958) reported that water tends to replace endogenous protein in starving cod before lipid reserves get utilized. These may explain the observed phenomena in the present case also. The rate of release of ammonia measured indirectly under relatively uncontrolled conditions gradually increased in starved fish indicating increased catabolism (Table 5).
It was observed that tissue protein decreased in starved fish significantly (Table 4). On the other hand, no marked change in the level of total lipid could be observed in starved fish. The depletion of endogenous protein prior to lipid indicated greater liability of protein for energy purposes and that lipids play a marginal role in this function. Wilkins ( 1967) observed a highly significant decrease in lipid of herring starved for 4 months. Evidence available from other fish species indicates that prolonged starvation resulted in depletion of both phospholipids and protein including a number of enzymes (Connel 1962). Thus it seems that unlike in higher vertebrates where endogenous protein is not normally metabolized until all lipid and carbohydrate stores have been fully depleted, the two carp species investigated herein have a tendency to first mobilize protein during periods of starvation.
Acknowledgement
The authors are grateful to Dr. S.D. Tripathi, Director, Central Institute of Freshwater Aquaculture, for his keen interest in the work and for constant encouragement.
References
AOAC. 1975. Official methods« analysi.J. Association« Official Analytical Otcmisu. Washington, DC. 1094 p. APHAtA WW AJWPCF. 1976. Standard methods for the examination of water and waste water. 14th ed. American Public Health Association,
American Water Woib Association and Water Pollution Control Federation. Washington, DC. 119 p. Connel, J.J. 1962. Fish muscle proteins, p. 136-146. /11 J. Hawthorn and J.M. Leach (eds.) Recent advances in food science. Butterworth, London. Hughes, R.B. 1963. Otcmical studies on the herring-VII. Collagen and cchesiveness in heat processed herring and observations on a seasonal
variation in collagen contenL J. Sci. Fd. Agric. 14: 432-44 l. Love, R.~. 1958. Swdies on the North Sea cod-III. Effects of starvation. J. Sci. Fd. Agric. 9: 617-620. Wilkins, :'11.P. 1967. Starvation of the herring (Clupt1a harengus): survival and some gross biochemical changes. Comp. Biochcm. Physiol. 23:
503-518.


Utilization of Carbohydrate and Lipid as Dietary Energy Sources by Stinging Catfish,
Heteropneustes fossilis (Bloch)
A.M.AKANDI M.R.HASAN2
M.A.B. HABIB2 lDepartment of Aquaculture and Management
2Department of Biology and Limnology Bangladesh Agricultural University, Mymensingh 2202
Bangladesh
AKAND, A.M., M.R. HASAN and M.A.B. HABIB. 1991. Utilization of carbohydrate and lipid as dietary energy sources by stinging catfish, Heteropneusles fossil is (Bloch), p. 93-100. In S.S. De Silva (ed.) Fish nutrition research in Asia. Proceedings of the Fourth Asian Fish Nutrition Workshop. Asian Fish. Soc. Spec. Puhl. 5, 205 p. Asian Fisheries Society, Manila, Philippines.
Abstract
A feeding trial was conducted to evaluate the utilization of carbohydrate and lipid as dietary energy sources by stinging catfish, Heteropneustes fossilis. Eight isonitrogenous diets were formulated from purified ingredients with varying levels of carbohydrate and lipid. Four lipid levels (3%, 5%, 10% and 15%) were used at two carbohydrate levels of 35% and 45%. Replicate groups of fishes were fed at the rate of 3% of the biomass daily for 8 weeks in 30-1 aquaria. Based on specific growth.rate (SGR), weight gain (%), food conversion ratio (FCR) and protein efficienty ratio (PER), it was obseived that H.fossilis utilized lipid heller than carbohydrate. At 35% carbohydrate level, SGR and weight gain(%) were significantly high (P <0.01) in fish fed 10% lipid diet and 3.70 kcalJg energy with energy to protein ratio of 10.48 (kcalJg protein). But at 45% carbohydrate level highest SGR and weight gain(%) were obtained with the diet containing 5% lipid, 3.65 kcalJg energy and energy to protein ratio of 10.41 (kcal/g protein).
The analyzed multiple correlation of SGR, FCR and PER of fish with the body weight gain of fish (r = 0.97) was highly significant (P <0.01). Weight gain of fish was found to be correlated to carcass lipid, protein, ash, and moisture content and FCR and PER of fish.
Introduction
The stinging catfish, Heteropneustes fossilis (Bloch), often called 'Shingi' or Indian catfish, is commercially as well as aquaculturally an important species in may Asian countries. There is information on its biology (Ghosh and Kar 1952) and feeding (Huq et al. 1973; Reddy and Katre 1979). However, little is known about its nutritional requirements except for a report on the dietary protein requirement (Akand et al. 1989). The present study was carried out to evaluate the utilization of lipid and carbohydrate as dietary energy sources and to determine the optimum dietary energy to protein ratio of H.fossilis.
93

94
Materials and Methods
Eight isonitrogenous diets (Table 1) were formulated using casein as a protein source with varying levels of lipid and carbohydrate. Four lipid levels (3%, 5%, 10% and 15%) were used at two carbohydrate levels of 35 and 45%. The dietary protein levels were approximately 34.8 to 35.3% and gross energy levels were 3.05 to 4.54 kcaVg. Purified dietary ingredients were mixed and pelleted using a meat grinder. The pellets were dried in an oven at 40°C and stored in a refrigerator at 6°C. The fish were fed twice a day at 1000 hours and 1700 hours at the rate of 3% of the body weight per day. Fish were weighed once every two weeks and the ration adjusted accordingly. The weighing of fish during and at termination of the experiment were as described by Hasan et al. (1989).
Table 1. Composition of test diets (% ).
Diet no.
Ingredients 2 3 4 5 6 7 8
Casein 36 36 36 36 36 36 36 36 Dextrin 20 20 20 20 30 30 30 30 a-starch 15 15 15 15 15 15 15 15 Lipid1 3 5 10 15 3 5 10 15 Mineral mixture2 3 3 3 3 3 3 3 3 Vitamin mixture2 0.5 0.5 0.5 0.5 0.5 0.5 0.5 0.5 Cellulose 19.5 17.5 12.5 7.5 9.5 7.5 2.5 0.5 Carboxymethyl cellulose 3 3 3 3 3 3 3 0
Nutrient con~nts Crude protein(%) 34.78 35.21 35.31 35.15 34.87 35.02 34.92 35.09
+ 1.03 +0.62 + l.ll + 0.42 + 1.21 + 1.09 + 1.20 + l.21 Crude lipid (%) 2.83 4.83 9.88 15.10 3.13 4.96 10.06 14.89
+ 0.21 +0.22 +0.53 + 0.62 + 0.31 + 0.26 +0.63 +0.54 Gross energy (kcalJg) 3.05 3.24 3.70 4.17 3.48 3.65 4.10 4.54 Energy to protein 8.76 9.21 10.48 ll.85 9.97 10.41 l l.75 1295 ratio (kcal/g protein)
l Mixture of soybean oil : cod liver oil (2: l) 2 After Akand et al. ( 1989)
Values are the means± SD, n=3.
Twenty-day old induced bred fry of H. fossilis (mean weight of 0.40 g, sd = 0.02) were used in the experiment. Fry were fed on Tubifex sp. until used in the experiment. Prior to initiation of the feeding trials, fish were conditioned for a week when they were adjusted to one of the test diets (Diet 1).
Each test diet was fed in triplicate groups for 8 weeks. Thirty fishes were stocked in an individual aquarium. Each of 30-1 glass aquarium was aerated continuously, cleaned and refilled with fresh water every morning.
Proximate composition of fish and feed samples were analyzed by the methods of AOAC (1970). Gross energy of the diets was calculated using kilocaloric values of 4/g protein, 9/g lipid and 4/g carbohydrate (CHO). Specific growth rate (loge final body weight-loge initial body weight/time * 100), food conversion ratio (dry food intake/live weight gain), protein efficiency ratio (live weight gain/protein intake) were calculated. Data were analyzed using their mean differences by least significant difference in randomized block design.

95
Results
During the feeding trial the fish readily accepted the diets, and survival was 82 to 93%. The growth responses under different dietary treatments are given in Table 2 and graphically
shown in Fig. 1. Initial body weights of the various dietary groups did not vary significantly but the performances were significantly different (P <0.01) in terms of specific growth rate (SGR), weight gain (% ), food conversion ratio (FCR) and protein efficiency ratio (PER).
The SGR, FCR and PER varied significantly (P <0.01) among the different groups (Table 2 and Figs. 2, 3 and 4). The SGR increased with the increase of dietary lipid level from 3 to 10% at carbohydrate level of 35% and beyond which the SGR decreased significantly (Table 2 and Fig. 2). At 35% carbohydrate level, the highest SGR was observed in fish fed Diet 3 containing 10% lipid and 3.70 kcaVg of energy with energy to protein ratio of 10.5. At 45% carbohydrate level, significantly (P <0.01) higher SGR was observed in fish fed Diet 6 (containing 5% lipid, 3.65 kcaVg of energy and energy to protein ratio of 10.4).
1200
1000
800
Cl
E l: 600
f >-
-0 0 ai l.00 c 0
~ 300
0
Table 2. Mean values of SGR, FCR PER and weight gain of fishes fed different diets.
Diet no. SGR PER FCR Weight gain (%)
I l.62 d 1.35 e 2.12 b 148.4 d 2 1.76 c 1.59 b 1.62 e 168.5 c 3 1.98 a 1.70 a 1.66 e 204.3 a 4 1.39 f 1.26 f 2.19 b 118.5 f 5 1.62 d 1.53 c 1.88 c 150.1 d 6 1.81 b 1.60 b 1.73 d 176.3 b 7 1.47 e 1.50 d 1.90 c 145.6 e 8 1.38 g 1.32 f 2.27 a 117.3 f
LSD =0.02 LSD= O.Q3 LSD =0.07 LSD= 2.09 (14, 7) (14, 7) (14, 7) (14, 7)
Means in each column with diffemt letters are significantly different (P<(l.01). SGR = specific growth rate; FCR = food conversion ratio; PER = protein efficiency ratio; LSD = least significant difference.
o----oDiet 1 1100 o---<> Diet 5
-Diet2 __ .. Diet6
o---<>Dlet 3 o---o Diet 7
.... - ... Diet·' --Dlet8 900
~ 700
l: 2'
~ >- 500
;B
§ ~ 300
1, 28 '2 56 0 ,, 28 Doy Doy
,2 56
hg. !(a). Growth response of H. fossilis fed diets containing Fig. l(b). Growth response of H. fossilis fed diets containing 35% carbohydrate. 45% carbohydrate.
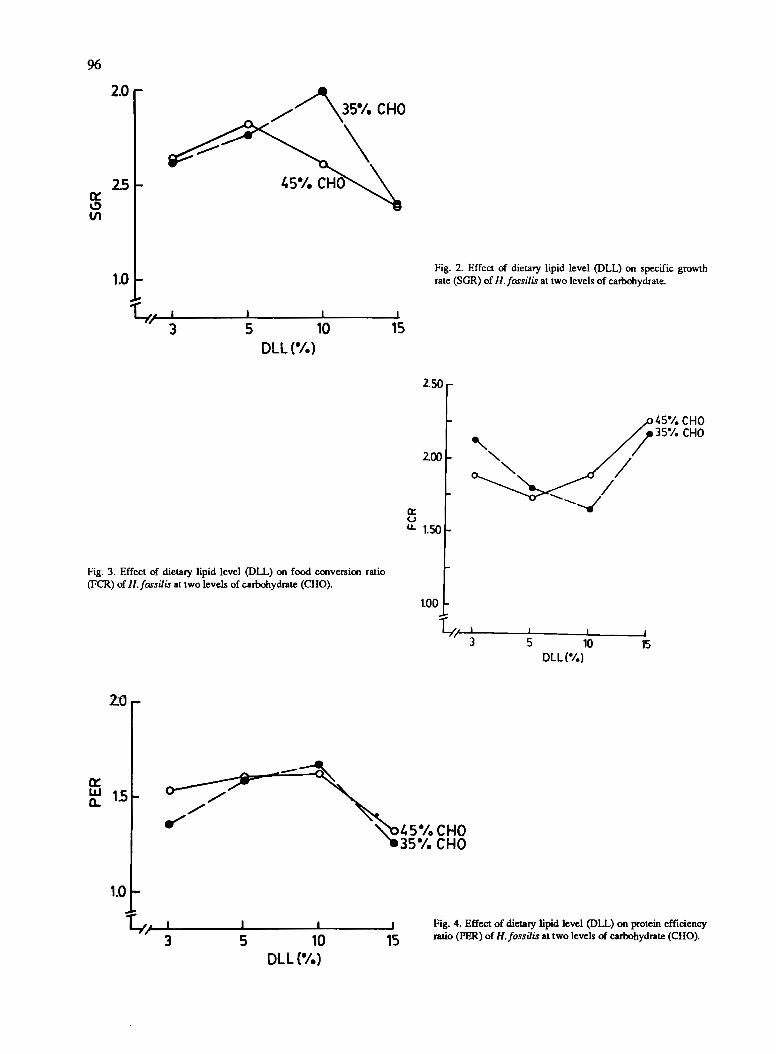
96
a:: ~ Vl
2.0
25
1.0
/~35•1.CHO
\
~-'~3~~----5~~----,o~~----,5 DLL (•/.)
Fig. 3. Effect of dietary lipid level (DLL) on food conversion ratio (FCR) of H.fossilis at two levels of carbohydrate (CHO).
2:0
a:: UJ 15 ~
1.0
~-----------3 5 10 15 DLL (•/.)
a:: u
Fig. 2. Effect of dietary lipid level (DLL) on specific growth rate (SGR) of H.fossilis at two levels of carbohydrate.
2.50
2.00
IL. 1.50
1.00
~_..__ _ __.___---L._ _ __J
3 5 10 15 DLL (%)
Fig. 4. Effect of dietary lipid level (DLL) on protein efficiency ratio (PER) of H.fossilis at two levels of carbohydrate (CHO).

97
The SOR of fish fed Diet 3 was significantly (P <0.01) higher than that of all other dietary groups (Table 2). There was no significant difference in SOR values among fish fed Diets 1, 2 and 6 and among those fed Diets 4, 5 and 7. Values of SOR ranged from 1.38 to 1.98. Similar to SOR, weight gain(%) was also significantly higher (P <0.01) in fish fed Diet 3 than that of other dietary groups (Table 2). Weight gain increased with increase of dietary lipid level from 3 to 10% at 35% carbohydrate level and thereafter decreased significantly (P <0.01). However, at 45% carbohydrate level the weight gain of fish increased linearly with the increase of lipid level up to 5% (Table 2, Fig. 2) and then decreased.
The FCR and PER of the different groups are presented in Table 2 and graphically shown in Figs. 3 and 4. The values of FCR ranged from 1.62 to 2.27 and were found to be significantly different among the different dietary treatments (Table 2 and Fig. 3). FCR was better among the groups where SOR and weight gain were also higher (Diets 2, 3 and 6). Figs. 5 and 6 show the effect of dietary energy to protein ratio (kcal/g protein) on SOR and FCR at 35% and 45% CHO levels, respectively. At 35% and 45% CHO levels, the best SOR and FCR were found when dietary energy to protein ratio was 10.41 to 10.48 kcal/g protein. PER showed a similar trend to that of SOR and the highest value (1.70) was observed in fish fed Diet 3 followed by the group fed Diet 6. PER which ranged from 1.32 to 1.70 and was found to be significantly different (P <0.01) among the various dietary groups (Table 2).
225
200
2.25
2.00
/FCR
>. 0
~ 175 :: 0:: ~ 1.50
1.75
0:: 1.50 it
SGR
1.25 1.25
1.00 1.00
0 836 9.22 10.48 11.85 0
Energy to protein 1t1tio KcoVg protein
Fig. S. Effect of dietary energy to protein ratio on specific growth rate (SOR) and food cmversion ratio (FCR) in H. {ossilis fed diets cmtaining 35% carbohydrate.
2.50
2.25
2.00 >. 0 .., .... 1.75 ~ :.... 0::
~ 1.50
1.25
1.00
0
,//
9!i17
_/FCR
/
SGR
Energy to protein ratio Kcol/g protein
2.50
2.25
2.00
1.75
1.50
1.25
1.00
Fig. 6. Effect of dietary energy to protein ratio on specific growth rate (SGR) and food cmvenion ratio in H. fossilis fed diets cmtaining 45% carbohydrate.
The proximate composition of fish is presented in Table 3. The carcass lipid, protein, ash and moisture were found to be significantly different (P <0.01) among treatment groups. High lipid contents were observed in fish on Diets 3 and 4 which were significantly different (P <0.01) from other diets. Highest carcass protein (%) was found in fish fed Diet 1 and it was significantly different from all other groups. There was no significant difference in protein content of fish fed Diets 3, 4 and 5. Low ash (%) was observed in fish fed Diets 7 and 8 which was not significantly different from each other. Sigriificantly high (P <0.01) moisture(%) was found by feeding 45% CHO diets (Diets 5, 6, 7 and 8) (Table 3). Moisture content was found to be decreasing from the initial value with growth in all groups.

98
Table 3. Mean values of wet carcass lipid, protein, ash and moisture.
Diet no. Moisture Lipid Protein Ash (%) (%) (%) (%)
1 TI.5de 2.9d 13.7. 2.8a 2 n.9c 3.2ce 12.9b 2.7 a 3 TI.6ce 4.1 a 12.4d 2.4b 4 TI.6de 4.0a 12.Sd 2.7a 5 79.6a 2.8 d 12.7 bf 2.5b 6 78.4b 3.3 b 12.3 c 2.6a 7 78.5b 3.3 be 11.8 d 2.4bd 8 79.8a 3.4b 11.3 e 2.2cd
LSD=0.29 LSD =0.13 LSD=0.36 LSD=0.21 (14, 7) (14, 7) (14, 7) (14, 7)
Means in each column with different letters are significantly different (P <0.01). The initial body canposition of fish was 81.00 ± 0.60, 13.06 ± 0.43, 1.53 ± 0.20 and 2. 71 ± 0.21 % (mean± SD, n = 3) for moisture, crude protein, crude fat and ash, respectively. LSD= least significant difference.
The multiple correlation of SGR, FCR and PER of fish with body weight gain (R = 0.97) was high (P <0.01). The estimated equation of Y (Y) of body weight gain with SGR, FCR and PER (X1 to X3) of fish is: Y = 49.92 + 99.05 X1 - 33.16 X2 + 4.27 X3 (r = 0.97; F = 118). The correlation of carcass lipid, protein, ash and moisture to increase in body weight was insignificant (P >0.05, R = 0.44) (Table 4).
Table 4. Correlation coefficients (r) of weight gain of fish to lipid, protein, ash, moisture, SGR, FCR and PER.
Variable
Bodyweight gain
Lipid Protein Ash Moisture SGR FCR PER
0.11 0.20 0.13 -0.32 0.95 -0.87•• 0.86••
df = 22, •p <0.05 and ••p <0.001. SGR = specific growth rate; FCR =food conversion ratio; PER = protein efficiency ratio.
Correlation coefficients of body weight gain to FCR and PER (X1 to X3) were calculated and it was found that the weight gain was significantly correlated (P <0.01); to FCR (r = 0.87) and PER (r = 0.86) (Table 4). The intracorrelations of SGR, FCR and PER of fish were analyzed (Table 5) where all the values were highly significant (P <0.01), but there were inverse correlations (P <0.001) of SGR with FCR (r = -0.82) and FCR with PER (r = 0.91).
The correlations of dietary lipid at 35% and 45% CHO with carcass lipid, protein and moisture were calculated and it was found that the dietary lipid at 35% CHO correlated inversely (P <0.05) with body moisture (r = -0.51) (Table 6). The correlation values of lipid at 35% and 45% CHO with SGR and PER of fish were negative but with FCR were positive (Table 6). Dietary lipid at 35% CHO was significantly (P <0.001) correlated to FCR (r = 0.93) and PER (r = -0_95).
Discu~ion
Based on the SGR, weight gain, FCR and PER, it was observed that H. fossilis utilized lipid better than CHO as a dietary energy source. Figs. 1 and 2 and Table 2 show that weight gain and SGR increased linearly with the increase of dietary lipid level from 3 to 10% at CHO level of

Table 5. Path coefficient analyses in carcass lipid, protein, ash and moisture and path coefficient analyses in SGR, FCR and PER of fish.
Variable Protein Ash Moisture FCR PER
Lipid -0.15 -0.09 -0.30
Protein 0.64** -0.46*
Ash -0.69**
SGR -0.82** 0.83••
FCR --0.9! ••
df = 22, *P <0.05 and **P <0.001. SGR = specific growth rate; FCR =food conversion ratio; PER = protein efficiency ratio.
Table 6. Correlation coefficients of dietary lipid level to carcass lipid, protein and moisture and path coefficient analyses in SGR, FCR and PER of dietary groups at 35% and 45% carbohydrate (CHO) level.
Variable Lipid Protein Moisture SGR FCR PER
Lipid at 0.17 0.22 - 0.51* --0.26 0.93*• --0.95 ... 35%CHO
Lipid at 0.35 -0.20 - 0.10 --0.23 --0.47• --0.33 45%CHO
df = 22, •p <0.05. SGR = specific growth rate; FCR = food conversion ratio; PER = protein efficiency ratio.
99
35% and thereafter growth decreased. Similarly SGR and weight gain increased with increasing dietary lipid up to 5% at CHO level of 45% and beyond when the weight gain and SGR decreased. Decrease in SGR and weight gain in both cases might be due to higher energy content in the diet (Page and Andrews 1973; Daniels and Robinson 1986). Daniels and Robinson (1986) found an inverse relationship between dietary energy and growth in juveniles red drum (Sciaenops ocellatus). The values of FCR are good at dietary energy to protein ratio (kcal/g protein) of 10.4 and 10.5 (Figs. 5 and 6). This ratio is a little higher than the value 8 to 9 kcal/g protein recommended for channel catfish (NRC 1983) but similar to the values reported by Hasan et al. (1990) for Indian major carp.
The values of FCR found in the present study are comparable to those obtained for stinging catfish (Akand et al. 1989) and Asian catfish Clarias batrachus (Hasan et al. 1989).
PER (Table 2 and Fig. 4) showed a trend similar to SGR. However, PER values were higher with diets containing 5 and 10% lipid at CHO level of 35% and with 5% lipid diet at 45% CHO level. Low PER values in fish fed low (3%) and high (15%) lipid contents might be due to inadequate dietary lipid or excess dietary energy (Daniels and Robinson 1986).
Body weight gain of fish was found to have significant correlation with SGR, FCR and PER of fish (Table 4) which is in agreement with the findings of De Silva et al. (1989). SGR and PER are strongly (P <0.001) and inversely correlated with FCR which indicate that the SGR and PER increased with the decrease of FCR and vice versa (Table 6). Dietary lipid both at 35 and 45% CHO was positively correlated to body lipid and inversely correlated to moisture (Table 6). Dietary lipid level at 35 and 45% CHO levels had an inverse correlation with SGR and PER of fish (Table 6). But up to a certain level of dietary lipid the SGR and PER increased followed by a sharp decrease (Figs. 2 and 4) for which correlation values become negative.

100
References
Akand, A.M., M.I. Mia and M.M Haque. 1989. Effect of dietary protein level Qll growth, food convenion and body composition of chingi (Heteropneustesfossilis Bloch). Aquaculture 77: 175-180.
AOAC. 1970. Official methods of analysis. Association of Official Analytical Chemists. Washington, DC. 1015 p. Daniels, W .H. and E.H. Robinson. 1986. Protein and energy requirements of juvenile red drum (Sciaenops ocellatus). Aquaculture 53 :243-252. De Silva, S.S., R.M. Gunasekera and D. Atapattu. 1989. Dietary protein requirement of Y<>IDIB Tilapia and evaluation of least cost dietary protein
levels. Aquaculture 80: 271-284. Ghosh, A. and A.B. Kar. 1952. Seasonal changes in the gonads of the common Indian catfish, Heteropneustes fossilis (Bloch). Proc. Zool. Soc. 5:
29-50. Hasan, M.R., M.G.M. Alam and M.A. Islam. 1989. Evaluation of some indigenous ingredients as dietary protein sources for the catfish (Clarias
baJrachus, Linnaeus) fry, p. 125-137. /n E.A. Huisman, N. Zonneveld and A.H.M. Bouwmans (eds.) Aquaculture research in Asia: management techniques and nutrition. Pudoc, Wageningen.
Hasan, M.R., M. Moniruzzaman and A.M. Omar Farooque. 1990. Evaluation of leucaena and water hyacinth leaf meal as dietary protein sources for the fry of Indian major carp, Labeo rohila (Hamilton), p. 275-278. In R. Hirano and I. Hanyu (eds.) The Second Asian Fisheries Forum. Asian Fisheries Society, Manila, Philippines.
Huq, M.F., M.K.I. Haque and A.K.M.A. Haque. 1973. An experiment on the feeding of fry of catfish (Heteropneustes fossilis). Indian J. Fish. 20: 35-42.
NRC. 1983. Nutritional requirements of warm water fishes and shellfish, p. 2-38. National Research Council, National Academy of Science, Washington, DC.
Page, J.W. and J.W. Andrews. 1973. Interactions of dietary levels of protein and energy on channel catfish (lctalurus punctatus). J. Nutr. 103: 139-1349.
Reddy, S.R. and S. Katre. 1979. Growth rate and conversion efficiency of the air-breathing catfish (Heteropneustesfossilis) in relation to ration siz.e. Aquaculture 18: 35-40.

The Nutritional Value of Commercial Feed Ingredients for Nile Tilapia ( Oreochromis niloticus L.) in China
LIZHONGJIE LEI WU YE JUN
HEXIQIN Institute of Hydrobiology Academia Sinica, Wuhan
China
U, Z., W. LEI, J. YE and X. HE. 1991. 1be nutritional value of conunercial feed ingredient.s for Nile tilapia (Oreoclvomis 11.iloticiu L.) in China, p. 101-106. /11 S.S. De Silva (ed.) Fish nutrition research in AsiL Proceedings of the Fourth A.;ian Fish Nutrition Workshop. Asian Fish. Soc. Spec. Puhl. 5, 205 p. Asian Fisheries Society, Manila, Philippines.
A feeding expt:rirnent was conducted to investigate the nutritive balance of the conunercial feeds used in Nile tilapia culture in China. The diet.s were composed of rapeseed cake, soybean cake, maize, wheat bran and a small amount of fish meal. Each diet was balanced for a proper ratio of essential amino acids derived from the plant ingredients. Three levels of protein (25.7, 27.2111d 33.2%) with digestible energy content.s of 3,283, 3,466111d 3,459 kcal,1tg were tested, respectively.
The results indicate that: (1) the above-mentioned plant ingredient.s could be ccrnbined in rational proportions to achieve the bal111ced dietary amino acid profile for Nile tilapia; and (2) no significant difference (P > 0.05) in weight gain and feed convenion ratio was fOIDld among the three treatment.s. Ccmpared to the diet of highest protein content, the lower protein diets supplemented with carbohydrates and lipids could spare 18-22% dietary protein.
Introduction
The nutritive balance of the feed influences feed utilization and growth. In order to make feeds economically viable and to provide a reasonable nutritive composition of the diets, a knowledge of the digestible energy to protein ratio (DE/P) and balance of essential amino acids of the diets are needed. Mazid et al. (1979), Winfree and Stickney (1981) and Wang et al. (1985b) studied the DE/P value for tilapia by using casein and egg albumin as dietary protein sources. Mazid et al. (1978) found that Tilapia zillii needs 10 amino acids as in other fishes. Jackson and Capper (1982) determined methionine, lysine and arginine requirements of Sarotherodon mossambicus by using semi-synthetic feeds. Teshima and Kanazawa (1985) found that a 3: 1 ratio of casein to gelatin provided an essential amino acid balance in Nile tilapia feeds. Santiago and Lovell (1988) determined the quantitative requirements of 10 essential amino acids for young Nile tilapia.
In recent years, Nile tilapia has become one of the major fish for intensive culture in China. The main feed ingredients used are cereals, oilseed cakes and other agricultural by-products,
101

102
supplemented with small amounts of animal by-product. The objective of this study was to evaluate the commercial diets for juvenile Nile tilapia Oreochromis niloticus (L.) on the basis of the optimum dietary amino acids profile and the digestible-energy-to-protein (DE/P} ratio.
Materials and Methods
Facilities and Test Fish
The experiment was carried out in 100-1(60x40 x 42 cm) glass aquaria with running water (flow rate was 121/hr). The water temperature was 27 ± 1.5°C, the dissolved oxygen content was 5. 8-7 .1 mg/l and the total chlorine was less than 0.03 mg/l. The tanks were cleaned daily.
Test fish were obtained from a commercial fish-farm. The initial weight of test fish was about 1 g. After a 30-min bath in 3% salt- solution, 14 fish were randomly stocked in each aquarium. Prior to the experiment, the fish were fed 35% dietary protein diet for two weeks.
Test Diets and Feeding
The test diets were formulated in two steps. Firstly, based on the known nutntive requirements of Nile tilapia, a preliminary assessment of the nutritive value of the diets was conducted. Then, linear programming was applied to select the appropriate plant ingredients from more than 10 plant products which were the main commercial feed ingredients used in China. By using the nutritive value as the object function, least cost formulated diet was obtained. The optimum ratios of plant ingredients were 20% maize gluten, 20% soybean cake meal, 34% rapeseed cake meal and 26% maize flour. Secondly, the wheat bran and maize oil were used to regulate the protein levels and digestible energy contents of the test diets (Tables 1 and 2).
Fish were fed 4% of body weight four times daily and feeding rate was adjusted every 10 days. The fish were starved one day before weighing. All experiments were carried out in duplicate and lasted 34 days.
Analytical Procedures
The crude protein and lipid were assayed with a semi-automatic nitrogen analyzer (Gerhardt Vapodest-5) and Soxhlet extraction method, respectively. The carbohydrate (nitrogen-free e~tract) and the essential amino acids of the dietary ingredients and test diets are based on data given by Chinese Animal Nutrition Research Association and Institute of Animal Husbandry of Chinese Agriculture Academy (1984).
Results
The percent weight gain, feed conversion ratio (FCR) and protein efficiency ratio (PER) among three test diets were not significantly different (P > 0.05) (Table 3). However, the protein deposition ratio (PDR) with diet 2 (protein: 27.2%, DE/P: 128) and diet 3 (protein: 25.7%, DE/P: 136) were significantly higher than for diet 1 (protein: 33.2%, DE/P: 99). The results indicate

Table 1. Composition of the experimental diets.
Ingredients
Fish meal Rapeseed calce Soybean calce Maize gluten Maize flour Wheat bran Maize oil Mineral premix• Vitamin premix•
Proximate composition
Crude protein Ether extract Nitrogen free extract Digestible energy
(kcalAcg)•• D FJP (kcalAcg diet)/
(%protein)
I (%)
5 30 17 17 23
2 5 1
33.2 5.7
31.9
3,283
99
Test diets
II m (%) (%)
5 5 24.8 19.8 14.6 11.6 14.6 11.6 19 15 11 25 5 6 5 5 1 1
27.2 25.7 9.4 9.4
34.9 36.9
3,466 3,459
128 136
The proximate compositions of the main ingredients are: fishmeal 62% P, 9.7% L, 6.1 % C; rapeseed calce 37% P, 5% L, 30% C; soybean calce 45% P, 1.1 % L, 32.6% C; mai.z.e gluten 48% P, 17% L, 4% C; mai.z.e flour 8.6% P, 3.5% L, 72% C; wheat bran 15% P, 3.1 % L, 56% C, where P, Land C refer to protein, lipid and carbohydrate (except crude fiber), respectively.
*Recommended by NRC (1977) for complete dieL **Calculated according to 4.5 kcal/g protein, 9 kcal/g lipid, and 4 kcal/g carbohydrate (Wang et
al. 1985b). ,
Table 2. Essential amino acid composition of the test diets.
Test diets Amino acids
(%of test diet) II m
Methionine and cystine 1.02 0.99 1.01 Lysine 1.44 1.33 1.22 Arginine 1.97 1.81 1.39 Threonine l.25 1.13 1.03 Isoleucine 1.23 1.12 0.98 Leucine 2.30 2.08 1.85 Tryptophan 0.38 0.36 0.34 Histidine 0.82 0.74 0.68 Valine 1.54 1.40 1.08 Phenylalanine and tyrosine 1.96 1.77 1.57
103
that increasing the appropriate nonprotein energy could increase the dietary deposition. The optimum DE/P ratio ranged between 128 and 136.
In order to determine the protein-sparing ability of Nile tilapia, the amount of dietary protein required for 1 kg weight gain was estimated (fable 4). For 1 kg weight gain, the fish fed diet 1 consumed 550 g of dietary protein, and fish fed diet 2 or diet 3 consumed only 430 g of dietary protein. The protein consumption of fish on diet 2 or diet 3 was 78.2% of that of fish on diet 1. This indicated a 21.8% dietary protein could be saved by using diet 2 or 3 instead of I.

104
Table 3. Average percent weight gain, feed conversion rlllio (FCR), protein efficimcy rlllio (PER) and protein deposition ratio (PDR) of Nile tilapia fed the test diets.
Diets
I II
III
•
•• ••• •••• •••••
Weight gain• (%) FCR0 PER•••
85.6 a••••• l.71 a l.79 a 97.0a l.58 a 2.34 a 84.3 a l.65 a 2.35 a
final fish weight - initial fish weight Weight gain (%)
initial fish weight
FCR dry feed consumed/wet fish weight gain PER wet fish weight gain/dietary protein consumed PDR dry fish protein gain/dietary protein consumed
x 100
PDR•••• (%)
18 a 29 a 29a
Figures in the same colmnn having the same superscripts are not significantly different (P < 0.05).
Table 4. Protein-sparing effect of nonprotein energy on the basis of fish weight gain and protein intake.
Protein Nonprotein Average Average required• digestible protein weight for l kg Protein
Test diets energy intake intake gain weight gain spared group (kcal) (g) (g) (g) (%) (%)
I 35.5 6.59 12 549 100 II 46.4 5.63 13.2 427 77.8 22.2
III 45.5 5.03 11.8 426 77.6 22.4
Average protein intake (g) •Protein required for l kg weight gain = x 1,000
Average weight gain (g)
The results proved that the dietary amino acid profile was well-balanced since the fish utilized the feed effectively. The FCR value of 1.58-1.71 and PER values of 2.35 were comparable to values reported by others who have used the casein or fish meal as main dietary protein sources (Appler and Jauncey 1983; Appler 1985; De Silva and Perera 1985; Wang et al. 1985a; Wee and Tuan 1988) or used local commercial feed ingredients as dietary protein sources (Coche 1982; Teshima and Kanazawa 1988; De Silva and Gunasekera 1989).
Discussion
There are three ways to satisfy the essential amino acid requirements of fish, namely, increasing the dietary protein content, supplementing the limiting amino acids, choosing a combination of proteins so that the shortcomings of one protein are compensated for by an abundance of required amino acids in another protein. The first approach is wasteful and the second is restricted by the availability of amino acids and lack of knowledge on the utilization of synthetic amino acids. The third method is acceptable in China and other developing countries as it promotes the development of diets using low-cost plant proteins.
In the present study, although the protein content of diet 3 was 25.7%, the dietary amino acids were sufficient to meet the requirements of amino acid for Nile tilapia (Santiago and Lovell 1988).

105
The protein requirements are affected by the nonprotein energy levels and composition of amino acids. The optimum protein level in this experiment was 25.7% with DE/P of 128, which was slightly different from other studies. The reasons could be either due to different protein sources or to different digestible energy of the diets (Appler and Jauncey 1983; Appler 1985; De Silva and Perera 1985; Wang et al. 1985a, 1985b; Wee and Tuan 1988; Teshima and Kanazawa 1988; De Silva et al. 1989). There was evidence that several fish species utilize lipid as an energy source to spare protein (Page and Andrews 1973; Garling and Wilson 1977; Bromley 1980; Tacon and Cowey 1985; Shimeno et al. 1985). Teshima and Kanazawa (1986) found that an increase in the dietary lipid content from 4 to 12% could increase the protein efficiency ratio and w~ight gain of tilapia. The results of the present experiment are comparable to this.
Although there is a controversy concerning the ability of fish to use carbohydrates for metabolism (Bowen 1987), some believe that carbohydrates are utilized to partially substitute some dietary protein and lipid for energy purposes (Garling and Wilson 1977; Bergot 1979a, 1979b; Pieper and Pfeffer 1980a, 1980b; Shimeno et al. 1985). It has been shown that maintaining proper protein and lipid levels in the diet, increasing the dietary carbohydrate level could promote growth of Nile tilapia (Teshima and Kanazawa 1986). Experiments with rainbow trout have shown that high-carbohydrate diets relative to high-protein diets resulted in higher levels of enzyme activity in the glycolytic pathway and lower levels of enzyme activity in the gluconeogenic pathway (Walton 1986, cited by Bowen 1987). Thus, the physiological interaction of protein, lipid and carbohydrate needs should be further studied.
References
Appler, H.N. 1985. Evaluation of Hydrodictyon reticulwm as a protein source in feeds for Oreochromis niloticus and Tilapia zillii. J. Fish Biol. 27: 327-334.
Appler, H.N. and K. Jawicey. 1983. The utilization of a filamentous green alga (Cladophora glomerata (L) Katzin) as a protein source in pelleted feeds for Sarotherodon (filapia) niJOlicus fingerlings. Aquaculture 30: 21-30.
Bergot, F. l 979a. Effects of dietary carbohydrates and their mode of distribution on glycaemia in rainbow trout (Sa/mo gairdneri Richardson). Comp. Biochem. Physiol. 64A: 543-547.
Bergot, F. 1979b. Carbohydrate in rainbow trout diets: effects of the level and source of carbohydrate and the number of meals on growth and body composition. Aquaculture 18: 157-167.
Bowen, S.H. 1987. Dietary protein requirements of fishes -a reassessmenL Can. J. Fish. Aquat. Sci. 44: 1995-2001. Bromley, P J. 1980. Effect of dietary protein, lipid and energy content on the growth of turbot (Scophlhalnws m=inws L). Aquaculture 19: 359-
369. Chinese Animal Nutrition Research Association and Institute of Animal Husbandry of Chinese Agricultural Academy. 1984. Handbook of feed
formulae. Publishing House of Chinese Finance and Economy, Beijing. (In Chinese). Coche, A.G. 1982. Cage culture of tilapia, p. 205-246. In R.S.V. Pullin and R.H. Lowe-McConnell (eds.) The biology and culture of tilapias.
ICLARM Conf. Proc. 7, 360 p. Manila, Philippines. De Silva, S.S. and R.M. Gunasekera. 1989. Effect of dietary protein level and amount of plant ingredient (Phaseolus aureus) incorporated into the
diets on consumption, growth pedormance and carcass composition in Oreochromis niloticus (L) fry. Aquaculture 80: 121-133. De Silva, S.S. and W.M.K. Perera. 1985. Effects of dietary protein level on growth, food conversion and protein use in ymmg Tilapia nilotica at
four salinities. Trans. Am. Fish. Soc. 114: 584-589. De Silva, S.S., R.M. Gunasekera and D. Atapattu. 1989. The dietary protein requirements of yotmg tilapia and an evaluation of the least cost
dietary protein levels. Aquaculture 80: 271-284. Garling, D.L and R.P. Wilson. 1977. Effects of dietary carbohydrate-to-lipid ratios on growth and body composition of fingerling channel
catfish. Prog. Fish-Cult. 39: 43-47. Jackson, A.J. and B.S. Capper. 1982. Investigations on the requirements of the tilapia Sarotherodon mossambicus for the dietary methionine,
lysine and argenine in semi-synthetic diets. Aquaculture 29: 289-297. Mazid, M.A., Y. Tanaka, T. Katayama, K.L. Simpson and C.O. Chichester. 1978. Metabolism of amino acid in aquatic animals - III.
Indispensable amino acids for Tilapia zillii. Bull. Jap. Soc. Sci. Fish. 44: 739-742. Mazid, M.A., Y. Tanaka, T. Katayama, M.A. Rahman, K.L Simpson and C.O. Chichester. 1979. Growth response of Tilapia zillii fingerlings fed
isocaloric diets with variable protein levels. Aquaculture 18: 115-122. National Research Cotmcil. 1977. Nutrient requirements of warm water fishes. National Academy of Sciences, Washington, DC. 78 p. Page, J.W. and J.W. Andrews. 1973. Interactions of dietary levels of protein and energy of channel catfish (lctalurus punctatus). J. Nutr. 103:
1339-1346. Pieper, A. and E. Pfeffer. l 980a. Studies on the comparative efficiency of utilization of gross energy from some carbohydrates, proteins and fats
by rainbow trout (Sa/mo gairdneri R.). Aquaculture 20: 323-332.

106
Pieper, A. and E. Pfeffer. l 980b. Studies on the increasing proponions of sucrose of gelatinized maize starch in diets for rainbow trout (Salmo gairdneri R.) on the utilization of dietary energy and protein. Aquaculture 20: 333-342.
Santiago, C.B. and R.T. Lovell. 1988. Amino acid requirements for growth of Nile tilapia. J. Nutr. 118: 1540-1546. Shimeno, S., H. Hosokawa, M. Takada, H. Kajiyama and T. Kaishe. 1985. Effect of dietary lipid and carl>ohydrate on growth, feed conversion
and body composition in young yellowtail. Bull. Jap. Soc. Sci. Fish. 51: 1893-1898. Tacon, A.G.J. and C.B. Cowey. 1985. Protein and amino acid requirements, p. 155-183. In P. Tytler and P. Calow (eds.) Fish energetics - new
perspectives. Croom Helm, London. Teshima, S. and A. Kanazawa. 1985. The growth and nutritive requirements of tilapia (I). J. Aquacult (Japan) 22: 108-113. Teshin1a, S. and A. Kanazawa. 1986. The growth and nutritive requirements of tilapia (II). J. AquaculL (Japan) 23: 106-111. Teshima, S. and A. Kanazawa. 1988. Nutritive value of methionine-enriched soybean plastein for Oreochromis niloticus fry, p. 393-399. In
R.S.V. Pullin, T. Bhukaswan, K. Tonguthai and J.L. Maclean (eds.) The Second International Symposium on Tilapia in Aquaculture. ICLARM Conf. Proc. 15, 623 p. Manila, Philippines.
Wang, K-W., T. Takeuchi and T. Watanabe. 1985a. Effect of dietary protein levels on growth of Tilapill niloticus. Bull. Jap. Soc. Sci. Fish. 51: 133-140.
Wang, K-W., T. Takeuchi and T. Watanabe. 1985b. Optimum protein and digestible energy levels in diets for Tilapill niloticus. Bull. Jap. Soc. Sci. Fish. 51: 141-146.
Wee, K.L. and N.A. Tuan. 1988. Effects of dietary protein level on growth and reproduction in Nile tilapia (Oreochromis niloticus), p. 401-410. In R.S.V. Pullin, T. Bhukaswan, K. Tonguthai and J.L Maclean (eds.) The Second International Symposium on Tilapia in Aquaculture. ICLARM Conf. Proc. 15, 623 p. Manila, Philippines.
Winfree, R.A. and R.R. Stickney. 1981. Effects of dietary protein and energy on growth, feed conversion efficiency and body composition of Tilapill aurea. J. Nutr. 111: 1001-1012.

Evaluation of Some Oilseed Cakes as Dietary Protein Sources for the Fry of Indian Major
Carp, lAbeo rohita (Hamilton)
M.R.HASANI A.K. AZADI
A.M. OMAR FAROOQUE2 A.M.AKAND2
P.M. DASJ lDepartment of Fisheries, Biology and Limnology
2Department of Aquaculture and Management 3Department of Pathology
Bangladesh Agricultural University Mymensingh 2202
Bangladesh
HASAN, M.R., A.K. AZAD, A.M. OMAR FAROOQUE, A.M. AKAND and P.M. DAS. 1991. Evaluation of sooie oilseed cakes as dietary prolein sources for the fry of Indian major carp, Labeo rohila (Hamilton), p. 107-117. /n S.S. De Silva (ed.) Fish nutritioo research in Asia. Proceedings of the Fourth Asian Fish Nutritioo Workshop. Asian Fish. Soc. Spec. Pub!. 5, 205 p. Asian Fisheries Society, Manila, Philippines.
Abstract
The suitability of mustard, sesame and linseed oil cakes, as partial substituies for dietary fish meal proiein in the diet of Indian major carp, Laino rohita (Hamiltoo) fry was evaluated. Six experimental diets were formulaied containing 209'0 and 40% of the total dietary protein as test protein using mustard, sesame and linseed oil cake. The control diet was prepared with fish meal as the sole source of protein. All diets were isooitrogenous containing about 40% prOlein. The 42-day growth trial was conducted under laboratory conditions with three replicatioos for each treatment. Based oo criteria such as feed acceptability, growth. food convenion, protein utilization and histopathological changes, the control diet showed the best performance. There was no significant variatioo (P > 0.05) in the growth performance with increased inclusion of plant protein in the diet for all treatments. However, in terms of cost of feed and econooiic return, diet containing 40% inclusioo of sesame oil cake proved to be the besL In general, fish fed diets containing higher levels of oil cake procein had higher carcass moisture and lower carcass protein and higher lipid conlents in comparisoo to the cootrol group. Histopathological examinations revealed abnormalities in the liver in fish fed mustard and linseed oil cakes. However, the severity of these abnormalities was more pronounced in fish fed linseed oil cake and it increased Bl higher inclusion level for both protein sources. Fish fed linseed oil cake had severe congestion and cytoplasmolysis, whereas in the case of fish fed mustard oil cake, dilation of sinusoids and cytoplasmolysis were observed.
Introduction
In recent years, the higher cost of fish meal has generated renewed interest in the use of many of the alternative protein sources for fish feed. The evaluation of various alternative protein sources as a partial or complete dietary replacement for fish meal has been carried out by
107

108
several workers for different fish species (Capper et al. 1982; Appler and Jauncey 1983; Tacon et al. 1984; Alexis et al. 1986; Hasan 1986; Nandeesha et al. 1989; Hasan et al. 1990a, 1990b; Higgs et al. 1988).
Various oilseed cakes, which are considered as good sources of alternative protein for fish feed, are available in Bangladesh on a large scale as by-products of the edible oil industry. These include mustard, linseed, sesame, groundnut and coconut. These oilseed cakes are rich in protein and traditionally used as valuable feed for farm animals. The efficiency of these oilseed cakes has been evaluated as dietary protein source for many other fish species, such as common carp (Capper et al. 1982; Hasan 1986). Asian catfish, C/arias batrachus (Hasan et al. 1989), Java tilapia, Oreochromis mossambicus (Cruz and Laudencia 1978; Jackson et al. 1982), tilapia, Tilapia aurea (Wu and Jan 1977). However, there is a paucity of information on the use of these ingredients as dietary protein sources for Indian major carp.
The present investigation was designed to evaluate the suitability of mustard, sesame and linseed oil cakes as partial substitutes for dietary fish meal protein for Indian major carp, Labeo rohita (Hamilton) fry.
Materials and Methods
Experimental system and fish
A static indoor rearing system was used to conduct the experiment. Forty liter capacity rectangular glass aquaria containing 30 1 water with aeration was used.
Due to the unavailability of sufficient number of fry of uniform size, two separate trials were conducted simultaneously using two different size classes of induced bred Labeo rohita fry. The fry were acclimated to the laboratory condition for 7 days prior to the initiation of the experiment and fed an artificial diet containing fish meal, rice bran, wheat bran and wheat flour (protein content 40% ).
Diet formulation and preparation
Seven isonitrogenous diets were formulated to evaluate mustard (Brassica juncea), sesame (Sesamum indicum) and linseed (Linum usitatissimum) oil cakes as dietary protein sources for Indian major carp fry. The control diet was prepared using fish meal as the sole source of protein. All the dietary ingredients were analyzed for proximate composition and mineral contents (Table 1) prior to the formulation of diets. Amino acid composition of dietary protein sources could not be analyzed due to lack of laboratory facilities and therefore were obtained from Hasan (1986). All the diets were formulated to contain 40% protein (Sen et al. 1978; Akand et al., in press), 10-12% lipid (NRC 1983), 2-6% crude fiber and 25-30% digestible carbohydrate (Sen et al. 1978; Furuichi and Yone 1980). Diets were also formulated to be isocaloric as far as possible.
All the test protein sources were tested at two inclusion levels (20 and 40% replacement of fish meal protein). The composition of the experimental diets are presented in Table 2. The proximate composition analysis and the calculated level of amino acids with the chemical score of each diet are presented in Tables 3 and 4, respectively. Amino acid requirement for common carp. (Cyprinus carpio) determined by Nose (1979) are given in Table 4 for comparison. The diets were prepared as described previously (Hasan et al. 1989).

109
Table I. Proximate composition and mineral content of feed ingredients (% dry mauer).
Ingredients
Fish Mustard Sesame Linseed Components meal oil cake oil cake oil cake
Drymauer 90.0 87.3 91.2 91.3 Crude protein 70.0 32.2 27.7 29.1 Ether extract 11.0 I I.I 13.9 14.5 Ash 19.4 I0.4 15.5 9.1 Crude fiber 13.4 7.7 IO.I Nitrogen free
extracts (l\'FE) 33.0 35.4 37.3 Calcium 4.6 0.5 2.3 0.5 Phosphorus 0.9 1.0 1.3 0.7
Table 2. Composition(% dry weight) and cost per kg of the experimental diets (Bangladesh Taka 35 = US$1).
Mustard Sesame Linseed Diet Control oil cake oil cake oil cake
Test protein as % of total protein 0 20 40 20 40 20 40
Test protein source 24.9 4C/.7 28.9 57.9 27.5 55.0 Fish meal 57.1 45.7 34.3 45.7 34.3 45.7 34.3 Dextrin 32.6 24.7 14.0 21.9 6.4 22.6 6.2 Soyabean oil 2. 7 1.8 0.3 1.2 2.8 3.0 Cod liver oil 1.0 1.4 0.8 Vitamin premix8 0.5 0.5 0.5 0.5 0.5 0.5 0.5 Mineral premixb 0.5 0.5 0.5 0.5 0.5 0.5 0.5 BinderC 1.0 Crude fiber" 4.0 Chromic oxide 0.5 0.5 0.5 0.5 0.5 0.5 0.5 Cast'1cg diet (Taka) 24.2 22.6 16.7 20.6 15.7 22.0 18.2
a After Jauncey and Ross (1982). bAfter Hasan et al. (1989). cSodium carboxymethyl cellulose (high viscosity). dAcid and alkali digested dry hay.
Table 3, Chemical composition of the experimental diets (%dry mllltcr).
Mustard Sesame Linseed Diet Control oil cake oil cake oil cake
Test protein as % of to1al protein 0 20 40 20 40 20 40
Crude protein 41.6 40.5 39.7 39.7 40.1 42.3 41.5 Ether extract IO.I I0.9 9.7 10.4 9.6 11.0 11.6 Ash 12.5 13.0 12.7 13.5 16.5 13.1 12.6 Crude fiber& 4.0 3.3 6.7 2.2 4.4 2.8 5.5 NFEa 32.6 32.9 30.4 32.1 26.8 32.8 26.7 Chromic oxide 0.5 0.5 0.5 0.5 0.4 0.5 0.5 Gross energy
(kcal/g) 4.5 4.6 4.3 4.5 4.2 4.7 4.4 Metabolizable ene~ (kcal/g) 3.9 3.9 3.7 3.8 3.6 4.0 3.8
PE ratio 107.6 103.7 I08.0 103.5 112.8 106.2 109.5
4Calculated values. bProtein to energy ratio in mg proteinJkcal of metaboli:z.able energy.

110
Table 4. Calculated level of amino acids in diets and amino acid requirement for common carp (Cyprinws carpio) in a 38.5% protein diet (Nose 1979) (% dry matter basis).
Mustard Sesame Linseed Requirements Diet Control oil cake oil cake oil cake for carp Plant protein as % of total protein 0 20 40 20 40 20 40
Arginine 3.3 3.2 3.0 3.3 3.2 3.5 3.7 l.6 Histidine l.l l.l l.l l.l l.l l.l l.O 0.8 Isoleucine l.7 l.7 l.6 l.7 l.7 l.7 l.7 0.9 Leu cine 3.3 3.2 3.0 3.2 3.2 3.2 3.0 l.3 Lysine 3.4 3.l 2.8 3.1 2.9 3.0 2.7 2.2 Methionine l.3 l.2 l.O l.2 l.O l.l l.O o.8a Phenylalanine l.7 l.7 l.7 l.7 l.8 l.8 l.8 1.3a Threonine 2.0 l.9 l.9 l.9 l.9 l.9 1.8 l.5 Tryptophan 0.5 0.5 0.5 0.5 0.5 0.5 0.6 0.3 Valine 2.5 2.4 2.2 2.4 2.3 2.4 2.3 l.4 Cystine 0.5 0.5 0.5 0.5 0.5 0.5 0.5 Tyrosine 1.4 l.4 l.3 1.4 1.4 1.4 l.3
Chemical score (%f 128.5 126.0 120.0 129.3 126.7 126.7 120.0
8 The values of methionine and phenylalanine are the requirements in the presence of 2% cystine and l % tyrosine of the diet, respectively. bChemical score calculated based on the amino acid requirement of carp (Nose 1979).
Analytical methods
Feed ingredients, experimental diets and fish samples were analyzed for their proximate composition according to AOAC (1970). The gross energy contents of the diets were estimated after Brody ( 1945). The metabolizable energy (ME) content of the diets was calculated as described by Hasan et al. (1989). The chromic oxide content of the experimental diets and feces were determined by the acid digestion method of Furukawa and Tsukahara (1966). Feed ingredients were analyzed for calcium and phosphorus by digesting the samples with a mixture of nitric and perchloric acid. Calcium was measured by using flame photometrically (Black 1965) and phosphorus was determined spectrophotometrically according to Golterman et al. (1978).
Water quality parameters were monitored throughout the experimental period following the procedure recommended by APHA (1980). Water quality parameters were similar between different test tanks throughout the experimental period. The ranges of the water quality parameters during the experimental period were temperature 25-28.5°C; pH 6.1-7.8; dissolved oxygen 4.9-7.0 mg/I.
At the end of the trial, fish samples from each diet were fixed in 10% buffered formalin and routine histopathological examinations on 5 micron thick paraffin embedded sections of the gills, liver, muscle, kidney and intestine were carried out to observe any changes between different dietary treatments.
Experimental procedure
Fish fry were randomly distributed at a rate of thirty fish per tank and three replicate tanks were used for each experimental diet including the control. All fish 'were fed four times daily at four hourly intervals between 0800 and 2000 hours at a fixed feeding rate of 7% and 8% body weight per day for trials 1 and 2, respectively, for the whole experimental period of six weeks. The method of feeding and weighing of fish during and on termination of the experiment were as

111
described by Hasan et al. (1989). In order to maintain good water quality, water in each tank was changed at three day intervals throughout the experimental period.
Analysis of experimental data
Specific growth rate (SGR), food conversion ratio (FCR), protein efficiency ratio (PER), apparent net protein utilization (ANPU) and apparent protein digestibility (APD) were calculated following EIF AC (1980) guidelines. Comparison of treatment means for each trial was carried out using one-way analysis of variance (Anova), followed by testing for pairwise differences using Duncan's multiple range test (Steel and Torrie 1960). For comparison of mortalities between treatment values, percentage mortality was subjected to arosin transformation (Zar 1974) and the resulting data were subjected to analysis of variance as above.
Economic evaluation
An economic analysis was performed to estimate the cost of feed to raise a unit biomass of fish. Cost of feed was used as a single economic criterion on the assumption that all other operating costs for commercial fish production will remain the same for all diets. The approximate cost of each diet tested was first calculated on the basis of the Mymensingh wholesale market price (1989) of all the dietary ingredients used. The cost of different dietary ingredients (in Taka/k:g) were as follows: fish meal - 20.00; mustard oil cake - 5.00; sesame oil cake - 4.50; linseed oil cake - 4.50; starch - 10.00; soyabean oil - 28.00; cod liver oil - 20.00/100 ml; mineral mix - 35.00/100 g; vitamin mix - 35.00/100 g and crude fiber - 8.00. The cost of dextrin was assumed to be equal to the cost of refined wheat flour. The cost of binder and chromic oxide has not been included in these estimations. An additional 7 .5% on the top of the total raw material costs has been included towards manufacturing costs, marketing expenses and operating margin (ADCP 1983).
Results
During the feeding trial the fishes were found to consume the feeds well, but the acceptabilities of all diets were not similar. In both trials control diets were preferred followed by diets containing 20% inclusion of oil cakes. In general, diets containing higher levels of oil cakes were less acceptable. Survival of fry were high in both trials. Mortality ranged between 6.7% and 22.2% (Table 5) and were not significantly (P > 0.05) different among dietary treatments.
The growth responses of carp fry fed various diets are summarized in Table 5 and illustrated graphically in Fig. 1. There were no statistically significant differences in the initial weights among various treatment groups but the performances differed significantly (P < 0.01) in terms of mean final weight, weight gain (%) and specific growth rate. For both trials, control diet sho\\'.ed significantly (P < 0.05) the best responses followed by the diets containing various inclusion of mustard, sesame and linseed oil cakes. However, there was no significant (P < 0.01) difference in growth responses with increased inclusion of plant protein in all diets.
Food conversion ratios (FCR) for various diets are presented in Table 5. Both control diets gave significantly (P < 0.05) the lowest FCRs (l.94 - trial 1 and 1.84 - trial 2) followed by diets containing various inclusion of oilseed cakes. There was no significant (P > 0.05) difference in FCRs among treatments with various inclusion of oilseed cakes. The trend of protein utilization

112
measured in terms of (a) protein efficiency ratio (PER) and (b) apparent net protein utilization ( ANPU % ) was found to be similar to that for FCR.
Apparent protein digestibility (APD % ) values for different diets are presented in Table 5. The digestibility values of mustard oil cake protein were found to be similar to that of fish meal based control diet. The APD values were found to be higher for diets containing sesame oil cake with a decreasing trend at higher inclusion level. Although APD values for diets containing low levels of linseed oil cake was similar to that for control, the APD increased at higher levels of incorporation.
Table 5. Mortality, growth, food conversion, protein utilization and cost per kg weight gain of Labeo rohita.
Trial I Trial 2
Diet Mulllard Sesame Linseed Control oil cake oil l'ai<e ±SE• Control oil cake ±SE•
Test protein as % of total proiein 0 20 40 20 40 0 20 40
Initial. weight (mg) 3348 .. 3358 332" 335• 337• 6.0 209" 2178 208• S.2
Final weight (mg) 1,0818 938h 88sh 88ob 889'> 24.7 77(/1 1rnh 67JC 4.6
Weight gain (%) 224.18 179.7'> 166. 7'> 163.3h 166.8h 8.6 272.18 22S.4h 223.3h 7.0
Specific growth rate(%) 2.8" i.sh 2.3h 2.3h 2.3h 0.1 3.18 2.8h 2.8h 0.1
SGRas % of control 100.0 87.2 89.9 81.9 83.3 100.0 89".8 89.1
%mortality 22.2• 12.2" 17.8• 6.7" 6.0 19.0" IS.fl' 10.0" 4.3 Food conver-
sion ratio 1.9" 2.2h i.sh 2.3h 2.3'> 0.1 t.8• 2.1h 2.lh 0.1 Protein effi-
ciency ratio 1.2• u•h t.ob uh uh 0.0 1.3• I.lb uh 0.1 Apparent net
protein utili· 19.ob zation (%) 22.38 16.6'> 19.3h 16.Sh 0.8 22.9" 11.sh 18.2h 0.6
Apparent protein digestibi-• lity(%) 77.S 75.4 77.1 86.2 81.4 73.6 72.3 79.1
Cost of diet/l<g weight gain (faka) 47.1 8 S0.4• 40.2h 47.s• 3S.7h 2.0 44.s• 46.s• 38.4h 1.2
•Standard error of r.reatmcnt mean. calrulated from residual mean square in lhc: analysis of variance. Ufignres in the same row with same 1upcnaipts for each trial arc not significantly different (P > O.OS; Duncan's test).
Histopathological examinations of the gills, liver, muscle, kidney and intestine of fish fed diets containing sesame oil cake revealed no noticeable changes. Liver histology, however, revealed abnormalities for fish fed both mustard and linseed oil cakes. The severity of these abnormalities was more pronounced in fish fed linseed oil cake and it increased at higher inclusion levels for the protein sources. Fish fed linseed oil cake had severe congestion of blood vessels (central veins), cytoplasmolysis and fatty changes in hepatocytes. Pyknotic nuclei were also noticed in places which indicates necrosis of the cells. In case of fish fed mustard oil cake, acute cellular swelling, dilation of sinusoids, cytoplasmolysis and fatty changes were observed. Mononuclear cell infiltration was also noticed in some cases.
The proximate carcass composition of fish at the start and end of the experiment are presented in Table 6. In general, fish fed diets with higher level of oil cakes have higher moisture and lower protein and lipid contents in comparison with control groups. However, no clear trend in the carcass composition was observed in relation to the level of oil cake protein in the diets.
The estimated total cost per kg of feed and the cost of feed to produce a kg weight of fish are shown in Tables 2 and 5, respectively. The cost analysis shows that in terms of cost of feed the control diet was found to be the most expensive and the diet containing 40% inclusion of

113
sesame oil cake the cheapest. However, in terms of the cost of feed per kg weight gain the diets containing higher amounts of oilseed cake were significantly (P < 0.05) cheaper than the control and all other diets .
.l200
1m
1000
900
a. 800 E l:
f 700
500
400
300
o----o 20% Muston! oll cake <>---o 40% Sesame oi coke TRIAL 1 0----0 llJ' I. ~lord oil coke
o---<> Control ]
<>---o NI. Sesomeoll coke ,,J:J
........_.... Control J ,,..,-' .._ __ .... 20"1.Linseed oil coke m1AL2 ,.,.a'// ,6§ -- 40-1. Linseed ollcoke ~/
/ 7
£~ .0-Z./~-
/~/ /~ / /~
/.~ /
/".
~
14 21 Doy
28 35
Fig. 1. Growth responses of l.Abeo rohila fry at different dietary treatments over the experimental period.
Table 6. Proximate carcass composition(% fresh weight) of fish samples at I.he start and end of the experiment.
Trial 1 Trial 2
Diet Initial Control Mustard Sesame Initial Control Linseed
Test protein as % of total protein 0 20 40 20 40 0 20 40
Moisture 79.8 76.3 76.8 75.2 77.1 76.1 79.4 76.0 76.8 76.7 Crude protein 13.5 16.5 15.7 15.2 14.8 14.2 13.9 16.4 14.9 15.1 Ether extract 2.6 3.0 3.9 3.4 3.8 3.5 2.3 3.3 4.2 4.6 Ash 3.7 2.9 2.6 2.9 2.1 3.0 3.2 2.8 1.8 1.9
Discu~ion
The results of the present study indicate that fish meal based control diet showed the best performance in terms of growth, food conversion and protein utilization compared to diets containing mustard, sesame and linseed oil cakes. The poor performance of major carp fry fed diets containing mustard oil cake even at low inclusion level is in agreement with the findings of Capper et al. (1982), and Hossain and Jauncey (1989) for common carp (Cyprinus carpio) fingerling, and that of Hasan (1986) for common carp fry. The above authors observed that untreated mustard oil cake included at 20-30.5% of the diet resulted in depression of live weight gain and adverse change in food conversion.

114
Untreated mustard oil cake is reported to contain several toxins and antinutritional factors (Tookey et al. 1980; Gohl 1981), which are presumably responsible for decreased growth rate and adverse change in food conversion of major carp fry observed in this study. The most potential of all toxic factors present in the mustard seed is the presence of glucosinolates otherwise known as thioglucosides which upon hydrolysis by an enzyme thioglucosidase, usually present in the seed, yields highly toxic isothiocyanates (Tookey et al. 1980). Morever, thioglucosidase may also act on glucosinolate to produce highly irritant mustard gas or intestinal irritants (Gohl 1981). Experimental evidence of the toxic action of isothiocyanates is well documented in rodents and poultry diets containing rapeseed (Brassica napus and B. campestris) meal. Rapeseed meal is also reported to contain high levels of glucosinolates which, upon hydrolysis by thioglucosidase, yield potentially toxic isothiocyanates and more a powerful goitrogenic substance known as goitrin (Tookey et al. 1980; Gohl 1981; McDonald et al. 1981). Rapeseed meal as low as 5% of the diet has been shown to cause enlarged thyroid, depressed growth rate and perosis in poultry (McDonald et al. 1981).
Mustard oil cake used in the present study is an expeller cake and not commercially heat treated and therefore presumably contains high levels of glucosinolates and its enzymatic break down products isothiocyanates.
Although diets containing sesame oil cakes at both inclusion levels had good amino acid profile (Table 4 ), both diets produced depressed growth and food utilization compared to fish meal based control diet. Sesame seed does not contain any known toxic factor (Liener 1980). Nevertheless, sesame seed has a high phytic acid content (Gohl 1981) which appears to bind metal ions such as calcium, magnesium, manganese, zinc and iron rendering them unavailable. Requirements of phosphorus. magnesium and zinc for carp and other finfish are well documented (Lall 1989; Jauncey 1982). The ability of phytic acid to bind metal ions is lost when the phosphate groups are hydrolyzed through the action of enzyme phytase (Liener 1977). Although phytase activity has been shown to be present in ruminants (McDonald et al. 1981), animals with a simple stomach such as fish lack this enzyme in their gastrointestinal tracts (Lall 1989). Therefore, fish cannot utilize the phytate bound phosphorus or other metal ions. Unless phytic acid is already saturated with metal ions naturally present in the plant and sufficient mineral supplementation has been used, mineral deficiency may occur. Therefore, the presence of high level of phytic acid in the sesame oil cake may be a factor for poor growth of major carp fry fed diets containing sesame oil cake.
The significant poor growth responses of major carp fry at both levels of linseed oil cake inclusion in the diets may be due to the presence of some nutritional deficiency or growth inhibitory substance in it. The efficiency of linseed oil cake as a dietary protein supplement for domestic farm animals have been investigated fairly extensively (Montgomery 1980; Gohl 1981; McDonald et al. 1981 ). Immature linseed contains a small amount of the cyanogenetic glucoside, linamarin, which in the presence of an associated enzyme, linase, liberates hydrogen cyanide (HCN) on hydrolysis. Unprocessed whole seeds, and linseed meal processed under low temperature, can be toxic to animals especially if wetted before being fed (Gohl 1981; McDonald et al. 1981). Normal processing conditions involving high temperature treatment, however, destroy linase and most of the linamarin, and the resultant meals are quite safe (Gohl 1981; McDonald et al. 1981; ADCP 1983). Linseed oil is relatively high in lipid which is also susceptible to oxidation. The fatty liver changes reported here also could be associated with rancid fat.
The linseed used in the present trial was in the form of expeller cake and, there:fore, presumably contained some amount of linamarin. The results of the present study support the

115
findings of Hossain and Jauncey (1989) for common carp fingerling, where poor growth response and feed utilization have been reported when fish were fed diets containing linseed meal of Bangladeshi origin. However, in conrrast, Hasan et al. (1989) did not observe any significant reduction in growth and food conversion when Asian catfish were fed diets containing 50% linseed oil cake.
Microscopic examinations of the liver of fish fed linseed and mustard oil cake revealed congestion and cytoplasmolysis. No abnormaliti~s, however, were observed in fish fed sesame oil cake. The severity of the lesions was more marked in fish fed linseed and it increased at higher inclusion levels for both protein sources. The vascular and fatty changes in the liver are presumably due to the presence of toxins in the feed which causes disturbance in metabolism and/or mobilization of fat. More advanced change, like pyknotic nucleus, was observed in the liver of fish fed linseed oil cake which indicates that the toxin present in the feed is comparatively more toxic for major carp fry. The occurrence of the mononuclear cell infiltration in the liver of fish fed mustard oil cake, not in the case of linseed oil cake fed fish, indicates that the toxin present in mustard cake also gives irritation in the liver tissue.
A higher level of intracellular lipid deposition (fatty changes) in the liver of fish fed mustard oil cake has been reported for common carp fry (Hasan 1986) and fingerling (Hossain and Jauncey 1989). Similarly Higgs et al. (1979) reported increased lipid deposition of coho salmon fed diets containing rapeseed meal. Increased lipid deposition in the liver of rats fed rapeseed meal containing low and high levels of glucosinolates have been reported by Oliver et al. (1971). The specific mode of toxic action of glucosinolates in fish is yet to be investigated. However, in the case of rats, it has been reported that its intestinal flora can hydrolyze gloucosinolates to a variety of aglucon products and some of the nitrile aglucon products are liver and kidney toxins (Tookey et al. 1980). Unlike mustard oil cake, reports on the histopathological changes in the liver or any other organ of fish fed linseed oil cake are not available. Further elaborate studies need to be conducted on specific toxic changes for both glucosinolates and linamarin in different organs of the fish body particularly liver, thyroid gland and kidney.
The results here indicate that unprocessed mustard and linseed oil cakes may not be recommended as dietary protein sources for major carp fry. However, further experiments may be carried out by using solvent extracted linseed and mustard oil cake and also by using these oil cakes after various methods of processing. Toasting or steaming or steeping in water at 85°C are few of the several processing methods which are reported to reduce the toxicity of glucosinolates and linamarin (Tookey et al. 1980; Gohl 1981 ). However, considering the absence of any histopathological change in the liver and other body organs and its clear economic advantage in the cost of fish production, sesame oil cake may be recommended as an alternative to fish meal. ADCP (1983) also reported good results with Labeo rohita fed diets containing 50% sesame oil cake. However, it is recommended that further experimentation may be carried out with mineral supplementation in the diet or in combination with other dietary protein sources containing high mineral content to overcome the actions of phytic acid present in sesame.
Acknowledgement
This study was conducted as a part of a research project on "Diet formulation for Indian major carp, Labeo rohita, using various commercially available indigenous ingredients" funded by the International Foundation for Science (IFS grant no. Nl 190-1 ), Stockholm, Sweden.

116
References
ADCP. 1983. Fish feeds and feeding in developing cowttries. Aquaculture Development and Coordination Programme. ADCP/REP/83/18. UNDP/FAO. 97 p.
Akand, A.M., M.R. Hasan, M. Soeb and M.G. Kibria. Nutritional requirements of Indian major carp, Labeo rohila (Hamilton) - l. Effect of dietary protein on growth, food conversion and body composition. Agriculture International 1. (In press).
Alexis, M.N., V. Theochari and E. Papaparaskeva-Popoutsoglu. 1986. Effect of diet composition and protein level on growth, body composition, haematological characteristics and cost of production of rainbow trout (Salmo gairdlleri). Aquaculrure 58: 75-85.
AOAC. 1970. Official methods of analysis of the Association of Official Analytical Chemists. Washington, DC. 1015 p. APHA. 1980. Standard methods for the examination of water and waste-water. 15th edition. American Public Health Association, American
Water Works Association and Water Pollution Control Federation. Washington, DC. 1134 p. Appler, H.N. and K. Jaimcey. 1983. The utilization of a filamentous green algae (Cladoplwra glomerata) as protein soun:e in pelleted feeds for
Sarotlumxlon niloticus fingerlings. Aquaculture 30: 21-30. Black, C.A. 1965. Methods of soil analysis. American Society of Agrooomy, NNC Publisher, Madison, Wisconsin, USA. 49 p. Brody, S. 1945. Bioenergetics and growth. Reinhold, New York. Capper, B.S., J.F. Wood and A.J. Jackson. 1982 The feeding value for carp of two types of mustard seed cakes from Nepal Aquaculrure 29: 373-
377. Cruz, E.M. and I.L. Laudencia. 1978. Screening of feedstuffs as ingredients in the rations of Nile tilapia. Kalikasan, Philipp. J. Biol. 7: 159-164. EIFAC, 1980. Report of the EIFAC, IUNS and ICES Working Group on Standardization of Methodology in Fish Nutrition Research. European
Inland Fisheries Advisory Commission. EIFACn'36. EIFAC/FAO. 24 p. Furuichi, M. and Y. Yone. 1980. Effect of dietary dextrin levetS on growth and feed efficiency, and chemical composition of liver and dorsal
muscle, and the absorption of dietary protein and dextrin in fishes. Bull. Japan. Soc. Sci. Fish. 46: 225-229. Furukawa, A. and H. Tsukahara. 1966. On the acid digestion method for determination of chromic oxide as an indicator substance in the srudy of
digestibility in fish. Bull. Japan. Soc. Sci. Fish. 32: 502-506. Gohl, B. 1981. Tropical feeds. Food and Agricultural Organization of the United Nations, Rome. 528 p. Golterman, H.L., R.S. Oymo and M.A.M. Ohnstad. 1978. Methods for physical and chemical analysis of freshwaters. Blackwell Scientific
Publications, Oxford. 214 p. Hasan, M.R. 1986. Husbandry factors affecting survival and growth of carp (Cyprinus carpio L) fry and an evaluation of dietary ingredients
available in Bangladesh for the formulation of a carp fry diet Institute of Aquaculture, University of Stirling, Scotland. 415 p. Ph.D. thesis.
Hasan, M.R., M.G.M. Alam and M.A. Islam. 1989. Evaluation of some indigenous ingredients as dietary protein sources for the catfish (Clarias batrachus, Linnaeus) fry, p. 125-137. In E.A. Huisman, N. Zonneveld and A.H.M; Bouwmans (eds.) Aquacuhural research in Asia: management techniques and nutrition. Pudoc, Wageningen.
Hasan, M.R., M. Moniruzzaman and A.M. Omar Farooque. 1990a. Evaluation of leucaena and water hyacinth leaf meal as dietary protein sources for the fry of Jnaian major carp, Labeo rohila (Hamilton), p. 275-278. In R. Hirano and 1 Hanyu (eds.) The Second Asian Fisheries Forum. Asian Fisheries Society, Manila, Philippines.
Hasan, M.R., S.N. Roy, A.M. Akand, P.M. Das and P.K. Roy. 199Cb. Evaluation of poultry offal meal as dietary protein source for the fry of Indian major carp, Labeo rohiJa (Hamilton). Paper presented at 22nd meeting of World Aquaculture Society, 10-14 Jime 1990, Halifax, Nova Scotia, Canada.
Higgs, D.A., J.R. Markert, D.W. Macquarrie, J.R. McBride, B.S. Dosanjh, C. Nichols and G. Hoskins. 1979. Development of partial dry diets for coho salmon, Oncorhynchus ldsuJch, using poultry by-product meal, feather meal, soybean meal and rapeseed meal as major protein sources, p. 191-218. In J.E. Halver and K. Tiews (eds.) Finfish nutrition and fish feed teclmology, Vol. II. Heenem81Dl Verlagsgesellschaft, Berlin.
Higgs, D.A., J.R. McBride. B.S. Dosanjh, U.H.M. Fagerlund, C. Archdekin, A.M. Hammons and W.C. Oarke. 1988. Nutritive value of plant protein sources for fish with special emphasis on canola products, p. 427-435. In Proceedings of the Aquacolture International Congress, 6-9 September 1988, British Columbia, Canada.
Hossain, M.A. and K. Jauncey. 1989. Nutritional evaluation of some Bangladeshi oilseed meals as partial substitutes for fish meal in the diets of common carp, Cyprinus carpio L Aquacult Fish. Manage. 20: 255-268.
Jackson, A.J., B.S. Capper and A.I. Matty. 1982 Evaluation of some plant proteins in complete diets for the tilapia Sarotlri!rodon mossambicus. Aquaculture 27: 97-109.
Jauncey, K. 1982. Carp (Cyprinus carpio) nutrition - a review, p. 215~263. In J.F. Muir and R.J. Roberts (eds.) Recent advances in aquaculture. Vol. II. Croom Helm, London.
Jauncey, K. and B. Ross. 1982. A guide to tilapia feeds and feeding. Instirute of Aquaculture, University of Stirling, Scotland. 111 p. Lall, S.P. 1989. Minerals in finfish nutrition, p. 85-97. In J.E. Halver and K. Tiews (eds.) Fmfish nutrition and fish feed tedmology, Vol. 1 H.
Heenemann Verlagsgesellschaft, Berlin. Llener, I.E. 1977. Removal of naturally ocruring toxicants through enzymatic processing. Adv. Chem. Ser. 160: 283-300. Liener, I.E. 1980. Miscellaneous toxic factors, p. 429-467. In 1.E Liener (ed.) Toxic constiruents of plant foodstuffs. Academic Press, New York. McDonald, P., R.A. Edwards and J.F.D. Greenhalgh. 1981. Animal nutrition. Longman, London. 479 p. Montgomery, R.D. 1980. Cyanogens, p. 429-467. In I.E. Liener (ed.) Toxic constituents of plant foodstuffs. Academic Press, New York. Nandeesha, M.C., G.K. Srikanth, t.J. Varghese, P. Keshavanath and H.P.C. Shelly. 1989. Growth performances of Indian major carp, Calla calla
(Ham.) on fish meal free diets, p. 137-142. In S.S. De Silva (ed.) Fish nutrition research in Asia. Asian Fuh. Soc. Spec. Publ. 4. 166 p. Nose, T. 1979. Summary report on the requirements of essential amino acids for carp, p. 145-156. In J.E. Halver and K. Tiews (eds.)-Finfish
nutrition and fishfeed technology. Vol. 1 Heenemann Verlagsgesellschaft, Berlin. NRC. 1983. Nutrient requirement of warmwater fishes and shellfishes. National Research Coimcil. National Academy of Science, Washington,
DC. 102p. Sen, P.R., N.G.S. Rao, S.R. Ghosh and M. Rout. 1978. Observations on the protein and carbohydrate requirements of carp. Aquacolrure 13: 245-
256. Steel, R.G.D. and J.H. Torrie. 1960. Principles and products of statistics. McGraw-Hill Book Co. Inc., New York. 480 p.

117
Tacon, A.GJ., J.L Webster and C.A. Martinez. 1984. Use of solvent extracted sunflower seed meal in complete diets for fingerling rainbow trout (Salmo gairdnui). Aquaatlture 43: 381-389.
Tookey, H.L., C.H. Van Etten and M.E. Dexenbichler. 1980. Glucosinolates, p. 103-142. !11 I.E. Liener (ed.) Toxic constituents of plant foodstuffs. Academic Press, New York.
Oliver, S.L, B.E. McDonalds and T. Opuszynska. 1971. Weight gain, protein utilization and liver histology of rats fed low and high thioglucoisides in rapeseed meal. Can. J. Physiol. Pharmacol. 48: 448-456.
Wee, K.L and S.S. Wang. 1986. Nutritive value of Leucaena leaf meal in pelleted feed for Nile tilapia. Aquaculture 62: 97-108. Wu, J.L and L Jan. 1977. Comparison of the nutritive value of dietary proteins in Tilapia aurea. J. Fish. Soc. Taiwan 5: 55-60. nir, J.H. 1974. Biostatistical analysis. Prentice Hall, Inc., Englewood Qiffs, New Jersey. 620 p. Zeitler, M.H., M. Kircbgeasner and F.J. Schwarz. 1984. Effects of different protein and energy supplies in carcass composition of carp (Cyprinus
carpio L.). Aquaculture 36: 37-48.


Evaluation of Partial Replacement of Fish Meal and Soybean Meal Cake by Alfalfa, Trifolium sp.,
in Practical Diets for Chinese Blunt Snout Bream, M egalobrama amblycephala, Finger lings
JIALIZHU HEXIQIN
YANG YUNXIA Institute of HydrobioltJgy Academia Sinica, Wuhan
China
IlA, L, X. HE and Y. YANG. 1991. Evaluation of partial replacement of fish meal and soybean meal cake by alfalfa, Trifolium sp., in practical diets for Chinese blunt snout bream, Megalobrama amblycephala, fingerlings, p. 119-123. In S.S. De Silva (ed.) Fish nutrition research in Asia. Proceedings of the Founh Asian Fish Nutrition Workshop. Asian Fish. Soc. Spec. Publ. S, 205 p. Asian Fisheries Society, Manila, Philippines.
Abstract
An experiment was carried out to evaluate the effects of alfalfa at various inclusion levels on percent weight gain, feed conversion ratio (FCR), protein efficiency ratio (PER) and productive protein value (PPV) of bream fingerlings in a laboratory recirculating system for 60 days. The test diets used had 30% protein with variable caloric levels.
The alfalfa proved to be an acceptable protein source, as the inclusion of alfalfa in the diets resulted in better palatability, increase feed intake and improvement of fish flesh. At 20-40% inclusion levels, in which 15-30% fish meal and soybean meal cake were substituted, growth, feed conversion ratio and protein utilization were comparable to the whole fish meal and soybean meal cake control dieL However, at 60% level of substitution with alfalfa, growth, feed conversion and protein utilization efficiency decreased; this is likely to be due to the amino acid profile and low energy cootent. Under the experimental conditions, the optimum protein and energy (P/E) ratio was found to be 22.3-22.8 mg protein/kl.
Introduction
Fish meal and soybean meal are the main dietary components traditionally used in formulated diets. However, the shortage and rising cost of fish meal and soybean meal have become a constraint for the development of the fish feed industry and culture of high quality fish. Numerous studies have been done on the replacement of fish meal by plant proteins in fish feeds (Tacon 1981; Jackson et al. 1982; Viola et al. 1982; Shiau et al. 1987; Wee and Wang 1987).
Alfalfa, Trifolium sp., is a perrenial pasturage belonging to the family Leguminosae. The plant grows well in neutral, fertile, sandy soil in warm wet weather. It has a wide distribution in China. There are approximately 20,000 ha of natural and artificial alfalfa lands in the western
119

120
part of Hubei province and 60,000 tonnes of dry alfalfa meal is produced yearly (Guo 1988). Trifolium sp. has a favorable proximate composition and is known to contain the ten essential amino acids for fish (Fang and Hu 1988).
The present investigation was aimed at evaluating the performance of blunt snout bream, Megalobrama amblycephalayih to diets incorporated with different levels of alfalfa.
Materials and Methods
Three experimental diets and one control diet, of the same protein content were formulated from practical feed ingredients. Fish meal and soybean meal (1:3 on protein basis) were used as basic protein sources. Whole fish meal and soybean meal served as a control (Diet 1) while 20%, 40% and 60% alfalfa meal, replacing 15%, 30% and 45% of the crude protein of fish meal and soybean meal, were incorporated in Diets 2, 3 and 4, respectively (Tables 1 and 2).
Table 1. The composition of test diets (% ).
Fish Soybean Starch Com Mineral Vitamin CMC Diet Alfalfa meal meal meal meal premix* premix**
1 11.4 47.6 33.8 3.42 3 0.5 2 20 9.8 40.6 22.26 2.84 3 0.5 3 40 8.1 33.6 11.52 2.28 3 0.5 4 60 6.4 26.6 0.79 1.71 3 0.5
*To supply lOOg diet: CaHP04 I 2H20. 2.07g; CaC03, 1.48g; KH2P04 lg; KCI, 0.lg; NaCl 0.6g; MgS04, 0.3g; MnS041 H20. 35mg; FeS0417H20. 50mg; ZnC03, 15mg; CuS04 f 5H20, 3mg; KI03, lmg; CoC12, 0.17mg.
**mg/lOOg diet: Thiamine, l; Riboflavin, l; Pyridoxine, 0.5; Pantothenic acid, l; Niacin, 3; Biotin, 0.1; Choline, 200; Inositol, 20; Ascorbic acid, 20; Vitamin A, 800 IU; Vitamine E, 10 IU.
Table 2. The nutrient contents of test diets.
Dry Crude Crude Crude Nitrogen Standard maner protein fat fiber Ash free Lysine Methionine Gross* physiological
Diet (%) (%) (%) (%) (%) extract(%) (%) (%) energy fuel value
90.98 30.15 5.65 2.92 11.82 40.40 1.57 0.32 16.33 13.91
2 90.24 30.50 5.04 5.22 9.67 39.81 1.54 0.31 16.04 13.67
3 90.73 30.15 5.35 7.50 10.89 36.84 1.50 0.30 15.35 13.23
4 90.94 29.20 5.05 9.79 12.10 34.80 1.47 0.29 14.88 12.62
*Gross energy (MJ/kg): based on 23.65 kJ/g protein, 39.57 kJ/g lipid, 17.17 kJ/g carbohydrate. **Standard physiological fuel value (MJ/kg): based on 16.75 kJ/g protein or carbohydrate, and 37.68 kJ/g lipid.
PIE (rngJkJ)
21.68
22.31
22.79
23.14
Bream fingerlings were obtained from the experimental fish farm at the Institute. Prior to the experiment, fish were fed a practical diet with 28% crude protein for one month. Twenty-five fish, with an average weight of 6.5 g, were stocked randomly in each circular tank (56 cm diameter and 86 cm depth) in a recirculating system incorporated with a biological filter. Each diet was tested in duplicate. The water temperature was 21 ± l.5°C, dissolved oxygen level was more than 4 mg/I and pH 7.5. The fish were fed to satiation three times daily and the amount of feed consumed was determined.

121
Proximate analysis was performed on each diet and on a representive fish sample at the beginning and end of the experiment. Protein content was determined by micro-Kjeldahl method, crude lipid by Soxhlet extraction using petroleum ether at 30-60°C, crude fiber by acid-base digestion, moisture by oven drying at 100°C to constant weight and ash content by burning in a muffle furnace at 600°C.
The effects of the replacement of fish meal and soybean meal by alfalfa were evaluated using percent weight gain, feed conversion ratio (FCR), protein efficiency ratio (PER) and protein productive value (PPV). Newman-Keuls multiple range tests were performed to evaluate the differences among individual diets.
Results
The bream rapidly accepted the alfalfa supplemented diets, as the fish fed actively. However, the fish fed the control diet maintained a slow-eating habit. The amount of feed intake and mean daily feeding rate increased with increase in the inclusion level of alfalfa in the diets (Table 3)
Table 3. Results from the 60-day experiments on the fingerlings of the blunt snout bream fed diets with various alfalfa inclusion levels*.
Total Initial Final Weight feed Feeding
Diet weight weight gain intake rate FCR•• PER••• ppv•••• (g) (g) (%) (g) (%/day)
163.5 254.3 55.5a 317.0 2.5 3.6a 0.96 73.51
2 158.0 244.5 54.7a 297.4 2.5 35a 0.97 71.31
3 163.0 247.3 51.7a 322.l 2.6 3.8a 0.88 72.69
4 167.5 229.6 37.lb 346.l 2.9 5.6b 0.60 58.56
*Values in the same row with the same superscript are not significantly different from eacn other (P >0.05).
••Feed conversion ratio: Dry weight feed consumed/Wet weight gain. •••Protein efficiency ratio: Wet weight gain (g)/Protein consumed (g). ••••Protein productive value (% ): (Final total body protein - Initial total body protein!fotal
protein consumed) x 100.
The percent weight gain and FCR in the group on Diet 2 (20% inclusion of alfalfa) were comparable to those of the control diet (Diet 1 ). The multiple comparison test indicated that there were no significant differences among Diet 3 (40% inclusion of alfalfa), Diet 2 and Diet 1. The percent weight gain in the group fed Diet 4 (60% inclusion of alfalfa) was significantly lower (P<0.05) and FCR was significantly higher (P<0.01) than that in the group fed the control diet.
PER and PPV follwed the same pattern as percent weight gain and FCR. As shown in Table 3, PER and PPV in the group fed Diet 4 were 37.5% and 20.3% lower, respectively, than in the control while groups fed Diets 3, 2 and 1 which showed values comparable to those in the control group.
There were substantial differences in the carcass composition of fish at the beginning and end of the experiment (fable 4). Both crude protein and fat content were much higher in the fish at the end of the experiment. The carcass protein content (Y) increased with increasing alfalfa

122
level (X) in the diets and their relationship was: Y = 55.08 + O.llX (r = 0.98). Th~ level of alfalfa (X) was negatively correlated with the carcass fat content (Y), Y = 25.05 - 0.15X (r = -0.99). There were no marked changes in the dry matter content between fish at the beginning and end of the experiment. The dry matter content of fish fed Diets 1 and 2 were similar while fish fed Diets 3 and 4 had slightly lower dry matter contents.
Table 4. Initial and final whole fish body oomposition of bhmt snout bream fmgerlings.
Dry matter basis
Dry Crude Crude matter(%) protein(%) fat(%}
Initial 24.0 48.0 14.6
Final Diet 1 26.0 58.4 22.5
Diet2 25.6 57.1 22.1
Diet 3 23.9 00.1 18.7
Diet4 23.7 61.5 16.0
Discu~ion
The results of ·this study indicate that the alfalfa is an acceptable protein source in diets for bream fingerlings. The inclusion of alfalfa in formulated diets at 20-40% levels resulted in better palatability, increased feed intake and a better quality in terms of relative carcass protein and fat content. Fish fed the alfalfa diets at these inclusion levels had a growth rate, FCR and protein utilization comparable to those fish fed the control diet.
At the higher inclusion level of alfalfa, although the consumption was higher than in fish fed the control diet, the growth performance and feed and protein utilization efficiencies were poorer. This could have been caused either by the nutritional imbalance or by the low caloric content in the diet. The lysine, methionine and caloric contents in Diet 4 were 6.4%, 9.4% and 8.9% lower, respectively, than in Diet 1. It will be interesting to explore whether it is possible to further increase the inclusion level of alfalfa if lysine, methionine and fat or carbohydrate were supplemented.
It would seem that the dietary caloric content had a profound influence on the feed intake and protein utilization. The substantial increase in consumption of fish on Diet 4 probably reflected the relationship between feed intake and caloric content of the diet since fish eat to satisfy their energy requirements. As PER and PPV values of fish fed Diet 4 were significantly lower than those in the control group, part of the protein consumed by fish fed Diet 4 may have been catabolized as an energy source and were not effectively used for growth and protein deposition.
The isonitrogenous, anisocaloric nature of the diets led to different PIE ratios among diets. Results of this experiment showed that the optimum PIE ratio for bream fingerlings was between 22.3 and 22.8 mg protein/kJ. This value is lower than the value of 27.9 mg/kJ for tilapia (Jauncey 1982), higher than the value of 20.8 mg/kJ for channel catfish (Garling and Wilson, 1976), and close to the value of 20.6 - 24.0 mg/kJ for carp (fakeuchi et al. 1979).

123
References
Fang Zhaobi and Hu DislDI. 1988. The exploitalion of the artificial dry grass sources in Oiina, p. 71-75. /11 Proceedings of the Feed Exploitation in Oiina. (In Oiinese ).
Garling, D.L., Jr. and R.P. Wilson. 1976. The optimmn dietary protein to energy ratio for channel catfish fmgerlings, lctalllTllS p1U1Ctatus. J. Nutr. 106: 1368-1375.
Guo Jin. 1988. The exploitation of alfalfa, Trifoli111n sp. resource. Feed Res. 1: 34-35, (In Oiinese). Jackson, AJ., B.S. Capper and A.J. Matty. 1982. Evaluation of some plant proteins in complete diets for the Tilapia Sarotliuodon mossambicus.
Aquaculture 27: 97-109. Ja1D1cey, K. 1982. The effects of varying dietary protein level on the growth, food conversion, protein utilization and body composition of
juvenile tilapias (SarOlMrodon mossambicus). Aquaculture '1:7: 43-54. Shiau, S.T., J.L. Chuang and C.L SIDI. 1987. Inclusion of soybean meal in tilapia (Oreocliromis x 0. aureus) diets at two protein levels.
Aquaculture 65: 251-261. Tacon, A.GJ. 1981. The possible substitution of fish meal in fish diets, p. 46-56. ln Proceedings of the SMBA/lilDB Fish Farming Meeting,
Oben, Great Britain. Takeuchi, T., T. Watanabe and C. Ogino. 1979. Availability of carbohydrate and lipid u dietary energy sources for carp. Bull. Japan. Soc. Sci.
Fish. 45: 9TI-982. Viola, S., S. Mokady and Y. Arieli. 1982. Partial and complete replacement of fishmeal by soybean meal in feeds for intensive culture of carp.
Aquaculture 26: 223-236. Wee, K.L and S.S. Wang. 1987. Nutritive value of uwcaena leaf and in pelleted feed for Nile tilapiL Aquaculture 62: 97-108.


Effects of Different Levels of Dietary Protein and a Legume Vigna catiang on Gonadal Development in
Oreochromis niloticus (L.)
P.R.T. CUMARANATUNGA K.L.G.P. MALLIKA
Department of Zoology Faculty of Science
University of Ruhuna !vfatara,SriLanka
CUMARANATUNGA, P.R.T. and K.LG.P. MALLIKA. 1991. Effects of different levels of dietary protein and a legume Vigna catiang on gonadal development in Oreochromis niloticus (L.), p. 125-133. In S.S. De Silva (ed.) Fish nutrition research in Asia. Proceedings of the Fourth Asian Fish Nutrition Workshop. Asian Fish. Soc. Spec. Pub!. 5, 205 p. Asian Fisheries Society, Manila, Philippines.
Abstract
Three groups of Oreochromis niloticus (L.) (2: 1 females:males) were fed to satiation twice daily with three diets: c1 (control), Ci and C3 (test diets) containing 40, 30 and 20% fishmeal, respectively; Ci and C:J contained 16 and 32% Vigna catiang, respectively. All diets contained 28% crude protein. After 9 weeks of feeding, the gonads were removed, the gonadosornatic index (GSD was determined and development studied histologically. Results were compared with those obtained from a similar group of 0. niloticus in a parallel experiment fed diet Di containing 30% fishmeal and a crude protein level of 25%.
The GSI of males fed C 1 (0.3123 ± 0.1268) was lower than that in all other groups and significantly lower (P < 0.05) than in those fed C3 (0.7519 ± 0.4819). The GSI of C1 fed females (2.3264 ± 2.2109) was lower than that in all other groups although the differences were not significant. Total number of vitellogenic oocytes (216 ± 46/10 g body weight) in the ovaries of D1 fed fish, which consisted mostly of the stage 5 oocytes was significantly higher (P < 0.05) than those fed C3 (148 ± 59/10 g body weight). The number of atretic vitellogenic oocytes in C:J fed females (95 ± 30/10 g body weight) was significantly higher (P < 0.01) than those fed Di (59 ± 13/10 g body weight). The mean oocyte diameter of vitellogenic oocytes of c1 fed fish (0.9843 ± 0.3293 mm) was significantly smaller than Ci. C:J and D1 fed females (1.2160 ± 0.4575 I'f!m, 1.0645 ± 0.3709 mm and 1.1593 ± 0.4623 mm, respectively). Further, the mean oocyte diameter in fish fed C3 was significantly larger than those fed Ci and Di (P < 0.01).
Introduction
Vigna catiang is a leguminous seed with a chemical composition and an amino acid profile acceptable for incorporation into fish diets (De Silva et al. 1988). The effects of V. catiang substituted diets on the digestibility, growth performance and carcass composition of Oreochromis niloticus (L.) have been determined by De Silva et al. (1988, 1990). The reproductive performance of 0. niloticus fed plant substituted diets has been studied only on few occasions (Santiago et al. 1988; De Silva and Radampola 1990).
125

126
A comparative histological survey on the ovarian development of 0. niloticus fed diets formulated with fish meal and V. catiang at different levels of inclusion (18 and 42%) and also with a crude protein content of 25% revealed that the V. catiang substituted diets may delay the ovarian development and reduce fecundity (Cumaranatunga and Thabrew 1989). The present study was conducted parallel to the above and also dealt with the gonadal development of female and male 0. niloticus fed diets formulated with fishmeal and V. catiang substituted at different levels but all diets contained 28% crude protein.
Materials and Methods
Three groups of 0. niloticus (L.) of 7.6-10.0 cm total length were introduced into a recirculating system of 3 tanks with a capacity of 37 1. Each group of 15-20 fish had a sex ratio of 2: 1 (females:males). They were acclimatized to the system for a week during which they were fed to satiation twice daily with the control diet (C1; Table 1).
Weight and length of all fish were measured at the commencement of the experiment and 10 fish of both sexes were sacrificed to obtain gonads in order to determine the gonadosomatic index (GSI) and maturity stages (Table 2). Subsequently three groups of fish were fed separately with the control diet (C1) and two test diets (C2 and C3; Table 1).
Feeding was carried out for 9 weeks after which all fish were sacrificed and gonads removed. Length, weight and gonadal weight of fish were recorded. Developmental stages of gonads were identified according to the stages described for cichlids (Babiker and Ibrahim 1979). The right ovary of all females and testis of all males were fixed in Bouin's fixative for histological studies. The left ovary was weighed separately and preserved in modified Gilson's fluid (Simpson 1951) for counting oocytes at different stages of development.
Histological Studies
All gonads fixed in Bouin's fixative were embedded in JB-4 methacrylate plastic (Polysciences, USA) sectioned at a thickness of 2u using a base-sledge microtome (Bright Instruments, UK), stained with hematoxylin and eosin, and examined and photographed using a photomicroscope (Olympus OMT-2, Japan). Oocytes were staged according to that described for rainbow trout (Van den Hurk and Peute 1979; Bromage and Cumaranatunga 1988), and also according to the approximate diameters determined for oocytes at different developmental stages in 0. niloticus (Cumaranatunga and Thabrew 1989). Different stages of spermatocytes were identified according to Yasutake and Wales (1983).
Oocyte Diameter Measurements and Counting
Ovaries kept in Gilson's fluid for a period of 2 to 4 weeks, when the oocytes separated out, were placed in a counting chamber and the oocyte diameters were measured using a microscope eye-piece graticule and numbers estimated. Small previtellogenic oocytes were subsampled with a 1-ml stempler pipette.
Using all the above data growth, GSI and gonadal development of both sexes and distribution and growth of oocytes in the ovaries of females fed C1, C2 and C3 diets were determined. This information was compared with each other and also with that obtained from a

127
Table I. The ingredient and proximate composition (calculated) of diets Cl, Ci. CJ and D1.
Constituc::nl " weight of uch constirui:nt Proldn, lipid and ash contriboud by uch diewy constiruc::nl in experimental dieu in experimental dicu ("dry weight)
PrOlein Lipid Ash
Ct C2 C3 Dt Ct C2 C3 Dt Ct C2 C3 Dt Ct C2 C3 Dt
Fish meol 40 30 20 30 t6.9t t2.68 8.4S t2.68 7.08 s:n 3.St s:n tt.28 8.46 S.64 8.46 Glyccne soya t6 t6 16 16 6.t8 6.18 6.t8 6.18 3.36 3.36 3.36 3.36 0.96 0.96 0.96 0.96 Coconut meal 13 t3 13 13 2.8t 2.81 2.8t 2.8t 2.98 2.98 2.98 2.98 0.9t 0.9t 0.9t 0.9t Vi1na Calia"I 16 32 4.04 8.08 t.34 2.68 0.66 t.32 Whutflour 27.S 2t 14 36 3.07 2.34 1.S6 4.03 0.88 0.71 0.4S I.IS o.ss 0.47 0.28 I.IS Vidnmix t t t t Mineral mix t t t I 0.98 0.98 0.98 0.98 Fishait 0.2S o.s t t 0.49 0.49 0.98 0.98 Plant oil 0.2S o.s t t 0.49 0.98 0.98 Cr2DJ t t t l
Toul 28.97 28.0S 27.08 2S.70 t4.73 t4.62 t4.94 t4.72 t4.68 t2.44 t0.09 t2.03
Table 2. Mean length, weight and GSI of 0. niloticus females fed C1, Ci. ~ and 0 1 diets. Mean± S.D. Number sampled is given in parentheses.
C1 C2 C3 D1
Length (cm) Initial 8.33 ± 0.58 (14) 8.70 ± 0.52 (12) 8.59 ± 0.56 (1 IJ • 8.60 ± 0.69 (10) Final 10.07 ± 0.19 (lO)b,c' 10.62 ± 0.57 (I I )a,d 10.68 ± 0.81 (9) ,a 10.16 ± 0.33 (Jfc
Weight (g) Initial 8.33 ± 1.48 (14) 8.98 ± 1.82 (12) 8.58 ± 1.77 (11) 8.86± 2.44 (10) Final 15.48 ± 1.38 (lO)bc" 17.63 ± 3.18 (11)8 19.85 ± 4.55 (9)a"d 16.63 ± 1.71 (J)C
GSI 2.4299 ± 2 7776 (10) 4.2030 ± 22854 (11) 3.8323 ± I. 7384 (9) 3.8885± 1.9857 (J)
a, a, a , a. - Difference from C1 fed females (a= 0.10 > P 0.05, a'= P < 0.05, a"= P < 0.025, a.= P < 0.01) b, b. - Difference from Ci fed females (b = 0.10 > P 0.05, b. = P < 0.01) c, c', c" - Difference from C3 fed females (c = 0.10 > P 0.05, c' = P < 0.05, c" =.P < 0.025)
similar group of fish from a parallel experiment fed on diet D1 containing 30% fishmeal, 0% V. catiang and 25% crude protein by dry weight. Students' t-test was used to test the differences statistical! y.
Results
Lengths of females fed V. catiang substituted diets (C2 and C3) were greater than those fed C1 (P < 0.01 and P < 0.05, respectively) and 0 1 (0.10 > P > 0.05; Table 2). Furthermore, the length of males fed C3 was greater than those fed C1 (P < 0.05; Table 3). The weight of C3 fed females was greater than those fed C1 and D1 and weight of C3 fed males was greater than those fed C1 (Tables 2 and 3). The GSI of females fed C1, C2 and C3 did not show any difference from each other and also from those fed D1 (Table 2). However, the GSI of males fed C1 was lower than those fed Ci, C3 (0.10 > P > 0.05) and D1 (P < 0.05) (Table 3). None of the experimental fish spawned but a few females and males from each group released ova and milt, on application of gentle pressure on the belly.
Gonadal Histology
Histological examinations of ovaries showed that at the commencement of the experiment ovaries contained only stage 5 and early stage 6 vitellogenic oocytes. After 9 weeks on diets Cl> Ci and C3 vitellogenic oocytes of all stages (stages 5, 6 and 7) were observed. However, in fish

128
fed diet C3 vitellogenic oocytes were at an advanced stage of development when compared to those fed diet C1 (Plates 1 and 2). Atretic stages 6 and 7 vitellogenic oocytes and a few postovulatory follicles were present in the ovaries of fish fed C3 (Plates 3 and 4 ). Groups fed diets C1 and Ci had atretic vitellogenic oocytes in stages 5 and 6 (Plate 5). In fish fed D1 although all stages of vitellogenic oocytes were present, stage 5 oocytes were more frequently observed and atretic oocytes of stages 5 and 6 were also present (Plate 6).
Table 3. Mean length, weight and GSI of 0. niloticus males fed C1, Cz, C:i and D1 diets. Mean± S.D. (n).
C1 Ci C3 D1
Initial 8.30 ± 0.47 [!) 8.50 ± 0.55 (7) 8.43 ± 0.72 (7) 8.30 ± 0.44 (6) Final 10.53 ± 0.46 (6)c' 11.17 ± 0.77 (6) 11.30 ± 0.59 (5)8 ' 10.84 ± 0.92 (5)
Length (cm)
Weight Initial 7 .84 ± 1.08 (7) 7.97 ± 1.28 (7) 8.05± 1.98 (7) 7.76± 1.60(6) Final 18.12 ± J.82 (6)C 20.43 ± 4.22 (6) 21.34 ± 2.96 (5)8 19.85 ± 5.46 (5)
GSI 0.2893 ± 0.1220 (6)bcd' 0.9944 ± 0.9354 (6)a 0.7519 ± 0.4819 (5)'1 0.8252 ± 0.5164 (5)'1
a , a' Difference from C1 fed males (a= 0.10 > P > 0.05, a'= P < 0.05) b Difference from C2 fed males (b = 0.10 > P > 0.05) c, c' Difference from C3 fed males (c = 0.10 > P > 0.05, c' = P < 0.05) d Difference from D1 fed males (d = 0.10 >I?> 0.05)
Plate I. Section of an ovary of 0 . ni/oticus fed diet C1 showing Plate 2. Section of an ovary of 0 . niloticus fed diet C3 showing stages 5 and 6 vitellogenic oocytes (ST5 and ST6) and late stage 6 (S1<,) oocytes. x 60 previtellogenic oocytes (P). x 100
Plate 3. Section of an ovary of 0. niloticus fed diet C3 showing Plate 4. Section of an ovary of 0. niloticus fed diet C:i showing a stages 6 and 7 atretic oocytes (A1<, and At,). x 100 post ovulatory follicle (POF) and previtellogenic oocytes (P). x
200

Plate 5. Section of an ovary ol 0 . 11iloticus fed diet C1 showing stages 5 and 6 atrctic oocytcs (A'5 and A'6). x 100
Plate 6. Section of an :>vary of 0 . 11iloticus fed diet 0 1 showing stages 5 and 6 vitellogcnic oocytcs (S'5 and S'6) and stages 5 and 6 atrctic oocytcs (At5 and A'6)· x 100
129
In males at the commencement of the experiment, testes contained spermatocytes of all stages and spermatids were frequently observed. After 9 weeks on diets C1, C2, C3 and 0 1 almost all the testes contained spermatozoa in addition to all stages of developing spermatocytes. Some had comparatively larger numbers of spermatids and spermatozoa and others had empty spaces among the spermatozoa within the lobules (Plates 7, 8 and 9).
Plate 7. Section of a testis of 0 . 11iloticus fed diet G.J showing spcnnal.OC)'ICs (Sc), spcnnatids (Sd) and lot of spcnna10wa (Sa). x400
Plate 8. Section of a testis of 0 . ni/oticus fed diet C1 showing spcnnal.OC)'ICs (Se), spcnnatids (Sd) and some spcnn11oroa (Sa) with empty sp1ces within the lobules (• ). x (i()()
Plate 9. Section of a teslll ol 0 . niloticus fed diet 0 1 showing promodial gcnn oclls (Pg), spcnnatocyt.cs (Sc), spcnnatids (Sd), spcnnatoroa (Sa) and lobules with few empty sp1ce1 (• ). x (i()()

130
Oocyte Numbers
Numbers of oocytes in the ovaries of experimental fish are given in Table 4. The total number of oocytes in the ovaries of fish fed C1 was higher than those fed C1 (0.10 > P > 0.05). The total number of oocytes in the ovaries of fish fed C2 and C3 was lower than those fed D1 (P < 0.05 and P < 0.025, respectively). Somewhat similar observations were made when total numbers of previtellogenic oocytes in C1, C2, C3 and D1 fed fish were compared. The total number of vitellogenic oocytes in C1, C2 and C3 fed fish did not show a significant difference from each other. However, the number of stage 7 oocytes in fish fed V. catiang substituted diets was higher than those fed C1 and the highest was observed in those fed C3• The total number of vitellogenic oocytes in fish fed C3 (148 ± 59/10 g body weight) was lower (P < 0.05) than fish fed D1 (216 ± 46/10 g body weight). Similarly, the number of stage 5 vitellogenic oocytes in C3
fed fish (35 ± 21/10 g body weight) was significantly lower (P < 0.05) than D1 fed fish (67 ± 28/10 g body weight), although the differences in the numbers of stages 6 and 7 oocytes were not significant. Numbers of atretic vitellogenic oocytes in C2 and C3 fed fish (90 ± 50 and 95 ± 30/10 g body weight, respectively) were higher (0.10 > P > 0.05 and P < 0.01, respectively) than those fed D1 (59 ± 13/10 g body weight). The number of atretic oocytes in fish fed C3 was higher (0.10 > P > 0.05) than those on C1 (59 ± 55/10 g body weight).
Oocyte Diameters
Oocyte diameters in fish fed c., C2, C3 and D1 diets are given in Table 5. The mean diameter of vitellogenic oocytes in fish fed C3 (1.2160 ± 0.45775 mm) was larger than those fed C1 (0.9843±0.3293 mm), C2 (1.0645 ± 0.3709 mm) and D1 (1.1593±0.4623 mm) (P < 0.001, P < 0.001 and P < 0.01, respectively). Mean diameters of vitellogenic oocytes in C3 and D1 fed fish were significantly larger than C1 fed fish (P < 0.001) and also D1 fed fish were larger than the C2
fed group (P < 0.001). Mean diameters of oocytes at stages 5, 6 and 7 in C1 fed fish are smaller than the oocytes at respective stages in fish fed C2, C3 and D 1• The mean diameter of stage 5 vitellogenic oocytes in fish fed C2 (0.6955 ± 0.0508 mm) is larger than those fed C3 (0.6894 ± 0.0493 mm) (0.10 > P > 0.05). The mean diameter of stage 6 oocytes in fish fed C3 (1.1819 ± 0.2783 mm) is larger than those fed D1 (1.1523±0.2741 mm) (0.10 > P > 0.05). Mean diameters of stage 7 oocytes in fish fed C2 and C3 (1.8831±0.1280 and 1.8902 ± 0.1346 mm, respectively) were smaller (0.10 > P > 0.05) than fish fed D1 (1.9140±0.1276 mm).
Discu~ion
Oreochromis niloticus fed Vigna catiang substituted diets with a total protein content of 28% (Ci and C3) enhanced the gonadal development of both males and females. This effect is clearly shown in the growth of oocytes at vitellogenic phase of development. During this phase hepatically produced vitellogenin (phosphoglycolipo protein) is known to be incorporated into the oocyte (Wallace and Selman 1981; Bromage and Cumaranatunga 1988). In contrast in a parallel study V. catiang substituted diets with a lower total protein content (25% by dry weight) retarded ovarian development compared to unsubstituted diets with a similar level of dietary protein. This was thought to be due to insufficient levels of vitellogenic protein and/or lipids in V. catiang compared to fish meal (Cumaranatunga and Thabrew 1989). Supportive observations

131
Table 4. Distribution of oocytes at different developmental stages in the ovaries of 0. niloticus fed diets Ci, Ci. ~ and Di.
Oocyte developmental stage Mean number of oocytes/l 0 g body weight of fish fed diets C1, Ci. <; and D1
Mean± S.D. (n)
c, Cz C3 D,
Chromatin nucleolar stage (1) 24,299 ± 'J:T,716 (lO)C 11,001±5,818o1f'' 8,596 ± 5,545 (9)8d" 51,067 ± 31,365 (5)b"c" Balbiani body stage (2) 11,144 ± 9,791 (lO)C 6,768±2,125 (11) 5,482 ± 3,049 (9)a 9,993 ± 6,789 (5) Late perinucleolar stage (3) 488 ± 484 (10) 222 ± 104 (11) 234± 82 (9) 222± 114 (5) Yolk vesicle stage ( 4) 613 ± 577 (10) 581±350 (11) 562 ± 196 (9) 487 ±245 (5) Total previtellogenic
oocytes (stages 1-4) 36,534 ± 36,571 (lQ)C 18,553 ±7,033 (llf" 14,808 ±7,605 (9)ad" 61,768 :±: 36,791 (b)b"c" Peripheral yolk granule
stage (5) 44± 54 (10) 97±1'1:1(11) 35±21 (9f 67 ±28 (5)c Germinal vesicle migration
stage (6) 75 ± 144 (10) 127 ± 93 (11) 91±41 (9) 109 ±46 (5) Germinal vesicle breakdown
stage (7) 8±21 (10) 9 ± 18 (10) 22 ±28 (9) 39 ±51 (5) Total vitellogenic oocytes
(stages 5-7) 1'1:1±214 (10) 234-± 181 (llJ 148 ± 59 (9)d' 216±46(5)C° Atretic oocytes 59 ± 55 (lO)c 90± 50 (11) 95 ± 30 (9)8d. 59 ± 13 (5)bc. Total number of oocytes
18,876±7,119 (llf (stages 1-7 + atretic) 38,319 ± 36,475 (lQ)C 15,051 ± 7,619 (9)8d. 62,043 ± 36,835 (5)b'c.
a - Difference from C1 fed fish (a= 0.10 > P 0.05) b,b',b" - Difference from C2 fed fish (b = 0.10 > P 0.0~. b' = P < 0.05, b" = P < 0.025) c,c',c",c. - Difference from C3 fed fish (c = 0.10 > P 0.05, c' = P < 0.05, c" = P < 0.025, c. = P < 0.01) d',d",d. - Difference from D1 fed fish (d' = P < 0.05, d" = P < 0.025, d. = P < 0.01)
Table 5. Mean diameter of vitellogenic oocytes at different stages of development in fish fed diets C1, Ci. CJ and D1.
Vitellogenic stage
Mean diameters of vitellogenic oocytes in C1, Cz, CJ and D1 fed fish. Mean diameter± S.D. (n).
5 6 7
(5+6+7)
0.6813 ± 0.0523 (240)hcd 1.1127 ± 0.2393 (3880~d' 1.8323 ± 0.1050 (27)b clJ_ 0.9843 ± 0.3293 (655~
0.6955 ± 0.0508 (528)AC l.lfi65 ± 0.2791 (l 116)il 1.8831 ± 0.1280 (99)a'd 1.0645 ± 0.3709 (1343~
0.6894 ± 0.0493 (311 )ab 1.1819 ± 0.2783 (733)lld 1.8902 ± 0.1346 (280)a,d 1.2160±0.4575 (1324~
a,a·~ Difference from C1 fed fish (a= 0.10 > P > 0.05, a'= P < 0.05, a= P < 0.001) b,b'.l! - Difference from Ci fed fish (b = 0.10 > P < 0.05, b' = P < 0.05, b = P < 0.001) c,c.,i;: - Difference from C3 fed fish (c = 0.10 > P > 0.05, c. = P < 0.01, c = P < 0.001) d,d',d.,4 - Difference from D1 fed fish (d = 0.10 > P > 0.05, d' = P < 0.05, d. = P < 0.01, d = P < 0.001)
0.6895 ± 0.0481 (240)a 1.1529 ± 0.2741 (413)a'c 1.9140 ± 0.1276 (152)1.bc 1.1593 ± 0.4623 (805~
are reported from 0. niloticus fed above diets with V. catiang substitutions and with a total dietary protein content of 25 and 28% (De Silva and Radampola, unpublished data). However, in the present study 0. niloticus fed a diet with 32% V. catiang and 20% fish meal and total dietary protein content of 28% (C3) had larger vitellogenic oocytes compared to those fed unsubstituted diets (C1 and D1) with 40 and 30% fish meal, with a total dietary protein content of 28 and 25%, respectively. A major portion of oocyte growth is known to occur during the germinal vesicle migratory stage (stage 6) as active uptake of hepatically produced vitellogenin occurs during this stage of oocyte development (Wallace and Selman 1981; Bromage and Cumaranatunga 1988). The presence of larger stage 6 oocytes in the ovaries of C3 fed fish compared to those fed unsubstituted diets is an indication of enhancement of vitellogenin production in the liver and/or vitellogenin uptake by stage 6 oocytes of 0. niloticus fed on a diet substituted with V. catiang but with a higher protein content. Cumaranatunga and Thabrew (1989) in a parallel study on 0. niloticus fed V. catiang substituted diets with a lower protein content (25%) observed a retardation of growth of oocytes at stage 6. Similar observations were reported for other cultured

132
species of fish as a result of dietary restncnons (Scott 1962; Springate et al. 1985; Cumaranatunga 1986). However, this change in the growth rate of vitellogenic oocytes could be due to a change in amino acid profile which could have occurred as a result of V. catiang substitution.
Amino acid lysine is known to be a limiting factor in most plant ingredients (Leiner 1980) and in V. catiang the lysine content is found to be 6.24% dry weight (De Silva et al. 1988). Although the lysine content of 0. niloticus eggs is not recorded, in rainbow trout eggs it is reported to be 13.8 n.mol./g dry weight, egg x 10 (Springate et al. 1985). In a study conducted parallel to the present one in which 0. niloticus fed diets substituted with V. catiang at 18 and 42% and the total dietary protein content was 25%, the retardation of oocyte growth has been attributed to a possible deficiency in amino acid lysine (Cumaranatunga and Thabrew 1989). Thus in the diet substituted with 32% V. catiang and with a total dietary protein content of 28%, the amino acid lysine and other essential amino acids may have been included in proportions required for an enhancement of vitellogenin production in 0. niloticus which in turn has enhanced their oocyte growth. However, further investigations on the amino acid profiles of 0. niloticus eggs and also of V. catiang substituted diets are necessary to evaluate the effect of lysine in V. catiang substituted diets on the ovarian growth of 0. niloticus.
The presence of few post-ovulatory follicles, smaller numbers of stage 5 vitellogenic oocytes and a large number of atretic vitellogenic oocytes of which most were in stage 7 in 0. niloticus fed C3, with 32% V. catiang and 28% total protein indicates an enhancement of vitellogenin production which has in turn enhanced the recruitment of vitellogenic oocytes into higher developmental stages. Somewhat similar observations were reported for rainbow trout maintained on a full ration (Springate et al. 1985). Stage 7 (mature) oocytes in C3 fed fish may have become atretic as a result of overrippening because facilities required for spawning was not provided during the present study. Resorption or atresia of ripe oocytes is reported to be a common phenomenon among species of tilapia (Peters 1983).
In 0. niloticus (L.) an improvement in reproductive performance is known to occur when dietary crude protein levels were increased up to 50% (Santiago et al. 1983) with an optimum performance at 25 to 30% (De Silva and Radampola 1990). Wee and Tuan (1988) observed higher fecundities in 0. niloticus fed diets with 20, 27 .5 and 35% protein. The total protein content of the diets used in the present study were kept within the above range. The unsubstituted diet (C1) with 28% crude protein fed to 0. niloticus showed an inhibitory effect on the ovarian development which is evident from the presence of significantly smaller (P < 0.001) vitellogenic oocytes in their ovaries compared to those fed diets with a lower total protein content (D1). Furthermore, somewhat similar observations are made on the gonadal growth of male 0. niloticus when dietary crude protein levels are increased. The GSI of males fed unsubstituted diets with 28% crude protein was significantly lower than that in fish fed diets with a higher crude protein content.
The above observations show that when formulating 0. niloticus broodstock diets, if fish meal is the only source of protein the crude protein level should be maintained below 28% in order to obtain larger eggs and an advancement in gonadal development which would result in early spawning. The above protein level is within the optimum range suggested by De Silva and Radampola (1990). With V. catiang substituted to a level of 28% crude protein an enhancement of gonadal development results. This enhancement is especially seen on the development of vitellogenic oocytes. However, to find the optimum levels of V. catiang which should be included in the diets for 0. niloticus, a more detailed study needs to be conducted using a wider range of diets with different levels of substitutions and crude protein levels.

133
Acknowledgements
We are grateful to Professor Sena S. De Silva of the Deparnnent of Zoology, National University of Singapore, for formulating diets used in this study and for critically reading the manuscript. This work was funded by an International Development Research Centre, Canada, grant offered to the first author.
References
Babiker, M.M. and H. Ibrahim. 1979. Studies on the biology of reproduction in the cichlid Tilapia nilotica (L.): gonadal maturatioo and feClDldity. J. Fish Biol 14: 437-448.
Bromage, N.R. and P.R.T. Cumaranatunga. 1988. Egg production in the rainbow trout, p. 63-138. In James F. Muir and Ronald J. Roberts (eds.) Recent advances in Aquaculture. Vol. 3. Croom Helm, London.
Cumaranatunga, P.R.T. 1986. The ovarian development of rainbow trout with special reference to atresia. University of Astoo in Birmingham, UK. Ph.D. thesis.
Cumaranatunga, P.R.T. and H. Thabrew. 1989. Effects of a legume (Vigna catiang) substituted diets oo the ovarian development of Oreochromis niloticus (L.), p. 333-344. In M. Takeda and T. Watanabe (eds.) The current status of fish nutritioo in aquaculture. Proc. Third Int. Symp. on Feeding and Nutr. in Fish. 28 August-I September 1989, Toba, Japan.
De Silva, S.S., C.N. Keembiyahetti and R.M. Gunasekera. 1988. Plant ingredient substitutes in Oreochromis niloticus (L.) diets: ingredient digestibility and effect of dietary protein content oo digestibility. J. Aqua. Trop. 3: 127-138.
De Silva, S.S. and K. Radampola. 1990. Effects of dietary protein level on the reproductive performance of Oreochromis niloticus (L.), p. 559-563. In R. Hirano and I. Hanyu (eds.) The Second Asian Fisheries Forum. 991 p. Asian Fisheries Society, Manila, Philippines.
De Silva, S.S. and R.M. Gunasekera. 1990. Effects of dietary protein level and amount of plant ingredient (Phaseolus aureus) incorporated into the diets on consumption, growth performance and carcass composition in Oreochromis niloticus (L.) fry. Aquaculture 80: 121-133.
Leiner, I.E., Editor. 1980. Toxic constituents of plant food stuffs. Academic Press, Londoo. Peters, H.M. 1983. Fecundity, egg weight and oocyte development in tilapias (Cichlidae, Teleostei). ICLARM Translatioos 2, 28 p. Santiago, C.B., M.B. Aldaba and M.A. Laron. 1983. Effects of varying dietary crude protein levels on spawning frequency and growth of
Sarotherodon niloticus breeders. Fish. Res. J. Philipp. 8: 9-10. Santiago, C.B., M.B. Aldaba, M.A. Laron and O.S. Reyes. 1988. Reproductive performance and growth of Nile tilapia (Oreochromis niloticus)
brood stock fed diets containing Lewcaena lewcocephala leaf meal Aquaculture 70: 53-61. Soon, D.P. 1962. Effects of food quality of fecundity of rainbow trout, Sa/mo gairdneri. J. Fish. Res. Board Can. 19: 715-731. Simpson, A.C. 1951. The fecundity of the plaice. Fishery Invest. Lond. Ser. 2. 17. ZT p. Springate, J.R.C., N.R. Bromage and P.R.T. Cumaranatunga. 1985. The effects of different rations oo fecundity and egg quality in the rainbow
trout (Salmo gairdneri), p. 371-391. In C.B. Cowey, A.M. Mackie and J.G. Bell (eds.) Nutrition and feeding in fish. Academic Press, London.
Van den Burk, R. and J. Peute. 1979. Cyclic changes in the ovary of the rainbow trout, Salmo gairdneri, with special reference to sites of steroidogenesis. Cell Tissue Res. 199: 289-306.
Wallace, R.A. and K. Selman. 1981. Cellular and dynamic aspects of oocyte growth in teleosts. Amer. Zoo!. 21: 325-343. Wee, K.L. and N.A. Tuan. 1988. Effecfs of dietary protein levels on the growth and reproductioo in Nile tilapia (Oreochromis niloticus), p. 401-
410. In R.S.V. Pullin, T. Bhukaswan, K. Tonguthai and J.L. Maclean (eds.) The Second Intematiooal Symposium oo Tilapia in Aquaculture. ICLARM Conf. Proc. 15, 623 p.
Yasutake, W.T. and J.H. Wales, Editors. 1983. Microscopic anatomy of salmonids: an atlas. Resource Publication. US Fish and Wildlife Services, Washington, DC.


Culture of the Cladoceran Moina micrura Kurz Using Agroindustrial Wastes*
S.H. TAY V.K. RAJBANSHI**
W.H. HO J.CHEW E.A. YAP
Aquaculture Division, Industrial Farm Primary Industries Enterprise
IO-A Punggol Port Road Singapore I954
TAY, S.H., V.K. RAJBANSl-Il, W.H. HO, J. CHEW and E.A. YAP. 1991. Culture of the cladoceran Moina micrura Kurz using agroindustrial wastes, p. 135-141. /n S.S. De Silva (ed.) Fish nutrition research in Asia. Proceedings of the Fourth Asian Fish Nutrition Workshop. Asian Fish. Soc. Spec. Pub!. 5, 205 p. Asian Fisheries Society, Manila, Philippines.
Abstract
Moina is particularly preferred due to its wide acceptability as a fish food and rich nutritional value. On a dry weight basis, it contains about 65.1 % crude protein, 8.7% crude fat and 5.3% crude fiber besides other micronutrients. Culture of Moina micrura was anempted using two agroindustrial wastes viz. soybean waste and spent grain separately in concentrations ranging from 0 to 15 liter wastes. Soybean waste of a concentration of 7 L W (7 1 waste/200 1 water) gave the best performance in terms of Moina yield (1,875/1), whereas at strengths, of 9 and 11 LW, the populations recorded were 1,150 and 1,132 individuals per liter, respectively. The spent grain was, however, less productive; at 13, 15 and 5 LW concentrations of rulture media produced 955, 850 and 792 individuals per liter, respeaively. The results of the different concentrations of wastes used have been analyzed with reference to the physico-chemical parameters of the culture media.
Introduction
Zooplankton maintains an important link in the sustenance of food chains. As such, their role is significant and are extensively used in the rearing of larvae and fry of commercially important fishes and crustaceans. Among the different groups of zooplankton cladocerans are preferred because of their rapid proliferation. The cladoceran, Moina is important due to its wide acceptability by a number of commonly cultured fish and shellfish larvae and its rich nutritional value. Techniques for the mass cultivation of Moina are still in their infancy as most of the reports related to its culture are only preliminary (Ventura and Enderez 1980; Lee et al. 1985; Rajbanshi et al. 1987; Shirgur and Indulkar 1987; Shim 1988).
•The views expressed in this paper are the views of the authors. They do not necessarily reflect the views of the funding agency or the organizations to which they belong.
• •Perma.;aent address: Department of Limnology and Fisheries, Rajasthan Agricultural University Campus, Udaipur 313 001, India.
135

136
In view of the growing demand of zooplankton as live farm feed in aquaculture and the rising need for utilizing organic wastes, we studied the cultivation of Moina micrura. The part presented in this communication limits to the screening batch culture using soybean waste and spent grain separately in culture media. However, the study is continued in its next phase, which would enable simulation of conditions in the field by initial seeding with phased fertilization and periodic harvesting and for establishing commercial yields. Since the knowledge of interaction between quantity and quality of food available for the zooplankton, and existing physicochemical parameters are equally important, the study has been conducted on the physicochemical characteristics of the culture media.
Materials and Methods
In the present experiment two types of wastes viz. soybean waste and spent grain, were used for culturing M. micrura. For each waste type, eight concentrations were tested with four replicates with the same number of controls. To prepare the waste concentrates, 10 kg of each raw waste were mixed separately in 100 1 of filtered pond water in fermentation tanks, each measuring 216 cm diameter and 80 cm height. The wastes in these tanks were stirred thoroughly to ensure homogeneity and allowed to settle for three days. From the above waste concentrates, 8 test concentrations were prepared separately using 1, 3, 5, 7, 9, 11, 13 and 15 1 of concentrates and topping to a level of 200 1 with filtered water in circular fiberglass tanks, each measuring 67 .5 cm in diameter and 64.5 cm in height. The test concentrates were designated as 1 I-waste, 3 I-waste, etc., and abbreviated as 1 LW, 3 LW and so on. All the tanks were placed on a platform under a transparent roofing covered with black shade net. Nettings were used to cover the tanks to prevent mosquito breeding. On the subsequent day, each tank was innoculated with an estimated population of 50,000 Moina.
The harvesting of Moina was done after 8 days by a 250 mesh net. Physical parameters of culture solutions including pH, temperature, dissolved oxygen (DO) and light intensity were measured daily at 0700, 0900 and 1500 hours. Air temperature was also recorded. Chemical analyses of culture solution were done on the day of seeding and then on the day of harvesting. Chlorides, nitrites, phosphates, sulphates were detected with a Dionex 2000 ion chromatograph. Ammonia-nitrogen, biochemical oxygen demand (BOD), total suspended solids (TSS) were analyzed as per standard methods (APHA 1985).
The density of M. micrura was determined by sampling with a 1 ml pipette. Plastic containers with Moina were agitated vigorously for homogeneity to minimize sampling error. The population was expressed as the quantity sampled per tank. LOTUS - 123 software was used for processing the data. Statistical tests were conducted for the results of the experiment according to the procedures given in Steel and Torrie (1980).
Results
Populations of M. micrura in the two wastes, used in culture experiments, with waste concentrations ranging from 1 LW to 15 LW, are shown in Fig. 1. Soybean waste was found to be a better substrate for the production of Moina as compared to spent grain. For soybean waste, 7 L W was found to be the optimum waste concentration for M. micrura, but this concentration did not differ markedly from other populations at 9 and 11 l wastes as shown by Student-

137
Newman-Keuls' (SNK) test (see Table 1). The yield obtained from spent grain was less, and was not significantly influenced by waste quantity. The population of M. micrura from spent grain treatment culture rose in 5 1 waste, thereafter it suddenly dropped in 7, 9 and 11 1 waste concentrations followed by a highest peak in 13 I waste and then gradual decline was noticed in 151 waste.
Table 1. Results of Student-Newman-Keuls' test for Moina population using two types of wastes.
Soybean- LW 15 0 3 1 Moina population 4,920 (6,049) 47,364 57,844
Spent grain - LW 0 3 1 9 Moina population (7,560) 10,303 23,872 34,139
Standard error normally ranged 10% or above in all the cases.
-U)
"C c:
400
~ 300 ::::J 0 .c --c: 0 -ctl ::::J a. 0 a.
200
ctl 100 c: 0 :!:
0 0 3 5
13 5 72,116 120,008
11 7 34,739 34,790
7 9
11 9 7 226,480 230,179 375,521
5 15 13 158,350 170,203 191,064
Waste types
0 Soya bean
• spent grain
II 13 15
Waste concentration (L/2001 water)
Fig. 1. Population of M. micrura vs. waste concentrations.
The results of the SNK test for the population means of M. micrura at harvest were 82,807 and 141,804 for spent grain and soybean waste, respectively. The results of F values on population data of M. micrura using two-way ANOV A for two types of wastes viz. soybean and spent grain were 44.02 (P <0.01) and 2.583, respectively. Harvest results of different chemical parameters for soybean waste and spent grain are given in Table 2, whereas the test values of chemical parameters in relation to soybean waste are shown in Table 3. Table 4 shows the correlation of various parameters for the two waste types both at seeding and harvesting.

138
Table 2. The mean concentrations of different chemical parameten and total suspended solids (fSS) in !he two types of waste.
Parameter Waste/value
Soybean Spent grain
Otlorides 7.32 12.53
Nitrites 1.33 1.61
Nitrates 1.58 0.52
Phosphates 4.59 1.64
Sulphates 20.69 20.62
Ammonia 4.66 2.19
BOD 32.03 9.29
TSS 4.36 9.11
All the parameters are in mg/I.
Table 3. Nitrite, sulphate and ammonia concentrations in soybean waste at harvesting.
Parameter Liter waste/value 0 3 5 7 9 11 13 15
Nitrites (13.10) 13.41 12.55 13.31 14.13 13.51 13.96 12.69 13.06
Sulphate 21.31 21.91 21.31 22.08 22.56 21.93 20.62 20.49 14.61
Ammonia (1.27) 0.25 1.90 4.01 7.25 6.70 7.63 7.89 1.61
All the parameters are in mg/I.
Discu~ion
Few attempts have been made to culture the cladocerans Moina and Daphnia as feed in aquaculture using varieties of agro-industrial residues and livestock wastes (Ang 1973; De Pauw et al. 1981; Lee 1982; Tay 1980; Ventura and Enderez 1980). The results of investigations have been summarized in Table 5. Among the various methods proposed for the cultivation of cladocerans little comparison could be made, since they were applied with different standardizations in methodology for the preparation of media, administration of the feed (concentration and frequency), and maintenance of the culture tanks, besides the physicochemical parameters.
The effectiveness of both wastes has been determined by Moina yield in the present study. Of the two wastes used; the concentration of 7 L W soybean proved to be more efficacious, with a production reaching more than seven and a half times that of seeding number. This was followed by the result of 13 L W spent grain concentration, which multiplied about three and a half times to that of seeding population. From the present findings, it is evident that exact dosing is very important since overfeeding usually causes high mortality due to excessive bacterial development leading to unfavorable culture conditions as also indicated by De Pauw et al. (1981).

Table 4. Correlation coefficients for physico-chemical parameters using two types of wastes at seeding and harvest.
p Spent values Soybean grain
Temperature s -0.18 0.08 H 0.02 -0.33
DO s -0.60 0.58 H -0.91 -0.69
pH s -0.06 -OA3 H 0.47 -0.19
Light s -0.94 -0.37 H -0.77 -0.28
Chlorides s -0.55 H 0.48 0.50
Nitrites s -0.31 -0.39 H 0.65 -0.30
Nitrates s -0.59 H -0.42
Phosphates s 0.92 0.65 H 0.80 0.70
Sulphates s 0.06 -0.59 H -0.69 0.70
Ammonia s 0.95 0.64 H 0.47 0.84
BOD s 0.88 0.72 H 0.79 0.27
TSS s 0.80 0.58 H 0.03 0.88
Light m an; temperature in °C; all other values in mgJI except pH; H - haivest; S - seeding; TSS - tootl suspended solids; ( -) not determined.
Table 5. Summary of results obtained by different investigators.
Names of researchers
Ang (1973)
De Pauw et al. (1981)
Lee (1982)
Tay (1980)
Ventura and Enderez (1980)
Substrates used in culture media
cow-dung, chicken dung
rice bran
soybean, wheat bran, rice bran, layer mesh, chicken manure and their mixtures
pig and chicken dung and their mixture
chicken manure in sac-method
Optimum yield
I 0,000 Moina/liter
reported successful yield of Daphnia magna
highest 862 - 1988 Moina/I with a mixture of soybean and chicken manure
O.nl8 g Moina/I with pig dung
20,000 - 40,000 Moina/0.5m2
139

140
The studies on the relationships among physico-chemical parameters and the quality and quantity of food in reference to physiological processes of the zooplankton are rare. Ong (1970) observed an increase in growth rate and rapid sexual maturity in M. micrura at higher temperature (maximum at 37°C in contrast to minimum 11°C). Length of embryonal development varies inversely with the rate of reproduction. Increasing temperature shortened the period of embryonal development, thus hastening the rate of reproduction. Further, it was discovered that the upper lethal limit (i.e., 50% mortality) was close to 40°C. It should be noted that Moina raised at higher temperatures experienced less longevity. Shirgur and lndulkar (1987) proposed a range of water temperature between 27 and 31.5°C for optimum growth of M. micrura. Sampled temperature for soybean waste averaged slightly below 30°C at 1500 hours. But in the case of spent grain it often rose above 30°C. Since soybean waste has proved more productive, the temperature factor apparently did not look that vital for Moina. Moreover, artificial control temperature under field conditions is not feasible and not at all cost effective.
On the basis of the results of the physico-chemical analysis (Table 4), the factor that could have retarded the growth of population was dissolved oxygen, particularly in a plant waste like that of soybean. Average values for dissolved oxygen in soybean waste on the first day of culture dropped to 0.1 mg/I starting from 3 L W. Then there was a gradual increase during the culture period for all waste concentrations, except for waste input at 13 and 15 LW, which remained below 1.0 mg/I after 7 days. Values of dissolved oxygen levels for spent grain were slightly higher, the lowest being 0.15 mg/I at 11 LW on the first day of culture. Correlation studies (Table 4) also showed that dissolved oxygen decreased with organic loading for both media. De Pauw et al. (1981) were able to maintain the culture medium for Daphnia magna at oxygen levels above 5 mg/I with aeration and intermittent renewal of rice bran. This prevented stratification within the tank. Anaerobic conditions were further avoided by siphoning unconsumed food, feces and pseudofeces from the bottom of the tank thrice a day. It was further stressed that aeration is an important culturing parameter.
In the production of Moina, pH did not appear to be critical in the present study, though values ranged between 5.0 and 6.0 for the first two days of culture. Lee (1982) reported a pH below 6 in Moina culture tanks during the first four days of experimentation; similar trend was observed for wheat bran and rice bran with the only exception being chicken manure. He found that an increase in pH to 10.5, by addition of 150 cc of 50% potassium hydroxide in culture media resulted in a significantly higher population density.
Very few studies have been made of the effect of anions on Moina. Chlorides, nitrates and sulphates did not appear to contribute significantly to Moina production, whereas a good correlation between nitrites and population was detected (Table 3). This seemed to be related to excretory products. As indicated in the present study, phosphates are closely correlated with Moina culture in soybean waste and spent grain (Table 4 ). This ascribes to the views of Ventura and Enderez (1980) that phophorus and other decomposable organic compounds are necessary for the growth of Moina. In the present study the average values of phosphates in soybean treatment were higher than that of the spent grain. But the trend was not similar in both the cultures, as in soybean the value of phosphates dropped at harvesting, whereas a rise in phosphates was noticed in spent grain after seeding.
The resultant phytoplankton bloom is believed to have a positive effect on Moina (Ventura and Enderez 1980). Norman et al. (1979) indicated that increased bacterial numbers caused Moina macrocopa to bloom when effluent was discharged into a lagoon used for waste treatment. Lower mean values were also observed for TSS and BOD when Moina were present,

141
showing an improvement in water quality in the lagoon. One salient feature in soybean waste was significantly higher BOD values as compared to spent grain at seeding and harvesting (Table 4). As BOD increased in proportion with waste input, it may be a beneficial indicator for Moina production. Thus, it is very likely that soybean waste favors the growth of organisms, e.g., bacteria and algae, in supplying the nutrients, which in tum serve as a potential food source for Moina.
Acknowledgements
This project was supported by a grant (No. BM/86/05) from the Science Council of Singapore. The authors wish to thank the Managing Director of the Primary Industries Enterprise for taking keen interest in the work. We also acknowledge the valuable assistance of the Director, Primary Production Department and Yeo Hiap Seng (Pte.) Ltd., for providing soybean waste. Miss Ho Oi Peng deserves appreciation for typing the manuscript.
References
Ang, K.J. 1973. A simple method for the mass rul.ture of woplankton. No. 8. Lapuran MARDI Report. 14 p. APHA. 1985. Standard methods for the examination of water and wastewater. 16th ed. American Public Health Association, New York. 1268 p. De Pauw, N.L., P. Laureys and J. Morales. 1981. Mass rul.tivation of Daphllia magna Straus on rice bran. Aquaculture 25: 141-152. Lee, H.L. 1982. Preliminary studies on the culture of Moina sp. using organic waste. University of Singapore. ICJ7 p. Hons. Thesis. Lee, H.L., T.W. Chen, LH. Teo and K.F. Shim. 1985. Culture of Moina sp. with waste materials, p. 2CJ7-222. /11 Proceedings of the Second
ASEAN Workshop on Technology of Animal Feed Production Utilising Food Waste Materials . ."\orman, K.F., J.B. Blakely and K.K. Chew. 1979. The ocrurrence and utilization of the cladoceran Moina macropodil (Straus) in a craft pulp mill
treatment lagoon. Proceedings of the World Mariculture Society 10: 116-121. Ong, L.N. 1970. Biology and reproduction of Moina sp. (Crustacea: Cladocera). University of Singapore. 61 p. Hons. Thesis. Rajbanshi, V.K., P. Jayapala and L.L Shama. 1987. Monoculture of Moina d.JJia: I. Effects of varying doses of poultry manure. In XXIIlrd
Congress of Intl. Asso. of Limnology, Hamilton, New Zealand. 106 p. Shim, K.F. 1988. Mass production of Moina in Singapore using pig waste. World Aquaculture Report 19: 59-60. Shirgar, G.A. and S.T. Indulkar. 1987. Continuous mass culture of cladocerari Moina micrura in plastic pool for daily exploitation. Punjab Fish.
Bull. 11: 43-48. Steel, R.G.D. and J.H. Torrie. 1980. Principles and procedures of statistics: a biometrical approach. 2nd ed. McGraw Hill, New York, 633 p. Tay, S.H. 1980. Experiments on the cultivation of Moina micrura Kurz. Pri. Prod. Dept Singapore (unpubl.). 4 p. Ventura, R.F. and E.M. Enderei.. 1980. Preliminary studies on Moina sp. production in freshwater tanks. Aquaculture 21: 93-96.


Supplementary Feeding of Fish in a Duck-Fish Integrated System. I. The Effect of Rice-Bran
AMARARATNE YAKUPITIY AGEI PETER EDWARDSI KOK LEONG WEE2
1Division of Agricultural and Food Engineering Asian Institute of Technology
POBox2754 Bangkok 10501
Thailand
2Tasmanian State Institute of Technology School of Applied Science
P.O. Box 1214, launceston Tasmania, Australia 7250
YAKUPTI1Y AGE, A., P. EDWARDS and K.L. WEE. 1991. Supplementary feeding of fish in a duck-fish integrated system. I. The effect of rice-bran, p. 143-157. /n S.S. De Silva (ed.) Fish nutrition research in Asia. Proceedings of the Fourth Asian Fish Nutritio11 Workshop. Asian Fish. Soc. Spec. Puhl. 5, 205 p. Asian Fisheries Society, Manila, Philippines.
Abstract
The efficacy of supplementary feeding of fish with rice-bran (RB) in an experimental duck/fish integrated system was investigated with a factorial design (two duck stocking density levels x three fish supplementary feeding levels). Eighteen 200-m2 ponds were stocked with Nile tilapia (Oreochromis niloticus) and silver barb (Punlius gonionotus) each at 1.5 m·2 plus Cyprinus carpio (common carp) at 0.1 m·2. Ducks (Khaki-Campbell x native Chonburi strain) were housed over the ponds at stocking densities of 15 or 30 ducks per pond. Fish were fed with RB at 0, I and 2% fish body weight (BW) day- I. The duck level significantly increased the growth rate of tilapia but not of silver barb or common carp. Doubling duck density per unit area resulted in an increase of net fish yield by 3 I/ha- I year-1, mainly as a result of increased tilapia yield. Supplementary RB at 1 % BW day-1 significantly improved the growth of all three species although higher feeding rates of RB had no influence on fish yield. The net yield increment due to addition of 1 % RB amounted to 2.6 t/ha-l year-1. There was no interactive effect of duck density and RB factors on fish growth. An average net total fish yield of 11.61/ha-l year-1 was obtained with 30 ducks pond-I with addition of RB at I% fish BW day-1.
Introduction
Organic manures are traditionally used in pond fertilization to improve fish productivity in tropical Asia (Prowse 1967). Improved traditional management practices have been called upon to fulfill the increasing market demand of fish (FAQ 1981), to ease the conflicting demand for land and water use in various agricultural practices (De Silva 1989), as well as to raise the living standards of crop-growing, fish-eating small-scale farmers in the developing world (Edwards et al. 1988). As small-scale farmers comprise the bulk of the population in the developing world, the challenge is to raise their productivity per unit area per unit effort (Edwards et al. 1988).
143

144
Fish growth and yield in a fertilized fish pond culture system are a function of the natural food availability, fish size and stocking density of fish under a given fertilization regime (Hepher 1975). The system is said to contain a critical standing crop (CSC) when natural food is fully utilized for maintenance and maximum growth of fish. Above the CSC, nutritional deficits developed (Hepher 1988) and fish should be provided with sufficient nutritional building blocks, as well as a substrate for energy metabolism in order to obtain the desired fish yield. While satisfying the nutritional demand of fish, however, the quantity of fertilizer added to increase in situ natural food production should not degrade environmental quality. Further increases in fish yield, therefore, should be sought by addition of supplementary feed.
Pelleted feeds are commonly used to supplement natural food (Hepher 1988), but few attempts have been made to evaluate the nutritional benefits of agricultural by-products such as sorghum (Hepher 1975) and coffee pulp (Bayne et al. 1976). Rice bran, a widely available agricultural by-product in Asia, has been traditionally used by Asian farmers as an animal feed. Although this by-product is also widely used as a supplementary feed in fish culture, there are few data on its nutritional benefit in pond fish culture. The addition of rice bran at 3% fish body weight in experimental duck and buffalo manured ponds increased fish yield but it was not economic since extra revenue from the increased fish yield in the rice bran fed treatments did not cover the cost of rice bran (AIT 1986).
Since the AIT (1986) study used relatively high feeding rates of rice bran, a series of experiments were designed to investigate the effect of supplementary feed value of lower levels of rice bran on fish growth in a duck-fish integrated system. The results of the first experiment in which the fish subsystem was supplemented with only rice-bran at a stocking density of 3 fish m-1 are presented in this paper.
Materials and Methods
A factorial experimental design (two duck stocking density levels x three fish supplementary feeding levels) was utilized to evaluate the main effects and interaction between in situ feed production resulting from different loading rates of duck manure and the rice bran for fish growth. The experiment was conducted for 6 months from 8 February to 8 August 1989 on the AIT campus, Pathumthani Province, Central Thailand.
Eighteen 200-m2 ponds were excavated from August to December 1989. Newly constructed ponds were limed with quicklime as the acid sulphate soil had a pH< 3.2. The lime requirement was calculated according to Boyd (1982) and was added at a rate of 100 kg lime per pond. Eighteen duck houses of two different sizes (nine houses of 6 m2 and the rest of 3 m2) were constructed over ponds to provide a stocking density of 5 ducks m-2 of house and were enclosed by a fence to provide 1.5 m2 total area per duck. Ponds were filled with canal water to 1 m in depth. Initial water quality parameters were measured and 24 day-old ducklings (KhakiCampbell x native Chonburi strain) were stocked at densities of 750 and 1,500 ducks ha-1 of pond surface area, i.e., 30 and 15 ducks pond-1 (Fig. 1). Ducklings were allowed to grow for a month over the ponds before fish were stocked. Ducks were vaccinated against duck plague disease and cholera at the age of 59 and 67 days and were fed ad libitum a mixed ration containing commercial duck feed concentrate (30% ), paddy (50%) and rice-bran (20% ). The proximate composition of ingredients and the duck feed mixture is shown in Table 1.
Experimental ponds were stocked with Nile tilapia (Oreochromis niloticus) and silver barb (Puntius gonionotus), each at 1.5 m-2, plus common carp (Cyprinus carpio), at 0.1 m-2 on 9 Feb-

145
ruary 1989. Ponds were supplied with rice bran at a rate of 0%, 1 % and 2% of body weight (BW) of fish day-1 (Fig. 1). The proximate composition of rice bran is shown in Table 1. Ten percent of the stocked fish were sampled monthly by seining; batch weights of samples were recorded for all experimental ponds and absolute feeding rations were adjusted accordingly.
0%RB 1%RB 2%RB
15 ducks Ponds Ponds Ponds
5,11,16 4,6,12 8,9,15
Ponds Ponds Ponds 1,7,17 3,14,18 2,10,15
30 ducks
Fig. 1. Schematic representation of the experimental design involving feeding rates of rice bran (RB) as a percent of fish body weight and number of ducks per 200 m2 pond
Table 1. Proximate composition of duck feed.
Components of the duck feed mixture(%)
Parameter Paddy Rice bran Concentrate
.\foisture 11.3 ± 0.5 10.9 ± 0.5 7.4± 0.4 Crude protein 11.4 ± 0.7 13.3 ±0.7 39.9 ± 1.8 Crude lipid 1.7 ±0.2 9.3 ± 1.1 4.6 ± 0.2 ~sh 6.9 ± 0.3 9.8 ±0.3 30.1 ±2.7 Phosphorous 0.3 ± 0.1 1.7 ±0.1 1.9±0.1 Carbon 39.0 ± 1.4 45.8 ±2.4 36.9± 1.8
*Paddy, 50% +rice bran, 30% +commercial feed concentrate, 20%.
Duck feed mixture*
10.7 ± 0.5 17.1±0.7 5.3 ± 0.4
18.3 ±0.9 1.3 ± 0.1
37.8 ± 1.8
Water quality parameters of the experimental ponds were monitored fortnightly for dissolved oxygen, total alkalinity, ammonia, nitrite, total phosphorus, pH, total and volatile suspended solids (APHA 1980). Chlorophyll a content (APHA 1980) and zooplankton density were also determined fortnightly. Phytoplankton biomass was estimated by multiplying the chlorophyll a content by a factor of 67 (APHA 1980). Duck houses were cleaned with pond water twice a week and fish ponds were filled up with canal water to counterbalance evaporation and seepage losses.
Manure loading rates were determined by randomly collecting a representative sample of six ducks at 0600 hours from each treatment. Selected ducks were housed in a cage on the pond dike, feed and water trays were supplied, and feces were collected for 24 hours. Approximately 5% of the duck feed mixture was found to be contaminated with feces. No attempts were made to separate feed and feces before analysis, assuming that a similar amount of feed mixture may have spilled to the ponds.
Duck feed, rice bran, and fish carcass were analyzed for moisture (100°C for 24 hours), crude protein (Kjeltec system 1026; Tecator), crude lipid (Soxtec system HT2; Tecator), crude fiber (Fibertec sysetem 1; Tecator) and ash content (550°C in a muffle furnace for 12 hours). In

146
addition, duck feed and manure were analyzed for phosphorus (Yoshida et al. 1971) and organic carbon (Dewis and Freitas 1970).
Ponds were drained at the end of the experiment and all fish were caught, counted and batch weighed by species to the nearest 10 kg. Samples of the three fish species from each pond were sacrificed and-dried in an oven at 100°C for 24 hours. Dried fish were ground with a mechanical grinder, sealed in air tight containers and stored in a deep freezer at -20°C until analysis was performed. A sample of fish from each of the three species was also subjected to the same procedure at the beginning of the experiment.
Experimental data were subjected to a two-way analysis of variance. The Student's t-test procedure was utilized to compare differences between selected treatments. The pH of pond water tended to decline drastically during the experimental period as the ponds were newly constructed in acid sulphate soil. Silver barb were killed in two ponds (see footnote, Table 1); and replicates which showed less than 50% survival of a particular species of fish were treated as missing values to avoid a possible analytical error caused by the effect of a reduction in stocking density of one species on the growth of the other species of fish.
Partial budget analysis of rice bran as supplementary feed for fish was performed using present commodity prices in Thailand.
Results
Duck manure composition and loading rate
Average dry matter loading rates of duck manure were 13 and 29 kg ha-1 day-I for duck stocking densities of 15 and 30 ducks per 200-m-2 pond, respectively (Table 2). Corresponding loading rates of carbon, nitrogen and phosphorus were 5.1, 0.6 and 0.24 kg ha-I day-I for the 15 duck treatment and 12.3, 1.3 and 0.5 kg ha-I day-1 for the 30 duck treatment. The proximate composition data showed a N:P ratio of duck manure of approximately 2.5.
Table 2. Manure composition and mean loading rates.
Parameter
Proximate composition (%)
Moisture Nitrogen Ash Phosphorous Carbon
Mean loading rate (kg dry wt ha.:l ..Qn:.:l}
Total input Total nitrogen Ash Phosphorous Carbon
Duck stocking density (number per pond) 15 Ducks 30 Ducks
76.1 ±2.1 4.6 ± 0.5
24.l ± 1.4 1.8 ± 0.2
39.5±0.9
13. I 0.6 3.2 0.2 5.2
75.0± 1.9 4.5 ± 0.5
24.5 ± 1.4 1.6±0.2
42.2 ± 1.6
29.9 1.3 7.3 0.5
12.6

147
Rice bran composition and feeding rate
There was a slight variation in the composition of rice bran especially the lipid content, which varied between 7 to 13% in different batches during the experimental period. The crude protein content was, however, relatively stable and ranged from 12 to 14%. Mean feeding rates and correspondin~ loading rates of C, N and P of rice bran for different experimental treatments are presented in Table 3.
Table 3. Mean feeding rates and corresponding C, N and P loading rates of rice bran.
Parameter Rice bran input (kg dry matter ha-1 day-.1)
1% 2%
Month Ducks Dry wt c N p Dry wt c N p
15 2.95 1.19 O.Q7 0.05 5.67 229 0.13 0.09 30 2.92 1.18 O.Q7 0.05 5.79 2.34 0.13 0.09
2 15 9.05 3.93 0.21 0.18 18.64 8.09 0.43 0.36 30 10.98 4.76 0.25 0.21 22.93 9.95 0.53 0.45
3 15 16.14 9.05 0.37 0.33 28.56 16.01 0.66 0.58 30 18.81 10.54 0.44 0.38 38.51 21.59 0.89 0.78
4 15 20.72 10.95 0.48 0.30 41.16 21.76 0.96 0.60 30 26.07 13.78 0.60 0.38 50.63 26.76 1.17 0.74
5 15 30.29 13.01 0.70 0.46 56.66 24.33 1.31 0.86 30 35.29 15.15 0.82 0.54 74.14 31.84 1.72 1.13
6 15 37.44 15.92 0.87 0.52 75.61 32.15 1.75 1.04 30 47.36 20.15 1.10 0.65 102.60 43.63 2.38 1.41
Fish growth, yield and survival
Results of analyses of variance and average effect of experimental factors are presented in Table 4. Detailed two-way presentations of growth, yield and survival parameters for the three species of fish in relation to experimental treatments are presented in Table 5. Growth curves for tilapia, silver barb and common carp are presented in Figs. 2a, b and c. Growth parameters such as specific growth rate are given in their linear form as growth patterns of all three species of fishes appeared to be linear with time (Fig. 2). The mean final weight of the three species in relation to assigned feeding rates of rice bran and duck stocking levels are shown in Fig. 3.
The results of the analyses of variance showed an explicit effect of duck density on tilapia's final weight but no effect on that of the other species (Table 4). The final weight of tilapia increased with increasing duck density (Fig. 3). However, these differences were significant only for pairs of ordinates at 0 and 1 % RB levels (Fig. 3). A similar trend of final weights could be seen for silver barb and common carp (Fig. 3). However, there was no significant difference between pairs of ordinates on response curves of both silver barb and common carp for a particular level of RB.
There was a general increasing trend of final weight of tilapia with increasing feeding rate of RB at a particular duck level. Further analyses of data with Student's 1-procedure, however, indicated that only differences in average final weight of tilapia between 0 and 1 % feeding rates of RB at each duck level were significant (P < 0.05). The main effect of rice bran was significant

148 Table 4. Two-way analyses of variance for net yield and final fish weight.
Source of variation SS
Total net yield Main effect: Ducks 23.7
RB 21.2 Interaction
Ducks vs. RB 4.5 Residual 7.5 Total 56.9
df ms F
23.7 37.8'" 10.6 16.9'"
2 2.2 3.6 12 0.6 17
Sc;parate ana!yses of variance for the three s.pecies FRatios
RB RB RB Ducks Ducks
Tilapia Silver barb
Net yield Main effect:Ducks Main effect:RB Interaction: (Ducks vs. RB) Final weight Main effect:Ducks Main effect:RB Interaction: (Ducks vs. RB)
'"Denotes significant effect at 95% confidence limit.
44.9'" 8.7• 3.8
39.0'" 12.4* 0.8
1.5 13.0'" 0.4
1.3 6.0* 0.1
A veraf e effect (tha- year-1)
0% 7.55 1% 10.13 2% 9.40
15 7.87 30 10.17
Common carp
0.38 0.98 1.33
l.41 0.79 0.11
only for final weight of tilapia and silver barb and there was no interaction between the two factors. Significantly different fish final weights at 0 and 1 % RB levels were observed at each duck level for silver barb but only at the 15 duck level for common carp.
As with final fish weight, extrapolated total net yield of fish also followed a similar trend (Fig. 4, Table 5). Analysis of variance indicated that there was a strong effect of both duck and ricebran on total fish yield. However, when analyses were carried out on individual species, an overwhelming effect of duck density on tilapia yield was observed. Duck density has no influence on net yield of either silver barb or common carp (Table 4 ). The main effect of rice bran was significant for both tilapia and silver barb and no interaction was observed between duck and RB factors on fish yield. Student's 1-test indicated that there was a significant (P < 0.05) positive effect of addition of rice bran at the 1 % level for both species at each duck density but that a further addition did not significantly increase net fish yield. Furthermore, an addition of 1 % rice bran at the 15 duck density significantly increased net yield of common carp.
Mean total survival of fish was approximately 80%, except for the 15 duck and 0% RB treatment. The observed low survival in the above treatment resulted from 100% mortality of silver barb in a replicate due to increased acidity of the pond water.
Fish carcass composition
Initial and final carcass composition of experimental fish are presented in Table 6. The final body moisture content of all three fish species was approximately 70%. The average crude lipid content, however, showed an increasing trend in treatments with increasing levels of RB at the 15 duck density and an inverse relationship with increasing RB level was found in carcass protein and ash contents. A similar relationship could be seen with common carp at the 30 duck level. No such trend, however, was observed in the final tilapia and silver barb carcass composition of treatments with 30 ducks.

149
Table 5. Two-way representation of growth response of tilapia, silver barb and common carp in relation to experimental fllCton (±one standard error).
Rice bran ('lo fish BW/day-1)
Filh Panmeacr Ducb °" It. 2'1.
Nile Weisht: lnitw IS 12±1 14±2 12± I tilapia (&) Final IS4±9 217± I 240±21
Initial 30 13± I 14±<1 13±<1 Final 247±8 288±2 297 ±23
Ave..,egrowth IS 0.9±<0.1 1.1 ± <0.1 1.2±0.1 (g/day-1) 30 1.2±<0.I l.S±<O.I t.S±0.1
Relative arowth IS 71±6 82± 10 99± 14 (g/kg·I day-I) 30 9S±3 107±2 120± 12
Mean survival IS 82 84 83 ('lo) 30 90 86 77
Gross yield IS 4.2±0.4 S.S±O.I S.9± O.S (t ha-I year-1) 30 6.6±0.3 7.4±0.6 6.8±0.S
Net yield IS 3.7±0.2 S.3±0.1 S.8±0.S (t ha-I year-I) 30 6.S±0.3 7.2±0.S 6.7±0.S
Silver Weisfit Initial IS 8±<1 8±<1 9±<1 barb (g) Final 76± I IOO±S 96± 11
Initial 30 8±<1 8±<1 9±<1 Final 80±8 112±3 HIS.± I
Average growth IS 0.4±<0.I O.S± <0.1 O.S±<O.I (g/day-1) 30 0.4±<0.I O.S±<O.I O.S± <0.1
Relative growth IS 46±<1 60±S S3±4 (g/kg·I day-I) 30 48±7 66±7 S8±6
Mean survival IS •47 92 90 ('lo) 30 80 #73 81
Gross yield IS 1.S±0.3 2.8 ±0.2 2.6± 0.3 (t ha-I year-I) 30 1.9±0.4 3.2±0.1 2.6±0.2
Net yield IS 1.S±0.2 2.8±0.2 2.S ± 0.3 (t ha-I year· I) 30 1.9±0.4 3.1 ±0.1 2.S±0.2
Commoo Weisfit Initial IS 13±2 13± I 12± I carp (g) Final 286± 12 316± 19 339±17
Initial 30 13±<1 12±<1 12±1 Final 330± 33 3SS±32 398±74
Average growth IS l.S±<O.I t.6±0.1 1.8±0.1 (g/day-1) 30 1.7±0.2 1.8±0.2 2.1 ±0.4
Relative growth IS 113 ± 18 123± 16 IS2±7 (g/kg·I day-I) 30 137± 16 IS4± IS 189±SI
Mean survival IS 83 98 100 ('lo) 30 100 100 90
Gross yield IS O.S±<O.I 0.6±<0.I 0.7±<0.I (t ha-I year-I) 30 0.7 ±<0.1 O.S±0.2 o.7±0.1
Net yield IS O.S±O.I 0.6±0.1 0.7±0.1 (tha-1 year-I) 30 0.7±0.I O.S±O.I 0.7±0.1
For whole s:ysl.Cm
Mean survival IS 6S 88 87 ('lo) 30 BS 79 79
Gro11yield IS 6.2±0.1 8.9:EO.I 9.2±0.7 (t ha-I year· I) 30 9.3±0.1 11.9±0.4 10.1±0.8
Netyidd IS 6.0±0.7 8.6±0.1 9.0±0.7 (t ha-I yea<-1) 30 9.1 ±0.1 11.6± 1.4 9.8±0.8
• and# denote that the high monality of 1ilver barb in a replicate of the1e treabnenll were IOO'I. and 6S'I., ro1pOctively. These replicates were considered as mi11ing values.

150 300 Tilapia
250
200
150
100
50
0 120 Silver barb
-C) 100 --.r:. C)
Cl> 80 3::
.r:. UJ 60 ;;::::
ca c:
;;:::: 40 c: ca Cl> :E 20
0
400 Common carp
300
200
100
0 0 2 3 4 5 6 7
Time (months)
Fig. 2. Mean individual fish weight in different treatments at successive monthly intervals. Fifteen ducks and 0% RB ( D ), 15 ducks and 1 % RB ( • ), 15 ducks and 2 % RB ( ~ ), 30 ducks and 0% RB ( • ), 30 ducks and 1 % RB ( o ) and 30 ducks per 200 m2 pond and 2% RB feeding levels as a percentage of fish body weight per day ( A ).

-C') --.c C')
G> 3: .c f/J ;:
400
350
300
250
as 200 c
150
100
50
151
0 2 Fig. 3. Mean individual final fish weight in different feeding levels of rice bran at 15 and 30 ducks per 200 m2
pond. Tilapia at 15 ( •)and 30 ( D) ducks, silver barb at 15 ( • ) and 30 ( o ) ducks and common carp at 15 ( • ) and 30 ( 6 ) ducks. Feeding rate of rice bran (% BW/day)
Fig. 4. Mean extrapolated net yield of the three species of fish in different duck densities at different feeding levels of rice bran. Tilapia at 15 ( o) and 30 ( • ) ducks, silver barb at 15 ( 0) and 30 ( O ) ducks, common carp at 15 (•)and 30 (•)ducks and total net yield at 15 (a. ) and 30 ( Q) ducks per 200 m2 pond.
-:i... as G> >---as .c ----"C G> >--G> z
12
10
8
6
4
2
0 I I • 0 2
Feeding level of rice bran (%BW/day)

152
Table 6. Two-way representation of initial and final carcass composition of tilapia, silver barb and common carp in relation to experimental factors.
Rice bran Fish Parameter Ducks 0% 1% 2%
Nile Moisture Initial 69.4 tilapia (%) 15 69.9±3.6 70.9± 1.8 70.3 ±0.6
30 71.5 ± 0.1 74.4±0.7 69.P±2.6
Crude Initial 65.5 protein 15 66.8±2.6 60.9±3.2 56.0±0.4 (%) 30 63.2±2.9 63.5±1.0 63.1±2.2
Crude Initial 16.8 lipid 15 14.5 ± 1.5 22.4± 3.5 31.0± 0.7 (%) 30 21.9 ± 3.9 19.8 ± 1.7 24.2±6.4
Ash Initial 13.1 (%) 15 16.9±0.7 13.6±0.3 12.4 ±0.2
30 13.5±0.9 16.0±0.7 14.7 ± 0.4
Silver Moisture Initial 73.7 barb (%) 15 68.9±3.0 69.9± 1.3 67.1 ±0.9
30 66.3 ± 2.1 65.2±0.2 64.7 ± 1.4
Crude Initial 50.8 protein 15 59.0±9.4 58.2 ± 3.1 52.8±3.3 (%) 30 54.1±3.5 51.1±3.6 51.0± 1.0
Crude Initial 16.8 lipid 15 26.4± 10.3 27-5±2.8 32.0 ± 2.1 (%) 30 33.9±5.6 29.7±0.2 32.3 ± 1.7
Ash Initial 11.9 (%) 15 11.5 ±0.2 9.0± 1.3 9.8±0.6
30 12.3 ± 2.1 9.3 ±0.9 10.0±0.4
Common Moisture Initial 81.1 carp (%) 15 74.7±4.5 70.8 ± 1.2 68.9± 1.1
30 70.7 ± 3.1 70.9± 4.1 67.2±2.5
Crude Initial 60.5 protein 15 66.1±6.2 57.1±2.3 53.3 ±2.0 (%) 30 64.3 ±4.8 53.2±2.0 49.5±1.7
Crude Initial 28.8 lipid 15 18.5 ± 6.6 27.9 ± 2.5 32.8±2.0 (%) 30 19.6 ± 6.4 30.4 ± 1.9 35.1±.4.8
Ash Initial 13.4 (%) 15 11.5 ± 1.0 8.6±0.7 7.9±0.2
30 11.2 ± 1.3 9.6± 1.0 9.4 ± 1.1
Plankton productivity and water quality pRrameters
As the ponds were newly constructed, a detailed study of water quality was carried out and observed minimum and maximum values of water quality parameters during the experimental period presented in Table 7. Mean water temperature fluctuated between 28 and 32°C. Dissolved oxygen levels at dawn were relatively high for manured ponds and tended to remain above 3 mg 1-1 although they reached 1 mg 1-1 occasionally, especially during the later stages of the. experiment. The major problem encountered was increased acidity during the experimental period. The pH of pond water at the beginning of the experiment ranged from 7 to 8. However,

153
Table 7. Ranges of water quality and plankton biomass parameters during the experimental period.
Rice bran (% fish BW day-1) Parameter Ducks (No/pond) 0 l 2
Temperature (0 C) 15 28.5 - 31.7 28.6 - 31.7 28.6 - 31.4 30 28.5 - 31.4 28.6 - 31.4 25.4 - 31.4
Dissolved oxygen 15 3.7 - 10.3 3.3 - 11.3 3.7 - 9.7 (mgl-1) 30 3.6 - 13.l 4.0 - 14.2 3.4 - 12.2
pH 15 3.8 - 7.5 4.6 - 7.5 4.1 - 7.6 30 4.l - 7.5 4.0 - 7.4 4.0 - 7.6
Total alkalinity 15 4.0 - 128.0 6.2 -· 136.0 8.0 - 121.l (mg 1-l as CaC03) 30 0.0 - 132.0 23.0 - 147.0 5.9 - 169.9
TotalNHrN 15 0.1 - 4.8 0.1 - l.6 0.1 - 4.8 (mg 1- ) 30 0.1 - 5.4 0.1 - 4.8 0.1 - 4.5
Nitrite-Nitrogen 15 0.0 - 0.1 0.0 - 0.1 0.0 - O.l (mgl-1) 30 0.0 - 0.1 0.0 - 0.1 0.0 - 0.1
Phosphate-phosphorous 15 0.0 - 0.7 0.0 - 0.5 0.0 - 0.5 (mg 1-1) 30 0.0 - 0.4 0.0 - 0.6 0.0 - 0.5
Total suspended 15 16.0 - 115.2 17.8 - 137.3 12.2 - 118.5 solids (mg 1-1) 30 14.3 - 117.3 15.8 - 119.8 16.7 - 146.3
Volatile suspended 15 6.2 - 66.5 6.2 - 73.0 5.7 - 72.2 solids (mg 1- l) 30 6.2 - 48.7 6.8 - 79.3 5.7 - 73.2
Phytoplankton biomass 15 0.4 - 21.4 0.2 - 30.2 0.6 - 28.5 (mg 1-1) 30 0.4 - 27.0 0.2 - 36.0 l.1 - 39.9
Zooplankton biomass 15 l.7 - 13.2 2.3 - 19.8 2.7 - 15.6 (mg m31) 30 3.6 - 31.9 1.9 - 23.7 3.4 - 30.5
pH fluctuated between 4 and 7 in 10 replicates from the third month until the end of the experiment (Fig. 5). The reduced pH of pond water was accompanied by low total alkalinity. Survival was minimal in two replicates in which pH declined below 4 for a short time period. Relatively high ammonia levels were also observed during the experimental period.
Phytoplankton and zooplankton biomass were high in treatments with 30 ducks per pond and plankton density increased towards the end of the experiment (Fig. 6). There was no clear relationship between RB levels and plankton density. Addition of RB appeared to enhance both phytoplankton and zooplankton biomass during the last three months of the experiment.
Discussion
The real interest in any factorial experimental design is not to examine how a particular combination of factors behaves, but whether basic factors act independently of one another. The results demonstrated that both duck density and rice bran acted independently to boost fish yield in a tilapia/silver barb/common carp polyculture system. Increasing duck density from 15 to 30 ducks per pond increased total net yield by 3 t/ha-1 year-• at 0 and 1 % rice bran feeding levels. The addition of 1 % rice bran enhanced the total net yield by 2.6 t/ha-1 year-1 at each duck level (Table 5). The lack of interaction between duck density and rice bran suggested that there was no synergistic effect of ingesting natural fcxxl and rice bran together. This observation indicates that rice bran contained some dispensable nutrient which might have a quantitative rather than a

154
qualitative effect. The lipid or energy fraction of rice bran may be responsible for the observed growth increment as rice bran is believed to be an energy supplement. Relatively higher body lipid contents of all three species at the zero RB level, however, indicate that energy may not have been limiting in the duck-fish integrated system. Thus, a plausible conclusion might be that the RB component in the ingested ration supplemented either the protein or both the protein and energy fractions of the fish diet.
8
7
a 6-
5
4 0 20 40 60 80 100 120 140 160 180 200
Time (days)
Fig. 5. Variation in mean pH of pond water in different treatments during the experimental period. Fifteen ducks and 0% RB ( a ), 15 ducks and I% RB ( • ), 15 ducks and 2 % RB ( A ), 30 ducks and 0% RB ( • ), 30 ducks and 1 % RB ( o ) and 30 ducks per 200 m2 pond and 2 % RB feeding levels as a percentage of fish body weight per day ( A ).
-:::::::: C> E -ti) ti) m E 0 .0 c: 0 -..:.::: c: m a. 0 ->a .c D..
50
40
30
20
10
0 0 20 40 60 80 100 120 140 160 180 200
Time (days)
Fig. 6. Mean phytoplankton biomass (mg L-1) in different treatments during the experimental period. Fifteen ducks and 0% RB ( a ), 15 ducks and 1 % RB ( • ), 15 ducks and 2% RB ( A ), 30 ducks and 0% RB ( • ), 30 ducks and 1 % RB ( o ) and 30 ducks per 200 m2 pond and 2% RB feeding levels as a percentage of fish body weight per day ( A ).

155
Separate analyses for each species of fish showed, however, that the main effect of duck density operated through enhancing the yield of tilapia. A two-fold increase in duck density increased tilapia yield by 2.7 t/ha-1 year-I which accounted for 91 % of the increase in total yield. Doubling the duck density probably stimulated both detrital and primary production pathways which may have increased tilapia yield. As duck density had no significant effect on silver barb growth, increases in primary production and detrital pathways apparently had a negligible effect on the growth of this species.
Analysis of variance also indicated that the added effect of rice bran was not as strong as that of increase in duck density on the growth of tilapia. The additional benefit of RB at 1 % fish BW at low duck density for tilapia yield was 1.6 t/ha-1 year-I although this was two times higher than the added yield of 0.8 t/ha-1 year-1 observed at the high duck density. There appeared to be a small interactive effect of duck and rice bran factors, but the F ratio was significant only at the 94% confidence level. The lack of interactive effect of duck and RB factors for tilapia yield was probably influenced by the absence of treatments with zero duck density. However, the noticeable effect of rice bran on tilapia yield plus relatively low fish body lipid content at the low duck density indicated that the energy or lipid fraction may have been an influential factor in the improvement of growth in tilapia. This observation suggests that tilapia may have reached the CSC at the low duck density. Further research with varying fish stocking densities is required to substantiate this conclusion.
Even though doubling the duck density did not influence the silver barb yield, the addition of 1 % rice bran increased the yield by 1.25 t/ha-1 year-1 at each duck density. This suggests that the observed positive effect of rice bran on silver barb growth was probably due to direc_t ingestion rather than through increasing pond natural productivity. Rice bran also appeared to improve the growth of common carp at the 15 duck level. However, in the present study, a relatively low stocking density of common carp was utilized to stir up the pond bottom, assuming that this would augment regeneration of elementary nutrients. As a result of the low stocking density of common carp compared to the other two species, no conclusion could be drawn concerning its growth performance in the present study.
The addition of 2% rice bran did not improve either growth or yield of fish. Since water quality parameters were similar in all treatments, the yield obtained in the study under the present environmental conditions may have been the highest possible with pond inputs used at a stocking density of 3 fish m-2. This finding also suggests that further research may be necessary to evaluate the effect of rice bran with varying stocking densities of fish.
The pH of the pond water drastically deteriorated between the second and fourth month of the experiment and probably had an adverse effect on the growth of the experimental fish. The final weight or net yield of fish obtained in the present study may be an underestimation and, even though the problem was alleviated later, fish in the experiment may not have achieved their maximum growth capacity. The net yield of 11.6 t/ha-1 year-I obtained with 30 ducks and 1 % RB in the present study, therefore, may not be the maximum possible yield with this management strategy and this needs to be investigated further. However, the yield of fish reported here is comparable to that in previous experiments with duck-fish integrated systems (Edwards 1983; AIT 1986).
As the commodity prices vary from country to country, a detailed economic analysis was not attempted in the present study. However, partial budget analysis using commodity prices of Central and Northeast Thailand showed that the increased yield due to the addition of 1 % RB was profitable at the 15 duck density and the additional yield at the 30 duck level was also

156
profitable in the Northeast Thailand (Table 8). The break-even price of fish (yield increase/cost of manure) with addition of 1 % rice bran was 0.5 US$ per kg. This is a considerable improvement on the previous study (AIT 1986) in which the addition of rice bran at 3% fish body weight was not economic as the extra revenue from the increased fish yield in the rice bran fed treatments did not cover the cost of rice bran. Since there was no treatment between 0 and 1 % ricebran levels in the present study, further research is required to quantify optimum rice bran feeding levels for different stocking densities offish.
Table 8. Partial budget analysis of rice bran as a supplementary feed for fish integrated with du&:s. US$= 25 bahL.Cost of rice bran= 0.14 US$. Fish market price: Central Thailand= 0.52 USS/kg, Northeast Thailand= 1 US$.
Number Net fish Increased Revenue and profits of ducks Weight yield yield due Additional (US$) (200m2 of rice (kg/200m2 to rice cost Central Northeast pond) bran (kg) 6months) bran (kg) (US$) Thailand Thailand
Previous stud)'. (AIT 1286) Rev. Pro. Rev. Pro. 10 48 IO 164 68 20 25 10 -15 20 -5 30 101 30 232 134 33 36 17 -19 36 0
P~entstu!!y
15 60 15 78 86 26 12 14 2 26 14 30 91 30 95 116 26 15 14 -1 26 11
Rev. =revenue, Pro. =profits.
The results also demonstrated Nile tilapia's growth and yield are functions of pond productivity and fertilization for a given size and stocking density. In contrast, increased fertilization rate did not affect the growth of silver barb and the above assertion may be valid only for planktivorous and/or detritovorous fish as pond fertilization only increases in primary production and detrital pathways. Since the principal natural food of silver barb is aquatic macrophytes, a next logical step in this series of experiments is an evaluation of the growth and the yield of these species of fish when rice bran and a macrophyte are added together as supplementary feed in a duck manured system.
Acknowledgements
The study was supported by the International Development Research Centre, Canada. Peter Edwards is seconded to AIT by the Overseas Development Administration, United Kingdom.
References
AIT. 1986. Buffalo/fish and duck/fish integrated systems for small scale farmers at the family level. AIT Research Report No. 198, Agricultural and Food Engineering Division, Asian Institute of Technology, Bangkok, Thailand. 138 p.
APHA. 1980. Standard methods for the examination of water and wastewater. American Public Health Organization. 15th edition. Washington, DC. 1134p.
Bayne, D.R., D. Dunseth and C.G. Ramirios. 1976. Supplemental feeds containing coffee pulp for rearing Tilapia in Central America. Aquaculture 7: 133-146.

157
Boyd, C.E. 1982. Water quality management for pond fish culture. Elsevier Scientific, Amsterdam. 318 p. De Silva, S.S. 1989. Introduction, p. vi. In. S.S. De Silva (ed.) Fish nutrition research in Asia. Proceedings of the Third Asian Fish·Nutrition
Networlc. Dewis, I. and F. Freitas. 1970. Physical and chemical methods of soil and water analysis. FAO Soils Bull. No. 10, FAO, Rome. Edwards, P., R.S.V. Pullin and I.A. Gartner. 1988. Research and education for the development of integrated crop-livesetock-fish farming
systems in the tropics. ICLARM Stud. Rev. 16, 53 p. International Center for Living Aquatic Resources Management, Manila, Philippines.
Edwards, P. 1983. The future potential of integrated farming systems in Asia, p. 273-281. /n Proceedings of the World Conference on Animal Production, Vol. 1..
FAO. 1981. Agriculture: towards 2000. FAO, Rome. Hepher, B. 1975. Supplementary feeding in fish culture, p. 183-198. In Proceedinos of 9th international congress of nutrition, Vol 3. Karger,
Basel, Mexico. Hepher, B. 1988. Nutrition of pond fishes. Cambridge University Press, Cambridge. 388 p. Prowse, G.A. 1967. A review of the methods of fertilizing warmwaterfish ponds in Asia and the far easL FAO Fish. Rep. 44(3): 7-12. Yoshida, S., A.F. Douglas, H.C. James. 1971. Laboratory manual for physiological studies of rice. The International Rice Research Institute, Los
Bafios Philippines. 61 p.


Modular Method of Rearing Milkfish with Artificial Feed
F.P. PASCUAL N.S. SUMAGAYSAY I.G. BORLONGAN Aquaculture Department
Southeast Asian Fisheries Development Center Tigbauan, Iloilo, Philippines
PASCUAL, F.P., N.S. SUMAGA YSA Y and I.G. BORLONGAN. 1991. Modular method of rearing milkfish with artificial feed, p. 159-167. In S.S. De Silva (ed.) Fish nutrition research in Asia. Proceedings of the Fourth Asian Fish Nutrition Workshop. Asian Fish. Soc. Spec. Publ. 5, 205 p. Asian Fisheries Society, Manila, Philippines.
Abstract
The study was conducted to determine the dfectivcncss of a practical diet, the profitability of feeding during two seasons, and the effect of a diet with cocmut oil on the fauy acid profile of milldish fingerlings.
Milkftsh fin~erlings of average weight 6.2 g and 10.2 g were reared in earthen ponds of three compartments (550, 1,100 and 2,200 m ) using the modular culture system. One month prior to harvest, fish in Treatment 1 were fed a practical diet containing 42% crude prw:in, 13.1% crude fat and 33.2% nitrogen-free extract while fish in Treatment 2 depended solely on the natural food in the pond. The fish fed during the last month of culture were heavier (141 g) than the unfed fish (100 g) in Experiment 1 (dry season) but had similar weights (44 and 41 g) in Experiment 2 (rainy season). Weight gain of fish in Experiment 1 was significantly higher
0
.tlian in Experiment 2. Varying temperature and salinity during different seasons influenced fish growth 1111d production. Feeding milkfuh was not profitable during the cooler months. Fany acid profile in depot fat of fed fish reflected that of the diet Palatability tests showed that fed fish were preferred to the unfed fish.
Introduction
Chanos chanos Forsskal, commonly called milkfish, is a popular food fish in Southeast Asia. It has been traditionally cultured in Indonesia, Taiwan and the Philippines. Around 200,000 ha of brackishwater ponds are being used for milkfish culture in the Philippines.
Various culture techniques have been developed in an effort to increase yields. Agbayani et al. (1989) reported that production as well as profits can be increased through the modular method of rearing milkfish at a traditional stocking density of 0.3 fish m-2. Likewise, Chiu et al. (1988) and Sumagaysay et al. (1990) showed that feeding milkfish in ponds stocked. at higher densities resulted in better profits. This study was carried out to test the effectiveness of a practical diet fed to milkfish stocked at 0.45 m-2 in earthen ponds using the modular culture method.
In view of the recent interest in fish oil from the human nutritional viewpoint the fatty acid profile of the fish fed supplemental diet was compared with those that fed solely on natural food.
159

160
Materials and Methods
Experimental ponds
This report covers two experiments conducted from May to August 1988 (dry season) and October 1988 to January 1989 (rainy season).
Four modules of earthen ponds, each consisting of three compartments of 550, 1,100 and 2,200 m2 (1:2:4.) were used. Wooden gates with slabs connected the adjacent compartments. A semi-circular net or "bulon" was placed at the gate for water exchange, to keep out predators and unwanted species, and prevent the escape of the milkfish. Pond preparation was done according to the procedure described by Lijauco et al. (1979).
Diet preparation
The diet was prepared according to a procedure described by Pascual ( 1989), except that fish pellets were not steamed. The diet composition and proximate analyses are shown in Table 1. Pellets were oven dried at 60°C to a moisture content of around 10%, placed in plastic bags, and stored at 5°C.
Table 1. Ingredients and proximate composition of milkfish diet on a dry basis.
Ingredients 1
Thailand fish meal Defatted soybean meal Rice bran Bread flour Coconut oil Rice hulls
Proximate composition
Crude protein Crude fat Crude fiber Crude ash NFE (nitrogen free extract)
1 Proximate composition of the ingredients in percent:
Crude Crude Ingredients protein fat
Thailand fish meal 71.0 12.4 Soybean meal 45.9* 1.57 Rice bran 14.7 14.9 Rice hulls 6.9 6.2 Bread flour 14.7** 1.5
*Factor 5.4 **Factor 5.1
Stock manipulation and water management
%
31.0 24.0 7.0
16.0 7.0
15.0
%
41.9 13.1 3.9 7.9
33.2
Crude fiber
2.13 5.39
10.0 28.4 0.6
NFE
2.07 40.13 48.5 43.4 83.0
Ash
12.40 7.10
11.8 15.1 0.7
Fry (4 mg) from the wild were first reared in a nursery pond for a month. The fingerlings with mean initial weights of 6.2 g and 10.2 g (Experiments 1and2, respectively) were restocked in the first compartment (550 m2) at 0.45 m2. The number of fish stocked was based on the area of the third compartment (2,200 m2).

161
The culture period lasted 90 days. After thirty days in the first compartment, the fish were transferred to the second compartment, reared for another 30 days, and then transferred to the last compartment and cultured for 30 days. Fish assigned to Treatment 1 were given a supplemental diet at 10% of biomass upon their transfer to the third compartment. Fish were fed at 0900, 1300 and 1600 hours daily. Fish assigned to Treatment 2 were not fed but subsisted solely on the natural food present in the ponds, i.e. "lumut" (green filamentous algae),· "lab-lab" (microbenthic mass of blue-green algae), and plankton.
Throughout the text, "fed fish" is used to mean fish that were given a supplemental diet one month prior to termination of the experiment. "Unfed fish" refers to fish that relied solely on the natural productivity of the pond.
The "pasulang" method was used to transfer the stock from one compartment to another. The pond with stock was partially drained during low tide, while the next compartment was flooded during high tide to achieve a difference in water depth. Being rheotactic, the milkfish swam against the current into the next compartment when the gate was opened.
Every 15 days, fifty fish were caught by cast netting and weighed in bulk on a top-loading Nutex balance.
Water exchange was done twice a month for four days during high tide. Water depth was maintained at 30 cm during the rearing period.
Salinity and temperature were taken in the morning and afternoon while dissolved oxygen was measured around 0830 to 0900 hours using a dissolved oxygen meter (YSL 51 model).
Harvest
The fish were caught with a seine net and the remaining fish were handpicked after the ponds were fully drained. The fish were placed immediately in ice water before they were transferred to rectangular plastic stocking trays or sacks. Fish were sold at the Iloilo Fishing Port to get the actual cost of the harvested fish. A simple economic analysis was carried out to determine the profitability of the culture method.
Palatability test
Random samples of 5 kg of fish from each treatment were kept in the freezer for consumer taste tests. Each fish was divided into 3 portions: head, middle and tail with only the middle portion offered for tasting. Fish were cooked for 10 minutes in two cups of boiling water.
Employees of the Aquaculture Department, Southeast Asian Fisheries Development Center were requested to taste samples of fish. There were 58 respondents in Experiment 1 and 47 in Experiment 2. Appendix 1 presents the sample questionnaire.
Chemical analyses
One kilogram of fish was random! y sampled from each pond and pooled by treatment. Proximate analyses of the fish were carried out using standard AOAC (1981) procedures for crude protein, crude fat, crude fiber, ash and nitrogen-free extract (NFE).
Fish liver and depot fat from the belly were analyzed for fatty acid. Fat was extracted by the Bligh and Dyer method (1959). The lipids were then converted into fatty acid methyl esters using a BF3-methanol reagent (Metcalfe et al. 1966). Fatty acid methyl esters (FAME) were

162
analyzed with a computerized Shimadzu GC-4PTF gas chromatograph equipped with flame ionization detector using FW-WCOT capillary column with stabilized cyanopropyl silicone coatings (CP-90, RESCOM, Belgium). The fatty acid methyl esters were identified by cochromatography with authentic fatty acid standards. The results are expressed as percent weight of the total fatty acids.
Experimental design and statistical analysis
A randomized complete block design and Duncan's multiple range test were used to determine differences among treatment means and seasons.
Results and Discussion
Experiment 1
Experiment 1 was carried out during the dry season when salinity and temperature ranged from 18 to 45 ppt and 25.1to35.0°C, respectively.
The average initial weight of milkfish was 6.2 g. After two months of culture, the mean weight of fish in Treatment 1 was 57 g whereas those assigned to Treatment 2 was 78 g (Table 2). Mean weight gain from the time of stocking (90 days) between the fed (135.4 g) and unfed (93.8 g) fish were not significantly different. Mean weight gain, however, of the fed fish (84.6 g) was significantly higher (a = 0.05) than the unfed (22.0 g) fish based on the 30-day feeding period. Final mean weight (90 days of culture) of fed fish was 141.6 g and the unfed fish was 100 g. Specific growth rate of the fed fish (2.98) was significantly higher than the unfed fish (0.88) from the time of feeding. Feed conversion ratio (FCR) of fed fish was 2.1. Ninety-six percent of the fish stocked was recovered from Treatment 1 and 79% in Treatment 2. Yield (kg ha-I) was 611 and 338 kg for Treatments 1 and 2, respectively. Results show that supplemental feeding increased yield.
Experiment 2
The second experiment was carried out during the rainy season. Average weight of fingerlings at stocking was 10.2 g. After two months of culture, fish in Treatments 1 and 2 weighed 25.6 and 42.3 g, respectively. Thirty days later, final mean weight of fed fish was 44.0 g whereas unfed fish weighed 40.8 g. Mean weight gain and specific growth rate for a period of 90 days were 34.4 g and 1.74 for the fed fish and, 30.1 g and 1.55 for the unfed fish, respectively. On the other hand, mean weight gain of the fed fish was significantly higher (18.4 g) than the unfed fish (-1.5 g) after the last 30 culture days. The lack of adequate nutrients to support higher biomass in the last compartment regressed growth in the unfed treatment. The yield per hectare, however, was similar for Treatments 1and2 (107 and 110 kg ha·1).
Smvival (53 and 63% for Trts. 1 and 2, respectively), and yields in Experiment 2 were poorer compared to Experiment 1. This study shows that the growth rate differs with the time and season of the year. Temperature and abrupt salinity changes (Table 3) appeared to influence fish growth and production. Benitez (1984) reported slow growth in fish cultured during the cold months. According to Juliano and Hirano (1986), milkfish grows optimally during the month of

Table 2. Growth, production, feed efficiency and survival of milkfish in brackishwater ponds with or without supplementary feeding.
Run Dry season Rainy season Treatment Fed Unfed Fed Unfed
20-day culture l!!lri!!Q:
Mean weight 135.4a 93.8a 34_4b 30.lb gain (g) ± 26.4 ±20.0 ±0.4 ±8.5
% weight 2,195a l,521a 387b 351b gain ±428 ±324 ±99 ±201
Specific growth 3.46a 3.09a l.74b 1.55b rate ±0.21 ±0.22 ±0.23 ±0.53
L;!st 30 days of culture:
Weight at start 57.0 78.0 25.6 42.3 of feeding (g) ± 1.0 ±20.0 ±3.2 ±3.9
Mean weight 84.6a 22.rP 18.4c -l.5a gainl (g) ±27.4 ±0.0 ±6.2 ±8.70
% weight gain 149.3a 30.2b 76.03 -l.65b ±50.7 ±7.8 ±33.6 ±20.5
Specific growth 2.98a o.88b l.82a -0.13b rate ±0.69 ±0.20 ±0.64 ±0.70
Final mean 141.6a 100.03 44.rP 40.8b weight (g) ±26.4 ±20.0 ±3.0 ±4.8
Yield (kg ha-1) 61 la 338a 107b 11rP ± 112 ± 10 ±43 ±32
FCR 2.1 14.6 ±0.4 ± 10.0
Survival 9~ 7'>11 53b 63b (%) ±0 ± 18 ± 18 ±25
lFor the respective treatments, mean weight at stocking (g): 6.2, 6.2, 9.6 ± 2.9, 10.7 ± 3.7. Mean values± SEM in a row with the same superscripts are not significantly different (a= 0.05).
Table 3. Salinity, temperature and dissolved oxygen (DO) ranges during the dry and rainy season.
Dry season:
May June July
Rainy season:
October November December
Salinity (ppt)
42-45 24-32 18-26
3-15 0-19 15-40
Temperature coq
28.0-35.0 27.5-29.5 25.1-29.5
26.0-31.0 26.0-27.0 23.3-27.5
DO (ppm)
not obtained not obtained
3.6-1~.2
3.0-9.0 5.0-10.0 4.3-11.0
163

164
May when temperature is relatively high. Better growth of "lab-lab" (natural food) during warm months results in faster growth of fish. Although milkfish is euryhaline, abrupt changes in salinity may have caused stress and slowed down growth. The slow growth of fish during the rainy season may also be due to the presence of trypsin inhibitor found in filamentous algae, e.g., Chaetomorpha (Benitez and Tiro 1982). Filamentous algae were observed to grow abundantly at lower salinity.
Palatability test
Out of 58 respondents for Experiment 1, 38 preferred the fish that were given a supplemental diet. The fed fish were said to be tastier than the fish that were dependent on natural food. Thirteen preferred the unfed fish while 7 had no preference.
Of the 47 respondents in Experiment 2, 21 preferred the fed fish, 13 preferred the unfed fish, and 13 had no preference.
The preference of the majority of the respondents for fed fish in both experiments can be explained by the comparatively high levels of depot and liver fat, and crude fat in carcass (Table 5). The fat which is found largely in the belly imparts flavor to the milkfish. In the Philippines, vendors often cut the milkfish belly to expose the fat and entice the customers. Restaurants regularly offer milkfish belly in their menu as "prime cuts".
Since Filipinos are deficient in both protein and calories, a fatty milkfish should help increase caloric intake. Furthermore, fish oil or fat has been found to help prevent heart attacks (Lands 1989; Pigott 1989). Although the diet contained 7% coconut oil, ro3 fatty acid in the depot fat between fed and unfed fish did not differ much. However, total ro6 fatty acids were higher in the depot fat of fed fish while the ratio of ro3 to ro6 was closer to one, with the fed than with the unfed fish (Table 6).
Table 4. Moisture ccotent of fresh fish and proximate composition of milldish carcass in % dry weight.
Run Treabnent
Moisture content of fresh fish
Crude protein Crude fat Crude fiber Crude ash Nitrogen-free
extract (NFE)
l Average of two determinations.
Dry season Fed Unfed
65.4 69.5 66.0 72.0 19.2 10.0
1-.0 l.O 10.9 13.4
3.1 3.6
Table 5. Total lipid in carcass, liver and depot fat (% ). •
Run Treabnent
Carcass Liver Depot fat
*Bligh and Dyer Method (1959).
Dry season Fed Unfed
19.0 27.7 58.42
12.4 17.7 27.5
Rainy season I Fed Unfed
72.3 70.2 62.0 69.0 18.7 14.7 0.3 0.1
11.4 13.7
4.9 6.1
Rainy season Fed Unfed
18.7 22.5
14.7 17.5

165
Table 6. Fatty acid composition (% by weight of total fatty acids) of the diet, milkfish depot fat and liver.
Mean Mean Fatty Milkfish Depot fat Liver acids diet Fed Unfed Fed Unfed
14:0 2.12 0.80 3.40 1.24 1.82 14:1 0.18 0.18 0.52 0.66 0.86 15:0 0.40 0.54 0.54 0.44 0.26 15:1 0.85 0.96 0.62 0.46 1.20 16:0 31.48 25.88 31.20 33.04 37.68 16:1 1.52 5.16 5.39 4.82 5.40 17:0 0.17 0.61 0.93 0.5.8 0.45 18:0 3.95 5.76 10.94 9.32 10.67 18: lro9 33.57 31.86 21.58 36.23 28.79 19:0 0.26 0.32 0.42 0.18 0.31 18:2w6 13.99 10.19 4.88 4.97 3.18 18:3w3 2.46 1.46 0.76 0.55 0.54 18:4w6 0.68 0.20 0.36 0.98 0.50 20: lro9 0.92 2.34 2.54 2.05 1.36 20:2w3 0.35 0.36 1.28 0.82 0.72 20:3w3 0.11 0.94 0.60 0.34 0.42 20:4w6 0.31 0.66 0.81 0.12 0.22 20:4w3 0.43 0.44 0.39 0.66 0.14 22:lro9 0.18 1.54 2.35 0.69 0.84 20:5w3 0.16 0.91 1.06 0.41 0.36 22:3w3 1.93 1.72 1.12 0.22 0.18 22:4oi6 0.27 0.12 0.44 0.22 0.41 22:4w3 0.26 0.66 1.02 0.21 1.05 24:lro9 0.14 0.52 2.18 0.20 0.56 22:5w3 0.35 1.48 1.92 0.26 0.89 22:6w3 2.96 3.42 2.76 0.42 1.21
Total saturated 38.38 34.91 47.43 44.80 51.19 Total unsaturated 61.62 65.10 52.57 55.21 48.81 Total monoenoic 37.36 42.56 35.18 45.11 39.01 TotalPUFA 24.26 22.54 17.39 10.10 9.81 Total w3 9.01 11.38 10.91 3.81 5.51 Totalw6 15.25 11.16 6.48 6.93 4.30 w3/w6 0.59 1.02 1.68 0.62 1.30
Liver fat W:3 (Table 6) was lower in the fed than unfed fish and the ratio of rojro6 was similar to that of the diet (0.6). The ro3:ro6 ratio in liver fat of the unfed fish was 1.3, almost twice the ratio of the fed fish. This higher ratio might be due to the fatty acids found in the natural food on which this group of fish was dependent. Although coconut oil, which is deficient in ro3, was used as the main lipid supplement in the diet, the fatty acids found in the other ingredients (Thailand fish meal, soybean meal and rice bran) contributed to the overall fatty acid profile of the milkfish diet. This suggests that coconut oil can be used as a lipid supplement in the diets for milk.fish in ponds. Aiava (1986) has shown that milkfish fed diets with 5% coconut oil and 5% cod liver oil gave the highest growth and survival compared with tho.se fed cod liver oil and beef tallow, or soybean oil or corn oil.
Carcass analyses
Crude protein appeared lower in fish given supplemental feed in both Experiments 1 and 2. Fish given a pelletized diet had higher crude fat content (Table 4), and more lipid in carcass, liver and depot fat than the unfed fish (Table 5).

166
Depot and liver fat of fed fish had a profile more closely resembling the practical diet (Table 6). There were more saturated fatty acids and lower unsaturated fatty acids in the liver than in depot fat. Highly unsaturated fatty acids were also higher in depot fat than in liver fat. Furthermore, ro3 was high in depot fat in fed and unfed fish compared to that in liver fat. A similar trend was also observed in fish that relied on natural food. rof ro6 ratio was lower in fed fish than in unfed fish.
Results of this study show that milkfish do not grow well during the cooler months of the year regardless of the feeding regimes. The net benefit increased when milkfish were fed during the dry season, but decreased during the rainy and cold season (Table 7). Profitability of feeding, however, will depend on the cost of milkfish at harvest. Chiu et al. (1987) have found that
Table 7. Cost-benefit analysis of milkfish production with or without supplementary feeding.
Run Treatment
Yield (kg ha-1) Gross income (P ha-1) Operating expenses
(Pl.75 ha-1)2 Cost of feed
(P9.40 kg-1)3 Total operating
expenses (P) Net income (P) Net benefit4 (P)
Dry season Fed Unfed
611 338 15,275 6,7flJ
4,810 4,720
6,254
11,064 4,720 4,211 2,040
2,171
Rainy season Fed Unfed
107 110 440 410
4,203 3,749
3,929
8,132 3,749 a ,692) C3.339)
(4,353)
1 Based on the following prices: P25, 20, 10, 10 for the respective treatments. Prices are based on fish size, i.e., weight at harvest (142, 100, 44, 41 g for the respective treatments). US$1 = P22.40 as of July 1990.
2Expenses for 3 compartments. 3Feed input for the lst run, 694 kg ha-1; for the 2nd, 418. 41ncremental revenue - incremental cost.
supplemental feeds do increase yield but the high cost of feeds can affect profitability. Feeding was not profitable when the price of milkfish per kg is P16.00 or approximately US$0.80. However, in recent months the price of milkfish increased to P50.00 or approximately US$2.23 kg-I. At this market price, feeding milkfish a supplemental diet that costs P9.40 (US$0.42) could be profitable. The use of cheaper source of lipid, e.g., coconut oil, can further lower feed cost.
Acknowledgements
The authors thank Romulo Ticar, Elsa Daza, Deograce Murillo, Armando Alcalde, Butch J uangga for their assistance in the conduct of the experiment, the staff of CAL for proximate analyses and the Chemistry Laboratory, Leganes Research Station, for soil analysis.
References
Aiava, V.R. 1986. Combinations of dietaiy fat llQUrces in diy diets for Cliiuios chanos fmgerlings, p. 519-521. In J.L Maclean, L.B. Dizon and L V. Hosillos (eds). The Fint Asim Fisheries Forum. Asim Fisheries Society, Manila, Philippines. 727 p.
Agbayani, R.D., D. Baliao, N.M. Franco, R.B. Ticar and N.G. Gwumin, Jr. 1989. An economic analysis of the modular pond system of milkfish production in the Philippines. Aquaculture 83: 249-259.
AOAC. 1981. Official methods of analysis. 14th ed. Association of Official Analytical Chemists. Washington, DC. 1141 p.

167
Benitez, L.V. 1984. Milkfish nutrition, p. 133-143. In J.V. Juario, R.P. Ferraris and L.V. Benitez (eds.) Advances in milkfish biology and culture. Island Publishing House, Manila, Philippines.
Benitez, L.V. and L.B. Tiro. 1982. Studies on the digestive proteases of the milkfish, Chmws chano.s. Mar. Biol. 71: 309-315. Bligh, E.G. and W.J. Dyer. 1959. A rapid method of total lipid extraction and purification. Can. J. Biochem. Physiol. 37: 911-917. Chiu, Y.N., V.J. Estilo, N.S. Sumagaysay and M.A.S. Sastrillo. 1988. Effects of supplementary feeding, increased stocking rates and aeration on
milkf1sh yields in brackish water pond. Univenity of the Philippines in the Visayas. (Unpublished report). Juliano, R.O. and R. Hirano. 1986. The growth rate of milkfish, Chano.s chmws in brackishwater ponds in the Philippines, p. 63-66. In J.L.
Maclean, L.B. Dizon and L.V. Hosillos (eds) 'The Fint Asian Fisheries Forum. Asian Fisheries Society, Manila, Philippines. Lands, W.E.M. 1989. FisH and human health: a story unfolding. World Aquaculture 20(1): 59-62. ' Lijauco, M., J.V. Juario, D.D. Baliao, E. Griiio and G. Quinitio. 1979. Mijkfish culture in brackishwater ponds, Aquaculture Extension Manual
No. 4. Aquaculture Department, Southeast Asian Fisheries Development Center, Iloilo, Philippines. Metcalle, LD., A.A. Schmitz and J.R. Pelka. 1966. The rapid preparation of fatty acid esten from lipids for gas chromatographic analysis. Anal.
Chem. 38: 514. Pascual, F.P. 1989. Nutrition and feeding of sugpo Penaeus monodon Fabricius. Extension Manual No.3. Aquaculture Department, Southeast
Asian Fisheries Development Center, Iloilo, Philippines. Pigon, G. 1989, The need to improve omega-3 content of cultured fish. World Aquaculture 20(1): 63-68. Sumagaysay, N.S., Y.N. Chiu-Oiem, VJ. Estilo and M.A.S. Sastrillo. 1990. Increasing milkfLSh (Chanos clumos) yields in brac:kishwater ponds
through increased stocking rates and supplementary feeding. Asian Fish. Sci. 3: 251-256.


Production of Nile Tilapia ( Oreochromis niloticus) in Different Culture and Harvesting Systems
C. NITITHAMYONGI J. CHIA YV AREESAJJAI S. CHIA YV AREESAJJA 1
C. WONGWITI R. T ANSAKUL2
lDepartment of Aquatic Science, Faculty of Natural Resources 2Department of Biology, Faculty of Science
Prince of Songkhla University Hat Yai, Songkhla 90112
Thailand
NITITIIAMYONG, C., I. CHIAYVAREESAJJA, S. CHIAYVAREESAJJA, C. WONGWIT and R. TANSAKUL. 1991. Production of Nile tilapia (Oreochromis niloticus) in different culture and harvesting systems, p. 169-174. In S.S. De Silva (ed.) Fish nutritioo research in Asia. Proceedings of the Fourth Asian Fish Nutrition Workshop. Asian Fish. Soc. Spec. Pub!. 5, 205 p. Asian Fisheries Society, Manila, Philippines.
Abstract
Nile tilapia (Oreochromi.Y niloticus) were reared in 2 systems, viz. monoculture and integration of tilapia and pig. Following a 3-month culture period, tilapia of marketable size were harvested monthly (multiple harvest) from one of the monoculture systems and from the integrated system until the end of the experiment. Total production of Nile tilapia from monoculture and integrated systems with multiple harvesting technique were 53.1 kg/unit and 100.0 kg/unit, respectively. Tilapia production from monoculture system with single harvest was 43.9 kg/uniL On an economical basis, integrated system with multiple harvest of tilapia gave a significantly lower return than monoculture of tilapia.
Introduction
Many culturing techniques have been developed to obtain more value added products in tilapia culture due to the low market price of Nile tilapia (Oreochromis niloticus) at the present time. Raising Nile tilapia with pig or other animals in integrated culture system was shown as one way to increase the fish biomass and thus generate more income from selling the fish (Woynarovich 1979; Schroeder and Hepher 1979; Chiayvareesajja et al. 1989). Moreover, Edwards (pers. comm., 1988) proposed the idea of multiple harvesting technique in tilapia ponds to provide more benefit for the farmers.
This study attempted to analyze the benefit from 3 tilapia culture systems with 2 harvesting techniques: a) tilapia monoculture with single harvest, b) tilapia monoculture with multiple harvesting technique and c) multiple harvesting of tilapia raised in an integrated system.
169

170
Materials and Methods
The study was performed at Thale Noi. A. completely randomized design was used to compare 3 treatments: a) monoculture of tilapia with single harvest at the end of a 6-month experiment, b) monoculture of tilapia with multiple harvest in which the large size fish (> 15 cm TL) were harvested monthly after a 3-month culture period and c) integrated culture system of tilapia with pig with multiple harvesting system as in b. Three replicates of each treatment were used and each replicate was conducted in a 160 m2 earthen pond. Nile tilapia (0. niloticus) of average weight 65 g were used for stocking in all treatments at the rate of 100 fish/pond with a sex ratio of female to male of 2 to 1. Three pigs averaging 7.7 kg were raised in a 4-m2 pen housed over each pond in the integrated system. Nile tilapia in the monoculture system were fed with aquatic weed mixture pellet (dry weed : rice bran : fish meal = 4 : 3 : 1) twice daily at the rate of 5% of fish body weight. Chiayvareesajja et al. (1990) described procedures of feed preparation. Feed allowance was adjusted every month after monthly sampling when body weight of fish and pig were determined. For the integrated system, no direct feed was given to fish but was instead fed to pigs at the rate of 10% of pig body weight, twice daily.
Water quality (pH, temperature, dissolved oxygen, conductivity and turbidity) was monitored at monthly intervals during the 6-month experiment.
At the end of the experiment, all fish were weighed, sorted and counted into 3 groups: large (> 15 cm in total length), medium (lD to 15 cm) and small(< 10 cm). Weights of pigs were also determined. Production costs including costs of feed, originally stocked Nile tilapia, and pigs were assessed by this time. Returns were also determined from final production and benefits from 3 different treatments were evaluated. Differences among treatments in all aspects except the percentage composition of size classes were subjected to analysis of variance. Duncan's multiple range test was used to verify the difference between treatments. Difference m percentage composition of 3 size classes among treatments was subjected to Chi-square test.
Results
During the 6-month period, water quality in all treatments was comparable; water temperature ranged from 29.6 to 35.0°C; dissolved oxygen from 4.1 to 8.2 mg/l; pH from 4.4 to 6.0; conductivity from 0.1to0.6 mS/cm and turbidity from 31 to more than 100 NTU.
Production of tilapia in 3 different rearing systems is shown in Tables 1 and 2. The integrated pig and tilapia culture with multiple harvesting technique showed maximum production of 29.1 kg medium size (10-15 cm TL) tilapia, 36.2 kg of large size fish (> 15 cm TL) and 1,889 small size fish (< 10 cm TL) per pond. This production gave a return of 1,813 baht/pond in the system. The other systems gave a similar return of 1, 195 and 1,093 baht/pond for monoculture with multiple and with single harvest, respectively (Table 1).
Comparing the production of small size tilapia among the systems, it was found that multiple harvesting technique in monoculture and integrated systems showed a similar number of small fish per pond which was higher than that in the monoculture system with single harvest (Table 1).
Percentage composition in weight of 3 size classes of tilapia is shown in Fig. 1. While single harvest of tilapia in the monoculture system showed 99% production of large size fish, other treatments gave a proportion of 3 size classes in the systems. In multiple harvesting systems,

171
monoculture of tilapia gave a slightly higher proportion of large fish than integrated culture of tilapia and pig (Fig. 1 and Table 1 ). These proportions of 3 size classes fish in the systems contributed to the difference in the final average tilapia weight (Table 2).
Production costs of 3 treatments are shown in Table 3. Total production cost of tilapia monoculture was lower than that of the integrated system. However, if the costs of pig and pig feed were omitted, the production cost would be much lower for the integrated system.
Table I. Productioo of Nile tilapia, pig and returns (bahl) from all production harvested in 3 different treatments (mean ± S.E.).
Multiple harvest + pig Multiple harvest Single harvest
Production
Tilapia Small siz.e (< 10 cm)
Number 1,889 ± 506a* 1,548 ± 319a 3 ±lb Weight (leg) 34.9± 8.2a 18.0±0.8a o.o±o.ob
Medium size (10-15 an) Number 6Tl ± 172a 188± 9b 5±3c Weight (leg) 29.l ± 1.3a 6.8±0.1b 0.4± o.2c
Large siz.e (> 15 cm) Number 141±2a 149±27a 185 ± 15a Weight (leg) 36.2 ± 3.la 28.2±5.7a 43.5 ±2.8a
Total Number 2,700 ± 658a l,999±276a 193±lb Weight (leg) 100.0±7.la 53.l ±6.7b 43.9± 3.ob
fig Weight (leg) 188.0 ± 10.1
Returns•• Tilapia 1,813.2 ± 118.3a 1,195.3 ±226.la 1,093.4 ± 73.3a
5& 4,700.0 ± 275.4
Total 6,513.2± 161.5a 1,195.3 ± 226.1 b 1,093.4 ± 73.3b
•Values in the same row with different supencripu are significantly different from each other al P < 0.0 I. **Price of tilapia: large siz.e (> 15 cm TL)= 25 bahl/kg; medium siz.e (10 lo 15 cm TL)= 15 bahl/kg; small
siz.e (< 10 cm TL) = 0.25 bahl each. Price of pig = 25 bahl/kg.
Table 2. Growth of cultured Nile tilapia, average weight and number of large lilapia harvested (± S.E.) using 3 different lreatrnenU.
Multiple harvest + pig Multiple harvest Single harvest
Average initial weight 62.3 ±o.~· of tilapia (g) 66.3 ± 2.2a 65.7 ± l.8a
Average final weight 228.5 ±7.7b of tilapia (g) 41.5 ± 9.2a 26.6±0.7a
Average final weight of 189.0± 3.2b 236.1±6.~.b large tilapia (g) 256.4 ± 19.la
Total number of large tilapia harvested 141±2a 149±27a 185 ± 15a
•Values in the same row with different supencripls are significantly different from each other al P < 0.0 I.

172
According to a brief economic analysis, 2 systems of tilapia monoculture gave a slight difference in benefit between single and multiple harvesting systems, 492 and 592 baht/pond, respectively, and were higher than that of the integrated system (Table 4).
I 10
100
90
80
- 70 c: Q) 60 0 ... Q) ll. 50
40
30
20
10
0
- Large
- Medium
D Small
Multiple harvest integrated
Multiple harvest monoculture
Harvesting technique
Single harvest monoculture
Fig. 1. Percentage composition in weight of 3 size classes of Nile tilapia cultured under 2 different harvesting techniques (mean± 2 S.E.).
Table 3. Production costs (baht ± S.E.) of Nile tilapia per pond cultured in single harvest and multiple harvest technique under monoculture and integrated system during the 6-rnonth experiment.
Cost of tilapia for initial stocking•
Cost of aquatic weed mixture feed••
Cost of pigs•••
Total cost
Multiple harvest + pig
93.5 ± l.3
6,040. 7 ± 290.6
2,100.0 ± 0.0
8,234.2 ± 291.4
•Tilapia costs 15 baht per kilogram; 25 baht = US$ I. ••Aquatic weed costs 4.42 baht per kilogram. ,. .. Pig costs 2,100 baht each.
Table 4. Economic analysis of 3 different culture systems.
Returns (baht)
Production cost (baht)
Benefit (baht)
Multiple harvest + pig
6,513±162
8,234±291
-1,721±1~·
Multiple harvest
98.5±2.8
504.4±10.7
602.9±8.0
Multiple harvest
1,195±226
603±8
592±219b
Single harvest
98.5±2.6
502.8 ± 18.6
606.3±16.0
Single harvest
l,093 ±73
606± 16
492±83b
•Values in the same row with different superscripts are significantly different from each other at P < 0.01.

173
Discussion
Tilapia production
Raising pig alone with aquatic weed mixture pellet at the present socioeconomic status in Thailand gave a loss of 3,400 baht/pond (Tables 1 and 3) as found by Tansakul (unpublished data). This modified system tried to alleviate the loss by applying multiple harvesting technique to the system as proposed by Hickling (1962) and Swingle (after Guerrero 1982).
Comparing tilapia production in the 3 treatments, it was found that the integrated system which produced the highest number of small fish gave the highest returns (1,813 baht/pond) (Table 1 ). Multiple harvesting technique significantly increased total number of fish harvested (Table 1 ). Total tilapia production in weight was also higher for the integrated system than the monoculture ones as found by Chiayvareesajja et al. (1989). The discrepancy in total production of tilapia cultured under different systems but with the same harvesting technique may be due to the higher nutrient load in the integrated system as was suggested by Chiayvareesajja et al. ( 1989). Total production of the multiple harvest in tilapia monoculture was not higher than that of single harvest which is in agreement with the results of Edwards (1988).
The low production of small tilapia in the single harvest system where no large size tilapia was harvested during the experiment may be because of high density of spawners in the system. In the multiple harvesting regime, low proportion of large fish allows more space for medium and small tilapia to be produced in the system when large fish were harvested monthly. Low amount of large size fish would also allow them to breed freely compared to those in a single harvest system. In addition, in the single harvest system due to high density of large size fish agonistic behavior might occur (Magnuson 1962) and consequently hinder reproduction (Allison et al. 1979). High rate of cannibalism might also occur with a high density of large size fish (Pantastico et al. 1988) and thus reduce the number of young (Macintosh and De Silva 1984).
In some areas like Thale Noi where small size tilapia can be sold as fish seed, a large proportion of small size fish could give a high return to the system.
Economic analysis
When comparing the tilapia production cost in monoculture of tilapia (single and multiple harvesting regimes), there was no significant difference in benefits (Table 4) due to similar tilapia production in the system (Table 1).
Tilapia production cost of integrated and monoculture multiple harvesting systems is not easily comparable due to their different feeding regimes. If tilapia production is a by-product from an integrated system, tilapia production cost would be about one-sixth of the cost for monoculture (Table 3). Raising pig alone with aquatic weed mixture pellet resulted in a loss as mentioned above.
Benefits from single harvest and multiple harvest of tilapia monoculture were 492 and 592 baht/pond (30,750 and 37,000 baht/ha) in 6 months or 61,500 and 74,000 baht/ha/year, respectively, which could be considered as a good income for rural villagers in Thale Noi. Concerning tilapia production as a by-product of the tilapia-pig integrated systems, raising tilapia in these systems could also provide a great benefit for pig farmers.

174
The feed for tilapia and pig used in this experiment was a formulated aquatic weed mixture pellet developed for poor rural areas where aquatic weeds are abundant such as Thale Noi (Tansakul 1985). This experiment also showed optimistic figures for using these weeds as tilapia and animal feed. One problem facing the implementation of fish culture in Thale Noi is the capital for initial investment (land, equipment, etc.). If this obstacle is overcome, raising tilapia with aquatic weed mixture pellet may be another way to control aquatic weed and at the same time provide income to poor villagers in Thale Noi or anywhere in the region where a similar problem exists.
Acknowledgements
This work was supported by the International Development Research Centre of Canada under grant number 3-P-85-0266. Special thanks are given to S. Angsupanich, P. Sirimontraporn and field personnel in Thale Noi village for cooperation and assistance in data collection.
References
Allison, R., R.O. Smitherman and J. Cabrero. 1979. Effect.a of high density culture and form of feed on reproduction and yield of Tilapia aurea, p. 168-110. In T.V.R. Pillay and W.M. Dill (eds.) Advances in aquaculture. Fishing News Book, Surrey, England.
Chiayvareesajja, S., C. Wongwit and R. Tansakul. 1990. Cage culture of tilapia (Oreochromis nilolicus) using aquatic weed-based pellets, p. 287-290. In R. Hirano and 1 Hanyu (eds.) The Second Fisheries Forum. Asian Fisheries Society, Manila, Philippines.
Chiayvareesajja, S., C. Wongwit, A. Cronin, K. Supamataya, C. Tantikitti and R. Tansakul. 1989. Utilization of aquatic weed mixture pellet as feed for Nile tilapia (Oreochromis niloticus) and pig, p. 143-147. In S. De Silva (ed.) Fish nutrition research in Asia. Asian Fisheries Society, Manila, Philippines.
Edwards, P. 1988. Tilapia raised on septage as high protein animal feed, p. 1-13. In R.S.V. Pullin, T. Bhukaswan, K. Tonguthai and J.L. Maclean (eds.) The Second International Symposium on Tilapia in Aquaculture. ICLARM Conf. Proc. 15, 623 p. Department of Fisheries, Bangkok, Thailand and International Center for Living Aquatic Resources- Management, Manila, Philippines.
Guerrero, R.D. ill. 1982. Control of tilapia reproduction, p. 309-329. In R.S.V. Pullin and R.H. Lowe-McConnell (eds.) The biology and culture of tilapias. ICLARM Conf. Proc. 7, 360 p. International Center for Living Aquatic Resources Management, Manila, Philippines.
Hickling, C.F. 1962. Fish culture. Faber and Faber, London. 295 p. Macintosh, D.J. and S.S. De Silva. 1984. The influence of stocking density and food ration on fry surviyal and growth in Oreochromis
mossambicus and 0. nilolicus female x 0. aureus male hybrids reared in a closed circulated system. Aquaculture 41: 345-358. Magnuson, I.I. 1962. An analysis of aggressive behavior, growth and competition for food and space in Medaka (Oryzias latipes (Pisces,
Cyprinodontidae)). Can. I. ZooL 40: 313-363. Pantastico, J.B., M.M.A. Dangilan and R. V. Eguia. 1988. Cannibalism among different siz.es of tilapia (Oreochromis nilolicus) fry/fingerlings
and the effect of natural food, p. 465-468. In R.S.V. Pullin, T. Bhukaswan, K. Tonguthai and J.L Maclean (eds.) The Second International Symposium on Tilapia in Aquaculture. ICLARM Conf. Proc. 15, 623 p. Department of Fisheries, Bangkok, Thailand and International Center for Living Aquatic Resources Management, Manila, Philippines.
Schroeder, G. and B. Hepher. 1979. Use of agricultural and urban wastes in fish culture, p. 487-489. In T.V.R. Pillay and W.M. Dill (eds.) Advances in aquaculture. Fishing News Book, Surrey, England.
Tansakul, R. 1985. Aquatic weeds (Thailand). Final report to the International Development Research Centre. Department of Biology, Faculty of Science, Prince of Songkla University, Hat Yai, Songkla, Thailand. 171 p.
Woynarovich, E. 1979. The feasibility of combining animal.husbandr)r with fish farming, with special reference to duck and pig production, p. 203-208. In T. V.R. Pillay and W .M. Dill (eds.) Advances in aquaculture. Fishing News Book, Surrey, England.

Growth and Production of Nile Tilapia ( Oreochromis niloticus) in Monoculture and Polyculture with Snakehead (Channa striata), and in Integrated
Culture with Pig and Snakehead
C. NITITHAMYONGt J. CHIA YV AREESAJJAI S. CHIA YV AREESAJJAI
R. T ANSAKUL2 C. WONGWITt
1Department of Aquatic Science, Faculty of Natural Resources 2Department of Biology, Faculty of Science
Prince of Song/ch/a University Hat Yai, Songkhla 90112
Thailand
:\TIITHAMYONG, C., J. ClllAYVAREESAJJA, S. CHIAYVAREESAJJA, R. TANSAKUL and C. WONGWIT. 1991. Growth and production of Nile tilapia (Oreochromis niloticus) in monoculture and polyculture with snakehead (Channa striata), and in integrated culture with pig and snakehead, p. 175-180. In S.S. De Silva (ed.) Fish nutrition research in Asia. Proceedings of the Fourth Asian Fish Nutrition Workshop. Asian Fish. Soc. Spec. Pub!. 5, 205 p. Asian Fisheries Sociely, Manila, Philippines.
Abstract
Juvenile Nile tilapia (Oreochronm niloticus) of mean body weight 67 g were stocked in ponds of surface area 160 m2 alone, with snakehead (Channa striala) or with snakehead and pig in an integrated culture system. Three replicates of each trealment were used. Stocking density for tilapia was 90 fish/pond for all treatments and that of snakehead was 10 fish/pond. Three pigs were raised in the pen housed over each pond for the integrated system. After 7 months, tilapia grown in the integrated system had a significantly higher mean body weight (P < 0.01) than those in the other treatments. On ~'11 economic!l basis, tilapia raised in the integrated system gave a substantially lower return than those in polyculture and monoculture systems.
Introduction
Nile tilapia (0. niloticus) has been found to be the most appropriate locally available species for culture in Thale Noi, an acidic freshwater lagoon of approximately 25 km2 in the uppermost part of Songkla Lake (Tansakul 1985). Aquatic weed (Ceratophyllwn demerswn) mixture pellet containing dry weed, rice bran and fish meal in a ratio of 4:3:1 is suitable as feed for the tilapia (Chiayvareesajja et al. 1990). One major constraint, however, in tilapia culture is precocious spawning (Bardach et al. 1972) which results in overpopulation and stunting. Stocking tilapia
175

176
with a natural predator has been successfully used to control recruitment of tilapia in several studies (Dunseth and Bayne 1978; Bedawi 1985; Iscandari 1986; Ofori 1988; Manzano 1990). One of the important piscivores, snakehead (Channa striata) is a popular food fish in Thailand owing to its delicate taste. It commands a high price. Therefore, one would expect that stocking Nile tilapia with snakehead will not only limit the number of small tilapia in culture ponds but also add a high value by-product.
The primary objective of the present study is to test snakehead as a predator to control Nile tilapia recruitment that would eventually enhance production of large size tilapia under polyculture and integrated culture systems.
Materials and Methods
The study was performed at Thale Noi. The experiment consisted of 3 treatments which were monocult~e of Nile tilapia, polyculture of Nile tilapia with snakehead and integrated culture of Nile tilapia, snakehead and pig. Each treatment was done in triplicate.
Experiment was conducted in 9 earthen ponds of 160 m2 each. Nile tilapia Oreochromis niloticus (L.) of average weight 81 g were used for initial stocking in all treatments at the rate of 90 fish/pond at a ratio of 2 females to 1 male. Fifteen male and female fish in each pond were tagged for growth evaluation. For polyculture and integrated systems, 10 snakehead averaging 80 g were stocked in each pond 2 months after the initial stocking of tilapia. In the integrated system, 3 pigs averaging 7 .5 kg were raised in a 4 m2 pen housed over each pond. Nile tilapia in monoculture and polyculture systems were fed with aquatic weed mixture pellet twice daily at the rate of 5% of fish body weight. Procedures for feed preparation were described by Chiayvareesajja et al. (1990). Amount of feed offered was adjusted every month after monthly sampling when body weights of tilapia, snakehead and pig were determined. For integrated system, instead of direct feeding of tilapia, pigs were fed at the rate of 10% body weight twice daily.
During the 7 month experiment, water quality (pH, temperature, dissolved oxygen, conductivity and turbidity) were monitored at monthly intervals.
At the end of the experiment, all tilapia were weighed, sorted and counted into 3 groups: large(> 15 cm in total length); medium (10 to 15 cm) and small(< 10 cm). In addition, 10 large female tilapia were also sampled from each pond and sacrificed to determine the gonadosomatic index. Weights of snakehead and pigs were also determined. Cost of feed, originally stocked Nile tilapia, snakehead and pigs were determined by this time. Returns were also evaluated from final production of these animals and benefits from 3 different treatments were then estimated. Discrepancy among treatments in all aspects except the percentage composition of size classes were subjected to analysis of variance. Duncan's multiple range test was used to verify the difference between treatments. Difference in percentage composition of 3 size classes among treatments was subjected to Chi-square test.
Results and Discussion
Water quality in all treatments during the experiment was as follows: temperature ranged from 30.4 to 34.9°C; dissolved oxygen from 3.5 to 8.2 mg/I; pH from 4.7 to 5.5; conductivity from 0.1 to 0.6 mS/cm and turbidity from 60 to more than 100 NTU. Values of each parameter were comparable among treatments.

177
During the experimental period, average pig weight increased from 7 .5 kg at the beginning to 49 .0 kg at the end of the experiment. No significant difference in growth performance of snakehead between polyculture and integrated systems was detected judging from the initial and final weights of the fish (Table 1 ). Growth performance and production of Nile tilapia in monoculture, polyculture and integrated systems are also shown in Table 1. Mean final wet weight of tilapia raised in the integrated system with pig and snakehead was significantly higher (P < 0.01) than those in other treatments. A similar result was obtained for the difference in average weights of large size tilapia at the end of the experiment (Table 1). However, no statistical difference was evident among treatments regarding the number of large size tilapia and total production of tilapia at harvest (Table 1 ). Growth of tagged tilapia is shown in Fig. 1. No statistical analysis was performed to evaluate differences in growth rates among treatments because not every tagged fish was sampled every month. Considering the total number of tilapia harvested, polyculture system of tilapia with snakehead gave a significantly higher number of fish than other systems (P < 0.01; Table 1 ), and a large proportion of them was medium sized (Fig. 2), demonstrating the trend of effective reduction of small tilapia by snakehead. The production of young tilapia, however, was considerably low in all treatments compared to other studies which normally would have more than 20% of small tilapia (Bedawi 1985; McGinty 1985; Ofori 1988).
In general, stocking tilapia with its predator decreases tilapia production due to the reduced number of recruits but increases the average size of tilapia (Dunseth and Bayne 1978; Ofori 1988; Manzano 1990). Contradictory results also have been reported (McGinty 1985). In our study, stocking tilapia with snakehead did not affect tilapia production nor number of large size tilapia harvested, and only in the integrated system that large size tilapia were significantly higher than those in monoculture. Snakehead appears to influence tilapia recruitment in
Table 1. Growth and production of fishes (± S.E.) under 3 different culrure systems.
Monoculture Polyculrure Integrated
Average initial weight 84.1 ± 11.28* of tilapia (g) 81.5 ± 1.ei 76.3 ± 2.'>8
Average final weight 290.5 ± 35b of tilapia (g) 122.1±21.28 88.0±7.03
Average initial weight of snakehead (g) 80.5 ± 6.58 80.0 ± 1.88
Average final weight of snakehead (g) 283.3 ± 42.'>8 246.0 ± 44.18
Total initial weight o! tilapia (kg) 7.6 ± 1.08 7.3 ±0.28 6.9±0.38
Total final weight of tilapi8 (kg) 41.7 ± 16.'>8 58.2± 2.ei 64.4 ± 3.'>8
Average final weight of 290.9± 3.3b large siz.e til8pia (g) 186.4± 9.et 203.7 ±7.78
Number of large siz.e tilapia (> 15 cm) 177 ±658 174 ± 238 222 ± 158
Total number of fish harvested 322±928 666±39b 222± 158
*Values in lhe same row wilh different supencripu are significantly different from each other at P < 0.01.

178 300
• Monoculture
250 • Polyculture
- • Integrated []) --.c 200 [])
Q)
:= Q) [])
150 m a.. Q) > <t
100
50 0 2 3 4 5 6 7
Experimental period (month)
Fig. l. Average weight of tagged Nile tilapia during 7-month period (mean± S.E.).
I 10 Large
100
90 • Medium
80 D Small
70 -c: 60 Q) 0 a..
50 Q) D.
40
30
20
10
0
Monoculture Polyculture Integrated
Culture system
Fig. 2. Percentage composition in weight of 3-siz.e classes of Nile tilapia raised under 3 different culture systems (mean± 2 S.E.).
8

179
integrated system but not in polyculture because the percentage composition of small size tilapia found in polyculture and monoculture was not significantly different (Fig. 2). The reason for the difference in recruitment control of tilapia by sna.k:ehead in polyculture and integrated systems are not clearly understood but several explanations can be proposed. Sna.k:ehead probably preyed upon tilapia fry instead of inhibiting gonad recrudescence of tilapia because gonadosomatic indices of fish in 3 treatments were not substantially different. The average gonadosomatic index of tilapia in monoculture was 1.96 ± 0.27 (mean ± S.E.), in polyculture 3.16 ± 0.90 and in integrated system 2.79 ± 0.59. Nile tilapia in the integrated system did not directly receive feed but probably fed on natural food prcxluced in the pond. Therefore, fish in this treatment received less energy than the ones in other treatments which were fed directly (Woynarovich 1979) and consequently growth of tilapia fry was low compared to other treatments. According to the optimum foraging theory, the smaller size tilapia in the integrated system would be more energetically beneficial for sna.k:ehead to prey upon resulting in reduced number of small fish in this particular system. Only when the number of tilapia fry was substantially reduced would snakehead switch to larger size tilapia. This was confinned by work done in our laboratory on prey selection of sna.k:ehead that normally would selectively prey on tilapia of total length less than 3 cm when tilapia of several size classes were offered (Nitithamyong, unpublished data). The selective foraging strategy of snakehead would then allow tilapia with total length more than 3 cm to grow to a larger size. Moreover, the ratio of sna.k:ehead to tilapia, the original size of snakehead stocked and the time of stocking the predator in this study may not be optimal. Several studies have shown that the ratio of predator to prey stocked markedly affects the recruitment control of prey species. Generally, the higher the ratio of predator to prey, the higher the proportion of large size tilapia harvested (Dunseth and Bayne 1978; Bedawi 1985; Manzano 1990). However, Ofori ( 1988) found that stocking Lates niloticus with Nile tilapia at the ratio of 1: 154 gave a significantly lower proportion of large size tilapia compared to those stocked at the ratios of 1 :250 or 1 :80. The stocking ratio of snakehead to tilapia in our study was 1: 10 which was high enough according to Pullin (1982). However, the stocking size of tilapia and the length of culture pericxl (2 months) before stocking snakehead in this study might allow tilapia to prcxluce too many fry for predators to cope with in the polyculture system. Therefore, it is advisable to conduct further research to evaluate the appropriate stocking strategy of snakehead and Nile tilapia. The size of snakehead (80 g) when it was stocked may be too small to elicit substantial effect because they might be too small to prey upon even small size tilapia due to its gape size.
On an economical basis, raising tilapia in the integrated system was not beneficial because larger amounts of aquatic weed mixture pellet were needed for feeding the pigs compared to those needed by the fish (Table 2). There was some profit in the other two treatments with no significant difference in profit between the two treatments demonstrating there was no economic
Table 2. Ecaiomic analysu m the different culture systems.
Rerum (batll)• Production cost (baht)•• Benefit (baht)
Mmocuhwe
968±394 S77±23 391 ±413a•••
Polyculture
I,337 ± 72 877±24 460±7~
Integrated
S,384±236 7,311 ±238 -I,927 ± 134b
•Price of tilapia: large size(> IS an TI..)= 2S bahllkg/ 2S baht = USSI; medium size (IO to IS cm TI..)= IS bahl/kg; small size (< 10 an TI..) = 0.2S bahl price of each pig = 2S bahllkg .
.. Tilapia costs IS bahtlkg, aquatic weed costs 4.42 bahllkg, pig cosll 2,100 bahl each. •••Values in the same row with different supencripu are signific;antly diffc;rent from each other at P < 0.01.

180
benefit in stocking tilapia with snakehead at this ratio and size. However, in the integrated system when the costs of pig feed and pig were excluded, there would be some profit as in the other treatments. This probably is the proper way to evaluate the profit because in the integrated system, one would have the swine manure free. Further research is still needed before the feasibility of stocking tilapia w1th snakehead can be confirmed.
Acknowledgements
This study was supported by the International Development Research Centre of Canada under grant number 3-P-85-0266. Sincere thanks are given to S. Angsupanich, P. Sirimontraporn and field research personnel in Thale Noi village for their kind cooperation and assistance in data collection.
References
Bardach, J.R., J.H. Ryther and W.D. McLamey. 1972. Aquaculture, the farming and husbandry of freshwater and marine organisms. Wiley Intencience, New Y orlc. 868 p.
Bedawi, R.M. 1985. Recruitment control and production of market-size Oreochromis niloticws with the predator I.Ates niloticws L. in the Sudan. J. Fish Biol. 26: 459-464.
Chiayvareesajja, S., C. Wongwit and R. Tansakul. 1990. Cage rulture oftilapia (Oreochromis niloticws) using aquatic weed-based pellets, p. 287-290. In R. Hirano and I. Hanyu (eds.) The Second Fisheries Forum. Asian Fisheries Society, Manila, Philippines.
Dunseth, D.R. and D.R. Bayne. 1978. Recruitment control and production of Tilapia aurea (Steindachner) with the predator, Cichlasoma managuense (Gunther). Aquaculture 14: 383-390.
Iscandari, N.B. 1986. Studies to determine the possible value of Notopteris afer as predator in Oreochromis niloticws ponds, p. 123-128. In E.A. Huisman (ed.) Aquaculture research in the Africa Region. International Foundation for Science (IFS), Wageningen, The Netherlands.
Manzano, V.B. 1990. Polyatlture systems using grouper (EpinepMlllS tauvina) and tilapia (Oreochromis mossambicus) in brackishwater ponds, p. 213-216. In R. Hirano and I. Hanyu (eds.) The Second Fisheries Forum. Asian Fisheries Society, Manila, Philippines.
McGinty, A.S. 1985. Effects of predation by largemouth bass in fish production ponds stocked with Tilapia nilotica. Aquaculture 46: 269-274. Ofori, J.K. 1988. The effect of predation by I.Ates niloticws on overpopulation and stunting in mixed sex ailture of tilapia species in ponds, p. 69-
73. In R.S.V. Pullin, T. Bhukaswan, K. Tonguthai and J.L Maclean (eds.) The Second International Symposium on Tilapia in Aquaculture. ICLARM Conf. Proc. 15, 623 p. Depa11ment of Fisheries, Bangkok, Thailand and International Center for Living Aquatic Resources M11nagement, Manila, Philippines.
Pullin, R.S.V. 1982. General discussion on the biology and culture of tilapias, p. 331-351. In R.S.V. Pullin and R.H. Lowe-McConnell (eds.) The biology and atlture of tilapias. ICLARM Conf. Proc. 7, 360 p. International Center for Living Aquatic Resources Management, Manila, Philippines.
Tansakul, R. 1985. Aquatic weeds (Thailand). Final report to the International Development Research Centre. Depa11ment of Biology, Faculty of Science, Prince of Songkla Univenity, Hat Yai, Songkla Thailand. 171 p.
Woynarovich, E. 1979. The feasibility of combining animal husbandry with fish farming, with special reference to duck and pig production, p. 203-208. In T.V.R. Pillay and W.M. Dill (eds.) Advances in aquaculture. Fishing News Book, Surrey, England.

Comparison of Feeding Strategies for Common Carp Based on Biomass and Biomass-Pond Interactions
HARJEET S. SEHGAL H.S. TOOR
Fisheries Research Complex Department of 'Zoology
Punjab Agricultural University Ludhiana 141 004
India
SEHGAL, H.S. and H.S. TOOR. 1991. Comparison of feeding strategies for common carp based on biomass and biomasspond interactions, p. 181-192. In S.S. De Silva (ed.) Fish nutrition research in Asia. Proceedings of the Fourth Asian Fish Nutrition Workshop. As;an Fish. Soc. Spec. Pub!. 5, 205 p. Asian Fisheries Society, Manila, Philippines.
Abstract
Fish biomass by and large is the only parameter that decides ration size in traditional carp feeding practices. However, the feed intake will depend not only on biomass but aho on water quality parameters (especially temperature, dissolved gases and metabolic wastes), quality of feed, feeding frequency and natural food. In a 330-day culture of common carp, Cyprinus carpio var. commwsis, feeding at I, 2 and 3% of fish biomass in tanks manured with 18,000 kg ha-I year-I of cowd1Dtg I: poultry droppings 3 (w/w basis) was wasteful during early (early April to mid-August) and later (mid-December to late February) parts of the rulture. Likewise, feeding at 2, 3 and 4% of.fish biomass was wasteful in unmanured tanks during this period. Feeding was not required in manured tanks during the first 135 days as sufficient natural food was present to support the relatively low fish biomass. Conversely, during the middle part of the culture (midAugust to late November), which corresponded to favorable water quality conditions, feeding rates up to 3% in manured, and up to 4% in IDlffianured tanks were fOIDld insufficient. Economics of fish biomass based and fish biomass-pond ecology based feeding strategies are considered. Use of computer-based regression models in estimating desired ration size is suggested.
Introduction
Supplementary feeding is the highest recurring cost in intensive and serm-rntensive fish culture systems. It forms approximately half of the total fish farming cost. In order to make supplementary feeding cost-effective, many studies have been made in the recent past. Most of these are, however, directed towards substituting fish meal with some less expensive protein sources such as plant products and animal wastes (Matty and Smith 1978; Beck et al. 1979; Jackson et al. 1982; Winfree and Stickney 1984; Appler 1985; Sehgal and Thomas 1985, 1987; Wee and Wang 1987; De Silva and Gunasekera 1989) or to investigate the levels of waterquality parameters like temperature and salinity that would allow maximum food consumption and/or conversion efficiency (De Silva and Perera 1985).
181

182
Another imponant aspect of supplementary feeding is to estimate desired levels of feeding under a particular set of pond ecological conditions. Overfeeding would not only waste·costly feed but would also result in fish monality due to oxygen depletion particularly during summer months. Underfeeding, on the other hand, would result in reduced fish growth and hence lower returns. Traditional carp feeding practice considers, by and large, fish biomass to be fed. However, the amount of food a fish will eat will not depend only upon fish biomass but also on ecological parameters like (i) water temperature, dissolved oxygen and metabolic wastes such as ammonia, (ii) quality of food in terms of its nutritional value, energy content and physical structure, and (iii) feeding frequency and availability and quality of natural food (Brett 1979; Brett and Groves 1979). Despite their importance in deciding ration size, ecological parameters are usually ignored. Lovell (1977) incorporated temperature, in a rough manner, in recommending pond feeding rates for channel catfish.
The present study is an attempt to incorporate water-quality parameters such as temperature, dissolved oxygen, and pH and natural food like zooplankton and green algae, besides fish biomass and age, in estimating desired ration levels for common carp, Cyprinus carpio var. communis. Economics of fish biomass based and fish biomass-pond ecology based feeding strategies are compared.
Materials and Methods
Studies were conducted at the Fisheries Research Complex of the Punjab Agricultural University, Ludhiana, India from 2 April 1986 to 25 February 1987 (330 days of culture). The experiments were conducted in eighteen rectangular cemented tanks, each measuring 13 m x 5.5 m x 1.83 m. Each of the nine treatments (described in Table 1) were run in duplicate. An approximately 5 cm-thick layer of soil was spread on the bottom of each tank. Six of the eighteen tanks were manured with 18,000 kg ha-I year-I of cow dung (1 part) and chicken manure (3 parts) (w/w basis) fifteen days before starting the experiment, when one tenth of the manure was applied and the rest was added in equal quanta twice a week. Thirty-day old common carp, Cyprinus carpio communis raised in our hatchery were stocked to correspond to 10,000 ha-1. The mean size at stocking was 1.67 ± 0.24 g.
The feed used in the present studies was prepared by using most commonly used ingredients such as rice bran, groundnut oil cake, and fishmeal. The vitamin and mineral premixes were used according to the recommendations of NRC (1983). The proximate composition of the feed was: crude protein (CP) - 35%, total carbohydrates (TC) - 27%, total lipids (TL) - 5.7%, and gross
Table 1. Description of various treatments (ration sizes manured and urunanured tanks).
Treatment code
Tl T2 T3 14 TS T6 17 TS T9
Description
No manuring, no feeding Only manuring* Manuring + 1 %** feeding Manuring + 2% feeding Manuring+ 3% feeding No manuring, 1 % feeding No manuring, 2% feeding No manuring, 3% feeding No manuring, 4% feeding
*Manuring was done with 18,000 kg ha-1 year-I of cow dung (1 part) and chicken droppings (2 pans) (w/w basis).
**Percent dry feed of fresh fish biomass.

183
energy (GE) - 3.7 kcal g-1. Proximate analysis was done by the following methods: CP - Lowry et al. (1951), TC - Yemmi and Wills (1954), TL - Folch et al. (1957), GE - by ascribing CP 5.7 kcal; TC 4 kcal and TL 9.5 kcal g-1 of the respective nutrient (Higgs et al. 1985). Dissolved oxygen was estimated by modified Winkler's method (APHA 1976) and pH was recorded with a digital pH meter (Naina model NIG 333). Phytoplankton and zooplankton were estimated by the methods recommended by APHA (1976).
Growth was measured in terms of average fish biomass (AFB), average daily weight gain (ADG), and specific growth rates (SGR). The values of AFB for 0-60 day culture are based on a combined sample of 25 randomly collected fish from each treatment and on individual weights of 20 fish from 7 5th day onwards. The ADG and SGR were calculated according to following formulae:
ADG = SGR = x 100 T- t T- t
where WT is the.final weight (at time T), W1 is the initial weight (at time t). Based on data collected on growth parameters and associated pond ecological factors, three
types of statistical analyses were performed. These are: (1) One-way ANOVA and multiple range test: One-way ANOVA was used to test the
significance of differences among treatments (ration size) with respect to AFB, ADG and SGR in both manured and unmanured tanks. Multiple range test (Scheffe's method) was used to find out homogeneous groups of treatments.
(2) Polynomial regression: On the ba~is of differences among effects of ration size on the growth of fish during different culture periods (as determined by one-way ANOV A), second order polynomial regression was used to determine maximum and optimum ration sizes during different periods of the culture. Polynomial regression analysis (from 2nd to 5th order) was also applied to determine relationships of ADG to various water quality parameters (temperature, dissolved oxygen, pH, green algae, total zooplankton), and age of the fish to evaluate their potential use in step-wise regression models for predicting desired ration sizes.
(3) Step-wise regression analysis (forward method): On the basis of individual statistical relationships of ADG to various water quality parameters and fish age, most of which were found highly significant, step-wise variable selection regression (forward method) was used to develop models for predicting the desired ration size.
All calculations were made on an IBM PC-AT (286) using STA TGRAPH and SIGMAPLQT statistical packages.
Results and Discussion
Ration size and growth
An overall analysis of data based on 330-day culture period revealed that common carp grew best in treatment T5 followed by T9 (ration sizes of 3 and 4% of fish biomass in manured and unmanured tanks, respectively (Fig. 1). Final average fish biomass (AFB), average daily weight gain (ADG), and specific growth rates (SGR), all reflect these differences (Table 2). The

184
:§! Ill Ill 1111 E 0 :a .c Ill ;;:::
• DI 1111 ... • > C(
450
400 0 Control
• Manure only
350 .0. Manure+ 1% feeding
• Manure + 2% feeding D Manure+ 3% feeding
300 • 1%feeding
v 2%feeding
250 • 3% feeding
0 4%feeding
200
150
100
50
0 0 30 60 90 120 150 180 210 240 270 300 330 360
Culture period (days)
Fig. 1. Increase in average carp biomass on different ration sizes in manured and unmanured tanks over 330 days of culture (2 April 1986 to 26 February 1987).
Table 2. Mean weight, average daily ~eight gain (ADG), and specific growth rates (SGR) of common carp on different rations in manured and unmanured tanks. SGR and ADG having the same supencripts are not significantly different (multiple range test; Scheff e's method).
Feeding rates (%body weight)
Manured tanks Unmanured tanks
0% 1% 2% 3% 0% 1% 2% 3% 4% p
0-330 days Mean initial weight (g) 1.5 1.5 1.9 1.5 1.7 1.7 1.5 1.5 1.5 Mean final weight (g) 177.5 285.4 311.6 431.6 97.5 172.2 229.1 279.6 312.8 ADG (g day-1) o.53abc 0.86d 0.93d 1.3oe o.29a o.52ab 0.69bcd 0.84cd 0.94d 0.0009 SGR (%day-I) 1.45abc 1.59d 1.54d 1.71e l.26a l.408b 1.52bcd l.58cd 1.5od 0.0005
0-135 days Mean weight p,ain (g) 66.0 83.0 90.7 101.0 22.1 63.9 78.0 95.0 92.7 ADG (g day- ) 0.49 0.62 0.67 0.75 0.23 0.47 0.58 0.70 0.69 n.s. SGR (% day-1) 2.82 2.99 2.88 3.13 2.19 2.71 2.94 3.08 2.78 n.s.
135-240 days Mean weight p,ain (g) 81.2 117.6 167.2 297.3 47.7 81.8 111.3 159.4 178.3 ADG (g day- ) o.11abc 1.12bcde 1.59de 2.83f 0.37a 0.78ab l.06abcd 1.52cde 1.1oe 0.0001 SGR (%day-I) 0.76ab o.85bc 0.98de l.3of 0.74a o.11ab 0.83bc 0.93cd I.Ole 0.007
240-330 days Mean weight p,ain (g) 28.8 83.3 51.8 31.8 26.0 24.8 38.3 23.7 40.3 ADG (g day- ) 0.32 0.92 0.58 0.35 0.29 0.27 0.43 0.26 0.45 n.s. SGR (% day-1) 0.20 0.38 0.20 0.08 0.34 0.17 0.20 0.09 0.15 n.s.

185
SGR, however, did not record its second highest value in T9; rather it was recorded in T8 (at a ration size of 3% of fish biomass in unmanured tanks). Differences among treatments were statistically significant (P < 0.001). Multiple range test suggested six homogeneous groups of treatments with respect to ADG and SGR (Table 2). These data therefore, suggest Rmax to be 3 and 4% of fish biomass in manured and unmanured tanks, respectively, which would simply be an overestimatio_n as discussed below.
A critical study of growth time (culture period) curve (Fig. 1) shows that three apparent growth stanza were recognizable. These are: stan"za 1 (Sl) - 0 to 135 days of culture (the period of slow but continuous growth), stanza 2 (S2) - 135 to 240 days of culture (the period of maximum growth), stanza 3 (S3) - 240 to 330 days of culture (the period of slow and static growth). Similar growth time curve has been observed for Cirrhina mrigala (Paul et al. 1990). Individual tests of significance based on data for stanzas S 1, S2 and S3 indicated that the differences among treatments regarding their effects on ADG and SGR were significant only during S2 (Table 2).
The second order polynomial regression analysis has frequently been used not only for estimating maximum and/or optimum ration levels (Brett 1979) but also in estimating protein and nutrient requirements of fish (Cowey et al. 1972; Zeitoun et al. 1976; Moore et al. 1988; De Silva et al. 1989). Application of a second order polynomial regression analysis to the present data in carp growth (SGR) suggests that growth (SGR)-ration (GR) curves in manured and unmanured tanks could be considered separately. In manured tanks, based on 330-day culture data, GR curve had a continuous rise. It did not flex downwards (Fig. 2a) suggesting Rmax quite away from 3%. This relationship, howevr;~, was insignificant based on data of Sl (Fig. 2b)
A ~ 1.8
c l.!!O
Ill "g
3:: t
1.6. ~
;.£!!
... s::. 1.00
i 1.4 0 ...
1:11 0.7!! u ;: u !. 1.2 UI 0 2 3
O.!!O 0 2 3
- B '&.. 3.!! Ill "g
D 0.40 • 3:: 0.3!!
t 0.30 .!! Ill ... 0.2!5 s::. 3.0 i 0.20 0 ... 1:11 0.1!5 £ :!: u 0.10
J 2.!l 0 2 3
0.0!! 0 2 3
Ration size (% fish biomass) Ration size (% fish biomass)
Fig. 2. Relationships of carp growth (specific growth rates) to ration sizes during different phases of 330-day culture period in manured tanks. Rmax· Ropl, Gmax and G~t refer to maximum and optimum ration sizes and the corresponding growth rates and A, B, C and D refer to 0-330 aays, 0-135 days, 135-240 days and 240-330 days of the culture period, respectively.

186
suggesting that no feeding was required during this period. Conversely, the GR curve based on data of S2 observed a steep rise with rather an abrupt increase towards the end (Fig. 2c) indicating that even the maximum ration size (3% of fish biomass) was insufficient or limiting during this part of the culture. The GR curve based on data from the last growth stanza, i.e., S3, flexed downwards after a small rise from 0 to 1 % ration size. Rmax and Ropt were found to be 1.13 and 1.0, respectively, with corresponding Gmax and G 0 pt to be 0.32 and 0.30, respectively (Fig. 2d). This distinct inflection downward at the top of the GR curve reflecting some adverse effects on Gmax with high ration for carp has also been recorded by Huisman (1974). Slightly different results were obtained on the basis of data from unmanured tanks. General GR curves were generated based on data from 0 to 330 days of culture and the stanza Sl (Figs. 3a, b). In the former case, ~ax was estimated to be 3 with corresponding Gmax to be 1.56; Ropt and G 0 pt were
A c ~ 1.6 Gmax. 1.50 • 'D
3:: t Gopt. 1.25
J!! ! ~
1.4 1.00
i E Cll 0.75 u ;::: u !. 1.2 0.50 I/) 0 2 3 4 0 2 3 4
B D ~ 3.2 0.40 Cll
Gmax. 'D
3:: 3.0 0.35
~ 2.8
3opt. 0.30 !! I!! 0.25 ~ 2.6
i 0.20
E 2.4 Cll 0.15 u 2.2 ;::: 0.10 u • GI 2.0 ll. 0.05
I/) 0 2 3 4 0 2 3 4
Ration size (%fish biomass) Ration size (% fish biomass)
Fig. 3. Relationships of carp growth (specific growth rates) to ration sizes during different phases of 330-day culture period in unmanured tanks. Rmax• ~t· Gmax and Gopt refer to maximmn and optimum ration sizes and the corresponding growth rates and A, B, C and D refer to 0-330 days, 0-135 days,. J 35-240 days and 240-330 days of the culture period, respectively.
calculated to be 1.46 and 1.2, respectively. As for manured tanks, the GR curve based on data from S2 for unmanured tanks also did not flex downwards and the line appeared almost linear (Fig. 3c) indicating Rmax lying considerably beyond the point of maximum ration size (4%). S3 data based GR curve suggested an inverse relationship; growth started decreasing with increasing ration size (Fig. 3d). Hence, it becomes clear that the desired ration size would vary considerably during different times of the culture possibly due to changes in environmental factors and the age of the fish. The insignificant differences during S 1 seem to be due to unfavorable temperature conditions (27 to 34 °C) which possibly adversely affected food consumption. The low temperature (12.4 to 20.2°C) and increased fish age during the last growth stanza (S3) seem to be responsible for the ineffectiveness of increased ration size in promoting growth.

187
Pond ecological conditions and growth
Many ecological factors are known to influence fish growth. Most common of these are temperature (McCormick et al. 1972; Elliott 1975), light (Henderson 1963; Wagner 1974), salinity (De Silva and Perera 1976, 1985), and dissolved oxygen (Doudoroff and Shumway 1967). Besides fish age, we observed significant individual relationships of ADG to various pond ecological characteristics (Figs. 4-9, Table 3). These relationships suggest, therefore, that pond ecology is an important aspect of fish feeding strategies.
~
~ as "D
.9
.c i 0 ... Cl ]!-a; "D
5
4
3
2
r=0.256 p=0.001 n=110
• Regression order= 3
• • • • • • • • • • • •
CD Cl as ... CD > c( fi~:t ••
.., .. ' 0
• -I
10 15 20 30
Temperature (°C)
Fig. 4. Relationship of carp growth (average daily growth rates, g day-I) to water temperature (0 C).
5 • r=0.207 • P=0.05
~ 4 n=110 Regression order= 3
... >. as
"D
.9 3
.c •• i .. 0
~.I • ... Cl 2 ]!o ·a; "D CD Cl as ... CD > c(
0
-I 2 4 6 8 10
Dissolved oxygen (mg 1-1)
Fig. 5. Relationship of carp growth (average daily growth rates. g day-I) to dissolved oxygen (mg rl ).
12

5 188 r=0.325 • P=0.001 •
4 n=110 Regression order= 5
~ m 'O
s 3 •• .c i E ••• • • • Cl 2 :i!' • 'iii •I 'O GI Cl l! GI • > C(
0 • -I •
6.5 7.0 7.5 8.0 8.5 9.0 9.5
pH
Fig. 6. Relationship of carp growth (average daily growth rates, g day-1) to pH.
5 • r=0.314 p=0.001
4 n=110 • Regre5sion order= 2
~ m 'O
s 3
.c i • • 0
Ci 2 •• :i!' • •• 'ii 'O • .. Cl) Cl • • l! • GI •• • • > C( • • 0 • •
-I 0 5 10 15 20 25 30
Green algae (no. 1-1x10⁻⁶)
Fig. 7. Relationship of carp growth (average daily growth rates, g day-1) to total zooplankton (No. i-1 ).
5
r=0.369 p=0.001
4 n=110 Regression order = 2 ';' >-m • 'O
S! 3 • .c i 2 Cl 2 :i!' 'ii 'O GI Cl e GI > C( 0
• -I
0 10 20 30 40 50 60 70 80 90
Total zooplankton (no. 1-1)
Fig: 8. Relationship of carp growth (average daily growth rates, g day-1) to green algae (No.1-l x lcP).

189 5
r=0.294 • Regression order = 2 p=0.001
4 n=110 ';' >-GI 'ti
s 3 • .c • i 0
Ci 2 • ~ 'iii 'ti • GI Cl • I! •t ••••••• GI > .. ,, ....... • "' 0 •• •
-I 0 60 120 180 240 300 360
Age of fish (days)
Fig. 9. Relationship of carp growth (average daily growth rates, g day-I) to fish age (days).
Table 3. The interrelationships between average daily growth (ADG) and different parameters.
Parameter Relatiooship n P<
ADGto:
Water temperature (T; 0 C) ADG = -7.44 + 1.04 T - 0.042 T2 + 0.0005 T3 0.258 110 0.001
Dissolved oxygen (DO; mg/l) ADG = 2.58 - l.28 DO + 0.22 oo2 -0.011 oo3 0.207 110 0.05
pH ADG = 7.25E4 - 4.64E4 pH+ 1.18E4 pH2 + 0.325 110 0.001 1.51E3 pH3 + 9.5El pH4 - 2.42 pH5
Toial zooplankton (IZ; No.1-l) ADG = 0.65 - O.Dl51Z + 0.00041Z2 0.369 110 0.001
Green algae (GA; No.1-l x lo6) ADG = 0.26 + 0.117 GA - 0.004 GA 2 0.314 110 0.001
Fish age (FA; days) ADG = -0.48 + 0.015 FA - 0.00004 FA2 0.39 110 0.001
Pond ecology and ration size
Since pond ecological conditions had significant effects on fish growth, these were considered for incorporation in multiple (step-wise variable selection) regression models for estimating the desired ration in relation to these parameters. The other parameters considered were the age and the biomass of the fish. In manured and unmanured tanks, the maximwn number of parameters were selected by the regression models during the middle part of the culture (S2) when growth rates were maximum. During the early part (S 1), ration size was suggested to be determined by dissolved oxygen (DO) and total zooplankton (lZ) in manured and only lZ in unmanured tanks. It was only in the latter part of the culture (S3) when only AFB and the age of the fish appeared to determine ration size (fable 4).

190
Table 4. The multiple (step-wise variable selection) regression relationships between ration size and different parameters.
Culture Tank period condition Relationship r2- F-ratio n P<
0-135 days Manured Ratiortsizel = -0.15 + 0.39 DO - 0.007 TZ 0.618 8.69 42 0.001 Unmanured Ration size= 4.50 - 0.08 TZ 0.763 32.24 42 0.001
135-240 days Manured Ration size= 2.12 + 0.04 T + 0.05 DO- 0.01 TZ 0.713 4.97 '30 0.05 Unmanured Ration size = 1.63 + 0.11 T - 0.006 FB2 + 0.51 DO 0.982 54.56 30 0.001
- 0.56 pH - 0.01 TZ
240-330 days Manured Ration size= -1.86 + 0.012 FB 0.951 155.65 36 0.001 Unmanured Ration size= 0.06 + 0.02 FB - 0.01 FA 0.981 227.76 36 0.001
l= Percent (dry feed) of fresh fish biomass. 2FB =average fish biomass (g), for all other symbols, please refer to Table 3.
Feeding strategies
In most South- and Southeast Asian countries, supplementary feeding is done based on the fish biomass present in a culture pond. Environmental factors and natural food which are known to influence food consumption and fish growth are seldom considered. No precise feeding schedule(s) or table(s) for most cultured fish are available. To make aquaculture economically viable therefore, it is desirable that feeding rates or ration sizes are determined based not only on fish biomass but also on pond ecology conditions which vary considerably, seasonally. Thus we derived economically suitable ration sizes during different phases of carp culture in grow-out ponds.
Using the second order polynomial regression analysis, it was determined that there were significant differences in the desired ration sizes during different phases of the 330-day culture which suggested the role of pond ecological conditions and/or fish size (weight) and age. Thus step-wise regression analysis was attempted to ascertain which of these factors were important in determining ration sizes.
The step-wise regression relationships (Table 4) were used in estimating ration sizes and the total amount of food required during different parts of the culture using data from an earlier study on carp growth and related ecological factors (Sehgal and Thomas 1985). The total amount of food fed to fish based on their biomass was also calculated using the same set of data. The cost of feed kg-1 basis was estimated according to the prevalent market price to determine differences in the economics of supplementary feeding according to fish biomass based and fish biomass-pond ecology based feeding strategies. It was found that during the period corresponding to S 1 or the high temperature period (28 to 34.5°C), a total of 890 kg diet costing Rs. 4,228 was wasteful. Similarly, during the period that corresponded to the period of maximum growth (S2) or the favorable temperature period (18.5 to 27°C), the desired ration size was estimated to be 3.1 % against the given size of 2% of fish biomass. This accounted for a total amount of 2,195 kg of diet which was underfed. Considering a mean FCR of 3.37 during this period (Sehgal and Thomas 1985) and a cost of Rs. 12 kg-I of fish a total loss of Rs. 7,812 is estimated (Table 5). Since during the last growth stanza (240-330 days of culture), only fish biomass and age were selected by the regression models, the comparisons for this stanza were not made. However, on the basis of high FCR values and the relationships derived from the second order polynomial regression analysis, it can be concluded that feeding at higher levels (above 1 % of fish biomass) would be wasteful.

191
Table 5. The comparison of fish biomass based versus fish biomass-pond ecology based feeding strategies. The estimates are given for a pond of 1 ha size with stocking density of 10,000 fish ha-1.
Culture period
0-135 days (2 April-15 August)
135-240 days (15 August-28 November)
Total
Actual amount of feed (kg)a
3,820
4,085
Estimated amount of feed (kg)b
2,930
5,680
Amount Excess of feed amount short of Cost of of feed the desired feed kg-I (kg)C (kg)d (Rs.) FCR
890 4.75
2,195 3.37
a = based on fish biomass; b = based on fish biomass and pond ecology; c = a - b; d = b - a.
Conclusions
Potential additional Cost of fish bio- fish Estimated
mass (kg) kg-I loss (Rs.)
4,228
651 12 7,812
12,040
The present study revealed that the desired ration sizes for carp varied considerably according to the season. Three distinct growth stanzas were observed in the context of differences among treatments, .i.e., the ration size. These differences can be safely attributed to environmental factors such as temperature, dissolved oxygen, and natural food - the phytoplankton and the zooplankton densities in addition to the age of the fish. The results therefore, suggest that the desired ration sizes should be decided according to the prevalent environmental conditions in addition to fish biomass than on the basis of the fish biomass alone. Ignoring these factors (the environmental) can lead either to under- or overestimation of the ration sizes as revealed by the relationships derived from step-wise regression models. In both cases considerable losses can occur. It is, therefore, economical to estimate ration sizes on the basis of pond ecological conditions and fish biomass than on the basis of fish biomass alone.
References
APHA. 1976. Standard method~ for the examination of water and the waste water. American Public Health Association, Washington, 1193 p. Appler, H.H. 1985. Evaluation of Hydrodictyon reticulum as a protein source in feeds for Oreochromis (filapia) niloticus and Tilapia zillii. J.
Fish Biol. 327-334. Beck, H., J. Groop, if. Koops and K. Tiews. 1979. Single protein in trout diets, p. 269-280. /n J.E. Halver and K. Tiews (eds.) Finfish nutrition
and fish feed technology. Vol. 2, Heenemann Verlagsgesellschaft, Berlin. Brett, J.R. 1979. Environmental factors and growth, p. 599-677. In W.S. Hoar, DJ. Randall and J.R. Brett (eds.) Fish physiology. Vol. 8,
Bioenergetics and growth. Academic Press, New York. Brett, J.R. and T.D.D. Groves. 1979. Physiological energetics, p. 280-352. In W.S. Hoar, D.J. Randall and J.R. Brett (eds.) Fish physiology. Vol.
8. Bioenergetics and growth. Academic Press, New York. Cowey, C.B., J.A. Pope, J.W. Adron and A. Blair. 1972. Studies on the nutrition of marine flat fish. The protein requirements of plaice
(Pleuronecle.11 platessa). Br. J. Nutr. 28: 448-456. De Silva, S.S. and R.M. Gunasekera. 1989. Effect of dietary protein level and amount of plant ingredient (Phaseolus aureus) incorporated into the
diets on consumption, growth performance and carcass composition in Oreochromjs niloticus (L) fry. Aquaculture 80: 121-133. De Silva, S.S. and M.a.K. Perera. 1985. Effects of dietary protein level on growth, food conversion and protein use in young Tilapia nilotica at
four salinities. Trans. Amer. Fish. Soc. 114~ 584-589. De Silva, S.S. and P.A.B. Perera. 1976. Studies on the young grey mullet, Mug ii cephalus LI. Effects of salinity on food intake, growth and food
conversion. Aquaculture 7: 327-338. De Silva, S.S., R.M. Gunasekera and D. Atapattu. 1989. The dietary protein requirements of young tilapia and an evaluation of the least cost
dietary protein levels. Aquaculture 80: 271-284. Doudoroff, P. and D.L. Shumway. 1967. Dissolved oxygen criteria for the production of fish. Amer. Fish. Soc. Spec.·Publ. No. 4, p. 13-19. Elliott, J.M. 1975. The growth rate of brown trout, Salmo trutla L fed on maximum rations. J. Apim. Ecol. 44: 805-821. Folch, J., M. Lees and G.H.S. Stanley. 1957. A simple method for the isolation and purification of total lipids from animal tissues. J. Biol. Chem.
226: 497-509.

192
Henderson, N.E. 1963. Influence of lighl and lemperature on the reproductive cycle of the eastern brook trout Salveli1111S fonlinalis (Mitchill). J. Fish. Res. Board Can. 20: 859-897.
Higgs, D.A., J.R. Markert, MD. Plotnik.off, J.R. McBride and B.S. Dosanjh. 1985. Development of nutritional and envirorunental strategies for maximizing the growth and survival of juvenile pink salmon (Onchorlrynchus gorbusclta). Aquaculture 47: 113-130.
Huisman, E.A. 1974. A study on optimal rearing conditions for carp (Cyprinus carpio L.). Spec. Puhl. Organisatie ter Verbetering van de Binnenvisserij, UtrechL
Jackson, AJ., B.S. Capper and AJ. Matty. 1982. Evaluation of some plant proteins in complete diets for the tilapia (Sarotherodon mossambicws). Aquaculture 27: 97-109.
Lovell, R.T. 1977. Feeding practices, p. 218. /n R.R. Stickney and R.T. Lovell (eds.) Nutrition and feeding of channel catfish. South Coop. Ser. Bull.
Lowry, O.H., NJ. Rosebrough, A.L. Farr and RJ. Randall. 1951. Protein measurement with Folin phenol reagent. J. Biol. Chem. 193: 265-275. Matty, A.I. and P. Smith. 1978. Evaluation of a yeast, a bacterium and an alga as a protein source for rainbow trouL I. Effect of protein level on
growth, gross coo.version efficiency and protein conversion efficiency. Aquaculture 14: 235-246. McCormick, J.H., K.E.F. Hokanson and B.R. Jones. 1972. Effects of temperature on growth and survival of young brook trout, Salvelinws
fonlinalis. J. Fish. Res. Board Can. 29: 1107-1112. Moore, B.J., S.S.O. HID!g and J.F. Medrano. 1988. Protein requirement of hatchery produced juvenile white sturgeon (Acipenser lransmonlanus).
Aquaculture 71: 235-245. NRC. 1983. Nutrient requirements of warm water fishes and shellfishes. National Research Council. National Academy Press, Washington, DC. Paul, S.K., H.S. Toor, H.S. Sehgal and J.R. Kaushal. 1990. Effects of varying levels of dietary protein and vitamin A on the growth and survival
ofCi"hina mrigala. Annal. Biol. 6. Sehgal, H.S. and J. Thomas. 1985. Efficacy of two newly formulated supplementary diets for carp Cyprinus carpio var. communis (Linn.). 1.
Effects on"Survival, growth and yield. Annal. Biol. 1(1): 46-55. Sehgal, H.S. and J. Thomas. 1987. Efficacy of two newly formulated supplementary diets for carp, Cyprinus carpio var. communis (Linn.).
Effects on flesh composition. Biol. Wastes 21: 179-187. Wagner, H.H. 1974. Photoperiod and temperature regulation of smolting in steel head trout (Salmo gairdneri). Can J. Zool. 52: 219-240. Winfree, R.A. and R.R. Stickney. 1984. Formulation and processing of hatchery diets for channel cat fish. Aquaculture 41: 311-323. Wee, K.L. and S.S. Wang. 1987. Nutritive value of Leucaena leaf meal in pelleted feed for Nile tilapia. Aquaculture 62: 97-108. Yemmi, E.W. and AJ. Wills. 1954. The estimation of caroooydrates in plant extracts by anthrone. Biochem. J. 57: 508. 7.eitoun, I.H., D.E. Ullrey and W.T. Magee. 1976. Quantifying nutrient requiremmts of fish. J. Fish. Res. Board Can. 33: 167-172.

Influence of Virginiamycin on Growth and Body Composition of Rohu (Labeo rohita) and
Common Carp (Cyprinus carpio)
P. KESHAVANATH S.SHYAMA
M.C. NANDEESHA T.J. VARGHESE College of Fisheries
University of Agricultural Sciences Mangalore - 575 002
Karnataka, India
KESHAVANATH, P., S. SHYAMA, M.C. NANDEESHA and TJ. VARGHESE. 1991. Influence of virginiamycin on growth and body composition of rohu (labeo rohi.Ja) and common carp (Cyprinus carpio), p. 193-200. /n S.S. De Silva (ed.) Fish nutrition research in Asia. Proceedings of the Fourth Asian Fish Nutrition Workshop. Asian Fish. Soc. Spec. Puhl. 5, 205 p. Asian Fisheries Society, Manila, Philippines.
Stafac-20 containing 2% virginiarnycin was incorporated at 20, 40, 60 and 80 mg/kg into a fish meal-based diet and fed to rohu and common carp fingerlings under monoculture for 126 days. The highest weight gain of rohu and common carp was recorded under 80 mg/kg and 20 mg/kg treatments, respectively. Weight gained by treated rohu did not differ significantly from that of the control, but all the groups of treated common carp differed significantly from the control. Interestingly, the highest survival was recorded under treatments producing the best growth of fish. Muscle protein, fat and RNNDNA ratios reflect the growth trend. It appears that virginiarnycin has a protein-sparing effect, thereby enhancing the growth of carps.
Introduction
Oral administration of anabolic agents is a convenient method of promoting growth in fish. Though antibiotics have been in use as anabolic agents for quite sometime (Moore et al. 1946; Jukes and Williams 1953; Jukes 1971; Pollmann et al. 1980), their use in fish culture for growth promotion is relatively recent. Investigations in this field have yielded contradictory results (Wagner 1954; Sneiszko 1957; Mitra and Ghosh 1967; Chua and Teng 1980; Parova et al. 1982; Viola and Arieli 1987; Ahmad and Matty 1989). The present study evaluates the effect of Stafac-20, a feed supplement with virginiamycin as the active ingredient, on growth and body composition of rohu and common carp.
Materials and Methods
Growth Studies
Two experiments were conducted employing fingerlings of rohu, Labeo rohita (Hamilton) and common carp, Cyprinus carpio L. for 126 days each, in cement cisterns of 25 m2 (5 x 5 x
193

194
1 m) without any soil base. The cisterns were flushed thoroughly to remove traces of soil particles and allowed to dry a few days before filling with water. The level of water in the tanks was maintained at 60 ± 5 cm throughout the experimental period. Stocking of individual species was done with more or less uniform-sized fingerlings, at the rate of 13 rohu and 20 common carp per cistern. Fish in three tanks each received one of the antibiotic-incorporated diets, while those in a set of three tanks were fed an antibiotic-free control diet. Feeding was done once daily at 5% body weight; the quantity of feed was adjusted after every fortnightly sampling.
Diet Preparation
The standard fish meal-based pelleted feed developed by Varghese et al. (1976) was used for antibiotic incorporation. Details of the diet are given in Table 1. Stafac-20, containing_ 2% virginiamycin (Eskayef Limited, Bangalore), was incorporated at dosages of 20, 40, 60 and 80 mg/kg to the cooked and cooled diet ingredients along with the vitamin-mineral mixture. The ingredients were mixed thoroughly to ensure uniform dispersal of the antibiotic before pelleting. The pellets were dried in a thermostatically controlled oven at 35°C to less than 10% moisture level and stored in air-tight heavy duty plastic bags.
Table 1. Ingredient and proximate composition of the dieL
Ingredient
Fish meal (60.9% C.P.) Rice bran (9.5% C.P.) Oil cake (41.2% C.P.) Tapioca flour (2.6% C.P.) Vitamin-mineral concentrate•
Proximate composition(%)
Dry matter Crude protein Crude fat Crude fiber Ash
•"Nuvimin Forte" Sarabhai Chemicals Ltd., India.
Sampling and Statistical Analysis
Amount (%)
27 22 40 10 1
90.8 35.2
7.3 9.7
10.0
The growth of fish was recorded at fortnightly intervals by sampling at least 50% of the fish stocked. On termination of the experiment, all the tanks were emptied, the surviving fish collected and their weight and length noted. Specific growth rate was calculated as
loge W 2 - loge W1 % SGR = -------
T2 -Ti x 100
The growth data were analyzed using the two-way analysis of variance (Snedecor. and Cochran 1968) and the multiple range test of Duncan (1955).

195
Biochemical Analysis
Proximate analysis of feed ingredients, feed and fish muscle was carried out. Protein was determined by Kjeldahl method, lipid by petroleum ether extraction, fiber by acid and alkali treatment and ash by incineration (AOAC 1970) and nitrogen-free extract by the difference method (Hastings 1976). The energy level of feed was calculated using factors 5 for protein (Smith 1975) and 9 and 4 for lipid and carbohydrate, respectively (Hastings 1975); while in the case of fish muscle, factors 4.1 for protein and carbohydrate and 9.3 for fat (Durve and Bal 1961) were used.
Nucleic Acids
Muscle nucleic acids were extracted using perchloric acid as described by Burton (1956). DNA content was estimated employing the diphenylamine method of Giles and Myres (1965)
-and RNA by the method of Ceriotti (1955). In brief the procedure of extraction consisted of homogenizing the tissue in physiological saline, mixing the homogenate with perchloric acid and centrifuging. DNA estimation involved mixing of the centrifuged extract with 4% diphenylamine in acetic acid and 1.6% acetaldehyde and incubation at 30°C, while for RNA estimation the extract was mixed with orcinol reagent and boiled for 45 minutes in a water bath. Readings were taken in a spectrophotometer.
Body Indices
Body indices viz., hepato-somatic index (HSI) and viscero-somatic index (VSI) were computed by sampling 15 harvested fish of each species from every treatment using the following formulae:
HSI =
VSI =
Weight of liver (g)
Weight of fish (g)
Weight of viscera (g)
Weight of fish (g)
Food Conversion Efficiency (FCE)
x 100
x 100
Food conversion efficiency was calculated by the following formula:
FCE (%) = Wet weight gain (g)
Feed intake (g)
Organolepti.c Evaluation
x 100
The raw and cooked meat of rohu and common carp fed on different experimental diets were evaluated organoleptically for attributes like texture, odor, flavor, etc. Cooked meat was

196
prepared by cooking the raw flesh in 1.5% salt solution. The hedonic scales in the evaluation proforma were converted into numerical scales to get the mean panel scores for each attribute, and analyzed statistically applying ANOV A.
Results
Data pertaining to growth, food conversion efficiency, body indices, nucleic acid ratios and muscle composition of rohu are given in !able 2. Best growth was obtained in 80 ppm treatment, followed by 60 ppm, 40 ppm, 20 ppm and control. Growth pattern of rohu in the different treatments was similar up to the 42nd day. The 60 ppm treatment induced the highest growth from the 42nd to 70th day; thereafter, 80 ppm treatment showed the best growth leading to the highest average weight on termination (Fig. 1). The percentage increment in growth over the control were 0.92 (20 ppm), 15.77 (40 ppm), 25.60 (60 ppm) and 44.05 (80 ppm); the respective final average weights being 110.8 g, 127.1g,137.9 g and 158.l gas against 109.8 g recorded for the control. However, the growth induced by the different treatments was not significantly (P < 0.05) different compared to the control.
Table 2. Effect of feeding different doses of virginiamycin on growth, survival, body indices and composition of rohu, labeo rohita.
Virginiamycin, mg/kg of diet 0 20 40 60 80
Average initial weight (g) 15.38 15.38 15.38 15.38 15.38
Average final weight (g) 109.75 110.77 127.06 137.85 158.10
Average net weight gain (g) 94.37 95.39 111.68 122.47 142.72
Average specific growth rate(%) 1.55 1.67 1.70 1.78 1.79
Average daily increment (g) 0.75 0.76 0.89 0.97 1.13 Food conversion
efficiency (%) 20.59 21.87 22.26 23.64 30.12 Increment over
control(%) 0.93 15.77 25.60 44.05 Survival(%) 79.47 77.69 76.35 76.91 84.61
Tissue RNA content (µg/g) 893.39 901.95 1,099.80 1,054.10 1,027.81
Tissue DNA content (µg/g) 120.74 102.06 101.19 84.97 70.18
RNA/DNA ratio 7.40 8.84 10.87 12.41 14.64 Somatic indices
HSI 0.56 0.50 0.58 0.55 0.78 VSI 13.40 12.14 12.76 11.55 14.31
Body composition(%) Moisture 77.16 75.24 76.28 75.29 75.05 Protein 16.83 17.90 17.95 17.68 18.31 Fat 3.50 4.25 4.14 4.45 4.49 Ash 2.11 1.80 1.44 1.80 1.49
Maximum average weight of common carp on termination was observed in 20 ppm (49.4 g), followed by 80 ppm (44.5 g), 60 ppm (43.6 g), 40 ppm (34.0 g) and control (21.8 g). The corresponding percentage increments over the control were 126.3, 103.6, 99.6 and 55.4. Growth of fish in 20 and 80 ppm treatments was superior to those of 40 and 60 ppm treatments from the 28th day onwards (Fig. 2). Tissue RNA/DNA ratios and % SGR followed the growth trend in both species (Tables 2 and 3). Improved food conversion efficiency was recorded in the

165
150
a Control 135 • s 20 0 s 40
120 "' s 60 x s 80
0
105 ... s:::. 0
" 90
~
" 75 0 0 ... " 60 > <l
45
30
15
0 0 14 28 42 56 70 84 98 112
Days
Fig. 1. Average weight (g) attained by rohu in different treaunents.
50
40
Ct
... 30 .&:. Ct CD ~
CD Ct 0 20 ... CD >
<(
10
0 0 14
0
• 0 6
x
28
Control s s s s
42
20 40 60 80
56 70
Days 84
126
98
Fig. 2. Average weight attained by common carp in different treaunents.
197
112 126

198
Table 3. Effect of feeding different do1e1 of virginiamycin on growth, 1Urvival, body indice• and compoaition of common carp, Cyprinus carpio.
Virginiamycin, mg!'kg of diet 0 20 40 60 80
Average initial weight (g) 4.50 4.50 4.50 4.50 4.50
Average final 49.44b 33.95bc 43.6lbc weight (g) 21.ssa 44.48c
Average net weight gain (g) 17.35 44.88 29.45 39.ll 39.97
Average specific growth rate(%) l.20 l.86 l.59 l.76 l.80
Average daily increment (g) 0.14 0.36 0.23 0.31 0.32
Food conversion efficiency (%) 20.20 37.43 29.97 30.99 35.29
Increment over control(%) 126.27 55.37 99.58 103.56
Survival (%) 80.00 85.00 76.f:fJ 80.00 83.33 Tissue RNA content
(µgig) 1,054.30 1,227.46 993.30 938.79 855.58 Tissue DNA content
(µg/g) 216.56 168.75 lf:fJ.09 149.01 129.83 RNA/DNA ratio 5.15 7.33 5.91 6.30 6.59 Somatic indices
HSI 0.82 0.53 0.33 0.44 0.50 VSI 25.44 24.18 21.42 21.47 23.00
Body compoaition (%) Moisture 77.40 75.93 76.46 75.35 75.64 Protein 17.40 18.17 17.52 17.34 18.15 Fat 3.94 4.38 4.54 5.02 4.75 Ash 1.14 0.97 1.05 1.30 1.23
Values with different superscripts in the same row differ significantly (P < 0.05).
antibiotic-fed groups, the best being in 80 ppm (30.1 %) for rohu and 20 ppm (37.4%) in the case of common carp. Survival ranged between 76.4 and 84.6% for the former and 76.7 and 85% for the latter. Body indices of treated fish were lower except in rohu from 80 ppm treatment. Impact of virginiamycin was not clear cut with regard to proximate composition of muscle, although a .fil.Umt increase in protein and fat contents was recorded in the muscle of treated fish, with the exception of common carp administered 60 ppm Stafac-20. Statistical analysis of the panel scores on raw and C<?oked flesh showed no significant (P < 0.05) difference in the organoleptic quality of fish flesh from different treatments in both species.
Discussion
In the present study, the beneficial influence of virginiamycin could be seen on the growth of rohu as well as common carp. In rohu, the growth enhancement was dose related, the highest dose yielding the best growth; however, growth of treated fish did not differ significantly from the control. ln·common carp, all the dose levels tested induced significantly (P < 0.05) higher growth than the control, but the rate of growth was not dose dependent. Interestingly, the best growth of common carp was observed with the lowest dose of Stafac-20 tested (20 ppm), closely followed by 80 ppm and 60 ppm (Table 3). The differential response of the two species to the various doses of virginiamycin is difficult to explain. Nonetheless, the findings are in agreement with many of the recent studies which have shown increased growth following treatment with different antibiotics in carp and trout (Mitra and Ghosh 1967; Sukhoverkhov 1967; Chua and

199
Teng 1980; Rijkers et al. 1980; Parova et al. 1982; Viola and Arieli 1987; Pathmasothy 1987; Ahmad and Matty 1989). The hypotheses put forth on the mcxie of action of antibiotics are: (1) they may destroy harmful bacteria in the intestine or those bacteria that compete for host nutrients or alternatively enable increased occurrence of beneficial bacteria that synthesize growth factors; and (2) they may enhance the efficiency of intestinal absorption and nutrient utilization possibly by decreasing the thickness of the intestinal wall (Jukes 1971; Visek 1978).
Ahmad and Matty (1989) who studied the gqt bacterial population of virginiamycin-treated common carp reported an increased Aeromonas hydrophila count. Based on the present study, it is not possible to pinpoint the mcxie of action of virginiamycin. Virginiamycin may enhance growth by increasing availability of nutrients by change in gut content or its absorptive capacity as reported by Madge (1973) in mice. Increased RNA/DNA ratios noticed in rohu and common carp corresponding to growth increment are indicative of higher protein synthesis which could be attributed to virginiamycin. Higher growth is also related to improved focxi conversion, reflecting better utilization of nutrients by the treated fish. Furthermore, an increase in protein and fat contents of virginiamycin-treated fish indicates energy storage for growth purpose. These changes presumably are related to the protein-sparing effect of virginiamycin. Ahmad and Matty (1989) reported protein sparing in common carp by virginiamycin only when incorporated in 40% protein diet, but not that containing 25% protein. They observed high deposition of fat in antibiotic-treated fish and opined that excess protein may have been stored as fat which can be considered as an indication of growth. According to Cravedi et al. ( 1987) antibiotics significantly enhance digestibility of some unsaturated fatty acids in trout. Digestibility studies with the two species are in progress.
Survival of fish in treatments that gave best growth was better than that of the respective controls. Both hepato-somatic and viscero-somatic indices declined in the treated fish, except rohu administered 80 ppm virginiamycin. Mobilization of fat from liver to muscle can reduce hepato-somatic index as observed by Lone and Matty (1980) in methyltestosterone-treated common carp. Simpson (1976), who found a decrease in viscero-somatic index of rainbow trout and salmon parr fed on l 7a-methyltestosterone and ethylestrenol, ascribed it to inadequacy of focxi provided which could not cope \\'ith the increasing demands of faster-growing fish. This factor may not have a role in the present experiment as 5% feeding is considered sufficient for carp when the dietary protein level is above 30%.
The organoleptic quality of raw and cooked flesh of the two species remained unchanged following treatment with virginiamycin. This makes it clear that the doses of virginiamycin tested have no adverse effect on fish quality. Studies conducted at Aston University, UK to detect residual virginiamycin in common carp showed no residues even at 100 ppm incorporation, 24 hours after feeding. Further studies are required to ascertain the mcxie of action of virginiamycin in the two test species.
References
Ahmad, T.S. and A.J. Many. 1989. The effect of feeding antibiotics on growth and body composition of carp (Cyprinus carpio). Aquaculture 77: 211-220.
AOAC. 1970. Methods of 111alysis. Association of Official Analytical Chemists, 12th Ed. Washington, DC. 1094 p. Bunon, K. 1956. A study of the conditions and mechanism of the diphenylamine reaction for the colorimetric estimation of deoxyribonucleic
acid. Biochem. J. 62: 315-323. Cerioni, C. 1955. Detennination of nucleic acids in animal tissues. J. Biol. Chem. 214: 59-70. Chua, T.K. and S.K.. Teng. 1980. Economic production of estuary grouper Epinepludus salmoitks Maxwell, reared in floating net cages.
Aquaculture 20: 187-228. Cravedi, J.P., G. Oioubert and G. Delous. 1987. Digestibility of chloramphenicol, oxolinic acid and oxytetracycline in rainbow trout and
influence of these antibiotics on lipid digestibility. Aquaculture 60: 133-1.42.

200
Duncan, D.B. 1955. Multiple range and multiple F-tests. Biometrics 11: 1-42. Dmve, V.S. and D.V. Bal. 1961. Studies on the chemical composition of the oyster, CrassostretJ gryphoides (Schlotheim). J. Zoo!. Soc. India 13:
70-77. Giles, K.W. and A. Myres. 1965. An improved diphenylamine method for the estimation of DNA. Nature 4979: 93. Hastin3s, W .H. 1975. Indonesia, preliminary testing of artificial feeds manufactured from local ingredients for milldish and shrimp. A report
prepared for the brackish water shrimp and milkfish culture research and development projecL FAO, Rome. 12 p. Hastings, W.H. 1976. Fish nutrition and fish feed manufacture. Paper presented at FAO Technical Conference on Aquaculture, Kyoto, Japan.
FIR: Aq/Confn6/R.'i3, p. 13. Jukes, T.H. 1971. The present status and background of antibiotics in the feeding of domestic animals. Ann. N. Y. Acad. Sci. 182: 362-378. Jukes, T.H. and S. Williams. 1953. Nutritional effects of antibiotics. Pharmacol. Rev. 5: 381-420. Lone, K.P. <Uld AJ. Matty. 1980. The effect of feeding testoscerone on the growth and body composition of common carp (Cyprinus carpio L.).
Gen. Comp. Endocrinol. 40: 409-424. Madge, D.S. 1973. Feed additives and intestinal absorption in mice. Comp. Gen. Pharmacol. 4: 365-373. Mitra, R. and S.C. Ghosh. 1967. The effect of terramycin on the growth of some freshwater food fisl;ies, Labeo rohila, Calla calla and Cirrhinus
mrigala. Proc. Natl. Acad. Sci., India, SecL B. 37: 406-408. Moore, P.R., A. Evenson, T.D. Luckey, E. McCoy, C.A. Elvejem and E.B. Han. 1946. Use of sulfasuxidine, streptathricin and streptomycin in
nutritional studies with chick. I. Biol. Chem. 165: 437-441. Parova, J., 0. Par and J. Tejnora. 1982. Nitrovin in feed mixture for the marlcet carp production. Zivocisna Vyroba 27: 801-810. Pathmasothy, S. 1987. Effect of feeding virginiamycin on the growth rate, feed conversion and carcass composition of Pangasius suJchi (Fowler),
p. 197-200. In Proceedings of the Tenth Annual Conference of the Malaysian Society of Animal Production, 2-4 April 1987, Pahang, Malaysia.
Pollmann, D.S., D.M." Danielson and E.R. Poe. 1980. Effect of microbial feed additives on performance of starter and growing-finishing pigs. J. Anim. Sci. 51: 577-581.
Rijkers, G.T., A.G. Teunissen, R. Osterom and W.B. Van Muiswinkel. 1980. The immune system of cyprinid fish. The immunosuppressive effect of the antibioticoxytetracycline in carp (Cyprinus carpio). Aquaculture 19: 177-189.
Simpson, T.H. 1976. Endocrine aspects of salmonid culture. Proc. Soc. Edinburg. Sect. B. 75(4): 241-252. Smith, R.R. 1975. Metabolisable energy for food stuffs for trout. Feed Stuffs 48: 16. Snedecor, G.W. and W.G. Cochran. 1968. Statistical methods. Oxford and IBH Publishing Co., Calcutta. 593 p. Snieszko, S.F. 1957. Use of antibiotics in the diet of salmonid fishes. Prog. Fish-CulL 19: 81-83. Sukhoverkhov, F.M. 1967. The effect of cobalt, vitamins, tissue preparations and antibiotics on carp production, p. 401-407. In Proc. World
Symp. Warmwater Pond Fish Culture. FAO Fish. Rep. Varghese, T J., K.V. Devaraj, B. Shantaram and H.P.C. Shetty. 1976. Growth response of the.common carp, Cyprinus carpio var. communis to
protein rich pelleted feed, p. 408-416. Jn The Symposium on Development and Utilization of Inland Fishery Resources, Colombo, Sri Lanka, 1977.
Viola, S. and Y. Arieli. 1987. Non-hormonal growth promoters for tilapia and carp. I. Screening tests in cages. Bamidgeh 39(2): 31-38. Visek, W.J. 1978. The mode of growth promotion by antibiotics. J. Anim. Sci. 46: 1447-1449. Wagner, E.D. 1954. The effect of antibiotics and arsanilic acid on the growth of rainbow trout fingerlings. Prog. Fish-CulL 16: 36-38.

Workshop Recommendations
1. The participants were of the view that there is a considerable amount of research findings that are published in national languages in the form of reports, and or in local journals which are generally not available to the other researchers. In order to make this literature available to others, as an initial step it was decided to compile lists of references on species which are commonly cultured and are of commercial importance to the region. On compilation of the lists of references attempts will be made to make available English translations of the more important articles to fish nutrition researchers in the region, and this be made an ongoing activity, with an updating being done once every three years.
2. The workshop endorsed an earlier recommendation that all endeavors should be made to encourage the use of equipment available in a particular institution to researchers from others.
3. The workshop recommended that short -- and medium-term exchange programs between senior fish nutrition researchers in the region should be encouraged and that such exchanges be budgeted when formulating research programs for donor support.
4. The workshop recommended that training in fish nutrition research is most needed for middle-level researchers, and the priorities for such training would be for
(a) training in experimental design, use of statistics and computers in fish nutrition research, and
(b) in analytical methods.
The workshop also recommended that the IDRC should consider providing support, primarily in the form of providing resource persons, for local training courses.
5. The participants were of the view that the format followed in the last two workshops was good and future workshops should be conducted along the same lines.
It was recommended that a set of Abstracts be made available to all participants in advance, and that full papers should be made available at the time of the workshop. Also posters should be encouraged as a component of the technical sessions. It was also felt that apart from the presentation of research findings and the ensuing discussions on the findings and on issues of general interest and relevance, that resource persons should be requested to conduct discussions on selected topic(s).
201

202
6. The workshop was of the view that a significant number of researchers do not take into consideration the digestible energy values of the ingredients in formulating diets. One reason for this is that data is not readily available.
The workshop recommended that digestible energy values of commonly used ingredients in fish diets in the region be compiled. The basic information should be supplemented with information on availability, type of processing, price, etc.
7. The workshop was of the view that priority for research support and funding be directed to
(a) areas of research on role of supplementary feeds and feeding in semi-intensive aquaculture systems,
(b) areas of research concerned with feed cost saving (direct or indirect), and
(c) for fish nutrition research under 'on-farm' conditions.
The workshop was of the view that research on the basic nutrient requirements on those species on which little information is available should be encouraged. Because of the long-term nature of such research, cost and often difficulty of acquiring proper purified ingredients, the major support for research funds for basic nutrient requirement studies must be sought through the country's own Government research agencies. Applied fish nutrition is considered more useful for aquaculture development in the region because findings from such research have direct applications in diet formulation and feed production.
8. The workshop also felt that there was little or very limited interaction amongst fish nutrition researchers and farmers. The workshop, therefore, recommended researchers to, as far as possible, work in conjunction with farmers and direct their research to on-farm conditions. Similarly, it was noted that there is a dearth of proper and appropriate economic analysis of use of laboratory developed diets, and that all endeavors should be made to test such diets under 'on-farm' conditions and perform proper economic evaluations.
9. The workshop was of the view that fish nutrition research, at the present stage of development of the industry in the region where the culture practices are mostly extensive to semi-intensive, should be confined to those species utilized in such practices.
10. The participants were of the view that the workshops have been very useful and have provided a forum to discuss their research findings and future research openly, uninhibited. The workshops also have enabled them to adopt proper techniques or to improve on the techniques already used, and most of all to obtain first-hand knowledge of the ongoing related work in the region. The workshop, therefore, recommends that future meetings of this nature should be held at regular intervals.

List of Participants 4th Fish Nutrition Workshop
(3-8September1990)
M.Q.Ahmed Scandinavian Technology
Consultants Tirumala Complex Sardjini Devi Road Secunderabad 500 003 India
Dr. A.M. Akand Department of Agriculture and
Management Bangladesh Agricultural
University Mymensingh 2202 Bangladesh
Prof. M. Babu Rao Department of Fishery Sciences AP. Agricultural University Kakinada 533 007 A.P. India
B. Vishnu Bhat The Marine Products Export
Development Authority Prawn Farm Project Complex V allarpadom, Cochin 682 031 India
Dr. M. Boonyaratapalin National Institute of Coastal
Aquaculture Kao-san Soi 1 Kaoseng, Songk:hla 90000 Thailand
Mr. Kenneth Chin 32 Jalan Petaling Larkin Industrial Estate P.O. Box 311 80730 Johor Bahru Malaysia
203
Dr. P.R.T. Cumaranatunga Department of 7.oology University of Ruhuna. Matara Sri Lanka
Dr.K.M. Das CIFA (ICAR) Kausalyagang Bhubaneshwar 7 51 002, Orissa India
Dr. Sena S. De Silva Department of 7.oology National University of Singapore Singapore 0511
Ms. R.M. Gunasekera Department of 7.oology National University of Singapore Singapore 0511
Dr. M.R. Hasan Department of Fisheries Biology
and Limnology Bangladesh Agricultural
University Mymensingh 2202 Bangladesh
Prof. Xiqin He Institute of Hydrobiology Academia Sinica \Vuhan,Hubei430072 China
A.J. Jacob Department of Aquatic Biology
and Fisheries University of Kerala Trivandrum 695 007 India

204
Dr. P. Keshavanath College of Fisheries Mangalore 575 002, Karnataka India
Dr. Kok Leong Wee Tasmanian Institute of
Technology P.O. Box 1214 Launceston, Tasmania 7250 Australia
Dr. V.R. Kulkarni Nav Maharashtra! Chakan Oil Mills Ltd. E/6 MIDC Kupwad Block Kupwad District Sangali, Maharashtra India 416 425
Dr. Santosh P. Lall Biological Science Branch Department of Fisheries and
Oceans P.O. Box 550 1707 Lower Water St. Halifax, Nova Scotia Canada B3J 2S7
Dr. S.N. Mohanty CIFA (ICAR) Kausalyagang Bhubaneshwar 751 002, Orissa India
Dr. P.K. Mukhopadhyay CIFA (ICAR) Kausalyagang Bhubaneshwar 751 002, Orissa India
Nikhil Nagpal HIM Feeds Private Limited 2A, Shankar Market Connaught Circus New Delhi 110 001 India
Dr. M.C. Nandeesha College of Fisheries Mangalore 575 002, Karnataka India
Dr. S.P. Netke Nutrition Consultant Deejay Enterprises St. Patrick's Complex Brigade Road Bangalore 560 025 India
Dr. Charoen Nitithamyong Department of Aquatic Science Prince of Songkhla University Had-Y ai, Songkhla 90112 Thailand
Ms. M. Parazo SEAFDEC/AQD Tigbauan, Iloilo Philippines
Dr. F.P. Pascual SEAFDEC/AQD Tigbauan, Iloilo Philippines
Mr. A.K. Rai Fisheries Development Division Department of Agriculture Harihar Bhawan, Lalitpur Nepal
Dr. V.K. Rajbanshi Aquaculture Division Industrial Farm Primary Industries Enterprise 10-A Punggol Port Road Singapore 1954
Dr. A.K. Ray Fisheries Laboratory Department of Zoology Visva Bharati University Santiniketan 731 235 India

Dr. Kasturi Samantaray College of Fisheries OUAT, P.O. - Rangailunda Berhampur 760 007, Orissa India
Dr. Corazon Santiago SEAFDEC/AQD Binangonan, Rizal Philippines
Mr. D. Seenappa Inland Fisheries Division University of Agricultural
Sciences Hebbal, Bangalore 560 024 India
Dr. H. Sehgal Department of Zoology Punjab Agricultural University Ludhiana 141 004, Punjab India
Dr. B.N. Singh CIFA (ICAR) Kausalyagang Bhubaneshwar 751 002, Orissa India
Ms. N. Sumagaysay SEAFDEC/AQD Tigbauan, Iloilo Philippines
Mr. S.H. Tay Aquaculture Division Industrial Farm Primary Industries Enterprise 10-A Punggol Port Rd. Singapore 1954
Dr. A. Y akupitiyage Division of Agriculture and Food
Engineering AIT, P.O. Box 2754 Bangkok 10501 Thailand
Mr. Xu Xueliang Yellow Sea Fisheries Research
Institute 19 Laiyang Road, Qingdao China
205
