anisotropy of elastic, magnetic and microstructural properties of the callovo-oxfordian argillite
TRANSCRIPT
www.elsevier.com/locate/pce
Physics and Chemistry of the Earth 32 (2007) 145–153
Anisotropy of elastic, magnetic and microstructural propertiesof the Callovo-Oxfordian argillite
Christian David *, Philippe Robion, Beatriz Menendez
GdR FORPRO 0788 – UMR 7072, Universite de Cergy-Pontoise, Departement des Sciences de la Terre et de l’Environnement,
5, mail Gay-Lussac, F-95031 Cergy-Pontoise, France
Received 1 July 2005; received in revised form 28 November 2005; accepted 30 November 2005Available online 11 October 2006
Abstract
We investigated the anisotropic behaviour of the Callovo-Oxfordian argillite in laboratory experiments, and analysed the rock micro-structure using different imaging techniques. The starting material was a core retrieved at 460 m depth in well EST204 at the site of theFrench Underground Research Laboratory in the Meuse/Haute-Marne region, from which 17 small subcores were prepared in threeorthogonal directions.
The anisotropy of magnetic susceptibility (AMS) was studied using a KLY3S kappabridge. The technique allows one to determine thesusceptibility tensor which can be represented by an ellipsoid with principal axes Kmax, Kint and Kmin in decreasing order. We found thatthe AMS ellipsoid is consistent with an oblate fabric. We have also investigated the elastic anisotropy through the measurement ofP-wave velocity in different directions, following the procedure described in our previous works [Louis, L., David, C., Robion, P.,2003. Comparison of the anisotropic behaviour of undeformed sandstones under dry and saturated conditions. Tectonophysics 370,193–212; Louis, L., Robion, P., David, C., 2004. A single method for the inversion of anisotropic data sets with application to structuralstudies. Journal of Structural Geology 26, 2065–2072]. The anisotropy of P-wave velocity is significantly larger than the anisotropy ofmagnetic susceptibility. Interestingly, we found an excellent correlation between AMS and the anisotropy of P-wave velocity, with a min-imum velocity Vmin and susceptibility Kmin fairly well constrained in the direction perpendicular to bedding. Both from the elastic andmagnetic viewpoint, the argillite behave as a transverse isotropic medium, which is typical of a sedimentary fabric with no clear sign oftectonic fabric. Our data set on P- and S-wave velocity measurements allowed for the full determination of the transverse isotropystiffness tensor as well as the Thomsen’s parameters within the framework of weak anisotropy.
We also present some results of a study of the rock microstructure and its structural anisotropy using stereological techniques andX-ray microtomography. The microtomography technique revealed the existence of tubular structures made of dense material (pyrite),the origin of which is not clearly defined but has probably to do with bioturbation during the formation of the sediment.� 2006 Elsevier Ltd. All rights reserved.
Keywords: Rock physics; Shales; Anisotropy; Magnetic susceptibility; Acoustic velocity; Microstructure
1. Introduction
Underground storage of nuclear waste requires a com-prehensive knowledge of the intrinsic properties of the hostrock. For that purpose, ANDRA (the French agency fornuclear waste management), is developing an extensive sci-entific programme in order to characterize the Callovo-
1474-7065/$ - see front matter � 2006 Elsevier Ltd. All rights reserved.
doi:10.1016/j.pce.2005.11.003
* Corresponding author. Tel.: +33 1 3425 7360; fax: +33 1 3425 7350.E-mail address: [email protected] (C. David).
Oxfordian argillite formation in the Meuse–Haute-Marneregion, Eastern France. Our goal is to study the elasticand magnetic anisotropy of the argillite by conducting athorough experimental program focusing on the measure-ment of elastic waves velocity and magnetic susceptibility.In underground research laboratories like in Mont Terrior in Bure, a major issue is to characterize the extensionand properties of the excavated disturbed or damaged zone(EDZ). This can be done by conducting seismic studiesusing different experimental configurations (Schuster and
146 C. David et al. / Physics and Chemistry of the Earth 32 (2007) 145–153
Alheid, 2005) directly in the galleries excavated at depth. Inorder to highlight the effect of damage and its evolutionwith time, obviously a preliminary step is to estimate theseismic properties of the undisturbed host rock. For shalesand more generally clay-rich sedimentary rocks, it is well-known that the elastic properties are strongly anisotropicdue to the foliated structure of the clay minerals and rockformation processes. As a consequence, a significant anisot-ropy in P- and S-wave velocities is generally observed insuch rocks, and this anisotropy can be correlated to thedegree of preferred orientation of the clay minerals detectedby X-ray analysis (Johnston and Christensen, 1995). Theelastic anisotropy of shales is generally well described bytransverse isotropy and can be modelled from the clay-par-ticle orientation distribution (Sayers, 1994). For the longterm monitoring of underground repositories evolution,remote seismic surveys and acoustic emission monitoringboth require a good knowledge of the host rock seismicproperties for microseismic events localization (Reyes-Montes et al., 2005). Obviously anisotropy has to be takeninto account in the localization algorithms when dealingwith shales. Investigating the anisotropy of magnetic sus-ceptibility (AMS) has been widely used in structural geol-ogy as a proxy for characterizing the deformation and therock fabric in sedimentary and tectonic settings (e.g. Hro-uda, 1982). For example Hirt et al. (1995) found a strongcorrelation between magnetic anisotropy and fabric inDevonian shales, which expresses the effect of compactionand tectonics on the Appalachian Plateau formations. Morerecently Louis et al. (2005) have shown that microstructuralfeatures such as pore shape anisotropy and clay-rich crosslaminations in sandstones can explain both the anisotropyof magnetic susceptibility and of P-wave velocity: oneimportant conclusion of this previous work was that com-bining magnetic and elastic studies provides a better insightinto the source of anisotropy in sedimentary rocks, whichcan also be identified by microstructural analyses.
2. Rock description and sampling method
The starting material was a core (diameter 10 cm, length31 cm) provided by ANDRA. It was retrieved in the Cal-
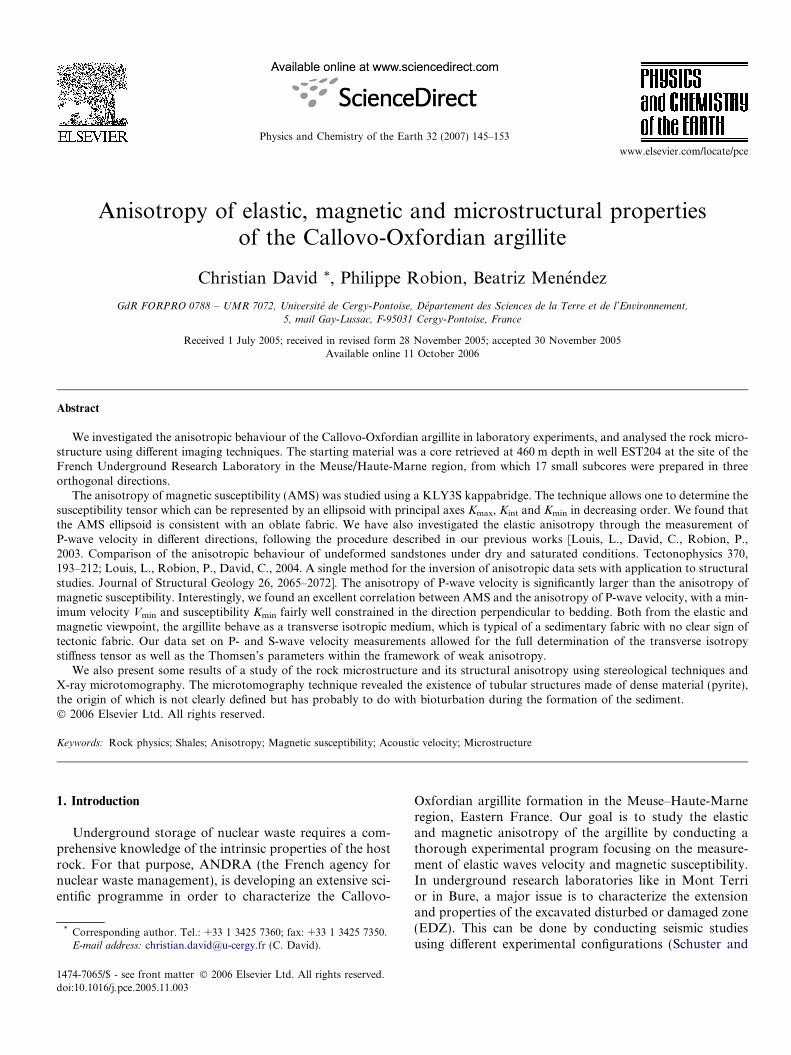
Fig. 1. Coring directions in the bulk material, geometry of standard samples foplotted on a stereographic diagram (equal area projection on lower hemisphe
lovo-Oxfordian argillite formation, at 460 m depth in thewell EST204 drilled at the site of the French undergroundresearch laboratory at Bure in the Meuse–Haute-Marneregion. The mineralogy is assumed to be similar to thatof cores retrieved at comparable depths in adjacent wells(EST205 and EST103) that were investigated by Gaucheret al. (2004): 30% Quartz+Feldspar, 40% clay mineralsand 25% carbonates. We first cut an 8 cm long slice fromthe big core, and from this block we cored and cut a totalof 17 small samples with diameter 25 mm and length22.5 mm which is the standard size for AMS studies. Inorder to keep as good as possible the original moisture con-tent of the rock, the samples were wrapped after coring in aplastic foil and stored at 5 �C. The subcoring was done inthree orthogonal directions: one corresponding to the bigcore axis, and the other two in the plane perpendicular tothe core axis, which is also the bedding plane of the forma-tion. As we have no information on the azimuthal orienta-tion of the core with respect to the local geographiccoordinates, the orthogonal directions in the bedding planewere chosen arbitrarily, one named the X-direction, andthe other one the Y-direction. The Z-axis is oriented alongthe big core axis towards the well bottom (Fig. 1). On eachsmall sample, we drew on one end surface 8 diameters withangular spacing 22.5� representing the directions in whichthe magnetic susceptibility and the P-wave velocity weremeasured. Our sample collection includes 9 small sampleswith their axis parallel to Z (called hereafter the Z-sam-ples), and 8 small samples with their axis parallel to thebedding plane, divided into 4 Y-samples and 4 X-samples.For any set of three orthogonal samples, a total number of24 directions are investigated, among which only 21 areindependent: the orientation of the measurement directionsis represented on the stereoplot in Fig. 1 (equal area lowerhemispheric projection).
3. Anisotropy of magnetic susceptibility
We measured the low field anisotropy of magnetic sus-ceptibility (AMS) in each sample using an impedancebridge KLY3S designed by AGICO. This device measuresthe induced magnetization M of a specimen in a coil pro-
r magnetic and acoustic measurements, and directional sampling in spacere).
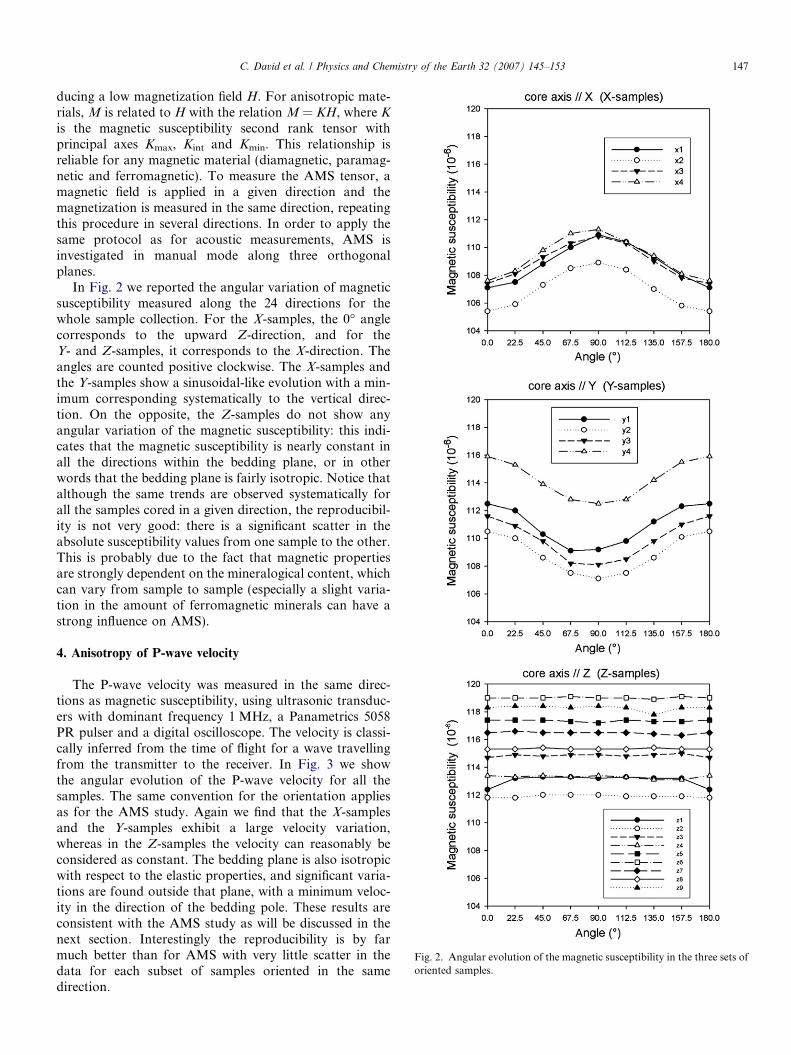
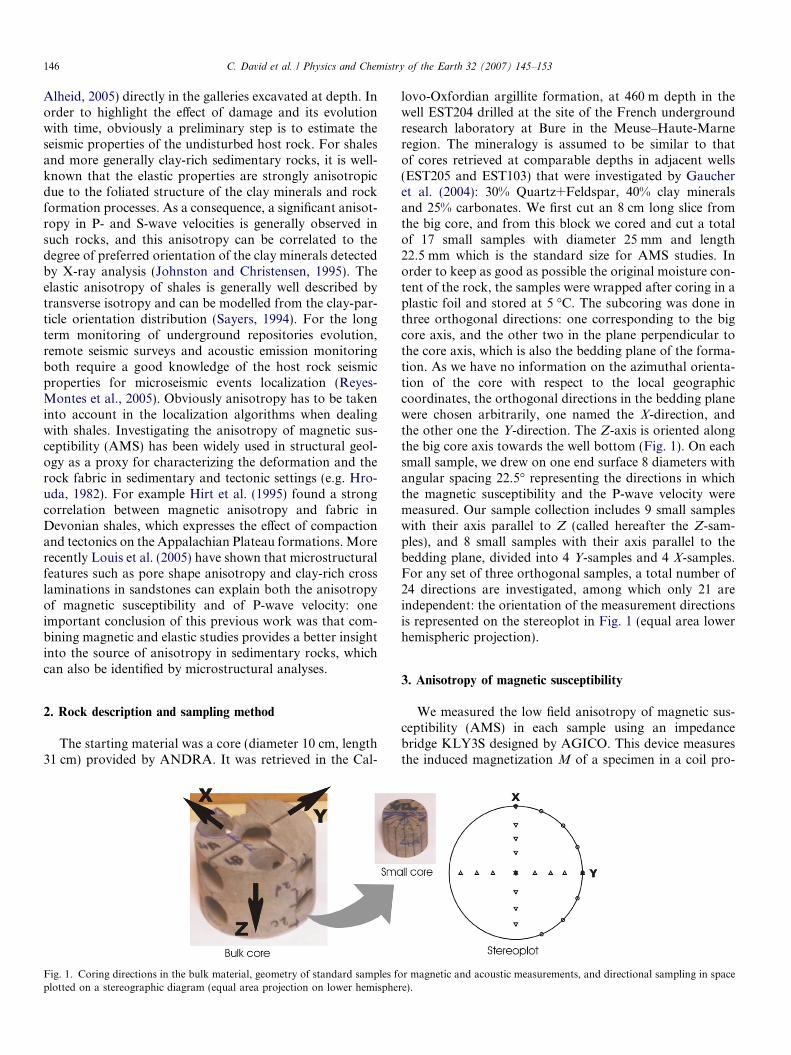
Fig. 2. Angular evolution of the magnetic susceptibility in the three sets oforiented samples.
C. David et al. / Physics and Chemistry of the Earth 32 (2007) 145–153 147
ducing a low magnetization field H. For anisotropic mate-rials, M is related to H with the relation M = KH, where K
is the magnetic susceptibility second rank tensor withprincipal axes Kmax, Kint and Kmin. This relationship isreliable for any magnetic material (diamagnetic, paramag-netic and ferromagnetic). To measure the AMS tensor, amagnetic field is applied in a given direction and themagnetization is measured in the same direction, repeatingthis procedure in several directions. In order to apply thesame protocol as for acoustic measurements, AMS isinvestigated in manual mode along three orthogonalplanes.
In Fig. 2 we reported the angular variation of magneticsusceptibility measured along the 24 directions for thewhole sample collection. For the X-samples, the 0� anglecorresponds to the upward Z-direction, and for theY- and Z-samples, it corresponds to the X-direction. Theangles are counted positive clockwise. The X-samples andthe Y-samples show a sinusoidal-like evolution with a min-imum corresponding systematically to the vertical direc-tion. On the opposite, the Z-samples do not show anyangular variation of the magnetic susceptibility: this indi-cates that the magnetic susceptibility is nearly constant inall the directions within the bedding plane, or in otherwords that the bedding plane is fairly isotropic. Notice thatalthough the same trends are observed systematically forall the samples cored in a given direction, the reproducibil-ity is not very good: there is a significant scatter in theabsolute susceptibility values from one sample to the other.This is probably due to the fact that magnetic propertiesare strongly dependent on the mineralogical content, whichcan vary from sample to sample (especially a slight varia-tion in the amount of ferromagnetic minerals can have astrong influence on AMS).
4. Anisotropy of P-wave velocity
The P-wave velocity was measured in the same direc-tions as magnetic susceptibility, using ultrasonic transduc-ers with dominant frequency 1 MHz, a Panametrics 5058PR pulser and a digital oscilloscope. The velocity is classi-cally inferred from the time of flight for a wave travellingfrom the transmitter to the receiver. In Fig. 3 we showthe angular evolution of the P-wave velocity for all thesamples. The same convention for the orientation appliesas for the AMS study. Again we find that the X-samplesand the Y-samples exhibit a large velocity variation,whereas in the Z-samples the velocity can reasonably beconsidered as constant. The bedding plane is also isotropicwith respect to the elastic properties, and significant varia-tions are found outside that plane, with a minimum veloc-ity in the direction of the bedding pole. These results areconsistent with the AMS study as will be discussed in thenext section. Interestingly the reproducibility is by farmuch better than for AMS with very little scatter in thedata for each subset of samples oriented in the samedirection.
Fig. 3. Angular evolution of the P-wave velocity in the three sets oforiented samples.
148 C. David et al. / Physics and Chemistry of the Earth 32 (2007) 145–153
5. Comparison and analysis of the results
5.1. Magnetic vs. elastic anisotropy
Let us compare our results for the spatial variation ofmagnetic susceptibility and P-wave velocity. To do so, wewill estimate the location of the principal axes of the ellip-soid describing the variability of both properties with ori-entation. This is straightforward to do for the magneticsusceptibility, which is fully described by a second ranktensor. On the contrary, as seismic velocities are controlledby a combination of elastic moduli function of the fourthrank rigidity tensor cijkl, the spatial evolution of P-wavevelocities can not be represented by an ellipsoid. However,following the approach proposed by Louis et al. (2003), itis possible to define a pseudo-tensor for the P-wave veloc-ities, which can be represented by an ellipsoid like forAMS. The principle of the method is to combine the radialVP measurements on the three orthogonal samples using aleast-squares scheme to derive the parameters of the equiv-alent ellipsoid. The reader can refer to Louis et al. (2003)for a detailed description of the method, and to Louiset al. (2004) for a discussion on the error induced whenapplying this approximation. We have therefore a unifiedapproach which allows one to compare the anisotropy ofdifferent rock properties using a single method: indeed itis possible to compare the location of the principal axesKmax, Kint and Kmin for AMS to the principal axes Vmax,Vint and Vmin derived from the P-wave velocity pseudo-ten-sor. To represent these principal directions, we use an equalarea lower hemispheric projection and add on the stereo-plot the ellipse of confidence for each determination, fol-lowing the work of Hext (1963). In Fig. 4 we plotted onthe left hand side the stereoplots for AMS and P-wavevelocity estimated from the average angular evolution ofeach property for the subset of samples cored in the samedirection. On the right hand side, we plotted the principaldirections of the individual tensors for 100 combinationsof three orthogonal samples taken randomly in our samplecollection. This kind of representation emphasizes the con-sistency of the tensor ellipsoidal shape over the whole dataset whereas the former highlights the global trend by takinginto account average properties. Comparing the plots forAMS and P-wave velocity, the striking result is the excel-lent agreement in the orientation of the minimum axis Kmin
and Vmin along the Z-direction. The other principal axesKmax, Vmax and Kint, Vint are located within the beddingplane but do not match each other. However the differencesin the magnitude of maximum and intermediate values arevery small so that the orientations in the bedding plane arenot well constrained.
5.2. Magnetic and elastic fabric
The second important feature is that the minimum axisfor both properties is much better constrained than theother axes, with a smaller ellipse of confidence. In fact there
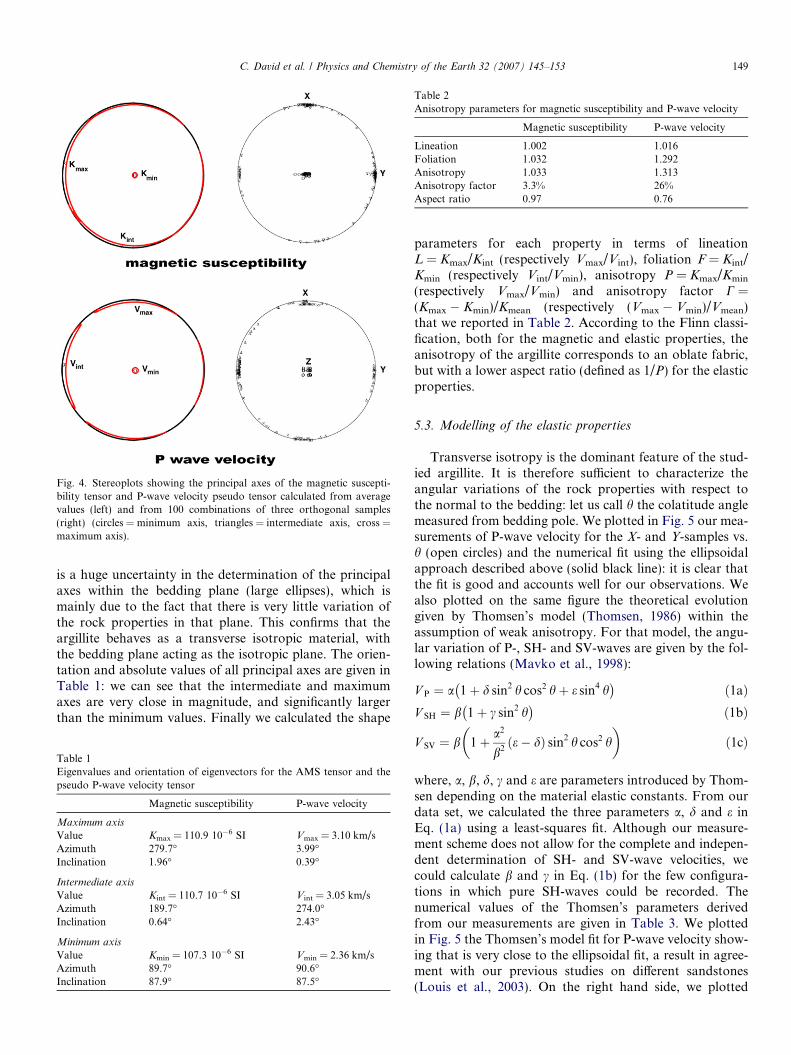
Fig. 4. Stereoplots showing the principal axes of the magnetic suscepti-bility tensor and P-wave velocity pseudo tensor calculated from averagevalues (left) and from 100 combinations of three orthogonal samples(right) (circles = minimum axis, triangles = intermediate axis, cross =maximum axis).
Table 2Anisotropy parameters for magnetic susceptibility and P-wave velocity
Magnetic susceptibility P-wave velocity
Lineation 1.002 1.016Foliation 1.032 1.292Anisotropy 1.033 1.313Anisotropy factor 3.3% 26%Aspect ratio 0.97 0.76
C. David et al. / Physics and Chemistry of the Earth 32 (2007) 145–153 149
is a huge uncertainty in the determination of the principalaxes within the bedding plane (large ellipses), which ismainly due to the fact that there is very little variation ofthe rock properties in that plane. This confirms that theargillite behaves as a transverse isotropic material, withthe bedding plane acting as the isotropic plane. The orien-tation and absolute values of all principal axes are given inTable 1: we can see that the intermediate and maximumaxes are very close in magnitude, and significantly largerthan the minimum values. Finally we calculated the shape
Table 1Eigenvalues and orientation of eigenvectors for the AMS tensor and thepseudo P-wave velocity tensor
Magnetic susceptibility P-wave velocity
Maximum axis
Value Kmax = 110.9 10�6 SI Vmax = 3.10 km/sAzimuth 279.7� 3.99�Inclination 1.96� 0.39�
Intermediate axis
Value Kint = 110.7 10�6 SI Vint = 3.05 km/sAzimuth 189.7� 274.0�Inclination 0.64� 2.43�
Minimum axis
Value Kmin = 107.3 10�6 SI Vmin = 2.36 km/sAzimuth 89.7� 90.6�Inclination 87.9� 87.5�
parameters for each property in terms of lineationL = Kmax/Kint (respectively Vmax/Vint), foliation F = Kint/Kmin (respectively Vint/Vmin), anisotropy P = Kmax/Kmin
(respectively Vmax/Vmin) and anisotropy factor C =(Kmax � Kmin)/Kmean (respectively (Vmax � Vmin)/Vmean)that we reported in Table 2. According to the Flinn classi-fication, both for the magnetic and elastic properties, theanisotropy of the argillite corresponds to an oblate fabric,but with a lower aspect ratio (defined as 1/P) for the elasticproperties.
5.3. Modelling of the elastic properties
Transverse isotropy is the dominant feature of the stud-ied argillite. It is therefore sufficient to characterize theangular variations of the rock properties with respect tothe normal to the bedding: let us call h the colatitude anglemeasured from bedding pole. We plotted in Fig. 5 our mea-surements of P-wave velocity for the X- and Y-samples vs.h (open circles) and the numerical fit using the ellipsoidalapproach described above (solid black line): it is clear thatthe fit is good and accounts well for our observations. Wealso plotted on the same figure the theoretical evolutiongiven by Thomsen’s model (Thomsen, 1986) within theassumption of weak anisotropy. For that model, the angu-lar variation of P-, SH- and SV-waves are given by the fol-lowing relations (Mavko et al., 1998):
V P ¼ a 1þ d sin2 h cos2 hþ e sin4 h� �
ð1aÞV SH ¼ b 1þ c sin2 h
� �ð1bÞ
V SV ¼ b 1þ a2
b2e� dð Þ sin2 h cos2 h
� �ð1cÞ
where, a, b, d, c and e are parameters introduced by Thom-sen depending on the material elastic constants. From ourdata set, we calculated the three parameters a, d and e inEq. (1a) using a least-squares fit. Although our measure-ment scheme does not allow for the complete and indepen-dent determination of SH- and SV-wave velocities, wecould calculate b and c in Eq. (1b) for the few configura-tions in which pure SH-waves could be recorded. Thenumerical values of the Thomsen’s parameters derivedfrom our measurements are given in Table 3. We plottedin Fig. 5 the Thomsen’s model fit for P-wave velocity show-ing that is very close to the ellipsoidal fit, a result in agree-ment with our previous studies on different sandstones(Louis et al., 2003). On the right hand side, we plotted
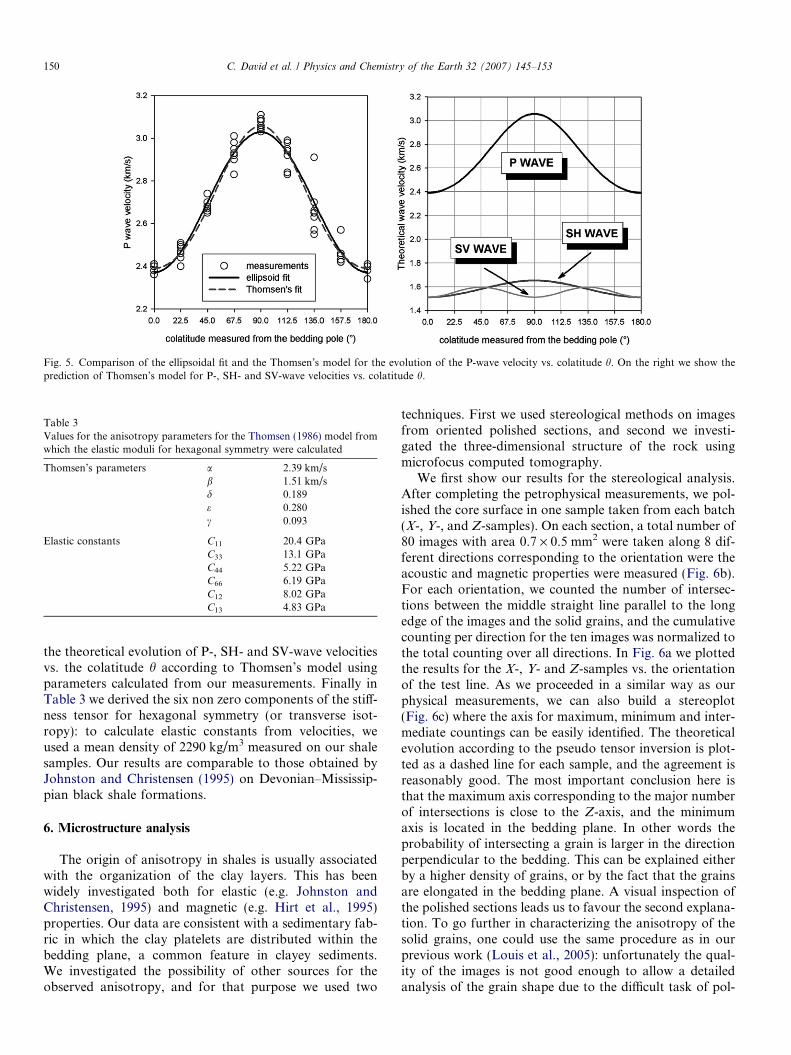
Fig. 5. Comparison of the ellipsoidal fit and the Thomsen’s model for the evolution of the P-wave velocity vs. colatitude h. On the right we show theprediction of Thomsen’s model for P-, SH- and SV-wave velocities vs. colatitude h.
Table 3Values for the anisotropy parameters for the Thomsen (1986) model fromwhich the elastic moduli for hexagonal symmetry were calculated
Thomsen’s parameters a 2.39 km/sb 1.51 km/sd 0.189e 0.280c 0.093
Elastic constants C11 20.4 GPaC33 13.1 GPaC44 5.22 GPaC66 6.19 GPaC12 8.02 GPaC13 4.83 GPa
150 C. David et al. / Physics and Chemistry of the Earth 32 (2007) 145–153
the theoretical evolution of P-, SH- and SV-wave velocitiesvs. the colatitude h according to Thomsen’s model usingparameters calculated from our measurements. Finally inTable 3 we derived the six non zero components of the stiff-ness tensor for hexagonal symmetry (or transverse isot-ropy): to calculate elastic constants from velocities, weused a mean density of 2290 kg/m3 measured on our shalesamples. Our results are comparable to those obtained byJohnston and Christensen (1995) on Devonian–Mississip-pian black shale formations.
6. Microstructure analysis
The origin of anisotropy in shales is usually associatedwith the organization of the clay layers. This has beenwidely investigated both for elastic (e.g. Johnston andChristensen, 1995) and magnetic (e.g. Hirt et al., 1995)properties. Our data are consistent with a sedimentary fab-ric in which the clay platelets are distributed within thebedding plane, a common feature in clayey sediments.We investigated the possibility of other sources for theobserved anisotropy, and for that purpose we used two
techniques. First we used stereological methods on imagesfrom oriented polished sections, and second we investi-gated the three-dimensional structure of the rock usingmicrofocus computed tomography.
We first show our results for the stereological analysis.After completing the petrophysical measurements, we pol-ished the core surface in one sample taken from each batch(X-, Y-, and Z-samples). On each section, a total number of80 images with area 0.7 · 0.5 mm2 were taken along 8 dif-ferent directions corresponding to the orientation were theacoustic and magnetic properties were measured (Fig. 6b).For each orientation, we counted the number of intersec-tions between the middle straight line parallel to the longedge of the images and the solid grains, and the cumulativecounting per direction for the ten images was normalized tothe total counting over all directions. In Fig. 6a we plottedthe results for the X-, Y- and Z-samples vs. the orientationof the test line. As we proceeded in a similar way as ourphysical measurements, we can also build a stereoplot(Fig. 6c) where the axis for maximum, minimum and inter-mediate countings can be easily identified. The theoreticalevolution according to the pseudo tensor inversion is plot-ted as a dashed line for each sample, and the agreement isreasonably good. The most important conclusion here isthat the maximum axis corresponding to the major numberof intersections is close to the Z-axis, and the minimumaxis is located in the bedding plane. In other words theprobability of intersecting a grain is larger in the directionperpendicular to the bedding. This can be explained eitherby a higher density of grains, or by the fact that the grainsare elongated in the bedding plane. A visual inspection ofthe polished sections leads us to favour the second explana-tion. To go further in characterizing the anisotropy of thesolid grains, one could use the same procedure as in ourprevious work (Louis et al., 2005): unfortunately the qual-ity of the images is not good enough to allow a detailedanalysis of the grain shape due to the difficult task of pol-
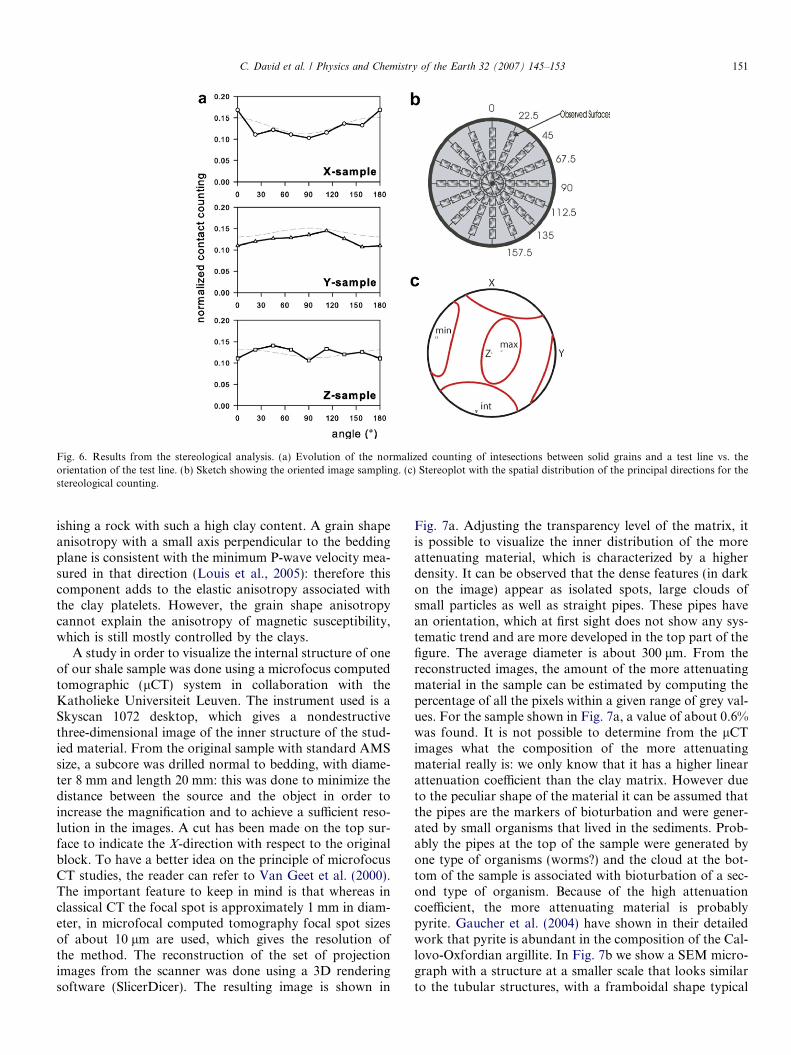
Fig. 6. Results from the stereological analysis. (a) Evolution of the normalized counting of intesections between solid grains and a test line vs. theorientation of the test line. (b) Sketch showing the oriented image sampling. (c) Stereoplot with the spatial distribution of the principal directions for thestereological counting.
C. David et al. / Physics and Chemistry of the Earth 32 (2007) 145–153 151
ishing a rock with such a high clay content. A grain shapeanisotropy with a small axis perpendicular to the beddingplane is consistent with the minimum P-wave velocity mea-sured in that direction (Louis et al., 2005): therefore thiscomponent adds to the elastic anisotropy associated withthe clay platelets. However, the grain shape anisotropycannot explain the anisotropy of magnetic susceptibility,which is still mostly controlled by the clays.
A study in order to visualize the internal structure of oneof our shale sample was done using a microfocus computedtomographic (lCT) system in collaboration with theKatholieke Universiteit Leuven. The instrument used is aSkyscan 1072 desktop, which gives a nondestructivethree-dimensional image of the inner structure of the stud-ied material. From the original sample with standard AMSsize, a subcore was drilled normal to bedding, with diame-ter 8 mm and length 20 mm: this was done to minimize thedistance between the source and the object in order toincrease the magnification and to achieve a sufficient reso-lution in the images. A cut has been made on the top sur-face to indicate the X-direction with respect to the originalblock. To have a better idea on the principle of microfocusCT studies, the reader can refer to Van Geet et al. (2000).The important feature to keep in mind is that whereas inclassical CT the focal spot is approximately 1 mm in diam-eter, in microfocal computed tomography focal spot sizesof about 10 lm are used, which gives the resolution ofthe method. The reconstruction of the set of projectionimages from the scanner was done using a 3D renderingsoftware (SlicerDicer). The resulting image is shown in
Fig. 7a. Adjusting the transparency level of the matrix, itis possible to visualize the inner distribution of the moreattenuating material, which is characterized by a higherdensity. It can be observed that the dense features (in darkon the image) appear as isolated spots, large clouds ofsmall particles as well as straight pipes. These pipes havean orientation, which at first sight does not show any sys-tematic trend and are more developed in the top part of thefigure. The average diameter is about 300 lm. From thereconstructed images, the amount of the more attenuatingmaterial in the sample can be estimated by computing thepercentage of all the pixels within a given range of grey val-ues. For the sample shown in Fig. 7a, a value of about 0.6%was found. It is not possible to determine from the lCTimages what the composition of the more attenuatingmaterial really is: we only know that it has a higher linearattenuation coefficient than the clay matrix. However dueto the peculiar shape of the material it can be assumed thatthe pipes are the markers of bioturbation and were gener-ated by small organisms that lived in the sediments. Prob-ably the pipes at the top of the sample were generated byone type of organisms (worms?) and the cloud at the bot-tom of the sample is associated with bioturbation of a sec-ond type of organism. Because of the high attenuationcoefficient, the more attenuating material is probablypyrite. Gaucher et al. (2004) have shown in their detailedwork that pyrite is abundant in the composition of the Cal-lovo-Oxfordian argillite. In Fig. 7b we show a SEM micro-graph with a structure at a smaller scale that looks similarto the tubular structures, with a framboidal shape typical
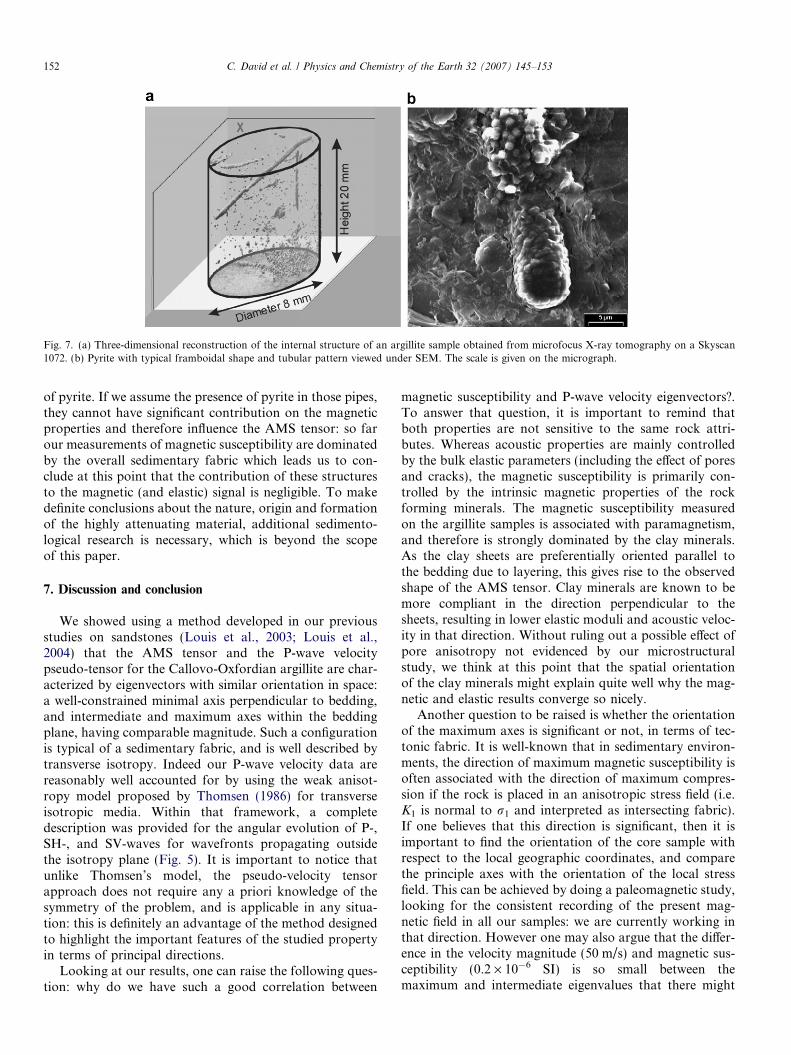
Fig. 7. (a) Three-dimensional reconstruction of the internal structure of an argillite sample obtained from microfocus X-ray tomography on a Skyscan1072. (b) Pyrite with typical framboidal shape and tubular pattern viewed under SEM. The scale is given on the micrograph.
152 C. David et al. / Physics and Chemistry of the Earth 32 (2007) 145–153
of pyrite. If we assume the presence of pyrite in those pipes,they cannot have significant contribution on the magneticproperties and therefore influence the AMS tensor: so farour measurements of magnetic susceptibility are dominatedby the overall sedimentary fabric which leads us to con-clude at this point that the contribution of these structuresto the magnetic (and elastic) signal is negligible. To makedefinite conclusions about the nature, origin and formationof the highly attenuating material, additional sedimento-logical research is necessary, which is beyond the scopeof this paper.
7. Discussion and conclusion
We showed using a method developed in our previousstudies on sandstones (Louis et al., 2003; Louis et al.,2004) that the AMS tensor and the P-wave velocitypseudo-tensor for the Callovo-Oxfordian argillite are char-acterized by eigenvectors with similar orientation in space:a well-constrained minimal axis perpendicular to bedding,and intermediate and maximum axes within the beddingplane, having comparable magnitude. Such a configurationis typical of a sedimentary fabric, and is well described bytransverse isotropy. Indeed our P-wave velocity data arereasonably well accounted for by using the weak anisot-ropy model proposed by Thomsen (1986) for transverseisotropic media. Within that framework, a completedescription was provided for the angular evolution of P-,SH-, and SV-waves for wavefronts propagating outsidethe isotropy plane (Fig. 5). It is important to notice thatunlike Thomsen’s model, the pseudo-velocity tensorapproach does not require any a priori knowledge of thesymmetry of the problem, and is applicable in any situa-tion: this is definitely an advantage of the method designedto highlight the important features of the studied propertyin terms of principal directions.
Looking at our results, one can raise the following ques-tion: why do we have such a good correlation between
magnetic susceptibility and P-wave velocity eigenvectors?.To answer that question, it is important to remind thatboth properties are not sensitive to the same rock attri-butes. Whereas acoustic properties are mainly controlledby the bulk elastic parameters (including the effect of poresand cracks), the magnetic susceptibility is primarily con-trolled by the intrinsic magnetic properties of the rockforming minerals. The magnetic susceptibility measuredon the argillite samples is associated with paramagnetism,and therefore is strongly dominated by the clay minerals.As the clay sheets are preferentially oriented parallel tothe bedding due to layering, this gives rise to the observedshape of the AMS tensor. Clay minerals are known to bemore compliant in the direction perpendicular to thesheets, resulting in lower elastic moduli and acoustic veloc-ity in that direction. Without ruling out a possible effect ofpore anisotropy not evidenced by our microstructuralstudy, we think at this point that the spatial orientationof the clay minerals might explain quite well why the mag-netic and elastic results converge so nicely.
Another question to be raised is whether the orientationof the maximum axes is significant or not, in terms of tec-tonic fabric. It is well-known that in sedimentary environ-ments, the direction of maximum magnetic susceptibility isoften associated with the direction of maximum compres-sion if the rock is placed in an anisotropic stress field (i.e.K1 is normal to r1 and interpreted as intersecting fabric).If one believes that this direction is significant, then it isimportant to find the orientation of the core sample withrespect to the local geographic coordinates, and comparethe principle axes with the orientation of the local stressfield. This can be achieved by doing a paleomagnetic study,looking for the consistent recording of the present mag-netic field in all our samples: we are currently working inthat direction. However one may also argue that the differ-ence in the velocity magnitude (50 m/s) and magnetic sus-ceptibility (0.2 · 10�6 SI) is so small between themaximum and intermediate eigenvalues that there might
C. David et al. / Physics and Chemistry of the Earth 32 (2007) 145–153 153
be the risk of overinterpreting the data. This might be true,but it must be mentioned that the acoustic signals arestrong enough so that the experimental error on the veloc-ity calculation is small, of the order of 25 m/s: in that caseone would conclude that the difference in velocity is signif-icant after all, and the data can be analyzed with the per-spective of seeking for a possible tectonic fabric: asmentioned we are currently exploring this way.
Our microstructural study revealed the existence ofunexpected tubular structures associated with biologicalactivity during the formation of the sediment. But we stillneed to do additional work on the microstructure charac-terization in order to have a better knowledge of the anisot-ropy source at the microscale level. Also further effort mustbe put into the channel-filling material characterizationusing XRD for example, with the idea of finding possiblesources of magnetic susceptibility anomalies associatedwith the worm-like structures if the filling material has astrong intrinsic susceptibility.
Acknowledgements
This work is financially supported by the CNRS andANDRA through the GdR FORPRO 0788 and corre-sponds to the GdR FORPRO contribution 2005/18A.The core material was kindly provided by ANDRA. Manythanks to both reviewers who helped in improving the pa-per. We thank Soizic Kerfontain and Emilie Delarue,undergraduate students at UCP for conducting the P-wavemeasurements and for preparing the polished sections,respectively. Laurent Louis developped the P-wave velocitypseudo tensor analysis while he was a PhD student in ourgroup. Katleen Remeysen did the microfocus X-ray tomog-raphy study within the frame of collaboration with RudySwennen at Katholieke Universiteit Leuven. Joel Sarout(ENS Paris) kindly provided the SEM micrograph. Finallywe thank Jean-Marc Siffre and Jean-Christian Colombierfor technical support and help in the measurements.
References
Gaucher, E., Robelin, C., Matray, J.M., Negrel, G., Gros, Y., Heitz, J.F.,Vinsot, A., Rebours, H., Cassagnabere, A., Bouchet, A., 2004.ANDRA underground research laboratory: interpretation of themineralogical and geochemical data acquired in the Callovo-Oxfordianformation by investigative drilling. Physics and Chemistry of the Earth29, 55–77.
Hext, G.R., 1963. The estimation of second-order tensors, with relatedtests and designs. Biometrika 50, 353–373.
Hirt, A.M., Evans, K.F., Engelder, T., 1995. Correlation betweenmagnetic anisotropy and fabric for Devonian shales on the Appala-chian Plateau. Tectonophysics 247, 121–132.
Hrouda, F., 1982. Magnetic anisotropy of rocks and its application ingeology and geophysics. Geophysical Survey 5, 37–82.
Johnston, J.E., Christensen, N.I., 1995. Seismic anisotropy of shales.Journal of Geophysical Research 100, 5991–6003.
Louis, L., David, C., Robion, P., 2003. Comparison of the anisotropicbehaviour of undeformed sandstones under dry and saturated condi-tions. Tectonophysics 370, 193–212.
Louis, L., Robion, P., David, C., 2004. A single method for the inversionof anisotropic data sets with application to structural studies. Journalof Structural Geology 26, 2065–2072.
Louis, L., David, C., Metz, V., Robion, P., Menendez, B., Kissel, C., 2005.Microstructural control on the anisotropy and transport properties inundeformed sandstones. International Journal of Rock Mechanics 42,911–923.
Mavko, G., Mukerji, T., Dvorkin, J., 1998. In: The rock physicshandbook – tools for seismic analysis in porous media. CambridgeUniversity Press.
Reyes-Montes, J.M., Rietbrock, A., Collins, D.S., Young, R.P., 2005.Relative location of excavation induced microseismicity at the Under-ground Research Laboratory (AECL, Canada) using surveyed refer-ence events. Geophysical Research Letters 32, L05308.
Sayers, C.M., 1994. The elastic anisotropy of shales. Journal ofGeophysical Research 99, 767–774.
Schuster, K., Alheid, H.J., 2005. Results gained from seismic in situmeasurements in the Opalinus clay at the Mont Terri rock laboratory.Communication presented at 2nd International Meeting on Clays inNatural & Engineered Barriers for Radioactive Waste Confinement.
Thomsen, L., 1986. Weak elastic anisotropy. Geophysics 51, 1954–1966.
Van Geet, M., Swennen, R., Wevers, M., 2000. Quantitative analysis ofreservoir rocks by microfocus X-ray computerized tomography.Sedimentary Geology 132, 25–36.