an overview of the lagrangian experiments undertaken during the north atlantic regional aerosol...
TRANSCRIPT

T ellus (2000), 52B, 290–320 Copyright © Munksgaard, 2000Printed in UK. All rights reserved TELLUS
ISSN 0280–6509
An overview of the Lagrangian experiments undertakenduring the North Atlantic regional Aerosol
Characterisation Experiment (ACE-2)
By DOUG W. JOHNSON1*, SIMON OSBORNE1, ROBERT WOOD1, KARSTEN SUHRE2,RANDY JOHNSON3, STEVEN BUSINGER4, PATRICIA K. QUINN5, ALFREDWIEDENSOHLER6, PHILIP A. DURKEE7, LYNN M. RUSSELL8, MEINRAT O. ANDREAE9,COLIN O’DOWD10, KEVIN J. NOONE11, BRIAN BANDY12, J. RUDOLPH13 andSPYROS RAPSOMANIKIS14, 1Met. Research Flight, Building Y 46, DERA, Farnborough, Hants, UK;2CNRM, University of T oulouse, France; 3NOAA, ARL , Idaho Falls, USA; 4University of Hawaii, USA;5PMEL , NOAA, Seattle, USA; 6IFT , L eipzig, Germany; 7CIRPAS, NPS, Monterey, USA; 8PrincetonUniversity, USA; 9MPI for Chemistry, Mainz, Germany; 10CMAS, University of Sunderland, UK; 11MISU,University of Stockholm, Sweden; 12University of East Anglia, UK; 13University of York, Canada;
14Demokritos University of T hrace, Greece
(Manuscript received 19 February 1999; in final form 22 September 1999)
ABSTRACT
One of the primary aims of the North Atlantic regional Aerosol Characterisation Experiment(ACE-2) was to quantify the physical and chemical processes affecting the evolution of themajor aerosol types over the North Atlantic. The best, practical way of doing this is in aLagrangian framework where a parcel of air is sampled over several tens of hours and itsphysical and chemical properties are intensively measured. During the intensive observationalphase of ACE-2, between 15 June 1997 and 24 July 1997, 3 cloudy Lagrangian experimentsand 3 cloud-free, Lagrangian experiments were undertaken between the south west tip of theIberian Peninsula and the Canary Islands. This paper gives an overview of the aims and logisticsof all of the Lagrangian experiments and compares and contrasts them to provide a frameworkfor the more focused Lagrangian papers in this issue and future process modelling studies andparametrisation development. The characteristics of the cloudy Lagrangian experiments wereremarkably different, enabling a wide range of different physical and chemical processes to bestudied. In the 1st Lagrangian, a clean maritime air mass was sampled in which salt particleproduction, due to increased wind speed, dominated the change in the accumulation modeconcentrations. In the 2nd Lagrangian, extensive cloud cover resulted in cloud processing ofthe aerosol in a polluted air mass, and entrainment of air from the free troposphere influencedthe overall decrease in aerosol concentrations in the marine boundary layer (MBL). Very littlechange in aerosol characteristics was measured in the 3rd Lagrangian, where the pollution inthe MBL was continually being topped up by entraining air from a residual continental bound-ary layer (CBL) above. From the analysis of all the Lagrangian experiments, it has been possibleto formulate, and present here, a generalised description of a European continental outbreakof pollution over the sub-tropical North Atlantic.
* Corresponding author address: MeteorologicalResearch Flight, Building Y46, DERA, Farnborough,Hants, GU14 0LX, UK.e-mail: [email protected]
Tellus 52B (2000), 2
291
1. Introduction tion processes and chemical budgets during theAtlantic Stratocumulus Transition Experiment(ASTEX, Huebert et al., 1996). The techniqueThe 1995 IPCC report highlights the fact that
the current estimates of the global mean radiative relies on being able to track a parcel of air overseveral hours or days. This is achieved by taggingforcing due to anthropogenic aerosol are highly
variable (−0.3 to −3.5 W m−2 ) and of a compar- the air parcel using constant level balloons
(Businger et al., 1996) which have GPS receiversable magnitude but opposite sign to the forcingdue to anthropogenic CO2 and the other green- and can transmit their positions to within a few
hundred meters. In ASTEX, the balloons’ abilityhouse gases (Charlson et al., 1991, 1992; Kiehl
and Briegleb, 1993; Penner et al., 1994). to stay at constant altitude was severely restrictedwhenever it got wet through entering cloud orConsidering the potential importance of aerosol
forcing it is remarkable how many global climate drizzle and its buoyancy decreased, often resulting
in it entering the sea. The strategy was furthermodels ignore the effects of aerosol and in thecase of the rest how poorly they parametrise their developed during the Aerosol Characterisation
Experiment (ACE-1, Bates et al., 1998) whereeffects. This is primarily due to the lack of both
globally distributed data and a clear understand- ‘‘smart’’ balloons (Businger et al., 1999) were used.Their buoyancy could be adjusted by pumping oring of the processes that link gaseous precursor
emissions, atmospheric aerosol properties and removing air from an internal bladder in order to
maintain a constant altitude. The balloons usedtheir direct and indirect radiative effects. Thus toobtain more accurate climate model predictions it during ACE-2 had the added advantage that their
buoyancy could be modified in flight by an oper-is imperative that attention be focused on quantify-
ing the processes controlling the natural and ator in the tracking aircraft (Johnson andBusinger, 2000).anthropogenic aerosol and on minimising the
uncertainties in the calculated climate forcing. The main aim of the Lagrangian experimentswas to satisfy the second objective of ACE-2 (RaesThe intensive observational phase of the North
Atlantic regional Aerosol Characterisation et al., 2000), i.e., to quantify the physical and
chemical processes controlling the evolution of theExperiment (ACE-2) (Raes et al., 2000) was under-taken in June and July 1997. One of the major major aerosol types and in particular their phys-
ical, chemical, radiative and cloud nucleatingprojects of ACE-2 was to study the evolution of
continental air masses in the marine environment properties. However, as measurements have beenmade which characterise the physical, chemical,and to understand the processes that dominate
that evolution. The only effective way of doing radiative and cloud nucleating properties of the
aerosol in the air parcel being followed, objectivethis is in a Lagrangian framework. It is extremelydifficult to interpret from a Eulerian approach 1 is also directly satisfied. In the longer term it is
hoped that the understanding about aerosol pro-how the aerosol characteristics of a parcel of air
are modified in time. Therefore it is necessary to cesses gained through the integration of the ana-lysis of the Lagrangian measurements with thefollow a parcel of air making measurements in it
continuously, or as often as possible, over an analysis from other ACE-2 projects, e.g.,
HILLCLOUD (Bower et al., 2000) andextended period. The major objective of theseLagrangian experiments was to follow outbreaks FREETROPE will indirectly, through parametris-
ation development, numerical modelling andof European continental air as they were advected
south westwards in the trade winds through the extrapolation of satellite observations, be used toassess the regional direct and indirect radiativesub-tropical North Atlantic and to investigate
using aircraft measurements how the aerosol forcing of aerosol and thus help attain objective 3.
characteristics and their effects on clouds evolvewith time. Using this approach ensures that theobserved changes are only due to chemical and 2. Scientific rationalephysical processing and not due to advection andchanging air mass. Our inability to model and predict climate
change comes about through a lack of understand-The Lagrangian approach attempted here wasfirst developed for measuring atmospheric oxida- ing of the processes governing the interactions
Tellus 52B (2000), 2

. . .292
between clouds, aerosols and atmospheric chem- 2.1. Processes in a cloud-free atmosphereistry. The ACE-2 Lagrangian experiments tried to
The aerosol concentration in a continental airimprove this position by producing a data set that
mass advecting in a cloud-free MBL will behas a diverse and complete enough set of measure-
depleted mainly by dry deposition, horizontalments whereby through a combination of data
dispersion and exchange between the MBL andinterpretation, process model simulation, and
free troposphere. During ASTEX the latter wasmodel parametrisation development the important
found to be important (Zhuang and Huebert,processes can be identified and understood.
1996). However, exchange with the free tropo-The processes that govern the number size
sphere may also be a source of aerosol in thedistribution and size dependent chemical composi-
MBL when a more highly polluted continental airtion of the aerosol in a parcel of air and hence its
mass is transported over the area in the freeradiative impact are qualitatively known. They
troposphere, e.g., a Saharan dust outbreak. Thusinclude the following.
aerosol profiles across the top of the MBL and
accurate entrainment rates must be quantified to(i) Homogeneous gas phase chemistry.close the aerosol mass and number balance of the(ii) New particle formation by multi-componentMBL (Russell et al., 1998; Van Dingenen et al.,homogeneous nucleation.1999). Presently, entrainment rates have been(iii) Condensation on aerosol.estimated only within a factor of 2 (Bretherton,(iv) Aerosol coagulation.1995; Russell et al., 1998) and so multiple redun-(v) Dry deposition of aerosol.dant measurement techniques have been used(vi) Cloud processing of aerosol, including, drop-during the Lagrangian experiments (Sollazzo et al.,let activation, in-cloud chemistry, droplet2000) to improve these estimates.coalescence, scavenging of aerosol by drop-
For aerosol species like black carbon and min-lets, droplet evaporation, and precipitation.eral dust, changes in the aerosol size distribution(vii) Meteorologyin the MBL will be indicative of entrainment, and
removal only. However, sulphate will be chemic-These processes will compete when a continentalally produced over the oceans from SO2 in theair mass is advected over the sea. The rates ofanthropogenic plume and from oceanic DMS.some of the individual processes have been investi-Homogeneous nucleation of precursors has beengated in the laboratory and parametrised in pro-observed in the MBL (Covert et al., 1992) andcess models. However, predictions of such models,does increase the number concentration. Howevereven when applied to the simple case of theits occurrence is subject to a variety of conditionsminimally polluted MBL, disagree strongly aboutsuch as pre-existing aerosol surface area, whichthe importance of individual processes (Pandisact as a sink for the precursor gases and precludeet al., 1994; Raes, 1995). Thus observations in thenucleation. Highly polluted continental plumesatmosphere are required to verify whether themay well provide enough aerosol surface area toprocesses that are presently accounted for in therestrict new nucleation. Similarly, in high windmodels are sufficient, and to develop improvedsituations, salt particle production from sea sprayaerosol parametrisations. The platforms involvedmay produce a large enough particle surface areain the Lagrangian experiments were comprehens-to be a sink for sulphur species in the MBLively instrumented (details in Section 4) to optim-(Sievering et al., 1992; Suhre et al., 1995). It hasise our ability to determine the processesbeen assumed that sea spray produces largeoperating; in particular, cloud processing, mixing(>1 mm) particles that have too short residencewith the free troposphere, and changes in thetimes to act as CCN (Charlson et al., 1987).accumulation mode and CCN characteristics (e.g.,However, recent observations have re-opened thesea spray emissions). One of the difficulties indebate about the role of sea salt particles in thestudying aerosol processes is accounting for theaerosol and cloud condensation nuclei (CCN)highly coupled nature of the aerosol, cloud andnumber concentration (O’Dowd et al., 1993;meteorological processes. It is therefore practicalMurphy et al., 1998) and the measurements madeto distinguish between processes in the cloud-free
and cloudy parts of the atmosphere. in ACE-2 have reiterated this (Johnson et al.,
Tellus 52B (2000), 2

293
2000). To obtain reliable rates for production, 1990). During ACE-1 Clarke et al. (1998) foundthat significant numbers of aerosol were beingtransformation and removal of aerosol, the mass
and number balances of the major aerosol com- formed in the free troposphere in the outflow from
convective towers. They postulated that over sev-ponents that were advected from the continent orwere produced in situ have been measured during eral days these could grow by coagulation and
condensation and eventually under subsidenceACE-2 using filter samples, and optical probes to
determine the change in aerosol size spectra over conditions be entrained into the MBL where theyhad the potential to become CCN.a wide range of sizes. Similarly, the role of coagula-
tion, condensational growth and dry deposition Cloud processing of aerosol can significantly
affect the indirect radiative forcing by aerosol.can be studied by measuring the evolution of thenumber size distribution down to the nanometre However, as cloud processing modifies the accu-
mulation mode, the resulting particles will becomerange.
more effective at directly scattering and absorbingsolar radiation in cloud-free areas of the atmo-
2.2. Processes in a cloudy atmospheresphere. Thus as most atmospheric aerosol during
their lifetime will be affected by cloud, cloudA variety of processes induced by clouds canaffect the aerosol mass and number concentration. processing of aerosol should not be neglected
when considering the evolution of aerosol spectraThe in-cloud oxidation of SO2 is a major pathway
for producing sulphate mass in the global atmo- for direct radiative forcing investigations.In cloudy MBLs, the cloud layer can becomesphere (Hegg, 1985; Langner and Rodhe, 1991;
Benkovitz et al., 1994). There are however large decoupled from the sea surface when the MBL
becomes relatively deep and the turbulent mixinguncertainties concerning the oxidation efficiencieswhich may account for a factor of 2 uncertainty caused by either cloud top radiative cooling or
wind shear is not enough to completely mix thein the estimates of the global direct forcing ofsulphate aerosols (Kiehl and Rodhe, 1995). The MBL (Nicholls and Leighton, 1986). This causes
stratification in the MBL which has implicationsLagrangian experiments and HILLCLOUD
(Bower et al., 2000) have attempted to make a on the evolution of aerosol in the various layersof the MBL as different processes can dominate.more accurate determination of this by measuring
O3 , H2O2 , cloud liquid water content and cloud Decoupling was encountered extensively during
ASTEX (Randall et al., 1996) and significantdroplet size spectrum, in combination with predic-tions from an explicit cloud microphysics model differences in chemistry were found between the
layers. However, little regard was given to the(Dore et al., 2000).
Processes such as droplet coalescence and scav- sampling strategy to differentiate between theselayers and valuable information was lost as aenging of interstitial particles by cloud droplets
affect the aerosol and CCN number budget. result (Huebert et al., 1996). In the Lagrangian
experiments in ACE-2 more attention was paid toCoalescence will reduce particle concentrations inthe MBL but increase particle sizes (Feingold better sampling of these layers with the aircraft.
In ACE-1 the experiments were biased to startinget al., 1996), thereby improving their CCN charac-
teristics. Scavenging of interstitial aerosol by cloud in cloud-free conditions. In ACE-2 many moreexperiments were carried out with extensive clouddroplets will reduce particle concentrations in the
MBL and modify the CCN supersaturation spec- cover to determine what cloud processing of aero-
sol occurs.tra. These processes, together with precipitation,play a major role in transforming the continentalair mass advecting within the MBL into a mari-
time air mass. A time-scale analysis of the relative 3. ACE-2 Lagrangian experimental strategycontribution of these and other processes to thetransformation is presented in Hoell et al. (2000). The LAGRANGIAN component of ACE-2
was split up into 2 sub-projects; a cloudyRecent measurements have shown that cloudsmay also be the source of particles through homo- air Lagrangian experiment, and a cloud-free
Lagrangian experiment. The cloudy airgeneous nucleation that is promoted by highrelative humidity (RH) near clouds (Hegg et al., Lagrangian experiments tracked air parcels in
Tellus 52B (2000), 2

. . .294
the MBL between the coast of Portugal and the Islands was selected for the cloudy-air LagrangianCanary Islands as they drifted southwest- experiments. Climatology showed that the epi-wards in the trade winds. As they can travel sodic outbreaks of anthropogenic pollutionup to 1000 km in 24 h, a long endurance, long effecting the Canary Islands usually came fromrange aircraft was required. Therefore the bulk northern Europe via the Bay of Biscay and theof the measurements were made using the W of the Spanish Peninsula or from theMeteorological Research Flight (MRF) C-130 air- Mediterranean via the Strait of Gibraltar. Area Acraft which was based in Tenerife but could reach in Fig. 1 indicates where the R/V Vodyanitskiy,40°N and still spend 3 or 4 h sampling the air the MRF C-130 and the CIRPAS Pelican operatedparcel. The Research Vessel (R/V) Vodyanitskiy, during cloudy-air Lagrangians and area B denoteswhich was also instrumented for measuring the the area off Sagres where the R/V Vodyanitskiyinitial aerosol and chemical characteristics of the and the MRF C-130 operated during the cloud-air parcel, was positioned at the head of forecast free Lagrangian experiments. These areas of themodel trajectories and then released perfluoro- North Atlantic have the potential to be affectedcarbon (PFC) tracer plumes and constant level
by 4 major aerosol types; anthropogenic aerosolsballoons into the parcel to be tracked. The MRF
from Europe and North America, mineral dustC-130 aircraft was then able to follow these parcels
from North Africa and the Sahara, and there willof air for up to 36 h by making ‘‘back to back’’
always be a background of sea salt in the lowestflights out to the vicinity of the smart balloons,
layers of the atmosphere produced mechanicallyfollowed on occasion by the CIRPAS Pelican
by the breaking of surface waves, and dimethylaircraft when the air parcels got close enough to
sulphide (DMS) generated particles throughoutthe Canary Islands. Measurements were made ofthe marine troposphere. The latter 2 will dominatethe aerosol physical and chemical characteristicsin clean maritime air masses that have spent athroughout the whole depth of the MBL and themajority of their lifetime over the central Northlower free troposphere during this period andAtlantic. ASTEX, which was conducted in thethe evolution of the MBL structure and cloudarea SE of the Azores in 1992 (Albrecht et alcharacteristics were closely monitored.1995), offered an invaluable data base on MBLThe cloud-free Lagrangian experiments tookdynamics (Bretherton et al., 1995), cloud dynamicsplace at the SW tip of Portugal to take advantage(Martin et al., 1995) and vertical stratification ofof the persistent cloud-free conditions that prevailthe aerosol (Clarke et al., 1996) which was usedthere in the summer. The main aim was to studyfor the planning of ACE-2 Lagrangian operations.how the aerosol characteristics of a parcel of air
changed immediately after it left the continent andpassed over the sea. This was done by instru-
3.2. Participants in ACE-2 L agrangianmenting a ground based site at Sagres and posi-tioning the Research Vessel Vodyanitskiy 200 km The LAGRANGIAN community consists ofdownwind to intercept a parcel of air that had groups from the UK, Sweden, Germany, Italy andbeen previously characterised by Sagres to see Canada who received support from the Europeanhow its aerosol had evolved. When available, the Union. Some participants received considerableMRF C-130 aircraft flew straight and level runs additional support from national sources andat different heights between the land station and there were several American groups who collabor-the ship to further sample how the aerosol charac- ated with the European Institutes throughout theteristics evolved and to see how the thermodyn- planning and execution of the experiment. Table 1amic and dynamic structure of the atmosphere gives a list of the contributors to ACE-2varied in the vertical. This also allowed the aircraft LAGRANGIAN.to estimate how much of the continental pollutionwas trapped in the MBL and what was transportedin the free troposphere. 4. Lagrangian measurements
3.1. ACE-2 L agrangian operational areaThe main aim of this paper is to give a broad
overview of the Lagrangian experiments and toThe area of the Atlantic from SW Portugal,along the African coast to the SW of the Canary compare and contrast the results from each. For
Tellus 52B (2000), 2

295
Fig. 1. Map of the area used for the ACE-2 Lagrangian experiments. Area A (surrounded by solid lines) indicatesthe location where the MRF C-130, R/V Vodyanitskiy and the CIRPAS Pelican made measurements during thecloudy air Lagrangian experiments and box B (dotted lines) around Sagres where the MRF C-130 and ship particip-ated in the cloud-free Lagrangian experiments.
specific details about individual Lagrangian counterflow virtual impactor (CVI), (Noone et al.,1988) for collecting and analysing cloud dropexperiments the reader should refer to other papers
in this issue. First, however, details are given of residuals was installed on the C-130. The instru-ment payload included the CVI probe, a PMSthe items common to all the experiments such as
the platforms used and the measurements made. PCASP-100 optical particle counter (OPC), a TSI
3010 condensation nuclei (CN) counter, and abank of computer-controlled filter samplers. It has
4.1. C-130 measurementsa 5 l/min sample rate and a lower cut off size of
3 mm, i.e., it collects water droplets and discardsThe instruments onboard the MRF C-130 weredesigned and operated by several international interstitial aerosol. The droplets are then evapor-
ated and the water vapour and residual particlesorganisations, including MRF, University of
Stockholm, Max Planck Institute, University of collected for sizing and counting and post flightchemical analysis. During ACE-2, 85 paired filterEast Anglia, University of Sunderland, KFA,
NOAA, University of Hawaii, University of York samples were collected of aerosol particles for
chemical analysis and these have been analysed(Canada) and Brookhaven National Laboratory.They are summarised in Table 2. Information for major aerosol ionic species using ion
chromatography.about the resolution and accuracy of the MRF
instrumentation has been detailed in previous 4.1.2. VACC/SMPS system (CMAS). An instru-ment to provide size distributions betweenpublications, notably Rogers et al. (1995) and
Martin et al. (1997). New instrumentation from 10–2000 nm diameter and physico-chemical
information on aerosols in the size range betweenother European Institutes had to be fitted to theMRF C-130 to enable improved characterisation 100 and 2000 nm (a VACC/SMPS system) was
installed on the C-130. The fine mode size distribu-of the physical and chemical properties of the
aerosol and pre-cursor gases. These are summar- tion was measured using a scanning/differentialmobility particle sizer (S/DMPS) which had aised below and their operating capabilities
discussed. sampling rate as high as one spectrum every 90 sand a typical size resolution of 32 channels per4.1.1. Counterflow virtual impactor (MISU). A
Tellus 52B (2000), 2

. . .296
Table 1. L ist of main ACE-2 L AGRANGIAN participants and their contributions
Research institute Main scientists Major contribution to ACE-2 LAGRANGIAN
Meteorological Research Doug Johnson Co-ordination of project, aircraft scientists onboardFlight, Meteorological Office, Simon Osborne the C-130, measurement and analysis of cloudUK Rob Wood microphysics, aerosol physics and chemistry,
Paul Field turbulence and met. parameters
Centre for Marine and Mike Smith Measurements and analysis of aerosol volatility andAtmospheric Science (CMAS), Colin O’Dowd aerosol physics onboard the MRF C-130University of Sunderland, UK
MISU, Stockholm University, Kevin Noone Measurements and analysis of cloud particleSweden Paul Glantz residuals, nephelometer and soot absorption
Elisabeth Ostrom onboard the C-130
Max Planck Institute (MPI), Meinrat O. Andreae Measurements and analysis of SO2 and DMS onMainz, Germany Wolfgang Elbert board the C-130 and analysis of filter samples
Reinhart Gabriel collected on the C-130Spyros RapsomanikisSuzanne Hassoun
IFT, Leipzig, Germany and A. Wiedensohler Measurements and analysis of aerosol physicsR/V Vodyanitskiy, NOAA D. S. Covert and chemistry at Sagres site and on board thePMEL, University of P. Quinn R/V VodyanitskiyWashington T. Bates
C. NeusubS. PhilippinB. BuschD. WeiseS. HenningF. Stratmann
University of East Anglia Brian Bandy Measurement and analysis of organic and inorganic(UEA), UK Stuart Penkett H2O2 on board the C-130
Joint Research Centre, Italy Katrin Nodop Release of PFC and smart balloons from the shipUniversity of Hawaii Steve Businger and analysis of balloon positionsNOAA Randy Johnson
KFA, Germany Andi Voltz-Thomas Measurement and analysis of CO and JNO2Christoph Gerbig measurements onboard the C-130
York University, Canada J. Rudolph, B. Keiser, Hydrocarbon analysis of bottle samples collected onB. Fu, and S. Fong the C-130
Princeton University Lynn Russell Entrainment rate calculations for the C-130Michael Sollazzo
size decade. A PMS ASASP-X OPC was deployed sampling probes (Andreae et al., 1988; Talbotet al., 1990) were fitted to the MRF C-130. Theseinside the aircraft with this system for the accumu-
lation mode particle sizing. Furthermore, the probes were used extensively during ACE-2 for
filter sampling using specially designed filter packs.chemical composition of these particles wasinferred using a novel high temperature, fast- 2 sorts of samples were collected; one for the
determination of water soluble components,response aerosol volatility analyser in conjunction
with an aerosol OPC (Jennings and O’Dowd, including SO2 , and the other for organic carbon.An inertial separator was used to remove large1990).
4.1.3. Aerosol sample inlets and mass spectro- cloud droplets and drizzle from the air stream.Both probes operated at sample flow rates ofmeter (MPI). Two aerosol and SO2 isokinetic
Tellus 52B (2000), 2

297
Table 2. A summary of the instrumentation installed on the MRF C-130 aircraft and the principal investig-ators involved with each measurement
Group Parameter Method Comments
MRF temperature Rosemount 102BL platinum resistanceMRF in cloud temperture CO2 absorption band MRF developed
thermometerMRF dew point General Eastern 1011B thermo-electric hygrometerMRF total water content Lyman – a absorption MRF developed
hygrometerMRF wind speed and direction Pitot static system, INU, full corrections made for
gust probes and GPS INU driftMRF vertical velocity Pitot static system, INU
and gust probesMRF lat. and long. GPS recieverMRF altitude radar altimeter, static radar alt below 1525 m
pressure systemMRF cloud conditons foward and downward
facing video camerasMRF liquid water content Johnson–Williams probeMRF accumulation mode PMS passive cavity aerosol 0.1 to 3.0 mm diameter
aerosol spectra spectrometer probe (PCASP)MRF cloud droplet spectra PMS forward scattering 2 to 45 mm diameter
spectrometer probe (FSSP)MRF drizzle spectra PMS 2D-cloud probe 25 to 800 mm diameterMRF total CN concentrations TSI 3025 CN>3 nmMRF CCN superstauration thermal gradient diffusion MRF developed
spectra chamberMRF ozone TECO 49 UV photometricMRF soot absorption radiance research particle
soot absorption photometerMRF aerosol scattering TSI 3563 nephelometer 3 wavelength (450, 550, 700 nm)MRF broadband solar radiation Eppley pyranometer — 0.3 to 3.0 mm
clear domeMRF broadband solar radiation Eppley pyranometer — 0.7 to 3.0 mm
red domeMRF radiometric surface temp. Heimann KT 19.82MISU cloud droplet residuals CVI inlet connected to filters, collects droplets >3 mm
PCASP and TSI 3010CMAS aerosol size segragated volatility technique. Heated
chemistry chamber connected toan ASASP-X
CMAS fine aerosol size SMPS 100 to 2000 nmspectra
MPI aerosol size segregated filter sampling; ionchemistry chromatography and
organic carbon analysisMPI SO2 filter samplesMPI high frequency DMS mass spectrometerMPI high frequency SO2 mass spectrometerUEA organic and inorganic fluorimetric 2 channel wet chemistry,
peroxide total peroxides and organicperoxides
University NMHC bottle samplesof York
KFA CO resonance fluorescence continuous fast responseKFA JNO2 UV photometer NO2 photolysis rateBNL PFC tracer detection dual trap analyser GC requires release of PFC
tracer for plume detectionUniversity ‘‘Smart’’ balloon receiver for balloon two-way communication
of Hawaii location transmissions between balloon andaircraft

. . .298
120 l min−1. The filter pack units consisted of 3 of the organic content was determined in the firstcoil and organic peroxides were subsequentlysequential filters (90 mm diameter) on PFA sup-
ports. The aerosol was collected on the 1st 2 filter measured again in the second coil. In this way the
hydrogen and organic peroxide concentration instages (an 8.0 mm Nuclepore filter followed by aPTFE Teflon filter) which separated them into the atmosphere could be determined. The instru-
ment has a 1 Hz sampling frequency and a flowcoarse (>1.7 mm diameter) and fine particles. The
3rd stage was a K2CO3 impregnated filter for rate of 1.5 l min−1. The detection limit was40±20 pptv for hydrogen peroxide and ap-collecting SO2 . Chemical analysis of the filters
exposed during ACE-2 was performed using ion proximately 100±50 pptv for the organic
measurements.chromatography and some were selected for singleparticle analysis using a scanning electron 4.1.5. NMHC analysis (MRF and York
University). During ACE-2, 76 bottle samplesmicroscope.
A system for fast response (20 Hz), high reso- (Rudolph et al., 1998) for analysis of non-methanehydrocarbons (NMHC) were collected on thelution DMS and SO2 measurements was
developed to enhance the aerosol pre-cursor gas C-130 aircraft. About 100 NMHCs were deter-
mined in each of the air samples which weremeasurements. An atmospheric pressure chemicalionization mass spectrometer (APCI-MS) was collected in stainless steel canisters (internally
electropolished by the SUMMA process) that wereused for this purpose. To reduce losses in SO2 an
inlet was modified to be made of PFA and in line cleaned, evacuated and filled with purified heliumto slightly above ambient pressure. During sam-Nafion driers were installed. As only one mass
spectrometer was used it was not possible to pling they were flushed with ambient air and then
pressurised to exclude the possibility of contam-measure DMS and SO2 simultaneously but theoperation of the instrument could be altered in ination with outside air during storage. The air
samples were analysed on 2 gas chromatographs,flight.4.1.4. Organic and inorganic peroxides (UEA). each equipped with a flame ionization detector.
Many of the NMHCs were present at mixingThe peroxide analyser (Penkett et al., 1995) which
had previously been used on the C-130 was ratios close to the lower limit of detection (about0.3–1 ppt). The measurements were evaluatedup-dated specifically to operate as a twin channel
instrument to enable the determination of both quantitatively by comparison with a calibration
gas of known composition. The hydrocarbon con-hydrogen and organic peroxide concentrations.Peroxides are stripped from the air by passage centrations in the calibration gas were accurate
within 5%.through a stripping coil and subsequent measure-
ment by fluorimetry. The measurement is based 4.1.6. C-130 L agrangian flights. Table 3 sum-marises the flights the C-130 undertook duringon the enzyme catalysed reaction between perox-
ides and para-hydroxy phenol acetic acid. The ACE-2. In all 9 flights were carried out as part of
3 separate cloudy air Lagrangian experiments andreaction produces water and a dimeric product,6,6-dihydroxy-3,3-biphenyldiacetic acid which a single flight was undertaken for the cloud-free
Lagrangian experiments.flouresces at a peak excitation wavelength of
320 nm and a peak emission wavelength of400 nm. Peroxidase enzyme catalyses the reaction
4.2. R/V Vodyanitskiy measurementsof both inorganic and organic peroxides to form
the flourescent dimer and so can be used to The R/V Vodyanitskiy took part in allLagrangian experiments. Its primary aim was todetermine the total peroxide concentration in the
sample. Hydrogen peroxide vapour has a collec- identify and characterise the air parcel to be
studied and then release constant level balloonstion efficiency of 99.99% in the 10 turn strippingcoil whilst organic peroxides have lower stripping and PFC tracer into it so that the aircraft could
follow it. The PFC tracer was released over a 2-hefficiencies. This difference in solubility allows the
determination of inorganic and organic peroxides period while the balloons were being filled andreleased.by using a second stripping coil which collected a
percentage of the remaining organic peroxides. Table 4 details the instrumentation aboard theR/V Vodyanitskiy. Aerosol particles were sampledThus all the hydrogen peroxide and a proportion
Tellus 52B (2000), 2

299
Table 3. A list of the flights undertaken by the MRF C-130 aircraft during ACE-2
Flight no. Date Flying hours Description
A546 15/6/97 4:30 Shake down flightA547 18/6/97 7:25 Aerosol/Stratocumulus interactionA548 22/6/97 7:40 Island Wake effect, Pelican intercomparisonA549 25/6/97 9:10 CLOUD FREE LAGRANGIANA550 26/6/97 5:35 CLOUDYCOLUMNA551 3–4/7/97 9:20 FULL LAGRANGIANA552 4/7/97 9:20 FULL LAGRANGIANA553 4–5/7/97 7:25 FULL LAGRANGIANA554 11/7/97 6:30 Ship intercomparison, Aerosol/Sc interactionA555 14/7/97 4:35 Instrument test flight. Pelican intercomparison,
Hidalgo intercomparisonA556 15/7/97 0:00 Ground intercomparison with PelicanA557 16/7/97 4:20 CLOUDYCOLUMNA558 16–17/7/97 9:25 FULL LAGRANGIANA559 17/7/97 8:55 FULL LAGRANGIANA560 17–18/7/97 9:20 FULL LAGRANGIANA561 18/7/97 4:05 Aerosol/Sc interactionA562 19/7/97 5:00 CLOUDYCOLUMNA563 20/7/97 10:00 CLEARCOLUMN over SagresA564 21/7/97 9:55 CLEARCOLUMN over SagresA565 22/7/97 9:05 CLEARCOLUMN over shipA566 23/7/97 9:15 FULL LAGRANGIANA567 23–24/7/97 9:30 FULL LAGRANGIANA568 24/7/97 9:10 FULL LAGRANGIAN
Total hours 169:30
at 10 m above sea level through a heated mast. meter. The sample air flow was maintained atapproximately 55% RH to match the samplingThe mast was capped with a rotating cone-shaped
5 cm diameter inlet that pointed into the wind RH of the impactors and nephelometer.The DMPS mobility distributions were invertedand air was sampled at 1 m3 min−1. The lower
1.5 m of the mast was heated to dry the aerosol to number distributions using the inversion rou-
tine of Stratman and Wiedensohler (1997) andto a RH of 55%. The aerosol was then sized every10 min using a UDMPS (ultrafine differential were corrected for diffusional losses (Covert et al.,
1997) and size dependent counting efficienciesmobility particle sizer), an APS (aerodynamic par-
ticle sizer), a DMPS (differential mobility particle (Wiedensohler et al., 1997) based on pre-ACE-2calibration experiments. The inverted 10 min datasizer) and TSI 3010 and TSI 3025 CN counters.
The UDMPS was a Vienna short column instru- were averaged into 30-min periods. The APS data
were converted from aerodynamic diameters toment connected to a TSI 3025 CN counter operat-ing with a negative particle charge. Data were geometric diameters by dividing by the square
root of the particle density. The densities werecollected in 9 size bins. It operated with an aerosol
flow rate of 1.5 l min−1 and a sheath air flow rate calculated using the analysed chemical massduring ACE-2 and the chemical equilibrium modelof 10 l min−1 for the first 10 days and then at
20 l min−1 for the rest of the period. The DMPS AeRho (Quinn and Coffman, 1998). Further
details of the instrumentation on the ship can bewas a TSI long column instrument connected toa TSI 3010 CN counter operating with a positive found in Quinn et al. (2000) and Bates et al. (2000).particle charge. Data were collected in 17 size bins
and it was operated with a flow rate of 1 l min−14.3. Pelican measurements
and a sheath air flow rate of 5 l min−1. The APS
was a TSI 3310A. Data were collected at 1 l min−1 The Pelican aircraft is a modified CessnaSkymaster operated by the Center forin size bins from 0.8 to 5.0 mm aerodynamic dia-
Tellus 52B (2000), 2

. . .300
Table 4. A summary of the instrumentation installed on the R/V Vodyanitskiy aircraft and the principalinvestigators involved with each measurement
Group Parameter Method Comments
PMEL Surface SW DMS Purge and Trap. GC/SCD(Tim Bates) Surface SW chlorophyl — continuous Flourometer excitation: 340–500 nm
emission: 680 nmSurface SW chlorophyl — discrete Fluorometer excitation: 340–500 nmAtm. DMS GC/SCDAtm. SO2 Pulsed fluorescence Det limit=50 pptvParticle concentration for D>5 nm UCPCParticle concentration for D>15 nm CPCParticle number size distribution
5–30 nm UDMPS20–570 nm DMPS850–5000 nm APS
CSIRO CCN (at 0.5% supersaturation)(John Gras)
PMEL Aerosol size segregated chemistry Impactors(Trish Quinn) Major ions IC
Organic and elemental carbon Thermal analysisTotal mass GravimetryRefractive index and density Model calculations Assume equilibriumAerosol scattering coefficient Nephelometer 450, 550, 700 nm
D<1 mm and D<10 mmAerosol backscattering coefficient Nephelometer 450, 550, 700 nm
D<1 mm and D<10 mmAerosol absorption coefficient PSAP 550 nm
MIM Vertical backscatter profiles Lidar 355, 532, 1064 nm(Matthias Wiegner) Cloud height 150 m to 5 km altitude
Aerosol layer borders for aerosol150 m to 12 km for cloudsMeas. more frequent
during intensive periods
NASA Aerosol optical depth 6-channel sun tracking 380, 453, 864, 1021 nm(Phil Russell ) Column integrated ozone and H2O photometer
SIO/UCSD Water leaving radiance Radiometer 443, 490, 560, 670, 865 nm(Robert Frouin) Aerosol optical depth
Surface SW Chlor, Phaeo Conc.
MPI Surface SW COS, CS2 , DMS, CH3SH(S. Rapsomonikis) Surface SW absorbance Filtered and unfiltered
samples, 200–900 nmSurface SW fluorescence Filtered and unfiltered
ex: 230, 254, 270, 280,308, 323, 340, 347, 355,370
Surface SW pHCTD profiles
IBSS Surface SW temp. and salinity Towed CTD Katran-4(Victor Egorov) Surface SW artificial radionuclides Filtration/sorption Suspended and dissolved
(137Cs, 90Sr, 239,240Po, 241Am) device CUNOand natural radionuclides radiochemical(40K, 210Pb, 226Ra) pre-processing
Backscattering layer Echo-sounder SIMRAD EK-500,38 and 120 kHz
Surface SW PCBs, particulate anddissolved Hg

301
Table 4 (cont’d)
Group Parameter Method Comments
NOAA Smart balloon releases(R. Johnson)
JRC (Fachinetti) Tracer releases
PMEL Atmospheric T, RH, P(Jim Johnson) True and relative wind spd and dir
Surface SW temp. and salinity TSGPrecipitation rate Optical rain gaugeAtm. ozoneAtm. Rn222Total light intensity EppleyVertical T, RH, P, wind spd and dir RadiosondesShip’s speed, heading, and positionPitch and roll statistics
GSF (Busch) Aerosol growth factor HTDMA 50, 100, 150, 250 nmdry to 55%, dry to 90%
Interdisciplinary Remotely Piloted Aircraft However, subtle changes in the position of the
axis of the ridge, which was either to the W ofStudies (CIRPAS) (Bluth et al., 1996). It particip-ated in 2 of the cloudy air Lagrangian experiments Ireland (as in the 1st Lagrangian) or over
N Europe and the British Isles (as in the 2nd andwhen the trajectories bought the air parcel beingfollowed near Tenerife. Its main aim was to charac- 3rd Lagrangian), caused significant changes to the
origin of the air parcel. More details of the synop-terise the aerosol and measure the turbulent fluxes
in the MBL and lower free troposphere. A com- tic conditions can be found in Verver et al (2000).Figs. 2–4 indicate where the air originated in theplete description of the instrumentation on board
the Pelican is given in Russell and Heintzenberg 1st, 2nd and 3rd Lagrangian, respectively. They
show 4 day trajectories of air that ends up at the(2000).top of the MBL as the constant level balloonpasses underneath that point. This air has the
potential of being entrained into the MBL and5. Comparison of the 3 cloudy air Lagrangianexperiments modify the characteristics of the air parcel that is
being followed. The 3D back trajectories were
calculated from NCEP analyses (Draxler and3 cloudy air Lagrangian experiments wereundertaken during ACE-2. The 1st between 3 and Hess, 1997 – HYSPLIT4 program). The top sec-
tion of each diagram shows the plan view of the5 July 1997, the 2nd between 16 and 18 July 1997
and the 3rd between 23 and 24 July 1997. All were trajectories and the bottom section the altitudeabove ground of each trajectory. Also shown areremarkably different in character. Details of the
measurements and initial interpretation of the the true trajectory of the balloons and a model
trajectory calculated for the altitude of the balloon.results are given for (a) 1st Lagrangian in Johnsonet al. (2000), (b) 2nd Lagrangian in Osborne et al. All the trajectories in the 1st Lagrangian origin-
ated from the centre of the North Atlantic and(2000), and (c) 3rd Lagrangian in Wood et al.
(2000). Here an overview and comparison of the did not pass over land in the previous 5 days; soit would be expected that the air would be rela-experiments are given.tively clean and maritime in origin. They also
indicate that there was significant subsidence5.1. Air mass trajectories
occurring in the free troposphere as all the traject-
ories came from higher up in the troposphere. TheIn all the cloudy air Lagrangians an anticyclonewas situated to the W or N of the Azores. average subsidence rate calculated from these is
Tellus 52B (2000), 2

. . .302
Fig. 2. Back trajectories calculated from the ECMWF model analysed fields of air that ends up at the top of theboundary layer as the air parcel being followed by the constant level balloon passes underneath during Lagrangian1. The top diagram shows a plan view of the trajectories, the bottom diagram a side view.
0.45 cm s−1. In the 2nd Lagrangian the start points northern France and the Low Countries. This
differed from the 2nd Lagrangian in that the airfor the trajectories are well scattered but they allwere influenced by land. Most of the air appears mass spent a lot of time over the Bay of Biscay
before it reached the measurement area. Therefore,to have originated near the surface over the Iberian
peninsula and southern France, so the air parcel the pollution would be a day or two older thanin the 2nd Lagrangian. As in the 1st Lagrangianwas influenced by anthropogenic pollution. The
most polluted of the experiments was the 3rd the trajectories indicate that there was significantsubsidence in the troposphere of about 0.7 cm s−1.Lagrangian. Here the trajectories originated over
Tellus 52B (2000), 2

303
Fig. 3. Same as Fig. 6 for Lagrangian 2.
Fig. 5 shows the aircraft flight tracks superim- various layers within the MBL and lower freetroposphere were well sampled. In the 1st 2posed on the balloon tracks for each cloudy
Lagrangian. In each experiment the C-130 flew 3 Lagrangians the CIRPAS Pelican carried out an
additional flight near Tenerife. In both cases theflights of 9 h each separated by 3 h. In the vicinityof the balloons, profiles were flown along with balloons had failed by this time and the area to
fly in was chosen based on extrapolated windsbox patterns at various altitudes in the MBL and
the lower free troposphere which drifted with the and forecast model trajectories. The flight patternswere used not only to characterise the MBLwind 5 to 10 km behind the position of the bal-
loons. The height of the box patterns were selected aerosol and chemistry but also to estimate theexchange rate of aerosol particles and gaseoususing information from the profiles so that the
Tellus 52B (2000), 2

. . .304
Fig. 4. Same as Fig. 6 for Lagrangian 3.
species within the MBL and with the lower free diluted with entrainment of air from the free
troposphere.troposphere. The box patterns were chosen so thata divergence technique, based on spatially integ-rated horizontal winds, could be compared with
5.2. Boundary layer and aerosol evolutionan eddy correlation approach where vertical stacksof straight and level runs were used to calculate The diversity of conditions found in the 3
experiments is depicted in the schematic diagramsvertical fluxes. Details of these calculations can be
found in Sollazzo et al. (2000). The flight patterns of the evolution of the MBL structure and generalaerosol characteristics for the 1st, 2nd, and 3rdwere also designed to map out the PFC plume
released from the ship so that a mass balance of Lagrangian in Fig. 6. Also Fig. 7 shows how theaccumulation mode aerosol concentrations variedPFC could be attempted to see how fast it was
Tellus 52B (2000), 2

305
Fig. 5. Flight tracks of the C-130 for all the flights carried out in the cloudy Lagrangian experiments. The constantlevel balloon trajectory is indicated by the dotted line. The 1st Lagrangian are the blue lines, the 2nd Lagrangianthe green lines and the 3rd Lagrangian the red lines.
in the profiles in each experiment; note the change air mass. This was accompanied by significant
changes in the MBL structure.in scale of the x axis in Fig. 7a compared to
Fig. 7b,c required to accommodate the change Initially the MBL was made up of 2 layers; a
surface mixed layer (SML) and a cloud layer.from a maritime to continental air mass. The
typical aerosol size spectra found in each of the Table 6 summarises the depths of the layers found.
The clouds were mainly well scattered cumulusexperiments is shown in Fig. 8. Table 5 compares
and contrasts the aerosol and meteorological con- which had their base at the top of the moist SML.
At times the cumulus extended up to the subsid-ditions encountered in each cloudy Lagrangian
experiment. ence inversion and flattened out into broken stra-
tocumulus layers. However, the surface wind speed5.2.1. 1st L agrangian. Even though the 1st
Lagrangian experiment sampled a clean maritime increased from 7 m s−1 to 16 m s−1. This, com-
bined with increased surface fluxes due to the airair mass some surprising evolution of the aerosol
characteristics was observed. The MBL started passing over a warmer sea surface temperature,
deepened the SML from 500 m to over 900 m. Atvery clean but the accumulation mode concentra-
tions increased 4-fold from 50 to 200 cm−3 (see the same time subsidence in the free troposphere
decreased the MBL depth from 1500 m to 900 m.Fig. 7a) in 24 h so that the MBL ended with
relatively high concentrations of CCN for a clean Therefore by the end of the experiment a well-
Tellus 52B (2000), 2

. . .306
Fig. 6. Schematic diagrams of the evolution of the boundary layer and cloud structure during (a) Lagrangian 1,(b) Lagrangian 2, and (c) Lagrangian 3.
Tellus 52B (2000), 2

307
Fig. 7. A comparison of accumulation mode aerosol concentrations measured using a PCASP (0.1–3 mm diameter)by the MRF C-130 during profiles close to the constant level balloons in (a) the 1st Lagrangian (6 profiles), (b) the2nd Lagrangian (9 profiles), and (c) the 3rd Lagrangian (9 profiles).

. . .308
Table 6. A summary of the boundary layer heightsduring the 1st L agrangian experiment as measuredin the profiles of the MRF C-130 close to the con-stant level balloons
SurfaceBoundary mixed
layer layerTime height height
Date (GMT) Profile (m) (m)
4 July 1997 00:17 P2 1570 3404 July 1997 02:55 P4 1540 4804 July 1997 11:40 P2 1330 6704 July 1997 16:28 P4 1310 8404 July 1997 22:26 P2 1130 9105 July 1997 02:14 P3 880 880
mixed MBL was observed. The total CN concen-trations had the reverse tendency to the accumula-
tion mode concentrations. They decreased fromFig. 8. A comparison of typical aerosol size spectrameasured during the 1st, 2nd, and 3rd Lagrangian experi- 960 to 800 cm−3 in the SML and were half thesements by the ship and aircraft in the MBL. values in the cloud layer.
Most of the number concentration increase inthe accumulation mode was in the 0.1 to 0.4 mm
diameter sizes. The reason for this is thought to
Table 5. A comparison of the conditions found in the 1st, 2nd, and 3rd L agrangian experiments
Lagragian 1 Lagragian 2 Lagragian 3
Air mass type Clean, Maritime Polluted from Spanish Polluted frompeninsula Northern Europe
Cloud conditions Very scattered CU 8/8 SC cover with some Scattered CU and SCspreading out into SC CU underneath
Total CN 1000 cm−3 decreasing to 800 cm−3 2000 cm−3 to 5000 cm−3 1800 cm−3decreasing to 1500 cm−3
Accumulation mode 50 cm−3 increasing to 200 cm−3 600 cm−3 to 1800 cm−3 1000 cm−3aerosol decreasing to 600 cm−3
Cloud droplet 60 cm−3 increasing to 110 cm−3 160 cm−3 to 320 cm−3 300 cm−3concentration decreasing to 170 cm−3
increasing to 230 cm−3Drizzle no yes noWind speed 7 m s−1 to 16 m s−1 11 m s−1 to 7 m s−1 10 m s−1 to 8 m s−1
to 11 m s−1Wind direction 330° to 030° 015° 340° to 020°Sea surface temp. 292 to 295 K 293 to 295 K 293 to 295 KElevated pollution layers no yes yesSO2 15 to 30 ppt 800 decreasing to 20 ppt 15 to 30 ppt MBL
60 to 100 ppt Pol. lay.Ozone 30 to 40 ppb 35 to 45 ppb MBL 50 to 60 ppb MBL
55 to 70 above MBL 70 to 80 ppb Pol. lay.H2O2 0.4 ppb 0.5 increasing to 1.0 ppb 0.5 ppb
Tellus 52B (2000), 2

309
be salt particle production due to the increased capped by stratocumulus cloud of variable thick-ness in which drizzle size droplets were forming.wind speeds (Hoell et al., 2000). The lower free
troposphere was relatively clean so entrainment However, it is thought that the drizzle was only
reaching the surface during the first flight whenacross the subsidence inversion is unlikely toaccount for the extra aerosol mass in the MBL. the cloud base was very low.
The MBL height increased rapidly during theSome of the sulphate mass increase observed may
be due to growth by direct condensation and some start of the experiment from 500 m to over 1000 mand the rapid entrainment of free tropospheric airaqueous phase chemistry in the scattered clouds.
The decrease in total CN concentration may be into the MBL resulted in a measurable change to
the aerosol and cloud microphysics. The airdue to in cloud scavenging of interstitial aerosolwhich will enhance the number of small accumula- entrained initially was also polluted, as extensive
pollution layers were present above the MBL. Thetion mode particles if they grow into the size range
of the PCASP. At the beginning of the experiment deepening of the MBL caused the cloud layer tobecome decoupled from the sea surface where awhere scavenging could be occurring the total CN
concentrations are decreased in the cloud layer SML formed. Cumuli then formed at the top of
the SML and some of these penetrated the basecompared with the SML. Also at the end of theexperiment the MBL was well mixed throughout of the stratocumulus. The heights of the pollution
layer and MBL are detailed in Table 7.its depth and much of the aerosol would have
been passing through cloud. When this happened Cloud processing of the aerosol was apparent.A distinct bimodal aerosol size distribution wasit was found that the total CN started to decrease
throughout the depth of the MBL. The total CN observed (Fig. 8) in the MBL and the accumu-
lation mode diameter showed small but measur-values may also be decreasing due to coagulationbut this seems unlikely as the time scales and the able increases in size during the experiment.
Furthermore, SO2 concentrations, at 800 ppt, werenumber of particles present are too small (Hoellet al., 2000). relatively high at the start but decreased signifi-
cantly to 40 ppt after 24 h. The sulphate fractionDue to the large change in CCN characteristics
in the MBL the cloud microphysics also changed of the total mass of soluble aerosol in the accumu-lation mode also increased over the correspondingsignificantly, with over a doubling of the cloud
droplet concentration from 50 to 120 cm−3 and a period. Overall during the experiment there was
a decrease in total CN in the MBL fromdecrease in the droplet effective radius.5.2.2. 2nd L agrangian. The 2nd Lagrangian was 5000 cm−3 to 1600 cm−3; most of which occurred
in the Aitken mode size ranges. There is stronggreatly different from the 1st and has provided an
excellent opportunity for comparing and con- evidence to suggest that these observations can beexplained by cloud processing of the aerosol, bothtrasting the processes occurring in clean air masses
and polluted ones in a marine environment. In through aqueous phase chemistry and droplet
coalescence, and dilution of the MBL with thethis case the MBL was polluted and continually
Table 7. A summary of the boundary layer and pollution layer heights during the 2nd L agrangian experi-ment as measured in the profiles of the MRF C-130 close to the constant level balloons
Time Maximum height of Boundary layer Surface mixed layerDate (GMT) Profile pollution layer (m) height (m) height (m)
16 July 1997 23:53 P2 2000 500 50017 July 1997 01:52 P3 800 40017 July 1997 03:20 P4 2000 600 60017 July 1997 10:53 P2 1200 1200 40017 July 1997 14:40 P3 1200 1200 40017 July 1997 16:06 P4 1200 1200 40017 July 1997 22:29 P1 1800 100018 July 1997 02:09 P2 1800 100018 July 1997 04:34 P5 1200 1200
Tellus 52B (2000), 2

. . .310
Table 8. A summary of the boundary layer and pol-free troposphere (Hoell et al., 2000; Dore et al.,2000). However, salt particle production, due to lution layer heights during the 3rd L agrangian
experiment as measured in the profiles of the MRFhigh surface wind speeds (10 to 11 m s−1), in cloud
scavenging of aerosol and vertical redistribution C-130 close to the constantby drizzle may all be processes that are having
Height of Boundarysignificant secondary roles.subsidence layer
The effect of the aerosol on the cloud microphys-Time inversion height
ics in this experiment was complex. During the Date (GMT) Profile (m) (m)initial rapid entrainment event, the cloud droplet
concentrations, for a short period of time, 23 July 1997 11:33 P2 2100 42023 July 1997 15:46 P3 2150 540increased sharply responding to the increased24 July 1997 02:19 P3 1910 795accumulation mode aerosol concentrations.24 July 1997 04:49 P4 1600 950However, towards the end of the experiment the24 July 1997 10:02 P2 1520 960
accumulation mode concentrations slowly24 July 1997 13:40 P3 1310 960
decreased but the fraction activated into cloud
droplets rose. Although the cloud was relativelythick throughout, coalescence of cloud droplets the recent past. The shape of the spectra and the
total number concentration (between 1800 andwas suppressed as the high CCN concentrations
kept cloud droplet sizes relatively small. As a 2000 cm−3 with 1000 cm−3>0.1 mm diameter)varied very little with height or time in the MIBLresult drizzle had little or no effect in washing out
the pollution from the MBL. We consider that and most of the soluble part of the fine mode
aerosol appeared to be ammonium sulphate. Thethis can be generalised to most pollution outbreaksin the subtropics and that high aerosol concentra- aerosol was fairly aged and SO2 concentrations
were very low indicating that most of the gas totions will almost completely suppress drizzlereaching the surface and will therefore extend the particle conversion had taken place prior to the
measurements.lifetime of high aerosol concentrations in the MBL.
5.2.3. 3rd L agrangian. During the 3rd The aerosol spectra within the MBL hadattained a ‘‘pseudo steady state’’ where either theLagrangian a complex, time varying MBL was
encountered. A deep, continental, pollution layer, sources and sinks of aerosol were in a fine balance
or the aerosol losses were extremely small and noover 2000 m deep and capped by a subsidenceinversion, was observed in which a marine internal processing of the aerosol was going on at all. The
MIBL was turbulent in nature and it wasboundary layer (MIBL) grew. As there was signi-
ficant subsidence in the free troposphere, the top entraining air into it from a relatively quiescentlayer above. But as this air was also polluted,of the pollution decreased in height to 1200 m
while the MIBL rapidly grew from 500 m to because it was the residual of the continental
boundary layer (CBL) that remained above the1000 m. Small cumuli grew within the MIBL andtheir vertical extent increased as the MIBL deep- MIBL, it had no dilution effect on the aerosol in
the MIBL. Thus the effect of entrainment of airened. On occasions the cumuli spread out into
well-broken stratocumulus layers at the top of the from the clean free troposphere was minimised.5.2.4. Inversion structure. The cloudy airMIBL. Table 8 shows the heights of the MBL and
pollution layer encountered during the aircraft Lagrangian experiments have offered an oppor-
tunity to investigate the evolution of a MBL. Inprofiles.Quite remarkably though, despite the rapid each case changes to the thermodynamic structure
of the layers containing the clouds have beenchanges in structure of the lower parts of the
atmosphere, the aerosol characteristics displayed observed and this has resulted in an evolution ofthe structure of the temperature inversion thatno change throughout the experiment. In contrast
to the 2nd Lagrangian, which was also polluted, caps the cloud layer. Fig. 9 shows a plot of the
change in total water against the change in equiva-the aerosol spectra in the 3rd Lagrangian werecharacterised by a single, broad mode centred on lent potential temperature across the inversion for
the Lagrangian experiments. The lines on the0.1 mm diameter (Fig. 8), suggesting that no cloudprocessing of the aerosol was going on now or in graph define regions where mixing of air from
Tellus 52B (2000), 2

311
and the R/V Vodyanitskiy, and one on 25 June1997 that included measurements from the MRFC-130.
6.1. Sagres site measurements
The instrument sites at Sagres were set up forthe ACE-2 CLEARCOLUMN experiment andthe instrumentation used there is documented in
Heintzenberg and Russell (2000). There were 2sites at Sagres; Sagres 50, at the SW tip of Portugal,and Mt. Foia, 900 m altitude. Sagres 50 and R/V
Vodyanitskiy had identical sets of instrumentationto determine aerosol physical (size distribution,
Fig. 9. A plot of the change in total water content againsthygroscopicity, particle number) and size segre-change in equivalent potential temperature across thegated chemical properties (Neususs et al., 2000).inversion capping the cloud in (a) the 1st cloudy
Lagrangian (stars), (b) the 2nd cloudy Lagrangian DMPS-systems were used at Sagres 50 and(circles) and (c) the 3rd cloudy Lagrangian (triangles). Mt. Foia to measure particle size distributions in
the range 3–800 nm diameter. Also, an APS wasoperated at Sagres 50 to determine the size distri-above and below the inversion leads to either a
stable result ( lower right of lines) or cloud-top bution from 800–10 000 nm diameter. At both
sites, total particle number concentrations >3 nmentrainment instability (upper left) which pro-motes more mixing. The dotted line indicates the were measured with an ultrafine condensation
particle counter and >10 nm with a condensationcloud-top entrainment stability criterion ofDeardorff et al. (1980) and Randall (1980) relevant particle counter. Size distributions were obtained
every 15 min and total number concentrationsto cases where air both above and below the
inversion is saturated. The dashed line shows the every minute. A volatility tandem differentialmobility analyser and a hygroscopicity tandemcriterion of MacVean and Mason (1990) for cases
where the air below the inversion is saturated but differential mobility analyser were operated to
perform continuous aerosol volatility (15 tothe air above is subsaturated. The dash-dottedline shows the criteria for instability when neither 150 nm diameter) and hygroscopicity (35 to
250 nm diameter) measurements at the Sagres-50of the layers are saturated. All the data from both
the 1st and 2nd Lagrangians are stable according site.2, 5-stage Berner impactors (0.05–10 mm particleto the criterion of MacVean and Mason, which
indicates that entrainment into the top of the diameter), and 2 filter-systems were used continu-
ously to take samples with a 12–24 h time reso-clouds during these experiments would not causean unstable condition where rapid entrainment lution. Mass loadings and the major ions of most
of the samples were determined and the absorbingand cloud breakup could occur. However, in the
3rd Lagrangian some of the data (to the left of aerosol fraction (Carrico et al., 2000) was meas-ured with an Aethalometer with a time resolutionthe MacVean and Mason line) suggest that the
presence of cloud below the inversion could lead of 15 min. Also, the gaseous compounds NO,
NO2 , O3 , CO, and SO2 were determined continu-to rapid increases in kinetic energy at the cloudtop as entraining parcels of air are evaporatively ously with a time resolution of 1 min. In general,
at the Sagres sites, it was found that particlescooled and become negatively buoyant.
between 0.05–1.2 mm diameter consisted mainly of(NH4 )nH(2-n)SO4 , whereas larger particles ori-ginated almost completely from sea-spray, where6. Cloud-free Lagrangian experimentsthe chloride was partly replaced by nitrate (up tomore than 50%). PIXE-analysis showed, that there3 cloud-free Lagrangian experiments were
undertaken during ACE-2; 2 on 6 July and 19 July were also low amounts of insoluble material (soil-derived) at Sagres 50.1997 that involved the surface-based sites at Sagres
Tellus 52B (2000), 2

. . .312
Table 9. A summary of the boundary layer heights6.2. Cloud-free L agrangian experiment on25 June 1997 during L agrangian 3 as measured in the profiles of
the MRF C-130 close to the constant level balloonsTo show an example of how the boundary layer
structure and aerosol characteristics change as a Distance from Depth of boundary Depth of pollutionpolluted air mass leaves the land and enters the Sagres (km) layer (m) layer (m)
marine environment, the cloud-free Lagrangian0 no boundary layer 1600experiment of 25 June 1997 is discussed. More
60 83 1400detailed analysis of these cases will be published90 120 1200
in future papers. The R/V Vodyanitskiy was posi-190 230 1100
tioned 200 km south of Sagres. The MRF C-130
aircraft flew profiles through the whole depth ofthe middle and lower troposphere over the ship the layer capped by the inversion had moistened
considerably. Table 9 also summarises the depthand Sagres, and through the MBL into the lower
free troposphere at various points between the of the pollution layer measured by the aircraft atdifferent distances from Sagres. Over Sagresship and Sagres. These were then followed by box
patterns at altitudes of 30 m, 500 m and 2000 m enhanced concentrations of aerosol were observed
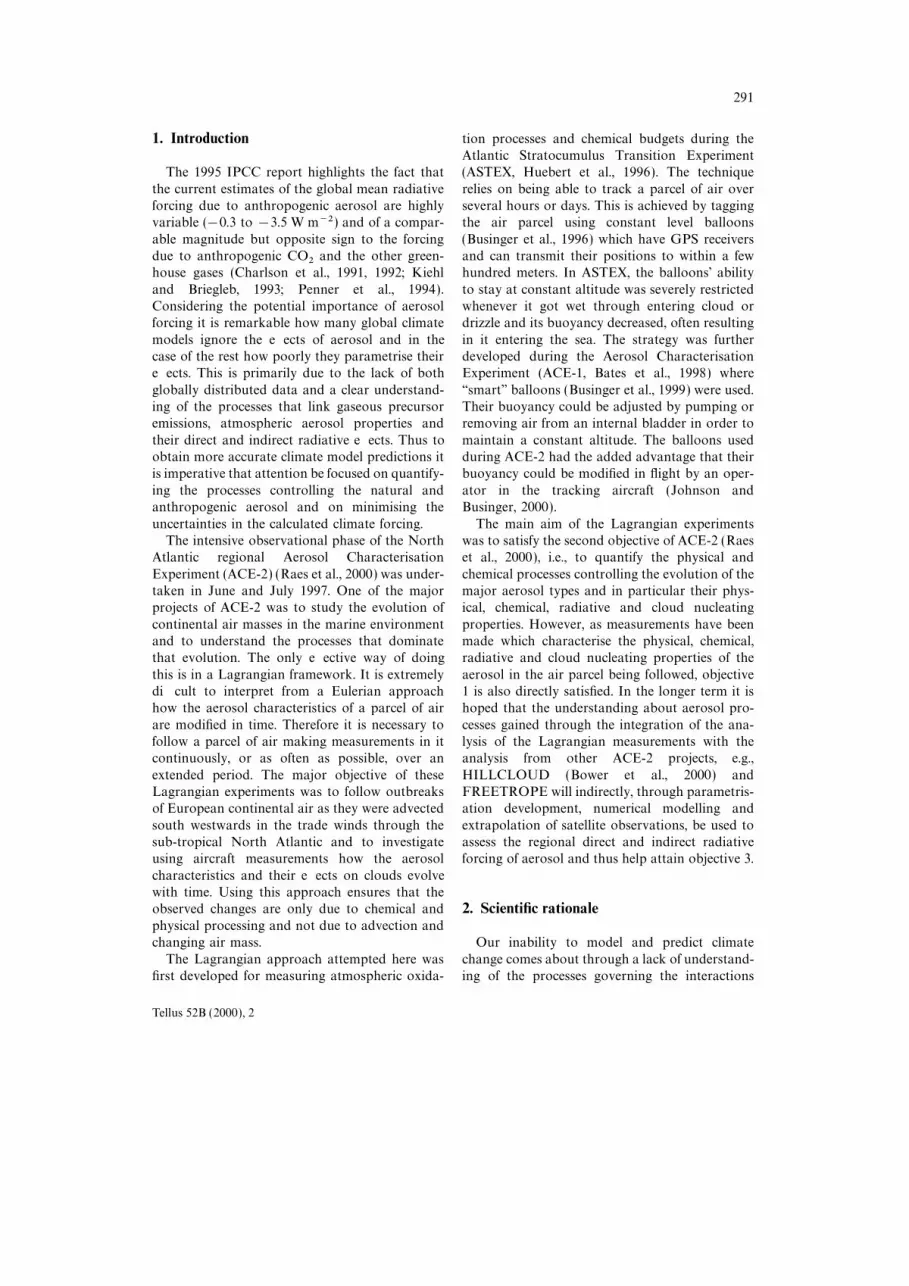
up to 1600 m high, whereas over the ship thein between Sagres and the ship. Fig. 10 shows theflight track of the C-130 in the vicinity of the ship pollution layer depth had decreased to 1100 m.
Fig. 11 shows the aircraft profile over the ship andand Sagres.
As the air left the Spanish Peninsula, the surface Sagres of accumulation mode aerosol and totalCN concentration on the left hand side, and onfluxes over the relatively cool ocean and the slow
subsidence in the free troposphere produced a the right hand side a contour plot of the accumula-tion mode particle size spectra over the ship.temperature inversion close to the surface. Further
away from the Sagres site this internal boundary Between 1100 m and 2000 m over the ship there
are still remnants of the pollution that once filledlayer or MBL started to deepen, increasing thestrength of the temperature inversion. Table 9 a deep, convectively driven CBL, but it has been
significantly diluted and in the MBL over the shipsummarises the depth of the MBL at different
distances from Sagres. Over the land the surface (up to a height of 230 m) the aerosol characteristicshave been slightly modified. Over the ship andlayer was very dry. However, 200 km off the coast
Fig. 10. Flight track of the C-130 in the cloud-free Lagrangian on 25 June 1997.
Tellus 52B (2000), 2
313
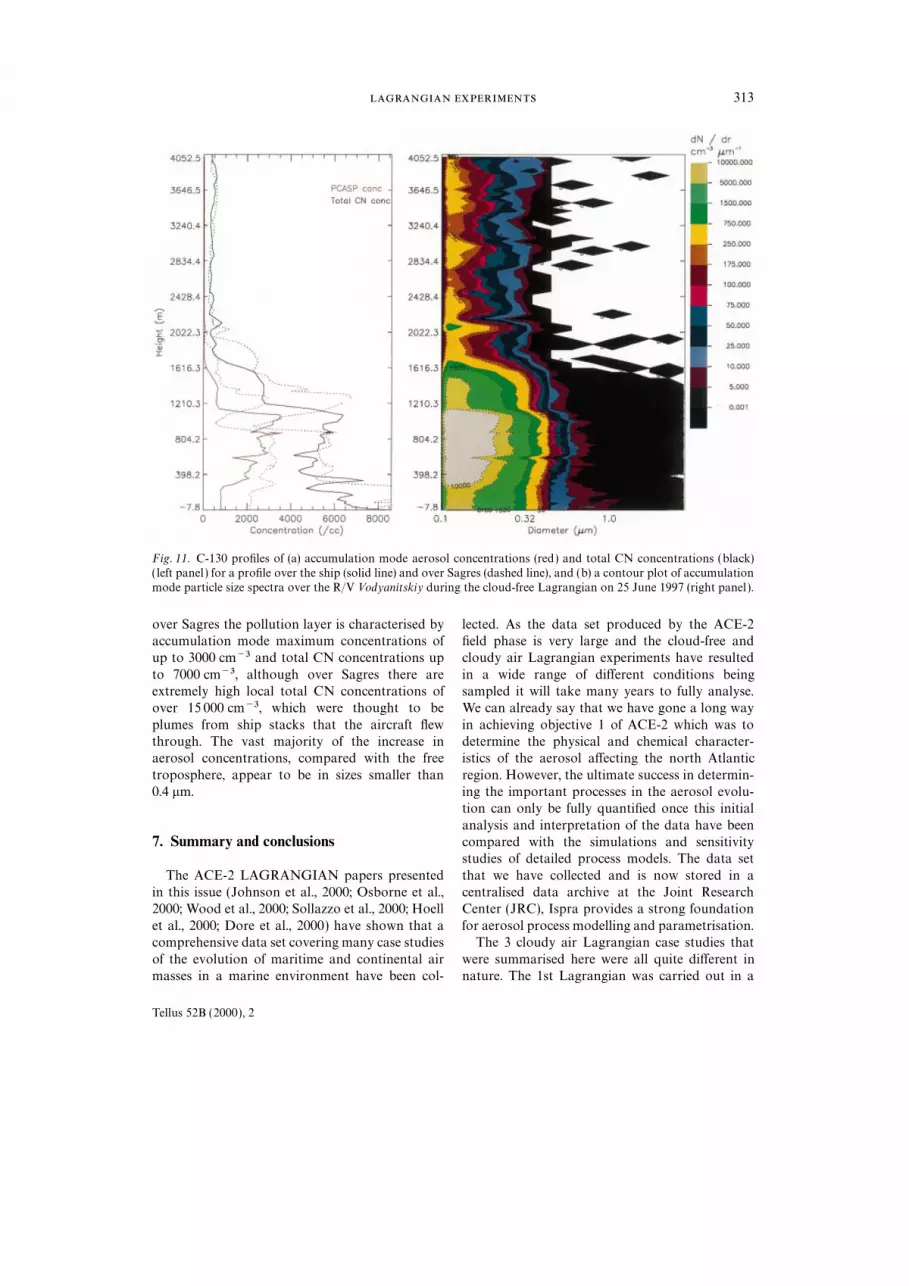
Fig. 11. C-130 profiles of (a) accumulation mode aerosol concentrations (red) and total CN concentrations (black)( left panel ) for a profile over the ship (solid line) and over Sagres (dashed line), and (b) a contour plot of accumulationmode particle size spectra over the R/V Vodyanitskiy during the cloud-free Lagrangian on 25 June 1997 (right panel ).
over Sagres the pollution layer is characterised by lected. As the data set produced by the ACE-2field phase is very large and the cloud-free andaccumulation mode maximum concentrations of
up to 3000 cm−3 and total CN concentrations up cloudy air Lagrangian experiments have resulted
in a wide range of different conditions beingto 7000 cm−3, although over Sagres there areextremely high local total CN concentrations of sampled it will take many years to fully analyse.
We can already say that we have gone a long wayover 15 000 cm−3, which were thought to be
plumes from ship stacks that the aircraft flew in achieving objective 1 of ACE-2 which was todetermine the physical and chemical character-through. The vast majority of the increase in
aerosol concentrations, compared with the free istics of the aerosol affecting the north Atlantic
region. However, the ultimate success in determin-troposphere, appear to be in sizes smaller than0.4 mm. ing the important processes in the aerosol evolu-
tion can only be fully quantified once this initial
analysis and interpretation of the data have beencompared with the simulations and sensitivity7. Summary and conclusionsstudies of detailed process models. The data set
that we have collected and is now stored in aThe ACE-2 LAGRANGIAN papers presentedin this issue (Johnson et al., 2000; Osborne et al., centralised data archive at the Joint Research
Center (JRC), Ispra provides a strong foundation2000; Wood et al., 2000; Sollazzo et al., 2000; Hoell
et al., 2000; Dore et al., 2000) have shown that a for aerosol process modelling and parametrisation.The 3 cloudy air Lagrangian case studies thatcomprehensive data set covering many case studies
of the evolution of maritime and continental air were summarised here were all quite different innature. The 1st Lagrangian was carried out in amasses in a marine environment have been col-
Tellus 52B (2000), 2

. . .314
clean maritime air mass and has acted as a very 7.1. General description of a continental outbreakof pollutiongood comparison with the other 2 Lagrangians
which were in polluted, continental air masses.From the analysis of the cloudy and clear air
It produced the largest changes in aerosol char-Lagrangian experiments, and information from
acteristics of the 3 experiments undertaken. Thethe CLEARCOLUMN experiments, we have been
quadrupling of the accumulation mode aerosolable to put together a generalised description of a
concentrations was highly correlated with theEuropean continental outbreak of pollution over
increased surface wind speeds observed and thethe sub-tropical north Atlantic. Fig. 12 shows a
increased salt particle production may well haveschematic diagram of the main features of such
acted as a sink for the sub-micron aerosol particlesan event. Over the continent the surface heating
by enhancing coagulation. The latter, possibly, inin the summer months produces a deep (2 to
combination with in cloud scavenging of inter- 5 km) convectively driven CBL. The anthropo-stitial aerosol and dilution with the free tropo- genic pollution produced over the continent issphere may have helped decrease the total CN well mixed throughout the CBL. When this isconcentrations in the MBL. advected over the relatively cold sea, the surface
The 2nd Lagrangian was carried out in a pol- fluxes cause a new MBL to form which rapidlyluted MBL that was completely capped by strato- grows as the air moves away from the coast. Thecumulus clouds, which was producing occasional CBL having lost the strong surface forcing col-light drizzle, but at no time reached the surface in lapses under the influence of the subsidence in thesignificant quantities. SO2 concentrations started free troposphere, which is generally present in theoff at relatively high levels and decreased signific- sub-tropical areas. The MBL grows within theantly during the experiment to quite low values. deep pollution layer and as the top of the MBLThis was probably due to cloud processing of the is generally stable, a part of the pollution isaerosol that caused a small increase in the size of trapped in a layer close to the surface. The pollu-the mode diameter in the accumulation mode and tion associated with the residual CBL above thedilution by entrainment from the free troposphere. top of the developing MBL will be differentiallyThe effect of the entrainment of air from the free advected away as there is generally a vertical windtroposphere varied during the course of the experi- shear associated with the temperature inversionment. Initially the air was very polluted above the capping the MBL.MBL and the entrainment served to pollute the Eventually the subsidence in the free tropo-MBL still further. Later differential advection had sphere limits the growth of the MBL (1 to 2 km)replaced the pollution with cleaner air above the and clean tropospheric air can be entrained intoMBL which slowly diluted the pollution in the MBL. It is this process which has the greatestthe MBL. effect on diluting the pollution in the MBL and
In the 3rd Lagrangian dramatic changes to the assisting in evolving the continental air mass intothermodynamic structure of the lower atmosphere a clean maritime air mass. Washout of the pollu-which an aged pollution layer was filling was, tion by drizzle produced by clouds in the MBL issurprisingly, accompanied by no significant thought to be minimal, as the high levels ofchanges in the aerosol characteristics. It appears pollution and soluble aerosol limit the size of theas though a deep CBL was advected out over the cloud droplets below the size where coalescencesea and an MIBL grew within it. Some clouds can be effective.then formed at the top of the MIBL. The aerosol The rate at which the pollution in the residualsize spectra were remarkably constant throughout CBL is differentially advected away has a significantthe whole of the experiment. It appeared to be in effect on the speed at which the dilution effect ofa ‘‘pseudo steady state’’, where either all the the clean free tropospheric air can have on con-sources and sinks of aerosol were delicately bal- verting a continental air mass into a maritime airanced or the sources and sinks were negligible mass. If the vertical wind shear above the MBL isand the processing extremely slow, i.e., with time only small then pollution layers above the MBLscales greater than the time period of the observa- can be entrained into the top of the MBL topping
up the aerosol there and thus maintaining thetions (30 h).
Tellus 52B (2000), 2

315
Fig. 12. A generalised picture of a European outbreak of pollution over the sub-tropical North Atlantic.
continental air mass for longer than would be increase the mean size of the aerosol through
sulphate production, (b) coalescence of cloud drop-expected. This was evidently true in the 3rd cloudyair Lagrangian where the air had been over the sea lets which will decrease the aerosol number concen-
tration and increase the aerosol mean size, andfor over 2 days but very little evolution of theaerosol in the MBL was going on as the residual (c) scavenging of interstitial aerosol by the cloud
droplets which will decrease the total CN concentra-CBL was still present above the top of the MBL. In
contrast, in the 2nd cloudy air Lagrangian the air tions and increase the aerosol mean size. All of theseprocesses will tend to enhance the accumulationhad only been over the sea for half a day but the
pollution in the residual CBL was advected away mode, which will firstly, improve the CCN charac-
teristics of the aerosol, and secondly modify therelatively quickly and so entrainment of clean freetropospheric air could begin to have a significant direct radiative forcing effect of the aerosol as the
aerosol size becomes more comparable with theeffect on the evolution of the aerosol in the MBL.
The evolution of the MBL also has a modifying wavelength of light which will increase its lightscattering capabilities.effect on the evolution of the aerosol characteristics.
As the air moves over progressively warmer seas The total length of time the aircraft were able to
track the parcels of air in the Lagrangian experi-the MBL deepens and moisture builds up andstratocumulus clouds form at the top of the MBL. ments was not enough to examine the complete
evolution from a continental to a maritime air mass.If the MBL gets deep enough then the generation
of turbulent kinetic energy, either by wind shear or Modelling studies by Fitzgerald et al. (1998) suggestthat the time scale of this is about 6 to 8 days.cloud top cooling, may not be enough to maintain
a well-mixed MBL. The cloud layer then becomes However, these experiments do show how import-
ant cloud processing and entrainment are in modify-decoupled from the moisture source at the surface.The MBL then becomes layered with a surface ing the aerosol size spectrum in the MBL as
suggested by Clarke et al. (1998), Russell et al.mixed layer (SML) and a layer containing the cloud.
Moisture builds up in the SML and it becomes (1998), Van Dingenen et al. (1999) and Fitzgeraldet al. (1998). The aerosol size spectra in the 2nd andconditionally unstable and cumulus clouds will
grow from the top of the SML and these will help 3rd cloudy air Lagrangian experiments were quite
different in nature, one being bi-modal due tomaintain the stratocumulus layer by locally supply-ing it with moisture. The cycling of the aerosol recent/continuing cloud processing and the other
uni-modal due to a limited interaction with clouds.through this cloud will process it either through:(a) aqueous phase chemical reactions which will In the 3rd Lagrangian experiment if cloud
Tellus 52B (2000), 2

. . .316
processing of the aerosol has taken place prior to 7.2. Development of parametrisations of aerosolprocessesthe measurements then more recent dilution with
the pollution layer above the MBL has filled in theIf the data are to have a major impact on the
cloud processing minimum in the aerosol spectra.reliability of climate model predictions then
The time constant for doing this is typically aroundimproved parametrisations of aerosol processes
2 days (Fitzgerald et al., 1998).have to be developed for large-scale numerical
Recent observations during ACE-1 (Clarke model physics packages. Due to the wide diversityet al., 1998; Russell et al., 1998) and modelling of conditions encountered during the Lagrangianstudies (Van Dingenen et al., 1999; Fitzgerald experiments an ideal platform for parametrisationet al., 1998) have indicated the importance of development is now available. The ultimate aimentrainment and dilution of the MBL air with free of this work will be to develop improved parame-tropospheric air. By its very nature it is a very trisations of aerosol processes in order that object-slow process, so at times, even in remote marine ive 3 of ACE-2 can be fulfilled, i.e., to determineareas, its effects can be swamped by stronger more the regional direct and indirect radiative forcingeffective processes. This was certainly the case in of aerosols in the North Atlantic region. Work isthe 1st cloudy Lagrangian experiment where the currently being undertaken in collaboration withsynoptic pressure gradient strengthened, increas- the UK Meteorological Office Hadley Centre anding the wind speed, and resulting in a significant the ECHAM modeling community in validatingsource of new particles at the surface which domin- and improving aerosol parametrisations for largeated entrainment processes and the evolution of scale numerical models. An example of a para-the MBL aerosol characteristics. At times, at the metrisation of a GCM sulphur cycle scheme thatstart of the 2nd cloudy Lagrangian and through- is being worked on is shown in Fig. 13. Theout the whole period of the 3rd cloudy Lagrangian, aerosol is split up into 3 modes; a dissolvedentrainment of polluted air from above the top of sulphate mode, an accumulation sulphate modethe MBL maintained the pollution characteristics and an Aitken sulphate mode. The sources andof the MBL. In the 3rd Lagrangian, as the aerosol sinks of mass for these 3 modes are shown in theabove the MBL had virtually the same character-
istics as the aerosol in the MBL this caused no
modification of the aerosol size spectra at all.
Homogeneous nucleation is a not well under-
stood. Clear correlations between new particle
formation events and pre-cursor gases, meteoro-
logy, and other aerosol properties such as surface
area have not been clearly determined. Weber
et al. (1995) found indications that with increasing
sulphuric acid concentrations in the gas phase,
particle formation is enhanced. Birmili (1998) and
Birmili and Wiedensohler (1998) found at a pol-
luted rural site in Germany frequent new particle
formation events of 20 000–200 000 cm−3 over sev-
eral hours in the morning (on average every tenth
day). However, in none of the cloudy Lagrangian
experiments was there any evidence of new particle
formation in the MBL. At Sagres, though, every
second day new particle formation was found in
the morning hours, and every fifth day, a growth
of the nucleation mode into the Aitken mode wasFig. 13. A schematic diagram of the parametrisation of
observed indicating that the new particle forma- the sulphur cycle proposed for the Unified Model usedtion took place regionally and was not caused by in the UK Met. Office (Courtesy of Dr. D. L. Roberts,
Hadley Centre).local point sources or ships.
Tellus 52B (2000), 2

317
diagram. A similar aerosol scheme for nitrates DETR, NERC, the German Max Planck Society,EC Joint Research Centre, and other nationalcould also be devised. The data set that has been
collected for ACE-2 LAGRANGIAN will help agencies in Sweden, USA, and Canada. Support
is also gratefully acknowledged from the Spanishconsiderably in determining how best to representthe movement of mass from one mode to another Meteorological service, ECMWF and UK
Meteorological Office for the forecasts for thein such a scheme but this will only be possible
once the important processes have been fully ACE-2 area and the trajectory analysis whichmade accurate prediction of the timing of aunderstood. Untangling the complex nature of the
different processes that are present in these differ- Lagrangian experiment possible. Thanks are also
due to the many collaborators, support staff andent Lagrangian experiments to modify the aerosolevolution will keep modellers and experimental students who could not all be mentioned in the
list of contributors. We thank the officers andphysicists busy for many years to come.
crew of the Research Vessel Vodyanitskiy.Financial support for ship time was provided bythe European Commission DG XII (Environment8. Acknowledgementsand Climate) and the NOAA Office of Oceanicand Atmospheric Research. Research by NOAAThis research is a contribution to the
International Global Atmospheric Chemistry and PMEL was funded by the Aerosol Project of
the NOAA Climate and Global Change Program(IGAC) Core Project of the InternationalGeosphere-Biosphere Programme (IGBP) and is and NOAA OAR. The Royal Air Force aircrew
of the MRF C-130 are also to be thanked for theirpart of the IGAC Aerosol Characterisation
Experiments It has been supported by the continuing professionalism and enthusiastic parti-cipation in this alien world of atmosphericEuropean Union under contract ENV4-CT95-
0032. Further support was obtained from the UK research.
REFERENCES
Albrecht, B. A., Bretherton, C. S., Johnson, D. W., Birmili, W. 1998. Production of new ultrafine aerosol par-Schubert, W. H. and Frisch, A. S. 1995. The Atlantic ticles in continental air mass. PhD thesis, University ofStratocumulus Transition Experiment – ASTEX. Bull. Leipzig, Germany.Amer. Met. Soc. 76, 889–904. Birmili, W. and Wiedensohler, A. 1998. The influence of
Andreae, M. O., Berresheim, H., Andreae, T. W., Kritz, meteorological parameters on ultrafine particle pro-M. A., Bates, T. S. and Merril, J. T. 1988. Vertical duction at a continental site. J. Aerosol. Sci. 29,distribution of dimethylsulfide, sulfur dioxide, aerosol S1015–1016.ions and radon over the north east Pacific Ocean. Bluth, R. T., Durkee, P. A., Seinfeld, J. H., Flagan, R. C.,J. Atmos. Chem. 6, 149–173. Russell, L. M., Crowley, P. A. and Finn, P. 1996.
Bates, T. S., Huebert, B. J., Gras, J. L., Griffiths, F. B. Center for Interdisciplinary Remotely-Piloted Aircraftand Durkee, P. A. 1998. International Global Atmo- Studies (CIRPAS). Bulletin of the American Met. Soc.spheric Chemistry (IGAC) Project’s First Aerosol 77, 2691–2699.Characterization Experiment (ACE-1): overview.
Bower, K., Choularton, T. W., Gallagher, M. W.,J. Geophys. Res. 103, 16,297–16,318.
Beswick, K. M., Flynn, M., Allen, A. G., Davison,Bates, T. S., Quinn, P. K., Covert, D. S., Coffman, D. J.,
B. M., James, J. D., Robertson, L., Harrison, R. M.,Johnson, J. E. and Wiedensohler, A. 2000. Aerosol
Hewitt, C. N., Cape, J. N., McFadyen, G. G., Mar-physical properties and controlling processes in the
tinsson, B. G., Frank, G., Swietlicki, E., Zhou, J., Berg,lower marine boundary layer: a comparison of submic-O. H., Mentes, B., Papaspiroulos, G., Hansson, H.-C.,ron data from ACE-1 and ACE-2. T ellus 52B,Kulmala, M., Aalto, P., Vakeva, M., Berner, A.,258–272.Bizjak, M., Fuzzi, S., Laj, P., Facchini, M.-C., Orsi, G.,Benkovitz, C. M., Berkovitz, C. M., Easter, R. C., Nemes-Ricci, L., Nielsen, M., Allan, B. J., Coe, H., McFig-ure, S., Wagener, R. and Schwartz, S. E. 1994. Sulphategans, G., Plane, J. M. C., Collett Jr., J. L., Moore,over the North Atlantic and adjacent continentalK. F. and Sherman, D. E. 2000. ACE-2 HILLCLOUD:regions: evaluation for October and November 1986an overview of the ACE-2 ground based cloud experi-using a three-dimensional model driven by observa-ment. T ellus 52B, 750–778.tion derived meteorology. J. Geophys. Res. 99,
20,725–20,756. Bretherton, C. S, Austin, P. and Siems, S. T. 1995. Cloudi-
Tellus 52B (2000), 2

. . .318
ness and marine boundary layer dynamics in the model to simulate multicomponent aerosol dynamicsASTEX Lagrangian experiments. Part II: cloudiness, in the marine boundary layer (2). Model application.drizzle, surface fluxes and entrainment. J. Atmos. Sci. J. Geophys. Res. 103, 16,103–16,117.52, 16, 2707–2723. Hegg, D. A. 1985. The importance of liquid phase oxida-
Businger, S., Chiswell, S. R., Ulmer, W. C. and John- tion of SO2 in the troposphere. J. Geophys. Res. 90,son, R. 1996. Balloons as a Lagrangian measurement 373–3779.platform for atmospheric research. J. Geophys. Res. Hegg, D. A., Radke, L. F. and Hobbs, P. V. 1990. Particle101, 4363–4376. production associated with marine clouds. J. Geophys.
Businger, S., Johnson, R., Katzfey, J., Siems, S. and Res. 95, 13,917–13,925.Wang, O. 1999. Smart Tetroons for Lagrangian air- Hoell, C., O’Dowd, C., Johnson, D. W., Osborne, S. R.mass tracking during ACE-1. J. Geophys. Res. 104, and Wood, R. 2000. Timescale analysis of marine11,709–11,722. boundary layer aerosol evolution: Lagrangian case
Carrico, C. M., Rood, M. J., Ogren, J., Neususs, C., studies under clean and polluted conditions. T ellusWiedensohler, A. and Heintzenburg, J. 2000. Aerosol 52B, 423–438.optical properties at Sagres, Portugal during ACE-2. Huebert, B. J., Pszenny, A. and Blomquist, B. 1996. TheT ellus 52B, 694–715. ASTEX/MAGE experiment. J. Geophys. Res. 101,
Charlson, R. J., Lovelock, J. E., Andreae, M. O. and 4319–4329.Warren, S. G. 1987. Oceanic phytoplankton, atmo- IPCC, 1995. Climate Change 1995. The science of climatespheric sulfur, cloud albedo and climate. Nature 326, change. Contribution of WG1 to the second assess-655–661. ment Report of the Intergovernmental Panel on Cli-
Charlson, R. J., Langner, J., Rodhe, H., Levoy, C. B. and mate Change (eds. Houghton, J. T., Meira Filho, L. G.,Warren, S. G. 1991. Perturbation of the northern hemi- Callender, B. A., Harris, N., Kattenberg, A and Mas-sphere radiative balance by backscattering from kell, K.). Cambridge University Press.anthropogenic sulfate aerosols. T ellus 43A/B, Jennings, S. G. and O’Dowd, C. 1990. Volatility of aero-152–163. sol at Mace Head on the West coast of Irelan. J. Geo-
Clarke, A. D., Uehara, T. and Porter, J. N. 1996. Lag- phys. Res. 95, 13,937–13,948.rangian evolution of an aerosol column during the
Johnson, D. W., Osborne, S., Wood, R., Suhre, K., Quinn,Atlantic Stratocumulus Transition Experiment. J. Geo-
P. K., Bates, T. S., Andreae, M. O., Noone, K.,phys. Res. 101, 4351–4362.
Glantz, P., Bandy, B., Rudolph, J. and O’Dowd, C.Clarke, A. D., Varner, J. L., Eisele, F., Mauldin, R. L,
2000. Observations of the evolution of the aerosol,Tanner, D. and Litchy, M. 1998. Particle production
cloud, and boundary layer characteristics during thein the remote marine atmosphere: cloud outflow and
first ACE-2 Lagrangian experiment. T ellus 52B,subsidence during ACE-1. J. Geophys. Res. 103,
348–374.16,397–16,409.
Johnson, R., Businger, S. and Baerman, A. 2000. Lag-Covert, D. S., Kapustin, V. N., Quinn, P. K. and Bates,
rangian air mass tracking with smart balloons duringT. S. 1992. New particle formation in the marine
ACE-2. T ellus 52B, 321–334.boundary layer. J. Geophys. Res. 92, 20,581–20,589.Kiehl, J. T. and Briegleb, B. P. 1993. The relative rolesCovert, D., Wiedensohler, A. and Russell, L. M. 1997.
of sulfate aerosols and greenhouse gases in climateParticle charging and transmission efficiencies of aero-forcing. Science 260, 311–314.sol charge neutralizers. Aerosol Sci. and T echnol. 27,
Kiehl, J. T. and Rodhe, H. 1995. Modelling geographical206–214.and seasonal forcing due to aerosols. In: Aerosol for-Deardorff, J. W., Willis, G. E. and Stockton, B. H. 1980.cing of climate (eds. Charlson, R. and Heintzenberg, J.).Laboratory studies of the entrainment zone of a con-Wiley Interscience.vectively mixed layer. J. Fluid Mech. 100, 41–46.
Langner, J. and Rodhe, H. 1991. A global three-dimen-Dore, A., Johnson, D. W., Osborne, S., Choularton, T.,sional model of the tropospheric sulfur cycle. J. Atmos.Bower, K., Andreae, M. O. and Bandy, B. 2000. TheChem. 13, 225–263.evolution of boundary layer aerosol particles due to
Martin, G. M., Johnson, D. W., Rogers, D. P., Jonas,in-cloud chemical reactions during the second Lag-P. R., Minnis, P. and Hegg, D. 1995. Observations ofrangian experiment of ACE-2. T ellus 52B, 452–463.the interaction between cumulus clouds and warmDraxler, R. R. and Hess, G. D. 1997. Description of hysplitstratocumulus clouds in the marine boundary layer4 modelling. Technical Memorandum ERL ARL-224,during ASTEX. J. Atmos. Sci. 52, 2902–2922.NOAA.
Martin, G. M., Johnson, D. W., Jonas, P. R., Rogers,Fiengold, G., Kreidenweiss, S. M., Stevens, B. andD. P. and Brooks, I. M. 1997. Effects of airmass typeCotton, W. R. 1996. Numerical simulations of strato-on the interaction between cumulus clouds and warmcumulus processing of cloud condensation nucleistratocumulus clouds in the marine boundary layer.through collision coalescence. J. Geophys. Res. 101,Quart. J. Roy. Meteor. Soc. 123, 849–882.21,391–21,402.
McVean, M. K. and Mason, P. J., 1990. Cloud topFitzgerald, J. W., Marti, J. J., Hoppel, W. A., Frick, G. M.and Gelbard, F. 1998. A one dimensional sectional entrainment instability through small scale mixing and
Tellus 52B (2000), 2

319
its parametrisation in numerical models. J. Atmos. Sci. nuclei in the remote marine boundary layer. J. Geo-phys. Res. 100, 2893–2903.47, 1012–1030.
Murphy, D. M., Anderson, J. R., Quinn, P. K., McInnes, Raes, F., Bates, T., Verver, G., McGovern, F.and VanLiedekerke, M. 2000. The second aerosol characteris-L. M., Brechtel, F. J., Kreidenweis, S. M.,
Middlebrook, A. M., Posfai, M., Thomson, D. S. and ation experiment (ACE-2): general context and mainresults. T ellus 52B, 111–126.Buseck, P. R. 1998. Influence of sea salt on aerosol
radiative properties in the Southern Ocean marine Randall, D. A. 1980. Conditional instability of the firstkind upside down. J. Atmos. Sci. 37, 125–130.boundary layer. Nature 392, 62–65.
Neususs, C., Weise, D., Birmili, W., Wex, H., Wieden- Randall, D. A., Albrecht, B., Cox, S., Johnson, D. W.,Minnis, P., Rossow, W. and Starr, D. O’C. 1996. Onsohler, A. and Covert, D. 2000. Size-segregated chem-
ical, gravimetric and number distribution derived mass FIRE at ten. Advances in Geophysics 38. AcademicPress.closure of the aerosol in Sagres, Portugal during
ACE-2. T ellus 52B, 169–184. Rogers, D. P., Johnson, D. W. and Friehe, C. A. 1995.The stable internal boundary layer over a coastal seaNicholls, S. and Leighton, J. 1986. An observational
study of the structure of stratiform cloud sheets. Part I: (I). Airborne measurements of the mean and turbu-lence structure. J. Atmos. Sci. 52, 667–683.structure. Quart. J. Roy. Meteor. Soc. 112, 431–460.
Noone, K. J., Ogren, J. A., Heintzenberg, J., Charlson, Rudolph, J., Kieser, B., Fu, B. and Fong. S. 1998. Hydro-carbon measurements during ACE-2. University ofR. J. and Covert, D. S. 1988. Design and calibration
of a counterflow virtual impactor for sampling of York report.Russell, P. B. and Heintzenberg, J. 2000. An overviewatmospheric fog and cloud droplets. Aerosol Sci. and
T echnol. 8, 235–244. of the ACE-2 clear sky column closure experiment(CLEARCOLUMN). T ellus 52B, 463–483.O’Dowd, C. D. and Smith, M. H. 1993. Physiochemical
properties of aerosols over the Northeast Atlantic: Russell, L. M., Lenschow, D. H., Laursen, K. K., Krum-mel, P. B., Siems, S. T., Bandy, A. R., Thornton, D. C.evidence for wind speed related submicron sea salt
aerosol production. J. Geophys. Res. 98, 1137–1149. and Bates, T. S. 1998. Bidirectional mixing in anACE-1 marine boundary layer overlain by a secondOsborne, S. R., Johnson, D. W., Wood, R., Bandy, B. J.,
Andreae, M. O., O’Dowd, C., Glantz, P., Noone, K., turbulent layer. J. Geophys. Res. 103, 16,411–16,432.Sievering, H., Boatman, J., Gorman, E., Kim, Y., Ander-Rudolf, J., Bates, T. and Quinn, P. 2000. Observations
of the evolution of the aerosol, cloud and boundary son, L., Ennis, G., Luria, M. and Pandis, S. 1992.Removal of sulfur from the marine boundary layer bylayer dynamic and thermodynamic characteristics
during the second Lagrangian experiment of ACE-2. ozone oxidation in sea salt aerosols. Nature 360,571–573.T ellus 52B, 375–400.
Pandis, S. N., Russell, L. M. and Seinfeld, J. H. 1994. Sollazzo, M. J., Russell, L. M., Percival, D., Osborne, S.,Wood, R. and Johnson, D. W. 2000. Entrainment ratesThe relationship between DMS flux and CCN concen-
tration in remote marine regions. J. Geophys. Res. 99, during ACE-2 Lagrangian experiments calculatedfrom aircraft measurements. T ellus 52B, 335–347.D8, 16,945–16,957.
Penkett, S. A., Bandy, B. J., Reeves, C. E., McKenna, D. Stratman, F. and Wiedensohler, A. 1997. A new datainversion algorithm for DMPS measurements.and Hignett, P. 1995. Measurements of peroxides in
the atmosphere and their relevance to the understand- J. Aerosol Sci. 27, S1, 339–340.Suhre, K., Andreae, M. O. and Rosset, R. 1995. Biogenicing of global tropospheric chemistry. Faraday Discus-
sions 100, 155–174. sulfur emissions and aerosols over the tropical SouthAtlantic (2). One dimensional simulation of sulfurPenner, J. E., Charlson, R. J., Hales, J. M., Laulainen, N.,
Leifer, R., Novakov, T., Ogren, J., Radke, L. F., chemistry in the marine boundary layer. J. Geophys.Res. 100, 11,323–11,334.Schwartz, S. E. and Travis, L. 1994. Quantifying and
minimizing uncertainty of climate forcing by anthro- Talbot, R. W., Andreae, M. O., Berresheim, H.,Artaxo, P., Garstang, M., Harriss, R. C., Beecher,pogenic aerosol. Bull. Amer. Met. Soc. 75, 375–400.
Quinn, P. K. and Coffman, D. J. 1998. Local closure K. M., and Li, S. M. 1990. Aerosol chemistry duringthe wet season in central Amazonia: the influenceduring the First Aerosol Characterization Experiment
(ACE-1): aerosol mass concentration and scattering of long range transport. J. Geophys. Res. 95,16,955–16,969.and backscattering coefficients. J. Geophys. Res. 103,
16,575–16,596. Van Dingenen, R., Raes, F., Putaud, J.-P., Virkkula, A.and Mangoni, M. 1999. Processes determining theQuinn, P. K., Bates, T. S., Coffman, D. J., Miller, T. L.
and Johnson, J. E. 2000. A comparison of aerosol relationship between aerosol number and non-sea-saltsulphate mass concentrations in the clean and per-chemical and optical properties from the first and
second aerosol characterisation experiments. T ellus turbed marine boundary layer. J. Geophys. Res. 104,8027–8038.52B, 239–257.
Raes, F. 1995. Entrainment of free tropospheric aerosols Verver., G., Raes, F., Vogelezang, D. and Johnson, D.2000. The second aerosol characterisation experimentas a regulating mechanism for cloud condensation
Tellus 52B (2000), 2

. . .320
(ACE-2): meteorological and chemical context. T ellus dependent counting efficiency of 26 condensation par-52B, 126–140. ticle counters. Aerosol Sci. and T echnol. 27, 224–242.
Weber, R. J., McMurry, P. H., Eisele, F. L. and Tanner, Wood, R., Johnson, D. W., Osborne, S. R., Bandy, B. J.,D. J. 1995. Measurement of expected nucleation pre- Andreae, M. O., O’Dowd, C., Glantz, P. and Noone,cursor species and 3 to 500 nm diameter particles at K. J. 2000. Boundary layer, aerosol and chemicalMauna Loa Observatory, Hawaii. J. Atmos. Sci. 12, evolution during the third Lagrangian experiment of2242–2257. ACE-2. T ellus 52B, 401–422.
Wiedensohler, A., Orsini, D., Covert, D. S., Coffmann, D., Zhuang, L. and Huebert, B. J. 1996. A Lagrangian ana-Cantrell, W., Havlicek, M., Brechtel, F. J., Russell, lysis of the total ammonia budget during ASTEX/L. M., Weber, R. J., Gras, J., Hudson, J. G. and MAGE. J. Geophys. Res. 101, 4341–4350.Litchy, M. 1997. Intercomparison study of size
Tellus 52B (2000), 2