amorphous and nanostructured silica and aluminosilicate spray-dried microspheres
TRANSCRIPT
Journal of Molecular Structure 1000 (2011) 62–68
Contents lists available at ScienceDirect
Journal of Molecular Structure
journal homepage: www.elsevier .com/locate /molstruc
Amorphous and nanostructured silica and aluminosilicate spray-dried microspheres
M. Todea, R.V.F. Turcu, B. Frentiu, M. Tamasan, H. Mocuta, O. Ponta, S. Simon ⇑Babes-Bolyai University, Faculty of Physics & Interdisciplinary Research Institute in Bio-Nano-Sciences, Cluj-Napoca, Romania
a r t i c l e i n f o a b s t r a c t
Article history:Received 16 March 2011Received in revised form 28 May 2011Accepted 28 May 2011Available online 2 June 2011
Keywords:MicrospheresSol–gelNanostructuresMicroscopyNMR
0022-2860/$ - see front matter � 2011 Elsevier B.V. Adoi:10.1016/j.molstruc.2011.05.053
⇑ Corresponding author. Tel.: +40 264 405375; fax:E-mail address: [email protected] (S. Simon
Amorphous silica and aluminosilicate microspheres with diameters in the 0.1–20 lm range were pro-duced by spray drying method. SEM, TEM and AFM images showed the spherical shape of the obtainedparticles. Based on thermal analysis data, several heat treatments have been applied on the as-preparedsamples in order to check the amorphous state stability of the microspheres and to develop nanosizedcrystalline phases. As-prepared microspheres remain amorphous up to 1400 �C. By calcination at1400 �C, cristobalite type nanocrystals are developed on silica sample, while in aluminosilicate samplefirst are developed mullite type nanocrystals and only after prolonged treatment are developed also cris-tobalite type nanocrystals. 29Si and 27Al MAS NMR results show that the local order around aluminumand silicon atoms strongly depend on the thermal history of the microspheres.
� 2011 Elsevier B.V. All rights reserved.
1. Introduction
The sol–gel method facilitates the preparation at relative lowtemperatures of materials with high purity and homogeneity. Be-cause of the possibility to influence the nanoscale structure, thesol–gel processing can lead to great structural properties, like highporosity and surface area, that allows the synthesis of new materi-als with different surface activity and degradation rate in liquidenvironments [1–3].
By spray-drying of sol–gels, microspheres with desired size canbe obtained [4,5]. Spray drying is a very important method used fornumerous industrial applications such as waste treatment, produc-tion of inorganic salts, pharmaceuticals and food stuffs. In spraydrying, a solution or suspension is fed to an atomizer and the drop-lets formed are mixed with a hot gas. This causes the solvent of thedroplets to evaporate, leaving a dry powder product [6–11]. Spraydrying is a promising method for preparation of sol–gel derived sil-ica and silicate microparticles for controlled release of drugs. Thedrug-loaded microspheres can be applied locally or delivered tothe target area after intravenous injection by either passive means(e.g., trapping by size) or active means (e.g., magnetic targeting)[12–14]. From a manufacturing point of view, spray drying offersthe advantage of being single-step process for synthesis of nano-crystalline particles, which can be readily scaled up [15–17]. Theunderstanding of many key properties of these materials demandsthe examination of their atomic level structure. Nuclear magneticresonance proved to be a powerful tool in investigation of the local
ll rights reserved.
+40 264 591906.).
structure, by providing complementary information to standardcharacterization techniques, such as diffraction and microscopy.It has been shown that the 29Si NMR spectra of silicate systemsare sensitive to the chemical nature of other atoms attached tothe oxygens of the [SiO4] tetrahedra [18–21]. 29Si and 27Al NMR re-sults concerning the effect of heat treatment temperature on thelocal order and crystallinity in aluminosilicate glasses and xerogelshave been published [22–27], but no NMR studies on aluminosili-cate microspheres were reported.
The nanostructure is significant to biomedical applications be-cause the protein adsorption is influenced by the crystallite size,and the smaller crystallite are responsible for better proteinabsorption [28]. At the same time, the crystallinity of the samplesdepend on the heat treatment parameters, and the heat treatmentapplied on the investigated samples was proper for development ofa nanocrystalline structure. In addition, for aluminosilicate sys-tems it was reported that mullite nanocrystalites can increasethe cells function [29].
The aim of the present study was to investigate the structure ofsilica and aluminosilicate microspheres prepared via spray dryingmethod, both before and after different heat treatments, for furthercorrelation with their behavior in medical applications. The heattreatments were applied to induce crystalline centers on the sur-face of the microspheres for further linking of functional groupsand control on their structural stability in biological fluids.
2. Experimental
Silica (Si) and aluminosilicate (AlSi) microspheres of less than20 lm in diameter were prepared by spray drying method. TheAl2O3/SiO2 molar ratio in AlSi samples was 1/4. As precursor of
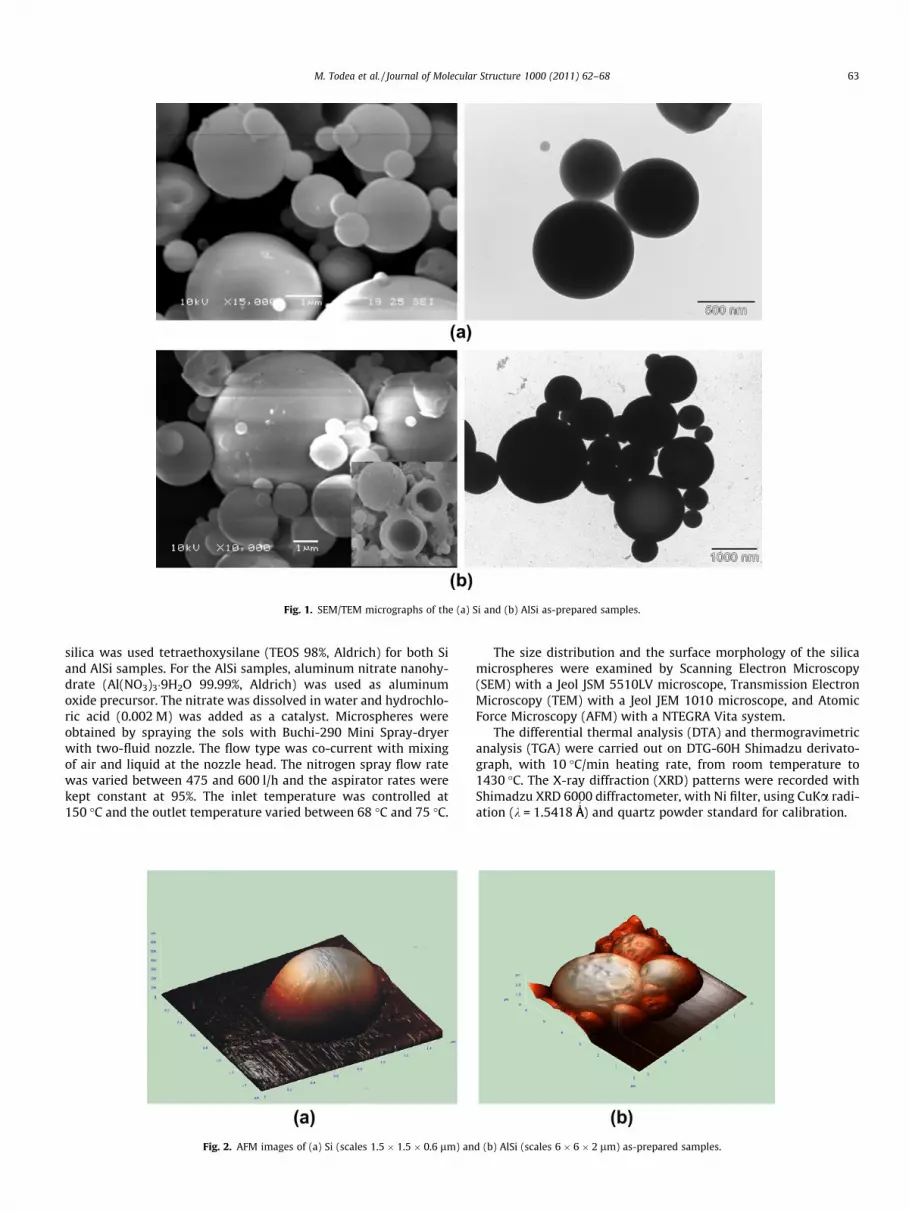
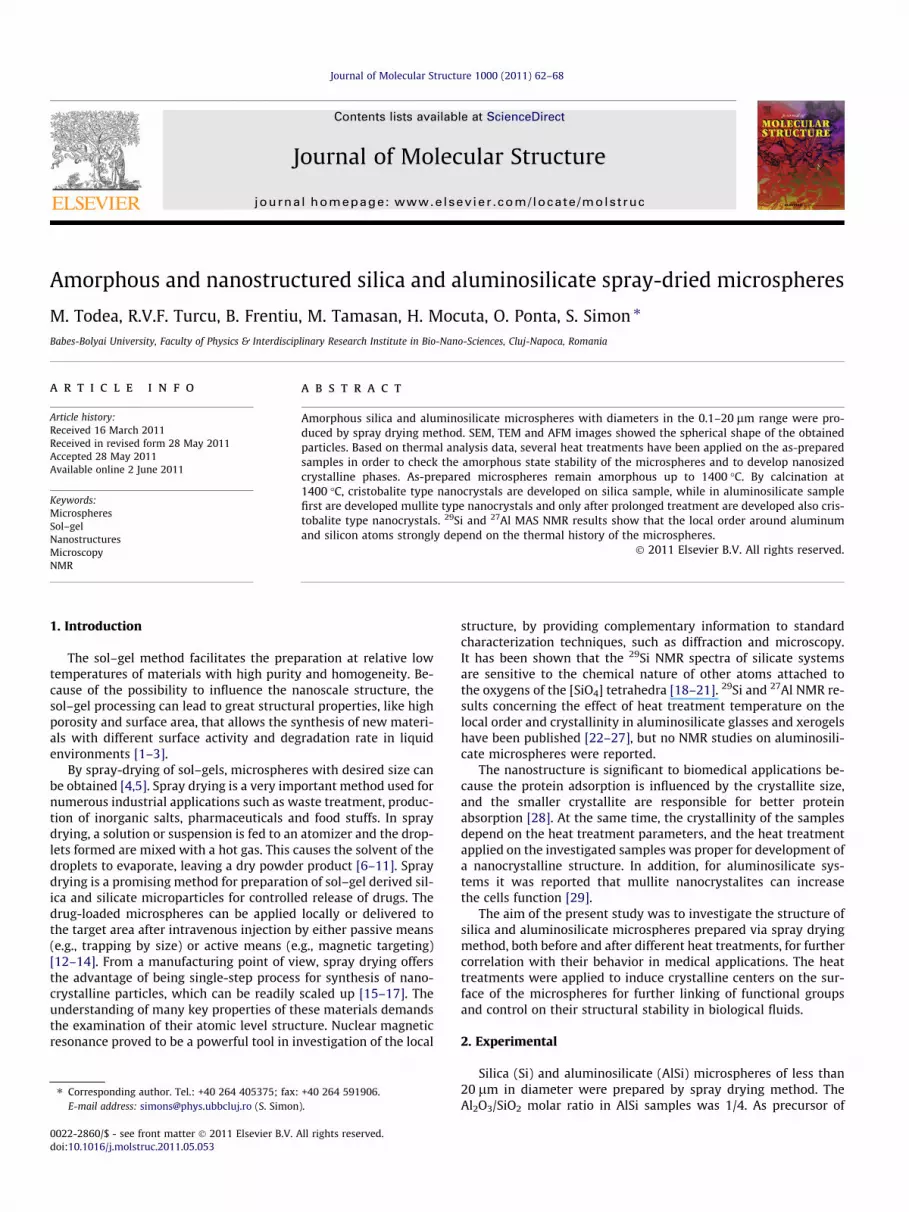
Fig. 1. SEM/TEM micrographs of the (a) Si and (b) AlSi as-prepared samples.
M. Todea et al. / Journal of Molecular Structure 1000 (2011) 62–68 63
silica was used tetraethoxysilane (TEOS 98%, Aldrich) for both Siand AlSi samples. For the AlSi samples, aluminum nitrate nanohy-drate (Al(NO3)3�9H2O 99.99%, Aldrich) was used as aluminumoxide precursor. The nitrate was dissolved in water and hydrochlo-ric acid (0.002 M) was added as a catalyst. Microspheres wereobtained by spraying the sols with Buchi-290 Mini Spray-dryerwith two-fluid nozzle. The flow type was co-current with mixingof air and liquid at the nozzle head. The nitrogen spray flow ratewas varied between 475 and 600 l/h and the aspirator rates werekept constant at 95%. The inlet temperature was controlled at150 �C and the outlet temperature varied between 68 �C and 75 �C.
Fig. 2. AFM images of (a) Si (scales 1.5 � 1.5 � 0.6 lm) an
The size distribution and the surface morphology of the silicamicrospheres were examined by Scanning Electron Microscopy(SEM) with a Jeol JSM 5510LV microscope, Transmission ElectronMicroscopy (TEM) with a Jeol JEM 1010 microscope, and AtomicForce Microscopy (AFM) with a NTEGRA Vita system.
The differential thermal analysis (DTA) and thermogravimetricanalysis (TGA) were carried out on DTG-60H Shimadzu derivato-graph, with 10 �C/min heating rate, from room temperature to1430 �C. The X-ray diffraction (XRD) patterns were recorded withShimadzu XRD 6000 diffractometer, with Ni filter, using CuKa radi-ation (k = 1.5418 ÅA
0
) and quartz powder standard for calibration.
d (b) AlSi (scales 6 � 6 � 2 lm) as-prepared samples.
200 400 600 800 1000 1200 1400Temp [C]
4.0
6.0
8.0
10.0
mgTGA
-60.0
-40.0
-20.0
0.0
uVDTA
75.00C
150.00C
220.00C
720.00C
1200.00C
720 C
220 C 150 C
75 C
1200 C
200 400 600 800 1000 1200 1400
Temp [C]
0.0
1.0
2.0
3.0
mgTGA
-30.0
-20.0
-10.0
0.0
uVDTA
90.00C
140.00C240.00C
800.00C90 C
140 C 240 C
800 C
(a)
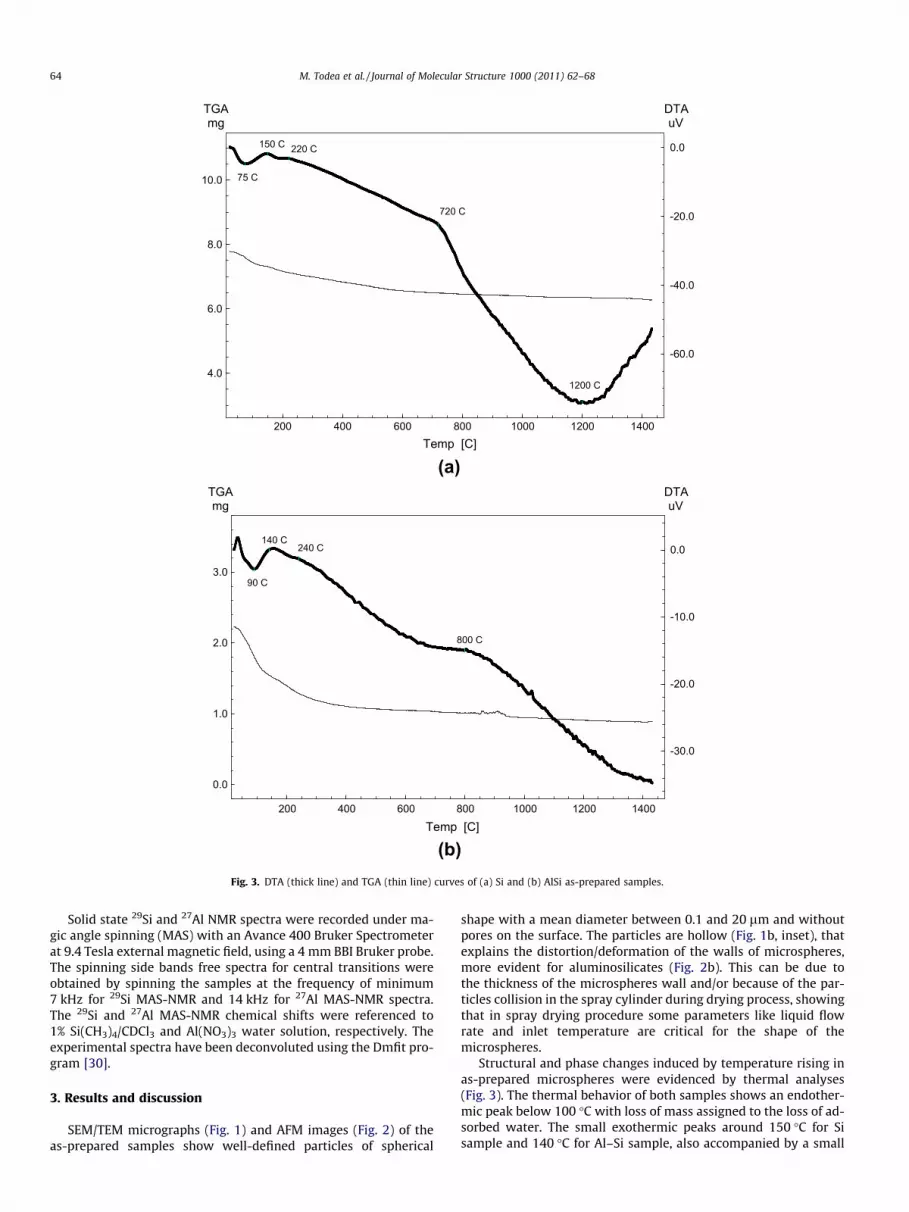
(b)Fig. 3. DTA (thick line) and TGA (thin line) curves of (a) Si and (b) AlSi as-prepared samples.
64 M. Todea et al. / Journal of Molecular Structure 1000 (2011) 62–68
Solid state 29Si and 27Al NMR spectra were recorded under ma-gic angle spinning (MAS) with an Avance 400 Bruker Spectrometerat 9.4 Tesla external magnetic field, using a 4 mm BBI Bruker probe.The spinning side bands free spectra for central transitions wereobtained by spinning the samples at the frequency of minimum7 kHz for 29Si MAS-NMR and 14 kHz for 27Al MAS-NMR spectra.The 29Si and 27Al MAS-NMR chemical shifts were referenced to1% Si(CH3)4/CDCl3 and Al(NO3)3 water solution, respectively. Theexperimental spectra have been deconvoluted using the Dmfit pro-gram [30].
3. Results and discussion
SEM/TEM micrographs (Fig. 1) and AFM images (Fig. 2) of theas-prepared samples show well-defined particles of spherical
shape with a mean diameter between 0.1 and 20 lm and withoutpores on the surface. The particles are hollow (Fig. 1b, inset), thatexplains the distortion/deformation of the walls of microspheres,more evident for aluminosilicates (Fig. 2b). This can be due tothe thickness of the microspheres wall and/or because of the par-ticles collision in the spray cylinder during drying process, showingthat in spray drying procedure some parameters like liquid flowrate and inlet temperature are critical for the shape of themicrospheres.
Structural and phase changes induced by temperature rising inas-prepared microspheres were evidenced by thermal analyses(Fig. 3). The thermal behavior of both samples shows an endother-mic peak below 100 �C with loss of mass assigned to the loss of ad-sorbed water. The small exothermic peaks around 150 �C for Sisample and 140 �C for Al–Si sample, also accompanied by a small
(212
)
(200
)
(102
)(1
11)
(101
)1400oC (30)
Inte
nsity
1400oC (0)
1200oC (30)
as prepared
300oC (30)
2 theta (degree)10 20 30 40 50 60 70
0 10 20 30 40 50 60 70 80 90
CC
300oC (30)
MMM
M
MMMM
M
M
MMM
MM - mulliteC - cristobaliteC
Inte
nsity
1400oC (10)
as prepared
1400oC (0)
2 theta (degree)
(110
)
(120
)(2
10)
(001
) (111
)
(201
)(1
21)
(230
)
(041
)
(430
)
(002
)
(220
)
(a)
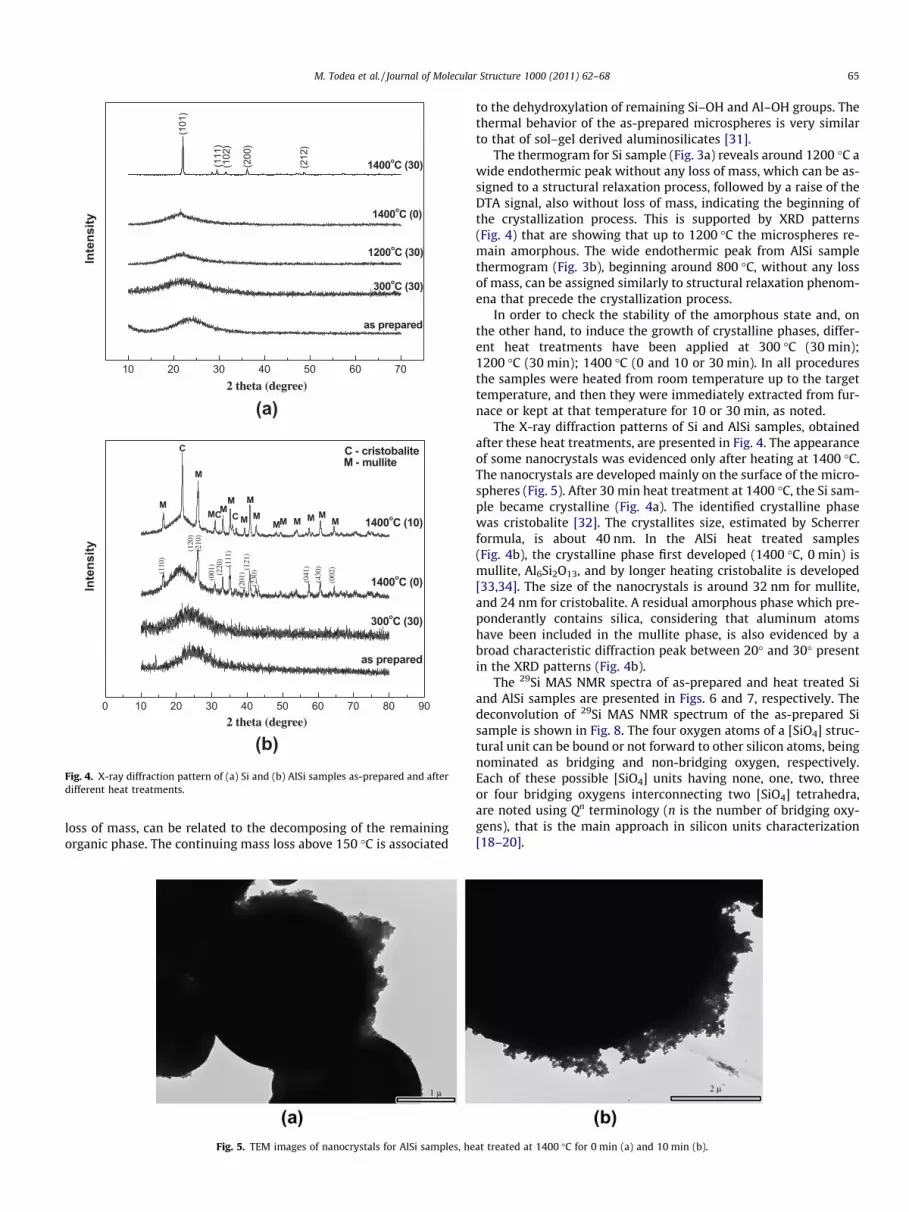
(b)Fig. 4. X-ray diffraction pattern of (a) Si and (b) AlSi samples as-prepared and afterdifferent heat treatments.
M. Todea et al. / Journal of Molecular Structure 1000 (2011) 62–68 65
loss of mass, can be related to the decomposing of the remainingorganic phase. The continuing mass loss above 150 �C is associated
Fig. 5. TEM images of nanocrystals for AlSi samples, he
to the dehydroxylation of remaining Si–OH and Al–OH groups. Thethermal behavior of the as-prepared microspheres is very similarto that of sol–gel derived aluminosilicates [31].
The thermogram for Si sample (Fig. 3a) reveals around 1200 �C awide endothermic peak without any loss of mass, which can be as-signed to a structural relaxation process, followed by a raise of theDTA signal, also without loss of mass, indicating the beginning ofthe crystallization process. This is supported by XRD patterns(Fig. 4) that are showing that up to 1200 �C the microspheres re-main amorphous. The wide endothermic peak from AlSi samplethermogram (Fig. 3b), beginning around 800 �C, without any lossof mass, can be assigned similarly to structural relaxation phenom-ena that precede the crystallization process.
In order to check the stability of the amorphous state and, onthe other hand, to induce the growth of crystalline phases, differ-ent heat treatments have been applied at 300 �C (30 min);1200 �C (30 min); 1400 �C (0 and 10 or 30 min). In all proceduresthe samples were heated from room temperature up to the targettemperature, and then they were immediately extracted from fur-nace or kept at that temperature for 10 or 30 min, as noted.
The X-ray diffraction patterns of Si and AlSi samples, obtainedafter these heat treatments, are presented in Fig. 4. The appearanceof some nanocrystals was evidenced only after heating at 1400 �C.The nanocrystals are developed mainly on the surface of the micro-spheres (Fig. 5). After 30 min heat treatment at 1400 �C, the Si sam-ple became crystalline (Fig. 4a). The identified crystalline phasewas cristobalite [32]. The crystallites size, estimated by Scherrerformula, is about 40 nm. In the AlSi heat treated samples(Fig. 4b), the crystalline phase first developed (1400 �C, 0 min) ismullite, Al6Si2O13, and by longer heating cristobalite is developed[33,34]. The size of the nanocrystals is around 32 nm for mullite,and 24 nm for cristobalite. A residual amorphous phase which pre-ponderantly contains silica, considering that aluminum atomshave been included in the mullite phase, is also evidenced by abroad characteristic diffraction peak between 20� and 30� presentin the XRD patterns (Fig. 4b).
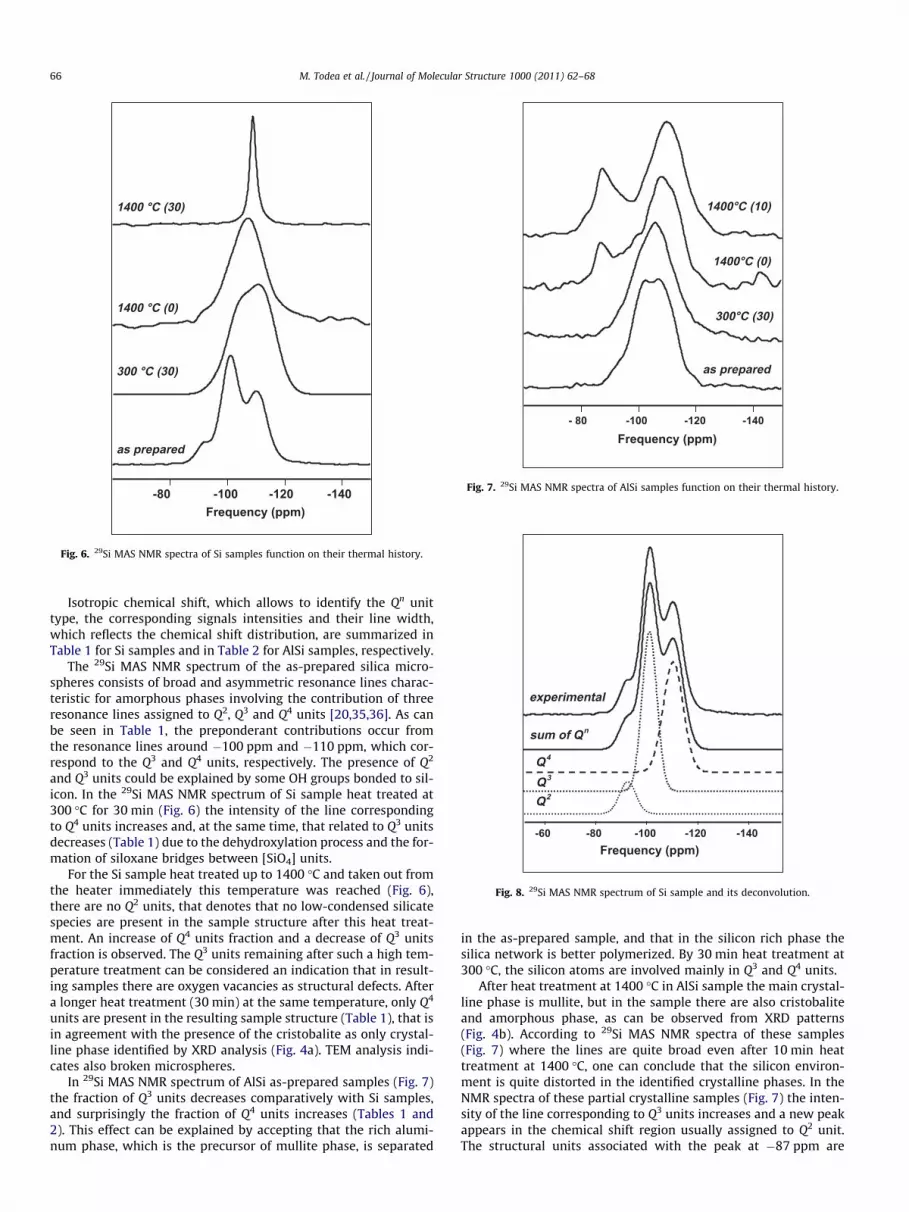
The 29Si MAS NMR spectra of as-prepared and heat treated Siand AlSi samples are presented in Figs. 6 and 7, respectively. Thedeconvolution of 29Si MAS NMR spectrum of the as-prepared Sisample is shown in Fig. 8. The four oxygen atoms of a [SiO4] struc-tural unit can be bound or not forward to other silicon atoms, beingnominated as bridging and non-bridging oxygen, respectively.Each of these possible [SiO4] units having none, one, two, threeor four bridging oxygens interconnecting two [SiO4] tetrahedra,are noted using Qn terminology (n is the number of bridging oxy-gens), that is the main approach in silicon units characterization[18–20].
at treated at 1400 �C for 0 min (a) and 10 min (b).
1400 °C (30)
1400 °C (0)
300 °C (30)
as prepared
-140-120-100-80Frequency (ppm)
Fig. 6. 29Si MAS NMR spectra of Si samples function on their thermal history.
1400°C (10)
1400°C (0)
as prepared
-140-120-100- 80Frequency (ppm)
300°C (30)
Fig. 7. 29Si MAS NMR spectra of AlSi samples function on their thermal history.
sum of Qn
Q4
Q3
Q2
Frequency (ppm)-140-120-100-80-60
experimental
Fig. 8. 29Si MAS NMR spectrum of Si sample and its deconvolution.
66 M. Todea et al. / Journal of Molecular Structure 1000 (2011) 62–68
Isotropic chemical shift, which allows to identify the Qn unittype, the corresponding signals intensities and their line width,which reflects the chemical shift distribution, are summarized inTable 1 for Si samples and in Table 2 for AlSi samples, respectively.
The 29Si MAS NMR spectrum of the as-prepared silica micro-spheres consists of broad and asymmetric resonance lines charac-teristic for amorphous phases involving the contribution of threeresonance lines assigned to Q2, Q3 and Q4 units [20,35,36]. As canbe seen in Table 1, the preponderant contributions occur fromthe resonance lines around �100 ppm and �110 ppm, which cor-respond to the Q3 and Q4 units, respectively. The presence of Q2
and Q3 units could be explained by some OH groups bonded to sil-icon. In the 29Si MAS NMR spectrum of Si sample heat treated at300 �C for 30 min (Fig. 6) the intensity of the line correspondingto Q4 units increases and, at the same time, that related to Q3 unitsdecreases (Table 1) due to the dehydroxylation process and the for-mation of siloxane bridges between [SiO4] units.
For the Si sample heat treated up to 1400 �C and taken out fromthe heater immediately this temperature was reached (Fig. 6),there are no Q2 units, that denotes that no low-condensed silicatespecies are present in the sample structure after this heat treat-ment. An increase of Q4 units fraction and a decrease of Q3 unitsfraction is observed. The Q3 units remaining after such a high tem-perature treatment can be considered an indication that in result-ing samples there are oxygen vacancies as structural defects. Aftera longer heat treatment (30 min) at the same temperature, only Q4
units are present in the resulting sample structure (Table 1), that isin agreement with the presence of the cristobalite as only crystal-line phase identified by XRD analysis (Fig. 4a). TEM analysis indi-cates also broken microspheres.
In 29Si MAS NMR spectrum of AlSi as-prepared samples (Fig. 7)the fraction of Q3 units decreases comparatively with Si samples,and surprisingly the fraction of Q4 units increases (Tables 1 and2). This effect can be explained by accepting that the rich alumi-num phase, which is the precursor of mullite phase, is separated
in the as-prepared sample, and that in the silicon rich phase thesilica network is better polymerized. By 30 min heat treatment at300 �C, the silicon atoms are involved mainly in Q3 and Q4 units.
After heat treatment at 1400 �C in AlSi sample the main crystal-line phase is mullite, but in the sample there are also cristobaliteand amorphous phase, as can be observed from XRD patterns(Fig. 4b). According to 29Si MAS NMR spectra of these samples(Fig. 7) where the lines are quite broad even after 10 min heattreatment at 1400 �C, one can conclude that the silicon environ-ment is quite distorted in the identified crystalline phases. In theNMR spectra of these partial crystalline samples (Fig. 7) the inten-sity of the line corresponding to Q3 units increases and a new peakappears in the chemical shift region usually assigned to Q2 unit.The structural units associated with the peak at �87 ppm are
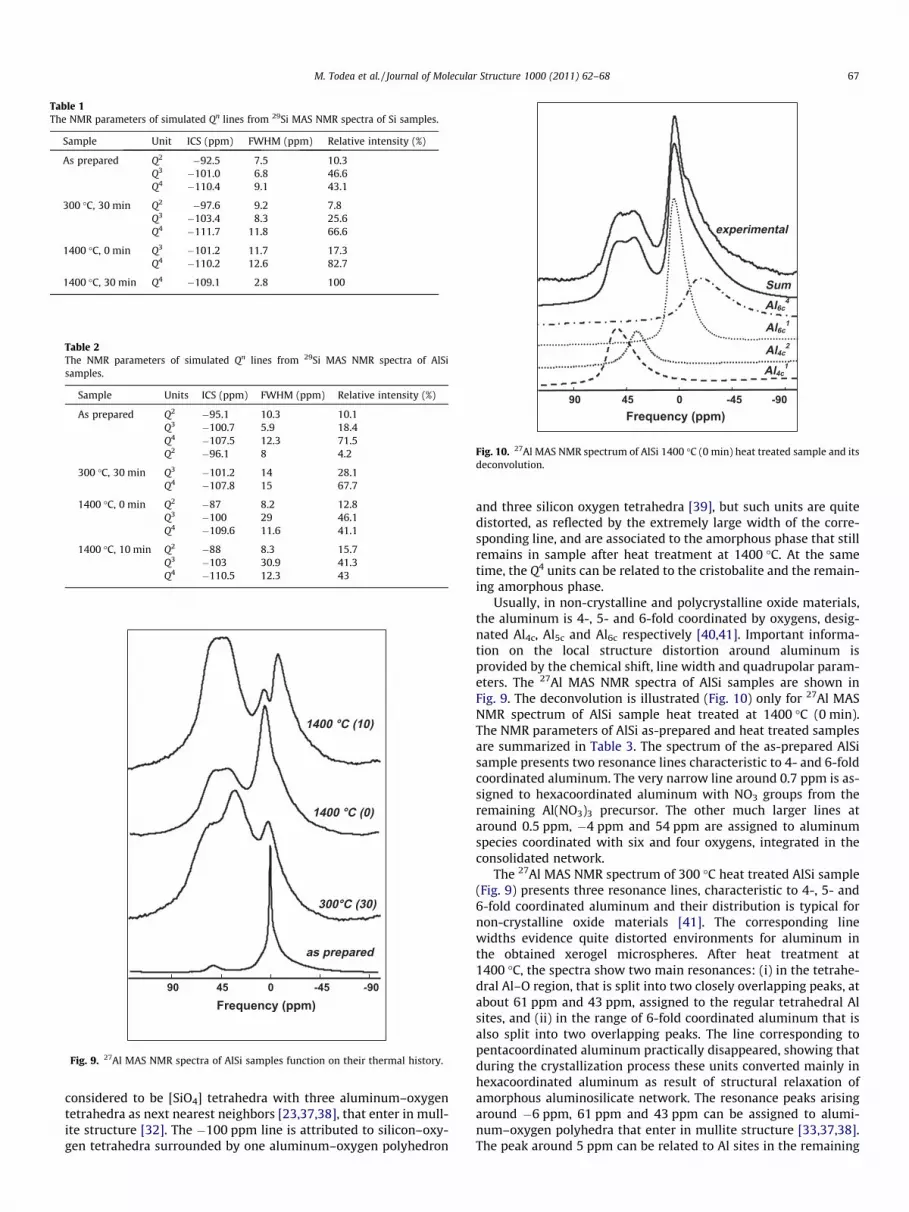
Table 1The NMR parameters of simulated Qn lines from 29Si MAS NMR spectra of Si samples.
Sample Unit ICS (ppm) FWHM (ppm) Relative intensity (%)
As prepared Q2 �92.5 7.5 10.3Q3 �101.0 6.8 46.6Q4 �110.4 9.1 43.1
300 �C, 30 min Q2 �97.6 9.2 7.8Q3 �103.4 8.3 25.6Q4 �111.7 11.8 66.6
1400 �C, 0 min Q3 �101.2 11.7 17.3Q4 �110.2 12.6 82.7
1400 �C, 30 min Q4 �109.1 2.8 100
Table 2The NMR parameters of simulated Qn lines from 29Si MAS NMR spectra of AlSsamples.
Sample Units ICS (ppm) FWHM (ppm) Relative intensity (%)
As prepared Q2 �95.1 10.3 10.1Q3 �100.7 5.9 18.4Q4 �107.5 12.3 71.5Q2 �96.1 8 4.2
300 �C, 30 min Q3 �101.2 14 28.1Q4 �107.8 15 67.7
1400 �C, 0 min Q2 �87 8.2 12.8Q3 �100 29 46.1Q4 �109.6 11.6 41.1
1400 �C, 10 min Q2 �88 8.3 15.7Q3 �103 30.9 41.3Q4 �110.5 12.3 43
0
300°C (30)
-90-454590Frequency (ppm)
as prepared
1400 °C (0)
1400 °C (10)
Fig. 9. 27Al MAS NMR spectra of AlSi samples function on their thermal history.
experimental
Al6c4
Sum
M. Todea et al. / Journal of Molecular Structure 1000 (2011) 62–68 67
i
Al6c1
Al4c2
Al4c1
-90-4504590Frequency (ppm)
Fig. 10. 27Al MAS NMR spectrum of AlSi 1400 �C (0 min) heat treated sample and itsdeconvolution.
considered to be [SiO4] tetrahedra with three aluminum–oxygentetrahedra as next nearest neighbors [23,37,38], that enter in mull-ite structure [32]. The �100 ppm line is attributed to silicon–oxy-gen tetrahedra surrounded by one aluminum–oxygen polyhedron
and three silicon oxygen tetrahedra [39], but such units are quitedistorted, as reflected by the extremely large width of the corre-sponding line, and are associated to the amorphous phase that stillremains in sample after heat treatment at 1400 �C. At the sametime, the Q4 units can be related to the cristobalite and the remain-ing amorphous phase.
Usually, in non-crystalline and polycrystalline oxide materials,the aluminum is 4-, 5- and 6-fold coordinated by oxygens, desig-nated Al4c, Al5c and Al6c respectively [40,41]. Important informa-tion on the local structure distortion around aluminum isprovided by the chemical shift, line width and quadrupolar param-eters. The 27Al MAS NMR spectra of AlSi samples are shown inFig. 9. The deconvolution is illustrated (Fig. 10) only for 27Al MASNMR spectrum of AlSi sample heat treated at 1400 �C (0 min).The NMR parameters of AlSi as-prepared and heat treated samplesare summarized in Table 3. The spectrum of the as-prepared AlSisample presents two resonance lines characteristic to 4- and 6-foldcoordinated aluminum. The very narrow line around 0.7 ppm is as-signed to hexacoordinated aluminum with NO3 groups from theremaining Al(NO3)3 precursor. The other much larger lines ataround 0.5 ppm, �4 ppm and 54 ppm are assigned to aluminumspecies coordinated with six and four oxygens, integrated in theconsolidated network.
The 27Al MAS NMR spectrum of 300 �C heat treated AlSi sample(Fig. 9) presents three resonance lines, characteristic to 4-, 5- and6-fold coordinated aluminum and their distribution is typical fornon-crystalline oxide materials [41]. The corresponding linewidths evidence quite distorted environments for aluminum inthe obtained xerogel microspheres. After heat treatment at1400 �C, the spectra show two main resonances: (i) in the tetrahe-dral Al–O region, that is split into two closely overlapping peaks, atabout 61 ppm and 43 ppm, assigned to the regular tetrahedral Alsites, and (ii) in the range of 6-fold coordinated aluminum that isalso split into two overlapping peaks. The line corresponding topentacoordinated aluminum practically disappeared, showing thatduring the crystallization process these units converted mainly inhexacoordinated aluminum as result of structural relaxation ofamorphous aluminosilicate network. The resonance peaks arisingaround �6 ppm, 61 ppm and 43 ppm can be assigned to alumi-num–oxygen polyhedra that enter in mullite structure [33,37,38].The peak around 5 ppm can be related to Al sites in the remaining
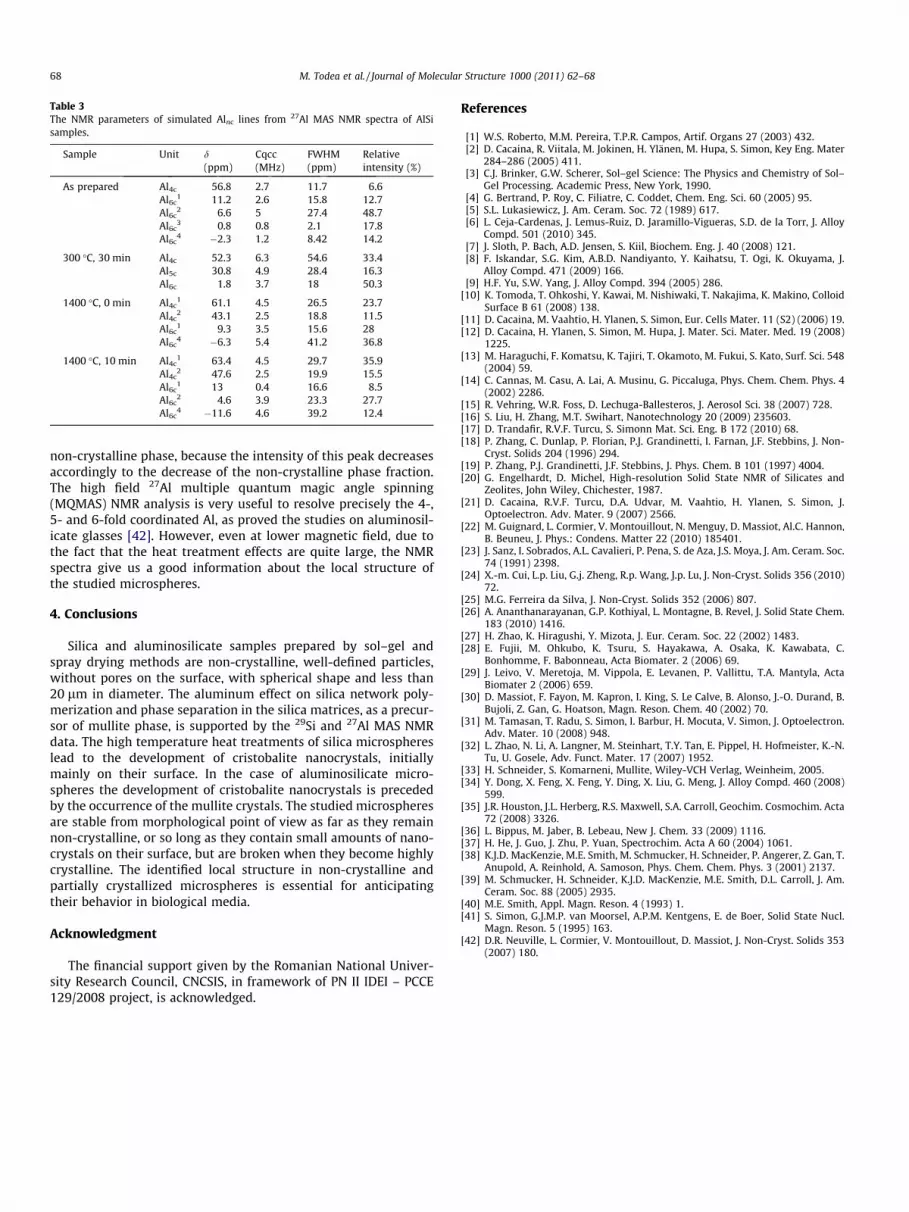
Table 3The NMR parameters of simulated Alnc lines from 27Al MAS NMR spectra of AlSisamples.
Sample Unit d(ppm)
Cqcc(MHz)
FWHM(ppm)
Relativeintensity (%)
As prepared Al4c 56.8 2.7 11.7 6.6Al6c
1 11.2 2.6 15.8 12.7Al6c
2 6.6 5 27.4 48.7Al6c
3 0.8 0.8 2.1 17.8Al6c
4 �2.3 1.2 8.42 14.2
300 �C, 30 min Al4c 52.3 6.3 54.6 33.4Al5c 30.8 4.9 28.4 16.3Al6c 1.8 3.7 18 50.3
1400 �C, 0 min Al4c1 61.1 4.5 26.5 23.7
Al4c2 43.1 2.5 18.8 11.5
Al6c1 9.3 3.5 15.6 28
Al6c4 �6.3 5.4 41.2 36.8
1400 �C, 10 min Al4c1 63.4 4.5 29.7 35.9
Al4c2 47.6 2.5 19.9 15.5
Al6c1 13 0.4 16.6 8.5
Al6c2 4.6 3.9 23.3 27.7
Al6c4 �11.6 4.6 39.2 12.4
68 M. Todea et al. / Journal of Molecular Structure 1000 (2011) 62–68
non-crystalline phase, because the intensity of this peak decreasesaccordingly to the decrease of the non-crystalline phase fraction.The high field 27Al multiple quantum magic angle spinning(MQMAS) NMR analysis is very useful to resolve precisely the 4-,5- and 6-fold coordinated Al, as proved the studies on aluminosil-icate glasses [42]. However, even at lower magnetic field, due tothe fact that the heat treatment effects are quite large, the NMRspectra give us a good information about the local structure ofthe studied microspheres.
4. Conclusions
Silica and aluminosilicate samples prepared by sol–gel andspray drying methods are non-crystalline, well-defined particles,without pores on the surface, with spherical shape and less than20 lm in diameter. The aluminum effect on silica network poly-merization and phase separation in the silica matrices, as a precur-sor of mullite phase, is supported by the 29Si and 27Al MAS NMRdata. The high temperature heat treatments of silica microsphereslead to the development of cristobalite nanocrystals, initiallymainly on their surface. In the case of aluminosilicate micro-spheres the development of cristobalite nanocrystals is precededby the occurrence of the mullite crystals. The studied microspheresare stable from morphological point of view as far as they remainnon-crystalline, or so long as they contain small amounts of nano-crystals on their surface, but are broken when they become highlycrystalline. The identified local structure in non-crystalline andpartially crystallized microspheres is essential for anticipatingtheir behavior in biological media.
Acknowledgment
The financial support given by the Romanian National Univer-sity Research Council, CNCSIS, in framework of PN II IDEI – PCCE129/2008 project, is acknowledged.
References
[1] W.S. Roberto, M.M. Pereira, T.P.R. Campos, Artif. Organs 27 (2003) 432.[2] D. Cacaina, R. Viitala, M. Jokinen, H. Ylänen, M. Hupa, S. Simon, Key Eng. Mater
284–286 (2005) 411.[3] C.J. Brinker, G.W. Scherer, Sol–gel Science: The Physics and Chemistry of Sol–
Gel Processing. Academic Press, New York, 1990.[4] G. Bertrand, P. Roy, C. Filiatre, C. Coddet, Chem. Eng. Sci. 60 (2005) 95.[5] S.L. Lukasiewicz, J. Am. Ceram. Soc. 72 (1989) 617.[6] L. Ceja-Cardenas, J. Lemus-Ruiz, D. Jaramillo-Vigueras, S.D. de la Torr, J. Alloy
Compd. 501 (2010) 345.[7] J. Sloth, P. Bach, A.D. Jensen, S. Kiil, Biochem. Eng. J. 40 (2008) 121.[8] F. Iskandar, S.G. Kim, A.B.D. Nandiyanto, Y. Kaihatsu, T. Ogi, K. Okuyama, J.
Alloy Compd. 471 (2009) 166.[9] H.F. Yu, S.W. Yang, J. Alloy Compd. 394 (2005) 286.
[10] K. Tomoda, T. Ohkoshi, Y. Kawai, M. Nishiwaki, T. Nakajima, K. Makino, ColloidSurface B 61 (2008) 138.
[11] D. Cacaina, M. Vaahtio, H. Ylanen, S. Simon, Eur. Cells Mater. 11 (S2) (2006) 19.[12] D. Cacaina, H. Ylanen, S. Simon, M. Hupa, J. Mater. Sci. Mater. Med. 19 (2008)
1225.[13] M. Haraguchi, F. Komatsu, K. Tajiri, T. Okamoto, M. Fukui, S. Kato, Surf. Sci. 548
(2004) 59.[14] C. Cannas, M. Casu, A. Lai, A. Musinu, G. Piccaluga, Phys. Chem. Chem. Phys. 4
(2002) 2286.[15] R. Vehring, W.R. Foss, D. Lechuga-Ballesteros, J. Aerosol Sci. 38 (2007) 728.[16] S. Liu, H. Zhang, M.T. Swihart, Nanotechnology 20 (2009) 235603.[17] D. Trandafir, R.V.F. Turcu, S. Simonn Mat. Sci. Eng. B 172 (2010) 68.[18] P. Zhang, C. Dunlap, P. Florian, P.J. Grandinetti, I. Farnan, J.F. Stebbins, J. Non-
Cryst. Solids 204 (1996) 294.[19] P. Zhang, P.J. Grandinetti, J.F. Stebbins, J. Phys. Chem. B 101 (1997) 4004.[20] G. Engelhardt, D. Michel, High-resolution Solid State NMR of Silicates and
Zeolites, John Wiley, Chichester, 1987.[21] D. Cacaina, R.V.F. Turcu, D.A. Udvar, M. Vaahtio, H. Ylanen, S. Simon, J.
Optoelectron. Adv. Mater. 9 (2007) 2566.[22] M. Guignard, L. Cormier, V. Montouillout, N. Menguy, D. Massiot, Al.C. Hannon,
B. Beuneu, J. Phys.: Condens. Matter 22 (2010) 185401.[23] J. Sanz, I. Sobrados, A.L. Cavalieri, P. Pena, S. de Aza, J.S. Moya, J. Am. Ceram. Soc.
74 (1991) 2398.[24] X.-m. Cui, L.p. Liu, G.j. Zheng, R.p. Wang, J.p. Lu, J. Non-Cryst. Solids 356 (2010)
72.[25] M.G. Ferreira da Silva, J. Non-Cryst. Solids 352 (2006) 807.[26] A. Ananthanarayanan, G.P. Kothiyal, L. Montagne, B. Revel, J. Solid State Chem.
183 (2010) 1416.[27] H. Zhao, K. Hiragushi, Y. Mizota, J. Eur. Ceram. Soc. 22 (2002) 1483.[28] E. Fujii, M. Ohkubo, K. Tsuru, S. Hayakawa, A. Osaka, K. Kawabata, C.
Bonhomme, F. Babonneau, Acta Biomater. 2 (2006) 69.[29] J. Leivo, V. Meretoja, M. Vippola, E. Levanen, P. Vallittu, T.A. Mantyla, Acta
Biomater 2 (2006) 659.[30] D. Massiot, F. Fayon, M. Kapron, I. King, S. Le Calve, B. Alonso, J.-O. Durand, B.
Bujoli, Z. Gan, G. Hoatson, Magn. Reson. Chem. 40 (2002) 70.[31] M. Tamasan, T. Radu, S. Simon, I. Barbur, H. Mocuta, V. Simon, J. Optoelectron.
Adv. Mater. 10 (2008) 948.[32] L. Zhao, N. Li, A. Langner, M. Steinhart, T.Y. Tan, E. Pippel, H. Hofmeister, K.-N.
Tu, U. Gosele, Adv. Funct. Mater. 17 (2007) 1952.[33] H. Schneider, S. Komarneni, Mullite, Wiley-VCH Verlag, Weinheim, 2005.[34] Y. Dong, X. Feng, X. Feng, Y. Ding, X. Liu, G. Meng, J. Alloy Compd. 460 (2008)
599.[35] J.R. Houston, J.L. Herberg, R.S. Maxwell, S.A. Carroll, Geochim. Cosmochim. Acta
72 (2008) 3326.[36] L. Bippus, M. Jaber, B. Lebeau, New J. Chem. 33 (2009) 1116.[37] H. He, J. Guo, J. Zhu, P. Yuan, Spectrochim. Acta A 60 (2004) 1061.[38] K.J.D. MacKenzie, M.E. Smith, M. Schmucker, H. Schneider, P. Angerer, Z. Gan, T.
Anupold, A. Reinhold, A. Samoson, Phys. Chem. Chem. Phys. 3 (2001) 2137.[39] M. Schmucker, H. Schneider, K.J.D. MacKenzie, M.E. Smith, D.L. Carroll, J. Am.
Ceram. Soc. 88 (2005) 2935.[40] M.E. Smith, Appl. Magn. Reson. 4 (1993) 1.[41] S. Simon, G.J.M.P. van Moorsel, A.P.M. Kentgens, E. de Boer, Solid State Nucl.
Magn. Reson. 5 (1995) 163.[42] D.R. Neuville, L. Cormier, V. Montouillout, D. Massiot, J. Non-Cryst. Solids 353
(2007) 180.