american eagle annual report - 2015.pdf - retail innovation
TRANSCRIPT

A N N U A L R E P O R T | 2 0 1 5

Aerie is bras, undies, swim, and so much more. We are committed to making girls of all sizes
feel good about their real selves.
#AerieREAL started as no retouching, but has grown to mean so much more. Thanks to the shared
stories and support of Aerie girls everywhere, #AerieREAL also means body positivity and loving
your REAL self. Inside and out.
HONEST. FUN. RELAXED. SEXY. NATURAL. STRONG. REAL.
THE REAL YOU IS SEXY ®
WE ARE AN: OPTIMISTIC, AUTHENTIC, ENERGETIC AMERICAN BRAND, ROOTED IN OUR HERITAGE AND PASSION FOR DENIM.
WE WORK TO CRAFT HIGH-QUALITY, ON-TREND CLOTHING PERFECT FOR
EVERY INDIVIDUAL STYLE.
WE ARE REAL. WE FIT EVERYONE. WE WELCOME ALL.
L I V E Y O U R L I F E

AMERICAN EAGLEOUTFITTERS, INC.
Dear Fellow Stockholders:In Fiscal 2015 we made progress on our initiatives, which resulted in an outstanding year for American EagleOutfitters, Inc. We achieved strong sales and earnings growth in a year that was highly challenging for much of theretail apparel industry. Strategic initiatives implemented to deliver improved merchandise, a stronger customerexperience and operating efficiencies fueled growth and enabled us to manage the business well. We controlledpromotions and leveraged expenses, resulting in a higher operating margin. For Fiscal 2015, revenue rose 7% andearnings per share grew 73%1 to $1.09. As I reflect back on the year, there were a number of highlights across thebusiness:
• The American Eagle brand recorded an outstanding year. Greater quality and value, combined withinnovation infused across the collections, struck a chord with customers.
• Our Aerie brand took off in Fiscal 2015, achieving record sales and profitability. Strong assortments and apowerful advertising campaign attracted new customers.
• Across brands, our digital business increased over 20%, driving more than $110 million of sales growth.Recent investments in technology upgrades and omni-channel tools are delivering returns to our business.
• In Fiscal 2015, we were pleased to add Tailgate and Todd Snyder to our portfolio of brands, which weanticipate will provide long-term positives, including Todd’s strong creative vision, new talent and excitingnew growth vehicles.
• The financials were strong, and we ended the year with $260 million in cash and no debt. In Fiscal 2015, wereturned cash to stockholders through $227 million in share repurchases and $97 million in dividends.
Now, we are focused on fueling business momentum and aim to broaden the appeal of our brands. We will continueto raise the bar across our collections. The teams are absolutely committed to maintaining a leadership position inproduct, continuously delivering compelling, innovative merchandise. In Fiscal 2016, we will ramp up customerengagement to strengthen the emotional connection with customers and appeal to a broader, global consumer base.Investments in technologies will continue and center on enhancing our capabilities and delivering the very best digitalexperience. We will also remain focused on driving operational excellence across the company.
As we work to strengthen and grow our business, we also remain committed to giving back and supporting ourcommunities. Our Company and associates continue to take part in community involvement and contribute tocharitable causes, focusing on: the environment; youth empowerment and education; young women’s health; workerrights; and equality.
It’s an exciting time for American Eagle Outfitters, Inc. I am extremely grateful for the dedication and passion of ourhighly talented associates. Together, we look forward to delivering further success in Fiscal 2016.
Thank you for your continued support.
Jay L. SchottensteinExecutive Chairman of the Board and Chief Executive Officer
1 Fiscal year 2014 adjusted EPS of $0.63 compares to GAAP EPS of $0.46, which includes ($0.17) of restructuring and asset impairment charges.See page 19 of our Fiscal 2015 10-K for additional detail on the charges and other important information regarding the use of non-GAAP oradjusted measures.
UNITED STATESSECURITIES AND EXCHANGE COMMISSION
Washington, D.C. 20549
Form 10-KÈ ANNUAL REPORT PURSUANT TO SECTION 13 OR 15(d) OF THE SECURITIES
EXCHANGE ACT OF 1934For the Fiscal Year Ended January 30, 2016
OR
‘ TRANSITION REPORT PURSUANT TO SECTION 13 OR 15(d) OF THE SECURITIESEXCHANGE ACT OF 1934
Commission File Number: 1-33338
American Eagle Outfitters, Inc.(Exact name of registrant as specified in its charter)
Delaware No. 13-2721761(State or other jurisdiction ofincorporation or organization)
(I.R.S. EmployerIdentification No.)
77 Hot Metal Street, Pittsburgh, PA 15203-2329(Address of principal executive offices) (Zip Code)
Registrant’s telephone number, including area code:(412) 432-3300
Securities registered pursuant to Section 12(b) of the Act:Common Shares, $0.01 par value New York Stock Exchange
(Title of class) (Name of each exchange on which registered)
Securities registered pursuant to Section 12(g) of the Act:None
Indicate by check mark if the registrant is a well-known seasoned issuer, as defined in Rule 405 of the Securities Act. YES È NO ‘
Indicate by check mark if the registrant is not required to file reports pursuant to Section 13 or Sections 15(d) of the Act. YES ‘ NO È
Indicate by check mark whether the registrant (1) has filed all reports required to be filed by Section 13 or 15(d) of the Securities Exchange Act of1934 during the preceding 12 months (or for such shorter period that the registrant was required to file such reports), and (2) has been subject tothe filing requirements for at the past 90 days. YES È NO ‘
Indicate by check mark whether the registrant has submitted electronically and posted on its corporate Web site, if any, every Interactive Data Filerequired to be submitted and posted pursuant to Rule 405 of Regulation S-T (§232.405 of this chapter) during the preceding 12 months (or forsuch shorter period that the registrant was required to submit and post such files). YES È NO ‘
Indicate by check mark if disclosure of delinquent filers pursuant to Item 405 of Regulation S-K (§229.405 of this chapter) is not contained herein,and will not be contained, to the best of registrant’s knowledge, in definitive proxy or information statements incorporated by reference in Part III ofthis Form 10-K or any amendment to this Form 10-K. ‘Indicate by check mark whether the registrant is a large accelerated filer, an accelerated filer, a non-accelerated filer, or a smaller reportingcompany. See the definitions of “large accelerated filer,” “accelerated filer” and “smaller reporting company” in Rule 12b-2 of the Exchange Act.(Check one):Large accelerated filer È Accelerated filer ‘
Non-accelerated filer ‘ (Do not check if a smaller reporting company) Smaller reporting company ‘
Indicate by check mark whether the registrant is a shell company (as defined in Rule 12b-2 of the Act). YES ‘ NO È
The aggregate market value of voting and non-voting common equity held by non-affiliates of the registrant as of August 1, 2015 was$3,211,142,684.Indicate the number of shares outstanding of each of the registrant’s classes of common stock, as of the latest practicable date: 180,659,762Common Shares were outstanding at March 7, 2016.
DOCUMENTS INCORPORATED BY REFERENCEPart III — Proxy Statement for 2016 Annual Meeting of Stockholders, in part, as indicated.

AMERICAN EAGLE OUTFITTERS, INC.TABLE OF CONTENTS
PageNumber
PART I
Item 1. Business . . . . . . . . . . . . . . . . . . . . . . . . . . . . . . . . . . . . . . . . . . . . . . . . . . . . . . . . . . . . . . . . . . . . . . . . . . . . . . . . . . . . . . . . 3Item 1A. Risk Factors . . . . . . . . . . . . . . . . . . . . . . . . . . . . . . . . . . . . . . . . . . . . . . . . . . . . . . . . . . . . . . . . . . . . . . . . . . . . . . . . . . . . 8Item 1B. Unresolved Staff Comments . . . . . . . . . . . . . . . . . . . . . . . . . . . . . . . . . . . . . . . . . . . . . . . . . . . . . . . . . . . . . . . . . . . . . . . 11Item 2. Properties . . . . . . . . . . . . . . . . . . . . . . . . . . . . . . . . . . . . . . . . . . . . . . . . . . . . . . . . . . . . . . . . . . . . . . . . . . . . . . . . . . . . . . . 11Item 3. Legal Proceedings . . . . . . . . . . . . . . . . . . . . . . . . . . . . . . . . . . . . . . . . . . . . . . . . . . . . . . . . . . . . . . . . . . . . . . . . . . . . . . . . 11Item 4. Mine Safety Disclosures . . . . . . . . . . . . . . . . . . . . . . . . . . . . . . . . . . . . . . . . . . . . . . . . . . . . . . . . . . . . . . . . . . . . . . . . . . . 11
PART II
Item 5. Market for the Registrant’s Common Equity, Related Stockholder Matters and Issuer Purchases of EquitySecurities . . . . . . . . . . . . . . . . . . . . . . . . . . . . . . . . . . . . . . . . . . . . . . . . . . . . . . . . . . . . . . . . . . . . . . . . . . . . . . . . . . . . . . . . . . . . 12
Item 6. Selected Consolidated Financial Data . . . . . . . . . . . . . . . . . . . . . . . . . . . . . . . . . . . . . . . . . . . . . . . . . . . . . . . . . . . . . . . . 15Item 7. Management’s Discussion and Analysis of Financial Condition and Results of Operations . . . . . . . . . . . . . . . . . . . . 16Item 7A. Quantitative and Qualitative Disclosures About Market Risk . . . . . . . . . . . . . . . . . . . . . . . . . . . . . . . . . . . . . . . . . . . . 28Item 8. Financial Statements and Supplementary Data . . . . . . . . . . . . . . . . . . . . . . . . . . . . . . . . . . . . . . . . . . . . . . . . . . . . . . . . 29Item 9. Changes in and Disagreements with Accountants on Accounting and Financial Disclosure . . . . . . . . . . . . . . . . . . . 57Item 9A. Controls and Procedures . . . . . . . . . . . . . . . . . . . . . . . . . . . . . . . . . . . . . . . . . . . . . . . . . . . . . . . . . . . . . . . . . . . . . . . . . 57Item 9B. Other Information . . . . . . . . . . . . . . . . . . . . . . . . . . . . . . . . . . . . . . . . . . . . . . . . . . . . . . . . . . . . . . . . . . . . . . . . . . . . . . . . 59
PART III
Item 10. Directors, Executive Officers and Corporate Governance . . . . . . . . . . . . . . . . . . . . . . . . . . . . . . . . . . . . . . . . . . . . . . 59Item 11. Executive Compensation . . . . . . . . . . . . . . . . . . . . . . . . . . . . . . . . . . . . . . . . . . . . . . . . . . . . . . . . . . . . . . . . . . . . . . . . . 59Item 12. Security Ownership of Certain Beneficial Owners and Management and Related Stockholder Matters . . . . . . . . . 59Item 13. Certain Relationships and Related Transactions, and Director Independence . . . . . . . . . . . . . . . . . . . . . . . . . . . . . 59Item 14. Principal Accounting Fees and Services . . . . . . . . . . . . . . . . . . . . . . . . . . . . . . . . . . . . . . . . . . . . . . . . . . . . . . . . . . . . . 59
PART IV
Item 15. Exhibits, Financial Statement Schedules . . . . . . . . . . . . . . . . . . . . . . . . . . . . . . . . . . . . . . . . . . . . . . . . . . . . . . . . . . . . . 60

PART IItem 1. Business.
General
American Eagle Outfitters, Inc., (“AEO Inc.,” the “Company,” “we,” “our”) a Delaware corporation, was founded in 1977. We are aleading specialty retailer, operating over 1,000 retail stores and online at ae.com and aerie.com in the U.S. and internationally. Weoffer a broad assortment of apparel and accessories for men and women under the American Eagle Outfitters brand, andintimates, apparel and personal care products for women under the Aerie brand. AEO Inc. operates stores in the United States,Canada, Mexico, Hong Kong, China and the United Kingdom. We also have license agreements with third parties to operateAmerican Eagle Outfitters and Aerie stores throughout Asia, Europe, Latin America and the Middle East. As of January 30, 2016,we operated 949 American Eagle Outfitters stores and 97 Aerie stand-alone stores. Our licensed store base has grown to 141locations in 22 countries and our online business ships to 81 countries worldwide.
Information concerning our segments and certain geographic information is contained in Note 2 of the Consolidated FinancialStatements included in this Form 10-K and is incorporated herein by reference. Additionally, a five-year summary of certainfinancial and operating information can be found in Part II, Item 6, Selected Consolidated Financial Data, of this Form 10-K. Seealso Part II, Item 8, Financial Statements and Supplementary Data.
Brands
American Eagle Outfitters Brand (“AEO Brand”)
The AEO Brand is an optimistic, authentic, energetic American brand. Our passion for denim is at the heart of everything we do,and our bottoms collection is complemented by a rich assortment of other apparel categories, as well as footwear andaccessories. We work to craft high-quality, on-trend clothing that represents a terrific value in every style. Each season, it is ourgoal to create an aspirational collection and campaign that encourages our customers to take what we make, and LIVE YOURLIFE.
As of January 30, 2016, the AEO Brand operated 949 stores and online at ae.com.
Aerie
Aerie is an intimates brand, offering bras, undies, swim and so much more for every girl. Aerie embodies a youthful spirit, which isfun, relaxed, sexy, natural, strong and real. We are committed to not retouching our images and our brand DNA is deeply rootedin our Aerie REAL campaign, which focuses on body positivity and inspiring confidence in our customers. We believe beautycomes from the inside out.
As of January 30, 2016, the Aerie brand operates 97 stand-alone stores and 67 side-by-side stores connected to AEO brandstores. In addition, the Aerie brand is sold in AEO brand stores and online at aerie.com.
Other brands
On November 2, 2015, AEO Inc. acquired Tailgate Clothing Company, which owns and operates Tailgate, a vintage, sports-inspired apparel brand with a college town store concept, and Todd Snyder New York, a premium menswear brand. As ofJanuary 30, 2016, we operated one Tailgate store in Iowa City, Iowa. Tailgate and Todd Snyder product is also sold online atTailgateClothing.com and ToddSnyder.com, respectively.
Business Priorities & Strategy
We are focused on delivering revenue growth and improved profitability as we execute on our key priorities. Our current prioritiesinclude:
• Capitalize on the strength of our brands to achieve growth through continued product innovation and product-focusedmarketing across both stores and digital channels to drive customer acquisition.
• Grow the Aerie brand through digital expansion, new customer acquisition and new store growth.
2015 Annual Report | 3

ITEM 1. BUSINESS
• Grow the digital business through our continued focus on advancing mobile, investing in digital marketing, expanding ourproduct offerings and improving the desktop experience.
• Pursue international expansion by advancing our digital capabilities and through our blended approach of licensed andCompany-owned store growth.
Real Estate
We ended Fiscal 2015 with 1,188 Company-owned and licensed store locations. Our AEO brand stores average approximately6,500 gross square feet and approximately 5,200 on a selling square foot basis. Our Aerie brand stores average approximately3,900 gross square feet and approximately 3,000 on a selling square foot basis. The gross square footage of our Company-owned stores remained flat during Fiscal 2015.
Company-Owned Stores
Our Company-owned retail stores are located in shopping malls, lifestyle centers and street locations in the U.S., Canada,Mexico, China, Hong Kong and the United Kingdom. Stores are located in high-traffic locations in most retail centers in which weoperate.
The following table provides the number of our Company-owned stores in operation as of January 30, 2016 and January 31, 2015.
January 30,2016
January 31,2015
AEO Brand:
United States 822 834
Canada 86 86
Mexico 23 18
China 9 9
Hong Kong 6 5
United Kingdom 3 3
Total AEO Brand 949 955
Aerie Brand:
United States 82 86
Canada 15 15
Mexico — —
Total Aerie Brand 97 101
Tailgate 1 —
Total Consolidated 1,047 1,056
The following table provides the changes in the number of our Company-owned stores for the past five fiscal years:
Fiscal YearBeginning of
Year Opened Closed End of Year
2015 1,056 23 (32) 1,047
2014 1,066 60 (70) 1,056
2013 1,044 64 (42) 1,066
2012 1,069 16 (41) 1,044
2011 1,077 21 (29) 1,069
4 | AMERICAN EAGLE OUTFITTERS, INC.
ITEM 1. BUSINESS
Licensed Stores
In addition to our Company-owned stores, our merchandise is sold at stores operated by licensees. Under these agreements, ourmerchandise is sold at American Eagle Outfitters and Aerie stores owned and operated by third party operators. Revenuerecognized under license agreements generally consists of royalties earned and recognized upon sale of merchandise byfranchise and license partners to retail customers.
As of January 30, 2016, our products are sold at 141 locations operated by licensees in 22 countries. We continue to increase thenumber of locations under these types of arrangements as part of our balanced approach to global expansion.
AEO Direct
We sell merchandise through our websites, ae.com and aerie.com, both domestically and internationally. The websites reinforceeach particular brand’s lifestyle, and are designed to complement the in-store experience.
Over the past several years, we have invested in building its technologies and digital capabilities. We focused our investments inthree key areas: making significant advances in mobile technology, investing in digital marketing and improving the desktopexperience.
Omni-Channel
In addition to our investments in technology, we have invested in building omni-channel capabilities to better serve customers andgain operational efficiencies. These upgraded technologies have provided a single view of inventory across channels, connectingphysical stores directly to our digital business, providing our customers with a more convenient and improved shoppingexperience. Our store-to-door tool enables store customers to seamlessly make purchases from online inventory. Additionally, wefulfill online orders at stores through our buy online, ship from store tool, improving online order fulfillment rates. We also offer areserve online, pick up in store service to our customers. We will continue to optimize these tools and services to build ongoingimprovements to the customer shopping experience.
Merchandise Suppliers
We design our merchandise, which is manufactured by third-party factories. During Fiscal 2015, we purchased substantially all ofour merchandise from non-North American suppliers. For the year, we sourced merchandise through approximately 300 vendorslocated throughout the world, primarily in Asia, and did not source more than 10% of our merchandise from any single factory orsupplier during the year.
We maintain a quality control department at our distribution centers to inspect incoming merchandise shipments for overall qualityof manufacturing. Periodic inspections are also made by our employees and agents at manufacturing facilities to identify qualityissues prior to shipment of merchandise.
We uphold an extensive factory inspection program to monitor compliance with our Vendor Code of Conduct. New garmentfactories must pass an initial inspection in order to do business with us and we continue to review their social complianceperformance both through internal audits by our compliance team and through the use of third-party monitors. We strive to partnerwith suppliers who respect local laws and share our dedication to utilize best practices in human rights, labor rights,environmental practices and workplace safety.
Inventory and Distribution
Merchandise is shipped directly from our vendors to our U.S. distribution centers in Hazelton, Pennsylvania and Ottawa, Kansas,or to our Canadian distribution center in Mississauga, Ontario. Additionally, an increasing amount of product is shipped directly tostores, by-passing our distribution centers which reduces transit times and lowers operating costs. We contract with third-partydistribution centers in the Netherlands, Mexico City, Hong Kong and Shanghai.
We strive to maintain sufficient quantities of inventory in our retail stores and distribution centers to offer customers a full selectionof current merchandise. We emphasize rapid turnover and take markdowns as required to keep merchandise fresh and current.
Regulation
We and our products are subject to regulation by various federal, state, local and foreign regulatory authorities. We are subject toa variety of customs regulations and international trade arrangements.
2015 Annual Report | 5
ITEM 1. BUSINESS
Competition
The retail apparel industry is highly competitive both in stores and on-line. We compete with various individual and chain specialtystores, as well as the casual apparel and footwear departments of department stores and discount retailers, primarily on the basisof quality, fashion, service, selection and price.
Trademarks and Service Marks
We have registered AMERICAN EAGLE OUTFITTERS®, AMERICAN EAGLE®, AE®, AEO®, LIVE YOUR LIFE®, Aerie® and theFlying Eagle Design with the United States Patent and Trademark Office. We also have registered or have applied to registerthese trademarks with the registries of the foreign countries in which our stores and/or manufacturers are located and/or whereour product is shipped.
We have registered AMERICAN EAGLE OUTFITTERS®, AMERICAN EAGLE®, AEO®, LIVE YOUR LIFE®, Aerie® and the FlyingEagle Design with the Canadian Intellectual Property Office. In addition, we have acquired rights in AETM for clothing products andregistered AE® in connection with certain non-clothing products.
In the U.S. and in other countries around the world, we also have registered, or have applied to register, a number of other marksused in our business, including our pocket stitch designs.
These registered trademarks are renewable indefinitely, and their registrations are properly maintained in accordance with thelaws of the country in which they are registered. We believe that the recognition associated with these trademarks makes themextremely valuable and, therefore, we intend to use and renew our trademarks in accordance with our business plans.
Employees
As of January 30, 2016, we had approximately 37,800 employees in the United States, Canada, Mexico, Hong Kong, China andthe United Kingdom of whom approximately 31,300 were part-time and seasonal hourly employees.
Executive Officers of the Registrant
Mary M. Boland, age 58, has served as our Executive Vice President, Chief Financial and Administrative Officer, and PrincipalFinancial Officer since July 2012. Prior to joining us, Ms. Boland served Levi Strauss & Co. as Senior Vice President Finance ofGlobal Levi’s from 2011 to 2012 and as Senior Vice President Finance of the Americas from 2006 to 2011. Prior to that time,Ms. Boland held a variety of finance positions with General Motors Corporation from 1979 to 2006 including Vice President andChief Financial Officer, North America from 2003 to 2006.
Jennifer M. Foyle, age 49, has served as our Global Brand President – Aerie since January 2015. Prior thereto, Ms. Foyle servedas Executive Vice President, Chief Merchandising Officer – Aerie from February 2014 to January 2015 and Senior Vice President,Chief Merchandising Officer – Aerie from August 2010 to February 2014. Prior to joining us, Ms. Foyle was President of CalypsoSt. Barth from 2009 to 2010. In addition, she held various positions at J. Crew Group, Inc., including Chief Merchandising Officer,from 2003 to 2009.
Charles F. Kessler, age 43, has served as our Global Brand President – American Eagle Outfitters since January 2015. Priorthereto, he served as our Executive Vice President, Chief Merchandising and Design Officer – American Eagle Outfitters fromFebruary 2014 to January 2015. Prior to joining us, Mr. Kessler served as Chief Merchandising Officer at Urban Outfitters, Inc.from October 2011 to November 2013 and as Senior Vice President, Corporate Merchandising at Coach, Inc. from July 2010 toOctober 2011. Prior to that time, Mr. Kessler held various positions with Abercrombie & Fitch Co. from 1994 to 2010, includingExecutive Vice President, Female Merchandising from 2008 to 2010.
Michael R. Rempell, age 42, has served as our Executive Vice President and Chief Operations Officer since June 2012. Priorthereto, he served as our Executive Vice President and Chief Operating Officer, New York Design Center, from April 2009 to June2012, as Senior Vice President and Chief Supply Chain Officer from May 2006 to April 2009, and in various other positions sincejoining us in February 2000.
Jay L. Schottenstein, age 61, has served as our Executive Chairman, Chief Executive Officer since December 2015. Prior thereto,Mr. Schottenstein served as our Executive Chairman, Interim Chief Executive Officer from January 2014 to December 2015. Hehas also served as our Chairman and its predecessors since March 1992. He served as our Chief Executive Officer from March1992 until December 2002 and prior to that time, he served as a Vice President and Director of our predecessors since 1980. Hehas also served as Chairman of the Board and Chief Executive Officer of Schottenstein Stores Corporation (“SSC”) since March1992 and as President since 2001. Prior thereto, Mr. Schottenstein served as Vice Chairman of SSC from 1986 to 1992. He has
6 | AMERICAN EAGLE OUTFITTERS, INC.

ITEM 1. BUSINESS
been a Director of SSC since 1982. Mr. Schottenstein also served as Chief Executive Officer from March 2005 to April 2009 andas Chairman of the Board since March 2005 of DSW Inc., a company traded on the New York Stock Exchange. He has alsoserved as an officer and director of various other entities owned or controlled by members of his family since 1976.
Fiscal Year
Our fiscal year ends on the Saturday nearest to January 31. As used herein, “Fiscal 2016” refers to the 52 week period endingJanuary 28, 2017. “Fiscal 2015”, “Fiscal 2014” and “Fiscal 2013” refer to the 52-week periods ended January 30,2016, January 31, 2015 and February 1, 2014, respectively. “Fiscal 2012” refers to the 53-week period ended February 2, 2013.
Available Information
Our Annual Reports on Form 10-K, Quarterly Reports on Form 10-Q, Current Reports on Form 8-K and amendments to thosereports are available under the “Investors” section of our website at www.ae.com. These reports are available as soon asreasonably practicable after such material is electronically filed with the Securities and Exchange Commission (the “SEC”).
Our corporate governance materials, including our corporate governance guidelines, the charters of our audit, compensation,and nominating and corporate governance committees, and our code of ethics may also be found under the “Investors.” sectionof our website at www.ae.com. Any amendments or waivers to our code of ethics will also be available on our website. A copy ofthe corporate governance materials is also available upon written request.
Additionally, our investor presentations are available under the “Investors” section of our website at www.ae.com. Thesepresentations are available as soon as reasonably practicable after they are presented at investor conferences.
Certifications
As required by the New York Stock Exchange (“NYSE”) Corporate Governance Standards Section 303A.12(a), on June 24, 2015,our Chief Executive Officer submitted to the NYSE a certification that he was not aware of any violation by the Company of NYSEcorporate governance listing standards. Additionally, we filed with this Form 10-K, the Principal Executive Officer and PrincipalFinancial Officer certifications required under Sections 302 and 906 of the Sarbanes-Oxley Act of 2002.
2015 Annual Report | 7

Item 1A. Risk Factors
Our inability to anticipate and respond to changing consumer preferences, fashion trends and acompetitive environment in a timely manner
Our future success depends, in part, upon our ability to identify and respond to fashion trends in a timely manner. The specialtyretail apparel business fluctuates according to changes in the economy and customer preferences, dictated by fashion andseason. These fluctuations especially affect the inventory owned by apparel retailers because merchandise typically must beordered well in advance of the selling season. While we endeavor to test many merchandise items before ordering largequantities, we are still susceptible to changing fashion trends and fluctuations in customer demands.
In addition, the cyclical nature of the retail business requires that we carry a significant amount of inventory, especially during ourpeak selling seasons. We enter into agreements for the manufacture and purchase of our private label apparel well in advance ofthe applicable selling season. As a result, we are vulnerable to changes in consumer demand, pricing shifts and the timing andselection of merchandise purchases. The failure to enter into agreements for the manufacture and purchase of merchandise in atimely manner could, among other things, lead to a shortage of inventory and lower sales. Changes in fashion trends, ifunsuccessfully identified, forecasted or responded to by us, could, among other things, lead to lower sales, excess inventoriesand higher markdowns, which in turn could have a material adverse effect on our results of operations and financial condition.
The effect of economic pressures and other business factors
The success of our operations depends to a significant extent upon a number of factors relating to discretionary consumerspending, including economic conditions affecting disposable consumer income such as payroll taxes, employment, consumerdebt, interest rates, increases in energy costs and consumer confidence. There can be no assurance that consumer spending willnot be further negatively affected by general, local or international economic conditions, thereby adversely impacting ourbusiness and results of operations.
Seasonality
Historically, our operations have been seasonal, with a large portion of total net revenue and operating income occurring in thethird and fourth fiscal quarters, reflecting increased demand during the back-to-school and year-end holiday selling seasons,respectively. As a result of this seasonality, any factors negatively affecting us during the third and fourth fiscal quarters of anyyear, including adverse weather or unfavorable economic conditions, could have a material adverse effect on our financialcondition and results of operations for the entire year. Our quarterly results of operations also may fluctuate based upon suchfactors as the timing of certain holiday seasons, the number and timing of new store openings, the acceptability of seasonalmerchandise offerings, the timing and level of markdowns, store closings and remodels, competitive factors, weather and generaleconomic conditions.
Our inability to react to raw material cost, labor and energy cost increases
Increases in our costs, such as raw materials, labor and energy may reduce our overall profitability. Specifically, fluctuations in thecost associated with the manufacture of merchandise we purchase from our suppliers impacts our cost of sales. We havestrategies in place to help mitigate these costs; however, our overall profitability depends on the success of thosestrategies. Additionally, increases in other costs, including labor and energy, could further reduce our profitability if not mitigated.
Our inability to achieve planned store financial performance
The results achieved by our stores may not be indicative of long-term performance or the potential performance of stores in otherlocations. The failure of stores to achieve acceptable results could result in additional store asset impairment charges, whichcould adversely affect our results of operations and financial condition.
Our ability to rebalance our store fleet and drive improved performance through new store openings,selective closings and existing store remodels and expansions
Our inability to drive improved performance will depend in part on our ability to rebalance our store fleet and expand and remodelexisting stores on a timely and profitable basis. During Fiscal 2016, we plan to open approximately 15 to 20 new American EagleOutfitters stores and approximately 10 new Aerie stores in North America and continue our international expansion. Additionally,we plan to remodel and refurbish 55 to 65 existing American Eagle Outfitters stores and close approximately 30 to 35 stores
8 | AMERICAN EAGLE OUTFITTERS, INC.

ITEM 1A. RISK FACTORS
during Fiscal 2016. Accomplishing our store rebalancing and expansion goals will depend upon a number of factors, includingthe ability to obtain suitable sites for new and expanded stores at acceptable costs, the hiring and training of qualified personnel,particularly at the store management level, the integration of new stores into existing operations and the expansion of our buyingand inventory capabilities. There can be no assurance that we will be able to achieve our store expansion and rebalancing goals,manage our growth effectively, migrate the business from closing stores to other stores or our direct business, successfullyintegrate the planned new stores into our operations or operate our new and remodeled stores profitably.
Our efforts to expand internationally
We are actively pursuing additional international expansion initiatives, which include wholly-owned stores and stores operated bythird parties in select international markets. The effect of these arrangements on our business and results of operations isuncertain and will depend upon various factors, including the demand for our products in new markets internationally.Furthermore, although we provide store operation training, literature and support, to the extent that the franchisee, licensee orother operator does not operate its stores in a manner consistent with our requirements regarding our brand and customerexperience standards, our business results and the value of our brand could be negatively impacted.
A failure to properly implement our expansion initiatives, or the adverse impact of political or economic risks in these internationalmarkets, could have a material adverse effect on our results of operations and financial condition. We have limited priorexperience operating internationally, where we face established competitors. In many of these locations, the real estate, labor andemployment, transportation and logistics and other operating requirements differ dramatically from those in the locations wherewe have more experience. Consumer demand and behavior, as well as tastes and purchasing trends, may differ substantially,and as a result, sales of our products may not be successful, or the margins on those sales may not be in line with those wecurrently anticipate. Any differences that we encounter as we expand internationally may divert financial, operational andmanagerial resources from our existing operations, which could adversely impact our financial condition and results of operations.In addition, we are increasingly exposed to foreign currency exchange rate risk with respect to our revenue, profits, assets, andliabilities denominated in currencies other than the U.S. dollar. We may in the future use instruments to hedge certain foreigncurrency risks; however, these measures may not succeed in offsetting all of the negative impact of foreign currency ratemovements on our business and results of operations.
As we pursue our international expansion initiatives, we are subject to certain laws, including the Foreign Corrupt Practices Act, aswell as the laws of the foreign countries in which we operate. Violations of these laws could subject us to sanctions or otherpenalties that could have an adverse effect on our reputation, operating results and financial condition.
Our international merchandise sourcing strategy
Our merchandise is manufactured by suppliers worldwide. Although we purchase a significant portion of our merchandisethrough a single international buying agent, we do not maintain any exclusive commitments to purchase from any one vendor.Because we have a global supply chain, any event causing the disruption of imports, including the insolvency of a significantsupplier or a major labor slow-down, strike or dispute including any such actions involving ports, transloaders, consolidators orshippers, could have an adverse effect on our operations. Given the volatility and risk in the current markets, our reliance onexternal vendors leaves us subject to certain risks should one or more of these external vendors become insolvent. Although wemonitor the financial stability of our key vendors and plan for contingencies, the financial failure of a key vendor could disrupt ouroperations and have an adverse effect on our cash flows, results of operations and financial condition. Other events that couldalso cause a disruption of imports include the imposition of additional trade law provisions or import restrictions, such asincreased duties, tariffs, anti-dumping provisions, increased United States Customs and Border Protection (CBP) enforcementactions, or political or economic disruptions.
We have a Vendor Code of Conduct (the “Code”) that provides guidelines for our vendors regarding working conditions,employment practices and compliance with local laws. A copy of the Code is posted on our website, www.ae.com, and is alsoincluded in our vendor manual in English and multiple other languages. We have a factory compliance program to audit forcompliance with the Code. However, there can be no assurance that all violations can be eliminated in our supply chain. Publicityregarding violation of our Code or other social responsibility standards by any of our vendor factories could adversely affect ourreputation, sales and financial performance.
We believe that there is a risk of terrorist activity on a global basis. Such activity might take the form of a physical act that impedesthe flow of imported goods or the insertion of a harmful or injurious agent to an imported shipment. We have instituted policies andprocedures designed to reduce the chance or impact of such actions. Examples include, but are not limited to, factory audits andself-assessments, including audit protocols on all critical security issues; the review of security procedures of our otherinternational trading partners, including forwarders, consolidators, shippers and brokers; and the cancellation of agreements with
2015 Annual Report | 9

ITEM 1A. RISK FACTORS
entities who fail to meet our security requirements. In addition, CBP has recognized us as a validated participant of theCustoms — Trade Partnership Against Terrorism program, a voluntary program in which an importer agrees to work with customsto strengthen overall supply chain security. However, there can be no assurance that terrorist activity can be prevented entirelyand we cannot predict the likelihood of any such activities or the extent of their adverse impact on our operations.
Our reliance on our ability to implement and sustain information technology systemsWe regularly evaluate our information technology systems and are currently implementing modifications and/or upgrades to theinformation technology systems that support our business. Modifications include replacing legacy systems with successorsystems, making changes to legacy systems or acquiring new systems with new functionality. We are aware of inherent risksassociated with operating, replacing and modifying these systems, including inaccurate system information and systemdisruptions. We believe we are taking appropriate action to mitigate the risks through testing, training, staging implementation andin-sourcing certain processes, as well as securing appropriate commercial contracts with third-party vendors supplying suchreplacement and redundancy technologies; however, there is a risk that information technology system disruptions andinaccurate system information, if not anticipated and/or promptly and appropriately mitigated, could have a material adverseeffect on our results of operations.
Our inability to safeguard against security breaches with respect to our information technologysystemsOur business employs systems and websites that allow for the storage and transmission of proprietary or confidential informationregarding our business, customers and employees including credit card information. Security breaches could expose us to a riskof loss or misuse of this information and potential liability. We may not be able to anticipate or prevent rapidly evolving types ofcyber-attacks. Actual or anticipated attacks may cause us to incur increasing costs including costs to deploy additional personneland protection technologies, train employees and engage third party experts and consultants. Advances in computer capabilities,new technological discoveries or other developments may result in the technology used by us to protect transaction or other databeing breached or compromised. Data and security breaches can also occur as a result of non-technical issues includingintentional or inadvertent breach by employees or persons with whom we have commercial relationships that result in theunauthorized release of personal or confidential information. Any compromise or breach could result in a violation of applicableprivacy and other laws, significant financial exposure and a loss of confidence in our security measures, which could have anadverse effect on our results of operations and our reputation.
Our reliance on key personnelOur success depends to a significant extent upon our ability to attract and retain qualified key personnel, including seniormanagement. Collective or individual changes in our senior management and other key personnel could have an adverse effecton our ability to determine and execute our strategies, which could adversely affect our business and results of operations. Thereis a high level of competition for senior management and other key personnel, and we cannot be assured we will be able toattract, retain and develop a sufficient number of qualified senior managers and other key personnel.
Failure to comply with regulatory requirementsAs a public company, we are subject to numerous regulatory requirements, including those imposed by the Sarbanes-Oxley Actof 2002, the SEC and the NYSE. In addition, we are subject to numerous domestic and foreign laws and regulations affecting ourbusiness, including those related to labor, employment, worker health and safety, competition, privacy, consumer protection,import/export and anti-corruption, including the Foreign Corrupt Practices Act. Although we have put into place policies andprocedures aimed at ensuring legal and regulatory compliance, our employees, subcontractors, vendors and suppliers couldtake actions that violate these requirements, which could have a material adverse effect on our reputation, financial condition andon the market price of our common stock. In addition, recent regulatory developments regarding the use of “conflict minerals,”certain minerals originating from the Democratic Republic of Congo and adjoining countries, could affect the sourcing andavailability of raw materials used by suppliers and subject us to costs associated with the regulations, including for the diligencepertaining to the presence of any conflict minerals used in our products, possible changes to products, processes or sources ofour inputs, and reporting requirements.
Fluctuations in foreign currency exchange rates could adversely impact our financial condition andresults of operationsWe have foreign currency exchange rate risk with respect to revenues, expenses, assets and liabilities denominated in currenciesother than the U.S. dollar. We currently do not utilize hedging instruments to mitigate foreign currency exchange risks.
10 | AMERICAN EAGLE OUTFITTERS, INC.
ITEM 1A. RISK FACTORS
Specifically, fluctuations in the value of the Canadian Dollar, Mexican Peso, Chinese Yuan, Hong Kong Dollar, British Pound andEuro against the U.S. Dollar could have a material adverse effect on our results of operations, financial condition and cash flows.
Other risk factorsAdditionally, other factors could adversely affect our financial performance, including factors such as: our ability to successfullyacquire and integrate other businesses; any interruption of our key infrastructure systems, including exceeding capacity in ourdistribution centers; any disaster or casualty resulting in the interruption of service from our distribution centers or in a largenumber of our stores; any interruption of our business related to an outbreak of a pandemic disease in a country where we sourceor market our merchandise; extreme weather conditions or changes in climate conditions or weather patterns; the effects ofchanges in current exchange rates and interest rates; and international and domestic acts of terror.
The impact of any of the previously discussed factors, some of which are beyond our control, may cause our actual results todiffer materially from expected results in these statements and other forward-looking statements we may make from time-to-time.
Item 1B. Unresolved Staff Comments.Not applicable.
Item 2. Properties.We own two buildings in urban Pittsburgh, Pennsylvania which house our corporate headquarters. These buildings total 186,000square feet and 150,000 square feet, respectively. We lease one location near our headquarters, which is used primarily for storeand corporate support services, totaling approximately 51,000 square feet. This lease expires in 2022.
In suburban Pittsburgh, Pennsylvania, we own a 45,000 square foot building, which houses our data center and additional officespace and lease an additional location of approximately 18,000 square feet, which is used for storage space. This lease expiresin 2017.
We rent approximately 142,000 square feet of office space in New York, New York for our designers and sourcing and productionteams. The lease for this space expires in May 2026. We also lease an additional 35,000 square feet of office space in New York,New York, with various terms expiring through 2016.
We lease 9,200 square feet of office space in San Francisco, California that functions as a technology center for our engineersand digital marketing team focused on our omni-channel strategy. The lease for this space expires in 2019.
We also lease offices in international locations including 5,800 square feet in Mexico City expiring in 2020, 15,400 square feet inHong Kong expiring in 2017 and 11,300 square feet in Shanghai, China expiring in 2017.
We own a distribution facility in Ottawa, Kansas consisting of approximately 1,220,000 total square feet. This facility is used tosupport new and existing growth initiatives, including AEO Direct and Aerie.
We opened a new distribution facility in 2014 in Hazleton, Pennsylvania consisting of approximately 1,000,000 total square feet.This is designed to enable faster, more efficient product deliveries and to support our long-term expansion goals.
We lease a building in Mississauga, Ontario with approximately 294,000 square feet, which houses our Canadian distributioncenter. The lease expires in 2018.
We lease our flagship store in the Times Square area of New York, New York. The 25,000 square foot location has an initial term of15 years with three options to renew for five years each. This flagship store opened in November 2009 and the initial lease termexpires in 2024.
All of our stores are leased and generally have initial terms of 10 years. Certain leases also include early termination options,which can be exercised under specific conditions. Most of these leases provide for base rent and require the payment of apercentage of sales as additional contingent rent when sales reach specified levels. Under our store leases, we are typicallyresponsible for tenant occupancy costs, including maintenance and common area charges, real estate taxes and certain otherexpenses. We have generally been successful in negotiating renewals as leases near expiration.
Item 3. Legal Proceedings.We are a party to various legal actions incidental to our business, including certain actions in which we are the plaintiff. At this time,our management does not expect the results of any of the legal actions to be material to our financial position or results of operations.
Item 4. Mine Safety Disclosures.Not Applicable
2015 Annual Report | 11

PART IIItem 5. Market for the Registrant’s Common Equity, Related Stockholder Matters andIssuer Purchases of Equity Securities.
Our common stock is traded on the NYSE under the symbol “AEO”. As of March 7, 2016, there were 512 stockholders of record.However, when including associates who own shares through our employee stock purchase plan, and others holding shares inbroker accounts under street name, we estimate the stockholder base at approximately 65,000. The following table sets forth therange of high and low closing prices of the common stock as reported on the NYSE during the periods indicated.
Market Price Cash Dividends perCommon ShareFor the Quarters Ended High Low
January 30, 2016 $16.64 $13.24 $0.125
October 31, 2015 $18.35 $14.68 $0.125
August 1, 2015 $18.31 $15.74 $0.125
May 2, 2015 $17.90 $13.96 $0.125
January 31, 2015 $14.63 $11.91 $0.125
November 1, 2014 $14.81 $10.42 $0.125
August 2, 2014 $11.97 $10.28 $0.125
May 3, 2014 $14.85 $10.95 $0.125
During Fiscal 2015 and Fiscal 2014, we paid quarterly dividends as shown in the table above. The payment of future dividends isat the discretion of our Board of Directors (the “Board”) and is based on future earnings, cash flow, financial condition, capitalrequirements, changes in U.S. taxation and other relevant factors. It is anticipated that any future dividends paid will be declaredon a quarterly basis.
12 | AMERICAN EAGLE OUTFITTERS, INC.

ITEM 5. MARKET FOR REGISTRANTS COMMON EQUITY, RELATED STOCKHOLDER MATTERS ANDISSUER PURCHASES OF EQUITY SECURITIES
Performance Graph
The following Performance Graph and related information shall not be deemed “soliciting material” or to be filed with the SEC, norshall such information be incorporated by reference into any future filing under the Securities Act of 1933 or Securities ExchangeAct of 1934, each as amended, except to the extent that we specifically incorporate it by reference into such filing.
The following graph compares the changes in the cumulative total return to holders of our common stock with that of the S&PMidcap 400 and the Dynamic Retail Intellidex. The comparison of the cumulative total returns for each investment assumes that$100 was invested in our common stock and the respective index on January 29, 2011 and includes reinvestment of all dividends.The plotted points are based on the closing price on the last trading day of the fiscal year indicated.
COMPARISON OF 5 YEAR CUMULATIVE TOTAL RETURN*Among American Eagle Outfitters, Inc., the S&P Midcap 400 Index and
Dynamic Retail Intellidex
$0
$50
$100
$150
$200
$250
$300
$350
1/29/11 1/28/12 2/2/13 2/1/14 1/31/15 1/30/16
American Eagle Outfitters, Inc. S&P Midcap 400 Dynamic Retail Intellidex
*$100 invested on 1/29/11 in stock or 1/31/11 in index, including reinvestment of dividends.Index calculated on month-end basis.
Copyright© 2016 S&P, a division of McGraw Hill Financial. All rights reserved.
1/29/11 1/28/12 2/2/13 2/1/14 1/31/15 1/30/16
American Eagle Outfitters, Inc. 100.00 99.30 157.61 108.24 116.77 125.51
S&P Midcap 400 100.00 102.71 121.77 148.39 164.55 153.54
Dynamic Retail Intellidex 100.00 118.07 151.92 188.17 261.55 294.64
2015 Annual Report | 13

ITEM 5. MARKET FOR REGISTRANTS COMMON EQUITY, RELATED STOCKHOLDER MATTERS ANDISSUER PURCHASES OF EQUITY SECURITIES
The following table provides information regarding our repurchases of common stock during the three months ended January 30,2016.
Issuer Purchases of Equity Securities
Period
TotalNumber of
Shares Purchased (1)
AveragePrice Paid
Per Share (2)
Total Number ofShares Purchased as
Part of PubliclyAnnounced Programs (1)(3)
Maximum Number ofShares that May
Yet be PurchasedUnder the Program (3)
Month #1 (November 1, 2015through November 28, 2015) — $ — — 17,400,000
Month #2 (November 29, 2015through January 2, 2016) 1,649,352 $15.69 1,649,116 15,750,884
Month #3 (January 3, 2016through January 30, 2016) 12,913,868 $14.36 12,913,868 2,837,016
Total 14,563,220 $14.51 14,562,984 2,837,016(1) There were 14.6 million shares repurchased as part of our publicly announced share repurchase program during the three months ended
January 30, 2016 and there were 236 shares repurchased for the payment of taxes in connection with the vesting of share-based payments.
(2) Average price paid per share excludes any broker commissions paid.
(3) In January 2013, our Board authorized the repurchase of 20.0 million shares of our common stock. The authorization of the remaining2.8 million shares that may yet be purchased expires on January 28, 2017.
The following table sets forth additional information as of the end of Fiscal 2015, about shares of our common stock that may beissued upon the exercise of options and other rights under our existing equity compensation plans and arrangements, dividedbetween plans approved by our stockholders and plans or arrangements not submitted to our stockholders for approval. Theinformation includes the number of shares covered by and the weighted average exercise price of, outstanding options and otherrights and the number of shares remaining available for future grants excluding the shares to be issued upon exercise ofoutstanding options, warrants and other rights.
Unregistered Sale of Equity Securities and Use of Proceeds
On November 2, 2015, the Company issued 197,496 shares of common stock, with the approximate value of $3,087,000, tocertain former stockholders of Tailgate Clothing Company, Corp. (“Tailgate”) in connection with the Company’s acquisition ofTailgate. These shares were issued in a private placement exempt from the registration requirements of the Securities Act of 1933,as amended (the “Securities Act”), in reliance on the exemptions set forth in Section 4(a)(2) of the Securities Act and Rule 506promulgated thereunder.
Equity Compensation Plan TableColumn (a) Column (b) Column (c)
Number of securitiesto be issued upon
exercise of outstandingoptions,
warrants and rights (1)
Weighted-averageexercise price of
outstanding options,warrants and
rights (1)
Number of securitiesremaining availablefor issuance under
equity compensationplans (excluding
securities reflectedin column (a)) (1)
Equity compensation plans approved bystockholders 1,212,930 $14.83 6,009,946
Equity compensation plans not approved bystockholders — — —
Total 1,212,930 $14.83 6,009,946(1) Equity compensation plans approved by stockholders include the 1999 Stock Incentive Plan, the 2005 Stock Award and Incentive Plan, as
amended (the “2005 Plan”), and the 2014 Stock Award and Incentive Plan (the “2014 Plan”).
14 | AMERICAN EAGLE OUTFITTERS, INC.

Item 6. Selected Consolidated Financial Data.The following Selected Consolidated Financial Data should be read in conjunction with “Management’s Discussion and Analysisof Financial Condition and Results of Operations,” included under Item 7 below and the Consolidated Financial Statements andNotes thereto, included in Item 8 below. Most of the selected Consolidated Financial Statements data presented below is derivedfrom our Consolidated Financial Statements, if applicable, which are filed in response to Item 8 below. The selected ConsolidatedStatement of Operations data for the years ended February 2, 2013 and January 28, 2012 and the selected Consolidated BalanceSheet data as of February 1, 2014, February 2, 2013 and January 28, 2012 are derived from audited Consolidated FinancialStatements not included herein.
For the Years Ended (1)
(In thousands, except per share amounts, ratios and otherfinancial information)
January 30,2016
January 31,2015
February 1,2014
February 2,2013
January 28,2012
Summary of Operations (2)
Total net revenue $3,521,848 $3,282,867 $3,305,802 $3,475,802 $3,120,065
Comparable sales increase (decrease) (3) 7% (5)% (6)% 9% 4%
Gross profit $1,302,734 $1,154,674 $1,113,999 $1,390,322 $1,144,594
Gross profit as a percentage of net sales 37.0% 35.2% 33.7% 40.0% 36.7%
Operating income $ 319,878 $ 155,765 $ 141,055 $ 394,606 $ 269,335
Operating income as a percentage of net sales 9.1% 4.7% 4.3% 11.4% 8.6%
Income from continuing operations $ 213,291 $ 88,787 $ 82,983 $ 264,098 $ 175,279
Income from continuing operations as a percentage ofnet sales 6.1% 2.6% 2.5% 7.6% 5.6%
Per Share Results
Income from continuing operations per commonshare-basic $ 1.10 $ 0.46 $ 0.43 $ 1.35 $ 0.90
Income from continuing operations per commonshare-diluted $ 1.09 $ 0.46 $ 0.43 $ 1.32 $ 0.89
Weighted average common shares outstanding —basic 194,351 194,437 192,802 196,211 194,445
Weighted average common shares outstanding —diluted 196,237 195,135 194,475 200,665 196,314
Cash dividends per common share $ 0.50 $ 0.50 $ 0.38 $ 2.05 $ 0.44
Balance Sheet Information
Total cash and short-term investments $ 260,067 $ 410,697 $ 428,935 $ 630,992 $ 745,044
Long-term investments $ — $ — $ — $ — $ 847
Total assets $1,612,246 $1,696,908 $1,694,164 $1,756,053 $1,950,802
Short-term debt $ — $ — $ — $ — $ —
Long-term debt $ — $ — $ — $ — $ —
Stockholders’ equity $1,051,376 $1,139,746 $1,166,178 $1,221,187 $1,416,851
Working capital $ 259,693 $ 368,947 $ 462,604 $ 647,668 $ 833,326
Current ratio 1.56 1.80 2.11 2.49 3.06
Average return on stockholders’ equity 19.9% 7.0% 7.0% 17.6% 11.0%
Other Financial Information (2)
Total stores at year-end 1,047 1,056 1,066 1,044 1,069
Capital expenditures $ 153,256 $ 245,002 $ 278,499 $ 93,939 $ 89,466
Net sales per average selling square foot (4) $ 545 $ 525 $ 547 $ 602 $ 547
Total selling square feet at end of period 5,285,025 5,294,744 5,205,948 4,962,923 5,028,493
Net sales per average gross square foot (4) $ 436 $ 420 $ 444 $ 489 $ 438
Total gross square feet at end of period 6,601,112 6,613,100 6,503,486 6,023,278 6,290,284
Number of employees at end of period 37,800 38,000 40,400 40,100 39,600
2015 Annual Report | 15
ITEM 6. SELECTED CONSOLIDATED FINANCIAL DATA
(1) Except for the fiscal year ended February 2, 2013, which includes 53 weeks, all fiscal years presented include 52 weeks.
(2) All amounts presented are from continuing operations for all periods presented. Refer to Note 15 to the accompanying Consolidated FinancialStatements for additional information regarding the discontinued operations of 77kids.
(3) The comparable sales increase for Fiscal 2012 ended February 2, 2013 is compared to the corresponding 53 week period in Fiscal 2011.Additionally, comparable sales for all periods include AEO Direct sales.
(4) Total net revenue per average square foot is calculated using retail store sales for the year divided by the straight average of the beginningand ending square footage for the year.
Item 7. Management’s Discussion and Analysis of Financial Condition and Results ofOperations.
The following discussion and analysis of financial condition and results of operations are based upon our Consolidated FinancialStatements and should be read in conjunction with those statements and notes thereto.
This report contains various “forward-looking statements” within the meaning of Section 27A of the Securities Act of 1933, asamended, and Section 21E of the Securities Exchange Act of 1934, as amended, which represent our expectations or beliefsconcerning future events, including the following:
• the planned opening of approximately 15 to 20 AEO stores and 10 Aerie stores in North America and continued internationalexpansion during Fiscal 2016;
• the success of our efforts to expand internationally, engage in future franchise/license agreements, and/or growth throughacquisitions or joint ventures;
• the selection of approximately 55 to 65 American Eagle Outfitters stores in the United States and Canada for remodeling andrefurbishing during Fiscal 2016;
• the potential closure of approximately 30 to 35 American Eagle Outfitters and 15 Aerie stores in the United States and Canadaduring Fiscal 2016;
• the planned opening of approximately 30 new international third party operated American Eagle Outfitters stores during Fiscal2016;
• the success of our core American Eagle Outfitters and Aerie brands through our omni-channel outlets within North America andinternationally;
• the expected payment of a dividend in future periods;
• the possibility that our credit facilities may not be available for future borrowings;
• the possibility that rising prices of raw materials, labor, energy and other inputs to our manufacturing process, if unmitigated,will have a significant impact to our profitability; and
• the possibility that we may be required to take additional store impairment charges related to underperforming stores.
We caution that these forward-looking statements, and those described elsewhere in this report, involve material risks anduncertainties and are subject to change based on factors beyond our control, as discussed within Part I, Item 1A of thisForm 10-K. Accordingly, our future performance and financial results may differ materially from those expressed or implied in anysuch forward-looking statement.
Critical Accounting Policies
Our Consolidated Financial Statements are prepared in accordance with accounting principles generally accepted in theUnited States (“GAAP”), which require us to make estimates and assumptions that may affect the reported financial condition andresults of operations should actual results differ from these estimates. We base our estimates and assumptions on the bestavailable information and believe them to be reasonable for the circumstances. We believe that of our significant accountingpolicies, the following involve a higher degree of judgment and complexity. Refer to Note 2 to the Consolidated FinancialStatements for a complete discussion of our significant accounting policies. Management has reviewed these critical accountingpolicies and estimates with the Audit Committee of our Board.
16 | AMERICAN EAGLE OUTFITTERS, INC.

ITEM 7. MANAGEMENT’S DISCUSSION AND ANALYSIS
Revenue Recognition. We record revenue for store sales upon the purchase of merchandise by customers. Our e-commerceoperation records revenue upon the estimated customer receipt date of the merchandise. Revenue is not recorded on thepurchase of gift cards. A current liability is recorded upon purchase, and revenue is recognized when the gift card is redeemedfor merchandise.
We estimate gift card breakage and recognize revenue in proportion to actual gift card redemptions as a component of total netrevenue. We determine an estimated gift card breakage rate by continuously evaluating historical redemption data and the timewhen there is a remote likelihood that a gift card will be redeemed.
Revenue is recorded net of estimated and actual sales returns and deductions for coupon redemptions and other promotions.The estimated sales return reserve is based on projected merchandise returns determined through the use of historical averagereturn percentages. We do not believe there is a reasonable likelihood that there will be a material change in the future estimatesor assumptions we use to calculate our sales return reserve. However, if the actual rate of sales returns increases significantly, ouroperating results could be adversely affected.
We recognize royalty revenue generated from our license or franchise agreements based upon a percentage of merchandisesales by the licensee/franchisee. This revenue is recorded as a component of total net revenue when earned.
Merchandise Inventory. Merchandise inventory is valued at the lower of average cost or market, utilizing the retail method.Average cost includes merchandise design and sourcing costs and related expenses. We record merchandise receipts at thetime which both title and risk of loss for the merchandise transfers to us.
We review our inventory in order to identify slow-moving merchandise and generally use markdowns to clear merchandise.Additionally, we estimate a markdown reserve for future planned markdowns related to current inventory. If inventory exceedscustomer demand for reasons of style, seasonal adaptation, changes in customer preference, lack of consumer acceptance offashion items, competition, or if it is determined that the inventory in stock will not sell at its currently ticketed price, additionalmarkdowns may be necessary. These markdowns may have a material adverse impact on earnings, depending on the extent andamount of inventory affected.
We estimate an inventory shrinkage reserve for anticipated losses for the period between the last physical count and the balancesheet date. The estimate for the shrinkage reserve is calculated based on historical percentages and can be affected by changesin merchandise mix and changes in actual shrinkage trends. We do not believe there is a reasonable likelihood that there will be amaterial change in the future estimates or assumptions we use to calculate our inventory shrinkage reserve. However, if actualphysical inventory losses differ significantly from our estimate, our operating results could be adversely affected.
Asset Impairment. In accordance with Financial Accounting Standards Board (“FASB”) Accounting Standard Codification (“ASC”)360, Property, Plant, and Equipment (“ASC 360”), we evaluate long-lived assets for impairment at the individual store level, whichis the lowest level at which individual cash flows can be identified. Impairment losses are recorded on long-lived assets used inoperations when events and circumstances indicate that the assets might be impaired and the undiscounted cash flowsestimated to be generated by those assets are less than the carrying amounts of the assets. When events such as these occur,the impaired assets are adjusted to their estimated fair value and an impairment loss is recorded separately as a component ofoperating income under loss on impairment of assets.
Our impairment loss calculations require management to make assumptions and to apply judgment to estimate future cash flowsand asset fair values, including forecasting useful lives of the assets and selecting the discount rate that reflects the risk inherentin future cash flows. We do not believe there is a reasonable likelihood that there will be a material change in the estimates orassumptions we use to calculate long-lived asset impairment losses. However, if actual results are not consistent with ourestimates and assumptions, our operating results could be adversely affected.
Share-Based Payments. We account for share-based payments in accordance with the provisions of ASC 718, Compensation —Stock Compensation (“ASC 718”). To determine the fair value of our stock option awards, we use the Black-Scholes option pricingmodel, which requires management to apply judgment and make assumptions to determine the fair value of our awards. Theseassumptions include estimating the length of time employees will retain their vested stock options before exercising them (the“expected term”) and the estimated volatility of the price of our common stock over the expected term.
We calculate a weighted-average expected term based on historical experience. Expected stock price volatility is based on acombination of historical volatility of our common stock and implied volatility. We choose to use a combination of historical andimplied volatility as we believe that this combination is more representative of future stock price trends than historical volatilityalone. Changes in these assumptions can materially affect the estimate of the fair value of our share-based payments and therelated amount recognized in our Consolidated Financial Statements.
2015 Annual Report | 17

ITEM 7. MANAGEMENT’S DISCUSSION AND ANALYSIS
Income Taxes. We calculate income taxes in accordance with ASC 740, Income Taxes (“ASC 740”), which requires the use of theasset and liability method. Under this method, deferred tax assets and liabilities are recognized based on the difference betweenthe Consolidated Financial Statement carrying amounts of existing assets and liabilities and their respective tax bases ascomputed pursuant to ASC 740. Deferred tax assets and liabilities are measured using the tax rates, based on certain judgmentsregarding enacted tax laws and published guidance, in effect in the years when those temporary differences are expected toreverse. A valuation allowance is established against the deferred tax assets when it is more likely than not that some portion or allof the deferred taxes may not be realized. Changes in our level and composition of earnings, tax laws or the deferred tax valuationallowance, as well as the results of tax audits, may materially impact the effective income tax rate.
We evaluate our income tax positions in accordance with ASC 740 which prescribes a comprehensive model for recognizing,measuring, presenting and disclosing in the financial statements tax positions taken or expected to be taken on a tax return,including a decision whether to file or not to file in a particular jurisdiction. Under ASC 740, a tax benefit from an uncertain positionmay be recognized only if it is “more likely than not” that the position is sustainable based on its technical merits.
The calculation of the deferred tax assets and liabilities, as well as the decision to recognize a tax benefit from an uncertainposition and to establish a valuation allowance require management to make estimates and assumptions. We believe that ourassumptions and estimates are reasonable, although actual results may have a positive or negative material impact on thebalances of deferred tax assets and liabilities, valuation allowances or net income.
Key Performance IndicatorsOur management evaluates the following items, which are considered key performance indicators, in assessing our performance:
Comparable sales — Comparable sales provide a measure of sales growth for stores and channels open at least one year overthe comparable prior year period. In fiscal years following those with 53 weeks, including Fiscal 2013, the prior year period isshifted by one week to compare similar calendar weeks. A store is included in comparable sales in the thirteenth month ofoperation. However, stores that have a gross square footage increase of 25% or greater due to a remodel are removed from thecomparable sales base, but are included in total sales. These stores are returned to the comparable sales base in the thirteenthmonth following the remodel. Sales from American Eagle Outfitters and Aerie stores, as well as sales from AEO Direct, areincluded in total comparable sales. Sales from licensed or franchise stores are not included in comparable sales. IndividualAmerican Eagle Outfitters and Aerie brand comparable sales disclosures represent sales from stores and AEO Direct.
AEO Direct sales are included in the individual American Eagle Outfitters and Aerie brand comparable sales metric for thefollowing reasons:
• Our approach to customer engagement is “omni-channel”, which provides a seamless customer experience through bothtraditional and non-traditional channels, including four wall store locations, web, mobile/tablet devices, social networks, email,in-store displays and kiosks; and
• Shopping behavior has continued to evolve across multiple channels that work in tandem to meet customer needs.Management believes that presenting a brand level performance metric that includes all channels (i.e., stores and AEO Direct)to be the most appropriate, given customer behavior.
We no longer present AEO Direct separately due to the continued evolution of omni-channel engagement and the reasonsdiscussed above.
Our management considers comparable sales to be an important indicator of our current performance. Comparable sales resultsare important to achieve leveraging of our costs, including store payroll, store supplies, rent, etc. Comparable sales also have adirect impact on our total net revenue, cash and working capital.
Gross profit — Gross profit measures whether we are optimizing the price and inventory levels of our merchandise and achievingan optimal level of sales. Gross profit is the difference between total net revenue and cost of sales. Cost of sales consists of:merchandise costs, including design, sourcing, importing and inbound freight costs, as well as markdowns, shrinkage andcertain promotional costs (collectively “merchandise costs”) and buying, occupancy and warehousing costs. Design costsconsist of: compensation, rent, depreciation, travel, supplies and samples.
Buying, occupancy and warehousing costs consist of: compensation, employee benefit expenses and travel for our buyers andcertain senior merchandising executives; rent and utilities related to our stores, corporate headquarters, distribution centers andother office space; freight from our distribution centers to the stores; compensation and supplies for our distribution centers,including purchasing, receiving and inspection costs; and shipping and handling costs related to our e-commerce operation. Theinability to obtain acceptable levels of sales, initial markups or any significant increase in our use of markdowns could have anadverse effect on our gross profit and results of operations.
18 | AMERICAN EAGLE OUTFITTERS, INC.

ITEM 7. MANAGEMENT’S DISCUSSION AND ANALYSIS
Operating income — Our management views operating income as a key indicator of our performance. The key drivers ofoperating income are comparable sales, gross profit, our ability to control selling, general and administrative expenses, and ourlevel of capital expenditures. Management also uses earnings before interest and taxes as an indicator of operating results.
Return on invested capital — Our management uses return on invested capital as a key measure to assess our efficiency atallocating capital to profitable investments. This measure is critical in determining which strategic alternatives to pursue.
Store productivity — Store productivity, including total net revenue per average square foot, sales per productive hour, averageunit retail price (“AUR”), conversion rate, the number of transactions per store, the number of units sold per store and the numberof units per transaction, is evaluated by our management in assessing our operational performance.
Inventory turnover — Our management evaluates inventory turnover as a measure of how productively inventory is bought andsold. Inventory turnover is important as it can signal slow moving inventory. This can be critical in determining the need to takemarkdowns on merchandise.
Cash flow and liquidity — Our management evaluates cash flow from operations, investing and financing in determining thesufficiency of our cash position. Cash flow from operations has historically been sufficient to cover our uses of cash. Ourmanagement believes that cash flow from operations will be sufficient to fund anticipated capital expenditures and working capitalrequirements.
Our goals are to drive improvements to our gross profit performance, bring greater consistency to our results and deliverprofitable growth over the long term.
Results of Operations
Overview
Our Fiscal 2015 performance was strong, in a challenging retail environment. We executed on our key priorities aimed atachieving sales and earnings growth. Specifically, we made improvements to the merchandise by refocusing on innovation,quality and more compelling styles. Both American Eagle and Aerie delivered increases in sales and profitability. We achievedhigher average selling prices and fewer markdowns. AEO’s digital business was particularly strong and the business benefitedfrom the utilization of advances in omni-channel tools. Inventories and expenses were well managed throughout the year. Weended the year with $260.1 million in cash and no long-term debt. Cash flow from operations for the year was strong and allowedfor the repurchase of 15.6 million shares for $227.1 million.
Total net revenue for the year increased 7% to $3.522 billion, compared to $3.283 billion last year. Total comparable salesincreased 7%. By brand, American Eagle Outfitters’ comparable sales rose 7% and Aerie increased 20%. Consolidated grossmargin increased 180 basis points to 37.0%, compared to 35.2% last year.
Income from continuing operations was $1.09 per diluted share this year, compared to $0.46 per diluted share last year. On anadjusted basis, income from continuing operations last year was $0.63 per diluted share, which excludes a ($0.17) per dilutedshare impact from impairment and restructuring charges.
The preceding paragraph contains non-GAAP financial measures (“non-GAAP” or “adjusted”), comprised of earnings per shareinformation excluding non-GAAP items. This financial measure is not based on any standardized methodology prescribed by U.S.generally accepted accounting principles (“GAAP”) and is not necessarily comparable to similar measures presented by othercompanies. We believe that this non-GAAP information is useful as an additional means for investors to evaluate our operatingperformance, when reviewed in conjunction with our GAAP financial statements. These amounts are not determined inaccordance with GAAP and, therefore, should not be used exclusively in evaluating our business and operations. The table belowreconciles the GAAP financial measure to the non-GAAP financial measure discussed above.
Earnings per ShareFor the FiscalYear Ended
January 31,2015
Income from continuing operations per diluted share — GAAP Basis $0.46
Add: Asset Impairments (1) 0.11
Add: Restructuring Charges (2) 0.06
Income from continuing operations per diluted share — Non-GAAP Basis $0.63
2015 Annual Report | 19

ITEM 7. MANAGEMENT’S DISCUSSION AND ANALYSIS
(1) Asset impairment costs of $0.11 per diluted share consist of $25.1 million for the impairment of 48 AEO and 31 Aerie stores.
(2) Restructuring charges of $0.06 per diluted share include $17.8 million of severance and related employee costs and corporate charges.
We ended Fiscal 2015 with $260.1 million in cash and cash equivalents, a decrease of $150.6 million from last year. During theyear, we generated $341.9 million of cash from operations. The cash from operations was offset by $227.1 million of sharerepurchases, $153.2 of capital expenditures and $97.2 million for payment of dividends. Merchandise inventory at the end ofFiscal 2015 was $305.2 million, an increase of 9% to last year.
The following table shows, for the periods indicated, the percentage relationship to total net revenue of the listed items included inour Consolidated Statements of Operations.
For the Fiscal Years Ended
January 30,2016
January 31,2015
February 1,2014
Total net revenue 100.0% 100.0% 100.0%
Cost of sales, including certain buying, occupancy and warehousing expenses 63.0 64.8 66.3
Gross profit 37.0 35.2 33.7
Selling, general and administrative expenses 23.7 24.6 24.1
Restructuring charges — 0.6 —
Loss on impairment of assets — 1.0 1.3
Depreciation and amortization expense 4.2 4.3 4.0
Operating income 9.1 4.7 4.3
Other income, net 0.1 0.1 —
Income before income taxes 9.2 4.8 4.3
Provision for income taxes 3.1 2.2 1.8
Income from continuing operations 6.1 2.6 2.5
Gain (Loss) from discontinued operations, net of tax 0.1 (0.2) —
Net income 6.2% 2.4% 2.5%
Comparison of Fiscal 2015 to Fiscal 2014
Total Net Revenue
Total net revenue this year increased 7% to $3.522 billion compared to $3.283 billion. For Fiscal 2015, total comparable salesincreased 7% compared to a 5% decrease for Fiscal 2014. By brand, including the respective AEO Direct revenue, AmericanEagle Outfitters brand comparable sales increased 7%, or $189.8 million, and Aerie brand increased 20%, or $34.6 million. AEOBrand men’s comparable sales increased in the low-single digits and AEO Brand women’s comparable sales increased in thehigh-single digits.
For the year, store transactions decreased in the low single digits while units per transaction increased in the low single digits andAUR increased in the high single digits.
Gross Profit
Gross profit increased 13% to $1.303 billion from $1.155 billion last year. On a consolidated basis, gross profit as a percent tototal net revenue increased by 180 basis points to 37.0% from 35.2% last year.
The improvement in the gross margin was primarily due to 270 basis points of markdown improvement and 30 basis points ofbuying, occupancy and warehousing (“BOW”) cost leverage. This was partially offset by 120 basis points of product costdeleverage as a result of higher incentive costs.
There was $21.0 million of share-based payment expense, consisting of both time and performance-based awards, included ingross profit this year. This is compared to $8.2 million of share-based payment expense included in gross profit last year.
20 | AMERICAN EAGLE OUTFITTERS, INC.

ITEM 7. MANAGEMENT’S DISCUSSION AND ANALYSIS
Our gross profit may not be comparable to that of other retailers, as some retailers include all costs related to their distributionnetwork, as well as design costs in cost of sales. Other retailers may exclude a portion of these costs from cost of sales, includingthem in a line item such as selling, general and administrative expenses. Refer to Note 2 to the Consolidated Financial Statementsfor a description of our accounting policy regarding cost of sales, including certain buying, occupancy and warehousingexpenses.
Selling, General and Administrative Expenses
Selling, general and administrative expense increased 3% to $834.7 million, compared to $806.5 million last year. The increase inFiscal 2015 was primarily due to higher incentive costs and investments in digital marketing, which were offset by a gain of$9.4 million on the sale of the previously closed Warrendale distribution center and savings from expense reduction initiatives. Asa rate to total net revenue, selling, general and administrative expenses improved 90 basis points to 23.7%, compared to 24.6%last year.
There was $14.0 million of share-based payment expense, consisting of time and performance-based awards, included in selling,general and administrative expenses this year compared to $7.9 million last year.
Restructuring Charges
For Fiscal 2014, restructuring charges were $17.8 million, or 0.6% as a rate to total net revenue. This amount consists of corporateoverhead reductions, including severance and related items, and office space consolidation. There were no restructuring chargesin Fiscal 2015.
The restructuring charges were aimed at strengthening our corporate assets. Corporate overhead expenses eliminatedredundancies at the home office. These changes are aimed at driving efficiencies and aligning investments in areas that help fuelthe business.
Loss on Impairment of Assets
Loss on impairment of assets in Fiscal 2014 was the result of a store fleet and corporate location review and challengingperformance last year, and consisted of $25.1 million for the impairment of 48 AEO Brand and 31 Aerie stores and $8.4 million forcorporate items. There was no loss on impairment of assets recorded in Fiscal 2015.
Depreciation and Amortization Expense
Depreciation and amortization expense increased to $148.2 million from $141.2 million last year, driven by omni-channel and ITinvestments, new factory and mainline AEO Brand stores, and the new fulfillment center. As a rate to total net revenue,depreciation and amortization decreased to 4.2% from 4.3% last year as a result of the higher total net revenue.
Other Income, Net
Other income was $2.0 million this year, compared to income of $3.7 million last year, primarily as a result of foreign currencyfluctuations.
Provision for Income Taxes
The effective income tax rate from continuing operations decreased to 33.7% this year from 44.3% last year. The lower effectiveincome tax rate in Fiscal 2015 was primarily due to an increase in world-wide earnings, income tax settlements, higher federal taxcredits, and a decrease to the valuation allowance on foreign deferred tax assets.
Refer to Note 14 to the Consolidated Financial Statements for additional information regarding our accounting for income taxes.
Income from Continuing Operations
Income from continuing operations this year was $213.3 million, or $1.09 per diluted share. Income from continuing operationslast year was $88.8 million, or $0.46 per diluted share. This includes $51.2 million, or $0.17 per diluted share, of after-taximpairment charges, asset write-offs, corporate charges and tax related items.
2015 Annual Report | 21
ITEM 7. MANAGEMENT’S DISCUSSION AND ANALYSIS
Gain from Discontinued Operations
In 2012, we exited the 77kids business and sold the stores and related e-commerce operations to a third party purchaser. InFiscal 2014, we became primarily liable for 21 store leases as the third party purchaser did not fulfill its obligations and incurred$13.7 million in pre-tax expense ($8.5 million net of tax) to terminate store leases. During Fiscal 2015, we recorded a $7.8 millionpre-tax gain ($4.8 million net of tax) as a result of favorably settling lease termination obligations.
Refer to Note 15 to the Consolidated Financial Statements for additional information regarding the discontinued operations of77kids.
Net Income
Net income increased to $218.1 million in this year from $80.3 million in last year. As a percent to total net revenue, net incomewas 6.2% and 2.4% for Fiscal 2015 and Fiscal 2014, respectively. Net income per diluted share was $1.11, compared to$0.42 last year. The change in net income was attributable to the factors noted above.
Comparison of Fiscal 2014 to Fiscal 2013
Total Net Revenue
Total net revenue for Fiscal 2014 decreased 1% to $3.283 billion compared to $3.306 billion for Fiscal 2013. For Fiscal 2014, totalcomparable sales decreased 5% compared to a 6% increase for the corresponding 52 week period in 2013. By brand, includingthe respective AEO Direct revenue, American Eagle Outfitters brand comparable sales decreased 6%, or $161.8 million, andAerie brand increased 6%, or $10.1 million. AEO Brand men’s comparable sales decreased in the high single-digits and AEOBrand women’s comparable sales decreased in the low single-digits.
For the year, store transactions decreased in the mid-single-digits while units per transaction increased in the low-single digitsand AUR remained flat.
Gross Profit
Gross profit increased 4% to $1.155 billion in Fiscal 2014 from $1.114 billion in Fiscal 2013. On a consolidated basis, gross profitas a percent to total net revenue increased by 150 basis points to 35.2% from 33.7% in Fiscal 2013. Included in gross profit inFiscal 2013 were $24.1 million of pre-tax charges related to fabric and product liabilities and the discontinuation of the AEPerformance line and $4.5 million of corporate and store asset write-offs.
Reduced markdowns and favorable product costs provided a combined 280 basis points of improvement in Fiscal 2014. BOWcosts deleveraged 130 basis points from higher delivery costs and deleverage of rent on negative comparable sales.
There was $8.2 million of share-based payment expense, consisting of both time and performance-based awards, included ingross profit in Fiscal 2014. This is compared to a net benefit of $6.9 million of share-based payment expense included in grossprofit in Fiscal 2013.
Our gross profit may not be comparable to that of other retailers, as some retailers include all costs related to their distributionnetwork, as well as design costs in cost of sales. Other retailers may exclude a portion of these costs from cost of sales, includingthem in a line item such as selling, general and administrative expenses. Refer to Note 2 to the Consolidated Financial Statementsfor a description of our accounting policy regarding cost of sales, including certain buying, occupancy and warehousingexpenses.
Selling, General and Administrative Expenses
Selling, general and administrative expense increased 1% to $806.5 million in Fiscal 2014, compared to $796.5 million in Fiscal2013. In Fiscal 2013, selling, general and administrative expense included $7.8 million of pre-tax employee related costs. As arate to total net revenue, selling, general and administrative expenses increased 50 basis points to 24.6%, compared to 24.1% inFiscal 2013. Higher incentive compensation and increased investment in advertising were partially offset by reduced overheadand variable expense.
There was $7.9 million of share-based payment expense, consisting of time and performance-based awards, included in selling,general and administrative expenses in Fiscal 2014 compared to $0.3 million in Fiscal 2013.
22 | AMERICAN EAGLE OUTFITTERS, INC.

ITEM 7. MANAGEMENT’S DISCUSSION AND ANALYSIS
Restructuring Charges
Restructuring charges were $17.8 million, or 0.6% as a rate to total net revenue, for Fiscal 2014. This amount consists of corporateoverhead reductions, including severance and related items, and office space consolidation. There were no restructuring chargesin Fiscal 2013.
The restructuring charges are aimed at strengthening our corporate assets. Corporate overhead expenses eliminatedredundancies at the home office. These changes are aimed at driving efficiencies and aligning investments in areas that help fuelthe business.
Loss on Impairment of Assets
Loss on impairment of assets in Fiscal 2014 was the result of a store fleet and corporate location review and challengingperformance in Fiscal 2014, and consisted of $25.1 million for the impairment of 48 AEO Brand and 31 Aerie stores and $8.4million for corporate items. In Fiscal 2013, the loss on impairment of assets was $44.5 million relating to 69 retail stores and ourWarrendale, Pennsylvania Distribution Center.
Depreciation and Amortization Expense
Depreciation and amortization expense increased to $141.2 million in Fiscal 2014 from $132.0 million in Fiscal 2013, driven byomni-channel and IT investments, new factory and international stores, and the new fulfillment center. As a rate to total netrevenue, depreciation and amortization increased to 4.3% from 4.0% in Fiscal 2013 as a result of the lower total net revenue andan increase in depreciation and amortization expense in Fiscal 2014. Depreciation and amortization includes $11.7 million ofasset write-offs in Fiscal 2013.
Other Income, Net
Other income was $3.7 million in Fiscal 2014, compared to income of $1.0 million in Fiscal 2013, primarily as a result of foreigncurrency fluctuations.
Provision for Income Taxes
The effective income tax rate from continuing operations increased 44.3% in Fiscal 2014 from 41.6% in Fiscal 2013. The highereffective income tax rate in Fiscal 2014 was primarily due to an increase to the valuation allowance on foreign deferred tax assets,offset by an overall increase in income levels.
Refer to Note 14 to the Consolidated Financial Statements for additional information regarding our accounting for income taxes.
Income from Continuing Operations
Income from continuing operations for Fiscal 2014 was $88.8 million, or $0.46 per diluted share. This includes $51.2 million, or($0.17) per diluted share, diluted share impact from impairment charges and restructuring charges. Income from continuingoperations for Fiscal 2013 was $83.0 million, or $0.43 per diluted share. This includes $60.9 million, or ($0.31) per diluted share, ofafter-tax impairment charges, asset write-offs, corporate charges and tax related items.
Loss from Discontinued Operations
We completed the sale of the 77kids stores and related e-commerce operations during 2012. Accordingly, the after-tax operatingresults appear in Loss from Discontinued Operations on the Consolidated Statements of Operations for all periods presented.
In Fiscal 2014, we became primarily liable for 21 store leases as the third party purchaser did not fulfill its obligations. We incurred$13.7 million in pre-tax expense to terminate store leases. Loss from Discontinued Operations, net of tax, was $8.5 million forFiscal 2014.
Refer to Note 15 to the Consolidated Financial Statements for additional information regarding the discontinued operations of77kids.
Net Income
Net income decreased to $80.3 million in Fiscal 2014 from $83.0 million in Fiscal 2013. As a percent to total net revenue, netincome was 2.4% and 2.5% for Fiscal 2014 and Fiscal 2013, respectively. Net income per diluted share was $0.42, compared to$0.43 in Fiscal 2013. The change in net income was attributable to the factors noted above.
2015 Annual Report | 23

ITEM 7. MANAGEMENT’S DISCUSSION AND ANALYSIS
Fair Value Measurements
ASC 820 defines fair value, establishes a framework for measuring fair value in accordance with GAAP, and expands disclosuresabout fair value measurements. Fair value is defined under ASC 820 as the exit price associated with the sale of an asset ortransfer of a liability in an orderly transaction between market participants at the measurement date:
Financial Instruments
Valuation techniques used to measure fair value under ASC 820 must maximize the use of observable inputs and minimize theuse of unobservable inputs. In addition, ASC 820 establishes this three-tier fair value hierarchy, which prioritizes the inputs used inmeasuring fair value. These tiers include:
• Level 1 — Quoted prices in active markets for identical assets or liabilities.
• Level 2 — Inputs other than Level 1 that are observable, either directly or indirectly, such as quoted prices for similar assets orliabilities; quoted prices in markets that are not active; or other inputs that are observable or can be corroborated by observablemarket data for substantially the full term of the assets or liabilities.
• Level 3 — Unobservable inputs (i.e., projections, estimates, interpretations, etc.) that are supported by little or no market activityand that are significant to the fair value of the assets or liabilities.
As of January 30, 2016 and January 31, 2015, we held certain assets that are required to be measured at fair value on a recurringbasis. These include cash equivalents and investments.
In accordance with ASC 820, the following tables represent the fair value hierarchy for our financial assets (cash equivalents andinvestments) measured at fair value on a recurring basis as of January 30, 2016:
Fair Value Measurements at January 30, 2016
(In thousands) Carrying Amount
Quoted MarketPrices in Active
Markets forIdenticalAssets
(Level 1)
Significant OtherObservable Inputs
(Level 2)
SignificantUnobservable
Inputs(Level 3)
Cash and cash equivalents
Cash $205,359 $205,359 $— $—
Money-market 54,708 54,708 — —
Total cash and cash equivalents $260,067 $260,067 $— $—
Percent to total 100% 100% — —
In the event we hold Level 3 investments, a discounted cash flow model is used to value those investments. There were no Level 3investments at January 30, 2016.
Liquidity and Capital Resources
Our uses of cash are generally for working capital, the construction of new stores and remodeling of existing stores, informationtechnology upgrades, distribution center improvements and expansion and the return of value to shareholders through therepurchase of common stock and the payment of dividends. Historically, these uses of cash have been funded with cash flowfrom operations and existing cash on hand. Also, we hold a five-year asset-based revolving credit facility that allows us to borrowup to $400 million. Additionally, our uses of cash include the development of the Aerie brand and our international expansionefforts. We expect to be able to fund our future cash requirements in North America through current cash holdings as well as cashgenerated from operations. In the future, we expect that our uses of cash will also include further expansion of our brandsinternationally.
Our growth strategy includes fortifying our brands and further international expansion or acquisitions. We periodically considerand evaluate these options to support future growth. In the event we do pursue such options, we could require additional equity ordebt financing. There can be no assurance that we would be successful in closing any potential transaction, or that any endeavorwe undertake would increase our profitability.
24 | AMERICAN EAGLE OUTFITTERS, INC.

ITEM 7. MANAGEMENT’S DISCUSSION AND ANALYSIS
The following sets forth certain measures of our liquidity:
January 30,2016
January 31,2015
Working Capital (in 000’s) $259,693 $368,947
Current Ratio 1.56 1.80
The $109.3 million decrease in our working capital and corresponding decrease in the current ratio as of January 30, 2016compared to January 31, 2015, related primarily to our use of cash for investing and financing activities, offset by net income, netof non-cash adjustments. Investing and financing activities primarily include capital expenditures, share repurchases, and thepayment of dividends. In Fiscal 2015, we repurchased 15.6 million shares for $227.1 million and paid $0.50 per share ofdividends for a total of $97.2 million.
Cash Flows from Operating Activities of Continuing Operations
Net cash provided by operating activities totaled $341.9 million during Fiscal 2015, compared to $338.4 million during Fiscal 2014and $229.9 during Fiscal 2013. Our major source of cash from operations was merchandise sales. Our primary outflows of cashfrom operations were for the payment of operational costs. The year-over-year increase in cash flows from operations this yearwas primarily driven by the increase in income from continuing operations, net of non-cash adjustments.
Cash Flows from Investing Activities of Continuing Operations
Investing activities for Fiscal 2015 included $153.3 million in capital expenditures for property and equipment, cash paid for ouracquisition of Tailgate Clothing Company of $10.4 million, and the purchase of intangible assets of $2.4 million, partially offset by$12.6 million of proceeds from the sale of the Warrendale Distribution Center. Investing activities for Fiscal 2014 included$245.0 million in capital expenditures for property and equipment, partially offset by $10.0 million of proceeds from the sale ofinvestments classified as available-for-sale. Investing activities for Fiscal 2013 included $278.5 million in capital expenditures forproperty and equipment, $20.8 million for the purchase of assets related to our international expansion strategy and $52.1 millionof investment purchases partially offset by $162.8 million of proceeds from the sale of investments classified as available-for-sale.For further information on capital expenditures, refer to the Capital Expenditures for Property and Equipment caption below.
Cash Flows from Financing Activities of Continuing Operations
During Fiscal 2015, cash used for financing activities resulted primarily from $227.1 million for the repurchase of shares as part ofour publicly announced repurchase program, $97.2 million for the payment of dividends and $5.2 million for the repurchase ofcommon stock from employees for the payment of taxes in connection with the vesting of share-based payments. During Fiscal2014, cash used for financing activities resulted primarily from $97.2 million for the payment of dividends and $7.5 million for therepurchase of common stock from employees for the payment of taxes in connection with the vesting of share-based payments.During Fiscal 2013, cash used for financing activities resulted primarily from $72.3 million for the payment of dividends and$33.1 million for the repurchase of 1.6 million shares as part of our publicly announced repurchase program.
Cash returned to shareholders through dividends and share repurchases was $324.3 million and $97.2 million in Fiscal 2015 andFiscal 2014, respectively.
ASC 718 requires that cash flows resulting from the benefits of tax deductions in excess of recognized compensation cost forshare-based payments be classified as financing cash flows. Accordingly, for Fiscal 2015, Fiscal 2014 and Fiscal 2013, theexcess tax benefits from share-based payments of $0.7 million, $0.7 million and $8.8 million, respectively, are classified asfinancing cash flows.
Capital Expenditures for Property and Equipment
Fiscal 2015 capital expenditures were $153.3 million, compared to $245.0 million in Fiscal 2014. Fiscal 2015 expendituresincluded $50.1 million related to investments in our AEO stores, including 22 new AEO stores, 28 remodeled and refurbishedstores, and fixtures and visual investments. Additionally, we continued to support our infrastructure growth by investing ininformation technology ($43.5 million), the improvement of our distribution centers and construction of a new distribution center($15.9 million) and investments in e-commerce ($29.1 million) and other home office projects ($14.7 million).
For Fiscal 2016, we expect capital expenditures to be approximately $160 to $170 million related to the continued support of ourexpansion efforts, stores, information technology upgrades to support growth and investments in e-commerce.
2015 Annual Report | 25

ITEM 7. MANAGEMENT’S DISCUSSION AND ANALYSIS
Credit Facilities
In Fiscal 2014, we entered into a Credit Agreement (“Credit Agreement”) for five-year, syndicated, asset-based revolving creditfacilities (the “Credit Facilities”). The Credit Agreement provides senior secured revolving credit for loans and letters of credit up to$400 million, subject to customary borrowing base limitations. The Credit Facilities provide increased financial flexibility and takeadvantage of a favorable credit environment.
All obligations under the Credit Facilities are unconditionally guaranteed by certain subsidiaries. The obligations under the CreditAgreement are secured by a first-priority security interest in certain working capital assets of the borrowers and guarantors,consisting primarily of cash, receivables, inventory and certain other assets and have been further secured by first-prioritymortgages on certain real property.
As of January 30, 2016, we were in compliance with the terms of the Credit Agreement and had $8.0 million outstanding in stand-by letters of credit. No loans were outstanding under the Credit Agreement as of January 30, 2016.
Additionally, we have borrowing agreements with two separate financial institutions under which we may borrow an aggregate of$130 million USD for the purposes of trade letter of credit issuances. The availability of any future borrowings under the trade letterof credit facilities is subject to acceptance by the respective financial institutions.
As of January 30, 2016, we had outstanding trade letters of credit of $0.4 million.
Stock Repurchases
During Fiscal 2015, as part of our publicly announced share repurchase program, we repurchased 15.6 million shares forapproximately $227.1 million, at a weighted average price of $14.57 per share. During Fiscal 2014, there were no sharerepurchases as a part of our publicly announced repurchase programs. During Fiscal 2013, as part of our publicly announcedshare repurchase program, we repurchased 1.6 million shares for approximately $33.1 million, at a weighted average price of$20.66 per share. As of January 30, 2016, we had 2.8 million shares remaining authorized for repurchase under the programauthorized by our Board in January 2013. The program authorized 20.0 million shares under a share repurchase program whichexpires on January 28, 2017. Subsequent to the fourth quarter of Fiscal 2015, our Board authorized 25.0 million shares under anew share repurchase program which expires on January 30, 2021.
During Fiscal 2015, Fiscal 2014 and Fiscal 2013, we repurchased approximately 0.3 million, 0.5 million and 1.1 million shares,respectively, from certain employees at market prices totaling $5.2 million, $7.5 million and $23.4 million, respectively. Theseshares were repurchased for the payment of taxes, not in excess of the minimum statutory withholding requirements, inconnection with the vesting of share-based payments, as permitted under the 2005 Stock Award and Incentive Plan, asamended.
The aforementioned share repurchases have been recorded as treasury stock.
Dividends
A $0.125 per share dividend was paid for each quarter of Fiscal 2015, resulting in a dividend yield of 3.4% for the trailing twelvemonths ended January 30, 2016. During Fiscal 2014, a $0.125 per share dividend was paid for each quarter, resulting in adividend yield of 3.6% for the trailing twelve months ended January 31, 2015. Subsequent to the fourth quarter of Fiscal 2015, ourBoard declared a quarterly cash dividend of $0.125 per share, payable on April 22, 2016 to stockholders of record at the close ofbusiness on April 8, 2016. The payment of future dividends is at the discretion of our Board and is based on future earnings, cashflow, financial condition, capital requirements, changes in U.S. taxation and other relevant factors. It is anticipated that any futuredividends paid will be declared on a quarterly basis.
26 | AMERICAN EAGLE OUTFITTERS, INC.

ITEM 7. MANAGEMENT’S DISCUSSION AND ANALYSIS
Obligations and Commitments
Disclosure about Contractual Obligations
The following table summarizes our significant contractual obligations as of January 30, 2016:
Payments Due by Period
(In thousands) TotalLess than
1 Year1-3
Years3-5
YearsMore than
5 Years
Operating Leases (1) $1,637,379 $285,100 $479,683 $370,449 $502,147
Unrecognized Tax Benefits (2) 7,030 2,464 — — 4,566
Purchase Obligations (3) 494,248 490,673 2,338 1,237 —
Total Contractual Obligations $2,138,657 $778,237 $482,021 $371,686 $506,713(1) Operating lease obligations consist primarily of future minimum lease commitments related to store operating leases (Refer to Note 10 to the
Consolidated Financial Statements). Operating lease obligations do not include common area maintenance, insurance or tax payments forwhich we are also obligated.
(2) The amount of unrecognized tax benefits as of January 30, 2016 was $7.0 million, including approximately $1.3 million of accrued interest andpenalties. Unrecognized tax benefits are positions taken or expected to be taken on an income tax return that may result in additionalpayments to tax authorities. We anticipate $2.5 million of unrecognized tax benefits will be realized within one year. The remaining balance ofunrecognized tax benefits of $4.6 million is included in the “More than 5 Years” column as we are not able to reasonably estimate the timing ofthe potential future payouts.
(3) Purchase obligations primarily include binding commitments to purchase merchandise inventory, as well as other legally bindingcommitments, made in the normal course of business that are enforceable and specify all significant terms. Included in the above purchaseobligations are inventory commitments guaranteed by outstanding letters of credit, as shown in the table below.
Disclosure about Commercial Commitments
The following table summarizes our significant commercial commitments as of January 30, 2016:
Amount of Commitment Expiration Per Period
(In thousands)Total AmountCommitted
Less than1 Year
1-3Years
3-5Years
More than5 Years
Trade Letters of Credit (1) $ 378 $ 378 — — —
Standby Letters of Credit (2) 7,999 7,999 — — —
Total Commercial Commitments $8,377 $8,377 — — —(1) Trade letters of credit represent commitments, guaranteed by a bank, to pay vendors for merchandise, as well as other commitments, upon
presentation of documents demonstrating that the merchandise has shipped.
(2) Standby letters of credit represent commitments, guaranteed by a bank, to pay landlords or vendors to the extent previously agreed criteriaare not met.
Off-Balance Sheet Arrangements
We are not a party to any off-balance sheet arrangements.
Recent Accounting Pronouncements
Recent accounting pronouncements are disclosed in Note 2 of the Consolidated Financial Statements.
Impact of Inflation
Historically, increases in the price of raw materials used in the manufacture of merchandise we purchase from suppliers hasnegatively impacted our cost of sales. Future increases in these costs, in addition to increases in the price of labor, energy andother inputs to the manufacture of our merchandise, could negatively impact our business and the industry in the future.
2015 Annual Report | 27

Item 7A. Quantitative and Qualitative Disclosures about Market Risk
We have market risk exposure related to interest rates and foreign currency exchange rates. Market risk is measured as thepotential negative impact on earnings, cash flows or fair values resulting from a hypothetical change in interest rates or foreigncurrency exchange rates over the next year.
Interest Rate Risk
Our earnings are not materially affected by changes in market interest rates. If our Fiscal 2015 average yield rate decreases by10% in Fiscal 2016, our income before taxes will decrease by approximately $0.1 million. Comparatively, if our Fiscal 2014average yield rate had decreased by 10% in Fiscal 2015, our income before taxes would have decreased by approximately$0.1 million. These amounts are determined by considering the impact of the hypothetical yield rates on our cash and investmentbalances and assumes no change in our investment structure.
Foreign Exchange Rate Risk
We are primarily exposed to the impact of foreign exchange rate risk primarily through our Canadian and Mexican operationswhere the functional currency is the Canadian dollar and Mexican peso, respectively. The impact of all other foreign currencies iscurrently immaterial to our financial results. We do not utilize hedging instruments to mitigate foreign currency exchange risks. Ahypothetical 10% movement in the Canadian dollar and Mexican peso exchange rate could result in a $13.3 million foreigncurrency translation fluctuation, which would be recorded in accumulated other comprehensive income within the consolidatedbalance sheets. An unrealized loss of $29.9 million is included in accumulated other comprehensive income as of January 30,2016.
28 | AMERICAN EAGLE OUTFITTERS, INC.

Item 8. Financial Statements and Supplementary Data.
Index to Consolidated Financial Statements
Report of Independent Registered Public Accounting Firm . . . . . . . . . . . . . . . . . . . . . . . . . . . . . . . . . . . . . . . . . . . . . . . . . . . . . . . . . 30
Consolidated Balance Sheets . . . . . . . . . . . . . . . . . . . . . . . . . . . . . . . . . . . . . . . . . . . . . . . . . . . . . . . . . . . . . . . . . . . . . . . . . . . . . . . . . 31
Consolidated Statements of Operations . . . . . . . . . . . . . . . . . . . . . . . . . . . . . . . . . . . . . . . . . . . . . . . . . . . . . . . . . . . . . . . . . . . . . . . . . 32
Consolidated Statements of Comprehensive Income . . . . . . . . . . . . . . . . . . . . . . . . . . . . . . . . . . . . . . . . . . . . . . . . . . . . . . . . . . . . . . 33
Consolidated Statements of Stockholders’ Equity . . . . . . . . . . . . . . . . . . . . . . . . . . . . . . . . . . . . . . . . . . . . . . . . . . . . . . . . . . . . . . . . . 34
Consolidated Statements of Cash Flows . . . . . . . . . . . . . . . . . . . . . . . . . . . . . . . . . . . . . . . . . . . . . . . . . . . . . . . . . . . . . . . . . . . . . . . . . 35
Notes to Consolidated Financial Statements . . . . . . . . . . . . . . . . . . . . . . . . . . . . . . . . . . . . . . . . . . . . . . . . . . . . . . . . . . . . . . . . . . . . . 36
2015 Annual Report | 29
Report of Independent Registered Public Accounting Firm
The Board of Directors and Stockholders ofAmerican Eagle Outfitters, Inc.
We have audited the accompanying consolidated balance sheets of American Eagle Outfitters, Inc. as of January 30, 2016 andJanuary 31, 2015, and the related consolidated statements of operations, comprehensive income, stockholders’ equity, and cashflows for each of the three years in the period ended January 30, 2016. These financial statements are the responsibility of theCompany’s management. Our responsibility is to express an opinion on these financial statements based on our audits.
We conducted our audits in accordance with the standards of the Public Company Accounting Oversight Board (United States).Those standards require that we plan and perform the audit to obtain reasonable assurance about whether the financialstatements are free of material misstatement. An audit includes examining, on a test basis, evidence supporting the amounts anddisclosures in the financial statements. An audit also includes assessing the accounting principles used and significant estimatesmade by management, as well as evaluating the overall financial statement presentation. We believe that our audits provide areasonable basis for our opinion.
In our opinion, the financial statements referred to above present fairly, in all material respects, the consolidated financial positionof American Eagle Outfitters, Inc. at January 30, 2016 and January 31, 2015, and the consolidated results of its operations and itscash flows for each of the three years in the period ended January 30, 2016, in conformity with U.S. generally acceptedaccounting principles.
We also have audited, in accordance with the standards of the Public Company Accounting Oversight Board (United States),American Eagle Outfitters, Inc.’s internal control over financial reporting as of January 30, 2016, based on criteria established inInternal Control — Integrated Framework issued by the Committee of Sponsoring Organizations of the Treadway Commission(2013 framework) and our report dated March 10, 2016 expressed an unqualified opinion thereon.
/s/ Ernst & Young LLP
Pittsburgh, PennsylvaniaMarch 10, 2016
30 | AMERICAN EAGLE OUTFITTERS, INC.

AMERICAN EAGLE OUTFITTERS, INC.Consolidated Balance Sheets
(In thousands, except per share amounts)January 30,
2016January 31,
2015
Assets
Current assets:
Cash and cash equivalents $ 260,067 $ 410,697
Merchandise inventory 305,178 278,972
Accounts receivable 80,912 67,894
Prepaid expenses and other 77,218 70,477
Total current assets 723,375 828,040
Property and equipment, at cost, net of accumulated depreciation 703,586 698,227
Intangible assets, at cost, net of accumulated amortization 51,832 47,206
Goodwill 17,186 13,096
Deferred income taxes 64,927 73,137
Other assets 51,340 37,202
Total assets $ 1,612,246 $1,696,908
Liabilities and Stockholders’ Equity
Current liabilities:
Accounts payable $ 182,789 $ 191,146
Accrued compensation and payroll taxes 79,302 44,884
Accrued rent 77,482 78,567
Accrued income and other taxes 22,223 33,110
Unredeemed gift cards and gift certificates 48,274 47,888
Current portion of deferred lease credits 12,711 12,969
Other liabilities and accrued expenses 40,901 50,529
Total current liabilities 463,682 459,093
Non-current liabilities:
Deferred lease credits 50,104 54,516
Non-current accrued income taxes 4,566 10,456
Other non-current liabilities 42,518 33,097
Total non-current liabilities 97,188 98,069
Commitments and contingencies — —
Stockholders’ equity:
Preferred stock, $0.01 par value; 5,000 shares authorized; none issued and outstanding — —
Common stock, $0.01 par value; 600,000 shares authorized; 249,566 sharesissued; 180,135 and 194,516 shares outstanding, respectively 2,496 2,496
Contributed capital 590,820 569,675
Accumulated other comprehensive loss, net of tax (29,868) (9,944)
Retained earnings 1,659,267 1,543,085
Treasury stock, 69,431 and 55,050 shares, respectively, at cost (1,171,339) (965,566)
Total stockholders’ equity 1,051,376 1,139,746
Total liabilities and stockholders’ equity $ 1,612,246 $1,696,908
Refer to Notes to Consolidated Financial Statements
2015 Annual Report | 31
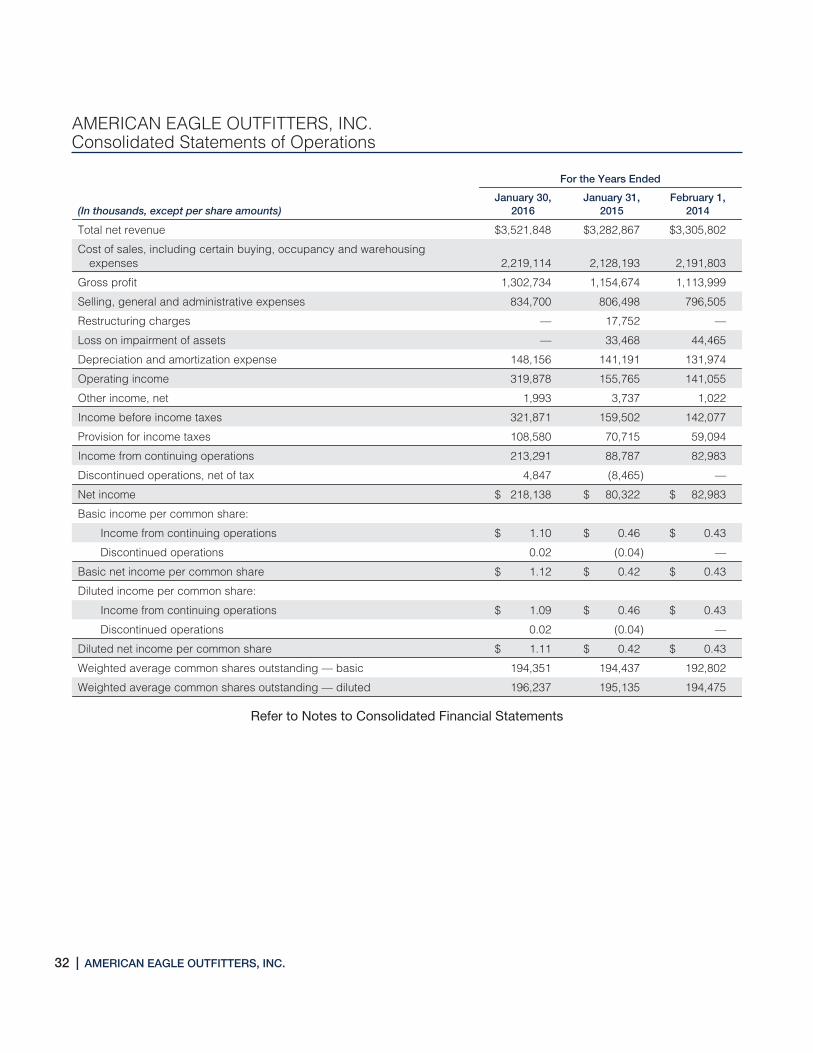
AMERICAN EAGLE OUTFITTERS, INC.Consolidated Statements of Operations
For the Years Ended
(In thousands, except per share amounts)January 30,
2016January 31,
2015February 1,
2014
Total net revenue $3,521,848 $3,282,867 $3,305,802
Cost of sales, including certain buying, occupancy and warehousingexpenses 2,219,114 2,128,193 2,191,803
Gross profit 1,302,734 1,154,674 1,113,999
Selling, general and administrative expenses 834,700 806,498 796,505
Restructuring charges — 17,752 —
Loss on impairment of assets — 33,468 44,465
Depreciation and amortization expense 148,156 141,191 131,974
Operating income 319,878 155,765 141,055
Other income, net 1,993 3,737 1,022
Income before income taxes 321,871 159,502 142,077
Provision for income taxes 108,580 70,715 59,094
Income from continuing operations 213,291 88,787 82,983
Discontinued operations, net of tax 4,847 (8,465) —
Net income $ 218,138 $ 80,322 $ 82,983
Basic income per common share:
Income from continuing operations $ 1.10 $ 0.46 $ 0.43
Discontinued operations 0.02 (0.04) —
Basic net income per common share $ 1.12 $ 0.42 $ 0.43
Diluted income per common share:
Income from continuing operations $ 1.09 $ 0.46 $ 0.43
Discontinued operations 0.02 (0.04) —
Diluted net income per common share $ 1.11 $ 0.42 $ 0.43
Weighted average common shares outstanding — basic 194,351 194,437 192,802
Weighted average common shares outstanding — diluted 196,237 195,135 194,475
Refer to Notes to Consolidated Financial Statements
32 | AMERICAN EAGLE OUTFITTERS, INC.

AMERICAN EAGLE OUTFITTERS, INC.Consolidated Statements of Comprehensive Income
For the Years Ended
(In thousands)January 30,
2016January 31,
2015February 1,
2014
Net income $218,138 $ 80,322 $ 82,983
Other comprehensive loss:
Foreign currency translation loss (19,924) (22,101) (17,140)
Other comprehensive loss (19,924) (22,101) (17,140)
Comprehensive income $198,214 $ 58,221 $ 65,843
Refer to Notes to Consolidated Financial Statements
2015 Annual Report | 33
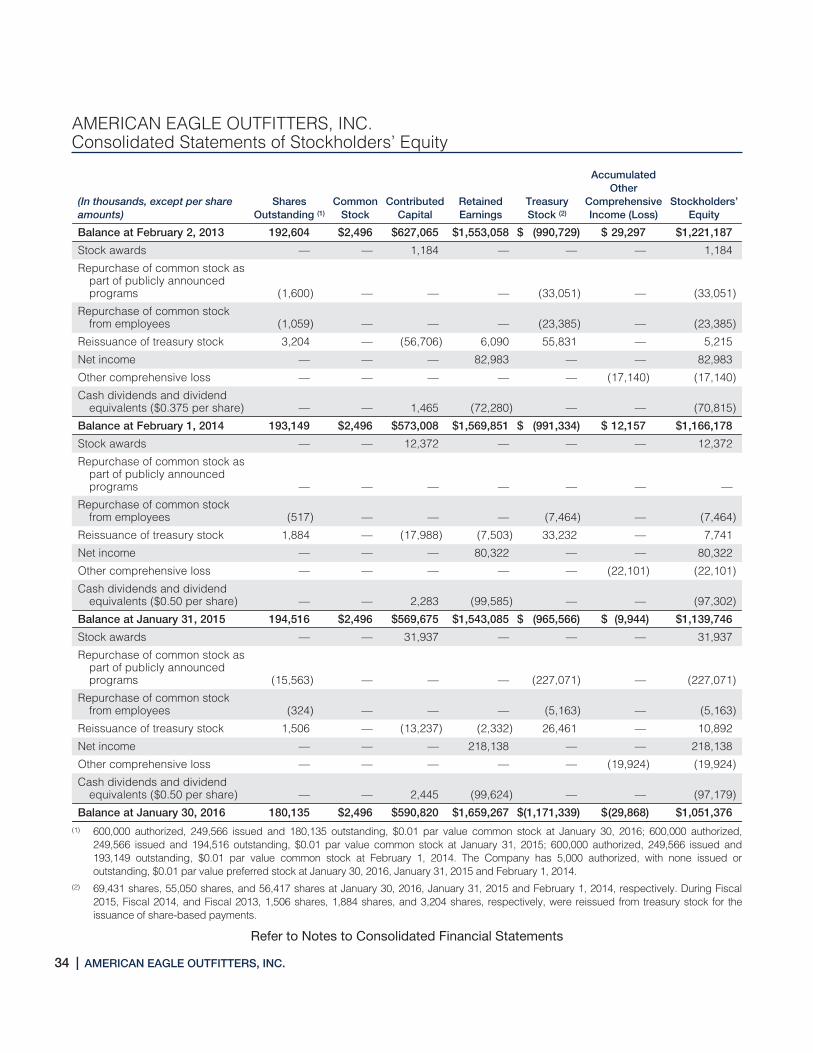
AMERICAN EAGLE OUTFITTERS, INC.Consolidated Statements of Stockholders’ Equity
(In thousands, except per shareamounts)
SharesOutstanding (1)
CommonStock
ContributedCapital
RetainedEarnings
TreasuryStock (2)
AccumulatedOther
ComprehensiveIncome (Loss)
Stockholders’Equity
Balance at February 2, 2013 192,604 $2,496 $627,065 $1,553,058 $ (990,729) $ 29,297 $1,221,187
Stock awards — — 1,184 — — — 1,184
Repurchase of common stock aspart of publicly announcedprograms (1,600) — — — (33,051) — (33,051)
Repurchase of common stockfrom employees (1,059) — — — (23,385) — (23,385)
Reissuance of treasury stock 3,204 — (56,706) 6,090 55,831 — 5,215
Net income — — — 82,983 — — 82,983
Other comprehensive loss — — — — — (17,140) (17,140)
Cash dividends and dividendequivalents ($0.375 per share) — — 1,465 (72,280) — — (70,815)
Balance at February 1, 2014 193,149 $2,496 $573,008 $1,569,851 $ (991,334) $ 12,157 $1,166,178
Stock awards — — 12,372 — — — 12,372
Repurchase of common stock aspart of publicly announcedprograms — — — — — — —
Repurchase of common stockfrom employees (517) — — — (7,464) — (7,464)
Reissuance of treasury stock 1,884 — (17,988) (7,503) 33,232 — 7,741
Net income — — — 80,322 — — 80,322
Other comprehensive loss — — — — — (22,101) (22,101)
Cash dividends and dividendequivalents ($0.50 per share) — — 2,283 (99,585) — — (97,302)
Balance at January 31, 2015 194,516 $2,496 $569,675 $1,543,085 $ (965,566) $ (9,944) $1,139,746
Stock awards — — 31,937 — — — 31,937
Repurchase of common stock aspart of publicly announcedprograms (15,563) — — — (227,071) — (227,071)
Repurchase of common stockfrom employees (324) — — — (5,163) — (5,163)
Reissuance of treasury stock 1,506 — (13,237) (2,332) 26,461 — 10,892
Net income — — — 218,138 — — 218,138
Other comprehensive loss — — — — — (19,924) (19,924)
Cash dividends and dividendequivalents ($0.50 per share) — — 2,445 (99,624) — — (97,179)
Balance at January 30, 2016 180,135 $2,496 $590,820 $1,659,267 $(1,171,339) $(29,868) $1,051,376(1) 600,000 authorized, 249,566 issued and 180,135 outstanding, $0.01 par value common stock at January 30, 2016; 600,000 authorized,
249,566 issued and 194,516 outstanding, $0.01 par value common stock at January 31, 2015; 600,000 authorized, 249,566 issued and193,149 outstanding, $0.01 par value common stock at February 1, 2014. The Company has 5,000 authorized, with none issued oroutstanding, $0.01 par value preferred stock at January 30, 2016, January 31, 2015 and February 1, 2014.
(2) 69,431 shares, 55,050 shares, and 56,417 shares at January 30, 2016, January 31, 2015 and February 1, 2014, respectively. During Fiscal2015, Fiscal 2014, and Fiscal 2013, 1,506 shares, 1,884 shares, and 3,204 shares, respectively, were reissued from treasury stock for theissuance of share-based payments.
Refer to Notes to Consolidated Financial Statements
34 | AMERICAN EAGLE OUTFITTERS, INC.

AMERICAN EAGLE OUTFITTERS, INC.Consolidated Statements of Cash Flows
For the Years Ended
(In thousands)January 30,
2016January 31,
2015February 1,
2014Operating activities:Net income $ 218,138 $ 80,322 $ 82,983(Gain) loss from discontinued operations, net of tax (4,847) 8,465 —Income from continuing operations $ 213,291 $ 88,787 $ 82,983Adjustments to reconcile net income to net cash provided by operating activities
Depreciation and amortization 148,858 142,351 134,047Share-based compensation 34,977 16,070 (6,541)Deferred income taxes 4,680 (2,279) 20,100Foreign currency transaction loss (gain) 2,977 (495) 1,378Loss on impairment of assets — 33,468 44,465Gain on sale of assets (9,422) — —
Changes in assets and liabilities:Merchandise inventory (22,259) 8,586 40,148Accounts receivable (10,093) 3,084 (29,511)Prepaid expenses and other (7,027) 14,282 (10,844)Other assets (10,017) 6,612 (36,089)Accounts payable (3,189) (5,280) 28,568Unredeemed gift cards and gift certificates 755 1,238 1,269Deferred lease credits (4,099) (4,528) 583Accrued compensation and payroll taxes 34,234 20,716 (42,465)Accrued income and other taxes (17,615) 24,826 (25,840)Accrued liabilities (14,133) (9,012) 27,605Total adjustments 128,627 249,639 146,873
Net cash provided by operating activities from continuing operations 341,918 338,426 229,856Investing activities:
Capital expenditures for property and equipment (153,256) (245,002) (278,499)Acquisitions and purchase of long-lived assets in business combination (10,442) — (20,751)Proceeds from sale of assets 12,579 — —Acquisition of intangible assets (2,382) (1,264) (6,835)Purchase of available-for-sale securities — — (52,065)Sale of available-for-sale securities — 10,002 162,785
Net cash used for investing activities from continuing operations (153,501) (236,264) (195,365)Financing activities:
Payments on capital leases and other (7,635) (7,143) (2,839)Repurchase of common stock as part of publicly announced programs (227,071) — (33,051)Repurchase of common stock from employees (5,163) (7,464) (23,386)Net proceeds from stock options exercised 7,283 7,305 6,197Excess tax benefit from share-based payments 657 742 8,833Cash dividends paid (97,237) (97,224) (72,280)
Net cash used for financing activities from continuing operations (329,166) (103,784) (116,526)Effect of exchange rates on cash (3,076) (7,578) (8,151)Cash flows of discontinued operations
Net cash (used for) provided by operating activities (6,805) 963 —Net cash used for investing activities — — —Net cash used for financing activities — — —Effect of exchange rates on cash — — —
Net cash (used for) provided by discontinued operations (6,805) 963 —Net decrease in cash and cash equivalents (150,630) (8,237) (90,186)Cash and cash equivalents — beginning of period $ 410,697 $ 418,933 $ 509,119Cash and cash equivalents — end of period $ 260,067 $ 410,697 $ 418,933
Refer to Notes to Consolidated Financial Statements
2015 Annual Report | 35

AMERICAN EAGLE OUTFITTERS, INC.
Notes to Consolidated Financial Statements
For the Year Ended January 30, 2016
1. Business Operations
American Eagle Outfitters, Inc. (the “Company”), a Delaware corporation, operates under the American Eagle Outfitters® (“AEO”)and Aerie® by American Eagle Outfitters® (“Aerie”) brands. The Company operated 77kids by American Eagle Outfitters®
(“77kids”) until its exit in Fiscal 2012.
Founded in 1977, American Eagle Outfitters is a leading apparel and accessories retailer that operates more than 1,000 retailstores in the U.S. and internationally, online at ae.com and aerie.com and international store locations managed by third-partyoperators. Through its brands, the Company offers high quality, on-trend clothing, accessories and personal care products ataffordable prices. The Company’s online business, AEO Direct, ships to 81 countries worldwide.
On November 2, 2015, AEO Inc. acquired Tailgate Clothing Company (“Tailgate”), which owns and operates Tailgate, a vintage,sports-inspired apparel brand with a college town store concept, and Todd Snyder New York, a premium menswear brand. As ofJanuary 30, 2016, the Company operated one Tailgate store in Iowa City, Iowa. Tailgate and Todd Snyder product is also soldonline at TailgateClothing.com and ToddSnyder.com, respectively.
Merchandise Mix
The following table sets forth the approximate consolidated percentage of total net revenue from continuing operationsattributable to each merchandise group for each of the periods indicated:
For the Years Ended
January 30,2016
January 31,2015
February 1,2014
Men’s apparel and accessories 37% 39% 40%
Women’s apparel and accessories (excluding Aerie) 54% 53% 52%
Aerie 9% 8% 8%
Total 100% 100% 100%
2. Summary of Significant Accounting Policies
Principles of Consolidation
The Consolidated Financial Statements include the accounts of the Company and its wholly-owned subsidiaries. All intercompanytransactions and balances have been eliminated in consolidation. At January 30, 2016, the Company operated in one reportablesegment.
The Company exited its 77kids brand in Fiscal 2012. These Consolidated Financial Statements reflect the results of 77kids asdiscontinued operations for all periods presented.
Fiscal Year
Our fiscal year ends on the Saturday nearest to January 31. As used herein, “Fiscal 2016” refers to the 52 week period endingJanuary 28, 2017. “Fiscal 2015”, “Fiscal 2014” and “Fiscal 2013” refer to the 52-week periods ended January 30,2016, January 31, 2015 and February 1, 2014, respectively. “Fiscal 2012” refers to the 53-week period ended February 2, 2013.
Estimates
The preparation of financial statements in conformity with accounting principles generally accepted in the United States ofAmerica (“GAAP”) requires the Company’s management to make estimates and assumptions that affect the reported amounts ofassets and liabilities and disclosure of contingent assets and liabilities at the date of the financial statements and the reportedamounts of revenues and expenses during the reporting period. Actual results could differ from those estimates. On an ongoing
36 | AMERICAN EAGLE OUTFITTERS, INC.

NOTES TO CONSOLIDATED FINANCIAL STATEMENTS
basis, our management reviews its estimates based on currently available information. Changes in facts and circumstances mayresult in revised estimates.
Recent Accounting Pronouncements
In May 2014, the Financial Accounting Standard Board (“FASB”) issued Accounting Standards Update (“ASU”) No. 2014-09,Revenue from Contracts with Customers (“ASU 2014-09”). ASU 2014-09 is a comprehensive new revenue recognition model thatexpands disclosure requirements and requires a company to recognize revenue to depict the transfer of goods or services to acustomer at an amount that reflects the consideration it expects to receive in exchange for those goods or services. Originally,ASU 2014-09 was effective for annual reporting periods beginning after December 15, 2016. In July 2015, the FASB voted toapprove amendments deferring the effective date by one year to be effective for annual reporting periods beginning afterDecember 15, 2017. Accordingly, the Company will adopt ASU 2014-09 on February 4, 2018. The Company does not expect amaterial impact of the adoption of this guidance on the Company’s consolidated financial condition, results of operations or cashflows
In November 2015, the FASB issued ASU No. 2015-17, Balance Sheet Classification of Deferred Taxes (“ASU 2015-17”), whichrequires entities to present deferred tax assets and deferred tax liabilities as noncurrent in a classified balance sheet. The ASUmay be applied prospectively or retrospectively. The Company adopted the ASU on January 30, 2016, applied retrospectively.
In February 2016, the FASB issued ASU No. 2016-02, Leases (“ASU 2016–02”) which replaces the existing guidance in ASC840, Leases. The new standard establishes a right-of-use (ROU) model that requires a lessee to record a ROU asset and a leaseliability on the balance sheet for all leases with terms longer than 12 months. Leases will be classified as either finance oroperating, with classification affecting the pattern of expense recognition in the income statement. The guidance is effective forfiscal years beginning after December 15, 2018, including interim periods within those fiscal years and requires retrospectiveapplication. The Company will adopt in Fiscal 2019 and is currently evaluating the impact of ASU 2016-02 to its ConsolidatedFinancial Statements.
Foreign Currency Translation
In accordance with Accounting Standards Codification (“ASC”) 830, Foreign Currency Matters, assets and liabilities denominatedin foreign currencies were translated into United States dollars (“USD”) (the reporting currency) at the exchange rates prevailingat the balance sheet date. Revenues and expenses denominated in foreign currencies were translated into USD at the monthlyaverage exchange rates for the period. Gains or losses resulting from foreign currency transactions are included in the results ofoperations, whereas, related translation adjustments are reported as an element of other comprehensive income in accordancewith ASC 220, Comprehensive Income (refer to Note 11 to the Consolidated Financial Statements).
Cash and Cash Equivalents
The Company considers all highly liquid investments purchased with a remaining maturity of three months or less to be cashequivalents.
As of January 30, 2016 and January 31, 2015, the Company held no short-term investments.
Refer to Note 3 to the Consolidated Financial Statements for information regarding cash and cash equivalents and investments.
Merchandise Inventory
Merchandise inventory is valued at the lower of average cost or market, utilizing the retail method. Average cost includesmerchandise design and sourcing costs and related expenses. The Company records merchandise receipts at the time whichboth title and risk of loss for the merchandise transfers to the Company.
The Company reviews its inventory levels to identify slow-moving merchandise and generally uses markdowns to clearmerchandise. Additionally, the Company estimates a markdown reserve for future planned permanent markdowns related tocurrent inventory. Markdowns may occur when inventory exceeds customer demand for reasons of style, seasonal adaptation,changes in customer preference, lack of consumer acceptance of fashion items, competition, or if it is determined that theinventory in stock will not sell at its currently ticketed price. Such markdowns may have a material adverse impact on earnings,depending on the extent and amount of inventory affected. The Company also estimates a shrinkage reserve for the periodbetween the last physical count and the balance sheet date. The estimate for the shrinkage reserve, based on historical results,can be affected by changes in merchandise mix and changes in actual shrinkage trends.
2015 Annual Report | 37
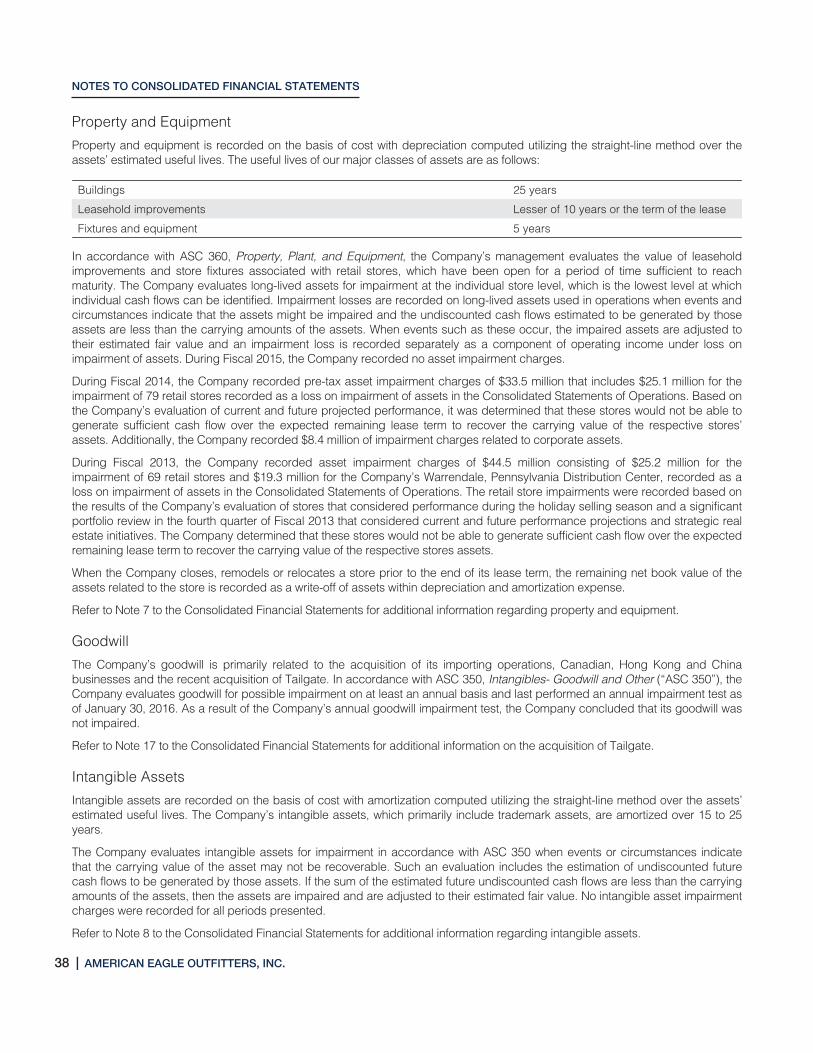
NOTES TO CONSOLIDATED FINANCIAL STATEMENTS
Property and Equipment
Property and equipment is recorded on the basis of cost with depreciation computed utilizing the straight-line method over theassets’ estimated useful lives. The useful lives of our major classes of assets are as follows:
Buildings 25 years
Leasehold improvements Lesser of 10 years or the term of the lease
Fixtures and equipment 5 years
In accordance with ASC 360, Property, Plant, and Equipment, the Company’s management evaluates the value of leaseholdimprovements and store fixtures associated with retail stores, which have been open for a period of time sufficient to reachmaturity. The Company evaluates long-lived assets for impairment at the individual store level, which is the lowest level at whichindividual cash flows can be identified. Impairment losses are recorded on long-lived assets used in operations when events andcircumstances indicate that the assets might be impaired and the undiscounted cash flows estimated to be generated by thoseassets are less than the carrying amounts of the assets. When events such as these occur, the impaired assets are adjusted totheir estimated fair value and an impairment loss is recorded separately as a component of operating income under loss onimpairment of assets. During Fiscal 2015, the Company recorded no asset impairment charges.
During Fiscal 2014, the Company recorded pre-tax asset impairment charges of $33.5 million that includes $25.1 million for theimpairment of 79 retail stores recorded as a loss on impairment of assets in the Consolidated Statements of Operations. Based onthe Company’s evaluation of current and future projected performance, it was determined that these stores would not be able togenerate sufficient cash flow over the expected remaining lease term to recover the carrying value of the respective stores’assets. Additionally, the Company recorded $8.4 million of impairment charges related to corporate assets.
During Fiscal 2013, the Company recorded asset impairment charges of $44.5 million consisting of $25.2 million for theimpairment of 69 retail stores and $19.3 million for the Company’s Warrendale, Pennsylvania Distribution Center, recorded as aloss on impairment of assets in the Consolidated Statements of Operations. The retail store impairments were recorded based onthe results of the Company’s evaluation of stores that considered performance during the holiday selling season and a significantportfolio review in the fourth quarter of Fiscal 2013 that considered current and future performance projections and strategic realestate initiatives. The Company determined that these stores would not be able to generate sufficient cash flow over the expectedremaining lease term to recover the carrying value of the respective stores assets.
When the Company closes, remodels or relocates a store prior to the end of its lease term, the remaining net book value of theassets related to the store is recorded as a write-off of assets within depreciation and amortization expense.
Refer to Note 7 to the Consolidated Financial Statements for additional information regarding property and equipment.
Goodwill
The Company’s goodwill is primarily related to the acquisition of its importing operations, Canadian, Hong Kong and Chinabusinesses and the recent acquisition of Tailgate. In accordance with ASC 350, Intangibles- Goodwill and Other (“ASC 350”), theCompany evaluates goodwill for possible impairment on at least an annual basis and last performed an annual impairment test asof January 30, 2016. As a result of the Company’s annual goodwill impairment test, the Company concluded that its goodwill wasnot impaired.
Refer to Note 17 to the Consolidated Financial Statements for additional information on the acquisition of Tailgate.
Intangible Assets
Intangible assets are recorded on the basis of cost with amortization computed utilizing the straight-line method over the assets’estimated useful lives. The Company’s intangible assets, which primarily include trademark assets, are amortized over 15 to 25years.
The Company evaluates intangible assets for impairment in accordance with ASC 350 when events or circumstances indicatethat the carrying value of the asset may not be recoverable. Such an evaluation includes the estimation of undiscounted futurecash flows to be generated by those assets. If the sum of the estimated future undiscounted cash flows are less than the carryingamounts of the assets, then the assets are impaired and are adjusted to their estimated fair value. No intangible asset impairmentcharges were recorded for all periods presented.
Refer to Note 8 to the Consolidated Financial Statements for additional information regarding intangible assets.
38 | AMERICAN EAGLE OUTFITTERS, INC.
NOTES TO CONSOLIDATED FINANCIAL STATEMENTS
Deferred Lease Credits
Deferred lease credits represent the unamortized portion of construction allowances received from landlords related to theCompany’s retail stores. Construction allowances are generally comprised of cash amounts received by the Company from itslandlords as part of the negotiated lease terms. The Company records a receivable and a deferred lease credit liability at thelease commencement date (date of initial possession of the store). The deferred lease credit is amortized on a straight-line basisas a reduction of rent expense over the term of the original lease (including the pre-opening build-out period). The receivable isreduced as amounts are received from the landlord.
Self-Insurance Liability
The Company is self-insured for certain losses related to employee medical benefits and worker’s compensation. Costs for self-insurance claims filed and claims incurred but not reported are accrued based on known claims and historical experience.Management believes that it has adequately reserved for its self-insurance liability, which is capped through the use of stop losscontracts with insurance companies. However, any significant variation of future claims from historical trends could cause actualresults to differ from the accrued liability.
Co-branded Credit Card and Customer Loyalty Program
The Company offers a co-branded credit card (the “AEO Visa Card”) and a private label credit card (the “AEO Credit Card”)under the AEO and Aerie brands. These credit cards are issued by a third-party bank (the “Bank”) in accordance with a creditcard agreement (“the Agreement”). The Company has no liability to the Bank for bad debt expense, provided that purchases aremade in accordance with the Bank’s procedures. We receive additional funding from the bank based on the Agreement and cardactivity. We recognize revenue for the additional funding when the amounts are fixed or determinable and collectability isreasonably assured. This revenue is recorded in other revenue, which is a component of total net revenue in our ConsolidatedStatements of Operations.
Once a customer is approved to receive the AEO Visa Card or the AEO Credit Card and the card is activated, the customer iseligible to participate in the credit card rewards program. Customers who make purchases at AEO and Aerie earn discounts inthe form of savings certificates when certain purchase levels are reached. Also, AEO Visa Card customers who make purchasesat other retailers where the card is accepted earn additional discounts. Savings certificates are valid for 90 days from issuance.
Points earned under the credit card rewards program on purchases at AEO and Aerie are accounted for by analogy toASC 605-25, Revenue Recognition, Multiple Element Arrangements (“ASC 605-25”). The Company believes that points earnedunder its point and loyalty programs represent deliverables in a multiple element arrangement rather than a rebate or refund ofcash. Accordingly, the portion of the sales revenue attributed to the award points is deferred and recognized when the award isredeemed or when the points expire. Additionally, credit card reward points earned on non-AEO or Aerie purchases areaccounted for in accordance with ASC 605-25. As the points are earned, a current liability is recorded for the estimated cost ofthe award, and the impact of adjustments is recorded in cost of sales.
The Company offers its customers the AEREWARDS® loyalty program (the “Program”). Under the Program, customersaccumulate points based on purchase activity and earn rewards by reaching certain point thresholds during three-month earningperiods. Rewards earned during these periods are valid through the stated expiration date, which is approximately one monthfrom the mailing date of the reward. These rewards can be redeemed for a discount on a purchase of merchandise. Rewards notredeemed during the one-month redemption period are forfeited. The Company determined that rewards earned using theProgram should be accounted for in accordance with ASC 605-25. Accordingly, the portion of the sales revenue attributed to theaward credits is deferred and recognized when the awards are redeemed or expire.
Income Taxes
The Company calculates income taxes in accordance with ASC 740, Income Taxes (“ASC 740”), which requires the use of theasset and liability method. Under this method, deferred tax assets and liabilities are recognized based on the difference betweenthe Consolidated Financial Statement carrying amounts of existing assets and liabilities and their respective tax bases ascomputed pursuant to ASC 740. Deferred tax assets and liabilities are measured using the tax rates, based on certain judgmentsregarding enacted tax laws and published guidance, in effect in the years when those temporary differences are expected toreverse. A valuation allowance is established against the deferred tax assets when it is more likely than not that some portion or allof the deferred taxes may not be realized. Changes in the Company’s level and composition of earnings, tax laws or the deferredtax valuation allowance, as well as the results of tax audits, may materially impact the Company’s effective income tax rate.
2015 Annual Report | 39

NOTES TO CONSOLIDATED FINANCIAL STATEMENTS
The Company evaluates its income tax positions in accordance with ASC 740 which prescribes a comprehensive model forrecognizing, measuring, presenting and disclosing in the financial statements tax positions taken or expected to be taken on a taxreturn, including a decision whether to file or not to file in a particular jurisdiction. Under ASC 740, a tax benefit from an uncertainposition may be recognized only if it is “more likely than not” that the position is sustainable based on its technical merits.
The calculation of the deferred tax assets and liabilities, as well as the decision to recognize a tax benefit from an uncertainposition and to establish a valuation allowance require management to make estimates and assumptions. The Company believesthat its assumptions and estimates are reasonable, although actual results may have a positive or negative material impact on thebalances of deferred tax assets and liabilities, valuation allowances or net income.
Revenue Recognition
Revenue is recorded for store sales upon the purchase of merchandise by customers. The Company’s e-commerce operationrecords revenue upon the estimated customer receipt date of the merchandise. Shipping and handling revenues are included intotal net revenue. Sales tax collected from customers is excluded from revenue and is included as part of accrued income andother taxes on the Company’s Consolidated Balance Sheets.
Revenue is recorded net of estimated and actual sales returns and deductions for coupon redemptions and other promotions.The Company records the impact of adjustments to its sales return reserve quarterly within total net revenue and cost of sales.The sales return reserve reflects an estimate of sales returns based on projected merchandise returns determined through the useof historical average return percentages.
For the Years Ended
(In thousands)January 30,
2016January 31,
2015February 1,
2014
Beginning balance $ 3,249 $ 2,205 $ 4,481
Returns (90,719) (79,813) (85,871)
Provisions 90,819 80,857 83,595
Ending balance $ 3,349 $ 3,249 $ 2,205
Revenue is not recorded on the purchase of gift cards. A current liability is recorded upon purchase, and revenue is recognizedwhen the gift card is redeemed for merchandise. Additionally, the Company recognizes revenue on unredeemed gift cards basedon an estimate of the amounts that will not be redeemed (“gift card breakage”), determined through historical redemption trends.Gift card breakage revenue is recognized in proportion to actual gift card redemptions as a component of total net revenue. Forfurther information on the Company’s gift card program, refer to the Gift Cards caption below.
The Company recognizes royalty revenue generated from its license or franchise agreements based upon a percentage ofmerchandise sales by the licensee/franchisee. This revenue is recorded as a component of total net revenue when earned.
Cost of Sales, Including Certain Buying, Occupancy and Warehousing Expenses
Cost of sales consists of merchandise costs, including design, sourcing, importing and inbound freight costs, as well asmarkdowns, shrinkage and certain promotional costs (collectively “merchandise costs”) and buying, occupancy and warehousingcosts.
Design costs are related to the Company’s Design Center operations and include compensation and employee benefit expenses,including salaries, incentives, travel, supplies and samples for our design teams, as well as rent and depreciation for theCompany’s Design Center. These costs are included in cost of sales as the respective inventory is sold.
Buying, occupancy and warehousing costs consist of compensation, employee benefit expenses and travel for the Company’sbuyers and certain senior merchandising executives; rent and utilities related to the Company’s stores, corporate headquarters,distribution centers and other office space; freight from the Company’s distribution centers to the stores; compensation andsupplies for the Company’s distribution centers, including purchasing, receiving and inspection costs; and shipping and handlingcosts related to our e-commerce operation. Gross profit is the difference between total net revenue and cost of sales.
40 | AMERICAN EAGLE OUTFITTERS, INC.

NOTES TO CONSOLIDATED FINANCIAL STATEMENTS
Selling, General and Administrative Expenses
Selling, general and administrative expenses consist of compensation and employee benefit expenses, including salaries,incentives and related benefits associated with the Company’s stores and corporate headquarters. Selling, general andadministrative expenses also include advertising costs, supplies for our stores and home office, communication costs, travel andentertainment, leasing costs and services purchased. Selling, general and administrative expenses do not include compensation,employee benefit expenses and travel for the Company’s design, sourcing and importing teams, the Company’s buyers and theCompany’s distribution centers as these amounts are recorded in cost of sales.
Advertising Costs
Certain advertising costs, including direct mail, in-store photographs and other promotional costs are expensed when themarketing campaign commences. As of January 30, 2016 and January 31, 2015, the Company had prepaid advertising expenseof $6.1 million and $6.6 million, respectively. All other advertising costs are expensed as incurred. The Company recognized$104.1 million, $94.2 million and $87.0 million in advertising expense during Fiscal 2015, Fiscal 2014 and Fiscal 2013,respectively.
Store Pre-Opening Costs
Store pre-opening costs consist primarily of rent, advertising, supplies and payroll expenses. These costs are expensed asincurred.
Other Income, Net
Other income, net consists primarily of foreign currency transaction gain/loss, interest income/expense and realized investmentgains/losses.
Gift Cards
The value of a gift card is recorded as a current liability upon purchase and revenue is recognized when the gift card is redeemedfor merchandise. The Company estimates gift card breakage and recognizes revenue in proportion to actual gift cardredemptions as a component of total net revenue. The Company determines an estimated gift card breakage rate by continuouslyevaluating historical redemption data and the time when there is a remote likelihood that a gift card will be redeemed. TheCompany recorded gift card breakage of $8.2 million, $7.0 million and $7.3 million during Fiscal 2015, Fiscal 2014 and Fiscal2013, respectively.
Legal Proceedings and Claims
The Company is subject to certain legal proceedings and claims arising out of the conduct of its business. In accordance withASC 450, Contingencies (“ASC 450”), the Company records a reserve for estimated losses when the loss is probable and theamount can be reasonably estimated. If a range of possible loss exists and no anticipated loss within the range is more likely thanany other anticipated loss, the Company records the accrual at the low end of the range, in accordance with ASC 450. As theCompany believes that it has provided adequate reserves, it anticipates that the ultimate outcome of any matter currently pendingagainst the Company will not materially affect the consolidated financial position, results of operations or consolidated cash flowsof the Company.
Supplemental Disclosures of Cash Flow Information
The table below shows supplemental cash flow information for cash amounts paid during the respective periods:
For the Years Ended
(In thousands)January 30,
2016January 31,
2015February 1,
2014
Cash paid during the periods for:
Income taxes $116,765 $38,501 $65,496
Interest $ 1,173 $ 638 $ 387
2015 Annual Report | 41

NOTES TO CONSOLIDATED FINANCIAL STATEMENTS
Segment InformationIn accordance with ASC 280, Segment Reporting (“ASC 280”), the Company has identified three operating segments (AmericanEagle Outfitters® Brand retail stores, Aerie® by American Eagle Outfitters® retail stores and AEO Direct) that reflect theCompany’s operational structure as well as the business’s internal view of analyzing results and allocating resources. All of theoperating segments have been aggregated and are presented as one reportable segment, as permitted by ASC 280.
The following tables present summarized geographical information:
For the Years Ended
(In thousands)January 30,
2016January 31,
2015February 1,
2014
Total net revenue:
United States $3,091,205 $2,895,310 $2,954,635
Foreign (1) 430,643 387,557 351,167
Total net revenue $3,521,848 $3,282,867 $3,305,802
(1) Amounts represent sales from American Eagle Outfitters and Aerie international retail stores, AEO Direct sales that are billed to and/or shippedto foreign countries and international franchise revenue.
(In thousands)January 30,
2016January 31,
2015
Long-lived assets, net:
United States $692,252 $668,105
Foreign 80,352 90,424
Total long-lived assets, net $772,604 $758,529
3. Cash and Cash EquivalentsThe following table summarizes the fair market value of our cash and marketable securities, which are recorded on theConsolidated Balance Sheets:
(In thousands)January 30,
2016January 31,
2015
Cash and cash equivalents:
Cash $205,359 $370,692
Money-market 54,708 40,005
Total cash and cash equivalents $260,067 $410,697
Proceeds from the sale of available-for-sale securities were $10.0 million and $162.8 million for Fiscal 2014 and Fiscal 2013,respectively.
4. Fair Value MeasurementsASC 820, Fair Value Measurement Disclosures (“ASC 820”), defines fair value, establishes a framework for measuring fair value inaccordance with GAAP, and expands disclosures about fair value measurements. Fair value is defined under ASC 820 as the exitprice associated with the sale of an asset or transfer of a liability in an orderly transaction between market participants at themeasurement date.
Financial InstrumentsValuation techniques used to measure fair value under ASC 820 must maximize the use of observable inputs and minimize theuse of unobservable inputs. In addition, ASC 820 establishes this three-tier fair value hierarchy, which prioritizes the inputs used inmeasuring fair value. These tiers include:
• Level 1 — Quoted prices in active markets for identical assets or liabilities.
42 | AMERICAN EAGLE OUTFITTERS, INC.
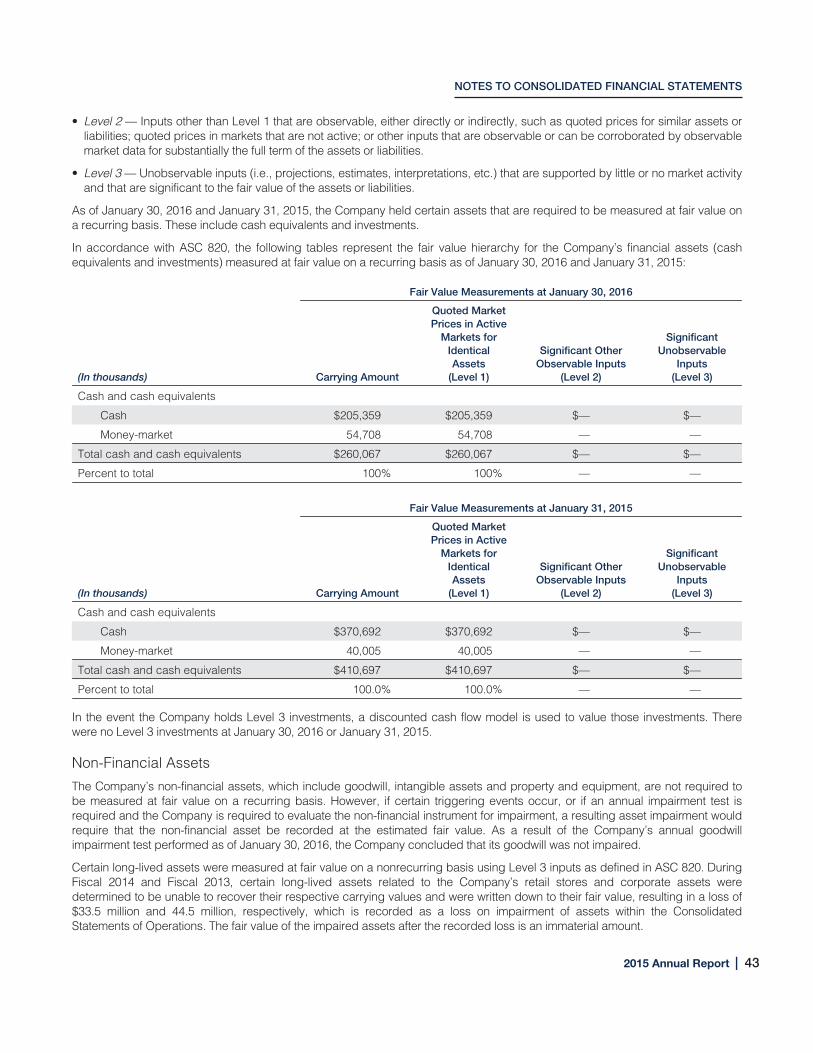
NOTES TO CONSOLIDATED FINANCIAL STATEMENTS
• Level 2 — Inputs other than Level 1 that are observable, either directly or indirectly, such as quoted prices for similar assets orliabilities; quoted prices in markets that are not active; or other inputs that are observable or can be corroborated by observablemarket data for substantially the full term of the assets or liabilities.
• Level 3 — Unobservable inputs (i.e., projections, estimates, interpretations, etc.) that are supported by little or no market activityand that are significant to the fair value of the assets or liabilities.
As of January 30, 2016 and January 31, 2015, the Company held certain assets that are required to be measured at fair value ona recurring basis. These include cash equivalents and investments.
In accordance with ASC 820, the following tables represent the fair value hierarchy for the Company’s financial assets (cashequivalents and investments) measured at fair value on a recurring basis as of January 30, 2016 and January 31, 2015:
Fair Value Measurements at January 30, 2016
(In thousands) Carrying Amount
Quoted MarketPrices in Active
Markets forIdenticalAssets
(Level 1)
Significant OtherObservable Inputs
(Level 2)
SignificantUnobservable
Inputs(Level 3)
Cash and cash equivalents
Cash $205,359 $205,359 $— $—
Money-market 54,708 54,708 — —
Total cash and cash equivalents $260,067 $260,067 $— $—
Percent to total 100% 100% — —
Fair Value Measurements at January 31, 2015
(In thousands) Carrying Amount
Quoted MarketPrices in Active
Markets forIdenticalAssets
(Level 1)
Significant OtherObservable Inputs
(Level 2)
SignificantUnobservable
Inputs(Level 3)
Cash and cash equivalents
Cash $370,692 $370,692 $— $—
Money-market 40,005 40,005 — —
Total cash and cash equivalents $410,697 $410,697 $— $—
Percent to total 100.0% 100.0% — —
In the event the Company holds Level 3 investments, a discounted cash flow model is used to value those investments. Therewere no Level 3 investments at January 30, 2016 or January 31, 2015.
Non-Financial Assets
The Company’s non-financial assets, which include goodwill, intangible assets and property and equipment, are not required tobe measured at fair value on a recurring basis. However, if certain triggering events occur, or if an annual impairment test isrequired and the Company is required to evaluate the non-financial instrument for impairment, a resulting asset impairment wouldrequire that the non-financial asset be recorded at the estimated fair value. As a result of the Company’s annual goodwillimpairment test performed as of January 30, 2016, the Company concluded that its goodwill was not impaired.
Certain long-lived assets were measured at fair value on a nonrecurring basis using Level 3 inputs as defined in ASC 820. DuringFiscal 2014 and Fiscal 2013, certain long-lived assets related to the Company’s retail stores and corporate assets weredetermined to be unable to recover their respective carrying values and were written down to their fair value, resulting in a loss of$33.5 million and 44.5 million, respectively, which is recorded as a loss on impairment of assets within the ConsolidatedStatements of Operations. The fair value of the impaired assets after the recorded loss is an immaterial amount.
2015 Annual Report | 43

NOTES TO CONSOLIDATED FINANCIAL STATEMENTS
The fair value of the Company’s stores were determined by estimating the amount and timing of net future cash flows anddiscounting them using a risk-adjusted rate of interest. The Company estimates future cash flows based on its experience andknowledge of the market in which the store is located.
5. Earnings per Share
The following is a reconciliation between basic and diluted weighted average shares outstanding:
For the Years Ended
(In thousands, except per share amounts)January 30,
2016January 31,
2015February 1,
2014
Weighted average common shares outstanding:
Basic number of common shares outstanding 194,351 194,437 192,802
Dilutive effect of stock options and non-vested restricted stock 1,886 698 1,673
Dilutive number of common shares outstanding 196,237 195,135 194,475
Equity awards to purchase approximately 13.000, 2.3 million and 1.7 million shares of common stock during the Fiscal 2015,Fiscal 2014 and Fiscal 2013, respectively, were outstanding, but were not included in the computation of weighted averagediluted common share amounts as the effect of doing so would have been anti-dilutive.
Additionally, for Fiscal 2015, approximately 0.7 million of performance-based restricted stock awards were not included in thecomputation of weighted average diluted common share amounts because the number of shares ultimately issued is contingenton the Company’s performance compared to pre-established performance goals. For Fiscal 2014, approximately 1.9 million ofperformance-based restricted stock awards were not included in the computation of weighted average diluted common shareamounts because the number of shares ultimately issued is contingent on the Company’s performance compared to pre-established performance goals.
Refer to Note 12 to the Consolidated Financial Statements for additional information regarding share-based compensation.
6. Accounts Receivable
Accounts receivable are comprised of the following:
(In thousands)January 30,
2016January 31,
2015
Franchise and license receivable $35,834 $24,945
Credit card program receivable 15,880 14,277
Merchandise sell-offs and vendor receivables 14,121 12,953
Gift card receivable 3,629 4,453
Landlord construction allowances 4,382 3,354
Other items 7,066 7,912
Total $80,912 $67,894
44 | AMERICAN EAGLE OUTFITTERS, INC.

NOTES TO CONSOLIDATED FINANCIAL STATEMENTS
7. Property and Equipment
Property and equipment consists of the following:
(In thousands)January 30,
2016January 31,
2015
Land $ 17,910 $ 19,796
Buildings 204,690 204,190
Leasehold improvements 580,758 571,312
Fixtures and equipment 963,758 852,408
Construction in progress 25,266 42,470
Property and equipment, at cost $ 1,792,382 $1,690,176
Less: Accumulated depreciation (1,088,796) (991,949)
Property and equipment, net $ 703,586 $ 698,227
Depreciation expense is summarized as follows:
For the Years Ended
(In thousands)January 30,
2016January 31,
2015February 1,
2014
Depreciation expense $140,616 $132,529 $116,761
Additionally, during Fiscal 2015, Fiscal 2014 and Fiscal 2013, the Company recorded $4.8 million, $6.4 million and $14.6 million,respectively, related to asset write-offs within depreciation and amortization expense.
8. Intangible Assets
Intangible assets include costs to acquire and register the Company’s trademark assets. During Fiscal 2015, the Company added$5.7 million net intangible assets from the Tailgate acquisition. The following table represents intangible assets as of January 30,2016 and January 31, 2015:
(In thousands)January 30,
2016January 31,
2015
Trademarks, at cost $ 67,398 $ 59,385
Less: Accumulated amortization (15,566) (12,179)
Intangible assets, net $ 51,832 $ 47,206
Amortization expense is summarized as follows:
For the Years Ended
(In thousands)January 30,
2016January 31,
2015February 1,
2014
Amortization expense $3,483 $3,465 $2,714
2015 Annual Report | 45

NOTES TO CONSOLIDATED FINANCIAL STATEMENTS
The table below summarizes the estimated future amortization expense for intangible assets existing as of January 30, 2016 forthe next five Fiscal Years:
(In thousands)Future
Amortization
2016 $3,603
2017 $3,595
2018 $3,584
2019 $3,584
2020 $2,911
Refer to Note 17 to the Consolidated Financial Statements for additional information on the acquisition of Tailgate.
9. Other Credit Arrangements
In Fiscal 2014, the Company entered into a new Credit Agreement (“Credit Agreement”) for five-year, syndicated, asset-basedrevolving credit facilities (the “Credit Facilities”). The Credit Agreement provides senior secured revolving credit for loans andletters of credit up to $400 million, subject to customary borrowing base limitations. The Credit Facilities provide increasedfinancial flexibility and take advantage of a favorable credit environment.
All obligations under the Credit Facilities are unconditionally guaranteed by certain subsidiaries. The obligations under the CreditAgreement are secured by a first-priority security interest in certain working capital assets of the borrowers and guarantors,consisting primarily of cash, receivables, inventory and certain other assets, and will be further secured by first-priority mortgageson certain real property.
As of January 30, 2016, the Company was in compliance with the terms of the Credit Agreement and had $8.0 million outstandingin stand-by letters of credit. No loans were outstanding under the Credit Agreement on January 30, 2016.
Additionally, the Company has borrowing agreements with two separate financial institutions under which it may borrow anaggregate of $130.0 million USD for the purposes of trade letter of credit issuances. The availability of any future borrowingsunder the trade letter of credit facilities is subject to acceptance by the respective financial institutions.
As of January 30, 2016, the Company had outstanding trade letters of credit of $0.4 million.
10. Leases
The Company leases all store premises, some of its office space and certain information technology and office equipment. Thestore leases generally have initial terms of 10 years and are classified as operating leases. Most of these store leases provide forbase rentals and the payment of a percentage of sales as additional contingent rent when sales exceed specified levels.Additionally, most leases contain construction allowances and/or rent holidays. In recognizing landlord incentives and minimumrent expense, the Company amortizes the items on a straight-line basis over the lease term (including the pre-opening build-outperiod).
A summary of fixed minimum and contingent rent expense for all operating leases follows:
For the Years Ended
(In thousands)January 30,
2016January 31,
2015February 1,
2014
Store rent:
Fixed minimum $282,300 $279,640 $260,668
Contingent 9,035 6,733 6,576
Total store rent, excluding common area maintenance charges, real estatetaxes and certain other expenses $291,335 $286,373 $267,244
Offices, distribution facilities, equipment and other 16,063 15,449 17,153
Total rent expense $307,398 $301,822 $284,397
46 | AMERICAN EAGLE OUTFITTERS, INC.

NOTES TO CONSOLIDATED FINANCIAL STATEMENTS
In addition, the Company is typically responsible under its store, office and distribution center leases for tenant occupancy costs,including maintenance costs, common area charges, real estate taxes and certain other expenses.
The table below summarizes future minimum lease obligations, consisting of fixed minimum rent, under operating leases in effectat January 30, 2016:
(In thousands)Fiscal years:
Future MinimumLease Obligations
2016 $ 285,100
2017 $ 254,677
2018 $ 225,006
2019 $ 194,806
2020 $ 175,643
Thereafter $ 502,147
Total $1,637,379
11. Other Comprehensive Income
The accumulated balances of other comprehensive income included as part of the Consolidated Statements of Stockholders’Equity follow:
(In thousands)
BeforeTax
Amount
TaxBenefit
(Expense)
AccumulatedOther
ComprehensiveIncome
Balance at February 2, 2013 $ 29,297 — $ 29,297
Foreign currency translation loss (1) (17,140) — (17,140)
Balance at February 1, 2014 $ 12,157 — $ 12,157
Foreign currency translation loss (1) (22,101) — (22,101)
Balance at January 31, 2015 $ (9,944) — $ (9,944)
Foreign currency translation loss (1) (14,535) — (14,535)
Loss on long-term intra-entity foreign currency transactions (8,805) 3,416 (5,389)
Balance at January 30, 2016 $(33,284) $3,416 $(29,868)
(1) Foreign currency translation adjustments are not adjusted for income taxes as they relate to permanent investments in our subsidiaries.
12. Share-Based Payments
The Company accounts for share-based compensation under the provisions of ASC 718, Compensation — Stock Compensation(“ASC 718”), which requires the Company to measure and recognize compensation expense for all share-based payments at fairvalue. Total share-based compensation expense included in the Consolidated Statements of Operations for Fiscal 2015 andFiscal 2014 was $35.0 million ($23.2 million, net of tax) and $16.1 million ($9.9 million, net of tax), respectively. Total share-basedcompensation expense included in the Consolidated Statements of Operations for Fiscal 2013 was a net benefit of $6.5 million($4.1 million, net of tax).
ASC 718 requires recognition of compensation cost under a non-substantive vesting period approach for awards containingprovisions that accelerate or continue vesting upon retirement. Accordingly, for awards with such provisions, the Companyrecognizes compensation expense over the period from the grant date to the date retirement eligibility is achieved, if that isexpected to occur during the nominal vesting period. Additionally, for awards granted to retirement eligible employees, the fullcompensation cost of an award must be recognized immediately upon grant.
At January 30, 2016, the Company had awards outstanding under three share-based compensation plans, which are describedbelow.
2015 Annual Report | 47
NOTES TO CONSOLIDATED FINANCIAL STATEMENTS
Share-based compensation plans
2014 Stock Award and Incentive Plan
The 2014 Plan was approved by the stockholders on May 29, 2014. The 2014 Plan authorized 11.5 million shares for issuance, inthe form of options, stock appreciation rights (“SARS”), restricted stock, restricted stock units, bonus stock and awards,performance awards, dividend equivalents and other stock based awards. The 2014 Plan provides that the maximum number ofshares awarded to any individual may not exceed 4.0 million shares per year for options and SARS and no more than 1.5 millionshares may be granted with respect to each of restricted shares of stock and restricted stock units plus any unused carryover limitfrom the previous year. The 2014 Plan allows the Compensation Committee of the Board to determine which employees receiveawards and the terms and conditions of the awards that are mandatory under the 2014 Plan. The 2014 Plan provides for grants todirectors who are not officers or employees of the Company, which are not to exceed in value $300,000 in any single calendaryear ($500,000 in the first year a person becomes a non-employee director). Through January 30, 2016, approximately 2.4 millionshares of restricted stock and approximately 71,000 shares of common stock had been granted under the 2014 Plan toemployees and directors. Approximately 50% of the restricted stock awards are performance-based and are earned if theestablished performance goals are met. The remaining 50% of the restricted stock awards are time-based and 85% vest ratablyover three years, 6% cliff vest in one year, 5% cliff vest in two years and 4% cliff vest in three years.
2005 Stock Award and Incentive Plan
The 2005 Plan was approved by the stockholders on June 15, 2005. The 2005 Plan authorized 18.4 million shares for issuance, ofwhich 6.4 million shares are available for full value awards in the form of restricted stock awards, restricted stock units or other fullvalue stock awards and 12.0 million shares are available for stock options, SAR, dividend equivalents, performance awards orother non-full value stock awards. The 2005 Plan was subsequently amended in Fiscal 2009 to increase the shares available forgrant to 31.9 million without taking into consideration 9.1 million non-qualified stock options, 2.9 million shares of restricted stockand 0.2 million shares of common stock that had been previously granted under the 2005 plan to employees and directors(without considering cancellations as of January 31, 2009 of awards for 2.9 million shares). The 2005 Plan provides that themaximum number of shares awarded to any individual may not exceed 6.0 million shares per year for options and SAR and nomore than 4.0 million shares may be granted with respect to each of restricted shares of stock and restricted stock units plus anyunused carryover limit from the previous year. The 2005 Plan allows the Compensation Committee of the Board to determinewhich employees receive awards and the terms and conditions of the awards that are mandatory under the 2005 Plan. The 2005Plan provides for grants to directors who are not officers or employees of the Company, which are not to exceed 20,000 sharesper year (not to be adjusted for stock splits). Through January 30, 2016, 17.1 million non-qualified stock options, 10.4 millionshares of restricted stock and 0.4 million shares of common stock had been granted under the 2005 Plan to employees anddirectors (without considering cancellations to date of awards for 14.0 million shares). Approximately 95% of the options grantedunder the 2005 Plan vest over three years, 4% vest over one year and 1% vest over five years. Options were granted for ten andseven year terms. Approximately 62% of the restricted stock awards are performance-based and are earned if the Companymeets established performance goals. The remaining 38% of the restricted stock awards are time-based and vest over threeyears. The 2005 Plan terminated on May 29, 2014 with all rights of the awardees and all unexpired awards continuing in force andoperation after the termination.
1999 Stock Incentive Plan
The 1999 Stock Option Plan (the “1999 Plan”) was approved by the stockholders on June 8, 1999. The 1999 Plan authorized18.0 million shares for issuance in the form of stock options, stock appreciation rights (“SAR”), restricted stock awards,performance units or performance shares. The 1999 Plan was subsequently amended to increase the shares available for grant to33.0 million. Additionally, the 1999 Plan provided that the maximum number of shares awarded to any individual may not exceed9.0 million shares. The 1999 Plan allowed the Compensation Committee to determine which employees and consultants receivedawards and the terms and conditions of these awards. The 1999 Plan provided for a grant of 1,875 stock options quarterly (not tobe adjusted for stock splits) to each director who is not an officer or employee of the Company starting in August 2003. TheCompany ceased making these quarterly stock option grants in June 2005. Under this plan, 33.2 million non-qualified stockoptions and 6.7 million shares of restricted stock were granted to employees and certain non-employees (without consideringcancellations to date of awards for 9.7 million shares). Approximately 33% of the options granted were to vest over eight yearsafter the date of grant but were accelerated as the Company met annual performance goals. Approximately 34% of the optionsgranted under the 1999 Plan vest over three years, 23% vest over five years and the remaining grants vest over one year. Alloptions expire after 10 years. Performance-based restricted stock was earned if the Company met established performancegoals. The 1999 Plan terminated on June 15, 2005 with all rights of the awardees and all unexpired awards continuing in forceand operation after the termination.
48 | AMERICAN EAGLE OUTFITTERS, INC.
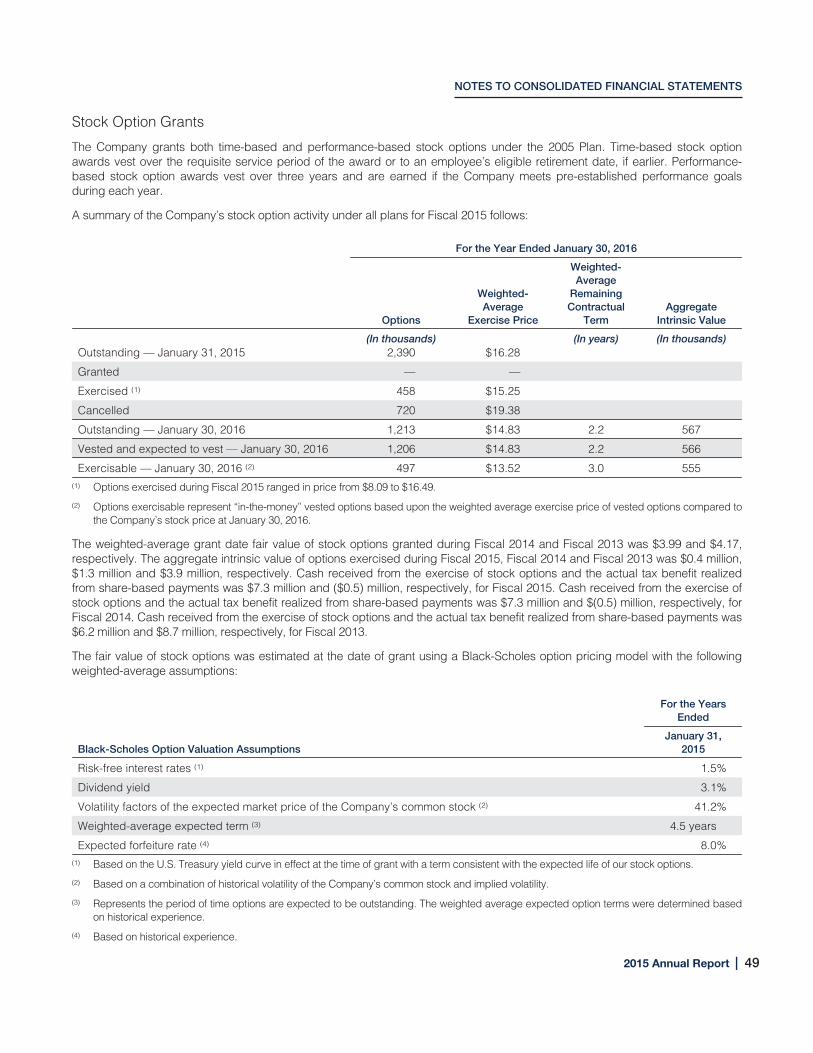
NOTES TO CONSOLIDATED FINANCIAL STATEMENTS
Stock Option Grants
The Company grants both time-based and performance-based stock options under the 2005 Plan. Time-based stock optionawards vest over the requisite service period of the award or to an employee’s eligible retirement date, if earlier. Performance-based stock option awards vest over three years and are earned if the Company meets pre-established performance goalsduring each year.
A summary of the Company’s stock option activity under all plans for Fiscal 2015 follows:
For the Year Ended January 30, 2016
Options
Weighted-Average
Exercise Price
Weighted-Average
RemainingContractual
TermAggregate
Intrinsic Value
(In thousands) (In years) (In thousands)Outstanding — January 31, 2015 2,390 $16.28
Granted — —
Exercised (1) 458 $15.25
Cancelled 720 $19.38
Outstanding — January 30, 2016 1,213 $14.83 2.2 567
Vested and expected to vest — January 30, 2016 1,206 $14.83 2.2 566
Exercisable — January 30, 2016 (2) 497 $13.52 3.0 555(1) Options exercised during Fiscal 2015 ranged in price from $8.09 to $16.49.
(2) Options exercisable represent “in-the-money” vested options based upon the weighted average exercise price of vested options compared tothe Company’s stock price at January 30, 2016.
The weighted-average grant date fair value of stock options granted during Fiscal 2014 and Fiscal 2013 was $3.99 and $4.17,respectively. The aggregate intrinsic value of options exercised during Fiscal 2015, Fiscal 2014 and Fiscal 2013 was $0.4 million,$1.3 million and $3.9 million, respectively. Cash received from the exercise of stock options and the actual tax benefit realizedfrom share-based payments was $7.3 million and ($0.5) million, respectively, for Fiscal 2015. Cash received from the exercise ofstock options and the actual tax benefit realized from share-based payments was $7.3 million and $(0.5) million, respectively, forFiscal 2014. Cash received from the exercise of stock options and the actual tax benefit realized from share-based payments was$6.2 million and $8.7 million, respectively, for Fiscal 2013.
The fair value of stock options was estimated at the date of grant using a Black-Scholes option pricing model with the followingweighted-average assumptions:
For the YearsEnded
Black-Scholes Option Valuation AssumptionsJanuary 31,
2015
Risk-free interest rates (1) 1.5%
Dividend yield 3.1%
Volatility factors of the expected market price of the Company’s common stock (2) 41.2%
Weighted-average expected term (3) 4.5 years
Expected forfeiture rate (4) 8.0%(1) Based on the U.S. Treasury yield curve in effect at the time of grant with a term consistent with the expected life of our stock options.
(2) Based on a combination of historical volatility of the Company’s common stock and implied volatility.
(3) Represents the period of time options are expected to be outstanding. The weighted average expected option terms were determined basedon historical experience.
(4) Based on historical experience.
2015 Annual Report | 49
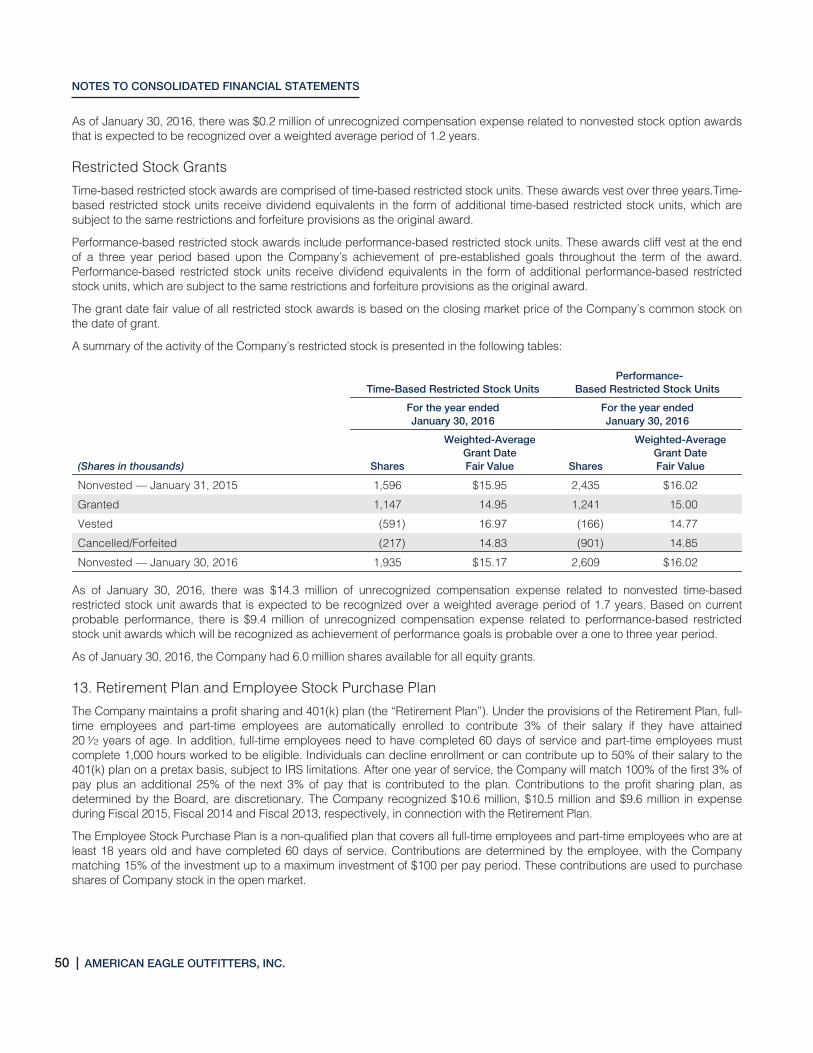
NOTES TO CONSOLIDATED FINANCIAL STATEMENTS
As of January 30, 2016, there was $0.2 million of unrecognized compensation expense related to nonvested stock option awardsthat is expected to be recognized over a weighted average period of 1.2 years.
Restricted Stock Grants
Time-based restricted stock awards are comprised of time-based restricted stock units. These awards vest over three years.Time-based restricted stock units receive dividend equivalents in the form of additional time-based restricted stock units, which aresubject to the same restrictions and forfeiture provisions as the original award.
Performance-based restricted stock awards include performance-based restricted stock units. These awards cliff vest at the endof a three year period based upon the Company’s achievement of pre-established goals throughout the term of the award.Performance-based restricted stock units receive dividend equivalents in the form of additional performance-based restrictedstock units, which are subject to the same restrictions and forfeiture provisions as the original award.
The grant date fair value of all restricted stock awards is based on the closing market price of the Company’s common stock onthe date of grant.
A summary of the activity of the Company’s restricted stock is presented in the following tables:
Time-Based Restricted Stock UnitsPerformance-
Based Restricted Stock Units
For the year endedJanuary 30, 2016
For the year endedJanuary 30, 2016
(Shares in thousands) Shares
Weighted-AverageGrant DateFair Value Shares
Weighted-AverageGrant DateFair Value
Nonvested — January 31, 2015 1,596 $15.95 2,435 $16.02
Granted 1,147 14.95 1,241 15.00
Vested (591) 16.97 (166) 14.77
Cancelled/Forfeited (217) 14.83 (901) 14.85
Nonvested — January 30, 2016 1,935 $15.17 2,609 $16.02
As of January 30, 2016, there was $14.3 million of unrecognized compensation expense related to nonvested time-basedrestricted stock unit awards that is expected to be recognized over a weighted average period of 1.7 years. Based on currentprobable performance, there is $9.4 million of unrecognized compensation expense related to performance-based restrictedstock unit awards which will be recognized as achievement of performance goals is probable over a one to three year period.
As of January 30, 2016, the Company had 6.0 million shares available for all equity grants.
13. Retirement Plan and Employee Stock Purchase Plan
The Company maintains a profit sharing and 401(k) plan (the “Retirement Plan”). Under the provisions of the Retirement Plan, full-time employees and part-time employees are automatically enrolled to contribute 3% of their salary if they have attained201⁄2 years of age. In addition, full-time employees need to have completed 60 days of service and part-time employees mustcomplete 1,000 hours worked to be eligible. Individuals can decline enrollment or can contribute up to 50% of their salary to the401(k) plan on a pretax basis, subject to IRS limitations. After one year of service, the Company will match 100% of the first 3% ofpay plus an additional 25% of the next 3% of pay that is contributed to the plan. Contributions to the profit sharing plan, asdetermined by the Board, are discretionary. The Company recognized $10.6 million, $10.5 million and $9.6 million in expenseduring Fiscal 2015, Fiscal 2014 and Fiscal 2013, respectively, in connection with the Retirement Plan.
The Employee Stock Purchase Plan is a non-qualified plan that covers all full-time employees and part-time employees who are atleast 18 years old and have completed 60 days of service. Contributions are determined by the employee, with the Companymatching 15% of the investment up to a maximum investment of $100 per pay period. These contributions are used to purchaseshares of Company stock in the open market.
50 | AMERICAN EAGLE OUTFITTERS, INC.
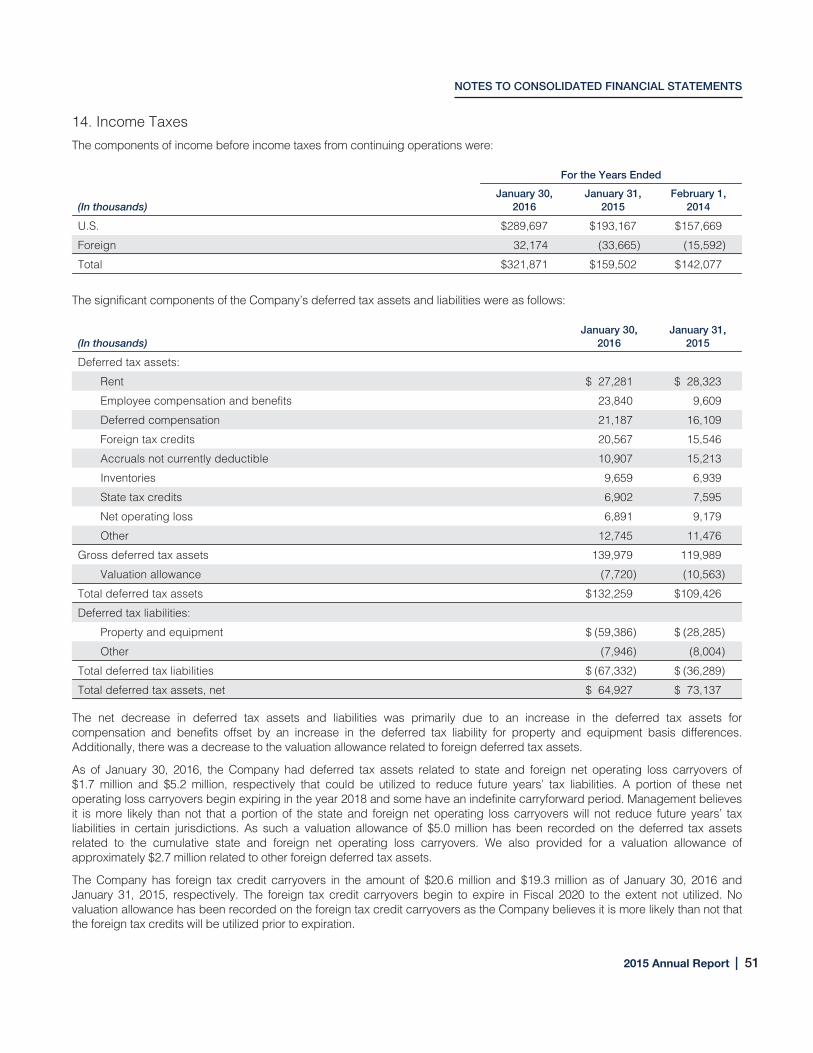
NOTES TO CONSOLIDATED FINANCIAL STATEMENTS
14. Income Taxes
The components of income before income taxes from continuing operations were:
For the Years Ended
(In thousands)January 30,
2016January 31,
2015February 1,
2014
U.S. $289,697 $193,167 $157,669
Foreign 32,174 (33,665) (15,592)
Total $321,871 $159,502 $142,077
The significant components of the Company’s deferred tax assets and liabilities were as follows:
(In thousands)January 30,
2016January 31,
2015
Deferred tax assets:
Rent $ 27,281 $ 28,323
Employee compensation and benefits 23,840 9,609
Deferred compensation 21,187 16,109
Foreign tax credits 20,567 15,546
Accruals not currently deductible 10,907 15,213
Inventories 9,659 6,939
State tax credits 6,902 7,595
Net operating loss 6,891 9,179
Other 12,745 11,476
Gross deferred tax assets 139,979 119,989
Valuation allowance (7,720) (10,563)
Total deferred tax assets $132,259 $109,426
Deferred tax liabilities:
Property and equipment $ (59,386) $ (28,285)
Other (7,946) (8,004)
Total deferred tax liabilities $ (67,332) $ (36,289)
Total deferred tax assets, net $ 64,927 $ 73,137
The net decrease in deferred tax assets and liabilities was primarily due to an increase in the deferred tax assets forcompensation and benefits offset by an increase in the deferred tax liability for property and equipment basis differences.Additionally, there was a decrease to the valuation allowance related to foreign deferred tax assets.
As of January 30, 2016, the Company had deferred tax assets related to state and foreign net operating loss carryovers of$1.7 million and $5.2 million, respectively that could be utilized to reduce future years’ tax liabilities. A portion of these netoperating loss carryovers begin expiring in the year 2018 and some have an indefinite carryforward period. Management believesit is more likely than not that a portion of the state and foreign net operating loss carryovers will not reduce future years’ taxliabilities in certain jurisdictions. As such a valuation allowance of $5.0 million has been recorded on the deferred tax assetsrelated to the cumulative state and foreign net operating loss carryovers. We also provided for a valuation allowance ofapproximately $2.7 million related to other foreign deferred tax assets.
The Company has foreign tax credit carryovers in the amount of $20.6 million and $19.3 million as of January 30, 2016 andJanuary 31, 2015, respectively. The foreign tax credit carryovers begin to expire in Fiscal 2020 to the extent not utilized. Novaluation allowance has been recorded on the foreign tax credit carryovers as the Company believes it is more likely than not thatthe foreign tax credits will be utilized prior to expiration.
2015 Annual Report | 51

NOTES TO CONSOLIDATED FINANCIAL STATEMENTS
The Company has state income tax credit carryforwards of $6.9 million (net of federal tax) and $7.6 million (net of federal tax) as ofJanuary 30, 2016 and January 31, 2015, respectively. These income tax credits can be utilized to offset future state income taxesand have a carryforward period of 10 to16 years. They will begin to expire in Fiscal 2022.
Significant components of the provision for income taxes from continuing operations were as follows:
For the Years Ended
(In thousands)January 30,
2016January 31,
2015February 1,
2014
Current:
Federal $ 86,122 $66,229 $29,794
Foreign taxes 3,836 (792) (50)
State 13,032 9,447 9,162
Total current 102,990 74,884 38,906
Deferred:
Federal $ 5,606 $ (1,178) $20,611
Foreign taxes (1,977) (85) 695
State 1,961 (2,906) (1,118)
Total deferred 5,590 (4,169) 20,188
Provision for income taxes $108,580 $70,715 $59,094
As a result of additional tax deductions related to share-based payments, tax benefits have been recognized as contributedcapital for Fiscal 2015, Fiscal 2014 and Fiscal 2013 in the amounts of $(0.5) million, $(0.5) million and $8.7 million, respectively.
U.S. income taxes have not been provided on the undistributed earnings of the Company’s foreign subsidiaries, as the Companyintends to indefinitely reinvest the undistributed foreign earnings outside of the United States. As of January 30, 2016, theunremitted earnings of the Company’s foreign subsidiaries were approximately $23.4 million (USD). Upon distribution of theearnings in the form of dividends or otherwise, the Company would be subject to income and withholding taxes offset by foreigntax credits. Determination of the amount of unrecognized deferred U.S. income tax liability on these unremitted earnings is notpracticable because of the complexities associated with this hypothetical calculation.
The following table summarizes the activity related to our unrecognized tax benefits:
For the Years Ended
(In thousands)January 30,
2016January 31,
2015February 1,
2014
Unrecognized tax benefits, beginning of the year balance $12,609 $14,601 $17,250
Increases in current period tax positions 2,727 2,166 2,294
Increases in tax positions of prior periods — — 440
Settlements — (73) —
Lapse of statute of limitations (516) (471) (453)
Decreases in tax positions of prior periods (9,072) (3,614) (4,930)
Unrecognized tax benefits, end of the year balance $ 5,748 $12,609 $14,601
As of January 30, 2016, the gross amount of unrecognized tax benefits was $5.7 million, of which $4.6 million would affect theeffective income tax rate if recognized. The gross amount of unrecognized tax benefits as of January 31, 2015 was $12.6 million,of which $9.1 million would affect the effective income tax rate if recognized.
Unrecognized tax benefits decreased by $6.9 million during Fiscal 2015, decreased $2.0 million during Fiscal 2014 anddecreased by $2.6 million during Fiscal 2013. The unrecognized tax benefit changes were primarily related to federal and stateincome tax settlements and other changes in income tax reserves. Over the next twelve months the Company believes it isreasonably possible the unrecognized tax benefits could decrease by as much as $2.8 million as the result of federal and statetax settlements, statute of limitations lapses, and other changes to the reserves.
52 | AMERICAN EAGLE OUTFITTERS, INC.
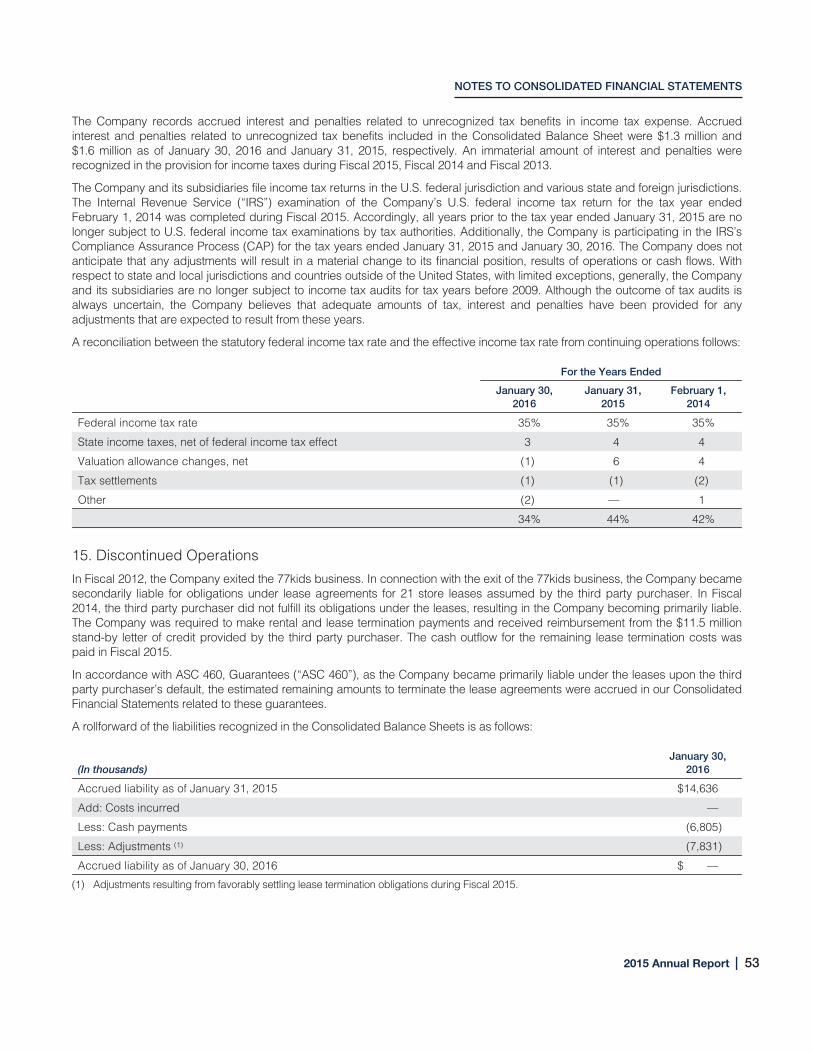
NOTES TO CONSOLIDATED FINANCIAL STATEMENTS
The Company records accrued interest and penalties related to unrecognized tax benefits in income tax expense. Accruedinterest and penalties related to unrecognized tax benefits included in the Consolidated Balance Sheet were $1.3 million and$1.6 million as of January 30, 2016 and January 31, 2015, respectively. An immaterial amount of interest and penalties wererecognized in the provision for income taxes during Fiscal 2015, Fiscal 2014 and Fiscal 2013.
The Company and its subsidiaries file income tax returns in the U.S. federal jurisdiction and various state and foreign jurisdictions.The Internal Revenue Service (“IRS”) examination of the Company’s U.S. federal income tax return for the tax year endedFebruary 1, 2014 was completed during Fiscal 2015. Accordingly, all years prior to the tax year ended January 31, 2015 are nolonger subject to U.S. federal income tax examinations by tax authorities. Additionally, the Company is participating in the IRS’sCompliance Assurance Process (CAP) for the tax years ended January 31, 2015 and January 30, 2016. The Company does notanticipate that any adjustments will result in a material change to its financial position, results of operations or cash flows. Withrespect to state and local jurisdictions and countries outside of the United States, with limited exceptions, generally, the Companyand its subsidiaries are no longer subject to income tax audits for tax years before 2009. Although the outcome of tax audits isalways uncertain, the Company believes that adequate amounts of tax, interest and penalties have been provided for anyadjustments that are expected to result from these years.
A reconciliation between the statutory federal income tax rate and the effective income tax rate from continuing operations follows:
For the Years Ended
January 30,2016
January 31,2015
February 1,2014
Federal income tax rate 35% 35% 35%
State income taxes, net of federal income tax effect 3 4 4
Valuation allowance changes, net (1) 6 4
Tax settlements (1) (1) (2)
Other (2) — 1
34% 44% 42%
15. Discontinued Operations
In Fiscal 2012, the Company exited the 77kids business. In connection with the exit of the 77kids business, the Company becamesecondarily liable for obligations under lease agreements for 21 store leases assumed by the third party purchaser. In Fiscal2014, the third party purchaser did not fulfill its obligations under the leases, resulting in the Company becoming primarily liable.The Company was required to make rental and lease termination payments and received reimbursement from the $11.5 millionstand-by letter of credit provided by the third party purchaser. The cash outflow for the remaining lease termination costs waspaid in Fiscal 2015.
In accordance with ASC 460, Guarantees (“ASC 460”), as the Company became primarily liable under the leases upon the thirdparty purchaser’s default, the estimated remaining amounts to terminate the lease agreements were accrued in our ConsolidatedFinancial Statements related to these guarantees.
A rollforward of the liabilities recognized in the Consolidated Balance Sheets is as follows:
(In thousands)January 30,
2016
Accrued liability as of January 31, 2015 $14,636
Add: Costs incurred —
Less: Cash payments (6,805)
Less: Adjustments (1) (7,831)
Accrued liability as of January 30, 2016 $ —
(1) Adjustments resulting from favorably settling lease termination obligations during Fiscal 2015.
2015 Annual Report | 53
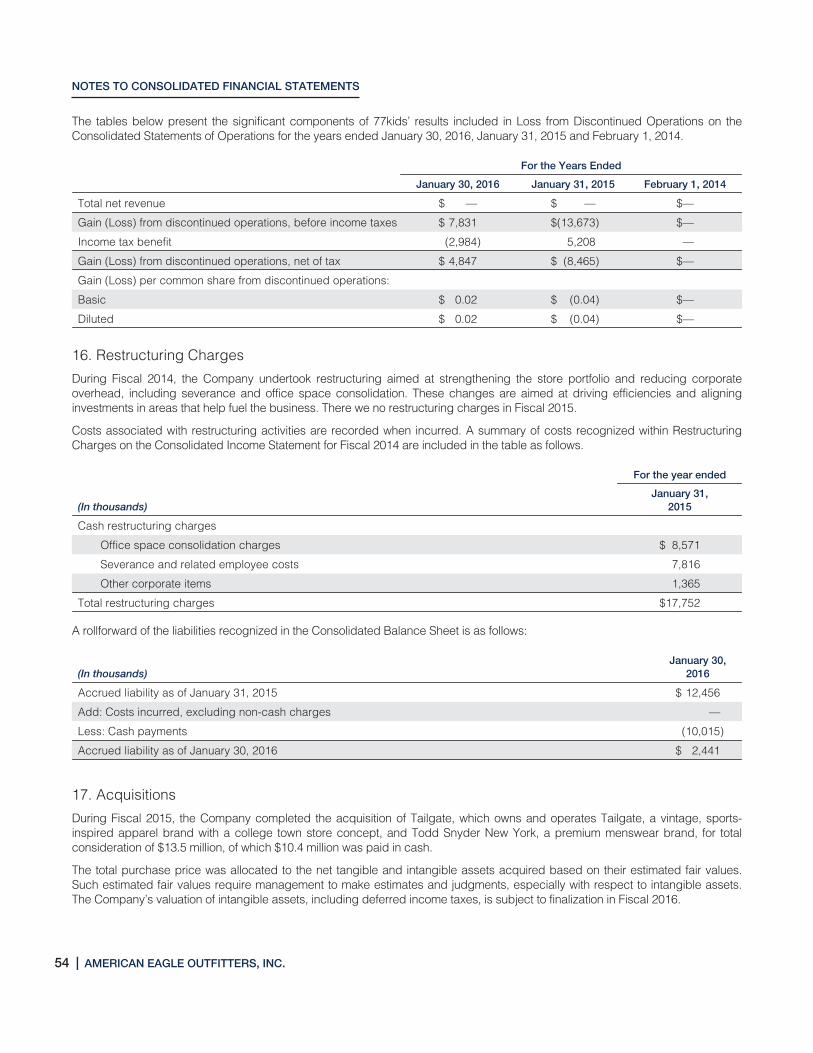
NOTES TO CONSOLIDATED FINANCIAL STATEMENTS
The tables below present the significant components of 77kids’ results included in Loss from Discontinued Operations on theConsolidated Statements of Operations for the years ended January 30, 2016, January 31, 2015 and February 1, 2014.
For the Years Ended
January 30, 2016 January 31, 2015 February 1, 2014
Total net revenue $ — $ — $—
Gain (Loss) from discontinued operations, before income taxes $ 7,831 $(13,673) $—
Income tax benefit (2,984) 5,208 —
Gain (Loss) from discontinued operations, net of tax $ 4,847 $ (8,465) $—
Gain (Loss) per common share from discontinued operations:
Basic $ 0.02 $ (0.04) $—
Diluted $ 0.02 $ (0.04) $—
16. Restructuring Charges
During Fiscal 2014, the Company undertook restructuring aimed at strengthening the store portfolio and reducing corporateoverhead, including severance and office space consolidation. These changes are aimed at driving efficiencies and aligninginvestments in areas that help fuel the business. There we no restructuring charges in Fiscal 2015.
Costs associated with restructuring activities are recorded when incurred. A summary of costs recognized within RestructuringCharges on the Consolidated Income Statement for Fiscal 2014 are included in the table as follows.
For the year ended
(In thousands)January 31,
2015
Cash restructuring charges
Office space consolidation charges $ 8,571
Severance and related employee costs 7,816
Other corporate items 1,365
Total restructuring charges $17,752
A rollforward of the liabilities recognized in the Consolidated Balance Sheet is as follows:
(In thousands)January 30,
2016
Accrued liability as of January 31, 2015 $ 12,456
Add: Costs incurred, excluding non-cash charges —
Less: Cash payments (10,015)
Accrued liability as of January 30, 2016 $ 2,441
17. Acquisitions
During Fiscal 2015, the Company completed the acquisition of Tailgate, which owns and operates Tailgate, a vintage, sports-inspired apparel brand with a college town store concept, and Todd Snyder New York, a premium menswear brand, for totalconsideration of $13.5 million, of which $10.4 million was paid in cash.
The total purchase price was allocated to the net tangible and intangible assets acquired based on their estimated fair values.Such estimated fair values require management to make estimates and judgments, especially with respect to intangible assets.The Company’s valuation of intangible assets, including deferred income taxes, is subject to finalization in Fiscal 2016.
54 | AMERICAN EAGLE OUTFITTERS, INC.

NOTES TO CONSOLIDATED FINANCIAL STATEMENTS
The preliminary allocation of the purchase price to the fair value of assets acquired is as follows:
(In thousands)
Merchandise inventory $ 4,078
Intangible assets and goodwill 10,121
Other current assets 4,231
Other liabilities (4,974)
Total purchase price $13,456
Results of operations of Tailgate have been included in our Consolidated Statements of Operations since the November 1, 2015acquisition date. Pro forma results of the acquired business have not been presented as the results were not material to ourConsolidated Financial Statements for all years presented and would not have been material had the acquisition occurred at thebeginning of Fiscal 2015.
18. Quarterly Financial Information — Unaudited
The sum of the quarterly EPS amounts may not equal the full year amount as the computations of the weighted average sharesoutstanding for each quarter and the full year are calculated independently.
Fiscal 2015Quarters Ended
(In thousands, except per share amounts)May 2,2015
August 1,2015
October 31,2015
January 30,2016
Total net revenue $699,520 $797,428 $919,072 $1,105,828
Gross profit $262,212 $285,039 $367,532 $ 387,951
Income from continuing operations 29,055 33,265 69,265 81,706
Gain from discontinued operations, net of tax — — 4,847 —
Net income $ 29,055 $ 33,265 $ 74,112 $ 81,706
Basic per common share amounts:
Income from continuing operations $ 0.15 $ 0.17 $ 0.35 $ 0.42
Loss from discontinued operations, net of tax — — 0.03 —
Basic net income per common share $ 0.15 $ 0.17 $ 0.38 $ 0.42
Diluted per common share amounts:
Income from continuing operations $ 0.15 $ 0.17 0.35 $ 0.42
Loss from discontinued operations, net of tax — — 0.03 —
Diluted net income per common share $ 0.15 $ 0.17 $ 0.38 $ 0.42
2015 Annual Report | 55
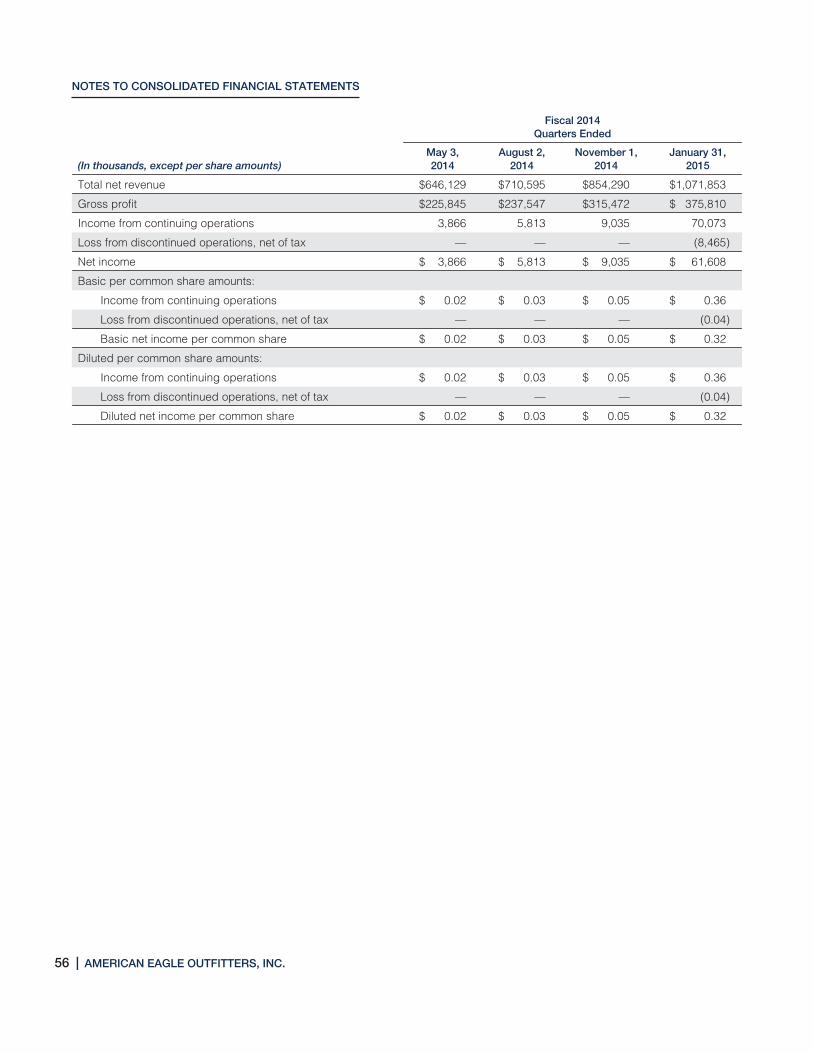
NOTES TO CONSOLIDATED FINANCIAL STATEMENTS
Fiscal 2014Quarters Ended
(In thousands, except per share amounts)May 3,2014
August 2,2014
November 1,2014
January 31,2015
Total net revenue $646,129 $710,595 $854,290 $1,071,853
Gross profit $225,845 $237,547 $315,472 $ 375,810
Income from continuing operations 3,866 5,813 9,035 70,073
Loss from discontinued operations, net of tax — — — (8,465)
Net income $ 3,866 $ 5,813 $ 9,035 $ 61,608
Basic per common share amounts:
Income from continuing operations $ 0.02 $ 0.03 $ 0.05 $ 0.36
Loss from discontinued operations, net of tax — — — (0.04)
Basic net income per common share $ 0.02 $ 0.03 $ 0.05 $ 0.32
Diluted per common share amounts:
Income from continuing operations $ 0.02 $ 0.03 $ 0.05 $ 0.36
Loss from discontinued operations, net of tax — — — (0.04)
Diluted net income per common share $ 0.02 $ 0.03 $ 0.05 $ 0.32
56 | AMERICAN EAGLE OUTFITTERS, INC.
Item 9. Changes in and Disagreements with Accountants on Accounting and FinancialDisclosure.
None.
Item 9A. Controls and Procedures.
Disclosure Controls and Procedures
We maintain disclosure controls and procedures that are designed to provide reasonable assurance that information required tobe disclosed in our reports under the Securities Exchange Act of 1934, as amended (the “Exchange Act”), is recorded,processed, summarized and reported within the time periods specified in the SEC’s rules and forms, and that such information isaccumulated and communicated to the management of American Eagle Outfitters, Inc. (the “Management”), including ourPrincipal Executive Officer and our Principal Financial Officer, as appropriate, to allow timely decisions regarding requireddisclosure. In designing and evaluating the disclosure controls and procedures, Management recognized that any controls andprocedures, no matter how well designed and operated, can provide only reasonable assurance of achieving the desired controlobjectives.
In connection with the preparation of this Annual Report on Form 10-K as of January 30, 2016, an evaluation was performed underthe supervision and with the participation of our Management, including the Principal Executive Officer and Principal FinancialOfficer, of the effectiveness of the design and operation of the Company’s disclosure controls and procedures (as defined inRule 13a-15(e) under the Exchange Act). Based upon that evaluation, our Principal Executive Officer and our Principal FinancialOfficer have concluded that our disclosure controls and procedures were effective at the reasonable assurance level as of theend of the period covered by this Annual Report on Form 10-K.
Management’s Annual Report on Internal Control Over Financial Reporting
Our Management is responsible for establishing and maintaining adequate internal control over financial reporting (as defined inRule 13a-15(f) under the Exchange Act). Our internal control over financial reporting is designed to provide a reasonableassurance to our Management and our Board regarding the preparation and fair presentation of published financial statements.
All internal control systems, no matter how well designed, have inherent limitations. Therefore, even those systems determined tobe effective can provide only reasonable assurance with respect to financial statement preparation and presentation.
Our Management assessed the effectiveness of our internal control over financial reporting as of January 30, 2016. In making thisassessment, our Management used the criteria set forth by the Committee of Sponsoring Organizations of the TreadwayCommission (COSO) in Internal Control — Integrated Framework (2013). Based on this assessment, our Management concludedthat we maintained effective internal control over financial reporting as of January 30, 2016.
The SEC’s general guidance permits the exclusion of an assessment of the effectiveness of a registrant’s internal controls overfinancial reporting for an acquired business during the first year following such acquisition, if among other circumstances andfactors there is not adequate time between the acquisition date and the date of assessment. As previously discussed in Note 17to the Consolidated Financial Statements, we completed the acquisition of Tailgate Clothing Company (“Tailgate”), onNovember 1, 2015. The acquired businesses constituted approximately 1% of total assets as of January 30, 2016 and less than1% of revenues and pre-tax income for the fiscal year then ended. Our Management’s assessment and conclusion on theeffectiveness of our disclosure controls and procedures as of January 30, 2016 excluded an assessment of the internal controlover financial reporting of the assets and business acquired for Tailgate.
Our independent registered public accounting firm that audited the financial statements included in this Annual Report issued anattestation report on our internal control over financial reporting.
Changes in Internal Control Over Financial Reporting
There were no changes in our internal control over financial reporting during the three months ended January 30, 2016 that havematerially affected, or are reasonably likely to materially affect, our internal control over financial reporting.
2015 Annual Report | 57

Report of Independent Registered Public Accounting Firm
The Board of Directors and Stockholders of American Eagle Outfitters, Inc.
We have audited American Eagle Outfitters, Inc.’s internal control over financial reporting as of January 30, 2016, based oncriteria established in Internal Control — Integrated Framework issued by the Committee of Sponsoring Organizations of theTreadway Commission (2013 framework) (the COSO criteria). American Eagle Outfitters Inc.’s management is responsible formaintaining effective internal control over financial reporting, and for its assessment of the effectiveness of internal control overfinancial reporting included in the accompanying Management’s Annual Report on Internal Control over Financial Reporting. Ourresponsibility is to express an opinion on the company’s internal control over financial reporting based on our audit.
We conducted our audit in accordance with the standards of the Public Company Accounting Oversight Board (United States).Those standards require that we plan and perform the audit to obtain reasonable assurance about whether effective internalcontrol over financial reporting was maintained in all material respects. Our audit included obtaining an understanding of internalcontrol over financial reporting, assessing the risk that a material weakness exists, testing and evaluating the design andoperating effectiveness of internal control based on the assessed risk, and performing such other procedures as we considerednecessary in the circumstances. We believe that our audit provides a reasonable basis for our opinion.
A company’s internal control over financial reporting is a process designed to provide reasonable assurance regarding thereliability of financial reporting and the preparation of financial statements for external purposes in accordance with generallyaccepted accounting principles. A company’s internal control over financial reporting includes those policies and procedures that(1) pertain to the maintenance of records that, in reasonable detail, accurately and fairly reflect the transactions and dispositionsof the assets of the company; (2) provide reasonable assurance that transactions are recorded as necessary to permitpreparation of financial statements in accordance with generally accepted accounting principles, and that receipts andexpenditures of the company are being made only in accordance with authorizations of management and directors of thecompany; and (3) provide reasonable assurance regarding prevention or timely detection of unauthorized acquisition, use, ordisposition of the company’s assets that could have a material effect on the financial statements.
Because of its inherent limitations, internal control over financial reporting may not prevent or detect misstatements. Also,projections of any evaluation of effectiveness to future periods are subject to the risk that controls may become inadequatebecause of changes in conditions, or that the degree of compliance with the policies or procedures may deteriorate.
As indicated in the accompanying Management’s Annual Report on Internal Control Over Financial Reporting, management’sassessment of and conclusion on the effectiveness of internal control over financial reporting did not include the internal controlsof Tailgate Clothing Company (“Tailgate”), which is included in the January 30, 2016 consolidated financial statements ofAmerican Eagle Outfitters, Inc. and constituted approximately 1% of total assets as of January 30, 2016 and less than 1% ofrevenues and pre-tax income for the fiscal year then ended. Our audit of internal control over financial reporting of AmericanEagle Outfitters, Inc. also did not include an evaluation of the internal control over financial reporting of Tailgate.
In our opinion, American Eagle Outfitters, Inc. maintained, in all material respects, effective internal control over financial reportingas of January 30, 2016, based on the COSO criteria.
We also have audited, in accordance with the standards of the Public Company Accounting Oversight Board (United States), theconsolidated balance sheets of American Eagle Outfitters, Inc. as of January 30, 2016 and January 31, 2015 and the relatedconsolidated statements of operations, comprehensive income, stockholders’ equity and cash flows for each of the three years inthe period ended January 30, 2016 of American Eagle Outfitters, Inc. and our report dated March 10, 2016 expressed anunqualified opinion thereon.
/s/ Ernst & Young LLP
Pittsburgh, PennsylvaniaMarch 10, 2016
58 | AMERICAN EAGLE OUTFITTERS, INC.
Item 9B. Other Information.
Not applicable.
PART IIIItem 10. Directors, Executive Officers and Corporate Governance.
The information appearing under the captions “Proposal One: Election of Directors,” “Section 16(a) Beneficial OwnershipReporting Compliance,” “Corporate Governance Information,” and “Board Committees” in our Proxy Statement relating to our2016 Annual Meeting of Stockholders is incorporated herein by reference. See also Part I, Item 1 under the caption “ExecutiveOfficers of the Registrant.”
Item 11. Executive Compensation.
The information appearing under the caption “Compensation Discussion and Analysis,” “Executive Officer Compensation,”“Director Compensation,” and “Compensation Committee Interlocks and Insider Participation” in our Proxy Statement relating toour 2016 Annual Meeting of Stockholders is incorporated herein by reference.
Item 12. Security Ownership of Certain Beneficial Owners and Management andRelated Stockholder Matters.
The information appearing under the captions “Security Ownership of Principal Stockholders and Management” in our ProxyStatement relating to our 2016 Annual Meeting of Stockholders is incorporated herein by reference.
Item 13. Certain Relationships and Related Transactions, and Director Independence.
The information appearing under the caption “Certain Relationships and Related Transactions” and “Board Committees” in ourProxy Statement relating to our 2016 Annual Meeting of Stockholders is incorporated herein by reference.
Item 14. Principal Accounting Fees and Services.
The information appearing under the caption “Independent Registered Public Accounting Firm Fees and Services” in our ProxyStatement relating to our 2016 Annual Meeting of Stockholders is incorporated herein by reference.
2015 Annual Report | 59

PART IVItem 15. Exhibits and Financial Statement Schedules.
(a) (1) The following consolidated financial statements are included in Item 8:
Consolidated Balance Sheets as of January 30, 2016 and January 31, 2015
Consolidated Statements of Operations for the fiscal years ended January 30, 2016, January 31, 2015 and February 1, 2014
Consolidated Statements of Comprehensive Income for the fiscal years ended January 30, 2016, January 31, 2015 andFebruary 1, 2014
Consolidated Statements of Stockholders’ Equity for the fiscal years ended January 30, 2016, January 31, 2015 and February 1,2014
Consolidated Statements of Cash Flows for the fiscal years ended January 30, 2016, January 31, 2015 and February 1, 2014
Notes to Consolidated Financial Statements
(a) (2) Financial statement schedules have been omitted because either they are not required or are not applicable orbecause the information required to be set forth therein is not material.
(a) (3) Exhibits
ExhibitNumber Description
3.1 Amended and Restated Certificate of Incorporation, as amended (1)
3.2 Amended and Restated Bylaws (2)
4.1 See Amended and Restated Certificate of Incorporation, as amended, in Exhibit 3.1 hereof
4.2 See Amended and Restated Bylaws in Exhibit 3.2 hereof
10.1^ Form of Indemnification Agreement (3)
10.2^ Employee Stock Purchase Plan (4)
10.3^ Form of the Registrant’s 1999 Stock Incentive Plan, as amended (5)
10.4^ Deferred Compensation Plan, as amended (6)
10.5^ Form of Director Deferred Compensation Agreement (7)
10.6^ 2005 Stock Award and Incentive Plan, as amended (8)
10.7^ Form of Change in Control Agreement dated April 21, 2010 (9)
10.8^ Form of RSU Confidentiality, Non-Solicitation, Non-Competition and Intellectual Property Agreement (10)
10.9^ Employment Agreement between the Registrant and Mary M. Boland, dated May 30, 2012 (11)
10.10^ Change in Control Agreement between the Registrant and Mary M. Boland, dated July 25, 2012 (12)
10.11^ Employment Agreement between the Registrant and Chad Kessler, dated December 2, 2013 (13)
10.12^ Employment Agreement between the Registrant and Jennifer Foyle, dated June 25, 2010 (14)
10.13 2014 Stock Award and Incentive Plan (15)
10.14^ Credit Agreement, dated December 2, 2014, among American Eagle Outfitters Outfitters, Inc. and certain of itssubsidiaries as borrowers, each lender from time to time party thereto, and HSBC Bank USA, N.A. as administrativeagent for the lenders, and certain other parties and agents (16)
10.15^ Third Amended and Restated Employment Agreement between the Registrant and Roger S. Markfield, datedJuly 23, 2014 (17)
10.16^ Form of Notice of Grant of Stock Options and Option Agreement (18)
10.17^ Form of Notice of Grant of Restricted Stock Units and Restricted Stock Units Awards Agreement (19)
10.18^ Form of Notice of Long Term Incentive Grant of Restricted Stock Units and Long Term Incentive Restricted StockUnits Award Agreement (20)
10.19^ Form of Notice and Grant Award Agreement under 2014 Stock Award and Incentive Plan (21)
60 | AMERICAN EAGLE OUTFITTERS, INC.
ITEM 15. EXHIBITS AND FINANCIAL STATEMENT SCHEDULES
ExhibitNumber Description
21* Subsidiaries
23* Consent of Independent Registered Public Accounting Firm
24* Power of Attorney
31.1* Certification by Jay L. Schottenstein pursuant to Rule 13a-14(a) or Rule 15d-14 (a)
31.2* Certification by Mary M. Boland pursuant to Rule 13a-14(a) or Rule 15d-14 (a)
32.1** Certification of Principal Executive Officer Pursuant to 18 U.S.C. Section 1350, as adopted Pursuant to Section 906 ofthe Sarbanes-Oxley Act of 2002
32.2** Certification of Principal Financial Officer Pursuant to 18 U.S.C. Section 1350, as adopted Pursuant to Section 906 ofthe Sarbanes-Oxley Act of 2002
101* Interactive Data File
(1) Previously filed as Exhibit 3.1 to the Form 10-Q dated August 4, 2007, filed September 6, 2007 and incorporated herein by reference.
(2) Previously filed as Exhibit 3.1 to the Form 8-K dated November 20, 2007, filed November 26, 2007 and incorporated herein by reference.
(3) Previously filed as Exhibit 10.7 to Registration Statement on Form S-1 (file no. 33-75294), filed February 14, 1994, as amended, andincorporated herein by reference.
(4) Previously filed as Exhibit 4(a) to Registration Statement on Form S-8 (file no. 33-33278), filed April 5, 1996 and incorporated herein byreference.
(5) Previously filed as Exhibit 10.5 to the Form 10-K dated February 3, 2007, filed April 4, 2007 and incorporated herein by reference.
(6) Previously filed as Exhibit 10.2 to the Form 8-K dated December 17, 2008, filed December 23, 2008 and incorporated herein by reference.
(7) Previously filed as Exhibit 10.1 to the Form 8-K dated December 30, 2005, filed January 5, 2006 and incorporated herein by reference.
(8) Previously filed as Appendix A to the Definitive Proxy Statement for the 2009 Annual Meeting of Stockholders held on June 16, 2009, filedMay 4, 2009 and incorporated herein by reference.
(9) Previously filed as Exhibit 10.1 to the Form 8-K dated April 21, 2010, filed April 26, 2010 and incorporated herein by reference.
(10) Previously filed as Exhibit 10.25 to the Form 10-K dated January 29, 2011, filed on March 11, 2011 and incorporated herein by reference.
(11) Previously filed as Exhibit 10.1 to the Form 8-K dated May 24, 2012, filed June 1, 2012 and incorporated herein by reference.
(12) Previously filed as Exhibit 10.1 to the Form 8-K dated July 25, 2012, filed July 27, 2012 and incorporated herein by reference.
(13) Previously filed as Exhibit 10.23 to the Form 10-K dated February 1, 2014, filed on March 13, 2014 and incorporated herein by reference.
(14) Previously filed as Exhibit 10.26 to the Form 10-K dated February 1, 2014, filed on March 13, 2014 and incorporated herein by reference.
(15) Previously filed as Appendix A to the Definitive Proxy Statement for the 2014 Annual Meeting of Stockholders held on May 29, 2014, filedApril 14, 2014 and incorporated herein by reference.
(16) Previously filed as Exhibit 10.1 to the Form 8-K dated December 2, 2014, filed December 4, 2014 and incorporated herein by reference.
(17) Previously filed as Exhibit 10.1 to the Form 8-K dated July 23, 2014, filed July 25, 2014 and incorporated herein by reference.
(18) Previously filed as Exhibit 10.24 to the Form 10-K dated January 28, 2012, filed on March 15, 2012 and incorporated herein by reference.
(19) Previously filed as Exhibit 10.25 to the Form 10-K dated January 28, 2012, filed on March 15, 2012 and incorporated herein by reference.
(20) Previously filed as Exhibit 10.26 to the Form 10-K dated January 28, 2012, filed on March 15, 2012 and incorporated herein by reference.
(21) Previously filed as Exhibit 10.1 to the Form 10-Q dated May 2, 2015, filed on May 27, 2015 and incorporated herein by reference.
^ Management contract or compensatory plan or arrangement.
* Filed herewith.
** Furnished herewith.
(b) Exhibits
The exhibits to this report have been filed herewith.
(c) Financial Statement Schedules
None.
2015 Annual Report | 61

SIGNATURESPursuant to the requirements of Section 13 or 15(d) of the Securities Exchange Act of 1934, the Registrant has duly caused thisreport to be signed on its behalf by the undersigned, thereunto duly authorized.
AMERICAN EAGLE OUTFITTERS, INC.
By: /s/ Jay L. Schottenstein
Jay L. SchottensteinChief Executive Officer
Dated March 10, 2016
Pursuant to the requirements of the Securities Exchange Act of 1934, this report has been signed by the following persons in thecapacities indicated on March 10, 2016.
Signature Title
/s/ Jay L. Schottenstein
Jay L. Schottenstein
Chief Executive Officer, Chairman of the Boardof Directors and Director
(Principal Executive Officer)
/s/ Mary M. Boland
Mary M. Boland
Chief Financial Officer andChief Administrative Officer(Principal Financial Officer)
/s/ Scott M. Hurd
Scott M. Hurd
Senior Vice President, Chief Accounting Officer(Principal Accounting Officer)
*
Michael G. Jesselson
Director
*
Thomas R. Ketteler
Director
*
Cary D. McMillan
Director
*
Janice E. Page
Director
*
David M. Sable
Director
*
Noel J. Spiegel
Director
*By: / s/ Mary M. Boland
Mary M. Boland,Attorney-in-Fact
62 | AMERICAN EAGLE OUTFITTERS, INC.
CORPORATE & STOCK INFORMATION BOARD OF DIRECTORS
JAY L. SCHOTTENSTEINEXECUTIVE CHAIRMAN OF THE BOARD,CHIEF EXECUTIVE OFFICER
MICHAEL G. JESSELSONDIRECTOR
THOMAS R. KETTELERDIRECTOR
CARY D. MCMILLANDIRECTOR
JANICE E. PAGEDIRECTOR
DAVID M. SABLEDIRECTOR
NOEL J . SPIEGELDIRECTOR
CORPORATE HEADQUARTERS AMERICAN EAGLE OUTFITTERS, INC.77 HOT METAL STREETPITTSBURGH, PA 15203 412-432-3300
WEBSITE INFORMATION REGARDING AMERICAN EAGLE OUTFITTERS, INC. AND OUR PRODUCTS IS AVAILABLE ON OUR WEBSITES: WWW.AE.COM AND WWW.AERIE.COM
STOCK DATA SHARES OF AMERICAN EAGLE OUTFITTERS, INC. COMMON STOCK ARE TRADED ON THE NEW YORK STOCK EXCHANGE UNDER THE SYMBOL “AEO”
ERNST & YOUNG LLP2100 ONE PPG PLACEPITTSBURGH, PA 15222
INDEPENDENT AUDITORS
INVESTOR INQUIRIES IF YOU WOULD LIKE GENERAL INFORMATION ON AMERICAN EAGLE OUTFITTERS, INC. AS A PUBLICLY TRADED COMPANY, PLEASE VISIT OUR INVESTOR RELATIONS WEBSITE LOCATED AT WWW.INVESTORS.AE.COM
TRANSFER AGENT COMPUTERSHARE TRUST COMPANY, N.A.PO BOX 43078PROVIDENCE, RI 029401-877-581-5548

A N N U A L R E P O R T | 2 0 1 5