american eagle outfitters, inc
TRANSCRIPT

UNITED STATESSECURITIES AND EXCHANGE COMMISSION
Washington, D.C. 20549
Form 10-K☒☒ ANNUAL REPORT PURSUANT TO SECTION 13 OR 15(d) OF THE SECURITIES EXCHANGE ACT OF 1934
For the Fiscal Year Ended February 2, 2019OR
☐☐ TRANSITION REPORT PURSUANT TO SECTION 13 OR 15(d) OF THE SECURITIES EXCHANGE ACT OF 1934Commission File Number: 1-33338
American Eagle Outfitters, Inc.(Exact name of registrant as specified in its charter)
Delaware(State or other jurisdiction ofincorporation or organization)
No. 13-2721761(I.R.S. Employer
Identification No.)
77 Hot Metal Street, Pittsburgh, PA 15203-2329(Address of principal executive offices) (Zip Code)
Registrant’s telephone number, including area code:(412) 432-3300
Securities registered pursuant to Section 12(b) of the Act:
Common Stock, $0.01 par value(Title of class)
New York Stock Exchange(Name of each exchange on which registered)
Securities registered pursuant to Section 12(g) of the Act:None
Indicate by check mark if the registrant is a well-known seasoned issuer, as defined in Rule 405 of the Securities Act. YES ☒ NO ☐Indicate by check mark if the registrant is not required to file reports pursuant to Section 13 or Sections 15(d) of the Act. YES ☐ NO ☒Indicate by check mark whether the registrant (1) has filed all reports required to be filed by Section 13 or 15(d) of the Securities Exchange Act of 1934 duringthe preceding 12 months (or for such shorter period that the registrant was required to file such reports), and (2) has been subject to the filing requirements for atthe past 90 days. YES ☒ NO ☐Indicate by check mark whether the registrant has submitted electronically, every Interactive Data File required to be submitted pursuant to Rule 405 ofRegulation S-T (§232.405 of this chapter) during the preceding 12 months (or for such shorter period that the registrant was required to submit suchfiles). YES ☒ NO ☐Indicate by check mark if disclosure of delinquent filers pursuant to Item 405 of Regulation S-K (§229.405 of this chapter) is not contained herein, and will not becontained, to the best of registrant’s knowledge, in definitive proxy or information statements incorporated by reference in Part III of this Form 10-K or anyamendment to this Form 10-K. ☒Indicate by check mark whether the registrant is a large accelerated filer, an accelerated filer, a non-accelerated filer, a smaller reporting company, or anemerging growth company. See the definitions of “large accelerated filer,” “accelerated filer,” “smaller reporting company,” and “emerging growth company” inRule 12b-2 of the Exchange Act.
Large accelerated filer ☒ Accelerated filer ☐
Non-accelerated filer ☐ Smaller reporting company ☐
Emerging growth company ☐
If an emerging growth company, indicate by check mark if the registrant has elected not to use the extended transition period for complying with any new orrevised financial accounting standards provided pursuant to Section 13(a) of the Exchange Act. ☐Indicate by check mark whether the registrant is a shell company (as defined in Rule 12b-2 of the Act). YES ☐ NO ☒The aggregate market value of voting and non-voting common equity held by non-affiliates of the registrant as of August 4, 2018 was $4,233,230,262.Indicate the number of shares outstanding of each of the registrant’s classes of common stock, as of the latest practicable date: 172,584,549 Common Shareswere outstanding at March 11, 2019.
DOCUMENTS INCORPORATED BY REFERENCEPortions of the Company’s Proxy Statement for the 2019 Annual Meeting of Stockholders scheduled to be held on June 6, 2019 are incorporated into Part IIIherein.

AMERICAN EAGLE OUTFITTERS, INC.TABLE OF CONTENTS
Page
NumberPART I Item 1. Business 3Item 1A. Risk Factors 9Item 1B. Unresolved Staff Comments 16Item 2. Properties 16Item 3. Legal Proceedings 16Item 4. Mine Safety Disclosures 16 PART II Item 5. Market for Registrant’s Common Equity, Related Stockholder Matters and Issuer Purchases of Equity Securities 17Item 6. Selected Consolidated Financial Data 19Item 7. Management’s Discussion and Analysis of Financial Condition and Results of Operations 20Item 7A. Quantitative and Qualitative Disclosures About Market Risk 34Item 8. Financial Statements and Supplementary Data 35Item 9. Changes in and Disagreements with Accountants on Accounting and Financial Disclosure 64Item 9A. Controls and Procedures 64Item 9B. Other Information 66 PART III Item 10. Directors, Executive Officers and Corporate Governance 66Item 11. Executive Compensation 66Item 12. Security Ownership of Certain Beneficial Owners and Management and Related Stockholder Matters 66Item 13. Certain Relationships and Related Transactions, and Director Independence 66Item 14. Principal Accounting Fees and Services 66 PART IV Item 15. Exhibits, Financial Statement Schedules 67
2
PART IItem 1. Business.
GeneralAmerican Eagle Outfitters, Inc., (“AEO Inc.,” the “Company,” “we,” “our”) a Delaware corporation, was founded in 1977. We are a leading multi-brand specialty retailer, and we operate and license over 1,200 retail stores and online at www.ae.com and www.aerie.com in the United States andinternationally. Our brands are connected under the core tenet of Real , which is inclusive, optimistic and celebrates self-expression. We offer abroad assortment of high-quality, on-trend apparel and accessories at affordable prices for men and women under the American Eagle brand, andintimates, apparel and personal care products for women under the Aerie brand. AEO Inc. operates stores in the United States, Canada, Mexico,Hong Kong, and China. As of February 2, 2019, we operated 934 American Eagle stores and 115 Aerie stand-alone stores. We also have licenseagreements with third-parties to operate American Eagle and Aerie stores throughout Asia, Europe, India, Latin America and the Middle East. Ourlicensed store base has grown to 231 locations in 24 countries. We also operate two emerging brands to complement our existing brands: Tailgate,a vintage, sports-inspired apparel brand, and Todd Snyder New York, a premium menswear brand.
A five-year summary of certain financial and operating information can be found in Part II, Item 6, Selected Consolidated Financial Data, of this Form10-K. See also Part II, Item 7, Management’s Discussion and Analysis of Financial Condition and Results of Operations, and Item 8, FinancialStatements and Supplementary Data.
Fiscal YearOur fiscal year is a 52 or 53-week year that ends on the Saturday nearest to January 31. As used herein, “Fiscal 2019” refers to the 52-week periodthat will end on February 1, 2020. “Fiscal 2018” refers to the 52-week period ended February 2, 2019, “Fiscal 2017” refers to the 53-week periodended February 3, 2018 and “Fiscal 2016” refers to the 52-week period ended January 28, 2017.
BrandsAmerican EagleWe are an American brand rooted in our denim heritage and passionate about providing the highest-quality products. Since 1977, American Eagle(or “AE”) has offered an assortment of specialty apparel and accessories for women and men that enables self-expression and empowers ourcustomers to celebrate their individuality. The brand has broadened its leadership in jeans by producing innovative fabric with options for all stylesand fits at a value. We aren’t just passionate about making great clothing, we’re passionate about making real connections with the people who wearthem.
As of February 2, 2019, AE operated 934 stores and online at www.ae.com.
AerieAerie is a lifestyle brand and is committed to making all women feel good about their REAL selves. We offer intimates, apparel, activewear andswim collections. With the #AerieREAL™ movement, Aerie celebrates its community by advocating for body positivity and the empowerment of allwomen. Aerie believes in inspiring customers to love their real selves, inside and out.
As of February 2, 2019, the Aerie brand operated 115 stand-alone stores and 147 side-by-side stores connected to AE brand stores. In addition, theAerie brand merchandise is sold online at www.aerie.com and certain items are sold in AE brand stores.
Other brandsTailgate is a vintage, sports-inspired apparel brand with a college town store concept. As of February 2, 2019, the Tailgate brand operated fivestores and is available online at www.ae.com.
3

Todd Snyder New York is a premium menswear brand. As of February 2, 2019, the Todd Snyder brand operated one stand-alon e store and onlineat www.ToddSnyder.com.
Key Business Priorities & StrategyWe are focused on driving our brands forward and delivering an exceptional customer experience across channels. Our current priorities include:
• Delivering innovation, quality and outstanding value to our customers;
• Leveraging American Eagle’s leading position in jeans and bottoms to “own the outfit”, by selling existing and new product categories tocustomers;
• Continuing to accelerate the growth of Aerie as a leading intimates-inspired lifestyle brand, differentiated by its purpose of allowing women tofeel good about their REAL selves;
• Growing our brands globally, using the appropriate ownership structure to balance risk/return in each market; and
• Focusing on delivering consistent profitable revenue growth and continuing to invest in high return projects that create shareholder value.
Real EstateWe ended Fiscal 2018 with a total of 1,286 stores, consisting of 1,055 Company-owned stores and 231 licensed store locations. Our AE brandstores average approximately 6,600 gross square feet and approximately 5,300 on a selling square foot basis. Our Aerie brand stand-alone storesaverage approximately 3,700 gross square feet and approximately 3,000 on a selling square foot basis. The gross square footage of our Company-owned stores increased by 1.0% to 6.6 million during Fiscal 2018.
Company-Owned StoresOur Company-owned retail stores are located in shopping malls, lifestyle centers and street locations in the United States, Canada, Mexico, Chinaand Hong Kong.
Refer to Note 15 to the Consolidated Financial Statements included in this Form 10-K for additional information regarding prior year impairment andrestructuring charges in China, Hong Kong and the United Kingdom.
The following table provides the number of our Company-owned stores in operation as of February 2, 2019 and February 3, 2018.
February 2, February 3, 2019 2018 AE Brand:
United States 800 802 Canada 86 85 Mexico 38 34 China 4 6 Hong Kong 6 6
Total AE Brand 934 933 Aerie Brand:
United States 97 91 Canada 18 18
Total Aerie Brand 115 109 Tailgate 5 4 Todd Snyder 1 1 Total Consolidated 1,055 1,047
4

The following table provides the changes in the number of our Company-owned stores for the past five fiscal years:
Fiscal Year Beginning of
Year Opened Closed End of Year 2018 1,047 29 (21) 1,055 2017 1,050 31 (34) 1,047 2016 1,047 29 (26) 1,050 2015 1,056 23 (32) 1,047 2014 1,066 60 (70) 1,056
Licensed StoresIn addition to our Company-owned stores, our merchandise is sold at stores operated by third-party licensees. Under these agreements, ourmerchandise is sold at American Eagle and Aerie stores owned and operated by third-party operators. Revenue recognized under licenseagreements generally consists of royalties earned and recognized upon sale of merchandise by license partners to retail customers.
As of February 2, 2019, our products were sold in 231 locations operated by licensees in 24 countries as provided in the following table. We plan tocontinue to increase the number of locations under these types of arrangements as part of our disciplined approach to global expansion.
February 2, February 3, 2019 2018
Israel 47 42Japan 34 34Saudi Arabia 26 20South Korea 16 20Chile 16 15Colombia 16 15UAE 14 13Philippines 12 10Greece 7 6Thailand 6 6India 6 0Kuwait 5 3Lebanon 5 5Qatar 4 4Egypt 4 3Panama 2 3Bahrain 2 2Costa Rica 2 2Guatemala 2 2Curacao 1 1Dominican Republic 1 1Jordan 1 1Oman 1 1Peru 1 1Singapore 0 2Morocco 0 2
Total Licensed Stores 231 214
AEO DirectWe sell merchandise through our digital channels, ae.com, aerie.com and our AEO apps, both domestically and internationally in 81 countries. Thedigital channels reinforce each particular brand platform, and are designed to complement the in-store experience.
5

Over the past several years, we have invested in building our technologies and digital capabilities. We focused our investments in three key areas:making significant advances in mobile technology, investing in digital marketing and improving the digi tal customer experience.
Omni-ChannelIn addition to our investments in technology, we have invested in building omni-channel capabilities to better serve customers and gain operationalefficiencies. These upgraded technologies provide a single view of inventory across channels, connecting physical stores directly to our digital storeand providing our customers with a more convenient and improved shopping experience. Our U.S. and Canadian distribution centers are fully omni-channel and service both stores and digital businesses. We offer the ability for customers to seamlessly return product via any channel regardlessof where it was originally purchased. Our store-to-door capability enables store customers to make purchases from online inventory while shoppingin our stores. Additionally, we fulfill online orders at stores through our buy online, ship from store capability, maximizing inventory exposure todigital traffic. We also offer a reserve online, pick up in store service to our customers which gives customers the ability to select in-store inventoryfrom all digital channels. We plan to continue to optimize these tools and services to continue to enhance and improve the total customer shoppingexperience.
Customer Loyalty ProgramWe offer AEO Connected, a new, highly-digitized loyalty program serving all American Eagle and Aerie customers. Members enjoy greaterconvenience, more rewards and a positive customer experience.
AEO Connected highlights include:
• Upgraded rewards for our best customers and brand advocates
• Full integration with AE and Aerie’s branded credit cards
• Special perks for purchasing key items, jeans and bras
• Exclusive member access to concerts, festivals and special events
Under AEO Connected, customers accumulate points based on purchase activity and earn rewards by reaching certain point thresholds. Customersearn rewards in the form of discount savings certificates. Rewards earned are valid through the stated expiration date, which is currently 45 daysfrom the issuance date of the reward. Rewards not redeemed during the 45-day redemption period are forfeited. Additional rewards are also givenfor key items such as jeans and bras.
Merchandise SuppliersWe design our merchandise, which is manufactured by third-party factories. During Fiscal 2018, we purchased substantially all of our merchandisefrom non-North American suppliers. We sourced merchandise through approximately 300 vendors located throughout the world, primarily in Asia,and did not source more than 10% of our merchandise from any single factory or supplier. Although we purchase a significant portion of ourmerchandise through a single international buying agent, we do not maintain any exclusive commitments to purchase from any one vendor.
We maintain a quality control department at our distribution centers to inspect incoming merchandise shipments for overall quality of manufacturing.Inspections are also made by our employees and agents at manufacturing facilities to identify quality issues prior to shipment of merchandise.
We uphold an extensive factory inspection program to monitor compliance with our Vendor Code of Conduct (“Vendor Code”). New garmentfactories must pass an initial inspection in order to do business with us and we continue to review their performance against our guidelines regardingworking conditions, employment practices and compliance with local laws through internal audits by our compliance team and the use of third-partymonitors. We strive to partner with suppliers who respect local laws and share our dedication to utilize best practices in human rights, labor rights,environmental practices and workplace safety. We are a certified member of the Customs-Trade Partnership Against Terrorism program (“CTPAT”),a designation we have held since 2004. CTPAT is a voluntary program offered by U.S. Customs and Border Protection (“CBP”) in which an importeragrees to work with CBP to strengthen overall supply chain security. As of September 2016, we were accepted into the Apparel, Footwear andTextiles Center, one of CBP’s Centers of Excellence and Expertise (“CEE”). The CEE was created to ensure uniformity, create efficiencies, reduce
6
redundancies, enhance industry expertise and facilitate trade, all with a final goal of reduced costs at t he border and allowing CBP to focus on high-risk shipments.
Inventory and DistributionMerchandise is shipped directly from our vendors to our Company-owned distribution centers in Hazleton, Pennsylvania and Ottawa, Kansas, or toour Canadian distribution center in Mississauga, Ontario. Additionally, product is shipped directly to stores which reduces transit times and lowersoperating costs. We contract with third-party distribution centers in Mexico, Hong Kong, and China to service our Company-owned stores in thoseregions.
RegulationWe and our products are subject to regulation by various federal, state, local and foreign regulatory authorities. Substantially all of our products aremanufactured by foreign suppliers and imported by us, and we are subject to a variety of trade laws, customs regulations and international tradeagreements. Apparel and other products sold by us are under the jurisdiction of multiple governmental agencies and regulations, including, in theU.S., the Federal Trade Commission and the Consumer Products Safety Commission. These regulations relate principally to product labeling,marketing, licensing requirements, and consumer product safety requirements and regulatory testing. We are also subject to regulations governingour employees both globally and in the U.S., and by disclosure and reporting requirements for publicly traded companies established under existingor new federal or state laws, including the rules and regulations of the Securities and Exchange Commission (“SEC”) and New York Stock Exchange(“NYSE”).
Our licensing partners, buying/sourcing agents, and the vendors and factories with which we contract for the manufacture and distribution of ourproducts are also subject to regulation. Our agreements require our licensing partners, buying/sourcing agents, vendors, and factories to operate incompliance with all applicable laws and regulations, and we are not aware of any violations that could reasonably be expected to have a materialadverse effect on our business or operating results.
CompetitionThe global retail apparel industry is highly competitive both in stores and online. We compete with various local, national, and global apparelretailers, as well as the casual apparel and footwear departments of department stores and discount retailers, primarily on the basis of quality,fashion, service, selection and price.
Trademarks and Service MarksWe have registered AMERICAN EAGLE OUTFITTERS ® , AMERICAN EAGLE ® , AE ® , AEO ® , LIVE YOUR LIFE ® , AERIE ® , and the FlyingEagle Design with the United States Patent and Trademark Office. We also have registered or have applied to register substantially all of thesetrademarks with the registries of the foreign countries in which our stores and/or manufacturers are located and/or where our product is shipped.
We have registered AMERICAN EAGLE OUTFITTERS ® , AMERICAN EAGLE ® , AEO ® , LIVE YOUR LIFE ® , AERIE ® , and the Flying EagleDesign with the Canadian Intellectual Property Office. In addition, we have acquired rights in AE TM for clothing products and registered AE ® inconnection with certain non-clothing products.
In the U.S. and in other countries around the world, we also have registered, or have applied to register, a number of other marks used in ourbusiness, including TODD SNYDER ® , TAILGATE ® and our pocket stitch designs.
Our registered trademarks are renewable indefinitely, and their registrations are properly maintained in accordance with the laws of the country inwhich they are registered. We believe that the recognition associated with these trademarks makes them extremely valuable and, therefore, weintend to use, renew, and enforce our trademarks in accordance with our business plans.
EmployeesAs of February 2, 2019, we had approximately 45,000 employees in the United States, Canada, Mexico, Hong Kong and China of whomapproximately 36,000 were part-time or seasonal hourly employees.
7

SeasonalityHistorically, our operations have been seasonal, with a large portion of total net revenue and operating income occurring in the third and fourth fiscalquarters, reflecting increased demand during the back-to-school and year-end holiday selling seasons, respectively. Our quarterly results ofoperations also may fluctuate based upon such factors as the timing of certain holiday seasons, the number and timing of new store openings, theacceptability of seasonal merchandise offerings, the timing and level of markdowns, store closings and remodels, competitive factors, weather andgeneral economic and political conditions.
Executive Officers of the RegistrantJennifer M. Foyle, age 52, has served as our Global Brand President – Aerie since January 2015. Prior thereto, Ms. Foyle served as ExecutiveVice President, Chief Merchandising Officer – Aerie from February 2014 to January 2015 and Senior Vice President, Chief Merchandising Officer –Aerie from August 2010 to February 2014. Prior to joining us, Ms. Foyle was President of Calypso St. Barth from 2009 to 2010. In addition, she heldvarious positions at J. Crew Group, Inc., including Chief Merchandising Officer, from 2003 to 2009. Early in her career, Ms. Foyle was the Women’sDivisional Merchandise Manager for Gap Inc. from 1999 – 2003 and held various roles at Bloomingdales from 1988-1999.
Charles F. Kessler , age 46, has served as our Global Brand President – American Eagle since January 2015. Prior thereto, he served as ourExecutive Vice President, Chief Merchandising and Design Officer – American Eagle from February 2014 to January 2015. Prior to joining us, Mr.Kessler served as Chief Merchandising Officer at Urban Outfitters, Inc. from October 2011 to November 2013 and as Senior Vice President,Corporate Merchandising at Coach, Inc. from July 2010 to October 2011. Prior to that time, Mr. Kessler held various positions with Abercrombie &Fitch Co. from 1994 to 2010, including Executive Vice President, Female Merchandising from 2008 to 2010.
Robert L. Madore , age 54, has served as our Executive Vice President and Chief Financial Officer since October 2016. Prior to joining us, Mr.Madore served as the Chief Financial Officer of Ralph Lauren Corporation from April 2015 to September 2016. Prior to that role, he held a number ofkey financial and operational roles at the Ralph Lauren Corporation, including Senior Vice President of Corporate Finance from December 2010 toMarch 2015, and Senior Vice President of Operations and Chief Financial Officer of its retail division from 2004 to December 2010. Prior to that time,Mr. Madore was Chief Financial Officer for New York & Company from 2003 to 2004, and served as Chief Operating Officer and Chief FinancialOfficer of FutureBrand, a division of McCann Erickson, from 2001 to 2003. Prior thereto, he held various executive management positions at NineWest Group, Inc. starting in 1995. Mr. Madore began his career in 1987 at Deloitte & Touche until 1995.
Andrew J. McLean , age 50, has served as our Executive Vice President, Chief Commercial Officer since April 2017. Prior thereto, he served asour Executive Vice President, International since October 2016. Prior to joining us, Mr. McLean served as Chief Operating Officer and Head ofInternational of Urban Outfitters, Inc. from 2014 to October 2016 and as Chief Operating Officer from 2008 to 2014. In addition, he held variouspositions at Liz Claiborne, Inc., including President, Outlet Division, from 2003 - 2008. Prior thereto, Mr. McLean held various roles at Gap, Inc. from2000 – 2003 and served as a management consultant early in his career.
Michael R. Rempell, age 45, has served as our Executive Vice President and Chief Operations Officer since June 2012. Prior thereto, he served asour Executive Vice President and Chief Operating Officer, New York Design Center, from April 2009 to June 2012, as Senior Vice President andChief Supply Chain Officer from May 2006 to April 2009, and in various other positions since joining us in February 2000.
Jay L. Schottenstein, age 64, has served as our Executive Chairman, Chief Executive Officer since December 2015. Prior thereto, Mr.Schottenstein served as our Executive Chairman, Interim Chief Executive Officer from January 2014 to December 2015. He has also served as theChairman of the Company and its predecessors since March 1992. He served as our Chief Executive Officer from March 1992 until December 2002and prior to that time, he served as a Vice President and Director of our predecessors since 1980. He has also served as Chairman of the Board andChief Executive Officer of Schottenstein Stores Corporation (“SSC”) since March 1992 and as President since 2001. Prior thereto, Mr. Schottensteinserved as Vice Chairman of SSC from 1986 to 1992. He has been a Director of SSC since 1982. Mr. Schottenstein also served as Chief ExecutiveOfficer from March 2005 to April 2009 and as Chairman of the Board since March 2005 of DSW Inc., a company traded on the NYSE. He has alsoserved as a member of the Board of Directors for AB Acquisition LLC (Albertsons/Safeway) since 2006. He has also served as an officer anddirector of various other entities owned or controlled by members of his family since 1976.
8
Stacy B. Siegal , age 52 , has served as our Executive Vice President, General Co unsel since March 2018. Prior thereto, she served as our SeniorVice President and General Counsel since November 2016. Prior to joining us, Ms. Siegal served as Senior Vice President, Chief Legal andAdministrative Officer at rue21, Inc. from March 2013 to November 2016; as Vice President, General Counsel from 2010 to 2013; and as CorporateCounsel since 2006. Prior to that time, Ms. Siegal served as a consultant providing legal and human resource guidance to retail companies andboards and as Corporate Counsel at General Nutrition Companies, Inc. since 1996.
Available InformationOur Annual Reports on Form 10-K, Quarterly Reports on Form 10-Q, Current Reports on Form 8-K and amendments to those reports, as well asother information that we file or furnish to the Securities Exchange Commission, or SEC, are available under the Investors section of our website atwww.investors.ae.com. These reports are available as soon as reasonably practicable, free of charge, after such material is electronically filed withthe SEC. Alternatively, you may access these reports at the SEC’s Internet website at www.sec.gov.
Our corporate governance materials, including our corporate governance guidelines, the charters of our audit, compensation, and nominating andcorporate governance committees, and our code of ethics may also be found under the Investors section of our website at www.ae.com. Anyamendments or waivers to our code of ethics will also be available on our website. A copy of the corporate governance materials is also availableupon written request.
Additionally, our investor presentations are available under the Investors section of our website at www.ae.com. These materials are available nolater than the time they are presented at investor conferences. Unless expressly noted, the information on our website or any other website is notincorporated by reference in this Form 10-K and should not be considered part of this Form 10-K or any other filing that we make with the SEC.
CertificationsAs required by the NYSE Corporate Governance Standards Section 303A.12(a), on June 27, 2018, our Chief Executive Officer submitted to theNYSE a certification that he was not aware of any violation by the Company of NYSE corporate governance listing standards. Additionally, we filedand furnished, as applicable, with this Form 10-K, the Principal Executive Officer and Principal Financial Officer certifications required underSections 302 and 906 of the Sarbanes-Oxley Act of 2002.
Item 1A. Risk Factors
Our inability to anticipate and respond to changing consumer preferences and fashion trends in a timely manner couldadversely impact our profitabilityOur future success depends, in part, upon our ability to identify and respond to fashion trends in a timely manner. The specialty retail apparelbusiness fluctuates according to changes in the economy and customer preferences, dictated by fashion and season. These fluctuations especiallyaffect the inventory owned by apparel retailers because merchandise typically must be ordered well in advance of the selling season. While weendeavor to test many merchandise items before ordering large quantities, we remain susceptible to changing fashion trends and fluctuations incustomer demands.
In addition, the cyclical nature of the retail business requires that we carry a significant amount of inventory, especially during our peak sellingseasons. We enter into agreements for the manufacture and purchase of our private label apparel well in advance of the applicable selling season.As a result, we are vulnerable to changes in consumer demand, pricing shifts and the timing and selection of merchandise purchases. Our failure toenter into agreements for the manufacture and purchase of merchandise in a timely manner could, among other things, lead to a shortage ofinventory and lower sales. Changes in fashion trends, if unsuccessfully identified, forecasted or responded to by us, could, among other matters,lead to lower sales, excess inventories and higher markdowns, which in turn could have a material adverse effect on our results of operations andfinancial condition.
9
Our market share may be adversely impacted by increasing competition and pricing pressures from companies withbrands or merchandise that are competitive with oursThe sale of apparel, accessories, intimates and personal care products is a highly competitive business with numerous participants, includingindividual and chain specialty apparel retailers, local, regional, national and international department stores, discount stores and online businesses.The substantial sales growth in the digital channel within the last several years has encouraged the entry of many new competitors and an increasein competition from established companies. We face a variety of competitive challenges, including:
• Anticipating and quickly responding to changing consumer demands or preferences better than our competitors;
• Maintaining favorable brand recognition and effective marketing of our products to consumers in several demographic markets;
• Sourcing merchandise efficiently;
• Developing innovative, high-quality merchandise in styles that appeal to our consumers and in ways that favorably distinguish us fromour competitors; and
• Countering the aggressive pricing and promotional activities of many of our competitors.
In light of the competitive challenges we face, we may not be able to compete successfully in the future. Additionally, increases in competition couldreduce our sales, which in turn could have a material adverse effect on our results of operations and financial condition.
The effect of economic pressures and other business factors on consumer spending could have a material adverseeffect on our business, results of operations and liquidityThe success of our operations depends to a significant extent on a number of factors relating to discretionary consumer spending, includingeconomic conditions affecting disposable consumer income such as income taxes, payroll taxes, employment, consumer debt, interest rates,increases in energy costs and consumer confidence. Additionally, changes in consumer preferences and discretionary spending habits maynegatively impact the specialty retail market. There can be no assurance that consumer spending will not be further negatively affected by general,local or international economic conditions and changing consumer preferences, thereby adversely impacting our results of operations and financialcondition.
Seasonality may cause sales to fluctuate and negatively impact our results of operationsHistorically, our operations have been seasonal, with a large portion of total net revenue and operating income occurring in the third and fourth fiscalquarters, reflecting increased demand during the back-to-school and year-end holiday selling seasons, respectively. As a result of this seasonality,factors negatively affecting us during the third and fourth fiscal quarters of any year, including adverse weather or unfavorable economic conditions,could have a material adverse effect on our financial condition and results of operations for the entire year. Our quarterly results of operations alsomay fluctuate based upon such factors as the timing of certain holiday seasons, the number and timing of new store openings, the acceptability ofseasonal merchandise offerings, the timing and level of markdowns, store closings and remodels, competitive factors, weather and generaleconomic and political conditions.
Our efforts to execute on our key business priorities could have a negative impact on our growth and profitabilityOur success depends on our ability to execute on our key priorities, which are centered on driving our brands forward and delivering an exceptionalcustomer experience across channels, including:
• Delivering innovation, quality and outstanding value to our customers;
• Leveraging American Eagle’s leading position in jeans and bottoms to “own the outfit”, by selling existing and new product categories tocustomers;
• Continuing to accelerate the growth of Aerie as a leading intimates-inspired lifestyle brand, differentiated by its purpose of allowingwomen to feel good about their REAL selves;
10

• Growing our brands globally, using the appropriate ownership structure to balance risk/return in each market; and
• Focusing on delivering consistent profitable revenue growth and continuing to invest in high return projects that create shareholdervalue.
Achieving these key business priorities depends on us executing our strategies successfully, and the initiatives that we implement in connection withthese goals may not resonate with our customers. It may take longer than anticipated to generate the expected benefits, and there can be noguarantee that these key priorities will result in improved operating results. Failure to successfully implement our key business priorities could have anegative impact on our growth and profitability.
Our inability to achieve planned store performance, gain market share in the face of declining shopping center traffic orattract customers to our stores could adversely impact our profitability and our results of operationsThe results achieved by our stores may not be indicative of long-term performance or the potential performance of stores in other locations. Part ofour future growth is dependent on our ability to operate stores in desirable locations with capital investment and lease costs providing the opportunityto earn a reasonable return. We cannot be sure as to when or whether such desirable locations will become available at reasonable costs. Thefailure of our stores to achieve acceptable results could result in store asset impairment charges, which could adversely affect our results ofoperations and financial condition.
Additionally, our real estate strategy may not be successful, and store locations may fail to produce desired results, which could impact ourcompetitive position and profitability. Customer shopping patterns have been evolving from brick-and-mortar locations to, increasingly, digitalchannels. We have Company-owned stores in shopping centers that have experienced declining traffic trends while our digital channels continue togrow. Our ability to grow revenue and acquire new customers is contingent on our ability to drive traffic to both store locations and digital channelsso that we are accessible to our customers when and where they want to shop.
We seek to locate our brick and mortar stores in prominent locations within successful shopping malls or street locations. Our stores benefit from theability of the malls’ “anchor” tenants, which generally are large department stores and other area attractions, to generate consumer traffic in thevicinity of our stores. We cannot control the increasing impact of digital channels on shopping center traffic, the loss of an anchor or other significanttenant in a shopping mall in which we have a store, the development of new shopping malls in the U.S. or around the world, the availability or cost ofappropriate locations, competition with other retailers for prominent locations, or the success of individual shopping malls. All of these factors mayimpact our ability to meet our productivity targets and could have a material adverse effect on our financial results. In addition, some malls andshopping centers that were in prominent locations when we opened our stores may cease to be viewed as prominent. If this trend continues or if thepopularity of mall shopping continues to decline generally among our customers, our sales may decline, which would impact our results of operationsand financial condition.
We have significant lease obligations, and are subject to risks associated with leasing substantial amounts of space,including future increases in occupancy costs and the need to generate significant cash flow to meet our leaseobligationsOperating lease obligations, which consist primarily of future minimum lease commitments related to store operating leases, represent a significantcontractual commitment. All of our stores are leased and generally have initial terms of 10 years. In the future, we may not be able to negotiatefavorable lease terms for the most desired store locations. Our inability to do so may cause our occupancy costs to be higher in future years or mayforce us to close stores in desirable locations.
Certain leases have early termination options, which can be exercised under certain specific conditions. In addition to future minimum leasepayments, some of our store leases provide for additional rental payments based on a percentage of net sales, or “percentage rent,” if sales at therespective stores exceed specified levels, as well as the payment of tenant occupancy costs, including maintenance costs, common area charges,real estate taxes and certain other expenses. Many of our lease agreements have defined escalating rent provisions over the initial term and anyextensions.
We depend on cash flow from operations to pay our lease expenses. If our business does not generate sufficient cash flow from operating activitiesto fund these expenses, due to continued decreases in mall traffic, the highly competitive and
11
promotional retail environment, or oth er factors, we may not be able to service our lease expenses, which could materially harm our business.Furthermore, the significant cash flow required to satisfy our obligations under the leases increases our vulnerability to adverse changes in generalec onomic, industry, and competitive conditions, and could limit our ability to fund working capital, incur indebtedness, and make capital expendituresor other investments in our business.
Our inability to grow our e-commerce channel and leverage omni-channel capabilities could adversely impact ourbusinessWe sell merchandise through our digital channels, both domestically and internationally. We have invested in building technologies and digitalcapabilities in three key areas: mobile technology, digital marketing and desktop experience. We have made significant capital investments in theseareas but there is no assurance that we will be able to continue to successfully maintain or expand our e-commerce business.
As omni-channel retailing continues to evolve, our customers are increasingly more likely to shop across multiple channels that work in tandem tomeet their needs. Our inability to respond to these changes and successfully maintain and expand our omni-channel business may have an adverseimpact on our results of operations.
Our efforts to expand internationally expose us to risks inherent in operating in new countriesWe are actively pursuing additional international expansion initiatives, which include Company-owned stores and stores operated by third-partiesthrough licensing arrangements in select international markets. The effect of international expansion arrangements on our business and results ofoperations is uncertain and will depend upon various factors, including the demand for our products in new markets internationally. Furthermore,although we provide store operation training, literature and support, to the extent that a licensee does not operate its stores in a manner consistentwith our requirements regarding our brand and customer experience standards, our business results and the value of our brand could be negativelyimpacted.
A failure to properly implement our expansion initiatives, or the adverse impact of political or economic risks in these international markets, couldhave a material adverse effect on our results of operations and financial condition. We have limited prior experience operating internationally, wherewe face established competitors. In many of these locations, the real estate, labor and employment, transportation and logistics and other operatingrequirements differ dramatically from those in the locations where we have more experience. Consumer demand and behavior, as well as tastes andpurchasing trends, may differ substantially, and as a result, sales of our products may not be successful, or the margins on those sales may not be inline with those we currently anticipate. Any differences that we encounter as we expand internationally may divert financial, operational andmanagerial resources from our existing operations, which could adversely impact our financial condition and results of operations. In addition, weare increasingly exposed to foreign currency exchange rate risk with respect to our revenue, profits, assets, and liabilities denominated in currenciesother than the U.S. dollar for which we have taken risk mitigating actions, when appropriate. We may also use instruments to hedge certain foreigncurrency risks in the future; however, these measures may not succeed in offsetting all of the negative impact of foreign currency rate movements onour business and results of operations.
As we pursue our international expansion initiatives, we are subject to certain laws, including the Foreign Corrupt Practices Act, as well as the lawsof the foreign countries in which we operate. Violations of these laws could subject us to sanctions or other penalties that could have an adverseeffect on our reputation, operating results and financial condition.
Our international merchandise sourcing strategy subjects us to risks that could adversely impact our business andresults of operationsOur merchandise is manufactured by suppliers worldwide. Although we purchase a significant portion of our merchandise through a singleinternational buying agent, we do not maintain any exclusive commitments to purchase from any one vendor. Because we have a global supplychain, any event causing the disruption of imports, including the insolvency of a significant supplier or a major labor slow-down, strike or disputeincluding any such actions involving ports, trans loaders, consolidators or shippers, could have an adverse effect on our operations. Given thevolatility and risk in the current markets, our reliance on external vendors leaves us subject to certain risks should one or more of these externalvendors become insolvent. Although we monitor the financial stability of our key vendors and plan for contingencies, the financial failure of a keyvendor could disrupt our operations and have an adverse effect on our cash flows, results of operations and financial condition.
12

We have a Vendor Code that provides guidelines for our vendors regarding working conditions, employment practices and compliance with locallaws. A copy of the Vendor Code is posted on our website, www.ae.com , and is also included in our vendor manual in English andmultiple other languages. We have a factory compliance program to audit for compliance with the Vendor Code. However, there can be noassurance that all violations can be eliminated in our supply chain. Publicity regarding violation of our Vendor Code or other social responsibilitystandards by any of our vendor factories could adversely affect our reputation, sales and financial performance.
There is a risk of terrorist activity on a global basis. Such activity might take the form of a physical act that impedes the flow of imported goods or theinsertion of a harmful or injurious agent to an imported shipment. We have instituted policies and procedures designed to reduce the chance orimpact of such actions. Examples include, but are not limited to, factory audits and self-assessments, including audit protocols on all critical securityissues; the review of security procedures of our other international trading partners, including forwarders, consolidators, shippers and brokers; andthe cancellation of agreements with entities who fail to meet our security requirements. In addition, U.S. Customs and Border Protection hasrecognized us as a validated participant of the CTPAT program, a voluntary program in which an importer agrees to work with customs to strengthenoverall supply chain security. However, there can be no assurance that terrorist activity can be prevented entirely and we cannot predict thelikelihood of any such activities or the extent of their adverse impact on our operations.
Our inability to implement and sustain adequate information technology systems could adversely impact our profitabilityWe regularly evaluate our information technology systems and are currently implementing modifications and/or upgrades to the informationtechnology systems that support our business. Modifications include replacing legacy systems with successor systems, making changes to legacysystems or acquiring new systems with new functionality. We are aware of inherent risks associated with operating, replacing and modifying thesesystems, including inaccurate system information and system disruptions. We believe we are taking appropriate action to mitigate the risks throughtesting, training, staging implementation and in-sourcing certain processes, as well as securing appropriate commercial contracts with third-partyvendors supplying such replacement and redundancy technologies; however, there is a risk that information technology system disruptions andinaccurate system information, if not anticipated and/or promptly and appropriately mitigated, could have a material adverse effect on our results ofoperations. Additionally, there can be no guarantee that, if any computer system failure, cyber-attack or security breach occurs, it will be timelydetected or sufficiently remediated. Furthermore, while we have disaster recovery and business continuity plans in place, if our informationtechnology systems are damaged, breached or cease to properly function for any reason, including the poor performance of, failure of, or cyber-attack on third-party service providers, catastrophic events, power outages, cyber-security breaches, network outages, failed upgrades or similarevents, and if such disaster recovery and business continuity plans do not effectively resolve such issues, we may suffer interruptions in our ability tomanage or conduct business, as well as reputational harm, and we may be subject to governmental investigations and litigation, any of which mayadversely impact our business, results of operations, and financial condition.
Our inability to safeguard against security breaches with respect to our information technology systems could damageour reputation and adversely impact our profitabilityOur business employs systems and websites that allow for the storage and transmission of proprietary or confidential information regarding ourbusiness, customers and employees including credit card information. Attackers continuously enhance and evolve their methods to compromisedata. We continue to research and deploy technology, process and controls that mitigate security risk including reducing financial gain to anadversary when possible. Security breaches could expose us to a risk of loss or misuse of this information and potential liability. We haveexperienced cyber incidents, which have not had a material adverse impact on our business or required external notification and for which we havetaken measures to prevent from reoccurring. We may, however, experience them in the future, potentially with more frequency and/orsophistication. We may not be able to anticipate or prevent rapidly evolving types of cyber-attacks. Actual or anticipated attacks may cause us toincur increasing costs including costs to deploy additional personnel and protection technologies, train employees and engage third-party expertsand consultants. Advances in computer capabilities, new technological discoveries or other developments may result in the technology we use toprotect transaction or other data, being breached or compromised. Data and security breaches can also occur as a result of non-technical issuesincluding intentional or inadvertent breach by employees or persons with whom we have commercial relationships that result in the unauthorizedrelease of personal or confidential information. Any compromise or breach could result in a violation of applicable privacy and other laws, significantfinancial exposure and a loss of confidence in our security measures, which could have an adverse effect on our results of operations and ourreputation.
13

We may be exposed to risks and costs associated with the loss of customer information that would cause us to incurunexpected expenses and loss of revenuesWe collect customer data, including encrypted credit card information, in our stores, at special events and online. For our sales channels to functionsuccessfully, we and third parties involved in processing customer transactions for us must be able to transmit confidential information, includingcredit card information, securely over public networks. We cannot guarantee that any of our security measures or the security measures of thirdparties with whom we work will effectively prevent others from obtaining unauthorized access to our customers’ information. If such a breach were tooccur, customers could lose confidence in our ability to secure their information and choose not to purchase from us. Any unauthorized access tocustomer information could expose us to data loss or manipulation, litigation and legal liability, and could seriously disrupt operations, negativelyimpact our marketing capabilities, cause us to incur significant expenses to notify customers of the breach and for other remediation activities, andharm our reputation and brand, any of which could adversely affect our financial condition and results of operations.
In addition, state, federal, and foreign governments are increasingly enacting laws and regulations protecting consumers’ privacy and personalinformation against identity theft and unwanted exposure. These laws and regulations likely will increase the costs of doing business. If we fail toimplement appropriate security measures or fail to detect and provide applicable notice of unauthorized access (as required by some of these lawsand regulations), we could be subject to potential governmental investigations, claims for damages, or other remedies, which could adversely affectour business and operations.
We rely on key personnel, the loss of whom could have a material adverse effect on our businessOur success depends to a significant extent upon our ability to attract and retain qualified key personnel, including senior management. Collective orindividual changes in our senior management and other key personnel could have an adverse effect on our ability to determine and execute ourstrategies, which could adversely affect our business and results of operations. There is a high level of competition for senior management andother key personnel, and we cannot be assured we will be able to attract, retain and develop a sufficient number of qualified senior managers andother key personnel.
A complex regulatory, compliance and legal environment could adversely affect usWe are subject to numerous domestic and foreign laws and regulations affecting our business, including those related to labor, employment, workerhealth and safety, competition, privacy, consumer protection, import/export and anti-corruption, including the Foreign Corrupt PracticesAct. Additional legal and regulatory requirements have increased the complexity of the regulatory environment and the cost of compliance. If theselaws change without our knowledge, or are violated by importers, designers, manufacturers, distributors or employees, we could experience delaysin shipments or receipt of goods or be subject to fines or other penalties, any of which could adversely affect our business. Also, changes in lawsand regulations could make operating our business more expensive or require us to change the way we do business. Although we have put intoplace policies and procedures aimed at ensuring legal and regulatory compliance, our employees, subcontractors, vendors and suppliers could takeactions that violate these requirements, which could have a material adverse effect on our reputation, financial condition and on the market price ofour common stock.
Fluctuations in foreign currency exchange rates may adversely impact our profitabilityWe have foreign currency exchange rate risk with respect to revenues, expenses, assets and liabilities denominated in currencies other than theU.S. dollar. We currently do not utilize hedging instruments to mitigate foreign currency exchange risks. Specifically, fluctuations in the value of theCanadian Dollar, Mexican Peso, Chinese Yuan and Hong Kong Dollar against the U.S. Dollar could have a material adverse effect on our results ofoperations, financial condition and cash flows.
Fluctuations in our tax obligations and effective tax rate could adversely affect usWe are subject to income taxes in many U.S. and certain foreign jurisdictions. We record tax expense based on our estimates of future payments,which include reserves for uncertain tax positions in multiple tax jurisdictions. At any one time, multiple tax years are subject to audit by varioustaxing authorities. The results of these audits and negotiations with taxing authorities may affect the ultimate settlement of these issues. In addition,the tax laws and regulations in the countries where we operate may change or there may be changes in interpretation and enforcement of existingtax laws. As a result, we expect that throughout the year there could be ongoing variability in our quarterly tax rates as events occur
14
and exposures are evaluated. In addition, our effective tax rate in a given financial statement period may be materially impacted by changes in themix and level of earnings by jurisdiction or by changes to existing accounting rules or regulat ions. As of February 2, 2019, the Company hascompleted its accounting for the tax effects of the enactment of the Tax Cuts and Jobs Act (the “Tax Act”); however, we continue to expect theUnited States Treasury and the Internal Revenue Service to issue r egulations and other guidance that could have a material impact on theCompany's effective tax rate in future periods.
Our product costs may be adversely affected by foreign trade issues (including import tariffs and other trade restrictionswith China), currency exchange rate fluctuations, increasing prices for raw materials, political instability or other reasons,which could impact our profitability.A significant portion of the products that we purchase, including those purchased from domestic suppliers, as well as most of our private brandmerchandise, is manufactured abroad. Foreign imports subject us to risk relating to changes in import duties, quotas, the introduction of U.S. taxeson imported goods or the extension of U.S. income taxes on our foreign suppliers' sales of imported goods through the adoption of destination-basedincome tax jurisdiction, loss of "most favored nation" status with the U.S., shipment delays and shipping port constraints, labor strikes, workstoppages or other disruptions, freight cost increases and economic uncertainties. Furthermore, we could face significantly higher U.S. income andsimilar taxes with respect to sales of products purchased from foreign suppliers if the U.S. were to adopt a system of taxation, such as a borderadjustment tax, under which the cost of imported products was not deductible in determining such products' tax base. If such a tax system wereadopted, we could also face higher prices for products manufactured or produced abroad that we purchase from our domestic suppliers if they weresubject to such a tax. In addition, the U.S. government periodically considers other restrictions on the importation of products obtained by ourvendors and us. General trade tensions between the U.S. and China have been escalating recently, with multiple rounds of U.S. tariffs on Chinesegoods taking effect during 2018. Furthermore, China or other countries may institute retaliatory trade measures in response to existing or futuretariffs imposed by the U.S. that could have a negative impact on our business. If any of these events continue as described, we may need to seekalternative suppliers or vendors, raise prices, or make changes to our operations, any of which could have a material adverse effect on our sales andprofitability, results of operations and financial condition. If any of these or other factors were to cause a disruption of trade from the countries inwhich our vendors' suppliers or our private brand products' manufacturers are located, our inventory levels may be reduced or the cost of ourproducts may increase. Additionally, we could be impacted by negative publicity or, in some cases, face potential liability to the extent that anyforeign manufacturers from which we directly or indirectly purchase products utilize labor, environmental, workplace safety and other practices thatvary from those commonly accepted in the U.S. or elsewhere. Also, the prices charged by foreign manufacturers may be affected by the fluctuationof their local currency against the U.S. dollar and the price of raw materials, which could cause the cost of our products to increase and negativelyimpact our sales or profitability.
Impact of various legal proceedings, lawsuits, disputes, and claims could have an adverse impact on our business,financial condition and results of operationsAs a multinational company, we are subject to various proceedings, lawsuits, disputes, and claims (“Actions”) arising in the ordinary course of ourbusiness. Many of these Actions raise complex factual and legal issues and are subject to uncertainties. Actions filed against us from time to timeinclude commercial, intellectual property, customer, employment, and data privacy claims, including class action lawsuits. Actions are in variousprocedural stages and some are covered in part by insurance. We cannot predict with assurance the outcome of Actions brought against us.Accordingly, developments, settlements, or resolutions may occur and impact income in the quarter of such development, settlement, or resolution.An unfavorable outcome could have an adverse impact on our business, financial condition and results of operations.
Other risk factorsAdditionally, other factors could adversely affect our financial performance, including factors such as: our ability to successfully acquire and integrateother businesses; any interruption of our key infrastructure systems, including exceeding capacity in our distribution centers; any disaster or casualtyresulting in the interruption of service from our distribution centers or in a large number of our stores; any interruption of our business related to anoutbreak of a pandemic disease in a country where we source or market our merchandise; extreme weather conditions or changes in climateconditions or weather patterns; the effects of changes in interest rates; and international and domestic acts of terror.
15

The impact of any of the previously discussed factors, some of which are beyond our control, and others about which we are not aware or do notcurrently consider material, may cause our actual results to differ materially from expected results in these statements and other forward-lookingstatements we may make from time-to-time.
Item 1B. Unresol ved Staff Comments.Not applicable.
Item 2. Properties.We own two buildings in urban Pittsburgh, Pennsylvania which house our corporate headquarters. These buildings total 186,000 square feet and150,000 square feet, respectively.
In suburban Pittsburgh, Pennsylvania, we own a 45,000 square foot building, which houses our data center and additional office space and lease anadditional location of approximately 18,000 square feet, which is used for storage space. This lease expires in 2020. We own distribution facilities inOttawa, Kansas and Hazleton, Pennsylvania consisting of approximately 1.2 million and 1.0 million square feet, respectively.
We rent approximately 182,000 square feet of office space in New York, New York for our designers and sourcing and production teams. The leasefor this space expires in 2026.
We lease 9,200 square feet of office space in San Francisco, California that functions as a technology center for our associates. The lease for thisspace expires in 2024.
We lease a building in Mississauga, Ontario with approximately 294,000 square feet, which houses our Canadian distribution center. The leaseexpires in 2028.
All of the above-noted properties are shared by all of our operating business segments (which we report in a single reportable segment).
As for our stores, all are leased and generally have initial terms of 10 years. Certain leases also include early termination options, which can beexercised under specific conditions. Most of these leases provide for base rent and require the payment of a percentage of sales as additionalcontingent rent when sales reach specified levels. Under our store leases, we are typically responsible for tenant occupancy costs, includingmaintenance and common area charges, real estate taxes and certain other expenses. We have generally been successful in negotiating renewalsas leases near expiration.
Item 3. Legal Proceedings.We are involved, from time to time, in actions associated with or incidental to our business, including, among other things, matters involving creditcard fraud, trademark and other intellectual property, licensing, importation of products, taxation, and employee relations. We believe at present thatthe resolution of currently pending matters will not individually or in the aggregate have a material adverse effect on our financial position or resultsof operations. However, our assessment of any litigation or other legal claims could potentially change in light of the discovery of facts not presentlyknown or determinations by judges, juries, or other finders of fact which are not in accord with management's evaluation of the possible liability oroutcome of such litigation or claims.
Item 4. Mine Safety Disclosures.Not Applicable.
16

PART IIItem 5. Market for the Registrant’s Common Equity, Related Stockholder Matters and Issuer Purchases of EquitySecurities.Our common stock is traded on the NYSE under the symbol “AEO”. As of March 11, 2019, there were 484 stockholders of record. However, whenincluding associates who own shares through our employee stock purchase plan, and others holding shares in broker accounts under street name,we estimate the stockholder base at approximately 43,000.
Performance GraphThe following Performance Graph and related information shall not be deemed “soliciting material” or to be filed with the SEC, nor shall suchinformation be incorporated by reference into any future filing under the Securities Act of 1933 or Securities Exchange Act of 1934, each asamended,excepttotheextentthatwespecificallyincorporateitbyreferenceintosuchfiling.
The following graph compares the changes in the cumulative total return to holders of our common stock with that of the S&P Midcap 400 and ourpeer group as described below. The comparison of the cumulative total returns for each investment assumes that $100 was invested in our commonstock and the respective index on February 1, 2014 and includes reinvestment of all dividends. The plotted points are based on the closing price onthe last trading day of the fiscal year indicated.
2/01/14 1/31/15 1/30/16 1/28/17 2/03/18 2/02/19 American Eagle Outfitters, Inc. 100.00 107.92 116.04 119.86 148.74 181.91 S&P MidCap 400 Index 100.00 110.89 103.47 135.43 155.48 151.75 Peer Group 100.00 111.72 95.52 82.83 90.77 87.88
*We compared our cumulative total return to a custom peer group that aligns with our compensation peer group, as disclosed in our 2018 ProxyStatement. This group consisted of the following companies: Abercrombie & Fitch Co., Ascena Retail Group. Inc., Burberry Group PLC, Chico’sFAS, Inc., Coach, Inc., Express, Inc., Gap, Inc., Guess?, Inc.,
17

Hanesbrands Inc., L Brands Inc., Lululemon Athletica, Inc., Michael Kors Holdings LTD, PVH Corp, Ralph Lauren Corp., Tailored Brands Inc .,Under Armour Inc, and Urban Outfitters, Inc. The following table provides information regarding our repurchases of common stock during the three months ended February 2, 2019.
Issuer Purchases of Equity Securities
Total Number of Maximum Number of Total Average Shares Purchased as Shares that May Number of Price Paid Part of Publicly Yet be Purchased
Period Shares Purchased Per Share Announced Programs Under the Program (1) (2) (1) (3) (3) Month #1 (November 4, 2018 through December 1, 2018)
7,091 $ 21.70 — 15,700,000
Month #2 (December 2, 2018 through January 5, 2019)
4,000,000 $ 18.50 4,000,000 11,700,000
Month #3 (January 6, 2019 through February 2, 2019)
— $ — — 11,700,000
Total 4,007,091 $ 18.51 4,000,000 11,700,000
(1) There were 4.0 million shares repurchased as part of our publicly announced share repurchase program during the three months ended
February 2, 2019 and there were 7,091 shares repurchased for the payment of taxes in connection with the vesting of share-based payments.(2) Average price paid per share excludes any broker commissions paid.(3) During Fiscal 2016, our Board authorized 25.0 million shares under a new share repurchase program which expires on January 30, 2021.
18
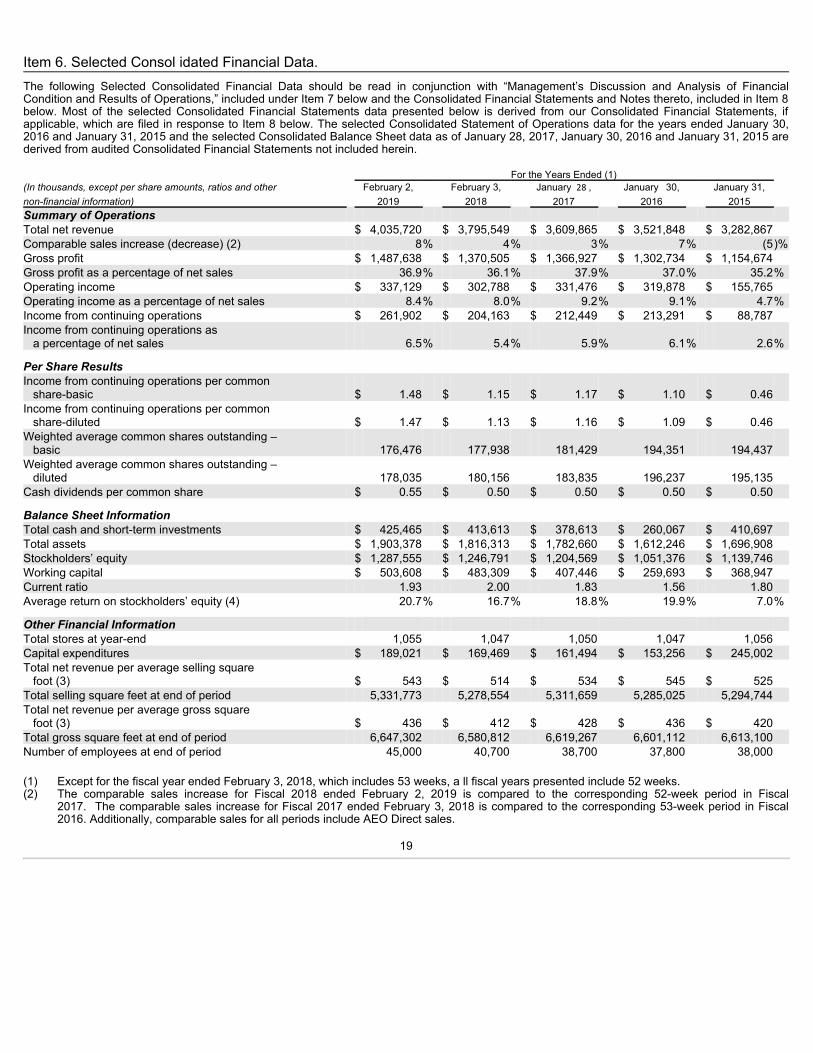
Item 6. Selected Consol idated Financial Data.The following Selected Consolidated Financial Data should be read in conjunction with “Management’s Discussion and Analysis of FinancialCondition and Results of Operations,” included under Item 7 below and the Consolidated Financial Statements and Notes thereto, included in Item 8below. Most of the selected Consolidated Financial Statements data presented below is derived from our Consolidated Financial Statements, ifapplicable, which are filed in response to Item 8 below. The selected Consolidated Statement of Operations data for the years ended January 30,2016 and January 31, 2015 and the selected Consolidated Balance Sheet data as of January 28, 2017, January 30, 2016 and January 31, 2015 arederived from audited Consolidated Financial Statements not included herein. For the Years Ended (1) (Inthousands,exceptpershareamounts,ratiosandother February 2, February 3, January 28 , January 30, January 31, non-financialinformation) 2019 2018 2017 2016 2015 Summary of Operations Total net revenue $ 4,035,720 $ 3,795,549 $ 3,609,865 $ 3,521,848 $ 3,282,867 Comparable sales increase (decrease) (2) 8% 4% 3% 7% (5)%Gross profit $ 1,487,638 $ 1,370,505 $ 1,366,927 $ 1,302,734 $ 1,154,674 Gross profit as a percentage of net sales 36.9% 36.1% 37.9% 37.0% 35.2%Operating income $ 337,129 $ 302,788 $ 331,476 $ 319,878 $ 155,765 Operating income as a percentage of net sales 8.4% 8.0% 9.2% 9.1% 4.7%Income from continuing operations $ 261,902 $ 204,163 $ 212,449 $ 213,291 $ 88,787 Income from continuing operations as a percentage of net sales 6.5% 5.4% 5.9% 6.1% 2.6%
Per Share Results Income from continuing operations per common share-basic $ 1.48 $ 1.15 $ 1.17 $ 1.10 $ 0.46 Income from continuing operations per common share-diluted $ 1.47 $ 1.13 $ 1.16 $ 1.09 $ 0.46 Weighted average common shares outstanding – basic 176,476 177,938 181,429 194,351 194,437 Weighted average common shares outstanding – diluted 178,035 180,156 183,835 196,237 195,135 Cash dividends per common share $ 0.55 $ 0.50 $ 0.50 $ 0.50 $ 0.50
Balance Sheet Information Total cash and short-term investments $ 425,465 $ 413,613 $ 378,613 $ 260,067 $ 410,697 Total assets $ 1,903,378 $ 1,816,313 $ 1,782,660 $ 1,612,246 $ 1,696,908 Stockholders’ equity $ 1,287,555 $ 1,246,791 $ 1,204,569 $ 1,051,376 $ 1,139,746 Working capital $ 503,608 $ 483,309 $ 407,446 $ 259,693 $ 368,947 Current ratio 1.93 2.00 1.83 1.56 1.80 Average return on stockholders’ equity (4) 20.7% 16.7% 18.8% 19.9% 7.0%
Other Financial Information Total stores at year-end 1,055 1,047 1,050 1,047 1,056 Capital expenditures $ 189,021 $ 169,469 $ 161,494 $ 153,256 $ 245,002 Total net revenue per average selling square foot (3) $ 543 $ 514 $ 534 $ 545 $ 525 Total selling square feet at end of period 5,331,773 5,278,554 5,311,659 5,285,025 5,294,744 Total net revenue per average gross square foot (3) $ 436 $ 412 $ 428 $ 436 $ 420 Total gross square feet at end of period 6,647,302 6,580,812 6,619,267 6,601,112 6,613,100 Number of employees at end of period 45,000 40,700 38,700 37,800 38,000
(1) Except for the fiscal year ended February 3, 2018, which includes 53 weeks, a ll fiscal years presented include 52 weeks.(2) The comparable sales increase for Fiscal 2018 ended February 2, 2019 is compared to the corresponding 52-week period in Fiscal
2017. The comparable sales increase for Fiscal 2017 ended February 3, 2018 is compared to the corresponding 53-week period in Fiscal2016. Additionally, comparable sales for all periods include AEO Direct sales.
19

(3) Total net revenue per average square foot is calculated using retail store sales for the year divided by the straight average of the beginning
and ending square footage for the year.(4) Average return on stockholders’ equity is calculated by using the annual reported net income divided by the straight average of the beginning
and ending stockholders’ equity balances from the consolidated balance sheets. Item 7. Management’s Discussion and Analysis of Financial Condition and Results of Operations.Thefollowingdiscussionandanalysis of financial conditionandresults of operationsarebaseduponourConsolidatedFinancial Statementsandshouldbereadinconjunctionwiththosestatementsandnotesthereto.
This report contains various “forward-looking statements” within the meaning of Section 27A of the Securities Act of 1933, as amended, andSection 21E of the Securities Exchange Act of 1934, as amended, which represent our expectations or beliefs concerning future events, includingthe following:
• the planned opening of approximately 15 to 20 American Eagle stores and 35 to 40 Aerie stores, and conversion of 25 to 35 Aerie side-by-side format stores in North America during Fiscal 2019;
• the success of our efforts to expand internationally, engage in future franchise/license agreements, and/or growth through acquisitions or jointventures;
• the selection of approximately 40 to 50 American Eagle stores in the United States and Canada for remodeling and refurbishing during Fiscal2019;
• the potential closure of approximately 10 to 15 American Eagle and 5 to 10 Aerie stores, primarily in North America, during Fiscal 2019;
• the planned opening of approximately 15 to 20 new international third-party operated American Eagle stores during Fiscal 2019;
• the success of our core American Eagle and Aerie brands through our omni-channel and licensed outlets within North America andinternationally;
• the success of our business priorities and strategies;
• the continued validity of our trademarks;
• our performance during the year-end holiday selling season;
• our ability to predict inventory turnover;
• the accuracy of the estimates and assumptions we make pursuant to our critical accounting policies;
• the expected payment of a dividend in future periods;
• the possibility that our credit facilities may not be available for future borrowings;
• the availability of sufficient cash flow to fund anticipated capital expenditures, dividends, and working capital requirements;
• the possibility that product costs are adversely affected by foreign trade issues (including import tariffs and other trade restrictions with Chinaand other countries), currency exchange rate fluctuations, increasing prices for raw materials, political instability or other reasons; and
• the possibility that we may be required to take additional store impairment charges related to underperforming stores.
We caution that these forward-looking statements, and those described elsewhere in this report, involve material risks and uncertainties and aresubject to change based on factors beyond our control, including as discussed within Part I, Item 1A of this Form 10-K. Accordingly, our futureperformance and financial results may differ materially from those expressed or implied in any such forward-looking statement.
Critical Accounting PoliciesOur Consolidated Financial Statements are prepared in accordance with accounting principles generally accepted in the United States (“GAAP”),which require us to make estimates and assumptions that may affect the reported financial
20
condition and results of operations should actual results differ from these estimates and assumptions . We base our estimates and assumptions onthe best available information and believe them to be reasona ble for the circumstances. We believe that of our significant accounting policies, thefollowing involve a higher degree of judgment and complexity. Refer to Note 2 to the Consolidated Financial Statements for a complete discussion ofour significant accou nting policies. Management has reviewed these critical accounting policies and estimates with the Audit Committee of ourBoard.
RevenueRecognition. In May 2014, the Financial Accounting Standards Board (“FASB”) issued Accounting Standard Codification “ASC” Topic606, RevenuefromContractswithCustomers (“ASC 606”). ASC 606 is a comprehensive new revenue recognition model that expands disclosurerequirements and requires a company to recognize revenue to depict the transfer of goods or services to a customer at an amount that reflects theconsideration it expects to receive in exchange for those goods or services. ASC 606 is effective for annual reporting periods beginning afterDecember 15, 2017. The Company adopted ASC 606 on February 4, 2018 using the modified retrospective method applied to all contracts as ofFebruary 4, 2018. Results for reporting periods beginning on or after February 4, 2018 are presented under ASC 606. Prior period amounts are notadjusted and continue to be reported in accordance with our historic accounting, and a cumulative adjustment was made to retained earnings.
Revenue is recorded for store sales upon the purchase of merchandise by customers. The Company’s e-commerce operation records revenue uponthe estimated customer receipt date of the merchandise. Shipping and handling revenues are included in total net revenue. Sales tax collected fromcustomers is excluded from revenue and is included as part of accrued income and other taxes on the Company’s Consolidated Balance Sheets.
Revenue is recorded net of estimated and actual sales returns and deductions for coupon redemptions and other promotions. The Company recordsthe impact of adjustments to its sales return reserve quarterly within total net revenue and cost of sales. The sales return reserve reflects anestimate of sales returns based on projected merchandise returns determined through the use of historical average return percentages.
Revenue is not recorded on the issuance of gift cards. A current liability is recorded upon issuance, and revenue is recognized when the gift card isredeemed for merchandise. Additionally, the Company recognizes revenue on unredeemed gift cards based on an estimate of the amounts that willnot be redeemed (“gift card breakage”), determined through historical redemption trends. Gift card breakage revenue is recognized in proportion toactual gift card redemptions as a component of total net revenue. For further information on the Company’s gift card program, refer to the Gift Cardscaption below.
The Company recognizes royalty revenue generated from its license or franchise agreements based upon a percentage of merchandise sales by thelicensee/franchisee. This revenue is recorded as a component of total net revenue when earned.
Customer Loyalty Program. The Company recently launched a new, highly digitized loyalty program called AEO Connected TM (the“Program”). This Program integrates the current credit card rewards program and the AEREWARDS ® loyalty program into one combined customeroffering. Under the Program, customers accumulate points based on purchase activity and earn rewards by reaching certain pointthresholds. Customers earn rewards in the form of discount savings certificates. Rewards earned are valid through the stated expiration date, whichis currently 45 days from the issuance date of the reward. Rewards not redeemed during the 45-day redemption period are forfeited. Additionalrewards are also given for key items such as jeans and bras.
Points earned under the Program on purchases at American Eagle and Aerie are accounted for in accordance with ASC 606. The portion of thesales revenue attributed to the award points is deferred and recognized when the award is redeemed or when the points expire, using the relativestand-alone selling price method. Additionally, reward points earned using the co-branded credit card on non-AE or Aerie purchases are accountedfor in accordance with ASC 606. As points are earned, a current liability is recorded for the estimated cost of the award, and the impact of theadjustments recorded in cost of sales. The Company recorded a net increase to opening retained earnings of $0.2 million as of February 4, 2018due to the cumulative impact of adoption of ASC 606.
MerchandiseInventory. Merchandise inventory is valued at the lower of average cost or net realizable value, utilizing the retail method. Averagecost includes merchandise design and sourcing costs and related expenses. The Company records merchandise receipts when control of themerchandise has transferred to the Company.
We review our inventory in order to identify slow-moving merchandise and generally use markdowns to clear merchandise. Additionally, we estimatea markdown reserve for future planned markdowns related to current inventory. If
21
inventory exceeds customer demand for reasons of style, seasonal adaptation, changes in customer preference, lack of consumer acceptance offashion items, competition, or if it is determined that the inventory in stock will not sell at its currently ticketed price, additio nal markdowns may benecessary. These markdowns may have a material adverse impact on earnings, depending on the extent and amount of inventory affected.
We estimate an inventory shrinkage reserve for anticipated losses for the period between the last physical count and the balance sheet date. Theestimate for the shrinkage reserve is calculated based on historical percentages and can be affected by changes in merchandise mix and changes inactual shrinkage trends. We do not believe there is a reasonable likelihood that there will be a material change in the future estimates orassumptions we use to calculate our inventory shrinkage reserve. However, if actual physical inventory losses differ significantly from our estimate,our operating results could be adversely affected.
AssetImpairment. In accordance with “FASB” ASC 360, Property,Plant,andEquipment(“ASC 360”), we evaluate long-lived assets for impairmentat the individual store level, which is the lowest level at which individual cash flows can be identified. Impairment losses are recorded on long-livedassets used in operations when events and circumstances indicate that the assets might be impaired and the undiscounted cash flows estimated tobe generated by those assets are less than the carrying amounts of the assets. When events such as these occur, the impaired assets are adjustedto their estimated fair value and an impairment loss is recorded separately as a component of operating income.
Our impairment loss calculations require management to make assumptions and to apply judgment to estimate future cash flows and asset fairvalues, including forecasting the useful lives of the assets and selecting the discount rate that reflects the risk inherent in future cash flows. We donot believe there is a reasonable likelihood that there will be a material change in the estimates or assumptions we use to calculate long-lived assetimpairment losses. However, if actual results are not consistent with our estimates and assumptions, our operating results could be adverselyaffected.
Share-BasedPayments. We account for share-based payments in accordance with ASC 718, Compensation–StockCompensation(“ASC 718”).To determine the fair value of our stock option awards, we use the Black-Scholes option pricing model, which requires management to applyjudgment and make assumptions to determine the fair value of our awards. These assumptions include estimating the length of time employees willretain their vested stock options before exercising them (the “expected term”) and the estimated volatility of the price of our common stock over theexpected term.
We calculate a weighted-average expected term based on historical experience. Expected stock price volatility is based on a combination ofhistorical volatility of our common stock and implied volatility. We choose to use a combination of historical and implied volatility as we believe thatthis combination is more representative of future stock price trends than historical volatility alone. Changes in these assumptions can materiallyaffect the estimate of the fair value of our share-based payments and the related amount recognized in our Consolidated Financial Statements.
IncomeTaxes. We calculate income taxes in accordance with ASC 740, IncomeTaxes (“ASC 740”), which requires the use of the asset andliability method. Under this method, deferred tax assets and liabilities are recognized based on the difference between the Consolidated FinancialStatement carrying amounts of existing assets and liabilities and their respective tax bases as computed pursuant to ASC 740. Deferred tax assetsand liabilities are measured using the tax rates, based on certain judgments regarding enacted tax laws and published guidance, in effect in theyears when those temporary differences are expected to reverse. A valuation allowance is established against the deferred tax assets when it ismore likely than not that some portion or all of the deferred taxes may not be realized. Changes in our level and composition of earnings, tax laws orthe deferred tax valuation allowance, as well as the results of tax audits, may materially impact the effective income tax rate.
We evaluate our income tax positions in accordance with ASC 740, which prescribes a comprehensive model for recognizing, measuring, presentingand disclosing in the financial statements tax positions taken or expected to be taken on a tax return, including a decision whether to file or not to filein a particular jurisdiction. Under ASC 740, a tax benefit from an uncertain position may be recognized only if it is “more likely than not” that theposition is sustainable based on its technical merits.
The calculation of the deferred tax assets and liabilities, as well as the decision to recognize a tax benefit from an uncertain position and to establisha valuation allowance require management to make estimates and assumptions. We believe that our assumptions and estimates are reasonable,although actual results may have a positive or negative material impact on the balances of deferred tax assets and liabilities, valuation allowances ornet income.
22
Key Performance IndicatorsOur management evaluates the following items, which are considered key performance indicators, in assessing our performance:
Comparablesales— Comparable sales provide a measure of sales growth for stores and channels open at least one year over the comparable prioryear period. In fiscal years following those with 53 weeks, including Fiscal 2018, the prior year period is shifted by one week to compare similarcalendar weeks. A store is included in comparable sales in the thirteenth month of operation. However, stores that have a gross square footageincrease of 25% or greater due to a remodel are removed from the comparable sales base, but are included in total sales. These stores are returnedto the comparable sales base in the thirteenth month following the remodel. Sales from company-owned stores, as well as sales from AEO Direct,are included in total comparable sales. Sales from licensed stores are not included in comparable sales. Individual American Eagle and Aerie brandcomparable sales disclosures represent sales from stores and AEO Direct.
AEO Direct sales are included in the individual American Eagle and Aerie brand comparable sales metric for the following reasons:
• Our approach to customer engagement is “omni-channel”, which provides a seamless customer experience through both traditional and non-traditional channels, including four wall store locations, web, mobile/tablet devices and apps, social networks, email, in-store displays andkiosks. Additionally, we fulfill online orders at stores through our buy online, ship from store capability, maximizing store inventory exposureto digital traffic and accept digital returns in stores. We also offer a reserve online, pick up in store service to our customers and give them theability to look up in store inventory from all digital channels; and
• Shopping behavior has continued to evolve across multiple channels that work in tandem to meet customer needs. Management believes thatpresenting a brand level performance metric that includes all channels (i.e., stores and AEO Direct) to be the most appropriate given customerbehavior.
Our management considers comparable sales to be an important indicator of our current performance. Comparable sales results are important toachieve leveraging of our costs, including store payroll, store supplies, rent, etc. Comparable sales also have a direct impact on our total netrevenue, cash and working capital.
Grossprofit — Gross profit measures whether we are optimizing the profitability of our sales. Gross profit is the difference between total net revenueand cost of sales. Cost of sales consists of: merchandise costs, including design, sourcing, importing and inbound freight costs, as well asmarkdowns, shrinkage and certain promotional costs (collectively “merchandise costs”) and buying, occupancy and warehousing costs. Design costsconsist of: compensation, rent, depreciation, travel, supplies and samples.
Buying, occupancy and warehousing costs consist of: compensation, employee benefit expenses and travel for our buyers and certain seniormerchandising executives; rent and utilities related to our stores, corporate headquarters, distribution centers and other office space; freight from ourdistribution centers to the stores; compensation and supplies for our distribution centers, including purchasing, receiving and inspection costs; andshipping and handling costs related to our e-commerce operation.
The inability to obtain acceptable levels of sales, initial markups or any significant increase in our use of markdowns could have an adverse effect onour gross profit and results of operations.
Operating income— Our management views operating income as a key indicator of our performance. The key drivers of operating income arecomparable sales, gross profit, our ability to control selling, general and administrative expenses, and our level of capital expenditures.
Omni-channel sales performance — Our management utilizes the following quality of sales metrics in evaluating our omni-channel salesperformance: sales per square foot, comparable sales, average unit retail price (“AUR”), units per transaction (“UPT”), average transaction value,transactions, customer traffic, conversion rates, average unit cost (“AUC”), and comparable gross margin dollars.
Inventory turnover — Our management evaluates inventory turnover as a measure of how productively inventory is bought and sold. Inventoryturnover is important as it can signal slow-moving inventory. This can be critical in determining the need to take markdowns on merchandise.
23
Cashflowandliquidity — Our management evaluates cash flow from operations, investing and financing in determining the sufficiency of our cashposition. Cash flow has historically been sufficient to cover our uses of cash. Our management believes that cash flow will be sufficient to fundanticipated capital expenditures, dividends and working capital requirements.
Results of OperationsOverviewFiscal 2018 represented a milestone year as we reached $4 billion in annual revenue with increased operating profit. American Eagle and Aeriecontinued to deliver consistent performance by combining great merchandise with an improved customer experience across channels. Total netrevenue for the year increased 6% to $4.036 billion, compared to $3.796 billion last year. Total comparable sales increased 8%. By brand, AmericanEagle comparable sales rose 5% and comparable sales for Aerie increased 29%. Gross profit increased 9% to $1.488 billion and grew by 80 basispoints to 36.9% as a percentage of revenue.
Net income was $1.47 per diluted share this year, compared to $1.13 per diluted share last year. On an adjusted basis, net income per diluted sharethis year increased 28% to $1.48, compared to adjusted net income per diluted share of $1.16 last year. Adjusted net income per diluted share thisyear excludes ($0.01) per diluted share impact from restructuring charges. Adjusted net income per diluted share last year excludes a $0.08 perdiluted share benefit from the impact of U.S. tax legislation and related actions, a ($0.03) impact from exiting a joint venture and a ($0.08) per dilutedshare impact from impairment and restructuring charges.
24
The preceding paragraph contains a discussion of earnings per share, excluding non-GAAP items, which is a non-GAAP or “adjusted” financialmeasure . This financial measure is not based on any standardized methodology prescribed by U.S. generally accepted accounting principles(“GAAP”) and is not necessarily comparable to similar measures presented by other companies. We believe that this non-GAAP information moreclearly reflects our financial results and is useful as an additional means for investors to evaluate our operating performance, when reviewed inconjunction with our GAAP financial statements. These amounts are not determined in accordance with GAAP and, therefore, should not be usedexclusively in evaluating our business and operations. The tab le below reconciles the GAAP financial measure to the non-GAAP financial measurediscussed above.
Earnings per Share
For the FiscalYear Ended
February 2,
2019 Net income per diluted share - GAAP Basis $ 1.47
Add: Restructuring (1) 0.01 Net income per diluted share - Non-GAAP Basis $ 1.48
(1) $1.6 million pre-tax restructuring charges, primarily consisting of corporate severance charges
Earnings per Share
For the FiscalYear Ended
February 3,
2018 Net income per diluted share - GAAP Basis $ 1.13
Add: Asset impairment & restructuring (1) 0.08 Add: Joint Business Venture Charges (2) 0.03 Less: U.S. Tax Reform Impact (3) (0.08)
Net income per diluted share - Non-GAAP Basis $ 1.16 (1) $22.3 million pre-tax restructuring charges, consisting of: • Inventory charges related to the restructuring of the United Kingdom, Hong Kong, and China ($1.7 million), recorded as a reduction of Gross Profit • Lease buyouts, store closure charges and severance and related charges ($19.9 million), which includes charges for the United Kingdom, Hong Kong, and China and corporate overhead reductions, recorded within Restructuring Charges.
(2) $8.0 million of net pre-tax charges related to the exit of a joint business venture, recorded within Other income (expense), net.
(3) $14.9 million of after-tax benefit resulting from the estimated impact of U.S. tax legislation enacted on December 22, 2017, referred to as the Tax Cuts and Jobs Act and related actions, specifically: • The benefit of a lower blended U.S. corporate tax rate in Fiscal 2017 • The net benefit from the re-measurement of deferred tax balances and the one-time transition tax on undistributed earnings of foreign subsidiaries • The acceleration of certain deductions into Fiscal 2017
We ended the year with $425.5 million in cash and short-term investments, a 3% increase from $413.6 million in cash and short-term investments asof the end of the prior fiscal year. During Fiscal 2018, we generated $456.6 million of cash from operations, which was offset by $189.0 million ofcapital expenditures, the repurchase of 7.3 million shares for $144.4 million and dividend payments of $97.1 million. Merchandise inventory at theend of Fiscal 2018 was $424.4 million, an increase of 7% as compared to Fiscal 2017, reflecting investments in bottoms, women’s tops and Aerieapparel to support strong sales trends as well as our clearance store strategy. We ended Fiscal 2018 with no short or long-term debt.
25
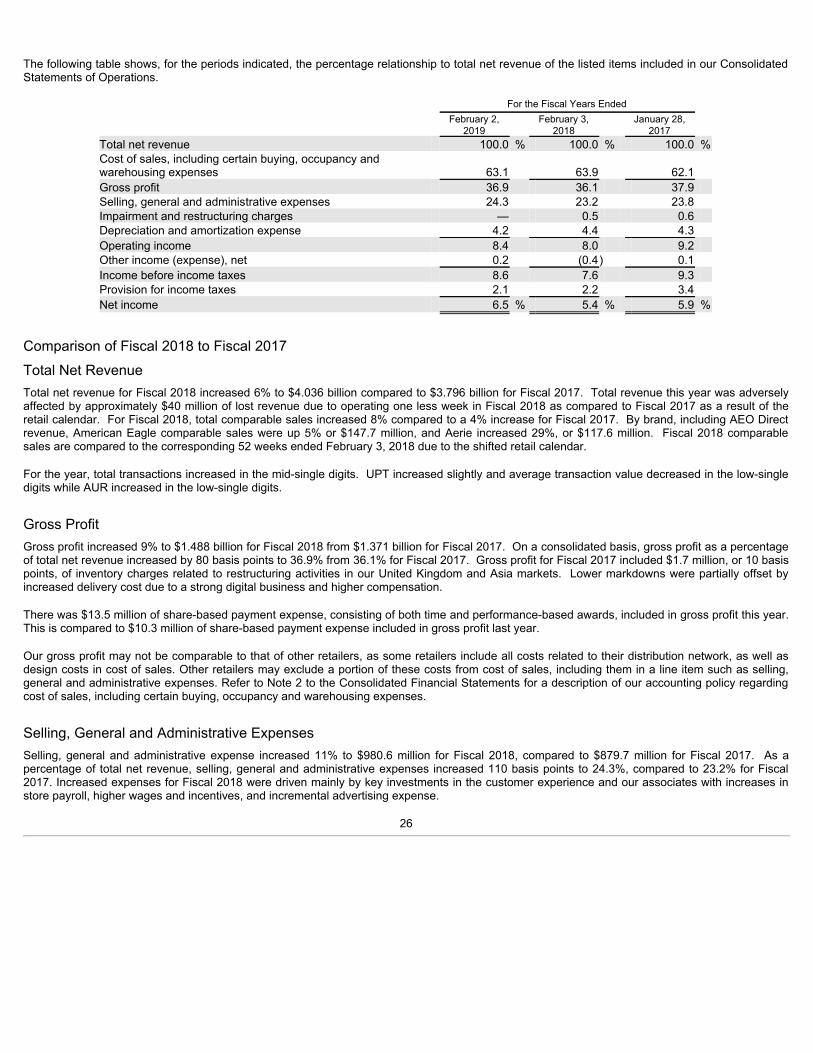
The following table shows, for the periods indicated, the percentage relationship to total net revenue of the listed items included in our ConsolidatedStatements of Operations.
For the Fiscal Years Ended February 2, February 3, January 28, 2019 2018 2017 Total net revenue 100.0 % 100.0 % 100.0 %Cost of sales, including certain buying, occupancy andwarehousing expenses 63.1 63.9 62.1 Gross profit 36.9 36.1 37.9 Selling, general and administrative expenses 24.3 23.2 23.8 Impairment and restructuring charges — 0.5 0.6 Depreciation and amortization expense 4.2 4.4 4.3 Operating income 8.4 8.0 9.2 Other income (expense), net 0.2 (0.4) 0.1 Income before income taxes 8.6 7.6 9.3 Provision for income taxes 2.1 2.2 3.4 Net income 6.5 % 5.4 % 5.9 %
Comparison of Fiscal 2018 to Fiscal 2017Total Net RevenueTotal net revenue for Fiscal 2018 increased 6% to $4.036 billion compared to $3.796 billion for Fiscal 2017. Total revenue this year was adverselyaffected by approximately $40 million of lost revenue due to operating one less week in Fiscal 2018 as compared to Fiscal 2017 as a result of theretail calendar. For Fiscal 2018, total comparable sales increased 8% compared to a 4% increase for Fiscal 2017. By brand, including AEO Directrevenue, American Eagle comparable sales were up 5% or $147.7 million, and Aerie increased 29%, or $117.6 million. Fiscal 2018 comparablesales are compared to the corresponding 52 weeks ended February 3, 2018 due to the shifted retail calendar.
For the year, total transactions increased in the mid-single digits. UPT increased slightly and average transaction value decreased in the low-singledigits while AUR increased in the low-single digits.
Gross ProfitGross profit increased 9% to $1.488 billion for Fiscal 2018 from $1.371 billion for Fiscal 2017. On a consolidated basis, gross profit as a percentageof total net revenue increased by 80 basis points to 36.9% from 36.1% for Fiscal 2017. Gross profit for Fiscal 2017 included $1.7 million, or 10 basispoints, of inventory charges related to restructuring activities in our United Kingdom and Asia markets. Lower markdowns were partially offset byincreased delivery cost due to a strong digital business and higher compensation.
There was $13.5 million of share-based payment expense, consisting of both time and performance-based awards, included in gross profit this year.This is compared to $10.3 million of share-based payment expense included in gross profit last year.
Our gross profit may not be comparable to that of other retailers, as some retailers include all costs related to their distribution network, as well asdesign costs in cost of sales. Other retailers may exclude a portion of these costs from cost of sales, including them in a line item such as selling,general and administrative expenses. Refer to Note 2 to the Consolidated Financial Statements for a description of our accounting policy regardingcost of sales, including certain buying, occupancy and warehousing expenses.
Selling, General and Administrative ExpensesSelling, general and administrative expense increased 11% to $980.6 million for Fiscal 2018, compared to $879.7 million for Fiscal 2017. As apercentage of total net revenue, selling, general and administrative expenses increased 110 basis points to 24.3%, compared to 23.2% for Fiscal2017. Increased expenses for Fiscal 2018 were driven mainly by key investments in the customer experience and our associates with increases instore payroll, higher wages and incentives, and incremental advertising expense.
26

There was $14.0 million of share-based payment expense, consisting of time and performance-based awards, included in selling, general and administrative expenses for Fiscal 2018 co mpared to $6.6 million for Fiscal 2017 .
Impairment and Restructuring ChargesIn Fiscal 2018, restructuring charges were $1.6 million. These charges primarily resulted from corporate severance charges.
In Fiscal 2017, restructuring charges were $20.6 million, or 0.5% as a percentage of total net revenue. These charges resulted from home officerestructuring and the previously announced initiative to explore the closure or conversion of Company-owned and operated stores in Hong Kong,China, and the United Kingdom to licensed partnerships. The closure of the Company-owned and operated United Kingdom stores was completedin Fiscal 2017.
Also during Fiscal 2017, and recorded separately from Impairment and Restructuring Charges on the Consolidated Statements of Operations, is$1.7 million, or 0.1% as a percentage of total revenue, of inventory charges related to restructuring activities recorded as a reduction in Gross Profitin our United Kingdom and Asia markets. Additionally, $8.0 million, or 0.2% as a percentage of total revenue, of net costs related to the exit of a jointbusiness venture are recorded within Other Income (Expense), Net.
Depreciation and Amortization ExpenseDepreciation and amortization expense increased 1% to $168.3 million for Fiscal 2018 from $167.4 million for Fiscal 2017, driven by omni-channeland information technology investments and new and remodeled mainline AE stores. As a percentage of total net revenue, depreciation andamortization decreased 20 basis points to 4.2% from 4.4% for Fiscal 2017.
Other Income (Expense), NetOther income was $8.0 million for Fiscal 2018, compared to other expense of $(15.6) million for Fiscal 2017. Included in other expense last yearwas $8.0 million of costs related to the planned exit of a joint business venture, along with a $15.2 million net charge associated with a reserveagainst a receivable, partially offset by foreign currency transaction gains, net.
Provision for Income TaxesThe effective income tax rate decreased to 24.1% for Fiscal 2018 from 28.9% for Fiscal 2017. The lower effective income tax rate this year primarilyresulted from the reduction in the U.S. federal corporate tax rate from 35% to 21% as a result of the enactment of the Tax Act in December 2017.Last year’s effective income tax rate included a 520 basis point net benefit primarily from the estimated impact of the Tax Act, including the re-measurement of our deferred tax assets and liabilities and the one-time transition tax on undistributed earnings of foreign subsidiaries, and excesstax benefits from share-based payments in accordance with ASU 2016-09. Our effective income tax rate is also dependent upon the overall mix ofearnings in jurisdictions with different tax rates.
During the fourth quarter of 2018, we have completed our assessment of the impacts of the Tax Act in accordance with the guidance in StaffAccounting Bulletin No. 118, Income Tax Accounting Implications of the Tax Cuts and Jobs Act (“SAB 118”), and as a result there were no materialchanges to the provisional amounts recorded for the re-measurement of our deferred tax assets and liabilities and the one-time transition tax as ofFebruary 3, 2018.
Refer to Note 14 to the Consolidated Financial Statements for additional information regarding our accounting for income taxes.
Net IncomeNet income increased to $261.9 million for Fiscal 2018 from $204.2 million for Fiscal 2017. The change in net income was attributable to the factorsnoted above. As a percentage of total net revenue, net income was 6.5% and 5.4% for Fiscal 2018 and Fiscal 2017, respectively. Net income perdiluted share was $1.47 per diluted share and included $1.6 million ($0.01 per diluted share) of pre-tax restructuring charges.
27

Net in come per diluted share for Fiscal 2017 was $1.13 per diluted sh a re, and included $22.3 million ($0.08 per diluted share) of pre-tax restructuring charges and $8.0 million ($0.03 per diluted share) of net pre-tax charges related to the exit of a joint business venture, partially offset by $14.9million ($0.08 per dilute d share) of after-tax benefit from the Tax Act and related actions.
Comparison of Fiscal 2017 to Fiscal 2016Total Net RevenueTotal net revenue for Fiscal 2017 increased 5% to $3.796 billion compared to $3.610 billion for Fiscal 2016. For Fiscal 2017, total comparable salesincreased 4% compared to a 3% increase for Fiscal 2016. Total comparable sales by brand, including the respective AEO Direct revenue: AmericanEagle comparable sales increased 2%, or $49.8 million, and Aerie increased 27%, or $83.4 million. The 53 rd week in Fiscal 2017 provided anadditional $43 million of sales.
For Fiscal 2017, total transactions increased in the mid-single digits. UPT and average transaction value decreased in the low-single digits whileAUR increased in the low-single digits.
Gross ProfitGross profit increased slightly to $1.371 billion in Fiscal 2017 from $1.367 billion in Fiscal 2016. On a consolidated basis, gross profit as apercentage of total net revenue decreased by 180 basis points to 36.1% from 37.9% in Fiscal 2016. Gross profit in Fiscal 2017 includes $1.7 million,or 10 basis points, of inventory charges related to restructuring activities in our United Kingdom and Asia markets. The decline in gross marginreflected higher promotional activity and increased shipping costs associated with a strong digital business.
Buying, occupancy, and warehousing costs increased 6% and increased as a percentage of net revenue by 20 basis points to 19.2% in Fiscal 2017from 19.0% in Fiscal 2016. The increase was a result of higher delivery costs from increased AEO Direct penetration, partially offset by decreasedshipments per order.
There was $10.3 million of share-based payment expense, consisting of both time and performance-based awards, included in gross profit in Fiscal2017. This is compared to $15.1 million of share-based payment expense included in gross profit in Fiscal 2016.
Our gross profit may not be comparable to that of other retailers, as some retailers include all costs related to their distribution network, as well asdesign costs in cost of sales. Other retailers may exclude a portion of these costs from cost of sales, including them in a line item such as selling,general and administrative expenses. Refer to Note 2 to the Consolidated Financial Statements for a description of our accounting policy regardingcost of sales, including certain buying, occupancy and warehousing expenses.
Selling, General and Administrative ExpensesSelling, general and administrative expenses increased 3% to $879.7 million in Fiscal 2017, compared to $857.6 million in Fiscal 2016. As apercentage of total net revenue, selling, general, and administrative expenses decreased by 60 basis points to 23.2%, compared to 23.8% in Fiscal2016. Increased expenses in Fiscal 2017 were driven mainly by increased salaries and advertising expense.
There was $6.6 million of share-based payment expense, consisting of time and performance-based awards, included in selling, general andadministrative expenses in Fiscal 2017 compared to $14.0 million in Fiscal 2016.
Impairment and Restructuring ChargesIn Fiscal 2017, restructuring charges were $20.6 million, or 0.5% as a percentage of total net revenue. These charges are the result of home officerestructuring and the previously announced initiative to explore the closure of conversion of Company-owned and operated stores in Hong Kong,China, and the United Kingdom to licensed partnerships. The closure of the Company owned and operated United Kingdom stores was completedin Fiscal 2017.
Also during Fiscal 2017, and recorded separately from Impairment and Restructuring Charges on the Consolidated Statements of Operations, was$1.7 million, or 0.1% as a percentage of total revenue, of inventory charges related to
28

restructuring activities recorded as a reduction in Gross Profit in our United Kingdom and Asia markets. Additionally, $8.0 million, or 0.2% as apercentage of total revenue, of net costs related to the exit of a joint business venture recorded within Other Income (Expense), Net.
In Fiscal 2016, impairment and restructuring charges were $21.2 million. This amount consists of the impairment of all Company-owned retail storesin the United Kingdom, Hong Kong, and China. Additionally, charges were incurred for goodwill and non-store corporate assets that support theinternational retail stores and e-commerce operations. In Fiscal 2016, the Company undertook an initiative to convert these markets to licensedpartnerships, as assets for these markets could not generate sufficient cash flow to cover their carrying value.
Depreciation and Amortization ExpenseDepreciation and amortization expense increased 7% to $167.4 million in Fiscal 2017 from $156.7 million in Fiscal 2016, driven by omni-channel andIT investments, and new and remodeled mainline AE brand stores. As a percentage of total net revenue, depreciation and amortization increased10 basis points to 4.4% from 4.3% in Fiscal 2016.
Other Income (Expense), NetOther expense was $(15.6) million in Fiscal 2017, compared to other income of $3.8 million in Fiscal 2016. Included in other expense in Fiscal 2017was $8.0 million of costs related to the planned exit of a joint business venture, along with a $15.2 million net charge associated with a reserveagainst a receivable, partially offset by foreign currency fluctuations.
Provision for Income TaxesThe effective income tax rate from continuing operations decreased to 28.9% in Fiscal 2017 from 36.6% in Fiscal 2016. Fiscal 2017 included a 520basis point net benefit to the effective tax rate primarily from the estimated impact of the Tax Act, and excess tax benefits from share-basedpayments in accordance with ASU 2016-09. Fiscal 2016 included a 100 basis point charge to the effective tax rate primarily from valuationallowances on the $21.2 million of impairment and restructuring charges. The remainder of the change in the effective tax rate was primarily relatedto the overall mix from earnings in jurisdictions with different tax rates. Under the Tax Act, the transition to a new territorial tax system resulted in theone-time transition tax of $3.5 million on undistributed earnings of foreign subsidiaries, offset by a $3.5 million benefit of a lower blended U.S.corporate tax rate. In addition, the reduction of the U.S. corporate tax rate from 35% to 21% effective January 1, 2018, resulted in an adjustment tothe Company's U.S. deferred tax assets and liabilities to the lower base rate of 21%. The impact of the re-measurement of deferred tax assets andliabilities resulted in a non-cash tax benefit of $12.1 million. The one-time transition tax, re-measurement of deferred tax assets and liabilities, andother items were recorded as provisional amounts in accordance with SAB 118.
Refer to Note 14 to the Consolidated Financial Statements for additional information regarding our accounting for income taxes.
Net IncomeNet income decreased to $204.2 million in Fiscal 2017 from $212.4 million in Fiscal 2016. As a percentage of total net revenue, net income was5.4% and 5.9% for Fiscal 2017 and Fiscal 2016, respectively. Net Income per diluted share was $1.13 per diluted share, and included $22.3 million,($0.08 per diluted share) of pre-tax restructuring charges and $8.0 million ($0.03 per diluted share) of net pre-tax charges related to the exit of a jointbusiness venture, partially offset by $14.9 million ($0.08 per diluted share) of after-tax benefit from the Tax Act and related actions.
Net Income in Fiscal 2016 was $212.4 million, or $1.16 per diluted share. This includes a ($0.09) per diluted share impact from pre-tax impairmentand restructuring charges. The change in net income was attributable to the factors noted above.
Fair Value MeasurementsASC 820 defines fair value, establishes a framework for measuring fair value in accordance with GAAP, and expands disclosures about fair valuemeasurements. Fair value is defined under ASC 820 as the exit price associated with the sale of an asset or transfer of a liability in an orderlytransaction between market participants at the measurement date:
29

Financial InstrumentsValuation techniques used to measure fair value under ASC 820 must maximize the use of observable inputs and minimize the use of unobservableinputs. In addition, ASC 820 establishes this three-tier fair value hierarchy, which prioritizes the inputs used in measuring fair value. These tiersinclude:
• Level1—Quoted prices in active markets.
• Level2—Inputs other than Level 1 that are observable, either directly or indirectly.
• Level 3 —Unobservable inputs that are supported by little or no market activity and that are significant to the fair value of the assets orliabilities.
As of February 2, 2019 and February 3, 2018, we held certain cash equivalents that are required to be measured at fair value on a recurring basis.
In accordance with ASC 820, the following table represents the fair value hierarchy for our financial assets (cash, cash equivalents, and short-terminvestments) measured at fair value on a recurring basis as of February 2, 2019.
Fair Value Measurements at February 2, 2019
(Inthousands) Carrying Amount
Quoted MarketPrices in Active
Markets forIdenticalAssets
(Level 1)
Significant OtherObservable Inputs
(Level 2)
SignificantUnobservable
Inputs(Level 3)
Cash and cash equivalents Cash $ 108,216 $ 108,216 — — Interest bearing deposits 165,274 165,274 — — Commercial paper 59,840 59,840 — —
Total cash and cash equivalents $ 333,330 333,330 — — Short-term investments (1)
Certificates of deposits 70,000 70,000 — — Commercial paper 22,135 22,135 — —
Total short-term investments 92,135 92,135 — — Total $ 425,465 $ 425,465 — — (1) Please see Note 2 to the Consolidated Financial Statements for a description of whatwe consider cash-equivalents and short-term investments.
Liquidity and Capital ResourcesOur uses of cash are generally for working capital, the construction of new stores and remodeling of existing stores, information technologyupgrades and investments, digital investments, distribution center improvements and expansion and the return of value to shareholders through therepurchase of common stock and the payment of dividends. Historically, these uses of cash have been funded with cash flow from operations andexisting cash on hand. Also, we maintain an asset-based revolving credit facility that allows us to borrow up to $400 million, which will expire inJanuary of 2024. Additionally, our uses of cash include the development of the Aerie brand, investments in technology and omni-channelcapabilities, and our international expansion efforts. We also made key investments in the customer experience and our associates, including storepayroll and higher wages, as well as incremental advertising expenses. We expect to be able to fund our future cash requirements through currentcash holdings as well as cash generated from operations.
Our growth strategy includes fortifying our brands and further international expansion or acquisitions. We periodically consider and evaluate theseoptions to support future growth. In the event we do pursue such options, we could require additional equity or debt financing. There can be noassurance that we would be successful in closing any potential transaction, or that any endeavor we undertake would increase our profitability.
30

The following sets forth certain measures of our liquidity:
February 2, February 3, 2019 2018
Working Capital (in 000's) $ 503,608 $ 483,309 Current Ratio 1.93 2.00
The $20.3 million increase in our working capital and corresponding decrease in the current ratio as of February 2, 2019 compared to February 3,2018, was driven by our cash flow from operations of $456.6 million, partially offset by our capital expenditures of $189.0 million, $144.4 million ofshare repurchases, and dividends of $97.1 million. For Fiscal 2017, our cash flow from operations was offset by capital expenditures and dividendsof $394.4 million, $169.5 million, and dividends of $88.5 million, respectively. In Fiscal 2018, we repurchased 7.3 million shares for $144.4 millionunder publicly announced programs. In Fiscal 2017, we repurchased 6.0 million shares for $87.7 million under publicly announced programs.
Cash Flows from Operating Activities of OperationsNet cash provided by operating activities totaled $456.6 million during Fiscal 2018, compared to $394.4 million during Fiscal 2017 and $365.6 millionduring Fiscal 2016. Our major source of cash from operations was merchandise sales. Our primary outflows of cash from operations were for thepayment of operational costs.
Cash Flows from Investing Activities of OperationsInvesting activities for Fiscal 2018 included $189.0 million in capital expenditures for property and equipment and $93.1 million of net short-terminvestment purchases, classified as available-for-sale. Investing activities for Fiscal 2017 included $169.5 million in capital expenditures for propertyand equipment. Investing activities for Fiscal 2016 included $161.5 million in capital expenditures for property and equipment. For furtherinformation on capital expenditures, refer to the Capital Expenditures for Property and Equipment caption below.
Cash Flows from Financing Activities of OperationsDuring Fiscal 2018, cash used for financing activities primarily consisted of $144.4 million of purchases of common stock under publically announcedprograms, $97.1 million for the payment of dividends, and $19.7 million for the repurchase of common stock from employees for the payment oftaxes in connection with the vesting of share-based payments. During Fiscal 2017, cash used for financing activities primarily consisted of $87.7million for purchases of common stock under publically announced programs, $88.5 million for the payment of dividends, and $12.5 million for therepurchase of common stock from employees for the payment of taxes in connection with the vesting of share-based payments. During Fiscal 2016,cash used for financing activities consisted of $90.7 million for the payment of dividends and $7.0 million for the repurchase of common stock fromemployees for the payment of taxes in connection with the vesting of share-based payments.
Cash returned to shareholders through dividends and share repurchases was $241.5 million, $176.2 million and $90.7 million in Fiscal 2018, Fiscal2017 and Fiscal 2016, respectively.
Accounting Standards Update (“ASU”) No. 2016-09, Compensation–StockCompensation(Topic718)(“ASU 2016-09”) clarified the Statement ofCash Flow presentation for excess tax benefits from share-based payments. ASC 718 requires that cash flows resulting from the benefits of taxdeductions in excess of recognized compensation cost for share-based payments be classified as financing cash flows. Accordingly, for Fiscal 2016,the excess tax benefits from share-based payments of $0.8 million are classified as financing cash flows. For Fiscal 2018 and Fiscal 2017, noexcess tax benefits were required to be classified as financing cash flows under ASU 2016-09.
Capital Expenditures for Property and EquipmentFiscal 2018 capital expenditures were $189.0 million, compared to $169.5 million in Fiscal 2017. Fiscal 2018 expenditures included $104.5 millionrelated to investments in our AEO stores, including 29 new AEO stores, 65 remodeled and refurbished stores, and fixtures and visual investments.Additionally, we continued to support our infrastructure growth by investing in information technology ($35.1 million), investments in e-commerce($32.0 million), the improvement of our distribution centers ($13.9 million) and other home office projects ($3.5 million).
31

For Fiscal 2019, we expect capital expenditures to be in the range of $200 million to $215 million related to the continued support of our expansionefforts, stores, information t echnology upgrades to support growth and investments in e-commerce. We expect to be able to fund our capitalexpenditures through current cash holdings and cash generated from operations.
Credit FacilitiesIn January 2019, we entered into a credit agreement (“Credit Agreement”) for five-year, syndicated, asset-based revolving credit facilities (the “CreditFacilities”). The Credit Agreement provides senior secured revolving credit for loans and letters of credit up to $400 million, subject to customaryborrowing base limitations. The Credit Facilities provide increased financial flexibility and take advantage of a favorable credit environment. Prior toentry into the Credit Agreement, we were party to a five-year, syndicated asset-based revolving credit facility providing senior secured revolvingcredit for loans and letters of credit up to $400 million, which we entered into in Fiscal 2014.
All obligations under the Credit Facilities are unconditionally guaranteed by certain subsidiaries. The obligations under the Credit Agreement aresecured by a first-priority security interest in certain working capital assets of the borrowers and guarantors, consisting primarily of cash, receivables,inventory and certain other assets and have been further secured by first-priority mortgages on certain real property.
As of February 2, 2019, we were in compliance with the terms of the Credit Agreement and had $8.1 million outstanding in stand-by letters of credit.No loans were outstanding under the Credit Facilities as of February 2, 2019.
Stock RepurchasesDuring Fiscal 2018, as part of our publicly announced share repurchase program, we repurchased 7.3 million shares for approximately $144.4million, at a weighted average price of $19.76 per share. During Fiscal 2017 there were 6.0 million shares purchased for approximately $87.7 millionshares at a weighted average price of $14.59 per share. During Fiscal 2016, there were no shares repurchased as a part of our publicly announcedrepurchase programs.
In Fiscal 2016, our Board authorized the repurchase of up to 25.0 million shares under a new share repurchase program which expires on January30, 2021. As of February 2, 2019, 11.7 million shares remain authorized for repurchase under this share repurchase program.
During Fiscal 2018, Fiscal 2017 and Fiscal 2016, we repurchased approximately 0.9 million, 0.9 million and 0.5 million shares, respectively, fromcertain employees at market prices totaling $19.7 million, $12.5 million and $7.0 million, respectively. These shares were repurchased for thepayment of taxes in connection with the vesting of share-based payments, as permitted under our equity incentive plans.
The aforementioned share repurchases have been recorded as treasury stock.
DividendsA $0.1375 per share dividend was paid for each quarter of Fiscal 2018, resulting in a dividend yield of 2.5% for Fiscal 2018. During Fiscal 2017, a$0.125 per share dividend was paid for each quarter, resulting in a dividend yield of 3.5% for Fiscal 2017. Subsequent to the fourth quarter of Fiscal2018, our Board declared a $0.1375 per share dividend, payable on April 26, 2019 to stockholders of record at close of business on April 12,2019. The payment of future dividends is at the discretion of our Board and is based on future earnings, cash flow, financial condition, capitalrequirements, changes in U.S. taxation and other relevant factors. It is anticipated that any future dividends paid will be declared on a quarterlybasis.
32
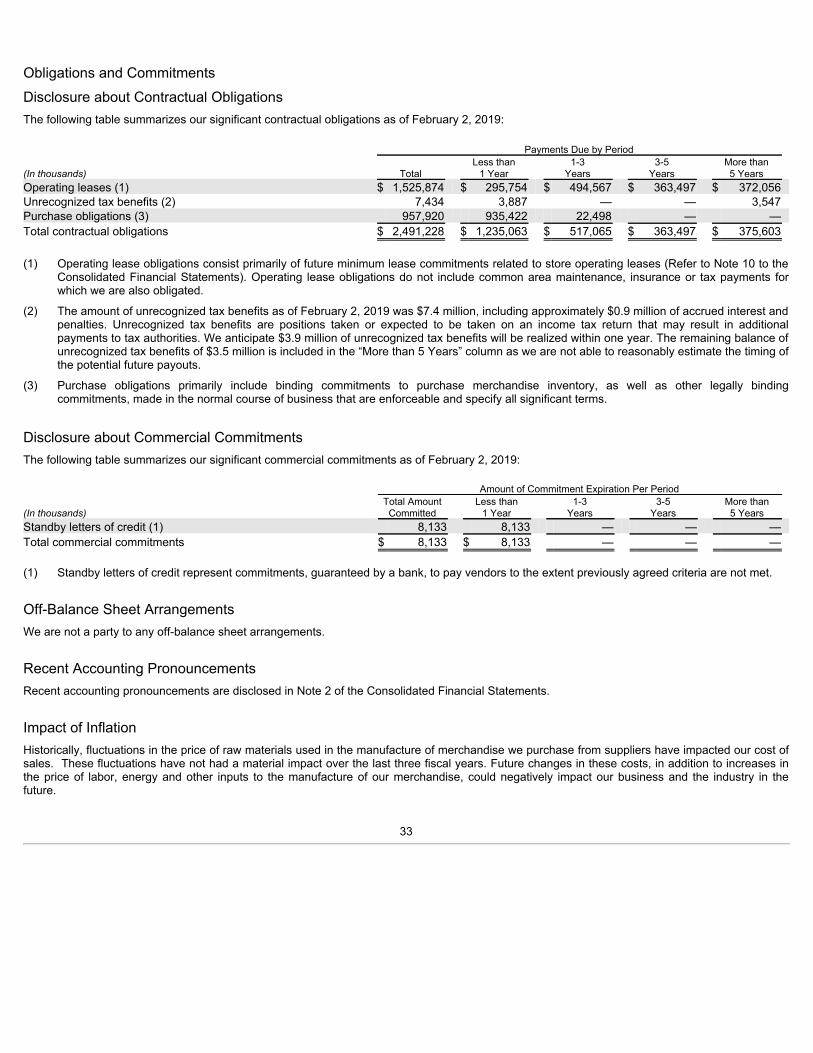
Obligations and CommitmentsDisclosure about Contractual ObligationsThe following table summarizes our significant contractual obligations as of February 2, 2019:
Payments Due by Period Less than 1-3 3-5 More than (Inthousands) Total 1 Year Years Years 5 Years Operating leases (1) $ 1,525,874 $ 295,754 $ 494,567 $ 363,497 $ 372,056 Unrecognized tax benefits (2) 7,434 3,887 — — 3,547 Purchase obligations (3) 957,920 935,422 22,498 — — Total contractual obligations $ 2,491,228 $ 1,235,063 $ 517,065 $ 363,497 $ 375,603
(1) Operating lease obligations consist primarily of future minimum lease commitments related to store operating leases (Refer to Note 10 to the
Consolidated Financial Statements). Operating lease obligations do not include common area maintenance, insurance or tax payments forwhich we are also obligated.
(2) The amount of unrecognized tax benefits as of February 2, 2019 was $7.4 million, including approximately $0.9 million of accrued interest andpenalties. Unrecognized tax benefits are positions taken or expected to be taken on an income tax return that may result in additionalpayments to tax authorities. We anticipate $3.9 million of unrecognized tax benefits will be realized within one year. The remaining balance ofunrecognized tax benefits of $3.5 million is included in the “More than 5 Years” column as we are not able to reasonably estimate the timing ofthe potential future payouts.
(3) Purchase obligations primarily include binding commitments to purchase merchandise inventory, as well as other legally bindingcommitments, made in the normal course of business that are enforceable and specify all significant terms.
Disclosure about Commercial CommitmentsThe following table summarizes our significant commercial commitments as of February 2, 2019: Amount of Commitment Expiration Per Period Total Amount Less than 1-3 3-5 More than (Inthousands) Committed 1 Year Years Years 5 Years Standby letters of credit (1) 8,133 8,133 — — — Total commercial commitments $ 8,133 $ 8,133 — — —
(1) Standby letters of credit represent commitments, guaranteed by a bank, to pay vendors to the extent previously agreed criteria are not met.
Off-Balance Sheet ArrangementsWe are not a party to any off-balance sheet arrangements.
Recent Accounting PronouncementsRecent accounting pronouncements are disclosed in Note 2 of the Consolidated Financial Statements.
Impact of InflationHistorically, fluctuations in the price of raw materials used in the manufacture of merchandise we purchase from suppliers have impacted our cost ofsales. These fluctuations have not had a material impact over the last three fiscal years. Future changes in these costs, in addition to increases inthe price of labor, energy and other inputs to the manufacture of our merchandise, could negatively impact our business and the industry in thefuture.
33

Item 7A. Quantitative and Qualita tive Disclosures about Market RiskWe have market risk exposure related to interest rates and foreign currency exchange rates. Market risk is measured as the potential negativeimpact on earnings, cash flows or fair values resulting from a hypothetical change in interest rates or foreign currency exchange rates over the nextyear.
We have estimated our market risk exposure using sensitivity analysis. To test the sensitivity of our market risk exposure, we have estimated thechanges in fair value of market risk sensitive instruments assuming a hypothetical 10 percent adverse change in market prices or rates. The resultsof the sensitivity analyses are summarized below.
Interest Rate RiskOur earnings are not materially affected by changes in market interest rates. If our Fiscal 2018 average yield rate decreases by 10% in Fiscal 2019,our income before taxes will decrease by approximately $0.1 million. Comparatively, if our Fiscal 2017 average yield rate had decreased by 10% inFiscal 2018, our income before taxes would have decreased by approximately $0.1 million. These amounts are determined by considering theimpact of the hypothetical yield rates on our cash and investment balances and assumes no change in our investment structure.
Foreign Exchange Rate RiskWe are primarily exposed to the impact of foreign exchange rate risk primarily through our Canadian and Mexican operations where the functionalcurrency is the Canadian dollar and Mexican peso, respectively. The impact of all other foreign currencies is currently immaterial to our financialresults. We do not utilize hedging instruments to mitigate foreign currency exchange risks. A hypothetical 10% movement in the Canadian dollar andMexican peso exchange rate could result in a $17.5 million foreign currency translation fluctuation, which would be recorded in accumulated othercomprehensive income within the consolidated balance sheets. An unrealized loss of $34.8 million is included in accumulated other comprehensiveincome as of February 2, 2019.
This sensitivity analysis has inherent limitations. The analysis disregards the possibility that rates of multiple foreign currencies will not always movein the same direction relative to the value of the U.S. dollar over time.
34

Item 8. Financial Sta temen ts and Supplementary Data.Index to Consolidated Financial Statements Report of Independent Registered Public Accounting Firm 36Consolidated Balance Sheets 37Consolidated Statements of Operations 38Consolidated Statements of Comprehensive Income 39Consolidated Statements of Stockholders’ Equity 40Consolidated Statements of Cash Flows 41Notes to Consolidated Financial Statements 42
35
Report of Independent Regist ered Public Accounting Firm
To the Stockholders and the Board of Directors ofAmerican Eagle Outfitters, Inc.
Opinion on the Financial StatementsWe have audited the accompanying consolidated balance sheets of American Eagle Outfitters, Inc. (the Company) as of February 2, 2019 andFebruary 3, 2018, and the related consolidated statements of operations, comprehensive income, stockholders’ equity and cash flows for each of thethree years in the period ended February 2, 2019, and the related notes (collectively referred to as the “consolidated financial statements”). In ouropinion, the consolidated financial statements present fairly, in all material respects, the financial position of the Company at February 2, 2019 andFebruary 3, 2018, and the results of its operations and its cash flows for each of the three years in the period ended February 2, 2019, in conformitywith U.S. generally accepted accounting principles.
We also have audited, in accordance with the standards of the Public Company Accounting Oversight Board (United States) (PCAOB), theCompany’s internal control over financial reporting as of February 2, 2019, based on criteria established in Internal Control-Integrated Frameworkissued by the Committee of Sponsoring Organizations of the Treadway Commission (2013 Framework) and our report dated March 14, 2019expressed an unqualified opinion thereon.
Basis for OpinionThese financial statements are the responsibility of the Company’s management. Our responsibility is to express an opinion on the Company’sfinancial statements based on our audits. We are a public accounting firm registered with the PCAOB and are required to be independent withrespect to the Company in accordance with the U.S. federal securities laws and the applicable rules and regulations of the Securities and ExchangeCommission and the PCAOB.
We conducted our audits in accordance with the standards of the PCAOB. Those standards require that we plan and perform the audit to obtainreasonable assurance about whether the financial statements are free of material misstatement, whether due to error or fraud. Our audits includedperforming procedures to assess the risks of material misstatement of the financial statements, whether due to error or fraud, and performingprocedures that respond to those risks. Such procedures included examining, on a test basis, evidence regarding the amounts and disclosures inthe financial statements. Our audits also included evaluating the accounting principles used and significant estimates made by management, as wellas evaluating the overall presentation of the financial statements. We believe that our audits provide a reasonable basis for our opinion.
/s/ Ernst & Young LLP
We have served as the Company’s auditor since 1993.
Pittsburgh, Pennsylvania
March 14, 2019
36

AMERICAN EAGLE OUTFITTERS, INC.Consolidated Balance Sheets February 2, February 3, (Inthousands,exceptpershareamounts) 2019 2018 Assets Current assets:
Cash and cash equivalents $ 333,330 $ 413,613 Short-term investments (available for sale) 92,135 — Merchandise inventory 424,404 398,213 Accounts receivable, net 93,477 78,304 Prepaid expenses and other 102,907 78,400
Total current assets 1,046,253 968,530 Property and equipment, net of accumulated depreciation 742,149 724,239 Intangible assets, net of accumulated amortization 43,268 46,666 Goodwill 14,899 15,070 Deferred income taxes 14,062 9,344 Other assets 42,747 52,464 Total assets $ 1,903,378 $ 1,816,313 Liabilities and Stockholders’ Equity Current liabilities:
Accounts payable $ 240,671 $ 236,703 Accrued compensation and payroll taxes 82,173 54,324 Accrued rent 89,076 83,312 Accrued income and other taxes 20,064 12,781 Unredeemed gift cards and gift certificates 53,997 52,347 Current portion of deferred lease credits 9,974 11,203 Other liabilities and accrued expenses 46,690 34,551
Total current liabilities 542,645 485,221 Non-current liabilities:
Deferred lease credits 47,377 47,977 Non-current accrued income taxes 3,547 7,269 Other non-current liabilities 22,254 29,055
Total non-current liabilities 73,178 84,301 Commitments and contingencies — — Stockholders’ equity:
Preferred stock, $0.01 par value; 5,000 shares authorized; none issued and outstanding — — Common stock, $0.01 par value; 600,000 shares authorized; 249,566 shares issued; 172,436 and 177,316 shares outstanding, respectively 2,496
2,496
Contributed capital 574,929 593,770 Accumulated other comprehensive loss, net of tax (34,832) (30,795)Retained earnings 2,054,654 1,883,592 Treasury stock, 77,130 and 72,250 shares, respectively, at cost (1,309,692) (1,202,272)
Total stockholders' equity 1,287,555 1,246,791 Total liabilities and stockholders’ equity $ 1,903,378 $ 1,816,313
Refer to Notes to Consolidated Financial Statements
37
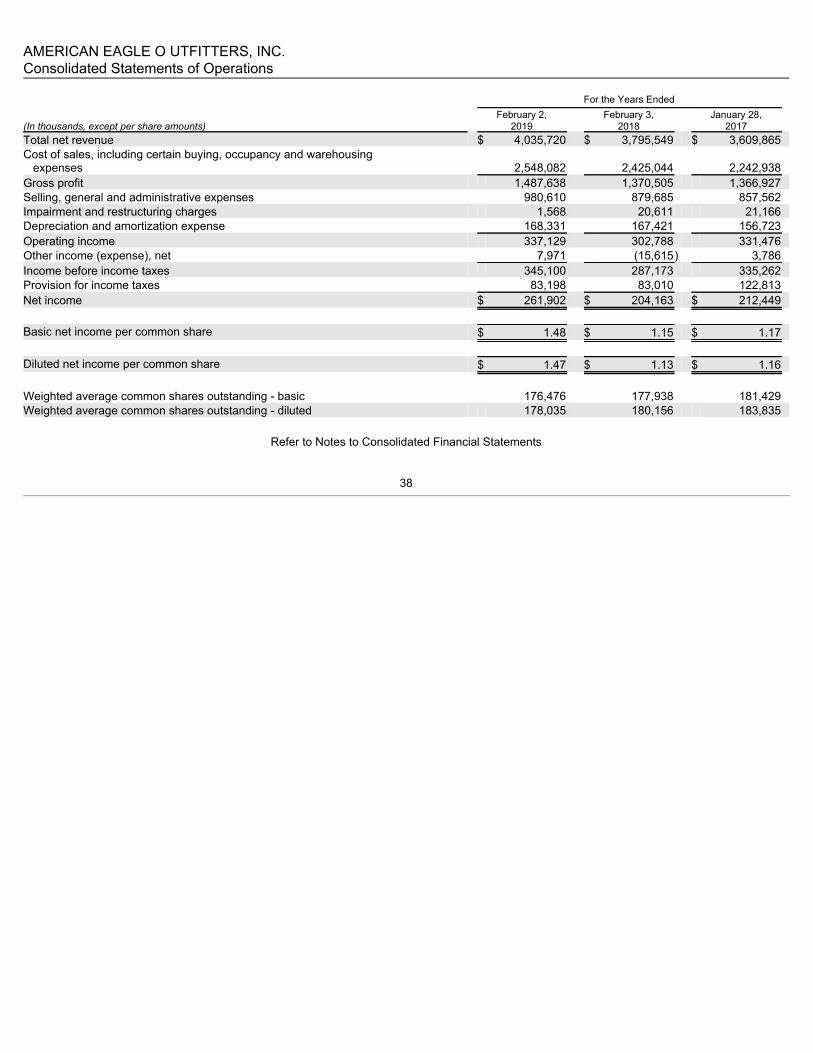
AMERICAN EAGLE O UTFITTERS, INC.Consolidated Statements of Operations
For the Years Ended February 2, February 3, January 28, (Inthousands,exceptpershareamounts) 2019 2018 2017 Total net revenue $ 4,035,720 $ 3,795,549 $ 3,609,865 Cost of sales, including certain buying, occupancy and warehousing expenses 2,548,082
2,425,044
2,242,938
Gross profit 1,487,638 1,370,505 1,366,927 Selling, general and administrative expenses 980,610 879,685 857,562 Impairment and restructuring charges 1,568 20,611 21,166 Depreciation and amortization expense 168,331 167,421 156,723 Operating income 337,129 302,788 331,476 Other income (expense), net 7,971 (15,615) 3,786 Income before income taxes 345,100 287,173 335,262 Provision for income taxes 83,198 83,010 122,813 Net income $ 261,902 $ 204,163 $ 212,449 Basic net income per common share $ 1.48 $ 1.15 $ 1.17 Diluted net income per common share $ 1.47 $ 1.13 $ 1.16 Weighted average common shares outstanding - basic 176,476 177,938 181,429 Weighted average common shares outstanding - diluted 178,035 180,156 183,835
Refer to Notes to Consolidated Financial Statements
38

AMERICAN EAGLE OUTFITTERS, INC.Consolidated Statements of Comprehensive Income
For the Years Ended February 2, February 3, January 28,
(Inthousands) 2019 2018 2017
Net income $ 261,902 $ 204,163 $ 212,449 Other comprehensive gain (loss): Foreign currency translation gain (loss) (4,037) 5,667 (6,594)Other comprehensive gain (loss) (4,037) 5,667 (6,594)Comprehensive income $ 257,865 $ 209,830 $ 205,855
Refer to Notes to Consolidated Financial Statements
39
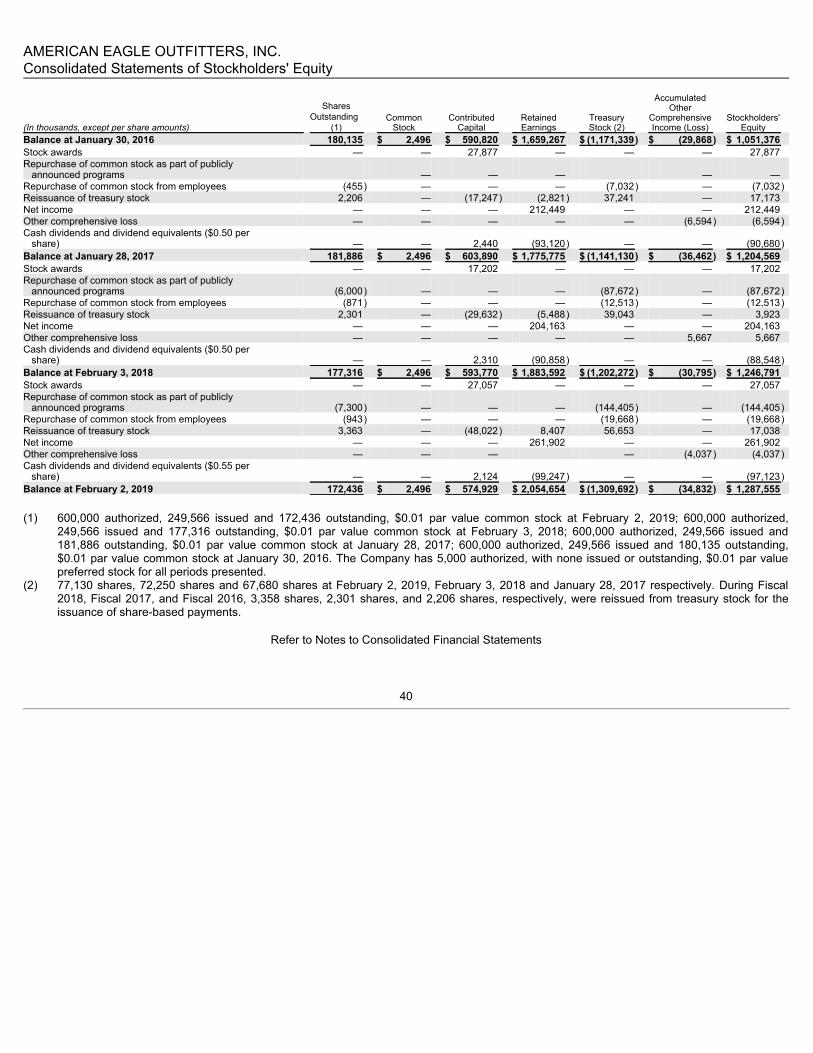
AMERICAN EAGLE OUTFITTERS, INC.Consolidated Statements of Stockholders' Equity
(Inthousands,exceptpershareamounts)
SharesOutstanding
(1) Common
Stock Contributed
Capital RetainedEarnings
TreasuryStock (2)
AccumulatedOther
ComprehensiveIncome (Loss)
Stockholders'Equity
Balance at January 30, 2016 180,135 $ 2,496 $ 590,820 $ 1,659,267 $ (1,171,339) $ (29,868) $ 1,051,376 Stock awards — — 27,877 — — — 27,877 Repurchase of common stock as part of publicly announced programs — — — — — Repurchase of common stock from employees (455) — — — (7,032) — (7,032)Reissuance of treasury stock 2,206 — (17,247) (2,821) 37,241 — 17,173 Net income — — — 212,449 — — 212,449 Other comprehensive loss — — — — — (6,594) (6,594)Cash dividends and dividend equivalents ($0.50 per share) — — 2,440 (93,120) — — (90,680)Balance at January 28, 2017 181,886 $ 2,496 $ 603,890 $ 1,775,775 $ (1,141,130) $ (36,462) $ 1,204,569 Stock awards — — 17,202 — — — 17,202 Repurchase of common stock as part of publicly announced programs (6,000) — — — (87,672) — (87,672)Repurchase of common stock from employees (871) — — — (12,513) — (12,513)Reissuance of treasury stock 2,301 — (29,632) (5,488) 39,043 — 3,923 Net income — — — 204,163 — — 204,163 Other comprehensive loss — — — — — 5,667 5,667 Cash dividends and dividend equivalents ($0.50 per share) — — 2,310 (90,858) — — (88,548)Balance at February 3, 2018 177,316 $ 2,496 $ 593,770 $ 1,883,592 $ (1,202,272) $ (30,795) $ 1,246,791 Stock awards — — 27,057 — — — 27,057 Repurchase of common stock as part of publicly announced programs (7,300) — — — (144,405) — (144,405)Repurchase of common stock from employees (943) — — — (19,668) — (19,668)Reissuance of treasury stock 3,363 — (48,022) 8,407 56,653 — 17,038 Net income — — — 261,902 — — 261,902 Other comprehensive loss — — — — (4,037) (4,037)Cash dividends and dividend equivalents ($0.55 per share) — — 2,124 (99,247) — — (97,123)Balance at February 2, 2019 172,436 $ 2,496 $ 574,929 $ 2,054,654 $ (1,309,692) $ (34,832) $ 1,287,555
(1) 600,000 authorized, 249,566 issued and 172,436 outstanding, $0.01 par value common stock at February 2, 2019; 600,000 authorized,
249,566 issued and 177,316 outstanding, $0.01 par value common stock at February 3, 2018; 600,000 authorized, 249,566 issued and181,886 outstanding, $0.01 par value common stock at January 28, 2017; 600,000 authorized, 249,566 issued and 180,135 outstanding,$0.01 par value common stock at January 30, 2016. The Company has 5,000 authorized, with none issued or outstanding, $0.01 par valuepreferred stock for all periods presented.
(2) 77,130 shares, 72,250 shares and 67,680 shares at February 2, 2019, February 3, 2018 and January 28, 2017 respectively. During Fiscal2018, Fiscal 2017, and Fiscal 2016, 3,358 shares, 2,301 shares, and 2,206 shares, respectively, were reissued from treasury stock for theissuance of share-based payments.
Refer to Notes to Consolidated Financial Statements
40

AMERICAN EAGLE OUTFITTERS, INC.Consolidated Statements of Cash Flows
For the Years Ended February 2, February 3, January 28, (Inthousands) 2019 2018 2017 Operating activities: Net income $ 261,902 $ 204,163 $ 212,449 Adjustments to reconcile net income to net cash provided by operating activities
Depreciation and amortization 170,504 169,473 158,174 Share-based compensation 27,506 16,890 29,137 Deferred income taxes (4,391) 44,312 14,838 Foreign currency transaction gain (397) (5,616) (835)Loss on impairment of assets 546 — 20,576
Changes in assets and liabilities: Merchandise inventory (28,496) (35,912) (53,613)Accounts receivable (14,093) 8,837 (7,705)Prepaid expenses and other (3,367) (399) (332)Other assets (4,746) 5,317 (6,705)Accounts payable 4,329 (16,663) 52,347 Unredeemed gift cards and gift certificates 1,882 (874) 4,465 Deferred lease credits (1,829) 984 (5,229)Accrued compensation and payroll taxes 28,043 1,289 (25,809)Accrued income and other taxes 7,221 565 (10,695)Accrued liabilities 12,031 2,060 (15,467)Total adjustments 194,743 190,263 153,147
Net cash provided by operating activities 456,645 394,426 365,596 Investing activities:
Capital expenditures for property and equipment (189,021) (169,469) (161,494)Purchase of available-for-sale investments (202,912) — — Sale of available-for-sale investments 109,776 — — Acquisition of intangible assets (672) (2,681) (1,528)
Net cash used for investing activities (282,829) (172,150) (163,022)Financing activities:
Payments on capital leases and other (6,802) (3,384) (4,375)Repurchase of common stock as part of publicly announced programs (144,405) (87,682) — Repurchase of common stock from employees (19,668) (12,513) (7,032)Net proceeds from stock options exercised 15,495 3,355 16,260 Excess tax benefit from share-based payments — — 763 Cash dividends paid (97,123) (88,548) (90,680)
Net cash used for financing activities (252,503) (188,772) (85,064)Effect of exchange rates on cash (1,596) 1,496 1,036 Net increase (decrease) in cash and cash equivalents (80,283) 35,000 118,546 Cash and cash equivalents - beginning of period $ 413,613 $ 378,613 $ 260,067 Cash and cash equivalents - end of period 333,330 413,613 378,613
Refer to Notes to Consolidated Financial Statements
41
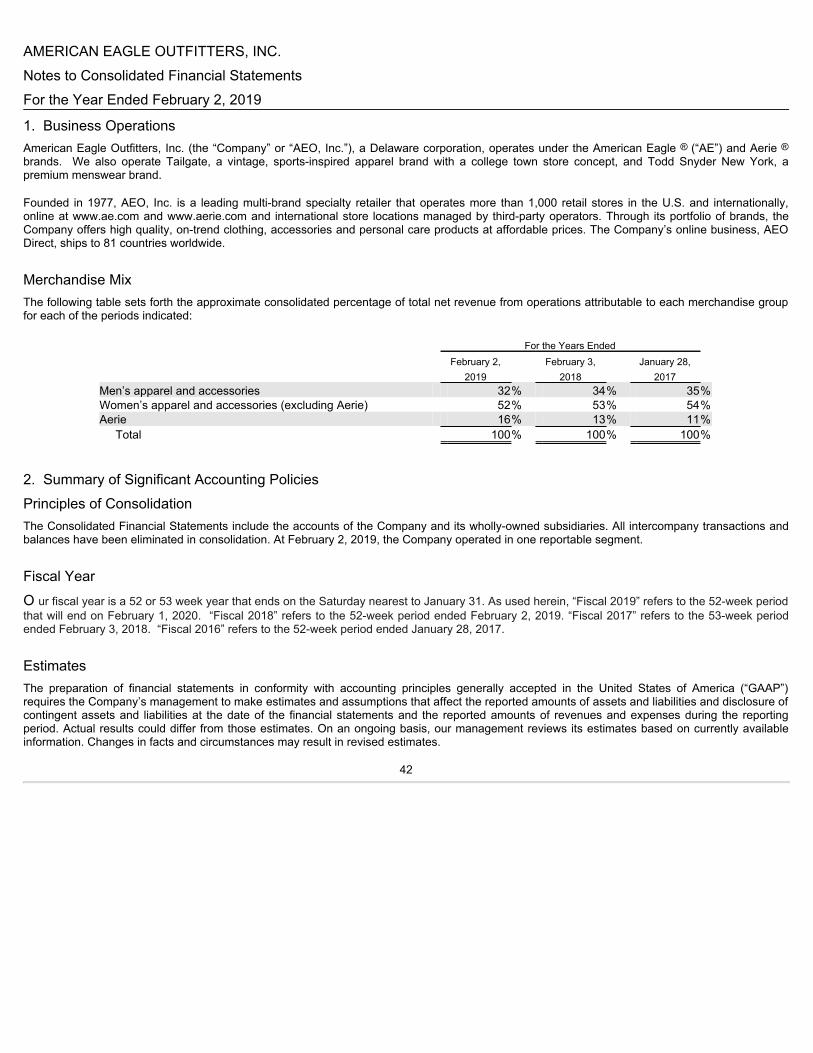
AMERICAN EAGLE OUTFITTERS, INC.Notes to Consolidated Financial StatementsFor the Year Ended February 2, 2019
1. Business OperationsAmerican Eagle Outfitters, Inc. (the “Company” or “AEO, Inc.”), a Delaware corporation, operates under the American Eagle ® (“AE”) and Aerie ®brands. We also operate Tailgate, a vintage, sports-inspired apparel brand with a college town store concept, and Todd Snyder New York, apremium menswear brand.
Founded in 1977, AEO, Inc. is a leading multi-brand specialty retailer that operates more than 1,000 retail stores in the U.S. and internationally,online at www.ae.com and www.aerie.com and international store locations managed by third-party operators. Through its portfolio of brands, theCompany offers high quality, on-trend clothing, accessories and personal care products at affordable prices. The Company’s online business, AEODirect, ships to 81 countries worldwide.
Merchandise MixThe following table sets forth the approximate consolidated percentage of total net revenue from operations attributable to each merchandise groupfor each of the periods indicated:
For the Years Ended February 2, February 3, January 28, 2019 2018 2017 Men’s apparel and accessories 32% 34% 35%Women’s apparel and accessories (excluding Aerie) 52% 53% 54%Aerie 16% 13% 11%
Total 100% 100% 100% 2. Summary of Significant Accounting PoliciesPrinciples of ConsolidationThe Consolidated Financial Statements include the accounts of the Company and its wholly-owned subsidiaries. All intercompany transactions andbalances have been eliminated in consolidation. At February 2, 2019, the Company operated in one reportable segment.
Fiscal YearO ur fiscal year is a 52 or 53 week year that ends on the Saturday nearest to January 31. As used herein, “Fiscal 2019” refers to the 52-week periodthat will end on February 1, 2020. “Fiscal 2018” refers to the 52-week period ended February 2, 2019. “Fiscal 2017” refers to the 53-week periodended February 3, 2018. “Fiscal 2016” refers to the 52-week period ended January 28, 2017.
EstimatesThe preparation of financial statements in conformity with accounting principles generally accepted in the United States of America (“GAAP”)requires the Company’s management to make estimates and assumptions that affect the reported amounts of assets and liabilities and disclosure ofcontingent assets and liabilities at the date of the financial statements and the reported amounts of revenues and expenses during the reportingperiod. Actual results could differ from those estimates. On an ongoing basis, our management reviews its estimates based on currently availableinformation. Changes in facts and circumstances may result in revised estimates.
42
Recent Accounting Pronouncements
In February 2016, the FASB issued ASU No. 2016-02, “Leases(Topic842),”which consists of a comprehensive lease accounting standard. Underthe new standard, right-of-use assets and lease liabilities arising from most leases will be recognized on the balance sheet and enhanceddisclosures on key quantitative and qualitative information about leasing arrangements will be required. Leases will be classified as either operatingor financing, and the lease classification will determine whether expense is recognized on a straight-line basis (operating leases) or based onseparately amortizing the right-of-use asset and applying an effective interest method on the lease liability (financing leases). The new standard iseffective for interim and annual periods on January 1, 2019, and the Company expects to apply the transitional package of practical expedientsallowed by the standard to not reassess the identification, classification and initial direct costs of leases commencing before the effective date ofTopic 842; however, the Company does not expect to elect the hindsight transitional practical expedient. The Company also expects to apply thepractical expedient to not separate lease and non-lease components to new leases as well as existing leases through transition. The Companyexpects to make an accounting policy election to not apply recognition requirements of the guidance to short-term leases. In July 2018, the FASB issued ASU No. 2018-11, "Leases: Targeted Improvements,"which provides an optional transition method that allowsentities to initially apply the new lease standard at the adoption date and recognize a cumulative-effect adjustment to the opening balance of retainedearnings in the period of adoption while comparative periods presented will continue to be in accordance with U.S. GAAP Topic 840. The Companyplans to use the optional transition method and apply the lease standard as of January 1, 2019 and does not anticipate a material cumulative-effectadjustment to the opening balance of retained earnings. The Company is nearing completion of its assessment process and its determination of theexpanded disclosure regarding leases, as well as the impact to the consolidated financial statements. The Company has made enhancements to itsinformation systems and internal controls in response to the new rule requirements including the implementation of a lease tracking software formanaging and reporting information related to leases. Upon adoption, the Company is prepared to provide expanded disclosures in the consolidatedfinancial and it expects to recognize assets and liabilities of approximately $1.2 to $1.5 billion. Among other process and internal control actions, theCompany is still finalizing the impact to the right of use asset for stores having historical impairments (which would impact the effect of adoption forthe right of use asset). The adoption of ASC 842 is not expected to have a material impact on the Company’s consolidated results of operations andcash flows. In February 2018, the FASB issued ASU 2018-02, ReclassificationofCertainTaxEffectsfromAccumulatedOtherComprehensiveIncome(“ASU2018-02”). The new guidance permits companies to reclassify the stranded tax effects of the Tax Cuts and Jobs Act (the “Tax Act”) on items withinaccumulated other comprehensive income to retained earnings. This guidance is effective for fiscal years beginning after December 15, 2018,including interim periods within those fiscal years. The Company will adopt ASU 2018-02 in Fiscal 2019 and does not expect a material impact fromthe adoption of this guidance to its Consolidated Financial Statements. In January 2017, the FASB issued ASU 2017-04, SimplifyingtheTest for Goodwill Impairment . This ASU simplifies the accounting for goodwillimpairments under Step 2 by eliminating the requirement to perform procedures to determine the fair value of the assets and liabilities of thereporting unit, including previously unrecognized assets and liabilities, in order to determine the fair value of the goodwill and any impairment chargeto be recognized. Under this ASU, the impairment charge to be recognized should be the amount by which the reporting unit's carrying valueexceeds the reporting unit's fair value as calculated under Step 1 provided that the loss recognized should not exceed the total amount of goodwillallocated to the reporting unit. This ASU is effective beginning in Fiscal 2019 and early adoption is permitted for interim or annual goodwillimpairment tests performed after January 1, 2017. The adoption of this ASU may have a material effect on our consolidated financial statements inthe event that we determine that goodwill for any of our reporting units is impaired.
Foreign Currency TranslationIn accordance with Accounting Standards Codification (“ASC”) 830, Foreign Currency Matters , assets and liabilities denominated in foreigncurrencies were translated into United States dollars (“USD”) (the reporting currency) at the exchange rates prevailing at the balance sheet date.Revenues and expenses denominated in foreign currencies were translated into USD at the monthly average exchange rates for the period. Gainsor losses resulting from foreign currency transactions are included in the consolidated results of operations, whereas, related translation adjustmentsare reported as an element of other comprehensive income in accordance with ASC 220, Comprehensive Income (refer to Note 11 to theConsolidated Financial Statements).
43

Cash and Cash Equivalents & Short-term InvestmentsThe Company considers all highly liquid investments purchased with a remaining maturity of three months or less to be cash equivalents.
As of February 2, 2019, short-term investments classified as available-for-sale included certificates of deposit and commercial paper with a maturityof greater than three months, but less than one year.
As of February 3, 2018, the Company held no short or long-term investments.
Refer to Note 3 to the Consolidated Financial Statements for information regarding cash and cash equivalents and short-term investments.
Merchandise InventoryMerchandise inventory is valued at the lower of average cost or net realizable value, utilizing the retail method. Average cost includes merchandisedesign and sourcing costs and related expenses. The Company records merchandise receipts when control of the merchandise has transferred tothe Company.
The Company reviews its inventory levels to identify slow-moving merchandise and generally uses markdowns to clear merchandise. Additionally,the Company estimates a markdown reserve for future planned permanent markdowns related to current inventory. Markdowns may occur wheninventory exceeds customer demand for reasons of style, seasonal adaptation, changes in customer preference, lack of consumer acceptance offashion items, competition, or if it is determined that the inventory in stock will not sell at its currently ticketed price. Such markdowns may have amaterial adverse impact on earnings, depending on the extent and amount of inventory affected. The Company also estimates a shrinkage reservefor the period between the last physical count and the balance sheet date. The estimate for the shrinkage reserve, based on historical results, can beaffected by changes in merchandise mix and changes in actual shrinkage trends.
Property and EquipmentProperty and equipment is recorded on the basis of cost with depreciation computed utilizing the straight-line method over the assets’ estimateduseful lives. The useful lives of our major classes of assets are as follows: Buildings 25 yearsLeasehold improvements Lesser of 10 years or the term of the leaseFixtures and equipment 5 yearsInformation technology 3-5 years As of February 2, 2019, the weighted average remaining useful life of our assets was approximately 8 years. In accordance with ASC 360, Property, Plant, andEquipment , the Company’s management evaluates the value of leasehold improvements andstore fixtures associated with retail stores, which have been open for a period of time sufficient to reach maturity. The Company evaluates long-livedassets for impairment at the individual store level, which is the lowest level at which individual cash flows can be identified. Impairment losses arerecorded on long-lived assets used in operations when events and circumstances indicate that the assets might be impaired and the undiscountedcash flows estimated to be generated by those assets are less than the carrying amounts of the assets. When events such as these occur, theimpaired assets are adjusted to their estimated fair value and an impairment loss is recorded separately as a component of operating income underloss on impairment of assets. During Fiscal 2018, the Company recorded no significant asset impairment charges. During Fiscal 2017, theCompany recorded no asset impairment charges.
During Fiscal 2016, the Company recorded pre-tax asset impairment charges of $20.6 million that included $7.2 million for the impairment of allCompany owned retail stores in the United Kingdom, Hong Kong and China. This amount is included within impairment and restructuring charges inthe Consolidated Statements of Operations. These charges were the result of business performance and exploring an initiative to convert thesemarkets to licensed partnerships. Retail stores in these markets no longer are able to generate sufficient cash flow over the expected remaininglease term to recover the carrying value of the respective stores’ assets. Additionally, the Company recorded $10.8 million of impairment chargesrelated to non-store corporate assets that support the United Kingdom, Hong Kong and China
44
Company owned retail store and e-commerce operations and $2.5 million of goodwill impairment for the China and Hong Kong retail operations.
When the Company closes, remodels or relocates a store prior to the end of its lease term, the remaining net book value of the assets related to thestore is recorded as a write-off of assets within depreciation and amortization expense.
Refer to Note 7 to these Consolidated Financial Statements for additional information regarding property and equipment and Note 15 for additionalinformation regarding impairment charges.
GoodwillThe Company’s goodwill is primarily related to acquisitions. In accordance with ASC 350, Intangibles-GoodwillandOther(“ASC 350”), the Companyevaluates goodwill for possible impairment annually, or more frequently if indicators of impairment exist, and last performed an annual impairmenttest as of February 2, 2019. As a result, there were no impairments recorded during Fiscal 2018. During Fiscal 2016, the Company concludedgoodwill was impaired resulting in a $2.5 million charge included within impairment and restructuring charges in the Consolidated Statements ofOperations as a result of the Company’s plans to convert these markets to licensed partnerships. All other goodwill for the Company was notimpaired as a result of the annual goodwill impairment test.
Intangible AssetsIntangible assets are recorded on the basis of cost with amortization computed utilizing the straight-line method over the assets’ estimated usefullives. The Company’s intangible assets, which consist primarily of trademark assets, are generally amortized over 15 to 25 years.
The Company evaluates intangible assets for impairment in accordance with ASC 350 when events or circumstances indicate that the carrying valueof the asset may not be recoverable. Such an evaluation includes the estimation of undiscounted future cash flows to be generated by those assets.If the sum of the estimated future undiscounted cash flows is less than the carrying amounts of the assets, then the assets are impaired and areadjusted to their estimated fair value. No intangible asset impairment charges were recorded for all periods presented.
Refer to Note 8 to these Consolidated Financial Statements for additional information regarding intangible assets.
Gift CardsRevenue is not recorded on the issuance of gift cards. The value of a gift card is recorded as a current liability upon issuance and revenue isrecognized when the gift card is redeemed for merchandise. The Company estimates gift card breakage and recognizes revenue in proportion toactual gift card redemptions as a component of total net revenue.
The Company determines an estimated gift card breakage rate by continuously evaluating historical redemption data and the time when there is aremote likelihood that a gift card will be redeemed. The Company recorded $8.9 million, $10.1 million, and $9.1 million during Fiscal 2018, Fiscal2017, and Fiscal 2016, respectively, of revenue related to gift card breakage.
Deferred Lease CreditsDeferred lease credits represent the unamortized portion of construction allowances received from landlords related to the Company’s retail stores.Construction allowances are generally comprised of cash amounts received by the Company from its landlords as part of the negotiated lease terms.The Company records a receivable and a deferred lease credit liability at the lease commencement date (date of initial possession of the store). Thedeferred lease credit is amortized on a straight-line basis as a reduction of rent expense over the term of the original lease (including the pre-openingbuild-out period). The receivable is reduced as amounts are received from the landlord.
Self-Insurance LiabilityThe Company uses a combination of insurance and self-insurance mechanisms for certain losses related to employee medical benefits and worker’scompensation. Costs for self-insurance claims filed and claims incurred but not reported are accrued based on known claims and historicalexperience. Management believes that it has adequately reserved for its
45
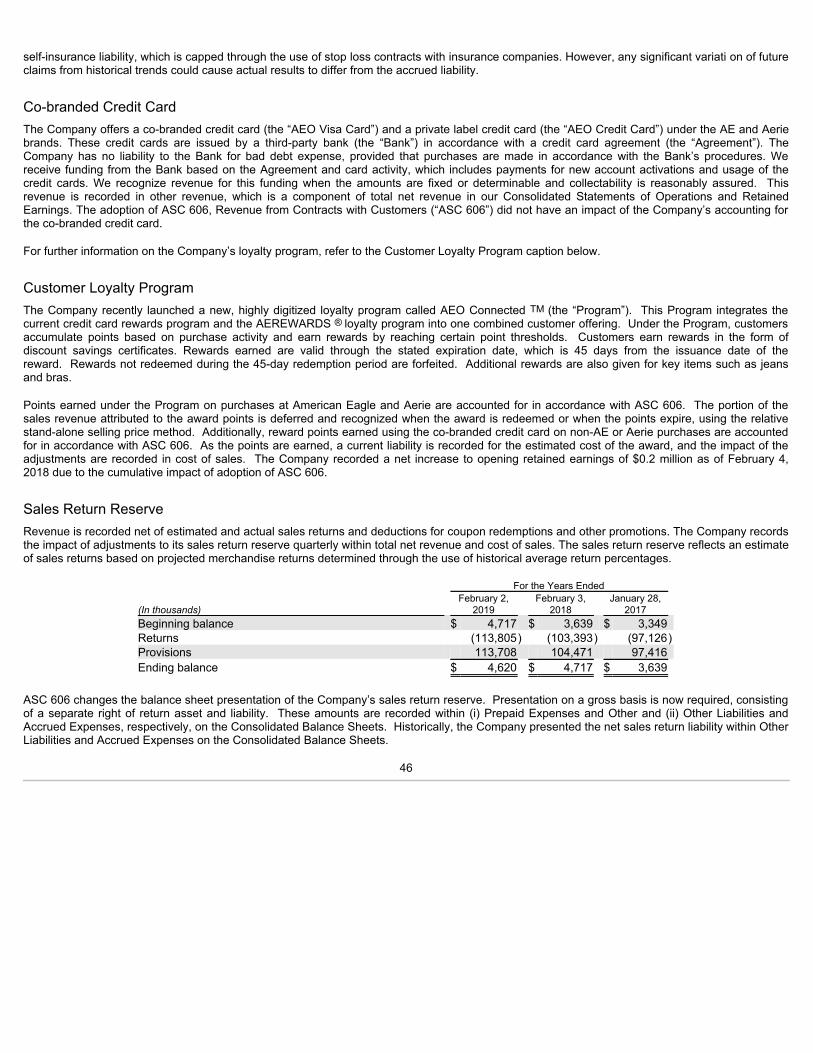
self-insurance liability, which is capped through the use of stop loss contracts with insurance companies. However, any significant variati on of futureclaims from historical trends could cause actual results to differ from the accrued liability.
Co-branded Credit CardThe Company offers a co-branded credit card (the “AEO Visa Card”) and a private label credit card (the “AEO Credit Card”) under the AE and Aeriebrands. These credit cards are issued by a third-party bank (the “Bank”) in accordance with a credit card agreement (the “Agreement”). TheCompany has no liability to the Bank for bad debt expense, provided that purchases are made in accordance with the Bank’s procedures. Wereceive funding from the Bank based on the Agreement and card activity, which includes payments for new account activations and usage of thecredit cards. We recognize revenue for this funding when the amounts are fixed or determinable and collectability is reasonably assured. Thisrevenue is recorded in other revenue, which is a component of total net revenue in our Consolidated Statements of Operations and RetainedEarnings. The adoption of ASC 606, Revenue from Contracts with Customers (“ASC 606”) did not have an impact of the Company’s accounting forthe co-branded credit card.
For further information on the Company’s loyalty program, refer to the Customer Loyalty Program caption below.
Customer Loyalty ProgramThe Company recently launched a new, highly digitized loyalty program called AEO Connected TM (the “Program”). This Program integrates thecurrent credit card rewards program and the AEREWARDS ® loyalty program into one combined customer offering. Under the Program, customersaccumulate points based on purchase activity and earn rewards by reaching certain point thresholds. Customers earn rewards in the form ofdiscount savings certificates. Rewards earned are valid through the stated expiration date, which is 45 days from the issuance date of thereward. Rewards not redeemed during the 45-day redemption period are forfeited. Additional rewards are also given for key items such as jeansand bras.
Points earned under the Program on purchases at American Eagle and Aerie are accounted for in accordance with ASC 606. The portion of thesales revenue attributed to the award points is deferred and recognized when the award is redeemed or when the points expire, using the relativestand-alone selling price method. Additionally, reward points earned using the co-branded credit card on non-AE or Aerie purchases are accountedfor in accordance with ASC 606. As the points are earned, a current liability is recorded for the estimated cost of the award, and the impact of theadjustments are recorded in cost of sales. The Company recorded a net increase to opening retained earnings of $0.2 million as of February 4,2018 due to the cumulative impact of adoption of ASC 606.
Sales Return ReserveRevenue is recorded net of estimated and actual sales returns and deductions for coupon redemptions and other promotions. The Company recordsthe impact of adjustments to its sales return reserve quarterly within total net revenue and cost of sales. The sales return reserve reflects an estimateof sales returns based on projected merchandise returns determined through the use of historical average return percentages.
For the Years Ended February 2, February 3, January 28, (Inthousands) 2019 2018 2017 Beginning balance $ 4,717 $ 3,639 $ 3,349 Returns (113,805) (103,393) (97,126)Provisions 113,708 104,471 97,416 Ending balance $ 4,620 $ 4,717 $ 3,639
ASC 606 changes the balance sheet presentation of the Company’s sales return reserve. Presentation on a gross basis is now required, consistingof a separate right of return asset and liability. These amounts are recorded within (i) Prepaid Expenses and Other and (ii) Other Liabilities andAccrued Expenses, respectively, on the Consolidated Balance Sheets. Historically, the Company presented the net sales return liability within OtherLiabilities and Accrued Expenses on the Consolidated Balance Sheets.
46

Revenue is recorded net of estimated and actual sales returns and deductions for coupon redemptions and other promotions. The Company recordsthe impact of adjustments to its sales return reserve quarterly within total net reve nue and cost of sales. The sales return reserve reflects anestimate of sales returns based on projected merchandise returns determined through the use of historical average return percentages.
Income TaxesThe Company calculates income taxes in accordance with ASC 740, Income Taxes (“ASC 740”), which requires the use of the asset and liabilitymethod. Under this method, deferred tax assets and liabilities are recognized based on the difference between the Consolidated Financial Statementcarrying amounts of existing assets and liabilities and their respective tax bases as computed pursuant to ASC 740. Deferred tax assets andliabilities are measured using the tax rates, based on certain judgments regarding enacted tax laws and published guidance, in effect in the yearswhen those temporary differences are expected to reverse. A valuation allowance is established against the deferred tax assets when it is morelikely than not that some portion or all of the deferred taxes may not be realized. Changes in the Company’s level and composition of earnings, taxlaws or the deferred tax valuation allowance, as well as the results of tax audits, may materially impact the Company’s effective income tax rate.
The Company evaluates its income tax positions in accordance with ASC 740 which prescribes a comprehensive model for recognizing, measuring,presenting and disclosing in the financial statements tax positions taken or expected to be taken on a tax return, including a decision whether to fileor not to file in a particular jurisdiction. Under ASC 740, a tax benefit from an uncertain position may be recognized only if it is “more likely than not”that the position is sustainable based on its technical merits.
The calculation of the deferred tax assets and liabilities, as well as the decision to recognize a tax benefit from an uncertain position and to establisha valuation allowance require management to make estimates and assumptions. The Company believes that its assumptions and estimates arereasonable, although actual results may have a positive or negative material impact on the balances of deferred tax assets and liabilities, valuationallowances or net income.
Refer to Note 14 to the Consolidated Financial Statements for additional information.
Revenue RecognitionIn May 2014, the FASB issued ASC 606. ASC 606 is a comprehensive new revenue recognition model that expands disclosure requirements andrequires a company to recognize revenue to depict the transfer of goods or services to a customer at an amount that reflects the consideration itexpects to receive in exchange for those goods or services. ASC 606 is effective for annual reporting periods beginning after December 15, 2017.The Company adopted ASC 606 on February 4, 2018 using the modified retrospective method applied to all contracts as of February 4,2018. Results for reporting periods beginning on or after February 4, 2018 are presented under ASC 606, while prior period amounts are notadjusted and continue to be reported in accordance with our historic accounting. The Company recorded a net increase to opening retained earningsof $0.2 million as of February 4, 2018 due to the cumulative impact of adoption. The impact was the result of accounting for customer loyaltyprograms using a relative stand-alone selling price method vs. incremental cost method. The Company defers a portion of the sales revenueattributed to the loyalty points and recognizes revenue when the points are redeemed or expire, consistent with the requirements of ASC 606. Referto the Customer Loyalty Program caption above for additional information.
Revenue is recorded for store sales upon the purchase of merchandise by customers. The Company’s e-commerce operation records revenue uponthe estimated customer receipt date of the merchandise. Shipping and handling revenues are included in total net revenue. Sales tax collected fromcustomers is excluded from revenue and is included as part of accrued income and other taxes on the Company’s Consolidated Balance Sheets.
Revenue is recorded net of estimated and actual sales returns and deductions for coupon redemptions and other promotions. The Company recordsthe impact of adjustments to its sales return reserve quarterly within total net revenue and cost of sales. The sales return reserve reflects anestimate of sales returns based on projected merchandise returns determined through the use of historical average return percentages. Revenue is not recorded on the issuance of gift cards. A current liability is recorded upon issuance, and revenue is recognized when the gift card isredeemed for merchandise. Additionally, the Company recognizes revenue on unredeemed gift cards based on an estimate of the amounts that willnot be redeemed (“gift card breakage”), determined through historical redemption trends. Gift card breakage revenue is recognized in proportion toactual gift card
47
redemptions as a component of total net revenue. For further information on the Company’s gift card program, refer to the Gift Cards caption above.
The Company recognizes royalty revenue generated from its license or franchise agreements based upon a percentage of merchandise sales by thelicensee/franchisee. This revenue is recorded as a component of total net revenue when earned.
Cost of Sales, Including Certain Buying, Occupancy and Warehousing ExpensesCost of sales consists of merchandise costs, including design, sourcing, importing and inbound freight costs, as well as markdowns, shrinkage andcertain promotional costs (collectively "merchandise costs") and buying, occupancy and warehousing costs.
Design costs are related to the Company's Design Center operations and include compensation, travel and entertainment, supplies and samples forour design teams, as well as rent and depreciation for our Design Center. These costs are included in cost of sales as the respective inventory issold.
Buying, occupancy and warehousing costs consist of compensation, employee benefit expenses and travel and entertainment for our buyers andcertain senior merchandising executives; rent and utilities related to our stores, corporate headquarters, distribution centers and other office space;freight from our distribution centers to the stores; compensation and supplies for our distribution centers, including purchasing, receiving andinspection costs; and shipping and handling costs related to our e-commerce operation. Gross profit is the difference between total net revenue andcost of sales.
Selling, General and Administrative ExpensesSelling, general and administrative expenses consist of compensation and employee benefit expenses, including salaries, incentives and relatedbenefits associated with our stores and corporate headquarters. Selling, general and administrative expenses also include advertising costs,supplies for our stores and home office, communication costs, travel and entertainment, leasing costs and services purchased. Selling, general andadministrative expenses do not include compensation, employee benefit expenses and travel for our design, sourcing and importing teams, ourbuyers and our distribution centers as these amounts are recorded in cost of sales. Additionally, selling, general and administrative expenses do notinclude rent and utilities related to our stores, operating costs of our distribution centers, and shipping and handling costs related to our e-commerceoperations.
Advertising CostsCertain advertising costs, including direct mail, in-store photographs and other promotional costs are expensed when the marketing campaigncommences. As of February 2, 2019 and February 2, 2018, the Company had prepaid advertising expense of $12.6 million and $6.6 million,respectively. All other advertising costs are expensed as incurred. The Company recognized $143.2 million, $129.8 million and $124.5 million inadvertising expense during Fiscal 2018, Fiscal 2017 and Fiscal 2016, respectively.
Store Pre-Opening CostsStore pre-opening costs consist primarily of rent, advertising, supplies and payroll expenses. These costs are expensed as incurred.
Other Income (Expense), NetOther income (expense), net consists primarily of foreign currency transaction gain (loss), interest income/expense and realized investmentgains/losses.
Legal Proceedings and ClaimsThe Company is subject to certain legal proceedings and claims arising out of the conduct of its business. In accordance with ASC 450,Contingencies(“ASC 450”), the Company records a reserve for estimated losses when the loss is probable and the amount can be reasonablyestimated. If a range of possible loss exists and no anticipated loss within the range is
48

more likely than any other anticipated loss, the Company records the accrual at the low end of the range, in accordance with ASC 450. As theCompany believes that it has provided adequate reserves, it anticipates that the ultimate outcome of any matter currently pen ding against theCompany will not materially affect the consolidated financial position, results of operations or consolidated cash flows of the Company. However,our assessment of any litigation or other legal claims could potentially change in light of the discovery of facts not presently known or determinationsby judges, juries, or other finders of fact which are not in accord with management’s evaluation of the possible liability or outcome of such litigation orclaims.
Supplemental Disclosures of Cash Flow InformationThe table below shows supplemental cash flow information for cash amounts paid during the respective periods:
For the Years Ended
February 2, February 3, January 28,
(Inthousands) 2019 2018 2017
Cash paid during the periods for: Income taxes $ 81,248 $ 47,094 $ 126,592 Interest $ 1,207 $ 1,098 $ 1,155
Segment InformationIn accordance with ASC 280, Segment Reporting (“ASC 280”), the Company has identified two operating segments (American Eagle Brand andAerie Brand) that reflect the Company’s operational structure as well as the business’s internal view of analyzing results and allocating resources. Allof the operating segments have met the aggregation criteria and have been aggregated and are presented as one reportable segment, as permittedby ASC 280.
The following tables present summarized geographical information:
For the Years Ended February 2, February 3, January 28, (Inthousands) 2019 2018 2017 Total net revenue:
United States $ 3,511,265 $ 3,295,066 $ 3,160,699 Foreign (1) 524,455 500,483 449,166
Total net revenue $ 4,035,720 $ 3,795,549 $ 3,609,865
(1) Amounts represent sales from American Eagle and Aerie international retail stores, and e-commerce sales that are billed to and/or shipped to
foreign countries and international franchise royalty revenue.
February 2, February 3, (Inthousands) 2019 2018 Long-lived assets, net:
United States $ 728,196 $ 706,778 Foreign 72,120 79,197
Total long-lived assets, net $ 800,316 $ 785,975
49
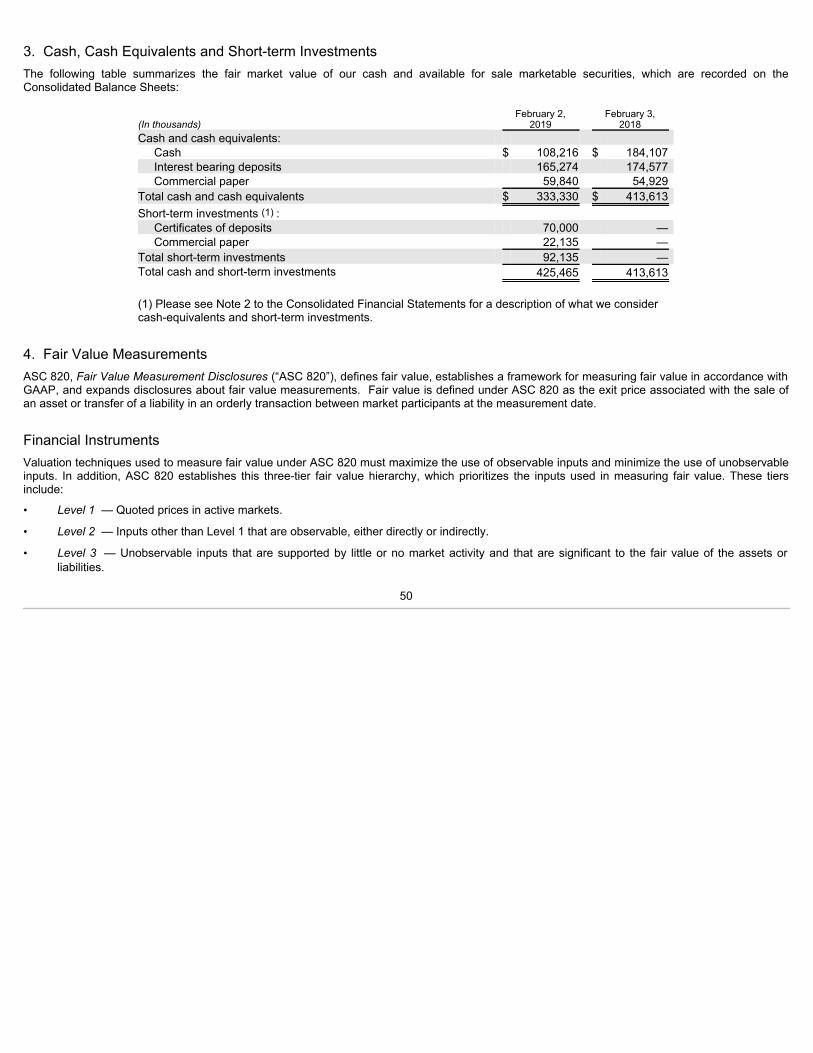
3. Cash, Cash Equivalents and Short-term InvestmentsThe following table summarizes the fair market value of our cash and available for sale marketable securities, which are recorded on theConsolidated Balance Sheets:
(Inthousands) February 2,
2019 February 3,
2018 Cash and cash equivalents:
Cash $ 108,216 $ 184,107 Interest bearing deposits 165,274 174,577 Commercial paper 59,840 54,929
Total cash and cash equivalents $ 333,330 $ 413,613 Short-term investments (1) :
Certificates of deposits 70,000 — Commercial paper 22,135 —
Total short-term investments 92,135 — Total cash and short-term investments 425,465 413,613 (1) Please see Note 2 to the Consolidated Financial Statements for a description of what we considercash-equivalents and short-term investments.
4. Fair Value MeasurementsASC 820, FairValueMeasurementDisclosures(“ASC 820”), defines fair value, establishes a framework for measuring fair value in accordance withGAAP, and expands disclosures about fair value measurements. Fair value is defined under ASC 820 as the exit price associated with the sale ofan asset or transfer of a liability in an orderly transaction between market participants at the measurement date.
Financial InstrumentsValuation techniques used to measure fair value under ASC 820 must maximize the use of observable inputs and minimize the use of unobservableinputs. In addition, ASC 820 establishes this three-tier fair value hierarchy, which prioritizes the inputs used in measuring fair value. These tiersinclude:
• Level1 — Quoted prices in active markets.
• Level2 — Inputs other than Level 1 that are observable, either directly or indirectly.
• Level 3 — Unobservable inputs that are supported by little or no market activity and that are significant to the fair value of the assets orliabilities.
50
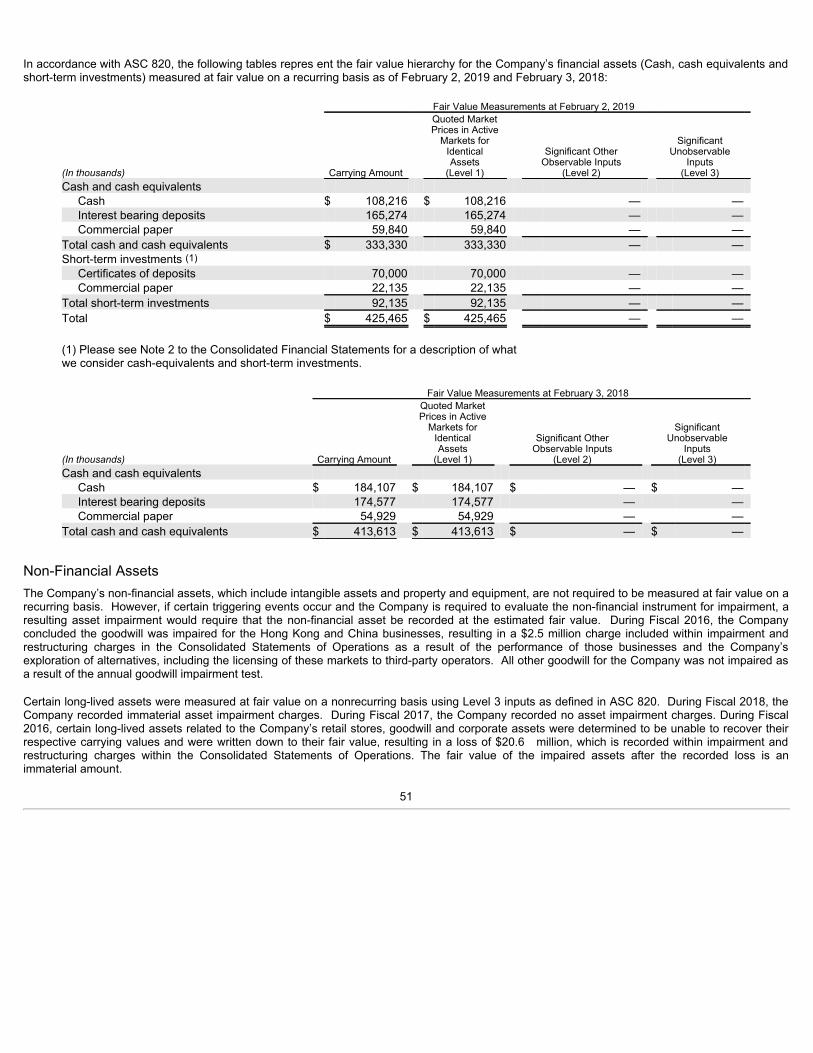
In accordance with ASC 820, the following tables repres ent the fair value hierarchy for the Company’s financial assets (Cash, cash equivalents andshort-term investments) measured at fair value on a recurring basis as of February 2, 2019 and February 3, 2018:
Fair Value Measurements at February 2, 2019
(Inthousands) Carrying Amount
Quoted MarketPrices in Active
Markets forIdenticalAssets
(Level 1)
Significant OtherObservable Inputs
(Level 2)
SignificantUnobservable
Inputs(Level 3)
Cash and cash equivalents Cash $ 108,216 $ 108,216 — — Interest bearing deposits 165,274 165,274 — — Commercial paper 59,840 59,840 — —
Total cash and cash equivalents $ 333,330 333,330 — — Short-term investments (1)
Certificates of deposits 70,000 70,000 — — Commercial paper 22,135 22,135 — —
Total short-term investments 92,135 92,135 — — Total $ 425,465 $ 425,465 — — (1) Please see Note 2 to the Consolidated Financial Statements for a description of whatwe consider cash-equivalents and short-term investments.
Fair Value Measurements at February 3, 2018
(Inthousands) Carrying Amount
Quoted MarketPrices in Active
Markets forIdenticalAssets
(Level 1)
Significant OtherObservable Inputs
(Level 2)
SignificantUnobservable
Inputs(Level 3)
Cash and cash equivalents Cash $ 184,107 $ 184,107 $ — $ — Interest bearing deposits 174,577 174,577 — — Commercial paper 54,929 54,929 — —
Total cash and cash equivalents $ 413,613 $ 413,613 $ — $ —
Non-Financial AssetsThe Company’s non-financial assets, which include intangible assets and property and equipment, are not required to be measured at fair value on arecurring basis. However, if certain triggering events occur and the Company is required to evaluate the non-financial instrument for impairment, aresulting asset impairment would require that the non-financial asset be recorded at the estimated fair value. During Fiscal 2016, the Companyconcluded the goodwill was impaired for the Hong Kong and China businesses, resulting in a $2.5 million charge included within impairment andrestructuring charges in the Consolidated Statements of Operations as a result of the performance of those businesses and the Company’sexploration of alternatives, including the licensing of these markets to third-party operators. All other goodwill for the Company was not impaired asa result of the annual goodwill impairment test.
Certain long-lived assets were measured at fair value on a nonrecurring basis using Level 3 inputs as defined in ASC 820. During Fiscal 2018, theCompany recorded immaterial asset impairment charges. During Fiscal 2017, the Company recorded no asset impairment charges. During Fiscal2016, certain long-lived assets related to the Company’s retail stores, goodwill and corporate assets were determined to be unable to recover theirrespective carrying values and were written down to their fair value, resulting in a loss of $20.6 million, which is recorded within impairment andrestructuring charges within the Consolidated Statements of Operations. The fair value of the impaired assets after the recorded loss is animmaterial amount.
51
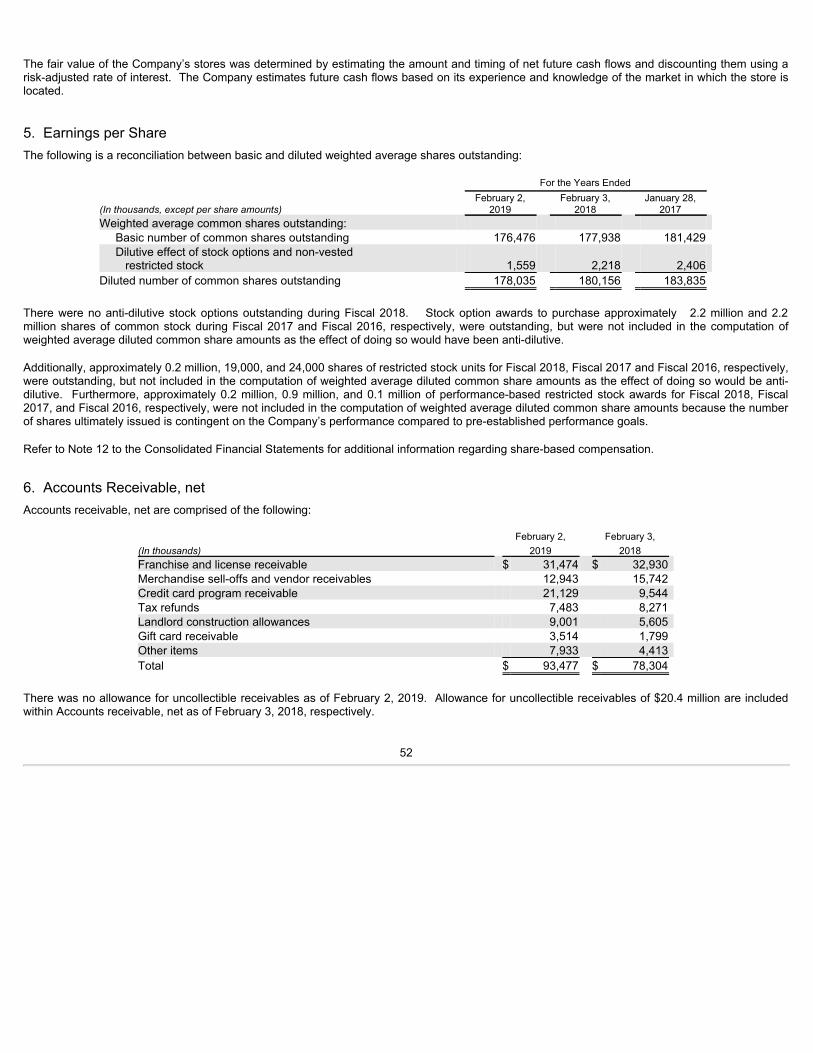
The fair value of the Company’s stores was determined by estimating the amount and timing of net future cash flows and discounting them using arisk-adjusted rate of interest. The Company estimates future cash flows based on its experience and knowledge of the market in which the store islocated. 5. Earnings per ShareThe following is a reconciliation between basic and diluted weighted average shares outstanding:
For the Years Ended February 2, February 3, January 28, (Inthousands,exceptpershareamounts) 2019 2018 2017 Weighted average common shares outstanding:
Basic number of common shares outstanding 176,476 177,938 181,429 Dilutive effect of stock options and non-vested restricted stock 1,559 2,218 2,406
Diluted number of common shares outstanding 178,035 180,156 183,835
There were no anti-dilutive stock options outstanding during Fiscal 2018. Stock option awards to purchase approximately 2.2 million and 2.2million shares of common stock during Fiscal 2017 and Fiscal 2016, respectively, were outstanding, but were not included in the computation ofweighted average diluted common share amounts as the effect of doing so would have been anti-dilutive.
Additionally, approximately 0.2 million, 19,000, and 24,000 shares of restricted stock units for Fiscal 2018, Fiscal 2017 and Fiscal 2016, respectively,were outstanding, but not included in the computation of weighted average diluted common share amounts as the effect of doing so would be anti-dilutive. Furthermore, approximately 0.2 million, 0.9 million, and 0.1 million of performance-based restricted stock awards for Fiscal 2018, Fiscal2017, and Fiscal 2016, respectively, were not included in the computation of weighted average diluted common share amounts because the numberof shares ultimately issued is contingent on the Company’s performance compared to pre-established performance goals.
Refer to Note 12 to the Consolidated Financial Statements for additional information regarding share-based compensation.
6. Accounts Receivable, netAccounts receivable, net are comprised of the following:
February 2, February 3, (Inthousands) 2019 2018 Franchise and license receivable $ 31,474 $ 32,930 Merchandise sell-offs and vendor receivables 12,943 15,742 Credit card program receivable 21,129 9,544 Tax refunds 7,483 8,271 Landlord construction allowances 9,001 5,605 Gift card receivable 3,514 1,799 Other items 7,933 4,413 Total $ 93,477 $ 78,304
There was no allowance for uncollectible receivables as of February 2, 2019. Allowance for uncollectible receivables of $20.4 million are includedwithin Accounts receivable, net as of February 3, 2018, respectively.
52

7. Property and EquipmentProperty and equipment consists of the following:
February 2, February 3, (Inthousands) 2019 2018 Land $ 17,910 $ 17,910 Buildings 209,487 206,505 Leasehold improvements 698,029 630,725 Fixtures and equipment 1,221,203 1,143,140 Construction in progress 34,221 25,595 Property and equipment, at cost $ 2,180,850 $ 2,023,875 Less: Accumulated depreciation (1,438,701) (1,299,636)Property and equipment, net $ 742,149 $ 724,239
Depreciation expense is summarized as follows:
For the Years Ended February 2, February 3, January 28, (Inthousands) 2019 2018 2017 Depreciation expense $ 164,265 $ 158,969 $ 152,644
Additionally, during Fiscal 2018, Fiscal 2017 and Fiscal 2016, the Company recorded $2.0 million, $6.0 million and $1.5 million, respectively, relatedto asset write-offs within depreciation and amortization expense. 8. Intangible AssetsIntangible assets include costs to acquire and register the Company’s trademark assets. The following table represents intangible assets as ofFebruary 2, 2019 and February 3, 2018:
February 2, February 3, (Inthousands) 2019 2018 Trademarks, at cost $ 70,994 $ 70,322 Less: Accumulated amortization (27,726) (23,656)Intangible assets, net $ 43,268 $ 46,666
Amortization expense is summarized as follows:
For the Years Ended February 2, February 3, January 28, (Inthousands) 2019 2018 2017 Amortization expense $ 4,225 $ 4,551 $ 4,007
The table below summarizes the estimated future amortization expense for intangible assets existing as of February 2, 2019 for the next five FiscalYears:
Future (Inthousands) Amortization 2019 $ 4,004 2020 $ 3,332 2021 $ 3,005 2022 $ 3,002 2023 $ 2,906
53
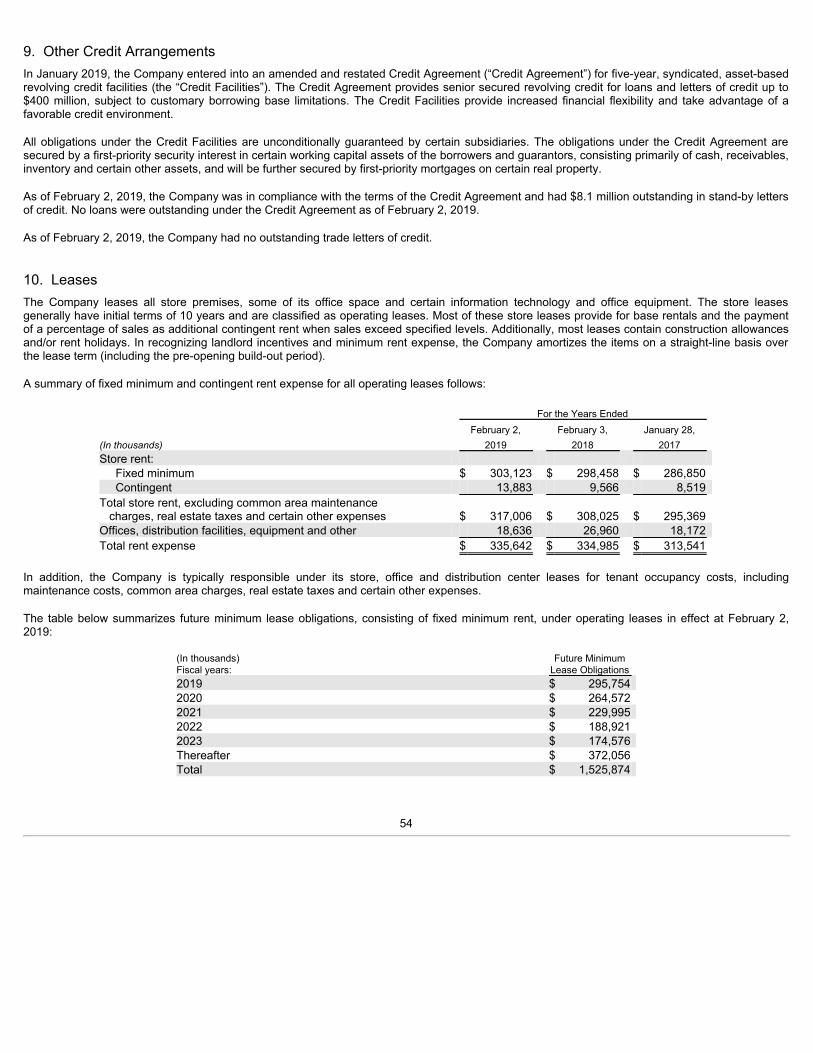
9. Other Credit ArrangementsIn January 2019, the Company entered into an amended and restated Credit Agreement (“Credit Agreement”) for five-year, syndicated, asset-basedrevolving credit facilities (the “Credit Facilities”). The Credit Agreement provides senior secured revolving credit for loans and letters of credit up to$400 million, subject to customary borrowing base limitations. The Credit Facilities provide increased financial flexibility and take advantage of afavorable credit environment.
All obligations under the Credit Facilities are unconditionally guaranteed by certain subsidiaries. The obligations under the Credit Agreement aresecured by a first-priority security interest in certain working capital assets of the borrowers and guarantors, consisting primarily of cash, receivables,inventory and certain other assets, and will be further secured by first-priority mortgages on certain real property.
As of February 2, 2019, the Company was in compliance with the terms of the Credit Agreement and had $8.1 million outstanding in stand-by lettersof credit. No loans were outstanding under the Credit Agreement as of February 2, 2019.
As of February 2, 2019, the Company had no outstanding trade letters of credit. 10. LeasesThe Company leases all store premises, some of its office space and certain information technology and office equipment. The store leasesgenerally have initial terms of 10 years and are classified as operating leases. Most of these store leases provide for base rentals and the paymentof a percentage of sales as additional contingent rent when sales exceed specified levels. Additionally, most leases contain construction allowancesand/or rent holidays. In recognizing landlord incentives and minimum rent expense, the Company amortizes the items on a straight-line basis overthe lease term (including the pre-opening build-out period).
A summary of fixed minimum and contingent rent expense for all operating leases follows:
For the Years Ended February 2, February 3, January 28, (Inthousands) 2019 2018 2017 Store rent:
Fixed minimum $ 303,123 $ 298,458 $ 286,850 Contingent 13,883 9,566 8,519
Total store rent, excluding common area maintenance charges, real estate taxes and certain other expenses $ 317,006 $ 308,025 $ 295,369 Offices, distribution facilities, equipment and other 18,636 26,960 18,172 Total rent expense $ 335,642 $ 334,985 $ 313,541
In addition, the Company is typically responsible under its store, office and distribution center leases for tenant occupancy costs, includingmaintenance costs, common area charges, real estate taxes and certain other expenses.
The table below summarizes future minimum lease obligations, consisting of fixed minimum rent, under operating leases in effect at February 2,2019:
(In thousands) Future Minimum Fiscal years: Lease Obligations 2019 $ 295,754 2020 $ 264,572 2021 $ 229,995 2022 $ 188,921 2023 $ 174,576 Thereafter $ 372,056 Total $ 1,525,874
54

11. Other Comprehensive IncomeThe accumulated balances of other comprehensive income included as part of the Consolidated Statements of Stockholders’ Equity follow:
Accumulated Before Tax Other Tax Benefit Comprehensive (Inthousands) Amount (Expense) Income Balance at January 30, 2016 $ (33,284) 3,416 $ (29,868)Foreign currency translation loss (1) (8,380) — (8,380)Gain on long-term intra-entity foreign currency transactions 2,919 (1,133) 1,786 Balance at January 28, 2017 $ (38,745) 2,283 $ (36,462)Foreign currency translation gain (1) 3,564 — 3,564 Gain on long-term intra-entity foreign currency transactions 3,436 (1,333) 2,103 Balance at February 3, 2018 $ (31,745) 950 $ (30,795)Foreign currency translation loss (1) (834) — (834)Loss on long-term intra-entity foreign currency transactions (3,225) 22 (3,203)Balance at February 2, 2019 $ (35,804) $ 972 $ (34,832)
(1) Foreign currency translation adjustments are not adjusted for income taxes as they relate to permanent investments in our subsidiaries.
12. Share-Based PaymentsThe Company accounts for share-based compensation under the provisions of ASC 718, Compensation–StockCompensation(“ASC 718”), whichrequires the Company to measure and recognize compensation expense for all share-based payments at fair value. Total share-basedcompensation expense included in the Consolidated Statements of Operations for Fiscal 2018, Fiscal 2017 and Fiscal 2016 was $27.5 million ($20.9million, net of tax), $16.9 million ($12.0 million, net of tax) and $29.1 million ($18.5 million, net of tax), respectively.
ASC 718 requires recognition of compensation cost under a non-substantive vesting period approach for awards containing provisions thataccelerate or continue vesting upon retirement. Accordingly, for awards with such provisions, the Company recognizes compensation expense overthe period from the grant date to the date retirement eligibility is achieved, if that is expected to occur during the nominal vesting period. Additionally,for awards granted to retirement eligible employees, the full compensation cost of an award must be recognized immediately upon grant.
At February 2, 2019, the Company had awards outstanding under two share-based compensation plans, which are described below.
Share-based compensation plans
2017 Stock Award and Incentive Plan
The 2017 Plan was approved by the stockholders on May 23, 2017. The 2017 Plan authorized 11.2 million shares for issuance, in the form ofoptions, stock appreciation rights (“SARS”), restricted stock, restricted stock units, bonus stock and awards, performance awards, dividendequivalents and other stock based awards. The 2017 Plan provides that for awards intended to qualify as “performance-based compensation” underCode Section 162(m) (i) the maximum number of shares awarded to any individual may not exceed 3.0 million shares per year for options and SARSand (ii) no more than 1.5 million shares may be granted with respect to each of restricted shares of stock and restricted stock units (subject to certainadjustments and exceptions provided therein). The 2017 Plan allows the Compensation Committee of the Board to determine which employeesreceive awards and the terms and conditions of the awards under the 2017 Plan. The 2017 Plan provides for grants to directors who are not officersor employees of the Company, which are not to exceed in value $750,000 in any single fiscal year. Through February 2, 2019, approximately 1.8million shares of restricted stock and approximately 3.9 million shares of common stock had been granted under the 2017 Plan to employees anddirectors. Approximately 60% of the restricted stock awards are performance-based and are earned if the established performance goals aremet. The remaining 40% of the restricted stock awards are time-based and 97% vest ratably over three years and 3% vest over a period of one totwo years.
55

2014 Stock Award and Incentive Plan
The 2014 Plan was approved by the stockholders on May 29, 2014. The 2014 Plan authorized 11.5 million shares for issuance, in the form ofoptions, SARS, restricted stock, restricted stock units, bonus stock and awards, performance awards, dividend equivalents and other stock basedawards. The 2014 Plan provides that the maximum number of shares awarded to any individual may not exceed 4.0 million shares per year foroptions and SARS and no more than 1.5 million shares may be granted with respect to each of restricted shares of stock and restricted stock units(subject to certain adjustments and exceptions provided therein). The 2014 Plan allows the Compensation Committee of the Board to determinewhich employees receive awards and the terms and conditions of the awards under the 2014 Plan. The 2014 Plan provides for grants to directorswho are not officers or employees of the Company, which are not to exceed in value $300,000 in any single calendar year ($500,000 in the first yeara person becomes a non-employee director). Through February 3, 2018, approximately 6.3 million shares of restricted stock and approximately 2.6million shares of common stock had been granted under the 2014 Plan to employees and directors. Approximately 60% of the restricted stockawards are performance-based and are earned if the established performance goals are met. The remaining 40% of the restricted stock awards aretime-based and 89% vest ratably over three years, 5% vest ratably over two years and 6% cliff vest in three years. After May 23, 2017, no newawards may be granted under the 2014 plan and all outstanding awards at that time continued in force and operation in accordance with theirrespective terms.
Stock Option Grants
The Company has granted both time-based and performance-based stock options under the 2014 and 2017 Plans. Time-based stock option awardsvest over the requisite service period of the award or to an employee’s eligible retirement date, if earlier. Performance-based stock option awardsvest over three years and are earned if the Company meets pre-established performance goals during each year.
A summary of the Company’s stock option activity under all plans for Fiscal 2018 follows:
For the Year Ended February 2, 2019
Weighted-Average
Weighted-Average
RemainingContractual Aggregate
Options Exercise Price Term Intrinsic Value (Inthousands) (Inyears) (Inthousands) Outstanding - February 3, 2018 2,190 $ 14.59 Granted 715 $ 19.60 Exercised (1) (993) $ 15.60 Cancelled 0 $ - Outstanding - February 2, 2019 1,912 $ 16.75 5.3 7,983 Vested and expected to vest - February 2, 2019 1,679 $ 17.06 5.3 6,634 Exercisable - February 2, 2019 (2) 171 $ 14.92 4.8 1,030
(1) Options exercised during Fiscal 2018 ranged in price from $13.70 to $19.89.(2) Options exercisable represent “in-the-money” vested options based upon the weighted average exercise price of vested options compared to
the Company’s stock price at February 2, 2019.
The weighted-average grant date fair value of stock options granted during Fiscal 2018 and Fiscal 2017 was $5.71 and $3.84, respectively. Theaggregate intrinsic value of options exercised during Fiscal 2018, Fiscal 2017 and Fiscal 2016 was $7.4 million, $0.2 million and $3.8 million,respectively. Cash received from the exercise of stock options and the actual tax benefit realized from share-based payments was $15.5 million and$3.1 million, respectively, for Fiscal 2018. Cash received from the exercise of stock options and the actual tax benefit realized from share-basedpayments was $3.4 million and $3.3 million, respectively, for Fiscal 2017. Cash received from the exercise of stock options and the actual taxbenefit realized from share-based payments was $16.3 million and $0.3 million, respectively, for Fiscal 2016.
56
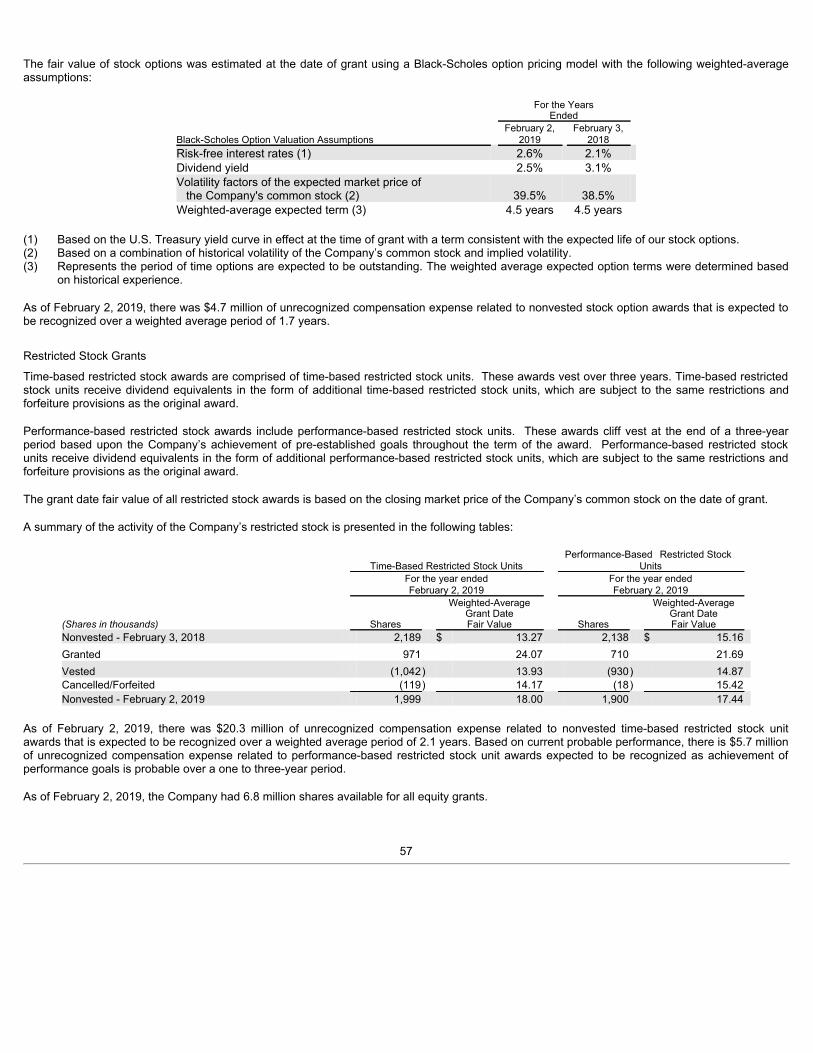
The fair value of stock options was estimated at the date of grant using a Black-Scholes option pricing model with the following weighted-averageassumptions:
For the YearsEnded
February 2, February 3, Black-Scholes Option Valuation Assumptions 2019 2018 Risk-free interest rates (1) 2.6% 2.1% Dividend yield 2.5% 3.1% Volatility factors of the expected market price of the Company's common stock (2) 39.5% 38.5% Weighted-average expected term (3) 4.5 years 4.5 years
(1) Based on the U.S. Treasury yield curve in effect at the time of grant with a term consistent with the expected life of our stock options.(2) Based on a combination of historical volatility of the Company’s common stock and implied volatility.(3) Represents the period of time options are expected to be outstanding. The weighted average expected option terms were determined based
on historical experience.
As of February 2, 2019, there was $4.7 million of unrecognized compensation expense related to nonvested stock option awards that is expected tobe recognized over a weighted average period of 1.7 years.
Restricted Stock Grants
Time-based restricted stock awards are comprised of time-based restricted stock units. These awards vest over three years. Time-based restrictedstock units receive dividend equivalents in the form of additional time-based restricted stock units, which are subject to the same restrictions andforfeiture provisions as the original award.
Performance-based restricted stock awards include performance-based restricted stock units. These awards cliff vest at the end of a three-yearperiod based upon the Company’s achievement of pre-established goals throughout the term of the award. Performance-based restricted stockunits receive dividend equivalents in the form of additional performance-based restricted stock units, which are subject to the same restrictions andforfeiture provisions as the original award.
The grant date fair value of all restricted stock awards is based on the closing market price of the Company’s common stock on the date of grant.
A summary of the activity of the Company’s restricted stock is presented in the following tables:
Time-Based Restricted Stock Units Performance-Based Restricted Stock
Units For the year ended For the year ended February 2, 2019 February 2, 2019
(Sharesinthousands) Shares
Weighted-AverageGrant DateFair Value Shares
Weighted-AverageGrant DateFair Value
Nonvested - February 3, 2018 2,189 $ 13.27 2,138 $ 15.16 Granted 971 24.07 710 21.69 Vested (1,042) 13.93 (930) 14.87 Cancelled/Forfeited (119) 14.17 (18) 15.42 Nonvested - February 2, 2019 1,999 18.00 1,900 17.44
As of February 2, 2019, there was $20.3 million of unrecognized compensation expense related to nonvested time-based restricted stock unitawards that is expected to be recognized over a weighted average period of 2.1 years. Based on current probable performance, there is $5.7 millionof unrecognized compensation expense related to performance-based restricted stock unit awards expected to be recognized as achievement ofperformance goals is probable over a one to three-year period.
As of February 2, 2019, the Company had 6.8 million shares available for all equity grants.
57

13. Retirement Plan and Employee Stock Purchase PlanThe Company maintains a profit sharing and 401(k) plan (the “Retirement Plan”). Under the provisions of the Retirement Plan, full-time employeesand part-time employees are automatically enrolled to contribute 3% of their salary if they have attained 20½ years of age. In addition, full-timeemployees need to have completed 60 days of service and part-time employees must complete 1,000 hours worked to be eligible. Individuals candecline enrollment or can contribute up to 50% of their salary to the 401(k) plan on a pretax basis, subject to IRS limitations. After one year ofservice, the Company will match 100% of the first 3% of pay plus an additional 25% of the next 3% of pay that is contributed to the plan.Contributions to the profit sharing plan, as determined by the Board, are discretionary. The Company recognized $12.1 million, $10.6 million and$9.8 million in expense during Fiscal 2018, Fiscal 2017 and Fiscal 2016, respectively, in connection with the Retirement Plan.
The Employee Stock Purchase Plan is a non-qualified plan that covers all full-time employees and part-time employees who are at least 18 years oldand have completed 60 days of service. Contributions are determined by the employee, with the Company matching 15% of the investment up to amaximum investment of $100 per pay period. These contributions are used to purchase shares of Company stock in the open market. 14. Income TaxesOn December 22, 2017, the U.S. government enacted comprehensive tax legislation commonly referred to as the Tax Cuts and Jobs Act (the “TaxAct”). The Tax Act makes broad and complex changes to the U.S. tax code including reducing the U.S. federal corporate tax rate from 35% to 21%effective January 1, 2018, and implementing a one-time transition tax on undistributed earnings of foreign subsidiaries. The Tax Act also adoptselements of a modified territorial tax system, revises the rules governing foreign tax credits, and permits certain capital expenditures to be expensedimmediately, as well as modifying or repealing many deductions and credits. Certain changes became effective for Fiscal 2017, while others becameeffective for Fiscal 2018.
As a result of the Tax Act, the Company recorded an estimated tax benefit of $12.1 million in the fourth quarter of Fiscal 2017 consisting of:
• a $3.5 million charge on previously undistributed foreign earnings as of December 31, 2017, net of estimated tax credits
• a $12.1 million benefit on the re-measurement of deferred tax assets and liabilities and tax reserves to the lower base federal corporatetax rate of 21%
• a $3.5 million benefit of a lower blended U.S. corporate tax rate as reflected in the starting point of the effective tax rate reconciliationtable below
In December 2017, the Securities and Exchange Commission (“SEC”) issued interpretive guidance under SAB 118 that allows for a measurementperiod of up to one year after the enactment date of the Tax Act to finalize the recording of the related tax impacts. The estimated tax impacts of theone-time transition tax, re-measurement of deferred tax assets and liabilities, and other items are recorded as provisional amounts in accordancewith SAB 118. During the fourth quarter of 2018, the Company completed its accounting for the tax effects of the Tax Act with no material netchanges to the provisional amounts recorded for the one-time transition tax and the re-measurement of deferred tax assets and liabilities as ofFebruary 3, 2018. Amounts recorded during Fiscal 2018 and Fiscal 2017 are reflected within the respective provision for income taxes in theConsolidated Statements of Income.
Additionally, the Tax Act includes a provision designed to currently tax global intangible low-taxed income (“GILTI”) earned by non-U.S. corporatesubsidiaries of large U.S. shareholders starting in 2018. The Company has elected, as permitted in FASB Staff Q&A - Topic 740 - No. 5, to treat anyfuture GILTI tax liabilities as period costs and will expense those liabilities in the period incurred. The Company therefore will not record deferredtaxes associated with the GILTI provision of the Tax Act.
58

The components of income before income taxes from continuing operations were:
For the Years Ended February 2, February 3, January 28, (Inthousands) 2019 2018 2017 U.S. $ 308,424 $ 255,621 $ 315,199 Foreign 36,676 31,552 20,063 Total $ 345,100 $ 287,173 $ 335,262
The significant components of the Company’s deferred tax assets and liabilities were as follows:
February 2, February 3, (Inthousands) 2019 2018 Deferred tax assets:
Rent $ 21,649 $ 20,753 Employee compensation and benefits 12,476 1,599 Inventories 9,276 8,900 Deferred compensation 8,874 7,698 Net operating loss 8,757 9,232 Accruals not currently deductible 7,675 5,631 State tax credits 7,216 7,492 Foreign tax credits 564 3,123 Other 5,000 4,936
Gross deferred tax assets 81,487 69,364 Valuation allowance (6,992) (7,096)
Total deferred tax assets $ 74,495 $ 62,268 Deferred tax liabilities:
Property and equipment $ (53,774) $ (46,165)Prepaid Expenses $ (4,128) $ (3,736)Other (2,531) (3,023)
Total deferred tax liabilities $ (60,433) $ (52,924) Total deferred tax assets, net $ 14,062 $ 9,344
The net increase in deferred tax assets and liabilities was primarily due to increases in employee compensation and benefits, partially offset by anincrease in the deferred tax liability for property and equipment basis differences.
As of February 2, 2019, the Company had deferred tax assets related to state and foreign net operating loss carryovers of $2.6 million and $6.2million, respectively that could be utilized to reduce future years’ tax liabilities. A portion of these net operating loss carryovers began expiring in theyear 2018 and some have an indefinite carryforward period. Management believes it is more likely than not that the foreign net operating losscarryovers will not reduce future years’ tax liabilities in certain jurisdictions. As such a valuation allowance of $5.2 million has been recorded on thedeferred tax assets related to the cumulative foreign net operating loss carryovers. We also provided for a valuation allowance of approximately$0.7 million related to other foreign deferred tax assets.
The Company had foreign tax credit carryovers in the amount of $0.6 million and $3.1 million as of February 2, 2019 and February 3, 2018,respectively. The foreign tax credit carryovers begin to expire in Fiscal 2028 to the extent not utilized. Management believes it is more likely thannot that the foreign tax credit carryover will not reduce future years’ tax liabilities in certain jurisdictions. As such a valuation allowance of $0.6 millionhas been recorded on the deferred tax assets related to the foreign tax credit carryovers.
The Company had state income tax credit carryforwards of $7.2 million (net of federal tax) and $7.5 million (net of federal tax) as of February 2, 2019and February 3, 2018, respectively. These income tax credits can be utilized to offset future state income taxes and have a carryforward period of10 to 16 years. They will begin to expire in Fiscal 2023. Management believes it is more likely than not that a portion of the state income tax creditcarryovers will not reduce
59
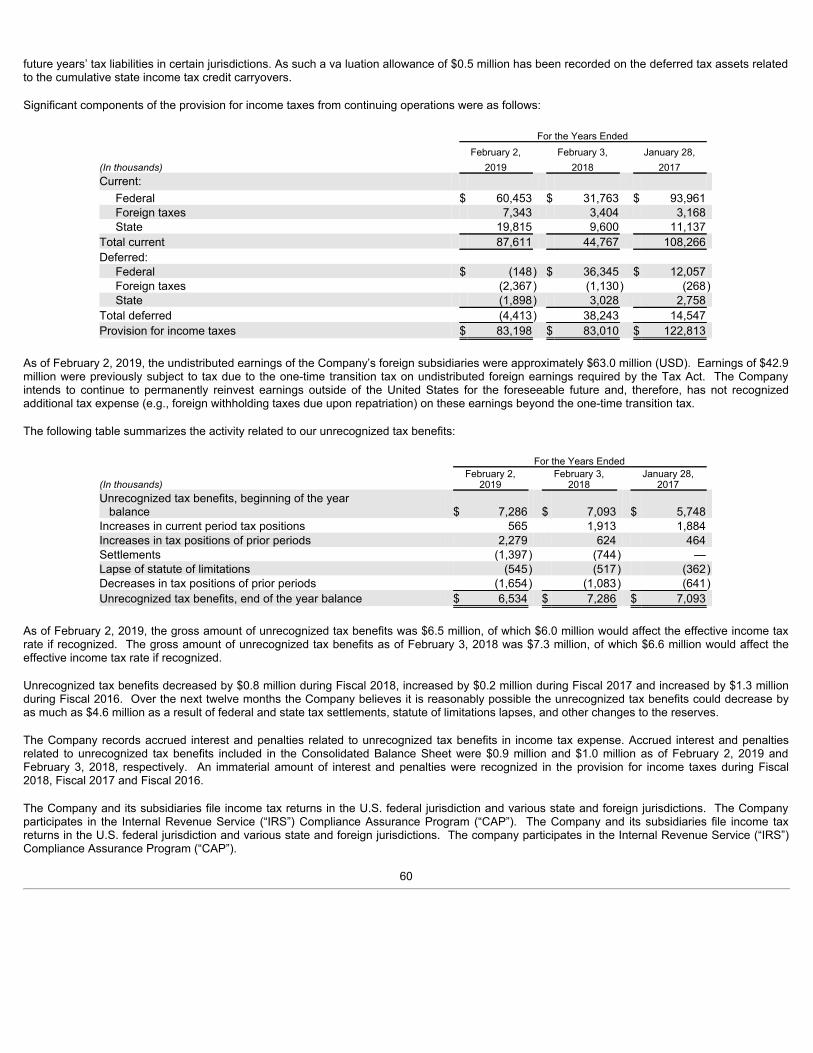
future years’ tax liabilities in certain jurisdictions. As such a va luation allowance of $0.5 million has been recorded on the deferred tax assets relatedto the cumulative state income tax credit carryovers.
Significant components of the provision for income taxes from continuing operations were as follows:
For the Years Ended February 2, February 3, January 28, (Inthousands) 2019 2018 2017 Current:
Federal $ 60,453 $ 31,763 $ 93,961 Foreign taxes 7,343 3,404 3,168 State 19,815 9,600 11,137
Total current 87,611 44,767 108,266 Deferred:
Federal $ (148) $ 36,345 $ 12,057 Foreign taxes (2,367) (1,130) (268)State (1,898) 3,028 2,758
Total deferred (4,413) 38,243 14,547 Provision for income taxes $ 83,198 $ 83,010 $ 122,813
As of February 2, 2019, the undistributed earnings of the Company’s foreign subsidiaries were approximately $63.0 million (USD). Earnings of $42.9million were previously subject to tax due to the one-time transition tax on undistributed foreign earnings required by the Tax Act. The Companyintends to continue to permanently reinvest earnings outside of the United States for the foreseeable future and, therefore, has not recognizedadditional tax expense (e.g., foreign withholding taxes due upon repatriation) on these earnings beyond the one-time transition tax.
The following table summarizes the activity related to our unrecognized tax benefits:
For the Years Ended
(Inthousands) February 2,
2019 February 3,
2018 January 28,
2017 Unrecognized tax benefits, beginning of the year balance $ 7,286 $ 7,093 $ 5,748 Increases in current period tax positions 565 1,913 1,884 Increases in tax positions of prior periods 2,279 624 464 Settlements (1,397) (744) — Lapse of statute of limitations (545) (517) (362)Decreases in tax positions of prior periods (1,654) (1,083) (641)Unrecognized tax benefits, end of the year balance $ 6,534 $ 7,286 $ 7,093
As of February 2, 2019, the gross amount of unrecognized tax benefits was $6.5 million, of which $6.0 million would affect the effective income taxrate if recognized. The gross amount of unrecognized tax benefits as of February 3, 2018 was $7.3 million, of which $6.6 million would affect theeffective income tax rate if recognized.
Unrecognized tax benefits decreased by $0.8 million during Fiscal 2018, increased by $0.2 million during Fiscal 2017 and increased by $1.3 millionduring Fiscal 2016. Over the next twelve months the Company believes it is reasonably possible the unrecognized tax benefits could decrease byas much as $4.6 million as a result of federal and state tax settlements, statute of limitations lapses, and other changes to the reserves.
The Company records accrued interest and penalties related to unrecognized tax benefits in income tax expense. Accrued interest and penaltiesrelated to unrecognized tax benefits included in the Consolidated Balance Sheet were $0.9 million and $1.0 million as of February 2, 2019 andFebruary 3, 2018, respectively. An immaterial amount of interest and penalties were recognized in the provision for income taxes during Fiscal2018, Fiscal 2017 and Fiscal 2016.
The Company and its subsidiaries file income tax returns in the U.S. federal jurisdiction and various state and foreign jurisdictions. The Companyparticipates in the Internal Revenue Service (“IRS”) Compliance Assurance Program (“CAP”). The Company and its subsidiaries file income taxreturns in the U.S. federal jurisdiction and various state and foreign jurisdictions. The company participates in the Internal Revenue Service (“IRS”)Compliance Assurance Program (“CAP”).
60
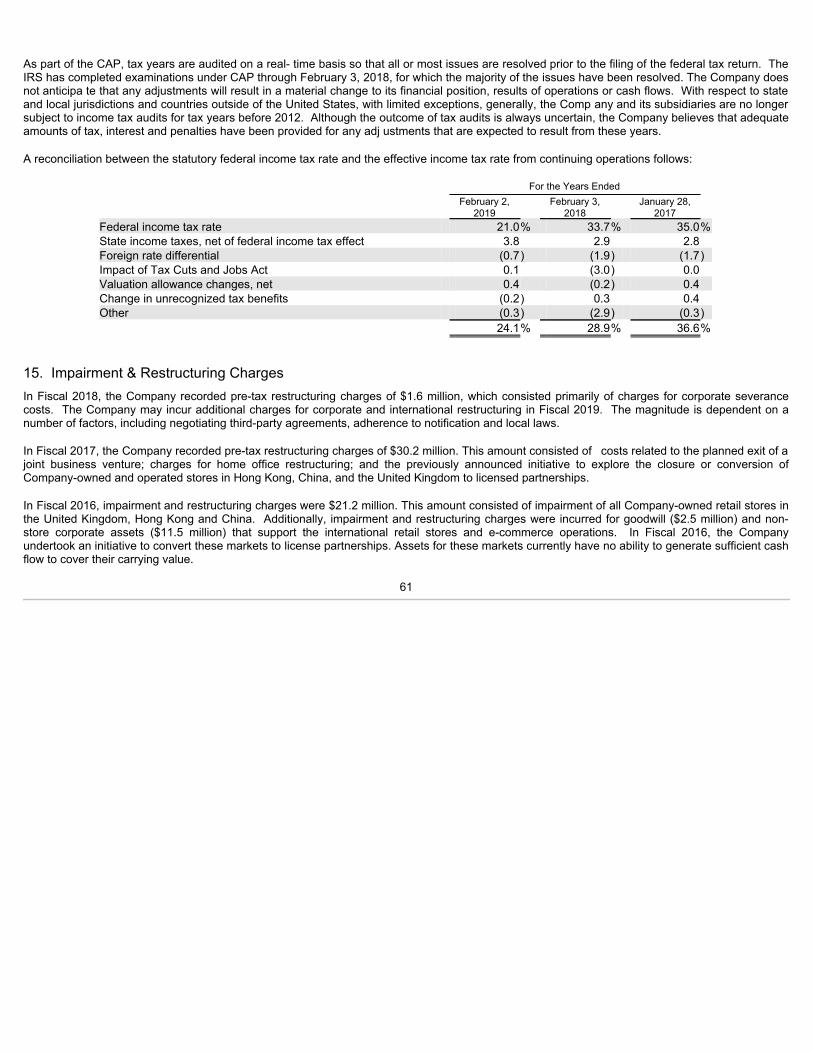
As part of the CAP, tax years are audited on a real- time basis so that all or most issues are resolved prior to the filing of the federal tax return. TheIRS has completed examinations under CAP through February 3, 2018, for which the majority of the issues have been resolved. The Company doesnot anticipa te that any adjustments will result in a material change to its financial position, results of operations or cash flows. With respect to stateand local jurisdictions and countries outside of the United States, with limited exceptions, generally, the Comp any and its subsidiaries are no longersubject to income tax audits for tax years before 2012. Although the outcome of tax audits is always uncertain, the Company believes that adequateamounts of tax, interest and penalties have been provided for any adj ustments that are expected to result from these years.
A reconciliation between the statutory federal income tax rate and the effective income tax rate from continuing operations follows:
For the Years Ended February 2, February 3, January 28, 2019 2018 2017 Federal income tax rate 21.0% 33.7% 35.0%State income taxes, net of federal income tax effect 3.8 2.9 2.8 Foreign rate differential (0.7) (1.9) (1.7)Impact of Tax Cuts and Jobs Act 0.1 (3.0) 0.0 Valuation allowance changes, net 0.4 (0.2) 0.4 Change in unrecognized tax benefits (0.2) 0.3 0.4 Other (0.3) (2.9) (0.3) 24.1% 28.9% 36.6%
15. Impairment & Restructuring Charges
In Fiscal 2018, the Company recorded pre-tax restructuring charges of $1.6 million, which consisted primarily of charges for corporate severancecosts. The Company may incur additional charges for corporate and international restructuring in Fiscal 2019. The magnitude is dependent on anumber of factors, including negotiating third-party agreements, adherence to notification and local laws.
In Fiscal 2017, the Company recorded pre-tax restructuring charges of $30.2 million. This amount consisted of costs related to the planned exit of ajoint business venture; charges for home office restructuring; and the previously announced initiative to explore the closure or conversion ofCompany-owned and operated stores in Hong Kong, China, and the United Kingdom to licensed partnerships.
In Fiscal 2016, impairment and restructuring charges were $21.2 million. This amount consisted of impairment of all Company-owned retail stores inthe United Kingdom, Hong Kong and China. Additionally, impairment and restructuring charges were incurred for goodwill ($2.5 million) and non-store corporate assets ($11.5 million) that support the international retail stores and e-commerce operations. In Fiscal 2016, the Companyundertook an initiative to convert these markets to license partnerships. Assets for these markets currently have no ability to generate sufficient cashflow to cover their carrying value.
61

The closure of the Company owned and operated United Kingdom stores was completed in Fiscal 2017. The Company may incur additionalcharges for international restructuring in Fiscal 2018. The magnitude is dependent on a number of factors, including negotiating third-partyagreements, adherence to notification requirements and local laws.
For the years ended February 2, February 3, January 28, (Inthousands) 2019 2018 2017
Severance and related employee costs $ 1,568 $ 10,660
$ 295
Lease termination and store closure costs —
$ 9,951
$ 295
Total cash restructuring charges (1) $ 1,568 20,611 590 Joint business venture charges (2) — 7,964 — Inventory charges (3) — 1,669 — Asset impairment charges (4) — — 20,576 Total impairment and restructuring charges $ 1,568
$ 30,244
$ 21,166
(1) Cash charges of $1.6 million, $20.6 million and $0.6 million for Fiscal 2018, Fiscal 2017 and Fiscal 2016, respectively, for lease termination,
store closures and severance were recorded within Impairment and Restructuring Charges on the Consolidated Statements of Operations
(2) $8.0 million ($3.5 million cash and $4.5 million non-cash) of net charges for Fiscal 2017 related to the planned exit of a joint business venturewere recorded within Other (Expense) Income, Net on the Consolidated Statements of Operations
(3) Non-cash inventory charges of $1.7 million for Fiscal 2017 related to restructuring activities for our United Kingdom and Asia marketsrecorded as a reduction in Gross Profit on the Consolidated Statements of Operations.
(4) Non-cash impairment charges of $20.6 million for Fiscal 2016 consisted of $7.2 million for the impairment of all Company-owned retail storesin the United Kingdom, Hong Kong and China, as well as $10.8 million of impairment and restructuring charges related to non-store corporateassets that support the international retail stores and e-commerce operations and $2.5 million of goodwill impairment for the China and HongKong retail operations.
A rollforward of the liabilities recognized in the Consolidated Balance Sheet is as follows:
February 2, (Inthousands) 2019 Accrued liability as of February 3, 2018 $ 7,650 Add: Costs incurred, excluding non-cash charges 1,568 Less: Cash payments and adjustments (2,589)Accrued liability as of February 2, 2019 $ 6,629
The accrued liability as of February 3, 2018 relates to previous restructuring activities disclosed in the Company’s Fiscal 2017 Form 10-K, whichremained unpaid at the beginning of Fiscal 2018.
62
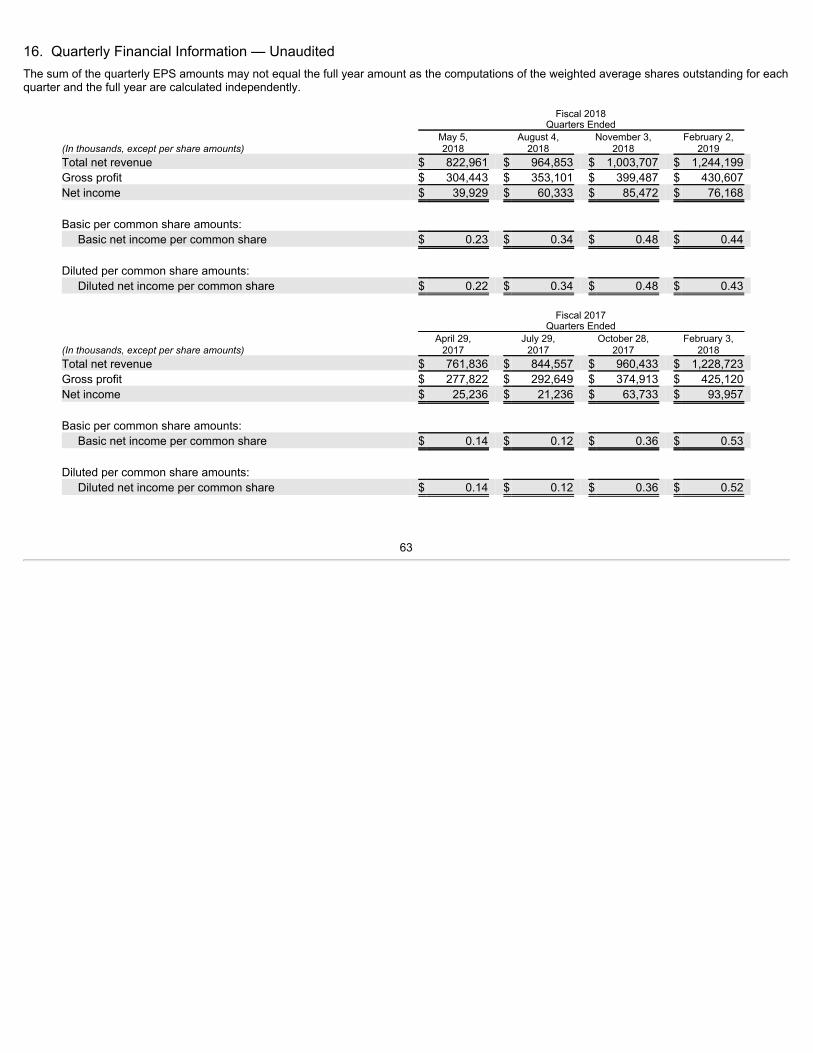
16. Quarterly Financial Information — UnauditedThe sum of the quarterly EPS amounts may not equal the full year amount as the computations of the weighted average shares outstanding for eachquarter and the full year are calculated independently.
Fiscal 2018
Quarters Ended May 5, August 4, November 3, February 2, (Inthousands,exceptpershareamounts) 2018 2018 2018 2019 Total net revenue $ 822,961 $ 964,853 $ 1,003,707 $ 1,244,199 Gross profit $ 304,443 $ 353,101 $ 399,487 $ 430,607 Net income $ 39,929 $ 60,333 $ 85,472 $ 76,168 Basic per common share amounts:
Basic net income per common share $ 0.23 $ 0.34 $ 0.48 $ 0.44 Diluted per common share amounts:
Diluted net income per common share $ 0.22 $ 0.34 $ 0.48 $ 0.43
Fiscal 2017
Quarters Ended April 29, July 29, October 28, February 3, (Inthousands,exceptpershareamounts) 2017 2017 2017 2018 Total net revenue $ 761,836 $ 844,557 $ 960,433 $ 1,228,723 Gross profit $ 277,822 $ 292,649 $ 374,913 $ 425,120 Net income $ 25,236 $ 21,236 $ 63,733 $ 93,957 Basic per common share amounts:
Basic net income per common share $ 0.14 $ 0.12 $ 0.36 $ 0.53 Diluted per common share amounts:
Diluted net income per common share $ 0.14 $ 0.12 $ 0.36 $ 0.52
63
Item 9. Changes in and Disagreements with Accou ntants on Accounting and Financial Disclosure.None.
Item 9A. Controls and Procedures.
Disclosure Controls and ProceduresWe maintain disclosure controls and procedures that are designed to provide reasonable assurance that information required to be disclosed in ourreports under the Securities Exchange Act of 1934, as amended (the “Exchange Act”), is recorded, processed, summarized and reported within thetime periods specified in the SEC’s rules and forms, and that such information is accumulated and communicated to the management of AmericanEagle Outfitters, Inc. (the “Management”), including our principal executive officer and our principal financial officer, as appropriate, to allow timelydecisions regarding required disclosure. In designing and evaluating the disclosure controls and procedures, Management recognized that anycontrols and procedures, no matter how well designed and operated, can provide only reasonable assurance of achieving the desired controlobjectives.
As of the end of the period covered by this Annual Report on Form 10-K, the Company performed an evaluation under the supervision and with theparticipation of Management, including our principal executive officer and principal financial officer, of the design and effectiveness of our disclosurecontrols and procedures (as defined in Rules 13a-15(e) or 15d-15(e) under the Exchange Act). Based upon that evaluation, our principal executiveofficer and principal financial officer concluded that, as of the end of the period covered by this Annual Report, our disclosure controls andprocedures were effective in the timely and accurate recording, processing, summarizing and reporting of material financial and non-financialinformation within the time periods specified within the SEC’s rules and forms. Our principal executive officer and principal financial officer alsoconcluded that our disclosure controls and procedures were effective to ensure that information required to be disclosed in the reports that we file orsubmit under the Exchange Act is accumulated and communicated to our Management, including our principal executive officer and principalfinancial officer, to allow timely decisions regarding required disclosure.
Management’s Annual Report on Internal Control Over Financial ReportingOur Management is responsible for establishing and maintaining adequate internal control over financial reporting (as defined in Rule 13a-15(f) orRule 15(d)-15(f) under the Exchange Act). Our internal control over financial reporting is designed to provide a reasonable assurance to ourManagement and our Board that the reported financial information is presented fairly, that disclosures are adequate, and that the judgments inherentin the preparation of financial statements are reasonable.
All internal control systems, no matter how well designed, have inherent limitations, including the possibility of human error and the overriding ofcontrols. Therefore, even those systems determined to be effective can provide only reasonable, not absolute, assurance with respect to financialstatement preparation and presentation.
Our Management assessed the effectiveness of our internal control over financial reporting as of February 2, 2019. In making this assessment, ourManagement used the framework and criteria set forth in InternalControl–IntegratedFramework(2013), issued by the Committee of SponsoringOrganizations of the Treadway Commission (COSO). Based on this assessment, our Management concluded that the Company’s internal controlover financial reporting was effective as of February 2, 2019.
Our independent registered public accounting firm, Ernst & Young LLP, was retained to audit the Company’s financial statements included in thisAnnual Report on Form 10-K and the effectiveness of the Company’s internal control over financial reporting. Ernst & Young LLP has issued anattestation report on our internal control over financial reporting as of February 2, 2019, which is included herein.
Changes in Internal Control Over Financial ReportingThere were no changes in our internal control over financial reporting (as defined in Rules 13a-15(f) or 15d-15(f) of the Exchange Act) during ourmost recently-completed fiscal quarter that have materially affected, or are reasonably likely to materially affect, our internal control over financialreporting.
64
Report of Independent Regist ered Public Accounting Firm
To the Stockholders and the Board of Directors of American Eagle Outfitters, Inc.
Opinion on Internal Control over Financial ReportingWe have audited American Eagle Outfitters, Inc.’s internal control over financial reporting as of February 2, 2019, based on criteria established inInternal Control—Integrated Framework issued by the Committee of Sponsoring Organizations of the Treadway Commission (2013 framework) (theCOSO criteria). In our opinion, American Eagle Outfitters, Inc. (the Company) maintained, in all material respects, effective internal control overfinancial reporting as of February 2, 2019, based on the COSO criteria.
We also have audited, in accordance with the standards of the Public Company Accounting Oversight Board (United States) (PCAOB), theconsolidated balance sheets of the Company as of February 2, 2019 and February 3, 2018, the related consolidated statements of operations,comprehensive income, stockholders’ equity and cash flows for each of the three years in the period ended February 2, 2019, and the related notes,and our report dated March 14, 2019 expressed an unqualified opinion thereon.
Basis for OpinionThe Company’s management is responsible for maintaining effective internal control over financial reporting and for its assessment of theeffectiveness of internal control over financial reporting included in the accompanying Management’s Annual Report on Internal Control overFinancial Reporting. Our responsibility is to express an opinion on the Company’s internal control over financial reporting based on our audit. Weare a public accounting firm registered with the PCAOB and are required to be independent with respect to the Company in accordance with the U.S.federal securities laws and the applicable rules and regulations of the Securities and Exchange Commission and the PCAOB.
We conducted our audit in accordance with the standards of the PCAOB. Those standards require that we plan and perform the audit to obtainreasonable assurance about whether effective internal control over financial reporting was maintained in all material respects.
Our audit included obtaining an understanding of internal control over financial reporting, assessing the risk that a material weakness exists, testingand evaluating the design and operating effectiveness of internal control based on the assessed risk, and performing such other procedures as weconsidered necessary in the circumstances. We believe that our audit provides a reasonable basis for our opinion.
Definition and Limitations of Internal Control Over Financial ReportingA company’s internal control over financial reporting is a process designed to provide reasonable assurance regarding the reliability of financialreporting and the preparation of financial statements for external purposes in accordance with generally accepted accounting principles. Acompany’s internal control over financial reporting includes those policies and procedures that (1) pertain to the maintenance of records that, inreasonable detail, accurately and fairly reflect the transactions and dispositions of the assets of the company; (2) provide reasonable assurance thattransactions are recorded as necessary to permit preparation of financial statements in accordance with generally accepted accounting principles,and that receipts and expenditures of the company are being made only in accordance with authorizations of management and directors of thecompany; and (3) provide reasonable assurance regarding prevention or timely detection of unauthorized acquisition, use, or disposition of thecompany’s assets that could have a material effect on the financial statements.
Because of its inherent limitations, internal control over financial reporting may not prevent or detect misstatements. Also, projections of anyevaluation of effectiveness to future periods are subject to the risk that controls may become inadequate because of changes in conditions, or thatthe degree of compliance with the policies or procedures may deteriorate.
/s/ Ernst & Young LLP
Pittsburgh, PennsylvaniaMarch 14, 2019
65

Item 9B. Other Information.Not Applicable.
PART IIIItem 10. Directors, Executive Officers and Corporate Governance.The information required by Item 401 of Regulation S-K regarding directors is contained under the caption “Proposal One: Election of Directors” inour Proxy Statement relating to our 2019 Annual Meeting of Stockholders (“Proxy Statement”), to be filed pursuant to Regulation 14A within 120days after February 2, 2019, is incorporated herein by reference. The information required by Item 401 of Regulation S-K regarding executiveofficers is set forth in Part I, Item 1 of this Annual Report on Form 10-K under the caption “Executive Officers of the Registrant.”
The information required by Item 405 of Regulation S-K is contained under the caption “Section 16(a) Beneficial Ownership Reporting Compliance”of the Proxy Statement and is incorporated herein by reference.
The Company’s Code of Ethics is publicly available on the Company’s Internet website at http://www.investors.ae.com under the section “Overview.”The remaining information required by Item 406 of Regulation S-K is contained under the caption “Corporate Governance” of the Proxy Statementand is incorporated herein by reference.
The applicable information required by Items 407(c)(3), (d)(4) and (d)(5) of Regulation S-K is included under the caption “Corporate Governance:Board Committees” of the Proxy Statement and is incorporated herein by reference.
Item 11. Executive Compensation.The information required by Item 402 of Regulation S-K is contained under the captions “Compensation Discussion and Analysis,” “CompensationTables and Related Information,” “Corporate Governance: Director Compensation,” and “Corporate Governance: Board Oversight of RiskManagement” of the Proxy Statement and is incorporated herein by reference.
The applicable information required by Item 407(e)(4) and (e)(5) of Regulation S-K is contained under the caption “Compensation CommitteeReport” of the Proxy Statement, which information (which shall not be deemed to be “filed”) is incorporated herein by reference.
Item 12. Security Ownership of Certain Beneficial Owners and Management and Related Stockholder Matters.The information required by Item 201(d) of Regulation S-K relating to securities authorized for issuance under equity compensation plans iscontained under the caption “Equity Compensation Plan Information” in the Proxy Statement.
The information required by Item 403 of Regulation S-K is contained under the caption “Ownership of Our Shares” of the Proxy Statement and isincorporated herein by reference.
Item 13. Certain Relationships and Related Transactions, and Director Independence.The information required by Item 404 of Regulation S-K regarding related party transactions is contained under the caption “Corporate Governance:Related Party Transactions” of our Proxy Statement and is incorporated herein by reference.
The information required by Item 407(a) of Regulation S-K regarding director independence is contained under the captions “Proposal One: Electionof Directors” and “Corporate Governance” of the Proxy Statement and is incorporated herein by reference.
Item 14. Principal Accounting Fees and Services.The information required by Item 9(e) of Schedule 14A is contained under the caption “Independent Registered Public Accounting Firm Fees andServices” of the Proxy Statement and is incorporated herein by reference.
66

PART IVItem 15. Exhibits and Financial Statement Schedules
(a) (1) The following consolidated financial statements are included in Item 8: Consolidated Balance Sheets as of February 2, 2019 and February 3, 2018
Consolidated Statements of Operations for the fiscal years ended February 2, 2019, February 3, 2018 and January 28, 2017
Consolidated Statements of Comprehensive Income for the fiscal years ended February 2, 2019, February 3, 2018 and January 28,2017
Consolidated Statements of Stockholders’ Equity for the fiscal years ended February 2, 2019, February 3, 2018 and January 28, 2017
Consolidated Statements of Cash Flows for the fiscal years ended February 2, 2019, February 3, 2018 and January 28, 2017
Notes to Consolidated Financial Statements
(a) (2) Financial statement schedules have been omitted because either they are not required or are not applicable or because the informationrequired to be set forth therein is not material.
(a) (3) Exhibits ExhibitNumber
Description
3.1 Amended and Restated Certificate of Incorporation of American Eagle Outfitters, Inc., as amended (incorporated by reference toExhibit 3.1 to the Company’s Form 10-Q filed on September 6, 2007 (SEC File No. 001-33338))
3.2 Amended and Restated Bylaws of American Eagle Outfitters, Inc. (incorporated by reference to Exhibit 3.1 to the Company’s Form 8-Kfiled on June 12, 2017 (SEC File No. 001-33338))
4.1 Voting and Stockholder Agreement among Jay L. Schottenstein, Ann S. Deshe, Susan S. Diamond, and other parties thereto, datedas of September 16, 2011 (incorporated by reference to Exhibit 1 to Schedule 13D filed by Jay L. Schottenstein on October 3, 2011(SEC File No. 005-49559))
10.1+ Amended and Restated Credit Agreement, dated January 30, 2019, among American Eagle Outfitters, Inc. and certain of itssubsidiaries as borrowers, each lender from time to time party thereto, and PNC Bank, National Association as administrative agent forthe lenders and certain other parties and agents (incorporated by reference to Exhibit 10.1 to the Company's Form 8-K filed onFebruary 5, 2019 (SEC filed No. 001-33338))
10.2^ American Eagle Outfitters, Inc. Deferred Compensation Plan, Amended and Restated December 22, 2008 (incorporated by referenceto Exhibit 10.2 to the Company’s Form 8-K filed on December 23, 2008 (SEC File No. 001-33338))
10.3^ American Eagle Outfitters, Inc. Form of Director Deferred Compensation Agreement (incorporated by reference to Exhibit 10.1 to theCompany’s Form 8-K filed on January 5, 2006 (SEC File No. 001-33338))
10.4^ Form of Change in Control Agreement dated April 21, 2010 (incorporated by reference to Exhibit 10.1 to the Company’s Form 8-K filedon April 26, 2010 (SEC File No. 001-33338))
10.5^ Form of RSU Confidentiality, Non-Solicitation, Non-Competition and Intellectual Property Agreement (incorporated by reference toExhibit 10.25 to the Company’s Form 10-K filed on March 11, 2011 (SEC File No. 001-33338))
10.6^ Letter Agreement with Chad Kessler dated December 2, 2013 (incorporated by reference to Exhibit 10.23 to the Company’s Form 10-K filed on March 13, 2014 (SEC File No. 001-33338))
10.7^ Letter Agreement with Jennifer Foyle dated June 25, 2010 (incorporated by reference to Exhibit 10.26 to the Company’s Form 10-Kfiled on March 13, 2014 (SEC File No. 001-33338))
67

ExhibitNumber
Description
10.8^ Letter Agreement with Robert L. Madore, dated September 23, 2016 (incorporated by reference to Exhibit 10.1 to the Company’s Form8-K filed September 29, 2016 (SEC File No. 001-33338))
10.9^ Change in Control Agreement between American Eagle Outfitters, Inc. and Robert L. Madore, dated September 23, 2016(incorporated by reference to Exhibit 10.2 to the Company’s Form 8-K filed September 29, 2016 (SEC File No. 001-33338))
10.10^ Form of 2016 Director and Officer Indemnification Agreement (incorporated by reference to Exhibit 10.18 to the Company’s Form 10-Kfiled March 10, 2017 (SEC File No. 001-33338))
10.11^ General Release and Form of Separation between Peter Z. Horvath and American Eagle Outfitters, Inc., dated October 5, 2017(incorporated by reference to Exhibit 10.1 to the Company’s Form 10-Q filed December 7, 2017 (SEC File No. 001-33338))
10.12^ American Eagle Outfitters, Inc. 2017 Stock Award and Incentive Plan (as amended and restated effective March 14, 2018)(incorporated by reference to Exhibit 10.1 to the Company’s Form 10-Q filed June 1, 2018 (SEC File No. 001-33338))
10.13^ Form of Notice of Grant of Time-Based Restricted Stock Units and Restricted Stock Units Awards Agreement (incorporated byreference to Exhibit 10.2 to the Company’s Form 10-Q filed June 1, 2018 (SEC File No. 001-33338))
10.14^ Form of Notice of Grant of Performance-Based Restricted Stock Units and Restricted Stock Units Awards Agreement (incorporated byreference to Exhibit 10.3 to the Company’s Form 10-Q filed June 1, 2018 (SEC File No. 001-33338))
10.15^ Form of Notice of Grant of Stock Option Award Agreement (incorporated by reference to Exhibit 10.4 to the Company’s Form 10-Qfiled June 1, 2018 (SEC File No. 001-33338))
10.16^ Notice of Long Term Incentive Grant of Special Engagement and Retention Restricted Stock Units (incorporated by reference toExhibit 10.1 to the Company’s Form 10-Q filed December 12, 2018 (SEC File No. 001-33338))
10.17^ Notice of Grant of Special Engagement and Retention Restricted Stock Units (incorporated by reference to Exhibit 10.2 to theCompany’s Form 10-Q filed December 12, 2018 (SEC File No. 001-33338))
21* Subsidiaries
23* Consent of Independent Registered Public Accounting Firm
24* Power of Attorney
31.1* Certification by Jay L. Schottenstein pursuant to Rule 13a-14(a) or Rule 15d-14(a)
31.2* Certification by Robert L. Madore pursuant to Rule 13a-14(a) or Rule 15d-14(a)
32.1** Certification of Principal Executive Officer Pursuant to 18 U.S.C. Section 1350, as adopted Pursuant to Section 906 of the Sarbanes-Oxley Act of 2002
32.2** Certification of Principal Financial Officer Pursuant to 18 U.S.C. Section 1350, as adopted Pursuant to Section 906 of the Sarbanes-Oxley Act of 2002
68
ExhibitNumber
Description
101* Interactive Data File
+ Portions of this exhibit have been omitted pursuant to a confidential treatment order from the SEC ^ Management contract or compensatory plan or arrangement.* Filed herewith.** Furnished herewith.
(b) Exhibits
The exhibits to this report have been filed herewith.
(c) Financial Statement Schedules
None.
69

SIGNATURES
Pursuant to the requirements of Section 13 or 15(d) of the Securities Exchange Act of 1934, the Registrant has duly caused this report to besigned on its behalf by the undersigned, thereunto duly authorized. AMERICAN EAGLE OUTFITTERS, INC. By: /s/ Jay L. Schottenstein Jay L. Schottenstein Chief Executive Officer
Dated March 14, 2019
Pursuant to the requirements of the Securities Exchange Act of 1934, this report has been signed by the following persons on behalf of theregistrant and in the capacities indicated on March 14, 2019.
Signature Title
/s/ Jay L. Schottenstein Chief Executive Officer, Chairman of the Board of Directorsand Director
(Principal Executive Officer)Jay L. Schottenstein
/s/ Robert L. Madore Executive Vice President, Chief Financial Officer(Principal Financial Officer)Robert L. Madore
/s/ James H. Keefer Vice President, Chief Accounting Officer(Principal Accounting Officer)James H. Keefer
* DirectorSujatha Chandrasekaran
* DirectorDeborah A. Henretta * DirectorThomas R. Ketteler
* DirectorCary D. McMillan
* DirectorJanice E. Page
* DirectorDavid M. Sable
* DirectorNoel J. Spiegel *By: /s/ Robert L. Madore
Robert L. Madore, Attorney-in-Fact
70
Exhibit 21
Subsidiaries
American Eagle Outfitters, Inc., a Delaware Corporation, has the following wholly owned subsidiaries:
AE Admin Services Co LLC, an Ohio Limited Liability Company
AE Corporate Services Co., a Delaware Corporation
AE Direct Co. LLC, a Delaware Limited Liability Company
AE Holdings Co., a Delaware Corporation
AE North Holdings Co, a Canadian (Nova Scotia) Unlimited Liability Company
AE Outfitters Retail Co., a Delaware Corporation
AE Retail West LLC, a Delaware Limited Liability Company
AEO Asia Trading, a People’s Republic of China Trust
AEO International Corp., a Delaware Corporation
AEO International Trading Corp., a Cayman Islands Exempted Company
AEO Israeli Services Co, a Delaware Corporation
AEO Management Co., a Delaware Corporation
AEO Realty Co LLC, a Delaware Limited Liability Company
American Eagle Cdn Hold Co., a Delaware Corporation
American Eagle Mexico Imports, S. de R.L. de C.V., a Mexican Limited Liability Company
American Eagle Mexico Retail, S. de R.L. de C.V., a Mexican Limited Liability Company
American Eagle Mexico Services, S. de R.L. de C.V., a Mexican Limited Liability Company
American Eagle NL Services Co B.V., a Netherlands Limited Liability Company
American Eagle Outfitters Asia Limited, a Hong Kong Limited Liability Company
American Eagle Outfitters Canada Corporation, a Canadian (Nova Scotia) Unlimited Liability Company
American Eagle Outfitters (China) Commercial Enterprise Co., Ltd., a Peoples Republic of China Foreign Investment Commercial Enterprise
American Eagle Outfitters Dutch Op Co B.V., a Netherlands Limited Liability Company
American Eagle Outfitters Holland Hold Co B.V., a Netherlands Limited Liability Company
American Eagle Outfitters Hong Kong Limited, a Hong Kong Limited Liability Company
American Eagle Outfitters UK Limited, a United Kingdom Limited Liability Company
Blue Heart Enterprises LLC, a Delaware Limited Liability Company
Blue Star Imports Ltd., a Delaware Corpora tion
Blue Star Imports, L.P., a Pennsylvania Limited Partnership
BSI Imports Company, LLC, a Delaware Limited Liability Company
Linmar Realty Company II LLC, a Delaware Limited Liability Company
NS Holdings Co., a Delaware Corporation
Retail Distribution East LLC, a Delaware Limited Liability Company
Retail Distribution West LLC, a Delaware Limited Liability Company
Retail Royalty Company, a Nevada Corporation
Tailgate Clothing Company Corp., an Iowa Corporation
Exhibit 23
Consent of Independent Registered Public Accounting Firm We consent to the incorporation by reference in the following Registration Statements: • Registration Statement and related prospectus (Form S-3 No. 333-68875) of American Eagle Outfitters, Inc., • Registration Statement (Form S-8 No. 333-03278) pertaining to the Employee Stock Purchase Plan of American Eagle Outfitters, Inc., • Registration Statement (Form S-8 No. 33-84796) pertaining to the Stock Fund of American Eagle Outfitters, Inc. Profit Sharing and 401(k)
Plan, • Registration Statements (Form S-8 Nos. 333-126278 and 333-161661) pertaining to the 2005 Stock Award and Incentive Plan of American
Eagle Outfitters, Inc., • Registration Statement (Form S-8 No. 333-197050) pertaining to the 2014 Stock Award and Incentive Plan of American Eagle Outfitters,
Inc., and • Registration Statement (Form S-8 No. 333-218194) pertaining to the 2017 Stock Award and Incentive Plan of American Eagle Outfitters,
Inc of our reports dated March 14, 2019, with respect to the consolidated financial statements of American Eagle Outfitters, Inc. and the effectiveness ofinternal control over financial reporting of American Eagle Outfitters, Inc. included in this Annual Report (Form 10-K) of American Eagle Outfitters,Inc. for the year ended February 2, 2019. /s/ Ernst & Young LLP Pittsburgh, Pennsylvania March 14, 2019
Exhibit 24
Power of Attorney
Each director and/or officer of American Eagle Outfitters, Inc. (the “Corporation”) whose signature appears below hereby appoints StacySiegal or Robert L. Madore as his or her attorneys or either of them individually as his or her attorney, to sign, in his or her name and behalf and inany and all capacities stated below, and to cause to be filed with the Securities and Exchange Commission (the “Commission”), the Corporation’sAnnual Report on Form 10-K (the “Form 10-K”) for the year ended February 2, 2019, and likewise to sign and file with the Commission any and allamendments to the Form 10-K, and the Corporation hereby appoints such persons as its attorneys-in-fact and each of them as its attorney-in-factwith like authority to sign and file the Form 10-K and any amendments thereto granting to each such attorney-in-fact full power of substitution andrevocation, and hereby ratifying all that any such attorney-in-fact or his substitute may do by virtue hereof.
IN WITNESS WHEREOF, we have hereunto set our hands as of March 14, 2019.
Signature Title /s/ Jay L. Schottenstein Chief Executive Officer,
Chairman of the Board of Directors and Director(Principal Executive Officer)
Jay L. Schottenstein
/s/ Robert L. Madore Chief Financial Officer
(Principal Financial Officer)Robert L. Madore /s/ James H. KeeferJames H. Keefer
Vice President, Chief Accounting Officer
(Principal Accounting Officer) /s/ Sujatha Chandrasekaran
Director
Sujatha Chandrasekaran /s/ Deborah A. Henretta DirectorDeborah A. Henretta /s/ Thomas R. Ketteler DirectorThomas R. Ketteler /s/ Cary D. McMillan DirectorCary D. McMillan /s/ Janice E. Page DirectorJanice E. Page /s/ David M. Sable DirectorDavid M. Sable /s/ Noel J. Spiegel DirectorNoel J. Spiegel
Exhibit 31.1
CERTIFICATIONS
I, Jay L. Schottenstein, certify that:
1. I have reviewed this Annual Report on Form 10-K of American Eagle Outfitters, Inc.;
2. Based on my knowledge, this report does not contain any untrue statement of a material fact or omit to state a material fact necessary tomake the statements made, in light of the circumstances under which such statements were made, not misleading with respect to the period coveredby this report;
3. Based on my knowledge, the financial statements, and other financial information included in this report, fairly present in all materialrespects the financial condition, results of operations and cash flows of the registrant as of, and for, the periods presented in this report;
4. The registrant’s other certifying officer(s) and I are responsible for establishing and maintaining disclosure controls and procedures (asdefined in Exchange Act Rules 13a-15(e) and 15d-15(e)) and internal control over financial reporting (as defined in Exchange Act Rules 13a-15(f)and 15d-15(f)) for the registrant and have:
a) Designed such disclosure controls and procedures, or caused such disclosure controls and procedures to be designed under oursupervision, to ensure that material information relating to the registrant, including its consolidated subsidiaries, is made known to us by otherswithin those entities, particularly during the period in which this report is being prepared;
b) Designed such internal control over financial reporting, or caused such internal control over financial reporting to be designed underour supervision, to provide reasonable assurance regarding the reliability of financial reporting and the preparation of financial statements forexternal purposes in accordance with generally accepted accounting principles;
c) Evaluated the effectiveness of the registrant’s disclosure controls and procedures and presented in this report our conclusions aboutthe effectiveness of the disclosure controls and procedures, as of the end of the period covered by this report based on such evaluation; and
d) Disclosed in this report any change in the registrant’s internal control over financial reporting that occurred during the registrant’smost recent fiscal quarter (the registrant’s fourth fiscal quarter in the case of an annual report) that has materially affected, or is reasonablylikely to materially affect, the registrant’s internal control over financial reporting; and
5. The registrant’s other certifying officer(s) and I have disclosed, based on our most recent evaluation of internal control over financialreporting, to the registrant’s auditors and the audit committee of the registrant’s board of directors (or persons performing the equivalent functions):
a) All significant deficiencies and material weaknesses in the design or operation of internal control over financial reporting which arereasonably likely to adversely affect the registrant’s ability to record, process, summarize and report financial information; and
b) Any fraud, whether or not material, that involves management or other employees who have a significant role in the registrant’sinternal control over financial reporting.
/s/ Jay L. Schottenstein Jay L. Schottenstein Chief Executive Officer (Principal Executive Officer) March 14, 2019
Exhibit 31.2
CERTIFICATIONS
I, Robert L. Madore, certify that:
1. I have reviewed this Annual Report on Form 10-K of American Eagle Outfitters, Inc.;
2. Based on my knowledge, this report does not contain any untrue statement of a material fact or omit to state a material fact necessary tomake the statements made, in light of the circumstances under which such statements were made, not misleading with respect to the period coveredby this report;
3. Based on my knowledge, the financial statements, and other financial information included in this report, fairly present in all materialrespects the financial condition, results of operations and cash flows of the registrant as of, and for, the periods presented in this report;
4. The registrant’s other certifying officer(s) and I are responsible for establishing and maintaining disclosure controls and procedures (asdefined in Exchange Act Rules 13a-15(e) and 15d-15(e)) and internal control over financial reporting (as defined in Exchange Act Rules 13a-15(f)and 15d-15(f)) for the registrant and have:
a) Designed such disclosure controls and procedures, or caused such disclosure controls and procedures to be designed under oursupervision, to ensure that material information relating to the registrant, including its consolidated subsidiaries, is made known to us by otherswithin those entities, particularly during the period in which this report is being prepared;
b) Designed such internal control over financial reporting, or caused such internal control over financial reporting to be designed underour supervision, to provide reasonable assurance regarding the reliability of financial reporting and the preparation of financial statements forexternal purposes in accordance with generally accepted accounting principles;
c) Evaluated the effectiveness of the registrant’s disclosure controls and procedures and presented in this report our conclusions aboutthe effectiveness of the disclosure controls and procedures, as of the end of the period covered by this report based on such evaluation; and
d) Disclosed in this report any change in the registrant’s internal control over financial reporting that occurred during the registrant’smost recent fiscal quarter (the registrant’s fourth fiscal quarter in the case of an annual report) that has materially affected, or is reasonablylikely to materially affect, the registrant’s internal control over financial reporting; and
5. The registrant’s other certifying officer(s) and I have disclosed, based on our most recent evaluation of internal control over financialreporting, to the registrant’s auditors and the audit committee of the registrant’s board of directors (or persons performing the equivalent functions):
a) All significant deficiencies and material weaknesses in the design or operation of internal control over financial reporting which arereasonably likely to adversely affect the registrant’s ability to record, process, summarize and report financial information; and
b) Any fraud, whether or not material, that involves management or other employees who have a significant role in the registrant’sinternal control over financial reporting.
/s/ Robert L. Madore Robert L. Madore Chief Financial Officer (Principal Financial Officer) March 14, 2019

Exhibit 32.1
Certification Pursuant to 18 U.S.C. Section 1350,as Adopted Pursuant to Section 906 of the Sarbanes-Oxley Act of 2002
In connection with the Annual Report of American Eagle Outfitters, Inc. (the “Company”) on Form 10-K for the period ended February 2, 2019as filed with the Securities and Exchange Commission on the date hereof (the “Report”), I, Jay L. Schottenstein, Principal Executive Officer of theCompany, certify to the best of my knowledge, pursuant to 18 U.S.C. Section 1350, as adopted pursuant to Section 906 of the Sarbanes-Oxley Actof 2002, that:
1. The Report fully complies with the requirements of Section 13(a) or 15(d) of the Securities Exchange Act of 1934; and
2. The information contained in the Report fairly presents, in all material respects, the financial condition and results of operations of theCompany.
/s/ Jay L. Schottenstein Jay L. Schottenstein Chief Executive Officer (Principal Executive Officer) March 14, 2019
Exhibit 32.2
Certification Pursuant to 18 U.S.C. Section 1350,as Adopted Pursuant to Section 906 of the Sarbanes-Oxley Act of 2002
In connection with the Annual Report of American Eagle Outfitters, Inc. (the “Company”) on Form 10-K for the period ended February 2, 2019as filed with the Securities and Exchange Commission on the date hereof (the “Report”), I, Robert L. Madore, Principal Financial Officer of theCompany, certify to the best of my knowledge, pursuant to 18 U.S.C. Section 1350, as adopted pursuant to Section 906 of the Sarbanes-Oxley Actof 2002, that:
1. The Report fully complies with the requirements of Section 13(a) or 15(d) of the Securities Exchange Act of 1934; and
2. The information contained in the Report fairly presents, in all material respects, the financial condition and results of operations of theCompany.
/s/ Robert L. Madore Robert L. Madore Chief Financial Officer (Principal Financial Officer) March 14, 2019