adoption of waste-reducing technology in manufacturing: regional factors and policy issues
TRANSCRIPT

Resource and Energy Economics 39 (2015) 53–67
Contents lists available at ScienceDirect
Resource and Energy Economics
j ournal homepage: www.elsev ier .com/ locate / ree
Adoption of waste-reducing technology inmanufacturing: Regional factors and policyissues�
Giulio Cainelli a,∗, Alessio D’Amatob, Massimiliano Mazzanti c
a Università di Padova, IRCRES – CNR, Milan and SEEDS, Italyb DEF and CEIS – Università degli Studi di Roma “Tor Vergata”, and SEEDS, Italyc Università di Ferrara, IRCRES – CNR, Milan, and SEEDS, Italy
a r t i c l e i n f o
Article history:Received 8 June 2013Received in revised form 18 November2014Accepted 20 November 2014Available online 28 November 2014
a b s t r a c t
The paper provides a joint theoretical–empirical investigation toassess the adoption by manufacturing firms of innovations aimedat improving waste related performance. In line with the recentemphasis on the ‘external’ factors stimulating innovation, whichoften are more important than ‘traditional’ drivers such as R&D,we address the role of local policy environments and regional fea-tures. We analyse firms’ innovation adoption choices in a simplifiedtechnology adoption model, augmented to account for factors rel-evant to determining environmental innovation (EI). We frame ourempirical analysis in an original integration of data from a firm levelsurvey (Italian CIS2008 survey of manufacturing firms) and regional
� The authors would like to thank Edilio Valentini, Mariangela Zoli and two anonymous reviewers for their precious sug-gestions. Previous versions of this paper have been presented at the Workshop on “Eco Innovation in the EU – Conceptualand Empirical Perspectives” (University of Ferrara, September 2013), at the University of Turin, Dipartimento di Economia S.Cognetti de Martinis (seminar organized by BRICK Collegio Carlo Alberto – January 30, 2013), and at a research seminar at theClimate Economics Chair, Paris Sorbonne, November 2013. Financial support from the EMInInn research project, funded bythe European Union under the 7th Framework Programme for Research (Grant Agreement No. 283002, www.emininn.eu) andfrom the Italian Ministry of Education, University and Research (Scientific Research Program of National Relevance – PRIN –2010–2011 on “Climate change in the Mediterranean area: scenarios, economic impacts, mitigation policies and technologicalinnovation”) is gratefully acknowledged. The usual disclaimers apply.
∗ Corresponding author at: Dipartimento di Scienze Economiche e Aziendali “Marco Fanno” (Dsea), Via del Santo, 33 Padova,Italy. Tel.: +39 049 8274227.
E-mail address: [email protected] (G. Cainelli).
http://dx.doi.org/10.1016/j.reseneeco.2014.11.0040928-7655/© 2014 Published by Elsevier B.V.

54 G. Cainelli et al. / Resource and Energy Economics 39 (2015) 53–67
JEL classification:D22Q53Q55
Keywords:Resource efficiencyInnovation adoptionFirm behaviourWaste policyRegional frameworks
level waste related information. Our econometric analysis showsthat firms adopt EI on the basis of some firm specific and relationalfactors, while usual drivers such as R&D have no impact. The evi-dence from our study supports the role of regional factors related towaste management and policy, that is, firms located in regions fea-turing better separated waste collection and stricter waste policyare more likely to adopt EI.
© 2014 Published by Elsevier B.V.
1. Introduction
Various streams of the ‘economics of waste’ literature explore the range of factors correlated withwaste performance, including waste generation, waste recycling/waste management and waste dis-posal, at the macro and micro levels (D’Amato et al., 2013; Johnstone and Labonne, 2004; Mazzantiand Montini, 2009; Shinkuma and Managi, 2011). Therefore, it is surprising that the role and determi-nants of innovation in waste and materials/resources consumption have only recently begun to attractresearch attention. The diffusion of environmental innovation (EI) is crucial (Kemp and Pontoglio,2011) to achieve sustainability and competitiveness, especially in highly industrialized countries. Theliterature suggests that several social, economic and policy factors contribute to explaining waste per-formance and, possibly, driving related innovation (Mazzanti and Zoboli, 2009; Mazzanti et al., 2008).Within this literature, there are several studies of waste generation and disposal and their drivers,that analyse regional frameworks (Allers and Hoeben, 2010; De Jaeger and Eyckmans, 2008; Dijkgraafand Gradus, 2009, 2004; Hage and Soderholm, 2008).
Among the very few papers that focus specifically on EI in the waste realm, Horbach et al. (2012)investigate the determinants of EI in several environmentally relevant fields, and use 2009 CIS (Com-munity Innovation Survey) data for Germany with a specific focus on the role played by (current andexpected) regulation, cost savings and consumer benefits. Managi et al. (2014) analyse the technol-ogy adopted by municipalities in Japan and suggest that central government’s policies may generateinappropriate incentives. We contribute to this literature by developing a joint theoretical–empiricalinvestigation of the decisions about innovation adoption made by manufacturing firms in the wasteand resources realm. We focus on the case of Italy, due to the significant degree of heterogeneityin terms of environmental and economic performance across different areas (Mazzanti et al., 2012),which has created problems related to the management of local ‘hot spots’. Italy provides a vividexample of the need to boost innovation, starting at firm level, in order to reduce the consumption ofmaterial resources and related production of waste.
In line with works that highlight the external influences affecting innovation, we investigate therole of local policy environments and regional structural features. R&D investment seems to have lostits primacy among the drivers of innovation at firm level. This ‘new framework’ is especially applicableto radical and socially interlinked innovations such as environmental inventions and their adoption.Research is shifting the focus of analysis in non-R&D centric directions (Cainelli et al., 2012).
We develop a series of theory-based, testable implications regarding the extent to which firmbehaviour is influenced by external factors, such as waste policies and infrastructures (landfill taxes,indicators of local commitment and performance related to waste, waste policy stringency, etc.). Weframe our empirical analysis in an original integration of firm survey data (CIS – 2006–2008 data)1
and regional level waste related information derived from the Italian Environmental Agency’s wastereports. We use CIS2008 data because this was the first survey that asked about EI adoption. Thedataset we exploit contains more than 6000 Italian manufacturing firms observed over 2006–2008.The merging of CIS data with regionally related data on waste performance is, to our knowledge, a
1 The Community Innovation Survey (CIS) is the main and official EU survey on innovation adoption by firms. Microdata areavailable only at the national (not regional) level, which is one of our justifications for choosing Italian CIS data.

G. Cainelli et al. / Resource and Energy Economics 39 (2015) 53–67 55
novel direction in the EI literature, and allows us to analyse how innovation adoption is influenced byfirm-based, sector-based and geographic policy-based factors.
Our paper is mostly linked to two literature streams. First, we refer to the literature on technologyadoption and environmental policy that originated with Milliman and Prince’s (1989) and Downingand White’s (1986) contributions.2 The very simple theoretical model developed in Section 2 of thispaper relies on the standard assumptions in that literature and derives, in particular, plausible con-clusions about how waste policy (in our setting, a landfill tax and/or a waste tariff) might affect theincentives for technology adoption. Secondly, and most importantly, the present study is linked to theliterature on the drivers and determinants of EI: specifically, EI adoption. Definitions of eco-innovation(Kemp, 2000, 2010) highlight the ecological attributes of specific new processes, products and meth-ods from a technical and ecological perspective. For example, the MEI (Measuring Eco-Innovation)research project defines eco-innovation as the production, assimilation and exploitation of a prod-uct, production process, service or management or business method, that is novel to the organization(developing or adopting it), whose life-cycle results in a reduction of environmental risks, pollutionand other negative impacts of resources use compared to relevant alternatives. The inclusion of neworganizational methods, products, services and knowledge-oriented innovations in this definition,differentiates it from the definition of environmental technologies as all technologies whose use isless environmentally harmful than relevant alternatives (Kemp, 2010). We aim to capture the driversof EI that are outside the firm’s boundary and reside in the institutional and economic features of theterritory. Theoretically, this implies the need to enrich the predictions of (policy oriented) theoreticalanalysis with the considerations included in a ‘regional systems of innovation’ approach (Beaudry andBreschi, 2003; Boschma and Lambooy, 2002; Iammarino, 2005; Iammarino and McCann, 2006), inorder to investigate the key elements of regions (Cainelli, 2008; Cainelli et al., 2007) that foster wasterelated innovations. Several papers investigate EI drivers. These include Horbach et al. (2012) which,as already referred to, focus on the determinants of EI in several environmental realms in Germany,and Kneller and Manderson (2012) which examine the link between innovation and environmentalregulations in UK. However, our contribution is, to our knowledge, one of very few studies to focuson how firm level innovation incentives are affected by local idiosyncratic features of waste relatedinfrastructures, and by the shape of policy interventions.
The paper is organized as follows. Section 2 presents the theoretical background that informs theempirical analysis; Section 3 describes the data and models; Section 4 discusses the main econometricevidence; and Section 5 concludes.
2. Conceptual framework
This section sets out our research hypotheses with respect to the main determinants of innova-tion, in the form of adoption, related to waste. We focus on the impact of waste related policies andthe existing waste infrastructures, and their influence on firms’ adoption of less resource-intensivetechnologies. We discuss the role of other relevant factors, including firm specific features.
2.1. Role of policy, infrastructures and firm specific features
We model a representative economic agent (we focus on a firm, but without loss of generality)generating waste and subject to regulation. We denote the waste production level as g. Our theoreticalframework is purposely stylized, so that g is intended broadly to measure the environmental impactof waste related choices taken by the agent: thus, it might quantify waste generation as well as theenvironmental impact of the firm’s waste management practices more generally.
The regulated firm features an existing technology, denoted by the waste reduction cost functionc(g,�); parameter � measures firm specific characteristics that the literature suggests are significantdrivers of eco innovation (Horbach et al., 2012). Relevant firm specific factors include technological
2 For a very good survey, see Requate (2005).

56 G. Cainelli et al. / Resource and Energy Economics 39 (2015) 53–67
capability improvements led by R&D, organizational innovations such as the adoption of Environ-mental Management Systems (EMS, Rennings et al., 2006), and the quality of the available knowledgetransfer mechanisms according to the sources of knowledge and the firm’s effectiveness at using theinformation.
The waste reduction cost function c(·) satisfies, for any given value of �, standard assumptions:cg(·) < 0 – costs decrease with waste production (or, more broadly, with poorer waste management bythe firm) – and cgg(·) > 0.3
We expect better firm specific characteristics to imply, ceteris paribus, lower costs, so that weassume that c�(·) < 0. Also cg�(·) > 0, that is, a larger � implies a smaller (absolute value of the) marginalcost related to g: in other words, the larger is �, the weaker are the incentives for the regulated firmto reduce costs by increasing g.
We address the role played by waste policy and waste related infrastructures in a simplified way.More specifically, these factors are subsumed in a unit payment for waste (e.g. a waste related tax),t = t(ˇ, ı), where is a measure of the waste policy stringency (a larger implying stricter regulation),and ı is a measure of the state of waste related infrastructures, with a larger ı implying worse wasterelated infrastructures. Parameter can be intended as a measure of the authorities’ commitmentto lower waste production and/or the impact of firms’ waste management practices, for example, inthe form of higher unit waste taxes or tariffs. A larger value of ı, on the other hand, can be linked toexisting separated collection or landfill rates. We assume that tˇ > 0, that is, waste production (or,more generally, a larger environmental impact related to waste management) is perceived as morecostly under stricter regulation. On the other hand, tı can be positive or negative: if it is positive,then a relatively poor state of existing waste related infrastructures implies a larger unit payment forregulated firms, for example, due to the need for the waste management authorities to cover relativelylarge landfill costs. If tı is negative, then a better state of waste related infrastructures results in a largerunit payment for waste related impacts; this can occur, for example, if better separated collectionfacilities imply that the relative “price” of separated collection over undifferentiated waste productiondecreases (i.e. the relative “price” of high impact waste practices increases). In this second case, a betterstate of waste related infrastructures acts in the same direction as a stricter waste policy.
Finally, we model technology adoption, assuming that the firm can choose to install a new technol-ogy featuring lower waste reduction costs for any given level of waste production and of the value ofparameter �. More specifically, by paying a fixed cost F, the regulated firm can reduce the costs c(·) bythe factor 0 < < 1, the smaller the factor the larger the cost savings due to the new technology. Thus,if the new technology is adopted, the cost of waste reduction (and, therefore, the cost advantage ofincreasing waste production) decreases.
The agent’s cost minimization problem under the existing technology can be written as:
mingCo = c(g, �) + t(ˇ, ı)g (1)
where the subscript o labels the “old” (i.e. existing) technology. Given the assumption of a convex costfunction,4 the first order (necessary and sufficient) conditions with respect to g imply:
cg(·) + t(·) = 0, (2)
resulting in a waste level go; the corresponding signs of the comparative statics are as reported in thesecond column in Table 1.5 As expected, a stricter waste policy and better firm specific features implylower levels of waste production. The impact of waste related infrastructures, however, is ambiguous.
The corresponding firm’s problem when the new technology is adopted is:
mingCn = F + ˛c(g, �) + t(ˇ, ı)g (3)
3 Coherently with the existing literature (e.g. Requate, 2005), the cost function c(g,�) can be interpreted as measuring thecosts of reducing waste to some level g below the laissez-faire (unregulated) level.
4 We limit our attention to interior solutions.5 Details concerning comparative statics are provided in Appendix A, Table A1.

G. Cainelli et al. / Resource and Energy Economics 39 (2015) 53–67 57
Table 1Comparative statics.
Parameter Existing technology (go) New technology (gn)
Policy strictness (ˇ) − −Infrastructures (ı) +/− +/−Firm specific features (�) − −New technology cost savings (˛) 0 +
where subscript n denotes the ‘new technology’. First order (necessary and sufficient) conditions are:
˛cg(·) + t(·) = 0, (4)
implying a waste level gn and the comparative statics reported in the third column of Table 1. Compar-ing (2) and (4), and accounting for the convexity of c(·) with respect to g, we can easily conclude that,for given parameters values, go > gn. Finally, we should note that a larger cost reduction potential ofthe new technology (a smaller parameter ˛) implies a smaller amount of waste produced using thesame technology, which is a reasonable conclusion.
In order to assess the incentives for the firm under scrutiny to adopt the cleaner technology, wedefine the net cost gain from adoption as follows:
� = c(go, �) − ˛c(gn, �) − F + t(ˇ, ı)(go − gn) (5)
that is, the difference arising between the equilibrium costs with the existing technology and thosewith the new technology. Clearly, a negative value of � implies that adoption does not take place,while incentives for adoption are stronger the larger the value of �. We can now turn to the mainresults of our theoretical analysis.6
Result 1. A stricter waste policy implies larger adoption incentives, namely the effect induced by thepolicy is improved technology adoption.
Result 1 is indeed reasonable: a stricter waste policy implies a larger unit payment t(·), making theadoption of the new technology (and the resulting decrease in equilibrium waste production) moreattractive.
Result 2. A better state of the ‘waste management related infrastructures’, for example, in the form ofbetter separated collection systems, has an ambiguous impact on adoption incentives.
The state of waste related infrastructures can lead to larger or smaller adoption incentives: inparticular, when t(·) increases as existing infrastructures improve (i.e. as ı decreases), then betterwaste related facilities – for example, proxied by larger (smaller) separated collection (landfill) rates– act exactly as a stricter waste policy, and imply stronger incentives for technology adoption.
Result 3. Improved firm specific characteristics can imply larger incentives for technology adoption. Thisis the case when firm specific factors are sufficiently effective in lowering the marginal costs of wastereduction.
The impact of firm specific features on adoption incentives can be explained as follows: first, due tocg� > 0 and to go > gn, then |c�(go, �)| < |c�(gn, �)|; in other words, better firm related characteristicshave a smaller impact (in absolute terms) on the c(·) function when the equilibrium waste productiong is set at the level arising under the old (i.e. existing) technology. This effect encourages adoption.On the other hand, the fact that < 1 implies that the impact of firm related characteristics is, ceterisparibus, weaker when the new technology is adopted (i.e. costs of waste reduction are affected less bya given increase in � for any level of g when the new technology is adopted). Therefore, the net effectdepends (also) on how the marginal cost reduction related to increases in g reacts to an improvementin firm specific characteristics.
6 The proofs are reported in Appendix A.

58 G. Cainelli et al. / Resource and Energy Economics 39 (2015) 53–67
One additional remark is needed. In our paper, we do not explicitly address other potential driversof innovation, the most important of which are market pull factors. As Horbach et al. (2012) underlinein surveying previous studies, evidence does not seem to provide strong support to the relevance ofdemand side factors; among others, Rehfeld et al. (2007) suggest that environmental product inno-vations are made tougher by the expensiveness of eco-friendly products, while Kammerer (2009)identifies the crucial role of consumer benefits in driving eco-innovation. The empirical analysis inHorbach et al. (2012) shows that the demand side is important in explaining eco-innovation (also) inthe areas of recycling and use of materials. We lack comprehensive information on potential marketpull factors, and leave the assessment of their impact on adoption incentives to future research.
2.2. Research hypotheses
The theoretical model suggests testable implications that can be summed up in two researchhypotheses related to our empirical analysis.
H1. Idiosyncratic regional waste factors related to waste management and waste policy are positivelycorrelated to EI.
This hypothesis is oriented to capturing ‘regulatory’, institutional and infrastructural aspects ofwaste systems that may influence adoption and EI more generally (Johnstone et al., 2012), in a regionalcontext. The assumption of a positive correlation between waste policy stringency and commitment toimproved public management of waste on the one side, and adoption incentives on the other, is basedon Result 1. However, as Result 2 shows, the hypothesis of a positive link between infrastructuresand EI adoption cannot be taken for granted. We also expect regional idiosyncratic factors to be moresignificant than the usual geographical factors captured by geo-dummies, for explaining EI adoption.We use two regional waste management and waste policy related proxies to test diverse elements ofthe ‘decentralized environment’: (i) regional performance in separated collection of municipal waste;(ii) diffusion of the new waste tariff. The new waste management tariff was introduced by ItalianLegislative Decree No. 22/1997 and, in theory, was expected to be an improvement on the formerwaste management tax by making total tariff payments increase with actual waste production.7 How-ever, because Legislative Decree 22/1997 provides for a transition phase that has proven gradual andvery slow, a mechanism close to the earlier tax continues to be levied in many Italian municipali-ties. Effective implementation of the tariff system is highly dependent on local policy decisions andpractices. Policy implementation is heterogeneous even across areas with similar incomes and similarsocio-economic variables. The shift away from the old ‘non environmentally oriented’ tax is, however,expected to capture commitment towards better waste management inherent in the new tariff.
Regional separated collection performance and implementation of a waste tariff are used as proxiesfor regional waste management and policy strategies, measured by actual performance (partly regu-latory driven) and policy commitment (e.g. taxes and tariffs). These proxies are complemented by athird measure of waste policy stringency, namely a regional landfill tax – introduced in 1996 in Italyand subject to regional competence in the definition of tax levels. Including the landfill tax providesan additional hint about the role of waste related infrastructures. More specifically, we cannot excludethe case where the landfill tax drives the results in an opposite direction with respect to the two othermeasures of policy commitment outlined above.
H2. The quality of information diffusion in local networks and firm specific features, such as belongingto a business group, R&D and so on, are expected to increase EI performance.
This set of drivers is linked to Result 3. Result 3 clarifies that we cannot expect all linkages to besupported by our empirical investigation. However, the intuition related to Result 3 suggests thatthe existence of a significant and positive impact of a subset of the considered firm specific factorsaccording to our estimates, would (indirectly) support the view that those factors are also effective
7 The former tax was calculated on the area of household living space; the new tariff is based on full-cost pricing principlesfor waste management services, and includes some market based features.

G. Cainelli et al. / Resource and Energy Economics 39 (2015) 53–67 59
in reducing the marginal cost savings generated by a larger waste production (or a poorer wastemanagement).
3. The data
We address our research questions using two different statistical sources. The first is the 2006–2008wave of the Italian CIS. This survey provides information on EI for a representative sample of 6483manufacturing firms. It also collects data on EI adoption along different dimensions. In this paper, weexploit information concerning firm level adoption of EI related to waste and material flows.
The question we focus on in the CIS survey asks: “During the three years 2006 to 2008, did yourenterprise introduce a product (good or service), process, organisational or marketing innovation withany of the following environmental benefits?”. More precisely, we use, as our dependent variable, thespecific answer concerning ‘Environmental benefits from the production of goods or services withinyour enterprise’ in relation to <Recycled waste, water or materials>”. We label the resulting variableas ECOWA.8
It has been established that EI adoption is generally considered a better proxy for measuring thefirm’s innovation capacity and intensity than environmental patents.
The second source is the dataset provided by ISPRA (the Italian Environmental Agency), whichcovers regional waste management and waste disposal, and provides information on regional wastepolicy.9 These data allow us to link regional information on waste to firms. Although CIS data do notprovide exact information on the specific location of firms, we know the region in which the firm islocated, which, given the idiosyncratic features of the Italian local systems of production, is very useful(Antonioli et al., 2013; Cainelli et al., 2012). The different ‘capitalistic models’ of the different areas ofItaly – some characterized by big firms (Lombardy, Piedmont), others by dense networks of small andmedium size firms agglomerated in districts (Veneto, Emilia Romagna) – and the decentralized natureof the waste management/policy process, require an understanding of whether, and how significantly,EI adoption derives from these local/regional factors. Turning to the ‘management/policy’ variablesassociated with waste, as already outlined in Section 2.2, we focus on (i) collection of separated waste,(ii) waste tariffs, and (iii) landfill taxation, which capture different factors of the regional regulatoryframework for waste management/disposal.
We merge CIS firm and waste data so that each firm is associated with well-defined heterogeneousregional – ‘meso’ – characteristics (Cole et al., 2009). To our knowledge, this dataset is a novelty inthe environmental innovation literature. It allows us to investigate new areas of regionally-relatedwaste performance, and to analyse the way that EI adoption is influenced by firm and geographicalpolicy-based factors.
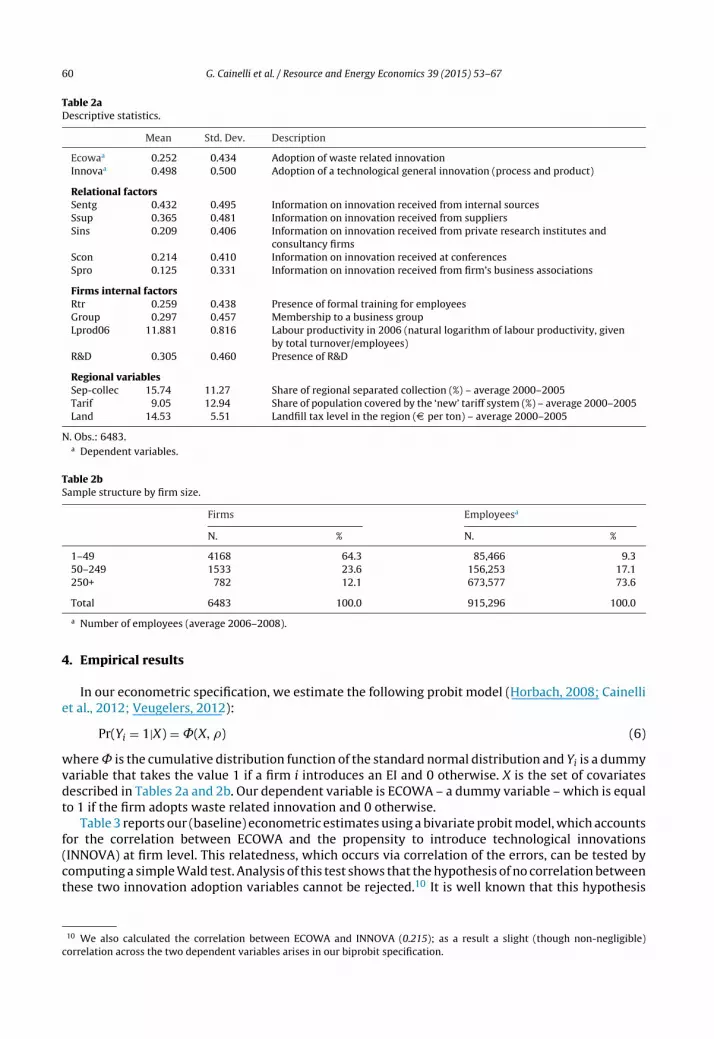
Table 2a provides a description of our main variables, and reports some descriptive statistics (meanand standard deviation). These variables, which refer to internal and regional ‘policy’ factors, areassumed to influence EI adoption. As the brief descriptions in Table 2a suggest, four categories ofvariables will be used in our econometric estimates. Our main dependent variable is the (alreadyoutlined) dummy variable related to the presence (or absence) of waste related EI (ECOWA). Wealso account for another dependent variable, related to the adoption by firms of process and productinnovation in general (INNOVA), which is often correlated with EI adoption. We then have two sets ofvariables related to firms’ features, namely, a first set of relational factors, mostly linked to informationflows, and a second set of firms’ characteristics, measuring productivity, R&D and other structuralfeatures. The last set of variables, already described in Section 2.2, is related to regional waste policyand performance. The econometric analysis also accounts for other more standard variables related tothe size (in terms of number of employees, see Table 2b) and the geographical location of firms underscrutiny.
8 This variable is the closest we are aware of to our empirical research focus.9 As an exception, for the landfill tax at regional level we have used data collected and exploited in Nicolli and Mazzanti
(2013); these data have been collected through the use of official regional web sites and through telephone interviews withregional offices. We thank the authors for making landfill tax data available.
60 G. Cainelli et al. / Resource and Energy Economics 39 (2015) 53–67
Table 2aDescriptive statistics.
Mean Std. Dev. Description
Ecowaa 0.252 0.434 Adoption of waste related innovationInnovaa 0.498 0.500 Adoption of a technological general innovation (process and product)
Relational factorsSentg 0.432 0.495 Information on innovation received from internal sourcesSsup 0.365 0.481 Information on innovation received from suppliersSins 0.209 0.406 Information on innovation received from private research institutes and
consultancy firmsScon 0.214 0.410 Information on innovation received at conferencesSpro 0.125 0.331 Information on innovation received from firm’s business associations
Firms internal factorsRtr 0.259 0.438 Presence of formal training for employeesGroup 0.297 0.457 Membership to a business groupLprod06 11.881 0.816 Labour productivity in 2006 (natural logarithm of labour productivity, given
by total turnover/employees)R&D 0.305 0.460 Presence of R&D
Regional variablesSep-collec 15.74 11.27 Share of regional separated collection (%) – average 2000–2005Tarif 9.05 12.94 Share of population covered by the ‘new’ tariff system (%) – average 2000–2005Land 14.53 5.51 Landfill tax level in the region (D per ton) – average 2000–2005
N. Obs.: 6483.a Dependent variables.
Table 2bSample structure by firm size.
Firms Employeesa
N. % N. %
1–49 4168 64.3 85,466 9.350–249 1533 23.6 156,253 17.1250+ 782 12.1 673,577 73.6
Total 6483 100.0 915,296 100.0
a Number of employees (average 2006–2008).
4. Empirical results
In our econometric specification, we estimate the following probit model (Horbach, 2008; Cainelliet al., 2012; Veugelers, 2012):
Pr(Yi = 1|X) = ˚(X, �) (6)
where is the cumulative distribution function of the standard normal distribution and Yi is a dummyvariable that takes the value 1 if a firm i introduces an EI and 0 otherwise. X is the set of covariatesdescribed in Tables 2a and 2b. Our dependent variable is ECOWA – a dummy variable – which is equalto 1 if the firm adopts waste related innovation and 0 otherwise.
Table 3 reports our (baseline) econometric estimates using a bivariate probit model, which accountsfor the correlation between ECOWA and the propensity to introduce technological innovations(INNOVA) at firm level. This relatedness, which occurs via correlation of the errors, can be tested bycomputing a simple Wald test. Analysis of this test shows that the hypothesis of no correlation betweenthese two innovation adoption variables cannot be rejected.10 It is well known that this hypothesis
10 We also calculated the correlation between ECOWA and INNOVA (0.215); as a result a slight (though non-negligible)correlation across the two dependent variables arises in our biprobit specification.

G. Cainelli et al. / Resource and Energy Economics 39 (2015) 53–67 61
Table 3Factors correlated to ECOWA and INNOVA.
Estimation method Biprobit
Dep. var. ECOWA INNOVA[1.] [2.]
Coeff. t-values Coeff. t-values
Sentg 0.117** 2.21 1.570*** 22.48Ssup 0.126*** 2.67 1.235*** 16.0Sins 0.201*** 4.12 0.517*** 4.42Scon 0.143*** 2.99 0.686*** 5.99Spro 0.109* 1.94 0.385** 2.33Rtr 0.183*** 3.91 1.22*** 10.29Group 0.123*** 2.64 −0.220*** −2.99Lprod06 0.066** 2.53 0.84** 2.25R&D 0.014 0.29 0.701*** 7.09D1-49 Ref. Ref. Ref. Ref.D50-249 0.096** 2.03 −0.007 −0.09D250+ 0.408*** 6.03 0.008 0.06North-West 0.014 0.13 0.329* 1.79North-East 0.170 1.52 0.286 1.55Centre 0.124 1.05 0.079 0.40South 0.169 1.40 0.114 0.58Islands Ref. Ref. Ref. Ref.Industry dummy Yes Yes Yes Yes
N. Obs. 6483 6483Wald test (p value) 0.182
Note: Standard errors are robust to heteroscedasticity.* Significant at 10%.
** Significant at 5%.*** Significant at 1%.
is crucial for understanding whether the phenomenon of eco-innovation adoption is correlated withthe general propensity to innovate. In this case, adoption of ECOWA seems to be a phenomenon thatcan be treated in isolation from INNOVA. This allows us to estimate our (baseline) specification adopt-ing a simple probit model. Table 4 presents the coefficients (column [1.]) and the related marginaleffects (column [2.]) of the same (baseline) econometric specification as in Table 3, estimated usingthis model. The main conclusions based on Table 4 can be summarized as follows. The informationfrom various ‘sources’ is positively correlated to ECOWA. This confirms the ‘relational’ needs andcontent of EI. In order to innovate, firms exploit their networks. Somewhat surprisingly, R&D is notstatistically significant for determining waste specific EI. This is a peculiar feature of the waste relatedEI adoption under scrutiny, while R&D turns out to be relevant for explaining innovation in broaderterms (see Table 3, column “INNOVA”). Among the firm specific variables, the dummies for whetherworkers receive a training programme and whether the firm belongs to a business group are positivelycorrelated with EI and statistically significant. The latter result is not unexpected since the businessgroup is the organizational form adopted by Italian firms that want to grow (Cainelli and Iacobucci,2007). Also, the lagged labour productivity variable seems to have a positive and statistically signif-icant effect on adoption of ECOWA. The evidence on firm specific features implies that support forour testable implication H2 is mixed: improvements in some of the firms’ characteristics (such as theability to exploit information sources and labour productivity) imply a larger willingness to adopt EI,indirectly also suggesting that such characteristics can indeed be relevant for reducing the incentivefor firms to increase their environmental impact to achieve short-run cost savings. On the other hand,firm specific features which, in principle, would be expected to influence EI more broadly (namelygeneral R&D), do not seem to matter for waste and resources related adoption.
Next, we move to analyse the impact of geographic related waste management/policy factors. Giventhat, as Table 4 suggests, geographical dummies are not statistically significant, we need to exploreother regional factors.

62 G. Cainelli et al. / Resource and Energy Economics 39 (2015) 53–67
Table 4Factors correlated to ECOWA.
Estimation method ProbitDep. var. ECOWA
[1.] [2.]
Coeff. t-values dF/dx t-values
Sentg 0.116** 2.19 0.036** 2.19Ssup 0.125*** 2.64 0.039*** 2.64Sins 0.201*** 4.12 0.064*** 4.12Scon 0.143*** 2.99 0.045*** 2.99Spro 0.109* 1.93 0.034* 1.93Rtr 0.184*** 3.92 0.058*** 3.92Group 0.123*** 2.63 0.038*** 2.63Lprod06 0.066** 2.52 0.020** 2.52R&D 0.014 0.28 0.004 0.28D1-49 Ref. Ref. Ref. Ref.D50-249 0.096** 2.04 0.030** 2.04D250+ 0.409*** 6.03 0.138*** 6.03North-West 0.014 0.13 0.004 0.13North-East 0.170 1.53 0.053 1.53Centre 0.124 1.05 0.039 1.05South 0.170 1.40 0.054 1.40Islands Ref. Ref. Ref. Ref.Industry dummy Yes Yes Yes Yes
N. Obs. 6483 6483Pseudo R2 0.088 0.088AIC 6757.7 6757.7BIC 7015.3 7015.3Correctly classified 75.5% 75.5%
Note: Standard errors are robust to heteroscedasticity.* Significant at 10%.
** Significant at 5%.*** Significant at 1%.
Introducing the share of separated waste collection (Table 5, column [1]), which is a target of EUand Italian law, does not change previous results. Its statistical significance is high, which means thatfirms located in regions with higher levels of separated collection (higher policy commitment), aremore likely to adopt ECOWA. This can be interpreted as evidence that better infrastructures (producingbetter performance) boost waste related EI adoption. In light of Result 2 and, consequently, testablehypothesis H1, this implies that better separated collection is perceived as reducing the opportunitycosts of clean waste practices by regulated firms; as a result, incentives for adoption are stronger. As inTables 3 and 4, geographical factors do not seem to matter, and the evidence concerning firm specificfactors is confirmed. Therefore, we can conclude that larger and more productive firms promote EI,and regional waste management provides further incentives.
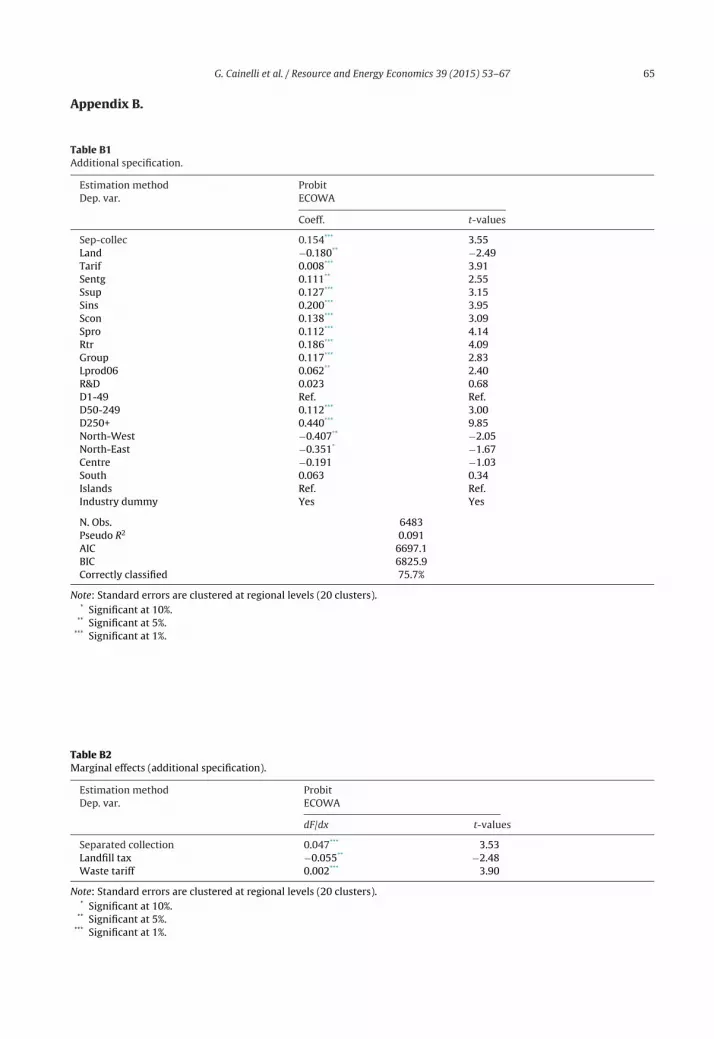
Columns [2] and [3] in Table 5 explore the implications of Results 1 and 2 using other proxies.We test the role of landfill taxes (column [2]) and waste tariffs (column [3]) (Mazzanti et al., 2012).Our estimates show that tariffs are positively correlated to ECOWA adoption, while landfill taxesseem, at least in this specification, to be not significant.11 Indeed, landfill taxes address waste disposalrather than waste generation and waste management. In other words, they act at a level which istoo “far” from waste production to provide any virtuous incentive along the waste filiere (Mazzantiand Zoboli, 2006) and, therefore, to encourage improvements in waste related adoption. Waste tariffs,
11 Appendix B reports a fourth specification which addresses the three policy variables simultaneously, and acts as an addi-tional check on our results (Tables B1–B3). We thank an anonymous referee for suggesting this extension. Notice that in thisspecification, the landfill tax is significant with a negative sign. This confirms that a higher landfill tax might be interpreted asa hint of a bad state of waste related infrastructures, with a related negative impact on adoption incentives.

G. Cainelli et al. / Resource and Energy Economics 39 (2015) 53–67 63
Table 5Factors correlated to ECOWA.
Estimation method ProbitDep. var. ECOWA
[1] [2] [3]
Coeff. t-values Coeff. t-values Coeff. t-values
Sep-collec 0.109** 2.16 . . . . . . . . . . . .Land . . . . . . −0.175 −1.48 . . . . . .Tarif . . . . . . . . . . . . 0.011*** 2.93Sentg 0.116** 2.54 0.114*** 2.59 0.112*** 2.56Ssup 0.126*** 3.10 0.125*** 3.04 0.128*** 3.18Sins 0.201*** 3.94 0.200*** 3.96 0.201*** 3.95Scon 0.142*** 3.34 0.142*** 3.30 0.139*** 3.15Spro 0.111*** 4.29 0.109*** 4.03 0.109*** 4.00Rtr 0.184*** 4.01 0.183*** 3.97 0.186*** 4.12Group 0.125*** 2.98 0.116*** 2.82 0.120*** 2.90Lprod06 0.064** 2.58 0.067*** 2.65 0.062** 2.41R&D 0.014 0.37 0.019 0.53 0.020 0.59D1-49 Ref. Ref. Ref. Ref. Ref. Ref.D50-249 0.097*** 3.00 0.101*** 2.96 0.109*** 2.97D250+ 0.411*** 10.05 0.418*** 11.01 0.433*** 10.26North-West −0.216 −0.98 −0.013 −0.08 −0.076 −0.41North-East −0.050 −0.22 0.222 1.13 −0.184 −0.86Centre −0.019 −0.09 0.134 0.77 −0.043 −0.23South 0.117 0.60 0.145 0.77 0.161 0.85Islands Ref. Ref. Ref. Ref. Ref. Ref.Industry dummy Yes Yes Yes Yes Yes Yes
N. Obs. 6483 6483 6483Pseudo R2 0.088 0.083 0.090AIC 6717.0 6713.1 6703.7BIC 6845.7 6841.9 6832.5Correctly classified 75.6% 75.4% 75.6%
Note: Standard errors are clustered at regional levels (20 clusters).* Significant at 10%.
** Significant at 5%.*** Significant at 1%.
instead, are at the core of the waste management systems in Italy. The more widespread these tariffs,the more firmly the waste system is rooted in economic incentives and oriented towards full costrecovery. Other results arising from our previous analysis are confirmed, in particular with respect tofirm-related factors. Again, as in previous tables, firm’s R&D efforts do not appear to be a statisticallysignificant firm specific factor.12
5. Conclusions
The paper presented a theoretical–empirical investigation of manufacturing firms’ innovationadoption decisions aimed at improving waste performances. Our emphasis on external innovationfactors as possibly being more important than ‘classic’ drivers such as R&D, allowed us to focus on therole of policy environments and structural regional features.
Our main results can be summarized as follows. First, firms located in regions where policy com-mitment to improve separated waste collection is stronger, are more likely to adopt waste relatedinnovations. In contrast, we find that ‘pure’ geographical effects are not statistically significant: EI
12 We also performed estimates by interacting our regional policy variables (e.g. separated collection interacted with thelandfill variable, and so on). The results are not particularly exciting, and interactions are either weakly statistically significantor even not significant. For this reason we do not report these estimates in the text. They are available upon request.

64 G. Cainelli et al. / Resource and Energy Economics 39 (2015) 53–67
adoption, therefore, is affected by specific regional policy attitudes in relation to environmental/wasteissues rather than by broadly defined regional features. The role of policies is confirmed by the evidenceconcerning the introduction of a new and decentralized waste tariff, which is statistically significantand affects adoption incentives positively. These econometric results are coherent with the currentNorth–South divide related to separated waste collection policy commitment in Italy, and are wor-rying in that they would seem to suggest that environmental management and policy effects mightfurther reinforce the existing technological divide among firms located in different areas, and mightincrease economic and environmental differences.
Second, in contrast to much existing work on innovation, waste related innovation seems not tobe sensitive to the presence of R&D, while other firm specific features, such as the availability andability to exploit information sources and labour productivity, have a positive impact on adoptionincentives. In other words, specific policy commitment and firm characteristics related to efficiencyand to networking attitudes are necessary to explain EI adoption in the waste realm, while moregeneral indicators of the propensity to innovate, such as the presence of R&D, do not seem to matter.
Further research could focus on even more localized spatial effects occurring at the provincial andmunicipal levels. Original survey data would be needed for such an investigation.
Appendix A.
See Table A1 for comparative statics details.
Proof of Result 1. Differentiating (5) with respect to we get:
∂�
∂ˇ= cg(go, �)
∂go
∂ˇ− ˛cg(gn, �)
∂gn
∂ˇ+ t(·) ∂(go − gn)
∂ˇ+ (go − gn)tˇ(·).
As first order conditions (2) and (4) require cg(go, �) = ˛cg(gn, �) = −t(·), then we are left with ∂�/∂ =(go − gn)tˇ(·) > 0. �
Proof of Result 2. Waste related infrastructures affect adoption incentives through parameter ı;following the same reasoning as in the proof of Result 1, we can conclude that ∂�/∂ı = (go − gn)tı(·),that can be either positive (if tı > 0) or negative (if tı < 0). �
Proof of Result 3. Differentiating (5) with respect to � we get:
∂�
∂�= cg(go, �)
∂go
∂�− ˛cg(gn, �)
∂gn
∂�+ c�(go, �) − ˛c�(gn, �) + t(·) ∂(go − gn)
∂�.
Accounting for cg(go, �) = ˛cg(gn, �) = −t(·) from (2) and (4) we are left with ∂�/∂� = c�(go, �) −˛c�(gn, �).
Under the assumption that cg�(·) > 0, and accounting for go > gn then |c�(go, �)| < |c�(gn, �)| so that(c�(go, �)/c�(gn, �)) < 1. We can therefore conclude that: ∂�/∂� > 0 when (c�(go, �)/c�(gn, �)) < <1, while ∂�/∂� < 0 when < (c�(go, �)/c�(gn, �)) < 1. As a consequence, ∂�/∂� > 0 requires thatc�(go, �)/c�(gn, �) is sufficiently small, i.e. that cg�(·) is sufficiently large to guarantee that |c�(gn, �)| issufficiently larger than |c�(go, �)|. �
Table A1Comparative statics.
Existing technology New technology
Policy strictness (ˇ) ∂go∂ˇ
= − tˇ (·)cgg (·) < 0 ∂gn
∂ˇ= − tˇ (·)
˛cgg (·) < 0
Waste related infrastructures (ı) ∂go∂ı
= − tı(·)cgg (·) ≥0 if tı ≤ 0 ∂gn
∂ı= − tı(·)
˛cgg (·) ≥0 if tı ≤ 0
Firm specific features (�) ∂go∂�
= − cg� (·)cgg (·) < 0 ∂gn
∂�= − cg� (·)
cgg (·) < 0
Cost reduction under the new technology (˛) – ∂gn∂˛
= − cg (·)˛cgg (·) > 0
G. Cainelli et al. / Resource and Energy Economics 39 (2015) 53–67 65
Appendix B.
Table B1Additional specification.
Estimation method ProbitDep. var. ECOWA
Coeff. t-values
Sep-collec 0.154*** 3.55Land −0.180** −2.49Tarif 0.008*** 3.91Sentg 0.111** 2.55Ssup 0.127*** 3.15Sins 0.200*** 3.95Scon 0.138*** 3.09Spro 0.112*** 4.14Rtr 0.186*** 4.09Group 0.117*** 2.83Lprod06 0.062** 2.40R&D 0.023 0.68D1-49 Ref. Ref.D50-249 0.112*** 3.00D250+ 0.440*** 9.85North-West −0.407** −2.05North-East −0.351* −1.67Centre −0.191 −1.03South 0.063 0.34Islands Ref. Ref.Industry dummy Yes Yes
N. Obs. 6483Pseudo R2 0.091AIC 6697.1BIC 6825.9Correctly classified 75.7%
Note: Standard errors are clustered at regional levels (20 clusters).* Significant at 10%.
** Significant at 5%.*** Significant at 1%.
Table B2Marginal effects (additional specification).
Estimation method ProbitDep. var. ECOWA
dF/dx t-values
Separated collection 0.047*** 3.53Landfill tax −0.055** −2.48Waste tariff 0.002*** 3.90
Note: Standard errors are clustered at regional levels (20 clusters).* Significant at 10%.
** Significant at 5%.*** Significant at 1%.

66 G. Cainelli et al. / Resource and Energy Economics 39 (2015) 53–67
Table B3Correlation matrix.
[1.] [2.] [3.]
[1.] 1.00[2.] 0.226 1.00[3.] 0.375 0.432 1.00
[1.] Separated collection.[2.] Landfill tax.[3.] Waste tariff.
References
Allers, M., Hoeben, C., 2010. Effects of unit based garbage pricing: a differences in differences approach. Environ. Resour. Econ.45, 405–428.
Antonioli, D., Mancinelli, S., Mazzanti, M., 2013. Is Environmental Innovation embedded within high-performance organisa-tional changes? The role of human resource management and complementarity in green business strategies. Res. Policy 42,975–988.
Beaudry, C., Breschi, S., 2003. Are firms in clusters really more innovative? Econ. Innov. New Technol. 12, 325–342.Boschma, R.A., Lambooy, J.G., 2002. Knowledge, market structure, and economic coordination. Growth Change 33, 291–311.Cainelli, G., 2008. Spatial agglomeration, technological innovations, and firm productivity: evidence from Italian industrial
districts. Growth Change 39, 414–435.Cainelli, G., Iacobucci, D., 2007. Agglomeration Technology and Business Groups. Edwar Elgar Publishing, Cheltenham.Cainelli, G., Mancinelli, S., Mazzanti, M., 2007. Social capital and innovation dynamics in district based local systems. J. Socioecon.
36, 932–948.Cainelli, G., Mazzanti, M., Montresor, S., 2012. Environmental innovations, local networks and internazionalization. Ind. Innov.
19, 697–734.Cole, M., Elliott, R., Lindsley, J., 2009. Dirty money: is there a wage premium for working in a pollution intensive industry? J.
Risk Uncertain. 39, 161–180.D’Amato, A., Mazzanti, M., Montini, A. (Eds.), 2013. Waste Management in Spatial Environments. Routledge, London.De Jaeger, S., Eyckmans, J., 2008. Assessing the effectiveness of voluntary solid waste reduction policies: methodology and a
Flemish case study. Waste Manage. 28, 1449–1460.Dijkgraaf, E., Gradus, R., 2009. Environmental activism and dynamics of unit based pricing systems. Resour. Energy Econ. 31,
13–23.Dijkgraaf, E., Gradus, R., 2004. Cost savings in unit based pricing of household waste: the case of The Netherlands. Resour. Energy
Econ. 26, 353–371.Downing, P.B., White, L.J., 1986. Innovation in pollution control. J. Environ. Econ. Manage. 13, 18–29.Hage, O., Soderholm, P., 2008. An econometric analysis of regional differences in household waste collection: the case of plastic
packaging waste in Sweden. Waste Manage. 28, 1720–1731.Horbach, J., 2008. Determinants of environmental innovation – new evidence from German panel data sources. Res. Policy 37,
163–173.Horbach, J., Rammer, C., Rennings, K., 2012. Determinants of eco-innovations by type of environmental impact – the role of
regulatory push/pull, technology push and market pull. Ecol. Econ. 78, 112–122.Iammarino, S., 2005. An evolutionary integrated view of regional systems of innovation: concepts, measures and historical
perspectives. Eur. Plan. Stud. 13, 497–519.Iammarino, S., McCann, P., 2006. The structure and evolution of industrial clusters: transactions, technology and knowledge
spillovers. Res. Policy 35, 1018–1036.Johnstone, N., Labonne, J., 2004. Generation of household solid waste in OECD countries. An empirical analysis using macroe-
conomic data. Land Econ. 80, 529–538.Johnstone, N., Hascic, I., Poirier, J., Hemar, M., Michel, C., 2012. Environmental policy stringency and technological innovation:
evidence from survey data and patent counts. Appl. Econ. 44, 2157–2170.Kammerer, D., 2009. The effects of customer benefit and regulation on environmental product innovation. Empirical evidence
from appliance manufacturers in Germany. Ecol. Econ. 68, 2285–2295.Kemp, R.,2000. Technology and environmental policy – innovation effects of past policies and suggestions for improvement.
In: OECD Proceedings Innovation and the Environment. OECD, Paris, pp. 35–61.Kemp, R., 2010. Eco-innovation: definition, measurement and open research issues. Econ. Politic. 27 (3), 397–420.Kemp, R., Pontoglio, S., 2011. The innovation effects of environmental policy instruments – a typical case of the blind men and
the elephant? Ecol. Econ. 72, 28–36.Kneller, R., Manderson, E., 2012. Environmental regulations and innovation activity in UK manufacturing. Resour. Energy Econ.
34, 211–235.Managi, S., Hibiki, A., Shimane, T., 2014. Efficiency of technology adoption: a case study in waste treatment technology. Resour.
Energy Econ. 36, 586–600.Mazzanti, M., Montini, A. (Eds.), 2009. Waste and Environmental Policy. Routledge, London.Mazzanti, M., Montini, A., Nicolli, F., 2012. Waste dynamics in economic and policy transitions decoupling, convergence and
spatial effects. J. Environ. Plan. Manage. 55, 563–581.Mazzanti, M., Montini, A., Zoboli, R., 2008. Municipal waste generation and socioeconomic drivers: evidence from comparing
northern and southern Italy. J. Environ. Dev. 17, 51–69.

G. Cainelli et al. / Resource and Energy Economics 39 (2015) 53–67 67
Mazzanti, M., Zoboli, R., 2009. Municipal waste Kuznets curves: evidence on socio-economic drivers and policy effectivenessfrom the EU. Environ. Resour. Econ. 44, 203–230.
Mazzanti, M., Zoboli, R., 2006. Economic instruments and induced innovation: the European policies on end-of-life vehicles.Ecol. Econ. 58, 318–337.
Milliman, S.R., Prince, R., 1989. Firm incentives to promote technological change in pollution. J. Environ. Econ. Manage. 17,247–265.
Nicolli, F., Mazzanti, M., 2013. Landfill diversion in a decentralized setting: a dynamic assessment of landfill taxes. Resour.Conserv. Recycl. 81, 17–23.
Rehfeld, K., Rennings, K., Ziegler, A., 2007. Integrated product policy and environmental product innovations: an empiricalanalysis. Ecol. Econ. 61, 91–100.
Rennings, K., Ziegler, A., Ankele, K., Hoffmann, E., 2006. The influence of different characteristics of the EU environmentalmanagement and auditing scheme on technical environmental innovations and economic performance. Ecol. Econ. 57,45–59.
Requate, T., 2005. Dynamic incentives by environmental policy instruments – a survey. Ecol. Econ. 54, 175–195.Shinkuma, T., Managi, S., 2011. Waste and Recycling: Theory and Empirics. Routledge, New York, USA.Veugelers, R., 2012. Which policy instruments to induce clean innovating? Res. Policy 41, 1770–1778.