adex benchmark - wordpress.com
TRANSCRIPT
Adex BenchmArk
2014EUROPEAN ONLINE
ADVERTISING EXPENDITURE
Published 2 July 2015
2 © IAB Europe and IHS IAB Europe AdEx Benchmark 2014
CONTENTS
3 Introduction
5 About this report
7 Executive summary
Section 1 – AdEx Benchmark 2014 analysis
9 Online advertising growth over time
11 Online advertising in a macroeconomic context
13 27 markets in perspective
13 Volume
15 Growth
17 Share of total media
18 Ad spend per capita
20 Share of formats
Section 2 – Online advertising overview by sector
22 Display
24 Classifieds and directories
26 Paid-for-search
28 Mobile
31 Video
Section 3 – Overview by country
33 Top 10
35 Rest of Europe
Section 4 – Background market data
37 Top properties December 2014
42 Online usage and connected devices in Europe in 2014
46 Internet penetration in Europe 2014
Section 5 – Appendices
47 Appendix i: definition of formats
49 Appendix ii: the participating IABs
50 Appendix iii: methodology and adjusted data
51 Appendix iv: adjustments by country
Section 6 – About Us
55 Our research partners
56 About IAB Europe
58 And finally
3 © IAB Europe and IHS IAB Europe AdEx Benchmark 2014
INTRODuCTION
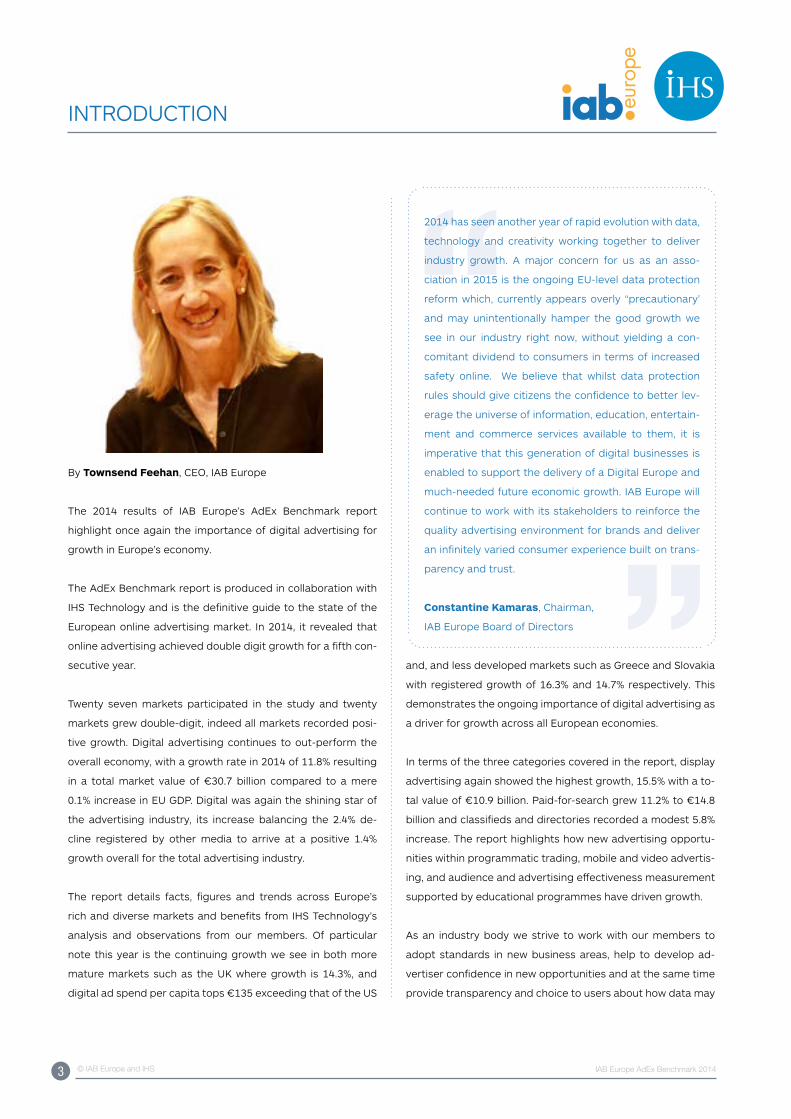
By Townsend Feehan, CEO, IAB Europe
The 2014 results of IAB Europe’s AdEx Benchmark report
highlight once again the importance of digital advertising for
growth in Europe’s economy.
The AdEx Benchmark report is produced in collaboration with
IHS Technology and is the definitive guide to the state of the
European online advertising market. In 2014, it revealed that
online advertising achieved double digit growth for a fifth con-
secutive year.
Twenty seven markets participated in the study and twenty
markets grew double-digit, indeed all markets recorded posi-
tive growth. Digital advertising continues to out-perform the
overall economy, with a growth rate in 2014 of 11.8% resulting
in a total market value of €30.7 billion compared to a mere
0.1% increase in Eu GDP. Digital was again the shining star of
the advertising industry, its increase balancing the 2.4% de-
cline registered by other media to arrive at a positive 1.4%
growth overall for the total advertising industry.
The report details facts, figures and trends across Europe’s
rich and diverse markets and benefits from IHS Technology’s
analysis and observations from our members. Of particular
note this year is the continuing growth we see in both more
mature markets such as the uK where growth is 14.3%, and
digital ad spend per capita tops €135 exceeding that of the uS
2014 has seen another year of rapid evolution with data,
technology and creativity working together to deliver
industry growth. A major concern for us as an asso-
ciation in 2015 is the ongoing Eu-level data protection
reform which, currently appears overly “precautionary’
and may unintentionally hamper the good growth we
see in our industry right now, without yielding a con-
comitant dividend to consumers in terms of increased
safety online. We believe that whilst data protection
rules should give citizens the confidence to better lev-
erage the universe of information, education, entertain-
ment and commerce services available to them, it is
imperative that this generation of digital businesses is
enabled to support the delivery of a Digital Europe and
much-needed future economic growth. IAB Europe will
continue to work with its stakeholders to reinforce the
quality advertising environment for brands and deliver
an infinitely varied consumer experience built on trans-
parency and trust.
Constantine Kamaras, Chairman,
IAB Europe Board of Directors
and, and less developed markets such as Greece and Slovakia
with registered growth of 16.3% and 14.7% respectively. This
demonstrates the ongoing importance of digital advertising as
a driver for growth across all European economies.
In terms of the three categories covered in the report, display
advertising again showed the highest growth, 15.5% with a to-
tal value of €10.9 billion. Paid-for-search grew 11.2% to €14.8
billion and classifieds and directories recorded a modest 5.8%
increase. The report highlights how new advertising opportu-
nities within programmatic trading, mobile and video advertis-
ing, and audience and advertising effectiveness measurement
supported by educational programmes have driven growth.
As an industry body we strive to work with our members to
adopt standards in new business areas, help to develop ad-
vertiser confidence in new opportunities and at the same time
provide transparency and choice to users about how data may
4 © IAB Europe and IHS IAB Europe AdEx Benchmark 2014
Section 1 - AdEx Benchmark 2014 Analysis
INTRODuCTION
be processed. We believe that regulatory frameworks should
enable digital advertising to fund the informational, educa-
tional, entertainment and e-commerce services that European
users enjoy at little or no cost to themselves. This is in contrast
to the current proposals for revised privacy rules which pose
a threat to the sector without achieving meaningful improve-
ments for consumers.
IAB Europe will continue to work with the network of national
IABs in the region to support growth and innovation. We are
delighted to release this 9th edition of the AdEx Benchmark
report and look forward to discussing and debating its findings
with industry, regulatory and civil society stakeholders.
ABOuT THIS REPORT
The IAB Europe AdEx Benchmark report provides a compre-
hensive perspective on online advertising spend across 27 Eu-
ropean countries. It offers a status quo and historical perspec-
tive on the size of the European market as a whole, as well as
like-for-like comparison between the constituent markets.
Painting a coherent picture of online advertising markets is
complex. Online advertising in Europe has developed largely
within national ecosystems that have their own traditions, cul-
tures, standards, and ways of doing business. Although there
is a growing harmonisation across Europe, this diversity still
means that each country measures online advertising spend
slightly differently. Differences occur on several levels: the rate
of spend (e.g. ratecard, gross, net), formats included, compa-
nies covered, or all these factors combined.
Data collected by national markets then are not directly com-
parable across Europe. A unified view of European advertising
spend is growing ever important in light of European policy,
attracting global start-up funding, benchmarking market de-
velopment trends, the increasingly pan-regional nature of
digital advertising investments and the role of Europe’s digital
economy in a global context.
This report is a response to these challenges and requirements.
Since its inception in 2006, the number of participating coun-
tries has doubled, recognising the importance of this task.
The basis for the IAB Europe AdEx Benchmark report are the
annual industry benchmarking studies conducted by each na-
tional Interactive Advertising Bureau (IAB) in Europe. These na-
tional studies represent the income of thousands of websites
and online advertising businesses, and data is compiled direct-
ly by local IABs based on information supplied by companies
selling advertising online in each country. The IAB Europe AdEx
Benchmark report conducts a meta-analysis of these studies.
It aggregates the data and makes the adjustments necessary
to enable the data to be comparable. In order to provide a full
like-for-like picture, the report draws on secondary data and
modelling by IHS in order to fill coverage gaps to ensure the
online advertising market is captured in its entirety, compris-
ing both of local and the full gamut of international players in
the European markets. Full details of this adjustment process
for each country are provided in Appendices iii and iv. In order
to provide the reader with a basic frame of reference, key defi-
nitions are outlined below.
The data in this report is stated on the basis of actual gross
income. Gross income is the amount of actual spend invoiced
by the publisher including any agency commission, but after
discounts from ratecard.
To avoid any double-counting, production costs and pan-re-
gional ad spend are taken out of the figures.
The report incorporates data from the following online adver-
tising formats:
• Display
• Paid-for-search
• Classifieds and directories
In 2012, the IAB Europe Research Committee in conjunction
with IHS held working groups to standardise and improve defi-
nitions and measurement across markets for emerging for-
mats. Since then, the AdEx Benchmark has systematically and
consistently incorporated data for spend on:
• Video advertising defined as in-stream video advertising
(pre-rolls, mid-rolls, post-rolls), as agreed by the IAB
Europe AdEx Benchmark Video Working Group. It is
considered as a subset of display.
• Mobile display advertising as any display advertising
viewed or read on a mobile phone including rich
media advertising, as agreed by the IAB Europe AdEx
Benchmark Mobile Working Group. This could be browser-
based as well as in-app.
This is the ninth edition of the report and therefore once again
we are able to include year-on-year comparisons for those
countries that have provided data for at least two years.
IHS does not audit the information or the data from local IABs
and provides no opinion or other form of assurance with re-
spect to the information. Only aggregate results are published
and individual company information is held in strict confidence
by the audit partners of local IAB studies.
5 © IAB Europe and IHS IAB Europe AdEx Benchmark 2014
6 © IAB Europe and IHS IAB Europe AdEx Benchmark 2014
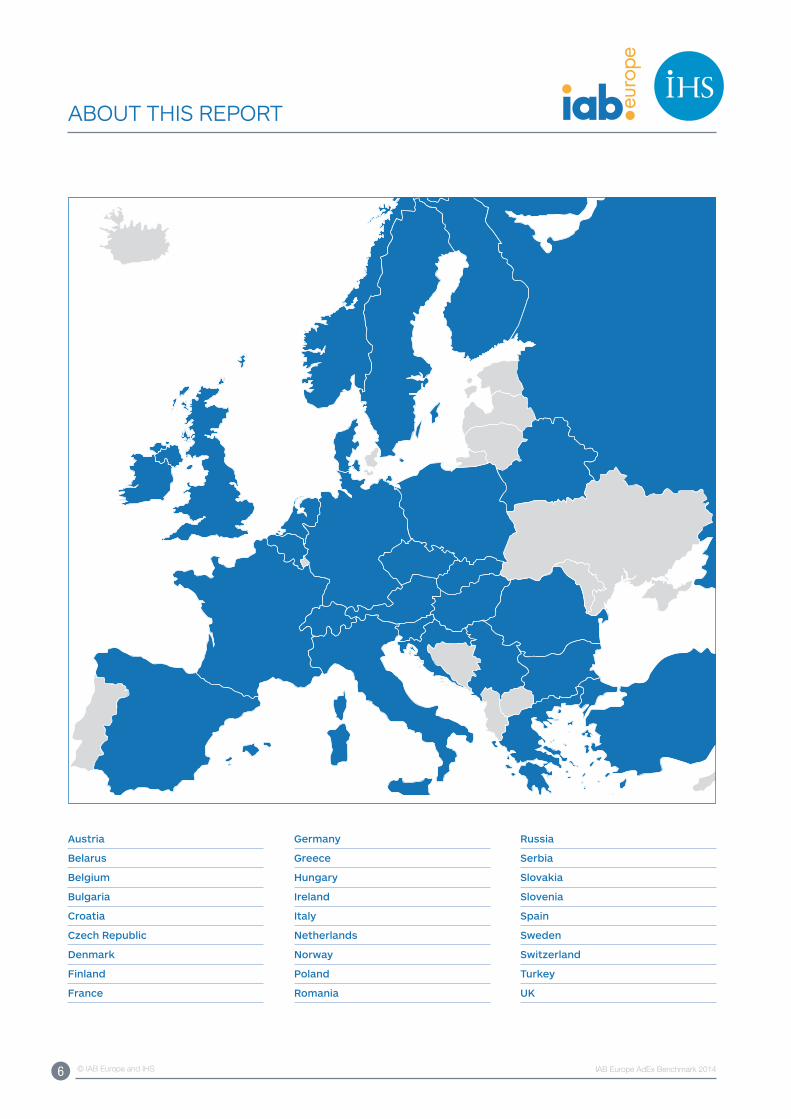
ABOuT THIS REPORT
Austria
Belarus
Belgium
Bulgaria
Croatia
Czech Republic
Denmark
Finland
France
Germany
Greece
Hungary
Ireland
Italy
Netherlands
Norway
Poland
Romania
Russia
Serbia
Slovakia
Slovenia
Spain
Sweden
Switzerland
Turkey
UK
7 © IAB Europe and IHS IAB Europe AdEx Benchmark 2014
ExECuTIVE SuMMARy
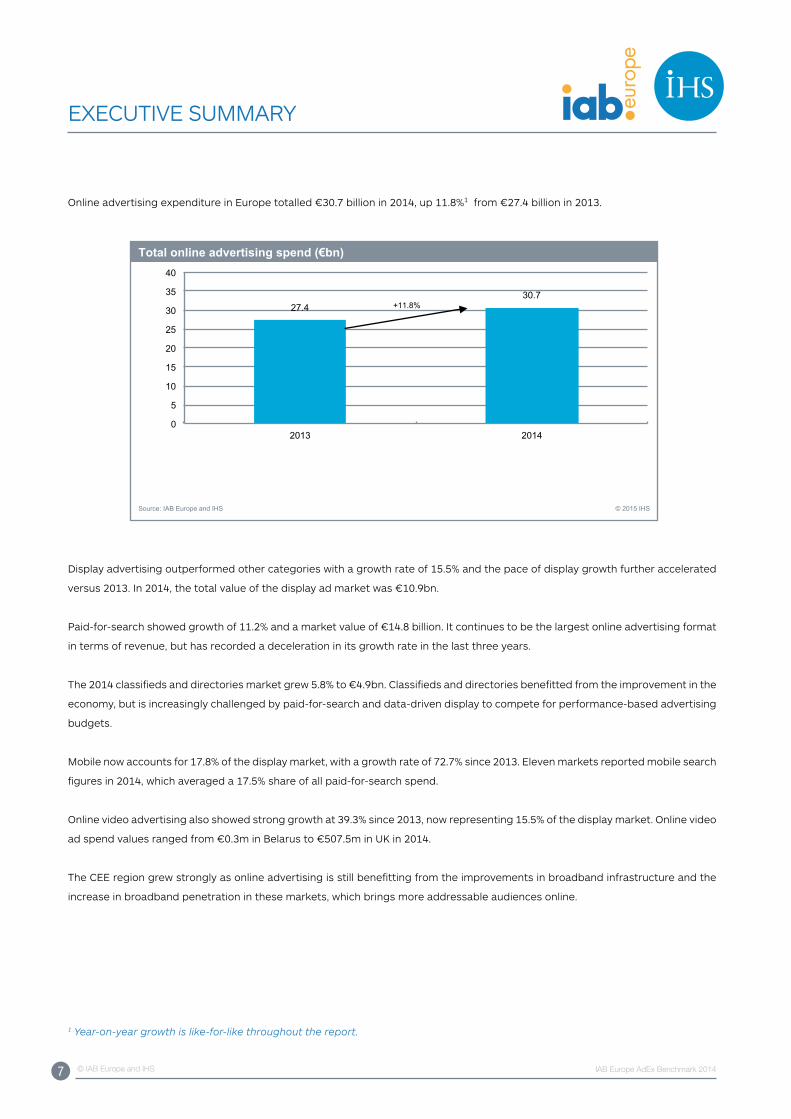
Online advertising expenditure in Europe totalled €30.7 billion in 2014, up 11.8%1 from €27.4 billion in 2013.
27.4 30.7
0
5
10
15
20
25
30
35
40
2013 2014
Total online advertising spend (€bn)
Source: IAB Europe and IHS © 2015 IHS
+11.8%
Display advertising outperformed other categories with a growth rate of 15.5% and the pace of display growth further accelerated
versus 2013. In 2014, the total value of the display ad market was €10.9bn.
Paid-for-search showed growth of 11.2% and a market value of €14.8 billion. It continues to be the largest online advertising format
in terms of revenue, but has recorded a deceleration in its growth rate in the last three years.
The 2014 classifieds and directories market grew 5.8% to €4.9bn. Classifieds and directories benefitted from the improvement in the
economy, but is increasingly challenged by paid-for-search and data-driven display to compete for performance-based advertising
budgets.
Mobile now accounts for 17.8% of the display market, with a growth rate of 72.7% since 2013. Eleven markets reported mobile search
figures in 2014, which averaged a 17.5% share of all paid-for-search spend.
Online video advertising also showed strong growth at 39.3% since 2013, now representing 15.5% of the display market. Online video
ad spend values ranged from €0.3m in Belarus to €507.5m in uK in 2014.
The CEE region grew strongly as online advertising is still benefitting from the improvements in broadband infrastructure and the
increase in broadband penetration in these markets, which brings more addressable audiences online.
1 Year-on-year growth is like-for-like throughout the report.
8 © IAB Europe and IHS IAB Europe AdEx Benchmark 2014
ExECuTIVE SuMMARy
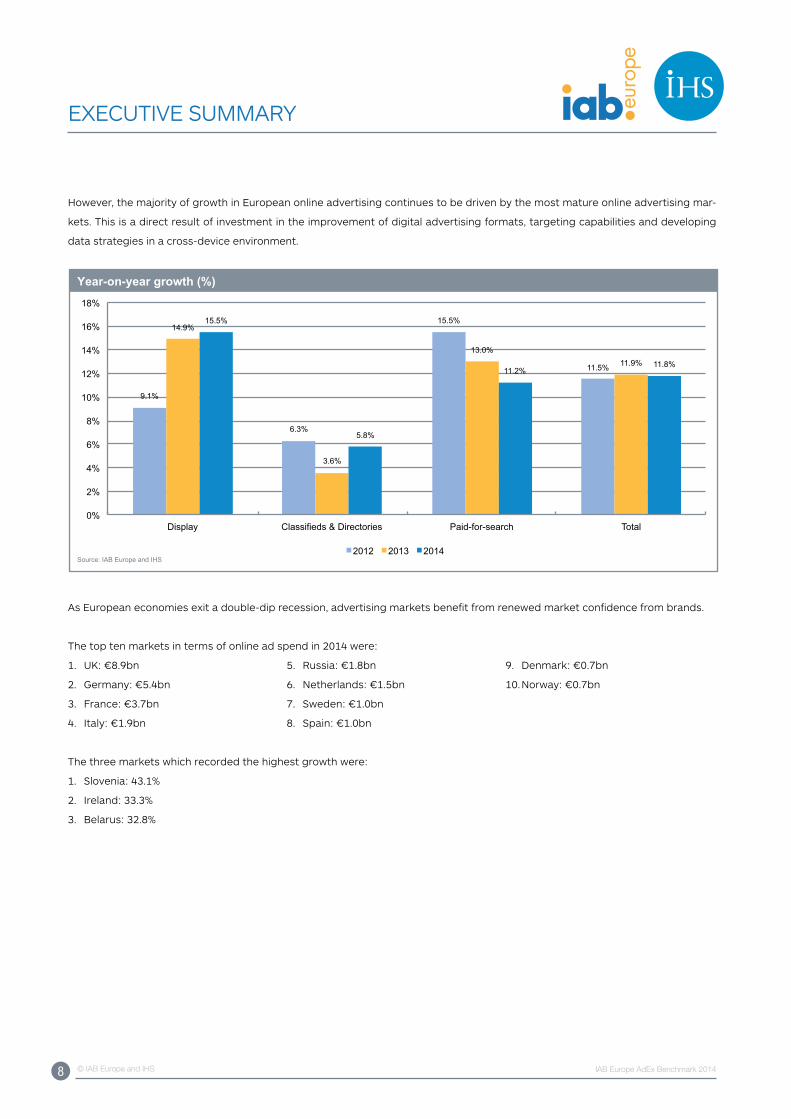
However, the majority of growth in European online advertising continues to be driven by the most mature online advertising mar-
kets. This is a direct result of investment in the improvement of digital advertising formats, targeting capabilities and developing
data strategies in a cross-device environment.
9.1%
6.3%
15.5%
11.5%
14.9%
3.6%
13.0% 11.9%
15.5%
5.8%
11.2% 11.8%
0%
2%
4%
6%
8%
10%
12%
14%
16%
18%
Display Classifieds & Directories Paid-for-search Total
2012 2013 2014
Year-on-year growth (%)
Source: IAB Europe and IHS
As European economies exit a double-dip recession, advertising markets benefit from renewed market confidence from brands.
The top ten markets in terms of online ad spend in 2014 were:
1. uK: €8.9bn
2. Germany: €5.4bn
3. France: €3.7bn
4. Italy: €1.9bn
5. Russia: €1.8bn
6. Netherlands: €1.5bn
7. Sweden: €1.0bn
8. Spain: €1.0bn
9. Denmark: €0.7bn
10. Norway: €0.7bn
The three markets which recorded the highest growth were:
1. Slovenia: 43.1%
2. Ireland: 33.3%
3. Belarus: 32.8%
9 © IAB Europe and IHS IAB Europe AdEx Benchmark 2014
Section 1 - AdEx Benchmark 2014 Analysis
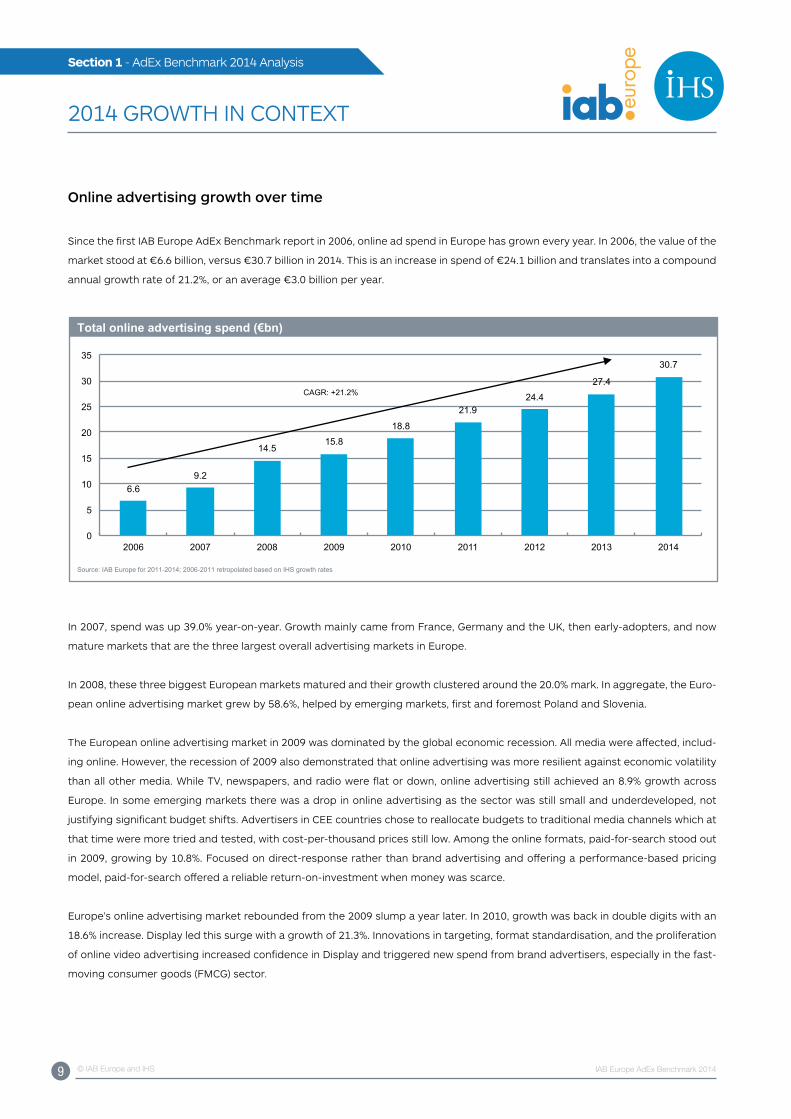
Online advertising growth over time
Since the first IAB Europe AdEx Benchmark report in 2006, online ad spend in Europe has grown every year. In 2006, the value of the
market stood at €6.6 billion, versus €30.7 billion in 2014. This is an increase in spend of €24.1 billion and translates into a compound
annual growth rate of 21.2%, or an average €3.0 billion per year.
6.6 9.2
14.5 15.8
18.8
21.9 24.4
27.4
30.7
0
5
10
15
20
25
30
35
2006 2007 2008 2009 2010 2011 2012 2013 2014
Total online advertising spend (€bn)
Source: IAB Europe for 2011-2014; 2006-2011 retropolated based on IHS growth rates © 2015 IHS
CAGR: +21.2%
In 2007, spend was up 39.0% year-on-year. Growth mainly came from France, Germany and the uK, then early-adopters, and now
mature markets that are the three largest overall advertising markets in Europe.
In 2008, these three biggest European markets matured and their growth clustered around the 20.0% mark. In aggregate, the Euro-
pean online advertising market grew by 58.6%, helped by emerging markets, first and foremost Poland and Slovenia.
The European online advertising market in 2009 was dominated by the global economic recession. All media were affected, includ-
ing online. However, the recession of 2009 also demonstrated that online advertising was more resilient against economic volatility
than all other media. While TV, newspapers, and radio were flat or down, online advertising still achieved an 8.9% growth across
Europe. In some emerging markets there was a drop in online advertising as the sector was still small and underdeveloped, not
justifying significant budget shifts. Advertisers in CEE countries chose to reallocate budgets to traditional media channels which at
that time were more tried and tested, with cost-per-thousand prices still low. Among the online formats, paid-for-search stood out
in 2009, growing by 10.8%. Focused on direct-response rather than brand advertising and offering a performance-based pricing
model, paid-for-search offered a reliable return-on-investment when money was scarce.
Europe’s online advertising market rebounded from the 2009 slump a year later. In 2010, growth was back in double digits with an
18.6% increase. Display led this surge with a growth of 21.3%. Innovations in targeting, format standardisation, and the proliferation
of online video advertising increased confidence in Display and triggered new spend from brand advertisers, especially in the fast-
moving consumer goods (FMCG) sector.
2014 GROWTH IN CONTExT
10 © IAB Europe and IHS IAB Europe AdEx Benchmark 2014
Section 1 - AdEx Benchmark 2014 Analysis
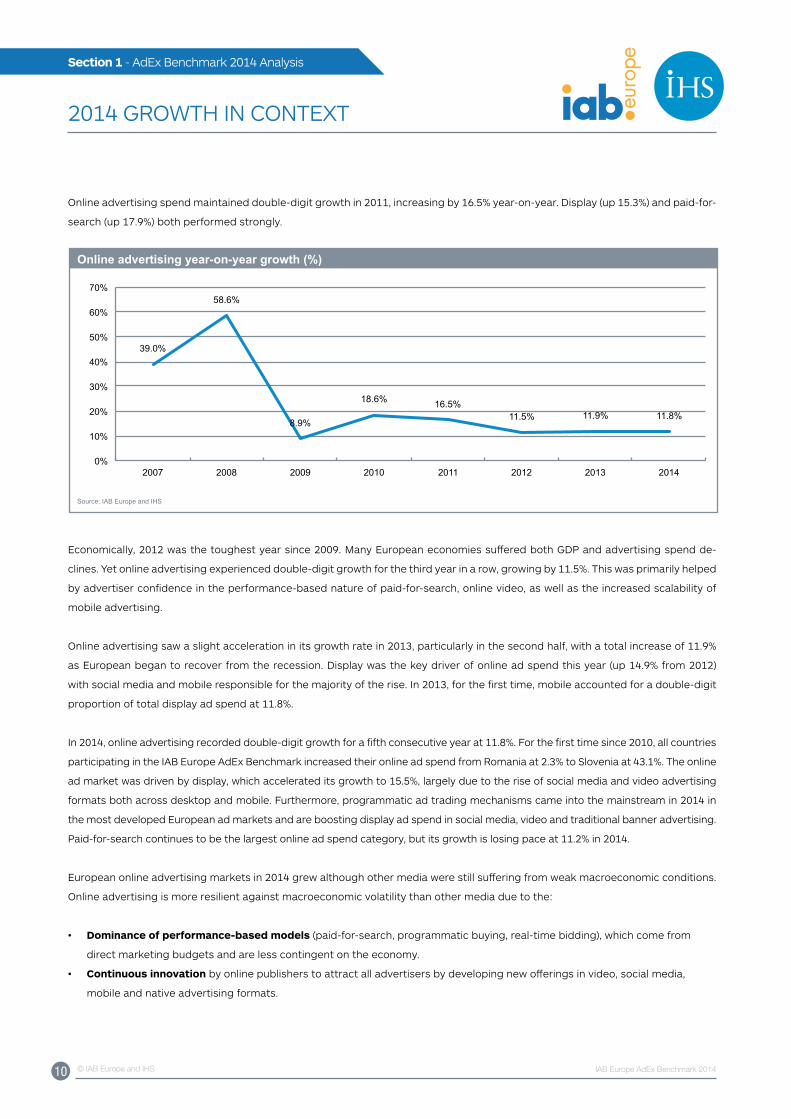
Online advertising spend maintained double-digit growth in 2011, increasing by 16.5% year-on-year. Display (up 15.3%) and paid-for-
search (up 17.9%) both performed strongly.
39.0%
58.6%
8.9%
18.6% 16.5% 11.5% 11.9% 11.8%
0%
10%
20%
30%
40%
50%
60%
70%
2007 2008 2009 2010 2011 2012 2013 2014
Online advertising year-on-year growth (%)
Source: IAB Europe and IHS
Economically, 2012 was the toughest year since 2009. Many European economies suffered both GDP and advertising spend de-
clines. yet online advertising experienced double-digit growth for the third year in a row, growing by 11.5%. This was primarily helped
by advertiser confidence in the performance-based nature of paid-for-search, online video, as well as the increased scalability of
mobile advertising.
Online advertising saw a slight acceleration in its growth rate in 2013, particularly in the second half, with a total increase of 11.9%
as European began to recover from the recession. Display was the key driver of online ad spend this year (up 14.9% from 2012)
with social media and mobile responsible for the majority of the rise. In 2013, for the first time, mobile accounted for a double-digit
proportion of total display ad spend at 11.8%.
In 2014, online advertising recorded double-digit growth for a fifth consecutive year at 11.8%. For the first time since 2010, all countries
participating in the IAB Europe AdEx Benchmark increased their online ad spend from Romania at 2.3% to Slovenia at 43.1%. The online
ad market was driven by display, which accelerated its growth to 15.5%, largely due to the rise of social media and video advertising
formats both across desktop and mobile. Furthermore, programmatic ad trading mechanisms came into the mainstream in 2014 in
the most developed European ad markets and are boosting display ad spend in social media, video and traditional banner advertising.
Paid-for-search continues to be the largest online ad spend category, but its growth is losing pace at 11.2% in 2014.
European online advertising markets in 2014 grew although other media were still suffering from weak macroeconomic conditions.
Online advertising is more resilient against macroeconomic volatility than other media due to the:
• Dominance of performance-based models (paid-for-search, programmatic buying, real-time bidding), which come from
direct marketing budgets and are less contingent on the economy.
• Continuous innovation by online publishers to attract all advertisers by developing new offerings in video, social media,
mobile and native advertising formats.
2014 GROWTH IN CONTExT
11 © IAB Europe and IHS IAB Europe AdEx Benchmark 2014
Section 1 - AdEx Benchmark 2014 Analysis
2014 GROWTH IN CONTExT
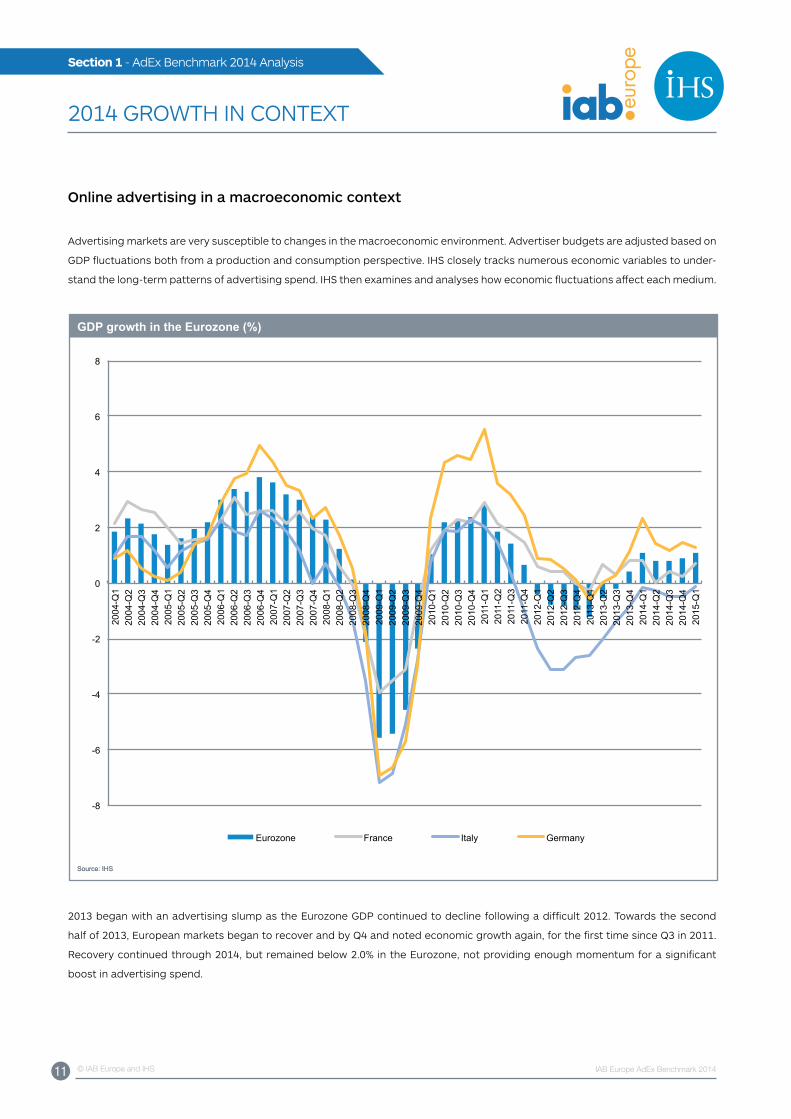
Online advertising in a macroeconomic context
Advertising markets are very susceptible to changes in the macroeconomic environment. Advertiser budgets are adjusted based on
GDP fluctuations both from a production and consumption perspective. IHS closely tracks numerous economic variables to under-
stand the long-term patterns of advertising spend. IHS then examines and analyses how economic fluctuations affect each medium.
-8
-6
-4
-2
0
2
4
6
8
2004
-Q1
2004
-Q2
2004
-Q3
2004
-Q4
2005
-Q1
2005
-Q2
2005
-Q3
2005
-Q4
2006
-Q1
2006
-Q2
2006
-Q3
2006
-Q4
2007
-Q1
2007
-Q2
2007
-Q3
2007
-Q4
2008
-Q1
2008
-Q2
2008
-Q3
2008
-Q4
2009
-Q1
2009
-Q2
2009
-Q3
2009
-Q4
2010
-Q1
2010
-Q2
2010
-Q3
2010
-Q4
2011
-Q1
2011
-Q2
2011
-Q3
2011
-Q4
2012
-Q1
2012
-Q2
2012
-Q3
2012
-Q4
2013
-Q1
2013
-Q2
2013
-Q3
2013
-Q4
2014
-Q1
2014
-Q2
2014
-Q3
2014
-Q4
2015
-Q1
Eurozone France Italy Germany
Source: IHS
GDP growth in the Eurozone (%)
Source: IHS
2013 began with an advertising slump as the Eurozone GDP continued to decline following a difficult 2012. Towards the second
half of 2013, European markets began to recover and by Q4 and noted economic growth again, for the first time since Q3 in 2011.
Recovery continued through 2014, but remained below 2.0% in the Eurozone, not providing enough momentum for a significant
boost in advertising spend.
12 © IAB Europe and IHS IAB Europe AdEx Benchmark 2014
Section 1 - AdEx Benchmark 2014 Analysis
2014 GROWTH IN CONTExT
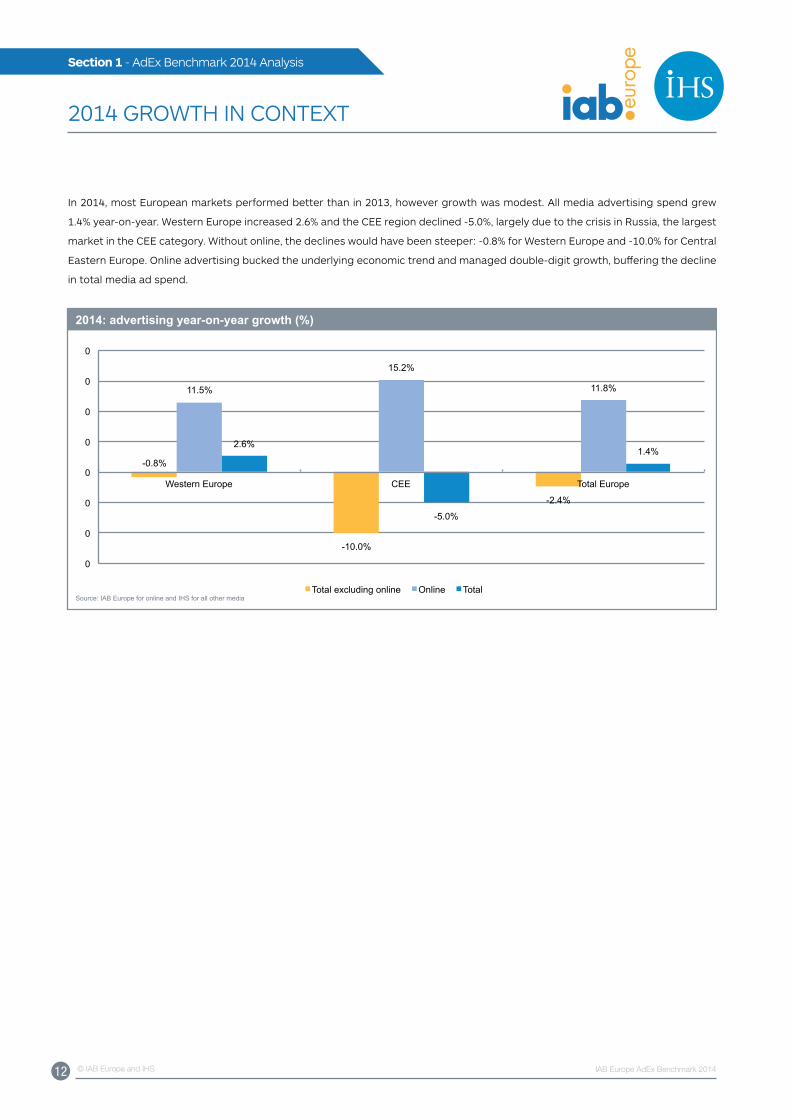
In 2014, most European markets performed better than in 2013, however growth was modest. All media advertising spend grew
1.4% year-on-year. Western Europe increased 2.6% and the CEE region declined -5.0%, largely due to the crisis in Russia, the largest
market in the CEE category. Without online, the declines would have been steeper: -0.8% for Western Europe and -10.0% for Central
Eastern Europe. Online advertising bucked the underlying economic trend and managed double-digit growth, buffering the decline
in total media ad spend.
-0.8%
-10.0%
-2.4%
11.5%
15.2%
11.8%
2.6%
-5.0%
1.4%
0
0
0
0
0
0
0
0
Western Europe CEE Total Europe
Total excluding online Online Total
2014: advertising year-on-year growth (%)
Source: IAB Europe for online and IHS for all other media
13 © IAB Europe and IHS IAB Europe AdEx Benchmark 2014
Section 1 - AdEx Benchmark 2014 Analysis
27 MARKETS IN PERSPECTIVE
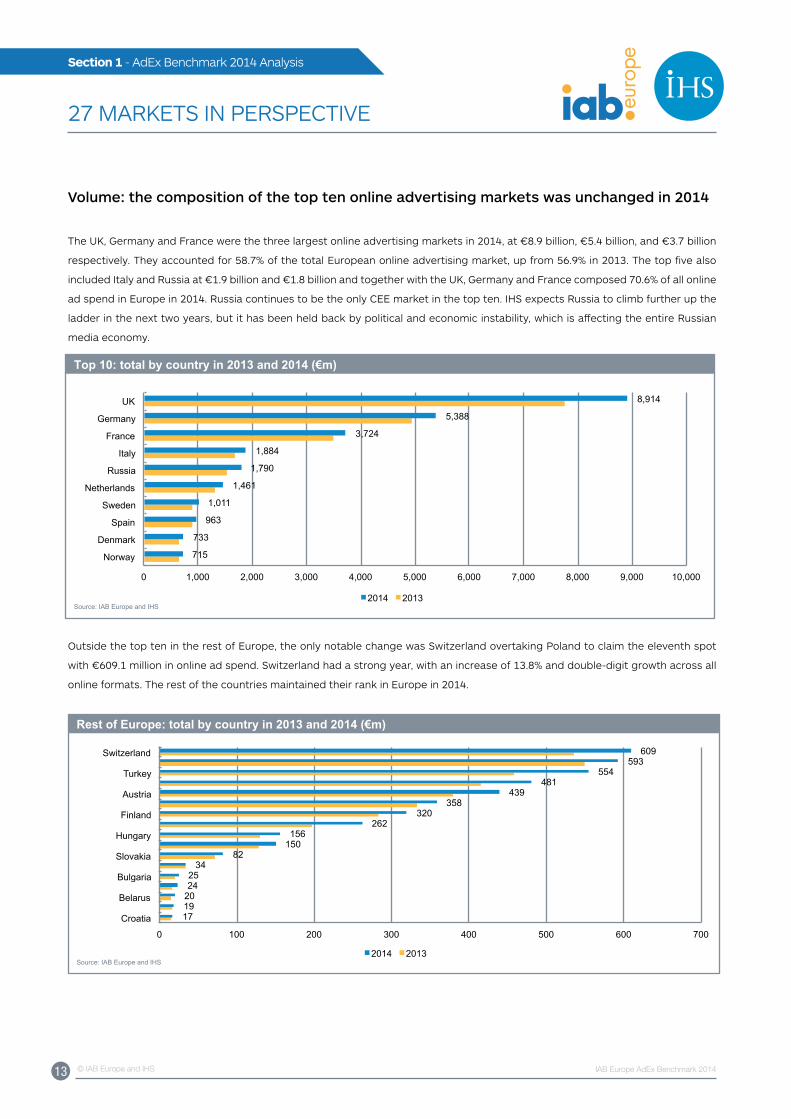
Volume: the composition of the top ten online advertising markets was unchanged in 2014
The uK, Germany and France were the three largest online advertising markets in 2014, at €8.9 billion, €5.4 billion, and €3.7 billion
respectively. They accounted for 58.7% of the total European online advertising market, up from 56.9% in 2013. The top five also
included Italy and Russia at €1.9 billion and €1.8 billion and together with the uK, Germany and France composed 70.6% of all online
ad spend in Europe in 2014. Russia continues to be the only CEE market in the top ten. IHS expects Russia to climb further up the
ladder in the next two years, but it has been held back by political and economic instability, which is affecting the entire Russian
media economy.
715
733
963
1,011
1,461
1,790
1,884
3,724
5,388
8,914
0 1,000 2,000 3,000 4,000 5,000 6,000 7,000 8,000 9,000 10,000
Norway
Denmark
Spain
Sweden
Netherlands
Russia
Italy
France
Germany
UK
2014 2013
Top 10: total by country in 2013 and 2014 (€m)
Source: IAB Europe and IHS
Outside the top ten in the rest of Europe, the only notable change was Switzerland overtaking Poland to claim the eleventh spot
with €609.1 million in online ad spend. Switzerland had a strong year, with an increase of 13.8% and double-digit growth across all
online formats. The rest of the countries maintained their rank in Europe in 2014.
17 19 20 24 25
34 82
150 156
262 320
358 439
481 554
593 609
0 100 200 300 400 500 600 700
Croatia
Belarus
Bulgaria
Slovakia
Hungary
Finland
Austria
Turkey
Switzerland
2014 2013
Rest of Europe: total by country in 2013 and 2014 (€m)
Source: IAB Europe and IHS
14 © IAB Europe and IHS IAB Europe AdEx Benchmark 2014
Section 1 - AdEx Benchmark 2014 Analysis
27 MARKETS IN PERSPECTIVE
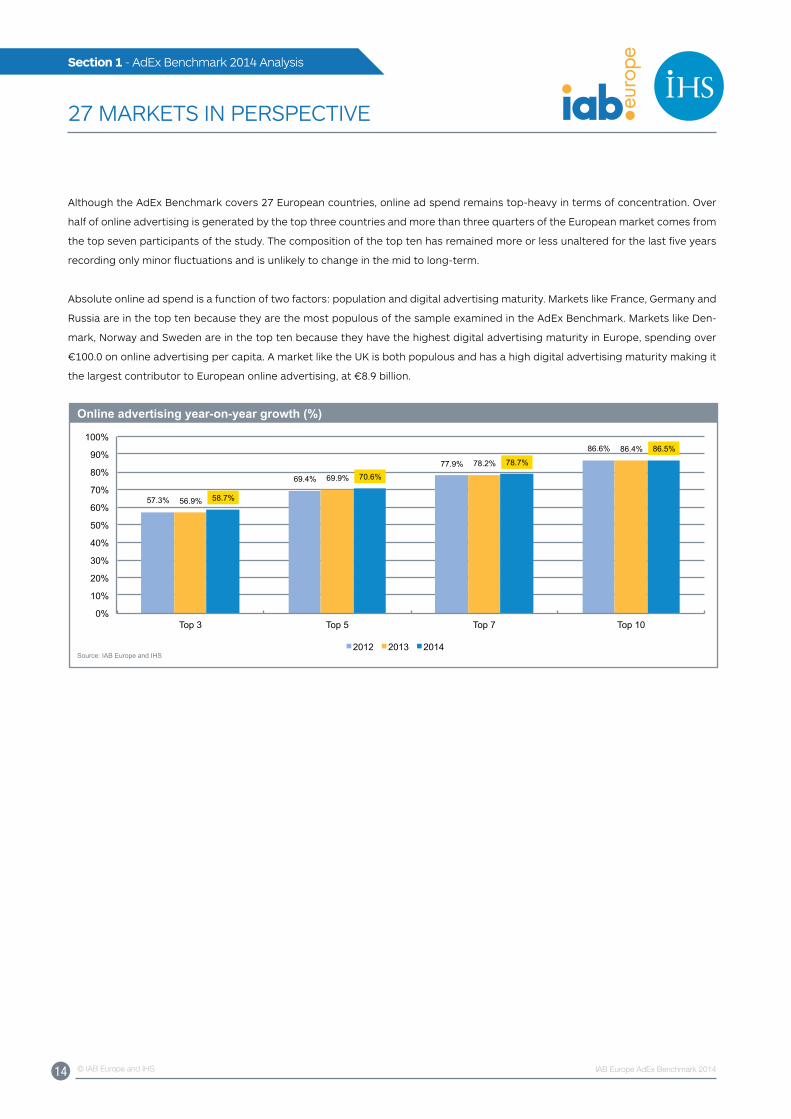
Although the AdEx Benchmark covers 27 European countries, online ad spend remains top-heavy in terms of concentration. Over
half of online advertising is generated by the top three countries and more than three quarters of the European market comes from
the top seven participants of the study. The composition of the top ten has remained more or less unaltered for the last five years
recording only minor fluctuations and is unlikely to change in the mid to long-term.
Absolute online ad spend is a function of two factors: population and digital advertising maturity. Markets like France, Germany and
Russia are in the top ten because they are the most populous of the sample examined in the AdEx Benchmark. Markets like Den-
mark, Norway and Sweden are in the top ten because they have the highest digital advertising maturity in Europe, spending over
€100.0 on online advertising per capita. A market like the uK is both populous and has a high digital advertising maturity making it
the largest contributor to European online advertising, at €8.9 billion.
57.3%
69.4%
77.9%
86.6%
56.9%
69.9%
78.2%
86.4%
58.7%
70.6%
78.7%
86.5%
0%
10%
20%
30%
40%
50%
60%
70%
80%
90%
100%
Top 3 Top 5 Top 7 Top 10
2012 2013 2014
Online advertising year-on-year growth (%)
Source: IAB Europe and IHS
15 © IAB Europe and IHS IAB Europe AdEx Benchmark 2014
Section 1 - AdEx Benchmark 2014 Analysis
27 MARKETS IN PERSPECTIVE
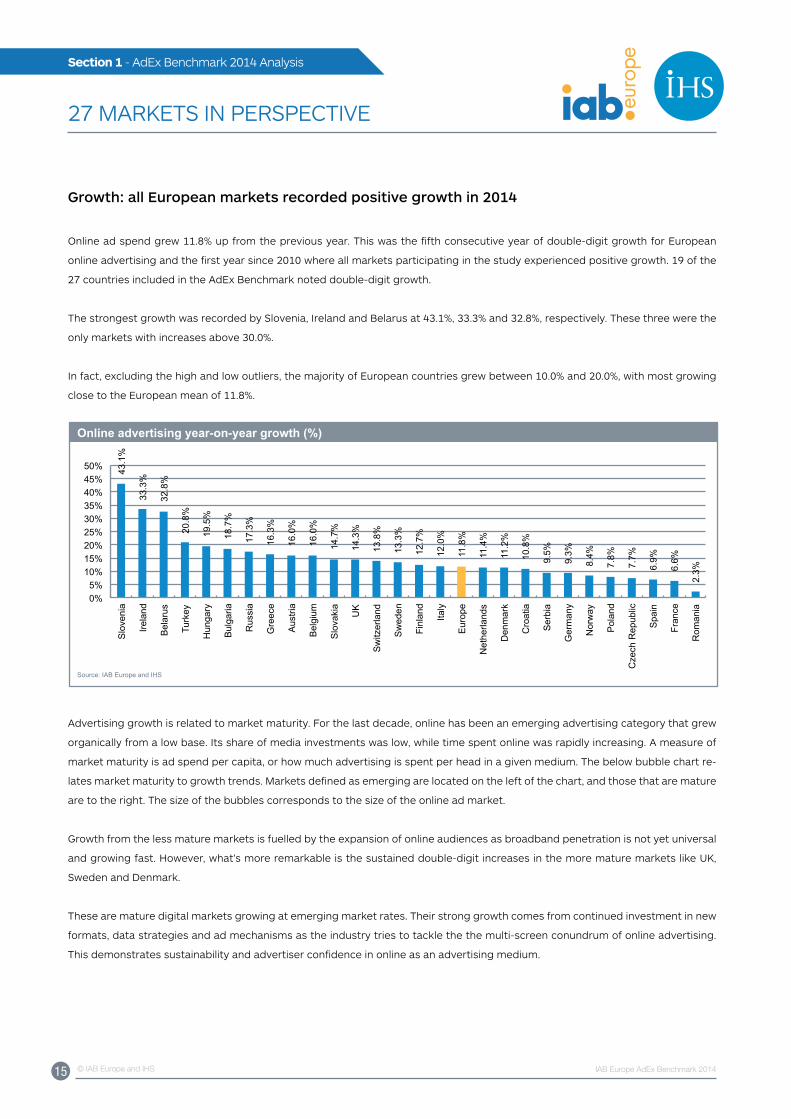
Growth: all European markets recorded positive growth in 2014
Online ad spend grew 11.8% up from the previous year. This was the fifth consecutive year of double-digit growth for European
online advertising and the first year since 2010 where all markets participating in the study experienced positive growth. 19 of the
27 countries included in the AdEx Benchmark noted double-digit growth.
The strongest growth was recorded by Slovenia, Ireland and Belarus at 43.1%, 33.3% and 32.8%, respectively. These three were the
only markets with increases above 30.0%.
In fact, excluding the high and low outliers, the majority of European countries grew between 10.0% and 20.0%, with most growing
close to the European mean of 11.8%.
43.1
%
33.3
%
32.8
%
20.8
%
19.5
%
18.7
%
17.3
%
16.3
%
16.0
%
16.0
%
14.7
%
14.3
%
13.8
%
13.3
%
12.7
%
12.0
%
11.8
%
11.4
%
11.2
%
10.8
%
9.5%
9.3%
8.4%
7.8%
7.7%
6.9%
6.6%
2.3%
0% 5%
10% 15% 20% 25% 30% 35% 40% 45% 50%
Slo
veni
a
Irela
nd
Bel
arus
Turk
ey
Hun
gary
Bul
garia
Rus
sia
Gre
ece
Aus
tria
Bel
gium
Slo
vaki
a
UK
Sw
itzer
land
Sw
eden
Finl
and
Italy
Eur
ope
Net
herla
nds
Den
mar
k
Cro
atia
Ser
bia
Ger
man
y
Nor
way
Pol
and
Cze
ch R
epub
lic
Spa
in
Fran
ce
Rom
ania
Online advertising year-on-year growth (%)
Source: IAB Europe and IHS © 2015 IHS
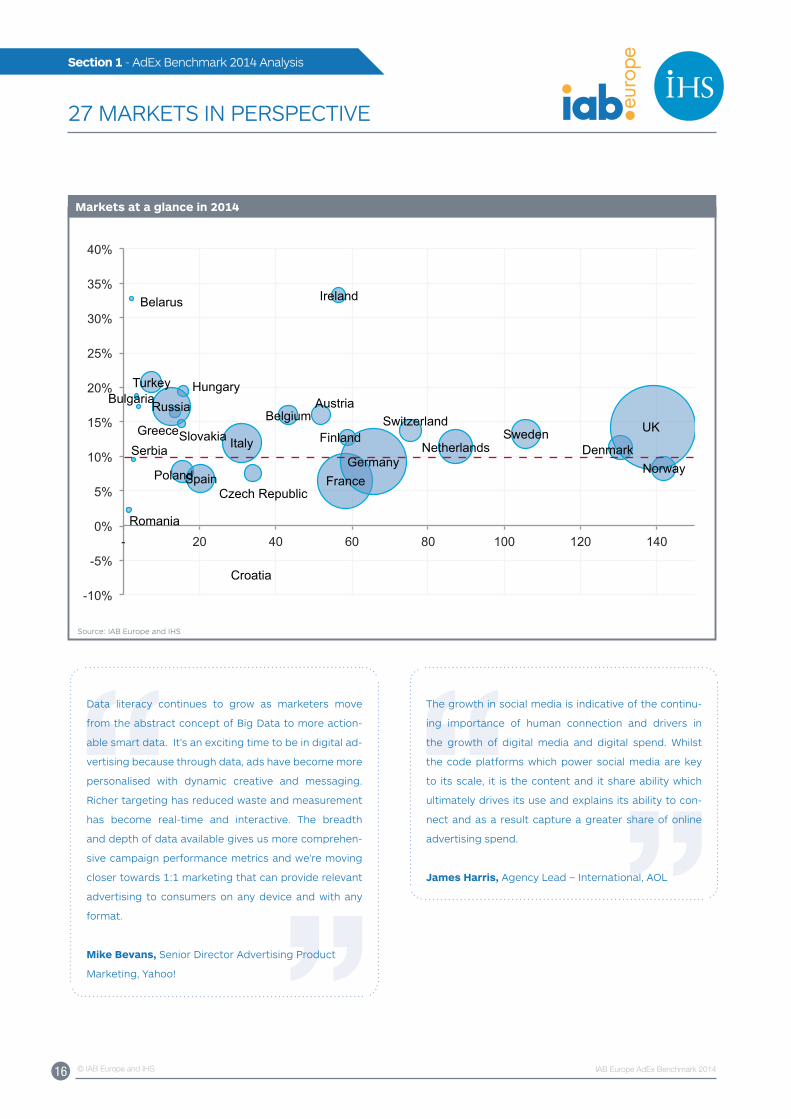
Advertising growth is related to market maturity. For the last decade, online has been an emerging advertising category that grew
organically from a low base. Its share of media investments was low, while time spent online was rapidly increasing. A measure of
market maturity is ad spend per capita, or how much advertising is spent per head in a given medium. The below bubble chart re-
lates market maturity to growth trends. Markets defined as emerging are located on the left of the chart, and those that are mature
are to the right. The size of the bubbles corresponds to the size of the online ad market.
Growth from the less mature markets is fuelled by the expansion of online audiences as broadband penetration is not yet universal
and growing fast. However, what’s more remarkable is the sustained double-digit increases in the more mature markets like uK,
Sweden and Denmark.
These are mature digital markets growing at emerging market rates. Their strong growth comes from continued investment in new
formats, data strategies and ad mechanisms as the industry tries to tackle the the multi-screen conundrum of online advertising.
This demonstrates sustainability and advertiser confidence in online as an advertising medium.
16 © IAB Europe and IHS IAB Europe AdEx Benchmark 2014
Section 1 - AdEx Benchmark 2014 Analysis
27 MARKETS IN PERSPECTIVE
Markets at a glance in 2014
Source: IAB Europe and IHS
Belgium Bulgaria
Croatia
Czech Republic
Denmark Finland
France Germany
Greece
Hungary
Ireland
Italy Netherlands Norway Poland
Romania
Russia
Slovakia
Spain
Austria
Belarus
Sweden Switzerland
Turkey
UK
-10%
-5%
0%
5%
10%
15%
20%
25%
30%
35%
40%
- 20 40 60 80 100 120 140
Serbia
Data literacy continues to grow as marketers move
from the abstract concept of Big Data to more action-
able smart data. It’s an exciting time to be in digital ad-
vertising because through data, ads have become more
personalised with dynamic creative and messaging.
Richer targeting has reduced waste and measurement
has become real-time and interactive. The breadth
and depth of data available gives us more comprehen-
sive campaign performance metrics and we’re moving
closer towards 1:1 marketing that can provide relevant
advertising to consumers on any device and with any
format.
Mike Bevans, Senior Director Advertising Product
Marketing, yahoo!
The growth in social media is indicative of the continu-
ing importance of human connection and drivers in
the growth of digital media and digital spend. Whilst
the code platforms which power social media are key
to its scale, it is the content and it share ability which
ultimately drives its use and explains its ability to con-
nect and as a result capture a greater share of online
advertising spend.
James Harris, Agency Lead – International, AOL
17 © IAB Europe and IHS IAB Europe AdEx Benchmark 2014
Section 1 - AdEx Benchmark 2014 Analysis
27 MARKETS IN PERSPECTIVE
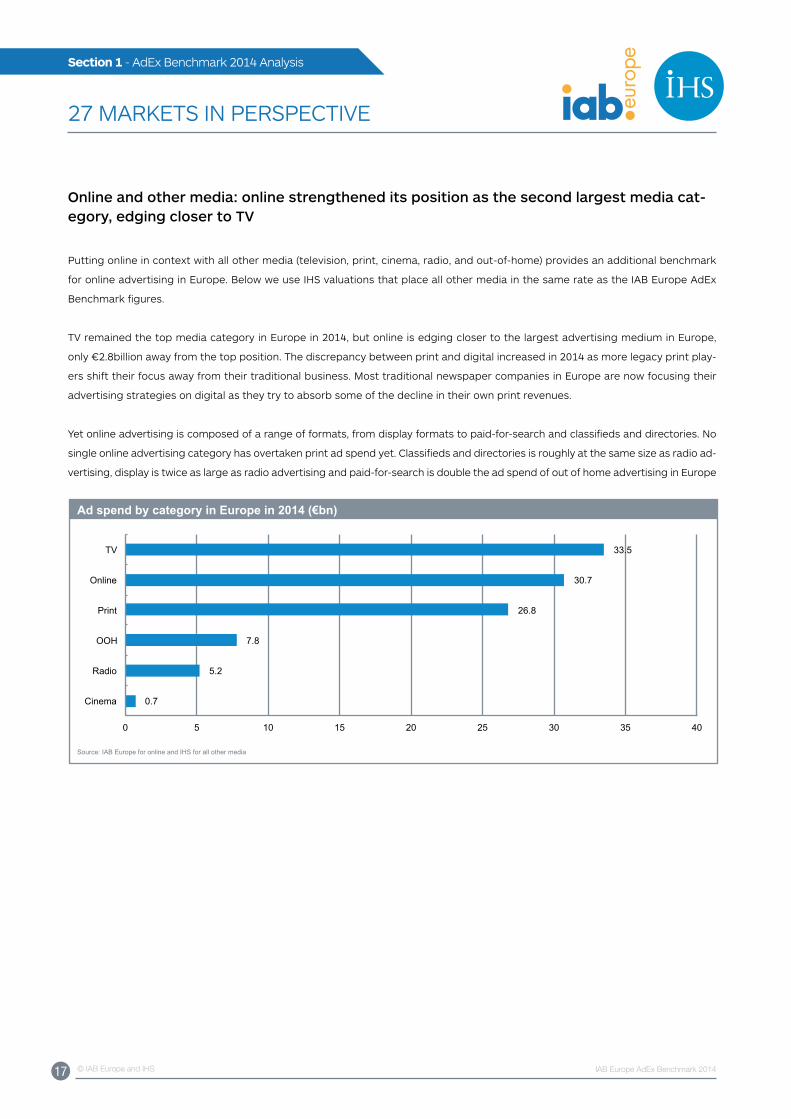
Online and other media: online strengthened its position as the second largest media cat-egory, edging closer to TV
Putting online in context with all other media (television, print, cinema, radio, and out-of-home) provides an additional benchmark
for online advertising in Europe. Below we use IHS valuations that place all other media in the same rate as the IAB Europe AdEx
Benchmark figures.
TV remained the top media category in Europe in 2014, but online is edging closer to the largest advertising medium in Europe,
only €2.8billion away from the top position. The discrepancy between print and digital increased in 2014 as more legacy print play-
ers shift their focus away from their traditional business. Most traditional newspaper companies in Europe are now focusing their
advertising strategies on digital as they try to absorb some of the decline in their own print revenues.
yet online advertising is composed of a range of formats, from display formats to paid-for-search and classifieds and directories. No
single online advertising category has overtaken print ad spend yet. Classifieds and directories is roughly at the same size as radio ad-
vertising, display is twice as large as radio advertising and paid-for-search is double the ad spend of out of home advertising in Europe
0.7
5.2
7.8
26.8
30.7
33.5
0 5 10 15 20 25 30 35 40
Cinema
Radio
OOH
Online
TV
Ad spend by category in Europe in 2014 (€bn)
Source: IAB Europe for online and IHS for all other media
18 © IAB Europe and IHS IAB Europe AdEx Benchmark 2014
Section 1 - AdEx Benchmark 2014 Analysis
27 MARKETS IN PERSPECTIVE
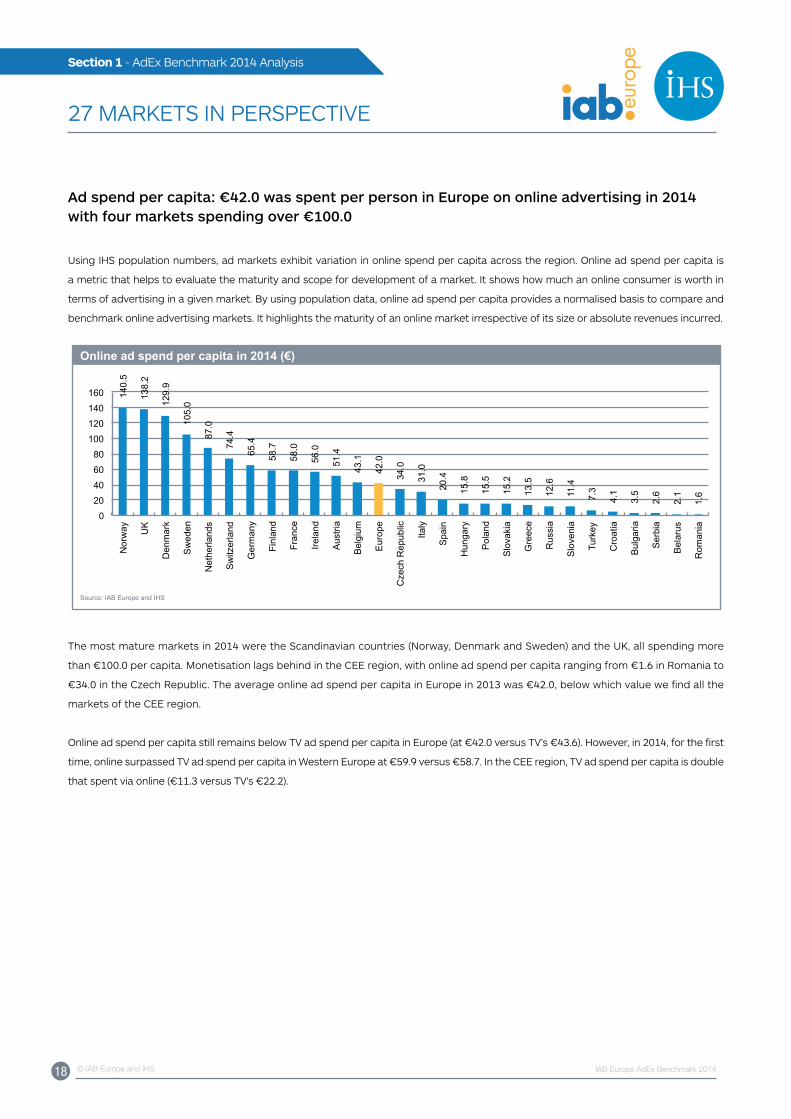
Ad spend per capita: €42.0 was spent per person in Europe on online advertising in 2014 with four markets spending over €100.0
using IHS population numbers, ad markets exhibit variation in online spend per capita across the region. Online ad spend per capita is
a metric that helps to evaluate the maturity and scope for development of a market. It shows how much an online consumer is worth in
terms of advertising in a given market. By using population data, online ad spend per capita provides a normalised basis to compare and
benchmark online advertising markets. It highlights the maturity of an online market irrespective of its size or absolute revenues incurred.
140.
5
138.
2
129.
9
105.
0
87.0
74.4
65.4
58.7
58.0
56.0
51.4
43.1
42.0
34.0
31.0
20.4
15.8
15.5
15.2
13.5
12.6
11.4
7.3
4.1
3.5
2.6
2.1
1.6
0 20 40 60 80
100 120 140 160
Nor
way
UK
Den
mar
k
Sw
eden
Net
herla
nds
Sw
itzer
land
Ger
man
y
Finl
and
Fran
ce
Irela
nd
Aus
tria
Bel
gium
Eur
ope
Cze
ch R
epub
lic
Italy
Spa
in
Hun
gary
Pol
and
Slo
vaki
a
Gre
ece
Rus
sia
Slo
veni
a
Turk
ey
Cro
atia
Bul
garia
Ser
bia
Bel
arus
Rom
ania
Online ad spend per capita in 2014 (€)
Source: IAB Europe and IHS
The most mature markets in 2014 were the Scandinavian countries (Norway, Denmark and Sweden) and the uK, all spending more
than €100.0 per capita. Monetisation lags behind in the CEE region, with online ad spend per capita ranging from €1.6 in Romania to
€34.0 in the Czech Republic. The average online ad spend per capita in Europe in 2013 was €42.0, below which value we find all the
markets of the CEE region.
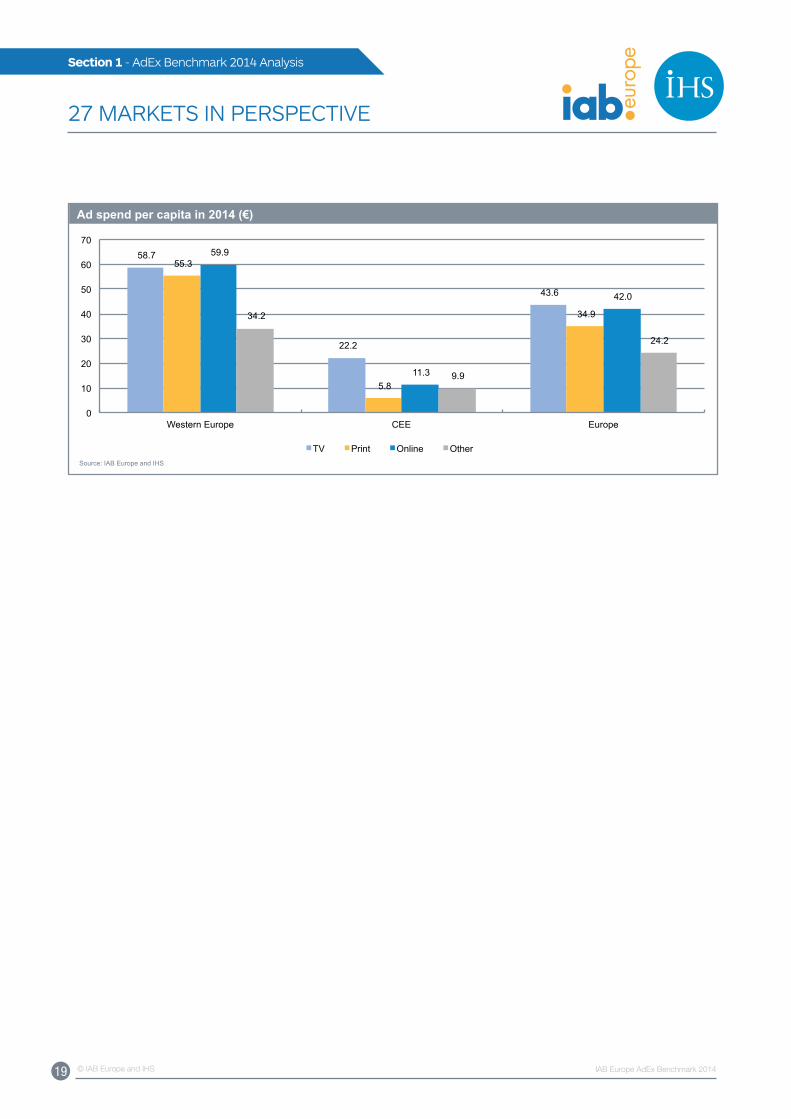
Online ad spend per capita still remains below TV ad spend per capita in Europe (at €42.0 versus TV’s €43.6). However, in 2014, for the first
time, online surpassed TV ad spend per capita in Western Europe at €59.9 versus €58.7. In the CEE region, TV ad spend per capita is double
that spent via online (€11.3 versus TV’s €22.2).
19 © IAB Europe and IHS IAB Europe AdEx Benchmark 2014
Section 1 - AdEx Benchmark 2014 Analysis
27 MARKETS IN PERSPECTIVE
58.7
22.2
43.6
55.3
5.8
34.9
59.9
11.3
42.0
34.2
9.9
24.2
0
10
20
30
40
50
60
70
Western Europe CEE Europe
TV Print Online Other
Ad spend per capita in 2014 (€)
Source: IAB Europe and IHS
20 © IAB Europe and IHS IAB Europe AdEx Benchmark 2014
Section 1 - AdEx Benchmark 2014 Analysis
27 MARKETS IN PERSPECTIVE
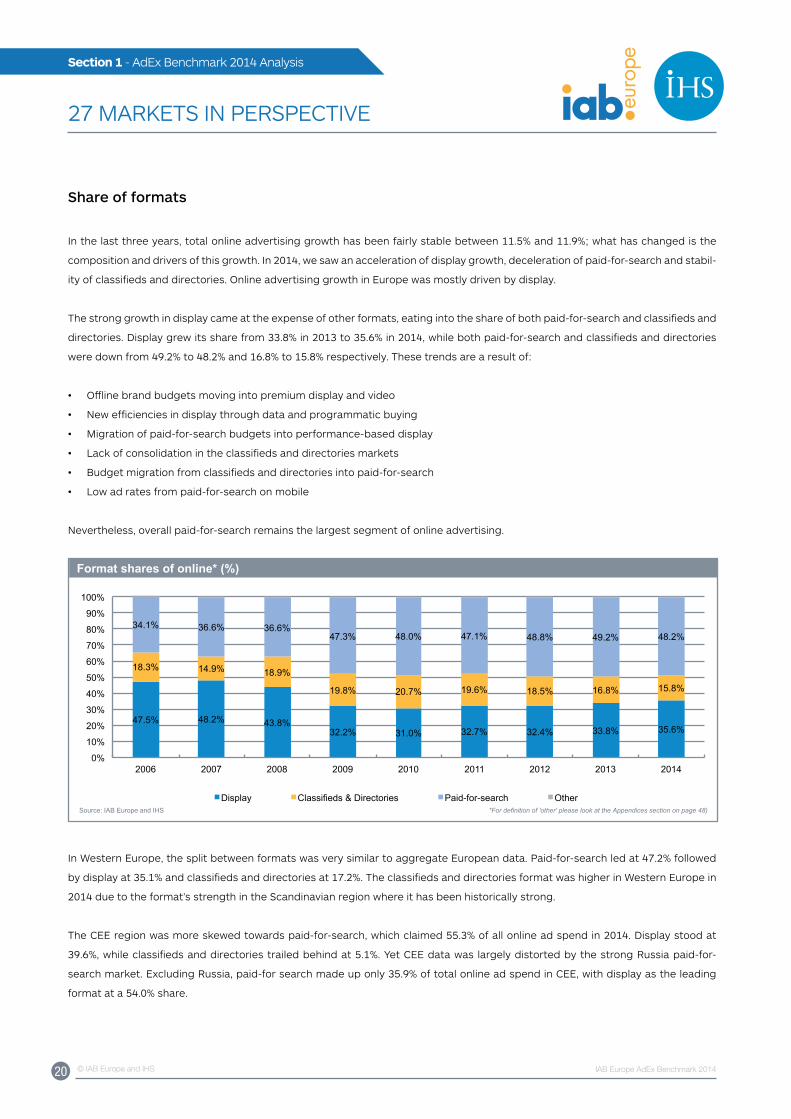
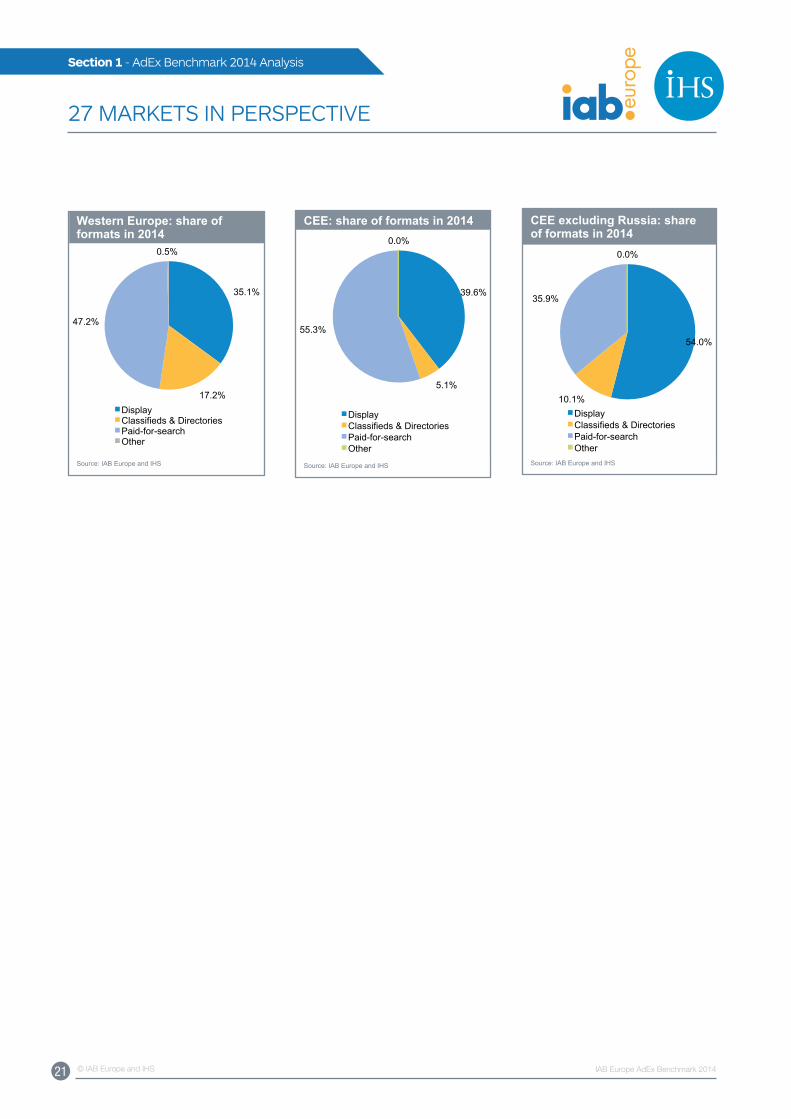
Share of formats
In the last three years, total online advertising growth has been fairly stable between 11.5% and 11.9%; what has changed is the
composition and drivers of this growth. In 2014, we saw an acceleration of display growth, deceleration of paid-for-search and stabil-
ity of classifieds and directories. Online advertising growth in Europe was mostly driven by display.
The strong growth in display came at the expense of other formats, eating into the share of both paid-for-search and classifieds and
directories. Display grew its share from 33.8% in 2013 to 35.6% in 2014, while both paid-for-search and classifieds and directories
were down from 49.2% to 48.2% and 16.8% to 15.8% respectively. These trends are a result of:
• Offline brand budgets moving into premium display and video
• New efficiencies in display through data and programmatic buying
• Migration of paid-for-search budgets into performance-based display
• Lack of consolidation in the classifieds and directories markets
• Budget migration from classifieds and directories into paid-for-search
• Low ad rates from paid-for-search on mobile
Nevertheless, overall paid-for-search remains the largest segment of online advertising.
47.5% 48.2% 43.8% 32.2% 31.0% 32.7% 32.4% 33.8% 35.6%
18.3% 14.9% 18.9%
19.8% 20.7% 19.6% 18.5% 16.8% 15.8%
34.1% 36.6% 36.6% 47.3% 48.0% 47.1% 48.8% 49.2% 48.2%
0%
10%
20%
30%
40%
50%
60%
70%
80%
90%
100%
2006 2007 2008 2009 2010 2011 2012 2013 2014
Display Classifieds & Directories Paid-for-search Other
Format shares of online* (%)
Source: IAB Europe and IHS
*For definition of 'other' please look at the Appendices section on page 48)
In Western Europe, the split between formats was very similar to aggregate European data. Paid-for-search led at 47.2% followed
by display at 35.1% and classifieds and directories at 17.2%. The classifieds and directories format was higher in Western Europe in
2014 due to the format’s strength in the Scandinavian region where it has been historically strong.
The CEE region was more skewed towards paid-for-search, which claimed 55.3% of all online ad spend in 2014. Display stood at
39.6%, while classifieds and directories trailed behind at 5.1%. yet CEE data was largely distorted by the strong Russia paid-for-
search market. Excluding Russia, paid-for search made up only 35.9% of total online ad spend in CEE, with display as the leading
format at a 54.0% share.
21 © IAB Europe and IHS IAB Europe AdEx Benchmark 2014
Section 1 - AdEx Benchmark 2014 Analysis
27 MARKETS IN PERSPECTIVE
35.1%
17.2%
47.2%
0.5%
Display Classifieds & Directories Paid-for-search Other
Western Europe: share of formats in 2014
Source: IAB Europe and IHS
39.6%
5.1%
55.3%
0.0%
Display Classifieds & Directories Paid-for-search Other
CEE: share of formats in 2014
Source: IAB Europe and IHS
54.0%
10.1%
35.9%
0.0%
Display Classifieds & Directories Paid-for-search Other
CEE excluding Russia: share of formats in 2014
Source: IAB Europe and IHS © 2015 IHS
22 © IAB Europe and IHS IAB Europe AdEx Benchmark 2014
Section 2 - Online advertising overview by sector
DISPLAy
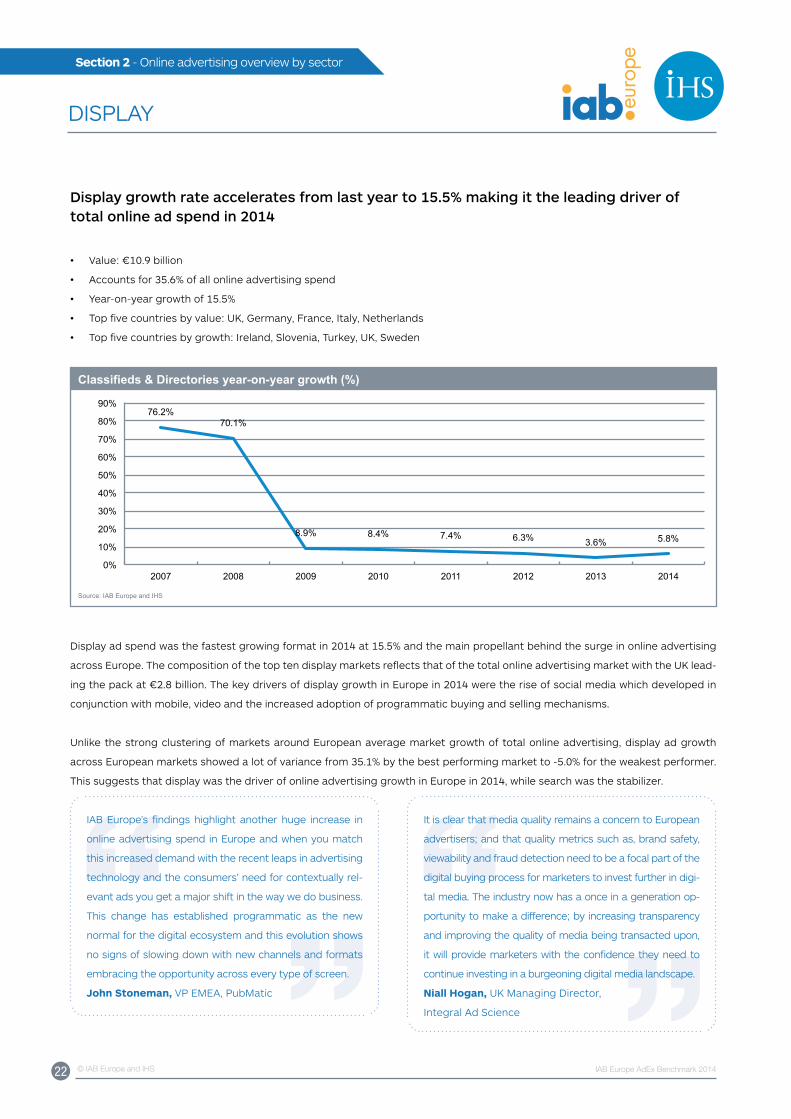
Display growth rate accelerates from last year to 15.5% making it the leading driver of total online ad spend in 2014
• Value: €10.9 billion
• Accounts for 35.6% of all online advertising spend
• year-on-year growth of 15.5%
• Top five countries by value: uK, Germany, France, Italy, Netherlands
• Top five countries by growth: Ireland, Slovenia, Turkey, uK, Sweden
76.2% 70.1%
8.9% 8.4% 7.4% 6.3% 3.6% 5.8%
0%
10%
20%
30%
40%
50%
60%
70%
80%
90%
2007 2008 2009 2010 2011 2012 2013 2014
Classifieds & Directories year-on-year growth (%)
Source: IAB Europe and IHS
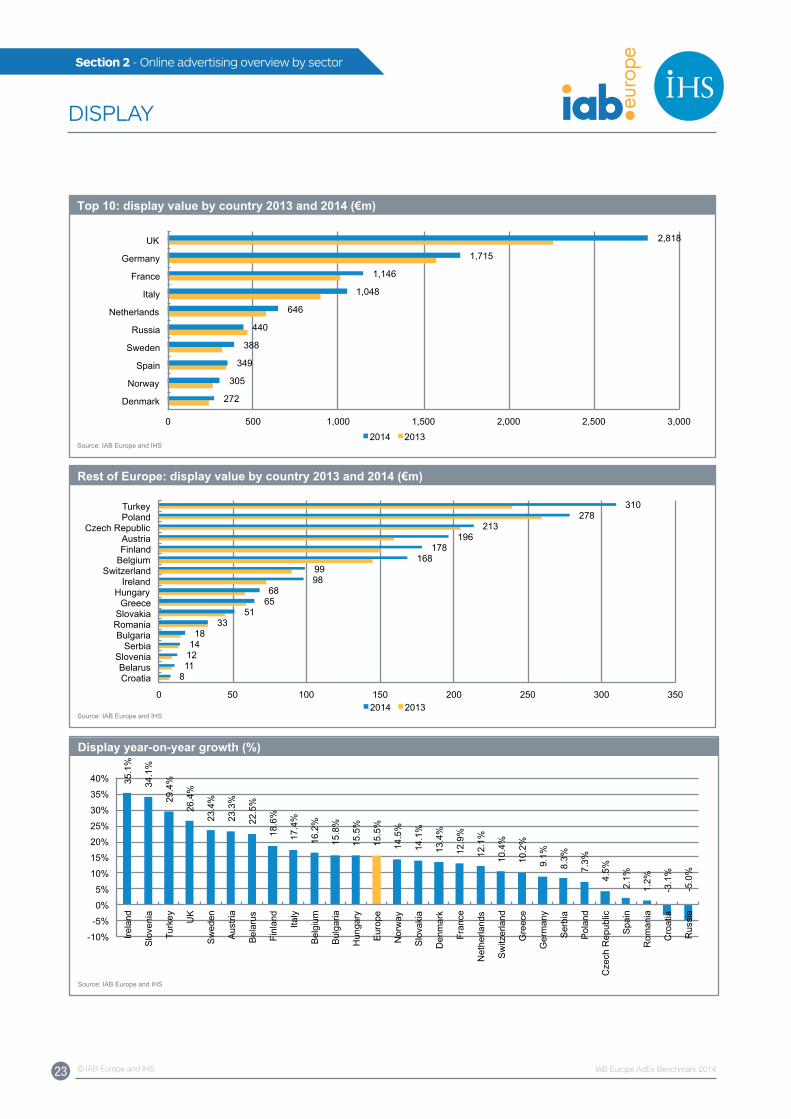
Display ad spend was the fastest growing format in 2014 at 15.5% and the main propellant behind the surge in online advertising
across Europe. The composition of the top ten display markets reflects that of the total online advertising market with the uK lead-
ing the pack at €2.8 billion. The key drivers of display growth in Europe in 2014 were the rise of social media which developed in
conjunction with mobile, video and the increased adoption of programmatic buying and selling mechanisms.
unlike the strong clustering of markets around European average market growth of total online advertising, display ad growth
across European markets showed a lot of variance from 35.1% by the best performing market to -5.0% for the weakest performer.
This suggests that display was the driver of online advertising growth in Europe in 2014, while search was the stabilizer.
IAB Europe’s findings highlight another huge increase in
online advertising spend in Europe and when you match
this increased demand with the recent leaps in advertising
technology and the consumers’ need for contextually rel-
evant ads you get a major shift in the way we do business.
This change has established programmatic as the new
normal for the digital ecosystem and this evolution shows
no signs of slowing down with new channels and formats
embracing the opportunity across every type of screen.
John Stoneman, VP EMEA, PubMatic
It is clear that media quality remains a concern to European
advertisers; and that quality metrics such as, brand safety,
viewability and fraud detection need to be a focal part of the
digital buying process for marketers to invest further in digi-
tal media. The industry now has a once in a generation op-
portunity to make a difference; by increasing transparency
and improving the quality of media being transacted upon,
it will provide marketers with the confidence they need to
continue investing in a burgeoning digital media landscape.
Niall Hogan, uK Managing Director,
Integral Ad Science
23 © IAB Europe and IHS IAB Europe AdEx Benchmark 2014
Section 2 - Online advertising overview by sector
DISPLAy
272
305
349
388
440
646
1,048
1,146
1,715
2,818
0 500 1,000 1,500 2,000 2,500 3,000
Denmark
Norway
Spain
Sweden
Russia
Netherlands
Italy
France
Germany
UK
2014 2013
Top 10: display value by country 2013 and 2014 (€m)
Source: IAB Europe and IHS
8 11 12 14 18
33 51
65 68
98 99
168 178
196 213
278 310
0 50 100 150 200 250 300 350
Croatia Belarus
Slovenia Serbia
Bulgaria Romania Slovakia Greece
Hungary Ireland
Switzerland Belgium Finland Austria
Czech Republic Poland Turkey
2014 2013
Rest of Europe: display value by country 2013 and 2014 (€m)
Source: IAB Europe and IHS
35.1
%
34.1
%
29.4
%
26.4
%
23.4
%
23.3
%
22.5
%
18.6
%
17.4
%
16.2
%
15.8
%
15.5
%
15.5
%
14.5
%
14.1
%
13.4
%
12.9
%
12.1
%
10.4
%
10.2
%
9.1%
8.3%
7.3%
4.5%
2.1%
1.2%
-3.1
%
-5.0
%
-10%
-5%
0%
5%
10%
15%
20%
25%
30%
35%
40%
Irela
nd
Slo
veni
a
Turk
ey
UK
Sw
eden
Aus
tria
Bel
arus
Finl
and
Italy
Bel
gium
Bul
garia
Hun
gary
Eur
ope
Nor
way
Slo
vaki
a
Den
mar
k
Fran
ce
Net
herla
nds
Sw
itzer
land
Gre
ece
Ger
man
y
Ser
bia
Pol
and
Cze
ch R
epub
lic
Spa
in
Rom
ania
Cro
atia
Rus
sia
Display year-on-year growth (%)
Source: IAB Europe and IHS
24 © IAB Europe and IHS IAB Europe AdEx Benchmark 2014
Section 2 - Online advertising overview by sector
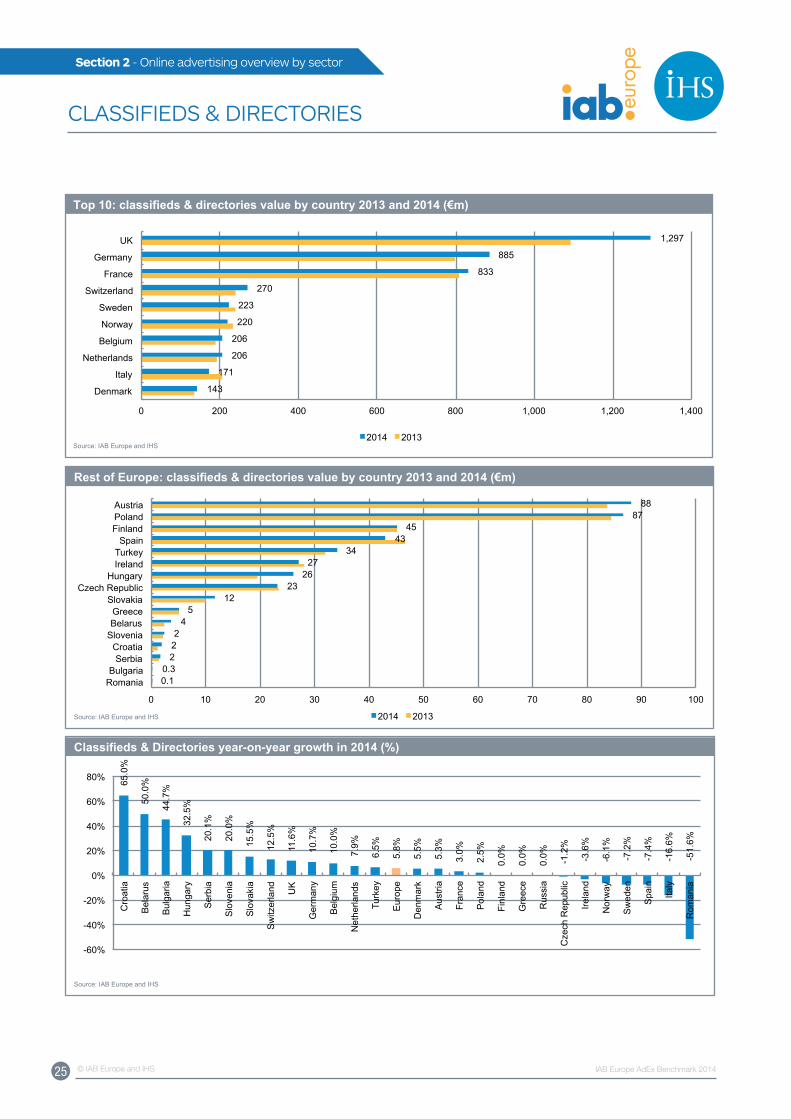
CLASSIFIEDS & DIRECTORIES
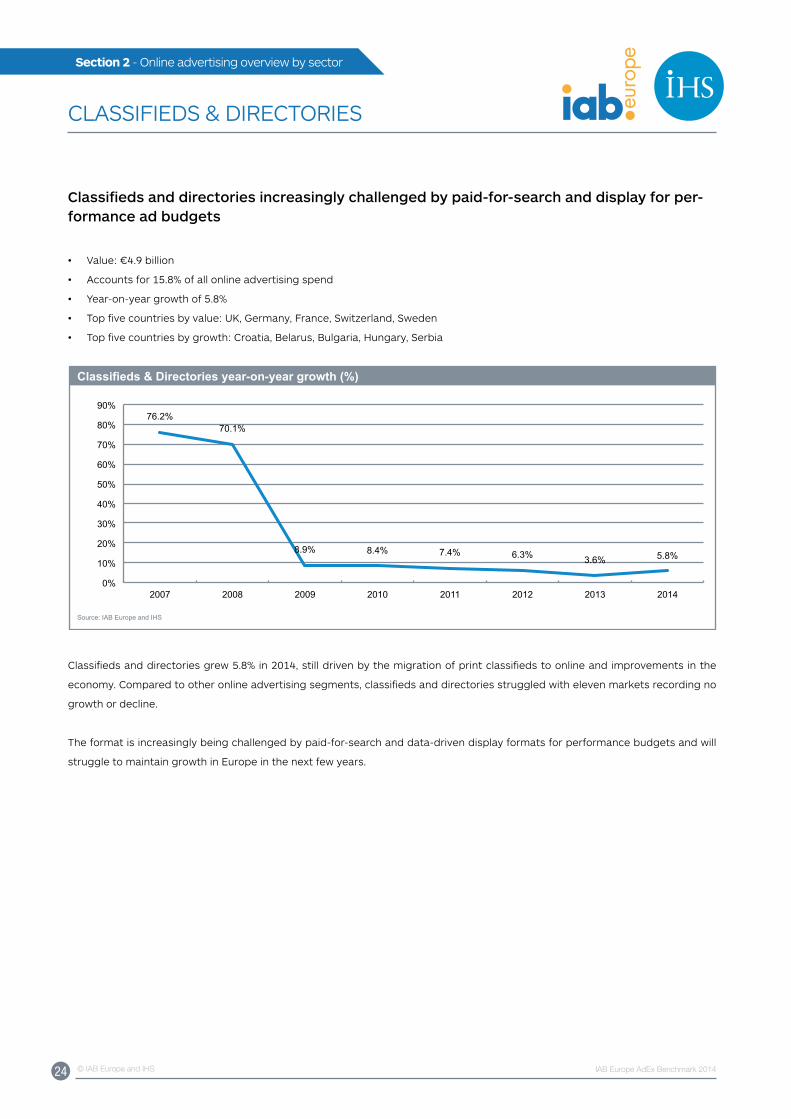
Classifieds and directories increasingly challenged by paid-for-search and display for per-formance ad budgets
• Value: €4.9 billion
• Accounts for 15.8% of all online advertising spend
• year-on-year growth of 5.8%
• Top five countries by value: uK, Germany, France, Switzerland, Sweden
• Top five countries by growth: Croatia, Belarus, Bulgaria, Hungary, Serbia
76.2% 70.1%
8.9% 8.4% 7.4% 6.3% 3.6% 5.8%
0%
10%
20%
30%
40%
50%
60%
70%
80%
90%
2007 2008 2009 2010 2011 2012 2013 2014
Classifieds & Directories year-on-year growth (%)
Source: IAB Europe and IHS
Classifieds and directories grew 5.8% in 2014, still driven by the migration of print classifieds to online and improvements in the
economy. Compared to other online advertising segments, classifieds and directories struggled with eleven markets recording no
growth or decline.
The format is increasingly being challenged by paid-for-search and data-driven display formats for performance budgets and will
struggle to maintain growth in Europe in the next few years.
25 © IAB Europe and IHS IAB Europe AdEx Benchmark 2014
Section 2 - Online advertising overview by sector
CLASSIFIEDS & DIRECTORIES
0.1 0.3
2 2 2
4 5
12 23
26 27
34 43
45 87
88
0 10 20 30 40 50 60 70 80 90 100
Romania Bulgaria
Serbia Croatia
Slovenia Belarus Greece
Slovakia Czech Republic
Hungary Ireland Turkey Spain
Finland Poland Austria
2014 2013
Rest of Europe: classifieds & directories value by country 2013 and 2014 (€m)
Source: IAB Europe and IHS
143
171
206
206
220
223
270
833
885
1,297
0 200 400 600 800 1,000 1,200 1,400
Denmark
Italy
Netherlands
Belgium
Norway
Sweden
Switzerland
France
Germany
UK
2014 2013
Top 10: classifieds & directories value by country 2013 and 2014 (€m)
Source: IAB Europe and IHS
65.0
%
50.0
%
44.7
%
32.5
%
20.1
%
20.0
%
15.5
%
12.5
%
11.6
%
10.7
%
10.0
%
7.9%
6.5%
5.8%
5.5%
5.3%
3.0%
2.5%
0.0%
0.0%
0.0%
-1.2
%
-3.6
%
-6.1
%
-7.2
%
-7.4
%
-16.
6%
-51.
6%
-60%
-40%
-20%
0%
20%
40%
60%
80%
Cro
atia
Bel
arus
Bul
garia
Hun
gary
Ser
bia
Slo
veni
a
Slo
vaki
a
Sw
itzer
land
UK
Ger
man
y
Bel
gium
Net
herla
nds
Turk
ey
Eur
ope
Den
mar
k
Aus
tria
Fran
ce
Pol
and
Finl
and
Gre
ece
Rus
sia
Cze
ch R
epub
lic
Irela
nd
Nor
way
Sw
eden
Spa
in
Italy
Rom
ania
Classifieds & Directories year-on-year growth in 2014 (%)
Source: IAB Europe and IHS
26 © IAB Europe and IHS IAB Europe AdEx Benchmark 2014
Section 2 - Online advertising overview by sector
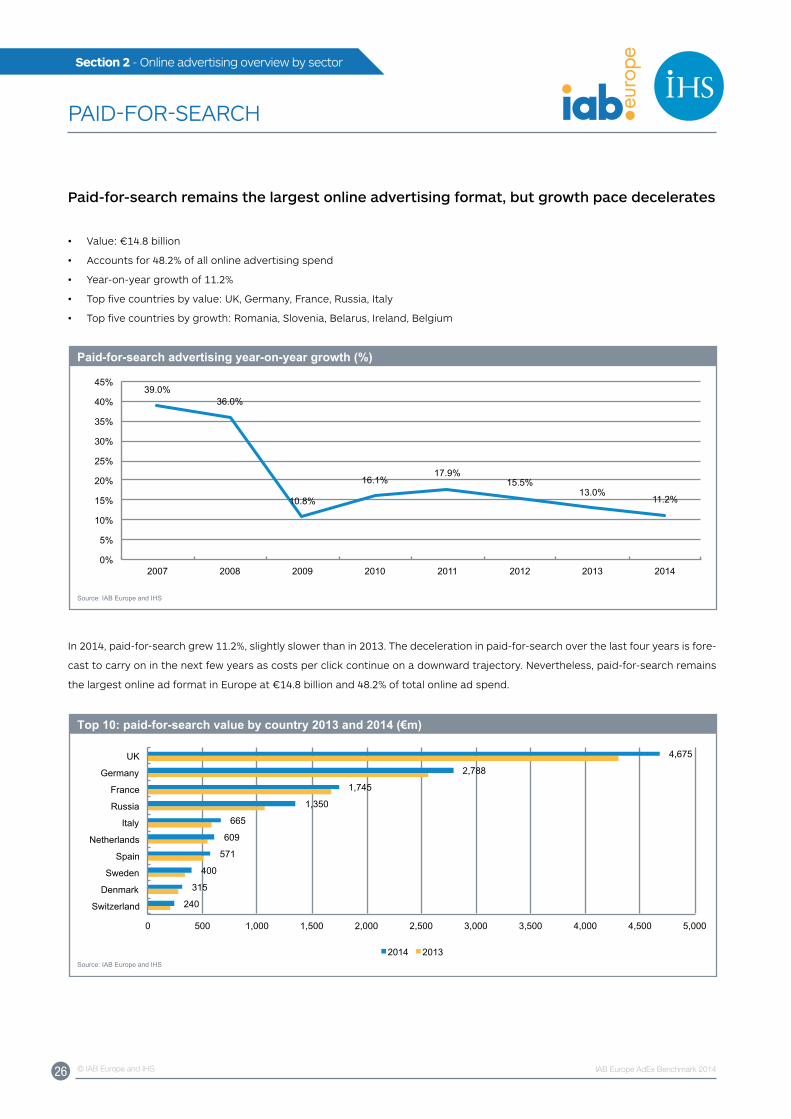
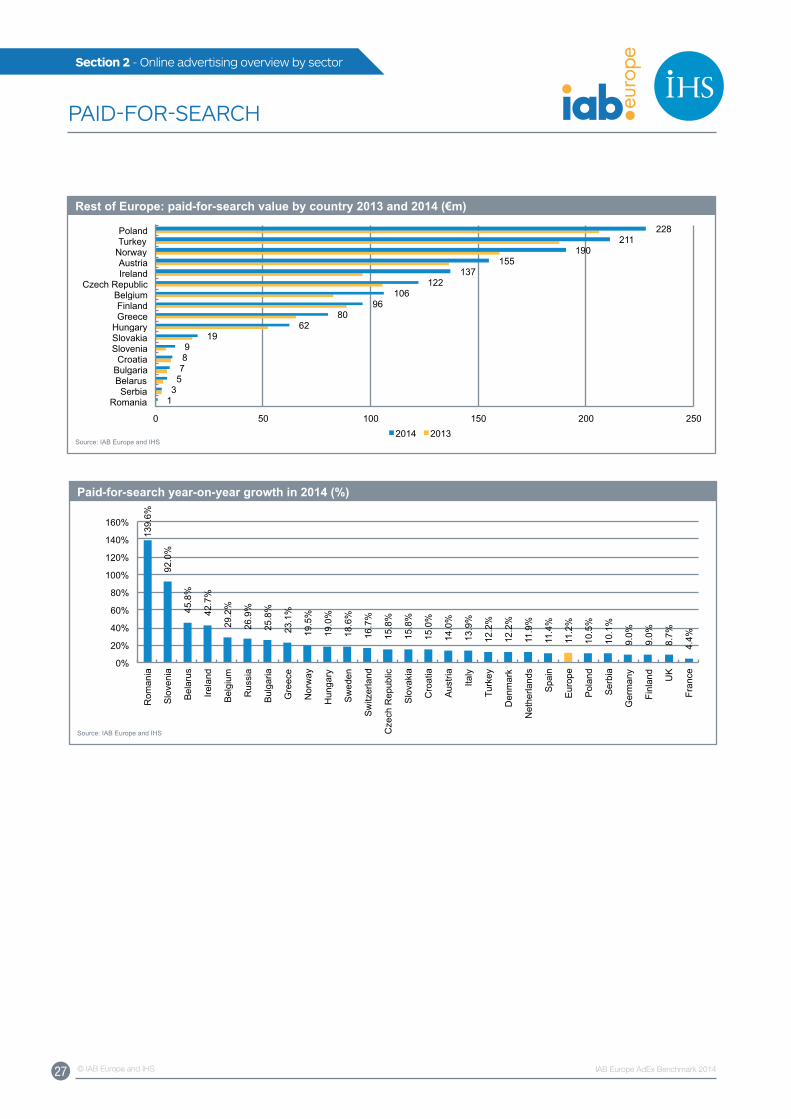
PAID-FOR-SEARCH
Paid-for-search remains the largest online advertising format, but growth pace decelerates
• Value: €14.8 billion
• Accounts for 48.2% of all online advertising spend
• year-on-year growth of 11.2%
• Top five countries by value: uK, Germany, France, Russia, Italy
• Top five countries by growth: Romania, Slovenia, Belarus, Ireland, Belgium
39.0% 36.0%
10.8%
16.1% 17.9%
15.5% 13.0%
11.2%
0%
5%
10%
15%
20%
25%
30%
35%
40%
45%
2007 2008 2009 2010 2011 2012 2013 2014
Paid-for-search advertising year-on-year growth (%)
Source: IAB Europe and IHS
In 2014, paid-for-search grew 11.2%, slightly slower than in 2013. The deceleration in paid-for-search over the last four years is fore-
cast to carry on in the next few years as costs per click continue on a downward trajectory. Nevertheless, paid-for-search remains
the largest online ad format in Europe at €14.8 billion and 48.2% of total online ad spend.
240
315
400
571
609
665
1,350
1,745
2,788
4,675
0 500 1,000 1,500 2,000 2,500 3,000 3,500 4,000 4,500 5,000
Switzerland
Denmark
Sweden
Spain
Netherlands
Italy
Russia
France
Germany
UK
2014 2013
Top 10: paid-for-search value by country 2013 and 2014 (€m)
Source: IAB Europe and IHS
27 © IAB Europe and IHS IAB Europe AdEx Benchmark 2014
Section 2 - Online advertising overview by sector
PAID-FOR-SEARCH
1 3
5 7 8 9
19 62
80 96
106 122
137 155
190 211
228
0 50 100 150 200 250
Romania Serbia
Belarus Bulgaria Croatia
Slovenia Slovakia Hungary Greece Finland
Belgium Czech Republic
Ireland Austria
Norway Turkey Poland
2014 2013
Rest of Europe: paid-for-search value by country 2013 and 2014 (€m)
Source: IAB Europe and IHS
139.
6%
92.0
%
45.8
%
42.7
%
29.2
%
26.9
%
25.8
%
23.1
%
19.5
%
19.0
%
18.6
%
16.7
%
15.8
%
15.8
%
15.0
%
14.0
%
13.9
%
12.2
%
12.2
%
11.9
%
11.4
%
11.2
%
10.5
%
10.1
%
9.0%
9.0%
8.7%
4.4%
0%
20%
40%
60%
80%
100%
120%
140%
160%
Rom
ania
Slo
veni
a
Bel
arus
Irela
nd
Bel
gium
Rus
sia
Bul
garia
Gre
ece
Nor
way
Hun
gary
Sw
eden
Sw
itzer
land
Cze
ch R
epub
lic
Slo
vaki
a
Cro
atia
Aus
tria
Italy
Turk
ey
Den
mar
k
Net
herla
nds
Spa
in
Eur
ope
Pol
and
Ser
bia
Ger
man
y
Finl
and
UK
Fran
ce
Paid-for-search year-on-year growth in 2014 (%)
Source: IAB Europe and IHS
28 © IAB Europe and IHS IAB Europe AdEx Benchmark 2014
Section 2 - Online advertising overview by sector
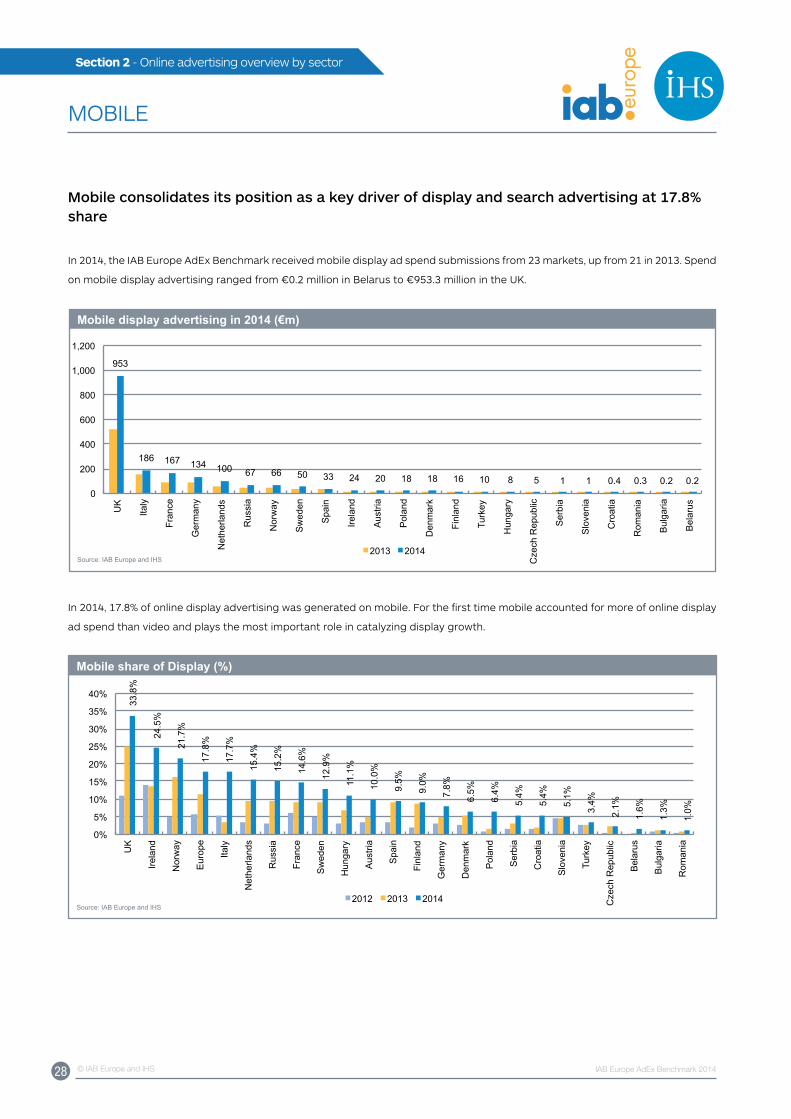
MOBILE
Mobile consolidates its position as a key driver of display and search advertising at 17.8% share
In 2014, the IAB Europe AdEx Benchmark received mobile display ad spend submissions from 23 markets, up from 21 in 2013. Spend
on mobile display advertising ranged from €0.2 million in Belarus to €953.3 million in the uK.
953
186 167 134 100 67 66 50 33 24 20 18 18 16 10 8 5 1 1 0.4 0.3 0.2 0.2 0
200
400
600
800
1,000
1,200
UK
Italy
Fran
ce
Ger
man
y
Net
herla
nds
Rus
sia
Nor
way
Sw
eden
Spa
in
Irela
nd
Aus
tria
Pol
and
Den
mar
k
Finl
and
Turk
ey
Hun
gary
Cze
ch R
epub
lic
Ser
bia
Slo
veni
a
Cro
atia
Rom
ania
Bul
garia
Bel
arus
2013 2014
Mobile display advertising in 2014 (€m)
Source: IAB Europe and IHS
In 2014, 17.8% of online display advertising was generated on mobile. For the first time mobile accounted for more of online display
ad spend than video and plays the most important role in catalyzing display growth.
33.8
%
24.5
%
21.7
%
17.8
%
17.7
%
15.4
%
15.2
%
14.6
%
12.9
%
11.1
%
10.0
%
9.5%
9.0%
7.8%
6.5%
6.4%
5.4%
5.4%
5.1%
3.4%
2.1%
1.6%
1.3%
1.0%
0%
5%
10%
15%
20%
25%
30%
35%
40%
UK
Irela
nd
Nor
way
Eur
ope
Italy
Net
herla
nds
Rus
sia
Fran
ce
Sw
eden
Hun
gary
Aus
tria
Spa
in
Finl
and
Ger
man
y
Den
mar
k
Pol
and
Ser
bia
Cro
atia
Slo
veni
a
Turk
ey
Cze
ch R
epub
lic
Bel
arus
Bul
garia
Rom
ania
2012 2013 2014
Mobile share of Display (%)
Source: IAB Europe and IHS
29 © IAB Europe and IHS IAB Europe AdEx Benchmark 2014
Section 2 - Online advertising overview by sector
MOBILE
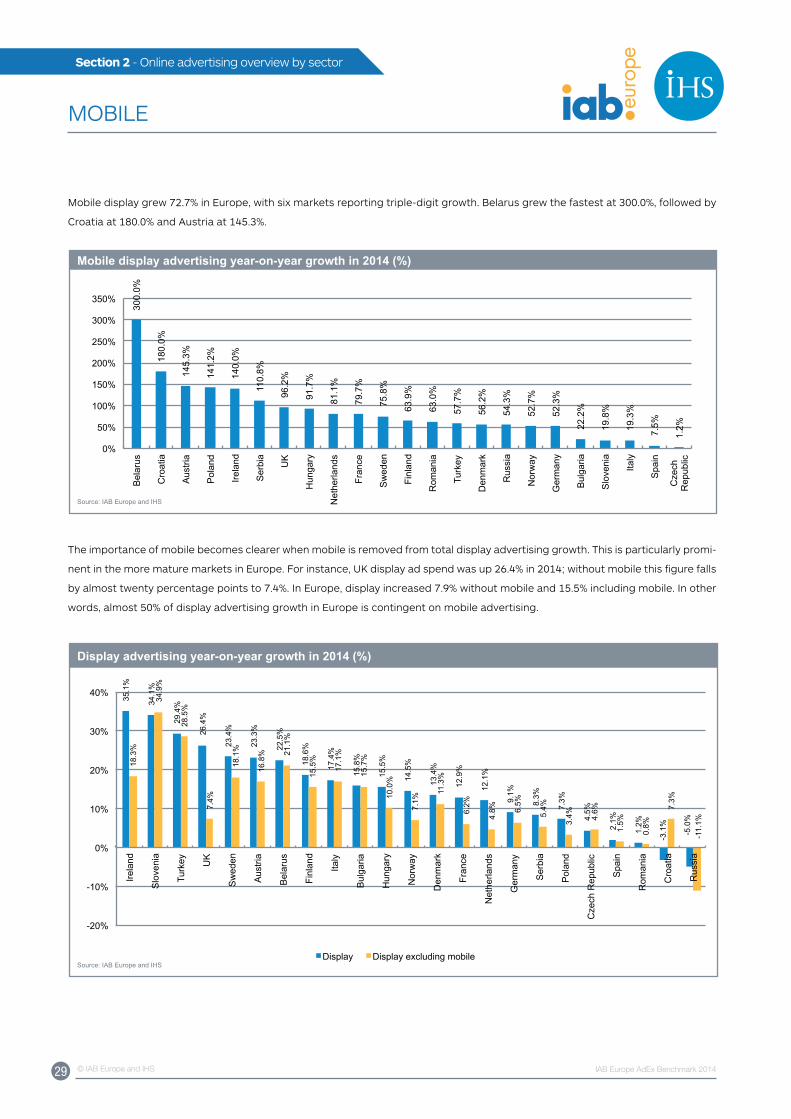
Mobile display grew 72.7% in Europe, with six markets reporting triple-digit growth. Belarus grew the fastest at 300.0%, followed by
Croatia at 180.0% and Austria at 145.3%.
300.
0%
180.
0%
145.
3%
141.
2%
140.
0%
110.
8%
96.2
%
91.7
%
81.1
%
79.7
%
75.8
%
63.9
%
63.0
%
57.7
%
56.2
%
54.3
%
52.7
%
52.3
%
22.2
%
19.8
%
19.3
%
7.5%
1.2%
0%
50%
100%
150%
200%
250%
300%
350%
Bel
arus
Cro
atia
Aus
tria
Pol
and
Irela
nd
Ser
bia
UK
Hun
gary
Net
herla
nds
Fran
ce
Sw
eden
Finl
and
Rom
ania
Turk
ey
Den
mar
k
Rus
sia
Nor
way
Ger
man
y
Bul
garia
Slo
veni
a
Italy
Spa
in
Cze
ch
Rep
ublic
Mobile display advertising year-on-year growth in 2014 (%)
Source: IAB Europe and IHS
The importance of mobile becomes clearer when mobile is removed from total display advertising growth. This is particularly promi-
nent in the more mature markets in Europe. For instance, uK display ad spend was up 26.4% in 2014; without mobile this figure falls
by almost twenty percentage points to 7.4%. In Europe, display increased 7.9% without mobile and 15.5% including mobile. In other
words, almost 50% of display advertising growth in Europe is contingent on mobile advertising.
35.1
%
34.1
%
29.4
%
26.4
%
23.4
%
23.3
%
22.5
%
18.6
%
17.4
%
15.8
%
15.5
%
14.5
%
13.4
%
12.9
%
12.1
%
9.1%
8.3%
7.3%
4.5%
2.1%
1.2%
-3.1
%
-5.0
%
18.3
%
34.9
%
28.5
%
7.4%
18.1
%
16.8
%
21.1
%
15.5
%
17.1
%
15.7
%
10.0
%
7.1%
11.3
%
6.2%
4.8%
6.5%
5.4%
3.4%
4.6%
1.5%
0.8%
7.3%
-11.
1%
-20%
-10%
0%
10%
20%
30%
40%
Irela
nd
Slo
veni
a
Turk
ey
UK
Sw
eden
Aus
tria
Bel
arus
Finl
and
Italy
Bul
garia
Hun
gary
Nor
way
Den
mar
k
Fran
ce
Net
herla
nds
Ger
man
y
Ser
bia
Pol
and
Cze
ch R
epub
lic
Spa
in
Rom
ania
Cro
atia
Rus
sia
Display Display excluding mobile
Display advertising year-on-year growth in 2014 (%)
Source: IAB Europe and IHS
30 © IAB Europe and IHS IAB Europe AdEx Benchmark 2014
Section 2 - Online advertising overview by sector
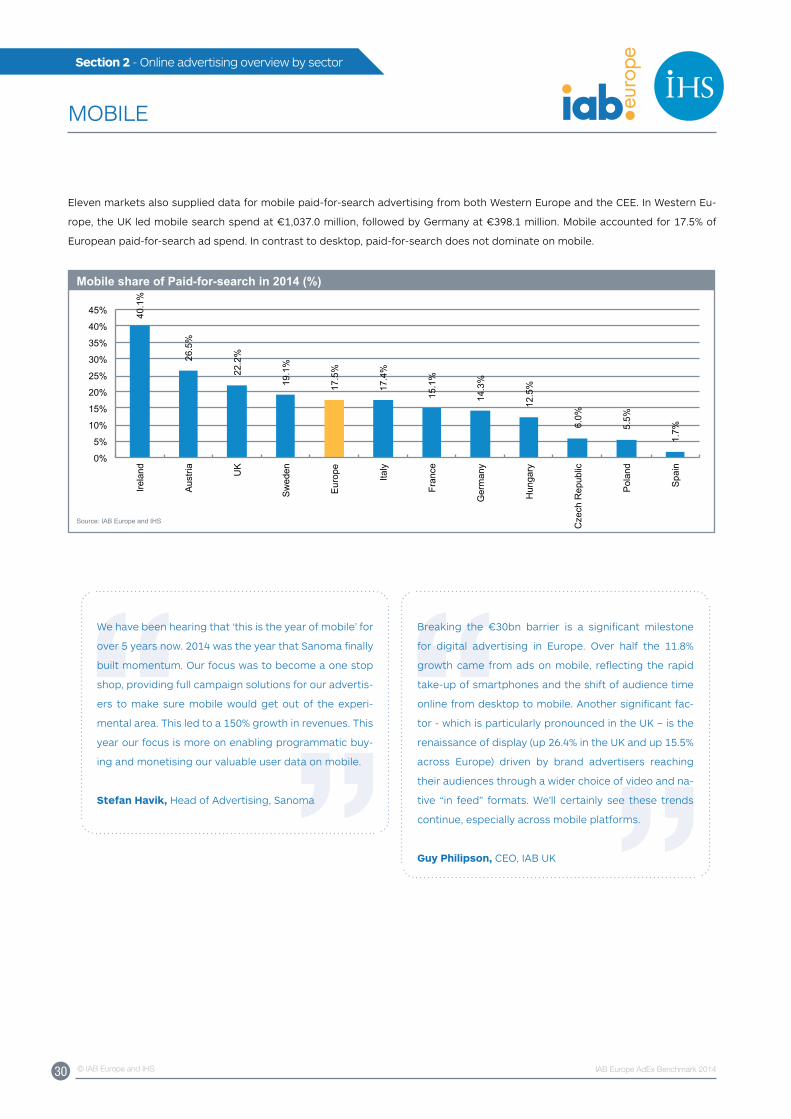
Eleven markets also supplied data for mobile paid-for-search advertising from both Western Europe and the CEE. In Western Eu-
rope, the uK led mobile search spend at €1,037.0 million, followed by Germany at €398.1 million. Mobile accounted for 17.5% of
European paid-for-search ad spend. In contrast to desktop, paid-for-search does not dominate on mobile.
40.1
%
26.5
%
22.2
%
19.1
%
17.5
%
17.4
%
15.1
%
14.3
%
12.5
%
6.0%
5.5%
1.7%
0%
5%
10%
15%
20%
25%
30%
35%
40%
45%
Irela
nd
Aus
tria
UK
Sw
eden
Eur
ope
Italy
Fran
ce
Ger
man
y
Hun
gary
Cze
ch R
epub
lic
Pol
and
Spa
in
Mobile share of Paid-for-search in 2014 (%)
Source: IAB Europe and IHS
MOBILE
We have been hearing that ‘this is the year of mobile’ for
over 5 years now. 2014 was the year that Sanoma finally
built momentum. Our focus was to become a one stop
shop, providing full campaign solutions for our advertis-
ers to make sure mobile would get out of the experi-
mental area. This led to a 150% growth in revenues. This
year our focus is more on enabling programmatic buy-
ing and monetising our valuable user data on mobile.
Stefan Havik, Head of Advertising, Sanoma
Breaking the €30bn barrier is a significant milestone
for digital advertising in Europe. Over half the 11.8%
growth came from ads on mobile, reflecting the rapid
take-up of smartphones and the shift of audience time
online from desktop to mobile. Another significant fac-
tor - which is particularly pronounced in the uK – is the
renaissance of display (up 26.4% in the uK and up 15.5%
across Europe) driven by brand advertisers reaching
their audiences through a wider choice of video and na-
tive “in feed” formats. We’ll certainly see these trends
continue, especially across mobile platforms.
Guy Philipson, CEO, IAB uK
31 © IAB Europe and IHS IAB Europe AdEx Benchmark 2014
Section 2 - Online advertising overview by sector
VIDEO
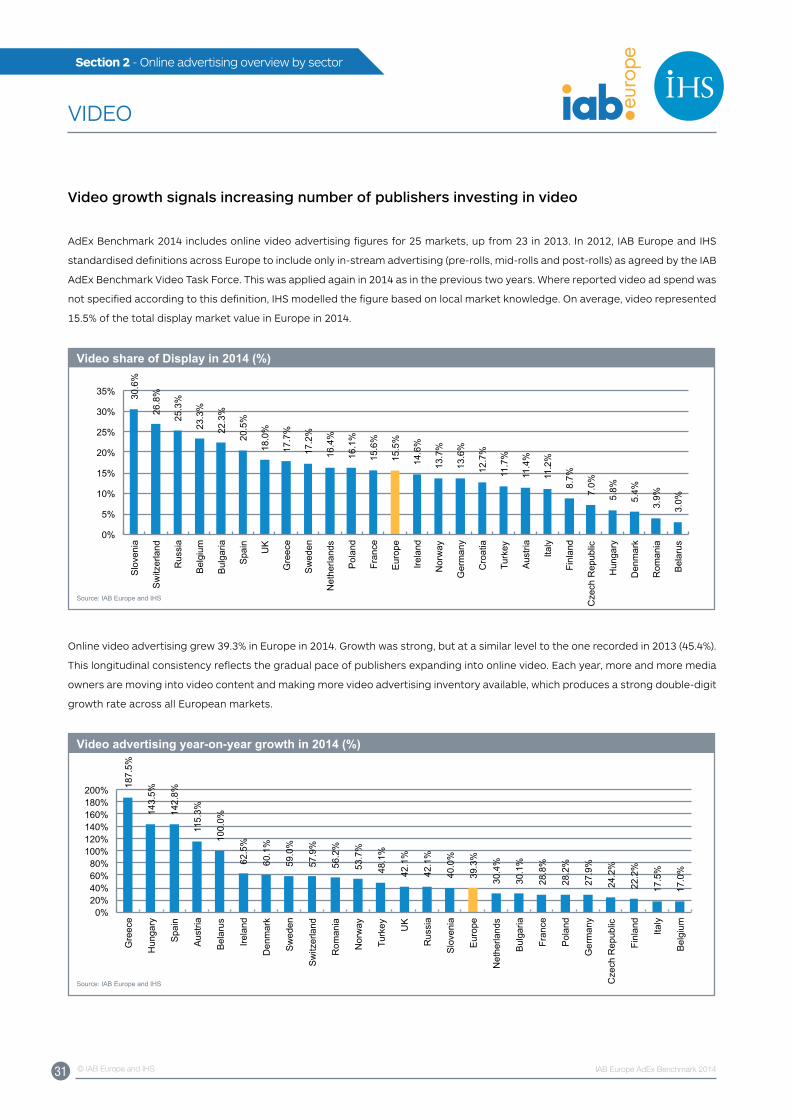
Video growth signals increasing number of publishers investing in video
AdEx Benchmark 2014 includes online video advertising figures for 25 markets, up from 23 in 2013. In 2012, IAB Europe and IHS
standardised definitions across Europe to include only in-stream advertising (pre-rolls, mid-rolls and post-rolls) as agreed by the IAB
AdEx Benchmark Video Task Force. This was applied again in 2014 as in the previous two years. Where reported video ad spend was
not specified according to this definition, IHS modelled the figure based on local market knowledge. On average, video represented
15.5% of the total display market value in Europe in 2014.
30.6
%
26.8
%
25.3
%
23.3
%
22.3
%
20.5
%
18.0
%
17.7
%
17.2
%
16.4
%
16.1
%
15.6
%
15.5
%
14.6
%
13.7
%
13.6
%
12.7
%
11.7
%
11.4
%
11.2
%
8.7%
7.0%
5.8%
5.4%
3.9%
3.0%
0%
5%
10%
15%
20%
25%
30%
35%
Slo
veni
a
Sw
itzer
land
Rus
sia
Bel
gium
Bul
garia
Spa
in
UK
Gre
ece
Sw
eden
Net
herla
nds
Pol
and
Fran
ce
Eur
ope
Irela
nd
Nor
way
Ger
man
y
Cro
atia
Turk
ey
Aus
tria
Italy
Finl
and
Cze
ch R
epub
lic
Hun
gary
Den
mar
k
Rom
ania
Bel
arus
Video share of Display in 2014 (%)
Source: IAB Europe and IHS
Online video advertising grew 39.3% in Europe in 2014. Growth was strong, but at a similar level to the one recorded in 2013 (45.4%).
This longitudinal consistency reflects the gradual pace of publishers expanding into online video. Each year, more and more media
owners are moving into video content and making more video advertising inventory available, which produces a strong double-digit
growth rate across all European markets.
187.
5%
143.
5%
142.
8%
115.
3%
100.
0%
62.5
%
60.1
%
59.0
%
57.9
%
56.2
%
53.7
%
48.1
%
42.1
%
42.1
%
40.0
%
39.3
%
30.4
%
30.1
%
28.8
%
28.2
%
27.9
%
24.2
%
22.2
%
17.5
%
17.0
%
0% 20% 40% 60% 80%
100% 120% 140% 160% 180% 200%
Gre
ece
Hun
gary
Spa
in
Aus
tria
Bel
arus
Irela
nd
Den
mar
k
Sw
eden
Sw
itzer
land
Rom
ania
Nor
way
Turk
ey
UK
Rus
sia
Slo
veni
a
Eur
ope
Net
herla
nds
Bul
garia
Fran
ce
Pol
and
Ger
man
y
Cze
ch R
epub
lic
Finl
and
Italy
Bel
gium
Video advertising year-on-year growth in 2014 (%)
Source: IAB Europe and IHS
32 © IAB Europe and IHS IAB Europe AdEx Benchmark 2014
Section 2 - Online advertising overview by sector
VIDEO
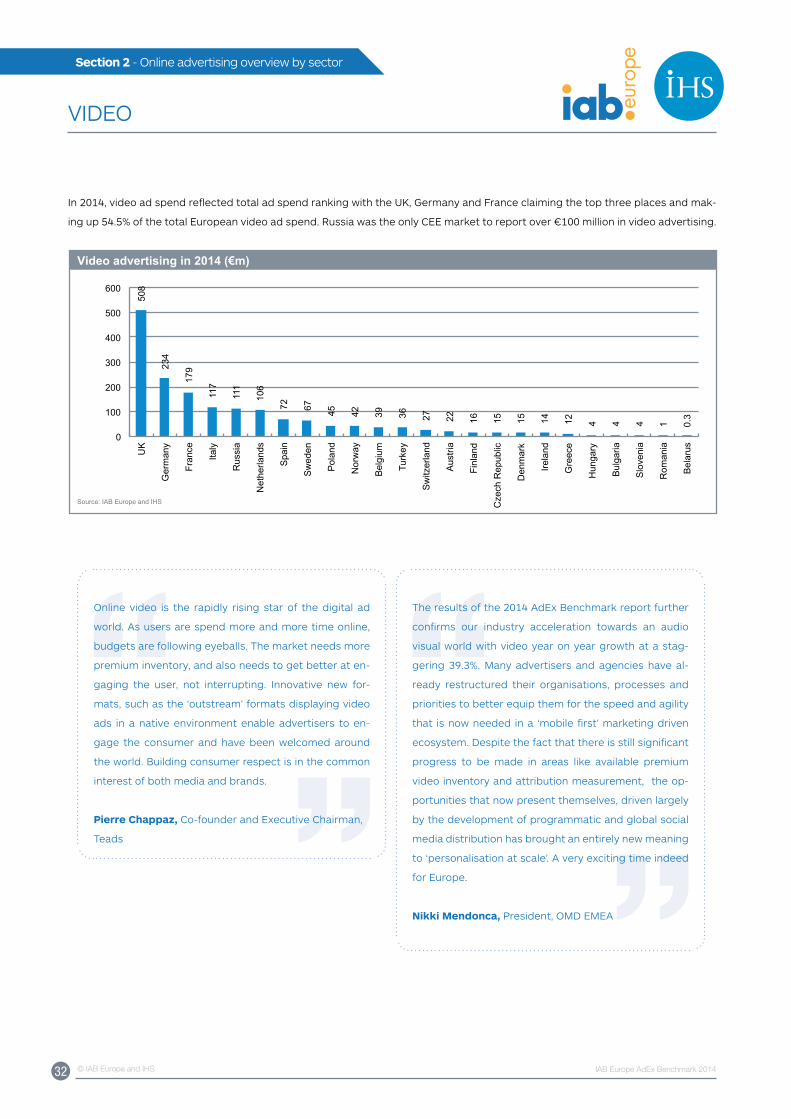
In 2014, video ad spend reflected total ad spend ranking with the uK, Germany and France claiming the top three places and mak-
ing up 54.5% of the total European video ad spend. Russia was the only CEE market to report over €100 million in video advertising.
508
234
179
117
111
106
72
67
45
42
39
36
27
22
16
15
15
14
12
4 4 4 1 0.3
0
100
200
300
400
500
600
UK
Ger
man
y
Fran
ce
Italy
Rus
sia
Net
herla
nds
Spa
in
Sw
eden
Pol
and
Nor
way
Bel
gium
Turk
ey
Sw
itzer
land
Aus
tria
Finl
and
Cze
ch R
epub
lic
Den
mar
k
Irela
nd
Gre
ece
Hun
gary
Bul
garia
Slo
veni
a
Rom
ania
Bel
arus
Video advertising in 2014 (€m)
Source: IAB Europe and IHS
Online video is the rapidly rising star of the digital ad
world. As users are spend more and more time online,
budgets are following eyeballs. The market needs more
premium inventory, and also needs to get better at en-
gaging the user, not interrupting. Innovative new for-
mats, such as the ‘outstream’ formats displaying video
ads in a native environment enable advertisers to en-
gage the consumer and have been welcomed around
the world. Building consumer respect is in the common
interest of both media and brands.
Pierre Chappaz, Co-founder and Executive Chairman,
Teads
The results of the 2014 AdEx Benchmark report further
confirms our industry acceleration towards an audio
visual world with video year on year growth at a stag-
gering 39.3%. Many advertisers and agencies have al-
ready restructured their organisations, processes and
priorities to better equip them for the speed and agility
that is now needed in a ‘mobile first’ marketing driven
ecosystem. Despite the fact that there is still significant
progress to be made in areas like available premium
video inventory and attribution measurement, the op-
portunities that now present themselves, driven largely
by the development of programmatic and global social
media distribution has brought an entirely new meaning
to ‘personalisation at scale’. A very exciting time indeed
for Europe.
Nikki Mendonca, President, OMD EMEA
33 © IAB Europe and IHS IAB Europe AdEx Benchmark 2014
Section 3 - Overview by country
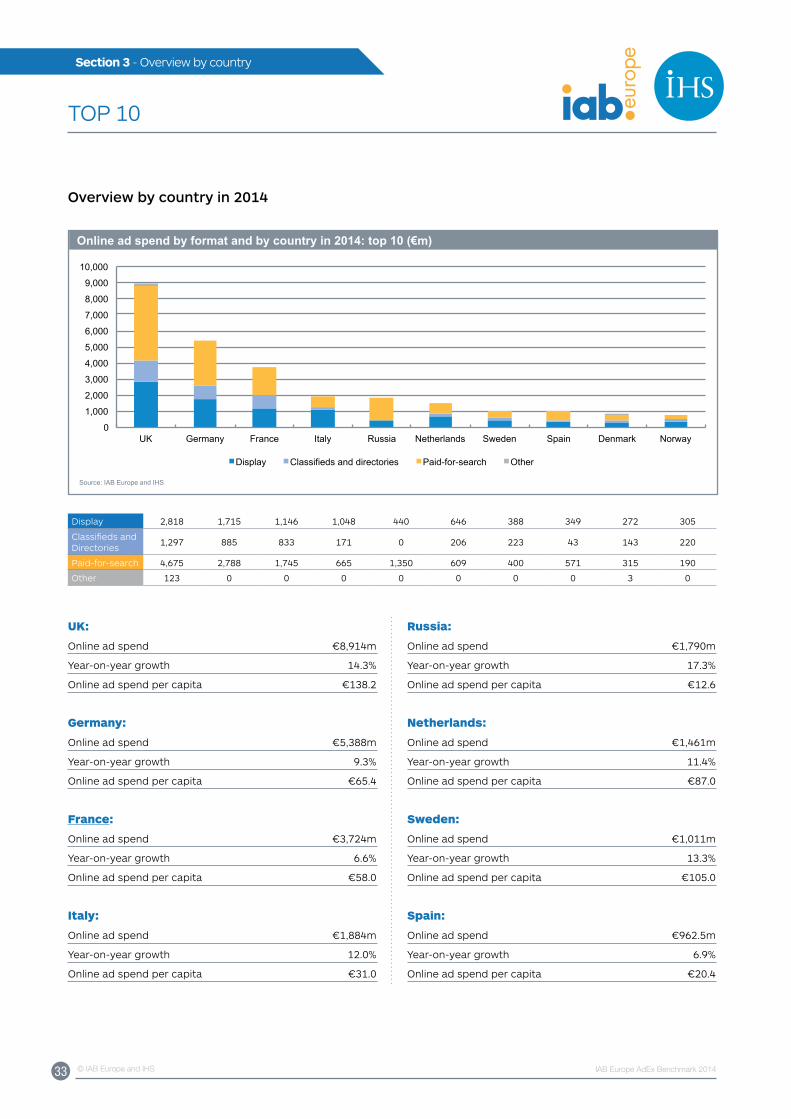
TOP 10
Overview by country in 2014
0
1,000
2,000
3,000
4,000
5,000
6,000
7,000
8,000
9,000
10,000
UK Germany France Italy Russia Netherlands Sweden Spain Denmark Norway
Display Classifieds and directories Paid-for-search Other
Online ad spend by format and by country in 2014: top 10 (€m)
Source: IAB Europe and IHS
Display 2,818 1,715 1,146 1,048 440 646 388 349 272 305
Classifieds and Directories
1,297 885 833 171 0 206 223 43 143 220
Paid-for-search 4,675 2,788 1,745 665 1,350 609 400 571 315 190
Other 123 0 0 0 0 0 0 0 3 0
UK:
Online ad spend €8,914m
year-on-year growth 14.3%
Online ad spend per capita €138.2
Germany:
Online ad spend €5,388m
year-on-year growth 9.3%
Online ad spend per capita €65.4
France:
Online ad spend €3,724m
year-on-year growth 6.6%
Online ad spend per capita €58.0
Italy:
Online ad spend €1,884m
year-on-year growth 12.0%
Online ad spend per capita €31.0
Russia:
Online ad spend €1,790m
year-on-year growth 17.3%
Online ad spend per capita €12.6
Netherlands:
Online ad spend €1,461m
year-on-year growth 11.4%
Online ad spend per capita €87.0
Sweden:
Online ad spend €1,011m
year-on-year growth 13.3%
Online ad spend per capita €105.0
Spain:
Online ad spend €962.5m
year-on-year growth 6.9%
Online ad spend per capita €20.4

34 © IAB Europe and IHS IAB Europe AdEx Benchmark 2014
Section 3 - Overview by country
TOP 10
Denmark:
Online ad spend €733m
year-on-year growth 11.2%
Online ad spend per capita €129.9
Norway:
Online ad spend €715m
year-on-year growth 8.4%
Online ad spend per capita €140.5
The digital display advertising market does show a sol-
id development for 2014. In comparison to other me-
dia types digital is still the fastest growing advertising
medium and has meanwhile also developed itself to
an established media type. Our responsibility now is to
face the challenges of our media and to strengthen it by
working jointly on initiatives to develop market educa-
tion (e.g. in the area of viewability), standardisation and
proof of advertising impact.
Paul Mudter, Chairman, Circle of Online Market-
ers (OVK) in the German Association for the Digital
Economy (BVDW)
It’s encouraging to see another successful year for dis-
play – a 15.5% increase highlights the importance adver-
tisers are placing on brand display and the 72.7% hike
in mobile display spend shows advertisers are realising
the value of mobile. Our Adform 2014 RTB Trend Report
supports this – we see a 650% increase in spending for
brand solutions (rich media formats) in 2014.
This is a welcome shift in objectives - from programmat-
ic performance campaigns to more cross-device pro-
grammatic branding campaigns (and we know premium
brands are also embracing programmatic). All parties
within the digital ecosystem need to work together, and
closely with the IAB Europe Brand Advertising Com-
mittee, to create standards to provide an increasingly
transparent industry that includes relevant and con-
sistent KPIs for brand effectiveness/purchasing intent,
cross-device, multi-screen reporting and evaluation.
Martin Stockfleth Larsen, CMO, Adform
35 © IAB Europe and IHS IAB Europe AdEx Benchmark 2014
Section 3 - Overview by country
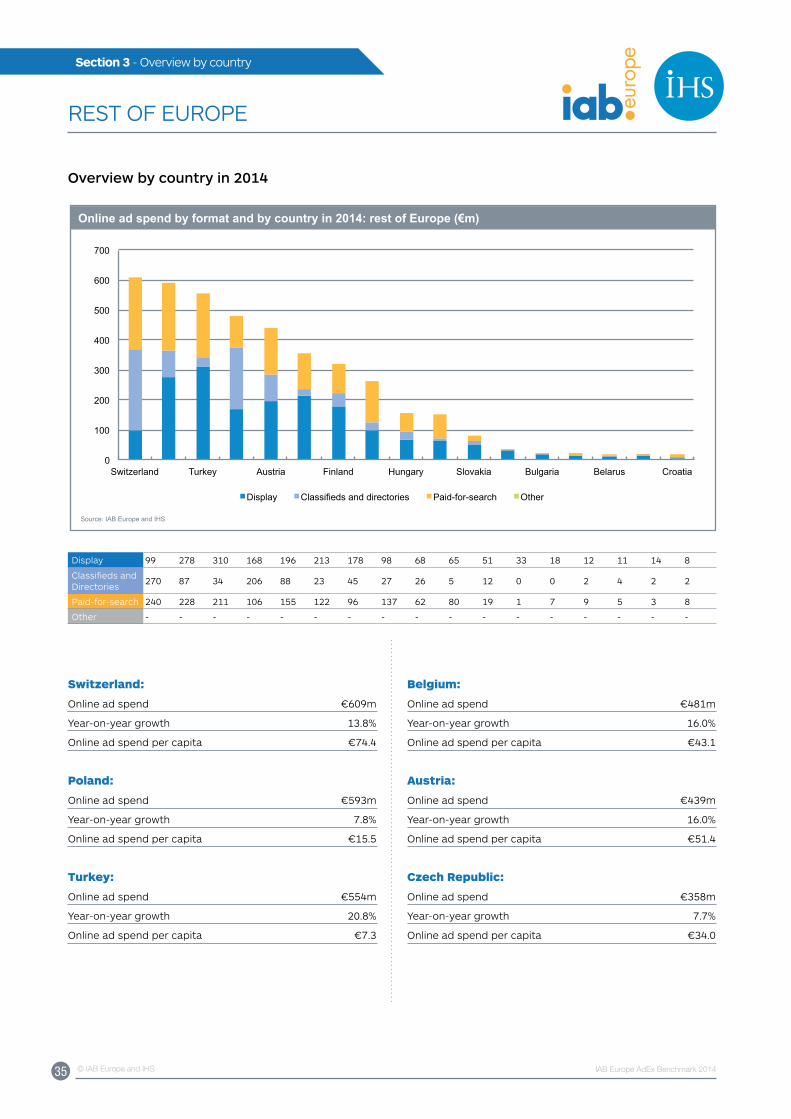
REST OF EuROPE
0
100
200
300
400
500
600
700
Switzerland Turkey Austria Finland Hungary Slovakia Bulgaria Belarus Croatia
Display Classifieds and directories Paid-for-search Other
Online ad spend by format and by country in 2014: rest of Europe (€m)
Source: IAB Europe and IHS
Display 99 278 310 168 196 213 178 98 68 65 51 33 18 12 11 14 8
Classifieds and Directories
270 87 34 206 88 23 45 27 26 5 12 0 0 2 4 2 2
Paid-for-search 240 228 211 106 155 122 96 137 62 80 19 1 7 9 5 3 8
Other - - - - - - - - - - - - - - - - -
Switzerland:
Online ad spend €609m
year-on-year growth 13.8%
Online ad spend per capita €74.4
Poland:
Online ad spend €593m
year-on-year growth 7.8%
Online ad spend per capita €15.5
Turkey:
Online ad spend €554m
year-on-year growth 20.8%
Online ad spend per capita €7.3
Belgium:
Online ad spend €481m
year-on-year growth 16.0%
Online ad spend per capita €43.1
Austria:
Online ad spend €439m
year-on-year growth 16.0%
Online ad spend per capita €51.4
Czech Republic:
Online ad spend €358m
year-on-year growth 7.7%
Online ad spend per capita €34.0
Overview by country in 2014
36 © IAB Europe and IHS IAB Europe AdEx Benchmark 2014
Section 3 - Overview by country
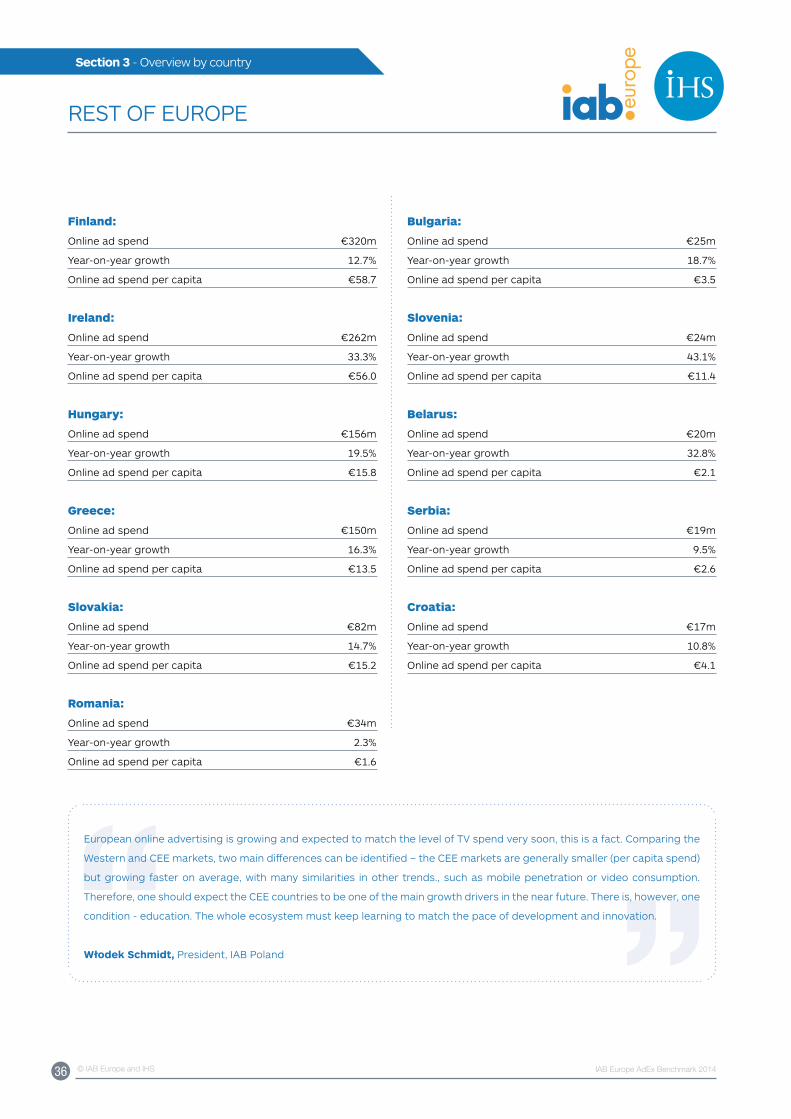
REST OF EuROPE
Finland:
Online ad spend €320m
year-on-year growth 12.7%
Online ad spend per capita €58.7
Ireland:
Online ad spend €262m
year-on-year growth 33.3%
Online ad spend per capita €56.0
Hungary:
Online ad spend €156m
year-on-year growth 19.5%
Online ad spend per capita €15.8
Greece:
Online ad spend €150m
year-on-year growth 16.3%
Online ad spend per capita €13.5
Slovakia:
Online ad spend €82m
year-on-year growth 14.7%
Online ad spend per capita €15.2
Romania:
Online ad spend €34m
year-on-year growth 2.3%
Online ad spend per capita €1.6
Bulgaria:
Online ad spend €25m
year-on-year growth 18.7%
Online ad spend per capita €3.5
Slovenia:
Online ad spend €24m
year-on-year growth 43.1%
Online ad spend per capita €11.4
Belarus:
Online ad spend €20m
year-on-year growth 32.8%
Online ad spend per capita €2.1
Serbia:
Online ad spend €19m
year-on-year growth 9.5%
Online ad spend per capita €2.6
Croatia:
Online ad spend €17m
year-on-year growth 10.8%
Online ad spend per capita €4.1
European online advertising is growing and expected to match the level of TV spend very soon, this is a fact. Comparing the
Western and CEE markets, two main differences can be identified – the CEE markets are generally smaller (per capita spend)
but growing faster on average, with many similarities in other trends., such as mobile penetration or video consumption.
Therefore, one should expect the CEE countries to be one of the main growth drivers in the near future. There is, however, one
condition - education. The whole ecosystem must keep learning to match the pace of development and innovation.
Włodek Schmidt, President, IAB Poland
37 © IAB Europe and IHS IAB Europe AdEx Benchmark 2014
Section 4 - Background Data
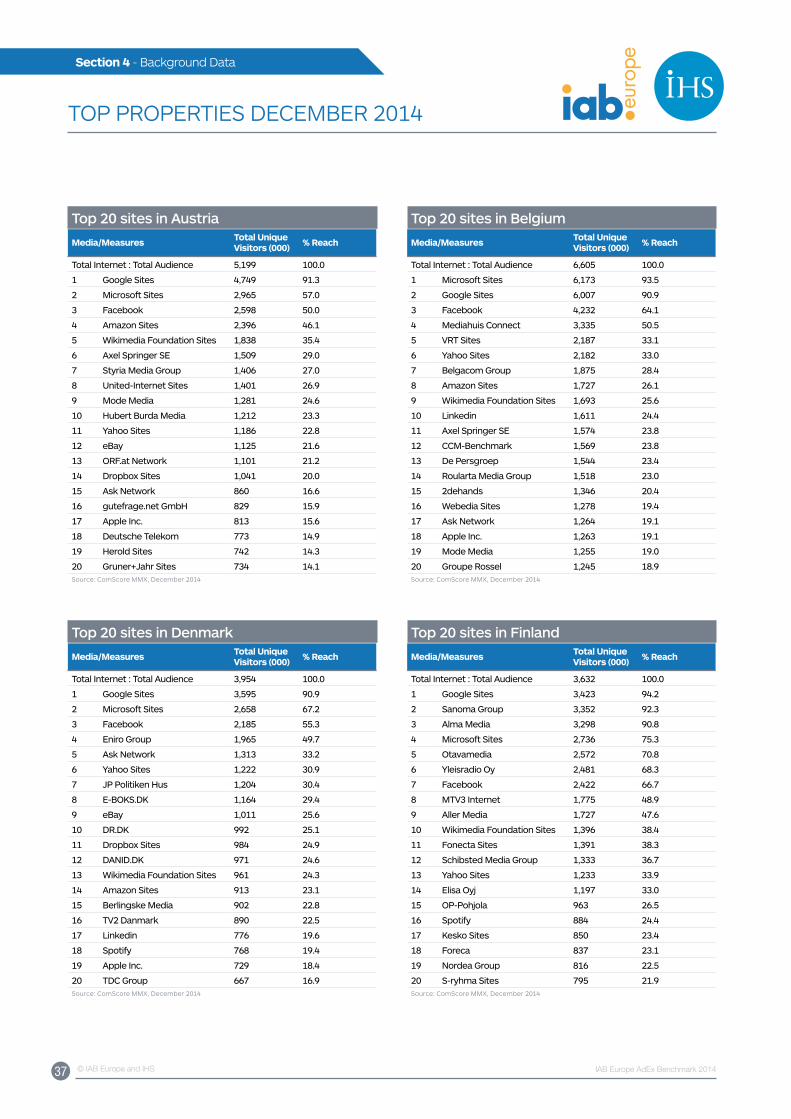
TOP PROPERTIES DECEMBER 2014
Top 20 sites in Belgium
Media/Measures Total Unique Visitors (000) % Reach
Total Internet : Total Audience 6,605 100.0
1 Microsoft Sites 6,173 93.5
2 Google Sites 6,007 90.9
3 Facebook 4,232 64.1
4 Mediahuis Connect 3,335 50.5
5 VRT Sites 2,187 33.1
6 Yahoo Sites 2,182 33.0
7 Belgacom Group 1,875 28.4
8 Amazon Sites 1,727 26.1
9 Wikimedia Foundation Sites 1,693 25.6
10 Linkedin 1,611 24.4
11 Axel Springer SE 1,574 23.8
12 CCM-Benchmark 1,569 23.8
13 De Persgroep 1,544 23.4
14 Roularta Media Group 1,518 23.0
15 2dehands 1,346 20.4
16 Webedia Sites 1,278 19.4
17 Ask Network 1,264 19.1
18 Apple Inc. 1,263 19.1
19 Mode Media 1,255 19.0
20 Groupe Rossel 1,245 18.9Source: ComScore MMx, December 2014
Top 20 sites in Finland
Media/Measures Total Unique Visitors (000) % Reach
Total Internet : Total Audience 3,632 100.0
1 Google Sites 3,423 94.2
2 Sanoma Group 3,352 92.3
3 Alma Media 3,298 90.8
4 Microsoft Sites 2,736 75.3
5 Otavamedia 2,572 70.8
6 Yleisradio Oy 2,481 68.3
7 Facebook 2,422 66.7
8 MTV3 Internet 1,775 48.9
9 Aller Media 1,727 47.6
10 Wikimedia Foundation Sites 1,396 38.4
11 Fonecta Sites 1,391 38.3
12 Schibsted Media Group 1,333 36.7
13 Yahoo Sites 1,233 33.9
14 Elisa Oyj 1,197 33.0
15 OP-Pohjola 963 26.5
16 Spotify 884 24.4
17 Kesko Sites 850 23.4
18 Foreca 837 23.1
19 Nordea Group 816 22.5
20 S-ryhma Sites 795 21.9Source: ComScore MMx, December 2014
Top 20 sites in Austria
Media/Measures Total Unique Visitors (000) % Reach
Total Internet : Total Audience 5,199 100.0
1 Google Sites 4,749 91.3
2 Microsoft Sites 2,965 57.0
3 Facebook 2,598 50.0
4 Amazon Sites 2,396 46.1
5 Wikimedia Foundation Sites 1,838 35.4
6 Axel Springer SE 1,509 29.0
7 Styria Media Group 1,406 27.0
8 United-Internet Sites 1,401 26.9
9 Mode Media 1,281 24.6
10 Hubert Burda Media 1,212 23.3
11 Yahoo Sites 1,186 22.8
12 eBay 1,125 21.6
13 ORF.at Network 1,101 21.2
14 Dropbox Sites 1,041 20.0
15 Ask Network 860 16.6
16 gutefrage.net GmbH 829 15.9
17 Apple Inc. 813 15.6
18 Deutsche Telekom 773 14.9
19 Herold Sites 742 14.3
20 Gruner+Jahr Sites 734 14.1Source: ComScore MMx, December 2014
Top 20 sites in Denmark
Media/Measures Total Unique Visitors (000) % Reach
Total Internet : Total Audience 3,954 100.0
1 Google Sites 3,595 90.9
2 Microsoft Sites 2,658 67.2
3 Facebook 2,185 55.3
4 Eniro Group 1,965 49.7
5 Ask Network 1,313 33.2
6 Yahoo Sites 1,222 30.9
7 JP Politiken Hus 1,204 30.4
8 E-BOKS.DK 1,164 29.4
9 eBay 1,011 25.6
10 DR.DK 992 25.1
11 Dropbox Sites 984 24.9
12 DANID.DK 971 24.6
13 Wikimedia Foundation Sites 961 24.3
14 Amazon Sites 913 23.1
15 Berlingske Media 902 22.8
16 TV2 Danmark 890 22.5
17 Linkedin 776 19.6
18 Spotify 768 19.4
19 Apple Inc. 729 18.4
20 TDC Group 667 16.9Source: ComScore MMx, December 2014
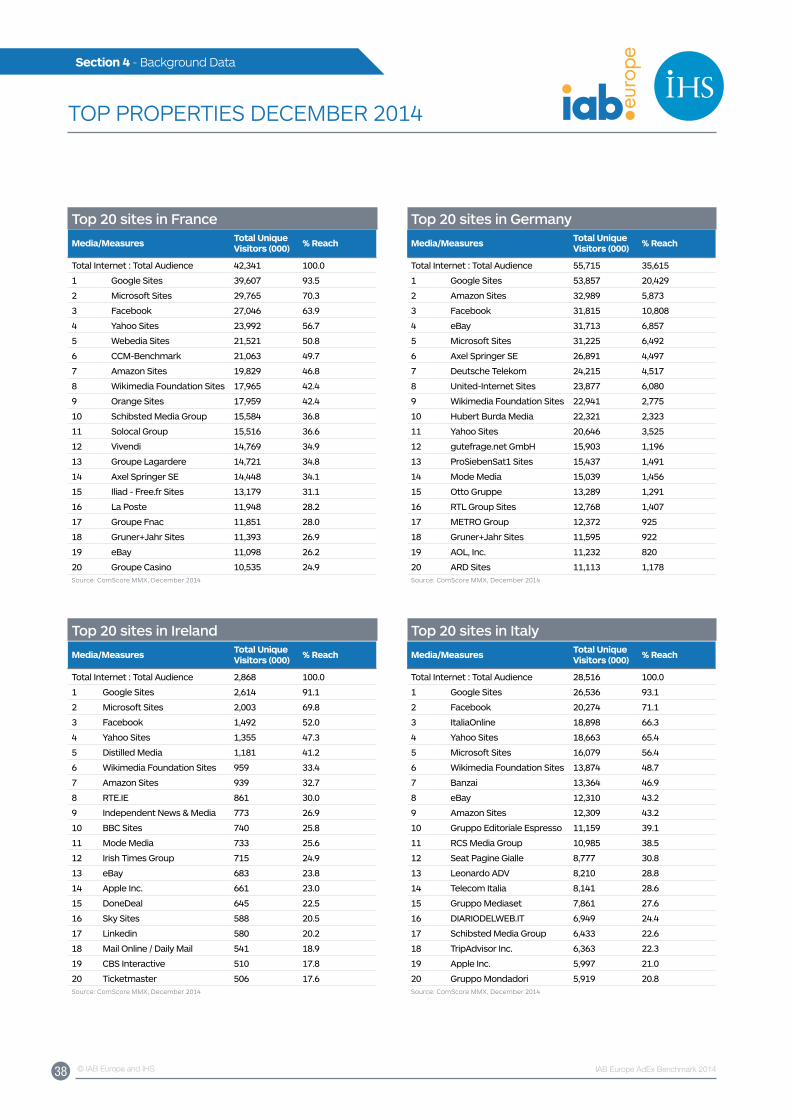
38 © IAB Europe and IHS IAB Europe AdEx Benchmark 2014
Section 4 - Background Data
TOP PROPERTIES DECEMBER 2014
Top 20 sites in Ireland
Media/Measures Total Unique Visitors (000) % Reach
Total Internet : Total Audience 2,868 100.0
1 Google Sites 2,614 91.1
2 Microsoft Sites 2,003 69.8
3 Facebook 1,492 52.0
4 Yahoo Sites 1,355 47.3
5 Distilled Media 1,181 41.2
6 Wikimedia Foundation Sites 959 33.4
7 Amazon Sites 939 32.7
8 RTE.IE 861 30.0
9 Independent News & Media 773 26.9
10 BBC Sites 740 25.8
11 Mode Media 733 25.6
12 Irish Times Group 715 24.9
13 eBay 683 23.8
14 Apple Inc. 661 23.0
15 DoneDeal 645 22.5
16 Sky Sites 588 20.5
17 Linkedin 580 20.2
18 Mail Online / Daily Mail 541 18.9
19 CBS Interactive 510 17.8
20 Ticketmaster 506 17.6Source: ComScore MMx, December 2014
Top 20 sites in Italy
Media/Measures Total Unique Visitors (000) % Reach
Total Internet : Total Audience 28,516 100.0
1 Google Sites 26,536 93.1
2 Facebook 20,274 71.1
3 ItaliaOnline 18,898 66.3
4 Yahoo Sites 18,663 65.4
5 Microsoft Sites 16,079 56.4
6 Wikimedia Foundation Sites 13,874 48.7
7 Banzai 13,364 46.9
8 eBay 12,310 43.2
9 Amazon Sites 12,309 43.2
10 Gruppo Editoriale Espresso 11,159 39.1
11 RCS Media Group 10,985 38.5
12 Seat Pagine Gialle 8,777 30.8
13 Leonardo ADV 8,210 28.8
14 Telecom Italia 8,141 28.6
15 Gruppo Mediaset 7,861 27.6
16 DIARIODELWEB.IT 6,949 24.4
17 Schibsted Media Group 6,433 22.6
18 TripAdvisor Inc. 6,363 22.3
19 Apple Inc. 5,997 21.0
20 Gruppo Mondadori 5,919 20.8Source: ComScore MMx, December 2014
Top 20 sites in France
Media/Measures Total Unique Visitors (000) % Reach
Total Internet : Total Audience 42,341 100.0
1 Google Sites 39,607 93.5
2 Microsoft Sites 29,765 70.3
3 Facebook 27,046 63.9
4 Yahoo Sites 23,992 56.7
5 Webedia Sites 21,521 50.8
6 CCM-Benchmark 21,063 49.7
7 Amazon Sites 19,829 46.8
8 Wikimedia Foundation Sites 17,965 42.4
9 Orange Sites 17,959 42.4
10 Schibsted Media Group 15,584 36.8
11 Solocal Group 15,516 36.6
12 Vivendi 14,769 34.9
13 Groupe Lagardere 14,721 34.8
14 Axel Springer SE 14,448 34.1
15 Iliad - Free.fr Sites 13,179 31.1
16 La Poste 11,948 28.2
17 Groupe Fnac 11,851 28.0
18 Gruner+Jahr Sites 11,393 26.9
19 eBay 11,098 26.2
20 Groupe Casino 10,535 24.9Source: ComScore MMx, December 2014
Top 20 sites in Germany
Media/Measures Total Unique Visitors (000) % Reach
Total Internet : Total Audience 55,715 35,615
1 Google Sites 53,857 20,429
2 Amazon Sites 32,989 5,873
3 Facebook 31,815 10,808
4 eBay 31,713 6,857
5 Microsoft Sites 31,225 6,492
6 Axel Springer SE 26,891 4,497
7 Deutsche Telekom 24,215 4,517
8 United-Internet Sites 23,877 6,080
9 Wikimedia Foundation Sites 22,941 2,775
10 Hubert Burda Media 22,321 2,323
11 Yahoo Sites 20,646 3,525
12 gutefrage.net GmbH 15,903 1,196
13 ProSiebenSat1 Sites 15,437 1,491
14 Mode Media 15,039 1,456
15 Otto Gruppe 13,289 1,291
16 RTL Group Sites 12,768 1,407
17 METRO Group 12,372 925
18 Gruner+Jahr Sites 11,595 922
19 AOL, Inc. 11,232 820
20 ARD Sites 11,113 1,178Source: ComScore MMx, December 2014
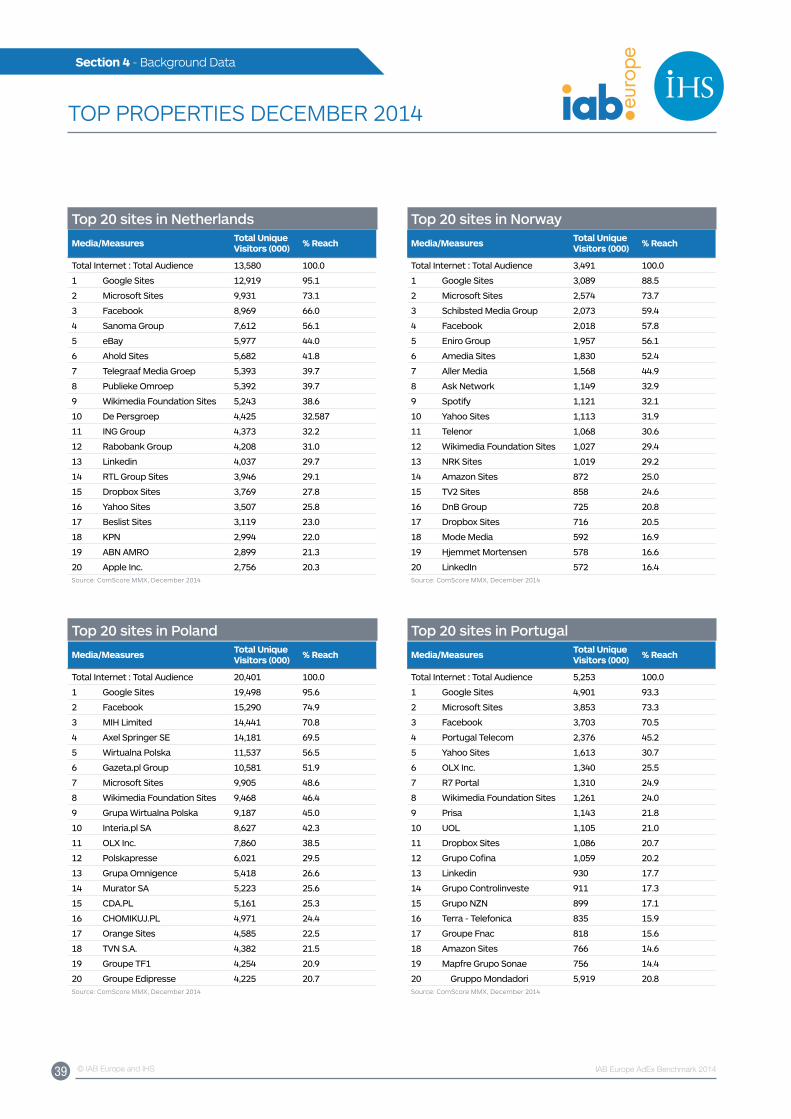
39 © IAB Europe and IHS IAB Europe AdEx Benchmark 2014
Section 4 - Background Data
TOP PROPERTIES DECEMBER 2014
Top 20 sites in Poland
Media/Measures Total Unique Visitors (000) % Reach
Total Internet : Total Audience 20,401 100.0
1 Google Sites 19,498 95.6
2 Facebook 15,290 74.9
3 MIH Limited 14,441 70.8
4 Axel Springer SE 14,181 69.5
5 Wirtualna Polska 11,537 56.5
6 Gazeta.pl Group 10,581 51.9
7 Microsoft Sites 9,905 48.6
8 Wikimedia Foundation Sites 9,468 46.4
9 Grupa Wirtualna Polska 9,187 45.0
10 Interia.pl SA 8,627 42.3
11 OLX Inc. 7,860 38.5
12 Polskapresse 6,021 29.5
13 Grupa Omnigence 5,418 26.6
14 Murator SA 5,223 25.6
15 CDA.PL 5,161 25.3
16 CHOMIKUJ.PL 4,971 24.4
17 Orange Sites 4,585 22.5
18 TVN S.A. 4,382 21.5
19 Groupe TF1 4,254 20.9
20 Groupe Edipresse 4,225 20.7Source: ComScore MMx, December 2014
Top 20 sites in Portugal
Media/Measures Total Unique Visitors (000) % Reach
Total Internet : Total Audience 5,253 100.0
1 Google Sites 4,901 93.3
2 Microsoft Sites 3,853 73.3
3 Facebook 3,703 70.5
4 Portugal Telecom 2,376 45.2
5 Yahoo Sites 1,613 30.7
6 OLX Inc. 1,340 25.5
7 R7 Portal 1,310 24.9
8 Wikimedia Foundation Sites 1,261 24.0
9 Prisa 1,143 21.8
10 UOL 1,105 21.0
11 Dropbox Sites 1,086 20.7
12 Grupo Cofina 1,059 20.2
13 Linkedin 930 17.7
14 Grupo Controlinveste 911 17.3
15 Grupo NZN 899 17.1
16 Terra - Telefonica 835 15.9
17 Groupe Fnac 818 15.6
18 Amazon Sites 766 14.6
19 Mapfre Grupo Sonae 756 14.4
20 Gruppo Mondadori 5,919 20.8Source: ComScore MMx, December 2014
Top 20 sites in Netherlands
Media/Measures Total Unique Visitors (000) % Reach
Total Internet : Total Audience 13,580 100.0
1 Google Sites 12,919 95.1
2 Microsoft Sites 9,931 73.1
3 Facebook 8,969 66.0
4 Sanoma Group 7,612 56.1
5 eBay 5,977 44.0
6 Ahold Sites 5,682 41.8
7 Telegraaf Media Groep 5,393 39.7
8 Publieke Omroep 5,392 39.7
9 Wikimedia Foundation Sites 5,243 38.6
10 De Persgroep 4,425 32.587
11 ING Group 4,373 32.2
12 Rabobank Group 4,208 31.0
13 Linkedin 4,037 29.7
14 RTL Group Sites 3,946 29.1
15 Dropbox Sites 3,769 27.8
16 Yahoo Sites 3,507 25.8
17 Beslist Sites 3,119 23.0
18 KPN 2,994 22.0
19 ABN AMRO 2,899 21.3
20 Apple Inc. 2,756 20.3Source: ComScore MMx, December 2014
Top 20 sites in Norway
Media/Measures Total Unique Visitors (000) % Reach
Total Internet : Total Audience 3,491 100.0
1 Google Sites 3,089 88.5
2 Microsoft Sites 2,574 73.7
3 Schibsted Media Group 2,073 59.4
4 Facebook 2,018 57.8
5 Eniro Group 1,957 56.1
6 Amedia Sites 1,830 52.4
7 Aller Media 1,568 44.9
8 Ask Network 1,149 32.9
9 Spotify 1,121 32.1
10 Yahoo Sites 1,113 31.9
11 Telenor 1,068 30.6
12 Wikimedia Foundation Sites 1,027 29.4
13 NRK Sites 1,019 29.2
14 Amazon Sites 872 25.0
15 TV2 Sites 858 24.6
16 DnB Group 725 20.8
17 Dropbox Sites 716 20.5
18 Mode Media 592 16.9
19 Hjemmet Mortensen 578 16.6
20 LinkedIn 572 16.4Source: ComScore MMx, December 2014
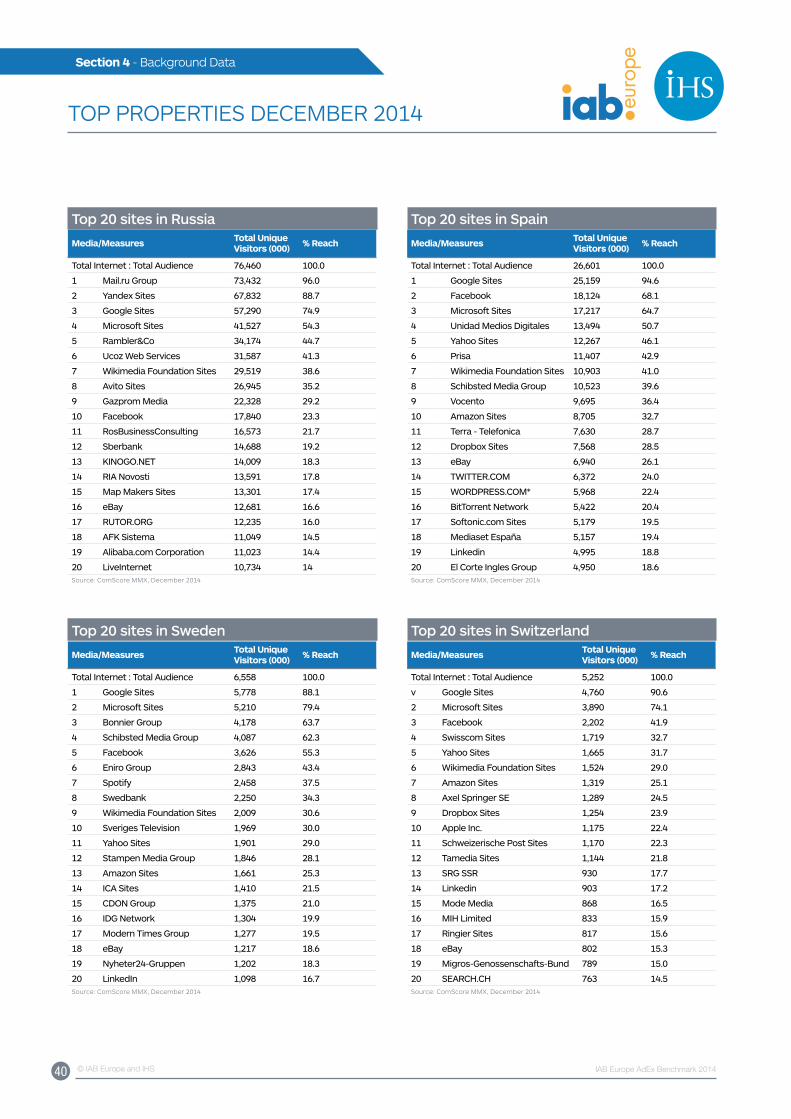
40 © IAB Europe and IHS IAB Europe AdEx Benchmark 2014
Section 4 - Background Data
TOP PROPERTIES DECEMBER 2014
Top 20 sites in Sweden
Media/Measures Total Unique Visitors (000) % Reach
Total Internet : Total Audience 6,558 100.0
1 Google Sites 5,778 88.1
2 Microsoft Sites 5,210 79.4
3 Bonnier Group 4,178 63.7
4 Schibsted Media Group 4,087 62.3
5 Facebook 3,626 55.3
6 Eniro Group 2,843 43.4
7 Spotify 2,458 37.5
8 Swedbank 2,250 34.3
9 Wikimedia Foundation Sites 2,009 30.6
10 Sveriges Television 1,969 30.0
11 Yahoo Sites 1,901 29.0
12 Stampen Media Group 1,846 28.1
13 Amazon Sites 1,661 25.3
14 ICA Sites 1,410 21.5
15 CDON Group 1,375 21.0
16 IDG Network 1,304 19.9
17 Modern Times Group 1,277 19.5
18 eBay 1,217 18.6
19 Nyheter24-Gruppen 1,202 18.3
20 LinkedIn 1,098 16.7Source: ComScore MMx, December 2014
Top 20 sites in Switzerland
Media/Measures Total Unique Visitors (000) % Reach
Total Internet : Total Audience 5,252 100.0
v Google Sites 4,760 90.6
2 Microsoft Sites 3,890 74.1
3 Facebook 2,202 41.9
4 Swisscom Sites 1,719 32.7
5 Yahoo Sites 1,665 31.7
6 Wikimedia Foundation Sites 1,524 29.0
7 Amazon Sites 1,319 25.1
8 Axel Springer SE 1,289 24.5
9 Dropbox Sites 1,254 23.9
10 Apple Inc. 1,175 22.4
11 Schweizerische Post Sites 1,170 22.3
12 Tamedia Sites 1,144 21.8
13 SRG SSR 930 17.7
14 Linkedin 903 17.2
15 Mode Media 868 16.5
16 MIH Limited 833 15.9
17 Ringier Sites 817 15.6
18 eBay 802 15.3
19 Migros-Genossenschafts-Bund 789 15.0
20 SEARCH.CH 763 14.5Source: ComScore MMx, December 2014
Top 20 sites in Russia
Media/Measures Total Unique Visitors (000) % Reach
Total Internet : Total Audience 76,460 100.0
1 Mail.ru Group 73,432 96.0
2 Yandex Sites 67,832 88.7
3 Google Sites 57,290 74.9
4 Microsoft Sites 41,527 54.3
5 Rambler&Co 34,174 44.7
6 Ucoz Web Services 31,587 41.3
7 Wikimedia Foundation Sites 29,519 38.6
8 Avito Sites 26,945 35.2
9 Gazprom Media 22,328 29.2
10 Facebook 17,840 23.3
11 RosBusinessConsulting 16,573 21.7
12 Sberbank 14,688 19.2
13 KINOGO.NET 14,009 18.3
14 RIA Novosti 13,591 17.8
15 Map Makers Sites 13,301 17.4
16 eBay 12,681 16.6
17 RUTOR.ORG 12,235 16.0
18 AFK Sistema 11,049 14.5
19 Alibaba.com Corporation 11,023 14.4
20 LiveInternet 10,734 14Source: ComScore MMx, December 2014
Top 20 sites in Spain
Media/Measures Total Unique Visitors (000) % Reach
Total Internet : Total Audience 26,601 100.0
1 Google Sites 25,159 94.6
2 Facebook 18,124 68.1
3 Microsoft Sites 17,217 64.7
4 Unidad Medios Digitales 13,494 50.7
5 Yahoo Sites 12,267 46.1
6 Prisa 11,407 42.9
7 Wikimedia Foundation Sites 10,903 41.0
8 Schibsted Media Group 10,523 39.6
9 Vocento 9,695 36.4
10 Amazon Sites 8,705 32.7
11 Terra - Telefonica 7,630 28.7
12 Dropbox Sites 7,568 28.5
13 eBay 6,940 26.1
14 TWITTER.COM 6,372 24.0
15 WORDPRESS.COM* 5,968 22.4
16 BitTorrent Network 5,422 20.4
17 Softonic.com Sites 5,179 19.5
18 Mediaset España 5,157 19.4
19 Linkedin 4,995 18.8
20 El Corte Ingles Group 4,950 18.6Source: ComScore MMx, December 2014
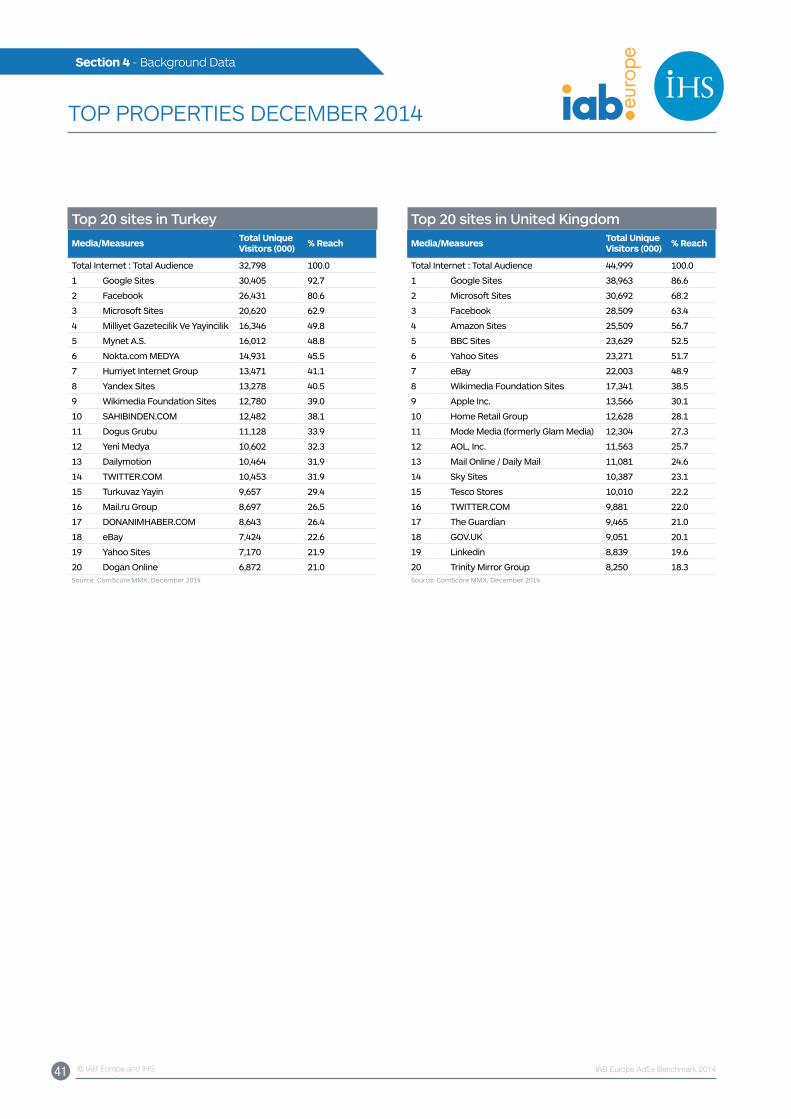
41 © IAB Europe and IHS IAB Europe AdEx Benchmark 2014
Section 4 - Background Data
TOP PROPERTIES DECEMBER 2014
Top 20 sites in Turkey
Media/Measures Total Unique Visitors (000) % Reach
Total Internet : Total Audience 32,798 100.0
1 Google Sites 30,405 92.7
2 Facebook 26,431 80.6
3 Microsoft Sites 20,620 62.9
4 Milliyet Gazetecilik Ve Yayincilik 16,346 49.8
5 Mynet A.S. 16,012 48.8
6 Nokta.com MEDYA 14,931 45.5
7 Hurriyet Internet Group 13,471 41.1
8 Yandex Sites 13,278 40.5
9 Wikimedia Foundation Sites 12,780 39.0
10 SAHIBINDEN.COM 12,482 38.1
11 Dogus Grubu 11,128 33.9
12 Yeni Medya 10,602 32.3
13 Dailymotion 10,464 31.9
14 TWITTER.COM 10,453 31.9
15 Turkuvaz Yayin 9,657 29.4
16 Mail.ru Group 8,697 26.5
17 DONANIMHABER.COM 8,643 26.4
18 eBay 7,424 22.6
19 Yahoo Sites 7,170 21.9
20 Dogan Online 6,872 21.0Source: ComScore MMx, December 2014
Top 20 sites in United Kingdom
Media/Measures Total Unique Visitors (000) % Reach
Total Internet : Total Audience 44,999 100.0
1 Google Sites 38,963 86.6
2 Microsoft Sites 30,692 68.2
3 Facebook 28,509 63.4
4 Amazon Sites 25,509 56.7
5 BBC Sites 23,629 52.5
6 Yahoo Sites 23,271 51.7
7 eBay 22,003 48.9
8 Wikimedia Foundation Sites 17,341 38.5
9 Apple Inc. 13,566 30.1
10 Home Retail Group 12,628 28.1
11 Mode Media (formerly Glam Media) 12,304 27.3
12 AOL, Inc. 11,563 25.7
13 Mail Online / Daily Mail 11,081 24.6
14 Sky Sites 10,387 23.1
15 Tesco Stores 10,010 22.2
16 TWITTER.COM 9,881 22.0
17 The Guardian 9,465 21.0
18 GOV.UK 9,051 20.1
19 Linkedin 8,839 19.6
20 Trinity Mirror Group 8,250 18.3Source: ComScore MMx, December 2014
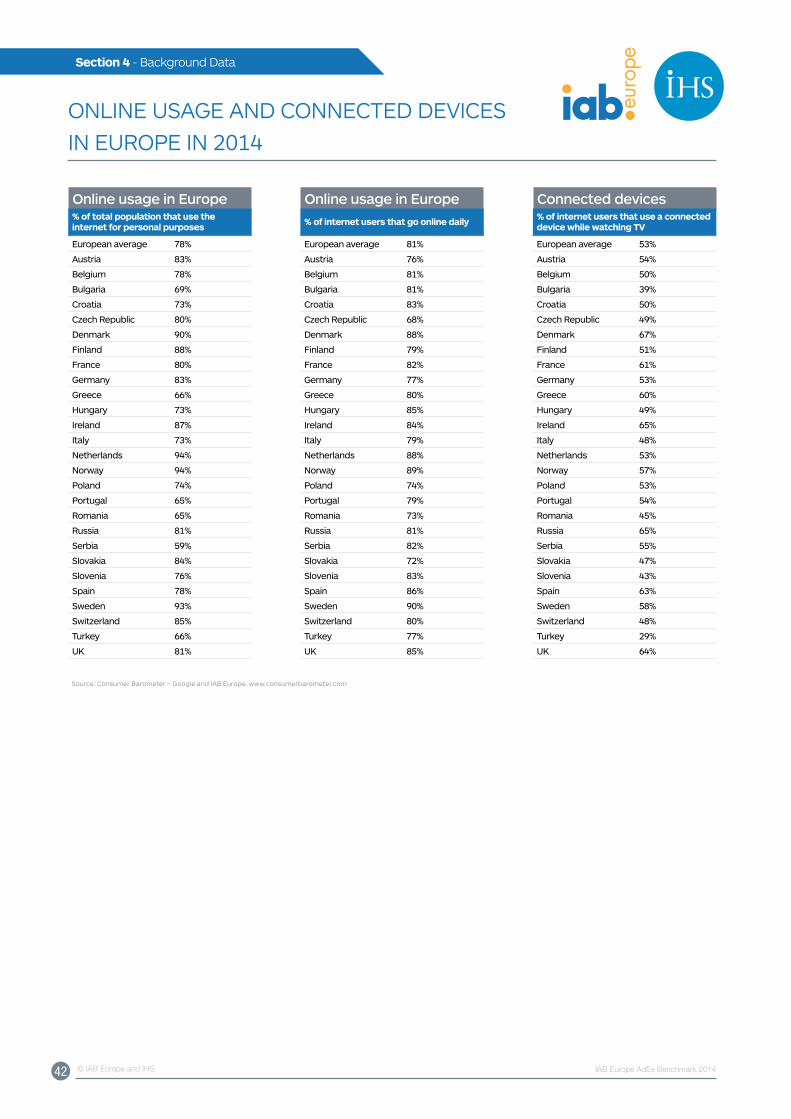
42 © IAB Europe and IHS IAB Europe AdEx Benchmark 2014
Section 4 - Background Data
ONLINE uSAGE AND CONNECTED DEVICES IN EuROPE IN 2014
Online usage in Europe Online usage in Europe Connected devices% of total population that use the internet for personal purposes
European average 78%
Austria 83%
Belgium 78%
Bulgaria 69%
Croatia 73%
Czech Republic 80%
Denmark 90%
Finland 88%
France 80%
Germany 83%
Greece 66%
Hungary 73%
Ireland 87%
Italy 73%
Netherlands 94%
Norway 94%
Poland 74%
Portugal 65%
Romania 65%
Russia 81%
Serbia 59%
Slovakia 84%
Slovenia 76%
Spain 78%
Sweden 93%
Switzerland 85%
Turkey 66%
UK 81%
% of internet users that go online daily
European average 81%
Austria 76%
Belgium 81%
Bulgaria 81%
Croatia 83%
Czech Republic 68%
Denmark 88%
Finland 79%
France 82%
Germany 77%
Greece 80%
Hungary 85%
Ireland 84%
Italy 79%
Netherlands 88%
Norway 89%
Poland 74%
Portugal 79%
Romania 73%
Russia 81%
Serbia 82%
Slovakia 72%
Slovenia 83%
Spain 86%
Sweden 90%
Switzerland 80%
Turkey 77%
UK 85%
% of internet users that use a connected device while watching TV
European average 53%
Austria 54%
Belgium 50%
Bulgaria 39%
Croatia 50%
Czech Republic 49%
Denmark 67%
Finland 51%
France 61%
Germany 53%
Greece 60%
Hungary 49%
Ireland 65%
Italy 48%
Netherlands 53%
Norway 57%
Poland 53%
Portugal 54%
Romania 45%
Russia 65%
Serbia 55%
Slovakia 47%
Slovenia 43%
Spain 63%
Sweden 58%
Switzerland 48%
Turkey 29%
UK 64%
Source: Consumer Barometer – Google and IAB Europe, www.consumerbarometer.com
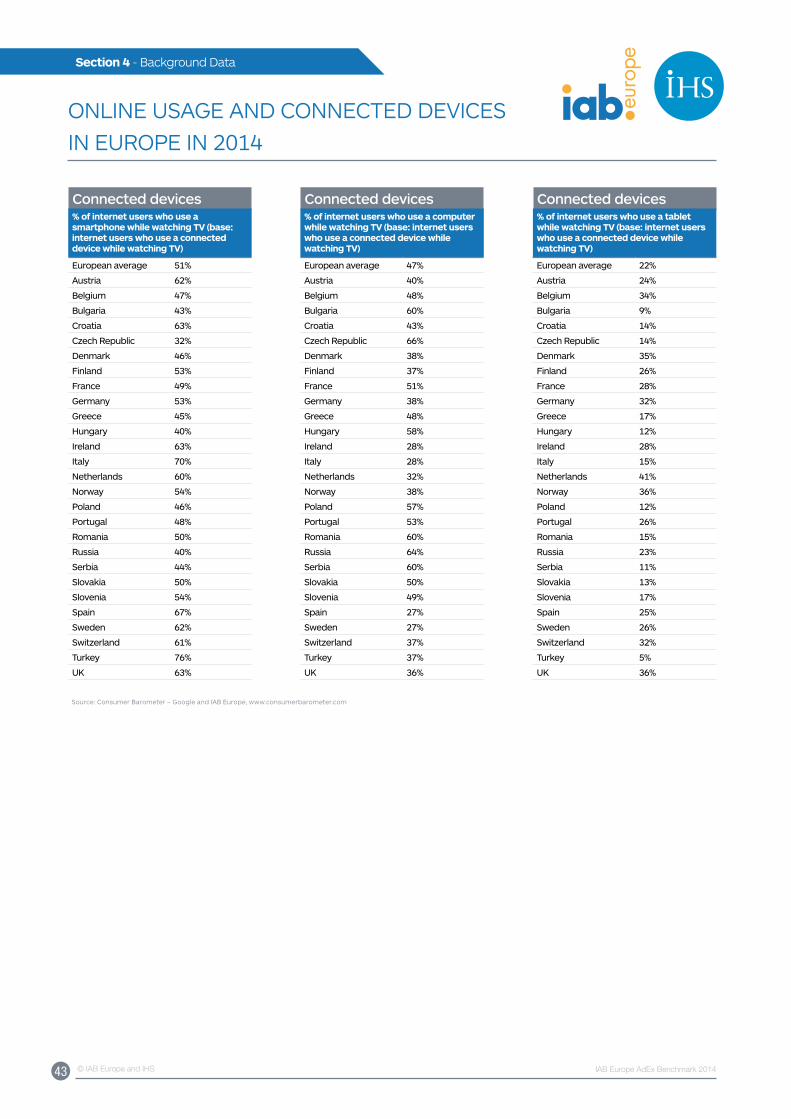
43 © IAB Europe and IHS IAB Europe AdEx Benchmark 2014
Section 4 - Background Data
Connected devices Connected devices Connected devices% of internet users who use a smartphone while watching TV (base: internet users who use a connected device while watching TV)
European average 51%
Austria 62%
Belgium 47%
Bulgaria 43%
Croatia 63%
Czech Republic 32%
Denmark 46%
Finland 53%
France 49%
Germany 53%
Greece 45%
Hungary 40%
Ireland 63%
Italy 70%
Netherlands 60%
Norway 54%
Poland 46%
Portugal 48%
Romania 50%
Russia 40%
Serbia 44%
Slovakia 50%
Slovenia 54%
Spain 67%
Sweden 62%
Switzerland 61%
Turkey 76%
UK 63%
% of internet users who use a computer while watching TV (base: internet users who use a connected device while watching TV)
European average 47%
Austria 40%
Belgium 48%
Bulgaria 60%
Croatia 43%
Czech Republic 66%
Denmark 38%
Finland 37%
France 51%
Germany 38%
Greece 48%
Hungary 58%
Ireland 28%
Italy 28%
Netherlands 32%
Norway 38%
Poland 57%
Portugal 53%
Romania 60%
Russia 64%
Serbia 60%
Slovakia 50%
Slovenia 49%
Spain 27%
Sweden 27%
Switzerland 37%
Turkey 37%
UK 36%
% of internet users who use a tablet while watching TV (base: internet users who use a connected device while watching TV)
European average 22%
Austria 24%
Belgium 34%
Bulgaria 9%
Croatia 14%
Czech Republic 14%
Denmark 35%
Finland 26%
France 28%
Germany 32%
Greece 17%
Hungary 12%
Ireland 28%
Italy 15%
Netherlands 41%
Norway 36%
Poland 12%
Portugal 26%
Romania 15%
Russia 23%
Serbia 11%
Slovakia 13%
Slovenia 17%
Spain 25%
Sweden 26%
Switzerland 32%
Turkey 5%
UK 36%
Source: Consumer Barometer – Google and IAB Europe, www.consumerbarometer.com
ONLINE uSAGE AND CONNECTED DEVICES IN EuROPE IN 2014
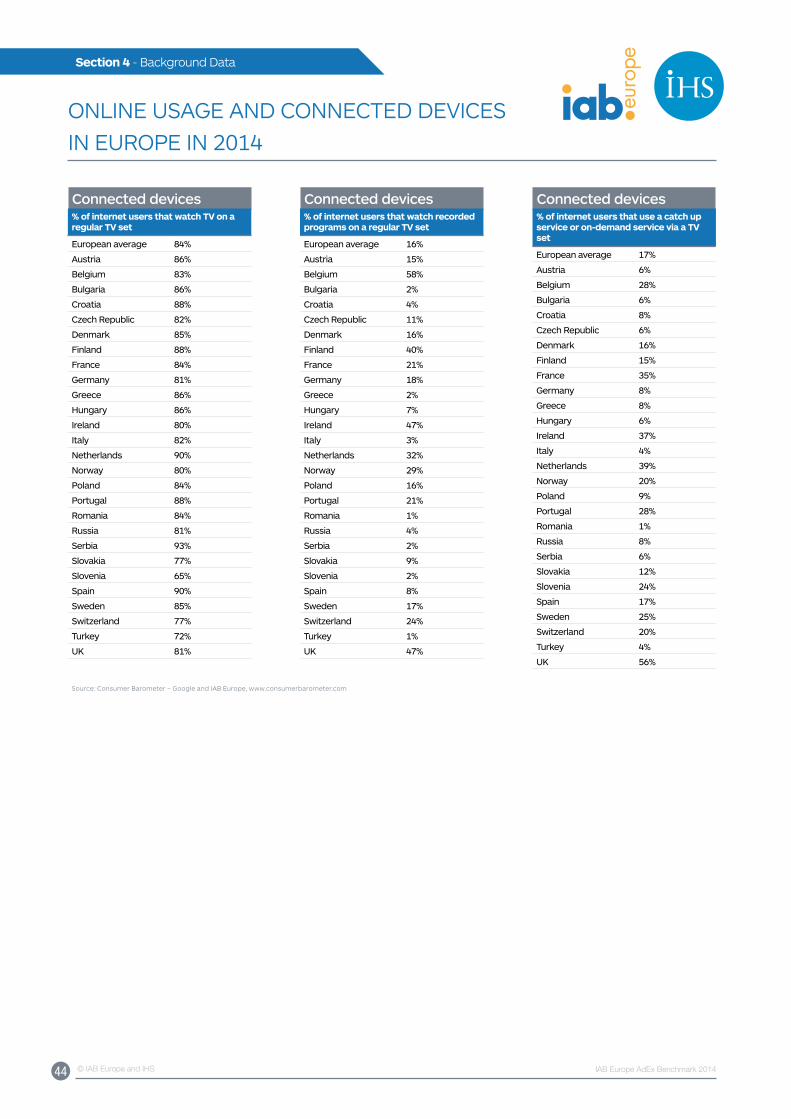
44 © IAB Europe and IHS IAB Europe AdEx Benchmark 2014
Section 4 - Background Data
Connected devices Connected devices Connected devices% of internet users that watch TV on a regular TV set
European average 84%
Austria 86%
Belgium 83%
Bulgaria 86%
Croatia 88%
Czech Republic 82%
Denmark 85%
Finland 88%
France 84%
Germany 81%
Greece 86%
Hungary 86%
Ireland 80%
Italy 82%
Netherlands 90%
Norway 80%
Poland 84%
Portugal 88%
Romania 84%
Russia 81%
Serbia 93%
Slovakia 77%
Slovenia 65%
Spain 90%
Sweden 85%
Switzerland 77%
Turkey 72%
UK 81%
% of internet users that watch recorded programs on a regular TV set
European average 16%
Austria 15%
Belgium 58%
Bulgaria 2%
Croatia 4%
Czech Republic 11%
Denmark 16%
Finland 40%
France 21%
Germany 18%
Greece 2%
Hungary 7%
Ireland 47%
Italy 3%
Netherlands 32%
Norway 29%
Poland 16%
Portugal 21%
Romania 1%
Russia 4%
Serbia 2%
Slovakia 9%
Slovenia 2%
Spain 8%
Sweden 17%
Switzerland 24%
Turkey 1%
UK 47%
% of internet users that use a catch up service or on-demand service via a TV set
European average 17%
Austria 6%
Belgium 28%
Bulgaria 6%
Croatia 8%
Czech Republic 6%
Denmark 16%
Finland 15%
France 35%
Germany 8%
Greece 8%
Hungary 6%
Ireland 37%
Italy 4%
Netherlands 39%
Norway 20%
Poland 9%
Portugal 28%
Romania 1%
Russia 8%
Serbia 6%
Slovakia 12%
Slovenia 24%
Spain 17%
Sweden 25%
Switzerland 20%
Turkey 4%
UK 56%
Source: Consumer Barometer – Google and IAB Europe, www.consumerbarometer.com
ONLINE uSAGE AND CONNECTED DEVICES IN EuROPE IN 2014
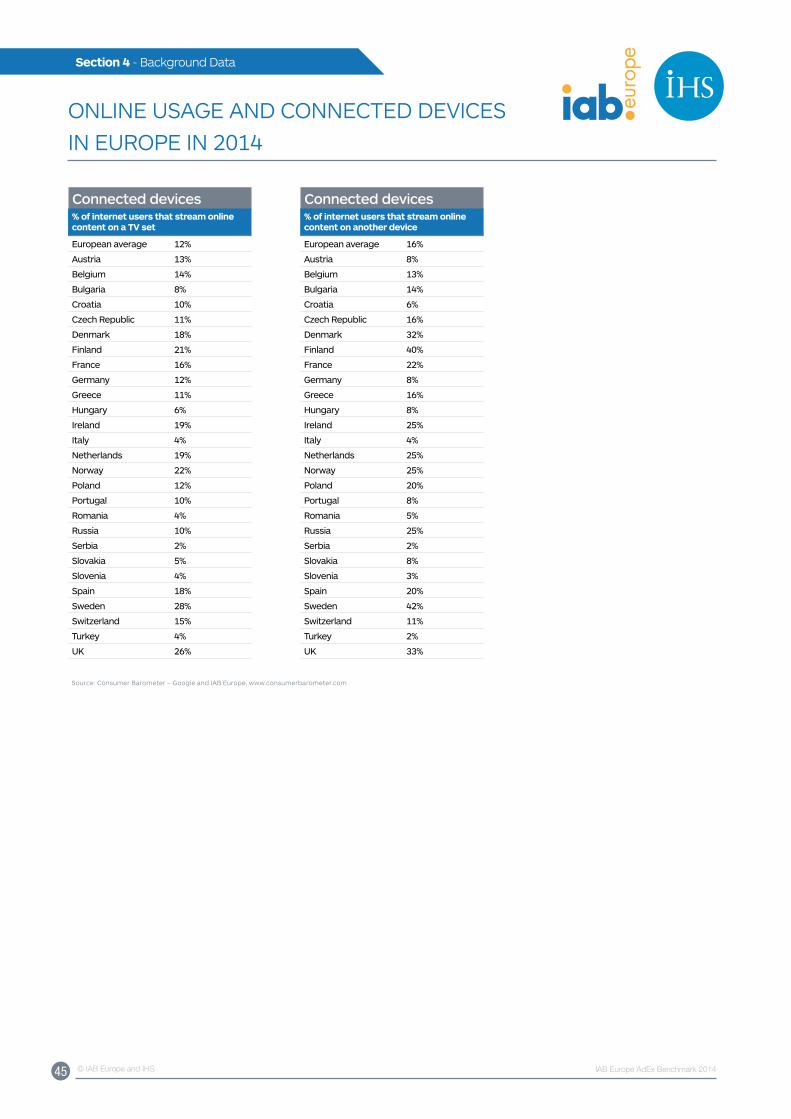
45 © IAB Europe and IHS IAB Europe AdEx Benchmark 2014
Section 4 - Background Data
Connected devices Connected devices% of internet users that stream online content on a TV set
European average 12%
Austria 13%
Belgium 14%
Bulgaria 8%
Croatia 10%
Czech Republic 11%
Denmark 18%
Finland 21%
France 16%
Germany 12%
Greece 11%
Hungary 6%
Ireland 19%
Italy 4%
Netherlands 19%
Norway 22%
Poland 12%
Portugal 10%
Romania 4%
Russia 10%
Serbia 2%
Slovakia 5%
Slovenia 4%
Spain 18%
Sweden 28%
Switzerland 15%
Turkey 4%
UK 26%
% of internet users that stream online content on another device
European average 16%
Austria 8%
Belgium 13%
Bulgaria 14%
Croatia 6%
Czech Republic 16%
Denmark 32%
Finland 40%
France 22%
Germany 8%
Greece 16%
Hungary 8%
Ireland 25%
Italy 4%
Netherlands 25%
Norway 25%
Poland 20%
Portugal 8%
Romania 5%
Russia 25%
Serbia 2%
Slovakia 8%
Slovenia 3%
Spain 20%
Sweden 42%
Switzerland 11%
Turkey 2%
UK 33%
Source: Consumer Barometer – Google and IAB Europe, www.consumerbarometer.com
ONLINE uSAGE AND CONNECTED DEVICES IN EuROPE IN 2014
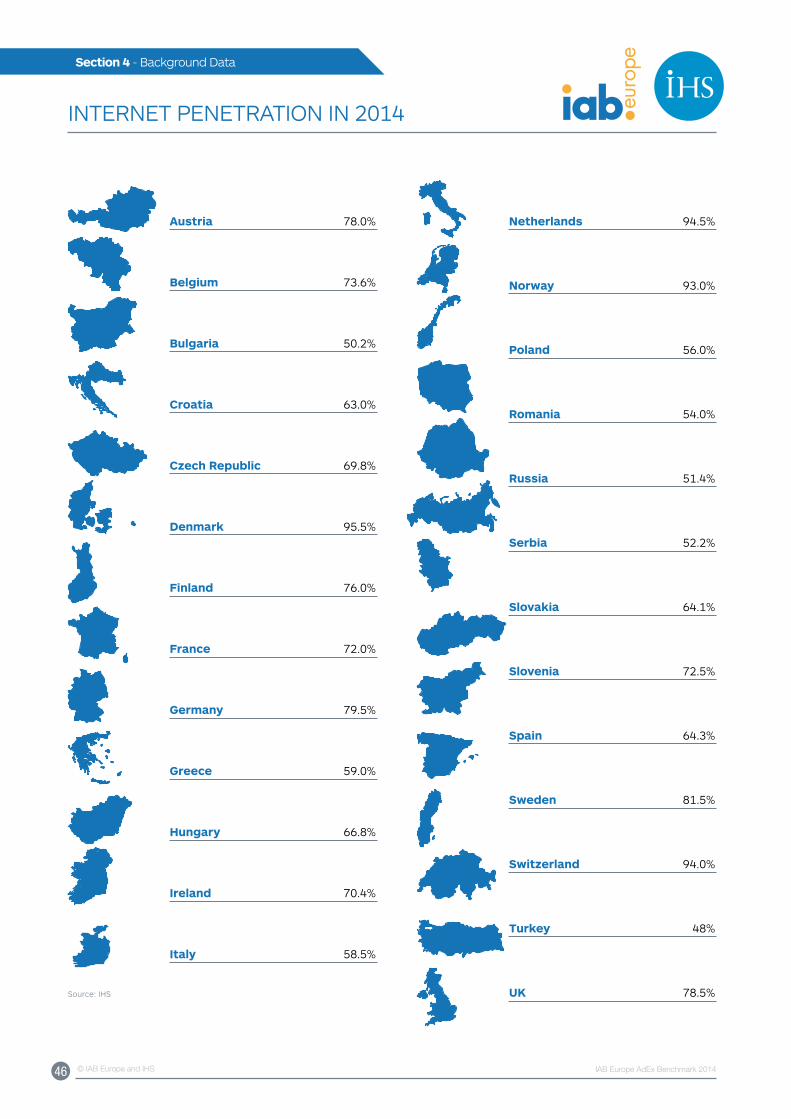
46 © IAB Europe and IHS IAB Europe AdEx Benchmark 2014
Section 4 - Background Data
INTERNET PENETRATION IN 2014
Austria 78.0%
Belgium 73.6%
Bulgaria 50.2%
Croatia 63.0%
Czech Republic 69.8%
Denmark 95.5%
Finland 76.0%
France 72.0%
Germany 79.5%
Greece 59.0%
Hungary 66.8%
Ireland 70.4%
Italy 58.5%
Netherlands 94.5%
Norway 93.0%
Poland 56.0%
Romania 54.0%
Russia 51.4%
Serbia 52.2%
Slovakia 64.1%
Slovenia 72.5%
Spain 64.3%
Sweden 81.5%
Switzerland 94.0%
Turkey 48%
UK 78.5%Source: IHS
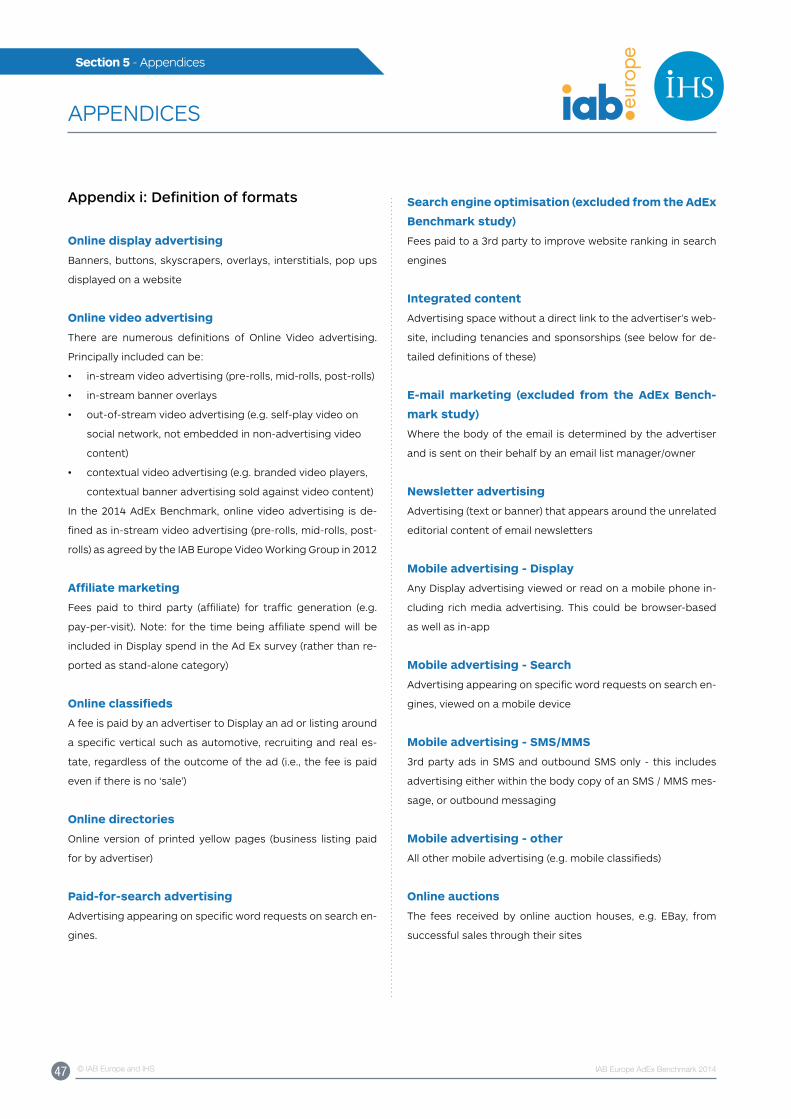
47 © IAB Europe and IHS IAB Europe AdEx Benchmark 2014
Section 5 - Appendices
APPENDICES
Appendix i: Definition of formats
Online display advertising
Banners, buttons, skyscrapers, overlays, interstitials, pop ups
displayed on a website
Online video advertising
There are numerous definitions of Online Video advertising.
Principally included can be:
• in-stream video advertising (pre-rolls, mid-rolls, post-rolls)
• in-stream banner overlays
• out-of-stream video advertising (e.g. self-play video on
social network, not embedded in non-advertising video
content)
• contextual video advertising (e.g. branded video players,
contextual banner advertising sold against video content)
In the 2014 AdEx Benchmark, online video advertising is de-
fined as in-stream video advertising (pre-rolls, mid-rolls, post-
rolls) as agreed by the IAB Europe Video Working Group in 2012
Affiliate marketing
Fees paid to third party (affiliate) for traffic generation (e.g.
pay-per-visit). Note: for the time being affiliate spend will be
included in Display spend in the Ad Ex survey (rather than re-
ported as stand-alone category)
Online classifieds
A fee is paid by an advertiser to Display an ad or listing around
a specific vertical such as automotive, recruiting and real es-
tate, regardless of the outcome of the ad (i.e., the fee is paid
even if there is no ‘sale’)
Online directories
Online version of printed yellow pages (business listing paid
for by advertiser)
Paid-for-search advertising
Advertising appearing on specific word requests on search en-
gines.
Search engine optimisation (excluded from the AdEx
Benchmark study)
Fees paid to a 3rd party to improve website ranking in search
engines
Integrated content
Advertising space without a direct link to the advertiser’s web-
site, including tenancies and sponsorships (see below for de-
tailed definitions of these)
E-mail marketing (excluded from the AdEx Bench-
mark study)
Where the body of the email is determined by the advertiser
and is sent on their behalf by an email list manager/owner
Newsletter advertising
Advertising (text or banner) that appears around the unrelated
editorial content of email newsletters
Mobile advertising - Display
Any Display advertising viewed or read on a mobile phone in-
cluding rich media advertising. This could be browser-based
as well as in-app
Mobile advertising - Search
Advertising appearing on specific word requests on search en-
gines, viewed on a mobile device
Mobile advertising - SMS/MMS
3rd party ads in SMS and outbound SMS only - this includes
advertising either within the body copy of an SMS / MMS mes-
sage, or outbound messaging
Mobile advertising - other
All other mobile advertising (e.g. mobile classifieds)
Online auctions
The fees received by online auction houses, e.g. EBay, from
successful sales through their sites
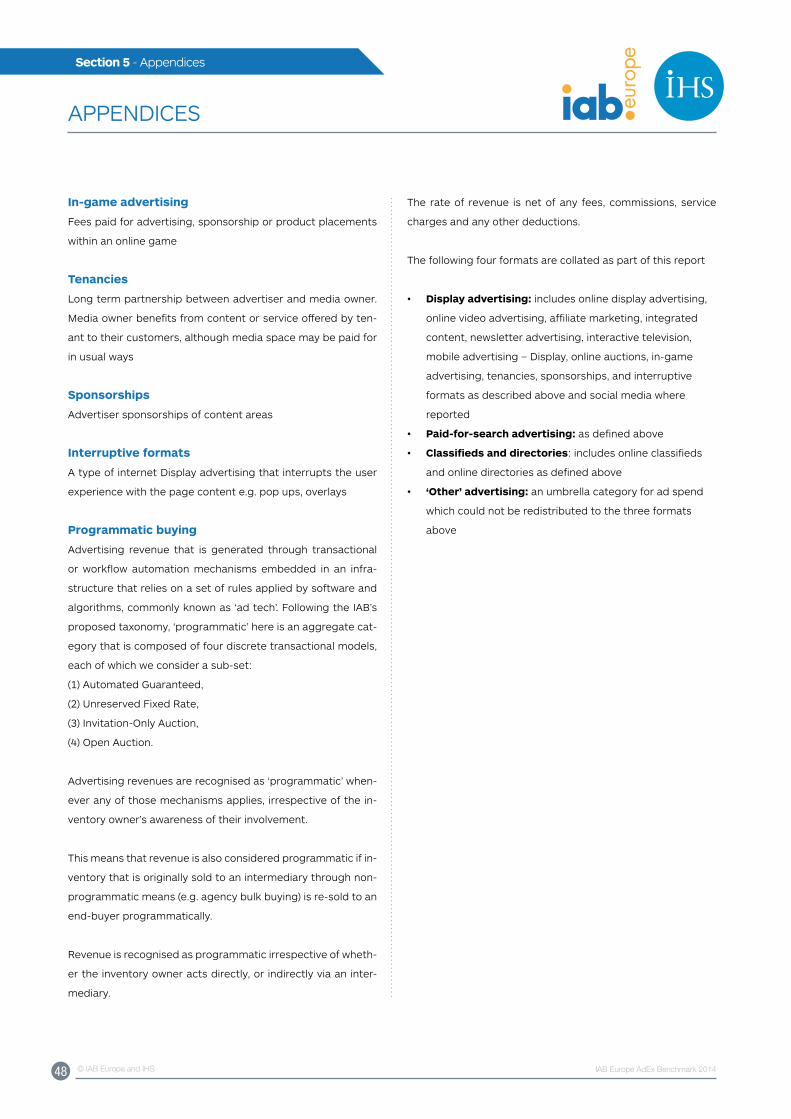
48 © IAB Europe and IHS IAB Europe AdEx Benchmark 2014
Section 5 - Appendices
APPENDICES
In-game advertising
Fees paid for advertising, sponsorship or product placements
within an online game
Tenancies
Long term partnership between advertiser and media owner.
Media owner benefits from content or service offered by ten-
ant to their customers, although media space may be paid for
in usual ways
Sponsorships
Advertiser sponsorships of content areas
Interruptive formats
A type of internet Display advertising that interrupts the user
experience with the page content e.g. pop ups, overlays
Programmatic buying
Advertising revenue that is generated through transactional
or workflow automation mechanisms embedded in an infra-
structure that relies on a set of rules applied by software and
algorithms, commonly known as ‘ad tech’. Following the IAB’s
proposed taxonomy, ‘programmatic’ here is an aggregate cat-
egory that is composed of four discrete transactional models,
each of which we consider a sub-set:
(1) Automated Guaranteed,
(2) unreserved Fixed Rate,
(3) Invitation-Only Auction,
(4) Open Auction.
Advertising revenues are recognised as ‘programmatic’ when-
ever any of those mechanisms applies, irrespective of the in-
ventory owner’s awareness of their involvement.
This means that revenue is also considered programmatic if in-
ventory that is originally sold to an intermediary through non-
programmatic means (e.g. agency bulk buying) is re-sold to an
end-buyer programmatically.
Revenue is recognised as programmatic irrespective of wheth-
er the inventory owner acts directly, or indirectly via an inter-
mediary.
The rate of revenue is net of any fees, commissions, service
charges and any other deductions.
The following four formats are collated as part of this report
• Display advertising: includes online display advertising,
online video advertising, affiliate marketing, integrated
content, newsletter advertising, interactive television,
mobile advertising – Display, online auctions, in-game
advertising, tenancies, sponsorships, and interruptive
formats as described above and social media where
reported
• Paid-for-search advertising: as defined above
• Classifieds and directories: includes online classifieds
and online directories as defined above
• ‘Other’ advertising: an umbrella category for ad spend
which could not be redistributed to the three formats
above
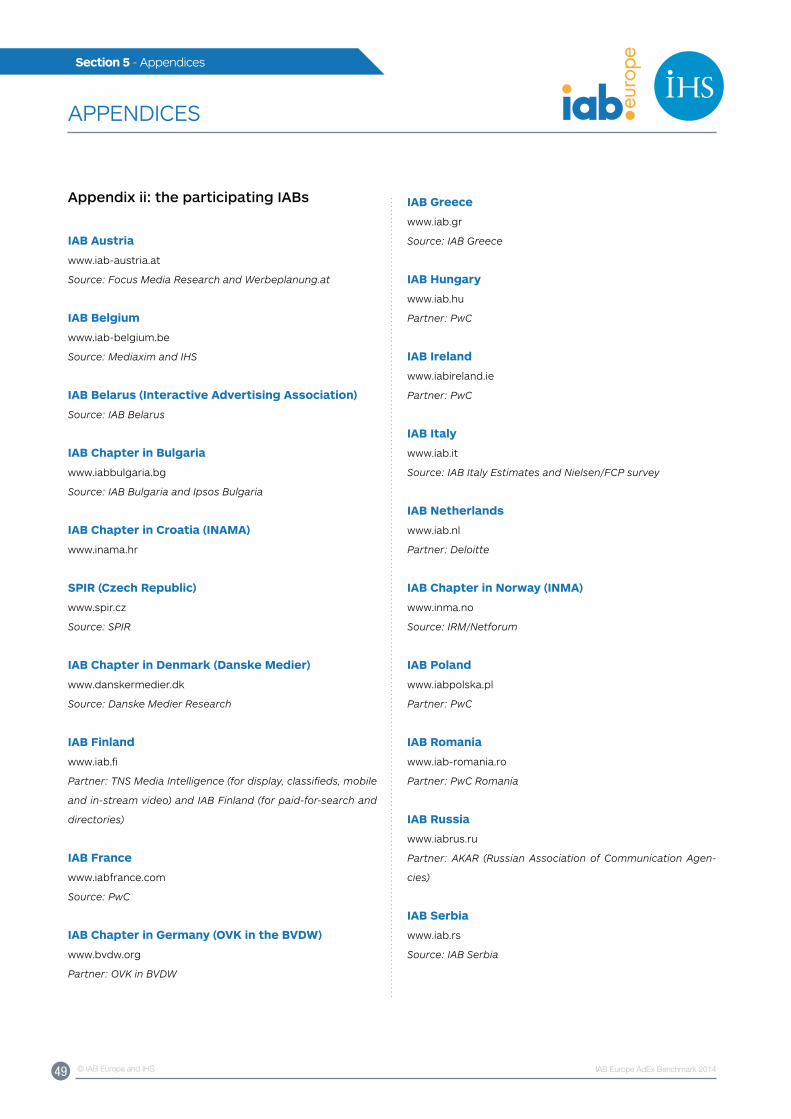
49 © IAB Europe and IHS IAB Europe AdEx Benchmark 2014
Section 5 - Appendices
APPENDICES
Appendix ii: the participating IABs
IAB Austria
www.iab-austria.at
Source: Focus Media Research and Werbeplanung.at
IAB Belgium
www.iab-belgium.be
Source: Mediaxim and IHS
IAB Belarus (Interactive Advertising Association)
Source: IAB Belarus
IAB Chapter in Bulgaria
www.iabbulgaria.bg
Source: IAB Bulgaria and Ipsos Bulgaria
IAB Chapter in Croatia (INAMA)
www.inama.hr
SPIR (Czech Republic)
www.spir.cz
Source: SPIR
IAB Chapter in Denmark (Danske Medier)
www.danskermedier.dk
Source: Danske Medier Research
IAB Finland
www.iab.fi
Partner: TNS Media Intelligence (for display, classifieds, mobile
and in-stream video) and IAB Finland (for paid-for-search and
directories)
IAB France
www.iabfrance.com
Source: PwC
IAB Chapter in Germany (OVK in the BVDW)
www.bvdw.org
Partner: OVK in BVDW
IAB Greece
www.iab.gr
Source: IAB Greece
IAB Hungary
www.iab.hu
Partner: PwC
IAB Ireland
www.iabireland.ie
Partner: PwC
IAB Italy
www.iab.it
Source: IAB Italy Estimates and Nielsen/FCP survey
IAB Netherlands
www.iab.nl
Partner: Deloitte
IAB Chapter in Norway (INMA)
www.inma.no
Source: IRM/Netforum
IAB Poland
www.iabpolska.pl
Partner: PwC
IAB Romania
www.iab-romania.ro
Partner: PwC Romania
IAB Russia
www.iabrus.ru
Partner: AKAR (Russian Association of Communication Agen-
cies)
IAB Serbia
www.iab.rs
Source: IAB Serbia
50 © IAB Europe and IHS IAB Europe AdEx Benchmark 2014
Section 5 - Appendices
APPENDICES
IAB Slovakia
www.iabslovakia.sk
Source: IAB Slovakia
IAB Slovenia
www.iab.si
Source: IAB Slovenia, Mediana
IAB Spain
www.iabspain.net
Partner: PwC
IAB Sweden
www.iabsvergie.se
Source: IRM
IAB Switzerland
www.iabswitzerland.ch
Partner: MediaFocus Schweiz GmbH
IAB Turkey
www.iab-turkiye.org
Source: IAB Turkey
IAB UK
www.iabuk.net
Partner: PwC
Appendix iii: methodology and adjusted data
Each national IAB runs its own annual online advertising spend
benchmark study. The method for the studies varies by coun-
try. Consequently, IHS standardises the data so that the find-
ings in the European report are comparable. This involves re-
adjusting figures to allow for different original methodologies,
adjusting currencies where local data is not collected in €s and
ensuring the year average exchange rate at 2014 has been
used. To provide data for previous year growth rates, the prior
year’s figures are also re-calculated using the current report’s
year-average exchange rate (i.e. the 2014 exchange rate is
used on the 2013 figures) in order to give transparency over
the growth rate.
Where ad spend is unavailable or incomplete, IHS models
the data based on public company reports, macroeconomic
variables, ad spend in other media from the IHS Advertising
Intelligence Service, interviews with key industry players and
econometric modelling, subject to the approval of the each
national IAB.
Appendix iv outlines the amount of actual, estimated and ad-
justed data included in the 2014 AdEx Benchmark by country.
51 © IAB Europe and IHS IAB Europe AdEx Benchmark 2014
Section 5 - Appendices
APPENDICES
Appendix iv: adjustments by country
Austria
• Ratecard data provided for all formats by Focus Media
Research and Werbeplanung.at (an Austrian consulting
company) in coordination with IAB Austria
• 2014 discounts applied based on IHS estimates as
follows:
• Display – 46.0%
• Classifieds and directories – 20.3%
• Paid-for-search – 0.0%
• 2013 discounts applied based on IHS estimates as
follows:
• Display – 43.9%
• Classifieds and directories – 23.3%
• Paid-for-search – 0.0%
Belarus
• Net data was provided by the Interactive Advertising
Association
• Agency commissions of 9.0% added to 2014 and 2013
display and classifieds and directories
Belgium
• Gross data provided for the display and paid-for-search
market by Mediaxim
• Classifieds and directories estimated by IHS based on
European averages
Bulgaria
• Ratecard data provided by IAB Bulgaria and Ipsos
Bulgaria for:
• Display advertising
• CPC and CPA advertising
• Mobile Display
• Video
• Social media and paid-for-search revenues estimated by
IHS
• CPC and CPA advertising, Mobile Display, Video, Social
media advertising added into Display
• Paid-for-search revenues based on estimated Bulgarian
Google revenues
• 2014 discounts applied based on IHS estimates as
follows:
• Display – 57.0%
• Classifieds and directories – 15.0%
• Paid-for-search – 0.0%
• 2013 discounts applied based on IHS estimates as
follows:
• Display – 57.0%
• Classifieds and directories –15.0%
• Paid-for-search – 0.0%
• Agency commissions of 15.0% added to 2014 and 2013
display
Croatia
• Gross data provided by IAB Croatia/INAMA
Czech Republic
• Ratecard data provided by SPIR for Display, Video,
Classifieds and Directories, PR articles
• Net data provided by SPIR for Paid-for-search, contextual
advertising, RTB
• 2014 discounts applied based on IHS estimates as
follows:
• Display – 49.0%
• Mobile display – 49.0%
• Video – 49.0%
• Contextual advertising – 0.0%
• Programmatic buying and real-time bidding – 0.0%
• Classifieds and directories – 49.0%
• Paid-for-search – 0.0%
• 2013 discounts applied based on IHS estimates as
follows:
• Display – 46.0%
• Mobile display – 46.0%
• Video – 46.0%
• Contextual advertising – 0.0%
• Programmatic buying and real-time bidding – 0.0%
• Classifieds and directories – 46.0%
• Paid-for-search – 0.0%
• Mobile display, video, contextual advertising, RTB added
into Display
52 © IAB Europe and IHS IAB Europe AdEx Benchmark 2014
Section 5 - Appendices
APPENDICES
• In-stream video was estimated by IHS based on total
video reported by SPIR and European averages
Denmark
• Net data provided by Danske Medier
• E-mail marketing excluded and newsletter marketing
added to display
• Data grossed up as follows:
• Display – 7.0% on 60.0% of display total
• Online video – 7.0% on 100.0% of display total
• Paid-for-search – 7.0% on 40.0% of paid-for-search
total
• Classifieds and directories – 0.0% on 100.0% of
classifieds and directories total
• Mobile display – 7.0% on 100.0% of mobile display total
Finland
• Net data provided by TNS Gallup for display, video, mobile
display and classifieds
• Net data provided by IAB Finland for paid-for-search,
directories and social media
• Data grossed up as follows based on local IAB
recommendations:
• Display – 15.0% on 100.0% of display total
• Classifieds and directories – 15.0% on 100.0% of
classifieds and directories total
• Paid-for-search – 15.0% on 50.0% of paid-for-search
total
France
• Net data provided by IAB France
• Newsletter advertising extracted from e-mail marketing
(estimated at 21.0% of e-mail marketing for 2013 and
2014) and added into display
• E-mail marketing excluded
• Classifieds and directories data made up of:
• Directories figure published by IREP
• Classifieds figure estimated by IHS for 2013 and 2014
• Data grossed up as follows:
• Display – 15.0%
• Video – 15.0%
• Classifieds and directories – 0.0%
• Paid-for-search – 0.0%
• Mobile display – 15.0%
Germany
• Gross data provided by OVK in the BVDW for display, paid-
for-search, mobile display and video
• Classifieds and directories and mobile search estimated
by IHS
Greece
• Gross data provided by IAB Greece for display, video,
paid-for-search, and classifieds and directories
Hungary
• Gross data provided by IAB Hungary for display, paid-for-
search, classifieds and directories, video, mobile display
and mobile search
• E-mail marketing excluded
Ireland
• Gross data provided by IAB Ireland for display, video,
paid-for-search, classifieds and directories, mobile display
and mobile search
• E-mail marketing excluded
Italy
• Net data provided by IAB Italia and FCP/Nielsen
• 2012 data restated to include Social media, Video and
Programmatic in Display
• E-mail marketing excluded
• Display reduced by 8.0% to exclude pan-European ad
spend
• SMS advertising taken out of classifieds and directories
figure
• Data grossed up as follows based on local IAB
recommendations:
• Display – €100 million added on top of reported figure
• Classifieds and directories – 15.0% on 100.0% of total
classifieds and directories
• Paid-for-search – 0.0% on 100.0% of total paid-for-
search
• Mobile display – 15.0% on 80.0% of mobile advertising
53 © IAB Europe and IHS IAB Europe AdEx Benchmark 2014
Section 5 - Appendices
APPENDICES
Netherlands
• Net data provided by IAB Netherlands and Deloitte
Netherlands
• Affiliate marketing redistributed as follows:
• 7.0% excluded as it was SEO
• 93.0% added into display category
• E-mail marketing excluded
• Data grossed up as follows:
• Display – 15.0%
• Video – 15.0%
• Mobile display – 15.0%
Norway
• Net data provided by IRM/INMA
• Display reduced by 10.0% to exclude transaction-oriented
payments
• Data was grossed up as follows based on local IAB
recommendations:
• Display – 6.0% on 75.0% of Display total
• Video – 6.0% on 100.0% of Video total
• Mobile advertising – 1.8% on 100.0% of Mobile total
Poland
• Gross data provided by IAB Poland
• E-mail marketing excluded
• Social media ad spend modelled by IHS
• Video figure reported included all definitions of video
advertising; in-stream online video (pre-rolls, mid-rolls,
post-rolls) provided for 2014 and estimated for 2013 using
European average
• unspecified spend distributed among all categories
based on each category’s share of total online ad spend
Romania
• Net data provided by IAB Romania
• Affiliate marketing, integrated content, newsletter
advertising, contextual advertising, and all unspecified
advertising added into the Display category
• Display grossed up by 5.0% based on local IAB
recommendations
Russia
• Net data provided by IAB Russia/AKAR
• Data grossed up as follows based on local IHS estimates:
• Display – 15.0% on 100.0% of Display total
• Video – 15.0% on 100.0% of Video total
• Mobile display – 15.0% on 100.0% of Mobile Display
total
• Paid-for-search – 15.0% on 30.0% of Paid-for-search
total
• Classifieds and directories not estimated because figure
is negligible in Russia
Serbia
• Gross data provided by IAB Serbia
• Search engine optimisation excluded
• Affiliate marketing, integrated content, newsletter
advertising, social marketing, contextual advertising,
mobile display and Facebook advertising added into
display
Slovakia
• Net data provided by IAB Slovakia
• Facebook and GDN removed from classifieds and
directories and moved into display
• Data grossed up as follows based on local IHS estimates:
• Display – 15.0% on 70.0% of Display total
• Classifieds and directories – 15.0% on 70.0% of
classifieds and directories total
• Paid-for-search – 0.0% on 100.0% of paid-for-search
total
• unspecified spend distributed among all categories
based on each category’s share of total online ad spend
Slovenia
• Gross data reported by IAB Slovenia
Spain
• Gross data provided by IAB Spain
• Classifieds extracted from display using IHS estimate and
moved into classifieds and directories category
54 © IAB Europe and IHS IAB Europe AdEx Benchmark 2014
Section 5 - Appendices
APPENDICES
Sweden
• Net data provided by IRM
• Newsletter advertising isolated within e-mail marketing
and added into display; e-mail marketing excluded
• Reported paid-for-search reduced by 10.0% to exclude
SEO revenue
• Display reduced by 10.0% to exclude transaction-oriented
payments
• In-stream video advertising estimated based on total
video advertising reported by IRM and European averages
• Data was grossed up as follows based on local IAB
recommendations:
• Display – 6.0% on 75.0% of Display total
• Video – 6.0% on 100.0% of Video total
• Mobile advertising – 1.8% on 100.0% of Mobile total
Switzerland
• Ratecard data provided by IAB Switzerland and Media
Focus
• 2014 discounts applied based on IHS estimates as follows
to net figures:
• Display – 55.1%
• Affiliate marketing – 55.1%
• 2013 discounts applied based on IHS estimates as follows
to net figures:
• Display – 54.1%
• Affiliate marketing – 54.1%
• Display and affiliate marketing grossed up by 15.0%
• Affiliate marketing category moved into Display
Turkey
• Net data provided by IAB Turkey
• E-mail marketing excluded
• Search is 79.0% of the sum of reported paid-for-search
and search engine advertising revenues
• Classifieds and directories include only classifieds
• Mobile display and 29.0% of the sum of reported paid-for-
search and search engine advertising revenues (which are
in fact display ads) added into the display category
• Data grossed up as follows:
• Display – 15.0%
• Classifieds and directories – 15.0%
• Paid-for-search – 15.0%
• Mobile display – 15.0%
UK
• Display, classifieds and directories, and paid-for-search
kept as reported
• Email marketing and mobile messaging excluded (from
online total
• Other calculated as the difference of the total reported
and total of display, classifieds and directories and paid-
for-search (this includes lead-generation, social Media ad
spend, solus email, audio)
55 © IAB Europe and IHS IAB Europe AdEx Benchmark 2014
Section 6 - About us
OuR RESEARCH PARTNERS
About IHS
IHS (NySE: IHS) is the leading source of information and insight in critical areas that shape today’s business landscape, including
energy and power; design and supply chain; defense, risk and security; environmental, health and safety (EHS) and sustainability;
country and industry forecasting; and commodities, pricing and cost. Businesses and governments around the globe rely on the
comprehensive content, expert independent analysis and flexible delivery methods of IHS to make high-impact decisions and de-
velop strategies with speed and confidence. IHS has been in business since 1959 and became a publicly traded company on the
New york Stock Exchange in 2005. Headquartered in Englewood, Colorado, uSA, IHS employs more than 6,000 people in more than
31 countries around the world.
www.ihs.com
Founded in 1999 and headquartered in Reston, Virginia, comScore, Inc. (NASDAQ: SCOR) is a global leader in digital media analyt-
ics. comScore makes audiences and advertising more valuable by providing trusted, independent metrics that help businesses
understand how people interact with content and advertising across TV and digital devices, giving a total view of the consumer.
Through its products and services, comScore helps its more than 2,500 clients understand their multi-platform audiences, know if
their advertising is working, and access data where they want and need it.
www.comscore.com
i-Media Research and Marketing manages key industry business, research and communications projects for IAB Europe amongst
others. The company, led by Alison Fennah with over 15 years digital advertising industry experience, manages key industry re-
search and communications projects for IAB Europe amongst others. Through its pan-European experience i-Media Research and
Marketing is able to work with multiple stakeholders to initiate projects, gain buy-in and communicate effectively with a focus on
delivering maximum ROI.
www.imedia-rm-co.uk
56 © IAB Europe and IHS IAB Europe AdEx Benchmark 2014
Section 6 - About Us
ABOuT IAB EuROPE
Our mission
IAB Europe is the voice of digital business and the leading
European-level industry association for the interactive adver-
tising ecosystem. Its mission is to promote the development
of this young and innovative sector by shaping the regulatory
environment, investing in research & education, and develop-
ing and facilitating the uptake of business standards.
Our research strategy
IAB Europe ‘proves’ the value of the online advertising industry
through an ongoing programme of research driven by the Re-
search Committee. It initiates and brings together the best of
research available on the consumer and the European online
advertising market through its network of members, national
IABs and partners. In addition to our AdEx Benchmark study
current projects and libraries include:
European Programmatic Market Sizing Study
The European Programmatic Market Sizing Study sizes the
programmatic market at a European level. The numbers are
based on ad spend reported by IABs, transactional data, sta-
tistical and econometric models to infer a European market
size and knowledge from industry experts.
Multi-Device and Connected World Library of Re-
search
The Multi-Device and Connected World Library of Research is
a library of media consumption research that has been under-
taken in Europe across multiple devices that showcases the
evolving consumer landscape and its potential for advertising.
Library of Ad Effectiveness Case Studies
The Library of Ad Effectiveness Case Studies showcases the
opportunities, potential and success that digital offers for
brand advertisers by featuring case studies that demonstrate
how a brand has achieved various KPIs through a digital or
cross media campaign
IAB European Agency Snapshot Survey
The Agency Snapshot Survey provides insight into current
knowledge surrounding mobile advertising and uptake within
today’s current media climate.
Attitudes towards Programmatic Advertising Survey
(Due Q3 2015)
This survey aims to gain insight on the drivers and barriers of
programmatic for advertisers, agencies and publishers in Eu-
rope and the current adoption of and attitudes toward pro-
grammatic of both the buy and sell side stakeholders.
Global Mobile Ad Revenue Report
The Global Mobile Ad Spend Report sizes the mobile advertis-
ing market at global and regional levels. The report covers 5
regions - North America, Asia-Pacific, Europe, Middle East &
Africa and Latin America – and the following mobile advertis-
ing formats are included: display, search and SMS/MMS.
Consumer Barometer with Google
The new Consumer Barometer is now available with up-to-
date digital consumer insights across 56 countries. Google has
collaborated with IAB Europe, TNS and Hive for the 2015 ver-
sion of the tool. Anyone can use the free tool to create and
download customised data and market-specific information.
These can help users discover anything from: how often peo-
ple go online, to how many connected devices they may have,
how people research and purchase online, the influence of on-
line video on their shopping habits or the differences between
generations and their online behaviour. An example of the data
available in the tool can be found in section 4.
Our other committees and task forces
Policy Committee
The Policy Committee is the main vehicle for developing and
executing IAB Europe’s regulatory and policy strategy, de-
livering on the Association’s aim of positively influencing the
regulatory and policy environment at Eu level, supporting the
development of the interactive media industry, working col-
57 © IAB Europe and IHS IAB Europe AdEx Benchmark 2014
Section 6 - About us
ABOuT IAB EuROPE
laboratively with other relevant Eu trade bodies to influence
the regulatory and policy environment.
Brand Advertising Committee
The Mission of IAB Europe’s Brand Advertising Committee is to
drive brand investment into digital by providing Brand Adver-
tisers with a reliable and trusted Brand Advertising Framework
for the converging digital and traditional media environment.
The Framework is composed of a set of initiatives designed to
be compatible with global programmes and there are three
areas of focus – Ad Formats, Metrics and KPIs and Quality and
Audience Segments. The Framework currently consists of ad
format recommendations for PC, Tablet and Mobile, a Meas-
urement Blueprint and a Viewable Impressions White Paper.
The third pillar on Quality is currently being scoped out.
Mobile Ad Formats Task Force
The Mobile Ad Formats Task Force has analysed the mobile
ad formats landscape across Europe and produced a recom-
mended set of in-page ad formats for brand advertising on
mobile platforms, the Mobile Brand Builders. The Task Force is
now focusing on responsive design formats.
Programmatic Trading Committee
The IAB Europe Programmatic Trading Committee is a multi-
stakeholder initiative to help Publishers, Agencies and Ad-
vertisers increase their understanding of the programmatic
ecosystem and the impact it is having on digital advertising.
The Committee will deliver a comprehensive pan-European
programme of educational activities.
Our board
Made up of ten national IABs and ten corporate members,
the Board represents the wide-ranging interests of the many
stakeholders in the European digital marketing industry.
Chairman: Constantine Kamaras, (Vice-Chairman, 24 Media
and Board Member, IAB Greece)
Vice-Chair: Anne Goodman (Senior VP Marketing Ad Sales, BBC
Worldwide)
Our network
The IAB network represents over 90 per cent of European digi-
tal revenues and is acting as voice for the industry at National
and European level.
Corporate members:
Adform, AdRoll, ADTECH, AdTruth, AOL Advertising, AppNexus,
AudienceScience, BBC Worldwide, CNN, comScore Europe,
Criteo, Deutsche Post, DMA Institute, eBay International Ad-
vertising, Expedia, Exponential, Fox Interactive Media, Gemius,
Goldbach Media Group, Google, GroupM, Improve Digital, Inte-
gral Ad Science, Koan, MediaMath, Meetrics, Microsoft Europe,
Millward Brown, Nielsen, nugg.ad, OMD, Orange Advertising
Group, Openx, PHD, Prisa, Publigroupe, PubMatic, Quantcast,
Retailmenot, Rocket Fuel, Sanoma Digital, Selligent, StickyADs.
tv, Teads, The Exchange Lab, Triton Digital, TrustE, united In-
ternet Media, White & Case, Widespace, WebSpectator, yahoo!
Country members:
Austria, Belarus, Belgium, Bulgaria, Croatia, Czech Republic,
Denmark, Finland, France, Germany, Greece, Hungary, Ireland,
Italy, Netherlands, Norway, Poland, Portugal, Romania, Russia,
Serbia, Slovakia, Slovenia, Spain, Sweden, Switzerland, Turkey
and united Kingdom.
58 © IAB Europe and IHS IAB Europe AdEx Benchmark 2014
Section 6 - About Us
AND FINALLy
Eleni Marouli,
Senior Analyst,
Advertising Research, IHS
Daniel Knapp,
Director of Advertising
Research, IHS
Authors of the AdEx Benchmark 2014 reportSpecial Thanks
With sincere thanks to all the contacts at the national IABs who
have supported the production of this report by supplying and
explaining their data to IAB Europe.
The AdEx Benchmark Task Force has created specific Working
Groups on Mobile, Video and Social Media agreeing scope of
the research, methods and definitions. We would like to thank
the Task Force and Working Groups for their valuable input to
this process and their contribution to the production of this
report.
contAct
IAB EuropeThe EGG – Communication Nest
Rue Bara 175
1070 Brussels, Belgium
+32 (0) 2 526 55 68
AdEx Benchmark enquiries: [email protected]
General information: [email protected]
www.iabeurope.eu
IHS133 Houndsditch
EC3A 7Bx
London, united Kingdom
+44 (0) 20 74242871