benchmark electronics - annualreports.com
TRANSCRIPT
2001 Annual Report
BenchmarkElectronics
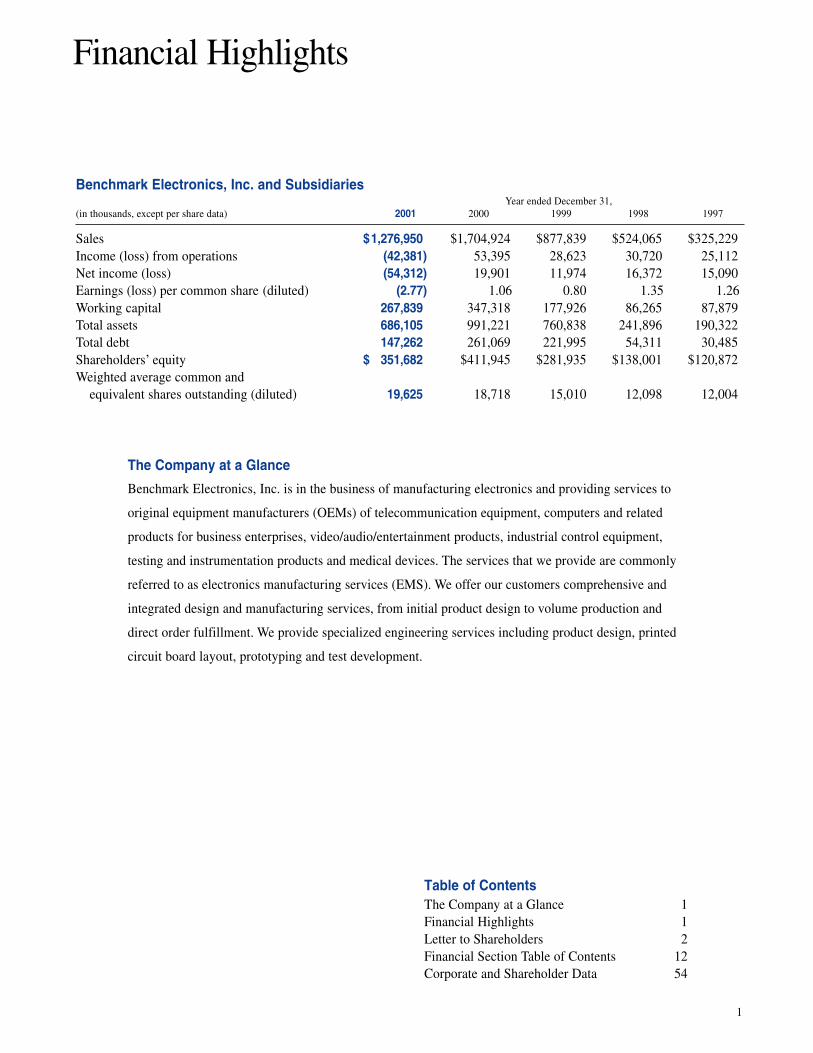
Benchmark Electronics, Inc. and SubsidiariesYear ended December 31,
(in thousands, except per share data) 2001 2000 1999 1998 1997
Sales $1,276,950 $1,704,924 $877,839 $524,065 $325,229Income (loss) from operations (42,381) 53,395 28,623 30,720 25,112Net income (loss) (54,312) 19,901 11,974 16,372 15,090Earnings (loss) per common share (diluted) (2.77) 1.06 0.80 1.35 1.26Working capital 267,839 347,318 177,926 86,265 87,879Total assets 686,105 991,221 760,838 241,896 190,322Total debt 147,262 261,069 221,995 54,311 30,485Shareholders’ equity $ 351,682 $411,945 $281,935 $138,001 $120,872Weighted average common and equivalent shares outstanding (diluted) 19,625 18,718 15,010 12,098 12,004
1
Financial Highlights
The Company at a Glance
Benchmark Electronics, Inc. is in the business of manufacturing electronics and providing services to
original equipment manufacturers (OEMs) of telecommunication equipment, computers and related
products for business enterprises, video/audio/entertainment products, industrial control equipment,
testing and instrumentation products and medical devices. The services that we provide are commonly
referred to as electronics manufacturing services (EMS). We offer our customers comprehensive and
integrated design and manufacturing services, from initial product design to volume production and
direct order fulfillment. We provide specialized engineering services including product design, printed
circuit board layout, prototyping and test development.
Table of ContentsThe Company at a Glance 1Financial Highlights 1Letter to Shareholders 2Financial Section Table of Contents 12Corporate and Shareholder Data 54
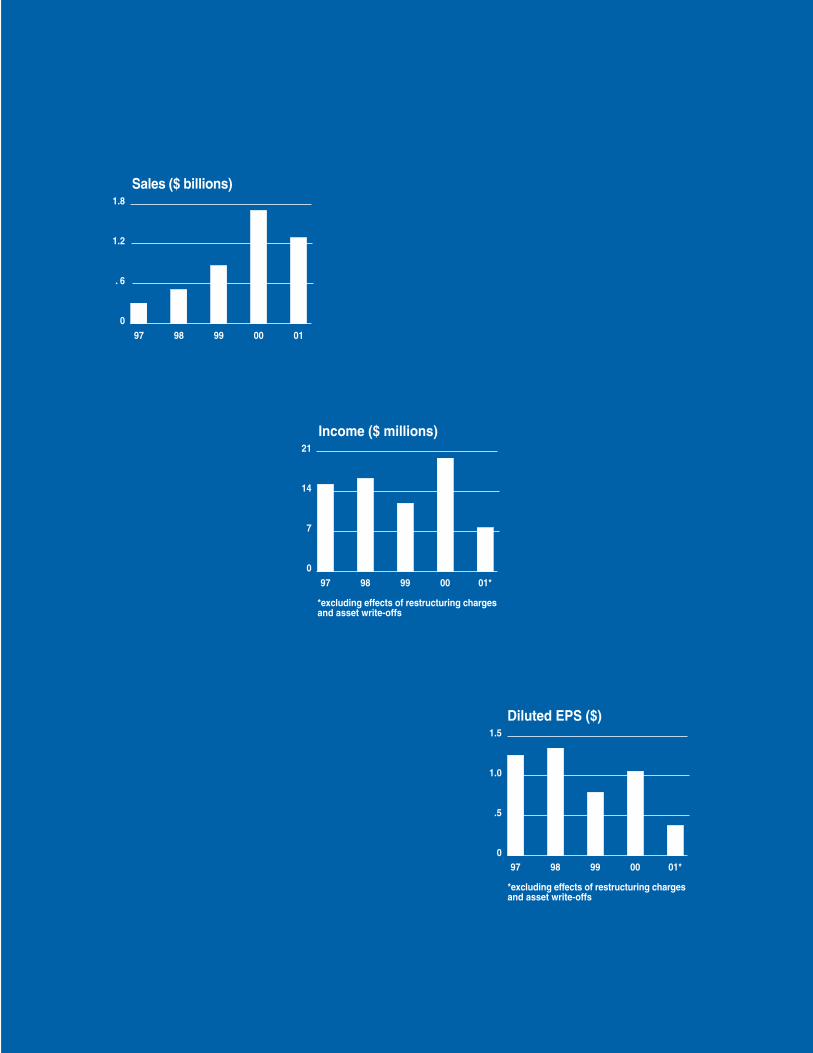
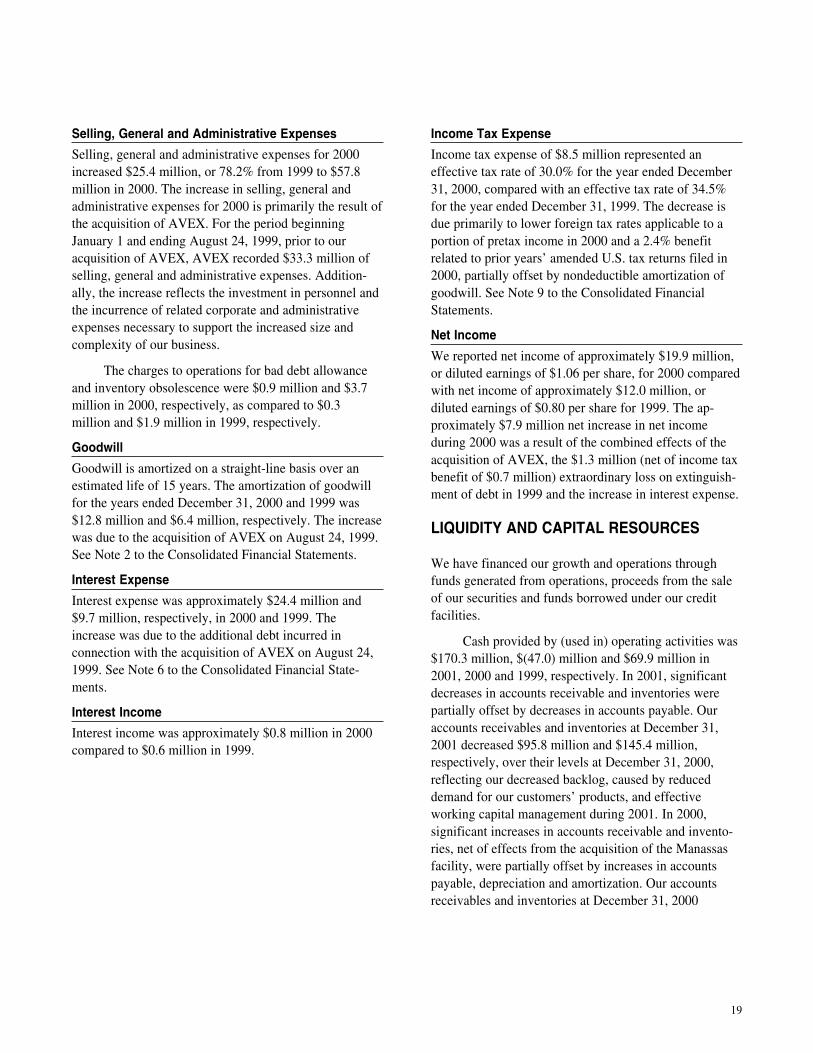
Sales ($ billions)
Diluted EPS ($)
Income ($ millions)
97 98 99 00 01*
*excluding effects of restructuring chargesand asset write-offs
1.8
1.2
. 6
097 98 99 00 01
21
14
7
097 98 99 00 01*
*excluding effects of restructuring chargesand asset write-offs
1.5
1.0
.5
0
Letter to Shareholders
3
The year 2001 is over! This challenging year began a differentiation process,
segregating many technology companies into
� quality marathon runners—those well poised for the longer term challenges
and opportunities, and
� sprinters—those struggling to survive and build up capable teams and pro-
cesses amidst the broad-based decline in demand for our customers’ products.
It was a difficult year, but in many respects, a rewarding one for Benchmark. We faced
this downtown as a marathon runner—with our processes and teams in place, prepared
to compete in a weakened marketplace. Our corporate culture and training served us
well. Although this uphill portion of our marathon, otherwise know as the year’s
economic downturn, cannot yet be proclaimed “finished,” the Benchmark teams proved
to be primed for the long haul. Our people worked with our customers to manage
effectively through the impact of lower demand levels for technology products.
Focused over the years on customer needs and objectives, these teams quickly under-
stood and adjusted to the changes in our customers’ end markets. We managed our
supply chain efficiently with the same conscientious skills and expertise demonstrated
in prior growth years, such as in the year 2000, when allocations and lack of avail-
ability of various electronic components were prevalent.
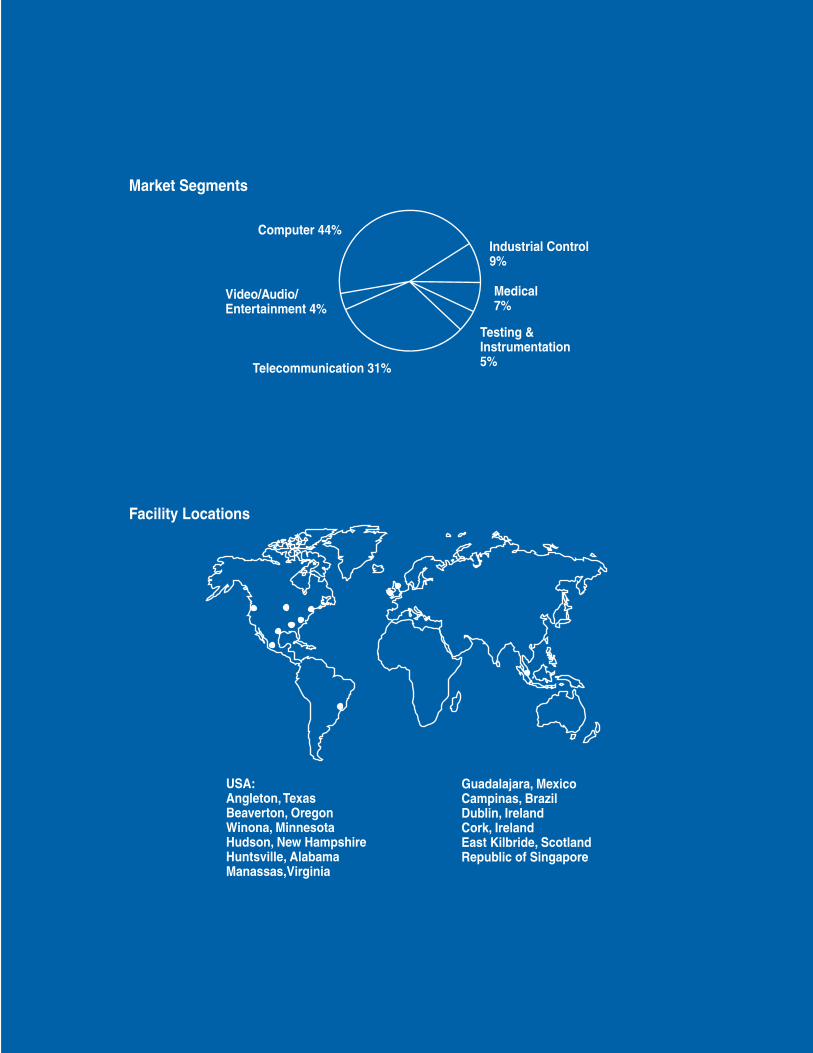
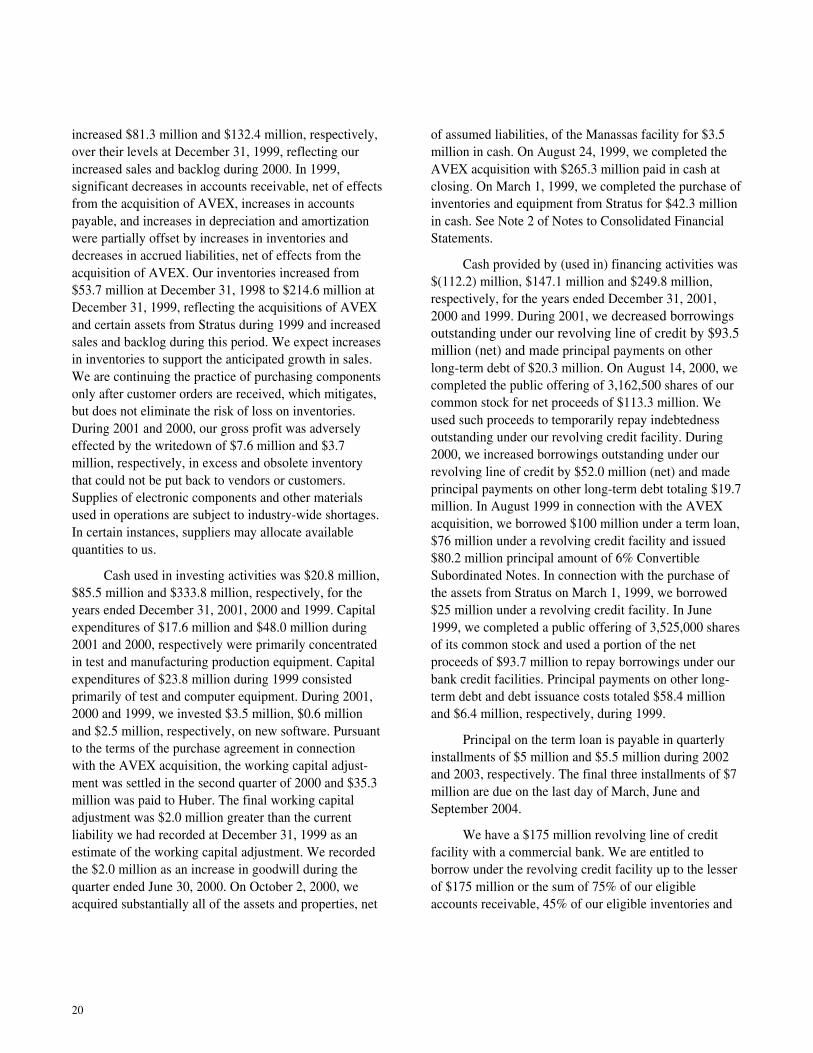
Facility Locations
USA:Angleton, TexasBeaverton, OregonWinona, MinnesotaHudson, New HampshireHuntsville, AlabamaManassas,Virginia
Guadalajara, MexicoCampinas, BrazilDublin, IrelandCork, IrelandEast Kilbride, ScotlandRepublic of Singapore
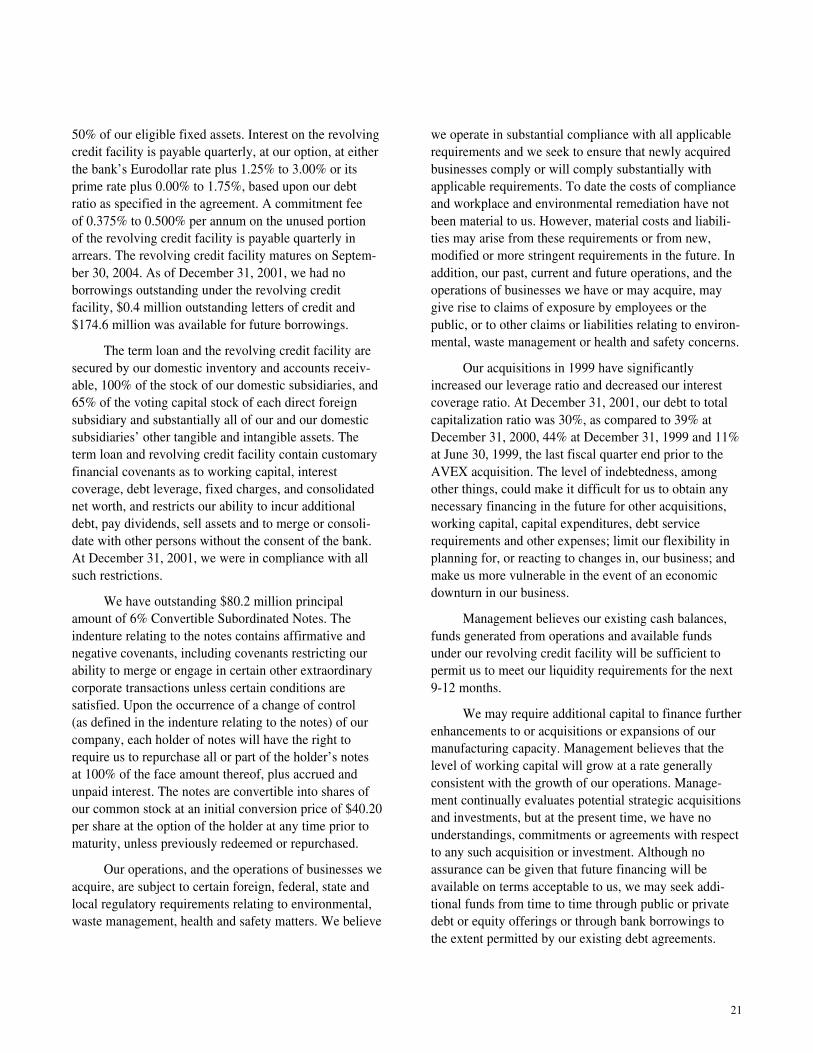
Industrial Control9%
Medical7%
Testing &Instrumentation5%Telecommunication 31%
Video/Audio/Entertainment 4%
Computer 44%
Market Segments
5
The initiative to expand our systems integration offerings from Europe into the United
States and Asia during late 2000 proved to be both timely and beneficial. As our cus-
tomers searched for opportunities to expand their outsourcing strategies, we were
ready. Our system integration teams now support customers in each of our primary
market segments, and we continue to see this as a major growth area for Benchmark
in the upcoming years.
During the downturn, our teams’ discipline and commitment were demonstrated to
you, our shareholders, in the form of improved working capital management, new
program wins, and proactive cost control efforts. It was both difficult and unpleasant
to downsize or close facilities, but the depth, breadth, and duration of this downturn
required us to do so. While we regret having to take these steps, we are proud of our
teams’ performance to ensure cost controls were addressed every day at every level to
limit the impact on our organization. Concurrently, this challenging time became an
opportunistic period in which to expand both the depth and breadth of certain engineer-
ing skill sets, augmenting our already capable team of engineers.
6
Through the various challenges facing our market place, be it managing growth or
managing recessionary times, our teams demonstrate that our flexible, customer-
focused culture differentiates us from competitors. This became more apparent to our
customers during the downturn than ever before. In our service industry, what counts is
exceptional execution. Benchmark does just that! In 2000 we faced supply shortages,
and showed our capabilities through meeting our customers’ requirements. In 2001,
by contrast, supplies were plentiful, while demands for our customers’ products were
down. Throughout both operating environments, our teams proved they simply execute
better than the competition on a consistent basis. What a difference a year made!
During May 2001, we made subtle but important changes in our executive team,
acknowledging the contributions and strength of leadership over the last 15 years.
Mr. John Custer, a retired senior executive of the Mason & Hanger-Silas Mason Co.,
Inc. of Lexington, Kentucky, retired as Chairman of the Board while continuing to
serve as a Board Member. I moved into the CEO and Chairman of the Board position,
taking primary responsibility for long-term strategic planning. After 15 years as Presi-
dent of Benchmark, I was pleased to hand over day-to-day operations to our new
President and Chief Operating Officer, Cary T. Fu.

Donald E. NigborChairman of the Board and CEO
Cary T. FuPresident and COO
7
Our customer-focused approach and flexibility provided tangible results even in the
midst of recession in 2001. But the economic and operating environment for 2002
remains challenging. Our plan is to stay the course of continuous improvement and
“Excellent Execution”—execution in terms of both operational performance for our
customers and financial performance for our shareholders. We look forward to building
on our strong base and reporting our progress to you as the economy recovers.
Sincerely yours,
Donald E. Nigbor Cary T. Fu
Chairman of the Board & CEO President & COO
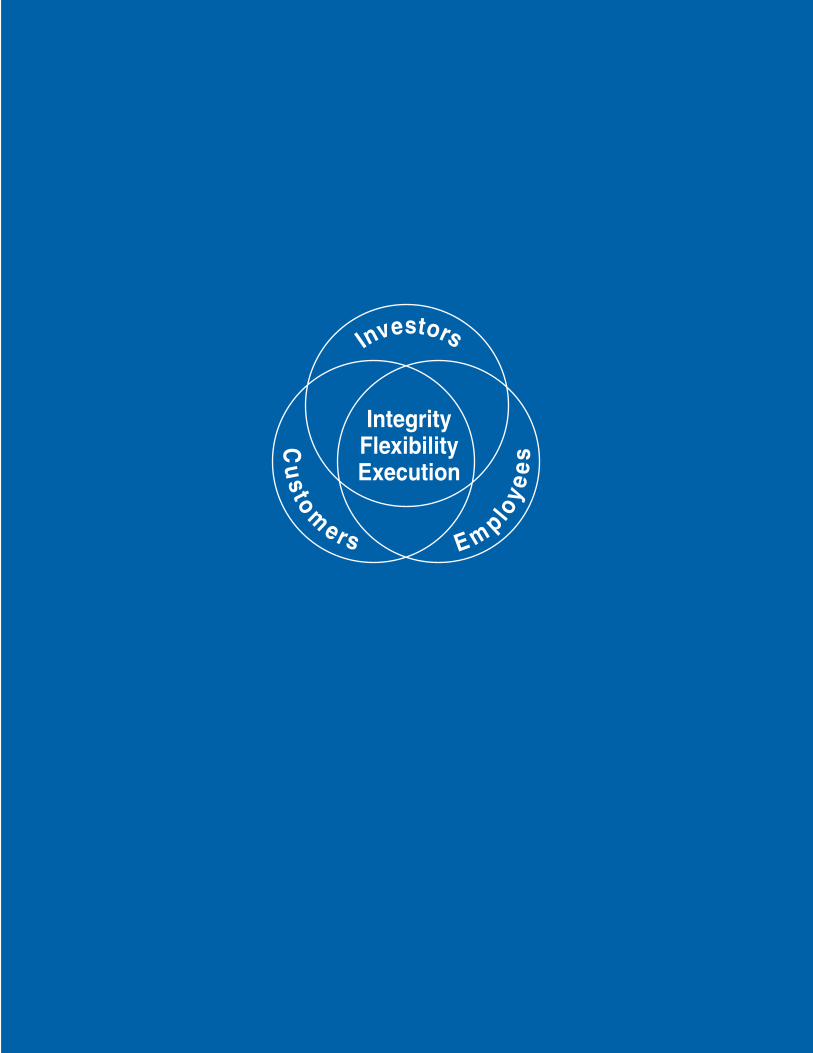
Investors
IntegrityFlexibilityExecution
Cu
stom
ers E mploye
es
Our culture . . .
9
demands flexibility and focus on the customer. It does more to differentiate us from our
competitors than anything that size or number of locations can do.
IntegrityWhen Benchmark became an independent company, our approach to the business was
based on honest, ethical and fair dealings inside and outside the company. It’s an
attitude that has served us well and will continue to do so. Ingrained in Benchmark’s
corporate culture, integrity is fundamental in all dealings with customers, suppliers,
investors and our family of employees. We believe our growth and success with all of
our partnership relationships are directly attributable to honesty, fairness and ethical
behavior in our everyday activities.
FlexibilityOur employees are as flexible as our manufacturing processes. Our flat management
structure keeps it that way. Decision-making close to the manufacturing floor allows
us to react rapidly to customer changes. Customers don’t have to alter the way they do
business to do business with us. We have no mandatory “rules of engagement”. Our
customers can take advantage of as much or as little of our comprehensive service
offerings as fits their business model.
10
ExecutionBenchmark takes a team approach to problem solving. We never forget that we are in a
service business. We ask, “What is happening in our customers’ marketplace, and what
are we doing to help them meet their objectives?” With resources ranging from an
experienced management team to continually updated technology, we offer customers
“Excellent Execution” in operational performance.
Over the years, we have thrived on and benefited from our “Excellent Execution”. We
have built our reputation by meeting and exceeding our customers’ expectations, from
the product design phase to the manufacturing phase. Our synergistic relationships
enable us to efficiently manage our supply chain, proactively control costs, and form
strengthened ties with long-term OEM customers.
Integrity. Flexibility. Execution. More than just concepts, these funda-
mentals represent Benchmark’s commitment to customers, employees and shareholders
to operate the kind of company they are proud to work with, work for and invest in for
the long-term.

“Don said that he wants customers to feel as though
Benchmark’s factories are their factories. It’s difficult for
us to be totally confident in the ‘factory that we can’t see,’
meaning our contract manufacturers. Benchmark is prov-
ing to us that, in fact, this concept is possible. Thanks for
your focus and dedication.”
—Customer Quote
Financial Section
Table of ContentsManagement’s Discussion and Analysis 13Consolidated Financial Statements 30Notes to Consolidated Financial Statements 34Independent Auditors’ Report 50Management’s Report 50Quarterly Financial Data 51Market for the Registrant’s Common Equity and Related Shareholder Matters 52Selected Financial Data 53Corporate and Shareholder Data 54
12
Management’s Discussion and Analysis ofFinancial Condition and Results of OperationsReferences in this report to “the Company”, “Bench-mark”, “we”, or “us” mean Benchmark Electronics, Inc.together with its subsidiaries. The followingManagement’s Discussion and Analysis of FinancialCondition and Results of Operations contains certainforward-looking statements within the meaning ofSection 27A of the Securities Act of 1933, as amendedand Section 21E of the Securities Exchange Act of 1934,as amended. These forward-looking statements areidentified as any statement that does not relate strictly tohistorical or current facts. They use words such as“anticipate,” “believe,” “intend,” “plan,” “projection,”“forecast,” “strategy,” “position,” “continue,” “estimate,”“expect,” “may,” “will,” or the negative of those terms orother variations of them or by comparable terminology.In particular, statements, express or implied, concerningfuture operating results or the ability to generate sales,income or cash flow are forward-looking statements.Forward-looking statements are not guarantees ofperformance. They involve risks, uncertainties andassumptions, including those discussed under the headingRisk Factors below. The future results of our operationsmay differ materially from those expressed in theseforward-looking statements. Many of the factors that willdetermine these results are beyond our ability to controlor predict. You should not put undue reliance on anyforward-looking statements. Should one or more of theserisks or uncertainties materialize, or should underlyingassumptions prove incorrect, actual outcomes may varymaterially from those indicated.
The following discussion should be read in con-junction with the Consolidated Financial Statements andNotes thereto.
RECENT ACQUISITIONS AND DISPOSITION
On October 2, 2000, we acquired substantially all of theassets and properties, net of assumed liabilities, of theMSI Division of Outreach Technologies, Inc. Thisoperation in Manassas, Virginia was acquired for $3.5million, as adjusted. The transaction was accounted forunder the purchase method of accounting, and, accord-ingly, the results of operations of the Manassas divisionsince October 2, 2000 have been included in our financialstatements. The acquisition resulted in goodwill ofapproximately $0.4 million that is being amortized on astraight-line basis over 15 years.
On September 15, 2000, we closed the previouslyannounced sale of our Swedish operations for $19.6million. The Swedish operations accounted for 3.7% and3.0% of our sales and 14.4% and 16.0% of our operatingincome for the years ended December 31, 2000 and 1999,respectively.
On August 24, 1999, we acquired AVEX Electron-ics, Inc. As consideration for the acquisition, we paid$265.3 million in cash at closing, subject to certainadjustments, including a working capital adjustment, andissued one million shares of our common stock. Theworking capital adjustment was settled in the secondquarter of 2000 and $35.3 million was paid to the seller.The transaction was accounted for under the purchasemethod of accounting, and, accordingly, the results ofoperations of AVEX since August 24, 1999 have beenincluded in our financial statements. The acquisitionresulted in goodwill of approximately $139.5 million,which is being amortized on a straight line basis over 15years. In order to finance the AVEX acquisition, we (i)obtained a term loan from a syndicate of commercialbanks in the amount of $100 million, (ii) obtained a newrevolving credit facility permitting draws of up to $125million, subject to a borrowing base calculation, andborrowed $46 million under such facility and (iii) issued$80.2 million in convertible subordinated debt. Inconnection with the AVEX acquisition, we borrowed $30million under the new revolving credit facility to refi-nance our prior senior indebtedness. Disputes have arisenbetween us and the seller relating to the AVEX acquisi-tion resulting in legal proceedings between the partiesover the transaction. See RISK FACTORS.
On March 1, 1999, we acquired certain assets fromStratus, a wholly-owned subsidiary of Ascend Communi-cations, Inc. for approximately $42.3 million in cash, asadjusted. The acquisition price was allocated $6.1 millionto equipment and other assets and $36.2 million toinventories. Stratus provided systems integration servicesfor large and sophisticated fault-tolerant mainframe
13
computers. In connection with the transaction, we enteredinto a three-year supply agreement to provide thesesystem integration services to Ascend and StratusHoldings Limited and we hired approximately 260employees. This agreement is under negotiation forrenewal and extension.
Recently adopted accounting principles will changethe way we account for amortization of goodwill byrequiring us to no longer amortize goodwill effectiveJanuary 1, 2002. We will also be required to test goodwillfor impairment at least annually. We are currentlyreviewing this statement to determine the impact itsadoption will have on our financial position, results ofoperations and cash flow. See Notes 1 and 2 to theConsolidated Financial Statements.
RESULTS OF OPERATIONS
The following table presents the percentage relationshipthat certain items in our Consolidated Statements ofIncome (Loss) bear to sales for the periods indicated. Thefinancial information and the discussion below should beread in conjunction with the Consolidated FinancialStatements and Notes thereto.
Percentage of SalesYear ended December 31,
2001 2000 1999
Sales 100.0% 100.0%100.0%Cost of sales 92.7 92.7 92.3
Gross profit 7.3 7.3 7.7Selling, general and
administrative expenses 4.3 3.4 3.7Restructuring charges .6 — —Asset write-offs 4.8 — —Amortization of goodwill 1.0 .8 .7
Income (loss) from operations (3.4) 3.1 3.3Other income (expense) (1.2) (1.4) (1.0)
Income (loss) before income taxes and extraordinary item (4.6) 1.7 2.3
Income tax benefit (expense) .3 (.5) (.8)
Income (loss) before extraordinary item (4.3) 1.2 1.5
Extraordinary item – loss on extinguishment of debt, net of tax — — .1
Net income (loss) (4.3)% 1.2% 1.4%
Year Ended December 31, 2001 Compared WithYear Ended December 31, 2000
Sales
Sales in 2001 decreased $428.0 million, or 25.1%, ascompared to 2000 sales, primarily as a result of recentunfavorable economic conditions and a decline indemand due to the downturn experienced by the electron-ics industry. Of this net decrease, there is a 14.8%decrease resulting from the sale of the Swedish opera-tions, a 23.5% increase attributable to the operation of thenew facilities added during the fourth quarter of 2000 andan approximately 108.7% net decrease in sales volumeresulting from the continued slowdown in the technologymarketplace.
We have 14 manufacturing facilities in the Ameri-cas, Europe and Asia to serve our customers. We areoperated and managed geographically. See Note 11 to theConsolidated Financial Statements. Our facilities in theAmericas provided 84.6% and 84.1% of net sales,respectively, during 2001 and 2000. Our Americas regionincludes facilities in Angleton, Texas, Beaverton,Oregon, Campinas, Brazil, Guadalajara, Mexico, Hudson,New Hampshire, Huntsville, Alabama, Manassas,Virginia and Winona, Minnesota. There are two facilitiesin Huntsville, Alabama - a systems integration facilityopened during 2000 and the PCB facility acquired fromAVEX in 1999. During 2001, we consolidated thePulaski, Tennessee manufacturing facility into theHuntsville, Alabama facility. The Pulaski facility iscurrently being held for sale. Our facilities in Europeprovided 13.3% and 13.8% of net sales, respectively,during 2001 and 2000. Our Europe region includesfacilities in Cork, Ireland, Dublin, Ireland and EastKilbride, Scotland. Our facilities in Asia provided 2.1%of our net sales during 2001 and 2000. There are twofacilities in Singapore - a systems integration facilityopened at the end of 2000 and the PCB facility acquiredfrom AVEX in 1999. We are currently in the process ofcombining the two facilities in Singapore into one site.
14
As a result of our international sales and facilities,our operations are subject to the risks of doing businessabroad. These dynamics have not had a material adverseeffect on our results of operations through December 31,2001. However, we cannot assure you that there will notbe an adverse impact in the future. See RISK FACTORSfor factors pertaining to our international sales andfluctuations in the exchange rates of foreign currency andfor further discussion of potential adverse effects inoperating results associated with the risks of doingbusiness abroad.
A substantial percentage of our sales have been to asmall number of customers, and the loss of a majorcustomer, if not replaced, would adversely affect us.During 2001, our three largest customers accounted forapproximately 44.9% of our sales, and our largestcustomer accounted for approximately 21.9% of sales.Our future sales are dependent on the success of ourcustomers, some of which operate in businesses associ-ated with rapid technological change and consequentproduct obsolescence. Developments adverse to ourmajor customers or their products, or the failure of amajor customer to pay for components or services, couldhave an adverse effect on us. Recently our customershave experienced a decline in demand for their products,which has had an adverse effect on our results of opera-tions. See Note 10 to the Consolidated FinancialStatements.
During 2001 and 2000, 23.3% and 28.5% of oursales were from our international operations. Thedecrease in the percentage of international sales for 2001as compared to 2000 primarily reflects the sale of theSwedish operations in September 2000 partially offset byadditional sales resulting from the operation of the newsystems integration facility in Singapore opened at theend of 2000.
We had a year-end backlog of approximately$855.1 million at December 31, 2001, as compared to the2000 year-end backlog of $1,600.4 million. Although weexpect to fill substantially all of our backlog during 2002,at December 31, 2001 we do not have long-term agree-ments with all of our customers and customer orders can
be canceled, changed or delayed by customers. Thetimely replacement of canceled, changed or delayedorders with orders from new customers cannot beassured, nor can there be any assurance that any of ourcurrent customers will continue to utilize our services.Because of these factors, backlog is not a meaningfulindicator of future financial results.
AmericasSales in the Americas during 2001 decreased $353.1million compared to 2000 as a result of recent unfavor-able economic conditions and a decline in demand due tothe downturn experienced by the electronics industry. Ofthis net decrease, there is a 23.3% increase attributable tothe operation of the systems integration facility inHuntsville, Alabama added during the fourth quarter of2000, approximately 3.1% was attributable to the acqui-sition of the Manassas, Virginia facility and an approxi-mately 126.4% resulted from a net decrease in salesvolume. During 2001, we consolidated the Pulaski,Tennessee manufacturing facility into the Huntsville,Alabama facility. The Pulaski facility is currently beingheld for sale.
EuropeSales in Europe during 2001 decreased $64.8 millioncompared to 2000 due primarily to the sale of theSwedish operations in September 2000 (representingapproximately 97.7% of this net decrease). The remain-ing 2.3% of the decrease in sales resulted from decreasesin sales volume.
In connection with the AVEX acquisition, weacquired operations in Sweden. On September 15, 2000,we closed the previously announced sale of our Swedishoperations for $19.6 million. The Swedish operationsaccounted for 3.7% of our sales and 14.4% of ouroperating income for the year ended December 31, 2000.On a pro forma basis, after giving effect to the disposi-tion of the Swedish operations as if it had occurred onJanuary 1, 2000, our income before income taxes andextraordinary item for the year ended December 31, 2000would have been $21.7 million.
AsiaSales in Asia during 2001 decreased by $10.1 millioncompared to 2000. This decrease in sales was partiallyoffset by additional sales resulting from the operation ofthe new systems integration facility in Singapore openedat the end of 2000.
15
Gross Profit
Gross profit decreased 24.7% to $93.5 million for 2001from $124.1 million in 2000. Gross profit as a percentageof sales remained consistent at 7.3% for both years. Thedecrease in gross profit was a result of the combinedeffect of the operation of new facilities added during thefourth quarter of 2000, the sale of the Swedish opera-tions, fluctuations in capacity utilization, lower salesvolumes, changes in product mix, favorable componentmarket conditions, cost reductions, and efforts to inte-grate recent acquisitions. The combined effect of thesefactors, which are continually changing and are interre-lated, make it impracticable to determine with precisionthe separate effect of each factor. We expect that anumber of high volume programs serving customers inprice sensitive markets will remain subject to competitiverestraints on the margin that may be realized from theseprograms and that these restraints will exert downwardpressure on our margins in the near future. For the fore-seeable future, our gross margin is expected to dependprimarily on the length and severity of the generalslowdown in the technology marketplaces, facilityutilization, product mix, start-up of new programs,pricing within the electronics industry, and the integra-tion of acquisitions. The gross margins at each facilityand for Benchmark as a whole are expected to continueto fluctuate. Increases in start-up costs associated withnew programs and pricing within the electronics industryalso could adversely impact our gross margin.
The 2001 and 2000 gross profit reflects chargesrelated to the write down of inventory. In 2001 and 2000,$7.6 million and $3.7 million of inventory was writtendown, respectively. These charges related to inventorywritten down to lower of cost (principally first-in, first-out method), or market, raw materials held specific tocustomers who were no longer in business, and changesin customer demand for inventory that resulted in excessquantities on hand. Inventory is procured by us based onspecific customer orders. Correspondingly, customermodifications to orders for inventory previously procuredby us (e.g. cancellations as well as inventory that ishighly customized and therefore not available for use byother customers) resulted in excess and obsolete inven-tory for the related customers that could not be recoveredthrough put back to vendors or the specific customerconcerned.
Selling, General and Administrative Expenses
Selling, general and administrative expenses for 2001decreased $3.5 million, or 6.0%, from 2000 to $54.4million in 2001. The decrease in selling, general andadministrative expenses reflects the impact of on-goingefforts to manage operating expenses in response to thecurrent business environment, offset by additionaladministrative expenses resulting from the acquisition ofthe Manassas, Virginia facility and the opening ofadditional facilities during the fourth quarter of 2000. Weanticipate selling, general and administrative expenseswill increase in absolute dollars in the future as wecontinue to develop the infrastructure necessary tosupport our current and prospective business.
The charge to operations for bad debt allowancewas $2.6 million for 2001 as compared to $0.9 millionin 2000.
Restructuring Charges and Asset Write-offs
During 2001, we recorded restructuring charges ofapproximately $7.6 million ($5.3 million after-tax).These charges related to reductions in our cost structure,including reductions in force and included costs resultingfrom payment of employee severance, consolidation offacilities and abandonment of leased equipment. Theserestructuring costs included severance costs of approxi-mately $6.6 million and losses from lease commitmentsof $1.0 million. Cash paid for severance costs and leasingexpenses during the year ended December 31, 2001totaled approximately $5.6 million and $0.9 million,respectively.
In the third quarter of 2001, we recorded assetwrite-offs of approximately $61.7 million ($43.2 millionafter-tax) for the write-down of long-lived assets to fairvalue. Included in the long-lived asset impairment arecharges of approximately $28.0 million which related toproperty, plant and equipment associated with theconsolidation and downsizing of certain manufacturingfacilities and the write-off of approximately $33.7 millionof the remaining goodwill and other intangibles related tothese facilities.
16
The employee severance and benefit costs relatedto the elimination of approximately 1,600 positionsworldwide. Approximately 85% of the positions elimi-nated were in the Americas region, 13% were in Europeand 2% were in Asia. The employment reductionsprimarily affected employees in manufacturing. Facilitiesand equipment subject to restructuring were primarilylocated in the Americas and Europe. See Note 16 to theConsolidated Financial Statements.
Goodwill
The amortization of goodwill for the years endedDecember 31, 2001 and 2000 was $12.2 million and$12.8 million, respectively. The decrease was due to thewrite-off of $33.7 million of goodwill related to certainfacilities that were consolidated and downsized during2001. Recently adopted accounting principles willchange the way we account for amortization of goodwillby requiring us to no longer amortize goodwill effectiveJanuary 1, 2002. We will also be required to test goodwillfor impairment at least annually. We are currentlyreviewing this statement to determine the impact itsadoption will have on our financial position, results ofoperations and cash flow. See Notes 1 and 2 to theConsolidated Financial Statements.
Interest Expense
Interest expense was approximately $17.0 million and$24.4 million, respectively, in 2001 and 2000. Thedecrease was due to reductions in interest rates andrepayments of outstanding debt. See Note 6 to theConsolidated Financial Statements.
Interest Income
Interest income was approximately $1.5 million in 2001compared to $0.8 million in 2000. The increase was dueto the investment of increased available cash in interestbearing cash equivalents offset by declining rates.
Income Tax Benefit (Expense)
Income tax benefit of $4.0 million represented aneffective tax rate of 6.8% for the year ended December31, 2001, compared with an effective tax rate of 30.0%for the year ended December 31, 2000. The decrease inthe effective tax rate was due primarily to lower foreigntax rates applicable to a portion of pretax income in 2001,
partially offset by nondeductible amortization ofgoodwill and for tax losses for which no benefit wasrecognized. See Note 9 to the Consolidated FinancialStatements.
Net Income (loss)
We reported net losses of approximately $(54.3) million,or diluted loss of $(2.77) per share for 2001, comparedwith net income of approximately $19.9 million, ordiluted earnings of $1.06 per share, respectively for 2000.The net decrease of $74.2 million in 2001 was a result ofthe decline in revenue caused by the reductions indemand for our customers’ products and the relatedrestructuring charges and asset write-offs combined withthe other factors discussed above.
Year Ended December 31, 2000 Compared WithYear Ended December 31, 1999
Sales
Sales in 2000 increased $827.1 million, or 94.2%, over1999 sales. Of this total increase in sales approximately67.3% was attributable to the acquisition of AVEX,approximately 2.8% was attributable to the operation ofthe systems integration facility in Huntsville, approxi-mately 1.1% was attributable to the operation of thesystems integration facility in Dublin, Ireland, approxi-mately 0.4% was attributable to the acquisition of theManassas operation, and approximately 28.4% resultedfrom ramping up of new programs and increase in salesvolume from both existing and new customers.
Our facilities in the Americas provided 84.1% and80.9% of net sales, respectively, during 2000 and 1999.Our facilities in Europe provided 13.8% and 17.6% of netsales, respectively, during 2000 and 1999. Our facilitiesin Asia provided 2.1% and 1.5% of our net sales, respec-tively, during 2000 and 1999.
A substantial percentage of our sales have been toa small number of customers, and the loss of a majorcustomer, if not replaced, would adversely affect us.During 2000, our three largest customers accounted forapproximately 34.2% of our sales, and our largestcustomer accounted for approximately 15.9% of sales.
After giving effect to the AVEX acquisition, wewould have derived 46% of our pro forma combined
17
sales in fiscal year 1999 from our international opera-tions. During 2000, 28.5% of our sales were from ourinternational operations. The decrease in the percentageof international sales on an actual basis for 2000 ascompared to the pro forma basis for 1999 reflects the saleof the Swedish operations and the loss of two of AVEX’scustomers. The loss of one of these customers, as well asthe deterioration in other customer relationships, includ-ing the major customer of the former Swedish operations,are the subject of litigation between Huber and us.
We had a record year-end backlog of approxi-mately $1.6 billion at December 31, 2000, as comparedto the 1999 year-end backlog of $1.0 billion.
AmericasOf the Americas sales growth of approximately $723.0million in fiscal 2000, approximately 70.5% was due tothe acquisition of AVEX, approximately 3.2% wasattributable to the operation of the systems integrationfacility in Huntsville, Alabama, approximately 0.5% wasattributable to the acquisition of the Manassas, Virginiafacility and approximately 25.8% resulted from demandincreases from existing and new customers.
EuropeOf the sales growth in Europe of approximately $80.8million in fiscal 2000, approximately 29.6% was due tothe acquisition of AVEX, approximately 11.6% was dueto the systems integration facility revenues in Dublin,Ireland and approximately 58.8% resulted from demandincreases from existing and new customers. The 1999Dublin, Ireland revenues were positively impacted bysignificant backlog fulfillment during that period result-ing from a period of customer transition. Dublin’s salesduring the remainder of 1999 and 2000 have returned tonormalized run rates.
In connection with the AVEX acquisition, weacquired operations in Sweden. On September 15, 2000,we closed the previously announced sale of our Swedishoperations for $19.6 million. The Swedish operationsaccounted for 3.7% and 3.0% of our sales and 14.4% and16.0% of our operating income for the years endedDecember 31, 2000 and 1999, respectively. On a proforma basis, after giving effect to the disposition of theSwedish operations as if it had occurred on January 1,2000, our income before income taxes and extraordinary
item for the year ended December 31, 2000 would havebeen $21.7 million. On a pro forma basis, after givingeffect to the AVEX acquisition, the Swedish operationsaccounted for 3.0% of our 1999 sales and 96.7% of our1999 operating income.
AsiaOur Singapore sales growth in fiscal 2000 was approxi-mately $23.3 million generated from the acquired AVEXfacility. The new Singapore systems integration facilitybegan sales contribution in January 2001.
Gross Profit
Gross profit increased $56.6 million, or 83.8%, over1999. Gross profit as a percentage of sales decreasedfrom 7.7% for 1999 to 7.3% for 2000 primarily due tolower gross margins at AVEX than at our other opera-tions. The increase in gross profit was due primarily tohigher sales volumes attributable to the AVEX acquisi-tion, the operations of the new systems integrationfacilities in Dublin, Ireland and Huntsville, Alabama anda shift in mix to customer programs with higher grossmargins. The decrease in gross profit as a percentage ofsales during 2000 was attributable primarily to theinclusion of AVEX in the results of operations during2000 for the full year, whereas during 1999, the AVEXoperations were included beginning on August 24, 1999,the date of acquisition. Historically, the AVEX opera-tions have had lower gross margin levels. Additionally,other factors impacting our gross margin for 2000 includethe level of start-up costs and inefficiencies associatedwith new programs, product mix, overall improvedcapacity utilization of surface mount and other equip-ment, and pricing within the electronics industry. Thecombined effect of these factors, which are continuallychanging and are interrelated, make it impracticable todetermine with precision the separate effect of eachfactor.
18
Selling, General and Administrative Expenses
Selling, general and administrative expenses for 2000increased $25.4 million, or 78.2% from 1999 to $57.8million in 2000. The increase in selling, general andadministrative expenses for 2000 is primarily the result ofthe acquisition of AVEX. For the period beginningJanuary 1 and ending August 24, 1999, prior to ouracquisition of AVEX, AVEX recorded $33.3 million ofselling, general and administrative expenses. Addition-ally, the increase reflects the investment in personnel andthe incurrence of related corporate and administrativeexpenses necessary to support the increased size andcomplexity of our business.
The charges to operations for bad debt allowanceand inventory obsolescence were $0.9 million and $3.7million in 2000, respectively, as compared to $0.3million and $1.9 million in 1999, respectively.
Goodwill
Goodwill is amortized on a straight-line basis over anestimated life of 15 years. The amortization of goodwillfor the years ended December 31, 2000 and 1999 was$12.8 million and $6.4 million, respectively. The increasewas due to the acquisition of AVEX on August 24, 1999.See Note 2 to the Consolidated Financial Statements.
Interest Expense
Interest expense was approximately $24.4 million and$9.7 million, respectively, in 2000 and 1999. Theincrease was due to the additional debt incurred inconnection with the acquisition of AVEX on August 24,1999. See Note 6 to the Consolidated Financial State-ments.
Interest Income
Interest income was approximately $0.8 million in 2000compared to $0.6 million in 1999.
Income Tax Expense
Income tax expense of $8.5 million represented aneffective tax rate of 30.0% for the year ended December31, 2000, compared with an effective tax rate of 34.5%for the year ended December 31, 1999. The decrease isdue primarily to lower foreign tax rates applicable to aportion of pretax income in 2000 and a 2.4% benefitrelated to prior years’ amended U.S. tax returns filed in2000, partially offset by nondeductible amortization ofgoodwill. See Note 9 to the Consolidated FinancialStatements.
Net Income
We reported net income of approximately $19.9 million,or diluted earnings of $1.06 per share, for 2000 comparedwith net income of approximately $12.0 million, ordiluted earnings of $0.80 per share for 1999. The ap-proximately $7.9 million net increase in net incomeduring 2000 was a result of the combined effects of theacquisition of AVEX, the $1.3 million (net of income taxbenefit of $0.7 million) extraordinary loss on extinguish-ment of debt in 1999 and the increase in interest expense.
LIQUIDITY AND CAPITAL RESOURCES
We have financed our growth and operations throughfunds generated from operations, proceeds from the saleof our securities and funds borrowed under our creditfacilities.
Cash provided by (used in) operating activities was$170.3 million, $(47.0) million and $69.9 million in2001, 2000 and 1999, respectively. In 2001, significantdecreases in accounts receivable and inventories werepartially offset by decreases in accounts payable. Ouraccounts receivables and inventories at December 31,2001 decreased $95.8 million and $145.4 million,respectively, over their levels at December 31, 2000,reflecting our decreased backlog, caused by reduceddemand for our customers’ products, and effectiveworking capital management during 2001. In 2000,significant increases in accounts receivable and invento-ries, net of effects from the acquisition of the Manassasfacility, were partially offset by increases in accountspayable, depreciation and amortization. Our accountsreceivables and inventories at December 31, 2000
19
increased $81.3 million and $132.4 million, respectively,over their levels at December 31, 1999, reflecting ourincreased sales and backlog during 2000. In 1999,significant decreases in accounts receivable, net of effectsfrom the acquisition of AVEX, increases in accountspayable, and increases in depreciation and amortizationwere partially offset by increases in inventories anddecreases in accrued liabilities, net of effects from theacquisition of AVEX. Our inventories increased from$53.7 million at December 31, 1998 to $214.6 million atDecember 31, 1999, reflecting the acquisitions of AVEXand certain assets from Stratus during 1999 and increasedsales and backlog during this period. We expect increasesin inventories to support the anticipated growth in sales.We are continuing the practice of purchasing componentsonly after customer orders are received, which mitigates,but does not eliminate the risk of loss on inventories.During 2001 and 2000, our gross profit was adverselyeffected by the writedown of $7.6 million and $3.7million, respectively, in excess and obsolete inventorythat could not be put back to vendors or customers.Supplies of electronic components and other materialsused in operations are subject to industry-wide shortages.In certain instances, suppliers may allocate availablequantities to us.
Cash used in investing activities was $20.8 million,$85.5 million and $333.8 million, respectively, for theyears ended December 31, 2001, 2000 and 1999. Capitalexpenditures of $17.6 million and $48.0 million during2001 and 2000, respectively were primarily concentratedin test and manufacturing production equipment. Capitalexpenditures of $23.8 million during 1999 consistedprimarily of test and computer equipment. During 2001,2000 and 1999, we invested $3.5 million, $0.6 millionand $2.5 million, respectively, on new software. Pursuantto the terms of the purchase agreement in connectionwith the AVEX acquisition, the working capital adjust-ment was settled in the second quarter of 2000 and $35.3million was paid to Huber. The final working capitaladjustment was $2.0 million greater than the currentliability we had recorded at December 31, 1999 as anestimate of the working capital adjustment. We recordedthe $2.0 million as an increase in goodwill during thequarter ended June 30, 2000. On October 2, 2000, weacquired substantially all of the assets and properties, net
of assumed liabilities, of the Manassas facility for $3.5million in cash. On August 24, 1999, we completed theAVEX acquisition with $265.3 million paid in cash atclosing. On March 1, 1999, we completed the purchase ofinventories and equipment from Stratus for $42.3 millionin cash. See Note 2 of Notes to Consolidated FinancialStatements.
Cash provided by (used in) financing activities was$(112.2) million, $147.1 million and $249.8 million,respectively, for the years ended December 31, 2001,2000 and 1999. During 2001, we decreased borrowingsoutstanding under our revolving line of credit by $93.5million (net) and made principal payments on otherlong-term debt of $20.3 million. On August 14, 2000, wecompleted the public offering of 3,162,500 shares of ourcommon stock for net proceeds of $113.3 million. Weused such proceeds to temporarily repay indebtednessoutstanding under our revolving credit facility. During2000, we increased borrowings outstanding under ourrevolving line of credit by $52.0 million (net) and madeprincipal payments on other long-term debt totaling $19.7million. In August 1999 in connection with the AVEXacquisition, we borrowed $100 million under a term loan,$76 million under a revolving credit facility and issued$80.2 million principal amount of 6% ConvertibleSubordinated Notes. In connection with the purchase ofthe assets from Stratus on March 1, 1999, we borrowed$25 million under a revolving credit facility. In June1999, we completed a public offering of 3,525,000 sharesof its common stock and used a portion of the netproceeds of $93.7 million to repay borrowings under ourbank credit facilities. Principal payments on other long-term debt and debt issuance costs totaled $58.4 millionand $6.4 million, respectively, during 1999.
Principal on the term loan is payable in quarterlyinstallments of $5 million and $5.5 million during 2002and 2003, respectively. The final three installments of $7million are due on the last day of March, June andSeptember 2004.
We have a $175 million revolving line of creditfacility with a commercial bank. We are entitled toborrow under the revolving credit facility up to the lesserof $175 million or the sum of 75% of our eligibleaccounts receivable, 45% of our eligible inventories and
20
50% of our eligible fixed assets. Interest on the revolvingcredit facility is payable quarterly, at our option, at eitherthe bank’s Eurodollar rate plus 1.25% to 3.00% or itsprime rate plus 0.00% to 1.75%, based upon our debtratio as specified in the agreement. A commitment feeof 0.375% to 0.500% per annum on the unused portionof the revolving credit facility is payable quarterly inarrears. The revolving credit facility matures on Septem-ber 30, 2004. As of December 31, 2001, we had noborrowings outstanding under the revolving creditfacility, $0.4 million outstanding letters of credit and$174.6 million was available for future borrowings.
The term loan and the revolving credit facility aresecured by our domestic inventory and accounts receiv-able, 100% of the stock of our domestic subsidiaries, and65% of the voting capital stock of each direct foreignsubsidiary and substantially all of our and our domesticsubsidiaries’ other tangible and intangible assets. Theterm loan and revolving credit facility contain customaryfinancial covenants as to working capital, interestcoverage, debt leverage, fixed charges, and consolidatednet worth, and restricts our ability to incur additionaldebt, pay dividends, sell assets and to merge or consoli-date with other persons without the consent of the bank.At December 31, 2001, we were in compliance with allsuch restrictions.
We have outstanding $80.2 million principalamount of 6% Convertible Subordinated Notes. Theindenture relating to the notes contains affirmative andnegative covenants, including covenants restricting ourability to merge or engage in certain other extraordinarycorporate transactions unless certain conditions aresatisfied. Upon the occurrence of a change of control(as defined in the indenture relating to the notes) of ourcompany, each holder of notes will have the right torequire us to repurchase all or part of the holder’s notesat 100% of the face amount thereof, plus accrued andunpaid interest. The notes are convertible into shares ofour common stock at an initial conversion price of $40.20per share at the option of the holder at any time prior tomaturity, unless previously redeemed or repurchased.
Our operations, and the operations of businesses weacquire, are subject to certain foreign, federal, state andlocal regulatory requirements relating to environmental,waste management, health and safety matters. We believe
we operate in substantial compliance with all applicablerequirements and we seek to ensure that newly acquiredbusinesses comply or will comply substantially withapplicable requirements. To date the costs of complianceand workplace and environmental remediation have notbeen material to us. However, material costs and liabili-ties may arise from these requirements or from new,modified or more stringent requirements in the future. Inaddition, our past, current and future operations, and theoperations of businesses we have or may acquire, maygive rise to claims of exposure by employees or thepublic, or to other claims or liabilities relating to environ-mental, waste management or health and safety concerns.
Our acquisitions in 1999 have significantlyincreased our leverage ratio and decreased our interestcoverage ratio. At December 31, 2001, our debt to totalcapitalization ratio was 30%, as compared to 39% atDecember 31, 2000, 44% at December 31, 1999 and 11%at June 30, 1999, the last fiscal quarter end prior to theAVEX acquisition. The level of indebtedness, amongother things, could make it difficult for us to obtain anynecessary financing in the future for other acquisitions,working capital, capital expenditures, debt servicerequirements and other expenses; limit our flexibility inplanning for, or reacting to changes in, our business; andmake us more vulnerable in the event of an economicdownturn in our business.
Management believes our existing cash balances,funds generated from operations and available fundsunder our revolving credit facility will be sufficient topermit us to meet our liquidity requirements for the next9-12 months.
We may require additional capital to finance furtherenhancements to or acquisitions or expansions of ourmanufacturing capacity. Management believes that thelevel of working capital will grow at a rate generallyconsistent with the growth of our operations. Manage-ment continually evaluates potential strategic acquisitionsand investments, but at the present time, we have nounderstandings, commitments or agreements with respectto any such acquisition or investment. Although noassurance can be given that future financing will beavailable on terms acceptable to us, we may seek addi-tional funds from time to time through public or privatedebt or equity offerings or through bank borrowings tothe extent permitted by our existing debt agreements.
21
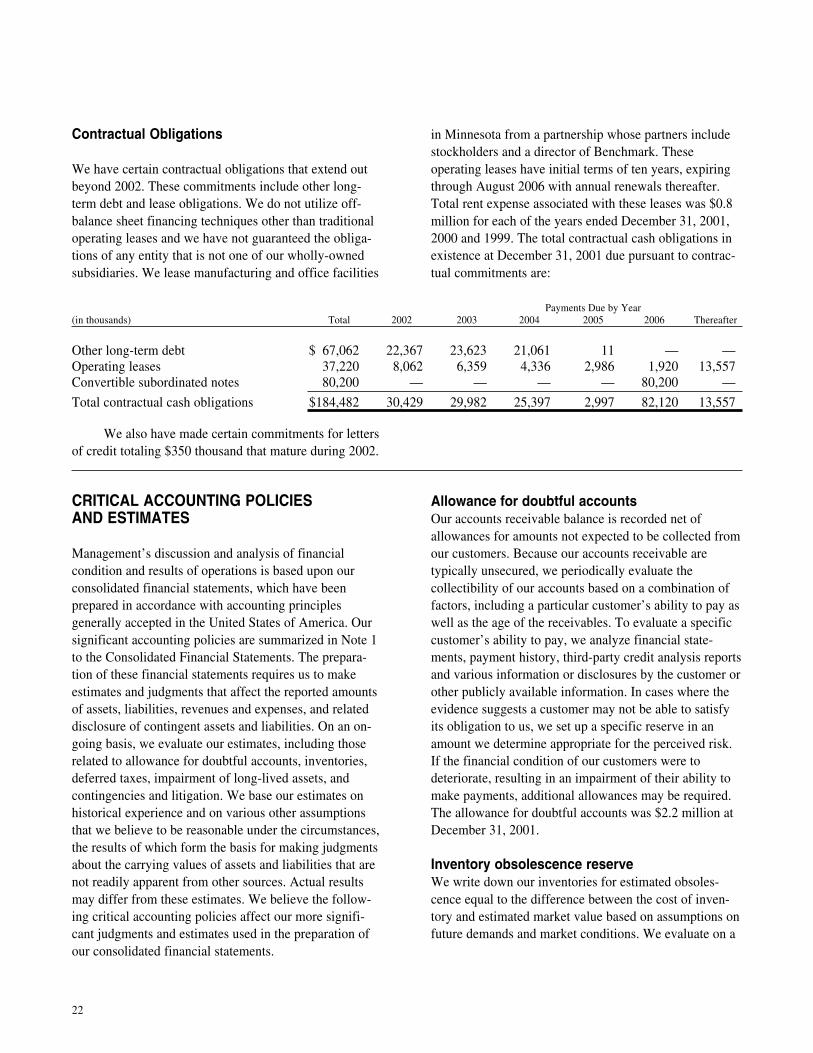
Contractual Obligations
We have certain contractual obligations that extend outbeyond 2002. These commitments include other long-term debt and lease obligations. We do not utilize off-balance sheet financing techniques other than traditionaloperating leases and we have not guaranteed the obliga-tions of any entity that is not one of our wholly-ownedsubsidiaries. We lease manufacturing and office facilities
Payments Due by Year(in thousands) Total 2002 2003 2004 2005 2006 Thereafter
Other long-term debt $ 67,062 22,367 23,623 21,061 11 — —Operating leases 37,220 8,062 6,359 4,336 2,986 1,920 13,557Convertible subordinated notes 80,200 — — — — 80,200 —
Total contractual cash obligations $184,482 30,429 29,982 25,397 2,997 82,120 13,557
We also have made certain commitments for lettersof credit totaling $350 thousand that mature during 2002.
in Minnesota from a partnership whose partners includestockholders and a director of Benchmark. Theseoperating leases have initial terms of ten years, expiringthrough August 2006 with annual renewals thereafter.Total rent expense associated with these leases was $0.8million for each of the years ended December 31, 2001,2000 and 1999. The total contractual cash obligations inexistence at December 31, 2001 due pursuant to contrac-tual commitments are:
CRITICAL ACCOUNTING POLICIESAND ESTIMATES
Management’s discussion and analysis of financialcondition and results of operations is based upon ourconsolidated financial statements, which have beenprepared in accordance with accounting principlesgenerally accepted in the United States of America. Oursignificant accounting policies are summarized in Note 1to the Consolidated Financial Statements. The prepara-tion of these financial statements requires us to makeestimates and judgments that affect the reported amountsof assets, liabilities, revenues and expenses, and relateddisclosure of contingent assets and liabilities. On an on-going basis, we evaluate our estimates, including thoserelated to allowance for doubtful accounts, inventories,deferred taxes, impairment of long-lived assets, andcontingencies and litigation. We base our estimates onhistorical experience and on various other assumptionsthat we believe to be reasonable under the circumstances,the results of which form the basis for making judgmentsabout the carrying values of assets and liabilities that arenot readily apparent from other sources. Actual resultsmay differ from these estimates. We believe the follow-ing critical accounting policies affect our more signifi-cant judgments and estimates used in the preparation ofour consolidated financial statements.
Allowance for doubtful accountsOur accounts receivable balance is recorded net ofallowances for amounts not expected to be collected fromour customers. Because our accounts receivable aretypically unsecured, we periodically evaluate thecollectibility of our accounts based on a combination offactors, including a particular customer’s ability to pay aswell as the age of the receivables. To evaluate a specificcustomer’s ability to pay, we analyze financial state-ments, payment history, third-party credit analysis reportsand various information or disclosures by the customer orother publicly available information. In cases where theevidence suggests a customer may not be able to satisfyits obligation to us, we set up a specific reserve in anamount we determine appropriate for the perceived risk.If the financial condition of our customers were todeteriorate, resulting in an impairment of their ability tomake payments, additional allowances may be required.The allowance for doubtful accounts was $2.2 million atDecember 31, 2001.
Inventory obsolescence reserveWe write down our inventories for estimated obsoles-cence equal to the difference between the cost of inven-tory and estimated market value based on assumptions onfuture demands and market conditions. We evaluate on a
22
quarterly basis the status of our inventory to ensure theamount recorded in our financial statements reflects thelower of our cost or the value we expect to receive whenwe sell the inventory. The allowance for excess andobsolete inventory was $9.0 million at December 31,2001. If actual market conditions are less favorable thanthose we projected, additional inventory write downsmay be required.
Deferred TaxesWe record a valuation allowance to reduce our deferredtax assets to the amount that is more likely than not to berealized. While we have considered future taxableincome and ongoing prudent and feasible tax planningstrategies in assessing the need for the valuation allow-ance, in the event we were to subsequently determine thatwe would be able to realize our deferred tax assets in thefuture in excess of our net recorded amount, an adjust-ment to the deferred tax asset would increase income inthe period such determination was made. Similarly,should we determine that we would not be able to realizeall or part of our net deferred tax asset in the future, anadjustment to the deferred tax asset would reduce incomein the period such determination was made.
Impairment of Long-Lived AssetsWe assess the impairment of our identifiable intangibles,long-lived assets and related goodwill whenever eventsor changes in circumstances indicate that the carryingvalue may not be recoverable. Factors consideredimportant which could trigger an impairment reviewinclude significant underperformance relative to expectedhistorical or projected future operating results, significantchanges in the manner of our use of the acquired assets orthe strategy for the overall business, significant negativeindustry or economic trends, and our market capitaliza-tion relative to net book value. When it is determined thatthe carrying value of intangibles, long-lived assets andrelated goodwill may not be recoverable based upon theexistence of one or more of the above indicators ofimpairment, the measurement of any impairment isdetermined and the carrying value is reduced as appropri-ate. As of December 31, 2001, we had net goodwill ofapproximately $119.2 million.
RISK FACTORS
We are exposed to general economic conditions,which could have a material adverse impact on ourbusiness, operating results and financial condition.
As a result of recent unfavorable economic conditionsand a decline in demand by the electronics industry, oursales declined 25% during 2001. We started to see salesdecline in the technology sector worldwide at the end ofthe first quarter of 2001 and it continued throughout2001. If the economic conditions and demand for ourcustomers’ products do not improve, we may experiencea material adverse impact on our business, operatingresults and financial condition.
The loss of a major customer would adversely affect us.
A substantial percentage of our sales have been to a smallnumber of customers, and the loss of a major customer, ifnot replaced, would adversely affect us. During 2001, ourthree largest customers accounted for approximately44.9% of our sales, and our largest customer accountedfor approximately 21.9% of sales. Our future sales aredependent on the success of our customers, some ofwhich operate in businesses associated with rapidtechnological change and consequent product obsoles-cence. Developments adverse to our major customers ortheir products, or the failure of a major customer to payfor components or services, could have an adverse effecton us.
We expect to continue to depend on the sales fromour largest customers and any material delay, cancella-tion or reduction of orders from these or other significantcustomers would have a material adverse effect on ourresults of operations. In addition, we generate significantaccounts receivable in connection with providingmanufacturing services to our customers. If one or moreof our customers were to become insolvent or otherwiseunable to pay for the manufacturing services provided byus, our operating results and financial condition would beadversely affected.
23
We may encounter significant delays or defaults inpayments owed to us by customers for products wehave manufactured or components that are unique toparticular customers.
We structure our agreements with customers to mitigateour risks related to obsolete or unsold inventory. How-ever, enforcement of these contracts may result inmaterial expense and delay in payment for inventory. Ifany of our significant customers become unable orunwilling to purchase such inventory, our business maybe materially harmed. During 2001 and 2000, our grossprofit was adversely affected by the write down of $7.6million and $3.7 million, respectively, in excess andobsolete inventory that could not be put back to vendorsor customers.
We are dependent on the success of our customers
We are dependent on the continued growth, viability andfinancial stability of our customers. Our customers areoriginal equipment manufacturers of:
• telecommunication equipment;• computers and related products for business
enterprises;• industrial control equipment;• medical devices;• video/audio/entertainment products; and• testing and instrumentation products.
These industries are, to a varying extent, subject torapid technological change, vigorous competition andshort product life cycles. When our customers areadversely affected by these factors, we may be similarlyaffected. Recently, our customers have experienced adecline in demand for their products, which has had anadverse effect on our results of operations.
Long-term contracts are unusual in our business andcancellations, reductions or delays in customerorders would affect our profitability.
We do not typically obtain firm long-term purchaseorders or commitments from our customers. Instead, wework closely with our customers to develop forecasts for
future orders, which are not binding. Customers maycancel their orders, change production quantities fromforecast volumes or delay production for a number ofreasons beyond our control. Cancellations, reductions ordelays by a significant customer or by a group of custom-ers would have an adverse effect on us. As many of ourcosts and operating expenses are relatively fixed, areduction in customer demand can disproportionatelyaffect our gross margins and operating income. Ourcustomers’ products have life cycles of varying duration.In the ordinary course of business, production starts,increases, declines and stops in accordance with aproduct’s life cycle. Should we fail to replace productsreaching the end of their life cycles with new programs,or if there should be a substantial time differencebetween the loss of a product and the receipt of revenuefrom replacement production, our revenues could beadversely affected.
We operate in a highly competitive industry.
We compete against many providers of electronicsmanufacturing services. Certain of our competitors havesubstantially greater resources and more geographicallydiversified international operations than we do. Ourcompetitors include large independent manufacturerssuch as Celestica, Inc., Flextronics International Ltd.,Jabil Circuit, Inc, Sanmina-SCI Corporation andSolectron Corporation. We also face competition fromthe manufacturing operations of our current and futurecustomers.
During periods of recession in the electronicsindustry, our competitive advantages in the areas of quickturnaround manufacturing and responsive customerservice may be of reduced importance to electronicsOEMs, who may become more price sensitive. We mayalso be at a competitive disadvantage with respect toprice when compared to manufacturers with lower coststructures, particularly those with offshore facilitieslocated where labor and other costs are lower.
We will experience intense competition, which isexpected to intensify further as more companies entermarkets in which we operate, as existing competitorsexpand capacity and as the industry consolidates. Tocompete effectively, we must continue to provide
24
technologically advanced manufacturing services,maintain strict quality standards, respond flexibly andrapidly to customers’ design and schedule changes anddeliver products globally on a reliable basis at competi-tive prices. Our inability to do so could have an adverseeffect on us.
We may be affected by consolidation in the electron-ics industry.
As a result of the current economic climate, consolidationin the electronics industry may increase. Consolidation inthe electronics industry could result in an increase inexcess manufacturing capacity as companies seek toclose plants or take other steps to increase efficienciesand realize synergies of mergers. The availability ofexcess manufacturing capacity could create increasedpricing and competitive pressures for the electronicsmanufacturing services industry as a whole and Bench-mark in particular. In addition, consolidation could alsoresult in an increasing number of very large electronicscompanies offering products in multiple sectors of theelectronics industry. The growth of these large compa-nies, with significant purchasing power and marketpower, could also result in increased pricing and com-petitive pressures for us. Accordingly, industry consoli-dation could harm our business.
Our international operations may be subject tocertain risks.
We currently operate outside the United States in Brazil,Ireland, Mexico, Scotland, and Singapore. During 2001and 2000, 23.3% and 28.5% of our sales were from ourinternational operations. These international operationsmay be subject to a number of risks, including:
• difficulties in staffing and managing foreignoperations;
• political and economic instability;• unexpected changes in regulatory requirements
and laws;
• longer customer payment cycles and difficultycollecting accounts receivable;
• export duties, import controls and trade barriers(including quotas);
• governmental restrictions on the transfer of funds;• burdens of complying with a wide variety of foreign
laws and labor practices;• fluctuations in currency exchange rates, which could
affect component costs, local payroll, utility and otherexpenses; and
• inability to utilize net operating losses incurred by ourforeign operations to reduce our U.S. income taxes.
We cannot assure you that our internationaloperations will contribute positively to our business,financial conditions or results of operations.
We do not use derivative financial instruments forspeculative purposes. Our policy is to maintain a hedgedposition for certain significant transaction exposures.These exposures are primarily, but not limited to, vendorpayments and inter-company balances in currencies otherthan the functional currency of the operating entity. Ourinternational operations in some instances operate in anatural hedge because both operating expenses and aportion of sales are denominated in local currency.Certain significant transactions involving our interna-tional operations may now require us to engage inhedging transactions to attempt to mitigate our exposureto fluctuations in foreign exchange rates. Effective Jan. 1,2001, we adopted the provisions of the Financial Ac-counting Standards Board’s (FASB) Statement ofFinancial Accounting Standards (SFAS) No. 133,“Accounting for Derivative Instruments and CertainHedging Activities” and SFAS No. 138, “Accounting forDerivative Instruments and Certain Hedging Activities,an Amendment of SFAS 133”. Note 1 to the consolidatedFinancial Statements describes and quantifies ouradoption of SFAS No. 133 and 138.
25
Shortages or price increases of components speci-fied by our customers would delay shipments andadversely affect our profitability.
Substantially all of our sales are derived from electronicsmanufacturing services in which we purchase compo-nents specified by our customers. In the past, supplyshortages have substantially curtailed production of allassemblies using a particular component. In addition,industry-wide shortages of electronic components,particularly of memory and logic devices, have occurred.If shortages of these components occur or if componentsreceived are defective, we may be forced to delayshipments, which could have an adverse effect on ourprofit margins. Because of the continued increase indemand for surface mount components, we anticipatecomponent shortages and longer lead times for certaincomponents to occur from time to time. Also, wetypically bear the risk of component price increases thatoccur between periodic repricings during the term of acustomer contract. Accordingly, certain component priceincreases could adversely affect our gross profit margins.
Our success will continue to depend to a significantextent on our executives.
We depend significantly on certain key executives,including, but not limited to, Donald E. Nigbor, StevenA. Barton, Cary T. Fu and Gayla J. Delly. The unex-pected loss of the services of any one of these executiveofficers would have an adverse effect on us.
We must successfully integrate the operations ofacquired companies to maintain profitability.
We have completed five acquisitions since July 1996.We may pursue additional acquisitions over time. Theseacquisitions involve risks, including:
• integration and management of the operations;• retention of key personnel;• integration of purchasing operations and information
systems;• retention of the customer base of acquired businesses;• management of an increasingly larger and more
geographically disparate business; and• diversion of management’s attention from other
ongoing business concerns.
Our profitability will suffer if we are unable tosuccessfully integrate and manage any future acquisitionsthat we might pursue, or if we do not achieve sufficientrevenue to offset the increased expenses associated withthese acquisitions.
We must maintain our technological and manufactur-ing process expertise.
The market for our manufacturing services is character-ized by rapidly changing technology and continuingprocess development. We are continually evaluating theadvantages and feasibility of new manufacturing pro-cesses. We believe that our future success will dependupon our ability to develop and provide manufacturingservices which meet our customers’ changing needs. Thisrequires that we maintain technological leadership andsuccessfully anticipate or respond to technologicalchanges in manufacturing processes on a cost-effectiveand timely basis. We cannot assure you that our processdevelopment efforts will be successful.
Environmental laws may expose us to financialliability and restrictions on operations.
We are subject to a variety of federal, state, local andforeign environmental laws and regulations relating toenvironmental, waste management, and health and safetyconcerns, including the handling, storage, discharge anddisposal of hazardous materials used in or derived fromour manufacturing processes. If we or companies weacquire have failed or fail in the future to comply withsuch laws and regulations, then we could incur liabilitiesand fines and our operations could be suspended. Suchlaws and regulations could also restrict our ability tomodify or expand our facilities, could require us toacquire costly equipment, or could impose other signifi-cant expenditures. In addition, our operations may giverise to claims of property contamination or humanexposure to hazardous chemicals or conditions.
26
Our acquisitions have significantly increased ourleverage.
Our acquisitions in 1999 have significantly increased ourleverage ratio and decreased our interest coverage ratio.At December 31, 2001, our debt to total capitalizationratio was 30%, as compared to 39% at December 31,2000, 44% at December 31, 1999 and 11% at June 30,1999, the last fiscal quarter end prior to the AVEXacquisition. The level of our indebtedness, among otherthings, could:
• make it difficult for us to obtain any necessaryfinancing in the future for other acquisitions, workingcapital, capital expenditures, debt service requirementsor other purposes;
• limit our flexibility in planning for, or reacting tochanges in, our business; and
• make us more vulnerable in the event of a downturn inour business.
There can be no assurance that we will be able tomeet our debt service obligations.
Provisions in our charter documents and state lawmay make it harder for others to obtain control ofBenchmark even though some shareholders mightconsider such a development to be favorable.
Our shareholder rights plan, provisions of our amendedand restated articles of incorporation and the TexasBusiness Corporation Act may delay, inhibit or preventsomeone from gaining control of Benchmark through atender offer, business combination, proxy contest orsome other method. These provisions include:
• a “poison pill” shareholder rights plan;• a statutory restriction on the ability of shareholders to
take action by less than unanimous written consent;and
• a statutory restriction on business combinations withsome types of interested shareholders.
We may experience fluctuations in quarterly results.
Our quarterly results may vary significantly dependingon various factors, many of which are beyond ourcontrol. These factors include:
• the volume of customer orders relative to ourcapacity;
• customer introduction and market acceptance ofnew products;
• changes in demand for customer products;• the timing of our expenditures in anticipation of future
orders;• our effectiveness in managing manufacturing
processes;• changes in cost and availability of labor and
components;• changes in our product mix;• changes in economic conditions; and• local factors and events that may affect our production
volume, such as local holidays.
Additionally, as is the case with many hightechnology companies, a significant portion of ourshipments typically occurs in the last few weeks of aquarter. As a result, our sales may shift from one quarterto the next, having a significant effect on reported results.
Our stock price is volatile.
Our common stock has experienced significant pricevolatility, and such volatility may continue in the future.The price of our common stock could fluctuate widely inresponse to a range of factors, including variations in ourreported financial results and changing conditions in theeconomy in general or in our industry in particular. Inaddition, stock markets generally experience significantprice and volume volatility from time to time which mayaffect the market price of our common stock for reasonsunrelated to our performance.
27
Fair Value atExpected Year of Maturity ($ in ’000’s) December 31,
Debt 2001 2002 2003 2004 Thereafter Total 2000
Convertible subordinated notes — — — — $80,200 $80,200 $70,408Fixed interest rate 6.00% 6.00% 6.00% 6.00% 6.00%
Variable rate term loan $18,000 $20,000 $22,000 $21,000 — $81,000 $81,000Average interest rate 9.47% 9.47% 9.47% 9.47% —
Variable rate revolving credit facility — — — $93,500 — $93,500 $93,500Average interest rate 11.00% 11.00% 11.00% 11.00% —
Interest Rate Derivative Financial Instruments Related to DebtInterest rate swapPay fixed/receive variable $9,000 $10,000 $21,500 — — $40,500 $(667)Average pay rate 9.38% 9.38% 9.38% — —Average receive rate 9.19% 9.19% 9.19% — —
Fair Value atExpected Year of Maturity ($ in ’000’s) December 31,
Debt 2002 2003 2004 2005 2006 Total 2001
Convertible subordinated notes — — — — $80,200 $80,200 $64,361Fixed interest rate 6.00% 6.00% 6.00% 6.00% 6.00%
Variable rate term loan $20,000 $22,000 $21,000 — — $63,000 $63,000Average interest rate 4.03% 4.03% 4.03% — —
Interest Rate Derivative Financial Instruments Related to DebtInterest rate swapPay fixed/receive variable $10,000 $21,500 — — — $31,500 $(1,556)Average pay rate 8.26% 8.26% — — —Average receive rate 3.94% 3.94% — — —
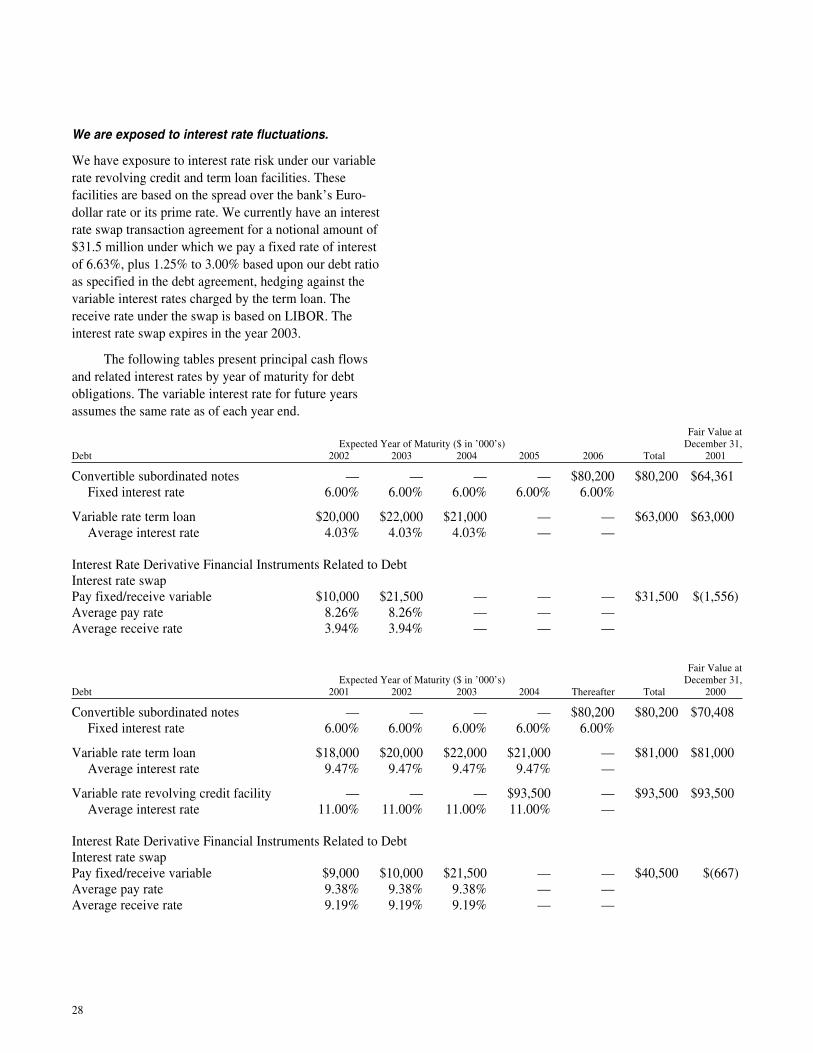
We are exposed to interest rate fluctuations.
We have exposure to interest rate risk under our variablerate revolving credit and term loan facilities. Thesefacilities are based on the spread over the bank’s Euro-dollar rate or its prime rate. We currently have an interestrate swap transaction agreement for a notional amount of$31.5 million under which we pay a fixed rate of interestof 6.63%, plus 1.25% to 3.00% based upon our debt ratioas specified in the debt agreement, hedging against thevariable interest rates charged by the term loan. Thereceive rate under the swap is based on LIBOR. Theinterest rate swap expires in the year 2003.
The following tables present principal cash flowsand related interest rates by year of maturity for debtobligations. The variable interest rate for future yearsassumes the same rate as of each year end.
28
We are involved in legal proceedings related to classaction lawsuits, the Avex acquisition and a patentinfringement lawsuit. An unfavorable decision in anyof these proceedings could have a material adverseeffect on us.
On October 18, 1999, we announced that our thirdquarter 1999 earnings announcement would be delayedand subsequently, on October 22, we announced ourearnings for the third quarter 1999 were below the levelof the same periods during 1998 and were below expecta-tions. Several class action lawsuits were filed in federaldistrict court in Houston, Texas against Benchmark andtwo of its officers and directors alleging violations of thefederal securities laws. These lawsuits were consolidatedin February 2000. The lawsuits seek to recover unspeci-fied damages. We deny the allegations in the lawsuits,however, and further deny that such allegations provide abasis for recovery of damages as we believe that we havemade all required disclosures on a timely basis. Manage-ment is vigorously defending against these actions.
Benchmark filed suit against J. M. Huber Corpora-tion (Seller) in the United States District Court for theSouthern District of Texas for breach of contract, fraudand negligent misrepresentation on December 14, 1999and is seeking an unspecified amount of damages inconnection with the contract between Benchmark andSeller pursuant to which Benchmark acquired all of thestock of AVEX and Kilbride Holdings B.V. On January5, 2000, Seller filed suit in the United States DistrictCourt for the Southern District of New York alleging thatBenchmark failed to comply with certain obligationsunder the contract requiring Benchmark to register sharesof its common stock issued to Seller as partial consider-ation for the acquisition. Seller’s suit has been consoli-dated with Benchmark’s suit in the United States DistrictCourt for the Southern District of Texas. Benchmarkintends to vigorously pursue its claims against Seller anddefend against Seller’s allegations.
On April 14, 2000, Benchmark, along with numer-ous other companies, was named as a defendant in alawsuit filed in the United States District Court for theDistrict of Arizona by the Lemelson Medical, Education& Research Foundation (the Foundation). The lawsuitalleges that Benchmark has infringed certain of theFoundation’s patents relating to machine vision and barcode technology utilized in machines Benchmark haspurchased. On November 2, 2000, Benchmark filed anAnswer, Affirmative Defenses, and a Motion to Staybased upon Declaratory Judgement Actions filed byCognex and Symbol, manufacturers of the equipment atissue. On March 29, 2001, the Court granted the defen-dants’ Motion to Stay and ordered that the lawsuit bestayed pending the entry of a final non-appealablejudgment in the cases filed by Cognex and Symbol. Wecontinue to explore any indemnity or similar rightsBenchmark may have against manufacturers of themachines or other third parties. Management intends tovigorously defend against such claim and pursue allrights it has against third parties.
29
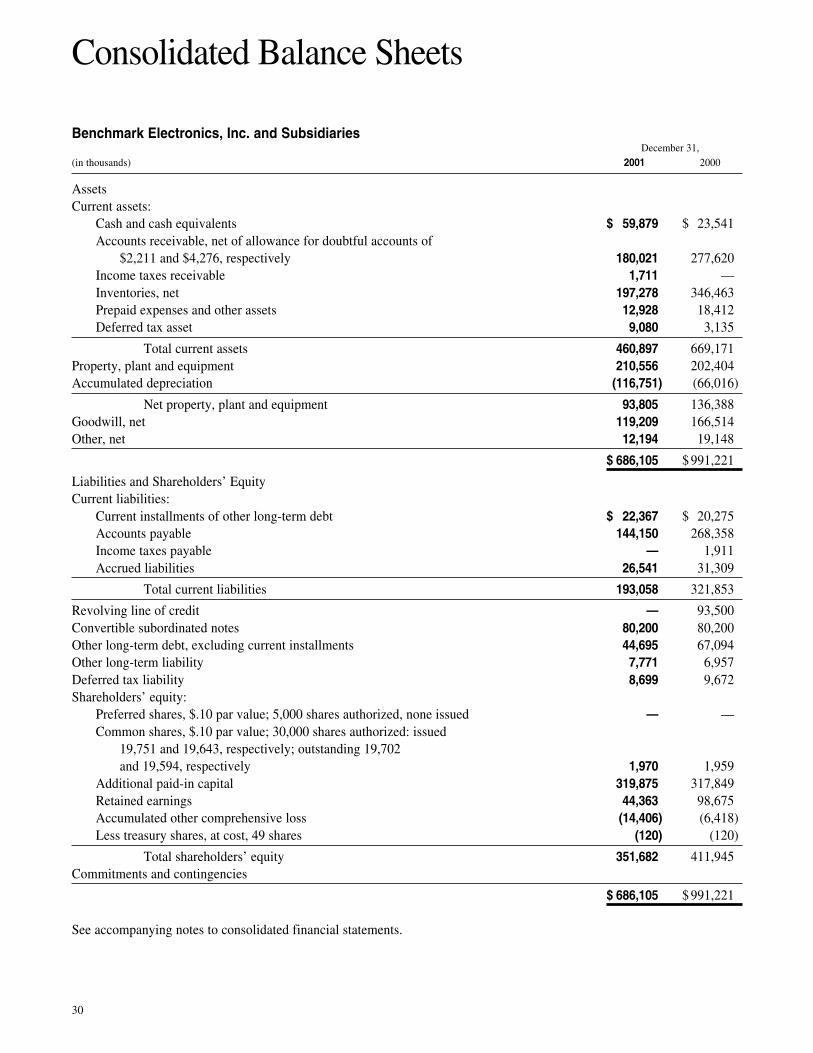
Benchmark Electronics, Inc. and SubsidiariesDecember 31,
(in thousands) 2001 2000
AssetsCurrent assets:
Cash and cash equivalents $ 59,879 $ 23,541Accounts receivable, net of allowance for doubtful accounts of
$2,211 and $4,276, respectively 180,021 277,620Income taxes receivable 1,711 —Inventories, net 197,278 346,463Prepaid expenses and other assets 12,928 18,412Deferred tax asset 9,080 3,135
Total current assets 460,897 669,171Property, plant and equipment 210,556 202,404Accumulated depreciation (116,751) (66,016)
Net property, plant and equipment 93,805 136,388Goodwill, net 119,209 166,514Other, net 12,194 19,148
$ 686,105 $ 991,221
Liabilities and Shareholders’ EquityCurrent liabilities:
Current installments of other long-term debt $ 22,367 $ 20,275Accounts payable 144,150 268,358Income taxes payable — 1,911Accrued liabilities 26,541 31,309
Total current liabilities 193,058 321,853
Revolving line of credit — 93,500Convertible subordinated notes 80,200 80,200Other long-term debt, excluding current installments 44,695 67,094Other long-term liability 7,771 6,957Deferred tax liability 8,699 9,672Shareholders’ equity:
Preferred shares, $.10 par value; 5,000 shares authorized, none issued — —Common shares, $.10 par value; 30,000 shares authorized: issued
19,751 and 19,643, respectively; outstanding 19,702and 19,594, respectively 1,970 1,959
Additional paid-in capital 319,875 317,849Retained earnings 44,363 98,675Accumulated other comprehensive loss (14,406) (6,418)Less treasury shares, at cost, 49 shares (120) (120)
Total shareholders’ equity 351,682 411,945Commitments and contingencies
$ 686,105 $ 991,221
See accompanying notes to consolidated financial statements.
Consolidated Balance Sheets
30
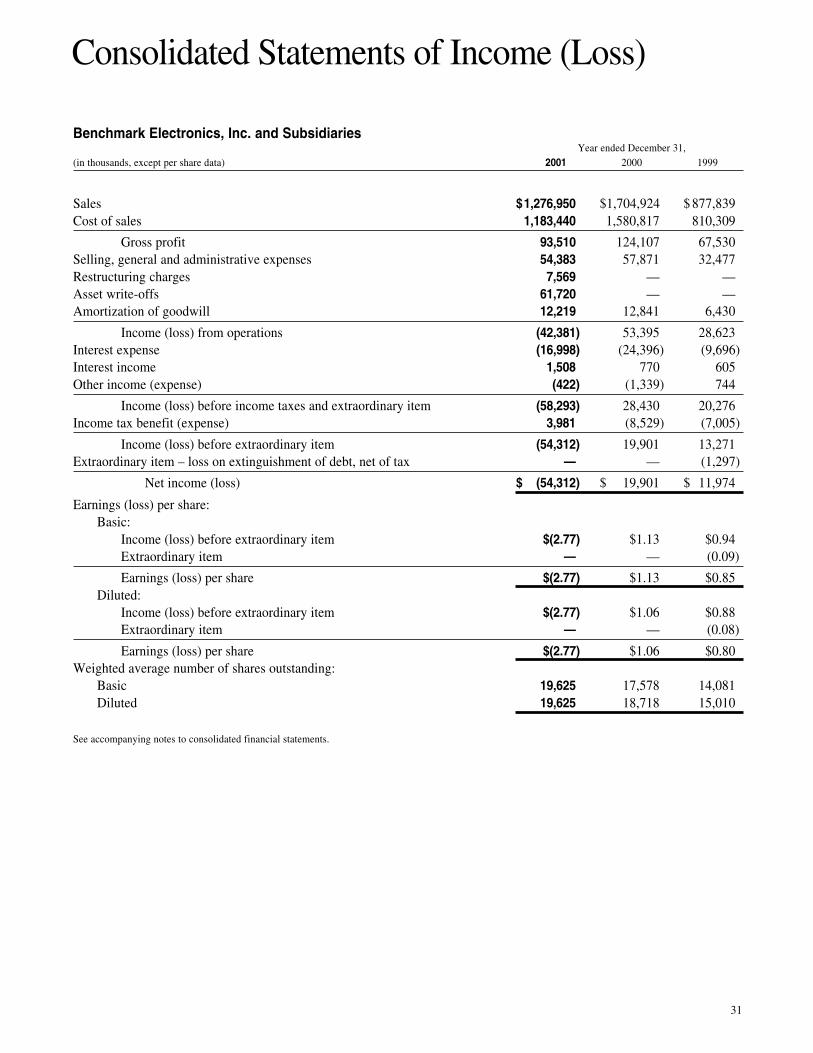
Benchmark Electronics, Inc. and SubsidiariesYear ended December 31,
(in thousands, except per share data) 2001 2000 1999
Sales $1,276,950 $1,704,924 $ 877,839Cost of sales 1,183,440 1,580,817 810,309
Gross profit 93,510 124,107 67,530Selling, general and administrative expenses 54,383 57,871 32,477Restructuring charges 7,569 — —Asset write-offs 61,720 — —Amortization of goodwill 12,219 12,841 6,430
Income (loss) from operations (42,381) 53,395 28,623Interest expense (16,998) (24,396) (9,696)Interest income 1,508 770 605Other income (expense) (422) (1,339) 744
Income (loss) before income taxes and extraordinary item (58,293) 28,430 20,276Income tax benefit (expense) 3,981 (8,529) (7,005)
Income (loss) before extraordinary item (54,312) 19,901 13,271Extraordinary item – loss on extinguishment of debt, net of tax — — (1,297)
Net income (loss) $ (54,312) $ 19,901 $ 11,974
Earnings (loss) per share:Basic:
Income (loss) before extraordinary item $(2.77) $1.13 $0.94Extraordinary item — — (0.09)
Earnings (loss) per share $(2.77) $1.13 $0.85Diluted:
Income (loss) before extraordinary item $(2.77) $1.06 $0.88Extraordinary item — — (0.08)
Earnings (loss) per share $(2.77) $1.06 $0.80Weighted average number of shares outstanding:
Basic 19,625 17,578 14,081Diluted 19,625 18,718 15,010
See accompanying notes to consolidated financial statements.
Consolidated Statements of Income (Loss)
31
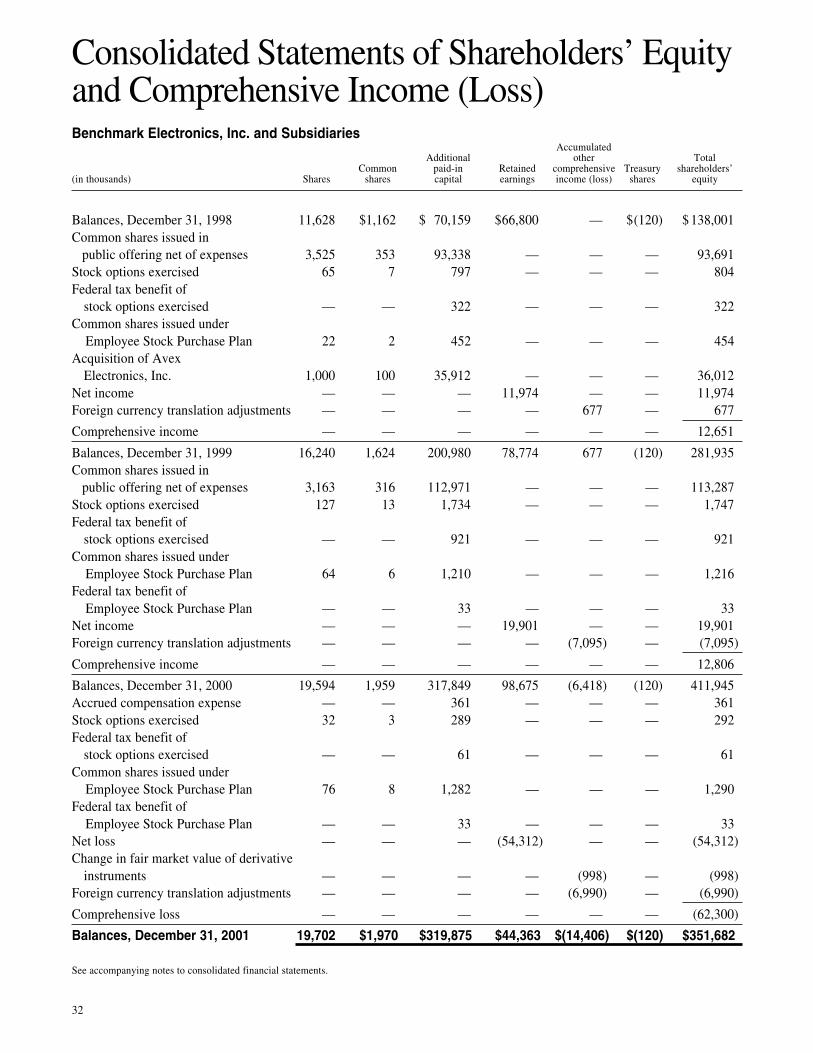
Benchmark Electronics, Inc. and SubsidiariesAccumulated
Additional other TotalCommon paid-in Retained comprehensive Treasury shareholders’
(in thousands) Shares shares capital earnings income (loss) shares equity
Balances, December 31, 1998 11,628 $1,162 $ 70,159 $66,800 — $(120) $ 138,001Common shares issued in public offering net of expenses 3,525 353 93,338 — — — 93,691Stock options exercised 65 7 797 — — — 804Federal tax benefit of
stock options exercised — — 322 — — — 322Common shares issued under Employee Stock Purchase Plan 22 2 452 — — — 454Acquisition of Avex
Electronics, Inc. 1,000 100 35,912 — — — 36,012Net income — — — 11,974 — — 11,974Foreign currency translation adjustments — — — — 677 — 677
Comprehensive income — — — — — — 12,651
Balances, December 31, 1999 16,240 1,624 200,980 78,774 677 (120) 281,935Common shares issued in public offering net of expenses 3,163 316 112,971 — — — 113,287Stock options exercised 127 13 1,734 — — — 1,747Federal tax benefit of
stock options exercised — — 921 — — — 921Common shares issued under Employee Stock Purchase Plan 64 6 1,210 — — — 1,216Federal tax benefit of Employee Stock Purchase Plan — — 33 — — — 33Net income — — — 19,901 — — 19,901Foreign currency translation adjustments — — — — (7,095) — (7,095)
Comprehensive income — — — — — — 12,806
Balances, December 31, 2000 19,594 1,959 317,849 98,675 (6,418) (120) 411,945Accrued compensation expense — — 361 — — — 361Stock options exercised 32 3 289 — — — 292Federal tax benefit of
stock options exercised — — 61 — — — 61Common shares issued under Employee Stock Purchase Plan 76 8 1,282 — — — 1,290Federal tax benefit of Employee Stock Purchase Plan — — 33 — — — 33Net loss — — — (54,312) — — (54,312)Change in fair market value of derivative
instruments — — — — (998) — (998)Foreign currency translation adjustments — — — — (6,990) — (6,990)
Comprehensive loss — — — — — — (62,300)
Balances, December 31, 2001 19,702 $1,970 $319,875 $44,363 $(14,406) $(120) $351,682
See accompanying notes to consolidated financial statements.
Consolidated Statements of Shareholders’ Equityand Comprehensive Income (Loss)
32
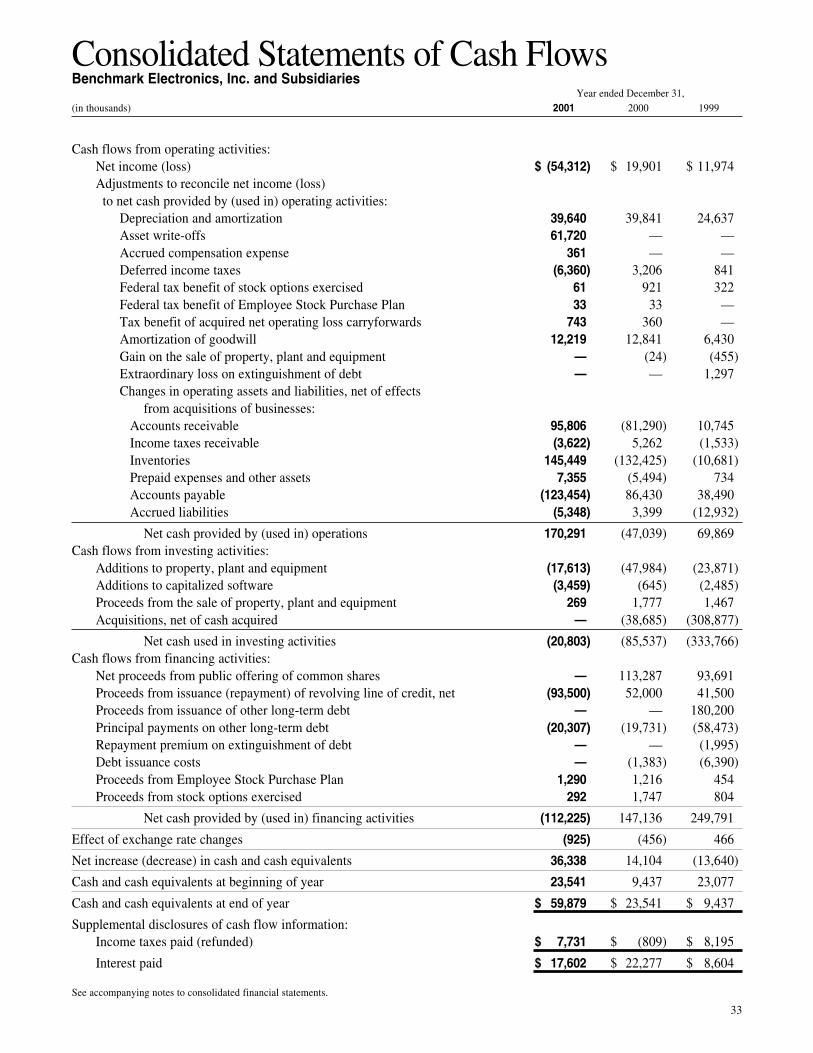
Benchmark Electronics, Inc. and SubsidiariesYear ended December 31,
(in thousands) 2001 2000 1999
Cash flows from operating activities:Net income (loss) $ (54,312) $ 19,901 $ 11,974Adjustments to reconcile net income (loss) to net cash provided by (used in) operating activities:
Depreciation and amortization 39,640 39,841 24,637Asset write-offs 61,720 — —Accrued compensation expense 361 — —Deferred income taxes (6,360) 3,206 841Federal tax benefit of stock options exercised 61 921 322Federal tax benefit of Employee Stock Purchase Plan 33 33 —Tax benefit of acquired net operating loss carryforwards 743 360 —Amortization of goodwill 12,219 12,841 6,430Gain on the sale of property, plant and equipment — (24) (455)Extraordinary loss on extinguishment of debt — — 1,297Changes in operating assets and liabilities, net of effects
from acquisitions of businesses: Accounts receivable 95,806 (81,290) 10,745 Income taxes receivable (3,622) 5,262 (1,533) Inventories 145,449 (132,425) (10,681) Prepaid expenses and other assets 7,355 (5,494) 734 Accounts payable (123,454) 86,430 38,490 Accrued liabilities (5,348) 3,399 (12,932)
Net cash provided by (used in) operations 170,291 (47,039) 69,869Cash flows from investing activities:
Additions to property, plant and equipment (17,613) (47,984) (23,871)Additions to capitalized software (3,459) (645) (2,485)Proceeds from the sale of property, plant and equipment 269 1,777 1,467Acquisitions, net of cash acquired — (38,685) (308,877)
Net cash used in investing activities (20,803) (85,537) (333,766)Cash flows from financing activities:
Net proceeds from public offering of common shares — 113,287 93,691Proceeds from issuance (repayment) of revolving line of credit, net (93,500) 52,000 41,500Proceeds from issuance of other long-term debt — — 180,200Principal payments on other long-term debt (20,307) (19,731) (58,473)Repayment premium on extinguishment of debt — — (1,995)Debt issuance costs — (1,383) (6,390)Proceeds from Employee Stock Purchase Plan 1,290 1,216 454Proceeds from stock options exercised 292 1,747 804
Net cash provided by (used in) financing activities (112,225) 147,136 249,791
Effect of exchange rate changes (925) (456) 466
Net increase (decrease) in cash and cash equivalents 36,338 14,104 (13,640)
Cash and cash equivalents at beginning of year 23,541 9,437 23,077
Cash and cash equivalents at end of year $ 59,879 $ 23,541 $ 9,437
Supplemental disclosures of cash flow information:Income taxes paid (refunded) $ 7,731 $ (809) $ 8,195
Interest paid $ 17,602 $ 22,277 $ 8,604
See accompanying notes to consolidated financial statements.
Consolidated Statements of Cash Flows
33
Notes to Consolidated Financial Statements
Note 1 – Summary of Significant AccountingPolicies
(a) Business
Benchmark Electronics, Inc. (the Company) is a Texascorporation in the business of manufacturing electronicsand provides services to original equipment manufactur-ers (OEMs) of telecommunication equipment, computersand related products for business enterprises, video/audio/entertainment products, industrial control equip-ment, testing and instrumentation products and medicaldevices. The Company has manufacturing operationslocated in the Americas, Europe and Asia.
(b) Principles of Consolidation
The consolidated financial statements include thefinancial statements of Benchmark Electronics, Inc. andits wholly owned subsidiaries. All significant intercom-pany balances and transactions have been eliminated inconsolidation.
(c) Cash and Cash Equivalents
The Company considers all highly liquid debt instru-ments with an original maturity of three months or less tobe cash equivalents.
(d) Inventories
Inventories include material, labor and overhead and arestated at the lower of cost (principally first-in, first-outmethod) or market.
(e) Property, Plant and Equipment
Property, plant and equipment are stated at cost. Depre-ciation is calculated on the straight-line method over theuseful lives of the assets, which range from three to thirtyyears. Leasehold improvements are amortized on thestraight-line method over the shorter of the useful life ofthe improvement or the remainder of the lease term.
(f) Goodwill and Other Assets
Goodwill, which represents the excess of purchase priceover fair value of net assets acquired, is amortized on astraight-line basis over the period of expected benefit of15 years. The accumulated amortization of goodwill atDecember 31, 2001 and 2000 was $37.2 million and$24.9 million, respectively. Other assets consist primarilyof capitalized software costs, which are amortized overthe estimated useful life of the related software, anddeferred financing costs, which are amortized over thelife of the related debt. During 2001, 2000 and 1999, $3.5million, $0.6 million and $2.5 million of software costs
were capitalized in connection with the new ERP systemimplementation. The accumulated amortization ofcapitalized software costs at December 31, 2001 and2000 was $2.9 million and $1.3 million, respectively. Theaccumulated amortization of deferred financing costs atDecember 31, 2001 and 2000 was $3.7 million and $2.1million, respectively. Recently enacted accountingprinciples will affect both the valuation of and theamortization of intangible assets in future years. SeeRecently Enacted Accounting Principles below.
(g) Impairment
In assessing and measuring the impairment of long-livedassets, the Company applies the provisions of Statementof Financial Accounting Standards (SFAS) No. 121,“Accounting for the Impairment of Long-Lived Assetsand for Long-Lived Assets to Be Disposed Of”. ThisStatement requires that long-lived assets and certainidentifiable intangibles be reviewed for impairmentwhenever events or changes in circumstances indicatethat the carrying amount of an asset may not be recover-able. Recoverability of assets to be held and used ismeasured by a comparison of the carrying amount of anasset to future net cash flows expected to be generated bythe asset. If the long-lived asset or identifiable intangiblebeing tested for impairment was acquired in a purchasebusiness combination, the goodwill that arose in thattransaction is included in the asset grouping in determin-ing whether an impairment has occurred. If some but notall of the assets acquired in that transaction are beingtested, goodwill is allocated to the assets being tested forimpairment based on the relative fair values of the long-lived assets and identifiable intangibles acquired at theacquisition date. If such assets are considered to beimpaired, the impairment to be recognized is measuredby the amount by which the carrying amount of the assetsexceeds the fair value of the assets. Additionally, wherean impairment loss is recognized for long-lived assetsand identifiable intangibles where goodwill has beenallocated to the asset grouping, as described immediatelyabove, the carrying amount of the allocated goodwill isimpaired (eliminated) before reducing the carryingamounts of impaired long-lived assets. Assets to bedisposed of are reported at the lower of the carryingamount or fair value less costs to sell.
With respect to the carrying amounts of goodwillremaining after the testing for impairment of long-livedassets and identifiable intangibles, including enterpriselevel goodwill not subject to impairment testing underSFAS No. 121, the Company assesses such carryingvalue for impairment whenever events or changes incircumstances indicate that the carrying amount of suchgoodwill may not be recoverable. The Company assesses
34
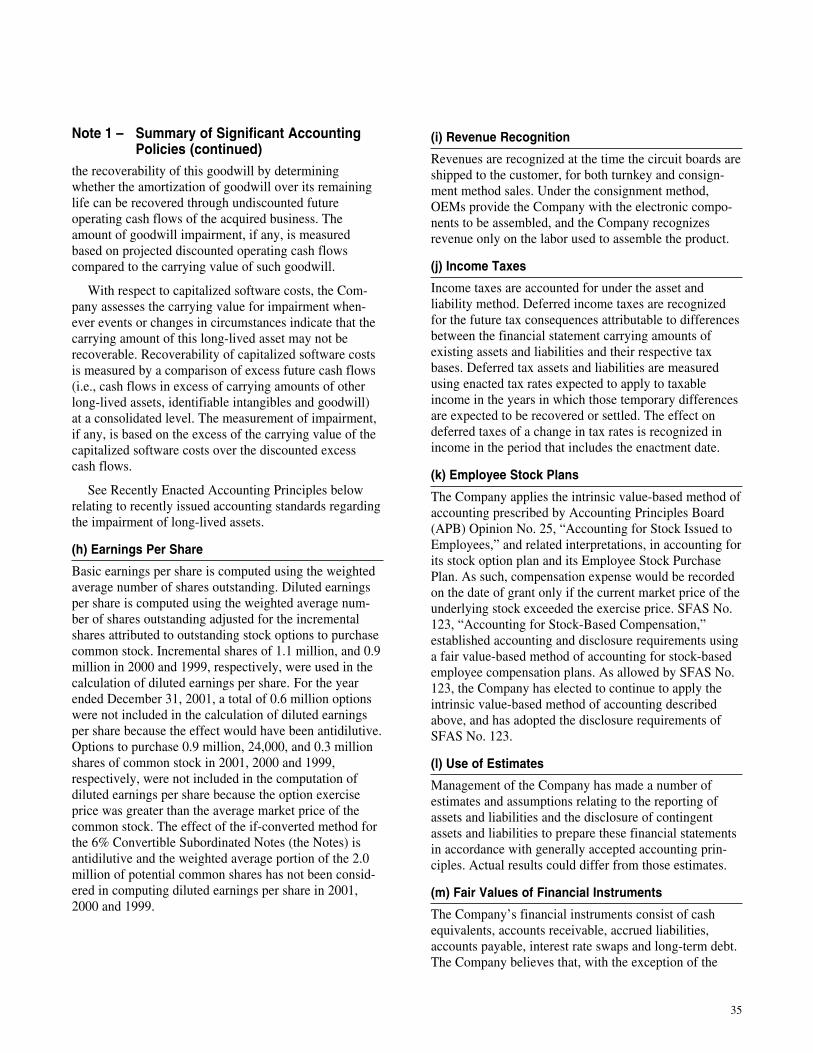
the recoverability of this goodwill by determiningwhether the amortization of goodwill over its remaininglife can be recovered through undiscounted futureoperating cash flows of the acquired business. Theamount of goodwill impairment, if any, is measuredbased on projected discounted operating cash flowscompared to the carrying value of such goodwill.
With respect to capitalized software costs, the Com-pany assesses the carrying value for impairment when-ever events or changes in circumstances indicate that thecarrying amount of this long-lived asset may not berecoverable. Recoverability of capitalized software costsis measured by a comparison of excess future cash flows(i.e., cash flows in excess of carrying amounts of otherlong-lived assets, identifiable intangibles and goodwill)at a consolidated level. The measurement of impairment,if any, is based on the excess of the carrying value of thecapitalized software costs over the discounted excesscash flows.
See Recently Enacted Accounting Principles belowrelating to recently issued accounting standards regardingthe impairment of long-lived assets.
(h) Earnings Per Share
Basic earnings per share is computed using the weightedaverage number of shares outstanding. Diluted earningsper share is computed using the weighted average num-ber of shares outstanding adjusted for the incrementalshares attributed to outstanding stock options to purchasecommon stock. Incremental shares of 1.1 million, and 0.9million in 2000 and 1999, respectively, were used in thecalculation of diluted earnings per share. For the yearended December 31, 2001, a total of 0.6 million optionswere not included in the calculation of diluted earningsper share because the effect would have been antidilutive.Options to purchase 0.9 million, 24,000, and 0.3 millionshares of common stock in 2001, 2000 and 1999,respectively, were not included in the computation ofdiluted earnings per share because the option exerciseprice was greater than the average market price of thecommon stock. The effect of the if-converted method forthe 6% Convertible Subordinated Notes (the Notes) isantidilutive and the weighted average portion of the 2.0million of potential common shares has not been consid-ered in computing diluted earnings per share in 2001,2000 and 1999.
(i) Revenue Recognition
Revenues are recognized at the time the circuit boards areshipped to the customer, for both turnkey and consign-ment method sales. Under the consignment method,OEMs provide the Company with the electronic compo-nents to be assembled, and the Company recognizesrevenue only on the labor used to assemble the product.
(j) Income Taxes
Income taxes are accounted for under the asset andliability method. Deferred income taxes are recognizedfor the future tax consequences attributable to differencesbetween the financial statement carrying amounts ofexisting assets and liabilities and their respective taxbases. Deferred tax assets and liabilities are measuredusing enacted tax rates expected to apply to taxableincome in the years in which those temporary differencesare expected to be recovered or settled. The effect ondeferred taxes of a change in tax rates is recognized inincome in the period that includes the enactment date.
(k) Employee Stock Plans
The Company applies the intrinsic value-based method ofaccounting prescribed by Accounting Principles Board(APB) Opinion No. 25, “Accounting for Stock Issued toEmployees,” and related interpretations, in accounting forits stock option plan and its Employee Stock PurchasePlan. As such, compensation expense would be recordedon the date of grant only if the current market price of theunderlying stock exceeded the exercise price. SFAS No.123, “Accounting for Stock-Based Compensation,”established accounting and disclosure requirements usinga fair value-based method of accounting for stock-basedemployee compensation plans. As allowed by SFAS No.123, the Company has elected to continue to apply theintrinsic value-based method of accounting describedabove, and has adopted the disclosure requirements ofSFAS No. 123.
(l) Use of Estimates
Management of the Company has made a number ofestimates and assumptions relating to the reporting ofassets and liabilities and the disclosure of contingentassets and liabilities to prepare these financial statementsin accordance with generally accepted accounting prin-ciples. Actual results could differ from those estimates.
(m) Fair Values of Financial Instruments
The Company’s financial instruments consist of cashequivalents, accounts receivable, accrued liabilities,accounts payable, interest rate swaps and long-term debt.The Company believes that, with the exception of the
Note 1 – Summary of Significant AccountingPolicies (continued)
35
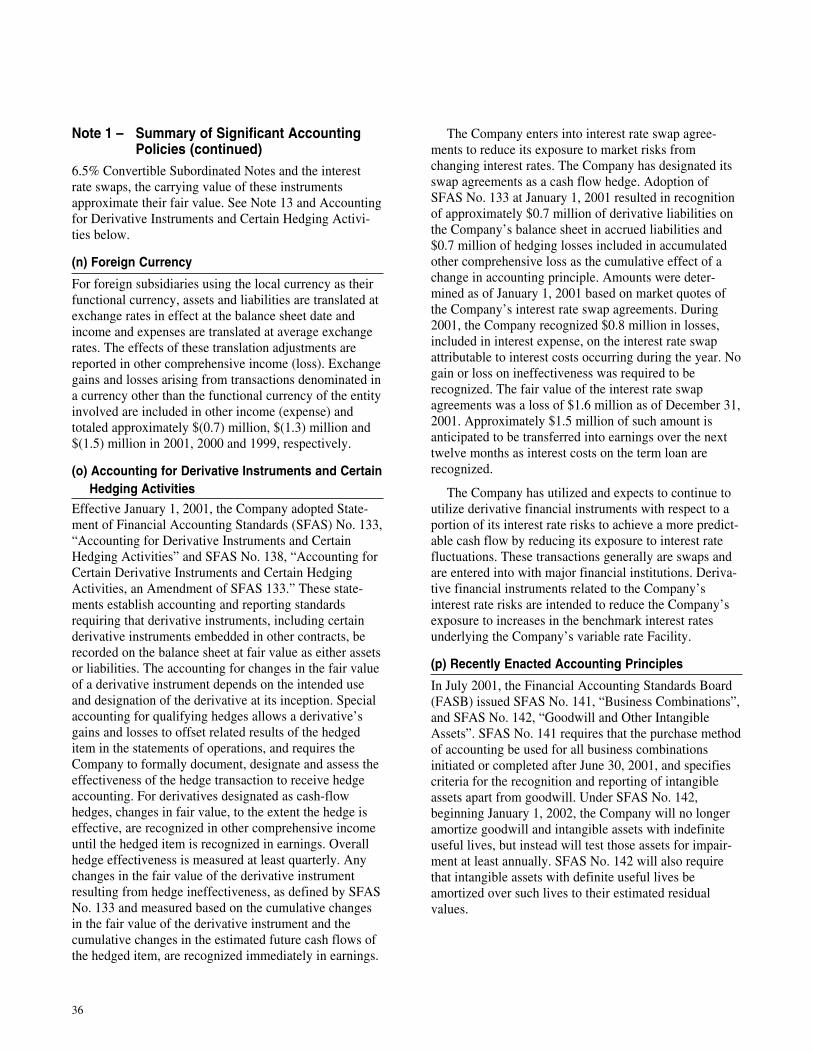
6.5% Convertible Subordinated Notes and the interestrate swaps, the carrying value of these instrumentsapproximate their fair value. See Note 13 and Accountingfor Derivative Instruments and Certain Hedging Activi-ties below.
(n) Foreign Currency
For foreign subsidiaries using the local currency as theirfunctional currency, assets and liabilities are translated atexchange rates in effect at the balance sheet date andincome and expenses are translated at average exchangerates. The effects of these translation adjustments arereported in other comprehensive income (loss). Exchangegains and losses arising from transactions denominated ina currency other than the functional currency of the entityinvolved are included in other income (expense) andtotaled approximately $(0.7) million, $(1.3) million and$(1.5) million in 2001, 2000 and 1999, respectively.
(o) Accounting for Derivative Instruments and Certain Hedging Activities
Effective January 1, 2001, the Company adopted State-ment of Financial Accounting Standards (SFAS) No. 133,“Accounting for Derivative Instruments and CertainHedging Activities” and SFAS No. 138, “Accounting forCertain Derivative Instruments and Certain HedgingActivities, an Amendment of SFAS 133.” These state-ments establish accounting and reporting standardsrequiring that derivative instruments, including certainderivative instruments embedded in other contracts, berecorded on the balance sheet at fair value as either assetsor liabilities. The accounting for changes in the fair valueof a derivative instrument depends on the intended useand designation of the derivative at its inception. Specialaccounting for qualifying hedges allows a derivative’sgains and losses to offset related results of the hedgeditem in the statements of operations, and requires theCompany to formally document, designate and assess theeffectiveness of the hedge transaction to receive hedgeaccounting. For derivatives designated as cash-flowhedges, changes in fair value, to the extent the hedge iseffective, are recognized in other comprehensive incomeuntil the hedged item is recognized in earnings. Overallhedge effectiveness is measured at least quarterly. Anychanges in the fair value of the derivative instrumentresulting from hedge ineffectiveness, as defined by SFASNo. 133 and measured based on the cumulative changesin the fair value of the derivative instrument and thecumulative changes in the estimated future cash flows ofthe hedged item, are recognized immediately in earnings.
The Company enters into interest rate swap agree-ments to reduce its exposure to market risks fromchanging interest rates. The Company has designated itsswap agreements as a cash flow hedge. Adoption ofSFAS No. 133 at January 1, 2001 resulted in recognitionof approximately $0.7 million of derivative liabilities onthe Company’s balance sheet in accrued liabilities and$0.7 million of hedging losses included in accumulatedother comprehensive loss as the cumulative effect of achange in accounting principle. Amounts were deter-mined as of January 1, 2001 based on market quotes ofthe Company’s interest rate swap agreements. During2001, the Company recognized $0.8 million in losses,included in interest expense, on the interest rate swapattributable to interest costs occurring during the year. Nogain or loss on ineffectiveness was required to berecognized. The fair value of the interest rate swapagreements was a loss of $1.6 million as of December 31,2001. Approximately $1.5 million of such amount isanticipated to be transferred into earnings over the nexttwelve months as interest costs on the term loan arerecognized.
The Company has utilized and expects to continue toutilize derivative financial instruments with respect to aportion of its interest rate risks to achieve a more predict-able cash flow by reducing its exposure to interest ratefluctuations. These transactions generally are swaps andare entered into with major financial institutions. Deriva-tive financial instruments related to the Company’sinterest rate risks are intended to reduce the Company’sexposure to increases in the benchmark interest ratesunderlying the Company’s variable rate Facility.
(p) Recently Enacted Accounting Principles
In July 2001, the Financial Accounting Standards Board(FASB) issued SFAS No. 141, “Business Combinations”,and SFAS No. 142, “Goodwill and Other IntangibleAssets”. SFAS No. 141 requires that the purchase methodof accounting be used for all business combinationsinitiated or completed after June 30, 2001, and specifiescriteria for the recognition and reporting of intangibleassets apart from goodwill. Under SFAS No. 142,beginning January 1, 2002, the Company will no longeramortize goodwill and intangible assets with indefiniteuseful lives, but instead will test those assets for impair-ment at least annually. SFAS No. 142 will also requirethat intangible assets with definite useful lives beamortized over such lives to their estimated residualvalues.
Note 1 – Summary of Significant AccountingPolicies (continued)
36
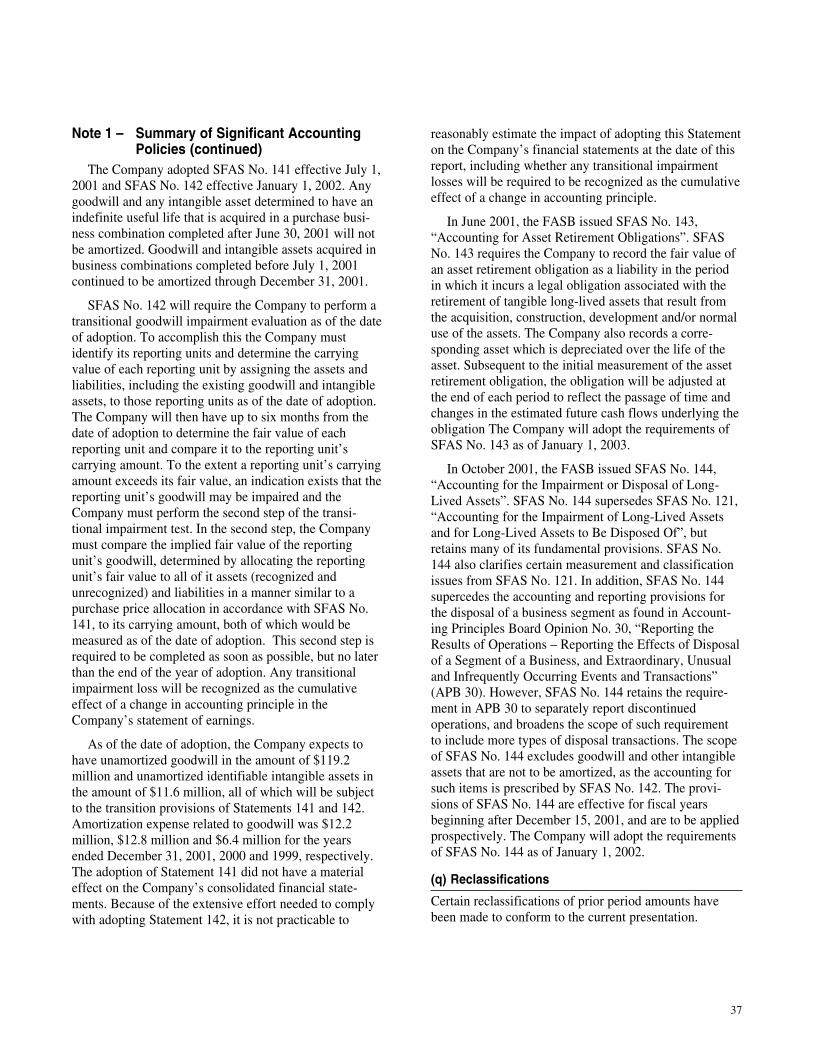
The Company adopted SFAS No. 141 effective July 1,2001 and SFAS No. 142 effective January 1, 2002. Anygoodwill and any intangible asset determined to have anindefinite useful life that is acquired in a purchase busi-ness combination completed after June 30, 2001 will notbe amortized. Goodwill and intangible assets acquired inbusiness combinations completed before July 1, 2001continued to be amortized through December 31, 2001.
SFAS No. 142 will require the Company to perform atransitional goodwill impairment evaluation as of the dateof adoption. To accomplish this the Company mustidentify its reporting units and determine the carryingvalue of each reporting unit by assigning the assets andliabilities, including the existing goodwill and intangibleassets, to those reporting units as of the date of adoption.The Company will then have up to six months from thedate of adoption to determine the fair value of eachreporting unit and compare it to the reporting unit’scarrying amount. To the extent a reporting unit’s carryingamount exceeds its fair value, an indication exists that thereporting unit’s goodwill may be impaired and theCompany must perform the second step of the transi-tional impairment test. In the second step, the Companymust compare the implied fair value of the reportingunit’s goodwill, determined by allocating the reportingunit’s fair value to all of it assets (recognized andunrecognized) and liabilities in a manner similar to apurchase price allocation in accordance with SFAS No.141, to its carrying amount, both of which would bemeasured as of the date of adoption. This second step isrequired to be completed as soon as possible, but no laterthan the end of the year of adoption. Any transitionalimpairment loss will be recognized as the cumulativeeffect of a change in accounting principle in theCompany’s statement of earnings.
As of the date of adoption, the Company expects tohave unamortized goodwill in the amount of $119.2million and unamortized identifiable intangible assets inthe amount of $11.6 million, all of which will be subjectto the transition provisions of Statements 141 and 142.Amortization expense related to goodwill was $12.2million, $12.8 million and $6.4 million for the yearsended December 31, 2001, 2000 and 1999, respectively.The adoption of Statement 141 did not have a materialeffect on the Company’s consolidated financial state-ments. Because of the extensive effort needed to complywith adopting Statement 142, it is not practicable to
reasonably estimate the impact of adopting this Statementon the Company’s financial statements at the date of thisreport, including whether any transitional impairmentlosses will be required to be recognized as the cumulativeeffect of a change in accounting principle.
In June 2001, the FASB issued SFAS No. 143,“Accounting for Asset Retirement Obligations”. SFASNo. 143 requires the Company to record the fair value ofan asset retirement obligation as a liability in the periodin which it incurs a legal obligation associated with theretirement of tangible long-lived assets that result fromthe acquisition, construction, development and/or normaluse of the assets. The Company also records a corre-sponding asset which is depreciated over the life of theasset. Subsequent to the initial measurement of the assetretirement obligation, the obligation will be adjusted atthe end of each period to reflect the passage of time andchanges in the estimated future cash flows underlying theobligation The Company will adopt the requirements ofSFAS No. 143 as of January 1, 2003.
In October 2001, the FASB issued SFAS No. 144,“Accounting for the Impairment or Disposal of Long-Lived Assets”. SFAS No. 144 supersedes SFAS No. 121,“Accounting for the Impairment of Long-Lived Assetsand for Long-Lived Assets to Be Disposed Of”, butretains many of its fundamental provisions. SFAS No.144 also clarifies certain measurement and classificationissues from SFAS No. 121. In addition, SFAS No. 144supercedes the accounting and reporting provisions forthe disposal of a business segment as found in Account-ing Principles Board Opinion No. 30, “Reporting theResults of Operations – Reporting the Effects of Disposalof a Segment of a Business, and Extraordinary, Unusualand Infrequently Occurring Events and Transactions”(APB 30). However, SFAS No. 144 retains the require-ment in APB 30 to separately report discontinuedoperations, and broadens the scope of such requirementto include more types of disposal transactions. The scopeof SFAS No. 144 excludes goodwill and other intangibleassets that are not to be amortized, as the accounting forsuch items is prescribed by SFAS No. 142. The provi-sions of SFAS No. 144 are effective for fiscal yearsbeginning after December 15, 2001, and are to be appliedprospectively. The Company will adopt the requirementsof SFAS No. 144 as of January 1, 2002.
(q) Reclassifications
Certain reclassifications of prior period amounts havebeen made to conform to the current presentation.
Note 1 – Summary of Significant AccountingPolicies (continued)
37
The following unaudited pro forma condensedconsolidated financial information reflects the acquisitionof AVEX as if it had occurred on January 1, 1999. Thesummary pro forma information is not necessarilyrepresentative of what the Company’s results of opera-tions would have been had the acquisition of AVEX in
under such facility and (iii) issued $80.2 million in Notes.In connection with the AVEX acquisition, the Companyborrowed $30 million under the new revolving creditfacility to refinance existing debt pursuant to theCompany’s prior senior note indebtedness. The AVEXacquisition was accounted for using the purchase methodof accounting. The acquisition resulted in goodwill ofapproximately $139.5 million.
The net purchase price paid in the AVEX acquisitionhas been allocated as follows :
(in thousands) 1999
Working capital, other than cash $135,311Property, plant and equipment 71,295Goodwill 139,517Other assets 4,152Other liabilities (5,629)Deferred income taxes (1,229)Long-term debt (4,457)
Purchase price, net of cash received $338,960
Net cash portion of purchase price $302,948Common stock issued 36,012
Purchase price, net of cash received $338,960
On March 1, 1999, the Company acquired certainequipment and inventories from Stratus Computer Ireland(Stratus), a wholly owned subsidiary of Ascend Commu-nications, Inc. (Ascend) for approximately $42.3 millionin cash as adjusted. The acquisition price was allocated$6.1 million to equipment and other assets, and $36.2million to inventories. Stratus provided systems integra-tion services for large and sophisticated fault-tolerantmainframe computers. In connection with the transaction,the Company entered into a three-year supply agreementto provide these system integration services to Ascendand Stratus Holdings Limited and the Company hiredapproximately 260 employees.
Note 2 – Acquisitions and DispositionsOn October 2, 2000, the Company acquired substantiallyall of the assets and properties, net of assumed liabilities,of the MSI Division of Outreach Technologies, Inc. Thisoperation in Manassas, Virginia was acquired for $3.5million, as adjusted. The transaction was accounted forunder the purchase method of accounting, and, accord-ingly, the results of operations of the Manassas divisionsince October 2, 2000 have been included in the accom-panying consolidated statements of income. The acquisi-tion resulted in goodwill of approximately $0.4 million.The acquisition was allocated $1.9 million to inventories,$2.1 million to accounts receivable, $0.1 million toprepaid expenses and other current assets, $0.8 million toequipment, $1.1 million to accounts payable, $0.3 millionto accrued liabilities, $0.4 million to other long-term debtand $0.4 million to goodwill.
On September 15, 2000, the Company closed thepreviously announced sale of its Swedish operationsfor $19.6 million, as adjusted. The Swedish operationsaccounted for 3.7% and 3.0% of the Company’s sales and14.4% and 16.0% of its operating income for the yearsended December 31, 2000 and 1999, respectively.
On August 24, 1999, the Company completed theacquisition of all of the outstanding capital stock ofAVEX from J.M. Huber Corporation (the Seller). AVEXhad manufacturing plants or design centers in the UnitedStates in Huntsville, Alabama and Pulaski, Tennessee,and elsewhere in Campinas, Brazil, Csongrad, Hungary,Guadalajara, Mexico, Cork, Ireland, Singapore, EastKilbride, Scotland, and Katrineholm, Sweden. In consid-eration for the capital stock of AVEX, the Companypaid $265.3 million in cash at closing, subject to certainadjustments, including a working capital adjustment, andissued one million shares of the Company’s commonstock to the Seller. The working capital adjustment wassettled in the second quarter of 2000 and $35.3 millionwas paid to the Seller. In addition, the Company paid$5.2 million in acquisition costs. In order to finance theAVEX acquisition, the Company (i) obtained a term loanfrom a syndicate of commercial banks in the amount of$100 million, (ii) obtained a new revolving credit facilitypermitting draws of up to $125 million, subject to aborrowing base calculation, and borrowed $46 million
38
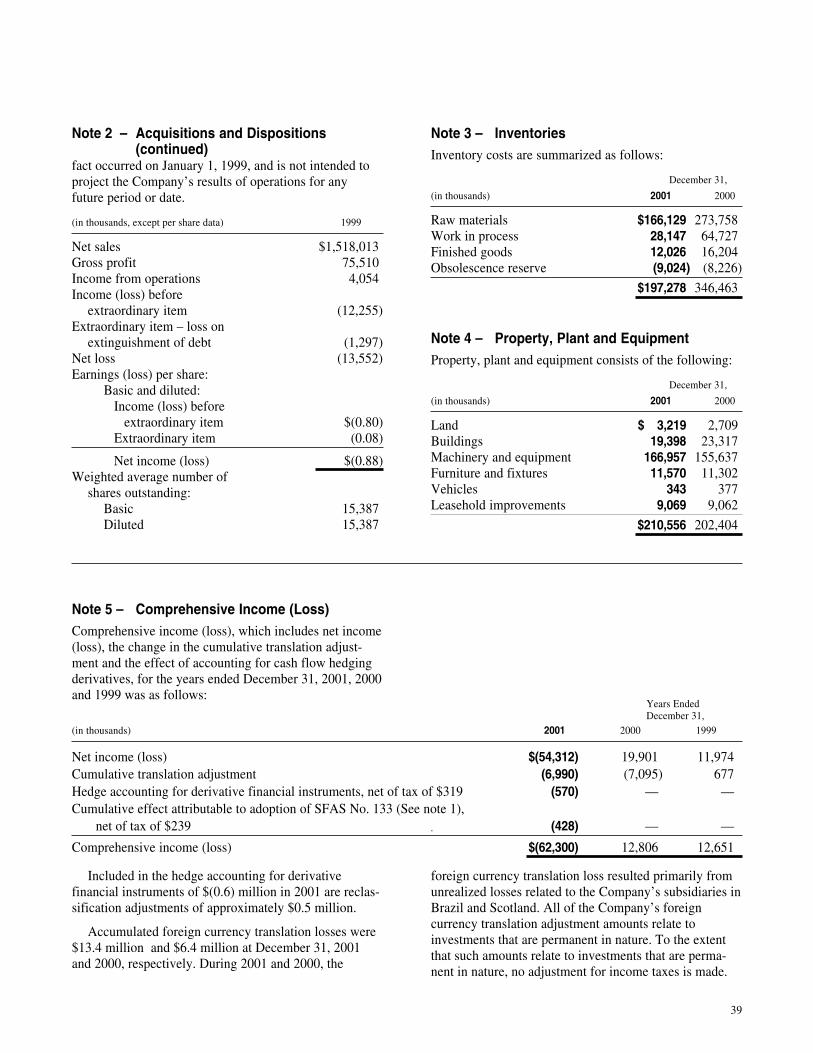
Note 3 – InventoriesInventory costs are summarized as follows:
December 31,
(in thousands) 2001 2000
Raw materials $166,129 273,758Work in process 28,147 64,727Finished goods 12,026 16,204Obsolescence reserve (9,024) (8,226)
$197,278 346,463
Note 4 – Property, Plant and EquipmentProperty, plant and equipment consists of the following:
December 31,
(in thousands) 2001 2000
Land $ 3,219 2,709Buildings 19,398 23,317Machinery and equipment 166,957 155,637Furniture and fixtures 11,570 11,302Vehicles 343 377Leasehold improvements 9,069 9,062
$210,556 202,404
Note 2 – Acquisitions and Dispositions(continued)
,
Note 5 – Comprehensive Income (Loss)Comprehensive income (loss), which includes net income(loss), the change in the cumulative translation adjust-ment and the effect of accounting for cash flow hedgingderivatives, for the years ended December 31, 2001, 2000and 1999 was as follows:
fact occurred on January 1, 1999, and is not intended toproject the Company’s results of operations for anyfuture period or date.
(in thousands, except per share data) 1999
Net sales $1,518,013Gross profit 75,510Income from operations 4,054Income (loss) before
extraordinary item (12,255)Extraordinary item – loss on
extinguishment of debt (1,297)Net loss (13,552)Earnings (loss) per share:
Basic and diluted: Income (loss) before extraordinary item $(0.80) Extraordinary item (0.08)
Net income (loss) $(0.88)Weighted average number of
shares outstanding:Basic 15,387Diluted 15,387
Years EndedDecember 31,
(in thousands) 2001 2000 1999
Net income (loss) $(54,312) 19,901 11,974Cumulative translation adjustment (6,990) (7,095) 677Hedge accounting for derivative financial instruments, net of tax of $319 (570) — —Cumulative effect attributable to adoption of SFAS No. 133 (See note 1),
net of tax of $239 (428) — —
Comprehensive income (loss) $(62,300) 12,806 12,651
Included in the hedge accounting for derivativefinancial instruments of $(0.6) million in 2001 are reclas-sification adjustments of approximately $0.5 million.
Accumulated foreign currency translation losses were$13.4 million and $6.4 million at December 31, 2001and 2000, respectively. During 2001 and 2000, the
foreign currency translation loss resulted primarily fromunrealized losses related to the Company’s subsidiaries inBrazil and Scotland. All of the Company’s foreigncurrency translation adjustment amounts relate toinvestments that are permanent in nature. To the extentthat such amounts relate to investments that are perma-nent in nature, no adjustment for income taxes is made.
39
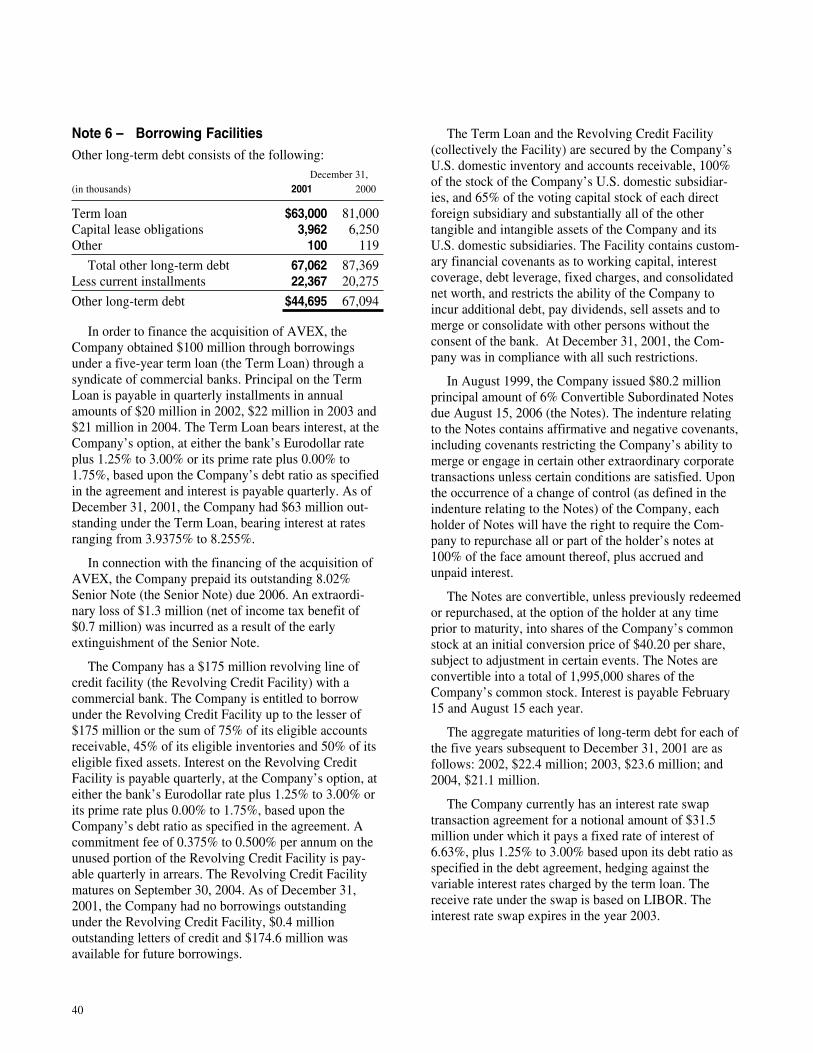
Note 6 – Borrowing FacilitiesOther long-term debt consists of the following:
December 31,(in thousands) 2001 2000
Term loan $63,000 81,000Capital lease obligations 3,962 6,250Other 100 119
Total other long-term debt 67,062 87,369Less current installments 22,367 20,275
Other long-term debt $44,695 67,094
In order to finance the acquisition of AVEX, theCompany obtained $100 million through borrowingsunder a five-year term loan (the Term Loan) through asyndicate of commercial banks. Principal on the TermLoan is payable in quarterly installments in annualamounts of $20 million in 2002, $22 million in 2003 and$21 million in 2004. The Term Loan bears interest, at theCompany’s option, at either the bank’s Eurodollar rateplus 1.25% to 3.00% or its prime rate plus 0.00% to1.75%, based upon the Company’s debt ratio as specifiedin the agreement and interest is payable quarterly. As ofDecember 31, 2001, the Company had $63 million out-standing under the Term Loan, bearing interest at ratesranging from 3.9375% to 8.255%.
In connection with the financing of the acquisition ofAVEX, the Company prepaid its outstanding 8.02%Senior Note (the Senior Note) due 2006. An extraordi-nary loss of $1.3 million (net of income tax benefit of$0.7 million) was incurred as a result of the earlyextinguishment of the Senior Note.
The Company has a $175 million revolving line ofcredit facility (the Revolving Credit Facility) with acommercial bank. The Company is entitled to borrowunder the Revolving Credit Facility up to the lesser of$175 million or the sum of 75% of its eligible accountsreceivable, 45% of its eligible inventories and 50% of itseligible fixed assets. Interest on the Revolving CreditFacility is payable quarterly, at the Company’s option, ateither the bank’s Eurodollar rate plus 1.25% to 3.00% orits prime rate plus 0.00% to 1.75%, based upon theCompany’s debt ratio as specified in the agreement. Acommitment fee of 0.375% to 0.500% per annum on theunused portion of the Revolving Credit Facility is pay-able quarterly in arrears. The Revolving Credit Facilitymatures on September 30, 2004. As of December 31,2001, the Company had no borrowings outstandingunder the Revolving Credit Facility, $0.4 millionoutstanding letters of credit and $174.6 million wasavailable for future borrowings.
The Term Loan and the Revolving Credit Facility(collectively the Facility) are secured by the Company’sU.S. domestic inventory and accounts receivable, 100%of the stock of the Company’s U.S. domestic subsidiar-ies, and 65% of the voting capital stock of each directforeign subsidiary and substantially all of the othertangible and intangible assets of the Company and itsU.S. domestic subsidiaries. The Facility contains custom-ary financial covenants as to working capital, interestcoverage, debt leverage, fixed charges, and consolidatednet worth, and restricts the ability of the Company toincur additional debt, pay dividends, sell assets and tomerge or consolidate with other persons without theconsent of the bank. At December 31, 2001, the Com-pany was in compliance with all such restrictions.
In August 1999, the Company issued $80.2 millionprincipal amount of 6% Convertible Subordinated Notesdue August 15, 2006 (the Notes). The indenture relatingto the Notes contains affirmative and negative covenants,including covenants restricting the Company’s ability tomerge or engage in certain other extraordinary corporatetransactions unless certain conditions are satisfied. Uponthe occurrence of a change of control (as defined in theindenture relating to the Notes) of the Company, eachholder of Notes will have the right to require the Com-pany to repurchase all or part of the holder’s notes at100% of the face amount thereof, plus accrued andunpaid interest.
The Notes are convertible, unless previously redeemedor repurchased, at the option of the holder at any timeprior to maturity, into shares of the Company’s commonstock at an initial conversion price of $40.20 per share,subject to adjustment in certain events. The Notes areconvertible into a total of 1,995,000 shares of theCompany’s common stock. Interest is payable February15 and August 15 each year.
The aggregate maturities of long-term debt for each ofthe five years subsequent to December 31, 2001 are asfollows: 2002, $22.4 million; 2003, $23.6 million; and2004, $21.1 million.
The Company currently has an interest rate swaptransaction agreement for a notional amount of $31.5million under which it pays a fixed rate of interest of6.63%, plus 1.25% to 3.00% based upon its debt ratio asspecified in the debt agreement, hedging against thevariable interest rates charged by the term loan. Thereceive rate under the swap is based on LIBOR. Theinterest rate swap expires in the year 2003.
40
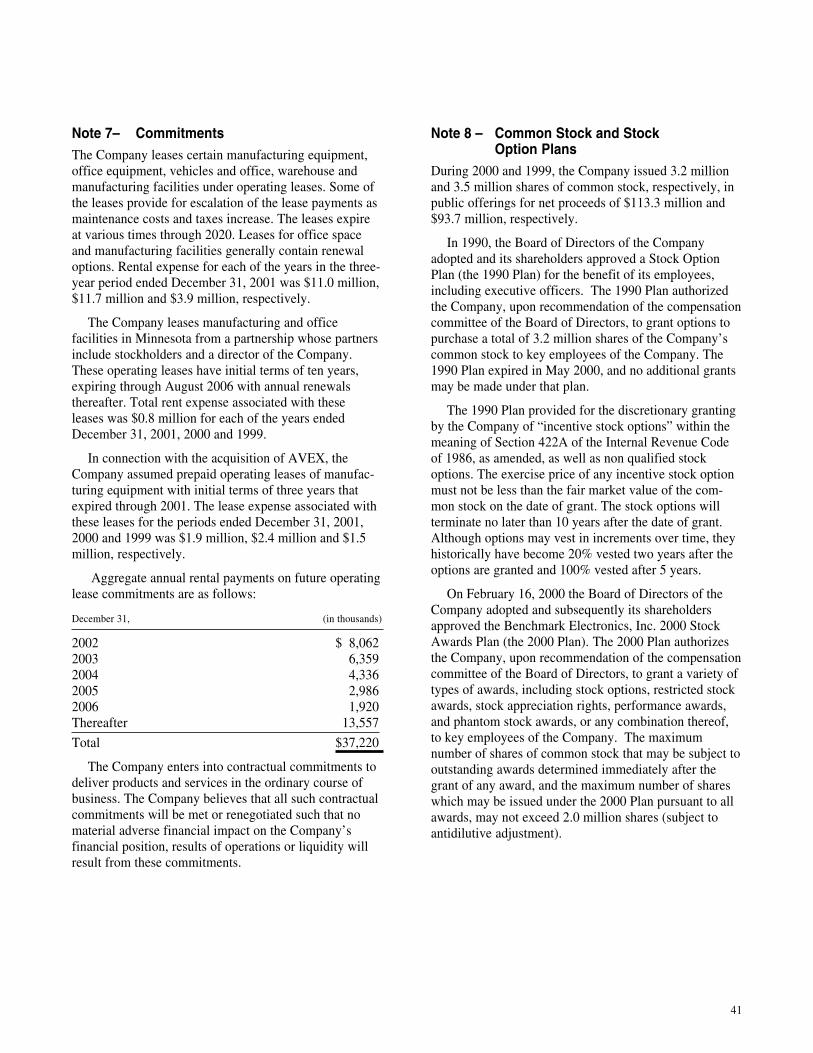
Note 7– CommitmentsThe Company leases certain manufacturing equipment,office equipment, vehicles and office, warehouse andmanufacturing facilities under operating leases. Some ofthe leases provide for escalation of the lease payments asmaintenance costs and taxes increase. The leases expireat various times through 2020. Leases for office spaceand manufacturing facilities generally contain renewaloptions. Rental expense for each of the years in the three-year period ended December 31, 2001 was $11.0 million,$11.7 million and $3.9 million, respectively.
The Company leases manufacturing and officefacilities in Minnesota from a partnership whose partnersinclude stockholders and a director of the Company.These operating leases have initial terms of ten years,expiring through August 2006 with annual renewalsthereafter. Total rent expense associated with theseleases was $0.8 million for each of the years endedDecember 31, 2001, 2000 and 1999.
In connection with the acquisition of AVEX, theCompany assumed prepaid operating leases of manufac-turing equipment with initial terms of three years thatexpired through 2001. The lease expense associated withthese leases for the periods ended December 31, 2001,2000 and 1999 was $1.9 million, $2.4 million and $1.5million, respectively.
Aggregate annual rental payments on future operatinglease commitments are as follows:
December 31, (in thousands)
2002 $ 8,0622003 6,3592004 4,3362005 2,9862006 1,920Thereafter 13,557
Total $37,220
The Company enters into contractual commitments todeliver products and services in the ordinary course ofbusiness. The Company believes that all such contractualcommitments will be met or renegotiated such that nomaterial adverse financial impact on the Company’sfinancial position, results of operations or liquidity willresult from these commitments.
Note 8 – Common Stock and StockOption Plans
During 2000 and 1999, the Company issued 3.2 millionand 3.5 million shares of common stock, respectively, inpublic offerings for net proceeds of $113.3 million and$93.7 million, respectively.
In 1990, the Board of Directors of the Companyadopted and its shareholders approved a Stock OptionPlan (the 1990 Plan) for the benefit of its employees,including executive officers. The 1990 Plan authorizedthe Company, upon recommendation of the compensationcommittee of the Board of Directors, to grant options topurchase a total of 3.2 million shares of the Company’scommon stock to key employees of the Company. The1990 Plan expired in May 2000, and no additional grantsmay be made under that plan.
The 1990 Plan provided for the discretionary grantingby the Company of “incentive stock options” within themeaning of Section 422A of the Internal Revenue Codeof 1986, as amended, as well as non qualified stockoptions. The exercise price of any incentive stock optionmust not be less than the fair market value of the com-mon stock on the date of grant. The stock options willterminate no later than 10 years after the date of grant.Although options may vest in increments over time, theyhistorically have become 20% vested two years after theoptions are granted and 100% vested after 5 years.
On February 16, 2000 the Board of Directors of theCompany adopted and subsequently its shareholdersapproved the Benchmark Electronics, Inc. 2000 StockAwards Plan (the 2000 Plan). The 2000 Plan authorizesthe Company, upon recommendation of the compensationcommittee of the Board of Directors, to grant a variety oftypes of awards, including stock options, restricted stockawards, stock appreciation rights, performance awards,and phantom stock awards, or any combination thereof,to key employees of the Company. The maximumnumber of shares of common stock that may be subject tooutstanding awards determined immediately after thegrant of any award, and the maximum number of shareswhich may be issued under the 2000 Plan pursuant to allawards, may not exceed 2.0 million shares (subject toantidilutive adjustment).
41
The 2000 Plan provides for the discretionary grantingby the Company of “incentive stock options” within themeaning of Section 422A of the Internal Revenue Codeof 1986, as amended, as well as non qualified stockoptions. Incentive stock options may only be granted toemployees of the Company or its subsidiaries. Theexercise price of any incentive stock option must not beless than the fair market value of the common stock onthe date of grant. The exercise price of any incentivestock option granted to 10% shareholders (employeeswho possess more than 10% of the total combined votingpower of all classes of shares of the Company) must be atleast 110% of the fair market value of the common stockat the time such option is granted. The stock options willterminate 5 years after the grant date for 10% sharehold-ers and 10 years after the date of grant for all otheroptionees. Options granted under the 2000 Plan vestover 4 years.
In December of 1994, the Board of Directors of theCompany adopted the Benchmark Electronics, Inc., 1994Stock Option Plan for Non-Employee Directors (the“Plan”) for the benefit of members of the Board ofDirectors of the Company or its affiliates who are notemployees of the Company or its affiliates (as defined inthe Plan). The aggregate number of shares of commonstock for which options may be granted under the Plan is200,000.
Under the terms of the Plan, as amended, eachmember of the Board of Directors of the Company or itsaffiliates who was not an employee of the Company orany of its affiliates on the date of the grant (a “Non-Employee Director”) will receive a grant of an option topurchase 6,000 shares of the Company’s common stock
upon the date of his election or re-election to the Boardof Directors. Additionally, any Non-Employee Directorwho was a director on the date the Board of Directorsadopted the Plan received (a) an option to purchase 6,000shares of common stock for the fiscal year in which thePlan was adopted by the Board of Directors and (b) anoption to purchase shares of common stock in amountequal to (i) 6,000, multiplied by (ii) the number ofconsecutive fiscal years (immediately preceding the fiscalyear during which the Plan was adopted) that the indi-vidual served as a director of the Company, provided thatthe number under clause (ii) shall not exceed three (3).During 2001, 2000 and 1999, pursuant to the Plan,18,000, 24,000 and 12,000 options, respectively, weregranted to Directors to purchase shares of common stockat an exercise price of $24.98, $36.88 and $32.13 pershare, respectively.
In April, 1999, the Board of Directors of the Companyadopted and subsequently its shareholders approved theBenchmark Electronics, Inc. Employee Stock PurchasePlan (the Purchase Plan). Under the Purchase Plan,employees meeting specific employment qualificationsare eligible to participate and can purchase shares semi-annually through payroll deductions at the lower of 85%of the fair market value of the stock at the commence-ment or end of the offering period. The Purchase Planpermits eligible employees to purchase common stockthrough payroll deductions for up to the lesser of 17% ofqualified compensation or $25,000. As of December 31,2001, 337,366 shares remain available for issuance underthe Purchase Plan. The weighted-average fair value of thepurchase rights granted during 2001, 2000 and 1999 was$6.10, $7.93 and $7.22, respectively.
Note 8 – Common Stock and Stock OptionPlans (continued)
42
(options in thousands)Options Outstanding Options Exercisable
WeightedAverage Weighted Weighted
Range of Outstanding Average AverageExercise Number Contractual Exercise Number ExercisePrices Outstanding Life (years) Price Exercisable Price
$5.75-$10 133 1.22 $7.66 133 $7.66$10-$15 695 3.99 $13.15 695 $13.15$15-$20 710 6.57 $17.56 368 $16.75$20-$25 790 8.04 $21.30 183 $22.01$25-$30 275 6.53 $28.33 151 $27.17$30-$35 424 7.59 $33.50 68 $31.37$35-$40 24 8.33 $36.88 24 $36.88
3,051 1,622
The following table summarizes the activities relatingto the Company’s stock option plans:
WeightedAverage
Number of Exercise(options in thousands) Options Price
Balance at December 31, 1998 2,109 $16.22Granted 715 $31.01Exercised (65) $12.20Canceled (146) $24.09
Balance at December 31, 1999 2,613 $19.93Granted 471 $24.47Exercised (127) $13.79Canceled (214) $27.29
Balance at December 31, 2000 2,743 $20.44Granted 510 $20.77Exercised (32) $9.22Canceled (170) $27.26
Balance at December 31, 2001 3,051 $20.24
The following table summarizes information concern-ing currently outstanding and exercisable options:
Note 8 – Common Stock and Stock OptionPlans (continued)
At December 31, 2001, the range of exercise pricesand weighted average remaining contractual life ofoutstanding options was $5.75 - $36.88 and 6.28 years,respectively.
At December 31, 2001, 2000 and 1999, the number ofoptions exercisable was 1.6 million, 1.1 million and 0.8million, respectively, and the weighted average exerciseprice of those options was $16.93, $14.89 and $12.86,respectively.
The Company applies APB Opinion No. 25 inaccounting for its stock option plans and, accordingly, nocompensation cost has been recognized for its stockoptions in the financial statements. Had the Companydetermined compensation cost based on the fair value atthe grant date for its stock options under SFAS No. 123,the Company’s net income (loss) would have beenapproximately $(59.0) million, or $(3.00) per sharediluted during 2001, $15.0 million, or $0.80 per sharediluted during 2000, and $7.9 million, or $0.53 per sharediluted during 1999. The weighted average fair value ofthe options granted during 2001, 2000, and 1999 isestimated as $5.66, $6.65 and $9.06, respectively, on thedate of grant using the Black-Scholes option-pricingmodel with the following assumptions: no dividend yieldfor all years, volatility of 54% for 2001, 50% for 2000and 50% for 1999, risk-free interest rate of 4.03% to4.15% in 2001, 6.12% to 6.72% in 2000, 4.46% to 5.83%in 1999, assumed annual forfeiture rate of 22% for 2001,20% for 2000 and 16% for 1999, and an expected life of4 years for all years.
43
Note 9 – Income TaxesIncome tax expense (benefit) based on income (loss)
before income taxes and extraordinary item consists of:
Year ended December 31,(in thousands) 2001 2000 1999
Current:U.S. Federal $2,428 (1,480) 1,855State and local 106 178 908Foreign (992) 5,311 2,260
1,542 4,009 5,023Deferred:
U.S. Federal (5,698) 2,332 1,146State and local (608) 269 —Foreign (54) 605 (305)
(6,360) 3,206 841Charges in lieu of taxes:
Attributable to employee stock plans 94 954 322Attributable to acquired net operating loss carryforwards 743 360 819
837 1,314 1,141
$(3,981) 8,529 7,005
Included in deferred taxes for 2001 is $0.6 millionrelated to the cumulative effect attributed to the adoptionof SFAS No. 133 and the change of the fair value of thederivative financial instrument included in other compre-hensive income (loss).
Total income tax expense for 1999 is $6.3 millionincluding the $0.7 million benefit allocated to theextraordinary loss.
Income tax expense (benefit) differed from theamounts computed by applying the U.S. federal statutoryincome tax rate to income (loss) before income tax andextraordinary item as a result of the following:
Year ended December 31,(in thousands) 2001 2000 1999
Tax at statutory rate $(20,403) 9,950 7,097State taxes,
net of federal benefit (326) 291 590Tax exempt interest — — (208)Tax benefit from use of
foreign sales corporation (446) (1,386) (341)Effect of foreign operations (2,093) (2,554) (1,616)Amortization of goodwill 1,935 2,032 1,481Write-off of goodwill 7,380 — —Adjustment to US taxes on
foreign income 2,555 — —Losses in foreign jurisdictions
for which no benefit hasbeen provided 7,449 — —
Other (32) 196 2
Total income tax expense(benefit) $ (3,981) 8,529 7,005
The tax effects of temporary differences that give riseto significant portions of the deferred tax assets anddeferred tax liabilities are presented below:
December 31,(in thousands) 2001 2000
Deferred tax assets:Carrying values of inventories $1,299 1,607Accrued liabilities and allowances deductible for tax purposes on a cash basis 4,727 1,528Plant and equipment 2,534 —Goodwill 4,895 —Net operating loss carryforwards 3,494 1,173
16,949 4,308Less valuation allowance (7,869) (1,173)
Net deferred tax assets 9,080 3,135
Deferred tax liabilities:Plant and equipment, due to differences in depreciation (4,155) (7,557)Undistributed earnings of foreign subsidiary (2,555) —Other (1,989) (2,115)
Gross deferred tax liability (8,699) (9,672)
Net deferred tax asset (liability) $ 381 (6,537)
44
Note 10 – Major CustomersThe Company’s customers operate in industries that are,to a varying extent, subject to rapid technological change,vigorous competition and short product life cycles.Developments adverse to the electronics industry, theCompany’s customers or their products could impact theCompany’s overall credit risk.
The Company extends credit based on evaluation of itscustomers’ financial condition and generally does notrequire collateral or other security from its customers andwould incur a loss equal to the carrying value of theaccounts receivable if its customer failed to performaccording to the terms of the credit arrangement.
Sales to major customers were as follows for theindicated periods:
Year ended December 31,(in thousands) 2001 2000 1999
Customer A 279,425 140,597 46,776Customer B 197,245 270,901 143,173Customer C 96,694 171,178 153,694Customer D 42,842 118,224 27,135
The valuation allowance for deferred tax assets as ofJanuary 1, 1999 was zero. The net change in the totalvaluation allowance for the years ended December 31,2001, 2000 and 1999 was an increase of $6.7 million,$0.7 million and $0.5 million, respectively. In assessingthe realizability of deferred tax assets, managementconsiders whether it is more likely than not that someportion or all of the deferred tax assets will not berealized. The ultimate realization of deferred tax assets isdependent upon the generation of future taxable incomeduring the periods in which those temporary differencesbecome deductible. Management considers the scheduledreversal of deferred tax liabilities, projected futuretaxable income, and tax planning strategies in makingthis assessment. Based upon the level of historicaltaxable income and projections for future taxable incomeover the periods which the deferred tax assets aredeductible, management believes it is more likely thannot the Company will realize the benefits of thesedeductible differences, net of the existing valuationallowances at December 31, 2001. At December 31,2001, the Company had operating loss carryforwards ofapproximately $1.2 million in Brazil, $2.5 million inScotland, and $2.4 million in Ireland with indefinitecarryforward periods and $6.0 million in Mexico with aten-year carryforward period. The utilization of these netoperating loss carryforwards is limited to the futureoperations of the Company in the tax jurisdictions inwhich such carryforwards arose. Tax benefits of approxi-mately $0.4 million that are realized in the future fromthe utilization of these carryforwards will be reported as areduction of goodwill.
Worldwide income (loss) before income taxes andextraordinary item consisted of the following:
Year ended December 31,(in thousands) 2001 2000 1999
United States $(51,552) 1,656 10,294Foreign (6,741) 26,774 9,982
$(58,293) 28,430 20,276
Note 9 – Income Taxes (continued) Cumulative undistributed earnings of certain foreignsubsidiaries amounted to $44.3 million as of December31, 2001. The Company considers earnings from theseforeign subsidiaries to be indefinitely reinvested and,accordingly, no provision for U.S. federal and stateincome taxes has been made for these earnings. Upondistribution of foreign subsidiary earnings in the form ofdividends or otherwise, such distributed earnings wouldbe reportable for U.S. income tax purposes (subject toadjustment for foreign tax credits). The Company’smanufacturing operations in Ireland are subject to a 10%tax rate through December 2010. Thereafter, the appli-cable statutory tax rate will be 12.5%. As a result of thesereduced rates, income tax expense for the years endedDecember 31, 2001, 2000 and 1999 is approximately$1.1 million (approximately $0.06 per share diluted),$1.2 million (approximately $0.06 per share diluted) and$1.0 million (approximately $0.07 per share diluted),respectively, lower than the amount computed byapplying the statutory tax rates (20% in 2001, 24% in2000 and 28% in 1999).
45
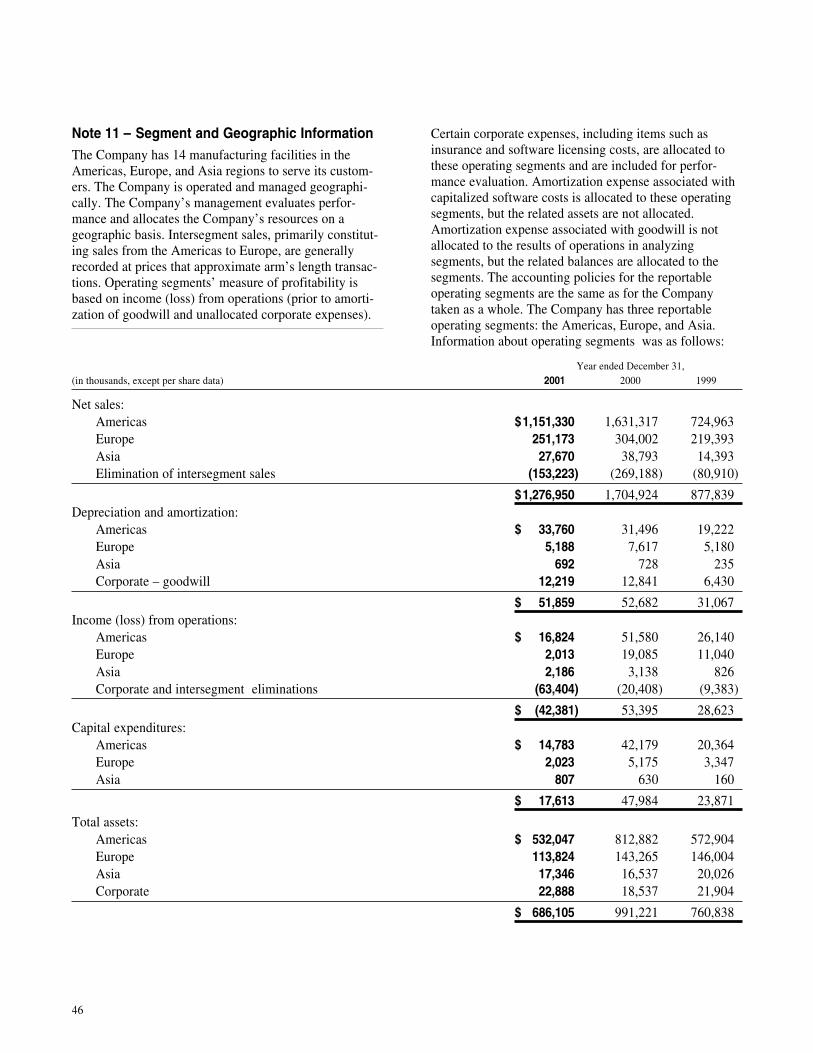
Note 11 – Segment and Geographic InformationThe Company has 14 manufacturing facilities in theAmericas, Europe, and Asia regions to serve its custom-ers. The Company is operated and managed geographi-cally. The Company’s management evaluates perfor-mance and allocates the Company’s resources on ageographic basis. Intersegment sales, primarily constitut-ing sales from the Americas to Europe, are generallyrecorded at prices that approximate arm’s length transac-tions. Operating segments’ measure of profitability isbased on income (loss) from operations (prior to amorti-zation of goodwill and unallocated corporate expenses).
Year ended December 31,(in thousands, except per share data) 2001 2000 1999
Net sales:Americas $1,151,330 1,631,317 724,963Europe 251,173 304,002 219,393Asia 27,670 38,793 14,393Elimination of intersegment sales (153,223) (269,188) (80,910)
$1,276,950 1,704,924 877,839Depreciation and amortization:
Americas $ 33,760 31,496 19,222Europe 5,188 7,617 5,180Asia 692 728 235Corporate – goodwill 12,219 12,841 6,430
$ 51,859 52,682 31,067Income (loss) from operations:
Americas $ 16,824 51,580 26,140Europe 2,013 19,085 11,040Asia 2,186 3,138 826Corporate and intersegment eliminations (63,404) (20,408) (9,383)
$ (42,381) 53,395 28,623Capital expenditures:
Americas $ 14,783 42,179 20,364Europe 2,023 5,175 3,347Asia 807 630 160
$ 17,613 47,984 23,871
Total assets:Americas $ 532,047 812,882 572,904Europe 113,824 143,265 146,004Asia 17,346 16,537 20,026Corporate 22,888 18,537 21,904
$ 686,105 991,221 760,838
Certain corporate expenses, including items such asinsurance and software licensing costs, are allocated tothese operating segments and are included for perfor-mance evaluation. Amortization expense associated withcapitalized software costs is allocated to these operatingsegments, but the related assets are not allocated.Amortization expense associated with goodwill is notallocated to the results of operations in analyzingsegments, but the related balances are allocated to thesegments. The accounting policies for the reportableoperating segments are the same as for the Companytaken as a whole. The Company has three reportableoperating segments: the Americas, Europe, and Asia.Information about operating segments was as follows:
46
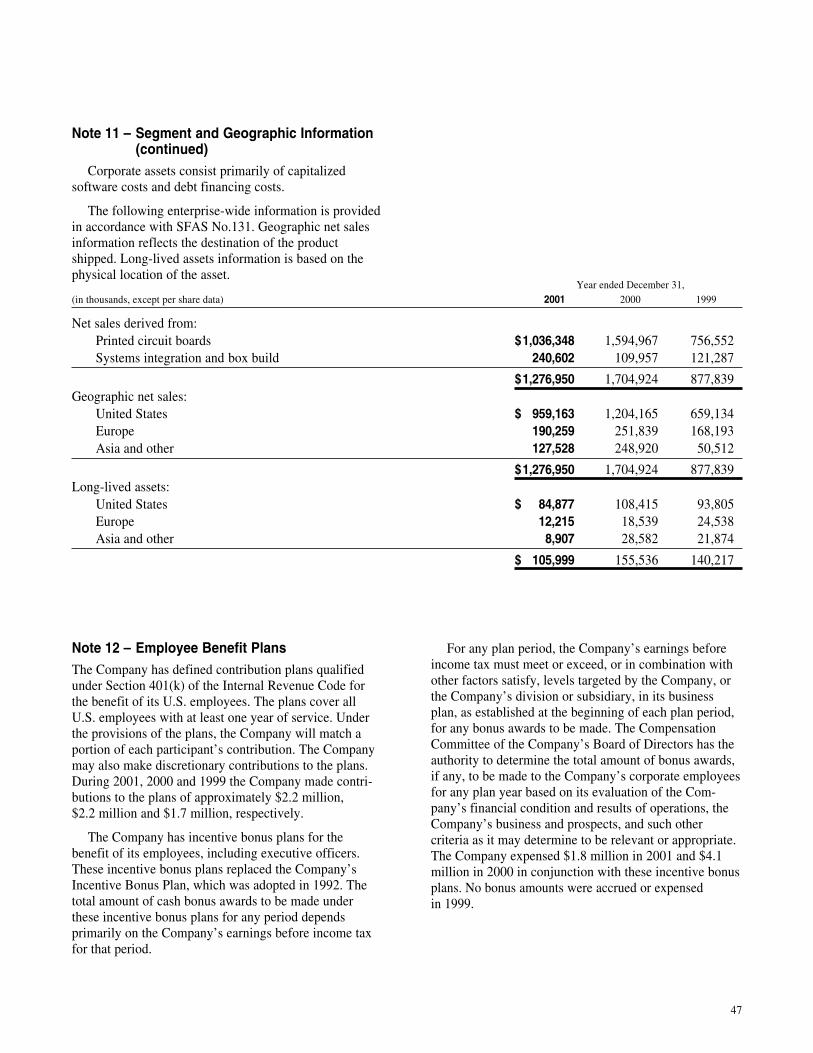
Note 12 – Employee Benefit PlansThe Company has defined contribution plans qualifiedunder Section 401(k) of the Internal Revenue Code forthe benefit of its U.S. employees. The plans cover allU.S. employees with at least one year of service. Underthe provisions of the plans, the Company will match aportion of each participant’s contribution. The Companymay also make discretionary contributions to the plans.During 2001, 2000 and 1999 the Company made contri-butions to the plans of approximately $2.2 million,$2.2 million and $1.7 million, respectively.
The Company has incentive bonus plans for thebenefit of its employees, including executive officers.These incentive bonus plans replaced the Company’sIncentive Bonus Plan, which was adopted in 1992. Thetotal amount of cash bonus awards to be made underthese incentive bonus plans for any period dependsprimarily on the Company’s earnings before income taxfor that period.
Note 11 – Segment and Geographic Information(continued)
For any plan period, the Company’s earnings beforeincome tax must meet or exceed, or in combination withother factors satisfy, levels targeted by the Company, orthe Company’s division or subsidiary, in its businessplan, as established at the beginning of each plan period,for any bonus awards to be made. The CompensationCommittee of the Company’s Board of Directors has theauthority to determine the total amount of bonus awards,if any, to be made to the Company’s corporate employeesfor any plan year based on its evaluation of the Com-pany’s financial condition and results of operations, theCompany’s business and prospects, and such othercriteria as it may determine to be relevant or appropriate.The Company expensed $1.8 million in 2001 and $4.1million in 2000 in conjunction with these incentive bonusplans. No bonus amounts were accrued or expensedin 1999.
Corporate assets consist primarily of capitalizedsoftware costs and debt financing costs.
The following enterprise-wide information is providedin accordance with SFAS No.131. Geographic net salesinformation reflects the destination of the productshipped. Long-lived assets information is based on thephysical location of the asset.
Year ended December 31,(in thousands, except per share data) 2001 2000 1999
Net sales derived from:Printed circuit boards $1,036,348 1,594,967 756,552Systems integration and box build 240,602 109,957 121,287
$1,276,950 1,704,924 877,839Geographic net sales:
United States $ 959,163 1,204,165 659,134Europe 190,259 251,839 168,193Asia and other 127,528 248,920 50,512
$1,276,950 1,704,924 877,839Long-lived assets:
United States $ 84,877 108,415 93,805Europe 12,215 18,539 24,538Asia and other 8,907 28,582 21,874
$ 105,999 155,536 140,217
47
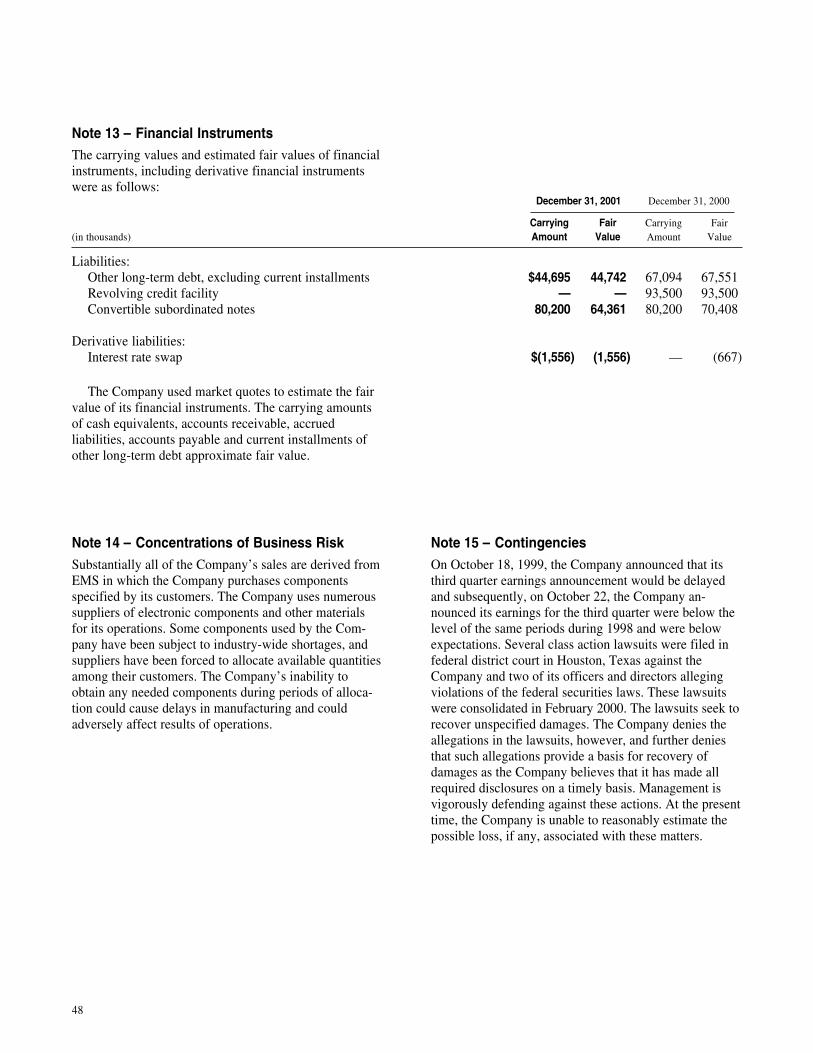
Note 14 – Concentrations of Business RiskSubstantially all of the Company’s sales are derived fromEMS in which the Company purchases componentsspecified by its customers. The Company uses numeroussuppliers of electronic components and other materialsfor its operations. Some components used by the Com-pany have been subject to industry-wide shortages, andsuppliers have been forced to allocate available quantitiesamong their customers. The Company’s inability toobtain any needed components during periods of alloca-tion could cause delays in manufacturing and couldadversely affect results of operations.
Note 13 – Financial InstrumentsThe carrying values and estimated fair values of financialinstruments, including derivative financial instrumentswere as follows:
The Company used market quotes to estimate the fairvalue of its financial instruments. The carrying amountsof cash equivalents, accounts receivable, accruedliabilities, accounts payable and current installments ofother long-term debt approximate fair value.
December 31, 2001 December 31, 2000
Carrying Fair Carrying Fair(in thousands) Amount Value Amount Value
Liabilities:Other long-term debt, excluding current installments $44,695 44,742 67,094 67,551Revolving credit facility — — 93,500 93,500Convertible subordinated notes 80,200 64,361 80,200 70,408
Derivative liabilities:Interest rate swap $(1,556) (1,556) — (667)
Note 15 – ContingenciesOn October 18, 1999, the Company announced that itsthird quarter earnings announcement would be delayedand subsequently, on October 22, the Company an-nounced its earnings for the third quarter were below thelevel of the same periods during 1998 and were belowexpectations. Several class action lawsuits were filed infederal district court in Houston, Texas against theCompany and two of its officers and directors allegingviolations of the federal securities laws. These lawsuitswere consolidated in February 2000. The lawsuits seek torecover unspecified damages. The Company denies theallegations in the lawsuits, however, and further deniesthat such allegations provide a basis for recovery ofdamages as the Company believes that it has made allrequired disclosures on a timely basis. Management isvigorously defending against these actions. At the presenttime, the Company is unable to reasonably estimate thepossible loss, if any, associated with these matters.
48
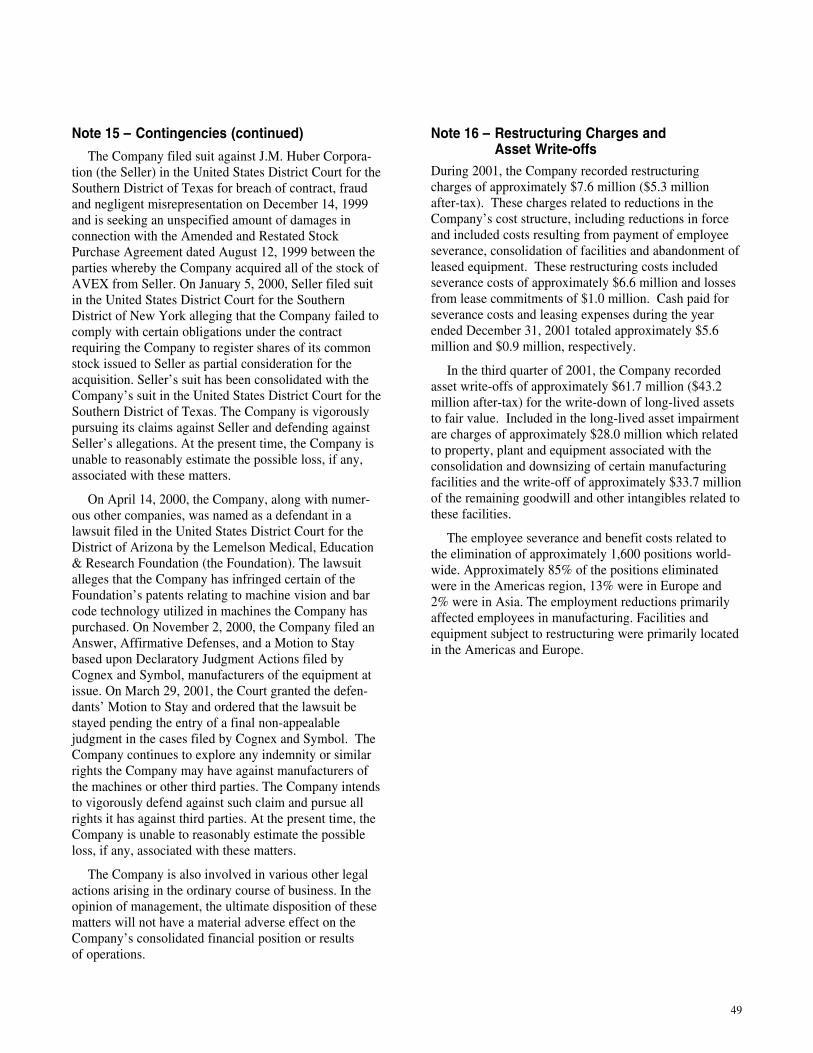
The Company filed suit against J.M. Huber Corpora-tion (the Seller) in the United States District Court for theSouthern District of Texas for breach of contract, fraudand negligent misrepresentation on December 14, 1999and is seeking an unspecified amount of damages inconnection with the Amended and Restated StockPurchase Agreement dated August 12, 1999 between theparties whereby the Company acquired all of the stock ofAVEX from Seller. On January 5, 2000, Seller filed suitin the United States District Court for the SouthernDistrict of New York alleging that the Company failed tocomply with certain obligations under the contractrequiring the Company to register shares of its commonstock issued to Seller as partial consideration for theacquisition. Seller’s suit has been consolidated with theCompany’s suit in the United States District Court for theSouthern District of Texas. The Company is vigorouslypursuing its claims against Seller and defending againstSeller’s allegations. At the present time, the Company isunable to reasonably estimate the possible loss, if any,associated with these matters.
On April 14, 2000, the Company, along with numer-ous other companies, was named as a defendant in alawsuit filed in the United States District Court for theDistrict of Arizona by the Lemelson Medical, Education& Research Foundation (the Foundation). The lawsuitalleges that the Company has infringed certain of theFoundation’s patents relating to machine vision and barcode technology utilized in machines the Company haspurchased. On November 2, 2000, the Company filed anAnswer, Affirmative Defenses, and a Motion to Staybased upon Declaratory Judgment Actions filed byCognex and Symbol, manufacturers of the equipment atissue. On March 29, 2001, the Court granted the defen-dants’ Motion to Stay and ordered that the lawsuit bestayed pending the entry of a final non-appealablejudgment in the cases filed by Cognex and Symbol. TheCompany continues to explore any indemnity or similarrights the Company may have against manufacturers ofthe machines or other third parties. The Company intendsto vigorously defend against such claim and pursue allrights it has against third parties. At the present time, theCompany is unable to reasonably estimate the possibleloss, if any, associated with these matters.
The Company is also involved in various other legalactions arising in the ordinary course of business. In theopinion of management, the ultimate disposition of thesematters will not have a material adverse effect on theCompany’s consolidated financial position or resultsof operations.
Note 16 – Restructuring Charges andAsset Write-offs
During 2001, the Company recorded restructuringcharges of approximately $7.6 million ($5.3 millionafter-tax). These charges related to reductions in theCompany’s cost structure, including reductions in forceand included costs resulting from payment of employeeseverance, consolidation of facilities and abandonment ofleased equipment. These restructuring costs includedseverance costs of approximately $6.6 million and lossesfrom lease commitments of $1.0 million. Cash paid forseverance costs and leasing expenses during the yearended December 31, 2001 totaled approximately $5.6million and $0.9 million, respectively.
In the third quarter of 2001, the Company recordedasset write-offs of approximately $61.7 million ($43.2million after-tax) for the write-down of long-lived assetsto fair value. Included in the long-lived asset impairmentare charges of approximately $28.0 million which relatedto property, plant and equipment associated with theconsolidation and downsizing of certain manufacturingfacilities and the write-off of approximately $33.7 millionof the remaining goodwill and other intangibles related tothese facilities.
The employee severance and benefit costs related tothe elimination of approximately 1,600 positions world-wide. Approximately 85% of the positions eliminatedwere in the Americas region, 13% were in Europe and2% were in Asia. The employment reductions primarilyaffected employees in manufacturing. Facilities andequipment subject to restructuring were primarily locatedin the Americas and Europe.
Note 15 – Contingencies (continued)
49
Management’s Report
The Board of Directors and ShareholdersBenchmark Electronics, Inc.:
We have audited the accompanying consolidatedbalance sheets of Benchmark Electronics, Inc. andsubsidiaries as of December 31, 2001 and 2000, and therelated consolidated statements of income (loss), share-holders’ equity and comprehensive income (loss), andcash flows for each of the years in the three-year periodended December 31, 2001. These consolidated financialstatements are the responsibility of the Company’smanagement. Our responsibility is to express an opinionon these consolidated financial statements based onour audits.
We conducted our audits in accordance with auditingstandards generally accepted in the United States ofAmerica. Those standards require that we plan andperform the audit to obtain reasonable assurance aboutwhether the financial statements are free of materialmisstatement. An audit includes examining, on a testbasis, evidence supporting the amounts and disclosures inthe financial statements. An audit also includes assessingthe accounting principles used and significant estimatesmade by management, as well as evaluating the overallfinancial statement presentation. We believe that ouraudits provide a reasonable basis for our opinion.
In our opinion, the consolidated financial statementsreferred to above present fairly, in all material respects,the financial position of Benchmark Electronics, Inc. andsubsidiaries as of December 31, 2001 and 2000, and theresults of their operations and their cash flows for each ofthe years in the three-year period ended December 31,2001, in conformity with accounting principles generallyaccepted in the United States of America.
As discussed in note 1 to the consolidated financialstatements, the Company changed its method of account-ing for derivative instruments and hedging activitiesin 2001.
Houston, TexasFebruary 5, 2002
Independent Auditors’Report
The management of Benchmark Electronics, Inc. hasprepared and is responsible for the consolidated financialstatements and related financial data contained in thisreport. The consolidated financial statements were pre-pared in accordance with accounting principles generallyaccepted in the United States of America and necessarilyinclude certain amounts based upon management’s bestestimates and judgments. The financial informationcontained elsewhere in this annual report is consistentwith that in the consolidated financial statements.
The Company maintains internal accounting controlsystems that are adequate to prepare financial records andto provide reasonable assurance that the assets are safe-guarded from loss or unauthorized use. We believe thesesystems are effective, and the cost of the systems doesnot exceed the benefits obtained.
The Audit Committee, composed exclusively ofoutside directors, has reviewed all financial data includedin this report. The committee meets periodically with theCompany’s management and independent public accoun-tants on financial reporting matters. The independentpublic accountants have complete access to the AuditCommittee and may meet with the committee, withoutmanagement present, to discuss their audit results andopinions on the quality of financial reporting.
The role of independent public accountants is torender a professional, independent opinion on manage-ment’s financial statements to the extent required bygenerally accepted auditing standards in the United Statesof America. Benchmark’s responsibility is to conduct itsaffairs according to the highest standards of personal andcorporate conduct.
Donald E. Nigbor Cary T. FuChairman & President &Chief Executive Officer Chief Operating Officer
Gayla J. DellyVice President Finance,Chief Financial Officer& Treasurer
50
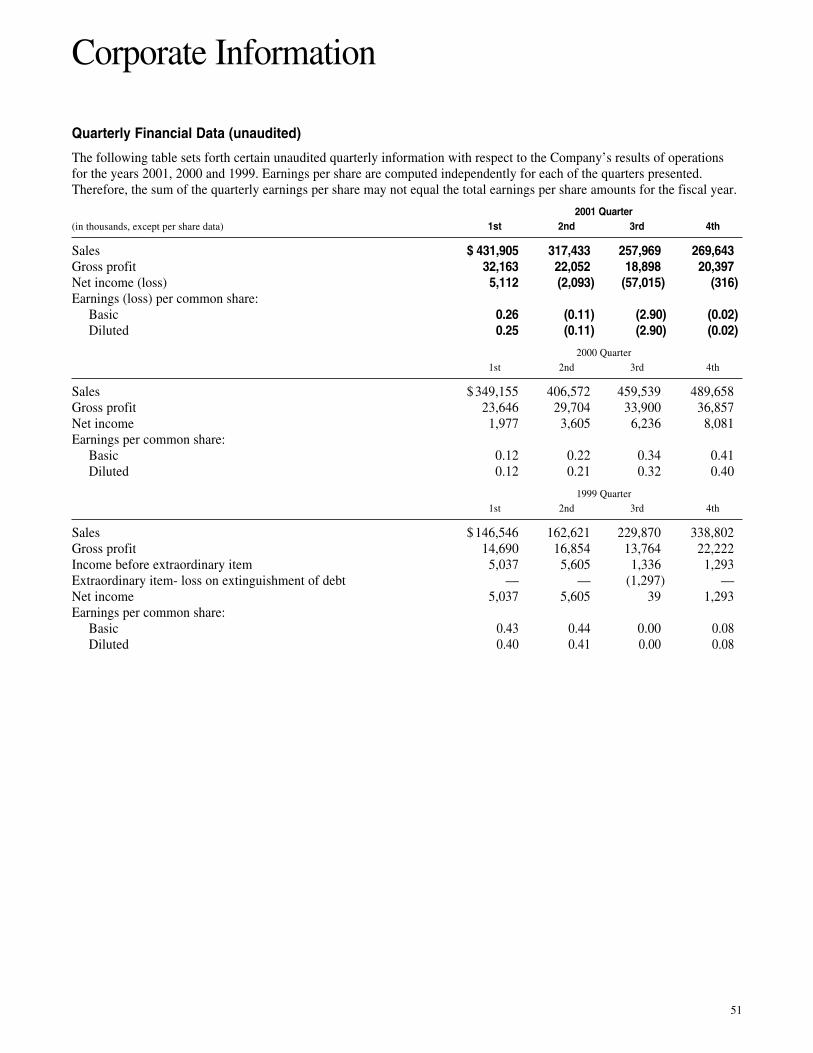
Quarterly Financial Data (unaudited)
The following table sets forth certain unaudited quarterly information with respect to the Company’s results of operationsfor the years 2001, 2000 and 1999. Earnings per share are computed independently for each of the quarters presented.Therefore, the sum of the quarterly earnings per share may not equal the total earnings per share amounts for the fiscal year.
2001 Quarter(in thousands, except per share data) 1st 2nd 3rd 4th
Sales $ 431,905 317,433 257,969 269,643Gross profit 32,163 22,052 18,898 20,397Net income (loss) 5,112 (2,093) (57,015) (316)Earnings (loss) per common share: Basic 0.26 (0.11) (2.90) (0.02) Diluted 0.25 (0.11) (2.90) (0.02)
2000 Quarter1st 2nd 3rd 4th
Sales $ 349,155 406,572 459,539 489,658Gross profit 23,646 29,704 33,900 36,857Net income 1,977 3,605 6,236 8,081Earnings per common share: Basic 0.12 0.22 0.34 0.41 Diluted 0.12 0.21 0.32 0.40
1999 Quarter1st 2nd 3rd 4th
Sales $ 146,546 162,621 229,870 338,802Gross profit 14,690 16,854 13,764 22,222Income before extraordinary item 5,037 5,605 1,336 1,293Extraordinary item- loss on extinguishment of debt — — (1,297) —Net income 5,037 5,605 39 1,293Earnings per common share: Basic 0.43 0.44 0.00 0.08 Diluted 0.40 0.41 0.00 0.08
Corporate Information
51
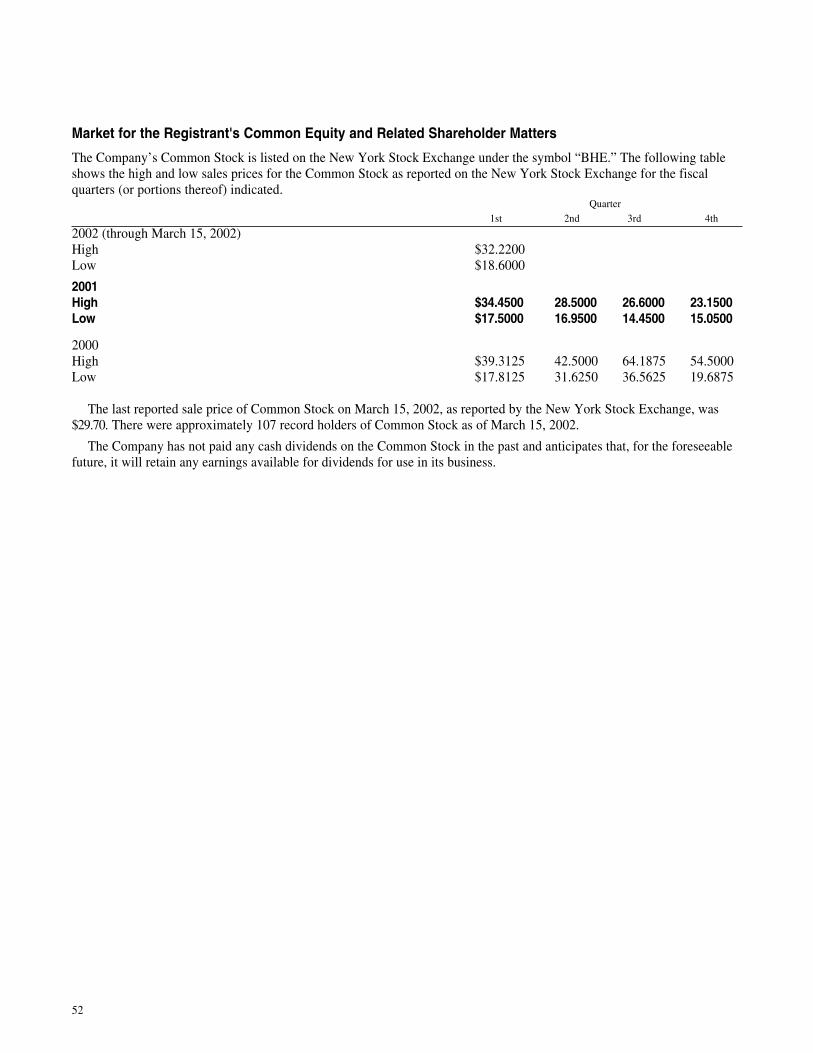
52
Market for the Registrant's Common Equity and Related Shareholder Matters
The Company’s Common Stock is listed on the New York Stock Exchange under the symbol “BHE.” The following tableshows the high and low sales prices for the Common Stock as reported on the New York Stock Exchange for the fiscalquarters (or portions thereof) indicated.
Quarter1st 2nd 3rd 4th
2002 (through March 15, 2002)High $32.2200Low $18.6000
2001High $34.4500 28.5000 26.6000 23.1500Low $17.5000 16.9500 14.4500 15.0500
2000High $39.3125 42.5000 64.1875 54.5000Low $17.8125 31.6250 36.5625 19.6875
The last reported sale price of Common Stock on March 15, 2002, as reported by the New York Stock Exchange, was$29.70. There were approximately 107 record holders of Common Stock as of March 15, 2002.
The Company has not paid any cash dividends on the Common Stock in the past and anticipates that, for the foreseeablefuture, it will retain any earnings available for dividends for use in its business.
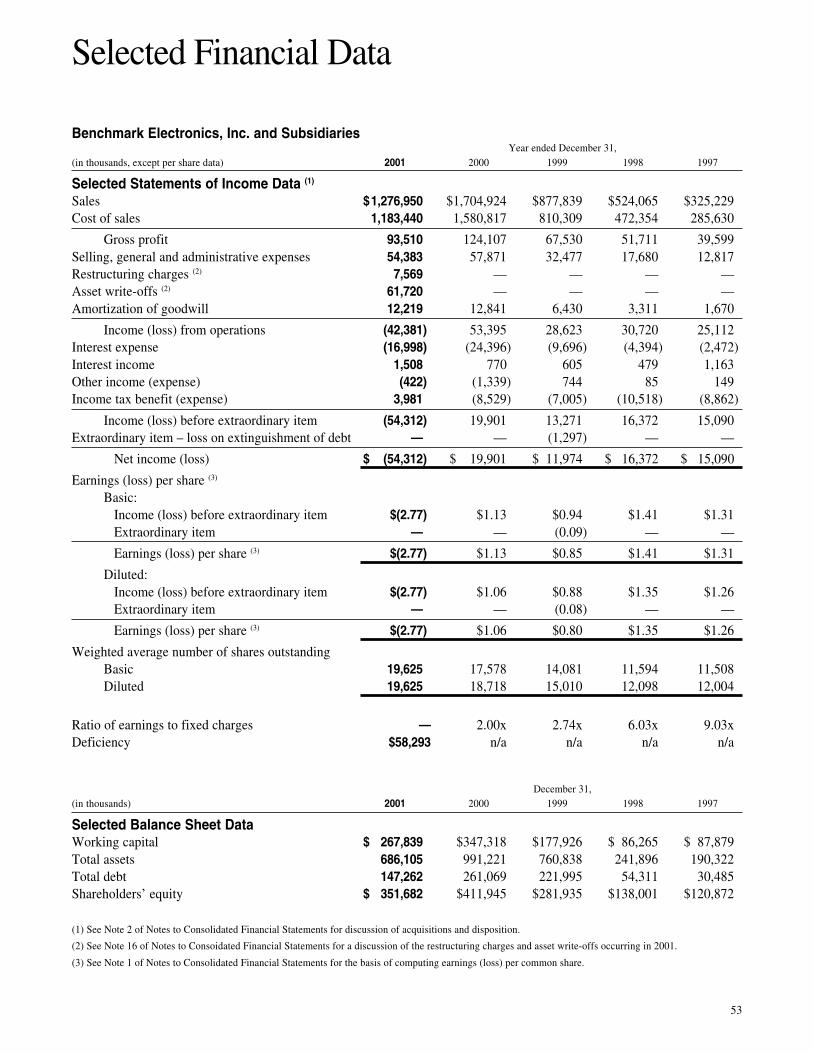
Benchmark Electronics, Inc. and SubsidiariesYear ended December 31,
(in thousands, except per share data) 2001 2000 1999 1998 1997
Selected Statements of Income Data (1)
Sales $1,276,950 $1,704,924 $877,839 $524,065 $325,229Cost of sales 1,183,440 1,580,817 810,309 472,354 285,630
Gross profit 93,510 124,107 67,530 51,711 39,599Selling, general and administrative expenses 54,383 57,871 32,477 17,680 12,817Restructuring charges (2) 7,569 — — — —Asset write-offs (2) 61,720 — — — —Amortization of goodwill 12,219 12,841 6,430 3,311 1,670
Income (loss) from operations (42,381) 53,395 28,623 30,720 25,112Interest expense (16,998) (24,396) (9,696) (4,394) (2,472)Interest income 1,508 770 605 479 1,163Other income (expense) (422) (1,339) 744 85 149Income tax benefit (expense) 3,981 (8,529) (7,005) (10,518) (8,862)
Income (loss) before extraordinary item (54,312) 19,901 13,271 16,372 15,090Extraordinary item – loss on extinguishment of debt — — (1,297) — —
Net income (loss) $ (54,312) $ 19,901 $ 11,974 $ 16,372 $ 15,090
Earnings (loss) per share (3)
Basic: Income (loss) before extraordinary item $(2.77) $1.13 $0.94 $1.41 $1.31 Extraordinary item — — (0.09) — —
Earnings (loss) per share (3) $(2.77) $1.13 $0.85 $1.41 $1.31
Diluted: Income (loss) before extraordinary item $(2.77) $1.06 $0.88 $1.35 $1.26 Extraordinary item — — (0.08) — —
Earnings (loss) per share (3) $(2.77) $1.06 $0.80 $1.35 $1.26
Weighted average number of shares outstandingBasic 19,625 17,578 14,081 11,594 11,508Diluted 19,625 18,718 15,010 12,098 12,004
Ratio of earnings to fixed charges — 2.00x 2.74x 6.03x 9.03xDeficiency $58,293 n/a n/a n/a n/a
December 31,(in thousands) 2001 2000 1999 1998 1997
Selected Balance Sheet DataWorking capital $ 267,839 $347,318 $177,926 $ 86,265 $ 87,879Total assets 686,105 991,221 760,838 241,896 190,322Total debt 147,262 261,069 221,995 54,311 30,485Shareholders’ equity $ 351,682 $411,945 $281,935 $138,001 $120,872
(1) See Note 2 of Notes to Consolidated Financial Statements for discussion of acquisitions and disposition.
(2) See Note 16 of Notes to Consoidated Financial Statements for a discussion of the restructuring charges and asset write-offs occurring in 2001.
(3) See Note 1 of Notes to Consolidated Financial Statements for the basis of computing earnings (loss) per common share.
Selected Financial Data
53
OfficersDonald E. Nigbor (1)
Chairman of the Board andChief Executive Officer
Cary T. Fu (1)
President andChief Operating Officer
Gayla J. Delly (1)
Vice President Finance,Chief Financial Officerand Treasurer
Steven A. Barton (2)
Executive Vice President
Lenora A. GurtonSecretary
Christopher NawrockiGroup President
Legal CounselBracewell & Patterson, L.L.P.Houston, Texas
Independent AuditorsKPMG LLPHouston, Texas
DirectorsDavid H. Arnold (3)(4)
Retired – Former PresidentEMD Associates, Inc.Winona, Minnesota(Acquired by Benchmark, 1996)
John C. Custer (3)(4)
Retired – Former Chairman of the BoardMason & Hanger–Silas Mason Co., Inc.Lexington, Kentucky(Technical services contracting andengineering firm)
Steven A. BartonExecutive Vice PresidentBenchmark Electronics, Inc.
Peter G. Dorflinger (3) (4)
PresidentGlasTech, Inc.Austin, Texas(Dental products manufacturer)
Cary T. FuPresident and Chief Operating OfficerBenchmark Electronics, Inc.
Donald E. NigborChairman of the Board andChief Executive OfficerBenchmark Electronics, Inc.
(1) Executive Officer(2) Part-time since June 1993(3) Member of Audit Committee(4) Member of Compensation Committee
Corporate and Shareholder Data
NoticesStock Transfer Agent and Registrar
Communications concerning stock transferrequirements, lost certificates or changes ofaddress should be directed to:
Computershare Trust Company, Inc.350 Indiana Street, Suite 800Golden, CO. 80401303/262-0600.
Stock Trading
The common stock of Benchmark Electronics,Inc. trades on the New York Stock Exchangeunder the symbol BHE.
SEC Form 10-K
Benchmark will provide a copy of its AnnualReport on Form 10-K (without exhibits) for thefiscal year ended December 31, 2001, filed withthe Securities and Exchange Commission,without charge upon written request to:
Gayla J. DellyVice President FinanceChief Financial Officer and TreasurerBenchmark Electronics, Inc.3000 Technology DriveAngleton, TX 77515.
Financial Mailing List
Shareholders whose stock is held in trust or bya brokerage firm may receive timely financialmailings directly from Benchmark by writing toMs. Gayla J. Delly at the above address.
Annual Meeting
Shareholders are invited to attend the BenchmarkElectronics, Inc. annual meeting, which will beheld at 10:00 a.m. on Tuesday, May 14, 2002,at the
Hyatt Regency Houston1200 Louisiana StreetHouston, Texas.
This annual report is printed on recycled paper.
54

3000 Technology DriveAngleton, Texas 77515
979/849-6550
www.bench.com