united states - annualreports.com
TRANSCRIPT

UNITED STATESSECURITIES AND EXCHANGE COMMISSION
WASHINGTON, D.C. 20549
FORM 10-K
(Mark One)
☒☒ ANNUAL REPORT PURSUANT TO SECTION 13 OR 15(d) OF THE SECURITIES EXCHANGE ACT OF 1934
For the Fiscal Year Ended June 30, 2021
OR
☐☐TRANSITION REPORT PURSUANT TO SECTION 13 OR 15(d) OF THE SECURITIES EXCHANGE ACT OF 1934
For the Transition Period From __________________ To __________________
Commission File Number 1-35593
HOMETRUST BANCSHARES, INC.
(Exact Name of Registrant as Specified in its Charter) Maryland 45-5055422
(State or Other Jurisdiction of Incorporation or Organization) (I.R.S. Employer Identification No.)
10 Woodfin Street, Asheville, North Carolina 28801(Address of Principal Executive Offices) (Zip Code)
Registrant’s Telephone Number, Including Area Code: (828) 259-3939
Securities Registered Pursuant to Section 12(b) of the Act: Title of Each Class Trading Symbol Name of Each Exchange on Which Registered
Common Stock, par value $0.01 per share HTBI The NASDAQ Stock Market LLC
Securities Registered Pursuant to Section 12(g) of the Act:
Preferred Share Purchase Rights
Indicate by check mark if the registrant is a well-known seasoned issuer, as defined in Rule 405 of the Securities Act. Yes ☐ No ☒
Indicate by check mark if the registrant is not required to file reports pursuant to Section 13 or Section 15(d) of the Act. Yes ☐ No ☒
Indicate by check mark whether the registrant (1) has filed all reports required to be filed by Section 13 or 15(d) of the Securities Exchange Act of 1934 during the preceding 12 months (or forsuch shorter period that the registrant was required to file such reports), and (2) has been subject to such filing requirements for the past 90 days. Yes ☒ No ☐.
Indicate by check mark whether the registrant has submitted electronically and posted on its corporate Web site, if any, every Interactive Data File required to be submitted and posted pursuantto Rule 405 of Regulation S-T (§ 232.405 of this chapter) during the preceding 12 months (or for such shorter period that the registrant was required to submit and post such files). Yes ☒ No☐.
Indicate by check mark whether the registrant is a large accelerated filer, an accelerated filer, a non-accelerated filer, a smaller reporting company, or an emerging growth company. See thedefinitions of “large accelerated filer,” “accelerated filer,” “smaller reporting company,” "emerging growth company" in Rule 12b-2 of the Exchange Act.
Large Accelerated Filer ☐ Accelerated Filer ☒Non-Accelerated Filer ☐ Smaller reporting company ☐Emerging growth company ☐
If an emerging growth company, indicate by check mark if the registrant has elected not to use the extended transition period for complying with any newor revised financial accounting standards provided pursuant to Section 13(a) of the Exchange Act. ☐ Indicate by check mark whether the registrant has filed a report on and attestation to its management’s assessment of the effectiveness of its internal control over financial reportingunder Section 404(b) of the Sarbanes-Oxley Act (15 U.S.C. 7262(b)) by the registered public accounting firm that prepared or issued its audit report. ☒
Indicate by check mark whether the registrant is a shell company (as defined in Rule 12b-2 of the Exchange Act). Yes ☐ No ☒.
As of September 7, 2021, there were issued and outstanding 16,460,302 shares of the Registrant’s Common Stock. The aggregate market value of the voting stock held by non-affiliates of theRegistrant computed by reference to the closing price of such stock as of December 31, 2020, was $312.6 million. (The exclusion from such amount of the market value of the shares owned byany person shall not be deemed an admission by the Registrant that such person is an affiliate of the Registrant).
Documents Incorporated By Reference
Portions of the Registrant's Proxy Statement for its 2021 Annual Meeting of Stockholders are incorporated by reference into Part III of this Form 10-K.

HOMETRUST BANCSHARES, INC.FORM 10-K
FOR THE FISCAL YEAR ENDED JUNE 30, 2021TABLE OF CONTENTS
PagePART I
Item 1 Business 6Item 1A. Risk Factors 37Item 1B. Unresolved Staff Comments 49Item 2 Properties 49Item 3 Legal Proceedings 49Item 4 Mine Safety Disclosures 50
PART IIItem 5 Market for Registrant’s Common Equity, Related Stockholder Matters, and Issuer Purchases of Equity Securities 50Item 6 Selected Financial Data 52Item 7 Management’s Discussion and Analysis of Financial Condition and Results of Operations 53Item 7A. Quantitative and Qualitative Disclosures About Market Risk 68Item 8 Financial Statements and Supplementary Data 69Item 9 Changes in and Disagreements with Accountants on Accounting and Financial Disclosure 125Item 9A. Controls and Procedures 125Item 9B. Other Information 126
PART IIIItem 10 Directors, Executive Officers and Corporate Governance 127Item 11 Executive Compensation 127Item 12 Security Ownership of Certain Beneficial Owners and Management and Related Stockholder Matters 127Item 13 Certain Relationships and Related Transactions, and Director Independence 127Item 14 Principal Accountant Fees and Services 127
PART IVItem 15 Exhibits and Financial Statement Schedules 128Item 16 Form 10-K Summary 131 Signatures 131
2

Glossary of Defined Terms
The following items may be used throughout this Form 10-K, including the Notes to Consolidated Financial Statements in Item 8 and Management's Discussion and Analysis ofFinancial Condition and Results of Operations in Item 7 of this Form 10-K.
Term DefinitionACL Allowance for Credit LossesAFS Available-For-Sale
AICPAAmerican Institute of Certified Public Accountants
ALL Allowance for Loan LossesAMLA Anti-Money Laundering Act of 2020AMT Alternative Minimum TaxARRC Alternative Reference Rates CommitteeASC Accounting Standards CodificationASU Accounting Standards UpdateBHCA Bank Holding Company ActBOLI Bank Owned Life InsuranceBSA Bank Secrecy Act of 1970
CARES ActCoronavirus Aid, Relief, and Economic Security Act of 2020
CBLRCommunity Bank Leverage Ratio
CDCertificate of Deposit
CDA Collateral Dependent Asset
CECLCurrent Expected Credit Losses
CET1Common Equity Tier 1
CFPBConsumer Financial Protection Bureau
COVID-19Coronavirus Disease 2019
CPIConsumer Price Index
CRACommunity Reinvestment Act
DCF Discounted Cash FlowsDodd-Frank Act Dodd-Frank Wall Street Reform and Consumer Protection Act
DTADeferred Tax Asset
ECL Expected Credit LossesEPS Earnings Per ShareESOP Employee Stock Ownership PlanExchange Act Securities Exchange Act of 1934, as amended
FASB Financial Accounting Standards BoardFDIC Federal Deposit Insurance Corporation
Federal ReserveBoard of Governors of the Federal Reserve System
FHFAFederal Housing Finance Agency
FHLB or FHLB of Atlanta Federal Home Loan BankFRB Federal Reserve Bank of Richmond
GAAPGenerally Accepted Accounting Principles in the United States
GSE Government-Sponsored EnterprisesHELOC Home Equity Line of Credit
IRCInternal Revenue Code
KSOPHomeTrust Bank KSOP Plan
LIBORLondon Interbank Offered Rate
LPOLoan Production Office
MBSMortgage-Backed Security
MSAMetropolitan Statistical Area

3

NBV Net Book Value
NCCOBNorth Carolina Office of the Commissioner of Banks
NOLNet Operating Loss
PCD Purchased Financial Assets with Credit DeteriorationPCI Purchased Credit ImpairedPPP Paycheck Protection ProgramPVE Present Value of EquityREO Real Estate OwnedROA Return on AssetsROE Return on EquityROU Right of Use
SASStatement of Auditing Standards
SBA U.S. Small Business AdministrationSBIC Small Business Investment CompaniesSEC Securities and Exchange CommissionSOFR Secured Overnight Financing RateSOX Act Sarbanes-Oxley Act of 2002
Tax ActTax Cuts and Jobs Act
TDR Troubled Debt Restructuring
USDA B&IUnited States Department of Agriculture Business & Industry
WNCSC Western North Carolina Service Corporation
4

Forward-Looking Statements
Certain matters in this Form 10-K constitute forward-looking statements within the meaning of the Private Securities Litigation Reform Act of 1995. These statements relate toour financial condition, results of operations, plans, objectives, future performance or business. Forward-looking statements are not statements of historical fact, are based oncertain assumptions and are generally identified by use of the words “believes,” “expects,” “anticipates,” “estimates,” “forecasts,” “intends,” “plans,” “targets,” “potentially,”“probably,” “projects,” “outlook” or similar expressions or future or conditional verbs such as “may,” “will,” “should,” “would,” and “could.” Forward-looking statementsinclude statements with respect to our beliefs, plans, objectives, goals, expectations, assumptions, and statements about future economic performance and projections of financialitems. These forward-looking statements are subject to known and unknown risks, uncertainties and other factors that could cause actual results to differ materially from theresults anticipated or implied by our forward-looking statements, including, but not limited to: the effect of the COVID-19 pandemic, including on the Company’ credit qualityand business operations, as well as its impact on general economic and financial market conditions and other uncertainties resulting from the COVID-19 pandemic, such as theextent and duration of the impact on public health, the U.S. and global economies, and consumer and corporate customers, including economic activity, employment levels andmarket liquidity; the credit risks of lending activities, including changes in the level and trend of loan delinquencies and write offs and changes in our allowance for credit lossesand provision for loan losses that may be impacted by deterioration in the housing and commercial real estate markets; management's assumptions in determining the adequacyof the allowance for credit losses; changes in general economic conditions, either nationally or in our market areas; changes in the levels of general interest rates, and the relativedifferences between short and long term interest rates, deposit interest rates, our net interest margin and funding sources; uncertainty regarding the future of the LIBOR, and thepotential transition away from LIBOR toward new interest rate benchmarks; fluctuations in the demand for loans, the number of unsold homes, land and other properties andfluctuations in real estate values in our market areas; decreases in the secondary market for the sale of loans that we originate; results of examinations of us by the FederalReserve, the NCCOB, or other regulatory authorities, including the possibility that any such regulatory authority may, among other things, require us to increase our allowancefor credit losses, write-down assets, change our regulatory capital position or affect our ability to borrow funds or maintain or increase deposits, which could adversely affect ourliquidity and earnings; legislative or regulatory changes that adversely affect our business including the effect of Dodd-Frank Wall Street Reform and Consumer Protection Act,changes in laws or regulations, changes in regulatory policies and principles or the application or interpretation of laws and regulations by regulatory agencies and tax authorities,including changes in deferred tax asset and liability activity, or the interpretation of regulatory capital or other rules, including as a result of Basel III; our ability to attract andretain deposits; our ability to control operating costs and expenses, especially costs associated with our operation as a public company; the use of estimates in determining fairvalue of certain assets, which estimates may prove to be incorrect and result in significant declines in valuation; difficulties in reducing risks associated with the loans on ourbalance sheet; staffing fluctuations in response to product demand or the implementation of corporate strategies that affect our workforce and potential associated charges;disruptions, security breaches, or other adverse events, failures or interruptions in, or attacks on, our information technology systems or on the third-party vendors who performseveral of our critical processing functions; our ability to retain key members of our senior management team; costs and effects of litigation, including settlements andjudgments; our ability to successfully integrate any assets, liabilities, customers, systems, and management personnel we may in the future acquire into our operations and ourability to realize related revenue synergies and cost savings within expected time frames and any goodwill charges related thereto; increased competitive pressures amongfinancial services companies; changes in consumer spending, borrowing and savings habits; the availability of resources to address changes in laws, rules, or regulations or torespond to regulatory actions; adverse changes in the securities markets; inability of key third-party providers to perform their obligations to us; changes in accounting principles,policies or guidelines and practices, as may be adopted by the financial institution regulatory agencies, the Public Company Accounting Oversight Board or the FinancialAccounting Standards Board; and other economic, competitive, governmental, regulatory, and technological factors affecting our operations, pricing, products and servicesincluding the CARES Act; and the other risks detailed from time to time in our filings with the SEC, including this report on Form 10-K.
Any of the forward-looking statements are based upon management’s beliefs and assumptions at the time they are made. We undertake no obligation to publicly update or reviseany forward-looking statements included in this report or to update the reasons why actual results could differ from those contained in such statements, whether as a result of newinformation, future events or otherwise. In light of these risks, uncertainties and assumptions, the forward-looking statements discussed in this report might not occur and youshould not put undue reliance on any forward-looking statements.
As used throughout this report, the terms “we”, “our”, “us”, “HomeTrust Bancshares” or the “Company” refer to HomeTrust Bancshares, Inc. and its consolidated subsidiaries,including HomeTrust Bank (“HomeTrust” or "Bank") unless the context indicates otherwise.
5

PART I
Item 1. Business
General
HomeTrust Bancshares, Inc., a Maryland corporation, was formed for the purpose of becoming the holding company for HomeTrust Bank in connection with HomeTrust Bank’sconversion from mutual to stock form, which was completed on July 10, 2012 (the “Conversion”). As a bank holding company and financial holding company, HomeTrustBancshares, Inc. is regulated by the Federal Reserve. At June 30, 2021, the Company had consolidated total assets of $3.5 billion, total deposits of $3.0 billion and stockholders’equity of $396.5 million. The Company has not engaged in any significant activity other than holding the stock of the Bank. Accordingly, the information set forth in this AnnualReport on Form 10-K (“Form 10-K”), including the audited consolidated financial statements and related data, relates primarily to the Bank and its subsidiary. As a NorthCarolina state-chartered bank, and member of the Federal Reserve, the Bank's primary regulators are the NCCOB and the Federal Reserve. The Bank's deposits are federallyinsured up to applicable limits by the FDIC. The Bank is a member of the FHLB of Atlanta, which is one of the 12 regional banks in the Federal Home Loan Bank System. Ourheadquarters is located in Asheville, North Carolina.
The Bank was originally formed in 1926. Between the fiscal years of 1996 and 2011, HomeTrust Bank's board of directors and executive management expanded the Bankbeyond its historical Asheville market and created a unique partnership through mergers between six established banks and one de novo bank located in Tryon, Shelby, Eden,Lexington, Cherryville and Forest City, North Carolina, through which hometown community banks could combine their financial resources to achieve a shared vision.
Starting in 2013, we entered seven attractive markets through various acquisitions and new office openings, as well as expanded our product lines. These included:
• BankGreenville Financial Corporation - one office in Greenville, South Carolina (acquired in July 2013)
• Jefferson Bancshares, Inc. - nine offices across East Tennessee (acquired in May 2014)
• Commercial LPO in Roanoke, Virginia (opened in July 2014)
• Bank of Commerce - one office in Charlotte, North Carolina (acquired in July 2014)
• Ten Bank of America Branch Offices - nine in southwest Virginia, one in Eden, North Carolina (acquired in November 2014)
• Commercial LPO in Raleigh, North Carolina (opened in November 2014) and later converted into full service branch (converted in April 2017)
• United Financial of North Carolina, Inc. - municipal lease company headquartered in Fletcher, North Carolina (acquired in December 2016)
• TriSummit Bancorp, Inc. - six offices in East Tennessee (acquired in January 2017)
• Began origination and sales of SBA loans through our new SBA line of business (September 2017)
• De novo branch in Cary, North Carolina (opened in March 2018)
• Began equipment finance line of business (May 2018)
• Began originations of HELOCs to be pooled and sold (March 2019)
By expanding our geographic footprint and hiring local experienced talent, we have built a foundation that allows us to focus on organic growth, while maintaining "OurCommitment to the Customer Experience" that has differentiated our brand and characterized our success to date.
Our mission is to create stockholder value by building relationships with our employees, customers, and communities. By building a platform that supports growth andprofitability, we are continuing our transition toward becoming a high-performing community bank and helping our customers every day to be "Ready For What's Next."
Our principal business consists of attracting deposits from the general public and investing those funds, along with borrowed funds, in commercial real estate loans, constructionand development loans, commercial and industrial loans, equipment finance leases, municipal leases, loans secured by first and second mortgages on one-to-four familyresidences including home equity loans, construction and land/lot loans, indirect automobile loans, and other consumer loans. We also originate one-to-four family loans, SBAloans, and HELOCs to sell to third parties. In addition, we invest in debt securities issued by United States Government agencies and GSEs, corporate bonds, commercial paperand certificates of deposit insured by the FDIC.
6
We offer a variety of deposit accounts for individuals, businesses, and nonprofit organizations. Deposits and borrowings are our primary source of funds for our lending andinvesting activities.
Market Areas
HomeTrust Bank operates in nine MSAs: Asheville, NC, with a population of 463,000 as of June 2019; Charlotte-Concord-Gastonia, NC-SC, with a population of 2.6 million asof June 2019; Greenville-Anderson-Mauldin, SC, with a population of 921,000 as of June 2019; Johnson City, TN, with a population of 204,000 as of June 2019; Kingsport-Bristol-Bristol, TN-VA, with a population of 307,000 as of June 2019; Knoxville, TN, with a population of 869,000 as of June 2019; Morristown, TN, with a population of143,000 as of June 2019; Roanoke, VA, with a population of 313,000 as of June 2019; and Raleigh, NC, with a population of 1.4 million as of June 2019 according to the UnitedStates Census Bureau. The information above is the latest available data from the U.S. Census Bureau.
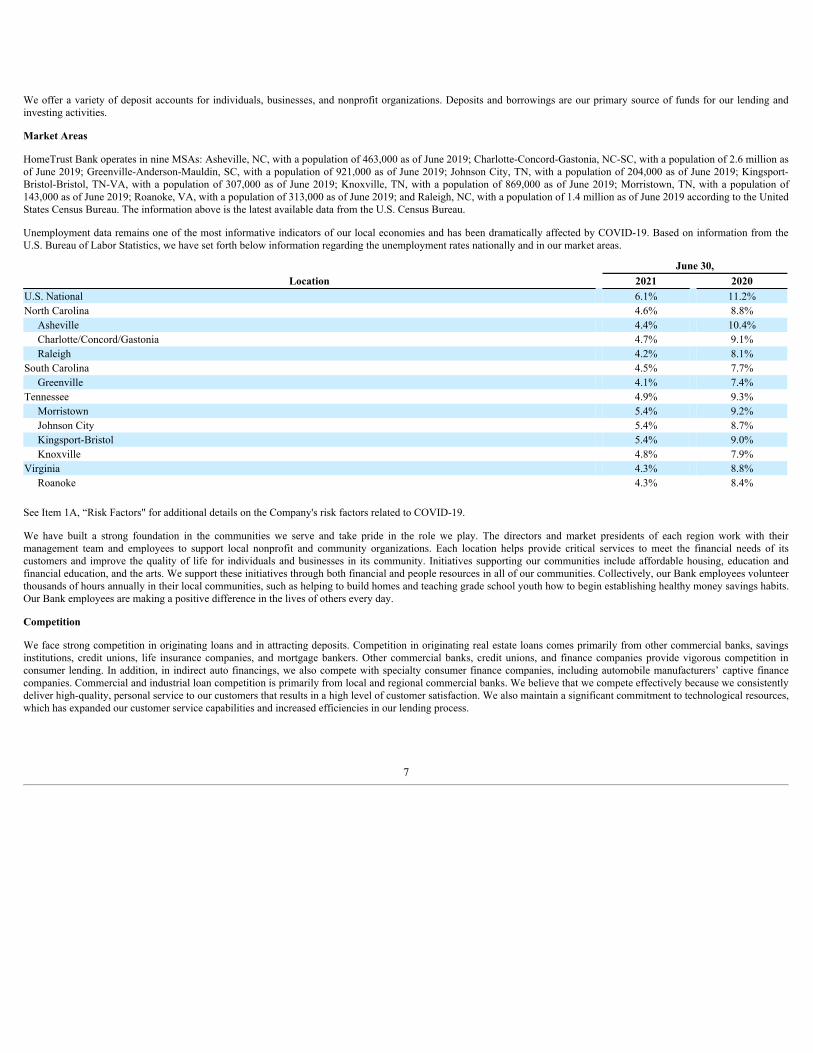
Unemployment data remains one of the most informative indicators of our local economies and has been dramatically affected by COVID-19. Based on information from theU.S. Bureau of Labor Statistics, we have set forth below information regarding the unemployment rates nationally and in our market areas.
June 30,Location 2021 2020
U.S. National 6.1% 11.2%North Carolina 4.6% 8.8% Asheville 4.4% 10.4% Charlotte/Concord/Gastonia 4.7% 9.1% Raleigh 4.2% 8.1%South Carolina 4.5% 7.7% Greenville 4.1% 7.4%Tennessee 4.9% 9.3% Morristown 5.4% 9.2% Johnson City 5.4% 8.7% Kingsport-Bristol 5.4% 9.0% Knoxville 4.8% 7.9%Virginia 4.3% 8.8% Roanoke 4.3% 8.4%
See Item 1A, “Risk Factors" for additional details on the Company's risk factors related to COVID-19.
We have built a strong foundation in the communities we serve and take pride in the role we play. The directors and market presidents of each region work with theirmanagement team and employees to support local nonprofit and community organizations. Each location helps provide critical services to meet the financial needs of itscustomers and improve the quality of life for individuals and businesses in its community. Initiatives supporting our communities include affordable housing, education andfinancial education, and the arts. We support these initiatives through both financial and people resources in all of our communities. Collectively, our Bank employees volunteerthousands of hours annually in their local communities, such as helping to build homes and teaching grade school youth how to begin establishing healthy money savings habits.Our Bank employees are making a positive difference in the lives of others every day.
Competition
We face strong competition in originating loans and in attracting deposits. Competition in originating real estate loans comes primarily from other commercial banks, savingsinstitutions, credit unions, life insurance companies, and mortgage bankers. Other commercial banks, credit unions, and finance companies provide vigorous competition inconsumer lending. In addition, in indirect auto financings, we also compete with specialty consumer finance companies, including automobile manufacturers’ captive financecompanies. Commercial and industrial loan competition is primarily from local and regional commercial banks. We believe that we compete effectively because we consistentlydeliver high-quality, personal service to our customers that results in a high level of customer satisfaction. We also maintain a significant commitment to technological resources,which has expanded our customer service capabilities and increased efficiencies in our lending process.
7

We attract our deposits through our branch office network. Competition for deposits is principally from other commercial banks, savings institutions, and credit unions located inthe same communities, as well as mutual funds and other alternative investments. We believe that we compete for deposits by offering superior service and a variety of depositaccounts at competitive rates. We also have a highly competitive suite of cash management services, online/mobile banking, and internal support expertise specific to the needsof small to mid-sized commercial business customers. Based on the most recent branch deposit data, HomeTrust Bank's deposit market share was:
Location Rank Deposit Market ShareNorth Carolina 18th 0.34% Asheville 6th 9.75% Charlotte/Gastonia 16th 0.03% Raleigh 20th 0.22%South Carolina 61st 0.08% Greenville 15th 0.82%Tennessee 43rd 0.32% Morristown 2nd 20.35% Johnson City 4th 8.67% Kingsport-Bristol 6th 5.19% Knoxville 13th 0.59%Virginia 61st 0.10% Roanoke 7th 3.27% Bristol 5th 3.63%
___________________________________________________________________(1) Source: FDIC data as of June 30, 2020
Overall, we distinguish ourselves from larger, national banks operating in our market areas by providing local decision-making and competitive customer-driven products withexcellent service, responsiveness, and execution. In addition, our larger capital base and product mix enable us to compete effectively against certain smaller banks. Our bankersbelieve that strong relationships lead to great things and strive everyday to ensure our customers are "Ready For What's Next" in their financial future.
In addition, the way we create differentiation from our competition to fuel organic growth is by focusing on “HOW” we deliver our products and services. Many of ouremployees have been a part of HomeTrust Bank for decades, while a significant number of employees have more recently brought their industry knowledge and expertise to usthrough internal growth and acquisitions, reflecting their desire to be a part of a high performing team that works well together to make a difference for customers. We strive tocreate organizational clarity by adhering to our core values of caring and teamwork while continuing to reach for our aspirational values of customer satisfaction, accountability,continuous improvement, and humility. This “culture model” includes four key principles:
• making a difference for customers every day is both fun and personally rewarding;
• success is built on relationships;
• we must continually add value to relationships with our customers and with each other; and
• we need to grow ourselves and our ability to make a difference.
In implementing these principles, the directors, management team, and employees work together as a team to meet the financial needs of our customers while supporting localnonprofit and community organizations to improve the quality of life for individuals and businesses in our communities. We support affordable housing and education initiativesto help build healthy communities through both financial assistance and employees volunteering thousands of hours annually in their local markets. We believe the opportunityto stay close to our customers gives us a unique position in the banking industry as compared to our larger competitors and we are committed to continuing to build strongrelationships with our employees, customers, and communities for generations to come.
(1) (1)
8

Lending Activities
The following table presents information concerning the composition of our loan portfolio in dollar amounts and in percentages (before deductions for deferred fees/costs and theACL) at the dates indicated.
June 30,(Dollars in thousands) 2021 2020 2019 2018 2017
Amount Percent Amount Percent Amount Percent Amount Percent Amount PercentCommercial loans:
Commercial real estate $ 1,142,276 41.79 % $ 1,052,906 38.03 % $ 927,261 34.28 % $ 857,315 33.93 % $ 730,408 31.04 %Construction anddevelopment 179,427 6.56 215,934 7.80 210,916 7.80 192,102 7.60 197,966 8.42 Commercial and industrial 141,341 5.17 154,825 5.59 160,471 5.93 135,336 5.36 120,387 5.12 Equipment finance 317,920 11.63 229,239 8.28 132,058 4.88 13,487 0.54 — — Municipal leases 140,421 5.14 127,987 4.62 112,016 4.14 109,172 4.32 101,175 4.30 PPP loans 46,650 1.71 80,697 2.91 — — — — — —
Total commercial loans 1,968,035 72.00 1,861,588 67.23 1,542,722 57.03 1,307,412 51.75 1,149,936 48.88 Retail consumer loans:
One-to-four family 406,549 14.87 % 473,693 17.11 % 660,591 24.42 % 664,289 26.29 % 684,089 29.08 %HELOCs - originated 130,225 4.76 137,447 4.96 139,435 5.16 137,564 5.44 157,068 6.68 HELOCs - purchased 38,976 1.43 71,781 2.59 116,972 4.32 166,276 6.58 162,407 6.90 Construction and land/lots 66,027 2.42 81,859 2.96 80,602 2.98 65,601 2.60 50,136 2.13 Indirect auto finance 115,093 4.21 132,303 4.78 153,448 5.67 173,095 6.85 140,879 5.99 Consumer 8,362 0.31 10,259 0.37 11,416 0.42 12,379 0.49 7,900 0.34
Total retail consumerloans 765,232 28.00 907,342 32.77 1,162,464 42.97 1,219,204 48.25 1,202,479 51.12
Total loans 2,733,267 100.00 % 2,768,930 100.00 % 2,705,186 100.00 % 2,526,616 100.00 % 2,352,415 100.00 %
Less: Deferred costs (fees), net
— 189 4 (764) (945) Allowance for creditlosses (35,468) (28,072) (21,429) (21,060) (21,151)
Net loans $ 2,697,799 $ 2,741,047 $ 2,683,761 $ 2,504,792 $ 2,330,319
_____________________________________________(1) Equipment finance line of business began operations in May 2018.(2) In accordance with the adoption of ASU No. 2016-13, "Financial Instruments-Credit Losses ("Topic 326"): Measurement of Credit Losses on Financial Instruments", the loan portfolio is shown at the amortized cost basis as of June
30, 2021, to include net deferred cost of $117,000 and unamortized discount total related to loans acquired of $3,123.
(1)
(2)
9

The following table shows the fixed- and variable-rate composition of our loan portfolio in dollar amounts and in percentages (before deductions for deferred fees/costs and theACL) at the dates indicated.
June 30,(Dollars in thousands) 2021 2020 2019 Amount Percent Amount Percent Amount PercentFixed-rate loans:Commercial loans:
Commercial real estate $ 556,647 20.4 % $ 526,680 19.0 % $ 491,683 18.2 %Construction and development 49,431 1.8 33,994 1.2 34,837 1.3 Commercial and industrial 63,938 2.3 73,610 2.7 81,238 3.0 Equipment finance 317,920 11.6 229,239 8.3 132,058 4.9 Municipal leases 140,421 5.1 127,406 4.6 112,016 4.1 PPP loans 46,650 1.7 80,697 2.9 — —
Retail consumer loans:One-to-four family 181,690 6.6 193,001 7.0 293,537 10.8 HELOCs - originated 608 — 1,004 — 446 — Construction and land/lots 63,391 2.3 77,973 2.8 74,989 2.8 Indirect auto finance 115,093 4.2 132,303 4.8 153,448 5.7 Consumer 3,826 0.1 4,323 0.2 12,583 0.5
Total fixed-rate loans 1,539,615 56.3 1,480,230 53.5 1,386,835 51.3 Adjustable-rate loans: Commercial loans:
Commercial real estate 585,629 21.4 526,226 19.0 435,578 16.1 Construction and development 129,996 4.8 181,940 6.6 176,079 6.5 Commercial and industrial 77,403 2.8 81,215 2.9 79,233 2.9 Municipal leases — — 581 — — —
Retail consumer loans:One-to-four family 224,859 8.2 280,692 10.2 367,054 13.6 HELOCs - originated 129,617 4.7 136,443 4.9 130,649 4.8 HELOCs - purchased 38,976 1.4 71,781 2.6 116,972 4.3 Construction and land/lots 2,636 0.1 3,886 0.1 5,613 0.2 Consumer 4,536 0.2 5,936 0.2 7,173 0.3
Total adjustable-rate loans 1,193,652 43.7 1,288,700 46.5 1,318,351 48.7 Total loans 2,733,267 100.0 % 2,768,930 100.0 % 2,705,186 100.0 %
Less: Deferred costs, net — 189 4 Allowance for credit losses (35,468) (28,072) (21,429)
Net loans $ 2,697,799 $ 2,741,047 $ 2,683,761
For further discussion, see "Management’s Discussion and Analysis of Financial Condition and Results of Operations" in Part II, Item 7 of this report.
10

Loan Maturity. The following tables set forth certain information at June 30, 2021 regarding the dollar amount of loans maturing in our portfolio based on their contractualterms to maturity, but do not include scheduled payments or potential prepayments. Loan balances do not include undisbursed loan proceeds, unearned discounts, unearnedincome and allowance for credit losses.
Commercial Loans(Dollars in thousands) Year Ended June 30,
2022 2023 2024 2025 to 2026 2027 to 2028 2029 to 20332034 andfollowing Total
Commercial real estate Amount $ 103,373 116,744 134,502 380,880 125,386 216,270 65,121 $ 1,142,276 Weighted Average Rate 3.48 % 3.52 3.60 3.46 3.01 2.69 3.55 3.30 %
Construction and developmentAmount $ 66,053 32,462 18,280 34,835 21,100 5,206 1,491 $ 179,427 Weighted Average Rate 3.78 % 3.76 3.83 3.76 3.45 3.11 3.51 3.72 %
Commercial and industrialAmount $ 34,859 17,729 11,724 31,300 14,294 30,471 964 $ 141,341 Weighted Average Rate 3.31 % 3.70 4.40 4.00 4.26 5.53 4.84 4.19 %
Equipment financeAmount $ 1,993 14,057 55,993 183,472 61,982 423 — $ 317,920 Weighted Average Rate 5.53 % 5.58 5.36 4.98 4.84 5.88 — 5.06 %
Municipal leasesAmount $ 12,478 12,416 5,655 13,779 10,701 36,845 48,547 $ 140,421 Weighted Average Rate 1.86 % 1.62 2.82 2.82 3.58 3.78 3.50 3.18 %
PPP loansAmount $ — 46,650 — — — — — $ 46,650 Weighted Average Rate — % 1.00 — — — — — 1.00 %
Retail Consumer(Dollars in thousands) Year Ended June 30,
2022 2023 2024 2025 to 2026 2027 to 2028 2029 to 20332034 andfollowing Total
One-to-four family Amount $ 11,600 8,368 10,995 33,698 23,018 40,251 278,619 406,549 Weighted Average Rate 4.20 % 4.19 4.73 4.07 3.92 4.08 3.81 3.91 %
Home equity - originatedAmount $ 3,809 6,116 5,244 5,268 2,487 6,271 101,030 130,225 Weighted Average Rate 4.98 % 3.81 3.67 4.31 4.33 4.08 4.06 4.07 %
Home equity - purchasedAmount $ — — — — — — 38,976 38,976 Weighted Average Rate — % — — — — — 5.10 5.10 %
Construction and land/lotsAmount $ 27 81 130 925 1,749 1,254 61,861 66,027 Weighted Average Rate 4.97 % 6.94 6.22 5.52 5.75 5.43 3.69 3.81 %
Indirect auto financeAmount $ 1,624 7,089 17,140 47,496 41,549 195 — 115,093 Weighted Average Rate 3.25 % 3.51 4.09 5.67 5.11 6.25 — 5.29 %
ConsumerAmount $ 80 306 5,400 1,865 322 40 349 8,362 Weighted Average Rate 4.74 % 4.89 4.30 6.02 5.04 2.80 16.62 5.24 %
(1)
11
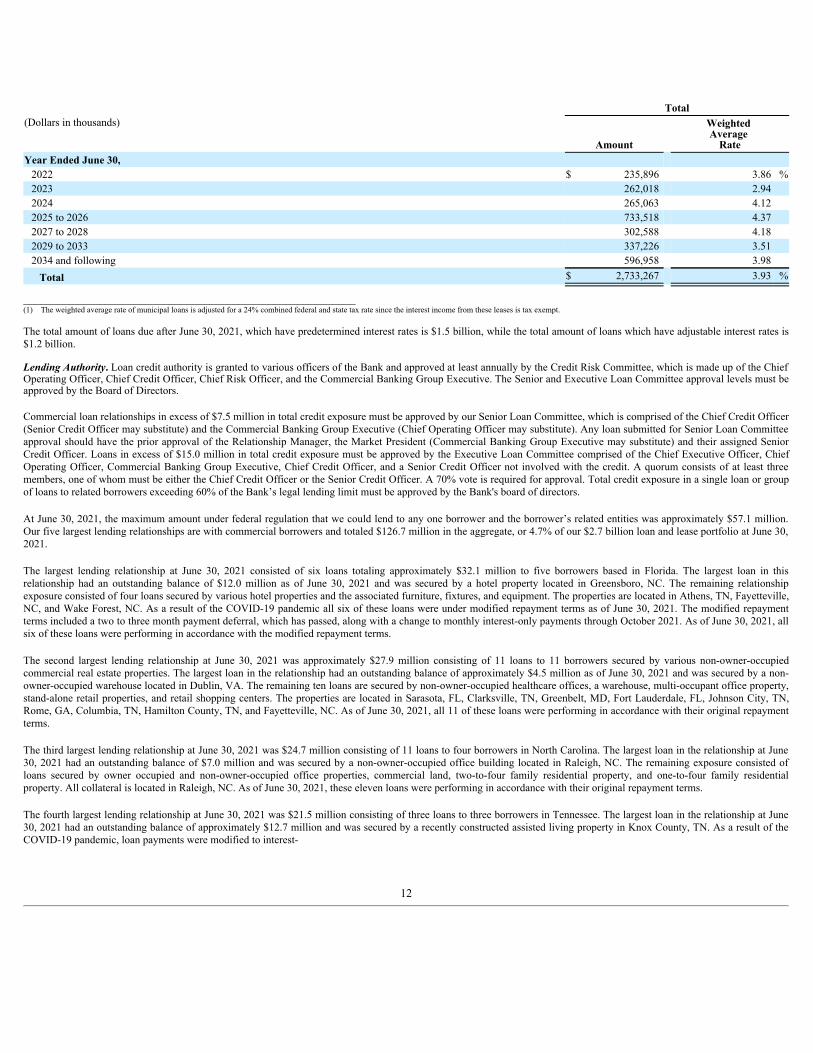
Total(Dollars in thousands)
Amount
Weighted Average
RateYear Ended June 30,
2022 $ 235,896 3.86 %2023 262,018 2.94 2024 265,063 4.12 2025 to 2026 733,518 4.37 2027 to 2028 302,588 4.18 2029 to 2033 337,226 3.51 2034 and following 596,958 3.98
Total $ 2,733,267 3.93 %
_________________________________________________________(1) The weighted average rate of municipal loans is adjusted for a 24% combined federal and state tax rate since the interest income from these leases is tax exempt.
The total amount of loans due after June 30, 2021, which have predetermined interest rates is $1.5 billion, while the total amount of loans which have adjustable interest rates is$1.2 billion.
Lending Authority. Loan credit authority is granted to various officers of the Bank and approved at least annually by the Credit Risk Committee, which is made up of the ChiefOperating Officer, Chief Credit Officer, Chief Risk Officer, and the Commercial Banking Group Executive. The Senior and Executive Loan Committee approval levels must beapproved by the Board of Directors.
Commercial loan relationships in excess of $7.5 million in total credit exposure must be approved by our Senior Loan Committee, which is comprised of the Chief Credit Officer(Senior Credit Officer may substitute) and the Commercial Banking Group Executive (Chief Operating Officer may substitute). Any loan submitted for Senior Loan Committeeapproval should have the prior approval of the Relationship Manager, the Market President (Commercial Banking Group Executive may substitute) and their assigned SeniorCredit Officer. Loans in excess of $15.0 million in total credit exposure must be approved by the Executive Loan Committee comprised of the Chief Executive Officer, ChiefOperating Officer, Commercial Banking Group Executive, Chief Credit Officer, and a Senior Credit Officer not involved with the credit. A quorum consists of at least threemembers, one of whom must be either the Chief Credit Officer or the Senior Credit Officer. A 70% vote is required for approval. Total credit exposure in a single loan or groupof loans to related borrowers exceeding 60% of the Bank’s legal lending limit must be approved by the Bank's board of directors.
At June 30, 2021, the maximum amount under federal regulation that we could lend to any one borrower and the borrower’s related entities was approximately $57.1 million.Our five largest lending relationships are with commercial borrowers and totaled $126.7 million in the aggregate, or 4.7% of our $2.7 billion loan and lease portfolio at June 30,2021.
The largest lending relationship at June 30, 2021 consisted of six loans totaling approximately $32.1 million to five borrowers based in Florida. The largest loan in thisrelationship had an outstanding balance of $12.0 million as of June 30, 2021 and was secured by a hotel property located in Greensboro, NC. The remaining relationshipexposure consisted of four loans secured by various hotel properties and the associated furniture, fixtures, and equipment. The properties are located in Athens, TN, Fayetteville,NC, and Wake Forest, NC. As a result of the COVID-19 pandemic all six of these loans were under modified repayment terms as of June 30, 2021. The modified repaymentterms included a two to three month payment deferral, which has passed, along with a change to monthly interest-only payments through October 2021. As of June 30, 2021, allsix of these loans were performing in accordance with the modified repayment terms.
The second largest lending relationship at June 30, 2021 was approximately $27.9 million consisting of 11 loans to 11 borrowers secured by various non-owner-occupiedcommercial real estate properties. The largest loan in the relationship had an outstanding balance of approximately $4.5 million as of June 30, 2021 and was secured by a non-owner-occupied warehouse located in Dublin, VA. The remaining ten loans are secured by non-owner-occupied healthcare offices, a warehouse, multi-occupant office property,stand-alone retail properties, and retail shopping centers. The properties are located in Sarasota, FL, Clarksville, TN, Greenbelt, MD, Fort Lauderdale, FL, Johnson City, TN,Rome, GA, Columbia, TN, Hamilton County, TN, and Fayetteville, NC. As of June 30, 2021, all 11 of these loans were performing in accordance with their original repaymentterms.
The third largest lending relationship at June 30, 2021 was $24.7 million consisting of 11 loans to four borrowers in North Carolina. The largest loan in the relationship at June30, 2021 had an outstanding balance of $7.0 million and was secured by a non-owner-occupied office building located in Raleigh, NC. The remaining exposure consisted ofloans secured by owner occupied and non-owner-occupied office properties, commercial land, two-to-four family residential property, and one-to-four family residentialproperty. All collateral is located in Raleigh, NC. As of June 30, 2021, these eleven loans were performing in accordance with their original repayment terms.
The fourth largest lending relationship at June 30, 2021 was $21.5 million consisting of three loans to three borrowers in Tennessee. The largest loan in the relationship at June30, 2021 had an outstanding balance of approximately $12.7 million and was secured by a recently constructed assisted living property in Knox County, TN. As a result of theCOVID-19 pandemic, loan payments were modified to interest-
12

only payments through November 2021. As of June 30, 2021, the loan was performing according to the modified repayment terms. The remaining relationship exposure wassecured by an assisted living facility and a self-storage property in Knox County, TN. As of June 30, 2021, these two loans were performing in accordance with their originalrepayment terms.
The fifth largest lending relationship at June 30, 2021 was approximately $21.4 million consisting of 15 loans to four North Carolina borrowers. The largest loan in therelationship at June 30, 2021 had an outstanding balance of $6.1 million and was secured by an owner-occupied office located in Asheville, NC. The remaining 14 loans weresecured by various owner occupied and non-owner-occupied properties, as well as furniture, fixtures, and equipment. The collateral securing these loans includes officeproperties, automotive properties, deposit accounts, restaurants, multifamily properties, one-to-four family residential properties, as well as retail gas stations and conveniencestores. All properties are located in the Asheville, NC metropolitan area. As of June 30, 2021, these loans were performing in accordance with their original repayment terms.
Commercial Loans
Commercial Real Estate Lending. We originate commercial real estate loans, including loans secured by office buildings, retail/wholesale facilities, hotels, industrial facilities,medical and professional buildings, churches, and multifamily residential properties located primarily in our market areas. As of June 30, 2021, $1.1 billion or 41.8% of our totalloan portfolio was secured by commercial real estate property, including multifamily loans totaling $90.6 million, or 3.3% of our total loan portfolio. Of the remaining amount,$322.3 million was identified as owner occupied commercial real estate, and $729.4 million was secured by income producing, or non-owner-occupied commercial real estate.Commercial real estate loans generally are priced at a higher rate of interest than one-to-four family residential loans. Typically, these loans have higher loan balances, are moredifficult to evaluate and monitor, and involve a greater degree of risk than one-to-four family residential loans. Often payments on loans secured by commercial or multi-familyproperties are dependent on the successful operation and management of the property; therefore, repayment of these loans may be affected by adverse conditions in the real estatemarket or the economy. We generally require and obtain loan guarantees from financially capable parties based upon the review of personal financial statements. If the borroweris a corporation, we generally require and obtain personal guarantees from the corporate principals based upon a review of their personal financial statements and individualcredit reports.
The average outstanding loan size in our commercial real estate portfolio was $881,000 as of June 30, 2021. The Bank’s commercial focus is on developing and fostering strongbanking relationships with small to mid-size clients within our market area. At June 30, 2021, the largest commercial real estate loan in our portfolio was for $16.2 millionsecured by a stand alone retail property located in Charlotte, NC. Our largest multifamily loan as of June 30, 2021 was a 60 unit apartment complex in Sanford, NC with anoutstanding balance of $5.3 million. Both of these loans were performing according to their original repayment terms as of June 30, 2021.
We offer both fixed- and adjustable-rate commercial real estate loans. Our commercial real estate mortgage loans generally include a balloon maturity of five years or less.Amortization terms are generally limited to 20 years. Adjustable rate-based loans typically include a floor and ceiling interest rate and are indexed to The Wall Street Journalprime rate, or the one-month LIBOR, plus or minus an interest rate margin and rates generally adjust daily. The maximum loan-to-value ratio for commercial real estate loans isgenerally up to 80% on purchases and refinances. We require appraisals of all non-owner-occupied commercial real estate securing loans in excess of $250,000, and all owner-occupied commercial real estate securing loans in excess of $500,000, performed by independent appraisers. For loans less than these amounts, we may use the tax assessedvalue, broker price opinions, and/or a property inspection in lieu of an appraisal.
If we foreclose on a commercial real estate loan, our holding period for the collateral typically is longer because there are fewer potential purchasers of the collateral. Further, ourcommercial real estate loans generally have relatively large balances to single borrowers or related groups of borrowers. Accordingly, if we make any errors in judgment in thecollectability of our commercial real estate loans, any resulting charge-offs may be larger on a per loan basis than those incurred with our retail loan portfolios.
Construction and Development Lending. We originate residential construction and development loans for the construction of single-family residences, condominiums,townhouses, and residential developments. Our commercial construction development loans are for the development of business properties, including multi-family, retail,office/warehouse, and office buildings. Our land, lots, and development loans are predominately for the purchase or refinance of unimproved land held for future residentialdevelopment, improved residential lots held for speculative investment purposes and for the future construction of speculative one-to-four family or commercial real estate.
Our expansion into larger metro markets combined with the hiring of experienced commercial real estate relationship managers, credit officers, and the development of aconstruction risk management group to better manage construction risk, has led to a significant increase in and focused effort to grow the construction and development portfolio.At June 30, 2021, our construction and development loans totaled $179.4 million, or 6.6% of our total loan portfolio. At June 30, 2021, $101.4 million, or 56.5% of ourconstruction and development loans, required interest-only payments. A minimal amount of these construction loans provide for interest payments to be paid out of an interestreserve, which is established in connection with the origination of the loan pursuant to which we will fund the borrower's monthly interest payments and add the payments to theoutstanding principal balance of the loan. Unfunded commitments at June 30, 2021 totaled $201.9 million compared to $85.0 million at June 30, 2020. Land acquisition anddevelopment loans are included in the construction and development loan portfolio, and represent loans made to developers for the purpose of acquiring raw land and/or for thesubsequent development and sale of residential lots. Such loans typically finance land purchase and infrastructure development of properties (i.e. roads, utilities, etc.) with theaim of making improved lots ready for subsequent sale to consumers or builders for ultimate construction of residential units. The primary source of repayment is generally thecash flow from developer sale of lots or improved parcels of land, secondary sources and personal guarantees, which may provide an additional measure of security for suchloans.
13

Land acquisition and development loans are generally secured by property in our primary market areas. In addition, these loans are secured by a first lien on the property, aregenerally limited to up to 65% of the lower of the acquisition price or the appraised value of the land and generally have a maximum amortization term of ten years with aballoon maturity of up to three years. We require title insurance and, if applicable, a hazardous waste survey reporting that the land is free of hazardous or toxic waste. At June30, 2021, our land acquisition and development loans in our commercial construction and development portfolio totaled $57.9 million. The largest land acquisition anddevelopment loan had an outstanding balance at June 30, 2021 of $4.5 million and was performing according to its original repayment terms. The subject loan is secured by aproposed 63 lot residential development in Smyrna, Tennessee. At June 30, 2021, six other land acquisition and development loans totaling $482,000 were classified asnonaccruing.
Part of our land acquisition and development portfolio consists of speculative construction loans for homes. These homes typically have an average price ranging from $250,000to $500,000. Speculative construction loans are made to home builders and are termed “speculative” because the home builder does not have, at the time of loan origination, asigned contract with a home buyer who has a commitment for permanent financing with either us or another lender for the finished home. The home buyer may be identifiedeither during or after the construction period, with the risk that the builder will have to fund the debt service on the speculative construction loan and finance real estate taxes andother carrying costs of the completed home for a significant period of time after the completion of construction, until a home buyer is identified. Loans to finance theconstruction of speculative single-family homes and subdivisions are generally offered to experienced builders with proven track records of performance, are qualified using thesame standards as other commercial loan credits and require cash reserves to carry projects through construction completions and sale of the project. These loans require paymentof interest-only during the construction phase. At June 30, 2021, loans for the speculative construction of single family properties totaled $51.2 million compared to $47.7million at June 30, 2020. At June 30, 2021, we had four borrowers each with an aggregate outstanding loan balance over $1.0 million which together comprise 9.9% of the totalbalance for the speculative construction of single family properties and secured by properties located in our market areas. At June 30, 2021, no speculative construction loanswere classified as nonaccruing. Unfunded commitments were $70.1 million at June 30, 2021 and $32.0 million at June 30, 2020.
Commercial construction and construction-to-permanent loans are offered on an adjustable interest rate or fixed interest rate basis. Adjustable interest rate loans typically includea floor and ceiling interest rate and are indexed to The Wall Street Journal prime rate, plus or minus an interest rate margin. The initial construction period is generally limited to12 to 24 months from the date of origination, and amortization terms are generally limited to 20 years; however, amortization terms of up to 25 years may be available for certainproperty types based on elevated underwriting and qualification criteria. Construction-to-permanent loans generally include a balloon maturity of five years or less; however,balloon maturities of greater than five years are allowed on a limited basis depending on factors such as property type, amortization term, lease terms, pricing, or the availabilityof credit enhancements. Construction loan proceeds are disbursed commensurate with the percentage of completion of work in place, as documented by periodic internal or third-party inspections. The maximum loan-to-value limit applicable to these loans is generally 80% of the appraised post-construction value. At June 30, 2021, we had $70.3 millionof non-residential construction loans included in our commercial construction and development loan portfolio.
We require all real estate securing construction and development loans to be appraised by an independent Bank-approved state-licensed or state-certified real estate appraiser.General liability, builder’s risk hazard insurance, title insurance, and flood insurance (as applicable, for properties located or to be built in a designated flood hazard area) are alsorequired on all construction and development loans.
Construction and development lending affords us the opportunity to achieve higher interest rates and fees with shorter terms to maturity than the rates and fees generated by oursingle-family permanent mortgage lending.
For the reasons set forth below, construction and development lending involves additional risks when compared with permanent residential lending. Our construction anddevelopment loans are based upon estimates of costs in relation to values associated with the completed project. Funds are advanced upon the collateral for the project based onan estimate of costs that will produce a future value at completion. Because of the uncertainties inherent in estimating construction costs, as well as the market value of thecompleted project and the effects of governmental regulation on real property, it is relatively difficult to evaluate accurately the total funds required to complete a project and thecompleted project loan-to-value ratio. Changes in the demand, such as for new housing, and higher than anticipated building costs may cause actual results to vary significantlyfrom those estimated. This type of lending also typically involves higher loan principal amounts and is often concentrated with a small number of builders. These loans ofteninvolve the disbursement of funds with repayment substantially dependent on the success of the ultimate project and the ability of the borrower to sell or lease the property orobtain permanent take-out financing, rather than the ability of the borrower or guarantor to repay principal and interest. If our appraisal of the value of a completed project provesto be overstated, we may have inadequate security for the repayment of the loan upon completion of construction of the project and may incur a loss. Because construction loansrequire active monitoring of the building process, including cost comparisons and on-site inspections, these loans are more difficult and costly to monitor. Increases in marketrates of interest may have a more pronounced effect on construction loans by rapidly increasing the end-purchasers' borrowing costs, thereby reducing the overall demand for theproject. Properties under construction are often difficult to sell and typically must be completed in order to be successfully sold which also complicates the process of workingout problem construction loans. This may require us to advance additional funds and/or contract with another builder to complete construction and assume the market risk ofselling the project at a future market price, which may or may not enable us to fully recover unpaid loan funds and associated construction and liquidation costs. Furthermore, inthe case of speculative construction loans, there is the added risk associated with identifying an end-purchaser for the finished project. Land acquisition and development loansalso pose additional risk because of the lack of income being produced by the property and the potential illiquid nature of the collateral. These risks can also be significantlyinfluenced by supply and demand conditions.
14
Commercial and Industrial Loans. We typically offer commercial and industrial loans to small businesses located in our primary market areas. These loans are primarilyoriginated as conventional loans to business borrowers, which include lines of credit, term loans, and letters of credit. These loans are typically secured by collateral and are usedfor general business purposes, including working capital financing, equipment financing, capital investment, and general investments. Loan terms typically vary from one to fiveyears. The interest rates on such loans are either fixed rate or adjustable rate indexed to The Wall Street Journal prime rate plus a margin. Inherent with our extension of businesscredit is the business deposit relationship which frequently includes multiple accounts and related services from which we realize low cost deposits plus service and ancillary feeincome.
Commercial and industrial loans typically have shorter maturity terms and higher interest rates than real estate loans, but generally involve more credit risk because of the typeand nature of the collateral. We are focusing our efforts on small- to medium-sized, privately-held companies with local or regional businesses that operate in our market areas.At June 30, 2021, commercial and industrial loans totaled $141.3 million, which represented 5.2% of our total loan portfolio. Our commercial and industrial lending policyincludes credit file documentation and analysis of the borrower’s background, capacity to repay the loan, the adequacy of the borrower’s capital and collateral, as well as anevaluation of other conditions affecting the borrower. Analysis of the borrower’s past, present and future cash flows is also an important aspect of our credit analysis. Wegenerally obtain personal guarantees on our commercial business loans.
We originate commercial business loans made under the SBA 7(a) and USDA B&I programs to small businesses located throughout the Southeast. We originate these loans andutilize a third party service provider that assists with processing and closing services based on the Bank’s underwriting and credit approval criteria. Loans made by the Bankunder the SBA 7(a) and USDA B&I programs generally are made to small businesses to provide working capital needs, to refinance existing debt or to provide funding for thepurchase of businesses, real estate, machinery, and equipment. These loans generally are secured by a combination of assets that may include receivables, inventory, furniture,fixtures, equipment, business real property, commercial real estate and sometimes additional collateral such as an assignment of life insurance and a lien on personal real estateowned by the guarantor(s). The terms of these loans vary by use of funds. The loans are primarily underwritten on the basis of the borrower’s ability to service the loan fromqualifying business income. Under the SBA 7(a) and USDA B&I loan program the loans carry a government guaranty up to 90% of the loan in some cases. Typical maturitiesfor this type of loan vary up to twenty-five years and can be thirty years in some circumstances. SBA 7(a) and USDA B&I loans will normally be adjustable rate loans basedupon The Wall Street Journal prime lending rate. Under the loan programs, we will typically sell in the secondary market the guaranteed portion of these loans to generatenoninterest income and retain the related unguaranteed portion of these loans; loan servicing is handled by a third party loan sub-service provider for a fee paid for by thepurchaser of the guaranteed loan portion. We generally offer SBA 7(a) loans up to $5.0 million and USDA B&I loans up to $10.0 million. During the year ended June 30, 2021,we originated $81.4 million and sold participating interests of $66.1 million in SBA 7(a) and USDA B&I loans. Beginning in July 2021, we moved the processing, closing, andservicing of these loans in-house from the third party service provider to generate additional servicing fees and gain on sale income as this portfolio continues to grow.
Repayment of our commercial and industrial loans is often dependent on the cash flows of the borrower, which may be unpredictable, and the collateral securing these loans mayfluctuate in value. Our commercial and industrial loans are originated primarily based on the identified cash flow of the borrower and secondarily on the underlying collateralprovided by the borrower. Most often, this collateral consists of equipment, inventory or accounts receivable. Credit support provided by the borrower for most of these loansand the probability of repayment is based on the liquidation of the pledged collateral and enforcement of a personal guarantee, if any. As a result, in the case of loans secured byaccounts receivable, the availability of funds for the repayment of these loans may be substantially dependent on the ability of the borrower to collect amounts due from itscustomers. The collateral securing other loans may depreciate over time, may be difficult to appraise and may fluctuate in value based on the success of the business.
Equipment Finance. Our Equipment Finance line of business offers companies that are purchasing equipment for their business various products to help manage tax andaccounting issues, while offering flexible and customizable repayment terms. These products are primarily made up of commercial finance agreements and commercial loans fortransportation, construction, and manufacturing equipment. The loans have terms ranging from 24 to 84 months, with an average of five years and are secured by the financedequipment. Typical transaction sizes range from $25,000 to $1.0 million, with an average size of approximately $120,000. At June 30, 2021, equipment finance loans totaled$317.9 million, which represented 11.6% of our total loan portfolio.
Municipal Leases. We offer ground and equipment lease financing to fire departments located primarily throughout North Carolina, South Carolina and, to a lesser extent,Virginia. Municipal leases are secured primarily by a ground lease in our name with a sublease to the borrower for a fire station or an equipment lease for fire trucks andfirefighting equipment. We originate and underwrite all loans prior to funding. These leases are at a fixed rate of interest and may have a term to maturity of up to 20 years.
At June 30, 2021, municipal leases totaled $140.4 million, which represented 5.1% of our total loan portfolio. At that date, $38.9 million, or 27.7% of our municipal leases weresecured by fire trucks, $48.7 million, or 34.7%, were secured by fire stations, $35.9 million or 25.6%, were secured by both, with the remaining $16.9 million or 12.0% securedby miscellaneous firefighting equipment and land. At June 30, 2021, the average outstanding municipal lease size was $438,000.
Repayment of our municipal leases is often dependent on the tax revenues collected by the county/municipality on behalf of the fire department. Although a municipal lease doesnot constitute a general obligation of the county/municipality for which the county/municipality's taxing power is pledged, a municipal lease is ordinarily backed by thecounty/municipality's covenant to budget for, appropriate and pay the tax revenues to the fire department. However, certain municipal leases contain "non-appropriation" clauseswhich provide that the municipality has no obligation to make lease or installment purchase payments in future years unless money is appropriated for such purpose
15

on a yearly basis. In the case of a "non-appropriation" lease, our ability to recover under the lease in the event of non-appropriation or default will be limited solely to therepossession of the leased property, without recourse to the general credit of the lessee, and disposition or releasing of the property might prove difficult. At June 30, 2021, $33.6million of our municipal leases contained a non-appropriation clause.
Retail Consumer Loans
One-to-Four Family Real Estate Lending. We originate loans secured by first mortgages on one-to-four family residences typically for the purchase or refinance of owner-occupied primary or secondary residences located primarily in our market areas. We generally originate one-to-four family residential mortgage loans through referrals from realestate agents, builders, and from existing customers. Walk-in customers are also important sources of loan originations. At June 30, 2021, $406.5 million, or 14.9%, of our loanportfolio consisted of loans secured by one-to-four family residences.
We originate both fixed-rate loans and adjustable-rate loans. We generally originate mortgage loans in amounts up to 80% of the lesser of the appraised value or purchase priceof a mortgaged property, but will also permit loan-to-value ratios of up to 95%. For loans exceeding an 80% loan-to-value ratio we generally require the borrower to obtainprivate mortgage insurance covering us for any loss on the amount of the loan in excess of 80% in the event of foreclosure.
The majority of our one-to-four family residential loans are originated with fixed rates and have terms of ten to 30 years. At June 30, 2021 our one-to-four family residential loanportfolio included $181.7 million in fixed rate loans. We generally originate fixed rate mortgage loans with terms greater than 10 years for sale to various secondary marketinvestors on a servicing released basis. We also originate adjustable-rate mortgage, or ARM, loans which have interest rates that adjust annually to the yield on U.S. Treasurysecurities adjusted to a constant one-year maturity plus a margin. Most of our ARM loans are hybrid loans, which after an initial fixed rate period of one, five, seven, or ten yearswill convert to an annual adjustable interest rate for the remaining term of the loan. Our ARM loans have terms up to 30 years. Our pricing strategy for mortgage loans includessetting interest rates that are competitive with other local financial institutions and consistent with our asset/liability management objectives. Our ARM loans generally have afloor interest rate set at the initial interest rate, and a cap of two percentage points on rate adjustments during any one year and six percentage points over the life of the loan. As aconsequence of using caps, the interest rates on these loans may not be as rate sensitive as is our cost of funds.
We generally retain ARM loans that we originate in our loan portfolio rather than selling them in the secondary market. The retention of ARM loans in our loan portfolio helpsus reduce our exposure to changes in interest rates. There are, however, unquantifiable credit risks resulting from the potential of increased interest to be paid by the customer asa result of increases in interest rates. It is possible that during periods of rising interest rates the risk of default on ARM loans may increase as a result of repricing and theincreased costs to the borrower. We attempt to reduce the potential for delinquencies and defaults on ARM loans by qualifying the borrower based on the borrower’s ability torepay the ARM loan assuming that the maximum interest rate that could be charged at the first adjustment period remains constant during the loan term. Another consideration isthat although ARM loans allow us to increase the sensitivity of our asset base due to changes in the interest rates, the extent of this interest sensitivity is limited by the periodicand lifetime interest rate adjustment limits. Because of these considerations, we have no assurance that yield increases on ARM loans will be sufficient to offset increases in ourcost of funds.
Most of our loans are written using generally accepted underwriting guidelines, and are readily saleable to Freddie Mac, Fannie Mae, or other private investors. Our real estateloans generally contain a “due on sale” clause allowing us to declare the unpaid principal balance due and payable upon the sale of the security property. The average size of ourone-to-four family residential loans was $138,944 at June 30, 2021.
A majority of our portfolio loans are “non-conforming” because they are adjustable rate mortgages which contain interest rate floors or do not satisfy credit or other requirementsdue to personal and financial reasons (i.e. divorce, bankruptcy, length of time employed, etc.), conforming loan limits (i.e. jumbo mortgages), and other requirements, imposedby secondary market purchasers. Some of these borrowers have higher debt-to-income ratios, or the loans are secured by unique properties in rural markets for which there are nosales of comparable properties to support the value according to secondary market requirements. We may require additional collateral or lower loan-to-value ratios to reduce therisk of these loans. We believe that these loans satisfy a need in our local market areas. As a result, subject to market conditions, we intend to continue to originate these types ofloans.
Property appraisals on real estate securing our one-to-four family loans in excess of $250,000 that are not originated for sale are made by a state-licensed or state-certifiedindependent appraiser approved by the board of directors. Appraisals are performed in accordance with applicable regulations and policies. For loans that are less than $250,000,we may use the tax assessed value, broker price opinions, and/or a property inspection in lieu of an appraisal. We generally require title insurance policies on all first mortgagereal estate loans originated. Homeowners, liability, fire and, if required, flood insurance policies are also required for one-to-four family loans. We do not originate permanentone-to-four family mortgage loans with a negatively amortizing payment schedule, and currently do not offer interest-only mortgage loans. We have not typically originatedstated income or low or no documentation one-to-four family loans. At June 30, 2021, $5.4 million of our one-to-four family loans were interest-only all of which served ascollateral for commercial purpose loans. In connection with the rules issued by the CFPB, which includes a definition for “qualified mortgage” loans based on the borrower’sability to repay the loan, we believe that substantially all of the mortgage loans approved by us meet this standard.
At June 30, 2021, $92.6 million of our one-to-four family loan portfolio consisted of loans secured by non-owner-occupied residential properties. Loans secured by residentialrental properties represent a unique credit risk to us and, as a result, we adhere to specific underwriting guidelines for such loans. Additionally, we have established specific loanportfolio concentration limits for loans secured by residential rental property to prevent excessive credit risk that could result from an elevated concentration of these loans. Aprimary risk
16

factor in non-owner-occupied residential real estate lending is the consistency of rental income of the property. Payments on loans secured by rental properties often depend onthe successful operation and management of the properties, as well as the ability of tenants to pay rent. As a result, repayment of such loans may be subject to adverse economicconditions and unemployment trends, and may be sensitive to changes in the supply and demand for such properties. We consider and review a rental income cash flow analysisof the borrower and consider the net operating income of the property, the borrower’s expertise, credit history and profitability, and the value of the underlying property. Wegenerally require collateral on these loans to be a first mortgage along with an assignment of rents and leases. We periodically monitor the performance and cash flow sufficiencyof certain residential rental property borrowers based on a number of factors such as loan performance, loan size, total borrower credit exposure, and risk grade.
Home Equity Lines of Credit. Our originated HELOCs consist primarily of adjustable-rate lines of credit. At June 30, 2021, HELOCs-originated totaled $130.2 million or 4.8%of our loan portfolio. The lines of credit may be originated in amounts, together with the amount of the existing first mortgage, typically up to 85% of the value of the propertysecuring the loan (less any prior mortgage loans) with an adjustable-rate of interest based on The Wall Street Journal prime rate plus a margin. Currently, our home equity line ofcredit floor interest rate is dependent on the overall loan to value, and has a cap of 16% above the floor rate over the life of the loan. Originated HELOCs generally have up to aten-year draw period and amounts may be reborrowed after payment at any time during the draw period. Once the draw period has lapsed, the payment is amortized over a 15-year period based on the loan balance at that time. At June 30, 2021, unfunded commitments on these lines of credit totaled $279.2 million.
Our underwriting standards for originated HELOCs are similar to our one-to-four family loan underwriting standards and include a determination of the applicant’s credit historyand an assessment of the applicant’s ability to meet existing obligations and payments on the proposed loan. The stability of the applicant’s monthly income may be determinedby verification of gross monthly income from primary employment, and additionally from any verifiable secondary income.
We no longer purchase HELOCs originated by other financial institutions. At June 30, 2021, HELOCs-purchased totaled $39.0 million, or 1.4% of our loan portfolio. Unfundedcommitments on these lines of credit were $27.4 million at June 30, 2021. The credit risk characteristics are different for these loans since they were not originated by theCompany and the collateral is located outside the Company’s market area, primarily in several western states. Loan charge-offs in this portfolio since December 2014 totaled$48,000.
HELOCs generally entail greater risk than do one-to-four family residential mortgage loans where we are in the first lien position. For those home equity lines secured by asecond mortgage, it is unlikely that we will be successful in recovering all or a portion of our loan proceeds in the event of default unless we are prepared to repay the firstmortgage loan and such repayment and the costs associated with a foreclosure are justified by the value of the property.
Construction and Land/Lots. We have been an active originator of construction-to-permanent loans to homeowners building a residence. In addition, we originate land/lot loanspredominately for the purchase or refinance of an improved lot for the construction of a residence to be occupied by the borrower. All of our construction and land/lot loans weremade on properties located within our market area.
At June 30, 2021, our construction and land/lot loan portfolio was $66.0 million compared to $81.9 million at June 30, 2020. At June 30, 2021, unfunded loan commitmentstotaled $75.7 million, compared to $32.0 million at June 30, 2020. Construction-to-permanent loans are made for the construction of a one-to-four family property which isintended to be occupied by the borrower as either a primary or secondary residence. Construction-to-permanent loans are originated to the homeowner rather than thehomebuilder and are structured to be converted to a first lien fixed- or adjustable-rate permanent loan at the completion of the construction phase. We do not originateconstruction phase only or junior lien construction-to-permanent loans. The permanent loan is generally underwritten to the same standards as our one-to-four family residentialloans and may be held by us for portfolio investment or sold in the secondary market. At June 30, 2021, our construction-to-permanent loans totaled $61.7 million, or 2.3% ofour loan portfolio and the average loan size was $181,000. During the construction phase, which typically lasts for six to 12 months, we make periodic inspections of theconstruction site and loan proceeds are disbursed directly to the contractors or borrowers as construction progresses. Typically, disbursements are made in monthly draws duringthe construction period. Loan proceeds are disbursed based on a percentage of completion. Construction-to-permanent loans require payment of interest only during theconstruction phase. Prior to making a commitment to fund a construction loan, we require an appraisal of the property by an independent appraiser. Construction loans may beoriginated up to 95% of the cost or of the appraised value upon completion, whichever is less; however, we generally do not originate construction loans which exceed the lowerof 80% loan to cost or appraised value without securing adequate private mortgage insurance or other form of credit enhancement such as the Federal Housing Administration orother governmental guarantee. We also require general liability, builder’s risk hazard insurance, title insurance, and flood insurance (as applicable, for properties located or to bebuilt in a designated flood hazard area) on all construction loans. At June 30, 2021, the largest construction-to-permanent loan had an outstanding balance of $974,000 and wasperforming according to the original repayment terms.
Included in our construction and land/lot loan portfolio are land/lot loans, which are typically loans secured by developed lots in residential subdivisions located in our marketareas. We originate these loans to individuals intending to construct their primary or secondary residence on the lot within one year from the date of origination. This portfoliomay also include loans for the purchase or refinance of unimproved land that is generally less than or equal to five acres, and for which the purpose is to commence theimprovement of the land and construction of an owner-occupied primary or secondary residence within one year from the date of loan origination.
Land/lot loans are typically originated in an amount up to 70% of the lower of the purchase price or appraisal, are secured by a first lien on the property, for up to a 20-year term,require payments of interest only and are structured with an adjustable rate of interest on terms similar
17
to our one-to-four family residential mortgage loans. At June 30, 2021, our land/lot loans totaled $4.3 million and the average land/lot loan size was $35,000. At June 30, 2021,the largest land/lot loan had an outstanding balance of $215,000.
Construction and land/lot lending affords us the opportunity to achieve higher interest rates and fees with shorter terms to maturity than the rates and fees generated by our one-to-four family permanent mortgage lending. Construction-to-permanent loans, however, generally involve a higher degree of risk than our one-to-four family permanentmortgage lending. If our appraisal of the value of the completed residence proves to be overstated, we may have inadequate security for the repayment of the loan uponcompletion of construction and may incur a loss. Land/lot loans also pose additional risk because of the lack of income being produced by the property and the potential illiquidnature of the collateral. These risks can also be significantly impacted by supply and demand conditions.
Indirect Auto Finance. As of June 30, 2021, our indirect auto finance installment contracts totaled $115.1 million, or 4.2% of our total loan portfolio. As an indirect lender, wemarket to automobile dealerships, both manufacturer franchised dealerships and independent dealerships, who utilize our origination platform to provide automotive financingthrough installment contracts on new and used vehicles. As of June 30, 2021, we worked with 68 auto dealerships located in western North Carolina and upstate South Carolina.Working with strong dealerships within our market area provides us with the opportunity to actively deepen customer relationships through cross-selling opportunities, as 90.7%of our indirect auto finance loans are originated to noncustomers.
The dealers are compensated via an industry standard commission, known as dealer reserve, on marked-up interest rates or from flat rate commission amounts. Our auto financesales team uses purchased industry data to provide quantitative analysis of dealer sales history to target strong dealerships as the starting point of building long lasting, successfulrelationships. Local, quick decisions, broad hour coverage, personalized customer service, and prompt contract funding are keys to our success in this competitive line ofbusiness. Additionally, our process has been designed to integrate with existing dealership practices, utilizing an industry leading decision engine, which provides our internalunderwriters with the tools needed to respond quickly to loans meeting our credit policy criteria.
Our underwriting guidelines for indirect auto loans allow for financing the entire cost of the vehicle and therefore focuses on the ability of the borrower to repay the loan ratherthan the value of the underlying collateral. Our underwriting procedures for indirect auto loans include an evaluation of an applicant's credit profile along with certain applicantspecific characteristics to arrive at an estimate of the associated credit risk. Additionally, internal underwriters may also verify an applicant's employment income and/orresidency or where appropriate, verify an applicant's payment history directly with the applicant's creditors. We will also generally verify receipt of the automobile and otherinformation directly with the borrower.
Indirect auto finance customers receive a fixed rate loan in an amount and at an interest rate that is commensurate to their FICO credit score, consumer payment credit history,loan term, and based on our underwriting procedures. The amount financed by us will generally be up to the full sales price of the vehicle plus sales tax, dealer preparation fees,license fees and title fees, plus the cost of service and warranty contracts and "GAP" insurance coverage obtained in connection with the vehicle or the financing (such amountsin addition to the sales price, collectively the "Additional Vehicle Costs"). Accordingly, the amount financed by us generally may exceed, depending on the credit score andapplicant’s profile, in the case of new vehicles, the manufacturer's suggested retail price of the financed vehicle and the Additional Vehicle Costs. In the case of used vehicles, ifthe applicant meets our creditworthiness criteria, the amount financed may exceed the vehicle's value as assigned by the NADA Official Used Car Guide, our primary referencesource of used cars and the Additional Vehicle Costs.
Our indirect auto portfolio at June 30, 2021, consisted of 8,348 installment loan contracts with an average FICO credit score of 752, and an average loan to value ratio of 93.7%based on wholesale dealer invoice on new cars and the NADA Official Used Car Guide for used cars. Approximately 31% were contracts on new vehicles and 69% werecontracts on used vehicles. The average loan term at origination was 67 months which is comparable to national auto industry data.
Because our primary focus for indirect auto loans is on the credit quality of the customer rather than the value of the collateral, the collectability of an indirect auto loan is morelikely than a single-family first mortgage loan to be affected by adverse personal circumstances. We rely on the borrower's continuing financial stability, rather than on the valueof the vehicle, for the repayment of an indirect auto loan. Because automobiles usually rapidly depreciate in value, it is unlikely that a repossessed vehicle will cover repaymentof the outstanding loan balance.
Consumer Lending. Our consumer loans consist of loans secured by deposit accounts or personal property such as automobiles, boats, and motorcycles, as well as unsecuredconsumer debt. At June 30, 2021, our consumer loans totaled $8.4 million, or 0.3% of our loan portfolio. We originate our consumer loans primarily in our market areas.
Consumer loans generally have shorter terms to maturity, which reduces our exposure to changes in interest rates. In addition, management believes that offering consumer loanproducts helps to expand and create stronger ties to our existing customer base by increasing the number of customer relationships and providing cross-marketing opportunities.
Our underwriting standards for consumer loans include a determination of the applicant’s credit history and an assessment of the applicant’s ability to meet existing obligationsand payments on the proposed loan. The stability of the applicant’s monthly income may be determined by verification of gross monthly income from primary employment, andadditionally from any verifiable secondary income.
Consumer loans generally entail greater risk than do one-to-four family residential mortgage loans, particularly in the case of consumer loans that are unsecured or secured byrapidly depreciable assets, such as automobiles. In these cases, any repossessed collateral for a defaulted loan
18

may not provide an adequate source of repayment of the outstanding loan balance. As a result, consumer loan collections are dependent on the borrower’s continuing financialstability and thus are more likely to be adversely affected by job loss, divorce, illness or personal bankruptcy.
Loan Originations, Purchases, Sales, Repayments and Servicing
We originate both fixed-rate and adjustable-rate loans. Our ability to originate loans, however, is dependent upon customer demand for loans in our market area. Demand isaffected by competition and the interest rate environment. During the past few years, we, like many other financial institutions, have experienced significant prepayments onloans due to the low interest rate environment prevailing in the United States. In periods of economic uncertainty, the ability of financial institutions, including us, to originatelarge dollar volumes of loans may be substantially reduced or restricted, with a resultant decrease in interest income. Currently, we do not generally purchase loans or loanparticipations. We actively sell the majority of our long-term fixed-rate residential first mortgage loans to the secondary market at the time of origination and retain ouradjustable-rate residential mortgages and certain fixed-rate mortgages with terms to maturity less than or equal to 10 years and other consumer and commercial loans. Inaddition, we sell the guaranteed portion of SBA 7(a) and USDA B&I loans. During the years ended June 30, 2021 and 2020, we sold $742.9 million and $458.9 million,respectively, of predominantly one-to-four family loans and SBA 7(a) loans to the secondary market. We generally release the servicing of one-to-four family loans we sell intothe secondary market, and retain the servicing on SBA 7(a) loans sold. Loans are generally sold on a non-recourse basis.
Beginning in fiscal year 2019, we started originating HELOCs through a third party which are then pooled and sold to other investors. During the years ended June 30, 2021 and2020, we originated $132.3 million and $105.5 million, respectively, of these HELOCs and sold $110.8 million during the year ended June 30, 2021. There were $62.0 million ofthese HELOCS sold during the year ended June 30, 2020.
In addition to interest earned on loans and loan origination fees, we receive fees for loan commitments, late payments and other miscellaneous services. The fees vary from timeto time, generally depending on the supply of funds and other competitive conditions in the market.
19

The following table shows our loan origination, purchase, sale and repayment activities for the periods indicated.
(Dollars in thousands) Year Ended June 30, 2021 2020 2019Originations:Commercial loans:
Commercial real estate $ 264,027 $ 230,456 $ 186,907 Construction and development 348,599 172,618 173,904 Commercial and industrial 124,127 80,928 78,089 Equipment finance 179,023 164,018 147,225 Municipal leases 33,026 27,458 22,748 PPP loans 43,138 80,732 —
Retail consumer:One-to-four family 481,246 279,469 182,483 HELOCs - originated 251,392 193,520 70,532 Construction and land/lots 134,611 99,767 106,933 Indirect auto finance 50,407 50,380 55,610 Consumer 103 1,432 9,096
Total loans originated $ 1,909,699 $ 1,380,778 $ 1,033,527
Purchases: Commercial loans:
Commercial real estate $ 380 $ 702 $ 1,005 Total loans purchased or acquired $ 380 $ 702 $ 1,005
Sales and repayments: Commercial loans:
Commercial real estate $ 9,300 $ 15,824 $ 28,759 Commercial and industrial 56,754 22,256 18,124
Retail consumer:One-to-four family 565,967 358,852 121,158 HELOCs - originated 110,834 61,959 —
Total sales 742,855 458,891 168,041 Principal repayments 1,186,714 799,658 674,851
Total reductions 1,929,569 1,258,549 842,892
Net increase (decrease) $ (19,490) $ 122,931 $ 191,640
_____________________________(1) Originations include one-to-four family loans, HELOCs, SBA 7(a) loans, and USDA B&I loans originated for sale of $657.7 million, $399.1 million, and $190.9 million for the years ended June 30, 2021, 2020, and 2019,
respectively.
Asset Quality
Loan Delinquencies and Collection Procedure. When a borrower fails to make a required payment on a residential real estate loan, we attempt to cure the delinquency bycontacting the borrower. A late notice is sent 15 days after the due date, and the borrower may also be contacted by phone at this time. If the delinquency continues, subsequentefforts are made to contact the delinquent borrower and additional collection notices and letters are sent. When a loan is 90 days delinquent, we may commence repossession or aforeclosure action. Reasonable attempts are made to collect from borrowers prior to referral to an attorney for collection. In certain instances, we may modify the loan or grant alimited moratorium on loan payments to enable the borrower to reorganize their financial affairs, and we attempt to work with the borrower to establish a repayment schedule tocure the delinquency.
Delinquent consumer loans are handled in a similar manner, except that late notices are sent within 30 days after the due date. Our procedures for repossession and sale ofconsumer collateral are subject to various requirements under the applicable consumer protection laws, as well as other applicable laws, and the determination by us that it wouldbe beneficial from a cost basis.
Delinquent commercial loans are initially handled by the relationship manager of the loan, who is responsible for contacting the borrower. Larger problem commercial loans aretransferred to the Bank's Special Assets Department for resolution or collection activities. The Special Assets Department may work with the commercial relationship managersto see that the necessary steps are taken to collect delinquent loans, while ensuring that standard default notices and letters are mailed to the borrower. If a commercial loanbecomes more problematic, or goes 90 days past the due date, a Special Assets officer will take over the loan for further collection activities including any legal action that maybe necessary. If an acceptable workout or disposition plan of a delinquent commercial loan cannot be reached, we generally initiate foreclosure or repossession proceedings onany collateral securing the loan.
(1)
20

The following table sets forth our loan delinquencies by type, by amount and by percentage of type at June 30, 2021.
Loans Delinquent For: Total Loans Delinquent 30-89 Days 90 Days and Over 30 Days or More(Dollars in thousands)
Number Amount
Percent of Loan
Category Number Amount
Percent of Loan
Category Number Amount
Percent of Loan
CategoryCommercial loans:
Commercial real estate 2 $ 396 0.03 % 4 $ 1,680 0.15 % 6 $ 2,076 0.18 %Construction and development — — — 1 37 0.02 1 37 0.02 Commercial and industrial 7 634 0.45 5 19 0.01 12 653 0.46 Equipment finance — — — 4 347 0.11 4 347 0.11
Retail consumer loans: One-to-four family 16 1,112 0.27 17 1,124 0.28 33 2,236 0.55 HELOCs - originated 5 290 0.22 6 186 0.14 11 476 0.36 HELOCs - purchased 3 198 0.51 1 79 0.20 4 277 0.71 Construction and land/lots 1 6 0.01 1 35 0.05 2 41 0.06 Indirect auto finance 16 299 0.26 16 259 0.22 32 558 0.48 Consumer 12 378 4.52 12 36 0.43 24 414 4.95
Total 62 $ 3,313 0.12 % 67 $ 3,802 0.14 % 129 $ 7,115 0.26 %
Nonperforming Assets. Nonperforming assets were $12.8 million, or 0.36% of total assets at June 30, 2021, compared to $16.3 million, or 0.44%, at June 30, 2020.
Over the past several years we have significantly improved our risk profile by aggressively managing and reducing our problem assets. We continue to believe our level ofnonperforming assets is manageable, and we believe that we have sufficient capital and human resources to manage the collection of our nonperforming assets in an orderlyfashion. However, our operating results could be adversely impacted if we are unable to effectively manage our nonperforming assets.
Loans are placed on nonaccrual status when the collection of principal and/or interest becomes doubtful or other factors involving the loan warrant placing the loan onnonaccrual status. TDRs are loans which have renegotiated loan terms to assist borrowers who are unable to meet the original terms of their loans. Such modifications to loanterms may include a below market interest rate, a reduction in principal balance, or a longer term to maturity. During the fiscal year ended June 30, 2021, 24 loans for $5.2million were modified from their original terms and were classified as a TDR. This compares to 15 loans for $1.8 million that were modified in the fiscal year ended June 30,2020. As of June 30, 2021, the outstanding balance of TDR loans was $16.6 million, comprised of 222 loans as compared to $19.5 million comprised of 250 loans at June 30,2020.
Once a nonaccruing TDR has performed according to its modified terms for six months and the collection of principal and interest under the revised terms is deemed probable,the TDR is removed from nonaccrual status. At June 30, 2021, $5.5 million of TDRs were classified as nonaccrual as compared to $6.3 million at June 30, 2020. As of June 30,2021, $11.1 million, or 66.6% of the TDRs have a current payment status as compared to $13.2 million, or 63.6% at June 30, 2020. Performing TDRs decreased $2.1 million, or15.7%, from June 30, 2020 to June 30, 2021. See "Recent Developments: COVID-19, the CARES Act, and Our Response" under Item 7, “Management's Discussion andAnalysis of Financial Condition and Results of Operations" and Note 5 of the Notes to the Consolidated Financial Statements included in Item 8 of this Form 10-K for additionaldetails on the Company's loan modifications related to COVID-19.
21
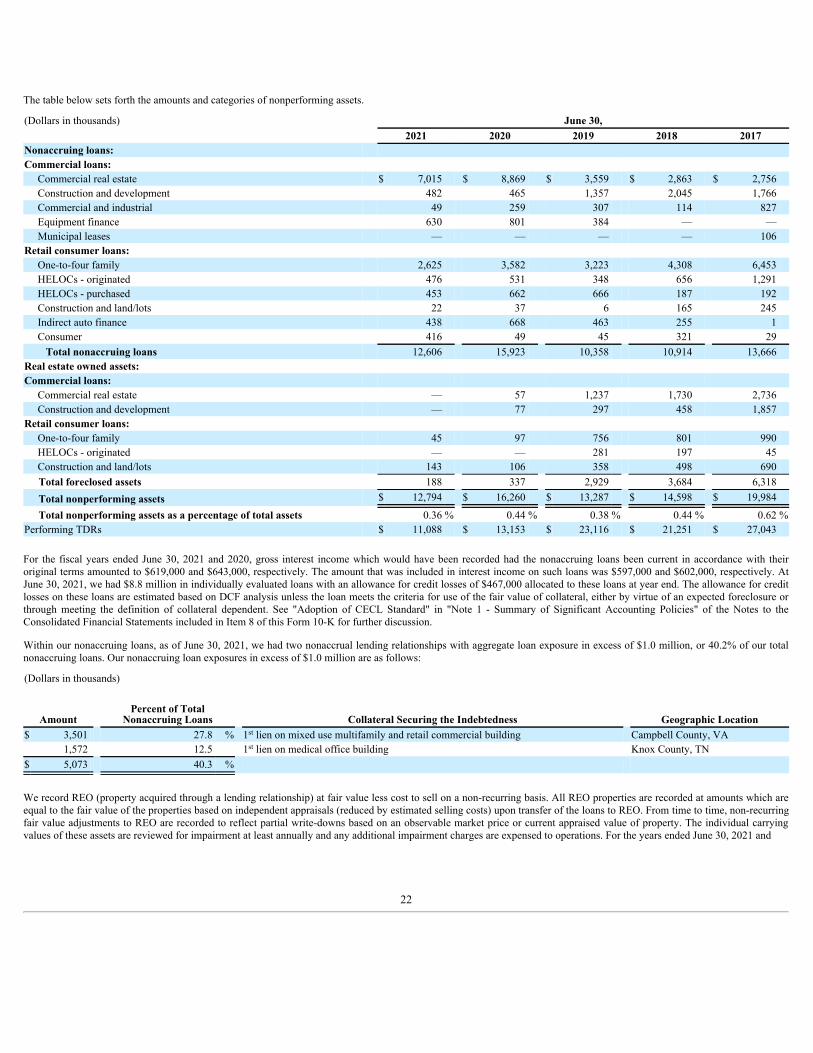
The table below sets forth the amounts and categories of nonperforming assets.
(Dollars in thousands) June 30, 2021 2020 2019 2018 2017Nonaccruing loans:Commercial loans:
Commercial real estate $ 7,015 $ 8,869 $ 3,559 $ 2,863 $ 2,756 Construction and development 482 465 1,357 2,045 1,766 Commercial and industrial 49 259 307 114 827 Equipment finance 630 801 384 — — Municipal leases — — — — 106
Retail consumer loans:One-to-four family 2,625 3,582 3,223 4,308 6,453 HELOCs - originated 476 531 348 656 1,291 HELOCs - purchased 453 662 666 187 192 Construction and land/lots 22 37 6 165 245 Indirect auto finance 438 668 463 255 1 Consumer 416 49 45 321 29
Total nonaccruing loans 12,606 15,923 10,358 10,914 13,666 Real estate owned assets: Commercial loans:
Commercial real estate — 57 1,237 1,730 2,736 Construction and development — 77 297 458 1,857
Retail consumer loans: One-to-four family 45 97 756 801 990 HELOCs - originated — — 281 197 45 Construction and land/lots 143 106 358 498 690 Total foreclosed assets 188 337 2,929 3,684 6,318 Total nonperforming assets $ 12,794 $ 16,260 $ 13,287 $ 14,598 $ 19,984
Total nonperforming assets as a percentage of total assets 0.36 % 0.44 % 0.38 % 0.44 % 0.62 %Performing TDRs $ 11,088 $ 13,153 $ 23,116 $ 21,251 $ 27,043
For the fiscal years ended June 30, 2021 and 2020, gross interest income which would have been recorded had the nonaccruing loans been current in accordance with theiroriginal terms amounted to $619,000 and $643,000, respectively. The amount that was included in interest income on such loans was $597,000 and $602,000, respectively. AtJune 30, 2021, we had $8.8 million in individually evaluated loans with an allowance for credit losses of $467,000 allocated to these loans at year end. The allowance for creditlosses on these loans are estimated based on DCF analysis unless the loan meets the criteria for use of the fair value of collateral, either by virtue of an expected foreclosure orthrough meeting the definition of collateral dependent. See "Adoption of CECL Standard" in "Note 1 - Summary of Significant Accounting Policies" of the Notes to theConsolidated Financial Statements included in Item 8 of this Form 10-K for further discussion.
Within our nonaccruing loans, as of June 30, 2021, we had two nonaccrual lending relationships with aggregate loan exposure in excess of $1.0 million, or 40.2% of our totalnonaccruing loans. Our nonaccruing loan exposures in excess of $1.0 million are as follows:
(Dollars in thousands)
AmountPercent of Total
Nonaccruing Loans Collateral Securing the Indebtedness Geographic Location$ 3,501 27.8 % 1 lien on mixed use multifamily and retail commercial building Campbell County, VA
1,572 12.5 1 lien on medical office building Knox County, TN$ 5,073 40.3 %
We record REO (property acquired through a lending relationship) at fair value less cost to sell on a non-recurring basis. All REO properties are recorded at amounts which areequal to the fair value of the properties based on independent appraisals (reduced by estimated selling costs) upon transfer of the loans to REO. From time to time, non-recurringfair value adjustments to REO are recorded to reflect partial write-downs based on an observable market price or current appraised value of property. The individual carryingvalues of these assets are reviewed for impairment at least annually and any additional impairment charges are expensed to operations. For the years ended June 30, 2021 and
st
st
22

2020, we recognized $0 and $206,000, respectively, of REO impairment charges. At June 30, 2021 and 2020, we had $188,000 and 337,000 of REO.
Other Loans of Concern. In addition to the nonperforming assets set forth in the table above, as of June 30, 2021, there were 264 accruing classified loans totaling $45.5 millionwith respect to which known information about the possible credit problems of the borrowers have caused management to have concerns as to the ability of the borrowers tocomply with present loan repayment terms and which may result in the future inclusion of such items in the nonperforming asset categories. These loans have been considered inmanagement’s determination of our allowance for credit losses.
Classified Assets. Loans and other assets, such as debt and equity securities considered to be of lesser quality, are classified as “substandard,” “doubtful” or “loss.” An asset isconsidered “substandard” if it is inadequately protected by the current net worth and paying capacity of the obligor or of the collateral pledged, if any. “Substandard” assetsinclude those characterized by the “distinct possibility” that we will sustain “some loss” if the deficiencies are not corrected. Assets classified as “doubtful” have all of theweaknesses in those classified “substandard,” with the added characteristic that the weaknesses present make “collection or liquidation in full,” on the basis of currently existingfacts, conditions and values, “highly questionable and improbable.” Assets classified as “loss” are those considered “uncollectible” and of such little value that their continuanceas assets without the establishment of a specific loss reserve is not warranted.
When we classify a problem asset as either substandard or doubtful, based on specific book balance thresholds, we may establish an individual allowance for credit losses in anamount deemed prudent by management when the loan no longer shares similar risk characteristics with its segment. A loan is classified as "loss" when the remaining loanbalance has been charged-off in full or 100% reserved with an allowance for credit losses. Our determination as to the classification of our assets and the amount of our valuationallowances is subject to review by our bank regulators, which may order the establishment of additional individual loss allowances. Assets which do not currently expose us tosufficient risk to warrant classification in one of the aforementioned categories but possess weakness are designated by us as “special mention.”
We regularly review the problem assets in our portfolio to determine whether any assets require classification in accordance with applicable regulations. On the basis ofmanagement's review of our assets, at June 30, 2021, our classified assets (consisting of $26.5 million of loans and $188,000 of REO) totaled $26.7 million, or 0.76%, of ourassets, of which $12.6 million was included in nonaccruing loans. The aggregate amounts of our classified assets and special mention loans at the dates indicated (as determinedby management), were as follows:
(Dollars in thousands) June 30,2021 2020
Classified assets:Loss $ 321 $ 19 Doubtful 471 207 Substandard – performing 14,228 15,311 Substandard – nonaccruing 11,472 15,256
Total classified loans 26,492 30,793 REO 188 337
Total classified assets 26,680 31,130 Special mention loans 27,569 36,010
Total classified assets and special mention loans $ 54,249 $ 67,140
Allowance for Credit Losses. The ACL is a valuation account that reflects our estimation of the credit losses that will result from the inability of our borrowers to make requiredloan payments. The allowance is maintained through provisions for credit losses that are charged to earnings in the period they are established. We charge losses on loans againstthe ACL when we believe the collection of loan principal is unlikely. Recoveries on loans previously charged off are added back to the allowance. On July 1, 2020, we adoptedthe new CECL accounting standard with an allowance for credit losses which included the impact of COVID-19 based on current expected credit losses. While leading economicindicators have improved as of June 30, 2021, we continue to maintain qualitative reserves in our allowance for credit losses which includes management's estimate of the impactof COVID-19. See "Comparison of Financial Condition at June 30, 2021 and 2020 - Asset Quality and Allowance for Credit Losses," for additional details on our ACL. See"Adoption of CECL Standard" in "Note 1 - Summary of Significant Accounting Policies," "Note 5 - Loans and Allowance for Credit Losses on Loans," and "Critical AccountingPolicies – Allowance for Credit Losses" of the Notes to the Consolidated Financial Statements included in Item 8 of this Form 10-K for further discussion of the adoption ofCECL.
At June 30, 2021, our nonaccruing loans decreased to $12.6 million as compared to $15.9 million at June 30, 2020. At June 30, 2021, $6.6 million, or 52.6%, of our totalnonaccruing loans were current on their loan payments as compared to $2.8 million, or 17.6%, of total nonaccruing loans at June 30, 2020. During fiscal 2021, classified loansdecreased $4.3 million, or 14.0% to $26.5 million and delinquent loans (loans delinquent 30 days or more) decreased $9.0 million, or 55.9%, to $7.1 million at June 30, 2021.There were $143,000 in net charge-offs during fiscal year 2021 compared to $1.9 million in net loan charge-offs during the fiscal year 2020. There was a $7.1 million benefit forcredit losses during fiscal 2021 compared to an $8.5 million provision in 2020.
23
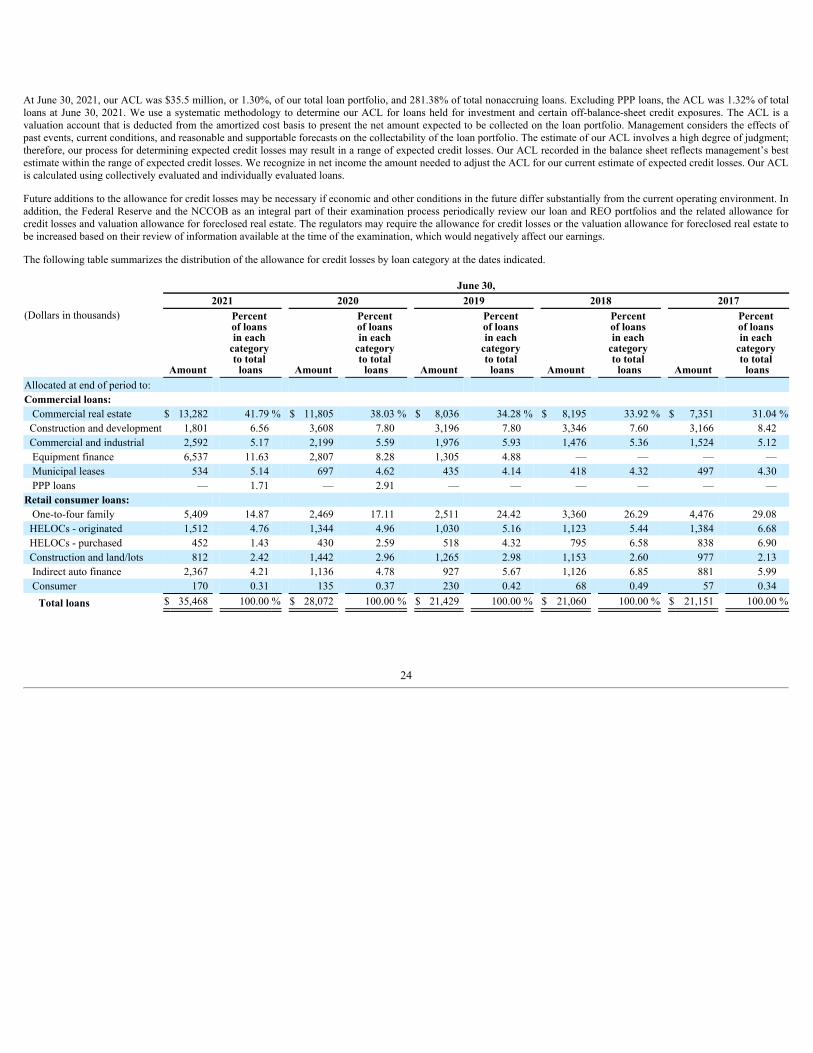
At June 30, 2021, our ACL was $35.5 million, or 1.30%, of our total loan portfolio, and 281.38% of total nonaccruing loans. Excluding PPP loans, the ACL was 1.32% of totalloans at June 30, 2021. We use a systematic methodology to determine our ACL for loans held for investment and certain off-balance-sheet credit exposures. The ACL is avaluation account that is deducted from the amortized cost basis to present the net amount expected to be collected on the loan portfolio. Management considers the effects ofpast events, current conditions, and reasonable and supportable forecasts on the collectability of the loan portfolio. The estimate of our ACL involves a high degree of judgment;therefore, our process for determining expected credit losses may result in a range of expected credit losses. Our ACL recorded in the balance sheet reflects management’s bestestimate within the range of expected credit losses. We recognize in net income the amount needed to adjust the ACL for our current estimate of expected credit losses. Our ACLis calculated using collectively evaluated and individually evaluated loans.
Future additions to the allowance for credit losses may be necessary if economic and other conditions in the future differ substantially from the current operating environment. Inaddition, the Federal Reserve and the NCCOB as an integral part of their examination process periodically review our loan and REO portfolios and the related allowance forcredit losses and valuation allowance for foreclosed real estate. The regulators may require the allowance for credit losses or the valuation allowance for foreclosed real estate tobe increased based on their review of information available at the time of the examination, which would negatively affect our earnings.
The following table summarizes the distribution of the allowance for credit losses by loan category at the dates indicated.
June 30, 2021 2020 2019 2018 2017(Dollars in thousands)
Amount
Percent of loans in each
category to total
loans Amount
Percent of loans in each
category to total
loans Amount
Percent of loans in each
category to total
loans Amount
Percent of loans in each
category to total
loans Amount
Percent of loans in each
category to total
loansAllocated at end of period to: Commercial loans:
Commercial real estate $ 13,282 41.79 % $ 11,805 38.03 % $ 8,036 34.28 % $ 8,195 33.92 % $ 7,351 31.04 %Construction and development 1,801 6.56 3,608 7.80 3,196 7.80 3,346 7.60 3,166 8.42 Commercial and industrial 2,592 5.17 2,199 5.59 1,976 5.93 1,476 5.36 1,524 5.12 Equipment finance 6,537 11.63 2,807 8.28 1,305 4.88 — — — — Municipal leases 534 5.14 697 4.62 435 4.14 418 4.32 497 4.30 PPP loans — 1.71 — 2.91 — — — — — —
Retail consumer loans: One-to-four family 5,409 14.87 2,469 17.11 2,511 24.42 3,360 26.29 4,476 29.08 HELOCs - originated 1,512 4.76 1,344 4.96 1,030 5.16 1,123 5.44 1,384 6.68 HELOCs - purchased 452 1.43 430 2.59 518 4.32 795 6.58 838 6.90 Construction and land/lots 812 2.42 1,442 2.96 1,265 2.98 1,153 2.60 977 2.13 Indirect auto finance 2,367 4.21 1,136 4.78 927 5.67 1,126 6.85 881 5.99 Consumer 170 0.31 135 0.37 230 0.42 68 0.49 57 0.34
Total loans $ 35,468 100.00 % $ 28,072 100.00 % $ 21,429 100.00 % $ 21,060 100.00 % $ 21,151 100.00 %
24

The following table sets forth an analysis of our allowance for credit losses at the dates and for the periods indicated.
(Dollars in thousands) Year Ended June 30,2021 2020 2019 2018 2017
Balance at beginning of period: $ 28,072 $ 21,429 $ 21,060 $ 21,151 $ 21,292 Impact of adoption on new CECL standard 14,809 — — — — Provision (benefit) for credit losses (7,270) 8,500 5,700 — — Charge-offs: Commercial loans:
Commercial real estate 998 1,005 — 282 139 Construction and development 1 102 50 381 21 Commercial and industrial 507 101 6,037 842 1,171 Equipment finance 471 1,753 186 — — Municipal leases — — — — —
Total commercial loans 1,977 2,961 6,273 1,505 1,331 Retail consumer loans:
One-to-four family 611 164 99 538 439 Home equity - originated — 30 499 9 18 Home equity - purchased — — — — 48 Construction and land/lots — 2 1 2 165 Indirect auto finance 843 639 509 578 531 Consumer 102 20 28 15 18
Total retail consumer loans 1,556 855 1,136 1,142 1,219 Total charge-offs 3,533 3,816 7,409 2,647 2,550
Recoveries: Commercial loans:
Commercial real estate 5 170 74 107 58 Construction and development 144 57 226 81 539 Commercial and industrial 1,871 252 506 1,378 728 Equipment finance 272 1 — — — Municipal leases — — — — —
Total commercial loans 2,292 480 806 1,566 1,325 Retail consumer loans:
One-to-four family 334 1,160 555 411 181 Home equity - originated 88 63 556 307 231 Construction and land/lots 310 141 57 173 487 Indirect auto finance 296 80 54 39 122 Consumer 70 35 50 60 63
Total retail consumer loans 1,098 1,479 1,272 990 1,084 Total recoveries 3,390 1,959 2,078 2,556 2,409 Net charge-offs 143 1,857 5,331 91 141 Balance at end of period $ 35,468 $ 28,072 $ 21,429 $ 21,060 $ 21,151
Net charge-offs during the period to average loans outstanding during theperiod — % 0.07 % 0.20 % — % 0.01 %
Net charge-offs during the period to average non-performing assets 0.98 % 12.30 % 50.00 % 0.53 % 0.67 %
Allowance as a percentage of nonperforming assets 277.29 % 172.64 % 161.28 % 144.27 % 105.84 %
Allowance as a percentage of total loans 1.30 % 1.01 % 0.79 % 0.83 % 0.90 %
______________(1) Excluding PPP loans, the allowance for credit losses was 1.32% and 1.04% of total loans at June 30, 2021 and 2020, respectively.
(1)
25

Investment Activities
The Bank invests in various securities based on investment policies that have been approved by our board of directors and adhere to bank regulations. These securities include:United States Treasury obligations, securities of various federal agencies, including mortgage-backed securities, callable agency securities, certain certificates of deposit ofinsured banks and savings institutions, municipal bonds, investment grade corporate bonds and commercial paper, and federal funds. See “How We Are Regulated - HomeTrustBank” for a discussion of additional restrictions on our investment activities.
Our chief executive officer and chief financial officer have the basic responsibility for the management of our investment portfolio, subject to the direction and guidance of theboard of directors. These officers consider various factors when making decisions, including the marketability, maturity, and tax consequences of the proposed investment. Thematurity structure of investments will be affected by various market conditions, including the current and anticipated slope of the yield curve, the level of interest rates, the trendof new deposit inflows, and the anticipated demand for funds via deposit withdrawals and loan originations and purchases.
The general objectives of our investment portfolio are to provide liquidity when loan demand is high, to assist in maintaining earnings when loan demand is low and to optimizeearnings while satisfactorily managing risk, including credit risk, reinvestment risk, liquidity risk, and interest rate risk. At June 30, 2021, our $156.5 million securities portfolioconsisted primarily of U.S. government agencies, MBSs, and corporate bonds, all held as available for sale. We currently do not have any investments held to maturity or fortrading.
These securities are of high quality, possess minimal credit risk, and have an aggregate market value which is $2.0 million more than total amortized cost as of June 30, 2021.For more information, please see Item 7 “Management’s Discussion and Analysis of Financial Condition and Results of Operations - Asset/Liability Management” and Note 2 ofthe Notes to Consolidated Financial Statements contained in Item 8 in this report.
We also purchase commercial paper to take advantage of higher short-term returns with relatively low credit risk, yet remain highly liquid. The commercial paper balance at June30, 2021 was $189.6 million. For more information, see Item 7 “Management’s Discussion and Analysis of Financial Condition and Results of Operations - Comparison ofFinancial Condition at June 30, 2021 and June 30, 2020.”
We do not currently participate in hedging programs, stand-alone contracts for interest rate caps, floors or swaps, or other activities involving the use of off-balance sheetderivative financial instruments and have no present intention to do so. Further, we do not invest in securities which are not rated investment grade.
As a member of the FHLB of Atlanta, we had $6.2 million in stock of the FHLB of Atlanta at June 30, 2021. For the years ended June 30, 2021 and 2020, we received $768,000and $1.6 million, respectively, in dividends from the FHLB of Atlanta. As a member bank of the Federal Reserve, the Bank is required to maintain stock in the FRB. At June 30,2021, we had $7.4 million in FRB stock. For the years ended June 30, 2021 and 2020, we received $442,000 and $441,000, respectively, in dividends from the FRB.
We also maintain equity investments in SBIC, which are considered equity securities without a readily determinable fair value. At June 30, 2021, we had $10.2 million in SBICinvestments. For the years ended June 30, 2021 and 2020, we received $1.1 million and $642,000, respectively, in earnings from our SBIC investments.
The following table sets forth the composition of our debt securities portfolio and other investments at the dates indicated. All securities at the dates indicated have beenclassified as available for sale. At June 30, 2021, our securities portfolio did not contain securities of any issuer with an aggregate book value in excess of 10% of our equitycapital, excluding those issued by the United States government or its agencies or United States government sponsored entities.
(Dollars in thousands) June 30,2021 2020 2019
Book Value
Fair Value
Book Value
Fair Value
Book Value
Fair Value
Debt securities available for sale: U.S. government agencies $ 18,975 $ 19,073 $ 3,957 $ 4,173 $ 15,099 $ 15,210 Residential MBS of U.S. government agencies and GSEs 42,119 43,404 46,629 48,355 74,778 75,180 Municipal bonds 9,098 9,551 16,090 16,631 24,896 25,312 Corporate bonds 84,301 84,431 58,242 58,378 6,061 6,084
Total debt securities available for sale 154,493 156,459 124,918 127,537 120,834 121,786 FHLB of Atlanta stock 6,153 6,153 23,309 23,309 31,969 31,969 FRB stock 7,386 7,386 7,368 7,368 7,335 7,335 SBIC investments 10,171 10,171 8,269 8,269 6,074 6,074
Total $ 178,203 $ 180,169 $ 163,864 $ 166,483 $ 166,212 $ 167,164
26

The composition and contractual maturities of our debt securities portfolio as of June 30, 2021, excluding SBIC investments, FHLB stock, and FRB stock, are indicated in thefollowing table. Maturities are based on the final contractual payment dates, and do not reflect the impact of prepayments or early redemptions that may occur.
(Dollars in thousands) June 30, 2021
1 year or lessOver 1 year to 5
yearsOver 5 to 10
years Over 10 years TotalDebt securities available for sale:U.S. government agencies:
Amortized cost $ — $ 18,975 $ — $ — $ 18,975 Fair value — 19,073 — — 19,073 Weighted average yield — % 0.75 % — % — % 0.75 %
Residential MBS of U.S. government agencies and GSEsAmortized cost 46 6,340 21,275 14,458 42,119 Fair value 48 6,393 22,083 14,880 43,404 Weighted average yield 1.46 % 0.82 % 1.96 % 2.16 % 1.86 %
Municipal bondsAmortized cost 3,504 3,584 2,010 — 9,098 Fair value 3,535 3,785 2,231 — 9,551 Weighted average yield 3.78 % 4.23 % 3.64 % — % 3.93 %
Corporate bondsAmortized cost 31,111 50,690 2,500 — 84,301 Fair value 31,149 50,775 2,507 — 84,431 Weighted average yield 0.73 % 0.73 % 3.13 % — % 0.80 %
Total securitiesAmortized cost $ 34,661 $ 79,589 $ 25,785 $ 14,458 $ 154,493
Fair value $ 34,732 $ 80,026 $ 26,821 $ 14,880 $ 156,459
Weighted average yield 1.04 % 0.90 % 2.21 % 2.16 % 1.27 %
Sources of Funds
General. Our sources of funds are primarily deposits, borrowings, payments of principal and interest on loans, and funds provided from operations. Deposits increased $169.8million, or 6.09%, to $3.0 billion at June 30, 2021 as compared to $2.8 billion at June 30, 2020.
Deposits. We offer a variety of deposit accounts with a wide range of interest rates and terms to both consumers and businesses. Our deposits consist of savings, money marketand demand accounts, and CDs. We solicit deposits primarily in our market areas. At June 30, 2021, 2020 and 2019, we had $4.3 million, $143.2 million, and $176.8 million inbrokered deposits, respectively. As of June 30, 2021, core deposits, which we define as our non-certificate or non-time deposit accounts, represented approximately 84.0% oftotal deposits.
We primarily rely on competitive pricing policies, marketing, and customer service to attract and retain deposits. The flow of deposits is influenced significantly by generaleconomic conditions, changes in money market and prevailing interest rates and competition. The variety of deposit accounts we offer has allowed us to be competitive inobtaining funds and to respond with flexibility to changes in consumer demand. We have become more susceptible to short-term fluctuations in deposit flows as customers havebecome more interest rate conscious. We try to manage the pricing of our deposits in keeping with our asset/liability management, liquidity and profitability objectives, subjectto competitive factors. Based on our experience, we believe that our deposits are relatively stable sources of funds. Despite this stability, our ability to attract and maintain thesedeposits and the rates paid on them has been and will continue to be significantly affected by market conditions.
Approximately 16.0% of our total deposits are comprised of CDs. Our liquidity could be reduced if a significant amount of CDs, maturing within a short period of time, are notrenewed. However, the need to retain these time deposits could result in an increase in our cost of funds.
27

The following table sets forth our deposit flow during the periods indicated.
(Dollars in thousands) Year Ended June 30,2021 2020 2019
Beginning balance $ 2,785,756 $ 2,327,257 $ 2,196,253 Net deposit increase 160,415 435,592 115,322 Interest credited 9,370 22,907 15,682
Ending balance $ 2,955,541 $ 2,785,756 $ 2,327,257
Net increase $ 169,785 $ 458,499 $ 131,004
Percent increase 6.09 % 19.70 % 5.96 %
The following table sets forth the dollar amount of deposits in the various types of deposit programs offered by us at the dates indicated.
Year Ended June 30,(Dollars in thousands) 2021 2020 2019
AmountPercent of Total Amount
Percent of Total Amount
Percent of Total
Transaction and savings deposits:Noninterest-bearing deposits $ 636,414 21.53 % $ 429,901 15.43 % $ 294,322 12.65 %Interest-bearing checking accounts 644,958 21.82 582,299 20.90 452,295 19.43 Money market accounts 975,001 32.99 836,738 30.04 691,172 29.70 Savings accounts 226,391 7.66 197,676 7.10 177,278 7.62
Total non-certificates $ 2,482,764 84.00 % $ 2,046,614 73.47 % $ 1,615,067 69.40 %Certificates:
0.00-0.99% $ 375,539 12.70 % $ 285,916 10.26 % $ 134,813 5.79 %1.00-1.99% 11,762 0.40 229,972 8.26 122,803 5.28 2.00-2.99% 77,652 2.63 215,518 7.74 441,911 18.99 3.00-3.99% 3,478 0.12 3,388 0.12 8,246 0.35 4.00-4.99% 4,346 0.15 4,346 0.16 4,415 0.19 5.00% and over — — 2 — 2 —
Total certificates $ 472,777 16.00 % $ 739,142 26.53 % $ 712,190 30.60 %Total deposits $ 2,955,541 100.00 % $ 2,785,756 100.00 % $ 2,327,257 100.00 %
The following table shows rate and maturity information for our CDs at June 30, 2021.
(Dollars in thousands)0.00- 0.99%
1.00- 1.99%
2.00- 2.99%
3.00- 3.99%
4.00- 4.99%
5.00% or
greater Total
Percent of
TotalQuarter ending:
September 30, 2021 124,020 1,652 21,918 — 2,018 — $ 149,608 31.6 %December 31, 2021 135,712 577 24,311 366 — — 160,966 33.9 March 31, 2022 56,335 419 8,687 30 — — 65,471 13.8 June 30, 2022 10,645 799 5,380 — — — 16,824 3.6 September 30, 2022 7,656 836 6,527 — 2,328 — 17,347 3.7 December 31, 2022 8,961 2,085 1,484 — — — 12,530 2.7 March 31, 2023 8,267 751 454 — — — 9,472 2.0 June 30, 2023 10,510 623 1,589 32 — — 12,754 2.7 September 30, 2023 1,929 84 1,445 3,043 — — 6,501 1.4 December 31, 2023 1,198 144 1,752 7 — — 3,101 0.7 March 31, 2024 997 755 1,973 — — — 3,725 0.8 June 30, 2024 1,342 632 785 — — — 2,759 0.6 Thereafter 7,967 2,405 1,347 — — — 11,719 2.5
Total $ 375,539 $ 11,762 $ 77,652 $ 3,478 $ 4,346 $ — $ 472,777 100.0 %
Percent of total 79.4 % 2.5 % 16.5 % 0.7 % 0.9 % — % 100.0 %
28

The following table indicates the amount of our CDs by time remaining until maturity as of June 30, 2021.
(Dollars in thousands) Maturity
3 Months or Less
Over 3 to 6
MonthsOver 6 to 12
MonthsOver
12 Months TotalCDs less than $250,000 $ 124,988 $ 131,938 $ 69,259 $ 67,425 $ 393,610 CDs of $250,000 or more 19,654 20,292 10,867 10,762 61,575 Public funds 4,966 8,736 2,169 1,721 17,592
Total certificates of deposit $ 149,608 $ 160,966 $ 82,295 $ 79,908 $ 472,777
_______________________________(1) Deposits from government and other public entities.
Borrowings. Although deposits are our primary source of funds, we may utilize borrowings to manage interest rate risk or as a cost-effective source of funds when they can beinvested at a positive interest rate spread for additional capacity to fund loan demand according to our asset/liability management goals. Our borrowings consist of advances fromthe FHLB of Atlanta.
We may obtain advances from the FHLB of Atlanta upon the security of certain of our real estate loans and mortgage-backed and other securities. These advances may be madepursuant to several different credit programs, each of which has its own interest rate, range of maturities and call features, and all long-term advances are required to providefunds for residential home financing. As of June 30, 2021, we had $115.0 million in FHLB advances outstanding and the ability to borrow an additional $289.4 million. Inaddition to FHLB advances, at June 30, 2021, we had a $92.9 million line of credit with the FRB, subject to qualifying collateral, and $100.0 million available through lines ofcredit with three unaffiliated banks, none of which was outstanding at June 30, 2021. See Note 10 of the Notes to Consolidated Financial Statements included in Item 8 of thisForm 10-K for more information about our borrowings.
The following tables set forth information regarding our borrowings at the end of and during the periods indicated.
(Dollars in thousands) Year ended June 30,2021 2020 2019
Maximum balance:FHLB advances $ 509,000 $ 708,000 $ 720,000 Average balances:FHLB advances $ 416,822 $ 568,377 $ 672,186 Weighted average interest rate:FHLB advances 1.45 % 1.64 % 2.18 %
(Dollars in thousands) June 30,2021 2020 2019
Balance outstanding at end of period: FHLB advances $ 115,000 $ 475,000 $ 680,000 Weighted average interest rate: FHLB advances 0.16 % 1.39 % 2.10 %
Subsidiary and Other Activities
HomeTrust Bank has one operating subsidiary, WNCSC, whose primary purpose is to own several office buildings in Asheville, North Carolina which are leased to HomeTrustBank. Our capital investment in WNCSC as of June 30, 2021 was $862,000.
Human Capital
For more than 90 years, HomeTrust Bank has been an employer of choice. As of June 30, 2021, we employed 551 full-time employees and 24 part-time employees, for a total of575 employees.
Our employees are located primarily in our four-state geographic footprint: North Carolina - 426, Tennessee - 64, Virginia - 62, and South Carolina - 16. Seven employees arelocated in other states across the U.S and work remotely. As of September 17, 2021, the total employee headcount will be reduced to approximately 548 due to the closure ofnine branch offices as part of our previously announced restructuring.
We value and promote diversity and inclusion in every aspect of our business and at every level within the company. We recruit, hire, and promote employees based on theirindividual ability and experience and in accordance with Affirmative Action and Equal Employment Opportunity laws and regulations. Our policy is that we do not discriminateon the basis of race, color, gender, national origin, religion, age, sexual orientation, gender identity, gender expression, genetic information, physical or mental disability,pregnancy, marital status, status as a protected veteran, or any other status protected by federal, state, or local law.
(1)
29

Our talent acquisition practices are designed to attract top talent in the financial services industry and foster an inclusive, respectful and rewarding workplace. Selection teams areguided by our Talent Acquisition professionals in the proper recruitment and selection of talent with a focus on competency-based hiring. We stay abreast of market trends andbest practices, ensuring that we remain competitive and an attractive place to work. An employee referral program serves to reward current employees for identifying top talentwho choose to apply and accept employment with us.
Our business strategy relies heavily on relationships with both internal and external stakeholders. At New Employee Orientation, newly hired employees are educated on ourcore values of personal responsibility, ethical behavior, trust and integrity, caring relationships, and teamwork.
We believe that a sense of belonging is essential for providing a work environment where everyone can perform their very best. We are committed to fostering an environmentthat encourages diverse viewpoints, backgrounds and experiences and with the support of our Board of Directors, we continue to explore additional diversity, equity, andinclusion efforts.
We offer a comprehensive benefits package to our employees and have designed our benefits and compensation programs to attract, retain, motivate, and reward employees. APaid Time Off program gives our employees a chance to step back from their professional commitments to spend time as they choose and to recharge. We provide programs suchas tuition reimbursement and employee banking services. We periodically administer an Employee Culture survey to gain perspective on what we do well and our opportunitiesfor improvement. As employees exit the organization, we seek their candid feedback in an effort to improve our processes, practices and overall work environment.
We are committed to serving and strengthening the communities in which we live, work and play and believe this commitment fosters strong and rewarding relationships withour clients and community partners. Community Service Leave (CSL) is awarded annually to employees in their volunteerism with charitable organizations of their choicethroughout the year. All employees are eligible for CSL and may use it throughout the calendar year to participate in eligible community service activities.
In addition, we support our communities through a variety of sponsorships and financial contributions to non-profit agencies across our footprint. We sponsor an annualworkplace campaign designed to promote volunteerism and monetary contributions by employees to community agencies they choose to support.
Valuing our people, our greatest asset, means that good health, safety, and well-being practices, both at home and at work, are woven into the fabric of our culture. We offer anemployee assistance program for employees and for those living in their households which provide tools, resources, and counseling at no charge to them. We provide a wellnessprogram, which delivers products, services, and tools to help employees maintain a healthy life.
During the peak of the pandemic, we partnered with a third-party vendor to assist in managing the COVID-19 related cases, ensuring confidentiality and consistency in theprocess. We provide up to four hours of leave for employees who need time away to receive the vaccine.
We also recognize the important of financial health by offering programs such as a 401(K) profit sharing plan and an employee stock ownership plan.
Internet Website
We maintain a website with the address www.htb.com. The information contained on our website is not included as a part of, or incorporated by reference into, this AnnualReport on Form 10-K. Other than an investor’s own Internet access charges, we make available free of charge through our website our Annual Report on Form 10-K, quarterlyreports on Form 10-Q and current reports on Form 8-K, and amendments to these reports, as soon as reasonably practicable after we have electronically filed such material with,or furnished such material to, the SEC.
HOW WE ARE REGULATED
General. HomeTrust Bancshares, Inc. is subject to examination and supervision by, and is required to file certain reports with, the Federal Reserve. HomeTrust Bancshares, Inc.is also subject to the rules and regulations of the SEC under the federal securities laws.
The Bank is subject to examination and regulation primarily by the NCCOB and the Federal Reserve. This system of regulation and supervision establishes a comprehensiveframework of activities in which the Bank may engage and is intended primarily for the protection of depositors and the FDIC deposit insurance fund. The Bank is periodicallyexamined by the NCCOB and the Federal Reserve to ensure that it satisfies applicable standards with respect to its capital adequacy, assets, management, earnings, liquidity andsensitivity to market interest rates. The NCCOB and the Federal Reserve also regulate the branching authority of the Bank. The Bank’s relationship with its depositors andborrowers is regulated by federal consumer protection laws. The CFPB issues regulations under those laws that the Bank must comply with. The Bank’s relationship with itsdepositors and borrowers is also regulated by state laws with respect to certain matters, including the enforceability of loan documents.
On August 25, 2014, the Bank converted from a federal savings bank to a national bank. In connection with this conversion of the Bank, HomeTrust Bancshares, Inc. changedfrom a savings and loan holding company to a bank holding company, regulated under the BHCA. On December 31, 2015, the Bank converted from a national bank to a NorthCarolina state-chartered bank and remained a member of the Federal Reserve System. Prior to December 31, 2015, the Bank was regulated by the Office of the Comptroller ofthe Currency. In connection with the charter change, the Company elected to be treated as a financial holding company by the Federal Reserve.
30

The following is a brief description of certain laws and regulations applicable to HomeTrust Bancshares, Inc. and the Bank. Descriptions of laws and regulations here andelsewhere in this report do not purport to be complete and are qualified in their entirety by reference to the actual laws and regulations. Legislation is introduced from time totime in the United States Congress and the North Carolina legislature that may affect the operations of HomeTrust Bancshares and the Bank. In addition, the regulations thatgovern us may be amended from time to time. Any such legislation or regulatory changes in the future could adversely affect our operations and financial condition.
Financial Regulatory Reform. The Dodd-Frank Act, which was enacted in July 2010, imposed various restrictions and an expanded framework of regulatory oversight forfinancial entities, including depository institutions and their holding companies.
In May 2018, the Economic Growth, Regulatory Relief and Consumer Protection Act (the “Regulatory Relief Act”), was enacted to modify or remove certain financial reformrules and regulations, including some of those implemented under the Dodd-Frank Act. While the Act maintains most of the regulatory structure established by the Dodd-FrankAct, it amends certain aspects of the regulatory framework for small depository institutions with assets of less than $10 billion and for large banks with assets of more than $50billion. Many of these changes could result in meaningful regulatory changes for community banks such as HomeTrust Bank, and their holding companies.
The Regulatory Relief Act, among other matters, expands the definition of qualified mortgages which may be held by a financial institution and simplifies the regulatory capitalrules for financial institutions and their holding companies with total consolidated assets of less than $10 billion by instructing the federal banking regulators to establish a singleCBLR. In September 2019, the regulatory agencies, including the NCCOB and FRB, adopted a final rule, effective January 1, 2020, creating the CBLR for institutions with totalconsolidated assets of less than $10 billion and that meet other qualifying criteria. The CBLR provides for a simple measure of capital adequacy for qualifying institutions.According to the final rule, qualifying institutions that elect to use the CBLR framework and that maintain a leverage ratio of greater than 9% will be considered to have satisfiedthe generally applicable risk-based and leverage capital requirements in the regulatory agencies' capital rules, and to have met the capital requirements for the well capitalizedcategory under the agencies' prompt corrective action framework. In April 2020, the federal bank regulatory agencies announced the issuance of two interim final rules, effectiveimmediately, to provide temporary relief to community banking organizations. Under the interim final rules, the CBLR requirement was a minimum of 8% for the remainder ofcalendar year 2020, and is 8.5% for calendar year 2021, and 9% thereafter. The Bank has not currently elected to adopt the CBLR framework, but may consider that election inthe future.
The regulatory agencies have adopted a rule that provides a banking organization the option to phase-in over a five-year period the effects of CECL on its regulatory capital uponthe adoption of the standard. The Company has adopted the five-year phase in provision as of July 1, 2020.
Regulation of HomeTrust Bank
The Bank is subject to regulation and oversight by the NCCOB and the Federal Reserve extending to all aspects of its operations, including but not limited to requirementsconcerning an allowance for credit losses, lending and mortgage operations, interest rates received on loans and paid on deposits, the payment of dividends to the Company,loans to officers and directors, mergers and acquisitions, capital, and the opening and closing of branches. See "- Current Capital Requirements for HomeTrust Bank," "-Limitations on Dividends and Other Capital Distributions" and “-New Capital Rules” for additional details.
As a state-chartered institution, the Bank is subject to periodic examinations by the NCCOB and the Federal Reserve. During these examinations, the examiners assesscompliance with state and federal banking regulations and the safety and soundness standards on such matters as loan underwriting and documentation, asset quality, earningsstandards, internal controls and audit systems, interest rate risk exposure, and employee compensation and benefits. Any institution that fails to comply with these standards mustsubmit a compliance plan.
The Bank is subject to a statutory lending limit on aggregate loans to one person or a group of persons combined because of certain relationships and common interests. Thatlimit is generally equal to 15% of unimpaired capital and surplus, which was $57.1 million as of June 30, 2021. The limit is increased to 25% for loans fully secured by readilymarketable collateral. The Bank has no lending relationships in excess of its lending limit.
The NCCOB and the Federal Reserve have enforcement responsibility over the Bank and the authority to bring actions against the Bank and certain institution-affiliated parties,including officers, directors, and employees, for violations of laws or regulations and for engaging in unsafe and unsound practices. Formal enforcement actions include theissuance of a capital directive or cease and desist order, civil money penalties, removal of officers and/or directors, and receivership or conservatorship of the institution.
Pursuant to the Dodd-Frank Act, federal banking and securities regulators issued final rules to implement Section 619 of the Dodd-Frank Act (the “Volcker Rule”). Generally,subject to a transition period and certain exceptions, the Volcker Rule restricts insured depository institutions and their affiliates from engaging in short-term proprietary tradingof certain securities, investing in funds not registered with the SEC with collateral not entirely comprised of loans, and from engaging in hedging activities that do not hedge aspecific identified risk. Banks with total consolidated assets of $10 billion or less and total consolidated trading assets and liabilities equal to 5% or less of total consolidatedassets, such as the Bank's are not subject to the Volcker Rule.
Insurance of Accounts and Regulation by the FDIC. The deposit insurance fund of the FDIC insures deposit accounts in HomeTrust Bank up to $250,000 per separatelyinsured deposit ownership right or category.
31

Under the FDIC’s risk-based assessment system, insured institutions are assessed based on supervisory ratings and in general, stronger institutions pay lower rates while riskierinstitutions pay higher rates. Currently, assessment rates (inclusive of certain possible adjustments) range from 1.5 to 40.0 basis points of each institution’s total averageconsolidated assets less average tangible equity (subject to upward adjustment for certain debt). The FDIC has authority to increase insurance assessments, and any significantincreases would have an adverse effect on the operating expenses and results of operations of the Company. Management cannot predict what assessment rates will be in thefuture.
Insurance of deposits may be terminated by the FDIC upon a finding that an institution has engaged in unsafe or unsound practices, is in an unsafe or unsound condition tocontinue operations or has violated any applicable law, regulation, rule, order or condition imposed by the FDIC. We do not currently know of any practice, condition, orviolation that may lead to termination of our deposit insurance.
Transactions with Related Parties. Federal laws strictly limit the ability of banks to engage in certain transactions with their affiliates, including their bank holding companies.Transactions between the Bank and its affiliates are required to be on terms as favorable to the Bank as transactions with non-affiliates. Certain of these transactions, such asloans to an affiliate, are restricted to a percentage of the Bank's capital, and loans to affiliates require eligible collateral in specified amounts. HomeTrust Bancshares, Inc. is anaffiliate of the Bank.
Federal law generally prohibits loans by HomeTrust Bancshares to its executive officers and directors, but there is a specific exception for loans made by HomeTrust Bank to itsexecutive officers and directors in compliance with federal banking laws. However, HomeTrust Bank’s authority to extend credit to its executive officers, directors and 10%stockholders (“insiders”), as well as entities those insiders control, is limited. The individual and aggregate amounts of loans that HomeTrust Bank may make to insiders arebased, in part, on HomeTrust Bank’s capital level and require that certain board approval procedures be followed. Such loans are required to be made on terms substantially thesame as those offered to unaffiliated individuals and not involve more than the normal risk of repayment. There is an exception for loans made pursuant to a benefit orcompensation program that is widely available to all employees of the institution and does not give preference to insiders over other employees. Loans to executive officers aresubject to additional limitations based on the type of loan involved.
Current Capital Requirements for HomeTrust Bank. The Bank is required to maintain specified levels of regulatory capital under federal banking regulations. The capitaladequacy requirements are quantitative measures established by regulation that require the Bank to maintain minimum amounts and ratios of capital. Failure to meet minimumcapital requirements can initiate certain mandatory and possibly additional discretionary actions by bank regulators that, if undertaken, could have a direct material effect on theCompany's financial statements.
Under the capital regulations, the minimum required capital ratios for the Company and the Bank are (i) a CETI capital ratio of 4.50%; (ii) a Tier 1 capital ratio of 6.00%; (iii) atotal capital ratio of 8.00%; and (iv) a leverage ratio (the ratio of Tier 1 capital to average total consolidated assets) of 4.00% for all financial institutions. CET1 generallyconsists of common stock and retained earnings. Tier 1 capital generally consists of CET1 and noncumulative perpetual preferred stock. Tier 2 capital generally consists of otherpreferred stock and subordinated debt meeting certain conditions plus an amount of the allowance for credit losses up to 1.25% of assets. Total capital is the sum of Tier 1 andTier 2 capital. The CET1 capital ratio, the Tier 1 capital ratio and the total capital ratio are sometimes referred to as the risk-based capital ratios and are determined based on risk-weightings of assets and certain off-balance sheet items that range from 0% to 1,250%.
Mortgage servicing and deferred tax assets over designated percentages of CET1 are deducted from capital. Because of our asset size, we were eligible to elect and have electedto permanently opt-out of the inclusion of unrealized gains and losses on available for sale debt and equity securities in our capital calculations.
In addition to the risk-based capital ratios, the Bank must maintain a capital conservation buffer consisting of additional CET1 capital greater than 2.50% of risk-weighted assetsabove the minimum levels for such ratios in order to avoid limitations on paying dividends, engaging in share repurchases, and paying discretionary bonuses based onpercentages of eligible retained income that could be utilized for such actions. To meet the minimum capital ratios and the capital conservation buffer requirements, the capitalratios applicable to the Company and the Bank are (i) a CETI capital ratio greater than 7.00%; (ii) a Tier 1 capital ratio greater than 8.50%; (iii) a total capital ratio greater than10.50%; and (iv) a Tier 1 leverage ratio greater than 4.00%. As of June 30, 2021, the conservation buffer for HomeTrust Bank was 3.96%.
To be considered “well capitalized,” a depository institution must have a Tier 1 capital ratio of at least 8.00%, a total capital ratio of at least 10.00%, a CET1 capital ratio of atleast 6.50% and a leverage ratio of at least 5.00% and not be subject to an individualized order, directive or agreement under which its primary federal banking regulator requiresit to maintain a specific capital level. Institutions that are not well capitalized are subject to certain restrictions on brokered deposits and interest rates on deposits. Under certaincircumstances, regulators are required to take certain actions against banks that fail to meet the minimum required capital ratios. Any such institution must submit a capitalrestoration plan and, until such plan is approved may not increase its assets, acquire another depository institution, establish a branch or engage in any new activities, or makecapital distributions. As of June 30, 2021, HomeTrust Bank met the requirements to be “well capitalized” and met the fully phased-in capital conservation buffer requirement.For additional information regarding the Bank’s required and actual capital levels at June 30, 2021, see Note 18 of the Notes to Consolidated Financial Statements included inItem 8 in this report.
Federal Home Loan Bank System. HomeTrust Bank is a member of the FHLB of Atlanta, one of 11 regional Federal Home Loan Banks that administer the home financingcredit function of financial institutions. The Federal Home Loan Banks are subject to the oversight of the FHFA and each FHLB serves as a reserve or central bank for itsmembers within its assigned region. The Federal Home Loan Banks are funded primarily from proceeds derived from the sale of consolidated obligations of the Federal HomeLoan Bank System and makes loans or advances to members in accordance with policies and procedures established by the Board of Directors of the FHLB, which are subject tothe oversight of the FHFA. All advances from the FHLB are required to be fully secured by sufficient collateral as determined by the FHLB. In
32

addition, all long-term advances are required to provide funds for residential home financing. See “Business - Sources of Funds - Borrowings.”
At June 30, 2021, the Bank held $6.2 million in FHLB stock that was in compliance with the holding requirements.
The FHLBs continue to contribute to low- and moderately-priced housing programs through direct loans or interest subsidies on advances targeted for community investmentand low- and moderate-income housing projects. These contributions have adversely affected the level of FHLB dividends paid and could continue to do so in the future. Thesecontributions could also have an adverse effect on the value of FHLB stock in the future. A reduction in value of the Bank’s FHLB stock may result in a decrease in net incomeand possibly capital.
Commercial Real Estate Lending Concentrations. The federal banking agencies have issued guidance on sound risk management practices for concentrations in commercialreal estate lending. The particular focus is on exposure to commercial real estate loans that are dependent on the cash flow from the real estate held as collateral and that arelikely to be sensitive to conditions in the commercial real estate market (as opposed to real estate collateral held as a secondary source of repayment or as an abundance ofcaution). The purpose of the guidance is not to limit a bank’s commercial real estate lending but to guide banks in developing risk management practices and capital levelscommensurate with the level and nature of real estate concentrations. The guidance directs the Federal Reserve and other bank regulatory agencies to focus their supervisoryresources on institutions that may have significant commercial real estate loan concentration risk. A bank that has experienced rapid growth in commercial real estate lending,has notable exposure to a specific type of commercial real estate loan, or is approaching or exceeding the following supervisory criteria may be identified for further supervisoryanalysis with respect to real estate concentration risk:
• Total reported loans for construction, land development and other land represent 100% or more of the bank’s total regulatory capital; or• Total commercial real estate loans (as defined in the guidance) represent 300% or more of the bank’s total regulatory capital and the outstanding balance of the bank’s
commercial real estate loan portfolio has increased 50% or more during the prior 36 months.
The guidance provides that the strength of an institution’s lending and risk management practices with respect to such concentrations will be taken into account in supervisoryguidance on evaluation of capital adequacy. As of June 30, 2021, HomeTrust Bank’s aggregate recorded loan balances for construction, land development and land loans were48.6% of regulatory capital. In addition, at June 30, 2021, HomeTrust Bank’s commercial real estate loans, as defined by the guidance, were 280.1% of regulatory capital.
Community Reinvestment and Consumer Protection Laws. In connection with its deposit-taking, lending and other activities, the Bank is subject to a number of federal lawsdesigned to protect consumers and promote lending for various purposes. The CFPB issues regulations and standards under these federal consumer protection laws, whichinclude the Equal Credit Opportunity Act, the Truth-in-Lending Act, the Home Mortgage Disclosure Act, the Real Estate Settlement Procedures Act and others. The CFPB haspromulgated a number of proposed and final regulations under these laws that will affect our consumer businesses. Among these regulatory initiatives, are final regulationssetting “ability to repay” and “qualified mortgage” standards for residential mortgage loans and establishing new mortgage loan servicing and loan originator compensationstandards. In addition, customer privacy regulations limit the ability of the Bank to disclose nonpublic consumer information to non-affiliated third parties. These regulationsrequire disclosure of privacy policies and allow consumers to prevent certain personal information from being shared with non-affiliated parties.
The CRA requires that the Federal Reserve assess the Bank's record in meeting the credit needs of the communities it serves, especially low and moderate incomeneighborhoods. Under the CRA, institutions are assigned a rating of "outstanding," "satisfactory," "needs to improve," or "substantial non-compliance." The Bank received a"satisfactory" rating in its most recent CRA evaluation.
BSA / Anti-Money Laundering Laws. The Bank is subject to the BSA and other anti-money laundering laws and regulations, including the USA PATRIOT Act of 2001. Theselaws and regulations require the Bank to implement policies, procedures, and controls to detect, prevent, and report money laundering and terrorist financing and to verify theidentity of their customers. Violations of these requirements can result in substantial civil and criminal sanctions. In addition, provisions of the USA PATRIOT Act require thefederal financial institution regulatory agencies to consider the effectiveness of a financial institution's anti-money laundering activities when reviewing mergers and acquisitions.
The AMLA, which amends the BSA, was enacted in January 2021. The AMLA is intended to be a comprehensive reform and modernization to U.S. bank secrecy and anti-money laundering laws. Among other things, it codifies a risk-based approach to anti-money laundering compliance for financial institutions; requires the development ofstandards for evaluating technology and internal processes for BSA compliance; expands enforcement- and investigation-related authority, including increasing availablesanctions for certain BSA violations and instituting BSA whistleblower incentives and protections
Limitations on Dividends. NCCOB and Federal Reserve regulations impose various restrictions on the ability of the Bank to pay dividends. The Bank generally may paydividends during any calendar year in an amount up to 100% of net income for the year-to-date plus retained net income for the two preceding years, without the approval of theFederal Reserve. If the Bank proposes to pay a dividend that will exceed this limitation, it must obtain the Federal Reserve's prior approval. The Federal Reserve may object to aproposed dividend based on safety and soundness concerns. No insured depository institution may pay a dividend if, after paying the dividend, the institution would beundercapitalized. In addition, as noted above, if the Bank does not have the required capital conservation buffer, its ability to pay dividends to HomeTrust Bancshares, Inc. willbe limited.
33

Holding Company Regulation
As a bank holding company under the BHCA, HomeTrust Bancshares, Inc. is subject to regulation, supervision, and examination by the Federal Reserve. The Federal Reservehas enforcement authority with respect to HomeTrust Bancshares, Inc. similar to its enforcement authority over the Bank. We are required to file quarterly reports with theFederal Reserve and provide additional information as the Federal Reserve may require. The Federal Reserve may examine us, and any of our subsidiaries, and charge us for thecost of the examination. The Federal Reserve also has extensive enforcement authority over bank holding companies, including, among other things, the ability to assess civilmoney penalties, to issue cease and desist or removal orders and to require that a holding company divest subsidiaries (including its bank subsidiaries). In general, enforcementactions may be initiated for violations of law and regulations and unsafe or unsound practices. HomeTrust Bancshares, Inc. is also required to file certain reports with, andotherwise comply with the rules and regulations of the SEC.
The Bank Holding Company Act. Under the BHCA, we are supervised by the Federal Reserve. The Federal Reserve has a policy that a bank holding company is required toserve as a source of financial and managerial strength to its subsidiary banks and may not conduct its operations in an unsafe or unsound manner. In addition, the Dodd-FrankAct and earlier Federal Reserve policy provide that a bank holding company should serve as a source of strength to its subsidiary banks by having the ability to provide financialassistance to its subsidiary banks during periods of financial distress to the banks. A bank holding company's failure to meet its obligation to serve as a source of strength to itssubsidiary banks will generally be considered by the Federal Reserve to be an unsafe and unsound banking practice or a violation of the Federal Reserve's regulations or both. Noregulations have yet been proposed by the Federal Reserve to implement the source of strength doctrine required by the Dodd-Frank Act. HomeTrust Bancshares, Inc. and anysubsidiaries that it may control are considered “affiliates” within the meaning of the Federal Reserve Act, and transactions between HomeTrust Bancshares, Inc. and affiliates aresubject to numerous restrictions. With some exceptions, HomeTrust Bancshares, Inc. and its subsidiaries are prohibited from tying the provision of various services, such asextensions of credit, to other services offered by HomeTrust Bancshares, Inc. or by its affiliates.
Permissible Activities. The business activities of HomeTrust Bancshares, Inc. are generally limited to those activities permissible for bank holding companies under Section 4(c)(8) of the BHCA, those permitted for a financial holding company under Section 4(f) of the BHCA, and certain additional activities authorized by regulation. The BHCAgenerally prohibits a financial holding company from acquiring direct or indirect ownership or control of more than 5% of the voting shares of any company which is not a bankor bank holding company. A bank holding company must obtain Federal Reserve approval before acquiring directly or indirectly, ownership or control of any voting shares ofanother bank or bank holding company if, after such acquisition, it would own or control more than 5% of such shares (unless it already owns or controls the majority of suchshares).
Capital Requirements for HomeTrust Bancshares. As a bank holding company, HomeTrust Bancshares, Inc. is subject to the minimum regulatory capital requirementsestablished by the Federal Reserve regulation, which generally are the same as the capital requirements for the Bank. These capital requirements include provisions that mightimpact the ability of the Company to pay dividends to its stockholders or repurchase its shares. For a description of the capital regulations, see "Regulation of HomeTrust Bank -Current Capital Requirements for HomeTrust Bank" and Note 18 of the Notes to Consolidated Financial Statements included in Item 8 in this report.
At June 30, 2021, the HomeTrust Bancshares, Inc. exceeded its minimum regulatory capital requirements under Federal Reserve regulations.
Federal Securities Law. The stock of HomeTrust Bancshares, Inc. is registered with the SEC under the Exchange Act. HomeTrust Bancshares, Inc. is subject to the information,proxy solicitation, insider trading restrictions, and other requirements of the SEC under the Exchange Act.
The SEC has adopted regulations and policies applicable to a registered company under the Exchange Act that seek to increase corporate responsibility, provide for enhancedpenalties for accounting and auditing improprieties and protect investors by improving the accuracy and reliability of corporate disclosures in SEC filings. These regulations andpolicies include very specific additional disclosure requirements and mandate corporate governance practices.
Sarbanes-Oxley Act. The SOX Act addresses a broad range of corporate governance, auditing and accounting, executive compensation, and disclosure requirements for publiccompanies and their directors and officers. The SOX Act requires our Chief Executive Officer and Chief Financial Officer to certify the accuracy of certain information includedin our quarterly and annual reports. The rules require these officers to certify that they are responsible for establishing, maintaining, and regularly evaluating the effectiveness ofour financial reporting and disclosure controls and procedures; that they have made certain disclosures to the auditors and to the Audit Committee of the Board of Directors aboutour controls and procedures; and that they have included information in their quarterly and annual filings about their evaluation and whether there have been significant changesto the controls and procedures or other factors which would significantly impact these controls subsequent to their evaluation. Section 404 of the SOX Act requires managementto undertake an assessment of the adequacy and effectiveness of our internal controls over financial reporting and requires our auditors to attest to and report on the effectivenessof these controls.
Dividends. The Federal Reserve has issued a policy statement on the payment of cash dividends by bank holding companies, which expresses its view that although there are nospecific regulations restricting dividend payments by bank holding companies other than state corporate laws, a bank holding company must maintain an adequate capitalposition and generally should not pay cash dividends unless the company's net income for the past year is sufficient to fully fund the cash dividends and that the prospective rateof earnings appears consistent with the company's capital needs, asset quality, and overall financial condition. The Federal Reserve policy statement also indicates that it wouldbe inappropriate for a company experiencing serious financial problems to borrow funds to pay dividends. As described above under “Regulation
34

of HomeTrust Bank-Current Capital Requirements for HomeTrust Bank," the capital conservation buffer requirement can also restrict the ability of HomeTrust Bancshares, Inc.and the Bank to pay dividends.
Stock Repurchases. A bank holding company, except for certain “well-capitalized” and highly rated bank holding companies, is required to give the Federal Reserve priorwritten notice of any purchase or redemption of its outstanding equity securities if the gross consideration for the purchase or redemption, when combined with the netconsideration paid for all such purchases or redemptions during the preceding twelve months, is equal to 10% or more of its consolidated net worth. The Federal Reserve maydisapprove such a purchase or redemption if it determines that the proposal would constitute an unsafe or unsound practice or would violate any law, regulation, Federal Reserveorder or any condition imposed by, or written agreement with, the Federal Reserve.
Legislative and Regulatory Proposals. Any changes in the extensive regulatory scheme to which HomeTrust Bancshares, Inc. or the Bank is and will be subject, whether by anyof the federal banking agencies or Congress, or the North Carolina legislature or NCCOB, could have a material effect on the Company or HomeTrust Bank, and HomeTrustBancshares, Inc. and the Bank cannot predict what, if any, future actions may be taken by legislative or regulatory authorities or what impact such actions may have.
Federal Taxation
General. HomeTrust Bancshares Inc. and the Bank are subject to federal income taxation in the same general manner as other corporations, with some exceptions discussedbelow. The following discussion of federal taxation is intended only to summarize material federal income tax matters and is not a comprehensive description of the tax rulesapplicable to HomeTrust Bancshares and HomeTrust. See Note 12 "Income Taxes" in the Notes to the Consolidated Financial Statements included in Item 8 of this Form 10-Kfor additional information.
Method of Accounting. For federal income tax purposes, the Company currently reports its income and expenses on the accrual method of accounting and uses a fiscal yearending on June 30th for filing its federal income tax return.
Net Operating Loss Carryovers. A financial institution may carry back net operating losses to the preceding two taxable years and forward to the succeeding 20 taxable years.This provision applies to losses incurred in taxable years beginning after August 6, 1997. In 2009, IRC 172 (b) (1) was amended to allow businesses to carry back losses incurredin 2008 and 2009 for up to five years to offset 50% of the available income from the fifth year and 100% of the available income for the other four years. At June 30, 2021, wehad $21.4 million of net operating loss carryforwards for federal income tax purposes.
Corporate Dividends-Received Deduction. HomeTrust Bancshares, Inc. files a consolidated return with the Bank. As a result, any dividends HomeTrust Bancshares, Inc.receives from the Bank will not be included as income to HomeTrust Bancshares, Inc. The corporate dividends-received deduction is 100%, or 65% in the case of dividendsreceived from corporations with which a corporate recipient does not file a consolidated tax return, depending on the level of stock ownership of the payer of the dividend.
State Taxation
North Carolina. The state of North Carolina requires all corporation chartered or doing business in the state to pay a corporate tax rate of 2.5%.
If a corporation in North Carolina does business in North Carolina and in one or more other states, North Carolina taxes a fraction of the corporation’s income based on theamount of sales, payroll, and property it maintains within North Carolina. North Carolina franchise tax is levied on business corporations at the rate of $1.50 per $1,000 of thelargest of the following three alternate bases: (i) the amount of the corporation’s capital stock, surplus, and undivided profits apportionable to the state; (ii) 55% of the appraisedvalue of the corporation’s property in the state subject to local taxation; or (iii) the book value of the corporation’s real and tangible personal property in the state less anyoutstanding debt that was created to acquire or improve real property in the state.
Any cash dividends, in excess of a certain exempt amount, that would be paid with respect to HomeTrust Bancshares common stock to a stockholder (including a partnership andcertain other entities) who is a resident of North Carolina will be subject to the North Carolina income tax. Any distribution by a corporation from earnings according topercentage ownership is considered a dividend, and the definition of a dividend for North Carolina income tax purposes may not be the same as the definition of a dividend forfederal income tax purposes. A corporate distribution may be treated as a dividend for North Carolina income tax purposes if it is paid from funds that exceed the corporation’searned surplus and profits under certain circumstances.
South Carolina. The state of South Carolina requires banks to file a bank tax return. As a multi-state bank, we pay taxes on the portion of revenue generated within the state. In2021 and 2020 the tax rate was 4.5%.
Tennessee. The state of Tennessee requires banks to file a franchise and excise tax form for financial institutions. The franchise tax is based on the portion of revenue generatedin the state, the net worth of the Bank, and the applicable franchise tax, which was $0.25 per $100 in 2021 and 2020. The excise tax is based on the taxable income (as defined bythe state), the portion of revenue generated in the state, and the applicable excise tax, which was 6.5% in 2021 and 2020.
Virginia. The state of Virginia requires banks to file a bank franchise tax. The tax is based on the portion of capital deployed within the state and county level (as defined by thestate) and taxed at $1 per $100 of taxable value.
35

INFORMATION ABOUT OUR EXECUTIVE OFFICERS
The following individuals are executive officers of HomeTrust Bancshares and HomeTrust Bank and hold the offices set forth below opposite their names. Name Age PositionDana L. Stonestreet 67 Chairman, President, and Chief Executive OfficerC. Hunter Westbrook 58 Senior Executive Vice President and Chief Operating OfficerTony J. VunCannon 56 Executive Vice President, Chief Financial Officer, Corporate Secretary, and TreasurerMarty Caywood 49 Executive Vice President and Chief Information OfficerKeith Houghton 59 Executive Vice President and Chief Credit OfficerAnna Marie Smith 53 Executive Vice President and Chief Human Resources OfficerParrish Little 53 Executive Vice President and Chief Risk Officer___________________(1) As of June 30, 2021.
Biographical Information. Set forth below is certain information regarding the executive officers of HomeTrust Bancshares and HomeTrust Bank. There are no familyrelationships among or between the executive officers.
Dana L. Stonestreet, Chairman, President and Chief Executive Officer. In his 32 years of service, Mr. Stonestreet has overseen ten acquisitions and the growth of HomeTrustBank from $300.0 million in assets to $3.5 billion in assets at June 30, 2021. Effective September 1, 2021, Mr. Stonestreet serves as Chairman and Chief Executive Officer ofHomeTrust Bancshares, Inc. and Chairman of HomeTrust Bank. Mr. Stonestreet also served as Chief Executive Officer of HomeTrust Bank prior to the promotion of Mr.Westbrook to this position effective September 1, 2021. Mr. Stonestreet joined HomeTrust Bank in 1989 as its Chief Financial Officer and was promoted to Chief OperatingOfficer in 2003 and President in 2008. He became Co-Chief Executive Officer of HomeTrust Bancshares and HomeTrust Bank in July 2013 and Chairman and Chief ExecutiveOfficer of HomeTrust Bancshares and HomeTrust Bank in November 2013. Mr. Stonestreet began his career with Hurdman & Cranston (an accounting firm that was latermerged into KPMG) as a certified public accountant. Mr. Stonestreet has served as Chairman of the Asheville Chamber of Commerce and as a director for RiverLink, theYMCA, United Way, the North Carolina Bankers Association and other community organizations. In July 2017, Mr. Stonestreet was appointed to the North Carolina BankingCommission for a four-year term.
C. Hunter Westbrook, Senior Executive Vice President and Chief Operating Officer. Effective September 1, 2021, Mr. Westbrook assumed the position of President and ChiefOperating Officer of HomeTrust Bancshares, Inc. and President and Chief Executive Officer of HomeTrust Bank. Prior to this promotion, Mr. Westbrook served as SeniorExecutive Vice President and Chief Operating Officer of HomeTrust Bancshares since October 2018, President and Chief Operating Officer of HomeTrust Bank since October2020 and Senior Executive Vice President and Chief Operating Officer of HomeTrust Bank since October 2018. Before that, Mr. Westbrook served as Executive Vice President(Senior Vice President prior to December 22, 2014) and Chief Banking Officer of HomeTrust Bancshares and HomeTrust Bank since June 2012. Mr. Westbrook began hiscareer in banking with TCF Bank in Minneapolis and later joined TCF National Bank Illinois as Senior Vice President of Finance. In 2004 he was promoted to Executive VicePresident of Retail Banking for Illinois, Wisconsin and Indiana markets that included 250 branches and $4 billion in deposits. He also served as President and Chief ExecutiveOfficer of First Community Bancshares in Texas, from 2006 to 2008, where he was responsible for repositioning the bank’s retail operating model and implemented the bank’sretail and corporate lending product offerings. In his most recent role, Mr. Westbrook served as Executive Vice President and Chief Operations Officer from 2008 to 2010 and asPresident and Chief Executive Officer from 2010 to 2012 of Second Federal Savings and Loan Association of Chicago, where he significantly grew core operating revenue, netchecking account balances, and repositioned the bank’s entire product line.
Tony J. VunCannon, Executive Vice President, Chief Financial Officer, Corporate Secretary, and Treasurer. Mr. VunCannon has served as HomeTrust Bank's Chief FinancialOfficer since July 2006. Mr. VunCannon joined the Bank in April 1992 as Controller; later becoming the Treasurer in March 1997 until July 2006 when he was also named ChiefFinancial Officer. In 2018, he was named Corporate Secretary. Prior to joining the Bank, Mr. VunCannon worked as an auditor in KPMG’s Charlotte office where his focus wasin the community banking sector. He is also a Certified Public Accountant.
Marty Caywood, Executive Vice President and Chief Information Officer. Mr. Caywood joined HomeTrust Bank in 1995 as the Bank’s first Network Administrator and workedin various roles including Information Security Officer and most recently as Senior Vice President and Director of Information Technology. Mr. Caywood was promoted toExecutive Vice President and Chief Information Officer in April 2019.
Keith Houghton, Executive Vice President and Chief Credit Officer. Mr. Houghton joined HomeTrust Bank in March of 2014 as our Chief Credit Officer. Mr. Houghton hasmore than 30 years of experience in the banking industry. For nearly 18 years, he held a variety of senior positions in the credit and lending areas with StellarOne Corporation, aCharlottesville, VA-based bank holding company with approximately $3 billion in assets, and its predecessors, until the sale of StellarOne to another bank in January 2014. Themost recent of those positions was Chief Credit Risk Officer, which Mr. Houghton held since 2007.
Anna Marie Smith, Executive Vice President and Chief Human Resources Officer. Ms. Smith joined HomeTrust Bank in March 2021 as Executive Vice President and ChiefHuman Resources Officer. Ms. Smith brings more than 25 years of experience leading diverse and high-
(1) (1)
36

performing teams while successfully driving large-scale initiatives. During her tenure at Wells Fargo (formerly Wachovia Bank), she led the team responsible for learning &development for over 10,000 employees nationally, oversaw mentorship programs, diversity & inclusion programs, and was the leader responsible for human resource servicesto executive and mid-level managers. Prior to joining the Bank, she served as Vice President of HR & Administrative Services at Forsyth Tech Community College in Winston-Salem NC, and as SVP, Learning & Development Senior Manager of Wells Fargo.
Parrish Little, Executive Vice President and Chief Risk Officer. Mr. Little joined HomeTrust Bank in March 2015 as our Chief Risk Officer. Prior to joining HomeTrust Bank,Mr. Little served as Senior Vice President, Director of Risk Management from 2008 to 2013 and Chief Audit Executive in 2014 for First Citizens Bank and Trust, Columbia,South Carolina. From 1997 to 2007, he served in several leadership roles with Bank of America in the areas of internal audit and risk management.
Item 1A. Risk Factors
An investment in our common stock is subject to risks inherent in our business. Before making an investment decision, you should carefully consider the risks anduncertainties described below together with all of the other information included in this report. In addition to the risks and uncertainties described below, other risks anduncertainties not currently known to us or that we currently deem to be immaterial also may materially and adversely affect our business, financial condition and results ofoperations. The value or market price of our common stock could decline due to any of these identified or other risks, and you could lose all or part of your investment.
Risks Related to Macroeconomic Conditions
COVID-19 Pandemic
The COVID-19 pandemic has adversely impacted our ability to conduct business, our financial results and those of our customers. The ultimate impact will depend on futuredevelopments, which are highly uncertain and cannot be predicted, including the scope and duration of the pandemic and actions taken by governmental authorities in responseto the pandemic.
During part of our fiscal year ended June 30, 2021, the COVID-19 pandemic significantly adversely affected our operations and the way we provided banking services tobusinesses and individuals during government issued modified stay-at-home orders. During the latter part of the fiscal year 2020, as an essential business, we provided bankingand financial services to our customers with drive-thru access at the majority of our branch locations and in-person services by appointment. In addition, we continued to provideaccess to banking and financial services through online banking, ATMs and by telephone. As the government issued orders were lifted during the latter part of fiscal year 2021and vaccinations were becoming available, businesses were able to reopen, but mask and social distancing measures slowed the pace of an economic rebound. We continue tomonitor the impact of the new Delta variant of COVID-19 which, subsequent to year-end, has prompted many health officials and municipalities to reinstate mask mandates andreconsider lifting pandemic restrictions. If the COVID-19 pandemic again worsens, it could limit or disrupt our ability to provide banking and financial services to ourcustomers.
If stay-at-home orders were to be reinstated by the government, many of our employees would be required to once again work remotely, potentially limiting our ability toprovide banking services to our customers. Heightened cybersecurity, information security and operational risks may result from these remote work-from-home arrangements.We also could be adversely affected if key personnel or a significant number of employees were to become unavailable due to the effects and restrictions of the continuedpandemic impacted by the new Delta variant. We rely upon our third-party vendors to help us conduct aspects of our business and to process, record and monitor transactions. Ifany of these vendors are unable to continue to provide us with their services, it could also negatively impact our ability to serve our customers. Although we have businesscontinuity plans and other safeguards in place that performed well during the current year ended June 30, 2021, there is no assurance that such plans and safeguards will beeffective in the future.
There remains uncertainty surrounding the future economic conditions that will emerge in the months and years ahead as the pandemic drags on. As a result, managementcontinues to be confronted with a significant and unfamiliar degree of uncertainty in estimating the impact of the pandemic on credit quality, revenues and asset values. TheCOVID-19 pandemic has resulted in overall declines in loan demand and loan originations and market interest rates. Because the length of the pandemic and the efficacy of theextraordinary measures put in place to address its economic consequences are not fully known, until the pandemic subsides, we expect our net interest income and net interestmargin will be adversely affected in the near term, if not longer. Many of our borrowers have been able to continue to make loan payments after allowing for short-term interestand principal payment deferrals and interest-only payments for 12 months; however, there continues to be certain businesses at risk of insolvency if their revenues declineprecipitously or remain at historically low rates for an extended period of time as a result of the impact of the new Delta variant of COVID-19, especially in industries related totravel, hospitality, leisure and physical personal services.
The impact of the pandemic is expected to continue to adversely affect us during fiscal year 2022 and possibly longer. Although we make estimates of loan losses related to thepandemic as part of our evaluation of the allowance for credit losses, such estimates involve significant judgment and are made in the context of significant uncertainty as to theimpact the pandemic will have on the credit quality of our loan portfolio. It is possible that loan delinquencies, adversely classified loans and loan charge-offs may increase in thefuture as a result of the pandemic. Early during the pandemic, and consistent with guidance provided by banking regulators, we modified loans by providing various loanpayment deferral options to our borrowers affected by the COVID-19 pandemic. Substantially all loans placed on full payment deferral during the pandemic have come out ofdeferral and borrowers are making regular loan payments or interest-only payments for up to 12 months. Notwithstanding these interest-only payment modifications, theseborrowers may not be able to resume making full payments on their loans once the COVID-19 pandemic is fully resolved. Any increases in the allowance for credit losses willresult in a decrease in net
37

income and, most likely, capital, and may have a material negative effect on our financial condition and results of operations. See "Recent Developments: COVID-19, theCARES Act, and Our Response" under Item 7, “Management's Discussion and Analysis of Financial Condition and Results of Operations" and Note 5 of the Notes to theConsolidated Financial Statements included in Item 8 of this Form 10-K for additional details on the Company's loan modifications related to COVID-19.
The PPP loans made by the Bank are guaranteed by the SBA and, if used by the borrower for authorized purposes, may be fully forgiven. However, in the event of a lossresulting from a default on a PPP loan and a determination by the SBA that there was a deficiency in the manner in which the PPP loan was originated, funded or serviced by theBank, the SBA may deny its liability under the guaranty, reduce the amount of the guaranty or, if it has already made payment under the guaranty, seek recovery of any lossrelated to the deficiency from the Bank. In addition, since the commencement of the PPP, several larger banks have been subject to litigation regarding their processing of PPPloan applications. The Bank may be exposed to the risk of similar litigation, from both customers and non-customers that approached the Bank seeking PPP loans. PPP lenders,including the Bank, may also be subject to the risk of litigation in connection with other aspects of the PPP, including but not limited to borrowers seeking forgiveness of theirloans. If any such litigation is filed against the Bank, it may result in significant financial or reputational harm to us. As of June 30, 2021, the PPP's funds were depleted andsubsequently the Company ended its participation in the program. We had a balance of $46.7 million in PPP loans as of June 30, 2021.
In accordance with GAAP, we record assets acquired and liabilities assumed at their fair value with the excess of the purchase consideration over the net assets acquired resultingin the recognition of goodwill. If adverse economic conditions or a decrease in our stock price and market capitalization as a result of the worsening of the pandemic were to bedeemed sustained rather than temporary, it may significantly affect the fair value of our goodwill and may trigger impairment charges. Any impairment charge could have amaterial adverse effect on our results of operations and financial condition. Goodwill has been evaluated for impairment as of our annual evaluation date, April 1, 2021, as wellas for triggering events at June 30, 2021 and it was determined that no impairment was required.
Even after the COVID-19 pandemic subsides, the U.S. economy will likely require some time to recover from its effects, the length of which is unknown, and during which wemay experience a recession. As a result, we anticipate our business may be materially and adversely affected during the recovery process. To the extent the effects of theCOVID-19 pandemic adversely impact our business, financial condition, liquidity or results of operations, it may also have the effect of heightening many of the other risksdescribed in this section.
Adverse economic conditions in the market areas we serve could adversely impact our earnings and could increase the credit risk associated with our loan portfolio.
Our primary market areas are concentrated in North Carolina (including the Asheville metropolitan area, Piedmont region, Charlotte, and Raleigh/Cary), South Carolina(Greenville), East Tennessee (including Kingsport/Johnson City/Bristol, Knoxville, and Morristown) and the Roanoke Valley area of Virginia. Adverse economic conditions inour market areas can reduce our rate of growth, affect our customers’ ability to repay loans and adversely impact our financial condition and earnings. General economicconditions, including inflation, unemployment and money supply fluctuations, also may affect our profitability adversely.
While real estate values and unemployment rates have recently improved, deterioration in economic conditions, particularly within our primary market areas could result in thefollowing consequences, among others, any of which could materially hurt our business:
• loan delinquencies, problem assets and foreclosures may increase;• we may increase our allowance for credit losses;• the slowing of sales of foreclosed assets;• demand for our products and services may decline, possibly resulting in a decrease in our total loans or assets;• collateral for loans made may decline further in value, exposing us to increased risk of loss on existing loans and reducing customers’ borrowing power;• the net worth and liquidity of loan guarantors may decline, impairing their ability to honor commitments to us; and• the amount of our deposits may decrease and the composition of our deposits may be adversely affected.
At June 30, 2021, the most significant portion of our loans located outside of our primary market areas were HELOCs-purchased totaling $39.0 million, or 1.4% of our loanportfolio, secured by one-to-four family properties located primarily in several western states. As a result, our financial condition and results of operations are subject to generaleconomic conditions and the real estate conditions prevailing in the markets in which the underlying properties securing these loans are located, as well as the conditions in ourprimary market areas. If economic conditions or if the real estate market declines in the areas in which these properties are located, we may suffer decreased net income or lossesassociated with higher default rates and decreased collateral values on our existing portfolio. Further, because of their geographical diversity, these loans can be more difficult tooversee than loans in our market areas in the event of delinquency.
A decline in economic conditions may have a greater effect on our earnings and capital than on the earnings and capital of larger financial institutions whose real estate loanportfolios are more geographically diverse. Many of the loans in our portfolio are secured by real estate. Deterioration in the real estate markets where collateral for a mortgageloan is located could negatively affect the borrower’s ability to repay the loan and the value of the collateral securing the loan. Real estate values are affected by various otherfactors, including changes in general or regional economic conditions, governmental rules or policies and natural disasters. If we are required to liquidate a significant amount ofcollateral during a period of reduced real estate values, our financial condition and profitability could be adversely affected.
38

Risks Related to Lending Activities
Our business may be adversely affected by credit risk associated with residential property.
At June 30, 2021, $406.5 million, or 14.9% of our total loan portfolio, was secured by liens on one-to-four family residential loans. These types of loans are generally sensitive toregional and local economic conditions that significantly impact the ability of borrowers to meet their loan payment obligations, making loss levels difficult to predict. A declinein residential real estate values resulting from a downturn in the housing market may reduce the value of the real estate collateral securing these types of loans and increase ourrisk of loss if borrowers default on their loans. Recessionary conditions or declines in the volume of real estate sales and/or the sales prices coupled with elevated unemploymentrates may result in higher than expected loan delinquencies or problem assets, and a decline in demand for our products and services. These potential negative events may causeus to incur losses, adversely affect our capital and liquidity, and damage our financial condition and business operations. Further, the Tax Act enacted in December 2017 couldnegatively impact our customers because it lowers the existing caps on mortgage interest deductions and limits state and local tax deductions. These changes could make it moredifficult for borrowers to make their loan payments, and could also negatively impact the housing market, which could adversely affect our business and loan growth.
A majority of our residential loans are “non-conforming” because they are adjustable rate mortgages which contain interest rate floors or do not satisfy credit or otherrequirements due to personal and financial reasons (i.e. divorce, bankruptcy, length of time employed, etc.), conforming loan limits (i.e. jumbo mortgages), and otherrequirements, imposed by secondary market purchasers. Some of these borrowers have higher debt-to-income ratios, or the loans are secured by unique properties in ruralmarkets for which there are no sales of comparable properties to support the value according to secondary market requirements. We may require additional collateral or lowerloan-to-value ratios to reduce the risk of these loans. We believe that these loans satisfy a need in our local market areas. As a result, subject to market conditions, we intend tocontinue to originate these types of loans.
High loan-to-value ratios on a portion of our residential mortgage loan portfolio exposes us to greater risk of loss.
Many of our one-to-four family loans and home equity lines of credit are secured by liens on mortgage properties in which the borrowers have little or no equity because ofdeclines in prior years in home values in our market areas. Residential loans with high combined loan-to-value ratios will be more sensitive to declining property values thanthose with lower combined loan-to-value ratios and therefore may experience a higher incidence of default and severity of losses. In addition, if the borrowers sell their homes,they may be unable to repay their loans in full from the sale. Further, the majority of our home equity lines of credit consist of second mortgage loans. For those home equitylines secured by a second mortgage, it is unlikely that we will be successful in recovering all or a portion of our loan proceeds in the event of default unless we are prepared torepay the first mortgage loan and such repayment and the costs associated with a foreclosure are justified by the value of the property. For these reasons, we may experiencehigher rates of delinquency, default and loss.
Our non-owner-occupied real estate loans may expose us to increased credit risk.
At June 30, 2021, $92.6 million, or 22.8%, of our one-to-four family loans and 3.4% of our total loan portfolio, consisted of loans secured by non-owner-occupied residentialproperties. Loans secured by non-owner-occupied properties generally expose a lender to greater risk of non-payment and loss than loans secured by owner-occupied propertiesbecause repayment of such loans depends primarily on the tenant’s continuing ability to pay rent to the property owner, who is our borrower, or, if the property owner is unableto find a tenant, the property owner’s ability to repay the loan without the benefit of a rental income stream. In addition, the physical condition of non-owner-occupied propertiesis often below that of owner-occupied properties due to lax property maintenance standards, which has a negative impact on the value of the collateral properties. Furthermore,some of our non-owner-occupied residential loan borrowers have more than one loan outstanding with HomeTrust Bank which may expose us to a greater risk of loss comparedto an adverse development with respect to an owner-occupied residential mortgage loan.
Our construction and development loans and construction and land/lot loans have a higher risk of loss than residential or commercial real estate loans.
At June 30, 2021, construction and land/lot loans in our retail consumer loan portfolio were $66.0 million, or 2.4%, of our total loan portfolio, and consist primarily ofconstruction to permanent loans to homeowners building a residence or developing lots in residential subdivisions intending to construct a residence within one year.Construction and development loans in our commercial loan portfolio at June 30, 2021, totaled $179.4 million, or 6.6%, of our total loan portfolio, and consist of loans tocontractors and builders primarily to finance the construction of single and multi-family homes, subdivisions, as well as commercial properties. We originate these loans whetheror not the collateral property underlying the loan is under contract for sale.
39

Construction and development lending generally involves additional risks because funds are advanced upon estimates of costs in relation to values associated with the completedproject. Construction and development lending involves additional risks when compared with permanent residential lending because funds are advanced upon the collateral forthe project based on an estimate of costs that will produce a future value at completion. Because of the uncertainties inherent in estimating construction costs, as well as themarket value of the complete project and the effects of governmental regulation on real property, it is relatively difficult to evaluate accurately the total funds required tocomplete a project and the completed project loan-to-value ratio. Changes in demand for new housing and higher than anticipated building costs, may cause actual results to varysignificantly from those estimated. This type of lending also typically involves higher loan principal amounts and is often concentrated with a small number of builders. For thesereasons, a downturn in housing, or the real estate market, could increase loan delinquencies, defaults and foreclosures, and significantly impair the value of our collateral and ourability to sell the collateral upon foreclosure. Some of the builders we deal with have more than one loan outstanding with us. Consequently, an adverse development withrespect to one loan or one credit relationship can expose us to a significantly greater risk of loss.
In addition, during the term of some of our construction and development loans, no payment from the borrower is required since the accumulated interest is added to theprincipal of the loan through an interest reserve. As a result, these loans often involve the disbursement of funds with repayment substantially dependent on the success of theultimate project and the ability of the borrower to sell or lease the property or obtain permanent take-out financing, rather than the ability of the borrower or guarantor to repayprincipal and interest. If our appraisal of the value of a completed project proves to be overstated, we may have inadequate security for the repayment of the loan uponcompletion of construction of the project and may incur a loss. Because construction loans require active monitoring of the building process, including cost comparisons and on-site inspections, these loans are more difficult and costly to monitor. Increases in market rates of interest may have a more pronounced effect on construction loans by rapidlyincreasing the end-purchasers' borrowing costs, thereby reducing the overall demand for the project. Properties under construction are often difficult to sell and typically must becompleted in order to be successfully sold which also complicates the process of working out problem construction loans. This may require us to advance additional funds and/orcontract with another builder to complete construction and assume the market risk of selling the project at a future market price, which may or may not enable us to fully recoverunpaid loan funds and associated construction and liquidation costs. Furthermore, in the case of speculative construction loans, there is the added risk associated with identifyingan end-purchaser for the finished project. At June 30, 2021, $51.2 million of our construction and development loans were for speculative construction loans and none wereclassified as nonaccruing.
Loans on land under development or held for future construction as well as lot loans made to individuals for the future construction of a residence also pose additional riskbecause the length of time from financing to completion of a development project is significantly longer than for a traditional construction loan, which makes them moresusceptible to declines in real estate values, declines in overall economic conditions which may delay the development of the land and changes in the political landscape thatcould affect the permitted and intended use of the land being financed, and the potential illiquid nature of the collateral. In addition, during this long period of time fromfinancing to completion, the collateral often does not generate any cash flow to support the debt service.
Our commercial real estate loans involve higher principal amounts than other loans and repayment of these loans may be dependent on factors outside our control orthe control of our borrowers.
While commercial real estate lending may potentially be more profitable than single-family residential lending, it is generally more sensitive to regional and local economicconditions, making loss levels more difficult to predict. Collateral evaluation and financial statement analysis in these types of loans require a more detailed analysis at the timeof loan underwriting and on an ongoing basis. At June 30, 2021, commercial real estate loans were $1.1 billion, or 41.8% of our total loan portfolio, including multifamily loanstotaling $90.3 million or 3.3% of our total loan portfolio. These loans typically involve higher principal amounts than other types of loans and some of our commercial borrowershave more than one loan outstanding with us. Consequently, an adverse development with respect to one loan or one credit relationship can expose us to a significantly greaterrisk of loss compared to an adverse development with respect to a one-to-four family residential mortgage loan. Repayment of these loans is dependent upon income beinggenerated from the property securing the loan in amounts sufficient to cover operating expenses and debt service, which may be adversely affected by changes in the economy orlocal market conditions. Commercial real estate loans also expose a lender to greater credit risk than loans secured by one-to-four family residential real estate because thecollateral securing these loans typically cannot be sold as easily as residential real estate. In addition, many of our commercial real estate loans are not fully amortizing andcontain large balloon payments upon maturity. Such balloon payments may require the borrower to either sell or refinance the underlying property in order to make the payment,which may increase the risk of default or non-payment. At June 30, 2021, commercial real estate loans that were nonperforming totaled $7.0 million, or 55.7% of our totalnonperforming loans.
A secondary market for most types of commercial real estate loans is not readily available, so we have less opportunity to mitigate credit risk by selling part or all of our interestin these loans. As a result of these characteristics, if we foreclose on a commercial real estate loan, our holding period for the collateral typically is longer than for one-to-fourfamily residential loans because there are fewer potential purchasers of the collateral. Accordingly, charge-offs on commercial real estate loans may be larger on a per loan basisthan those incurred with our residential and consumer loan portfolios.
The level of our commercial real estate loan portfolio may subject us to additional regulatory scrutiny.
The FDIC, the Federal Reserve and the Office of the Comptroller of the Currency have promulgated joint guidance on sound risk management practices for financial institutionswith concentrations in commercial real estate lending. Under this guidance, a financial institution that, like us, is actively involved in commercial real estate lending shouldperform a risk assessment to identify concentrations. A financial institution may have a concentration in commercial real estate lending if, among other factors (i) total reportedloans for
40

construction, land development, and other land represent 100% or more of total capital, or (ii) total reported loans secured by multifamily and non-farm/non-residentialproperties, loans for construction, land development and other land, and loans otherwise sensitive to the general commercial real estate market, including loans to commercialreal estate related entities, represent 300% or more of total capital. Based on the criteria, the Bank has a concentration in commercial real estate lending as total loans formultifamily, non-farm/non-residential, construction, land development and other land represented 280.1% of total risk-based capital at June 30, 2021. The particular focus of theguidance is on exposure to commercial real estate loans that are dependent on the cash flow from the real estate held as collateral and that are likely to be at greater risk toconditions in the commercial real estate market (as opposed to real estate collateral held as a secondary source of repayment or as an abundance of caution). The purpose of theguidance is to guide banks in developing risk management practices and capital levels commensurate with the level and nature of real estate concentrations. The guidance statesthat management should employ heightened risk management practices including board and management oversight and strategic planning, development of underwritingstandards, risk assessment and monitoring through market analysis and stress testing. While we believe we have implemented policies and procedures with respect to our loanportfolio consistent with this guidance, bank regulators could require us to implement additional policies and procedures consistent with their interpretation of the guidance thatmay result in additional costs to us.
Our equipment finance and auto finance lending increases our exposure to lending risks.
At June 30, 2021, $317.9 million and $115.1 million, or 11.6% and 4.2%, of our total loan portfolio consisted of equipment finance and indirect auto finance loans, respectively,originated by us. Equipment finance and indirect auto finance loans are inherently risky as they are secured by assets that depreciate rapidly. In some cases, repossessed collateralfor transportation, construction, and manufacturing equipment for equipment finance loans and a defaulted automobile loan for indirect auto finance loans may not provide anadequate source of repayment for the outstanding loan and the remaining deficiency may not warrant further substantial collection efforts against the borrower. Equipmentfinance loan collections depend on the customer's continuing financial stability, and therefore, are more likely to be adversely affected by the cash flows of the business withincertain industries. Similarly, automobile loan collections depend on the borrower’s continuing financial stability, and therefore, are more likely to be adversely affected by jobloss, divorce, illness, or personal bankruptcy. In addition for indirect auto finance loans, our ability to originate loans is reliant on our relationships with automotive dealers. Inparticular, our automotive finance operations depend in large part upon our ability to establish and maintain relationships with reputable automotive dealers that direct customersto our offices or originate loans at the point-of-sale. Although we have relationships with certain automotive dealers, none of our relationships are exclusive and any may beterminated at any time. If our existing dealer base experiences decreased sales we may experience decreased loan volume in the future, which may have an adverse effect on ourbusiness, results of operations, and financial condition.
Repayment of our municipal leases is dependent on the fire department receiving tax revenues from the county/municipality.
At June 30, 2021, municipal leases were $140.4 million, or 5.1%, of our total loan portfolio. We offer ground and equipment lease financing to fire departments locatedthroughout North Carolina and, to a lesser extent, South Carolina. Repayment of our municipal leases is often dependent on the tax revenues collected by the county/municipalityon behalf of the fire department. Although a municipal lease does not constitute a general obligation of the county/municipality for which the county/municipality's taxing poweris pledged, a municipal lease is ordinarily backed by the county/municipality's covenant to budget for, appropriate and pay the tax revenues to the fire department. However,certain municipal leases contain "non-appropriation" clauses which provide that the municipality has no obligation to make lease or installment purchase payments in futureyears unless money is appropriated for that purpose on a yearly basis. In the case of a "non-appropriation" lease, our ability to recover under the lease in the event of non-appropriation or default will be limited solely to the repossession of the leased property, without recourse to the general credit of the lessee, and disposition or releasing of theproperty might prove difficult. At June 30, 2021, $33.6 million of our municipal leases contained a non-appropriation clause.
Our allowance for credit losses may prove to be insufficient to absorb losses in our loan portfolio.
Lending money is a substantial part of our business and each loan carries a certain risk that it will not be repaid in accordance with its terms, or that any underlying collateral willnot be sufficient to assure repayment. This risk is affected by, among other things:
• cash flow of the borrower and/or the project being financed;
• the changes and uncertainties as to the future value of the collateral, in the case of a collateralized loan;
• the duration of the loan;
• the character and creditworthiness of a particular borrower; and
• changes in economic and industry conditions.
We maintain an allowance for credit losses, which we believe is an appropriate reserve to provide for expected losses in our loan portfolio. The allowance is funded byprovisions for credit losses charged to expense. The amount of this allowance is determined by our management through periodic reviews and consideration of several factors,including, but not limited to:
• our reserve on loans collectively evaluated, based on peer loss experience which management believes provides the best basis for its assessment of expected creditlosses and considers the effects of past events, current conditions, and reasonable and supportable forecasts on the collectability of the loan portfolio;
41
• our reserve on loans individually evaluated, based on DCF analysis unless the loan meets the criteria for use of the fair value of collateral, either by virtue of anexpected foreclosure or through meeting the definition of collateral dependent, for loans no longer sharing similar risk characteristics; and
• a qualitative reserve based on factors that are relevant within the qualitative framework.
We make various assumptions and judgments about the collectability of our loan portfolio, including the creditworthiness of our borrowers and the value of the real estate andother assets serving as collateral for the repayment of many of our loans. In determining the amount of the allowance for credit losses, we review our loans and our loss anddelinquency experience, and we evaluate economic conditions. If our assumptions are incorrect, our allowance for credit losses may not be sufficient to cover expected creditlosses in our loan portfolio, resulting in additions to our allowance for credit losses through the provision for credit losses on loans which is charged against income.
Additionally, pursuant to our growth strategy, management recognizes that significant new growth in loan portfolios, new loan products and the refinancing of existing loans canresult in portfolios comprised of unseasoned loans that may not perform in a historical or projected manner and will increase the risk that our allowance may be insufficient toabsorb credit losses without significant additional provisions. Further, we have adopted a new accounting standard that was effective beginning July 1, 2020 for our current fiscalyear. This standard, referred to as CECL, required financial institutions to determine periodic estimates of lifetime expected credit losses on loans and recognize the expectedcredit losses as an allowance for credit losses. This changed the prior method of providing allowances for credit losses that are probable, which required us to increase ourallowance for credit losses, and greatly increase the types of data we collect and review to determine the appropriate level of the allowance for credit losses. In addition, bankregulatory agencies periodically review our allowance for credit losses and may require an increase in the provision for possible credit losses or the recognition of further loancharge-offs, based on judgments different than those of management. If charge-offs in future periods exceed the allowance for credit losses, we will need additional provisionsto replenish the allowance for credit losses. Any additional provisions will result in a decrease in net income and possibly capital, and may have a material adverse effect on ourfinancial condition and results of operations.
If our nonperforming assets increase, our earnings will be adversely affected.
Our nonperforming assets (which consist of nonaccruing loans and REO) were $12.8 million, or 0.36%, of total assets at June 30, 2021, compared to $16.3 million, or 0.44% oftotal assets, and $13.3 million, or 0.38% of total assets, at June 30, 2020 and 2019, respectively. Our nonperforming assets adversely affect our net income in various ways:
• we record interest income only on a cash basis for nonaccrual loans and any nonperforming debt securities; and do not record interest income for REO;
• we must provide for expected credit losses through a current period charge to the provision for credit losses;
• noninterest expense increases when we write down the value of properties in our REO portfolio to reflect changing market values or recognize credit impairment onnonperforming debt securities;
• there are legal fees associated with the resolution of problem assets, as well as carrying costs, such as taxes, insurance and maintenance fees related to our REO; and
• the resolution of nonperforming assets requires the active involvement of management, which can distract them from more profitable activity.
If additional borrowers become delinquent and do not pay their loans and we are unable to successfully manage our nonperforming assets, our losses and troubled assets couldincrease significantly, which could have a material adverse effect on our financial condition and results of operations. We have also classified $11.1 million in loans asperforming TDRs at June 30, 2021.
If our REO is not properly valued or sufficiently reserved to cover actual losses, or if we are required to increase our valuation reserves, our earnings could bereduced.
We obtain updated valuations in the form of appraisals and broker price opinions when a loan has been foreclosed and the property taken in as REO and at certain other timesduring the asset’s holding period. Our NBV in the loan at the time of foreclosure and thereafter is compared to the updated market value of the foreclosed property less estimatedselling costs (fair value). A charge-off is recorded for any excess in the asset’s NBV over its fair value. If our valuation process is incorrect, or if property values decline, the fairvalue of our REO may not be sufficient to recover our carrying value in such assets, resulting in the need for additional charge-offs.
Significant charge-offs to our REO could have a material adverse effect on our financial condition and results of operations.
In addition, bank regulators periodically review our REO and may require us to recognize further charge-offs. Any increase in our charge-offs may have a material adverse effecton our financial condition and results of operations.
42

Risks Related to Market Interest Rates
Our debt securities portfolio may be negatively impacted by fluctuations in market value and interest rates.
Our debt securities portfolio may be impacted by fluctuations in market value, potentially reducing accumulated other comprehensive income and/or earnings. Fluctuations inmarket value may be caused by changes in market interest rates, lower market prices for debt securities and limited investor demand. In addition, our debt securities portfolio isevaluated periodically for credit impairment. If this evaluation shows impairment to the actual or projected cash flows associated with one or more securities, a potential loss toearnings may occur. Changes in interest rates can also have an adverse effect on our financial condition, as our available-for-sale securities are reported at their estimated fairvalue, and therefore are impacted by fluctuations in interest rates. Our stockholders' equity adjusts by the amount of change in the estimated fair value of the available-for-saledebt securities, net of taxes. There can be no assurance that declines in market value will not result in credit impairment of these assets, which would lead to accounting chargesthat could have a material adverse effect on our net income and capital levels.
An increase in interest rates, change in the programs offered by GSEs or our ability to qualify for such programs may reduce our gains on sale of loans held for sale,which would negatively impact our noninterest income.
Our mortgage banking and SBA lending operations provide a significant portion of our noninterest income. We generate mortgage revenues primarily from gains on the sale ofsingle-family residential loans pursuant to programs currently offered by Fannie Mae, Freddie Mac, Ginnie Mae and other investors on a servicing released basis. These entitiesaccount for a substantial portion of the secondary market in residential mortgage loans. We also generate commercial business loan revenues from the gains on the sale of theguaranteed portion of SBA and business and industry loans pursuant to programs currently offered by the SBA and USDA B&I. Any future changes in these programs,significant impairment of our eligibility to participate in such programs, the criteria for loans to be accepted or laws that significantly affect the activity of such entities could, inturn, result in a lower volume of corresponding loan originations or increase other administrative costs which may materially adversely affect our results of operations.
Mortgage production, especially refinancing, generally declines in rising interest rate environments resulting in fewer loans that are available to be sold to investors. Wheninterest rates rise, or even if they do not, there can be no assurance that our mortgage production will continue at current levels. The profitability of our mortgage bankingoperations depends in large part upon our ability to aggregate a high volume of loans and sell them in the secondary market at a gain. Thus, in addition to the interest rateenvironment, our mortgage business is dependent upon (i) the existence of an active secondary market and (ii) our ability to profitably sell loans into that market. Similar tomortgage production, our SBA and USDA B&I business and industry operations are dependent upon (i) and (ii) previously mentioned. The loans in our held-for-sale portfolioare carried at the lower of cost or fair market value less estimated costs to sell with changes recognized in our statement of operations. Carrying the loans at fair value may alsoincrease the volatility in our earnings.
In addition, our results of operations are affected by the amount of noninterest expense associated with mortgage banking and SBA lending activities, such as salaries andemployee benefits, occupancy, equipment and data processing expense and other operating costs. During periods of reduced loan demand, our results of operations may beadversely affected to the extent that we are unable to reduce expenses commensurate with the decline in loan originations. In addition, although we sell loans into the secondarymarket without recourse, we are required to give customary representations and warranties about the loans to the buyers. If we breach those representations and warranties, thebuyers may require us to repurchase the loans and we may incur a loss on the repurchase.
Beginning July 1, 2021, we have brought our back-office SBA loan servicing process in-house, which is designated to provide additional servicing fee and gain on sale income.If we are unable to manage the processes in-house effectively within the guidelines of the SBA and USDA B&I which negatively impact the sales of those loans in the secondarymarket, our business, financial condition and results of operations could be materially affected.
Fluctuating interest rates can adversely affect our profitability.
Our earnings and cash flows are largely dependent upon our net interest income. Interest rates are highly sensitive to many factors that are beyond our control, including generaleconomic conditions and policies of various governmental and regulatory agencies and, in particular, the Federal Reserve. In an attempt to help the overall economy, the FederalReserve has dropped interest rates low through its targeted Fed Funds rate. The targeted federal funds rate is currently at 0.00% to 0.25% at June 30, 2021. In August 2020, theFederal Reserve announced in a new policy approach of “average inflation” targeting in which inflation will run moderately above the Federal Reserve’s 2% target “for sometime.” This new shift in policy is expected to keep rates lower for longer. At the Federal Reserve's meeting in July 2021, the staff noted that inflation continues to run higher thanits inflation target and expected the 12-month change in prices to move down gradually over the second part of calendar year 2021. Further, the Federal Reserve is projectinginflation to continue running well above 2% at the end of calendar year 2021. The staff continues to expect this year's rise in inflation to be transitory in nature.
We principally manage interest rate risk by managing our volume and mix of our earning assets and funding liabilities. Changes in monetary policy, including changes in interestrates, could influence not only the interest we receive on loans and investments and the amount of interest we pay on deposits and borrowings, but these changes could also affect(i) our ability to originate loans and obtain deposits, (ii) the fair value of our financial assets and liabilities, which could negatively impact stockholders' equity, and our ability torealize gains from the sale of such assets; (iii) our ability to obtain and retain deposits in competition with other available investment alternatives; (iv) the ability of our borrowersto repay adjustable or variable rate loans; and (v) the average duration of our debt securities portfolio and other interest-earning assets. If the interest rates paid on deposits andother borrowings increase at a faster rate than the interest rates received on loans and other
43

investments, our net interest income, and therefore earnings, could be adversely affected. In a changing interest rate environment, we may not be able to manage this riskeffectively. If we are unable to manage interest rate risk effectively, our business, financial condition and results of operations could be materially affected.
Changes in interest rates could also have a negative impact on our results of operations by reducing the ability of borrowers to repay their current loan obligations (generally, ifrates increase) or by reducing our margins and profitability (generally, if rates decrease). Our net interest margin is the difference between the yield we earn on our assets and theinterest rate we pay for deposits and our other sources of funding. Changes in interest rates-up or -down could adversely affect our net interest margin and, as a result, our netinterest income. Although the yield we earn on our assets and our funding costs tend to move in the same direction in response to changes in interest rates, one can rise or fallfaster than the other, causing our net interest margin to expand or contract. In anticipation of a rising-rate environment, our assets tend to be shorter in duration than ourliabilities, so they may adjust faster in response to changes in interest rates. As a result, when interest rates decline, the yield we earn on our assets may decline faster than therate we pay on funding, causing our net interest margin to contract until the interest rates on interest-bearing liabilities catch up. In anticipation of a declining-rate environment,our liabilities tend to be shorter in duration than our assets, so they may adjust faster in response to changes in interest rates. As a result, when interest rates rise, our fundingcosts may rise faster than the yield we earn on our assets, causing our net interest margin to contract until the yields on interest-earning assets catch up. Changes in the slope ofthe “yield curve”, or the spread between short-term and long-term interest rates could also reduce our net interest margin. Normally, the yield curve is upward sloping, meaningshort-term rates are lower than long-term rates. Because our liabilities tend to be shorter in duration than our assets in periods where we anticipate a declining-rate environment,when the yield curve flattens or even inverts, we will experience pressure on our net interest margin as our cost of funds increases relative to the yield we can earn on our assets.Also, interest rate decreases can lead to increased prepayments of loans and mortgage-backed securities as borrowers refinance their loans to reduce borrowing costs. Under thesecircumstances, we are subject to reinvestment risk as we may have to redeploy such repayment proceeds into lower yielding investments, which would likely hurt our income.
A sustained increase in market interest rates could adversely affect our earnings. As a result of the exceptionally low interest rate environment, an increasing percentage of ourdeposits have been comprised of deposits bearing no or a relatively low rate of interest and having a shorter duration than our assets. At June 30, 2021, we had $392.9 million incertificates of deposit that mature within one year and $2.5 billion in checking, savings, and money market accounts. If the interest rates paid on deposits and other borrowingsincrease at a faster rate than the interest rates received on loans and other investments, our net interest income, and therefore earnings, could be adversely affected.
In addition, a substantial amount of our loans have adjustable interest rates. As a result, these loans may experience a higher rate of default in a rising interest rate environment.Further, a significant portion of our adjustable rate loans have interest rate floors below which the loan’s contractual interest rate may not adjust. As of June 30, 2021, our loanswith interest rate floors totaled approximately $543.5 million or 19.9% of our total loan portfolio and had a weighted average floor rate of 3.9%. At that date, $353.5 million ofthese loans were at their floor rate, of which $323.6 million, or 91.5%, had yields that would begin floating again once prime rates increase at least 200 basis points. The inabilityof our loans to adjust downward can contribute to increased income in periods of declining interest rates, although this result is subject to the risks that borrowers may refinancethese loans during periods of declining interest rates. Also, when loans are at their floors, there is a further risk that our interest income may not increase as rapidly as our cost offunds during periods of increasing interest rates which could have a material adverse effect on our results of operations.
Changes in interest rates also affect the value of our interest-earning assets and in particular our debt securities portfolio. Generally, the fair value of fixed-rate debt securitiesfluctuates inversely with changes in interest rates. Unrealized gains and losses on debt securities available for sale are reported as a separate component of equity, net of tax.Decreases in the fair value of debt securities available for sale resulting from increases in interest rates could have an adverse effect on stockholders’ equity.
Although management believes it has implemented effective asset and liability management strategies to reduce the potential effects of changes in interest rates on our results ofoperations, any substantial, unexpected or prolonged change in market interest rates could have a material adverse effect on our financial condition, liquidity and results ofoperations. Also, our interest rate risk modeling techniques and assumptions likely may not fully predict or capture the impact of actual interest rate changes on our consolidatedbalance sheet or projected operating results. For further discussion of how changes in interest rates could impact us, see "Part II, Item 7A. Quantitative and QualitativeDisclosures About Market Risk" for additional information about our interest rate risk management.
Uncertainty relating to the LIBOR calculation process and phasing out of LIBOR may adversely affect our results of operations.
On July 27, 2017, the Chief Executive of the United Kingdom Financial Conduct Authority, which regulates LIBOR, announced that it intends to stop persuading or compellingbanks to submit rates for the calibration of LIBOR to the administrator of LIBOR after 2021. The announcement indicates that the continuation of LIBOR on the current basiscannot and will not be guaranteed after 2021. It is impossible to predict whether and to what extent banks will continue to provide LIBOR submissions to the administrator ofLIBOR or whether any additional reforms to LIBOR may be enacted in the United Kingdom or elsewhere. At this time, no consensus exists as to what rate or rates may becomeacceptable alternatives to LIBOR and it is impossible to predict the effect of any such alternatives on the value of LIBOR-based securities and variable-rate loans, subordinateddebentures, or other securities or financial arrangements, given LIBOR's role in determining market interest rates globally. Uncertainty as to the nature of alternative referencerates and as to potential changes or other reforms to LIBOR may adversely affect LIBOR rates and the value of LIBOR-based loans and securities in our portfolio, and mayimpact the availability and cost of hedging instruments and borrowings. If LIBOR rates are no longer available, and we are required to implement substitute indices for thecalculation of interest rates under our loan agreements with our borrowers, we may incur significant expenses in effecting the transition,
44

and may be subject to disputes or litigation with customers over the appropriateness or comparability to LIBOR of the substitute indices, which could have an adverse effect onour results of operations. The ARRC has recommended SOFR as the preferred replacement benchmark rate for LIBOR. SOFR represents the cost of borrowing cash overnightcollateralized by U.S. Treasury securities. We plan to use SOFR as a substitute for LIBOR for new originations prior to the end of calendar year 2021. As of June 30, 2021, therewere $239.8 million loans in our portfolio tied to LIBOR.
If limitations arise in our ability to utilize the national brokered deposit market or to replace short-term deposits, our ability to replace maturing deposits onacceptable terms could be adversely impacted.
HomeTrust Bank utilizes the national brokered deposit market for a portion of our funding needs. At June 30, 2021, brokered deposits totaled $4.3 million or 0.1% of totaldeposits, with remaining maturities of 14 months or less. Under FDIC regulations, in the event we are deemed to be less than well-capitalized, we would be subject to restrictionson our use of brokered deposits and the interest rate we can offer on our deposits. If this happens, our use of brokered deposits and the rates we would be allowed to pay ondeposits may significantly limit our ability to use deposits as a funding source. If we are unable to participate in this market for any reason in the future, our ability to replacethese deposits at maturity could be adversely impacted.
Further, there may be competitive pressures to pay higher interest rates on deposits, which would increase our funding costs. If deposit clients move money out of our Bankdeposit products and into other investments (or into similar products at other institutions that may provide a higher rate of return), we could lose a relatively low cost source offunds, increasing our funding costs and reducing our net interest income and net income. Additionally, any such loss of funds could result in reduced loan originations, whichcould materially negatively impact our growth strategy and results of operations.
Risks Related to Liquidity
Conditions in the financial markets may limit our access to additional funding to meet our liquidity needs.
Liquidity is essential to our business. We rely on a number of different sources in order to meet our potential liquidity demands. Our primary sources of liquidity are increases indeposit accounts, cash flows from loan payments and our securities portfolio. Borrowings also provide us with a source of funds to meet liquidity demands. An inability to raisefunds through deposits, borrowings, the sale of loans or debt securities and other sources could have a substantial negative effect on our liquidity. Our access to funding sourcesin amounts adequate to finance our activities or on terms which are acceptable to us could be impaired by factors that affect us specifically, or the financial services industry oreconomy in general. Factors that could detrimentally impact our access to liquidity sources include a decrease in the level of our business activity as a result of a downturn in theNorth Carolina, South Carolina, Virginia, and/or Tennessee markets in which our loans are concentrated or adverse regulatory action against us. Our ability to borrow could alsobe impaired by factors that are not specific to us, such as a disruption in the financial markets or negative views and expectations about the prospects for the financial servicesindustry or deterioration in credit markets. In particular, our liquidity position could be significantly constrained if we are unable to access funds from the FHLB Atlanta or otherwholesale funding sources, or if adequate financing is not available at acceptable interest rates. Finally, if we are required to rely more heavily on more expensive fundingsources, our revenues may not increase proportionately to cover our costs. Any decline in available funding could adversely impact our ability to originate loans, invest insecurities, meet our expenses, or fulfill obligations such as repaying our borrowings or meeting deposit withdrawal demands, any of which could, in turn, have a material adverseeffect on our business, financial condition and results of operations.
Risks Related to Acquisition Activities
Our strategy of pursuing acquisitions exposes us to financial, execution and operational risks that could adversely affect us.
We have implemented a strategy of supplementing organic growth by acquiring other financial institutions or other businesses that we believe will help us fulfill our strategicobjectives and enhance our earnings. There are risks associated with this strategy; however, including the following:
• We may be exposed to potential asset quality issues or unknown or contingent liabilities of the banks, businesses, assets and liabilities we acquire. If these issues orliabilities exceed our estimates, our results of operations and financial condition may be materially negatively affected;
• Prices at which future acquisitions can be made may not be acceptable to us;
• Our growth initiatives may require us to recruit experienced personnel to assist in such initiatives. The failure to identify and retain such personnel would place significantlimitations on our ability to execute our growth strategy;
• Our strategic efforts may divert resources or management’s attention from ongoing business operations and may subject us to additional regulatory scrutiny;
• The acquisition of other entities generally requires integration of systems, procedures and personnel of the acquired entity into our company to make the transactioneconomically successful. This integration process is complicated and time consuming and can also be disruptive to the customers of the acquired business. If the integrationprocess is not conducted successfully and with minimal effect on the acquired business and its customers, we may not realize the anticipated economic benefits of particularacquisitions to the extent
45

expected or within the expected time frame, and we may lose customers or employees of the acquired business. We may also experience greater than anticipated customerlosses even if the integration process is successful;
• To finance a future acquisition, we may borrow funds, thereby increasing our leverage and diminishing our liquidity, or raise additional capital, which could dilute theinterests of our existing stockholders;
• We have completed five acquisitions during the past eight fiscal years that enhanced our rate of growth. We may not be able to continue to sustain our past rate of growth orto grow at all in the future; and
• We expect our net income will increase following our acquisitions; however, we also expect our general and administrative expenses and consequently our efficiency rateswill also increase. Ultimately, we would expect our efficiency ratio to improve; however, if we are not successful in our integration process, this may not occur, and ouracquisitions or branching activities may not be accretive to earnings in the short or long-term.
The required accounting treatment of loans we acquire through acquisitions, including purchased financial assets with credit deterioration, could result in higher netinterest margins and interest income in current periods and lower net interest margins and interest income in future periods.
Under GAAP, we are required to record loans acquired through acquisitions, including PCD, at fair value. Estimating the fair value of such loans requires management to makeestimates based on available information and facts and circumstances as of the acquisition date. Actual performance could differ from management's initial estimates. If theseloans outperform our original fair value estimates, the difference between our original estimate and the actual performance of the loan (the “discount”) is accreted into netinterest income. Thus, our net interest margins may initially increase due to the discount. We expect the yields on our loans to decline as our acquired loan portfolio pays downor matures and the discount decreases, and we expect downward pressure on our interest income to the extent that the runoff on our acquired loan portfolio is not replaced withcomparable high-yielding loans. This could result in higher net interest margins and interest income in current periods and lower net interest rate margins and lower interestincome in future periods.
Risks Related to Regulation
We operate in a highly regulated environment and may be adversely affected by changes in federal and state laws and regulations.The financial services industry is extensively regulated. Federal and state banking regulations are designed primarily to protect the deposit insurance funds and consumers, not tobenefit a company’s stockholders. These regulations may sometimes impose significant limitations on operations. The significant federal and state banking regulations that affectus are described under the heading "Business-How We Are Regulated” in Item I of this Form 10-K. These regulations, along with the currently existing tax, accounting,securities, insurance, and monetary laws, regulations, rules, standards, policies, and interpretations control the methods by which financial institutions conduct business,implement strategic initiatives and tax compliance, and govern financial reporting and disclosures. New proposals for legislation continue to be introduced in the U.S. Congressthat could further alter the regulation of the bank and non-bank financial services industries and the manner in which firms within the industry conduct business. In this regard,the Regulatory Relief Act was enacted to reduce the application of certain financial reform regulations, including the Dodd-Frank Act, on community banks such as us. The Act,among other matters, expands the definition of qualified mortgages which may be held by a financial institution and simplifies the regulatory capital rules for financialinstitutions and their holding companies with total consolidated assets of less than $10 billion by instructing the federal banking regulators to establish a single CBLR. InSeptember 2019, the regulatory agencies, including the NCCOB and FRB, adopted a final rule, effective January 1, 2020, creating the CBLR for institutions with totalconsolidated assets of less than $10 billion and that meet other qualifying criteria. The CBLR provides for a simple measure of capital adequacy for qualifying institutions.According to the final rule, qualifying institutions that elect to use the CBLR framework and that maintain a leverage ratio of greater than 9% will be considered to have satisfiedthe generally applicable risk-based and leverage capital requirements in the regulatory agencies' capital rules, and to have met the capital requirements for the well capitalizedcategory under the agencies' prompt corrective action framework. In April 2020, the federal bank regulatory agencies announced the issuance of two interim final rules, effectiveimmediately, to provide temporary relief to community banking organizations. Under the interim final rules, the CBLR requirement is minimum of 8% for calendar year 2021,and 9% thereafter. To date, the Bank has not elected to adopt the CBLR framework, but may consider that election in the future.
Non-compliance with the USA PATRIOT Act, Bank Secrecy Act, or other laws and regulations could result in fines or sanctions and limit our ability to get regulatoryapproval of acquisitions.
The USA PATRIOT and Bank Secrecy Acts require financial institutions to develop programs to prevent financial institutions from being used for money laundering andterrorist activities. If such activities are detected, financial institutions are obligated to file suspicious activity reports with the U.S. Treasury’s Office of Financial CrimesEnforcement Network. These rules require financial institutions to establish procedures for identifying and verifying the identity of customers seeking to open new financialaccounts. Failure to comply with these regulations could result in fines or sanctions and limit our ability to get regulatory approval of acquisitions. Recently several bankinginstitutions have received large fines for non-compliance with these laws and regulations. While we have developed policies and procedures designed to assist in compliancewith these laws and regulations, no assurance can be given that these policies and procedures will be effective in preventing violations of these laws and regulations.
46

Risks Related to Technology and Cybersecurity and Other Operational Matters
We are subject to certain risks in connection with our use of technology.
Our security measures may not be sufficient to mitigate the risk of a cyber attack. Communications and information systems are essential to the conduct of our business, as weuse such systems to manage our customer relationships, our general ledger and virtually all other aspects of our business. Our operations rely on the secure processing, storage,and transmission of confidential and other information in our computer systems and networks. Although we take protective measures and endeavor to modify them ascircumstances warrant, the security of our computer systems, software, and networks may be vulnerable to breaches, fraudulent or unauthorized access, denial or degradation ofservice attacks, misuse, computer viruses, malware or other malicious code and cyber-attacks that could have a security impact. If one or more of these events occur, this couldjeopardize our or our customers' confidential and other information processed and stored in, and transmitted through, our computer systems and networks, or otherwise causeinterruptions or malfunctions in our operations or the operations of our customers or counterparties. We may be required to expend significant additional resources to modify ourprotective measures or to investigate and remediate vulnerabilities or other exposures, and we may be subject to litigation and financial losses that are either not insured againstor not fully covered through any insurance maintained by us. We could also suffer significant reputational damage.
Further, our cardholders use their debit and credit cards to make purchases from third parties or through third party processing services. As such, we are subject to risk from databreaches of such third party’s information systems or their payment processors. Such a data security breach could compromise our account information. The payment methodsthat we offer also subject us to potential fraud and theft by criminals, who are becoming increasingly more sophisticated, seeking to obtain unauthorized access to or exploitweaknesses that may exist in the payment systems. If we fail to comply with applicable rules or requirements for the payment methods we accept, or if payment-related data iscompromised due to a breach or misuse of data, we may be liable for losses associated with reimbursing our clients for such fraudulent transactions on clients’ card accounts, aswell as costs incurred by payment card issuing banks and other third parties or may be subject to fines and higher transaction fees, or our ability to accept or facilitate certaintypes of payments may be impaired. We may also incur other costs related to data security breaches, such as replacing cards associated with compromised card accounts. Inaddition, our customers could lose confidence in certain payment types, which may result in a shift to other payment types or potential changes to our payment systems that mayresult in higher costs.
Breaches of information security also may occur through intentional or unintentional acts by those having access to our systems or our clients’ or counterparties’ confidentialinformation, including employees. The Company is continuously working to install new and upgrade its existing information technology systems and provide employeeawareness training around phishing, malware, and other cyber risks to further protect the Company against cyber risks and security breaches.
There continues to be a rise in electronic fraudulent activity, security breaches and cyber-attacks within the financial services industry, especially in the commercial bankingsector due to cyber criminals targeting commercial bank accounts. We are regularly the target of attempted cyber and other security threats and must continuously monitor anddevelop our information technology networks and infrastructure to prevent, detect, address and mitigate the risk of unauthorized access, misuse, computer viruses and otherevents that could have a security impact. Insider or employee cyber and security threats are increasingly a concern for companies, including ours. We are not aware that we haveexperienced any material misappropriation, loss or other unauthorized disclosure of confidential or personally identifiable information as a result of a cyber-security breach orother act, however, some of our clients may have been affected by these breaches, which could increase their risks of identity theft, credit card fraud and other fraudulent activitythat could involve their accounts with us.
Security breaches in our internet banking activities could further expose us to possible liability and damage our reputation. Increases in criminal activity levels andsophistication, advances in computer capabilities, new discoveries, vulnerabilities in third party technologies (including browsers and operating systems) or other developmentscould result in a compromise or breach of the technology, processes and controls that we use to prevent fraudulent transactions and to protect data about us, our clients andunderlying transactions. Any compromise of our security could deter customers from using our internet banking services that involve the transmission of confidentialinformation. We rely on standard internet security systems to provide the security and authentication necessary to effect secure transmission of data. Although we havedeveloped and continue to invest in systems and processes that are designed to detect and prevent security breaches and cyber-attacks and periodically test our security, theseprecautions may not protect our systems from compromises or breaches of our security measures, and could result in losses to us or our customers, our loss of business and/orcustomers, damage to our reputation, the incurrence of additional expenses, disruption to our business, our inability to grow our online services or other businesses, additionalregulatory scrutiny or penalties, or our exposure to civil litigation and possible financial liability, any of which could have a material adverse effect on our business, financialcondition and results of operations.
Our security measures may not protect us from system failures or interruptions. While we have established policies and procedures to prevent or limit the impact of systemsfailures and interruptions, there can be no assurance that such events will not occur or that they will be adequately addressed if they do. In addition, we outsource certain aspectsof our data processing and other operational functions to certain third-party providers. While the Company selects third-party vendors carefully, it does not control their actions.If our third-party providers encounter difficulties including those resulting from breakdowns or other disruptions in communication services provided by a vendor, failure of avendor to handle current or higher transaction volumes, cyber-attacks and security breaches or if we otherwise have difficulty in communicating with them, our ability toadequately process and account for transactions could be affected, and our ability to deliver products and services to our customers and otherwise conduct business operationscould be adversely impacted. Replacing these third-party vendors could also entail significant delay and expense. Threats to information security also exist in the processing ofcustomer information through various other vendors and their personnel. We cannot assure you that such breaches, failures or interruptions will not occur or, if they do
47

occur, that they will be adequately addressed by us or the third parties on which we rely. We may not be insured against all types of losses as a result of third party failures andinsurance coverage may be inadequate to cover all losses resulting from breaches, system failures or other disruptions. If any of our third-party service providers experiencefinancial, operational or technological difficulties, or if there is any other disruption in our relationships with them, we may be required to identify alternative sources of suchservices, and we cannot assure you that we could negotiate terms that are as favorable to us, or could obtain services with similar functionality as found in our existing systemswithout the need to expend substantial resources, if at all. Further, the occurrence of any systems failure or interruption could damage our reputation and result in a loss ofcustomers and business, could subject us to additional regulatory scrutiny, or could expose us to legal liability. Any of these occurrences could have a material adverse effect onour financial condition and results of operations.
The financial services market is undergoing rapid technological changes, and if we are unable to stay current with those changes, we will not be able to effectivelycompete.
The financial services market, including banking services, is undergoing rapid changes with frequent introductions of new technology-driven products and services. Our futuresuccess will depend, in part, on our ability to keep pace with the technological changes and to use technology to satisfy and grow customer demand for our products and servicesand to create additional efficiencies in our operations. We expect that we will need to make substantial investments in our technology and information systems to competeeffectively and to stay current with technological changes. Some of our competitors have substantially greater resources to invest in technological improvements and will be ableto invest more heavily in developing and adopting new technologies, which may put us at a competitive disadvantage. We may not be able to effectively implement newtechnology-driven products and services or be successful in marketing these products and services to our customers. As a result, our ability to effectively compete to retain oracquire new business may be impaired, and our business, financial condition or results of operations may be adversely affected.
Our operations rely on numerous external vendors.
We rely on numerous external vendors to provide us with products and services necessary to maintain our day-to-day operations. Accordingly, our operations are exposed to riskthat these vendors will not perform in accordance with the contracted arrangements under service level agreements. The failure of an external vendor to perform in accordancewith the contracted arrangements under service level agreements because of changes in the vendor’s organizational structure, financial condition, support for existing productsand services or strategic focus or for any other reason, could be disruptive to our operations, which in turn could have a material negative impact on our financial condition andresults of operations. We also could be adversely affected to the extent such an agreement is not renewed by a third party vendor or is renewed on terms less favorable to us.Additionally, the bank regulatory agencies expect financial institutions to be responsible for all aspects of our vendors’ performance, including aspects which they delegate tothird parties. Disruptions or failures in the physical infrastructure or operating systems that support our business and clients, or cyber-attacks or security breaches of thenetworks, systems or devices that our clients use to access our products and services could result in client attrition, regulatory fines, penalties or intervention, reputationaldamage, reimbursement or other compensation costs, and/or additional compliance costs, any of which could materially adversely affect our results of operations or financialcondition.
Our framework for managing risks may not be effective in mitigating risk and loss to us.
We have established processes and procedures intended to identify, measure, monitor, report, analyze and control the types of risk to which we are subject. These risks includeliquidity risk, credit risk, market risk, interest rate risk, operational risk, legal and compliance risk, and reputational risk, among others. We also maintain a compliance programto identify, measure, assess, and report on our adherence to applicable laws, policies and procedures. While we assess and improve these programs on an ongoing basis, there canbe no assurance that our risk management or compliance programs, along with other related controls, will effectively mitigate all risk and limit losses in our business. As withany risk management framework, there are inherent limitations to our risk management strategies as there may exist, or develop in the future, risks that we have not appropriatelyanticipated or identified. If our risk management framework proves ineffective, we could suffer unexpected losses which could have a material adverse effect on our financialcondition and results of operations.
Our business may be adversely affected by an increasing prevalence of fraud and other financial crimes.
As a bank, we are susceptible to fraudulent activity that may be committed against us or our clients, which may result in financial losses or increased costs to us or our clients,disclosure or misuse of our information or our client information, misappropriation of assets, privacy breaches against our clients, litigation or damage to our reputation. Suchfraudulent activity may take many forms, including check fraud, electronic fraud, wire fraud, phishing, social engineering and other dishonest acts. Nationally, reported incidentsof fraud and other financial crimes have increased. We have also experienced losses due to apparent fraud and other financial crimes. While we have policies and proceduresdesigned to prevent such losses, there can be no assurance that such losses will not occur.
Managing reputational risk is important to attracting and maintaining customers, investors and employees.
Threats to our reputation can come from many sources, including adverse sentiment about financial institutions generally, unethical practices, employee misconduct, failure todeliver minimum standards of service or quality, compliance deficiencies, and questionable or fraudulent activities of our customers. We have policies and procedures in place toprotect our reputation and promote ethical conduct, but these policies and procedures may not be fully effective. Negative publicity regarding our business, employees, orcustomers, with or without merit, may result in the loss of customers, investors and employees, costly litigation, a decline in revenues and increased governmental regulation.
48
Risks Related to Future Growth
We may experience future goodwill impairment.
In accordance with GAAP, we record assets acquired and liabilities assumed at their fair value, and, as such, acquisitions typically result in recording goodwill. We perform agoodwill evaluation at least annually to test for goodwill impairment. As part of our testing, we first assesses qualitative factors to determine whether it is more likely than notthat the fair value of a reporting unit is less than its carrying amount. If we determine the fair value of a reporting unit is less than its carrying amount using these qualitativefactors, we then compare the fair value of goodwill with its carrying amount, and then measure impairment loss by comparing the implied fair value of goodwill with thecarrying amount of that goodwill. Adverse conditions in our business climate, including a significant decline in future operating cash flows, a significant change in our stockprice or market capitalization, or a deviation from our expected growth rate and performance may significantly affect the fair value of our goodwill and may trigger additionalimpairment losses, which could be materially adverse to our operating results and financial position.
We cannot provide assurance that we will not be required to take an impairment charge in the future. Any impairment charge has an adverse effect on stockholders’ equity andfinancial results and could cause a decline in our stock price.
Our growth or future losses may require us to raise additional capital in the future, but that capital may not be available when it is needed or the cost of that capitalmay be very high.
We are required by federal regulatory authorities to maintain adequate levels of capital to support our operations. Currently, we believe our capital resources satisfy our capitalrequirements for the foreseeable future. However, we may at some point need to raise additional capital to support our growth.
Our ability to raise additional capital, if needed, will depend on conditions in the capital markets at that time, which are outside of our control, and on our financial condition andperformance. Accordingly, we cannot make assurances that we will be able to raise additional capital if needed on terms that are acceptable to us, or at all. If we cannot raiseadditional capital when needed, our ability to further expand our operations could be materially impaired and our financial condition and liquidity could be materially andadversely affected. In addition, any additional capital we obtain may result in the dilution of the interests of existing holders of our common stock. Further, if we are unable toraise additional capital when required by our bank regulators, we may be subject to adverse regulatory action.
We rely on dividends from the Bank for substantially all of our revenue at the holding company level.
We are an entity separate and distinct from our principal subsidiary, HomeTrust Bank, and derive substantially all of our revenue at the holding company level in the form ofdividends from that subsidiary. Accordingly, we are, and will be, dependent upon dividends from the Bank to pay the principal of and interest on our indebtedness, to satisfy ourother cash needs and to pay dividends on our common stock. HomeTrust Bank’s ability to pay dividends is subject to its ability to earn net income and to meet certain regulatoryrequirements. In the event the Bank is unable to pay dividends to us, we may not be able to pay dividends on our common stock or continue stock repurchases. Also, our right toparticipate in a distribution of assets upon a subsidiary’s liquidation or reorganization is subject to the prior claims of the subsidiary’s creditors.
Item 1B. Unresolved Staff Comments
None.
Item 2. Properties
We maintain our administrative office, which is owned by us, in Asheville, North Carolina. In total, as of June 30, 2021, we have 41 locations, which include: North Carolina(including the Asheville metropolitan area, the "Piedmont" region, Charlotte, and Raleigh/Cary), Upstate South Carolina (Greenville), East Tennessee (includingKingsport/Johnson City/Bristol, Knoxville, and Morristown) and Southwest Virginia (including the Roanoke Valley).
Of those offices, 16 are leased facilities. We also own an operations center located in Asheville, North Carolina. We lease additional space, which is adjacent to the facility weown, for administrative and operations personnel. The lease terms for our branch offices, operations center and other offices are not individually material. Lease expirationsrange from one to five years. In the opinion of management, all properties are adequately covered by insurance, are in a good state of repair and are appropriately designed fortheir present and future use. See Notes 6 and 11 in the Notes to the Consolidated Financial Statements included in Item 8 of this Form 10-K for additional information.
We maintain depositor and borrower customer files on an online basis, utilizing a telecommunications network, portions of which are leased. Management has a disasterrecovery plan in place with respect to the data processing system, as well as our operations as a whole.
Item 3. Legal Proceedings
The "Litigation" section of Note 17 to the Notes to Consolidated Financial Statements included in Item 8 of this Form 10-K is incorporated herein by reference.
49

Item 4. Mine Safety Disclosures.
Not applicable.
PART II
Item 5. Market for Registrant’s Common Equity, Related Stockholder Matters and Issuer Purchases of Equity Securities.
The Company’s common stock is listed on the Nasdaq Global Market under the symbol “HTBI.” As of the close of business on September 7, 2021, there were 16,460,302 sharesof common stock outstanding held by 1,116 holders of record. Certain shares are held in “nominee” or “street” name and accordingly, the number of beneficial owners of suchshares is not known or included in the foregoing number.
The Company began paying its first cash dividends during the second fiscal quarter of 2019. The timing and amount of cash dividends paid depends on our earnings, capitalrequirements, financial condition and other relevant factors. We also have the ability to receive dividends or capital distributions from HomeTrust Bank, our wholly ownedsubsidiary. There are regulatory restrictions on the ability of HomeTrust Bank to pay dividends. See Item 1, “Business—How We Are Regulated,” for more informationregarding the restrictions on the Company’s and the Bank’s abilities to pay dividends.
Purchases of Equity Securities by the Issuer and Affiliated Purchasers
The following table provides information about repurchases of common stock by the Company during the quarter ended June 30, 2021:
PeriodTotal Number
Of Shares Purchased
Average Price Paid per
Share
Total Number OfShares Purchased as
Part of PubliclyAnnounced Plans
Maximum Number of
Shares that May Yet Be Purchased
Under PubliclyAnnounced Plans
April 1 - April 30, 2021 57,753 $ 24.76 57,753 226,796 May 1 - May 31, 2021 83,080 27.29 83,080 143,716 June 1 - June 30, 2021 26,059 28.22 26,059 117,657
Total 166,892 $ 26.56 166,892 117,657
On April 2, 2020, the Company announced that its Board of Directors had authorized the repurchase of up to 851,004 shares of the Company's common stock, representing 5%of the Company's outstanding shares at the time of the announcement. The shares may be purchased in the open market or in privately negotiated transactions, from time to timedepending upon market conditions and other factors. As of June 30, 2021, 733,347 of these shares had been purchased at an average price of $22.03. As of July 26, 2021, werepurchased the remaining 117,657 shares. On July 28, 2021, an additional 825,941 shares of common stock were authorized for repurchase representing 5% of the Company'soutstanding shares at the time of the announcement.
Equity Compensation Plans
The equity compensation plan information presented under Part III, Item 12 of this report is incorporated herein by reference.
50

Shareholder Return Performance Graph Presentation
The performance graph below compares the Company’s cumulative shareholder return on its common stock since June 30, 2016 to the cumulative total return of the NasdaqComposite and the Nasdaq Bank Index for the periods indicated. The information presented below assumes $100 was invested on June 30, 2016, in the Company’s commonstock and in each of the indices and assumes the reinvestment of all dividends. Historical stock price performance is not necessarily indicative of future stock price performance.Total return assumes the reinvestment of all dividends and that the value of common stock and each index was $100 on June 30, 2016.
Year Ended June 30,
2016 2017 2018 2019 2020 2021HomeTrust Bancshares, Inc. 100.00 131.89 152.16 135.89 86.49 150.81NASDAQ Bank Index 100.00 137.37 151.18 134.51 99.79 164.83NASDAQ Composite 100.00 126.80 155.09 165.33 207.71 299.50
51
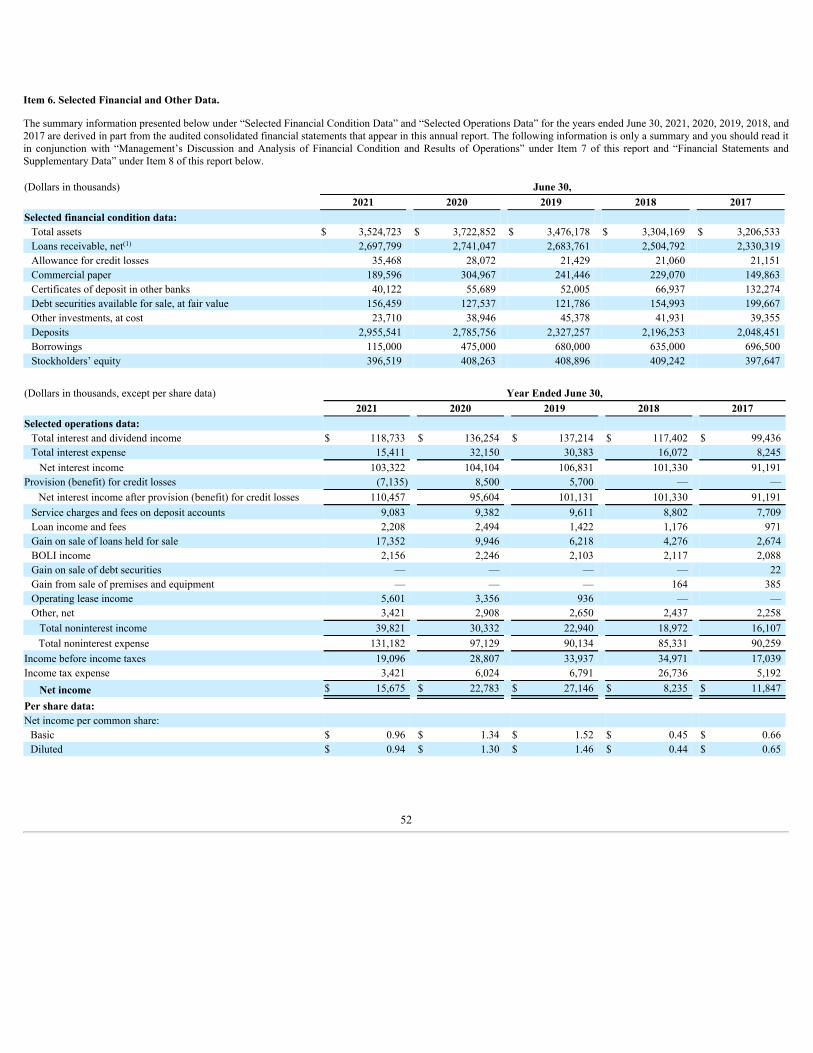
Item 6. Selected Financial and Other Data.
The summary information presented below under “Selected Financial Condition Data” and “Selected Operations Data” for the years ended June 30, 2021, 2020, 2019, 2018, and2017 are derived in part from the audited consolidated financial statements that appear in this annual report. The following information is only a summary and you should read itin conjunction with “Management’s Discussion and Analysis of Financial Condition and Results of Operations” under Item 7 of this report and “Financial Statements andSupplementary Data” under Item 8 of this report below.
(Dollars in thousands) June 30,2021 2020 2019 2018 2017
Selected financial condition data: Total assets $ 3,524,723 $ 3,722,852 $ 3,476,178 $ 3,304,169 $ 3,206,533 Loans receivable, net 2,697,799 2,741,047 2,683,761 2,504,792 2,330,319 Allowance for credit losses 35,468 28,072 21,429 21,060 21,151 Commercial paper 189,596 304,967 241,446 229,070 149,863 Certificates of deposit in other banks 40,122 55,689 52,005 66,937 132,274 Debt securities available for sale, at fair value 156,459 127,537 121,786 154,993 199,667 Other investments, at cost 23,710 38,946 45,378 41,931 39,355 Deposits 2,955,541 2,785,756 2,327,257 2,196,253 2,048,451 Borrowings 115,000 475,000 680,000 635,000 696,500 Stockholders’ equity 396,519 408,263 408,896 409,242 397,647
(Dollars in thousands, except per share data) Year Ended June 30,2021 2020 2019 2018 2017
Selected operations data: Total interest and dividend income $ 118,733 $ 136,254 $ 137,214 $ 117,402 $ 99,436 Total interest expense 15,411 32,150 30,383 16,072 8,245
Net interest income 103,322 104,104 106,831 101,330 91,191 Provision (benefit) for credit losses (7,135) 8,500 5,700 — —
Net interest income after provision (benefit) for credit losses 110,457 95,604 101,131 101,330 91,191 Service charges and fees on deposit accounts 9,083 9,382 9,611 8,802 7,709 Loan income and fees 2,208 2,494 1,422 1,176 971 Gain on sale of loans held for sale 17,352 9,946 6,218 4,276 2,674 BOLI income 2,156 2,246 2,103 2,117 2,088 Gain on sale of debt securities — — — — 22 Gain from sale of premises and equipment — — — 164 385 Operating lease income 5,601 3,356 936 — — Other, net 3,421 2,908 2,650 2,437 2,258
Total noninterest income 39,821 30,332 22,940 18,972 16,107 Total noninterest expense 131,182 97,129 90,134 85,331 90,259
Income before income taxes 19,096 28,807 33,937 34,971 17,039 Income tax expense 3,421 6,024 6,791 26,736 5,192
Net income $ 15,675 $ 22,783 $ 27,146 $ 8,235 $ 11,847
Per share data: Net income per common share:
Basic $ 0.96 $ 1.34 $ 1.52 $ 0.45 $ 0.66 Diluted $ 0.94 $ 1.30 $ 1.46 $ 0.44 $ 0.65
(1)
52

At or For the Year Ended June 30,2021 2020 2019 2018 2017
Selected financial ratios and other data: Performance ratios:
Return on assets (ratio of net income to average total assets) 0.42 % 0.63 % 0.80 % 0.25 % 0.40 %Return on equity (ratio of net income to average equity) 3.88 5.54 6.62 2.05 3.14 Tax equivalent yield on earning assets 3.49 4.13 4.39 4.00 3.79 Rate paid on interest-bearing liabilities 0.57 1.18 1.16 0.65 0.37 Tax equivalent average interest rate spread 2.92 2.95 3.23 3.35 3.42 Tax equivalent net interest margin 3.04 3.17 3.43 3.46 3.49 Noninterest expense to average total assets 3.55 2.70 2.65 2.63 3.04 Average interest-earning assets to average interest-bearing liabilities 128.01 122.10 120.39 120.77 120.26 Efficiency ratio 91.64 72.25 69.46 70.93 84.12 Efficiency ratio - adjusted 74.08 71.62 68.83 70.12 75.48
Asset quality ratios: Nonperforming assets to total assets 0.36 % 0.44 % 0.38 % 0.44 % 0.62 %Nonaccruing loans to total loans 0.46 0.58 0.38 0.43 0.58 Total classified assets to total assets 0.64 0.84 0.89 1.00 1.57 Allowance for credit losses to nonaccruing loans 281.38 176.30 206.90 192.96 154.77 Allowance for credit losses to total loans 1.30 1.01 0.79 0.83 0.90 Net charge-offs to average loans 0.01 0.07 0.20 — 0.01
Capital ratios:Equity to total assets at end of period 11.25 % 10.97 % 11.76 % 12.39 % 12.40 %Average equity to average assets 10.91 11.46 12.06 12.41 12.80 Dividend payout ratio 32.01 19.98 11.70 — — Dividends declared per common share $ 0.31 $ 0.27 $ 0.18 — —
_____________________
(1) Net of allowances for loan losses and deferred loan costs.(2) For the years ended June 30, 2021, 2020, and 2019 the weighted average rate for municipal leases is adjusted for a 24% combined federal and state tax rate since the interest from these leases is tax exempt. For 2018 it was adjusted
for a 30% rate and all other years were for 37% rate.(3) Net interest income divided by average interest-earning assets.(4) See Part II, Item 7 - "Non-GAAP Financial Measures" for additional details.(5) Nonperforming assets include nonaccruing loans including certain restructured loans and REO. At June 30, 2021, there were $5.5 million of restructured loans included in nonaccruing loans and $6.6 million, or 52.6%, of
nonaccruing loans were current on their loan payments.
Item 7. Management’s Discussion and Analysis of Financial Condition and Results of Operations
This discussion and analysis reviews our consolidated financial statements and other relevant statistical data and is intended to enhance your understanding of our financialcondition and results of operations. The information in this section has been derived from the Consolidated Financial Statements and notes thereto, which are included in Item 8of this Form 10-K. You should read the information in this section in conjunction with the business and financial information regarding us as provided in this Form 10-K.
Overview
Our principal business consists of attracting deposits from the general public and investing those funds, along with borrowed funds, in commercial real estate loans, constructionand development loans, commercial and industrial loans, equipment finance leases, municipal leases, loans secured by first and second mortgages on one-to-four familyresidences including home equity loans, construction and land/lot loans, indirect automobile loans, and other consumer loans. We also originate one-to-four family loans, SBAloans, and HELOCs to sell to third parties. In addition, we invest in debt securities issued by United States Government agencies and GSEs, corporate bonds, commercial paperand certificates of deposit in other banks insured by the FDIC.
We offer a variety of deposit accounts for individuals, businesses, and nonprofit organizations. Deposits and borrowings are our primary source of funds for our lending andinvesting activities.
We are significantly affected by prevailing economic conditions, as well as, government policies and regulations concerning, among other things, monetary and fiscal affairs,housing and financial institutions. Deposit flows are influenced by a number of factors, including interest rates paid on competing time deposits, other investments, accountmaturities, and the overall level of personal income and savings. Lending activities are influenced by the demand for funds, the number and quality of lenders, and regionaleconomic cycles.
(2)
(2)
(2)(3)
(4)
(5)
(5)
(5)
53

Our primary source of pre-tax income is net interest income. Net interest income is the difference between interest income, which is the income that we earn on our loans andinvestments, and interest expense, which is the interest that we pay on our deposits and borrowings. Changes in levels of interest rates affect our net interest income. Changes inlevels of interest rates affect our net interest income. Because the length of the COVID-19 pandemic and the efficacy of the extraordinary measures being put in place to addressits economic consequences are unknown, including the 150 basis point reduction in the targeted federal funds rate during 2020, until the pandemic subsides, expect our netinterest income and net interest margin to be adversely affected throughout fiscal 2021 and possibly longer.
A secondary source of income is noninterest income, which includes revenue we receive from providing products and services, including service charges and fees on depositaccounts, loan income and fees, gains on the sale of loans held for sale, and gains and losses from sales of debt securities.
An offset to net interest income is the provision for credit losses which is required to establish the ACL at a level that adequately provides for current expected credit lossesinherent in our loan portfolio, off balance sheet commitments, and debt securities. Under the new CECL standard all financial assets measured at amortized cost and off balancesheet credit exposures, including loans, investment securities and unfunded commitments are evaluated for credit losses. See Note 1 "Summary of Significant AccountingPolicies" in this report on Form 10-K for further discussion.
Our noninterest expenses consist primarily of salaries and employee benefits, expenses for occupancy, marketing and computer services, and FDIC deposit insurance premiums.Salaries and benefits consist primarily of the salaries and wages paid to our employees, payroll taxes, expenses for retirement and other employee benefits. Occupancy expenses,which are the fixed and variable costs of buildings and equipment, consist primarily of lease payments, property taxes, depreciation charges, maintenance and costs of utilities.
Our geographic footprint includes seven markets accessed through numerous strategic acquisitions as well as two de novo commercial loan offices. Looking forward, we believeopportunities currently exist within our market areas to grow our franchise. While COVID-19 has dampened our growth activities, we believe as the local and global economyreturns to normalcy we remain in a position to create organic growth through marketing efforts. We may also seek to expand our franchise through the selective acquisition ofindividual branches, loan purchases and, to a lesser degree, whole bank transactions that meet our investment and market objectives. We will continue to be disciplined as itpertains to future expansion focusing primarily on organic growth in our current market areas.
At June 30, 2021, we had 41 locations in North Carolina (including the Asheville metropolitan area, Piedmont region, Charlotte, and Raleigh/Cary), Upstate South Carolina(Greenville), East Tennessee (including Kingsport/Johnson City/Bristol, Knoxville, and Morristown) and Southwest Virginia (including the Roanoke Valley).
Business and Operating Strategy and Goals
Our primary objective is to continue to operate and grow HomeTrust Bank as a well-capitalized, profitable, independent, community banking organization. Our mission is tocreate stockholder value by building relationships with our employees, customers, and communities in our primary markets in North Carolina (including the Ashevillemetropolitan area, Piedmont region, Charlotte, and Raleigh/Cary), Upstate South Carolina (Greenville), East Tennessee (including Kingsport/Johnson City/Bristol, Knoxville,and Morristown) and Southwest Virginia (including the Roanoke Valley) through exceptional service and helping our customers every day to be "Ready For What’s Next" intheir financial lives. We will also need to continue providing our employees with the tools necessary to effectively deliver our products and services to customers in order tocompete effectively with other financial institutions operating in our market areas and to fulfill our "Commitment to the Customer Experience."
Since our Conversion in 2012, we have been busy implementing new lines of business, adding new markets, improving processes, and updating our systems. We now have thelines of business and markets necessary to continue our growth. Our focus over the next few years will be on strategic initiatives to enhance profitability by reducing ongoingcosts and increasing revenues in our diversified maturing lines of business. The focus on the operating environment will be designed to maximize our new systems and createefficient scalable processes. In connection with profitability improvement initiatives, we recently announced the closure of nine branches and restructuring of our balance sheetwith the prepayment of our remaining long-term borrowings. In addition, beginning July 1, 2021, the Bank brought its back-office SBA loan servicing process in-house, which isexpected to provide additional servicing fee and gain on sale income. In aggregate, our approach is designated to lead to increased profitability and franchise value over time.
Critical Accounting Policies
Certain of our accounting policies are important to the portrayal of our financial condition, since they require management to make difficult, complex or subjective judgments,some of which may relate to matters that are inherently uncertain. Estimates associated with these policies are susceptible to material changes as a result of changes in facts andcircumstances. Facts and circumstances which could affect these judgments include, but are not limited to, changes in interest rates, changes in the performance of the economyand changes in the financial condition of borrowers.
54

The following represent our critical accounting policies:
Allowance for Credit Losses or ACL. The ACL reflects our estimate of credit losses that will result from the inability of our borrowers to make required loan payments. Werecord loans charged off against the ACL and subsequent recoveries, if any, increase the ACL when they are recognized. We use a systematic methodology to determine ourACL for loans held for investment and certain off-balance-sheet credit exposures. The ACL is a valuation account that is deducted from the amortized cost basis to present thenet amount expected to be collected on the loan portfolio. We consider the effects of past events, current conditions, and reasonable and supportable forecasts on thecollectability of the loan portfolio. The estimate of our ACL involves a high degree of judgment; therefore, our process for determining expected credit losses may result in arange of expected credit losses. Our ACL recorded in the balance sheet reflects our best estimate within the range of expected credit losses. We recognize in net income theamount needed to adjust the ACL for management’s current estimate of expected credit losses. Our ACL is calculated using collectively evaluated and individually evaluatedloans. See "Adoption of CECL Standard" in "Note 1 - Summary of Significant Accounting Policies" of the Notes to the Consolidated Financial Statements included in Item 8 ofthis Form 10-K for further discussion of the adoption of CECL.
Goodwill and Intangibles. We review goodwill for potential impairment on an annual basis during the fourth quarter, or more often if events or circumstances indicate there maybe impairment. In testing goodwill for impairment, we have the option to assess either qualitative or quantitative factors to determine whether the existence of events orcircumstances leads to a determination that it is more likely than not that the estimated fair value of a reporting unit is less than its carrying amount. If we elect to perform aqualitative assessment and determine that an impairment is more likely than not, we are then required to perform a quantitative impairment test, otherwise no further analysis isrequired. Under the quantitative impairment test, the evaluation involves comparing the current fair value of each reporting unit to its carrying value, including goodwill. If theestimated fair value of a reporting unit exceeds its carrying value, goodwill is considered not to be impaired. If the carrying value exceeds estimated fair value an impairmentcharge is recognized for the difference, but limited by the amount of goodwill allocated to that reporting unit. Other identifiable intangible assets are evaluated for impairment ifevents or changes in circumstances indicate a possible impairment.
Non-GAAP Financial Measures
In addition to results presented in accordance with GAAP, this Form 10-K contains certain non-GAAP financial measures, which include: efficiency ratio; tangible book valueper share; tangible equity to tangible assets ratio and the ratio of the allowance for credit losses to total loans excluding PPP loans and acquired loans. We believe these non-GAAP financial measures and ratios as presented are useful for both investors and management to understand the effects of certain items and provide an alternative view of ourperformance over time and in comparison to our competitors. These non-GAAP measures have inherent limitations, are not required to be uniformly applied and are not audited.They should not be considered in isolation or as a substitute for total stockholders' equity or operating results determined in accordance with GAAP. These non-GAAP measuresmay not be comparable to similarly titled measures reported by other companies. Set forth below is a reconciliation to GAAP of our efficiency ratio:
(Dollars in thousands) Year Ended June 30,2021 2020 2019 2018 2017
Noninterest expense $ 131,182 $ 97,129 $ 90,134 $ 85,331 $ 90,259 Less: merger-related expenses — — — — 7,805 Less: branch closure and restructuring expenses 1,513 — — — — Less: prepayment penalties on borrowings 22,690 — — — — Noninterest expense – as adjusted $ 106,979 $ 97,129 $ 90,134 $ 85,331 $ 82,454
Net interest income $ 103,322 $ 104,104 $ 106,831 $ 101,330 $ 91,191 Plus: noninterest income 39,821 30,332 22,940 18,972 16,107 Plus: tax equivalent adjustment 1,267 1,190 1,173 1,559 2,354 Less: gain from sale of premises and equipment — — — 164 385 Less: realized gain on sale of debt securities — — — — 22 Net interest income plus noninterest income – as adjusted $ 144,410 $ 135,626 $ 130,944 $ 121,697 $ 109,245 Efficiency ratio - adjusted 74.08 % 71.62 % 68.83 % 70.12 % 75.48 %Efficiency ratio - unadjusted 91.64 % 72.25 % 69.46 % 70.93 % 84.12 %
55

Set forth below is a reconciliation to GAAP of tangible book value and tangible book value per share:
(Dollars in thousands, except per share data) June 30,2021 2020 2019 2018 2017
Total stockholders' equity $ 396,519 $ 408,263 $ 408,896 $ 409,242 $ 397,647 Less: goodwill, core deposit intangibles, net of taxes 25,902 26,468 27,562 29,125 30,157 Tangible book value $ 370,617 $ 381,795 $ 381,334 $ 380,117 $ 367,490 Common shares outstanding 16,636,483 17,021,357 17,984,105 19,041,668 18,967,875 Tangible book value per share $ 22.28 $ 22.43 $ 21.20 $ 19.96 $ 19.37 Book value per share $ 23.83 $ 23.99 $ 22.74 $ 21.49 $ 20.96 _________________________________________________________________(1) Tangible book value is equal to total stockholders' equity less goodwill and core deposit intangibles, net of related deferred tax liabilities.
Set forth below is a reconciliation to GAAP of tangible equity to tangible assets:
(Dollars in thousands) June 30,2021 2020 2019 2018 2017
Tangible equity $ 370,617 $ 381,795 $ 381,334 $ 380,117 $ 367,490 Total assets 3,524,723 3,722,852 3,476,178 3,304,169 3,206,533 Less: goodwill, core deposit intangibles, net of taxes 25,902 26,468 27,562 29,125 30,157 Total tangible assets $ 3,498,821 $ 3,696,384 $ 3,448,616 $ 3,275,044 $ 3,176,376 Tangible equity to tangible assets 10.59 % 10.33 % 11.06 % 11.61 % 11.57 %_________________________________________________________________(1) Tangible equity (or tangible book value) is equal to total stockholders' equity less goodwill and core deposit intangibles, net of related deferred tax liabilities.(2) Total tangible assets is equal to total assets less goodwill and core deposit intangibles, net of related deferred tax liabilities.
Set forth below is a reconciliation to GAAP of the allowance for credit losses to total loans and the allowance for credit losses as adjusted to exclude PPP loans:
(Dollars in thousands) June 30,2021 2020
Total gross loans receivable (GAAP) $ 2,733,267 $ 2,768,930 Less: PPP loans 46,650 80,697
Adjusted loans (non-GAAP) $ 2,686,617 $ 2,688,233
Allowance for credit losses (GAAP) $ 35,468 $ 28,072 Allowance for credit losses / Adjusted loans (non-GAAP) 1.32 % 1.04 %_________________________________________________________________ (1) PPP loans are fully guaranteed loans by the U.S. government.
(1)
(1)
(2)
56

Recent Developments: COVID-19, the CARES Act, and Our Response
The COVID-19 pandemic has caused economic and social disruption on an unprecedented scale. While some industries have been impacted more severely than others, allbusinesses have been impacted to some degree. This disruption resulted in business closures across the country, significant job loss, and aggressive measures by the federalgovernment.
Congress, the President, and the Federal Reserve have taken several actions designed to cushion the economic fallout. Most notably, the CARES Act (Coronavirus Aid, Relief,and Economic Security Act of 2020) was signed into law on March 27, 2020 as a $2.2 trillion legislative package. The purpose of the CARES Act was to prevent a severeeconomic downturn through various measures, including direct financial aid to families and economic stimulus to significantly impacted industry sectors. The package alsoincluded extensive emergency funding for hospitals and healthcare providers. On December 27, 2020, the 2021 Consolidated Appropriations Act was signed into law providingan additional $900 billion in stimulus relief. Effective February 24, 2021, the Biden Administration extended the national emergency declaration for one year due to COVID-19.In addition to the general impact of COVID-19, certain provisions of the CARES Act as well as the Consolidated Appropriations Act and regulatory relief efforts have had amaterial impact on our operations.
In response to the COVID-19 pandemic, we offered a variety of relief options designed to support our customers and the communities we serve. As businesses reopened and theeconomy started to improve, we began to see our markets return to some normalcy; however, we continue to monitor the impact of the new Delta variant of COVID-19 whichhas prompted many public health officials and municipalities to reinstate mask mandates and reconsider lifting pandemic restrictions. While it is not possible to know the fullextent of the impact as of the date of this filing, set forth (below) are potentially material items of which we are aware.
See "Note 1 - Summary of Significant Accounting Policies" in the Notes to the Consolidated Financial Statements included in Item 8 of this Form 10-K for additionalinformation.
Paycheck Protection Program Participation. The CARES Act authorized the SBA to temporarily guarantee loans under the new PPP loan program. The goal of the PPP was toavoid as many layoffs as possible, and to encourage small businesses to maintain payrolls. As a qualified SBA lender, we were automatically authorized to originate PPP loansupon commencement of the program in April 2020. PPP loans have: (a) an interest rate of 1.0%, (b) a two-year loan term to maturity; and (c) principal and interest paymentsdeferred for six months from the date of disbursement. The SBA guarantees 100% of the PPP loans made to eligible borrowers. The entire principal amount of the borrower’sPPP loan, including any accrued interest, is eligible to be forgiven and repaid by the SBA so long as employee and compensation levels of the business are maintained and 60%of the loan proceeds are used for payroll expenses, with the remaining 40% of the loan proceeds used for other qualifying expenses.
We participated in the SBA PPP during calendar years 2020 and 2021. During the quarter ended June 30, 2021, the program’s funds were depleted and subsequently we endedour participation. We originated a total of $112.0 million or 469 PPP loans under the program throughout the pandemic which included a total of $31.2 million in PPP loans forcalendar year 2021. As of June 30, 2021, outstanding PPP loans totaled $46.7 million which included $1.1 million in net deferred fees that will be accreted into interest incomeover the remaining life of the loans unless the loans are forgiven, at which point these fees would be accelerated into income. We earned $1.8 million and $179,000 in feesthrough accretion including some accelerated accretion resulting from loan forgiveness for the years ended June 30, 2021 and 2020, respectively. We have worked with the SBAand our customers to forgive a total of $64.2 million in PPP loans during our participation in the program.
Loan Modifications. As of June 30, 2021, substantially all loans placed on full payment deferral during the pandemic had come out of deferral and borrowers are either makingregular loan payments or interest-only payments until the latter part of calendar year 2021. As of June 30, 2021, we had $78.9 million in commercial loan deferrals on interest-only payments and only $107,000 in loans with full principal and interest payment deferrals compared to $551.3 million as of June 30, 2020. We continue to work with ourcustomers to determine the best option for repayment of accrued interest on the deferred payments.
We believe the steps we have taken and continue to take are necessary to effectively manage our portfolio and assist our customers through the ongoing uncertainty surroundingthe duration, impact and government response to the COVID-19 pandemic. In addition, we will continue to work with our customers to determine the best option for repaymentof accrued interest on the deferred payments.
Allowance for Credit Losses. We recorded a benefit for credit losses of $7.1 million for the year ended June 30, 2021, compared to a $8.5 million provision in the year endedJune 30, 2020. On July 1, 2020, we adopted the new CECL accounting standard with an allowance for credit losses which included the impact of COVID-19 based on the currentexpected credit losses. While leading economic indicators have improved as of June 30, 2021, we continue to maintain qualitative reserves in our allowance for credit losseswhich includes management's estimate of the impact for COVID-19. Under the prior incurred loss model, approximately $4.3 million of the prior year provision reflects probablecredit losses related to COVID-19 based upon the conditions that existed as of June 30, 2020, including consideration for the downturn in certain leading economic indicators,such as the weaker stock market, lower manufacturing activity and retail sales, consumer confidence, and increases in unemployment with the remaining provision being drivenby increased charge-offs and impairments in our commercial and equipment finance portfolios. The provision during the previous year was primarily related to the additionalallowance stemming from our assessment of COVID-19 on the loan portfolio.
Branch Operations and Support Personnel. Throughout the pandemic we have provided banking services with a focus on the health and safety of our customers and employees.We continue to monitor the effects of customer behavior specific to in-person branch transactions and have experienced meaningful increases in digital banking activity andonline deposit account openings. Partially in response to these changes,
57
we recently announced our plans to close nine branches in North Carolina, Tennessee, and Virginia. We continue to respond to the banking needs of our customers whetherthrough physical branch locations and/or digital banking services.
Capital. At June 30, 2021 and 2020, our tangible equity to total tangible assets ratio was 10.59% and 10.33%, respectively, and HomeTrust Bank’s capital was well in excess ofall regulatory requirements. As a result of our strong capital levels, we are well positioned to face the challenges of the COVID-19 pandemic.
Accounting and Reporting Considerations. The CARES Act provides that a financial institution may elect to suspend (1) the requirements under GAAP for certain loanmodifications that would otherwise be categorized as a TDR and (2) any determination that such loan modifications would be considered a TDR, including the relatedimpairment for accounting purposes. We have elected this as a policy change.
Also in response to the COVID-19 pandemic, the Federal Reserve, the FDIC, the National Credit Union Administration, the Office of the Comptroller of the Currency, and theCFPB, in consultation with the state financial regulators (collectively, the “agencies”) issued a joint interagency statement (issued March 22, 2020; revised statement issued April7, 2020). Some of the provisions applicable to us include, but are not limited to:
• Loan modifications that do not meet the conditions of the CARES Act may still qualify as a modification that does not need to be accounted for as a TDR. Theagencies confirmed with FASB staff that short-term modifications made on a good faith basis in response to COVID-19 to borrowers who were current prior to anyrelief are not TDRs. This includes short-term (e.g., six months) modifications such as payment deferrals, fee waivers, extensions of repayment terms, or insignificantdelays in payment.
• With regard to loans not otherwise reportable as past due, financial institutions are not expected to designate loans with deferrals granted due to COVID-19 as past duebecause of the deferral. A loan’s payment date is governed by the due date stipulated in the legal agreement. If a financial institution agrees to a payment deferral, theseloans would not be considered past due during the period of the deferral.
• While short-term COVID-19 modifications are in effect, these loans generally should not be reported as nonaccrual or as classified.
See "Risk Factors" under Part I, Item 1A for additional risks related to COVID-19.
Comparison of Financial Condition at June 30, 2021 and June 30, 2020
General. Total assets and liabilities decreased by $198.1 million and $186.4 million, down to $3.5 billion and $3.1 billion, respectively, at June 30, 2021 as compared to June30, 2020. The cumulative decrease of $201.6 million, or 41.8% in cash and cash equivalents, commercial paper, and certificates of deposit in other banks; along with the $169.8million, or 6.1% increase in deposits was used to pay down borrowings by $360.0 million. The $16.4 million, or 21.2% increase in loans held for sale primarily relates toadditional one-to-four family and home equity loans originated for sale during the period. The $15.2 million, or 39.1% decrease in other investments, at cost was due to FHLBstock being sold back in connection with the paydown of borrowings mentioned below.
On July 1, 2020, we adopted the CECL accounting standard in accordance with ASU 2016-13, "Financial Instruments-Credit Losses (Topic 326): Measurement of Credit Losseson Financial Instruments." The cumulative effect adjustment from this change in accounting policy resulted in an increase in our allowance for credit losses for loans of $14.8million, additional deferred tax assets of $3.9 million, additional reserve for unfunded loan commitments of $2.3 million, and a reduction to retained earnings of $13.2 million. Inaddition, an allowance for credit losses for commercial paper was established for $250,000 with a deferred tax asset of $58,000. The adoption of this ASU did not have an effecton available-for-sale debt securities for the year ended June 30, 2021.
Cash, cash equivalents, and commercial paper. Total cash and cash equivalents decreased $70.6 million, or 58.1%, to $51.0 million at June 30, 2021 from $121.6 million atJune 30, 2020. The commercial paper balance decreased $115.4 million, or 37.8% to $189.6 million at June 30, 2021 from $305.0 million at June 30, 2020. Our investments incommercial paper have short-term maturities and limited exposure of $15.0 million per each highly-rated company.
Investments. Debt securities available for sale increased $28.9 million, or 22.7%, to $156.5 million at June 30, 2021 compared to $127.5 million at June 30, 2020. During fiscalyear 2021, $108.0 million of securities were purchased (primarily shorter term corporate bonds) partially offset by $61.5 million of securities which matured and $15.2 million ofMBS principal repayments which were received. The overall higher levels of shorter-term corporate bonds provides us with higher yields compared to MBS and agencysecurities while remaining within our investment policy. At June 30, 2021, certificates of deposit in other banks decreased $15.6 million, or 28.0% to $40.1 million compared to$55.7 million at June 30, 2020. The decrease in certificates of deposit in other banks was due to $22.9 million in maturities partially offset by $7.3 million in purchases. Allcertificates of deposit in other banks are fully insured by the FDIC. On a quarterly basis, management evaluates securities for impairment where there has been a decline in fairvalue below the amortized cost basis of a security to determine whether there is a credit loss associated with the decline in fair value. All debt securities available for sale in anunrealized loss position as of June 30, 2021 continue to perform as scheduled and management does not believe that there is a credit loss or that a provision for credit losses isnecessary. Other investments at cost decreased $15.2 million, or 39.1% to $23.7 million at June 30, 2021 from $38.9 million at June 30, 2020. Other investments at cost includedSBIC investments, FRB stock, and FHLB stock totaling $10.2 million, $7.3 million, and $6.2 million, respectively. The overall decrease was driven by a $17.2 million, or 73.6%reduction in FHLB stock as a result of the payoff of borrowings during fiscal year 2021.
58

Loans held for sale. Loans held for sale increased to $93.5 million at June 30, 2021 from $77.2 million at June 30, 2020. The $16.4 million, or 21.2% increase was driven by a$9.7 million increase HELOCs originated for sale, a $3.8 million increase in mortgage loans originated for sale, and a $2.9 million increase in SBA commercial loans originatedfor sale.
Loans. Total loans decreased $35.9 million, or 1.3%, to $2.7 billion at June 30, 2021 driven by PPP loan forgiveness totaling $64.2 million, the continued payoff of purchasedHELOCs of $32.8 million, partially offset by $31.0 million in organic loan growth (which excludes PPP loans and purchases of home equity lines of credit).
Retail consumer and commercial loans consist of the following at the dates indicated:Percent of Total
(Dollars in thousands) June 30, Change June 30,2021 2020 Amount % 2021 2020
Commercial loans:Commercial real estate $ 1,142,276 $ 1,052,906 $ 89,370 8.5 % 41.8 % 38.0 %Construction and development 179,427 215,934 (36,507) (16.9) 6.6 7.8 Commercial and industrial 141,341 154,825 (13,484) (8.7) 5.2 5.6 Equipment finance 317,920 229,239 88,681 38.7 11.6 8.3 Municipal leases 140,421 127,987 12,434 9.7 5.1 4.6 PPP loans 46,650 80,697 (34,047) (42.2) 1.7 2.9
Total commercial loans 1,968,035 1,861,588 106,447 5.7 72.0 67.2 Retail consumer loans:
One-to-four family 406,549 473,693 $ (67,144) (14.2) 14.9 17.0 HELOCs - originated 130,225 137,447 (7,222) (5.3) 4.8 5.0 HELOCs - purchased 38,976 71,781 (32,805) (45.7) 1.4 2.6 Construction and land/lots 66,027 81,859 (15,832) (19.3) 2.4 3.0 Indirect auto finance 115,093 132,303 (17,210) (13.0) 4.2 4.8 Consumer 8,362 10,259 (1,897) (18.5) 0.3 0.4
Total retail consumer loans 765,232 907,342 (142,110) (15.7) 28.0 32.8 Total loans $ 2,733,267 $ 2,768,930 $ (35,663) (1.3)% 100.0 % 100.0 %
Asset quality. Nonperforming assets decreased by $3.5 million, or 21.3% to $12.8 million, or 0.36% of total assets, at June 30, 2021 compared to $16.3 million, or 0.44% of totalassets at June 30, 2020. Nonperforming assets included $12.6 million in nonaccruing loans and $188,000 in REO at June 30, 2021, compared to $15.9 million and $337,000 innonaccruing loans and REO, respectively, at June 30, 2020. The decrease in nonaccruing loans primarily relates to five loans totaling $3.3 million that were charged off or paidoff during the fiscal year. Included in nonperforming loans at June 30, 2021 are $5.5 million of TDR loans of which $4.2 million were current at June 30, 2021, with respect totheir modified payment terms. At June 30, 2021, $6.6 million, or 52.6%, of nonaccruing loans were current on their loan payments. The ratio of nonperforming loans to totalloans was 0.46% at June 30, 2021 and 0.58% at June 30, 2020. Performing TDRs that were excluded from nonaccruing loans totaled $11.1 million and $13.2 million at June 30,2021 and June 30, 2020, respectively.
The ratio of classified assets to total assets decreased to 0.76% at June 30, 2021 from 0.84% at June 30, 2020 due to the decrease in classified loans during fiscal 2021. Classifiedassets decreased to $26.7 million at June 30, 2021 compared to $31.1 million at June 30, 2020 primarily due to $5.7 million in payoffs, $1.6 million in charge-offs, and $950,000in upgrades during the year ended June 30, 2021. Delinquent loans (loans delinquent 30 days or more) at June 30, 2021 were $7.1 million, or 0.3% of total loans compared to$16.1 million, or 0.6% of total loans at June 30, 2020.
Our overall asset quality metrics continue to demonstrate our commitment to growing and maintaining a loan portfolio with a moderate risk profile; however, we will remaindiligent in our review of the portfolio and overall economy as we continue to maneuver through the uncertainty surrounding COVID-19. See "Recent Developments: COVID-19,the CARES Act, and Our Response" on page 57 for additional information regarding our response to COVID-19.
Allowance for credit losses. As previously mentioned, we adopted the CECL accounting standard in accordance with ASU 2016-13, "Financial Instruments-Credit Losses (Topic326): Measurement of Credit Losses on Financial Instruments." See "Adoption of CECL Standard" in "Note 1 - Summary of Significant Accounting Policies," "Note 5 - Loansand Allowance for Credit Losses on Loans," and "Critical Accounting Policies – Allowance for Credit Losses" of the Notes to the Consolidated Financial Statements included inItem 8 of this Form 10-K for further discussion of the adoption of CECL.
The allowance for credit losses was $35.5 million, or 1.30% of total loans, at June 30, 2021 compared to $28.1 million, or 1.01% of total loans, at June 30, 2020, which wasprimarily driven by additional allowance stemming from the our adoption of the new CECL accounting standard. The allowance for credit losses to total gross loans excludingPPP loans was 1.32% at June 30, 2021, compared to 1.04% at June 30, 2020.
59

There was a net benefit for credit losses of $7.1 million for the year ended June 30, 2021, compared to an $8.5 million provision for credit losses for fiscal year 2020. The netbenefit for credit losses was primarily driven by changes in the economic forecast which improved in outlook since the adoption of the standard and a decline in the balance oftotal loans. Net charge-offs totaled $143,000 for the year ended June 30, 2021, compared to $1.9 million for fiscal year 2020. Net charge-offs as a percentage of average loanswere 0.01% and 0.07% for the years ended June 30, 2021 and 2020, respectively.
Our individually evaluated loans are comprised of loans meeting certain thresholds, on nonaccrual status, and all TDRs, whether performing or on nonaccrual status under theirrestructured terms. Individually evaluated loans may be evaluated for reserve purposes using either the cash flow or the collateral valuation method. As of June 30, 2021, therewere $8.8 million in loans individually evaluated. For more information on these individually evaluated loans, see "Note 5 - Loans and Allowance for Credit Losses on Loans" inthis Quarterly Report on Form 10-Q.
Management believes the ACL as of June 30, 2021 was adequate to absorb the estimated losses in the loan portfolio at that date. While management believes the estimates andassumptions used in our determination of the adequacy of the allowance are reasonable, there can be no assurance that such estimates and assumptions will not be provenincorrect in the future, or that the actual amount of future provisions will not exceed the amount of past provisions or that any increased provisions that may be required will notadversely impact our financial condition and results of operations. In addition, the determination of the amount of the ACL is subject to review by bank regulators as part of theroutine examination process, which may result in the establishment of additional reserves based upon their judgment of information available to them at the time of theirexamination. Lastly, a further deterioration in national and local economic conditions, as a result of the COVID-19 pandemic or other factors, could result in a material increasein the ACL and may adversely affect our financial condition and results of operations.
Real estate owned. REO decreased $149,000, or 44.2% to $188,000 at June 30, 2021 from $337,000 at June 30, 2020.
Deferred income taxes. Deferred income taxes increased $567,000, or 3.5%, to $16.9 million at June 30, 2021 from $16.3 million at June 30, 2020. The increase was primarilydriven by a $1.7 million increase in deferred tax assets related to the allowance for credit losses partially offset by a $1.0 million increase in deferred tax liabilities related to thedepreciable basis in premises and equipment and other deferred tax liabilities.
Other assets. Other assets increased $8.0 million, or 16.1%, to $57.5 million at June 30, 2021 from $49.5 million at June 30, 2020. The increase was driven by a $4.3 millionincrease in operating leases from our equipment finance line of business, a $1.4 million increase in current taxes receivable, a $1.1 million increase in SBA servicing assets, anda $897,000 increase in ROU assets, partially offset by decreases across various other assets.
Deposits. Total deposits increased $169.8 million, or 6.1%, to $3.0 billion at June 30, 2021 from $2.8 billion at June 30, 2020. The increase was driven by a $436.2 million, or21.3% increase in core deposits as a result of additional funds to customers from government stimulus and our focused effort to realign the deposit mix. Partially offsetting theincrease was a managed runoff of certificates of deposit and brokered deposits totaling $266.4 million, or 36.0% down to $472.8 million at June 30, 2021.
Borrowings. Total borrowings decreased $360.0 million, or 75.8% to $115.0 million at June 30, 2021 from $475.0 million at June 30, 2020 due to the early retirement of $475.0million in long-term FHLB borrowings partially offset by $115.0 million in additional borrowings at lower rates and 30-day maturities.
Equity. Stockholders’ equity at June 30, 2021 decreased $11.7 million, or 2.9% to $396.5 million from $408.3 million at June 30, 2020. Changes within stockholders' equityincluded $15.7 million in net income and $6.7 million in stock-based compensation and stock option exercises, offset by $13.4 million related to the adoption of the new CECLaccounting standard, 733,347 shares of common stock being repurchased at an average cost of $22.03, or approximately $16.2 million in total, and $5.0 million related to cashdividends declared. As of June 30, 2021, we were considered "well capitalized" in accordance with the regulatory capital guidelines and exceeded all regulatory capitalrequirements. Tangible book value per share decreased $0.15, or 0.7% to $22.28 as of June 30, 2021 compared to $22.43 at June 30, 2020.
60

Average Balances, Interest and Average Yields/CostThe following table sets forth the average balance sheet, interest income and expense, and average yields and costs for the years indicated. All average balances are daily averagebalances. Nonaccruing loans have been included in the table as loans carrying a zero yield.
Year Ended June 30, 2021 2020 2019
(Dollars in thousands)
Average Balance
Outstanding
Interest Earned/
PaidYield/ Rate
Average Balance
Outstanding
Interest Earned/
PaidYield/ Rate
Average Balance
Outstanding
Interest Earned/
PaidYield/ Rate
Assets:Interest-earning assets:Loans receivable $ 2,819,180 $ 113,065 4.01 % $ 2,748,124 $ 123,364 4.49 % $ 2,633,298 $ 123,076 4.67 %Commercial paper and deposits in other banks 447,721 2,573 0.57 % 385,208 7,699 2.00 % 326,035 8,278 2.54 %Debt securities available for sale 137,863 2,024 1.47 % 150,249 3,687 2.45 % 145,344 3,443 2.37 %Other interest-earning assets 36,519 2,338 6.40 % 42,119 2,694 6.40 % 46,360 3,590 7.74 %
Total interest-earning assets 3,441,283 120,000 3.49 % 3,325,700 137,444 4.13 % 3,151,037 138,387 4.39 %Other assets 257,111 265,376 245,859
Total assets $ 3,698,394 $ 3,591,076 $ 3,396,896 Liabilities and equity:Interest-bearing liabilities:Interest-bearing checking accounts $ 609,754 $ 1,552 0.25 % $ 457,455 $ 1,627 0.36 % $ 462,933 $ 1,251 0.27 %Money market accounts 882,252 1,699 0.19 % 767,315 6,910 0.90 % 689,946 5,102 0.74 %Savings accounts 211,192 155 0.07 % 166,588 195 0.12 % 194,635 245 0.13 %Certificate accounts 568,284 5,964 1.05 % 764,013 14,105 1.85 % 596,727 9,159 1.53 %
Total interest-bearing deposits 2,271,482 9,370 0.41 % 2,155,371 22,837 1.06 % 1,944,241 15,757 0.81 %Borrowings 416,822 6,041 1.45 % 568,377 9,313 1.64 % 672,186 14,626 2.18 %
Total interest-bearing liabilities 2,688,304 15,411 0.57 % 2,723,748 32,150 1.18 % 2,616,427 30,383 1.16 %Noninterest-bearing deposits 550,265 365,634 307,420 Other liabilities 56,315 90,247 63,229
Total liabilities 3,294,884 3,179,629 2,987,076 Stockholders' equity 403,510 411,447 409,820
Total liabilities and stockholders' equity $ 3,698,394 $ 3,591,076 $ 3,396,896
Net earning assets $ 752,979 $ 601,952 $ 534,610 Average interest-earning assets to average interest-
bearing liabilities 128.01 % 122.10 % 120.43 %
Tax-equivalent:Net interest income $ 104,589 $ 105,294 $ 108,004 Interest rate spread 2.92 % 2.95 % 3.23 %Net interest margin 3.04 % 3.17 % 3.43 %
Non-tax-equivalent:Net interest income $ 103,322 $ 104,104 $ 106,831 Interest rate spread 2.88 % 2.92 % 3.19 %Net interest margin 3.00 % 3.13 % 3.39 %
(1) The average loans receivable, net balances include loans held for sale and nonaccruing loans.(2) Interest income used in the average interest/earned and yield calculation includes the tax equivalent adjustment of $1.3 million, $1.2 million, and $1.2 million for fiscal years ended June 30, 2021, 2020, and 2019, respectively, calculated based on a combined
federal and state tax rate of 24% for all three years.(3) The average other interest-earning assets consists of FRB stock, FHLB stock, and SBIC investments.(4) Net interest income divided by average interest-earning assets.
(2) (2) (2) (2) (2) (2)
(1)
(3)
(4)
(4)
61
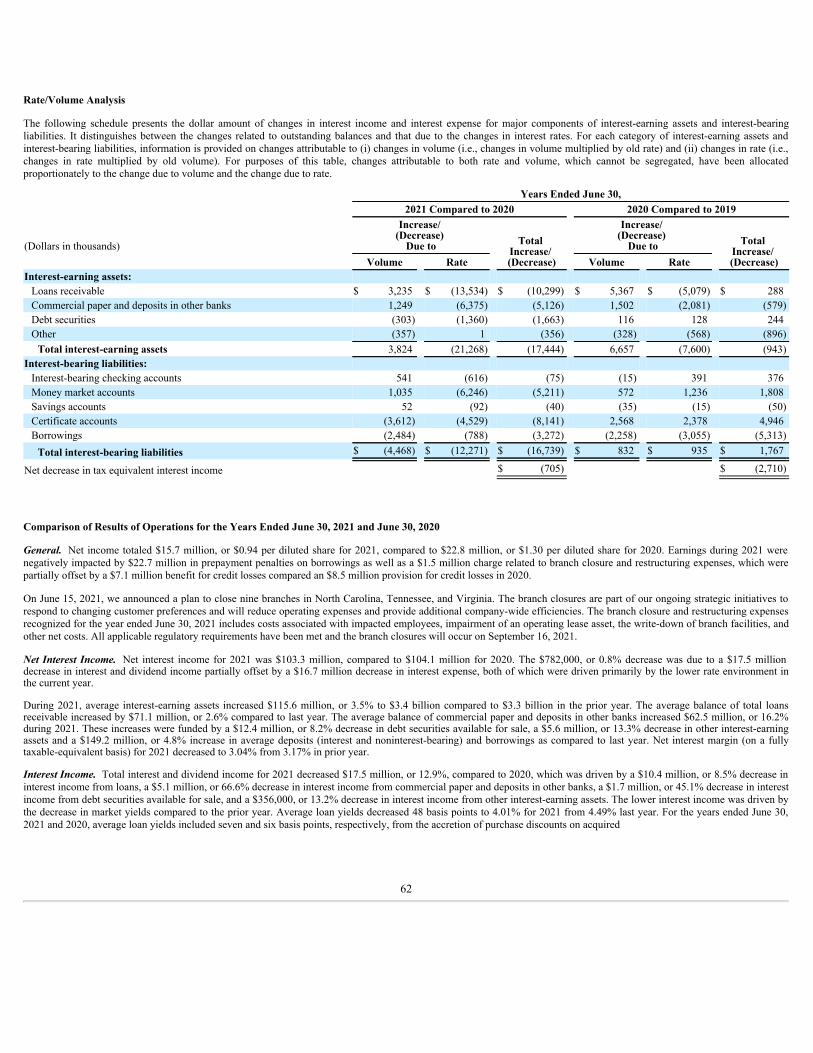
Rate/Volume Analysis
The following schedule presents the dollar amount of changes in interest income and interest expense for major components of interest-earning assets and interest-bearingliabilities. It distinguishes between the changes related to outstanding balances and that due to the changes in interest rates. For each category of interest-earning assets andinterest-bearing liabilities, information is provided on changes attributable to (i) changes in volume (i.e., changes in volume multiplied by old rate) and (ii) changes in rate (i.e.,changes in rate multiplied by old volume). For purposes of this table, changes attributable to both rate and volume, which cannot be segregated, have been allocatedproportionately to the change due to volume and the change due to rate.
Years Ended June 30,2021 Compared to 2020 2020 Compared to 2019
(Dollars in thousands)
Increase/ (Decrease)
Due to Total Increase/ (Decrease)
Increase/ (Decrease)
Due to Total Increase/ (Decrease)Volume Rate Volume Rate
Interest-earning assets:Loans receivable $ 3,235 $ (13,534) $ (10,299) $ 5,367 $ (5,079) $ 288 Commercial paper and deposits in other banks 1,249 (6,375) (5,126) 1,502 (2,081) (579)Debt securities (303) (1,360) (1,663) 116 128 244 Other (357) 1 (356) (328) (568) (896)
Total interest-earning assets 3,824 (21,268) (17,444) 6,657 (7,600) (943)Interest-bearing liabilities:
Interest-bearing checking accounts 541 (616) (75) (15) 391 376 Money market accounts 1,035 (6,246) (5,211) 572 1,236 1,808 Savings accounts 52 (92) (40) (35) (15) (50)Certificate accounts (3,612) (4,529) (8,141) 2,568 2,378 4,946 Borrowings (2,484) (788) (3,272) (2,258) (3,055) (5,313)
Total interest-bearing liabilities $ (4,468) $ (12,271) $ (16,739) $ 832 $ 935 $ 1,767
Net decrease in tax equivalent interest income $ (705) $ (2,710)
Comparison of Results of Operations for the Years Ended June 30, 2021 and June 30, 2020
General. Net income totaled $15.7 million, or $0.94 per diluted share for 2021, compared to $22.8 million, or $1.30 per diluted share for 2020. Earnings during 2021 werenegatively impacted by $22.7 million in prepayment penalties on borrowings as well as a $1.5 million charge related to branch closure and restructuring expenses, which werepartially offset by a $7.1 million benefit for credit losses compared an $8.5 million provision for credit losses in 2020.
On June 15, 2021, we announced a plan to close nine branches in North Carolina, Tennessee, and Virginia. The branch closures are part of our ongoing strategic initiatives torespond to changing customer preferences and will reduce operating expenses and provide additional company-wide efficiencies. The branch closure and restructuring expensesrecognized for the year ended June 30, 2021 includes costs associated with impacted employees, impairment of an operating lease asset, the write-down of branch facilities, andother net costs. All applicable regulatory requirements have been met and the branch closures will occur on September 16, 2021.
Net Interest Income. Net interest income for 2021 was $103.3 million, compared to $104.1 million for 2020. The $782,000, or 0.8% decrease was due to a $17.5 milliondecrease in interest and dividend income partially offset by a $16.7 million decrease in interest expense, both of which were driven primarily by the lower rate environment inthe current year.
During 2021, average interest-earning assets increased $115.6 million, or 3.5% to $3.4 billion compared to $3.3 billion in the prior year. The average balance of total loansreceivable increased by $71.1 million, or 2.6% compared to last year. The average balance of commercial paper and deposits in other banks increased $62.5 million, or 16.2%during 2021. These increases were funded by a $12.4 million, or 8.2% decrease in debt securities available for sale, a $5.6 million, or 13.3% decrease in other interest-earningassets and a $149.2 million, or 4.8% increase in average deposits (interest and noninterest-bearing) and borrowings as compared to last year. Net interest margin (on a fullytaxable-equivalent basis) for 2021 decreased to 3.04% from 3.17% in prior year.
Interest Income. Total interest and dividend income for 2021 decreased $17.5 million, or 12.9%, compared to 2020, which was driven by a $10.4 million, or 8.5% decrease ininterest income from loans, a $5.1 million, or 66.6% decrease in interest income from commercial paper and deposits in other banks, a $1.7 million, or 45.1% decrease in interestincome from debt securities available for sale, and a $356,000, or 13.2% decrease in interest income from other interest-earning assets. The lower interest income was driven bythe decrease in market yields compared to the prior year. Average loan yields decreased 48 basis points to 4.01% for 2021 from 4.49% last year. For the years ended June 30,2021 and 2020, average loan yields included seven and six basis points, respectively, from the accretion of purchase discounts on acquired
62
loans. Average yields on commercial paper and deposits in other banks decreased 143 basis points to 0.57% for 2021 from 2.00% in the prior year. Average yields on debtsecurities available for sale decreased 98 basis points to 1.47% for 2021 from 2.45% in the prior year.
Interest Expense. Total interest expense in 2021 decreased $16.7 million, or 52.1%, compared to 2020. The decrease was driven by a $13.5 million, or 59.0% decrease ininterest expense on deposits and a $3.3 million, or 35.1% decrease in interest expense on borrowings compared to last year. The $116.1 million, or 5.4% increase in averageinterest-bearing deposits for 2021 was more than offset by the 65 basis point decrease down to 0.41% in the corresponding cost of deposits compared to 1.06% in 2020. Averageborrowings for 2021 decreased $151.6 million, or 26.7% along with a 19 basis point decrease in the average cost of borrowings compared to last year. The overall average costof funds decreased 61 basis points to 0.57% for 2021 compared to 1.18% last year due primarily to the impact of the lower amount of borrowings and reduced market rates.
Provision for Credit Losses. During 2021, there was a net benefit for credit losses of $7.1 million compared to a $8.5 million provision for credit losses in 2020. As discussedearlier, the current year benefit was driven by changes in the economic forecast which continue to improve since the adoption of the CECL standard. See "Comparison ofFinancial Condition at June 30, 2021 and 2020 - Asset Quality and Allowance for Credit Losses" for additional details.
Noninterest Income. Noninterest income in 2021 increased $9.5 million, or 31.3% to $39.8 million from $30.3 million in 2020 primarily due to a $7.4 million, or 74.5%increase in the gain on sale of loans held for sale and a $2.8 million, or 44.0% increase in other noninterest income, partially offset by a $299,000, or 3.2% decrease in servicecharges and fees on deposit accounts, and a $286,000, or 11.5% decrease in loan income and fees. The increase in the gain on sale of loans held for sale was primarily driven byan increase in sales of mortgage, SBA and home equity loans. There were $406.5 million of residential mortgage loans originated for sale which were sold with gains of $10.5million compared to $203.9 million sold with gains of $5.4 million in the prior year. Included in the prior year's gain on sale of loans was an additional $1.3 million non-recurring gain related to $154.9 million one-to-four family portfolio loans reclassed to loans held for sale that were sold during the year. During 2021, $66.1 million of theguaranteed portion of SBA commercial loans were sold with recorded gains of $6.1 million compared to $38.1 million sold with gains of $2.8 million in 2020. In addition,$110.8 million of home equity loans were sold during 2021 with gains of $724,000 compared to $71.1 million sold with gains of $415,000 in 2020. The increase in othernoninterest income primarily related to a $2.2 million, or 66.9% increase in operating lease income from the equipment finance line of business and a $538,000, or 63.4%increase in the investment services line of business. The decrease in service charges and fees on deposit accounts was primarily related to lower nonsufficient fund fees ascustomers decreased spending during the pandemic. The decrease in loan income and fees was primarily a result of lower fees from our adjustable rate conversion program.
Noninterest Expense. Noninterest expense for 2021 increased $34.1 million, or 35.1% to $131.2 million compared to $97.1 million in 2020. The increase was primarily due to$22.7 million in prepayment penalties on borrowings and $1.5 million in branch closure and restructuring charges previously mentioned. In addition, there was a $6.2 million, or11.0% increase in salaries and employee benefits; a $2.9 million, or 20.8% increase in other expenses, driven by depreciation from our equipment finance line of business; a $1.5million, or 17.8% increase in computer services; an $899,000 increase in deposit insurance premiums as a result of credits issued by the FDIC being utilized in the prior yearperiod; and a $293,000, or 3.2% increase in net occupancy expense. Partially offsetting these increases was a $686,000, or 48.3% decrease in core deposit intangible amortizationand a cumulative decrease of $399,000, or 7.8% in telephone, postage, and supplies expense, and marketing and advertising expense for the year ended June 30, 2021 comparedto last year. In addition, there was a $893,000, or 60.5% decrease in REO related expenses as a result of fewer properties held, no post-foreclosure writedowns, and a gain on thesale of REO in the current period compared to a loss last year.
Income Taxes. Income tax expense for 2021 decreased $2.6 million, or 43.2% to $3.4 million from $6.0 million in 2020 as a result of lower taxable income. The effective taxrate for 2021 and 2020 was 17.9% and 20.9%, respectively. The lower effective tax rate in the current period compared to the prior period was driven by a comparable amount oftax-exempt income in each period compared to lower pre-tax book income for 2021. For more information on income taxes and deferred taxes, see "Note 12 - Income Taxes" ofthe Notes to the Consolidated Financial Statements included in Item 8 of this Form 10-K.
Comparison of Results of Operation for the Years Ended June 30, 2020 and June 30, 2019
General. During 2020, net income totaled $22.8 million, or $1.30 per diluted share for the year ended June 30, 2020, compared to $27.1 million, or $1.46 per diluted share forfiscal year 2019. Earnings during the year ended June 30, 2020 were negatively impacted by a significant increase in the provision for credit losses based on our assessment ofCOVID-19 on various macroeconomic factors. In addition, the decrease in interest rates over the past year has negatively affected our net interest margin.
Net Interest Income. Net interest income for 2020 was $104.1 million, compared to $106.8 million for 2019. The $2.7 million, or 2.6% decrease was due to a $960,000 decreasein interest and dividend income primarily driven by a decrease in yields and a $1.8 million increase in interest expense.
During 2020, average interest-earning assets increased $174.7 million, or 5.5% to $3.3 billion compared to $3.2 billion in the prior year. For the year ended June 30, 2020, theaverage balance of total loans receivable increased $114.8 million, or 4.4% compared to last year primarily due to organic loan growth. The average balance of commercial paperand deposits in other banks increased $59.2 million, or 18.1% between the years driven by increases in commercial paper investments. These increases were primarily funded bythe $165.5 million, or 5.7% increase in average interest-bearing liabilities and noninterest-bearing deposits, as compared to last year. Net interest margin (on a fully taxable-equivalent basis) for the year ended June 30, 2020 decreased to 3.17% from 3.43% for the year ended June 30, 2019.
63

Interest Income. Total interest and dividend income for 2020 decreased $960,000, or 0.7%, compared to 2019, which was driven by a $896,000, or 25.0% decrease in interestincome on other interest-earning assets and a $579,000, or 7.0% decrease in interest income from commercial paper and interest-bearing deposits in other banks. The reducedincome was a result of lower interest rates on commercial paper and other investments as well as lower interest earned on FHLB stock as borrowings were paid down during theyear. The overall decreases were partially offset by a $271,000, or 0.2% increase in loan interest income and a $244,000, or 7.1% increase in interest income from debt securitiesavailable for sale. The additional loan interest income was driven by the increase in the average balance of loans receivable offset by a decrease in loan interest yield compared tothe prior year. Average loan yields decreased by 18 basis points to 4.49% for the year ended June 30, 2020 from 4.67% last year. For the years ended June 30, 2020 and 2019,average loan yields included six and eight basis points, respectively, from the accretion of purchase discounts on acquired loans. The accretion on purchase discounts on acquiredloans stems from the discount established at the time these loan portfolios were acquired and the related impact of prepayments on purchased loans. Each quarter prior to theadoption of ASU No. 206-13, we analyzed the cash flow assumptions on loan pools purchased and, at least semi-annually, we updated loss estimates, prepayment speeds, andother variables when analyzing cash flows. In addition to this accretion income, which was recognized over the estimated life of the loans pools, if a loan was removed from apool due to payoff or foreclosure, the unaccreted discount in excess of losses was recognized as an accretion gain in interest income. As a result, income from loan pools couldbe volatile from quarter to quarter as well as year over year.
Interest Expense. Total interest expense in 2020 increased $1.8 million, or 5.8%, compared to 2019. The increase was driven by a $7.1 million, or 44.9% increase in depositinterest expense partially offset by a $5.3 million, or 36.3% decrease in interest expense on borrowings. The additional deposit interest expense was a result of a $211.1 million,or 10.9% increase in the average balance of interest-bearing deposits along with a 25 basis point increase in the average cost of those deposits for the year ended June 30, 2020 ascompared to last year. Average borrowings for the year ended June 30, 2020 decreased $103.8 million, or 15.4% along with a 54 basis point decrease in the average cost ofborrowings compared to last year. The overall cost of funds increased two basis points to 1.18% for the year ended June 30, 2020 compared to 1.16% last year.
Provision for Credit Losses. During 2020, there was an $8.5 million provision for credit losses, compared to a $5.7 million in 2019. As discussed earlier, the current yearprovision was driven by COVID-19 and increased charge-offs compared to prior year's provision which primarily related to one commercial relationship.
Noninterest Income. Noninterest income in 2020 increased $7.4 million, or 32.2% to $30.3 million from $22.9 million in 2019 primarily dueto a $3.7 million, or 60.0% increase in the gain on sale of loans held for sale, a $2.7 million, or 74.7% increase in other noninterest income, and a $1.1 million, or 75.4% increasein loan income and fees. The increase in the gain on sale of loans held for sale was a result of the one-to-four family loans sold during the period which resulted in a non-recurring $1.3 million gain. In addition to this non-recurring gain, $203.9 million of residential mortgage loans were sold with gains of $5.4 million for the year ended June 30,2020, compared to $120.6 million sold with gains of $2.8 million in the prior year. During the year ended June 30, 2020, $38.1 million of SBA commercial loans were sold withrecorded gains of $2.8 million compared to $47.4 million sold and gains of $3.4 million in the prior year. In addition, $71.1 million of home equity loans were sold during theyear for a gain of $415,000. The increase in other noninterest income primarily related to a $2.4 million increase in operating lease income from the equipment finance line ofbusiness. The increase in loan income and fees is primarily a result of our adjustable rate conversion program and prepayment fees on equipment finance loans.
Noninterest Expense. Noninterest expense for 2020 increased $7.0 million, or 7.8% to $97.1 million compared to $90.1 million in 2019. Theincrease was primarily due to a $4.4 million, or 8.4% increase in salaries and employee benefits; a $3.0 million, or 27.4% increase in other expenses, mainly driven bydepreciation from our equipment finance line of business and expenses related to our core conversion; a $489,000,or 6.4% increase in computer services; a $235,000, or 7.7% increase in telephone, postage, and supplies; and a $162,000, or 12.3% increase inREO-related expenses. Partially offsetting these increases was a $608,000, or 30.0% decrease in core deposit intangible amortization; a decrease of $526,000, or 36.9% indeposit insurance premiums related to credit from the FDIC; and a $226,000, or 2.4% decrease in net occupancy expenses for the year ended June 30, 2020 compared to the lastyear.
Income Taxes. Income tax expense for 2020 decreased $767,000, or 11.3% to $6.0 million from $6.8 million in 2019 as a result of lower taxable income. The effective tax ratefor the years ended June 30, 2020 and 2019 was 20.9% and 20.0%, respectively.
Asset/Liability Management
Our Risk When Interest Rates Change. The rates of interest we earn on assets and pay on liabilities generally are established contractually for a period of time. Market interestrates change over time. Our loans generally have longer maturities than our deposits. Accordingly, our results of operations, like those of other financial institutions, areimpacted by changes in interest rates and the interest rate sensitivity of our assets and liabilities. The risk associated with changes in interest rates and our ability to adapt to thesechanges is known as interest rate risk and is our most significant market risk. If interest rates rise, our net interest income could be reduced because interest paid on interest-bearing liabilities, including deposits and borrowings, could increase more quickly than interest received on interest-earning assets, including loans and other investments. Inaddition, rising interest rates may hurt our income because they may reduce the demand for loans.
How We Measure Our Risk of Interest Rate Changes. As part of our process to manage our exposure to changes in interest rates and comply with applicable regulations, wemonitor our interest rate risk. In monitoring interest rate risk we continually analyze and manage assets and liabilities based on market conditions, their payment streams andinterest rates, the timing of their maturities, their sensitivity to actual or potential changes in market interest rates, and interest rate sensitivities of our non-maturity deposits withrespect to interest rates
64

paid and the level of balances. The board of directors sets the asset and liability policy of HomeTrust Bank, which is implemented by management and an asset/liabilitycommittee whose members include certain members of senior management.
The purpose of this committee is to communicate, coordinate and control asset/liability management consistent with our business plan and board approved policies. Thecommittee establishes and monitors the volume and mix of assets and funding sources taking into account relative costs and spreads, interest rate sensitivity and liquidity needs.The objectives are to manage assets and funding sources to produce results that are consistent with liquidity, capital adequacy, growth, risk, and profitability goals.
The committee generally meets on a quarterly basis to review, among other things, economic conditions and interest rate outlook, current and projected liquidity needs andcapital position, anticipated changes in the volume and mix of assets and liabilities and interest rate risk exposure limits versus current projections pursuant to net present valueof portfolio equity analysis and income simulations. The committee recommends strategy changes based on this review. The committee is responsible for reviewing andreporting on the effects of the policy implementations and strategies to the board of directors at least quarterly.
Among the techniques we have used at various times to manage interest rate risk are: (i) increasing our portfolio of hybrid and adjustable-rate one-to-four family residential loansand commercial loans; (ii) maintaining a strong capital position, which provides for a favorable level of interest-earning assets relative to interest-bearing liabilities; and (iii)emphasizing less interest rate sensitive and lower-costing “core deposits.” We also maintain a portfolio of short-term or adjustable-rate assets and use fixed-rate FHLB advancesand brokered deposits to extend the term to repricing of our liabilities.
We consider the relatively short duration of our deposits in our overall asset/liability management process. As short-term rates increase, we have assets and liabilities thatincrease with the market. This is reflected in the change in our PVE when rates increase (see the table below). PVE is defined as the net present value of our existing assets andliabilities. In addition, we have historically demonstrated an ability to maintain retail deposits through various interest rate cycles. If local retail deposit rates increasedramatically, we also have access to wholesale funding through our lines of credit with the FHLB and FRB, as well as through the brokered deposit market to replace retaildeposits, as needed.
Depending on the level of general interest rates, the relationship between long- and short-term interest rates, market conditions and competitive factors, the committee may in thefuture determine to increase our interest rate risk position somewhat in order to maintain or increase our net interest margin. In particular, during certain periods of stable ordeclining interest rates, we believe that the increased net interest income resulting from a mismatch in the maturity of our assets and liabilities portfolios may provide highenough returns to justify increased exposure to sudden and unexpected increases in interest rates. As a result of this philosophy, our results of operations and the economic valueof our equity will remain vulnerable to increases in interest rates and to declines due to differences between long- and short-term interest rates.
The committee regularly reviews interest rate risk by forecasting the impact of alternative interest rate environments on net interest income and our PVE. The committee alsoevaluates these impacts against the potential changes in net interest income and market value of our portfolio equity that are monitored by the board of directors of HomeTrustBank generally on a quarterly basis.
Our asset/liability management strategy sets limits on the change in PVE given certain changes in interest rates. The table presented here, as of June 30, 2021, is forward-lookinginformation about our sensitivity to changes in interest rates. The table incorporates data from an independent service, as it relates to maturity repricing andrepayment/withdrawal of interest-earning assets and interest-bearing liabilities. Interest rate risk is measured by changes in PVE for instantaneous parallel shifts in the yieldcurve up and down 400 basis points. Given the current targeted federal funds rate is 0.00% to 0.25% making an immediate change of -200, -300 and -400 basis pointsimprobable, a PVE calculation for a decrease of greater than 100 basis points has not been prepared. An increase in rates would increase our PVE because the repricing ofnonmaturing deposits tend to lag behind the increase in market rates. This positive impact is partially offset by the negative effect from our loans with interest rate floors whichwill not adjust until such time as a loan’s current interest rate adjusts to an increase in market rates which exceeds the interest rate floor. Conversely, in a falling interest rateenvironment these interest rate floors will assist in maintaining our net interest income. As of June 30, 2021, our loans with interest rate floors totaled approximately $543.5million or 19.9% of our total loan portfolio and had a weighted average floor rate of 3.9%, $353.5 million of these loans were at their floor rate, of which $323.6 million, or91.5%, had yields that would begin floating again once prime rates increase at least 200 basis points.
June 30, 2021Change in Interest Rates in Present Value Equity PVE
Basis Points Amount $ Change % Change Ratio(Dollars in Thousands)
+ 400 $ 812,406 $ 166,407 26 % 24 %+ 300 786,659 140,660 22 23 + 200 751,582 105,583 16 22 + 100 704,238 58,239 9 20 Base 645,999 — — 18 - 100 520,130 (125,869) (19) 15
65

In evaluating our exposure to interest rate movements, certain shortcomings inherent in the method of analysis presented in the foregoing table must be considered. For example,although certain assets and liabilities may have similar maturities or repricing periods, they may react in different degrees to changes in market interest rates. Also, the interestrates on certain types of assets and liabilities may fluctuate in advance of changes in market interest rates, while interest rates on other types may lag behind changes in interestrates. Additionally, certain assets, such as adjustable rate mortgages, have features which restrict changes in interest rates on a short-term basis and over the life of the asset.Further, in the event of a significant change in interest rates, prepayment and early withdrawal levels would likely deviate significantly from those assumed above. Finally, theability of many borrowers to service their debt may decrease in the event of an interest rate increase. We consider all of these factors in monitoring our exposure to interest raterisk.
The board of directors and management of HomeTrust Bank believe that certain factors afford HomeTrust Bank the ability to operate successfully despite its exposure to interestrate risk. HomeTrust Bank may manage its interest rate risk by originating and retaining adjustable rate loans in its portfolio, by borrowing from the FHLB to match the durationof our funding to the duration of originated fixed rate one-to-four family and commercial loans held in portfolio and by selling on an ongoing basis certain currently originatedlonger term fixed rate one-to-four family real estate loans.
Liquidity
Management maintains a liquidity position that it believes will adequately provide funding for loan demand and deposit run-off that may occur in the normal course of business.We rely on a number of different sources in order to meet our potential liquidity demands. The primary sources are increases in deposit accounts and cash flows from loanpayments and the securities portfolio.
In addition to these primary sources of funds, management has several secondary sources available to meet potential funding requirements. As of June 30, 2021, HomeTrustBank had an additional borrowing capacity of $289.4 million with the FHLB of Atlanta, a $92.9 million line of credit with the FRB, and three lines of credit with threeunaffiliated banks totaling $100.0 million. Additionally, we classify our securities portfolio as available for sale, providing an additional source of liquidity. Managementbelieves that our security portfolio is of high quality and the securities would therefore be marketable. In addition, we have historically sold fixed-rate mortgage loans in thesecondary market to reduce interest rate risk and to create still another source of liquidity. From time to time we also utilize brokered time deposits to supplement our othersources of funds. Brokered time deposits are obtained by utilizing an outside broker that is paid a fee. This funding requires advance notification to structure the type of depositdesired by us. Brokered deposits can vary in term from one month to several years and have the benefit of being a source of longer-term funding. We also utilize brokereddeposits to help manage interest rate risk by extending the term to repricing of our liabilities, enhance our liquidity and fund asset growth. Brokered deposits are typically fromoutside our primary market areas, and our brokered deposit levels may vary from time to time depending on competitive interest rate conditions and other factors. At June 30,2021, brokered deposits totaled $4.3 million or 0.2% of total deposits.
Liquidity management is both a daily and long-term function of business management. Excess liquidity is generally invested in short-term investments, such as overnightdeposits and federal funds. On a longer term basis, we maintain a strategy of investing in various lending products and debt securities, including mortgage-backed securities. Ona stand-alone level we are a separate legal entity from HomeTrust Bank and must provide for our own liquidity and pay our own operating expenses. Our primary source offunds consists of dividends or capital distributions from HomeTrust Bank, although there are regulatory restrictions on the ability of HomeTrust Bank to pay dividends. At June30, 2021, we (on an unconsolidated basis) had liquid assets of $9.6 million.
At the Bank level, we use our sources of funds primarily to meet our ongoing commitments, pay maturing deposits and fund withdrawals, and to fund loan commitments. AtJune 30, 2021, the total approved loan commitments and unused lines of credit outstanding amounted to $401.1 million and $530.5 million, respectively, as compared to $199.4million and $398.8 million, respectively, as of June 30, 2020. Certificates of deposit scheduled to mature in one year or less at June 30, 2021, totaled $392.9 million. It ismanagement's policy to manage deposit rates that are competitive with other local financial institutions. Based on this management strategy, we believe that a majority ofmaturing deposits will remain with us.
During fiscal 2021, cash and cash equivalents decreased $70.6 million, or 58.1%, from $121.6 million as of June 30, 2020 to $51.0 million as of June 30, 2021. Cash used infinancing activities of $229.7 million was partially offset by cash provided by investing activities of $156.3 million and operating activities of $2.8 million. Primary uses of cashduring the year included the prepayment (or early retirement) of $475.0 million in borrowings, $108.0 million in purchases of debt securities available for sale, $22.7 million inprepayment penalties on borrowings, $16.2 million in common stock repurchases, $16.1 million in purchases of premises and equipment, $9.2 million in purchases of operatinglease equipment, and $5.0 million in cash dividends. Primary sources of cash for the year ended June 30, 2021 included a $169.8 million increase in deposits, $116.2 million netdecrease in commercial paper, $64.2 million decrease in loans, $61.5 million in maturing debt securities available for sale, $15.6 million in maturities of certificates of deposit inother banks, net of purchases, $15.2 million in principal repayments from MBSs, and $15.2 million in net redemptions of other investments. All sources and uses of cash reflectour cash management strategy to increase our higher yielding investments and loans by increasing lower costing borrowings and reducing our holdings of lower yieldinginvestments.
During fiscal 2020, cash and cash equivalents increased $50.6, or 71.2%, from $71.0 million as of June 30, 2019 to $121.6 million as of June 30, 2020. Cash provided byfinancing activities of $217.6 million was partially offset by cash used in investing activities of $124.9 million and operating activities of $42.1 million. Primary sources of cashfor the year ended June 30, 2020 included a $450.3 million increase in deposits, $154.9 million in loans not initially originated for sale were sold, $57.9 million in maturing debtsecurities available for sale, $14.5 million in principal repayments from MBSs, and $6.4 million in net redemptions of other investments. Primary uses of cash during the year
66
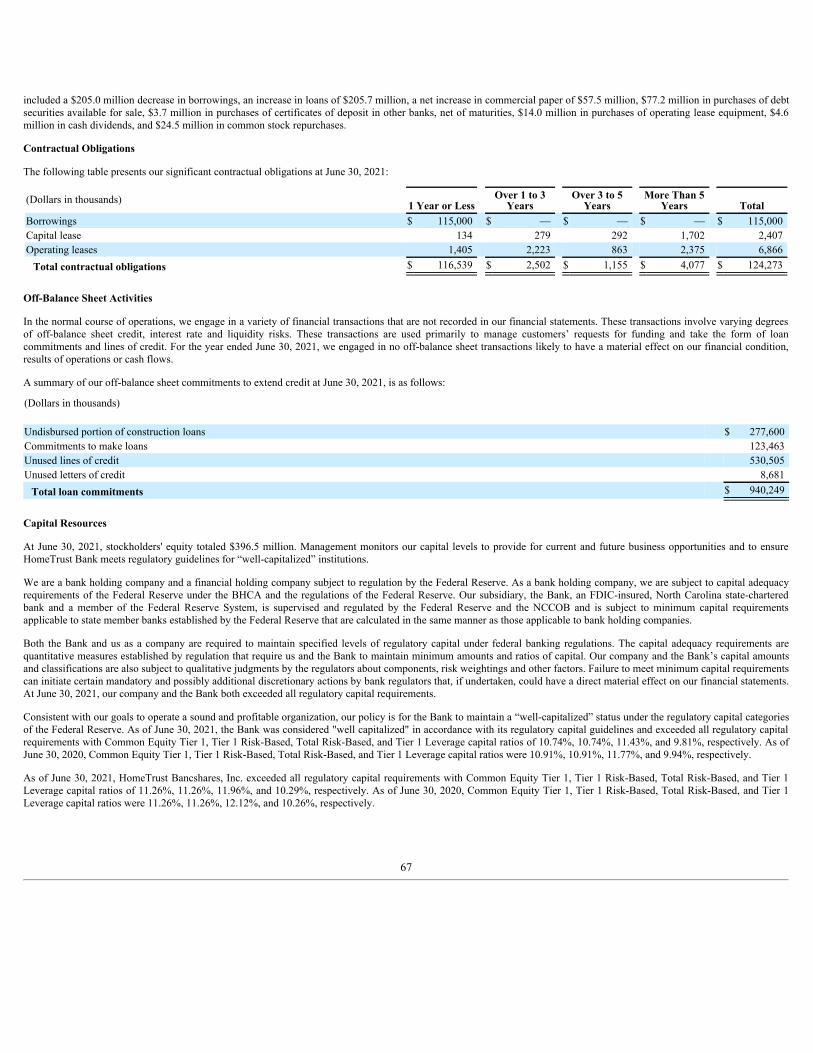
included a $205.0 million decrease in borrowings, an increase in loans of $205.7 million, a net increase in commercial paper of $57.5 million, $77.2 million in purchases of debtsecurities available for sale, $3.7 million in purchases of certificates of deposit in other banks, net of maturities, $14.0 million in purchases of operating lease equipment, $4.6million in cash dividends, and $24.5 million in common stock repurchases.
Contractual Obligations
The following table presents our significant contractual obligations at June 30, 2021:
(Dollars in thousands) 1 Year or Less Over 1 to 3
YearsOver 3 to 5
YearsMore Than 5
Years TotalBorrowings $ 115,000 $ — $ — $ — $ 115,000 Capital lease 134 279 292 1,702 2,407 Operating leases 1,405 2,223 863 2,375 6,866
Total contractual obligations $ 116,539 $ 2,502 $ 1,155 $ 4,077 $ 124,273
Off-Balance Sheet Activities
In the normal course of operations, we engage in a variety of financial transactions that are not recorded in our financial statements. These transactions involve varying degreesof off-balance sheet credit, interest rate and liquidity risks. These transactions are used primarily to manage customers’ requests for funding and take the form of loancommitments and lines of credit. For the year ended June 30, 2021, we engaged in no off-balance sheet transactions likely to have a material effect on our financial condition,results of operations or cash flows.
A summary of our off-balance sheet commitments to extend credit at June 30, 2021, is as follows:
(Dollars in thousands)
Undisbursed portion of construction loans $ 277,600 Commitments to make loans 123,463 Unused lines of credit 530,505 Unused letters of credit 8,681
Total loan commitments $ 940,249
Capital Resources
At June 30, 2021, stockholders' equity totaled $396.5 million. Management monitors our capital levels to provide for current and future business opportunities and to ensureHomeTrust Bank meets regulatory guidelines for “well-capitalized” institutions.
We are a bank holding company and a financial holding company subject to regulation by the Federal Reserve. As a bank holding company, we are subject to capital adequacyrequirements of the Federal Reserve under the BHCA and the regulations of the Federal Reserve. Our subsidiary, the Bank, an FDIC-insured, North Carolina state-charteredbank and a member of the Federal Reserve System, is supervised and regulated by the Federal Reserve and the NCCOB and is subject to minimum capital requirementsapplicable to state member banks established by the Federal Reserve that are calculated in the same manner as those applicable to bank holding companies.
Both the Bank and us as a company are required to maintain specified levels of regulatory capital under federal banking regulations. The capital adequacy requirements arequantitative measures established by regulation that require us and the Bank to maintain minimum amounts and ratios of capital. Our company and the Bank’s capital amountsand classifications are also subject to qualitative judgments by the regulators about components, risk weightings and other factors. Failure to meet minimum capital requirementscan initiate certain mandatory and possibly additional discretionary actions by bank regulators that, if undertaken, could have a direct material effect on our financial statements.At June 30, 2021, our company and the Bank both exceeded all regulatory capital requirements.
Consistent with our goals to operate a sound and profitable organization, our policy is for the Bank to maintain a “well-capitalized” status under the regulatory capital categoriesof the Federal Reserve. As of June 30, 2021, the Bank was considered "well capitalized" in accordance with its regulatory capital guidelines and exceeded all regulatory capitalrequirements with Common Equity Tier 1, Tier 1 Risk-Based, Total Risk-Based, and Tier 1 Leverage capital ratios of 10.74%, 10.74%, 11.43%, and 9.81%, respectively. As ofJune 30, 2020, Common Equity Tier 1, Tier 1 Risk-Based, Total Risk-Based, and Tier 1 Leverage capital ratios were 10.91%, 10.91%, 11.77%, and 9.94%, respectively.
As of June 30, 2021, HomeTrust Bancshares, Inc. exceeded all regulatory capital requirements with Common Equity Tier 1, Tier 1 Risk-Based, Total Risk-Based, and Tier 1Leverage capital ratios of 11.26%, 11.26%, 11.96%, and 10.29%, respectively. As of June 30, 2020, Common Equity Tier 1, Tier 1 Risk-Based, Total Risk-Based, and Tier 1Leverage capital ratios were 11.26%, 11.26%, 12.12%, and 10.26%, respectively.
67

See Item 1, “Business-How We are Regulated,” and Note 18 of the Notes to the Consolidated Financial Statements included in Item 8 of this Form 10-K for additional details onour capital requirements.
Impact of Inflation
The Consolidated Financial Statements and related financial data presented herein have been prepared in accordance with accounting principles generally accepted in the UnitedStates of America. These principles generally require the measurement of financial position and operating results in terms of historical dollars, without considering changes inthe relative purchasing power of money over time due to inflation.
Unlike most industrial companies, virtually all the assets and liabilities of a financial institution are monetary in nature. The primary impact of inflation is reflected in theincreased cost of our operations. As a result, interest rates generally have a more significant impact on a financial institution’s performance than do general levels of inflation.Interest rates do not necessarily move in the same direction or to the same extent as the prices of goods and services. In a period of rapidly rising interest rates, the liquidity andmaturity structures of our assets and liabilities are critical to the maintenance of acceptable performance levels.
The principal effect of inflation on earnings, as distinct from levels of interest rates, is in the area of noninterest expense. Expense items such as employee compensation,employee benefits, and occupancy and equipment costs may be subject to increases as a result of inflation. An additional effect of inflation is the possible increase in dollar valueof the collateral securing loans that we have made. Our management is unable to determine the extent, if any, to which properties securing loans have appreciated in dollar valuedue to inflation.
Recent Accounting Pronouncements
For a discussion of recent accounting pronouncements, see Note 1 of the Notes to the Consolidated Financial Statements included in Item 8 of this Form 10-K.
Item 7A. Quantitative and Qualitative Disclosures About Market Risk
Market risk is the risk of loss from adverse changes in market prices and rates. Our market risk arises principally from interest rate risk inherent in our lending, investing, depositand borrowings activities. Management actively monitors and manages its interest rate risk exposure. In addition to other risks that we manage in the normal course of business,such as credit quality and liquidity, management considers interest rate risk to be a significant market risk that could have a potentially material effect on our financial conditionand result of operations. The information contained in Item 7, “Management’s Discussion and Analysis of Financial Condition and Results of Operations – Asset LiabilityManagement” in this Form 10-K is incorporated herein by reference.
68
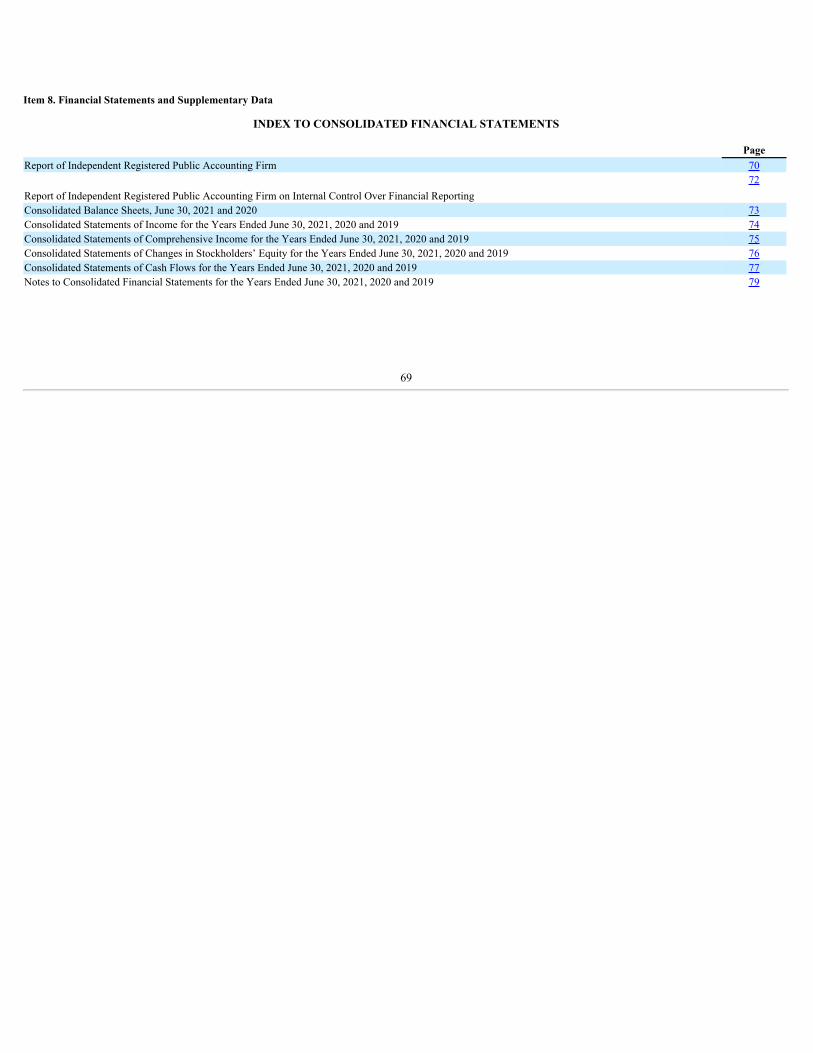
Item 8. Financial Statements and Supplementary Data
INDEX TO CONSOLIDATED FINANCIAL STATEMENTS
PageReport of Independent Registered Public Accounting Firm 70
Report of Independent Registered Public Accounting Firm on Internal Control Over Financial Reporting72
Consolidated Balance Sheets, June 30, 2021 and 2020 73Consolidated Statements of Income for the Years Ended June 30, 2021, 2020 and 2019 74Consolidated Statements of Comprehensive Income for the Years Ended June 30, 2021, 2020 and 2019 75Consolidated Statements of Changes in Stockholders’ Equity for the Years Ended June 30, 2021, 2020 and 2019 76Consolidated Statements of Cash Flows for the Years Ended June 30, 2021, 2020 and 2019 77Notes to Consolidated Financial Statements for the Years Ended June 30, 2021, 2020 and 2019 79
69

Report of Independent Registered Public Accounting Firm
Stockholders and the Board of DirectorsHomeTrust Bancshares, Inc. and Subsidiary
Opinion on the Consolidated Financial StatementsWe have audited the accompanying consolidated balance sheets of HomeTrust Bancshares, Inc. and Subsidiary (the "Company") as of June 30, 2021 and 2020, the relatedconsolidated statements of income, comprehensive income, changes in stockholders’ equity and cash flows for each of the three years in the period ended June 30, 2021, and therelated notes (collectively referred to as the "consolidated financial statements"). In our opinion, the consolidated financial statements present fairly, in all material respects, thefinancial position of the Company as of June 30, 2021 and 2020, and the results of their operations and their cash flows for each of the three years in the period ended June 30,2021, in conformity with U.S. generally accepted accounting principles.
We also have audited, in accordance with the standards of the Public Company Accounting Oversight Board (United States) ("PCAOB"), the Company’s internal control overfinancial reporting as of June 30, 2021, based on criteria established in Internal Control- Integrated Framework (2013) issued by the Committee of Sponsoring Organizations ofthe Treadway Commission and our report dated September 10, 2021 expressed an unqualified opinion thereon.
Change in Accounting PrincipleAs discussed in Notes 1 and 5 to the consolidated financial statements, the Company changed its method of accounting for credit losses effective July 1, 2020 due to the adoptionof Accounting Standards Codification (“ASC”) Topic 326, Financial Instruments – Credit Losses.
Basis for OpinionThese consolidated financial statements are the responsibility of the Company's management. Our responsibility is to express an opinion on the Company's consolidated financialstatements based on our audits. We are a public accounting firm registered with the PCAOB and are required to be independent with respect to the Company in accordance withthe U.S. federal securities laws and the applicable rules and regulations of the Securities and Exchange Commission and the PCAOB.We conducted our audits in accordance with the standards of the PCAOB. Those standards require that we plan and perform the audit to obtain reasonable assurance aboutwhether the consolidated financial statements are free of material misstatement, whether due to error or fraud.
Our audits included performing procedures to assess the risks of material misstatement of the consolidated financial statements, whether due to error or fraud, and performingprocedures that respond to those risks. Such procedures included examining, on a test basis, evidence regarding the amounts and disclosures in the consolidated financialstatements. Our audits also included evaluating the accounting principles used and significant estimates made by management, as well as evaluating the overall presentation ofthe consolidated financial statements. We believe that our audits provide a reasonable basis for our opinion.
Critical Audit MattersThe critical audit matter communicated below is a matter arising from the current period audit of the consolidated financial statements that was communicated or required to becommunicated to the audit committee and that: (1) relates to accounts or disclosures that are material to the consolidated financial statements and (2) involved our especiallychallenging, subjective, or complex judgments. The communication of critical audit matters does not alter in any way our opinion on the consolidated financial statements, takenas a whole, and we are not, by communicating the critical audit matter below, providing a separate opinion on the critical audit matter or on the accounts or disclosures to whichit relates.
Allowance for Credit LossesAs described in Notes 1 and 5 to the consolidated financial statements, the Company’s allowance for credit losses on loans (“ACL”) was $35.5 million at June 30, 2021. Theallowance is estimated by management using information about past events, current conditions and reasonable and supportable forecasts on the collectability of the loanportfolio. The Company collectively evaluates loans that share similar risk characteristics and in general has segmented loans into pools by regulatory categories, resulting in themost significant portion of the ACL. A discounted cash flow method is used to evaluate the cash flows for each loan in each collectively evaluated pool which relies on aperiodic tendency to default and absolute loss given default applied to a projective model of the pool’s cash flow while considering prepayment and principal curtailment effects.Management has determined that peer loss data provides the best basis for assessing expected credit losses and has incorporated macroeconomic drivers using a statisticalregression modeling methodology, where considered appropriate, to adjust historical loss information for current conditions. Included in management’s systematic methodologyis consideration of the need to qualitatively adjust the ACL for risks not already incorporated within the loss estimation process. The Company considers qualitative adjustmentswhich can either increase or decrease the quantitative model within their qualitative framework.
We identified the allowance for credit losses as a critical audit matter. The principal considerations for our determination included the high degree of judgement and subjectivityinvolved in management’s determination of reasonable and supportable forecasts and the identification
70

and measurement of qualitative adjustments. Auditing management’s judgements around those estimates involved a high degree of subjectivity, audit effort, and specializedskills and knowledge.
The primary procedures we performed to address this critical audit matter included:
• We obtained an understanding of the Company’s model and process for establishing the ACL, and evaluated the design and operating effectiveness of controls relatingto management’s determination of the ACL, including:
◦ Controls over the development of the allowance for credit losses model, including an independent validation of the model and selection of peer loss data,◦ Controls over the completeness and accuracy of data input into the model used to determine the ACL, and◦ Controls over management’s review and approval of the ACL, including management’s determination of a reasonable and supportable forecast and
qualitative adjustments applied to address risks not already incorporated within the model.• We evaluated management’s determination of reasonable and supportable forecasts, including comparing key factors to independent sources, as well as involving our
valuation specialists in testing the application of forecasts in the model calculation.• We evaluated management’s application of qualitative adjustments to the ACL, which included substantively testing management’s identification of risks not already
incorporated within the model, the application of qualitative adjustments within the Company’s policy, and assessing completeness and accuracy of data used todevelop qualitative adjustments, including substantively testing supporting calculations.
• We evaluated management’s judgments and assumptions related to the magnitude of qualitative adjustments for reasonableness by assessing relevant trends in creditquality and evaluating the relationship of the trends to the qualitative adjustments applied to the ACL.
/s/ DIXON HUGHES GOODMAN LLP
We have served as the Company's auditor since 2005.
Atlanta, GeorgiaSeptember 10, 2021
71

Report of Independent Registered Public Accounting Firm
Stockholders and the Board of DirectorsHomeTrust Bancshares, Inc. and Subsidiary
Opinion on Internal Control Over Financial ReportingWe have audited HomeTrust Bancshares, Inc. and Subsidiary's (the “Company”) internal control over financial reporting as of June 30, 2021, based on criteria established inInternal Control—Integrated Framework (2013) issued by the Committee of Sponsoring Organizations of the Treadway Commission. In our opinion, HomeTrust Bancshares,Inc. and Subsidiary maintained, in all material respects, effective internal control over financial reporting as of June 30, 2021, based on criteria established in Internal Control—Integrated Framework (2013) issued by the Committee of Sponsoring Organizations of the Treadway Commission.
We also have audited, in accordance with the standards of the Public Company Accounting Oversight Board (United States) (“PCAOB”), the consolidated financial statements ofthe Company as of June 30, 2021 and 2020, and for each of the three years in the period ended June 30, 2021, and our report dated September 10, 2021, expressed an unqualifiedopinion on those consolidated financial statements.
Basis for OpinionThe Company's management is responsible for maintaining effective internal control over financial reporting, and for its assessment of the effectiveness of internal control overfinancial reporting, included in the accompanying management’s report on internal control over financial reporting. Our responsibility is to express an opinion on the Company'sinternal control over financial reporting based on our audit. We are a public accounting firm registered with the PCAOB and are required to be independent with respect to theCompany in accordance with the U.S. federal securities laws and the applicable rules and regulations of the Securities and Exchange Commission and the PCAOB.
We conducted our audit in accordance with the standards of the PCAOB. Those standards require that we plan and perform the audit to obtain reasonable assurance aboutwhether effective internal control over financial reporting was maintained in all material respects. Our audit included obtaining an understanding of internal control overfinancial reporting, assessing the risk that a material weakness exists, testing and evaluating the design and operating effectiveness of internal control based on the assessed risk,and performing such other procedures as we considered necessary in the circumstances. We believe that our audit provides a reasonable basis for our opinion.
Definition and Limitations of Internal Control Over Financial ReportingA company's internal control over financial reporting is a process designed to provide reasonable assurance regarding the reliability of financial reporting and the preparation offinancial statements for external purposes in accordance with generally accepted accounting principles. A company's internal control over financial reporting includes thosepolicies and procedures that (1) pertain to the maintenance of records that, in reasonable detail, accurately and fairly reflect the transactions and dispositions of the assets of thecompany; (2) provide reasonable assurance that transactions are recorded as necessary to permit preparation of financial statements in accordance with generally acceptedaccounting principles, and that receipts and expenditures of the company are being made only in accordance with authorizations of management and directors of the company;and (3) provide reasonable assurance regarding prevention or timely detection of unauthorized acquisition, use, or disposition of the company's assets that could have a materialeffect on the financial statements.
Because of its inherent limitations, internal control over financial reporting may not prevent or detect misstatements. Also, projections of any evaluation of effectiveness to futureperiods are subject to the risk that controls may become inadequate because of changes in conditions, or that the degree of compliance with the policies or procedures maydeteriorate.
/s/ DIXON HUGHES GOODMAN LLP
Atlanta, GeorgiaSeptember 10, 2021
72

HOMETRUST BANCSHARES, INC. AND SUBSIDIARYConsolidated Balance Sheets
(Dollars in thousands, except per share data)
June 30,2021 2020
AssetsCash $ 22,312 $ 31,908 Interest-bearing deposits 28,678 89,714
Cash and cash equivalents 50,990 121,622 Commercial paper 189,596 304,967 Certificates of deposit in other banks 40,122 55,689 Debt securities available for sale, at fair value (amortized cost of $154,493 and $124,918 at June 30, 2021 and June 30,
2020, respectively) 156,459 127,537 Other investments, at cost 23,710 38,946 Loans held for sale 93,539 77,177 Total loans, net of deferred loan fees and costs 2,733,267 2,769,119 Allowance for credit losses (35,468) (28,072)
Net loans 2,697,799 2,741,047 Premises and equipment, net 70,909 58,462 Accrued interest receivable 7,933 12,312 Real Estate Owned ("REO") 188 337 Deferred income taxes 16,901 16,334 Bank Owned Life Insurance ("BOLI") 93,108 92,187 Goodwill 25,638 25,638 Core deposit intangibles 343 1,078 Other assets 57,488 49,519
Total assets $ 3,524,723 $ 3,722,852
Liabilities and stockholders’ equity Liabilities
Deposits $ 2,955,541 $ 2,785,756 Borrowings 115,000 475,000 Other liabilities 57,663 53,833
Total liabilities 3,128,204 3,314,589 Stockholders’ equity
Preferred stock, $0.01 par value, 10,000,000 shares authorized, none issued or outstanding — — Common stock, $0.01 par value, 60,000,000 shares authorized, 16,636,483 shares issued and outstanding at June 30,
2021; 17,021,357 at June 30, 2020 167 170 Additional paid in capital 160,582 169,648 Retained earnings 240,075 242,776 Unearned Employee Stock Ownership Plan ("ESOP") shares (5,819) (6,348)Accumulated other comprehensive income 1,514 2,017
Total stockholders’ equity 396,519 408,263 Total liabilities and stockholders’ equity $ 3,524,723 $ 3,722,852
The accompanying notes are an integral part of these consolidated financial statements.
73
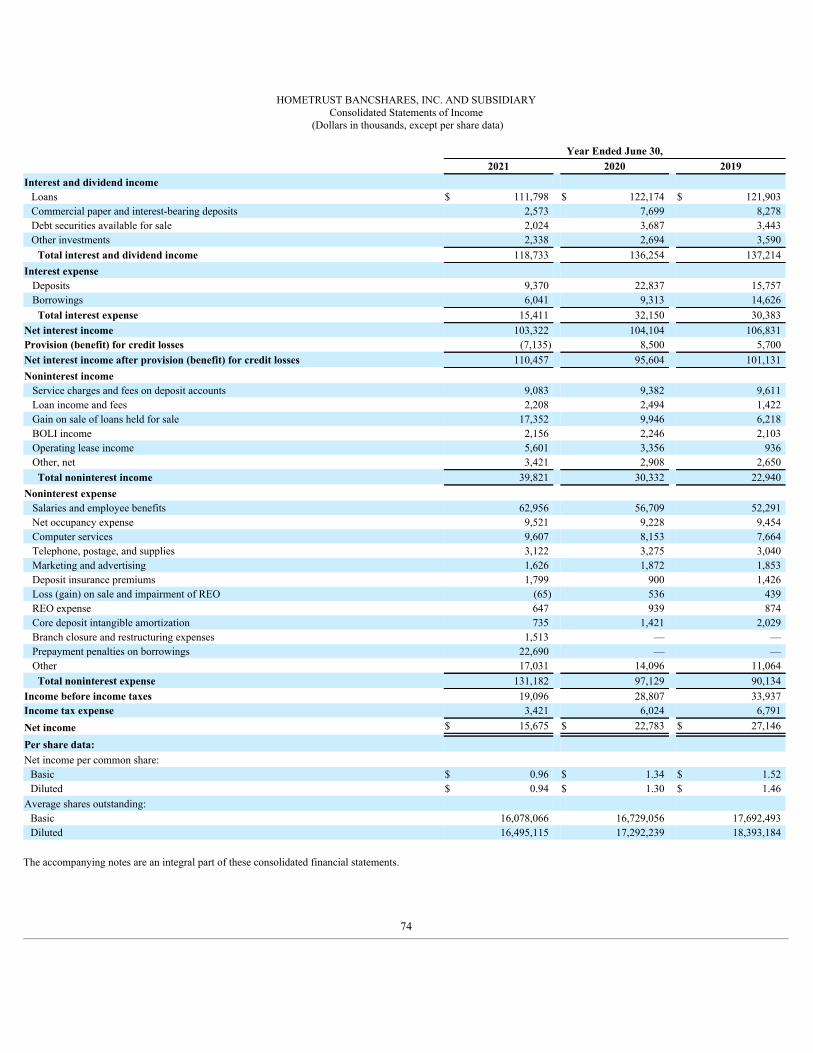
HOMETRUST BANCSHARES, INC. AND SUBSIDIARYConsolidated Statements of Income
(Dollars in thousands, except per share data)
Year Ended June 30,2021 2020 2019
Interest and dividend income Loans $ 111,798 $ 122,174 $ 121,903 Commercial paper and interest-bearing deposits 2,573 7,699 8,278 Debt securities available for sale 2,024 3,687 3,443 Other investments 2,338 2,694 3,590
Total interest and dividend income 118,733 136,254 137,214 Interest expense
Deposits 9,370 22,837 15,757 Borrowings 6,041 9,313 14,626
Total interest expense 15,411 32,150 30,383 Net interest income 103,322 104,104 106,831 Provision (benefit) for credit losses (7,135) 8,500 5,700 Net interest income after provision (benefit) for credit losses 110,457 95,604 101,131 Noninterest income
Service charges and fees on deposit accounts 9,083 9,382 9,611 Loan income and fees 2,208 2,494 1,422 Gain on sale of loans held for sale 17,352 9,946 6,218 BOLI income 2,156 2,246 2,103 Operating lease income 5,601 3,356 936 Other, net 3,421 2,908 2,650
Total noninterest income 39,821 30,332 22,940 Noninterest expense
Salaries and employee benefits 62,956 56,709 52,291 Net occupancy expense 9,521 9,228 9,454 Computer services 9,607 8,153 7,664 Telephone, postage, and supplies 3,122 3,275 3,040 Marketing and advertising 1,626 1,872 1,853 Deposit insurance premiums 1,799 900 1,426 Loss (gain) on sale and impairment of REO (65) 536 439 REO expense 647 939 874 Core deposit intangible amortization 735 1,421 2,029 Branch closure and restructuring expenses 1,513 — — Prepayment penalties on borrowings 22,690 — — Other 17,031 14,096 11,064
Total noninterest expense 131,182 97,129 90,134 Income before income taxes 19,096 28,807 33,937 Income tax expense 3,421 6,024 6,791 Net income $ 15,675 $ 22,783 $ 27,146
Per share data: Net income per common share:
Basic $ 0.96 $ 1.34 $ 1.52 Diluted $ 0.94 $ 1.30 $ 1.46
Average shares outstanding: Basic 16,078,066 16,729,056 17,692,493 Diluted 16,495,115 17,292,239 18,393,184
The accompanying notes are an integral part of these consolidated financial statements.
74

HOMETRUST BANCSHARES, INC. AND SUBSIDIARYConsolidated Statements of Comprehensive Income
(Dollars in thousands)
Year Ended June 30, 2021 2020 2019Net income $ 15,675 $ 22,783 $ 27,146 Other comprehensive income (loss)
Unrealized holding gains (losses) on debt securities available for sale Gains (losses) arising during the period (653) 1,667 3,027 Deferred income tax benefit (expense) 150 (383) (696)
Total other comprehensive income (loss) (503) 1,284 2,331 Comprehensive Income $ 15,172 $ 24,067 $ 29,477
The accompanying notes are an integral part of these consolidated financial statements.
75

HOMETRUST BANCSHARES, INC. AND SUBSIDIARYConsolidated Statements of Changes in Stockholders’ Equity
(Dollars in thousands)
Common Stock AdditionalPaid InCapital
RetainedEarnings
UnearnedESOP Shares
Accumulated OtherComprehensiveIncome (Loss)
TotalStockholders’
EquityShares AmountBalance at June 30, 2018 19,041,668 $ 191 $ 217,480 $ 200,575 $ (7,406) $ (1,598) $ 409,242
Net income — — — 27,146 — — 27,146 Cash dividends declared on common stock,
$0.18/common share — — — (3,176) — — (3,176)Stock repurchased (1,149,785) (11) (30,627) — — — (30,638)Granted restricted stock 23,625 — — — — — — Forfeited restricted stock (4,300) — — — — — — Retired stock (7,414) — (205) — — — (205)Exercised stock options 80,311 — 1,173 — — — 1,173 Stock option expense — — 736 — — — 736 Restricted stock expense — — 865 — — — 865 ESOP shares allocated — — 893 — 529 — 1,422 Other comprehensive income — — — — — 2,331 2,331
Balance at June 30, 2019 17,984,105 $ 180 $ 190,315 $ 224,545 $ (6,877) $ 733 $ 408,896 Net income — — — 22,783 — — 22,783 Cash dividends declared on common stock,
$0.27/common share — — — (4,552) — — (4,552)Stock repurchased (1,114,094) (12) (24,472) — — — (24,484)Granted restricted stock 56,306 — — — — — — Forfeited restricted stock (3,400) — — — — — — Retired stock (8,474) (222) (222)Exercised stock options 106,914 2 1,539 — — — 1,541 Stock option expense — — 717 — — — 717 Restricted stock expense — — 1,105 — — — 1,105 ESOP shares allocated — — 666 — 529 — 1,195 Other comprehensive income — — — — — 1,284 1,284
Balance at June 30, 2020 17,021,357 $ 170 $ 169,648 $ 242,776 $ (6,348) $ 2,017 $ 408,263 Net income — — — 15,675 — — 15,675 Cumulative-effect adjustment due to the
adoption of ASU 2016-13 — — — (13,358) — — (13,358)Cash dividends declared on common stock,
$0.31/common share — — — (5,018) — — (5,018)Stock repurchased (733,347) (8) (16,147) — — — (16,155)Granted restricted stock 45,260 — — — — — — Forfeited restricted stock (6,575) — — — — — — Retired stock (9,106) — (204) — — — (204)Exercised stock options 318,894 5 4,587 — — — 4,592 Stock option expense — — 632 — — — 632 Restricted stock expense — — 1,470 — — — 1,470 ESOP shares allocated — — 596 — 529 — 1,125 Other comprehensive income — — — — — (503) (503)
Balance at June 30, 2021 16,636,483 $ 167 $ 160,582 $ 240,075 $ (5,819) $ 1,514 $ 396,519
The accompanying notes are an integral part of these consolidated financial statements.
76
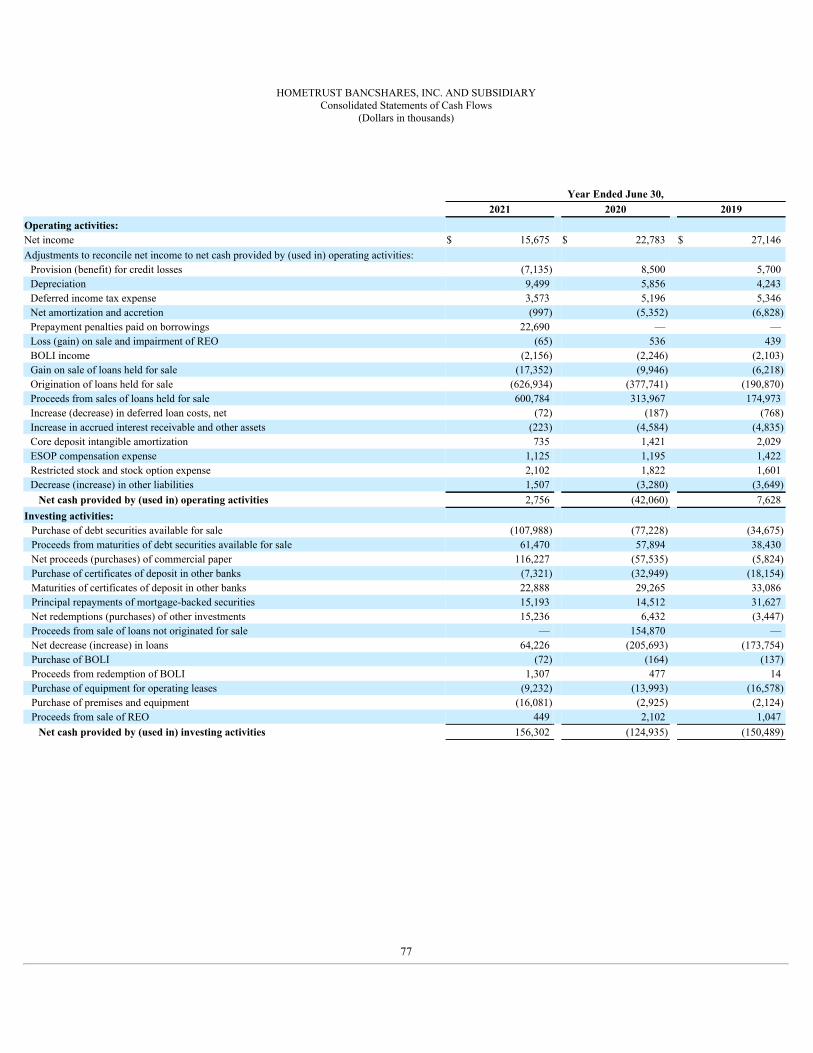
HOMETRUST BANCSHARES, INC. AND SUBSIDIARYConsolidated Statements of Cash Flows
(Dollars in thousands)
Year Ended June 30,2021 2020 2019
Operating activities: Net income $ 15,675 $ 22,783 $ 27,146 Adjustments to reconcile net income to net cash provided by (used in) operating activities:
Provision (benefit) for credit losses (7,135) 8,500 5,700 Depreciation 9,499 5,856 4,243 Deferred income tax expense 3,573 5,196 5,346 Net amortization and accretion (997) (5,352) (6,828)Prepayment penalties paid on borrowings 22,690 — — Loss (gain) on sale and impairment of REO (65) 536 439 BOLI income (2,156) (2,246) (2,103)Gain on sale of loans held for sale (17,352) (9,946) (6,218)Origination of loans held for sale (626,934) (377,741) (190,870)Proceeds from sales of loans held for sale 600,784 313,967 174,973 Increase (decrease) in deferred loan costs, net (72) (187) (768)Increase in accrued interest receivable and other assets (223) (4,584) (4,835)Core deposit intangible amortization 735 1,421 2,029 ESOP compensation expense 1,125 1,195 1,422 Restricted stock and stock option expense 2,102 1,822 1,601 Decrease (increase) in other liabilities 1,507 (3,280) (3,649)
Net cash provided by (used in) operating activities 2,756 (42,060) 7,628 Investing activities:
Purchase of debt securities available for sale (107,988) (77,228) (34,675)Proceeds from maturities of debt securities available for sale 61,470 57,894 38,430 Net proceeds (purchases) of commercial paper 116,227 (57,535) (5,824)Purchase of certificates of deposit in other banks (7,321) (32,949) (18,154)Maturities of certificates of deposit in other banks 22,888 29,265 33,086 Principal repayments of mortgage-backed securities 15,193 14,512 31,627 Net redemptions (purchases) of other investments 15,236 6,432 (3,447)Proceeds from sale of loans not originated for sale — 154,870 — Net decrease (increase) in loans 64,226 (205,693) (173,754)Purchase of BOLI (72) (164) (137)Proceeds from redemption of BOLI 1,307 477 14 Purchase of equipment for operating leases (9,232) (13,993) (16,578)Purchase of premises and equipment (16,081) (2,925) (2,124)Proceeds from sale of REO 449 2,102 1,047
Net cash provided by (used in) investing activities 156,302 (124,935) (150,489)
77

HOMETRUST BANCSHARES, INC. AND SUBSIDIARYConsolidated Statements of Cash Flows (continued)
(Dollars in thousands)
Year Ended June 30,2021 2020 2019
Financing activities: Net increase in deposits 169,785 450,291 131,004 Net increase (decrease) in borrowings (382,690) (205,000) 45,000 Common stock repurchased (16,155) (24,484) (30,638)Cash dividends paid (5,018) (4,552) (3,176)Retired stock (204) (222) (205)Exercised stock options 4,592 1,541 1,173
Net cash provided by (used in) financing activities (229,690) 217,574 143,158 Net increase (decrease) in cash and cash equivalents (70,632) 50,579 297 Cash and cash equivalents at beginning of period 121,622 71,043 70,746 Cash and cash equivalents at end of period $ 50,990 $ 121,622 $ 71,043
Year Ended June 30, 2021 2020 2019Supplemental disclosures: Cash paid during the period for:
Interest $ 16,446 $ 33,315 $ 28,997 Income taxes 532 1,686 1,549
Noncash transactions: Unrealized gain (loss) in value of debt securities available for sale, net of income taxes (503) 1,284 2,331 Transfers of loans to REO 236 46 731 Transfers from loans held for sale to total loans held for investment 27,140 98,288 — Transfers of loans to held for sale from loans held for investment — 240,453 5,794 New ROU assets - operating leases 2,586 5,296 — Transfer of land from premises and equipment to other assets due to the adoption of ASU
2016-02 — 2,052 — ACL due to the adoption of ASU 2016-13 17,347 — —
The accompanying notes are an integral part of these consolidated financial statements.
78

HOMETRUST BANCSHARES, INC. AND SUBSIDIARYNotes to Consolidated Financial Statements(Dollars in thousands, except per share data)
1. Summary of Significant Accounting Policies
Business
The consolidated financial statements presented in this report include the accounts of HomeTrust Bancshares, Inc., a Maryland corporation (“HomeTrust”), and its wholly-ownedsubsidiary, HomeTrust Bank (the “Bank”). As used throughout this report, the term the “Company” refers to HomeTrust and its consolidated subsidiary, unless the contextotherwise requires. HomeTrust is a bank holding company primarily engaged in the business of planning, directing, and coordinating the business activities of the Bank. TheBank is a North Carolina state chartered bank and provides a wide range of retail and commercial banking products within its geographic footprint, which includes: NorthCarolina (the Asheville metropolitan area, Greensboro/"Piedmont" region, Charlotte, and Raleigh/Cary), Upstate South Carolina (Greenville), East Tennessee(Kingsport/Johnson City/Bristol, Knoxville, and Morristown) and Southwest Virginia (the Roanoke Valley). The Bank operates under a single set of corporate policies andprocedures and is recognized as a single banking segment for financial reporting purposes.
Operating, Accounting and Reporting Considerations related to COVID-19
The COVID-19 pandemic has negatively impacted the global economy. In response to this crisis, the CARES Act was passed by Congress and signed into law on March 27,2020. The CARES Act provides an estimated $2.2 trillion to fight the COVID-19 pandemic and stimulate the economy by supporting individuals and businesses through loans,grants, tax changes, and other types of relief. Some of the provisions applicable to the Company include, but are not limited to:
• Accounting for Loan Modifications - The CARES Act provides that a financial institution may elect to suspend (i) the requirements under GAAP for certain loan modificationsthat would otherwise be categorized as a TDR and (ii) any determination that such loan modifications would be considered a TDR, including the related impairment foraccounting purposes. The Bank has elected this as a policy change.
• PPP - The CARES Act established the PPP, an expansion of the SBA's 7(a) loan program and the Economic Injury Disaster Loan Program, administered directly by the SBA.
On December 27, 2020, the 2021 Consolidated Appropriations Act was signed into law providing $900 billion in stimulus relief for the COVID-19 pandemic. The legislationextended certain relief provisions from the March CARES Act that were set to expire at the end of 2020. This new legislation extended the relief to financial institutions tosuspend TDR assessment and reporting requirements under GAAP for loan modifications to the earlier of 60 days after the national emergency termination date or January 1,2022. The legislation included additional funding for businesses that did not receive PPP funds under the CARES Act, especially minority- and women-owned businesses. Inaddition, it allowed businesses another opportunity to borrow PPP funds if they can show losses of 25% or more in 2020 based on their 2020 revenue. At the year ended June 30,2021, the program’s funds were depleted and subsequently the Company ended its participation.
Also in response to the COVID-19 pandemic, the Board of Governors of the Federal Reserve System, the FDIC, the National Credit Union Administration, the Office of theComptroller of the Currency, and the Consumer Financial Protection Bureau, in consultation with the state financial regulators (collectively, the “agencies”) issued a jointinteragency statement (issued March 22, 2020; revised statement issued April 7, 2020). Some of the provisions applicable to the Company include, but are not limited to:
• Accounting for Loan Modifications - A loan modification that does not meet the conditions of the CARES Act may still qualify as a modification that does not need to beaccounted for as a TDR. The agencies confirmed with FASB staff that short-term modifications made on a good faith basis in response to COVID-19 to borrowers who werecurrent prior to any relief are not TDRs. This includes short-term (e.g., six months) modifications such as payment deferrals, fee waivers, extensions of repayment terms, orinsignificant delays in payment.
• Past Due Reporting - With regard to loans not otherwise reportable as past due, financial institutions are not expected to designate loans with deferrals granted due to COVID-19 as past due because of the deferral. A loan’s payment date is governed by the due date stipulated in the legal agreement. If a financial institution agrees to a paymentdeferral, these loans would not be considered past due during the period of the deferral.
• Nonaccrual Status and Charge-offs - While short-term COVID-19 modifications are in effect, these loans generally should not be reported as nonaccrual or as classified.
Effective February 24, 2021, the Biden Administration extended the national emergency declaration for one year due to COVID-19.
See "Note 5 – Loans and Allowance for Credit Losses on Loans" for more information on COVID-19 specific loans that have been modified or in deferral.
Accounting Principles
The accounting and reporting policies of the Company conform to accounting principles generally accepted in the United States (“US GAAP”).
79

HOMETRUST BANCSHARES, INC. AND SUBSIDIARYNotes to Consolidated Financial Statements(Dollars in thousands, except per share data)
Principles of Consolidation and Subsidiary Activities
The accompanying consolidated financial statements include the accounts of HomeTrust, the Bank, and its wholly-owned subsidiary, WNCSC at or for the years ended June 30,2021, 2020, and 2019. WNCSC owns office buildings in Asheville, North Carolina that are leased to the Bank. All intercompany items have been eliminated.
Reclassifications
Certain amounts reported in prior periods’ consolidated financial statements have been reclassified to conform to the current presentation. Such reclassifications had no effect onpreviously reported cash flows, stockholders’ equity or net income.
Use of Estimates in Financial Statements
The preparation of financial statements in conformity with US GAAP requires management to make estimates and assumptions that affect the reported amounts of assets andliabilities and disclosure of contingent assets and liabilities at the date of the financial statements and the reported amounts of revenues and expenses during the reporting period.Actual results could differ from those estimates.
Cash and Cash Equivalents
Cash and cash equivalents include cash and interest-bearing deposits with initial terms to maturity of 90 days or less.
Commercial Paper
Commercial paper includes highly liquid short-term debt of investment graded corporations with maturities less than one year. These instruments are typically purchased at adiscount based on prevailing interest rates and do not exceed $15,000 per issuer.
Debt Securities
The Company classifies debt securities as trading, available for sale, or held to maturity.
Debt securities available for sale are carried at fair value. These securities are used to execute asset/liability management strategies, manage liquidity, and leverage capital, andtherefore may be sold prior to maturity. Adjustments for unrealized gains or losses, net of the income tax effect, are made to accumulated other comprehensive income, aseparate component of total stockholders’ equity.
Securities held to maturity are stated at cost, net of unamortized balances of premiums and discounts. When these securities are purchased, the Company intends to and has theability to hold such securities until maturity.
Management no longer evaluates securities for other than temporary impairment, as ASC Subtopic 326-30, "Financial Instruments—Credit Losses—Available-for-Sale DebtSecurities," changes the accounting for recognizing impairment on available-for-sale debt securities. Each quarter management evaluates impairment where there has been adecline in fair value below the amortized cost basis of a security to determine whether there is a credit loss associated with the decline in fair value. See "Adoption of CECLStandard" below for additional details.
Premiums and discounts are amortized or accreted over the life of the security as an adjustment to yield. Dividend and interest income are recognized when earned. Gains orlosses on the sale of securities are recognized on a specific identification, trade date basis.
Loans
Portfolio loans are carried at their outstanding principal amount, less unearned income and deferred nonrefundable loan fees, net of certain origination costs. Interest income isrecorded as earned on an accrual basis based on the contractual rate and the outstanding balance, except for nonaccruing loans where interest is recorded as earned on a cashbasis. Net deferred loan origination fees/costs are deferred and amortized to interest income over the life of the related loan.
Loan Segments and Classes
The Company’s loan portfolio is grouped into two segments (commercial loans and retail consumer loans) and into various classes within each segment. The Companyoriginates, services, and manages its loans based on these segments and classes. The Company’s portfolio segments and classes within those segments are subject to risks thatcould have an adverse impact on the credit quality of the loan portfolio. Management identified the risks described below as significant risks that are generally similar among theloan segments and classes.
Commercial Loan Segment
The Company’s commercial loans are centrally underwritten based primarily on the customer’s ability to generate the required cash flow to service the debt in accordancewith the contractual terms and conditions of the loan agreement. The Company’s commercial lenders and underwriters work to understand the borrower’s businesses andmanagement experiences. The majority of the Company’s commercial loans are secured by collateral, so collateral values are important to the transaction. In commercialloan transactions where the principals or other parties provide personal guarantees, the Company’s commercial lenders and underwriters analyze the relative
80
HOMETRUST BANCSHARES, INC. AND SUBSIDIARYNotes to Consolidated Financial Statements(Dollars in thousands, except per share data)
financial strength and liquidity of each guarantor. Risks that are common to the Company’s commercial loan classes include general economic conditions, demand for theborrowers’ products and services, the personal circumstances of the principals, and reductions in collateral values. In addition to these common risks for the Company’scommercial loans, the various commercial loan classes also have certain risks specific to them.
Construction and development loans are highly dependent on the supply and demand for commercial real estate in the Company’s markets as well as the demand for thenewly constructed residential and commercial properties and lots being developed by the Company’s commercial loan customers. Prolonged deterioration in demand couldresult in significant decreases in the underlying collateral values and make repayment of the outstanding loans more difficult for the Company’s commercial borrowers.
Commercial real estate and commercial and industrial loans are primarily dependent on the ability of the Company’s commercial loan customers to achieve business resultsconsistent with those projected at loan origination resulting in cash flow sufficient to service the debt. To the extent that a borrower’s actual business results significantlyunderperform the original projections, the ability of that borrower to service the Company’s loan on a basis consistent with the contractual terms may be at risk. While theseloans and leases are generally secured by real property, personal property, or business assets such as inventory or accounts receivable, it is possible that the liquidation of thecollateral will not fully satisfy the obligation.
Municipal leases are primarily made to volunteer fire departments and depend on the tax revenues received from the county or municipality. These leases are mainlysecured by vehicles, fire stations, land, or equipment. The underwriting of the municipal leases is based on the cash flows of the fire department as well as projections offuture income.
Equipment finance is primarily made up of commercial finance agreements and commercial loans and leases provided by our new Equipment Finance line of business, andprimarily for transportation, construction, and manufacturing equipment. The loans have terms on average of five years or less and are secured by the financed equipment.
PPP loans are an expansion of the SBA's 7(a) loan program and the Economic Injury Disaster Loan Program, administered directly by the SBA and as a result of theCARES Act passed by Congress in response to the COVID-19 pandemic. The PPP loans are low interest notes to small business customers to cover payroll expenses and toa lesser extent other various expense ranging from interest on mortgage obligations, rent, utilities, and interest on outstanding debt. The loans are intended to be forgivable ifthe borrower maintains employees and complies with the CARES Act.
Retail Consumer Loan Segment
The Company underwrites its retail consumer loans using automated credit scoring and analysis tools. These credit scoring tools take into account factors such as paymenthistory, credit utilization, length of credit history, types of credit currently in use, and recent credit inquiries. To the extent that the loan is secured by collateral, the value ofthe collateral is also evaluated. Common risks to each class of retail consumer loans include general economic conditions within the Company’s markets, such asunemployment and potential declines in collateral values, and the personal circumstances of the borrowers. In addition to these common risks for the Company’s retailconsumer loans, various retail consumer loan classes may also have certain risks specific to them.
One-to-four family and construction and land/lot loans are to individuals and are typically secured by one-to-four family residential property, undeveloped land, andpartially developed land in anticipation of pending construction of a personal residence. Significant and rapid declines in real estate values can result in residential mortgageloan borrowers having debt levels in excess of the current market value of the collateral, which can lead to higher levels of foreclosures. Construction and land/lot loans mayexperience delays in completion and cost overruns that exceed the borrower’s financial ability to complete the project. Such cost overruns can result in foreclosure ofpartially completed and unmarketable collateral.
Originated home equity lines of credit are often secured by second liens on residential real estate, thereby making such loans particularly susceptible to declining collateralvalues. A substantial decline in collateral value could render the Company’s second lien position to be effectively unsecured. Additional risks include lien perfectioninaccuracies and disputes with first lien holders that may further weaken collateral positions. Further, the open-end structure of these loans creates the risk that customersmay draw on the lines in excess of the collateral value if there have been significant declines since origination. From time to time, the Company purchases certain HELOCsfrom a third party. The credit risk characteristics are different for these loans since they were not originated by the Company and the collateral is located outside theCompany’s market area, primarily in several western states. The Company established an allowance for credit losses based on the historical losses of the portfolio. TheCompany monitors the performance of these loans and adjusts the allowance for credit losses as necessary.
Indirect auto finance loans are primarily for new and used personal automobiles originated by franchised and independent auto dealers within the Company's geographicfootprint. The bank-dealer relationship is governed by contract, which provides warranties and representations, payment schedules, and rights and remedies upon breach.The underwriting process and standards are maintained by the Company and implemented via an automated decision tool, which incorporates the borrower's credit score,loan to value ratio, and terms of the loan to determine the borrower's creditworthiness.
Consumer loans include loans secured by deposit accounts or personal property such as automobiles, boats, and motorcycles, as well as unsecured consumer debt. The valueof underlying collateral within this class is especially volatile due to potential rapid depreciation in values since date of loan origination in excess of principal repayment.
81

HOMETRUST BANCSHARES, INC. AND SUBSIDIARYNotes to Consolidated Financial Statements(Dollars in thousands, except per share data)
Credit Quality Indicators
Loans are monitored for credit quality on a recurring basis and the composition of the loans outstanding by credit quality indicator is provided below. Loan credit qualityindicators are developed through review of individual borrowers on an ongoing basis. Generally, loans are monitored for performance on a quarterly basis with the credit qualityindicators adjusted as needed. The indicators represent the rating for loans as of the date presented based on the most recent assessment performed. These credit quality indicatorsare defined as follows:
Pass—A pass rated asset is not adversely classified because it does not display any of the characteristics for adverse classification.
Special Mention—A special mention asset has potential weaknesses that deserve management’s close attention. If left uncorrected, such potential weaknesses may result indeterioration of the repayment prospects or collateral position at some future date. Special mention assets are not adversely classified and do not warrant adverseclassification.
Substandard—A substandard asset is inadequately protected by the current net worth and paying capacity of the obligor, or of the collateral pledged, if any. Assets classifiedas substandard generally have a well-defined weakness, or weaknesses, that jeopardize the liquidation of the debt. These assets are characterized by the distinct possibilityof loss if the deficiencies are not corrected.
Doubtful—An asset classified doubtful has all the weaknesses inherent in an asset classified substandard with the added characteristic that the weaknesses make collectionor liquidation in full highly questionable and improbable, on the basis of currently existing facts, conditions, and values.
Loss—Assets classified loss are considered uncollectible and of such little value that their continuing to be carried as an asset is not warranted. This classification is notnecessarily equivalent to no potential for recovery or salvage value, but rather that it is not appropriate to defer a full write-off even though partial recovery may be effectedin the future.
Loans Held for Sale
Residential mortgages held for sale are valued at the lower of cost or fair value as determined by outstanding commitments from investors on a “best efforts” basis or currentinvestor yield requirements, calculated on the aggregate loan basis.
The Company originates loans guaranteed by the SBA for the purchase of businesses, business startups, business expansion, equipment, and working capital. All SBA loans areunderwritten and documented as prescribed by the SBA. SBA loans are generally fully amortizing and have maturity dates and amortizations of up to 25 years. SBA loans areclassified as held for sale and are carried at the lower of cost or fair value. The guaranteed portion of the loan is sold and the servicing rights are retained. At the time of the sale,an asset is recorded for the value of the servicing rights and is amortized over the remaining life of the loan on the effective interest method. The servicing asset is included inother assets and the corresponding servicing fees are recorded in noninterest income. A gain is recorded for any premium received in excess of the carrying value of the net assetstransferred in the sale and is also included in noninterest income. The portion of SBA loans that are retained are adjusted to fair value and reclassified total loans, net of deferredcosts (loans held for investment). The net value of the retained loans is included in the appropriate loan classification for disclosure purposes.
Beginning in fiscal year 2019, the Company began originating HELOCs through a third party. These loans are originated in various states outside the Company's geographicfootprint, but are underwritten to the Company's underwriting guidelines. The loans are held for sale by the Company over a 90 to 180 day period and are serviced by the thirdparty. The loans are marketed by the third party to investors in pools and once sold the Company recognizes a gain or loss on the sale.
Allowance for Credit Losses
See "Adoption of CECL standard" below for details.
Nonperforming Assets
Nonperforming assets can include loans that are past due 90 days or more based on the loan’s contractual terms and continue to accrue interest, loans on which interest is notbeing accrued, and REO.
Loans Past Due 90 Days or More, Nonaccruing, Impaired, or Restructured
The Company’s policies related to when loans are placed on nonaccruing status conform to guidelines prescribed by bank regulatory authorities. Generally, the Companysuspends the accrual of interest on loans (i) that are maintained on a cash basis because of the deterioration of the financial condition of the borrower, (ii) for which payment infull of principal or interest is not expected (impaired loans), or (iii) on which principal or interest has been in default for a period of 90 days or more, unless the loan is both wellsecured and in the process of collection. Under the Company’s cost recovery method, interest income is subsequently recognized only to the extent cash payments are received inexcess of principal due. Loans are returned to accruing status when all principal and interest amounts contractually due are brought current and concern no longer exists as to thefuture collectability of principal and interest, which is generally confirmed when the loan demonstrates performance for six consecutive months or payment cycles.
82

HOMETRUST BANCSHARES, INC. AND SUBSIDIARYNotes to Consolidated Financial Statements(Dollars in thousands, except per share data)
Restructured loans to borrowers who are experiencing financial difficulty, and on which the Company has granted concessions that modify the terms of the loan, are accountedfor as troubled debt restructurings (“TDRs”). These loans remain as TDRs until the loan has been paid in full, modified to its original terms, or charged off. The Company mayplace these loans on accrual or nonaccrual status depending on the individual facts and circumstances of the borrower. Generally, these loans are put on nonaccrual status untilthere is adequate performance that evidences the ability of the borrower to make the contractual payments. This period of performance is normally at least six months, and mayinclude performance immediately prior to or after the modification, depending on the specific facts and circumstances of the borrower.
Loan Charge-offs
The Company charges off loan balances, in whole or in part to net realizable value or fair value less costs to sell, when available, verifiable, and documentable informationconfirms that specific loans, or portions of specific loans, are uncollectible or unrecoverable. For unsecured loans, losses are confirmed when it can be determined that theborrower, or any guarantors, are unwilling or unable to pay the amounts as agreed. When the borrower, or any guarantor, is unwilling or unable to pay the amounts as agreed ona loan secured by collateral and any recovery will be realized upon the sale of the collateral, the loan is deemed to be collateral dependent. Repayments or recoveries forcollateral dependent loans are directly affected by the value of the collateral at liquidation. As such, loan repayment can be affected by factors that influence the amountrecoverable, the timing of the recovery, or a combination of the two. Such factors include economic conditions that affect the markets in which the loan or its collateral is sold,bankruptcy, repossession and foreclosure laws, and consumer banking regulations. Losses are also confirmed when the loan, or a portion of the loan, is classified as loss resultingfrom loan reviews conducted by the Company or its bank regulatory examiners.
Charge-offs of loans in the commercial loan segment are recognized when the uncollectibility of the loan balance and the inability to recover sufficient value from the sale of anycollateral securing the loan is confirmed. The uncollectibility of the loan balance is evidenced by the inability of the commercial borrower to generate cash flows sufficient torepay the loan as agreed causing the loan to become delinquent. For collateral dependent commercial loans, the Company determines the net realizable value of the collateralbased on appraisals, current market conditions, and estimated costs to sell the collateral. For collateral dependent commercial loans where the loan balance, including anyaccrued interest, net deferred fees or costs, and unamortized premiums or discounts, exceeds the net realizable value of the collateral securing the loan, the deficiency isidentified as unrecoverable, is deemed to be a confirmed loss, and is charged off.
Charge-offs of loans in the retail consumer loan segment are generally confirmed and recognized in a manner similar to charge-offs of loans in the commercial loan segment.Secured retail consumer loans that are identified as uncollectible and are deemed to be collateral dependent are confirmed as loss to the extent the net realizable value of thecollateral is insufficient to recover the loan balance. Consumer loans not secured by real estate that become 90 days past due are charged off to the extent that the fair value ofany collateral, less estimated costs to sell the collateral, is insufficient to recover the loan balance. Consumer loans secured by real estate that become 120 days past due arecharged off to the extent that the fair value of the real estate securing the loan, less estimated costs to sell the collateral, is insufficient to recover the loan balance. Loans toborrowers in bankruptcy are subject to modification by the bankruptcy court and are charged off to the extent that the fair value of any collateral securing the loan, less estimatedcosts to sell the collateral, is insufficient to recover the loan balance, unless the Company expects repayment is likely to occur. Such loans are charged off within 60 days of thereceipt of notification from a bankruptcy court or when the loans become 120 days past due, whichever is shorter.
Real Estate Owned
REO consists of real estate acquired as a result of customers’ loan defaults. REO is stated at the fair value of the property net of the estimated costs of disposal with a charge tothe allowance for credit losses upon foreclosure, if necessary. Any write-downs subsequent to foreclosure are charged against operating earnings. To the extent recoverable, costsrelating to the development and improvement of property are capitalized, whereas those costs relating to holding the property are charged to expense.
Premises and Equipment
Premises and equipment are stated at cost less accumulated depreciation. Depreciation is computed using the straight-line method over the estimated useful lives. Leaseholdimprovements are amortized over the lives of the respective leases or the estimated useful life of the leasehold improvement, whichever is less. Maintenance and repair costs areexpensed as incurred. Capitalized leases are amortized using the same methods as premises and equipment over the estimated useful lives or lease terms, whichever is less.Obligations under capital leases are amortized using the interest method to allocate payments between principal reduction and interest expense.
Other Investments, At Cost
As a requirement for membership, the Bank invests in the stock of both the FHLB of Atlanta and the FRB. No ready market exists for these securities so carrying value, or cost,approximates their fair value based on the redemption provisions of the FHLB of Atlanta and the FRB, respectively. SBIC investments are equity securities without a readilydeterminable fair value and are recorded at cost.
Business Combinations
The Company uses the acquisition method of accounting for all business combinations. An acquirer must be identified for each business combination, and the acquisition date isthe date the acquirer achieves control. The acquisition method of accounting requires the Company as acquirer to recognize the fair value of assets acquired and liabilitiesassumed at the acquisition date as well as recognize goodwill or a gain from a bargain purchase, if appropriate. Any acquisition-related costs and restructuring costs arerecognized as period expenses as incurred.
83

HOMETRUST BANCSHARES, INC. AND SUBSIDIARYNotes to Consolidated Financial Statements(Dollars in thousands, except per share data)
Goodwill
Goodwill represents the excess of the purchase price over the sum of the estimated fair values of the tangible and identifiable intangible assets acquired less the estimated fairvalue of the liabilities assumed in a business combination. Goodwill has an indefinite useful life and is evaluated for impairment annually in the fourth quarter or more frequentlyif events and circumstances indicate that the asset might be impaired. An impairment loss is recognized to the extent that the carrying amount exceeds the asset’s fair value.
In testing goodwill for impairment, we have the option to assess either qualitative or quantitative factors to determine whether the existence of events or circumstances leads to adetermination that it is more likely than not that the estimated fair value of a reporting unit is less than its carrying amount. If we elect to perform a qualitative assessment anddetermine that an impairment is more likely than not, we are then required to perform a quantitative impairment test, otherwise no further analysis is required.
Under the quantitative impairment test, the evaluation involves comparing the current fair value of each reporting unit to its carrying value, including goodwill. If the estimatedfair value of a reporting unit exceeds its carrying value, goodwill is considered not to be impaired. If the carrying value exceeds estimated fair value an impairment charge isrecognized for the difference, but limited by the amount of goodwill allocated to the reporting unit. The Company uses a combination of the market and income approaches toestimate the fair value of its reporting unit when the quantitative impairment approach is chosen or required. All inputs are evaluated by management at the evaluation date ofApril 1st and reviewed again each reporting period for triggering events to ensure no significant changes occurred that could indicate impairment. Subsequent reversal ofgoodwill impairment losses is not permitted.
Core Deposit Intangibles
Core deposit intangibles represent the estimated value of long-term deposit relationships acquired in business combinations. These core deposit premiums are amortized using anaccelerated method over the estimated useful lives of the related deposits typically between five and ten years. The estimated useful lives are periodically reviewed forreasonableness.
Income Taxes
The Company accounts for income taxes using the asset and liability method. Deferred tax assets and liabilities are recognized for the future tax consequences attributable todifferences between the financial statement carrying amounts of existing assets and liabilities and their respective tax bases and operating loss and tax creditcarryforwards. Deferred tax assets and liabilities are measured using enacted tax rates expected to apply to taxable income in the years in which those temporary differences areexpected to be recovered or settled. The effect on deferred tax assets and liabilities of a change in tax rates is recognized in income in the period that includes the enactmentdate. Deferred tax assets are reduced, if necessary, by the amount of such benefits that are not expected to be realized based upon available evidence. See Note 12 for additionalinformation.
The Company recognizes interest and penalties accrued relative to unrecognized tax benefits in its respective federal or state income taxes accounts. As of June 30, 2021 and2020, there were no accruals for uncertain tax positions and no accruals for interest and penalties. The Company is no longer subject to examination for federal and statepurposes for tax years prior to 2017.
Employee Benefit Plans
The KSOP is comprised of two components, the 401(k) Plan and the ESOP. The KSOP benefits employees with at least 1,000 hours of service during a 12-month period andwho have attained age 21.
Under the 401(k), the Company matches employee contributions at 50% of employee deferrals up to 6% of each employee’s compensation. The Company may also makediscretionary profit sharing contributions for the benefit of all eligible participants as long as total contributions do not exceed applicable limitations. Employer contributions vestin 20% increments for years two through six, becoming fully vested after six years of service, based on the employee's entry date.
Under the ESOP, the amount of the Bank's annual contribution is discretionary; however, it must be sufficient to pay the annual loan payment to the Company. Shares releasedare allocated to each eligible participant based on the ratio of each participant’s compensation, as defined in the ESOP, to the total compensation of all eligible plan participants.Forfeited shares are reallocated among other participants in the Plan. At the discretion of the Bank, cash dividends, when paid on allocated shares, are distributed to participants’accounts, paid in cash to the participants, or used to repay the principal and interest on the ESOP loan used to acquire Company stock on which dividends were paid. Cashdividends on unallocated shares are used to repay the outstanding debt of the ESOP. It is anticipated that the Bank will make contributions to the ESOP in amounts necessary toamortize the ESOP loan payable to the Company over a 20-year period. Unearned ESOP shares are shown as a reduction of stockholders’ equity. The Company recognizescompensation expense equal to the fair value of the Company’s ESOP shares during the periods in which they become committed to be released. To the extent that the fair valueof the Company’s ESOP shares differs from the cost of such shares, the differential is recognized as additional paid in capital. The Company recognizes a tax deduction equal tothe cost of the shares released. Because the ESOP is internally leveraged through a loan from the Company to the ESOP, the loan receivable by the Company from the ESOP isnot reported as an asset nor is the debt of the ESOP shown as a liability in the consolidated financial statements.
See Note 13 for additional information.
84
HOMETRUST BANCSHARES, INC. AND SUBSIDIARYNotes to Consolidated Financial Statements(Dollars in thousands, except per share data)
Equity Incentive Plan
The Company issues restricted stock, restricted stock units, and stock options under the HomeTrust Bancshares, Inc. 2013 Omnibus Incentive Plan (“2013 Omnibus IncentivePlan”) to key officers and outside directors. In accordance with the requirements of the FASB ASC 718, Compensation – Stock Compensation, the Company has adopted a fairvalue based method of accounting for employee stock compensation plans, whereby compensation cost is measured based on the fair value of the award as of the grant date andrecognized over the vesting period. The Company accounts for forfeitures as they occur.
Comprehensive Income
Comprehensive income consists of net income and net unrealized gains (losses) on debt securities available for sale and is presented in the consolidated statements ofcomprehensive income.
Derivative Instruments and Hedging
The Company recognizes all derivatives as either assets or liabilities in the balance sheet, and measures those instruments at fair value. Changes in the fair value of thosederivatives are reported in current earnings or other comprehensive income depending on the purpose for which the derivative is held and whether the derivative qualifies forhedge accounting. Loan commitments related to the origination or acquisition of mortgage loans that will be held for sale must be accounted for as derivative instruments. TheCompany enters into commitments to originate loans whereby the interest rate on the loan is determined prior to funding (rate lock commitments). The Company also enters intoforward sales commitments for the mortgage loans underlying the rate lock commitments. The fair values of these two derivative financial instruments are collectivelyinsignificant to the consolidated financial statements.
Net Income per Share
Per the provisions of ASC 260, Earnings Per Share, basic EPS are computed by dividing net income by the weighted-average number of common shares outstanding for the year,less the average number of nonvested restricted stock awards. Diluted EPS reflect the potential dilution from the issuance of additional shares of common stock caused by theexercise of stock options and restricted stock awards. In addition, nonvested share-based payment awards that contain nonforfeitable rights to dividends or dividend equivalentsare considered participating securities and are included in the computation of EPS pursuant to the two-class method. The two-class method is an earnings allocation formula thatdetermines EPS for each class of common stock and participating security according to dividends declared (or accumulated) and participation rights in undistributed earnings.ESOP shares are considered outstanding for basic and diluted EPS when the shares are committed to be released.
Net income is allocated between the common stock and participating securities pursuant to the two-class method, based on their rights to receive dividends, participate inearnings, or absorb losses. See Note 15 for further discussion on the Company’s EPS.
Adoption of CECL Standard
On July 1, 2020, the Company adopted ASU No. 2016-13, "Financial Instruments-Credit Losses ("Topic 326"): Measurement of Credit Losses on Financial Instruments",sometimes referred to herein as ASU 2016-13. Topic 326 was subsequently amended by ASU No. 2019-11, Codification Improvements to Topic 326, Financial Instruments-Credit Losses; ASU No. 2019-05, Codification Improvements to Topic 326, Financial Instruments-Credit Losses; and ASU No. 2019-04, Codification Improvements to Topic326, Financial Instruments-Credit Losses, Topic 815, Derivatives and Hedging, and Topic 825, Financial Instruments. This standard applies to all financial assets measured atamortized cost and off balance sheet credit exposures, including loans, debt securities and unfunded commitments. The Company applied the standard’s provisions using themodified retrospective method as a cumulative effect adjustment to retained earnings as of July 1, 2020. With this transition method, the Company did not have to restatecomparative prior periods presented in the financial statements related to Topic 326, but will present comparative prior period disclosures using the previous accounting guidancefor the allowance for loan losses. This adoption method is considered a change in accounting principle requiring additional disclosure regarding the nature of and reason for thechange, which is solely a result of the adoption of the required standard.
ACL – Debt Securities
Management uses a systematic methodology to determine its ACL for debt securities held to maturity. The ACL is a valuation account that is deducted from the amortized costbasis to present the net amount expected to be collected on the held-to-maturity portfolio. Management considers the effects of past events, current conditions, and reasonableand supportable forecasts on the collectability of the portfolio. The Company’s estimate of its ACL involves a high degree of judgment; therefore, management’s process fordetermining expected credit losses may result in a range of expected credit losses. Management monitors the held-to-maturity portfolio to determine whether a valuation accountwould need to be recorded. The Company currently has no debt securities held to maturity.
Management excludes the accrued interest receivable balance from the amortized cost basis in measuring expected credit losses on debt securities and does not record anallowance for credit losses on accrued interest receivable. As of June 30, 2021, the accrued interest receivable for debt securities available for sale was $754.
The Company’s estimate of expected credit losses includes a measure of the expected risk of credit loss even if that risk is remote. However, the Company does not measureexpected credit losses on a debt security in which historical credit loss information adjusted for current
85
HOMETRUST BANCSHARES, INC. AND SUBSIDIARYNotes to Consolidated Financial Statements(Dollars in thousands, except per share data)
conditions and reasonable and supportable forecast results in an expectation that nonpayment of the amortized cost basis is zero. Management does not expect nonpayment of theamortized cost basis to be zero solely on the basis of the current value of collateral securing the security but, instead, also considers the nature of the collateral, potential futurechanges in collateral values, default rates, delinquency rates, third-party guarantees, credit ratings, interest rate changes since purchase, volatility of the security’s fair value andhistorical loss information for financial assets secured with similar collateral. The Company performed an analysis that determined that the following securities have a zeroexpected credit loss: U.S. government agencies, residential MBS of U.S. government agencies and GSEs, and municipal bonds. All of the U.S. government agencies and U.S.government agency backed securities have the full faith and credit backing of the United States Government or one of its agencies. Municipal bonds that do not have a zeroexpected credit loss will be evaluated quarterly to determine whether there is a credit loss associated with a decline in fair value.
Management no longer evaluates securities for credit impairment, as ASC Subtopic 326-30, "Financial Instruments—Credit Losses—Available-for-Sale Debt Securities,"changes the accounting for recognizing impairment on available-for-sale debt securities. Each quarter management evaluates impairment where there has been a decline in fairvalue below the amortized cost basis of a security to determine whether there is a credit loss associated with the decline in fair value. Management considers the nature of thecollateral, potential future changes in collateral values, default rates, delinquency rates, third-party guarantees, credit ratings, interest rate changes since purchase, volatility of thesecurity’s fair value and historical loss information for financial assets secured with similar collateral among other factors. Credit losses are calculated individually, rather thancollectively, using a DCF method, whereby management compares the present value of expected cash flows with the amortized cost basis of the security. The credit losscomponent would be recognized through the provision for credit losses in the Consolidated Statements of Income.
ACL - Loans and Leases
The ACL reflects management’s estimate of losses that will result from the inability of its borrowers to make required loan payments. The Company established the incrementalincrease in the ACL at adoption of the CECL standard through the cumulative effect adjustment to equity and subsequent adjustments will be made through a provision for creditlosses charged against earnings. Management records loans charged off against the ACL and subsequent recoveries, if any, increase the ACL when they are recognized.
Management uses a systematic methodology to determine its ACL for loans held for investment and certain off-balance-sheet credit exposures. The ACL is a valuation accountthat is deducted from the amortized cost basis to present the net amount expected to be collected on the loan portfolio. Management considers the effects of past events, currentconditions, and reasonable and supportable forecasts on the collectability of the loan portfolio. The Company’s estimate of its ACL involves a high degree of judgment;therefore, management’s process for determining expected credit losses may result in a range of expected credit losses. The Company’s ACL recorded in the balance sheetreflects management’s best estimate within the range of expected credit losses. The Company recognizes in net income the amount needed to adjust the ACL for management’scurrent estimate of expected credit losses. The Company’s ACL is calculated using collectively evaluated and individually evaluated loans.
The Company collectively evaluates loans that share similar risk characteristics. In general, management has segmented loans by regulatory call code category and collectivelyevaluates loans within the retail and commercial categories. Loans within the retail consumer category include: one-to-four family, HELOCs - originated, HELOCs - purchased,construction and land/lots, indirect auto finance, and consumer. Loans within the commercial category include: commercial real estate, construction and development,commercial and industrial, equipment finance, and municipal leases.
For collectively evaluated loans, the Company uses a DCF method for each loan in a pool, and the results are aggregated at the pool level. A periodic tendency to default andabsolute loss given default are applied to a projective model of the pool’s cash flow while considering prepayment and principal curtailment effects. The analysis producesexpected cash flows for each instrument in the pool by pairing loan-level term information (maturity date, payment amount, interest rate, etc.) with top-down pool assumptions(default rates, prepayment speeds). The Company has identified the following portfolio segments for the current calculation: one-to-four family construction, one-to-four familymortgage – jr. lien, one-to-four family mortgage – sr. lien, commercial and industrial, commercial leases, construction – multi-family, construction – non-owner-occupied,construction – owner occupied, consumer – auto, consumer – other, consumer – revolving, farmland, land and lot, multifamily, municipal leases, non-owner-occupied CRE,owner occupied CRE, and HELOCs. PPP loans are fully guaranteed by the SBA; therefore, management estimates a zero reserve for PPP loans within its allowance for creditlosses.
Management has determined that the peer loss experience provides the best basis for its assessment of expected credit losses to determine the ACL. The Company utilized peercall report data to measure historical credit loss experience with similar risk characteristics within the segments over an economic cycle. Management reviewed the historical lossinformation to appropriately adjust for differences in current asset specific risk characteristics. Management also considered further adjustments to historical loss information forcurrent conditions and reasonable and supportable forecasts that differ from the conditions that existed for the period over which historical information was evaluated. For allsegment models for collectively evaluated loans (except for HELOCs), the Company incorporated one macroeconomic driver using a statistical regression modelingmethodology. The HELOC segment incorporated two macroeconomic drivers. Due to the low loss rates of municipal leases and the expectation of them remaining low,management has elected to separately pool these loans. Management has elected to use readily available municipal default rates and loss given defaults in order to calculateexpected credit losses.
Management considers forward-looking information in estimating expected credit losses. The Company uses the Fannie Mae quarterly economic forecast which is a baselineoutlook for the United States economy. Management has evaluated the appropriateness of the reasonable and supportable forecast for the current period along with the inputsused in the estimation of expected credit losses. For the
86
HOMETRUST BANCSHARES, INC. AND SUBSIDIARYNotes to Consolidated Financial Statements(Dollars in thousands, except per share data)
contractual term that extends beyond the reasonable and supportable forecast period, the Company reverts to historical loss information within four quarters using a straight-lineapproach. Management may apply different reversion techniques depending on the economic environment for the financial asset portfolio and as of the current period hasutilized a linear reversion technique. Management has evaluated the appropriateness of a reversion period for the current period and noted that it was reasonable.
Included in its systematic methodology to determine its ACL for loans held for investment and certain off-balance-sheet credit exposures, management considers the need toqualitatively adjust expected credit losses for risks not already captured in the loss estimation process. These qualitative adjustments can either increase or decrease thequantitative model estimation (i.e. formulaic model results). Each period the Company considers qualitative factors that are relevant within the qualitative framework that includethe following: 1) lending policies and procedures, 2) credit review function, 3) experience and depth of management and staff, 4) external factors, and 5) actual and expectedchanges in economic and business conditions.
When a loan no longer shares similar risk characteristics with its segment, the asset is assessed to determine whether it should be included in another pool or should beindividually evaluated. For these individually evaluated loans, the Company maintains specific book balance thresholds for retail or consumer loans, commercial loans,municipal and equipment leases, and unsecured commercial loans. Management would adjust these thresholds if future analysis suggests a change is needed based on the creditenvironment at that time. Generally, individually evaluated loans other than TDRs are on nonaccrual status. Based on the thresholds above, financial assets will generally remainin pools unless they meet the dollar threshold or foreclosure is expected. The expected credit losses on individually evaluated loans will be estimated based on DCF analysisunless the loan meets the criteria for use of the fair value of collateral, either by virtue of an expected foreclosure or through meeting the definition of collateral dependent.Financial assets that have been individually evaluated can be returned to a pool for purposes of estimating the expected credit loss insofar as their credit profile improves and thatthe repayment terms are not considered to be unique to the asset.
Management measures expected credit losses over the contractual term of the loans. When determining the contractual term, the Company considers expected prepayments but isprecluded from considering expected extensions, renewals, or modifications, unless the Company reasonably expects it will execute a TDR with a borrower. In the event of areasonably-expected TDR, the Company factors the reasonably-expected TDR into the current expected credit losses estimate. The effects of a TDR are recorded when anindividual asset is specifically identified as a reasonably-expected TDR. The Company identifies the point at which it offers the modification to the borrower as the point atwhich the TDR is reasonably expected for both commercial and consumer loans. The Company uses a DCF methodology to calculate the effect of the concession provided to theborrower in TDR within the ACL.
PCD assets are defined as acquired individual financial assets (or acquired groups of financial assets with similar risk characteristics) that, as of the date of acquisition, haveexperienced a more-than-insignificant deterioration in credit quality since origination, as determined by the Company’s assessment. The Company records acquired PCD loansby adding the expected credit losses (i.e., ACL) to the purchase price of the financial assets rather than recording through the provision for credit losses in the income statement.The expected credit loss, as of the acquisition day, of a PCD loan is added to the ACL. The non-credit discount or premium is the difference between the unpaid principalbalance and the amortized cost basis as of the acquisition date. Subsequent to the acquisition date, the change in the ACL on PCD loans is recognized through the provision forcredit losses. The non-credit discount or premium is accreted or amortized, respectively, into interest income over the remaining life of the PCD loan on a level-yield basis. Inaccordance with the transition requirements within the standard, the Company’s PCI loans were treated as PCD loans.
The Company follows its nonaccrual policy by reversing contractual interest income in the income statement when the Company places a loan on nonaccrual status. Therefore,management excludes the accrued interest receivable balance from the amortized cost basis in measuring expected credit losses on the portfolio and does not record an ACL onaccrued interest receivable.
The Company has a variety of assets that have a component that qualifies as an off-balance sheet exposure. These primarily include undrawn portions of revolving lines of creditand standby letters of credit. The expected losses associated with these exposures within the unfunded portion of the expected credit loss will be recorded as a liability on thebalance sheet with an offset to the provision for credit losses. Management has determined that a majority of the Company’s off-balance-sheet credit exposures are notunconditionally cancellable. See "Note 5 – Loans and Allowance for Credit Losses on Loans" for additional details related to the Company's off-balance-sheet credit exposure.The current adjustment to the ACL for unfunded commitments would be recognized through the provision for credit losses in the Statement of Income.
Recent Accounting Pronouncements
In June 2016, the FASB issued ASU No. 2016-13, "Financial Instruments-Credit Losses (Topic 326): Measurement of Credit Losses on Financial Instruments." The ASUsignificantly changes the impairment model for most financial assets that are measured at amortized cost and certain other instruments from an incurred loss model to anexpected loss model. The Company adopted this ASU on July 1, 2020, applying the modified-retrospective method. Related to the implementation of this ASU, the Companyrecorded additional ACL on financial instruments of $15,059, additional deferred tax assets of $3,989, additional reserve for unfunded commitments of $2,288, and a reductionto retained earnings of $13,358. The adoption of this ASU did not have an effect on AFS debt securities. See "Adoption of CECL Standard" above and "Note 5 – Loans andAllowance for Credit Losses on Loans" for additional details related to the adoption of this ASU.
87

HOMETRUST BANCSHARES, INC. AND SUBSIDIARYNotes to Consolidated Financial Statements(Dollars in thousands, except per share data)
See table below for impact of this ASU on the Company's consolidated balance sheet:July 1, 2020
As Reported Under ASC326
Pre-ASC 326Adoption
Impact of ASC 326Adoption
Assets:ACL on commercial paper $ (250) $ — $ (250)
ACL on loans:Retail consumer loans $ (17,692) $ (6,956) $ (10,736)Commercial loans (25,189) (21,116) (4,073)
Total ACL on loans $ (42,881) $ (28,072) $ (14,809)
Deferred income taxes $ 20,323 $ 16,334 $ 3,989
Liabilities:Liability for credit losses on off-balance sheet credit exposures $ 2,288 $ — $ 2,288
Equity:Retained earnings $ 229,418 $ 242,776 $ (13,358)
In August 2018, the FASB issued ASU 2018-13, "Fair Value Measurement (Topic 820): Disclosure Framework-Changes to the Disclosure Requirements for Fair ValueMeasurement." The amendments in this ASU remove, modify, and add certain disclosure requirements related to fair value measurements in ASC 820. The Company adoptedthis ASU on July 1, 2020. The adoption did not have a material effect on the Company's Consolidated Financial Statements.
In November 2018, the FASB issued ASU 2018-19, "Codification Improvements to Topic 326, Financial Instruments—Credit Losses." This update clarifies that receivablesarising from operating leases are not within the scope of Subtopic 326-20. Instead, impairment of receivables arising from operating leases should be accounted for in accordancewith Topic 842, Leases. The Company adopted this ASU on July 1, 2020. The adoption did not have a material effect on the Company's Consolidated Financial Statements.
In April 2019, the FASB issued ASU 2019-04, "Codification Improvements to Topic 326, Financial Instruments-Credit Losses, Topic 815, Derivatives and Hedging, and Topic825, Financial Instruments." The amendments in this update are part of the FASB's ongoing project to improve codification and correcting unintended application. The itemswithin this ASU are not expected to have a significant effect on current accounting practice. The Company adopted the amendments to Financial Instruments (ASU 2016-01) onJuly 1, 2020. The Company adopted the amendments to Financial Instruments-Credit Losses (ASU 2016-13) on July 1, 2020 . The Company adopted the amendments toDerivatives and Hedging (ASU 2017-12) on July 1, 2019. The adoption did not have a material effect on the Company's Consolidated Financial Statements.
In May 2019, the FASB issued ASU 2019-05, "Financial Instruments - Credit Losses (Topic 326): Targeted Transition Relief." The amendments in this update allow companiesto irrevocably elect, upon the adoption of ASU 2016-13, the fair value option for financial instruments that i) were previously recorded at amortized cost and ii) are within thescope of the credit losses guidance in ASC 326-20, iii) are eligible for the fair value option under ASC 825-10, and iv) are not held-to-maturity debt securities. The Companyadopted this ASU on July 1, 2020. The adoption did not have a material effect on the Company's Consolidated Financial Statements.
In November 2019, the FASB issued ASU 2019-11, "Codification Improvements to Topic 326, Financial Instruments-Credit Losses." This ASU clarifies certain aspects of theamendments in ASU 2016-13 and is part of the FASB's ongoing project to improve codification and correcting unintended application. The items within this ASU are notexpected to have a significant effect on current accounting practice. The Company adopted this ASU on July 1, 2020. The adoption did not have a material effect on theCompany's Consolidated Financial Statements.
In December 2019, the FASB issued ASU 2019-12, "Income Taxes (Topic 740): Simplifying the Accounting for Income Taxes." This ASU is part of the FASB's simplificationinitiative to reduce complexity in accounting standards. The items within this ASU are not expected to have a significant effect on current accounting practice. The effective dateand transition requirements for the first and second items of this ASU are effective for annual periods, and interim periods within those annual periods, beginning after December15, 2020 and early adoption is permitted. The adoption of ASU No. 2019-12 is not expected to have a material impact on the Company's Consolidated Financial Statements.
In January 2020, the FASB issued ASU 2020-01, "Investment—Equity Securities (Topic 321), Investments—Equity Method and Joint Ventures (Topic 323), and Derivativesand Hedging (Topic 815): Clarifying the Interactions between Topic 321, Topic 323, and Topic 815." This ASU clarified the interaction of the accounting for equity securitiesunder Topic 321 and investments accounted for under the equity method of accounting in Topic 323 and the accounting for certain forward contracts and purchased optionsaccounted for under Topic 815. The amendments in this ASU are effective for annual periods, and interim periods within those annual periods, beginning after December 15,
88

HOMETRUST BANCSHARES, INC. AND SUBSIDIARYNotes to Consolidated Financial Statements(Dollars in thousands, except per share data)
2021 and early adoption is permitted. The adoption of this ASU is not expected to have a material impact on the Company's Consolidated Financial Statements.
In March 2020, the FASB issued ASU 2020-03, "Codification Improvements to Financial Instruments." This ASU makes certain narrow-scope amendments to the following: i)clarified that all entities are required to provide fair value option disclosures; ii) clarified the applicability of the portfolio exception in ASC 820 to nonfinancial items; iii) aligneddisclosures for depository and lending institutions (Topic 942) with guidance in Topic 320; iv) added cross-references to guidance in ASC 470-50 on line-of-credit or revolving-debt arrangements; v) added cross-references to net asset value practical expedient in ASC 820-10; vi) clarified the interaction between ASC 842 and ASC 326; and vii) clarifiedthe interaction between ASC 326 and ASC 860-20. The amendments for issues i, ii, iv, and v became effective upon issuance and did not have a material effect on theCompany's Consolidated Financial Statements. The Company adopted the amendments related to issue iii, vi, and vii on July 1, 2020. The adoption did not have a material effecton the Company's Consolidated Financial Statements.
In September 2020, the FASB issued ASU 2020-06, "Debt with Conversion and Other Options (Subtopic 470-20) and Derivatives and Hedging-Contracts in Entity's Own Equity(Subtopic 815-40)." This ASU simplifies the accounting for certain financial instruments with characteristics of liabilities and equity, including convertible instruments andcontracts on an entity's own equity. Specifically the ASU removes: i) major separation models required under GAAP and ii) certain settlement conditions that are required forequity contracts to qualify for the derivative scope exception, which will permit more equity contract to qualify for the exception. The amendments in this ASU are effective forannual periods, and interim periods within those annual periods, beginning after December 15, 2021 and early adoption is permitted. The adoption of this ASU is not expected tohave a material impact on the Company's Consolidated Financial Statements.
In October 2020, the FASB issued ASU 2020-08, "Codification Improvements to Subtopic 310-20, Receivables—Nonrefundable Fees and Other Costs." This ASU clarified thatentities should reevaluate whether a callable debt security is within the scope of paragraph 310-20-35-33 for each reporting period. The amendments in this ASU are effective forannual periods, and interim periods within those annual periods, beginning after December 15, 2020. The adoption of this ASU is not expected to have a material impact on theCompany's Consolidated Financial Statements.
In October 2020, the FASB issued ASU 2020-09, "Debt (Topic 470): Amendments to SEC Paragraphs Pursuant to SEC Release No. 33-10762." This ASU updates financialdisclosure requirements for subsidiary issuers and guarantors of registered debt securities and affiliates whose securities are pledged as collateral for registered securities. Theamendments in this ASU are effective January 4, 2021. The adoption did not have an effect on the Company's Consolidated Financial Statements.
In October 2020, the FASB issued ASU 2020-10, "Codification Improvements." The amendments in this update are part of the FASB's ongoing project to improve codificationand correcting unintended application. This ASU, i) removes references to various FASB Concepts Statements, ii) situates all disclosure guidance in the appropriate disclosuresection of the Codification, and iii) makes other improvements and technical corrections to the Codification. The items within this ASU are not expected to have a significanteffect on current accounting practice. The amendments in this ASU are effective for annual periods, and interim periods within those annual periods, beginning after December15, 2020 and early adoption is permitted. The adoption of this ASU is not expected to have a material impact on the Company's Consolidated Financial Statements.
2. Debt Securities
Debt securities available for sale consist of the following at the dates indicated:
June 30, 2021
Amortized Cost
Gross Unrealized
Gains
Gross Unrealized
Losses
Estimated Fair Value
U.S. government agencies $ 18,975 $ 135 $ (37) $ 19,073 Residential MBS of U.S. government agencies and GSEs 42,119 1,339 (54) 43,404 Municipal bonds 9,098 453 — 9,551 Corporate bonds 84,301 257 (127) 84,431
Total $ 154,493 $ 2,184 $ (218) $ 156,459
89

HOMETRUST BANCSHARES, INC. AND SUBSIDIARYNotes to Consolidated Financial Statements(Dollars in thousands, except per share data)
June 30, 2020
Amortized Cost
Gross Unrealized
Gains
Gross Unrealized
Losses
Estimated Fair Value
U.S. government agencies $ 3,957 $ 216 $ — $ 4,173 Residential MBS of U.S. government agencies and GSEs 46,629 1,776 (50) 48,355 Municipal bonds 16,090 541 — 16,631 Corporate bonds 58,242 270 (134) 58,378
Total $ 124,918 $ 2,803 $ (184) $ 127,537
Debt securities available for sale by contractual maturity at the dates indicated are shown below. Mortgage-backed securities are not included in the maturity categories becausethe borrowers in the underlying pools may prepay without penalty; therefore, it is unlikely that the securities will pay at their stated maturity schedule.
June 30, 2021Amortized
CostEstimated Fair Value
Due within one year $ 34,615 $ 34,684 Due after one year through five years 73,249 73,633 Due after five years through ten years 4,510 4,738 Due after ten years — — Mortgage-backed securities 42,119 43,404
Total $ 154,493 $ 156,459
June 30, 2020Amortized
CostEstimated Fair Value
Due within one year $ 29,190 $ 29,247 Due after one year through five years 44,881 45,516 Due after five years through ten years 2,434 2,630 Due after ten years 1,784 1,789 Mortgage-backed securities 46,629 48,355
Total $ 124,918 $ 127,537
The Company had no sales of debt securities available for sale during the years ended June 30, 2021, 2020, and 2019. There were no gross realized gains or losses for the yearsended June 30, 2021, 2020, and 2019.
Debt securities available for sale with amortized costs totaling $97,603 and $82,888 and market values of $98,890 and $84,456 at June 30, 2021 and June 30, 2020, respectively,were pledged as collateral to secure various public deposits and borrowings.
The gross unrealized losses and the fair value for debt securities available for sale aggregated by the length of time that individual securities have been in a continuous unrealizedloss position as of June 30, 2021 and June 30, 2020 were as follows:
June 30, 2021Less than 12 Months 12 Months or More Total
Fair Value
Unrealized Losses
Fair Value
Unrealized Losses
Fair Value
Unrealized Losses
U.S. government agencies $ 14,963 $ (37) $ — $ — $ 14,963 $ (37)Residential MBS of U.S. government agencies and GSEs 5,212 (28) 1,205 (26) 6,417 (54)Corporate bonds 19,873 (127) — — 19,873 (127)
Total $ 40,048 $ (192) $ 1,205 $ (26) $ 41,253 $ (218)
90

HOMETRUST BANCSHARES, INC. AND SUBSIDIARYNotes to Consolidated Financial Statements(Dollars in thousands, except per share data)
June 30, 2020Less than 12 Months 12 Months or More Total
Fair Value
Unrealized Losses
Fair Value
Unrealized Losses
Fair Value
Unrealized Losses
Residential MBS of U.S. government agencies and GSEs $ 227 $ (10) $ 2,435 $ (40) $ 2,662 $ (50)Corporate bonds 11,779 (134) — — 11,779 (134)
Total $ 12,006 $ (144) $ 2,435 $ (40) $ 14,441 $ (184)
The total number of securities with unrealized losses at June 30, 2021, and June 30, 2020 were 28 and 24, respectively.
Management evaluates securities for impairment where there has been a decline in fair value below the amortized cost basis of a security to determine whether there is a creditloss associated with the decline in fair value on at least a quarterly basis, and more frequently when economic or market concerns warrant such evaluation. All debt securitiesavailable for sale in an unrealized loss position as of June 30, 2021 continue to perform as scheduled and management does not believe that there is a credit loss or that aprovision for credit losses is necessary. Also, as part of management's evaluation of its intent and ability to hold investments for a period of time sufficient to allow for anyanticipated recovery in the market, management considers its investment strategy, cash flow needs, liquidity position, capital adequacy and interest rate risk position.Management does not currently intend to sell the securities within the portfolio and it is not more-likely-than-not that securities will be required to be sold. See "Note 1 –Summary of Significant Account Policies" for further discussion.
Management continues to monitor all of its securities with a high degree of scrutiny. There can be no assurance that management will not conclude in future periods thatconditions existing at that time indicate some or all of its securities may be sold or would require a charge to earnings as a provision for credit losses in such periods.
3. Other Investments
Other investments, at cost consist of the following at the dates indicated:
June 30,2021 2020
FHLB of Atlanta stock $ 6,153 $ 23,309 FRB stock 7,386 7,368 SBIC investments 10,171 8,269
Total $ 23,710 $ 38,946
As a requirement for membership, the Bank invests in the stock of both the FHLB of Atlanta and the FRB. No ready market exists for these securities so carrying valueapproximates their fair value based on the redemption provisions of the FHLB of Atlanta and the FRB, respectively. SBIC investments are equity securities without a readilydeterminable fair value and are recorded at cost.
4. Loans Held For Sale
Loans held for sale as of the dates indicated consist of the following:
June 30,2021 2020
One-to-four family $ 31,873 $ 28,152 SBA 4,160 1,240 HELOCs 57,506 47,785
Total $ 93,539 $ 77,177
91

HOMETRUST BANCSHARES, INC. AND SUBSIDIARYNotes to Consolidated Financial Statements(Dollars in thousands, except per share data)
5. Loans and Allowance for Credit Losses on Loans
Loans consist of the following at the dates indicated:
June 30,2021 2020
Commercial loans:Commercial real estate $ 1,142,276 $ 1,052,906 Construction and development 179,427 215,934 Commercial and industrial 141,341 154,825 Equipment finance 317,920 229,239 Municipal leases 140,421 127,987 PPP loans 46,650 80,697
Total commercial loans 1,968,035 1,861,588 Retail consumer loans:
One-to-four family 406,549 473,693 HELOCs - originated 130,225 137,447 HELOCs - purchased 38,976 71,781 Construction and land/lots 66,027 81,859 Indirect auto finance 115,093 132,303 Consumer 8,362 10,259
Total retail consumer loans 765,232 907,342 Total loans 2,733,267 2,768,930
Deferred loan costs, net — 189 Total loans, net of deferred loan fees and costs 2,733,267 2,769,119
Allowance for credit losses (35,468) (28,072)Net loans $ 2,697,799 $ 2,741,047
________
(1) The June 30, 2020 information in the above table reflects the loan portfolio prior to the adoption of ASU 2016-13. This information was reported as shown in the below tables under "loans and the related ACL, by segment and class,prior to the adoption of ASU 2016-13", with the acquired loans being net of earned income and related discounts, which includes the credit discount on the acquired credit impaired loans.
(2) In accordance with the adoption of ASU 2016-13, the loan portfolio is shown at the amortized cost basis as of June 30, 2021, to include net deferred cost of $117 and unamortized discount total related to loans acquired of $3,123.Accrued interest receivable at June 30, 2021 of $7,339 is accounted for separately from the amortized cost basis. The ACL at June 30, 2020 includes the valuation allowance on PCI loans of $182.
All qualifying one-to-four family first mortgage loans, HELOCs, commercial real estate loans, and FHLB of Atlanta stock are pledged as collateral by a blanket pledge to secureoutstanding FHLB advances.
Loans are made to the Company's executive officers and directors and their associates during the ordinary course of business. The aggregate amount of loans to related partiestotaled approximately $245 and $1,498 at June 30, 2021 and 2020, respectively. In relation to these loans are unfunded commitments that totaled approximately $11 and $54 atJune 30, 2021 and 2020, respectively.
(1)
(2)
92

HOMETRUST BANCSHARES, INC. AND SUBSIDIARYNotes to Consolidated Financial Statements(Dollars in thousands, except per share data)
The following table presents the credit risk profile by risk grade for commercial loans by origination year: Term Loans By Origination Fiscal Year
June 30, 2021 2020 2019 2018 2017 Prior Revolving TotalCommercial real estateRisk rating:
Pass $ 227,850 $ 177,691 $ 142,407 $ 158,147 $ 158,525 $ 220,834 $ 25,860 $ 1,111,314 Special mention — — — 16,951 1,256 3,092 — 21,299 Substandard — — — 630 4,993 3,642 398 9,663 Doubtful — — — — — — — — Loss — — — — — — — —
Total commercial real estate 227,850 177,691 142,407 175,728 164,774 227,568 26,258 1,142,276 Construction and developmentRisk rating:
Pass 18,262 6,523 10,349 6,008 2,693 7,153 123,843 174,831 Special mention — — — — — 286 3,827 4,113 Substandard — — — — — 482 — 482 Doubtful — — — — — — — — Loss — — — — — 1 — 1
Total construction and development 18,262 6,523 10,349 6,008 2,693 7,922 127,670 179,427 Commercial and industrialRisk rating:
Pass 29,606 14,010 18,826 10,759 15,346 10,589 36,165 135,301 Special mention — 21 438 110 32 125 37 763 Substandard 31 33 300 — — 83 4,829 5,276 Doubtful — — — — — — — — Loss — — — — — 1 — 1
Total commercial and industrial 29,637 14,064 19,564 10,869 15,378 10,798 41,031 141,341 Equipment financeRisk rating:
Pass 154,685 104,681 53,178 4,773 — — — 317,317 Special mention — — — — — — — Substandard — — 323 — — — — 323 Doubtful — — 280 — — — — 280 Loss — — — — — — — —
Total equipment finance 154,685 104,681 53,781 4,773 — — — 317,920 Municipal leasesRisk rating:
Pass 23,358 19,240 14,005 17,979 9,738 47,144 8,700 140,164 Special mention — — — — — 257 — 257 Substandard — — — — — — — — Doubtful — — — — — — — — Loss — — — — — — —
Total municipal leases 23,358 19,240 14,005 17,979 9,738 47,401 8,700 140,421 PPP loansRisk rating:
Pass 29,667 16,983 — — — — — 46,650 Special mention — — — — — — — — Substandard — — — — — — — — Doubtful — — — — — — — — Loss — — — — — — — —
Total PPP loans 29,667 16,983 — — — — — 46,650 Total commercial loansRisk rating:
Pass 483,428 339,128 238,765 197,666 186,302 285,720 194,568 1,925,577 Special mention — 21 438 17,061 1,288 3,760 3,864 26,432 Substandard 31 33 623 630 4,993 4,207 5,227 15,744 Doubtful — — 280 — — — — 280 Loss — — — — — 2 — 2
Total commercial loans $ 483,459 $ 339,182 $ 240,106 $ 215,357 $ 192,583 $ 293,689 $ 203,659 $ 1,968,035
93
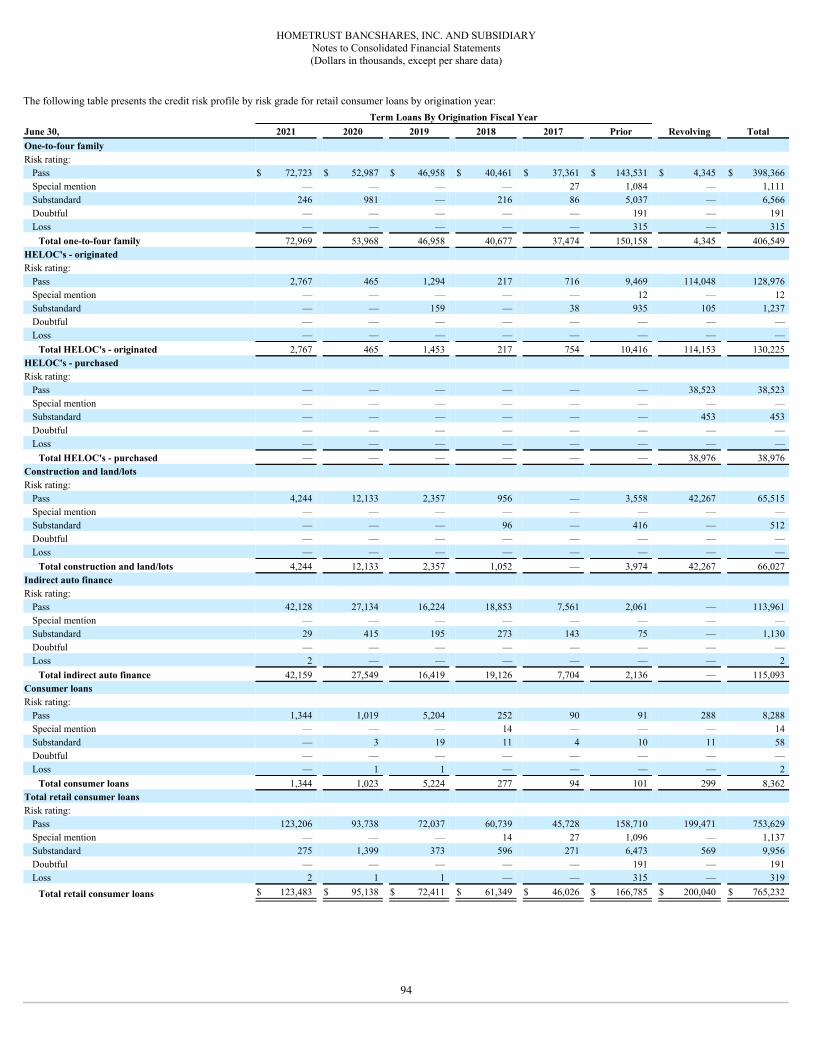
HOMETRUST BANCSHARES, INC. AND SUBSIDIARYNotes to Consolidated Financial Statements(Dollars in thousands, except per share data)
The following table presents the credit risk profile by risk grade for retail consumer loans by origination year: Term Loans By Origination Fiscal Year
June 30, 2021 2020 2019 2018 2017 Prior Revolving TotalOne-to-four familyRisk rating:
Pass $ 72,723 $ 52,987 $ 46,958 $ 40,461 $ 37,361 $ 143,531 $ 4,345 $ 398,366 Special mention — — — — 27 1,084 — 1,111 Substandard 246 981 — 216 86 5,037 — 6,566 Doubtful — — — — — 191 — 191 Loss — — — — — 315 — 315
Total one-to-four family 72,969 53,968 46,958 40,677 37,474 150,158 4,345 406,549 HELOC's - originatedRisk rating:
Pass 2,767 465 1,294 217 716 9,469 114,048 128,976 Special mention — — — — — 12 — 12 Substandard — — 159 — 38 935 105 1,237 Doubtful — — — — — — — — Loss — — — — — — — —
Total HELOC's - originated 2,767 465 1,453 217 754 10,416 114,153 130,225 HELOC's - purchasedRisk rating:
Pass — — — — — — 38,523 38,523 Special mention — — — — — — — — Substandard — — — — — — 453 453 Doubtful — — — — — — — — Loss — — — — — — — —
Total HELOC's - purchased — — — — — — 38,976 38,976 Construction and land/lotsRisk rating:
Pass 4,244 12,133 2,357 956 — 3,558 42,267 65,515 Special mention — — — — — — — — Substandard — — — 96 — 416 — 512 Doubtful — — — — — — — — Loss — — — — — — — —
Total construction and land/lots 4,244 12,133 2,357 1,052 — 3,974 42,267 66,027 Indirect auto financeRisk rating:
Pass 42,128 27,134 16,224 18,853 7,561 2,061 — 113,961 Special mention — — — — — — — — Substandard 29 415 195 273 143 75 — 1,130 Doubtful — — — — — — — — Loss 2 — — — — — — 2
Total indirect auto finance 42,159 27,549 16,419 19,126 7,704 2,136 — 115,093 Consumer loansRisk rating:
Pass 1,344 1,019 5,204 252 90 91 288 8,288 Special mention — — — 14 — — — 14 Substandard — 3 19 11 4 10 11 58 Doubtful — — — — — — — — Loss — 1 1 — — — — 2
Total consumer loans 1,344 1,023 5,224 277 94 101 299 8,362 Total retail consumer loansRisk rating:
Pass 123,206 93,738 72,037 60,739 45,728 158,710 199,471 753,629 Special mention — — — 14 27 1,096 — 1,137 Substandard 275 1,399 373 596 271 6,473 569 9,956 Doubtful — — — — — 191 — 191 Loss 2 1 1 — — 315 — 319
Total retail consumer loans $ 123,483 $ 95,138 $ 72,411 $ 61,349 $ 46,026 $ 166,785 $ 200,040 $ 765,232
94

HOMETRUST BANCSHARES, INC. AND SUBSIDIARYNotes to Consolidated Financial Statements(Dollars in thousands, except per share data)
The following table presents the credit risk profile by risk grade for total non-purchased and purchased performing consumer and commercial loans, prior to the adoption of ASU2016-13:
PassSpecial Mention Substandard Doubtful Loss Total
June 30, 2020Commercial loans:
Commercial real estate $ 1,028,709 $ 7,580 $ 10,779 $ — $ 16 $ 1,047,084 Construction and development 212,370 2,723 250 1 — 215,344 Commercial and industrial 130,202 20,439 2,622 — — 153,263 Equipment finance 228,288 150 801 — — 229,239 Municipal leases 127,706 281 — — — 127,987 PPP loans 80,697 — — — — 80,697
Retail consumer loans:One-to-four family 458,248 1,724 9,042 206 — 469,220 HELOCs - originated 134,697 902 1,848 — — 137,447 HELOCs - purchased 71,119 — 662 — — 71,781 Construction and land/lots 81,112 — 402 — — 81,514 Indirect auto finance 130,975 — 1,328 — 132,303 Consumer 9,894 4 361 — — 10,259
Total loans $ 2,694,017 $ 33,803 $ 28,095 $ 207 $ 16 $ 2,756,138
The following table presents the credit risk profile by risk grade for PCI consumer and commercial loans, prior to adoption of ASU 2016-13:
PassSpecial Mention Substandard Doubtful Loss Total
June 30, 2020Commercial loans:
Commercial real estate $ 3,181 $ 1,742 $ 899 $ — $ — $ 5,822 Construction and development 271 — 319 — — 590 Commercial and industrial 1,556 — 3 — 3 1,562
Retail consumer loans:One-to-four family 2,994 465 1,014 — — 4,473 Construction and land/lots 108 — 237 — — 345
Total loans $ 8,110 $ 2,207 $ 2,472 $ — $ 3 $ 12,792
95
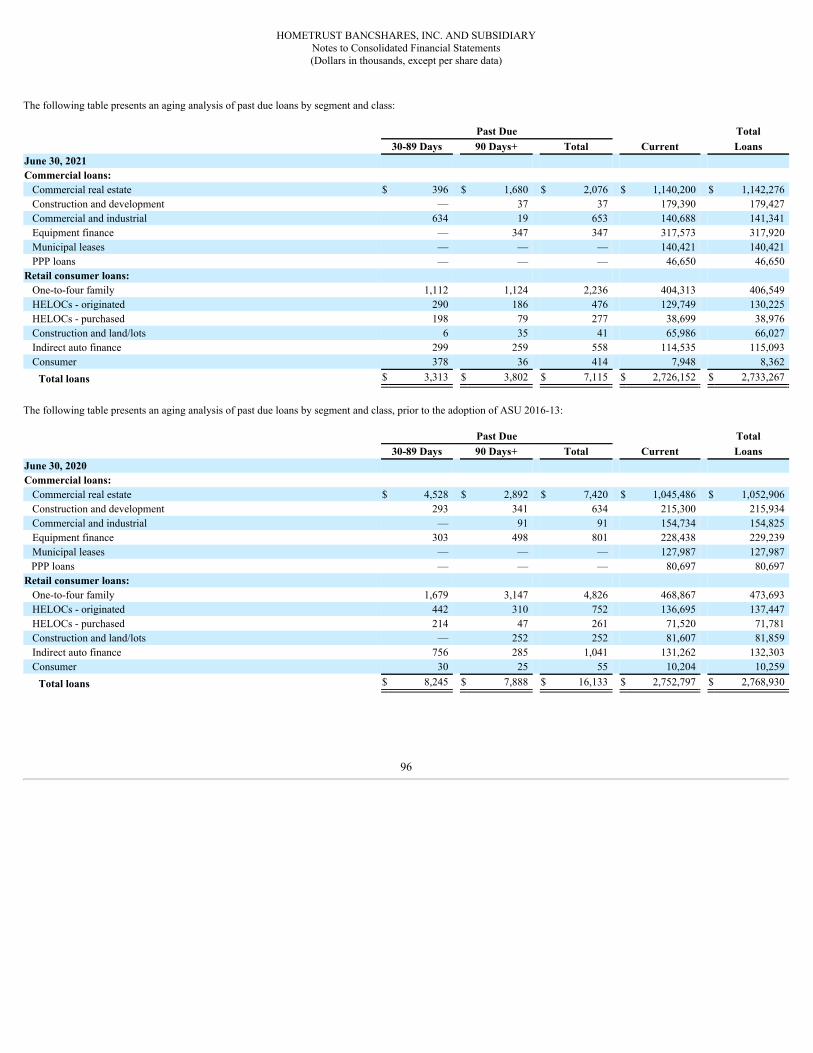
HOMETRUST BANCSHARES, INC. AND SUBSIDIARYNotes to Consolidated Financial Statements(Dollars in thousands, except per share data)
The following table presents an aging analysis of past due loans by segment and class:
Past Due Total30-89 Days 90 Days+ Total Current Loans
June 30, 2021Commercial loans:
Commercial real estate $ 396 $ 1,680 $ 2,076 $ 1,140,200 $ 1,142,276 Construction and development — 37 37 179,390 179,427 Commercial and industrial 634 19 653 140,688 141,341 Equipment finance — 347 347 317,573 317,920 Municipal leases — — — 140,421 140,421 PPP loans — — — 46,650 46,650
Retail consumer loans:One-to-four family 1,112 1,124 2,236 404,313 406,549 HELOCs - originated 290 186 476 129,749 130,225 HELOCs - purchased 198 79 277 38,699 38,976 Construction and land/lots 6 35 41 65,986 66,027 Indirect auto finance 299 259 558 114,535 115,093 Consumer 378 36 414 7,948 8,362
Total loans $ 3,313 $ 3,802 $ 7,115 $ 2,726,152 $ 2,733,267
The following table presents an aging analysis of past due loans by segment and class, prior to the adoption of ASU 2016-13:
Past Due Total30-89 Days 90 Days+ Total Current Loans
June 30, 2020Commercial loans:
Commercial real estate $ 4,528 $ 2,892 $ 7,420 $ 1,045,486 $ 1,052,906 Construction and development 293 341 634 215,300 215,934 Commercial and industrial — 91 91 154,734 154,825 Equipment finance 303 498 801 228,438 229,239 Municipal leases — — — 127,987 127,987 PPP loans — — — 80,697 80,697
Retail consumer loans:One-to-four family 1,679 3,147 4,826 468,867 473,693 HELOCs - originated 442 310 752 136,695 137,447 HELOCs - purchased 214 47 261 71,520 71,781 Construction and land/lots — 252 252 81,607 81,859 Indirect auto finance 756 285 1,041 131,262 132,303 Consumer 30 25 55 10,204 10,259
Total loans $ 8,245 $ 7,888 $ 16,133 $ 2,752,797 $ 2,768,930
96

HOMETRUST BANCSHARES, INC. AND SUBSIDIARYNotes to Consolidated Financial Statements(Dollars in thousands, except per share data)
The following table presents recorded investment in loans on nonaccrual status, by segment and class, including restructured loans. It also includes interest income recognized onnonaccrual loans for the year ended June 30, 2021.
June 30, 2021 June 30, 2020
90 Days + &still accruing as of
June 30, 2021
Nonaccrual with noallowance as ofJune 30, 2021
Interest incomerecognized
Commercial loans:Commercial real estate $ 7,015 $ 8,869 $ — $ 3,849 $ 280 Construction and development 482 465 — 80 41 Commercial and industrial 49 259 — 24 15 Equipment finance 630 801 — 275 160
Retail consumer loans:One-to-four family 2,625 3,582 — 807 160 HELOCs - originated 476 531 — — 37 HELOCs - purchased 453 662 — — 23 Construction and land/lots 22 37 — — — Indirect auto finance 438 668 — — 37 Consumer 416 49 — — 9
Total loans $ 12,606 $ 15,923 $ — $ 5,035 $ 762
The decrease in the nonaccrual balance in the above schedule, compared to June 30, 2020, is mainly due to the payoffs and charge offs of five loans totaling $3,298, and theaddition to nonaccrual loans of $486 of PCI loans, formerly accounted for as credit impaired loans, prior to the adoption of ASU 2016-13, partially offset by two equipmentfinance loans moving into nonaccrual during the fiscal year. These loans were previously excluded from nonaccrual loans. The adoption of CECL resulted in the discontinuationof pool-level accounting for acquired credit impaired loans which was replaced with a loan-level evaluation for nonaccrual status.
TDRs are loans which have renegotiated loan terms to assist borrowers who are unable to meet the original terms of their loans. Such modifications to loan terms may include alower interest rate, a reduction in principal, or a longer term to maturity.
The Company’s loans that were performing under the payment terms of TDRs that were excluded from nonaccruing loans above at the dates indicated follows:
June 30,2021 2020
Performing TDRs $ 11,088 $ 13,153
The following table presents a breakdown of the provision (benefit) for credit losses included in our Consolidated Statements of Income:
Year Ended June 30,2021 2020
Provision (benefit) for credit losses:Loans $ (7,270) $ 8,500 Off-balance-sheet credit exposure 35 — Commercial paper 100 —
Total provision (benefit) for credit losses $ (7,135) $ 8,500
97

HOMETRUST BANCSHARES, INC. AND SUBSIDIARYNotes to Consolidated Financial Statements(Dollars in thousands, except per share data)
The following table presents an analysis of the ACL on loans by segment:
Year Ended June 30, 2021
CommercialRetail
Consumer TotalBalance at beginning of period $ 21,116 $ 6,956 $ 28,072
Impact of adoption ASU 2016-13 4,073 10,736 14,809 Benefit for credit losses (758) (6,512) (7,270)Charge-offs (1,977) (1,556) (3,533)Recoveries 2,292 1,098 3,390 Net recoveries (charge-offs) 315 (458) (143)
Balance at end of period $ 24,746 $ 10,722 $ 35,468
The following table presents an analysis of ALL by segment, prior to the adoption of ASU 2016-13:Year Ended June 30, 2020
PCI CommercialRetail
Consumer TotalBalance at beginning of period $ 201 $ 14,809 $ 6,419 $ 21,429
Provision (benefit) for credit losses (19) 8,656 (137) 8,500 Charge-offs — (2,961) (855) (3,816)Recoveries — 480 1,479 1,959
Balance at end of period $ 182 $ 20,984 $ 6,906 $ 28,072
Year Ended June 30, 2019
PCI CommercialRetail
Consumer TotalBalance at beginning of period $ 483 $ 13,050 $ 7,527 $ 21,060
Provision (benefit) for credit losses (282) 7,226 (1,244) 5,700 Charge-offs — (6,273) (1,136) (7,409)Recoveries — 806 1,272 2,078
Balance at end of period $ 201 $ 14,809 $ 6,419 $ 21,429
98

HOMETRUST BANCSHARES, INC. AND SUBSIDIARYNotes to Consolidated Financial Statements(Dollars in thousands, except per share data)
The following table presents ending balances of loans and the related ACL, by segment and class:
Allowance for Credit Losses Total Loans ReceivableLoans
Individually Evaluated
Loans Collectively Evaluated Total
Loans Individually
Evaluated
Loans Collectively Evaluated Total
June 30, 2021Commercial loans:
Commercial real estate $ 456 $ 12,826 $ 13,282 $ 5,729 $ 1,136,547 $ 1,142,276 Construction and development — 1,801 1,801 80 179,347 179,427 Commercial and industrial 9 2,583 2,592 760 140,581 141,341 Equipment finance — 6,537 6,537 275 317,645 317,920 Municipal leases — 534 534 — 140,421 140,421 PPP loans — — — — 46,650 46,650
Retail consumer loans:One-to-four family 2 5,407 5,409 1,977 404,572 406,549
HELOCs - originated — 1,512 1,512 — 130,225 130,225 HELOCs - purchased — 452 452 — 38,976 38,976 Construction and land/lots — 812 812 — 66,027 66,027 Indirect auto finance — 2,367 2,367 — 115,093 115,093 Consumer — 170 170 — 8,362 8,362 Total $ 467 $ 35,001 $ 35,468 $ 8,821 $ 2,724,446 $ 2,733,267
The following table presents ending balances of loans and the related ALL, by segment and class, prior to the adoption of ASU 2016-13:
Allowance for Loan Losses Total Loans Receivable
PCI
Loans Individually
Evaluated for Impairment
Loans Collectively Evaluated Total PCI
Loans Individually
Evaluated for Impairment
Loans Collectively Evaluated Total
June 30, 2020Commercial loans:
Commercial real estate $ 113 $ 961 $ 10,731 $ 11,805 $ 5,822 $ 7,924 $ 1,039,160 $ 1,052,906 Construction and development 4 5 3,599 3,608 590 299 215,045 215,934 Commercial and industrial 15 31 2,153 2,199 1,562 852 152,411 154,825 Equipment finance — 209 2,598 2,807 — 801 228,438 229,239 Municipal leases — — 697 697 — — 127,987 127,987 PPP loans — — — — — — 80,697 80,697
Retail consumer loans:One-to-four family 17 52 2,400 2,469 4,473 4,304 464,916 473,693 HELOCs - originated — — 1,344 1,344 — — 137,447 137,447 HELOCs - purchased — — 430 430 — — 71,781 71,781 Construction and land/lots 33 — 1,409 1,442 345 296 81,218 81,859 Indirect auto finance — — 1,136 1,136 — 10 132,293 132,303 Consumer — — 135 135 — — 10,259 10,259
Total $ 182 $ 1,258 $ 26,632 $ 28,072 $ 12,792 $ 14,486 $ 2,741,652 $ 2,768,930
Prior to the adoption of ASU 2016-13, loans acquired from acquisitions were initially excluded from the allowance for loan losses in accordance with the acquisition method ofaccounting for business combinations. The Company recorded these loans at fair value, which includes a credit discount, therefore, no allowance for credit losses is establishedfor these acquired loans at acquisition. A provision for loan losses was recorded for any further deterioration in these acquired loans subsequent to the acquisition.
99

HOMETRUST BANCSHARES, INC. AND SUBSIDIARYNotes to Consolidated Financial Statements(Dollars in thousands, except per share data)
The following table presents impaired loans and the related allowance, by segment and class, excluding PCI loans, prior to the adoption of ASU 2016-13:
Total Impaired Loans
UnpaidPrincipalBalance
RecordedInvestment
With a Recorded Allowance
RecordedInvestmentWith No Recorded Allowance
Total RecordedInvestment
RelatedRecordedAllowance
June 30, 2020Commercial loans:
Commercial real estate $ 10,401 $ 8,062 $ 1,068 $ 9,130 $ 976 Construction and development 1,785 818 80 898 11 Commercial and industrial 9,782 1,058 26 1,084 34 Equipment finance 2,631 303 498 801 209
Retail consumer loans:One-to-four family 16,560 10,805 3,374 14,179 412 HELOCs - originated 2,087 1,585 53 1,638 43 HELOCs - purchased 662 662 — 662 3 Construction and land/lots 1,585 749 296 1,045 13 Indirect auto finance 1,075 486 241 727 5 Consumer 297 38 27 65 2
Total impaired loans $ 46,865 $ 24,566 $ 5,663 $ 30,229 $ 1,708
The table above includes $15,743 of recorded investments in impaired loans that were not individually evaluated because these loans did not meet the Company’s threshold forindividual impairment evaluation. The recorded allowance above includes $450 related to these loans that were not individually evaluated.
The following table presents average recorded investments in impaired loans and interest income recognized on impaired loans, prior to the adoption of ASU 2016-13:
Year Ended June 30,2020 2019
Average Recorded Investment
Interest Income
Recognized
Average Recorded Investment
Interest Income
RecognizedCommercial loans:
Commercial real estate $ 8,661 $ 336 $ 5,026 466Construction and development 1,218 54 1,779 65Commercial and industrial 868 236 315 249Equipment finance 652 29 192 37
Retail consumer loans:One-to-four family 14,796 687 17,319 950HELOCs - originated 1,698 99 1,005 63HELOCs - purchased 533 41 320 13Construction and land/lots 1,149 83 1,441 94Indirect auto finance 547 53 373 29Consumer 194 7 1,328 67
Total loans $ 30,316 $ 1,625 $ 29,098 $ 2,033
100

HOMETRUST BANCSHARES, INC. AND SUBSIDIARYNotes to Consolidated Financial Statements(Dollars in thousands, except per share data)
The following table presents a summary of changes in the accretable yield for PCI loans, prior to the adoption of ASU 2016-13:
Year Ended June 30,2020 2019
Accretable yield, beginning of period $ 5,259 $ 5,734 Reclass from nonaccretable yield 458 576 Other changes, net (316) 1,018 Interest income (1,496) (2,069)
Accretable yield, end of period $ 3,905 $ 5,259
______________________________(1) Represents changes attributable to expected losses assumptions.(2) Represents changes in cash flows expected to be collected due to the impact of modifications, changes in prepayment assumptions, and changes in interest rates
In estimating ECL, ASC 326 prescribes that if foreclosure is expected, a CDA is required to be measured at the fair value of collateral, but as a practical expedient, if foreclosureis not expected, fair value measurement is optional. For those CDA loans measured at the fair value of collateral, a credit loss expense is recorded for loan amounts in excess offair value. The following table provides a breakdown between loans identified as CDAs and non-CDAs, by segment and class, and securing collateral, as well as collateralcoverage for those loans:
Type of Collateral and Extent to Which Collateral Secures FinancialAssets
ResidentialProperty
InvestmentProperty
CommercialProperty Business Assets
FinancialAssets NotConsideredCollateralDependent Total
June 30, 2021Commercial loans:
Commercial real estate $ — $ 3,421 $ 2,308 $ — $ 1,136,547 $ 1,142,276 Construction and development — 80 — — 179,347 179,427 Commercial and industrial — — — 25 141,316 141,341 Equipment finance — — — — 317,920 317,920 Municipal finance — — — — 140,421 140,421 PPP loans — — — — 46,650 46,650
Retail consumer loans:One-to-four family 807 — — — 405,742 406,549 HELOCs - originated — — — — 130,225 130,225 HELOCs - purchased — — — — 38,976 38,976 Construction and land/lots — — — — 66,027 66,027 Indirect auto finance — — — — 115,093 115,093 Consumer — — — — 8,362 8,362
Total $ 807 $ 3,501 $ 2,308 $ 25 $ 2,726,626 $ 2,733,267
Total collateral value $ 1,160 $ 3,602 $ 2,723 $ 26
(1)
(2)
101

HOMETRUST BANCSHARES, INC. AND SUBSIDIARYNotes to Consolidated Financial Statements(Dollars in thousands, except per share data)
The following table presents a breakdown of the types of concessions made on TDRs by loan class for the periods indicated below:
Year Ended June 30,2021 2020 2019
Number ofLoans
PreModificationOutstanding
RecordedInvestment
PostModificationOutstanding
RecordedInvestment
Number ofLoans
PreModificationOutstanding
RecordedInvestment
PostModificationOutstanding
RecordedInvestment
Number ofLoans
PreModificationOutstanding
RecordedInvestment
PostModificationOutstanding
RecordedInvestment
Below market interestrate:
Commercial:Commercial real estate — $ — $ — 1 $ 88 $ 86 — $ — $ —
Retail consumer:One-to-four family — — — — — — 1 85 84
Total below marketinterest rate — — — 1 88 86 1 85 84
Extended payment terms:Commercial:
Commercial andindustrial — — — 1 826 826 — — —
Retail consumer:One-to-four family — — — 2 70 61 1 34 34 Indirect auto finance 2 28 27 — — — — — — Consumer — — — — — — 2 34 33 Total extendedpayment terms 2 28 27 3 896 887 3 68 67
Other TDRs:Commercial:
Commercial real estate 1 4,408 3,421 1 30 21 3 5,440 5,427 Construction and
development — — — 1 182 79 1 182 182 Retail consumer:
One-to-four family 4 269 256 5 511 502 18 1,452 1,433 HELOCs - originated 2 53 74 1 27 27 — — — Construction and
land/lots 1 225 213 — — — 1 29 28 Indirect auto finance 13 180 131 3 63 49 1 33 26 Consumer 1 27 13 — — — 1 2 2 Total other TDRs 22 5,162 4,108 11 813 678 21 1,516 1,489 Total 24 $ 5,190 $ 4,135 15 $ 1,797 $ 1,651 25 $ 1,669 $ 1,640
102

HOMETRUST BANCSHARES, INC. AND SUBSIDIARYNotes to Consolidated Financial Statements(Dollars in thousands, except per share data)
The following table presents loans that were modified as TDRs within the previous 12 months and for which there was a payment default during the periods indicated below:
Year Ended June 30,2021 2020 2019
Number of Loans
Recorded Investment
Number of Loans
Recorded Investment
Number of Loans
Recorded Investment
Other TDRs:Commercial:
Construction and development — $ — 1 $79 — $ — Retail consumer:
One-to-four family — — — — 1 72 Consumer — — — — 1 2 Indirect auto finance 1 30 — — — —
Total 1 $ 30 1 $ 79 2 $ 74
Other TDRs include TDRs that have a below market interest rate and extended payment terms. The Company does not typically forgive principal when restructuring troubleddebt.
In the determination of the ACL, management considers TDRs for all loan classes, and the subsequent nonperformance in accordance with their modified terms, by measuringimpairment on a loan-by-loan basis based on either the value of the loan’s expected future cash flows discounted at the loan’s original effective interest rate or on the collateralvalue, net of the estimated costs of disposal, if the loan is collateral dependent.
Off-Balance-Sheet Credit Exposure
The Company maintains a separate reserve for credit losses on off-balance-sheet credit exposures, including unfunded loan commitments, which is included in other liabilities onthe consolidated balance sheet. The reserve for credit losses on off-balance-sheet credit exposures is adjusted as a provision for credit losses in the consolidated statement ofincome. The estimate includes consideration of the likelihood that funding will occur and an estimate of ECLs on commitments expected to be funded over its estimated life,utilizing the same models and approaches for the Company's other loan portfolio segments described above, as these unfunded commitments share similar risk characteristics asits loan portfolio segments. The Company has identified the unfunded portion of certain lines of credit as unconditionally cancellable credit exposures, meaning the Companycan cancel the unfunded commitment at any time. No credit loss estimate is reported for off-balance-sheet credit exposures that are unconditionally cancellable by the Companyor for undrawn amounts under such arrangements that may be drawn prior to the cancellation of the arrangement.
Modifications and deferrals in response to COVID-19
Beginning in March 2020, the Company began offering short-term loan modifications for full deferral of principal and interest to assist borrowers during the COVID-19pandemic. The CARES Act along with a joint agency statement issued by banking agencies and confirmed by FASB staff stated that short-term modifications made in responseto COVID-19 are not considered TDRs. Accordingly, the Company does not account for such loan modifications as TDRs.
The Bank offered payment and financial relief programs for borrowers impacted by COVID-19. These programs include full principal and interest loan payment deferrals for upto 90 days (which can be renewed for another 90 days under certain circumstances) waived late fees, and suspension of foreclosure proceedings and repossessions. Since March2020, the Company received numerous requests from borrowers for some type of payment relief; however, substantially all full principal and interest payment deferrals haveended and borrowers are again making regular loan payments. The breakout of loans deferred by loan type as of the dates indicated is as follows:
103

HOMETRUST BANCSHARES, INC. AND SUBSIDIARYNotes to Consolidated Financial Statements(Dollars in thousands, except per share data)
Principal and Interest Deferrals by Loan TypesJune 30,
2021 2020
DeferralPercent of TotalLoan Portfolio Deferral
Percent of TotalLoan Portfolio
Lodging $ — — % $ 108,171 4.0 %Other commercial real estate, construction and development, and commercial and industrial — — 367,443 13.7 Equipment finance — — 33,693 1.3 One-to-four family — — 36,821 1.4 Other consumer loans 107 — 5,203 0.2 Total $ 107 — % $ 551,331 20.5 %
___________________________(1) Modified loans are not included in classified assets or nonperforming asset.(2) Principal and interest is being deferred.
Substantially all loans placed on principal and interest payment deferral during the pandemic have come out of deferral as of June 30, 2021. However, the Company has allowedfor continued relief to borrowers in the form of interest-only payments for certain loans that were originally placed on full principal and interest payment deferral. As of June 30,2021, the Company had $78,850 in commercial loans on interest-only payments for a period of time no greater than 12 months before requiring that they return to their originalcontractual payments.
(1)(2)
104

HOMETRUST BANCSHARES, INC. AND SUBSIDIARYNotes to Consolidated Financial Statements(Dollars in thousands, except per share data)
6. Premises and Equipment
Premises and equipment as of the dates indicated consist of the following:
June 30,2021 2020
Land $ 25,488 $ 20,785 Office buildings 68,861 59,333 Furniture, fixtures and equipment 16,244 15,724
Total 110,593 95,842 Less accumulated depreciation (39,684) (37,380)
Premises and equipment, net $ 70,909 $ 58,462
7. Accrued Interest Receivable
Accrued interest receivable as of the dates indicated consists of the following:
June 30,2021 2020
Loans $ 7,043 $ 11,360 Debt securities available for sale 754 710 Other 136 242
Total $ 7,933 $ 12,312
8. Goodwill and Core Deposit Intangibles
The carrying amount of the Company's goodwill was $25,638 as of June 30, 2021 and 2020. Amortization expense related to core deposit intangibles was $735, $1,421, and$2,029 for the years ended June 30, 2021, 2020, and 2019, respectively. As of June 30, 2021, the estimated amortization expense for each of the next five years is as follows:
2022 $ 250 2023 90 2024 3 2025 — 2026 —
Total $ 343
9. Deposit Accounts
Deposit accounts at the dates indicated consist of the following:
Weighted Average Interest Rates
June 30, June 30,2021 2020 2021 2020
Noninterest-bearing accounts $ 636,414 $ 429,901 — % — %NOW accounts 644,958 582,299 0.09 % 0.10 %Money market accounts 975,001 836,738 0.15 % 0.46 %Savings accounts 226,391 197,676 0.06 % 0.07 %Certificates of deposit 472,777 739,142 0.74 % 1.45 %
Total $ 2,955,541 $ 2,785,756 0.19 % 0.54 %
Deposits received from executive officers and directors and their associates totaled approximately $4,618 and $4,307 at June 30, 2021 and 2020, respectively.
105
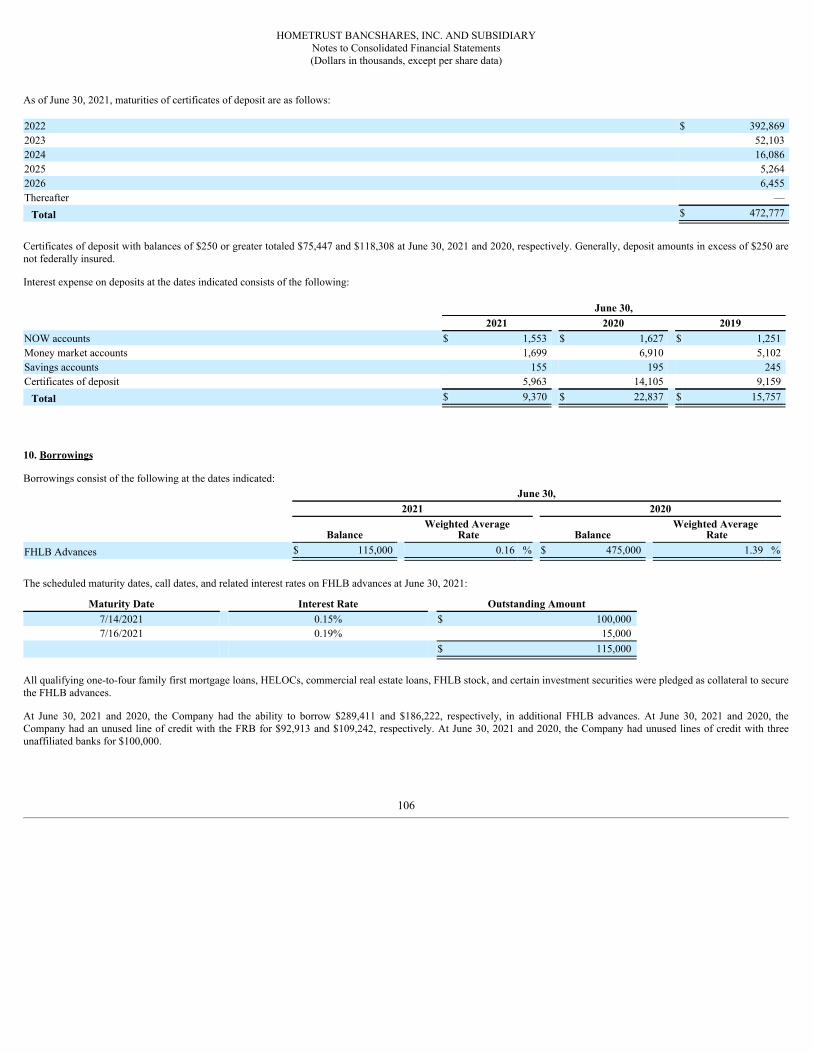
HOMETRUST BANCSHARES, INC. AND SUBSIDIARYNotes to Consolidated Financial Statements(Dollars in thousands, except per share data)
As of June 30, 2021, maturities of certificates of deposit are as follows:
2022 $ 392,869 2023 52,103 2024 16,086 2025 5,264 2026 6,455 Thereafter —
Total $ 472,777
Certificates of deposit with balances of $250 or greater totaled $75,447 and $118,308 at June 30, 2021 and 2020, respectively. Generally, deposit amounts in excess of $250 arenot federally insured.
Interest expense on deposits at the dates indicated consists of the following:
June 30,2021 2020 2019
NOW accounts $ 1,553 $ 1,627 $ 1,251 Money market accounts 1,699 6,910 5,102 Savings accounts 155 195 245 Certificates of deposit 5,963 14,105 9,159
Total $ 9,370 $ 22,837 $ 15,757
10. Borrowings
Borrowings consist of the following at the dates indicated:June 30,
2021 2020
BalanceWeighted Average
Rate BalanceWeighted Average
RateFHLB Advances $ 115,000 0.16 % $ 475,000 1.39 %
The scheduled maturity dates, call dates, and related interest rates on FHLB advances at June 30, 2021:
Maturity Date Interest Rate Outstanding Amount7/14/2021 0.15% $ 100,000 7/16/2021 0.19% 15,000
$ 115,000
All qualifying one-to-four family first mortgage loans, HELOCs, commercial real estate loans, FHLB stock, and certain investment securities were pledged as collateral to securethe FHLB advances.
At June 30, 2021 and 2020, the Company had the ability to borrow $289,411 and $186,222, respectively, in additional FHLB advances. At June 30, 2021 and 2020, theCompany had an unused line of credit with the FRB for $92,913 and $109,242, respectively. At June 30, 2021 and 2020, the Company had unused lines of credit with threeunaffiliated banks for $100,000.
106

HOMETRUST BANCSHARES, INC. AND SUBSIDIARYNotes to Consolidated Financial Statements(Dollars in thousands, except per share data)
11. Leases
As Lessee - Operating Leases
The Company's operating leases primarily include office space and bank branches. Certain leases include one or more options to renew, with renewal terms that can extend thelease term up to 15 additional years. The exercise of lease renewal options is at our sole discretion. When it is reasonably certain that the Company will exercise our option torenew or extend the lease term, that option is included in estimating the value of the ROU and lease liability. At June 30, 2021, the Company had one lease that had not yetcommenced for which it had created a ROU asset and a lease liability. The Company's lease agreements do not contain any material residual value guarantees or materialrestrictive covenants. Most of the Company's lease agreements include periodic rate adjustments for inflation. The depreciable life of ROU assets and leasehold improvementsare limited to the shorter of the useful life or the expected lease term. Leases with an initial term of 12 months or less are not recorded on the Company's Consolidated BalanceSheets. The Company recognize lease expenses for these leases over the lease term.
The following tables present supplemental balance sheet information related to operating leases. ROU assets are included in other assets and lease liabilities are included in otherliabilities.
June 30,2021 2020
Supplemental balance sheet information:
ROU assets $ 5,498 $ 4,601 Lease liabilities $ 5,926 $ 4,590 Weighted-average remaining lease terms 9.49 5.02Weighted-average discount rate 3.18 % 2.97 %
The following schedule summarizes aggregate future minimum lease payments under these operating leases at June 30, 2021:
Fiscal year ending June 30:2022 $ 1,405 2023 1,347 2024 876 2025 492 2026 371 Thereafter 2,375
Total of future minimum payments $ 6,866
The following table presents components of operating lease expense for the year ended:
Year Ended June 30,2021 2020
Operating lease cost (included in occupancy expense) $ 1,818 $ 1,821 Sublease income (included in other, net noninterest income) (223) (242)
Total operating lease expense, net $ 1,595 $ 1,579
As Lessee - Finance Lease
The Company currently leases land for one of its branch office locations under a finance lease. The ROU asset for the finance lease totaled $2,052 at June 30, 2021 and 2020 andis included in other assets. The corresponding lease liability totaled $1,804 and $1,843 at June 30, 2021 and 2020, respectively, and is included in other liabilities. For the yearended June 30, 2021 and 2020, interest expense on the lease liability totaled $95 and $97, respectively. The finance lease has a maturity date of July 2028 and a discount rate of5.18%.
107

HOMETRUST BANCSHARES, INC. AND SUBSIDIARYNotes to Consolidated Financial Statements(Dollars in thousands, except per share data)
The following schedule summarizes aggregate future minimum lease payments under this finance lease obligation at June 30, 2021:
Fiscal year ending June 30:2022 $ 134 2023 134 2024 145 2025 146 2026 146 Thereafter 1,702
Total minimum lease payments 2,407 Less: amount representing interest (603)
Present value of net minimum lease payments $ 1,804
Supplemental lease cash flow information for the year ended June 30:
Year Ended June 30,2021 2020
ROU assets - noncash additions (operating leases) $ 2,586 $ 5,296 ROU assets - noncash addition (finance lease) — 2,052 Cash paid for amounts included in the measurement of lease liabilities (operating leases) 2,036 2,142 Cash paid for amounts included in the measurement of lease liabilities (finance leases) 134 134
As Lessor - General
The Company leases equipment to commercial end users under operating and finance lease arrangements. Our equipment finance leases consist mainly of construction,transportation, medical, and manufacturing equipment. Many of our operating and finance leases offer the lessee the option to purchase the equipment at fair value or for anominal fixed purchase option; and most of the leases that do not have a nominal purchase option include renewal provisions resulting in some leases continuing beyond initialcontractual terms. Our leases do not include early termination options, and continued rent payments are due if leased equipment is not returned at the end of the lease.
As Lessor - Operating Leases
Operating lease income is recognized as a component of noninterest income on a straight-line basis over the lease term. Lease terms range from 1 to 5 years. Assets related tooperating leases are included in other assets and the corresponding depreciation expense is recorded on a straight-line basis as a component of other noninterest expense. The netbook value of leased assets totaled $25,932 and $21,595 with a residual value of $15,330 and $12,370 as of June 30, 2021 and 2020, respectively. For the years ended June 30,2021 and 2020, equipment finance operating lease income totaled $5,601 and $3,356, respectively. For the years ended June 30, 2021 and 2020, depreciation expense totaled$5,864 and $2,394, respectively.
The following schedule summarizes aggregate future minimum operating lease payments to be received at June 30, 2021:
Fiscal year ending June 30:2022 $ 1,684 2023 5,705 2024 3,890 2025 1,685 2026 449 Thereafter 127
Total of future minimum payments $ 13,540
108
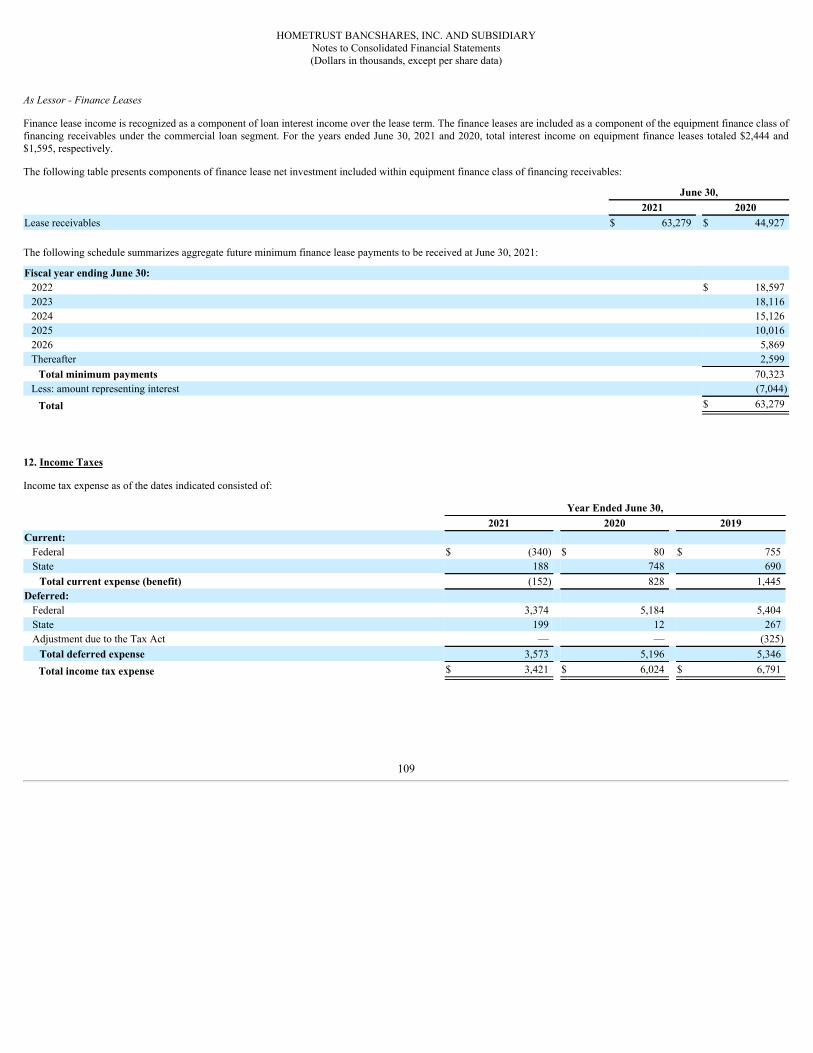
HOMETRUST BANCSHARES, INC. AND SUBSIDIARYNotes to Consolidated Financial Statements(Dollars in thousands, except per share data)
As Lessor - Finance Leases
Finance lease income is recognized as a component of loan interest income over the lease term. The finance leases are included as a component of the equipment finance class offinancing receivables under the commercial loan segment. For the years ended June 30, 2021 and 2020, total interest income on equipment finance leases totaled $2,444 and$1,595, respectively.
The following table presents components of finance lease net investment included within equipment finance class of financing receivables:
June 30,2021 2020
Lease receivables $ 63,279 $ 44,927
The following schedule summarizes aggregate future minimum finance lease payments to be received at June 30, 2021:
Fiscal year ending June 30:2022 $ 18,597 2023 18,116 2024 15,126 2025 10,016 2026 5,869 Thereafter 2,599
Total minimum payments 70,323 Less: amount representing interest (7,044)
Total $ 63,279
12. Income Taxes
Income tax expense as of the dates indicated consisted of:
Year Ended June 30,2021 2020 2019
Current:Federal $ (340) $ 80 $ 755 State 188 748 690
Total current expense (benefit) (152) 828 1,445 Deferred:
Federal 3,374 5,184 5,404 State 199 12 267 Adjustment due to the Tax Act — — (325)
Total deferred expense 3,573 5,196 5,346 Total income tax expense $ 3,421 $ 6,024 $ 6,791
109

HOMETRUST BANCSHARES, INC. AND SUBSIDIARYNotes to Consolidated Financial Statements(Dollars in thousands, except per share data)
The provision for income taxes differs from the amount of income tax determined by applying the applicable U.S. statutory federal income tax rate to income before incometaxes as a result of the following differences for the periods indicated:
Year Ended June 30,2021 2020 2019
Amount Rate Amount Rate Amount RateTax at federal income tax rate $ 4,010 21 % $ 6,049 21 % $ 7,127 21 %Increase (decrease) resulting from:
Tax exempt income (911) (5)% (872) (3)% (855) (2)%Change in valuation allowance for deferred tax
assets, allocated to income tax expense — — % — — % (325) (1)%State tax, net of federal benefit 306 2 % 600 2 % 756 2 %Other 16 — % 247 1 % 88 — %
Total $ 3,421 18 % $ 6,024 21 % $ 6,791 20 %
The sources and tax effects of temporary differences that give rise to significant portions of the deferred tax assets (liabilities) at June 30, 2021 and 2020 are presented below:
June 30,2021 2020
Deferred tax assets:Allowance for credit losses $ 8,158 $ 6,456 Deferred compensation and post-retirement benefits 8,349 8,637 Impairments on real estate owned 110 198 Other than temporary impairment on investments 2,205 2,207 Net operating loss carryforward 4,489 4,513 Discount from business combination 2,474 2,192 Stock compensation plans 2,166 2,279 Other 1,412 1,274
Total gross deferred tax assets 29,363 27,756 Deferred tax (liabilities):
Depreciable basis of fixed assets (6,555) (6,017)Deferred loan fees (753) (603)FHLB stock, book basis in excess of tax (89) (89)Unrealized gain on debt securities available for sale (452) (602)Other (4,613) (4,111)
Total gross deferred tax liabilities (12,462) (11,422)Net deferred tax assets $ 16,901 $ 16,334
The Company had federal NOL carry forwards of $21,377 and $21,488 as of June 30, 2021 and June 30, 2020, respectively, with a recorded tax benefit of $4,489 and $4,513included in deferred tax assets. The majority of these NOLs will expire for federal tax purposes from 2028 through 2036, if not previously used.
Retained earnings at June 30, 2021 and 2020 include $19,570 representing pre-1988 tax bad debt reserve base year amounts for which no deferred tax liability has been providedsince these reserves are not expected to reverse and may never reverse. Circumstances that would require an accrual of a portion or all of this unrecorded tax liability are a failureto meet the definition of a bank, dividend payments in excess of current year or accumulated earnings and profits, or other distributions in dissolution or liquidation of the Bank.The Company is no longer subject to examination for federal and state purposes for tax years prior to 2017.
13. Employee Benefit Plans
The HomeTrust Bank KSOP Plan is comprised of two components, the 401(k) Plan and the ESOP. The KSOP benefits employees with at least 1,000 hours of service during a12-month period and who have attained age 21. Under the 401(k), the Company matches employee contributions at 50% of employee deferrals up to 6% of each employee’scompensation. The Company may also make discretionary profit sharing contributions for the benefit of all eligible participants as long as total contributions do not exceedapplicable limitations. Employees become fully vested in the Company’s contributions after six years of service. Under the ESOP, the amount of the Bank's annual contributionis discretionary; however, it must be sufficient to pay the annual loan payment to the Company.
110
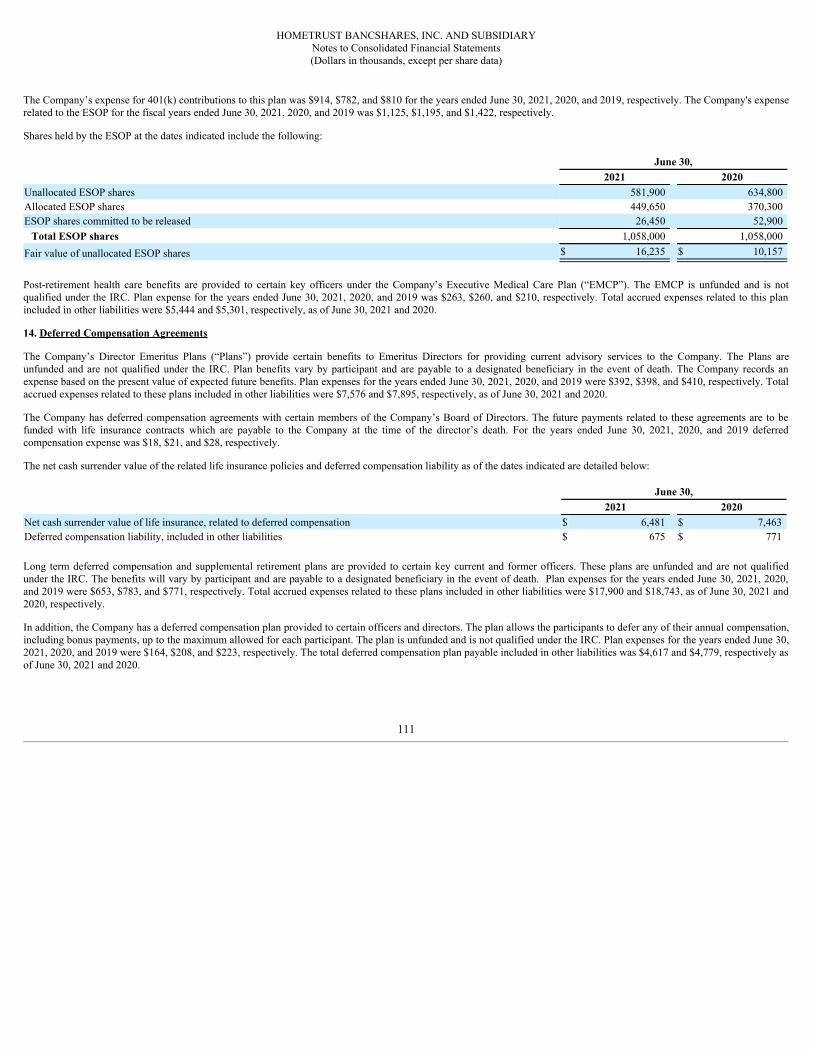
HOMETRUST BANCSHARES, INC. AND SUBSIDIARYNotes to Consolidated Financial Statements(Dollars in thousands, except per share data)
The Company’s expense for 401(k) contributions to this plan was $914, $782, and $810 for the years ended June 30, 2021, 2020, and 2019, respectively. The Company's expenserelated to the ESOP for the fiscal years ended June 30, 2021, 2020, and 2019 was $1,125, $1,195, and $1,422, respectively.
Shares held by the ESOP at the dates indicated include the following:
June 30,2021 2020
Unallocated ESOP shares 581,900 634,800 Allocated ESOP shares 449,650 370,300 ESOP shares committed to be released 26,450 52,900
Total ESOP shares 1,058,000 1,058,000 Fair value of unallocated ESOP shares $ 16,235 $ 10,157
Post-retirement health care benefits are provided to certain key officers under the Company’s Executive Medical Care Plan (“EMCP”). The EMCP is unfunded and is notqualified under the IRC. Plan expense for the years ended June 30, 2021, 2020, and 2019 was $263, $260, and $210, respectively. Total accrued expenses related to this planincluded in other liabilities were $5,444 and $5,301, respectively, as of June 30, 2021 and 2020.
14. Deferred Compensation Agreements
The Company’s Director Emeritus Plans (“Plans”) provide certain benefits to Emeritus Directors for providing current advisory services to the Company. The Plans areunfunded and are not qualified under the IRC. Plan benefits vary by participant and are payable to a designated beneficiary in the event of death. The Company records anexpense based on the present value of expected future benefits. Plan expenses for the years ended June 30, 2021, 2020, and 2019 were $392, $398, and $410, respectively. Totalaccrued expenses related to these plans included in other liabilities were $7,576 and $7,895, respectively, as of June 30, 2021 and 2020.
The Company has deferred compensation agreements with certain members of the Company’s Board of Directors. The future payments related to these agreements are to befunded with life insurance contracts which are payable to the Company at the time of the director’s death. For the years ended June 30, 2021, 2020, and 2019 deferredcompensation expense was $18, $21, and $28, respectively.
The net cash surrender value of the related life insurance policies and deferred compensation liability as of the dates indicated are detailed below:
June 30,2021 2020
Net cash surrender value of life insurance, related to deferred compensation $ 6,481 $ 7,463 Deferred compensation liability, included in other liabilities $ 675 $ 771
Long term deferred compensation and supplemental retirement plans are provided to certain key current and former officers. These plans are unfunded and are not qualifiedunder the IRC. The benefits will vary by participant and are payable to a designated beneficiary in the event of death. Plan expenses for the years ended June 30, 2021, 2020,and 2019 were $653, $783, and $771, respectively. Total accrued expenses related to these plans included in other liabilities were $17,900 and $18,743, as of June 30, 2021 and2020, respectively.
In addition, the Company has a deferred compensation plan provided to certain officers and directors. The plan allows the participants to defer any of their annual compensation,including bonus payments, up to the maximum allowed for each participant. The plan is unfunded and is not qualified under the IRC. Plan expenses for the years ended June 30,2021, 2020, and 2019 were $164, $208, and $223, respectively. The total deferred compensation plan payable included in other liabilities was $4,617 and $4,779, respectively asof June 30, 2021 and 2020.
111

HOMETRUST BANCSHARES, INC. AND SUBSIDIARYNotes to Consolidated Financial Statements(Dollars in thousands, except per share data)
15. Net Income per Share
The following is a reconciliation of the numerator and denominator of basic and diluted net income per share of common stock as of the dates indicated:
Year Ended June 30,2021 2020 2019
Numerator:Net income $ 15,675 $ 22,783 $ 27,146 Allocation of earnings to participating securities (145) (194) (189)
Numerator for basic EPS - Net income available to common stockholders $ 15,530 $ 22,589 $ 26,957 Effect of dilutive securities:
Dilutive effect to participating securities 4 6 7 Numerator for diluted EPS $ 15,534 $ 22,595 $ 26,964
Denominator:Weighted-average common shares outstanding - basic 16,078,066 16,729,056 17,692,493 Effect of dilutive shares 417,049 563,183 700,691
Weighted-average common shares outstanding - diluted 16,495,115 17,292,239 18,393,184
Net income per share - basic $ 0.96 $ 1.34 $ 1.52 Net income per share - diluted $ 0.94 $ 1.30 $ 1.46
There were 529,850 and 511,800 outstanding stock options that were anti-dilutive as of June 30, 2021 and 2020, respectively.
16. Equity Incentive Plan
The Company provides stock-based awards through the 2013 Omnibus Incentive Plan which provides for awards of restricted stock, restricted stock units, stock options, stockappreciation rights, and cash awards to directors, emeritus directors, officers, employees, and advisory directors. The cost of equity-based awards under the 2013 OmnibusIncentive Plan generally is based on the fair value of the awards on their grant date. The maximum number of shares that may be utilized for awards under the plan is 2,962,400,including 2,116,000 for stock options and stock appreciation rights and 846,400 for awards of restricted stock and restricted stock units.
Shares of common stock issued under the plan would be issued out of authorized but unissued shares, some or all of which may be repurchased shares. As of June 30, 2013, theCompany had repurchased all 846,400 shares on the open market for issuance under the 2013 Omnibus Incentive Plan, for $13,297, at an average cost of $15.71 per share.
Share based compensation expense related to stock options and restricted stock recognized for the fiscal year ended June 30, 2021, 2020, and 2019 was $2,102, $1,822, and$1,601, respectively, before the related tax benefit of $494, $428, and $376, respectively.
112

HOMETRUST BANCSHARES, INC. AND SUBSIDIARYNotes to Consolidated Financial Statements(Dollars in thousands, except per share data)
The table below presents stock option activity and related information:
Options
Weighted- average
exercise price
Remaining contractual life
(years)
Aggregate Intrinsic
ValueOptions outstanding at June 30, 2018 1,718,270 17.29 5.9 $ 18,664
Granted 40,500 27.51 — — Exercised 80,311 14.62 — — Forfeited 20,300 23.30 — — Expired 945 23.82 — — Options outstanding at June 30, 2019 1,657,214 $ 17.29 5.0 $ 12,909
Exercisable at June 30, 2019 1,279,614 $ 15.39
Granted 66,000 25.46 — — Exercised 106,914 14.41 — — Forfeited 800 17.35 — — Options outstanding at June 30, 2020 1,615,500 $ 18.12 4.4 $ 1,711
Exercisable at June 30, 2020 1,298,000 $ 16.27
Granted 49,750 23.44 — — Exercised 318,894 14.40 — — Forfeited 26,900 25.77 — — Options outstanding at June 30, 2021 1,319,456 $ 19.07 3.9 $ 11,657
Exercisable at June 30, 2021 1,074,706 $ 17.63 3.1 $ 11,036
Non-vested at June 30, 2021 244,750 $ 25.37 7.5 $ 621
The fair value of each option is estimated on the date of grant using the Black-Scholes-Merton option pricing model. Assumptions used for grants were as follows:
Assumptions in Estimating Option ValuesYear Ended June 30,
2021 2020Weighted-average volatility 28.32 % 25.60 %Expected dividend yield 1.33 % 1.05 %Risk-free interest rate 0.77 % 1.43 %Expected life (years) 6.5 6.5Weighted-average fair value of options granted $ 5.61 $ 5.88
At June 30, 2021, the Company had $1,258 of unrecognized compensation expense related to 244,750 stock options originally scheduled to vest over a five-year vestingperiod. The weighted average period over which compensation cost related to non-vested awards is expected to be recognized was 1.6 years at June 30, 2021. At June 30, 2020,the Company had $1,701 of unrecognized compensation expense related to 317,500 stock options originally scheduled to vest over a five-year vesting period. The weightedaverage period over which compensation cost related to non-vested awards is expected to be recognized was 1.8 years at June 30, 2020. All unexercised options expire ten yearsafter the grant date.
113

HOMETRUST BANCSHARES, INC. AND SUBSIDIARYNotes to Consolidated Financial Statements(Dollars in thousands, except per share data)
The table below presents restricted stock award activity and related information:
Restricted stock awards
Weighted- average grant date fair value
Aggregate Intrinsic
ValueNon-vested at June 30, 2018 133,410 $ 22.85 $ 3,755
Granted 34,000 27.51 — Vested 39,310 21.64 — Forfeited 4,300 19.08 —
Non-vested at June 30, 2019 123,800 24.65 2,258 Granted 67,556 26.39 — Vested 38,925 23.02 — Forfeited 8,385 24.88 —
Non-vested at June 30, 2020 144,046 25.89 2,305 Granted 58,547 23.10 — Vested 45,296 25.17 — Forfeited 5,722 25.02 —
Non-vested at June 30, 2021 151,575 $ 25.06 $ 4,229
The table above includes performance-based restrictive stock units totaling 30,780 and 11,250 at June 30, 2021 and 2020, respectively. These stock units are scheduled to vestover 3.0 years assuming certain performance metrics are met.
At June 30, 2021, unrecognized compensation expense was $2,811 related to 151,575 shares of restricted stock originally scheduled to vest over three- and five-year vestingperiods. The weighted average period over which compensation cost related to non-vested awards is expected to be recognized was 1.7 years at June 30, 2021. At June 30, 2020,unrecognized compensation expense was $3,048 related to 144,046 shares of restricted stock originally scheduled to vest over three- and five-year vesting periods. The weightedaverage period over which compensation cost related to non-vested awards is expected to be recognized was 1.8 years at June 30, 2020.
17. Commitments and Contingencies
Loan Commitments
Legally binding commitments to extend credit are agreements to lend to a customer as long as there is no violation of any condition established in the contract. Commitmentsgenerally have fixed expiration dates or other termination clauses and may require payment of a fee. Since many commitments may expire without being drawn upon, the totalcommitment amounts do not necessarily represent future cash requirements. In the normal course of business, there are various outstanding commitments to extend credit that arenot reflected in the consolidated financial statements. At June 30, 2021 and June 30, 2020, respectively, loan commitments (excluding $277,600 and $141,557 of undisbursedportions of construction loans) totaled $123,463 and $57,798 of which $45,270 and $10,678 were variable rate commitments and $78,193 and $47,120 were fixed ratecommitments. The fixed rate loans had interest rates ranging from 2.50% to 8.36% at June 30, 2021 and 1.74% to 8.54% at June 30, 2020, and terms ranging from three to 30years. Pre-approved but unused lines of credit (principally second mortgage home equity loans and overdraft protection loans) totaled $530,505 and $398,781 at June 30, 2021and 2020, respectively. These amounts represent the Company’s exposure to credit risk, and in the opinion of management have no more than the normal lending risk that theCompany commits to its borrowers. The Company has two types of commitments related to mortgage loans held for sale: rate lock commitments and forward loan salecommitments. Rate lock commitments are commitments to extend credit to a customer that has an interest rate lock and are considered derivative instruments. The rate lockcommitments do not qualify for hedge accounting. In order to mitigate the risk from interest rate fluctuations, the Company enters into forward loan sale commitments on a “bestefforts” basis, which do not meet the definition of a derivative instrument. The fair value of these commitments was not material at June 30, 2021 or June 30, 2020.
The Company grants construction and permanent loans collateralized primarily by residential and commercial real estate to customers throughout its primary market area. Inaddition, the Company grants equipment financing throughout the eastern United States and municipal leases to customers throughout North Carolina, South Carolina, andVirginia. The Company’s loan portfolio can be affected by the general economic conditions within these market areas. Management believes that the Company has no significantconcentration of credit in the loan portfolio.
Restrictions on Cash
In response to COVID-19, the FRB reduced the reserve requirements to zero on March 15, 2020. Prior to this change the Bank was required by regulation to maintain a varyingcash reserve balance with the FRB.
114

HOMETRUST BANCSHARES, INC. AND SUBSIDIARYNotes to Consolidated Financial Statements(Dollars in thousands, except per share data)
Guarantees
Standby letters of credit obligate the Company to meet certain financial obligations of its customers, if, under the contractual terms of the agreement, the customers are unable todo so. The financial standby letters of credit issued by the Company are irrevocable and payment is only guaranteed upon the borrower’s failure to perform its obligations to thebeneficiary. Total commitments under standby letters of credit as of June 30, 2021 and 2020 were $8,681 and $7,766, respectively. There was no liability recorded for theseletters of credit at June 30, 2021 or June 30, 2020.
Litigation
The Company is involved in several litigation matters in the ordinary course of business. These proceedings and the associated legal claims are often contested and the outcomeof individual matters is not always predictable. These claims and counter claims typically arise during the course of collection efforts on problem loans or with respect to actionsto enforce liens on properties in which the Company holds a security interest. There can be no assurance that loan workouts and other activities will not expose the Company toadditional legal actions, including lender liability or environmental claims. Therefore, the Company may be exposed to substantial liabilities, which could adversely affect itsresults of operations and financial condition. Moreover, the expenses of legal proceedings will adversely affect its results of operations until they are resolved. The Company isnot a party to any pending legal proceedings that management believes would have a material adverse effect on the Company’s financial condition or results of operations.
18. Capital
At June 30, 2021, stockholders' equity totaled $396,519. HomeTrust Bancshares, Inc. is a bank holding company subject to regulation by the Federal Reserve. As a bank holdingcompany, they are subject to capital adequacy requirements of the Federal Reserve under the Bank Holding Company Act of 1956, as amended and the regulations of the FederalReserve. The Company's subsidiary, the Bank, an FDIC-insured, North Carolina state-chartered bank and a member of the Federal Reserve System, is supervised and regulatedby the Federal Reserve and the NCCOB and is subject to minimum capital requirements applicable to state member banks established by the Federal Reserve that are calculatedin a manner similar to those applicable to bank holding companies. Failure to meet minimum capital requirements can initiate certain mandatory and possibly additionaldiscretionary actions by bank regulators that, if undertaken, could have a direct material effect on the Company's financial statements.
Under capital adequacy guidelines and the regulatory framework for prompt corrective action, the Bank must meet specific capital guidelines that involve quantitative measuresof the Bank’s assets, liabilities and certain off-balance-sheet items as calculated under regulatory accounting practices. The Bank’s capital amounts and classification are alsosubject to qualitative judgments by the regulators about components, risk weightings and other factors.
At June 30, 2021, HomeTrust Bancshares, Inc. and the Bank each exceeded all regulatory capital requirements as of that date. Consistent with the Company's goals to operate asound and profitable organization, their policy is for the Bank to maintain a “well-capitalized” status under the regulatory capital categories of the Federal Reserve. The Bankwas categorized as "well-capitalized" at June 30, 2021 under applicable regulatory requirements.
115

HOMETRUST BANCSHARES, INC. AND SUBSIDIARYNotes to Consolidated Financial Statements(Dollars in thousands, except per share data)
HomeTrust Bancshares, Inc. and the Bank's actual and required minimum capital amounts and ratios are as follows:
Regulatory Requirements
ActualMinimum for Capital
Adequacy PurposesMinimum to Be Well Capitalized
Amount Ratio Amount Ratio Amount RatioHomeTrust Bancshares, Inc.June 30, 2021CET1 capital (to risk-weighted assets) $ 375,320 11.26 % $ 149,943 4.50 % $ 216,584 6.50 %Tier 1 capital (to total adjusted assets) $ 375,320 10.29 % $ 145,915 4.00 % $ 182,393 5.00 %Tier 1 capital (to risk-weighted assets) $ 375,320 11.26 % $ 199,924 6.00 % $ 266,565 8.00 %Total risk-based capital (to risk-weighted assets) $ 398,408 11.96 % $ 266,565 8.00 % $ 333,206 10.00 %
June 30, 2020 CET1 capital (to risk-weighted assets) $ 374,437 11.26 % $ 149,614 4.50 % $ 216,109 6.50 %Tier 1 capital (to total adjusted assets) $ 374,437 10.26 % $ 146,047 4.00 % $ 182,559 5.00 %Tier 1 capital (to risk-weighted assets) $ 374,437 11.26 % $ 199,485 6.00 % $ 265,980 8.00 %Total risk-based capital (to risk-weighted assets) $ 402,964 12.12 % $ 265,980 8.00 % $ 332,476 10.00 %
HomeTrust Bank: June 30, 2021 CET1 capital (to risk-weighted assets) $ 357,767 10.74 % $ 149,936 4.50 % $ 216,575 6.50 %Tier 1 capital (to total adjusted assets) $ 357,767 9.81 % $ 145,933 4.00 % $ 182,417 5.00 %Tier 1 capital (to risk-weighted assets) $ 357,767 10.74 % $ 199,915 6.00 % $ 266,553 8.00 %Total risk-based capital (to risk-weighted assets) $ 380,855 11.43 % $ 266,553 8.00 % $ 333,192 10.00 %
June 30, 2020 CET1 capital (to risk-weighted assets) $ 362,841 10.91 % $ 149,608 4.50 % $ 216,100 6.50 %Tier 1 capital (to total adjusted assets) $ 362,841 9.94 % $ 146,010 4.00 % $ 182,512 5.00 %Tier 1 capital (to risk-weighted assets) $ 362,841 10.91 % $ 199,477 6.00 % $ 265,969 8.00 %Total risk-based capital (to risk-weighted assets) $ 391,368 11.77 % $ 265,969 8.00 % $ 332,461 10.00 %
___________________________________In addition to the minimum CET1, Tier 1 and total risk-based capital ratios, HomeTrust Bancshares, Inc. and the Bank have to maintain a capital conservation buffer consistingof additional CET1 capital of more than 2.50% above the required minimum levels in order to avoid limitations on paying dividends, engaging in share repurchases, and payingdiscretionary bonuses based on percentages of eligible retained income that could be utilized for such actions. As of June 30, 2021, the conservation buffer was 3.96% and 3.43%for HomeTrust Bancshares, Inc. and the Bank, respectively.
116

HOMETRUST BANCSHARES, INC. AND SUBSIDIARYNotes to Consolidated Financial Statements(Dollars in thousands, except per share data)
A reconciliation of HomeTrust Bancshares, Inc.'s stockholders' equity under US GAAP and regulatory capital amounts as of the dates indicated follows:
June 30,2021 2020
Total stockholders' equity under US GAAP $ 396,519 $ 408,263 Accumulated other comprehensive income, net of tax (1,514) (2,017)Investment in nonincludable subsidiary (862) (815)Disallowed deferred tax assets (4,459) (4,526)Disallowed goodwill and other disallowed intangible assets (25,902) (26,468)Cumulative-effect adjustment due to the adoption of ASU 2016-13 13,358 — Modifed CECL transition adjustment (1,820) — Tier 1 Capital and CET1 375,320 374,437 Allowable portion of allowance for credit losses and loan commitments 23,088 28,527
Total risk-based capital $ 398,408 $ 402,964
_____________________(1) The Company made an election to use the 2020 CECL transition provision as adopted by the Federal Reserve and the FDIC. This transition provision provides banking organizations that were required to adopt CECL for GAAP
purposes during the 2020 calendar year, the option to delay for up to two years an estimate of CECL's effect on regulatory capital followed by a three-year transition period.
19. Parent Company Financial Information
The Company’s principal asset is its investment in its subsidiary, the Bank. The following tables present condensed financial information of the Company:
Condensed Balance Sheet
June 30,2021 2020
Assets:Cash and cash equivalents $ 9,602 $ 3,888 REO 143 143 Investment in bank subsidiary 378,966 396,667 ESOP loan receivable 6,665 6,918 Other assets 1,241 731
Total assets $ 396,617 $ 408,347 Liabilities and stockholders’ equity:
Other liabilities $ 98 $ 84 Stockholders’ equity 396,519 408,263
Total liabilities and stockholders’ equity $ 396,617 $ 408,347
(1)
117
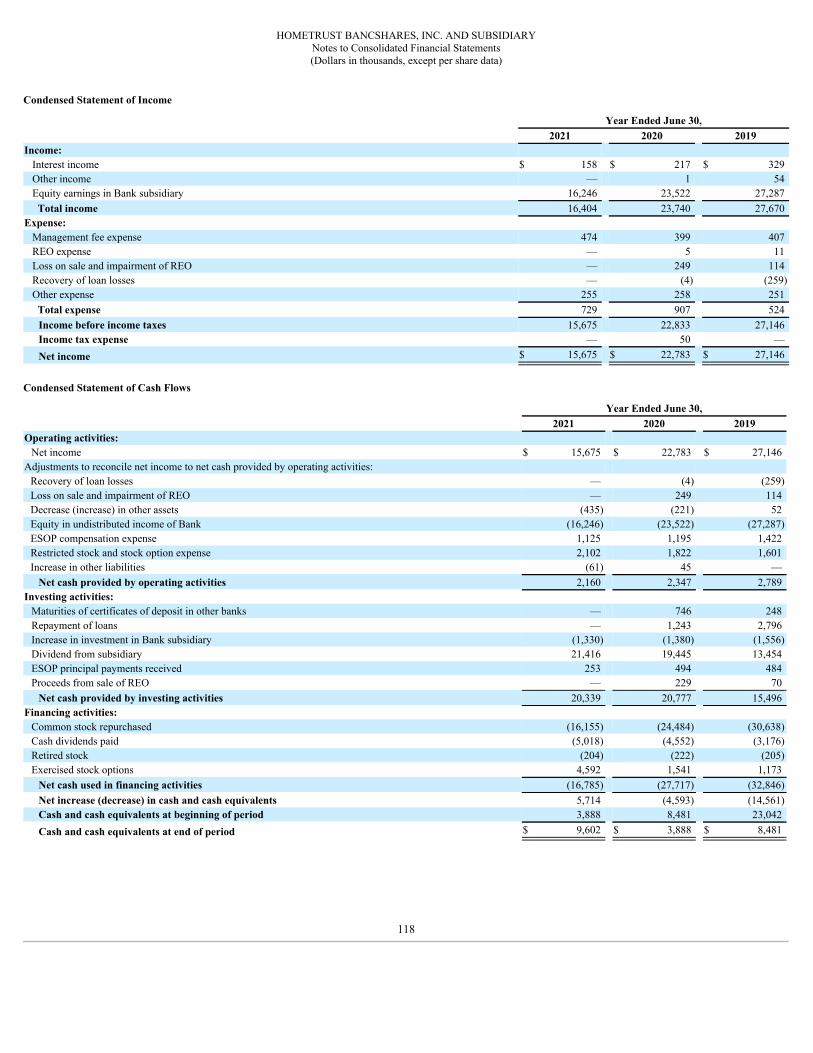
HOMETRUST BANCSHARES, INC. AND SUBSIDIARYNotes to Consolidated Financial Statements(Dollars in thousands, except per share data)
Condensed Statement of Income
Year Ended June 30,2021 2020 2019
Income:Interest income $ 158 $ 217 $ 329 Other income — 1 54 Equity earnings in Bank subsidiary 16,246 23,522 27,287
Total income 16,404 23,740 27,670 Expense:
Management fee expense 474 399 407 REO expense — 5 11 Loss on sale and impairment of REO — 249 114 Recovery of loan losses — (4) (259)Other expense 255 258 251
Total expense 729 907 524 Income before income taxes 15,675 22,833 27,146 Income tax expense — 50 — Net income $ 15,675 $ 22,783 $ 27,146
Condensed Statement of Cash Flows
Year Ended June 30,2021 2020 2019
Operating activities:Net income $ 15,675 $ 22,783 $ 27,146
Adjustments to reconcile net income to net cash provided by operating activities:Recovery of loan losses — (4) (259)Loss on sale and impairment of REO — 249 114 Decrease (increase) in other assets (435) (221) 52 Equity in undistributed income of Bank (16,246) (23,522) (27,287)ESOP compensation expense 1,125 1,195 1,422 Restricted stock and stock option expense 2,102 1,822 1,601 Increase in other liabilities (61) 45 —
Net cash provided by operating activities 2,160 2,347 2,789 Investing activities:
Maturities of certificates of deposit in other banks — 746 248 Repayment of loans — 1,243 2,796 Increase in investment in Bank subsidiary (1,330) (1,380) (1,556)Dividend from subsidiary 21,416 19,445 13,454 ESOP principal payments received 253 494 484 Proceeds from sale of REO — 229 70
Net cash provided by investing activities 20,339 20,777 15,496 Financing activities:
Common stock repurchased (16,155) (24,484) (30,638)Cash dividends paid (5,018) (4,552) (3,176)Retired stock (204) (222) (205)Exercised stock options 4,592 1,541 1,173
Net cash used in financing activities (16,785) (27,717) (32,846)Net increase (decrease) in cash and cash equivalents 5,714 (4,593) (14,561)Cash and cash equivalents at beginning of period 3,888 8,481 23,042 Cash and cash equivalents at end of period $ 9,602 $ 3,888 $ 8,481
118

HOMETRUST BANCSHARES, INC. AND SUBSIDIARYNotes to Consolidated Financial Statements(Dollars in thousands, except per share data)
20. Fair Value of Financial Instruments
The Company utilizes fair value measurements to record fair value adjustments to certain assets and to determine fair value disclosures. Debt securities available for sale arerecorded at fair value on a recurring basis. Additionally, from time to time, the Company may be required to record at fair value other assets on a nonrecurring basis, such asimpaired loans. These nonrecurring fair value adjustments typically involve application of lower of cost or market accounting or write-downs of individual assets. The Companymeasures the fair value of loans receivable under the exit price notion. The fair value of nonperforming loans is based on the underlying value of the collateral.
Fair Value HierarchyThe Company groups assets at fair value in three levels, based on the markets in which the assets are traded and the reliability of the assumptions used to determine fair value.These levels are:
Level 1: Valuation is based upon quoted prices for identical instruments traded in active markets.
Level 2: Valuation is based upon quoted prices for similar instruments in active markets, quoted prices for identical or similar instruments in markets that are not active,and model-based valuation techniques for which all significant assumptions are observable in the market.
Level 3: Valuation is generated from model-based techniques that use at least one significant assumption not observable in the market. These unobservable assumptionsreflect estimates of assumptions that market participants would use in pricing the asset. Valuation techniques include use of option pricing models,discounted cash flow models and similar techniques.
Following is a description of valuation methodologies used for assets recorded at fair value. The Company does not have any liabilities recorded at fair value.
Debt Securities Available for SaleDebt securities available for sale are valued on a recurring basis at quoted market prices where available. If quoted market prices are not available, fair values are based onquoted prices of comparable securities. Level 1 securities include those traded on an active exchange, such as the New York Stock Exchange or U.S. Treasury securities that aretraded by dealers or brokers in active over-the-counter markets and money market funds. Level 2 securities include MBS and debentures issued by GSEs, municipal bonds, andcorporate debt securities. The Company has no Level 3 securities.
Loans Held for SaleLoans held for sale are adjusted to lower of cost or fair value. Fair value is based on commitments on hand from investors or, if commitments have not yet been obtained, whatinvestors are currently offering for loans with similar characteristics. The Company considers all loans held for sale carried at fair value as nonrecurring Level 3.
Individually Evaluated LoansThe Company does not record loans at fair value on a recurring basis. From time to time, however, a loan is individually evaluated and an allowance for credit loss is established.Loans for which it is expected that payment of principal and interest will not be made in accordance with the contractual terms of the loan agreement are individually evaluated.Once a loan is identified, the fair value is estimated using one of two ways, which include collateral value and discounted cash flows. The Company reviews all individuallyevaluated loans each quarter to determine if an allowance is necessary. Those individually evaluated loans not requiring an allowance represent loans for which the fair value ofthe expected repayments or collateral exceed the recorded investments in such loans.
Loans are considered collateral dependent if repayment is expected solely from the collateral. For these collateral dependent loans, the Company obtains updated appraisals atleast annually. These appraisals are reviewed for appropriateness and then discounted for estimated closing costs to determine if an allowance is necessary. As part of thequarterly review of individually evaluated loans, the Company reviews these appraisals to determine if any additional discounts to the fair value are necessary. If a currentappraisal is not obtained, the Company determines whether a discount is needed to the value from the original appraisal based on the decline in value of similar properties withrecent appraisals. For loans that are not collateral dependent, estimated fair value is based on the present value of expected future cash flows using the interest rate implicit in theoriginal agreement. Individually evaluated loans where a charge-off has occurred or an allowance is established during the period being reported require classification in the fairvalue hierarchy. The Company records such loans as a nonrecurring Level 3 in the fair value hierarchy.
Real Estate OwnedREO is considered held for sale and is adjusted to fair value less estimated selling costs upon transfer of the loan to foreclosed assets. Fair value is based upon independentmarket prices, appraised value of the collateral or management’s estimation of the value of the collateral. The Company considers all REO that has been charged off or receivedan allowance during the period as nonrecurring Level 3.
119
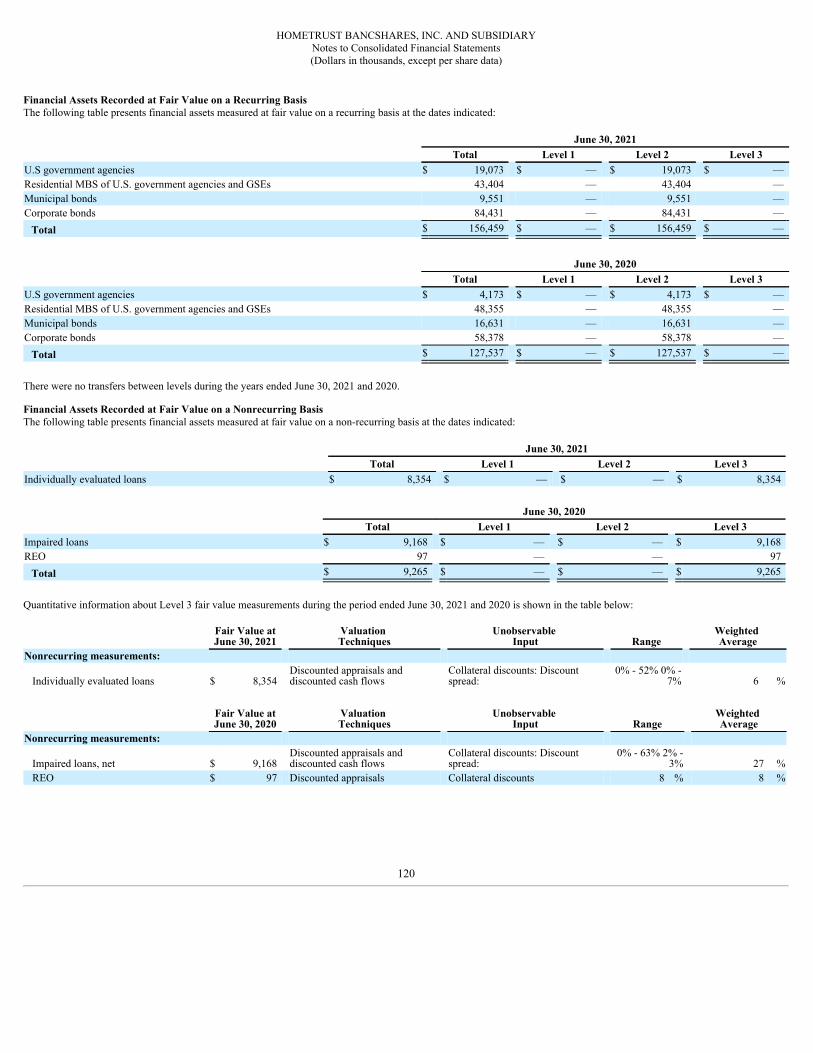
HOMETRUST BANCSHARES, INC. AND SUBSIDIARYNotes to Consolidated Financial Statements(Dollars in thousands, except per share data)
Financial Assets Recorded at Fair Value on a Recurring BasisThe following table presents financial assets measured at fair value on a recurring basis at the dates indicated:
June 30, 2021Total Level 1 Level 2 Level 3
U.S government agencies $ 19,073 $ — $ 19,073 $ — Residential MBS of U.S. government agencies and GSEs 43,404 — 43,404 — Municipal bonds 9,551 — 9,551 — Corporate bonds 84,431 — 84,431 —
Total $ 156,459 $ — $ 156,459 $ —
June 30, 2020Total Level 1 Level 2 Level 3
U.S government agencies $ 4,173 $ — $ 4,173 $ — Residential MBS of U.S. government agencies and GSEs 48,355 — 48,355 — Municipal bonds 16,631 — 16,631 — Corporate bonds 58,378 — 58,378 —
Total $ 127,537 $ — $ 127,537 $ —
There were no transfers between levels during the years ended June 30, 2021 and 2020.
Financial Assets Recorded at Fair Value on a Nonrecurring BasisThe following table presents financial assets measured at fair value on a non-recurring basis at the dates indicated:
June 30, 2021Total Level 1 Level 2 Level 3
Individually evaluated loans $ 8,354 $ — $ — $ 8,354
June 30, 2020Total Level 1 Level 2 Level 3
Impaired loans $ 9,168 $ — $ — $ 9,168 REO 97 — — 97
Total $ 9,265 $ — $ — $ 9,265
Quantitative information about Level 3 fair value measurements during the period ended June 30, 2021 and 2020 is shown in the table below:
Fair Value atJune 30, 2021
Valuation Techniques
Unobservable Input Range
Weighted Average
Nonrecurring measurements:
Individually evaluated loans $ 8,354 Discounted appraisals anddiscounted cash flows
Collateral discounts: Discountspread:
0% - 52% 0% -7% 6 %
Fair Value atJune 30, 2020
Valuation Techniques
Unobservable Input Range
Weighted Average
Nonrecurring measurements:
Impaired loans, net $ 9,168 Discounted appraisals anddiscounted cash flows
Collateral discounts: Discountspread:
0% - 63% 2% -3% 27 %
REO $ 97 Discounted appraisals Collateral discounts 8 % 8 %
120

HOMETRUST BANCSHARES, INC. AND SUBSIDIARYNotes to Consolidated Financial Statements(Dollars in thousands, except per share data)
The stated carrying value and estimated fair value amounts of financial instruments as of June 30, 2021 and June 30, 2020, are summarized below:
June 30, 2021Carrying
ValueFair Value Level 1 Level 2 Level 3
Assets:Cash and cash equivalents $ 50,990 $ 50,990 $ 50,990 $ — $ — Commercial paper 189,596 189,596 189,596 — — Certificates of deposit in other banks 40,122 40,122 — 40,122 — Debt securities available for sale 156,459 156,459 — 156,459 — Loans held for sale 93,539 94,779 — — 94,779 Loans, net 2,697,799 2,668,570 — — 2,668,570 FHLB stock 6,153 6,153 6,153 — — FRB stock 7,386 7,386 7,386 — — SBIC investments 10,171 10,171 — — 10,171 Accrued interest receivable 7,933 7,933 52 542 7,339
Liabilities:Noninterest-bearing and NOW deposits 1,281,372 1,281,372 — 1,281,372 — Money market accounts 975,001 975,001 — 975,001 — Savings accounts 226,391 226,391 — 226,391 — Certificates of deposit 472,777 474,397 — 474,397 — Borrowings 115,000 115,000 — 115,000 — Accrued interest payable 52 52 — 52 —
June 30, 2020Carrying
ValueFair Value Level 1 Level 2 Level 3
Assets:Cash and cash equivalents $ 121,622 $ 121,622 $ 121,622 $ — $ — Commercial paper 304,967 304,967 304,967 — — Certificates of deposit in other banks 55,689 55,689 — 55,689 — Debt securities available for sale 127,537 127,537 — 127,537 — Loans held for sale 77,177 78,129 — — 78,129 Loans, net 2,741,047 2,692,265 — — 2,692,265 FHLB stock 23,309 23,309 23,309 — — FRB stock 7,368 7,368 7,368 — — SBIC investments 8,269 8,269 — — 8,269 Accrued interest receivable 12,312 12,312 208 744 11,360
Liabilities:Noninterest-bearing and NOW deposits 1,012,200 1,012,200 — 1,012,200 — Money market accounts 836,738 836,738 — 836,738 — Savings accounts 197,676 197,676 — 197,676 — Certificates of deposit 739,142 745,078 — 745,078 — Borrowings 475,000 511,529 — 511,529 — Accrued interest payable 1,087 1,087 — 1,087 —
The Company had off-balance sheet financial commitments, which include approximately $931,568 and $598,136 of commitments to originate loans, undisbursed portions ofinterim construction loans, and unused lines of credit at June 30, 2021 and 2020 (see Note 17), respectively. Since these commitments are based on current rates, the carryingamount approximates the fair value.
Estimated fair values were determined using the following methods and assumptions:
Cash and interest-bearing deposits – The stated amounts approximate fair values as maturities are less than 90 days.
Commercial paper – The stated amounts approximate fair value due to the short-term nature of these investments.
121

HOMETRUST BANCSHARES, INC. AND SUBSIDIARYNotes to Consolidated Financial Statements(Dollars in thousands, except per share data)
Certificates of deposit in other banks – The stated amounts approximate fair values.
Debt securities available for sale – Fair values are based on quoted market prices where available. If quoted market prices are not available, fair values are based on quotedmarket prices of comparable instruments.
Loans held for sale – The fair value of mortgage loans held for sale is determined by outstanding commitments from investors on a "best efforts" basis or current investor yieldrequirements, calculated on the aggregate loan basis. The fair value of SBA loans and HELOCs held for sale is based on what investors are currently offering for loans withsimilar characteristics.
Loans, net – Fair values for loans are estimated by segregating the portfolio by type of loan and discounting scheduled cash flows using current market interest rates for loanswith similar terms and credit quality. A prepayment assumption is used as an estimate of the portion of loans that will be repaid prior to their scheduled maturity. A liquiditypremium assumption is used as an estimate for the additional return required by an investor of assets that are potentially considered illiquid.
FHLB and FRB stock – No ready market exists for these stocks and they have no quoted market value. However, redemption of these stocks has historically been at parvalue. Accordingly, cost is deemed to be a reasonable estimate of fair value.
SBIC – No ready market exists for these investments and they have no quoted market value. SBIC investments are valued at cost, less any impairment, plus or minus changesresulting from observable price changes in orderly transactions of identical or similar investments. Accordingly, cost is deemed to be a reasonable estimate of fair value.
Deposits – Fair values for demand deposits, money market accounts, and savings accounts are the amounts payable on demand as of June 30, 2021 and June 30, 2020. The fairvalue of certificates of deposit is estimated by discounting the contractual cash flows using current market interest rates for accounts with similar maturities.
Borrowings – The fair value of advances from the FHLB is estimated based on current rates for borrowings with similar terms.
Accrued interest receivable and payable – The stated amounts of accrued interest receivable and payable approximate the fair value.
Limitations – Fair value estimates are made at a specific point in time, based on relevant market information and information about the financial instrument. These estimates donot reflect any premium or discount that could result from offering for sale at one time the Company’s entire holdings of a particular financial instrument. Because no marketexists for a significant portion of the Company’s financial instruments, fair value estimates are based on judgments regarding future expected loss experience, current economicconditions, risk characteristics of various financial instruments, and other factors. These estimates are subjective in nature and involve uncertainties and matters of significantjudgment and therefore cannot be determined with precision. Changes in assumptions could significantly affect the estimates.
Fair value estimates are based on existing on-and-off balance sheet financial instruments without attempting to estimate the value of anticipated future business and the value ofassets and liabilities that are not considered financial instruments. For example, a significant asset not considered a financial asset is premises and equipment. In addition, taxramifications related to the realization of the unrealized gains and losses can have a significant effect on fair value estimates and have not been considered in any of the estimates.
21. Revenue
Revenue from Contracts with Customers (Topic 606) is applicable to noninterest revenue streams such as deposit related fees, interchange fees, merchant income, and variousother service fees. Topic 606 does not apply to revenue associated with financial instruments, including revenue from loans and securities. In addition, certain noninterest incomestreams such as fees associated with mortgage servicing rights, financial guarantees, and certain credit card fees are also not in scope of the guidance.
The table below presents the Company's sources of noninterest income, segregated by in-scope and out-of-scope revenue streams of Topic 606 for the periods indicated:
Year Ended June 30,2021 2020 2019
In-scope of Topic 606:Service charges on deposit accounts $ 2,785 $ 3,772 $ 3,978 Fees, interchange, and other service charges 7,013 6,332 6,377 Other 576 470 775
Noninterest income (in-scope of Topic 606) 10,374 10,574 11,130 Noninterest income (out-of-scope of Topic 606) 29,447 19,758 11,810
Total noninterest income $ 39,821 $ 30,332 $ 22,940
122

HOMETRUST BANCSHARES, INC. AND SUBSIDIARYNotes to Consolidated Financial Statements(Dollars in thousands, except per share data)
The following is a description of revenue streams accounted for under Topic 606:
Service charges on deposit accounts
Service charges on deposit accounts consist of account analysis fees (i.e., net fees earned on analyzed business and public checking accounts), monthly service fees, nonsufficientfund fees, check orders, and other deposit account related fees. The Company’s performance obligation for account analysis fees and monthly service fees is generally satisfied,and the related revenue recognized, over the period in which the service is provided. Nonsufficient fund fees, check orders and other deposit account related fees are largelytransactional based, and therefore, the Company’s performance obligation is satisfied and related revenue recognized, at a point in time. Payment for service charges on depositaccounts is primarily received immediately or in the following month through a direct charge to customers’ accounts.
Fees, interchange, and other service charges
Fees, interchange, and other service charges are primarily comprised of debit and credit card income, ATM fees, merchant services income, and other service charges. Debit andcredit card income is primarily comprised of interchange fees earned whenever the Company’s debit and credit cards are processed through card payment networks such as Visa.ATM fees are primarily generated when a Company cardholder uses a non-Company ATM or a non-Company cardholder uses a Company ATM. Merchant services incomemainly represents fees charged to merchants to process their debit and credit card transactions, in addition to account management fees. Other service charges include revenuefrom processing wire transfers, cashier’s checks, and other services. The Company’s performance obligation for fees, interchange, and other service charges are largely satisfied,and related revenue recognized, when the services are rendered or upon completion. Payment is typically received immediately or in the following month.
Other
Other noninterest income consists of safety deposit box rental fees and other miscellaneous revenue streams. Safe deposit box rental fees are charged to the customer on anannual basis and recognized upon receipt of payment. The Company determined that since rentals and renewals occur fairly consistently over time, revenue is recognized on abasis consistent with the duration of the performance obligation.
22. Unaudited Interim Financial Information
The unaudited statements of income for each of the quarters during the fiscal years ended June 30, 2021, 2020 and 2019 are summarized below:
Three Months Ended
June 30, 2021 March 31, 2021December 31,
2020 September 30, 2020Interest and dividend income $ 28,806 $ 29,321 $ 30,157 $ 30,449 Interest expense 2,808 3,628 4,035 4,940 Net interest income 25,998 25,693 26,122 25,509 Provision (benefit) for credit losses (955) (4,100) (3,030) 950
Net interest income after provision (benefit) for credit losses 26,953 29,793 29,152 24,559 Noninterest income 11,160 10,678 9,344 8,639 Noninterest expense 48,233 30,506 26,443 26,000
Income before income taxes (10,120) 9,965 12,053 7,198 Income tax benefit (2,712) 2,096 2,592 1,445
Net income (loss) $ (7,408) $ 7,869 $ 9,461 $ 5,753
Net income (loss) per common share: Basic $ (0.46) $ 0.49 $ 0.58 $ 0.35 Diluted $ (0.46) $ 0.48 $ 0.57 $ 0.35
123

HOMETRUST BANCSHARES, INC. AND SUBSIDIARYNotes to Consolidated Financial Statements(Dollars in thousands, except per share data)
Three Months Ended
June 30, 2020 March 31, 2020December 31,
2019 September 30, 2019Interest and dividend income $ 31,074 $ 33,037 $ 35,896 $ 36,247 Interest expense 6,386 7,728 8,862 9,174 Net interest income 24,688 25,309 27,034 27,073 Provision for credit losses 2,700 5,400 400 —
Net interest income after provision for credit losses 21,988 19,909 26,634 27,073 Noninterest income 7,223 6,375 9,074 7,660 Noninterest expense 24,652 24,903 24,041 23,533
Income before income taxes 4,559 1,381 11,667 11,200 Income tax expense 964 188 2,476 2,396
Net income $ 3,595 $ 1,193 $ 9,191 $ 8,804
Net income per common share: Basic $ 0.22 $ 0.07 $ 0.54 $ 0.51 Diluted $ 0.22 $ 0.07 $ 0.52 $ 0.49
Three Months Ended
June 30, 2019 March 31, 2019December 31,
2018 September 30, 2018Interest and dividend income $ 35,820 $ 34,714 $ 34,400 $ 32,280 Interest expense 8,931 8,145 7,299 6,008 Net interest income 26,889 26,569 27,101 26,272 Provision for credit losses 200 5,500 — —
Net interest income after provision for credit losses 26,689 21,069 27,101 26,272 Noninterest income 6,846 5,396 5,085 5,613 Noninterest expense 23,415 22,978 21,858 21,883
Income before income taxes 10,120 3,487 10,328 10,002 Income tax expense 2,107 185 2,287 2,212
Net income $ 8,013 $ 3,302 $ 8,041 $ 7,790 Net income per common share:
Basic $ 0.45 $ 0.19 $ 0.45 $ 0.43 Diluted $ 0.44 $ 0.18 $ 0.43 $ 0.41
124
Item 9. Changes In and Disagreements With Accountants on Accounting and Financial Disclosure
None.
Item 9A. Controls and Procedures
Evaluation of Disclosure Controls and Procedures An evaluation of the Company’s disclosure controls and procedures (as defined in Section 13a-15(e) of the SecuritiesExchange Act of 1934 (the “Act”)) was carried out under the supervision and with the participation of the Company’s Chief Executive Officer, Chief Financial Officer, andseveral other members of the Company’s senior management as of the end of the period covered by this report. The Company’s Chief Executive Officer and Chief FinancialOfficer concluded that the Company’s disclosure controls and procedures as of June 30, 2021 were effective in ensuring that the information required to be disclosed by theCompany in the reports it files or submits under the Act is (i) accumulated and communicated to the Company’s management (including the Chief Executive Officer and ChiefFinancial Officer) in a timely manner, and (ii) recorded, processed, summarized and reported within the time periods specified in the SEC’s rules and forms.
Report of Management on Internal Control over Financial Reporting The management of the Company is responsible for establishing and maintaining adequate internal controlover financial reporting. The internal control process has been designed under our supervision to provide reasonable assurance regarding the reliability of financial reporting andthe preparation of the Company’s financial statements for external reporting purposes in accordance with accounting principles generally accepted in the United States ofAmerica.
Management conducted an assessment of the effectiveness of the Company’s internal control over financial reporting as of June 30, 2021, utilizing the framework established inInternal Control – Integrated Framework 2013 issued by the Committee of Sponsoring Organizations of the Treadway Commission ("COSO"). Based on this assessment,management has determined that the Company’s internal control over financial reporting as of June 30, 2021 was effective.
Our internal control over financial reporting includes policies and procedures that pertain to the maintenance of records that accurately and fairly reflect, in reasonable detail,transactions and dispositions of assets; and provide reasonable assurances that: (1) transactions are recorded as necessary to permit preparation of financial statements inaccordance with accounting principles generally accepted in the United States; (2) receipts and expenditures are being made only in accordance with authorizations ofmanagement and the directors of the Company; and (3) unauthorized acquisition, use, or disposition of the Company’s assets that could have a material effect on the Company’sfinancial statements are prevented or timely detected.
All internal control systems, no matter how well designed, have inherent limitations. Therefore, even those systems determined to be effective can provide only reasonableassurance with respect to financial statement preparation and presentation. Also, projections of any evaluation of effectiveness to future periods are subject to the risk thatcontrols may become inadequate because of changes in conditions, or that the degree of compliance with the policies or procedures may deteriorate.
Dixon Hughes Goodman LLP, an independent registered public accounting firm, has audited the consolidated financial statements included in this Annual Report and has issueda report on the effectiveness of our internal control over financial reporting, which report is included in Item 8 of this Form 10-K. The audit report expresses an unqualifiedopinion on the effectiveness of the Company's internal control over financial reporting as of June 30, 2021.
Changes in Internal Controls Beginning July 1, 2021, the Company adopted ASU No. 2016-13, "Financial Instruments — Credit Losses (Topic 326): Measurement of CreditLosses on Financial Instruments." The Company implemented changes to the policies, processes, and controls over the estimation of the allowance for credit losses to support theadoption of ASU 2016-13. New controls were established over the review of the model implementation and design, model governance, and economic forecasting projectionsobtained from an independent third party and controls over data and assumptions were expanded. Except as related to the adoption of ASU 2016-13, there have been no changesin the Company’s internal control over financial reporting during the fourth quarter ended June 30, 2021 that have materially affected, or are reasonably likely to materiallyaffect, the Company’s internal control over financial reporting.
The Company intends to continually review and evaluate the design and effectiveness of its disclosure controls and procedures and to improve its controls and procedures overtime and to correct any deficiencies that it may discover in the future. The goal is to ensure that senior management has timely access to all material financial and non-financialinformation concerning the Company's business. While the Company believes the present design of its disclosure controls and procedures is effective to achieve its goal, futureevents affecting its business may cause the Company to modify its disclosure controls and procedures. The Company does not expect that its disclosure controls and proceduresand internal control over financial reporting will prevent every error or instance of fraud. A control procedure, no matter how well conceived and operated, can provide onlyreasonable, not absolute, assurance that the objectives of the control procedure are met. Because of the inherent limitations in all control procedures, no evaluation of controlscan provide absolute assurance that all control issues and instances of fraud, if any, within the Company have been detected. These inherent limitations include the realities thatjudgments in decision-making can be faulty, and that breakdowns in controls or procedures can occur because of simple error or mistake. Additionally, controls can becircumvented by the individual acts of some persons, by collusion of two or more people, or by management override of the control. The design of any control procedure isbased in part upon certain assumptions about the likelihood of future events, and there can be no assurance that any design will succeed in achieving its stated goals under allpotential future conditions; over time, controls become inadequate because of changes in conditions, or the degree of compliance with the policies or procedures may deteriorate.Because of the inherent limitations in a cost-effective control procedure, misstatements due to error or fraud may occur and not be detected.
125

Item 9B. Other Information
None.
126
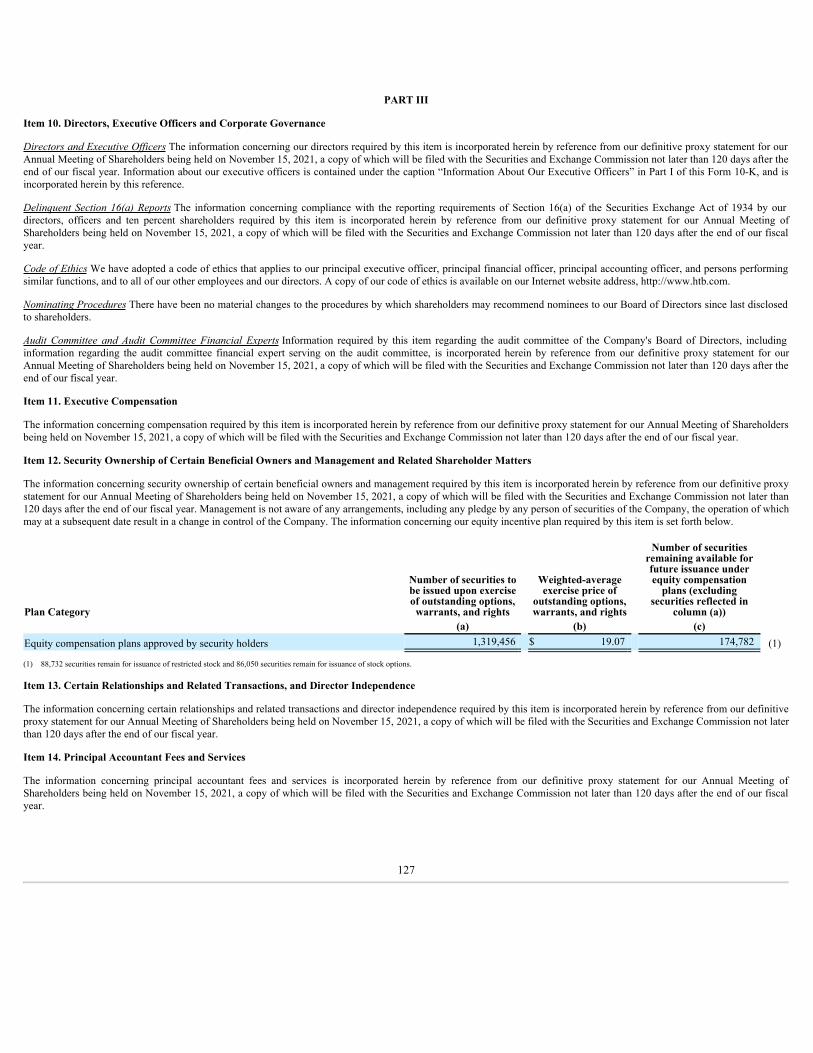
PART III
Item 10. Directors, Executive Officers and Corporate Governance
Directors and Executive Officers The information concerning our directors required by this item is incorporated herein by reference from our definitive proxy statement for ourAnnual Meeting of Shareholders being held on November 15, 2021, a copy of which will be filed with the Securities and Exchange Commission not later than 120 days after theend of our fiscal year. Information about our executive officers is contained under the caption “Information About Our Executive Officers” in Part I of this Form 10-K, and isincorporated herein by this reference.
Delinquent Section 16(a) Reports The information concerning compliance with the reporting requirements of Section 16(a) of the Securities Exchange Act of 1934 by ourdirectors, officers and ten percent shareholders required by this item is incorporated herein by reference from our definitive proxy statement for our Annual Meeting ofShareholders being held on November 15, 2021, a copy of which will be filed with the Securities and Exchange Commission not later than 120 days after the end of our fiscalyear.
Code of Ethics We have adopted a code of ethics that applies to our principal executive officer, principal financial officer, principal accounting officer, and persons performingsimilar functions, and to all of our other employees and our directors. A copy of our code of ethics is available on our Internet website address, http://www.htb.com.
Nominating Procedures There have been no material changes to the procedures by which shareholders may recommend nominees to our Board of Directors since last disclosedto shareholders.
Audit Committee and Audit Committee Financial Experts Information required by this item regarding the audit committee of the Company's Board of Directors, includinginformation regarding the audit committee financial expert serving on the audit committee, is incorporated herein by reference from our definitive proxy statement for ourAnnual Meeting of Shareholders being held on November 15, 2021, a copy of which will be filed with the Securities and Exchange Commission not later than 120 days after theend of our fiscal year.
Item 11. Executive Compensation
The information concerning compensation required by this item is incorporated herein by reference from our definitive proxy statement for our Annual Meeting of Shareholdersbeing held on November 15, 2021, a copy of which will be filed with the Securities and Exchange Commission not later than 120 days after the end of our fiscal year.
Item 12. Security Ownership of Certain Beneficial Owners and Management and Related Shareholder Matters
The information concerning security ownership of certain beneficial owners and management required by this item is incorporated herein by reference from our definitive proxystatement for our Annual Meeting of Shareholders being held on November 15, 2021, a copy of which will be filed with the Securities and Exchange Commission not later than120 days after the end of our fiscal year. Management is not aware of any arrangements, including any pledge by any person of securities of the Company, the operation of whichmay at a subsequent date result in a change in control of the Company. The information concerning our equity incentive plan required by this item is set forth below.
Plan Category
Number of securities tobe issued upon exerciseof outstanding options,
warrants, and rights
Weighted-averageexercise price of
outstanding options,warrants, and rights
Number of securitiesremaining available forfuture issuance underequity compensation
plans (excludingsecurities reflected in
column (a))(a) (b) (c)
Equity compensation plans approved by security holders 1,319,456 $ 19.07 174,782 (1)
(1) 88,732 securities remain for issuance of restricted stock and 86,050 securities remain for issuance of stock options.
Item 13. Certain Relationships and Related Transactions, and Director Independence
The information concerning certain relationships and related transactions and director independence required by this item is incorporated herein by reference from our definitiveproxy statement for our Annual Meeting of Shareholders being held on November 15, 2021, a copy of which will be filed with the Securities and Exchange Commission not laterthan 120 days after the end of our fiscal year.
Item 14. Principal Accountant Fees and Services
The information concerning principal accountant fees and services is incorporated herein by reference from our definitive proxy statement for our Annual Meeting ofShareholders being held on November 15, 2021, a copy of which will be filed with the Securities and Exchange Commission not later than 120 days after the end of our fiscalyear.
127

PART IV
Item 15. Exhibits and Financial Statement Schedules
(a)(1) Financial Statements: See Part II--Item 8. Financial Statements and Supplementary Data.
(a)(2) Financial Statement Schedules: All financial statement schedules have been omitted as the information is not required under the related instructions or is not applicable.
(a)(3) Exhibits: See Exhibit Index.
(b) Exhibits: The following exhibits are filed as part of this Form 10-K and this list constitutes the Exhibit Index.
Regulation S-K ExhibitNumber Document
Reference to Prior Filing orExhibit Number Attached
Hereto
2.1 Agreement and Plan of Merger, dated as of September 20, 2016, by and between HomeTrust Bancshares, Inc. andTriSummit Bancorp, Inc. (a)
2.2 Purchase and Assumption Agreement, dated as of June 9, 2014, between Bank of America, National Associationand HomeTrust Bank (b)
2.3 Agreement and Plan of Merger, dated as of January 22, 2014, by and between HomeTrust Bancshares, Inc. andJefferson Bancshares, Inc. (c)
3.1 Charter of HomeTrust Bancshares, Inc. (d)3.2 Articles Supplementary to the Charter of HomeTrust Bancshares, Inc. for HomeTrust Bancshares, Inc.’s Junior
Participating Preferred Stock, Series A (e)3.3 Amended and Restated Bylaws of HomeTrust Bancshares, Inc. (f)4.1 Tax Benefits Preservation Plan, dated as of September 25, 2012, between HomeTrust Bancshares, Inc. and
Computershare Trust Company, N.A., as successor rights agent to Registrar and Transfer Company (e)4.2 Amendment No. 1, dated as of August 31, 2015, to Tax Benefits Preservation Plan, dated as of September 25,
2012, between HomeTrust Bancshares, Inc. and Computershare Trust Company, N.A., as successor rights agent toRegistrar and Transfer Company (o)
4.3 Amendment No. 2, dated as of August 21, 2018, to Tax Benefits Preservation Plan, dated as of September 25,2012, between HomeTrust Bancshares, Inc. and Computershare Trust Company, N.A., as successor rights agent toRegistrar and Transfer Company (t)
4.4 Description of HomeTrust Bancshares, Inc. Securities Registered Pursuant to Section 12 of the SecuritiesExchange Act of 1934. 4.4
10.1 HomeTrust Bancshares, Inc. Strategic Operating Committee Incentive Plan (s)10.2 Amended and Restated Employment Agreement entered into between HomeTrust Bancshares, Inc. and Dana L.
Stonestreet (g)10.3 Amended and Restated Employment Agreement entered into between HomeTrust Bancshares, Inc. and C. Hunter
Westbrook (g)10.3A Amendment No. One to Amended and Restated Employment Agreement entered into between HomeTrust
Bancshares, Inc. and C. Hunter Westbrook (u)10.3B Amendment No. Two dated as of October 27, 2020, to Amended and Restated Employment Agreement, dated as
of September 11, 2018, by and between the Company and C. Hunter Westbrook (h)10.3C Amendment No. Three dated as of July 26, 2021, to Amended and Restated Employment Agreement, dated as of
September 11, 2018, by and between the Company and C. Hunter Westbrook (q)10.4 Amended and Restated Employment Agreement entered into between HomeTrust Bancshares, Inc. and Tony J.
VunCannon (g)10.5 Employment Agreement between HomeTrust Bancshares, Inc. and Howard L. Sellinger (g)10.6 Employment Agreement between HomeTrust Bank and Sidney A. Biesecker (d)10.7 HomeTrust Bank Executive Supplemental Retirement Income Master Agreement (“SERP”) (d)
10.7A SERP Joinder Agreement for F. Edward Broadwell, Jr. (d)10.7B SERP Joinder Agreement for Dana L. Stonestreet (d)
128
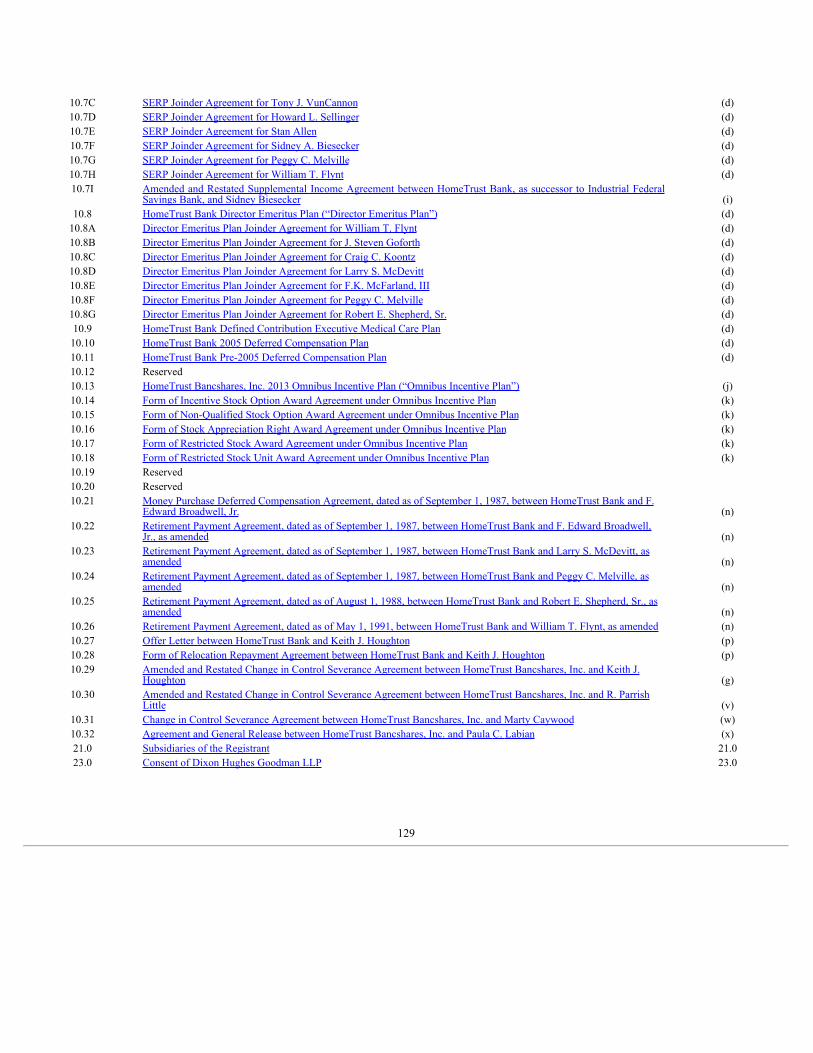
10.7C SERP Joinder Agreement for Tony J. VunCannon (d)10.7D SERP Joinder Agreement for Howard L. Sellinger (d)10.7E SERP Joinder Agreement for Stan Allen (d)10.7F SERP Joinder Agreement for Sidney A. Biesecker (d)10.7G SERP Joinder Agreement for Peggy C. Melville (d)10.7H SERP Joinder Agreement for William T. Flynt (d)10.7I Amended and Restated Supplemental Income Agreement between HomeTrust Bank, as successor to Industrial Federal
Savings Bank, and Sidney Biesecker (i)10.8 HomeTrust Bank Director Emeritus Plan (“Director Emeritus Plan”) (d)
10.8A Director Emeritus Plan Joinder Agreement for William T. Flynt (d)10.8B Director Emeritus Plan Joinder Agreement for J. Steven Goforth (d)10.8C Director Emeritus Plan Joinder Agreement for Craig C. Koontz (d)10.8D Director Emeritus Plan Joinder Agreement for Larry S. McDevitt (d)10.8E Director Emeritus Plan Joinder Agreement for F.K. McFarland, III (d)10.8F Director Emeritus Plan Joinder Agreement for Peggy C. Melville (d)10.8G Director Emeritus Plan Joinder Agreement for Robert E. Shepherd, Sr. (d)10.9 HomeTrust Bank Defined Contribution Executive Medical Care Plan (d)10.10 HomeTrust Bank 2005 Deferred Compensation Plan (d)10.11 HomeTrust Bank Pre-2005 Deferred Compensation Plan (d)10.12 Reserved10.13 HomeTrust Bancshares, Inc. 2013 Omnibus Incentive Plan (“Omnibus Incentive Plan”) (j)10.14 Form of Incentive Stock Option Award Agreement under Omnibus Incentive Plan (k)10.15 Form of Non-Qualified Stock Option Award Agreement under Omnibus Incentive Plan (k)10.16 Form of Stock Appreciation Right Award Agreement under Omnibus Incentive Plan (k)10.17 Form of Restricted Stock Award Agreement under Omnibus Incentive Plan (k)10.18 Form of Restricted Stock Unit Award Agreement under Omnibus Incentive Plan (k)10.19 Reserved10.20 Reserved10.21 Money Purchase Deferred Compensation Agreement, dated as of September 1, 1987, between HomeTrust Bank and F.
Edward Broadwell, Jr. (n)10.22 Retirement Payment Agreement, dated as of September 1, 1987, between HomeTrust Bank and F. Edward Broadwell,
Jr., as amended (n)10.23 Retirement Payment Agreement, dated as of September 1, 1987, between HomeTrust Bank and Larry S. McDevitt, as
amended (n)10.24 Retirement Payment Agreement, dated as of September 1, 1987, between HomeTrust Bank and Peggy C. Melville, as
amended (n)10.25 Retirement Payment Agreement, dated as of August 1, 1988, between HomeTrust Bank and Robert E. Shepherd, Sr., as
amended (n)10.26 Retirement Payment Agreement, dated as of May 1, 1991, between HomeTrust Bank and William T. Flynt, as amended (n)10.27 Offer Letter between HomeTrust Bank and Keith J. Houghton (p)10.28 Form of Relocation Repayment Agreement between HomeTrust Bank and Keith J. Houghton (p)10.29 Amended and Restated Change in Control Severance Agreement between HomeTrust Bancshares, Inc. and Keith J.
Houghton (g)10.30 Amended and Restated Change in Control Severance Agreement between HomeTrust Bancshares, Inc. and R. Parrish
Little (v)10.31 Change in Control Severance Agreement between HomeTrust Bancshares, Inc. and Marty Caywood (w)10.32 Agreement and General Release between HomeTrust Bancshares, Inc. and Paula C. Labian (x)21.0 Subsidiaries of the Registrant 21.023.0 Consent of Dixon Hughes Goodman LLP 23.0
129

31.1 Certification of Chief Executive Officer pursuant to Securities Exchange Act Rules 13a-14(a) and 15d-14(a) as adoptedpursuant to Section 302 of the Sarbanes-Oxley Act of 2002 31.1
31.2 Certification of Chief Financial Officer pursuant to Securities Exchange Act Rules 13a-14(a) and 15d-14(a) as adoptedpursuant to Section 302 of the Sarbanes-Oxley Act of 2002 31.2
32.0 Certificate of Chief Executive Officer and Chief Financial Officer pursuant to Section 906 of the Sarbanes-Oxley Act of2002 32.0
101 The following materials from HomeTrust Bancshares’ Annual Report on Form 10-K for the year ended June 30, 2021,formatted in Extensible Business Reporting Language (XBRL): (a) Consolidated Balance Sheets; (b) ConsolidatedStatements of Income; (c) Consolidated Statements of Comprehensive Income; (d) Consolidated Statements of Changesin Stockholders' Equity; (e) Consolidated Statements of Cash Flows; and (f) Notes to Consolidated Financial Statements. 101
(a) Attached as Appendix A to the proxy statement/prospectus filed by HomeTrust Bancshares on November 2, 2016 pursuant to Rule 424(b) of the Securities Act of 1933.(b) Filed as an exhibit to HomeTrust Bancshares’s Current Report on Form 8-K filed on June 10, 2014 (File No. 001-35593).(c) Attached as Appendix A to the joint proxy statement/prospectus filed by HomeTrust Bancshares on April 28, 2014 pursuant to Rule 424(b) of the Securities Act of 1933.(d) Filed as an exhibit to HomeTrust Bancshares’s Registration Statement on Form S-1 (File No. 333-178817) filed on December 29, 2011.(e) Filed as an exhibit to HomeTrust Bancshares’s Current Report on Form 8-K filed on September 25, 2012 (File No. 001-35593).(f) Filed as an exhibit to HomeTrust Bancshares's Quarterly Report on Form 10-Q for the quarter ended March 31, 2021 (File No. 001-35593).(g) Filed as an exhibit to HomeTrust Bancshares’s Current Report on Form 8-K filed on September 11, 2018 (File No. 001-35593).(h) Filed as an exhibit to HomeTrust Bancshares's Current Report on Form 8-K filed on October 28, 2020 (File No. 001-35593).(i) Filed as an exhibit to Amendment No. One to HomeTrust Bancshares’s Registration Statement on Form S-1 (File No. 333-178817) filed on March 9, 2012.(j) Attached as Appendix A to HomeTrust Bancshares’s definitive proxy statement filed on December 5, 2012 (File No. 001-35593).(k) Filed as an exhibit to HomeTrust Bancshares’s Registration Statement on Form S-8 (File No. 333-186666) filed on February 13, 2013.(l) Filed as an exhibit to HomeTrust Bancshares’s Current Report on Form 8-K filed on June 3, 2014 (File No. 001-35593).(m) Filed as an exhibit to Jefferson Bancshares's, Inc.’s Quarterly Report on Form 10-Q for the quarter ended December 31, 2008 (File No. 000-50347).(n) Filed as an exhibit to HomeTrust Bancshares's Annual Report on Form 10-K for the fiscal year ended June 30, 2014 (File No. 001-35593).(o) Filed as an exhibit to HomeTrust Bancshares’s Current Report on Form 8-K filed on August 31, 2015 (File No. 001-35593).(p) Filed as an exhibit to HomeTrust Bancshares's Annual Report on Form 10-K for the fiscal year ended June 30, 2015 (File No. 001-35593).(q) Filed as an exhibit to HomeTrust Bancshares's Current Report on Form 8-K filed on July 26, 2021 (File No. 001-35593).(r) Reserved(s) Filed as an exhibit to HomeTrust Bancshares's Quarterly Report on Form 10-Q for the quarter ended December 31, 2020 (File No. 001-35593).(t) Filed as an exhibit to HomeTrust Bancshares’s Current Report on Form 8-K filed on August 21, 2018 (File No. 001-35593).(u) Filed as an exhibit to HomeTrust Bancshares’s Current Report on Form 8-K filed on September 25, 2018 (File No. 001-35593).(v) Filed as an exhibit to HomeTrust Bancshares's Annual Report on Form 10-K for the fiscal year ended June 30, 2018 (File No. 001-35593).(w) Filed as an exhibit to HomeTrust Bancshares's Quarterly Report on Form 10-Q for the quarter ended March 31, 2019 (File No. 001-35593).(x) Filed as an exhibit to HomeTrust Bancshares's Quarterly Report on Form 10-Q for the quarter ended March 31, 2021 (File No. 001-35593).
130

Item 16. Form 10-K Summary
None.
SIGNATURES
Pursuant to the requirements of Section 13 or 15(d) of the Securities Exchange Act of 1934, the Registrant has duly caused this report to be signed on its behalf by theundersigned, thereunto duly authorized.
HOMETRUST BANCSHARES, INC.
Date: September 10, 2021 By: /s/ Dana L. StonestreetDana L. StonestreetChairman of the Boardand Chief Executive Officer
131
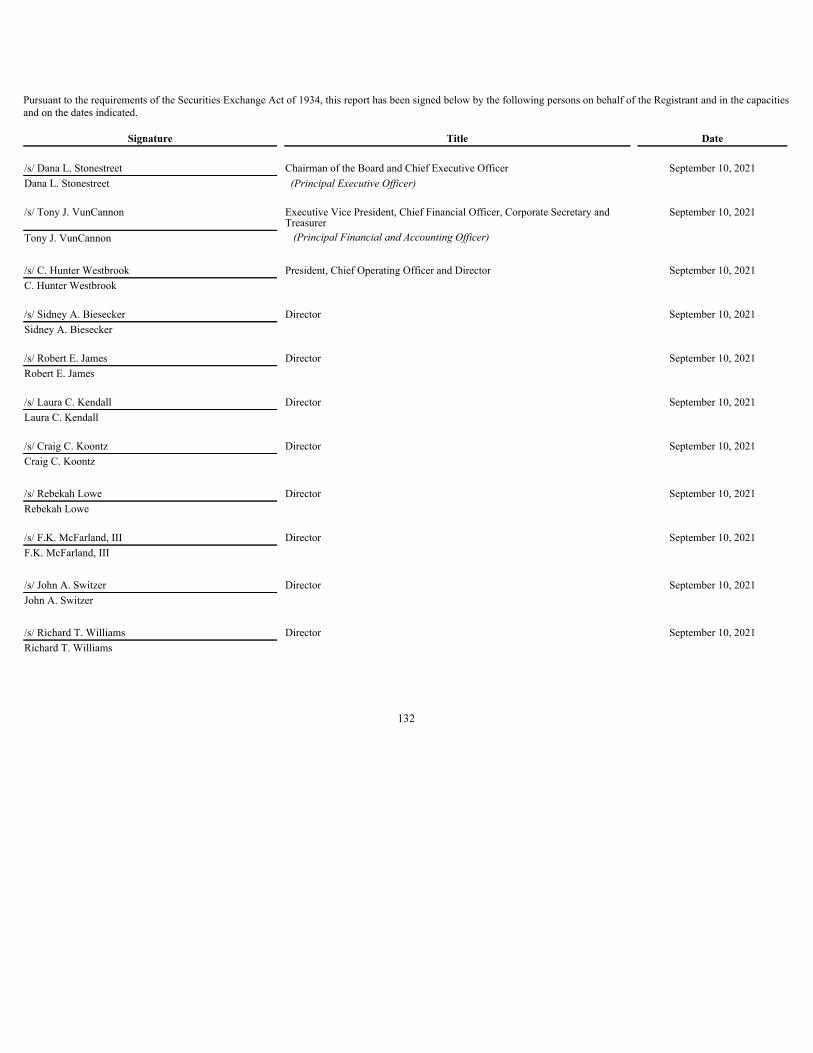
Pursuant to the requirements of the Securities Exchange Act of 1934, this report has been signed below by the following persons on behalf of the Registrant and in the capacitiesand on the dates indicated.
Signature Title Date /s/ Dana L. Stonestreet Chairman of the Board and Chief Executive Officer September 10, 2021Dana L. Stonestreet (Principal Executive Officer) /s/ Tony J. VunCannon Executive Vice President, Chief Financial Officer, Corporate Secretary and
TreasurerSeptember 10, 2021
Tony J. VunCannon (Principal Financial and Accounting Officer)
/s/ C. Hunter Westbrook President, Chief Operating Officer and Director September 10, 2021C. Hunter Westbrook /s/ Sidney A. Biesecker Director September 10, 2021Sidney A. Biesecker /s/ Robert E. James Director September 10, 2021Robert E. James /s/ Laura C. Kendall Director September 10, 2021Laura C. Kendall /s/ Craig C. Koontz Director September 10, 2021Craig C. Koontz
/s/ Rebekah Lowe Director September 10, 2021Rebekah Lowe /s/ F.K. McFarland, III Director September 10, 2021F.K. McFarland, III
/s/ John A. Switzer Director September 10, 2021John A. Switzer
/s/ Richard T. Williams Director September 10, 2021Richard T. Williams
132

Exhibit 21
SUBSIDIARIES OF THE REGISTRANT
Parent SubsidiaryPercentage of
Ownership State of Incorporation orOrganization
HomeTrust Bancshares, Inc. HomeTrust Bank 100% North Carolina
HomeTrust Bank Western North Carolina Service Corporation 100% North Carolina

Exhibit 23
Consent of Independent Registered Public Accounting Firm
We consent to the incorporation by reference in the Registration Statements on Forms S-8 (Nos. 333-182635, 333-186666 and 333-210167) of HomeTrust Bancshares, Inc. andSubsidiary (the "Company"), of our reports dated September 10, 2021, with respect to the consolidated financial statements of HomeTrust Bancshares, Inc. and the effectivenessof internal control over financial reporting, included in this Annual Report on Form 10-K for the year ended June 30, 2021.
/s/ DIXON HUGHES GOODMAN LLP
Atlanta, Georgia September 10, 2021

Exhibit 31.1
CERTIFICATION
I, Dana L. Stonestreet, certify that:
1. I have reviewed this annual report on Form 10-K of HomeTrust Bancshares, Inc.;
2. Based on my knowledge, this report does not contain any untrue statement of a material fact or omit to state a material fact necessary to make the statements made, in lightof the circumstances under which such statements were made, not misleading with respect to the period covered by this report;
3. Based on my knowledge, the financial statements, and other financial information included in this report, fairly present in all material respects the financial condition, resultsof operations and cash flows of the registrant as of, and for, the periods presented in this report;
4. The registrant's other certifying officer and I are responsible for establishing and maintaining disclosure controls and procedures (as defined in Exchange Act Rules 13a-15(e) and 15d-15(e)) and internal control over financial reporting (as defined in Exchange Act Rules 13a-15(f) and 15d-15(f)) for the registrant and have:
a) designed such disclosure controls and procedures, or caused such disclosure controls and procedures to be designed under our supervision, to ensure that materialinformation relating to the registrant, including its consolidated subsidiaries, is made known to us by others within those entities, particularly during the period inwhich this report is being prepared;
b) designed such internal control over financial reporting, or caused such internal control over financial reporting to be designed under our supervision, to providereasonable assurance regarding the reliability of financial reporting and the preparation of financial statements for external purposes in accordance with generallyaccepted accounting principles;
c) evaluated the effectiveness of the registrant's disclosure controls and procedures and presented in this report our conclusions about the effectiveness of the disclosurecontrols and procedures, as of the end of the period covered by this report based on such evaluation; and
d) disclosed in this report any change in the registrant’s internal control over financial reporting that occurred during the registrant’s most recent fiscal quarter (theregistrant’s fourth fiscal quarter in the case of an annual report) that has materially affected, or is reasonably likely to materially affect, the registrant’s internal controlover financial reporting; and
5. The registrant's other certifying officer and I have disclosed, based on our most recent evaluation of internal control over financial reporting, to the registrant's auditors andthe audit committee of the registrant's board of directors (or persons performing the equivalent functions):
a) all significant deficiencies and material weaknesses in the design or operation of internal control over financial reporting which are reasonably likely to adverselyaffect the registrant's ability to record, process, summarize and report financial information; and
b) any fraud, whether or not material, that involves management or other employees who have a significant role in the registrant's internal control over financialreporting.
Date: September 10, 2021
/s/ Dana L. Stonestreet Dana L. StonestreetChairman of the Board,President and Chief Executive Officer
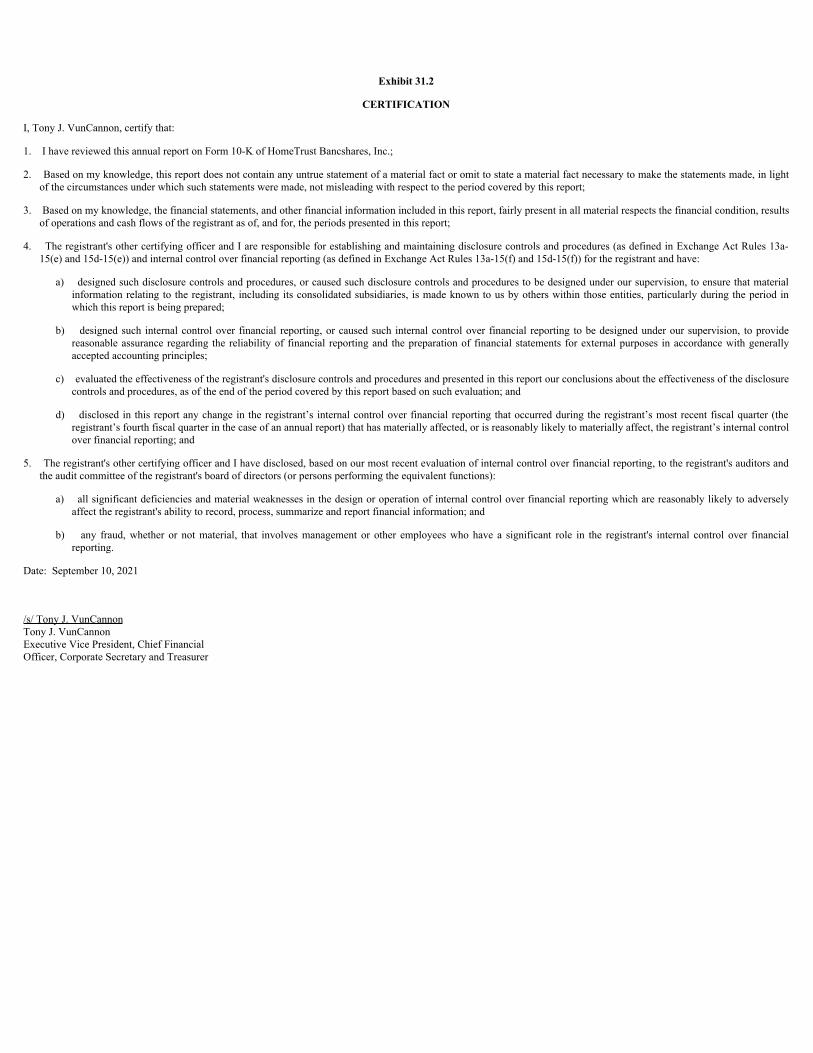
Exhibit 31.2
CERTIFICATION
I, Tony J. VunCannon, certify that:
1. I have reviewed this annual report on Form 10-K of HomeTrust Bancshares, Inc.;
2. Based on my knowledge, this report does not contain any untrue statement of a material fact or omit to state a material fact necessary to make the statements made, in lightof the circumstances under which such statements were made, not misleading with respect to the period covered by this report;
3. Based on my knowledge, the financial statements, and other financial information included in this report, fairly present in all material respects the financial condition, resultsof operations and cash flows of the registrant as of, and for, the periods presented in this report;
4. The registrant's other certifying officer and I are responsible for establishing and maintaining disclosure controls and procedures (as defined in Exchange Act Rules 13a-15(e) and 15d-15(e)) and internal control over financial reporting (as defined in Exchange Act Rules 13a-15(f) and 15d-15(f)) for the registrant and have:
a) designed such disclosure controls and procedures, or caused such disclosure controls and procedures to be designed under our supervision, to ensure that materialinformation relating to the registrant, including its consolidated subsidiaries, is made known to us by others within those entities, particularly during the period inwhich this report is being prepared;
b) designed such internal control over financial reporting, or caused such internal control over financial reporting to be designed under our supervision, to providereasonable assurance regarding the reliability of financial reporting and the preparation of financial statements for external purposes in accordance with generallyaccepted accounting principles;
c) evaluated the effectiveness of the registrant's disclosure controls and procedures and presented in this report our conclusions about the effectiveness of the disclosurecontrols and procedures, as of the end of the period covered by this report based on such evaluation; and
d) disclosed in this report any change in the registrant’s internal control over financial reporting that occurred during the registrant’s most recent fiscal quarter (theregistrant’s fourth fiscal quarter in the case of an annual report) that has materially affected, or is reasonably likely to materially affect, the registrant’s internal controlover financial reporting; and
5. The registrant's other certifying officer and I have disclosed, based on our most recent evaluation of internal control over financial reporting, to the registrant's auditors andthe audit committee of the registrant's board of directors (or persons performing the equivalent functions):
a) all significant deficiencies and material weaknesses in the design or operation of internal control over financial reporting which are reasonably likely to adverselyaffect the registrant's ability to record, process, summarize and report financial information; and
b) any fraud, whether or not material, that involves management or other employees who have a significant role in the registrant's internal control over financialreporting.
Date: September 10, 2021
/s/ Tony J. VunCannonTony J. VunCannonExecutive Vice President, Chief FinancialOfficer, Corporate Secretary and Treasurer

Exhibit 4.4
DESCRIPTION OF THE REGISTRANT’S SECURITIESREGISTERED PURSUANT TO SECTION 12 OF THE
SECURITIES EXCHANGE ACT OF 1934
General
The Company’s authorized capital stock currently consists of:
• 60,000,000 shares of common stock, $0.01 par value per share; and• 10,000,000 shares of preferred stock, $0.01 value per share.No shares of our preferred stock are currently outstanding. The Company’s common stock is traded on NASDAQ under the symbol “HTBI.”
Common Stock
The following description of our common stock is a summary and does not purport to be complete. It is subject to and qualified in its entirety by reference to our Charter (the“Charter”) and our Amended and Restated Bylaws (the “Bylaws”), each of which is incorporated by reference as an exhibit to the Annual Report on Form 10-K of which thisExhibit 4.4 is a part. We encourage you to read our Charter, our Bylaws and the applicable provisions of Maryland General Corporation Law, for additional information.
Each share of our common stock has the same relative rights and is identical in all respects with each other share of our common stock. The Company’s common stockrepresents non-withdrawable capital, is not of an insurable type and is not insured by the FDIC or any other government agency.
Subject to any prior rights of the holders of any preferred or other stock of the Company then outstanding, holders of our common stock are entitled to receive such dividends asare declared by the board of directors of the Company out of funds legally available for dividends.
Except with respect to greater than 10% shareholders, full voting rights are vested in the holders of our common stock and each share is entitled to one vote. Subject to any priorrights of the holders of any of our preferred stock then outstanding, in the event of a liquidation, dissolution or winding up of the Company, holders of shares of our commonstock will be entitled to receive, pro rata, any assets distributable to shareholders in respect of shares held by them. Holders of shares of Company common stock do not have anypreemptive rights to subscribe for any additional securities which may be issued by the Company, nor do they have cumulative voting rights.
In addition to the foregoing, provisions in our Charter and Bylaws may discourage attempts to acquire HomeTrust Bancshares, pursue a proxy contest for control of HomeTrustBancshares, assume control of HomeTrust Bancshares by a holder of a larger block of common stock, and remove HomeTrust Bancshares’ management, all of whichshareholders might think are in their best interests.
These provisions include:
• an 80% shareholder vote requirement for certain business combinations not approved by disinterested directors, for amendments to some provisions of the articles ofincorporation and for any amendment of the bylaws by shareholders;
• the election of directors to staggered terms of three years;• provisions requiring advance notice of shareholder proposals and director nominations;• a requirement that the calling of a special meeting by shareholders requires the written request of shareholders entitled to vote at least a majority of all votes entitled to vote
at the meeting; and• the removal of directors only for cause and by a vote of a majority of the outstanding shares of common stock.
Federal banking law also restricts acquisitions of control of savings and loan holding companies such as HomeTrust Bancshares. In addition, the business corporation law ofMaryland, the state where HomeTrust Bancshares is incorporated, provides for certain restrictions on acquisition of HomeTrust Bancshares.
Preferred Share Purchase Rights
The following description of our preferred share purchase rights (the “Rights”) is a summary and does not purport to be complete. It is subject to and qualified in its entirety byreference to our Articles Supplementary to our Charter (“Articles Supplementary”)
1

and our Tax Benefits Preservation Plan (the “Plan”), each of which is incorporated by reference as an exhibit to the Annual Report on Form 10-K of which this Exhibit 4.4 is apart. We encourage you to read our Articles Supplementary and the Plan, for additional information.
On September 25, 2012, the Board of Directors of the Company declared a dividend of one Right for each share its common stock outstanding at the close of business onOctober 9, 2012 (the “Rights Record Date”), and to become outstanding between the Record Date and the earlier of the Distribution Date and the Expiration Date (each asdefined below). The Rights will be issued pursuant to the Plan, dated as of September 25, 2012, as amended on August 31, 2015 and August 21, 2018, between the Companyand Computershare Trust Company, as rights agent (the “Rights Agent”). Each Right represents the right to purchase, upon the terms and subject to the conditions set forth inthe Plan, 1/1,000 of a share of Junior Participating Preferred Stock, Series A, par value $0.01 per share (“Preferred Share”), for $22.63 (the “Purchase Price”), subject toadjustment as provided in the Plan.
The purpose of the Plan is to protect the Company’s ability to use certain tax assets, including net operating loss carryforwards (the “Tax Benefits”), to offset future taxableincome. The Company’s use of the Tax Benefits in the future would be substantially limited if it experiences an “ownership change” for purposes of Section 382 of the InternalRevenue Code of 1986, as amended (the “Code”). In general, an ownership change will occur if the Company’s “5-percent shareholders,” as defined in Section 382 of the Code,collectively increase their ownership in the Company by more than 50 percentage points over a rolling three-year period.
The Plan is designed to reduce the likelihood that the Company will experience an ownership change by discouraging any person from becoming a beneficial owner of 4.99% ormore of the then outstanding common stock (a “Threshold Holder”). There is no guarantee, however, that the Plan will prevent the Company from experiencing an ownershipchange. A corporation that experiences an ownership change will generally be subject to an annual limitation on certain of its pre-ownership change tax assets in an amountequal to the fair market value of the corporation’s outstanding stock immediately prior to the ownership change, multiplied by the long-term tax-exempt rate.
Distribution Date. Initially, the Rights will be attached to all shares of our common stock then outstanding, and no separate Right certificates will be distributed. On or after theDistribution Date, the Rights will separate from the shares of common stock and become exercisable.
The “Distribution Date” will occur on the earlier of (i) the close of business on the tenth business day after a Shares Acquisition Date (as defined below) and (ii) the close ofbusiness on the tenth business day (or such later day as may be designated prior to a Shares Acquisition Date by the Company’s Board of Directors) after the date of thecommencement of a tender or exchange offer by any person if, upon consummation of the offer, such person would or could be an Acquiring Person (as defined below).
A “Shares Acquisition Date” is the date of the first public announcement by the Company or an Acquiring Person indicating that an Acquiring Person has become such.
An “Acquiring Person” means any person who or which, together with its affiliates, beneficially owns 4.99% or more of the Company’s common stock (or any other securities ofthe Company then outstanding that would be treated as “stock” under Section 382 of the Code), other than (i) the U.S. Government; (ii) the Company or any subsidiary oremployee benefit plan or compensation arrangement of the Company; (iii) any person or entity who or which, together with its affiliates, was on the Rights Record Date, thebeneficial owner of 4.99% or more of the Company’s common stock, unless that person or entity subsequently increases their beneficial ownership percentage (other than as aresult of any stock dividend, stock split or similar transaction or stock repurchase by the Company); (iv) any person or entity who or which the Company’s Board of Directorsdetermines, in its sole discretion, has inadvertently become a 4.99% or greater stockholder so long as such person or entity promptly divests sufficient shares to no longer be a4.99% or greater stockholder; (v) any person or entity who or which has become the beneficial owner of 4.99% or more of the Company’s common stock as a result of anacquisition of shares of common stock by the Company which, by reducing the number of shares outstanding, increased the proportionate number of shares beneficially ownedby that person or entity, provided that the person or entity does not acquire any additional shares other than as a result of any stock dividend, stock split or similar transaction;and (vi) any person or entity who or which has become a 4.99% or greater stockholder if the Company’s Board of Directors in good faith determines that the attainment of suchstatus has not jeopardized or endangered the Company’s utilization of the Tax Benefits.
Flip-In. From and after a Shares Acquisition Date, (i) Rights owned by the Acquiring Person and its affiliates and certain of their transferees will automatically be void; and (ii)each other Right will automatically become a Right to buy, for the Purchase Price, in lieu of Series A Preferred Stock, that number of shares of the Company’s common stockequal to (a) the Purchase Price multiplied by the number of 1/1000ths of a share of Series A Preferred Stock for which the Right is then exercisable divided by (b) 50% of thethen-current per share market price of the Company’s common stock.
Exchange. At any time after a Shares Acquisition Date the Company’s Board of Directors may, at its option, exchange all or part of the then outstanding and exercisable Rightsfor shares of common stock at an exchange ratio of one share of common
th
2

stock per Right, subject to adjustments and limitations described in the Plan. The Board may enter into a trust agreement pursuant to which the Company would deposit into atrust shares of common stock that would be distributable to stockholders (excluding the Acquiring Person and its affiliates) in the event the exchange is implemented. Thisfeature is intended to facilitate a more orderly distribution of shares of common stock in the event that a Shares Acquisition Date occurs.
Redemption. At any time prior to the Distribution Date, the Company’s Board of Directors may, at its option, redeem all, but not fewer than all, of the then outstanding Rights ata redemption price of $0.0001 per Right.
Amendments. the Company may from time to time before the Distribution Date supplement or amend the Plan without the approval of any holders of Rights.
After the Distribution Date, the Plan may not be amended in any manner that would adversely affect the interests of the holders of Rights.
Expiration. The Rights will expire on the earliest of (i) August 21, 2021, (ii) the time at which all Rights have been redeemed by the Company, (iii) the time at which all Rightshave been exchanged by the Company, (iv) such time as the Company’s Board of Directors determines, in its sole discretion, that the Rights and the Plan are no longer necessaryfor the preservation of existence of the Tax Benefits, and (v) a date prior to a Shares Acquisition Date on which the Board determines, in its sole discretion, that the Rights andthe Plan are no longer in the best interests of the Company and its stockholders.
Anti-Takeover Impact. The Plan could have an anti-takeover effect because it will restrict the ability of a person, entity or group to accumulate 4.99% or more of our commonstock, and the ability of persons, entities or groups owning 4.99% or more of our common stock prior to the adoption of the Plan, from acquiring additional shares of ourcommon stock without the approval of the Company’s Board of Directors. The Plan also could have an anti-takeover effect because an Acquiring Person’s ownership may bediluted substantially upon the occurrence of a triggering event. Accordingly, the overall effects of the Tax Benefits Preservation Plan may be to render more difficult, ordiscourage, a merger, tender offer, proxy contest or assumption of control by a substantial holder of Company stock.
3

Exhibit 32
CERTIFICATION UNDER SECTION 906 OFTHE SARBANES-OXLEY ACT OF 2002
Pursuant to Section 906 of the Sarbanes-Oxley Act of 2002, each of the undersigned certifies in the capacity indicated below that this Annual Report on Form 10-K ofHomeTrust Bancshares, Inc. (the “Company”) for the year ended June 30, 2021 fully complies with the requirements of Section 13(a) of the Securities Exchange Act of 1934, asamended, and that information contained in such report fairly presents, in all material respects, the financial condition and results of operations of the Company as of the datesand for the periods presented in the financial statements included in such report.
Date: September 10, 2021 /s/ Dana L. Stonestreet Chairman of the Board, President and Chief Executive Officer Date: September 10, 2021 /s/ Tony J. VunCannon Tony J. VunCannon Executive Vice President, Chief Financial Officer, Corporate Secretary and Treasurer
This certification accompanies this periodic report pursuant to Section 906 of the Sarbanes-Oxley Act of 2002 and shall not be deemed filed by for purposes of Section 18 of theSecurities Exchange Act of 1934, as amended.