activation of sirt1 by resveratrol represses transcription of the gene for the cytosolic form of...
TRANSCRIPT

1
The activation of SIRT1 by resveratrol represses transcription of the gene for the cytosolic form of phosphoenolpyruvate carboxykinase (GTP) by deacetylating HNF4α
Jianqi Yang¶*, Xiaoying Kong*, Maria Emilia S. Martins-Santos, Gabriela Aleman, Ernestine Chaco, George E. Liu‡, Shwu-Yuan Wu#, David Samols, Parvin Hakimi, Cheng-Ming Chiang#, and
Richard W. Hanson¶
Department of Biochemistry, Case Western Reserve University School of Medicine, Cleveland, OH 44106-4935; ‡USDA, ARS, ANRI, Bovine Functional Genomics Laboratory, Beltsville Agricultural
Research Center, Beltsville, MD, 20705; #Simmons Comprehensive Cancer Center, University of Texas Southwestern Medical Center, 5323 Harry Hines Blvd., Dallas, TX 75390-8807.
Running title: Inhibition of PEPCK-C gene transcription by SIRT1 *These authors contributed equally to this research.
¶ To whom correspondence should be addressed: Richard W. Hanson, Department of Biochemistry, Case Western Reserve University School of Medicine, Cleveland, OH 44106-4935 Tel. 216-368-3634; Fax. 216-368-4544; E-mail: [email protected]
The SIRT1 activators isonicotinamide (IsoNAM), resveratrol, fisetin, and butein repressed transcription of the gene for the cytosolic form of phosphoenolpyruvate carboxykinase (GTP) (PEPCK-C). An evolutionarily conserved binding site for HNF4α (-272/-252) was identified, which was required for transcriptional repression of the PEPCK-C gene promoter caused by these compounds. This site contains an overlapping AP1 binding site and is adjacent to the C/EBP binding element (-248/-234); the latter is necessary for hepatic transcription of PEPCK-C. AP-1 competed with HNF4α for binding to this site and also decreased HNF4α stimulation of transcription from the PEPCK-C gene promoter. ChIP experiments demonstrated that HNF4α and AP-1, but not C/EBPβ, reciprocally bound to this site prior to and after treating HepG2 cells with IsoNAM. IsoNAM treatment resulted in deacetylation of HNF4α, which decreased its binding affinity to the PEPCK-C gene promoter. In HNF4α-null CHO cells, IsoNAM and resveratrol failed to repress transcription from the PEPCK-C gene promoter; over-expression of HNF4α in CHO cells re-established transcriptional inhibition. Exogenous SIRT1 expression repressed transcription, while knockdown of SIRT-1 by
RNAi reversed this effect. IsoNAM decreased the level of mRNA for PEPCK-C but had no effect on mRNA for glucose-6-phosphatase in AML12 mouse hepatocytes. We conclude that SIRT1 activation inhibited transcription of the gene for PEPCK-C in part by deacetylation of HNF4α. However, SIRT1 deacetylation of other key regulatory proteins that control PEPCK-C gene transcription also likely contributed to the inhibitory effect.
INTRODUCTION
The cytosolic isoform of phosphoenolpyruvate carboxykinase (GTP) (PEPCK-C)1 (EC 4.1.1.32) is a key enzyme in gluconeogenesis in the liver and kidney cortex, and glyceroneogenesis in the liver, white and brown adipose tissue and skeletal muscle (1). Ablation of this gene in adipose tissue caused lipodystrophy in mice, due to an alteration in the rate of glyceroneogenesis in that tissue (2). Conversely, over–expression of the gene for PEPCK-C in adipose tissue resulted in obesity (3) and diabetes when mice are fed a high fat diet (4). PEPCK-C thus plays a critical role in the genesis of Type 2 diabetes by regulating both hepatic glucose output and the rate of triglyceride synthesis and deposition in adipose tissue (5); the
http://www.jbc.org/cgi/doi/10.1074/jbc.M109.047340The latest version is at JBC Papers in Press. Published on August 3, 2009 as Manuscript M109.047340
Copyright 2009 by The American Society for Biochemistry and Molecular Biology, Inc.
by guest on February 9, 2016http://w
ww
.jbc.org/D
ownloaded from

2
aberrant expression of this gene has been proposed to result in diabetes and obesity in humans (6).
Transcription of the gene for PEPCK-C is acutely regulated by hormones, diet and number of small effector molecules (7). Insulin represses PEPCK-C gene transcription via a mechanism that involves PGC1α, FOXO1, and HNF4α (8). In addition, SREBP-1c has also been implicated in the repression of transcription of the gene by insulin (9-10). Glucocorticoids stimulate transcription of the gene for PEPCK-C in the liver (11-12) but inhibit this process in adipose tissue (13). Various small molecules also provide potentially valuable tools for controlling PEPCK-C gene transcription and thus in regulating hepatic glucose output. For example, rosiglitasone induces PEPCK-C gene transcription in adipose tissue by activating PPARγ2 (14), while epigallocatechin gallate, an active ingredient of green tea, has a strong inhibitory effect on transcription from the PEPCK-C gene promoter (15). In the current study, the effect of SIRT1 chemical activators, including isonicotinamide (IsoNAM) and resveratrol, on hepatic PEPCK-C gene transcription has been investigated.
Sir2 (silencing information regulator 2) is critical for survival during calorie restriction in Saccharomyces cerevisiae (16) and Caenorhabditis elegans (17). SIRT1, the mammalian homologue of Sir2, is an NAD+-dependent deacetylase (18) and has also been shown to regulate a number of metabolic processes during calorie restriction in mammals (19). SIRT1 deacetylates a variety of proteins, including histones, transcription factors (20) and transcriptional co-regulators (21,22).
There are conflicting reports of the effect of SITR1 activation on transcription of the gene for PEPCK-C. It has been proposed that an increase in SIRT1 activity stimulates PEPCK-C gene transcription, presumably due to deacetylation of specific transcription factors and co-regulators, such as Foxo1 and PGC-1α. Rodgers et al. (22) presented data showing that SIRT1 deacetylates, and thereby activates PGC-1α, which in turn induces transcription of the genes for PEPCK-C and glucose-6-phosphatase. There is also evidence that diabetic rats, in which the mRNA for SIRT1 in the liver was reduced to 25% of control values, have a marked decrease in the level of PEPCK mRNA (23). These and other studies (24)
contrast with other reports in the literature (25) (26) (27) and with the results of the present study, in which we report that the activation of SIRT1 by resveratrol or IsoNAM markedly repressed transcription of the gene for PEPCK-C in HepG2 hepatoma cells and in AML12 hepatocytes; it had no effect on the level of mRNA for G6Pase. The molecular mechanism that is responsible for this effect was investigated.
EXPERIMENTAL PROCEDURES Materials- IsoNAM, resveratrol, butein, and
fisetin were purchased from Sigma (St. Louis, MO) and cFos, and cJun were from Biomol. ( Plymouth Meeting, PA).
DNA constructs and site-direct mutagenesis- The luciferase reporter construct, p2000-Luc was generated by subcloning a segment of the rat PEPCK-C gene promoter (-2367/+72) into the pGL3-Basic plasmid (Promega, Madison, WI). Truncations of the gene promoter were created using restriction enzymes to delete segments of the promoter within p2000-Luc. A site-directed mutagenesis kit (Stratagene, La Jolla, CA) was used to construct mutants of the PEPCK-C gene promoter by following the manufacture’s procedure. Two HNF4α-binding sites at -272/-252 (HNF4α site-2) and -454/-430 (AF1) were mutated from CAAAG and CTTTG to ACCAT and AGGTT respectively, using the following primers: 5'- GCA TCA GCA ACA GTC ACG GTA CCA TTT TAG TCA ATC AAA CGT TGT GTA AGG AC -3' and 5'- TCA GAG CTG AAT TCC CTT CTC ATG ACA GGT TGC CGT GGG AGT GAC ACC TCA C -3'. Plasmids that over-express mouse SIRT1 and FLAG-tagged human HNF4α cDNAs were gifts from Dr. Duna Massillon.
Cell culture, transfection, luciferase assay, and siRNA knocking down studies- HepG2 (human), FTO-2B (rat), and AML12 (mouse) hepatocytes were cultured at 37°C in DMEM/F-12 (half/half) medium, supplemented with 10% fetal bovine serum (FBS), 10 units/ml of penicillin, and 10 μg/ml of streptomycin (Invitrogen, Carlsbad, CA). The medium used to culture AML12 cells was also supplemented with insulin-transferrin-selenium (ITS) (Invitrogen Carlsbad, CA) and 40 ng/ml dexamethasone. When 500 mM of 8-bromo-cAMP was used, cells were starved with
by guest on February 9, 2016http://w
ww
.jbc.org/D
ownloaded from
3
0.5% fetal bovine serum for 24 h. After another 24 h with 8-bromo-cAMP, the cells were treated with 5 or 10 mM isonicotinamide for 17 h. Transient transfection was performed in triplicate. Approximately 200,000 cells were cultured in one well of 24-well plates for 24 h and then transfected with 0.2 to 0.4 μg of plasmid DNA using FuGENE6 (Roche, Indianapolis, IN). After 24 h, the cells were collected and lysed using a cell lysis reagent (Promega, Madison, WI) and luciferase activity was measured using a luminometer (Molecular Devices, Sunnyvale, CA). The protein content of the lysate was determined using BCATM protein assay reagent (Pierce, Rockford, IL). The final results were expressed as relative luciferase units (RLU) per μg of protein. When chemicals, such as IsoNAM and resveratrol were tested, they were added to medium 1 h after transfection to a desired final concentration. For siRNA knocking down of SIRT1, HepG2 cells were transfected with a mixture of p2000-Luc DNA and siRNA (Dharmacon, Chicago, IL) or a mixture of p2000-Luc DNA and negative control siRNA, using the DharmaFECT Duo transfection reagent (Dharmacon, Chicago, IL). IsoNAM was added to the medium 20 h after transfection, at a final concentration of 5 mM, and the activity of luciferase was determined 24 h later.
RT-PCR and Northern blotting- HepG2 hepatoma cells, AML12 mouse hepatocytes or FTO2B hepatoma cells were grown in 6-well plates to 70% confluency and treated with 5 mM or 10 mM IsoNAM. Total RNA was isolated using VersageneTM RNA purification kit (Gentra Systems, Minneapolis, MN), according to the manufacturer’s protocol. Northern blotting was done following the protocol described previously (28). The One-Step RT-PCR Kit (USB, Solon, OH) was used to reverse transcribe mRNA for PCR analysis according to the manufacturer’s instructions. In each reaction, 0.5 μg of the template RNA was used. The primer sequences were as follows: PEPCK-C forward 5’ GCA TGG GGT GTT TGT AGG AG 3’, PEPCK-C reverse 5’ CCC TAG CCT GTT CTC TGT GC 3’; G6Pase forward 5’ GTG AAT TAC CAA GAC TCC CAG 3’, G6Pase reverse 5’ GCC CAT GGC ATG GCC AGA GGG 3’; GAPDH forward 5’ CCC ATC ACC ATC TTC CAG GA 3’, GAPDH
reverse 5’ CCA CCA CCC TGT TGC TGT AG 3’.
Nuclear extracts and fluorescent electrophoretic mobility shift assays (EMSA) Nuclear extracts were prepared as described previously (29). Briefly, HepG2 cells from one 150-mm plate were collected and lysed by using Nonidet P-40 at a final concentration of 0.33%. Nuclei were then collected and lysed in 200 µl of lyses buffer (50 mM Tris-HCl at pH 7.4, 150 mM NaCl, 0.5 % triton X-100, 20% glycerol, and 1X EDTA-free proteinase inhibitors). After centrifugation at 12,000 x g for 10 min at 4ºC, the resultant supernatant was saved as nuclear extract. Fluorescent EMSA was performed with a protocol described previously (10). DNA fragments were generated by annealing two complementary oligonucleotides, one of which was labeled with 6-FAM at the 5’-end (Integrated DNA Technologies, Coralville, IA). The labeled oligonucleotides were: 5’- /6-FAM/-CAA CAG TCA CGG TCA AAG TTT AGT CAA TCA A-3’ for the wild type sequence of HNF4α site-2 (-272/-252), 5’- /6-FAM/- CAA CAG TCA CGG TAC CAT TTT AGT CAA TCA A-3’ for a mutant sequence, and 5’-/6-FAM/-CTC CCA CGG CCA AAG GTC ATG ACC G-3' for the wild type sequence of AF1.
Western blotting and immunoprecipitation- Western blotting was performed as previously described (30), using antisera raised against HNF4α (SC-8987, 1:1000 dilution) and SIRT1 (SC-15404, 1:1000 dilution) (Santa Cruz Biotechnology, Santa Cruz, CA). For immunoprecipitation studies, 500 μg of nuclear extract was pre-cleared at 4ºC for 2 h, using 30 µl of Protein G agarose slurry (Roche, IN). The supernatant was then transferred to a new tube and incubated at 4ºC for 2 h with 2 µg of the antibody against HNF4α, followed by an additional 2 h incubation with 40 µl of Protein G agarose slurry at 4ºC. At the end of the incubation, the beads were collected by centrifugation at 1,000 x g at 4ºC for 5 min, and washed three times with 1X TTBS (1mM Tris-HCl at pH 7.5, 0.09% NaCl, 0.05% Tween-20). After the final wash, the immunoprecipitated protein was recovered from the beads by re-suspending the pellet in 20 µl of 2X electrophoresis sample buffer, and heated at 95ºC for 5 min.
by guest on February 9, 2016http://w
ww
.jbc.org/D
ownloaded from
4
Purification of HNF4α and SIRT1, and the in vitro deacetylation assay- A plasmid expressing FLAG-tagged human HNF4α was transfected into HepG2 cells using FuGENE6 (Roche, IN). Stably transfected colonies were established by selection with medium containing 0.5 mg/ml of G418 (Invitrogen, Carlsbad, CA). For purification of HNF4α, cells expressing FLAG-tagged HNF4α were collected from twenty 150-mm plates and proteins extracted using the procedure described above. FLAG-tagged HNF4α was purified using EZviewTM Red Anti-FLAG M2 Affinity gel, and eluted with 3X FLAG peptide (Sigma, St. Louis, MO) following the manufacturer’s manual. Eluted protein was further concentrated to an appropriate concnetration using Microcon YM-10 (Millipore, Billlerica, MA) and stored at -80 ºC in lysis buffer. FLAG-tagged SIRT1 was purified from bacteria BL21(DE3)plysS, expressing FLAG-tagged human SIRT1 as described (31). Deacetylation in vitro was carried out at 37˚C for 2 h in a reaction solution containing 0.2 µg of FLAG-HNF4α, 0.4 µg of SIRT1, 40 mM Tris-HCl at pH 8.0, 4 mM MgCl2, 1 mM DTT, 2 mM IsoNAM, 0.1 mg/ml BSA, and 1 mM NAD+.
Chromatin immunoprecipitation (ChIP) Assay- HepG2 cells were treated with IsoNAM as desired. ChIP assay was performed as described previously (10). Briefly, cells were sequentially incubated with 1% formaldehyde at room temperature for 10 min and with 125 mM glycine for another 5 min. The cells were then washed, collected, and completely lysed in 1 ml of RIPA buffer (20 mM Tris-HCl, pH 8.0, 140 mM NaCl, 1% Triton X-100, 1% SDS, 1% deoxycholic acid, 2 mM EDTA, and freshly added protease inhibitors) by passing them through a 30-gauge needle. The chromatin was sheared with sonication using a Fisher Scientific 550 Sonic Dismembrator (power settings of 3, 14 cycles of 10 sec on and 50 sec off), and then cleared with 30 µl of Protein G agarose slurry (Roche, Indianapolis, IN), 2 µg of sheared salmon sperm DNA, and 2.5 µg of pre-immune serum. One hundred μg of DNA (shared chromatin) was used for immunoprecipitation experiments, by mixing it with primary antibodies against HNF4α, c-Fos, C/EBPβ (Santa Cruz Biotechnology, Santa Cruz, CA) or water for overnight at 4 °C, then mixing with 30 µl of protein G agarose beads and 2 µg of
sheared salmon sperm DNA for additional 1 h. Immune-precipitated complex (beads) was collected and subjected to sequential washes and centrifugations at 7,500 x g for 5 min at 4°C. The buffers sequentially used for washing were 1 ml of RIPA buffer, 1 ml of RIPA-500 buffer (20 mM Tris-HCl, pH 8.0, 500 mM NaCl, 1% Triton X-100, 0.1% SDS, 1% deoxycholic acid, and protease inhibitor mixture), 1 ml of a LiCl detergent solution (0.5% deoxycholic acid, 1 mM EDTA, 250 mM LiCl, 0.5% Nonidet P-40, 20 mM Tris-HCl at pH 8.0, and protease inhibitor mixture), and then 1 ml of 1X TBS. Immuno-precipitated complexes were then eluted by incubating the beads twice with 100 µl of elution buffer (1% SDS, 1 mM Tris-HCl at pH 8.0, and 1 mM EDTA) at 65 °C for 10 min; the two elutes were then combined. DNA was purified by reversing cross-link followed by using a QIAquick PCR purification kit (Qiagen, Balancia, CA). The DNA isolated from the immunoprecipitate was analyzed using PCR with primers 5’-GCC AGC AGC ATA TGA AGT CCA-3’ and 5’-AAC TTT GGG GAG ATA ATG ATT GAA C-3’ for HNF4α binding site-2, and primers 5’-AGC ACT CTT CGT CAC TCT TAT GTC TC-3’ and 5’-CAA GGC AAG GAT CTC TCT CTC G-3’ for the negative control (non-target region). The amplified DNA fragments were separated by electrophoresis using 1.5% agarose gels and stained with ethidium bromide.
Statistic analysis - Unpaired Student’s t test was performed using SigmaPlot (Systat Software, Chicago, IL); a p < 0.05 was considered as statistically significant.
RESULTS
Activators of SIRT1 inhibited PEPCK-C gene transcription- The effect of SIRT1 activators IsoNAM, resveratrol, butein, and fisetin on the regulation of transcription from the PEPCK-C gene promoter was determined. HepG2 cells were transiently transfected with a luciferase reporter plasmid p2000-Luc. IsoNAM addition resulted in a dose-dependent inhibition of transcription, with an IC50 of 1.1 mM (Figure 1A, dash line). Over-expressing the catalytic subunit of protein kinase A (PKAc) markedly stimulated transcription. Despite this stimulation, IsoNAM repressed transcription from the PEPCK-C gene promoter
by guest on February 9, 2016http://w
ww
.jbc.org/D
ownloaded from
5
(p2000-Luc) with an IC50 of 2.3 mM (Figure 1A, solid line). At 5 mM of IsoNAM, only about 17% of the luciferase activity remained (i.e. an 83% inhibition). As predicted, nicotinamide (NAM), a SIRT1 inhibitor, caused an increase in PEPCK-C activity in rat liver (insert in Figure 1A). Treatment of the cells with other SIRT1 activators, such as resveratrol (Figure 1B), butein or festin (Figure 1C) also markedly repressed transcription from the PEPCK-C gene promoter. IsoNAM was used for most of the subsequent experiments, in part because of its excellent solubility and stability in water solution.
To determine how endogenous PEPCK-C gene responded to SIRT1 activators, HepG2 cells, FTO-2B cells, and AML12 mouse hepatocytes were treated with 5 mM IsoNAM and PEPCK-C mRNA was analyzed by Northern blotting or by RT-PCR. IsoNAM decreased the levels of endogenous PEPCK-C mRNA in a time- and dose-dependent manner (Figures 1D & 1E). In contrast, there was only a marginal change in the level of G6Pase mRNA (data not shown). To rule out the possibility that decreases in PEPCK-C mRNA were due to excessive cell death, cell numbers were counted and parallel increases in cell number were noted in both IsoNAM- and water-treated cells (data not shown). Furthermore, removing IsoNAM from the cell culture medium resulted in an increase in PEPCK-C mRNA (Figure 1F), indicating that the repression of PEPCK-C gene transcription by IsoNAM was reversible.
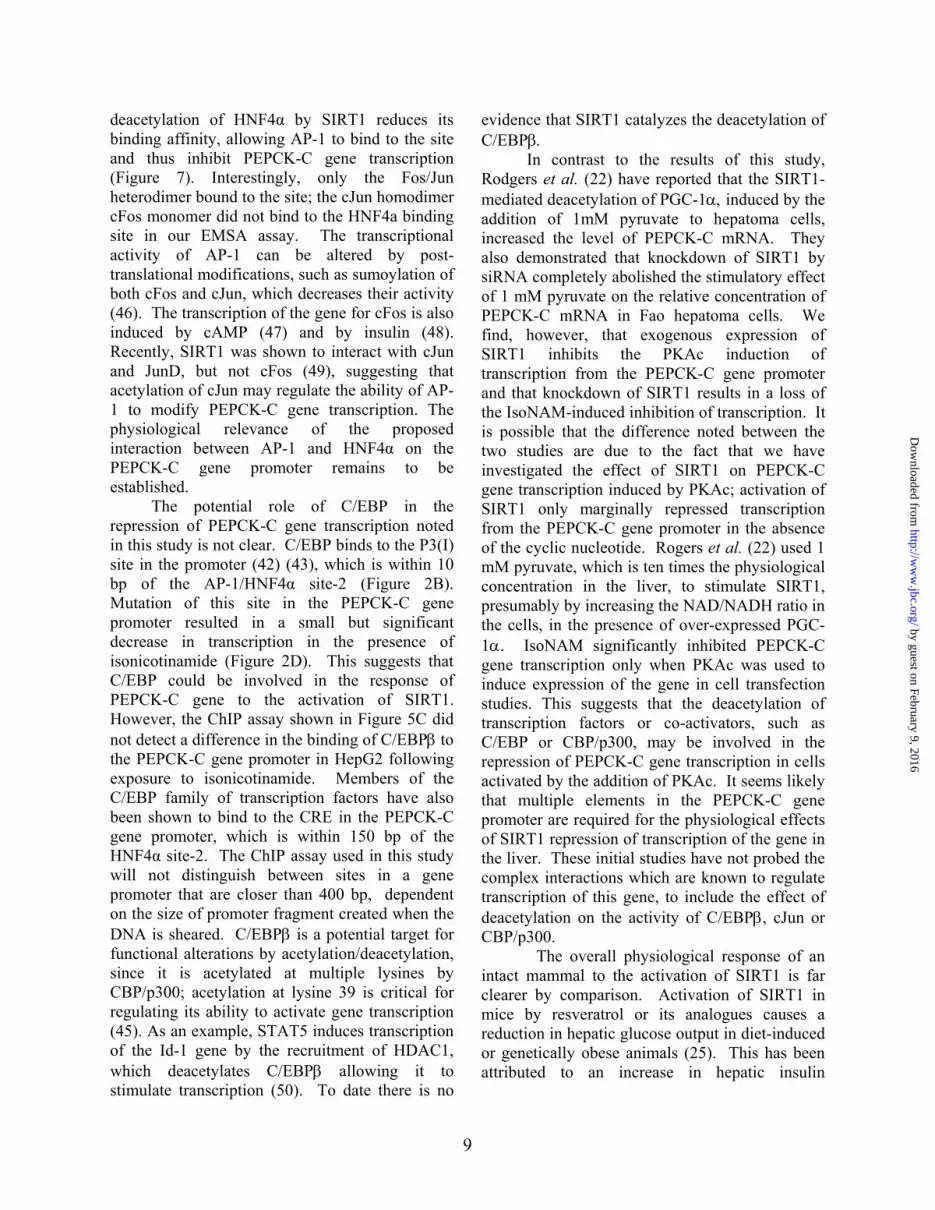
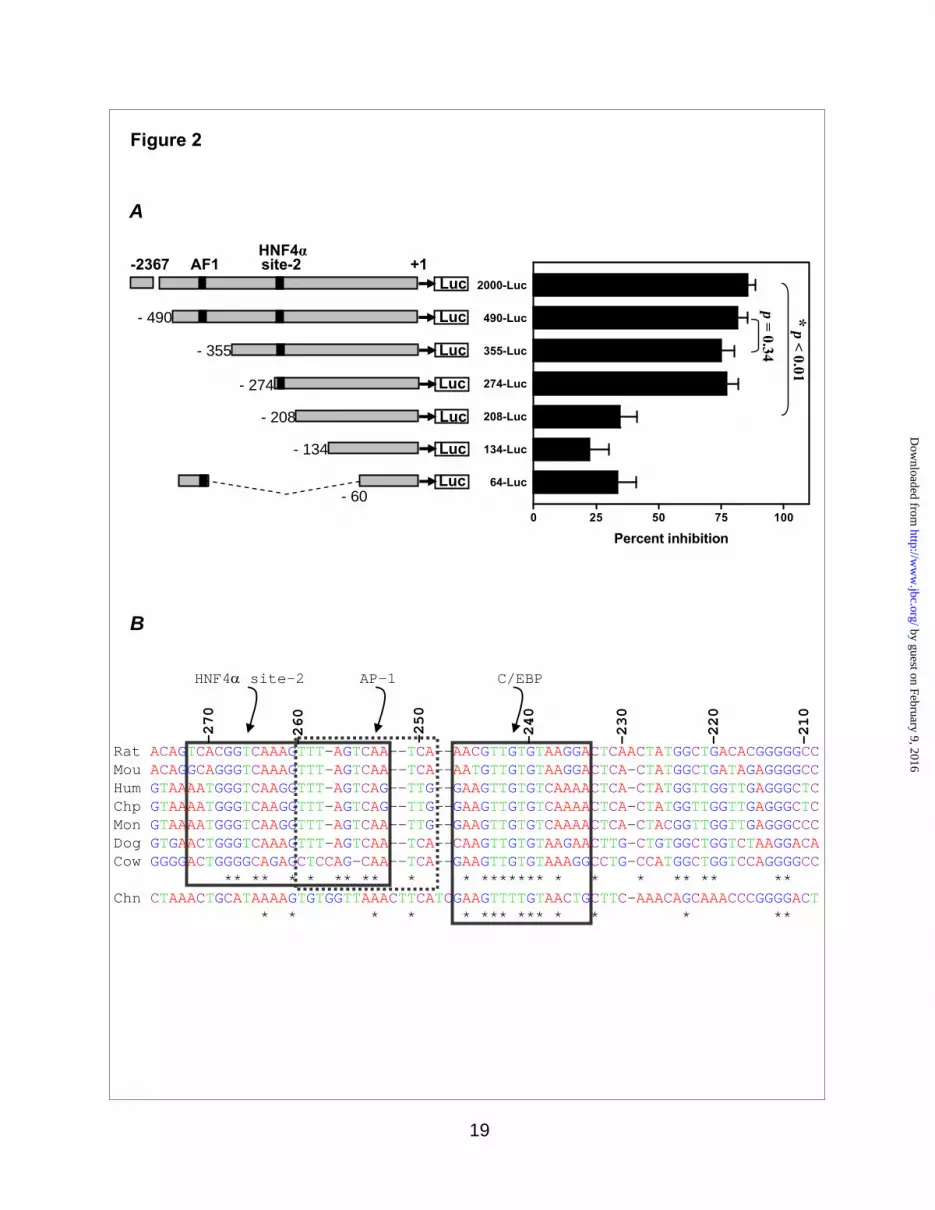
A HNF4α-containing binding site cluster was involved in repression of PEPCK-C transcription by IsoNAM- To determine the specific region(s) in the PEPCK-C gene promoter that is responsible for transcriptional repression by IsoNAM, a series of sequentially truncated segments of the PEPCK-C gene promoter, linked to the luciferase gene, were transfected into HepG2 cells. IsoNAM (5 mM) caused about an 85% inhibition in transcription from the full-length PEPCK-C gene promoter (p2000-Luc), as compared to water-treated control cells (Figure 2A). Shortening the PEPCK-C gene promoter between -274 and -208 markedly decreased such inhibition to 34% (Figure 2A), suggesting that IsoNAM response element(s) resided in this segment of the gene promoter. TFLOC algorithm, an in silico method of predicting cross-species
conservations of transcription factor binding sites, was used to analyze the sequence between -274 and -208 in the PEPCK-C gene promoter from seven mammalian species. Three evolutionarily conserved binding sites, HNF4α, AP-1, and C/EBP were identified in this region (Figure 2B). Among them, the HNF4α binding site located at -272/-252, which was previously unknown and designated as HNF4α site-2, to distinguish it from a previously described site, termed Accessory Factor 1 (AF1), at -454/-430 (32,33). EMSA assays demonstrated that an oligonucleotide containing the HNF4α site-2 sequence bound to HNF4α (Figure 2C, lanes 2 to 3) just as well as it did to the AF1-containing oligonucleotide (Figure 2C, lanes 9 & 10). In contrast, an oligonucleotide containing a mutated HNF4α site-2 did not interact with HNF4α (Figure 2C, lanes 5 to 8).
To examine the involvement of the HNF4α site-2, AP-1, and C/EBP sites in the IsoNAM mediated transcriptional repression of PEPCK-C, these regions in the PEPCK-C gene promoter were mutated individually or in combination, using p2000-Luc as the parent plasmid (Figure 2D, left side). The AF1 site was also mutated to serve as a control. Mutation in the individual HNF4α site-2, AP-1, and C/EBP sites resulted in about 10% decrease in the IsoNAM-induced repression (Figure 2D), while mutation in AF1 had no effect. This result was consistent with the data from truncation analysis between 490-Luc and 355-Luc, in which the AF1 site was absent (Figure 2A). When all three conserved sites were mutated, IsoNAM mediated-inhibition was decreased from 90% to 57% (Figure 2D, triple mutant). This result indicated that the cluster of three binding sites was required for maximal IsoNAM-induced repression. Indeed, when a triplicate of aforementioned binding cluster was linked to a minimal TK promoter, it recapitulated IsoNAM-induced repression (Figure 2E). Since the overall relief of inhibition was not complete in the triple mutant (only 57%), unknown factor(s) other than this cluster of binding sites was likely involved in IsoNAM-induced repression of transcription from the PEPCK-C gene promoter.
To further assess the role of HNF4α in the IsoNAM-induced repression of transcription of the PEPCK-C gene, CHO cells, which have no detectable HNF4α, were transfected with p2000-Luc. IsoNAM or resveratrol treatment resulted in
by guest on February 9, 2016http://w
ww
.jbc.org/D
ownloaded from

6
marginal effects on transcription from the PEPCK-C gene promoter (Figure 3, lanes 1 & 2, 7 & 8). When a plasmid encoding HNF4α was co-transfected with p2000-Luc, luciferase activity was markedly stimulated (Figure 3, lanes lanes 1 vs 3 and 5; lanes 7 vs 9 and 10). However, addition of either IsoNAM or resveratrol to culture medium blocked this stimulation (Figure 3). Western blotting analyses showed that HNF4α levels were decreased in IsoNAM or resveratrol treated CHO cells (Figure 3 inserts).
IsoNAM caused deacetylation of HNF4α and decreased its DNA binding affinity - Acetylation of HNF4α enhances its nuclear retention and DNA binding affinity (34). Since IsoNAM activates SIRT1, we determined the effect of IsoNAM treatment on the acetylation status of endogenous HNF4α. While there was only a modest decrease in the level of total nuclear HNF4α during 24 h of IsoNAM treatment, the acetylated species of HNF4α decreased markedly and reached its lowest level 14 h after adding IsoNAM to the culture medium (Figure 4A, lanes 1-7); as a control, water did not alter the acetylation status of HNF4α (Figure 4A, lanes 8-14). This observation suggested that SIRT1, activated by IsoNAM, likely de-acetylated HNF4α in vivo. To test this hypothesis, purified FLAG-HNF4α was incubated with SIRT1. Western blotting showed that HNF4α was deacetylated by SIRT1 in vitro (Figure 4B). In addition, EMSA assays demonstrated that deacetylation of HNF4α by SIRT1 in vitro decreased the binding affinity of HNF4α to an oligonucleotide containing the HNF4α site-2 sequence (Figure 4C). NAD+, a cofactor for SIRT1 was omitted in a control reaction. To further assess the effect of deacetylation of HNF4α on its binding affinity to the PEPCK-C gene promoter in vivo, chromatin IP (ChIP) assay was performed using cells treated with 5 mM IsoNAM or water for 6, 10, or 20 h. The binding of HNF4α to the promoter was markedly decreased at 10 and 20 h (Figure 4D), which was consistent with the low level of acetylation of HNF4α (Figure 4A)
AP-1 and HNF4α reciprocally interacted with the HNF4α site-2/AP-1 binding site in the PEPCK-C gene promoter - Three AP-1 binding sites in the PEPCK-C gene promoter have been previously identified (35), one of which was located in -274/-208 (Figure 2B). Since this AP-1
site overlapped the HNF4α site-2, we speculated that only one of these transcription factors could interact with DNA at a given time, due to the spatial restriction. EMSA assays demonstrated that DNA containing the HNF4α site-2/AP-1 binding sites only interacted with the cJun/cFos hetero-dimer (i.e., AP-1), but not to homodimers of cJun (Figure 5A). To determine whether AP-1 and HNF4α competed for the HNF4α site-2/AP-1 binding site on the PEPCK-C gene promoter, four EMSA reactions were carried out, in which the amount of AP-1 was kept constant, while the amount of HNF4α was increased over a range of 0, 1, 2, 3 pmoles. An increase in the concentration of HNF4α resulted in an increase in the HNF4α-DNA complex (Figure 5B, lanes 2-5) and a reduction in the AP-1/DNA complex. These results indicated that HNF4α compete away DNA from the AP-1/DNA complex. As a control, the addition of 21 pmoles of BSA did not disrupt the AP-1/DNA complex. In a reciprocal manner, increasing concentrations of AP-1 effectively competed with HNF4α for binding to the DNA probe (Figure 5B, lanes 7-10).
Since binding of HNF4α to the PEPCK-C gene promoter was attenuated by IsoNAM treatment to cells (Figure 4D), and since AP-1 and HNF4α competed for the HNF4α site-2/AP-1 sequence (Figure 5B), we hypothesized that AP-1 would occupy the binding site in the IsoNAM-treated cells. A ChIP assay showed that binding of AP-1 to the HNF4α site-2/AP-1 site was greatly enhanced after 10 h of treatment with IsoNAM, while the binding of HNF4α markedly decreased (Figure 5C). At the same time, the binding of C/EBPβ to its site did not change significantly.
Gurney et al reported that AP-1 stimulated PEPCK-C gene transcription (35). One of three AP-1 binding sites, the cyclic AMP regulatory element (CRE) played a critical role for such stimulation. With the CRE site present in p2000-Luc, it is therefore difficult to determine if there was a competition between AP-1 and HNF4α at the HNF4α site-2/AP-1 site. When the CRE was mutated in the p2000-Luc reporter plasmid, HNF4α and AP-1 competed with each other in regulating transcription from the PEPCK-C gene promoter (Figure 5D). Taken together, our data indicate that when SIRT1 is activated by IsoNAM, the subsequent deacetylation of HNF4α decreases its affinity for the HNF4α site-2/AP-1 site, thus
by guest on February 9, 2016http://w
ww
.jbc.org/D
ownloaded from

7
permitting AP1 to bind to its overlapping site on the PEPCK-C gene promoter.
SIRT1 repressed transcription from the PEPCK-C gene promoter - Since SIRT1 activators activate SIRT1, and SIRT1 deacetylated HNF4α (Figure 4B), we assessed the effect of the over-expression of SIRT1 on transcription regulation of PEPCK-C gene in HepG2 cells. Exogenous expression of SIRT1 repressed luciferase activity from co-transfected p2000-Luc reporter plasmid (Figure 6A). The repression extent for transcription was directly related to the quantity of SIRT1 transfected. In addition, when endogenous SIRT1 was knocked down using SIRT1 RNAi, IsoNAM-induced repression of PEPCK-C gene promoter was greatly attenuated (Figure 6B). This result demonstrates that factors which activate SIRT1, such as IsoNAM and resveratrol, do so by deacetylating, and thus inactivating, key transcription factors, such as HNF4α, which are required for hepatic PEPCK-C gene transcription.
DISCUSSION
SIRT1 is a member of a class of NAD+-dependent deacetylases that ADP-ribosylates acetyl-lysine-protein substrates to remove acetate (see reference (36) for a detailed review of the enzymology involved). SIRTs are found in a wide variety of organisms and are responsive to dietary restriction (37) and to changes in cellular redox state (22). The involvement of SIRT1 in glucose homeostasis is controversial and requires further investigation. Studies have shown that activation of SIRT1 induces transcription of genes coding for key enzymes in gluconeogenesis, thus stimulating hepatic glucose output via deacetylation of PGC-1α (22). Erion et al. (23) noted a decrease in PEPCK-C mRNA in the livers of diabetic rats in which SIRT1 mRNA had been reduced to 25% of control levels using an antisense oligonucleotide. In addition, Frescas et al. (24) reported that the activation of SIRT1 in wild type cells (an immortalized liver cell line) by resveratrol had no effect of PEPCK-C mRNA but stimulated the expression of the gene for glucose-6-phosphatase (G6Pase). The introduction of Foxo1, into wild type cells, via an adenoviral vector, resulted in a marked elevation of PEPCK-C mRNA. However, Banks et al. (26) found that over-expression of SIRT1 did not result in hyperglycemia in transgenic mice, but instead improved insulin
sensitivity. In addition, analogues of resveratrol, which are 1,000 times more potent SIRT1 activators, have been developed (25). These compounds act by lowering the Km of acetylated proteins for SIRT1 and have been shown to improve insulin sensitivity, lower the concentration of glucose in the blood of dietary-induced and genetically obese mice, and to generally improve whole body glucose homeostasis in the animals (25). While not measured directly, the implication of these studies is that expression of the gene for PEPCK-C in the liver would be decreased to account for a lowered rate of gluconeogenesis noted in that tissue. Finally, Liu et al. (27) reported that disrupting SIRT1 activity resulted in an increase in glucose output. There are thus a series of studies that come to opposite conclusions regarding the effect of SIRT1 on hepatic gluconeogenesis in the liver.
It is likely that the activation of SIRT1 will have a broad effect on transcription factors and more directly by deacetylating target proteins. Lin et al (38) reported that PEPCK in yeast was acetylated at lysines 19 and 514, and that deacetylation of the enzyme caused by the activation of SIRT2 resulted in a loss of enzyme activity of the enzyme in yeast. Acetylation of lysine 514 was required both for enzyme activity and for the ability of yeast to grow in non-fermentable carbon sources. In addition, the deacetylation of PEPCK-C in yeast blocked the expected extension of lifespan caused by water starvation (38). If this effect of SIRT1 can be duplicated in the livers of mice, it would be consistent with a decrease in the rate of gluconeogenesis and in hepatic glucose output and supports our finding that PEPCK-C gene transcription is decreased when SIRT1 is activated by resveratrol.
Here we report a detailed study on the effect of activating SIRT1 using resveratrol, butein, fisetin or isonicotinamide on the transcription of PEPCK-C. We find that activation of SIRT1, causes a marked inhibition of transcription from the PEPCK-C gene promoter via deacetylation of a transcription factor/co-activator(s) required for expression of the gene in the liver (Figure 7). Our data demonstrated that a major target of SIRT1-mediated deacetylation is HNF4α, an orphan nuclear receptor that is closely linked to diabetes. HNF4α was originally isolated from the liver, but
by guest on February 9, 2016http://w
ww
.jbc.org/D
ownloaded from
8
is present in a number of tissues, including small intestine, kidney and pancreatic islet. A number of mutations in the gene for HNF4α has been identified and associated with an atypical form of diabetes, termed maturity onset diabetes of the young (39). HNF4α regulates transcription of a broad variety of genes in the liver, including HNF1α, glucose-6-phosphatase and PEPCK-C. HNF4α binds to the AF1 site (-454 to -430) in the Glucocorticoid Regulatory Unit (GRU) of the PEPCK-C gene promoter, where it is involved in the glucocorticoid-stimulated transcription of the PEPCK-C gene (32), (12). The carboxy-terminal, zinc-finger domain of HNF4α binds to the PEPCK-C gene promoter and interacts with co-regulatory molecules such as CBP/p300 (40) and PGC-1α (41).
HNF4α is a component of the triad of regulatory proteins involved in the effect of insulin on PEPCK-C gene transcription. The forkhead protein Foxo1, HNF4α and the co-activator PGC-1α have been shown to interact at the AF1 site within GRU of the PEPCK-C gene promoter (41). Insulin alters this interaction and inhibits gene transcription, in part by initiating the PKB-catalyzed phosphorylation of Foxo1, which results in a dissociation of the complex. HNF4α is acetylated (34), which increases its binding affinity for both CBP and its binding domain on a target gene promoter; deacetylation decreases binding. Thus, the AF1 site within the GRU of the PEPCK-C gene promoter would be a logical candidate as a site in the promoter responsible for its negative effect on PEPCK-C gene transcription caused by the activation of SIRT1 by IsoNAM. However, mutation of this site had no effect on the inhibition of transcription caused by either IsoNAM or resveratrol. We have identified a hitherto unknown HNF4α regulatory element in the PEPCK-C gene promoter (HNF4α site-2), which maps between -272 and -248 (Figure 7). Since this region of the gene promoter does not bind Foxo1, we conclude that the SIRT1-catalyzed deacetylation of HNF4α noted in this study, does not involve an interaction with the complex of Foxo1 and PGC-1α that occurs at the AF1 site of the GRU. However the lack of inhibition by SIRT1 activation caused by a deletion of the AF1 site could also be explained by the fact that endogenous Foxo1 and PGC-1α are undetectable
in HepG2 cells by Western blotting (data not shown). It is also clear that factors acting at the HNF4α site-2 are not entirely responsible for the dramatic reduction in PEPCK-C gene transcription noted upon activation of SIRT1 by resveratrol or IsoNAM, since mutation of HNF4α-2 site only partly reversed IsoNAM induced inhibition. However, the deacetylation of other key regulatory transcription factors or co-activators is likely involved in the inhibition of PEPCK-C gene transcription noted in this study. For example, SIRT1 represses the action of CBP/300, an important co-regulator of PEPCK-C gene transcription, by deacetylating lysines 1020 and 1024, within the cell cycle regulatory domain (21). It would be of interest to determine the effect of deacetylating CBP/p300 on the transcription of this gene.
The HNF4α site-2 maps to a region of PEPCK-C gene promoter as shown by Roesler et al. (42), using DNase I footprinting, to bind nuclear proteins; this area of the promoter is highly conserved in a number of mammalian species (see Figure 2) and is in a region of the gene promoter that is critical for control of the PEPCK-C gene transcription (43). Our original analysis of the PEPCK-C gene promoter (42), (43) identified two regulatory elements in this region: P3(I), which binds members of the C/EBP family of transcription factors and P3(II), which binds AP-1 (a Fos/Jun heterodimer) and stimulates PEPCK-C gene transcription (35). P3(I) is required for liver-specific transcription of the gene (44) and acts together with the CRE (-128 to -77), in the cAMP stimulation of hepatic PEPCK-C gene transcription (43). C/EBPβ, which binds to the P3(I) site, itself has multiple acetylation sites (45). However, the ChIP data shown in Figure 5C did not detect an IsoNAM-induced alteration in the binding of C/EBPβ to the PEPCK-C gene promoter.
The AP-1 site identified in this study overlaps the HNF4α regulatory domain in the PEPCK-C gene promoter, suggesting a potential competition between the two transcription factors for binding to this site. We have demonstrated that increasing concentrations of AP-1 competes with HNF4α binding to the gene promoter (Figure 5B) and markedly reduces the induction of PEPCK-C gene transcription by HNF4α in HepG2 cells (Figure 5D). Our hypothesis is that
by guest on February 9, 2016http://w
ww
.jbc.org/D
ownloaded from
9
deacetylation of HNF4α by SIRT1 reduces its binding affinity, allowing AP-1 to bind to the site and thus inhibit PEPCK-C gene transcription (Figure 7). Interestingly, only the Fos/Jun heterodimer bound to the site; the cJun homodimer cFos monomer did not bind to the HNF4a binding site in our EMSA assay. The transcriptional activity of AP-1 can be altered by post-translational modifications, such as sumoylation of both cFos and cJun, which decreases their activity (46). The transcription of the gene for cFos is also induced by cAMP (47) and by insulin (48). Recently, SIRT1 was shown to interact with cJun and JunD, but not cFos (49), suggesting that acetylation of cJun may regulate the ability of AP-1 to modify PEPCK-C gene transcription. The physiological relevance of the proposed interaction between AP-1 and HNF4α on the PEPCK-C gene promoter remains to be established.
The potential role of C/EBP in the repression of PEPCK-C gene transcription noted in this study is not clear. C/EBP binds to the P3(I) site in the promoter (42) (43), which is within 10 bp of the AP-1/HNF4α site-2 (Figure 2B). Mutation of this site in the PEPCK-C gene promoter resulted in a small but significant decrease in transcription in the presence of isonicotinamide (Figure 2D). This suggests that C/EBP could be involved in the response of PEPCK-C gene to the activation of SIRT1. However, the ChIP assay shown in Figure 5C did not detect a difference in the binding of C/EBPβ to the PEPCK-C gene promoter in HepG2 following exposure to isonicotinamide. Members of the C/EBP family of transcription factors have also been shown to bind to the CRE in the PEPCK-C gene promoter, which is within 150 bp of the HNF4α site-2. The ChIP assay used in this study will not distinguish between sites in a gene promoter that are closer than 400 bp, dependent on the size of promoter fragment created when the DNA is sheared. C/EBPβ is a potential target for functional alterations by acetylation/deacetylation, since it is acetylated at multiple lysines by CBP/p300; acetylation at lysine 39 is critical for regulating its ability to activate gene transcription (45). As an example, STAT5 induces transcription of the Id-1 gene by the recruitment of HDAC1, which deacetylates C/EBPβ allowing it to stimulate transcription (50). To date there is no
evidence that SIRT1 catalyzes the deacetylation of C/EBPβ.
In contrast to the results of this study, Rodgers et al. (22) have reported that the SIRT1-mediated deacetylation of PGC-1α, induced by the addition of 1mM pyruvate to hepatoma cells, increased the level of PEPCK-C mRNA. They also demonstrated that knockdown of SIRT1 by siRNA completely abolished the stimulatory effect of 1 mM pyruvate on the relative concentration of PEPCK-C mRNA in Fao hepatoma cells. We find, however, that exogenous expression of SIRT1 inhibits the PKAc induction of transcription from the PEPCK-C gene promoter and that knockdown of SIRT1 results in a loss of the IsoNAM-induced inhibition of transcription. It is possible that the difference noted between the two studies are due to the fact that we have investigated the effect of SIRT1 on PEPCK-C gene transcription induced by PKAc; activation of SIRT1 only marginally repressed transcription from the PEPCK-C gene promoter in the absence of the cyclic nucleotide. Rogers et al. (22) used 1 mM pyruvate, which is ten times the physiological concentration in the liver, to stimulate SIRT1, presumably by increasing the NAD/NADH ratio in the cells, in the presence of over-expressed PGC-1α. IsoNAM significantly inhibited PEPCK-C gene transcription only when PKAc was used to induce expression of the gene in cell transfection studies. This suggests that the deacetylation of transcription factors or co-activators, such as C/EBP or CBP/p300, may be involved in the repression of PEPCK-C gene transcription in cells activated by the addition of PKAc. It seems likely that multiple elements in the PEPCK-C gene promoter are required for the physiological effects of SIRT1 repression of transcription of the gene in the liver. These initial studies have not probed the complex interactions which are known to regulate transcription of this gene, to include the effect of deacetylation on the activity of C/EBPβ, cJun or CBP/p300.
The overall physiological response of an intact mammal to the activation of SIRT1 is far clearer by comparison. Activation of SIRT1 in mice by resveratrol or its analogues causes a reduction in hepatic glucose output in diet-induced or genetically obese animals (25). This has been attributed to an increase in hepatic insulin
by guest on February 9, 2016http://w
ww
.jbc.org/D
ownloaded from

10
sensitivity caused by the activation of SIRT1. Sun et al. (51) reported that SIRT1 is down regulated in insulin resistant cells and that expression of SIRT1 increases insulin sensitivity. Since insulin decreases transcription of the gene for PEPCK-C (52), it is likely that an increase in insulin sensitivity, caused by SIRT1 activation, will lead to a decrease in transcription of the gene for PEPCK-C and contribute to a reduction in hepatic glucose output. The effect of SIRT1 on insulin sensitivity has been attributed to repression of transcription of the gene for PTP1B (51), a well-known negative regulator of the insulin signaling pathway (53). It is thus likely that resveratrol exerts its long-term metabolic effects, in part, by modulating the rate of gluconeogenesis and thus controlling the overall levels of hepatic glucose output in mammals.
Since diabetes is a disease of both carbohydrate and lipid metabolism (54), it is critical that resveratrol or its analogues effect not only hepatic glucose output, but also adipose tissue to control the rate of lipolysis and/or FFA re-esterification by that tissue. Glyceroneogenesis is the major metabolic pathway for the formation of the glycerol-3-phosphate used for the triglyceride synthesis in adipose tissue (55); a key enzyme in the process is PEPCK-C (56) (2). Picard et al. (57) reported that resveratrol increased the rate of epinephrine-induced FFA release from adipose tissues and that nicotinamide, a SIRT1 inhibitor, decreased FFA release. If PEPCK-C in adipose tissues responds to alterations in deacetylation of transcription factors
such as PPARγ2 and HNF4α in a manner similar to the liver, one would predict that resveratrol would decrease transcription of the gene for the enzyme, decreasing glyceroneogenesis and thus diminishing the rate of FFA re-esterification, resulting in a greater release of FFA. In contrast, Reshef and Hanson (58) found that nicotinamide, markedly decreased the activity of PEPCK-C in adipose tissues, while it increased PEPCK-C activity in the liver. Based on these results, SIRT1-mediated de-acetylation would have an inverse effect on PEPCK-C gene transcription in the two tissues: inhibition in the liver and induction the adipose tissue. This is similar to the differential effect of glucocorticoids on PEPCK-C gene transcription in adipose tissue and liver (59), (60), (61). This underscores the importance of insuring that excess FFA does not accumulate in the blood, since fatty acid metabolism in skeletal muscle inhibits both the uptake of glucose from the blood and its subsequent oxidation in that tissue (62), often leading to insulin resistance and Type 2 diabetes (63). The effect of SIRT1 on the control of PEPCK-C gene transcription in adipose tissues is potentially a key factor in understanding the mechanism underlying the effect of drugs aimed at altering the rate of acetylation of transcription factors to control the clinical symptoms of Type 2 diabetes in humans. In view of the contrasting results discussed above, more extensive studies on the effect of resveratrol and its analogues on PEPCK-C gene transcription on the white adipose tissue would be of interest.
REFRENCES 1. Hanson, R. W., and Patel, Y. M. (eds). (1994) P-enolpyruvate carboxykinase: the gene and the
enzyme, John Wiley and Sons, New York 2. Olswang, Y., Cohen, H., Papo, O., Cassuto, H., Croniger, C. M., Hakimi, P., Tilghman, S. M.,
Hanson, R. W., and Reshef, L. (2002) Proc Natl Acad Sci U S A 99(2), 625-630. 3. Franckhauser, S., Munoz, S., Pujol, A., Casellas, A., Riu, E., Otaegui, P., Su, B., and Bosch, F.
(2002) Diabetes 51, 624-630 4. Franckhauser, S., Munoz, S., Elias, I., Ferre, T., and Bosch, F. (2006) Diabetes 55(2), 273-280 5. Reshef, L., Olswang, Y., Cassuto, H., Blum, B., Croniger, C. M., Kalhan, S. C., Tilghman, S. M.,
and Hanson, R. W. (2003) J Biol Chem 278, 30413-30416 6. Beale, E. G., Harvey, B. J., and Forest, C. (2007) Cell biochemistry and biophysics 48, 89-95 7. Chakravarty, K., Cassuto, H., Reshef, L., and Hanson, R. W. (2005) Crit Rev Biochem Mol Biol
40, 129-154 8. Puigserver, P., Rhee, J., Donovan, J., Walkey, C. J., Yoon, J. C., Oriente, F., Kitamura, Y.,
Altomonte, J., Dong, H., Accili, D., and Spiegelman, B. M. (2003) Nature 423, 550-555
by guest on February 9, 2016http://w
ww
.jbc.org/D
ownloaded from

11
9. Chakravarty, K., Leahy, P., Becard, D., Hakimi, P., Foretz, M., Ferre, P., Foufelle, F., and Hanson, R. W. (2001) J Biol Chem 276, 34816-34823.
10. Chakravarty, K., Wu, S.-Y., Chiang, C.-M., Samols, D., and Hanson, R. W. (2004) J. Biol. Chem. 279, 15385-15395
11. Imai, E., Miner, J. N., Mitchel, J. A., Yamamoto, K. R., and Granner, D. A. (1993) J. Biol. Chem. 268, 5353-5356
12. Wang, J. C., Stromstedt, P. E., Sugiyama, T., and Granner, D. K. (1999) Mol Endocrinol 13(4), 604-618
13. Meyuhas, O., Reshef, L., Ballard, F. J., and Hanson, R. W. (1976) Biochem. J. 158, 9-16 14. Leroyer, S. N., Tordjman, J., Chauvet, G., Quette, J., Chapron, C., Forest, C., and Antoine, B.
(2006) J Biol Chem 281, 13141-13149 15. Waltner-Law, M. E., Wang, X. L., Law, B. K., Hall, R. K., Nawano, M., and Granner, D. K.
(2002) J Biol Chem 277, 34933-34940. 16. Kaeberlein, M., McVey, M., and Guarente, L. (1999) Genes Dev 13, 2570-2580 17. Tissenbaum, H. A., and Guarente, L. (2001) Nature 410, 227-230 18. Denu, J. M. (2005) Current opinion in chemical biology 9, 431-440 19. Anastasiou, D., and Krek, W. (2006) Physiology (Bethesda, Md 21, 404-410 20. Luo, J., Nikolaev, A. Y., Imai, S., Chen, D., Su, F., Shiloh, A., Guarente, L., and Gu, W. (2001)
Cell 107, 137-148 21. Bouras, T., Fu, M., Sauve, A. A., Wang, F., Quong, A. A., Perkins, N. D., Hay, R. T., Gu, W.,
and Pestell, R. G. (2005) J Biol Chem 280, 10264-10276 22. Rodgers, J. T., Lerin, C., Haas, W., Gygi, S. P., Spiegelman, B. M., and Puigserver, P. (2005)
Nature 434, 113-118 23. Erion, D. M., Yonemitsu, S., Nie, Y., Nagai, Y., Gillum, M. P., Hsiao, J. J., Iwasaki, T., Stark, R.,
Weismann, D., Yu, X. X., Murray, S. F., Bhanot, S., Monia, B. P., Horvath, T. L., Gao, Q., Samuel, V. T., and Shulman, G. I. (2009) Proc Natl Acad Sci U S A
24. Frescas, D., Valenti, L., and Accili, D. (2005) J Biol Chem 280, 20589-20595 25. Milne, J. C., Lambert, P. D., Schenk, S., Carney, D. P., Smith, J. J., Gagne, D. J., Jin, L., Boss,
O., Perni, R. B., Vu, C. B., Bemis, J. E., Xie, R., Disch, J. S., Ng, P. Y., Nunes, J. J., Lynch, A. V., Yang, H., Galonek, H., Israelian, K., Choy, W., Iffland, A., Lavu, S., Medvedik, O., Sinclair, D. A., Olefsky, J. M., Jirousek, M. R., Elliott, P. J., and Westphal, C. H. (2007) Nature 450, 712-716
26. Banks, A. S., Kon, N., Knight, C., Matsumoto, M., Gutierrez-Juarez, R., Rossetti, L., Gu, W., and Accili, D. (2008) Cell metabolism 8, 333-341
27. Liu, Y., Dentin, R., Chen, D., Hedrick, S., Ravnskjaer, K., Schenk, S., Milne, J., Meyers, D. J., Cole, P., Yates, J., 3rd, Olefsky, J., Guarente, L., and Montminy, M. (2008) Nature 456, 269-273
28. Yang, J., Croniger, C. M., Lekstrom-Himes, J., Zhang, P., Fenyus, M., Tenen, D. G., Darlington, G. J., and Hanson, R. W. (2005) J Biol Chem 280, 38689-38699
29. Yang, J., Kawai, Y., Hanson, R. W., and Arinze, I. J. (2001) J Biol Chem 276(28), 25742-25752. 30. Croniger, C. M., Millward, C., Yang, J., Kawai, Y., Arinze, I. J., Liu, S., Harada-Shiba, M.,
Chakravarty, K., Friedman, J. E., Poli, V., and Hanson, R. W. (2001) J Biol Chem 276, 629-638. 31. Wu, S. Y., Lee, A. Y., Hou, S. Y., Kemper, J. K., Erdjument-Bromage, H., Tempst, P., and
Chiang, C. M. (2006) Genes Dev 20, 2383-2396 32. Hall, R. K., Sladek, F. M., and Granner, D. K. (1995) Proc. Natl. Acad. Sci. USA 92, 412-416 33. Ahmad, F., Gao, G., Wang, L. M., Landstrom, T. R., Degerman, E., Pierce, J. H., and
Manganiello, V. C. (1999) J. Immunol. 162, 4864-4875 34. Soutoglou, E., Katrakili, N., and Talianidis, I. (2000) Mol Cell 5, 745-751 35. Gurney, A. L., Park, E. A., Giralt, M., Liu, J., and Hanson, R. W. (1992) J. Biol. Chem. 267,
18133-18139 36. Sauve, A. A., and Schramm, V. L. (2004) Current medicinal chemistry 11, 807-826 37. Bordone, L., and Guarente, L. (2005) Nat Rev Mol Cell Biol 6, 298-305
by guest on February 9, 2016http://w
ww
.jbc.org/D
ownloaded from

12
38. Lin, Y. Y., Lu, J. Y., Zhang, J., Walter, W., Dang, W., Wan, J., Tao, S. C., Qian, J., Zhao, Y., Boeke, J. D., Berger, S. L., and Zhu, H. (2009) Cell 136, 1073-1084
39. Ryffel, G. U. (2001) J. Molec. Endocrin. 27, 11-29 40. Leahy, P., Crawford, D. R., Grossman, G., Chaudhry, A., Gronostajski, R., and Hanson, R. W.
(1999) J. Biol. Chem. 274, 8813-8822 41. Yoon, J. C., Puigserver, P., Chen, G., Donovan, J., Wu, Z., Rhee, J., Adelmant, G., Stafford, J.,
Kahn, C. R., Granner, D. K., Newgard, C. B., and Spiegelman, B. M. (2001) Nature 413, 131-138.
42. Roesler, W. J., Vandenbark, G. R., and Hanson, R. W. (1989) J. Biol. Chem. 264, 9657-9664 43. Liu, J., Park, E. A., Gurney, A. L., Roesler, W. J., and Hanson, R. W. (1991) J. Biol. Chem. 266,
19095-19102 44. Patel, Y. M., Yun, J. S., Liu, J., McGrane, M. M., and Hanson, R. W. (1994) J. Biol. Chem. 269,
5619-5628 45. Cesena, T. I., Cardinaux, J. R., Kwok, R., and Schwartz, J. (2007) J Biol Chem 282, 956-967 46. Bossis, G., Malnou, C. E., Farras, R., Andermarcher, E., Hipskind, R., Rodriguez, M., Schmidt,
D., Muller, S., Jariel-Encontre, I., and Piechaczyk, M. (2005) Mol Cell Biol 25, 6964-6979 47. Squinto, S. P., Block, A. L., and Doucet, J. P. (1989) Mol Endocrinol 3, 433-446 48. Mohn, K. L., Laz, T. M., Hsu, J. C., Melby, A. E., Bravo, R., and Taub, R. (1991) Mol Cell Biol
11, 381-390 49. Dey, S., Bakthavatchalu, V., Tseng, M. T., Wu, P., Florence, R. L., Grulke, E. A., Yokel, R. A.,
Dhar, S. K., Yang, H. S., Chen, Y., and St Clair, D. K. (2008) Carcinogenesis 29, 1920-1929 50. Xu, M., Nie, L., Kim, S. H., and Sun, X. H. (2003) Embo J 22, 893-904 51. Sun, C., Zhang, F., Ge, X., Yan, T., Chen, X., Shi, X., and Zhai, Q. (2007) Cell metabolism 6,
307-319 52. Granner, D. K., Andreone, T., Sasaki, K., and Beale, E. (1983) Nature 305, 549-551 53. Alonso, A., Sasin, J., Bottini, N., Friedberg, I., Friedberg, I., Osterman, A., Godzik, A., Hunter,
T., Dixon, J., and Mustelin, T. (2004) Cell 117, 699-711 54. McGarry, D. (1992) Science 258, 766-770 55. Nye, C. K., Hanson, R. W., and Kalhan, S. C. (2008) J Biol Chem 283, 27565-27574 56. Reshef, L., Hanson, R. W., and Ballard, F. J. (1970) J Biol Chem 245, 5979-5984 57. Picard, F., Kurtev, M., Chung, N., Topark-Ngarm, A., Senawong, T., Machado De Oliveira, R.,
Leid, M., McBurney, M. W., and Guarente, L. (2004) Nature 429, 771-776 58. Reshef, L., and Hanson, R. W. (1972) Biochem. J. 127, 809-818 59. Eisenberger, C. L., Nechushtan, H., Cohen, H., Shanti, M., and Reshef, L. (1992) Mol. Cell. Biol.
12, 1396-1403 60. Meyuhas, O., Reshef, L., Gunn, J. M., Hanson, R. W., and Ballard, F. J. (1976) Biochem. J. 158,
1-7 61. Nechushtan, H., Benvenisty, N., Brandeis, R., and Reshef, L. (1987) Nucleic Acids Res. 15, 6405-
6417 62. Boden, G., Chen, X., Ruiz, J., White, J. V., and Rossetti, L. (1994) J Clin Invest 93, 2438-2446 63. Roden, M. (2004) News Physiol Sci 19, 92-96
FOOTNOTES
* This work was supported by NIH Grants DK058620 and DK025541 (to RWH), and CA103867 and CA124760 (to C-M.C.). JY was a fellow on the Metabolism Training Grant DK07319.
1The abbreviations used are: SIRT1, Sirtuin1; IsoNAM, isonicotinamide; NAM, nicotinamide; PEPCK-C, the cytosolic form of phosphoenolpyruvate carboxykinase (GTP); FFA, free fatty acids; HNF4α, hepatic nuclear factor 4α; AP-1, activator protein-1; GRU, glucocorticoid regulatory unit; AF1, accessory factor 1; GAPDH, glyceraldehyde-3-phosphate dehydrogenase; PKAc, the catalytic subunit of Protein Kinase A; CBP, cAMP regulatory element binding protein; PPAR, peroxisome proliferator-activated receptor;
by guest on February 9, 2016http://w
ww
.jbc.org/D
ownloaded from

13
PGC-1α, peroxisome proliferator-activated receptor coactivator-1α; RNAi, inhibitory RNA; Foxo-1, forkhead box class O-1; C/EBP, CAAT/enhancer binding protein; ChIP assay, chromatin immunoprecipitation assay; CRE, cAMP regulatory element; BSA, bovine serum albumin; RLU, relative light units; LUC, luciferase; EMSA, electrophoretic mobility shift assay; CHO cells, Chinese hamster ovary cells; TFLOC, transcription factor binding site locator.
FIGURE LEGENDS Figure 1. Transcriptional repression of PEPCK-C gene promoter by SIRT1 activators. HepG2
cells were co-transfected with 200 ng of p2000-Luc plasmid DNA and 50 ng of PKAc plasmid DNA or 50 ng of empty vector DNA, by following the protocol described in Experimental Procedures. Cells were then treated with indicated concentrations of SIRT1 activators, namely IsoNAM (Panel A), resveratrol (Panel B), fisetin and butein (Panel C) for 24 h. The insert in Panel A was a redrawn from data in Table 5 of a paper by Reshef and Hanson (58), in which fed rats were given 5 mmoles of nicotinamide (NAM) /kg body weight for 5 h and the activity of hepatic PEPCK-C determined. A unit of enzyme activity represents the conversion of one μmole of substrate to product per min. The IC50 was the concentration of IsoNAM required to achieve 50% inhibition of transcription from the PEPCK-C gene promoter. Values were expressed as means ± S.E. of triplicate determinations. * p < 0.001 and ** p < 0.023 as compared to untreated controls. Northern blotting (Panel D) and RT-PCR (Panel E) were used to determine endogenous mRNA levels of PEPCK-C in FTO-2B and HepG2 cells treated with IsoNAM for various times, or in AML12 mouse hepytocytes treated with IsoNAM at the indicated concentrations. The 18S rRNA stained with ethidium bromide or GAPDH mRNA was used as loading controls. Panel F. IsoNAM-induced inhibition of PEPCK-C was reversible. FTO-2B cells were cultured in Krebs Ringer bicarbonate buffer, supplemented with 2% of BSA and 5 mM glucose in the absence (untreated) or presence of 5 mM IsoNAM (treated). After 6 h of treatment, IsoNAM was withdrawn from culture medium. Cells were collected at the time points indicated. PEPCK-C mRNA was measured using RT-PCR; the level of GAPDH mRNA was used as a control.
Figure 2. A novel HNF4α binding site in the PEPCK-C gene promoter was required for IsoNAM-induced transcriptional repression- Panel A. HepG2 cells were treated with 5 mM IsoNAM or water (untreated control) after co-transfection of PKAc DNA and luciferase reporter constructs, which harbored various segments of the PEPCK-C gene promoter from rat. IsoNAM-dependent repression to the PEPCK-C gene promoter was expressed as a percent inhibition of treated as compared to untreated cells. Values were expressed as means ± S.E. of four separated tests, with each test performed in triplicate. Panel B. The sequence from -272 to -208 of the rat PEPCK-C gene promoter was aligned with corresponding sequences from the mouse (Mou), human (Hum), chimpanzee (Chp), monkey (Mon), dog (Dog), cow (Cow), and chicken (Chn). Evolutionary conserved sites were indicated by boxes. Panel C. HNF4α binding site-2 interacted with HNF4α. Purified FLAG-HNF4α was used to perform EMSA assays with the wild type or mutated DNA oligonucleotides corresponding to the HNF4α binding site-2 sequence, or with the wild type DNA corresponding to AF1, as described in the Experimental Procedures. For the supershift assays, either anti-HNF4α serum or anti-β actin serum was added to reactions. Panel D. HNF4α binding sites were mutated individually or jointly with other conserved biding sites for AP1 and C/EBP in the p2000-Luc plasmid. The effect of IsoNAM on transcription from the PEPCK-C gene promoter, in the presence of co-transfected PKAc was measured using the procedure outlined in Panel A. Values were expressed as means ± S.E. of three separated tests, with each test done in triplicate. * p < 0.001 and ** p < 0.016 as compared to the wild type gene promoter control. Panel E. An artificial promoter, composed of three copies of HNF4α-Ap1-C/EBP binding sequences (-277/-218) and the TK minimal gene promoter, was cloned to pGL3-basic to generate a reporter plasmid (insert). When this reporter plasmid was co-transfected with PKAc to HepG2 cells, IsoNAM rendered a dose-dependent inhibition of transcription from the PEPCK-C gene promoter. Values were expressed as means ± S.E. of three separate analyses.
by guest on February 9, 2016http://w
ww
.jbc.org/D
ownloaded from

14
Figure 3. HNF4α was required for SIRT1 activators-induced transcriptional repression of
PEPCK-C. CHO cells were co-transfected with p2000-Luc, PKAc, and various amounts of plasmid over-expressing HNF4α. Cells were then treated with 5 mM IsoNAM or 20 µM resveratrol. The total amount DNA for each transfection was adjusted to the same value by adding empty vector DNA. The results were expressed as the means ± S.E. of triplicate measurements. * p < 0.001 and ** p < 0.004. Inserts show levels of HNF4α in cells as determined by Western blotting.
Figure 4. IsoNAM-induced deacetylation of HNF4α attenuated its binding to PEPCK-C gene promoter. Panel A. IsoNAM treatment resulted in a time-dependent deacetylation of nuclear HNF4α. HepG2 cells were treated with 5 mM IsoNAM or water for the times indicated in the panel. Total nuclear HNF4α was measured using Western blotting; lamin B was used as a loading control. The acetylated species of endogenous HNF4α was assayed using immunoprecipitation of HNF4α, followed by Western blotting of acetyl-lysine. Panel B. SIRT1 deacetylated HNF4α in vitro. Purified FLAG-HNF4α was mixed with reaction buffer or reaction buffer plus SIRT1. The acetylation status of HNF4α was then assayed using Western blotting for acetyl-lysine. The band density was quantified by densitomitry and the value of the control was set as 1. Panel C. Deacetylation of HNF4α attenuated its binding to DNA. Purified FLAG-HNF4α was deacetylated in vitro by SIRT1 in the presence or absence of NAD+. The resultant proteins were used in EMSA reactions. Panel D. IsoNAM treatment attenuated the binding of HNF4α to the HNF4α site-2 in the PEPCK-C gene promoter as determined by a ChIP assay. HepG2 cells were treated with water or 5 mM IsoNAM for the time indicated. Binding of HNF4α to the HNF4α site-2 was assessed using a ChIP assay, as described in the Experimental Procedures.
Figure 5. IsoNAM enhanced binding of AP-1 to the PEPCK-C gene promoter. Panel A. EMSA of the purified AP-1 components bound to the overlapping HNF4α site-2/AP-1 region in the PEPCK-C gene promoter. Panel B. Purified AP-1 and HNF4α compete for the overlapping HNF4α site-2/AP-1 region in the PEPCK-C gene promoter. Panel C. IsoNAM enhanced the interaction of AP-1, but decreased the binding of HNF4α, to the PEPCK-C gene promoter. HepG2 cells were treated 5 mM IsoNAM for 10 h. A ChIP assay was used to monitor the binding of AP-1, HNF4α and C/EBPβ to the overlapping HNF4α site-2/AP-1 region (target region). Panel D. AP-1 and HNF4α competitively regulated a CRE-mutated PEPCK-C gene promoter. HepG2 cells were co-transfected with a CRE-mutated p2000-Luc plasmid and with 0.05 and 0.1 μg of plasmids expressing HNF4α or AP-1 and luciferase activity was measured. The values are expressed as the means ± S.E. of triplicate measurements. * p < 0.05 and ** p < 0.01.
Figure 6. SIRT1 repressed transcription of the PEPCK-C gene in HepG2 cells Panel A. Mouse SIRT1 was over-expressed in HepG2 cells in the absence (open bar) or presence of PKAc (black bar). Transcription of PEPCK-C gene promoter was determined using a luciferase reporter assay. Panel B. RNAi knock-down of SIRT1 attenuated IsoNAM-induced transcriptional repression of PEPCK-C. HepG2 cells were co-transfected with p2000-Luc and no RNAi, control RNAi, or Sirt1 RNAi, and then treated with water (open bar) or 5 mM IsoNAM (black bar). Luciferase activity was measured 24 h later. The insert was a Western blot of SIRT1 in the lysates of the transfected cells. The luciferase activities were expressed as the mean ± S.E. from triplicate measurements.
Figure 7. A model for the SIRT1-induced transcriptional repression of PEPCK-C gene promoter. PEPCK-C gene promoter and several key transcription factor binding sites are drawn to scale. The abbreviations used in the Figure are: PEPCK-C, cytosolic isoform of phosphoenolpyruvate carboxykinase; cAMP, cyclic AMP; CREB, cyclic AMP regulatory element binding protein; CBP, CREB binding protein; C/EBP, CAAT/enhancer binding protein; HNF4α, hepatic nuclear factor 4α; AC, acetate.
by guest on February 9, 2016http://w
ww
.jbc.org/D
ownloaded from

15
CRE, cyclic AMP regulatory element; AP-1, activating protein-1; SIRT1, silencing information regulator 1.
by guest on February 9, 2016http://w
ww
.jbc.org/D
ownloaded from

0 1 2 3 4 50
25
50
75+ PKAc, IC50=2.3 mM
-PKAc, IC50=1.1 mM
Isonicotinamide (IsoNAM) mM
RLU
/μg
prot
ein
A
Figure 1
B
0 5 10 20 50 μM0
20
40
+ PKAc
RLU/μ g protein
0
2
4
Resveratrol 0 5 10 20 50
- PKAc
RLU/μ
g pr
otei
n
0
2
4
6
Untreated5 mM NAM
Hep
atic
PEP
CK
-C a
ctiv
ity(u
nits
/g o
f tis
sue)
* *
16
by guest on February 9, 2016http://w
ww
.jbc.org/D
ownloaded from

C
Figure 1
D
No PKAc 50 ng of PKAc0
1
2
3
4DMSOFisetin 10μMButein 10μM
RLU
/μg
prot
ein
5 mM IsoNAM 0 2 4 8 12 20 h HepG
2 cells FTO-2B
cells
PEPCK-C
18S rRNA
PEPCK-C
18S rRNA
******
17
by guest on February 9, 2016http://w
ww
.jbc.org/D
ownloaded from

E
Figure 1
18
F
untreated IsoNAM withdraw IsoNAM at 6 h IsoNAM24 2 4 6 6.5 7 8 14 24 8 24 h
PEPCK-CGAPDH
PEPCK-CGAPDH
10500IsoNAM (mM)0.50.50.508Br-cAMP (mM)
AM
L12 cells
by guest on February 9, 2016http://w
ww
.jbc.org/D
ownloaded from
A
Figure 2
B
*p < 0.01
Rat ACAGTCACGGTCAAAGTTT-AGTCAA--TCA--AACGTTGTGTAAGGACTCAACTATGGCTGACACGGGGGCCMou ACAGGCAGGGTCAAAGTTT-AGTCAA--TCA--AATGTTGTGTAAGGACTCA-CTATGGCTGATAGAGGGGCCHum GTAAAATGGGTCAAGGTTT-AGTCAG--TTG--GAAGTTGTGTCAAAACTCA-CTATGGTTGGTTGAGGGCTCChp GTAAAATGGGTCAAGGTTT-AGTCAG--TTG--GAAGTTGTGTCAAAACTCA-CTATGGTTGGTTGAGGGCTCMon GTAAAATGGGTCAAGGTTT-AGTCAA--TTG--GAAGTTGTGTCAAAACTCA-CTACGGTTGGTTGAGGGCCCDog GTGAACTGGGTCAAAGTTT-AGTCAA--TCA--CAAGTTGTGTAAGAACTTG-CTGTGGCTGGTCTAAGGACACow GGGGACTGGGGCAGAGCTCCAG-CAA--TCA--GAAGTTGTGTAAAGGCCTG-CCATGGCTGGTCCAGGGGCC
** ** * * ** ** * * ******* * * * ** ** ** Chn CTAAACTGCATAAAAGTGTGGTTAAACTTCATCGAAGTTTTGTAACTGCTTC-AAACAGCAAACCCGGGGACT
* * * * * *** *** * * * **
-2
50
-2
60
-2
70
-2
20
-2
10
-2
40
-2
30
HNF4α site-2 AP-1 C/EBP
Luc
Luc
Luc
Luc
Luc
Luc
Luc
0 25 50 75 100
64-Luc
134-Luc
208-Luc
274-Luc
355-Luc
490-Luc
2000-Luc
Percent inhibition
- 490
- 355
- 274
- 208
- 134
- 60
p = 0.34
19
-2367 AF1 site-2 +1HNF4α
by guest on February 9, 2016http://w
ww
.jbc.org/D
ownloaded from

C
Figure 2
D
Lane 1 2 3 4 5 6 7 8 9 10
HNF4α - + + + - + + + + +Anti-HNF4α - - + - - - + - - +Anti-β actin - - - + - - - + - -
Supershift
HNF4α
Free probe
Site-2 WT Site-2 mutated AF1 WT DNA oligo DNA oligo DNA oligo
AF1
AP-1
HN
F4αsite-2
C/EB
P
-236
7
0 25 50 75 100
Percent inhibition
Luc
Luc
Luc
Luc
Luc
Luc
XX
XXX X
X
+1-490
*
***
*
20
by guest on February 9, 2016http://w
ww
.jbc.org/D
ownloaded from

0.0 1.0 2.0 3.0 4.0 5.00
10
20
30
Isonicotinamide (IsoNAM) mM
RLU/μ
g pr
otei
nE
Figure 2
21
LucMinimal TK Promoter
3X HNF4α/Ap1/C/EBP
by guest on February 9, 2016http://w
ww
.jbc.org/D
ownloaded from

Figure 3
0.00 μg 0.02 μg 0.10 μg0
50
100
150
200
water 5 mM IsoNAM
RLU/μ
g pr
otei
n
HNF4α
0.00 μg 0.02 μg 0.10 μg0
50
100
150
200
HNF4α
96% ethanol 20 μM resveratrol
RLU/μ
g pr
otei
n
**
*
*
**
22
HNF4α
β-actin
Lane 1 2 3 4 5 6
HNF4αβ-actin
Lane 7 8 9 10 11 12
Lane 7 8 9 10 11 12
Lane 1 2 3 4 5 6
by guest on February 9, 2016http://w
ww
.jbc.org/D
ownloaded from

A
Figure 4
B
AcetylatedHNF4α
IP: HNF4αWB: anti-acetyl-lysine
Total HNF4α
Lamin B
5 mM IsoNAM Water
0 1 3 6 10 14 20 0 1 3 6 10 14 20 h
4000SIRT1 (ng)
Lane 1 2
FLAG-HNF4α (ng) 200 200
Relative intensity 1.00 0.48
1413121110987654321Lanes
C
HNF4α
Free probe
10NAD+ (mM)
0.671.00Relative intensity of shifted HNF4α band
Lane 1 2
FLAG-HNF4α (ng) 200 200SIRT1 (ng) 400 400
D
HNF4α
No Antibody
Input
5 mM IsoNAM - - - + + + - - - + + +Time (h) 6 10 20 6 10 20 6 10 20 6 10 20
HNF4α site-2 region Non-target region
23
by guest on February 9, 2016http://w
ww
.jbc.org/D
ownloaded from

A
Figure 5
B
HNF4αAP-1
Free probe
1110987654321
HNF4α (pmol) - - 1.0 2.0 3.0 - 1.0 1.0 1.0 1.0 1.0AP-1 (cJun/cFos) (pmol) - 0.6 0.6 0.6 0.6 0.6 - 0.4 0.8 1.5 -BSA (20.9 pmol) - - - - - + - - - - +
SupershiftAP-1
Free probe
7654321
AP-1 (cJun/cFos) (pmol) - 0.6 0.6 - - - -cJun/cJun (pmol) - - - 0.6 - 1.2 -cFos/cFos (pmol) - - - - 0.6 - 1.2IgG against cFos - - + - - - -
C C-Fos HNF4α C/EBPβ Input
5mM IsoNAM - + - + - + - +Target region
Non-targetregion
24
by guest on February 9, 2016http://w
ww
.jbc.org/D
ownloaded from

Figure 5
25
0
1
2
3
HNF4α 0 0 0.05 0.1 0.1 0.1 0.1 μgAP1 0 0.1 0.1 0.1 0 0.05 0.1 μg
RLU/μ
g to
tal p
rote
inD
*
**
by guest on February 9, 2016http://w
ww
.jbc.org/D
ownloaded from

Figure 6
No RNAi Con. RNAi Sirt1 RNAi0
1
2
3
4
5
water 5 mM IsoNAM
RLU/μ
g pr
otei
n
SIRT1β-actin
No RNAi Con. RNAi SIRT1 RNAi
26
0.0
0.5
1.0
1.5
2.0
2.5
SIRT1 - 0.02 0.05 0.1
- PKAc+ PKAc
RLU/μ
g pr
otei
n
A
B by guest on February 9, 2016http://w
ww
.jbc.org/D
ownloaded from

Figure 7
27
CRE
TATA
PEPCK-C promoter
C/EB
PAP
-1HN
F4α
cAMP Resveratrol
-300 -200 -100 +1
C/EBPHNF4αC/EBP
CBP/p300
C/EBP
HNF4α
C/EBP
CBP/p300
Fos/Jun
AC−
AC−
SIRT1
deacetylation ?
by guest on February 9, 2016http://w
ww
.jbc.org/D
ownloaded from

Chiang and Richard W. HansonChaco, George E. Liu, Shwu-Yuan Wu, David Samols, Parvin Hakaimi, Cheng-Ming
Jianqi Yang, Xiaoying Kong, Maria Emilia S. Martins-Santos, Gabriela Aleman, ErnestineHNF4alpha
cytosolic form of phosphoenolpyruvate carboxykinase (GTP) by deacetylating The activation of SIRT1 by resveratrol represses transcription of the gene for the
published online August 3, 2009J. Biol. Chem.
10.1074/jbc.M109.047340Access the most updated version of this article at doi:
Alerts:
When a correction for this article is posted•
When this article is cited•
to choose from all of JBC's e-mail alertsClick here
http://www.jbc.org/content/early/2009/08/03/jbc.M109.047340.full.html#ref-list-1
This article cites 0 references, 0 of which can be accessed free at
by guest on February 9, 2016http://w
ww
.jbc.org/D
ownloaded from