bcl6 controls neurogenesis through sirt1-dependent epigenetic repression of selective notch targets
TRANSCRIPT
nature neurOSCIenCe VOLUME 15 | NUMBER 12 | DECEMBER 2012 1627
a r t I C l e S
Neurogenesis is an important fate transition in neural development, during which relatively simple, mitotically active NPCs convert into postmitotic cells that differentiate further into fully mature neurons. The neurogenic conversion implies global changes in gene expres-sion and epigenetic regulation, but the mechanisms by which these modifications affect single promoters or particular pathways remain poorly understood1–3.
The Notch signaling pathway interacts with proneural factors to control the balance between self-renewal of NPCs and neuronal dif-ferentiation4–7. Activation of the Notch receptor releases the Notch intracellular domain (NICD), which, after nuclear translocation, forms a complex with the CBF-1–SuH–LAG-1 (CSL) DNA binding protein and recruits co-activators such as Mastermind-like 1 (Maml1) to promote target gene transcription6,8. Main Notch targets include basic helix loop helix Hes transcription factors that maintain NPC undifferentiated by repressing the expression of proneural factors5,9. The neurogenic transition is thought to occur through stable down-regulation of Notch target genes and upregulation of proneural genes beyond a certain threshold, leading to neuronal differentiation10,11. Several transcriptional co-repressors associate with CSL and may mediate repression of target genes in the absence of Notch signaling12, but the precise mechanisms initiating and consolidating Hes gene repression remain unknown. Indeed, in many cases, Notch signaling remains active later on during neuronal differentiation, most notably in the mammalian forebrain13–16. This implies a selective change in responsiveness to Notch during the neurogenic transition, with dif-ferent sets of transcriptional targets being triggered following Notch activation, depending on the progression of differentiation.
In the cerebral cortex, most NPC are radial glial cells (RGCs)17, which produce pyramidal neurons, the major cortical neuron sub-type, either directly through asymmetric self-renewing divisions or indirectly via intermediate progenitor cells (IPCs)18–20. The rate of neuronal differentiation from RGCs and/or IPCs is regulated by various intrinsic and extrinsic cues, including Notch and proneural factors such as neurogenins, which collectively control the number and fate of cortical neurons21–23.
We used an embryonic stem cell (ESC)-based model of cortical neurogenesis24,25 to screen for transcription factors involved in neuro-genesis. We identified Bcl6, an oncogene in B lymphocytes that encodes a BTB/POZ zinc finger transcriptional repressor26,27, as a proneuro-genic gene in the mouse cerebral cortex. BCL6 was expressed during the transition from cortical NPCs to pyramidal neurons and was neces-sary for proper cortical neurogenesis in vivo. BCL6 acted by altering the composition of Notch-dependent transcriptional complexes at the level of the Hes5 promoter, including the recruitment of the NAD+-dependent deacetylase Sirt1. The resulting epigenetic switch led to stable repression of Hes5 despite ongoing Notch signaling, thereby enabling the neurogenic transition to proceed irreversibly.
RESULTSAn ESC screen identifies Bcl6 as a proneurogenic geneUsing an in vitro model of cortical neurogenesis from mouse ESCs24, we performed a gain of function screen for novel genes involved in this process (L.T., T.B. and P.V., unpublished data). About 20 tran-scription factors known to be expressed in the developing cortex, but without a well-characterized function, were overexpressed during
1Université Libre de Bruxelles (ULB), Institute for Interdisciplinary Research, ULB Neuroscience Institute, Brussels, Belgium. 2Department of Neurology, Ghent University Hospital, Ghent, Belgium. 3Université Libre de Bruxelles, Laboratory of Neurophysiology and ULB Neuroscience Institute, Belgium. 4University of Minnesota, Lillehei Heart Institute, Minneapolis, Minnesota, USA. 5Welbio, Université Libre de Bruxelles, Brussels, Belgium. 6These authors contributed equally to this work. Correspondence should be addressed to P.V. ([email protected]).
Received 18 June; accepted 18 October; published online 18 November 2012; doi:10.1038/nn.3264
BCL6 controls neurogenesis through Sirt1-dependent epigenetic repression of selective Notch targetsLuca Tiberi1,6, Jelle van den Ameele1,2,6, Jordane Dimidschstein1, Julie Piccirilli1, David Gall3, Adèle Herpoel1, Angéline Bilheu1, Jerome Bonnefont1, Michelina Iacovino4, Michael Kyba4, Tristan Bouschet1 & Pierre Vanderhaeghen1,5
During neurogenesis, neural stem/progenitor cells (NPCs) undergo an irreversible fate transition to become neurons. The Notch pathway is important for this process, and repression of Notch-dependent Hes genes is essential for triggering differentiation. However, Notch signaling often remains active throughout neuronal differentiation, implying a change in the transcriptional responsiveness to Notch during the neurogenic transition. We identified Bcl6, an oncogene, as encoding a proneurogenic factor that is required for proper neurogenesis of the mouse cerebral cortex. BCL6 promoted the neurogenic conversion by switching the composition of Notch-dependent transcriptional complexes at the Hes5 promoter. BCL6 triggered exclusion of the co-activator Mastermind-like 1 and recruitment of the NAD+-dependent deacetylase Sirt1, which was required for BCL6-dependent neurogenesis. The resulting epigenetic silencing of Hes5 led to neuronal differentiation despite active Notch signaling. Our findings suggest a role for BCL6 in neurogenesis and uncover Notch-BCL6-Sirt1 interactions that may affect other aspects of physiology and disease.
npg
© 2
012
Nat
ure
Am
eric
a, In
c. A
ll rig
hts
rese
rved
.
1628 VOLUME 15 | NUMBER 12 | DECEMBER 2012 nature neurOSCIenCe
a r t I C l e S
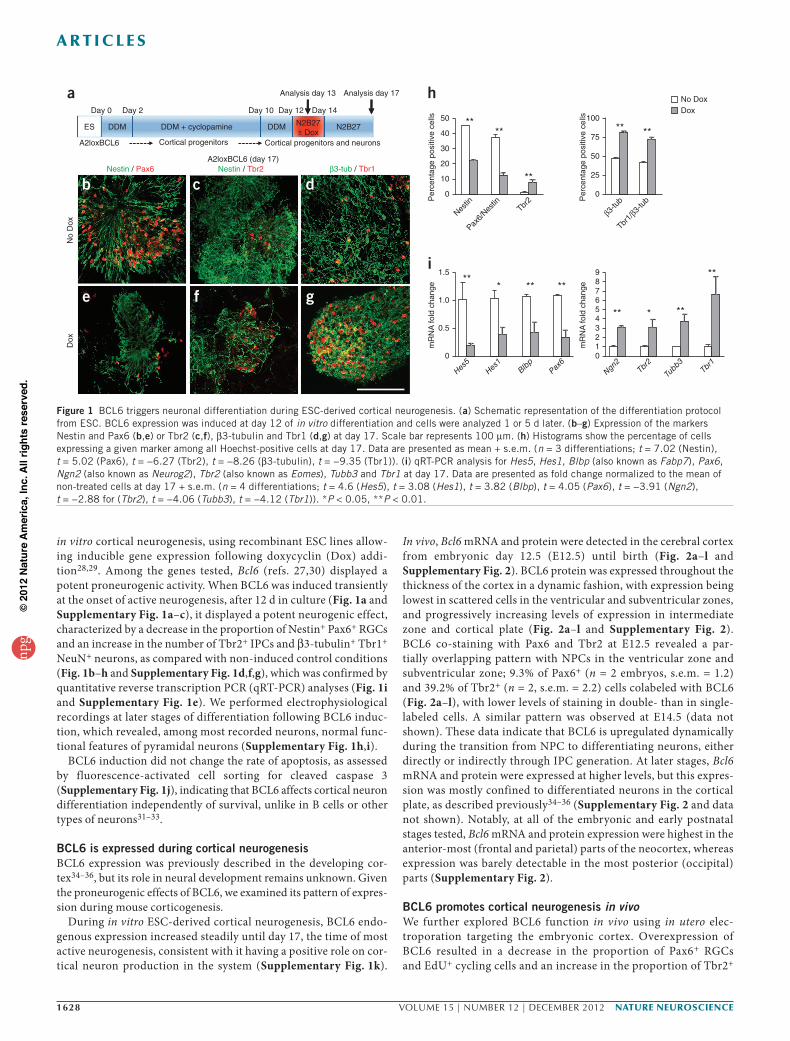
in vitro cortical neurogenesis, using recombinant ESC lines allow-ing inducible gene expression following doxycyclin (Dox) addi-tion28,29. Among the genes tested, Bcl6 (refs. 27,30) displayed a potent proneurogenic activity. When BCL6 was induced transiently at the onset of active neurogenesis, after 12 d in culture (Fig. 1a and Supplementary Fig. 1a–c), it displayed a potent neurogenic effect, characterized by a decrease in the proportion of Nestin+ Pax6+ RGCs and an increase in the number of Tbr2+ IPCs and β3-tubulin+ Tbr1+ NeuN+ neurons, as compared with non-induced control conditions (Fig. 1b–h and Supplementary Fig. 1d,f,g), which was confirmed by quantitative reverse transcription PCR (qRT-PCR) analyses (Fig. 1i and Supplementary Fig. 1e). We performed electrophysiological recordings at later stages of differentiation following BCL6 induc-tion, which revealed, among most recorded neurons, normal func-tional features of pyramidal neurons (Supplementary Fig. 1h,i).
BCL6 induction did not change the rate of apoptosis, as assessed by fluorescence-activated cell sorting for cleaved caspase 3 (Supplementary Fig. 1j), indicating that BCL6 affects cortical neuron differentiation independently of survival, unlike in B cells or other types of neurons31–33.
BCL6 is expressed during cortical neurogenesisBCL6 expression was previously described in the developing cor-tex34–36, but its role in neural development remains unknown. Given the proneurogenic effects of BCL6, we examined its pattern of expres-sion during mouse corticogenesis.
During in vitro ESC-derived cortical neurogenesis, BCL6 endo-genous expression increased steadily until day 17, the time of most active neurogenesis, consistent with it having a positive role on cor-tical neuron production in the system (Supplementary Fig. 1k).
In vivo, Bcl6 mRNA and protein were detected in the cerebral cortex from embryonic day 12.5 (E12.5) until birth (Fig. 2a–l and Supplementary Fig. 2). BCL6 protein was expressed throughout the thickness of the cortex in a dynamic fashion, with expression being lowest in scattered cells in the ventricular and subventricular zones, and progressively increasing levels of expression in intermediate zone and cortical plate (Fig. 2a–l and Supplementary Fig. 2). BCL6 co-staining with Pax6 and Tbr2 at E12.5 revealed a par-tially overlapping pattern with NPCs in the ventricular zone and subventricular zone; 9.3% of Pax6+ (n = 2 embryos, s.e.m. = 1.2) and 39.2% of Tbr2+ (n = 2, s.e.m. = 2.2) cells colabeled with BCL6 (Fig. 2a–l), with lower levels of staining in double- than in single- labeled cells. A similar pattern was observed at E14.5 (data not shown). These data indicate that BCL6 is upregulated dynamically during the transition from NPC to differentiating neurons, either directly or indirectly through IPC generation. At later stages, Bcl6 mRNA and protein were expressed at higher levels, but this expres-sion was mostly confined to differentiated neurons in the cortical plate, as described previously34–36 (Supplementary Fig. 2 and data not shown). Notably, at all of the embryonic and early postnatal stages tested, Bcl6 mRNA and protein expression were highest in the anterior-most (frontal and parietal) parts of the neocortex, whereas expression was barely detectable in the most posterior (occipital) parts (Supplementary Fig. 2).
BCL6 promotes cortical neurogenesis in vivoWe further explored BCL6 function in vivo using in utero elec-troporation targeting the embryonic cortex. Overexpression of BCL6 resulted in a decrease in the proportion of Pax6+ RGCs and EdU+ cycling cells and an increase in the proportion of Tbr2+
aDay 10 Day 12 Day 14Day 2Day 0
N2B27ES DDM DDM + cyclopamine DDM N2B27± Dox
A2loxBCL6 Cortical progenitors Cortical progenitors and neurons
Analysis day 13 Analysis day 17
Dox
N
o D
ox
Nestin / Pax6 Nestin / Tbr2 β3-tub / Tbr1
b
e
c
f
d
g
A2loxBCL6 (day 17)
Nestin
50 100
No DoxDox
75
50
25
0
40
30
20
10
0
Pax6/
Nestin
β3-tu
b
Tbr1/
β3-tu
b
****
**
****
Per
cent
age
posi
tive
cells
h
Tbr2 P
erce
ntag
e po
sitiv
e ce
lls
Hes5
Ngn2
*** **
** * **
**
mR
NA
fold
cha
nge
i**
Hes1
Blbp
Pax6
Tbr2
Tubb3
Tbr1
mR
NA
fold
cha
nge
1.5 9
78
6543210
1.0
0.5
0
Figure 1 BCL6 triggers neuronal differentiation during ESC-derived cortical neurogenesis. (a) Schematic representation of the differentiation protocol from ESC. BCL6 expression was induced at day 12 of in vitro differentiation and cells were analyzed 1 or 5 d later. (b–g) Expression of the markers Nestin and Pax6 (b,e) or Tbr2 (c,f), β3-tubulin and Tbr1 (d,g) at day 17. Scale bar represents 100 µm. (h) Histograms show the percentage of cells expressing a given marker among all Hoechst-positive cells at day 17. Data are presented as mean + s.e.m. (n = 3 differentiations; t = 7.02 (Nestin), t = 5.02 (Pax6), t = −6.27 (Tbr2), t = −8.26 (β3-tubulin), t = −9.35 (Tbr1)). (i) qRT-PCR analysis for Hes5, Hes1, Blbp (also known as Fabp7), Pax6, Ngn2 (also known as Neurog2), Tbr2 (also known as Eomes), Tubb3 and Tbr1 at day 17. Data are presented as fold change normalized to the mean of non-treated cells at day 17 + s.e.m. (n = 4 differentiations; t = 4.6 (Hes5), t = 3.08 (Hes1), t = 3.82 (Blbp), t = 4.05 (Pax6), t = −3.91 (Ngn2), t = −2.88 for (Tbr2), t = −4.06 (Tubb3), t = −4.12 (Tbr1)). *P < 0.05, **P < 0.01.
npg
© 2
012
Nat
ure
Am
eric
a, In
c. A
ll rig
hts
rese
rved
.
nature neurOSCIenCe VOLUME 15 | NUMBER 12 | DECEMBER 2012 1629
a r t I C l e S
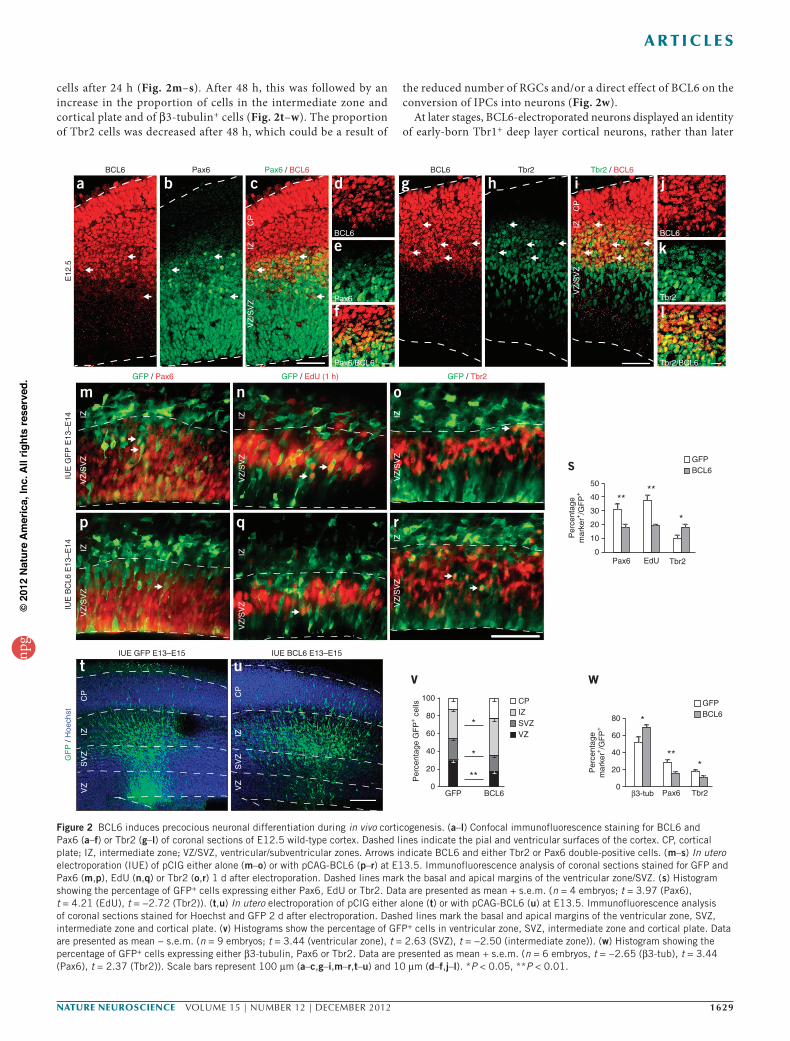
cells after 24 h (Fig. 2m–s). After 48 h, this was followed by an increase in the proportion of cells in the intermediate zone and cortical plate and of β3-tubulin+ cells (Fig. 2t–w). The proportion of Tbr2 cells was decreased after 48 h, which could be a result of
the reduced number of RGCs and/or a direct effect of BCL6 on the conversion of IPCs into neurons (Fig. 2w).
At later stages, BCL6-electroporated neurons displayed an identity of early-born Tbr1+ deep layer cortical neurons, rather than later
GF
P /
Hoe
chst
IUE GFP E13–E15
VZ
SV
ZIZ
CP
tIUE BCL6 E13–E15
u
VZ
SV
ZIZ
CP
E12
.5
d
BCL6
e
Pax6
f
Pax6/BCL6
BCL6
aPax6
bPax6 / BCL6
c
VZ
/SV
ZIZ
CP
j
BCL6
k
Tbr2
l
Tbr2/BCL6
BCL6
gTbr2
hTbr2 / BCL6
i
VZ
/SV
ZIZ
CP
IUE
GF
P E
13–E
14IU
E B
CL6
E13
–E14
m
VZ
/SV
ZIZ
p
VZ
/SV
ZIZ
r
VZ
/SV
ZIZ
n
VZ
/SV
ZIZ
GFP / Pax6 GFP / EdU (1 h) GFP / Tbr2
oV
Z/S
VZ
IZ
q
VZ
/SV
ZIZ 0
10
20
30
40
50
Pax6 Tbr2EdU
s
Per
cent
age
mar
ker+
/GF
P+ **
**
*
BCL6GFP
w
β3-tub Tbr2
*
Pax60
20
40
60
80
Per
cent
age
mar
ker+
/GF
P+
***
BCL6GFP
v
Per
cent
age
GF
P+ c
ells
GFP BCL6
*
**
*
0
20
40
60
100
80 IZSVZVZ
CP
Figure 2 BCL6 induces precocious neuronal differentiation during in vivo corticogenesis. (a–l) Confocal immunofluorescence staining for BCL6 and Pax6 (a–f) or Tbr2 (g–l) of coronal sections of E12.5 wild-type cortex. Dashed lines indicate the pial and ventricular surfaces of the cortex. CP, cortical plate; IZ, intermediate zone; VZ/SVZ, ventricular/subventricular zones. Arrows indicate BCL6 and either Tbr2 or Pax6 double-positive cells. (m–s) In utero electroporation (IUE) of pCIG either alone (m–o) or with pCAG-BCL6 (p–r) at E13.5. Immunofluorescence analysis of coronal sections stained for GFP and Pax6 (m,p), EdU (n,q) or Tbr2 (o,r) 1 d after electroporation. Dashed lines mark the basal and apical margins of the ventricular zone/SVZ. (s) Histogram showing the percentage of GFP+ cells expressing either Pax6, EdU or Tbr2. Data are presented as mean + s.e.m. (n = 4 embryos; t = 3.97 (Pax6), t = 4.21 (EdU), t = −2.72 (Tbr2)). (t,u) In utero electroporation of pCIG either alone (t) or with pCAG-BCL6 (u) at E13.5. Immunofluorescence analysis of coronal sections stained for Hoechst and GFP 2 d after electroporation. Dashed lines mark the basal and apical margins of the ventricular zone, SVZ, intermediate zone and cortical plate. (v) Histograms show the percentage of GFP+ cells in ventricular zone, SVZ, intermediate zone and cortical plate. Data are presented as mean − s.e.m. (n = 9 embryos; t = 3.44 (ventricular zone), t = 2.63 (SVZ), t = −2.50 (intermediate zone)). (w) Histogram showing the percentage of GFP+ cells expressing either β3-tubulin, Pax6 or Tbr2. Data are presented as mean + s.e.m. (n = 6 embryos, t = −2.65 (β3-tub), t = 3.44 (Pax6), t = 2.37 (Tbr2)). Scale bars represent 100 µm (a–c,g–i,m–r,t–u) and 10 µm (d–f,j–l). *P < 0.05, **P < 0.01.
npg
© 2
012
Nat
ure
Am
eric
a, In
c. A
ll rig
hts
rese
rved
.
1630 VOLUME 15 | NUMBER 12 | DECEMBER 2012 nature neurOSCIenCe
a r t I C l e S
born Cux1+ upper layer neurons (Supplementary Fig. 3a–f), a fate change that is consistent with precocious differentiation. Analysis of dendritic and axonal growth revealed that the BCL6-induced neu-rons acquired mature properties of pyramidal projection neurons (Supplementary Fig. 3g–r).
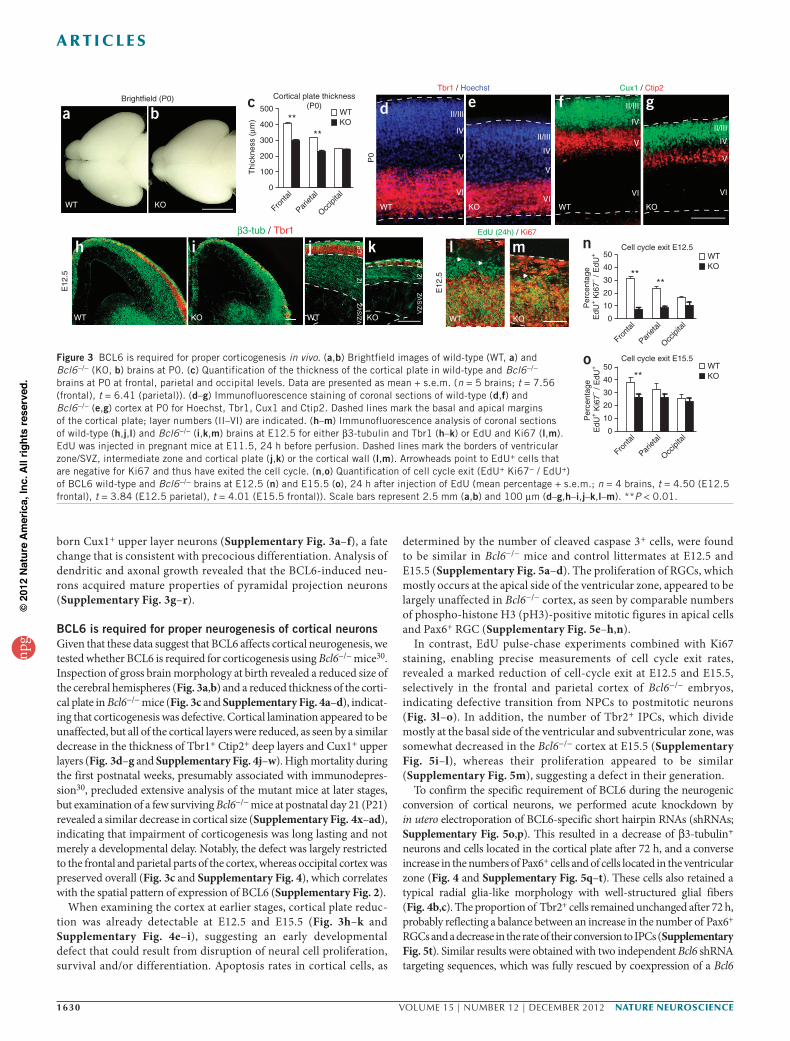
BCL6 is required for proper neurogenesis of cortical neuronsGiven that these data suggest that BCL6 affects cortical neurogenesis, we tested whether BCL6 is required for corticogenesis using Bcl6−/− mice30. Inspection of gross brain morphology at birth revealed a reduced size of the cerebral hemispheres (Fig. 3a,b) and a reduced thickness of the corti-cal plate in Bcl6−/− mice (Fig. 3c and Supplementary Fig. 4a–d), indicat-ing that corticogenesis was defective. Cortical lamination appeared to be unaffected, but all of the cortical layers were reduced, as seen by a similar decrease in the thickness of Tbr1+ Ctip2+ deep layers and Cux1+ upper layers (Fig. 3d–g and Supplementary Fig. 4j–w). High mortality during the first postnatal weeks, presumably associated with immunodepres-sion30, precluded extensive analysis of the mutant mice at later stages, but examination of a few surviving Bcl6−/− mice at postnatal day 21 (P21) revealed a similar decrease in cortical size (Supplementary Fig. 4x–ad), indicating that impairment of corticogenesis was long lasting and not merely a developmental delay. Notably, the defect was largely restricted to the frontal and parietal parts of the cortex, whereas occipital cortex was preserved overall (Fig. 3c and Supplementary Fig. 4), which correlates with the spatial pattern of expression of BCL6 (Supplementary Fig. 2).
When examining the cortex at earlier stages, cortical plate reduc-tion was already detectable at E12.5 and E15.5 (Fig. 3h–k and Supplementary Fig. 4e–i), suggesting an early developmental defect that could result from disruption of neural cell proliferation, survival and/or differentiation. Apoptosis rates in cortical cells, as
determined by the number of cleaved caspase 3+ cells, were found to be similar in Bcl6−/− mice and control littermates at E12.5 and E15.5 (Supplementary Fig. 5a–d). The proliferation of RGCs, which mostly occurs at the apical side of the ventricular zone, appeared to be largely unaffected in Bcl6−/− cortex, as seen by comparable numbers of phospho-histone H3 (pH3)-positive mitotic figures in apical cells and Pax6+ RGC (Supplementary Fig. 5e–h,n).
In contrast, EdU pulse-chase experiments combined with Ki67 staining, enabling precise measurements of cell cycle exit rates, revealed a marked reduction of cell-cycle exit at E12.5 and E15.5, selectively in the frontal and parietal cortex of Bcl6−/− embryos, indicating defective transition from NPCs to postmitotic neurons (Fig. 3l–o). In addition, the number of Tbr2+ IPCs, which divide mostly at the basal side of the ventricular and subventricular zone, was somewhat decreased in the Bcl6−/− cortex at E15.5 (Supplementary Fig. 5i–l), whereas their proliferation appeared to be similar (Supplementary Fig. 5m), suggesting a defect in their generation.
To confirm the specific requirement of BCL6 during the neurogenic conversion of cortical neurons, we performed acute knockdown by in utero electroporation of BCL6-specific short hairpin RNAs (shRNAs; Supplementary Fig. 5o,p). This resulted in a decrease of β3-tubulin+ neurons and cells located in the cortical plate after 72 h, and a converse increase in the numbers of Pax6+ cells and of cells located in the ventricular zone (Fig. 4 and Supplementary Fig. 5q–t). These cells also retained a typical radial glia-like morphology with well-structured glial fibers (Fig. 4b,c). The proportion of Tbr2+ cells remained unchanged after 72 h, probably reflecting a balance between an increase in the number of Pax6+ RGCs and a decrease in the rate of their conversion to IPCs (Supplementary Fig. 5t). Similar results were obtained with two independent Bcl6 shRNA targeting sequences, which was fully rescued by coexpression of a Bcl6
WT
aBrightfield (P0)
KO
b
E12
.5
β3-tub / Tbr1
h i
WT KO
k
VZ
/SV
ZIZ
VZ
/SV
ZIZ
CP
CPj
KOWT
Tbr1 / Hoechst
KO
e
II/III
IV
V
VIWT
II/III
IV
V
VI
d
KO
gII/III
IV
V
VI
Cux1 / Ctip2
WT
f II/III
IV
V
VI
P0
EdU (24h) / Ki67
l m
KOWT
E12
.5
Cortical plate thickness(P0)
Occipi
tal
Front
al
500
400
300
200
100
0
Pariet
al
**
**
c
Thi
ckne
ss (
µm)
WTKO
Cell cycle exit E12.5n
Per
cent
age
EdU
+ K
i67– /
EdU
+
Occipi
tal
Front
al
50
40
30
20
10
0
Pariet
al
****
WTKO
WTKO
Per
cent
age
EdU
+ K
i67– /
EdU
+
o Cell cycle exit E15.5
Occipi
tal
Front
al
50
40
30
20
10
0
Pariet
al
**
Figure 3 BCL6 is required for proper corticogenesis in vivo. (a,b) Brightfield images of wild-type (WT, a) and Bcl6−/− (KO, b) brains at P0. (c) Quantification of the thickness of the cortical plate in wild-type and Bcl6−/− brains at P0 at frontal, parietal and occipital levels. Data are presented as mean + s.e.m. (n = 5 brains; t = 7.56 (frontal), t = 6.41 (parietal)). (d–g) Immunofluorescence staining of coronal sections of wild-type (d,f) and Bcl6−/− (e,g) cortex at P0 for Hoechst, Tbr1, Cux1 and Ctip2. Dashed lines mark the basal and apical margins of the cortical plate; layer numbers (II–VI) are indicated. (h–m) Immunofluorescence analysis of coronal sections of wild-type (h,j,l) and Bcl6−/− (i,k,m) brains at E12.5 for either β3-tubulin and Tbr1 (h–k) or EdU and Ki67 (l,m). EdU was injected in pregnant mice at E11.5, 24 h before perfusion. Dashed lines mark the borders of ventricular zone/SVZ, intermediate zone and cortical plate (j,k) or the cortical wall (l,m). Arrowheads point to EdU+ cells that are negative for Ki67 and thus have exited the cell cycle. (n,o) Quantification of cell cycle exit (EdU+ Ki67− / EdU+) of BCL6 wild-type and Bcl6−/− brains at E12.5 (n) and E15.5 (o), 24 h after injection of EdU (mean percentage + s.e.m.; n = 4 brains, t = 4.50 (E12.5 frontal), t = 3.84 (E12.5 parietal), t = 4.01 (E15.5 frontal)). Scale bars represent 2.5 mm (a,b) and 100 µm (d–g,h–i,j–k,l–m). **P < 0.01.
npg
© 2
012
Nat
ure
Am
eric
a, In
c. A
ll rig
hts
rese
rved
.
nature neurOSCIenCe VOLUME 15 | NUMBER 12 | DECEMBER 2012 1631
a r t I C l e S
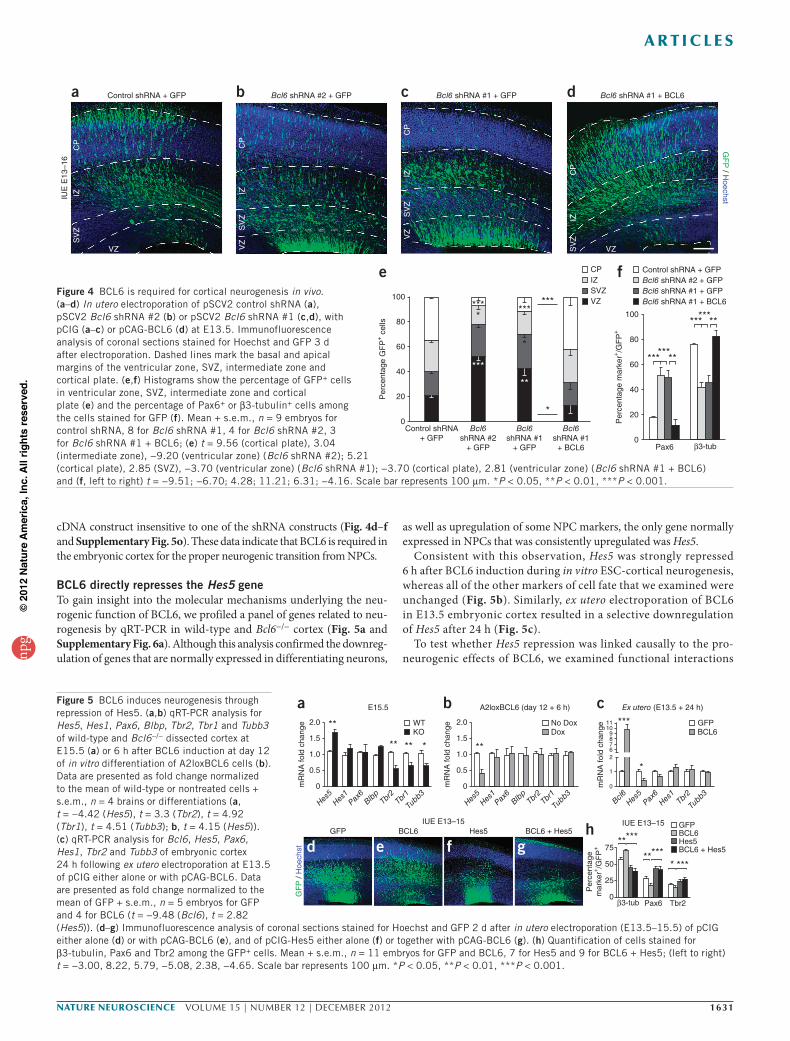
cDNA construct insensitive to one of the shRNA constructs (Fig. 4d–f and Supplementary Fig. 5o). These data indicate that BCL6 is required in the embryonic cortex for the proper neurogenic transition from NPCs.
BCL6 directly represses the Hes5 geneTo gain insight into the molecular mechanisms underlying the neu-rogenic function of BCL6, we profiled a panel of genes related to neu-rogenesis by qRT-PCR in wild-type and Bcl6−/− cortex (Fig. 5a and Supplementary Fig. 6a). Although this analysis confirmed the downreg-ulation of genes that are normally expressed in differentiating neurons,
as well as upregulation of some NPC markers, the only gene normally expressed in NPCs that was consistently upregulated was Hes5.
Consistent with this observation, Hes5 was strongly repressed 6 h after BCL6 induction during in vitro ESC-cortical neurogenesis, whereas all of the other markers of cell fate that we examined were unchanged (Fig. 5b). Similarly, ex utero electroporation of BCL6 in E13.5 embryonic cortex resulted in a selective downregulation of Hes5 after 24 h (Fig. 5c).
To test whether Hes5 repression was linked causally to the pro-neurogenic effects of BCL6, we examined functional interactions
Per
cent
age
GF
P+ c
ells
IZSVZVZ
CP
Control shRNA+ GFP
Bcl6shRNA #1
+ GFP
Bcl6shRNA #2
+ GFP
Bcl6shRNA #1
+ BCL6
f
Per
cent
age
mar
ker+
/GF
P+
Pax6 β3-tub0
20
40
60
80
100
******
******
**
**
40
60
80
100
20
0
****
***
***
*
**
*
***
e
IUE
E13
–16
a
VZ
SV
ZIZ
CP
Control shRNA + GFP c
VZ
SV
ZIZ
CP
Bcl6 shRNA #1 + GFPb
VZ
SV
ZIZ
CP
Bcl6 shRNA #2 + GFP
GF
P / H
oechst
d
VZSV
ZIZ
CP
Bcl6 shRNA #1 + BCL6
Bcl6 shRNA #2 + GFPBcl6 shRNA #1 + GFPBcl6 shRNA #1 + BCL6
Control shRNA + GFP
Figure 4 BCL6 is required for cortical neurogenesis in vivo. (a–d) In utero electroporation of pSCV2 control shRNA (a), pSCV2 Bcl6 shRNA #2 (b) or pSCV2 Bcl6 shRNA #1 (c,d), with pCIG (a–c) or pCAG-BCL6 (d) at E13.5. Immunofluorescence analysis of coronal sections stained for Hoechst and GFP 3 d after electroporation. Dashed lines mark the basal and apical margins of the ventricular zone, SVZ, intermediate zone and cortical plate. (e,f) Histograms show the percentage of GFP+ cells in ventricular zone, SVZ, intermediate zone and cortical plate (e) and the percentage of Pax6+ or β3-tubulin+ cells among the cells stained for GFP (f). Mean + s.e.m., n = 9 embryos for control shRNA, 8 for Bcl6 shRNA #1, 4 for Bcl6 shRNA #2, 3 for Bcl6 shRNA #1 + BCL6; (e) t = 9.56 (cortical plate), 3.04 (intermediate zone), −9.20 (ventricular zone) (Bcl6 shRNA #2); 5.21 (cortical plate), 2.85 (SVZ), −3.70 (ventricular zone) (Bcl6 shRNA #1); −3.70 (cortical plate), 2.81 (ventricular zone) (Bcl6 shRNA #1 + BCL6) and (f, left to right) t = −9.51; −6.70; 4.28; 11.21; 6.31; −4.16. Scale bar represents 100 µm. *P < 0.05, **P < 0.01, ***P < 0.001.
Figure 5 BCL6 induces neurogenesis through repression of Hes5. (a,b) qRT-PCR analysis for Hes5, Hes1, Pax6, Blbp, Tbr2, Tbr1 and Tubb3 of wild-type and Bcl6−/− dissected cortex at E15.5 (a) or 6 h after BCL6 induction at day 12 of in vitro differentiation of A2loxBCL6 cells (b). Data are presented as fold change normalized to the mean of wild-type or nontreated cells + s.e.m., n = 4 brains or differentiations (a, t = −4.42 (Hes5), t = 3.3 (Tbr2), t = 4.92 (Tbr1), t = 4.51 (Tubb3); b, t = 4.15 (Hes5)). (c) qRT-PCR analysis for Bcl6, Hes5, Pax6, Hes1, Tbr2 and Tubb3 of embryonic cortex 24 h following ex utero electroporation at E13.5 of pCIG either alone or with pCAG-BCL6. Data are presented as fold change normalized to the mean of GFP + s.e.m., n = 5 embryos for GFP and 4 for BCL6 (t = −9.48 (Bcl6), t = 2.82 (Hes5)). (d–g) Immunofluorescence analysis of coronal sections stained for Hoechst and GFP 2 d after in utero electroporation (E13.5–15.5) of pCIG either alone (d) or with pCAG-BCL6 (e), and of pCIG-Hes5 either alone (f) or together with pCAG-BCL6 (g). (h) Quantification of cells stained for β3-tubulin, Pax6 and Tbr2 among the GFP+ cells. Mean + s.e.m., n = 11 embryos for GFP and BCL6, 7 for Hes5 and 9 for BCL6 + Hes5; (left to right) t = −3.00, 8.22, 5.79, −5.08, 2.38, −4.65. Scale bar represents 100 µm. *P < 0.05, **P < 0.01, ***P < 0.001.
IUE E13–15 IUE E13–15
GF
P /
Hoe
chst
GFP Hes5 BCL6 + Hes5
ghBCL6
ed f
2.0
a b c
1.5
1.0
0.5
mR
NA
fold
cha
nge
mR
NA
fold
cha
nge
mR
NA
fold
cha
nge
0
Hes5
Hes1
Blbp
Pax6
Tbr2
Tbr1
Tubb3
Hes5
Hes5
Bcl6Hes
1Hes
1Blb
pPax
6Pax
6Tb
r2Tb
r2Tb
r1
Tubb3
Tubb3
2.0WT
E15.5 A2loxBCL6 (day 12 + 6 h) Ex utero (E13.5 + 24 h)
KONo Dox 11 GFP
BCL6
GFPBCL6
BCL6 + Hes5Hes5
1098762
1
0
75*****
**
**** ** *
*
***
****** ***
β3-tub Pax6 Tbr2
50
25
0
Per
cent
age
mar
ker+
/GF
P+
Dox1.5
1.0
0.5
0
npg
© 2
012
Nat
ure
Am
eric
a, In
c. A
ll rig
hts
rese
rved
.
1632 VOLUME 15 | NUMBER 12 | DECEMBER 2012 nature neurOSCIenCe
a r t I C l e S
between BCL6 and Hes5 in vivo by in utero electroporation. As expected9, Hes5 gain of function resulted in a strong decrease in neurogenesis, whereas BCL6 overexpression had the opposite effect (Fig. 5d–h). Notably, coexpression of Hes5 and BCL6 resulted in a complete block of BCL6-dependent neurogenesis (Fig. 5h), thereby directly linking Hes5 repression to the proneurogenic effect of BCL6 in vivo.
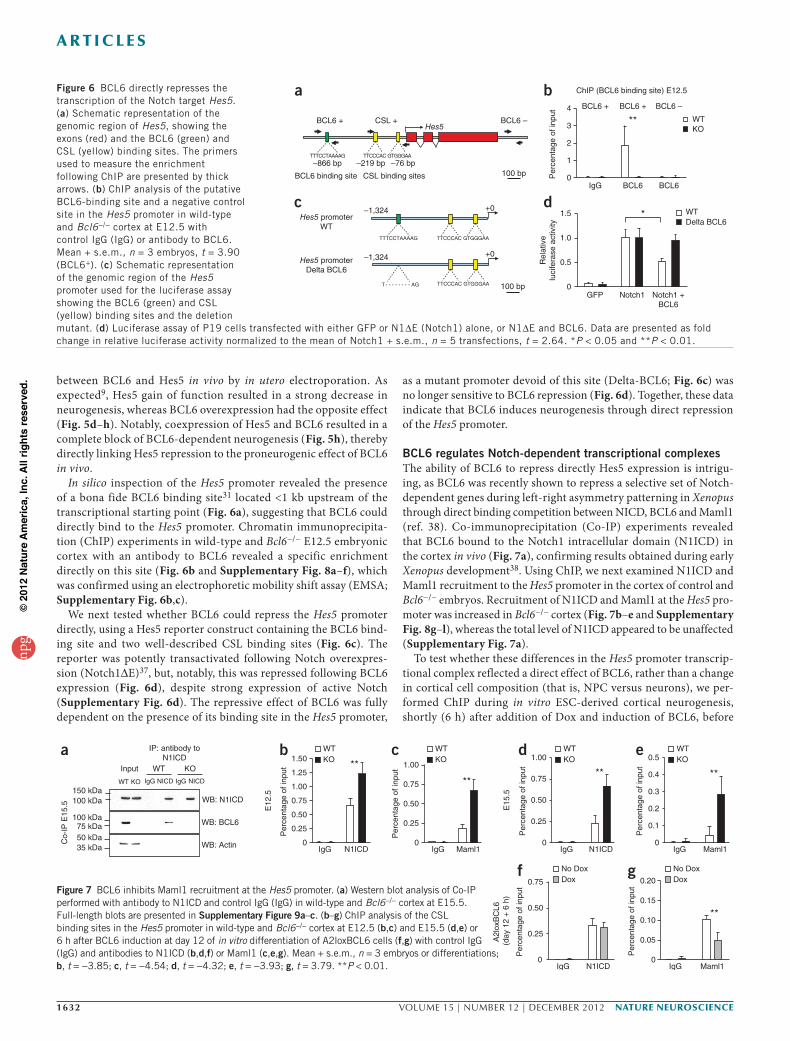
In silico inspection of the Hes5 promoter revealed the presence of a bona fide BCL6 binding site31 located <1 kb upstream of the transcriptional starting point (Fig. 6a), suggesting that BCL6 could directly bind to the Hes5 promoter. Chromatin immunoprecipita-tion (ChIP) experiments in wild-type and Bcl6−/− E12.5 embryonic cortex with an antibody to BCL6 revealed a specific enrichment directly on this site (Fig. 6b and Supplementary Fig. 8a–f), which was confirmed using an electrophoretic mobility shift assay (EMSA; Supplementary Fig. 6b,c).
We next tested whether BCL6 could repress the Hes5 promoter directly, using a Hes5 reporter construct containing the BCL6 bind-ing site and two well-described CSL binding sites (Fig. 6c). The reporter was potently transactivated following Notch overexpres-sion (Notch1∆E)37, but, notably, this was repressed following BCL6 expression (Fig. 6d), despite strong expression of active Notch (Supplementary Fig. 6d). The repressive effect of BCL6 was fully dependent on the presence of its binding site in the Hes5 promoter,
as a mutant promoter devoid of this site (Delta-BCL6; Fig. 6c) was no longer sensitive to BCL6 repression (Fig. 6d). Together, these data indicate that BCL6 induces neurogenesis through direct repression of the Hes5 promoter.
BCL6 regulates Notch-dependent transcriptional complexesThe ability of BCL6 to repress directly Hes5 expression is intrigu-ing, as BCL6 was recently shown to repress a selective set of Notch-dependent genes during left-right asymmetry patterning in Xenopus through direct binding competition between NICD, BCL6 and Maml1 (ref. 38). Co-immunoprecipitation (Co-IP) experiments revealed that BCL6 bound to the Notch1 intracellular domain (N1ICD) in the cortex in vivo (Fig. 7a), confirming results obtained during early Xenopus development38. Using ChIP, we next examined N1ICD and Maml1 recruitment to the Hes5 promoter in the cortex of control and Bcl6−/− embryos. Recruitment of N1ICD and Maml1 at the Hes5 pro-moter was increased in Bcl6−/− cortex (Fig. 7b–e and Supplementary Fig. 8g–l), whereas the total level of N1ICD appeared to be unaffected (Supplementary Fig. 7a).
To test whether these differences in the Hes5 promoter transcrip-tional complex reflected a direct effect of BCL6, rather than a change in cortical cell composition (that is, NPC versus neurons), we per-formed ChIP during in vitro ESC-derived cortical neurogenesis, shortly (6 h) after addition of Dox and induction of BCL6, before
Figure 6 BCL6 directly represses the transcription of the Notch target Hes5. (a) Schematic representation of the genomic region of Hes5, showing the exons (red) and the BCL6 (green) and CSL (yellow) binding sites. The primers used to measure the enrichment following ChIP are presented by thick arrows. (b) ChIP analysis of the putative BCL6-binding site and a negative control site in the Hes5 promoter in wild-type and Bcl6−/− cortex at E12.5 with control IgG (IgG) or antibody to BCL6. Mean + s.e.m., n = 3 embryos, t = 3.90 (BCL6+). (c) Schematic representation of the genomic region of the Hes5 promoter used for the luciferase assay showing the BCL6 (green) and CSL (yellow) binding sites and the deletion mutant. (d) Luciferase assay of P19 cells transfected with either GFP or N1∆E (Notch1) alone, or N1∆E and BCL6. Data are presented as fold change in relative luciferase activity normalized to the mean of Notch1 + s.e.m., n = 5 transfections, t = 2.64. *P < 0.05 and **P < 0.01.
a
WB: N1ICD
WB: BCL6
WB: Actin
WT KO
IP: antibody toN1ICD
100 kDa
75 kDa
150 kDa
100 kDa
50 kDa35 kDa
IgG NICD IgG NICD
WT KOInput
Co-
IP E
15.5
f
N1ICDIgG
Per
cent
age
of in
put
0.75
0.50
0.25
0
No DoxDox
g
**
Maml1IgG
Per
cent
age
of in
put
0.20
0.15
0.10
0.05
0
No DoxDox
b**
N1ICDIgG
E12
.5
Per
cent
age
of in
put
1.50WTKO
1.25
1.00
0.75
0.50
0.25
0
d
E15
.5
**
N1ICDIgG
Per
cent
age
of in
put
1.00
0.75
0.50
0.25
0
WTKO
e**
Maml1IgG
Per
cent
age
of in
put
0.5
0.4
0.3
0.2
0.1
0
WTKO
c
**
Maml1IgG
Per
cent
age
of in
put 1.00
0.75
0.50
0.25
0
WTKO
A2l
oxB
CL6
(d
ay 1
2 +
6 h
)
Figure 7 BCL6 inhibits Maml1 recruitment at the Hes5 promoter. (a) Western blot analysis of Co-IP performed with antibody to N1ICD and control IgG (IgG) in wild-type and Bcl6−/− cortex at E15.5. Full-length blots are presented in Supplementary Figure 9a–c. (b–g) ChIP analysis of the CSL binding sites in the Hes5 promoter in wild-type and Bcl6−/− cortex at E12.5 (b,c) and E15.5 (d,e) or 6 h after BCL6 induction at day 12 of in vitro differentiation of A2loxBCL6 cells (f,g) with control IgG (IgG) and antibodies to N1ICD (b,d,f) or Maml1 (c,e,g). Mean + s.e.m., n = 3 embryos or differentiations; b, t = −3.85; c, t = −4.54; d, t = −4.32; e, t = −3.93; g, t = 3.79. **P < 0.01.
BCL6IgG BCL6
BCL6 +4
3
2
1
0
1.5
BCL6 + BCL6 –
WTKO
WTDelta BCL6
**
d
Rel
ativ
elu
cife
rase
act
ivity
GFP Notch1 Notch1 +BCL6
ChIP (BCL6 binding site) E12.5b
*
Per
cent
age
of in
put
cHes5 promoter
WTTTTCCTAAAAG TTCCCAC GTGGGAA
+0–1,324
100 bp
Hes5 promoterDelta BCL6
T- - - - - - - - AG
–1,324 +0
TTCCCAC GTGGGAA
a
Hes5
TTTCCTAAAAG
–866 bp
BCL6 binding site
TTCCCAC GTGGGAA
BCL6 + CSL + BCL6 –
CSL binding sites
–219 bp –76 bp100 bp
1.0
0.5
0
npg
© 2
012
Nat
ure
Am
eric
a, In
c. A
ll rig
hts
rese
rved
.
nature neurOSCIenCe VOLUME 15 | NUMBER 12 | DECEMBER 2012 1633
a r t I C l e S
any cell fate change was detectable (Fig. 5b). We observed a strong decrease of Maml1 recruitment at the Hes5 promoter, whereas no difference could be detected in N1ICD recruitment (Fig. 7f,g and Supplementary Fig. 8m–r).
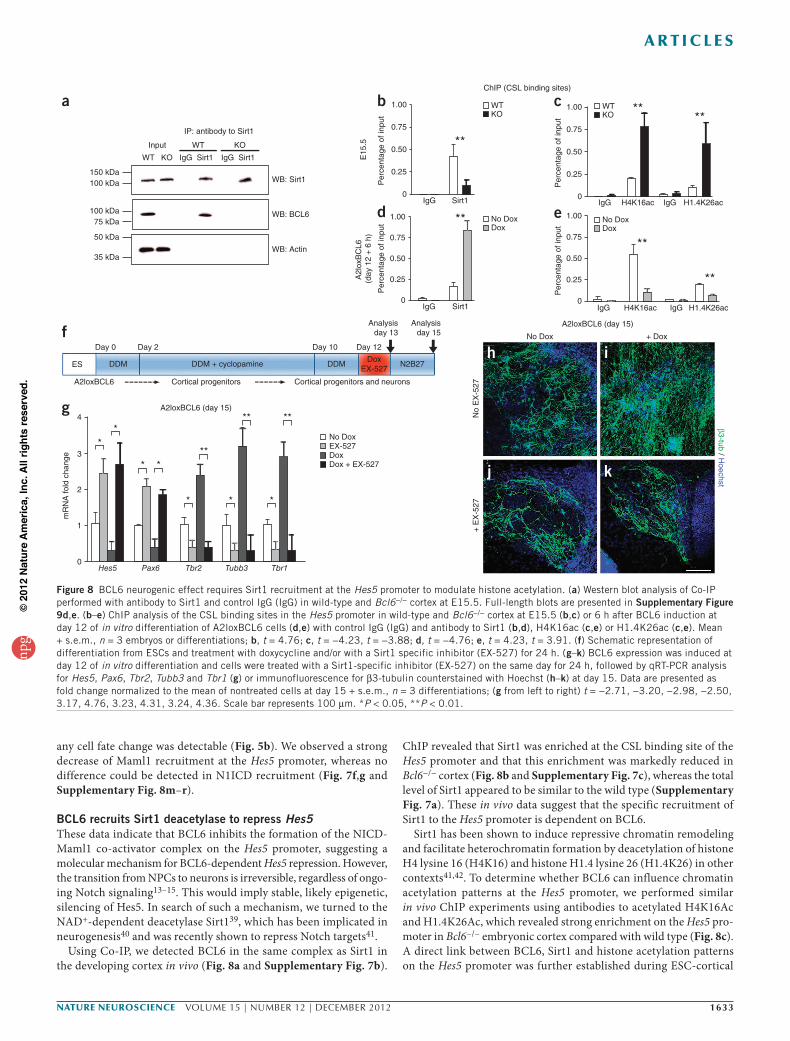
BCL6 recruits Sirt1 deacetylase to repress Hes5These data indicate that BCL6 inhibits the formation of the NICD-Maml1 co-activator complex on the Hes5 promoter, suggesting a molecular mechanism for BCL6-dependent Hes5 repression. However, the transition from NPCs to neurons is irreversible, regardless of ongo-ing Notch signaling13–15. This would imply stable, likely epigenetic, silencing of Hes5. In search of such a mechanism, we turned to the NAD+-dependent deacetylase Sirt139, which has been implicated in neurogenesis40 and was recently shown to repress Notch targets41.
Using Co-IP, we detected BCL6 in the same complex as Sirt1 in the developing cortex in vivo (Fig. 8a and Supplementary Fig. 7b).
ChIP revealed that Sirt1 was enriched at the CSL binding site of the Hes5 promoter and that this enrichment was markedly reduced in Bcl6−/− cortex (Fig. 8b and Supplementary Fig. 7c), whereas the total level of Sirt1 appeared to be similar to the wild type (Supplementary Fig. 7a). These in vivo data suggest that the specific recruitment of Sirt1 to the Hes5 promoter is dependent on BCL6.
Sirt1 has been shown to induce repressive chromatin remodeling and facilitate heterochromatin formation by deacetylation of histone H4 lysine 16 (H4K16) and histone H1.4 lysine 26 (H1.4K26) in other contexts41,42. To determine whether BCL6 can influence chromatin acetylation patterns at the Hes5 promoter, we performed similar in vivo ChIP experiments using antibodies to acetylated H4K16Ac and H1.4K26Ac, which revealed strong enrichment on the Hes5 pro-moter in Bcl6−/− embryonic cortex compared with wild type (Fig. 8c). A direct link between BCL6, Sirt1 and histone acetylation patterns on the Hes5 promoter was further established during ESC-cortical
WB: BCL6
WB: Sirt1
WB: Actin
75 kDa100 kDa
50 kDa
35 kDa
100 kDa150 kDa
WT KO
IP: antibody to Sirt1
IgG Sirt1 IgG Sirt1
WT KOInput
No Dox + Dox
A2loxBCL6 (day 15)
β3-tub / Hoechst
i
kj
h
+ E
X-5
27N
o E
X-5
27
KOWT
DoxNo Dox
A2l
oxB
CL6
(d
ay 1
2 +
6 h
)
**d
Per
cent
age
of in
put
Sirt1IgG
**
Sirt1
b
IgG
1.00
0.75
0.50
0.25
0
Per
cent
age
of in
put
E15
.5
1.00
0.75
0.50
0.25
0
DoxNo Dox
KOWT
IgG IgGH4K16ac H1.4K26ac
IgG IgGH4K16ac H1.4K26ac
Per
cent
age
of in
put
**
e
**
c
Per
cent
age
of in
put
****
1.00
0.75
0.50
0.25
0
1.00
0.75
0.50
0.25
0
aChIP (CSL binding sites)
**
* *
*
**
*
**
*
**A2loxBCL6 (day 15)
EX-527No Dox
mR
NA
fold
cha
nge
Hes5 Pax6 Tbr2 Tubb3 Tbr1
4
3
2
1
0
DoxDox + EX-527
g
ES
Day 10 Day 12
DDMDox
EX-527DDM + cyclopamine DDM
A2loxBCL6 Cortical progenitors Cortical progenitors and neurons
Day 2Day 0
N2B27
Analysisday 13
Analysisday 15f
Figure 8 BCL6 neurogenic effect requires Sirt1 recruitment at the Hes5 promoter to modulate histone acetylation. (a) Western blot analysis of Co-IP performed with antibody to Sirt1 and control IgG (IgG) in wild-type and Bcl6−/− cortex at E15.5. Full-length blots are presented in Supplementary Figure 9d,e. (b–e) ChIP analysis of the CSL binding sites in the Hes5 promoter in wild-type and Bcl6−/− cortex at E15.5 (b,c) or 6 h after BCL6 induction at day 12 of in vitro differentiation of A2loxBCL6 cells (d,e) with control IgG (IgG) and antibody to Sirt1 (b,d), H4K16ac (c,e) or H1.4K26ac (c,e). Mean + s.e.m., n = 3 embryos or differentiations; b, t = 4.76; c, t = −4.23, t = −3.88; d, t = −4.76; e, t = 4.23, t = 3.91. (f) Schematic representation of differentiation from ESCs and treatment with doxycycline and/or with a Sirt1 specific inhibitor (EX-527) for 24 h. (g–k) BCL6 expression was induced at day 12 of in vitro differentiation and cells were treated with a Sirt1-specific inhibitor (EX-527) on the same day for 24 h, followed by qRT-PCR analysis for Hes5, Pax6, Tbr2, Tubb3 and Tbr1 (g) or immunofluorescence for β3-tubulin counterstained with Hoechst (h–k) at day 15. Data are presented as fold change normalized to the mean of nontreated cells at day 15 + s.e.m., n = 3 differentiations; (g from left to right) t = −2.71, −3.20, −2.98, −2.50, 3.17, 4.76, 3.23, 4.31, 3.24, 4.36. Scale bar represents 100 µm. *P < 0.05, **P < 0.01.
npg
© 2
012
Nat
ure
Am
eric
a, In
c. A
ll rig
hts
rese
rved
.
1634 VOLUME 15 | NUMBER 12 | DECEMBER 2012 nature neurOSCIenCe
a r t I C l e S
neurogenesis in vitro, where a 6-h induction of BCL6 expression was sufficient to trigger recruitment of Sirt1 to the Hes5 promoter (Fig. 8d) and a converse decrease in acetylated H4K16Ac and H1.4K26Ac (Fig. 8e). Overall, these results strongly suggest that BCL6 modulates Notch signaling by recruiting Sirt1 to the Hes5 promoter, thereby influencing the acetylation state of the chromatin, leading to a stable epigenetic repression of Hes5 during the neurogenic transition.
To test for the functional links between Sirt1 and the neuro-genic effects of BCL6, we examined the effect of a Sirt1 inhibitor (EX-527)43 during in vitro cortical neurogenesis (Fig. 8f). Sirt1 inhi-bition resulted in a complete block of BCL6-induced neurogenesis (Fig. 8g–k and Supplementary Fig. 7d–h) and Hes5 repression (Fig. 8g and Supplementary Fig. 7d), indicating that Sirt1 function is required for the biological and molecular effects of BCL6 during cortical neurogenesis.
DISCUSSIONImportant and irreversible changes in gene expression occur during neurogenesis, which requires extensive chromatin remodeling1–3, but it remains unclear how these modifications affect selective and relevant sets of genes. Similarly, given the almost universal use of Notch in cell fate renewal and transition, a central question in developmental biology is how specific parts of the Notch-depend-ent transcriptional program are used selectively, depending on the cellular context6,8,44.
We identified Bcl6, a widely studied lymphoma oncogene, as a proneurogenic factor and selective regulator of Notch-dependent transcription during cortical neurogenesis (Supplementary Fig. 7i). BCL6 acts by modifying the composition of transcriptional com-plexes and chromatin structure at the promoter of the Notch target gene Hes5. By selective binding to the Hes5 promoter, BCL6 excludes Maml1 from the Notch transcriptional complex, preventing transcrip-tional activation, and recruits the NAD+-dependent deacetylase Sirt1, which results in histone deacetylation and consequent epigenetic silencing of Hes5. BCL6 therefore acts as an essential trigger for the neurogenic conversion of NPCs into neurons.
In the cerebral cortex, the Notch pathway promotes self-renewal of RGCs, but it is also active later on during the neurogenic transition13, as well as in differentiated neurons14–16. This raises the question of how cells switch their competence to respond to Notch signaling dur-ing cortical neurogenesis in a selective way. Although various negative regulators of Notch signaling have been identified during neurogen-esis45,46, most of them appear to inhibit generic components of the Notch pathway rather than specific transcriptional targets. Similarly, various transcriptional co-repressors have been identified that can repress Notch target gene expression, including Sirt1 (ref. 41), but are thought to act mainly in the absence of active Notch signaling, and it remains unknown how they are able to repress differentially specific NICD/CSL targets12.
In contrast, our data point to a role for BCL6 in selective regulation of Notch signaling, as it appears to act as a site-specific repressor of defined Notch transcriptional targets such as Hes5. Similarly, BCL6 was shown to repress a selected set of Notch target genes during the establishment of left-right asymmetry in Xenopus laevis, where it appears to act through the exclusion of Maml1 (ref. 38). This sug-gests that BCL6 may contribute to target-specific restriction of Notch signals in a wide variety of cellular contexts. On the other hand, the Hamlet transcription factor was recently reported to modulate Drosophila olfactory neuron specification through selective repres-sion of Notch-dependent targets in a cell context–dependent fashion, reminiscent of our observations with BCL6 (ref. 47).
Although our data suggest that Hes5 repression is an important mechanism of action of BCL6 during neurogenesis, other target genes are likely to be involved. Future work should investigate the transcrip-tional targets of BCL6 at the genome-wide level and determine which of these are actually targeted by the Notch-CSL complex and/or involve the recruitment of Sirt1, not only during cortical neurogenesis, but also during later aspects of cortical development, given the prominent expression of BCL6 in postmitotic pyramidal neurons. Conversely, it will be important to determine the upstream factors that trigger the upregulation of BCL6 during the neurogenic transition. The impor-tance of regional expression of BCL6 in distinct areas of the cortex, with the highest levels of expression occurring in frontal/parietal regions, also remains to be investigated, as it may reveal a link between the regulation of neurogenesis and cortical areal patterning21.
Finally, our findings uncover for the first time, to the best of our knowledge, a direct molecular link between BCL6 and Sirt1. Sirt1 deacetylase activity has been associated with a wide variety of protein substrates and cellular processes, from metabolic control to onco-genesis39. These processes include neurogenesis and gliogenesis, in which Sirt1 has been proposed to act as a sensor linking cell fate and metabolic state40,48. Although our findings suggest that histones are the most critical substrates of Sirt1 in the context of Hes5 repression, consistent with a recent study linking Notch target repression and Sirt1 in Drosophila41, other proteins present at the Hes5 locus may be targeted by Sirt1 deacetylation, including NICD itself42. Our data raise the possibility that BCL6-dependent Sirt1 recruitment to specific pro-moters may represent a more general mechanism in other processes in which BCL6 is involved. Conversely, BCL6 could be involved in other Sirt1-dependent processes in physiology and disease, including synaptic plasticity49 and neurodegeneration50. Future work should reveal which other processes are regulated by the BCL6-Notch-Sirt1 ménage à trois.
METHODSMethods and any associated references are available in the online version of the paper.
Note: Supplementary information is available in the online version of the paper.
AcknowledgmentSWe thank G. Vassart for continuous support and interest, D. Christophe and members of the Vanderhaeghen lab and Institute for Interdisciplinary Research for helpful discussions and advice, F. Bollet-Quivogne (Fonds National de la Recherche Scientifique (FNRS) Logistic Scientist) of the Light Microscopy Facility for his support with imaging, R. Dalla-Favera (Columbia University) for generously sharing Bcl6−/− mice, F. Guillemot (National Institute of Medical Research) for kindly providing P19 cells, and G. Del Sal ((Laboratorio Nazionale CIB) Trieste) for the pCS2-N∆E construct, and B. Hassan, A. Soldano and K. De Backer for critically reading the manuscript. This work was funded by grants from the Belgian Queen Elizabeth Medical Foundation, the Fondations Pierre Clerdent and Roger de Spoelberch, the Action de Recherches Concertées Programs, the Interuniversity Attraction Poles Program, Belgian State, Federal Office for Scientific, Technical and Cultural Affairs, the Belgian FNRS and Fonds pour la Recherche Scientifique Médicale, and the Welbio and Programme d’Excellence CIBLES of the Walloon Region (to P.V.), as well as an EMBO Long-Term Fellowship (to L.T.) and a Marie Curie Fellowship (to T.B.). P.V. is Research Director, L.T. Postdoctoral Fellow, and J.v.d.A. and J.P. Research Fellows of the FNRS.
AUtHoR contRIBUtIonSL.T., J.v.d.A., J.D., J.P., D.G., A.H., A.B. and J.B. performed all experiments. T.B., M.I. and M.K. provided crucial cell reagents. L.T., J.v.d.A. and P.V. designed and analyzed all experiments and wrote the manuscript.
comPetIng FInAncIAl InteReStSThe authors declare no competing financial interests.
npg
© 2
012
Nat
ure
Am
eric
a, In
c. A
ll rig
hts
rese
rved
.
nature neurOSCIenCe VOLUME 15 | NUMBER 12 | DECEMBER 2012 1635
a r t I C l e S
Published online at http://www.nature.com/doifinder/10.1038/nn.3264. Reprints and permissions information is available online at http://www.nature.com/reprints/index.html.
1. Hsieh, J. & Gage, F.H. Chromatin remodeling in neural development and plasticity. Curr. Opin. Cell Biol. 17, 664–671 (2005).
2. Yoo, A.S. & Crabtree, G.R. ATP-dependent chromatin remodeling in neural development. Curr. Opin. Neurobiol. 19, 120–126 (2009).
3. Hirabayashi, Y. & Gotoh, Y. Epigenetic control of neural precursor cell fate during development. Nat. Rev. Neurosci. 11, 377–388 (2010).
4. Bertrand, N., Castro, D.S. & Guillemot, F. Proneural genes and the specification of neural cell types. Nat. Rev. Neurosci. 3, 517–530 (2002).
5. Kageyama, R., Ohtsuka, T., Shimojo, H. & Imayoshi, I. Dynamic Notch signaling in neural progenitor cells and a revised view of lateral inhibition. Nat. Neurosci. 11, 1247–1251 (2008).
6. Louvi, A. & Artavanis-Tsakonas, S. Notch signaling in vertebrate neural development. Nat. Rev. Neurosci. 7, 93–102 (2006).
7. Pierfelice, T., Alberi, L. & Gaiano, N. Notch in the vertebrate nervous system: an old dog with new tricks. Neuron 69, 840–855 (2011).
8. Kopan, R. & Ilagan, M.X. The canonical Notch signaling pathway: unfolding the activation mechanism. Cell 137, 216–233 (2009).
9. Ohtsuka, T., Sakamoto, M., Guillemot, F. & Kageyama, R. Roles of the basic helix-loop-helix genes Hes1 and Hes5 in expansion of neural stem cells of the developing brain. J. Biol. Chem. 276, 30467–30474 (2001).
10. Shimojo, H., Ohtsuka, T. & Kageyama, R. Oscillations in notch signaling regulate maintenance of neural progenitors. Neuron 58, 52–64 (2008).
11. Kawaguchi, D., Yoshimatsu, T., Hozumi, K. & Gotoh, Y. Selection of differentiating cells by different levels of delta-like 1 among neural precursor cells in the developing mouse telencephalon. Development 135, 3849–3858 (2008).
12. Borggrefe, T. & Liefke, R. Fine-tuning of the intracellular canonical Notch signaling pathway. Cell Cycle 11, 264–276 (2012).
13. Mizutani, K., Yoon, K., Dang, L., Tokunaga, A. & Gaiano, N. Differential Notch signaling distinguishes neural stem cells from intermediate progenitors. Nature 449, 351–355 (2007).
14. Redmond, L., Oh, S.R., Hicks, C., Weinmaster, G. & Ghosh, A. Nuclear Notch1 signaling and the regulation of dendritic development. Nat. Neurosci. 3, 30–40 (2000).
15. Sestan, N., Artavanis-Tsakonas, S. & Rakic, P. Contact-dependent inhibition of cortical neurite growth mediated by notch signaling. Science 286, 741–746 (1999).
16. Hashimoto-Torii, K. et al. Interaction between Reelin and Notch signaling regulates neuronal migration in the cerebral cortex. Neuron 60, 273–284 (2008).
17. Kriegstein, A. & Alvarez-Buylla, A. The glial nature of embryonic and adult neural stem cells. Annu. Rev. Neurosci. 32, 149–184 (2009).
18. Noctor, S.C., Martinez-Cerdeno, V., Ivic, L. & Kriegstein, A.R. Cortical neurons arise in symmetric and asymmetric division zones and migrate through specific phases. Nat. Neurosci. 7, 136–144 (2004).
19. Miyata, T. et al. Asymmetric production of surface-dividing and non–surface-dividing cortical progenitor cells. Development 131, 3133–3145 (2004).
20. Malatesta, P., Hartfuss, E. & Gotz, M. Isolation of radial glial cells by fluorescent-activated cell sorting reveals a neuronal lineage. Development 127, 5253–5263 (2000).
21. Tiberi, L., Vanderhaeghen, P. & van den Ameele, J. Cortical neurogenesis and morphogens: diversity of cues, sources and functions. Curr. Opin. Cell Biol. 24, 269–276 (2012).
22. Götz, M. & Huttner, W.B. The cell biology of neurogenesis. Nat. Rev. Mol. Cell Biol. 6, 777–788 (2005).
23. Okano, H. & Temple, S. Cell types to order: temporal specification of CNS stem cells. Curr. Opin. Neurobiol. 19, 112–119 (2009).
24. Gaspard, N. et al. An intrinsic mechanism of corticogenesis from embryonic stem cells. Nature 455, 351–357 (2008).
25. Gaspard, N. & Vanderhaeghen, P. Mechanisms of neural specification from embryonic stem cells. Curr. Opin. Neurobiol. 20, 37–43 (2010).
26. Chang, C.C., Ye, B.H., Chaganti, R.S. & Dalla-Favera, R. BCL-6, a POZ/zinc-finger protein, is a sequence-specific transcriptional repressor. Proc. Natl. Acad. Sci. USA 93, 6947–6952 (1996).
27. Ye, B.H. et al. Alterations of a zinc finger-encoding gene, BCL-6, in diffuse large-cell lymphoma. Science 262, 747–750 (1993).
28. Iacovino, M. et al. Inducible cassette exchange: a rapid and efficient system enabling conditional gene expression in embryonic stem and primary cells. Stem Cells 29, 1580–1588 (2011).
29. van den Ameele, J. et al. Eomesodermin induces Mesp1 expression and cardiac differentiation from embryonic stem cells in the absence of Activin. EMBO Rep. 13, 355–362 (2012).
30. Ye, B.H. et al. The Bcl6 proto-oncogene controls germinal-centre formation and Th2-type inflammation. Nat. Genet. 16, 161–170 (1997).
31. Phan, R.T. & Dalla-Favera, R. The Bcl6 proto-oncogene suppresses p53 expression in germinal-centre B cells. Nature 432, 635–639 (2004).
32. Otaki, J.M., Hatano, M., Matayoshi, R., Tokuhisa, T. & Yamamoto, H. The proto-oncogene Bcl6 promotes survival of olfactory sensory neurons. Dev. Neurobiol. 70, 424–435 (2010).
33. Zhang, S.J. et al. Decoding NMDA receptor signaling: identification of genomic programs specifying neuronal survival and death. Neuron 53, 549–562 (2007).
34. Bedogni, F. et al. Tbr1 regulates regional and laminar identity of postmitotic neurons in developing neocortex. Proc. Natl. Acad. Sci. USA 107, 13129–13134 (2010).
35. Funatsu, N., Inoue, T. & Nakamura, S. Gene expression analysis of the late embryonic mouse cerebral cortex using DNA microarray: identification of several region- and layer-specific genes. Cereb. Cortex 14, 1031–1044 (2004).
36. Leamey, C.A. et al. Differential gene expression between sensory neocortical areas: potential roles for Ten_m3 and Bcl6 in patterning visual and somatosensory pathways. Cereb. Cortex 18, 53–66 (2008).
37. Ong, C.T. et al. Target selectivity of vertebrate notch proteins. Collaboration between discrete domains and CSL-binding site architecture determines activation probability. J. Biol. Chem. 281, 5106–5119 (2006).
38. Sakano, D. et al. BCL6 canalizes Notch-dependent transcription, excluding Mastermind-like1 from selected target genes during left-right patterning. Dev. Cell 18, 450–462 (2010).
39. Herranz, D. & Serrano, M. SIRT1: recent lessons from mouse models. Nat. Rev. Cancer 10, 819–823 (2010).
40. Hisahara, S. et al. Histone deacetylase SIRT1 modulates neuronal differentiation by its nuclear translocation. Proc. Natl. Acad. Sci. USA 105, 15599–15604 (2008).
41. Mulligan, P. et al. A SIRT1-LSD1 co-repressor complex regulates Notch target gene expression and development. Mol. Cell 42, 689–699 (2011).
42. Guarani, V. et al. Acetylation-dependent regulation of endothelial Notch signaling by the SIRT1 deacetylase. Nature 473, 234–238 (2011).
43. Min, S.W. et al. Acetylation of tau inhibits its degradation and contributes to tauopathy. Neuron 67, 953–966 (2010).
44. Bray, S. & Bernard, F. Notch targets and their regulation. Curr. Top. Dev. Biol. 92, 253–275 (2010).
45. Hoeck, J.D. et al. Fbw7 controls neural stem cell differentiation and progenitor apoptosis via Notch and c-Jun. Nat. Neurosci. 13, 1365–1372 (2010).
46. Sabharwal, P., Lee, C., Park, S., Rao, M. & Sockanathan, S. GDE2 regulates subtype-specific motor neuron generation through inhibition of Notch signaling. Neuron 71, 1058–1070 (2011).
47. Endo, K. et al. Chromatin modification of Notch targets in olfactory receptor neuron diversification. Nat. Neurosci. 15, 224–233 (2012).
48. Prozorovski, T. et al. Sirt1 contributes critically to the redox-dependent fate of neural progenitors. Nat. Cell Biol. 10, 385–394 (2008).
49. Gao, J. et al. A novel pathway regulates memory and plasticity via SIRT1 and miR-134. Nature 466, 1105–1109 (2010).
50. Donmez, G., Wang, D., Cohen, D.E. & Guarente, L. SIRT1 suppresses beta-amyloid production by activating the alpha-secretase gene ADAM10. Cell 142, 320–332 (2010).
npg
© 2
012
Nat
ure
Am
eric
a, In
c. A
ll rig
hts
rese
rved
.
nature neurOSCIenCe doi:10.1038/nn.3264
ONLINE METHODScell culture and differentiation. ICE (A2lox.Cre) mouse ESCs28 were routinely propagated on irradiated mouse embryonic fibroblasts in DMEM (Invitrogen) supplemented with 15% ESC-certified fetal bovine serum (vol/vol, Invitrogen), 0.1 mM nonessential amino acids (Invitrogen), 1 mM sodium pyruvate (Invitrogen), 0.1 mM β-mercaptoethanol (Sigma), 50 U ml−1 penicillin/streptomycin and 103 U ml−1 leukemia inhibitor factor (ESGRO). For differen-tiation, ESC were plated at low density (20 × 103 ml−1) on gelatin-coated coverslips and cultured as previously described51. P19 cells (a gift from F. Guillemot) were routinely cultured as a monolayer in DMEM supplemented with 10% fetal bovine serum, 1% l-glutamine (vol/vol) and 1% penicillin/streptomycin (vol/vol).
Plasmids. The coding sequence of BCL6 was amplified by PCR from cDNA with an N-terminal Myc tag, sequence verified and cloned into the p2lox plas-mid28 and pCAG. The coding sequence of Hes5 was amplified by PCR from cDNA and cloned into pCAG-IRES-GFP (pCIG). pCS2-N1∆E was a kind gift from G. Del Sal (LNCIB Trieste). Double-stranded oligonucleotides coding for Bcl6 shRNA #1 (target sequence, 5′-gacacggatctgagaatct-3′)31, Bcl6 shRNA #2 (target sequence, 5′-tgatgttcttctcaaccttaa-3′)33 and control shRNA (target sequence, 5′-actaccgttgttataggtg-3′) were cloned downstream of the U6 promoter into the pSilencer2.1-CAG-Venus (pSCV2)-plasmid (a kind gift from F. Polleux, the Scripps Research Institute) according to the pSilencer instructions from Ambion. A fragment of the Hes5 promoter (from −1,324 to 0 bp) was amplified by PCR from genomic DNA, sequence verified and cloned into the pGL3 basic vector (Promega). We deleted 8 bp (–875 to −868 bp) of the BCL6 binding site by PCR-mediated ligation (primers: forward, 5′-ggcagccatggTAgccacgcgggagtagtgatc-3′; reverse, 5′-tcccgcgtggcTAccatggctgcccttaactcc-3′).
generation of a tetracyclin-inducible mycBcl6 eSc line. A tetracyclin-inducible MycBCL6 ESC line was generated as described previously28,29. Briefly, 5 × 10⁶ ICE (A2lox.Cre) ESCs were electroporated with the p2lox-MycBCL6 vector, allowing unidirectional recombination of the transgene in the Hprt locus. Clones were screened by immunofluorescence against BCL6 after 24 h in the absence or presence of 1 µg ml−1 doxycyclin to verify transgene expression. Results were confirmed in three independent clones.
transactivation assay. Transactivation assays were performed in P19 cells using a 1,324-bp Hes5 promoter upstream of Luciferase52. For transfection, P19 cells were seeded at 25 × 103 cells per 24 wells and transfected 24 h later using Lipofectamin2000 reagent52 with 10 ng of pRL-TK and 200 ng of pHes5-pGL3, with or without 200 ng of pCS2-N1∆E and 200 ng of pCAG-BCL6. pCIG was used as control vector up to a final DNA amount of 800 ng. Renilla and firefly luciferase activities were measured after 48 h using a Dual Luciferase kit (Promega). Data from five independent experiments are presented as firefly luciferase activity relative to renilla luciferase activity and subsequently normalized to the mean of the control conditions.
RnA isolation and qRt-PcR. For total RNA preparation, cells were lysed in RNeasy lysis buffer + 1% β-mercaptoethanol (vol/vol), and RNA was isolated using RNeasy RNA preparation minikit (Qiagen) according to the manufac-turer’s instructions. Reverse transcription was done using Superscript II kit and protocol (Invitrogen). Quantitative PCR (qPCR) was performed in duplicate using Power SybrGreen Mix and a 7500 Real-Time PCR System (Applied Biosystems). Results are presented as linearized Ct values normalized to the housekeeping gene Tbp and the indicated reference value (2-∆∆Ct). The results of qRT-PCR following ex utero electroporation were normalized to the mean value of all GFP electroporations for each litter separately. The primers used are summarized in Supplementary table 1.
western blot, co-IP, chIP, chIP qPcR and emSA. Western blot and Co-IP were performed as previously described on dissected E10.5, E12.5, E14.5, E15.5, E16.5 and E18.5 cortex53. ChIP was performed as described previously53 on dif-ferentiating ESCs or dissected E12.5 or 15.5 cortex. qPCR analysis was performed in duplicate using primers amplifying genomic DNA encompassing consensus BCL6 or CSL binding sites. Primers are summarized in Supplementary table 1.
Results were analyzed comparing the particular antibody to the input and pre-sented as a percentage of the input. EMSA was performed as described54 on P19 cells transfected with pCIG or pCAG-MycBCL6. Briefly, 50 fM DIG-labeled probe and 1 µg of nuclear proteins were used. The antibody detection reaction was performed with a CDP-Star (Roche cat. no.1685627). Competitive EMSA was performed by adding a 5- or 50-fold molar excess of unlabeled double-stranded oligonucleotide (competitor) to the mixture. The wild-type oligonucleotide (sense, aaggcagccatggtttcctaaaagccacg; antisense, aacgtggcttttaggaaaccatggctgcc) corresponded to the endogenous sequence of the Hes5 promoter containing the BCL6 binding site, whereas the mutant oligonucleotides (sense, aaggcagccatggtt-gcccaacagccacg; antisense, aacgtggctgttgggcaaccatggctgcc) contained a mutation in the BCL6 binding site.
Immunofluorescence staining and immunohistochemistry. Cells were fixed in 4% paraformaldehyde (wt/vol) for 30 min and washed three times in phosphate- buffered saline (PBS). Embryos and P0 pups were fixed by perfusion with 4% paraformaldehyde and where appropriate cryoprotected in 30% sucrose (wt/vol, Merck). Immunofluorescence stainings were performed on coverslips, 20-µm-thick cryosections or 60–100-µm vibratome sections. Blocking solution con-sisted of PBS supplemented with 5% horse serum (Invitrogen), 0.3% Triton X-100 (Sigma) and 3% bovine serum albumin (BSA, vol/vol, Sigma). Antibody solution consisted of PBS supplemented with 1% horse serum, 0.1% Triton X-100 and 3% BSA. Primary antibodies were incubated overnight at 4 °C and secondary during 2 h at 15–25 °C. Nuclei were stained with bisbenzimide (Hoechst#33258, Sigma). Sections and coverslips were mounted with glycergel (DAKO). EdU revelation was performed with a solution containing 100 mM Tris, 1 mM CuSO4, 100 mM ascorbic acid and fluorescent azide (Alexa Fluor 488 Azide, Invitrogen).
Immunohistochemistry was performed in 4-µm-thick paraffin sections30. Briefly the slides were deparaffinized with toluene, rehydrated and antigen retrieval was performed by incubating slices for 30 min in retrieval solution in a water bath at 98 °C. Retrieval solution consisted of 10 mM EDTA and 0.2% Tween-20 (vol/vol) at pH 7.5. BCL6 primary antibody (Santa Cruz N3 sc-858) diluted (1:25) in PBS with 3% horse serum and 0.1% Triton X-100 was incubated overnight at 4 °C and afterwards for 1 h at 15–25 °C with a biotin-conjugated antibody to rabbit (Jackson ImmunoResearch 711-065-152) diluted (1:250) in PBS with 3% horse serum with 0.1% Triton X-100. ABC solution was used 2 h at 15–25 °C (Vectastain Elite ABC Kit Standard PK-6100). The sections were incubated with the substrate at 15–25 °C until suitable staining was observed (DAB Peroxidase Substrate Kit, SK-4100).
For BCL6-Tbr2 and BCL6-Pax6 double labeling, paraffin sections were first processed for BCL6 immunofluorescence with tyramide signal amplification (TSA kit T30954, Invitrogen), and then for Pax6 or Tbr2 IF. Double labeling was confirmed using confocal immunofluorescence (single optical section, thickness = 1 µm in Fig. 2a–c,g–i and 0.38 µm in Fig. 2d–f,j–l). All BCL6 immunostainings were controlled negatively with sections of Bcl6−/− mice, which did not display any substantial staining (Supplementary Fig. 2 and data not shown).
Antibodies. For primary antibodies, we used antibodies to β3-tubulin (TuJ1, MMS435P, Covance), Tbr2 (ab23345, Abcam), Cux1 (sc-13024, Santa Cruz Biotechnology), BCL6 (sc-858, Santa Cruz Biotechnology), Ki67 (ab15580, Abcam), GFP (ab13970, Abcam), Nestin (ab6142, Abcam), pH3 (10543, Abcam), Ctip2 (ab18465, Abcam), Tbr1 (Eurogentec), Pax6 (PRB278P, Covance), cleaved caspase 3 (MAB835, R&D), N1ICD (2421, Cell Signaling), Sirt1 (Co-IP, sc-15404, Santa Cruz Biotechnology), Sirt1 (ChIP, 07-131, Millipore), H1.4K26Ac (H7789, Sigma), H4K16Ac (07-329, Millipore) and control-IgG (sc-805, Santa Cruz Biotechnology). For secondary antibodies (1:400), we used donkey antibodies to mouse (715-166-150), goat (705-165-147) and rabbit (711-165-152, 711-175-152) coupled to cyanin-3 or cyanin-5 (Jackson ImmunoResearch) or donkey antibodies to mouse (A21202), goat (A11055) and rabbit (A21206) coupled to Alexa Fluor 488 (Molecular Probes).
mice, in utero and ex utero electroporation. All mouse experiments were per-formed with the approval of the Université Libre de Bruxelles Committee for animal welfare. The Bcl6+/− mice (mixed C57BL/6 and CD1 background), in which the null allele lacked exons 4–10, were a generous gift from R. Dalla-Favera (Columbia University)30. For EdU labeling, timed-pregnant female mice were
npg
© 2
012
Nat
ure
Am
eric
a, In
c. A
ll rig
hts
rese
rved
.
nature neurOSCIenCedoi:10.1038/nn.3264
injected intraperitoneally with a single pulse (50 mg per kg of body weight) of EdU and killed after 1 or 24 h. In utero surgery and electroporation were performed as described55. Briefly, timed pregnant CD1 mice at E13.5 or E12.5 were anesthesized and their uterus was exposed. A solution of pCIG, pCAG-MycBCL6 or pCIG-Hes5 (total concentration of 1 µg µl−1), or pSCV2–Bcl6 shRNA or pSCV2–control shRNA (0.5 µg µl−1) together with pCIG-GFP or pCAG-MycBCL6 (1 µg µl−1) was injected into one lateral ventricle of in utero embryos or both ventricles of ex utero embryos, and 5–8 electric pulses at 30 V at E13.5 or 25 V at E12.5, were delivered using forceps-type electrodes. After ex utero electroporation, brains were dissected and 300-µm-thick vibratome sections were cultured for 24 h (ref. 56) after which the GFP-expressing regions were microdissected under a fluorescent binocular microscope and further processed for RNA extraction.
Statistical analysis. Unless stated otherwise, data are presented as mean + s.e.m. of at least three biologically independent in vitro experiments, or of 3–13 embryos from two to five different litters. For quantification of cell numbers in vitro, at least 200 cells were counted in five different fields from at least three biologically independent experiments; for in vivo cell counting, all positive cells were counted in a 100- or 200-µm-wide area of the cortex, where appropriate at three rostro-caudal levels, carefully matched between animals. For quantification of pH3, all positive cortical progenitors were counted per brain section. Whenever possible, quantifications were performed blind to genotype or condition, and no animals or data points were excluded during the analysis. Two-sided Student’s t test was used for calculating significance values.
In situ RnA hybridization. In situ RNA hybridization using DIG-labeled RNA probes on brain cryosections was performed as described57. All hybridization results obtained with antisense probes were compared with control sense probes. In situ hybridization probes for Bcl6: bp 1,088–1,828 (Supplementary Fig. 2a–l), bp 102–331 and bp 928–1,576 (data not shown) of the mRNA (NCBI reference sequence: NM_009744.3).
Imaging. Pictures of the in situ RNA hybridization, immunohistochemistry and immunofluorescence staining were acquired with an Axioplan2 Zeiss microscope and a Spot RT camera, or with a LSM510 Zeiss Confocal.
electrophysiology. Whole-cell patch-clamp recordings were performed on ESC-derived individual neurons identified as previously described24. All record-ings were made with a Dual EPC10 amplifier and acquired using Pulse soft-ware (HEKA). Signals were filtered at 4 kHz using the built-in filter of EPC10 and digitally sampled at 20 kHz. Data were analyzed with Igor Pro software (WaveMetrics). The presence of voltage-gated sodium current was assessed by submitting the cells to a depolarizing step to 0 mV from a holding potential of −70 mV. Intrinsic excitability was investigated in current clamp by setting membrane potential at −70 mV and injecting 1-s step current pulses with 10-pA increments. Spontaneous excitatory postsynaptic currents were recorded at a holding potential of −70 mV. To further check the nature of spontaneous postsynaptic currents, we used 6-cyano-7-nitroquinoxaline-2,3-dione (10 µM) and d-(-)-2-amino-5-phosphonopentanoic acid (10 µM) to block AMPA and NMDA receptors, respectively.
51. Gaspard, N. et al. Generation of cortical neurons from mouse embryonic stem cells. Nat. Protoc. 4, 1454–1463 (2009).
52. Heng, J.I. et al. Neurogenin 2 controls cortical neuron migration through regulation of Rnd2. Nature 455, 114–118 (2008).
53. Rustighi, A. et al. The prolyl-isomerase Pin1 is a Notch1 target that enhances Notch1 activation in cancer. Nat. Cell Biol. 11, 133–142 (2009).
54. Takeda, N. et al. Bcl6 is a transcriptional repressor for the IL-18 gene. J. Immunol. 171, 426–431 (2003).
55. Saito, T. & Nakatsuji, N. Efficient gene transfer into the embryonic mouse brain using in vivo electroporation. Dev. Biol. 240, 237–246 (2001).
56. Dufour, A. et al. Area specificity and topography of thalamocortical projections are controlled by ephrin/Eph genes. Neuron 39, 453–465 (2003).
57. Depaepe, V. et al. Ephrin signalling controls brain size by regulating apoptosis of neural progenitors. Nature 435, 1244–1250 (2005).
npg
© 2
012
Nat
ure
Am
eric
a, In
c. A
ll rig
hts
rese
rved
.